handprinted symbol recognition system
TRANSCRIPT

Pattern R~'ct,¢mr£on. Vol. 21. %o 2. pp gl l lg. log8 Printed in Great Britain. Pergamon Press pie
Pattern Rect,gntttt~n ~c le !
HANDPRINTED SYMBOL RECOGNITION SYSTEM*
R. M. BROWN, T. H. FAY and C. U WALKER+
Pattern Analysis Laboratory, Naval Ocean Research and Development Activity, NSTL, MS 39529-5004. U.S.A.
(Receired 29 January 1987)
Abstract--In this paper the design characteristics of a recognition system for unconstrained handprinted symbols are described. The targeted symbols and accuracy requirements from a mapping and charting environment posed problems requiring the development of new OCR techniques. The recognition system employs smart thinning algorithms to produce centerline thinned stick figure images from raster scanned characters. The recognition logic interacts with the feature extraction algorithms to extract just those topological, geometrical and local measurements that are needed to identify the character or to reject the character as unrecognizable. Results from a numeric character data base consist of some 7000 numerals collected from a broad spectrum of sources and yield an efficiency rate of 97%. Substitution error rate is 0.3~, and rejection rate is 2.7~ o. Preliminary results for the recognition of alphabetic characters are also discussed.
Optical character recognition Handprint Thinning Rccognition tree Unthinnable regions Feature extraction OCR Symbol recognition
I . I N T R O D U C T I O N
Over the past few years, the Pattern Analysis Laboratory in the Mapping, Charting and Geodesy Division of the Naval Ocean Research and Develop- ment Activity has developed a tlandprint Symbol Recognition System capable of digitizing and reading a wide variety of isolated, unconstrained, freeform, handprinted symbols appearing on various map- and chart-related documents (bathymetry smooth sheets, digital feature analysis data, reference sheets, internal numbers on contour elevation sheets, etc.). This recognition system has been successfully applied to numeric and alphabetic characters and has been documented in several technical notes and reportsfl 4~ The requirements in a mapping and charting environment for extremely high accuracy rates and for the recognition of unconstrained, freeform, handprint dictated the development of new "OCR" techniques. The system to be described here has achieved remarkable accuracies in recognizing numeric characters.
The Pattern Analysis Laboratory optical character recognition system (Fig. I) is a software package for recognizing isolated handprinted alphanumeric characters. The package incorporates shape measure- ment and recognition tools that provide for expansion
* Much of the work presented here was done by the first author, but the information was only incorporated into technical notes he was preparing before his untimely death in 1985.
t To whom correspondence should be addressed.
of the system to include the recognition of foreign diacritics, and other map and chart symbols. Referring to Fig. I, the general modules shown outside the dashed box were developed primarily by the Measure- ment Concept Corporation under contract to Rome Air Development Center. The system within the dashed box, whose description constitutes the major portion of this article, is composed of three main modules (preprocessing, feature extraction and decision logic) that perform two major functions: thin characters and recognize characters. The decision to separate these three fundamental parts of the system for investigation was critical to the progress on each module and on the system as a whole. It provided for the efficiency and performance of each module to be analysed and then synthesized into the whole system.
An input character is scanned and digitized on an optical scanner to produce a digital image consisting of a matrix of black and white points (pixels). This binarized image is put through preprocessing routines that smooth the image and eliminate noise+ artificial holes and other artifacts produced by the scanning and digitizing process. The approach of this software is to obtain a high degree of discrimination by extracting simple, easily detectable features that are predefined in a first-level feature extractor. The final classification is accomplished by a second-level local analysis of the character. Within the taxonomical hierarchy used to define the recognition tree, the structural or qualitative analysis has priority (first-level topological feature extraction); if this analysis is unambiguous, the recognition is terminated by character labeling. Otherwise, the recognition system shifts into a numeric
91

92 R.M. Brown. T. H. F.a~ and C. L. WALKER
SCANNER
L_
t 1 l, SCAN
CHARACTERSJ
DIGITIZE ] CHARACTERS]
ISOLATE CHARACTERS
I I CHARACTERSI
1 RECOGNIZE
CHARACTERS
HSR SCOPE
HANDPRINTED DATA INPUT
COMPOSE CHARACfER
GROUPS
t ouTpu, I NFORMATION]
Fig. 1. Character recognition.
feature test mode and computes only those features that are needed to resolve the ambiguity of the structural analysis.
It is important to recognize the influence of the map and chart environment upon the design requirements: hence, we give some attention to this in the following section of this paper. Any character recognition system that relies on thinning, as this one does, is only as good as its preprocessor and thinning algorithm; consequently we give considerable detail in the preprocessing section. A section discussing feature extraction and the recognition decision logic con- stitutes the main body of the paper. Results of the system applied to numeric and alphabetic data conclude the article.
2. CONSTRAINTS
Maps and charts are complex, two-dimensional
representations of significant information about the environment. The information contained on these products provides an abstracted structure or model of the real world from which the data was collected: aerial and satellite imagery, many different kinds of surveys {hydrographic, topographic, magnetic, gravitic, etc.), census data, book and records, and so on. Over the past few years there has been considerable effort put forth by various agencies to automate various aspects of map and chart production, in particular, to store and retrieve maps and charts from computer data bases. The development of the recognition system under discussion was undertaken in the hope that such a system would assist in transitioning collected real-world data into digital format maps and charts; that is, to assist in what is now being called Automated Cartography. A critical link to automated cartographic information extraction and transforma- tion is the ability to automatically recognize symbols

Handprinted symbol recognition system 93
on the analog documents and convert them and their associated attributes (including information such as position, size, font, etc.) to all-digital information storage schemes.
The Pattern Analysis Laboratory chose (perhaps for obvious reasons} naval hydrographic "Smooth Sheets" as its source of handprinted numeric charac- ters. Smooth sheets are the end product of hydrographic surveys and consist of corrected water depth soundings properly located on a plotting sheet. They are the archival hydrographic data storage medium and have been used to transmit survey data between the Naval Oceanographic Office and the Defense Mapping Agency; as such, they constitute a primary data source in the production of hydrographic charts. The very high accuracy require- ments for nautical charts imposes unusual problems for the automated digitization of smooth sheet data: errors in soundings must be held to an absolute minimum. The performance requirements for the recognition system were given as "the minimum correct sounding determination rate is 9570". Accord- ingly, the accuracy requirement for OCR algorithms for use in the system under development was set at approx. 99.77,,, i.e. 0.3)~ undetected substitution errors at the isolated symbol level (soundings generally are composed of several isolated symbols).
The task of recognizing isolated, free-form, charac- ters includes the following:
• character preprocessing, • stroke generation, • context, • shape, • feature extraction, • decision logic, • quality assurance.
The primary problems associated with this task are in the nature of "'information coding". This uncon- strained coding problem consists of two parts:
(1) the meaning of the character is not explicitly represented in a fixed geometrical form but is constrained in a complex measure of the relative shape of various parts of the symbol. Symbols of the same class can range widely in style, geometric detail, and construction, e.g. pen width.
(2) the characters do not appear in a regular or standardized "'layout"; they can vary widely in size, orientation, positioning and spacing. For example, the orientation and spacing can change within a word as in the case of names that are laid out along an extended cartographic feature, such as a mountain range or a river.
The recognition problem is even more complicated by the requirement of high performance, both in accuracy and efficiency, over a wide range of input data. To deal successfully with these problems the recognition system developed is almost independent of the orientation, size, and shape or style of the input data. Furthermore, the system has been implemented
in such a manner that the control of its performance is determined by its design. The accuracy is basically determined by the recognition logic, which employs a quality assurance module to guarantee that labeled characters have a very high probability of being properly recognized, i.e. the system can identify "unrecognizable" characters with its current decision logic and "reject" them instead of running the risk of misrecognizing them (undetected substitution error). Thus ill-formed or otherwise rejected characters are flagged for manual recognition or editing. The efficiency of the system is the percentage of characters labeled and is primarily a function of the input quality of the data (provided, of course, the data set is one for which the system has been "trained").
3. PREPROCESSING
There are important interactions between the preprocessing of character images and the feature extraction process. Feature extraction or shape measurement can be misled if the images have little or no preprocessing. Noise-contaminated descriptions of character images can lead to mislabeling by the recognition logic. Similarly there are interactions between feature extraction and the decision logic. It was decided early in the development of the recognition system to treat these three functions as if they stood alone. This approach made it difficult to attack and optimize each of these modules. However, once one module was separated, the separation of the others was easier. Several important concepts were developed from the analysis of the preprocessing module:
• stroke concept and information content, • model of the pen, • problems in using the Medial Axis Transformation
(MAT) for generating stroke information, • unthinnable regions (UR), • special knowledge expert submodules (SKE) for
unthinnable regions, • detection schemes for identifying unthinnable
regions, • application of sufficient class membership rules at
the preprocessing level.
The input to the preprocessor is a raster-scanned, binary-sampled image of an isolated character. To preserve the inherent information contained in the original image on the analog document, the scanner threshold must be carefully set. A heuristic model for this information content was used. It was assumed that the original printed character was made with definite thin-line strokes and that these strokes contain the inherent information. This points out the difference between alphanumeric characters and other symbols, such as a filled-in square or a period. The analysis of the stroke concept led to the concept of a model for a pen and the analysis of line weight-to-size ratio. When this ratio is too large, the individual strokes of a
94 R.M. BRov,",;, T. H. FAY and C. L. ~'ALKER
character are no longer distinguishable, as can be seen in a ~6" with a filled-in loop. With a model of ' s t roke" and of "pen". it was sometimes possible to reconstruct a thin-line stick figure that contained the correct stroke information.
Use of the pen model incorporating smart algorithms permits the recovery of overlapping strokes, and so that, for example, a filled-in ~6" is distinguishable from a filled in circle (a period) in that the former was formed by a stroke while the latter was not. Thus SKE modules that detect unthinnable regions and take appropriate action are built into the preprocessor.
The sampling interval is critical to performance of the system as well. The pen model, actual original printing instrument, and the penmanship determine the smallest feature or symbol size; this size restriction applies to both the stroke width and the gaps between various parts of the symbol. The information contained in both the strokes and gaps is critical for recognition. Analysis of input analog documents indicated that the sampling size should be approx. 2 - 3 ~ of the overall image size in order to preserve strokes and gaps. Figure 3 shows how gap information can be lost if the sampling size is incorrectly chosen.
3.1. The thinning preprocessor: PREPRO
The main function of a thinning processor is to transform a raster image into an image composed of linearly connected points, i.e. a "stick figure'. The purpose of applying this transformation prior to recognition is twofold: to reduce the number of black points by repeatedly peeling off boundary points until only the centerline remains; and to define the beginning, the end, and the crossing positions of strokes. The resultant transformed image contains the original stroke information.
Due to the nature of map and chart input data, the following criteria were required for the thinning processor:
• rotation and shift independent, • character size independent, • preserve original strokes, • independent of"styles" and "authorship".
Early thinning algorithms have severe defects; they tended to inadequately handle spurs and branch points (crossings), original strokes were not properly represented, decimal points and periods were thinned to straight lines, center lines tended to be staircase-like. The present thinning algorithm does not suffer from
TYPE I NOISE • * * * * , , , ,
* * * * * * * * * * * * * * * * * * * * * * * * * * *
• * t * * * * * * * * * * * * *
• * t * * * * * * * * *
* * * * * * *
* * * * *
t * t t *
TYPE 4 NOISE
©
- - ============================ • * * * * * * * * * * * * * * * * * * * * * * * * * * * * *
• * * * * * * * * * * * * * * * * * * * * * * * * * * * * *
TYPE 2 NOISE
TYPE 3 NOISE
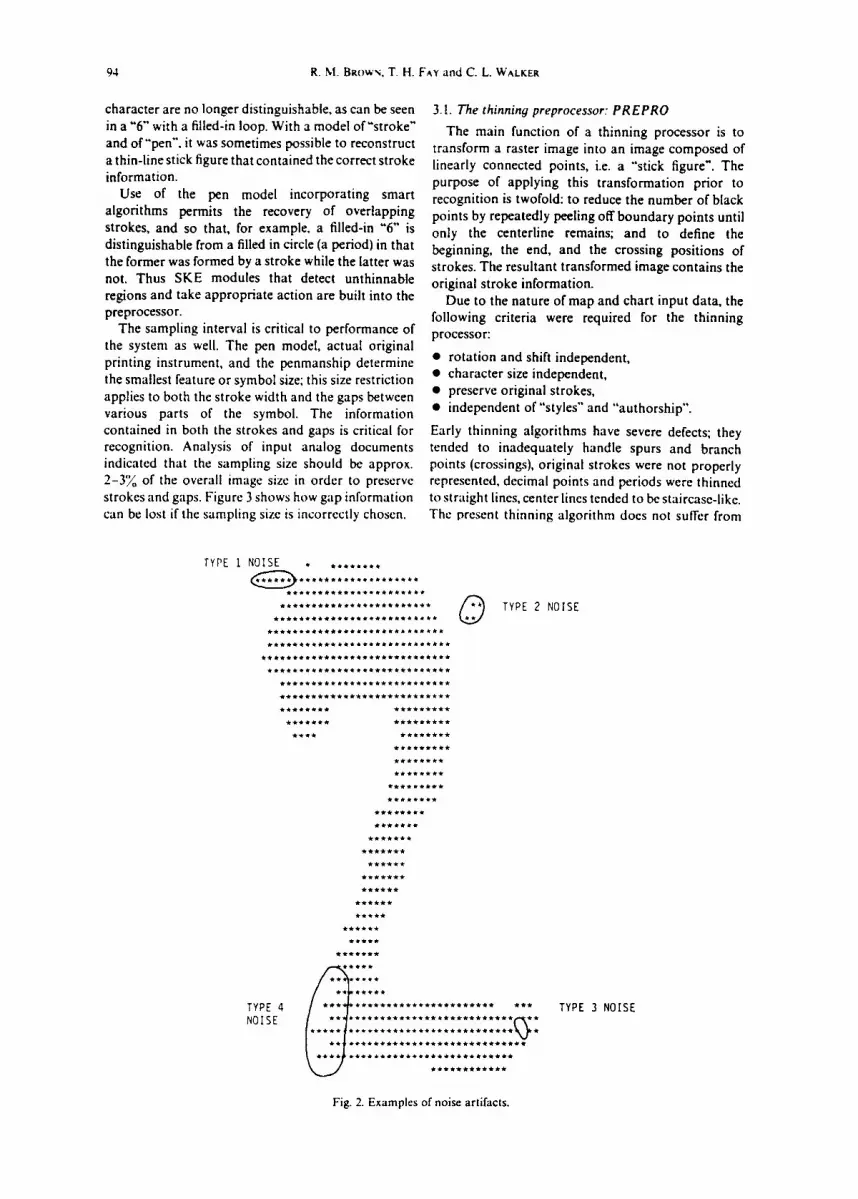
Fig. 2. Examples of noise artifacts.

Handprinted symbol recognition system 95
THE RASTER IMAGE BEFORE PREFIL IS CALLED
THE RASTER IMAGE AFTER PREFILE IS CALLED (K:I)
::1" . : : : : : : :
THE GAP ~ * * *
. e * * * * * * * * * * * *
* *e * *
* * * * * * * * *e * * * * *
Fig. 3. Example of too small a gap.
THE RASTER IMAGE BEFORE THE RASTER IMAGE AFTER PREFIL IS CALLED PREFIL IS CALLED (K:I)
11:1 . . . . . . . . . . . . . * * A LINEAR * * * * * . . * * * * * .
* * * . * * * * . , , . * * * * * . A R T I F A C T o * * * * * * * * * * * * * *
Fig. 4. Linear artifact
these defects. As presently implemented the thinning preprocessor, PREPRO, performs two functions: smoothing and filtering, and stick-figure generation. The processing modules PRECUT and PREFIL implement the first function, the module THININ performs the second.
3.1.1. The smoothing modules: PRECUT and PREFIL. A raster-scanned input image is generally not in good condition due to noise. There are four types of noise (see Fig. 2):
• Type 1: a linear artifact. This kind of noise is often longer than shown in Fig. 2, particularly if it is caused by the scanner, e.g. saturation along the line (see Fig. 4). • Type 2: isolated dot. Often these arise from stains or dirt on the analog input or if the scanner picks up a partial clump actually belonging to another character. • Type 3: an artificial hole. The size of the hole can be single or multiple pixel dropouts. • Type 4: rough edge. Such an edge results in irregularity in a character contour.
The smoothing method used by PREFIL is a single pass, moving average (low-pass filter). The filter is
interacts with PREFIL.
nonrecursive. If more than half of the pixels in a (wk + 1) by (2k + I) window centered on the pixel in question are black, then the centered pixel is marked black; if not, then it is marked as a white point. The problems of using this smoothing method are essentially related to determining the proper window size. If the window is too small, there is insufficient smoothing; if too large, there may be too much smoothing. As presently implemented, the window size (the value of k) is left to the user. Experiments have shown that if the character is smaller than 50 by 50, then the value k = 1 is best; k = 2 is more appropriate for characters of greater size.
The smoothing method used by PRECUT was motivated by the appearance of a common artifact occurring in the number "8" (see Fig. 4). In this case a linear artifact bisects a true hole in the character. To prevent this eligible hole from being filled in by PREFIL, this linear artifact must be removed. The method used by PRECUT is based on moving a 1 by 5 and a 5 by 1 matrix over the image in a single pass. A black point center pixel is changed to white if the two vertical or two horizontal pixels are simultaneously occupied by two white points. The linear artifact is

96 R.M. BRowx, T. H. FAY and C. L. WALKER
removed point by point by this method. 3.1.2. The thinning module: THININ. The thinning
method used in this recognition system is a new attempt to recover the original stroke information from the raster-scanned image of the handprinted symbol. The problems already outlined above imply that the centerline thinning method cannot be arbitrarily applied to the raster image ofa handprinted character: the strokes and ink applied to form the character must be taken into account.
The following discussion is a brief overview of the steps performed by THININ. First, details of the definitions used in the overall flow chart shown in Fig. 5 are discussed. Second, due to the complexity and the number of algorithms involved, two sections are devoted to boundary processing and unthinnable regions.
The steps involved with THININ are as follows:
Step h Unpack the whole raster image into a two-dimensional array. A black point pixel is designated by an ","; a white point pixel remains blank. Step 2: Identify and collect the black points in the exterior boundary. This is accomplished by searching (clockwise for odd-numbered passes and coun- terclockwise for even-numbered passes). All boundary points are changed from an " ," mark to an "E" mark to distinguish them from other black points in the raster image. Step 3: Smooth the boundary contour. This smoothing function smoothes only the little wrinkles occurring in the boundary contour. It is assumed that PREFIL and PRECUT have already been applied.
I Unpack RLC Raster image ] tnto a 2-dimension array
[ oo, o,oo oooo0 ,, oo,o,]
Search and collect interior boundary points
Smooth interior boundary
l Determine status of each interior boundary point
t" ! Use external boundary to extract I
remaining raster reg=ons I
?
krlowludlJe ~'xpf~rt modult~
1
I
I Change marks on boundary ] to "keep" or delete
go to Step / to start another thinning pass
J Store the "'keep po,nts *n I lhe output ~mage buffer
1 ( s,oo )
Fig. 5. Flow chart of THININ.

Handprinted symbol recognition system 97
Step 4: Determine the status of each boundary point. A boundar) point that is potentially deletable is replaced by a "0" mark. Otherwise, the point is marked according to its occurrences in the array of boundary points. These various marks make software im- plementation and verification much easier. Step 5: Search for a black point that is qualified to initiate an interior boundary; if such a point exists, the procedure goes to the next step, otherwise, it jumps to Step 9. Step 6: Identify and collect the black points in the interior boundary (in accordance with the procedure in Step 2). Step 7: Smooth the interior boundary. Step 8: Determine the status of each interior boundary point. After this step is completed, the procedure recycles back to Step 5 to search for another interior boundary. Step 9: Use the exterior boundary to extract the remaining raster regions during this particular thinning pass. The information concerning the regions is stored in arrays. Step 10: Investigate any remaining regions that are unthinnable. If there are any, the procedure then handles them differently. This step contains various subroutines to handle unthinnable regions. For example, it can punch an artificial hole for a filled-in numeral "6", "8", or '9"', or draw an artificial line in place of the entire triangle-like region for a filled-in numeral "4". This step processes itcratively until all regions have been checked. Step I I: Change the boundary points marked by a "0"" to a blank to denote deletion, and change all other boundary points to a "K" (keep) mark to indicate that
T
L
Fig. 6. 4-connccted matrices used by PRECUT.
z
Fig. 7. Two definitions of a boundary.
the point has been thinned to an appropriate centerline position. The peeling process is performed through these changes. If all the boundary points are not removable, the procedure goes to the next step: otherwise, move back to Step 2 to initiate a new thinning pass. Step 12: Store the remaining points marked by a "'K" into the black point format. At this point the thinning process is complete; the character has been trans- formed from a raster image into a stick figure image in which the stroke information has been recovered.
3.1.3. The alyorithms used by THININ. The definition of a boundary point may vary (see Fig. 7t. Visually, the boundary using the second definition appears to be more consistent with the original stroke than with the first definition, which tends to create a wiggly boundary.
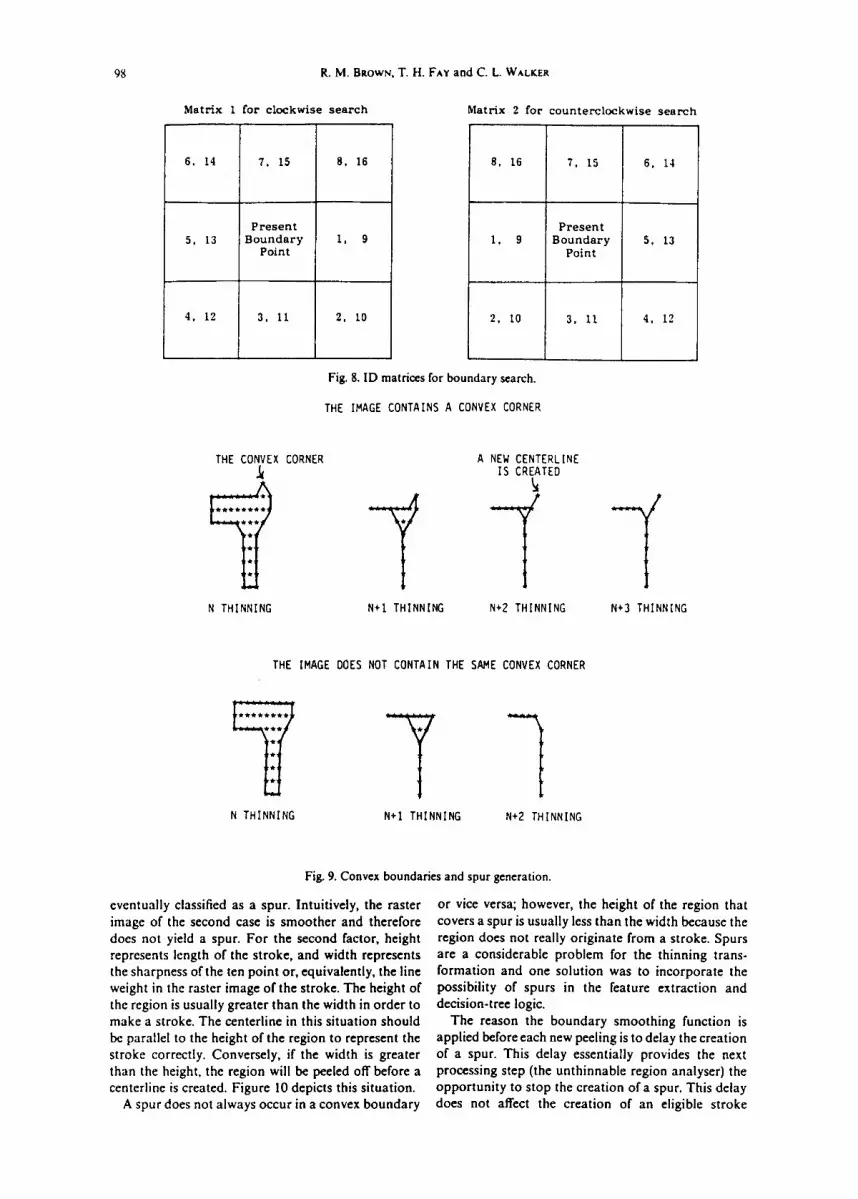
The boundary search algorithm used by THININ requires a 3 by 3 pixel matrix. Except for the center one, each pixel is assigned a pair of ID numbers to indicate its searching priority in the matrix. For example, the i - I pixel is always considered before the i pixel as the succeeding boundary point of the present boundary point, which is located at the center pixcl during a search. Figure 8 presents these assigned ID numbers in two matrices. The first matrix is used for clockwise searches and the second for counterclock- wise searches. Supposedly, the j boundary point is located at the i pixel of the preceding matrix. To properly select thej + 1 boundary point (the first black point within the searching range), the search must bc initiated at the i - 2 pixel of the present matrix. This means that the i - 2 pixel is always considered to be at the first location where the succeeding boundary point might be located. Initiating a search at any other pixel can cause a boundary to have incomplete or redundant points. Even worse, it can cause the search processor to totally lose the boundary track. Although moving two pixels backward to initiate a search is a simple rule, its effectiveness can easily be seen by applying this rule manually with some examples. Because a boundary point can occur at any pixel and the initial location of a search can vary, two ID numbers were deliberately assigned to each pixel so that the terminal location of a search can always be calculated by the initial location. This means that the range of a search can be initiated at i - 2 pixel and terminated at i - 2 + 7 pixel, where i is a variable.
Two factors can affect the creation of a stroke centerline: the curvature of the boundary surrounding a raster region, and the height and width of a raster region. For the first factor, if the boundary is sharply convex, a stroke centerline initially will be created in this convex area. Once a point(s) is created, the stroke centerline will continue to develop inwardly until the entire region is thinned. If the boundary is smooth, the creation of stroke centerline will at least be delayed or eliminated. Figure 9 depicts one such example. The raster image of the first case contains a sharply convex corner. The boundary results in a centerline that is
98 R. M. BROWN, T. H. FAY and C. L. WALKER
Matrix I for clockwise search Matrix 2 for counterclockwise search
6. 14
5, 13
4, 12
7. 15
Present Boundary
Point
3, 11
8, 16
i, 9
2, I0
8, 16
1, 9
2, 10
7, 15
Present Boundary
Point
3, i i
6, 14
5, 13
4, 12
Fig. 8. lD matrices for boundary scarch.
THE IMAGE CONTAINS A CONVEX CORNER
THE CONVEX CORNER A NEW CENTERLINE ~( IS CREATED
N THINNING N+I THINNING N*2 THINNING N+3 THINNING
THE IMAGE DOES NOT CONTAIN THE SAME CONVEX CORNER
- z t . . . . . . .
t * * * * * * e
Y N THINNING N+I THINNING N+2 THINNING
Fig. 9. Convex boundaries and spur generation.
eventually classified as a spur. Intuitively, the raster image of the second case is smoother and therefore does not yield a spur. For the second factor, height represents length of the stroke, and width represents the sharpness of the ten point or, equivalently, the line weight in the raster image of the stroke. The height of the region is usually greater than the width in order to make a stroke. The centerline in this situation should be parallel to the height of the region to represent the stroke correctly. Conversely, if the width is greater than the height, the region will be peeled off before a centerline is created. Figure 10 depicts this situation.
A spur does not always occur in a convex boundary
or vice versa; however, the height of the region that covers a spur is usually less than the width because the region does not really originate from a stroke. Spurs are a considerable problem for the thinning trans- formation and one solution was to incorporate the possibility of spurs in the feature extraction and decision-tree logic.
The reason the boundary smoothing function is applied before each new peeling is to delay the creation of a spur. This delay essentially provides the next processing step (the unthinnable region analyser) the opportunity to stop the creation of a spur. This delay does not affect the creation of an eligible stroke

WIDTH
*************
Handpnnted symbol r~ognition system
HEIGHT
. . . . . . . . . . . . . "~***~*~ HEIGHT
I
**************--******* W?~Tu | --tu1~
l i * * i * r I * * * * * l
|*****
I***** HEIGHT
I*****1 I*****1
WIDTH
N+3 THINNING
N THINNING
N+I THINNING
N+2 THINNING
N+4 THINNING
99
Fig. 10. Example of height and width description of strokes.
centerline. The experimental results of numerous samples indicated that the number of spur images created by THININ decreased to near zero when this smoothing procedure was used.
The function of the boundary point marker is to indicate the status of a boundary point. Recall that a deletable boundary point is marked by a "0", otherwise, it is marked with its occurrences. A point marked with its occurrences indicates that the point has been thinned to the stroke centerline. The peeling routine will delete those points marked with a "0" and will replace occurrences with a "K". Thus the boundary point marker is the key routine for thinning, the peeling routine merely performs as a switcher to delete points. At the conclusion of the thinning algorithm, it should be pointed out, not all remaining points in the black point image will have been marked
with a "K". Figure 11 represents a final thinned image of a numeral "4". This image contains 32 "K" points and one black point marked %" that was originally unpacked from the run length code input. This black point will eventually be classified by the feature extraction module as a branch point of Type 4.
K K K
K K K K
K K KKKKKKKKKKKKK*KKKKKK
K K K K
The only black point ( ') which is not a boundary point.
Fig. 1 I. Final thinned image of a numeral 4.

I(~) R.M. BKown, T. H. FAY and C. L. WALtzeR
3.2. Unthinnable reyions
When a small character is written on a smooth sheet, the smaller the character, the easier it usually is to overwrite areas of the character. Therefore, the ink spread in an overwritten area is greater than the ink normally spread in other areas along the strokes. This line weight-to-image size ratio is illustrated in Fig. 12, which represents two identical raster images created from two different symbols. Both images are repre- sented by circles that depict the instantaneous spread of ink by an ideal pen. The centerline inside each image represents how the actual symbol was drawn. Medial Axis Transformation processing may be unable to recover strokes representing the symbols. Examples of incorrect MAT-thinning are depicted in Fig. 13.
Intuitively, an unthinnable region is a raster region in which the centerline thinning fails to generate the most appropriate thinned lines to represent the original handwritten strokes. The concept of unthin- nable region was fundamental to the solution of the distortions described above. The distinction betwen a thinnable and unthinnable region can be ambiguous and subjective; moreover, their occurrence is varied arid unpredictable.
tlowever, when dealing only with numeric charac- ters (for example soundings from a bathymetric chart), the types and the locations of unthinnable regions become very stable. This means that the occurrences of unthinnable regions can often be identified in a numeric image during its thinning progression. Thus, the distortion caused by an unthinnable region can be replaced by segments that preserve the original stroke information.
During the thinning pass, the module THININ initiates a collection of regions yet to be thinned after searching and marking the exterior and interior boundaries of the present image. Each boundary point under this circumstance becomes distinct because of its mark ("0", "'1", "2", etc.). The boundary points surrounding a raster area must be marked by "0"'s. This distinction allows THININ to extract for further
investigation a region that has not been thinned to a centerline position. THININ examines every region to determine whether or not the region is unthinnable. If the region is unthinnable, THININ will use a different method to handle the region instead of using the centerline thinning method. The thinning methods used for an unthinnable region can vary, depending upon the types, shapes, and sizes of the region as well as the content of the present image; they are made up of SKE modules.
An examination of large numeric data bases has identified a number of common unthinnable problem types. When these types are processed using the MAT-type thinning (peeling) algorithm, the resultant stick-figure output distorts the stroke information inherent in the original raster image. Such distortions can range from very mild to very severe; the latter cases cause rejections or substitutions after they are passed to the recognition logic.
A heuristic approach to these types was used to identify the problem regions in numeric characters. Rules were then devised that allow the image to be properly thinned. Figures 14-22 depict the various types of unthinnable regions that occur. In each figure, five images are shown:
• Figure A depicts the outline of the original raster image of an example character selected from the data base. • Figure B repeatedly plots the resultant image after every thinning pass until the unthinnable region is created. • Figure C shows how this unthinnable region is handled by THININ. • Figure D overlays the final thinned image generated by THININ with the original image. • Figure E overlays the final thinned image based on MAT-type thinning only.
4. FEATURE EXTRACTION
An input to the feature extraction phase of the
T h e r e g i o n in w h i c h t h e i n k is r e p e a t e d l y o v e r l a p p e d
Fig. 12. Confusion between two symbols written by an ideal pen.

Handprinted symbol recognition system 101
(A} (B)
(C) (D)
• \ (F)
/
Fig. 13. Example of incorrect MAT-thinning for overwritten symbols.
recognition system is a thin-line or stick figure representation of the original raster image of the input character. This thin-line representation is still in raster format. This image has not been organized to give it the necessary "stroke structure" for further processing. The data description of this image is a simple list of all the points that are black starting with coordinates in the upper left corner and proceeding along each scan line from left to right and from top to bottom•
The first function performed on this input data is to increase its information density content by organizing the image points into segment lists. Each point is classified on the basis of the points in its immediate 3 by 3 neighborhood; its connection to these points determined; and its ordering in the segment string is
assigned. This segment generation process is based on the 256 possible 3 by 3 matrix neighborhood patterns. an image segment is defined as a connected, ordered set of points bounded by two terminators; a terminator is an "end point" or a "'branch point"• Each segment must have at least two points; single segments enclosing a region are a special case in which the beginning and end terminators of the list are the same. The result of this segment organization is an ordered list of the points in each segment, and a segment description list containing the top-level information about each segment, e.g. its terminators, number of points, etc. On the basis of these list structures so generated, one can build the complete "stroke structure" of the character.

102
(A)
R. M. BROWS, T. H. FAy and C. L. WALKER
(B) (C)
(D)
Fig. 14. An unthinnable region enclosed by
(E)
two exterior boundary segments; selective peeling.
The process of increasing the organizational information content by obtaining the segment struc- ture is followed by a processing module which generates a linear approximation of the segmented image. This process is made up of three subfunctions: (1) a filtration to remove localized (single point) variations; (2) a compression of the character description by reducing the number of points in the segment lists; and (3) an identification of special extreme points.
The linear approximation technique employed
(which gave the best results) is a global, recursive binary search for the points that are most distant from the line joining the end points of the segment and its subsequently partitioned subsegments. This is illustrated in Fig. 23. The process halts when the maximum distance becomes less than a predefined threshold. Excellent results have been obtained with this algorithm, and it appears to be essential to obtaining proper curvature measures for the character. In cartography, this procedure is called the Douglas- Peneker line generalization.

Handprinted symbol recognition system 103
(A)
/ - , ,
P4
(B) (c)
(E)
t Fig. 15. An unthinnabl¢ region enclosed by two exterior boundary segments, stroke replacement.
The thinning preprocess, which generates the input data to the feature extractor, can create artifacts or "skeleton failures"; three common examples (spurs, improper crossings, and displaced branch points) are shown in Fig. 24. These artifacts are easy to identify after the segment list structure and the linear approximations have been generated. Improvements made in both the thinning process and in the recognition logic have minimized the difficulty of the displaced branch points; however, spurs and improper crosses are more difficult to handle.
4.1. Spur removal
Spurs have been a persistent problem for recog- nition systems that depend on a thin-line representation generated from a raster image. The problem results from the fact that a"spur segment ~ can appear just like any other segment that might carry information. One approach taken with alphabetic characters was to incorporate the possibility of spur formation into the recognition logic by writing recognition submodules that distinguished characters by taking into account all segments of the thinned image. Because the number of numeric characters is
limited and because spurs cannot appear in all regions of an image for such characters, spur removal routines were written for the numeric character data bases.
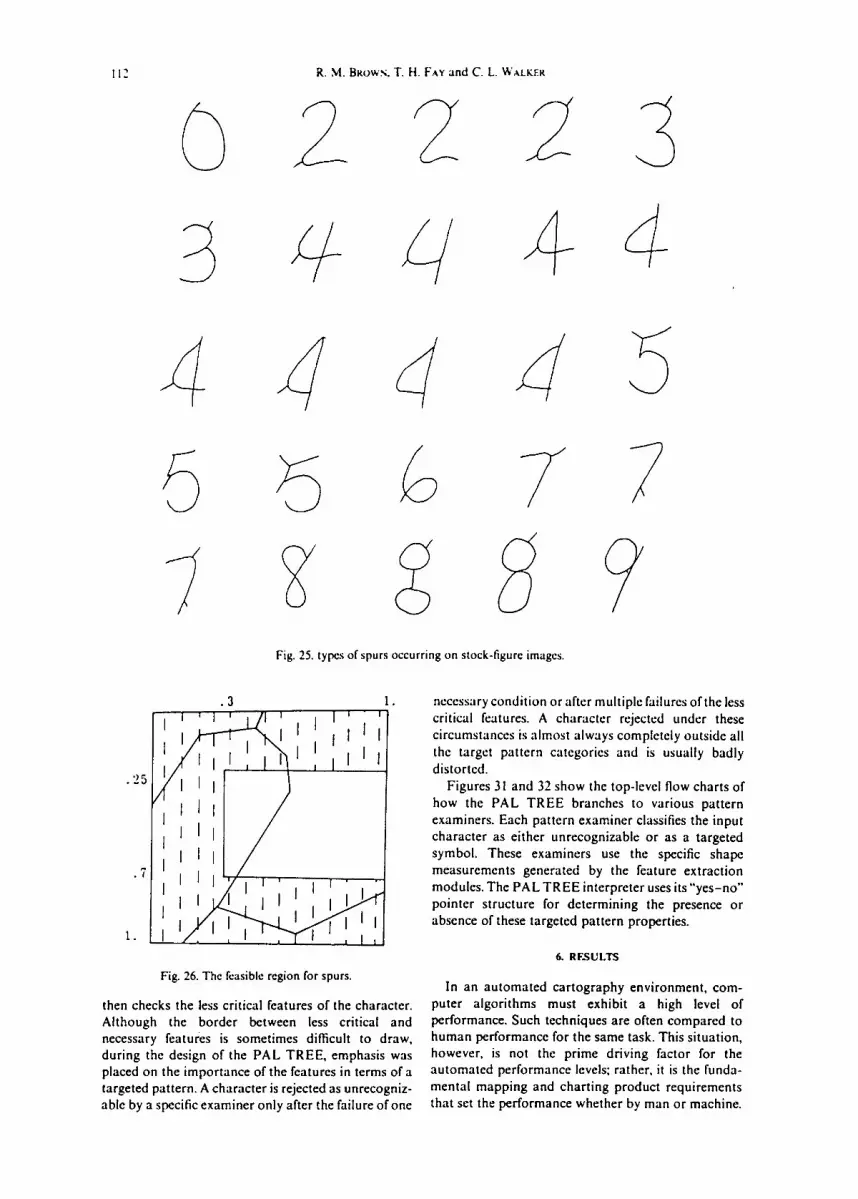
As spurs cannot generally be identified with a high degree of certainty, a module, SPURS, was designed to recognize only certain specific and "insured spurs" under the guideline that a substitution error resulting from the spur removal operation must not occur. A detailed analysis of the length, location and charac- teristics of known, human-identified spurs was performed, and typical spurs, which can occur for each numeral class, were determined. Figure 25 depicts these regularly occurring spurs which account for approx. 95% of all spurs found in the numeric data base.
The following criteria were developed for the detection of a spur.
(1) A spur must have a branch point of type 3 and an end point as terminators.
(2) A spur must be relatively short in terms of character size. In addition, a spur must be shorter than the other two segments terminating at the same type 3 branch point.
(3) A spur must appear within the "feasible region"

(D)
R. M. BROWS, T. H. FAy and C. L. WALKER
)
(.
Fig. 16. An unthinnable region enclosed by three exterior boundary segments; potential concave branch point.
of a character. The feasible region for a character is determined by placing a box around the character; the combination of the lower 25~o, the upper 70~ of the height, and the left 30~ of the width of this box is defined as the feasible region (see Fig. 26).
The feasible-region criteria are based on extensive review of spurred characters and should prevent the misidentification of the middle segment of numeral "Y' and the right segment of the numeral "4" as a spur. In fact, almost all spurs observed are actually within the feasible region, if the character is within 60 degrees of being upright.
The performance of SPURS was evaluated carefully; both removing segments that were not spurs and not removing human-identified spurs were considered as failures. Fortunately, the failures were insignificant in comparison with the successes. The failures did not
result in an increase of the substitution error; characters containing such spur failures were rejected as unrecognizable. The accuracy of SPURS consider- ably enhanced the efficiency of the numeric character recognition process.
4.2. Improper cross removal
The improper crossing type of artifact can also be identified sometimes and then removed, it most often occurs when one stroke crosses another or itself, e.g. when an " x ' , "+'°, or an "8" are handprinted. The function of the "improper cross" processor, called MIDPT, is to find such artificial segments and reduce them to a single branch point of type 4. MIDPT finds this type of "false segment" based on the following criteria.

Handprinted symbol recognition system 105
/ , i
/ /
I I l " , l~ l /
Illi~::"J Ililllj:J
"H". ,i
R;,S--,:_-._____,'=, 4 ,.;./ ' ~ i :--,~,N III, i
~%,.*t111~I ~'e
I" !i i t i l/!ltt*, iH I'(1[/il[!]'t.
)/,/',1 il
i
-"}ti;i ", ~ kttna~ LI
t,t I1t y~l !!.i~!
(D) /S-~
51l Fig. 17. An unthinnable region enclosed by three exterior
boundary segments; location of most concave point.
(1) The segment must be terminated at both ends by branch points of type 3.
(2) The segment must be less than a predefined threshold; 10~ of the total length of the character has been found adequate for the line weight used on bathymetric smooth sheets.
(3) The segment must not enclose a region; for example, the top loop segment in a numeral "8".
For numeric characters this phenomenon occurs most often on the numerals "4" and "8". Figure 27 presents examples of this occurrence and shows how MIDPT handles them. The modification is accom- plished easily by updating the segment tables and approximation lists. Eliminating the artificial segment that occurs at the "intersection point" of strokes reduces the variety of topology that must be
considered for numerals "4" and "8" and brings the topology into agreement with the human-intended strokes.
4.3• Ct, rve wudysis oral geometric measurement
The two major functions discussed, namely, segment generation and artifact removal, have essentially prepared the input character image so that detailed analyses and measurements can be made about the shape of the curves from which it is composed. The curve analysis and measurement process is made up of two parts:
(I) construction of strokes from several segments. (2) geometric measurement of these strokes.
The process adopted makes use of the segments just as
PR 2 1 : 2 - C

(D)
R. M. BRows. T. H. FAy and C. L. W~t.t<ER
( B ) / ~ The ( C ) / ~
106
Fig. 18. An unthinnable region enclosed by one exterior and one interior boundary segment.
they are generated as well as the set of all binary combinations of segments. The latter will include the human-intended strokes, as well as some other potentially useful combined segments. These combina- tions of segments are called macrosegments.
The macrosegment processing module takes every segment and combines it with another segment to form a macrosegment. This set of macrosegments, after duplications have been eliminated, forms the basic description of the input character. The curve analyser module processes macrosegments and segments to generate some very basic geometric information about the input image. A new axis is considered that joins the end points of the macrosegment or segment and the (macro)segment is traced from one end to the other. During this process the following information is recorded.
(1) The turning angle at each point. (2) The coordinates of the approximation points:
that is, the perpendicular distance to the new axis and the parallel distance along the new axis.
(3) The coordinates of the local maxima and minima relative to the new axis.
(4) A "curvature code" for the whole (macro)segment that indicates the number and type of maxima and minima exhibited by the (macro)segment.
The curvature code is constructed by assigning the value 10 to each maximum or minimum on the positive side oftbe axis, and the value 5 to each maximum and minimum on the negative side of the axis. These values are summed as a special curvature code to represent the approximate overall shape of the (macro)segment displays (see Fig. 28).
4.4. Shape information and feature extraction
The feature extraction modules are designed to process the geometric information from the curve

Handprinted symbol recognition system 107
C)
~ B)
P1
P3
i ~ D)
L:
(N . E )
Fig. 19. An unthinnable region enclosed by two exterior and one interior boundary segments.
analysis and measurement module and the topological information generated by the segment construction module. The shape features generated by these modules will be used as defining properties necessary for the symbol recognition. Moreover, perhaps with the exception of the feasible region for spur removal, the processing functions preceding this shape feature extraction stage have been independent of the symbols to be recognized. The only assumptions about the symbols have been that they are printed with a "'thin-line" writing instrument, that the human-inten- ded stroke model is appropriate, and that an
individual symbol is distinguishable on the basis of its "measured" shape characteristics.
To build a library of shape feature extraction algorithms for unconstrained handprinted symbols, however, one needs to consider the target character set. In the case of the numerals, for example, the target set is much larger than 10 elements, since some of the numbers have several varieties of patterns: open-top "'4", triangle-top "4", "1'" with or without pedestals, "regular . . . . T', and European "7". Variations in handprinting also contribute to the target set: for example, the open-top "8" (incompletely enclosed

108 R.M. BRowr~. T. H. FAY and C. L. W~,L~tm
/
\
c o r n e r
l >
\
'7
Fig. 20. An unthinnable region enclosed by three exterior and one interior boundary segments.
region) and the two-enclosed region "8". The targeted numeral patterns used in the design of the recognition system are grouped by their simple topology measures (Figs 29 and 30). Symbols can exhibit a fairly wide range of shape variations within each of these categories and still be successfully recognized. An empirical examination of digital images and other mapping and charting documents show that almost all handprinted numerals for these products fall within these pattern categories. Note that certain nonconven- tional human-intended patterns appear in Fig. 30. These patterns are included because they sometimes arise when the artifact removal algorithms occasion- ally fail and because they have distinctive geometrical features that can be recognized by the feature extractor and recognition logic.
It is not feasible in this top-level review of the recognition system to discuss the details of all the shape feature measures. A few examples to illustrate
the type of shape processing involved, however, follow. The relative positions of the end points and branch points are generated; these properties are used, for example, in distinguishing the numerals "6'" and "9". The number, types, and position of crossings that a segment or macrosegment makes with the axis joining its end points (stroke axis) are also recorded; in the single segment case, these features are used in analysing "2"', "5", and "7"'. The beginning and ending angles of a segment relative to the stroke axis are also useful properties; this measure, along with the straightness and intersection angles, can be used to determine the numeral "'7".
5. RECOGNITION LOGIC
This section presents an overview of the final major processing function of the recognition system. The critical problems in unconstrained handprinted

Handprinted symbol recognition system 109
(A) (B)
(C)
~ (D)
/-
/
Fig. 21. A filled-in numeral 6.
character recognition are defining and selecting the important information-carrying shape features. The success of these measurements is determined by their proper partitioning of the feature space into honorer- lapping regions. However, this partitioning also depends in an important way on the decision mechanism used. A binary decision tree has been selected to implement the recognition process of the system. While such binary logic trees are similar to linear classifiers, they have two important additional advantages: the recognition decisions are allowed to interact with the feature extraction process and decision trees provide a good insight mechanism as how the classification process is working and allow
easy manipulation and experimentation of both features and decisions. As the recognition system developed, the processing naturally became more complex. The interaction of feature extraction and the recognition process became more inevitable. The feature extractor needs the information (results) of the decision mechanism to know which feature to calculate next, since all features are not meaningful for all symbols. Conversely, not all features are needed in the identification and verification of any given symbol.
A powerful language system has been developed to implement this feature measurement and decision logic integration; it is called the PAL TREE, for Pattern Analysis Language Tree. This collection of

110 R.M. Baowx, T. H. FAY and C. L. ~'ALKE~
le
(
Fig. 22. A filled-in numeral 8.
FORTRAN subroutines is an interpreter specifically code syntax, etc., and is beyond the scope of this report. designed to make it easy to develop and modify binary In general terms, each program line in the interpreter decision tree structures concerning arbitrary feature describes an"operation ~ or"decision" and automatic- systems. A detailed discussion of PAL TREE involves ally points to the next program line, depending on the the concepts of virtual processors, language structures, outcome of the process. The top-level flow chart of a

Handprinted symbol recognition system I 11
End Poin t
/ Fi r~,t Pom~
i I "" ~,,4;,~,,, \ / / /
Third ~ N Point
/ I / Second Point
: ~ /
£1 '-'1 .~
C , .~" /
"r, ~ / / /
)/" ff Fifth Point
End Point
Fig. 23. Rccursive binary search for approximation points.
Fig. 24 contd. Improper representation of stroke crossing.
Fig. 24. Displaced branch point.
pattern analysis scheme can easily be placed in a one-to-one correspondence with the PAL TREE program lines. What "'operations" or "decisions" are executed is contained in the "micro code" subroutine library of the PAL TREE System and can be tailored to meet the requirements for a specific symbol problem.
The intention of any PAL TREE program is to provide recognition logic with enough "expert knowledge" to identify an input character as a targeted
f/ i
J
~ J Fig. 24 contd. Spur artifact.
symbol or as unrecognizable. This knowledge includes the criteria for all targeted pattern categories and the decision flow that can be followed to reach the final identification for a character. The PAL TREE initially tests topologic features, e.g. number of segments, number of enclosed regions, etc.; the results of these tests branch the process into various pattern examiners or expert questioners. Each target pattern examiner begins by checking the necessary features that the input character should possess. The examiner
112 R. M. BRows. T. H. FAy and C. L. WALKER
2 2
Fig. 25. types of spurs occurring on stock-figure images.
.25
.7
1.
.3 I ' I ' l i t I 1 '
i ~ 1 I i I I //~/I I I ~ i I I l l
1 I I / I i I / [ I i / i I I / i J I i I • - I I t/ I I I I I ~ r
Fig. 26. The feasible region for spurs.
then checks the less critical features of the character. Although the border between less critical and necessary features is sometimes difficult to draw, during the design of the PAL TREE, emphasis was placed on the importance of the features in terms of a targeted pattern. A character is rejected as unrecogniz- able by a specific examiner only after the failure of one
necessary condition or after multiple failures of the less critical features. A character rejected under these circumstances is almost always completely outside all the target pattern categories and is usually badly distorted.
Figures 31 and 32 show the top-level flow charts of how the PAL TREE branches to various pattern examiners. Each pattern examiner classifies the input character as either unrecognizable or as a targeted symbol. These examiners use the specific shape measurements generated by the feature extraction modules. The PAL TREE interpreter uses its"yes-no" pointer structure for determining the presence or absence of these targeted pattern properties.
6. RESULTS
In an automated cartography environment, com- puter algorithms must exhibit a high level of performance. Such techniques are often compared to human performance for the same task. This situation, however, is not the prime driving factor for the automated performance levels; rather, it is the funda- mental mapping and charting product requirements that set the performance whether by man or machine.

Handprinted symbol recognition system 113
/ I
I
I t I I
1'
idp0int
i III
Before MIOPT is called
i /
After MIOPT is called
j J
Fig. 27. Removal of the improper crosses for the numeral "4".
Historically, the recognition system was first implemented to recognize numeric characters only, which is why the narrative perhaps concentrates on numeric characters more than alphabetic characters. The original data tested were bathymetric "smooth sheets", which contain bathymetric soundings com- posed often of four or more numerals. In general qualitative terms, the recognition system was found to have a higher performance than the human "ground truther". This statement, which at first appears to be a contradiction in terms, means that a comparison of the disagreement between ground truth value and the recognizer value often resulted in either the human mistyping the entry, or in some cases, apparently mislabeling the character. This second determination was made by comparing several "double-blind experiment" values of different people for the symbols in disagreement.
The data sets used in the performance evaluation of numeric symbols consisted of portions of a smooth sheet scanned by a Hamilton Standard Raster Scanner consisting of 261 characters. A portion of this data is shown in Fig. 33. The remainder of the data was scanned in the Pattern Analysis Laboratory using a video scanner system. This data consisted of 1298 characters from two separate smooth sheets, 5053 characters from two plotting sheets (field sheets
produced in the preparation of smooth sheets) and 388 characters collected from different authors. Thus a fairly broad representation of data and styles was obtained.
A great deal of effort was expended to establish ground truth data for this test set. Since the primary purpose of the test was the recognition performance evaluation for raster scan data, the original smooth sheets were not taken as the ground truth. An image was ground truthed as a numeral if it could be recognized as such by the human evaluator. In a few ambiguous images, personal subjectiveness was unavoidably introduced. Even in these cases, however, subjective judgment was minimized by using multiple ground truth evaluators.
in preparing the ground truth data, the following images or symbols were classified as trash and ignored in the evaluation:
• images con ta in i ng more than one ex terna l boun- dary ,
• images with more than two enclosed regions, • images clearly not a numeral, • incomplete images, e.g. broken top "5", open top
i,0"" '
• images containing a large number of data droupouts.

114 R.M. BROWS. T. H. FAY and C. L. WALKER
X N / / / /
/ I Midp oint
/ / \ \
Before MIDPT is called After MIDPT is called
Fig. 27 contd. Removal of the improper crosses for the numeral "8"'.
The data set was put through the recognition system and compared with the ground truth. The results are shown in Fig. 34. The most important results are:
• an efficiency rate of 0.97, • a substitution error rate of 0.003, • a rejection rate 0.027.
These figures are for individual isolated characters. The sounding efficiencies implied by these results for four-digit soundings are 0.885 with an accuracy of 0.988.
Due to the success of the numeric character recognition, it was decided to expand the recognition logic to include alphabetic characters. Thus a PAL TREE recognition program was devised for the recognition of unconstrained handprinted capital letters. Due to the unconstrained nature of the input
data, and to the difficulty in deciding between an "N" and a "Z" or between an "M" and a "W" without knowing an orientation, certain letters were grouped into "ambiguity classes". Of course, once a high degree of recognition of characters and ambiguity classes is achieved, contextual or other information might be used to determine an orientation and thus resolve the ambiguity.
In the present state of the program, a data base of 3771 images, without "O"s and "D"s, yielded 3238 correctly identified characters (or ambiguity classes), 421 incorrectly identified characters, and 112 images rejected. Thus, a 3~ rejection rate was achieved and an 88.5~ recognition rate obtained. By including images of"O"s and "D"s, the rejection rate improved slightly, but the recognition rate was slightly reduced. This was to be expected, as no "O"s or "D"s were rejected, and

Handprinted symbol recognition system 115
Se,~ment Code 15
I) l t l v e maximum
Nega maximum "~
Segment Code [5
Negatlve maximum /
/
/
[~O";i t i VL' r11;I X I II'1 t l [11
I segment. I enclosed-region
2 segments, i enclosed-region
2 segments. 2 enclosed-regions
3 segments, 2 enclosed-regions
4 segments, 2 enclosed-regions
5 segments, 2 enclosed-regions
3 segments, I enclosed-region
4 segments, I enclosed-region
O
4
Sc~rm'ut Code 30
I
I'osittv,, [~la N: igtJ I l l l l
V ~ i l X i n : I I 1 ~ 1 ositive tu:txilut~m
i Fig. 28. Segment code examples.
8
5 segments, I enclosed-region
7 segments. I enclosed-rcg'ion
Fig. 30. Numeral pattern categories with one or more enclosed regions.
4
q
I segment, 0 enclosed-region / 2 ,3 5
3 ~egments, 0 enelosed-rebdon
9
/ / 4 seffmunts. 0 enclosed-region ( , ~
Fig. 29. Numeral pattern categories with zero enclosed regions.

116 R.M. Baow.'<. T. H. FAY and C. L. WALKER
()
r
G5 ¥e~
T~t, ~or
©
Te~l~ for
g
~ ~ ~ c ' s "f~s Te~ts for
t o . t . f,,c
~r
~p~ment~
Te~t~ for
$
1?,.~t, for
g
Fig. 31. PAL TREE (top-level structure).
0 NR
2_L R e i e c t t o n
No
S t r n i g ~ t
P r o i e c t i o n
IO
<...
Fig. 31 contd.
Tests for
/
T e s t s for
Tests for
Test,~ for
2. 5-
T , . s t ~ f o e
Tost '~ ft~r 1
<..
<.,
T e s t s fop
3
l.q l o w e r
A2_ T e s t s f o r
T e s t s f o r
Tests for
P
m *~S
9t=m 4 3.,m,~ &d~.~*,fmr utu, O~4L ~Aw, O~rl##l"
Fig. 31 contd. Fig. 32. Schematic of the first level feature extraction.

Handprinted symbol recognition system 117
l
• 1.1 '~ ~
• 1.7,- TM
. ~ ~.".-'~
• 7. '1- ~ '~
• ~ 1.* i . |
• 1 . .~ ~
• "~@
. l J l , , ' °
•',~)*
• ~,~1
• ~,..~ " I '~
.~ .Mc ' I -
• 1.4 I ' I
.1..,4"~ ~
• ~.41'-'
• ~ '
.12,11,•
.~,~
• ~,.~,~ I
. ~,~ ~.'f
, ~ , . p I I .
. ~
• -,p ~"
• .~,~ 1..
• ,11.. 41,,,
. . ' , ,
• -bL,5 c"
• -Ik,'lb ~
• "1.~ ° ~
• -/. ~L~"
• ~ 1
• ~
. ~
• ~ .T ~'1
• I.,~ ' ~
, ~ .~1~
Fig, 33. Example of Data Smooth Sheet (only section inside lines processed).
Numer ic Tota l Classes C h a r a c t e r s
0 482 1 1061 2 1052 3 564 4 394 5 536 6 512 7 528 8 625 9 515
I0 ( t r a s h ) 731
Tota l 7000
Tota l Tota l Successes S u b s t i t u t i o n s
473 98.14 0 0.0~ 1051 99.0~ O 0.0~ 1032 98.1~ 4 0.4*0
546 96.84 1 0.2~ 344 87.2~ 7 1.8~ 529 98.7~ 0 0.0~ 488 95.3~ 1 0 . 2 ~ 519 9 8 . 3 ~ 1 0 . 2 ~ 610 98.0~ 2 0.2~ 472 91.64 1 0.2~ 728 99.6~ 3 0.4~
6792 97.0~ 20 0.3~
Fig. 34. Recognition performance system flow.
Tota l Re jec t ions
9 1.9~ 10 1.0~ 16 1.5~, 17 3.0~, 43 11.0"o
7 1.34 23 4.5*0
8 1.5"0 13 1.8':10 42 8.2*0
0 0.0*0
188 2 . 7 ~ ,

118 R.M. BROWN. T. H. FAY and C. L. WALKER
the discrimination between " O ' s and "D"s was threshold sensitive and, at present, poor, human recognition of digitized "O"s and "D"s was equally poor. Of a total number of 4208 images, including"O"s and "D"s, there was a 2.66% rejection rate, and of 4096 recognized images, 3541 were correctly identified, yielding an 86.5°,; recognition rate.
Some errors that affect both the rejection rate and the recognition rate are due to the creation of spurs in the thinning process. As more strokes are generally used in printing alphabetic characters, concomitantly, more spurs are created in the thinning process. Enlarging the number of targeted classes to allow for characters with spurs will undoubtedly improve the recognition rates immediately. More difficult problems occur in trying to distinguish betwen "Y"s and "T"s; the thinning problem of a displaced branch point made distinguishing between them difficult for the human evaluator. The recognition tree for alphabetic characters needs improvement before the alphabetic recognition scheme can be merged with the numeric recognition scheme. Unfortunately, due to funding constraints, these improvements have not been implemented.
SUMMARY
In this paper we have given an overview of the design specifications of a handprinted character recognition system intended for recognizing a wide variety of unconstrained handprinted symbols, par-
ticularly those arising from a map and chart environment. Due to the complexities of such automatic recognition, the new OCR techniques were developed, particularly in the area of character thinning and preprocessing. Extremely fine recog- nition, efficiency, and rejection rates for numeric characters were achieved (99.7, 97 and 2.7%, respec- tively). Preliminary results on alphabetic data were promising, perhaps indicating that the software tools developed were indeed character independent. The use of general topological and geometric features, easily derived from centerline thinned raster images, and the use of the PAL TREE recognition logic make the system flexible and able to be easily modified to recognize other groups of symbols.
REFERENCES
1. T. Fay and C. Walker, Handprint symbol recognition: alphabetic characters, Naval Ocean Research and Development Activity, NSTL, Miss., NORDA Report 114 (1985)•
2. R. M. Brown, Preprocessing for symbol recognition, Naval Ocean Research and Development Activity, NSTL, Miss., Tech. Note 210 (1985).
3. R. M. Brown and C. F. Cheng. Optical character recognition for automated cartography: The advanced development handprinted symbol recognition system. Naval Ocean Research and Development Activity, NSTL, Miss.. Tech. Note 187 {1983).
4. C. Walker, R. M. Brown and W. Osterman. Raster scan recognition system. Naval Ocean Research and Develop- ment Activity, NSTL. Miss., Tech. Note 188 (19831.
About the Author-- ROnF.RT M. BROW,'q received the A.B. degree in mathematics from Vanderbilt University in 1961 and attended graduate school at Yale University. In 1967, he was awarded a Ph.D. degree in physics from Vanderbilt University.
Dr Brown came to the Naval Ocean Research and Development Activity (NORDA) in 1979 from the Computer Science Corp. where he was a senior computer scientist. Dr Brown was a physicist in the Mapping, Charting and Geodesy Division at NORDA until he became Head of the Pattern Analysis Branch in 1982. He held this position until his death in 1985.
Dr Brown's research efforts at NORDA were concentrated in unconstrained, free-form handprint recognition. He also conducted research in computer image processing, particularly in automatically cxtracting water depth information from stereo photographic pairs•
Dr Brown was a member of Sigma Xi, Phi Beta Kappa and IEEE.
About the Author--TEMPLE HAROLD FAY received the B.S. degree from Guilford College in 1963, the M.A. degree from Wake Forest University in 1964, and the Ph.D. degree in mathematics from the University of Florida in 1971.
Dr Fay joined the University of Southern Mississippi in 1979 as an Associate Professor, and has been Professor of Mathematics since 1982. Since 1983, he has been a consultant with the Pattern Analysis Branch of the Mapping. Charting and Geodesy Division of the Naval Ocean Research and Development Activity. His research interests center around abstract algebra and category theory, and feature extraction from digital imagery.
In addition to his classroom teaching and consulting activities, Dr Fay directs an active undergraduate research program. He has been a NASA Summer Faculty Fellow, and is a member of the American Mathematical Society, the Oceanic Society and Sigma Xi.
About the Author -- CH^gLES L. WALTER received the B.S. dcgree in physics from Mississippi State University in 1965. He received an M.S. degree in 1973 and a Ph.D. degree in 1975 from Mississippi State University, both in electrical engineering.
Dr Walker joined the Naval Ocean Research and Development Activity (NORDA)in 1982 from the Naval Coastal Systems Center where he developed signal processing techniques for superconducting magnetometer data. At NORDA he has worked in the area of automatic recognition of free-form handprinted characters. Dr Walker's research interests include digital image processing, remote sensing and pattern analysis.