growth dynamics ofartemisia annua hairy roots in three culture systems
TRANSCRIPT

Growth Dynamics of Artemisia annuaHairy Roots in Three Culture Systems
Yoo Jeong Kim,1 Pamela J. Weathers,2 Barbara E. Wyslouzil1
1Department of Chemical Engineering, Worcester Polytechnic Institute, 100Institute Road, Worcester, Massachusetts 01609; telephone:508-831-5493; fax: 508-831-5853; e-mail: [email protected] of Biology and Biotechnology, Worcester PolytechnicInstitute, 100 Institute Road, Worcester, Massachusetts 01609
Received 26 June 2002; accepted 3 February 2003
DOI: 10.1002/bit.10685
Abstract: The transient growth of Artemisia annua hairyroots was compared for cultures grown in shake flasksand in bubble column and mist reactors. Instantaneousgrowth rates were obtained by numerically differentiat-ing the transient biomass measurements. Specific sugarconsumption rates showed good agreement with litera-ture values. From the growth rate and sugar consump-tion rate, the specific yield and maintenance coefficientfor sugar were determined for all three culture systems.These values were statistically indistinguishable forroots grown in shake flasks and bubble columns. In con-trast, the values for roots grown in bubble columns andmist reactors were statistically different, suggesting thatsugar utilization by roots grown in these two systemsmay be different. By measuring respiration rates in thebubble column reactor we also determined the actualbiomass yield and maintenance coefficient for O2 andCO2. Together with an elemental analysis of the roots,this allowed us to obtain a reasonable carbon balance.© 2003 Wiley Periodicals, Inc. Biotechnol Bioeng 83: 428–443,2003.
INTRODUCTION
Bioreactor design remains a key issue that must be ad-dressed before secondary metabolite production from hairyroots can be commercially successful. Developing a deeperunderstanding of how transformed roots respond to differentreactor environments is particularly important, and the goalof our research is to quantitatively assess the relative effec-tiveness of liquid- and gas-phase reactors for culturing theseplant tissues. In an earlier study (Kim et al., 2001), we foundthat the level of artemisinin contained in Artemisia annuahairy roots was significantly higher in the mist reactor thanin the bubble column, and that the roots grown in shakeflasks contained a negligible amount of artemisinin. On theother hand, a side-by-side comparative study of the overallbiomass productivity showed that both the effective growthrate and a 2-week average growth rate were almost always
higher in the bubble column than in the mist reactor (Kim etal., 2002).
In this paper, we compare the transient growth of A.annua hairy roots in different reactor environments and de-termine the nutrient utilization rates. Nutrient utilizationrates for hairy root cultures are usually reported as the ap-parent biomass yield—the ratio of the amount of nutrientconsumed to the increase in biomass (Bhadra and Shanks,1997; Kwok and Doran, 1995). The apparent yield can befurther subdivided into the actual yield, a conversion effi-ciency of the nutrient consumed for biomass gain, and themaintenance coefficient, the nutrient required to maintainviability of existing biomass (Schnapp et al., 1991). Thesevalues can provide deeper insight into the bioconversionprocess and may clarify the advantages that one reactordesign may have over another. Obtaining actual yield andmaintenance coefficients requires following transient bio-mass closely, a task that is more difficult for hairy rootcultures than cell suspension cultures. Thus, there is littledata of this type available in the literature.
As in our previous work, we chose a bubble column anda nutrient mist reactor as representative liquid- and gas-phase reactors, respectively. We cultured the YUT16 hairyroot clone of A. annua in these two reactors as well as inshake flasks. We first compared the biomass productivityand the changes in the major nutrients observed in the re-actors directly to those observed in shake flask experimentsas a function of time. We then estimated transient biomassin the reactors during culture, using correlations based onshake flask experiments, and determined the instantaneousspecific growth rates. The specific growth rates were relatedto the specific sugar consumption rates to determine theactual biomass yield and the maintenance coefficients forsugar as a function of the culture environment. For thebubble column reactors, we also measured the specific res-piration rate, related this to the specific growth rate, andcalculated the actual biomass yield and the maintenancecoefficient for oxygen and carbon dioxide. Finally, usingboth actual yields and maintenance coefficients for sugarand oxygen from the bubble column reactors, we performeda carbon balance to determine the reliability of our results.
Correspondence to: Barbara E. Wyslouzil, Department of Chemical En-gineering, 100 Institute Road, Worcester, MA 01609.
Contract grant sponsors: NSF; NIHContract grant numbers: BES-9414858; R21AI39170-01
© 2003 Wiley Periodicals, Inc.

MATERIALS AND METHODS
Hairy Roots
Cultures of the YUT16 hairy root clone of A. annua L.(Weathers et al., 1994) were grown at 100 rpm in 125-mLshake flasks containing 50 mL of Gamborg’s B5 medium(Gamborg et al., 1968) with half-strength CaCl2 � 2H2O and30 g/L sucrose and were subcultured every 2 weeks. Allexperiments were performed under continuous cool whitefluorescent light (4 ± 0.5 �E/m2/s) and at 23 ± 2°C. Theseconditions were identical to those used in Kim et al. (2002).
Shake Flask Experiments
Two identical sets of shake flask experiments (Shake FlaskExp 1 and 2) were conducted at different times using themedium described above. A third set of shake flask experi-ments (Shake Flask Exp 3) was performed using mediumthat contained KNO3 at 2/3 the concentration found in stan-dard B5 medium. All shake flask experiments used 50 mLof medium in 125-mL Erlenmeyer flasks. The medium wasadjusted to pH 5.7 ± 0.1 prior to autoclaving at 121°C for 22min. Roots grown in shake flasks for 2 weeks were washedwith sterile distilled water. Young healthy root tips, 2–3 cmlong, were cut, blotted, weighed, and inoculated into flasksat 6 g fresh weight (FW)/L. The flasks were placed on anorbital shaker (25.4-mm orbit diameter, Lab-Line Instru-ments Inc., Melrose Park, IL) at 100 rpm. During eachexperiment, at least 3 shake flasks were harvested every 3days from day 3 to day 27. The harvested roots were thenrinsed with distilled water and blotted, FW measured, andplaced in an oven at 60°C for 3 days, to obtain dry weight(DW). The pH and specific conductivity (conductivity me-ter, Cole-Parmer, Vernon Hills, IL) of the medium weremeasured. For Shake Flask Exp 2 and 3, the volume of themedium remaining at harvest was also determined. The me-dium was stored at −20°C until it was analyzed for glucose,fructose, sucrose, nitrate, and ammonium.
Reactor Experiments
Figure 1 contains schematic diagrams for the bubble columnand the nutrient mist reactors. A total of 27 bubble columnand 12 mist reactor runs were completed. To ensure thesame degree of initial root distribution, the mist reactor ranas a hybrid reactor system, i.e., it ran as a bubble columnreactor for 6–21 days and was then switched to mist mode.The culture chamber of both reactor systems was identicaland contained a cylindrical stainless steel mesh structure tofacilitate even distribution of the roots. The working volumeof the culture chamber was 1.5 L. The detailed operatingprocedures for the reactors were described in Kim et al.(2002) and are not included here. Table I summarizes thereactor culture conditions and the reactor run numbers cor-responding to each condition. All the reactor runs wereconsidered batch operations unless the medium was ex-
changed during the run. The latter reactors are referred to asfed-batch reactors. For the mist reactors, the medium vol-ume in the reservoir was also monitored during mist mode.Every 3 days, 10 mL of the medium was taken from bothreactors to measure the specific conductivity as well as theconcentrations of glucose, fructose, sucrose, nitrate, andammonium. At harvest, the root bed and trellis were re-moved from the reactors, and the volume of the remainingmedium was determined. The roots were rinsed with dis-tilled water and blotted, and the total fresh weight was de-termined. The dry weight to fresh weight ratio (DW/FWratio) was obtained by placing representative root sampleswith known FW in an oven at 60°C for 3 days and mea-suring the resulting DW. At least five different root sampleswere taken from different positions in the root bed, and theDW/FW ratio were independently determined. The averageand the standard deviation of the DW/FW ratio for the runwere calculated from these independent measurements. Theharvested FW and the averaged DW/FW ratio were used tocalculate the total harvested DW. The biomass concentra-tion (g/L) was calculated by dividing FW or DW by theinitial medium volume (1.5 L).
Respiration Rate Measurements
On the same day that the medium was sampled, respirationrates were measured for seven of the bubble column reac-tors. The CO2 and O2 levels of the inlet and outlet gas weremeasured using an infrared CO2 and a paramagnetic O2 gasanalyzer (Columbus Instruments, Columbus, OH) that wascalibrated using two gas mixtures: 18.00% O2/82.00% N2
and 0.70% CO2/21.99% O2/77.31% N2 (Wesco, Billerica,MA). When room air was used as the inlet gas, humantraffic to the culture room where the reactors were locatedwas prohibited during the measurements. The concentra-tions of O2 and CO2 were measured every 30 s and recordedusing a data acquisition system. The inlet gas was monitoredfor 1 h, the exit gas from the reactor was measured for 1–3h, and the individual readings were combined to yield theaverage concentration and the standard deviation. The res-piration rates were obtained using the gas flow rate to thereactor and the difference in the average concentrations ofO2 or CO2 in the inlet and outlet gas assuming that theincrease in biomass during the measurement period wasnegligible. The respiratory quotient was determined fromthe ratio of the CO2 evolution rate to the O2 consumptionrate.
Sugar, NO3−, and NH4
+ Analyses
For each medium sample we made three independent mea-surements of the concentrations of sugar, nitrate, and am-monium ion.
Glucose, fructose, and sucrose concentrations were de-termined by HPLC (Waters, Milford, MA) using a Micro-sorb amino column (5 �m, 250 × 4.6 mm, 100 Å, VarianAnalytical Instruments, Walnut Creek, CA) with an R401
KIM ET AL.: GROWTH DYNAMICS OF A. ANNUA HAIRY ROOTS 429

refractive index detector (Waters). The mobile phase was a80:20 (v/v) acetonitrile (HPLC grade, EM Science, Gibbs-town, NJ)/water mixture at a flow rate of 1 mL/min, and theinjected sample volume was 20 �L.
For nitrate concentration, 0.5 mL of medium was addedto 5 mL of Szechrome NAS (Polysciences, Inc., Warring-ton, PA) reagent (0.5% w/v) dissolved in a mixture of 50:50(v/v) concentrated H3PO4/concentrated H2SO4. After 45min, OD570 was recorded using a spectrophotometer (Hita-chi Instruments Inc., U-2001, San Jose, CA).
Ammonium ion concentration in the medium was ana-lyzed colorimetrically according to Sigma Technical Bulle-
tin No. 640 using a phenol–nitroprusside solution (Sigma,640-1, St. Louis, MO) and an alkaline hypochlorite solution(Sigma, 640-3).
Elemental Analysis
The harvest roots from the reactors were freeze-dried andsent to Quantitative Technologies Inc. (Whitehouse, NJ) forelemental analysis of C, H, N, and ash content. Oxygencontent was calculated by mass balance. For the bubblecolumn reactors, 27 root samples from 23 reactors grownfor 7–38 days were analyzed. A total of 16 root samples
Figure 1. Schematic diagrams for the (a) bubble column and (b) mist reactors.
430 BIOTECHNOLOGY AND BIOENGINEERING, VOL. 83, NO. 4, AUGUST 20, 2003
from 12 reactors grown for 21–38 days were analyzed forthe mist reactors.
RESULTS AND DISCUSSION
Direct Measurements of Transient BiomassAccumulation in Shake Flasks and Reactors
Gyratory shake flasks often show the best biomass accumu-lation per unit volume (McKelvey et al., 1993; Taya et al.,1989b). They are, therefore, the standard used to comparethe performance of other reactors (Jung and Tepfer, 1987;McKelvey at al., 1993; Toivonen et al., 1990). Figure 2presents the data from three sets of shake flask experimentsperformed over a 2-year period, and the results confirm thestability of the root clone. In shake flasks, the roots exhibitexponential growth for up to 9 days, and the average valueof �max for A. annua hairy roots was 0.22 day−1, corre-
sponding to a doubling time of 3.1 days. Thus, A. annuahairy roots grow more slowly than Atropa belladonna (spe-cific growth rate, 0.55–0.30 day−1; doubling time, 1.3–2.3day; Kanokwaree and Doran, 1997) or Hyoscyamus muticus(effective specific growth rate, 0.32 day−1; Bordonaro andCurtis, 2000) but are comparable to Catharanthus roseushairy roots (doubling time, 3.6 days; Bhadra and Shanks,1997) and faster than Arabidopsis thaliana hairy roots (spe-cific growth rate, 0.045–0.101 day−1; Shiao and Doran,2000).
Batch experiments were also conducted using the bubblecolumn and mist reactors, with harvest times of 1, 2, 3, and4 weeks. All of the reactor results are included in Fig. 2, andat first glance, the biomass accumulation in the reactorsappears both much lower and more variable than in shakeflasks, especially at shorter culture periods. Both of theseobservations are primarily the result of inoculum levels inthe reactors that varied from 1.9 to 7.1 g FW/L in contrast
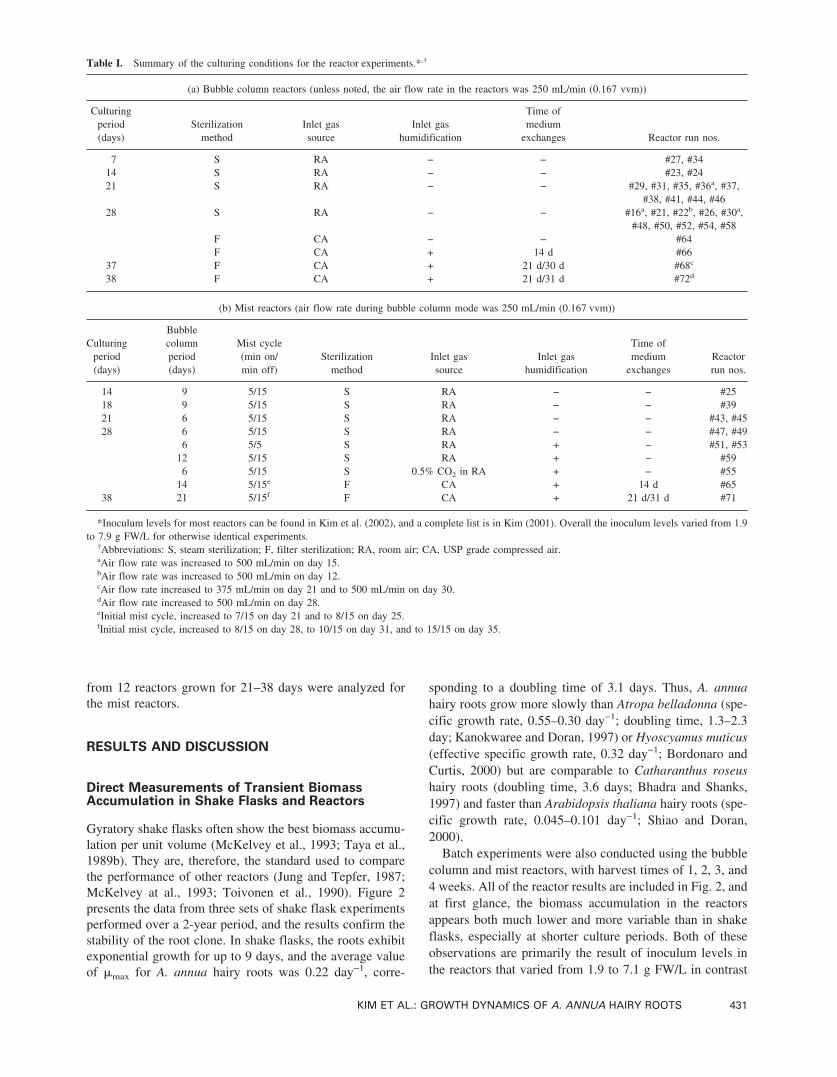
Table I. Summary of the culturing conditions for the reactor experiments.*,†
(a) Bubble column reactors (unless noted, the air flow rate in the reactors was 250 mL/min (0.167 vvm))
Culturingperiod(days)
Sterilizationmethod
Inlet gassource
Inlet gashumidification
Time ofmedium
exchanges Reactor run nos.
7 S RA − − #27, #3414 S RA − − #23, #2421 S RA − − #29, #31, #35, #36a, #37,
#38, #41, #44, #4628 S RA − − #16a, #21, #22b, #26, #30a,
#48, #50, #52, #54, #58F CA − − #64F CA + 14 d #66
37 F CA + 21 d/30 d #68c
38 F CA + 21 d/31 d #72d
(b) Mist reactors (air flow rate during bubble column mode was 250 mL/min (0.167 vvm))
Culturingperiod(days)
Bubblecolumnperiod(days)
Mist cycle(min on/min off)
Sterilizationmethod
Inlet gassource
Inlet gashumidification
Time ofmedium
exchangesReactorrun nos.
14 9 5/15 S RA − − #2518 9 5/15 S RA − − #3921 6 5/15 S RA − − #43, #4528 6 5/15 S RA − − #47, #49
6 5/5 S RA + − #51, #5312 5/15 S RA + − #59
6 5/15 S 0.5% CO2 in RA + − #5514 5/15e F CA + 14 d #65
38 21 5/15f F CA + 21 d/31 d #71
*Inoculum levels for most reactors can be found in Kim et al. (2002), and a complete list is in Kim (2001). Overall the inoculum levels varied from 1.9to 7.9 g FW/L for otherwise identical experiments.
†Abbreviations: S, steam sterilization; F, filter sterilization; RA, room air; CA, USP grade compressed air.aAir flow rate was increased to 500 mL/min on day 15.bAir flow rate was increased to 500 mL/min on day 12.cAir flow rate increased to 375 mL/min on day 21 and to 500 mL/min on day 30.dAir flow rate increased to 500 mL/min on day 28.eInitial mist cycle, increased to 7/15 on day 21 and to 8/15 on day 25.fInitial mist cycle, increased to 8/15 on day 28, to 10/15 on day 31, and to 15/15 on day 35.
KIM ET AL.: GROWTH DYNAMICS OF A. ANNUA HAIRY ROOTS 431
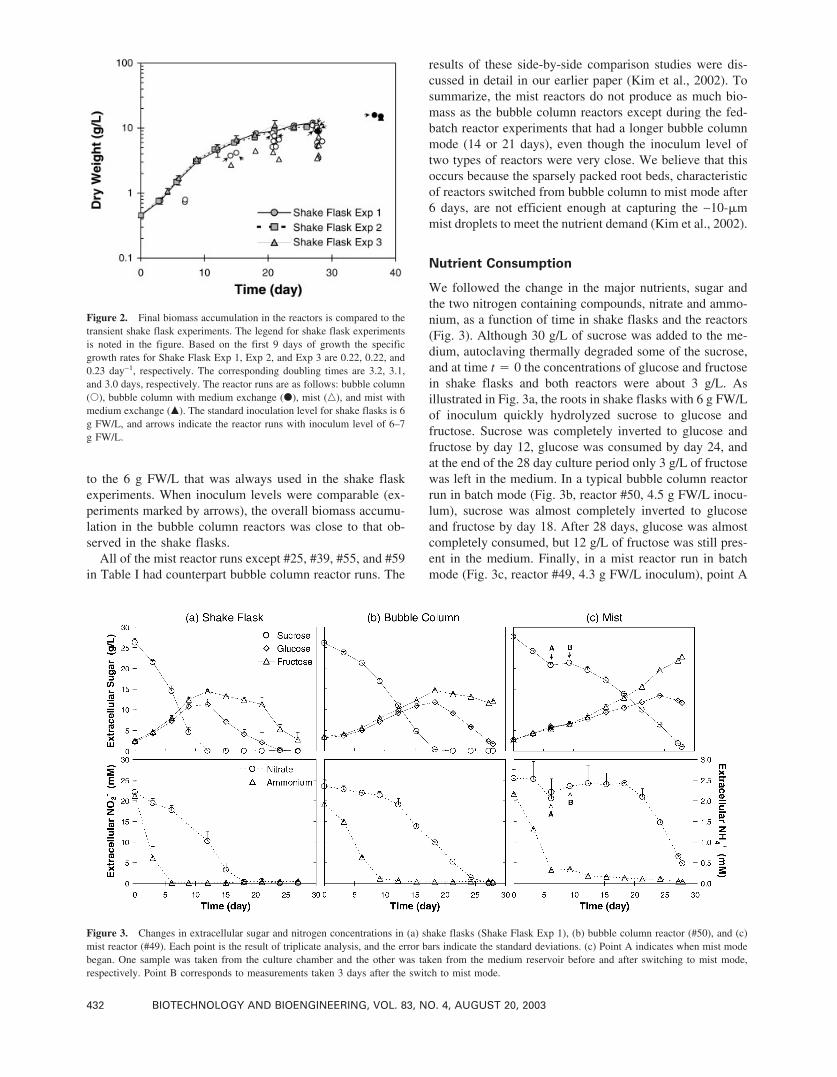
to the 6 g FW/L that was always used in the shake flaskexperiments. When inoculum levels were comparable (ex-periments marked by arrows), the overall biomass accumu-lation in the bubble column reactors was close to that ob-served in the shake flasks.
All of the mist reactor runs except #25, #39, #55, and #59in Table I had counterpart bubble column reactor runs. The
results of these side-by-side comparison studies were dis-cussed in detail in our earlier paper (Kim et al., 2002). Tosummarize, the mist reactors do not produce as much bio-mass as the bubble column reactors except during the fed-batch reactor experiments that had a longer bubble columnmode (14 or 21 days), even though the inoculum level oftwo types of reactors were very close. We believe that thisoccurs because the sparsely packed root beds, characteristicof reactors switched from bubble column to mist mode after6 days, are not efficient enough at capturing the ∼10-�mmist droplets to meet the nutrient demand (Kim et al., 2002).
Nutrient Consumption
We followed the change in the major nutrients, sugar andthe two nitrogen containing compounds, nitrate and ammo-nium, as a function of time in shake flasks and the reactors(Fig. 3). Although 30 g/L of sucrose was added to the me-dium, autoclaving thermally degraded some of the sucrose,and at time t � 0 the concentrations of glucose and fructosein shake flasks and both reactors were about 3 g/L. Asillustrated in Fig. 3a, the roots in shake flasks with 6 g FW/Lof inoculum quickly hydrolyzed sucrose to glucose andfructose. Sucrose was completely inverted to glucose andfructose by day 12, glucose was consumed by day 24, andat the end of the 28 day culture period only 3 g/L of fructosewas left in the medium. In a typical bubble column reactorrun in batch mode (Fig. 3b, reactor #50, 4.5 g FW/L inocu-lum), sucrose was almost completely inverted to glucoseand fructose by day 18. After 28 days, glucose was almostcompletely consumed, but 12 g/L of fructose was still pres-ent in the medium. Finally, in a mist reactor run in batchmode (Fig. 3c, reactor #49, 4.3 g FW/L inoculum), point A
Figure 2. Final biomass accumulation in the reactors is compared to thetransient shake flask experiments. The legend for shake flask experimentsis noted in the figure. Based on the first 9 days of growth the specificgrowth rates for Shake Flask Exp 1, Exp 2, and Exp 3 are 0.22, 0.22, and0.23 day−1, respectively. The corresponding doubling times are 3.2, 3.1,and 3.0 days, respectively. The reactor runs are as follows: bubble column(�), bubble column with medium exchange (�), mist (�), and mist withmedium exchange (�). The standard inoculation level for shake flasks is 6g FW/L, and arrows indicate the reactor runs with inoculum level of 6–7g FW/L.
Figure 3. Changes in extracellular sugar and nitrogen concentrations in (a) shake flasks (Shake Flask Exp 1), (b) bubble column reactor (#50), and (c)mist reactor (#49). Each point is the result of triplicate analysis, and the error bars indicate the standard deviations. (c) Point A indicates when mist modebegan. One sample was taken from the culture chamber and the other was taken from the medium reservoir before and after switching to mist mode,respectively. Point B corresponds to measurements taken 3 days after the switch to mist mode.
432 BIOTECHNOLOGY AND BIOENGINEERING, VOL. 83, NO. 4, AUGUST 20, 2003

indicates when bubble column mode ended and mist modebegan. At point B (3 days later), the sucrose concentrationhad increased slightly because evaporational water loss con-centrated the medium. At the end of the culture period,sucrose was almost completely inverted to glucose and fruc-tose, and the glucose and fructose concentrations in themedium were 12 g/L glucose and 23 g/L fructose, respec-tively. At harvest, the volume of medium remaining was910 mL for the bubble column reactor (#50) and 345 mL forthe mist reactor (#49). Thus, the total sugar consumption inthe bubble column (#50) was 34.5 ± 0.5 g (glucose equiva-lent) for a biomass increase of 12.8 g DW, with an apparentsugar yield of 0.37 ± 0.02 g DW per gram of sugar. In themist reactor, the total sugar consumption was 33.8 ± 0.8 g(glucose equivalent), the biomass increase was 10.6 g DW,and the apparent yield was 0.31 ± 0.02 g DW per gram ofsugar.
B5 medium contains two nitrogen sources, nitrate andammonium ions, with initial concentrations of 24.7 and 2.02mM, respectively. In shake flasks (Fig. 3a), ammonium andnitrate were completely consumed in 6 and 18 days, respec-tively. Ammonium levels also dropped rapidly in the bubblecolumn reactor (Fig. 3b). After 9 days only 6% of the initialammonium was left in the medium. Nitrate level decreasedto 20% of the initial level after about 3 weeks, and most ofthe nitrate was consumed by the end of the culturing period.In the mist reactor (Fig. 3c), ammonium dropped rapidly forthe first 6 days of bubble column mode but leveled off afterthe reactor was switched to mist mode. During bubble col-umn mode, the nitrate concentration also decreased, butafter the switch to mist mode this ion concentration in-creased for 12 days. The behavior of both the sugar and thenitrogen concentrations shows that concentration changesalone cannot reflect nutrient consumption properly in themist reactor because of heavy evaporational water loss.
Transient Biomass and Instantaneous SpecificGrowth Rates in the Reactors
In shake flasks, one can readily determine transient growthrates by growing many root cultures at the same inoculumlevel and harvesting at different times. Although a similarapproach can be used in reactors (Kwok and Doran, 1995),it is generally too expensive in terms of time, labor, equip-ment, and space. For hairy root cultures, where it is notpossible to directly sample a representative population, de-veloping reliable aseptic methods to estimate biomass in agrowing culture has been a challenge (Ramakrishnan et al.,1999). The most widely used methods relate nutrient con-centration or consumption to biomass increase (Ra-makrishnan et al., 1999; Ryu et al., 1990; Taya et al.,1989a). As detailed in the Appendix, we developed fourcorrelations to follow biomass in the reactors: two directconductivity correlations, a conductivity correlation that ac-counts for the medium volume change during culture, and asugar mass correlation. The correlations are summarized inTable AI and are labeled as Eqs. (C1)–(C4).
Figure 4 shows the biomass concentration in the fed-batch mist (#71) and bubble column (#72) reactors esti-mated using correlations (C2)–(C4). For both reactors, thedry weights estimated by the direct conductivity correlation,Eq. (C2), prior to medium exchange, were very close tothose estimated by the conductivity correlation incorporat-ing the volume correction, Eq. (C3). The final biomass pre-dicted using Eq. (C3) was also in very good agreement withthe actual harvested biomass. The sugar mass correlation,Eq. (C4), on the other hand, underestimated biomass accu-mulation in both reactors. We therefore used the conduc-tivity correlation with volume change (Eq. (C3)) to estimatebiomass in all of the subsequent analyses.
From the transient biomass concentration in the reactors,we obtained the instantaneous specific growth rate by nu-merical differentiation. A central difference scheme wasused,
��ti� =1
X�ti�
dX�ti�
dti=
1
X�ti�
X�ti+1� − X�ti−1�
ti+1 − ti−1, (1)
Figure 4. Dry weight biomass concentration in the reactors was esti-mated using three different correlations. Symbols: (�) actual inoculum andharvest; (�) estimated from conductivity, see Eq. (C2); (×) estimated fromconductivity with volume correction, see Eq. (C3); (�) estimated fromsugar mass, see Eq. (C4).
KIM ET AL.: GROWTH DYNAMICS OF A. ANNUA HAIRY ROOTS 433

where �(ti) is the specific growth rate at sampling time ti,and X(ti) is biomass at ti, except at t � 0 and the time ofharvest. At the end points, forward and backward differ-ences were used. Figure 5 shows the instantaneous specificgrowth rates calculated for the fed-batch reactor runs illus-trated in Fig. 4 and for the mist batch reactor run illustratedin Fig. 3c. Fed-batch reactors #71 and #72 were operated asnormal bubble column reactors until day 21. Over this timeperiod, the instantaneous specific growth rate decreasedsteadily with time and the reactors are essentially indistin-guishable. On day 21, the medium was exchanged in bothreactors and reactor #71 was switched to mist mode. Threedays after the addition of fresh medium, the specific growthrate in the bubble column reactor (#72) increased to 0.122day−1 but then dropped rapidly. Meanwhile, in the mistreactor (#71), the specific growth rate increased onlyslightly to 0.084 day−1 after medium addition but remainedrelatively constant for more than 10 days. This “constant”specific growth rate during mist mode is more pronouncedin a typical batch mist reactor (#49). In our previous paper(Kim et al., 2002), we calculated a 2-week average specificgrowth rate (�avg � ln(x2/x1)/(t2 − t1)) in both reactor types,and �avg in the mist reactor was constant at ∼0.07 day−1
regardless of the initial biomass concentration. In contrast,�avg in the bubble column reactor was higher (>0.12 day−1)at low initial biomass concentration but decreased with in-creasing initial biomass concentration. The average specificgrowth rates reported earlier and the instantaneous specificgrowth rates reported here are consistent with each otherand give the following overall picture: hairy roots grown inthe bubble column reactor show the highest growth rate atthe beginning of culture (at low biomass) and as the biomassincreases the growth rate decreases. In the mist reactor, thespecific growth rate is relatively constant throughout themist culture and significantly lower than that in the bubblecolumn reactor at earlier times. For the mist reactor to ac-
cumulate more biomass than the bubble column reactor,there must be enough time with � in the counterpart bubblecolumn reactor below 0.07 day−1 to overcome the differencein biomass created when � in the bubble column reactor ishigher than 0.07 day−1.
Sugar Requirements
Sugar is the major carbon source in our system, and weexamined the transient sugar concentration changes in allthree culture systems. The easiest way to characterize sugarutilization for hairy roots and other plant cell cultures is tocalculate the apparent or observed biomass yield coeffi-cient, YX/S. This is simply the ratio of biomass increase tothe total sugar consumption, or
YX�S =�X
�S. (2)
Eq. (2) is identical to Eq. (C4), the correlation that wedeveloped to estimate biomass in the reactor from sugarconsumption observed in the shake flasks. The slope of thecorrelation line in Fig. A1d is the coefficient of �(VcTS)/Vo
in Eq. (C4), and the value, 0.35 g DW biomass g−1 glucoseequivalent, is to YX/S for A. annua hairy roots in shakeflasks. As summarized in Table II, our value is very similarto the value reported by Kwok and Doran (1995) for A.belladonna hairy roots or that reported by Bhadra andShanks (1997) for C. roseus hairy roots. Figure A1d alsoincludes the results from the bubble column and the mistreactors. Regressing the data from the bubble column ex-periments alone yields a slope of 0.38 g DW biomass g−1
glucose equivalent. The slopes from the shake flasks andbubble column reactors were compared using the Student’st-test (Zar, 1999b) and did not differ statistically. As dis-cussed in the Appendix, some of the mist reactor results lieconsiderably to the right of the correlation line based on theshake flask results (Fig. A1). This trend is the result of asystematic error related to mist loss through the coalescerduring early experiments. We did not, therefore, correlatethe mist reactor data by itself.
Sugar utilization can be further subdivided into that re-quired to produce new biomass and that used to maintainviability of the existing biomass (Pirt, 1965; Schnapp et al.,1991). Thus, the specific sugar uptake rate QS may be writ-ten as
QS =−1
X�t�
dS
dt=
1
Y�X�S� + mS, (3)
where Y�X/S is the actual biomass yield from sugar (g DW/gglucose equivalent) and mS is the maintenance coefficient (gglucose equivalent/g DW/day). The sugar uptake rate attime t is
dS
dt=
d�cTSV�
dt, (4)
where cTS(t) is the total sugar concentration, and V(t) is the
Figure 5. Specific growth rates in the reactors were calculated using thebiomass values estimated by the conductivity mass correlation Eq. (C3)and numerical differentiation. ME indicates the medium exchange in bothfed-batch reactors #71 and #72.
434 BIOTECHNOLOGY AND BIOENGINEERING, VOL. 83, NO. 4, AUGUST 20, 2003
volume of the medium at time t. In Eq. (3) we have ignoredthe fact that part of the sugar consumed forms excretedbyproducts. Without an independent measure of the byprod-uct production rate, we will assume that biomass productiondominates. The consequences of this assumption are dis-cussed further in the carbon balance section.
The total sugar concentration of the medium was mea-sured in all of the experiments. The volume of the mediumwas measured for the shake flasks, while in the bubblecolumn reactors it was calculated using Eq. (A5) (see Ap-pendix). For the mist reactors, the medium volume was setequal to the sum of that observed in the reservoir, the tub-ing, and the mist chamber. As discussed in the Appendix,the mist deposited on the surface of roots was ignored. Thesugar uptake rate at time t was then calculated by numericaldifferentiation using a central difference scheme. Biomasswas measured directly in the shake flasks and was estimatedwith Eq. (C3) for the bubble column and mist reactors. Onlythe mist reactor runs where the final predicted biomass waswithin the 10% of the actual biomass were used for thisanalysis. Eq. (1) was then used to obtain � from either themeasured or the estimated biomass values.
Figure 6 shows the relationships between the specificsugar uptake rates and the specific growth rates in the shakeflasks, bubble column, and mist reactors. We note that thevalues at inoculation and harvest are not included in thisanalysis, and for the mist reactors only the values duringmist mode are presented. There are errors associated withboth the values of QS and �, and we have included repre-sentative error bars on selected points to show the range.The error bars indicate the standard errors, calculated usingan error propagation equation (Bevington and Robinson,1992). The sources of error include the sugar concentrationmeasurements as well as the biomass measurements (forshake flask) or the biomass estimates based on correlation
(C3) (for the mist and bubble column reactors). The stan-dard error for the estimated biomass was calculated from68.3% confidence interval for the value (Zar, 1999a). Thestandard deviations in the sugar concentration measurementwere quite small. The large errors at high QS and � for thebubble column and the mist reactors come primarily fromthe error associated with estimating small changes in bio-mass.
A simple least-squares fit can give misleading results iferrors are not homogeneous within a data set (Riu and Rius,1996), and in all three culture systems the errors associatedwith both QS and � increase with QS and �. To properlyaccount for the errors in the linear regression, we followedthe algorithm presented by Press et al. (1992). For astraight-line model y(x) � a + bx, we minimized the �2
merit function
�2�a,b� = �i=1
N�yi − a − bxi�
2
�yi2 + b2�xi
2 (5)
with respect to a and b, where �xi and �yi are the standarderrors of x and y for the ith point, respectively. The resultinglines are shown in Fig. 6, and the slopes and interceptscorrespond to 1/Y�X/S and mS, respectively. Figure 6d illus-trates the joint confidence regions that were obtained byplotting the ��2 � 6.17 contour. This contour correspondsto the 95% confidence level for 2 degrees of freedom. Evenat the 95% confidence level, the joint confidence regions forthe bubble column and the mist reactors do not overlap,indicating that the correlations derived for the bubble col-umn and mist reactors are statistically different. The bubblecolumn and the shake flasks, on the other hand, exhibit ahigh degree of overlap at the 95% confidence level and aretherefore not statistically distinguishable. This overlap per-sists even at the 68% confidence level (��2 � 2.31, not
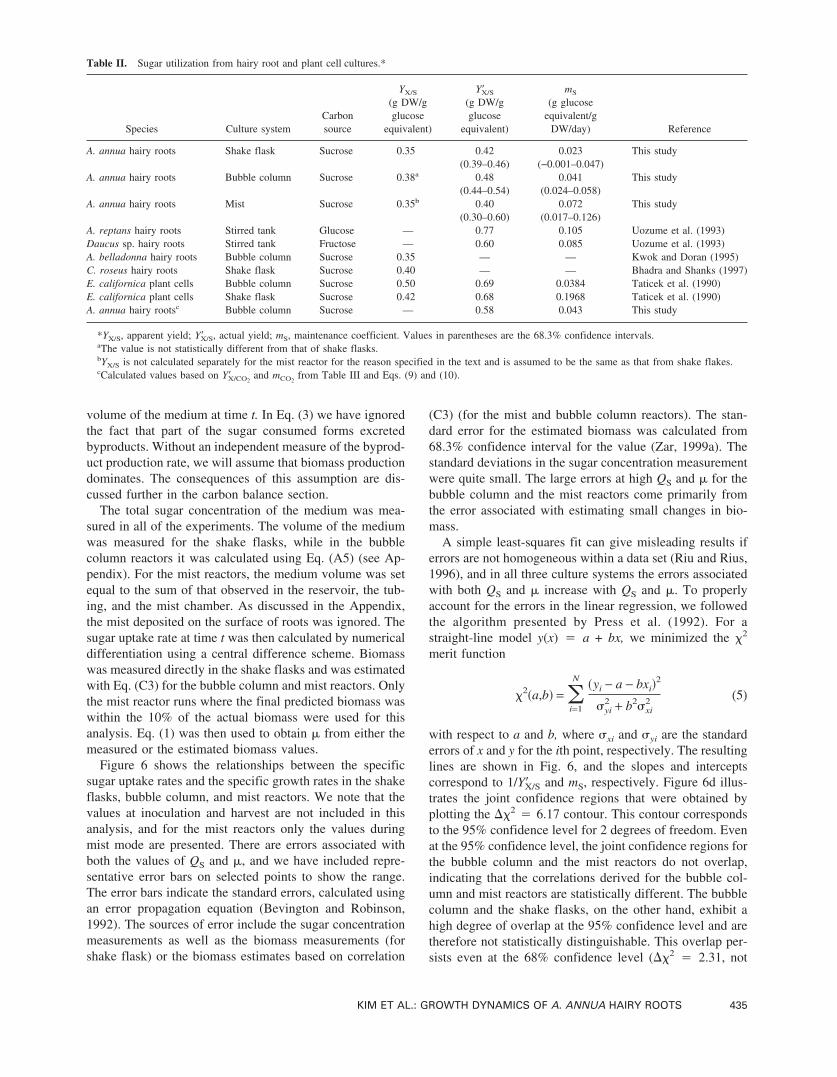
Table II. Sugar utilization from hairy root and plant cell cultures.*
Species Culture systemCarbonsource
YX/S
(g DW/gglucose
equivalent)
Y�X/S
(g DW/gglucose
equivalent)
mS
(g glucoseequivalent/g
DW/day) Reference
A. annua hairy roots Shake flask Sucrose 0.35 0.42(0.39–0.46)
0.023(−0.001–0.047)
This study
A. annua hairy roots Bubble column Sucrose 0.38a 0.48(0.44–0.54)
0.041(0.024–0.058)
This study
A. annua hairy roots Mist Sucrose 0.35b 0.40(0.30–0.60)
0.072(0.017–0.126)
This study
A. reptans hairy roots Stirred tank Glucose — 0.77 0.105 Uozume et al. (1993)Daucus sp. hairy roots Stirred tank Fructose — 0.60 0.085 Uozume et al. (1993)A. belladonna hairy roots Bubble column Sucrose 0.35 — — Kwok and Doran (1995)C. roseus hairy roots Shake flask Sucrose 0.40 — — Bhadra and Shanks (1997)E. californica plant cells Bubble column Sucrose 0.50 0.69 0.0384 Taticek et al. (1990)E. californica plant cells Shake flask Sucrose 0.42 0.68 0.1968 Taticek et al. (1990)A. annua hairy rootsc Bubble column Sucrose — 0.58 0.043 This study
*YX/S, apparent yield; Y�X/S, actual yield; mS, maintenance coefficient. Values in parentheses are the 68.3% confidence intervals.aThe value is not statistically different from that of shake flasks.bYX/S is not calculated separately for the mist reactor for the reason specified in the text and is assumed to be the same as that from shake flakes.cCalculated values based on Y�X/CO2
and mCO2from Table III and Eqs. (9) and (10).
KIM ET AL.: GROWTH DYNAMICS OF A. ANNUA HAIRY ROOTS 435

shown). Finally, there is some overlap between the shakeflask and the mist reactor at the 95% confidence level butnot at the 68% confidence level.
Table II summarizes the values of YX/S, Y�X/S, and mS
derived in our study and compares them to values reportedin the literature for other hairy root clones and plant cellcultures. In general, our results are somewhat lower butquite consistent with other literature values. We note thatthe values of Y�X/S and mS for the bubble column reactorsvaried by less than 10%, when either Eq. (C4) or, wherepossible, Eq. (C1) was used to estimate biomass instead ofEq. (C3). For the mist reactors, the values of Y�X/S and mS
derived using Eq. (C4) were also within 10% of thoseshown above.
Respiration Rates in Bubble Column Reactors
Oxygen is often the most difficult nutrient to deliver to cells(Taticek et al., 1990) due to its low solubility in water andthe difficulty in transferring oxygen across the hydrody-namic boundary layer (Kanokwaree and Doran, 1998; Kino-Oka et al., 1996; Tescione et al., 1997; Williams and Doran,1999). To better understand the oxygen requirements for ourroot clone, we determined the actual yield of biomass fromoxygen Y�X/O2
and the maintenance coefficient for oxygenmO2
from the relationship between the specific growth rateand the specific O2 consumption rate given by
QO2=
1
Y�X�O2
� + mO2. (6)
Likewise, we independently determined the actual yield ofbiomass from carbon dioxide Y�X/CO2
and the maintenancecoefficient for carbon dioxide mCO2
from
QCO2=
1
Y�X�CO2
� + mCO2. (7)
Here, the units of Y�X/O2and Y�X/CO2
are in g DW/mmol, andthose of mO2
and mCO2are in mmol/g DW/day. We only
investigated oxygen requirements and carbon dioxide evo-lutions for the bubble column because the intermittent airflow rate in the mist reactors makes pseudo-steady-staterespiration rates impossible to measure.
Figure 7a illustrates a typical increase in root respirationrate in the bubble column reactor as a function of time. Therespiratory quotient, the ratio of CO2 evolution rate to O2
consumption rate, was relatively constant and close to 1throughout culturing. This is consistent with the results ofKwok and Doran (1995) and Ramakrishnan et al. (1999).The measured O2 consumption rate divided by the biomassestimated using Eq. (C3) gives QO2
, and the measured CO2
evolution rate divided by the biomass gives QCO2. Figures
7b and c show the relationship between the specific respi-ration rates (QO2
and QCO2, mmol/g DW/day) and the spe-
cific growth rate (�, day−1), where � was calculated usingEq. (1). Errors in the specific respiration rates were againdominated by errors associated with estimating biomass.
Figure 6. Variation of the specific sugar uptake rate with the specificgrowth rate in (a) shake flask, (b) bubble column, and (c) mist reactors.Representative error bars for QS and � (positive directions only) are in-cluded for selected points. The solid line indicates the results of theweighted linear regression, and the resulting equation is included on thegraph, (d). Joint confidence regions for the slopes and intercepts from(a)–(c) for the 95% confidence level.
436 BIOTECHNOLOGY AND BIOENGINEERING, VOL. 83, NO. 4, AUGUST 20, 2003

The fits in Figs. 6b and c were derived using Eq. (5), and thefit parameters are summarized in Table III. The ratio of theslope in Fig. 7c to that in Fig. 7b is 1.1, and the ratio of theintercepts is 1.0. These numbers are consistent with the
respiratory quotient (Fig. 7a). Also included in Fig. 7c arethe correlations for the specific respiration rate of H. muti-cus hairy roots grown in trickle bed (Ramakrishnan et al.,1999) and in bubble column reactors (Bordonaro and Curtis,2000) as a function of the specific growth rate. The valuesare also given in Table III. The actual biomass yield Y�X/CO2
of A. annua grown in our bubble column reactors lies be-tween those of H. muticus in two different reactor systems,and the maintenance coefficients mCO2
are also all quiteclose even though the specific growth rates for H. muticusranged from 0.05 to 0.4 day−1. Finally, the values from plantcell suspension cultures are not far removed from the valuesreported here.
Carbon Balance
The generalized stoichiometry for hairy root cultures (Kwokand Doran, 1995; Rho and Andre, 1991; Taticek et al.,1990) states that sugar (the carbon source) is consumed inorder to maintain the viability of existing cells, as well asproduce new biomass and byproducts. In the process CO2 isalso formed. Figure 8 summarizes the sources and sinks ofcarbon in our system. As noted in the previous section, thespecific CO2 evolution rate can also be written in terms ofmaintenance and yield coefficients. One of the unique as-pects of the current work is that we have enough informa-tion for the bubble column reactors to carefully examinehow well we can balance the carbon in our hairy root cul-tures.
In Fig. 8, j and m are sugar consumption rates (g glucoseequivalent/g DW/day) associated with building new cellsand maintaining the existing cells, respectively. The bio-mass production rate is k (g DW/g DW/day), and the CO2
evolution rates (g CO2/g DW/day) due to growth and main-tenance are l and n, respectively. Based on an elementalbalance, and still ignoring byproduct formation, the flux ofcarbon through j should equal that through k + l. If wb, ws,and wc are the mass fractions of carbon in biomass, sugar(glucose), and carbon dioxide, respectively, then
wb � k + wc � l = ws � j (8)
or
wb
ws
k
j+
wc
ws
l
j= 1. (9)
Here, the ratio of k/j equals Y�X/S, the actual biomass yieldfrom sugar, and l/j � (k/j)/(k/l) � (44/1000) � Y�X/S/Y�X/CO2
.To complete the balance, we only need to know wb. Assummarized in Table IV, the average carbon content in theroots grown in the bubble column reactor is 40.5 ± 1.7%(w/w). Evaluating the left-hand side of Eq. (9) with the yieldvalues obtained earlier (see Tables II and III) gives 0.83,i.e., on the growth side 83% of the carbon is accounted for.
The sugar used for maintenance should all be converted
Figure 7. (a) Time course of the O2 consumption rate (�), the CO2
evolution rate (�), and the respiratory quotient (�) in the bubble columnreactor (#50). (b) Change in the specific growth rate with the specificoxygen uptake rate from 7 bubble column reactor runs (run nos. 44, 46, 48,50, 52, 54, and 58). Representative error bars for QO2
and � (positivedirections only) are included for selected points. The solid line indicates theweighted least-squares fit of the data, and the equation is QO2
� 21.86� +1.42. (c) Change in the specific growth rate with the specific carbon di-oxide evolution rate from 7 bubble column reactor runs. Representativeerror bars for QCO2
and � (positive directions only) are included for se-lected points. The solid line indicates the weighted least-squares fit of thedata, and the equation is QCO2
� 23.94� + 1.42. The dashed lines labeledA and B correspond to H. muticus grown in a bubble column reactor(Bordonaro and Curtis, 2000) and in a trickle bed reactor (Ramakrishnan etal. 1999), respectively. The equations are as follows for A and B: A, QCO2
� 23.26� + 1.87; B, QCO2� 15.48� + 2.28.
KIM ET AL.: GROWTH DYNAMICS OF A. ANNUA HAIRY ROOTS 437

to carbon dioxide and possibly a small amount of byproduct.Ignoring the latter gives
ws � m =44
1000wc � n, (10)
where m and n in Fig. 8 are mS and mCO2, respectively. The
value of mS is 0.041 g glucose equivalent/g DW/day, and,based on an carbon balance, this should be converted to 1.37mmol CO2/g DW/day. The value of mCO2
in Table IIIb isonly 4% higher than the value calculated from mS by solv-ing Eq. (10).
Up to this point we have assumed that sugar is convertedonly to biomass and CO2. Plant cell cultures are, however,capable of producing extracellular polysaccharides (van Gu-
lik et al., 1992). Furthermore, extracellular proteins and theproducts of cell lysis also accumulate in the medium, andthese are considered byproducts in hairy root cultures(Kwok and Doran, 1995). For A. belladonna hairy rootsgrown in a bubble column reactor, a stoichiometric studysuggested that the ratio of biomass to byproduct in hairyroot cultures is approximately 4:1 (Kwok and Doran, 1995).In cases of plant cell cultures, van Gulik et al. (1992)showed that the ratio of the specific growth rate to thespecific lysis product formation rate was between 3.2 and12.9 and between 3.7 and 7.8 for C. roseus and N. tabacum,respectively, in steady-state chemostat cultures. These stud-ies indicate that in some cultures byproduct formation isconsiderable and may not be neglected.
If we assume that byproduct formation follows Leudek-ing–Piret kinetics (Bailey and Ollis, 1986), then
dP
dt= �
dX
dt+ �X, (11)
where P is the byproduct in this case. The first term in theright-hand side of Eq. (11) is the growth-associated contri-bution, while the second term is the non-growth-associatedcontribution. Because forming byproduct also uses sugar,Bailey and Ollis (1986) give the following generalized formof Eq. (3):
−dS
dt=
1
Y�X�S
dX
dt+
1
Y�P�S
dP
dt+ mSX. (12)
Combining Eqs. (11) and (12) yields
Table III. (a) Actual yields and maintenance coefficients from oxygen from this study and other references.*
Species Culture system Y�X/O2(g DW/mmol O2) mO2
(mmol/g DW/day) Reference
A. annua hairy roots Bubble column 0.046 (0.039–0.055) 1.42 (1.14–1.69) This studyN. tabacum L. plant cells Stirred tank 0.061 2.16 Kato and Nagai (1979)E. californica plant cells Bubble column 0.039 3.55 Taticek et al. (1990)E. californica plant cells Shake flask 0.027 6.05 Taticek et al. (1990)
(b) Actual yields and maintenance coefficients from carbon dioxide from this study and other references.*
Species Culture system Y�X/CO2(g DW/mmol O2) mCO2
(mmol/g DW/day) Reference
A. annua hairy roots Bubble column 0.042 (0.036–0.050) 1.42 (1.13–1.71) This studyH. muticus hairy roots Bubble column 0.033 1.87 Bordonaro and Curtis (2000)H. muticus hairy roots Trickle bed 0.065 2.28 Ramakrishnan et al. (1999)
*Values in parentheses are the 68% confidence intervals.
Figure 8. Nutrient utilization and stoichiometry in hairy root cultures.The excreted byproduct has been included in some cases (Kwok andDoran, 1995) and ignored in others (Rho and Andre, 1991; Taticek at al.,1990). In this figure, j is the rate (g glucose equivalent/g DW/day) at whichsugar is consumed by biomass production, k is the biomass production rate(g DW/g DW/ day), l is the CO2 evolution rate (g CO2/g DW/day) due tobiomass production, m is the sugar consumption rate (g glucose equiva-lent/g DW/day) for maintaining cell viability, and n is the CO2 evolutionrate (g CO2/g DW/day) from maintenance.
Table IV. Result of elemental analysis of A. annua hairy roots from thebubble column and mist reactors.*
% (w/w) Bubble column Mist
C 40.47 ± 1.68 41.48 ± 2.12H 5.26 ± 0.22 5.27 ± 0.31N 3.69 ± 0.54 3.67 ± 0.29O 36.39 ± 2.58 36.37 ± 2.67Ash 14.19 ± 1.87 13.21 ± 1.57
*Values are means ± standard deviations.
438 BIOTECHNOLOGY AND BIOENGINEERING, VOL. 83, NO. 4, AUGUST 20, 2003
−1
X
dS
dt= � + , (13)
where
=1
Y�X�S+
�
Y�P�S(14)
and
=�
Y�P�S+ mS (15)
(Bailey and Ollis, 1986). In this case, and correspond tothe slope and the intercept of the regression line in Fig. 6b,but without a measurement of dP/dt we cannot directly cal-culate Y�P/S. We can, however, examine the effect this termmay have on our estimates of Y�X/S and mS.
We start with the maintenance coefficient. Because Eq.(10) is almost completely balanced, it is probably safe toassume that the contribution from �/Y�P/S is negligible. Onthe other hand, in the bubble column reactors, Eq. (9) ac-counts for only 83% of the carbon. This suggests that thebyproduct formation is most likely growth-associated, thatY�P/S should not be neglected, and that Eq. (9) should berewritten to include byproduct formation. Finally, because�/Y�P/S is a positive number, our estimate of Y�X/S from thelinear regression for the bubble column given in Table IImust be a lower bound. If we extrapolate this result to theshake flask and mist reactors, then our estimates of Y�X/S inthese culture systems are also underestimated. Finally, usingthe Eqs. (9) and (10), the Y�X/CO2
and mCO2in Table III were
converted to Y�X/Sand mS, and these values are also shown inTable II. As we expected, Y�X/S calculated from Y�X/CO2
ishigher than Y�X/S obtained from the linear regression.
CONCLUSION
We studied the transient biomass accumulation and the nu-trient levels in the medium for A. annua hairy roots culturedin shake flasks, bubble column, and mist reactors. In allthree culture systems, we observed that (1) sucrose wascompletely hydrolyzed to glucose and fructose, (2) glucosewas preferentially consumed over fructose, (3) ammoniumwas consumed faster than nitrate, and (4) sugar lasted longerin the medium than nitrate. Because of the high evapora-tional water loss in the mist reactor compared to the twoother culture systems, it was important to track the amountof nutrient rather than the nutrient concentration in order tocompare the nutrient consumption in each culture system.
From the shake flask experiments, we developed fourcorrelations to estimate biomass accumulation in the reac-tors. Although the direct conductivity correlation workedwell for the batch bubble column reactors, it failed to predictbiomass accumulation in the mist reactors or fed-batch op-erations of the reactors. Therefore, we used the conductivitycorrelation that incorporated the volume correction to esti-mate transient biomass.
From the estimated biomass, the instantaneous specificgrowth rates in the reactors were obtained by numericaldifferentiation. The specific sugar consumption rate wascalculated from measured sugar concentration in the me-dium, estimated or measured biomass, and the medium vol-ume using numerical differentiation. From the specificgrowth rate and the specific sugar uptake rate, we obtainedthe actual biomass yields from sugar and maintenance co-efficients for sugar in three different culture systems. Ourvalues showed good agreement with the literature values.Our analysis also showed that the biomass yield and main-tenance for sugar by the hairy roots grown in the bubblecolumn and mist reactors were statistically different, sug-gesting that culture environments may affect sugar utiliza-tion by the roots. From the respiration rate measurement inthe bubble column reactors, we determined the actual bio-mass yields and maintenance coefficients for oxygen andcarbon dioxide. Finally, the redundancy in our measure-ments for the bubble column reactors enabled us to balancethe carbon element in our sugar and carbon dioxide utiliza-tion rates and proved them to be reasonable.
The authors thank Mr. Sev Ritchie Jr., WPI, for his assistance inconstructing the bioreactors and Dr. Kristin K. Wobbe for criticalreading of the manuscript.
NOMENCLATURE
cG glucose concentration [g/L]cF fructose concentration [g/L]cS sucrose concentration [g/L]cTS total sugar concentration [g glucose equivalent/L]j sugar consumption rate associated with growth [g glucose
equivalent/g DW/day]k biomass production rate [g DW/g DW/day]l CO2 evolution rate associated with growth [g CO2/g DW/day]m sugar consumption rate associated with maintenance [g glucose
equivalent/g DW/day]mCO2
maintenance coefficient for carbon dioxide [(mmol CO2) � (gbiomass)−1 day−1]
mO2maintenance coefficient for oxygen [(mmol O2) � (g biomass)−1
day−1]mS maintenance coefficient for substrate [(g glucose equivalent) � (g
biomass)−1 day−1]n CO2 evolution rate associated with maintenace [g CO2/g DW/
day]QCO2
specific carbon dioxide evolution rate [mmol (g biomass)−1
day−1]QO2
specific oxygen consumption rate [mmol (g biomass)−1 day−1]QS specific substrate uptake rate [(g glucose equivalent) � (g bio-
mass)−1 day−1]P byproduct content [g]S substrate content [g]ti culture time at ith sampling [day]V(ti) volume of the medium at time ti [L]Vo initial volume of the medium [L]wb mass fraction of carbon in biomass [g carbon/g biomass]wc mass fraction of carbon in carbon dioxide [g carbon/g CO2]ws mass fraction of carbon in substrate [g carbon/g glucose equiva-
lent]x(ti) biomass concentration at time ti [g/L]X(ti) biomass at time ti [g]YX/S apparent or observed biomass yield from substrate [(g
KIM ET AL.: GROWTH DYNAMICS OF A. ANNUA HAIRY ROOTS 439
biomass) � (g glucose equivalent)−1]Y�P/S actual byproduct yield from substrate [g � (g glucose equiva-
lent)−1]Y�X/CO2
actual biomass yield from carbon dioxide [(g biomass) � (mmolCO2)−1]
Y�X/O2actual biomass yield from oxygen [(g biomass) � (mmol O2)−1]
Y�X/S actual biomass yield from substrate [(g biomass) � (g glucoseequivalent)−1]
Greek symbols
� specific conductivity [�S/cm]�avg 2-week averaged specific growth rate [day−1] (Kim et al., 2002)�(ti) instantaneous specific growth rate at time ti [day−1]
APPENDIX
Correlating Biomass Increase withNutrient Consumption
To follow the transient biomass accumulation in the reactor,we developed correlations based on the conductivity and thesugar content of the medium (Ramakrishnan et al., 1999;Ryu et al., 1990; Taya et al., 1989a). The simple correlation
x(t2) − x(t1) � a � �� (A1)
is adequate when neither water or nutrients are added orremoved from the reactor during culturing. In Eq. (A1), x(t)is either the DW or FW biomass concentration (g/L) at timet, �� � �(t2) − �(t1), where �(t) is the specific conductivity(�S/cm) at t, and a (g � cm/�S � L) is an empirical yieldcoefficient (Jung et al., 1998; Taya et al., 1989a). For hairyroot cultures, x(t) is the total biomass X(t) divided by theinitial medium volume Vo or the working volume of thereactor. Here, Vo is 0.05 L for shake flask experiments and1.5 L for the reactor runs.
Because water is taken up by the tissues and lost byevaporation, the volume of medium in the reactor is notconstant. Thus, a more robust way to estimate biomass ac-cumulation is to measure the decrease in nutrient massrather than the decrease in nutrient concentration (Jung etal., 1998; Ramakrishnan et al., 1999; Tescione et al., 1997).A more general equation is
X�t2� − X�t1� = � � ��V��, (A2)
where
��V�� = V�t1���t1� − V�t2���t2� + ��Vadd � �add�− ��Vrem � �rem�. (A3)
In Eq. (A3), V(t) is the medium volume (L) at time t,(Vadd�add) is the product of the volume of medium added tothe system and its specific conductivity, while (Vrem�rem) isthe product of the volume of the medium removed and itsspecific conductivity between t1 and t2. To transfer theshake flask results to the reactors, we normalized Eq. (A3)by the initial medium volume, so that
x�t2� − x�t1� =�
Vo� ��V��, (A4)
and now x(t) is the same biomass concentration (g/L) as inEq. (A1).
Eqs. (A1) and (A4) can be modified to correlate biomassaccumulation with sugar content by replacing � with thetotal glucose-equivalent sugar concentration cTS(t) (Rho andAndre, 1991; Toivonen et al., 1990). Because sucrose isinverted to glucose and fructose by the roots during cultur-ing, cTS(t) � cG(t) + cF(t) + 360/342 � cS(t), where cG(t),cF(t), and cS(t) are the concentrations (g/L) of glucose, fruc-tose, and sucrose, respectively. The factor of 360/342 takesinto account the molecule of water that is incorporated dur-ing hydrolysis of sucrose (Sharp and Doran, 1990).
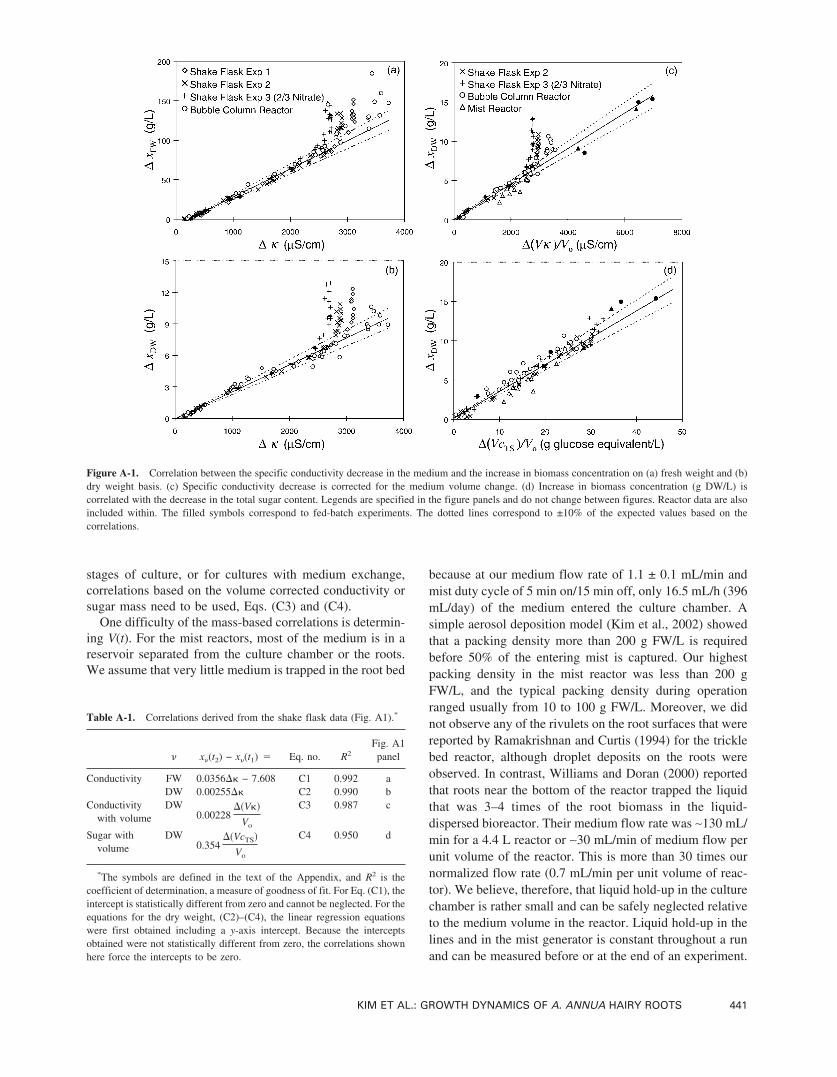
As illustrated in parts a–c of Fig. A1, the change in bio-mass concentration for the shake flask experiments varieslinearly with the change in conductivity, with and withoutcorrecting for volume changes, until the conductivity dropsbelow ∼10% of the initial value. When the initial nitrateconcentration was only 2/3 of the usual amount (ShakeFlask Exp 3), the slope was not affected but the linearrelationship held in a narrower range due to a lower initial�. These observations agree with those made by othergroups (Ryu et al., 1990; Toivonen et al., 1990), and thecorrelations summarized in Table AI are based on thepooled shake flask data in the linear range. For sugar, alinear correlation only exists if volume changes in the me-dium are considered. Although the sugar data do not exhibitthe systematic deviation from the linear relationships ob-served for the conductivity-based correlations, Fig. A1d, thescatter in the data is somewhat higher.
The reactor data, based on harvested biomass and me-dium measurements, are also included in Fig. A1. Most ofthe bubble column data agree with the correlations to within10% as long as the reduction in initial conductivity is lessthan 90%. Concentration-based correlations cannot workfor the mist reactors because evaporation in the mist reactoris enhanced by the high air flow rate (5 L/min) and the highsurface area of the mist droplets. Even after corrections aremade for the volume change, however, the mist reactor datado not agree with the correlations as well as the bubblecolumn reactor data do. For many of the mist reactors, thedata points lie to the right of the correlation lines. The worstcases correspond to early experiments where the coalescerwas not capturing the mist efficiently. The unaccountedmist losses overestimate �(V�) or �(VcTS) and move thedata points to the right.
Estimating Transient Biomass Accumulation inthe Reactors
Based on the results in Fig. A1, transient biomass accumu-lation in the bubble column reactor can be estimated usingEqs. (C1) and (C2) in Table A1 as long as the specificconductivity decrease is less than 90% of the initial value.For the mist reactor, the bubble column reactor in the late
440 BIOTECHNOLOGY AND BIOENGINEERING, VOL. 83, NO. 4, AUGUST 20, 2003
stages of culture, or for cultures with medium exchange,correlations based on the volume corrected conductivity orsugar mass need to be used, Eqs. (C3) and (C4).
One difficulty of the mass-based correlations is determin-ing V(t). For the mist reactors, most of the medium is in areservoir separated from the culture chamber or the roots.We assume that very little medium is trapped in the root bed
because at our medium flow rate of 1.1 ± 0.1 mL/min andmist duty cycle of 5 min on/15 min off, only 16.5 mL/h (396mL/day) of the medium entered the culture chamber. Asimple aerosol deposition model (Kim et al., 2002) showedthat a packing density more than 200 g FW/L is requiredbefore 50% of the entering mist is captured. Our highestpacking density in the mist reactor was less than 200 gFW/L, and the typical packing density during operationranged usually from 10 to 100 g FW/L. Moreover, we didnot observe any of the rivulets on the root surfaces that werereported by Ramakrishnan and Curtis (1994) for the tricklebed reactor, although droplet deposits on the roots wereobserved. In contrast, Williams and Doran (2000) reportedthat roots near the bottom of the reactor trapped the liquidthat was 3–4 times of the root biomass in the liquid-dispersed bioreactor. Their medium flow rate was ∼130 mL/min for a 4.4 L reactor or ∼30 mL/min of medium flow perunit volume of the reactor. This is more than 30 times ournormalized flow rate (0.7 mL/min per unit volume of reac-tor). We believe, therefore, that liquid hold-up in the culturechamber is rather small and can be safely neglected relativeto the medium volume in the reactor. Liquid hold-up in thelines and in the mist generator is constant throughout a runand can be measured before or at the end of an experiment.
Table A-1. Correlations derived from the shake flask data (Fig. A1).*
x (t2) − x (t1) � Eq. no. R2Fig. A1panel
Conductivity FW 0.0356�� − 7.608 C1 0.992 aDW 0.00255�� C2 0.990 b
Conductivitywith volume
DW0.00228
��V��
Vo
C3 0.987 c
Sugar withvolume
DW0.354
��VcTS�
Vo
C4 0.950 d
*The symbols are defined in the text of the Appendix, and R2 is thecoefficient of determination, a measure of goodness of fit. For Eq. (C1), theintercept is statistically different from zero and cannot be neglected. For theequations for the dry weight, (C2)–(C4), the linear regression equationswere first obtained including a y-axis intercept. Because the interceptsobtained were not statistically different from zero, the correlations shownhere force the intercepts to be zero.
Figure A-1. Correlation between the specific conductivity decrease in the medium and the increase in biomass concentration on (a) fresh weight and (b)dry weight basis. (c) Specific conductivity decrease is corrected for the medium volume change. (d) Increase in biomass concentration (g DW/L) iscorrelated with the decrease in the total sugar content. Legends are specified in the figure panels and do not change between figures. Reactor data are alsoincluded within. The filled symbols correspond to fed-batch experiments. The dotted lines correspond to ±10% of the expected values based on thecorrelations.
KIM ET AL.: GROWTH DYNAMICS OF A. ANNUA HAIRY ROOTS 441

Thus, V(t) is approximately equal to the sum of the mediumin the reservoir plus that in the mist generator and the trans-fer lines.
For the bubble column reactor, the medium cannot beseparated from the roots without stopping the experiment.Estimating the volume of medium requires the volume bal-ance
V�t� = Vo − Vevap�t� + �0
t
Vadd − �0
t
Vrem
− Vo�xFW�t� − xDW�t� − xFW,o + xDW,o� �1
�water,
(A5)
where xFW(t) � XFW(t)/Vo, xDW(t) � XDW(t)/Vo, and 1,000g/L was used for �water. Our volume balance is essentiallythe same as that of Tescione et al. (1997) and of Ra-makrishnan et al. (1999). The key unknowns in Eq. (A5)include Vevap(t) and the final term that corresponds to theamount of water taken up by the roots. Tescione et al.(1997) estimated Vevap(t) by measuring the humidity of theinlet and the outlet air. We estimated Vevap(t) by solving Eq.(A5) at the time of harvest, th, to determine Vevap(th). As-suming the humidity of the inlet air during a run was con-stant, we then estimated that to first order, Vevap(t) is givenby
Vevap�t� = Vevap�th� ��
0
tFairdt
�0
thFairdt
, (A6)
where Fair is the air flow rate.Finally, the difficulty in evaluating the last term in Eq.
(A5) is caused by the fact that the DW/FW ratio of the rootsis not constant during culture (Bhadra and Shanks, 1997).The DW/FW ratio of the inoculum (14-day-old roots) is∼7.6%. For the first few days after inoculation, the DW/FWratio increases rapidly, peaking at ∼12% after 3 days andbefore starting to decrease. Ramakrishnan et al. (1999)evaluated the last term in Eq. (A5) by developing a corre-lation between the specific water content in the roots and theosmolality of the medium. We related DW to FW using theconductivity correlations (Eq. (C1) and Eq. (C2)), and inthis case,
xFW(t) � 13.86xDW(t) −7.32. (A7)
The result is the solid line in Fig. A2 that also shows theexperimental DW/FW values plotted as a function of dryweight. Since the solid line was derived from the DW andFW relationships from the shake flasks, it agrees well withthe direct experimental results from shake flasks. The DW/FW ratio from the reactors also shows good agreement withEq. (A7) except in the later stages of culture (xDW > 10 g/L),where the DW/FW ratio eventually approaches ∼6% in thereactors compared to 7–8% in shake flasks. However, Eq.(A7) can be used for the most of time. The value of xDW(t)can be obtained by substituting Eqs. (A5), (A6), and (A7)
into Eqs. (C3) or (C4) and solving. Finally, XDW(t) is simplyxDW(t) � Vo.
References
Bailey JE, Ollis DF. 1986. Biochemical engineering fundamentals, 2nd ed.New York: McGraw-Hill. p 423–424.
Bevington PR, Robinson DK. 1992. Data reduction and error analysis forthe physical sciences, 2nd ed. New York: WCB/McGraw-Hill. p38–52.
Bhadra R, Shanks JV. 1997. Transient studies of nutrient uptake, growth,and indole alkaloid accumulation in heterotrophic cultures of hairyroots of Catharanthus roseus. Biotechnol Bioeng 55:527–534.
Bordonaro JL, Curtis WR. 2000. Inhibitory role of root hairs on transportwithin root culture bioreactors. Biotechnol Bioeng 70:176–186.
Gamborg OL, Miller RA, Ojima K. 1968. Nutrient requirements of sus-pension cultures of soybean root cells. Exp Cell Res 50:148–151.
Jung G, Tepfer D. 1987. Use of genetic transformation by the Ri T-DNAof Agrobacterium rhizogenes to stimulate biomass and tropane alka-loid production in Atropa belladonna and Calystegia sepium rootsgrown in vitro. Plant Sci 50:145–151.
Jung K, Kwak S, Liu JR. 1998. Procedure for biomass estimation consid-ering the change in biomass volume during high density culture ofhairy roots. J Ferment Bioeng 85:454–457.
Kanokwaree K, Doran PM. 1997. Effect of inoculum size on growth ofAtropa belladonna hairy roots in shake flasks. J Ferment Bioeng 84:378–381.
Kanokwaree K, Doran PM. 1998. Application of membrane tubing aerationand perfluorocarbon to improve oxygen delivery to hairy root cultures.Biotechnol Prog 14:479–486.
Kato A, Nagai S. 1979. Energetics of tobacco cells, Nicotiana tabacum L.,growing on sucrose medium. Eur J Appl Microbiol Biotechnol 7:219–225.
Kim Y. 2001. Assessment of bioreactors for transformed root cultures.Ph.D. thesis. Worcester, MA: Worcester Polytechnic Institute.
Kim Y, Wyslouzil BE, Weathers PJ. 2001. A comparative study of mistand bubble column reactors in the in vitro production of artemisinin.Plant Cell Rep 20:451–455.
Kim YJ, Weathers PJ, Wyslouzil BE. 2002. The growth of Artemisiaannua hairy roots in liquid and gas phase reactors. Biotechnol Bioeng80:454–464.
Kino-Oka M, Tsutsumi S, Tone S. 1996. Oxygen transfer in bioreactor forculture of plant hairy roots. J Chem Eng Jpn 29:531–534.
Figure A-2. Change in the DW/FW ratio as a function of the dry weightbiomass concentration in shake flasks and the reactors. The error barsindicate standard deviations, and the solid line is Eq. (A7).
442 BIOTECHNOLOGY AND BIOENGINEERING, VOL. 83, NO. 4, AUGUST 20, 2003

Kwok KH, Doran PM. 1995. Kinetic and stoichiometric analysis of hairyroots in a segmented bubble column reactor. Biotechnol Prog 11:429–435.
McKelvey SA, Gehrig JA, Hollar KA, Curtis WR. 1993. Growth of plantroot cultures in liquid- and gas-dispersed reactor environments. Bio-technol Prog 9:371–322.
Pirt SJ. 1965. The maintenance energy of bacteria in growing cultures. ProcR Soc Lond (Biol) 163:224–231.
Press WH, Teukolsky SA, Vetterling WT, Flannery BP. 1992. Numericalrecipes in Fortran 77: the art of scientific computing, 2nd ed. NewYork: Cambridge University Press. p 660–666.
Ramakrishnan D, Curtis WR. 1994. Fluid dynamic studies on plant rootcultures for application to bioreactor design. In: Ryu DDY, Furusaki S,editors. Studies in plant science. 4. Advances in plant biotechnology:production of secondary metabolites. Amsterdam: Elsevier. p281–305.
Ramakrishnan D, Luyk D, Curtis WR. 1999. Monitoring biomass in rootculture systems. Biotechnol Bioeng 62:711–721.
Rho D, Andre G. 1991. Growth and stoichiometry of a Catharanthusroseus cell suspension culture grown under nitrogen-limiting condi-tions. Biotechnol Bioeng 38:579–587.
Riu J, Rius FX. 1996. Assessing the accuracy of analytical methods usinglinear regression with errors in both axes. Anal Chem 68:1851–1857.
Ryu DDY, Lee SO, Romani RJ. 1990. Determination of growth rate forplant cell cultures: comparative studies. Biotechnol Bioeng 35:305–311.
Schnapp SR, Curtis WR, Bressan RA, Hasegawa PM. 1991. Growth yieldsand maintenance coefficients of unadapted and NaCl-adapted tobaccocells grown in semicontinuous culture. Plant Physiol 96:1289–1293.
Sharp JM, Doran PM. 1990. Characteristics of growth and tropane alkaloidsynthesis in Atropa belladonna roots transformed by Agrobacteriumrhizogenes. J Biotechnol 16:171–186.
Shiao T-L, Doran PM. 2000. Root hairiness: effect on fluid flow andoxygen transfer in hairy root cultures. J Biotechnol 83:199–210.
Taticek RA, Moo-Young M, Legge RL. 1990. Effect of bioreactor con-
figuration on substrate uptake by cell suspension cultures of the plantEschscholtzia californica. Appl Microbiol Biotechnol 33:280–286.
Taya M, Hegglin M, Prenosil JE, Bourne JR. 1989a. On-line monitoring ofcell growth in plant tissue cultures by conductometry. Enzyme MicrobTechnol 11:170–176.
Taya M, Yoyoma A, Kondo O, Kobayashi T, Matsui C. 1989b. Growthcharacteristics of plant hairy roots and their cultures in bioreactors. JChem Eng Jpn 22:84–89.
Tescione LD, Ramakrishnan D, Curtis WR. 1997. The role of liquid mix-ing and gas-phase dispersion in a submerged, sparged root reactor.Enzyme Microbial Technol 20:207–213.
Toivonen L, Ojala M, Kauppinen V. 1990. Indole alkaloid production byhairy root cultures of Catharanthus roseus: growth kinetics and fer-mentation. Biotechnol Lett 12:519–524.
Uozumi N, Kohketsu K, Kobayashi T. 1993. Growth and kinetic param-eters of Ajuga hairy root in fed-batch culture on monosaccharide me-dium. J Chem Tech Biotechnol 57:155–161.
van Gulik WM, ten Hoopen HJG, Heijnen JJ. 1992. Kinetics and stoichi-ometry of growth of plant cell cultures of Catharanthus roseus andNicotiana tabacum in batch and continuous fermentors. BiotechnolBioeng 40:863–874.
Weathers PJ, Cheetham RD, Follansbee E, Teoh T. 1994. Artemisininproduction by transformed roots of Artemisia annua. Biotechnol Lett16:1281–1286.
Williams GRC, Doran PM. 1999. Investigation of liquid–solid hydrody-namic boundary layers and oxygen requirements in hairy root cultures.Biotechnol Bioeng 64:729–740.
Williams GRC, Doran PM. 2000. Hairy root culture in a liquid-dispersedbioreactor: characterization of spatial heterogeneity. Biotechnol Prog16:391–401.
Zar JH. 1999a. Biostatistical analysis, 4th ed. Upper Saddle River, NJ:Prentice Hall. p 337–340.
Zar JH. 1999b. Biostatistical analysis, 4th ed. Upper Saddle River, NJ:Prentice Hall. p 360–376.
KIM ET AL.: GROWTH DYNAMICS OF A. ANNUA HAIRY ROOTS 443