growth and fledging in the common tern (sterna hirundo)
TRANSCRIPT

GROWTH AND FLEDGING IN THE
COMMON TERN (STERNA HIRUNDO) BY I.\/[ARY LECRoY AND SARA. LECRoY
INTRODUCTION
Studies in 1967 and 1968 of known-age young Common and Roseate terns (Sterna hitundo and S. dougallii) showed that chicks surviving to the flying stage were quite variable in size (LeCroy and Collins, 1972). For example, during part of its growth period one of the heaviest chicks might be as much as 100 percent heavier than one of the lightest. But the data were insufficient for an analysis of possible factors contributing to this variability, and it was impossible to tell whether weight during the growth period affected age at fiedging. In 1969 and 1970, we weighed and mea- sured larger samples of Common Tern chicks, hoping to elucidate some of the factors responsible for the variability.
METHODS
To obtain the data reported below, we spent 14 June - 13 July 1969, 18 June - 31 July 1970, and weekends in May and early June of both years on Great Gull Island, Suffolk Co., New York. Our study areas were set up in April before the terns arrived. The areas were enclosed by one-inch poultry mesh, two feet high and were for the most part the same areas used in the 1968 study. A few new, smaller plots were enclosed in areas where Roseares nest, but few Common Terns nested in these areas and provided only minimal data on Common chicks. The main areas were originally known to be productive and offered a range of clutch sizes, but we have no reason to believe that they are unique or nonrepresentative of the colony.
As part of the overall study of the breeding biology of the terns on Great Gull Island, daily checks of nests and eggs were made colony-wide, and new nests and eggs were marked as they appeared. On the day of hatching (day 0) chicks were banded with numbered colored plastic bands, and as soon as they were sufficiently large, they were banded with U.S. Fish and Wildlife Service aluminum bands and unique color combinations. (For a description of these colony-wide techniques, see Hays, 1970.) Thus, we had accurate knowledge of egg sequence, loss of eggs, hatching sequence and fate of chicks, and were often able to identify flying young.
Our measuring and weighing techniques were the same as those used in 1968. Weights were taken on a Pesola scale, to the nearest 0.5 g for chicks weighing less than 30 g and to the nearest 1.0 g for chicks weighing over 30 g. Wing chord measurements were made to the nearest 0.1 mm using dial calipers.
In the following analysis, only data from chicks known or be- lieved to have survived to fiedging (= flying) have been included. In most cases we have sufficient data to allow us to determine •vith
certainty both the clutch size and the brood size of any particular chick and its sequence within that clutch or brood. In a few cases
326

Vol. 45, No. 4 Growth of Common Terns [327
we do not have these data when a chick within a brood died or
disappeared. In these cases we included data on the surviving siblings if the death was on day 4 or earlier, our logic being that the early death of these chicks and the shape of their "growth" curves indicate that they were receiving very little food. There- fore, their presence would have little effect on the growth of the surviving chicks during the period before very rapid growth begins. Surviving chicks whose siblings died after day 4 or whose clutch or brood sequence were unknown are maintained as a separate category and data from them are used only in the totals for the two years. In all other analyses below, we only used data from chicks hatching from eggs of known clutch sequence, whose brood size remained constant throughout the growth period, except for the few cases where siblings died on day 4 or earlier.
At least part of the clutch hatched in 42 of the nests checked in 1969. These contained a total of 107 eggs of which 95 hatched. Twelve of the chicks died (on days 1(2), 2(1), 6(1), 7(3), 9(2), 10(1), 13(1) and 15(1) ), 4 disappeared (on days 2(2), 4(1), 6(1) ), and our stay on the island terminated before 4 were old enough for us to classify them as to survival. Data on the remaining 75 chicks are included. Six were last handled at the end of our stay on days 12(1), 13(3), and 17(2) and were gaining weight. The other 69 chicks were last handled on the following days: 19(3), 20(1), 21(6), 22(6), 23(13), 24(8), 25(13), 26(4), 27(7), 28(2), 29(4), and 30(2). We saw 11 of these birds subsequent to fledging, on days 23(3), 24(1), 25(2), 26(1), 27(3), and 29(1). The 75 chicks comprised 14 one-chick, 17 two-chick and 4 three-chick broods, and 15 other chicks which could not easily be assigned to a brood- size category (death of a sibling after day 4, etc.). Of the same 75 chicks, 31 hatched from first or single eggs, 34 from second, 9 from third, and one from an egg of unknown sequence. The number of individuals handled each day was usually between 60 zn'd 70 up to day 23, when the first bird fledged. Thereafter fewer and fewer chicks were found each day with only 15 being handled on day 27 and 2 on day 30.
In 1970, we had 43 nests with at least part of the clutch hatching. These contained a total of 93 eggs, 82 of which hatehe& Fifteen chicks died (on day 0(1), 1(1), 2(3), 3(2), 4(2), 5(2), 6(1), 8(1), and 16(2) ), 7 disappeared (one each on days 2, 4, 5, 6, 8, 12, and 15), and 4 were not old enough for us to classify as to survival at the end of our stay. The remaining 56 chicks were last handled on days 20(3), 21(3), 22(1), 23(5), 29(2), and 30(1). Fifteen were seen subsequent to fledging, on days 22(1), 23(2), 25(3), 26(4), 27(2), 28(1), 29(1), and 30(1). The 56 chicks comprised 16 one-chick, 15 two-chick, and 1 three-chick broods, with 7 additional chicks not assigned to a brood size cate- gory. Of these 56 chicks, 33 hatched from first or single eggs, 16 from second, 1 from third, and 6 from eggs of unknown sequence. The number of individuals handled each day was usually between 51 and 56 up to day 22, when the first bird fledged. Subsequently, fewer and fewer were found, with only 12 being handled on day 27 and 1 on day 30.

328] M. LeCroy and S. LeCroy Bird-Banding Autumn 1974
Our first inclination was to analyze chick growth by grouping the chicks according to the size of the brood in which they were raised and to the sequence of the chicks within the brood. When we did this we realized that one-chick broods show extremely variable growth and are, in fact, comprised of chicks from true one-egg clutches and of surviving chicks from larger clutches. Also it seemed to us that the smaller size at hatching of chicks from the normally smaller third eggs might affect their subsequent growth. If this were the case, analysis by brood size would conceal this factor. Previous studies have shown that eggs one and two in a clutch are similar in size and that egg three is smaller (Gemperle and Preston, 1955; LeCroy, unpublished); single eggs seem to be more variable in size. We therefore decided to analyze the growth data by grouping the chicks according to the sequence in the clutch of the egg from which they were hatched. A further breakdown was attempted in order to compare chicks that were raised in the same sequence in the brood as their eggs appeared in the clutch with those that were not. But sample sizes became too small to be statistically meaningful.
RESULTS
Following is our analysis of data according to clutch size and sequence of the egg within the clutch. The standard used for com- parison in each year is the group of chicks hatched from egg i of 2 in that year. Although it might seem more logical to use chicks from 1-egg clutches as the standard, we had only one 1-egg clutch in 1969. Also birds laying one egg are more likely to be inexperi- enced birds laying for the first time.
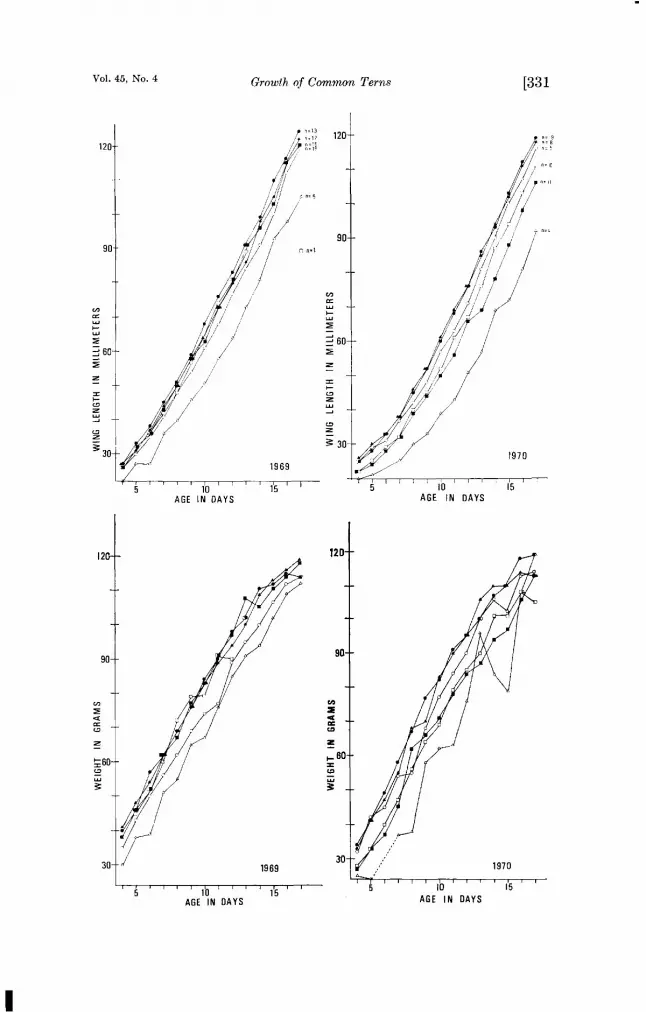
For analysis we kept 6 separate categories (i.e., 1-egg clutches, first egg of 2, first egg of 3, etc.). Tables i and 2 list the coefficients of variation on days 0 through 23 (when chicks begin to fledge) for each of the categories in both years (except as mentioned, we had only one true 1-egg clutch in 1969 and only one chick survive from a third egg in 1970. These are omitted from the tables.) Figure i shows the means for each of the categories for both years. In general the variation was greater in 1970 than in 1969, providing evidence, in addition to survival, that 1970 was less optimal than 1969. The most variable groups were chicks from egg 3 of 3 in 1969 and chicks from eggs 2 of 2 and 2 of 3 in 1970, when only one chick survived from a third egg. That the wing length was so extremely variable in 1970 in chicks from egg 2 of 2 is in part due to one chick with a quite short wing. It was also the lightest chick in its category, but the difference was not as extreme. Later in the growth period the wing length also moved nearer the mean. The chick was not unusually small at hatching and there were no signs of fault bars in the feathers or other indications of inadequate diet. The chick appeared normal. Thus we can offer no explana- tion for its extreme growth pattern and must assume it to be within normal limits.
•n addition to the increase in variability in 1970, there was also an absolute difference in mean size between the categories and

Vol. 45, No. 4 Growth of Commor• Terns
TABL• 1. Coeiiicien• of varia%ion in weigh% of chicks from:
[329
Egg Egg Egg Egg Egg Egg D•y i of I I of 2 2 of 2 i of 3 2 of 3 3 of 3
1970 1969 1970 1969 1970 1969 1970 1969 1970 1969
0 10.7 12.9 9.3 9.7 8.9 11.9 10.4 10.3 4.8 5.3
1 12.8 10.6 13.0 13.9 15.5 10.6 18.0 8.0 9.5 13.8
2 21.0 14.0 14.3 14.8 16.3 10.2 19.3 11.4 12.0 14.9
3 24.4 13.7 15.4 15.4 22.4 12.3 24.0 13.2 13.4 17.7
4 19.3 10.2 19.8 13.5 24.2 11.3 21.6 17.4 13.4 16.0
5 14.7 14.1 17.4 10.9 27.9 11.1 17.2 20.2 14.9 20.1
6 9.7 11.2 16.1 14.6 26.4 9.3 21.5 14.6 18.4 19.5
7 15.8 12.8 16.1 14.2 29.2 6.5 15.7 17.1 27.8 22.3
8 8.0 15.2 16.6 12.0 24.6 10.3 18.1 16.9 27.2 21.0
9 10.1 15.1 14.0 10.9 24.6 10.5 16.1 18.0 22.7 18.9
10 12.3 15.0 17.3 12.1 25.5 12.3 13.2 16.4 23.8 19.7
11 10.9 13.5 15.4 12.0 22.1 12.0 14.5 15.2 20.7 18.5
12 12.8 11.0 11.3 9.6 24.9 13.6 8.5 18.5 18.2 19.9
13 10.1 10.1 12.5 9.4 27.2 10.4 7.6 14.4 16.1 12.2
14 6.6 8.6 11.0 11.3 15.8 10.3 8.4 13.7 8.6 13.3
15 10.1 7.2 10.7 8.5 20.3 11.1 8.5 9.4 10.7 9.6
16 8.1 10.0 7.5 8.8 16.8 9.1 7.7 8.3 9.8 11.9
17 8.6 10.6 9.0 6.3 15.6 6.9 9.6 7.6 9.7 11.2
18 12.4 8.8 11.9 6.6 17.4 7.2 8.0 6.4 7.6 10.5
19 8.4 5.9 8.5 4.9 13.7 5.6 8.4 6.0 5.6 10.1
20 4.9 7.6 9.8 5.5 12.9 8.9 6.6 4.6 6.7 10.0
21 10.4 5.8 6.4 5.5 14.6 7.0 6.9 5.9 8.0 11.4
22 10.6 3.3 7.8 6.6 7.6 7.7 6.7 6.4 4.7 8.0
23 13.3 5.3 9.0 5.3 6.1 6.5 6.5 4.3 6.8 9.4
between years. The Student's t-test (P (.05) was used to compare the daily means of weight and wing measurements of all chicks in our standard category with those of chicks in each of the other categories. In 1969, chicks from third eggs were significantly smaller than the standard in both weight and wing length during a large portion of the pre-fiedging period (Table 3). Chicks hatched from egg 2 of 3 were significantly smaller on • number of days in the center of the growth period, but there were no significant differences in size of the sir•glc chick from a l-egg clutch and chicks from eggs 2 of 2 and i of 3 compared to the standard. In 1970, chicks from single egg clutches •nd from the second of two eggs were significantly smaller than the standard over much of the growth period, and the only chick from egg 3 of 3 was significantly lighter during most of the growth period. Wing length was sig-

330] M. LeCroy a•d S. LeCroy Bird-Banding Autumn 1974
TXBL•,• 2.
Coefficient of variation in wing length of chicks from:
Egg Egg Egg Egg Egg Egg Day 1 of 1 1 of 2 2of2 lof3 2of3 3of3
1970 1969 1970 1969 1970 1969 1970 1969 1970 1969
5
6
7
8
9
10
11
12
13
14
15
16
17
18
19
20
21
22
23
7.5 4.9 5.4 7.8 6.9 5.5 7.6 5.3 7.7 8.1
6.2 7.0 6.7 8.4 7 7 6.0 6 8 8.4 11.9 9.1
9.7 7.8 7 8 9.3 7 2 6.0 6 4 6.7 6.8 11.8
8.0 5.9 10 8 10.5 11 8 8.5 10 8 10.4 7.4 16.7
11 0 10.1 15 9 10.2 12 0 8.5 13 3 13.2 7.5 16.2
11 9 11.4 13 3 8.1 16 6 13.2 12 5 11.7 8.7 18.6
9 8 10.1 13 7 11.7 19 9 8.8 13 7 11.2 8.3 13.2
12 4 10.2 14 1 12.5 22 7 5.1 14 2 13.6 9.0 19.4
9 8 7.9 15 7 11.3 22 9 9.0 15 8 11.2 13.7 17.1
11 3 10.0 14 9 10.7 25 7 9.1 13 5 14.0 15.9 16.4
11.1 9.1 14.0 9.3 25.4 8.8 13.5 11.6 18.0 18.5
11.4 7.3 12.5 11.2 26.7 8.6 14.7 11.7 14.6 16.9
9.9 7.3 11.3 9.0 20.2 6.8 9.8 11.7 14.4 16.4
$.2 6.1 10.5 6.6 23.0 9.3 9.1 10.6 12.0 16.7
7.2 6.2 9.3 10.9 21.7 8.5 8.6 11.5 15.3 14.9
6.4 5.7 9.1 11.8 20.9 7.9 10.1 11.5 14.8 14.1
5.9 7.9 9.2 9.3 18.0 7.3 7.9 9.8 9.6 14.1
6.6 8.1 7.0 9.3 16.5 5.5 7.8 8.2 10.5 12.5
5.0 7.0 7.1 8.5 16.6 5.3 6 5 7.3 7.3 11.5
5.2 7.0 5.7 10.4 14.9 6.2 6 4 6.0 7.8 9.4
4.1 6.9 7.1 7.0 14.1 5.5 6 7 7.3 8.1 7.6
3.8 7.7 6.6 6.6 13.2 5.3 6 2 6.4 6.0 7.8
2.5 6.4 5.2 7.2 8.2 4.1 3 3 6.3 5.8 6.2
2.9 5.8 4.7 5.6 10.1 4.6 3 7 5.7 5.9 5.8
nificantly shorter only during part of that period. No significant differences were f½,und between the standard and chicks from eggs 1 and 2 of 3.
Comparison of the total samples for each year, including all of the chicks weighed and measured (Fig. 2), shows that mean weights in 1970 were lower than 1969 until day 11. The differences are significant at the .01 level on days 1-7 and at the .001 level on
Fmug• 1. Chick growth according to egg sequence in the clutch. Top graphs, wing length in 1969 and 1970; bottom graphs, weight in 1969 and 1970. Chick from: []single egg; ßegglof2; ßegg2of2; ßegglof3; ¸ egg 2 of 3; /x egg 3 of 3; n -- rottuber of individuals in each category weighed and measured.
Vol. 45, No. 4 Growth of Common Terns [331
120-
/ /
lO AGE IN DAYS
1969
120-
?
• 30-
IO
AGE IN DAYS
1970
•6o c•
1969
1'0 .... 1'5 AGE IN DAYS AGE IN DAYS
1970
15

332] M. LeCroy and S. LeCroy Bird-Banding Autumn 1974
T•n•,• 3.
Comparison of growth of chicks according to clutch size and the sequence within the clutch of the eggs from which they hatched, using Student's t-test
Chick from egg 1 of 2 (1969, n = 13, 1970, n = 19) significantly larger than:
Weight Wing length P < .05 on days:
Chick from 1-egg clutch
Chicks from egg 2 of 2
Chicks from egg 1 of 3
Chicks from egg 2 of 3
Chicks from egg 3 of 3
n = 1 1969 NS NS
n = 6 1970 5-9, 17 7,12,13,15,18,19
n = 15 1969 NS NS
n = 11 1970 2-7,14-16,20 4-7,9-21,23,24
n = 17 1969 NS NS
n = 8 1970 NS NS
n = 19 1969 2,4,6,10,11 0,2,5,10-15 n = 5 1970 NS NS
n = 9 1969 0-8,10-11,13-15 0-15,17,18,20-23 n = 1 1970 7-25 2-8, 15
days 2 and 4-6. The means .are similar after day 11. Mean wing lengths were lower in 1970 than 1969 between days 3 and 22. The differences are significant at the .01 level on days 4-14 and at the .001 level on days 5-10 and day 12. When these means are compared with the data from 1967 and 1968 (LeCroy and Collins, 1972), it is obvious that the means for both of these earlier years are far below even the 1970 level.
In 1969, we saw 12 chicks that were actually flying on the day after we had last weighed them; in 1970 we saw 15. An exami- nation of the xveight curve of each of these chicks disclosed a characteristic prefledging weight decrease, a decrease that is dis- tinct from the pattern of fluctuation in weight which occurs during the latter third of the growth period after the initial very rapid growth has slowed. It usually occurs over a period of 3 to 5 days before the birds are last handled, and the weight drops several grams from day to day. Occasionally a small weight increase occurs on one of these days but the fluctuation is considerably smaller than that occurring earlier, and the last weight recorded is in general lower than the low points previously measured.
In addition to the chicks actually flying, we had 20 chicks in 1969 and 21 chicks in 1970 that were probably last handled on the day before they flew. These chicks were at least 23 days old (the age of the youngest chick known to fly), had shown the character- istic prefledging weight decrease, and had been missing from within the fence for at least 3 days before the end of our measuring period

Vol. 45, No. 4 Growth of Common Terns [333
•oo
o s le i• ao 2• •o
FIGURE 2. Wing measurements and weights of surviving chicks in 1969 (left) and 1970 (right). Vertical line = range; vertical bar = _+ 1 standard devi- ation; horizontal line = mean.
(to preclude the rather unlikely possibility that we had missed them once or twice in the daily search for chicks).
In 1969, the 32 chicks for which we believe we have accurate fledging ages fledged on the following days: 23(9), 24(4), 25(9), 26(3), 27(5), 29(2); in 1970, the 36 chicks fledged on the following days: 23(4), 24(4), 25(10), 26(6), 27(6), 28(3), 29(2), 30(1).
When we compared pairs of chicks in the same brood, we found that they tended to fledge at about the same age in 1969, but in 1970, the younger chick usually took one to three days longer. The one fledging age that we have for a youngest chick of 3 is day 28, and more data would undoubtedly show that these slower- growing chicks take longer to fledge. Also the tendency in 1970 was towards a slightly later fledging for all chicks. This was slight, however, and most chicks fledged between days 23 and 27 in both years. Very few healthy birds reach day 30 without having flown, and our combined data show no correlation between egg sequence or brood size with age at fledging for chicks hatching from eggs 1 and 2.
The data for these 68 chicks for which age at first flight was known or could be accurately estimated were analyzed in three ways: the maximum weight attained and the weight at fledging were plotted against wing length at fledging and the hatching weight was plot- ted against day of age at fledging. No apparent correlation was detected among any of these parameters, except, as would be

334] M. LeCroy a•d S. LeCroy Bird-Banding Autumn 1974
expected, chicks that were very light at hatching tended to take longer to fly. An analysis of 21 surviving chicks from both years that hatched weighing 14.0 g or less shows that 11 were last handled on day 27 or later and 3 on days 24-26, only one of which was probably flying. Thus the majority of these small chicks are still in evidence after most chicks would have fledged. This is probably related to Nisbet's (1973) finding that chicks hatched from smaller third eggs are smaller at 3 days of age and survive less well than chicks hatched from larger third eggs.
DISCUSSION
In comparing the relatively good years of 1969 and 1970, the following factors are of interest.
(1) The hatchability of the eggs in 1969 (88.7 percent) and 1970 (88.1 percent) is almost the same as that for the poor year 1967 (89.3 percent for 2-egg clutches and 86.7 percent for 3-egg clutches; LeCroy and Collins, 1972). Hatchability seems to be high even in poor years and has not been a factor in the subsequent growth and survival of the chicks. We want to stress, however, that these figures apply only to the nests within our experimental plots, in which some eggs hatched, and may not reflect the situa- tion in the entire colony.
(2) In 1969, there were relatively more 3-egg clutches, and more chicks from third eggs survived tl•an in 1970. There were fewer 1-egg clutches in 1969 and only one of these chicks survived. If the shift to more 1-egg clutches in 1970 held for the colony as a whole, it may reflect a generally poorer condition of the adults prior to breeding or a relatively greater number of young birds breeding. In either case the adults would be likely to behave less efficiently as parents. No shortage of fish was apparent in either year.
(3) Significant differences were found in the two years in the means of daily weights and wing lengths in the pooled data for surviving chicks (see earlier discussion).
(4) In 1969, 78.9 percent of the chicks we measured survived, whereas in 1970, 68.3 percent survived.
(5) There was some indication of slightly later fiedging on the average in 1970; in 1969, siblings fledged at about the same age, whereas in 1970, there were 1-3 days difference with the younger taking longer.
Each of these points indicates that 1970 was somewhat less optimal than 1969 although neither year had periods of cold rainy weather or food shortage such as were apparent in 1967 and 1968.
The analysis with regard to egg sequence within the clutch of the surviving chicks in the two years also gives some indication that brood size was more important in 1970 than in 1969. In both years chicks from small third eggs were significantly smaller during much of their growth period than those from egg 1 of 2. But in

Vol. 45, No. 4 Growth of Common Terns [335
1969, the only other significant difference was that chicks from egg 2 of 3 were significantly smaller on 5 cf their growth days. In 1970, chicks from 1-egg clutches and from egg 2 of 2 were sig- nificantly smaller than the standard. There were no significant differences in size between chicks from eggs I and 2 of 3 and the standard, but it is relevant that only one of the 3-egg clutches was raised as a brood of 3. Also variability within the various cate- gories of chicks was greater in 1970 than in 1969.
Chicks from eggs I and 2 of multi-egg clutches are similar in size at hatching and usually hatch •ithin a day or two of each other. Their differences in growth thus more clearly reflect preferential feeding of the older and perhaps more vigorous chick. In years such as 1969, which appeared to be an optimal year in many respects, differences in size do not occur between these chicks that are similar in size at hatching. But in the less optimal year of 1970 such differences do occur. One would also expect chicks from egg 2 of 3 to show some significant differences, but the fact that they do not may perhaps be due to the small sample size (4).
In summary, more multi-chick broods were raised with less difference in size among the individuals in 1969 than in 1970, when brood sizes averaged smaller and the individual differences were greater in broods of 2.
It is our belief that chicks from third eggs, smaller from hatching, are at a disadvantage in any year as far as survival is concerned. That they may be raised as third chicks further increases their disadvantage, as does the longer period between hatching of second and third eggs (LeCroy and Collins, ]972). If they are raised as chicks in smaller br½ods their chances for survival are increased due to the probability that they will receive more food than they would have as third chicks. But their small size and age difference are still disadvantageous; and, in fact, the difference in age of the chicks may be greater if egg 2 was the non-hatching one.
Considering the three years ]967, ]969, and ]970, we can see how selection would favor the retention of a clutch size varying within the species from ] to 3 eggs. In 1967, a year of food shortage and bad weather, birds having small clutches fared better. In 1969, parents would have had a good chance of raising all of their chicks: 1970 could then be considered an intermediate year with generally good survival but with practically no return for third eggs laid. Heavy prodarien on eggs and young chicks in 1968 (LeCroy and Collins, 1972) complicates the picture and makes the results in that year less comparable to the other three years.
The conclusions we have reached with regard to third chick survival differ from those of Langham (1972). However, Langham used both natural and artificial broods of 3 and stressed that more observations are needed on natural broods of 3. We believe that this is the critical factor, because the third chicks in his artificial broods of 3 hatched closely in time to the second chicks and were from eggs that were not necessarily third in the laying sequence.
If, as Langham suggests, broods of 3 are generally brooded longer during the week after the last chick hatches than broods of

336] M. LeCroy a,•d S. LeCroy Bird-Banding Autumn 1974
2, we would interpret this as a response by the parents to the presence of a third chick and not, as he interprets it, as a brooding response to the satiated first and second chicks. If his interpre- tation were correct, it seems to us that parents of broods of both 2 and 3 would brood for similar periods. (Or parents of 3-chick broods might even be expected to brood less during the week after the last chick hatches, because their first and second chicks are older and presumably require less brooding than broods where the second chick is the last to hatch.) If, as we believe, the parents are responding to the presence of the third chick by brooding longer, this might help to offset the effect of chilling and concomitant reduced begging by younger birds unable to thermoregulate (Le- Croy and Collins, 1972). Nevertheless, the third chick is smaller and weaker than its siblings, and while the older chicks rush out, begging loudly, it is much more likely, in this early period at least, to stay near the nest and beg less noisily. Thus it is our hypothesis that size at hatching and days between hatching of siblings are im- portant factors in subsequent growth and survival of the young, even in years when food is plentiful. These factors become more important when food is less abundant.
The weight at fledging for those chicks known to have flown in 1969 averaged 111.2 g (101-125, n = 32) and in 1970, averaged 113.2 g (95-128, n = 36). The weights of 265 adults in 1970 ranged from 103-145 g with an average of 120.4 ,so the young do fledge at an average weight lower than that of tile adult, although there is much overlap. However, it is important to point out that each chick reaches a peak weight somewhat in excess of its fledging weight a few days before it flies. The maximum weight attained averaged 123.1 g (108-142, n = 32) in 1969 and 131.4 g (114-148, n = 36) in 1970. The data for 1967 and 1968 reported by LeCroy and Collins (1972) indicated the preflcdging decrease and our more extensive data reported in this paper fully confirm the de- crease in all chicks known to fledge. The graphs showing totals (Fig. 2) do not sho• T this drop as clearly as graphs for individual chicks because earlier fledging chicks are losing weight while later fledging chicks are still gaining and the two tend to cancel each other. Also wing growth in individuals does not slow down as much as the graphs of totals seem to indicate. Rather, the longer- winged birds are fledging aftdr day 23, biasing the data downward.
Comparison of two relatively good years (1969 and 1970) with two relatively bad years (1967 and 1968, LeCroy and Collins, 1972) reveals the extreme range in size tolerated by the growing Common Tern. With two additional years' data available we must modify two generalizations made in the earlier paper. It has become in- creasingly apparent that weight and wing length are not reliable criteria for estimating the age of a chick picked up at random in a colony. Environmental factors affect the mean weight and wing length so much from year to year, and undoubtedly from colony to colony as well, and the range and variability are so great that no mean can be devised that would be useful in all colonies and

Vol. 45, No. 4 Growth of Commo• Ter•s [337
years. For example, over the four years, the wing length of day 19 chicks varied from 67.5 to 151.0 ram, but a day 9 chick may have a wing of 70.9 (1969) and a day 29 chick a wing of 151.0 (1968).
The same wide range is apparent in overall plumage development reported by Nisbct and Drury (1972). Their data cover only one year but are from different colonies. They separate third chicks into a separate category. (We do not agree with their designation of the third chicks as "retarded." We have no reason to suspect their development is in any way abnormal.) But our point is that anyone attempting to age chicks in a colony for which they have no hatching data would not be able to separate these chicks and that normal variation in growth and development among the chicks makes it impossible to accurately estimate the age of a chick picked up at random. Perhaps workers familiar xvith the birds may be able to make more accurate estimates of age than these extremes indicate, using cues as yet unrecognized.
Also wing growth is not as independent of weight as the data of 1967 and 1968 suggested. In 1969 and 1970, when birds were on the average significantly heavier, their wings were also longer. It is apparent, however, from the many graphs we have drawn of individual chicks, that the wing growth curve is always smooth although the weight may be variable on a day-to-day basis, prob- ably due to such uncontrolled variables as time since last meal and size of meal. Factors adversely affecting weight may also affect wing growth, but with something like a 3-day lag; this is demon- strated by curves of weight and wing length for a chick found dead on day 16 (Fig. 3). This is further supported by the analysis of the total means for 1969 and 1970. The means of weight become sig- nificantly different (P (.01) on days 1-7, the means of wing length on days 4-14. In normally growing chicks weight decreases are infrequent during the first 2 1/2 weeks of the growth period and usually last for only one day when they do occur. In such cases a corresponding delay in wing growth may not show up, but low weights for a long period of time would change the slope of the wing growth curve, as in 1967.
It is also interesting to note the wide range in weights of sur- viving birds even in the good year 1969. We had assumed that the wide range found in 1967 and 1968 indicated marginal survival by some chicks in poor years, but this is certainly not a complete explanation, although the ranges are less extensive in 1969. Some of the difference could be sexual, although we have no data on that point.
Vcrmecr (1970) has noted that California, Ring-billed, and Glaucous-winged gull chicks have doubled their hatching weight by 4 1/2 days, trebled it by 10 days and quadrupled it by 20 days, xxSth the increase in the number of days between each 100 percent increase in weight indicating a slowing down of growth rate. Terns, growing more rapidly, have on the average doubled their hatching weight by day 4, trebled it by day 6, quadrupled it by day 8; a slower growth rate does not occur until the weight is 6 to 7 times hatching weight. In the poor year, 1967, weight was doubled by

338] M. LeCroy a•&d S. LeCroy Bird-Banding Autumn 1974
8o
r..D -- Z
o i I I I I 0 5 I0 15 20
AGE IN DAYS
F•c. ugE 3. Growth of a chick that died on day 16. Solid line = weight in grams; dashed line = wing length in mm.
d•y 5, trebled by d•y 7-8, •nd quadrupled by d•y 11-12; in 1968, weight w•s doubled by d•y 3-4, trebled by d•y 7-8, and quad- rupled by d•y 8-9. So whereas the r•tes •re generally similar in 1968, 1969, •nd 1970, they are considerably slower in 1967. This technique is useful for quick comparisons of growth rate in diverse species, but it is •pp•rent from the •bove discussion that the rate m•y v•ry within • single species from year to year.
Since the publication of LeCroy and Collins (1972), we h•ve obtained •n English translation of the p•per by Cymborowski and Szulc-Olechow• (1967) •nd find that they •lso looked •t tern growth r•te in relation to the •mount of time required for both captive •nd wild young Common Terns to double their weight. The terns measured under n•tur•l conditions doubled their weights in 3.8 days •fter h•tching. This is very close to our figure.
They •lso expressed growth r•te •s the •ver•ge d•ily weight increase/average weight of the preceding d•y x 100. They found that the r•te of weight g•in is over 10 percent up until •bout the 10th d•y •nd then gradually drops to zero about d•y 19. When

vol. 45, No. 4 Growth of Common Tervs [339
our birds were analyzed in this xvay, the results in both 1969 and 1970 exactly coincided with those of the Polish workers. In addi- tion, we analyzed wing growth in this manner and found that the growth rate in both years is over 10 percent from approximately days 2 to 15. The decline is then gradual down to a rate of 3-4 percent at fiedging. As noted by LeCroy and Collins (1972) the wing continues to grow after fiedging. It should perhaps be men- tioned here that the "growth rate" mentioned repeatedly in Lang- ham's paper (1972) is not a rate, which is change with time, but is a direct measurement of growth.
In 1969, many chicks showed a decline in weight or a plateau for a day or two between 19 and 24 June, irrespective of age. The weather was good on these days and there was no observable reason for the apparent decrease in food. In contrast, a rather dramatic event took place on 17 July 1970, when almost every chick lost weight. On 16 July 1.8 inches of rain fell and the chicks were probably not fed for most of the day. One of our very young chicks died as a consequence of the storm. In our earlier paper we discussed the effects of several days of cold, wet weather on the chicks, particularly in the period just after hatching when they are unable to thermoregulatc. In general, the chicks in 1970 were older and able to thermoregulate and some were almost ready to fly. The inclement weather lasted only one day; nevertheless it did have a n•ticeable effect on the chicks. Such events serve to demonstrate the dynamic balance in the growth of each chick between prehatching factors, such as size and sequence of egg from which it was hatched and its own genetic makeup, and posthatch- ing factors, such as parental care, food supply, and weather during the growth period.
SUMMARY
Growth data obtained in 1969 and 1970 for young Common Terns, known or believed to have survived to fiedging, are analyzed according to brood size and sequence of the chick in brood, and according to original clutch size and the laying sequence of the eggs from which chicks hatched. Analysis according to laying sequence proved to be the most informative approach because it pointed out the importance of the smaller size of chicks from third eggs, a factor that later affects their growth.
Comparison of the data for 1969 and 1970 revealed average differences in growth and an increased variability within chick categories in 1970. The differences between the two years are assumed to be due to differences in environmental factors in the
two years and perhaps also to age and experience of the parents. Special attention has been given to weight at fledging, maximum
weight, and wing length at fledging; there is no apparent close correlation between these parameters and age at fledging. Weight at fledging is always less than the maximum weight attained. Weight at hatching may be inversely correlated with age at fledging, at least for chicks hatching from third eggs.
The rate of growth in our birds is similar to that of Common Terns studied in Poland. It is faster than that of gulls.

Bird-Banding 340] M. LeCroy and S. LeCroy Autumn 1974
ACKNOWLEDGMENTS
We would like especially to thank Helen Hays and Kenneth C. Parkes for their help both in the field and in offering much helpful criticism during the preparation of this paper. We also appreciate the help given us by all the participants in the Great Gull Island project, especially that of Virginia Richards, David Duffy, and Lauren LeCroy who helped us take measurements. In addition, David Duffy very kindly allowed us to use his data on adult weights. Our thanks are also due to Dean Amadon for reading our manuscript, William B. Robertson for sending us an English translation of the Cymborowski and Szule-Oleehowa paper, Marl- anna Neighbout for typing the manuscript, and Robert Stephenson for helping with many details. Financial support by the Mae P. Smith Memorial Fund is gratefully acknowledged.
LITERATURE CITED
CYMBOnOWSK•, B., AN•) B. SZULC-OLEcaOw•. 1967. Comparison of post-embri- onal development of Common Tern, Sterna hirunda L., in natural and arti- ficial conditions. Acta Ornithol., 10: 213-225.
GEMPEnLE, M. E., XN•) F. W. PaESTON. 1955. Variation of shape in the eggs of the Common Tern in the clutch-sequence. Auk, 72: 184-198.
HA•es, H. 1970. Great G•fil Island report on nesting species 1967-68. Proc. Linn. Soc. N.Y., No. 71, p. 105-119.
L•N•m•M, N. P. E. 1972. Chick survival in terns (Sterna spp.) with particular reference to the Common Tern. J. Anita. Ecol., 41: 385-395.
L•Cno•e, M., 5N•) C. T. CO•NS. 1972. Growth and survival of Roseate and Common tern chicks. Auk, 8.: 595-611.
NrSBE% I.' C. T. 1973. Courtship-feeding, egg-size and breeding success in Common Terns. Nature, 241: 141-142.
NrSBE•, I. C. T., •N•) W. H. Dnun•. 1972. Measuring breeding success in Com- mon and Roseate terns. Bird-Banding, 43: 97-106.
V•nM•En, K. 1970. Breeding biology of California and Ring-billed gulls. Can. Wildl. Serv. Rept. Set. No. 12.
Department of Ornithology, American Museum of Notural History, New York, N.Y. 10024.
Received 15 May 1973, accepted 20 July 1974.