green workflow by design - psi software ag
TRANSCRIPT

Annual Report 2020
Green
WorkfloW
By DEsiGn
2 Letter from the Executive Board
6 Letter from the supervisory Board
12 Green WorkfloW by DeSIGn
23 The Psi share
29 fInAnCIAl STATeMenTS (IfrS)
30 Consolidated Management Report
46 sustainability and CsR
49 Consolidated Financial statements (iFRs)
58 notes to the Consolidated Financial statements
92 Remuneration Report
95 Responsibility statement
96 independent Auditor’s Report
106 Psi Key Figures
108 investor Relations
Publication Details
PSI software products stand for safe, environmentally friendly and efficient energy supply, sustainable mobility and optimized production and logistics processes worldwide.
As an independent software producer, PSI has been a technological leader in process control systems for energy grid operation and industrial production since 1969. PSI software ensures efficient use of energy, labor and raw materials in its target sectors. In the Energy Management segment, PSI products support electricity and gas grids, heating, cooling and water networks, energy trading and public transport. In the Production Management segment, PSI software ensures efficiency in metals production, automotive manufacturing, mechanical engineering and logistics. To this end, PSI has been successfully relying on a combination of artificial intelligence methods and other industrially proven optimization methods for two decades.
ConTenTS
PSI – InTellIGenT SofTWAre
for SuSTAInAble enerGy SuPPly,
MobIlITy AnD ProDuCTIon
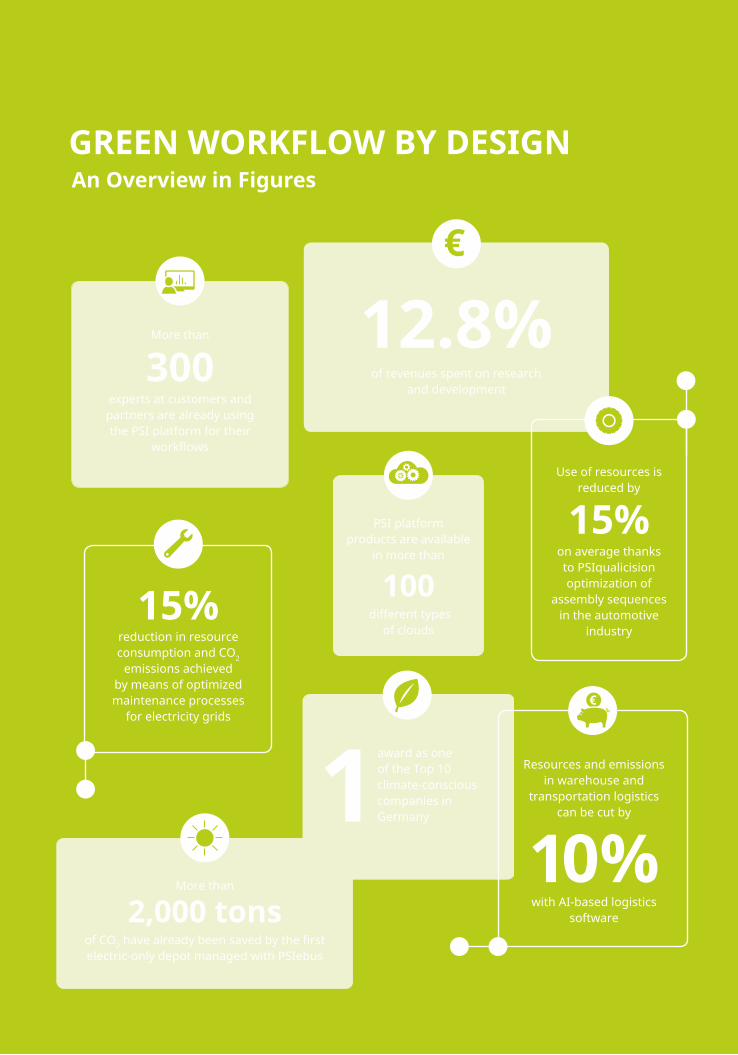
Green WorkfloW by DeSIGn
An overview in figures
More than
300experts at customers and partners are already using the Psi platform for their
workflows
Use of resources is reduced by
15%on average thanks to Psiqualicision optimization of
assembly sequences in the automotive
industry
of revenues spent on research and development
12.8%
Resources and emissions in warehouse and
transportation logistics can be cut by
10% with Ai-based logistics
software
15% reduction in resource consumption and CO2
emissions achieved by means of optimized maintenance processes
for electricity grids
More than
2,000 tonsof CO2 have already been saved by the first electric-only depot managed with Psiebus
1award as one of the Top 10 climate-conscious companies in Germany
Psi platform products are available
in more than
100 different types
of clouds

our SeGMenTS
PSI GrouP In fIGureS
energy Management
intelligent solutions for energy grid operators and for public transport. The focus here is on reliable and cost- effective solutions for intelligent grid management and safe operation of transport systems, as well as solutions for energy trading and distribution.
Production Management
software products and solutions for production planning, production control and logistics. The focus is on optimizing the use of resources and cost-effectiveness in the metals industry, machinery/plant engineering, the automotive industry and logistics.
2020 2019
Revenues* 97,793 109,425
Operating result* 11,776 11,763
Employees 1,018 954* in EUR thousand
2020 2019
Revenues* 120,002 115,755
Operating result* 6,023 7,199
Employees 1,038 1,030* in EUR thousand
in eur million 2020 2019 %Revenues 217.8 225.2 –3.3
Operating result 14.9 17.2 –13.4
Earnings before taxes 13.7 16.4 –16.5
Group net result 10.3 14.3 –28.0
shareholders’ equity 100.3 94.5 6.1
Equity ratio (in %) 38.7 38.0 1.8
Return on equity (in %) 10.3 15.1 –35.1
investments* 5.8 11.2 –48.2
Research and development expenses 27.8 24.0 15.8
Research and development ratio (in %) 12.8 10.7 19.6
new orders 229 236.0 –3.0
Order backlog on December 31 149 142.0 4.9
Employees on December 31 (number) 2,056 1,948 5.5* Company acquisitions, intangible assets, property, plant and equipment

Green WorkfloW by Design
For more than 50 years, Psi software solutions have been helping the energy industry and energy-intensive sectors to structure their core business processes in a sustainable way. With the modern Psi software platform, we are now providing more and more products in our customers’ clouds. Using simple graphic tools, customers and partners can quickly structure optimized workflows, automate them and adapt them to their needs with Psi Click Design.
PsiAnnual Report
2020

Harald fuchs, 56 Member of the executive board
Responsibilities: Organization, HR,Finances and Controlling
Dr. Harald Schrimpf, 56executive board Chairman
Responsibilities: Marketing, sales,Technology and investor Relations
2_
year (EUR 17.2 million) and hence somewhat above the guidance of –20% issued in March. In consulta- tion with the Supervisory Board, the Executive Board will propose a dividend of 30 euro cents (previous year: 5 euro cents) to the Annual General Meeting.
enerGy ManaGeMent GroWtH In the Energy Management segment, BTC SmartGrid, which was acquired in early 2019, achieved a turn-around in its operating result (including all alloca- tions) as the “Integrated Municipal Utilities and Industry” division and contributed to the segment’s revenue growth of 4% to EUR 120 million. Weak energy prices in the summer led to the postponement of some Russian orders. With the acquisition of PSI Prognos, we strengthened our meteorological exper-tise for more accurate renewable energy feed-in fore- casting. The acquisition of the Swiss grid planning software NEPLAN in October brought us additional grid calculations and 500 customers around the world.
laDieS anD GentleMen,
Your PSI Software AG enjoyed robust business de-velopment in 2020 despite the pandemic, and we are extremely confident with regard to our performance in 2021. In February 2020, we expanded our IT infra- structure to include 3,000 encrypted remote access- es, allowing us to work from home throughout the lockdown. In March, we issued capital market guid- ance stating that our new orders and revenues could decline by up to 5% and our operating result by up to 20%. Thanks to an industrious end to the year, our new orders amounted to EUR 229 million, down just 3% on the record level generated in the previous year (EUR 236 million). Similarly, revenues were only 3% lower than the prior-year figure (EUR 225 million) at almost EUR 218 million. New orders and rev- enues in the previous year included EUR 5.5 million from the first-time consolidation of an acquisition and EUR 3 million more for third-party products (hardware). Despite risk provisions in several emerg-ing economies, our operating result amounted to EUR 14.9 million, just 13% less than in the previous
PSIAnnual Report
2020
_3letter from the executive Board
GooD operatinG reSult for proDuction ManaGeMentIn the Production Management segment, we generat- ed additional major orders from the steel industry in North America, Russia and China. However, we were also required to recognize risk provisions in emerging economies. The pandemic hit our Automotive divi-sion just as the new PSI product ASM MES was being launched. PSI Polska doubled its new orders and operating result once again.
Although its revenues declined by 11% to EUR 97.8 million, the Production Management segment achiev- ed an operating result of EUR 11.8 million following its migration to the partner-friendly Group platform, almost twice that recorded by the Energy Manage-ment segment (EUR 6.0 million) even with its larger
headcount. As part of our work to transition the prod- ucts in the Energy Management segment to the plat-form, we have completely overhauled the field staff deployment system. We are currently migrating the second of three energy management products to the platform’s time series module. The new JSCADA control system on the PSI platform is being upgraded for a national gas distribution grid. And its applica-tions include cloud-based, intelligent low-voltage grids, which are booming thanks to solar roofs, heat pumps and electric vehicles.
4_
We would like to expressly thank our customers for their part in enabling the quick transition to video conferences for all commissioning, product meetings and approvals. PSI’s employees also deserve our huge gratitude for their strict adherence to the pandemic rules and the diligence with which they provided services to our customers while working from home. They had to overcome mental hardship in the pro-cess, not least grieving for victims of the pandemic in their own families and friendship groups. Despite the workforce adjustment in crisis-hit Malaysia in early 2020, PSI recorded net growth of 72 to 2,056 employees thanks to new appointments in Poland, Germany and the U.S. in particular.
Assuming there are no further shocks to the world economy, we are aiming to generate an operating re-sult in excess of EUR 20 million and single-digit growth in 2021. However, if the vaccination campa-igns pick up pace and the economy recovers, we can expect to enjoy stronger growth in the second half of the year.
Berlin, March 2021
Dr. Harald Schrimpf Harald Fuchs
SuBStantial inveStMentS in tecHnoloGyPSI invested EUR 27.8 million in research, product functionality and platform technology in 2020. The platform was expanded to include multi-cloud tech-nology and an app store that delivers platform prod-ucts to the more than 100 different private clouds of our Group customers and the PSI cloud. After deli-very, these products are modified for the customer’s specific operations at runtime by the customer’s IT department, partners and PSI consultants and subse-quently rolled out across all affected workstations and technical systems. PSI delivers regular upgrades-as-a-services for the software products and the PSI platform.
DeSiGn WorkfloW intuitivelyUnlike consumer apps, where adjustments might in-volve clicking five sliding switches, modifying indus-trial software means consistently setting 50,000 para-meters. To this end, PSI has developed intuitive tools like workflow management (PSI BPM), PSI Click Design (graphic interface design), screen adjustment (responsiveness), web capability, interface tools and many more to be industry-ready. More than 300 con- sultants are already using this application-platform- as-a-service (aPaaS) offering with customers and partners around the world. The motto for the year “Green Workflow by Design” underlines the fact that this technology cuts the duration of customers’ continuous improvement processes (Kaizen) from years to weeks, saving time, stress, money, energy, emis- sions, travel and health risks – and often making the transition to climate-neutral production processes possible in the first place.
PSIAnnual Report
2020
_5letter from the executive Board

Your PSI Software AG demonstrated impressive ope-rational strength in the 2020 financial year de- spite the effects of the COVID-19 pandemic. In this challenging year, the Supervisory Board continued to work in trusting cooperation with the Executive Board. Its work particularly focused on the Group’s current financial situation in the context of the pan-demic, the medium-term corporate planning and the strategic development of the Group. We therefore regularly monitored the Executive Board’s work and provided advice according to the law, the company’s Articles of Association and the German Corporate
Dear pSi SHareHolDerS,Dear frienDS anD partnerS of our coMpany,
karsten trippelsupervisory board Chairman
6_
Governance Code. The Board regularly informed us promptly, in writing and orally about the situation of PSI Software AG. On this basis, we discussed busi-ness performance and decisions in detail. The Execu-tive Board fully met its obligations to provide the Supervisory Board with information.
The Supervisory Board ensured that the law, the Ar-ticles of Association and the rules of procedure of the Supervisory Board and the Executive Board were complied with. It passed the resolutions required by the law and the Articles of Association. When busi-ness transactions required the Supervisory Board’s approval, it discussed them in depth with the Execu-tive Board before passing a resolution. Cooperation between the Supervisory Board and the Executive Board was always constructive and purposeful.
The Chairman of the Supervisory Board was also in regular contact with the Executive Board outside of Supervisory Board meetings and was informed about the business situation and material business transac-tions. The consultation between him and the two Executive Board members was ongoing and exten- sive. The Supervisory Board Chairman shared the material information from each of these exchanges with the other members of the Supervisory Board.
Main areaS of DiScuSSion for tHe SuperviSory BoarDIn the performance of its monitoring function, the Supervisory Board’s discussions included the follow- ing main topics:
– Development of new orders, revenues and earnings of the PSI Group and the individual business units,
– Supervision and review of the acquisition of the fore- casting software provider Prognos Energy GmbH in order to supplement the product and service range for grid operators with very precise, weather- dependent forecasts,
– Supervision and review of the acquisition of the Swiss network planning software specialist NEPLAN AG in order to supplement the product range with soft-ware for network planning and asset management,
– Supervision of further measures to improve earnings and reduce risks in Southeast Asia,
– Ongoing supervision of further steps in the Group’s transformation to a product-based business model with a focus on increasing recurring revenue,
– Supervision of the app store and multi-cloud initia-tive for automated provision of further products for customers and partners based on the PSI platform.
One particular focus of the Supervisory Board’s work in 2020 was the upcoming changes on the Execu- tive Board of PSI Software AG. With effect from July 1, 2021, Mr. Gunnar Glöckner was appointed as the new Board member for Organization, HR, Finance and Controlling at PSI Software AG. He is taking over from Mr. Harald Fuchs, who will leave the com-pany when his contract ends as of June 30, 2021. The Supervisory Board would like to thank Mr. Fuchs for his trusting cooperation over the past eight years, his great commitment to the PSI Group and his contri-bution to the further development of the company.
PSIAnnual Report
2020
_7letter from the Supervisory Board
Work of tHe SuperviSory BoarD coMMitteeSThe Supervisory Board has formed two committees.
The Personnel Committee deals with the employ-ment contracts and personnel matters of the Execu-tive Board. The committee met three times in the financial year with full attendance. One focus of the committee’s work was preparing the Supervisory Board resolutions on the appointment of Mr. Gunnar Glöckner to the Executive Board with effect from July 1, 2021 and on the departure of Mr. Harald Fuchs as of June 30, 2021. It also dealt with the system for Executive Board remuneration. In this respect, there was a focus on reviewing the current remuneration system, which was approved by the Annual General Meeting on May 16, 2019, for any necessary adjust-ments in line with the changed recommendations of the 2020 German Corporate Governance Code.
The Audit Committee is particularly concerned with issues of accounting and risk management. The com-mittee met three times in 2020, with one meeting serving to prepare the adoption of the annual finan-cial statements and the approval of the consolidated financial statements. All three meetings were attend- ed by all committee members.
corporate GovernanceAs in previous year, the Executive Board and the Su-pervisory Board monitored the Group’s compliance with the rules of the German Corporate Governance Code. The Supervisory Board adopted the declara-tion of compliance according to Section 161 of the German Stock Corporation Act on December 18, 2020. The company fulfils the majority of the Code’s recommendations. The few deviations are also explai- ned in the corporate governance declaration, which has been published on the website at www.psi.de.
SuperviSory BoarD MeetinGS anD key topicSThe Supervisory Board held eight ordinary meetings to perform its duties in 2020, two of which were held as meetings in person and six as video conferences. It was in full attendance at all meetings. The key topics addressed by the Supervisory Board and the dates of the meetings are summarized in the table below:
In addition to the financial performance of PSI Soft-ware AG and the Group, the Supervisory Board also concerned itself with the development of individual subsidiaries, paying particular attention to their activ- ities abroad and the impact of the pandemic in the individual regions. The Supervisory Board was also provided detailed information from the Executive Board on an ongoing basis regarding the develop-ment of the business and financial situation, the risk situation, the market and competitive situation and the personnel situation in these areas.
March 20, 2020 Discussion of the 2019 annual financial statements
March 23, 2020 Adoption of the 2019 annual financial statements
June 2, 2020 Preparation for the Annual general Meeting
June 9, 2020 Constitutive meeting of the supervisory board
september 8, 2020 Discussion of the current development of operating business
september 9, 2020 Discussion of the group’s future development and strategy
December 2, 2020 Discussion of the group’s future planning and strategy
December 3, 2020 Audit of the supervisory board’s work
8_

The Supervisory Board examined the efficiency of its own work again at an audit meeting in 2020.
In the 2021 financial year that has now begun, the company’s corporate governance will once again be an important aspect of the work of the Supervisory Board and its committees. As of January 1, 2020, new legal provisions came into effect that also relate to the remuneration system for the Executive Board. The current version of the German Corporate Gover- nance Code also issues several new recommenda-tions and proposals regarding the remuneration of the Executive Board. The Personnel Committee and the Supervisory Board therefore carefully reviewed the remuneration system for the members of the Executive Board, and will present it to the Annual General Meeting in 2021 for approval again after adapting it to the new requirements.
coMpoSition of tHe SuperviSory BoarD anD tHe coMMitteeSIn the 2020 financial year, the Supervisory Board comprised the shareholder representatives Karsten Trippel (Chairman), Prof. Ulrich Wilhelm Jaroni (Deputy Chairman), Andreas Böwing and Prof. Uwe Hack and the employee representatives Elena Günzler and Uwe Seidel. The Personnel Committee comprised the Supervisory Board members Karsten Trippel as Chairman, Prof. Ulrich Wilhelm Jaroni and Elena Günzler, while the Audit Committee comprised the Supervisory Board members Prof. Uwe Hack (Chairman), Andreas Böwing, Prof. Ulrich Wilhelm Jaroni, Uwe Seidel and Karsten Trippel.
auDit of annual anD conSoliDateD financial StateMentSAt the Annual General Meeting of PSI Software AG on June 9, 2020, Deloitte GmbH Wirtschafts-prüfungsgesellschaft was elected as the auditor of the financial statements. This company audited the an-nual financial statements, the management report, the consolidated financial statements and the con-solidated management report for the financial year from January 1 to December 31, 2020, and issued an unqualified audit opinion in each case.
All Supervisory Board members received the finan- cial statements and management reports, the audi-tor’s reports and the Executive Board’s proposal on the appropriation of net profit after they were compiled and in due time ahead of the meeting convened to approve the annual accounts. After preparatory dis- cussion by the Audit Committee, the Supervisory Board as a whole dealt with these documents at its meeting on March 23, 2021. These meetings were attended by members of the Executive Board and re-presentatives of the auditor. The latter reported on the audit in general, the audit priorities set, the ma-terial findings of the audit and the services that the auditor provided in addition to the audit services, and answered the Supervisory Board members’ ques-tions. There were no objections from the Supervisory Board, which therefore acknowledged and approved the results of the audit.
The Supervisory Board examined the consolidated financial statements and Group management report and the annual financial statements and management report for 2020 as well as the results of the audit by the auditor. In accordance with the conclusive findings of these examinations, it raised no objections and adop-ted the annual financial statements and approved the consolidated financial statements on March 23, 2021.
PSIAnnual Report
2020
_9letter from the Supervisory Board
In addition, the Supervisory Board also reviewed the Executive Board’s (separate) non-financial CSR re-port for the company and the Group for 2020 and discussed it with the Executive Board at the meeting on March 23, 2021. There were no objections raised, so the Supervisory Board also approved the CSR report.
In 2020, PSI recorded continued strong demand for solutions for the intelligent management of energy grids, the electrification of transport and the optimi-zation of steel production, with the effect that new orders almost reached the previous year’s record level despite the effects of the coronavirus crisis. Thanks to its rapid response to the coronavirus-related restric-tions in place from spring 2020, sales presentations, project meetings and approval processes with almost all customers were switched to digital formats. The PSI Group was thus able to limit the negative impact from the pandemic and achieve the targets for new or-ders, revenues and earnings in 2020 that it had set in March 2020. In 2020, PSI continued to benefit from the technology investments made in recent years, which also form the basis for the app store and multi- cloud initiative for the automated provision of initial pilot products from the cloud. Despite the challeng- ing environment, important new customers were ac-quired and follow-up orders from existing customers were obtained in Germany and in export business. The successes achieved jointly by the Executive Board, management and employees against the back-drop of the coronavirus crisis deserve recognition and respect. The Supervisory Board therefore thanks everyone involved for the work they have done and for their great commitment.
It also thanks customers and shareholders for the confidence they showed in 2020. The PSI Group will continue to support its customers with advanced prod-ucts and market-leading functions, to be a reliable partner to them and contribute to managing the changes on their markets in 2021. Satisfied reference customers are still the basis for gaining further new customers and continuing PSI’s positive development.
Berlin, March 2021
Karsten TrippelSupervisory Board Chairman
10_

PSIAnnual Report
2020
_11

WorkfloW anD click DeSiGn
business processes and interfaces can
be adapted easily at any time
Green WorkfloW By DeSiGncoMpanieS must adapt quickly and flexibly to changes in their business, while keeping sustainability in mind. The Psi software platform frees customers and partners from rigid iT structures, and its innovative tools enable fast, simple adjustments.
inteGr ateD ai optiMization
industrial intelligence makes industrial processes
much more sustainable
12_

Secure anD reliaBle
Critical infrastructures are managed sustainably and securely with high-availability
Psi software
PSIAnnual Report
2020
_13Green Workflow by Design

SuStainaBle enerGy Supply, proDuction anD loGiSticS
reduction in greenhouse gas emissions targeted in the eU by 2030
55%
Falling costs for energy from renewable sourcessource: OurWorldinData.org
for solar energy (photovoltaics)
for wind energy (onshore)
2010 20102019 2019
$ 68
/MW
h
$ 86
/MW
h
$ 53
/MW
h
$ 37
8/M
Wh
14_
Renewable energy accounted for more
than 50% of net electricity production
in germany for the first time in 2020
green electricity: Ready for the Commercial energy Transition
Costs for electricity from renewable energy sources have fallen sharply in the past ten years. the respec-tive decreases of 82% for photovoltaics and 39% for onshore wind energy mean that renewable energy is now a low-cost alternative to fossil fuels in a growing number of regions.
The rising level of energy from decentralized, renewable sources is posing major challenges for grid operators in more and more countries. Firstly, the number of generating systems is much higher than in a conventional structure with just a few large-
scale power stations. Sec- ondly, feed-in of renew- able energy obviously fluc- tuates significantly due to
changes in the weather. This is increasingly leading to grid destabilization, which can be countered either with additional grid expansion or with dynamic, intelligent grid management. PSI products for network management have been successfully using industrial artificial intelligence methods to forecast re-newable feed-in and calculate commercially and technically
optimum switching meas-ures for many years now – entirely as an autopilot for complex electricity grids. Consequently, demand is
rising in a growing number of countries for these functions that are well established in Germany and neighboring Euro- pean states. PSI further boosted its expertise in meteorologi- cally-based feed-in forecasts and further grid calculations through two acquisitions in 2020.
Growing Complexity Requires Intelligent Grid
Management
More and More Grid Operators Are Using PSI
Software as a Grid autopilot
PSIAnnual Report
2020
_15Green Workflow by Design
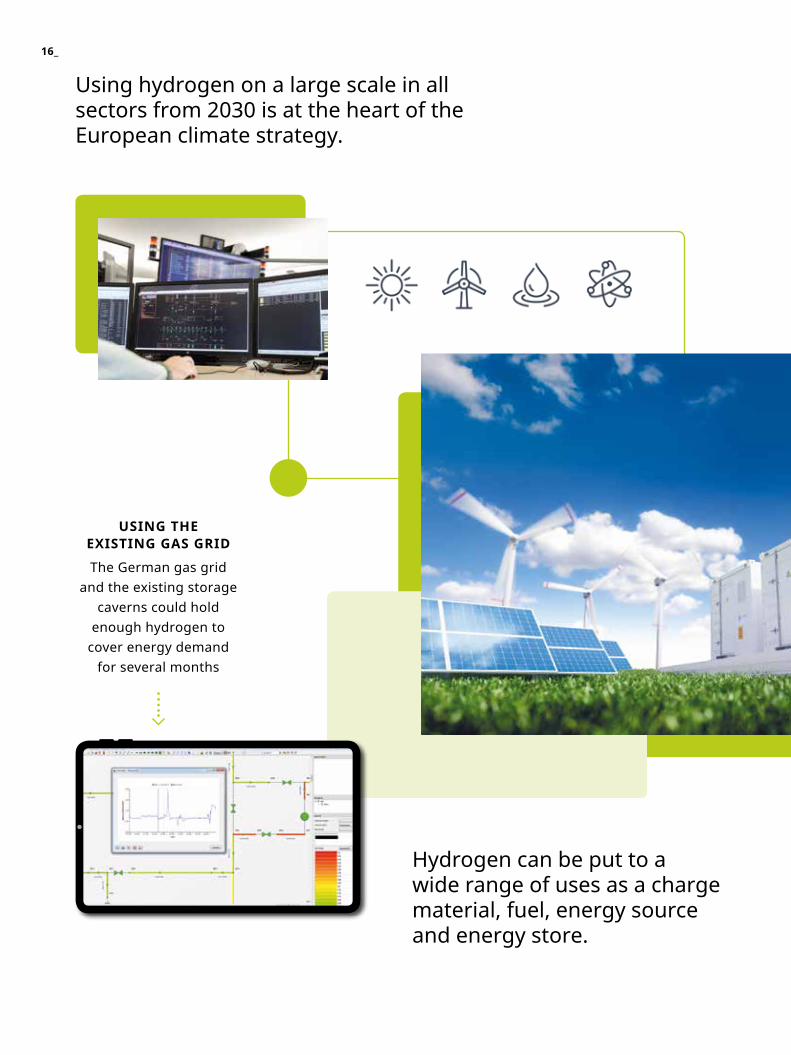
Using hydrogen on a large scale in all sectors from 2030 is at the heart of the european climate strategy.
uSinG tHe exiStinG GaS GriD
The german gas grid and the existing storage
caverns could hold enough hydrogen to
cover energy demand for several months
Hydrogen can be put to a wide range of uses as a charge material, fuel, energy source and energy store.
16_
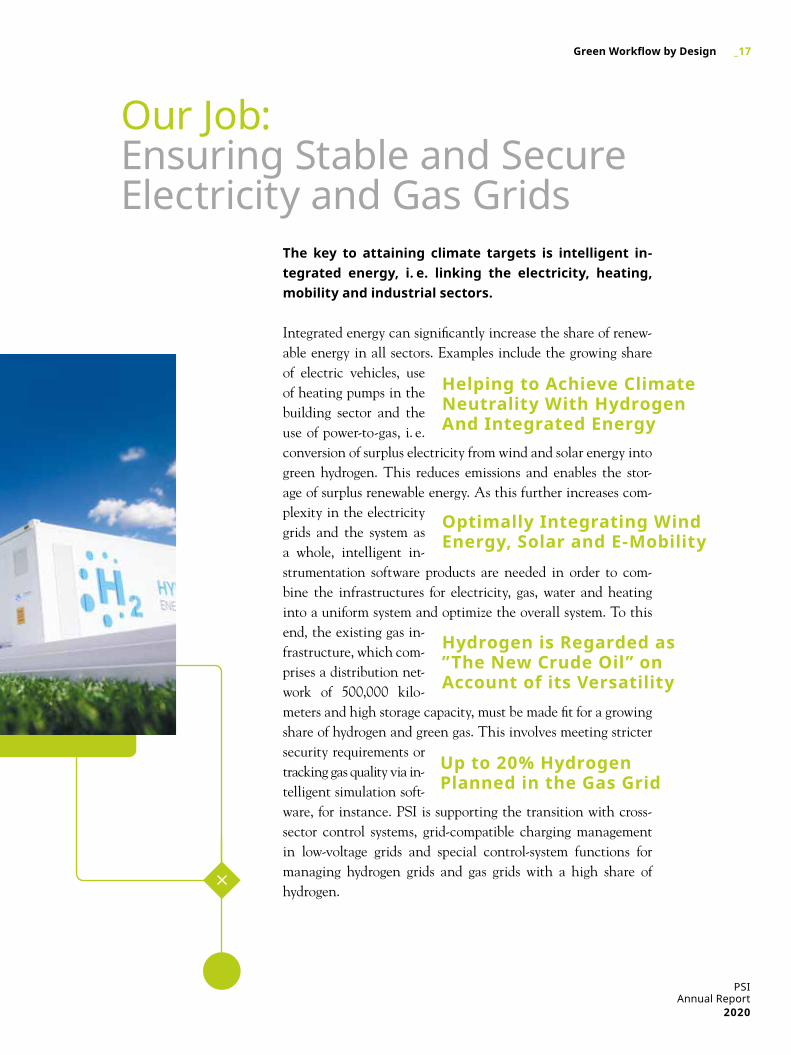
Our Job: ensuring stable and secure electricity and gas grids
Helping to Achieve Climate Neutrality With Hydrogen And Integrated Energy
Up to 20% Hydrogen planned in the Gas Grid
Optimally Integrating Wind Energy, Solar and E-Mobility
Hydrogen is Regarded as ”The New Crude Oil” on account of its versatility
The key to attaining climate targets is intelligent in- tegrated energy, i. e. linking the electricity, heating, mobility and industrial sectors.
Integrated energy can significantly increase the share of renew- able energy in all sectors. Examples include the growing share of electric vehicles, use of heating pumps in the building sector and the use of power-to-gas, i. e. conversion of surplus electricity from wind and solar energy into green hydrogen. This reduces emissions and enables the stor-age of surplus renewable energy. As this further increases com-plexity in the electricity grids and the system as a whole, intelligent in-strumentation software products are needed in order to com-bine the infrastructures for electricity, gas, water and heating into a uniform system and optimize the overall system. To this end, the existing gas in- frastructure, which com- prises a distribution net-work of 500,000 kilo- meters and high storage capacity, must be made fit for a growing share of hydrogen and green gas. This involves meeting stricter security requirements or tracking gas quality via in- telligent simulation soft- ware, for instance. PSI is supporting the transition with cross- sector control systems, grid-compatible charging management in low-voltage grids and special control-system functions for managing hydrogen grids and gas grids with a high share of hydrogen.
PSIAnnual Report
2020
_17Green Workflow by Design

SpeeD anD flexiBility in inDuStry anD loGiSticS
autoMateD WorkfloWS
Multi-clouD Support
ai optiMization
18_
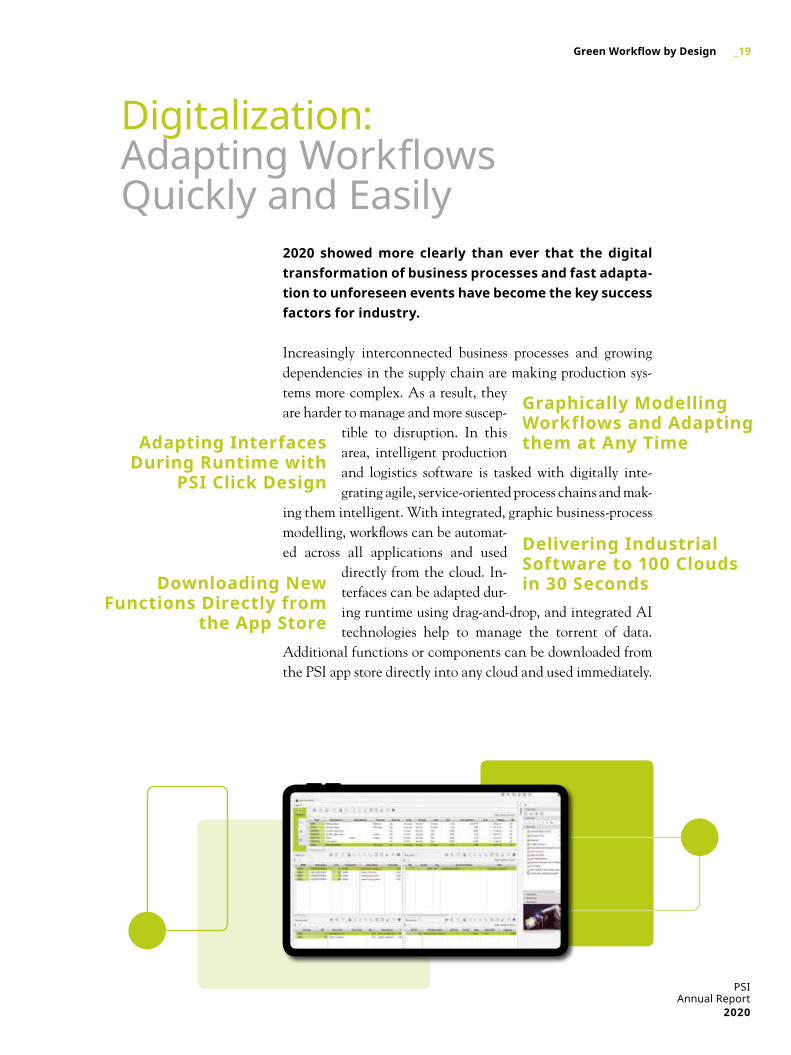
Digitalization: Adapting Workflows Quickly and easily
2020 showed more clearly than ever that the digital transformation of business processes and fast adapta- tion to unforeseen events have become the key success factors for industry.
Increasingly interconnected business processes and growing dependencies in the supply chain are making production sys-tems more complex. As a result, they are harder to manage and more suscep-
tible to disruption. In this area, intelligent production and logistics software is tasked with digitally inte- grating agile, service-oriented process chains and mak-
ing them intelligent. With integrated, graphic business-process modelling, workflows can be automat- ed across all applications and used
directly from the cloud. In-terfaces can be adapted dur- ing runtime using drag-and-drop, and integrated AI technologies help to manage the torrent of data.
Additional functions or components can be downloaded from the PSI app store directly into any cloud and used immediately.
Graphically Modelling Workflows and Adapting them at any time
Delivering Industrial Software to 100 Clouds in 30 SecondsDownloading New
functions Directly from the app Store
Adapting Interfaces During Runtime with
PSI Click Design
PSIAnnual Report
2020
_19Green Workflow by Design
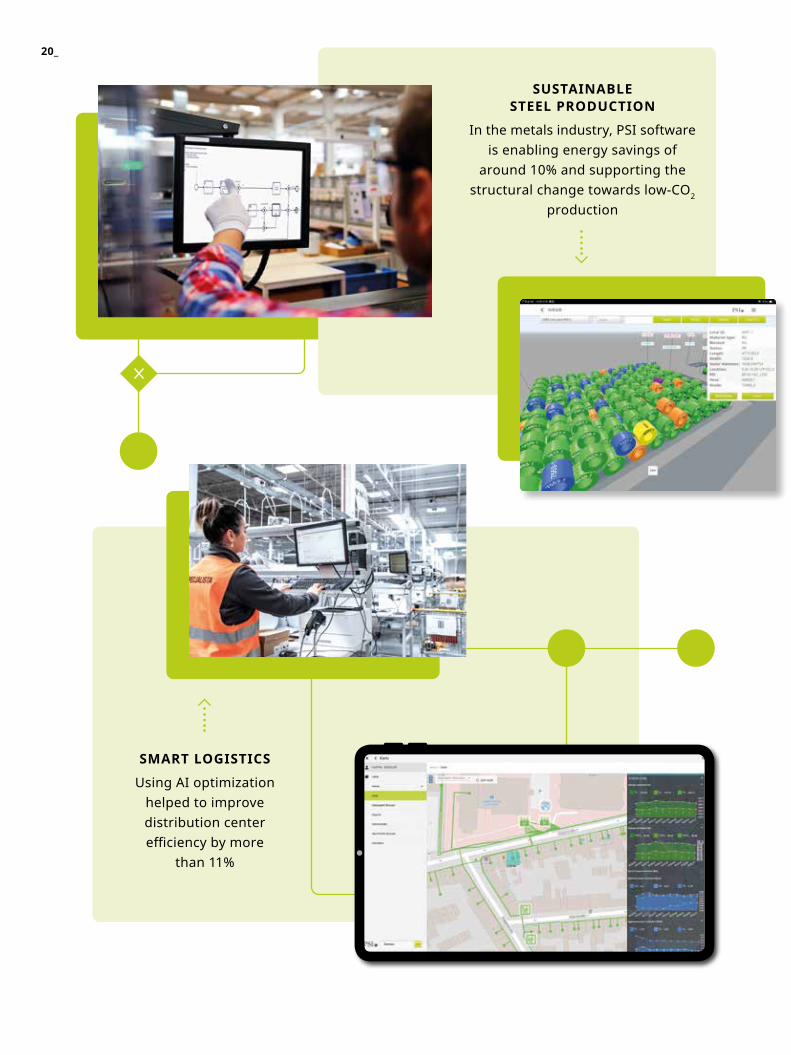
SMart loGiSticS
Using Ai optimization helped to improve distribution center efficiency by more
than 11%
SuStainaBle Steel proDuction
in the metals industry, Psi software is enabling energy savings of
around 10% and supporting the structural change towards low-CO2
production
20_
Robust Processes: Achieving Long-term successwith Flexible software and intelligent Optimization
With the digital transformation, it is becoming increasingly im-portant for companies to be faster, more efficient and smarter than their competitors, and to keep on adapting to changed
market conditions. Choosing a soft-ware package that combines maximum flexibility with long-term investment
security is becoming a key success factor. This relates to fast usability of the software through direct availability in 100 dif- ferent clouds, ease of adaptation with graphic tools and support of all workstations and devices. However, the main factor in long-term success is planning and optimization regarding all manner of key performance indicators. Along with business in-dicators relating to costs, productivity or quality, this increas- ingly includes aspects such as sustainability of business pro- cesses and employee satisfaction. Examples are support of struc-
tural change in the steel industry towards low-CO2 production and opti- mization of assembly sequences in the automotive industry, which improves
productivity by 10% to 20% depending on the initial situation. In logistics, the use of artificial intelligence boosts efficiency by over 10%. Optimized charging management for electric vehi- cles and management of elec-tricity grids are areas where substantial sustainability effects are achieved through precise feed-in forecasts based on AI, and determination of optimum switching measures.
up to 20% More productive with Swarm Production
Intelligent Charging Management for Successful
E-Mobility
Optimizing Throughput in the Distribution Center with AI
More capacity and Stability Through Intelligent Grid Management
PSIAnnual Report
2020
_21Green Workflow by Design
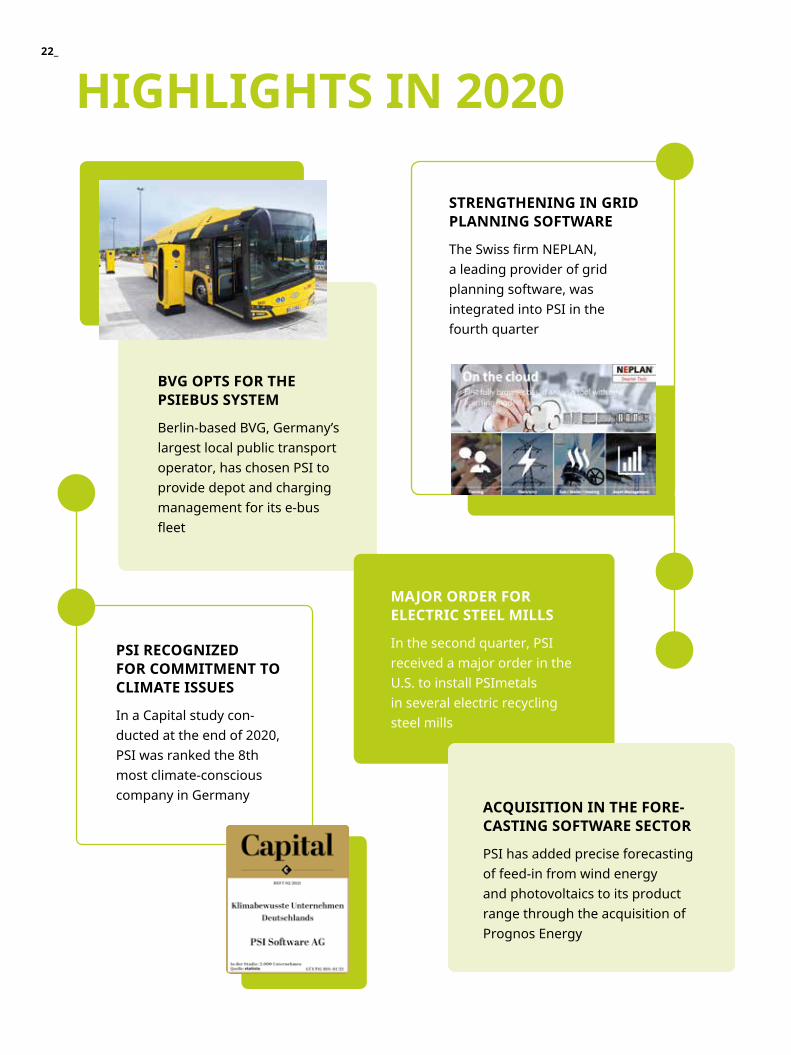
BvG optS for tHe pSieBuS SySteM
berlin-based bVg, germany’s largest local public transport operator, has chosen Psi to provide depot and charging management for its e-bus fleet
StrenGtHeninG in GriD planninG SoftWare
The Swiss firm NEPLAN, a leading provider of grid planning software, was integrated into Psi in the fourth quarter
pSi recoGnizeD for coMMitMent to cliMate iSSueS
in a Capital study con- ducted at the end of 2020, Psi was ranked the 8th most climate-conscious company in germany
HiGHliGHtS in 2020
Major orDer for electric Steel MillS
in the second quarter, Psi received a major order in the U.s. to install Psimetals in several electric recycling steel mills
acquiSition in tHe fore- caStinG SoftWare Sector
Psi has added precise forecasting of feed-in from wind energy and photovoltaics to its product range through the acquisition of Prognos energy
22_
The dominant issue on the stock markets in 2020 was the COViD-19 pandemic and its effects on companies and markets. After a sharp slump in the second half of March, the financial markets quickly recovered from the coronavirus shock and reached new highs in the summer already. Despite some uncertainty in connection with the U.S. elections and Brexit, the approval of the first COViD-19 vaccines prompted fresh optimism, allowing the major stock markets to end the year above the previous year’s levels.
tHe pSi SHare
PSIAnnual Report
2020
_23the pSi Share
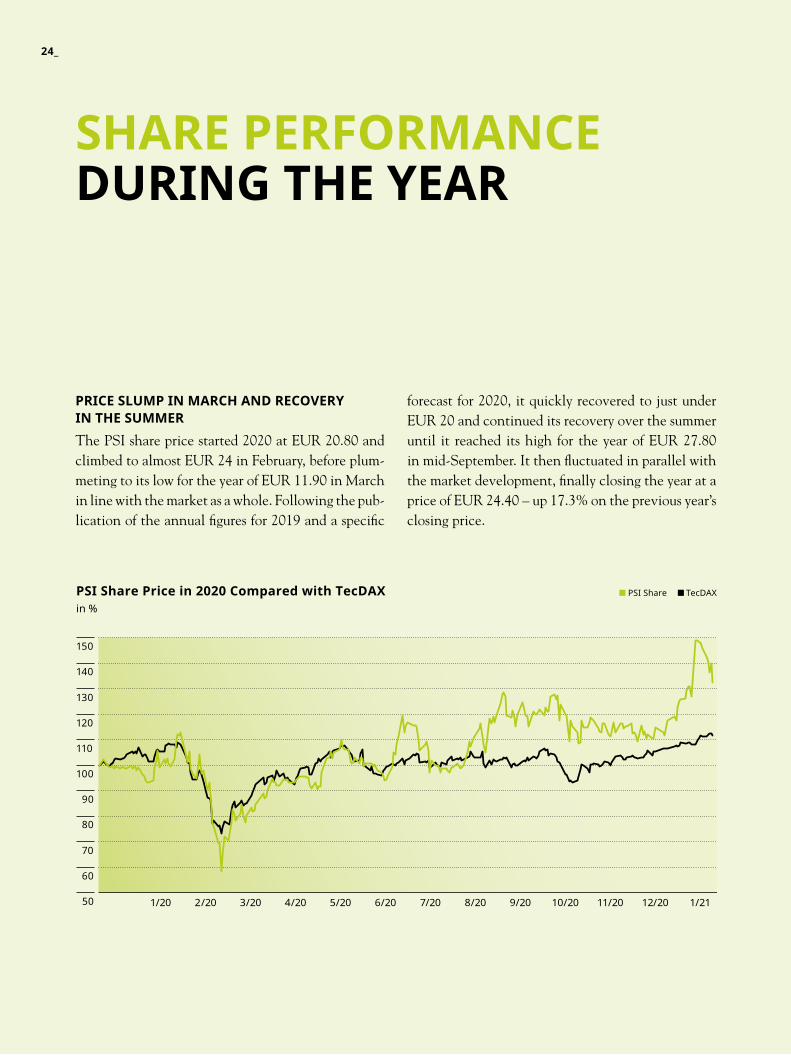
price SluMp in MarcH anD recovery in tHe SuMMerThe PSI share price started 2020 at EUR 20.80 and climbed to almost EUR 24 in February, before plum-meting to its low for the year of EUR 11.90 in March in line with the market as a whole. Following the pub- lication of the annual figures for 2019 and a specific
forecast for 2020, it quickly recovered to just under EUR 20 and continued its recovery over the summer until it reached its high for the year of EUR 27.80 in mid-September. It then fluctuated in parallel with the market development, finally closing the year at a price of EUR 24.40 – up 17.3% on the previous year’s closing price.
SHare perforMance DurinG tHe year
130
140
120
110
100
90
80
70
50 1/20 2/20 3/20 4/20 5/20 6/20 7/20 8/20 9/20 10/20 11/20 12/20 1/21
60
150
PSI Share Price in 2020 Compared with TecDAXin %
PSI Share TecDAX
24_
capital Market coMMunication via DiGital cHannelSDespite the restrictions resulting from the corona- virus, we once again communicated actively and in- tensively with the capital market in 2020. At the start of the year, we presented PSI at three investor conferences held in person and a roadshow in Germa-ny and Europe. From March onward, capital market communication was shifted entirely to digital chan-nels, meaning that we reported virtually at another 12 investor conferences and roadshows and at our Annual General Meeting. Another 17 virtual investor
visits also took place, as well as one investor visit held in person during the temporary easing of measures in the summer. Our intensive dialog with financial and business journalists resulted in almost 60 positive reports on PSI in print media, in online media and on stock market radio, TV and podcasts. The most important topics were the effects of the pandemic on PSI’s business and the long-term transformation strategy. In the second half of the year, there was a stronger focus again on PSI products’ positive contri- bution to climate protection and the energy transi- tion and on the resulting business opportunities.
2019
350
300
250
200
150
100
50
0 2011 2012 2013 2014 2015 2016 2017 2018 2020
400
450
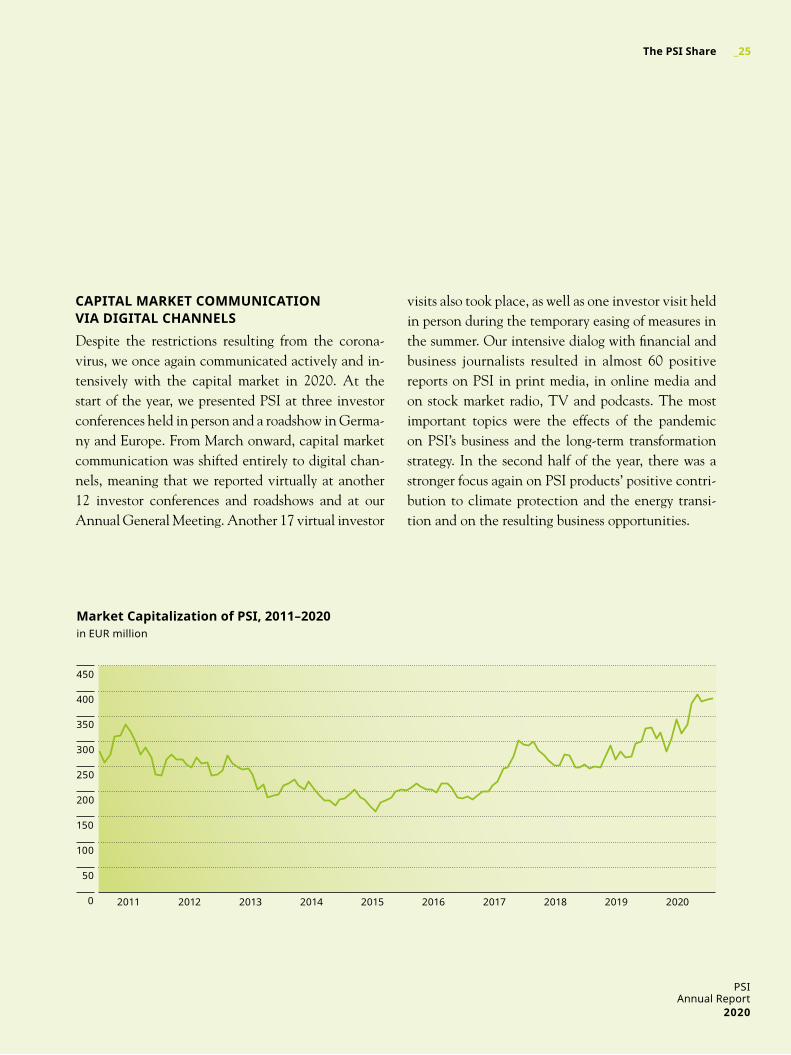
Market Capitalization of PSI, 2011–2020in EUR million
PSIAnnual Report
2020
_25the pSi Share
tranSforMinG into a SoftWare proDuct anD platforM proviDerIn 2020, PSI continued to press ahead with its trans- formation into a software product provider with long-term customer relationships and increasing recurring revenues. To this end, we expanded our technologi-cally leading PSI software platform with multi-cloud technology and an app store, while also pressing ahead with the standardization of our product base. With intuitive tools such as workflow management and PSI Click Design, we will offer customers and partners a modern application platform as a service from any desired cloud environment.
inDuStrial artificial intelliGence BrinGS coMpetitive aDvantaGeSPSI combines the outstanding industry expertise it has gathered over five decades with more than 50 different artificial intelligence methods that create tangible competitive advantages for customers and thereby make them fit for technological change and the challenges of the future. This creates additional growth potential for revenues and profits at PSI.
pioneer in DiGitalization, inteGrateD enerGy anD inDuStry 4.0PSI has invested at an early stage in future topics such as cloud-based, intelligent low-voltage manage-ment for energy distribution, integrated energy in the energy transition and decentralized, self-organ- izing manufacturing structures. This enables our cus-
tomers to achieve digital transformation of their busi- ness processes and opens up new growth potential both for them and for us.
GroWtH potential froM cliMate protection anD tranSition in enerGy anD tranSport
PSI products make a key contribution to integrating the growing share of renewable energy into the exist- ing electricity grids. Our systems for safe and cost- effective gas supply management support the in- creased use of green gas and hydrogen as part of the supply infrastructure. With specialized solutions for intelligent charging management and intelligent pro- duction of electric vehicles with Industry 4.0 methods, PSI is supporting the transition to zero-emission pub-lic and private transport.
creatinG lonG-terM value
26_
Data on the pSi Share
stock exchanges Xetra, Frankfurt, berlin, stuttgart, Düsseldorf, Hamburg, Hanover, Munich, Tradegate
stock exchange segment Regulated Market, Prime standard
inclusion in indices Technology All share, DAXsector software, DAXsector All software, DAXsubsector software, DAXsubsector All software, Prime All share, CDAX
isin De000A0Z1JH9
Securities identification number (WKn) A0Z1JH
stock exchange symbol PsAn
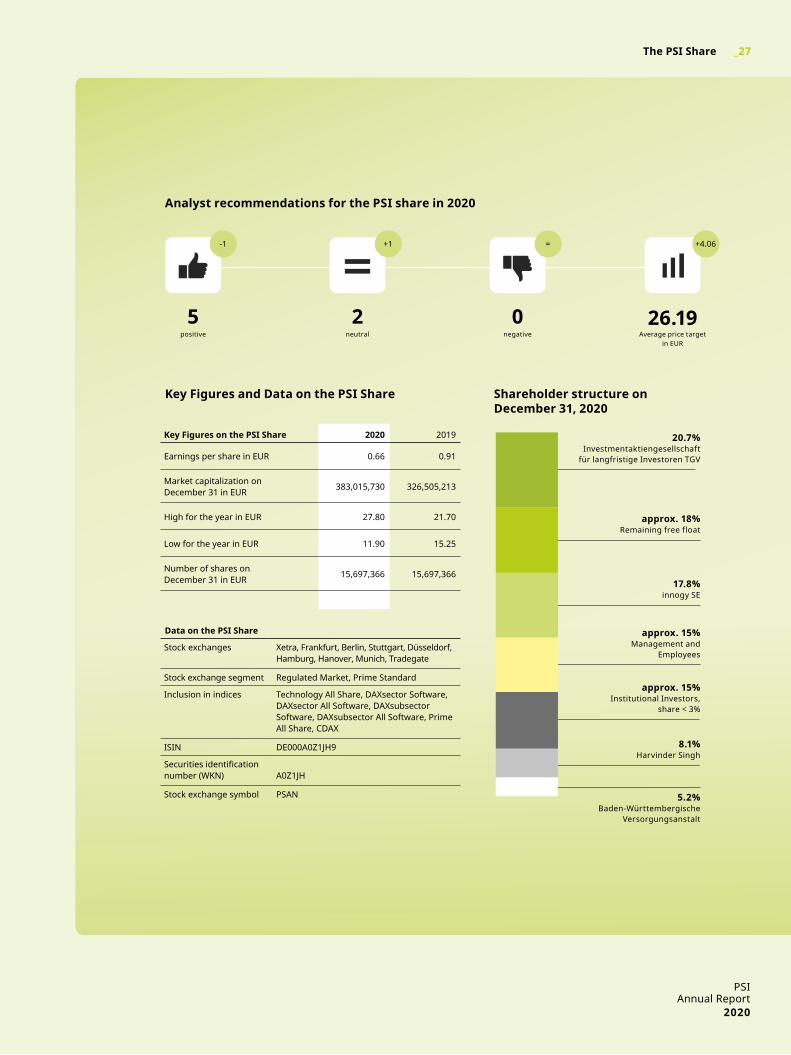
Key Figures on the PSI Share 2020 2019
earnings per share in eUR 0.66 0.91
Market capitalization on December 31 in eUR 383,015,730 326,505,213
High for the year in eUR 27.80 21.70
Low for the year in eUR 11.90 15.25
number of shares on December 31 in eUR 15,697,366 15,697,366
Key Figures and Data on the PSI Share
8.1%Harvinder singh
5.2%baden-Württembergische
Versorgungsanstalt
approx. 15%institutional investors,
share < 3%
approx. 18%Remaining free float
17.8%innogy se
20.7%investmentaktiengesellschaft
für langfristige investoren TgV
approx. 15%Management and
employees
Shareholder structure on December 31, 2020
analyst recommendations for the pSi share in 2020
positive neutral negative Average price target in eUR
5 2 0 26.19
+4.06=-1 +1
PSIAnnual Report
2020
_27the pSi Share
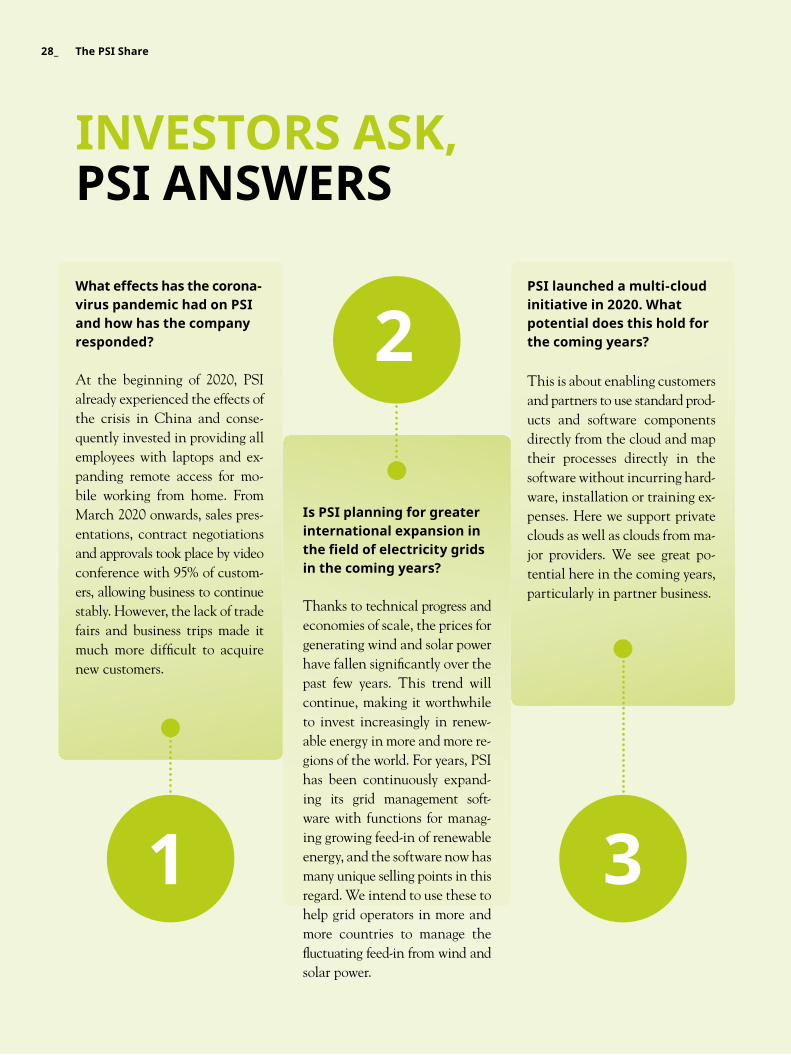
What effects has the corona- virus pandemic had on pSi and how has the company responded?
At the beginning of 2020, PSI already experienced the effects of the crisis in China and conse-quently invested in providing all employees with laptops and ex-panding remote access for mo- bile working from home. From March 2020 onwards, sales pres- entations, contract negotiations and approvals took place by video conference with 95% of custom- ers, allowing business to continue stably. However, the lack of trade fairs and business trips made it much more difficult to acquire new customers.
pSi launched a multi-cloud initiative in 2020. What potential does this hold for the coming years?
This is about enabling customers and partners to use standard prod- ucts and software components directly from the cloud and map their processes directly in the software without incurring hard- ware, installation or training ex-penses. Here we support private clouds as well as clouds from ma-jor providers. We see great po-tential here in the coming years, particularly in partner business.
Is PSI planning for greater international expansion in the field of electricity grids in the coming years?
Thanks to technical progress and economies of scale, the prices for generating wind and solar power have fallen significantly over the past few years. This trend will continue, making it worthwhile to invest increasingly in renew- able energy in more and more re- gions of the world. For years, PSI has been continuously expand- ing its grid management soft- ware with functions for manag- ing growing feed-in of renewable energy, and the software now has many unique selling points in this regard. We intend to use these to help grid operators in more and more countries to manage the fluctuating feed-in from wind and solar power.
inveStorS aSk, pSi anSWerS
1 3
2
the pSi Share28_
30 Consolidated management report
31 Basic Information on the Group
34 Economic Report
39 Statutory Disclosures
41 Risk Report
45 Forecast
46 sustainability and Csr
49 Consolidated finanCial statements (ifrs)
50 Consolidated Balance Sheet
52 Consolidated Income Statement
52 Consolidated Statement of Comprehensive Income
53 Consolidated Cash Flow Statement
54 Consolidated Statement of Changes in Equity
54 Consolidated Segment Reporting
56 Development of Fixed Assets
58 Notes to the Consolidated Financial Statements
92 Remuneration Report
95 Responsibility Statement
96 Independent Auditor’s Report
finanCial statements (ifrs)
_29
PSIAnnual Report
2020
financial statements

basiC information on the groupbusiness model of the group
The core business of the PSI Group consists of process control and information systems for the management of energy and material flows in the following target industries:
– utility companies in the electricity grid, gas grid, pipeline, heating and water network sectors and public transport providers
– industry in the metallurgy, mechanical and plant engineering, automotive, automotive supply and logistics sectors
The Group is accordingly divided into the Energy Manage-ment and Production Management segments. For these economic sectors, PSI develops and sells its own software products and complete systems based on these software products.
In the Energy Management segment, the PSI Group develops software products in the areas of control systems for electricity grids, cross-sector control systems, gas and pipeline management systems, and products for energy trading, energy distribution, smart grids, power plant optimization, gas industry planning and the operation of public transport system.
In Production Management, PSI has an integrated port- folio of solutions for planning and controlling production processes in metals production, logistics, mechanical engineering and automotive manufacturing.
PSI has over 2,000 employees worldwide. As a specialist in process control and optimization systems, the Group has gained a leading position nationally, as well as internatio-nally in the target export markets, particularly among utility companies and metals producers. PSI continuously invests in the functionality and innovativeness of its products in
order to secure and improve its competitive position. PSI was established in 1969, making it one of the most experienced German software companies.
In Germany, the PSI Group has locations in Berlin, Aachen, Aschaffenburg, Dortmund, Düsseldorf, Essen, Hamburg, Hanover, Karlsruhe, Munich, Oldenburg, Potsdam and Stuttgart. Internationally, PSI is represen-ted by subsidiaries and representative offices in Austria, Bahrain, Belgium, Brazil, China, Denmark, India, Japan, Malaysia, the Netherlands, Oman, Poland, Russia, Sweden, Switzerland, Thailand, the United Kingdom and the U.S.
strategy and Control systemThe central aspects of the Group’s strategy are increasing its market share, internationalization and a stronger focus on the software product business. In this way, PSI creates and maintains sustainable and secure jobs. To achieve its strategic goals, the PSI Group focuses on technology leadership, the openness of the Group technology platform and a high pace of development in order to influence the target sectors. In some cases, products and technologies are developed in collaboration with customers in pilot projects.
PSI pursues a growth strategy with a particular focus on international business. After establishing subsidiaries in Russia, Poland, China and Southeast Asia, PSI is invest- ing in the markets in Northern and Central Europe and increasingly also in North America. Over the coming years, PSI will endeavor to achieve a further increase in the share of revenues attributable to products, to expand the share attributable to exports, and to step up business in the geo-graphical target markets. This will create economies of scale and therefore improve the conditions for further increases in profitability.
As a result of its strategy aimed at growth and profitability, the PSI Group has boosted its revenues from EUR 115.2 million in 2004 to EUR 217.8 million. The share of the Group’s revenues attributable to international business
Consolidated management report
PSIAnnual Report
2020
_31Consolidated Management Report
climbed from 13.4% to 35.8% in this period. In the same period, the share of consolidated revenues attributable to license business rose from 4.1% to 5.5% and the share of revenues attributable to long-term maintenance agreements was more than doubled, increasing from 17% to 36.4%.
The key performance indicators for achievement of the strategic goals are:
– the ratio of operating result to revenues (EBIT margin) as the main key figure for improvement in the Group’s profitability
– the development of revenues as a key figure for the Group’s growth rate
– new orders as a significant leading indicator of future revenues growth
– the share of consolidated revenues attributable to license revenues and maintenance revenues as key figures for PSI’s transformation from a service-oriented IT provider to a software product provider
In the non-financial area, the PSI Group has since 2017 been calculating the following key figures to measure its performance with regard to employee commitment and customer loyalty:
– an employee commitment index showing the employees’ motivation and loyalty and the extent to which they identify with PSI
– a customer loyalty index that measures the customers’ willingness to rely on PSI in the long term and to provide a reference.
research and development
PSI continuously invests in the further development of existing products, new software products and components, and the modernity of the Group-wide technology platform. The goal of these investments is to strengthen the com- petitive position by developing innovative software prod-ucts and creating new unique selling points. Functionality and modernity are pivotal factors for economic success, as are the use of Group-wide development platforms and the exchange of new functionalities within the Group.
When developing new products, PSI works closely with pilot customers. This collaboration is intended to ensure the marketability of the products right from the start. These products are then continuously evolved in follow-up projects and adapted to the development in the target markets. The resulting products form the basis for wider distribution and export.
One focus of development activities in 2020 was the ex- pansion of the Group-wide software platform to include cloud technology and an app store, with the aim of delivering platform products directly to the private clouds of Group customers or to the PSI cloud. Easy-to-use tools allow customers and consulting partners to adjust workflows and graphic user interfaces during runtime and to use both traditional PC workstations (rich clients) and web appli-cations (thin clients) from a single application. PSI has established a Group-wide development community and de-veloped a modern software platform that will form the basis
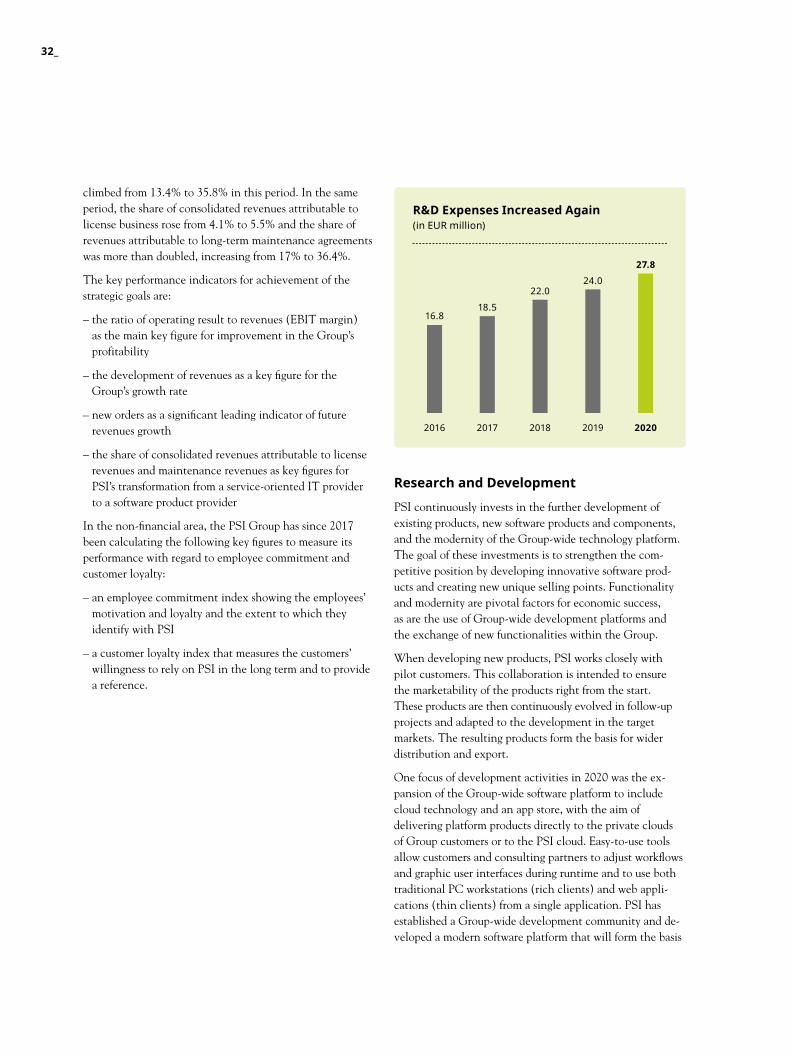
r&d expenses increased again(in EUR million)
2016 2017 2018 2019 2020
16.818.5
22.024.0
27.8
32_
for all products in the medium term. All relevant products in the Production Management segment and a third of the Energy Management products already run on the platform. The transition for additional products began in 2020 as part of pilot projects. Reusing the same software modules in the Group and standardizing software tools and pro- gramming language for all employees worldwide improves the conditions for further export growth and also reduces development costs.
In 2020, the PSI Group’s research and development expenses (costs recognized directly as expenses and capital- ized software development costs) amounted to EUR 27.8 million, up 15.8% from EUR 24.0 million in the previous year. This amount did not include any relevant purchased services.
Development work in 2020 focused on:
– the new version 4.8 of the PSIcontrol grid control system with enhanced functions for troubleshooting analysis and improved web integration.
– expanding the network status forecasting and optimization software PSIsaso/DSO to include components for imple-menting statutory requirements on Redispatch 2.0
– expanding the AI-based depot and charging management system for electric buses to include an open interface for the intelligent exchange of data
– expanding the PSIgassuite to include functions to opti- mize the feed-in of hydrogen into the existing gas trans-port network
– expanding the warehouse management software PSIwms to include an additional software-as-a-service option (SaaS) with app store integration and cloud-based provision
– expanding the metals production software PSImetals to include a new service platform for business process model- ing and communication
– ongoing further development of the PSI software platform and its rollout in additional products. In particular, further development relates to creating a cloud-based application platform and an app store and ensuring that business process and user interfaces can be easily modified using graphic tools
In addition, PSI has also been involved in state-subsidized research projects for fundamental technology development for many years.
This research focuses on projects related to successfully implementing the energy transition and integrating an increasing share of energy from renewable sources. This includes the development of smart grid technologies, intelligent integration of electric mobility in municipal distribution grids, grid restoration taking account of future generation structures, marketing of energy flexibilities of industrial consumers, and mathematical methods for the simulation of power grids taking account of future inte- grated energy scenarios.
Another focus of PSI’s research is projects dedicated to im-plementing the future-oriented Industry 4.0 project initiated by the German federal government. This includes develop- ing platforms for creating adaptable production systems, implementing autonomous transport and logistics concepts and optimizing series production through industrial artificial intelligence.
The knowledge gained in the projects is used in accordance with the cooperation or consortium agreements concluded between the parties involved in the respective research association. The subsidies cover around 40% to 50% of the personnel expenses and operating expenses incurred for these research projects in the PSI Group. In the 2020 financial year, the PSI Group received state subsidies totaling EUR 2.2 million.
PSIAnnual Report
2020
_33Consolidated Management Report

eConomiC reportbusiness performance and general Conditions
global steel market sees production decrease slightlyFor a focused software provider like PSI, the economic development in its key target sectors is particularly impor- tant. According to the World Steel Association, the global steel market, in which PSI is one of the main software suppliers, recorded a 0.9% decrease in global crude steel production in 2020 after growth of 3.4% in the previous year. Declines of 11.8% in the EU and 17.2% in the USA were offset by increases of 2.6% in Russia and 5.2% in China. In this environment, PSI improved on the previous year’s new orders for steel software, partly due to orders from China, Russia and the USA. Against the backdrop of low raw material prices, PSI’s Gas Grids and Pipelines division saw reduced demand on account of contract awards shifting to Russia.
In the Electrical Energy division, the positive trend of the previous years continued with another year-on-year increase in new orders. This was particularly attributable to demand for software for intelligent electricity grid management in Germany, which increased as a result of the growing share of renewable energy in the German energy mix and the expansion of charging infrastructure for electric vehicles.
energy segment boosts revenues, stable earnings in the production segmentThanks primarily to stable earnings in production manage-ment and revenues growth in energy management, PSI limited the negative impact of the COVID-19 pandemic. Revenues declined by 3.3%, with the operating result falling by 13.4%. At EUR 229 million, the Group’s new orders were 3% lower than the previous year’s level of EUR 236 million. The order backlog at the end of the year was up 4.9% year-on-year at EUR 149 million.
international presence and locations in europe and Worldwide
psi locations: Austria, Bahrain, Belgium, Brazil, China, Denmark, Germany, India, Japan, Malaysia, Netherlands, Oman, Poland, Russia, Sweden, Switzerland, Thailand, United Kingdom, USA
new orders and revenues by region (in EUR million)
New orders Revenues
Germany Middle East
3.3
1.9
North and South America Western Europe
Russia and Eastern Europe
China, Southeast Asia, Pacific
25.1
12.0
35.4
33.7 139.8
132.2
17.3
22.010.6
13.1
34_
overall assessment of the business performancePSI achieved its 2020 target of only a slight decline in new orders and revenues, with new orders decreasing by 3% to EUR 229 million and revenues by 3.3% to EUR 217.8 milli-on. The operating result fell by 13.4% to EUR 14.9 million, less than the 20% drop expected. As a result of this stronger earnings downturn, the EBIT margin decreased from 7.6% in the previous year to 6.8%. The share of total revenues attributable to license business declined from 8.3% to 5.5% due to lower business with new customers, while that of maintenance business rose from 33.5% to 36.4% thanks to very stable business with existing customers. A significant increase in revenues in Energy Management – particularly with electricity grids – was accompanied by stable earnings performance in Production Management. Business was stable chiefly in the industrialized countries of Northern and Western Europe, with North America enjoying growth and Southeast Asia and Russia seeing downturns. Overall, the PSI Group was able to limit the negative impact of the COVID-19 pandemic in 2020.
In the Production Management segment, PSI Poland increased new orders, revenues and earnings, whereas Metals Production, Automotive & Industry and Logistics were affected by the pandemic in the spring. In the energy market, the Electrical Energy division increased its new orders and revenues whereas earnings were down slightly. New orders and the earnings contribution in the Gas Grids and Pipelines division declined as a result of low prices for energy commodities.
In public transport business, demand for software for electric bus depots remained high and new orders picked up, whereas revenues and earnings declined against the previous year.
Effective July 1, 2020, PSI took over Prognos Energy GmbH effective, a software provider for precise forecasting of feed-in from wind energy and photovoltaics. The Swiss grid planning software specialist NEPLAN AG was acquired with effect from October 29, 2020. Both companies will help further expand the company’s market position in the area of power grid software.
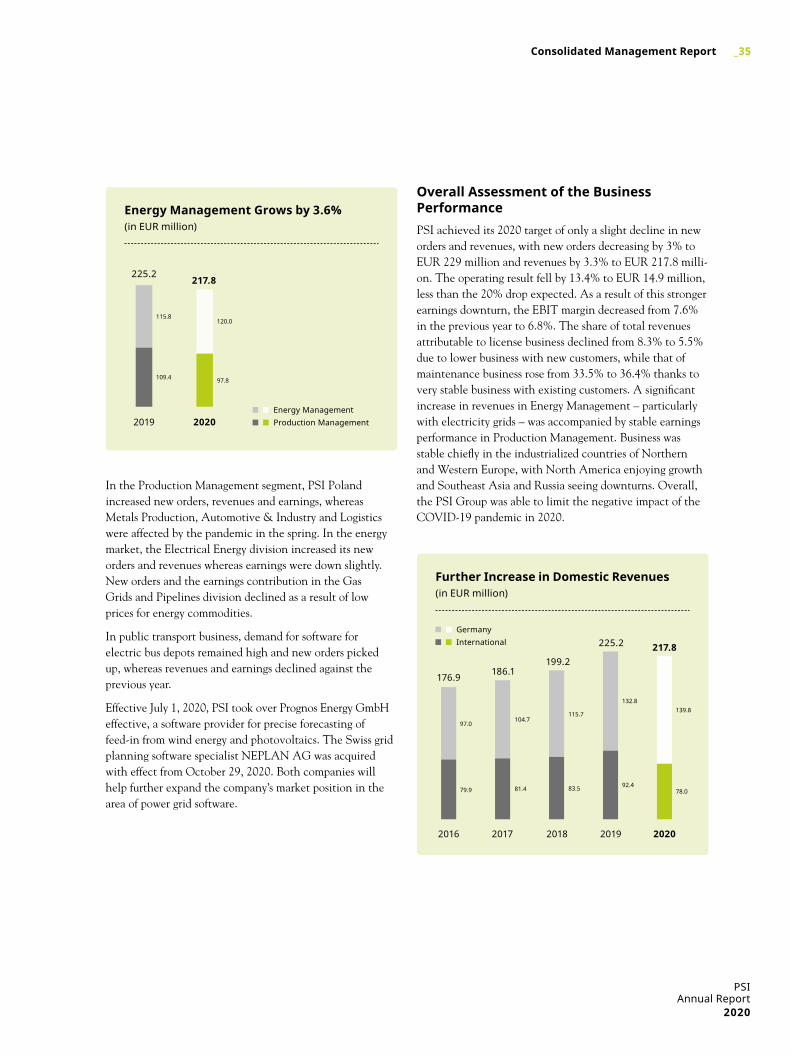
further increase in domestic revenues(in EUR million)
2020
217.8
78.0
139.8
2016
176.9
79.9
97.0
2017
186.1
81.4
104.7
2018 2019
199.2
225.2
83.5 92.4
115.7
132.8
Germany International
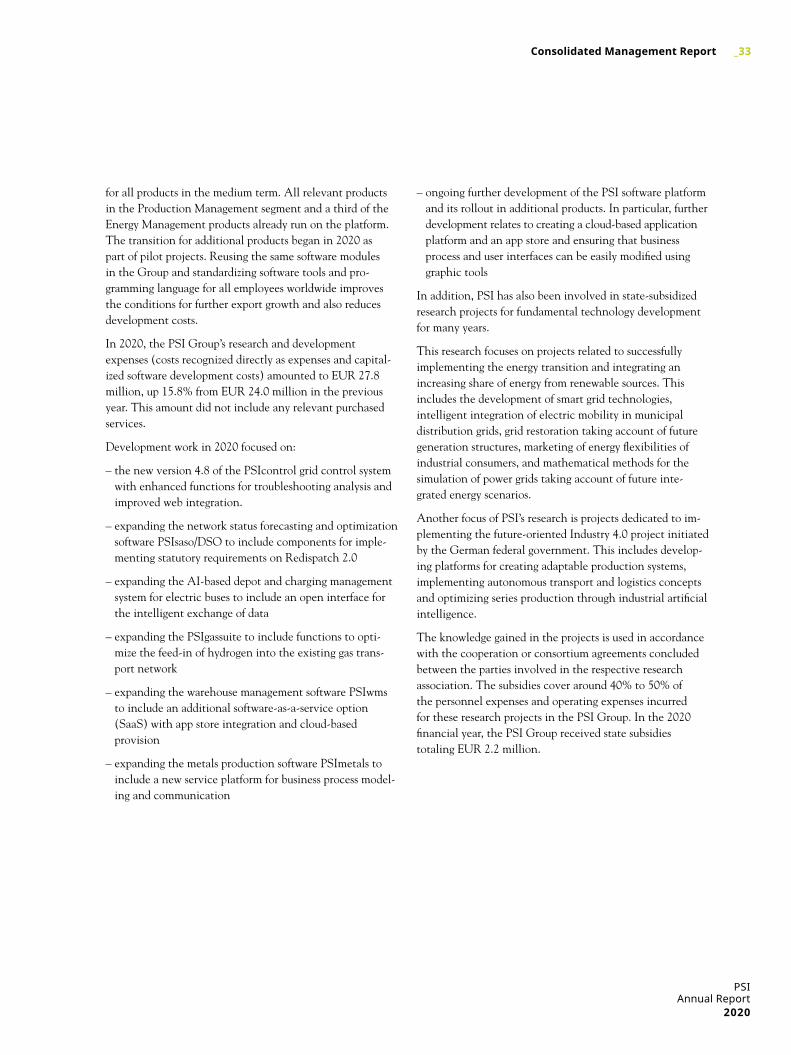
115.8120.0
109.4 97.8
energy management grows by 3.6%(in EUR million)
2019 2020
225.2217.8
Energy Management Production Management
PSIAnnual Report
2020
_35Consolidated Management Report
result of operationsConsolidated revenues down 3.3% on previous yearConsolidated revenues amounted to EUR 217.8 million in 2020, down 3.3% on the previous year’s figure of EUR 225.2 million. Energy Management generated revenue growth of 3.6% as against the previous year, while Production Management saw revenues decline by 10.6%. Revenues per employee, based on the average number of people employed in the Group including countries with lower labor costs, decreased from EUR 115,000 in the previous year to almost EUR 109,000.
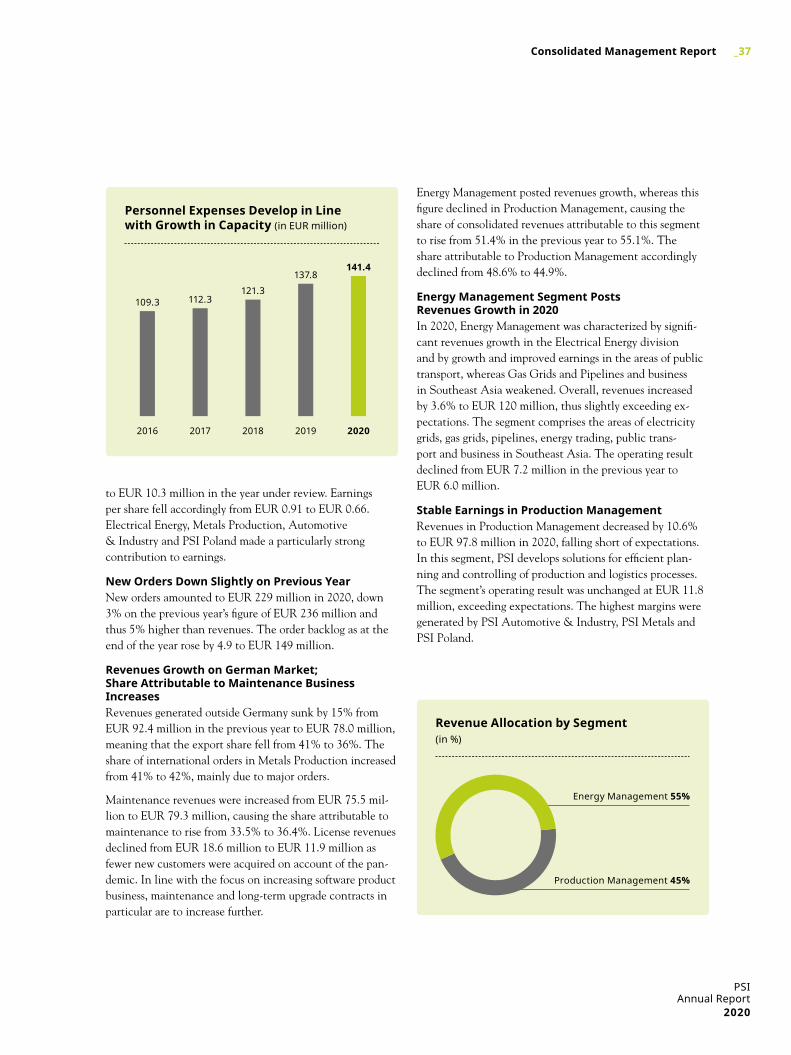
lower share of purchased services and higher personnel expensesExpenses for purchased goods and services declined by EUR 2.5 million to EUR 29.7 million. Expenses for project- related procurement of hardware and licenses decreased by EUR 0.7 million, while expenses for purchased services were down EUR 1.9 million. At EUR 141.4 million, personnel expenses were up 2.6% year-on-year.
decline in operating result and group net resultAt EUR 14.9 million, the Group’s operating result was 13.1% lower than the previous year’s EUR 17.2 million. The Group net result diminished from EUR 14.3 million
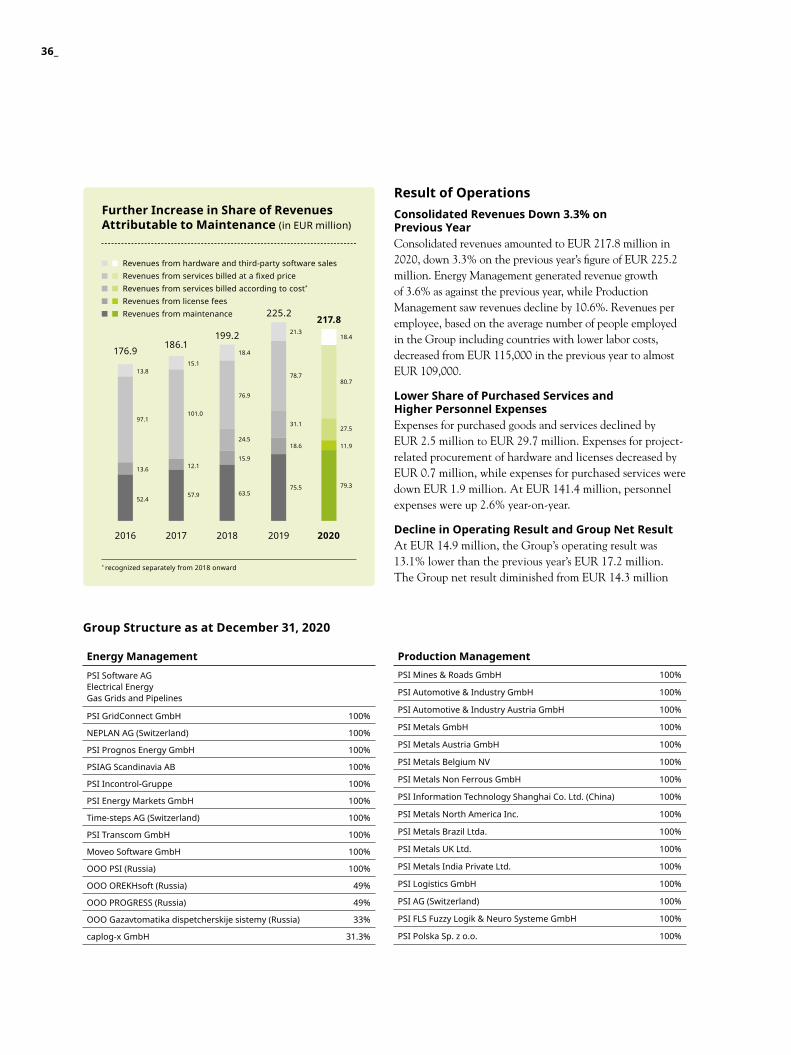
further increase in share of revenues attributable to maintenance (in EUR million)
Revenues from hardware and third-party software sales Revenues from services billed at a fixed price Revenues from services billed according to cost*
Revenues from license fees Revenues from maintenance
* recognized separately from 2018 onward
27.5
11.9
13.8
97.1
13.6
52.4
2016
176.915.1
101.0
12.1
57.9
2017
186.118.4
18.421.3
76.9
78.780.7
24.5
31.1
15.9
18.6
63.575.5 79.3
2018 2019 2020
199.2
225.2217.8
energy management
PSI Software AG Electrical EnergyGas Grids and Pipelines
PSI GridConnect GmbH 100%
NEPLAN AG (Switzerland) 100%
PSI Prognos Energy GmbH 100%
PSIAG Scandinavia AB 100%
PSI Incontrol-Gruppe 100%
PSI Energy Markets GmbH 100%
Time-steps AG (Switzerland) 100%
PSI Transcom GmbH 100%
Moveo Software GmbH 100%
OOO PSI (Russia) 100%
OOO OREKHsoft (Russia) 49%
OOO PROGRESS (Russia) 49%
OOO Gazavtomatika dispetcherskije sistemy (Russia) 33%
caplog-x GmbH 31.3%
production managementPSI Mines & Roads GmbH 100%
PSI Automotive & Industry GmbH 100%
PSI Automotive & Industry Austria GmbH 100%
PSI Metals GmbH 100%
PSI Metals Austria GmbH 100%
PSI Metals Belgium NV 100%
PSI Metals Non Ferrous GmbH 100%
PSI Information Technology Shanghai Co. Ltd. (China) 100%
PSI Metals North America Inc. 100%
PSI Metals Brazil Ltda. 100%
PSI Metals UK Ltd. 100%
PSI Metals India Private Ltd. 100%
PSI Logistics GmbH 100%
PSI AG (Switzerland) 100%
PSI FLS Fuzzy Logik & Neuro Systeme GmbH 100%
PSI Polska Sp. z o.o. 100%
group structure as at december 31, 2020
36_
to EUR 10.3 million in the year under review. Earnings per share fell accordingly from EUR 0.91 to EUR 0.66. Electrical Energy, Metals Production, Automotive & Industry and PSI Poland made a particularly strong contribution to earnings.
new orders down slightly on previous yearNew orders amounted to EUR 229 million in 2020, down 3% on the previous year’s figure of EUR 236 million and thus 5% higher than revenues. The order backlog as at the end of the year rose by 4.9 to EUR 149 million.
revenues growth on german market; share attributable to maintenance business increasesRevenues generated outside Germany sunk by 15% from EUR 92.4 million in the previous year to EUR 78.0 million, meaning that the export share fell from 41% to 36%. The share of international orders in Metals Production increased from 41% to 42%, mainly due to major orders.
Maintenance revenues were increased from EUR 75.5 mil-lion to EUR 79.3 million, causing the share attributable to maintenance to rise from 33.5% to 36.4%. License revenues declined from EUR 18.6 million to EUR 11.9 million as fewer new customers were acquired on account of the pan-demic. In line with the focus on increasing software product business, maintenance and long-term upgrade contracts in particular are to increase further.
Energy Management posted revenues growth, whereas this figure declined in Production Management, causing the share of consolidated revenues attributable to this segment to rise from 51.4% in the previous year to 55.1%. The share attributable to Production Management accordingly declined from 48.6% to 44.9%.
energy management segment posts revenues growth in 2020In 2020, Energy Management was characterized by signifi- cant revenues growth in the Electrical Energy division and by growth and improved earnings in the areas of public transport, whereas Gas Grids and Pipelines and business in Southeast Asia weakened. Overall, revenues increased by 3.6% to EUR 120 million, thus slightly exceeding ex- pectations. The segment comprises the areas of electricity grids, gas grids, pipelines, energy trading, public trans-port and business in Southeast Asia. The operating result declined from EUR 7.2 million in the previous year to EUR 6.0 million.
stable earnings in production managementRevenues in Production Management decreased by 10.6% to EUR 97.8 million in 2020, falling short of expectations. In this segment, PSI develops solutions for efficient plan-ning and controlling of production and logistics processes. The segment’s operating result was unchanged at EUR 11.8 million, exceeding expectations. The highest margins were generated by PSI Automotive & Industry, PSI Metals and PSI Poland.
Energy Management 55%
revenue allocation by segment(in %)
Production Management 45%
personnel expenses develop in line with growth in Capacity (in EUR million)
2016 2017 2018 2019 2020
109.3 112.3121.3
137.8141.4
PSIAnnual Report
2020
_37Consolidated Management Report
financial position
PSI’s monthly liquidity planning and the measures derived on this basis ensure that the financial requirements for operating business and investments are covered. Risk Management prepares a rolling monthly forecast that covers all companies and has a planning horizon of twelve months. This minimizes taking up bank loans by the individual Group companies and optimizes net finance costs. Current financial liabilities fell from EUR 1.1 million to EUR 0.1 million in 2020.
financing from operating business as far as possiblePSI’s investing activities are focused on further develop- ment of its products on the basis of the Group-wide software platform and international expansion of its business, both of which are intended to be financed from operating busi- ness as far as possible. With regard to both international- ization and the development of new products and functio-nalities, PSI focuses on collaboration with pilot customers and partners.
On December 31, 2020, PSI had guarantee and cash credit facilities totaling EUR 106.4 million for financing its operating business. In the previous year, guarantee and cash credit facilities had amounted to EUR 109.0 million. Utilization related entirely to the guarantee credit facilities and increased from EUR 44.4 million in the previous year to EUR 46.4 million as at the end of the reporting period. In the 2020 financial year, the Group was able to meet its payment obligations at all times. The Group has internal ratings from its principal banks that roughly correspond to the rating categories between BBB+ and BBB.
Cash flow from Operating Activities Down on previous yearCash flow from operating activities improved from EUR 12.5 million in the previous year to EUR 24.8 million. It was mainly influenced by year-on-year changes to working capital.
Cash flow from investing activities declined from EUR –8.7 million to EUR –13.4 million, shaped chiefly by the acquisition of NEPLAN AG.
Cash flow from financing activities improved from EUR –10.2 million to EUR –7.9 million, predominantly as a result of the lower dividend payment.
Cash and cash equivalents at the end of the year rose from EUR 38.7 million to EUR 40.5 million.
net asset situationasset structure: increase in goodwillIn 2020, the PSI Group invested a total of EUR 5.8 mil- lion in intangible assets and property, plant and equipment. The investments primarily related to intangible assets and property, plant and equipment acquired from third parties. In the previous year, investments had amounted to EUR 11.2 million and were significantly influenced by the acquisition of BTC Smart Grid.
The carrying amount of goodwill increased from EUR 54.9 million to EUR 60.8 million due to the acquisition of rognos Energy GmbH and NEPLAN AG.
structure of the balance sheet: equity ratio increases to 38.7%The PSI Group’s total assets rose from EUR 248.8 million to EUR 259.4 million in 2020.
On the assets side, non-current assets increased from EUR 112.5 million to EUR 124.8 million. Current assets declined slightly from EUR 136.3 million to EUR 134.6 million. Within this category, cash and cash equivalents increased by EUR 1.8 million, while trade receivables were EUR 9.3 million lower and receivables from long-term development contracts rose by EUR 7.0 million.
On the equity and liabilities side, current liabilities saw a slight decrease from EUR 76.3 million to EUR 74.6 mil- lion. Non-current liabilities rose from EUR 78.0 million to EUR 84.4 million, driven primarily by IFRS 16 effects. Equity increased from EUR 94.5 million to EUR 100.3 million. In line with this, the equity ratio rose from 38.0% to 38.7%.
38_
overall assessment of net assets, financial position and results of operations
The Group’s net assets deteriorated in the 2020 financial year compared to the previous year, whereas its financial position improved and results of operations were largely unchanged. There were particularly significant declines in the operating result and the Group net result, whereas cash flow from operating activities and the liquidity posi- tion improved. Overall, the Group still has the financial prerequisites to finance organic growth and selective acquisitions.
statutory disClosuresdisclosures in accordance with section 315a (1) of the german Commercial Code (hgb)
As at December 31, 2020, the share capital of PSI Software AG amounted to EUR 40,185,256.96 and was divided into 15,697,366 no-par-value shares with an accounting par value of EUR 2.56. Each share confers the right to one vote. There are no different classes of shares. The shareholders exercise their voting rights at the Annual General Meeting in accordance with the statutory requirements and the Articles of Association. There may be statutory restrictions on voting rights in accordance with section 136 of the German Stock Corporation Act (AktG) or, to the extent that the Company holds treasury shares, in accordance with section 71b AktG. In the second half of 2019, PSI Software AG issued a total of 18,994 shares in PSI Software AG to employees as staff shares. A contractual prohibition on the sale of these shares until December 2, 2021 was agreed. There are no further restrictions with regard to voting rights or transfers of shares.
In the 2020 financial year, Mr. Norman Rentrop, Germany, held a 20.65% interest in PSI Software AG, held via Invest- mentaktiengesellschaft für langfristige Investoren TGV, which he controls. According to the notification in accord- ance with section 27a (1) of the German Securities Trading Act (WpHG) dated September 7, 2017, the investment in PSI Software AG serves the long-term objective of generat- ing trading profits.
In the 2020 financial year, Westenergie AG (formerly innogy SE), Essen, Germany, held a 17.77% interest in PSI Software AG. According to PSI Software AG’s knowledge, Westenergie AG is a company in which E.ON SE, Essen, has a majority shareholding. Westenergie AG is a major distribution grid operator and an important customer of PSI Software AG in the Energy Management segment. Accord- ing to the notification from E.ON SE in accordance with section 43 (1) sentence 3 of the German Securities Trading Act (WpHG) dated October 22, 2019, the investment in PSI Software AG is a direct consequence of the acquisition of the majority interest in the former innogy SE and thus serves the purpose of implementing strategic goals.
PSI Software AG has not issued any shares with special rights.
PSIAnnual Report
2020
_39Consolidated Management Report
There are no voting right controls at PSI Software AG in relation to employee shares if employees have an invest-ment in the Company’s capital and do not exercise control rights directly.
In accordance with Article 8 (1) of the Articles of Associa- tion, members of the Executive Board are appointed and dismissed by the Supervisory Board, which also determines the number of members of the Executive Board. Sections 84 et seq. AktG also apply to the appointment and dismissal of Executive Board members.
In accordance with Article 11 of the Articles of Associa-tion, the Supervisory Board is authorized to make amend-ments and additions to the Articles of Association that affect the wording only. Other than this, the Articles of Association are resolved by the Annual General Meet- ing with a simple majority of the votes cast and a simple majority of the share capital represented when the resolu-tion is adopted, as stipulated in Article 19 of the Articles of Association. This applies except in cases where the law requires resolutions to be adopted with a majority of at least three-quarters of the share capital represented when the resolution is adopted.
PSI Software AG has authorized capital of EUR 8.0 million in place until May 15, 2024 that was created by resolution of the Annual General Meeting on May 16, 2019. This re-solution authorizes the Executive Board, with the approval of the Supervisory Board and without requiring a further resolution by the Annual General Meeting, to increase the Company’s share capital in exchange for cash or contribu-tions in kind. This can be utilized for any purpose permitted by law. The Company has not yet exercised this authoriza-tion to date.
PSI Software AG also has contingent capital of EUR 8.0 million in place until May 15, 2022. This serves the purpose of servicing convertible and warrant-linked bonds and profit-sharing certificates. The Company was authorized to issue this contingent capital in a total nominal amount of up to EUR 100.0 million by the Annual General Meeting on May 16, 2017. The Company has not yet exercised this authorization to date.
The Executive Board of PSI Software AG was authorized by the Annual General Meeting on June 9, 2020 to acquire treasury shares in the Company in a volume of up to 10% of the share capital until the end of June 30, 2023. To-gether with treasury shares acquired for other reasons that
are owned by or attributable to the Company, the shares acquired on the basis of this authorization must not exceed 10% of the Company’s share capital at any time. Treasury shares may be acquired only if the Company was able to establish a reserve in the amount of the expenses for the acquisition without reducing the share capital or any reserve to be established in accordance with the law or the Articles of Association that must not be used for payments to the shareholders. The authorization must not be used for the purpose of trading in treasury shares. In keeping with the principle of equal treatment, the Executive Board shall choose to acquire the shares either on the stock market or by way of a public purchase offer to all shareholders of the company. The authorization may be exercised one or more times in full or in partial amounts.
There are no significant agreements of the Company that are subject to the condition of a change of control following a takeover bid.
40_
risk reportThe PSI Group’s risk policy has the aim of securing the Group’s success in the long term. This requires effective identification and analysis of business risks in order to eliminate or limit them by means of suitable control measures.
To this end, PSI has set up a risk management system that is used by the management of the Company as a tool for the early recognition and prevention of risks. This particularly applies to risks whose effects could jeopardize the continued existence of the PSI Group as a going concern. The risk management tasks comprise risk identification, risk assess-ment, risk communication, risk management and control, risk documentation and risk system monitoring. The Company’s risk management system is developed further on an ongoing basis and the knowledge gained from the management system is integrated in corporate planning.
description of the key features of the internal Control and risk management system with regard to the group accounting process (section 315 (4) hgb)
The PSI Group’s risk management system covers all organi- zational regulations and measures for identifying and dealing with the risks and opportunities of its business activities.
The Executive Board has overall responsibility for the inter-nal control and risk management system with regard to the accounting processes of the consolidated companies and the accounting process in the Group. The Accounting depart-ment prepares the consolidated financial statements for the PSI Group based on the recognized separate financial state-ments of the companies and reports consolidated financial information to the Executive Board. The separate financial statements are prepared on the basis of a Group-wide ac-counting manual. All companies and divisions included in the consolidated financial statements are integrated by way of a clearly defined management and reporting organization.
With regard to the accounting processes of the consolidated companies and the group accounting process, we consider features of the internal control and risk management system to be material if they could have a significant impact on the group accounting and the overall view presented in the consolidated financial statements including the Group management report. This particularly includes the following elements:
– identification of key risk areas and control areas relevant to the Group-wide accounting process
– controls for monitoring the Group-wide accounting pro-cess and its results at Executive Board level and division level
– preventive control measures in the Finance and Accoun-ting departments of the Group and the divisions and in operational, performance-related business processes that generate significant information for the preparation of the consolidated financial statements and the Group manage- ment report, including a separation of functions and predefined approval processes in relevant areas
– measures that ensure proper IT-based processing of facts and data relating to Group accounting
– In addition, the Group has implemented a risk manage-ment system with regard to the accounting process that includes measures to identify and assess significant risks and corresponding measures to limit risks in order to ensure the correctness of the consolidated financial statements
PSI has identified the following key risks and integrated them in its early warning system:
– market: too low level of new orders/order backlog
– employees: lack of availability of the necessary qualifications
– liquidity: bad payment terms and insufficient credit facilities
– costs and revenues: deviation from planning figures, particularly in project implementation or development
When assessing the risks, the individual categories are regularly regarded at business unit level. Depending on the risk assessment and the importance of the business unit for the Group, the Executive Board intensifies the dialog with the management of the business unit and resolves specific measures as required.
PSIAnnual Report
2020
_41Consolidated Management Report
In the 2020 financial year, the risks were classified as not jeopardizing the Group’s continued existence as a going concern, neither individually nor in combination.
The risk management guideline governs the areas of:
– risk strategy: explicit principles for minimizing the main risks and general risk management principles
– risk management organization: responsibilities of the management levels and controllers involved
– risk identification, control and monitoring: tools for identifying risks and monitoring the key figures used
– risk management system: application of the Group-wide commercial information system and a Group-wide issue tracking solution
These provisions are supplemented by a guideline on risk management in projects. This governs the implementa- tion of risk management in the project, the identification, recording, analysis and assessment of risks and the planning, specification and monitoring of measures to minimize risks in the context of projects. This particularly relates to measures to limit prefinancing in projects.
The commercial information system has an integrated management information system (MIS) and serves as a uni- form information and controlling tool for all levels of the Group. Regular MIS reports, which are generally prepared on a monthly basis, provide key figures from the divisions as defined in the guideline system:
– development of the order situation and capacity utilization
– liquidity planning
– development of net asset situation and financial position
– forecast of key economic figures
– sales forecast and market development
– project controlling and contract management
analysis of opportunities and risks
The PSI Group is exposed to a number of risks, including normal risks from its business operations, general econo-mic risks, tax and financial risks, and risks that could arise from the shareholder structure. In the 2020 financial year, the risk profile changed mainly as a result of the economic repercussions of the COVID-19 pandemic in Germany and Europe. There were no substantial changes in the risk profile with regard to the shareholder structure or the regulatory environment in the energy sector.
As a result of the spread of the new coronavirus SARS-CoV-2 (COVID-19), there is still a risk of an ongoing economic slowdown due to restrictions imposed on eco-nomic activity as a consequence of measures to control infections. PSI has a high order backlog and, as a software producer with a large proportion of internally generated value added, would hardly be affected by a disruption of global supply chains. However, in the first half of 2021 in particular, there is a risk that customers in the industrial and industry-associated logistics sectors may postpone contract awards.
opportunities and risks for the segmentsIn Energy Management, PSI again boosted revenues in 2020, while new orders and earnings remained lower than in previous years. Whereas the areas of electricity grids and transport systems saw new orders increase, performance in gas grids and business in Southeast Asia was weaker. This increased the dependency on investments in electric- ity grids and on the German market. In the short term, there could be a decline in investments in electrical grids in Germany due to regulatory uncertainties, particularly with regard to the regulation of fees for electricity and gas grids, whereas the planned measures under the German federal government’s climate protection package present an opportunity for further increases in demand. If raw material prices remain low, this would present a risk of lower demand in export business in Gas Grids and Pipelines, whereas in Germany there are opportunities arising from the planned development of hydrogen infrastructure. In the long term, the transnational effects of the expansion of renewable energy, continuing digitalization, integrated energy, electric mobility and the expansion of storage technologies will result in additional business potential, as investments will be required for these purposes. The expansion of interna- tional business may result in an increased need for prefinanc- ing and guarantee credit.
42_
By their nature, major export projects involve implemen-tation risks in relation to local partners and their training, differing performance interpretations and standards and sometimes also changes in customer policy. The existing international partnerships extend the sales reach and thus increase the opportunities for sales of PSI’s products. At the same time, they also create new dependencies.
In the Transport Systems division, PSI is largely dependent on the financial situation of its predominantly public- sector clients. Over the last few years, PSI has developed unique selling points and consolidated its market position, particularly for depot management systems. As a result of the increasing deployment of electric buses in local public transport, this means there is growth potential in the shape of new functions such as range management and charging management.
With the PSI Incontrol Group, PSI has had direct access to the electrical energy markets in Southeast Asia and the Middle East since 2009. PSI has access to inexpensive hardware and integration services. As a result of the high share of system integration business and the associated need to prefinance projects, business at PSI Incontrol also entails risks. In 2020, capacity in Southeast Asia was adjusted to account for lower demand, while further progress continued to be made in developing the software business, which is less strongly impacted than system integration business by fluctuations in the economic cycle.
In Production Management, PSI reported a significant decline in revenues and slightly weaker new orders in 2020, but was able to maintain earnings on par with the previous year. Automotive suffered as a result of disruption to supply chains and plant closures in the spring, whereas Metal Production offset weak performance in Germany and Europe chiefly thanks to major orders in North America. Even after demand picked up again, the global steel market is still facing a risk that investments may be postponed as a result of economic uncertainty and possible import duties. There are opportunities in the event of international trade agree-ments, as well as continuing opportunities due to growing demand from large metal producers for group rollouts of PSI solutions. In some countries of East Asia, the risk remains as a result of a not completely developed awareness for quality and trademark protection.
The Logistics and Production Control/ERP divisions are particularly affected by fluctuations in the economic climate
on account of their market position and customer struc-ture. For this reason, there is a risk that new orders may be too low in the event of a weak domestic economy. In the Logistics division, PSI is therefore primarily focusing on solutions for logistics service providers, internet companies and the automotive industry.
Continued good demand in the Logistics division could be negatively impacted by a deterioration in the consumer climate, while growth in online mail order business and the increasing complexity of industrial logistics flows will give rise to further growth potential for PSI’s logistics solutions in the short and medium term. The production software subsidiary PSI Automotive & Industry is increasingly focus- ing on the growth trend Industry 4.0 and the production of electric vehicles. This creates growth potential due to the establishment of additional electric vehicle production plants, but also results in implementation risks, particularly in export business.
opportunities and risks of internationalizationThe share of international activities decreased in 2020, causing an increase in dependency on the domestic market. At the same time, the export share of 36.0% continues to limit dependency on the domestic economy and presents further international growth opportunities. However, the international expansion will give rise to new risks from the integration of new subsidiaries into the Group and depend- ency on international partners, exchange rates and legal systems. On the other hand, opportunities and risks will be more broadly diversified as a result of the further expansion of international activities. Due to the low share of revenues in the United Kingdom, Brexit does not pose any relevant risk to the PSI Group.
opportunities and risks from new products and technologiesIn order to strengthen its competitive position, PSI con- stantly invests in new product versions and product en-hancements. At the same time, PSI has brought products and components together on a joint platform as part of a Group-wide convergence process to enable it to benefit from high quantities. The platform was expanded in 2020 to include multi-cloud technology and an app store to further automate and speed up the supply of PSI products in the future. The future income and liquidity development of the PSI Group will largely depend on the market success of its new products and on its command of newly developed technologies.
PSIAnnual Report
2020
_43Consolidated Management Report
risks from the shareholder structureIf attendance of the Annual General Meeting is consi-derably below 100%, there is a risk that one of the major shareholders of PSI Software AG may exercise decisive influence on the Annual General Meeting and use this for its own interests, which may differ from the Company’s aims. The same risk arises if there is high attendance at the Annual General Meeting but major shareholders coordi-nate their voting. In addition, an acquisition of shares with negative tax effects cannot be ruled out.
tax risksPSI cannot rule out the risk that external audits by the taxation authorities may lead to subsequent tax claims for which the Company has not recognized provisions or that result in an unforeseen liquidity requirement. The tax audit for the years 2014 to 2016 is still underway.
financial risksTo finance its operating business, PSI uses instruments that chiefly consist of trade receivables, cash and cash equiva-lents, liabilities to banks and guarantees. The main risks in this context are credit risks, liquidity risks and fair value risks. Credit risks and liquidity risks are managed by using credit facilities and monitoring procedures. There is no con-centration of credit risk for PSI with individual counterpar-ties or with a group of counterparties. The Group endeavors to ensure that it has sufficient liquidity and credit facilities to meet its obligations (see “Financial Position” section).
The PSI Group predominantly enters into transactions concluded in euro. In the 2020 financial year, the Group did not use any transactions to hedge currency risks.
employeesBecause PSI performs technically challenging tasks, the Group is reliant on employing suitably qualified staff. In Germany in particular, there is a risk that it may not be able to acquire a sufficient number of suitable employees due to the demographic development. PSI counters this risk with active HR marketing and measures to strengthen employee loyalty. In this way, the Company has so far succeeded in hiring, integrating and permanently retaining a sufficient number of qualified employees. The staff turnover rate is low. The remuneration structure includes performance and earnings-related components. Since the freezing of the pen-sion provisions as at the end of 2006, all future benefits have been specified, direct salary components and have been almost entirely covered by insurance policies.
future risksPSI’s strategy for the coming years is focused on the Group’s further transformation into an international software product provider, on ongoing internationali- zation and on expanding the cloud strategy. If this does not succeed as planned, there is a risk that the PSI Group may not achieve its revenues and earnings targets. In addition, PSI would then still be dependent to a large extent on the general economic develop- ment and regulatory framework in Germany.
44_
foreCastPSI started 2021 with an increased order backlog of EUR 149 million and a strengthened market position in the Electrical Energy division due to the acquisition of Prognos Energy and NEPLAN. The operating result de- clined by 13.4% as a result of the COVID-19 pandemic, risk provisioning measures and continued high expenses for research and development. With the further product migrations, pilot projects and investments in the cloud strategy, the conditions for a broader-based marketing of the new product versions to existing and new customers were also improved in 2020.
As a provider of software products for the optimization of energy and material flows at operators of energy and trans-port infrastructure and in the steel and automotive industry, PSI sees the climate debate as an opportunity and an obli-gation to contribute to the success of the climate protection measures with intelligent software products, especially after the pandemic. Specifically, this relates to the integration of growing quantities of significantly fluctuating renewable energy in the existing infrastructure, the increasing inter- connection of the electricity, heating and transport sectors (integrated energy) and the associated trend towards ex- pansion of electric mobility. As a leading provider of cross- sector grid control systems, PSI is very well positioned in this market and has increased its market share in recent years. In production management, the development of pro- duction capacity for electric vehicles and vehicle compo-nents requires investments in new manufacturing processes and software, while in local public transport investments in infrastructure and infrastructure management are needed. PSI developed new products and functions for these areas and launched them in 2019. Following the integration of the activities acquired in 2019 and 2020, PSI’s focus in the Electrical Energy division in 2021 will increasingly be on export business, as the expansion of renewable energy is giving rise to additional sales opportunities in further export regions. In the Gas Grids and Pipelines division, the importance of gas as a backup technology for the fluctuating generation from renewable energy sources increased follow- ing the decision to phase out coal power. There will also be effects from the increasing generation of hydrogen and green gas using renewable energy.
By means of the migration of further products to the new, uniform software platform and convergence of our technical base, we intend to further increase the quantities sold and expand the share of revenues attributable to licenses, up- grades and maintenance. Customers also use the PSI software platform for their own developments, modifica- tions and rollouts. This reduces risks for PSI and increases the quantities sold. We will continue to selectively expand our portfolio in order to take advantage of opportunities and increase our efficiency. In this way, we will improve the basis for enabling us to generate double-digit returns in the future.
In the Energy Management segment, we expect the positive trends for Electrical Energy to continue and domestic demand in the Gas Grids and Pipelines division to pick up again in 2021. In Production Management, we are continu- ing to invest in the future-oriented topics of Industry 4.0 and industrial artificial intelligence. We intend to improve our revenues and profitability further in the long term with the renewed product base and the digitalization of our own sales and service processes. Assuming there are no further shocks to the world economy, we are aiming to generate an operating result in excess of EUR 20 million and to increase new orders and revenues by about 5% in 2021. We are also aiming to slightly increase license and maintenance rev- enues, with our focus here being on long-term maintenance and upgrade agreements and less on licenses.
In order to achieve our goals, we will continue to invest in the unique selling points and quality of our development and runtime platform and our products.
Berlin, March 15, 2021
Dr. Harald Schrimpf Harald Fuchs
PSIAnnual Report
2020
_45Consolidated Management Report
Ever since the Company was founded in 1969, social responsibility and sustainability have been a very important issue for PSI, both in customer projects and in its internal processes. In addition to environmental and social concerns, this particularly includes the areas of employees and cus- tomers.
transparent and responsible Corporate governance
PSI follows ethical principles in its dealings with customers, shareholders, employees, partners and competitors. These principles are set out in the Code of Conduct, which is publicly accessible on the Group’s website at www.psi.de. Here, PSI commits to fair business practices and compliance with legal standards for fair working conditions, protection of natural resources, fair business conduct and protection of intellectual property.
In addition to the Code of Conduct, PSI has adopted a guideline system that governs many different aspects of sustainable and responsible corporate governance. PSI once again complied with the recommendations of the Govern-ment Commission on the German Corporate Governance Code in 2020, with a small number of exceptions that are discussed in the declaration of compliance. The declaration of compliance and the corporate government declaration are published on PSI Software AG’s website at www.psi.de/en/psi-investor-relations/corporate-governance.
sustainability in psi products and internal processes
PSI supports the 17 sustainability goals of the United Nations and its software products make a significant con- tribution to careful and sustainable use of energy, raw materials and labor in the energy industry and the prod- uction and transport sector. This way, PSI particularly contributes to the goal of sustainable energy supply, sustainable production, resilient infrastructure and sus- tainable cities. PSI also indirectly helps combat climate change, end poverty, generate sustainable economic growth and promote decent work.
PSI’s production management systems for the steel and aluminum industry incorporate functions for optimizing the
use of energy and using quantities of energy that are released during production. PSI automotive production solutions use enhanced fuzzy logic for sequence optimization in prod- uction, taking account of conflicts between various targets and thus boosting productivity by 8% to 10%.
PSI’s control systems for managing major electricity grids have been and still are continuously expanded with func-tions that enable the feed-in of renewable energy to be managed intelligently. Together with partners from the energy industry and academia, PSI is actively involved in developing the intelligent energy supply infrastructure of the future. This includes products for virtual power plants, smart microgrids and the integration of charging infra-structure for electric vehicles into the existing electricity grids. PSI’s gas management systems optimize the transfer, distribution and storage of natural gas, green gas and hydrogen. They optimize the compressor stations required for grid operation and minimize technical losses. Leak detection and location systems help reduce losses when transporting gas and fuels over long distances and avoid environmental damage.
In the field of logistics and transport, PSI has in recent years developed new solutions for dynamic control of optimized logistics networks that help reduce transport costs and emissions by up to 10%. Further functions in- clude energy optimized driving in rail transport and a depot and charging management system to optimize the dispatch of zero-emission buses. This gives customers effective support in reducing greenhouse gases and saving energy.
Due to the fact that PSI as a services company does not manufacture any physical products, the PSI business processes impact the environment and resources only in a marginal fashion. PSI works with energy from renewable sources and uses combined heat, cooling and power gen- eration at its location in Aschaffenburg. To evaluate energy flows and potential for improvement in the area of energy efficiency, in 2020 PSI carried out an energy audit in line with DIN EN 16247. PSI has participated in the Carbon Disclosure Project since 2011 and received a score of C and a Supplier Engagement Rating of B in 2020. As in previous years, PSI was again awarded the DZ Bank Seal of Quality
sustainability and Csr
46_
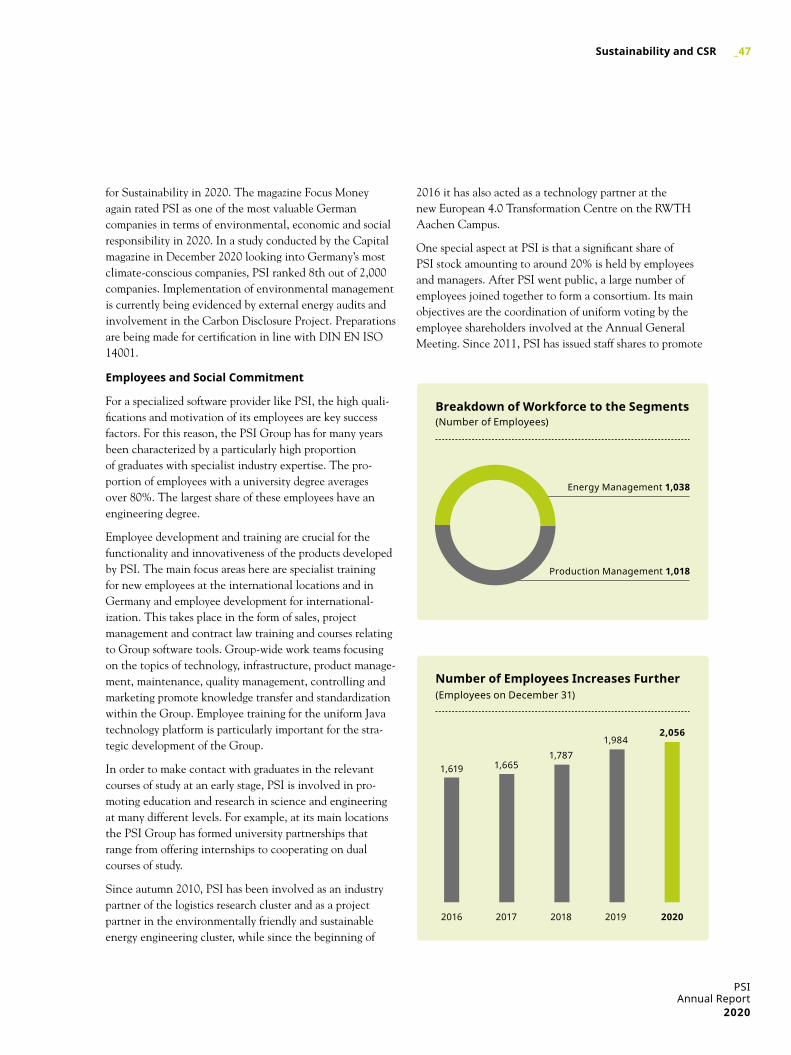
for Sustainability in 2020. The magazine Focus Money again rated PSI as one of the most valuable German companies in terms of environmental, economic and social responsibility in 2020. In a study conducted by the Capital magazine in December 2020 looking into Germany’s most climate-conscious companies, PSI ranked 8th out of 2,000 companies. Implementation of environmental management is currently being evidenced by external energy audits and involvement in the Carbon Disclosure Project. Preparations are being made for certification in line with DIN EN ISO 14001.
employees and social Commitment
For a specialized software provider like PSI, the high quali- fications and motivation of its employees are key success factors. For this reason, the PSI Group has for many years been characterized by a particularly high proportion of graduates with specialist industry expertise. The pro- portion of employees with a university degree averages over 80%. The largest share of these employees have an engineering degree.
Employee development and training are crucial for the functionality and innovativeness of the products developed by PSI. The main focus areas here are specialist training for new employees at the international locations and in Germany and employee development for international- ization. This takes place in the form of sales, project management and contract law training and courses relating to Group software tools. Group-wide work teams focusing on the topics of technology, infrastructure, product manage-ment, maintenance, quality management, controlling and marketing promote knowledge transfer and standardization within the Group. Employee training for the uniform Java technology platform is particularly important for the stra- tegic development of the Group.
In order to make contact with graduates in the relevant courses of study at an early stage, PSI is involved in pro- moting education and research in science and engineering at many different levels. For example, at its main locations the PSI Group has formed university partnerships that range from offering internships to cooperating on dual courses of study.
Since autumn 2010, PSI has been involved as an industry partner of the logistics research cluster and as a project partner in the environmentally friendly and sustainable energy engineering cluster, while since the beginning of
2016 it has also acted as a technology partner at the new European 4.0 Transformation Centre on the RWTH Aachen Campus.
One special aspect at PSI is that a significant share of PSI stock amounting to around 20% is held by employees and managers. After PSI went public, a large number of employees joined together to form a consortium. Its main objectives are the coordination of uniform voting by the employee shareholders involved at the Annual General Meeting. Since 2011, PSI has issued staff shares to promote
Energy Management 1,038
breakdown of Workforce to the segments (Number of Employees)
Production Management 1,018
number of employees increases further(Employees on December 31)
2016 2017 2018 2019 2020
1,619 1,6651,787
1,9842,056
PSIAnnual Report
2020
_47sustainability and Csr
employee participation; these shares can be acquired for this purpose on the stock market, for example.
The number of employees as at the end of the year rose by 72 to 2,056. A total of 1,038 employees were allocated to the Energy Management segment and 1,018 to Production Management.
PSI has been involved in social activities for many years. Examples include various regional initiatives to support charitable organizations based near PSI locations. In addi-tion, PSI supports team sports activities of various different employee groups by funding participation in competitions and equipment. In early 2020, PSI was ranked 16th in the telecommunications and IT sector in a large-scale survey of working conditions at 2,500 German companies conducted by the magazine Stern. In November 2020, German daily DIE WELT recognized PSI as a very attrac- tive employer.
Non-financial Statement
In an internal process, PSI assessed the non-financial topic areas of the environment, customers, employees, society, human rights and combating corruption in terms of their relevance to the Group and derived non-financial key per-formance indicators on this basis. Because PSI is a developer of specialized software solutions that does not manufacture any physical products, it is primarily employee commitment and long-term customer relationships that are key to the PSI Group’s success. In order to measure its performance with regard to these parameters, PSI has been calculating an employee commitment index and a customer loyalty index since 2017.
Employee commitment shows the employees’ motivation and loyalty and the extent to which they identify with PSI. The employee commitment index includes average employee turnover, employee satisfaction and the average sick leave rate in the Group, with targets being defined for all three criteria. In the subsequent calculation of the index based on the respective level of target achievement, employee turnover and employee satisfaction are given a higher weighting than the sick leave rate. The PSI Group achieved an employee commitment index score of 98% in 2020 after 85% in 2019 and was thus above the target range. This reflected a substantial decline in turnover, a clear increase in employee satisfaction and a moderate decrease in the sick leave rate. PSI believes that this is also a result of the hygiene policies introduced and the
expansion of remote working during the COVID-19 pandemic. For 2021, PSI is aiming for an index value of between 94% and 98%.
Long-term customer relationships form the basis for the PSI Group’s sustained positive economic performance. The customer loyalty index therefore takes account of customers’ willingness to conclude long-term maintenance and upgrade contracts and to provide a reference. Targets are defined and their achievement is measured both for the share of consolidated revenues attributable to maintenance and upgrade contracts and for the level of willingness to provide a reference. The target achievement levels calculated in this way are included in the index with equal weightings. The customer loyalty index score came to 96% in 2020, up from 86% in the previous year. This was thanks mostly to a continued rise in PSI customers’ willingness to provide a reference, but also to the increase in maintenance and upgrade revenues at the same time as a slight decrease in revenues. This development put the customer loyalty index in 2020 above the target range. For 2021, PSI is aiming for an index value of between 92% and 96%.
Berlin, March 15, 2021
Dr. Harald Schrimpf Harald Fuchs
48_

Consolidated finanCial statements (ifrs)
_49
PSIAnnual Report
2020
Consolidated financial statements
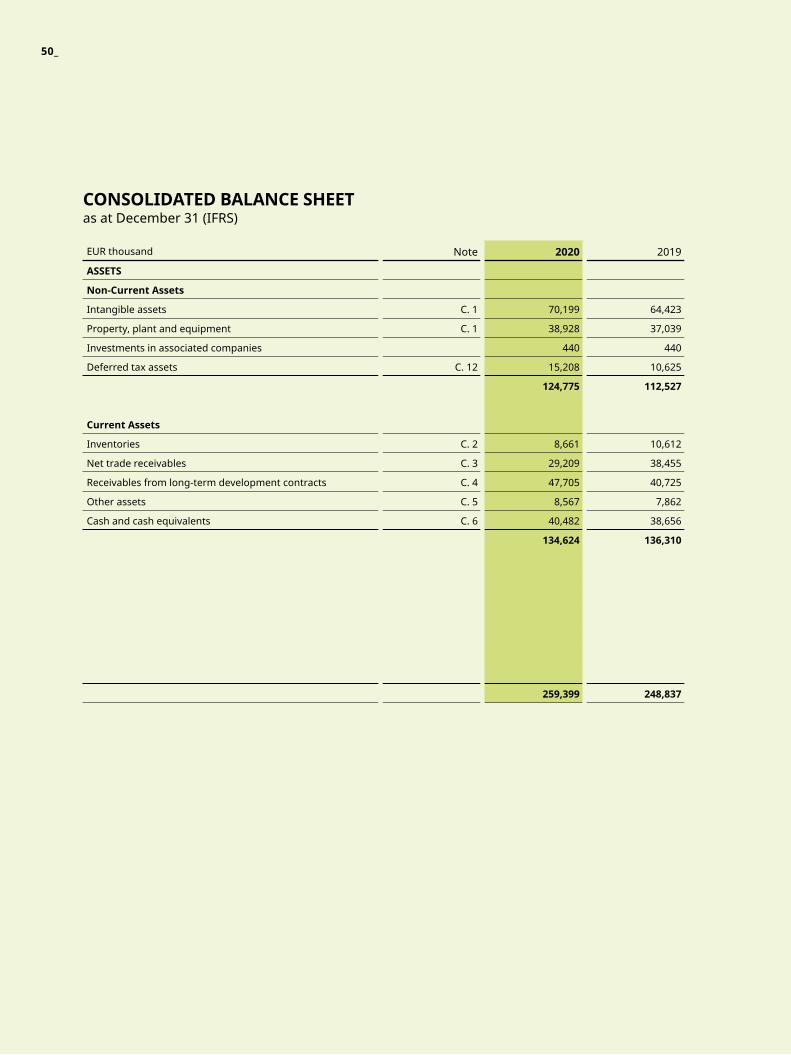
EUR thousand Note 2020 2019
assets
non-Current assets
Intangible assets C. 1 70,199 64,423
Property, plant and equipment C. 1 38,928 37,039
Investments in associated companies 440 440
Deferred tax assets C. 12 15,208 10,625
124,775 112,527
Current assets
Inventories C. 2 8,661 10,612
Net trade receivables C. 3 29,209 38,455
Receivables from long-term development contracts C. 4 47,705 40,725
Other assets C. 5 8,567 7,862
Cash and cash equivalents C. 6 40,482 38,656
134,624 136,310
259,399 248,837
Consolidated balanCe sheet as at December 31 (IFRS)
50_

EUR thousand Note 2020 2019
eQuity and liabilities
equity
Share capital C. 7 40,185 40,185
Capital reserves C. 7 35,137 35,137
Reserve for treasury shares C. 7 80 16
Other reserves C. 7 –26,033 –22,257
Unappropriated surplus C. 7 50,954 41,458
100,323 94,539
non-Current liabilities
Pension provisions and similar obligations C.8 56,416 54,737
Deferred tax liabilities C. 12 8,726 6,328
Other liabilities C. 11 2,555 1,610
Lease liabilities C. 9 19,132 16,917
Financial liabilities C. 10 168 0
86,997 79,592
Current liabilities
Trade payables 17,977 17,454
Other liabilities C. 11 34,609 33,322
Liabilities from long-term development contracts C. 4 13,930 17,212
Lease liabilities C. 9 5,498 5,606
Financial liabilities C. 10 65 1,112
72,079 74,706
259,399 248,837
PSIAnnual Report
2020
_51Consolidated Financial Statements
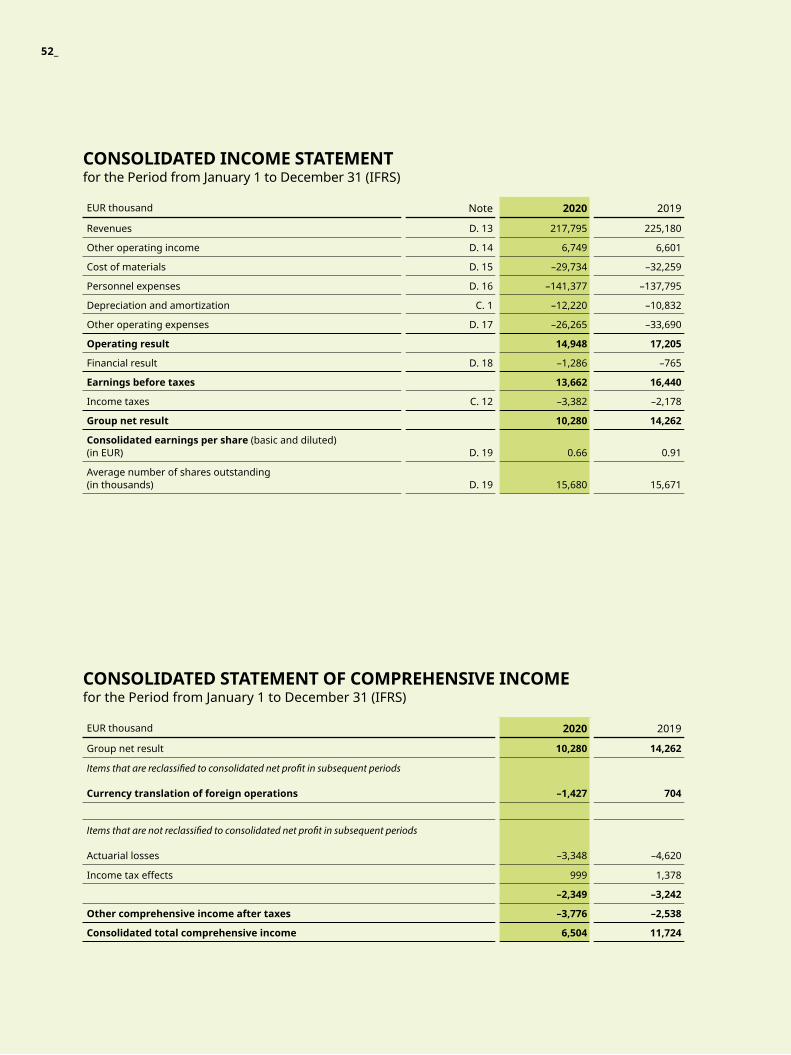
EUR thousand Note 2020 2019
Revenues D. 13 217,795 225,180
Other operating income D. 14 6,749 6,601
Cost of materials D. 15 –29,734 –32,259
Personnel expenses D. 16 –141,377 –137,795
Depreciation and amortization C. 1 –12,220 –10,832
Other operating expenses D. 17 –26,265 –33,690
operating result 14,948 17,205
Financial result D. 18 –1,286 –765
earnings before taxes 13,662 16,440
Income taxes C. 12 –3,382 –2,178
group net result 10,280 14,262
Consolidated earnings per share (basic and diluted) (in EUR)
D. 19
0.66
0.91
Average number of shares outstanding(in thousands)
D. 19
15,680
15,671
EUR thousand 2020 2019
Group net result 10,280 14,262
Items that are reclassified to consolidated net profit in subsequent periods
Currency translation of foreign operations
–1,427
704
Items that are not reclassified to consolidated net profit in subsequent periods
Actuarial losses
–3,348
–4,620
Income tax effects 999 1,378
–2,349 –3,242
other comprehensive income after taxes –3,776 –2,538
Consolidated total comprehensive income 6,504 11,724
Consolidated inCome statement for the Period from January 1 to December 31 (IFRS)
Consolidated statement of Comprehensive inCome for the Period from January 1 to December 31 (IFRS)
52_
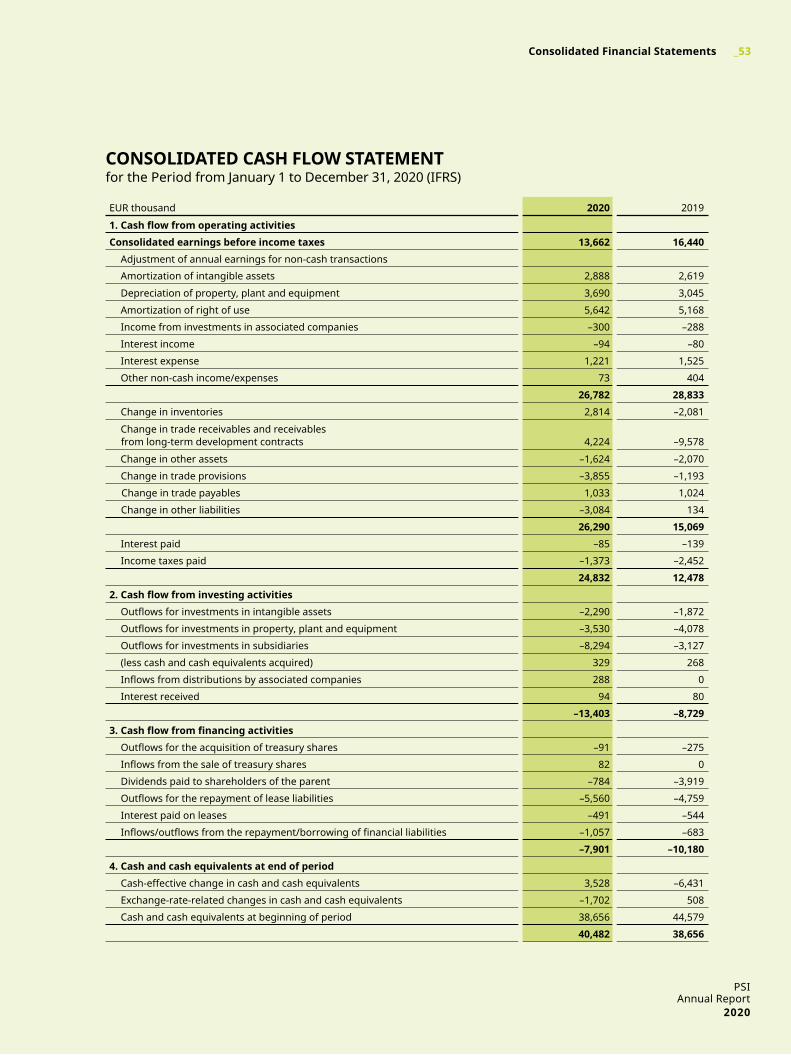
EUR thousand 2020 2019
1. Cash flow from operating activitiesConsolidated earnings before income taxes 13,662 16,440 Adjustment of annual earnings for non-cash transactions
Amortization of intangible assets 2,888 2,619
Depreciation of property, plant and equipment 3,690 3,045
Amortization of right of use 5,642 5,168
Income from investments in associated companies –300 –288
Interest income –94 –80
Interest expense 1,221 1,525
Other non-cash income/expenses 73 404
26,782 28,833 Change in inventories 2,814 –2,081
Change in trade receivables and receivables from long-term development contracts 4,224 –9,578
Change in other assets –1,624 –2,070
Change in trade provisions –3,855 –1,193
Change in trade payables 1,033 1,024
Change in other liabilities –3,084 134
26,290 15,069 Interest paid –85 –139
Income taxes paid –1,373 –2,452
24,832 12,4782. Cash flow from investing activities Outflowsforinvestmentsinintangibleassets –2,290 –1,872
Outflowsforinvestmentsinproperty,plantandequipment –3,530 –4,078
Outflowsforinvestmentsinsubsidiaries –8,294 –3,127
(less cash and cash equivalents acquired) 329 268
Inflowsfromdistributionsbyassociatedcompanies 288 0
Interest received 94 80
–13,403 –8,7293. Cash flow from financing activities Outflowsfortheacquisitionoftreasuryshares –91 –275
Inflowsfromthesaleoftreasuryshares 82 0
Dividends paid to shareholders of the parent –784 –3,919
Outflowsfortherepaymentofleaseliabilities –5,560 –4,759
Interest paid on leases –491 –544
Inflows/outflowsfromtherepayment/borrowingoffinancialliabilities –1,057 –683
–7,901 –10,1804. Cash and cash equivalents at end of period Cash-effective change in cash and cash equivalents 3,528 –6,431
Exchange-rate-related changes in cash and cash equivalents –1,702 508
Cash and cash equivalents at beginning of period 38,656 44,579
40,482 38,656
Consolidated Cash floW statement for the Period from January 1 to December 31, 2020 (IFRS)
PSIAnnual Report
2020
_53Consolidated Financial Statements
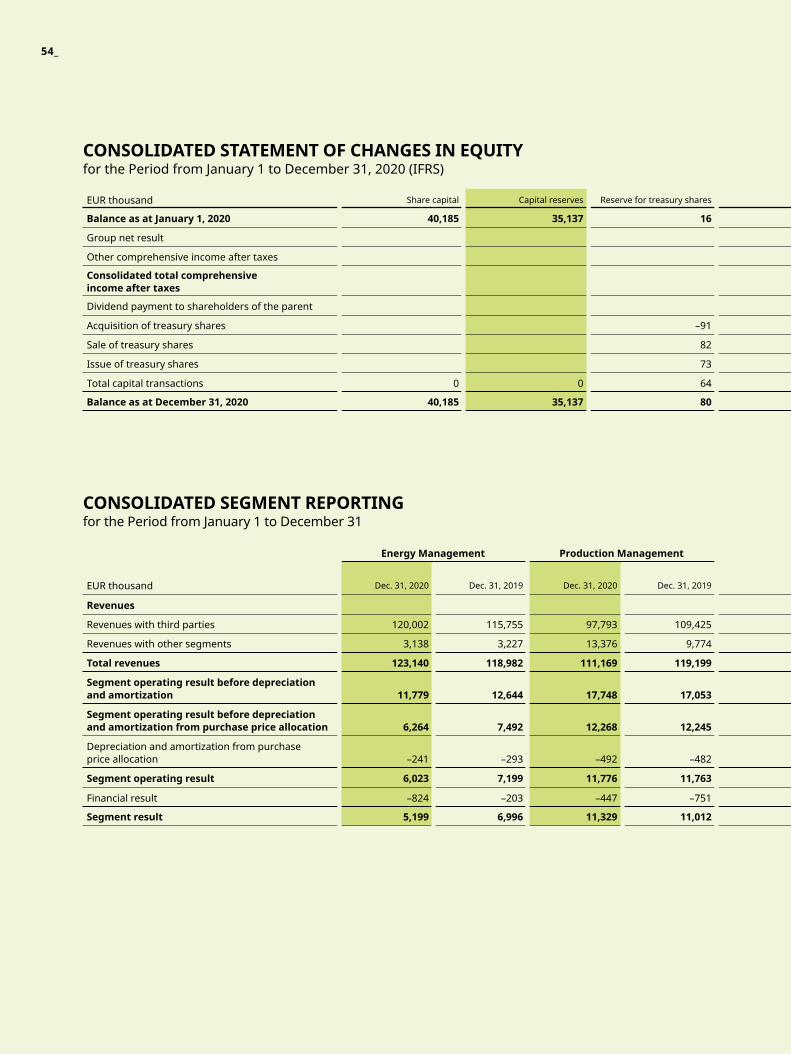
EUR thousand Share capital Capital reserves Reserve for treasury shares Other reserves Unappropriated surplus Total
balance as at January 1, 2020 40,185 35,137 16 –22,257 41,458 94,539
Group net result 10,280 10,280
Other comprehensive income after taxes –3,776 –3,776
Consolidated total comprehensive income after taxes –3,776 10,280 6,504
Dividend payment to shareholders of the parent –784 –784
Acquisition of treasury shares –91 –91
Sale of treasury shares 82 82
Issue of treasury shares 73 73
Total capital transactions 0 0 64 0 –784 –720
balance as at december 31, 2020 40,185 35,137 80 –26,033 50,954 100,323
Consolidated statement of Changes in eQuity for the Period from January 1 to December 31, 2020 (IFRS)
Consolidated segment reporting for the Period from January 1 to December 31
energy management production management reconciliation psi group
EUR thousand Dec. 31, 2020 Dec. 31, 2019 Dec. 31, 2020 Dec. 31, 2019 Dec. 31, 2020 Dec. 31, 2019 Dec. 31, 2020 Dec. 31, 2019
revenues
Revenues with third parties 120,002 115,755 97,793 109,425 0 0 217,795 225,180
Revenues with other segments 3,138 3,227 13,376 9,774 –16,514 –13,001 0 0
total revenues 123,140 118,982 111,169 119,199 –16,514 –13,001 217,795 225,180
segment operating result before depreciationand amortization 11,779 12,644 17,748 17,053 –2,359 –1,660 27,168 28,037
segment operating result before depreciation and amortization from purchase price allocation
6,264
7,492 12,268
12,245
–2,851
–1,757
15,681
17,980
Depreciation and amortization from purchaseprice allocation –241 –293 –492 –482 0 0 –733 –775
segment operating result 6,023 7,199 11,776 11,763 –2,851 –1,757 14,948 17,205
Financial result –824 –203 –447 –751 –15 189 –1,286 –765
segment result 5,199 6,996 11,329 11,012 –2,866 –1,568 13,662 16,440
54_
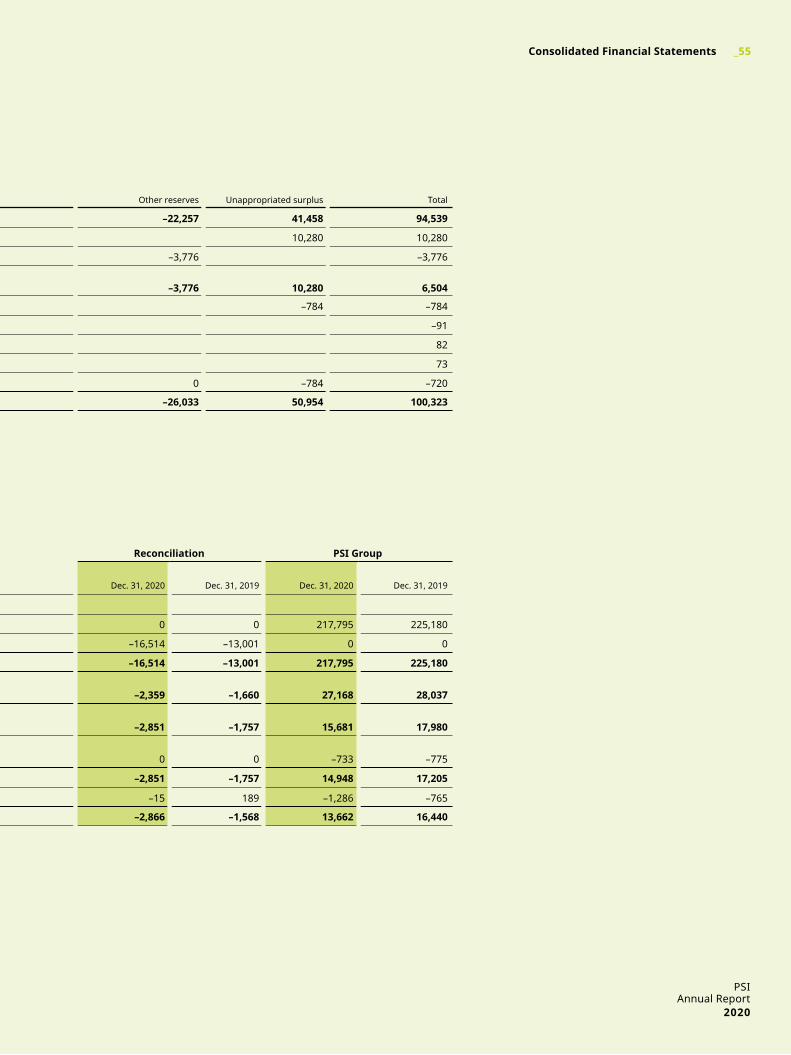
EUR thousand Share capital Capital reserves Reserve for treasury shares Other reserves Unappropriated surplus Total
balance as at January 1, 2020 40,185 35,137 16 –22,257 41,458 94,539
Group net result 10,280 10,280
Other comprehensive income after taxes –3,776 –3,776
Consolidated total comprehensive income after taxes –3,776 10,280 6,504
Dividend payment to shareholders of the parent –784 –784
Acquisition of treasury shares –91 –91
Sale of treasury shares 82 82
Issue of treasury shares 73 73
Total capital transactions 0 0 64 0 –784 –720
balance as at december 31, 2020 40,185 35,137 80 –26,033 50,954 100,323
energy management production management reconciliation psi group
EUR thousand Dec. 31, 2020 Dec. 31, 2019 Dec. 31, 2020 Dec. 31, 2019 Dec. 31, 2020 Dec. 31, 2019 Dec. 31, 2020 Dec. 31, 2019
revenues
Revenues with third parties 120,002 115,755 97,793 109,425 0 0 217,795 225,180
Revenues with other segments 3,138 3,227 13,376 9,774 –16,514 –13,001 0 0
total revenues 123,140 118,982 111,169 119,199 –16,514 –13,001 217,795 225,180
segment operating result before depreciationand amortization 11,779 12,644 17,748 17,053 –2,359 –1,660 27,168 28,037
segment operating result before depreciation and amortization from purchase price allocation
6,264
7,492 12,268
12,245
–2,851
–1,757
15,681
17,980
Depreciation and amortization from purchaseprice allocation –241 –293 –492 –482 0 0 –733 –775
segment operating result 6,023 7,199 11,776 11,763 –2,851 –1,757 14,948 17,205
Financial result –824 –203 –447 –751 –15 189 –1,286 –765
segment result 5,199 6,996 11,329 11,012 –2,866 –1,568 13,662 16,440
PSIAnnual Report
2020
_55Consolidated Financial Statements
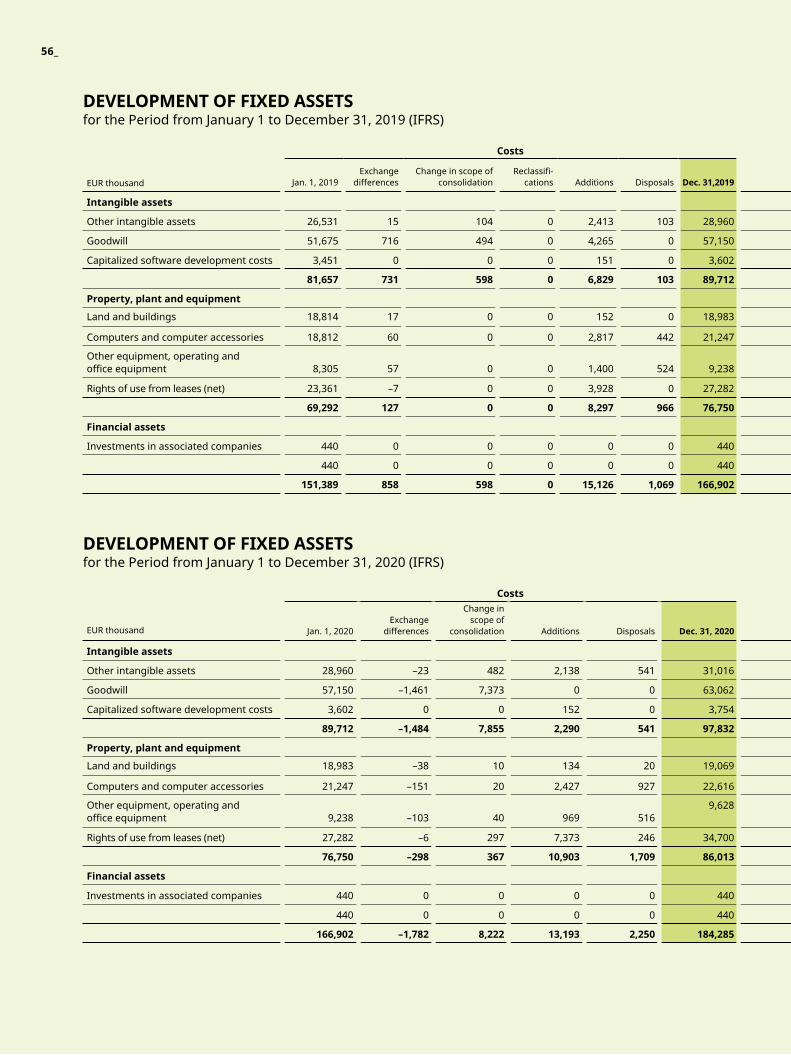
development of fixed assets for the Period from January 1 to December 31, 2020 (IFRS)
Costs accumulated amortization/depreciation Carrying amounts
EUR thousand Jan. 1, 2020
Exchange differences
Change in scope of
consolidation
Additions
Disposals
dec. 31, 2020
Jan. 1, 2020Exchange
differences
Additions
Disposals
dec. 31, 2020
dec. 31, 2020
Dec. 31, 2019
intangible assets
Other intangible assets 28,960 –23 482 2,138 541 31,016 20,543 –3 2,432 541 22,431 8,585 8,417
Goodwill 57,150 –1,461 7,373 0 0 63,062 2,258 0 0 0 2,258 60,804 54,892
Capitalized software development costs 3,602 0 0 152 0 3,754 2,488 0 456 0 2,944 810 1,114
89,712 –1,484 7,855 2,290 541 97,832 25,289 -3 2,888 541 27,633 70,199 64,423
property, plant and equipment
Land and buildings 18,983 –38 10 134 20 19,069 11,831 –38 739 20 12,512 6,557 7,152
Computers and computer accessories 21,247 –151 20 2,427 927 22,616 16,274 –121 2,390 924 17,619 4,997 4,973
Other equipment, operating and officeequipment 9,238 –103 40 969 516
9,6286,438 –84 561 516 6,399 3,229 2,800
Rights of use from leases (net) 27,282 –6 297 7,373 246 34,700 5,168 –10 5,642 245 10,555 24,145 22,114
76,750 –298 367 10,903 1,709 86,013 39,711 –253 9,332 1,705 47,085 38,928 37,039
financial assets
Investments in associated companies 440 0 0 0 0 440 0 0 0 0 0 440 440
440 0 0 0 0 440 0 0 0 0 0 440 440
166,902 –1,782 8,222 13,193 2,250 184,285 65,000 –256 12,220 2,246 74,718 109,567 101,902
development of fixed assets for the Period from January 1 to December 31, 2019 (IFRS)
Costs accumulated amortization/depreciation Carrying amounts
EUR thousand
Jan. 1, 2019
Exchange differences
Change in scope of consolidation
Reclassifi- cations
Additions
Disposals
dec. 31,2019
Jan. 1,2019
Exchange differences
Additions
Disposals
dec. 31, 2019
dec. 31, 2019 Dec. 31, 2018
intangible assets
Other intangible assets 26,531 15 104 0 2,413 103 28,960 18,562 0 2,083 102 20,543 8,417 7,969
Goodwill 51,675 716 494 0 4,265 0 57,150 2,258 0 0 0 2,258 54,892 49,417
Capitalized software development costs 3,451 0 0 0 151 0 3,602 1,952 0 536 0 2,488 1,114 1,499
81,657 731 598 0 6,829 103 89,712 22,772 0 2,619 102 25,289 64,423 58,885
property, plant and equipment
Land and buildings 18,814 17 0 0 152 0 18,983 11,486 16 329 0 11,831 7,152 7,328
Computers and computer accessories 18,812 60 0 0 2,817 442 21,247 14,555 37 2,121 439 16,274 4,973 4,257
Other equipment, operating and officeequipment 8,305 57 0
0 1,400 524 9,238 6,298 49 595 504 6,438 2,800 2,007
Rights of use from leases (net) 23,361 –7 0 0 3,928 0 27,282 0 0 5,168 0 5,168 22,114 0
69,292 127 0 0 8,297 966 76,750 32,339 102 8,213 943 39,711 37,039 13,592
financial assets
Investments in associated companies 440 0 0 0 0 0 440 0 0 0 0 0 440 440
440 0 0 0 0 0 440 0 0 0 0 0 440 440
151,389 858 598 0 15,126 1,069 166,902 55,111 102 10,832 1,045 65,000 101,902 72,917
56_
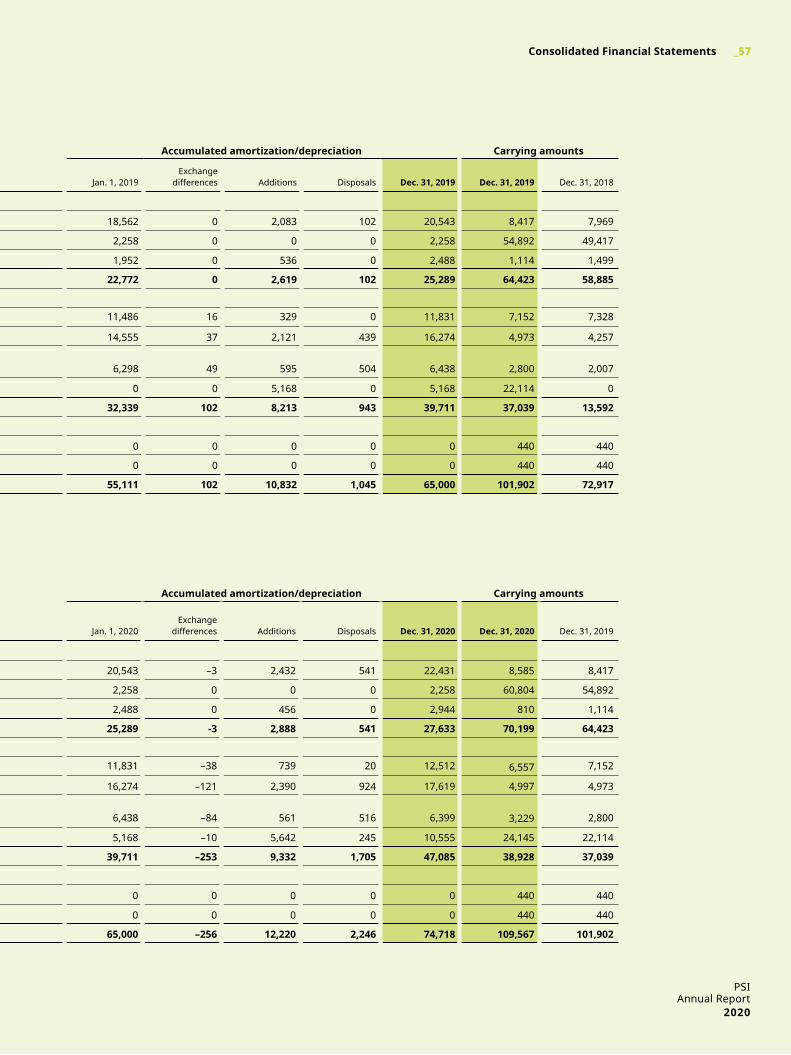
Costs accumulated amortization/depreciation Carrying amounts
EUR thousand Jan. 1, 2020
Exchange differences
Change in scope of
consolidation
Additions
Disposals
dec. 31, 2020
Jan. 1, 2020Exchange
differences
Additions
Disposals
dec. 31, 2020
dec. 31, 2020
Dec. 31, 2019
intangible assets
Other intangible assets 28,960 –23 482 2,138 541 31,016 20,543 –3 2,432 541 22,431 8,585 8,417
Goodwill 57,150 –1,461 7,373 0 0 63,062 2,258 0 0 0 2,258 60,804 54,892
Capitalized software development costs 3,602 0 0 152 0 3,754 2,488 0 456 0 2,944 810 1,114
89,712 –1,484 7,855 2,290 541 97,832 25,289 -3 2,888 541 27,633 70,199 64,423
property, plant and equipment
Land and buildings 18,983 –38 10 134 20 19,069 11,831 –38 739 20 12,512 6,557 7,152
Computers and computer accessories 21,247 –151 20 2,427 927 22,616 16,274 –121 2,390 924 17,619 4,997 4,973
Other equipment, operating and officeequipment 9,238 –103 40 969 516
9,6286,438 –84 561 516 6,399 3,229 2,800
Rights of use from leases (net) 27,282 –6 297 7,373 246 34,700 5,168 –10 5,642 245 10,555 24,145 22,114
76,750 –298 367 10,903 1,709 86,013 39,711 –253 9,332 1,705 47,085 38,928 37,039
financial assets
Investments in associated companies 440 0 0 0 0 440 0 0 0 0 0 440 440
440 0 0 0 0 440 0 0 0 0 0 440 440
166,902 –1,782 8,222 13,193 2,250 184,285 65,000 –256 12,220 2,246 74,718 109,567 101,902
Costs accumulated amortization/depreciation Carrying amounts
EUR thousand
Jan. 1, 2019
Exchange differences
Change in scope of consolidation
Reclassifi- cations
Additions
Disposals
dec. 31,2019
Jan. 1,2019
Exchange differences
Additions
Disposals
dec. 31, 2019
dec. 31, 2019 Dec. 31, 2018
intangible assets
Other intangible assets 26,531 15 104 0 2,413 103 28,960 18,562 0 2,083 102 20,543 8,417 7,969
Goodwill 51,675 716 494 0 4,265 0 57,150 2,258 0 0 0 2,258 54,892 49,417
Capitalized software development costs 3,451 0 0 0 151 0 3,602 1,952 0 536 0 2,488 1,114 1,499
81,657 731 598 0 6,829 103 89,712 22,772 0 2,619 102 25,289 64,423 58,885
property, plant and equipment
Land and buildings 18,814 17 0 0 152 0 18,983 11,486 16 329 0 11,831 7,152 7,328
Computers and computer accessories 18,812 60 0 0 2,817 442 21,247 14,555 37 2,121 439 16,274 4,973 4,257
Other equipment, operating and officeequipment 8,305 57 0
0 1,400 524 9,238 6,298 49 595 504 6,438 2,800 2,007
Rights of use from leases (net) 23,361 –7 0 0 3,928 0 27,282 0 0 5,168 0 5,168 22,114 0
69,292 127 0 0 8,297 966 76,750 32,339 102 8,213 943 39,711 37,039 13,592
financial assets
Investments in associated companies 440 0 0 0 0 0 440 0 0 0 0 0 440 440
440 0 0 0 0 0 440 0 0 0 0 0 440 440
151,389 858 598 0 15,126 1,069 166,902 55,111 102 10,832 1,045 65,000 101,902 72,917
PSIAnnual Report
2020
_57Consolidated Financial Statements
NOteS tO the CONSOliDAteD finanCial statementspsi software ag, berlin, as of december 31, 2020
a. general information on the Company
The parent company of the PSI Group is PSI Software AG (PSI AG), headquartered at Dircksenstrasse 42–44 in 10178 Berlin, Germany. It is entered in the commercial register of the Charlottenburg district court with the num-ber HRB 51463.
The Executive Board prepared the consolidated finan- cial statements as of December 31, 2020 and the group management report for the 2020 financial year on March 15, 2021 and then approved them for submission to the Supervisory Board.
The business operations of the PSI Group comprise the development and sale of software systems and products that meet the specific needs and requirements of custo-mers chiefly operating in the following industries and service sectors: energy supply, production, infrastructure, software technology, internet applications and business consultancy. In addition, the PSI Group performs services of all kinds in the field of data processing, sells electronic equipment and runs data processing systems.
The PSI Group is divided into two main business areas (segments), Energy Management and Production Management.
The Company is publicly listed in the Prime Standard on the German stock exchange in Frankfurt am Main (securities identification number (WKN), A0Z1JH).
b. presentation of accounting policies and financial risk management methods
basis of preparation of the financial statements
The consolidated financial statements of the PSI Group are generally prepared on the basis of the historical cost principle.
The consolidated financial statements of the PSI Group are prepared in accordance with International Financial Reporting Standards (IFRSs) as endorsed by the EU. The consolidated financial statements were prepared in euro. Unless specified otherwise, all figures are rounded up or down to the nearest thousand euro in line with commercial rounding.
Changes in accounting policies
The accounting policies applied in the 2020 financial year generally correspond to those applied in the previous year, with the exception of the new accounting standards presented below.
58_
effects of new accounting standards required to be applied in the financial year
In October 2018, the IASB published amendments regarding the definition of a business for IFRS 3 Business Combinations. These are intended to help companies determine whether a transaction is to be accounted for as a business combination or as an acquisition of assets. They specify the minimum requirements for a business (existence of input factors and a substantive process that significantly contributes to the ability to create outputs). The previously required assessment of whether market participants are capable of replacing any missing elements in this process has been removed. Additional guidance is intended to help entities assess whether an acquired business process is substantive. Furthermore, the definitions of a business have been narrowed by focusing on goods and services provided to customers. The amendments were to be applied prospec-tively for the first time on January 1, 2020. The amend-ments affected business combinations in the financial year.
The amendments to IAS 1 (Presentation of Financial Statements) and IAS 8 (Accounting Policies, Changes in Accounting Estimates and Errors) in relation to the definition of materiality were published in October 2018. The aim of the amendment was to simplify the definition of the term “material” in all standards and to specify certain aspects of the definition. According to the new definition, information is material if omitting, misstating or obscuring it could reasonably be expected to influence decisions that the primary users of general purpose financial statements make on the basis of those financial statements, which provide financial information about a specific reporting entity. The amendments were to be applied prospectively for the first time on January 1, 2020. The content-related amendments have already been taken into account in the materiality assessment to date, which is why there was no impact on the consolidated financial statements in the financial year.
The IASB and the IFRS IC published further pronounce-ments in the year under review. The standards and pro- nouncements required to be applied for the first time in the financial year did not have any effects on the consolidated financial statements of the PSI Group.
effects of new accounting standards that Were not yet required to be applied in the financial year
The IASB has published the following standards and interpretations that were not yet required to be applied in the 2020 financial year. These standards and interpreta-tions are not being applied early by the Group:
In January 2020, the IASB published amendments to IAS 1 “Presentation of Financial Statements” that clarify the criteria for the classification of liabilities as current or non- current. Only “rights” that exist at the end of the reporting period will in future be relevant to the classification of a liability in terms of its maturity.
Both amendments are to be applied retroactively for the first time to financial years beginning on or after January 1, 2023. Early application is permitted and must be disclosed accordingly. The PSI Group intends to apply the amend-ments as at the stipulated effective date.
The IASB and the IFRS IC have published further pro- nouncements, but these were not yet required to be applied in the financial year. These standards and pronouncements are not expected to have any significant effects on the con- solidated financial statements of the PSI Group.
PSIAnnual Report
2020
_59 Notes to the Consolidated Financial Statements
Significant Judgments, estimates and assumptions
In preparing the consolidated financial statements, the management makes judgments, estimates and assumptions that affect the amount of reported income, expenses, assets and liabilities and the associated disclosures as well as the disclosure of contingent liabilities.
In applying the Group’s accounting policies, the manage-ment did not make any significant judgments that have a significant impact on the amounts in the consolidated financial statements.
The main assumptions regarding the future and other major sources of estimation uncertainty at the end of the reporting period that entail a risk of causing a material adjustment to the carrying amounts of assets and liabilities within the next financial year are described below. Judgments, estimates and assumptions are based on historical information and planning data and information on economic conditions in the sectors of regions in which PSI customers operate. Changes to these may adversely affect the estimates. Even if the management believes that its estimates regarding the future development of underlying uncertainties are appropriate, it cannot guarantee that the financial impact of these will reflect the assumptions taken into account for the reported assets, liabilities, income and expenses and the contingent liabilities disclosed in PSI’s consolidated financial statements. Actual results may differ from the original estimates and assumptions made by management.
Impairment of non-current assets: The PSI Group tests non-current assets for impairment once a year based on the provisions of IAS 36. The impairment tests are based on the future surplus cash generated for individual assets or for groups of assets combined in cash-generating units. An asset or a cash-generating unit is impaired if its carrying amount exceeds its recoverable amount. The recoverable amount of an asset or a cash-generating unit is the higher of its fair value less costs to sell and its value in use. Value in use is calculated using a discounted cash flow method. The re- coverable amount depends on the discount rate used when applying the discounted cash flow method as well as on the expected future cash inflows and the growth rate used for extrapolation purposes. Significant non-current assets that are tested for impairment on an annual basis relate to the goodwill reported in the PSI Group. Further details with regard to impairment testing can be found in section C. 1 of the notes. Changes in the carrying amounts of capitalized development costs are shown in the development of fixed assets on page 56.
Project valuation: The PSI Group recognizes revenues on the basis of estimated performance in the projects. Perfor-mance estimates are based on an estimated hourly volume and estimated costs for purchased services or on contrac- tually agreed milestones and are continuously updated. Further details on the income recognized for projects but not yet invoiced are provided in section C. 4 of the notes.
Deferred taxes: Deferred tax assets are recognized for all unused tax loss carryforwards and temporary differences to the extent that it is probable or there is convincing evidence that taxable income will be available for this purpose, meaning that the tax benefits depicted can actually be used in the near future. To determine the amount of the deferred tax assets, the management must make an estimate based on the expected timing and amount of future taxable income and on the future tax planning strategy (timing of tax results, taking account of tax risks, etc.). As at Decem-ber 31, 2020, the amount of non-capitalized tax benefits
60_

from loss carryforwards for corporation tax (including foreign companies) came to EUR 19.7 million, while those from loss carryforwards for trade tax came to EUR 7.5 million (previous year: EUR 42.5 million/EUR 28.4 million). PSI AG’s tax loss carryforwards as at December 31, 2019 and December 31, 2020 already take into account the findings of ongoing external tax audits. Deferred tax assets on tax loss carryforwards from the past were capitalized in the amount of EUR 1,386 thousand in the financial year (previous year: EUR 949 thousand). Further details are presented in section C. 12 of the notes.
Calculating global income tax liabilities requires judgments as to whether an uncertain tax treatment is to be considered separately or together with other uncertain tax treatments and whether the impact of the uncertainty is to be accoun-ted for using the most likely amount or the expected value. When making these judgments, the PSI Group takes into account the nature, the individual factors and circumstan-ces of each uncertain tax treatment and the features of the respective legal system, including the applicable tax laws and interpretations of this system.
Pensions and other post-employment benefits: The expenses from post-employment defined benefit plans and the present value of the pension liability are determined using actuarial calculations. The actuarial valuation is based on assumptions relating to discount rates, the expected retirement age, future increases in wages and salaries, mortality, and future pension increases. In view of the long-term nature of these plans, such estimates are subject to significant uncertainties. All assumptions are reviewed at the end of each reporting period. The manage-ment determines an appropriate discount rate based on the interest rates of corporate bonds that are denominated in the same currency as the post-employment benefit obliga- tion and have a rating of at least AA from an internationally recognized rating agency. Where necessary, these interest rates are adjusted to the expected duration of the defined benefit obligation by way of extrapolation along the yield curve. Further details can be found in section C. 8 of the notes.
Development costs: Development costs are capitalized using the accounting policy described in the research and development costs on page 66. Initial capitalization of the costs is based on the management’s assessment that technical and commercial viability is demonstrated. For the purposes of determining the amounts to be capitalized, the management makes assumptions with regard to the amount of expected future cash flows from the project. The carrying amounts of capitalized development costs are shown in the development of fixed assets on page 56.
PSIAnnual Report
2020
_61 Notes to the Consolidated Financial Statements
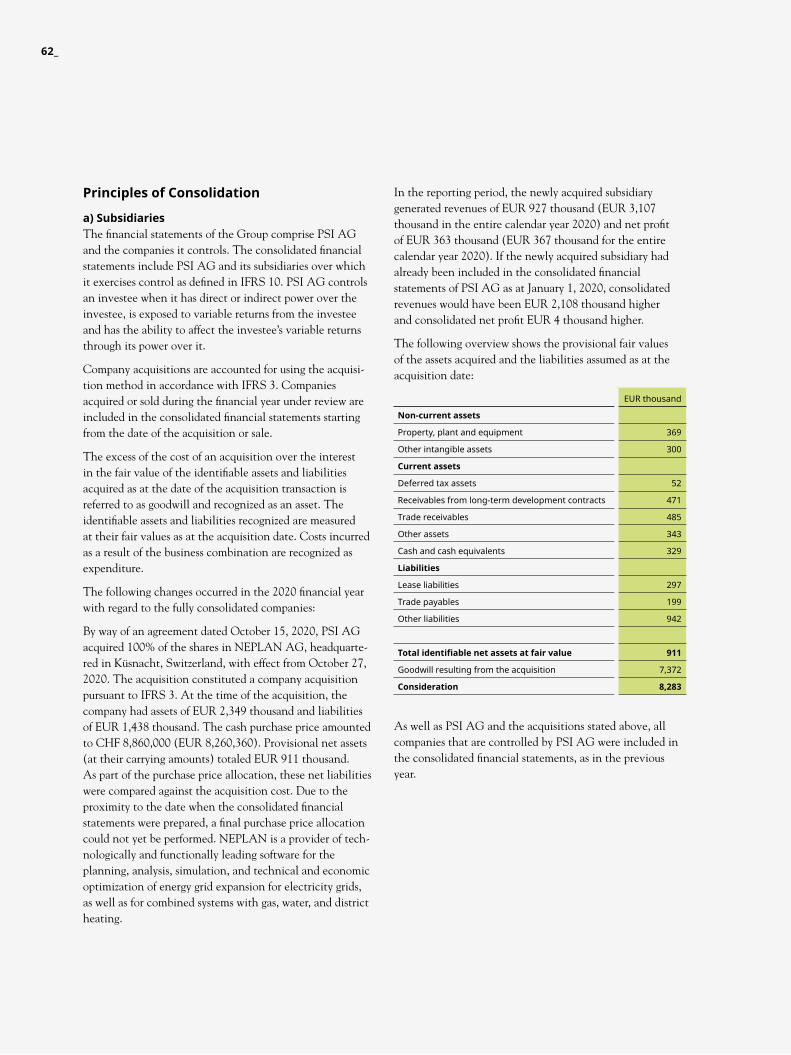
principles of Consolidation
a) subsidiaries The financial statements of the Group comprise PSI AG and the companies it controls. The consolidated financial statements include PSI AG and its subsidiaries over which it exercises control as defined in IFRS 10. PSI AG controls an investee when it has direct or indirect power over the investee, is exposed to variable returns from the investee and has the ability to affect the investee’s variable returns through its power over it.
Company acquisitions are accounted for using the acquisi- tion method in accordance with IFRS 3. Companies acquired or sold during the financial year under review are included in the consolidated financial statements starting from the date of the acquisition or sale.
The excess of the cost of an acquisition over the interest in the fair value of the identifiable assets and liabilities acquired as at the date of the acquisition transaction is referred to as goodwill and recognized as an asset. The identifiable assets and liabilities recognized are measured at their fair values as at the acquisition date. Costs incurred as a result of the business combination are recognized as expenditure.
The following changes occurred in the 2020 financial year with regard to the fully consolidated companies:
By way of an agreement dated October 15, 2020, PSI AG acquired 100% of the shares in NEPLAN AG, headquarte-red in Küsnacht, Switzerland, with effect from October 27, 2020. The acquisition constituted a company acquisition pursuant to IFRS 3. At the time of the acquisition, the company had assets of EUR 2,349 thousand and liabilities of EUR 1,438 thousand. The cash purchase price amounted to CHF 8,860,000 (EUR 8,260,360). Provisional net assets (at their carrying amounts) totaled EUR 911 thousand. As part of the purchase price allocation, these net liabilities were compared against the acquisition cost. Due to the proximity to the date when the consolidated financial statements were prepared, a final purchase price allocation could not yet be performed. NEPLAN is a provider of tech- nologically and functionally leading software for the planning, analysis, simulation, and technical and economic optimization of energy grid expansion for electricity grids, as well as for combined systems with gas, water, and district heating.
In the reporting period, the newly acquired subsidiary generated revenues of EUR 927 thousand (EUR 3,107 thousand in the entire calendar year 2020) and net profit of EUR 363 thousand (EUR 367 thousand for the entire calendar year 2020). If the newly acquired subsidiary had already been included in the consolidated financial statements of PSI AG as at January 1, 2020, consolidated revenues would have been EUR 2,108 thousand higher and consolidated net profit EUR 4 thousand higher.
The following overview shows the provisional fair values of the assets acquired and the liabilities assumed as at the acquisition date:
As well as PSI AG and the acquisitions stated above, all companies that are controlled by PSI AG were included in the consolidated financial statements, as in the previous year.
EUR thousand
non-current assets
Property, plant and equipment 369
Other intangible assets 300
Current assets
Deferred tax assets 52
Receivables from long-term development contracts 471
Trade receivables 485
Other assets 343
Cash and cash equivalents 329
liabilities
Lease liabilities 297
Trade payables 199
Other liabilities 942
total identifiable net assets at fair value 911
Goodwill resulting from the acquisition 7,372
Consideration 8,283
62_

The following changes occurred in the 2019 financial year with regard to the fully consolidated companies:
By way of an agreement dated December 10, 2018, PSI Software AG acquired the assets and assumed the liabilities of the “PRINS and GridAgent network control software” business of BTC Business Technology Consulting AG, Oldenburg, with effect from January 1, 2019 (asset deal). The acquisition constituted a company acquisition pursuant to IFRS 3. Part 1 of the cash purchase price amounted to EUR 3,900 thousand, while part 2 was calculated based on the spin-off balance sheet. Part 1 of the purchase price was reduced by EUR 1,566 thousand to EUR 2,334 thousand as a result of the value of part 2. As part of the purchase price allocation, the fair values of the assets acquired and liabilities assumed were compared against the acquisition cost. The resulting difference is attributable to identifiable intangible assets with a limited useful life and to goodwill. The intangible assets result from the valuation of the “PRINS” software product developed internally by BTC and from a customer base. The goodwill reflects the position of the “PRINS and GridAgent network control software” on the market. Over more than 20 years, the acquired process information system (PRINS), with 140 highly regarded managers and specialists, has accomplished remarkable achievements and created modern technology.
By way of an agreement dated May 6, 2019 and with effect from May 1, 2019, 100% of the shares in BTC Business Technology Consulting SP. Z O.O., headquartered in Poznan (BTC Poland), were acquired. The acquisition con- stituted a company acquisition pursuant to IFRS 3. Part 1 of the cash purchase price amounted to EUR 730 thousand, while part 2 was calculated based on the balance sheet as at the reporting date and amounted to EUR 63 thousand. As part of the purchase price allocation, the fair values of the assets acquired and liabilities assumed were compared against the acquisition cost (cash purchase price 1 and 2: EUR 793 thousand). The resulting difference is attributable to identifiable intangible assets with a limited useful life and to goodwill. In terms of its content, this transaction is related to the purchase agreement dated December 10, 2018, with BTC Business Technology Consulting AG, Oldenburg.
The following overview shows the fair values of the assets acquired and the liabilities assumed as at the acquisition date:
b) associated CompaniesAn associated company as defined in IAS 28 is a company in which the PSI Group generally holds more than 20% of the voting rights and over which the Group has signifi-cant influence. Investments in associated companies are accounted for using the equity method. In accordance with the equity method, investments in an associated company are recognized in the balance sheet at acquisition cost plus changes in the Group’s share of the associated company’s net assets that occurred after the acquisition. The consolidated income statement includes the share of the associated company’s profit or loss attributable to the Group. Changes reported directly in the associated com- pany’s equity are recognized by the Group in the amount of its share in the statement of changes in equity where
agreement dated dec. 10, 2018fair values after acquisitioneur thousand
agreement dated may 6, 2019fair values after acquisitioneur thousand
non-current assets
Property, plant and equipment 280 11
Other intangible assets 672 122
Current assets
Inventories 0 13
Trade receivables 0 314
Receivables from long-term development contracts 1,576 0
Cash and cash equivalents 0 268
Prepaid expenses 0 75
liabilities
Deferred taxes 0 20
Provisions 0 116
Trade payables 0 93
Other liabilities 3,665 260
Liabilities from long-term development contracts 771 0
Prepaid expenses 24 15
total identifiable net assets at fair value –1,932 299
Goodwill resulting from the acquisition 4,266 494
Consideration 2,334 793
PSIAnnual Report
2020
_63 Notes to the Consolidated Financial Statements
appropriate. Unrealized gains and losses from transactions between the Group and the associated company are eliminated in line with the share in the associated company.
The investments in the following associated companies are measured using the equity method:
– caplog-x GmbH, Leipzig (“caplog-x”), 31.3% (previous year: 31.3%)
– OOO Gazavtomatika dispetcherskije sistemy, Moscow, Russia, 33.0% (previous year: 33.0%)
c) measures and uniform measurement throughout the group
The annual financial statements of the subsidiaries and associated companies included in the consolidated finan- cial statements are based on uniform accounting stand- ards and reporting periods/reporting dates.
Intragroup balances and transactions and resulting in- tragroup gains and unrealized gains and losses between consolidated companies were eliminated in full. Unrealized losses were eliminated only if the transactions did not provide evidence of an impairment of the asset transferred.
fair value measurement
Fair value is the price that would be received to sell an asset or paid to transfer a liability in an orderly transaction between independent market participants at the measure-ment date. In a fair value measurement, it is assumed that the transaction in which the asset is sold or the liability is transferred takes place either in the
– principal market for the asset or liability or
– the most advantageous market for the asset or liability, if there is no principal market.
The Group must have access to the principal market or to the most advantageous market. The fair value of an asset or liability is measured using the assumptions that market participants would use when pricing the asset or liability. It is assumed that the market participants act in their economic best interest. Measurements of the fair value of a non-financial asset take account of the market participant’s ability to generate economic benefits from the highest and best use of the asset or from its sale to another market participant that finds the best use for the asset. The Group uses valuation techniques that are appropriate in the cir- cumstances and for which sufficient data are available for measuring the fair value. In doing so, the use of relevant observable inputs is to be maximized and the use of unobservable inputs is to be minimized.
64_
All assets and liabilities whose fair value is determined or reported in the financial statements are classified in the fair value hierarchy described below based on the lowest-level input that is significant to the entire fair value measure-ment:
– Level 1 – Quoted prices (unadjusted) in active markets for identical assets or liabilities
– Level 2 – Valuation methods in which the lowest-level input that is significant to the entire fair value measure-ment is directly or indirectly observable on the market
– Level 3 – Valuation methods in which the lowest-level input that is significant to the entire fair value measure-ment is not observable on the market
In the case of assets and liabilities that are recognized in the financial statements on a recurring basis, the Group determines whether there have been any transfers between the levels of the hierarchy by reviewing the classification at the end of each reporting period.
Currency translation
PSI’s consolidated financial statements are prepared in euro, the functional currency and presentation currency of the Group. Each company within the Group determines its own functional currency. The items included in the respective company’s financial statements are measured using this functional currency. Foreign currency transactions are initially translated at the spot exchange rate between the functional currency and the foreign currency at the date of the transaction. Monetary assets and liabilities in foreign currencies are translated into the functional currency at the closing rate. All associated exchange differences are recognized in the net profit or loss for the period. Non- monetary items of the Group balance sheet in foreign currencies are updated at historical exchange rates.
The functional currency of the main foreign companies is generally the respective local currency. As at the end of the reporting period, the assets and liabilities of these subsidiaries are translated into the presentation currency of PSI AG (the euro) at the closing rate. For practical reasons, income and expenses are translated at the average rate in the 2020 financial year. The effects of using the average rate as compared to the rate on the transaction date are imma- terial overall for the financial year and for the previous year. The exchange differences that arise on translation are recognized as a separate component of equity.
PSIAnnual Report
2020
_65 Notes to the Consolidated Financial Statements
non-Current assets
a) intangible assets Intangible assets are initially measured at cost. Intangible assets are recognized if it is probable that the future economic benefits that are attributable to the asset will flow to the company and if the cost of the asset can be measured reliably. For the purposes of subsequent measurement, intangible assets are recognized at cost less accumulated amortization and accumulated impairment losses (reported under depreciation and amortization). The amortization period and the amortization method are reviewed at the end of each financial year.
Intangible assets comprise:
goodwillGoodwill from a business combination is initially measured at cost, which is calculated as the excess of the cost of the business combination over the PSI Group’s interest in the fair values of the identifiable assets acquired and the identifiable liabilities and contingent liabilities assumed. After initial recognition, goodwill is measured at cost less accumulated impairment losses. Goodwill is tested for impairment at least once a year or when facts or changes in circumstances indicate that its carrying amount may have decreased. To check whether goodwill acquired in a business combination is impaired, this goodwill must be allocated to a cash-generating unit. If the recoverable amount of the cash-generating unit is lower than its carrying amount, an impairment loss must be recognized. Reversals of impairment losses are not recognized.
industrial property rights and licenses Amounts paid to purchase industrial property rights and license rights are capitalized and subsequently amortized on a straight-line basis over their expected useful lives (three to eight years).
The acquisition cost of new software is capitalized and treated as an intangible asset, provided it does not consti- tute an integral part of the related hardware. Software is amortized on a straight-line basis over a period of three to five years.
Costs incurred to restore or maintain the future eco- nomic benefits that the Company had originally expected are recognized as an expense.
research and development CostsResearch costs are recognized as an expense in the period in which they are incurred. Development costs for an individ- ual project are capitalized as an intangible asset only if the criteria for capitalization under IAS 38.57 are met, i.e. if the Group can demonstrate the following:
– the technical feasibility of completing the intangible asset
– the intention to complete the intangible asset and the ability to use or sell it
– how the asset will generate future economic benefits
– the availability of resources for completing the asset
– the ability to measure reliably the expenditure attributable to the intangible asset during its development
After their initial recognition, development costs are accounted for at cost less accumulated impairment losses. The amortization period generally lasts five years, beginning when the development phase is completed and as soon as the asset is available for use. The asset is amortized over the period during which future use is expected and this amortization is recognized under depreciation and amorti- zation. During the development phase, an impairment test is performed on an annual basis.
b) property, plant and equipmentProperty, plant and equipment is measured at cost less any accumulated depreciation and any accumulated impairment losses. For property, plant and equipment acquired as part of business combinations, cost corresponds to the fair value at the acquisition date. If items of property, plant and equip- ment are sold or scrapped or if no further economic benefit is expected from their use, then the corresponding cost and accumulated depreciation are derecognized. Any realized gain or loss on disposal is reported in the consolidated income statement.
66_

The cost of an item of property, plant and equipment com- prises the purchase price including the costs necessary to bring the item into condition for its intended use. Sub- sequent expenses such as servicing and maintenance costs that arise after the fixed assets have started being used are recognized as an expense when incurred. If it is likely that expenses will result in the Company receiving future economic benefits in excess of the originally assessed per- formance of the existing asset, these expenses are capitalized as additional costs of property, plant and equipment.
Depreciation is calculated on a straight-line basis over an estimated useful life, assuming a residual carrying amount of EUR 0. The following estimated useful lives are used for the individual asset groups:
The useful lives and depreciation method for property, plant and equipment are reviewed on an annual basis to ensure that the depreciation method and depreciation period are consistent with the expected pattern of economic benefits from the items of property, plant and equipment.
c) leases – lesseeDetermining whether an arrangement is or contains a lease is based on the economic substance of the arrangement and requires an assessment as to whether the fulfillment of the contractual arrangement is dependent on the use of a specific asset or assets and whether the arrangement grants a right to use the asset.
The PSI Group has mainly concluded leases for properties, vehicles, and hardware (servers). In accordance with IFRS 16, the Group recognizes right-of-use assets and lease liabilities as at the commencement date for leases with a term of more than twelve months, provided the underlying asset is not of low value. Rights of use are measured at cost less any accumulated amortization. The costs of rights of use include the recognized lease liabilities, the initial direct costs incurred, and the lease payments made at or before the commencement date, less any lease incentives received. Extension options are included in the term of the lease if it is reasonably certain that they will be exercised.
Rights of use are amortized on a straight-line basis over the term or the expected useful life of the leases as follows:
In calculating the present value of the lease payments, the Group uses the incremental borrowing rate from the impairment analysis of 0.85% (previous year: 2.30%), as the interest rate implicit in the lease cannot be readily determined. The carrying amount of the lease liabilities is also adjusted in the case of changes in the lease, the term, the lease payments, or the assessment.
An overview of the maturities of lease liabilities is presented in section C. “Disclosures on the consolidated balance sheet,” sub-item “Lease liabilities.”
Other financial obligations from short-term leases and low-value leases that do not come under IFRS 16 as a result of applying the exemption are shown in section G. “Other disclosures,” sub-item “Other financial obligations from rental and lease agreements.”
Buildings 25 to 50 years
Exterior facilities, other constructions
10 to 20 years
Computer hardware 3 to 7 years
Leasehold improvements Based on remaining term of the lease or actual useful life if shorter
Otherofficeequipment 5 to 13 years
Properties 2 to 10 years
Movable assets 3 to 5 years
PSIAnnual Report
2020
_67 Notes to the Consolidated Financial Statements
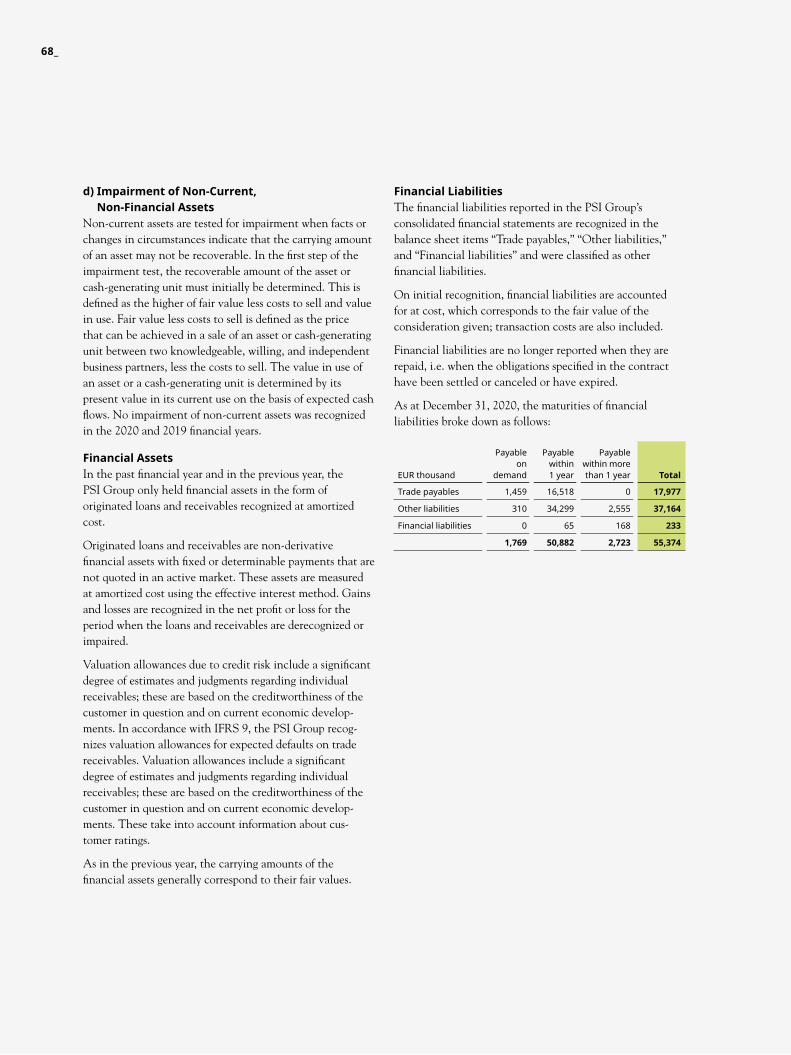
d) impairment of non-Current, non-financial assets
Non-current assets are tested for impairment when facts or changes in circumstances indicate that the carrying amount of an asset may not be recoverable. In the first step of the impairment test, the recoverable amount of the asset or cash-generating unit must initially be determined. This is defined as the higher of fair value less costs to sell and value in use. Fair value less costs to sell is defined as the price that can be achieved in a sale of an asset or cash-generating unit between two knowledgeable, willing, and independent business partners, less the costs to sell. The value in use of an asset or a cash-generating unit is determined by its present value in its current use on the basis of expected cash flows. No impairment of non-current assets was recognized in the 2020 and 2019 financial years.
financial assetsIn the past financial year and in the previous year, the PSI Group only held financial assets in the form of originated loans and receivables recognized at amortized cost.
Originated loans and receivables are non-derivative financial assets with fixed or determinable payments that are not quoted in an active market. These assets are measured at amortized cost using the effective interest method. Gains and losses are recognized in the net profit or loss for the period when the loans and receivables are derecognized or impaired.
Valuation allowances due to credit risk include a significant degree of estimates and judgments regarding individual receivables; these are based on the creditworthiness of the customer in question and on current economic develop-ments. In accordance with IFRS 9, the PSI Group recog- nizes valuation allowances for expected defaults on trade receivables. Valuation allowances include a significant degree of estimates and judgments regarding individual receivables; these are based on the creditworthiness of the customer in question and on current economic develop-ments. These take into account information about cus- tomer ratings.
As in the previous year, the carrying amounts of the financial assets generally correspond to their fair values.
financial liabilities The financial liabilities reported in the PSI Group’s consolidated financial statements are recognized in the balance sheet items “Trade payables,” “Other liabilities,” and “Financial liabilities” and were classified as other financial liabilities.
On initial recognition, financial liabilities are accounted for at cost, which corresponds to the fair value of the consideration given; transaction costs are also included.
Financial liabilities are no longer reported when they are repaid, i.e. when the obligations specified in the contract have been settled or canceled or have expired.
As at December 31, 2020, the maturities of financial liabilities broke down as follows:
EUR thousand
Payable on
demand
Payable within 1 year
Payable within morethan 1 year total
Trade payables 1,459 16,518 0 17,977
Other liabilities 310 34,299 2,555 37,164
Financial liabilities 0 65 168 233
1,769 50,882 2,723 55,374
68_
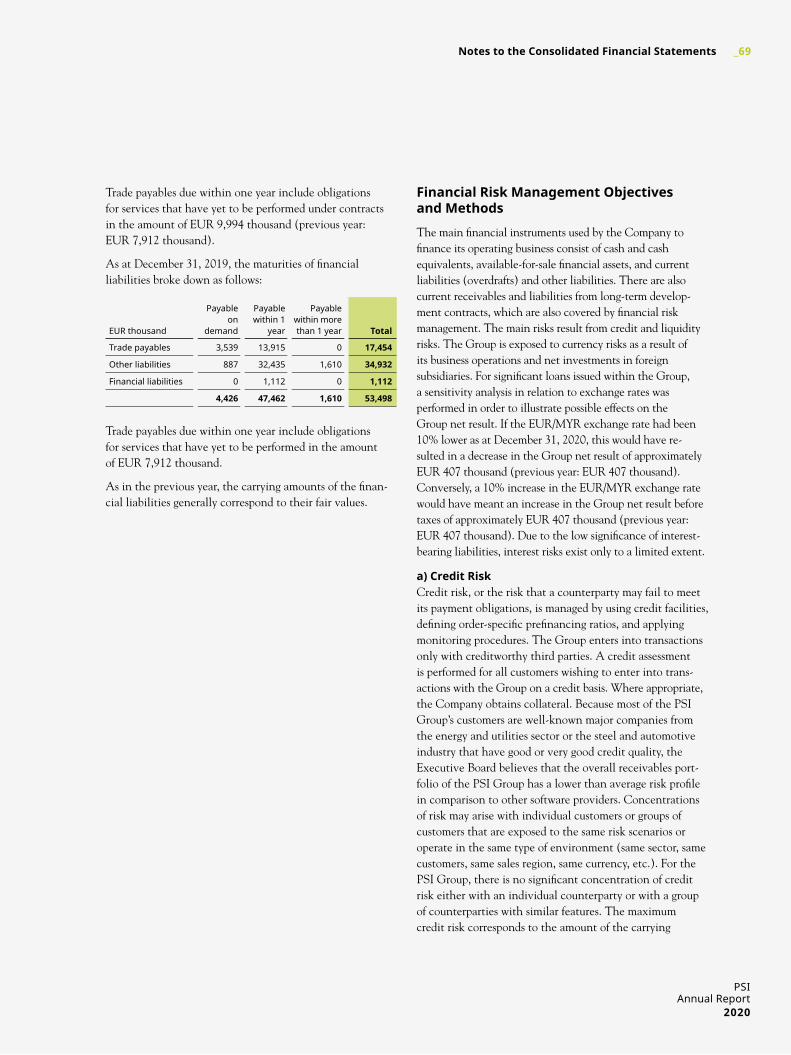
Trade payables due within one year include obligations for services that have yet to be performed under contracts in the amount of EUR 9,994 thousand (previous year: EUR 7,912 thousand).
As at December 31, 2019, the maturities of financial liabilities broke down as follows:
Trade payables due within one year include obligations for services that have yet to be performed in the amount of EUR 7,912 thousand.
As in the previous year, the carrying amounts of the finan- cial liabilities generally correspond to their fair values.
financial risk management objectives and methods
The main financial instruments used by the Company to finance its operating business consist of cash and cash equivalents, available-for-sale financial assets, and current liabilities (overdrafts) and other liabilities. There are also current receivables and liabilities from long-term develop-ment contracts, which are also covered by financial risk management. The main risks result from credit and liquidity risks. The Group is exposed to currency risks as a result of its business operations and net investments in foreign subsidiaries. For significant loans issued within the Group, a sensitivity analysis in relation to exchange rates was performed in order to illustrate possible effects on the Group net result. If the EUR/MYR exchange rate had been 10% lower as at December 31, 2020, this would have re- sulted in a decrease in the Group net result of approximately EUR 407 thousand (previous year: EUR 407 thousand). Conversely, a 10% increase in the EUR/MYR exchange rate would have meant an increase in the Group net result before taxes of approximately EUR 407 thousand (previous year: EUR 407 thousand). Due to the low significance of interest- bearing liabilities, interest risks exist only to a limited extent.
a) Credit risk Credit risk, or the risk that a counterparty may fail to meet its payment obligations, is managed by using credit facilities, defining order-specific prefinancing ratios, and applying monitoring procedures. The Group enters into transactions only with creditworthy third parties. A credit assessment is performed for all customers wishing to enter into trans- actions with the Group on a credit basis. Where appropriate, the Company obtains collateral. Because most of the PSI Group’s customers are well-known major companies from the energy and utilities sector or the steel and automotive industry that have good or very good credit quality, the Executive Board believes that the overall receivables port- folio of the PSI Group has a lower than average risk profile in comparison to other software providers. Concentrations of risk may arise with individual customers or groups of customers that are exposed to the same risk scenarios or operate in the same type of environment (same sector, same customers, same sales region, same currency, etc.). For the PSI Group, there is no significant concentration of credit risk either with an individual counterparty or with a group of counterparties with similar features. The maximum credit risk corresponds to the amount of the carrying
EUR thousand
Payable on
demand
Payable within 1
year
Payable within more than 1 year total
Trade payables 3,539 13,915 0 17,454
Other liabilities 887 32,435 1,610 34,932
Financial liabilities 0 1,112 0 1,112
4,426 47,462 1,610 53,498
PSIAnnual Report
2020
_69 Notes to the Consolidated Financial Statements

Current assets
a) inventoriesInventories are measured at the lower of cost and expected net disposal proceeds, less costs to be incurred.
b) Cash and Cash equivalentsCash and cash equivalents comprise cash on hand, fixed term deposits, and demand deposits. The cash and cash equivalents reported in the Group statement of cash flows are delimited according to the above definition.
amounts reported in the balance sheet for the financial assets from trade receivables and other assets.
The Group continuously monitors the risk of a liquidity shortage using liquidity planning tools (maturity, expected cash flows). The aim of this monitoring is to maintain a balance between continuously covering financing require-ments and ensuring flexibility. In monitoring the financial balance, it is particularly important to monitor project financing. The PSI Group endeavors to maximize the prefinancing ratio (ratio of advance payments received for projects to receivables from long-term development con- tracts) for each project. Because there are significant differences in customers’ payment history in relation to prefinancing depending on the industry in which the customers operate, the PSI Group has not made any speci- fications with regard to the exact amount of prefinancing. In general, a sufficient prefinancing ratio is targeted in the Group as a whole. There are no further individual targets for key figures in the area of liquidity monitoring.
b) Capital management The primary objective of the PSI Group’s capital manage-ment is to ensure that a high credit rating and a good equity ratio are maintained so as to support business operations and maximize shareholder value.
The PSI Group manages its capital structure in line with the prevailing economic conditions. No adjustment measures or amendments to capital management goals and targets were made in the 2020 or 2019 financial years.
The PSI Group monitors its capital using the equity ratio on a consolidated basis.
70_
equity
Shareholders’ equity comprises the share capital, the capital reserve, retained earnings, treasury shares, other reserves, and accumulated profit or loss.
The capital reserve includes premiums in accordance with section 150 of the German Stock Corporation Act (AktG) and offset loss carryforwards in line with resolutions on the allocation of earnings.
Retained earnings include earnings allocations in accor- dance with section 174 AktG.
If the PSI Group acquires treasury shares, these are deduct- ed from shareholders’ equity. The purchase, sale, issue, or withdrawal of treasury shares is not recognized in profit or loss.
Other reserves include unrealized gains and losses from currency translation and actuarial gains and losses from the measurement of pension provisions.
pension provisions
The PSI Group has several defined benefit pension plans. In some cases, there are plan assets in the form of pension liability insurance for the defined benefit plans. The expenses for benefits granted under the defined benefit plans are calculated separately for each plan using the projected unit credit method. Actuarial gains and losses are recognized directly in other comprehensive income.
Current liabilities and provisions
Current liabilities mainly include provisions. A provision is reported if the PSI Group has a present (statutory, con- tractual, or constructive) obligation due to a past event, if it is likely that the settlement of the obligation will result in an outflow of resources that represent an economic benefit, and if the amount of the obligation can be esti- mated reliably. Provisions are reviewed at the end of each reporting period and adjusted to reflect the current best estimate. If the corresponding interest effect is material, the amount of the provision corresponds to the present value of the expenses likely to be required to settle the obligation. Where discounting is used, the increase in the provision to reflect the passage of time is recognized as borrowing costs.
PSIAnnual Report
2020
_71 Notes to the Consolidated Financial Statements
government grants
Government grants are recognized if there is reasonable assurance that the Company will comply with the condi-tions attaching to it. Government grants are recognized in profit or loss as scheduled in line with the recognition of the related costs which they are intended to compensate. Grants received for the acquisition of property, plant and equipment are reported under other liabilities as deferred income that is recognized as income in line with the re- ported depreciation during the use of the asset in question. Income generated in connection with the grants is reported as other operating income in the consolidated income statement.
In 2020 the PSI Group received subsidies totaling EUR 2,233 thousand (previous year: EUR 1,968 thousand) under various subsidy programs, including programs offered by the German federal government, the State of Berlin, and the European Union. As in the previous year, the sub- sidies granted were recognized in profit or loss and reported as a reduction of the corresponding expenses. Besides the obligation to demonstrate the amount of the expenses for which the subsidies were granted, there are no further conditions or obligations arising from the subsidy projects.
borrowing Costs
No borrowing costs were incurred or capitalized as part of the production of qualifying assets in the financial year under review or in the previous year.
research and development Costs
Research and development costs amounted to EUR 27.7 million in the 2020 financial year (previous year: EUR 23.9 million).
72_
recognition of revenues and income
The PSI Group primarily generates its revenues from pro- ject business and from issuing licenses for the use of its own software products to end customers, both with and without customer-specific adjustments. Revenues are also generated from the sale of third-party software, hardware, and services such as installation, consultancy, training, and mainten- ance. The PSI Group recognizes revenues when control over definable goods or services is transferred to the customer, i.e. when the customer has the ability to deter- mine the use of the transferred goods or services and primarily derives the remaining benefits from them. This is subject to the condition that there must be contract with enforceable rights and obligations and that receipt of the consideration must be probable, taking account of the customer’s creditworthiness. The revenues correspond to the transaction price to which the PSI Group is expected to be entitled. Variable consideration is included in the transaction price if it is highly likely that there will not be a significant reduction in revenues once there is no longer any uncertainty in connection with the variable considera-tion. The amount of the variable consideration is deter-mined either in line with the expected value method or at the most likely amount, depending on which value re- presents the most accurate estimate of the variable conside-ration. If there is a period of more than twelve months between the transfer of the goods or services and the payment date and if the financing results in a significant benefit for the customer or the PSI Group, the considera- tion is adjusted for the time value of money. If a contract includes multiple definable goods or services, the trans- action price is allocated to the performance obligations based on the relative individual selling prices. If individual selling prices are not directly observable, the PSI Group estimates them in an appropriate amount. For each per- formance obligation, revenues are recognized either at a specific point in time or over a specific period.
a) project businessRevenues are recognized over a specific period in line with the percentage-of-completion method based on the ratio of the costs already incurred to the estimated total costs or based on contractually defined milestones. An anticipated loss from a contract is immediately recognized as an ex- pense. Invoices are issued in accordance with the contrac- tual conditions; the payment terms usually stipulate payment within 30 days of the invoice being issued. With the percentage-of-completion method, the estimate of the percentage of completion is particularly important; in addition, it may include estimates regarding the scope of deliveries and services required to fulfill the contractual obligations. These significant estimates comprise the esti- mated total costs, total estimated revenues, order risks – including technical, political, and regulatory risks – and other relevant parameters. Under the percentage-of- completion method, changes in estimates may increase or reduce revenues. It must also be assessed whether the continuation of the contract in question or its termination represents the most likely scenario. For this assessment, all relevant facts and circumstances must be taken into account individually for each contract.
b) sale of licensesThe PSI Group recognizes its revenues on the basis of a corresponding contract as soon as the license has been delivered, the selling price is fixed or determinable, there are no significant obligations to customers and collection of the receivables is considered probable.
c) maintenance, other servicesIncome from maintenance agreements is recognized on a straight-line basis over the term of the agreement on the basis of past experience. Income from consultancy and training services is recognized as soon as the service is performed. Income from maintenance is reported as revenues from software development and maintenance in the notes to the consolidated financial statements, together with income from project business (less merchandise/hardware for which the costs are passed on).
d) recognition of interest incomeInterest is recognized on a time proportion basis, taking account of the effective yield on the asset.
PSIAnnual Report
2020
_73 Notes to the Consolidated Financial Statements
income taxes
Actual tax receivables and tax liabilities for the current period and for previous periods are to be measured at the amount expected to be recovered from or paid to the taxation authorities. This amount is calculated based on the tax rates and tax laws that are applicable or will soon be applicable as at the end of the reporting period.
Deferred taxes are accounted for using the liability method for all temporary differences as at the end of the reporting period between the carrying amount of an asset or liability in the balance sheet and its tax base. Deferred tax liabilities are recognized for all taxable temporary differences with the exception of:
– deferred tax liabilities from the initial recognition of good-will or of an asset or liability in a transaction that is not a business combination and does not affect the accounting profit for the period or the taxable profit at the time of the transaction
– the deferred tax liability from taxable temporary differ- ences relating to investments in subsidiaries, associated companies and interests in joint ventures that cannot be recognized if the timing of the reversal of the tempo-rary differences can be controlled and it is probable that the temporary differences will not reverse in the foresee-able future
Deferred tax assets are recognized for all deductible tempo- rary differences, unused tax loss carryforwards, and unused tax credits to the extent that it is probable or there is convincing evidence that taxable income will be available against which the deductible temporary differences and the unused tax loss carryforwards and tax credits can be offset, with the exception of:
– deferred tax assets from deductible temporary differences arising from the initial recognition of an asset or liability in a transaction that is not a business combination and does not affect the accounting profit for the period or the taxable profit at the time of the transaction
– deferred tax assets from deductible temporary differences relating to investments in subsidiaries, associated com- panies, and interests in joint ventures. These can be recognized only to the extent that it is probable that the temporary differences will reverse in the foreseeable future and sufficient taxable profit will be available against which the temporary differences can be utilized.
The carrying amount of the deferred tax assets is reviewed at the end of each reporting period and written down to the extent that it is no longer probable that sufficient taxable profit will be available against which the deferred tax asset can be at least partially offset. Unrecognized deferred tax assets are reviewed at the end of each reporting period and recognized to the extent that it has become probable or convincing evidence has emerged that future taxable profit will allow the deferred tax asset to be recovered.
Deferred tax assets and liabilities are measured at the tax rates that are expected to apply in the period when the asset is realized or the liability is settled. This is done based on the tax rates (and tax laws) that are applicable or have been announced and will soon be applicable as at the end of the reporting period. Income taxes relating to items recognized directly in equity are recognized in equity and not in the consolidated income statement.
Deferred tax assets and deferred tax liabilities are offset against one another if they relate to income taxes of the same taxable entity levied by the same taxation authority and if it is not possible to offset the deferred taxes against one another.
74_
sales tax
Revenues, expenses, and assets are recognized net of sales tax, except in the following cases:
– If the sales tax incurred when purchasing assets or services cannot be claimed from the taxation authority, the sales tax is recognized as part of the cost of the asset or as part of the expenses.
– Receivables and liabilities are recognized including the associated amount of sales tax.
The amount of sales tax reimbursed by or paid to the taxation authority is recognized in the consolidated balance sheet under receivables or liabilities.
segment reporting
a) business segmentsIn accordance with IFRS 8, business segments are to be differentiated on the basis of internal reporting on areas of the Group that are reviewed regularly by the Group’s chief operating decision maker to make decisions about the allocation of resources to these segments and assess their performance. The PSI Group essentially differentiates between the following two business segments:
– Energy Management
– Production Management
Financial information on the business segments and geographical segments is presented in section F. and in the segment reporting on page 54f.
b) transactions between business segments Transfers between business segments are included in the “Reconciliation” column in section F. and in the segment reporting on page 54f.
PSIAnnual Report
2020
_75 Notes to the Consolidated Financial Statements
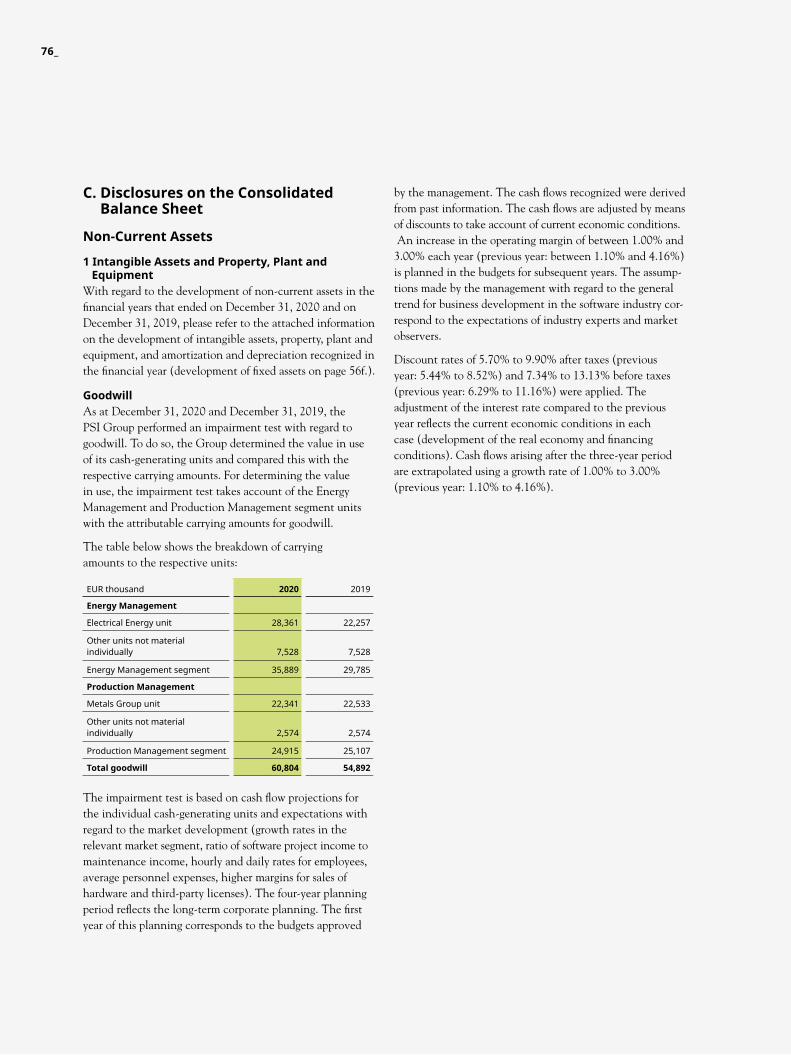
C. disclosures on the Consolidated balance sheet
non-Current assets
1 intangible assets and property, plant and equipmentWith regard to the development of non-current assets in the financial years that ended on December 31, 2020 and on December 31, 2019, please refer to the attached information on the development of intangible assets, property, plant and equipment, and amortization and depreciation recognized in the financial year (development of fixed assets on page 56f.).
goodwillAs at December 31, 2020 and December 31, 2019, the PSI Group performed an impairment test with regard to goodwill. To do so, the Group determined the value in use of its cash-generating units and compared this with the respective carrying amounts. For determining the value in use, the impairment test takes account of the Energy Management and Production Management segment units with the attributable carrying amounts for goodwill.
The table below shows the breakdown of carrying amounts to the respective units:
The impairment test is based on cash flow projections for the individual cash-generating units and expectations with regard to the market development (growth rates in the relevant market segment, ratio of software project income to maintenance income, hourly and daily rates for employees, average personnel expenses, higher margins for sales of hardware and third-party licenses). The four-year planning period reflects the long-term corporate planning. The first year of this planning corresponds to the budgets approved
by the management. The cash flows recognized were derived from past information. The cash flows are adjusted by means of discounts to take account of current economic conditions. An increase in the operating margin of between 1.00% and 3.00% each year (previous year: between 1.10% and 4.16%) is planned in the budgets for subsequent years. The assump- tions made by the management with regard to the general trend for business development in the software industry cor- respond to the expectations of industry experts and market observers.
Discount rates of 5.70% to 9.90% after taxes (previous year: 5.44% to 8.52%) and 7.34% to 13.13% before taxes (previous year: 6.29% to 11.16%) were applied. The adjustment of the interest rate compared to the previous year reflects the current economic conditions in each case (development of the real economy and financing conditions). Cash flows arising after the three-year period are extrapolated using a growth rate of 1.00% to 3.00% (previous year: 1.10% to 4.16%).
EUR thousand 2020 2019
energy management
Electrical Energy unit 28,361 22,257
Other units not material individually 7,528 7,528
Energy Management segment 35,889 29,785
production management
Metals Group unit 22,341 22,533
Other units not material individually 2,574 2,574
Production Management segment 24,915 25,107
total goodwill 60,804 54,892
76_
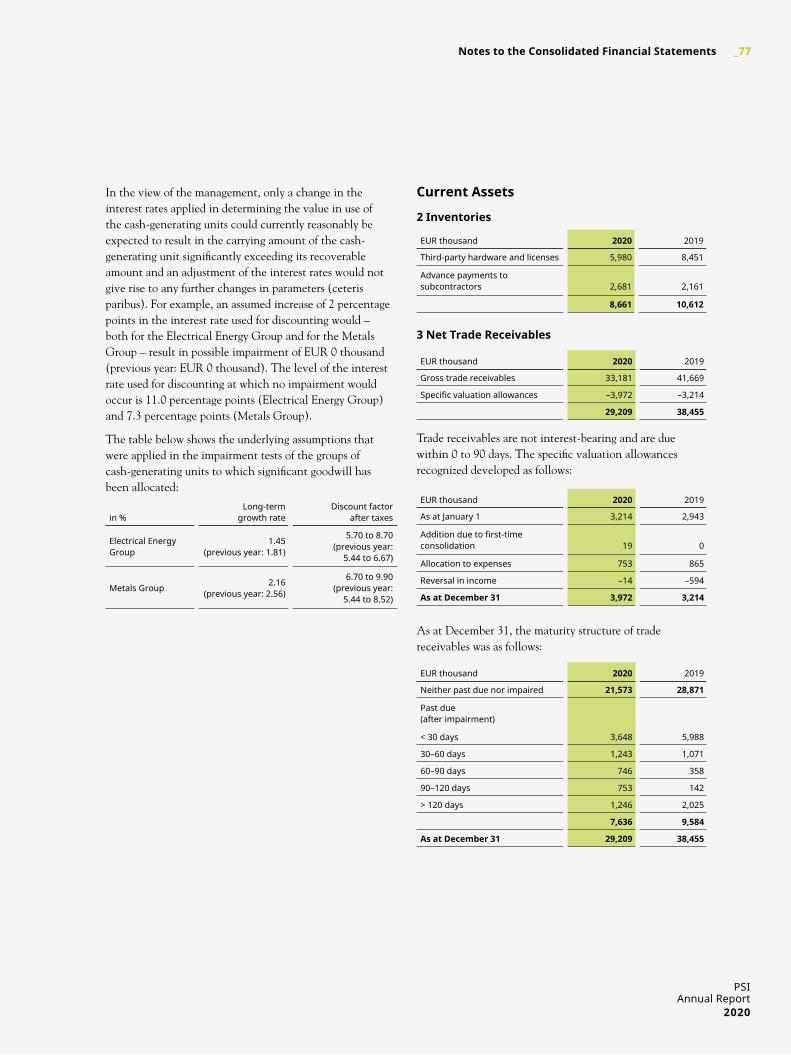
In the view of the management, only a change in the interest rates applied in determining the value in use of the cash-generating units could currently reasonably be expected to result in the carrying amount of the cash- generating unit significantly exceeding its recoverable amount and an adjustment of the interest rates would not give rise to any further changes in parameters (ceteris paribus). For example, an assumed increase of 2 percentage points in the interest rate used for discounting would – both for the Electrical Energy Group and for the Metals Group – result in possible impairment of EUR 0 thousand (previous year: EUR 0 thousand). The level of the interest rate used for discounting at which no impairment would occur is 11.0 percentage points (Electrical Energy Group) and 7.3 percentage points (Metals Group).
The table below shows the underlying assumptions that were applied in the impairment tests of the groups of cash-generating units to which significant goodwill has been allocated:
Current assets
2 inventories
3 net trade receivables
Trade receivables are not interest-bearing and are due within 0 to 90 days. The specific valuation allowances recognized developed as follows:
As at December 31, the maturity structure of trade receivables was as follows:
in %Long-term
growth rateDiscount factor
after taxes
Electrical Energy Group
1.45 (previous year: 1.81)
5.70 to 8.70 (previous year:
5.44 to 6.67)
Metals Group 2.16 (previous year: 2.56)
6.70 to 9.90 (previous year:
5.44 to 8.52)
EUR thousand 2020 2019
Third-party hardware and licenses 5,980 8,451
Advance payments to subcontractors 2,681 2,161
8,661 10,612
EUR thousand 2020 2019
Gross trade receivables 33,181 41,669
Specificvaluationallowances –3,972 –3,214
29,209 38,455
EUR thousand 2020 2019
As at January 1 3,214 2,943
Additionduetofirst-time consolidation 19 0
Allocation to expenses 753 865
Reversal in income –14 –594
as at december 31 3,972 3,214
EUR thousand 2020 2019
Neither past due nor impaired 21,573 28,871
Past due (after impairment)
< 30 days 3,648 5,988
30–60 days 1,243 1,071
60–90 days 746 358
90–120 days 753 142
> 120 days 1,246 2,025
7,636 9,584
as at december 31 29,209 38,455
PSIAnnual Report
2020
_77 Notes to the Consolidated Financial Statements
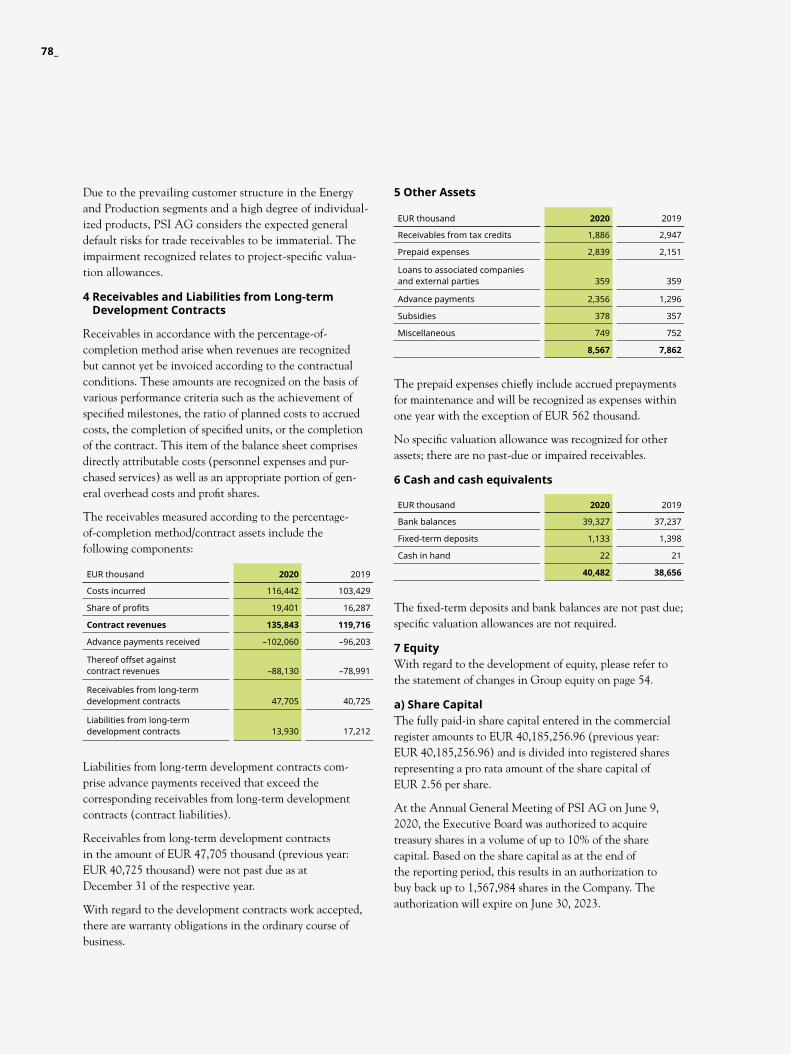
5 other assets
The prepaid expenses chiefly include accrued prepayments for maintenance and will be recognized as expenses within one year with the exception of EUR 562 thousand.
No specific valuation allowance was recognized for other assets; there are no past-due or impaired receivables.
6 Cash and cash equivalents
The fixed-term deposits and bank balances are not past due; specific valuation allowances are not required.
7 equityWith regard to the development of equity, please refer to the statement of changes in Group equity on page 54.
a) share CapitalThe fully paid-in share capital entered in the commercial register amounts to EUR 40,185,256.96 (previous year: EUR 40,185,256.96) and is divided into registered shares representing a pro rata amount of the share capital of EUR 2.56 per share.
At the Annual General Meeting of PSI AG on June 9, 2020, the Executive Board was authorized to acquire treasury shares in a volume of up to 10% of the share capital. Based on the share capital as at the end of the reporting period, this results in an authorization to buy back up to 1,567,984 shares in the Company. The authorization will expire on June 30, 2023.
Due to the prevailing customer structure in the Energy and Production segments and a high degree of individual- ized products, PSI AG considers the expected general default risks for trade receivables to be immaterial. The impairment recognized relates to project-specific valua- tion allowances.
4 receivables and liabilities from long-term development Contracts
Receivables in accordance with the percentage-of- completion method arise when revenues are recognized but cannot yet be invoiced according to the contractual conditions. These amounts are recognized on the basis of various performance criteria such as the achievement of specified milestones, the ratio of planned costs to accrued costs, the completion of specified units, or the completion of the contract. This item of the balance sheet comprises directly attributable costs (personnel expenses and pur- chased services) as well as an appropriate portion of gen- eral overhead costs and profit shares.
The receivables measured according to the percentage- of-completion method/contract assets include the following components:
Liabilities from long-term development contracts com- prise advance payments received that exceed the corresponding receivables from long-term development contracts (contract liabilities).
Receivables from long-term development contracts in the amount of EUR 47,705 thousand (previous year: EUR 40,725 thousand) were not past due as at December 31 of the respective year.
With regard to the development contracts work accepted, there are warranty obligations in the ordinary course of business.
EUR thousand 2020 2019
Bank balances 39,327 37,237
Fixed-term deposits 1,133 1,398
Cash in hand 22 21
40,482 38,656EUR thousand 2020 2019
Costs incurred 116,442 103,429
Shareofprofits 19,401 16,287
Contract revenues 135,843 119,716
Advance payments received –102,060 –96,203
Thereof offset against contract revenues –88,130 –78,991
Receivables from long-term development contracts 47,705 40,725
Liabilities from long-term development contracts 13,930 17,212
EUR thousand 2020 2019
Receivables from tax credits 1,886 2,947
Prepaid expenses 2,839 2,151
Loans to associated companies and external parties 359 359
Advance payments 2,356 1,296
Subsidies 378 357
Miscellaneous 749 752
8,567 7,862
78_
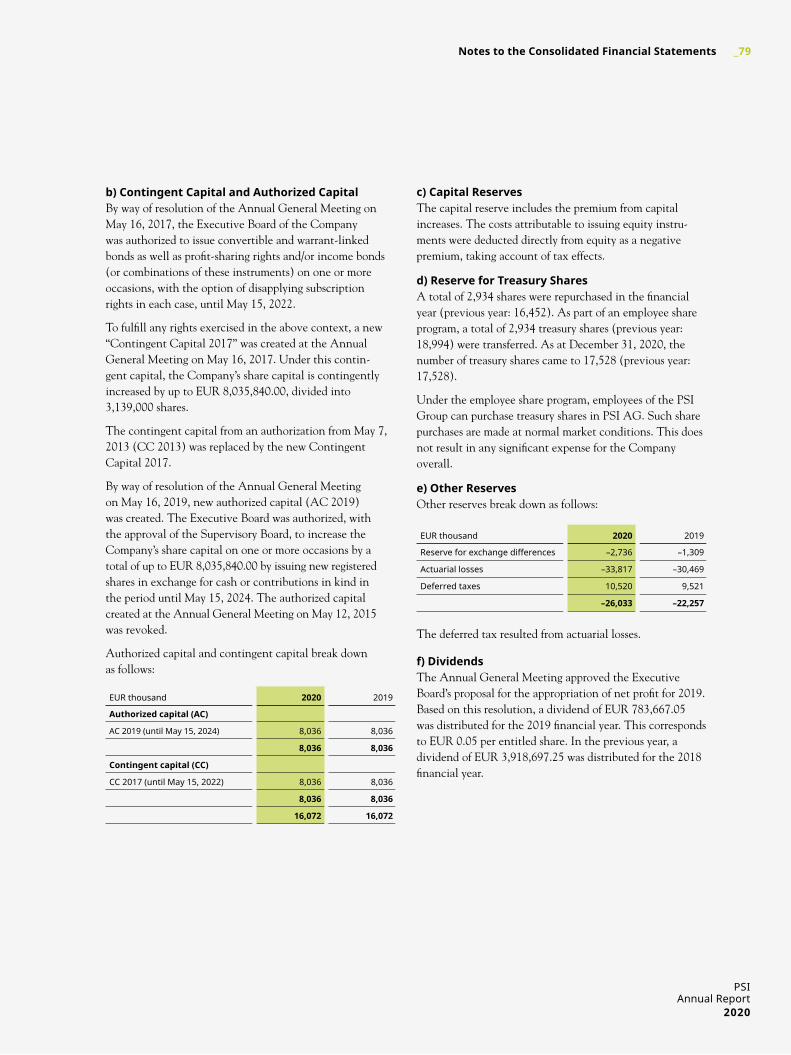
c) Capital reservesThe capital reserve includes the premium from capital increases. The costs attributable to issuing equity instru-ments were deducted directly from equity as a negative premium, taking account of tax effects.
d) reserve for treasury shares A total of 2,934 shares were repurchased in the financial year (previous year: 16,452). As part of an employee share program, a total of 2,934 treasury shares (previous year: 18,994) were transferred. As at December 31, 2020, the number of treasury shares came to 17,528 (previous year: 17,528).
Under the employee share program, employees of the PSI Group can purchase treasury shares in PSI AG. Such share purchases are made at normal market conditions. This does not result in any significant expense for the Company overall.
e) other reservesOther reserves break down as follows:
The deferred tax resulted from actuarial losses.
f) dividendsThe Annual General Meeting approved the Executive Board’s proposal for the appropriation of net profit for 2019. Based on this resolution, a dividend of EUR 783,667.05 was distributed for the 2019 financial year. This corresponds to EUR 0.05 per entitled share. In the previous year, a dividend of EUR 3,918,697.25 was distributed for the 2018 financial year.
b) Contingent Capital and authorized Capital By way of resolution of the Annual General Meeting on May 16, 2017, the Executive Board of the Company was authorized to issue convertible and warrant-linked bonds as well as profit-sharing rights and/or income bonds (or combinations of these instruments) on one or more occasions, with the option of disapplying subscription rights in each case, until May 15, 2022.
To fulfill any rights exercised in the above context, a new “Contingent Capital 2017” was created at the Annual General Meeting on May 16, 2017. Under this contin- gent capital, the Company’s share capital is contingently increased by up to EUR 8,035,840.00, divided into 3,139,000 shares.
The contingent capital from an authorization from May 7, 2013 (CC 2013) was replaced by the new Contingent Capital 2017.
By way of resolution of the Annual General Meeting on May 16, 2019, new authorized capital (AC 2019) was created. The Executive Board was authorized, with the approval of the Supervisory Board, to increase the Company’s share capital on one or more occasions by a total of up to EUR 8,035,840.00 by issuing new registered shares in exchange for cash or contributions in kind in the period until May 15, 2024. The authorized capital created at the Annual General Meeting on May 12, 2015 was revoked.
Authorized capital and contingent capital break down as follows:
EUR thousand 2020 2019
Reserve for exchange differences –2,736 –1,309
Actuarial losses –33,817 –30,469
Deferred taxes 10,520 9,521
–26,033 –22,257
EUR thousand 2020 2019
authorized capital (aC)
AC 2019 (until May 15, 2024) 8,036 8,036
8,036 8,036
Contingent capital (CC)
CC 2017 (until May 15, 2022) 8,036 8,036
8,036 8,036
16,072 16,072
PSIAnnual Report
2020
_79 Notes to the Consolidated Financial Statements
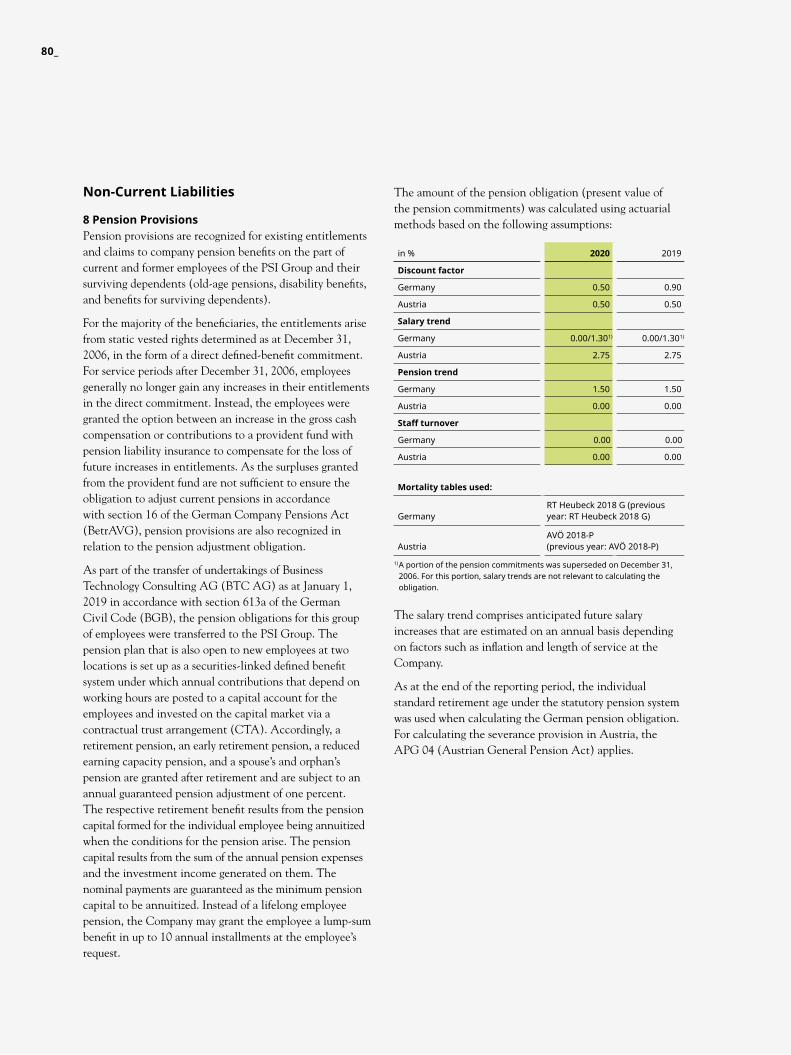
The amount of the pension obligation (present value of the pension commitments) was calculated using actuarial methods based on the following assumptions:
The salary trend comprises anticipated future salary increases that are estimated on an annual basis depending on factors such as inflation and length of service at the Company.
As at the end of the reporting period, the individual standard retirement age under the statutory pension system was used when calculating the German pension obligation. For calculating the severance provision in Austria, the APG 04 (Austrian General Pension Act) applies.
non-Current liabilities
8 pension provisions Pension provisions are recognized for existing entitlements and claims to company pension benefits on the part of current and former employees of the PSI Group and their surviving dependents (old-age pensions, disability benefits, and benefits for surviving dependents).
For the majority of the beneficiaries, the entitlements arise from static vested rights determined as at December 31, 2006, in the form of a direct defined-benefit commitment. For service periods after December 31, 2006, employees generally no longer gain any increases in their entitlements in the direct commitment. Instead, the employees were granted the option between an increase in the gross cash compensation or contributions to a provident fund with pension liability insurance to compensate for the loss of future increases in entitlements. As the surpluses granted from the provident fund are not sufficient to ensure the obligation to adjust current pensions in accordance with section 16 of the German Company Pensions Act (BetrAVG), pension provisions are also recognized in relation to the pension adjustment obligation.
As part of the transfer of undertakings of Business Technology Consulting AG (BTC AG) as at January 1, 2019 in accordance with section 613a of the German Civil Code (BGB), the pension obligations for this group of employees were transferred to the PSI Group. The pension plan that is also open to new employees at two locations is set up as a securities-linked defined benefit system under which annual contributions that depend on working hours are posted to a capital account for the employees and invested on the capital market via a contractual trust arrangement (CTA). Accordingly, a retirement pension, an early retirement pension, a reduced earning capacity pension, and a spouse’s and orphan’s pension are granted after retirement and are subject to an annual guaranteed pension adjustment of one percent. The respective retirement benefit results from the pension capital formed for the individual employee being annuitized when the conditions for the pension arise. The pension capital results from the sum of the annual pension expenses and the investment income generated on them. The nominal payments are guaranteed as the minimum pension capital to be annuitized. Instead of a lifelong employee pension, the Company may grant the employee a lump-sum benefit in up to 10 annual installments at the employee’s request.
in % 2020 2019
discount factor
Germany 0.50 0.90
Austria 0.50 0.50
salary trend
Germany 0.00/1.301) 0.00/1.301)
Austria 2.75 2.75
pension trend
Germany 1.50 1.50
Austria 0.00 0.00
staff turnover
Germany 0.00 0.00
Austria 0.00 0.00
mortality tables used:
Germany
RT Heubeck 2018 G (previous year: RT Heubeck 2018 G)
Austria
AVÖ 2018-P (previous year: AVÖ 2018-P)
1) A portion of the pension commitments was superseded on December 31, 2006. For this portion, salary trends are not relevant to calculating the obligation.
80_
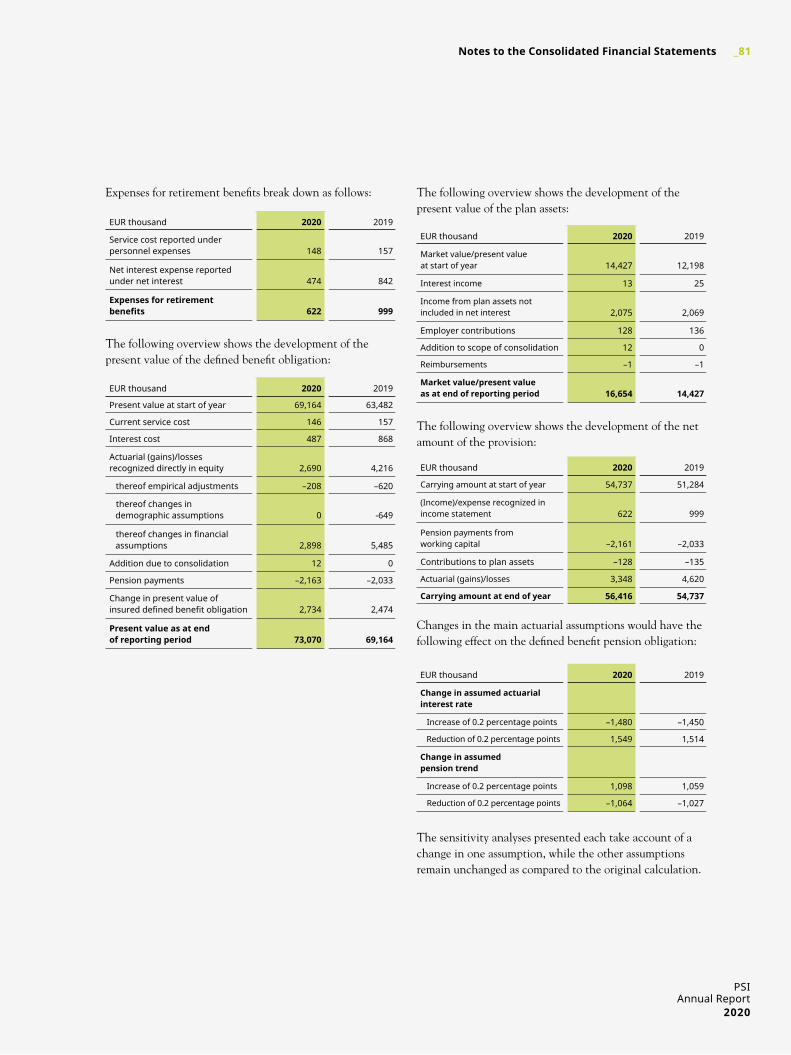
The following overview shows the development of the present value of the plan assets:
The following overview shows the development of the net amount of the provision:
Changes in the main actuarial assumptions would have the following effect on the defined benefit pension obligation:
The sensitivity analyses presented each take account of a change in one assumption, while the other assumptions remain unchanged as compared to the original calculation.
Expenses for retirement benefits break down as follows:
The following overview shows the development of the present value of the defined benefit obligation:
EUR thousand 2020 2019
Service cost reported under personnel expenses 148
157
Net interest expense reported under net interest 474
842
expenses for retirement benefits 622
999
EUR thousand 2020 2019
Present value at start of year 69,164 63,482
Current service cost 146 157
Interest cost 487 868
Actuarial (gains)/losses recognized directly in equity 2,690 4,216
thereof empirical adjustments –208 –620
thereof changes in demographic assumptions 0 -649
thereofchangesinfinancial assumptions 2,898 5,485
Addition due to consolidation 12 0
Pension payments –2,163 –2,033
Change in present value of insureddefinedbenefitobligation 2,734 2,474
present value as at end of reporting period 73,070 69,164
EUR thousand 2020 2019
Market value/present value at start of year 14,427 12,198
Interest income 13 25
Income from plan assets not included in net interest 2,075 2,069
Employer contributions 128 136
Addition to scope of consolidation 12 0
Reimbursements –1 –1
market value/present value as at end of reporting period 16,654 14,427
EUR thousand 2020 2019
Carrying amount at start of year 54,737 51,284
(Income)/expense recognized in income statement 622 999
Pension payments from working capital –2,161 –2,033
Contributions to plan assets –128 –135
Actuarial (gains)/losses 3,348 4,620
Carrying amount at end of year 56,416 54,737
EUR thousand 2020 2019
Change in assumed actuarial interest rate
Increase of 0.2 percentage points –1,480 –1,450
Reduction of 0.2 percentage points 1,549 1,514
Change in assumed pension trend
Increase of 0.2 percentage points 1,098 1,059
Reduction of 0.2 percentage points –1,064 –1,027
PSIAnnual Report
2020
_81 Notes to the Consolidated Financial Statements
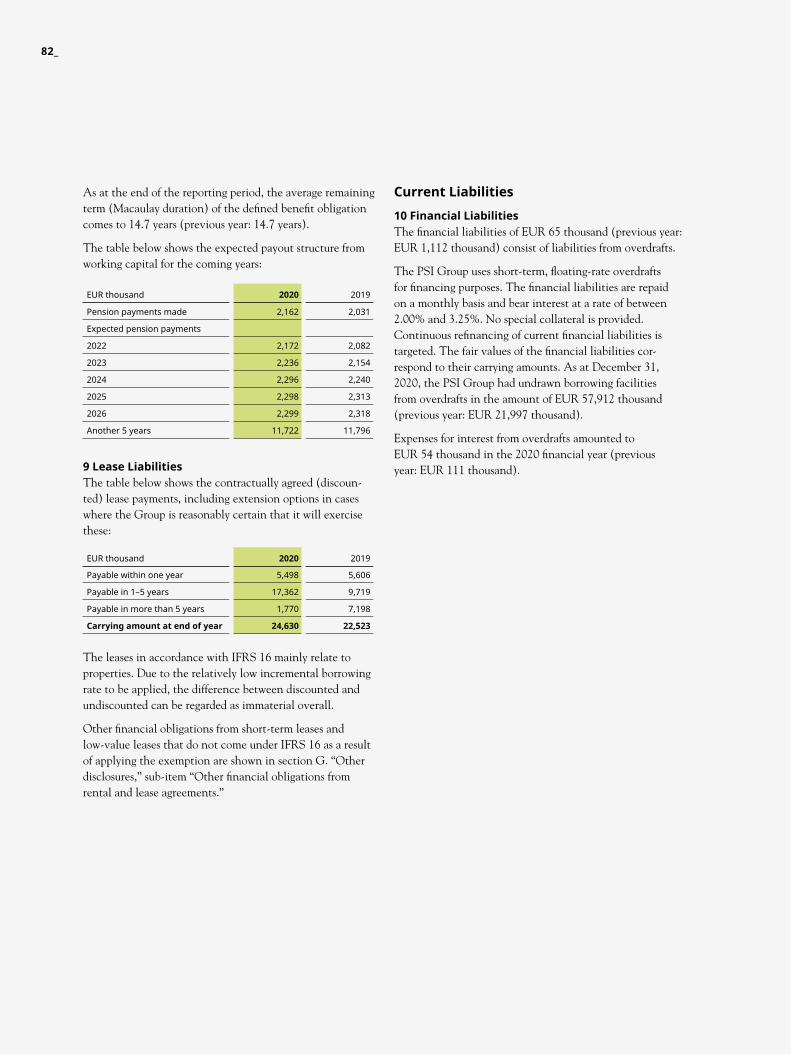
Current liabilities
10 financial liabilities The financial liabilities of EUR 65 thousand (previous year: EUR 1,112 thousand) consist of liabilities from overdrafts.
The PSI Group uses short-term, floating-rate overdrafts for financing purposes. The financial liabilities are repaid on a monthly basis and bear interest at a rate of between 2.00% and 3.25%. No special collateral is provided. Continuous refinancing of current financial liabilities is targeted. The fair values of the financial liabilities cor- respond to their carrying amounts. As at December 31, 2020, the PSI Group had undrawn borrowing facilities from overdrafts in the amount of EUR 57,912 thousand (previous year: EUR 21,997 thousand).
Expenses for interest from overdrafts amounted to EUR 54 thousand in the 2020 financial year (previous year: EUR 111 thousand).
As at the end of the reporting period, the average remaining term (Macaulay duration) of the defined benefit obligation comes to 14.7 years (previous year: 14.7 years).
The table below shows the expected payout structure from working capital for the coming years:
9 lease liabilitiesThe table below shows the contractually agreed (discoun-ted) lease payments, including extension options in cases where the Group is reasonably certain that it will exercise these:
The leases in accordance with IFRS 16 mainly relate to properties. Due to the relatively low incremental borrowing rate to be applied, the difference between discounted and undiscounted can be regarded as immaterial overall.
Other financial obligations from short-term leases and low-value leases that do not come under IFRS 16 as a result of applying the exemption are shown in section G. “Other disclosures,” sub-item “Other financial obligations from rental and lease agreements.”
EUR thousand 2020 2019
Payable within one year 5,498 5,606
Payable in 1–5 years 17,362 9,719
Payable in more than 5 years 1,770 7,198
Carrying amount at end of year 24,630 22,523
EUR thousand 2020 2019
Pension payments made 2,162 2,031
Expected pension payments
2022 2,172 2,082
2023 2,236 2,154
2024 2,296 2,240
2025 2,298 2,313
2026 2,299 2,318
Another 5 years 11,722 11,796
82_
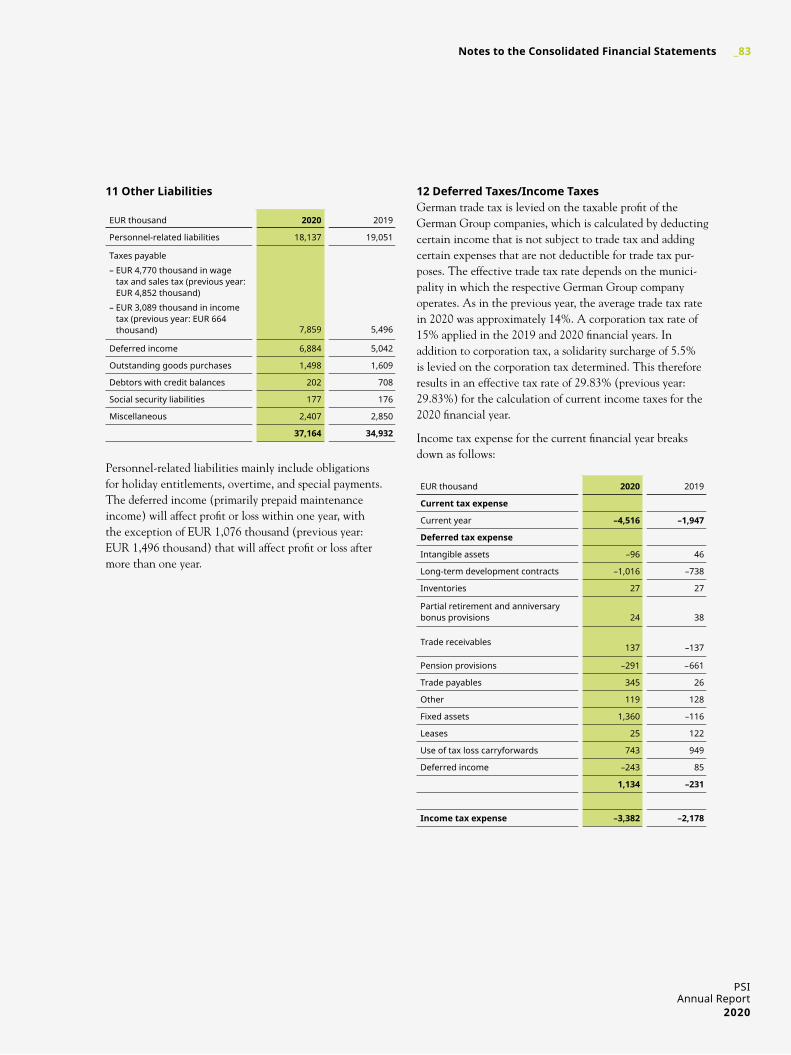
12 deferred taxes/income taxesGerman trade tax is levied on the taxable profit of the German Group companies, which is calculated by deducting certain income that is not subject to trade tax and adding certain expenses that are not deductible for trade tax pur- poses. The effective trade tax rate depends on the munici- pality in which the respective German Group company operates. As in the previous year, the average trade tax rate in 2020 was approximately 14%. A corporation tax rate of 15% applied in the 2019 and 2020 financial years. In addition to corporation tax, a solidarity surcharge of 5.5% is levied on the corporation tax determined. This therefore results in an effective tax rate of 29.83% (previous year: 29.83%) for the calculation of current income taxes for the 2020 financial year.
Income tax expense for the current financial year breaks down as follows:
11 other liabilities
Personnel-related liabilities mainly include obligations for holiday entitlements, overtime, and special payments. The deferred income (primarily prepaid maintenance income) will affect profit or loss within one year, with the exception of EUR 1,076 thousand (previous year: EUR 1,496 thousand) that will affect profit or loss after more than one year.
EUR thousand 2020 2019
Current tax expense
Current year –4,516 –1,947
deferred tax expense
Intangible assets –96 46
Long-term development contracts –1,016 –738
Inventories 27 27
Partial retirement and anniversary bonus provisions 24
38
Trade receivables 137
–137
Pension provisions –291 –661
Trade payables 345 26
Other 119 128
Fixed assets 1,360 –116
Leases 25 122
Use of tax loss carryforwards 743 949
Deferred income –243 85
1,134 –231
income tax expense –3,382 –2,178
EUR thousand 2020 2019
Personnel-related liabilities 18,137 19,051
Taxes payable
– EUR 4,770 thousand in wage tax and sales tax (previous year: EUR 4,852 thousand)
– EUR 3,089 thousand in income tax (previous year: EUR 664 thousand) 7,859 5,496
Deferred income 6,884 5,042
Outstanding goods purchases 1,498 1,609
Debtors with credit balances 202 708
Social security liabilities 177 176
Miscellaneous 2,407 2,850
37,164 34,932
PSIAnnual Report
2020
_83 Notes to the Consolidated Financial Statements
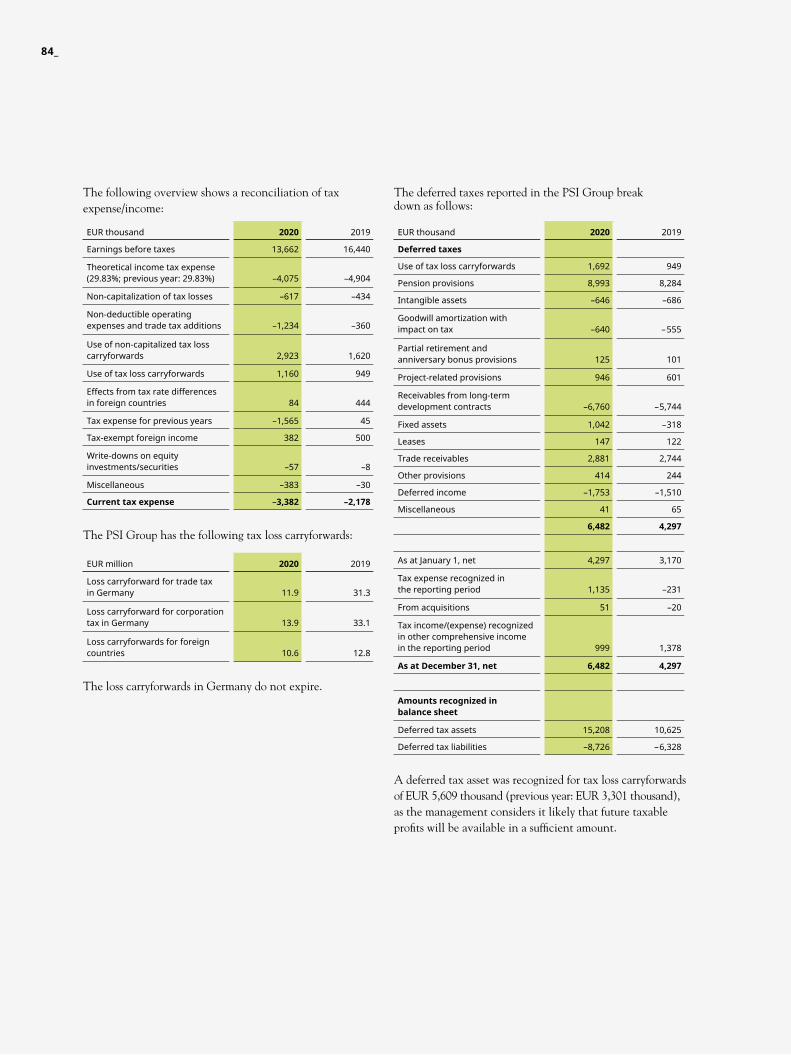
The deferred taxes reported in the PSI Group break down as follows:
A deferred tax asset was recognized for tax loss carryforwards of EUR 5,609 thousand (previous year: EUR 3,301 thousand), as the management considers it likely that future taxable profits will be available in a sufficient amount.
The following overview shows a reconciliation of tax expense/income:
The PSI Group has the following tax loss carryforwards:
The loss carryforwards in Germany do not expire.
EUR thousand 2020 2019
deferred taxes
Use of tax loss carryforwards 1,692 949
Pension provisions 8,993 8,284
Intangible assets –646 –686
Goodwill amortization with impact on tax –640
–555
Partial retirement and anniversary bonus provisions 125 101
Project-related provisions 946 601
Receivables from long-term development contracts –6,760
–5,744
Fixed assets 1,042 –318
Leases 147 122
Trade receivables 2,881 2,744
Other provisions 414 244
Deferred income –1,753 –1,510
Miscellaneous 41 65
6,482 4,297
As at January 1, net 4,297 3,170
Tax expense recognized in the reporting period 1,135
–231
From acquisitions 51 –20
Tax income/(expense) recognized in other comprehensive income in the reporting period 999
1,378
as at december 31, net 6,482 4,297
amounts recognized in balance sheet
Deferred tax assets 15,208 10,625
Deferred tax liabilities –8,726 –6,328
EUR thousand 2020 2019
Earnings before taxes 13,662 16,440
Theoretical income tax expense (29.83%; previous year: 29.83%) –4,075 –4,904
Non-capitalization of tax losses –617 –434
Non-deductible operating expenses and trade tax additions –1,234 –360
Use of non-capitalized tax loss carryforwards 2,923 1,620
Use of tax loss carryforwards 1,160 949
Effects from tax rate differences in foreign countries 84 444
Tax expense for previous years –1,565 45
Tax-exempt foreign income 382 500
Write-downs on equity investments/securities –57 –8
Miscellaneous –383 –30
Current tax expense –3,382 –2,178
EUR million 2020 2019
Loss carryforward for trade tax in Germany 11.9 31.3
Loss carryforward for corporation tax in Germany 13.9 33.1
Loss carryforwards for foreign countries 10.6 12.8
84_
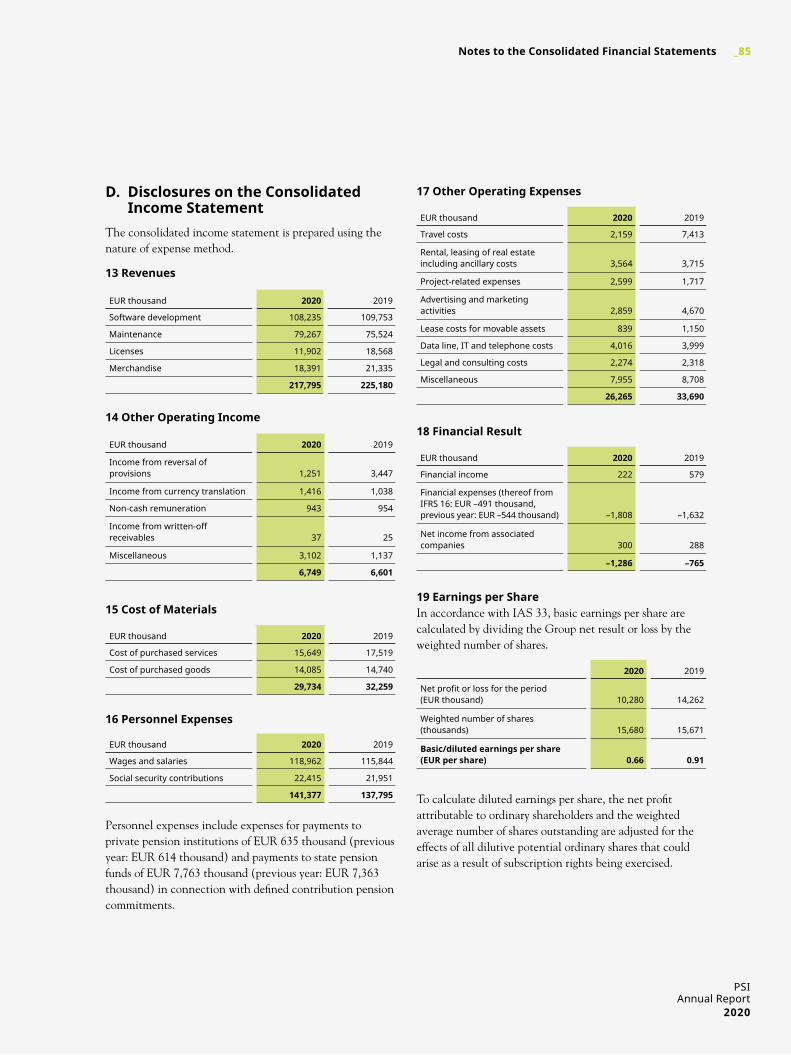
17 other operating expenses
18 financial result
19 earnings per shareIn accordance with IAS 33, basic earnings per share are calculated by dividing the Group net result or loss by the weighted number of shares.
To calculate diluted earnings per share, the net profit attributable to ordinary shareholders and the weighted average number of shares outstanding are adjusted for the effects of all dilutive potential ordinary shares that could arise as a result of subscription rights being exercised.
d. disclosures on the Consolidated income statement
The consolidated income statement is prepared using the nature of expense method.
13 revenues
14 other operating income
15 Cost of materials
16 personnel expenses
Personnel expenses include expenses for payments to private pension institutions of EUR 635 thousand (previous year: EUR 614 thousand) and payments to state pension funds of EUR 7,763 thousand (previous year: EUR 7,363 thousand) in connection with defined contribution pension commitments.
EUR thousand 2020 2019
Travel costs 2,159 7,413
Rental, leasing of real estate including ancillary costs 3,564 3,715
Project-related expenses 2,599 1,717
Advertising and marketing activities 2,859 4,670
Lease costs for movable assets 839 1,150
Data line, IT and telephone costs 4,016 3,999
Legal and consulting costs 2,274 2,318
Miscellaneous 7,955 8,708
26,265 33,690
EUR thousand 2020 2019
Financial income 222 579
Financial expenses (thereof from IFRS 16: EUR –491 thousand, previous year: EUR –544 thousand) –1,808 –1,632
Net income from associated companies 300 288
–1,286 –765
2020 2019
Netprofitorlossfortheperiod (EUR thousand) 10,280 14,262
Weighted number of shares (thousands) 15,680
15,671
basic/diluted earnings per share (eur per share) 0.66
0.91
EUR thousand 2020 2019
Software development 108,235 109,753
Maintenance 79,267 75,524
Licenses 11,902 18,568
Merchandise 18,391 21,335
217,795 225,180
EUR thousand 2020 2019
Income from reversal of provisions 1,251 3,447
Income from currency translation 1,416 1,038
Non-cash remuneration 943 954
Income from written-off receivables 37 25
Miscellaneous 3,102 1,137
6,749 6,601
EUR thousand 2020 2019
Cost of purchased services 15,649 17,519
Cost of purchased goods 14,085 14,740
29,734 32,259
EUR thousand 2020 2019
Wages and salaries 118,962 115,844
Social security contributions 22,415 21,951
141,377 137,795
PSIAnnual Report
2020
_85 Notes to the Consolidated Financial Statements
e. disclosures on the Cash flow statement
The reported cash and cash equivalents are not subject to any restrictions on their availability due to third parties. During the year under review, a dividend of 5 euro cents per share (previous year: 25 euro cents per share) was dis- tributed to the shareholders for the 2019 financial year. The breakdown of cash and cash equivalents is shown in the table under C. 6. Overdraft liabilities were not includ- ed in cash and cash equivalents.
f. disclosures on segment reportingThe PSI Group has two main segments that are reportable and applies IFRS 8 “Segment Reporting.” This standard includes regulations on the disclosure of information on business areas and geographical segments.
description of the segments
− Energy Management: Intelligent solutions for utility companies in the electricity, gas, oil, and water sectors. The focus here is on reliable and cost-effective solutions for grid management and for trade and distribution in liberalized energy markets.
− Production Management: Software products and individual solutions for production planning, particularly tasks relating to production control and efficient logistics. The focus is on optimizing the use of resources and increasing quality and cost-effectiveness.
reconciliationRevenues from transactions with other segments are grouped in the “Reconciliation” column. Revenues between business segments amounted to EUR 16,514 thousand as at December 31, 2020 (previous year: EUR 13,001 thou- sand). Certain expenses are not allocated to the individual segments. The result from reconciliation amounts to EUR –2,866 thousand (previous year: EUR –1,568 thousand).
additional geographical disclosures In the 2020 financial year, the PSI Group generated revenues of EUR 139.8 million (previous year: EUR 132.8 million) in Germany and revenues of EUR 78.5 million (previous year: EUR 92.4 million) in foreign countries. Non-current assets of EUR 46,107 thousand (previous year: EUR 38,357 thousand) are attributable to foreign countries.
86_
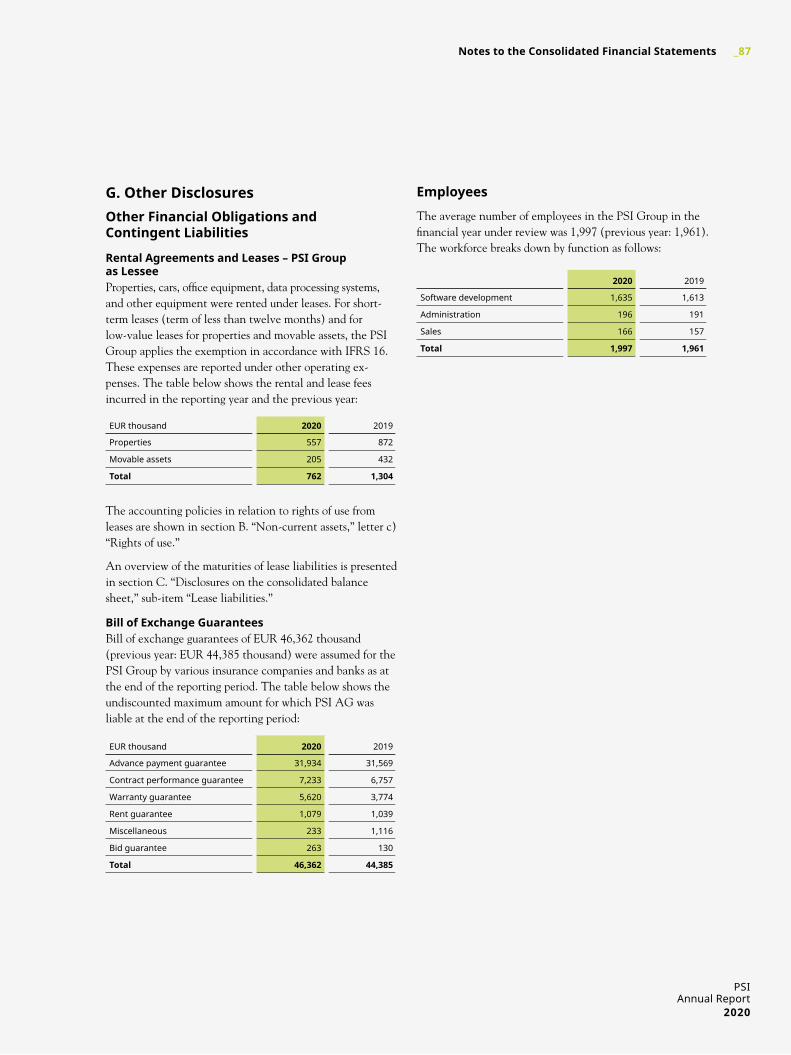
g. other disclosuresother financial obligations and Contingent liabilities
rental agreements and leases – psi group as lesseeProperties, cars, office equipment, data processing systems, and other equipment were rented under leases. For short- term leases (term of less than twelve months) and for low-value leases for properties and movable assets, the PSI Group applies the exemption in accordance with IFRS 16. These expenses are reported under other operating ex- penses. The table below shows the rental and lease fees incurred in the reporting year and the previous year:
The accounting policies in relation to rights of use from leases are shown in section B. “Non-current assets,” letter c) “Rights of use.”
An overview of the maturities of lease liabilities is presented in section C. “Disclosures on the consolidated balance sheet,” sub-item “Lease liabilities.”
bill of exchange guaranteesBill of exchange guarantees of EUR 46,362 thousand (previous year: EUR 44,385 thousand) were assumed for the PSI Group by various insurance companies and banks as at the end of the reporting period. The table below shows the undiscounted maximum amount for which PSI AG was liable at the end of the reporting period:
employees
The average number of employees in the PSI Group in the financial year under review was 1,997 (previous year: 1,961). The workforce breaks down by function as follows:
EUR thousand 2020 2019
Properties 557 872
Movable assets 205 432
total 762 1,304
EUR thousand 2020 2019
Advance payment guarantee 31,934 31,569
Contract performance guarantee 7,233 6,757
Warranty guarantee 5,620 3,774
Rent guarantee 1,079 1,039
Miscellaneous 233 1,116
Bid guarantee 263 130
total 46,362 44,385
2020 2019
Software development 1,635 1,613
Administration 196 191
Sales 166 157
total 1,997 1,961
PSIAnnual Report
2020
_87 Notes to the Consolidated Financial Statements
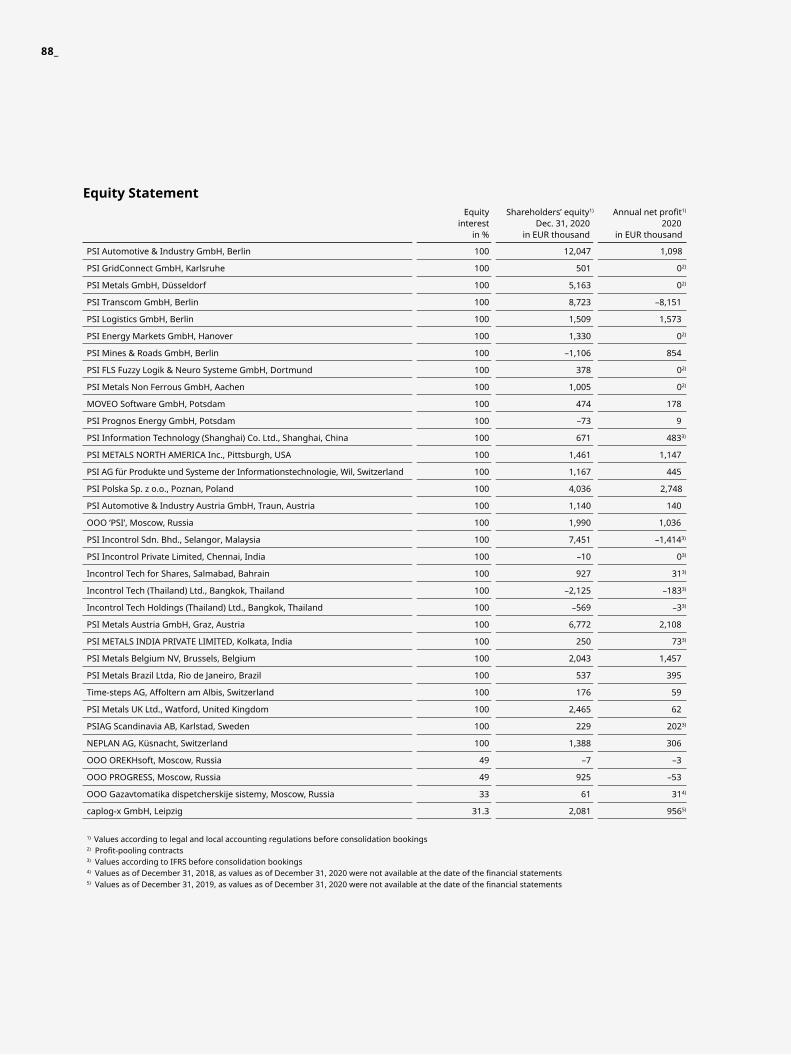
equity statementEquity
interest in %
Shareholders’ equity1)
Dec. 31, 2020in EUR thousand
Annualnetprofit1)
2020in EUR thousand
PSI Automotive & Industry GmbH, Berlin 100 12,047 1,098
PSI GridConnect GmbH, Karlsruhe 100 501 02)
PSI Metals GmbH, Düsseldorf 100 5,163 02)
PSI Transcom GmbH, Berlin 100 8,723 –8,151
PSI Logistics GmbH, Berlin 100 1,509 1,573
PSI Energy Markets GmbH, Hanover 100 1,330 02)
PSI Mines & Roads GmbH, Berlin 100 –1,106 854
PSI FLS Fuzzy Logik & Neuro Systeme GmbH, Dortmund 100 378 02)
PSI Metals Non Ferrous GmbH, Aachen 100 1,005 02)
MOVEO Software GmbH, Potsdam 100 474 178
PSI Prognos Energy GmbH, Potsdam 100 –73 9
PSI Information Technology (Shanghai) Co. Ltd., Shanghai, China 100 671 4833)
PSI METALS NORTH AMERICA Inc., Pittsburgh, USA 100 1,461 1,147
PSI AG für Produkte und Systeme der Informationstechnologie, Wil, Switzerland 100 1,167 445
PSI Polska Sp. z o.o., Poznan, Poland 100 4,036 2,748
PSI Automotive & Industry Austria GmbH, Traun, Austria 100 1,140 140
OOO ’PSI’, Moscow, Russia 100 1,990 1,036
PSI Incontrol Sdn. Bhd., Selangor, Malaysia 100 7,451 –1,4143)
PSI Incontrol Private Limited, Chennai, India 100 –10 03)
Incontrol Tech for Shares, Salmabad, Bahrain 100 927 313)
Incontrol Tech (Thailand) Ltd., Bangkok, Thailand 100 –2,125 –1833)
Incontrol Tech Holdings (Thailand) Ltd., Bangkok, Thailand 100 –569 –33)
PSI Metals Austria GmbH, Graz, Austria 100 6,772 2,108
PSI METALS INDIA PRIVATE LIMITED, Kolkata, India 100 250 733)
PSI Metals Belgium NV, Brussels, Belgium 100 2,043 1,457
PSI Metals Brazil Ltda, Rio de Janeiro, Brazil 100 537 395
Time-steps AG, Affoltern am Albis, Switzerland 100 176 59
PSI Metals UK Ltd., Watford, United Kingdom 100 2,465 62
PSIAG Scandinavia AB, Karlstad, Sweden 100 229 2023)
NEPLAN AG, Küsnacht, Switzerland 100 1,388 306
OOO OREKHsoft, Moscow, Russia 49 –7 –3
OOO PROGRESS, Moscow, Russia 49 925 –53
OOO Gazavtomatika dispetcherskije sistemy, Moscow, Russia 33 61 314)
caplog-x GmbH, Leipzig 31.3 2,081 9565)
1) Values according to legal and local accounting regulations before consolidation bookings 2)Profit-poolingcontracts 3) Values according to IFRS before consolidation bookings 4)ValuesasofDecember31,2018,asvaluesasofDecember31,2020werenotavailableatthedateofthefinancialstatements5)ValuesasofDecember31,2019,asvaluesasofDecember31,2020werenotavailableatthedateofthefinancialstatements
88_
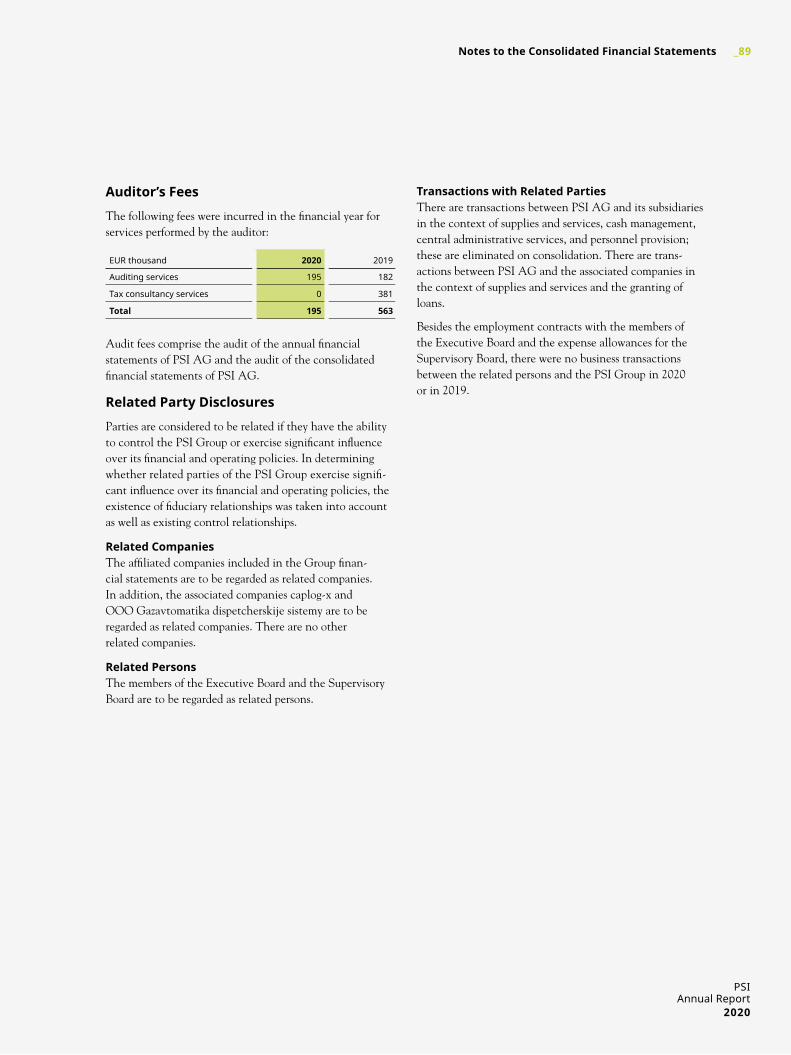
auditor’s fees
The following fees were incurred in the financial year for services performed by the auditor:
Audit fees comprise the audit of the annual financial statements of PSI AG and the audit of the consolidated financial statements of PSI AG.
related party disclosures
Parties are considered to be related if they have the ability to control the PSI Group or exercise significant influence over its financial and operating policies. In determining whether related parties of the PSI Group exercise signifi- cant influence over its financial and operating policies, the existence of fiduciary relationships was taken into account as well as existing control relationships.
related CompaniesThe affiliated companies included in the Group finan- cial statements are to be regarded as related companies. In addition, the associated companies caplog-x and OOO Gazavtomatika dispetcherskije sistemy are to be regarded as related companies. There are no other related companies.
related personsThe members of the Executive Board and the Supervisory Board are to be regarded as related persons.
transactions with related parties There are transactions between PSI AG and its subsidiaries in the context of supplies and services, cash management, central administrative services, and personnel provision; these are eliminated on consolidation. There are trans- actions between PSI AG and the associated companies in the context of supplies and services and the granting of loans.
Besides the employment contracts with the members of the Executive Board and the expense allowances for the Supervisory Board, there were no business transactions between the related persons and the PSI Group in 2020 or in 2019.
EUR thousand 2020 2019
Auditing services 195 182
Tax consultancy services 0 381
total 195 563
PSIAnnual Report
2020
_89 Notes to the Consolidated Financial Statements
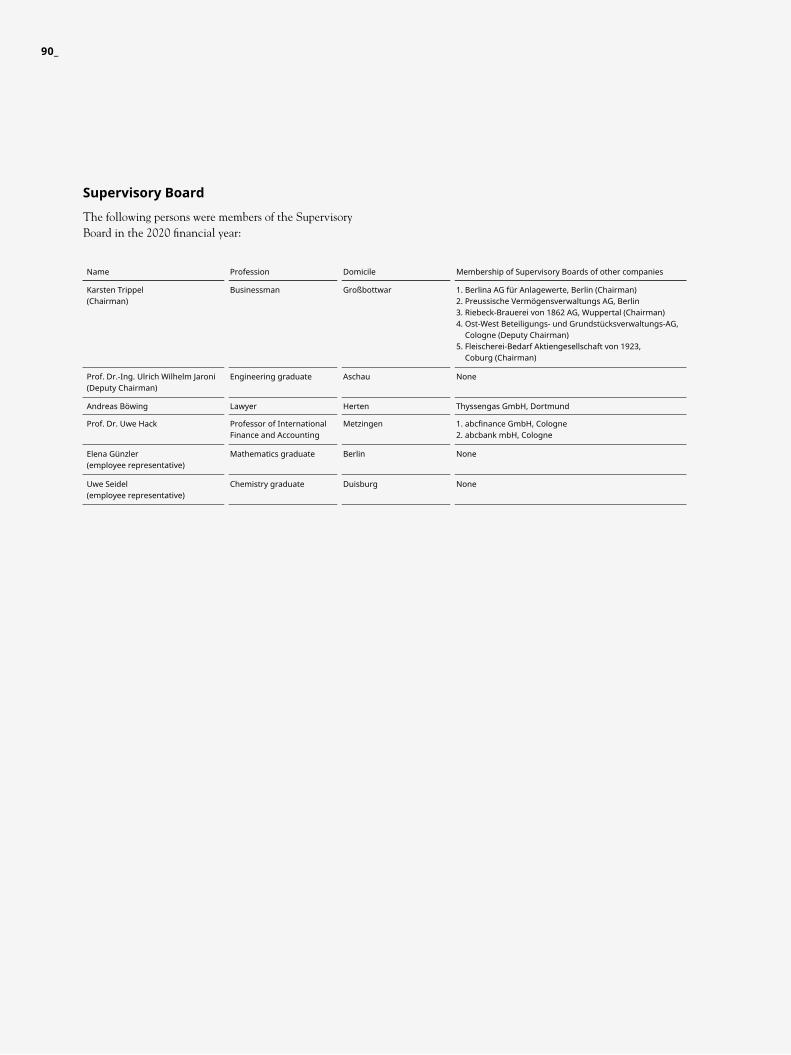
supervisory board
The following persons were members of the Supervisory Board in the 2020 financial year:
Name Profession Domicile Membership of Supervisory Boards of other companies
Karsten Trippel(Chairman)
Businessman Großbottwar 1. Berlina AG für Anlagewerte, Berlin (Chairman)2. Preussische Vermögensverwaltungs AG, Berlin3. Riebeck-Brauerei von 1862 AG, Wuppertal (Chairman)4. Ost-West Beteiligungs- und Grundstücksverwaltungs-AG,
Cologne (Deputy Chairman)5. Fleischerei-Bedarf Aktiengesellschaft von 1923,
Coburg (Chairman)
Prof. Dr.-Ing. Ulrich Wilhelm Jaroni (Deputy Chairman)
Engineering graduate Aschau None
Andreas Böwing Lawyer Herten Thyssengas GmbH, Dortmund
Prof. Dr. Uwe Hack Professor of International Finance and Accounting
Metzingen 1.abcfinanceGmbH,Cologne2. abcbank mbH, Cologne
Elena Günzler (employee representative)
Mathematics graduate Berlin None
Uwe Seidel (employee representative)
Chemistry graduate Duisburg None
90_
remuneration of executive board and supervisory board Remuneration totaling EUR 1,610 thousand (previous year: EUR 1,550 thousand) was granted to the Executive Board of PSI AG for the 2020 financial year. EUR 382 thousand (previous year: EUR 292 thousand) of this total remunera- tion related to long-term remuneration.
Pension provisions of EUR 320 thousand (previous year: EUR 643 thousand) are reported for former Executive Board members. Besides pension payments to former members of the governing bodies in the amount of EUR 34 thousand (previous year: EUR 56 thousand), no other benefits were paid in the 2020 financial year.
The Supervisory Board received remuneration of EUR 304 thousand (previous year: EUR 298 thousand) in the year under review.
Individualized information on the remuneration of the Executive Board and the Supervisory Board is presented in the remuneration report, which forms part of the Group management report.
disclosures on the german Corporate governance CodePSI AG issued the statements required in accordance with section 161 of the German Stock Corporation Act on December 18, 2020. They are permanently available to the shareholders in the investor relations section of PSI AG’s website (www.psi.de).
Berlin, March 15, 2021
Dr. Harald Schrimpf Harald Fuchs(CEO)
PSIAnnual Report
2020
_91 Notes to the Consolidated Financial Statements
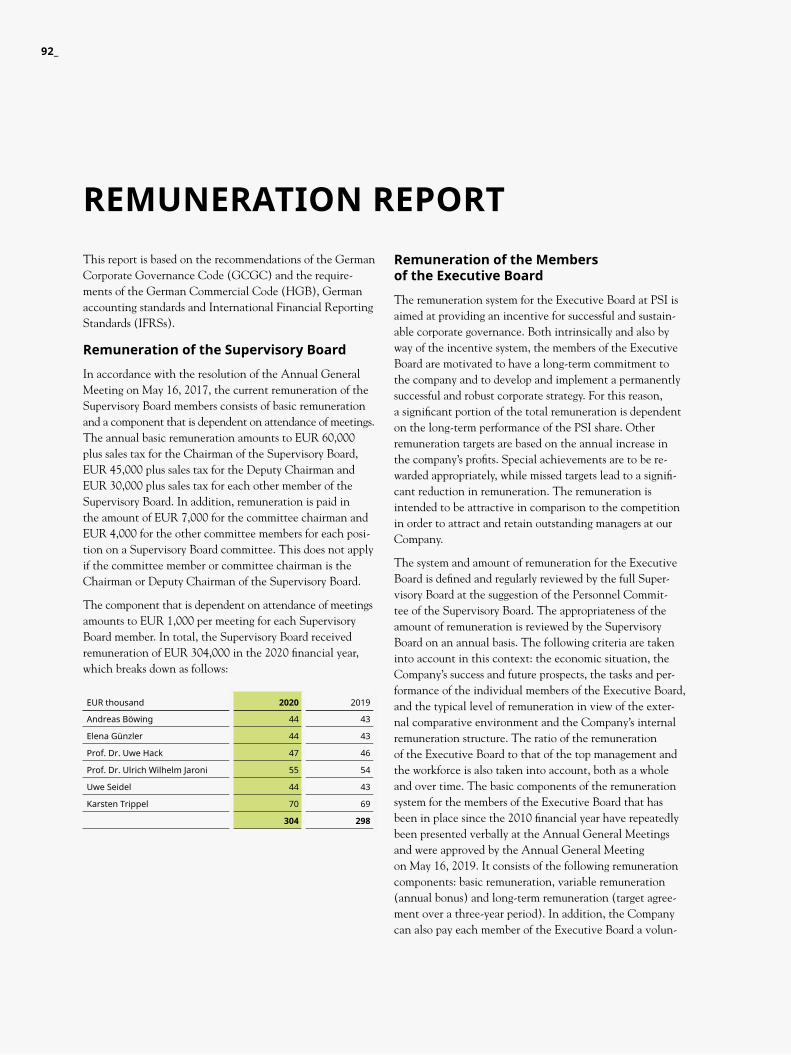
remuneration reportThis report is based on the recommendations of the German Corporate Governance Code (GCGC) and the require-ments of the German Commercial Code (HGB), German accounting standards and International Financial Reporting Standards (IFRSs).
remuneration of the supervisory board
In accordance with the resolution of the Annual General Meeting on May 16, 2017, the current remuneration of the Supervisory Board members consists of basic remuneration and a component that is dependent on attendance of meetings. The annual basic remuneration amounts to EUR 60,000 plus sales tax for the Chairman of the Supervisory Board, EUR 45,000 plus sales tax for the Deputy Chairman and EUR 30,000 plus sales tax for each other member of the Supervisory Board. In addition, remuneration is paid in the amount of EUR 7,000 for the committee chairman and EUR 4,000 for the other committee members for each posi-tion on a Supervisory Board committee. This does not apply if the committee member or committee chairman is the Chairman or Deputy Chairman of the Supervisory Board.
The component that is dependent on attendance of meetings amounts to EUR 1,000 per meeting for each Supervisory Board member. In total, the Supervisory Board received remuneration of EUR 304,000 in the 2020 financial year, which breaks down as follows:
remuneration of the members of the executive board
The remuneration system for the Executive Board at PSI is aimed at providing an incentive for successful and sustain-able corporate governance. Both intrinsically and also by way of the incentive system, the members of the Executive Board are motivated to have a long-term commitment to the company and to develop and implement a permanently successful and robust corporate strategy. For this reason, a significant portion of the total remuneration is dependent on the long-term performance of the PSI share. Other remuneration targets are based on the annual increase in the company’s profits. Special achievements are to be re- warded appropriately, while missed targets lead to a signifi- cant reduction in remuneration. The remuneration is intended to be attractive in comparison to the competition in order to attract and retain outstanding managers at our Company.
The system and amount of remuneration for the Executive Board is defined and regularly reviewed by the full Super- visory Board at the suggestion of the Personnel Commit-tee of the Supervisory Board. The appropriateness of the amount of remuneration is reviewed by the Supervisory Board on an annual basis. The following criteria are taken into account in this context: the economic situation, the Company’s success and future prospects, the tasks and per-formance of the individual members of the Executive Board, and the typical level of remuneration in view of the exter-nal comparative environment and the Company’s internal remuneration structure. The ratio of the remuneration of the Executive Board to that of the top management and the workforce is also taken into account, both as a whole and over time. The basic components of the remuneration system for the members of the Executive Board that has been in place since the 2010 financial year have repeatedly been presented verbally at the Annual General Meetings and were approved by the Annual General Meeting on May 16, 2019. It consists of the following remuneration components: basic remuneration, variable remuneration (annual bonus) and long-term remuneration (target agree-ment over a three-year period). In addition, the Company can also pay each member of the Executive Board a volun-
EUR thousand 2020 2019
Andreas Böwing 44 43
Elena Günzler 44 43
Prof. Dr. Uwe Hack 47 46
Prof. Dr. Ulrich Wilhelm Jaroni 55 54
Uwe Seidel 44 43
Karsten Trippel 70 69
304 298
92_
tary annual recognition bonus that is capped at a certain amount. However, there is no legal entitlement to this bonus, even if it is repeatedly paid. No voluntary recogni- tion bonus has been paid since 2005.
In the 2020 financial year, the remuneration system for the Executive Board consisted of the following components:
non-performance-related Components
basic remunerationThe basic remuneration is paid out as a monthly salary. It amounts to EUR 450,000 per year for the Chairman of the Executive Board, Dr. Harald Schrimpf, and EUR 302,281 per year for Mr. Harald Fuchs.
Fringe BenefitsEach member of the Executive Board is provided with a leased vehicle for business and personal use for the duration of his or her actual term of office. A Board mem- ber may choose to do without this company car, in which case his or her basic remuneration increases. Other fringe benefits include various types of insurance such as statutory contributions to health and nursing insurance and a pro-fessional liability insurance policy that is taken out by the company for its executive bodies.
performance-related Components
variable remuneration (annual bonus)Variable remuneration (the annual bonus) is based on the Company’s business performance in the past financial year. 50% of the annual bonus depends on the Group net result (IFRS), 25% depends on key figures for PSI’s transforma- tion into an international software product and SaaS cloud provider, and 25% depends on other strategic targets. Corresponding targets are also applied for senior executives, in addition to other employees, in order to achieve a con- sistent target system at the company. If the results fall significantly short of the targets, the variable remuneration may not be paid out at all (0%). The bonus is capped at 200%.
The annual bonus is paid entirely in cash.
long-term remuneration
The long-term performance-related remuneration is based on a target agreement over a three-year period. The most recent long-term target agreement was concluded for the period from January 2019 to December 2021. Two targets were agreed for this: firstly, the EBIT return as a percentage of consolidated revenues, and secondly the development of the total return on the PSI share compared to the TecDAX. Pro rata provisions are recognized each year and the re- muneration is not paid until after the end of the three-year period. If the results fall significantly short of the targets, the long-term remuneration may not be paid out at all (0%). The long-term remuneration is capped at 200%.
The long-term remuneration is paid entirely in cash. For reasons of simplicity, there is no stock option program. Even though there is no stock option program, both mem-bers of the Executive Board hold shares in the Company. The exact number of shares held by the Executive Board is shown below.
pension CommitmentsThere are no pension commitments for the current members of the Executive Board.
Commitments in Connection with the termination of employment on the executive boardIn the event of premature termination of employment on the Executive Board by mutual agreement and without good cause, the contracts of the members of the Executive Board stipulate a compensation payment that is limited to a maximum amount of two times the annual remuneration and does not remunerate more than the remaining term of the employment contract (severance payment cap). The amount of the compensation payment is calculated based on the basic remuneration and the performance-related variable remuneration (annual bonus), the non-cash fringe benefits and the pro rata long-term remuneration.
In the event of a change of control that results in a signi-ficant change in the position of the individual member of the Executive Board – for example, due to a change in the company’s strategy or a change in the Board member’s field of activity – the Board member has the right to terminate his or her employment contract. A change of control
PSIAnnual Report
2020
_93remuneration report

occurs, for example, if one shareholder or multiple sharehol-ders acting jointly acquire 25% or 30% of the voting rights in PSI Software AG and exercise a controlling influence, if PSI Software AG becomes a dependent company as a result of concluding an intercompany agreement as defined in section 291 of the German Stock Corporation Act (AktG) or if it is merged with another company. If the Board mem-ber exercises this termination right, he or she is entitled to a severance payment for the remaining term of his or her contract. In addition to the basic remuneration and the target amount for the annual bonus, the calculation of the annual remuneration also includes an annual tranche of the long-term remuneration. To generally reflect discounting and other earnings, compensation or severance payments are reduced by 5% or 25% respectively.
secondary activities of members of the executive boardDecisions on whether to approve secondary activities of members of the Executive Board, particularly supervisory board mandates outside the Group, are taken by the Supervisory Board. The performance of mandates at Group companies is considered to be compensated by the con- tractual remuneration for members of the Executive Board. In the year under review, the members of the Executive Board did not perform any secondary activities that required approval.
remuneration of the members of the executive board for the 2020 financial year
In the context of the annual financial statements, the Supervisory Board determined the level of target achieve- ment for the variable remuneration (bonus) and the long-term remuneration.
total remunerationBased on the above stipulations of the Supervisory Board, total remuneration of the Executive Board for the 2020 financial year amounted to EUR 1.6 million (previous year: EUR 1.6 million). EUR 0.4 million (previous year: EUR 0.3 million) of this total remuneration related to long-term remuneration. A detailed, individualized presentation of the remuneration for the 2020 financial year is provided below:
On December 31, 2020, the members of the Executive Board and the Supervisory Board held the following num-bers of PSI shares:
EUR thousand 2020 2019
fixed remuneration
Harald Fuchs 315 315
Dr. Harald Schrimpf 463 463
778 778
variable remuneration
Harald Fuchs 150 120
Dr. Harald Schrimpf 300 360
450 480
long-term remuneration
Harald Fuchs 164 125
Dr. Harald Schrimpf 218 167
382 292
total remuneration
Harald Fuchs 629 560
Dr. Harald Schrimpf 981 990
1,610 1,550
Shares 2020 2019
executive board
Harald Fuchs 7,023 7,023
Dr. Harald Schrimpf 62,000 67,000
supervisory board
Andreas Böwing 0 0
Elena Günzler 1,976 1,962
Prof. Dr. Uwe Hack 600 600
Prof. Dr. Ulrich Wilhelm Jaroni 0 0
Uwe Seidel 447 433
Karsten Trippel 111,322 111,322
94_
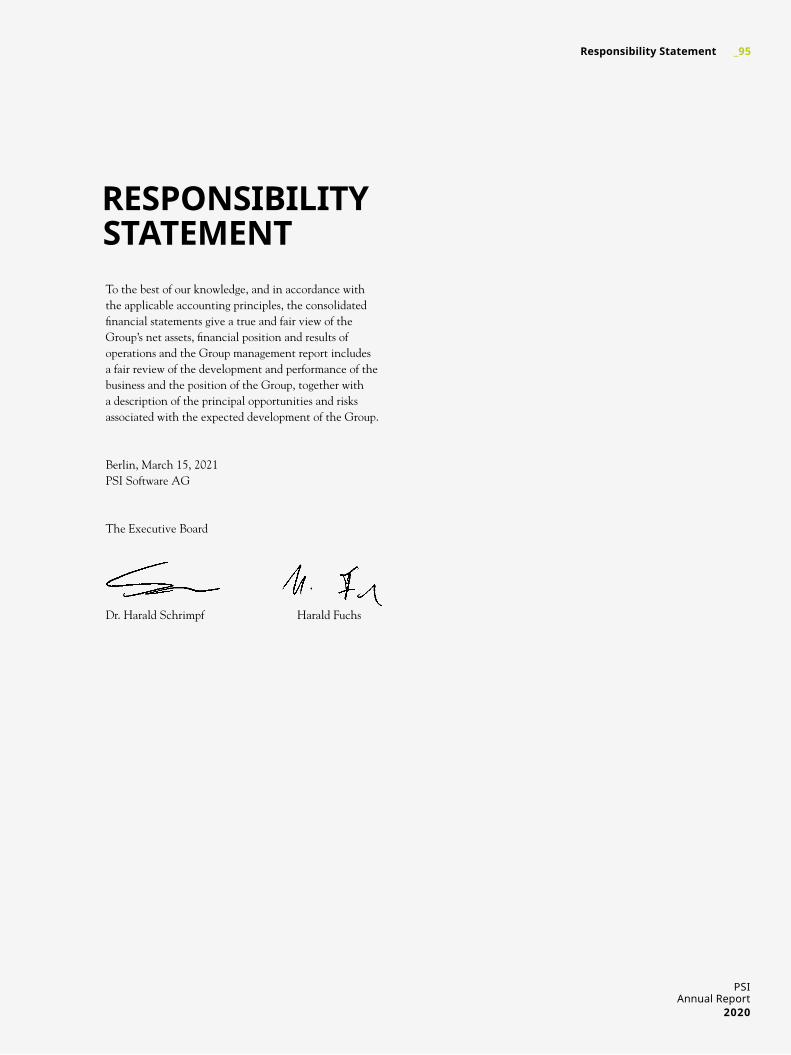
To the best of our knowledge, and in accordance withthe applicable accounting principles, the consolidatedfinancial statements give a true and fair view of theGroup’s net assets, financial position and results ofoperations and the Group management report includesa fair review of the development and performance of thebusiness and the position of the Group, together witha description of the principal opportunities and risksassociated with the expected development of the Group.
Berlin, March 15, 2021PSI Software AG
The Executive Board
Dr. Harald Schrimpf Harald Fuchs
responsibilitystatement
PSIAnnual Report
2020
_95responsibility statement
independent auditor’s report
to psi software ag, berlin
report on the audit of the Consolidated financial statements and of the group management report
opinions
We have audited the consolidated financial statements of PSI Software AG, Berlin, and its subsidiaries (the Group), which comprise the consolidated balance sheet as of December 31, 2020, the consolidated comprehensive income statement, the consolidated statement of changes in equity, the consolidated cash flow statement, and the Group segment reporting for the fiscal year from January 1 to December 31, 2020, and the notes to the consolidated financial statements, including a summary of significant accounting policies. In addition, we have audited the Group management report of PSI Software AG, Berlin, for the fiscal year from January 1 to December 31, 2020. In accordance with the German legal requirements, we have not audited the content of the combined statement on corporate governance in accordance with Sec. 289f HGB and Sec. 315d HGB [“Handelsgesetzbuch”: German Commercial Code], which is referred to in the Group management report, or of the Group non-financial state- ment included in the Group management report.
In our opinion, on the basis of the knowledge obtained in the audit,
− the accompanying consolidated financial statements comply, in all material respects, with the IFRSs as adopted by the EU, and the additional requirements of German commercial law pursuant to Sec. 315e (1) HGB and, in compliance with these requirements, give a true and fair view of the assets, liabilities, and financial position of the Group as of December 31, 2020, and of its financial performance for the fiscal year from January 1 to December 31, 2020, and
− the accompanying Group management report as a whole provides an appropriate view of the Group’s position. In all material respects, this Group management report is consistent with the consolidated financial statements, complies with German legal requirements and appropri- ately presents the opportunities and risks of future development. Our opinion on the Group management report does not cover the content of the combined statement on corporate governance or the Group non- financial statement referred to above.
Pursuant to Sec. 322 (3) Sentence 1 HGB, we declare that our audit has not led to any reservations relating to the legal compliance of the consolidated financial statements and of the Group management report.
96_
basis for the opinions
We conducted our audit of the consolidated financial statements and of the Group management report in accord- ance with Sec. 317 HGB and the EU Audit Regulation (No. 537/2014, referred to subsequently as “EU Audit Regulation”) and in compliance with German Generally Accepted Standards for Financial Statement Audits pro- mulgated by the Institut der Wirtschaftsprüfer [Institute of Public Auditors in Germany] (IDW). Our responsibil- ities under those requirements and principles are further described in the “Auditor’s responsibilities for the audit of the consolidated financial statements and of the Group management report” section of our auditor’s report. We are independent of the group entities in accordance with the requirements of European law and German commer- cial and professional law, and we have fulfilled our other German professional responsibilities in accordance with these requirements. In addition, in accordance with Art. 10 (2) f) of the EU Audit Regulation, we declare that we have not provided non-audit services prohibited under Art. 5 (1) of the EU Audit Regulation. We believe that the audit evidence we have obtained is sufficient and appropriate to provide a basis for our opinions on the con- solidated financial statements and on the Group manage-ment report.
key audit matters for the audit of the Consolidated financial statements
Key audit matters are such matters that, in our professional judgment, were the most significant in our audit of the consolidated financial statements for the fiscal year from January 1 to December 31, 2020. These matters were addressed in the context of our audit of the consolidated financial statements as a whole, and in forming our opinion thereon; we do not provide a separate opinion on these matters.
Below, we present what we consider to be the key audit matters:
1. Project-related revenue recognition
2. Impairment of goodwill
We have structured our presentation of this key audit matter as follows:
a) description of the matter (including reference to related disclosures in the consolidated financial statements)
b) auditor’s response
1. project-related revenue recognition
a) Revenues of EUR 217,795 thousand are reported in the consolidated income statement for the fiscal year 2020. This mainly resulted from the development and implementation of software and from the sale of soft- ware licenses and maintenance. In cases of software development, the revenues are recognized over the period of time in line with the transfer of the associated significant risks and rewards to the customer. In cases where the customer purchases licenses, the revenues are recognized at the time when the customer obtains access to and thus control over the software. Mainte- nance agreements are recognized in the respective period.
The high degree of individualization and the large number of different contractual agreements in the project business of the PSI Group’s two segments (Energy Management and Production Management) as well as the extensive effects of project-related revenue recognition on disclosures of assets and liabilities as well as income and expense items result in a high degree of complexity in revenue recognition. This entails an increased risk of accounting misstatements, which is why we identified project-related revenue recognition as a key audit matter.
PSIAnnual Report
2020
_97independent auditor’s report
Disclosures on the accounting and valuation principles applied for revenues are contained in section B “Presen- tation of accounting policies and financial risk manage- ment method” under “Significant judgments, estimates and assumptions” and “Recognition of revenues and income” of the notes to the consolidated financial state- ments. Information about the breakdown of revenues can also be found in the “Disclosures on the consolidated income statement” section under D. 13 “Revenues” of the notes to the consolidated financial statements. Addi- tional relevant information is included in the “Disclosures on the consolidated balance sheet” section under C. 3 and C. 4 of the notes to the consolidated financial statements.
b) For the purposes of risk assessment, we obtained an idea of the business development in the year under review and assessed the extent to which the revenue recognition was influenced by subjectivity, complexity, or other inherent risk factors. During our audit, we assessed the accounting and valuation principles applied for the recognition of project-related revenues in the PSI Group’s consolidated financial statements using the criteria defined in IFRS 15. Our audit approach focused in particular on the question of whether the recognition of revenues at a point in time or over a period of time was appropriate. In particular, we examined the existence of an enforceable legal right and the possibility for alternative use of the contractual service relationships. In addition, we examined which different types of services were included in the contracts and whether these could be differentiated and thus ac- counted for separately. We assessed the appropriateness of the process implemented by the Executive Board of the PSI Group. We also examined whether the account- ing and valuation principles of the Group accounting guideline for project revenue recognition comply with the requirements of IFRS 15.
In addition, we reconciled project revenue recognition based on the contractual agreements by inspecting agree-ments, project documents such as correspondence with customers, and evidence of hours booked.
We examined the calculation of revenues allocation for transactions which have not yet been completed using substantive audit procedures as well as an analysis of the contractual bases.
98_
2. impairment of goodwill
a) Goodwill of EUR 60,804 thousand, accounting for roughly 23% of total assets, is reported under “Intangible assets” in the consolidated financial statements of the PSI Group. The company allocates goodwill to the business units. In the impairment tests for goodwill as of the end of the reporting period, the respective carrying amounts are compared with their respective recoverable amount. The recoverable amount, as the higher of fair value less costs to sell and value in use, was calculated based on a valuation model in line with the discounted cash flow method. The cash inflows used in the cash flow calculation model result from the multi-annual planning for the next three years that was approved by the execu- tive directors, acknowledged by the Supervisory Board, and was valid at the time the impairment test was perfor-med; this planning was updated with assumptions regar-ding long-term growth rates (perpetuity). Expectations for the future market development and country-specific assumptions regarding the development of macroeco- nomic parameters were also taken into account here.
The result of this impairment test is influenced to a large extent by uncertainties in relation to the assumptions made regarding future cash inflows and the discount rate used. In particular, the estimate of the future development as a basis for the planned future cash inflows is subject to consid- erable uncertainty. This matter was therefore particularly important in the context of our audit.
Disclosures on the accounting and valuation principles applied for goodwill are contained in section B “Presen- tation of accounting policies and financial risk manage- ment method” under “Significant judgments, estimates and assumptions,” “Goodwill,” and “Impairment of non- current, non-financial assets” of the notes to the consoli- dated financial statements. Information about the break-down of goodwill and the impairment test can also be found in the “Disclosures on the consolidated balance sheet” section under C. 1 “Intangible assets and property, plant and equipment” of the notes to the consolidated financial statements.
b) During our audit, in which we involved our internal valuation experts, we verified the procedure for perfor-ming impairment tests and assessed the extent to which the procedure was influenced by uncertainty of estimates, subjectivity, complexity, or other inherent risk factors. We examined the Group’s adherence to planning in advance based on a comparison of the previous year’s planning with the results achieved in the fiscal year. In the case of significant differences, we examined the disclosures and evidence provided by the Executive Board.
Taking account of our findings from the examination of adherence to planning, we verified and assessed the estab-lished planning process and the process for preparing the impairment test. For our assessment of the results of the impairment tests, we compared the general and industry- specific market expectations with the market models and assumptions of the Executive Board for the expected cash inflows and then examined and assessed any differ- ences. We also examined whether the financial surpluses to be received in the future were derived appropriately from the assumptions made and the premises set. Based on our knowledge that even relatively small changes in the discount rates used can at times have significant effects on the recoverable amount, we analyzed the parameters used to determine the discount rates used. We also mathemati-cally verified the calculation method for determining fair values.
We also performed sensitivity analyses in order to estimate the effect of any potential impairment risk associated with a reasonably possible change in one of the significant assumptions used in the valuation.
PSIAnnual Report
2020
_99independent auditor’s report
other information
The Executive Board and the Supervisory Board are responsible for the other information. The other informa- tion comprises:
− the report by the Supervisory Board
− the combined statement on corporate governance in accordance with Sec. 289f HGB and Sec. 315d HGB, which is referred to in the Group management report
− the Group non-financial statement included in the Group management report
− the responsibility statement in accordance with Sec. 297 (2) sentence 4 HGB and Sec. 315 (1) sentence 5 HGB on the consolidated financial statements and the Group management report
− all other parts of the annual report
− but not the consolidated financial statements, the disclosures in the Group management report whose content was audited, or our related auditor’s report
The Supervisory Board is responsible for the report of the Supervisory Board. The Executive Board and the Supervisory Board are responsible for the declaration in accordance with Sec. 161 AktG [“Aktiengesetz”: Ger- man Stock Corporation Act] on the German Corporate Governance Code, which forms parts of combined state- ment on corporate governance in accordance with Sec. 289f HGB and Sec. 315d HGB, which is referred to in the Group management report. In all other respects, the Executive Board is responsible for the other information.
Our opinions on the consolidated financial statements and on the Group management report do not cover the other information, and consequently we do not express an opinion or any other form of assurance conclusion thereon.
In connection with our audit, our responsibility is to read the other information referred to above and, in so doing, to consider whether the other information
− is materially inconsistent with the consolidated financial statements, with the disclosures in the Group manage-ment report whose content was audited, or with our knowledge obtained in the audit, or
− otherwise appears to be materially misstated.
responsibilities of the executive board and the supervisory board for the Consolidated financial statements and the group management report
The Executive Board is responsible for the preparation of the consolidated financial statements that comply, in all material respects, with IFRSs as adopted by the EU and the additional requirements of German commercial law pursuant to Sec. 315e (1) HGB, and that the consolidated financial statements, in compliance with these require-ments, give a true and fair view of the assets, liabilities, financial position and financial performance of the Group. In addition, the Executive Board is responsible for such internal control as they have determined necessary to enable the preparation of consolidated financial statements that are free from material misstatement, whether due to fraud or error.
In preparing the consolidated financial statements, the Executive Board is responsible for assessing the Group’s ability to continue as a going concern. They also have the responsibility for disclosing, as applicable, matters related to continuation as a going concern. In addition, they are responsible for financial reporting based on the going concern basis of accounting unless there is an intention to liquidate the Group or to cease operations, or there is no realistic alternative but to do so.
Furthermore, the Executive Board is responsible for the preparation of the Group management report that, as a whole, provides an appropriate view of the Group’s position and is, in all material respects, consistent with the consoli- dated financial statements, complies with German legal
100_
requirements, and appropriately presents the opportunities and risks of future development. In addition, the Executive Board is responsible for such arrangements and measures (systems) as they have considered necessary to enable the preparation of a Group management report that is in ac- cordance with the applicable German legal requirements, and to be able to provide sufficient appropriate evidence for the assertions in the Group management report.
The Supervisory Board is responsible for overseeing the Group’s financial reporting process for the preparation of the consolidated financial statements and of the Group management report.
Auditorʹs Responsibilities for the Audit of the Consolidated financial statements and of the group management report
Our objectives are to obtain reasonable assurance about whether the consolidated financial statements as a whole are free from material misstatement, whether due to fraud or error, and whether the Group management report as a whole provides an appropriate view of the Group’s position and, in all material respects, is consistent with the consoli-dated financial statements and the knowledge obtained in the audit, complies with the German legal requirements and appropriately presents the opportunities and risks of future development, as well as to issue an auditor’s report that includes our opinions on the consolidated financial state- ments and on the Group management report.
Reasonable assurance is a high level of assurance, but is not a guarantee that an audit conducted in accordance with Sec. 317 HGB and the EU Audit Regulation and in compliance with German Generally Accepted Standards for Financial Statement Audits promulgated by the Institut der Wirtschaftsprüfer (IDW) will always detect a material misstatement. Misstatements can arise from fraud or error and are considered material if, individually or in the aggregate, they could reasonably be expected to influence the economic decisions of users taken on the basis of these consolidated financial statements and this group manage-ment report.
We exercise professional judgment and maintain profes- sional skepticism throughout the audit. In addition, we:
− identify and assess the risks of material misstatement of the consolidated financial statements and of the Group management report, whether due to fraud or error, design and perform audit procedures responsive to those risks, and obtain audit evidence that is sufficient and appro- priate to provide a basis for our opinions. The risk of not detecting a material misstatement resulting from fraud is higher than for one resulting from error, as fraud may involve collusion, forgery, intentional omissions, mis- representations, or the override of internal control.
− obtain an understanding of internal control relevant to the audit of the consolidated financial statements and of arrangements and measures (systems) relevant to the audit of the Group management report in order to design audit procedures that are appropriate in the circumstances, but not for the purpose of expressing an opinion on the effectiveness of these systems.
− evaluate the appropriateness of accounting policies used by the Executive Board and the reasonableness of estima-tes made by the Executive Board and related disclosures.
− conclude on the appropriateness of the Executive Board’s use of the going concern basis of accounting and, based on the audit evidence obtained, whether a material uncertainty exists related to events or conditions that may cast significant doubt on the Group’s ability to con-tinue as a going concern. If we conclude that a material uncertainty exists, we are required to draw attention in the auditor’s report to the related disclosures in the con- solidated financial statements and in the Group manage- ment report or, if such disclosures are inadequate, to modify our respective opinions. Our conclusions are based on the audit evidence obtained up to the date of our auditor's report. However, future events or conditions may cause the Group to cease to be able to continue as a going concern.
PSIAnnual Report
2020
_101independent auditor’s report
− evaluate the overall presentation, structure and content of the consolidated financial statements, including the disclosures, and whether the consolidated financial state-ments present the underlying transactions and events in a manner that the consolidated financial statements give a true and fair view of the assets, liabilities, finan- cial position and financial performance of the Group in compliance with IFRSs as adopted by the EU and the additional requirements of German commercial law pursuant to Sec. 315e (1) HGB.
− obtain sufficient appropriate audit evidence regarding the financial information of the entities or business activities within the Group to express opinions on the consolidated financial statements and on the Group management report. We are responsible for the direc- tion, supervision and performance of the group audit. We remain solely responsible for our audit opinions.
− evaluate the consistency of the Group management report with the consolidated financial statements, its conformity with [German] law, and the view of the Group’s position it provides.
− perform audit procedures on the prospective informa- tion presented by the Executive Board in the Group management report. On the basis of sufficient appropriate audit evidence we evaluate, in particular, the significant assumptions used by the Executive Board as a basis for the prospective information, and evaluate the proper derivation of the prospective information from these assumptions. We do not express a separate opinion on the prospective information and on the assumptions used as a basis. There is a substantial unavoidable risk that future events will differ materially from the prospective information.
We communicate with those charged with governance regarding, among other matters, the planned scope and timing of the audit and significant audit findings, including any significant deficiencies in internal control that we identify during our audit.
We also provide those charged with governance with a statement that we have complied with the relevant in- dependence requirements, and communicate with them all relationships and other matters that may reasonably be thought to bear on our independence and where applicable, the related safeguards.
From the matters communicated with those charged with governance, we determine those matters that were of most significance in the audit of the consolidated financial state-ments of the current period and are therefore the key audit matters. We describe these matters in our auditor’s report unless law or regulation precludes public disclosure about the matter.
102_

other legal and regulatory requirements
report on the audit of the electronic reproductions of the Consolidated financial statements and the group management report in accordance with sec. 317 (3)b hgb prepared for the purposes of disclosure
opinion In accordance with Sec. 317 (3)b HGB, we have conduct- ed an audit with reasonable assurance as to whether the reproductions of the consolidated financial statements and the management report prepared for the purposes of disclosure and contained in the attached file with the SHA-256 value E7C938D193D84EF0F0E7C301CD1A 7A7324712746550597F1DCA92C8A4AC491CA (also referred to hereinafter as “ESEF documents”) meet the re-quirements of Sec. 328 (1) HGB for the electronic reporting format (“ESEF format”) in all material respects. In accor-dance with the German legal requirements, this audit covers only the transfer of the information in the consolidated financial statements and the Group management report to the ESEF format and therefore does not cover the informa-tion contained in these reproductions or other information contained in the file referred to above.
In our opinion, the reproductions of the consolidated financial statements and the Group management report prepared for the purposes of disclosure and contained in the attached file referred to above meet the require- ments of in Sec. 328 (1) HGB for the electronic reporting format (“ESEF format”) in all material respects. Besides this audit opinion and our audit opinions contained in the above “Report on the audit of the consolidated financial statements and of the Group management report” on the attached consolidated financial statements and the attached Group management report for the fiscal year from January 1 to December 31, 2020, we do not provide any audit opinion on the information contained in these reproductions or on the other information contained in the file referred to above.
basis for the opinionWe conducted our audit of the reproductions of the con-solidated financial statements and the Group management report contained in the attached file referred to above in accordance with Sec. 317 (3)b HGB and in compliance with the draft of the IDW Auditing Standard: Audit of Electronic Reproductions of Financial Statements and Management Reports Prepared for the Purposes of Disclosure in Accordance with Sec. 317 (3)b HGB (IDW EPS 410). Our associated responsibilities are further de- scribed in the “Auditor’s responsibilities for the audit of the ESEF documents” section. Our audit firm applied the requirements for the quality management system of the IDW Quality Management Standard: Requirements for Quality Management at Audit Firms (IDW QS 1).
PSIAnnual Report
2020
_103independent auditor’s report
responsibilities of the executive board and the supervisory board for the esef documents
The company’s Executive Board is responsible for the preparation of the ESEF documents with the electronic reproductions of the consolidated financial statements and the Group management report in accordance with Sec. 328 (1) sentence 4 no. 1 HGB and for the markup of the consolidated financial statements in accordance with Sec. 328 (1) sentence 4 no. 2 HGB.
In addition, the company’s Executive Board is responsible for such internal controls as they deem necessary to enable the preparation of ESEF documents that are free of material violations of the requirements of Sec. 328 (1) HGB for the electronic reporting format, whether due to fraud or error.
The company’s Executive Board is also responsible for the submission of the ESEF documents, together with the auditor’s report and the attached audited consolidated financial statements and audited Group management report as well as other documents to be disclosed, to the operator of the Bundesanzeiger (Federal Gazette).
The Supervisory Board is responsible for overseeing the preparation of the ESEF documents as part of the account- ing process.
auditor’s responsibilities for the audit of the esef documents
Our objective is to obtain reasonable assurance as to whether the ESEF documents are free of material violations of the requirements of Sec. 328 (1) HGB, whether due to fraud or error. We exercise professional judgment and maintain professional skepticism throughout the audit. In addition, we:
− identify and assess the risks of material violations of the requirements of Sec. 328 (1) HGB, whether due to fraud or error, design and perform audit procedures responsive to those risks, and obtain audit evidence that is sufficient and appropriate to provide a basis for our opinion.
– obtain an understanding of the internal controls relevant to the audit of the ESEF documents in order to design au-dit procedures that are appropriate in the circumstances, but not for the purpose of expressing an opinion on the effectiveness of these controls.
– assess the technical validity of the ESEF documents, i.e. whether the file containing the ESEF documents meets the requirements of Delegated Regulation (EU) 2019/815 in the version applicable as of the end of the reporting period for the technical specifications for this file.
– assess whether the ESEF documents allow for an XHTML reproduction of the audited consolidated financial state-ments and the audited Group management report with identical content.
– assess whether the markup of the ESEF documents with Inline XBRL technology (iXBRL) allows for an appro- priate and complete machine-readable XBRL copy of the XHTML reproduction.
104_
further information pursuant to art. 10 of the eu audit regulation
We were elected as group auditor by the Annual General Meeting on June 9, 2020. We were engaged by the Super- visory Board on October 17, 2020. We have been the group auditor of PSI Software AG, Berlin, since fiscal year 2020.
We declare that the opinions expressed in this auditor’s report are consistent with the additional report to the audit committee pursuant to Art. 11 of the EU Audit Regulation (long-form audit report).
german public auditor responsible for the engagement
The German Public Auditor responsible for the engagement is Gerald Reiher.
Berlin, March 23, 2021
Deloitte GmbHWirtschaftsprüfungsgesellschaft
(Gerald Reiher) (Christoph Henry Krause)German Public Auditor German Public Auditor
PSIAnnual Report
2020
_105independent auditor’s report
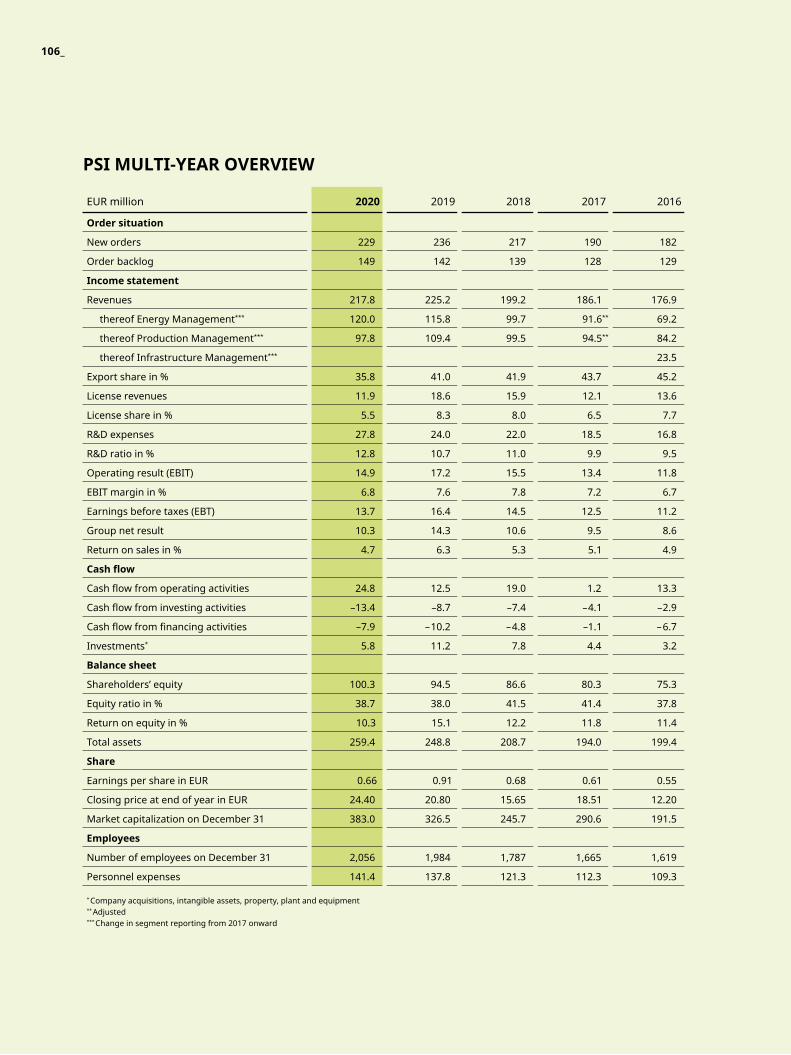
psi multi-year overvieW
EUR million 2020 2019 2018 2017 2016
order situation
New orders 229 236 217 190 182
Order backlog 149 142 139 128 129
income statement
Revenues 217.8 225.2 199.2 186.1 176.9
thereof Energy Management*** 120.0 115.8 99.7 91.6** 69.2
thereof Production Management*** 97.8 109.4 99.5 94.5** 84.2
thereof Infrastructure Management*** 23.5
Export share in % 35.8 41.0 41.9 43.7 45.2
License revenues 11.9 18.6 15.9 12.1 13.6
License share in % 5.5 8.3 8.0 6.5 7.7
R&D expenses 27.8 24.0 22.0 18.5 16.8
R&D ratio in % 12.8 10.7 11.0 9.9 9.5
Operating result (EBIT) 14.9 17.2 15.5 13.4 11.8
EBIT margin in % 6.8 7.6 7.8 7.2 6.7
Earnings before taxes (EBT) 13.7 16.4 14.5 12.5 11.2
Group net result 10.3 14.3 10.6 9.5 8.6
Return on sales in % 4.7 6.3 5.3 5.1 4.9
Cash flow
Cashflowfromoperatingactivities 24.8 12.5 19.0 1.2 13.3
Cashflowfrominvestingactivities –13.4 –8.7 –7.4 –4.1 –2.9
Cashflowfromfinancingactivities –7.9 –10.2 –4.8 –1.1 –6.7
Investments* 5.8 11.2 7.8 4.4 3.2
balance sheet
Shareholders’ equity 100.3 94.5 86.6 80.3 75.3
Equity ratio in % 38.7 38.0 41.5 41.4 37.8
Return on equity in % 10.3 15.1 12.2 11.8 11.4
Total assets 259.4 248.8 208.7 194.0 199.4
share
Earnings per share in EUR 0.66 0.91 0.68 0.61 0.55
Closing price at end of year in EUR 24.40 20.80 15.65 18.51 12.20
Market capitalization on December 31 383.0 326.5 245.7 290.6 191.5
employees
Number of employees on December 31 2,056 1,984 1,787 1,665 1,619
Personnel expenses 141.4 137.8 121.3 112.3 109.3
* Company acquisitions, intangible assets, property, plant and equipment ** Adjusted*** Change in segment reporting from 2017 onward
106_
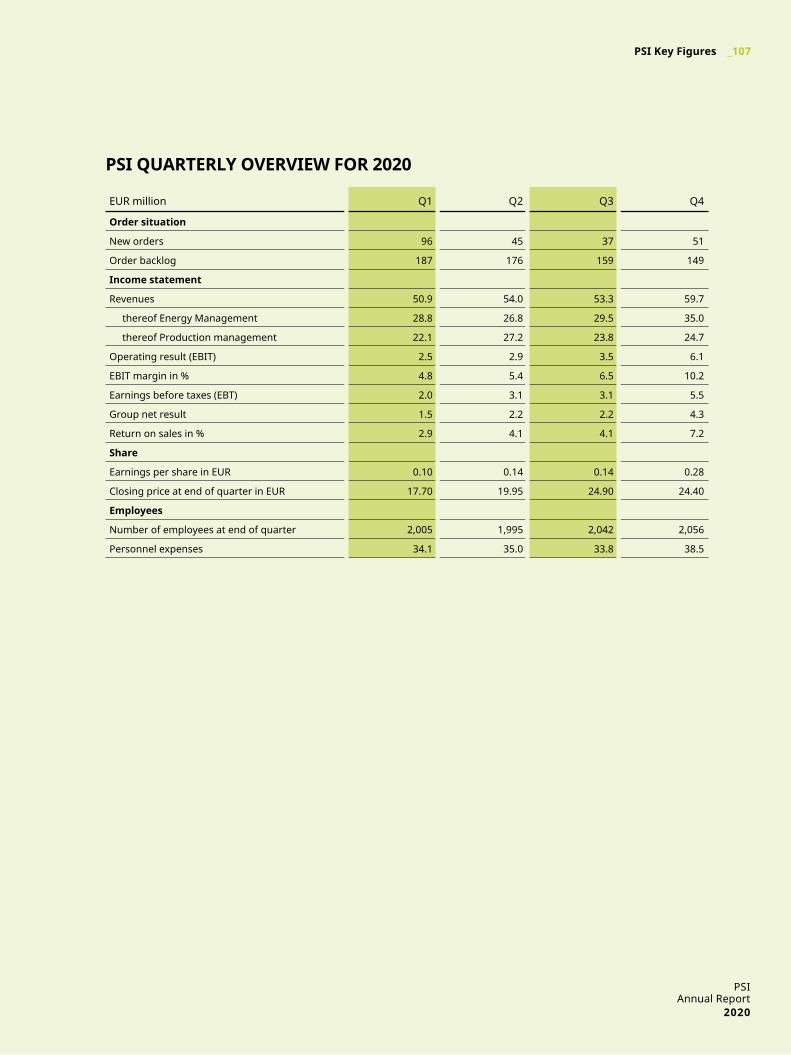
EUR million Q1 Q2 Q3 Q4
order situation
New orders 96 45 37 51
Order backlog 187 176 159 149
income statement
Revenues 50.9 54.0 53.3 59.7
thereof Energy Management 28.8 26.8 29.5 35.0
thereof Production management 22.1 27.2 23.8 24.7
Operating result (EBIT) 2.5 2.9 3.5 6.1
EBIT margin in % 4.8 5.4 6.5 10.2
Earnings before taxes (EBT) 2.0 3.1 3.1 5.5
Group net result 1.5 2.2 2.2 4.3
Return on sales in % 2.9 4.1 4.1 7.2
share
Earnings per share in EUR 0.10 0.14 0.14 0.28
Closing price at end of quarter in EUR 17.70 19.95 24.90 24.40
employees
Number of employees at end of quarter 2,005 1,995 2,042 2,056
Personnel expenses 34.1 35.0 33.8 38.5
psi Quarterly overvieW for 2020
PSIAnnual Report
2020
_107psi key figures

karsten pierschkeHead of Investor Relations and Corporate Communications
PSI Software AGDircksenstraße 42–4410178 Berlin, Germany
Phone: +49 30 2801-2727 Fax: +49 30 2801-1000 E-Mail: [email protected]
We would be glad to add your name to our shareholder information mailing list. Please also get in touch if you would like a copy of thePSIAGfinancialstatements.Forthelatestinvestor news, please visit our website at www.psi.de/en/psi-investor-relations/.
your investor relations ContaCt
“2020 was a challenging year in every respect. thanks to our stable business model and timely reaction to the challenges of the pandemic, we managed to limit the negative effects. We are convinced that we will be among the winners in the coming years with our solutions for efficient use of energy and raw materials.”
Publication of annual results March 24, 2021
Analyst conference March 24, 2021
Reportonfirstquarter April28,2021
Annual General Meeting May 19, 2021
Reportonfirsthalfofyear July28,2021
Report on third quarter October 29, 2021
German Equity Forum Analyst Conference November 22 to 24, 2021
Stock exchange segment Prime Standard
Stock exchange symbol PSAN
Securitiesidentificationnumber(WKN) A0Z1JH
ISIN DE000A0Z1JH9
finanCial Calendar for 2021 the psi share
108_ investor relations
PublICATIon
DeTAIlS
Publisher
Psi software AG, Berlin, Germany
Concept and layout
KorteMaerzWolff Kommunikation, Hamburg, Germany
Photos
nürnberg Luftbild, Hajo Dietz (p. 4 l.)Architektur-Bildarchiv/Gerald Zabel (p. 4 r.)ra2 studio/shutterstock.com (p. 12 l.)Amprion GmbH, Hauptschaltleitung Brauweiler (p. 13)peterschreiber.media/istock (p. 14 r.)Avacon netz GmbH (p. 16 l.)Petmal/istock (p. 16 r.)RMD Logistics GmbH (p. 18)Aydinmutlu/istock (p. 20 l.)LPP sA (p. 20 m.)BVG/Kevin Doan (p. 22 l.)Psi software AG: all other images
ID-No. 2199792

PSI Software AG
Dircksenstraße 42– 4410178 BerlinGermany
Phone: +49 30 2801-0 Fax: +49 30 2801-1000 E-Mail: [email protected] www.psi.de