graphene oxide modified with pmma via atrp as a reinforcement filler
TRANSCRIPT
PAPER www.rsc.org/materials | Journal of Materials Chemistry
Dow
nloa
ded
by U
NIV
ER
SIT
Y O
F A
VE
IRO
on
08 O
ctob
er 2
010
Publ
ishe
d on
27
Sept
embe
r 20
10 o
n ht
tp://
pubs
.rsc
.org
| do
i:10.
1039
/C0J
M01
674H
View Online
Graphene oxide modified with PMMA via ATRP as a reinforcement filler
Gil Goncalves,a Paula A. A. P. Marques,*a Ana Barros-Timmons,b Igor Bdkin,a Manoj K. Singh,a
Nazanin Emamic and Jos�e Gr�acioa
Received 31st May 2010, Accepted 26th July 2010
DOI: 10.1039/c0jm01674h
Graphene is a two-dimensional new allotrope of carbon, which is stimulating great curiosity due to its
superior mechanical, electrical, thermal and optical properties.
Particularly attractive is the availability of bulk quantities of graphene (G) which can be easily
processed by chemical exfoliation, yielding graphene oxide (GO). The resultant oxygenated graphene
sheets covered with hydroxyl, epoxy and carboxyl groups offer tremendous opportunities for further
functionalization opening plenty of opportunities for the preparation of advanced composite materials.
In this work poly(methyl methacrylate) (PMMA) chains have been grafted from the GO surface via
atom transfer radical polymerization (ATRP), yielding a nanocomposite which was soluble in
chloroform. The surface of the PMMA grafted GO (GPMMA) was characterized by AFM, HRTEM,
Raman, FTIR and contact angle. The interest of these novel nanocomposites lies in their potential to be
homogenously dispersed in polymeric dense matrices and to promote good interfacial adhesion, of
particular relevance in stress transfer to the fillers. PMMA composite films were prepared using
different percentages of GPMMA and pristine GO. Mechanical analysis of the resulting films showed
that loadings as low as 1% (w/w) of GPMMA are effective reinforcing agents, yielding tougher films
than pure PMMA films and even than composite films of PMMA prepared with GO. In fact, addition
of 1% (w/w) of GPMMA fillers led to a significant improvement of the elongation at break, yielding
a much more ductile and therefore tougher material. Thermal analysis showed an increase of the
thermal stability properties of these films providing evidence that strong interfacial interactions
between PMMA and GPMMA are achieved. In addition, AFM analysis, in friction force mode, is
demonstrated to be an effective tool to analyse the surface filler distribution on polymer matrices.
1. Introduction
Graphene is one of the most exciting materials being investigated
today for fundamental studies as well as for potential applica-
tions. Pristine graphene is an atomically thin two-dimensional
honeycomb material, however multiple layered graphene sheets
are also of great interest.1,2 For this reason the preparation of
large quantities of different types of graphene and their charac-
terization is receiving much attention.3 Graphene can be
obtained by the exfoliation of graphite yielding well separated
2-D aromatic sheets which consist of sp2-bonded carbon atoms.4
Graphene sheets offer extraordinary electronic, thermal and
mechanical properties and are expected to find a variety of
applications such as in sensors, batteries, supercapacitors,
hydrogen storage and reinforcing agents.5 One possible route to
harnessing these properties for applications would be the incor-
poration of graphene sheets into a composite material. Nano-
composites incorporating graphene have the potential to rival or
even surpass the performance of their carbon nanotube-based
counterparts provided that cheap, large-scale production and
processing methods for graphene become available.6 An effective
aTEMA-NRD, Mechanical Engineering Department, University of Aveiro,3810-193 Aveiro, Portugal. E-mail: [email protected]; Fax: +351 234 370953; Tel: +351 234 370 830bCICECO, Department of Chemistry, University of Aveiro, 3810-193Aveiro, Portugal; Fax: + 351 234 370 084; Tel: + 351 234 401 525cDepartment of Applied Physics and Mechanical Eng, Lule�a University ofTechnology, Sweden
This journal is ª The Royal Society of Chemistry 2010
approach in this regard is based on the chemical exfoliation of
graphite to GO.7 This material consists of graphene derived
sheets, heavily oxygenated, bearing hydroxyl, epoxide, carbonyl
and carboxylic functional groups.8 The high density of oxygen
functionalities at the GO sheet surface makes them highly
hydrophilic and very stable aqueous dispersions can be
obtained.7,9 However, aqueous dispersions are of limited interest
in many applications. This is especially true regarding the prep-
aration of polymer based nanocomposites, since most polymers
are only soluble in organic solvents. In fact, recent works show
an increasing interest in the dispersion of graphene in organic
solvents.10,11
In the present work, the surface of GO was functionalized with
an atom transfer polymerization initiator (ATRP) and subse-
quently PMMA chains were grown via living/controlled poly-
merization to yield a nanocomposite soluble in chloroform.
Polymerizations from surfaces, also known as SIP (surface
initiated polymerization), have been widely used in the prepa-
ration of nanocomposites.12 In this context, living/controlled
radical polymerization mechanisms, such as ATRP, offer the
possibility of preparing multifunctional materials with good
control over the polymer molecular weight, polydispersity index,
composition and end group functionality.13 Recently Lee et al.14
have also demonstrated the effectiveness of the ATRP strategy to
grow styrene, methyl methacrylate, or butyl acrylate directly
from the surface of GO without damaging the GO structure.
The surface modification of GO with PMMA chains aimed at
increasing the compatibility between nano-sheets and polymer
J. Mater. Chem.
Scheme 1 Reaction pathway involved in the functionalization of GO
nanosheets with polymer chains.
Dow
nloa
ded
by U
NIV
ER
SIT
Y O
F A
VE
IRO
on
08 O
ctob
er 2
010
Publ
ishe
d on
27
Sept
embe
r 20
10 o
n ht
tp://
pubs
.rsc
.org
| do
i:10.
1039
/C0J
M01
674H
View Online
matrices as surface characteristics are determinant to yield
nanocomposites with improved properties. Indeed, polymer
nanocomposites have received much attention due to their
enhanced mechanical, thermal, optical and barrier properties in
comparison to pure polymer and/or micron-size composites.15
Some researchers also mention that the use of nanosized fillers
has the potential to fundamentally improve the general perfor-
mance of thermoplastic polymers.16,17 In fact, it has been shown
that a considerable improvement in polymer nanocomposite
mechanical properties can be achieved by adding nanosized
fillers, such as SiO2 and ZnO, at low volume content, i.e. in the
range 1–5 vol%,18–20 which is very important due to the high cost
of nanosized fillers. However, when nanoparticles are used as
fillers to prepare polymer nanocomposites, a homogeneous
dispersion in the matrix is required. As the nanoparticles tend to
aggregate, special techniques have to be developed to achieve
homogeneous dispersions. One solution is mechanical mixing
using high shear forces for dis-aggregation, whereas another
technique is ultrasonic irradiation. Chemical methods can also be
used, such as sol–gel processing21,22 or surface modification23–25
of nanoparticles to increase the compatibility between the
nanoparticles and the organic phase. This opens a new way to
prepare high performance polymeric materials, as was demon-
strated by Fang et al.26 who functionalized GO with polystyrene
(PS) chains and used these as reinforcement of the PS matrix.
They found that both thermal and mechanical properties were
improved relative to the pure polymer.
In this work, small percentages of previously modified GO,
with PMMA chains via ATRP, were blended in a PMMA matrix.
The effect of GO grafting with PMMA on the ensuing nano-
composite properties was studied by TGA and uniaxial tensile
tests and complemented by AFM studies in friction mode. This,
together with nanoindentation tests, provided further informa-
tion to that previously reported in the literature.
2. Experimental methods
Materials
All chemicals were of analytical grade and used as received unless
otherwise stated, except for the monomer (methyl methacrylate)
which was passed through a column of alumina (Merck, 70–230
mesh) before use.
GO preparation
GO nanosheets were prepared by chemical exfoliation of
graphite following the method described in a previous work of
ours.27 Basically it consists of the chemical exfoliation of graphite
in a strong oxidant medium (conc. H2SO4 and KMnO4) under
vigorous stirring. The resultant suspension was extensively
washed with distilled water by filtration and subsequent centri-
fugation in order to remove residual unexfoliated graphite and
oxidizing agents. The resulting GO was lyophilised to prevent
agglomeration.
GO nanosheets functionalization with PMMA
This procedure involved a three-step reaction pathway as illus-
trated in Scheme 1.
J. Mater. Chem.
Step I - GO (200 mg) was suspended in SOCl2 (20 mL) and
stirred for 24 h at 65 �C in a round-bottom flask equipped with
a condenser, N2 inlet and magnetic bar. Upon this, excess SOCl2was removed by successive centrifugation/redispersion using
THF. The resulting solid was suspended in ethylene glycol
(20 mL) in a round-bottom flask equipped with a condenser and
the suspension was stirred for 48 h at 120 �C. As done previously,
unreacted ethylene glycol was removed by successive centrifu-
gation/redispersion using THF. The solid was then dried under
vacuum to yield hydroxyl functionalized graphene (G–OH).
Step II - G–OH (200 mg) was dispersed in CHCl3 (15 mL) in
a round-bottom flask. The suspension was purged with N2 for
one hour and then, triethylamine (1.64 mmol) and 4-
dimethylaminopyridine (1.64 mmol) were added and the mixture
was stirred for 1 h. Next, the ATRP initiator (2-bromo-2-
methylpropionyl bromide) was added (13.0 mmol) and the
mixture was stirred for 48 h at room temperature. The resulting
ATRP modified graphene (G-Br) was purified by successive
centrifugation/redispersion using CHCl3.
Step III - G-Br (200 mg) was dissolved in DMF (6 mL) and
CuBr (0.27 mmol) and PMDETA (0.27 mmol) were added.
Upon purging the reaction mixture with N2 for 30 min, methyl
methacrylate (28 mmol), was added and the temperature was
raised to 65 �C. The polymerization was carried out for 24 h. The
graphene/PMMA nanocomposite (GPMMA) was isolated by
three successive centrifugation/redispersion using CHCl3. All the
modification steps were monitored by solubility tests.
Hydrolysis of PMMA from GPMMA
GPMMA (20 mg) was dissolved in THF (3 mL) with 8 mg of
KOH and the reaction mixture was stirred for 10 h at 50 �C under
a nitrogen atmosphere, following a method described else-
where.28 The resultant solution was filtered through a 0.3 mm
Teflon filter to remove the graphene sheets and analysed by GPC.
Preparation of PMMA/GPMMA films
The preparation of PMMA reinforced films was based on the
solvent casting method. First, specific amounts of the function-
alized graphene sheets were dispersed in chloroform by
This journal is ª The Royal Society of Chemistry 2010
Dow
nloa
ded
by U
NIV
ER
SIT
Y O
F A
VE
IRO
on
08 O
ctob
er 2
010
Publ
ishe
d on
27
Sept
embe
r 20
10 o
n ht
tp://
pubs
.rsc
.org
| do
i:10.
1039
/C0J
M01
674H
View Online
sonication during 30 min at room temperature and then PMMA
(30 wt%) was dissolved in the same medium. The resultant
mixtures were slowly poured onto Teflon plates and dried at
85 �C overnight. Finally, the dried films were removed from the
Teflon plates to yield PMMA/GPMMA films with an average
thickness of 0.065 � 0.002 mm. These films were stored at 25 �C
and 40% humidity before analysis.
Characterization
The thermogravimetric (TGA) assays were carried out in a Shi-
madzu TGA 50 analyzer equipped with a platinum cell. The
samples were heated at a constant rate of 10 �C min�1 from room
temperature to 600 �C, under N2 flow.
Ultra-high resolution analytical scanning electron microscope
HR-FESEM Hitachi SU-70 was used to observe the samples.
Conventional high resolution TEM (JEOL 2200F TEM/STEM)
operated at 200 kV with a point resolution of 0.16 nm, equipped
with a GIF-2000 spectrometer was also used. The samples for
TEM analysis were prepared by depositing an aliquot of the GO
and G-PMMA suspension onto a carbon grid and then the
solvent was allowed to evaporate.
The FTIR spectra were recorded from KBr pellets (Aldrich,
99%, FT-IR grade) using a Mattson 7000 FT-IR spectrometer
with resolution 8 and 256 interferograms.
A digital instruments MultiMode Scanning Probe Microscope
(SPM) with a Nanoscope IIIA controller in contact friction
mode was used for the AFM measurements.
FT-Raman spectra were recorded using a Bruker RFS100/S
FT-Raman spectrometer (Nd:YAG laser, 1064 nm excitation).
For SEC analysis, 5 mg of polymer was dissolved in 1000 mL of
DMA solution at 20 �C for 30 min and further filtered through
a 0.3 mm filter yielding a sample concentration of circa 0.5%
(5 mg mL�1). The SEC analysis was carried out on two PLgel
10 mm MIXED B 300 � 7.5 mm columns protected by a PLgel
10 mm pre-column (Polymer Laboratories, UK) using a PL-GPC
110 system (Polymer Laboratories, UK). The columns, injector
system and the detector (RI) were maintained at 70 �C during the
analysis. The eluant (DMA) was pumped at a flow rate of 0.9 mL
min�1. The analytical columns were calibrated with polystyrene
standards (Polymer Laboratories, UK) in the range 1.7–100.0
kDa. The injected volume was 100 mL.
Tensile properties of the films were measured on a texture
analyser (model TA.Hdi, Stable Micro Systems, England)
equipped with fixed grips lined with thin rubber on the ends. The
specimens were cut into 10 mm wide and 90 mm long strips. The
initial grip length was 50 mm and the specimens were uniaxially
stretched at a constant crosshead speed of 0.5 mm s�1. All
experiments were conducted at 25 � 2 �C and 50 � 2% RH. At
least, ten samples of each film type were tested. Young’s modulus
(E), percentage elongation or strain at break and tensile strength
or stress at break, were determined from stress–strain curves
obtained from tensile tests.
Nanoindentation tests were performed using the CSM
Nanoindenter with a Berkovich diamond tip. The hardness and
elastic modulus of nanocomposites with different graphene
percentages were measured as a function of indentation depth
(20 tests for each sample).
This journal is ª The Royal Society of Chemistry 2010
The typical nanoindentation test consists of applying a force of
1 mN at a loading/unloading rate of 2 mN min�1 with a pause of
2 s at maximum force. The hardness and elastic modulus were
obtained from the curves using the Oliver–Pharr method.29
Water contact angles (CA) were measured using a ‘‘surface
energy evaluation system’’ commercialized by Brno University
(Czech Republic). Each q value was the average of five deter-
minations.
3. Results and discussion
Graphene oxide functionalization with PMMA
The prepared aqueous dispersion of GO was characterized to
confirm the presence of well exfoliated GO sheets as described by
the present authors in a previous publication.27 The GO solution
was then freeze dried by lyophilisation to obtain a feathery
powder.
Taking advantage of the oxygen functionalities of the as-
prepared GO nanosheets, the functionalization with polymer
chains via ATRP was carried out. Following the procedures
described in the literature,30–32 the free carboxylic acid groups of
GO were converted to acyl chloride groups, which upon treat-
ment with ethylene glycol, yielded graphene sheets rich in
hydroxyl groups. In a second step, the ATRP initiator was
grafted onto the OH rich graphene sheets and finally PMMA
chains were grown via ATRP.
After surface modification of GO with PMMA the reaction
mixture changed from yellow-brown to a black colour indicating
the conversion of GO to form GPMMA. The suspension of
GPMMA in the chloroform solution is shown in the inset of
Fig. 1d, which is clearly darker than the GO/water solution (see
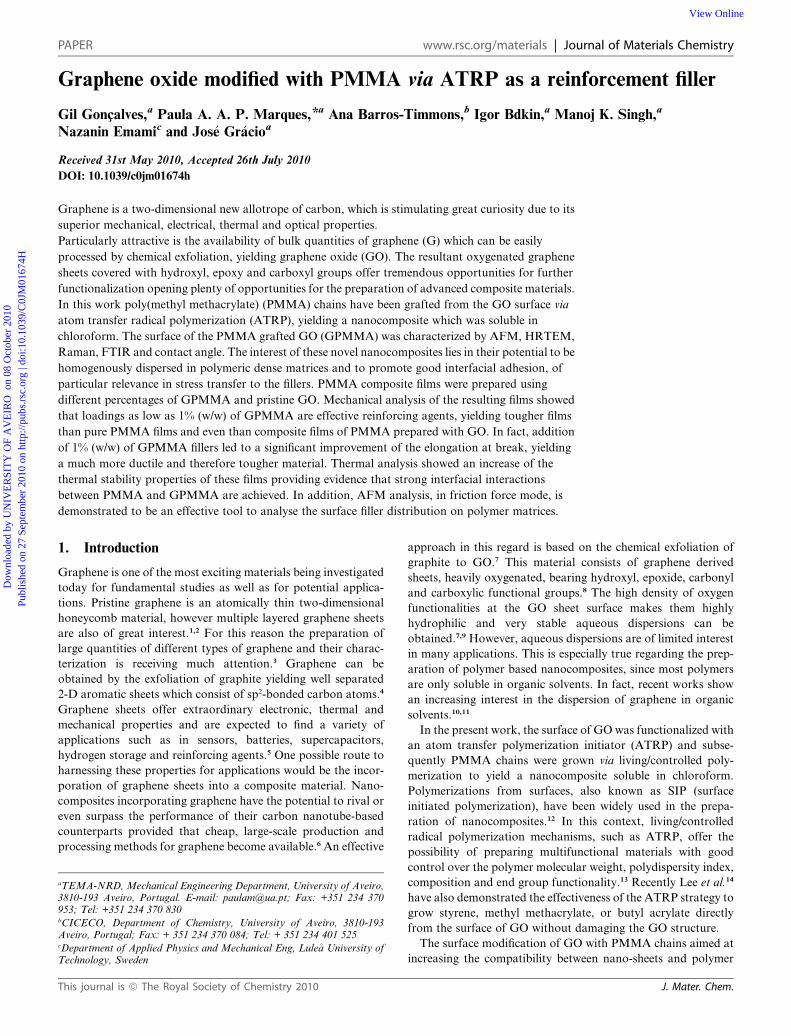
the inset of Fig. 1a). For a detailed morphological study, TEM
analysis of as synthesized GO and GPMMA was performed.
Fig. 1a shows a general view of a GO nanosheet on the TEM
carbon grid, clearly illustrating the flake-like shape of GO where
the edges tend to fold and roll. Fig. 1b shows a higher magnifi-
cation of the area denoted by the square in Fig. 1a. The same
image, after filtering in the frequency domain to remove
unwanted noise (fast Fourier transform), is shown in Fig. 1c
where the hexagonal graphene network can be observed. Fig. 1d
depicts the TEM image of the GPMMA sample where some dark
features can be observed. The high magnification image (Fig. 1e)
of the area denoted by the square region in Fig. 1d, clearly shows
these dark spots as opposed to what it observed for pristine GO
(Fig. 1b). The presence of such spots can be attributed to polymer
brushes and has been observed by other authors with different
polymers as described elsewhere.33,34 According to Yang et al.,33
in solution the grafted polymer chains are extended due to their
solubility in the solvent, however, after drying the polymer
chains collapse onto the surface of the GO sheets forming
nanosized domains that correspond to the dark spots observed.
The surface of GPMMA was characterized by infrared spec-
troscopy and compared to GO (Fig. 2). The characteristic
features of GO in the FTIR spectrum are the absorption bands
corresponding to the C]O stretching vibrations from carbonyl
and carboxylic groups at 1720 cm�1, the C–OH stretching at
1227 cm�1, and the C–O vibrations of the epoxy groups at ca.
1139 cm�1 and 873 cm�1.35,36 The spectrum also shows a band at
J. Mater. Chem.
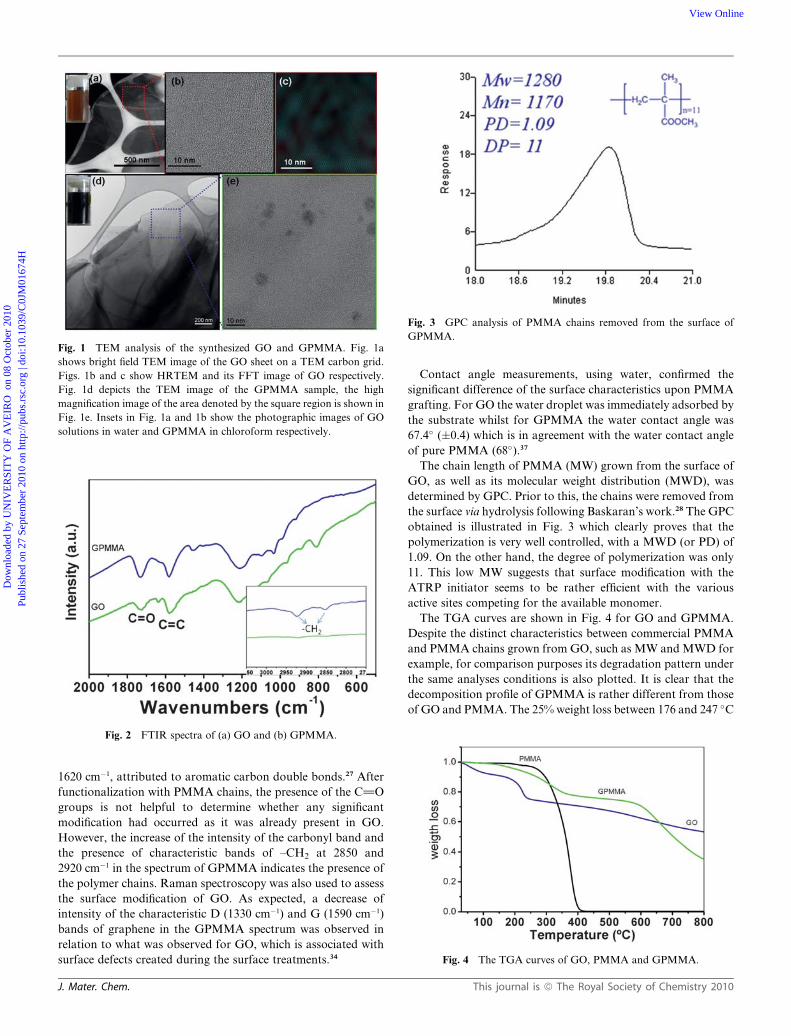
Fig. 1 TEM analysis of the synthesized GO and GPMMA. Fig. 1a
shows bright field TEM image of the GO sheet on a TEM carbon grid.
Figs. 1b and c show HRTEM and its FFT image of GO respectively.
Fig. 1d depicts the TEM image of the GPMMA sample, the high
magnification image of the area denoted by the square region is shown in
Fig. 1e. Insets in Fig. 1a and 1b show the photographic images of GO
solutions in water and GPMMA in chloroform respectively.
Fig. 2 FTIR spectra of (a) GO and (b) GPMMA.
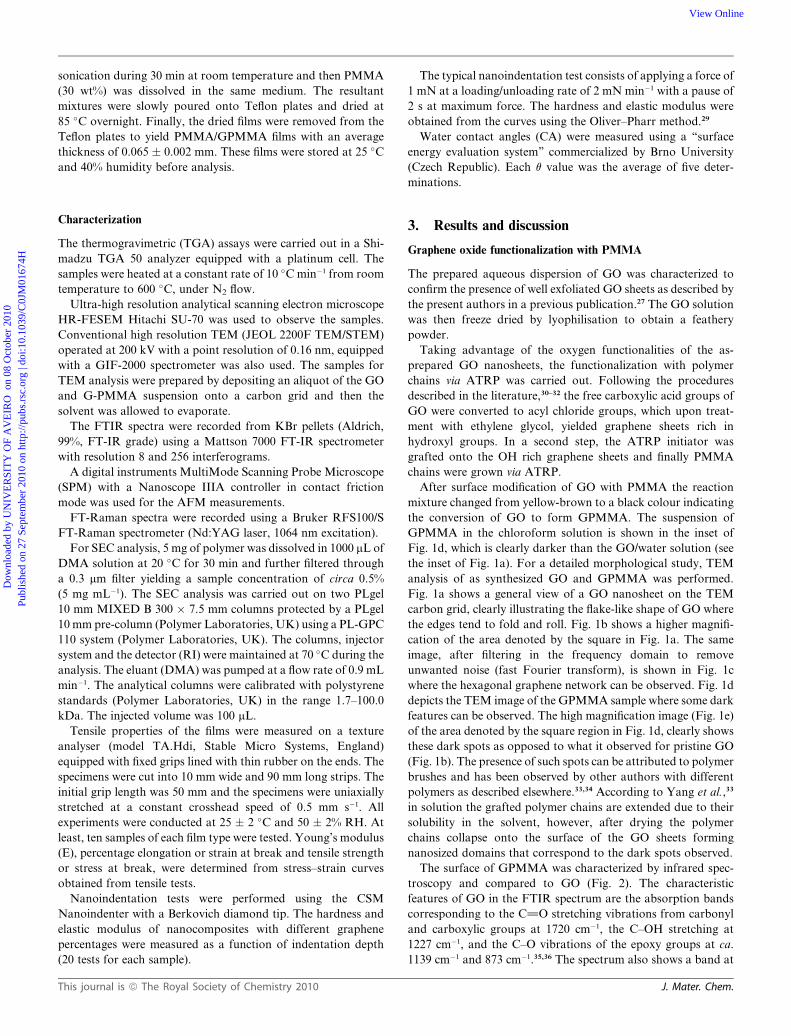
Fig. 3 GPC analysis of PMMA chains removed from the surface of
GPMMA.
Fig. 4 The TGA curves of GO, PMMA and GPMMA.
Dow
nloa
ded
by U
NIV
ER
SIT
Y O
F A
VE
IRO
on
08 O
ctob
er 2
010
Publ
ishe
d on
27
Sept
embe
r 20
10 o
n ht
tp://
pubs
.rsc
.org
| do
i:10.
1039
/C0J
M01
674H
View Online
1620 cm�1, attributed to aromatic carbon double bonds.27 After
functionalization with PMMA chains, the presence of the C]O
groups is not helpful to determine whether any significant
modification had occurred as it was already present in GO.
However, the increase of the intensity of the carbonyl band and
the presence of characteristic bands of –CH2 at 2850 and
2920 cm�1 in the spectrum of GPMMA indicates the presence of
the polymer chains. Raman spectroscopy was also used to assess
the surface modification of GO. As expected, a decrease of
intensity of the characteristic D (1330 cm�1) and G (1590 cm�1)
bands of graphene in the GPMMA spectrum was observed in
relation to what was observed for GO, which is associated with
surface defects created during the surface treatments.34
J. Mater. Chem.
Contact angle measurements, using water, confirmed the
significant difference of the surface characteristics upon PMMA
grafting. For GO the water droplet was immediately adsorbed by
the substrate whilst for GPMMA the water contact angle was
67.4� (�0.4) which is in agreement with the water contact angle
of pure PMMA (68�).37
The chain length of PMMA (MW) grown from the surface of
GO, as well as its molecular weight distribution (MWD), was
determined by GPC. Prior to this, the chains were removed from
the surface via hydrolysis following Baskaran’s work.28 The GPC
obtained is illustrated in Fig. 3 which clearly proves that the
polymerization is very well controlled, with a MWD (or PD) of
1.09. On the other hand, the degree of polymerization was only
11. This low MW suggests that surface modification with the
ATRP initiator seems to be rather efficient with the various
active sites competing for the available monomer.
The TGA curves are shown in Fig. 4 for GO and GPMMA.
Despite the distinct characteristics between commercial PMMA
and PMMA chains grown from GO, such as MW and MWD for
example, for comparison purposes its degradation pattern under
the same analyses conditions is also plotted. It is clear that the
decomposition profile of GPMMA is rather different from those
of GO and PMMA. The 25% weight loss between 176 and 247 �C
This journal is ª The Royal Society of Chemistry 2010
Dow
nloa
ded
by U
NIV
ER
SIT
Y O
F A
VE
IRO
on
08 O
ctob
er 2
010
Publ
ishe
d on
27
Sept
embe
r 20
10 o
n ht
tp://
pubs
.rsc
.org
| do
i:10.
1039
/C0J
M01
674H
View Online
registered for GO is attributed to the decomposition of labile
oxygen functional-containing groups.38 After that, GO is stable
up to 500 �C when decomposition of the carbon structure occurs.
As regards the GPMMA nanocomposite a 35% weight loss is
observed between 145 and 397 �C, whilst for the commercial
PMMA sample thermal degradation only begins at 270 �C. The
difference between GPMMA and the commercial PMMA is
thought to be due to the thermal decomposition of oxygen-
containing groups present on the GPMMA surface resulting
from previous surface treatments of the GO. Further differences
are also observed at higher temperatures. Whilst the commercial
PMMA sample is completely degraded at 400 �C, the PMMA
grafted on the GO surface is stable up to 560 �C. The increase in
thermal stability observed for the grafted PMMA, i.e. GPMMA
may be ascribed to the ability of the graphene surface to capture
free radicals generated during thermal decomposition.
To further understand the surface of GO and GPMMA and to
obtain complementary information to the TEM analysis, AFM
studies in friction mode were performed. It is known that the
adhesion force (Fad) and the friction coefficient (m) of a material
depend on its atomic structure and can be calculated by the
following equation FL ¼ m(FN + Fad), where FL is the lateral
force, also known as friction force, and FN the normal force.
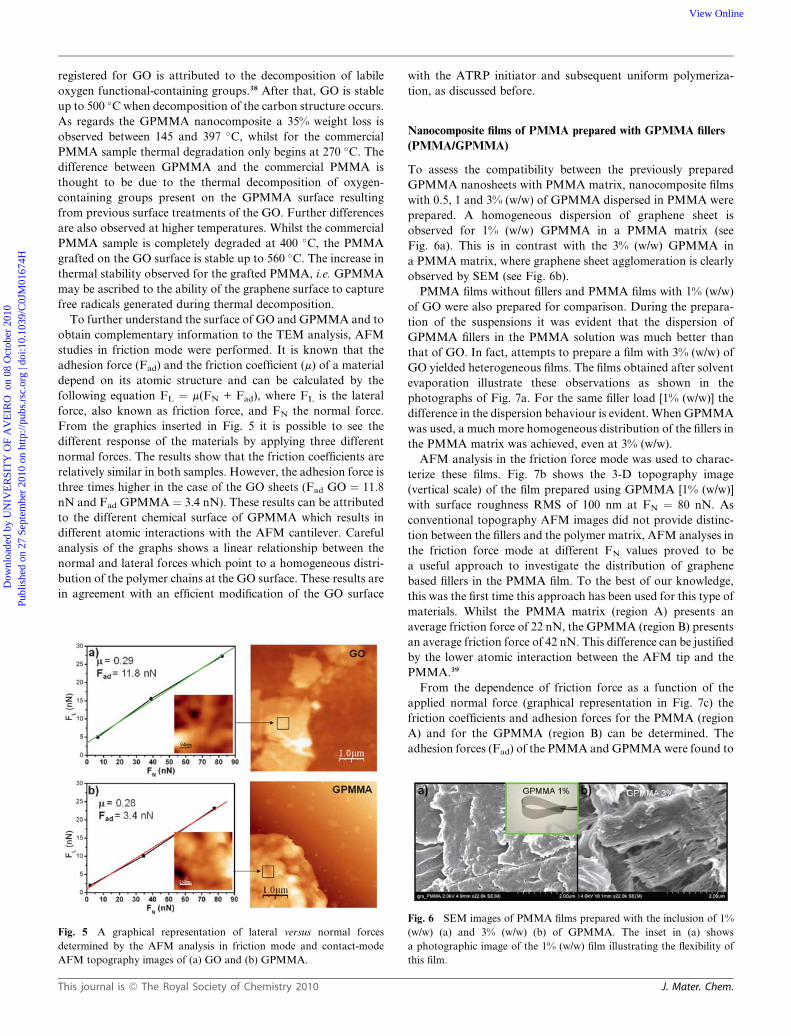
From the graphics inserted in Fig. 5 it is possible to see the
different response of the materials by applying three different
normal forces. The results show that the friction coefficients are
relatively similar in both samples. However, the adhesion force is
three times higher in the case of the GO sheets (Fad GO ¼ 11.8
nN and Fad GPMMA ¼ 3.4 nN). These results can be attributed
to the different chemical surface of GPMMA which results in
different atomic interactions with the AFM cantilever. Careful
analysis of the graphs shows a linear relationship between the
normal and lateral forces which point to a homogeneous distri-
bution of the polymer chains at the GO surface. These results are
in agreement with an efficient modification of the GO surface
Fig. 5 A graphical representation of lateral versus normal forces
determined by the AFM analysis in friction mode and contact-mode
AFM topography images of (a) GO and (b) GPMMA.
This journal is ª The Royal Society of Chemistry 2010
with the ATRP initiator and subsequent uniform polymeriza-
tion, as discussed before.
Nanocomposite films of PMMA prepared with GPMMA fillers
(PMMA/GPMMA)
To assess the compatibility between the previously prepared
GPMMA nanosheets with PMMA matrix, nanocomposite films
with 0.5, 1 and 3% (w/w) of GPMMA dispersed in PMMA were
prepared. A homogeneous dispersion of graphene sheet is
observed for 1% (w/w) GPMMA in a PMMA matrix (see
Fig. 6a). This is in contrast with the 3% (w/w) GPMMA in
a PMMA matrix, where graphene sheet agglomeration is clearly
observed by SEM (see Fig. 6b).
PMMA films without fillers and PMMA films with 1% (w/w)
of GO were also prepared for comparison. During the prepara-
tion of the suspensions it was evident that the dispersion of
GPMMA fillers in the PMMA solution was much better than
that of GO. In fact, attempts to prepare a film with 3% (w/w) of
GO yielded heterogeneous films. The films obtained after solvent
evaporation illustrate these observations as shown in the
photographs of Fig. 7a. For the same filler load [1% (w/w)] the
difference in the dispersion behaviour is evident. When GPMMA
was used, a much more homogeneous distribution of the fillers in
the PMMA matrix was achieved, even at 3% (w/w).
AFM analysis in the friction force mode was used to charac-
terize these films. Fig. 7b shows the 3-D topography image
(vertical scale) of the film prepared using GPMMA [1% (w/w)]
with surface roughness RMS of 100 nm at FN ¼ 80 nN. As
conventional topography AFM images did not provide distinc-
tion between the fillers and the polymer matrix, AFM analyses in
the friction force mode at different FN values proved to be
a useful approach to investigate the distribution of graphene
based fillers in the PMMA film. To the best of our knowledge,
this was the first time this approach has been used for this type of
materials. Whilst the PMMA matrix (region A) presents an
average friction force of 22 nN, the GPMMA (region B) presents
an average friction force of 42 nN. This difference can be justified
by the lower atomic interaction between the AFM tip and the
PMMA.39
From the dependence of friction force as a function of the
applied normal force (graphical representation in Fig. 7c) the
friction coefficients and adhesion forces for the PMMA (region
A) and for the GPMMA (region B) can be determined. The
adhesion forces (Fad) of the PMMA and GPMMA were found to
Fig. 6 SEM images of PMMA films prepared with the inclusion of 1%
(w/w) (a) and 3% (w/w) (b) of GPMMA. The inset in (a) shows
a photographic image of the 1% (w/w) film illustrating the flexibility of
this film.
J. Mater. Chem.
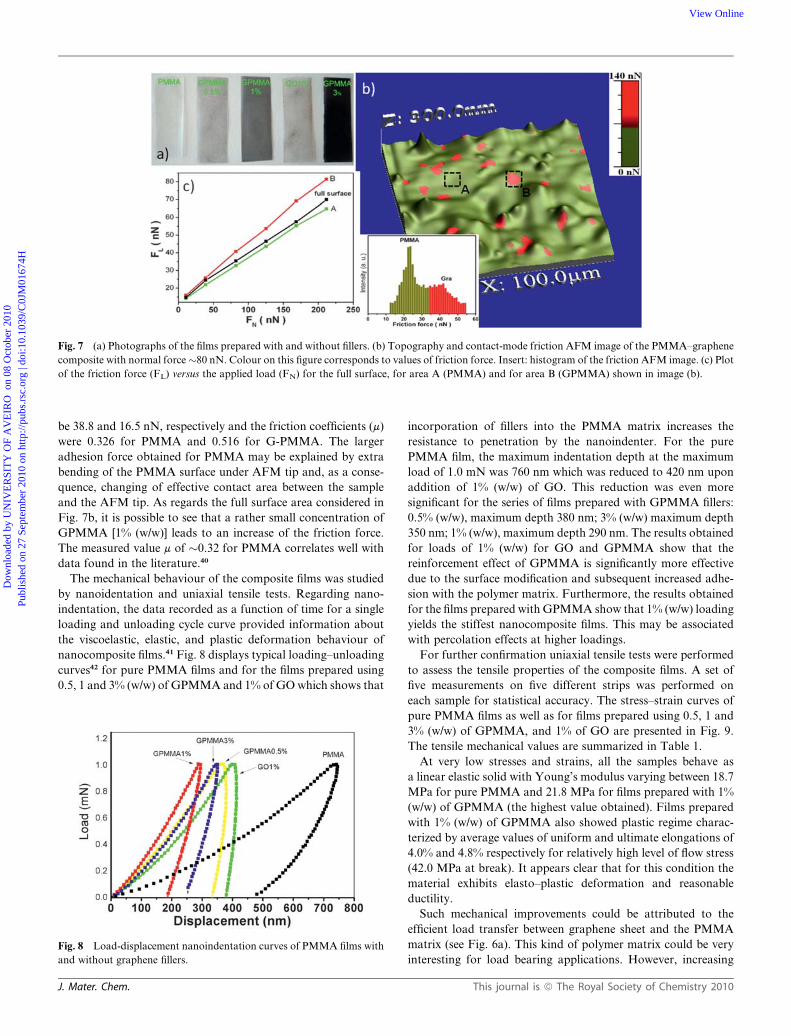
Fig. 7 (a) Photographs of the films prepared with and without fillers. (b) Topography and contact-mode friction AFM image of the PMMA–graphene
composite with normal force�80 nN. Colour on this figure corresponds to values of friction force. Insert: histogram of the friction AFM image. (c) Plot
of the friction force (FL) versus the applied load (FN) for the full surface, for area A (PMMA) and for area B (GPMMA) shown in image (b).
Dow
nloa
ded
by U
NIV
ER
SIT
Y O
F A
VE
IRO
on
08 O
ctob
er 2
010
Publ
ishe
d on
27
Sept
embe
r 20
10 o
n ht
tp://
pubs
.rsc
.org
| do
i:10.
1039
/C0J
M01
674H
View Online
be 38.8 and 16.5 nN, respectively and the friction coefficients (m)
were 0.326 for PMMA and 0.516 for G-PMMA. The larger
adhesion force obtained for PMMA may be explained by extra
bending of the PMMA surface under AFM tip and, as a conse-
quence, changing of effective contact area between the sample
and the AFM tip. As regards the full surface area considered in
Fig. 7b, it is possible to see that a rather small concentration of
GPMMA [1% (w/w)] leads to an increase of the friction force.
The measured value m of �0.32 for PMMA correlates well with
data found in the literature.40
The mechanical behaviour of the composite films was studied
by nanoidentation and uniaxial tensile tests. Regarding nano-
indentation, the data recorded as a function of time for a single
loading and unloading cycle curve provided information about
the viscoelastic, elastic, and plastic deformation behaviour of
nanocomposite films.41 Fig. 8 displays typical loading–unloading
curves42 for pure PMMA films and for the films prepared using
0.5, 1 and 3% (w/w) of GPMMA and 1% of GO which shows that
Fig. 8 Load-displacement nanoindentation curves of PMMA films with
and without graphene fillers.
J. Mater. Chem.
incorporation of fillers into the PMMA matrix increases the
resistance to penetration by the nanoindenter. For the pure
PMMA film, the maximum indentation depth at the maximum
load of 1.0 mN was 760 nm which was reduced to 420 nm upon
addition of 1% (w/w) of GO. This reduction was even more
significant for the series of films prepared with GPMMA fillers:
0.5% (w/w), maximum depth 380 nm; 3% (w/w) maximum depth
350 nm; 1% (w/w), maximum depth 290 nm. The results obtained
for loads of 1% (w/w) for GO and GPMMA show that the
reinforcement effect of GPMMA is significantly more effective
due to the surface modification and subsequent increased adhe-
sion with the polymer matrix. Furthermore, the results obtained
for the films prepared with GPMMA show that 1% (w/w) loading
yields the stiffest nanocomposite films. This may be associated
with percolation effects at higher loadings.
For further confirmation uniaxial tensile tests were performed
to assess the tensile properties of the composite films. A set of
five measurements on five different strips was performed on
each sample for statistical accuracy. The stress–strain curves of
pure PMMA films as well as for films prepared using 0.5, 1 and
3% (w/w) of GPMMA, and 1% of GO are presented in Fig. 9.
The tensile mechanical values are summarized in Table 1.
At very low stresses and strains, all the samples behave as
a linear elastic solid with Young’s modulus varying between 18.7
MPa for pure PMMA and 21.8 MPa for films prepared with 1%
(w/w) of GPMMA (the highest value obtained). Films prepared
with 1% (w/w) of GPMMA also showed plastic regime charac-
terized by average values of uniform and ultimate elongations of
4.0% and 4.8% respectively for relatively high level of flow stress
(42.0 MPa at break). It appears clear that for this condition the
material exhibits elasto–plastic deformation and reasonable
ductility.
Such mechanical improvements could be attributed to the
efficient load transfer between graphene sheet and the PMMA
matrix (see Fig. 6a). This kind of polymer matrix could be very
interesting for load bearing applications. However, increasing
This journal is ª The Royal Society of Chemistry 2010
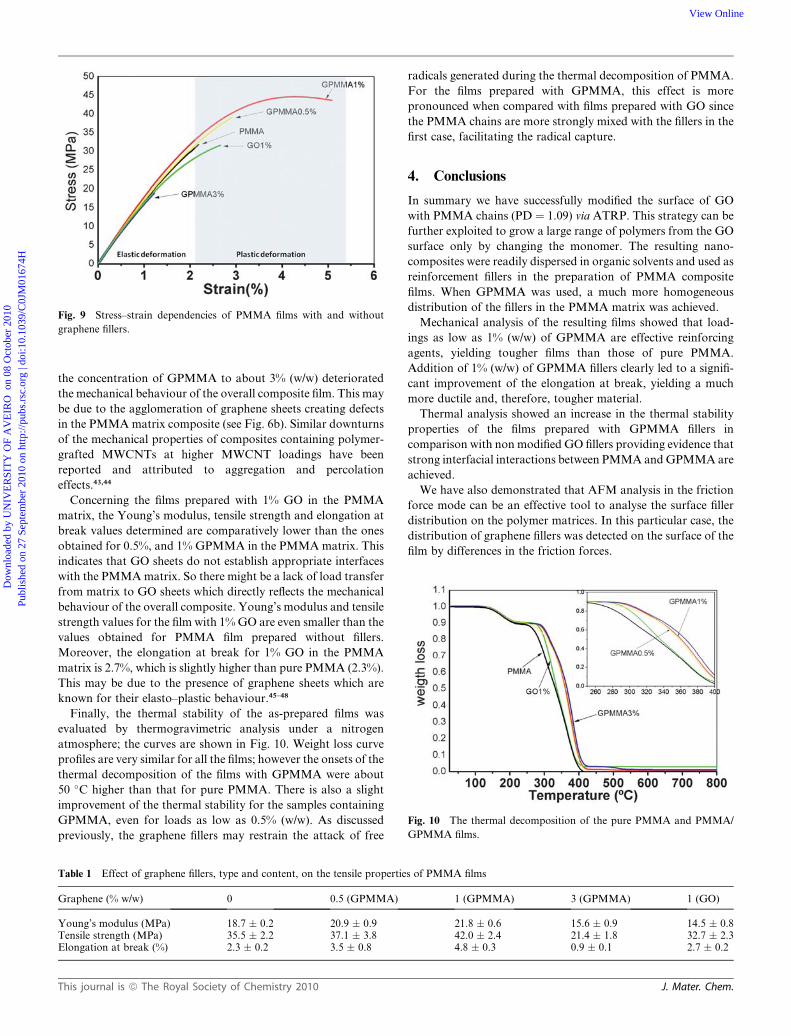
Fig. 9 Stress–strain dependencies of PMMA films with and without
graphene fillers.
Fig. 10 The thermal decomposition of the pure PMMA and PMMA/
GPMMA films.
Dow
nloa
ded
by U
NIV
ER
SIT
Y O
F A
VE
IRO
on
08 O
ctob
er 2
010
Publ
ishe
d on
27
Sept
embe
r 20
10 o
n ht
tp://
pubs
.rsc
.org
| do
i:10.
1039
/C0J
M01
674H
View Online
the concentration of GPMMA to about 3% (w/w) deteriorated
the mechanical behaviour of the overall composite film. This may
be due to the agglomeration of graphene sheets creating defects
in the PMMA matrix composite (see Fig. 6b). Similar downturns
of the mechanical properties of composites containing polymer-
grafted MWCNTs at higher MWCNT loadings have been
reported and attributed to aggregation and percolation
effects.43,44
Concerning the films prepared with 1% GO in the PMMA
matrix, the Young’s modulus, tensile strength and elongation at
break values determined are comparatively lower than the ones
obtained for 0.5%, and 1% GPMMA in the PMMA matrix. This
indicates that GO sheets do not establish appropriate interfaces
with the PMMA matrix. So there might be a lack of load transfer
from matrix to GO sheets which directly reflects the mechanical
behaviour of the overall composite. Young’s modulus and tensile
strength values for the film with 1% GO are even smaller than the
values obtained for PMMA film prepared without fillers.
Moreover, the elongation at break for 1% GO in the PMMA
matrix is 2.7%, which is slightly higher than pure PMMA (2.3%).
This may be due to the presence of graphene sheets which are
known for their elasto–plastic behaviour.45–48
Finally, the thermal stability of the as-prepared films was
evaluated by thermogravimetric analysis under a nitrogen
atmosphere; the curves are shown in Fig. 10. Weight loss curve
profiles are very similar for all the films; however the onsets of the
thermal decomposition of the films with GPMMA were about
50 �C higher than that for pure PMMA. There is also a slight
improvement of the thermal stability for the samples containing
GPMMA, even for loads as low as 0.5% (w/w). As discussed
previously, the graphene fillers may restrain the attack of free
Table 1 Effect of graphene fillers, type and content, on the tensile propertie
Graphene (% w/w) 0 0.5 (GPMMA)
Young’s modulus (MPa) 18.7 � 0.2 20.9 � 0.9Tensile strength (MPa) 35.5 � 2.2 37.1 � 3.8Elongation at break (%) 2.3 � 0.2 3.5 � 0.8
This journal is ª The Royal Society of Chemistry 2010
radicals generated during the thermal decomposition of PMMA.
For the films prepared with GPMMA, this effect is more
pronounced when compared with films prepared with GO since
the PMMA chains are more strongly mixed with the fillers in the
first case, facilitating the radical capture.
4. Conclusions
In summary we have successfully modified the surface of GO
with PMMA chains (PD ¼ 1.09) via ATRP. This strategy can be
further exploited to grow a large range of polymers from the GO
surface only by changing the monomer. The resulting nano-
composites were readily dispersed in organic solvents and used as
reinforcement fillers in the preparation of PMMA composite
films. When GPMMA was used, a much more homogeneous
distribution of the fillers in the PMMA matrix was achieved.
Mechanical analysis of the resulting films showed that load-
ings as low as 1% (w/w) of GPMMA are effective reinforcing
agents, yielding tougher films than those of pure PMMA.
Addition of 1% (w/w) of GPMMA fillers clearly led to a signifi-
cant improvement of the elongation at break, yielding a much
more ductile and, therefore, tougher material.
Thermal analysis showed an increase in the thermal stability
properties of the films prepared with GPMMA fillers in
comparison with non modified GO fillers providing evidence that
strong interfacial interactions between PMMA and GPMMA are
achieved.
We have also demonstrated that AFM analysis in the friction
force mode can be an effective tool to analyse the surface filler
distribution on the polymer matrices. In this particular case, the
distribution of graphene fillers was detected on the surface of the
film by differences in the friction forces.
s of PMMA films
1 (GPMMA) 3 (GPMMA) 1 (GO)
21.8 � 0.6 15.6 � 0.9 14.5 � 0.842.0 � 2.4 21.4 � 1.8 32.7 � 2.34.8 � 0.3 0.9 � 0.1 2.7 � 0.2
J. Mater. Chem.
Dow
nloa
ded
by U
NIV
ER
SIT
Y O
F A
VE
IRO
on
08 O
ctob
er 2
010
Publ
ishe
d on
27
Sept
embe
r 20
10 o
n ht
tp://
pubs
.rsc
.org
| do
i:10.
1039
/C0J
M01
674H
View Online
5. Acknowledgements
This work was co-financed by the International Iberian Nano-
technology Laboratory - Foundation of Science and Technology
(FCT – Portugal) NANO/NMed-AT/0115/2007 (FCOMP-01-
0124-FEDER-008439).
The authors P. A. A. P. Marques, Igor Bdkin and M. K. Singh
would like to thank the Ciencia Program, FCT. G. Goncalves
thanks the PhD grant from INL (International Iberian Nano-
technology Laboratory).
We also thank the facility RNME - Pole University of Aveiro,
FCT Project REDE/1509/RME/2005.
6. References
1 M. J. Allen, V. C. Tung and R. B. Kaner, Chem. Rev., 2010, 110, 132.2 C. N. R. Rao, K. Biswas, K. S. Subrahmanyam and A. Govindaraj, J.
Mater. Chem., 2009, 19, 2457.3 V. C. Tung, M. J. Allen, Y. Yang and R. B. Kaner, Nat. Nanotechnol.,
2009, 4, 25.4 B. Z. Jang and A. Zhamu, J. Mater. Sci., 2008, 43, 5092.5 D. Li, M. B. Muller, S. Gilje, R. B. Kaner and G. G. Wallace, Nat.
Nanotechnol., 2008, 3, 101.6 S. Villar-Rodil, J. I. Paredes, A. Martinez-Alonso and
J. M. D. Tascon, J. Mater. Chem., 2009, 19, 3591.7 W. S. Hummers and R. E. Offeman, J. Am. Chem. Soc., 1958, 80,
1339.8 N. A. Kotov, Nature, 2006, 442, 254.9 S. Niyogi, E. Bekyarova, M. E. Itkis, J. L. McWilliams, M. A. Hamon
and R. C. Haddon, J. Am. Chem. Soc., 2006, 128, 7720.10 Y. Liang, D. Wu, X. Feng and K. Mullen, Adv. Mater., 2009, 21,
1679.11 S. Villar-Rodil, J. I. Paredes, A. Mart�ınez-Alonso and
J. M. D. Tasc�on, J. Mater. Chem., 2009, 19, 3591.12 H. Kong, C. Gao and D. Yan, J. Am. Chem. Soc., 2004, 126, 412.13 M. Ghislandi, L. Prado, A. D. Oyerviedes, H. Wittich, K. Schulte and
A. Barros-Timmons, J. Polym. Sci., Part A: Polym. Chem., 2008, 46,3326.
14 S. H. Lee, D. R. Dreyer, J. An, A. Velamakanni, R. D. Piner, S. Park,Y. Zhu, S. O. Kim, C. W. Bielawski and R. S. Ruoff, Macromol.Rapid Commun., 2010, 31, 281.
15 F. A. Zhang, D. K. Lee and T. J. Pinnavaia, Polymer, 2009, 50, 4768.16 M. Tanahashi, M. Hirose, J. C. Lee and K. Takeda, Polym. Adv.
Technol., 2006, 17, 981.17 H. P. Fu, R. Y. Hong, Y. J. Zhang, H. Z. Li, B. Xu, Y. Zheng and
D. G. Wei, Polym. Adv. Technol., 2009, 20, 84.18 Y. P. Zheng, Y. Zheng and R. C. Ning, Mater. Lett., 2003, 57, 2940.19 T. Naganuma and Y. Kagawa, Compos. Sci. Technol., 2002, 62, 1187.
J. Mater. Chem.
20 R. Y. Hong, L. L. Chen, J. H. Li, H. Z. Li, Y. Zheng and J. Ding,Polym. Adv. Technol., 2007, 18, 901.
21 S. Kang, S. I. Hong, C. R. Choe, M. Park, S. Rim and J. Kim,Polymer, 2001, 42, 879.
22 T. Kotoky and S. K. Dolui, Colloid Polym. Sci., 2006, 284, 1163.23 Y. Hong, H. P. Fu, Y. J. Zhang, L. Liu, J. Wang, H. Z. Li and
Y. Zheng, J. Appl. Polym. Sci., 2007, 105, 2176.24 R. G. Mathew, M. Y. Huh, J. M. Rhee, M. H. Lee and C. Nah,
Polym. Adv. Technol., 2004, 15, 400.25 H. Zhang, J. Han and B. Yang, Adv. Funct. Mater., 2010, 20, 1533.26 M. Fang, K. Wang, H. Lu, Y. Yanga and S. Nutt, J. Mater. Chem.,
2009, 19, 7098.27 G. Goncalves, P. A. A. P. Marques, C. M. Granadeiro,
H. I. S. Nogueira, M. K. Singh and J. Gr�acio, Chem. Mater., 2009,21, 4796.
28 D. Baskaran, Angew. Chem. Int. Ed., 2004, 43, 2138.29 W. C. Oliver and G. M. Pharr, J. Mater. Res., 1992, 7, 1564.30 Z. Spitalsky, D. Tasis, K. Papagelis and C. Galiotis, Prog. Polym.
Res., 2010, 35, 357.31 A. Niedermayer, Anal. Chem., 1967, 39, 953.32 Z. Spitalskya, D. Tasisb, K. Papagelis and C. Galiotis, Prog. Polym.
Sci., 2010, 35, 357.33 Y. Yang, J. Wang, J. Zhang, J. Liu, X. Yang and H. Zhao, Langmuir,
2009, 25, 11808.34 M. Fang, K. Wang, H. Lu, Y. Yang and S. Nutt, J. Mater Chem.,
2010, 20, 1982.35 H. F. Yang, F. Li, C. Shan, D. Han, Q. Zhang, L. Niu and A. Ivaska,
J. Mater. Chem, 2009, 19, 4632.36 S. R. Wang, Y. Zhang, N. Abidi and L. Cabrales, Langmuir, 2009, 25,
11078.37 Y. Ma, X. Y. Cao, X. J. Feng, Y. M. Ma and H. Zou, Polymer, 2007,
48, 7455.38 X. B. Fan, W. C. Peng, Y. Li, X. Y. Li, S. L. Wang, G. L. Zhang and
F. B. Zhang, Adv. Mater., 2008, 20, 4490.39 C. Lee, X. Wei, Q. Li, R. Carpick, J. W. Kysar and J. Hone, Phys.
Status Solid B, 2009, 246, 2562.40 C. Hall. in Polymer Materials. An Introduction for Technologists and
Scientists, 2nd edn, Max Milian, London, 1989, p. 86.41 K. Yusoh, J. Jin and M. Song, Prog. Org. Coat., 2010, 67, 220.42 H. N. Dhakal, Z. Y. Zhang and M. O. W. Richardson, Polym. Test.,
2006, 25, 846.43 B. X. Yang, J. H. Shi, K. P. Pramoda and S. H. Goh, Compos. Sci.
Technol., 2008, 68, 2490.44 D. Blond, V. Barron, M. Ruether, K. P. Ryan, V. Nicolosi, W. J. Blau
and J. N. Coleman, Adv. Funct. Mater., 2006, 16, 1608.45 D. A. Dikin, S. Stankovich, E. J. Zimney, R. D. Piner,
G. H. B. Dommett, G. Evmenenko, S. T. Nguyen and R. S. Ruoff,Nature, 2007, 448, 457.
46 S. Stankovich, D. A. Dikin, G. H. B. Dommett, K. M. Kohlhaas,E. J. Zimney, E. A. Stach, R. D. Piner, S. T. Nguyen andR. S. Ruoff, Nature, 2006, 442, 282.
47 M. Topsakal and S. Ciraci, Phys. Rev. B, 2010, 81, 024107.48 T. Tallinen, J. A. �Astr€om and J. Timonen, Nat. Mater., 2009, 8, 25.
This journal is ª The Royal Society of Chemistry 2010