grade 12 results - examinations
TRANSCRIPT

Preface by the HEAD: Education
From 2012 academic year, we put a turnaround organizational plan to achieve these three critical objectives, to:
Create hope for the department to turnaround and perform
maximally,
Ensure unity of purpose among all employees, teachers and stakeholders in driving the core business of the department and
Improve learner performance and academic achievement.
Through collective leadership effort, we have partially achieved these three objectives and this has been shown by:
Maximum participation of key stakeholders in decision making processes leading to observed stability in the year under review;
Maximum participation by teachers in Numeracy and Literacy intervention projects as evidenced by the ANA results of 2012 and 2013.
Improved Grade 12 results from 58% to 61.6% in 2012 and that has set a strong and firm foundation for 2013 academic year.
Then 2013 has been a year characterized by both good and challenging policy implementation issues. Because of our focus in transforming the operations of the department and an attempt to do issues that were never done since the inception of this department, we had to face issues head-on in order to provide teachers to the needy and deserving schools. We have further accelerated interventions in districts, compelling them all both on supervised fortnightly lesson preparation per subject and monthly accountability meetings focused on progress made in improving learner performance. In essence the results of the class of 2013, is the product of hardwork by all, viz: officials of the department, principals, teachers, stakeholders, parents, communities who supported learners in their Learner Attainment Improvement Strategy (LAIS) planned activities and projects.
To those who have not met their set targets, I want to reiterate that hard work breeds success. Through thick and thin never give up, but continue working until you get good results. At the same time discipline is the foundation of success. Serious introspection and the study of the culture existing in each school will make a reliable benchmark for improvement. All must know that “the greatest glory in living lies not in never falling, but in rising every time we fall” (Dr. Nelson Mandela). I expect that from the analysis of Grade 12 results of the class of 2013 and the analysis of Grade 11 results of the class of 2013 (current Grade 12 class), each district reviews its LAIS plan and focuses clearly on the subjects that are underperformed and at the same time ensuring improvement in others, because there is no limit in how high one can achieve in life. Let us work with all relevant stakeholders and focus our energies in supporting learners’ learning to improve their performance in all Grades. Each district must set high but realistic targets to improve learner performance in all grades and schools to follow suite under the tutorage of Circuit Managers. I applaud teachers who have done good work in 2013 and also for always knowing that they are accompanying learners (whom we teach) on their journey to maturity. This means that by teaching them we are touching their lives daily. Indeed we can make a difference simply by choosing to do so. We can start our day by saying ‘I choose to make a difference today’ and see where that attitude takes us (Marie Russel). Teachers must double their efforts of improving learner performance in 2014. My approach is simply to say, let us all maximize our performance at all levels of operation with efficiency, effectiveness and speed required to improve academic performance of our learners in 2014. I subscribe to this phrase thus: “If a man is called to be a street sweeper, he should sweep streets as Michelangelo painted or Beethoven composed music, or Shakespeare poetry. He should sweep streets so that all the hosts of heaven and earth will pause to say, ‘here lived a great street sweeper who did his job well’ (Martin Luther King Jr). In 2014, I want all officials, managers, teachers and learners at all levels of this organization to focus and improve these 10 pillars in our schools (where principals have to lead):
Support for system-wide improvement (specifically moving from theory to practice in everything being done);
Quality of teaching and learning in all Grades;
Effective instructional leadership and management;
Creation of a climate in which teachers and learners conduct tuition work daily;
Maximizing of tuition time at all costs to finish syllabus on time, as per the pace setters;
A high priority given to learners’ activities that promote effective learning and ultimately improvement of their academic performance;
Sense of urgency in teaching and learning and in doing everything to improve learner performance;
Frequent monitoring of the quality of tasks given to learners and their performance in all tasks given with immediate remedial work where necessary;
Application of relevant and immediate interventions / projects as need arises; and
Clear and collaborative relationships, especially interpreting and managing the external environment to improve learner performance.
In conclusion I call on all stakeholders to rekindle the fighting spirit for good results within the framework of Quality Learning and Teaching Campaign (QLTC) and particularly through the community supported learner camps in all schools of this province. Let all District Directors ensure in 2014 that learners are taught and that they also LEARN every day. Lastly, I urge you all to participate and play a meaningful role in ILIMA within QLTC approach, in improving learner performance significantly. To support this move, I am setting up District Intervention Teams to work with a Provincial Intervention Team to deal with underperformance in schools.
Essential to us all, 2014 is declared a year of action, accelerated accountability and improved learner results.
M.L. Ngonzo Superintendent-General 07 January 2014
Table of Contents
Contents 1. INTRODUCTION ............................................................................................................................................... 5
2. SCHOOL-BASED ASSESSMENT ......................................................................................................................... 5
3. VERIFICATION OF IMPLEMENTATION OF SCHOOL BASED ASSESSMENT (SBA) AND ITS MODERATION ........ 6
4. WHAT ARE THE REQUIREMENTS FOR A NATIONAL SENIOR CERTIFICATE? .................................................... 6
5. RATING SCALE .................................................................................................................................................. 6
6. MINIMUM ADMISSION REQUIREMENTS TO HIGHER EDUCATION ................................................................. 7
7. STATISTICS FOR THE NATIONAL SENIOR CERTIFICATE 2013 ........................................................................... 7
8. CHALLENGES .................................................................................................................................................... 8
• Irregularities ................................................................................................................................................ 8
• POLICIES NOT ADHERED TO ......................................................................................................................... 9
• NON-PROVISION OF LEARNER AND EDUCATOR EVIDENCE TO BACK UP SBA MARKS ................................ 9
9. CONCLUSION ................................................................................................................................................... 9
RESULTS ................................................................................................................................................................. 10
1. PROVINCIAL PASS RATE ............................................................................................................................ 10
2. DISTRICT PASS RATE.................................................................................................................................. 10
3. NUMBER OF CENTRES OBTAINED <60% IN A DISTRICT ........................................................................... 11
4. PASS RATE BY QUINTILE ........................................................................................................................... 12
5. CENTRES WITH ZERO PASS RATE .............................................................................................................. 12
6. CENTRE PASS RATE PER CATEGORY (Learners) ........................................................................................ 12
7. CENTRE PASS RATE PER CATEGORY (%) ................................................................................................... 13
8. SUBJECT ANALYSIS (Excluding Home Languages) .................................................................................... 13
9. SUBJECT ANALYSIS (Home Languages) ..................................................................................................... 15
10. SUBJECT BY CATEGORY ......................................................................................................................... 16
11. PROMOTION CLASSIFICATION .............................................................................................................. 28
12. DISTINCTIONS ........................................................................................................................................ 28
APPENDIX............................................................................................................................................................... 29
CENTRE PERFORMANCE .................................................................................................................................... 29
TOP 50 PERFORMING SCHOOLS ....................................................................................................................... 65
WORST 50 PERFORMING SCHOOLS .................................................................................................................. 66
CENTRES OBTAINED <40% 3 CONSECUTIVE YEARS ......................................................................................... 67
NUMBER OF CENTRES PER CATEGORY ............................................................................................................. 69
EXAMINATIONS IN THE EASTERN CAPE
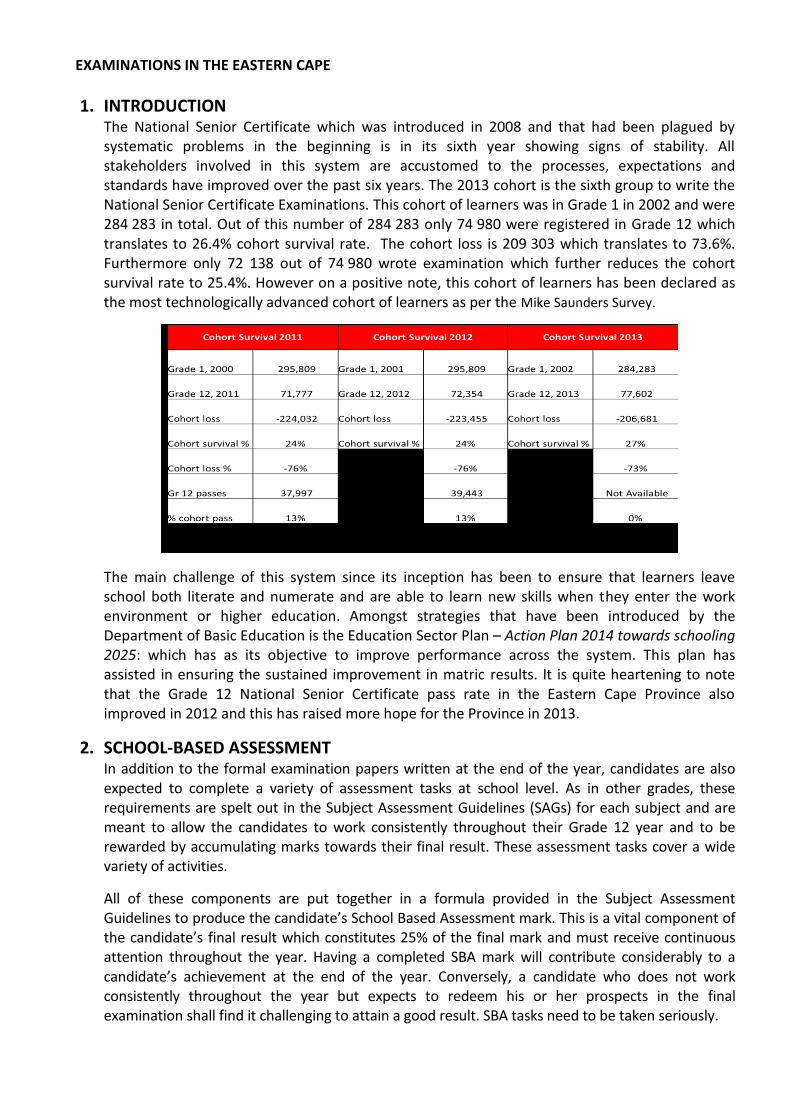
1. INTRODUCTION The National Senior Certificate which was introduced in 2008 and that had been plagued by systematic problems in the beginning is in its sixth year showing signs of stability. All stakeholders involved in this system are accustomed to the processes, expectations and standards have improved over the past six years. The 2013 cohort is the sixth group to write the National Senior Certificate Examinations. This cohort of learners was in Grade 1 in 2002 and were 284 283 in total. Out of this number of 284 283 only 74 980 were registered in Grade 12 which translates to 26.4% cohort survival rate. The cohort loss is 209 303 which translates to 73.6%. Furthermore only 72 138 out of 74 980 wrote examination which further reduces the cohort survival rate to 25.4%. However on a positive note, this cohort of learners has been declared as the most technologically advanced cohort of learners as per the Mike Saunders Survey.
The main challenge of this system since its inception has been to ensure that learners leave school both literate and numerate and are able to learn new skills when they enter the work environment or higher education. Amongst strategies that have been introduced by the Department of Basic Education is the Education Sector Plan – Action Plan 2014 towards schooling 2025: which has as its objective to improve performance across the system. This plan has assisted in ensuring the sustained improvement in matric results. It is quite heartening to note that the Grade 12 National Senior Certificate pass rate in the Eastern Cape Province also improved in 2012 and this has raised more hope for the Province in 2013.
2. SCHOOL-BASED ASSESSMENT In addition to the formal examination papers written at the end of the year, candidates are also expected to complete a variety of assessment tasks at school level. As in other grades, these requirements are spelt out in the Subject Assessment Guidelines (SAGs) for each subject and are meant to allow the candidates to work consistently throughout their Grade 12 year and to be rewarded by accumulating marks towards their final result. These assessment tasks cover a wide variety of activities.
All of these components are put together in a formula provided in the Subject Assessment Guidelines to produce the candidate’s School Based Assessment mark. This is a vital component of the candidate’s final result which constitutes 25% of the final mark and must receive continuous attention throughout the year. Having a completed SBA mark will contribute considerably to a candidate’s achievement at the end of the year. Conversely, a candidate who does not work consistently throughout the year but expects to redeem his or her prospects in the final examination shall find it challenging to attain a good result. SBA tasks need to be taken seriously.
3. VERIFICATION OF IMPLEMENTATION OF SCHOOL BASED ASSESSMENT (SBA) AND ITS MODERATION
Verification and monitoring of implementation of School Based Assessment (SBA) is a mandate by the Department of Basic Education to all Provinces. The SBA mark has to undergo all processes of moderation and verification to ensure that it is valid, reliable and authentic. To ensure that all SBA moderation levels are observed, the Provincial SBA co-ordinator developed a SBA verification Programme which focused on on-site visits to verify implementation and moderation of SBA at the District, cluster and school levels. A sample of Districts and schools were monitored and verified. DBE moderators visited the Province to moderate NSC Grade 12 SBA. This was done in June and in September 2013. In all occasions this was a great success .On 23 – 27 October 2013 the Centralized SBA Provincial moderation was successfully conducted. A sample of 16 subjects was moderated during this moderation session. This was done in two centres. Twenty Percent of the number of schools doing each subject in the Province was moderated.
4. WHAT ARE THE REQUIREMENTS FOR A NATIONAL SENIOR CERTIFICATE?
In order to obtain a National Senior Certificate the learner must:
Offer seven approved subjects and provide full evidence of School Based Assessment for each subject.
Complete the programme requirements for Grades 10, 11 and 12 separately and obtain distinct outcomes and associated standards for all the grades.
Comply with internal assessment requirements for Grades 10, 11 and 12; and the external assessment requirements of Grade 12.
Achieve at least 40% in three subjects, one of which must be an official language at Home Language level.
Must achieve at least 30% in three other subjects.
Provide full evidence of the SBA component in the subject failed.
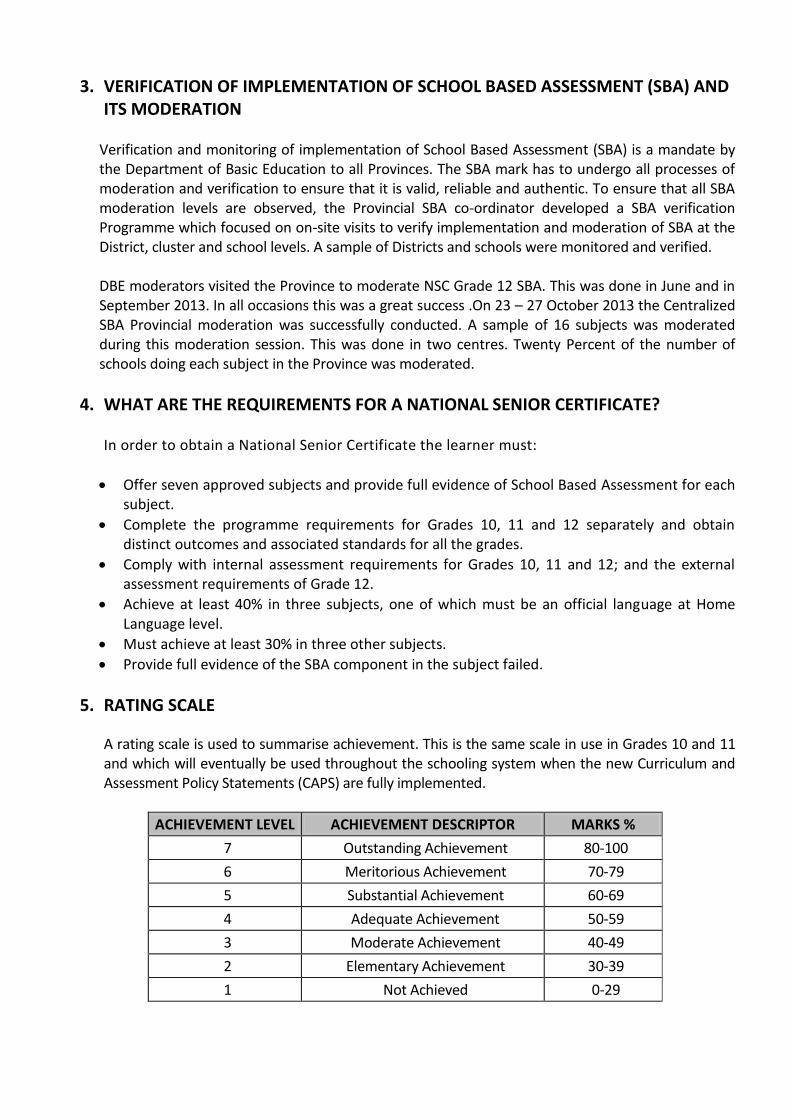
5. RATING SCALE
A rating scale is used to summarise achievement. This is the same scale in use in Grades 10 and 11 and which will eventually be used throughout the schooling system when the new Curriculum and Assessment Policy Statements (CAPS) are fully implemented.
ACHIEVEMENT LEVEL ACHIEVEMENT DESCRIPTOR MARKS %
7 Outstanding Achievement 80-100
6 Meritorious Achievement 70-79
5 Substantial Achievement 60-69
4 Adequate Achievement 50-59
3 Moderate Achievement 40-49
2 Elementary Achievement 30-39
1 Not Achieved 0-29
6. MINIMUM ADMISSION REQUIREMENTS TO HIGHER EDUCATION
It must be emphasised that the minimum requirements for admission to Higher Educations are set by Higher Education Institutions (HEIs). HEIs are at liberty to raise these requirements at any time, depending on the number of applicants they receive. They are also at liberty to set their own entrance and placement tests and to set higher requirements for entrance into particular courses or fields of study. Some HEIs do not recognise particular subjects for selection processes into certain study areas. For example, Mathematical Literacy is not recognised in some HEIs for entrance into courses of study involving Engineering and Sciences. Candidates should consult the HEI of their choice to ascertain entrance requirements.
• HIGHER CERTIFICATE (HC) • NSC with minimum of 30% in the Language of Learning and Teaching (LOLT). • Institutional and programme needs may require additional combinations of recognized NSC
subjects and levels of achievements. • DIPLOMA
• NSC with minimum of 30% in the Language of Learning and Teaching (LOLT). • Achievement rating of 3 (moderate achievement (40-49%) or better in four (4) recognized
NSC 20- credit subjects. • Institutional and programme needs may require additional combinations of recognized NSC
subjects and levels of achievement. • BACHELOR'S DEGREE
• NSC with minimum of 30% in the Language of Learning and Teaching (LOLT) • Achievement rating of 4 (adequate achievement, 50 - 59%) or better in four subjects chosen
from the recognised 20-credit NSC subjects (which will be known as the designated subject list) below:
Accounting Engineering Graphics and Design Mathematics
Agricultural Science Geography Mathematical Literacy
Business Studies History Music
Consumer Studies Information Technology Physical Science
Dramatic Arts Languages Religion Studies
Economics Life Sciences Visual Arts
7. STATISTICS FOR THE NATIONAL SENIOR CERTIFICATE 2013
• NUMBER OF FULL-TIME CANDIDATES AND EXAMINATION CENTRES
The figures in Table 1.1 and Table 1.2 below provide a comparison of the number of candidates who have entered for the National Senior Certificate (NSC) examinations in the Province this year and last year. It is worth noting that the Eastern Cape has the fourth largest number of candidates for the NSC after Kwa Zulu Natal, Limpopo and Gauteng provinces.
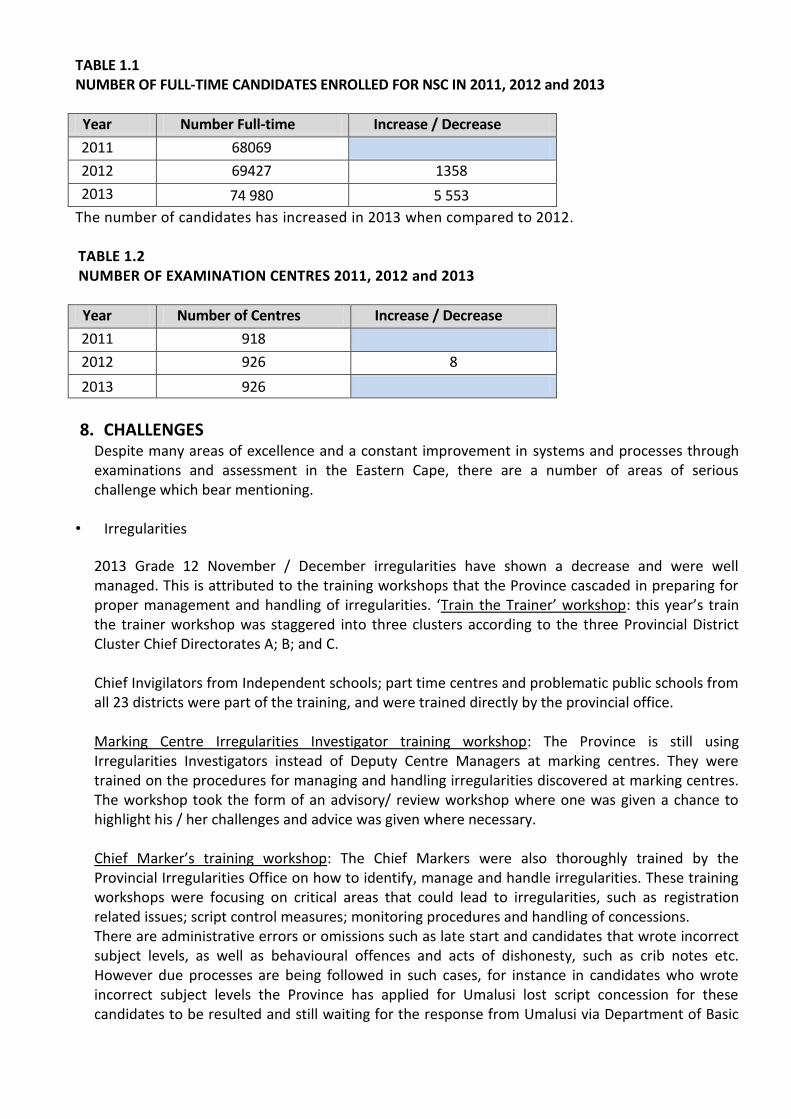
TABLE 1.1 NUMBER OF FULL-TIME CANDIDATES ENROLLED FOR NSC IN 2011, 2012 and 2013
Year Number Full-time Increase / Decrease
2011 68069
2012 69427 1358
2013 74 980 5 553
The number of candidates has increased in 2013 when compared to 2012. TABLE 1.2 NUMBER OF EXAMINATION CENTRES 2011, 2012 and 2013
Year Number of Centres Increase / Decrease
2011 918
2012 926 8
2013 926
8. CHALLENGES Despite many areas of excellence and a constant improvement in systems and processes through examinations and assessment in the Eastern Cape, there are a number of areas of serious challenge which bear mentioning.
• Irregularities
2013 Grade 12 November / December irregularities have shown a decrease and were well managed. This is attributed to the training workshops that the Province cascaded in preparing for proper management and handling of irregularities. ‘Train the Trainer’ workshop: this year’s train the trainer workshop was staggered into three clusters according to the three Provincial District Cluster Chief Directorates A; B; and C. Chief Invigilators from Independent schools; part time centres and problematic public schools from all 23 districts were part of the training, and were trained directly by the provincial office. Marking Centre Irregularities Investigator training workshop: The Province is still using Irregularities Investigators instead of Deputy Centre Managers at marking centres. They were trained on the procedures for managing and handling irregularities discovered at marking centres. The workshop took the form of an advisory/ review workshop where one was given a chance to highlight his / her challenges and advice was given where necessary. Chief Marker’s training workshop: The Chief Markers were also thoroughly trained by the Provincial Irregularities Office on how to identify, manage and handle irregularities. These training workshops were focusing on critical areas that could lead to irregularities, such as registration related issues; script control measures; monitoring procedures and handling of concessions. There are administrative errors or omissions such as late start and candidates that wrote incorrect subject levels, as well as behavioural offences and acts of dishonesty, such as crib notes etc. However due processes are being followed in such cases, for instance in candidates who wrote incorrect subject levels the Province has applied for Umalusi lost script concession for these candidates to be resulted and still waiting for the response from Umalusi via Department of Basic
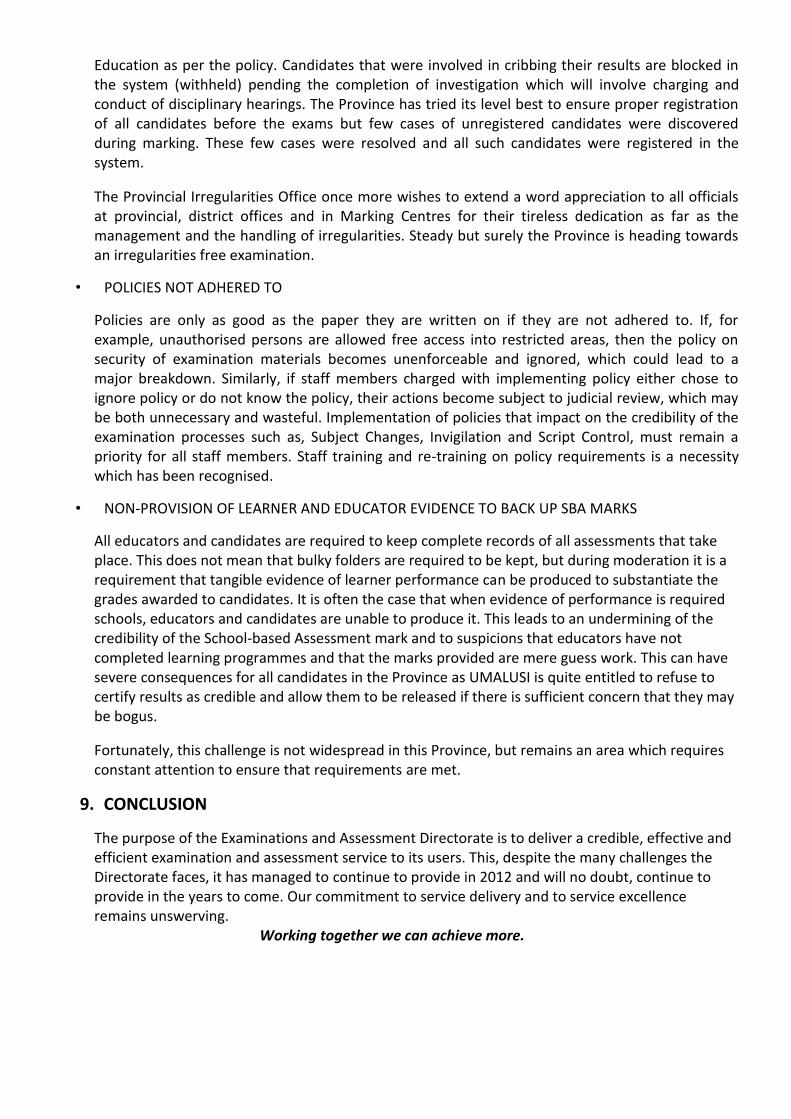
Education as per the policy. Candidates that were involved in cribbing their results are blocked in the system (withheld) pending the completion of investigation which will involve charging and conduct of disciplinary hearings. The Province has tried its level best to ensure proper registration of all candidates before the exams but few cases of unregistered candidates were discovered during marking. These few cases were resolved and all such candidates were registered in the system.
The Provincial Irregularities Office once more wishes to extend a word appreciation to all officials at provincial, district offices and in Marking Centres for their tireless dedication as far as the management and the handling of irregularities. Steady but surely the Province is heading towards an irregularities free examination.
• POLICIES NOT ADHERED TO
Policies are only as good as the paper they are written on if they are not adhered to. If, for example, unauthorised persons are allowed free access into restricted areas, then the policy on security of examination materials becomes unenforceable and ignored, which could lead to a major breakdown. Similarly, if staff members charged with implementing policy either chose to ignore policy or do not know the policy, their actions become subject to judicial review, which may be both unnecessary and wasteful. Implementation of policies that impact on the credibility of the examination processes such as, Subject Changes, Invigilation and Script Control, must remain a priority for all staff members. Staff training and re-training on policy requirements is a necessity which has been recognised.
• NON-PROVISION OF LEARNER AND EDUCATOR EVIDENCE TO BACK UP SBA MARKS
All educators and candidates are required to keep complete records of all assessments that take place. This does not mean that bulky folders are required to be kept, but during moderation it is a requirement that tangible evidence of learner performance can be produced to substantiate the grades awarded to candidates. It is often the case that when evidence of performance is required schools, educators and candidates are unable to produce it. This leads to an undermining of the credibility of the School-based Assessment mark and to suspicions that educators have not completed learning programmes and that the marks provided are mere guess work. This can have severe consequences for all candidates in the Province as UMALUSI is quite entitled to refuse to certify results as credible and allow them to be released if there is sufficient concern that they may be bogus.
Fortunately, this challenge is not widespread in this Province, but remains an area which requires constant attention to ensure that requirements are met.
9. CONCLUSION
The purpose of the Examinations and Assessment Directorate is to deliver a credible, effective and efficient examination and assessment service to its users. This, despite the many challenges the Directorate faces, it has managed to continue to provide in 2012 and will no doubt, continue to provide in the years to come. Our commitment to service delivery and to service excellence remains unswerving.
Working together we can achieve more.
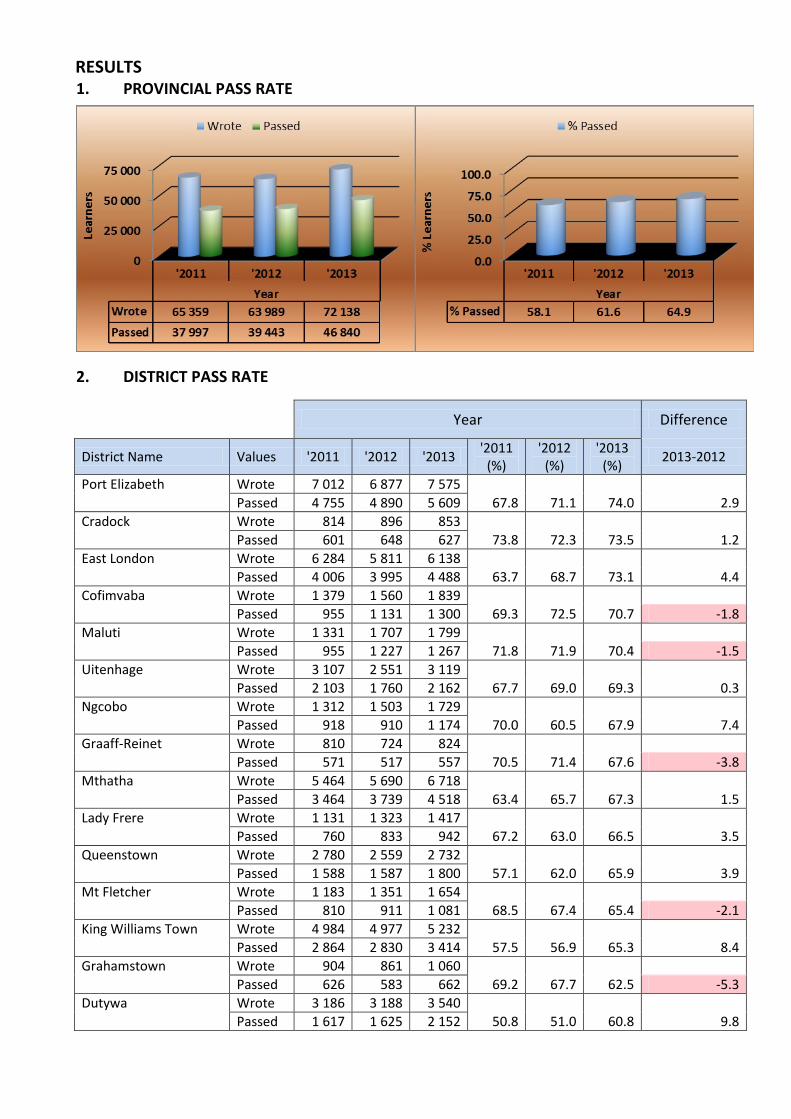
RESULTS 1. PROVINCIAL PASS RATE
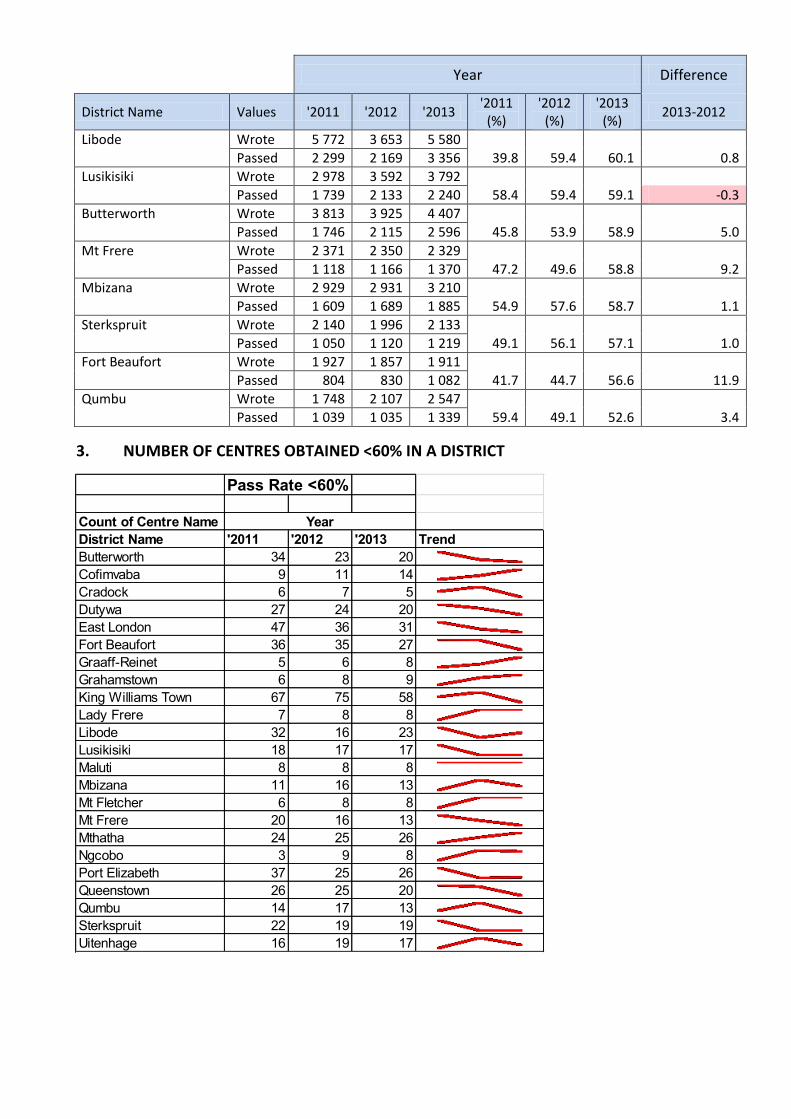
2. DISTRICT PASS RATE
Year Difference
District Name Values '2011 '2012 '2013 '2011
(%) '2012
(%) '2013
(%) 2013-2012
Port Elizabeth Wrote 7 012 6 877 7 575
Passed 4 755 4 890 5 609 67.8 71.1 74.0 2.9
Cradock Wrote 814 896 853
Passed 601 648 627 73.8 72.3 73.5 1.2
East London Wrote 6 284 5 811 6 138
Passed 4 006 3 995 4 488 63.7 68.7 73.1 4.4
Cofimvaba Wrote 1 379 1 560 1 839
Passed 955 1 131 1 300 69.3 72.5 70.7 -1.8
Maluti Wrote 1 331 1 707 1 799
Passed 955 1 227 1 267 71.8 71.9 70.4 -1.5
Uitenhage Wrote 3 107 2 551 3 119
Passed 2 103 1 760 2 162 67.7 69.0 69.3 0.3
Ngcobo Wrote 1 312 1 503 1 729
Passed 918 910 1 174 70.0 60.5 67.9 7.4
Graaff-Reinet Wrote 810 724 824
Passed 571 517 557 70.5 71.4 67.6 -3.8
Mthatha Wrote 5 464 5 690 6 718
Passed 3 464 3 739 4 518 63.4 65.7 67.3 1.5
Lady Frere Wrote 1 131 1 323 1 417
Passed 760 833 942 67.2 63.0 66.5 3.5
Queenstown Wrote 2 780 2 559 2 732
Passed 1 588 1 587 1 800 57.1 62.0 65.9 3.9
Mt Fletcher Wrote 1 183 1 351 1 654
Passed 810 911 1 081 68.5 67.4 65.4 -2.1
King Williams Town Wrote 4 984 4 977 5 232
Passed 2 864 2 830 3 414 57.5 56.9 65.3 8.4
Grahamstown Wrote 904 861 1 060
Passed 626 583 662 69.2 67.7 62.5 -5.3
Dutywa Wrote 3 186 3 188 3 540
Passed 1 617 1 625 2 152 50.8 51.0 60.8 9.8
Year Difference
District Name Values '2011 '2012 '2013 '2011
(%) '2012
(%) '2013
(%) 2013-2012
Libode Wrote 5 772 3 653 5 580
Passed 2 299 2 169 3 356 39.8 59.4 60.1 0.8
Lusikisiki Wrote 2 978 3 592 3 792
Passed 1 739 2 133 2 240 58.4 59.4 59.1 -0.3
Butterworth Wrote 3 813 3 925 4 407
Passed 1 746 2 115 2 596 45.8 53.9 58.9 5.0
Mt Frere Wrote 2 371 2 350 2 329
Passed 1 118 1 166 1 370 47.2 49.6 58.8 9.2
Mbizana Wrote 2 929 2 931 3 210
Passed 1 609 1 689 1 885 54.9 57.6 58.7 1.1
Sterkspruit Wrote 2 140 1 996 2 133
Passed 1 050 1 120 1 219 49.1 56.1 57.1 1.0
Fort Beaufort Wrote 1 927 1 857 1 911
Passed 804 830 1 082 41.7 44.7 56.6 11.9
Qumbu Wrote 1 748 2 107 2 547
Passed 1 039 1 035 1 339 59.4 49.1 52.6 3.4
3. NUMBER OF CENTRES OBTAINED <60% IN A DISTRICT
Pass Rate <60%
Count of Centre Name
District Name '2011 '2012 '2013 Trend
Butterworth 34 23 20
Cofimvaba 9 11 14
Cradock 6 7 5
Dutywa 27 24 20
East London 47 36 31
Fort Beaufort 36 35 27
Graaff-Reinet 5 6 8
Grahamstown 6 8 9
King Williams Town 67 75 58
Lady Frere 7 8 8
Libode 32 16 23
Lusikisiki 18 17 17
Maluti 8 8 8
Mbizana 11 16 13
Mt Fletcher 6 8 8
Mt Frere 20 16 13
Mthatha 24 25 26
Ngcobo 3 9 8
Port Elizabeth 37 25 26
Queenstown 26 25 20
Qumbu 14 17 13
Sterkspruit 22 19 19
Uitenhage 16 19 17
Year
4. PASS RATE BY QUINTILE
Year Difference
Quintile Values '2011 '2012 '2013 '2011 (%) '2012 (%) '2013 (%) 2013-2012
'~ Wrote 1 714 402 0
Passed 937 247 0 54.7 61.4
'1 Wrote 13 968 13 957 17 753
Passed 7 124 7 792 10 283 51.0 55.8 57.9 2.1
'2 Wrote 12 180 12 192 13 794
Passed 6 354 7 078 8 434 52.2 58.1 61.1 3.1
'3 Wrote 14 272 14 390 16 277
Passed 7 550 7 939 9 882 52.9 55.2 60.7 5.5
'4 Wrote 8 868 8 674 9 157
Passed 5 171 5 477 6 158 58.3 63.1 67.2 4.1
'5 Wrote 11 096 11 530 12 455
Passed 8 804 9 037 10 110 79.3 78.4 81.2 2.8
'99 Wrote 3 261 2 844 2 702
Passed 2 057 1 873 1 973 63.1 65.9 73.0 7.2
~ Quintile not Recorded 99 Independent Schools
5. CENTRES WITH ZERO PASS RATE
Year
'2011 '2012 '2013
Centre Name District Name Wrote Wrote Wrote
Dalibunga Comprehensive High School (12) Libode 30
Emizamoyethu Senior Secondary School (13) Ngcobo 54
Impey Siwisa High School (17) Fort Beaufort 4
Klipplaat Senior Secondary School (20) Graaff-Reinet 15
Reshwa Senior Secondary School (19) King Williams Town 6
Sea View Secondary School (10) Mthatha 47
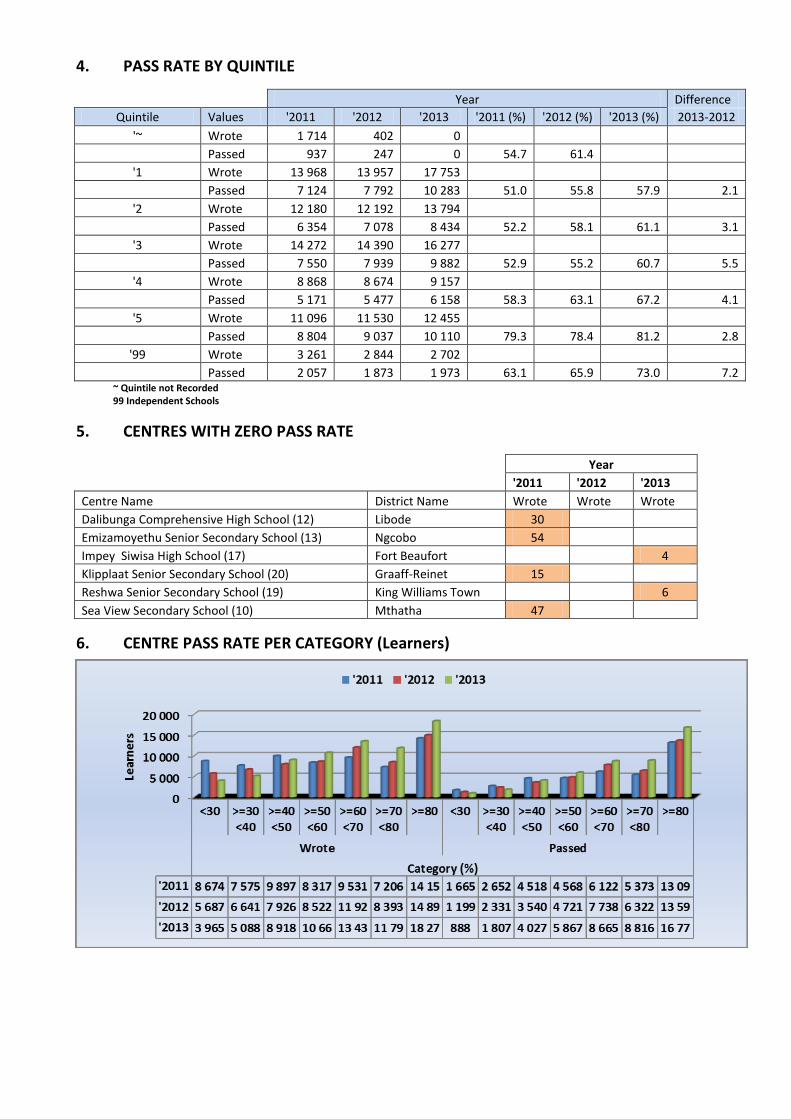
6. CENTRE PASS RATE PER CATEGORY (Learners)
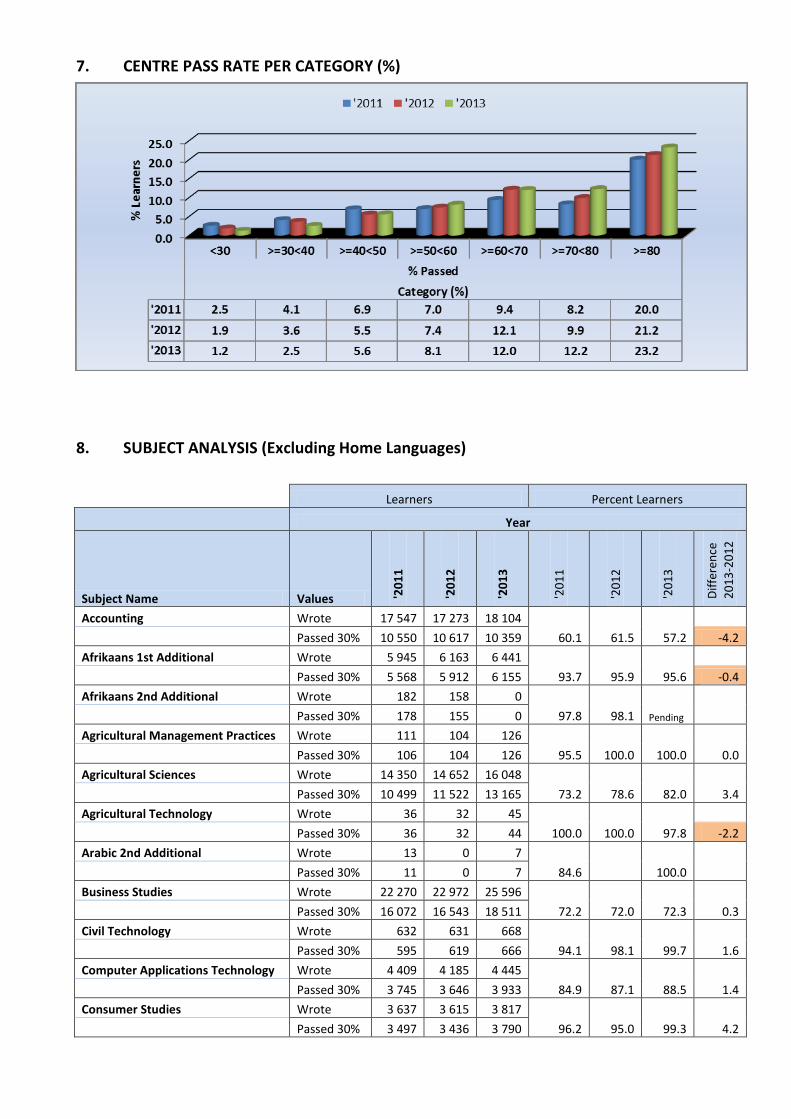
7. CENTRE PASS RATE PER CATEGORY (%)
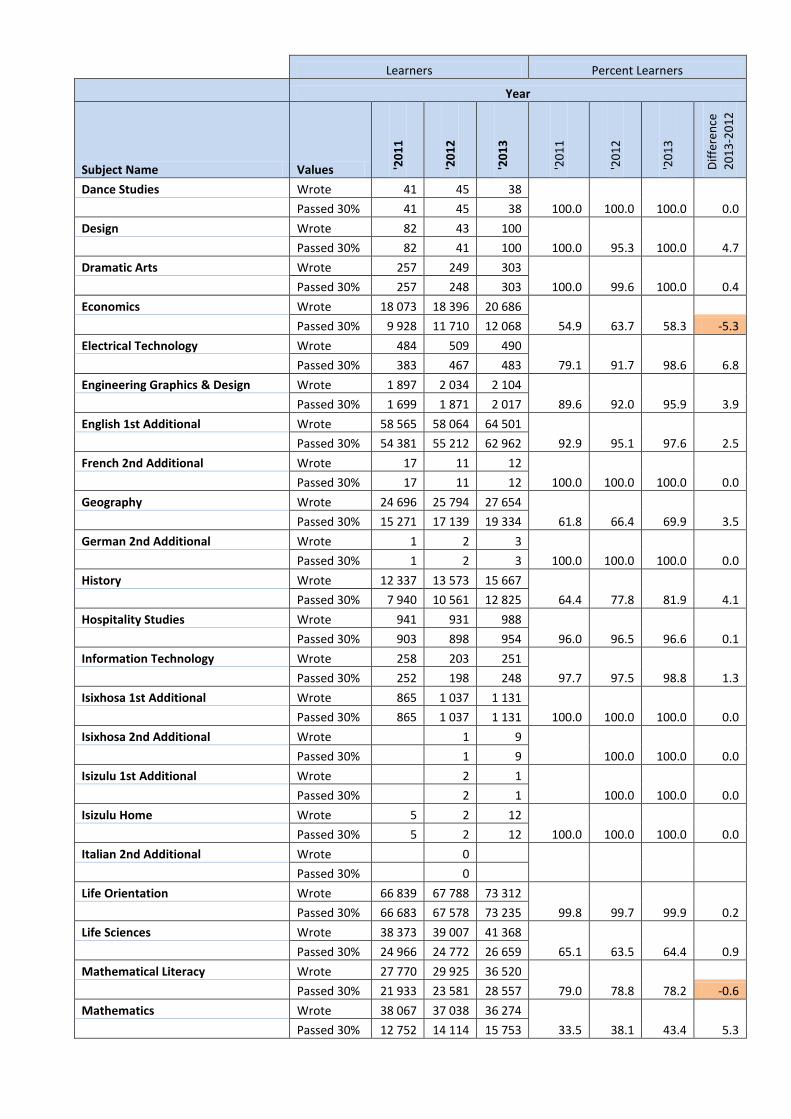
8. SUBJECT ANALYSIS (Excluding Home Languages)
Learners Percent Learners
Year
Subject Name Values '20
11
'20
12
'20
13
'20
11
'20
12
'20
13
Dif
fere
nce
20
13
-20
12
Accounting Wrote 17 547 17 273 18 104
Passed 30% 10 550 10 617 10 359 60.1 61.5 57.2 -4.2
Afrikaans 1st Additional Wrote 5 945 6 163 6 441
Passed 30% 5 568 5 912 6 155 93.7 95.9 95.6 -0.4
Afrikaans 2nd Additional Wrote 182 158 0
Passed 30% 178 155 0 97.8 98.1 Pending
Agricultural Management Practices Wrote 111 104 126
Passed 30% 106 104 126 95.5 100.0 100.0 0.0
Agricultural Sciences Wrote 14 350 14 652 16 048
Passed 30% 10 499 11 522 13 165 73.2 78.6 82.0 3.4
Agricultural Technology Wrote 36 32 45
Passed 30% 36 32 44 100.0 100.0 97.8 -2.2
Arabic 2nd Additional Wrote 13 0 7
Passed 30% 11 0 7 84.6 100.0
Business Studies Wrote 22 270 22 972 25 596
Passed 30% 16 072 16 543 18 511 72.2 72.0 72.3 0.3
Civil Technology Wrote 632 631 668
Passed 30% 595 619 666 94.1 98.1 99.7 1.6
Computer Applications Technology Wrote 4 409 4 185 4 445
Passed 30% 3 745 3 646 3 933 84.9 87.1 88.5 1.4
Consumer Studies Wrote 3 637 3 615 3 817
Passed 30% 3 497 3 436 3 790 96.2 95.0 99.3 4.2
Learners Percent Learners
Year
Subject Name Values '20
11
'20
12
'20
13
'20
11
'20
12
'20
13
Dif
fere
nce
20
13
-20
12
Dance Studies Wrote 41 45 38
Passed 30% 41 45 38 100.0 100.0 100.0 0.0
Design Wrote 82 43 100
Passed 30% 82 41 100 100.0 95.3 100.0 4.7
Dramatic Arts Wrote 257 249 303
Passed 30% 257 248 303 100.0 99.6 100.0 0.4
Economics Wrote 18 073 18 396 20 686
Passed 30% 9 928 11 710 12 068 54.9 63.7 58.3 -5.3
Electrical Technology Wrote 484 509 490
Passed 30% 383 467 483 79.1 91.7 98.6 6.8
Engineering Graphics & Design Wrote 1 897 2 034 2 104
Passed 30% 1 699 1 871 2 017 89.6 92.0 95.9 3.9
English 1st Additional Wrote 58 565 58 064 64 501
Passed 30% 54 381 55 212 62 962 92.9 95.1 97.6 2.5
French 2nd Additional Wrote 17 11 12
Passed 30% 17 11 12 100.0 100.0 100.0 0.0
Geography Wrote 24 696 25 794 27 654
Passed 30% 15 271 17 139 19 334 61.8 66.4 69.9 3.5
German 2nd Additional Wrote 1 2 3
Passed 30% 1 2 3 100.0 100.0 100.0 0.0
History Wrote 12 337 13 573 15 667
Passed 30% 7 940 10 561 12 825 64.4 77.8 81.9 4.1
Hospitality Studies Wrote 941 931 988
Passed 30% 903 898 954 96.0 96.5 96.6 0.1
Information Technology Wrote 258 203 251
Passed 30% 252 198 248 97.7 97.5 98.8 1.3
Isixhosa 1st Additional Wrote 865 1 037 1 131
Passed 30% 865 1 037 1 131 100.0 100.0 100.0 0.0
Isixhosa 2nd Additional Wrote 1 9
Passed 30% 1 9 100.0 100.0 0.0
Isizulu 1st Additional Wrote 2 1
Passed 30% 2 1 100.0 100.0 0.0
Isizulu Home Wrote 5 2 12
Passed 30% 5 2 12 100.0 100.0 100.0 0.0
Italian 2nd Additional Wrote 0
Passed 30% 0
Life Orientation Wrote 66 839 67 788 73 312
Passed 30% 66 683 67 578 73 235 99.8 99.7 99.9 0.2
Life Sciences Wrote 38 373 39 007 41 368
Passed 30% 24 966 24 772 26 659 65.1 63.5 64.4 0.9
Mathematical Literacy Wrote 27 770 29 925 36 520
Passed 30% 21 933 23 581 28 557 79.0 78.8 78.2 -0.6
Mathematics Wrote 38 067 37 038 36 274
Passed 30% 12 752 14 114 15 753 33.5 38.1 43.4 5.3
Learners Percent Learners
Year
Subject Name Values '20
11
'20
12
'20
13
'20
11
'20
12
'20
13
Dif
fere
nce
20
13
-20
12
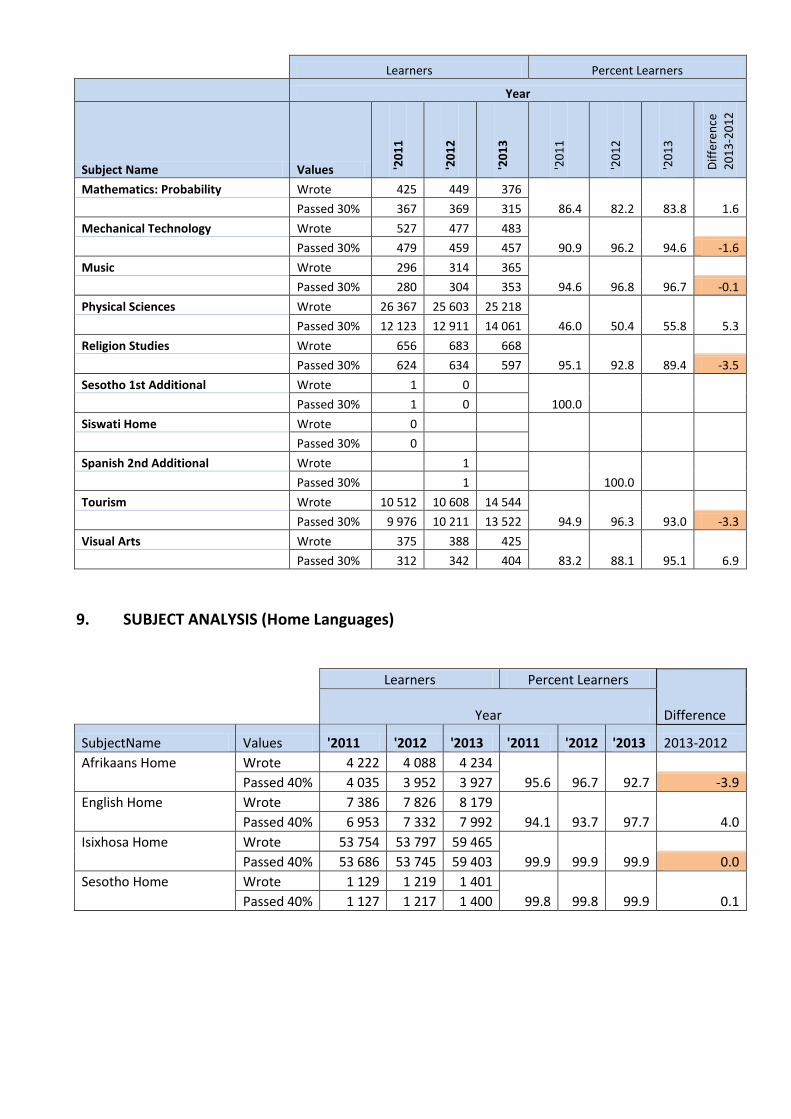
Mathematics: Probability Wrote 425 449 376
Passed 30% 367 369 315 86.4 82.2 83.8 1.6
Mechanical Technology Wrote 527 477 483
Passed 30% 479 459 457 90.9 96.2 94.6 -1.6
Music Wrote 296 314 365
Passed 30% 280 304 353 94.6 96.8 96.7 -0.1
Physical Sciences Wrote 26 367 25 603 25 218
Passed 30% 12 123 12 911 14 061 46.0 50.4 55.8 5.3
Religion Studies Wrote 656 683 668
Passed 30% 624 634 597 95.1 92.8 89.4 -3.5
Sesotho 1st Additional Wrote 1 0
Passed 30% 1 0 100.0
Siswati Home Wrote 0
Passed 30% 0
Spanish 2nd Additional Wrote 1
Passed 30% 1 100.0
Tourism Wrote 10 512 10 608 14 544
Passed 30% 9 976 10 211 13 522 94.9 96.3 93.0 -3.3
Visual Arts Wrote 375 388 425
Passed 30% 312 342 404 83.2 88.1 95.1 6.9
9. SUBJECT ANALYSIS (Home Languages)
Learners Percent Learners
Difference
Year
SubjectName Values '2011 '2012 '2013 '2011 '2012 '2013 2013-2012
Afrikaans Home Wrote 4 222 4 088 4 234
Passed 40% 4 035 3 952 3 927 95.6 96.7 92.7 -3.9
English Home Wrote 7 386 7 826 8 179
Passed 40% 6 953 7 332 7 992 94.1 93.7 97.7 4.0
Isixhosa Home Wrote 53 754 53 797 59 465
Passed 40% 53 686 53 745 59 403 99.9 99.9 99.9 0.0
Sesotho Home Wrote 1 129 1 219 1 401
Passed 40% 1 127 1 217 1 400 99.8 99.8 99.9 0.1
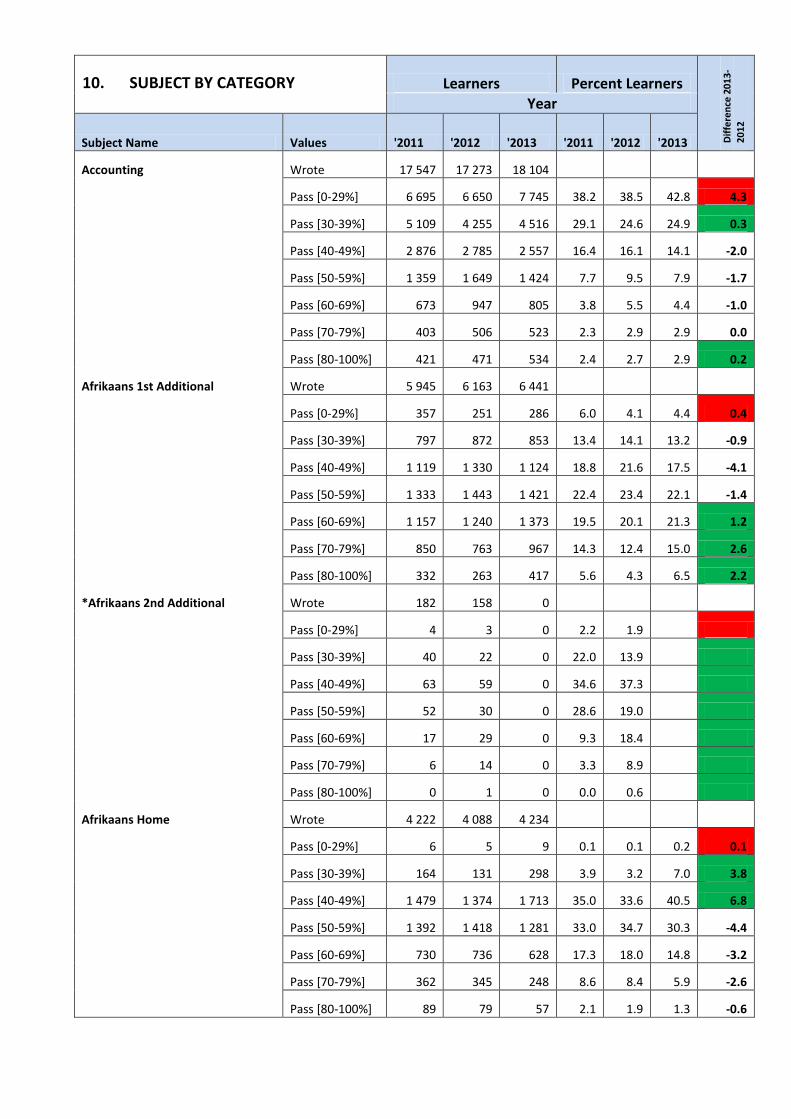
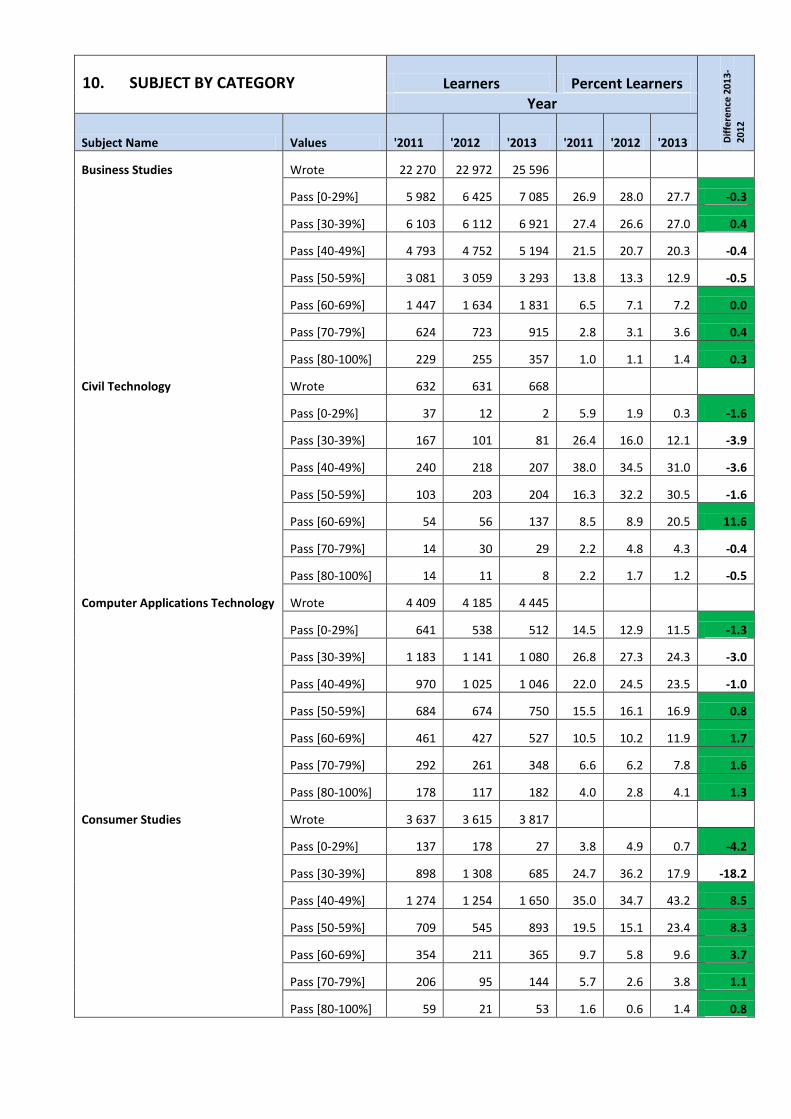
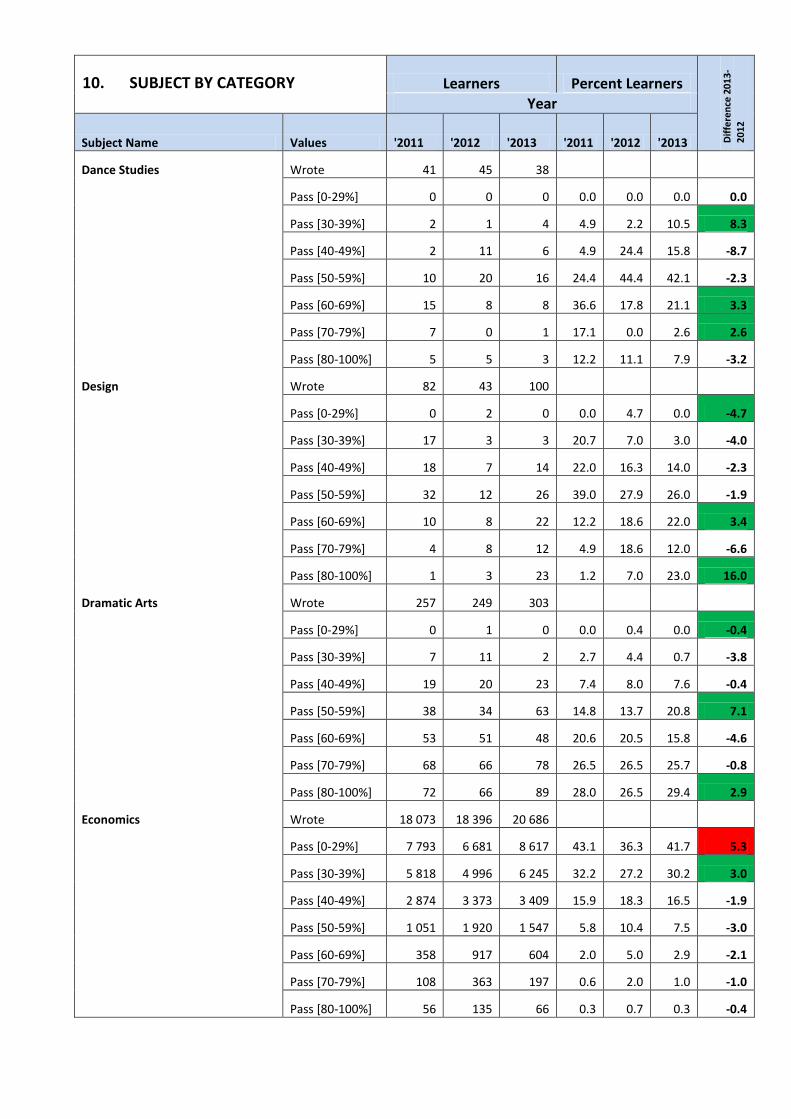
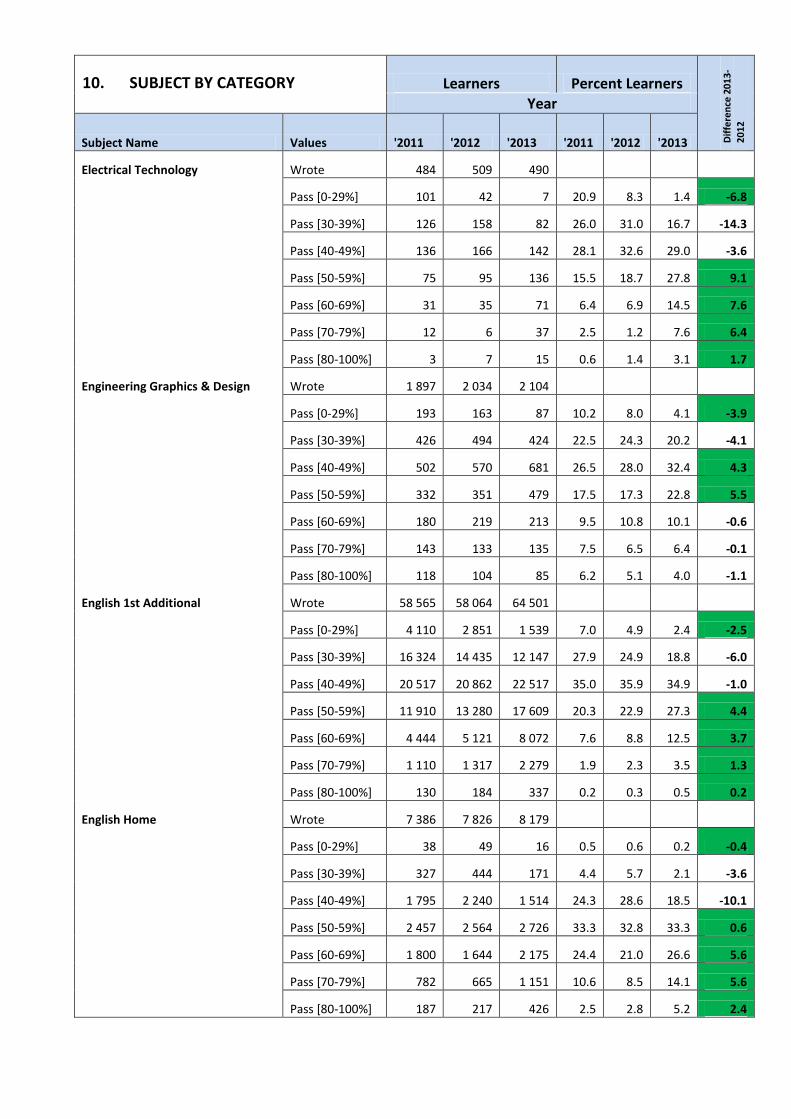
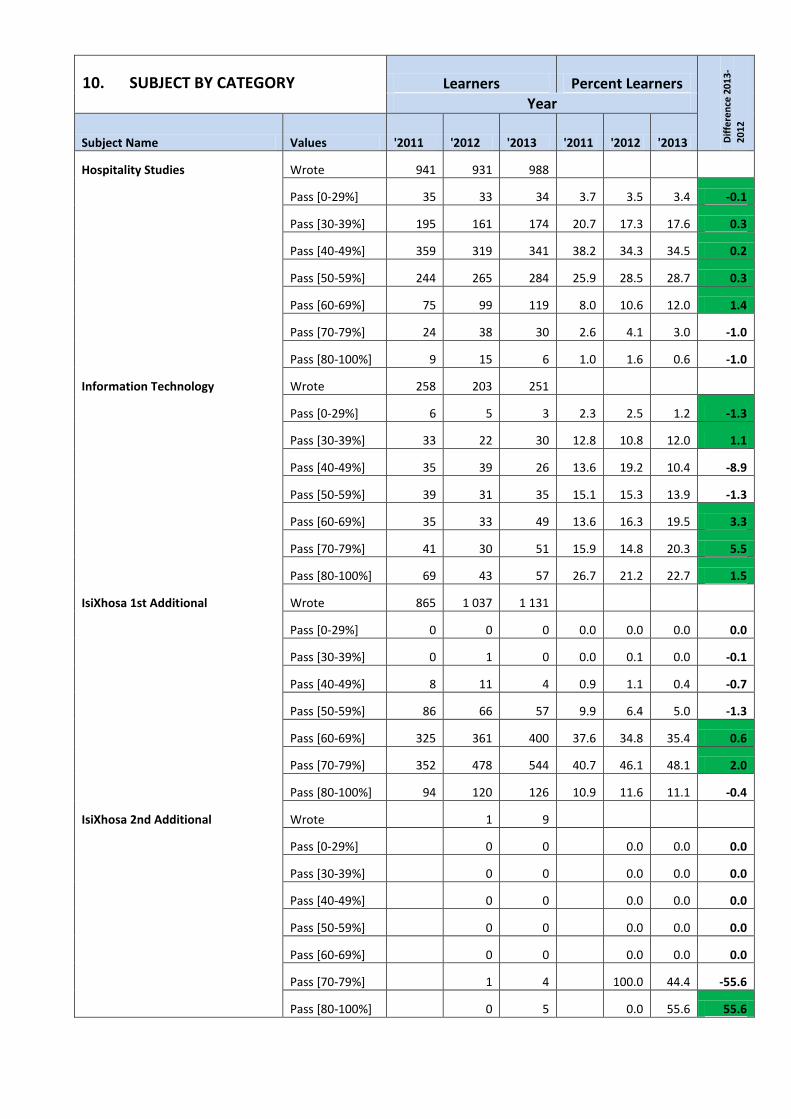
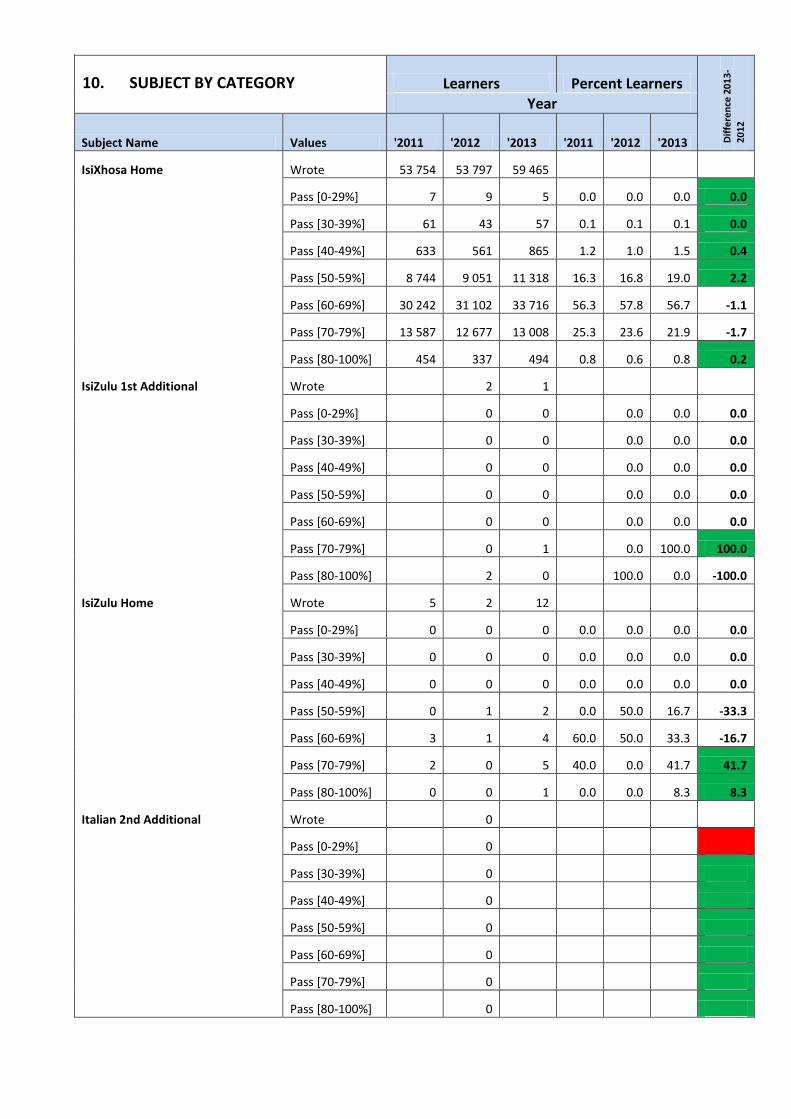
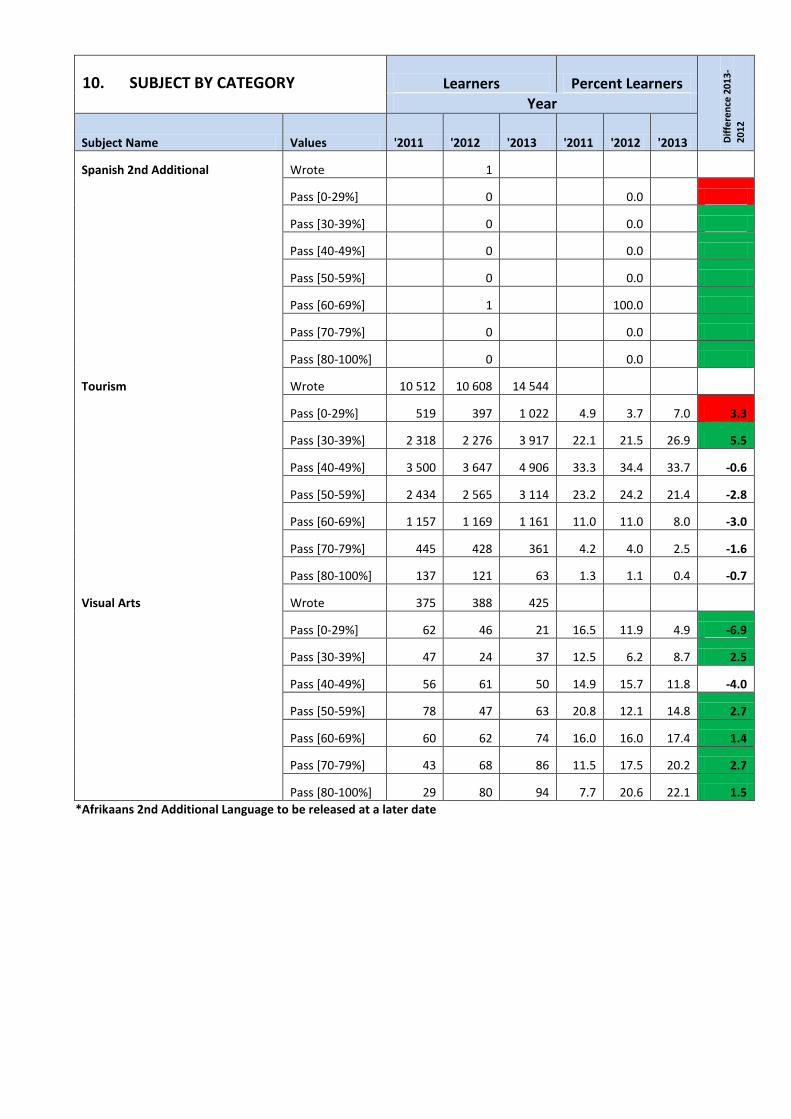
10. SUBJECT BY CATEGORY Learners Percent Learners
Dif
fere
nce
20
13
-
20
12
Year
Subject Name Values '2011 '2012 '2013 '2011 '2012 '2013
Accounting Wrote 17 547 17 273 18 104
Pass [0-29%] 6 695 6 650 7 745 38.2 38.5 42.8 4.3
Pass [30-39%] 5 109 4 255 4 516 29.1 24.6 24.9 0.3
Pass [40-49%] 2 876 2 785 2 557 16.4 16.1 14.1 -2.0
Pass [50-59%] 1 359 1 649 1 424 7.7 9.5 7.9 -1.7
Pass [60-69%] 673 947 805 3.8 5.5 4.4 -1.0
Pass [70-79%] 403 506 523 2.3 2.9 2.9 0.0
Pass [80-100%] 421 471 534 2.4 2.7 2.9 0.2
Afrikaans 1st Additional Wrote 5 945 6 163 6 441
Pass [0-29%] 357 251 286 6.0 4.1 4.4 0.4
Pass [30-39%] 797 872 853 13.4 14.1 13.2 -0.9
Pass [40-49%] 1 119 1 330 1 124 18.8 21.6 17.5 -4.1
Pass [50-59%] 1 333 1 443 1 421 22.4 23.4 22.1 -1.4
Pass [60-69%] 1 157 1 240 1 373 19.5 20.1 21.3 1.2
Pass [70-79%] 850 763 967 14.3 12.4 15.0 2.6
Pass [80-100%] 332 263 417 5.6 4.3 6.5 2.2
*Afrikaans 2nd Additional Wrote 182 158 0
Pass [0-29%] 4 3 0 2.2 1.9
Pass [30-39%] 40 22 0 22.0 13.9
Pass [40-49%] 63 59 0 34.6 37.3
Pass [50-59%] 52 30 0 28.6 19.0
Pass [60-69%] 17 29 0 9.3 18.4
Pass [70-79%] 6 14 0 3.3 8.9
Pass [80-100%] 0 1 0 0.0 0.6
Afrikaans Home Wrote 4 222 4 088 4 234
Pass [0-29%] 6 5 9 0.1 0.1 0.2 0.1
Pass [30-39%] 164 131 298 3.9 3.2 7.0 3.8
Pass [40-49%] 1 479 1 374 1 713 35.0 33.6 40.5 6.8
Pass [50-59%] 1 392 1 418 1 281 33.0 34.7 30.3 -4.4
Pass [60-69%] 730 736 628 17.3 18.0 14.8 -3.2
Pass [70-79%] 362 345 248 8.6 8.4 5.9 -2.6
Pass [80-100%] 89 79 57 2.1 1.9 1.3 -0.6
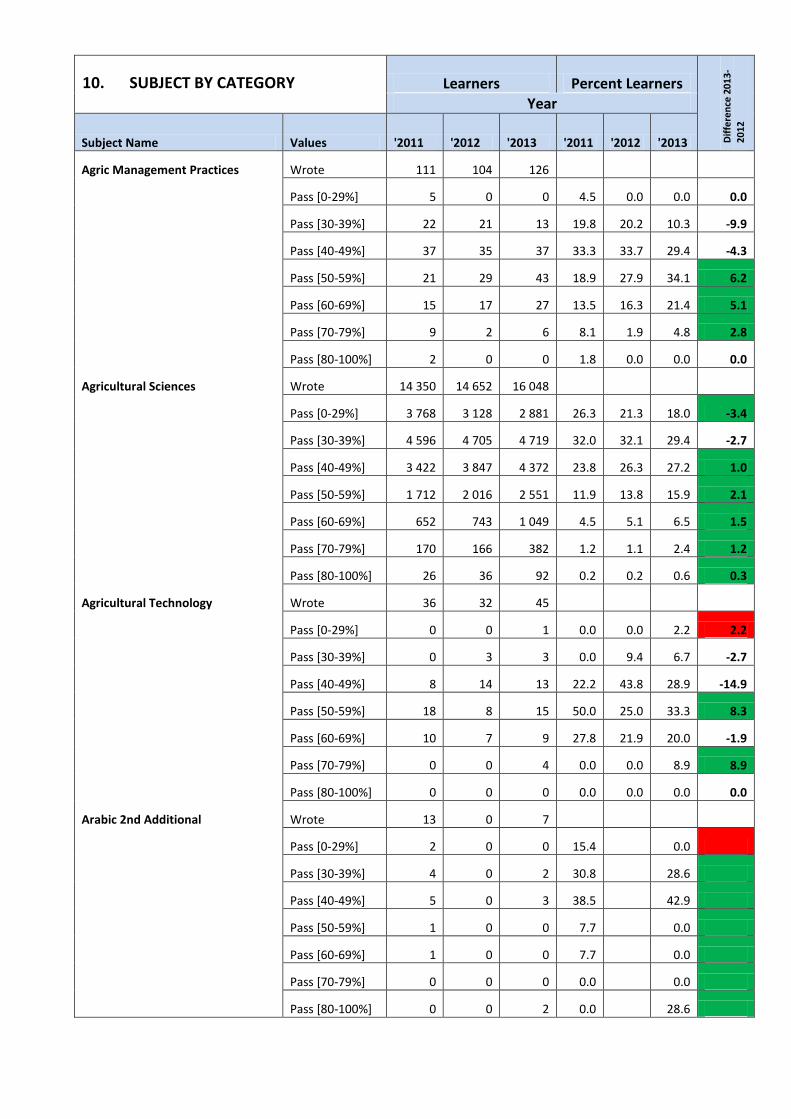
10. SUBJECT BY CATEGORY Learners Percent Learners
Dif
fere
nce
20
13
-
20
12
Year
Subject Name Values '2011 '2012 '2013 '2011 '2012 '2013
Agric Management Practices Wrote 111 104 126
Pass [0-29%] 5 0 0 4.5 0.0 0.0 0.0
Pass [30-39%] 22 21 13 19.8 20.2 10.3 -9.9
Pass [40-49%] 37 35 37 33.3 33.7 29.4 -4.3
Pass [50-59%] 21 29 43 18.9 27.9 34.1 6.2
Pass [60-69%] 15 17 27 13.5 16.3 21.4 5.1
Pass [70-79%] 9 2 6 8.1 1.9 4.8 2.8
Pass [80-100%] 2 0 0 1.8 0.0 0.0 0.0
Agricultural Sciences Wrote 14 350 14 652 16 048
Pass [0-29%] 3 768 3 128 2 881 26.3 21.3 18.0 -3.4
Pass [30-39%] 4 596 4 705 4 719 32.0 32.1 29.4 -2.7
Pass [40-49%] 3 422 3 847 4 372 23.8 26.3 27.2 1.0
Pass [50-59%] 1 712 2 016 2 551 11.9 13.8 15.9 2.1
Pass [60-69%] 652 743 1 049 4.5 5.1 6.5 1.5
Pass [70-79%] 170 166 382 1.2 1.1 2.4 1.2
Pass [80-100%] 26 36 92 0.2 0.2 0.6 0.3
Agricultural Technology Wrote 36 32 45
Pass [0-29%] 0 0 1 0.0 0.0 2.2 2.2
Pass [30-39%] 0 3 3 0.0 9.4 6.7 -2.7
Pass [40-49%] 8 14 13 22.2 43.8 28.9 -14.9
Pass [50-59%] 18 8 15 50.0 25.0 33.3 8.3
Pass [60-69%] 10 7 9 27.8 21.9 20.0 -1.9
Pass [70-79%] 0 0 4 0.0 0.0 8.9 8.9
Pass [80-100%] 0 0 0 0.0 0.0 0.0 0.0
Arabic 2nd Additional Wrote 13 0 7
Pass [0-29%] 2 0 0 15.4 0.0
Pass [30-39%] 4 0 2 30.8 28.6
Pass [40-49%] 5 0 3 38.5 42.9
Pass [50-59%] 1 0 0 7.7 0.0
Pass [60-69%] 1 0 0 7.7 0.0
Pass [70-79%] 0 0 0 0.0 0.0
Pass [80-100%] 0 0 2 0.0 28.6
10. SUBJECT BY CATEGORY Learners Percent Learners
Dif
fere
nce
20
13
-
20
12
Year
Subject Name Values '2011 '2012 '2013 '2011 '2012 '2013
Business Studies Wrote 22 270 22 972 25 596
Pass [0-29%] 5 982 6 425 7 085 26.9 28.0 27.7 -0.3
Pass [30-39%] 6 103 6 112 6 921 27.4 26.6 27.0 0.4
Pass [40-49%] 4 793 4 752 5 194 21.5 20.7 20.3 -0.4
Pass [50-59%] 3 081 3 059 3 293 13.8 13.3 12.9 -0.5
Pass [60-69%] 1 447 1 634 1 831 6.5 7.1 7.2 0.0
Pass [70-79%] 624 723 915 2.8 3.1 3.6 0.4
Pass [80-100%] 229 255 357 1.0 1.1 1.4 0.3
Civil Technology Wrote 632 631 668
Pass [0-29%] 37 12 2 5.9 1.9 0.3 -1.6
Pass [30-39%] 167 101 81 26.4 16.0 12.1 -3.9
Pass [40-49%] 240 218 207 38.0 34.5 31.0 -3.6
Pass [50-59%] 103 203 204 16.3 32.2 30.5 -1.6
Pass [60-69%] 54 56 137 8.5 8.9 20.5 11.6
Pass [70-79%] 14 30 29 2.2 4.8 4.3 -0.4
Pass [80-100%] 14 11 8 2.2 1.7 1.2 -0.5
Computer Applications Technology Wrote 4 409 4 185 4 445
Pass [0-29%] 641 538 512 14.5 12.9 11.5 -1.3
Pass [30-39%] 1 183 1 141 1 080 26.8 27.3 24.3 -3.0
Pass [40-49%] 970 1 025 1 046 22.0 24.5 23.5 -1.0
Pass [50-59%] 684 674 750 15.5 16.1 16.9 0.8
Pass [60-69%] 461 427 527 10.5 10.2 11.9 1.7
Pass [70-79%] 292 261 348 6.6 6.2 7.8 1.6
Pass [80-100%] 178 117 182 4.0 2.8 4.1 1.3
Consumer Studies Wrote 3 637 3 615 3 817
Pass [0-29%] 137 178 27 3.8 4.9 0.7 -4.2
Pass [30-39%] 898 1 308 685 24.7 36.2 17.9 -18.2
Pass [40-49%] 1 274 1 254 1 650 35.0 34.7 43.2 8.5
Pass [50-59%] 709 545 893 19.5 15.1 23.4 8.3
Pass [60-69%] 354 211 365 9.7 5.8 9.6 3.7
Pass [70-79%] 206 95 144 5.7 2.6 3.8 1.1
Pass [80-100%] 59 21 53 1.6 0.6 1.4 0.8
10. SUBJECT BY CATEGORY Learners Percent Learners
Dif
fere
nce
20
13
-
20
12
Year
Subject Name Values '2011 '2012 '2013 '2011 '2012 '2013
Dance Studies Wrote 41 45 38
Pass [0-29%] 0 0 0 0.0 0.0 0.0 0.0
Pass [30-39%] 2 1 4 4.9 2.2 10.5 8.3
Pass [40-49%] 2 11 6 4.9 24.4 15.8 -8.7
Pass [50-59%] 10 20 16 24.4 44.4 42.1 -2.3
Pass [60-69%] 15 8 8 36.6 17.8 21.1 3.3
Pass [70-79%] 7 0 1 17.1 0.0 2.6 2.6
Pass [80-100%] 5 5 3 12.2 11.1 7.9 -3.2
Design Wrote 82 43 100
Pass [0-29%] 0 2 0 0.0 4.7 0.0 -4.7
Pass [30-39%] 17 3 3 20.7 7.0 3.0 -4.0
Pass [40-49%] 18 7 14 22.0 16.3 14.0 -2.3
Pass [50-59%] 32 12 26 39.0 27.9 26.0 -1.9
Pass [60-69%] 10 8 22 12.2 18.6 22.0 3.4
Pass [70-79%] 4 8 12 4.9 18.6 12.0 -6.6
Pass [80-100%] 1 3 23 1.2 7.0 23.0 16.0
Dramatic Arts Wrote 257 249 303
Pass [0-29%] 0 1 0 0.0 0.4 0.0 -0.4
Pass [30-39%] 7 11 2 2.7 4.4 0.7 -3.8
Pass [40-49%] 19 20 23 7.4 8.0 7.6 -0.4
Pass [50-59%] 38 34 63 14.8 13.7 20.8 7.1
Pass [60-69%] 53 51 48 20.6 20.5 15.8 -4.6
Pass [70-79%] 68 66 78 26.5 26.5 25.7 -0.8
Pass [80-100%] 72 66 89 28.0 26.5 29.4 2.9
Economics Wrote 18 073 18 396 20 686
Pass [0-29%] 7 793 6 681 8 617 43.1 36.3 41.7 5.3
Pass [30-39%] 5 818 4 996 6 245 32.2 27.2 30.2 3.0
Pass [40-49%] 2 874 3 373 3 409 15.9 18.3 16.5 -1.9
Pass [50-59%] 1 051 1 920 1 547 5.8 10.4 7.5 -3.0
Pass [60-69%] 358 917 604 2.0 5.0 2.9 -2.1
Pass [70-79%] 108 363 197 0.6 2.0 1.0 -1.0
Pass [80-100%] 56 135 66 0.3 0.7 0.3 -0.4
10. SUBJECT BY CATEGORY Learners Percent Learners
Dif
fere
nce
20
13
-
20
12
Year
Subject Name Values '2011 '2012 '2013 '2011 '2012 '2013
Electrical Technology Wrote 484 509 490
Pass [0-29%] 101 42 7 20.9 8.3 1.4 -6.8
Pass [30-39%] 126 158 82 26.0 31.0 16.7 -14.3
Pass [40-49%] 136 166 142 28.1 32.6 29.0 -3.6
Pass [50-59%] 75 95 136 15.5 18.7 27.8 9.1
Pass [60-69%] 31 35 71 6.4 6.9 14.5 7.6
Pass [70-79%] 12 6 37 2.5 1.2 7.6 6.4
Pass [80-100%] 3 7 15 0.6 1.4 3.1 1.7
Engineering Graphics & Design Wrote 1 897 2 034 2 104
Pass [0-29%] 193 163 87 10.2 8.0 4.1 -3.9
Pass [30-39%] 426 494 424 22.5 24.3 20.2 -4.1
Pass [40-49%] 502 570 681 26.5 28.0 32.4 4.3
Pass [50-59%] 332 351 479 17.5 17.3 22.8 5.5
Pass [60-69%] 180 219 213 9.5 10.8 10.1 -0.6
Pass [70-79%] 143 133 135 7.5 6.5 6.4 -0.1
Pass [80-100%] 118 104 85 6.2 5.1 4.0 -1.1
English 1st Additional Wrote 58 565 58 064 64 501
Pass [0-29%] 4 110 2 851 1 539 7.0 4.9 2.4 -2.5
Pass [30-39%] 16 324 14 435 12 147 27.9 24.9 18.8 -6.0
Pass [40-49%] 20 517 20 862 22 517 35.0 35.9 34.9 -1.0
Pass [50-59%] 11 910 13 280 17 609 20.3 22.9 27.3 4.4
Pass [60-69%] 4 444 5 121 8 072 7.6 8.8 12.5 3.7
Pass [70-79%] 1 110 1 317 2 279 1.9 2.3 3.5 1.3
Pass [80-100%] 130 184 337 0.2 0.3 0.5 0.2
English Home Wrote 7 386 7 826 8 179
Pass [0-29%] 38 49 16 0.5 0.6 0.2 -0.4
Pass [30-39%] 327 444 171 4.4 5.7 2.1 -3.6
Pass [40-49%] 1 795 2 240 1 514 24.3 28.6 18.5 -10.1
Pass [50-59%] 2 457 2 564 2 726 33.3 32.8 33.3 0.6
Pass [60-69%] 1 800 1 644 2 175 24.4 21.0 26.6 5.6
Pass [70-79%] 782 665 1 151 10.6 8.5 14.1 5.6
Pass [80-100%] 187 217 426 2.5 2.8 5.2 2.4

10. SUBJECT BY CATEGORY Learners Percent Learners
Dif
fere
nce
20
13
-
20
12
Year
Subject Name Values '2011 '2012 '2013 '2011 '2012 '2013
French 2nd Additional Wrote 17 11 12
Pass [0-29%] 0 0 0 0.0 0.0 0.0 0.0
Pass [30-39%] 0 0 0 0.0 0.0 0.0 0.0
Pass [40-49%] 1 0 0 5.9 0.0 0.0 0.0
Pass [50-59%] 2 2 3 11.8 18.2 25.0 6.8
Pass [60-69%] 1 3 5 5.9 27.3 41.7 14.4
Pass [70-79%] 5 4 2 29.4 36.4 16.7 -19.7
Pass [80-100%] 8 2 2 47.1 18.2 16.7 -1.5
Geography Wrote 24 696 25 794 27 654
Pass [0-29%] 9 080 8 646 8 318 36.8 33.5 30.1 -3.4
Pass [30-39%] 7 317 8 076 8 245 29.6 31.3 29.8 -1.5
Pass [40-49%] 4 748 5 199 5 815 19.2 20.2 21.0 0.9
Pass [50-59%] 2 242 2 456 3 215 9.1 9.5 11.6 2.1
Pass [60-69%] 875 957 1 421 3.5 3.7 5.1 1.4
Pass [70-79%] 341 338 489 1.4 1.3 1.8 0.5
Pass [80-100%] 86 109 148 0.3 0.4 0.5 0.1
German 2nd Additional Wrote 1 2 3
Pass [0-29%] 0 0 0 0.0 0.0 0.0 0.0
Pass [30-39%] 0 0 0 0.0 0.0 0.0 0.0
Pass [40-49%] 0 0 0 0.0 0.0 0.0 0.0
Pass [50-59%] 0 0 0 0.0 0.0 0.0 0.0
Pass [60-69%] 0 0 0 0.0 0.0 0.0 0.0
Pass [70-79%] 0 0 0 0.0 0.0 0.0 0.0
Pass [80-100%] 1 2 3 100.0 100.0 100.0 0.0
History Wrote 12 337 13 573 15 667
Pass [0-29%] 4 272 3 011 2 841 34.6 22.2 18.1 -4.1
Pass [30-39%] 3 131 3 211 3 513 25.4 23.7 22.4 -1.2
Pass [40-49%] 2 338 3 062 3 687 19.0 22.6 23.5 1.0
Pass [50-59%] 1 418 2 111 2 766 11.5 15.6 17.7 2.1
Pass [60-69%] 605 1 278 1 658 4.9 9.4 10.6 1.2
Pass [70-79%] 355 651 773 2.9 4.8 4.9 0.1
Pass [80-100%] 215 242 428 1.7 1.8 2.7 0.9
10. SUBJECT BY CATEGORY Learners Percent Learners
Dif
fere
nce
20
13
-
20
12
Year
Subject Name Values '2011 '2012 '2013 '2011 '2012 '2013
Hospitality Studies Wrote 941 931 988
Pass [0-29%] 35 33 34 3.7 3.5 3.4 -0.1
Pass [30-39%] 195 161 174 20.7 17.3 17.6 0.3
Pass [40-49%] 359 319 341 38.2 34.3 34.5 0.2
Pass [50-59%] 244 265 284 25.9 28.5 28.7 0.3
Pass [60-69%] 75 99 119 8.0 10.6 12.0 1.4
Pass [70-79%] 24 38 30 2.6 4.1 3.0 -1.0
Pass [80-100%] 9 15 6 1.0 1.6 0.6 -1.0
Information Technology Wrote 258 203 251
Pass [0-29%] 6 5 3 2.3 2.5 1.2 -1.3
Pass [30-39%] 33 22 30 12.8 10.8 12.0 1.1
Pass [40-49%] 35 39 26 13.6 19.2 10.4 -8.9
Pass [50-59%] 39 31 35 15.1 15.3 13.9 -1.3
Pass [60-69%] 35 33 49 13.6 16.3 19.5 3.3
Pass [70-79%] 41 30 51 15.9 14.8 20.3 5.5
Pass [80-100%] 69 43 57 26.7 21.2 22.7 1.5
IsiXhosa 1st Additional Wrote 865 1 037 1 131
Pass [0-29%] 0 0 0 0.0 0.0 0.0 0.0
Pass [30-39%] 0 1 0 0.0 0.1 0.0 -0.1
Pass [40-49%] 8 11 4 0.9 1.1 0.4 -0.7
Pass [50-59%] 86 66 57 9.9 6.4 5.0 -1.3
Pass [60-69%] 325 361 400 37.6 34.8 35.4 0.6
Pass [70-79%] 352 478 544 40.7 46.1 48.1 2.0
Pass [80-100%] 94 120 126 10.9 11.6 11.1 -0.4
IsiXhosa 2nd Additional Wrote 1 9
Pass [0-29%] 0 0 0.0 0.0 0.0
Pass [30-39%] 0 0 0.0 0.0 0.0
Pass [40-49%] 0 0 0.0 0.0 0.0
Pass [50-59%] 0 0 0.0 0.0 0.0
Pass [60-69%] 0 0 0.0 0.0 0.0
Pass [70-79%] 1 4 100.0 44.4 -55.6
Pass [80-100%] 0 5 0.0 55.6 55.6
10. SUBJECT BY CATEGORY Learners Percent Learners
Dif
fere
nce
20
13
-
20
12
Year
Subject Name Values '2011 '2012 '2013 '2011 '2012 '2013
IsiXhosa Home Wrote 53 754 53 797 59 465
Pass [0-29%] 7 9 5 0.0 0.0 0.0 0.0
Pass [30-39%] 61 43 57 0.1 0.1 0.1 0.0
Pass [40-49%] 633 561 865 1.2 1.0 1.5 0.4
Pass [50-59%] 8 744 9 051 11 318 16.3 16.8 19.0 2.2
Pass [60-69%] 30 242 31 102 33 716 56.3 57.8 56.7 -1.1
Pass [70-79%] 13 587 12 677 13 008 25.3 23.6 21.9 -1.7
Pass [80-100%] 454 337 494 0.8 0.6 0.8 0.2
IsiZulu 1st Additional Wrote 2 1
Pass [0-29%] 0 0 0.0 0.0 0.0
Pass [30-39%] 0 0 0.0 0.0 0.0
Pass [40-49%] 0 0 0.0 0.0 0.0
Pass [50-59%] 0 0 0.0 0.0 0.0
Pass [60-69%] 0 0 0.0 0.0 0.0
Pass [70-79%] 0 1 0.0 100.0 100.0
Pass [80-100%] 2 0 100.0 0.0 -100.0
IsiZulu Home Wrote 5 2 12
Pass [0-29%] 0 0 0 0.0 0.0 0.0 0.0
Pass [30-39%] 0 0 0 0.0 0.0 0.0 0.0
Pass [40-49%] 0 0 0 0.0 0.0 0.0 0.0
Pass [50-59%] 0 1 2 0.0 50.0 16.7 -33.3
Pass [60-69%] 3 1 4 60.0 50.0 33.3 -16.7
Pass [70-79%] 2 0 5 40.0 0.0 41.7 41.7
Pass [80-100%] 0 0 1 0.0 0.0 8.3 8.3
Italian 2nd Additional Wrote 0
Pass [0-29%] 0
Pass [30-39%] 0
Pass [40-49%] 0
Pass [50-59%] 0
Pass [60-69%] 0
Pass [70-79%] 0
Pass [80-100%] 0
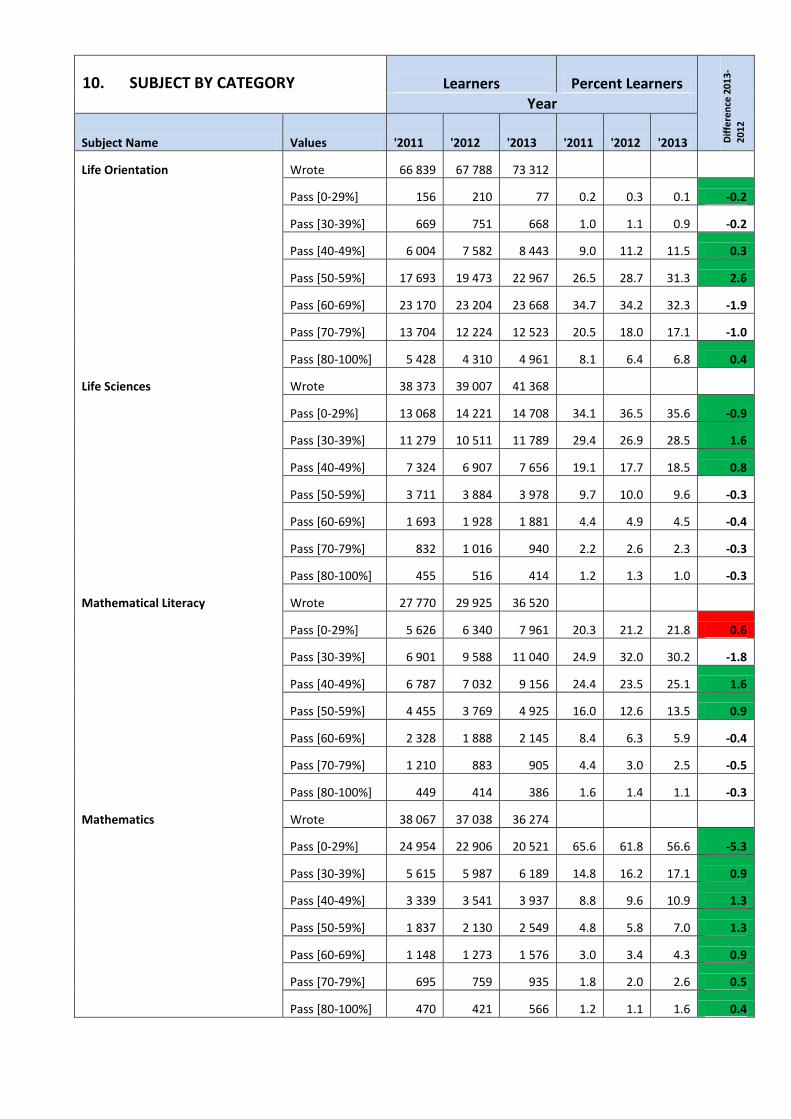
10. SUBJECT BY CATEGORY Learners Percent Learners
Dif
fere
nce
20
13
-
20
12
Year
Subject Name Values '2011 '2012 '2013 '2011 '2012 '2013
Life Orientation Wrote 66 839 67 788 73 312
Pass [0-29%] 156 210 77 0.2 0.3 0.1 -0.2
Pass [30-39%] 669 751 668 1.0 1.1 0.9 -0.2
Pass [40-49%] 6 004 7 582 8 443 9.0 11.2 11.5 0.3
Pass [50-59%] 17 693 19 473 22 967 26.5 28.7 31.3 2.6
Pass [60-69%] 23 170 23 204 23 668 34.7 34.2 32.3 -1.9
Pass [70-79%] 13 704 12 224 12 523 20.5 18.0 17.1 -1.0
Pass [80-100%] 5 428 4 310 4 961 8.1 6.4 6.8 0.4
Life Sciences Wrote 38 373 39 007 41 368
Pass [0-29%] 13 068 14 221 14 708 34.1 36.5 35.6 -0.9
Pass [30-39%] 11 279 10 511 11 789 29.4 26.9 28.5 1.6
Pass [40-49%] 7 324 6 907 7 656 19.1 17.7 18.5 0.8
Pass [50-59%] 3 711 3 884 3 978 9.7 10.0 9.6 -0.3
Pass [60-69%] 1 693 1 928 1 881 4.4 4.9 4.5 -0.4
Pass [70-79%] 832 1 016 940 2.2 2.6 2.3 -0.3
Pass [80-100%] 455 516 414 1.2 1.3 1.0 -0.3
Mathematical Literacy Wrote 27 770 29 925 36 520
Pass [0-29%] 5 626 6 340 7 961 20.3 21.2 21.8 0.6
Pass [30-39%] 6 901 9 588 11 040 24.9 32.0 30.2 -1.8
Pass [40-49%] 6 787 7 032 9 156 24.4 23.5 25.1 1.6
Pass [50-59%] 4 455 3 769 4 925 16.0 12.6 13.5 0.9
Pass [60-69%] 2 328 1 888 2 145 8.4 6.3 5.9 -0.4
Pass [70-79%] 1 210 883 905 4.4 3.0 2.5 -0.5
Pass [80-100%] 449 414 386 1.6 1.4 1.1 -0.3
Mathematics Wrote 38 067 37 038 36 274
Pass [0-29%] 24 954 22 906 20 521 65.6 61.8 56.6 -5.3
Pass [30-39%] 5 615 5 987 6 189 14.8 16.2 17.1 0.9
Pass [40-49%] 3 339 3 541 3 937 8.8 9.6 10.9 1.3
Pass [50-59%] 1 837 2 130 2 549 4.8 5.8 7.0 1.3
Pass [60-69%] 1 148 1 273 1 576 3.0 3.4 4.3 0.9
Pass [70-79%] 695 759 935 1.8 2.0 2.6 0.5
Pass [80-100%] 470 421 566 1.2 1.1 1.6 0.4
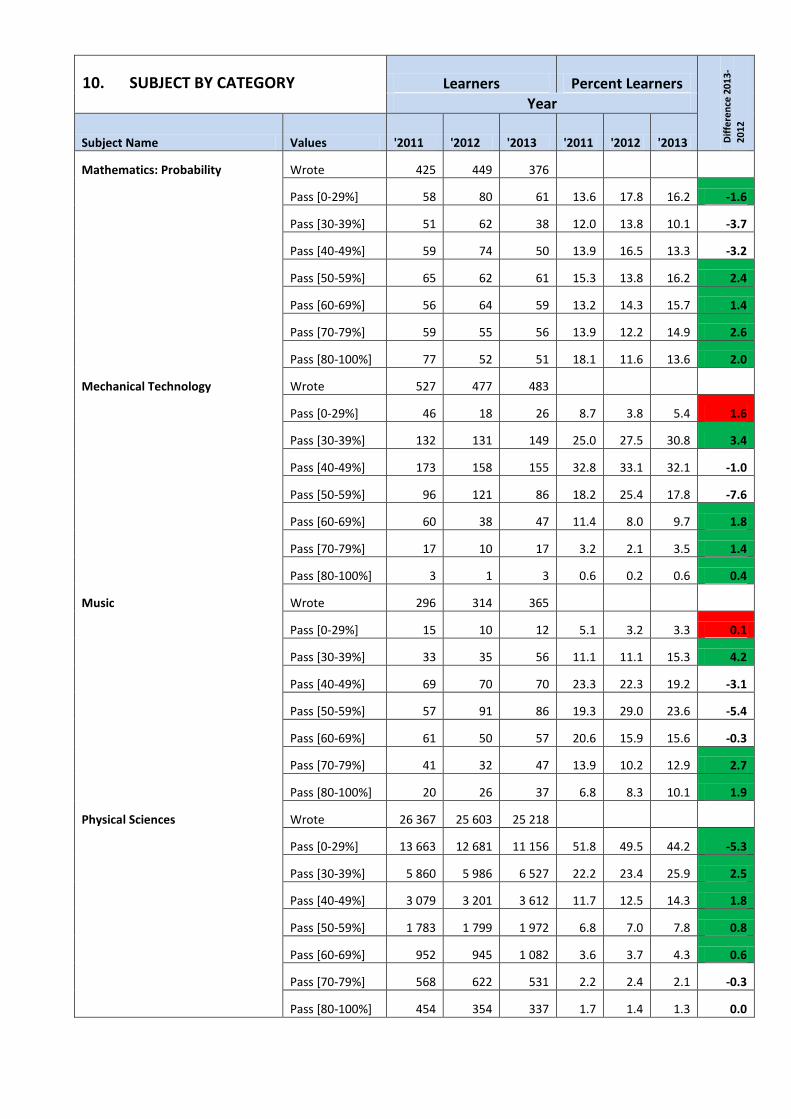
10. SUBJECT BY CATEGORY Learners Percent Learners
Dif
fere
nce
20
13
-
20
12
Year
Subject Name Values '2011 '2012 '2013 '2011 '2012 '2013
Mathematics: Probability Wrote 425 449 376
Pass [0-29%] 58 80 61 13.6 17.8 16.2 -1.6
Pass [30-39%] 51 62 38 12.0 13.8 10.1 -3.7
Pass [40-49%] 59 74 50 13.9 16.5 13.3 -3.2
Pass [50-59%] 65 62 61 15.3 13.8 16.2 2.4
Pass [60-69%] 56 64 59 13.2 14.3 15.7 1.4
Pass [70-79%] 59 55 56 13.9 12.2 14.9 2.6
Pass [80-100%] 77 52 51 18.1 11.6 13.6 2.0
Mechanical Technology Wrote 527 477 483
Pass [0-29%] 46 18 26 8.7 3.8 5.4 1.6
Pass [30-39%] 132 131 149 25.0 27.5 30.8 3.4
Pass [40-49%] 173 158 155 32.8 33.1 32.1 -1.0
Pass [50-59%] 96 121 86 18.2 25.4 17.8 -7.6
Pass [60-69%] 60 38 47 11.4 8.0 9.7 1.8
Pass [70-79%] 17 10 17 3.2 2.1 3.5 1.4
Pass [80-100%] 3 1 3 0.6 0.2 0.6 0.4
Music Wrote 296 314 365
Pass [0-29%] 15 10 12 5.1 3.2 3.3 0.1
Pass [30-39%] 33 35 56 11.1 11.1 15.3 4.2
Pass [40-49%] 69 70 70 23.3 22.3 19.2 -3.1
Pass [50-59%] 57 91 86 19.3 29.0 23.6 -5.4
Pass [60-69%] 61 50 57 20.6 15.9 15.6 -0.3
Pass [70-79%] 41 32 47 13.9 10.2 12.9 2.7
Pass [80-100%] 20 26 37 6.8 8.3 10.1 1.9
Physical Sciences Wrote 26 367 25 603 25 218
Pass [0-29%] 13 663 12 681 11 156 51.8 49.5 44.2 -5.3
Pass [30-39%] 5 860 5 986 6 527 22.2 23.4 25.9 2.5
Pass [40-49%] 3 079 3 201 3 612 11.7 12.5 14.3 1.8
Pass [50-59%] 1 783 1 799 1 972 6.8 7.0 7.8 0.8
Pass [60-69%] 952 945 1 082 3.6 3.7 4.3 0.6
Pass [70-79%] 568 622 531 2.2 2.4 2.1 -0.3
Pass [80-100%] 454 354 337 1.7 1.4 1.3 0.0
10. SUBJECT BY CATEGORY Learners Percent Learners
Dif
fere
nce
20
13
-
20
12
Year
Subject Name Values '2011 '2012 '2013 '2011 '2012 '2013
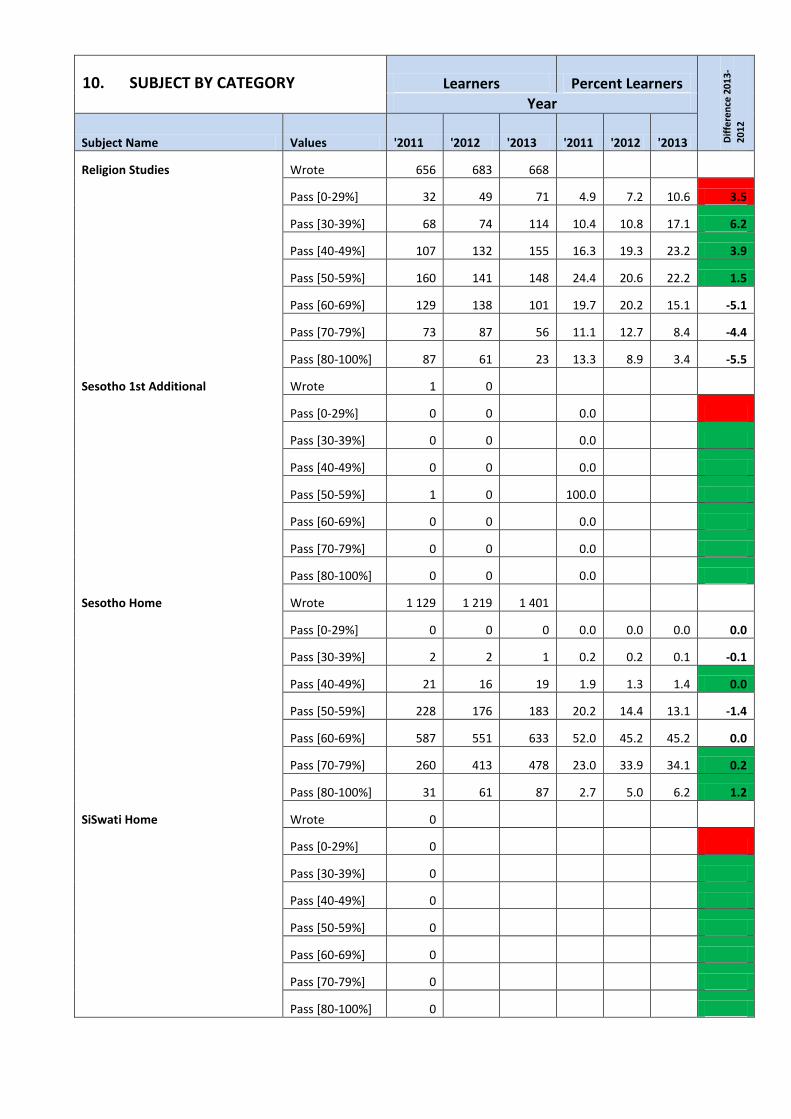
Religion Studies Wrote 656 683 668
Pass [0-29%] 32 49 71 4.9 7.2 10.6 3.5
Pass [30-39%] 68 74 114 10.4 10.8 17.1 6.2
Pass [40-49%] 107 132 155 16.3 19.3 23.2 3.9
Pass [50-59%] 160 141 148 24.4 20.6 22.2 1.5
Pass [60-69%] 129 138 101 19.7 20.2 15.1 -5.1
Pass [70-79%] 73 87 56 11.1 12.7 8.4 -4.4
Pass [80-100%] 87 61 23 13.3 8.9 3.4 -5.5
Sesotho 1st Additional Wrote 1 0
Pass [0-29%] 0 0 0.0
Pass [30-39%] 0 0 0.0
Pass [40-49%] 0 0 0.0
Pass [50-59%] 1 0 100.0
Pass [60-69%] 0 0 0.0
Pass [70-79%] 0 0 0.0
Pass [80-100%] 0 0 0.0
Sesotho Home Wrote 1 129 1 219 1 401
Pass [0-29%] 0 0 0 0.0 0.0 0.0 0.0
Pass [30-39%] 2 2 1 0.2 0.2 0.1 -0.1
Pass [40-49%] 21 16 19 1.9 1.3 1.4 0.0
Pass [50-59%] 228 176 183 20.2 14.4 13.1 -1.4
Pass [60-69%] 587 551 633 52.0 45.2 45.2 0.0
Pass [70-79%] 260 413 478 23.0 33.9 34.1 0.2
Pass [80-100%] 31 61 87 2.7 5.0 6.2 1.2
SiSwati Home Wrote 0
Pass [0-29%] 0
Pass [30-39%] 0
Pass [40-49%] 0
Pass [50-59%] 0
Pass [60-69%] 0
Pass [70-79%] 0
Pass [80-100%] 0
10. SUBJECT BY CATEGORY Learners Percent Learners
Dif
fere
nce
20
13
-
20
12
Year
Subject Name Values '2011 '2012 '2013 '2011 '2012 '2013
Spanish 2nd Additional Wrote 1
Pass [0-29%] 0 0.0
Pass [30-39%] 0 0.0
Pass [40-49%] 0 0.0
Pass [50-59%] 0 0.0
Pass [60-69%] 1 100.0
Pass [70-79%] 0 0.0
Pass [80-100%] 0 0.0
Tourism Wrote 10 512 10 608 14 544
Pass [0-29%] 519 397 1 022 4.9 3.7 7.0 3.3
Pass [30-39%] 2 318 2 276 3 917 22.1 21.5 26.9 5.5
Pass [40-49%] 3 500 3 647 4 906 33.3 34.4 33.7 -0.6
Pass [50-59%] 2 434 2 565 3 114 23.2 24.2 21.4 -2.8
Pass [60-69%] 1 157 1 169 1 161 11.0 11.0 8.0 -3.0
Pass [70-79%] 445 428 361 4.2 4.0 2.5 -1.6
Pass [80-100%] 137 121 63 1.3 1.1 0.4 -0.7
Visual Arts Wrote 375 388 425
Pass [0-29%] 62 46 21 16.5 11.9 4.9 -6.9
Pass [30-39%] 47 24 37 12.5 6.2 8.7 2.5
Pass [40-49%] 56 61 50 14.9 15.7 11.8 -4.0
Pass [50-59%] 78 47 63 20.8 12.1 14.8 2.7
Pass [60-69%] 60 62 74 16.0 16.0 17.4 1.4
Pass [70-79%] 43 68 86 11.5 17.5 20.2 2.7
Pass [80-100%] 29 80 94 7.7 20.6 22.1 1.5
*Afrikaans 2nd Additional Language to be released at a later date
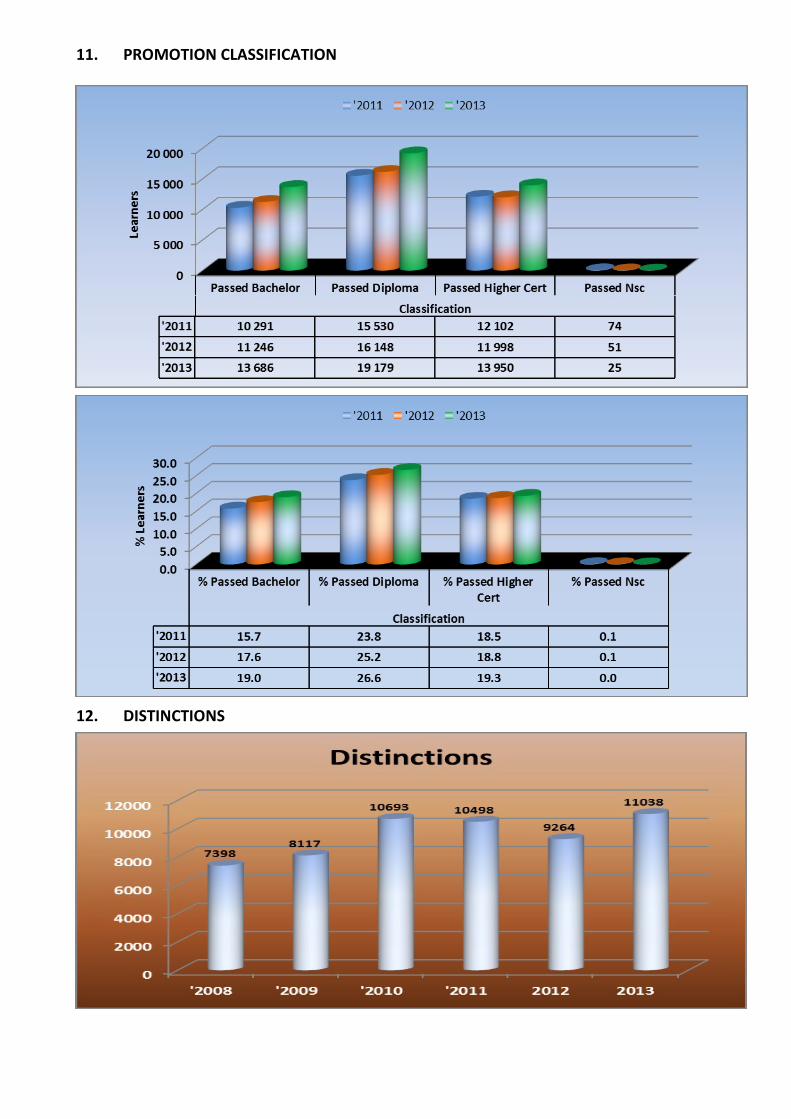
11. PROMOTION CLASSIFICATION
12. DISTINCTIONS
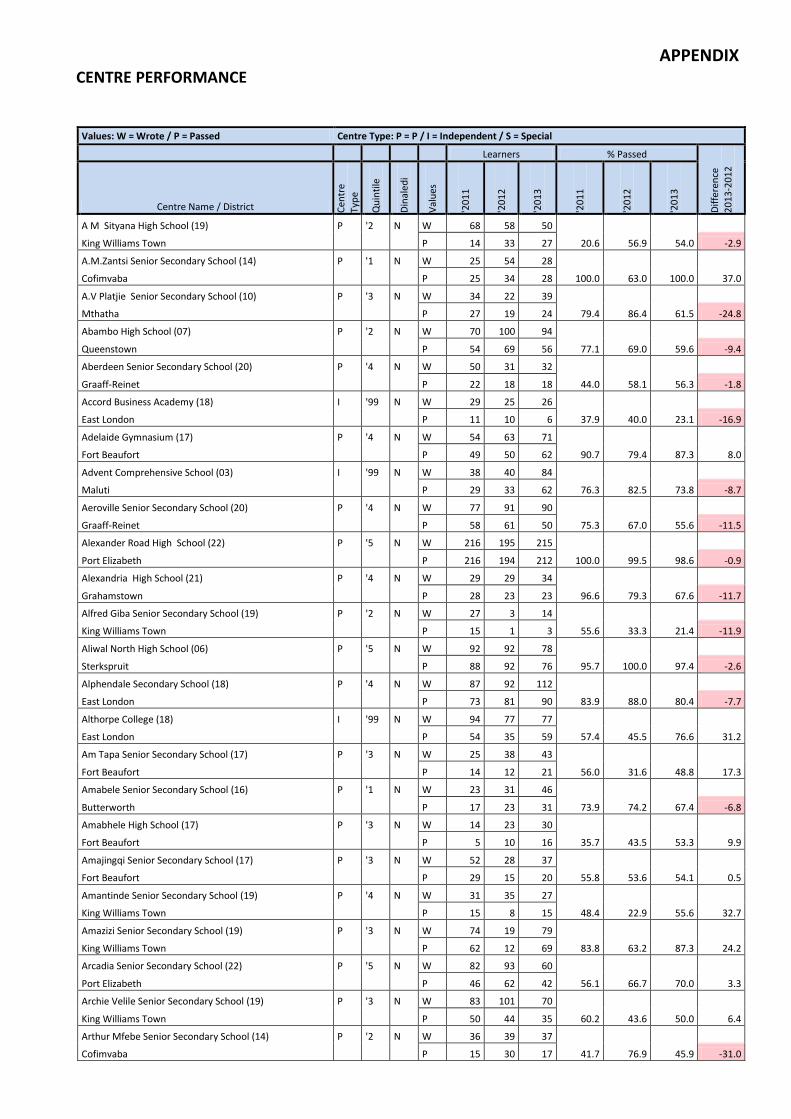
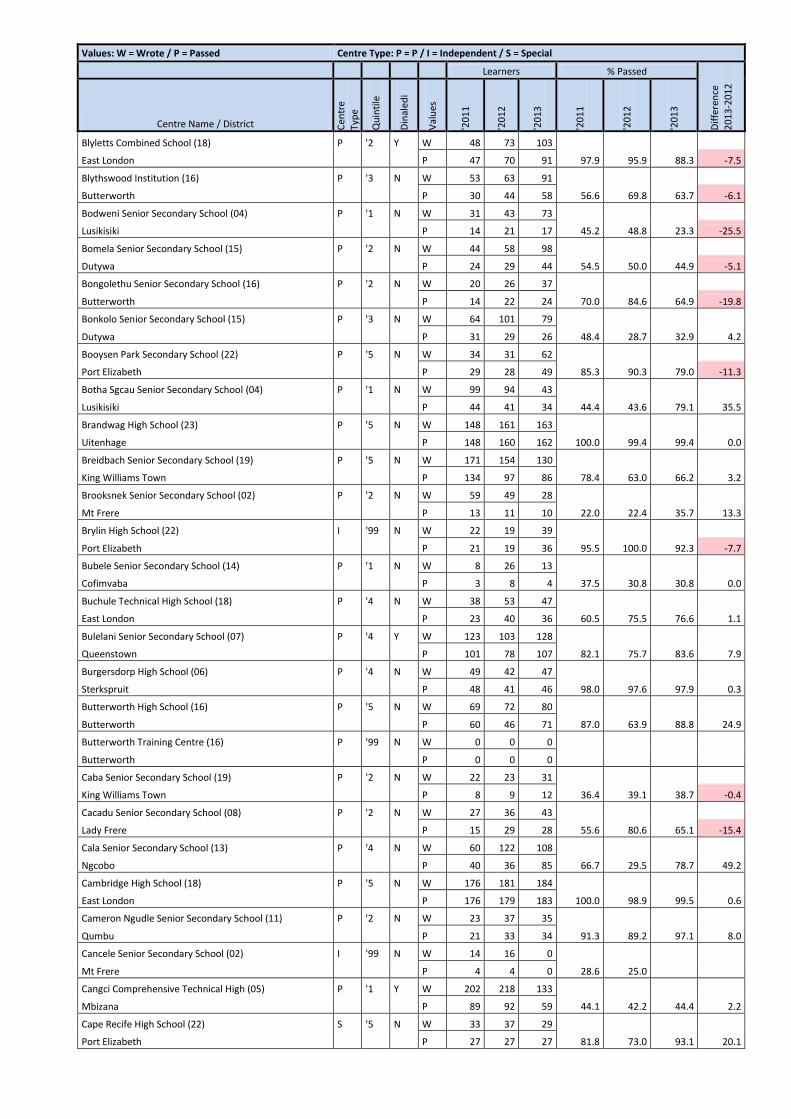
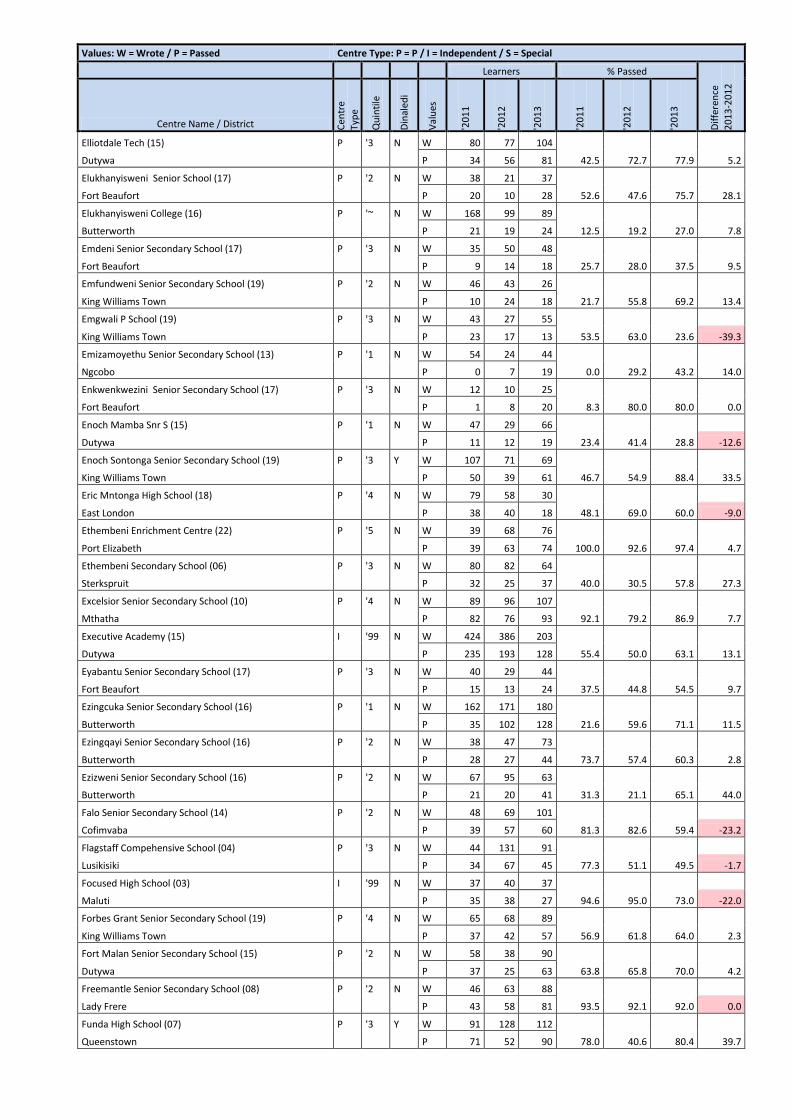
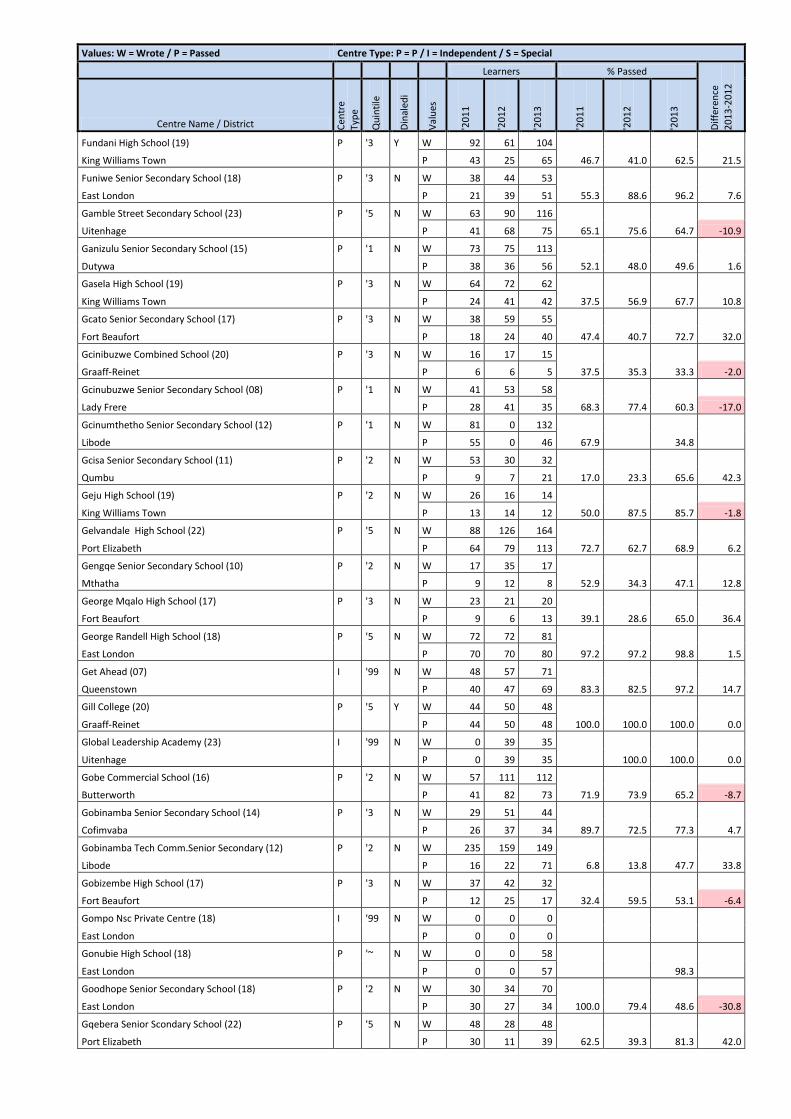
APPENDIX CENTRE PERFORMANCE
Values: W = Wrote / P = Passed Centre Type: P = P / I = Independent / S = Special
Learners % Passed
Dif
fere
nce
20
13
-20
12
Centre Name / District Cen
tre
Typ
e
Qu
inti
le
Din
aled
i
Val
ues
'20
11
'20
12
'20
13
'20
11
'20
12
'20
13
A M Sityana High School (19) P '2 N W 68 58 50
King Williams Town P 14 33 27 20.6 56.9 54.0 -2.9
A.M.Zantsi Senior Secondary School (14) P '1 N W 25 54 28
Cofimvaba P 25 34 28 100.0 63.0 100.0 37.0
A.V Platjie Senior Secondary School (10) P '3 N W 34 22 39
Mthatha P 27 19 24 79.4 86.4 61.5 -24.8
Abambo High School (07) P '2 N W 70 100 94
Queenstown P 54 69 56 77.1 69.0 59.6 -9.4
Aberdeen Senior Secondary School (20) P '4 N W 50 31 32
Graaff-Reinet P 22 18 18 44.0 58.1 56.3 -1.8
Accord Business Academy (18) I '99 N W 29 25 26
East London P 11 10 6 37.9 40.0 23.1 -16.9
Adelaide Gymnasium (17) P '4 N W 54 63 71
Fort Beaufort P 49 50 62 90.7 79.4 87.3 8.0
Advent Comprehensive School (03) I '99 N W 38 40 84
Maluti P 29 33 62 76.3 82.5 73.8 -8.7
Aeroville Senior Secondary School (20) P '4 N W 77 91 90
Graaff-Reinet P 58 61 50 75.3 67.0 55.6 -11.5
Alexander Road High School (22) P '5 N W 216 195 215
Port Elizabeth P 216 194 212 100.0 99.5 98.6 -0.9
Alexandria High School (21) P '4 N W 29 29 34
Grahamstown P 28 23 23 96.6 79.3 67.6 -11.7
Alfred Giba Senior Secondary School (19) P '2 N W 27 3 14
King Williams Town P 15 1 3 55.6 33.3 21.4 -11.9
Aliwal North High School (06) P '5 N W 92 92 78
Sterkspruit P 88 92 76 95.7 100.0 97.4 -2.6
Alphendale Secondary School (18) P '4 N W 87 92 112
East London P 73 81 90 83.9 88.0 80.4 -7.7
Althorpe College (18) I '99 N W 94 77 77
East London P 54 35 59 57.4 45.5 76.6 31.2
Am Tapa Senior Secondary School (17) P '3 N W 25 38 43
Fort Beaufort P 14 12 21 56.0 31.6 48.8 17.3
Amabele Senior Secondary School (16) P '1 N W 23 31 46
Butterworth P 17 23 31 73.9 74.2 67.4 -6.8
Amabhele High School (17) P '3 N W 14 23 30
Fort Beaufort P 5 10 16 35.7 43.5 53.3 9.9
Amajingqi Senior Secondary School (17) P '3 N W 52 28 37
Fort Beaufort P 29 15 20 55.8 53.6 54.1 0.5
Amantinde Senior Secondary School (19) P '4 N W 31 35 27
King Williams Town P 15 8 15 48.4 22.9 55.6 32.7
Amazizi Senior Secondary School (19) P '3 N W 74 19 79
King Williams Town P 62 12 69 83.8 63.2 87.3 24.2
Arcadia Senior Secondary School (22) P '5 N W 82 93 60
Port Elizabeth P 46 62 42 56.1 66.7 70.0 3.3
Archie Velile Senior Secondary School (19) P '3 N W 83 101 70
King Williams Town P 50 44 35 60.2 43.6 50.0 6.4
Arthur Mfebe Senior Secondary School (14) P '2 N W 36 39 37
Cofimvaba P 15 30 17 41.7 76.9 45.9 -31.0
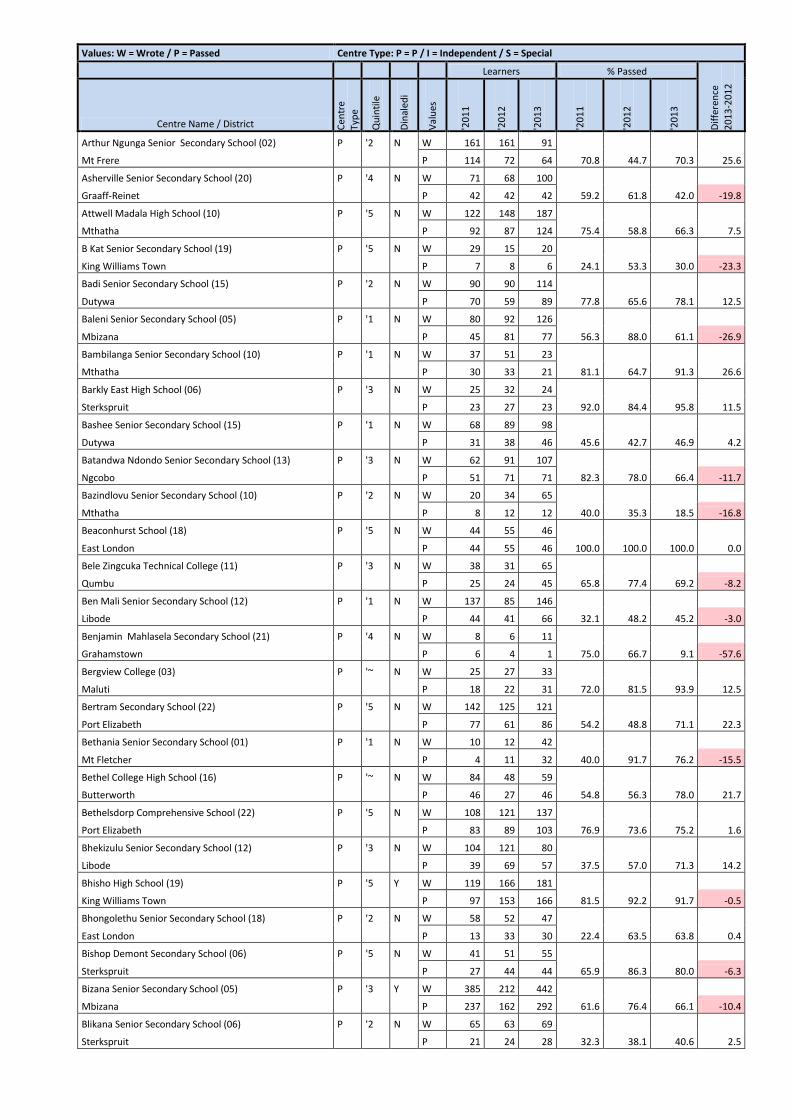
Values: W = Wrote / P = Passed Centre Type: P = P / I = Independent / S = Special
Learners % Passed
Dif
fere
nce
20
13
-20
12
Centre Name / District Cen
tre
Typ
e
Qu
inti
le
Din
aled
i
Val
ues
'20
11
'20
12
'20
13
'20
11
'20
12
'20
13
Arthur Ngunga Senior Secondary School (02) P '2 N W 161 161 91
Mt Frere P 114 72 64 70.8 44.7 70.3 25.6
Asherville Senior Secondary School (20) P '4 N W 71 68 100
Graaff-Reinet P 42 42 42 59.2 61.8 42.0 -19.8
Attwell Madala High School (10) P '5 N W 122 148 187
Mthatha P 92 87 124 75.4 58.8 66.3 7.5
B Kat Senior Secondary School (19) P '5 N W 29 15 20
King Williams Town P 7 8 6 24.1 53.3 30.0 -23.3
Badi Senior Secondary School (15) P '2 N W 90 90 114
Dutywa P 70 59 89 77.8 65.6 78.1 12.5
Baleni Senior Secondary School (05) P '1 N W 80 92 126
Mbizana P 45 81 77 56.3 88.0 61.1 -26.9
Bambilanga Senior Secondary School (10) P '1 N W 37 51 23
Mthatha P 30 33 21 81.1 64.7 91.3 26.6
Barkly East High School (06) P '3 N W 25 32 24
Sterkspruit P 23 27 23 92.0 84.4 95.8 11.5
Bashee Senior Secondary School (15) P '1 N W 68 89 98
Dutywa P 31 38 46 45.6 42.7 46.9 4.2
Batandwa Ndondo Senior Secondary School (13) P '3 N W 62 91 107
Ngcobo P 51 71 71 82.3 78.0 66.4 -11.7
Bazindlovu Senior Secondary School (10) P '2 N W 20 34 65
Mthatha P 8 12 12 40.0 35.3 18.5 -16.8
Beaconhurst School (18) P '5 N W 44 55 46
East London P 44 55 46 100.0 100.0 100.0 0.0
Bele Zingcuka Technical College (11) P '3 N W 38 31 65
Qumbu P 25 24 45 65.8 77.4 69.2 -8.2
Ben Mali Senior Secondary School (12) P '1 N W 137 85 146
Libode P 44 41 66 32.1 48.2 45.2 -3.0
Benjamin Mahlasela Secondary School (21) P '4 N W 8 6 11
Grahamstown P 6 4 1 75.0 66.7 9.1 -57.6
Bergview College (03) P '~ N W 25 27 33
Maluti P 18 22 31 72.0 81.5 93.9 12.5
Bertram Secondary School (22) P '5 N W 142 125 121
Port Elizabeth P 77 61 86 54.2 48.8 71.1 22.3
Bethania Senior Secondary School (01) P '1 N W 10 12 42
Mt Fletcher P 4 11 32 40.0 91.7 76.2 -15.5
Bethel College High School (16) P '~ N W 84 48 59
Butterworth P 46 27 46 54.8 56.3 78.0 21.7
Bethelsdorp Comprehensive School (22) P '5 N W 108 121 137
Port Elizabeth P 83 89 103 76.9 73.6 75.2 1.6
Bhekizulu Senior Secondary School (12) P '3 N W 104 121 80
Libode P 39 69 57 37.5 57.0 71.3 14.2
Bhisho High School (19) P '5 Y W 119 166 181
King Williams Town P 97 153 166 81.5 92.2 91.7 -0.5
Bhongolethu Senior Secondary School (18) P '2 N W 58 52 47
East London P 13 33 30 22.4 63.5 63.8 0.4
Bishop Demont Secondary School (06) P '5 N W 41 51 55
Sterkspruit P 27 44 44 65.9 86.3 80.0 -6.3
Bizana Senior Secondary School (05) P '3 Y W 385 212 442
Mbizana P 237 162 292 61.6 76.4 66.1 -10.4
Blikana Senior Secondary School (06) P '2 N W 65 63 69
Sterkspruit P 21 24 28 32.3 38.1 40.6 2.5
Values: W = Wrote / P = Passed Centre Type: P = P / I = Independent / S = Special
Learners % Passed
Dif
fere
nce
20
13
-20
12
Centre Name / District Cen
tre
Typ
e
Qu
inti
le
Din
aled
i
Val
ues
'20
11
'20
12
'20
13
'20
11
'20
12
'20
13
Blyletts Combined School (18) P '2 Y W 48 73 103
East London P 47 70 91 97.9 95.9 88.3 -7.5
Blythswood Institution (16) P '3 N W 53 63 91
Butterworth P 30 44 58 56.6 69.8 63.7 -6.1
Bodweni Senior Secondary School (04) P '1 N W 31 43 73
Lusikisiki P 14 21 17 45.2 48.8 23.3 -25.5
Bomela Senior Secondary School (15) P '2 N W 44 58 98
Dutywa P 24 29 44 54.5 50.0 44.9 -5.1
Bongolethu Senior Secondary School (16) P '2 N W 20 26 37
Butterworth P 14 22 24 70.0 84.6 64.9 -19.8
Bonkolo Senior Secondary School (15) P '3 N W 64 101 79
Dutywa P 31 29 26 48.4 28.7 32.9 4.2
Booysen Park Secondary School (22) P '5 N W 34 31 62
Port Elizabeth P 29 28 49 85.3 90.3 79.0 -11.3
Botha Sgcau Senior Secondary School (04) P '1 N W 99 94 43
Lusikisiki P 44 41 34 44.4 43.6 79.1 35.5
Brandwag High School (23) P '5 N W 148 161 163
Uitenhage P 148 160 162 100.0 99.4 99.4 0.0
Breidbach Senior Secondary School (19) P '5 N W 171 154 130
King Williams Town P 134 97 86 78.4 63.0 66.2 3.2
Brooksnek Senior Secondary School (02) P '2 N W 59 49 28
Mt Frere P 13 11 10 22.0 22.4 35.7 13.3
Brylin High School (22) I '99 N W 22 19 39
Port Elizabeth P 21 19 36 95.5 100.0 92.3 -7.7
Bubele Senior Secondary School (14) P '1 N W 8 26 13
Cofimvaba P 3 8 4 37.5 30.8 30.8 0.0
Buchule Technical High School (18) P '4 N W 38 53 47
East London P 23 40 36 60.5 75.5 76.6 1.1
Bulelani Senior Secondary School (07) P '4 Y W 123 103 128
Queenstown P 101 78 107 82.1 75.7 83.6 7.9
Burgersdorp High School (06) P '4 N W 49 42 47
Sterkspruit P 48 41 46 98.0 97.6 97.9 0.3
Butterworth High School (16) P '5 N W 69 72 80
Butterworth P 60 46 71 87.0 63.9 88.8 24.9
Butterworth Training Centre (16) P '99 N W 0 0 0
Butterworth P 0 0 0
Caba Senior Secondary School (19) P '2 N W 22 23 31
King Williams Town P 8 9 12 36.4 39.1 38.7 -0.4
Cacadu Senior Secondary School (08) P '2 N W 27 36 43
Lady Frere P 15 29 28 55.6 80.6 65.1 -15.4
Cala Senior Secondary School (13) P '4 N W 60 122 108
Ngcobo P 40 36 85 66.7 29.5 78.7 49.2
Cambridge High School (18) P '5 N W 176 181 184
East London P 176 179 183 100.0 98.9 99.5 0.6
Cameron Ngudle Senior Secondary School (11) P '2 N W 23 37 35
Qumbu P 21 33 34 91.3 89.2 97.1 8.0
Cancele Senior Secondary School (02) I '99 N W 14 16 0
Mt Frere P 4 4 0 28.6 25.0
Cangci Comprehensive Technical High (05) P '1 Y W 202 218 133
Mbizana P 89 92 59 44.1 42.2 44.4 2.2
Cape Recife High School (22) S '5 N W 33 37 29
Port Elizabeth P 27 27 27 81.8 73.0 93.1 20.1
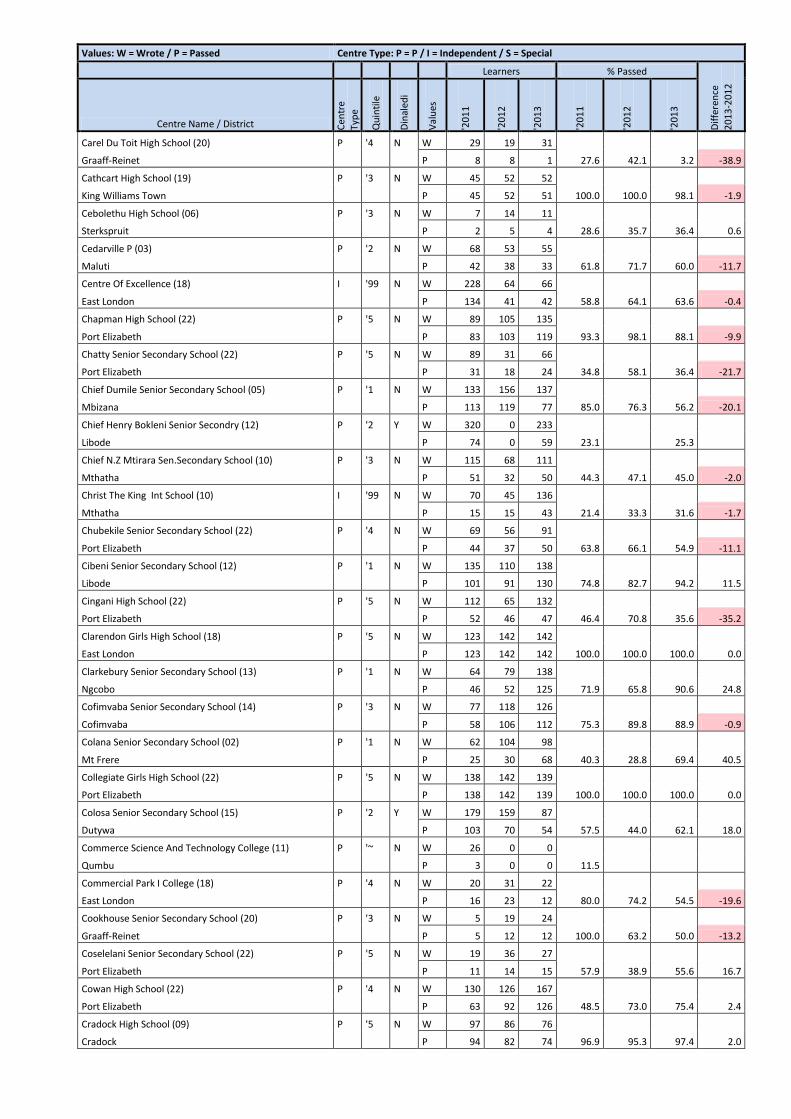
Values: W = Wrote / P = Passed Centre Type: P = P / I = Independent / S = Special
Learners % Passed
Dif
fere
nce
20
13
-20
12
Centre Name / District Cen
tre
Typ
e
Qu
inti
le
Din
aled
i
Val
ues
'20
11
'20
12
'20
13
'20
11
'20
12
'20
13
Carel Du Toit High School (20) P '4 N W 29 19 31
Graaff-Reinet P 8 8 1 27.6 42.1 3.2 -38.9
Cathcart High School (19) P '3 N W 45 52 52
King Williams Town P 45 52 51 100.0 100.0 98.1 -1.9
Cebolethu High School (06) P '3 N W 7 14 11
Sterkspruit P 2 5 4 28.6 35.7 36.4 0.6
Cedarville P (03) P '2 N W 68 53 55
Maluti P 42 38 33 61.8 71.7 60.0 -11.7
Centre Of Excellence (18) I '99 N W 228 64 66
East London P 134 41 42 58.8 64.1 63.6 -0.4
Chapman High School (22) P '5 N W 89 105 135
Port Elizabeth P 83 103 119 93.3 98.1 88.1 -9.9
Chatty Senior Secondary School (22) P '5 N W 89 31 66
Port Elizabeth P 31 18 24 34.8 58.1 36.4 -21.7
Chief Dumile Senior Secondary School (05) P '1 N W 133 156 137
Mbizana P 113 119 77 85.0 76.3 56.2 -20.1
Chief Henry Bokleni Senior Secondry (12) P '2 Y W 320 0 233
Libode P 74 0 59 23.1 25.3
Chief N.Z Mtirara Sen.Secondary School (10) P '3 N W 115 68 111
Mthatha P 51 32 50 44.3 47.1 45.0 -2.0
Christ The King Int School (10) I '99 N W 70 45 136
Mthatha P 15 15 43 21.4 33.3 31.6 -1.7
Chubekile Senior Secondary School (22) P '4 N W 69 56 91
Port Elizabeth P 44 37 50 63.8 66.1 54.9 -11.1
Cibeni Senior Secondary School (12) P '1 N W 135 110 138
Libode P 101 91 130 74.8 82.7 94.2 11.5
Cingani High School (22) P '5 N W 112 65 132
Port Elizabeth P 52 46 47 46.4 70.8 35.6 -35.2
Clarendon Girls High School (18) P '5 N W 123 142 142
East London P 123 142 142 100.0 100.0 100.0 0.0
Clarkebury Senior Secondary School (13) P '1 N W 64 79 138
Ngcobo P 46 52 125 71.9 65.8 90.6 24.8
Cofimvaba Senior Secondary School (14) P '3 N W 77 118 126
Cofimvaba P 58 106 112 75.3 89.8 88.9 -0.9
Colana Senior Secondary School (02) P '1 N W 62 104 98
Mt Frere P 25 30 68 40.3 28.8 69.4 40.5
Collegiate Girls High School (22) P '5 N W 138 142 139
Port Elizabeth P 138 142 139 100.0 100.0 100.0 0.0
Colosa Senior Secondary School (15) P '2 Y W 179 159 87
Dutywa P 103 70 54 57.5 44.0 62.1 18.0
Commerce Science And Technology College (11) P '~ N W 26 0 0
Qumbu P 3 0 0 11.5
Commercial Park I College (18) P '4 N W 20 31 22
East London P 16 23 12 80.0 74.2 54.5 -19.6
Cookhouse Senior Secondary School (20) P '3 N W 5 19 24
Graaff-Reinet P 5 12 12 100.0 63.2 50.0 -13.2
Coselelani Senior Secondary School (22) P '5 N W 19 36 27
Port Elizabeth P 11 14 15 57.9 38.9 55.6 16.7
Cowan High School (22) P '4 N W 130 126 167
Port Elizabeth P 63 92 126 48.5 73.0 75.4 2.4
Cradock High School (09) P '5 N W 97 86 76
Cradock P 94 82 74 96.9 95.3 97.4 2.0
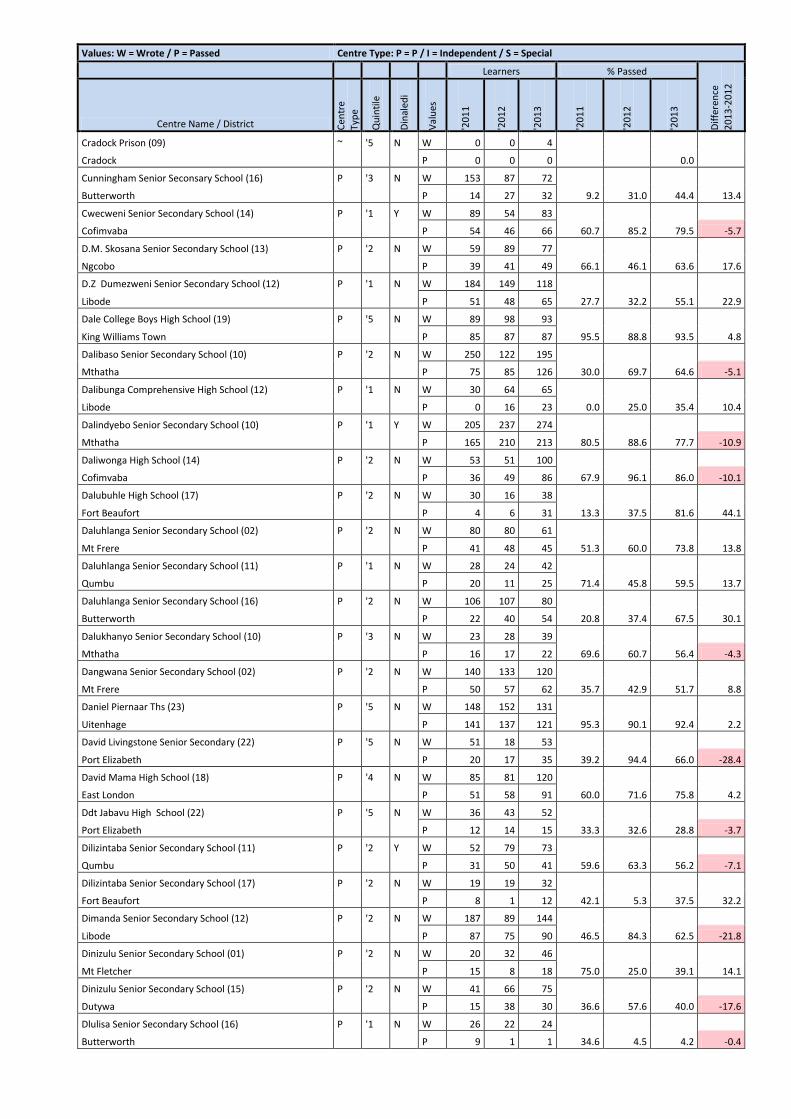
Values: W = Wrote / P = Passed Centre Type: P = P / I = Independent / S = Special
Learners % Passed
Dif
fere
nce
20
13
-20
12
Centre Name / District Cen
tre
Typ
e
Qu
inti
le
Din
aled
i
Val
ues
'20
11
'20
12
'20
13
'20
11
'20
12
'20
13
Cradock Prison (09) ~ '5 N W 0 0 4
Cradock P 0 0 0 0.0
Cunningham Senior Seconsary School (16) P '3 N W 153 87 72
Butterworth P 14 27 32 9.2 31.0 44.4 13.4
Cwecweni Senior Secondary School (14) P '1 Y W 89 54 83
Cofimvaba P 54 46 66 60.7 85.2 79.5 -5.7
D.M. Skosana Senior Secondary School (13) P '2 N W 59 89 77
Ngcobo P 39 41 49 66.1 46.1 63.6 17.6
D.Z Dumezweni Senior Secondary School (12) P '1 N W 184 149 118
Libode P 51 48 65 27.7 32.2 55.1 22.9
Dale College Boys High School (19) P '5 N W 89 98 93
King Williams Town P 85 87 87 95.5 88.8 93.5 4.8
Dalibaso Senior Secondary School (10) P '2 N W 250 122 195
Mthatha P 75 85 126 30.0 69.7 64.6 -5.1
Dalibunga Comprehensive High School (12) P '1 N W 30 64 65
Libode P 0 16 23 0.0 25.0 35.4 10.4
Dalindyebo Senior Secondary School (10) P '1 Y W 205 237 274
Mthatha P 165 210 213 80.5 88.6 77.7 -10.9
Daliwonga High School (14) P '2 N W 53 51 100
Cofimvaba P 36 49 86 67.9 96.1 86.0 -10.1
Dalubuhle High School (17) P '2 N W 30 16 38
Fort Beaufort P 4 6 31 13.3 37.5 81.6 44.1
Daluhlanga Senior Secondary School (02) P '2 N W 80 80 61
Mt Frere P 41 48 45 51.3 60.0 73.8 13.8
Daluhlanga Senior Secondary School (11) P '1 N W 28 24 42
Qumbu P 20 11 25 71.4 45.8 59.5 13.7
Daluhlanga Senior Secondary School (16) P '2 N W 106 107 80
Butterworth P 22 40 54 20.8 37.4 67.5 30.1
Dalukhanyo Senior Secondary School (10) P '3 N W 23 28 39
Mthatha P 16 17 22 69.6 60.7 56.4 -4.3
Dangwana Senior Secondary School (02) P '2 N W 140 133 120
Mt Frere P 50 57 62 35.7 42.9 51.7 8.8
Daniel Piernaar Ths (23) P '5 N W 148 152 131
Uitenhage P 141 137 121 95.3 90.1 92.4 2.2
David Livingstone Senior Secondary (22) P '5 N W 51 18 53
Port Elizabeth P 20 17 35 39.2 94.4 66.0 -28.4
David Mama High School (18) P '4 N W 85 81 120
East London P 51 58 91 60.0 71.6 75.8 4.2
Ddt Jabavu High School (22) P '5 N W 36 43 52
Port Elizabeth P 12 14 15 33.3 32.6 28.8 -3.7
Dilizintaba Senior Secondary School (11) P '2 Y W 52 79 73
Qumbu P 31 50 41 59.6 63.3 56.2 -7.1
Dilizintaba Senior Secondary School (17) P '2 N W 19 19 32
Fort Beaufort P 8 1 12 42.1 5.3 37.5 32.2
Dimanda Senior Secondary School (12) P '2 N W 187 89 144
Libode P 87 75 90 46.5 84.3 62.5 -21.8
Dinizulu Senior Secondary School (01) P '2 N W 20 32 46
Mt Fletcher P 15 8 18 75.0 25.0 39.1 14.1
Dinizulu Senior Secondary School (15) P '2 N W 41 66 75
Dutywa P 15 38 30 36.6 57.6 40.0 -17.6
Dlulisa Senior Secondary School (16) P '1 N W 26 22 24
Butterworth P 9 1 1 34.6 4.5 4.2 -0.4
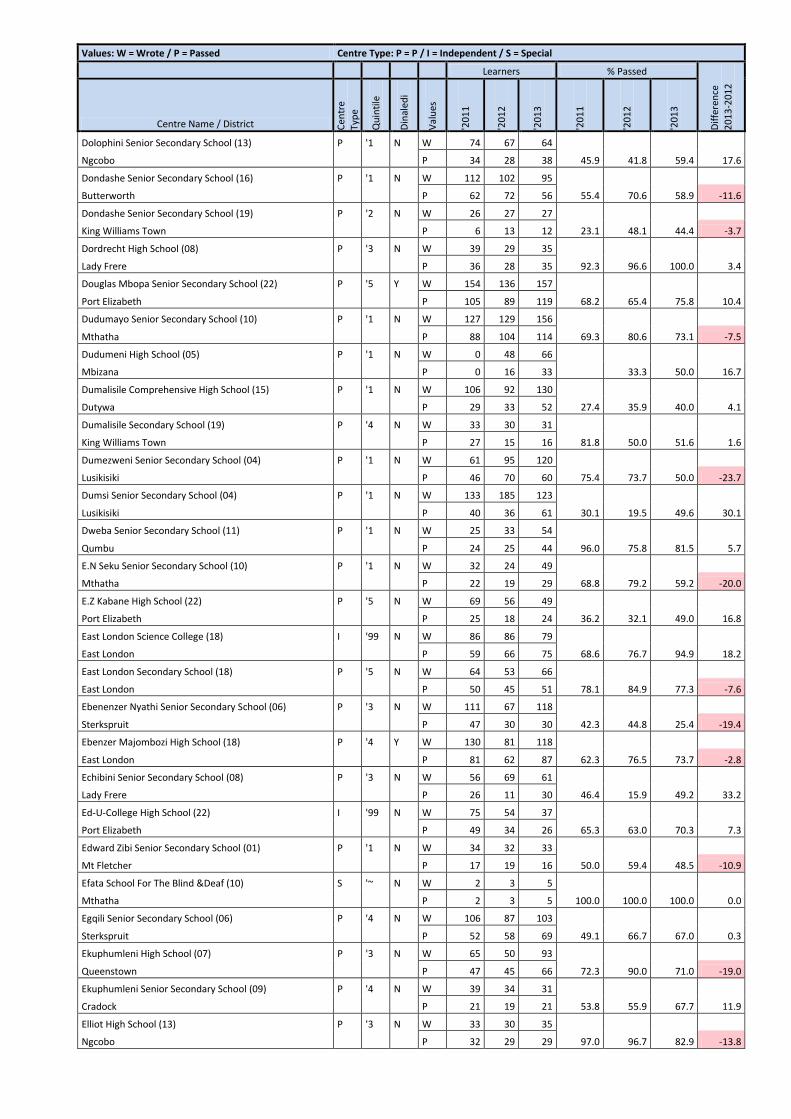
Values: W = Wrote / P = Passed Centre Type: P = P / I = Independent / S = Special
Learners % Passed
Dif
fere
nce
20
13
-20
12
Centre Name / District Cen
tre
Typ
e
Qu
inti
le
Din
aled
i
Val
ues
'20
11
'20
12
'20
13
'20
11
'20
12
'20
13
Dolophini Senior Secondary School (13) P '1 N W 74 67 64
Ngcobo P 34 28 38 45.9 41.8 59.4 17.6
Dondashe Senior Secondary School (16) P '1 N W 112 102 95
Butterworth P 62 72 56 55.4 70.6 58.9 -11.6
Dondashe Senior Secondary School (19) P '2 N W 26 27 27
King Williams Town P 6 13 12 23.1 48.1 44.4 -3.7
Dordrecht High School (08) P '3 N W 39 29 35
Lady Frere P 36 28 35 92.3 96.6 100.0 3.4
Douglas Mbopa Senior Secondary School (22) P '5 Y W 154 136 157
Port Elizabeth P 105 89 119 68.2 65.4 75.8 10.4
Dudumayo Senior Secondary School (10) P '1 N W 127 129 156
Mthatha P 88 104 114 69.3 80.6 73.1 -7.5
Dudumeni High School (05) P '1 N W 0 48 66
Mbizana P 0 16 33 33.3 50.0 16.7
Dumalisile Comprehensive High School (15) P '1 N W 106 92 130
Dutywa P 29 33 52 27.4 35.9 40.0 4.1
Dumalisile Secondary School (19) P '4 N W 33 30 31
King Williams Town P 27 15 16 81.8 50.0 51.6 1.6
Dumezweni Senior Secondary School (04) P '1 N W 61 95 120
Lusikisiki P 46 70 60 75.4 73.7 50.0 -23.7
Dumsi Senior Secondary School (04) P '1 N W 133 185 123
Lusikisiki P 40 36 61 30.1 19.5 49.6 30.1
Dweba Senior Secondary School (11) P '1 N W 25 33 54
Qumbu P 24 25 44 96.0 75.8 81.5 5.7
E.N Seku Senior Secondary School (10) P '1 N W 32 24 49
Mthatha P 22 19 29 68.8 79.2 59.2 -20.0
E.Z Kabane High School (22) P '5 N W 69 56 49
Port Elizabeth P 25 18 24 36.2 32.1 49.0 16.8
East London Science College (18) I '99 N W 86 86 79
East London P 59 66 75 68.6 76.7 94.9 18.2
East London Secondary School (18) P '5 N W 64 53 66
East London P 50 45 51 78.1 84.9 77.3 -7.6
Ebenenzer Nyathi Senior Secondary School (06) P '3 N W 111 67 118
Sterkspruit P 47 30 30 42.3 44.8 25.4 -19.4
Ebenzer Majombozi High School (18) P '4 Y W 130 81 118
East London P 81 62 87 62.3 76.5 73.7 -2.8
Echibini Senior Secondary School (08) P '3 N W 56 69 61
Lady Frere P 26 11 30 46.4 15.9 49.2 33.2
Ed-U-College High School (22) I '99 N W 75 54 37
Port Elizabeth P 49 34 26 65.3 63.0 70.3 7.3
Edward Zibi Senior Secondary School (01) P '1 N W 34 32 33
Mt Fletcher P 17 19 16 50.0 59.4 48.5 -10.9
Efata School For The Blind &Deaf (10) S '~ N W 2 3 5
Mthatha P 2 3 5 100.0 100.0 100.0 0.0
Egqili Senior Secondary School (06) P '4 N W 106 87 103
Sterkspruit P 52 58 69 49.1 66.7 67.0 0.3
Ekuphumleni High School (07) P '3 N W 65 50 93
Queenstown P 47 45 66 72.3 90.0 71.0 -19.0
Ekuphumleni Senior Secondary School (09) P '4 N W 39 34 31
Cradock P 21 19 21 53.8 55.9 67.7 11.9
Elliot High School (13) P '3 N W 33 30 35
Ngcobo P 32 29 29 97.0 96.7 82.9 -13.8
Values: W = Wrote / P = Passed Centre Type: P = P / I = Independent / S = Special
Learners % Passed
Dif
fere
nce
20
13
-20
12
Centre Name / District Cen
tre
Typ
e
Qu
inti
le
Din
aled
i
Val
ues
'20
11
'20
12
'20
13
'20
11
'20
12
'20
13
Elliotdale Tech (15) P '3 N W 80 77 104
Dutywa P 34 56 81 42.5 72.7 77.9 5.2
Elukhanyisweni Senior School (17) P '2 N W 38 21 37
Fort Beaufort P 20 10 28 52.6 47.6 75.7 28.1
Elukhanyisweni College (16) P '~ N W 168 99 89
Butterworth P 21 19 24 12.5 19.2 27.0 7.8
Emdeni Senior Secondary School (17) P '3 N W 35 50 48
Fort Beaufort P 9 14 18 25.7 28.0 37.5 9.5
Emfundweni Senior Secondary School (19) P '2 N W 46 43 26
King Williams Town P 10 24 18 21.7 55.8 69.2 13.4
Emgwali P School (19) P '3 N W 43 27 55
King Williams Town P 23 17 13 53.5 63.0 23.6 -39.3
Emizamoyethu Senior Secondary School (13) P '1 N W 54 24 44
Ngcobo P 0 7 19 0.0 29.2 43.2 14.0
Enkwenkwezini Senior Secondary School (17) P '3 N W 12 10 25
Fort Beaufort P 1 8 20 8.3 80.0 80.0 0.0
Enoch Mamba Snr S (15) P '1 N W 47 29 66
Dutywa P 11 12 19 23.4 41.4 28.8 -12.6
Enoch Sontonga Senior Secondary School (19) P '3 Y W 107 71 69
King Williams Town P 50 39 61 46.7 54.9 88.4 33.5
Eric Mntonga High School (18) P '4 N W 79 58 30
East London P 38 40 18 48.1 69.0 60.0 -9.0
Ethembeni Enrichment Centre (22) P '5 N W 39 68 76
Port Elizabeth P 39 63 74 100.0 92.6 97.4 4.7
Ethembeni Secondary School (06) P '3 N W 80 82 64
Sterkspruit P 32 25 37 40.0 30.5 57.8 27.3
Excelsior Senior Secondary School (10) P '4 N W 89 96 107
Mthatha P 82 76 93 92.1 79.2 86.9 7.7
Executive Academy (15) I '99 N W 424 386 203
Dutywa P 235 193 128 55.4 50.0 63.1 13.1
Eyabantu Senior Secondary School (17) P '3 N W 40 29 44
Fort Beaufort P 15 13 24 37.5 44.8 54.5 9.7
Ezingcuka Senior Secondary School (16) P '1 N W 162 171 180
Butterworth P 35 102 128 21.6 59.6 71.1 11.5
Ezingqayi Senior Secondary School (16) P '2 N W 38 47 73
Butterworth P 28 27 44 73.7 57.4 60.3 2.8
Ezizweni Senior Secondary School (16) P '2 N W 67 95 63
Butterworth P 21 20 41 31.3 21.1 65.1 44.0
Falo Senior Secondary School (14) P '2 N W 48 69 101
Cofimvaba P 39 57 60 81.3 82.6 59.4 -23.2
Flagstaff Compehensive School (04) P '3 N W 44 131 91
Lusikisiki P 34 67 45 77.3 51.1 49.5 -1.7
Focused High School (03) I '99 N W 37 40 37
Maluti P 35 38 27 94.6 95.0 73.0 -22.0
Forbes Grant Senior Secondary School (19) P '4 N W 65 68 89
King Williams Town P 37 42 57 56.9 61.8 64.0 2.3
Fort Malan Senior Secondary School (15) P '2 N W 58 38 90
Dutywa P 37 25 63 63.8 65.8 70.0 4.2
Freemantle Senior Secondary School (08) P '2 N W 46 63 88
Lady Frere P 43 58 81 93.5 92.1 92.0 0.0
Funda High School (07) P '3 Y W 91 128 112
Queenstown P 71 52 90 78.0 40.6 80.4 39.7
Values: W = Wrote / P = Passed Centre Type: P = P / I = Independent / S = Special
Learners % Passed
Dif
fere
nce
20
13
-20
12
Centre Name / District Cen
tre
Typ
e
Qu
inti
le
Din
aled
i
Val
ues
'20
11
'20
12
'20
13
'20
11
'20
12
'20
13
Fundani High School (19) P '3 Y W 92 61 104
King Williams Town P 43 25 65 46.7 41.0 62.5 21.5
Funiwe Senior Secondary School (18) P '3 N W 38 44 53
East London P 21 39 51 55.3 88.6 96.2 7.6
Gamble Street Secondary School (23) P '5 N W 63 90 116
Uitenhage P 41 68 75 65.1 75.6 64.7 -10.9
Ganizulu Senior Secondary School (15) P '1 N W 73 75 113
Dutywa P 38 36 56 52.1 48.0 49.6 1.6
Gasela High School (19) P '3 N W 64 72 62
King Williams Town P 24 41 42 37.5 56.9 67.7 10.8
Gcato Senior Secondary School (17) P '3 N W 38 59 55
Fort Beaufort P 18 24 40 47.4 40.7 72.7 32.0
Gcinibuzwe Combined School (20) P '3 N W 16 17 15
Graaff-Reinet P 6 6 5 37.5 35.3 33.3 -2.0
Gcinubuzwe Senior Secondary School (08) P '1 N W 41 53 58
Lady Frere P 28 41 35 68.3 77.4 60.3 -17.0
Gcinumthetho Senior Secondary School (12) P '1 N W 81 0 132
Libode P 55 0 46 67.9 34.8
Gcisa Senior Secondary School (11) P '2 N W 53 30 32
Qumbu P 9 7 21 17.0 23.3 65.6 42.3
Geju High School (19) P '2 N W 26 16 14
King Williams Town P 13 14 12 50.0 87.5 85.7 -1.8
Gelvandale High School (22) P '5 N W 88 126 164
Port Elizabeth P 64 79 113 72.7 62.7 68.9 6.2
Gengqe Senior Secondary School (10) P '2 N W 17 35 17
Mthatha P 9 12 8 52.9 34.3 47.1 12.8
George Mqalo High School (17) P '3 N W 23 21 20
Fort Beaufort P 9 6 13 39.1 28.6 65.0 36.4
George Randell High School (18) P '5 N W 72 72 81
East London P 70 70 80 97.2 97.2 98.8 1.5
Get Ahead (07) I '99 N W 48 57 71
Queenstown P 40 47 69 83.3 82.5 97.2 14.7
Gill College (20) P '5 Y W 44 50 48
Graaff-Reinet P 44 50 48 100.0 100.0 100.0 0.0
Global Leadership Academy (23) I '99 N W 0 39 35
Uitenhage P 0 39 35 100.0 100.0 0.0
Gobe Commercial School (16) P '2 N W 57 111 112
Butterworth P 41 82 73 71.9 73.9 65.2 -8.7
Gobinamba Senior Secondary School (14) P '3 N W 29 51 44
Cofimvaba P 26 37 34 89.7 72.5 77.3 4.7
Gobinamba Tech Comm.Senior Secondary (12) P '2 N W 235 159 149
Libode P 16 22 71 6.8 13.8 47.7 33.8
Gobizembe High School (17) P '3 N W 37 42 32
Fort Beaufort P 12 25 17 32.4 59.5 53.1 -6.4
Gompo Nsc Private Centre (18) I '99 N W 0 0 0
East London P 0 0 0
Gonubie High School (18) P '~ N W 0 0 58
East London P 0 0 57 98.3
Goodhope Senior Secondary School (18) P '2 N W 30 34 70
East London P 30 27 34 100.0 79.4 48.6 -30.8
Gqebera Senior Scondary School (22) P '5 N W 48 28 48
Port Elizabeth P 30 11 39 62.5 39.3 81.3 42.0
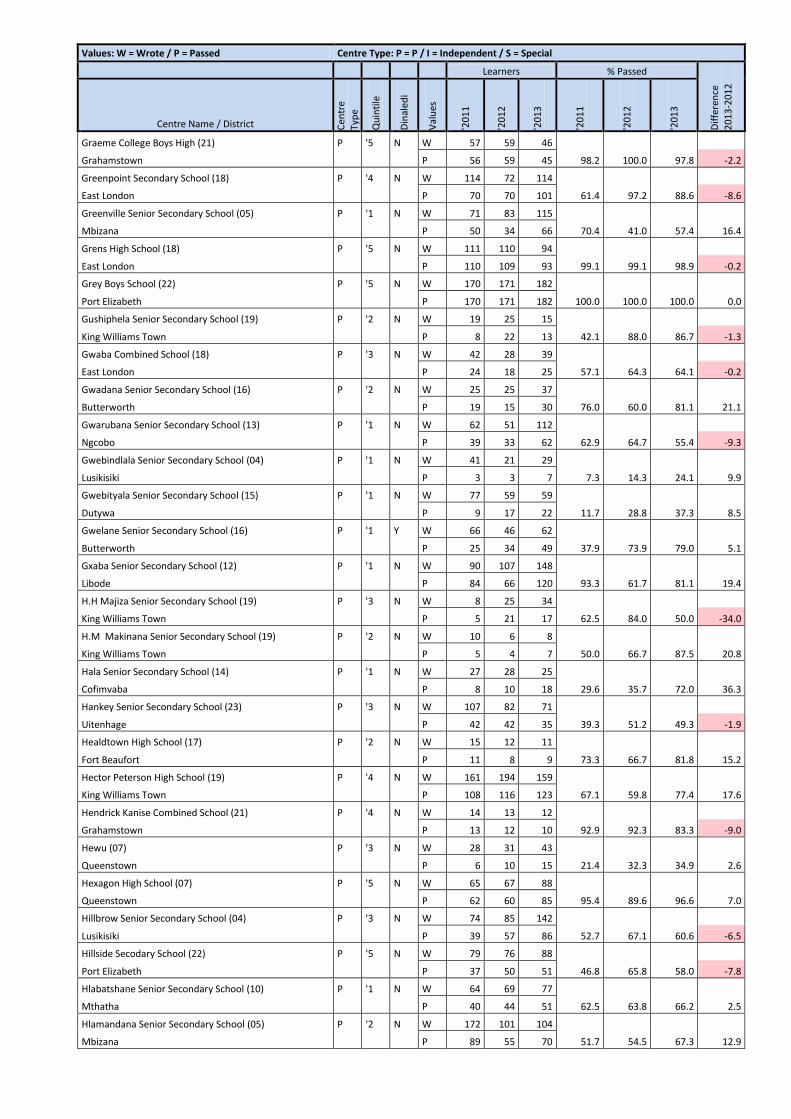
Values: W = Wrote / P = Passed Centre Type: P = P / I = Independent / S = Special
Learners % Passed
Dif
fere
nce
20
13
-20
12
Centre Name / District Cen
tre
Typ
e
Qu
inti
le
Din
aled
i
Val
ues
'20
11
'20
12
'20
13
'20
11
'20
12
'20
13
Graeme College Boys High (21) P '5 N W 57 59 46
Grahamstown P 56 59 45 98.2 100.0 97.8 -2.2
Greenpoint Secondary School (18) P '4 N W 114 72 114
East London P 70 70 101 61.4 97.2 88.6 -8.6
Greenville Senior Secondary School (05) P '1 N W 71 83 115
Mbizana P 50 34 66 70.4 41.0 57.4 16.4
Grens High School (18) P '5 N W 111 110 94
East London P 110 109 93 99.1 99.1 98.9 -0.2
Grey Boys School (22) P '5 N W 170 171 182
Port Elizabeth P 170 171 182 100.0 100.0 100.0 0.0
Gushiphela Senior Secondary School (19) P '2 N W 19 25 15
King Williams Town P 8 22 13 42.1 88.0 86.7 -1.3
Gwaba Combined School (18) P '3 N W 42 28 39
East London P 24 18 25 57.1 64.3 64.1 -0.2
Gwadana Senior Secondary School (16) P '2 N W 25 25 37
Butterworth P 19 15 30 76.0 60.0 81.1 21.1
Gwarubana Senior Secondary School (13) P '1 N W 62 51 112
Ngcobo P 39 33 62 62.9 64.7 55.4 -9.3
Gwebindlala Senior Secondary School (04) P '1 N W 41 21 29
Lusikisiki P 3 3 7 7.3 14.3 24.1 9.9
Gwebityala Senior Secondary School (15) P '1 N W 77 59 59
Dutywa P 9 17 22 11.7 28.8 37.3 8.5
Gwelane Senior Secondary School (16) P '1 Y W 66 46 62
Butterworth P 25 34 49 37.9 73.9 79.0 5.1
Gxaba Senior Secondary School (12) P '1 N W 90 107 148
Libode P 84 66 120 93.3 61.7 81.1 19.4
H.H Majiza Senior Secondary School (19) P '3 N W 8 25 34
King Williams Town P 5 21 17 62.5 84.0 50.0 -34.0
H.M Makinana Senior Secondary School (19) P '2 N W 10 6 8
King Williams Town P 5 4 7 50.0 66.7 87.5 20.8
Hala Senior Secondary School (14) P '1 N W 27 28 25
Cofimvaba P 8 10 18 29.6 35.7 72.0 36.3
Hankey Senior Secondary School (23) P '3 N W 107 82 71
Uitenhage P 42 42 35 39.3 51.2 49.3 -1.9
Healdtown High School (17) P '2 N W 15 12 11
Fort Beaufort P 11 8 9 73.3 66.7 81.8 15.2
Hector Peterson High School (19) P '4 N W 161 194 159
King Williams Town P 108 116 123 67.1 59.8 77.4 17.6
Hendrick Kanise Combined School (21) P '4 N W 14 13 12
Grahamstown P 13 12 10 92.9 92.3 83.3 -9.0
Hewu (07) P '3 N W 28 31 43
Queenstown P 6 10 15 21.4 32.3 34.9 2.6
Hexagon High School (07) P '5 N W 65 67 88
Queenstown P 62 60 85 95.4 89.6 96.6 7.0
Hillbrow Senior Secondary School (04) P '3 N W 74 85 142
Lusikisiki P 39 57 86 52.7 67.1 60.6 -6.5
Hillside Secodary School (22) P '5 N W 79 76 88
Port Elizabeth P 37 50 51 46.8 65.8 58.0 -7.8
Hlabatshane Senior Secondary School (10) P '1 N W 64 69 77
Mthatha P 40 44 51 62.5 63.8 66.2 2.5
Hlamandana Senior Secondary School (05) P '2 N W 172 101 104
Mbizana P 89 55 70 51.7 54.5 67.3 12.9
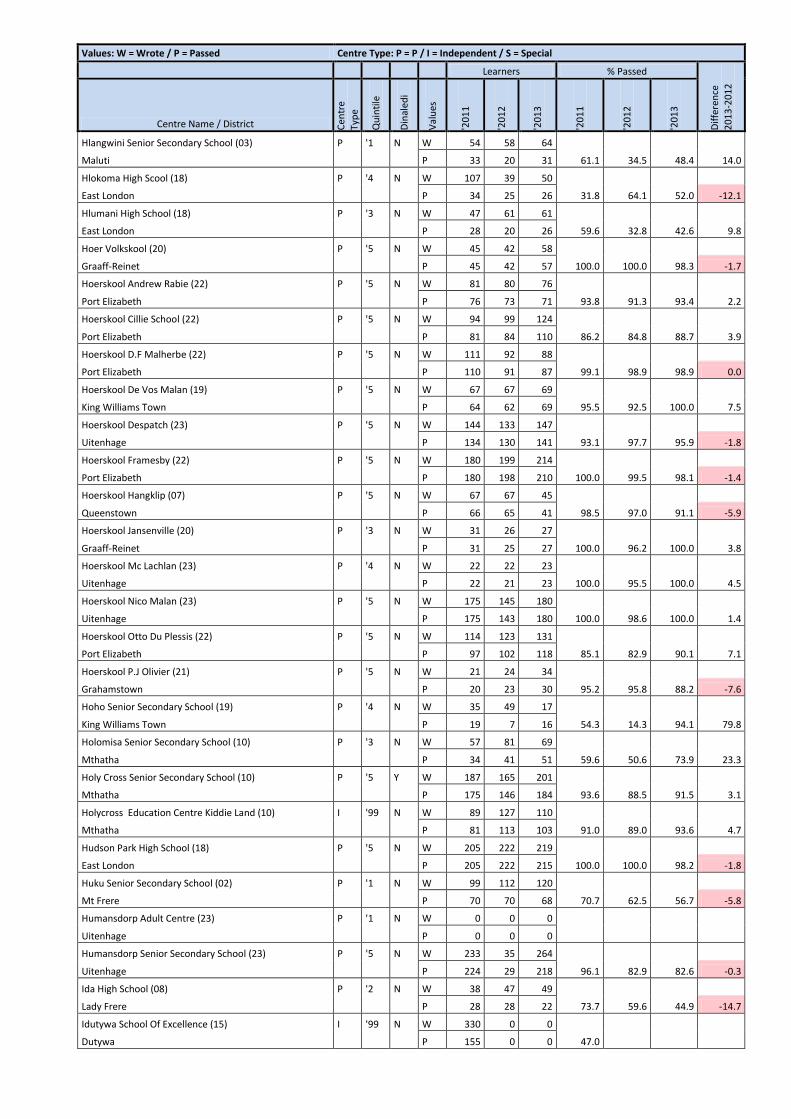
Values: W = Wrote / P = Passed Centre Type: P = P / I = Independent / S = Special
Learners % Passed
Dif
fere
nce
20
13
-20
12
Centre Name / District Cen
tre
Typ
e
Qu
inti
le
Din
aled
i
Val
ues
'20
11
'20
12
'20
13
'20
11
'20
12
'20
13
Hlangwini Senior Secondary School (03) P '1 N W 54 58 64
Maluti P 33 20 31 61.1 34.5 48.4 14.0
Hlokoma High Scool (18) P '4 N W 107 39 50
East London P 34 25 26 31.8 64.1 52.0 -12.1
Hlumani High School (18) P '3 N W 47 61 61
East London P 28 20 26 59.6 32.8 42.6 9.8
Hoer Volkskool (20) P '5 N W 45 42 58
Graaff-Reinet P 45 42 57 100.0 100.0 98.3 -1.7
Hoerskool Andrew Rabie (22) P '5 N W 81 80 76
Port Elizabeth P 76 73 71 93.8 91.3 93.4 2.2
Hoerskool Cillie School (22) P '5 N W 94 99 124
Port Elizabeth P 81 84 110 86.2 84.8 88.7 3.9
Hoerskool D.F Malherbe (22) P '5 N W 111 92 88
Port Elizabeth P 110 91 87 99.1 98.9 98.9 0.0
Hoerskool De Vos Malan (19) P '5 N W 67 67 69
King Williams Town P 64 62 69 95.5 92.5 100.0 7.5
Hoerskool Despatch (23) P '5 N W 144 133 147
Uitenhage P 134 130 141 93.1 97.7 95.9 -1.8
Hoerskool Framesby (22) P '5 N W 180 199 214
Port Elizabeth P 180 198 210 100.0 99.5 98.1 -1.4
Hoerskool Hangklip (07) P '5 N W 67 67 45
Queenstown P 66 65 41 98.5 97.0 91.1 -5.9
Hoerskool Jansenville (20) P '3 N W 31 26 27
Graaff-Reinet P 31 25 27 100.0 96.2 100.0 3.8
Hoerskool Mc Lachlan (23) P '4 N W 22 22 23
Uitenhage P 22 21 23 100.0 95.5 100.0 4.5
Hoerskool Nico Malan (23) P '5 N W 175 145 180
Uitenhage P 175 143 180 100.0 98.6 100.0 1.4
Hoerskool Otto Du Plessis (22) P '5 N W 114 123 131
Port Elizabeth P 97 102 118 85.1 82.9 90.1 7.1
Hoerskool P.J Olivier (21) P '5 N W 21 24 34
Grahamstown P 20 23 30 95.2 95.8 88.2 -7.6
Hoho Senior Secondary School (19) P '4 N W 35 49 17
King Williams Town P 19 7 16 54.3 14.3 94.1 79.8
Holomisa Senior Secondary School (10) P '3 N W 57 81 69
Mthatha P 34 41 51 59.6 50.6 73.9 23.3
Holy Cross Senior Secondary School (10) P '5 Y W 187 165 201
Mthatha P 175 146 184 93.6 88.5 91.5 3.1
Holycross Education Centre Kiddie Land (10) I '99 N W 89 127 110
Mthatha P 81 113 103 91.0 89.0 93.6 4.7
Hudson Park High School (18) P '5 N W 205 222 219
East London P 205 222 215 100.0 100.0 98.2 -1.8
Huku Senior Secondary School (02) P '1 N W 99 112 120
Mt Frere P 70 70 68 70.7 62.5 56.7 -5.8
Humansdorp Adult Centre (23) P '1 N W 0 0 0
Uitenhage P 0 0 0
Humansdorp Senior Secondary School (23) P '5 N W 233 35 264
Uitenhage P 224 29 218 96.1 82.9 82.6 -0.3
Ida High School (08) P '2 N W 38 47 49
Lady Frere P 28 28 22 73.7 59.6 44.9 -14.7
Idutywa School Of Excellence (15) I '99 N W 330 0 0
Dutywa P 155 0 0 47.0
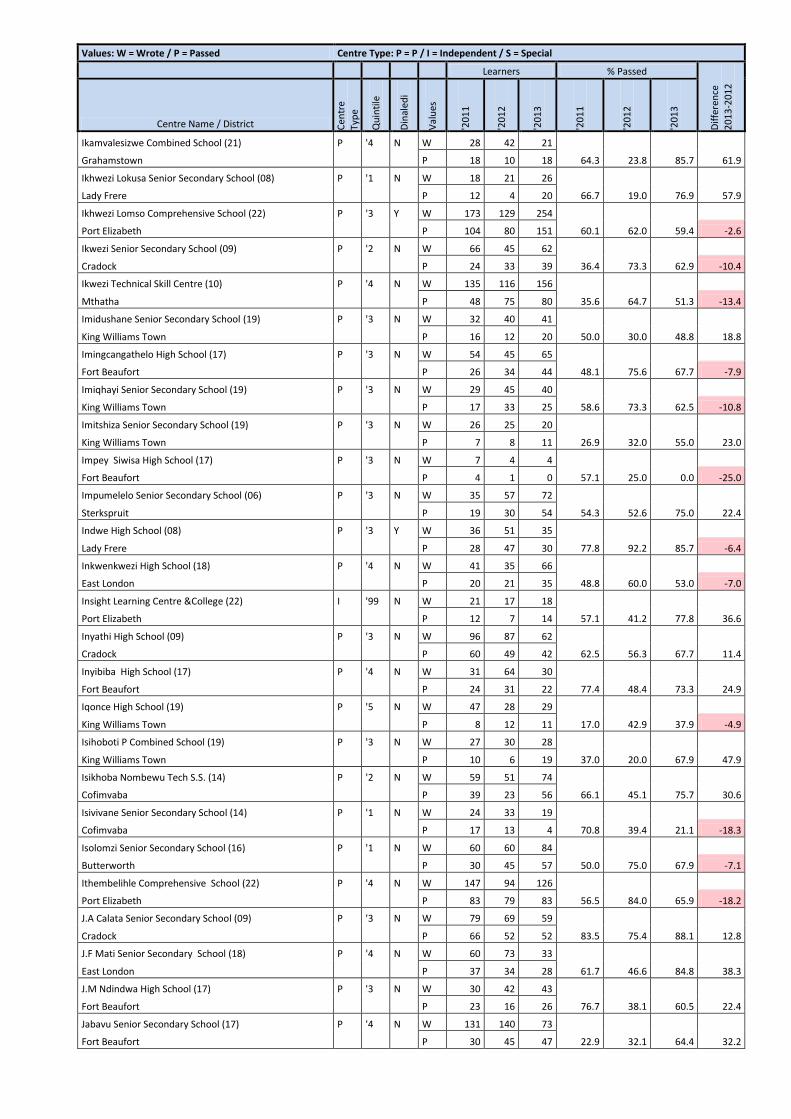
Values: W = Wrote / P = Passed Centre Type: P = P / I = Independent / S = Special
Learners % Passed
Dif
fere
nce
20
13
-20
12
Centre Name / District Cen
tre
Typ
e
Qu
inti
le
Din
aled
i
Val
ues
'20
11
'20
12
'20
13
'20
11
'20
12
'20
13
Ikamvalesizwe Combined School (21) P '4 N W 28 42 21
Grahamstown P 18 10 18 64.3 23.8 85.7 61.9
Ikhwezi Lokusa Senior Secondary School (08) P '1 N W 18 21 26
Lady Frere P 12 4 20 66.7 19.0 76.9 57.9
Ikhwezi Lomso Comprehensive School (22) P '3 Y W 173 129 254
Port Elizabeth P 104 80 151 60.1 62.0 59.4 -2.6
Ikwezi Senior Secondary School (09) P '2 N W 66 45 62
Cradock P 24 33 39 36.4 73.3 62.9 -10.4
Ikwezi Technical Skill Centre (10) P '4 N W 135 116 156
Mthatha P 48 75 80 35.6 64.7 51.3 -13.4
Imidushane Senior Secondary School (19) P '3 N W 32 40 41
King Williams Town P 16 12 20 50.0 30.0 48.8 18.8
Imingcangathelo High School (17) P '3 N W 54 45 65
Fort Beaufort P 26 34 44 48.1 75.6 67.7 -7.9
Imiqhayi Senior Secondary School (19) P '3 N W 29 45 40
King Williams Town P 17 33 25 58.6 73.3 62.5 -10.8
Imitshiza Senior Secondary School (19) P '3 N W 26 25 20
King Williams Town P 7 8 11 26.9 32.0 55.0 23.0
Impey Siwisa High School (17) P '3 N W 7 4 4
Fort Beaufort P 4 1 0 57.1 25.0 0.0 -25.0
Impumelelo Senior Secondary School (06) P '3 N W 35 57 72
Sterkspruit P 19 30 54 54.3 52.6 75.0 22.4
Indwe High School (08) P '3 Y W 36 51 35
Lady Frere P 28 47 30 77.8 92.2 85.7 -6.4
Inkwenkwezi High School (18) P '4 N W 41 35 66
East London P 20 21 35 48.8 60.0 53.0 -7.0
Insight Learning Centre &College (22) I '99 N W 21 17 18
Port Elizabeth P 12 7 14 57.1 41.2 77.8 36.6
Inyathi High School (09) P '3 N W 96 87 62
Cradock P 60 49 42 62.5 56.3 67.7 11.4
Inyibiba High School (17) P '4 N W 31 64 30
Fort Beaufort P 24 31 22 77.4 48.4 73.3 24.9
Iqonce High School (19) P '5 N W 47 28 29
King Williams Town P 8 12 11 17.0 42.9 37.9 -4.9
Isihoboti P Combined School (19) P '3 N W 27 30 28
King Williams Town P 10 6 19 37.0 20.0 67.9 47.9
Isikhoba Nombewu Tech S.S. (14) P '2 N W 59 51 74
Cofimvaba P 39 23 56 66.1 45.1 75.7 30.6
Isivivane Senior Secondary School (14) P '1 N W 24 33 19
Cofimvaba P 17 13 4 70.8 39.4 21.1 -18.3
Isolomzi Senior Secondary School (16) P '1 N W 60 60 84
Butterworth P 30 45 57 50.0 75.0 67.9 -7.1
Ithembelihle Comprehensive School (22) P '4 N W 147 94 126
Port Elizabeth P 83 79 83 56.5 84.0 65.9 -18.2
J.A Calata Senior Secondary School (09) P '3 N W 79 69 59
Cradock P 66 52 52 83.5 75.4 88.1 12.8
J.F Mati Senior Secondary School (18) P '4 N W 60 73 33
East London P 37 34 28 61.7 46.6 84.8 38.3
J.M Ndindwa High School (17) P '3 N W 30 42 43
Fort Beaufort P 23 16 26 76.7 38.1 60.5 22.4
Jabavu Senior Secondary School (17) P '4 N W 131 140 73
Fort Beaufort P 30 45 47 22.9 32.1 64.4 32.2
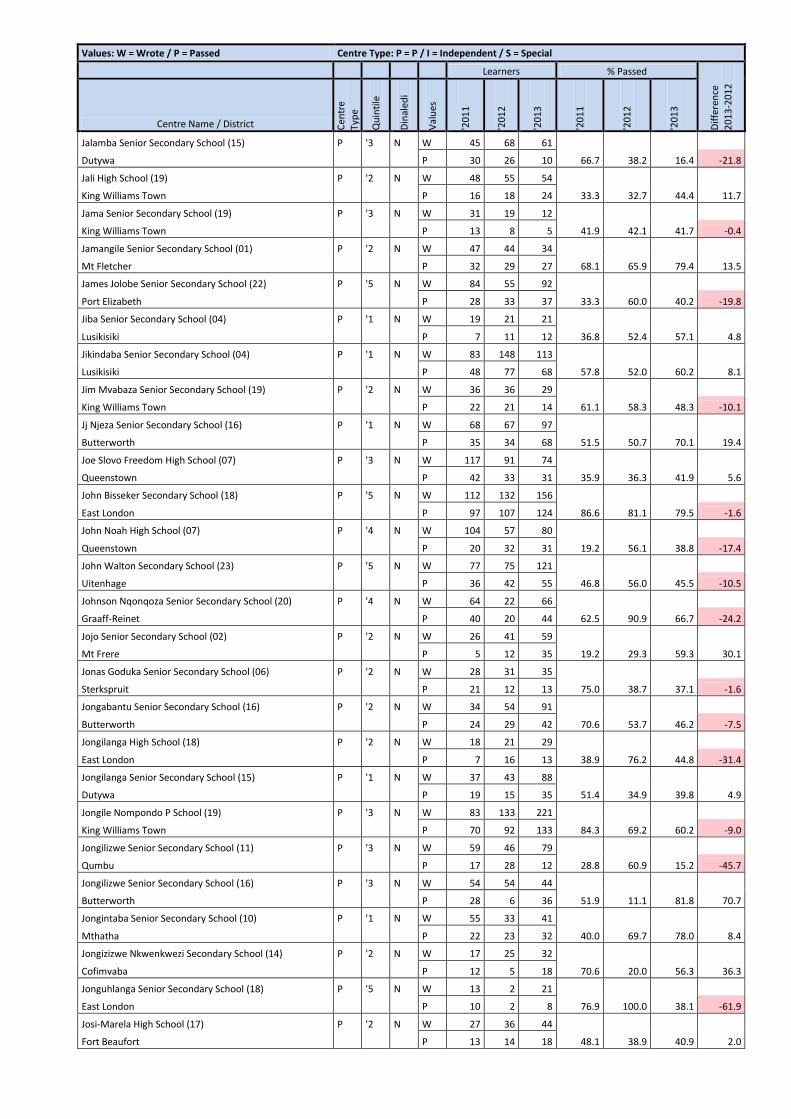
Values: W = Wrote / P = Passed Centre Type: P = P / I = Independent / S = Special
Learners % Passed
Dif
fere
nce
20
13
-20
12
Centre Name / District Cen
tre
Typ
e
Qu
inti
le
Din
aled
i
Val
ues
'20
11
'20
12
'20
13
'20
11
'20
12
'20
13
Jalamba Senior Secondary School (15) P '3 N W 45 68 61
Dutywa P 30 26 10 66.7 38.2 16.4 -21.8
Jali High School (19) P '2 N W 48 55 54
King Williams Town P 16 18 24 33.3 32.7 44.4 11.7
Jama Senior Secondary School (19) P '3 N W 31 19 12
King Williams Town P 13 8 5 41.9 42.1 41.7 -0.4
Jamangile Senior Secondary School (01) P '2 N W 47 44 34
Mt Fletcher P 32 29 27 68.1 65.9 79.4 13.5
James Jolobe Senior Secondary School (22) P '5 N W 84 55 92
Port Elizabeth P 28 33 37 33.3 60.0 40.2 -19.8
Jiba Senior Secondary School (04) P '1 N W 19 21 21
Lusikisiki P 7 11 12 36.8 52.4 57.1 4.8
Jikindaba Senior Secondary School (04) P '1 N W 83 148 113
Lusikisiki P 48 77 68 57.8 52.0 60.2 8.1
Jim Mvabaza Senior Secondary School (19) P '2 N W 36 36 29
King Williams Town P 22 21 14 61.1 58.3 48.3 -10.1
Jj Njeza Senior Secondary School (16) P '1 N W 68 67 97
Butterworth P 35 34 68 51.5 50.7 70.1 19.4
Joe Slovo Freedom High School (07) P '3 N W 117 91 74
Queenstown P 42 33 31 35.9 36.3 41.9 5.6
John Bisseker Secondary School (18) P '5 N W 112 132 156
East London P 97 107 124 86.6 81.1 79.5 -1.6
John Noah High School (07) P '4 N W 104 57 80
Queenstown P 20 32 31 19.2 56.1 38.8 -17.4
John Walton Secondary School (23) P '5 N W 77 75 121
Uitenhage P 36 42 55 46.8 56.0 45.5 -10.5
Johnson Nqonqoza Senior Secondary School (20) P '4 N W 64 22 66
Graaff-Reinet P 40 20 44 62.5 90.9 66.7 -24.2
Jojo Senior Secondary School (02) P '2 N W 26 41 59
Mt Frere P 5 12 35 19.2 29.3 59.3 30.1
Jonas Goduka Senior Secondary School (06) P '2 N W 28 31 35
Sterkspruit P 21 12 13 75.0 38.7 37.1 -1.6
Jongabantu Senior Secondary School (16) P '2 N W 34 54 91
Butterworth P 24 29 42 70.6 53.7 46.2 -7.5
Jongilanga High School (18) P '2 N W 18 21 29
East London P 7 16 13 38.9 76.2 44.8 -31.4
Jongilanga Senior Secondary School (15) P '1 N W 37 43 88
Dutywa P 19 15 35 51.4 34.9 39.8 4.9
Jongile Nompondo P School (19) P '3 N W 83 133 221
King Williams Town P 70 92 133 84.3 69.2 60.2 -9.0
Jongilizwe Senior Secondary School (11) P '3 N W 59 46 79
Qumbu P 17 28 12 28.8 60.9 15.2 -45.7
Jongilizwe Senior Secondary School (16) P '3 N W 54 54 44
Butterworth P 28 6 36 51.9 11.1 81.8 70.7
Jongintaba Senior Secondary School (10) P '1 N W 55 33 41
Mthatha P 22 23 32 40.0 69.7 78.0 8.4
Jongizizwe Nkwenkwezi Secondary School (14) P '2 N W 17 25 32
Cofimvaba P 12 5 18 70.6 20.0 56.3 36.3
Jonguhlanga Senior Secondary School (18) P '5 N W 13 2 21
East London P 10 2 8 76.9 100.0 38.1 -61.9
Josi-Marela High School (17) P '2 N W 27 36 44
Fort Beaufort P 13 14 18 48.1 38.9 40.9 2.0
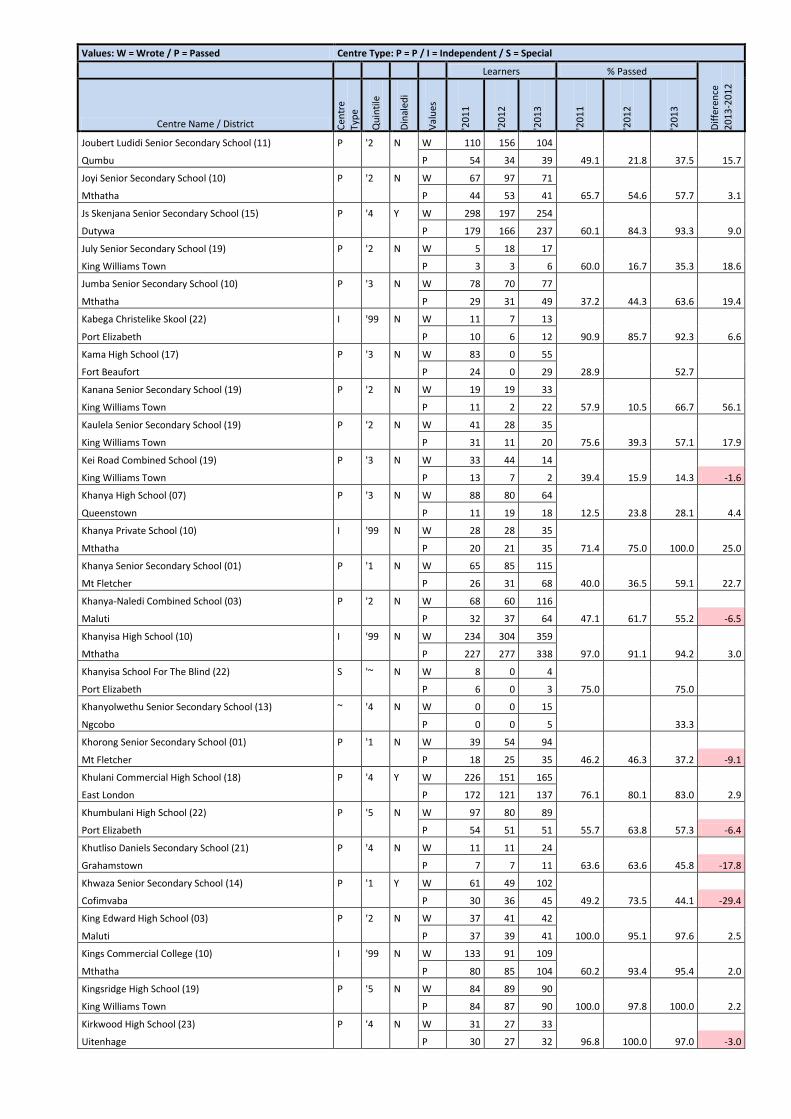
Values: W = Wrote / P = Passed Centre Type: P = P / I = Independent / S = Special
Learners % Passed
Dif
fere
nce
20
13
-20
12
Centre Name / District Cen
tre
Typ
e
Qu
inti
le
Din
aled
i
Val
ues
'20
11
'20
12
'20
13
'20
11
'20
12
'20
13
Joubert Ludidi Senior Secondary School (11) P '2 N W 110 156 104
Qumbu P 54 34 39 49.1 21.8 37.5 15.7
Joyi Senior Secondary School (10) P '2 N W 67 97 71
Mthatha P 44 53 41 65.7 54.6 57.7 3.1
Js Skenjana Senior Secondary School (15) P '4 Y W 298 197 254
Dutywa P 179 166 237 60.1 84.3 93.3 9.0
July Senior Secondary School (19) P '2 N W 5 18 17
King Williams Town P 3 3 6 60.0 16.7 35.3 18.6
Jumba Senior Secondary School (10) P '3 N W 78 70 77
Mthatha P 29 31 49 37.2 44.3 63.6 19.4
Kabega Christelike Skool (22) I '99 N W 11 7 13
Port Elizabeth P 10 6 12 90.9 85.7 92.3 6.6
Kama High School (17) P '3 N W 83 0 55
Fort Beaufort P 24 0 29 28.9 52.7
Kanana Senior Secondary School (19) P '2 N W 19 19 33
King Williams Town P 11 2 22 57.9 10.5 66.7 56.1
Kaulela Senior Secondary School (19) P '2 N W 41 28 35
King Williams Town P 31 11 20 75.6 39.3 57.1 17.9
Kei Road Combined School (19) P '3 N W 33 44 14
King Williams Town P 13 7 2 39.4 15.9 14.3 -1.6
Khanya High School (07) P '3 N W 88 80 64
Queenstown P 11 19 18 12.5 23.8 28.1 4.4
Khanya Private School (10) I '99 N W 28 28 35
Mthatha P 20 21 35 71.4 75.0 100.0 25.0
Khanya Senior Secondary School (01) P '1 N W 65 85 115
Mt Fletcher P 26 31 68 40.0 36.5 59.1 22.7
Khanya-Naledi Combined School (03) P '2 N W 68 60 116
Maluti P 32 37 64 47.1 61.7 55.2 -6.5
Khanyisa High School (10) I '99 N W 234 304 359
Mthatha P 227 277 338 97.0 91.1 94.2 3.0
Khanyisa School For The Blind (22) S '~ N W 8 0 4
Port Elizabeth P 6 0 3 75.0 75.0
Khanyolwethu Senior Secondary School (13) ~ '4 N W 0 0 15
Ngcobo P 0 0 5 33.3
Khorong Senior Secondary School (01) P '1 N W 39 54 94
Mt Fletcher P 18 25 35 46.2 46.3 37.2 -9.1
Khulani Commercial High School (18) P '4 Y W 226 151 165
East London P 172 121 137 76.1 80.1 83.0 2.9
Khumbulani High School (22) P '5 N W 97 80 89
Port Elizabeth P 54 51 51 55.7 63.8 57.3 -6.4
Khutliso Daniels Secondary School (21) P '4 N W 11 11 24
Grahamstown P 7 7 11 63.6 63.6 45.8 -17.8
Khwaza Senior Secondary School (14) P '1 Y W 61 49 102
Cofimvaba P 30 36 45 49.2 73.5 44.1 -29.4
King Edward High School (03) P '2 N W 37 41 42
Maluti P 37 39 41 100.0 95.1 97.6 2.5
Kings Commercial College (10) I '99 N W 133 91 109
Mthatha P 80 85 104 60.2 93.4 95.4 2.0
Kingsridge High School (19) P '5 N W 84 89 90
King Williams Town P 84 87 90 100.0 97.8 100.0 2.2
Kirkwood High School (23) P '4 N W 31 27 33
Uitenhage P 30 27 32 96.8 100.0 97.0 -3.0
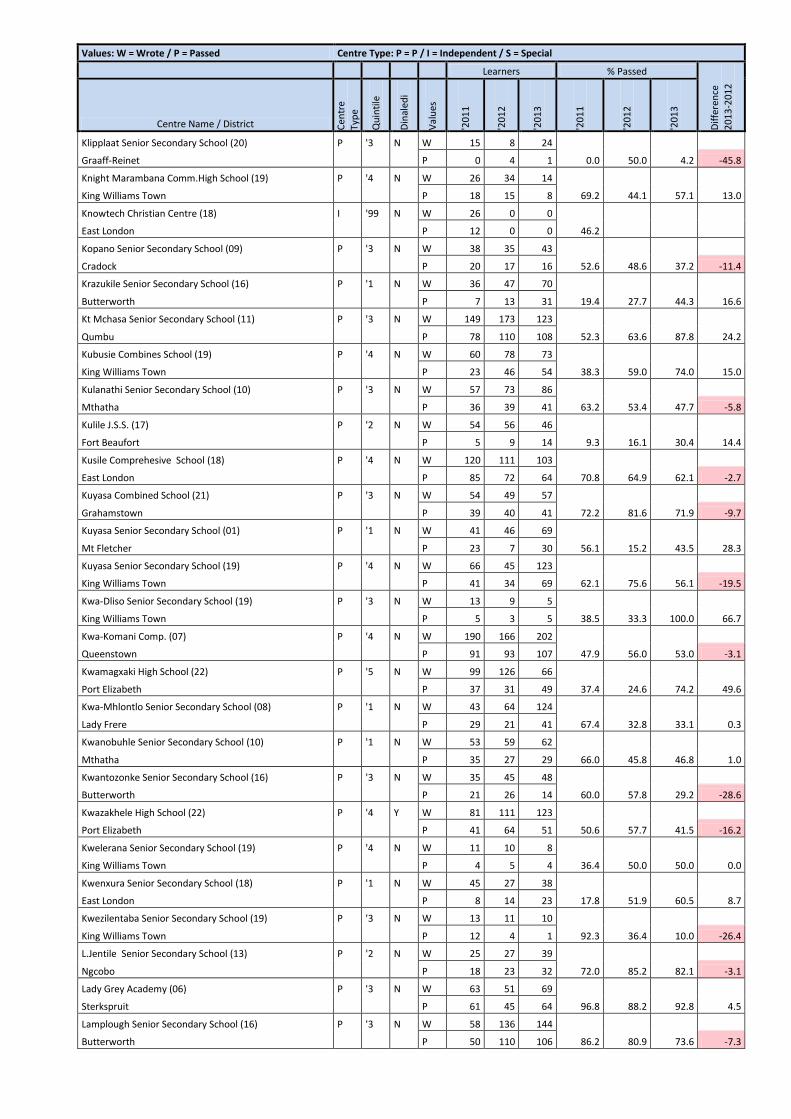
Values: W = Wrote / P = Passed Centre Type: P = P / I = Independent / S = Special
Learners % Passed
Dif
fere
nce
20
13
-20
12
Centre Name / District Cen
tre
Typ
e
Qu
inti
le
Din
aled
i
Val
ues
'20
11
'20
12
'20
13
'20
11
'20
12
'20
13
Klipplaat Senior Secondary School (20) P '3 N W 15 8 24
Graaff-Reinet P 0 4 1 0.0 50.0 4.2 -45.8
Knight Marambana Comm.High School (19) P '4 N W 26 34 14
King Williams Town P 18 15 8 69.2 44.1 57.1 13.0
Knowtech Christian Centre (18) I '99 N W 26 0 0
East London P 12 0 0 46.2
Kopano Senior Secondary School (09) P '3 N W 38 35 43
Cradock P 20 17 16 52.6 48.6 37.2 -11.4
Krazukile Senior Secondary School (16) P '1 N W 36 47 70
Butterworth P 7 13 31 19.4 27.7 44.3 16.6
Kt Mchasa Senior Secondary School (11) P '3 N W 149 173 123
Qumbu P 78 110 108 52.3 63.6 87.8 24.2
Kubusie Combines School (19) P '4 N W 60 78 73
King Williams Town P 23 46 54 38.3 59.0 74.0 15.0
Kulanathi Senior Secondary School (10) P '3 N W 57 73 86
Mthatha P 36 39 41 63.2 53.4 47.7 -5.8
Kulile J.S.S. (17) P '2 N W 54 56 46
Fort Beaufort P 5 9 14 9.3 16.1 30.4 14.4
Kusile Comprehesive School (18) P '4 N W 120 111 103
East London P 85 72 64 70.8 64.9 62.1 -2.7
Kuyasa Combined School (21) P '3 N W 54 49 57
Grahamstown P 39 40 41 72.2 81.6 71.9 -9.7
Kuyasa Senior Secondary School (01) P '1 N W 41 46 69
Mt Fletcher P 23 7 30 56.1 15.2 43.5 28.3
Kuyasa Senior Secondary School (19) P '4 N W 66 45 123
King Williams Town P 41 34 69 62.1 75.6 56.1 -19.5
Kwa-Dliso Senior Secondary School (19) P '3 N W 13 9 5
King Williams Town P 5 3 5 38.5 33.3 100.0 66.7
Kwa-Komani Comp. (07) P '4 N W 190 166 202
Queenstown P 91 93 107 47.9 56.0 53.0 -3.1
Kwamagxaki High School (22) P '5 N W 99 126 66
Port Elizabeth P 37 31 49 37.4 24.6 74.2 49.6
Kwa-Mhlontlo Senior Secondary School (08) P '1 N W 43 64 124
Lady Frere P 29 21 41 67.4 32.8 33.1 0.3
Kwanobuhle Senior Secondary School (10) P '1 N W 53 59 62
Mthatha P 35 27 29 66.0 45.8 46.8 1.0
Kwantozonke Senior Secondary School (16) P '3 N W 35 45 48
Butterworth P 21 26 14 60.0 57.8 29.2 -28.6
Kwazakhele High School (22) P '4 Y W 81 111 123
Port Elizabeth P 41 64 51 50.6 57.7 41.5 -16.2
Kwelerana Senior Secondary School (19) P '4 N W 11 10 8
King Williams Town P 4 5 4 36.4 50.0 50.0 0.0
Kwenxura Senior Secondary School (18) P '1 N W 45 27 38
East London P 8 14 23 17.8 51.9 60.5 8.7
Kwezilentaba Senior Secondary School (19) P '3 N W 13 11 10
King Williams Town P 12 4 1 92.3 36.4 10.0 -26.4
L.Jentile Senior Secondary School (13) P '2 N W 25 27 39
Ngcobo P 18 23 32 72.0 85.2 82.1 -3.1
Lady Grey Academy (06) P '3 N W 63 51 69
Sterkspruit P 61 45 64 96.8 88.2 92.8 4.5
Lamplough Senior Secondary School (16) P '3 N W 58 136 144
Butterworth P 50 110 106 86.2 80.9 73.6 -7.3
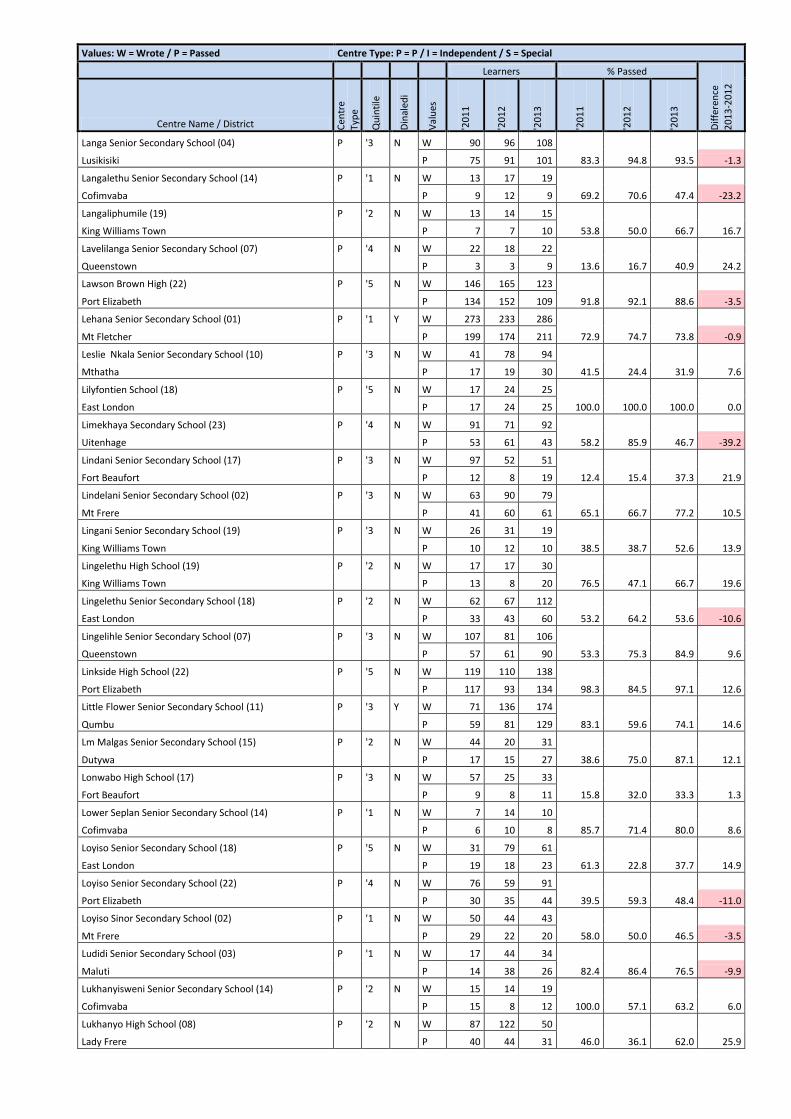
Values: W = Wrote / P = Passed Centre Type: P = P / I = Independent / S = Special
Learners % Passed
Dif
fere
nce
20
13
-20
12
Centre Name / District Cen
tre
Typ
e
Qu
inti
le
Din
aled
i
Val
ues
'20
11
'20
12
'20
13
'20
11
'20
12
'20
13
Langa Senior Secondary School (04) P '3 N W 90 96 108
Lusikisiki P 75 91 101 83.3 94.8 93.5 -1.3
Langalethu Senior Secondary School (14) P '1 N W 13 17 19
Cofimvaba P 9 12 9 69.2 70.6 47.4 -23.2
Langaliphumile (19) P '2 N W 13 14 15
King Williams Town P 7 7 10 53.8 50.0 66.7 16.7
Lavelilanga Senior Secondary School (07) P '4 N W 22 18 22
Queenstown P 3 3 9 13.6 16.7 40.9 24.2
Lawson Brown High (22) P '5 N W 146 165 123
Port Elizabeth P 134 152 109 91.8 92.1 88.6 -3.5
Lehana Senior Secondary School (01) P '1 Y W 273 233 286
Mt Fletcher P 199 174 211 72.9 74.7 73.8 -0.9
Leslie Nkala Senior Secondary School (10) P '3 N W 41 78 94
Mthatha P 17 19 30 41.5 24.4 31.9 7.6
Lilyfontien School (18) P '5 N W 17 24 25
East London P 17 24 25 100.0 100.0 100.0 0.0
Limekhaya Secondary School (23) P '4 N W 91 71 92
Uitenhage P 53 61 43 58.2 85.9 46.7 -39.2
Lindani Senior Secondary School (17) P '3 N W 97 52 51
Fort Beaufort P 12 8 19 12.4 15.4 37.3 21.9
Lindelani Senior Secondary School (02) P '3 N W 63 90 79
Mt Frere P 41 60 61 65.1 66.7 77.2 10.5
Lingani Senior Secondary School (19) P '3 N W 26 31 19
King Williams Town P 10 12 10 38.5 38.7 52.6 13.9
Lingelethu High School (19) P '2 N W 17 17 30
King Williams Town P 13 8 20 76.5 47.1 66.7 19.6
Lingelethu Senior Secondary School (18) P '2 N W 62 67 112
East London P 33 43 60 53.2 64.2 53.6 -10.6
Lingelihle Senior Secondary School (07) P '3 N W 107 81 106
Queenstown P 57 61 90 53.3 75.3 84.9 9.6
Linkside High School (22) P '5 N W 119 110 138
Port Elizabeth P 117 93 134 98.3 84.5 97.1 12.6
Little Flower Senior Secondary School (11) P '3 Y W 71 136 174
Qumbu P 59 81 129 83.1 59.6 74.1 14.6
Lm Malgas Senior Secondary School (15) P '2 N W 44 20 31
Dutywa P 17 15 27 38.6 75.0 87.1 12.1
Lonwabo High School (17) P '3 N W 57 25 33
Fort Beaufort P 9 8 11 15.8 32.0 33.3 1.3
Lower Seplan Senior Secondary School (14) P '1 N W 7 14 10
Cofimvaba P 6 10 8 85.7 71.4 80.0 8.6
Loyiso Senior Secondary School (18) P '5 N W 31 79 61
East London P 19 18 23 61.3 22.8 37.7 14.9
Loyiso Senior Secondary School (22) P '4 N W 76 59 91
Port Elizabeth P 30 35 44 39.5 59.3 48.4 -11.0
Loyiso Sinor Secondary School (02) P '1 N W 50 44 43
Mt Frere P 29 22 20 58.0 50.0 46.5 -3.5
Ludidi Senior Secondary School (03) P '1 N W 17 44 34
Maluti P 14 38 26 82.4 86.4 76.5 -9.9
Lukhanyisweni Senior Secondary School (14) P '2 N W 15 14 19
Cofimvaba P 15 8 12 100.0 57.1 63.2 6.0
Lukhanyo High School (08) P '2 N W 87 122 50
Lady Frere P 40 44 31 46.0 36.1 62.0 25.9
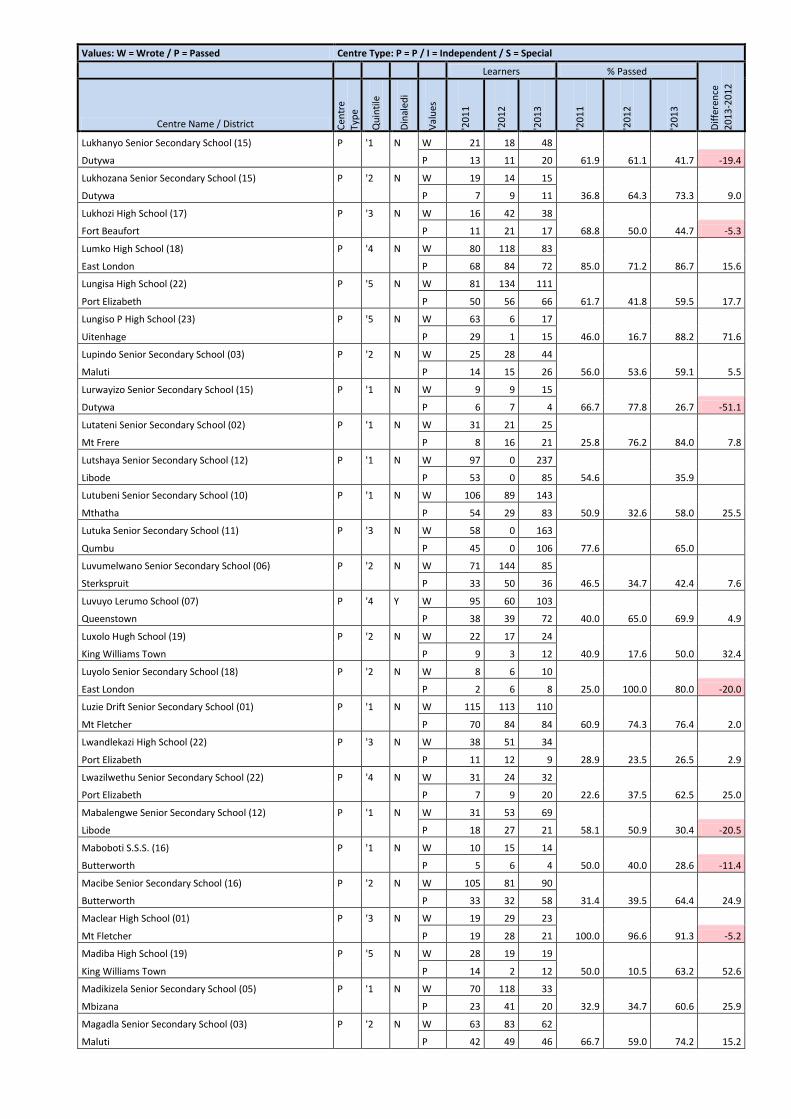
Values: W = Wrote / P = Passed Centre Type: P = P / I = Independent / S = Special
Learners % Passed
Dif
fere
nce
20
13
-20
12
Centre Name / District Cen
tre
Typ
e
Qu
inti
le
Din
aled
i
Val
ues
'20
11
'20
12
'20
13
'20
11
'20
12
'20
13
Lukhanyo Senior Secondary School (15) P '1 N W 21 18 48
Dutywa P 13 11 20 61.9 61.1 41.7 -19.4
Lukhozana Senior Secondary School (15) P '2 N W 19 14 15
Dutywa P 7 9 11 36.8 64.3 73.3 9.0
Lukhozi High School (17) P '3 N W 16 42 38
Fort Beaufort P 11 21 17 68.8 50.0 44.7 -5.3
Lumko High School (18) P '4 N W 80 118 83
East London P 68 84 72 85.0 71.2 86.7 15.6
Lungisa High School (22) P '5 N W 81 134 111
Port Elizabeth P 50 56 66 61.7 41.8 59.5 17.7
Lungiso P High School (23) P '5 N W 63 6 17
Uitenhage P 29 1 15 46.0 16.7 88.2 71.6
Lupindo Senior Secondary School (03) P '2 N W 25 28 44
Maluti P 14 15 26 56.0 53.6 59.1 5.5
Lurwayizo Senior Secondary School (15) P '1 N W 9 9 15
Dutywa P 6 7 4 66.7 77.8 26.7 -51.1
Lutateni Senior Secondary School (02) P '1 N W 31 21 25
Mt Frere P 8 16 21 25.8 76.2 84.0 7.8
Lutshaya Senior Secondary School (12) P '1 N W 97 0 237
Libode P 53 0 85 54.6 35.9
Lutubeni Senior Secondary School (10) P '1 N W 106 89 143
Mthatha P 54 29 83 50.9 32.6 58.0 25.5
Lutuka Senior Secondary School (11) P '3 N W 58 0 163
Qumbu P 45 0 106 77.6 65.0
Luvumelwano Senior Secondary School (06) P '2 N W 71 144 85
Sterkspruit P 33 50 36 46.5 34.7 42.4 7.6
Luvuyo Lerumo School (07) P '4 Y W 95 60 103
Queenstown P 38 39 72 40.0 65.0 69.9 4.9
Luxolo Hugh School (19) P '2 N W 22 17 24
King Williams Town P 9 3 12 40.9 17.6 50.0 32.4
Luyolo Senior Secondary School (18) P '2 N W 8 6 10
East London P 2 6 8 25.0 100.0 80.0 -20.0
Luzie Drift Senior Secondary School (01) P '1 N W 115 113 110
Mt Fletcher P 70 84 84 60.9 74.3 76.4 2.0
Lwandlekazi High School (22) P '3 N W 38 51 34
Port Elizabeth P 11 12 9 28.9 23.5 26.5 2.9
Lwazilwethu Senior Secondary School (22) P '4 N W 31 24 32
Port Elizabeth P 7 9 20 22.6 37.5 62.5 25.0
Mabalengwe Senior Secondary School (12) P '1 N W 31 53 69
Libode P 18 27 21 58.1 50.9 30.4 -20.5
Maboboti S.S.S. (16) P '1 N W 10 15 14
Butterworth P 5 6 4 50.0 40.0 28.6 -11.4
Macibe Senior Secondary School (16) P '2 N W 105 81 90
Butterworth P 33 32 58 31.4 39.5 64.4 24.9
Maclear High School (01) P '3 N W 19 29 23
Mt Fletcher P 19 28 21 100.0 96.6 91.3 -5.2
Madiba High School (19) P '5 N W 28 19 19
King Williams Town P 14 2 12 50.0 10.5 63.2 52.6
Madikizela Senior Secondary School (05) P '1 N W 70 118 33
Mbizana P 23 41 20 32.9 34.7 60.6 25.9
Magadla Senior Secondary School (03) P '2 N W 63 83 62
Maluti P 42 49 46 66.7 59.0 74.2 15.2
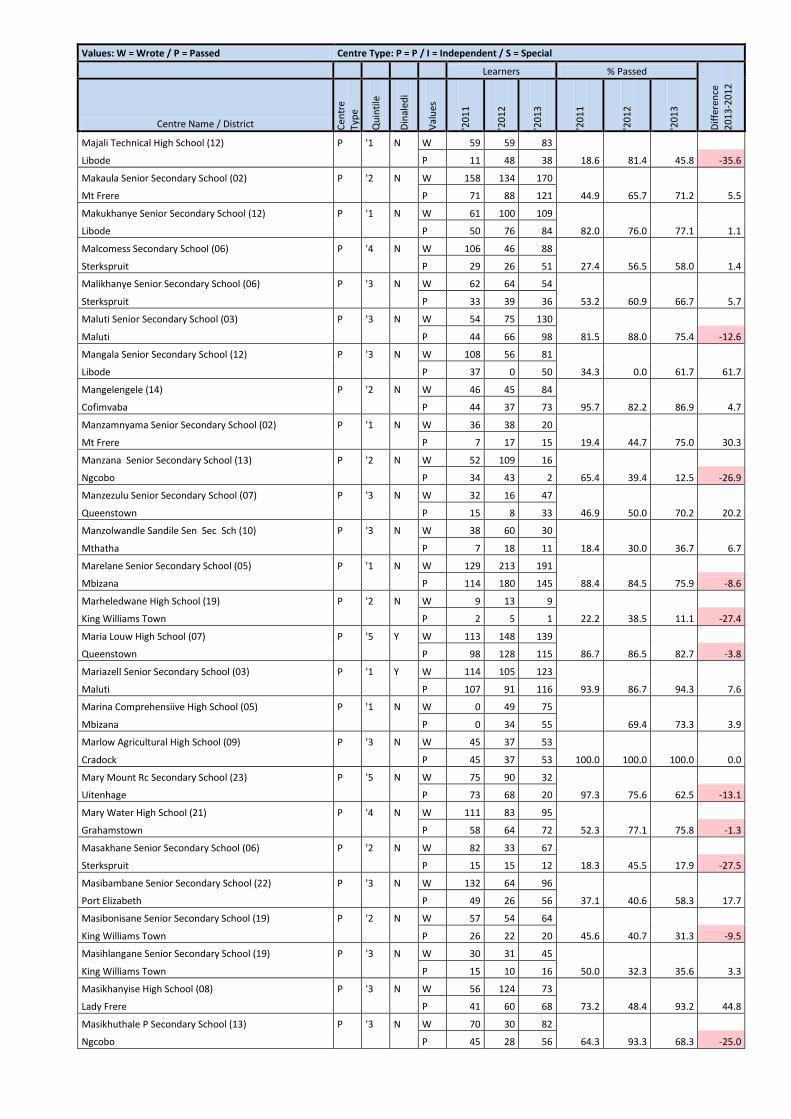
Values: W = Wrote / P = Passed Centre Type: P = P / I = Independent / S = Special
Learners % Passed
Dif
fere
nce
20
13
-20
12
Centre Name / District Cen
tre
Typ
e
Qu
inti
le
Din
aled
i
Val
ues
'20
11
'20
12
'20
13
'20
11
'20
12
'20
13
Majali Technical High School (12) P '1 N W 59 59 83
Libode P 11 48 38 18.6 81.4 45.8 -35.6
Makaula Senior Secondary School (02) P '2 N W 158 134 170
Mt Frere P 71 88 121 44.9 65.7 71.2 5.5
Makukhanye Senior Secondary School (12) P '1 N W 61 100 109
Libode P 50 76 84 82.0 76.0 77.1 1.1
Malcomess Secondary School (06) P '4 N W 106 46 88
Sterkspruit P 29 26 51 27.4 56.5 58.0 1.4
Malikhanye Senior Secondary School (06) P '3 N W 62 64 54
Sterkspruit P 33 39 36 53.2 60.9 66.7 5.7
Maluti Senior Secondary School (03) P '3 N W 54 75 130
Maluti P 44 66 98 81.5 88.0 75.4 -12.6
Mangala Senior Secondary School (12) P '3 N W 108 56 81
Libode P 37 0 50 34.3 0.0 61.7 61.7
Mangelengele (14) P '2 N W 46 45 84
Cofimvaba P 44 37 73 95.7 82.2 86.9 4.7
Manzamnyama Senior Secondary School (02) P '1 N W 36 38 20
Mt Frere P 7 17 15 19.4 44.7 75.0 30.3
Manzana Senior Secondary School (13) P '2 N W 52 109 16
Ngcobo P 34 43 2 65.4 39.4 12.5 -26.9
Manzezulu Senior Secondary School (07) P '3 N W 32 16 47
Queenstown P 15 8 33 46.9 50.0 70.2 20.2
Manzolwandle Sandile Sen Sec Sch (10) P '3 N W 38 60 30
Mthatha P 7 18 11 18.4 30.0 36.7 6.7
Marelane Senior Secondary School (05) P '1 N W 129 213 191
Mbizana P 114 180 145 88.4 84.5 75.9 -8.6
Marheledwane High School (19) P '2 N W 9 13 9
King Williams Town P 2 5 1 22.2 38.5 11.1 -27.4
Maria Louw High School (07) P '5 Y W 113 148 139
Queenstown P 98 128 115 86.7 86.5 82.7 -3.8
Mariazell Senior Secondary School (03) P '1 Y W 114 105 123
Maluti P 107 91 116 93.9 86.7 94.3 7.6
Marina Comprehensiive High School (05) P '1 N W 0 49 75
Mbizana P 0 34 55 69.4 73.3 3.9
Marlow Agricultural High School (09) P '3 N W 45 37 53
Cradock P 45 37 53 100.0 100.0 100.0 0.0
Mary Mount Rc Secondary School (23) P '5 N W 75 90 32
Uitenhage P 73 68 20 97.3 75.6 62.5 -13.1
Mary Water High School (21) P '4 N W 111 83 95
Grahamstown P 58 64 72 52.3 77.1 75.8 -1.3
Masakhane Senior Secondary School (06) P '2 N W 82 33 67
Sterkspruit P 15 15 12 18.3 45.5 17.9 -27.5
Masibambane Senior Secondary School (22) P '3 N W 132 64 96
Port Elizabeth P 49 26 56 37.1 40.6 58.3 17.7
Masibonisane Senior Secondary School (19) P '2 N W 57 54 64
King Williams Town P 26 22 20 45.6 40.7 31.3 -9.5
Masihlangane Senior Secondary School (19) P '3 N W 30 31 45
King Williams Town P 15 10 16 50.0 32.3 35.6 3.3
Masikhanyise High School (08) P '3 N W 56 124 73
Lady Frere P 41 60 68 73.2 48.4 93.2 44.8
Masikhuthale P Secondary School (13) P '3 N W 70 30 82
Ngcobo P 45 28 56 64.3 93.3 68.3 -25.0
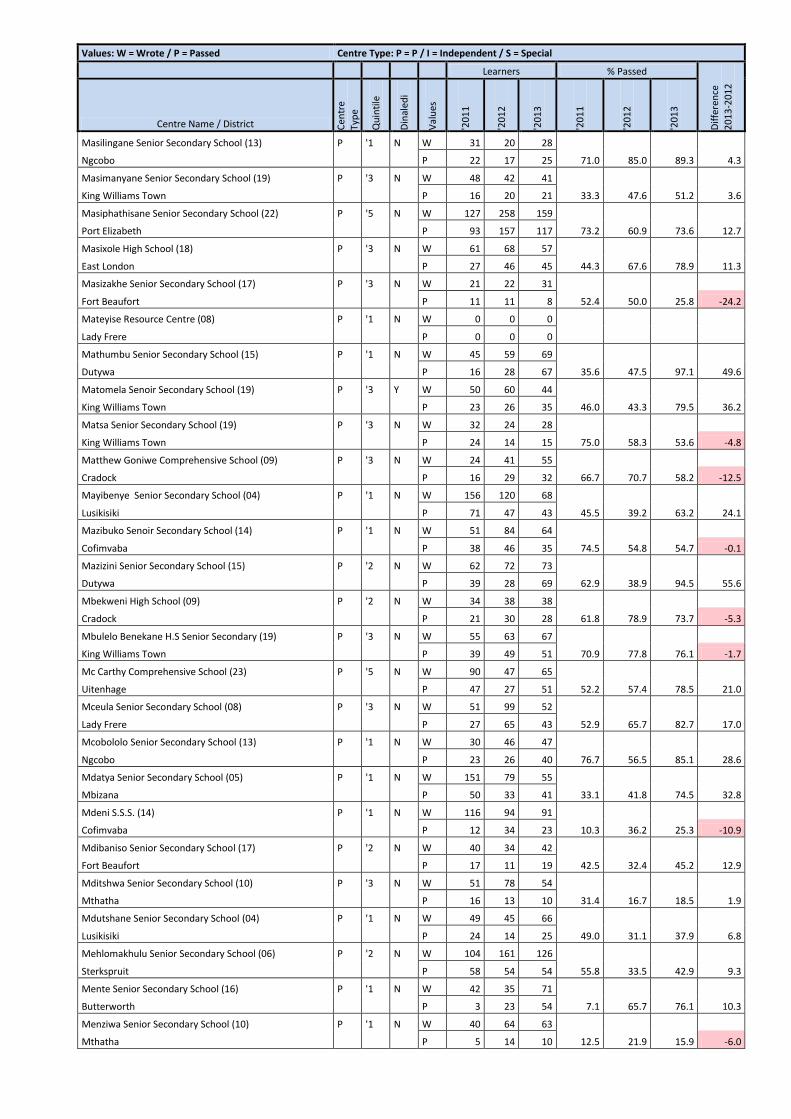
Values: W = Wrote / P = Passed Centre Type: P = P / I = Independent / S = Special
Learners % Passed
Dif
fere
nce
20
13
-20
12
Centre Name / District Cen
tre
Typ
e
Qu
inti
le
Din
aled
i
Val
ues
'20
11
'20
12
'20
13
'20
11
'20
12
'20
13
Masilingane Senior Secondary School (13) P '1 N W 31 20 28
Ngcobo P 22 17 25 71.0 85.0 89.3 4.3
Masimanyane Senior Secondary School (19) P '3 N W 48 42 41
King Williams Town P 16 20 21 33.3 47.6 51.2 3.6
Masiphathisane Senior Secondary School (22) P '5 N W 127 258 159
Port Elizabeth P 93 157 117 73.2 60.9 73.6 12.7
Masixole High School (18) P '3 N W 61 68 57
East London P 27 46 45 44.3 67.6 78.9 11.3
Masizakhe Senior Secondary School (17) P '3 N W 21 22 31
Fort Beaufort P 11 11 8 52.4 50.0 25.8 -24.2
Mateyise Resource Centre (08) P '1 N W 0 0 0
Lady Frere P 0 0 0
Mathumbu Senior Secondary School (15) P '1 N W 45 59 69
Dutywa P 16 28 67 35.6 47.5 97.1 49.6
Matomela Senoir Secondary School (19) P '3 Y W 50 60 44
King Williams Town P 23 26 35 46.0 43.3 79.5 36.2
Matsa Senior Secondary School (19) P '3 N W 32 24 28
King Williams Town P 24 14 15 75.0 58.3 53.6 -4.8
Matthew Goniwe Comprehensive School (09) P '3 N W 24 41 55
Cradock P 16 29 32 66.7 70.7 58.2 -12.5
Mayibenye Senior Secondary School (04) P '1 N W 156 120 68
Lusikisiki P 71 47 43 45.5 39.2 63.2 24.1
Mazibuko Senoir Secondary School (14) P '1 N W 51 84 64
Cofimvaba P 38 46 35 74.5 54.8 54.7 -0.1
Mazizini Senior Secondary School (15) P '2 N W 62 72 73
Dutywa P 39 28 69 62.9 38.9 94.5 55.6
Mbekweni High School (09) P '2 N W 34 38 38
Cradock P 21 30 28 61.8 78.9 73.7 -5.3
Mbulelo Benekane H.S Senior Secondary (19) P '3 N W 55 63 67
King Williams Town P 39 49 51 70.9 77.8 76.1 -1.7
Mc Carthy Comprehensive School (23) P '5 N W 90 47 65
Uitenhage P 47 27 51 52.2 57.4 78.5 21.0
Mceula Senior Secondary School (08) P '3 N W 51 99 52
Lady Frere P 27 65 43 52.9 65.7 82.7 17.0
Mcobololo Senior Secondary School (13) P '1 N W 30 46 47
Ngcobo P 23 26 40 76.7 56.5 85.1 28.6
Mdatya Senior Secondary School (05) P '1 N W 151 79 55
Mbizana P 50 33 41 33.1 41.8 74.5 32.8
Mdeni S.S.S. (14) P '1 N W 116 94 91
Cofimvaba P 12 34 23 10.3 36.2 25.3 -10.9
Mdibaniso Senior Secondary School (17) P '2 N W 40 34 42
Fort Beaufort P 17 11 19 42.5 32.4 45.2 12.9
Mditshwa Senior Secondary School (10) P '3 N W 51 78 54
Mthatha P 16 13 10 31.4 16.7 18.5 1.9
Mdutshane Senior Secondary School (04) P '1 N W 49 45 66
Lusikisiki P 24 14 25 49.0 31.1 37.9 6.8
Mehlomakhulu Senior Secondary School (06) P '2 N W 104 161 126
Sterkspruit P 58 54 54 55.8 33.5 42.9 9.3
Mente Senior Secondary School (16) P '1 N W 42 35 71
Butterworth P 3 23 54 7.1 65.7 76.1 10.3
Menziwa Senior Secondary School (10) P '1 N W 40 64 63
Mthatha P 5 14 10 12.5 21.9 15.9 -6.0
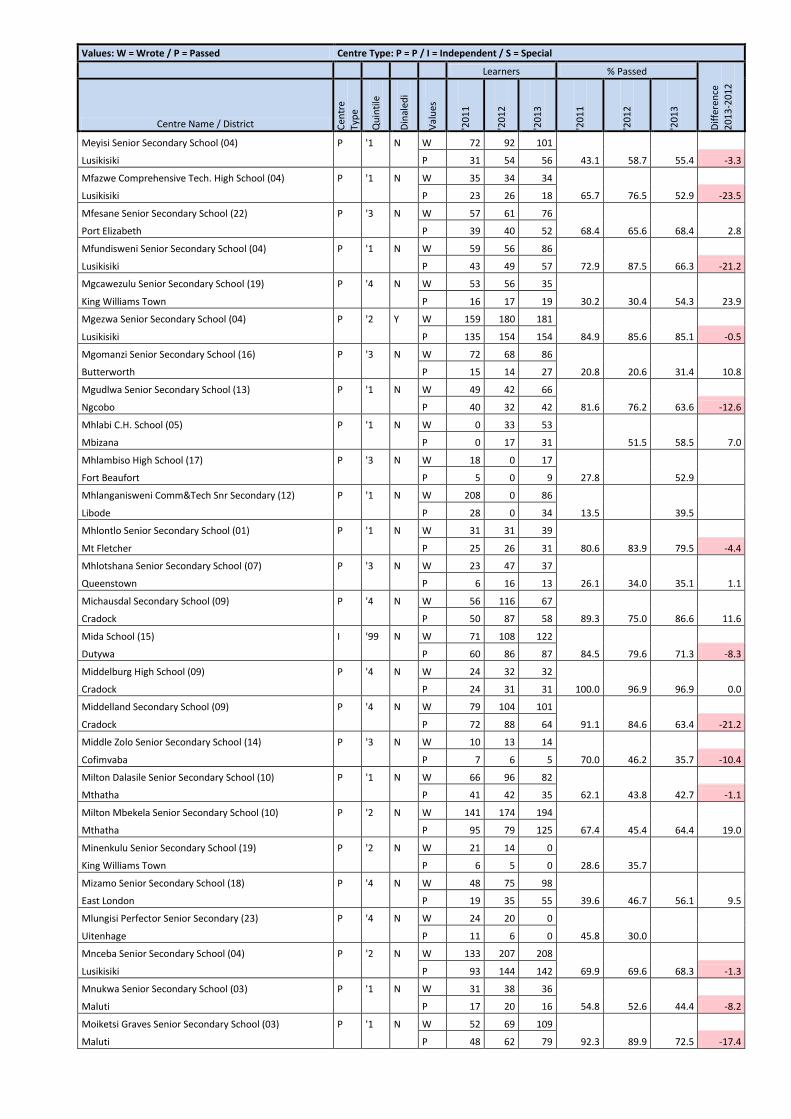
Values: W = Wrote / P = Passed Centre Type: P = P / I = Independent / S = Special
Learners % Passed
Dif
fere
nce
20
13
-20
12
Centre Name / District Cen
tre
Typ
e
Qu
inti
le
Din
aled
i
Val
ues
'20
11
'20
12
'20
13
'20
11
'20
12
'20
13
Meyisi Senior Secondary School (04) P '1 N W 72 92 101
Lusikisiki P 31 54 56 43.1 58.7 55.4 -3.3
Mfazwe Comprehensive Tech. High School (04) P '1 N W 35 34 34
Lusikisiki P 23 26 18 65.7 76.5 52.9 -23.5
Mfesane Senior Secondary School (22) P '3 N W 57 61 76
Port Elizabeth P 39 40 52 68.4 65.6 68.4 2.8
Mfundisweni Senior Secondary School (04) P '1 N W 59 56 86
Lusikisiki P 43 49 57 72.9 87.5 66.3 -21.2
Mgcawezulu Senior Secondary School (19) P '4 N W 53 56 35
King Williams Town P 16 17 19 30.2 30.4 54.3 23.9
Mgezwa Senior Secondary School (04) P '2 Y W 159 180 181
Lusikisiki P 135 154 154 84.9 85.6 85.1 -0.5
Mgomanzi Senior Secondary School (16) P '3 N W 72 68 86
Butterworth P 15 14 27 20.8 20.6 31.4 10.8
Mgudlwa Senior Secondary School (13) P '1 N W 49 42 66
Ngcobo P 40 32 42 81.6 76.2 63.6 -12.6
Mhlabi C.H. School (05) P '1 N W 0 33 53
Mbizana P 0 17 31 51.5 58.5 7.0
Mhlambiso High School (17) P '3 N W 18 0 17
Fort Beaufort P 5 0 9 27.8 52.9
Mhlanganisweni Comm&Tech Snr Secondary (12) P '1 N W 208 0 86
Libode P 28 0 34 13.5 39.5
Mhlontlo Senior Secondary School (01) P '1 N W 31 31 39
Mt Fletcher P 25 26 31 80.6 83.9 79.5 -4.4
Mhlotshana Senior Secondary School (07) P '3 N W 23 47 37
Queenstown P 6 16 13 26.1 34.0 35.1 1.1
Michausdal Secondary School (09) P '4 N W 56 116 67
Cradock P 50 87 58 89.3 75.0 86.6 11.6
Mida School (15) I '99 N W 71 108 122
Dutywa P 60 86 87 84.5 79.6 71.3 -8.3
Middelburg High School (09) P '4 N W 24 32 32
Cradock P 24 31 31 100.0 96.9 96.9 0.0
Middelland Secondary School (09) P '4 N W 79 104 101
Cradock P 72 88 64 91.1 84.6 63.4 -21.2
Middle Zolo Senior Secondary School (14) P '3 N W 10 13 14
Cofimvaba P 7 6 5 70.0 46.2 35.7 -10.4
Milton Dalasile Senior Secondary School (10) P '1 N W 66 96 82
Mthatha P 41 42 35 62.1 43.8 42.7 -1.1
Milton Mbekela Senior Secondary School (10) P '2 N W 141 174 194
Mthatha P 95 79 125 67.4 45.4 64.4 19.0
Minenkulu Senior Secondary School (19) P '2 N W 21 14 0
King Williams Town P 6 5 0 28.6 35.7
Mizamo Senior Secondary School (18) P '4 N W 48 75 98
East London P 19 35 55 39.6 46.7 56.1 9.5
Mlungisi Perfector Senior Secondary (23) P '4 N W 24 20 0
Uitenhage P 11 6 0 45.8 30.0
Mnceba Senior Secondary School (04) P '2 N W 133 207 208
Lusikisiki P 93 144 142 69.9 69.6 68.3 -1.3
Mnukwa Senior Secondary School (03) P '1 N W 31 38 36
Maluti P 17 20 16 54.8 52.6 44.4 -8.2
Moiketsi Graves Senior Secondary School (03) P '1 N W 52 69 109
Maluti P 48 62 79 92.3 89.9 72.5 -17.4
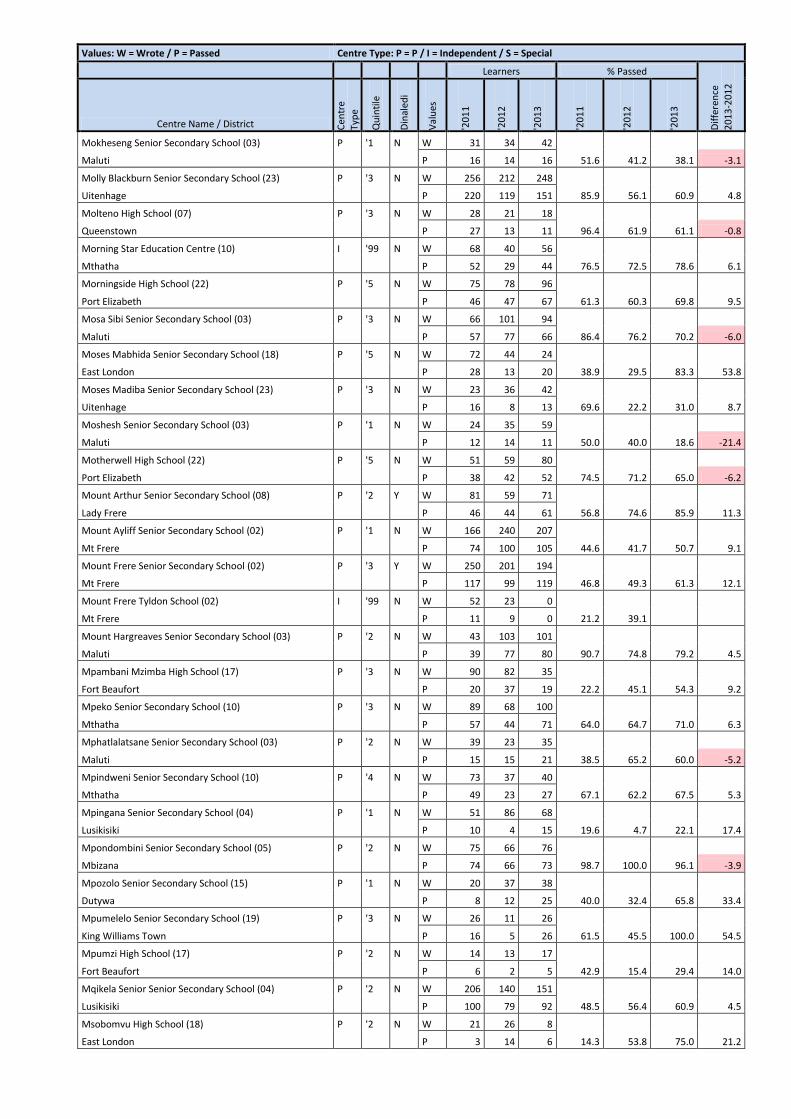
Values: W = Wrote / P = Passed Centre Type: P = P / I = Independent / S = Special
Learners % Passed
Dif
fere
nce
20
13
-20
12
Centre Name / District Cen
tre
Typ
e
Qu
inti
le
Din
aled
i
Val
ues
'20
11
'20
12
'20
13
'20
11
'20
12
'20
13
Mokheseng Senior Secondary School (03) P '1 N W 31 34 42
Maluti P 16 14 16 51.6 41.2 38.1 -3.1
Molly Blackburn Senior Secondary School (23) P '3 N W 256 212 248
Uitenhage P 220 119 151 85.9 56.1 60.9 4.8
Molteno High School (07) P '3 N W 28 21 18
Queenstown P 27 13 11 96.4 61.9 61.1 -0.8
Morning Star Education Centre (10) I '99 N W 68 40 56
Mthatha P 52 29 44 76.5 72.5 78.6 6.1
Morningside High School (22) P '5 N W 75 78 96
Port Elizabeth P 46 47 67 61.3 60.3 69.8 9.5
Mosa Sibi Senior Secondary School (03) P '3 N W 66 101 94
Maluti P 57 77 66 86.4 76.2 70.2 -6.0
Moses Mabhida Senior Secondary School (18) P '5 N W 72 44 24
East London P 28 13 20 38.9 29.5 83.3 53.8
Moses Madiba Senior Secondary School (23) P '3 N W 23 36 42
Uitenhage P 16 8 13 69.6 22.2 31.0 8.7
Moshesh Senior Secondary School (03) P '1 N W 24 35 59
Maluti P 12 14 11 50.0 40.0 18.6 -21.4
Motherwell High School (22) P '5 N W 51 59 80
Port Elizabeth P 38 42 52 74.5 71.2 65.0 -6.2
Mount Arthur Senior Secondary School (08) P '2 Y W 81 59 71
Lady Frere P 46 44 61 56.8 74.6 85.9 11.3
Mount Ayliff Senior Secondary School (02) P '1 N W 166 240 207
Mt Frere P 74 100 105 44.6 41.7 50.7 9.1
Mount Frere Senior Secondary School (02) P '3 Y W 250 201 194
Mt Frere P 117 99 119 46.8 49.3 61.3 12.1
Mount Frere Tyldon School (02) I '99 N W 52 23 0
Mt Frere P 11 9 0 21.2 39.1
Mount Hargreaves Senior Secondary School (03) P '2 N W 43 103 101
Maluti P 39 77 80 90.7 74.8 79.2 4.5
Mpambani Mzimba High School (17) P '3 N W 90 82 35
Fort Beaufort P 20 37 19 22.2 45.1 54.3 9.2
Mpeko Senior Secondary School (10) P '3 N W 89 68 100
Mthatha P 57 44 71 64.0 64.7 71.0 6.3
Mphatlalatsane Senior Secondary School (03) P '2 N W 39 23 35
Maluti P 15 15 21 38.5 65.2 60.0 -5.2
Mpindweni Senior Secondary School (10) P '4 N W 73 37 40
Mthatha P 49 23 27 67.1 62.2 67.5 5.3
Mpingana Senior Secondary School (04) P '1 N W 51 86 68
Lusikisiki P 10 4 15 19.6 4.7 22.1 17.4
Mpondombini Senior Secondary School (05) P '2 N W 75 66 76
Mbizana P 74 66 73 98.7 100.0 96.1 -3.9
Mpozolo Senior Secondary School (15) P '1 N W 20 37 38
Dutywa P 8 12 25 40.0 32.4 65.8 33.4
Mpumelelo Senior Secondary School (19) P '3 N W 26 11 26
King Williams Town P 16 5 26 61.5 45.5 100.0 54.5
Mpumzi High School (17) P '2 N W 14 13 17
Fort Beaufort P 6 2 5 42.9 15.4 29.4 14.0
Mqikela Senior Senior Secondary School (04) P '2 N W 206 140 151
Lusikisiki P 100 79 92 48.5 56.4 60.9 4.5
Msobomvu High School (18) P '2 N W 21 26 8
East London P 3 14 6 14.3 53.8 75.0 21.2

Values: W = Wrote / P = Passed Centre Type: P = P / I = Independent / S = Special
Learners % Passed
Dif
fere
nce
20
13
-20
12
Centre Name / District Cen
tre
Typ
e
Qu
inti
le
Din
aled
i
Val
ues
'20
11
'20
12
'20
13
'20
11
'20
12
'20
13
Msobomvu Senior Secondary School (16) P '4 N W 259 313 246
Butterworth P 189 192 152 73.0 61.3 61.8 0.4
Mt White Senior Secondary School (02) P '1 N W 66 47 53
Mt Frere P 26 31 52 39.4 66.0 98.1 32.2
Mtawelanga Senior Secondary School (16) P '2 N W 88 86 103
Butterworth P 62 52 64 70.5 60.5 62.1 1.7
Mtebele Senior Secondary School (16) P '2 N W 84 97 98
Butterworth P 38 34 37 45.2 35.1 37.8 2.7
Mtengwane Senior Secondary School (11) P '2 N W 40 40 51
Qumbu P 21 15 23 52.5 37.5 45.1 7.6
Mtetuvumile (14) P '1 N W 39 34 59
Cofimvaba P 35 33 48 89.7 97.1 81.4 -15.7
Mthatha College Of Maths Science & Comm (10) I '99 N W 49 76 94
Mthatha P 41 67 50 83.7 88.2 53.2 -35.0
Mthwaku Senior Secondary School (19) P '2 N W 30 19 23
King Williams Town P 13 8 17 43.3 42.1 73.9 31.8
Mtirara Senior Secondary School (08) P '1 N W 54 64 81
Lady Frere P 43 44 40 79.6 68.8 49.4 -19.4
Mtombe Senior Secondary School (19) P '2 N W 12 10 8
King Williams Town P 3 4 4 25.0 40.0 50.0 10.0
Mtweni Senior Secondary School (12) P '2 N W 147 72 140
Libode P 49 69 44 33.3 95.8 31.4 -64.4
Muir College Boys High School (23) P '5 N W 69 63 76
Uitenhage P 66 54 68 95.7 85.7 89.5 3.8
Mvenyane Senior Secondary School (03) P '2 N W 75 181 116
Maluti P 61 143 94 81.3 79.0 81.0 2.0
Mzamba Comprehensive High School (05) P '2 N W 0 39 53
Mbizana P 0 31 48 79.5 90.6 11.1
Mzamo Senor Secondary School (08) P '1 N W 23 27 33
Lady Frere P 18 18 33 78.3 66.7 100.0 33.3
Mzamomhle High School (07) P '2 N W 19 23 16
Queenstown P 5 7 8 26.3 30.4 50.0 19.6
Mzamomhle S.S.S. (16) P '3 N W 13 8 9
Butterworth P 6 6 8 46.2 75.0 88.9 13.9
Mzamowethu P School (18) P '3 N W 0 41 28
East London P 0 19 15 46.3 53.6 7.2
Mzikayise Dalasile Secondary School (13) P '2 N W 81 63 101
Ngcobo P 61 48 77 75.3 76.2 76.2 0.0
Mzimvubu Senior Secondary School (14) P '1 N W 23 26 47
Cofimvaba P 23 25 36 100.0 96.2 76.6 -19.6
Mzokhanyo High School (18) P '5 N W 135 159 101
East London P 67 63 50 49.6 39.6 49.5 9.9
Mzomhle Senior Secondary School (06) P '2 N W 73 61 61
Sterkspruit P 22 20 32 30.1 32.8 52.5 19.7
Mzomhle Senior Secondary School (18) P '3 N W 72 68 63
East London P 38 44 44 52.8 64.7 69.8 5.1
Mzomtsha High School (19) P '3 N W 14 33 24
King Williams Town P 12 11 16 85.7 33.3 66.7 33.3
Mzontsundu Senior Secondary School (19) P '3 N W 35 47 46
King Williams Town P 12 23 23 34.3 48.9 50.0 1.1
Mzontsundu Senior Secondary School (22) P '3 N W 76 113 68
Port Elizabeth P 27 40 34 35.5 35.4 50.0 14.6
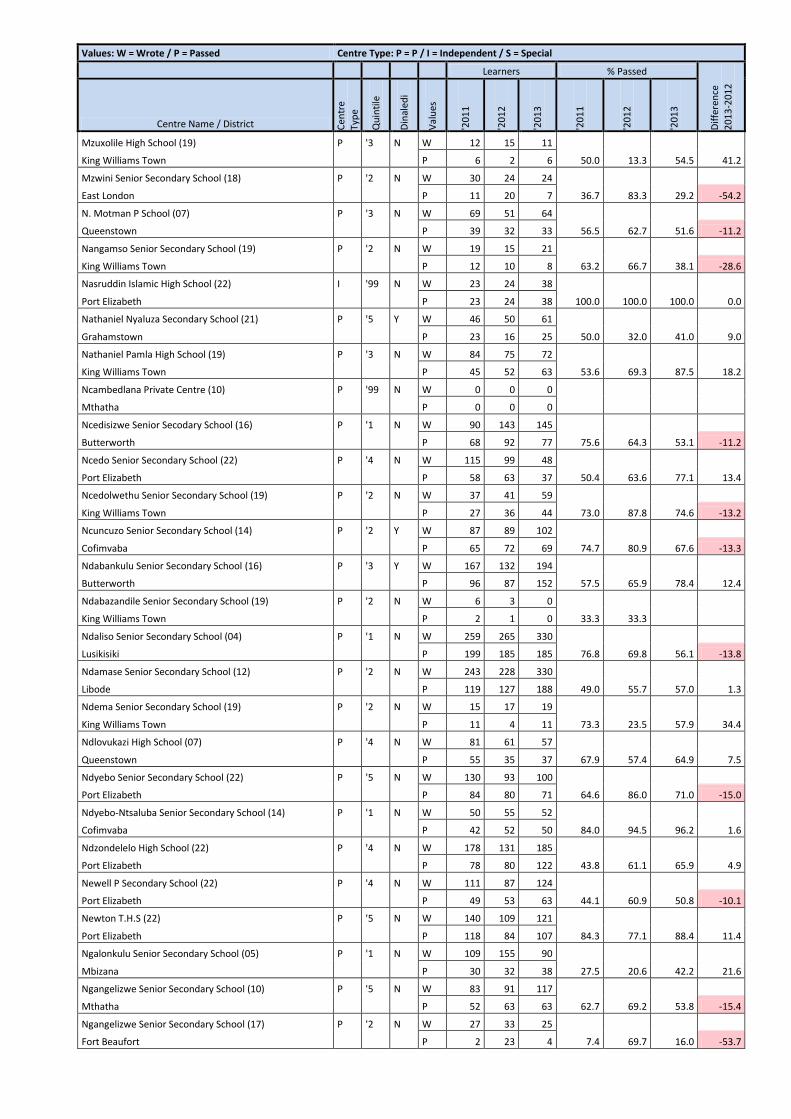
Values: W = Wrote / P = Passed Centre Type: P = P / I = Independent / S = Special
Learners % Passed
Dif
fere
nce
20
13
-20
12
Centre Name / District Cen
tre
Typ
e
Qu
inti
le
Din
aled
i
Val
ues
'20
11
'20
12
'20
13
'20
11
'20
12
'20
13
Mzuxolile High School (19) P '3 N W 12 15 11
King Williams Town P 6 2 6 50.0 13.3 54.5 41.2
Mzwini Senior Secondary School (18) P '2 N W 30 24 24
East London P 11 20 7 36.7 83.3 29.2 -54.2
N. Motman P School (07) P '3 N W 69 51 64
Queenstown P 39 32 33 56.5 62.7 51.6 -11.2
Nangamso Senior Secondary School (19) P '2 N W 19 15 21
King Williams Town P 12 10 8 63.2 66.7 38.1 -28.6
Nasruddin Islamic High School (22) I '99 N W 23 24 38
Port Elizabeth P 23 24 38 100.0 100.0 100.0 0.0
Nathaniel Nyaluza Secondary School (21) P '5 Y W 46 50 61
Grahamstown P 23 16 25 50.0 32.0 41.0 9.0
Nathaniel Pamla High School (19) P '3 N W 84 75 72
King Williams Town P 45 52 63 53.6 69.3 87.5 18.2
Ncambedlana Private Centre (10) P '99 N W 0 0 0
Mthatha P 0 0 0
Ncedisizwe Senior Secodary School (16) P '1 N W 90 143 145
Butterworth P 68 92 77 75.6 64.3 53.1 -11.2
Ncedo Senior Secondary School (22) P '4 N W 115 99 48
Port Elizabeth P 58 63 37 50.4 63.6 77.1 13.4
Ncedolwethu Senior Secondary School (19) P '2 N W 37 41 59
King Williams Town P 27 36 44 73.0 87.8 74.6 -13.2
Ncuncuzo Senior Secondary School (14) P '2 Y W 87 89 102
Cofimvaba P 65 72 69 74.7 80.9 67.6 -13.3
Ndabankulu Senior Secondary School (16) P '3 Y W 167 132 194
Butterworth P 96 87 152 57.5 65.9 78.4 12.4
Ndabazandile Senior Secondary School (19) P '2 N W 6 3 0
King Williams Town P 2 1 0 33.3 33.3
Ndaliso Senior Secondary School (04) P '1 N W 259 265 330
Lusikisiki P 199 185 185 76.8 69.8 56.1 -13.8
Ndamase Senior Secondary School (12) P '2 N W 243 228 330
Libode P 119 127 188 49.0 55.7 57.0 1.3
Ndema Senior Secondary School (19) P '2 N W 15 17 19
King Williams Town P 11 4 11 73.3 23.5 57.9 34.4
Ndlovukazi High School (07) P '4 N W 81 61 57
Queenstown P 55 35 37 67.9 57.4 64.9 7.5
Ndyebo Senior Secondary School (22) P '5 N W 130 93 100
Port Elizabeth P 84 80 71 64.6 86.0 71.0 -15.0
Ndyebo-Ntsaluba Senior Secondary School (14) P '1 N W 50 55 52
Cofimvaba P 42 52 50 84.0 94.5 96.2 1.6
Ndzondelelo High School (22) P '4 N W 178 131 185
Port Elizabeth P 78 80 122 43.8 61.1 65.9 4.9
Newell P Secondary School (22) P '4 N W 111 87 124
Port Elizabeth P 49 53 63 44.1 60.9 50.8 -10.1
Newton T.H.S (22) P '5 N W 140 109 121
Port Elizabeth P 118 84 107 84.3 77.1 88.4 11.4
Ngalonkulu Senior Secondary School (05) P '1 N W 109 155 90
Mbizana P 30 32 38 27.5 20.6 42.2 21.6
Ngangelizwe Senior Secondary School (10) P '5 N W 83 91 117
Mthatha P 52 63 63 62.7 69.2 53.8 -15.4
Ngangelizwe Senior Secondary School (17) P '2 N W 27 33 25
Fort Beaufort P 2 23 4 7.4 69.7 16.0 -53.7
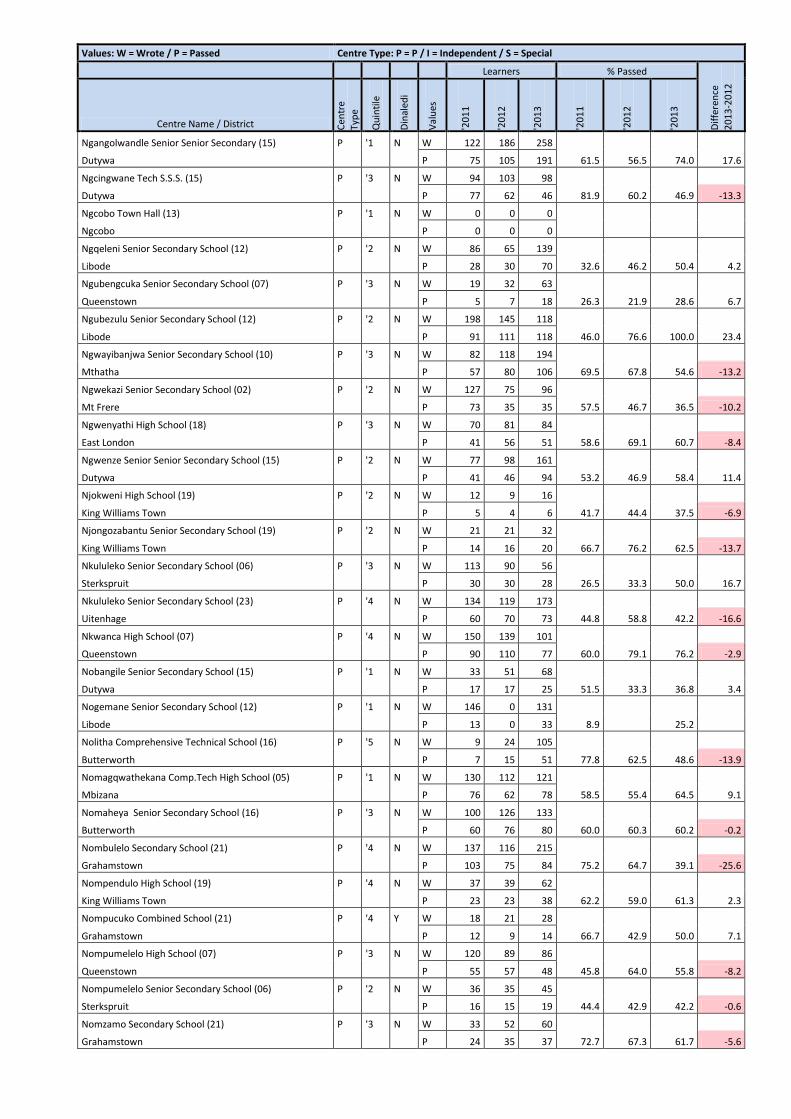
Values: W = Wrote / P = Passed Centre Type: P = P / I = Independent / S = Special
Learners % Passed
Dif
fere
nce
20
13
-20
12
Centre Name / District Cen
tre
Typ
e
Qu
inti
le
Din
aled
i
Val
ues
'20
11
'20
12
'20
13
'20
11
'20
12
'20
13
Ngangolwandle Senior Senior Secondary (15) P '1 N W 122 186 258
Dutywa P 75 105 191 61.5 56.5 74.0 17.6
Ngcingwane Tech S.S.S. (15) P '3 N W 94 103 98
Dutywa P 77 62 46 81.9 60.2 46.9 -13.3
Ngcobo Town Hall (13) P '1 N W 0 0 0
Ngcobo P 0 0 0
Ngqeleni Senior Secondary School (12) P '2 N W 86 65 139
Libode P 28 30 70 32.6 46.2 50.4 4.2
Ngubengcuka Senior Secondary School (07) P '3 N W 19 32 63
Queenstown P 5 7 18 26.3 21.9 28.6 6.7
Ngubezulu Senior Secondary School (12) P '2 N W 198 145 118
Libode P 91 111 118 46.0 76.6 100.0 23.4
Ngwayibanjwa Senior Secondary School (10) P '3 N W 82 118 194
Mthatha P 57 80 106 69.5 67.8 54.6 -13.2
Ngwekazi Senior Secondary School (02) P '2 N W 127 75 96
Mt Frere P 73 35 35 57.5 46.7 36.5 -10.2
Ngwenyathi High School (18) P '3 N W 70 81 84
East London P 41 56 51 58.6 69.1 60.7 -8.4
Ngwenze Senior Senior Secondary School (15) P '2 N W 77 98 161
Dutywa P 41 46 94 53.2 46.9 58.4 11.4
Njokweni High School (19) P '2 N W 12 9 16
King Williams Town P 5 4 6 41.7 44.4 37.5 -6.9
Njongozabantu Senior Secondary School (19) P '2 N W 21 21 32
King Williams Town P 14 16 20 66.7 76.2 62.5 -13.7
Nkululeko Senior Secondary School (06) P '3 N W 113 90 56
Sterkspruit P 30 30 28 26.5 33.3 50.0 16.7
Nkululeko Senior Secondary School (23) P '4 N W 134 119 173
Uitenhage P 60 70 73 44.8 58.8 42.2 -16.6
Nkwanca High School (07) P '4 N W 150 139 101
Queenstown P 90 110 77 60.0 79.1 76.2 -2.9
Nobangile Senior Secondary School (15) P '1 N W 33 51 68
Dutywa P 17 17 25 51.5 33.3 36.8 3.4
Nogemane Senior Secondary School (12) P '1 N W 146 0 131
Libode P 13 0 33 8.9 25.2
Nolitha Comprehensive Technical School (16) P '5 N W 9 24 105
Butterworth P 7 15 51 77.8 62.5 48.6 -13.9
Nomagqwathekana Comp.Tech High School (05) P '1 N W 130 112 121
Mbizana P 76 62 78 58.5 55.4 64.5 9.1
Nomaheya Senior Secondary School (16) P '3 N W 100 126 133
Butterworth P 60 76 80 60.0 60.3 60.2 -0.2
Nombulelo Secondary School (21) P '4 N W 137 116 215
Grahamstown P 103 75 84 75.2 64.7 39.1 -25.6
Nompendulo High School (19) P '4 N W 37 39 62
King Williams Town P 23 23 38 62.2 59.0 61.3 2.3
Nompucuko Combined School (21) P '4 Y W 18 21 28
Grahamstown P 12 9 14 66.7 42.9 50.0 7.1
Nompumelelo High School (07) P '3 N W 120 89 86
Queenstown P 55 57 48 45.8 64.0 55.8 -8.2
Nompumelelo Senior Secondary School (06) P '2 N W 36 35 45
Sterkspruit P 16 15 19 44.4 42.9 42.2 -0.6
Nomzamo Secondary School (21) P '3 N W 33 52 60
Grahamstown P 24 35 37 72.7 67.3 61.7 -5.6
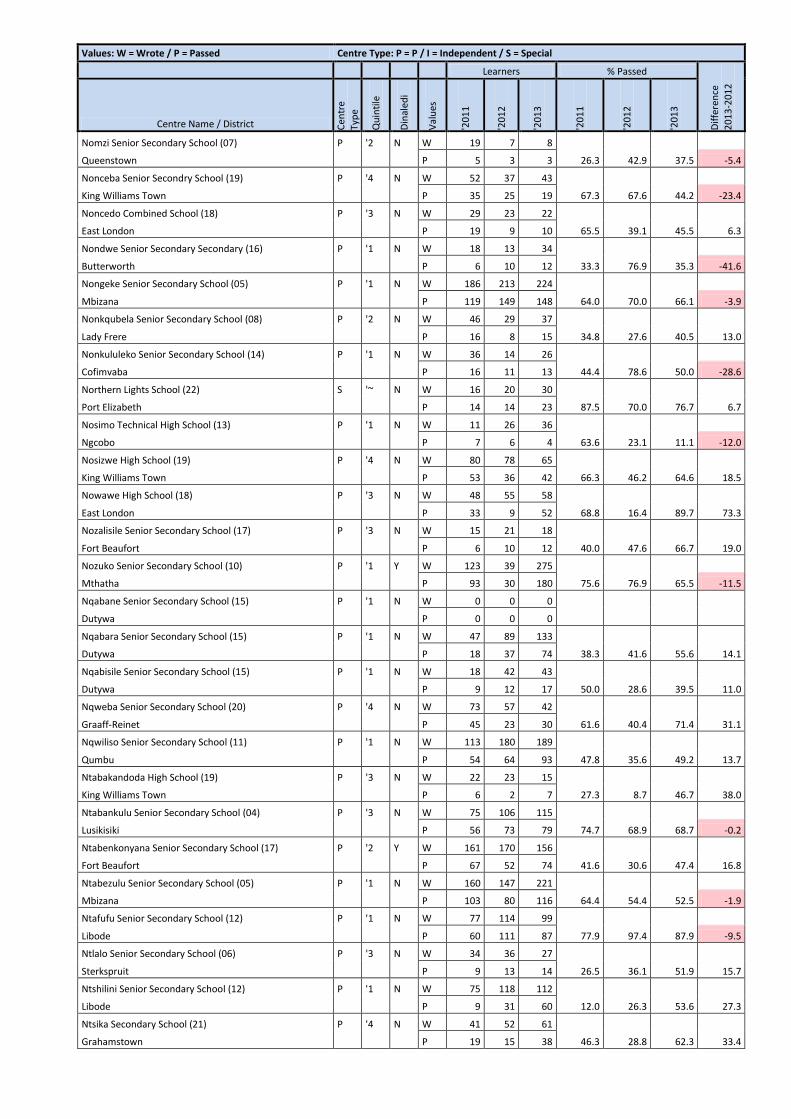
Values: W = Wrote / P = Passed Centre Type: P = P / I = Independent / S = Special
Learners % Passed
Dif
fere
nce
20
13
-20
12
Centre Name / District Cen
tre
Typ
e
Qu
inti
le
Din
aled
i
Val
ues
'20
11
'20
12
'20
13
'20
11
'20
12
'20
13
Nomzi Senior Secondary School (07) P '2 N W 19 7 8
Queenstown P 5 3 3 26.3 42.9 37.5 -5.4
Nonceba Senior Secondry School (19) P '4 N W 52 37 43
King Williams Town P 35 25 19 67.3 67.6 44.2 -23.4
Noncedo Combined School (18) P '3 N W 29 23 22
East London P 19 9 10 65.5 39.1 45.5 6.3
Nondwe Senior Secondary Secondary (16) P '1 N W 18 13 34
Butterworth P 6 10 12 33.3 76.9 35.3 -41.6
Nongeke Senior Secondary School (05) P '1 N W 186 213 224
Mbizana P 119 149 148 64.0 70.0 66.1 -3.9
Nonkqubela Senior Secondary School (08) P '2 N W 46 29 37
Lady Frere P 16 8 15 34.8 27.6 40.5 13.0
Nonkululeko Senior Secondary School (14) P '1 N W 36 14 26
Cofimvaba P 16 11 13 44.4 78.6 50.0 -28.6
Northern Lights School (22) S '~ N W 16 20 30
Port Elizabeth P 14 14 23 87.5 70.0 76.7 6.7
Nosimo Technical High School (13) P '1 N W 11 26 36
Ngcobo P 7 6 4 63.6 23.1 11.1 -12.0
Nosizwe High School (19) P '4 N W 80 78 65
King Williams Town P 53 36 42 66.3 46.2 64.6 18.5
Nowawe High School (18) P '3 N W 48 55 58
East London P 33 9 52 68.8 16.4 89.7 73.3
Nozalisile Senior Secondary School (17) P '3 N W 15 21 18
Fort Beaufort P 6 10 12 40.0 47.6 66.7 19.0
Nozuko Senior Secondary School (10) P '1 Y W 123 39 275
Mthatha P 93 30 180 75.6 76.9 65.5 -11.5
Nqabane Senior Secondary School (15) P '1 N W 0 0 0
Dutywa P 0 0 0
Nqabara Senior Secondary School (15) P '1 N W 47 89 133
Dutywa P 18 37 74 38.3 41.6 55.6 14.1
Nqabisile Senior Secondary School (15) P '1 N W 18 42 43
Dutywa P 9 12 17 50.0 28.6 39.5 11.0
Nqweba Senior Secondary School (20) P '4 N W 73 57 42
Graaff-Reinet P 45 23 30 61.6 40.4 71.4 31.1
Nqwiliso Senior Secondary School (11) P '1 N W 113 180 189
Qumbu P 54 64 93 47.8 35.6 49.2 13.7
Ntabakandoda High School (19) P '3 N W 22 23 15
King Williams Town P 6 2 7 27.3 8.7 46.7 38.0
Ntabankulu Senior Secondary School (04) P '3 N W 75 106 115
Lusikisiki P 56 73 79 74.7 68.9 68.7 -0.2
Ntabenkonyana Senior Secondary School (17) P '2 Y W 161 170 156
Fort Beaufort P 67 52 74 41.6 30.6 47.4 16.8
Ntabezulu Senior Secondary School (05) P '1 N W 160 147 221
Mbizana P 103 80 116 64.4 54.4 52.5 -1.9
Ntafufu Senior Secondary School (12) P '1 N W 77 114 99
Libode P 60 111 87 77.9 97.4 87.9 -9.5
Ntlalo Senior Secondary School (06) P '3 N W 34 36 27
Sterkspruit P 9 13 14 26.5 36.1 51.9 15.7
Ntshilini Senior Secondary School (12) P '1 N W 75 118 112
Libode P 9 31 60 12.0 26.3 53.6 27.3
Ntsika Secondary School (21) P '4 N W 41 52 61
Grahamstown P 19 15 38 46.3 28.8 62.3 33.4
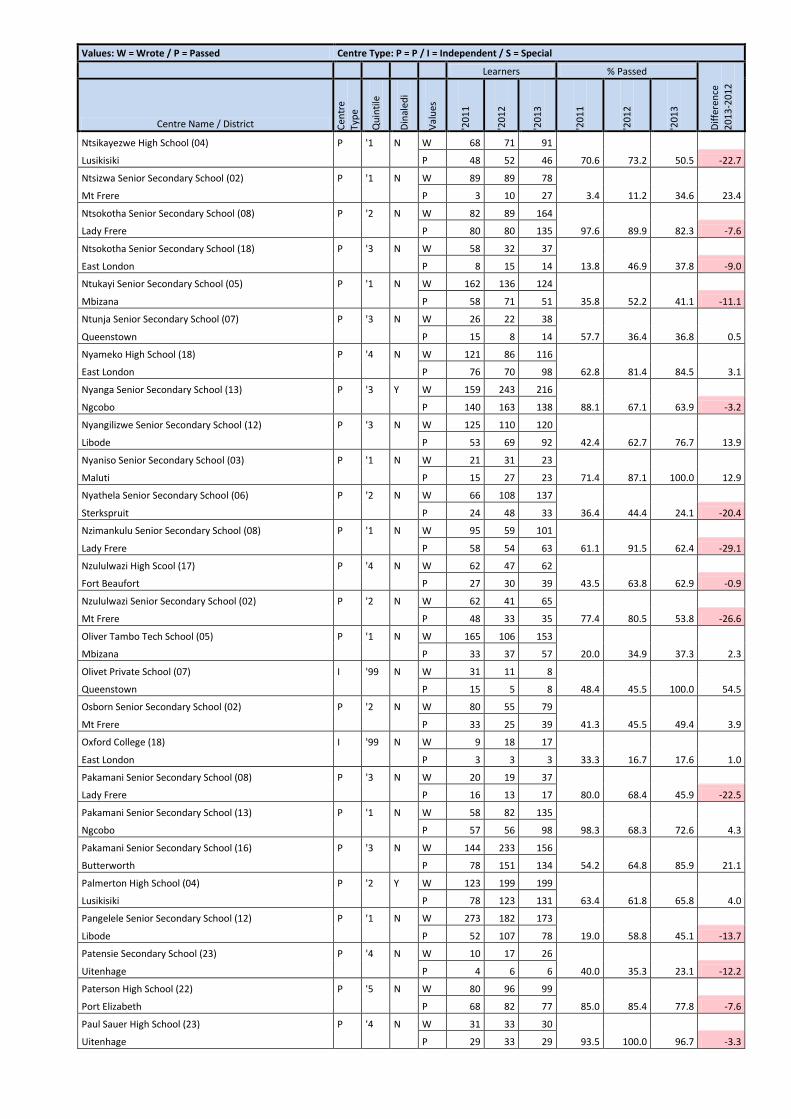
Values: W = Wrote / P = Passed Centre Type: P = P / I = Independent / S = Special
Learners % Passed
Dif
fere
nce
20
13
-20
12
Centre Name / District Cen
tre
Typ
e
Qu
inti
le
Din
aled
i
Val
ues
'20
11
'20
12
'20
13
'20
11
'20
12
'20
13
Ntsikayezwe High School (04) P '1 N W 68 71 91
Lusikisiki P 48 52 46 70.6 73.2 50.5 -22.7
Ntsizwa Senior Secondary School (02) P '1 N W 89 89 78
Mt Frere P 3 10 27 3.4 11.2 34.6 23.4
Ntsokotha Senior Secondary School (08) P '2 N W 82 89 164
Lady Frere P 80 80 135 97.6 89.9 82.3 -7.6
Ntsokotha Senior Secondary School (18) P '3 N W 58 32 37
East London P 8 15 14 13.8 46.9 37.8 -9.0
Ntukayi Senior Secondary School (05) P '1 N W 162 136 124
Mbizana P 58 71 51 35.8 52.2 41.1 -11.1
Ntunja Senior Secondary School (07) P '3 N W 26 22 38
Queenstown P 15 8 14 57.7 36.4 36.8 0.5
Nyameko High School (18) P '4 N W 121 86 116
East London P 76 70 98 62.8 81.4 84.5 3.1
Nyanga Senior Secondary School (13) P '3 Y W 159 243 216
Ngcobo P 140 163 138 88.1 67.1 63.9 -3.2
Nyangilizwe Senior Secondary School (12) P '3 N W 125 110 120
Libode P 53 69 92 42.4 62.7 76.7 13.9
Nyaniso Senior Secondary School (03) P '1 N W 21 31 23
Maluti P 15 27 23 71.4 87.1 100.0 12.9
Nyathela Senior Secondary School (06) P '2 N W 66 108 137
Sterkspruit P 24 48 33 36.4 44.4 24.1 -20.4
Nzimankulu Senior Secondary School (08) P '1 N W 95 59 101
Lady Frere P 58 54 63 61.1 91.5 62.4 -29.1
Nzululwazi High Scool (17) P '4 N W 62 47 62
Fort Beaufort P 27 30 39 43.5 63.8 62.9 -0.9
Nzululwazi Senior Secondary School (02) P '2 N W 62 41 65
Mt Frere P 48 33 35 77.4 80.5 53.8 -26.6
Oliver Tambo Tech School (05) P '1 N W 165 106 153
Mbizana P 33 37 57 20.0 34.9 37.3 2.3
Olivet Private School (07) I '99 N W 31 11 8
Queenstown P 15 5 8 48.4 45.5 100.0 54.5
Osborn Senior Secondary School (02) P '2 N W 80 55 79
Mt Frere P 33 25 39 41.3 45.5 49.4 3.9
Oxford College (18) I '99 N W 9 18 17
East London P 3 3 3 33.3 16.7 17.6 1.0
Pakamani Senior Secondary School (08) P '3 N W 20 19 37
Lady Frere P 16 13 17 80.0 68.4 45.9 -22.5
Pakamani Senior Secondary School (13) P '1 N W 58 82 135
Ngcobo P 57 56 98 98.3 68.3 72.6 4.3
Pakamani Senior Secondary School (16) P '3 N W 144 233 156
Butterworth P 78 151 134 54.2 64.8 85.9 21.1
Palmerton High School (04) P '2 Y W 123 199 199
Lusikisiki P 78 123 131 63.4 61.8 65.8 4.0
Pangelele Senior Secondary School (12) P '1 N W 273 182 173
Libode P 52 107 78 19.0 58.8 45.1 -13.7
Patensie Secondary School (23) P '4 N W 10 17 26
Uitenhage P 4 6 6 40.0 35.3 23.1 -12.2
Paterson High School (22) P '5 N W 80 96 99
Port Elizabeth P 68 82 77 85.0 85.4 77.8 -7.6
Paul Sauer High School (23) P '4 N W 31 33 30
Uitenhage P 29 33 29 93.5 100.0 96.7 -3.3
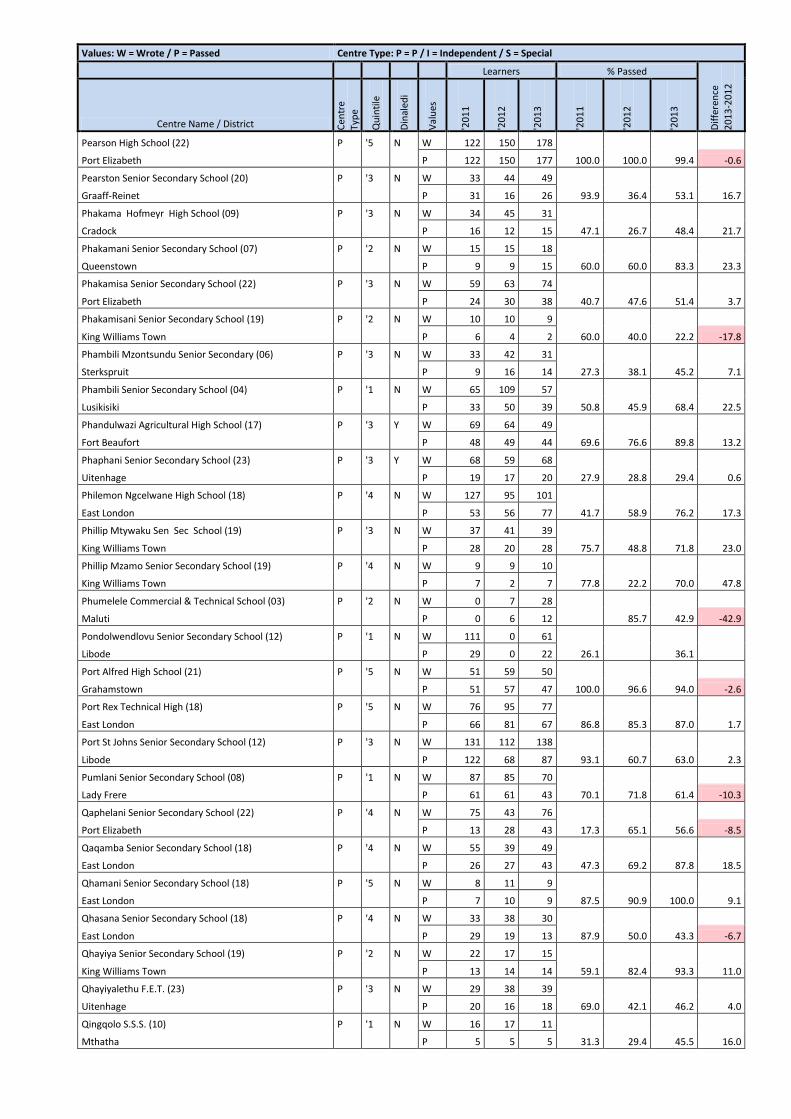
Values: W = Wrote / P = Passed Centre Type: P = P / I = Independent / S = Special
Learners % Passed
Dif
fere
nce
20
13
-20
12
Centre Name / District Cen
tre
Typ
e
Qu
inti
le
Din
aled
i
Val
ues
'20
11
'20
12
'20
13
'20
11
'20
12
'20
13
Pearson High School (22) P '5 N W 122 150 178
Port Elizabeth P 122 150 177 100.0 100.0 99.4 -0.6
Pearston Senior Secondary School (20) P '3 N W 33 44 49
Graaff-Reinet P 31 16 26 93.9 36.4 53.1 16.7
Phakama Hofmeyr High School (09) P '3 N W 34 45 31
Cradock P 16 12 15 47.1 26.7 48.4 21.7
Phakamani Senior Secondary School (07) P '2 N W 15 15 18
Queenstown P 9 9 15 60.0 60.0 83.3 23.3
Phakamisa Senior Secondary School (22) P '3 N W 59 63 74
Port Elizabeth P 24 30 38 40.7 47.6 51.4 3.7
Phakamisani Senior Secondary School (19) P '2 N W 10 10 9
King Williams Town P 6 4 2 60.0 40.0 22.2 -17.8
Phambili Mzontsundu Senior Secondary (06) P '3 N W 33 42 31
Sterkspruit P 9 16 14 27.3 38.1 45.2 7.1
Phambili Senior Secondary School (04) P '1 N W 65 109 57
Lusikisiki P 33 50 39 50.8 45.9 68.4 22.5
Phandulwazi Agricultural High School (17) P '3 Y W 69 64 49
Fort Beaufort P 48 49 44 69.6 76.6 89.8 13.2
Phaphani Senior Secondary School (23) P '3 Y W 68 59 68
Uitenhage P 19 17 20 27.9 28.8 29.4 0.6
Philemon Ngcelwane High School (18) P '4 N W 127 95 101
East London P 53 56 77 41.7 58.9 76.2 17.3
Phillip Mtywaku Sen Sec School (19) P '3 N W 37 41 39
King Williams Town P 28 20 28 75.7 48.8 71.8 23.0
Phillip Mzamo Senior Secondary School (19) P '4 N W 9 9 10
King Williams Town P 7 2 7 77.8 22.2 70.0 47.8
Phumelele Commercial & Technical School (03) P '2 N W 0 7 28
Maluti P 0 6 12 85.7 42.9 -42.9
Pondolwendlovu Senior Secondary School (12) P '1 N W 111 0 61
Libode P 29 0 22 26.1 36.1
Port Alfred High School (21) P '5 N W 51 59 50
Grahamstown P 51 57 47 100.0 96.6 94.0 -2.6
Port Rex Technical High (18) P '5 N W 76 95 77
East London P 66 81 67 86.8 85.3 87.0 1.7
Port St Johns Senior Secondary School (12) P '3 N W 131 112 138
Libode P 122 68 87 93.1 60.7 63.0 2.3
Pumlani Senior Secondary School (08) P '1 N W 87 85 70
Lady Frere P 61 61 43 70.1 71.8 61.4 -10.3
Qaphelani Senior Secondary School (22) P '4 N W 75 43 76
Port Elizabeth P 13 28 43 17.3 65.1 56.6 -8.5
Qaqamba Senior Secondary School (18) P '4 N W 55 39 49
East London P 26 27 43 47.3 69.2 87.8 18.5
Qhamani Senior Secondary School (18) P '5 N W 8 11 9
East London P 7 10 9 87.5 90.9 100.0 9.1
Qhasana Senior Secondary School (18) P '4 N W 33 38 30
East London P 29 19 13 87.9 50.0 43.3 -6.7
Qhayiya Senior Secondary School (19) P '2 N W 22 17 15
King Williams Town P 13 14 14 59.1 82.4 93.3 11.0
Qhayiyalethu F.E.T. (23) P '3 N W 29 38 39
Uitenhage P 20 16 18 69.0 42.1 46.2 4.0
Qingqolo S.S.S. (10) P '1 N W 16 17 11
Mthatha P 5 5 5 31.3 29.4 45.5 16.0
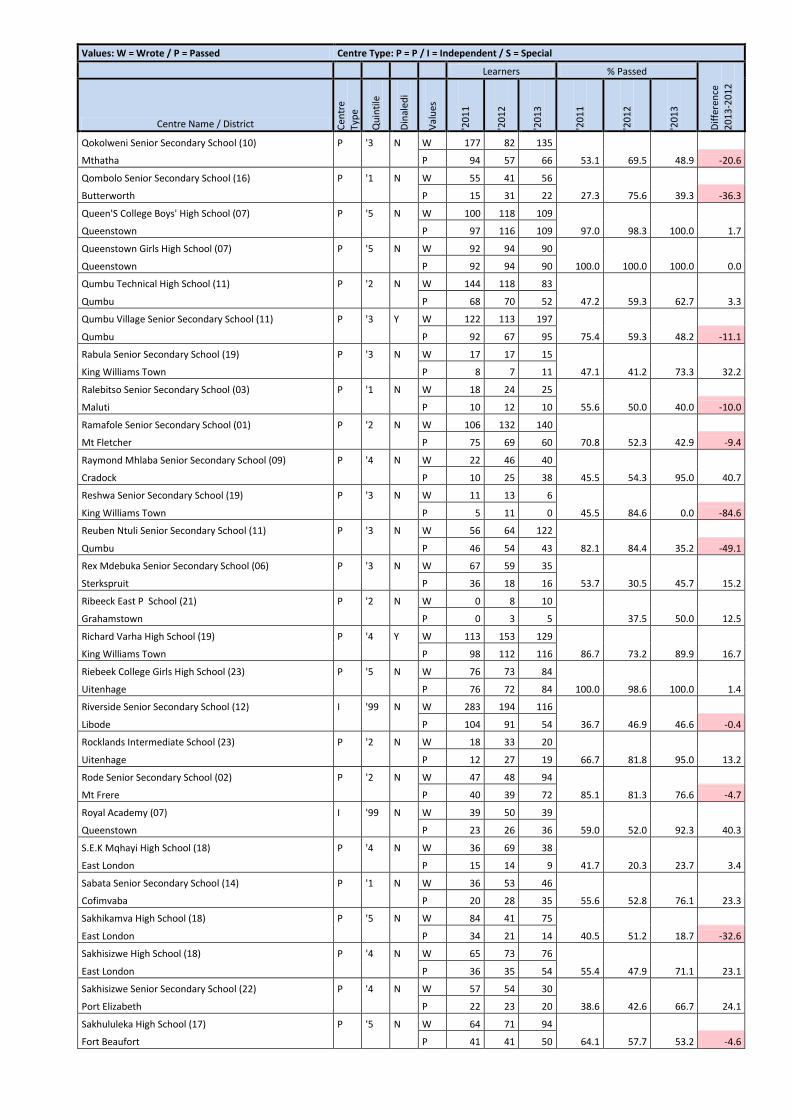
Values: W = Wrote / P = Passed Centre Type: P = P / I = Independent / S = Special
Learners % Passed
Dif
fere
nce
20
13
-20
12
Centre Name / District Cen
tre
Typ
e
Qu
inti
le
Din
aled
i
Val
ues
'20
11
'20
12
'20
13
'20
11
'20
12
'20
13
Qokolweni Senior Secondary School (10) P '3 N W 177 82 135
Mthatha P 94 57 66 53.1 69.5 48.9 -20.6
Qombolo Senior Secondary School (16) P '1 N W 55 41 56
Butterworth P 15 31 22 27.3 75.6 39.3 -36.3
Queen'S College Boys' High School (07) P '5 N W 100 118 109
Queenstown P 97 116 109 97.0 98.3 100.0 1.7
Queenstown Girls High School (07) P '5 N W 92 94 90
Queenstown P 92 94 90 100.0 100.0 100.0 0.0
Qumbu Technical High School (11) P '2 N W 144 118 83
Qumbu P 68 70 52 47.2 59.3 62.7 3.3
Qumbu Village Senior Secondary School (11) P '3 Y W 122 113 197
Qumbu P 92 67 95 75.4 59.3 48.2 -11.1
Rabula Senior Secondary School (19) P '3 N W 17 17 15
King Williams Town P 8 7 11 47.1 41.2 73.3 32.2
Ralebitso Senior Secondary School (03) P '1 N W 18 24 25
Maluti P 10 12 10 55.6 50.0 40.0 -10.0
Ramafole Senior Secondary School (01) P '2 N W 106 132 140
Mt Fletcher P 75 69 60 70.8 52.3 42.9 -9.4
Raymond Mhlaba Senior Secondary School (09) P '4 N W 22 46 40
Cradock P 10 25 38 45.5 54.3 95.0 40.7
Reshwa Senior Secondary School (19) P '3 N W 11 13 6
King Williams Town P 5 11 0 45.5 84.6 0.0 -84.6
Reuben Ntuli Senior Secondary School (11) P '3 N W 56 64 122
Qumbu P 46 54 43 82.1 84.4 35.2 -49.1
Rex Mdebuka Senior Secondary School (06) P '3 N W 67 59 35
Sterkspruit P 36 18 16 53.7 30.5 45.7 15.2
Ribeeck East P School (21) P '2 N W 0 8 10
Grahamstown P 0 3 5 37.5 50.0 12.5
Richard Varha High School (19) P '4 Y W 113 153 129
King Williams Town P 98 112 116 86.7 73.2 89.9 16.7
Riebeek College Girls High School (23) P '5 N W 76 73 84
Uitenhage P 76 72 84 100.0 98.6 100.0 1.4
Riverside Senior Secondary School (12) I '99 N W 283 194 116
Libode P 104 91 54 36.7 46.9 46.6 -0.4
Rocklands Intermediate School (23) P '2 N W 18 33 20
Uitenhage P 12 27 19 66.7 81.8 95.0 13.2
Rode Senior Secondary School (02) P '2 N W 47 48 94
Mt Frere P 40 39 72 85.1 81.3 76.6 -4.7
Royal Academy (07) I '99 N W 39 50 39
Queenstown P 23 26 36 59.0 52.0 92.3 40.3
S.E.K Mqhayi High School (18) P '4 N W 36 69 38
East London P 15 14 9 41.7 20.3 23.7 3.4
Sabata Senior Secondary School (14) P '1 N W 36 53 46
Cofimvaba P 20 28 35 55.6 52.8 76.1 23.3
Sakhikamva High School (18) P '5 N W 84 41 75
East London P 34 21 14 40.5 51.2 18.7 -32.6
Sakhisizwe High School (18) P '4 N W 65 73 76
East London P 36 35 54 55.4 47.9 71.1 23.1
Sakhisizwe Senior Secondary School (22) P '4 N W 57 54 30
Port Elizabeth P 22 23 20 38.6 42.6 66.7 24.1
Sakhululeka High School (17) P '5 N W 64 71 94
Fort Beaufort P 41 41 50 64.1 57.7 53.2 -4.6
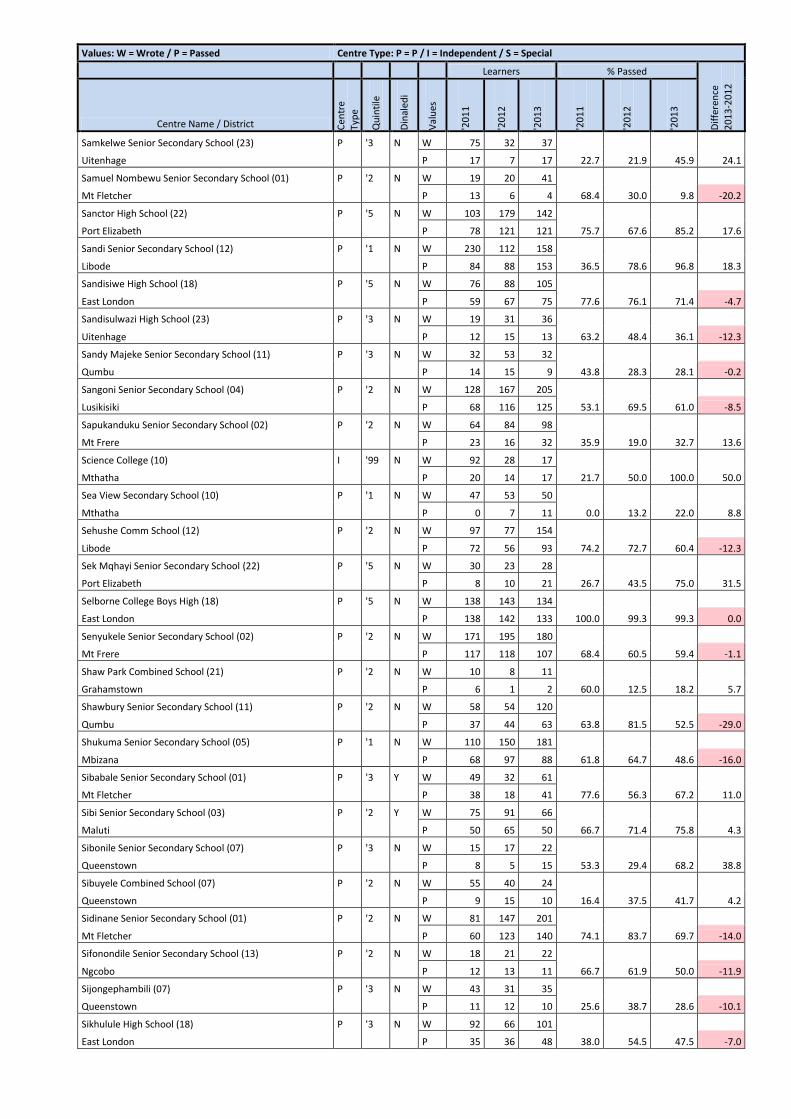
Values: W = Wrote / P = Passed Centre Type: P = P / I = Independent / S = Special
Learners % Passed
Dif
fere
nce
20
13
-20
12
Centre Name / District Cen
tre
Typ
e
Qu
inti
le
Din
aled
i
Val
ues
'20
11
'20
12
'20
13
'20
11
'20
12
'20
13
Samkelwe Senior Secondary School (23) P '3 N W 75 32 37
Uitenhage P 17 7 17 22.7 21.9 45.9 24.1
Samuel Nombewu Senior Secondary School (01) P '2 N W 19 20 41
Mt Fletcher P 13 6 4 68.4 30.0 9.8 -20.2
Sanctor High School (22) P '5 N W 103 179 142
Port Elizabeth P 78 121 121 75.7 67.6 85.2 17.6
Sandi Senior Secondary School (12) P '1 N W 230 112 158
Libode P 84 88 153 36.5 78.6 96.8 18.3
Sandisiwe High School (18) P '5 N W 76 88 105
East London P 59 67 75 77.6 76.1 71.4 -4.7
Sandisulwazi High School (23) P '3 N W 19 31 36
Uitenhage P 12 15 13 63.2 48.4 36.1 -12.3
Sandy Majeke Senior Secondary School (11) P '3 N W 32 53 32
Qumbu P 14 15 9 43.8 28.3 28.1 -0.2
Sangoni Senior Secondary School (04) P '2 N W 128 167 205
Lusikisiki P 68 116 125 53.1 69.5 61.0 -8.5
Sapukanduku Senior Secondary School (02) P '2 N W 64 84 98
Mt Frere P 23 16 32 35.9 19.0 32.7 13.6
Science College (10) I '99 N W 92 28 17
Mthatha P 20 14 17 21.7 50.0 100.0 50.0
Sea View Secondary School (10) P '1 N W 47 53 50
Mthatha P 0 7 11 0.0 13.2 22.0 8.8
Sehushe Comm School (12) P '2 N W 97 77 154
Libode P 72 56 93 74.2 72.7 60.4 -12.3
Sek Mqhayi Senior Secondary School (22) P '5 N W 30 23 28
Port Elizabeth P 8 10 21 26.7 43.5 75.0 31.5
Selborne College Boys High (18) P '5 N W 138 143 134
East London P 138 142 133 100.0 99.3 99.3 0.0
Senyukele Senior Secondary School (02) P '2 N W 171 195 180
Mt Frere P 117 118 107 68.4 60.5 59.4 -1.1
Shaw Park Combined School (21) P '2 N W 10 8 11
Grahamstown P 6 1 2 60.0 12.5 18.2 5.7
Shawbury Senior Secondary School (11) P '2 N W 58 54 120
Qumbu P 37 44 63 63.8 81.5 52.5 -29.0
Shukuma Senior Secondary School (05) P '1 N W 110 150 181
Mbizana P 68 97 88 61.8 64.7 48.6 -16.0
Sibabale Senior Secondary School (01) P '3 Y W 49 32 61
Mt Fletcher P 38 18 41 77.6 56.3 67.2 11.0
Sibi Senior Secondary School (03) P '2 Y W 75 91 66
Maluti P 50 65 50 66.7 71.4 75.8 4.3
Sibonile Senior Secondary School (07) P '3 N W 15 17 22
Queenstown P 8 5 15 53.3 29.4 68.2 38.8
Sibuyele Combined School (07) P '2 N W 55 40 24
Queenstown P 9 15 10 16.4 37.5 41.7 4.2
Sidinane Senior Secondary School (01) P '2 N W 81 147 201
Mt Fletcher P 60 123 140 74.1 83.7 69.7 -14.0
Sifonondile Senior Secondary School (13) P '2 N W 18 21 22
Ngcobo P 12 13 11 66.7 61.9 50.0 -11.9
Sijongephambili (07) P '3 N W 43 31 35
Queenstown P 11 12 10 25.6 38.7 28.6 -10.1
Sikhulule High School (18) P '3 N W 92 66 101
East London P 35 36 48 38.0 54.5 47.5 -7.0
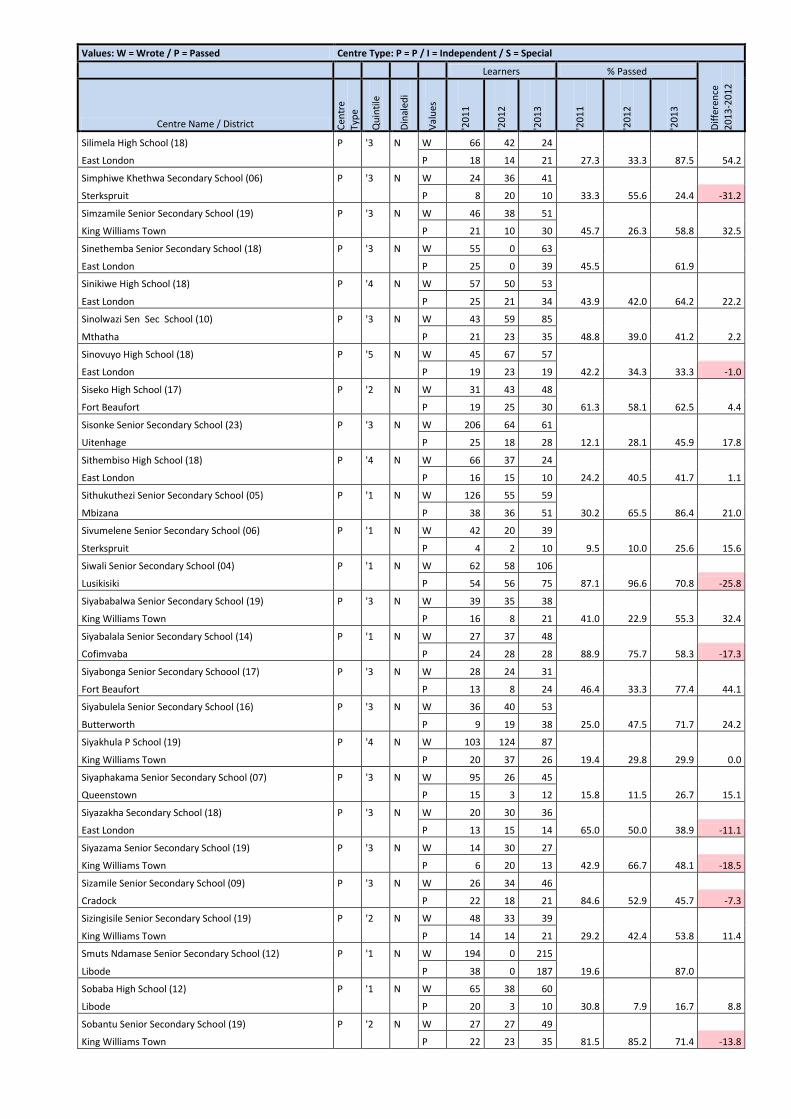
Values: W = Wrote / P = Passed Centre Type: P = P / I = Independent / S = Special
Learners % Passed
Dif
fere
nce
20
13
-20
12
Centre Name / District Cen
tre
Typ
e
Qu
inti
le
Din
aled
i
Val
ues
'20
11
'20
12
'20
13
'20
11
'20
12
'20
13
Silimela High School (18) P '3 N W 66 42 24
East London P 18 14 21 27.3 33.3 87.5 54.2
Simphiwe Khethwa Secondary School (06) P '3 N W 24 36 41
Sterkspruit P 8 20 10 33.3 55.6 24.4 -31.2
Simzamile Senior Secondary School (19) P '3 N W 46 38 51
King Williams Town P 21 10 30 45.7 26.3 58.8 32.5
Sinethemba Senior Secondary School (18) P '3 N W 55 0 63
East London P 25 0 39 45.5 61.9
Sinikiwe High School (18) P '4 N W 57 50 53
East London P 25 21 34 43.9 42.0 64.2 22.2
Sinolwazi Sen Sec School (10) P '3 N W 43 59 85
Mthatha P 21 23 35 48.8 39.0 41.2 2.2
Sinovuyo High School (18) P '5 N W 45 67 57
East London P 19 23 19 42.2 34.3 33.3 -1.0
Siseko High School (17) P '2 N W 31 43 48
Fort Beaufort P 19 25 30 61.3 58.1 62.5 4.4
Sisonke Senior Secondary School (23) P '3 N W 206 64 61
Uitenhage P 25 18 28 12.1 28.1 45.9 17.8
Sithembiso High School (18) P '4 N W 66 37 24
East London P 16 15 10 24.2 40.5 41.7 1.1
Sithukuthezi Senior Secondary School (05) P '1 N W 126 55 59
Mbizana P 38 36 51 30.2 65.5 86.4 21.0
Sivumelene Senior Secondary School (06) P '1 N W 42 20 39
Sterkspruit P 4 2 10 9.5 10.0 25.6 15.6
Siwali Senior Secondary School (04) P '1 N W 62 58 106
Lusikisiki P 54 56 75 87.1 96.6 70.8 -25.8
Siyababalwa Senior Secondary School (19) P '3 N W 39 35 38
King Williams Town P 16 8 21 41.0 22.9 55.3 32.4
Siyabalala Senior Secondary School (14) P '1 N W 27 37 48
Cofimvaba P 24 28 28 88.9 75.7 58.3 -17.3
Siyabonga Senior Secondary Schoool (17) P '3 N W 28 24 31
Fort Beaufort P 13 8 24 46.4 33.3 77.4 44.1
Siyabulela Senior Secondary School (16) P '3 N W 36 40 53
Butterworth P 9 19 38 25.0 47.5 71.7 24.2
Siyakhula P School (19) P '4 N W 103 124 87
King Williams Town P 20 37 26 19.4 29.8 29.9 0.0
Siyaphakama Senior Secondary School (07) P '3 N W 95 26 45
Queenstown P 15 3 12 15.8 11.5 26.7 15.1
Siyazakha Secondary School (18) P '3 N W 20 30 36
East London P 13 15 14 65.0 50.0 38.9 -11.1
Siyazama Senior Secondary School (19) P '3 N W 14 30 27
King Williams Town P 6 20 13 42.9 66.7 48.1 -18.5
Sizamile Senior Secondary School (09) P '3 N W 26 34 46
Cradock P 22 18 21 84.6 52.9 45.7 -7.3
Sizingisile Senior Secondary School (19) P '2 N W 48 33 39
King Williams Town P 14 14 21 29.2 42.4 53.8 11.4
Smuts Ndamase Senior Secondary School (12) P '1 N W 194 0 215
Libode P 38 0 187 19.6 87.0
Sobaba High School (12) P '1 N W 65 38 60
Libode P 20 3 10 30.8 7.9 16.7 8.8
Sobantu Senior Secondary School (19) P '2 N W 27 27 49
King Williams Town P 22 23 35 81.5 85.2 71.4 -13.8
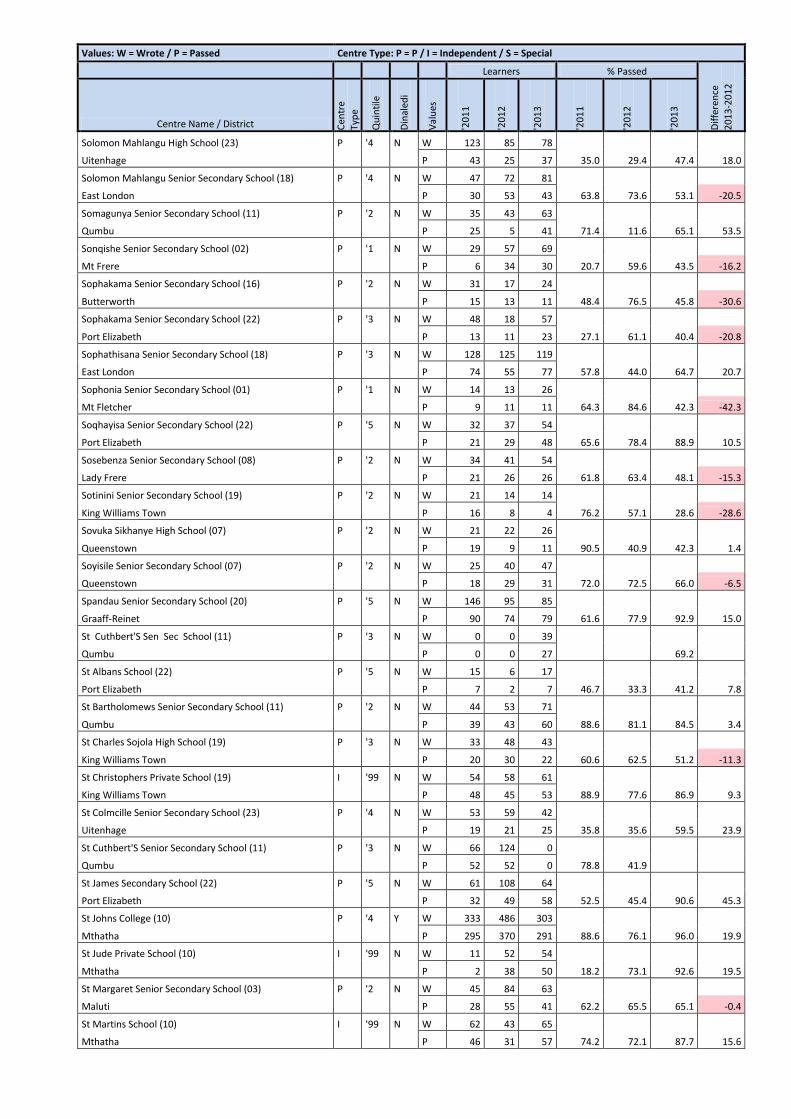
Values: W = Wrote / P = Passed Centre Type: P = P / I = Independent / S = Special
Learners % Passed
Dif
fere
nce
20
13
-20
12
Centre Name / District Cen
tre
Typ
e
Qu
inti
le
Din
aled
i
Val
ues
'20
11
'20
12
'20
13
'20
11
'20
12
'20
13
Solomon Mahlangu High School (23) P '4 N W 123 85 78
Uitenhage P 43 25 37 35.0 29.4 47.4 18.0
Solomon Mahlangu Senior Secondary School (18) P '4 N W 47 72 81
East London P 30 53 43 63.8 73.6 53.1 -20.5
Somagunya Senior Secondary School (11) P '2 N W 35 43 63
Qumbu P 25 5 41 71.4 11.6 65.1 53.5
Sonqishe Senior Secondary School (02) P '1 N W 29 57 69
Mt Frere P 6 34 30 20.7 59.6 43.5 -16.2
Sophakama Senior Secondary School (16) P '2 N W 31 17 24
Butterworth P 15 13 11 48.4 76.5 45.8 -30.6
Sophakama Senior Secondary School (22) P '3 N W 48 18 57
Port Elizabeth P 13 11 23 27.1 61.1 40.4 -20.8
Sophathisana Senior Secondary School (18) P '3 N W 128 125 119
East London P 74 55 77 57.8 44.0 64.7 20.7
Sophonia Senior Secondary School (01) P '1 N W 14 13 26
Mt Fletcher P 9 11 11 64.3 84.6 42.3 -42.3
Soqhayisa Senior Secondary School (22) P '5 N W 32 37 54
Port Elizabeth P 21 29 48 65.6 78.4 88.9 10.5
Sosebenza Senior Secondary School (08) P '2 N W 34 41 54
Lady Frere P 21 26 26 61.8 63.4 48.1 -15.3
Sotinini Senior Secondary School (19) P '2 N W 21 14 14
King Williams Town P 16 8 4 76.2 57.1 28.6 -28.6
Sovuka Sikhanye High School (07) P '2 N W 21 22 26
Queenstown P 19 9 11 90.5 40.9 42.3 1.4
Soyisile Senior Secondary School (07) P '2 N W 25 40 47
Queenstown P 18 29 31 72.0 72.5 66.0 -6.5
Spandau Senior Secondary School (20) P '5 N W 146 95 85
Graaff-Reinet P 90 74 79 61.6 77.9 92.9 15.0
St Cuthbert'S Sen Sec School (11) P '3 N W 0 0 39
Qumbu P 0 0 27 69.2
St Albans School (22) P '5 N W 15 6 17
Port Elizabeth P 7 2 7 46.7 33.3 41.2 7.8
St Bartholomews Senior Secondary School (11) P '2 N W 44 53 71
Qumbu P 39 43 60 88.6 81.1 84.5 3.4
St Charles Sojola High School (19) P '3 N W 33 48 43
King Williams Town P 20 30 22 60.6 62.5 51.2 -11.3
St Christophers Private School (19) I '99 N W 54 58 61
King Williams Town P 48 45 53 88.9 77.6 86.9 9.3
St Colmcille Senior Secondary School (23) P '4 N W 53 59 42
Uitenhage P 19 21 25 35.8 35.6 59.5 23.9
St Cuthbert'S Senior Secondary School (11) P '3 N W 66 124 0
Qumbu P 52 52 0 78.8 41.9
St James Secondary School (22) P '5 N W 61 108 64
Port Elizabeth P 32 49 58 52.5 45.4 90.6 45.3
St Johns College (10) P '4 Y W 333 486 303
Mthatha P 295 370 291 88.6 76.1 96.0 19.9
St Jude Private School (10) I '99 N W 11 52 54
Mthatha P 2 38 50 18.2 73.1 92.6 19.5
St Margaret Senior Secondary School (03) P '2 N W 45 84 63
Maluti P 28 55 41 62.2 65.5 65.1 -0.4
St Martins School (10) I '99 N W 62 43 65
Mthatha P 46 31 57 74.2 72.1 87.7 15.6
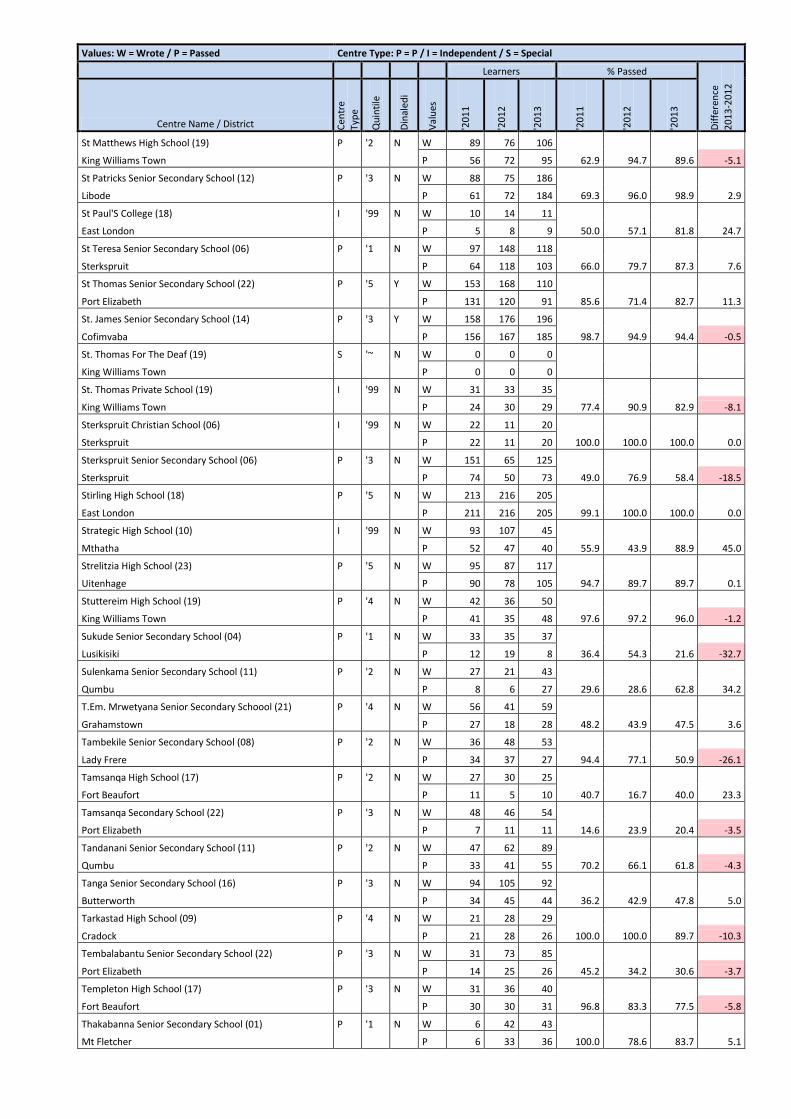
Values: W = Wrote / P = Passed Centre Type: P = P / I = Independent / S = Special
Learners % Passed
Dif
fere
nce
20
13
-20
12
Centre Name / District Cen
tre
Typ
e
Qu
inti
le
Din
aled
i
Val
ues
'20
11
'20
12
'20
13
'20
11
'20
12
'20
13
St Matthews High School (19) P '2 N W 89 76 106
King Williams Town P 56 72 95 62.9 94.7 89.6 -5.1
St Patricks Senior Secondary School (12) P '3 N W 88 75 186
Libode P 61 72 184 69.3 96.0 98.9 2.9
St Paul'S College (18) I '99 N W 10 14 11
East London P 5 8 9 50.0 57.1 81.8 24.7
St Teresa Senior Secondary School (06) P '1 N W 97 148 118
Sterkspruit P 64 118 103 66.0 79.7 87.3 7.6
St Thomas Senior Secondary School (22) P '5 Y W 153 168 110
Port Elizabeth P 131 120 91 85.6 71.4 82.7 11.3
St. James Senior Secondary School (14) P '3 Y W 158 176 196
Cofimvaba P 156 167 185 98.7 94.9 94.4 -0.5
St. Thomas For The Deaf (19) S '~ N W 0 0 0
King Williams Town P 0 0 0
St. Thomas Private School (19) I '99 N W 31 33 35
King Williams Town P 24 30 29 77.4 90.9 82.9 -8.1
Sterkspruit Christian School (06) I '99 N W 22 11 20
Sterkspruit P 22 11 20 100.0 100.0 100.0 0.0
Sterkspruit Senior Secondary School (06) P '3 N W 151 65 125
Sterkspruit P 74 50 73 49.0 76.9 58.4 -18.5
Stirling High School (18) P '5 N W 213 216 205
East London P 211 216 205 99.1 100.0 100.0 0.0
Strategic High School (10) I '99 N W 93 107 45
Mthatha P 52 47 40 55.9 43.9 88.9 45.0
Strelitzia High School (23) P '5 N W 95 87 117
Uitenhage P 90 78 105 94.7 89.7 89.7 0.1
Stuttereim High School (19) P '4 N W 42 36 50
King Williams Town P 41 35 48 97.6 97.2 96.0 -1.2
Sukude Senior Secondary School (04) P '1 N W 33 35 37
Lusikisiki P 12 19 8 36.4 54.3 21.6 -32.7
Sulenkama Senior Secondary School (11) P '2 N W 27 21 43
Qumbu P 8 6 27 29.6 28.6 62.8 34.2
T.Em. Mrwetyana Senior Secondary Schoool (21) P '4 N W 56 41 59
Grahamstown P 27 18 28 48.2 43.9 47.5 3.6
Tambekile Senior Secondary School (08) P '2 N W 36 48 53
Lady Frere P 34 37 27 94.4 77.1 50.9 -26.1
Tamsanqa High School (17) P '2 N W 27 30 25
Fort Beaufort P 11 5 10 40.7 16.7 40.0 23.3
Tamsanqa Secondary School (22) P '3 N W 48 46 54
Port Elizabeth P 7 11 11 14.6 23.9 20.4 -3.5
Tandanani Senior Secondary School (11) P '2 N W 47 62 89
Qumbu P 33 41 55 70.2 66.1 61.8 -4.3
Tanga Senior Secondary School (16) P '3 N W 94 105 92
Butterworth P 34 45 44 36.2 42.9 47.8 5.0
Tarkastad High School (09) P '4 N W 21 28 29
Cradock P 21 28 26 100.0 100.0 89.7 -10.3
Tembalabantu Senior Secondary School (22) P '3 N W 31 73 85
Port Elizabeth P 14 25 26 45.2 34.2 30.6 -3.7
Templeton High School (17) P '3 N W 31 36 40
Fort Beaufort P 30 30 31 96.8 83.3 77.5 -5.8
Thakabanna Senior Secondary School (01) P '1 N W 6 42 43
Mt Fletcher P 6 33 36 100.0 78.6 83.7 5.1
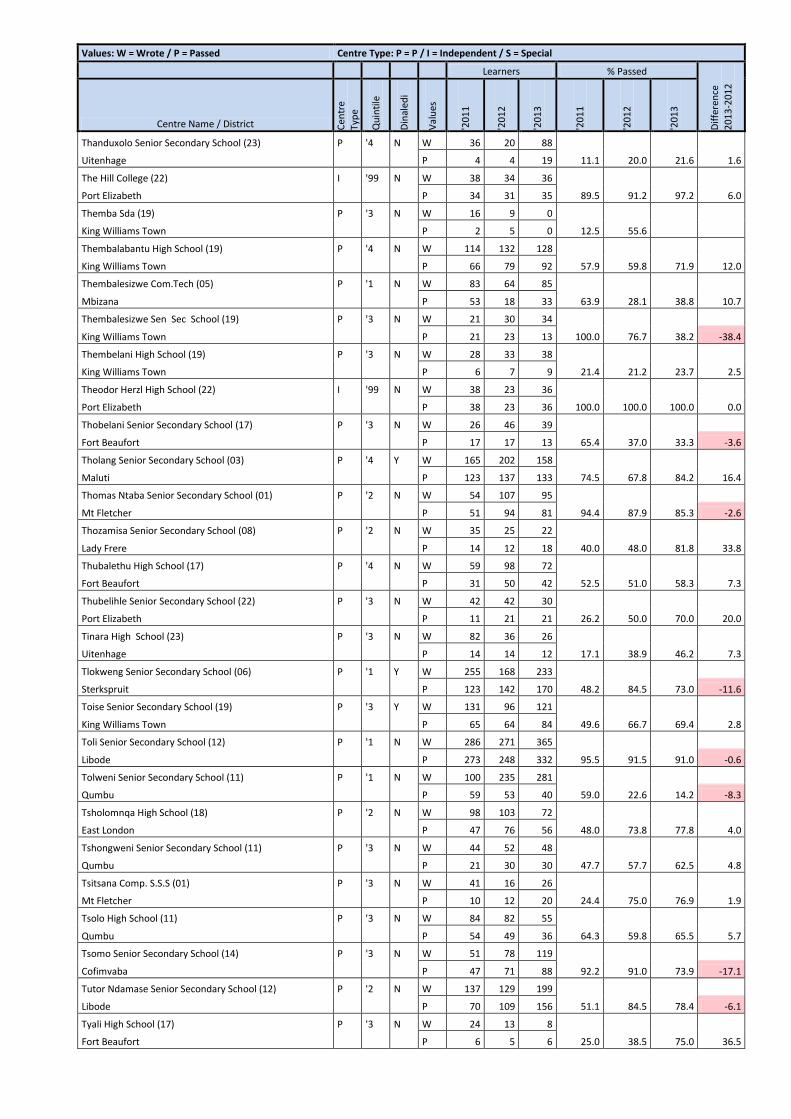
Values: W = Wrote / P = Passed Centre Type: P = P / I = Independent / S = Special
Learners % Passed
Dif
fere
nce
20
13
-20
12
Centre Name / District Cen
tre
Typ
e
Qu
inti
le
Din
aled
i
Val
ues
'20
11
'20
12
'20
13
'20
11
'20
12
'20
13
Thanduxolo Senior Secondary School (23) P '4 N W 36 20 88
Uitenhage P 4 4 19 11.1 20.0 21.6 1.6
The Hill College (22) I '99 N W 38 34 36
Port Elizabeth P 34 31 35 89.5 91.2 97.2 6.0
Themba Sda (19) P '3 N W 16 9 0
King Williams Town P 2 5 0 12.5 55.6
Thembalabantu High School (19) P '4 N W 114 132 128
King Williams Town P 66 79 92 57.9 59.8 71.9 12.0
Thembalesizwe Com.Tech (05) P '1 N W 83 64 85
Mbizana P 53 18 33 63.9 28.1 38.8 10.7
Thembalesizwe Sen Sec School (19) P '3 N W 21 30 34
King Williams Town P 21 23 13 100.0 76.7 38.2 -38.4
Thembelani High School (19) P '3 N W 28 33 38
King Williams Town P 6 7 9 21.4 21.2 23.7 2.5
Theodor Herzl High School (22) I '99 N W 38 23 36
Port Elizabeth P 38 23 36 100.0 100.0 100.0 0.0
Thobelani Senior Secondary School (17) P '3 N W 26 46 39
Fort Beaufort P 17 17 13 65.4 37.0 33.3 -3.6
Tholang Senior Secondary School (03) P '4 Y W 165 202 158
Maluti P 123 137 133 74.5 67.8 84.2 16.4
Thomas Ntaba Senior Secondary School (01) P '2 N W 54 107 95
Mt Fletcher P 51 94 81 94.4 87.9 85.3 -2.6
Thozamisa Senior Secondary School (08) P '2 N W 35 25 22
Lady Frere P 14 12 18 40.0 48.0 81.8 33.8
Thubalethu High School (17) P '4 N W 59 98 72
Fort Beaufort P 31 50 42 52.5 51.0 58.3 7.3
Thubelihle Senior Secondary School (22) P '3 N W 42 42 30
Port Elizabeth P 11 21 21 26.2 50.0 70.0 20.0
Tinara High School (23) P '3 N W 82 36 26
Uitenhage P 14 14 12 17.1 38.9 46.2 7.3
Tlokweng Senior Secondary School (06) P '1 Y W 255 168 233
Sterkspruit P 123 142 170 48.2 84.5 73.0 -11.6
Toise Senior Secondary School (19) P '3 Y W 131 96 121
King Williams Town P 65 64 84 49.6 66.7 69.4 2.8
Toli Senior Secondary School (12) P '1 N W 286 271 365
Libode P 273 248 332 95.5 91.5 91.0 -0.6
Tolweni Senior Secondary School (11) P '1 N W 100 235 281
Qumbu P 59 53 40 59.0 22.6 14.2 -8.3
Tsholomnqa High School (18) P '2 N W 98 103 72
East London P 47 76 56 48.0 73.8 77.8 4.0
Tshongweni Senior Secondary School (11) P '3 N W 44 52 48
Qumbu P 21 30 30 47.7 57.7 62.5 4.8
Tsitsana Comp. S.S.S (01) P '3 N W 41 16 26
Mt Fletcher P 10 12 20 24.4 75.0 76.9 1.9
Tsolo High School (11) P '3 N W 84 82 55
Qumbu P 54 49 36 64.3 59.8 65.5 5.7
Tsomo Senior Secondary School (14) P '3 N W 51 78 119
Cofimvaba P 47 71 88 92.2 91.0 73.9 -17.1
Tutor Ndamase Senior Secondary School (12) P '2 N W 137 129 199
Libode P 70 109 156 51.1 84.5 78.4 -6.1
Tyali High School (17) P '3 N W 24 13 8
Fort Beaufort P 6 5 6 25.0 38.5 75.0 36.5
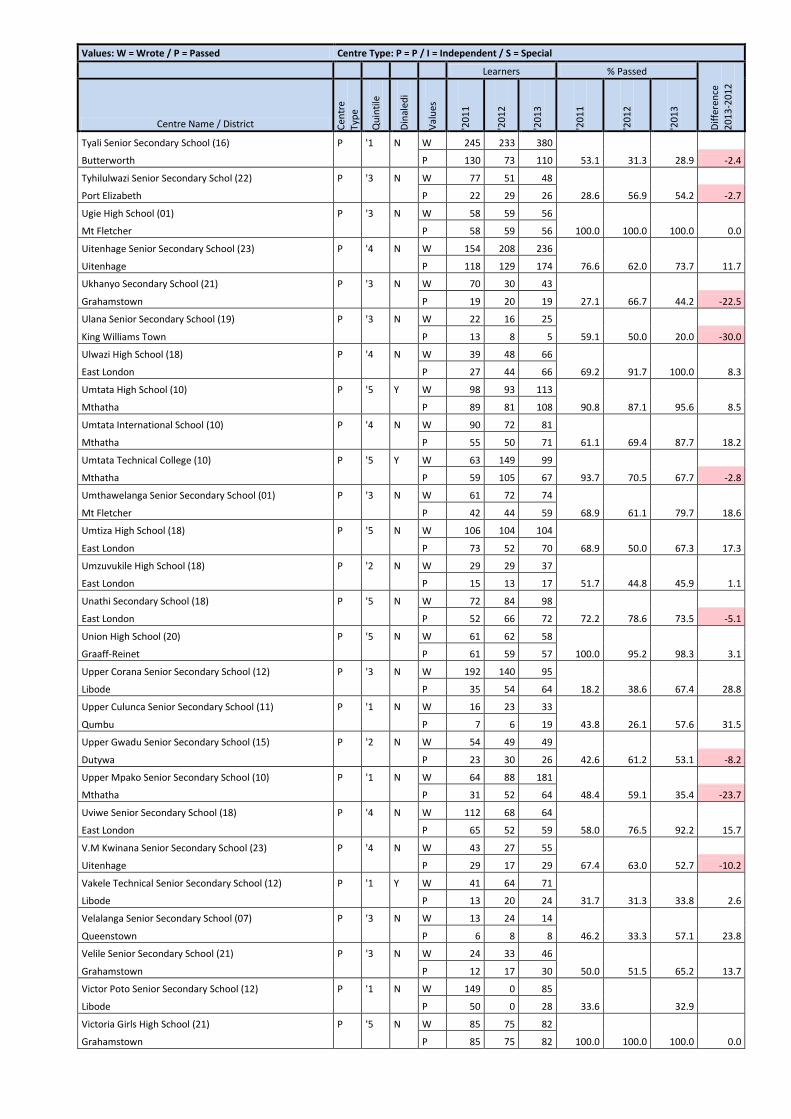
Values: W = Wrote / P = Passed Centre Type: P = P / I = Independent / S = Special
Learners % Passed
Dif
fere
nce
20
13
-20
12
Centre Name / District Cen
tre
Typ
e
Qu
inti
le
Din
aled
i
Val
ues
'20
11
'20
12
'20
13
'20
11
'20
12
'20
13
Tyali Senior Secondary School (16) P '1 N W 245 233 380
Butterworth P 130 73 110 53.1 31.3 28.9 -2.4
Tyhilulwazi Senior Secondary Schol (22) P '3 N W 77 51 48
Port Elizabeth P 22 29 26 28.6 56.9 54.2 -2.7
Ugie High School (01) P '3 N W 58 59 56
Mt Fletcher P 58 59 56 100.0 100.0 100.0 0.0
Uitenhage Senior Secondary School (23) P '4 N W 154 208 236
Uitenhage P 118 129 174 76.6 62.0 73.7 11.7
Ukhanyo Secondary School (21) P '3 N W 70 30 43
Grahamstown P 19 20 19 27.1 66.7 44.2 -22.5
Ulana Senior Secondary School (19) P '3 N W 22 16 25
King Williams Town P 13 8 5 59.1 50.0 20.0 -30.0
Ulwazi High School (18) P '4 N W 39 48 66
East London P 27 44 66 69.2 91.7 100.0 8.3
Umtata High School (10) P '5 Y W 98 93 113
Mthatha P 89 81 108 90.8 87.1 95.6 8.5
Umtata International School (10) P '4 N W 90 72 81
Mthatha P 55 50 71 61.1 69.4 87.7 18.2
Umtata Technical College (10) P '5 Y W 63 149 99
Mthatha P 59 105 67 93.7 70.5 67.7 -2.8
Umthawelanga Senior Secondary School (01) P '3 N W 61 72 74
Mt Fletcher P 42 44 59 68.9 61.1 79.7 18.6
Umtiza High School (18) P '5 N W 106 104 104
East London P 73 52 70 68.9 50.0 67.3 17.3
Umzuvukile High School (18) P '2 N W 29 29 37
East London P 15 13 17 51.7 44.8 45.9 1.1
Unathi Secondary School (18) P '5 N W 72 84 98
East London P 52 66 72 72.2 78.6 73.5 -5.1
Union High School (20) P '5 N W 61 62 58
Graaff-Reinet P 61 59 57 100.0 95.2 98.3 3.1
Upper Corana Senior Secondary School (12) P '3 N W 192 140 95
Libode P 35 54 64 18.2 38.6 67.4 28.8
Upper Culunca Senior Secondary School (11) P '1 N W 16 23 33
Qumbu P 7 6 19 43.8 26.1 57.6 31.5
Upper Gwadu Senior Secondary School (15) P '2 N W 54 49 49
Dutywa P 23 30 26 42.6 61.2 53.1 -8.2
Upper Mpako Senior Secondary School (10) P '1 N W 64 88 181
Mthatha P 31 52 64 48.4 59.1 35.4 -23.7
Uviwe Senior Secondary School (18) P '4 N W 112 68 64
East London P 65 52 59 58.0 76.5 92.2 15.7
V.M Kwinana Senior Secondary School (23) P '4 N W 43 27 55
Uitenhage P 29 17 29 67.4 63.0 52.7 -10.2
Vakele Technical Senior Secondary School (12) P '1 Y W 41 64 71
Libode P 13 20 24 31.7 31.3 33.8 2.6
Velalanga Senior Secondary School (07) P '3 N W 13 24 14
Queenstown P 6 8 8 46.2 33.3 57.1 23.8
Velile Senior Secondary School (21) P '3 N W 24 33 46
Grahamstown P 12 17 30 50.0 51.5 65.2 13.7
Victor Poto Senior Secondary School (12) P '1 N W 149 0 85
Libode P 50 0 28 33.6 32.9
Victoria Girls High School (21) P '5 N W 85 75 82
Grahamstown P 85 75 82 100.0 100.0 100.0 0.0
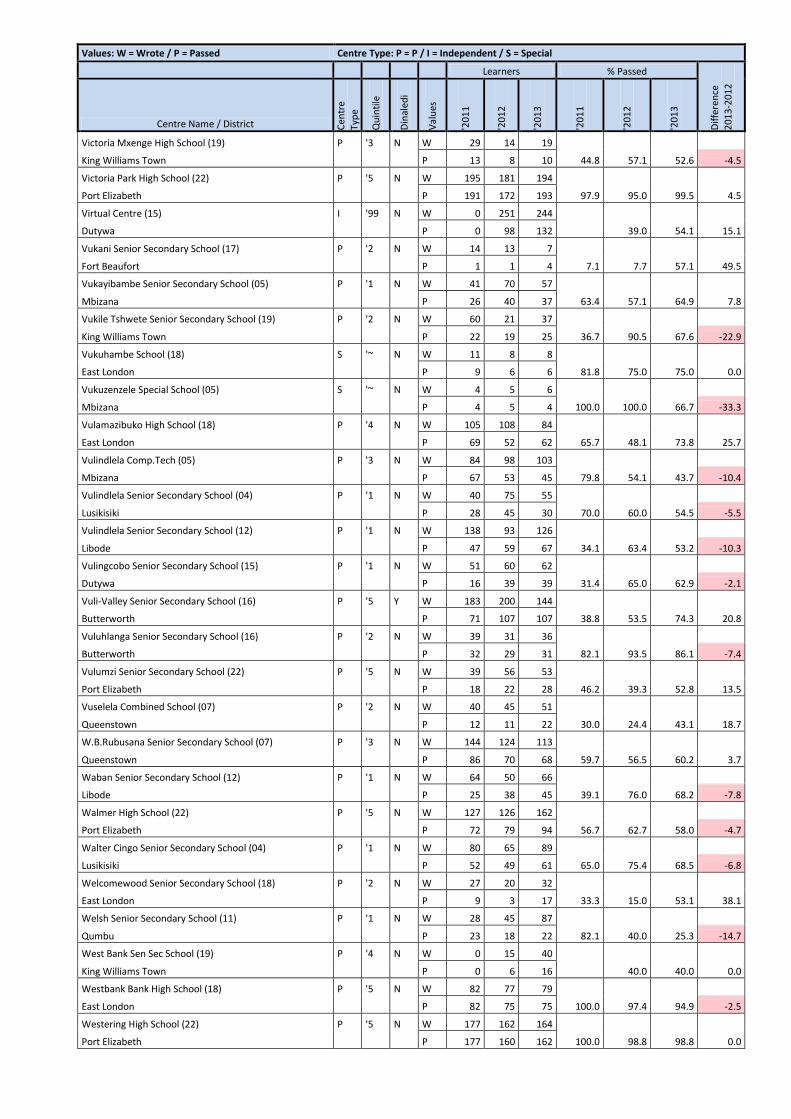
Values: W = Wrote / P = Passed Centre Type: P = P / I = Independent / S = Special
Learners % Passed
Dif
fere
nce
20
13
-20
12
Centre Name / District Cen
tre
Typ
e
Qu
inti
le
Din
aled
i
Val
ues
'20
11
'20
12
'20
13
'20
11
'20
12
'20
13
Victoria Mxenge High School (19) P '3 N W 29 14 19
King Williams Town P 13 8 10 44.8 57.1 52.6 -4.5
Victoria Park High School (22) P '5 N W 195 181 194
Port Elizabeth P 191 172 193 97.9 95.0 99.5 4.5
Virtual Centre (15) I '99 N W 0 251 244
Dutywa P 0 98 132 39.0 54.1 15.1
Vukani Senior Secondary School (17) P '2 N W 14 13 7
Fort Beaufort P 1 1 4 7.1 7.7 57.1 49.5
Vukayibambe Senior Secondary School (05) P '1 N W 41 70 57
Mbizana P 26 40 37 63.4 57.1 64.9 7.8
Vukile Tshwete Senior Secondary School (19) P '2 N W 60 21 37
King Williams Town P 22 19 25 36.7 90.5 67.6 -22.9
Vukuhambe School (18) S '~ N W 11 8 8
East London P 9 6 6 81.8 75.0 75.0 0.0
Vukuzenzele Special School (05) S '~ N W 4 5 6
Mbizana P 4 5 4 100.0 100.0 66.7 -33.3
Vulamazibuko High School (18) P '4 N W 105 108 84
East London P 69 52 62 65.7 48.1 73.8 25.7
Vulindlela Comp.Tech (05) P '3 N W 84 98 103
Mbizana P 67 53 45 79.8 54.1 43.7 -10.4
Vulindlela Senior Secondary School (04) P '1 N W 40 75 55
Lusikisiki P 28 45 30 70.0 60.0 54.5 -5.5
Vulindlela Senior Secondary School (12) P '1 N W 138 93 126
Libode P 47 59 67 34.1 63.4 53.2 -10.3
Vulingcobo Senior Secondary School (15) P '1 N W 51 60 62
Dutywa P 16 39 39 31.4 65.0 62.9 -2.1
Vuli-Valley Senior Secondary School (16) P '5 Y W 183 200 144
Butterworth P 71 107 107 38.8 53.5 74.3 20.8
Vuluhlanga Senior Secondary School (16) P '2 N W 39 31 36
Butterworth P 32 29 31 82.1 93.5 86.1 -7.4
Vulumzi Senior Secondary School (22) P '5 N W 39 56 53
Port Elizabeth P 18 22 28 46.2 39.3 52.8 13.5
Vuselela Combined School (07) P '2 N W 40 45 51
Queenstown P 12 11 22 30.0 24.4 43.1 18.7
W.B.Rubusana Senior Secondary School (07) P '3 N W 144 124 113
Queenstown P 86 70 68 59.7 56.5 60.2 3.7
Waban Senior Secondary School (12) P '1 N W 64 50 66
Libode P 25 38 45 39.1 76.0 68.2 -7.8
Walmer High School (22) P '5 N W 127 126 162
Port Elizabeth P 72 79 94 56.7 62.7 58.0 -4.7
Walter Cingo Senior Secondary School (04) P '1 N W 80 65 89
Lusikisiki P 52 49 61 65.0 75.4 68.5 -6.8
Welcomewood Senior Secondary School (18) P '2 N W 27 20 32
East London P 9 3 17 33.3 15.0 53.1 38.1
Welsh Senior Secondary School (11) P '1 N W 28 45 87
Qumbu P 23 18 22 82.1 40.0 25.3 -14.7
West Bank Sen Sec School (19) P '4 N W 0 15 40
King Williams Town P 0 6 16 40.0 40.0 0.0
Westbank Bank High School (18) P '5 N W 82 77 79
East London P 82 75 75 100.0 97.4 94.9 -2.5
Westering High School (22) P '5 N W 177 162 164
Port Elizabeth P 177 160 162 100.0 98.8 98.8 0.0
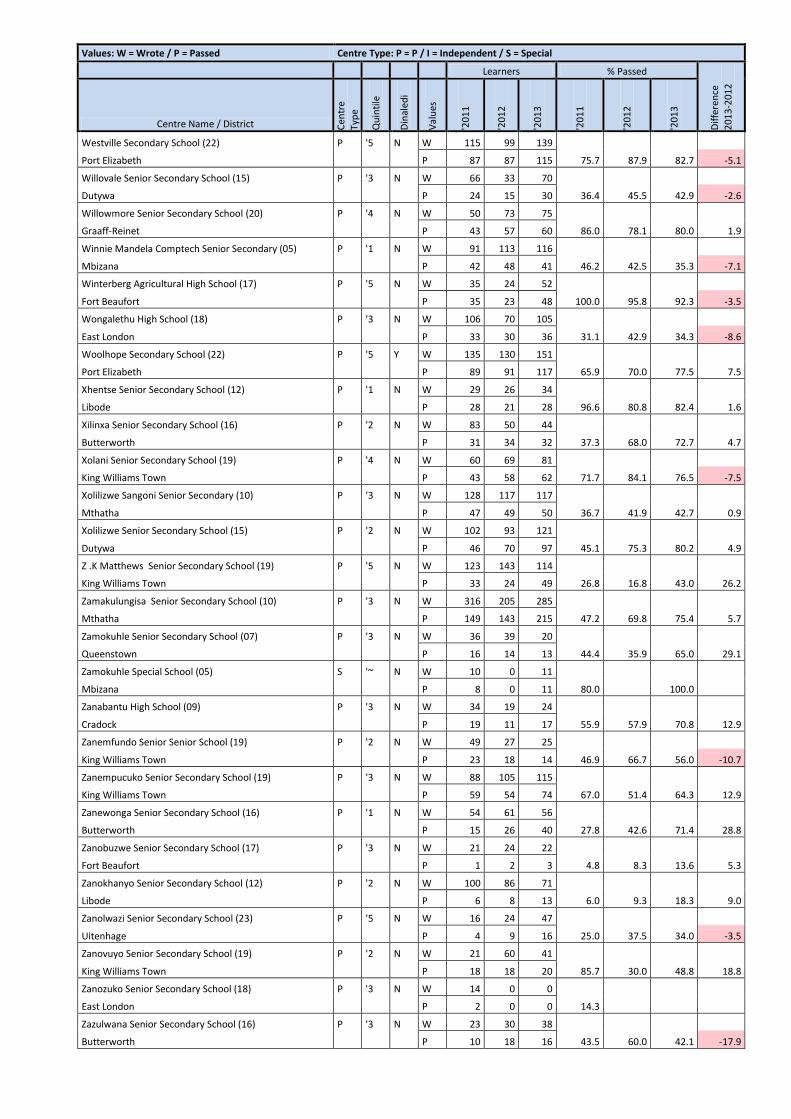
Values: W = Wrote / P = Passed Centre Type: P = P / I = Independent / S = Special
Learners % Passed
Dif
fere
nce
20
13
-20
12
Centre Name / District Cen
tre
Typ
e
Qu
inti
le
Din
aled
i
Val
ues
'20
11
'20
12
'20
13
'20
11
'20
12
'20
13
Westville Secondary School (22) P '5 N W 115 99 139
Port Elizabeth P 87 87 115 75.7 87.9 82.7 -5.1
Willovale Senior Secondary School (15) P '3 N W 66 33 70
Dutywa P 24 15 30 36.4 45.5 42.9 -2.6
Willowmore Senior Secondary School (20) P '4 N W 50 73 75
Graaff-Reinet P 43 57 60 86.0 78.1 80.0 1.9
Winnie Mandela Comptech Senior Secondary (05) P '1 N W 91 113 116
Mbizana P 42 48 41 46.2 42.5 35.3 -7.1
Winterberg Agricultural High School (17) P '5 N W 35 24 52
Fort Beaufort P 35 23 48 100.0 95.8 92.3 -3.5
Wongalethu High School (18) P '3 N W 106 70 105
East London P 33 30 36 31.1 42.9 34.3 -8.6
Woolhope Secondary School (22) P '5 Y W 135 130 151
Port Elizabeth P 89 91 117 65.9 70.0 77.5 7.5
Xhentse Senior Secondary School (12) P '1 N W 29 26 34
Libode P 28 21 28 96.6 80.8 82.4 1.6
Xilinxa Senior Secondary School (16) P '2 N W 83 50 44
Butterworth P 31 34 32 37.3 68.0 72.7 4.7
Xolani Senior Secondary School (19) P '4 N W 60 69 81
King Williams Town P 43 58 62 71.7 84.1 76.5 -7.5
Xolilizwe Sangoni Senior Secondary (10) P '3 N W 128 117 117
Mthatha P 47 49 50 36.7 41.9 42.7 0.9
Xolilizwe Senior Secondary School (15) P '2 N W 102 93 121
Dutywa P 46 70 97 45.1 75.3 80.2 4.9
Z .K Matthews Senior Secondary School (19) P '5 N W 123 143 114
King Williams Town P 33 24 49 26.8 16.8 43.0 26.2
Zamakulungisa Senior Secondary School (10) P '3 N W 316 205 285
Mthatha P 149 143 215 47.2 69.8 75.4 5.7
Zamokuhle Senior Secondary School (07) P '3 N W 36 39 20
Queenstown P 16 14 13 44.4 35.9 65.0 29.1
Zamokuhle Special School (05) S '~ N W 10 0 11
Mbizana P 8 0 11 80.0 100.0
Zanabantu High School (09) P '3 N W 34 19 24
Cradock P 19 11 17 55.9 57.9 70.8 12.9
Zanemfundo Senior Senior School (19) P '2 N W 49 27 25
King Williams Town P 23 18 14 46.9 66.7 56.0 -10.7
Zanempucuko Senior Secondary School (19) P '3 N W 88 105 115
King Williams Town P 59 54 74 67.0 51.4 64.3 12.9
Zanewonga Senior Secondary School (16) P '1 N W 54 61 56
Butterworth P 15 26 40 27.8 42.6 71.4 28.8
Zanobuzwe Senior Secondary School (17) P '3 N W 21 24 22
Fort Beaufort P 1 2 3 4.8 8.3 13.6 5.3
Zanokhanyo Senior Secondary School (12) P '2 N W 100 86 71
Libode P 6 8 13 6.0 9.3 18.3 9.0
Zanolwazi Senior Secondary School (23) P '5 N W 16 24 47
Uitenhage P 4 9 16 25.0 37.5 34.0 -3.5
Zanovuyo Senior Secondary School (19) P '2 N W 21 60 41
King Williams Town P 18 18 20 85.7 30.0 48.8 18.8
Zanozuko Senior Secondary School (18) P '3 N W 14 0 0
East London P 2 0 0 14.3
Zazulwana Senior Secondary School (16) P '3 N W 23 30 38
Butterworth P 10 18 16 43.5 60.0 42.1 -17.9
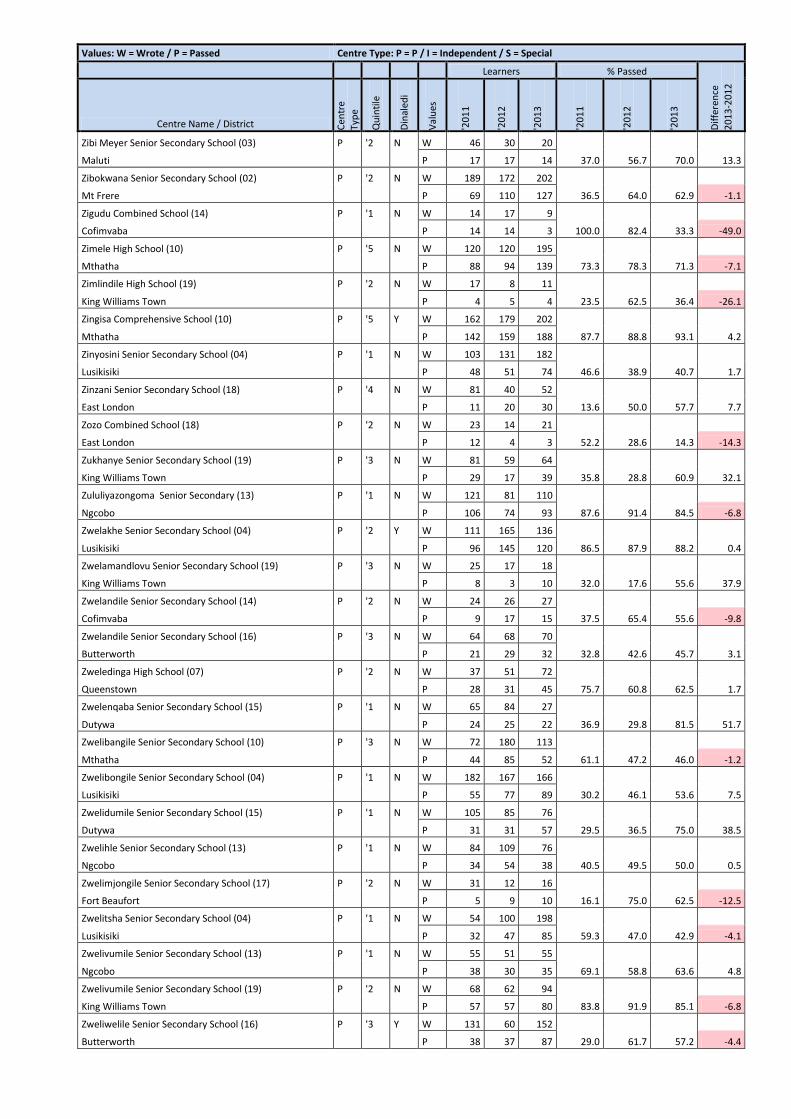
Values: W = Wrote / P = Passed Centre Type: P = P / I = Independent / S = Special
Learners % Passed
Dif
fere
nce
20
13
-20
12
Centre Name / District Cen
tre
Typ
e
Qu
inti
le
Din
aled
i
Val
ues
'20
11
'20
12
'20
13
'20
11
'20
12
'20
13
Zibi Meyer Senior Secondary School (03) P '2 N W 46 30 20
Maluti P 17 17 14 37.0 56.7 70.0 13.3
Zibokwana Senior Secondary School (02) P '2 N W 189 172 202
Mt Frere P 69 110 127 36.5 64.0 62.9 -1.1
Zigudu Combined School (14) P '1 N W 14 17 9
Cofimvaba P 14 14 3 100.0 82.4 33.3 -49.0
Zimele High School (10) P '5 N W 120 120 195
Mthatha P 88 94 139 73.3 78.3 71.3 -7.1
Zimlindile High School (19) P '2 N W 17 8 11
King Williams Town P 4 5 4 23.5 62.5 36.4 -26.1
Zingisa Comprehensive School (10) P '5 Y W 162 179 202
Mthatha P 142 159 188 87.7 88.8 93.1 4.2
Zinyosini Senior Secondary School (04) P '1 N W 103 131 182
Lusikisiki P 48 51 74 46.6 38.9 40.7 1.7
Zinzani Senior Secondary School (18) P '4 N W 81 40 52
East London P 11 20 30 13.6 50.0 57.7 7.7
Zozo Combined School (18) P '2 N W 23 14 21
East London P 12 4 3 52.2 28.6 14.3 -14.3
Zukhanye Senior Secondary School (19) P '3 N W 81 59 64
King Williams Town P 29 17 39 35.8 28.8 60.9 32.1
Zululiyazongoma Senior Secondary (13) P '1 N W 121 81 110
Ngcobo P 106 74 93 87.6 91.4 84.5 -6.8
Zwelakhe Senior Secondary School (04) P '2 Y W 111 165 136
Lusikisiki P 96 145 120 86.5 87.9 88.2 0.4
Zwelamandlovu Senior Secondary School (19) P '3 N W 25 17 18
King Williams Town P 8 3 10 32.0 17.6 55.6 37.9
Zwelandile Senior Secondary School (14) P '2 N W 24 26 27
Cofimvaba P 9 17 15 37.5 65.4 55.6 -9.8
Zwelandile Senior Secondary School (16) P '3 N W 64 68 70
Butterworth P 21 29 32 32.8 42.6 45.7 3.1
Zweledinga High School (07) P '2 N W 37 51 72
Queenstown P 28 31 45 75.7 60.8 62.5 1.7
Zwelenqaba Senior Secondary School (15) P '1 N W 65 84 27
Dutywa P 24 25 22 36.9 29.8 81.5 51.7
Zwelibangile Senior Secondary School (10) P '3 N W 72 180 113
Mthatha P 44 85 52 61.1 47.2 46.0 -1.2
Zwelibongile Senior Secondary School (04) P '1 N W 182 167 166
Lusikisiki P 55 77 89 30.2 46.1 53.6 7.5
Zwelidumile Senior Secondary School (15) P '1 N W 105 85 76
Dutywa P 31 31 57 29.5 36.5 75.0 38.5
Zwelihle Senior Secondary School (13) P '1 N W 84 109 76
Ngcobo P 34 54 38 40.5 49.5 50.0 0.5
Zwelimjongile Senior Secondary School (17) P '2 N W 31 12 16
Fort Beaufort P 5 9 10 16.1 75.0 62.5 -12.5
Zwelitsha Senior Secondary School (04) P '1 N W 54 100 198
Lusikisiki P 32 47 85 59.3 47.0 42.9 -4.1
Zwelivumile Senior Secondary School (13) P '1 N W 55 51 55
Ngcobo P 38 30 35 69.1 58.8 63.6 4.8
Zwelivumile Senior Secondary School (19) P '2 N W 68 62 94
King Williams Town P 57 57 80 83.8 91.9 85.1 -6.8
Zweliwelile Senior Secondary School (16) P '3 Y W 131 60 152
Butterworth P 38 37 87 29.0 61.7 57.2 -4.4
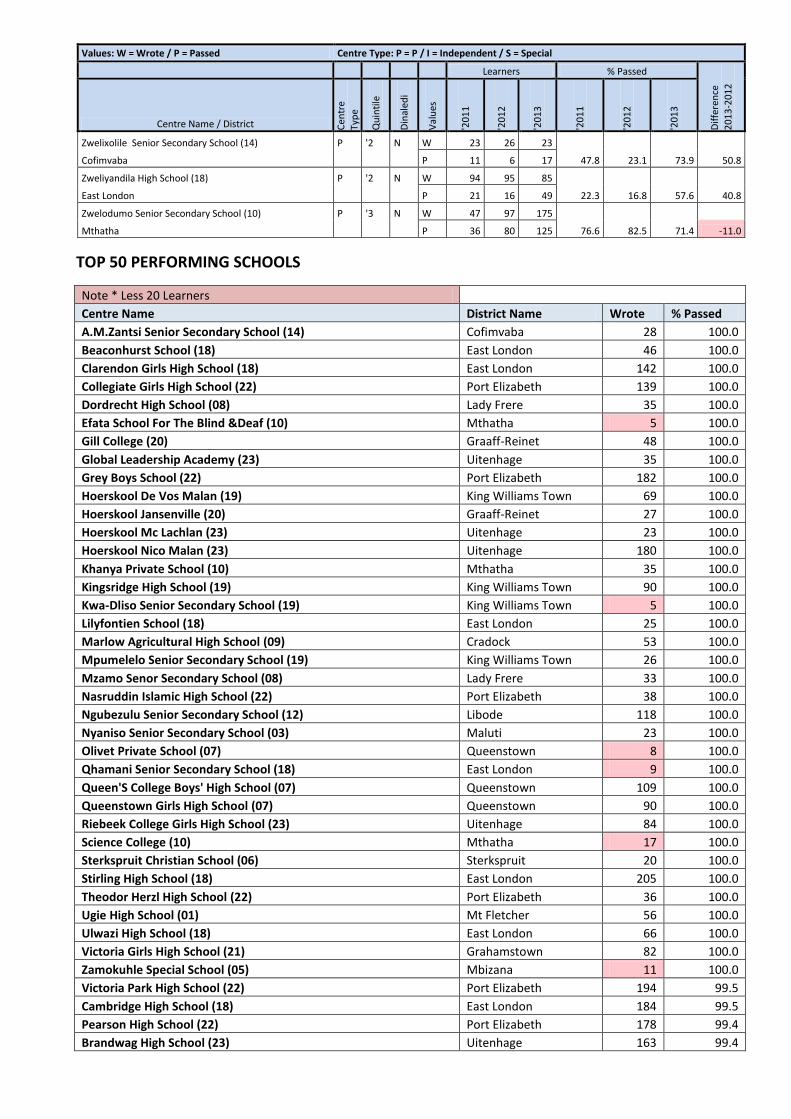
Values: W = Wrote / P = Passed Centre Type: P = P / I = Independent / S = Special
Learners % Passed
Dif
fere
nce
20
13
-20
12
Centre Name / District Cen
tre
Typ
e
Qu
inti
le
Din
aled
i
Val
ues
'20
11
'20
12
'20
13
'20
11
'20
12
'20
13
Zwelixolile Senior Secondary School (14) P '2 N W 23 26 23
Cofimvaba P 11 6 17 47.8 23.1 73.9 50.8
Zweliyandila High School (18) P '2 N W 94 95 85
East London P 21 16 49 22.3 16.8 57.6 40.8
Zwelodumo Senior Secondary School (10) P '3 N W 47 97 175
Mthatha P 36 80 125 76.6 82.5 71.4 -11.0
TOP 50 PERFORMING SCHOOLS
Note * Less 20 Learners Centre Name District Name Wrote % Passed
A.M.Zantsi Senior Secondary School (14) Cofimvaba 28 100.0
Beaconhurst School (18) East London 46 100.0
Clarendon Girls High School (18) East London 142 100.0
Collegiate Girls High School (22) Port Elizabeth 139 100.0
Dordrecht High School (08) Lady Frere 35 100.0
Efata School For The Blind &Deaf (10) Mthatha 5 100.0
Gill College (20) Graaff-Reinet 48 100.0
Global Leadership Academy (23) Uitenhage 35 100.0
Grey Boys School (22) Port Elizabeth 182 100.0
Hoerskool De Vos Malan (19) King Williams Town 69 100.0
Hoerskool Jansenville (20) Graaff-Reinet 27 100.0
Hoerskool Mc Lachlan (23) Uitenhage 23 100.0
Hoerskool Nico Malan (23) Uitenhage 180 100.0
Khanya Private School (10) Mthatha 35 100.0
Kingsridge High School (19) King Williams Town 90 100.0
Kwa-Dliso Senior Secondary School (19) King Williams Town 5 100.0
Lilyfontien School (18) East London 25 100.0
Marlow Agricultural High School (09) Cradock 53 100.0
Mpumelelo Senior Secondary School (19) King Williams Town 26 100.0
Mzamo Senor Secondary School (08) Lady Frere 33 100.0
Nasruddin Islamic High School (22) Port Elizabeth 38 100.0
Ngubezulu Senior Secondary School (12) Libode 118 100.0
Nyaniso Senior Secondary School (03) Maluti 23 100.0
Olivet Private School (07) Queenstown 8 100.0
Qhamani Senior Secondary School (18) East London 9 100.0
Queen'S College Boys' High School (07) Queenstown 109 100.0
Queenstown Girls High School (07) Queenstown 90 100.0
Riebeek College Girls High School (23) Uitenhage 84 100.0
Science College (10) Mthatha 17 100.0
Sterkspruit Christian School (06) Sterkspruit 20 100.0
Stirling High School (18) East London 205 100.0
Theodor Herzl High School (22) Port Elizabeth 36 100.0
Ugie High School (01) Mt Fletcher 56 100.0
Ulwazi High School (18) East London 66 100.0
Victoria Girls High School (21) Grahamstown 82 100.0
Zamokuhle Special School (05) Mbizana 11 100.0
Victoria Park High School (22) Port Elizabeth 194 99.5
Cambridge High School (18) East London 184 99.5
Pearson High School (22) Port Elizabeth 178 99.4
Brandwag High School (23) Uitenhage 163 99.4
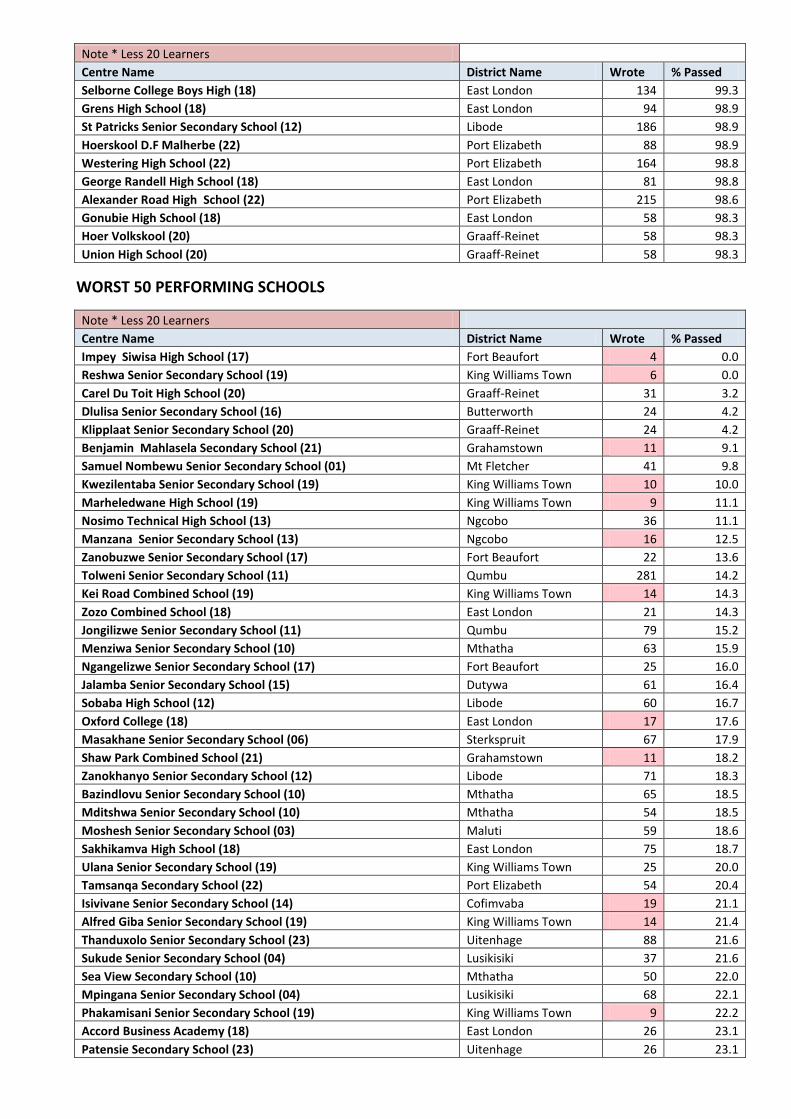
Note * Less 20 Learners Centre Name District Name Wrote % Passed
Selborne College Boys High (18) East London 134 99.3
Grens High School (18) East London 94 98.9
St Patricks Senior Secondary School (12) Libode 186 98.9
Hoerskool D.F Malherbe (22) Port Elizabeth 88 98.9
Westering High School (22) Port Elizabeth 164 98.8
George Randell High School (18) East London 81 98.8
Alexander Road High School (22) Port Elizabeth 215 98.6
Gonubie High School (18) East London 58 98.3
Hoer Volkskool (20) Graaff-Reinet 58 98.3
Union High School (20) Graaff-Reinet 58 98.3
WORST 50 PERFORMING SCHOOLS
Note * Less 20 Learners
Centre Name District Name Wrote % Passed
Impey Siwisa High School (17) Fort Beaufort 4 0.0
Reshwa Senior Secondary School (19) King Williams Town 6 0.0
Carel Du Toit High School (20) Graaff-Reinet 31 3.2
Dlulisa Senior Secondary School (16) Butterworth 24 4.2
Klipplaat Senior Secondary School (20) Graaff-Reinet 24 4.2
Benjamin Mahlasela Secondary School (21) Grahamstown 11 9.1
Samuel Nombewu Senior Secondary School (01) Mt Fletcher 41 9.8
Kwezilentaba Senior Secondary School (19) King Williams Town 10 10.0
Marheledwane High School (19) King Williams Town 9 11.1
Nosimo Technical High School (13) Ngcobo 36 11.1
Manzana Senior Secondary School (13) Ngcobo 16 12.5
Zanobuzwe Senior Secondary School (17) Fort Beaufort 22 13.6
Tolweni Senior Secondary School (11) Qumbu 281 14.2
Kei Road Combined School (19) King Williams Town 14 14.3
Zozo Combined School (18) East London 21 14.3
Jongilizwe Senior Secondary School (11) Qumbu 79 15.2
Menziwa Senior Secondary School (10) Mthatha 63 15.9
Ngangelizwe Senior Secondary School (17) Fort Beaufort 25 16.0
Jalamba Senior Secondary School (15) Dutywa 61 16.4
Sobaba High School (12) Libode 60 16.7
Oxford College (18) East London 17 17.6
Masakhane Senior Secondary School (06) Sterkspruit 67 17.9
Shaw Park Combined School (21) Grahamstown 11 18.2
Zanokhanyo Senior Secondary School (12) Libode 71 18.3
Bazindlovu Senior Secondary School (10) Mthatha 65 18.5
Mditshwa Senior Secondary School (10) Mthatha 54 18.5
Moshesh Senior Secondary School (03) Maluti 59 18.6
Sakhikamva High School (18) East London 75 18.7
Ulana Senior Secondary School (19) King Williams Town 25 20.0
Tamsanqa Secondary School (22) Port Elizabeth 54 20.4
Isivivane Senior Secondary School (14) Cofimvaba 19 21.1
Alfred Giba Senior Secondary School (19) King Williams Town 14 21.4
Thanduxolo Senior Secondary School (23) Uitenhage 88 21.6
Sukude Senior Secondary School (04) Lusikisiki 37 21.6
Sea View Secondary School (10) Mthatha 50 22.0
Mpingana Senior Secondary School (04) Lusikisiki 68 22.1
Phakamisani Senior Secondary School (19) King Williams Town 9 22.2
Accord Business Academy (18) East London 26 23.1
Patensie Secondary School (23) Uitenhage 26 23.1
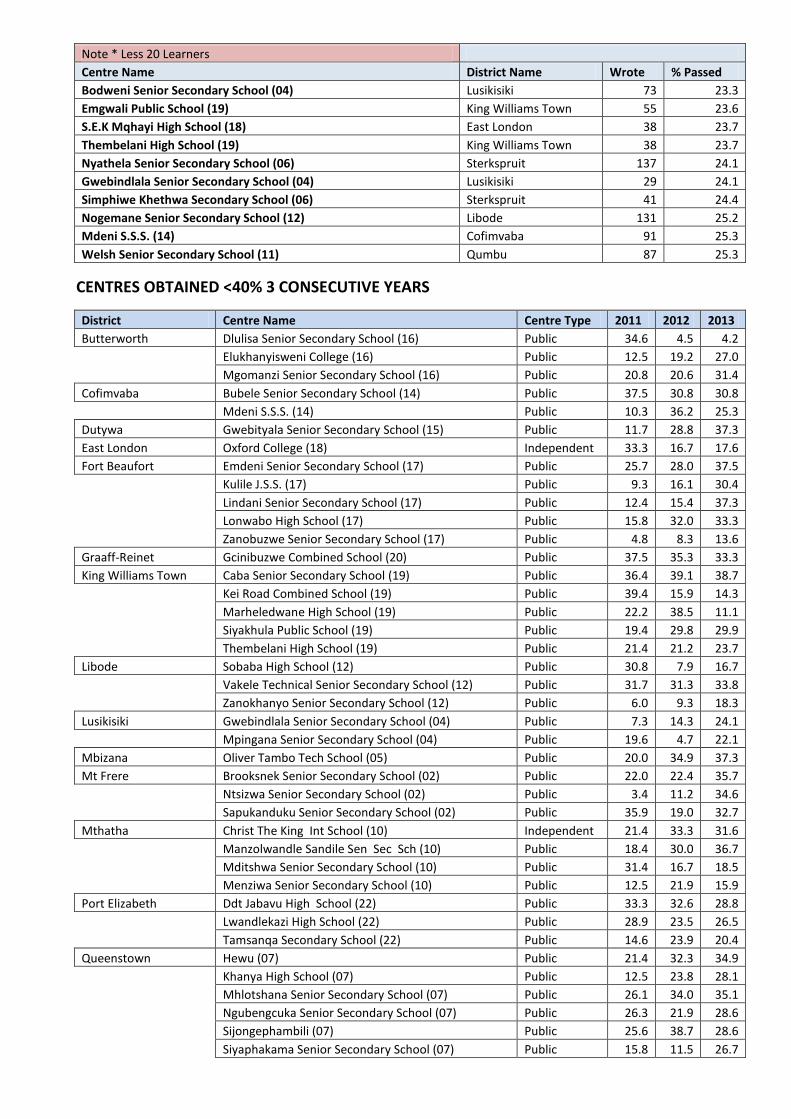
Note * Less 20 Learners
Centre Name District Name Wrote % Passed
Bodweni Senior Secondary School (04) Lusikisiki 73 23.3
Emgwali Public School (19) King Williams Town 55 23.6
S.E.K Mqhayi High School (18) East London 38 23.7
Thembelani High School (19) King Williams Town 38 23.7
Nyathela Senior Secondary School (06) Sterkspruit 137 24.1
Gwebindlala Senior Secondary School (04) Lusikisiki 29 24.1
Simphiwe Khethwa Secondary School (06) Sterkspruit 41 24.4
Nogemane Senior Secondary School (12) Libode 131 25.2
Mdeni S.S.S. (14) Cofimvaba 91 25.3
Welsh Senior Secondary School (11) Qumbu 87 25.3
CENTRES OBTAINED <40% 3 CONSECUTIVE YEARS
District Centre Name Centre Type 2011 2012 2013
Butterworth Dlulisa Senior Secondary School (16) Public 34.6 4.5 4.2
Elukhanyisweni College (16) Public 12.5 19.2 27.0
Mgomanzi Senior Secondary School (16) Public 20.8 20.6 31.4
Cofimvaba Bubele Senior Secondary School (14) Public 37.5 30.8 30.8
Mdeni S.S.S. (14) Public 10.3 36.2 25.3
Dutywa Gwebityala Senior Secondary School (15) Public 11.7 28.8 37.3
East London Oxford College (18) Independent 33.3 16.7 17.6
Fort Beaufort Emdeni Senior Secondary School (17) Public 25.7 28.0 37.5
Kulile J.S.S. (17) Public 9.3 16.1 30.4
Lindani Senior Secondary School (17) Public 12.4 15.4 37.3
Lonwabo High School (17) Public 15.8 32.0 33.3
Zanobuzwe Senior Secondary School (17) Public 4.8 8.3 13.6
Graaff-Reinet Gcinibuzwe Combined School (20) Public 37.5 35.3 33.3
King Williams Town Caba Senior Secondary School (19) Public 36.4 39.1 38.7
Kei Road Combined School (19) Public 39.4 15.9 14.3
Marheledwane High School (19) Public 22.2 38.5 11.1
Siyakhula Public School (19) Public 19.4 29.8 29.9
Thembelani High School (19) Public 21.4 21.2 23.7
Libode Sobaba High School (12) Public 30.8 7.9 16.7
Vakele Technical Senior Secondary School (12) Public 31.7 31.3 33.8
Zanokhanyo Senior Secondary School (12) Public 6.0 9.3 18.3
Lusikisiki Gwebindlala Senior Secondary School (04) Public 7.3 14.3 24.1
Mpingana Senior Secondary School (04) Public 19.6 4.7 22.1
Mbizana Oliver Tambo Tech School (05) Public 20.0 34.9 37.3
Mt Frere Brooksnek Senior Secondary School (02) Public 22.0 22.4 35.7
Ntsizwa Senior Secondary School (02) Public 3.4 11.2 34.6
Sapukanduku Senior Secondary School (02) Public 35.9 19.0 32.7
Mthatha Christ The King Int School (10) Independent 21.4 33.3 31.6
Manzolwandle Sandile Sen Sec Sch (10) Public 18.4 30.0 36.7
Mditshwa Senior Secondary School (10) Public 31.4 16.7 18.5
Menziwa Senior Secondary School (10) Public 12.5 21.9 15.9
Port Elizabeth Ddt Jabavu High School (22) Public 33.3 32.6 28.8
Lwandlekazi High School (22) Public 28.9 23.5 26.5
Tamsanqa Secondary School (22) Public 14.6 23.9 20.4
Queenstown Hewu (07) Public 21.4 32.3 34.9
Khanya High School (07) Public 12.5 23.8 28.1
Mhlotshana Senior Secondary School (07) Public 26.1 34.0 35.1
Ngubengcuka Senior Secondary School (07) Public 26.3 21.9 28.6
Sijongephambili (07) Public 25.6 38.7 28.6
Siyaphakama Senior Secondary School (07) Public 15.8 11.5 26.7
District Centre Name Centre Type 2011 2012 2013
Sterkspruit Cebolethu High School (06) Public 28.6 35.7 36.4
Sivumelene Senior Secondary School (06) Public 9.5 10.0 25.6
Uitenhage Phaphani Senior Secondary School (23) Public 27.9 28.8 29.4
Thanduxolo Senior Secondary School (23) Public 11.1 20.0 21.6
Zanolwazi Senior Secondary School (23) Public 25.0 37.5 34.0
Notes
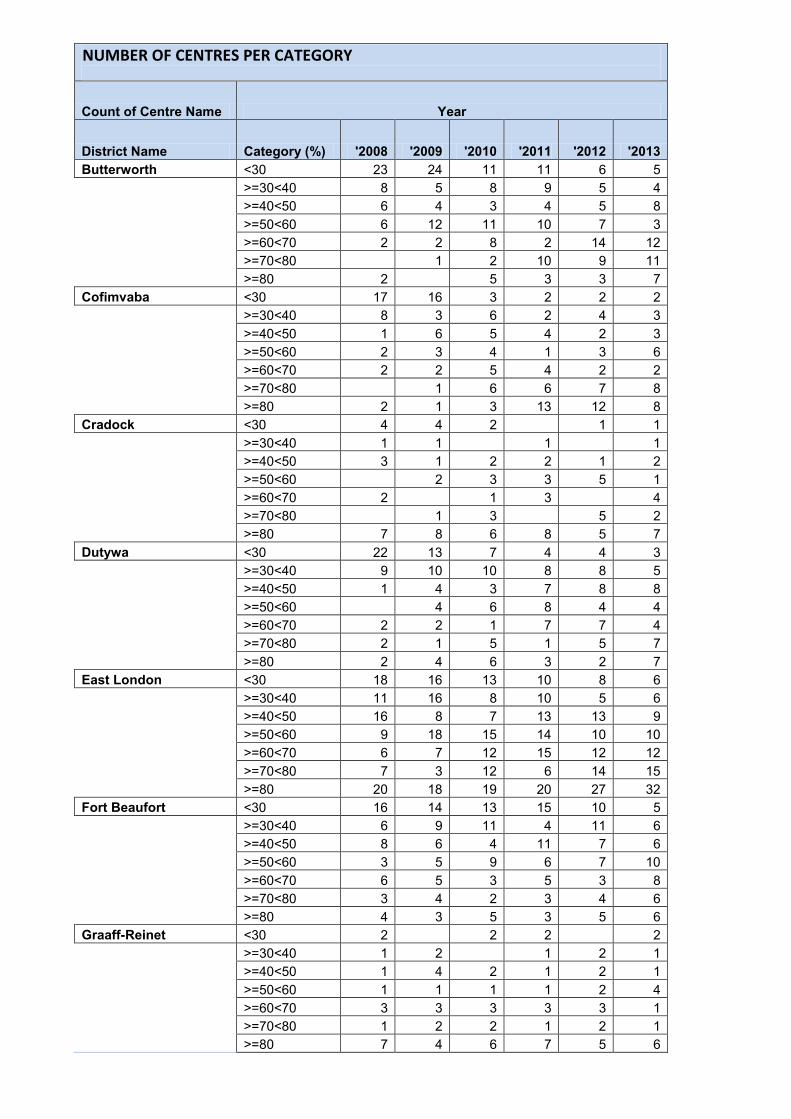
NUMBER OF CENTRES PER CATEGORY
Count of Centre Name Year
District Name Category (%) '2008 '2009 '2010 '2011 '2012 '2013
Butterworth <30 23 24 11 11 6 5
>=30<40 8 5 8 9 5 4
>=40<50 6 4 3 4 5 8
>=50<60 6 12 11 10 7 3
>=60<70 2 2 8 2 14 12
>=70<80 1 2 10 9 11
>=80 2 5 3 3 7
Cofimvaba <30 17 16 3 2 2 2
>=30<40 8 3 6 2 4 3
>=40<50 1 6 5 4 2 3
>=50<60 2 3 4 1 3 6
>=60<70 2 2 5 4 2 2
>=70<80 1 6 6 7 8
>=80 2 1 3 13 12 8
Cradock <30 4 4 2 1 1
>=30<40 1 1 1 1
>=40<50 3 1 2 2 1 2
>=50<60 2 3 3 5 1
>=60<70 2 1 3 4
>=70<80 1 3 5 2
>=80 7 8 6 8 5 7
Dutywa <30 22 13 7 4 4 3
>=30<40 9 10 10 8 8 5
>=40<50 1 4 3 7 8 8
>=50<60 4 6 8 4 4
>=60<70 2 2 1 7 7 4
>=70<80 2 1 5 1 5 7
>=80 2 4 6 3 2 7
East London <30 18 16 13 10 8 6
>=30<40 11 16 8 10 5 6
>=40<50 16 8 7 13 13 9
>=50<60 9 18 15 14 10 10
>=60<70 6 7 12 15 12 12
>=70<80 7 3 12 6 14 15
>=80 20 18 19 20 27 32
Fort Beaufort <30 16 14 13 15 10 5
>=30<40 6 9 11 4 11 6
>=40<50 8 6 4 11 7 6
>=50<60 3 5 9 6 7 10
>=60<70 6 5 3 5 3 8
>=70<80 3 4 2 3 4 6
>=80 4 3 5 3 5 6
Graaff-Reinet <30 2 2 2 2
>=30<40 1 2 1 2 1
>=40<50 1 4 2 1 2 1
>=50<60 1 1 1 1 2 4
>=60<70 3 3 3 3 3 1
>=70<80 1 2 2 1 2 1
>=80 7 4 6 7 5 6
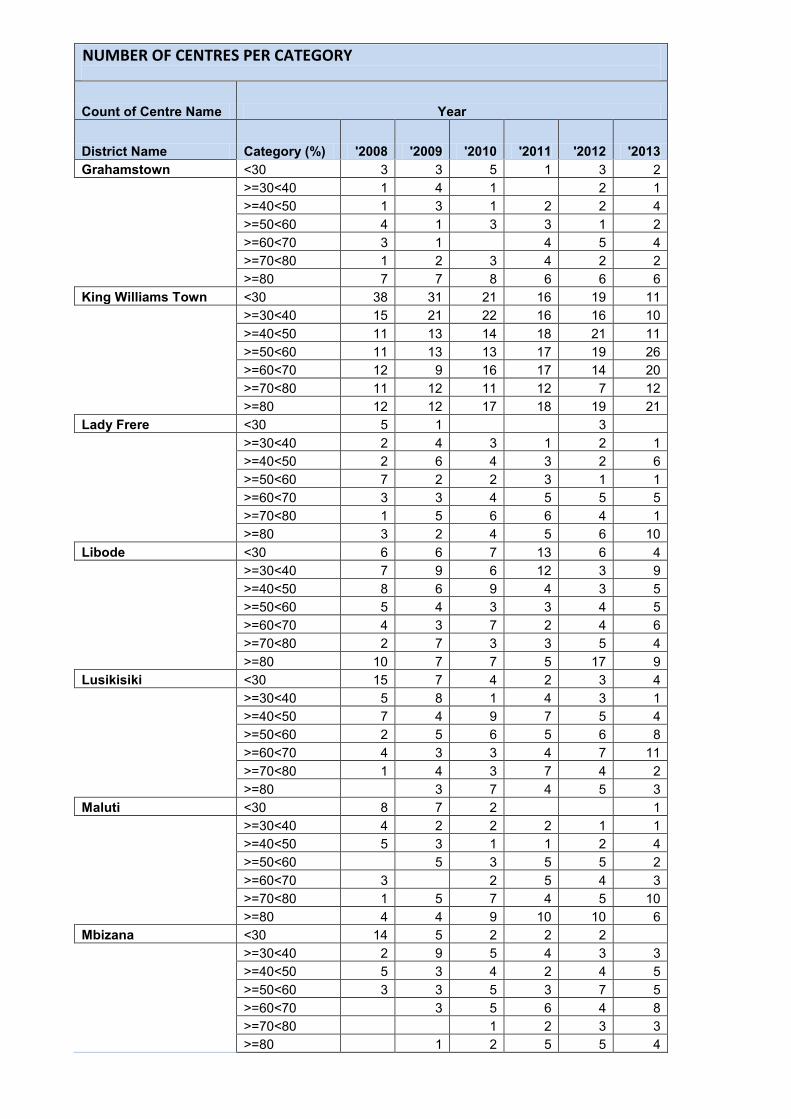
NUMBER OF CENTRES PER CATEGORY
Count of Centre Name Year
District Name Category (%) '2008 '2009 '2010 '2011 '2012 '2013
Grahamstown <30 3 3 5 1 3 2
>=30<40 1 4 1 2 1
>=40<50 1 3 1 2 2 4
>=50<60 4 1 3 3 1 2
>=60<70 3 1 4 5 4
>=70<80 1 2 3 4 2 2
>=80 7 7 8 6 6 6
King Williams Town <30 38 31 21 16 19 11
>=30<40 15 21 22 16 16 10
>=40<50 11 13 14 18 21 11
>=50<60 11 13 13 17 19 26
>=60<70 12 9 16 17 14 20
>=70<80 11 12 11 12 7 12
>=80 12 12 17 18 19 21
Lady Frere <30 5 1 3
>=30<40 2 4 3 1 2 1
>=40<50 2 6 4 3 2 6
>=50<60 7 2 2 3 1 1
>=60<70 3 3 4 5 5 5
>=70<80 1 5 6 6 4 1
>=80 3 2 4 5 6 10
Libode <30 6 6 7 13 6 4
>=30<40 7 9 6 12 3 9
>=40<50 8 6 9 4 3 5
>=50<60 5 4 3 3 4 5
>=60<70 4 3 7 2 4 6
>=70<80 2 7 3 3 5 4
>=80 10 7 7 5 17 9
Lusikisiki <30 15 7 4 2 3 4
>=30<40 5 8 1 4 3 1
>=40<50 7 4 9 7 5 4
>=50<60 2 5 6 5 6 8
>=60<70 4 3 3 4 7 11
>=70<80 1 4 3 7 4 2
>=80 3 7 4 5 3
Maluti <30 8 7 2 1
>=30<40 4 2 2 2 1 1
>=40<50 5 3 1 1 2 4
>=50<60 5 3 5 5 2
>=60<70 3 2 5 4 3
>=70<80 1 5 7 4 5 10
>=80 4 4 9 10 10 6
Mbizana <30 14 5 2 2 2
>=30<40 2 9 5 4 3 3
>=40<50 5 3 4 2 4 5
>=50<60 3 3 5 3 7 5
>=60<70 3 5 6 4 8
>=70<80 1 2 3 3
>=80 1 2 5 5 4
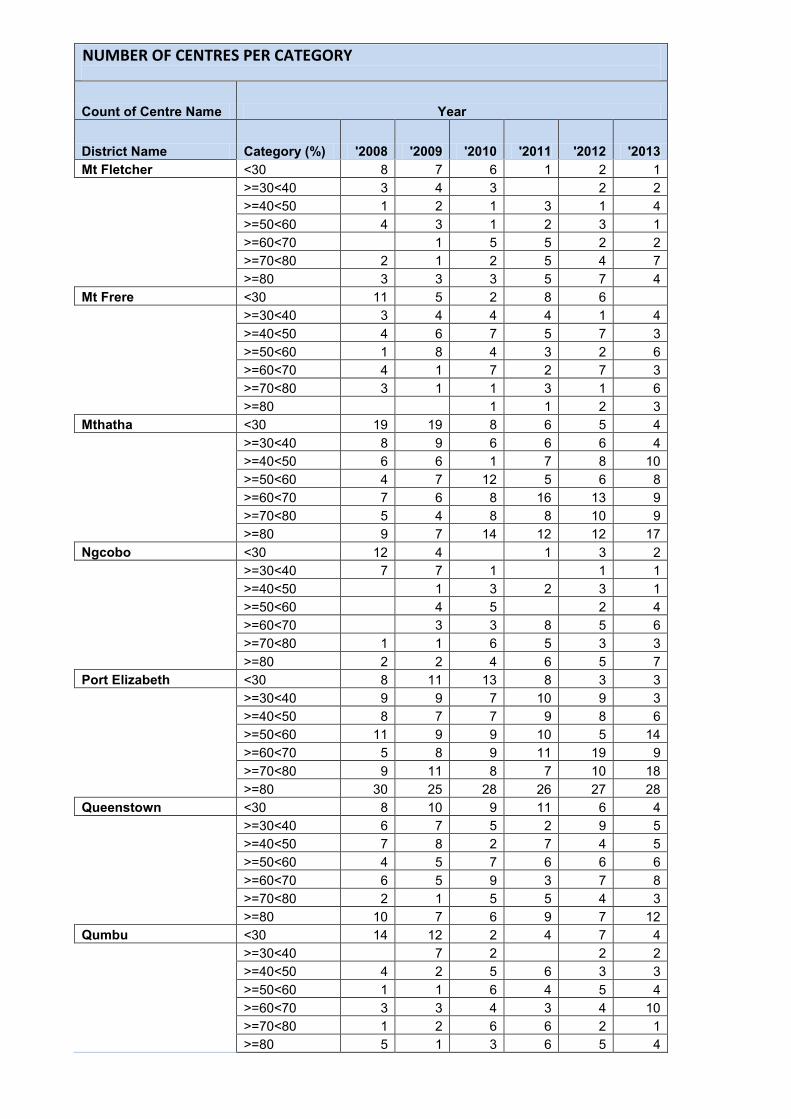
NUMBER OF CENTRES PER CATEGORY
Count of Centre Name Year
District Name Category (%) '2008 '2009 '2010 '2011 '2012 '2013
Mt Fletcher <30 8 7 6 1 2 1
>=30<40 3 4 3 2 2
>=40<50 1 2 1 3 1 4
>=50<60 4 3 1 2 3 1
>=60<70 1 5 5 2 2
>=70<80 2 1 2 5 4 7
>=80 3 3 3 5 7 4
Mt Frere <30 11 5 2 8 6
>=30<40 3 4 4 4 1 4
>=40<50 4 6 7 5 7 3
>=50<60 1 8 4 3 2 6
>=60<70 4 1 7 2 7 3
>=70<80 3 1 1 3 1 6
>=80 1 1 2 3
Mthatha <30 19 19 8 6 5 4
>=30<40 8 9 6 6 6 4
>=40<50 6 6 1 7 8 10
>=50<60 4 7 12 5 6 8
>=60<70 7 6 8 16 13 9
>=70<80 5 4 8 8 10 9
>=80 9 7 14 12 12 17
Ngcobo <30 12 4 1 3 2
>=30<40 7 7 1 1 1
>=40<50 1 3 2 3 1
>=50<60 4 5 2 4
>=60<70 3 3 8 5 6
>=70<80 1 1 6 5 3 3
>=80 2 2 4 6 5 7
Port Elizabeth <30 8 11 13 8 3 3
>=30<40 9 9 7 10 9 3
>=40<50 8 7 7 9 8 6
>=50<60 11 9 9 10 5 14
>=60<70 5 8 9 11 19 9
>=70<80 9 11 8 7 10 18
>=80 30 25 28 26 27 28
Queenstown <30 8 10 9 11 6 4
>=30<40 6 7 5 2 9 5
>=40<50 7 8 2 7 4 5
>=50<60 4 5 7 6 6 6
>=60<70 6 5 9 3 7 8
>=70<80 2 1 5 5 4 3
>=80 10 7 6 9 7 12
Qumbu <30 14 12 2 4 7 4
>=30<40 7 2 2 2
>=40<50 4 2 5 6 3 3
>=50<60 1 1 6 4 5 4
>=60<70 3 3 4 3 4 10
>=70<80 1 2 6 6 2 1
>=80 5 1 3 6 5 4
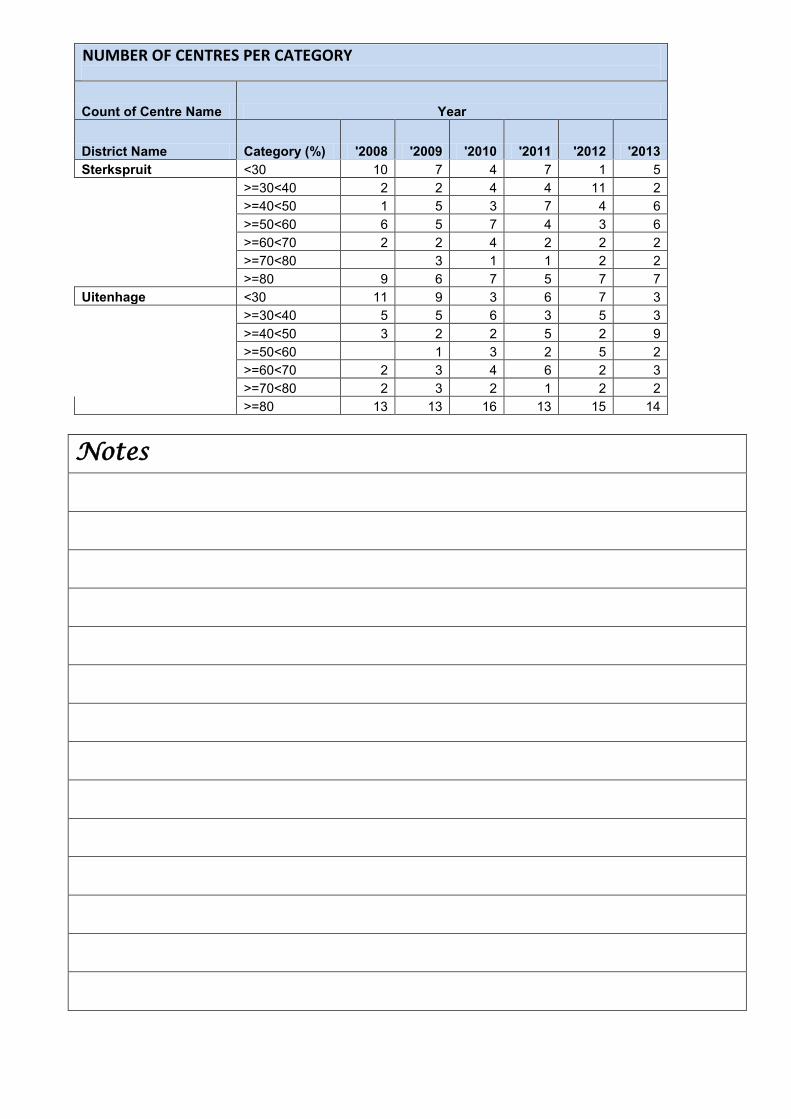
NUMBER OF CENTRES PER CATEGORY
Count of Centre Name Year
District Name Category (%) '2008 '2009 '2010 '2011 '2012 '2013
Sterkspruit <30 10 7 4 7 1 5
>=30<40 2 2 4 4 11 2
>=40<50 1 5 3 7 4 6
>=50<60 6 5 7 4 3 6
>=60<70 2 2 4 2 2 2
>=70<80 3 1 1 2 2
>=80 9 6 7 5 7 7
Uitenhage <30 11 9 3 6 7 3
>=30<40 5 5 6 3 5 3
>=40<50 3 2 2 5 2 9
>=50<60 1 3 2 5 2
>=60<70 2 3 4 6 2 3
>=70<80 2 3 2 1 2 2
>=80 13 13 16 13 15 14
Notes