gps-based mapping system reveals lightning inside storms
TRANSCRIPT

Eos,Vol. 81, No. 3, January 18, 2000
VOLUME 81 NUMBER 3
JANUARY 18, 2000
PAGES 21-32
GPS-based Mapping System Reveals Lightning Inside Storms PAGES 21-22,25
Great Plains storms are known for their ability to produce severe weather.They are also prodigious producers of lightning; just how prodigious has been vividly illustrated by observations in central Oklahoma with a new Global Positioning System (GPS)-based lightning mapping system.The observations are useful not only for studying storm electrifica
tion but also provide a valuable indicator of storm structure and intensity
The system maps lightning in three spatial dimensions by measuring the times at which impulsive VHF radiation events arrive at a network of ground-based measurement stations. Low-cost GPS receivers provide sufficient timing accuracy to produce high-quality pictures of the total lightning activity over a large area.
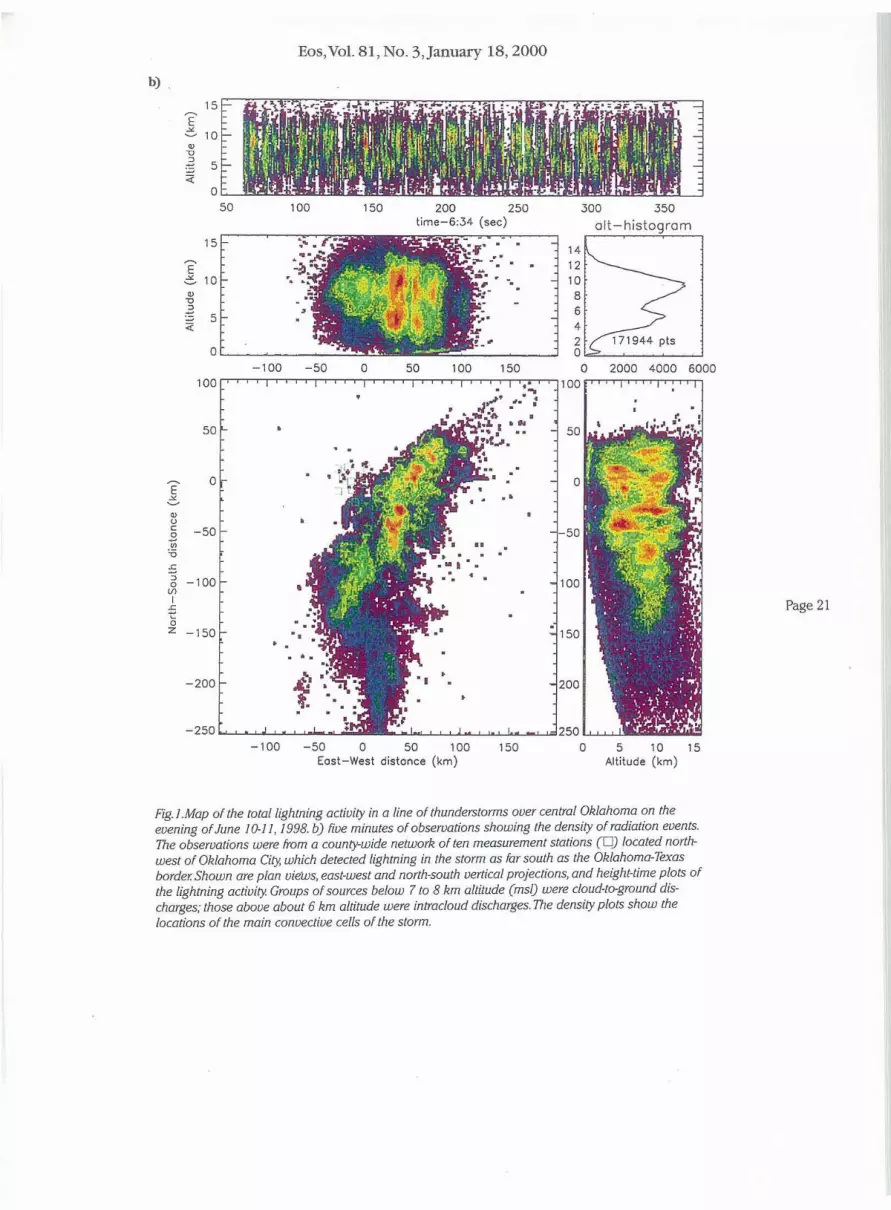
Figure 1 shows observations from a line of thunderstorms that moved over central Oklahoma on the night of June 10-11,1998.Ten mapping stations were deployed over a county-wide area northwest of Oklahoma City and detected lightning from the storm system as far south as the Oklahoma-Texas border. Figure la shows one minute of activity in the storm; major lightning discharges occurred about once per second at different locations along the 200-300 km extent of the storm,out to the maximum range of the mapping system.
Figure lb shows a slightly expanded view of five minutes of observations from the storm. Instead of overlaying individual radiation
0 100
-West distance ( k m )
200 0 5 10 15 2 0
Aitltude ( km) - 1 0 0 - 5 0 0 5 0 ION
E a s t - W e s t distance (km) 0 5 10 15
Altitude (km)
Fig. 1. Map of the total lightning activity in a line of thunderstorms over central Oklahoma on the evening of June 10-11,1998. a) One minute of observations showing individual radiation events from lightning discharges in the storm; b) five minutes of observations showing the density of radiation events. The observations were from a county-wide network often measurement stations(n) located northwest of Oklahoma City, which detected lightning in the storm as far south as the Oklahoma-Texas border, shown are plan views, east-west and north-south vertical projections, and height-time plots of the lightning activity. Groups of sources below 7 to 8 km altitude (msl) were cloud-to-ground discharges; those above about 6 km altitude were intraclooud discharges. The density plots show the locations of the main convective sells of the storm. Original color image appears at the back of this volume.
E O S , T R A N S A C T I O N S , A M E R I C A N G E O P H Y S I C A L U N I O N

Eos,Vol. 81, No. 3, January 18,2000
is 4 r
14 r
12 r
10 r
4 r
2 l -
20 ~
0 -
« - 2 0 "D
O CO
- 4 0 -o z
- 6 0
- 8 0 b
MS A 22.0 22.5
t i m e - 6 : 3 3 ( s e c )
-20 20 40 -i 1 r-
• J
- 2 0 20 40
23.0
ai t -h istogram
-a 14
12
0 100 200 300 in pirp111ui[rrrjTTTjn]j
20
-20
-40
- 6 0
d - 8 0
0 2 4 6 8 1 0 1 2 1 4
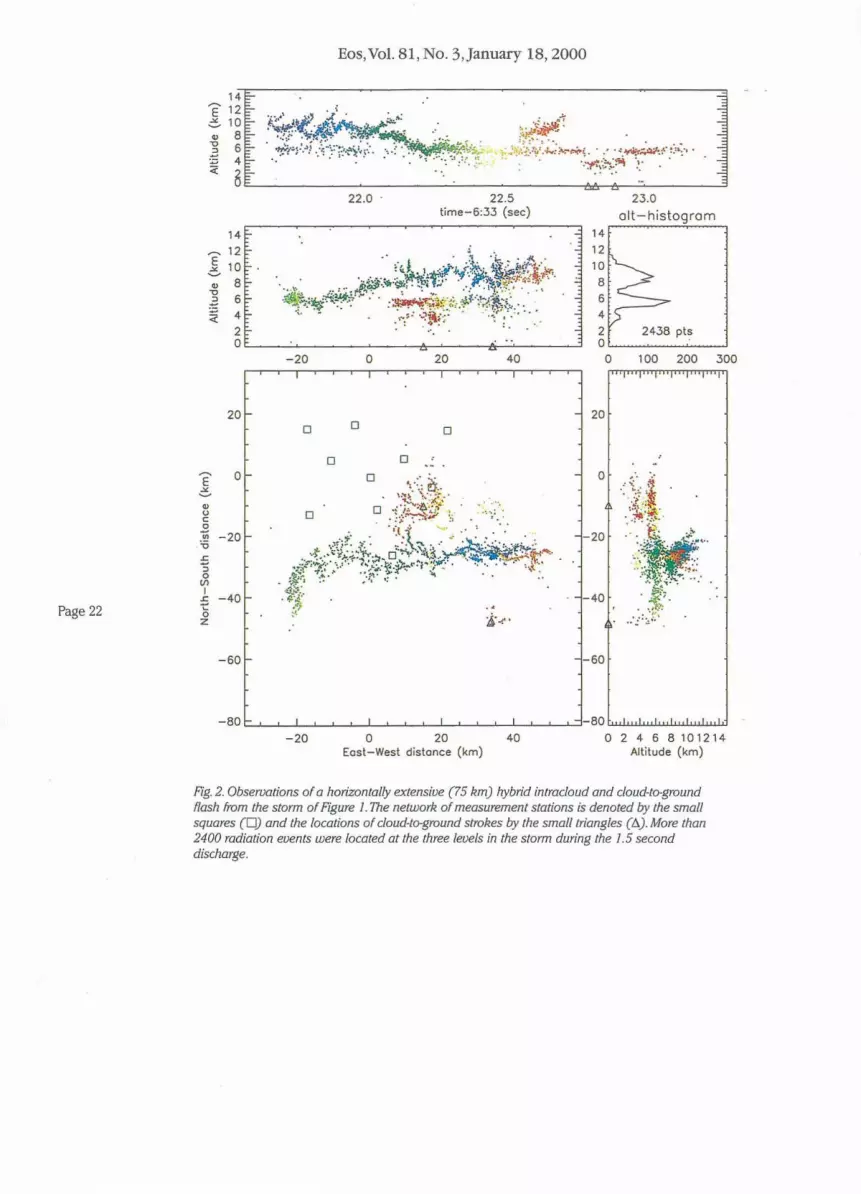
Fig. 2. Observations of a horizontally extensive (75 km) hybrid intracloud and cloud-to-ground Hash from the storm of Figure 1. The network of measurement stations is denoted by the small squares (U) and the locations of cloud-to-ground strokes by the small triangles (A). More than 2400 radiation events were located at the three levels in the storm during the 1.5 second discharge. Original color image appears at the back of this volume.
sources on top of one another, as in Figure la, the figure now shows the density of the radiation sources.The lightning activity was most concentrated in several locations that corresponded to the main convective cells of the storm. Animations of the observations show the motion of both the individual cells and of the storm as a whole.
System Operation
The mapping system was developed at the New Mexico Institute of Mining and Technology under an Academic Research Infrastructure grant from the National Science Foundation, and was initially operated in Oklahoma during June 1998.The system is patterned after the Lightning Detection and Ranging (LDAR) system developed at NASAs Kennedy Space Center [Maier et al, 1995], and operates by detecting radiation from lightning discharges in an unused VHF television channel, in this case, channel 3 (60-66 MHZ).
Rather than telemeter high-bandwidth data to a central site to measure the time-of-arrival values, as in the LDAR system, the new system takes advantage of low-cost GPS technology to measure the arrival times independently at each remote location.The arrival times are determined with 50 ns time resolution by synchronizing a 20 MHZ digitizer to the 1 pulse per second output of a GPS receiver at each station [Rison etal., 1999].
The time of the peak radiation event is recorded in every 100 microsecond window that the lightning signal exceeds a noise threshold.The observations are then post-processed using an automated procedure that determines the source of the radiation in space and time.The statistics of the measurement errors indicate overall timing uncertainties of 40-50 ns rms, corresponding to 50 to 100 m best-case location errors over the network. The errors increase with distance from the network, with the locations becoming two-dimensional at large distances.The radio signal propagation is primarily line-of-sight, causing the minimum source altitude to increase with range, as seen in Figure 1.
The time-of-arrival technique constitutes an accurate space-time filter that extracts correlated events from the complex data stream and rejects uncorrelated events.This allows sorting of simultaneous activity either from a given lightning discharge or from multiple discharges in different locations.The sorting ability is crucial in large storm systems where lightning activity is widespread and often nearly continuous. During the Oklahoma studies it was not unusual for the system to be triggered in 90% of the 100 microsecond data windows during active storms; 500 to 1000 events per second were typically located during such activity.
A Horizontally Extensive Discharge
Figure 2 shows observations of a horizontally extensive lightning discharge from the Figure
1 storm.The discharge occurred over the southeastern edge of the measurement network and had an extent of 75 km in an east-west direction. It discharged three charge levels in the storm; from other studies, the middle level (at 5-6 km mean sea level (msl)) corresponded to the main negative charge region of the storm and the upper level to the upper positive charge [e.g.,Shao and Krehbiel, \996].
The lightning began as an intracloud discharge between the main negative and upper positive charges. During this time the upper level channel propagated more than 50 km to the west and decreased in altitude (blue and green sources), indicating that the upper positive charge region similarly decreased in altitude. Subsequent breakdown in the main negative charge region extended the discharge to the north (red sources), where it produced a
negative-polarity stroke to ground.The time and location of the ground stroke are indicated by data from the National Lightning Detection Network (NLDN) [Cummins et al., 1998], denoted by the small triangle near x = +15 km, y = -10 km in Figure 2.
In the process of going to ground, the breakdown appeared to discharge a region of lower positive charge, indicated by a third level of (red) radiation sources between 3 and 4 km altitude. At the same time, a simpler cloud-to-ground discharge occurred in a separate part of the storm to the south, for which the NLDN located two strokes to ground.
Supercell Lightning
Figure 3 shows one minute of lightning in a large "supercell" storm, one of several that occurred over central Oklahoma on the after-
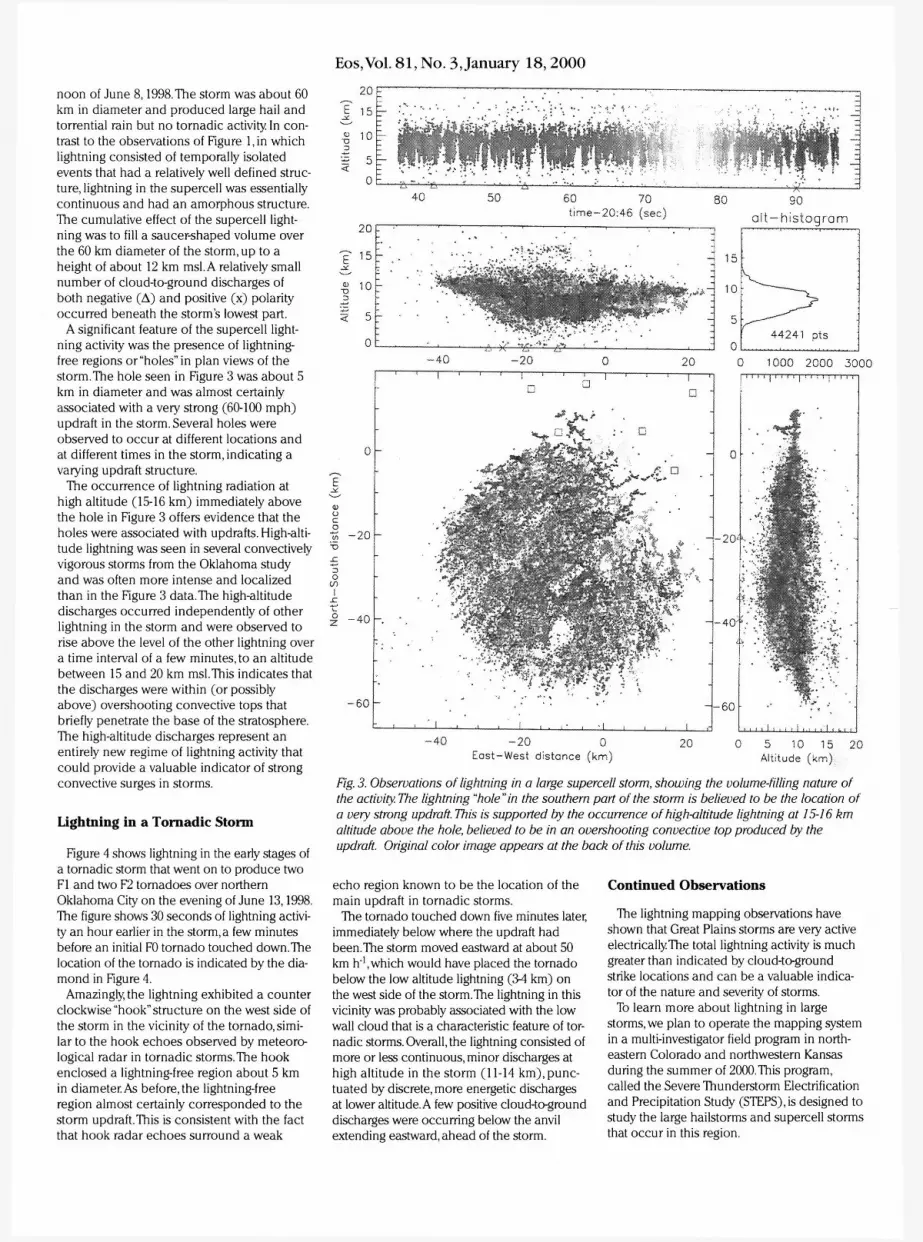
noon of June 8,1998.The storm was about 60 km in diameter and produced large hail and torrential rain but no tornadic activity In contrast to the observations of Figure 1, in which lightning consisted of temporally isolated events that had a relatively well defined structure, lightning in the supercell was essentially continuous and had an amorphous structure. The cumulative effect of the supercell lightning was to fill a saucer-shaped volume over the 60 km diameter of the storm, up to a height of about 12 km msl. A relatively small number of cloud-to-ground discharges of both negative ( A ) and positive ( x ) polarity occurred beneath the storm's lowest part.
A significant feature of the supercell lightning activity was the presence of lightning-free regions or "holes" in plan views of the storm. The hole seen in Figure 3 was about 5 km in diameter and was almost certainly associated with a very strong (60-100 mph) updraft in the storm. Several holes were observed to occur at different locations and at different times in the storm, indicating a varying updraft structure.
The occurrence of lightning radiation at high altitude (15-16 km) immediately above the hole in Figure 3 offers evidence that the holes were associated with updrafts. High-altitude lightning was seen in several convectively vigorous storms from the Oklahoma study and was often more intense and localized than in the Figure 3 data.The high-altitude discharges occurred independently of other lightning in the storm and were observed to rise above the level of the other lightning over a time interval of a few minutes, to an altitude between 15 and 20 km msl.This indicates that the discharges were within (or possibly above) overshooting convective tops that briefly penetrate the base of the stratosphere. The high-altitude discharges represent an entirely new regime of lightning activity that could provide a valuable indicator of strong convective surges in storms.
Lightning in a Tornadic Storm
Figure 4 shows lightning in the early stages of a tornadic storm that went on to produce two Fl and two F2 tornadoes over northern Oklahoma City on the evening of June 13,1998. The figure shows 30 seconds of lightning activity an hour earlier in the storm, a few minutes before an initial F0 tornado touched down.The location of the tornado is indicated by the diamond in Figure 4.
Amazingly, the lightning exhibited a counter clockwise "hook" structure on the west side of the storm in the vicinity of the tornado, similar to the hook echoes observed by meteorological radar in tornadic storms.The hook enclosed a lightning-free region about 5 km in diameter. As before, the lightning-free region almost certainly corresponded to the storm updraft.This is consistent with the fact that hook radar echoes surround a weak
Eos, Vol. 81, No. 3 January 18, 2000
t • . y . '*':.. .... =
E~ 1 ::li.lEff!
40 50 60 70 t i m e - 2 0 : 4 6 ( s e c )
80
ol
-. y( :
90
I -h istogram
-40 - 2 0 0 Eas t -West distance ( k m )
0 5 10 15 20 Altitude ( k m )
Fig. 3. Observations of lightning in a large supercell storm, showing the volume-filling nature of the activity. The lightning "hole"in the southern part of the storm is believed to be the location of a very strong updraft. This is supported by the occurrence of high-altitude lightning at 15-16 km altitude above the hole, believed to be in an overshooting convective top produced by the updraft. Original color image appears at the back of this volume.
echo region known to be the location of the main updraft in tornadic storms.
The tornado touched down five minutes later, immediately below where the updraft had been.The storm moved eastward at about 50 km h"1, which would have placed the tornado below the low altitude lightning (34 km) on the west side of the storm.The lightning in this vicinity was probably associated with the low wall cloud that is a characteristic feature of tornadic storms. Overall, the lightning consisted of more or less continuous, minor discharges at high altitude in the storm (11-14 km), punctuated by discrete, more energetic discharges at lower altitude. A few positive cloud-to-ground discharges were occurring below the anvil extending eastward, ahead of the storm.
Continued Observations
The lightning mapping observations have shown that Great Plains storms are very active electrically The total lightning activity is much greater than indicated by cloud-to-ground strike locations and can be a valuable indicator of the nature and severity of storms.
To learn more about lightning in large storms, we plan to operate the mapping system in a multi-investigator field program in northeastern Colorado and northwestern Kansas during the summer of 2000.This program, called the Severe Thunderstorm Electrification and Precipitation Study (STEPS), is designed to study the large hailstorms and supercell storms that occur in this region.

Eos, Vol. 81, No. 3, January 18, 2000
20
« 10
i 5
20
15
10
5
0
10 15
-20
- 2 0
a - 4 0 ~
-60
-80 t -20
, • X A 1
20 25 30 t ime-0 :1 1 ( s e c )
20 - X - X * ^
40 60
X ><f. <
20 40 60 East-West distance ( k m )
35 40 alt-histogram
80 0 500 1000 1500 ' ' I ' ' I ' ! ' ' I I I ' I
— 2 0 *
•40
-60
d - 8 0
v^-
0 5 10 15 20 Altitude ( k m )
Fig. 4. Observations of lightning at the beginning of a tornado-producing storm.The black diamond nearx = 0 km,y = -30 km indicates the location of the first, small F0 tornado from the storm. The lightning activity exhibited a hook-like structure on the west side of the storm and a lightning-free region immediately above the tornado track, similar to the hook echoes and weak-echo regions observed by meteorological radars. Original color image appears at the back of this volume.
In STEPS, the lightning observations will be compared with in-cloud measurements of the electrical and microphysical structure of the storms, as well as with Doppler and dual-polarization meteorological radar measurements. Similar observations have been obtained on smaller New Mexico storms at Tech's Langmuir Laboratory for Atmospheric Research, using the mapping system.
Another network of mapping stations will be operated by NASA scientists in northern Alabama to study storms in the southern United States. Low-Earth-Orbit optical lightning imagers are providing fascinating observations of the distribution of lightning over the surface of the Earth [e.g., Christian and Latham, 1998], and the NASA mapping system will be used to help evaluate a
proposed geosynchronous optical Lightning Mapping Sensor. Satellite observations of individual lightning discharges have been shown to be well correlated with ground-based measurements from the lightning mapping system (/?. J. Thomas et al, Comparison of ground-based 3-dimensional lightning mapping observations with satellite-based LIS observations in Oklahoma, submitted to Geophysical Research Letters, 1999).
Current work with the lightning mapping system is directed at processing the observations in real time, both for research studies and for potential operational applications.The realtime observations are obtained by communicating the time-of-arrival measurements to a central location via wireless links or the Internet for processing and display For further information on the lightning mapping observations,see http://www.lightning.nmt.edu/nmt_lms.
Acknowledgments
This work has been supported by the National Science Foundation under ARI Grant ATM-9601652. Initial development of the lightning mapping system was supported by the U.S. Air Force Office of Scientific Research under Grant F49620-96-1-0304.
Authors
Paul R. Krehbiel, Ronald J. Thomas, William Rison, Timothy Hamlin, Jeremiah Harlin, and Michael Davis Langmuir Laboratory for Atmospheric Research, Geophysical Research Center, New Mexico Institute of Mining and Technology, Socorro, NewMex.,USA
References
Christian, H. J.,and J. Latham, Satellite measurements of global lightning, Q.J. R.Meteorol.Soc, 124,1771-1773,1998.
Cummins, K. L., M.J. Murphy, E. A. Bardo, W L. Hiscox, R. B. Pyle, and A. E. Pifer, A combined TOA/MDF technology upgrade of the U.S. National Lightning Detection Network,./ Geophys.Res., 703,9O3S 9044,1998.
Maier, L., C. Lennon,T. Britt, and S. Schaefer, LDAR system performance and analysis, paper presented at International Conference on Cloud Physics, Am. Meteorol. Soc, Dallas, Tex., Jan. 1995.
Rison, W , R. J.Thomas, PR. Krehbiel,T. Hamlin, and J. Harlin, A GPS-based three-dimensional lightning mapping system: Initial observations in central New Mexico, Geophys. Res. Lett., 26,3573-3576,1999.
Shao,X.M.,and PR.Krehbiel,The spatial and temporal development of intracloud lightning, J. Geophys.Res., 707,26,641-26,668,1996.

Page 21
a)
20
E 15 C-
0 10 "0
.~ 5 '1 0
10
20
E 15 C-o 10 "0
~ '1 5
a -200
100
E C-o a u c 0 ;; '0
"' '5 0 Vl I -100
'2 0 z
-200
-200
Eos,Yol. 81, No. 3,January 18,2000
20 30 40 50 time-6:36 (sec)
'.-': .
-100
, .
-100 0 100 East- West distance (km)
0 .:
60 70 olt-histogrom
15
10
5
a 200 a 500 1000 1500
100
200 0 5 10 15 20 AIHtude (km)
Fig. I. Map of the total lightning activity in a line of thunderstorms over central Oklahoma on the evening of June 10-1 J, 1998. oj One minute a/observations showing individual radiation events from lightning discharges in the storm. The observations were from a county-wide network of ten measure· menl stations (0) located northwest of Oklahoma City, which detected lightning in the storm as far south as the Oklahoma· Texas border. Shown are plan views, east·west and north-south vertical projections, and heighHime plots of the lightning activity. Groups of sources below 7 to 8 km altitude (ms/) were cloud-ta-ground discharges; those above about 6 km altitude were intracioud discharges. The density plots show the locations of the main convective cells of the storm.
Eos,Vol. 81, No. 3,January 18,2000
b)
15 E 6 10 • u
~ 5
" a 50 100 150 200 250 300 350
time-6:34 (sec) alt-histogram 15
14
E 12 6 10 " 10
• 8 u
~ 5 6
" 4
a 2 171944 pts a
-100 a 2000 4000 6000 100
50
E a 6 ' . • u c -50 0 ;;; .. 'i5 .c "5 -100 0 • Ul I
= " z -150
-200 1-- 250
-100 -50 a 50 100 150 a 5 10 15 East-West distance (km) Altitude (km)
Fig.l.Map of the lolallightning activity in a line of thunderstorms over central Oklahoma on the evening of June} 0-11, 1998. b) five minutes of observations showing the density of radiation events. The observations were from a county-wide network of ten measurement stations (0) located northwest of Oklahoma City, which detected lightning in the storm as far south as the Oklahoma-Texas border: Shown are plan vieWs, east-west and north-south vertical projections, and height-time plots of the lightning activity. Croups of sources below 7 to 8 km altitude (ms/) were cloud-la-ground discharges; those above about 6 km altitude were intracloud discharges. The density plots show the locations of the main convective cells of the storm.
Page 21
Page 22
14
~ 12 f~ 10 -; 8 :3 6~ ~ 4
2
Eos,Vol. 81, No. 3, January 18,2000
22.0 22.5 time-6:33 (sec)
14 " 12
23.0
alt-histogram
OL-__ ~ ____ ~ ____ ~~ __ ~~ __ ~ 2438 pt~
20
E 0 C-o u c o ;;; -20 f'6 .c .., o
III I
,s -40 f-a z
-60 f-
-20 0 , ,
0 0
0
20 40 a 100 200 300 , ",. .,".,'
20 0
0
- 0
- -20
-40
-60
-80 t:.->.~_L-I ~~_,..L.l~~~''-'~~-'-~~.......::l-80 " ',, ... . .. -20 0 20 40 02468 101214
East-West distance (km) Altitude (km)
Fig. 2. Observations of a horizontally extensive (75 km) hybrid intrac/oud and cloud-la-ground flash from the storm of Figure I . The network of measurement stations is denoted by the small squares (0) and the locations of cloud-to-ground strokes by the small triangles (A). More than 2400 radiation events were located at the three levels in the storm during the 1.5 second discharge.
20
E IS c.-o 10 " ~ 5
" a .40
20
E IS
c.-o 10 " 2 ~ 5
a
a
E c.-o u c 0 ;;; -20 'U .c "5 0
V> I
.c
15 -40 z
,
-60
-40
Eos,Vol. 81, No. 3,January 18,2000
50 60 70 80 time-20:46 (sec)
IS
10
5
a
0 0 0
-20 a 20 East-West distance (km)
90 olt-histogrom
44241 pts
a 1000 2000 3000
a 5 10 15 20 Altitude (km)
Fig. 3. Observations of lightning in Q large supercell storm, showing the volume-filling nature of the activity. The lightning "hole" in the southern part of the storm is believed to be the location of a very strong updraft. This is supported by the occu"ence of high-allilude lightning at J 5-1 6 km altitude above the hole, believed to be in an overshooting convective top produced by the updraft.
Page 25

Page 25
Eos,Vol. 81,No. 3,]anuary 18, 2000
:,~¥~'1f~ ~ .f . . ' ~
OC-~r-~ __________________ ~X~ ____ ~~ ______ ~
10 15 20 25 30 35 40 time-O:l1 (sec) olt-histogrom
20
E 15 15 c- ,:. . • 10 10 "0
2 ;; 5 5
12433 pts 0 0 -20 0 20 40 60 80 0 500 1000 1500
o 0
o o o o
.. q :" . ,' .. o
E -=- -20 • u c o
'" ·is
'"
...
~ -40 Vl I 5 ;; z ".
-60 " ~; ': " ~." . . ,
-80~~~-L~~~-L~~~-L~i-~~~·-80~~~~~~
- 20 0 20 40 60 80 0 5 10 15 20 East-West distance (km) Altitude (km)
Fig. 4. Obseroat':ons of lightning at the beginning of a tornado-producing storm. The black diamond near x = 0 km, Y = ·30 km indicates the location of the first, small FO tornado from the storm. The lightning activity exhibited a hook-like structure on the west side of the storm and a lightning-free region immediately above the tornado track, similar to the hook echoes and weak-echo regions observed by meteorological radars.