gpcr expression using baculovirus-infected sf9 cells
TRANSCRIPT

Chapter 8
GPCR Expression Using Baculovirus-Infected Sf 9 Cells
Amanda L. Aloia, Richard V. Glatz, Edward J. McMurchie,
and Wayne R. Leifert
Summary
Expression of proteins in insect cells using recombinant baculoviruses has gainedwide use in theG protein-coupled receptor (GPCR) community. This expression system produces high yields of functional receptor,is able to perform post-translational modifications, and is readily adaptable to large-scale culture. Here, wedescribe the generic methods for expressing a GPCR using baculovirus-infected insect cells, including themaintenance of insect cell culture. Data are presented for polyhedrin promoter-driven expression of aC-terminal 6�histidine-taggedmammalianM2muscarinic receptor in Sf 9 cells. Results demonstrate thatexpressed receptor could be detected and quantified using radiolabeled ligand binding, that expression wasmaximal at approximately 72 h post-infection, and that expression levels could be altered by addition ofvarious ligands to cultures of infected insect cells.
Key words: Baculovirus, Insect cell, GPCR expression, M2 muscarinic receptor.
1. Introduction
Insect cell culture has proved as a valuable expression system for Gprotein-coupled receptors (GPCRs) owing to a combination oflow maintenance requirements and the ability of insect cells toperform post-translational modifications such that vertebrate orinvertebrate receptor function is not significantly altered from thatin vivo. There are two insect cell lines in predominant use, Sf 9 andSf 21, although a large range of insect cell types are used forprotein expression (1). The Sf 21 cell line was originally preparedfrom the ovaries of Spodoptera fruigiperda (J.E. Smith) (2), theFall armyworm, with the Sf 9 line derived from Sf 21 cells. Inrecent years, other cell lines have been developed and optimized
Wayne R. Leifert (ed.), G Protein-Coupled Receptors in Drug Discovery, vol. 552ª Humana Press, a part of Springer Science+Business Media, LLC 2009Book doi: 10.1007/978-1-60327-317-6_8
115

to produce recombinant proteins with mammalian glycosylationprofiles (e.g., MimicTM Sf 9) and to increase expression ofsecreted proteins (e.g., High FiveTM cells, which are derivedfrom a different species, Trichoplusia ni (Hubner)) (3, 4).
Each of these cell lines allow replication of the Autographacalifornica multiple nuclear polyhedrosis virus (a baculovirus),which will express inserted transgenes as part of the viral infectionand replication process. The ease and efficiency of recombinantbaculovirus production were significantly improved in 1997 by thedevelopment of anEscherichia coli cell line that containedmodifiedbaculovirus DNA (5). This technology has subsequently beencommercialized by Invitrogen (Bac-to-Bac1 Baculovirus Expres-sion System) and is now widely applied as it removes the need forhomologous recombination in insect cells and the use of plaqueassays for selection of cells containing pure recombinant virus.Recombination is now carried out within the specialized bacteria,which can be selected for the presence of recombinant baculovirusDNA. The DNA is then purified and used to transfect insect cellsso that users can be confident that the infected cells contain purerecombinant virus.
Many GPCRs have been expressed using the baculovirus/insect cell system (4). A range of baculoviral promoters that varyin strength and timing of expression are available for expression offoreign proteins. Generally, the polyhedrin promoter is utilized as itis an extremely strong promoter. However, this promoter is also a‘‘very-late’’ baculovirus promoter which begins expression at atime point that is late in the infection cycle (within a given cell)and when cell lysis is beginning. The lytic infection process mayresult in degradation of recombinant proteins and limit the use ofthese late promoters for cellular assays. However, the strong latepromoters are useful for providing maximal quantities of thereceptor and so are useful, for example, if the receptor is to bepurified and/or crystallized (6, 7). The p10 promoter is anotherexample of a late promoter that could be utilized for receptorproduction (8). This promoter has been utilized in various bacu-lovirus vectors, including pFastBacTM. Dual vector (Invitrogen)which is designed for coexpression of two genes, one driven bythe p10 promoter and the other by the polyhedrin promoter. Ifmaximum protein production is required at an early stage of infec-tion (i.e., before lysis is beginning) then early promoters can beutilized (9). Alternatively, stably transformed cells can be utilizedfor expression using viral promoters (removing the infection processwhich leads to cell lysis), although vectors designed for this purposegenerally utilize weaker promoters (10, 11). Crude cell membranepreparations can be prepared from the infected cells providing asource of receptors for ligand binding, drug screening, or otherGPCR functional assays such as interaction with purified G proteinsubunits.
116 Aloia et al.

This chapter covers the expression of a GPCR using recombi-nant baculovirus-infected insect cells, including the growth andmaintenance of Sf 9 cells. In addition, we discuss infection condi-tions and determination of optimal parameters for receptorexpression.
2. Materials
2.1. Growth and
Maintenance of Sf9
Cells
1. Vessels for cell culture should be thoroughly cleaned andsterilized (autoclaved).
2. Sf 900-II serum-free media (Invitrogen). Store at 4°C.
3. 80% v/v ethanol in water. Caution ethanol is flammable.
4. 0.4% w/v Trypan blue prepared in phosphate-buffered saline(PBS). It can be stored at room temperature for several years.
5. 1% v/v hypochlorite solution.
6. Preservation media (for long-term storage of viable insectcells): Resuspend 15% w/v dimethyl sulfoxide (DMSO) in10 mL of Sf900-II serum-free media. In the laminar flowhood, pass the media through a syringe filter to sterilize.The preservation media should be prepared on the day thecells are frozen and chilled to 4°C before use.
7. Hemocytometer, light microscope, sterile transfer pipettes,cryo-vials, liquid nitrogen storage facility.
2.2. Amplification of
the Virus
1. Sterile syringes and 0.2 mm syringe filters.
2. Fetal bovine serum.
2.3. Infection of Sf9
Cells for Receptor
Expression
1. Sterile syringes and 0.2 mm syringe filters.
2. Incubation buffer: 250 mM sucrose, 10 mM Tris-HCl (pH8.0), and 3mMMgCl2 in sterile distilledH2O. This stock canbe stored at 4°C for a few months. On the day of use add theprotease inhibitors: phenylmethyl sulfonyl fluoride to a finalconcentration of 0.02mg/mL, benzamidine (0.03mg/mL),bacitracin (0.025 mg/mL), and soybean trypsin inhibitor(0.03 mg/mL).
2.4. Saturation Ligand
Binding
1. 4 mL (or other available size) polypropylene, round bottomtube, with cap.
2. TMN buffer: 50 mM Trizma1, 10 mM MgCl2, 100 mMNaCl (pH 7.6).
3. 50 nM [3H]-scopolamine prepared in TMN buffer.
4. 500 mM atropine prepared in TMN buffer.
GPCR Expression Using Baculovirus-Infected Sf9 Cells 117

5. Cell aliquots (e.g., as prepared from Section 3.3) at a totalprotein concentration of 1 mg/mL.
6. Filtration manifold.
7. 4 mL scintillation counting tubes. For example, Pico ProVialsTM from PerkinElmer.
8. Liquid scintillant for b-counting. For example, UltimaGoldTM from PerkinElmer.
9. b-Counter. For example, Wallac Liquid Scintillation Counterfrom PerkinElmer.
2.5. Ligand Culture 1. 1 mM atropine (>98%, Sigma-Aldrich) prepared in water.Stock can be aliquoted and stored at –20°C for a few months.
2. 500 mM pirenzipine (>98%) prepared in water. Stock can bealiquoted and stored at –20°C for a few months.
3. 10 mM acetylcholine (>99%) prepared in water. The solutionshould be prepared on the day of use and not stored as a liquid.
3. Methods
3.1. Growth and
Maintenance of Sf9
Cells
Cell culture work should be done with aseptic technique within alaminar flow hood.
3.1.1. Growing Cells from
Frozen Stocks
Sf 9 cells in serum-free medium can be frozen in 1 mL aliquots ofapproximately 20 � 106 cells/mL (see Section 3.1.3).
1. Place a sterilized 50 mL glass Schott bottle (or other appro-priate sized shaker flask, see Note 1) into the laminar flowhood.
2. Using aseptic technique, add an appropriate volume ofSf 900-II serum-free media to the bottle to provide a finalcell concentration of 2 � 106cells/mL (e.g., for a frozenaliquot containing 20 � 106 cells, add 10 mL of media).
3. Rapidly thaw the frozen cells in a 37°C water bath, this can bedone by plunging the vial in and out of the water and invertingthe vial in between plunges. The temperature of the cells shouldbe kept below approximately 25°C and the vial should only beplunged into the water bath until the cells are just defrosted.
4. Spray the outside of the vial with 80% v/v ethanol and, in thelaminar flow hood, pour the entire contents of the vial intothe Schott bottle containing the media. A sterile transferpipette and media (from the Schott bottle) can be used totransfer any remaining cells from the vial to the bottle.
118 Aloia et al.

5. Loosely screw (1 to 2 turns is fine) the lid onto the Schottbottle and place the cells into a 27°C incubator shaking at130–140 r.p.m.
6. Approximately 48 h after beginning the cell culture, count thecells and determine cell viability (see Note 2).
7. Once a normal growth rate and high proportion of viable cellsis achieved, the culture can be maintained as described inSection 3.1.2.
3.1.2. Maintenance of Sf9
cells
In our laboratory, we found it convenient to dilute (passage) cellsto 0.5 � 106 cells/mL on Monday, Wednesday, and Friday ofeach week for maintenance of the Sf 9 cell cultures.
1. Before diluting Sf 9 cells, heat Sf900-II serum-free mediumto 27°C by placing into a 27°C water bath or incubator.
2. Collect the cell culture bottle from the shaking incubator,spray the bottle with 80% v/v ethanol, and place in thelaminar flow hood (see Note 3).
3. Using a sterile transfer pipette transfer a small volume(500 mL is more than sufficient) of cells to a 1.5 mL micro-centrifuge tube. Return the cell culture bottle to the shakingincubator.
4. Remove the cell aliquot from the hood and, on the laboratorybench, transfer 20 mLof cells to a cleanmicro-centrifuge tube.
5. Add an equal volume (20 mL) of 0.4% v/v Trypan blue to thecells and mix well.
6. Count cells using a hemocytometer, and calculate thepercentage of non-viable cells (stained blue) and thedensity of viable cells (not stained; see Note 4). In ahealthy culture, cell viability should be greater than 95%(see Note 5).
7. Double (to account for dilution by the Trypan blue addition)the number of total cells counted to give the concentration ofcells in the culture.
8. Determine the required final volume of cells required (e.g.,for maintenance of the culture only 20–50 mL may besufficient or, if the culture is being scaled up in preparationfor infection and protein expression, 500 mL may bedesired) and calculate the required volume of cells neededto prepare the final volume to a cell concentration of 0.5 �
106 cells/mL.
9. Label a sterilized Schott bottle of appropriate size with (atleast) the passage number of the cells, that is, the number oftimes that the cells have been diluted (see Note 6). Spray thebottle with 80% v/v ethanol and place in the laminar flowhood.
GPCR Expression Using Baculovirus-Infected Sf9 Cells 119

10. In the labeled Schott bottle, combine the required volume ofcells and media for a final cell concentration of 0.5 � 106
cells/mL (see Note 7). Place diluted cells into the shakingincubator set at 27°C.
11. Destroy any unused cells by adding an equal volume of 1% v/vhypochlorite and leaving at room temperature for 24 h. Cellscan then be discarded in accordance with established proce-dures relevant to individual institutions.
3.1.3. Freezing Cells 1. Prepare approximately 200 mL of cells at 2 � 106 cells/mL,for example, by diluting 200 mL of cells to approximately 0.5� 106 cells/mL, 48 h prior to freezing.
2. In the laminar flow hood, label 20 sterile 2 mL cryo-vials withthe date, Sf 9 cells, 20 � 106 cells/mL, and the passagenumber of the cells to be frozen.
3. Centrifuge the cell suspension at 1500 � g for 10 min in asterile centrifuge tube (see Note 8) Discard the supernatantwith the exception of 10 mL of the media (supernatant),which should remain with the cell pellet.
4. Add 10 mL of cold (4°C) preservation media and use a steriletransfer pipette to gently resuspend the cells to give a final cellconcentration of 20 � 106 cells/mL.
5. Aliquot 1 mL of the resuspended cells into each of the labeledcryo-vials.
6. Place the cells at 4°C for 30 min. Invert the tubes to mix thecells and then place at –20°C for 1 h followed by –80°C for1 day. Vials should then be transferred to liquid nitrogen forlong-term storage.
3.2. Amplification
of Recombinant
Baculovirus
The amount of virus added to the Sf 9 cells for either cell infectionor baculovirus amplification is determined by the followingequation:
Virus required (mL) ¼desired MOI� total no. of cells
viral titer (PFU)
where MOI is the multiplicity of infection and PFU is plaque-forming units. For amplification of the recombinant baculovirus itis desirable to inoculate with a low MOI, we use 0.1. Thus,assuming a viral titer of 5 � 107pfu/mL, 2 mL of virus is addedto 500mL of cells that are at a concentration of 2 � 106cells/mL.A low MOI is used for virus amplification as a precautionarymeasure in the case that there is any non-recombinant viruswithin the viral population. The lower concentration of virusused, compared to the MOI used during cell infection for proteinproduction, decreases the potential for an increase in any non-recombinant component of the viral population, a problem thatwill compound with subsequent amplifications.
120 Aloia et al.

1. Approximately 48 h prior to the desired day of virusamplification dilute the required volume of Sf 9 cells to0.5 � 106 cells/mL.
2. On the day of virus amplification, count the Sf 9 cells asdescribed in Section 3.1. Ideally cells should be at a concen-tration of approximately 2 � 106 cells/mL (see Note 9).
3. Using the equation shown above, calculate the volume ofvirus required.
4. In the laminar flow hood, draw up the required amount of virusin a syringe, attach a 0.2 mm syringe filter, and filter the virusinto the cell culture. Return the cells to the 27°Corbital shaker.
5. Approximately 72 h post-infection count the cells and deter-mine the cell viability. Cell viability should be �75% and cellsshould appear larger than non-infected cells with expandednuclei occupying much of the cell volume (a key sign ofinfection). In addition, cells should be at a lower densitythan what would be expected for healthy cells which doublein density in approximately 24 h.
6. Transfer cell culture to a sterile centrifuge tube and centrifugeat 1500 � g for 10 min.
7. Using a syringe and 0.2 mm syringe filter, transfer the super-natant (which contains the virus) to a sterile storage container(see Note 10).
8. Using a 0.2 mm syringe filter, add fetal bovine serum (FBS) to afinal concentration of 2–3% v/v. FBS is thought to aid in pre-servation of virion proteins as it contains trypsin inhibitors (12).
9. Store the virus at 4°C in the dark.
3.3. Infection of Insect
Cells and Expression
of GPCR
In our laboratory it is standard to infect Sf 9 cells for proteinproduction using a MOI of 2. When the receptors are requiredin large quantities (e.g., for purification attempts) it may be desir-able to optimize the MOI for your particular receptor as theexpression patterns of different receptors may vary (4). Here, wepresent data relating to expression of a GPCR in insect cells,specifically a C-terminal, 6�histidine-tagged mammalian M2
muscarinic receptor. The method for baculovirus production isnot given as it is well described in the manual for the commerciallyavailable Bac-to-Bac1system from Invitrogen.
1. Infect the cells as described in Steps 1–4 of Section 3.2.Whencalculating the amount of virus required, remember to use anMOI of 2.
2. Approximately 72 h post-infection (see Note 11), count thecells and determine cell viability as described in Section 3.1.2.Cell viability should be �50% at the time of cell harvest as thissuggests viral infection and subsequently maximal protein
GPCR Expression Using Baculovirus-Infected Sf9 Cells 121

expression. Cells can be harvested at higher percentage viabil-ities in order to reduce levels of degraded protein (though thismay also reduce the level of functional protein harvested)depending on the type of promoter and MOI used.
3. Centrifuge the infected cell suspension at 1500 � g for10 min and discard the supernatant.
4. If desired, resuspend the cells in incubation buffer. We foundthat cells may then be frozen at –80°C without loss of recep-tor activity.
5. Determine the receptor density by radioligand binding assay(seeSection3.4). An example is shown inFig. 1, where tritiatedscopolamine ([3H]-Scopolamine) was used to confirm expres-sion of a 6�histidine-taggedmammalianM2muscarinic recep-tor. It should be noted that ligand binding is a measurement ofexpression levels of receptor with a correctly formed ligand bind-ing region and is not a direct measurement of levels of functionalreceptor (in terms of G protein coupling and signaling abilities),nor total receptor production (including non-functional recep-tor, which may be determined by Western blot).
3.4. Saturation Ligand
Binding Assay
In this section a basic saturation ligand binding assay is described.The reagents listed are for the M2 muscarinic receptor, but the assayis readily adapted for other receptors. The assay volume and concen-tration of components can also be modified as appropriate. Here, afinal concentration of 0.2 mg of total cellular protein/mL is used forthe receptor containing cells (10 mg total protein per 50 mL assay),but this concentration will need to be modified depending on theconcentration of receptors within the cell sample. The protein
0 3 6 9 12 15 180
2
4
6
8
10
[3H]-Scopalamine (nM)
[3H
]-S
copola
min
e B
ound
(pm
ol/m
g)
Fig. 1. Detection and quantification of baculovirus-expressed mammalian M2R muscari-
nic receptor. [3H]-Scopolamine (antagonist) binding to membranes prepared from Sf 9
cells infected with M2R recombinant baculovirus was measured. Non-specific binding
was determined in the presence of 10 mM of the specific antagonist atropine. Analysis
confirmed a single [3H]-Scopolamine binding site which had an apparent dissociation
constant (Kd) of 2.0 nM. Receptor binding sites were saturated at 9.4 pmol/mg of total
membrane protein (Bmax).
122 Aloia et al.

concentration used is determined such fact that the measured b
counts (from tritium) for each assay do not exceed 10% of the totalcounts determined for each assay condition (see Steps 9 and 10below). This is a requirement to ensure that laws of mass action arefollowed within the binding assay and so allow calculation of Bmax
and apparent Kd. For this reason it is useful to conduct a small-scaleversion of the assay described below, perhaps using only 2 to 3radioligand concentrations and single points, to determine whetherthis requirement is beingmet. The protein concentration can then bemodified accordingly in a subsequent, more thorough assay. Proteinconcentration and/or radioligand concentrationmay also need to bemodified to ensure that saturation of the ligand binding sites occurs.Furthermore, the time of assay incubation will need to be adapteddepending on the receptor–ligand pair being studied. The incuba-tion time should be such that a steady binding state is reached. (Thistime can be determined by using a single radioligand concentrationand varying assay time; plot time against specific binding.)
1. Defrost infected cell aliquots on ice.
2. Label ten 4mL clear disposable tubes, in duplicate (i.e., a totalof 20 tubes) and place on ice.
3. Assays can be prepared as shown in Table 1.
Buffer, cells, and atropine (where applicable) can be com-bined and then the reaction can be started with addition ofthe [3H]-scopolamine. Following the table described, even
Table 1
Preparation of sample tubes for the saturation ligand binding
assay (all volumes are given in mL)
Tube # Buffer Cells
[3H]-Scopolamine(final
concentration, nM) Atropine
1a, 1b 60 14 1(0.6) 0
2a, 2b 58.5 14 1(0.6) 1.5
3a, 3b 58 14 3(2) 0
4a, 4b 56.5 14 3(2) 1.5
5a, 5b 53.5 14 7.5(5) 0
6a, 6b 52 14 7.5(5) 1.5
7a, 7b 46 14 15(10) 0
8a, 8b 44.5 14 15(10) 1.5
9a, 9b 31 14 30(20) 0
10a, 10b 29.5 14 30(20) 1.5
GPCR Expression Using Baculovirus-Infected Sf9 Cells 123

numbered tubes will describe the non-specific binding of the[3H]-scopolamine (that which occurs in the presence ofexcess unlabeled antagonist atropine) and odd numberedtubes will represent the total radioligand binding.
4. Cap tubes and place in a shaking 25°C water bath for 1 h.
5. During the incubation period, place 20 GF/C filters in a trayof TMN buffer. Just prior to the end of the assay incubationperiod place a single GF/C filter onto each of the manifoldfiltration localities.
6. Pipette 50 mL of each reaction onto the center of a GF/Cfilter which has been placed on a filtration manifold. Do notdiscard the remaining assay mixture in each tube (see Step 9).
7. Wash theGF/C filter with 3 � 3mLof ice-cold TMNbuffer.
8. Use forceps to transfer the filter into a labeled 4 mL scintilla-tion counting tube. Leave tubes at room temperature, orplace in a heated incubator, until GF/C filters are dry.
9. Label (e.g., 1Ta, 1 Tb, 2Ta, and 2 Tb) an additional twenty4 mL scintillation tubes and place a GF/C filter in each one.
10. Pipette 5 mL of the remains of each assay onto a dry GF/Cfilter from Step 9. These tubes will provide the total radio-active counts within each assay.
11. Add 3mL of scintillant to each tube, cap the tube, and invert afew times to ensure that the GF/C filter is completely sub-merged in the scintillant.
12. Place tubes in a b-counter, count each tube for 1 min. Mea-sured radioactivity will be produced as counts per minute(c.p.m.) or disintegrations per minute (d.p.m.).
13. To determine the specific radioligand binding, subtract non-specific binding (even numbered tubes) from total binding(odd numbered tubes) for each assay condition.
14. To determine the percentage of specific binding divide the valuecalculated in Step 13 by the total counts measured for the assaycondition (odd numbered tubes) and multiply by 100.
15. To determine molarity of radioligand bound per milligram oftotal protein a mol/c.p.m. value for the radioligand firstneeds to be calculated. This can be done from the countsdetermined in Steps 9 and 10. This value is then applied tothe counts determined each assay condition, giving a molvalue (usually fmol or pmol) of radioligand binding for theassay. This mol value is then divided by the total protein (mg)in the assay.
16. A program such as GraphPad Prism can be used to determineBmax and apparent Kd. Plot the mol/mg value determinedin Step 15 against the total concentration of radioligand
124 Aloia et al.

in the assay (described in table 1). Commonly, data willfit to a non-linear regression, single site binding equa-tion. This type of analysis was used in Figs. 1, 2, and 3.
3.5. Time Course of
Receptor Expression
1. Infect 300 mL of Sf 9 cells (in a single bottle) as described inSection 3.3.
2. 24 h after infection, remove cells from the shaker and in alaminar flow hood carefully pour 50 mL of cells into a cen-trifuge tube. Replace the infected culture (�250 mL) in theorbital shaker.
3. Take a small sample (e.g., 50 mL) of the collected cellsand determine and record the cell viability as described inSection 3.1.2.
4. Centrifuge the 50 mL of cells at 1500 � g for 10 min.Discard the supernatant.
5. Resuspend the cells in incubation buffer (� 2 mL) using ahomogenizer. Aliquot the cells into 500 mL aliquots, freeze inliquid nitrogen, and store at –80°C.
6. Repeat Steps 2–4 at 48, 72, 96, and 120 h post-infection.
7. Analyze receptor expression in the cells by radioligand bind-ing assay (see Section 3.4).
8. A plot of hours post-infection against Bmax may be useful indetermining the time to harvest infected cells for maximumfunctional (ligand binding site intact) receptor yield. Anexample is given in Fig. 2, which illustrates that the highest
24 48 72 960
1
2
3
Hours Post Infection
[3H
]-S
co
po
lam
ine
Bm
ax (
pm
ol/m
g)
Fig. 2. Time course of expression of 6� histidine-tagged mammalian M2 muscarinic
receptor in Sf 9 cells. [3H]-Scopolamine binding (pmol/mg of total cellular protein) to
cells infected with M2 receptor recombinant baculovirus was measured. Cells were
collected at 24 h intervals after baculovirus addition and assayed for specific [3H]-
Scopolamine binding. Non-specific binding was determined in the presence of 10 mM of
the specific antagonist atropine. Bmax values were calculated from saturation curves
consisting of data points for which the mean – S.E.M was calculated for three separate
experiments. High levels of ligand binding were measured between 48 and 72 h post-
infection, with highest levels of functional receptor detected at 72 h post-infection.
GPCR Expression Using Baculovirus-Infected Sf9 Cells 125

level of functional (as defined above) 6� histidine-taggedmammalian M2 muscarinic receptor was detected at around72 h post-infection (MOI=2), when expression was driven bythe polyhedrin promoter. Again, this is a measure of ligandbinding and does not confirm full receptor function such asG protein coupling (receptor-specific functional assaysare required for this purpose), nor total (including non-functional receptor protein) receptor expressed.
3.6. Receptor Ligand
Addition to Cell Culture
GPCR expression in baculovirus-infected Sf 9 cells may be regu-lated by addition of receptor ligands to the infected cell culture. Itmay present a simple method for increasing the expression of yourreceptor of interest. A method to test for ligand modulation of M2
muscarinic receptor expression is described in this section, but thestandard method can be applied to all receptor expression bychanging the ligands used to those specific for the receptor beingexpressed.
1. Infect 1 L of culture as described in Section 3.3.
2. 48 h after infection of the cells, determine the cell concentra-tion and viability. If cells are being prepared for infection inmore than one bottle, they should be combined in a singlebottle prior to counting and the proceeding steps (seeNote 12)
3. In the laminar flow hood, pour 250 mL of the culture intoeach of 4 � 1 L Schott bottles. Label the bottles (a)–(d).
4. In three separate 5 mL tubes add:(a) 12.5 mL of atropine or
(b) 25 mL of pirenzipine or
(c) 5 mL of acetylcholine or
(d) no addition (negative control) (see Note 13).
5. Add serum-free media to each tube to a final volume ofapproximately 5 mL.
6. Use a 5mL syringe and syringe filter to add one ligand (or thecontrol with no ligand) to each of the four Schott bottles. Besure to label the bottle with the name of the added ligand.
7. Return the cell cultures bottles to the shaking incubator.
8. 72hpost-infection (24h after ligand addition), collect the cells bycentrifugation at 1500 � g for 10 min. Discard the supernatant.
9. Use a transfer pipette to resuspend each of the cell pellets in250 mL of PBS, centrifuge as above to collect the cell pellet.Repeat this step twice.
10. Resuspend the final cell pellets in incubation buffer.
11. Use the ligand binding assay as described in (see Section 3.4)to determine receptor density (Bmax) in the cells and comparethe effect of the ligand treatments. An example for a 6�
126 Aloia et al.
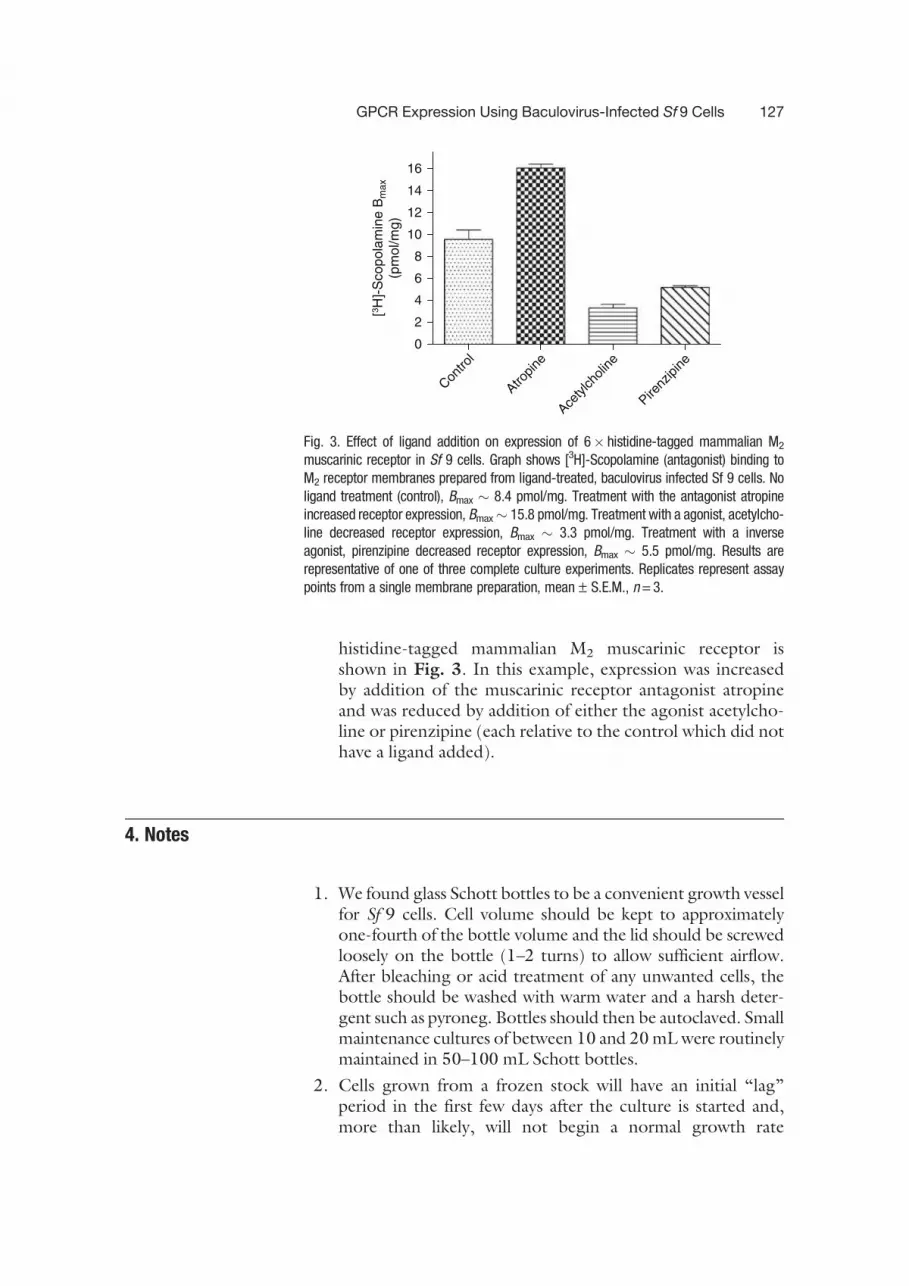
histidine-tagged mammalian M2 muscarinic receptor isshown in Fig. 3. In this example, expression was increasedby addition of the muscarinic receptor antagonist atropineand was reduced by addition of either the agonist acetylcho-line or pirenzipine (each relative to the control which did nothave a ligand added).
4. Notes
1. We found glass Schott bottles to be a convenient growth vesselfor Sf 9 cells. Cell volume should be kept to approximatelyone-fourth of the bottle volume and the lid should be screwedloosely on the bottle (1–2 turns) to allow sufficient airflow.After bleaching or acid treatment of any unwanted cells, thebottle should be washed with warm water and a harsh deter-gent such as pyroneg. Bottles should then be autoclaved. Smallmaintenance cultures of between 10 and 20mLwere routinelymaintained in 50–100 mL Schott bottles.
2. Cells grown from a frozen stock will have an initial ‘‘lag’’period in the first few days after the culture is started and,more than likely, will not begin a normal growth rate
Con
trol
Atropine
Acetylcho
line
Pirenz
ipine
0
2
4
6
8
10
12
14
16
[3H
]-S
co
po
lam
ine
Bm
ax
(pm
ol/m
g)
Fig. 3. Effect of ligand addition on expression of 6� histidine-tagged mammalian M2
muscarinic receptor in Sf 9 cells. Graph shows [3H]-Scopolamine (antagonist) binding to
M2 receptor membranes prepared from ligand-treated, baculovirus infected Sf 9 cells. No
ligand treatment (control), Bmax � 8.4 pmol/mg. Treatment with the antagonist atropine
increased receptor expression, Bmax� 15.8 pmol/mg. Treatment with a agonist, acetylcho-
line decreased receptor expression, Bmax � 3.3 pmol/mg. Treatment with a inverse
agonist, pirenzipine decreased receptor expression, Bmax � 5.5 pmol/mg. Results are
representative of one of three complete culture experiments. Replicates represent assay
points from a single membrane preparation, mean – S.E.M., n=3.
GPCR Expression Using Baculovirus-Infected Sf9 Cells 127

(approximately a double in cell number over 24 h) until afterthis time. In the first week after beginning the culture it maybe best to keep the viable cell concentration at around 2 �
106 cells/mL and then gradually, over the course of a week,bring the final dilution to 0.5 � 106 viable cells/mL asdescribed in the Section 3.1.
3. Do not leave the cells in the laminar flow hood for a pro-longed period of time as cells will settle during this timecausing inaccurate cell count and potentially damaging thecells.
4. Trypan blue cannot penetrate an intact cell membrane, thuscells that are not stained blue are considered viable.
5. Cells which have recently been grown from a frozen stock willhave a low viability (<50% is normal); however, this shouldincrease and reach >95% within 2–3 weeks. If this is not thecase cells should be discarded and a new culture started. Inour laboratory cells were not routinely assessed using Trypanblue staining; if cells demonstrate a 24 h doubling rate this isgenerally sufficient to demonstrate cell health. Cell viabilitywas assessed, however, prior to and following cell infectionwith recombinant baculovirus.
6. It is good practice to dilute/passage cells no more than 40times as normal cell metabolism and health may be compro-mised. At passage 40 cells should be discarded and a newculture started from frozen stock.
7. A high degree of accuracy is not required for the cell dilution,cells can be poured between Schott bottles and the markerson the bottle used to estimate volume as it is acceptable forcells to be diluted to a density range of between 0.5 and 1million viable cells/mL.
8. It is convenient to sequentially centrifuge multiple cell ali-quots in a single sterile 50 mL tube thus containing all cells inone cell pellet.
9. Dilution of the cells to 0.5 � 106 cells/mL 48 h prior toinfection should result in a cell concentration of approxi-mately 2 � 106 cells/mL on the day of infection (as cellsdouble in number in approximately 24 h). Small variationsfrom this value can be dealt with using the equation shown inSection 3.2 (i.e., the amount of virus or cells can be altered toproduce the correct MOI if cell density differs from 2 millioncells/mL).
10. For larger culture volumes (> 100 mL), Steritop filters (Mili-pore) can be attached directly to a Schott bottle to allowautomated filtering of the virus containing supernatent viasuction through the filter.
128 Aloia et al.

11. The post-infection time that cells should be harvested formaximum functional protein yield will vary between recep-tors. For this reason, it is best to perform a ‘‘time course ofreceptor expression’’ experiment (see Section 3.5).
12. Tominimize variations in receptor expression, cells should besplit from a single source.
13. Generally, nanomolar concentrations of antagonist/inverseagonist and micromolar concentrations of agonist should besufficient to assess any effect of ligand addition on receptorexpression. If an effect is demonstrated for a particular ligand,conditions (such as ligand concentration and time of ligandaddition) can be optimized to maximize the observed effect.
References
1. Lynn, D.E. (2007) Available Lepidopteraninsect cell lines. In: Murhammer, D. W.(Ed.), Baculovirus and Insect Cell ExpressionProtocols Springer, New York.
2. Vaughn, J.L., Goodwin, R.H., Tompkins,G.J., McCawley, P. (1977) The establish-ment of two cell lines from the insect Spo-doptera frugiperda (Lepidoptera;Noctuidae). In Vitro 13, 213–217.
3. Leifert, W.R., Aloia, A. L., Bucco, O., Glatz,R.V., McMurchie, E.J. (2005) G protein-coupled receptors in drug discovery: nano-sizing using cell-free technologies andmolecular biology approaches. J. Biomol.Screen. 10, 765–779.
4. Massotte, D. (2003) G protein-coupledreceptor overexpression with the baculo-virus-insect cell system: a tool for structuraland functional studies. Biochim. Biophys.Acta 1610, 77–89.
5. Ciccarone, V., Polayes, D., Luckow, V.(1997) Generation of recombinant baculo-virus DNA in E. coli using a baculovirus shut-tle vector. Meth. Mol. Med. 13, 213–235.
6. Ratnala, V. R., Swarts, H. G., VanOostrum,J., Leurs, R., DeGroot, H. J., Bakker, R. A.,et al. (2004) Large-scale overproduction,functional purification and ligand affinitiesof the His-tagged human histamine H1receptor. Eur. J. Biochem. 271, 2636–2646.
7. Cherezov, V., Rosenbaum, D.M., Hanson,M.A., Rasmussen, S.G., Thian, F.S.,
Kobilka, T.S., et al. (2007) High-resolutioncrystal structure of an engineered human b2-adrenergic G protein-coupled receptor.Science 318, 1258–1265.
8. Fraser, M.J. (1992) Baculovirus infectedinsect cell cultures as a eukaryotic geneexpression system. Curr. Top. Microbiol.Immun. 158, 131–172.
9. Kojima, K., Hayakawa, T., Asano, S.,Bando, H. (2001) Tandem repetition ofbaculovirus ie1 promoter results in upregu-lation of transcription. Arch. Virol. 146,1407–1414.
10. Douris, V., Swevers, L., Labropoulou, V.,Andronopoulou, E., Georgoussi, Z., Iatrou,K. (2006) Stably transformed insect celllines: tools for expression of secreted andmembrane-anchored proteins and high-throughput screening platforms for drugand insecticide discovery. Adv. Virus Res.68, 113–156.
11. Harvey, L., Reid, R.E., Ma, C., Knight, P.J.,Pfeifer, T.A., Grigliatti, T.A. (2003)Humangenetic variations in the 5HT2A receptor: asingle nucleotide polymorphism identifiedwith altered response to clozapine. Pharma-cogenetics 13, 107–118.
12. Lynn, D.E. (2007) Routine maintenanceand storage of lepidopteran cell lines andbaculoviruses. In: Murhammer, D. W. (Ed.),Baculovirus and Insect Cell Expression Proto-cols. Springer, New York.
GPCR Expression Using Baculovirus-Infected Sf9 Cells 129