government book of documents (march 29, 2021).pdf
TRANSCRIPT
IN THE MATTER OF THE JUDGES ACT, R.S.C. 1985, c. J-1
2020 JUDICIAL COMPENSATION
AND BENEFITS COMMISSION
GOVERNMENT’S BOOK OF DOCUMENTS
March 29, 2021
ATTORNEY GENERAL OF CANADA Department of Justice
50 O’Connor St, Suite 500
Ottawa, Ontario
K1A 0H8
Per: Christopher Rupar
Kirk G. Shannon
Samar Musallam
Tel: (613) 670-6291
Fax: (613) 954-1920
Email: [email protected]
Counsel for the Government of Canada

INDEX
Volume 1
Parliamentary Transcripts
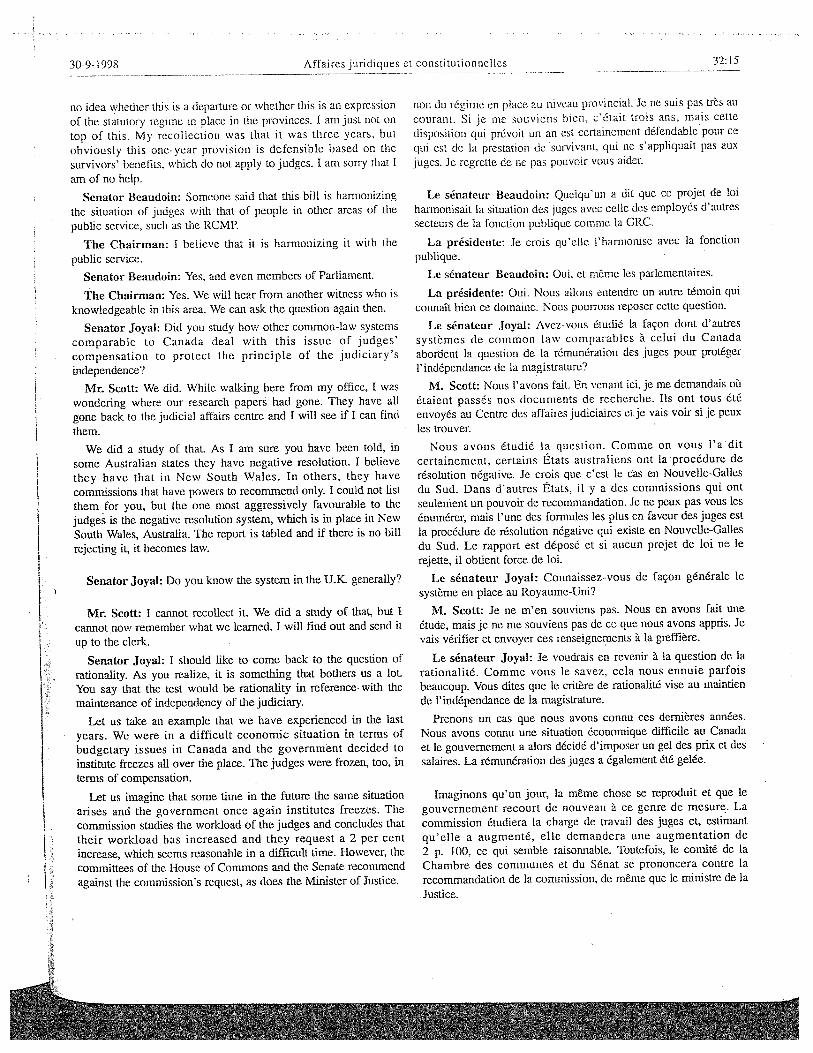
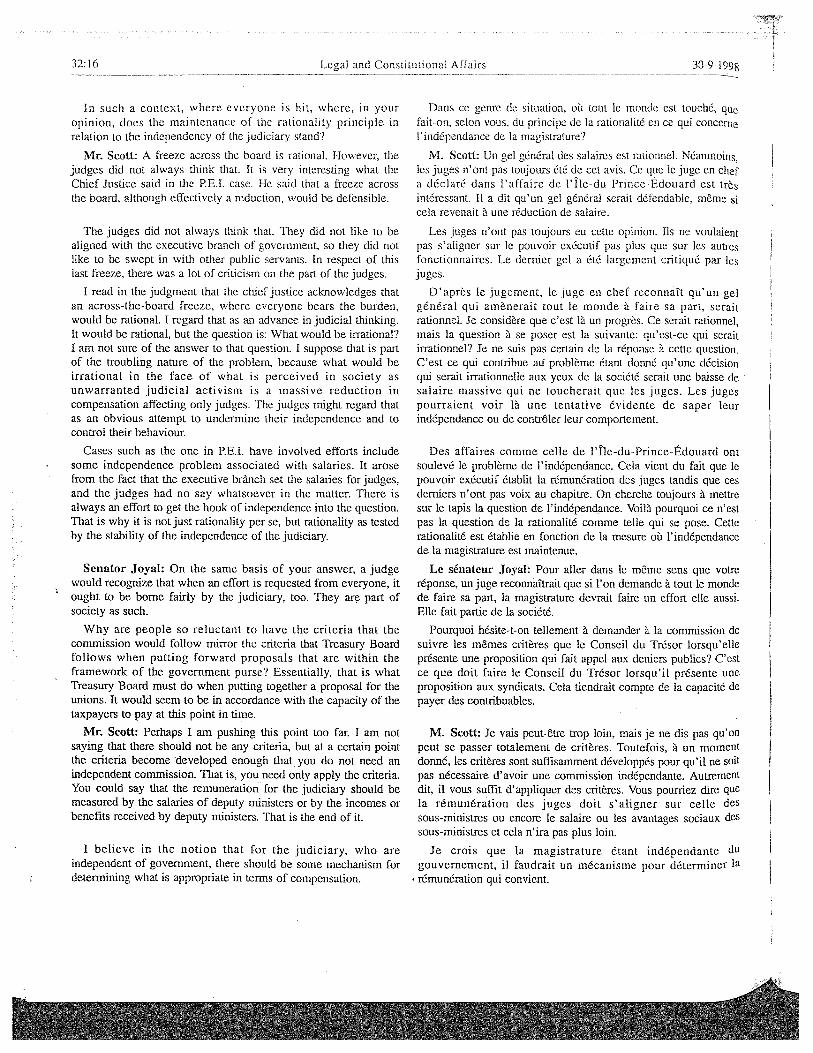
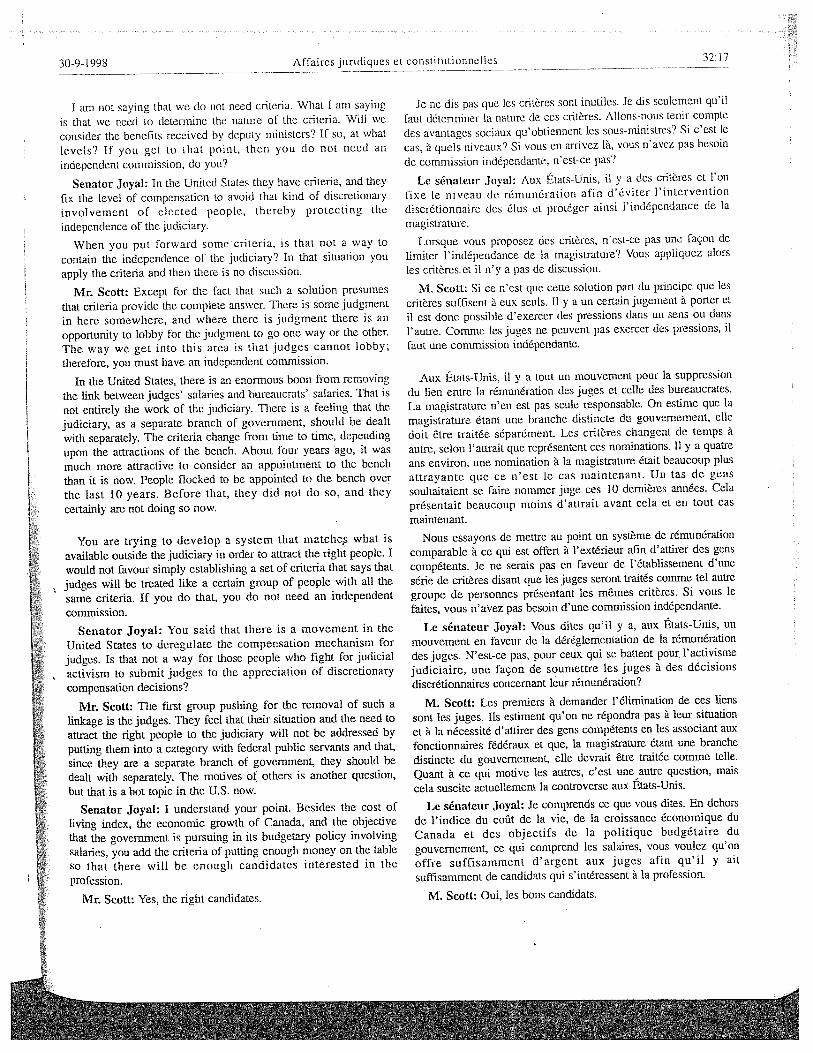
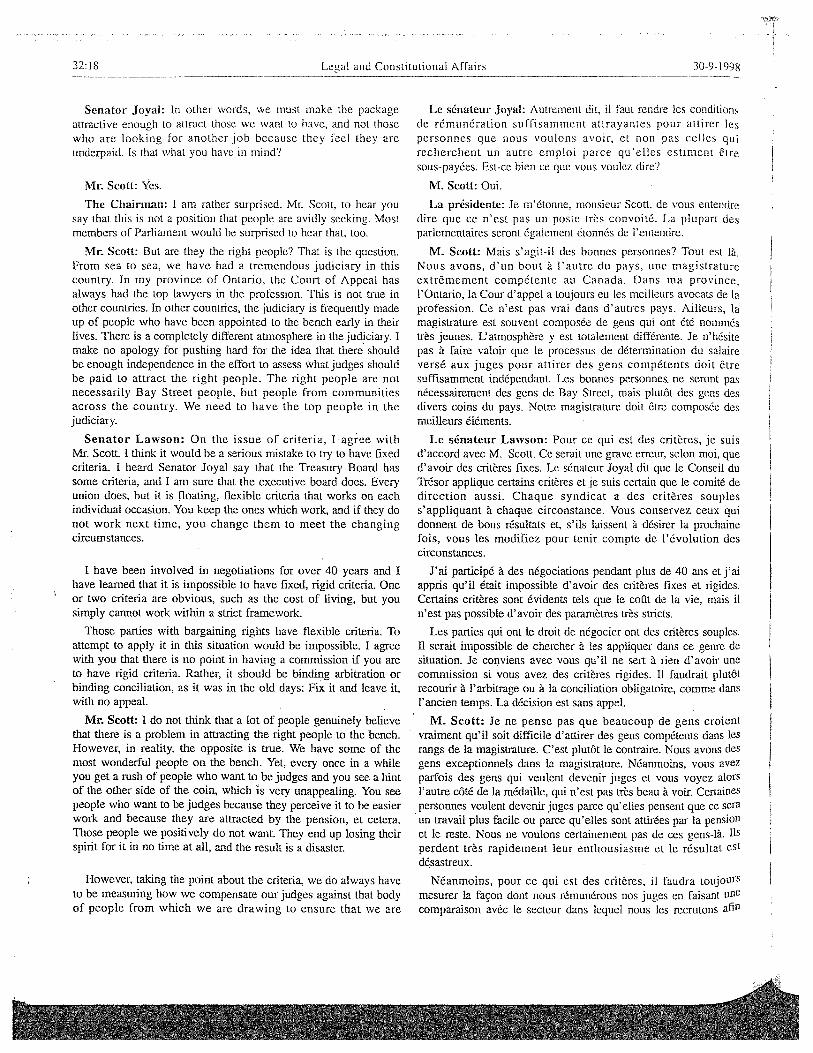
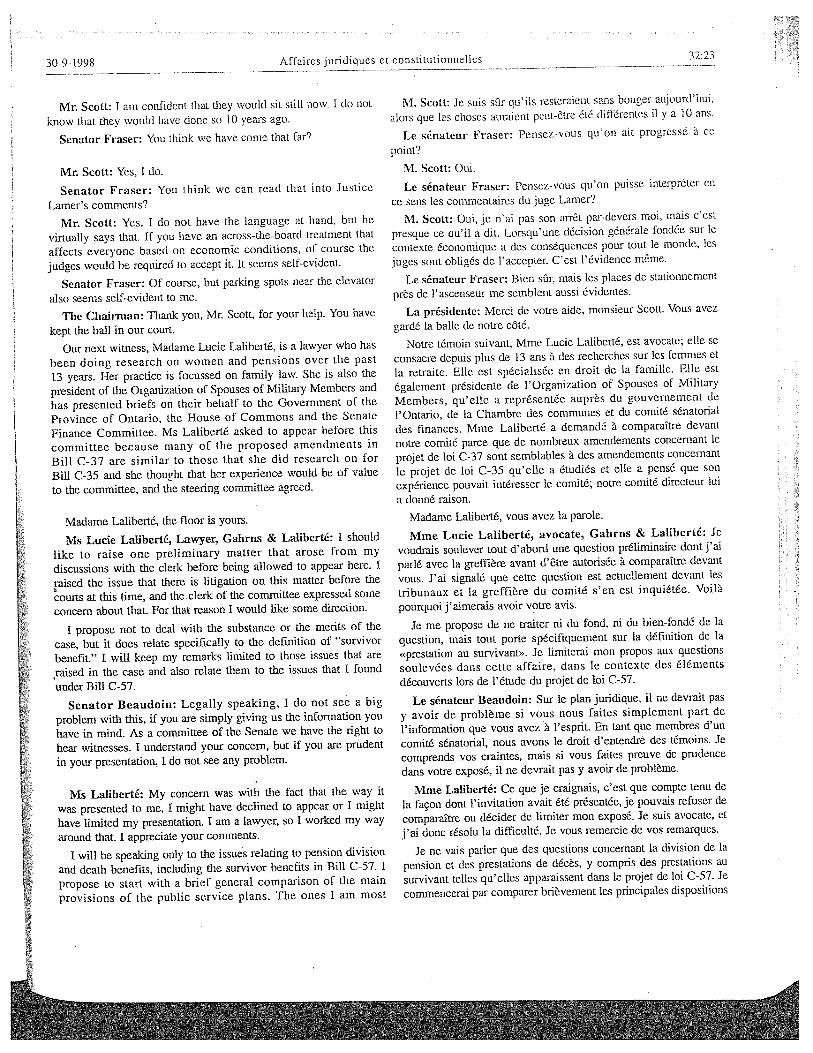
1. Proceedings of the Standing Senate Committee on Legal and Constitutional Affairs,
Issue No 32, 1st Sess, 36th Parl, September 30, 1998 (excerpts)
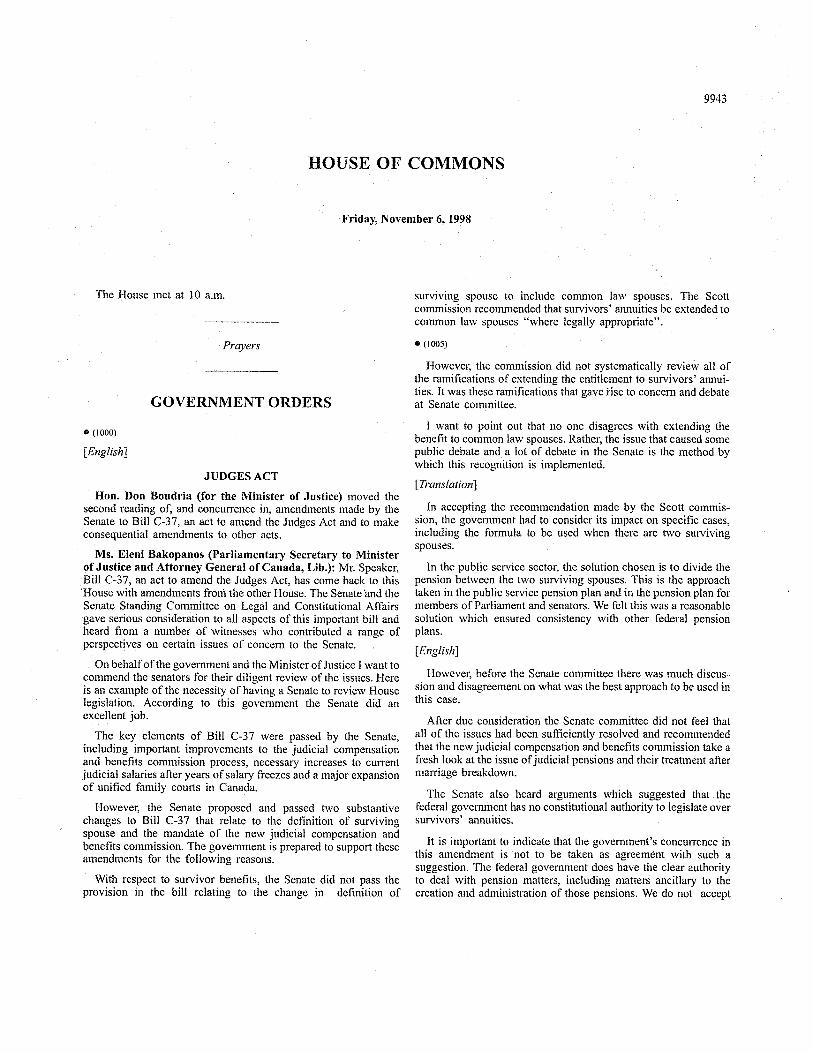
2. House of Commons Debates, 36th Parl, 1st Sess, No 151 (6 November 1998)
(excerpts)
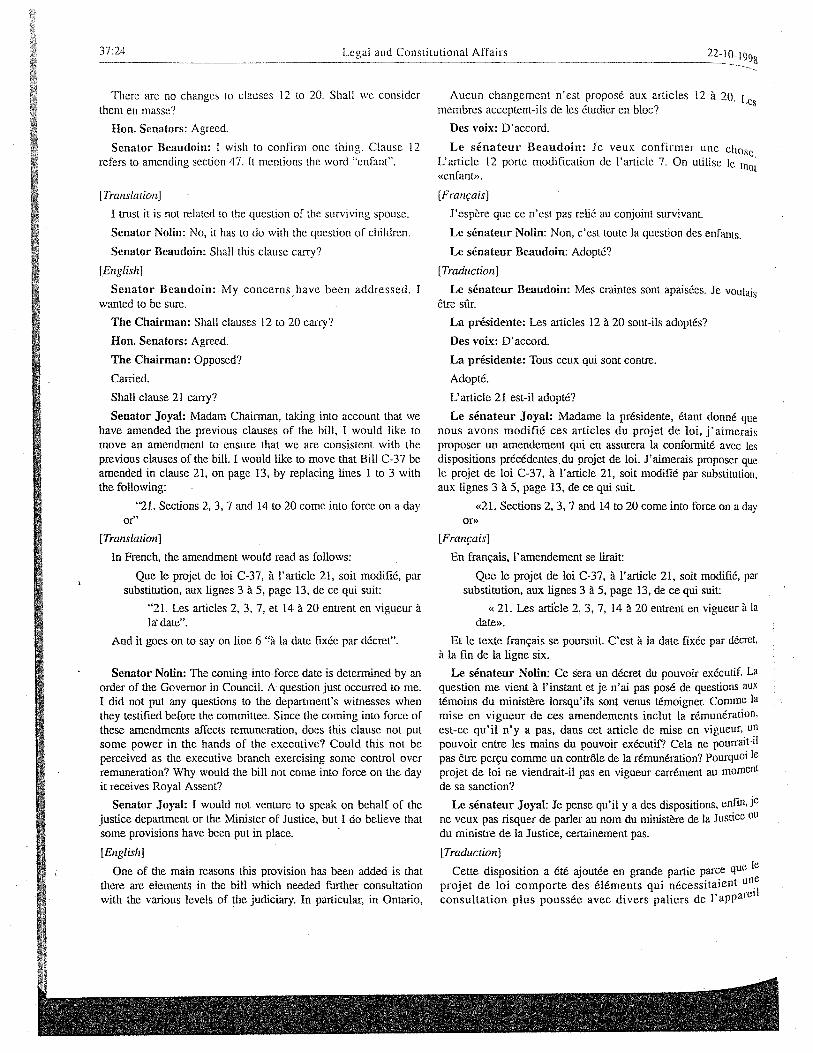
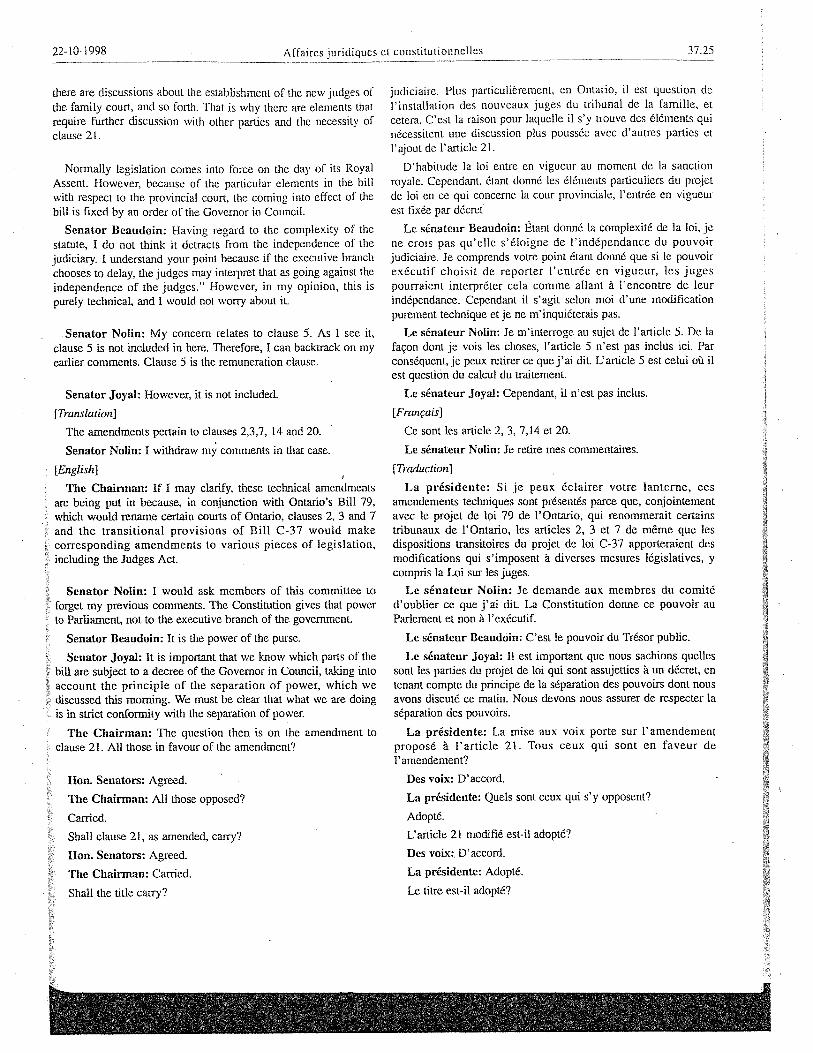
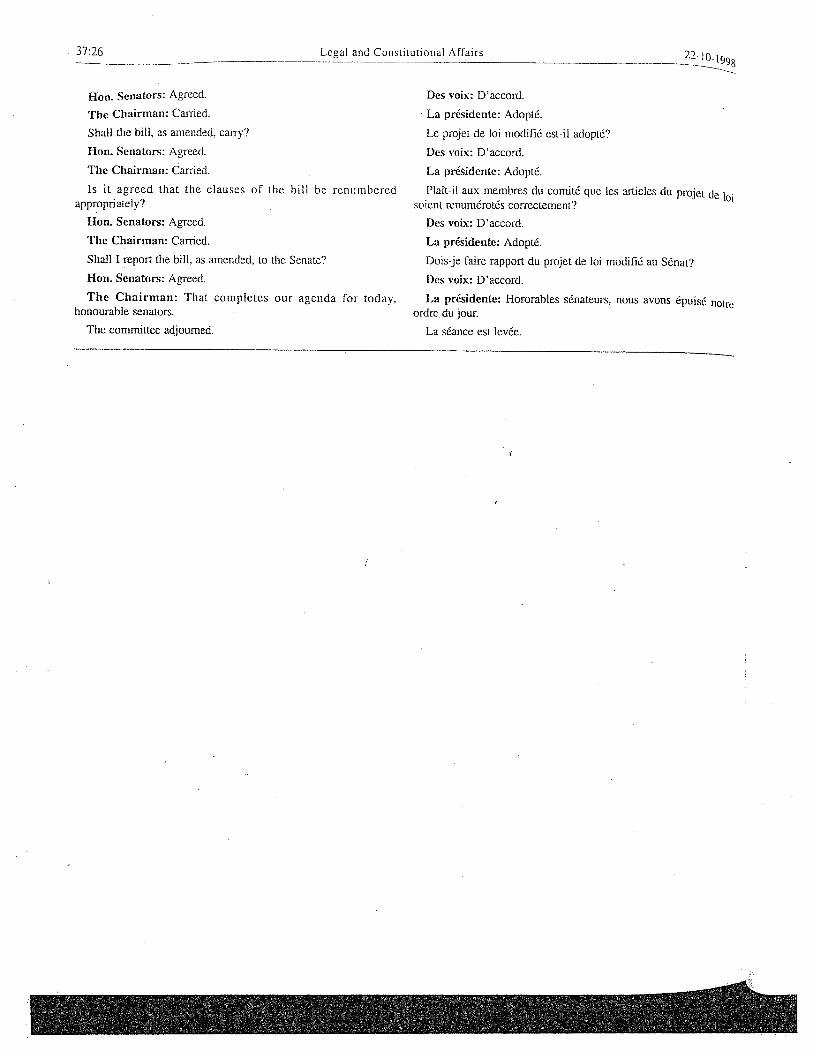
3. Proceedings of the Standing Senate Committee on Legal and Constitutional Affairs,
Issue No 37, 1st Sess, 36th Parl, October 22, 1998 (excerpts)
Expert Reports
4. Expert Report of Peter Gorham, Compensation Review of Federally Appointed
Judges, March 26, 2021.
5. Expert Report of Mark Szekely, Columbia Pacific Consulting Ltd., March 23,
2021.
Commissioner for Federal Judicial Affairs
6. Commissioner for Federal Judicial Affairs, Yearly Judicial Salaries, 2000-2020
7. Anonymized Data Re: Appointment, Supernumerary Status and Retirement, 1933
to 2020
Statistics Canada
8. Statistics Canada, “Gross domestic product, income and expenditure, fourth quarter
2020”, March 2, 2021, online: https://www150.statcan.gc.ca/n1/en/daily-
quotidien/210302/dq210302a-eng.pdf?st=Z-ce4CK1
9. Statistics Canada, “Standard Geographical Classification (SGC) 2016 – Volume I,
The Classification”, (excerpts) online:
https://www.statcan.gc.ca/eng/subjects/standard/sgc/2016/introduction#a5.1
Privy Council Office
10. Privy Council Office, “Performance Management Program Guidelines for Deputy
Ministers, Associate Deputy Ministers and Individuals Paid in the GX Salary
Range”, updated October 2020, online: https://www.canada.ca/en/privy-
council/programs/appointments/governor-council-appointments/performance-
management/senior-public-servants.html (excerpt)
2
11. GCQ defined, Privy Council Office, online: https://www.canada.ca/en/privy-
council/programs/appointments/governor-council-appointments/compensation-
terms-conditions-employment/remuneration-guidelines-agencies-boards-
commissions.html
Government of Ontario, Treasury Board Secretariat
12. Government of Ontario, Treasury Board Secretariat, “Public Sector Salary
Disclosure for 2019: Universities”, online: https://www.ontario.ca/page/public-
sector-salary-disclosure (excerpt)

Compensation Review of Federally Appointed Judges
Department of Justice regarding the 2020 Judicial Compensation and Benefits Commission
26March2021
Table of Contents
A. PurposeofReport......................................................................................................................................................4B. ExecutiveSummary...................................................................................................................................................5
IncreaseinBaseJudicialSalaryasof1April2021................................................................................6
C. Introduction..................................................................................................................................................................9D. CommentsandOpinionsonRelevantCompensationTopics...............................................................10
TotalCompensationvsCashCompensation.........................................................................................10
RetirementSavings..........................................................................................................................................10
HealthandWelfareBenefits.........................................................................................................................11
Disability...............................................................................................................................................................12
SupernumeraryStatus....................................................................................................................................13
IndustrialAggregateIncreases(“IAI").....................................................................................................16
HowDoes2.9MillionWorkersGettingLaid-offCauseAverageIncometoIncrease?........18
WeightedAverages...........................................................................................................................................20
E. JudicialTotalCompensation...............................................................................................................................23Salary......................................................................................................................................................................23
RetirementSavings..........................................................................................................................................23
TheJudicialAnnuity.........................................................................................................................................24
ValueoftheJudicialAnnuity........................................................................................................................26
WhatisValue?....................................................................................................................................................27
Health&WelfareBenefits.............................................................................................................................32
CanadaPensionPlanContributions..........................................................................................................33
BaseJudicialTotalCompensation.............................................................................................................33
F. Self-EmployedLawyers........................................................................................................................................37Percentiles............................................................................................................................................................37
Self-EmployedLawyers’Income................................................................................................................37
Howcanpercentilesmisleadus?...............................................................................................................46
Self-EmployedLawyersandRetirementSavings...............................................................................48
/Users/peter/Documents/Clients/Legal/DOJ/Quad Comm/AR - 2020 Judicial Commission - 2021-03-26.docx
G. DeputyMinistersWithintheFederalGovernment..................................................................................49DeputyMinisterCompensation..................................................................................................................50GovernmentAgencyAppointmentsCompensation...........................................................................53TheBlockComparator....................................................................................................................................55DeputyMinisterTenure.................................................................................................................................57
H. DataTablesUtilisedintheReport...................................................................................................................58NumberofSelf-EmployedLawyers..........................................................................................................58
DataPresentation.............................................................................................................................................59
NetIncomesforAllRegionsandAllAges2015to2019..................................................................61
NetIncomesfor10LargestCMAsandAllAges2015to2019......................................................64
NetIncomesforOtherRegionsandAllAges2015to2019...........................................................67
ComparisonofNetIncomesbyAge..........................................................................................................70
ComparisonofNetIncomesbyCensusMetropolitanArea............................................................73
ComparisonofNetIncomesbyProvince................................................................................................75
RecentAppointmentstoFederalJudiciary............................................................................................77
ElectionofSupernumeraryStatus.............................................................................................................82
I. SummaryofCompensationAmounts.............................................................................................................83SummaryofBaseSalaries.............................................................................................................................83
SummaryofTotalCompensation...............................................................................................................85
J. Certification................................................................................................................................................................88Appendix1 CurriculumVitaeofPeterGorham,F.S.A,F.C.I.A.................................................................89Appendix2 DocumentsUtilised..........................................................................................................................90Appendix3 SummaryofJudicialAnnuityBenefits.....................................................................................93Appendix4 ActuarialAssumptionsUtilised...................................................................................................94

Department of Justice 2020 Quadrennial Commission Page 4
A. Purpose of Report
1. IampresidentandactuarywithJDMActuarialExpertServicesInc.Iregularlyprovideactuarialconsultingservicesaswellasactuarialexperttestimony.IamafellowoftheCanadianInstituteofActuariesandoftheSocietyofActuaries.IreceivedmyActuarialFellowshipin1980andhaveprovidedpension,benefitsandactuarialconsultingservicesforapproximately43years.AcopyofmycurriculumvitaeisattachedasAppendix1.
2. Iunderstandandacknowledgethatasanexpert,Ihaveadutytoprovideevidenceinthisproceedingasfollows:
a. toprovideopinionevidencethatisfair,objectiveandnon-partisan;
b. toprovideopinionevidencethatisrelatedonlytomattersthatarewithinmyareaofexpertise;and
c. toprovidesuchadditionalassistanceasthe2020JudicialCompensationandBenefitsCommission(the“QuadrennialCommission”)mayreasonablyrequire.
3. IacknowledgethatthedutyreferredtoaboveprevailsoveranyobligationthatImayowetoanypartybywhomoronwhosebehalfIamengaged.
4. ThisreporthasbeenpreparedfortheDepartmentofJusticeoftheGovernmentofCanada.
5. Thepurposeofthisreportisto:
a. reviewandprovidemyopinionondataprovidedbyCanadaRevenueAgencyaboutself-employedearningsoflawyersinCanada;
b. providecommentsaboutissuestoconsiderregardingthetotalcompensation(earnings,benefits,pensionandanyotherremuneration)ofself-employedlawyers,deputyministersandsimilarpositionsoftheGovernmentofCanadaandfederallyappointedjudges;
c. providecostestimatesofthejudicialannuitythatprovidesalifetimepensiontofederallyappointedjudgesupontheirretirementaswellasprovidingapensionintheeventofpermanentdisability;and
d. providecommentsandmyopinionaboutfuturechangesintheIndustrialAggregateIndex.
6. TheintendedusersofthisreportaretheDepartmentofJustice,theQuadrennialCommission,andthevariouspartiesappearingbeforetheCommission.Thereportshouldnotbeprovidedtoanyonewhoisnotanintendeduserexceptasmayberequiredbylaw.Thefindingshereinshouldnotberelieduponbyanypartyotherthananintendeduser.
Department of Justice 2020 Quadrennial Commission Page 5
B. Executive Summary
7. ThisreporttakesalookattheincomeandtotalcompensationofvariousjobswiththegoalofassistingtheDepartmentofJusticepreparetheirsubmissiontotheQuadrennialCommissionandalsoassisttheQuadrennialCommissionintheirreviewofcompensationforfederallyappointedjudges.
8. Inthisreport,
a. IdeterminethevalueoftheJudicialAnnuitythatisavailabletofederallyappointedjudgesuponretirementfromthebench;
b. Ireviewrecentcompensationforself-employedlawyers,deputyministersandgovernmentappointmentstoseniorrolesingovernmentagencies;
c. Iestablishatotalcompensationforeachofthesepositionssothatcompensationcanbeviewedonan“applestoapples”basis;and
d. Ipresenttheresultsofmyanalysesalongwithcommentsonanumberofcompensationissuesrelatedtothesepositions,butImakenorecommendations.
9. Therearemanywaystocompensatesomeoneforperformingwork.Itstartswithsalaryorwages.Addingtothatiscommissions,overtime,vacation,bonuses(alsoreferredtoasperformancepay,at-riskpay,etc.),healthandwelfarebenefits,pensionplan,stockoptions,etc.Thesumofalltheseformsofcompensationisreferredtoastotalcompensation.
10. Noteveryjobcomeswiththesamecomponentsofcompensationandevenwhentheydo,eachofthecomponentsarelikelyworthdifferentamounts.Toprovideafairbasisforanycomparisons,Idetermineatotalcompensationforeachofthejobsreferencedherein.Totalcompensationallowsustocomparelikewithlike.
11. Twojobsmayhavedifferentsalaries,butthetotalcompensationmaybethesimilar.Twojobsmayhavesimilarsalaries,butthetotalcompensationmaybeverydifferent.Ifwecomparetwojobsonthebasisofsalaryonly,itdevaluespotentiallylargedifferencesinotheraspectsofcompensation.
12. TheJudgesActsetsoutanumberofjudicialpositionsandannualsalaries,includingprothonotaries,puisnejudges,andjudgesoftheSupremeCourt.Iunderstandthatthesalaryforeachofthesepositionscanbeexpressedasapercentageadjustmenttothesalaryorapuisnejudge.Inthisreport,IrefertothesalaryofapuisnejudgeastheBaseJudicialSalary.Fortheyearbeginning1April2020,thesalaryforpuisnejudgesis$338,800.Thesalaryforaprothonotaryiscurrentlysetat80%oftheBaseJudicial
Department of Justice 2020 Quadrennial Commission Page 6
Salary,whichis$271,000beginning1April2020.Similarcalculationscanbeperformedforotherpositions.
13. BaseJudicialSalaryisnotappropriateforcomparisonwithotherjobs.Forafaircomparison,weneedtousetotalcompensation.Inthisreport,Ihavefocussedonthetotalcompensationforpuisnejudges.But,forfederallyappointedjudges,thevalueoftheirpensionvariesbasedontheirageatappointmentandthereforetheirtotalcompensationwillvarybasedontheirageatappointment.Tosimplifymattersandtoprovideareasonablebasisforanycomparisonsofcompensation,Icalculateanaverageamountoftotalcompensationforpuisnejudgesthatreflectstheagedistributionofalljudgeswhenappointed.IrefertothatasBaseJudicialTotalCompensation.Todeterminethetotalcompensationoftheotherjudicialpositions,onecanapplythesamepercentageaswewouldapplytotheBaseJudicialSalarytoobtainthebasesalaryofthatotherposition1.
14. Inthisreport,Ireviewthesalariesofthefederallyappointedjudgesandofdeputyministersandcalculatetheirtotalcompensation.Iwasalsoprovidedwiththenetincomeamountsforself-employedlawyersinCanadabetween2015and2019bytheCanadaRevenueAgency.Ihaverevieweditandpresentsummariesofthatdatafromvariousperspectives.Thenetincomeoftheself-employedlawyersistheirtotalcompensation2.
15. Thegoalistoprovideaseriesoftotalcompensationamountswithafairrelationshiptoeachother.ThoseamountsaresetoutinTables280,281and282.
Increase in Base Judicial Salary as of 1 April 2021
16. BaseJudicialSalaryis$338,800fortheyear1April2020to31March2021.UndertheJudgesAct,andsubjecttoanyadjustmentsrecommendedbytheQuadrennialCommission,itwillbeadjustedeffective1April2021bychangesintheIndustrial
1 TheresultofusingthesamepercentageasonewouldapplytoBaseJudicialSalarywillactuallyresultina
smallunderstatementofthetotalcompensationofprothonotariesandasmalloverstatementoftotalcompensationforallotherjudicialpositions.Thoseoverandunderstatementsareeachlessthan$1,000andarenotmaterialforthepurposesofthisreport.
2 Normally,thecostofhealthandwelfarebenefitsformpartoftotalcompensation.Self-employedlawyerscanprovidehealthandwelfarebenefitsforthemselvesaspartoftheirbusinessexpensesthatarepaidoutofgrossincomepriortothecalculationofnet-income.Healthandwelfarebenefitsalsowouldnormallyformpartofbothjudicialanddeputyministertotalcompensation.Toavoidhavingtomakehundredsofadjustmentstotheincomeamountshereinforeachoflawyers,judgesanddeputyministers,Ihavechosentosimplyignoreitsinceitsvalueisnotmateriallydifferentbetweenthesepositions.
Department of Justice 2020 Quadrennial Commission Page 7
Aggregate,adataseriesmaintainedbyStatisticsCanadathatmeasureschangesintheaverageearningsofCanadians.
17. Ihaveestimatedthatincreasewillbe6.74%,raisingtheBaseJudicialSalaryto$361,600effective1April2021.
EffectonBaseJudicialTotalCompensation3
18. Ideterminedthatonaverage,theBaseJudicialTotalCompensationfor2019to2020(basedonthe$329,900BaseJudicialSalaryeffectiveApril2019)is$496,000.Ifaself-employedlawyerhadanetincomeof$496,000in2019,Iestimatethatwouldbeaboutthe88thpercentileforallself-employedlawyersinCanada.
19. Ideterminedthatonaverage,theBaseJudicialTotalCompensationfor2020to2021(basedonthe$338,800BaseJudicialSalary)is$509,400.Ifaself-employedlawyerhadanetincomeof$509,400in2020,Iestimatethatwouldbeaboutthe88thpercentileforallself-employedlawyersinCanada.
20. Ialsodeterminedthatonaverage,theBaseJudicialTotalCompensationfor2021to2022(basedonthe$361,600Iestimatedabove)willbe$543,800.Ifaself-employedlawyerhadanetincomeof$543,800in2021,Iestimatethatwouldbeaboutthe89thpercentileforallself-employedlawyersinCanada.
EffectonTotalCompensationofProthonotaries
21. ForApril2019toMarch2020,thebasesalaryofaprothonotarywas$263,900,fromApril2020toMarch2021itis$271,000andIestimatebeginningApril2021itwillbe$289,200(80%oftheBaseJudicialSalary).
22. Ideterminedthatthetotalcompensationofaprothonotaryfor2019to2020(basedon80%oftheBaseJudicialTotalCompensationandadjustingfora$600understatement(seefootnote1))is$397,300.Ifaself-employedlawyerhadanetincomeof$397,300in2019,Iestimatethatwouldbeaboutthe82ndpercentileforallself-employedlawyersinCanada.
23. Ideterminedthatthetotalcompensationofaprothonotaryfor2020to2021(usingthesamebasisasfor2019-2020)is$408,100.Ifaself-employedlawyerhadanetincomeof$408,100in2020,Iestimatethatwouldbeaboutthe82ndpercentileforallself-employedlawyersinCanada.
3 Detailsofthesecalculationsareatparagraphs153andfollowing.
Department of Justice 2020 Quadrennial Commission Page 8
24. Ialsodeterminedthatthetotalcompensationofaprothonotaryfor2021to2022(usingthesamebasisasfor2019-2020)isestimatedtobe$435,500.Ifaself-employedlawyerhadanetincomeof$435,500in2021,Iestimatethatwouldbeaboutthe86thpercentileforallself-employedlawyersinCanada.

Department of Justice 2020 Quadrennial Commission Page 9
C. Introduction
25. IwasretainedbytheDepartmentofJusticetoprepareareporttoassisttheQuadrennialCommissionintheirreviewofjudicialcompensation.
26. Inpreparingthisreport,Ihaveassumedthatthemostappropriateperspectiveistolookattotalcompensationandtheindividualcomponentsthatcomprisetotalcompensation.
27. AswithpastreportsforpriorQuadrennialCommissions,Ihaverevieweddataregardingnetincomeforself-employedlawyerstoprovideonecomparatorforcompensation.IalsohavereviewedcompensationofseniordeputyministerswithintheGovernmentofCanadaandappointmentstoseniorgovernmentagenciesasanotherobjectivefactor.
28. Ihaveapproachedthereportinthefollowingorder:
a. Generalcommentsandopinionsoncompensationtopics.
b. Reviewofthecurrentsituationforfederaljudgeswithrespecttosalary,theJudicialAnnuity,disabilityincomeandhealthandwelfarebenefits.
c. Reviewofcompensationforlawyersinprivatepracticewithrespecttonetincome,retirementsavings,disabilityandhealthandwelfarebenefits.
d. Reviewofcompensationforseniordeputyministerswithrespecttothesamecomponents.
e. Relationshipofcurrentjudicialcompensationtothatoflawyersanddeputyministers.
29. Inthisreport,whereIrefertoalawyer,itshouldbetakenasmeaningaself-employedlawyerunlessthecontextclearlyindicatesotherwise.
30. Inthisreport,whereIrefertoajudge,itshouldbetakenasmeaningafederallyappointedjudge.Therearenoexceptions.
Department of Justice 2020 Quadrennial Commission Page 10
D. Comments and Opinions on Relevant Compensation Topics
Total Compensation vs Cash Compensation
31. Therearemanywaysthatapersoncanbecompensatedforwork.Inalmostallsituations,compensationstartswithsalary,basepay,hourlywagerateorsomesimilarmeasure(hereinreferredtoas“salary”).Anindividualmayalsobeentitledtootherformsofcompensation4,suchasbonuses,commissions,performanceincentives,stockoptions,benefits,retirementsavings,healthclubmembership,etc.
32. Whencomparingcompensationbetweenjobs,itisrarethatlookingonlyatcashcompensationprovidesatruepictureofanydifferences.
33. Totalcompensationisameasurethatlooksatallformsofpay,includingcashcompensation,anddeterminesatotalvalue.Incomparingthecompensationbetweentwoorganisations,totalcompensationprovidesamoreaccurateresult.Forexample,AcmeCompanymightprovidetheiremployeeswithafullsuiteofhealthandwelfarebenefitsaswellasagenerouspensionplan.BodenCorporationmightprefertoforegothehealth,welfareandpensionplansandinsteadpaysalariesthatareabout25%larger.AnemployeeatAcmewhodiscoversthehighersalariesatBodenmaybeledtochangeemployers–atleastuntilfindingoutaboutthedifferenceintheotherformsofcompensation.PresumablytheywouldonlychangeemployersiftheydeterminethatthetotalcompensationfromAcmeislessthanthetotalcompensationfromBoden.
34. Comparingtwojobsonthebasisofsalaryonlyistodevaluepotentiallylargedifferencesinotheraspectsofcompensation.
Retirement Savings
35. Onecomponentofcompensationisretirementincomeaccumulation.WhilemanyCanadians5enjoyanemployer-sponsoredretirementplan,mostCanadiansareleftto
4 Someoftheseotherformsofcompensationmayalsobepaidincash,buttheydonotformpartof“salary”
sincethereisnormallyanelementofrisk,oruncertaintyregardingtheamounttobereceivedorthereisadelaybeforeanyamountwillbepayable.
5 Obtainingdataaboutmembershipinanemployer-sponsoredpensionplanisverydifficult.ManyreferencesaremadetotheReportonTrusteedPensionPlanspublishedperiodicallybyStatisticsCanada.Butthatreportdoesnotincludethemanypensionplansthatarenottrusteed.ItalsoignorestheorganisationsthatdonotsponsoraregisteredpensionplanbutratherprovideretirementsavingsthroughagroupRRSP.StatisticsCanadapublishesareportonregisteredpensionplanmembership(butthatalsoignoresgroupRRSPs)thatshows37.5%ofpaidworkersaremembersofaregisteredpensionplanin2018.[https://www150.statcan.gc.ca/n1/daily-quotidien/200813/t002b-eng.htm].

Department of Justice 2020 Quadrennial Commission Page 11
lookaftertheirpersonalretirementsavingontheirown,generallythroughcontributingtoapersonalRegisteredRetirementSavingsPlan(“RRSP”).
36. TherearemanydifferenttypesofretirementplansinCanada.Mostretirementplansprovidedbyanemployerrequirepartoftheannualcontributiontobepaidbytheemployeesandthebalancebytheemployer.Afewplansarefundedentirelybytheemployerwithnocontributionrequiredfromemployees6.Wherethereisnoretirementplanofferedbytheemployer,theentirecostofretirementsavingsisbornebytheindividualemployee.
37. Forthevastmajority,ifnotallself-employedlawyers,retirementsavingsarefundedentirelyoutoftheindividual’searnings.UndertheIncomeTaxAct7,self-employedpersonsarenotpermittedtosponsororearnbenefitsunderaregisteredpensionplanleavingtheonlyoptionsanRRSPornon-tax-shelteredsavings.
38. Forfederallyappointedjudges,theJudicialAnnuityprovidesretirementincomewiththejudgespaying7%ofincomeeachyearuntiltheyareeligibleforanunreducedannuityatwhichtime,contributionsdecreaseto1%ofincome8.CanadaisresponsibleforthebalanceofthetotalcostwhichispaidoutoftheConsolidatedRevenueFund.
39. Toproperlyreflectretirementsavingscostsforself-employedlawyersandforfederallyappointedjudges,weneedtoconsidertheirdifferingopportunitiesanddifferingcostsforretirementsaving.
Health and Welfare Benefits
40. Mostemployersprovideaselectionofhealthandwelfareorgroupinsurancebenefits.Typically,theseincludelifeinsurance,medicalanddrugbenefitsanddentalbenefits.
41. Thevalueofthesetoanindividualdependsonhowmuchthebenefitsareused,usuallywithrespecttoprescriptiondrugsanddental.
42. Someemployersprovidethesebenefitsatnocosttoemployees,whileothersmayrequirepartofthecosttobepaidbyemployees.Canadapaysallcostsrelatedtothe
6 In2019,5.7millionCanadiansweremembersofapensionplanrequiringemployeecontributions.0.7
millionCanadiansweremembersofapensionplanwheretheydidnothavetocontribute.[StatisticsCanadadatatable11-10-0106-01]
7 IncomeTaxRegulations8503(3)(a)
8 Judges Act R.S.C., 1985, c. J-1, section 50(2)
Department of Justice 2020 Quadrennial Commission Page 12
healthandwelfarebenefitsofjudges.Self-employedlawyerswilltypicallypayforthesebenefitsoutoftheirgrossincome.
Disability
43. Disabilityincomeprotectionisgenerallyprovidedthroughacombinationofshort-termandlong-termdisability9.Inmyexperience,short-termdisabilityisusuallyentirelypaidbytheemployerwhilelong-termdisabilityvaries–duetoincometaximplications,usuallypaidentirelybytheemployerorentirelybytheemployee.
44. Self-employedlawyerswilltypicallypayforlong-termdisabilityinsuranceoutoftheirincomeandwilltypicallyself-fundforshort-termdisability.
45. Short-termdisabilityprotectionisprovidedtojudgesbyacontinuationofsalary.Long-termdisabilityincomeprotectionisprovidedthroughtheJudicialAnnuityforapermanentdisabilityandbyacontinuationofsalaryforanon-permanentdisability.
46. Basedonactuarialtablesregardingdisabilityclaimrates,mostpeoplewillneverclaimadisabilitybenefit.Inmyexperience,manypeoplebelieveitisnotanimportantbenefittohaveorthecostistoomuchtobeworthhaving.Forthosethatdohaveadisability,itisinvaluable.Asoneages,thechancesofhavingadisabilityclaimincreases.Atyoungages,disabilitywillnormallyarisefromanaccident,butasoneages,illnessessuchascancers,cardiovascularandmentalhealthissuesbecomeincreasinglyprevalentinadditiontoaccidentsandleadtoagreaterlikelihoodofclaims.
47. Whiletheincidencerateissmallinanysingleyear,itbecomesmuchlargeroveranumberofyearsandespeciallyasoneages.TheactuarialassumptionsIusedshowthat0.02%ofjudgesatage40(that’stwoofevery10,000judges)areexpectedtobecomepermanentlydisabled.Thatrisesto0.1%byage52(10ofevery10,000),to0.2%byage60(20ofevery10,000)andto1.0%atage74(100ofevery10,000).
48. Theaverageannualincidenceoverallagesisabout0.3%(30ofevery10,000judges).
49. TheDepartmentofJusticeprovidedmewithhistoricdataonjudgeswhoincurredapermanentdisability.From1985to2020,94federallyappointedjudgeshavebecome
9 Short-termdisabilityusuallystartsonthefirstdayofabsenceduetoillnessorinjuryorshortlythereafter
andcontinuesforanywherefromaboutthree-monthstoaboutayear.Attheendofthattime,long-termdisability,ifitexists,willcommenceandnormallyprovideincomeprotectionuptorecoveryorage65.
Department of Justice 2020 Quadrennial Commission Page 13
permanentlydisabled.Iestimatethattheactuarialassumptionaboutdisabilitywouldresultinaboutthesamenumberofexpectedpermanentdisabilities.
50. Boththeaverageandmedianageofpermanentdisabilitywas63following11yearsofservice.
51. Forajudgeappointedatage53,thereisan8.8%probabilityofbecomingpermanentlydisabledbeforeage75.Butthat53-year-oldwouldhaveachievedentitlementtoafullretirementannuityatage68,sothereisnoadditionalfinancialprotectionfromthedisabilitybenefitafterage68.
52. Forajudgeappointedatage53,thereisa4.3%probabilityofbecomingpermanentlydisabledbeforeage68.
53. Whileanannualprobabilityof0.3%maymakethedisabilitybenefitsoundlikeitisnotworthverymuch,aprobabilityof4.3%(1personoutofevery23)becomingpermanentlydisabledovera15-yearperiodbetweenage53and68shouldcausemostpeopletoreconsiderthevalueofpermanentdisabilityprotection.
54. Since1985,therehavebeen1,495judgeswhohaveleftthebench(retirement,disabilityordeath).94ofthosewereduetopermanentdisability–6.3%ofalljudgesleavingthebench.Thatincludesjudgeswhobecamepermanentlydisabledafterhavingqualifiedforafullretirementannuityandwherethedisabilityannuitydidnotprovideanyadditionalfinancialprotection.
55. Wecanconcludethatabout4.3%ofjudgeswillbecomepermanentlydisabledpriortoqualifyingforafullannuityand2.0%willbecomepermanentlydisabledafterqualifyingforafullannuity.
Supernumerary Status
56. Avaluablebenefitavailabletojudgesistheabilitytoelectsupernumerarystatus,wherethejudgeisgivenareducedworkloadandcontinuestoreceivefullcompensation.IwasinformedbytheDepartmentofJusticethatthereisnospecificreference,butitisgenerallyacceptedthattypically,theworkloadisabout50%.
57. Tobeeligibleforsupernumerarystatus,thejudgemusthaveservedatleast15yearsasafederallyappointedjudgeandhaveasumofageplusyearsofservicetotallingatleast80,orbeatleast70yearsoldwithatleasttenyearsofserviceasafederallyappointedjudge.AnexceptionisjudgesoftheSupremeCourtwhoarenoteligiblefor
Department of Justice 2020 Quadrennial Commission Page 14
supernumerarystatus.Judgesmaysitasasupernumeraryforamaximumoftenyearsortoage75,whichevercomesfirst.
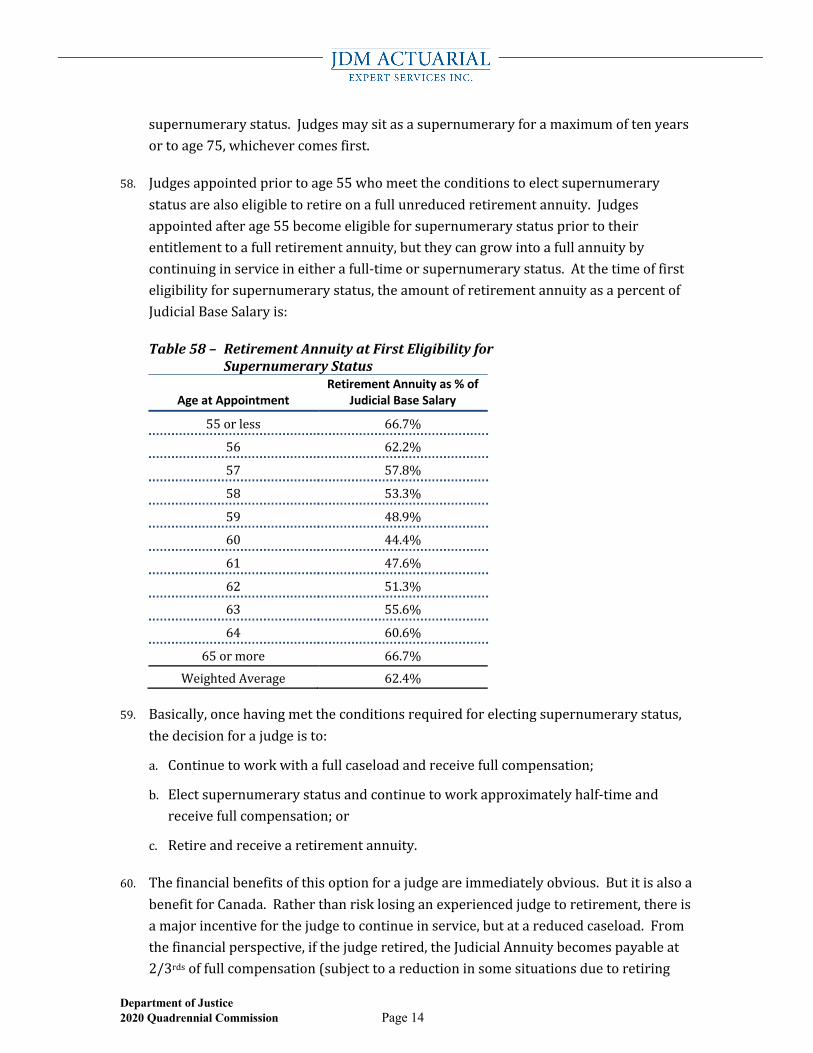
58. Judgesappointedpriortoage55whomeettheconditionstoelectsupernumerarystatusarealsoeligibletoretireonafullunreducedretirementannuity.Judgesappointedafterage55becomeeligibleforsupernumerarystatuspriortotheirentitlementtoafullretirementannuity,buttheycangrowintoafullannuitybycontinuinginserviceineitherafull-timeorsupernumerarystatus.Atthetimeoffirsteligibilityforsupernumerarystatus,theamountofretirementannuityasapercentofJudicialBaseSalaryis:
Table58– RetirementAnnuityatFirstEligibilityforSupernumeraryStatus
Age at Appointment Retirement Annuity as % of
Judicial Base Salary
55orless 66.7%
56 62.2%
57 57.8%
58 53.3%
59 48.9%
60 44.4%
61 47.6%
62 51.3%
63 55.6%
64 60.6%
65ormore 66.7%WeightedAverage 62.4%
59. Basically,oncehavingmettheconditionsrequiredforelectingsupernumerarystatus,thedecisionforajudgeisto:
a. Continuetoworkwithafullcaseloadandreceivefullcompensation;
b. Electsupernumerarystatusandcontinuetoworkapproximatelyhalf-timeandreceivefullcompensation;or
c. Retireandreceivearetirementannuity.
60. Thefinancialbenefitsofthisoptionforajudgeareimmediatelyobvious.ButitisalsoabenefitforCanada.Ratherthanrisklosinganexperiencedjudgetoretirement,thereisamajorincentiveforthejudgetocontinueinservice,butatareducedcaseload.Fromthefinancialperspective,ifthejudgeretired,theJudicialAnnuitybecomespayableat2/3rdsoffullcompensation(subjecttoareductioninsomesituationsduetoretiring
Department of Justice 2020 Quadrennial Commission Page 15
early).Bycontinuingasasupernumerary,thejudgereceivesfullcompensation–adifferenceofbetween33.3%and55.6%ofthefullcompensation.
61. ForCanada,theaveragecostofasupernumeraryjudgeisabout38%ofthefullcompensation10whilethesupernumeraryjudgecarriesabout50%ofafullcaseload.
62. Asof1March2021,thereare1,206federallyappointedjudgesinCanadaofwhom292aresupernumeraries11.Thatisjustunder25%ofalljudges.
63. Ireviewedthestatisticsof1,495judgeswholeftthebenchbetween1985and2020(seetable267foradditionaldetails).Ofthosejudges,
a. 1%ofjudgesdidnotqualifyforsupernumerarystatuspriortoage75;
b. 19%retiredpriortoqualifyingforsupernumerarystatus;
c. 80%attainedeligibilityforelectingsupernumerarystatus,ofwhom:
i. 8%chosetoretireratherthanelectsupernumerarystatus;and
ii. 72%electedsupernumerarystatusand90%ofthem(65%ofalljudges)soelectedwithinoneyearofbecomingeligible.
64. Iestimatedtheaveragelengthofserviceasasupernumeraryduringtheperiod1985to2020was6.0years.Thatlengthenedslightlyto6.2yearsforthesupernumerariesservingbetween2000and2020.Theaverageageatwhichajudgeelectssupernumerarystatusis68withanaverageofabout18to19yearsofservice.
65. Asoftheendof2020,therewere336judgeswhohadmettheeligibilityconditionsforsupernumerarystatus.292hadpreviouslyelectedtoserveassupernumeraries(87%ofallthoseeligible)and44remainedservingfull-time(13%ofthoseeligible).
66. Inmyexperiencewithorganisationsintheprivatesector,ifanemployeeispermittedtoelectareducedworkload,itisaccompaniedbyanequivalentreductioninpay.Butwithintheprivatesector,thepaymentofpensionsisnormallyfromadifferentsource12
10 Orslightlylessduetosomejudgesdelayingtheirelectionbeyondtheirfirsteligibilityorneverelecting
supernumerarystatus.The37.6%averagecosttoCanadaisthedifferencebetween100%ofBaseJudicialSalaryandthe62.4%averageretirementannuitypercentfromTable58.
11 https://www.fja-cmf.gc.ca/appointments-nominations/judges-juges-eng.aspx12 Intheprivatesector,pensionsarepaidoutofthepensionplan,whichisanentityseparateandapartfrom
theemployer.Anybenefittoanemployerfromanemployeedelayingretirementwithintheprivatesectorisatbestindirect.Privatesectoremployerswhodonotsponsorapensionplanhavenoeconomic…incentivetopayfull-timeincomeforpart-timework,sinceanemployee’spensionisfromtheemployee’sownsavingsandthereisnodirectorindirectoffsettothecompensationpaid.Forthefederallyappointedjudges,bothcompensationandtheJudicialAnnuityarepaidoutoftheConsolidatedRevenueFund.
Department of Justice 2020 Quadrennial Commission Page 16
thantheemployer’spayroll,sotheeconomicadvantageofpaying100%ofcompensationforabout50%ofworkisverydifferent.
67. Itisclearthattheavailabilityofsupernumerarystatusisvaluedbyjudgeswiththemajorityofthemelectingtospendtheirfinalyearsonthebenchasasupernumerary.
68. Ihavelookedatwaystocalculateavalueforthisbenefitandamnotsatisfiedthatanyofmyapproachesissufficientlyrobustandimpartialbetweentheparties.Asaresult,inmyopinion,theavailabilityofelectingsupernumerarystatushasafinancialvaluethatisintangible.IhavenotincludedanyvalueforthisaspartoftheBaseJudicialTotalCompensation(seeparagraph104).
Industrial Aggregate Increases (“IAI")
69. TheJudgesActsetsouthowfederallyappointedjudges’salariesaredeterminedeachyear.Increasesareeffectiveasof1Aprilineachcalendaryear.AnadjustmentfactoriscalculatedbasedontheyearoveryearchangeintheIndustrialAggregate,adataseriesmaintainedbyStatisticsCanada13.Thefactorisbasedonthemostrecentlyavailabledataasofthefirstdayoftheperiodforwhichthesalaryamountisdetermined.
70. TheIndustrialAggregatemeasuresthenumberofworkingCanadiansandtheiraverageweeklyearnings.Therearesometypesofjobs,likefarming,fishingandmilitarythatareexcluded.EarningsaretrackedandtheIndustrialAggregateisupdatedmonthly.TheIndustrialAggregatecanbeconsideredassimilartotheConsumerPriceIndexexcepttheConsumerPriceIndextrackspricesofitemsthataretypicallypurchasedbyCanadianconsumerswhereastheIndustrialAggregatetracksthenumberofworkersinCanadaandtheirearnings14.
71. Inthisreport,whenreferringtothedataseries,IusethetermIndustrialAggregate.Judges’salariesareadjustedannuallybythepercentchangeintheIndustrialAggregatevalue.IwillrefertopercentchangesintheIndustrialAggregateas“IAI”.
72. BasedonStatisticsCanada’spublicationschedule,thereisusuallyatwo-monthlagbetweenworkers’paydatesandthepublicationoftheIndustrialAggregate.Forexample,theIndustrialAggregatedatathatispublishedinFebruaryreportsonworkersandwagesasofthepreviousDecember.Basedonthedataavailableasof
13 IhaveassumedthatthedataseriesreferencedistheoneidentifiedbyStatisticsCanadaas“Averageweekly
earningsbyindustry,monthly,unadjustedforseasonality”,series14-10-0203-01andspecifically,thesub-series“IndustrialAggregateexcludingunclassifiedbusinesses”.
14 Ibid.
Department of Justice 2020 Quadrennial Commission Page 17
earlyMarch2021(dataforDecember2020)andmyassumptionabouthowthecalculationistobedone15,Ihavedeterminedtheincreaseinjudges’salarieswilllikelybe6.74%in2021.
73. Inthepastfifteenyears,theincreaseinBaseJudicialSalaryduetochangesintheIAIhasvariedfrom0.40%to3.60%withanaverageof2.42%.Theaverageincreaseoverthepastfiveyears(2015to2020)was1.90%.
74. Whathasgivenrisetothislargeincreaseexpectedin2021?Covid-19.
75. BusinessinCanadawaslargelyshutdowninMarch2020andmanyworkerswerelaidoff.ThelossofjobsandofincomewasfirstreflectedintheIndustrialAggregatereportedforApril2020.TheIAIincreasedby5.7%fromMarchtoApril.
76. Thevastmajorityofworkerswholosttheirjobsandincomewerefromthelowerpayingjobs–workthatcouldnotbeperformedfromhomeandworkthatisimpactedbylockdowns,suchasretailsomeoftheserviceindustryandmanufacturing16.Forthosewithhigherpayingjobs,theiremploymentstatuswasmainlyunaffectedbytheclosureofbusinessasmanyofthosejobscouldbeperformedfromhome.
77. Ifalower-paidworkersuffersalargereductioninincomebutremainsemployed,theIndustrialAggregatewilldecrease.Butifalower-paidworkerlosestheirjob,theydisappearfromthecalculationoftheaverageandtheIndustrialAggregatewillincrease17.WithCovid-19,thatincreaseintheIndustrialAggregatehappenedsuddenlyasabout2.9millionworkerslosttheirjobsorwerelaidoffinthesecondhalfofMarchandearlyApril202018.
78. Inparticular,theincreaseinIAIduring2020wasnotbecauseofworkersreceivinglargewageincreases,itwasprimarilybecauseofworkerslosingtheirincome.
15 TheaverageoftheIndustrialAggregateasreportedbyStatisticsCanadaineachofthe12-months
immediatelypriortothedateoftheincrease,dividedbytheaverageineachofthe12-monthsimmediatelypriortothefirstaveragingperiodabove.
16 StatisticsCanada,Infographic“COVID-19andtheLabourMarketinMay2019.Publication11-627-m/11-627-m2020038.[https://www150.statcan.gc.ca/n1/pub/11-627-m/11-627-m2020038-eng.htm]
17 Considerfournumbers–8,10,12and14.Theaverageis11.Ifthe8isreducedto4,theaveragereducesto10.Butifthe8issimplyremoved(aswouldhappenwithalay-offorjobloss),theaverageincreasesto12.
18 ChangeintotalnumberofworkersinCanadabetweenFebruaryandMay,StatisticsCanadaTable14-10-0201-01,Employmentbyindustry,monthly,unadjustedforseasonality.
Department of Justice 2020 Quadrennial Commission Page 18
Estimated increase without the Covid-19 Effect
79. IfwehadnotexperiencedCovid-19andassuming2020wouldhavebeensimilartotheaverageyearwithrespecttowagesofallCanadians,itislikelythattheIndustrialAggregatewouldhaveincreasedbutjustnotasmuch.Inthissection,IestimatewhatthatincreasewouldhavebeenbylookingatthebudgetplansforwageincreasesofemployersacrossCanada.
80. Anumberofemployeebenefitsandcompensationconsultingfirmsconductcompensationsurveystogatherinformationoncorporatebudgetplansforcompensationincreasesinthefollowingyear.
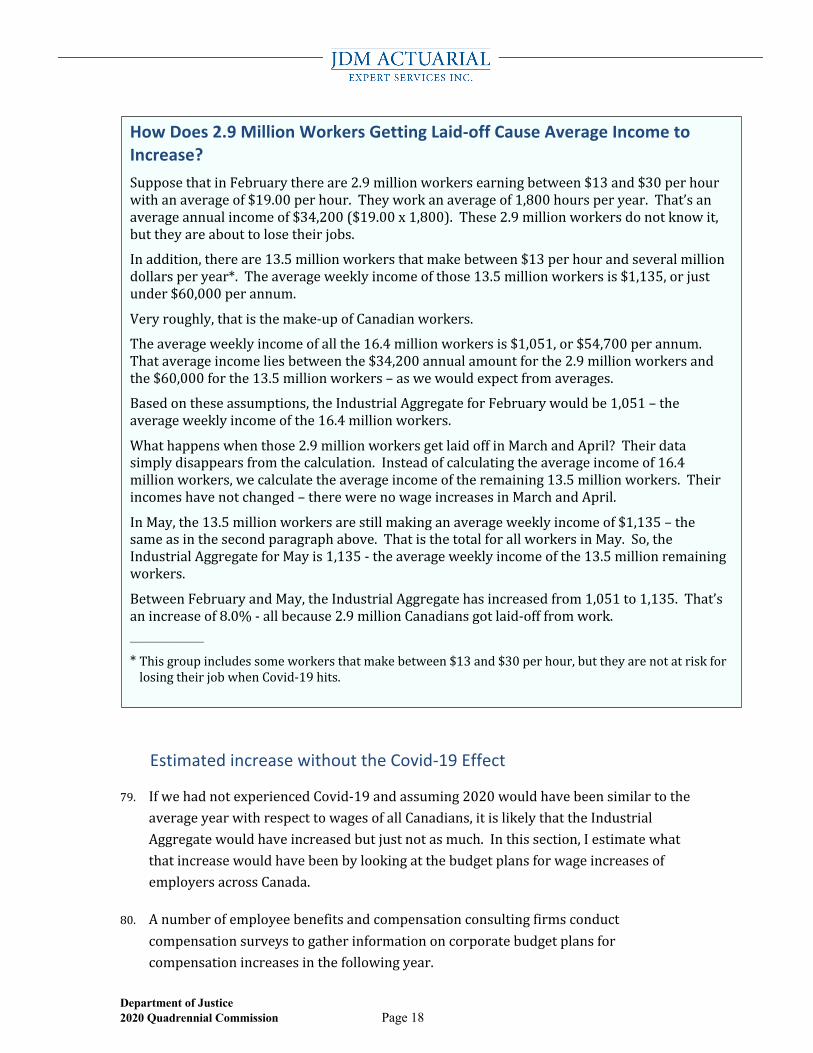
How Does 2.9 Million Workers Getting Laid-off Cause Average Income to Increase? SupposethatinFebruarythereare2.9millionworkersearningbetween$13and$30perhourwithanaverageof$19.00perhour.Theyworkanaverageof1,800hoursperyear.That’sanaverageannualincomeof$34,200($19.00x1,800).These2.9millionworkersdonotknowit,buttheyareabouttolosetheirjobs.
Inaddition,thereare13.5millionworkersthatmakebetween$13perhourandseveralmilliondollarsperyear*.Theaverageweeklyincomeofthose13.5millionworkersis$1,135,orjustunder$60,000perannum.
Veryroughly,thatisthemake-upofCanadianworkers.
Theaverageweeklyincomeofallthe16.4millionworkersis$1,051,or$54,700perannum.Thataverageincomeliesbetweenthe$34,200annualamountforthe2.9millionworkersandthe$60,000forthe13.5millionworkers–aswewouldexpectfromaverages.
Basedontheseassumptions,theIndustrialAggregateforFebruarywouldbe1,051–theaverageweeklyincomeofthe16.4millionworkers.
Whathappenswhenthose2.9millionworkersgetlaidoffinMarchandApril?Theirdatasimplydisappearsfromthecalculation.Insteadofcalculatingtheaverageincomeof16.4millionworkers,wecalculatetheaverageincomeoftheremaining13.5millionworkers.Theirincomeshavenotchanged–therewerenowageincreasesinMarchandApril.
InMay,the13.5millionworkersarestillmakinganaverageweeklyincomeof$1,135–thesameasinthesecondparagraphabove.ThatisthetotalforallworkersinMay.So,theIndustrialAggregateforMayis1,135-theaverageweeklyincomeofthe13.5millionremainingworkers.
BetweenFebruaryandMay,theIndustrialAggregatehasincreasedfrom1,051to1,135.That’sanincreaseof8.0%-allbecause2.9millionCanadiansgotlaid-offfromwork.____________________
*Thisgroupincludessomeworkersthatmakebetween$13and$30perhour,buttheyarenotatriskforlosingtheirjobwhenCovid-19hits.
Department of Justice 2020 Quadrennial Commission Page 19
81. MorneauShepell19reportedabudgetedaveragesalaryincreaseof1.9%for2021.Ifthoseexpectedtoreceivenoincreaseareexcluded,theaverageincreaseisbudgetedas2.5%for2021.However,theyreportthat46%ofsurveyrespondentsremainedundecidedatthetimeofrespondingtothesurvey.Theyalsoreportedthatin2020,basesalariesincreasedby1.6%onaverage.Ifthosewhosesalarieswerefrozenareexcluded,theaverageincreasein2020was2.6%.MorneauShepell’ssurveyresultsshowedthat36%oforganisationsfrozesalariesin2020comparedwithonly2%thathadbudgetedforafreeze.Iassumethatmost,ifnotallofthosechangeswerearesponsetoCovid-19.
82. NormandinBeaudry20reportanaveragebudgetedsalaryincreasefor2021of2.6%,excludingorganisationsthatplantofreezesalaries.Whenthoseorganisationsthatplantofreezesalariesareincluded,theaverageincreasewaslowerbybetween0.1%fororganisationsthathaveexperiencedlittlenegativeeffecttoapositiveeffectfromCovi-19to0.5%lowerfororganisationswithanegativeeffectfromCovid-19.
83. Mercer21reportthat2021budgetsaverage2.3%fortotalsalaryincreases.Ifthe13%oforganisationsthatplantohavenosalaryincreaseareexcluded,theaverageincreaseisbudgetedtobe2.4%for2021,comparedwith2.6%for2020.
84. Basedonthevarioussurveysofbudgetedsalaryincreasesfor2021,itappearsthattheaveragewillbebetween2.0%and2.5%.Thesurveyresultsindicatedasimilaraveragewasbudgetedfor2020increasespriortochangesresultingfromCovid-19.
85. Inmyopinion,basedontheresultsofthesethreesurveysofemployerplansforsalaryadjustments,hadtherenotbeenanemploymentdisruptionfromCovid-19,theincreaseintheIAIforthe2021judicialsalaryincreasewouldlikelyhavebeenbetween2.0%and2.5%withasimilarincreaseintheIAIfor2022increases.
Effect on IAI Increases in Future Years
86. InFebruary2020,therewere16.4millionworkersincludedintheIndustrialAggregateearningsaverage.Threemonthslater,therewere13.5millionworkers,adecreaseof
19 “News&Views”,Volume17,Issue10,October2020,page6.20 “Updateofthe2021SalaryForecasts”,January2021,[www.normandin-beaudry.ca/en/update-of-the-
2021-salary-forecasts/]21 “MovingForwardWithOptimism”,24November2020,[www.imercer.com/ca/articledetail/moving-
forward-with-optimism-1]

Department of Justice 2020 Quadrennial Commission Page 20
2.9million.Thelossof2.9millionjobsresultedinanimmediate8.0%increaseintheaverageindustrialwageinCanada22.
87. ByDecember2020,2.3millionworkershadreturnedtowork.TheIndustrialAggregatehasdecreasedsinceMayduetotheirreturn.The8.0%increasebetweenFebruaryandMayhaddroppedtoa7.0%increasebetweenFebruaryandDecember23.
88. Ifthe550,000workerswhohavestillnotreturnedtoworkaremostlyatthebottomofthewagecontinuum,itislikelytheIndustrialAggregatewilldecreaseasandiftheyreturntowork.Ifall550,000weretoreturntoworkin2021andiftheiraverageearningsarelessthan$20perhour,IestimatetheIAIwillfurtherdecreasebybetween0.5%and1.0%.
89. Itislikelythatdecreasewillbeoffsetbywageincreasesgrantedtoallworkersin2021.Inparagraph85,IestimatedtheincreasetojudicialsalariesintheabsenceofCovid-19wouldbebetween2.0%and2.5%fortheApril2022changes.Combiningthatwiththeeffectof550,000morelaid-offworkersreturningtoworkgivesanetchangeintheIAIofbetween1.0%and2.0%.Iflessthan550,000ofthoselaid-offworkersreturntowork,IestimatethechangeintheIAIforApril2022willlieintherangeof1.0%to2.5%.
90. InaletterfromFrançoisLemire,DirectoroftheOfficeoftheChiefActuaryforCanadatoAnnaDekkerdated26February2021,Mr.LemiresetsouttheChiefActuary’scurrentestimateforfuturechangesintheIAI.HereferencestherecentincreaseinIndustrialAggregatewascausedbyemploymentlossesandthatfuturedecreasesintheIndustrialAggregateareexpected.HisassumptionforfuturechangesintheIAIwouldresultinincreasestoJudicialBaseSalaryof6.7%in2021and2.1%in202224.That2.1%increasefor2022lieswithintherangeIhaveestimated,butitisattheupperendoftherange.Basedonmycalculations,itlikelyassumesfewoftheremaininglaid-offworkerswillreturntowork.
Weighted Averages
91. Inthediscussionsinthisreportaboutincomeandbenefits,manyoftheitemsvarybyage.Sometimesthevarianceisbyageofappointmentandsometimesitisbycurrent
22 StatisticsCanada,IndustrialAggregateIndex,Table:14-10-0203-01.23 Ibid.24 Heincludedassumptionsforfutureyearsof2.6%in2023,2.8%in2024,2.9%in2025and3.0%in2026
andbeyond.
Department of Justice 2020 Quadrennial Commission Page 21
age.Itcanbehelpfulinthosesituationstoalsoknowtheaverageamount.Inaddition,amountsmayvarybyprovinceorbyCensusMetropolitanAreas.
92. Takingastraightaverageofthevaluesshowninatablecan,insomesituations,bemisleading.Forexample,inahigh-schoolclass,therewereonlythreedifferentgradesonthelasttest–50,70and90.Theaverageofthosemarksis70.Butifwearetoldthatthereweretenstudentswithagradeof50,tenwith70andonewith90,theweightedaverageis6125.
93. Whenwelookatincomesthatvarybyage,wecouldcalculateanaverageofthoseamounts–ifthereare30agesinvolved,weaverage30incomeamounts.Thatwouldgiveareasonableanswerifthejudgesorlawyerswereevenlydistributedacrossall30ages.
94. Ifwearelookingatincomesof500peoplewhoaredistributedacrossthose30ages,amoreappropriateresultistotakeanaverageoftheincomesforthe500peopleratherthananaverageofthe30agegroups.Wecouldcreateatablewiththe500amountsandcalculatethataverage.Orwecanachievethesameresultbycalculatingaweightedaverage.Aweightedaverageissimplyamathematicalshortcuttocalculatingtheaverageforall500people26.
95. Inthisreport,theweightedaverageisnotanaverageofthevaluesshowninatable.Itisbasedontakingthosevaluesinthetable,determiningforeachofthemanyindividualsthevaluethatapplies,andtakinganaverageoveralltheindividuals.
96. MostofthetimeinthisreportwhereIcalculateaweightedaverage,itisanage-basedweightedaverage.
97. Forexample,inTable133,therightmostcolumn(TotalValueofPensionandDisabilityNetofJudges’Contributions)showsaweightedaverageof34.9%.Ifwetakeanaverageofthevaluesshowninthetableforeachage,weget42.1%(notshowninTable133).
a. The42.1%wouldbereasonabletouseifthereareanequalnumberofjudgesappointedateachage40to69.
b. The34.9%isappropriatetousetoreflecttheactualhistoricaldistributionofjudgesbyageatappointment.
25 Thatweightedaveragecanbeverifiedbywritingdownall21marks–10studentsgot50,tengot70and
onegot90.Theaverageofthose21marksis61.Weightedaverageisaquickerwaytoachievethesameresultwithoutactuallylistingall21(orinmanysituations,significantlymore)values.
26 Atleast,inthisexample,itis500people.
Department of Justice 2020 Quadrennial Commission Page 22
c. Adifferentresultmightbeappropriatetouseifthefutureageofjudicialappointmentsisexpectedtochangesignificantlyfrompastagesatappointment.
98. Inthisreport,Ihavelookedataveragesbasedontheageofthejudgesupontheirappointmenttothebenchaswellasthegeographiclocationofthejudgesjustpriortotheirappointment.Toperformthosecalculations,Iwasprovidedwithasummaryoftheageofallappointmentsasafederaljudgefrom1April2011to31March2015andfrom1April2015to23October202027.
99. Intotal,therewere598appointmentsduringthat9.5-yearperiod–226from2011to2015and372from2015to2020.
100. Iexaminedthedistributionbyageduringeachofthetwoperiodsaswellastheentire9.5yearsandfoundtherewasverylittledifference.
a. Theaverageageatappointmentwas52.4between2011and2015anditwas52.7between2015and2020.Overtheentireperiod,theaverageageatappointmentwas52.6.
b. WhenIcalculatedtheweightedaveragevaluefortheJudicialAnnuityasapercentofcompensation(adiscussionoftheJudicialAnnuitybeginsatparagraph112),Iobtained37.6%,38.0%and37.8%respectivelyforappointmentsduring2011to2015,2015to2020andovertheentireperiod2011to2020.
101. Inmyopinion,thosedifferencesarenotmaterialforthepurposesofthisreport,andIhavethereforeonlycalculatedweightedaveragesbasedonthedistributionoffederaljudicialappointmentsovertheentire9.5-yearperiodfrom2011to2020.
27 TheDepartmentofJusticeprovidedmewithstatisticsonjudicialappointmentsfromApril2011toOctober
2020,madeavailablebytheOfficeoftheCommissionerforFederalJudicialAffairs.
Department of Justice 2020 Quadrennial Commission Page 23
E. Judicial Total Compensation
102. Iunderstandthattherearethreemaincomponentstofederaljudicialtotalcompensation28–salary,healthandwelfarebenefits(oftencalledgroupinsurancebenefits)andtheJudicialAnnuity,encompassingbothpermanentdisabilityincomeprotectionandretirementincome.TheremaybeotheritemsincludedandIhaveassumedthattheyarenotmaterialforthepurposesofthisreport.
103. Thenatureofthejudicialannuityisthatthevaluevariessignificantlybasedontheageatappointmentofajudge.Consequently,thetotalcompensationforafederaljudgewillalsodifferamongjudgesbasedontheirageatappointment.
Salary
104. Thesalaryforafederallyappointedjudgein2020was$338,80029.Foreaseofreference,Irefertothebasesalary($338,800for2020to2021)astheBaseJudicialSalary.IwillrefertothetotalcompensationforajudgewhoreceivestheBaseJudicialSalaryastheBaseJudicialTotalCompensation30.
105. Forthisreport,IwillfocusontheBaseJudicialSalaryandwillignoretheeffectofanysupplementalamountsbasedondifferingpositionsandgeography.
106. AssumingthattheincreaseintheIAIwillbe6.74%inApril2021,theBaseJudicialSalarywillbeincreasedto$361,600asof1April2021–anincreaseof$22,800.
Retirement Savings
107. Onecomponentofcompensationisretirementincomeaccumulation.WhilemanyCanadiansenjoyanemployer-sponsoredretirementplan,mostCanadiansarelefttolookaftertheirpersonalretirementsavingontheirown,generallythroughcontributingtoapersonalRegisteredRetirementSavingsPlan(“RRSP”).
28 “GuideforCandidates”,OfficeoftheCommissionerforFederalJudicialAffairs,[www.fja-
cmf.gc.ca/appointments-nominations/guideCandidates-eng.html] 29 Ibid.Inaddition,therearesupplementalamountschiefjustices,associatechiefjustices,justicesofcertain
courtsandnorthernallowances. 30 Asdiscussedlater(Paragraphs141to142),thetotalcompensationforjudgesvariesbytheirageat
appointment.Idetermineanaverageamountthatreflectstheageprofileofjudgesuponappointmentandusethat–soBaseJudicialTotalCompensationreferstotheaveragetotalcompensationofalljudgesbasedontheiragesatappointment.
Department of Justice 2020 Quadrennial Commission Page 24
108. TherearemanydifferenttypesofretirementplansinCanada.Mostretirementplansprovidedbyanemployerrequirepartoftheannualcontributiontobepaidbytheemployeesandthebalancebytheemployer.Afewplansarefundedentirelybytheemployerwithnocontributionrequiredfromemployees.Wherethereisnoretirementplanofferedbytheemployer,theentirecostofretirementsavingsisbornebytheindividualemployee.
109. Forthevastmajority,ifnotall,self-employedlawyers,retirementsavingsarefundedentirelyoutoftheindividual’snetincome.
110. Forfederallyappointedjudges,theJudicialAnnuityprovidesretirementincomewiththejudgespaying7%ofincomeeachyearuntiltheyareeligibleforanunreducedannuityatwhichtime,contributionsdecreaseto1%ofincome.Canadaisresponsibleforthebalanceofthetotalcost.
111. Toproperlyreflectretirementsavingscostsforself-employedlawyersandforfederallyappointedjudges,weneedtoconsidertheirdifferingopportunities,differingcostsanddifferingvaluesforretirementsaving.
The Judicial Annuity
112. TheJudicialAnnuityprovidesexcellentretirementbenefitstoretiredjudges.ItisoneofthebestretirementplansinCanada.
a. Alifetimeannuityequalto⅔rdsofthefinalyear’searningsprovidedthejudgehasmetoneofthreethresholdsinvolvingageandjudicialservice31.Areducedlifetimeannuityisavailableuponretirementpriortothosethresholds.
b. Alifetimeannuityequalto⅔rdsofthefinalyear’searningsuponpermanentdisabilitywhileservingasafederaljudgewithnominimumservicerequirement.
c. Asurvivingspouseincomepayablefollowingthedeathofajudge(bothbeforeandafterretirement)equaltohalfoftheamountpayabletothejudge.
d. InflationprotectionbasedonchangesintheConsumerPriceIndexineachyearwhiletheannuityispayable.
31 Attainedage75andservedatleasttenyears;Servedatleast15yearsandhasatotalofageplusserviceof
atleast80;ServedontheSupremeCourtofCanadaforatotalofatleasttenyears.
Department of Justice 2020 Quadrennial Commission Page 25
113. Inadditiontoretirementbenefits,theJudicialAnnuityprovidespermanentdisabilityincomeshouldajudgebecomepermanentlydisabled32.Withintheprivatesector,ifdisabilityincomeprotectionisprovided,itisusuallydonethroughlong-termdisabilityinsurancewhichcoversbothtemporaryandpermanentdisabilities.
114. So,theJudicialAnnuityisacombinationofretirementsavingsandpermanentdisabilityincomeprotection.
115. JudgesmustcontributepartofthecostoftheJudicialAnnuitythroughpayrolldeductionsequalto7%ofsalaryineachyearuntiltheyareeligibletoretirewithoutareductiontotheamountoftheannuity,followingwhichthecontributionis1%ofsalaryineachyear.Canadaisresponsibleforthebalanceofthetotalcost.
Retirement Income Requirements
116. Thegeneralruleusedbyfinancialplannersforretirementincomesufficiencyhasformanydecadesbeen70%ofpre-retirementincome.Forsomepeople,70%isnotsufficienttomaintaintheirlifestyle.Forsomepeople,70%ismorethansufficient.33
117. Ifwelookataverages,thereplacementpercentdecreasesaspre-retirementincomeincreases34.Forexample,afamilyearning$30,000perannumpriortoretirementisunlikelytobeabletomaintaintheirlifestyleona70%($21,000)pension.Afamilyearning$1millionannuallyislikelytohavemorethanenoughtomaintainalifestyleona70%($700,000)pension.Formostfamilies,thisisbecauseofsavings.Thelargertheincome,generallythelargertheamountsavedeachyear.Andinmostsituations,savingsarenolongerrequiredfollowingretirement.
118. Twootherfactorsthataffectretirementincomeneedsare:
a. whetheroneownsahomethathasbecomemortgage-freeinthelastfewyears;
b. thenumberofchildrenandwhethertheyhavebecomefinanciallyindependent35.
119. Basedonmyexperiencesworkingwithpeopleplanningforretirement,itismyopinionthata70%pensionisusuallyappropriateforfamilieswithatotalincomeof$60,000to
32 JudgesAct(s.42(1.1)(b))33 “Isa70%retirementreplacementincometargettoohigh?”byFredVettese,Globe&Mail,14Feb2018,
[www.theglobeandmail.com/globe-investor/retirement/retire-planning/book-excerpt-retirement-income-for-life-getting-more-without-savingmore/article37971172/]
34 BasedonmyworkingwithpeoplepreparingforretirementaswellasonunpublishedresearchIhavedoneoverthepast30years.
35 “RetirementIncomeforLife:GettingMoreWithoutSavingMore”byFredVettese,Milner&AssociatesInc.,2March2018.
Department of Justice 2020 Quadrennial Commission Page 26
$75,000.Ahigherpercentisneededforlowerincomeamountsandlessforthosewithhigherincomes.
120. Consequently,inmyopinion,thevastmajorityofjudgeswillhavemoreincomefromtheJudicialAnnuitythanisrequiredtomaintaintheirpre-retirementlifestyle.
121. WhileajudgemaynotrequirealloftheincomepayablefromtheJudicialAnnuitytomaintainalifestyle,theJudicialAnnuitystilldeliversafullvaluetothejudges.Itprovidesthemwithanabilitytosupportanincreaseinlifestyleiftheyshouldsowish,greaterconfidenceintheirfinancialfuture,aswellaspossibilitiestoprovidelargerinheritancesandgreaterphilanthropicactivities.
Value of the Judicial Annuity
122. Withinthepensionindustry,onegenerallyexpressesthevalueofretirementsavingsasapercentofsalary(ratherthanastotaldollars),therebyremovingsalarylevelasafactorforcostdifference.Inparagraph128below,IpresentthetotaldollarvalueoftheJudicialAnnuityforallyearsofservice.Fortherestofthereport,IexpressthevalueoftheJudicialAnnuityasapercentofBaseJudicialSalary.
123. Further,thereareanumberofwaystolookatthevalueofaretirementpension.Thetwomostcommonwaysare:
a. AnnualValue:theamountoffundsrequiredasacontributionineachyearofserviceuptoretirement,whichcanbeexpressedaseitheradollaramountorapercentofearnings;and
b. TotalValue:thetotalamountoffundsrequiredtopayforthetotalamountofretirementincomeearnedasofthedateofretirement.
124. Thereisnomethodthatresultsinthesamevalueforeachperson.Atthetimeofretirement,thetotalvaluewillvarybyageofthejudge,spousalstatusandgender.Theannualvaluewillvarybyageofthejudge,expectedretirementage,expectedspousalstatusatretirement,yearsofserviceasajudgeandgender.
a. Theyoungerajudgeiswhenappointedtothebench,themoreyearstherewillbeforthetimevalueofmoneytodiscountthevaluefromthefutureretirementagetothepresent,sothelowertheannualvalueofthepension.
b. Theyoungerajudgeisatretirement,thegreaterwillbethevalueoftheirpensionsincetheywillberetiredforalongertimeandreceivegreatertotalpaymentsthaniftheyretiredatanolderage.
Department of Justice 2020 Quadrennial Commission Page 27
c. Ifthejudgehasaspouse36,theJudicialAnnuitywillbeworthmorethanifthereisnospousebecausetheannuitycontinuesfollowingthedeathofthejudgeaslongasthespouseremainsalive.
d. Thevalueofapensionforafemaleisgreaterthanforamalesincefemales’lifeexpectancyisgreaterthanformales.
125. Thevalueofapensionisbaseduponexpectationsatretirementaswellasexpectationspriortoretirement(ageatretirement,futurecompensationincreases,etc.).Whilefutureeventsbothbeforeandafterretirementwillaffectthefinalcostofapension,thevalueisalwaysbasedonexpectationsaboutwhatwillhappeninthefuture.Whilea60-year-oldretireeisexpectedtolivemoreyearsthana75-year-oldretiree,thatdoesnotalwayshappen.
126. UnlessoneiswillingtowaitforthecostofaJudicialAnnuitytorevealitselfonceallretiredjudgeshavedied,wemustdeterminethevaluebasedonactuarialassumptions–expectationsforthefuture.
127. Ihavefocussedonthevalueforeachyearofserviceasajudgeandhavecalculatedtheexpectedoraveragevalueeachyearfromappointmenttoexpectedretirementbasedonasetofactuarialassumptions.ThoseassumptionsaresummarisedinAppendix4.
a. Theassumptionsrecognisethatjudgesretireatdifferentagesandfollowingdifferentnumberofyearsofservice.TheprobabilityofretirementforeachageandservicecombinationwastakenfromtheActuarialReportonthePensionPlanforFederallyAppointedJudgesasof31March2019(themostrecentasofthedateImadethecalculations).ThoseassumptionsweredevelopedbytheChiefActuarybasedonpastexperienceofwhenjudgeshaveretired.
36 And/orchildren.ThereisaprovisionforcontinuationoftheJudicialAnnuitytoanysurvivingdependent
children.Frommycalculations,thatprovisionhasanimmaterialeffectoncosts.
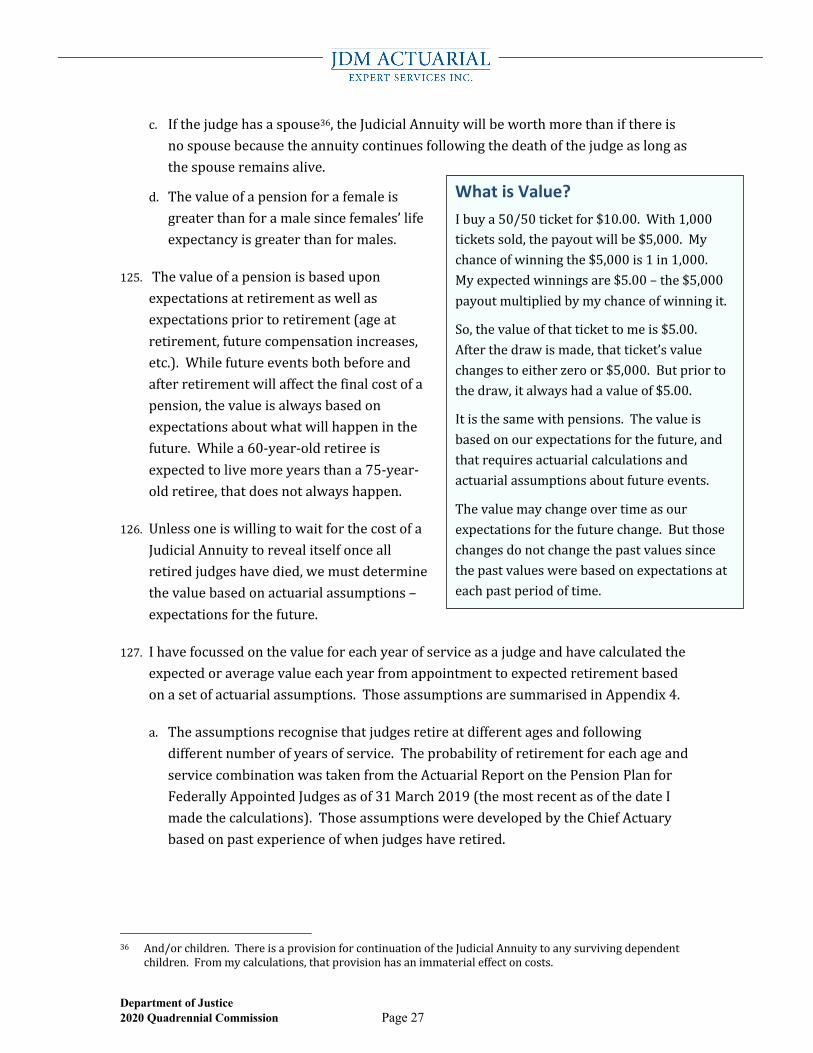
What is Value? Ibuya50/50ticketfor$10.00.With1,000ticketssold,thepayoutwillbe$5,000.Mychanceofwinningthe$5,000is1in1,000.Myexpectedwinningsare$5.00–the$5,000payoutmultipliedbymychanceofwinningit.
So,thevalueofthattickettomeis$5.00.Afterthedrawismade,thatticket’svaluechangestoeitherzeroor$5,000.Butpriortothedraw,italwayshadavalueof$5.00.
Itisthesamewithpensions.Thevalueisbasedonourexpectationsforthefuture,andthatrequiresactuarialcalculationsandactuarialassumptionsaboutfutureevents.
Thevaluemaychangeovertimeasourexpectationsforthefuturechange.Butthosechangesdonotchangethepastvaluessincethepastvalueswerebasedonexpectationsateachpastperiodoftime.
Department of Justice 2020 Quadrennial Commission Page 28
b. Theretirementassumptionsvaryfromage55(where½of1%ofjudgesareassumedtoretire)toage75(wherealljudgeswhoarestillservingareassumedtoretire).
c. Basedonthoseassumptions,theaverageageofretirementvariesfromage68forajudgeappointedat40;toage72forajudgeappointedat50;andage75forajudgeappointedat60andabove.
d. Assumptionsarealsomadeforfutureinterest(torecognisethetimevalueofmoney),futuresalaryincreases,gendersplitofthejudges,mortalityrates,disabilityratesandprobabilityoftherebeingasurvivorentitledtosurvivorbenefitsfollowingthejudge’sdeath.
128. ThedollarvalueoftheJudicialAnnuityisroughlysimilarregardlessoftheageatappointment.Inthefollowing,Icalculatedtheweightedaveragesbasedonthenumberofjudgesappointedateachagefrom40to69overthepast9.5years(April2011toOctober2020)37.
a. Thetotalvalueforpensionanddisabilitybenefitsrangesfrom$1,775,000to$2,172,000forappointmentatages40to65.Thedifferencesaremainlyduetothetimevalueofmoney.Theweightedaverageoverallagesis$1,885,000.
b. Thetotalamountofcontributionsbyajudgeovertheirentireperiodofservicevariesfrom$187,000to$356,000forappointmentatages40to65.Thedifferencesaremainlydueofthelengthoftimeinservice–theyoungeroneisappointed,themorethetotalcontributionswilltotal.Theweightedaverageoverallagesis$280,000.
c. Thetotalvalueofthepensionanddisabilitybenefits,netofjudges’contributionsrangesfrom$1,447,000to$1,984,000forappointmentatages40to65.Thosedifferencesaremainlyduetothetimevalueofmoney.Theweightedaverageoverallagesis$1,605,000.
129. Theaverageageofretirement,basedontheactuarialassumptions,isabout72.Alljudgesareassumedtoretireuponturning75orpriortothat.
130. Thesetotalvalueamountsarenotusefulfordeterminingtotalcompensationnoraretheyusefulforacomparisonwithretirementsavingsofself-employedlawyersandotherprofessionals.Forthat,IhaveexpressedthevalueoftheJudicialAnnuityasapercentofannualBaseJudicialSalary–apercentthatremainsthesameforeachyearofserviceasajudge.
37 Thisaveragingmethodisdiscussedfurtheratparagraphs91to101.
Department of Justice 2020 Quadrennial Commission Page 29
131. ThevalueoftheretirementincomeportionoftheJudicialAnnuityvariesfrom26.3%ofBaseJudicialSalaryforajudgeappointedatage40to78.6%ofBaseJudicialSalaryforajudgeappointedatage70.Assumingthejudges’contributionsareallutilisedtofundtheretirementincomebenefit,thevalueofthepensionnetofcontributionsrangesfrom20.6%forajudgeappointedatage40to71.6%forajudgeappointedatage70.
132. ThevalueofthedisabilityincomeportionoftheJudicialAnnuityvariesfrom2.3%ofearningsforajudgeappointedatage40to9.4%ofearningsforajudgeappointedatage70.Thatassumesthatnoportionofthejudge’scontributionisusedfordisabilityincomeprotection.
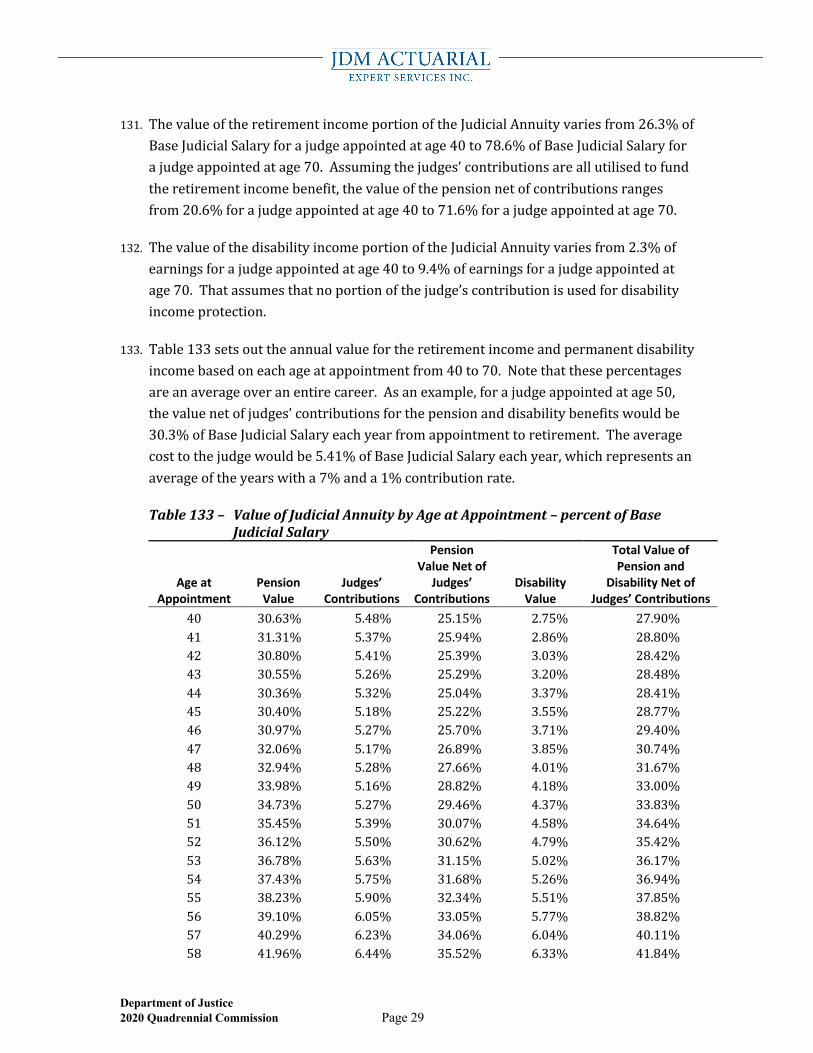
133. Table133setsouttheannualvaluefortheretirementincomeandpermanentdisabilityincomebasedoneachageatappointmentfrom40to70.Notethatthesepercentagesareanaverageoveranentirecareer.Asanexample,forajudgeappointedatage50,thevaluenetofjudges’contributionsforthepensionanddisabilitybenefitswouldbe30.3%ofBaseJudicialSalaryeachyearfromappointmenttoretirement.Theaveragecosttothejudgewouldbe5.41%ofBaseJudicialSalaryeachyear,whichrepresentsanaverageoftheyearswitha7%anda1%contributionrate.
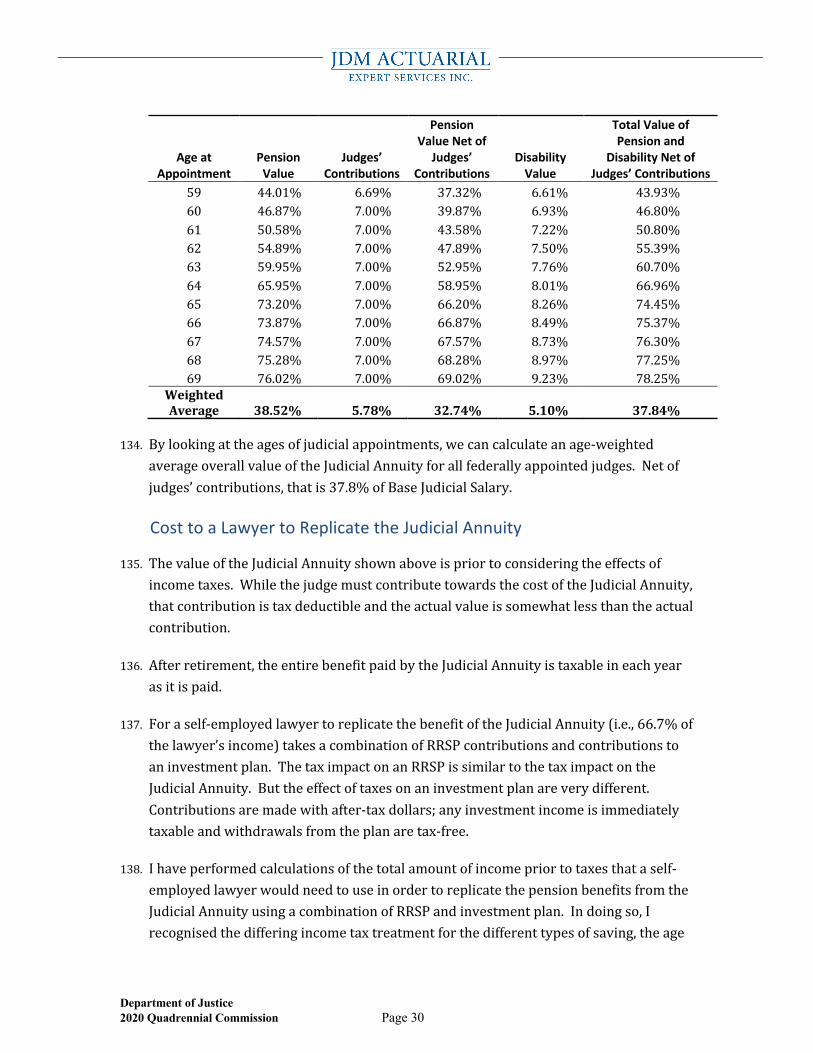
Table133– ValueofJudicialAnnuitybyAgeatAppointment–percentofBaseJudicialSalary
Age at Appointment
Pension Value
Judges’ Contributions
Pension Value Net of
Judges’ Contributions
Disability Value
Total Value of Pension and
Disability Net of Judges’ Contributions
40 30.63% 5.48% 25.15% 2.75% 27.90%41 31.31% 5.37% 25.94% 2.86% 28.80%42 30.80% 5.41% 25.39% 3.03% 28.42%43 30.55% 5.26% 25.29% 3.20% 28.48%44 30.36% 5.32% 25.04% 3.37% 28.41%45 30.40% 5.18% 25.22% 3.55% 28.77%46 30.97% 5.27% 25.70% 3.71% 29.40%47 32.06% 5.17% 26.89% 3.85% 30.74%48 32.94% 5.28% 27.66% 4.01% 31.67%49 33.98% 5.16% 28.82% 4.18% 33.00%50 34.73% 5.27% 29.46% 4.37% 33.83%51 35.45% 5.39% 30.07% 4.58% 34.64%52 36.12% 5.50% 30.62% 4.79% 35.42%53 36.78% 5.63% 31.15% 5.02% 36.17%54 37.43% 5.75% 31.68% 5.26% 36.94%55 38.23% 5.90% 32.34% 5.51% 37.85%56 39.10% 6.05% 33.05% 5.77% 38.82%57 40.29% 6.23% 34.06% 6.04% 40.11%58 41.96% 6.44% 35.52% 6.33% 41.84%
Department of Justice 2020 Quadrennial Commission Page 30
Age at Appointment
Pension Value
Judges’ Contributions
Pension Value Net of
Judges’ Contributions
Disability Value
Total Value of Pension and
Disability Net of Judges’ Contributions
59 44.01% 6.69% 37.32% 6.61% 43.93%60 46.87% 7.00% 39.87% 6.93% 46.80%61 50.58% 7.00% 43.58% 7.22% 50.80%62 54.89% 7.00% 47.89% 7.50% 55.39%63 59.95% 7.00% 52.95% 7.76% 60.70%64 65.95% 7.00% 58.95% 8.01% 66.96%65 73.20% 7.00% 66.20% 8.26% 74.45%66 73.87% 7.00% 66.87% 8.49% 75.37%67 74.57% 7.00% 67.57% 8.73% 76.30%68 75.28% 7.00% 68.28% 8.97% 77.25%69 76.02% 7.00% 69.02% 9.23% 78.25%
WeightedAverage 38.52% 5.78% 32.74% 5.10% 37.84%
134. Bylookingattheagesofjudicialappointments,wecancalculateanage-weightedaverageoverallvalueoftheJudicialAnnuityforallfederallyappointedjudges.Netofjudges’contributions,thatis37.8%ofBaseJudicialSalary.
Cost to a Lawyer to Replicate the Judicial Annuity
135. ThevalueoftheJudicialAnnuityshownaboveispriortoconsideringtheeffectsofincometaxes.WhilethejudgemustcontributetowardsthecostoftheJudicialAnnuity,thatcontributionistaxdeductibleandtheactualvalueissomewhatlessthantheactualcontribution.
136. Afterretirement,theentirebenefitpaidbytheJudicialAnnuityistaxableineachyearasitispaid.
137. Foraself-employedlawyertoreplicatethebenefitoftheJudicialAnnuity(i.e.,66.7%ofthelawyer’sincome)takesacombinationofRRSPcontributionsandcontributionstoaninvestmentplan.ThetaximpactonanRRSPissimilartothetaximpactontheJudicialAnnuity.Buttheeffectoftaxesonaninvestmentplanareverydifferent.Contributionsaremadewithafter-taxdollars;anyinvestmentincomeisimmediatelytaxableandwithdrawalsfromtheplanaretax-free.
138. Ihaveperformedcalculationsofthetotalamountofincomepriortotaxesthataself-employedlawyerwouldneedtouseinordertoreplicatethepensionbenefitsfromtheJudicialAnnuityusingacombinationofRRSPandinvestmentplan.Indoingso,Irecognisedthedifferingincometaxtreatmentforthedifferenttypesofsaving,theage
Department of Justice 2020 Quadrennial Commission Page 31
atappointmenttothejudiciaryandtheaverageageofretirementoffederaljudgesofage72.
Total Value of the Judicial Annuity to a Self-Employed Lawyer
139. ThevalueoftheJudicialAnnuityshowninTable133ispriortorecognisingthattheincometaxtreatmentaffordedtheJudicialAnnuityisnotavailabletoindividualCanadians,includingtheself-employedlawyers.Therefore,thevalueoftheJudicialAnnuityshowninTable133underestimatestheactualvaluetothelawyer.
140. ThecosttoreplicatethepensionfromtheJudicialAnnuityrangesfromabout8%moreforappointmentatage40comparedwiththevalueoftheJudicialAnnuityto18%moreforappointmentatage65comparedwiththevalueoftheJudicialAnnuity38.
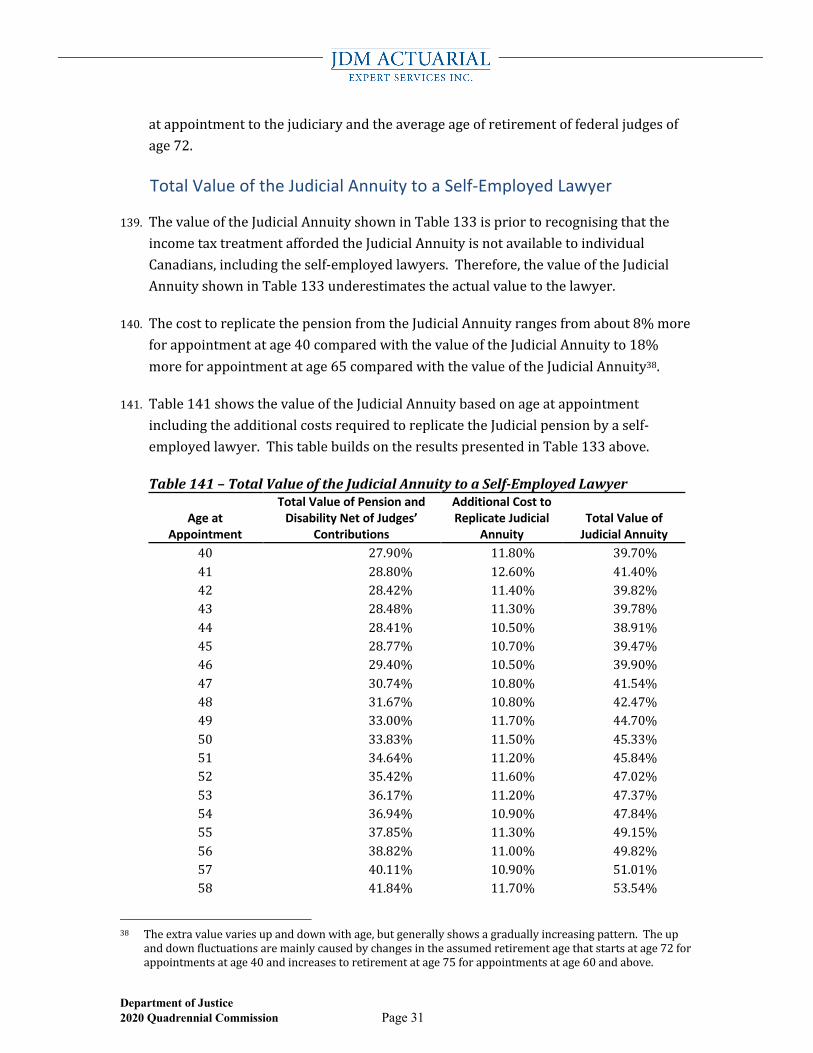
141. Table141showsthevalueoftheJudicialAnnuitybasedonageatappointmentincludingtheadditionalcostsrequiredtoreplicatetheJudicialpensionbyaself-employedlawyer.ThistablebuildsontheresultspresentedinTable133above.
Table141–TotalValueoftheJudicialAnnuitytoaSelf-EmployedLawyer
Age at Appointment
Total Value of Pension and Disability Net of Judges’
Contributions
Additional Cost to Replicate Judicial
Annuity Total Value of
Judicial Annuity 40 27.90% 11.80% 39.70%41 28.80% 12.60% 41.40%42 28.42% 11.40% 39.82%43 28.48% 11.30% 39.78%44 28.41% 10.50% 38.91%45 28.77% 10.70% 39.47%46 29.40% 10.50% 39.90%47 30.74% 10.80% 41.54%48 31.67% 10.80% 42.47%49 33.00% 11.70% 44.70%50 33.83% 11.50% 45.33%51 34.64% 11.20% 45.84%52 35.42% 11.60% 47.02%53 36.17% 11.20% 47.37%54 36.94% 10.90% 47.84%55 37.85% 11.30% 49.15%56 38.82% 11.00% 49.82%57 40.11% 10.90% 51.01%58 41.84% 11.70% 53.54%
38 Theextravaluevariesupanddownwithage,butgenerallyshowsagraduallyincreasingpattern.Theup
anddownfluctuationsaremainlycausedbychangesintheassumedretirementagethatstartsatage72forappointmentsatage40andincreasestoretirementatage75forappointmentsatage60andabove.
Department of Justice 2020 Quadrennial Commission Page 32
Age at Appointment
Total Value of Pension and Disability Net of Judges’
Contributions
Additional Cost to Replicate Judicial
Annuity Total Value of
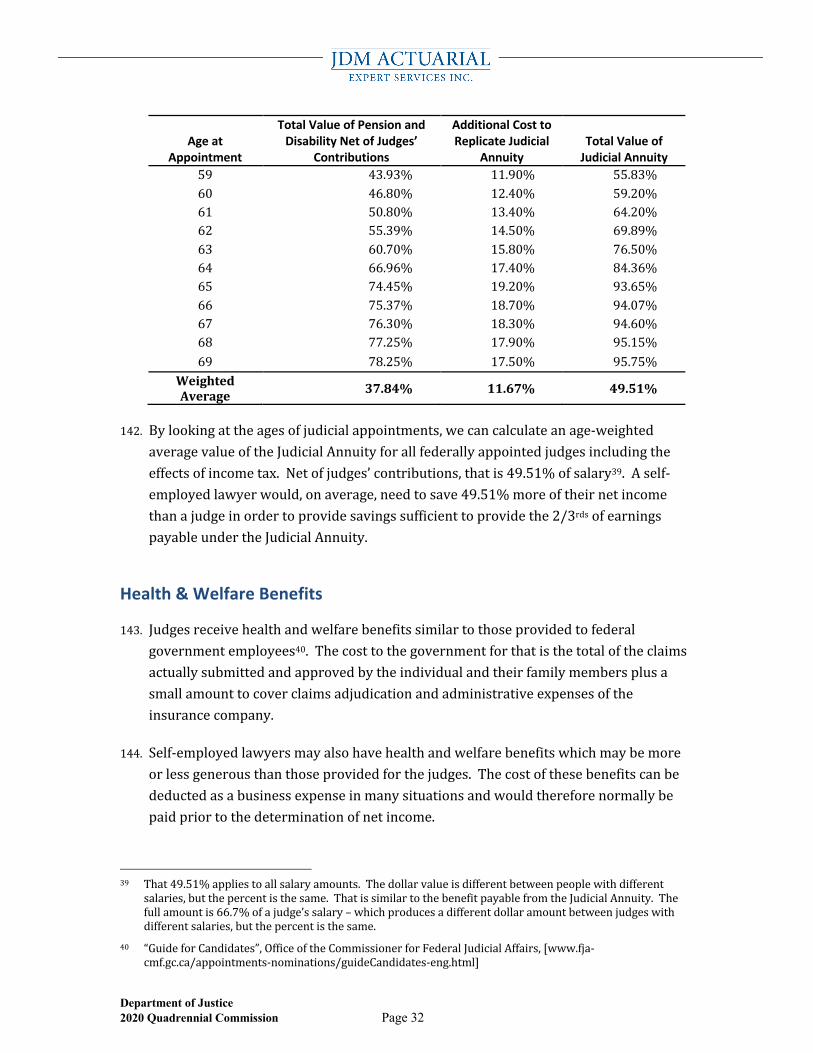
Judicial Annuity 59 43.93% 11.90% 55.83%60 46.80% 12.40% 59.20%61 50.80% 13.40% 64.20%62 55.39% 14.50% 69.89%63 60.70% 15.80% 76.50%64 66.96% 17.40% 84.36%65 74.45% 19.20% 93.65%66 75.37% 18.70% 94.07%67 76.30% 18.30% 94.60%68 77.25% 17.90% 95.15%69 78.25% 17.50% 95.75%
WeightedAverage 37.84% 11.67% 49.51%
142. Bylookingattheagesofjudicialappointments,wecancalculateanage-weightedaveragevalueoftheJudicialAnnuityforallfederallyappointedjudgesincludingtheeffectsofincometax.Netofjudges’contributions,thatis49.51%ofsalary39.Aself-employedlawyerwould,onaverage,needtosave49.51%moreoftheirnetincomethanajudgeinordertoprovidesavingssufficienttoprovidethe2/3rdsofearningspayableundertheJudicialAnnuity.
Health & Welfare Benefits
143. Judgesreceivehealthandwelfarebenefitssimilartothoseprovidedtofederalgovernmentemployees40.Thecosttothegovernmentforthatisthetotaloftheclaimsactuallysubmittedandapprovedbytheindividualandtheirfamilymembersplusasmallamounttocoverclaimsadjudicationandadministrativeexpensesoftheinsurancecompany.
144. Self-employedlawyersmayalsohavehealthandwelfarebenefitswhichmaybemoreorlessgenerousthanthoseprovidedforthejudges.Thecostofthesebenefitscanbedeductedasabusinessexpenseinmanysituationsandwouldthereforenormallybepaidpriortothedeterminationofnetincome.
39 That49.51%appliestoallsalaryamounts.Thedollarvalueisdifferentbetweenpeoplewithdifferent
salaries,butthepercentisthesame.ThatissimilartothebenefitpayablefromtheJudicialAnnuity.Thefullamountis66.7%ofajudge’ssalary–whichproducesadifferentdollaramountbetweenjudgeswithdifferentsalaries,butthepercentisthesame.
40 “GuideforCandidates”,OfficeoftheCommissionerforFederalJudicialAffairs,[www.fja-cmf.gc.ca/appointments-nominations/guideCandidates-eng.html]
Department of Justice 2020 Quadrennial Commission Page 33
145. Whiletheremaybesome,orevenmany,self-employedlawyerswhodonotbuyhealthandwelfarebenefitsforthemselves,Iassumethatthosewithnetincomesabovethemediandohavethesebenefitsandthatthecostisroughlysimilarasforajudge.
146. Thecostofbenefitstypicallyformspartoftotalcompensation.Sincethecostsarelikelyawashinmostsituations,Ihavechosentoignoreitforpurposesofthisreport.
Canada Pension Plan Contributions
147. Thereareatleasttwobenefitswithadifferentcostimpactbetweenself-employedlawyersandfederallyappointedjudges:partoftheCanadaPensionPlan(CPP)contributionsandretirementsavings.Retirementsavingsareaddressedaboveinparagraphs135to142.
148. CPPcontributionsin2021total10.9%ofearningsbetween$3,500and$61,600.Halfispaidbytheemployeeandhalfbytheemployer.Forself-employedCanadians,theentireamountispaidbytheself-employedperson.Forapersonearningover$61,600in2021,theemployeeportionis$3,166andtheself-employedtotalcontributionis$6,333.Thosecontributionsaremadeoutofnetincome.Ajudgethereforehas$3,166lessinCPPcontributionsthantheself-employedlawyer.
149. ToproperlyreflectthisdifferenceintheCPPcontributions,wecouldeitherreduceeachofthenetincomeamountsofself-employedlawyersshowninthetablesinthisreportbythe$3,166differenceorwecouldincludethe$3,166asabenefitavailabletothejudgesaspartoftotalcompensation.Inmyopinion,itiseasiertoincludethisbenefitasapartofthejudges’totalcompensationsincethatinvolvesadjustingonlyoneamount.
Base Judicial Total Compensation
150. TheBaseJudicialTotalCompensationisequaltotheBaseJudicialSalaryplusanamountforCanadaPensionPlancontributionsplusthevaluefortheJudicialAnnuityplusthevalueofanyotheritemsorperquisites.IhaveassumedthatthevalueofanyotheritemsorperquisitesisnotmaterialandIhaveassignedazerovaluetothemforpurposesofthisreport.
151. Forajudgeappointedatage40,theBaseJudicialTotalCompensationin2020is$338,800plus39.7%(fromtable141)fortheJudicialAnnuityplus$3,166forCPP
Department of Justice 2020 Quadrennial Commission Page 34
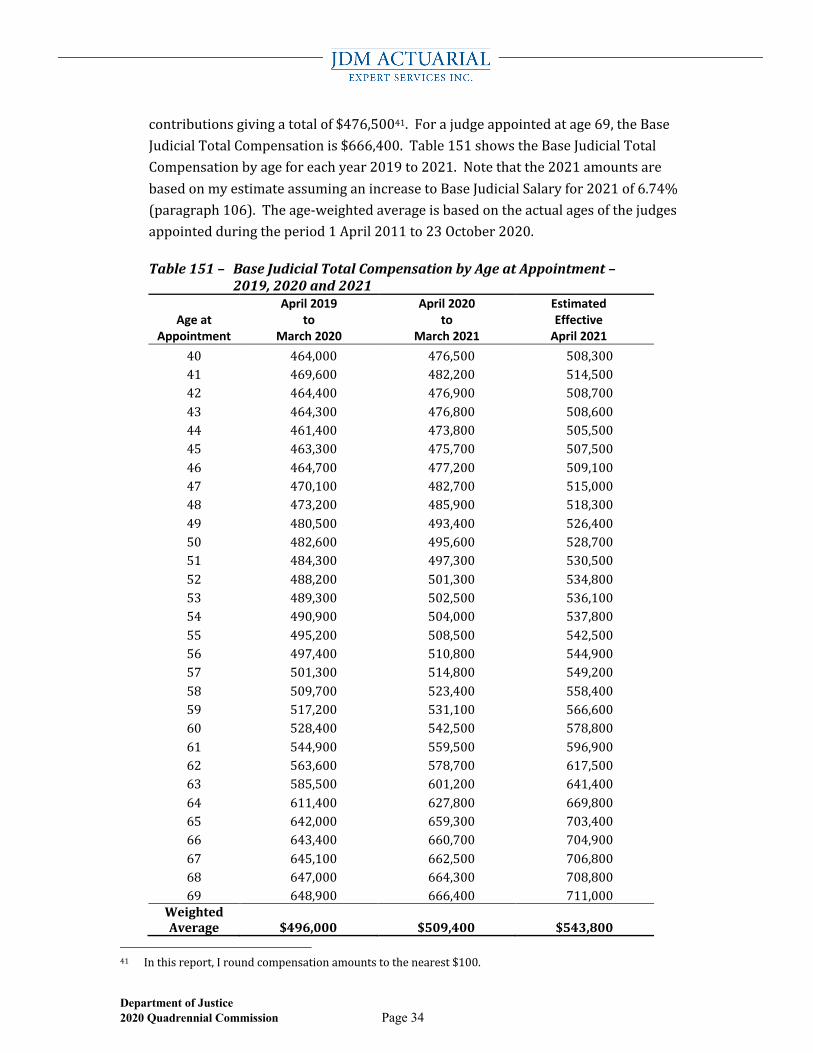
contributionsgivingatotalof$476,50041.Forajudgeappointedatage69,theBaseJudicialTotalCompensationis$666,400.Table151showstheBaseJudicialTotalCompensationbyageforeachyear2019to2021.Notethatthe2021amountsarebasedonmyestimateassuminganincreasetoBaseJudicialSalaryfor2021of6.74%(paragraph106).Theage-weightedaverageisbasedontheactualagesofthejudgesappointedduringtheperiod1April2011to23October2020.
Table151– BaseJudicialTotalCompensationbyAgeatAppointment–2019,2020and2021
Age at Appointment
April 2019 to
March 2020
April 2020 to
March 2021
Estimated Effective
April 2021 40 464,000 476,500 508,30041 469,600 482,200 514,50042 464,400 476,900 508,70043 464,300 476,800 508,60044 461,400 473,800 505,50045 463,300 475,700 507,50046 464,700 477,200 509,10047 470,100 482,700 515,00048 473,200 485,900 518,30049 480,500 493,400 526,40050 482,600 495,600 528,70051 484,300 497,300 530,50052 488,200 501,300 534,80053 489,300 502,500 536,10054 490,900 504,000 537,80055 495,200 508,500 542,50056 497,400 510,800 544,90057 501,300 514,800 549,20058 509,700 523,400 558,40059 517,200 531,100 566,60060 528,400 542,500 578,80061 544,900 559,500 596,90062 563,600 578,700 617,50063 585,500 601,200 641,40064 611,400 627,800 669,80065 642,000 659,300 703,40066 643,400 660,700 704,90067 645,100 662,500 706,80068 647,000 664,300 708,80069 648,900 666,400 711,000
WeightedAverage $496,000 $509,400 $543,800
41 Inthisreport,Iroundcompensationamountstothenearest$100.
Department of Justice 2020 Quadrennial Commission Page 35
EffectonBaseJudicialTotalCompensation
152. TheBaseJudicialTotalCompensationshowninTable151iscomprisedofthreeitems–BaseJudicialSalarywhichisthesameateachage,thevalueoftheJudicialAnnuitywhichvariesbyageatappointmentandtheportionofthejudge’sCanadaPensionPlancontributionspaidbyCanadawhichisthesameateachage.Todetermineasinglevaluerepresentativeofalljudges,Ihavecalculatedthe“weightedaverageforageatappointment”ofBaseJudicialTotalCompensationeffectiveApril2019tobe$496,000.
153. Thesimilarage-weightedaverageBaseJudicialTotalCompensationeffectiveApril2020is$509,400.
154. Ifthe2021BaseJudicialSalaryincreasesasIestimated(paragraph106)to361,600,theage-weightedaverageBaseJudicialTotalCompensationeffectiveApril2021willbe$543,800.
155. Ihaveestimatedatwhichpercentileofnetincomeforself-employedlawyersinallregionsofCanadathesejudicialcompensationamountsfall42.Itookthe2019net-incomeamountsforallself-employedlawyersinallregionsofCanadaandadjustedthemto2020andto2021usinganincreasebasedontheaverageannualincreasesbetween2015to2019.Thoseaverageincreasepercentagesweredeterminedseparatelyforeachofthepercentileranges43.
156. IestimatethattheaverageBaseJudicialTotalCompensationin2019of$496,000isapproximatelyatthe88thpercentileoftheself-employedlawyersin201944.
157. IestimatethattheaverageBaseJudicialTotalCompensationin2020of$509,400isapproximatelyatthe88thpercentileoftheself-employedlawyersin202045.
42 Thenetincomesforself-employedlawyersinCanadaarediscussedinSectionFanddetailedtablesofnet-
incomearefoundinSectionH.43 Thatproducedanannualincreaseintheself-employedlawyers’netincomefor2020andagainfor2021by
percentileof:
65-70thpercentile: 1.39%70-75thpercentile: 1.21%75-80thpercentile: 1.09%80-85thpercentile: 0.80%85-90thpercentile: 1.07%90-95thpercentile: 1.21%95-100thpercentile: 1.72%
44 Iftheself-employedlawyer’swithnetincomebelow$60,000areexcluded,thisisthe84thpercentileoftheapproximately70%ofallself-employedlawyerswhohavenetincomesgreaterthan$60,000.
45 Iftheself-employedlawyer’swithnetincomebelow$60,000areexcluded,thisisthe84thpercentileoftheapproximately70%ofallself-employedlawyerswhohavenetincomesgreaterthan$60,000.
Department of Justice 2020 Quadrennial Commission Page 36
158. IestimatethattheaverageBaseJudicialTotalCompensationin2021of$543,800willbeapproximatelyatthe89thpercentileoftheself-employedlawyersin202146.
EffectonTotalCompensationofProthonotaries
159. ForApril2019toMarch2020,thebasesalaryofaprothonotarywas$263,900,fromApril2020toMarch2021itis$271,000andIestimatebeginningApril2021itwillbe$289,200(80%oftheBaseJudicialSalary).
160. Usingthesameadjustmentstoobtaintotalcompensationasusedforpuisnejudges47,Ideterminedthetotalcompensationofaprothonotary.
161. The2019averagetotalcompensationofaprothonotaryis$397,300.Thatisaboutthe84thpercentileforallself-employedlawyersinCanada.
162. The2020averagetotalcompensationofaprothonotaryis$408,100.Thatisaboutthe84thpercentileforallself-employedlawyersinCanada.
163. The2021averagetotalcompensationofaprothonotaryisestimatedtobe$435,500.Thatisaboutthe86thpercentileforallself-employedlawyersinCanada.
46 Iftheself-employedlawyer’swithnetincomebelow$60,000areexcluded,thisisthe85thpercentileofthe
approximately70%ofallself-employedlawyerswhohavenetincomesgreaterthan$60,000.47 Takethebasesalary,addthevalueoftheJudicialAnnuity(basedontheaveragevalueof49.51%)andadd
thevalueofthegovernmentpayinghalfoftheCanadaPensionplancontribution.Thisimplicitlyassumesthatprothonotarieshaveasimilarageprofileatappointmentasdothefederallyappointedjudges.
Department of Justice 2020 Quadrennial Commission Page 37
F. Self-Employed Lawyers
164. About2/3rdsofthefederaljudicialappointees(2011to2020)arelawyersfromprivatepractice.Thatincludestheself-employedlawyersaswellaslawyerspracticinginacorporationincludingprofessionalcorporations.Judgesarealsoappointedfromlawyerswhoareemployedbyorganisationswithinthebroaderpublicsector.CanadaRevenueAgencyprovidedanonymousnetincomedataforself-employedlawyersbutwasnotabletoprovidesufficientlyreliableemploymentinformationforlawyersworkingforacorporationorwithinthebroaderpublicsector.Consequently,Ihaveutilisedonlyself-employedlawyersasanincomecomparator.
165. Aself-employedlawyermustcoverallbusinessexpensesoutofthegrossincome.Theamountleftover,ornetincome,isavailabletoprovideapersonalincome,retirementsavings,andhealthandwelfarebenefits.
Self-Employed Lawyers’ Income
166. CanadaRevenueAgencyprovidedadatafileofthenetearningsofself-employedlawyersinCanada.IhaveanalysedthoseandsetoutvariousanalysesinsectionA.
167. SimilardatahasbeenprovidedandincludedinreportspreparedforpriorQuadrennialCommissions.Ihaveprovidedresultsusingsimilaranalysesaswasdoneinprioryears.ThereisanissuewiththoseanalysesthatIdiscusslater(seethecall-outboxonpage46).However,datathatwouldhavepermittedmetoaddresstheissuewasnotavailable.
168. Compensationcomparisonsareanormalpartofcompensationreviewsandareusedmainlytodeterminehowanorganisation’stotalcompensationamountscomparewithsimilarorganisations.Itisnormaltoselectotherorganisationsthatareinthesameindustryandsimilarsizedorganisationsthatcompeteforpeoplewiththesameskills.
169. Oncethedatahasbeencollected,onemustdeterminewhatpointsintherangeofsalariesyouwanttoutilise.Iftheevaluationisforemployeeswithaverageskillsand
Percentiles Percentileshelpuseasilyrankarangeofnumbers,likecompensation.Whendealingwithcompensation,the40thpercentilereferstothecompensationamountwhere40%ofalllawyersearnlessandtherest(60%)earnmore.The75thpercentileistheamountwhere75%oflawyersearnlessandthebalance(25%)earnmore.
The50thpercentileisalsoreferredtoasthemedian.Notethatthemedianandtheaveragearenotthesame.Theyaresometimescloseinvalue,buttheycanalsobeverydifferent–indicatingtheunderlyingdataisskewed.
Considerthenumbers2,3,8,15,27.Theaverageis11.Themedianis8–thevaluethatisinthemiddle–inthiscasewherethereare2valuesbelowitandtwovaluesaboveit.
Department of Justice 2020 Quadrennial Commission Page 38
averageperformance,thefocuswouldbeontheaverageorthemediancompensationfromthestudy.Topayanaverageperformingemployeecompensationmeasuredatthe75thpercentilewouldbeoverpayingandcouldleadtowageinflationwithinthatjobsector.Iftheevaluationisforhighperformingemployees,thefocuswouldlikelybeoncompensationatthe70thto80thpercentile–orevenhigheriftheindividualisastarperformer.Topayaveragecompensationtoahighperformingemployeecouldleadtothemquittingoracessationofperformingwell.
170. Inthissection,Iwillfocusonthecompensationofself-employedlawyers48.Specifically,Iusethenetincomeofself-employedlawyers.Netincomeisequaltothetotalincomefromallservicesprovidedlessbusinessexpenses,suchascompensationforemployees,officeexpenses,etc.Netincomeisbasicallythetotalcompensationavailabletotheself-employedlawyer.
171. Thereisawiderangeofnetincomeamonglawyersandanindividuallawyer’snetincomecouldfluctuategreatlyfromyeartoyear.Forexample,in2019theaverageincomereportedbyCanadaRevenueAgencyinmetropolitanareasrangedfrom$7,530to$1,037,000($8,800to$1,223,000inToronto)49.Whatthedatadoesnotshowiswhetherandbyhowmuchanindividuallawyer’sincomefluctuates.
SalaryExclusion
172. Withinthecompensationindustry,medianisfrequentlyused–butthatdependsonthetypeofcandidateonewantstoattract.Thisprocessmaynotcompletelytranslatetotherelationshipoflawyersandjudges’compensationbecauseincomeisnotaperfectindicatorofsuitabilityforajudicialposition.
173. SomeofthedataprovidedtopriorQuadrennialCommissionshasbeenbasedonincomeamountsthatexcludednetincomesbelowathresholdof$60,000or$80,000.Excludinglowersalariesisaveryunusualmethodthatresultsindistortedresults.Iamunabletodetermineavalidandappropriatereasonforsuchanexclusion.
48 Itwouldbebettertoalsoincludecompensationoflawyerswhoareemployedbyanorganisation,butCanada
RevenueAgencyadvisedtherearepracticalissueswithbeingabletoextractthatdataandensuretheaccuracyofit.
49 CanadaRevenueAgencyuseamodifiedpercentilemethodofreportingnetearnings.Thelowestearningsreported(referredtoasthe“1stdecilemean”)isdescribedastheaverageofthenetincomeforlawyerswhofallbetweenthe5thpercentileand10thpercentile.Forclarity,thereisnoinformationprovidedonthebottom5percentofincomes,althoughthoseincomesareutilisedincalculatingsomeofthenumbers.
Thehighestearningsreported(referredtoasthe“10thdecilemean”)istheaverageofthenetincomeforthetop5%oflawyers–thatistheaverageofincomesfromthe95thpercentiletothe100thpercentile.
Department of Justice 2020 Quadrennial Commission Page 39
174. Forexample,byexcludingthosewithanetincomelessthan$60,000forthe2019data,oneexcludesabout34%oftheself-employedlawyersinBritishColumbia,30%inAlberta,29.5%inOntario,39%inQuebec,and29%inAtlanticCanada.TherewerenotenoughlawyersinSaskatchewan,Manitoba,andthethreeTerritoriestopreserveconfidentiality,andCanadaRevenueAgencythereforesuppressedalmostalldata.Asaresult,theeffectofanincomeexclusioncouldnotbedeterminedforthosefivejurisdictions.
175. Ifweassumethatincomeisoneindicatorofsuitabilityforafederaljudicialappointment,thosepercentagessuggestthatonly30%oftheself-employedlawyersinAlberta,OntarioandAtlanticCanadaareunsuitablewhilealmost40%ofthoseinQuebecareunsuitable.
176. Basedonmypastexperienceofworkingwithlargeamountsofdata,itismyopinionthattherearelikelynoorveryfewregionaldifferencesinthepercentageoflawyersthatpossessspecificqualities.Thatimpliestherearenoorfewregionaldifferencesinthepercentageoflawyersthatpossessthespecificqualitiesdesiredforafederaljudicialappointment.
177. Normally,whenlookingatcompensationdata,welookatdataintherangeofwhereonewantstoattractemployees.Inmostindustries,onelooksforcandidatesfromasimilarpositioninotherorganisations.Ifyouwanttohaveastaffofaverageperformers,youwouldtendtolooktothemedianincome.Ifyouwantaboveaverageperformers,youwilltendtolooktothe60thto70thpercentiles.Ifyouwantoutstandingperformers,youwilltendtolooktothe70thandhigherpercentiles.
178. Byexcludingincomesbelowathreshold,theincomeamountsateachofthepercentilesissimplyincreasedwhilethenumberofpeople(ordatapoints)isdecreased.Themedianincomebecomestheincomeforabove-averageperformers.The75thpercentilebecomestheincomeforveryoutstandingperformers.
179. Evenifthereisavalidreasontoexcludelowearnings,doingsoleavesaperceptionthattheexclusionisartificialandwasdoneinordertoobtainapre-conceivedresult.Ifweknowthatweneedtofocusprimarilyonincomesofthetop25%ofalllawyersinordertoattractqualitycandidates,welooktotheincomestatisticsofthoseatthe75thandhigherpercentiles.
180. Toexcludethosewithnetincomesbelow$60,000andthendeterminethepercentilesresultsininflatingtheincomesateachpercentile.Thetop25%ofthoseearningmorethan$60,000maybethetop20%ofalllawyers(anevensmallerpercentinQuebec).Toactuallyincludethetop25%ofalllawyers,wewouldneedtoadjustoursightstolooks

Department of Justice 2020 Quadrennial Commission Page 40
atroughlythetop30%(lowerpercentinQuebec)ofalllawyersearningmorethan$60,000.Thatbecomesacommunicationchallengewhentryingtoexplaintootherswhythetop25%ofalllawyersincludesthoseinthetop30%.
181. Sincewecanobtainthesameendresultwithoutexcludinganyincome,oneneedstoaskwhyanincomeexclusionwasused.Sayweendupselectingtheincomeamountatthe80thpercentileofthelawyersearningmorethan$60,000.Thatsameresultcouldbeobtainedbyselectingtheincomeamountat(approximately)the85thpercentileofalllawyers(noincomeexclusion).
182. Ifweexcludeanydataduetotheamountofincome,theresultsbecomeinconsistentbetweengeographicareas.Ifwemakenoexclusions,thedataisconsistent.
183. ThereportofthefifthJudicialCompensationandBenefitsCommission(the“2015QuadrennialCommission”)submitted30June2016addressedtheissueofexcludingsalaries.TheysummarisedthepositionoftheCanadianSuperiorCourtsJudgesAssociation(the“Association”)andtheCanadianJudicialCouncil(the“Council”)bystating“theirrationalewasthatthosewhoearnbelowacertainthresholdarenotsuitablecandidatesforthejudiciary:lowincomereflectsalackofsuccessortimecommitmentincommensuratewiththedemandsofajudicialappointment.”
184. Therearemanyreasonswhyanindividuallawyermayhavealowincome,includingissuesaroundcompetenceandcommitmentassuggestedbytheAssociationandCouncil.Buttherearealsoreasons,suchaspersonalpassions,practiceareasandlocation,thatcouldresultinlowincomewithoutimplyingunsuitabilityforajudicialappointment50.
185. Ialsonotethatduetothevariabilitiesofnetincome,itislikelythatmanylawyerswillfluctuatebetweennetincomesthatareaboveandbelowalow-incomethreshold.
186. IfweacceptthepositionoftheAssociationandCouncilthatitisreasonabletoexcludelownetincomesfromthecompensationcomparators,weshouldalsoconsideranexclusionofhighnetincomes.Inmanysituations,highincomemorelikelyimpliesbusinesssuccess(asopposedtolegalacumen),awillingnesstohustletoobtainclientsandafocusonfinancialrewardsratherthanimplyingqualitiescommensuratewithajudicialappointment.Excludinglownet-incomeaswellashighnet-incomedoesnot
50 “GuideforCandidates”,OfficeoftheCommissionerforFederalJudicialAffairs.Indescribingtheassessment
processandconsiderations,thereisnomentionmadeofthesalaryofanapplicant.Referenceismadeto“professionalcompetenceandexperience,personalcharacteristics,andpotentialimpedimentstoappointment.”
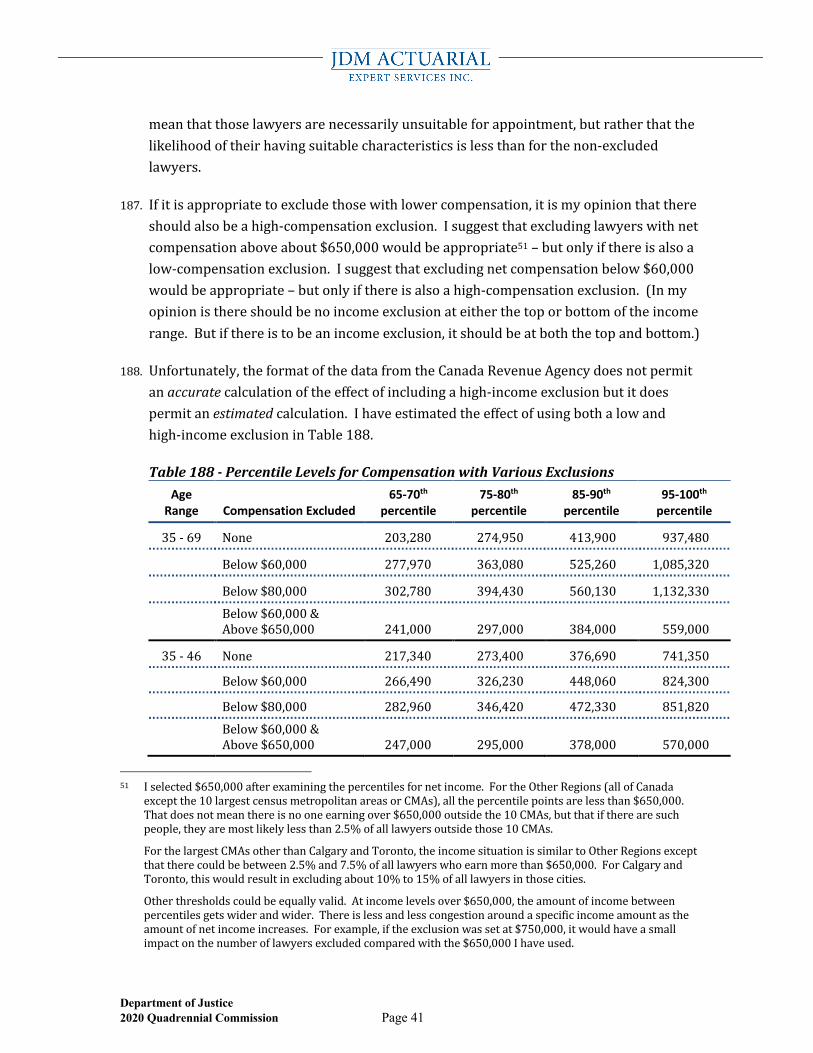
Department of Justice 2020 Quadrennial Commission Page 41
meanthatthoselawyersarenecessarilyunsuitableforappointment,butratherthatthelikelihoodoftheirhavingsuitablecharacteristicsislessthanforthenon-excludedlawyers.
187. Ifitisappropriatetoexcludethosewithlowercompensation,itismyopinionthatthereshouldalsobeahigh-compensationexclusion.Isuggestthatexcludinglawyerswithnetcompensationaboveabout$650,000wouldbeappropriate51–butonlyifthereisalsoalow-compensationexclusion.Isuggestthatexcludingnetcompensationbelow$60,000wouldbeappropriate–butonlyifthereisalsoahigh-compensationexclusion.(Inmyopinionisthereshouldbenoincomeexclusionateitherthetoporbottomoftheincomerange.Butifthereistobeanincomeexclusion,itshouldbeatboththetopandbottom.)
188. Unfortunately,theformatofthedatafromtheCanadaRevenueAgencydoesnotpermitanaccuratecalculationoftheeffectofincludingahigh-incomeexclusionbutitdoespermitanestimatedcalculation.Ihaveestimatedtheeffectofusingbothalowandhigh-incomeexclusioninTable188.
Table188-PercentileLevelsforCompensationwithVariousExclusionsAge
Range Compensation Excluded 65-70th
percentile 75-80th
percentile 85-90th
percentile 95-100th
percentile
35-69 None 203,280 274,950 413,900 937,480
Below$60,000 277,970 363,080 525,260 1,085,320
Below$80,000 302,780 394,430 560,130 1,132,330
Below$60,000&Above$650,000 241,000 297,000 384,000 559,000
35-46 None 217,340 273,400 376,690 741,350
Below$60,000 266,490 326,230 448,060 824,300
Below$80,000 282,960 346,420 472,330 851,820
Below$60,000&Above$650,000 247,000 295,000 378,000 570,000
51 Iselected$650,000afterexaminingthepercentilesfornetincome.FortheOtherRegions(allofCanada
exceptthe10largestcensusmetropolitanareasorCMAs),allthepercentilepointsarelessthan$650,000.Thatdoesnotmeanthereisnooneearningover$650,000outsidethe10CMAs,butthatiftherearesuchpeople,theyaremostlikelylessthan2.5%ofalllawyersoutsidethose10CMAs.
ForthelargestCMAsotherthanCalgaryandToronto,theincomesituationissimilartoOtherRegionsexceptthattherecouldbebetween2.5%and7.5%ofalllawyerswhoearnmorethan$650,000.ForCalgaryandToronto,thiswouldresultinexcludingabout10%to15%ofalllawyersinthosecities.
Otherthresholdscouldbeequallyvalid.Atincomelevelsover$650,000,theamountofincomebetweenpercentilesgetswiderandwider.Thereislessandlesscongestionaroundaspecificincomeamountastheamountofnetincomeincreases.Forexample,iftheexclusionwassetat$750,000,itwouldhaveasmallimpactonthenumberoflawyersexcludedcomparedwiththe$650,000Ihaveused.
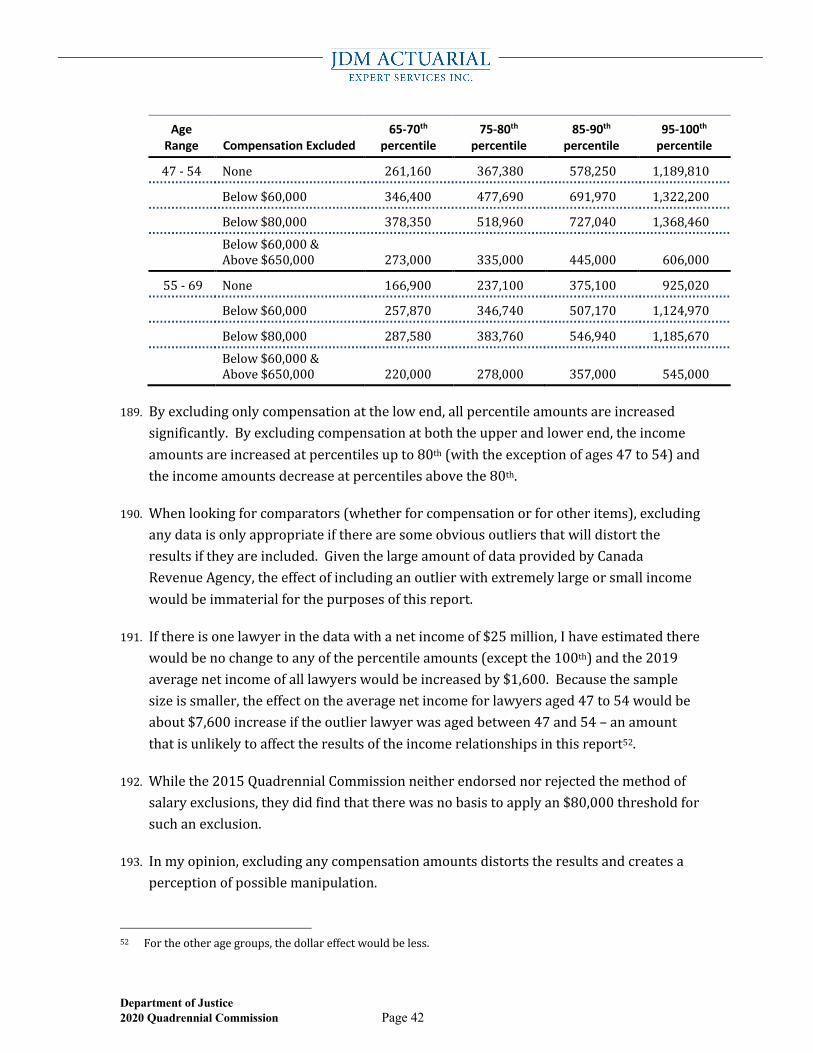
Department of Justice 2020 Quadrennial Commission Page 42
Age Range Compensation Excluded
65-70th percentile
75-80th percentile
85-90th percentile
95-100th percentile
47-54 None 261,160 367,380 578,250 1,189,810
Below$60,000 346,400 477,690 691,970 1,322,200
Below$80,000 378,350 518,960 727,040 1,368,460
Below$60,000&Above$650,000 273,000 335,000 445,000 606,000
55-69 None 166,900 237,100 375,100 925,020
Below$60,000 257,870 346,740 507,170 1,124,970
Below$80,000 287,580 383,760 546,940 1,185,670
Below$60,000&Above$650,000 220,000 278,000 357,000 545,000
189. Byexcludingonlycompensationatthelowend,allpercentileamountsareincreasedsignificantly.Byexcludingcompensationatboththeupperandlowerend,theincomeamountsareincreasedatpercentilesupto80th(withtheexceptionofages47to54)andtheincomeamountsdecreaseatpercentilesabovethe80th.
190. Whenlookingforcomparators(whetherforcompensationorforotheritems),excludinganydataisonlyappropriateiftherearesomeobviousoutliersthatwilldistorttheresultsiftheyareincluded.GiventhelargeamountofdataprovidedbyCanadaRevenueAgency,theeffectofincludinganoutlierwithextremelylargeorsmallincomewouldbeimmaterialforthepurposesofthisreport.
191. Ifthereisonelawyerinthedatawithanetincomeof$25million,Ihaveestimatedtherewouldbenochangetoanyofthepercentileamounts(exceptthe100th)andthe2019averagenetincomeofalllawyerswouldbeincreasedby$1,600.Becausethesamplesizeissmaller,theeffectontheaveragenetincomeforlawyersaged47to54wouldbeabout$7,600increaseiftheoutlierlawyerwasagedbetween47and54–anamountthatisunlikelytoaffecttheresultsoftheincomerelationshipsinthisreport52.
192. Whilethe2015QuadrennialCommissionneitherendorsednorrejectedthemethodofsalaryexclusions,theydidfindthattherewasnobasistoapplyan$80,000thresholdforsuchanexclusion.
193. Inmyopinion,excludinganycompensationamountsdistortstheresultsandcreatesaperceptionofpossiblemanipulation.
52 Fortheotheragegroups,thedollareffectwouldbeless.
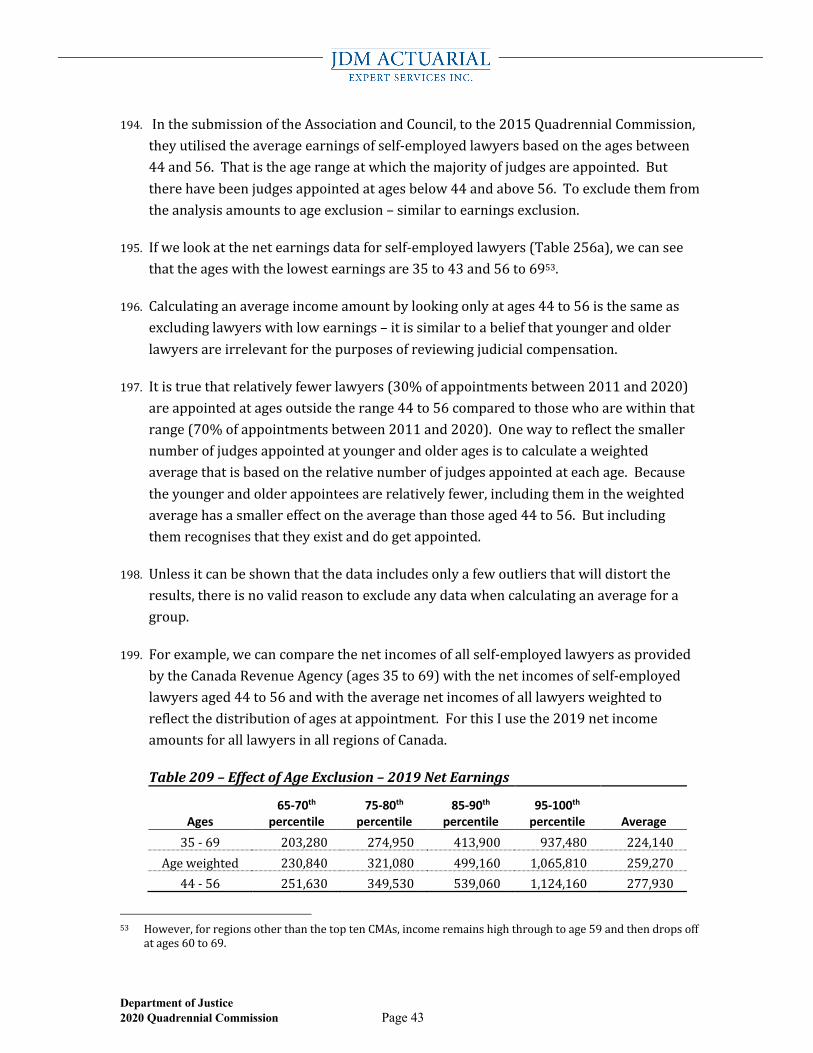
Department of Justice 2020 Quadrennial Commission Page 43
194. InthesubmissionoftheAssociationandCouncil,tothe2015QuadrennialCommission,theyutilisedtheaverageearningsofself-employedlawyersbasedontheagesbetween44and56.Thatistheagerangeatwhichthemajorityofjudgesareappointed.Buttherehavebeenjudgesappointedatagesbelow44andabove56.Toexcludethemfromtheanalysisamountstoageexclusion–similartoearningsexclusion.
195. Ifwelookatthenetearningsdataforself-employedlawyers(Table256a),wecanseethattheageswiththelowestearningsare35to43and56to6953.
196. Calculatinganaverageincomeamountbylookingonlyatages44to56isthesameasexcludinglawyerswithlowearnings–itissimilartoabeliefthatyoungerandolderlawyersareirrelevantforthepurposesofreviewingjudicialcompensation.
197. Itistruethatrelativelyfewerlawyers(30%ofappointmentsbetween2011and2020)areappointedatagesoutsidetherange44to56comparedtothosewhoarewithinthatrange(70%ofappointmentsbetween2011and2020).Onewaytoreflectthesmallernumberofjudgesappointedatyoungerandolderagesistocalculateaweightedaveragethatisbasedontherelativenumberofjudgesappointedateachage.Becausetheyoungerandolderappointeesarerelativelyfewer,includingthemintheweightedaveragehasasmallereffectontheaveragethanthoseaged44to56.Butincludingthemrecognisesthattheyexistanddogetappointed.
198. Unlessitcanbeshownthatthedataincludesonlyafewoutliersthatwilldistorttheresults,thereisnovalidreasontoexcludeanydatawhencalculatinganaverageforagroup.
199. Forexample,wecancomparethenetincomesofallself-employedlawyersasprovidedbytheCanadaRevenueAgency(ages35to69)withthenetincomesofself-employedlawyersaged44to56andwiththeaveragenetincomesofalllawyersweightedtoreflectthedistributionofagesatappointment.ForthisIusethe2019netincomeamountsforalllawyersinallregionsofCanada.
Table209–EffectofAgeExclusion–2019NetEarnings
Ages 65-70th
percentile 75-80th
percentile 85-90th
percentile 95-100th
percentile Average 35-69 203,280 274,950 413,900 937,480 224,140
Ageweighted 230,840 321,080 499,160 1,065,810 259,27044-56 251,630 349,530 539,060 1,124,160 277,930
53 However,forregionsotherthanthetoptenCMAs,incomeremainshighthroughtoage59andthendropsoff
atages60to69.
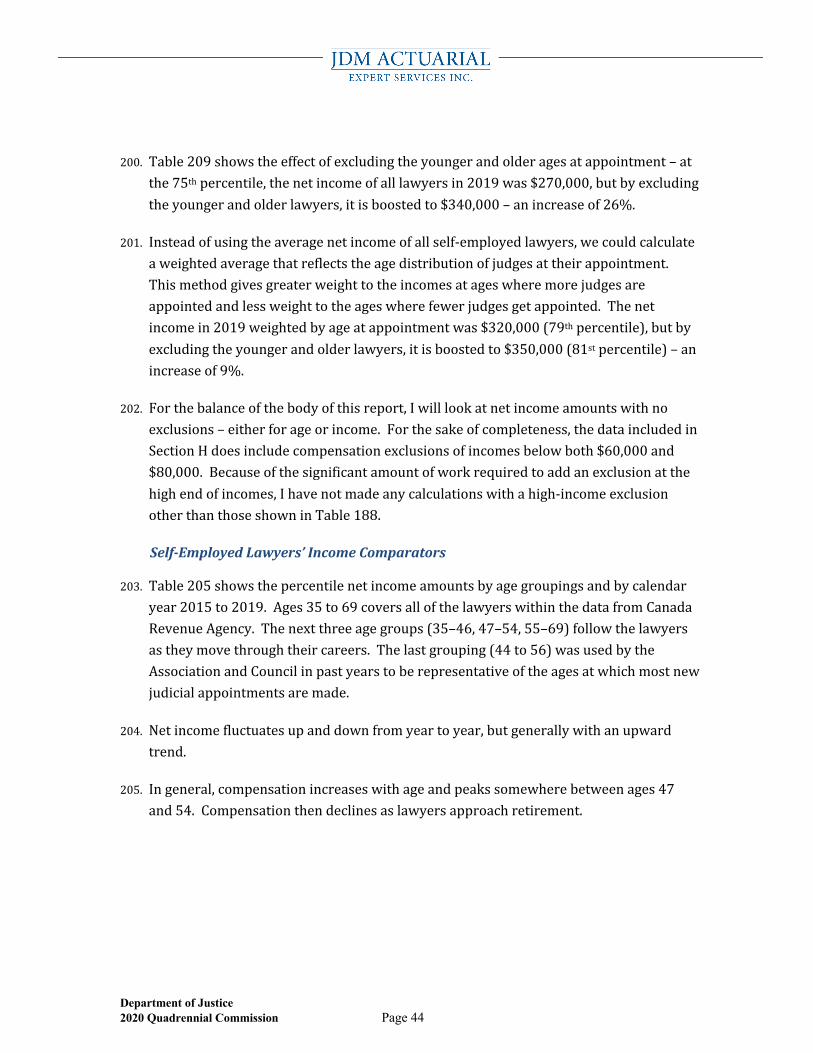
Department of Justice 2020 Quadrennial Commission Page 44
200. Table209showstheeffectofexcludingtheyoungerandolderagesatappointment–atthe75thpercentile,thenetincomeofalllawyersin2019was$270,000,butbyexcludingtheyoungerandolderlawyers,itisboostedto$340,000–anincreaseof26%.
201. Insteadofusingtheaveragenetincomeofallself-employedlawyers,wecouldcalculateaweightedaveragethatreflectstheagedistributionofjudgesattheirappointment.Thismethodgivesgreaterweighttotheincomesatageswheremorejudgesareappointedandlessweighttotheageswherefewerjudgesgetappointed.Thenetincomein2019weightedbyageatappointmentwas$320,000(79thpercentile),butbyexcludingtheyoungerandolderlawyers,itisboostedto$350,000(81stpercentile)–anincreaseof9%.
202. Forthebalanceofthebodyofthisreport,Iwilllookatnetincomeamountswithnoexclusions–eitherforageorincome.Forthesakeofcompleteness,thedataincludedinSectionHdoesincludecompensationexclusionsofincomesbelowboth$60,000and$80,000.Becauseofthesignificantamountofworkrequiredtoaddanexclusionatthehighendofincomes,Ihavenotmadeanycalculationswithahigh-incomeexclusionotherthanthoseshowninTable188.
Self-EmployedLawyers’IncomeComparators
203. Table205showsthepercentilenetincomeamountsbyagegroupingsandbycalendaryear2015to2019.Ages35to69coversallofthelawyerswithinthedatafromCanadaRevenueAgency.Thenextthreeagegroups(35–46,47–54,55–69)followthelawyersastheymovethroughtheircareers.Thelastgrouping(44to56)wasusedbytheAssociationandCouncilinpastyearstoberepresentativeoftheagesatwhichmostnewjudicialappointmentsaremade.
204. Netincomefluctuatesupanddownfromyeartoyear,butgenerallywithanupwardtrend.
205. Ingeneral,compensationincreaseswithageandpeakssomewherebetweenages47and54.Compensationthendeclinesaslawyersapproachretirement.
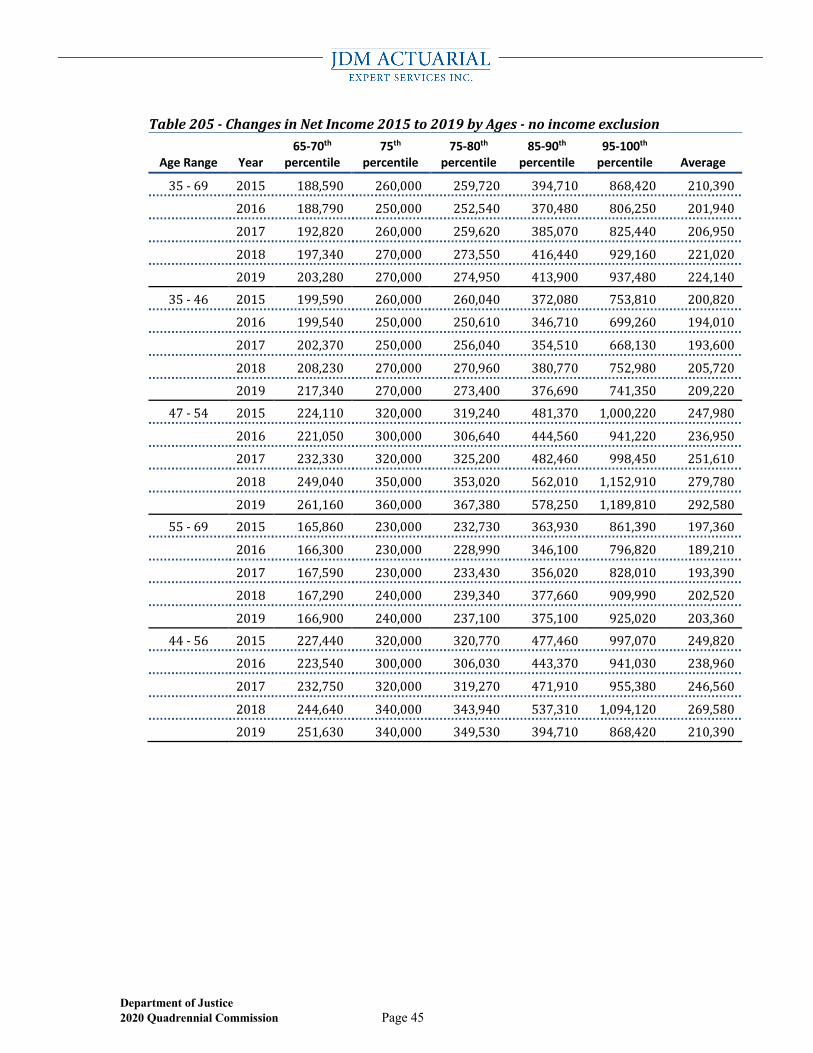
Department of Justice 2020 Quadrennial Commission Page 45
Table205-ChangesinNetIncome2015to2019byAges-noincomeexclusion
Age Range Year 65-70th
percentile 75th
percentile 75-80th
percentile 85-90th
percentile 95-100th
percentile Average
35-69 2015 188,590 260,000 259,720 394,710 868,420 210,390
2016 188,790 250,000 252,540 370,480 806,250 201,940
2017 192,820 260,000 259,620 385,070 825,440 206,950
2018 197,340 270,000 273,550 416,440 929,160 221,020
2019 203,280 270,000 274,950 413,900 937,480 224,14035-46 2015 199,590 260,000 260,040 372,080 753,810 200,820
2016 199,540 250,000 250,610 346,710 699,260 194,010
2017 202,370 250,000 256,040 354,510 668,130 193,600
2018 208,230 270,000 270,960 380,770 752,980 205,720
2019 217,340 270,000 273,400 376,690 741,350 209,22047-54 2015 224,110 320,000 319,240 481,370 1,000,220 247,980
2016 221,050 300,000 306,640 444,560 941,220 236,950
2017 232,330 320,000 325,200 482,460 998,450 251,610
2018 249,040 350,000 353,020 562,010 1,152,910 279,780
2019 261,160 360,000 367,380 578,250 1,189,810 292,58055-69 2015 165,860 230,000 232,730 363,930 861,390 197,360
2016 166,300 230,000 228,990 346,100 796,820 189,210
2017 167,590 230,000 233,430 356,020 828,010 193,390
2018 167,290 240,000 239,340 377,660 909,990 202,520
2019 166,900 240,000 237,100 375,100 925,020 203,36044-56 2015 227,440 320,000 320,770 477,460 997,070 249,820
2016 223,540 300,000 306,030 443,370 941,030 238,960
2017 232,750 320,000 319,270 471,910 955,380 246,560
2018 244,640 340,000 343,940 537,310 1,094,120 269,580
2019 251,630 340,000 349,530 394,710 868,420 210,390
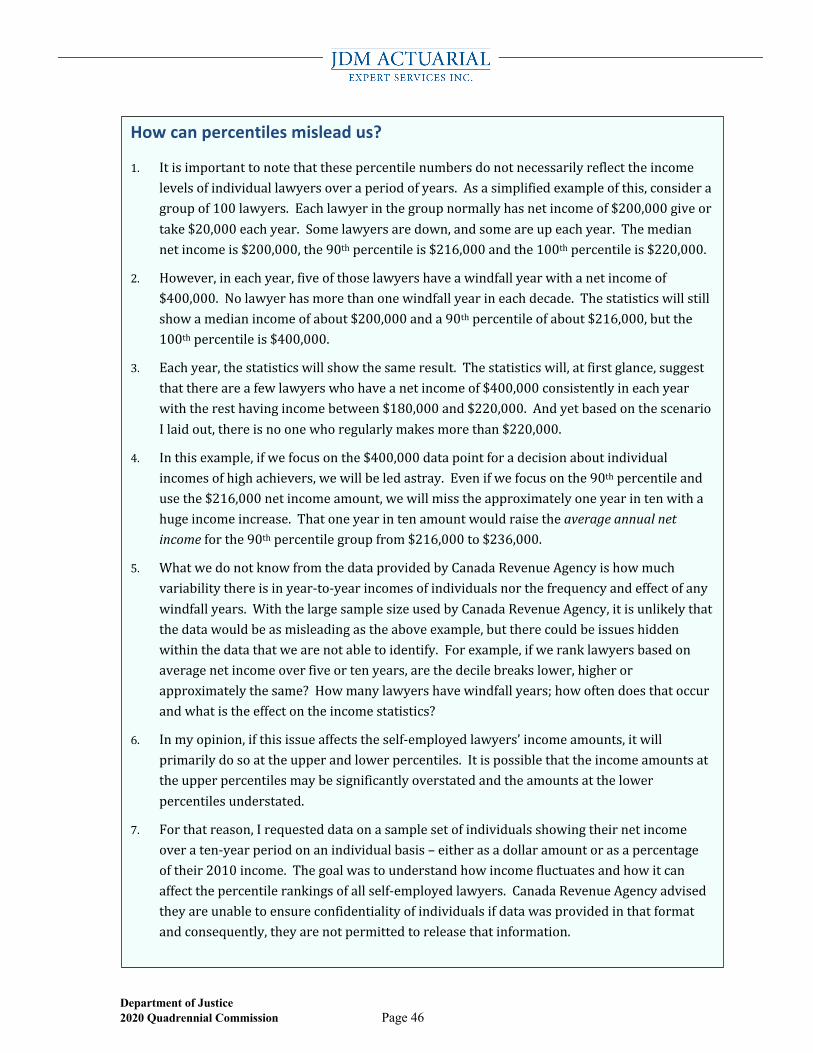
Department of Justice 2020 Quadrennial Commission Page 46
How can percentiles mislead us?
1. Itisimportanttonotethatthesepercentilenumbersdonotnecessarilyreflecttheincomelevelsofindividuallawyersoveraperiodofyears.Asasimplifiedexampleofthis,consideragroupof100lawyers.Eachlawyerinthegroupnormallyhasnetincomeof$200,000giveortake$20,000eachyear.Somelawyersaredown,andsomeareupeachyear.Themediannetincomeis$200,000,the90thpercentileis$216,000andthe100thpercentileis$220,000.
2. However,ineachyear,fiveofthoselawyershaveawindfallyearwithanetincomeof$400,000.Nolawyerhasmorethanonewindfallyearineachdecade.Thestatisticswillstillshowamedianincomeofabout$200,000anda90thpercentileofabout$216,000,butthe100thpercentileis$400,000.
3. Eachyear,thestatisticswillshowthesameresult.Thestatisticswill,atfirstglance,suggestthatthereareafewlawyerswhohaveanetincomeof$400,000consistentlyineachyearwiththeresthavingincomebetween$180,000and$220,000.AndyetbasedonthescenarioIlaidout,thereisnoonewhoregularlymakesmorethan$220,000.
4. Inthisexample,ifwefocusonthe$400,000datapointforadecisionaboutindividualincomesofhighachievers,wewillbeledastray.Evenifwefocusonthe90thpercentileandusethe$216,000netincomeamount,wewillmisstheapproximatelyoneyearintenwithahugeincomeincrease.Thatoneyearintenamountwouldraisetheaverageannualnetincomeforthe90thpercentilegroupfrom$216,000to$236,000.
5. WhatwedonotknowfromthedataprovidedbyCanadaRevenueAgencyishowmuchvariabilitythereisinyear-to-yearincomesofindividualsnorthefrequencyandeffectofanywindfallyears.WiththelargesamplesizeusedbyCanadaRevenueAgency,itisunlikelythatthedatawouldbeasmisleadingastheaboveexample,buttherecouldbeissueshiddenwithinthedatathatwearenotabletoidentify.Forexample,ifweranklawyersbasedonaveragenetincomeoverfiveortenyears,arethedecilebreakslower,higherorapproximatelythesame?Howmanylawyershavewindfallyears;howoftendoesthatoccurandwhatistheeffectontheincomestatistics?
6. Inmyopinion,ifthisissueaffectstheself-employedlawyers’incomeamounts,itwillprimarilydosoattheupperandlowerpercentiles.Itispossiblethattheincomeamountsattheupperpercentilesmaybesignificantlyoverstatedandtheamountsatthelowerpercentilesunderstated.
7. Forthatreason,Irequesteddataonasamplesetofindividualsshowingtheirnetincomeoveraten-yearperiodonanindividualbasis–eitherasadollaramountorasapercentageoftheir2010income.Thegoalwastounderstandhowincomefluctuatesandhowitcanaffectthepercentilerankingsofallself-employedlawyers.CanadaRevenueAgencyadvisedtheyareunabletoensureconfidentialityofindividualsifdatawasprovidedinthatformatandconsequently,theyarenotpermittedtoreleasethatinformation.
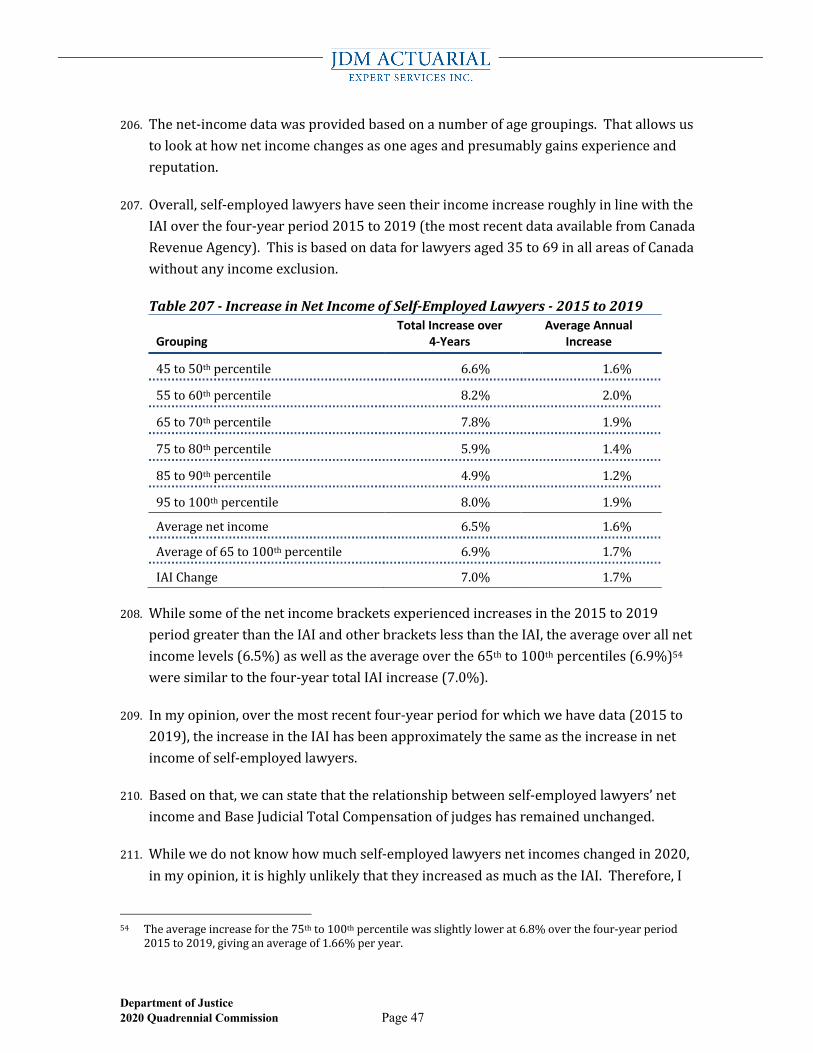
Department of Justice 2020 Quadrennial Commission Page 47
206. Thenet-incomedatawasprovidedbasedonanumberofagegroupings.Thatallowsustolookathownetincomechangesasoneagesandpresumablygainsexperienceandreputation.
207. Overall,self-employedlawyershaveseentheirincomeincreaseroughlyinlinewiththeIAIoverthefour-yearperiod2015to2019(themostrecentdataavailablefromCanadaRevenueAgency).Thisisbasedondataforlawyersaged35to69inallareasofCanadawithoutanyincomeexclusion.
Table207-IncreaseinNetIncomeofSelf-EmployedLawyers-2015to2019
Grouping Total Increase over
4-Years Average Annual
Increase
45to50thpercentile 6.6% 1.6%
55to60thpercentile 8.2% 2.0%
65to70thpercentile 7.8% 1.9%
75to80thpercentile 5.9% 1.4%
85to90thpercentile 4.9% 1.2%
95to100thpercentile 8.0% 1.9%
Averagenetincome 6.5% 1.6%
Averageof65to100thpercentile 6.9% 1.7%
IAIChange 7.0% 1.7%
208. Whilesomeofthenetincomebracketsexperiencedincreasesinthe2015to2019periodgreaterthantheIAIandotherbracketslessthantheIAI,theaverageoverallnetincomelevels(6.5%)aswellastheaverageoverthe65thto100thpercentiles(6.9%)54weresimilartothefour-yeartotalIAIincrease(7.0%).
209. Inmyopinion,overthemostrecentfour-yearperiodforwhichwehavedata(2015to2019),theincreaseintheIAIhasbeenapproximatelythesameastheincreaseinnetincomeofself-employedlawyers.
210. Basedonthat,wecanstatethattherelationshipbetweenself-employedlawyers’netincomeandBaseJudicialTotalCompensationofjudgeshasremainedunchanged.
211. Whilewedonotknowhowmuchself-employedlawyersnetincomeschangedin2020,inmyopinion,itishighlyunlikelythattheyincreasedasmuchastheIAI.Therefore,I
54 Theaverageincreaseforthe75thto100thpercentilewasslightlylowerat6.8%overthefour-yearperiod
2015to2019,givinganaverageof1.66%peryear.
Department of Justice 2020 Quadrennial Commission Page 48
concludethattheBaseJudicialSalarywilllikelyincreasemoreinApril2021thanwillself-employedlawyers’netincome.
Self-Employed Lawyers and Retirement Savings
212. Forself-employedCanadians,savingforretirementinvolvesmakingcontributionstoanRRSPandoncethemaximumcontributionisreached,contributingtoanon-registeredinvestmentaccount.RRSPshaveincometaxadvantagesthatmakethemmoreefficientforretirementsavingsthanotheroptions.
213. ItisimportanttorecognisethattheJudicialAnnuityprovidesaretirementincomethatexceedsthemaximumtax-assistedpensionpermittedundertheIncomeTaxActfortheprivatesector.Thesameretirementincomesavingsareavailablewithintheprivatesector,butthemajorityofthatamountmustbefundedwithoutthetax-shelteringofregisteredpensionplansandRRSPs.Consequently,thecostofhavingequivalentsavingsishigherthanthevalueoftheJudicialAnnuity.
214. IfaCanadianwantstoenjoyaretirementlifestylemoreexpensivethancanbeprovidedoutofgovernmentbenefits(CPPandOldAgeSecurity),theywillneedtosave.Ihaveassumedthatalljudgesandallself-employedlawyerswithincomesabovethemedianwantmoreincomethanprovidedbygovernmentbenefits.TheJudicialAnnuityservesthatpurposeforjudgesandsotheymostlikelydonotneedtosaveanyadditionalmoniesforretirementbeyondtheircontributionstowardstheJudicialAnnuity.Anysavingsforretirementbyaself-employedlawyerwillcomeoutofnetincomebecausetheIncomeTaxActdoesnotpermittheself-employedtohavearetirementsavingsplanwherecontributionsarepermittedasabusinessexpense.
215. Table141showsthevalueofreplicatingtheJudicialAnnuityforaself-employedlawyer.Tomaintainconsistencyinanyreviewofincomerelationships55,wecaneitherreducetheself-employedlawyers’netincomebytherequiredamountforretirementsavingandcomparethattotheBaseJudicialSalary,orwecanusethetotalamountoftheself-employednetincomeandcomparethatwiththeBaseJudicialTotalCompensationwhichincludesthevalueoftheJudicialAnnuityisfullyreflected.Eitherbasisiscomparinglikewithlike.Ihavechosenthelatterasitinvolvesfewercalculations.
55 Thatis,toensurewearelookingat“applesandapples”andhavenotincludedanyorangesinthereview.
Department of Justice 2020 Quadrennial Commission Page 49
G. Deputy Ministers Within the Federal Government
216. PastQuadrennialCommissionshavereviewedthecompensationofdeputyministersinrelationtothecompensationoffederallyappointedjudges.
217. Likejudges,deputyministersreceivebothhealthandwelfarebenefitsandpensionbenefitsinadditiontotheirsalary.Theybotharerequiredtomakecontributionstowardsthepension.CPPcontributionsarethesame–thegovernmentpayshalfandtheemployeepaystheotherhalf.Therearetwosignificantdifferences–performancepayandthevalueofthepension56.
218. Deputyministersareeligibleforperformancepayinadditiontotheirbasesalary.Thathasbeenreflectedinthetablesinthissection.
219. Thepensionarrangementsfordeputyministersdiffersfromthatforfederallyappointedjudges.Toobtainasimilarpensionincome,adeputyministerneedstoworkwithinthepublicserviceforabout35yearsandtocontributetothePublicServiceSuperannuationPlanforthoseyears.Thatlikelyincludesmanyyearsofservicepriortobeingappointedasadeputyminister.
220. Thecontributionratesareslightlygreaterthanthe7%ofbasecompensationforthejudges–9.83%onthefirst$61,600ofincomeand12.26%onthebalance57.Foradeputyministerearning$300,000perannum,thatisacontributionofabout11.75%ofbasecompensation,orabout4.75%morethanajudgeisrequiredtocontribute.
221. Iestimatethattheannualvalueofthepensionforadeputyminister,netofcontributions,isroughly17.0%ofadeputyminister’sbasecompensation58.
56 Thereisalsoadifferenceincontributionstothepensionplan,butthatwillbeincludedaspartofthepension
plandifference.57 Lowercontributionratesapplytothosehiredafter2012,buttheprovisionsofthepensionarelessgenerous
forretirementpriortoage65.58 ADeputyMinisterrequiresabout35yearsoffederalgovernmentservicetoearnapensionequivalenttoa
judicialpension.Theaveragetenureofajudge,basedontheassumptionsusedinthevaluationofthejudicialannuity,is20.7years.Theaveragevalueofthejudicialannuityforappointmentsbetweenages40and65is36.7%ofbasecompensation.Adjustingthat36.7%forthedifferencesintenureandthensubtracting4.75%toreflectthehighercontributionsrequiredofadeputyministerresultsinanestimatedvalueforadeputyminister’spensionof17.0%ofcompensation.Asmalladditionaladjustmentshouldbemadetoreflectthedifferencesinincometaxtreatmentbetweenthepensionplanandretirementsavingsavailabletoself-employedlawyers.Ihaveignoredthatadjustment.
Department of Justice 2020 Quadrennial Commission Page 50
222. Tobeabletomakeavalidandfaircomparisonofearnings,weneedtousethetotalcompensationofadeputyminister.Inparticular,thereisalargedifferencebetweenthevalueofajudge’spensionandthevalueofadeputyminister’spension.TocalculatethetotalcompensationofadeputyministersothattherelationshipwithBaseJudicialTotalCompensationisafairandproperone,weshouldgross-upthedeputyministerialcompensationby17.0%.
Deputy Minister Compensation
223. Iwasprovidedwithahistoryofcompensationfordeputyministers.Therearefourlevelsofdeputyminister–DM-1,DM-2,DM-3,andDM-4.
224. Thecompensationinformationsetoutthesalaryrangeforeachyear(ApriltoMarch),theaveragebasecompensationandaverageamountofat-riskpay.Iwasalsoprovidedwiththemaximumamountthatcouldbepayableasat-riskpay,expressedasapercentageofbasecompensation.Theamountofat-riskpayvariesbyindividualandisawardedatyear-endbasedontheindividual’sperformance.
Block Comparator
225. The2015QuadrennialCommissiondiscussed59usingcompensationofdeputyministersattheDM-3level,andtheiryear-over-yearincreasesasareferenceforjudicialcompensation(the“BlockComparator”).TheBlockComparatorineachyearisthemid-pointoftheDM-3basesalaryrangeplushalfofthetotalat-riskpay60.
226. The2015QuadrennialCommissioncommentedonaproposalfromtheAssociationandCouncilthattheBlockComparatorbechangedtoequalthetotalaveragecompensationofDM-3s61.ThenumberofDM-3sissmallandaveragecompensationcanvaryconsiderablybasedonthecompositionofthedeputyministers.TheyconcludedthatusingaveragepayofDM-3swouldnot“provideaconsistentreflectionofyearoveryearchangesincompensation.”Iagree.
59 “ReportandRecommendationsSubmittedtotheMinisterofJusticeofCanada”bytheJudicialCompensation
andBenefitsCommission,30June2016,paragraphs45-56.60 Totalat-riskpayisthemaximumamountthatadeputyministercanearnbaseduponperformance.The
amountofat-riskpayactuallypaidwillvaryfromyeartoyearandfrompersontoperson.61 “ReportandRecommendationsSubmittedtotheMinisterofJusticeofCanada”bytheJudicialCompensation
andBenefitsCommission,30June2016,paragraph49-51.
Department of Justice 2020 Quadrennial Commission Page 51
227. TheBlockComparatorisbasedononlytwoofthecomponentsoftotalcompensation–salaryandat-riskpay(seeparagraphs31to34).Itignoresthepensionplanandotherformsofcompensationavailabletodeputyministers.Inessence,itassumesthevalueofadeputyminister’spensionplanisequivalenttothevalueoftheJudicialAnnuity.Consequently,inmyopinion,theBlockComparatorshouldbeusedwithcareandrecognitionshouldbemadeeitherdirectlyorindirectlytothelargedifferenceinvalueofthetwopensionplans.
228. Inthissection,IfirstreviewthetotalcompensationofdeputyministersandofseniorgovernmentagencyappointmentsoverthepastfiveyearsandthenIcalculatetheBlockComparator.
Total Compensation for Deputy Ministers.
229. Theamountofat-riskpayshowninthetablesbelowistheaverageamountpaidtoalldeputyministersateachlevelandislikelydifferentbyindividual.Theat-riskpayfortheyearbeginning2020wasnotavailableasofthedateofthisreportandsoIhaveestimatedittobethesamepercentageofmid-pointsalaryasin2019(showninred).Thetotalcompensationincludesthevalueofthepensionnetofcontributions(paragraph221).
230. Inotethesalaryrangeshavenotchangedinthelastfouryears,butthedeputyministers’basecompensationhasincreased,likelyasaresultoftheirprogressingthroughthesalarygrids.WiththepossibleexceptionofDM-462,basecompensationisnearingthetop-endofthesalaryrangeanditislikelythatatleastsomeofthedeputyministershavenotreceivedanincreaseincompensationinthepastfewyears.
62 ThepossibleexceptionofDM-4isbecausethereisnotenoughdatadisclosedtobeabletomakeafindingon
thisissue.
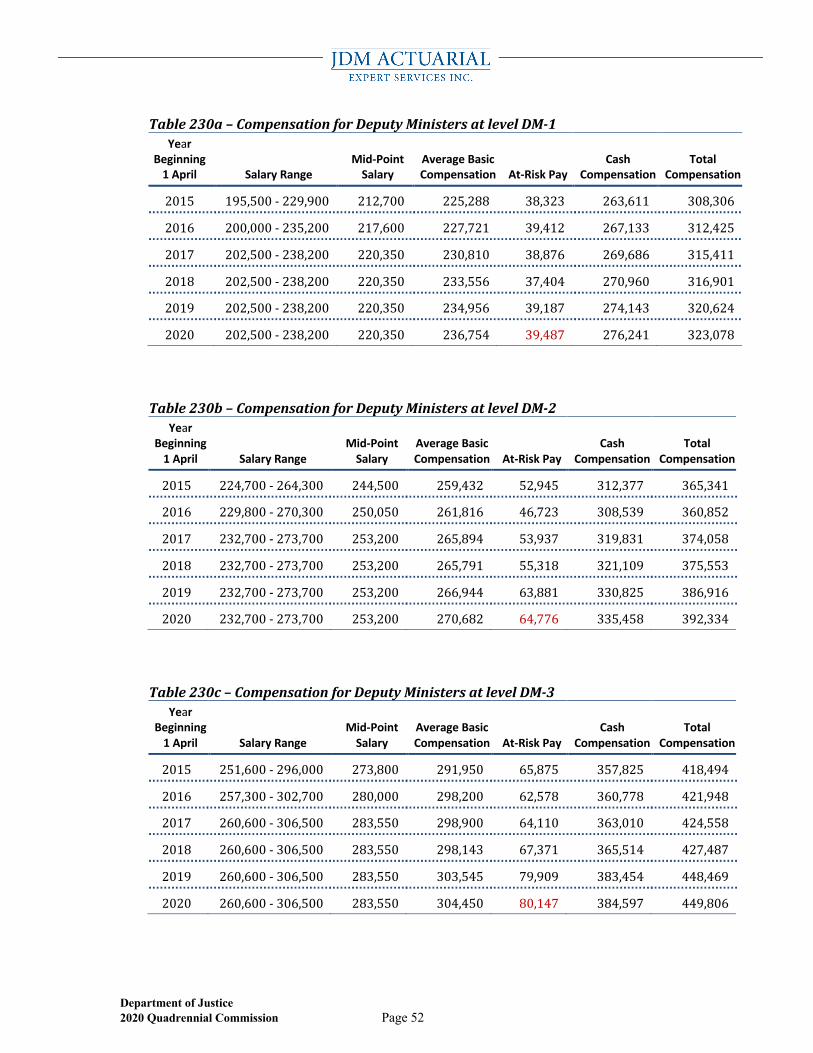
Department of Justice 2020 Quadrennial Commission Page 52
Table230a–CompensationforDeputyMinistersatlevelDM-1Year
Beginning 1 April Salary Range
Mid-Point Salary
Average Basic Compensation At-Risk Pay
Cash Compensation
Total Compensation
2015 195,500-229,900 212,700 225,288 38,323 263,611 308,306
2016 200,000-235,200 217,600 227,721 39,412 267,133 312,425
2017 202,500-238,200 220,350 230,810 38,876 269,686 315,411
2018 202,500-238,200 220,350 233,556 37,404 270,960 316,901
2019 202,500-238,200 220,350 234,956 39,187 274,143 320,624
2020 202,500-238,200 220,350 236,754 39,487 276,241 323,078
Table230b–CompensationforDeputyMinistersatlevelDM-2Year
Beginning 1 April Salary Range
Mid-Point Salary
Average Basic Compensation At-Risk Pay
Cash Compensation
Total Compensation
2015 224,700-264,300 244,500 259,432 52,945 312,377 365,341
2016 229,800-270,300 250,050 261,816 46,723 308,539 360,852
2017 232,700-273,700 253,200 265,894 53,937 319,831 374,058
2018 232,700-273,700 253,200 265,791 55,318 321,109 375,553
2019 232,700-273,700 253,200 266,944 63,881 330,825 386,916
2020 232,700-273,700 253,200 270,682 64,776 335,458 392,334
Table230c–CompensationforDeputyMinistersatlevelDM-3Year
Beginning 1 April Salary Range
Mid-Point Salary
Average Basic Compensation At-Risk Pay
Cash Compensation
Total Compensation
2015 251,600-296,000 273,800 291,950 65,875 357,825 418,494
2016 257,300-302,700 280,000 298,200 62,578 360,778 421,948
2017 260,600-306,500 283,550 298,900 64,110 363,010 424,558
2018 260,600-306,500 283,550 298,143 67,371 365,514 427,487
2019 260,600-306,500 283,550 303,545 79,909 383,454 448,469
2020 260,600-306,500 283,550 304,450 80,147 384,597 449,806
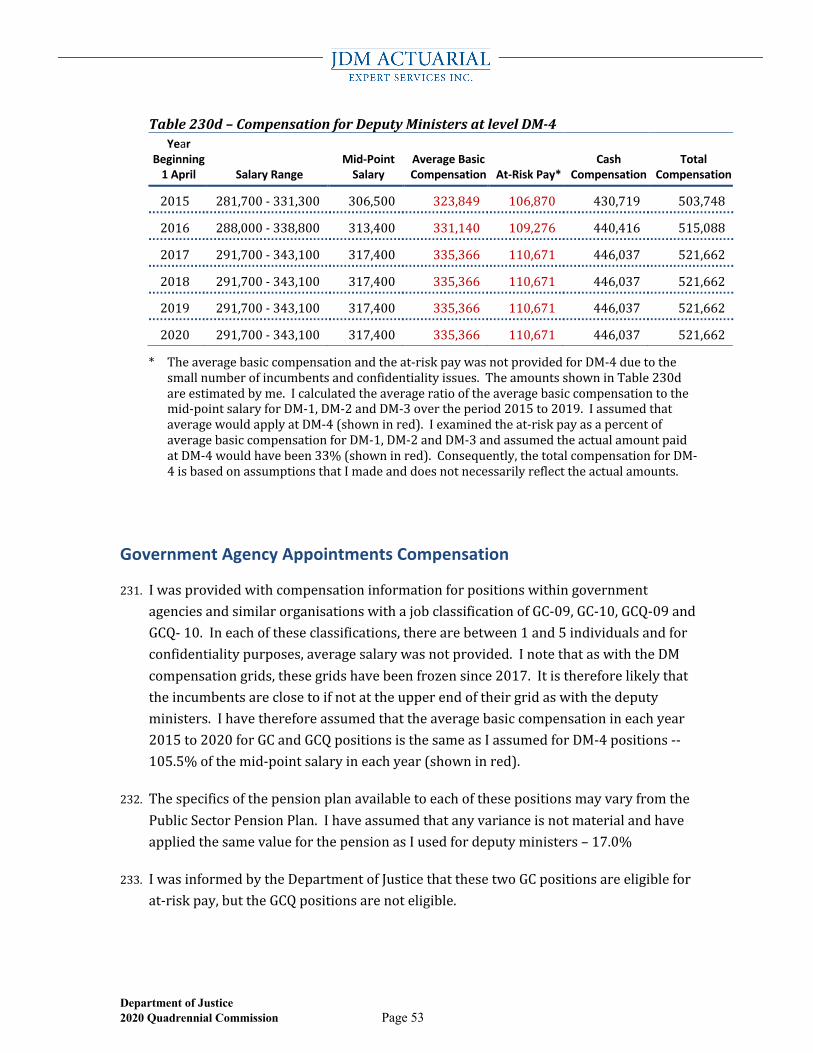
Department of Justice 2020 Quadrennial Commission Page 53
Table230d–CompensationforDeputyMinistersatlevelDM-4Year
Beginning 1 April Salary Range
Mid-Point Salary
Average Basic Compensation At-Risk Pay*
Cash Compensation
Total Compensation
2015 281,700-331,300 306,500 323,849 106,870 430,719 503,748
2016 288,000-338,800 313,400 331,140 109,276 440,416 515,088
2017 291,700-343,100 317,400 335,366 110,671 446,037 521,662
2018 291,700-343,100 317,400 335,366 110,671 446,037 521,662
2019 291,700-343,100 317,400 335,366 110,671 446,037 521,662
2020 291,700-343,100 317,400 335,366 110,671 446,037 521,662
* Theaveragebasiccompensationandtheat-riskpaywasnotprovidedforDM-4duetothesmallnumberofincumbentsandconfidentialityissues.TheamountsshowninTable230dareestimatedbyme.Icalculatedtheaverageratiooftheaveragebasiccompensationtothemid-pointsalaryforDM-1,DM-2andDM-3overtheperiod2015to2019.IassumedthataveragewouldapplyatDM-4(showninred).Iexaminedtheat-riskpayasapercentofaveragebasiccompensationforDM-1,DM-2andDM-3andassumedtheactualamountpaidatDM-4wouldhavebeen33%(showninred).Consequently,thetotalcompensationforDM-4isbasedonassumptionsthatImadeanddoesnotnecessarilyreflecttheactualamounts.
Government Agency Appointments Compensation
231. IwasprovidedwithcompensationinformationforpositionswithingovernmentagenciesandsimilarorganisationswithajobclassificationofGC-09,GC-10,GCQ-09andGCQ-10.Ineachoftheseclassifications,therearebetween1and5individualsandforconfidentialitypurposes,averagesalarywasnotprovided.InotethataswiththeDMcompensationgrids,thesegridshavebeenfrozensince2017.Itisthereforelikelythattheincumbentsareclosetoifnotattheupperendoftheirgridaswiththedeputyministers.Ihavethereforeassumedthattheaveragebasiccompensationineachyear2015to2020forGCandGCQpositionsisthesameasIassumedforDM-4positions--105.5%ofthemid-pointsalaryineachyear(showninred).
232. ThespecificsofthepensionplanavailabletoeachofthesepositionsmayvaryfromthePublicSectorPensionPlan.IhaveassumedthatanyvarianceisnotmaterialandhaveappliedthesamevalueforthepensionasIusedfordeputyministers–17.0%
233. IwasinformedbytheDepartmentofJusticethatthesetwoGCpositionsareeligibleforat-riskpay,buttheGCQpositionsarenoteligible.
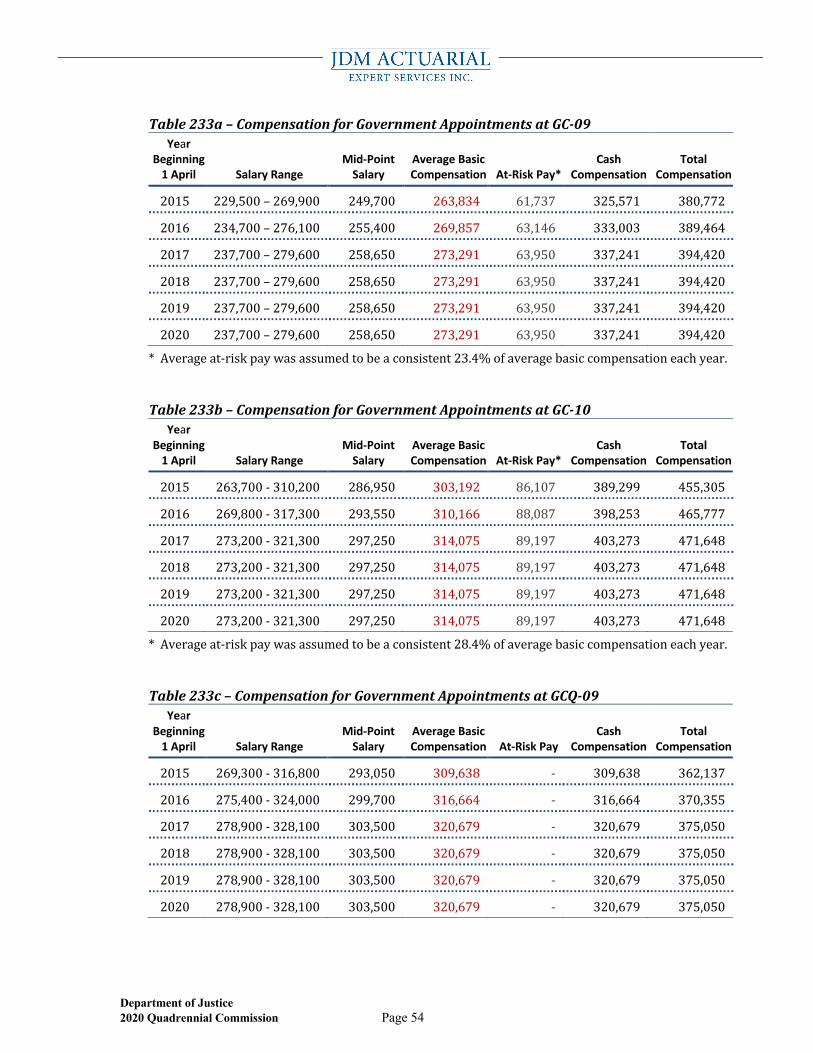
Department of Justice 2020 Quadrennial Commission Page 54
Table233a–CompensationforGovernmentAppointmentsatGC-09Year
Beginning 1 April Salary Range
Mid-Point Salary
Average Basic Compensation At-Risk Pay*
Cash Compensation
Total Compensation
2015 229,500–269,900 249,700 263,834 61,737 325,571 380,772
2016 234,700–276,100 255,400 269,857 63,146 333,003 389,464
2017 237,700–279,600 258,650 273,291 63,950 337,241 394,420
2018 237,700–279,600 258,650 273,291 63,950 337,241 394,420
2019 237,700–279,600 258,650 273,291 63,950 337,241 394,420
2020 237,700–279,600 258,650 273,291 63,950 337,241 394,420
*Averageat-riskpaywasassumedtobeaconsistent23.4%ofaveragebasiccompensationeachyear.
Table233b–CompensationforGovernmentAppointmentsatGC-10Year
Beginning 1 April Salary Range
Mid-Point Salary
Average Basic Compensation At-Risk Pay*
Cash Compensation
Total Compensation
2015 263,700-310,200 286,950 303,192 86,107 389,299 455,305
2016 269,800-317,300 293,550 310,166 88,087 398,253 465,777
2017 273,200-321,300 297,250 314,075 89,197 403,273 471,648
2018 273,200-321,300 297,250 314,075 89,197 403,273 471,648
2019 273,200-321,300 297,250 314,075 89,197 403,273 471,648
2020 273,200-321,300 297,250 314,075 89,197 403,273 471,648
*Averageat-riskpaywasassumedtobeaconsistent28.4%ofaveragebasiccompensationeachyear.
Table233c–CompensationforGovernmentAppointmentsatGCQ-09Year
Beginning 1 April Salary Range
Mid-Point Salary
Average Basic Compensation At-Risk Pay
Cash Compensation
Total Compensation
2015 269,300-316,800 293,050 309,638 - 309,638 362,137
2016 275,400-324,000 299,700 316,664 - 316,664 370,355
2017 278,900-328,100 303,500 320,679 - 320,679 375,050
2018 278,900-328,100 303,500 320,679 - 320,679 375,050
2019 278,900-328,100 303,500 320,679 - 320,679 375,050
2020 278,900-328,100 303,500 320,679 - 320,679 375,050
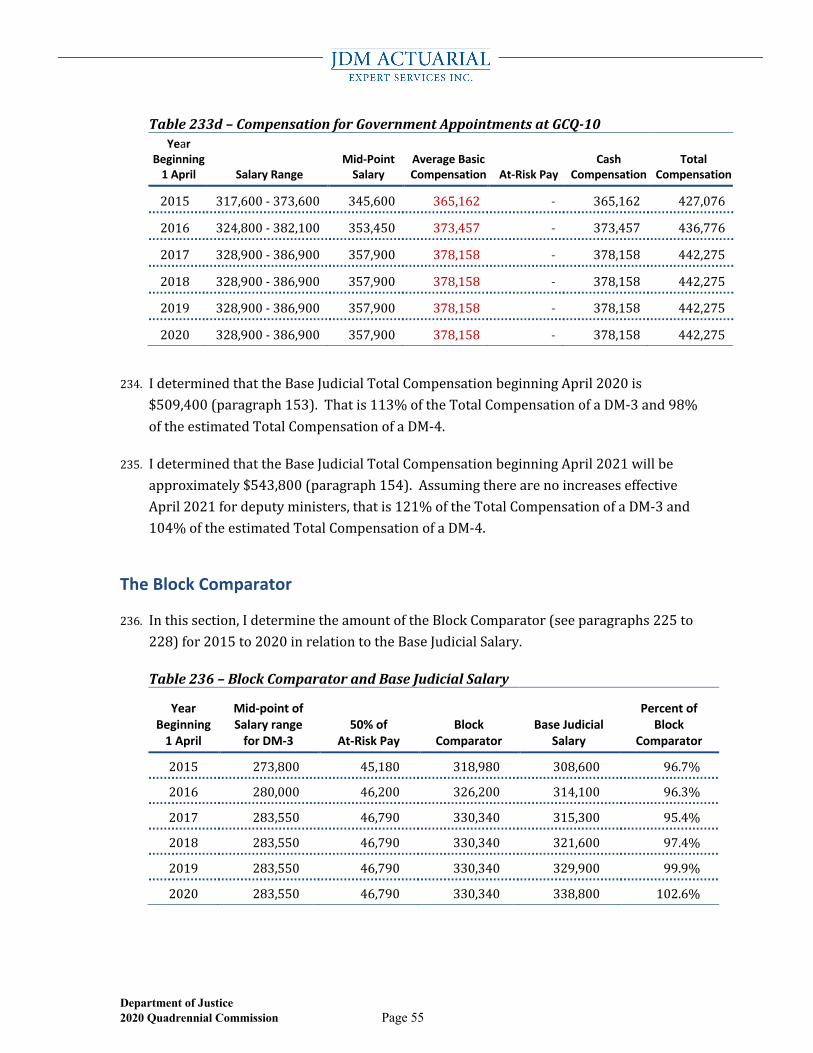
Department of Justice 2020 Quadrennial Commission Page 55
Table233d–CompensationforGovernmentAppointmentsatGCQ-10Year
Beginning 1 April Salary Range
Mid-Point Salary
Average Basic Compensation At-Risk Pay
Cash Compensation
Total Compensation
2015 317,600-373,600 345,600 365,162 - 365,162 427,076
2016 324,800-382,100 353,450 373,457 - 373,457 436,776
2017 328,900-386,900 357,900 378,158 - 378,158 442,275
2018 328,900-386,900 357,900 378,158 - 378,158 442,275
2019 328,900-386,900 357,900 378,158 - 378,158 442,275
2020 328,900-386,900 357,900 378,158 - 378,158 442,275
234. IdeterminedthattheBaseJudicialTotalCompensationbeginningApril2020is$509,400(paragraph153).Thatis113%oftheTotalCompensationofaDM-3and98%oftheestimatedTotalCompensationofaDM-4.
235. IdeterminedthattheBaseJudicialTotalCompensationbeginningApril2021willbeapproximately$543,800(paragraph154).AssumingtherearenoincreaseseffectiveApril2021fordeputyministers,thatis121%oftheTotalCompensationofaDM-3and104%oftheestimatedTotalCompensationofaDM-4.
The Block Comparator
236. Inthissection,IdeterminetheamountoftheBlockComparator(seeparagraphs225to228)for2015to2020inrelationtotheBaseJudicialSalary.
Table236–BlockComparatorandBaseJudicialSalary
Year Beginning
1 April
Mid-point of Salary range
for DM-3 50% of
At-Risk Pay Block
Comparator Base Judicial
Salary
Percent of Block
Comparator
2015 273,800 45,180 318,980 308,600 96.7%
2016 280,000 46,200 326,200 314,100 96.3%
2017 283,550 46,790 330,340 315,300 95.4%
2018 283,550 46,790 330,340 321,600 97.4%
2019 283,550 46,790 330,340 329,900 99.9%
2020 283,550 46,790 330,340 338,800 102.6%
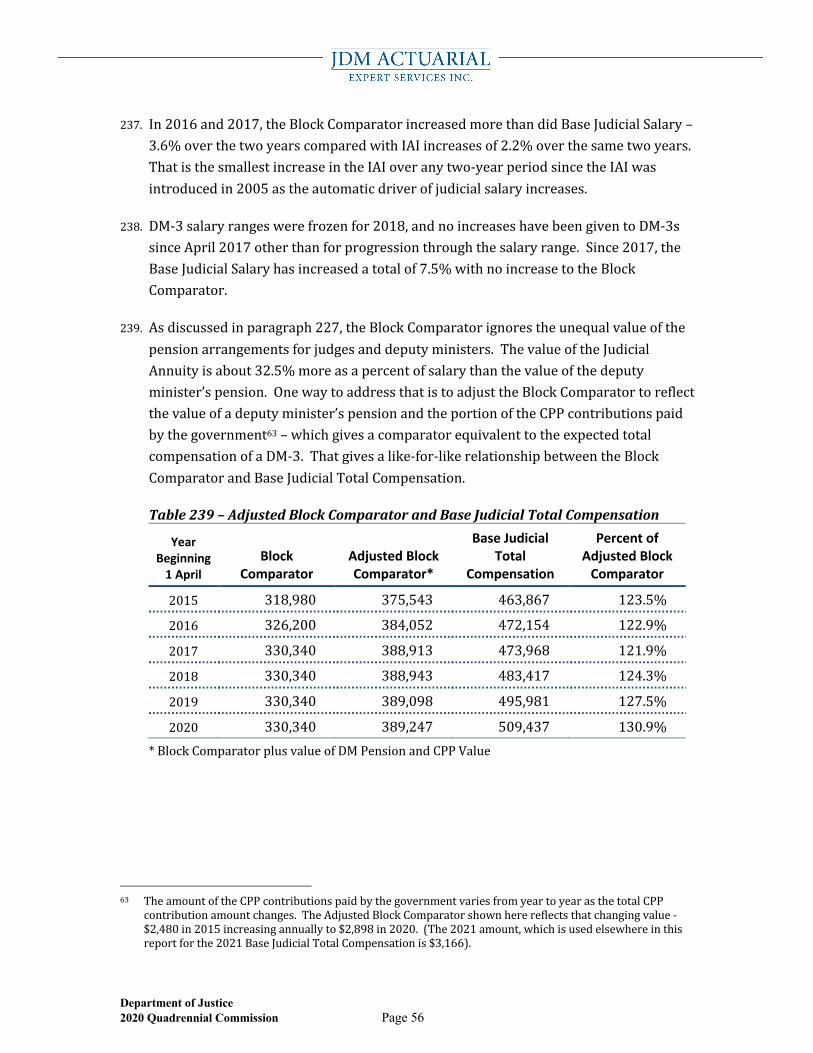
Department of Justice 2020 Quadrennial Commission Page 56
237. In2016and2017,theBlockComparatorincreasedmorethandidBaseJudicialSalary–3.6%overthetwoyearscomparedwithIAIincreasesof2.2%overthesametwoyears.ThatisthesmallestincreaseintheIAIoveranytwo-yearperiodsincetheIAIwasintroducedin2005astheautomaticdriverofjudicialsalaryincreases.
238. DM-3salaryrangeswerefrozenfor2018,andnoincreaseshavebeengiventoDM-3ssinceApril2017otherthanforprogressionthroughthesalaryrange.Since2017,theBaseJudicialSalaryhasincreasedatotalof7.5%withnoincreasetotheBlockComparator.
239. Asdiscussedinparagraph227,theBlockComparatorignorestheunequalvalueofthepensionarrangementsforjudgesanddeputyministers.ThevalueoftheJudicialAnnuityisabout32.5%moreasapercentofsalarythanthevalueofthedeputyminister’spension.OnewaytoaddressthatistoadjusttheBlockComparatortoreflectthevalueofadeputyminister’spensionandtheportionoftheCPPcontributionspaidbythegovernment63–whichgivesacomparatorequivalenttotheexpectedtotalcompensationofaDM-3.Thatgivesalike-for-likerelationshipbetweentheBlockComparatorandBaseJudicialTotalCompensation.
Table239–AdjustedBlockComparatorandBaseJudicialTotalCompensation
Year Beginning
1 April Block
Comparator Adjusted Block Comparator*
Base Judicial Total
Compensation
Percent of Adjusted Block
Comparator
2015 318,980 375,543 463,867 123.5%
2016 326,200 384,052 472,154 122.9%
2017 330,340 388,913 473,968 121.9%
2018 330,340 388,943 483,417 124.3%
2019 330,340 389,098 495,981 127.5%
2020 330,340 389,247 509,437 130.9%*BlockComparatorplusvalueofDMPensionandCPPValue
63 TheamountoftheCPPcontributionspaidbythegovernmentvariesfromyeartoyearasthetotalCPP
contributionamountchanges.TheAdjustedBlockComparatorshownherereflectsthatchangingvalue-$2,480in2015increasingannuallyto$2,898in2020.(The2021amount,whichisusedelsewhereinthisreportforthe2021BaseJudicialTotalCompensationis$3,166).
Department of Justice 2020 Quadrennial Commission Page 57
Deputy Minister Tenure
240. Iwasprovidedwithdetailsofpastdeputyministerssettingouttheirpositions,initialappointmentasadeputyministerandthedatetheylefttheranksofdeputyminister.Fromthat,Icalculatedthetimeservedasadeputyministerandtheaveragetenureofdeputyministers.Thedataincluded107peoplewhosetermendedateitheraDM-3orDM-4level.Twoofthosewereactingdeputyministerandhadatermoflessthanonemonth,andIhaveexcludedthem.Thatleaves105withtermsofmorethanonemonth.
241. ThetenuresfordeputyministerswhowereDM-3orDM-4attheendoftheirservicerangedfromfivemonthsto20.7years.Theaveragetenureofthose105deputyministerswas8.75years.
242. Theaveragetenureofthesedeputyministersissignificantlyshorterthantheaverageexpectedtenureofajudge.BasedontheassumptionsusedinvaluingtheJudicialAnnuity,theaveragetenureofafederallyappointedjudgeis20.3years–overtwicethelengthofadeputyministerwhoreachedaDM-3orDM-4level.
243. Inmyopinion,therearethreepossiblereasonsforthisdifferentialintenure.
a. Deputyministersretiremuchearlierthanjudges.UnderthePublicServiceSuperannuationAct,mostgovernmentemployeesretireatorpriortoage65.Forlong-termemployees,thereislittleornoincentivetoremainworkingbeyondage65.BasedontheassumptionsusedinvaluingtheJudicialAnnuity,theaverageexpectedretirementageforjudgesisaboutage72.Retirementcouldaccountforbetween7and12-yearsdifferentialintenure.
b. Deputyministersserveatthepleasureofthegovernmentandcouldbeterminatedatanytime.Thejobsecurityofadeputyministermaynotbeashighasitiswithjudges.
c. Deputyministersmaybesubjecttomorestressand/ordifferentstressorsandmaybeunabletofunctionatthehighleveldemandedoftheirpositionforaslongasajudge.
244. IamnotabletoofferanopinionastowhetherandtowhatextentthisdifferentialintenureshouldorcouldbereflectedinanyrelationshipbetweentotalcompensationofdeputyministersandJudicialTotalCompensation.
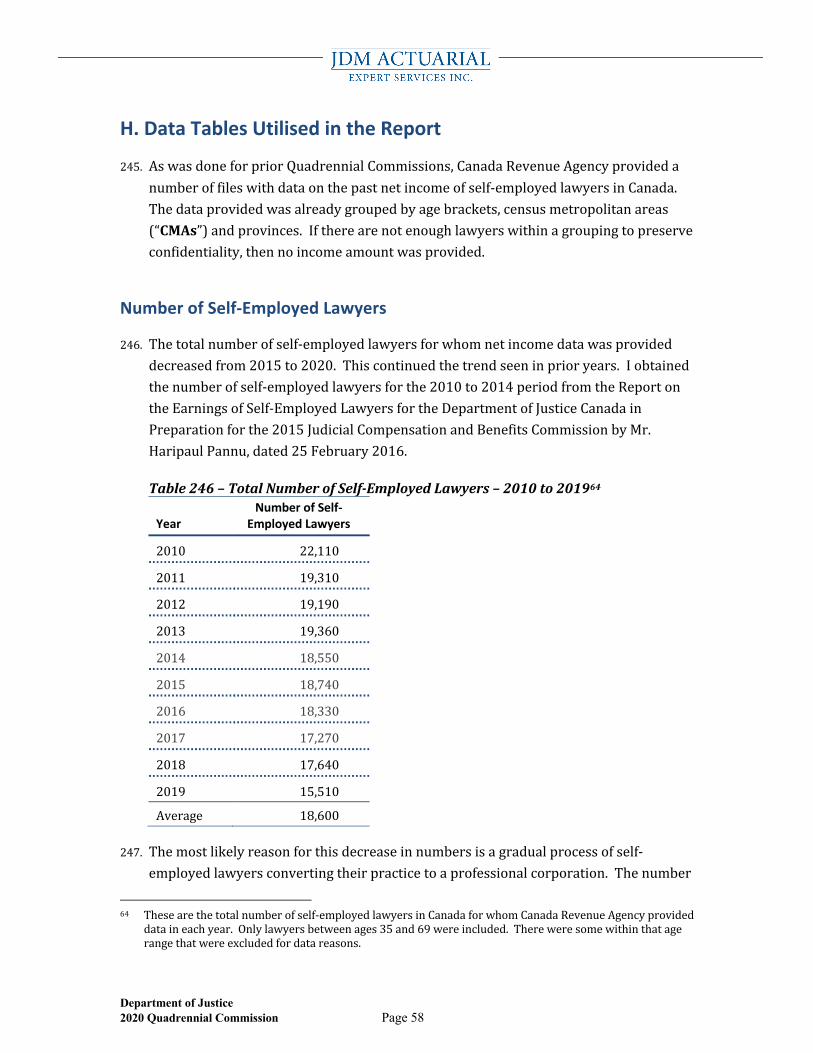
Department of Justice 2020 Quadrennial Commission Page 58
H. Data Tables Utilised in the Report
245. AswasdoneforpriorQuadrennialCommissions,CanadaRevenueAgencyprovidedanumberoffileswithdataonthepastnetincomeofself-employedlawyersinCanada.Thedataprovidedwasalreadygroupedbyagebrackets,censusmetropolitanareas(“CMAs”)andprovinces.Iftherearenotenoughlawyerswithinagroupingtopreserveconfidentiality,thennoincomeamountwasprovided.
Number of Self-Employed Lawyers
246. Thetotalnumberofself-employedlawyersforwhomnetincomedatawasprovideddecreasedfrom2015to2020.Thiscontinuedthetrendseeninprioryears.Iobtainedthenumberofself-employedlawyersforthe2010to2014periodfromtheReportontheEarningsofSelf-EmployedLawyersfortheDepartmentofJusticeCanadainPreparationforthe2015JudicialCompensationandBenefitsCommissionbyMr.HaripaulPannu,dated25February2016.
Table246–TotalNumberofSelf-EmployedLawyers–2010to201964
Year Number of Self-
Employed Lawyers
2010 22,110
2011 19,310
2012 19,190
2013 19,360
2014 18,550
2015 18,740
2016 18,330
2017 17,270
2018 17,640
2019 15,510
Average 18,600
247. Themostlikelyreasonforthisdecreaseinnumbersisagradualprocessofself-employedlawyersconvertingtheirpracticetoaprofessionalcorporation.Thenumber
64 Thesearethetotalnumberofself-employedlawyersinCanadaforwhomCanadaRevenueAgencyprovided
dataineachyear.Onlylawyersbetweenages35and69wereincluded.Thereweresomewithinthatagerangethatwereexcludedfordatareasons.
Department of Justice 2020 Quadrennial Commission Page 59
ofself-employedlawyerscouldalsobeaffectedbyashiftintheageofsuchlawyers–reducingthenumbersbetween35and69.Inmyopinion,thatislikelytohaveamuchsmallereffectthantheconversionofpractices.
248. CanadaRevenueAgencyadvisethattheyarenotabletoprovideaccurateincomeamountsfromaprofessionalcorporation.Thereportingofincomefromtheprovisionoflegalservicesisnotseparatedfromothertypesofincomeprovidedonincometaxreturnsandsoanyinformationcouldbemisleading.Thatismuchlesslikelytohappenwithnetincomefromtheself-employed.
Data Presentation
249. Therearemanywaysthedatacanbepresentedandreviewed.Inthetablesthatfollowinthissection,Ihavepresentedthedatainseveralwaysthatinmyopinionprovidedifferingwaystoconsidertherelationships.Withtheexceptionofthefirstthreegroupsoftables(Tables253ato255c),Ihaveonlyshownthe65-70thandhigherpercentilerangesalongwiththemedianincomeand75thpercentile.
250. Definitions:
a. Median:thenetincomeamountwherehalfofalllawyersmakelessandhalfmakemore.
b. AverageorMean:theincomeamountthatistheaverageofallthenetincomesforalllawyersinthegroup.Iftheaverageisgreaterthanthemedian,itindicatesthatthenetincomesareskewedtowardsthehighend–thatis,therearesomelawyerswithveryhighnetincomesrelativetotheentiregroup.
c. Percentile:Asystemofrankingdatafromthesmallesttothelargest.Forincomeranking,the65thpercentileistheamountwhere65%ofallself-employedlawyersmakelessand35%makemore.Referalsotothecall-outboxonpage37.
d. Percentilerange:InthedatafromCanadaRevenueAgency,theactualpercentileswerenotprovided,butinsteadtheaverageincomeamountforthefivepercentilesbelowtheindicatedpercentilewasgiven.Forexample,the75thpercentileistheaverageofthenetincomesforalllawyerswithincomesbetweenthe70thand75thpercentiles.The100thpercentileistheaverageofthenetincomesofthetopfivepercentofself-employedlawyers.WhereIrefertothepercentiledataprovidedbyCanadaRevenueAgency,Ishowtherange,suchas70-75thpercentile.Wecanestimatewithsufficientlyhighaccuracytheactualsingle-pointpercentile
Department of Justice 2020 Quadrennial Commission Page 60
representedbyarangeofpercentilesisthemid-point.Forexample,therange70-75thpercentileisthe72.5thpercentile65.
e. AllAges:Thedataprovidedincludesself-employedlawyersaged35to69.Soareferenceto“AllAges”shouldbeconsideredasages35to69.
f. CMAs:ThelawyersweregroupedwithinthetenlargestCensusMetropolitanAreas(CMAs)–inorderofdecreasingsize,Toronto,Montréal,Vancouver,Calgary,Edmonton,Ottawa,Winnipeg,QuébecCityandcombinedintoonegroupforconfidentialitypurposes,HamiltonandtheKitchener,Cambridge,Waterlooareas).AllotherregionsofCanadawerecombinedandarereferencedas“OtherRegions”).
251. CanadaRevenueAgencyroundedallincomeamountstothenearest$10withtheexceptionofthemedianandthe75thpercentileswhichwereroundedtothenearest$10,000.Thedatacontainsacoupleofapparentanomaliesthataretheresultofthedifferentrounding66.Inmyopinion,thoseanomaliesarenotmaterialforthepurposesofthisreport,andIhavenotdrawnattentiontothemelsewhere.
252. Whileitismyopinionthatincomeexclusionsshouldhavenoplaceinacompensationcomparison,IhaveincludedtablesbasedonanincomeexclusionsincethatdatawasprovidedbyCanadaRevenueAgencyandmayhavebeenutilisedbypriorQuadrennialCommissionsintheirdeliberations.
65 Thisworkswelluptothe75thpercentile.Fromthe75thto90thpercentile,itgivesaresultthatis
approximatelyequaltothecorrectvalueandabovethe90thpercentile,itwillgivearesultthatislow.66 Forexample,the70-75thpercentileisslightlygreaterthanthe75thpercentile.Ifroundingweredone
consistently,the70-75thpercentileshouldneverbelargerthanthe75thpercentile.
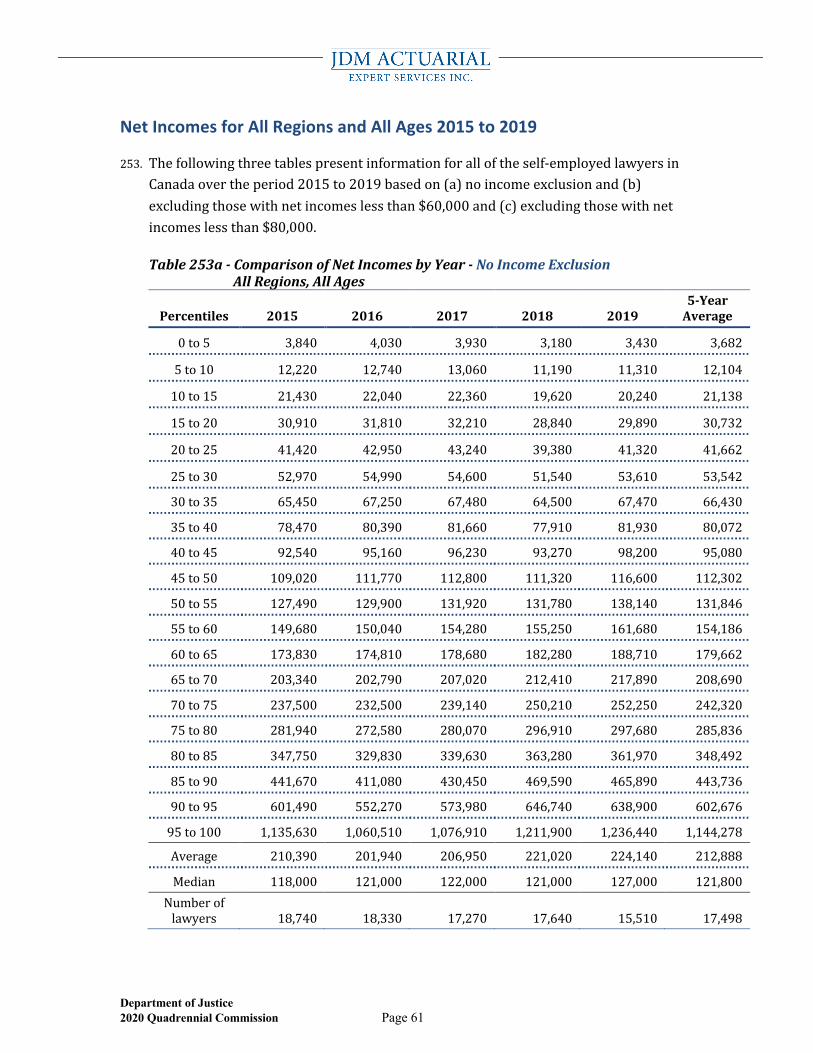
Department of Justice 2020 Quadrennial Commission Page 61
Net Incomes for All Regions and All Ages 2015 to 2019
253. Thefollowingthreetablespresentinformationforalloftheself-employedlawyersinCanadaovertheperiod2015to2019basedon(a)noincomeexclusionand(b)excludingthosewithnetincomeslessthan$60,000and(c)excludingthosewithnetincomeslessthan$80,000.
Table253a-ComparisonofNetIncomesbyYear-NoIncomeExclusion AllRegions,AllAges
Percentiles 2015 2016 2017 2018 20195-YearAverage
0to5 3,840 4,030 3,930 3,180 3,430 3,682
5to10 12,220 12,740 13,060 11,190 11,310 12,104
10to15 21,430 22,040 22,360 19,620 20,240 21,138
15to20 30,910 31,810 32,210 28,840 29,890 30,732
20to25 41,420 42,950 43,240 39,380 41,320 41,662
25to30 52,970 54,990 54,600 51,540 53,610 53,542
30to35 65,450 67,250 67,480 64,500 67,470 66,430
35to40 78,470 80,390 81,660 77,910 81,930 80,072
40to45 92,540 95,160 96,230 93,270 98,200 95,080
45to50 109,020 111,770 112,800 111,320 116,600 112,302
50to55 127,490 129,900 131,920 131,780 138,140 131,846
55to60 149,680 150,040 154,280 155,250 161,680 154,186
60to65 173,830 174,810 178,680 182,280 188,710 179,662
65to70 203,340 202,790 207,020 212,410 217,890 208,690
70to75 237,500 232,500 239,140 250,210 252,250 242,320
75to80 281,940 272,580 280,070 296,910 297,680 285,836
80to85 347,750 329,830 339,630 363,280 361,970 348,492
85to90 441,670 411,080 430,450 469,590 465,890 443,736
90to95 601,490 552,270 573,980 646,740 638,900 602,676
95to100 1,135,630 1,060,510 1,076,910 1,211,900 1,236,440 1,144,278
Average 210,390 201,940 206,950 221,020 224,140 212,888
Median 118,000 121,000 122,000 121,000 127,000 121,800Numberoflawyers 18,740 18,330 17,270 17,640 15,510 17,498
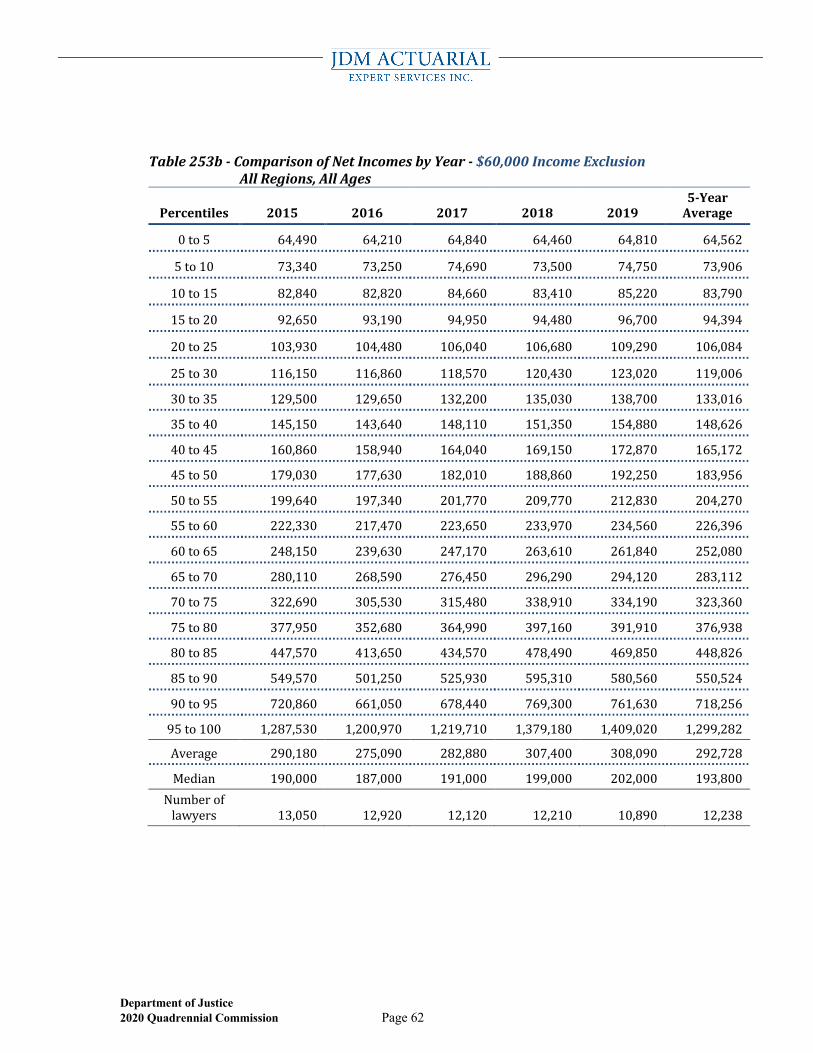
Department of Justice 2020 Quadrennial Commission Page 62
Table253b-ComparisonofNetIncomesbyYear-$60,000IncomeExclusion AllRegions,AllAges
Percentiles 2015 2016 2017 2018 20195-YearAverage
0to5 64,490 64,210 64,840 64,460 64,810 64,562
5to10 73,340 73,250 74,690 73,500 74,750 73,906
10to15 82,840 82,820 84,660 83,410 85,220 83,790
15to20 92,650 93,190 94,950 94,480 96,700 94,394
20to25 103,930 104,480 106,040 106,680 109,290 106,084
25to30 116,150 116,860 118,570 120,430 123,020 119,006
30to35 129,500 129,650 132,200 135,030 138,700 133,016
35to40 145,150 143,640 148,110 151,350 154,880 148,626
40to45 160,860 158,940 164,040 169,150 172,870 165,172
45to50 179,030 177,630 182,010 188,860 192,250 183,956
50to55 199,640 197,340 201,770 209,770 212,830 204,270
55to60 222,330 217,470 223,650 233,970 234,560 226,396
60to65 248,150 239,630 247,170 263,610 261,840 252,080
65to70 280,110 268,590 276,450 296,290 294,120 283,112
70to75 322,690 305,530 315,480 338,910 334,190 323,360
75to80 377,950 352,680 364,990 397,160 391,910 376,938
80to85 447,570 413,650 434,570 478,490 469,850 448,826
85to90 549,570 501,250 525,930 595,310 580,560 550,524
90to95 720,860 661,050 678,440 769,300 761,630 718,256
95to100 1,287,530 1,200,970 1,219,710 1,379,180 1,409,020 1,299,282
Average 290,180 275,090 282,880 307,400 308,090 292,728
Median 190,000 187,000 191,000 199,000 202,000 193,800Numberoflawyers 13,050 12,920 12,120 12,210 10,890 12,238
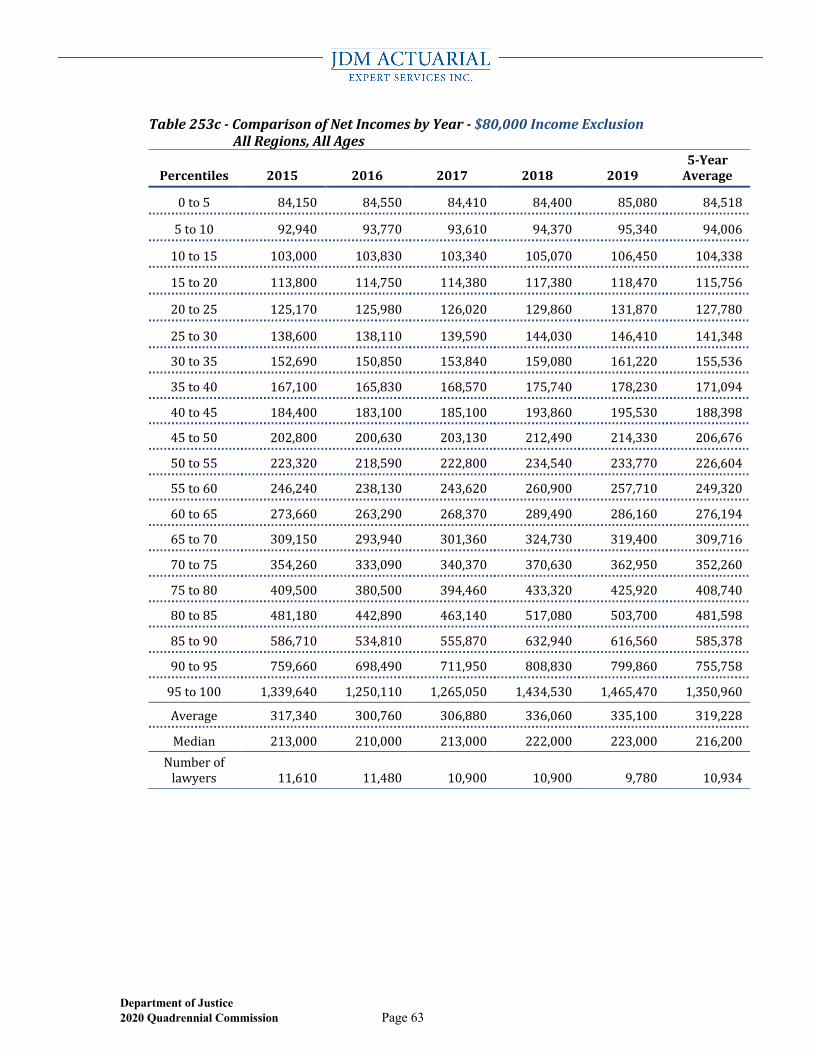
Department of Justice 2020 Quadrennial Commission Page 63
Table253c-ComparisonofNetIncomesbyYear-$80,000IncomeExclusion AllRegions,AllAges
Percentiles 2015 2016 2017 2018 20195-YearAverage
0to5 84,150 84,550 84,410 84,400 85,080 84,518
5to10 92,940 93,770 93,610 94,370 95,340 94,006
10to15 103,000 103,830 103,340 105,070 106,450 104,338
15to20 113,800 114,750 114,380 117,380 118,470 115,756
20to25 125,170 125,980 126,020 129,860 131,870 127,780
25to30 138,600 138,110 139,590 144,030 146,410 141,348
30to35 152,690 150,850 153,840 159,080 161,220 155,536
35to40 167,100 165,830 168,570 175,740 178,230 171,094
40to45 184,400 183,100 185,100 193,860 195,530 188,398
45to50 202,800 200,630 203,130 212,490 214,330 206,676
50to55 223,320 218,590 222,800 234,540 233,770 226,604
55to60 246,240 238,130 243,620 260,900 257,710 249,320
60to65 273,660 263,290 268,370 289,490 286,160 276,194
65to70 309,150 293,940 301,360 324,730 319,400 309,716
70to75 354,260 333,090 340,370 370,630 362,950 352,260
75to80 409,500 380,500 394,460 433,320 425,920 408,740
80to85 481,180 442,890 463,140 517,080 503,700 481,598
85to90 586,710 534,810 555,870 632,940 616,560 585,378
90to95 759,660 698,490 711,950 808,830 799,860 755,758
95to100 1,339,640 1,250,110 1,265,050 1,434,530 1,465,470 1,350,960
Average 317,340 300,760 306,880 336,060 335,100 319,228
Median 213,000 210,000 213,000 222,000 223,000 216,200Numberoflawyers 11,610 11,480 10,900 10,900 9,780 10,934
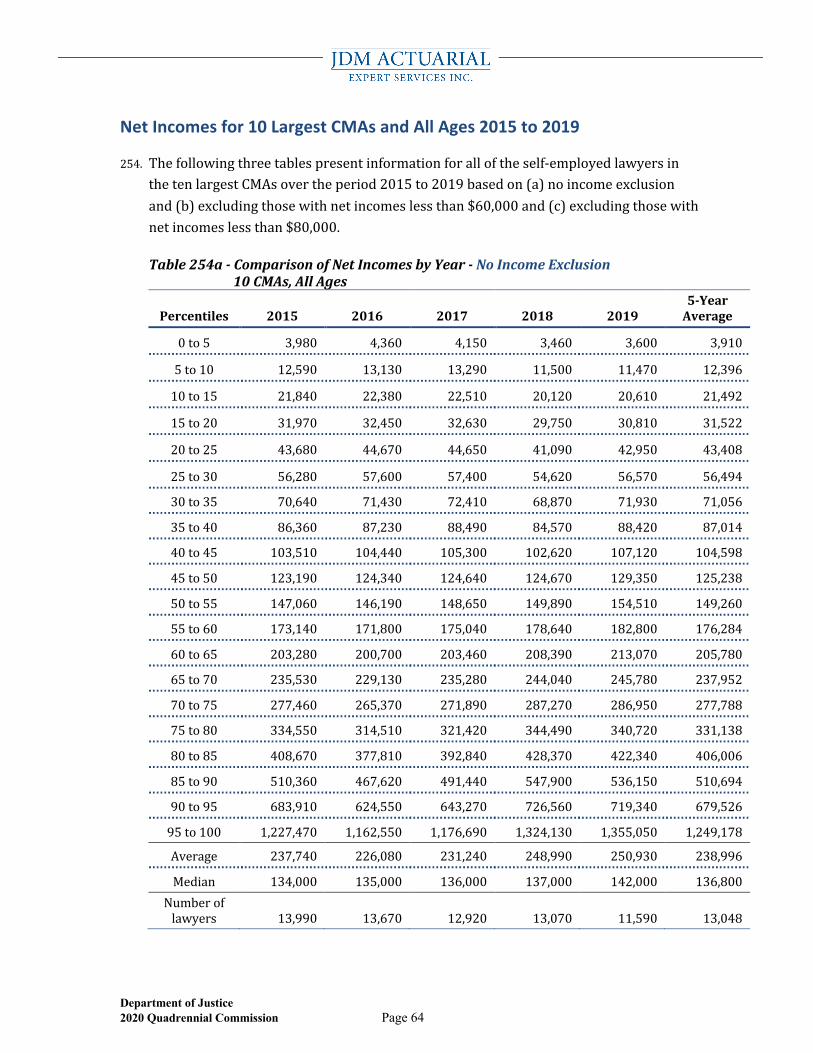
Department of Justice 2020 Quadrennial Commission Page 64
Net Incomes for 10 Largest CMAs and All Ages 2015 to 2019
254. Thefollowingthreetablespresentinformationforalloftheself-employedlawyersinthetenlargestCMAsovertheperiod2015to2019basedon(a)noincomeexclusionand(b)excludingthosewithnetincomeslessthan$60,000and(c)excludingthosewithnetincomeslessthan$80,000.
Table254a-ComparisonofNetIncomesbyYear-NoIncomeExclusion 10CMAs,AllAges
Percentiles 2015 2016 2017 2018 20195-YearAverage
0to5 3,980 4,360 4,150 3,460 3,600 3,910
5to10 12,590 13,130 13,290 11,500 11,470 12,396
10to15 21,840 22,380 22,510 20,120 20,610 21,492
15to20 31,970 32,450 32,630 29,750 30,810 31,522
20to25 43,680 44,670 44,650 41,090 42,950 43,408
25to30 56,280 57,600 57,400 54,620 56,570 56,494
30to35 70,640 71,430 72,410 68,870 71,930 71,056
35to40 86,360 87,230 88,490 84,570 88,420 87,014
40to45 103,510 104,440 105,300 102,620 107,120 104,598
45to50 123,190 124,340 124,640 124,670 129,350 125,238
50to55 147,060 146,190 148,650 149,890 154,510 149,260
55to60 173,140 171,800 175,040 178,640 182,800 176,284
60to65 203,280 200,700 203,460 208,390 213,070 205,780
65to70 235,530 229,130 235,280 244,040 245,780 237,952
70to75 277,460 265,370 271,890 287,270 286,950 277,788
75to80 334,550 314,510 321,420 344,490 340,720 331,138
80to85 408,670 377,810 392,840 428,370 422,340 406,006
85to90 510,360 467,620 491,440 547,900 536,150 510,694
90to95 683,910 624,550 643,270 726,560 719,340 679,526
95to100 1,227,470 1,162,550 1,176,690 1,324,130 1,355,050 1,249,178
Average 237,740 226,080 231,240 248,990 250,930 238,996
Median 134,000 135,000 136,000 137,000 142,000 136,800Numberoflawyers 13,990 13,670 12,920 13,070 11,590 13,048
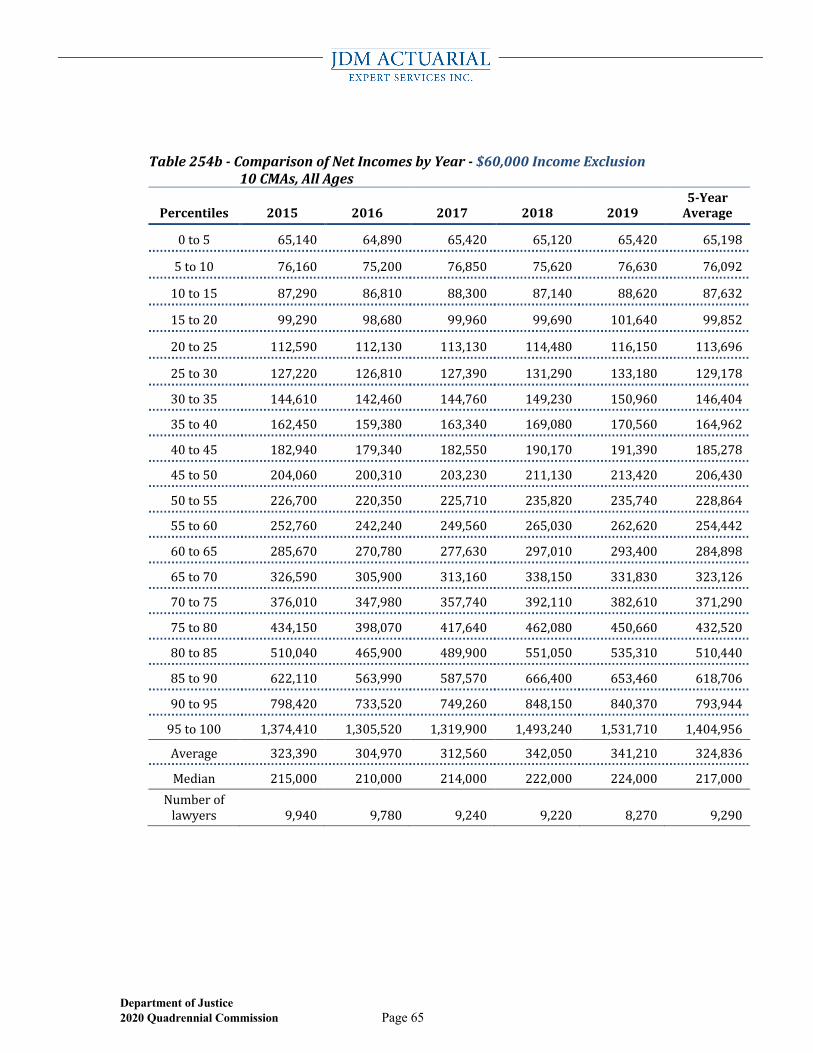
Department of Justice 2020 Quadrennial Commission Page 65
Table254b-ComparisonofNetIncomesbyYear-$60,000IncomeExclusion 10CMAs,AllAges
Percentiles 2015 2016 2017 2018 20195-YearAverage
0to5 65,140 64,890 65,420 65,120 65,420 65,198
5to10 76,160 75,200 76,850 75,620 76,630 76,092
10to15 87,290 86,810 88,300 87,140 88,620 87,632
15to20 99,290 98,680 99,960 99,690 101,640 99,852
20to25 112,590 112,130 113,130 114,480 116,150 113,696
25to30 127,220 126,810 127,390 131,290 133,180 129,178
30to35 144,610 142,460 144,760 149,230 150,960 146,404
35to40 162,450 159,380 163,340 169,080 170,560 164,962
40to45 182,940 179,340 182,550 190,170 191,390 185,278
45to50 204,060 200,310 203,230 211,130 213,420 206,430
50to55 226,700 220,350 225,710 235,820 235,740 228,864
55to60 252,760 242,240 249,560 265,030 262,620 254,442
60to65 285,670 270,780 277,630 297,010 293,400 284,898
65to70 326,590 305,900 313,160 338,150 331,830 323,126
70to75 376,010 347,980 357,740 392,110 382,610 371,290
75to80 434,150 398,070 417,640 462,080 450,660 432,520
80to85 510,040 465,900 489,900 551,050 535,310 510,440
85to90 622,110 563,990 587,570 666,400 653,460 618,706
90to95 798,420 733,520 749,260 848,150 840,370 793,944
95to100 1,374,410 1,305,520 1,319,900 1,493,240 1,531,710 1,404,956
Average 323,390 304,970 312,560 342,050 341,210 324,836
Median 215,000 210,000 214,000 222,000 224,000 217,000Numberoflawyers 9,940 9,780 9,240 9,220 8,270 9,290
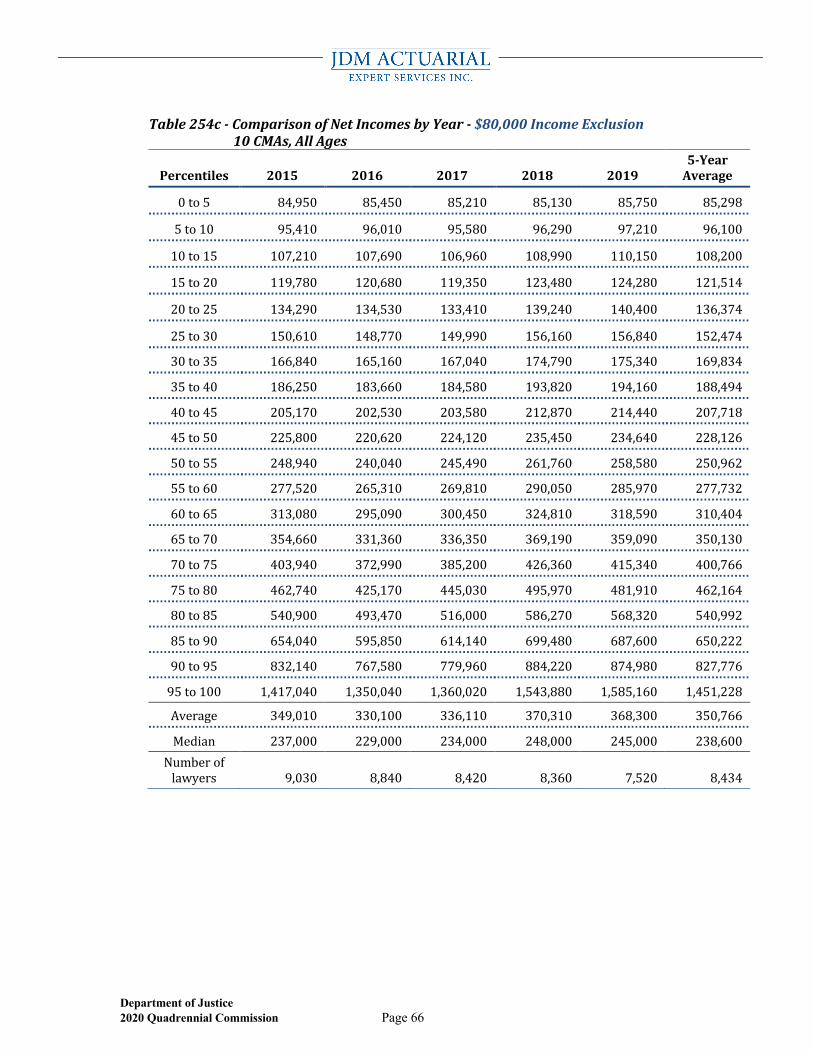
Department of Justice 2020 Quadrennial Commission Page 66
Table254c-ComparisonofNetIncomesbyYear-$80,000IncomeExclusion 10CMAs,AllAges
Percentiles 2015 2016 2017 2018 20195-YearAverage
0to5 84,950 85,450 85,210 85,130 85,750 85,298
5to10 95,410 96,010 95,580 96,290 97,210 96,100
10to15 107,210 107,690 106,960 108,990 110,150 108,200
15to20 119,780 120,680 119,350 123,480 124,280 121,514
20to25 134,290 134,530 133,410 139,240 140,400 136,374
25to30 150,610 148,770 149,990 156,160 156,840 152,474
30to35 166,840 165,160 167,040 174,790 175,340 169,834
35to40 186,250 183,660 184,580 193,820 194,160 188,494
40to45 205,170 202,530 203,580 212,870 214,440 207,718
45to50 225,800 220,620 224,120 235,450 234,640 228,126
50to55 248,940 240,040 245,490 261,760 258,580 250,962
55to60 277,520 265,310 269,810 290,050 285,970 277,732
60to65 313,080 295,090 300,450 324,810 318,590 310,404
65to70 354,660 331,360 336,350 369,190 359,090 350,130
70to75 403,940 372,990 385,200 426,360 415,340 400,766
75to80 462,740 425,170 445,030 495,970 481,910 462,164
80to85 540,900 493,470 516,000 586,270 568,320 540,992
85to90 654,040 595,850 614,140 699,480 687,600 650,222
90to95 832,140 767,580 779,960 884,220 874,980 827,776
95to100 1,417,040 1,350,040 1,360,020 1,543,880 1,585,160 1,451,228
Average 349,010 330,100 336,110 370,310 368,300 350,766
Median 237,000 229,000 234,000 248,000 245,000 238,600Numberoflawyers 9,030 8,840 8,420 8,360 7,520 8,434
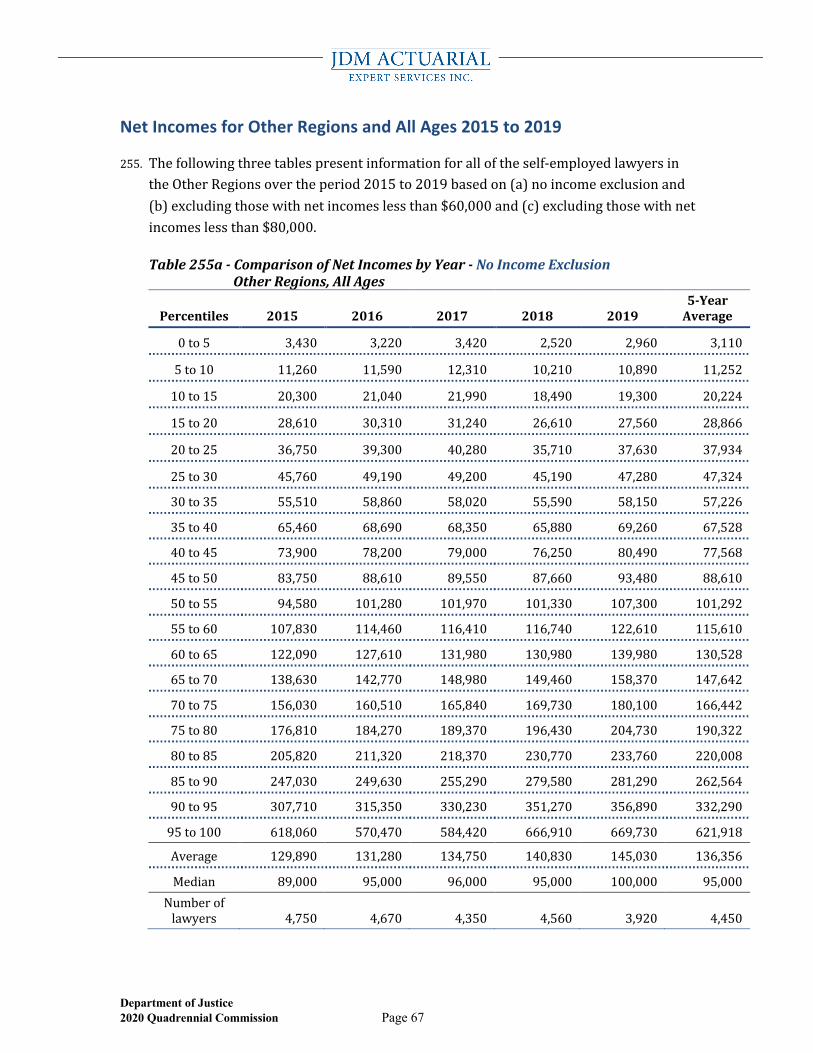
Department of Justice 2020 Quadrennial Commission Page 67
Net Incomes for Other Regions and All Ages 2015 to 2019
255. Thefollowingthreetablespresentinformationforalloftheself-employedlawyersintheOtherRegionsovertheperiod2015to2019basedon(a)noincomeexclusionand(b)excludingthosewithnetincomeslessthan$60,000and(c)excludingthosewithnetincomeslessthan$80,000.
Table255a-ComparisonofNetIncomesbyYear-NoIncomeExclusion OtherRegions,AllAges
Percentiles 2015 2016 2017 2018 20195-YearAverage
0to5 3,430 3,220 3,420 2,520 2,960 3,110
5to10 11,260 11,590 12,310 10,210 10,890 11,252
10to15 20,300 21,040 21,990 18,490 19,300 20,224
15to20 28,610 30,310 31,240 26,610 27,560 28,866
20to25 36,750 39,300 40,280 35,710 37,630 37,934
25to30 45,760 49,190 49,200 45,190 47,280 47,324
30to35 55,510 58,860 58,020 55,590 58,150 57,226
35to40 65,460 68,690 68,350 65,880 69,260 67,528
40to45 73,900 78,200 79,000 76,250 80,490 77,568
45to50 83,750 88,610 89,550 87,660 93,480 88,610
50to55 94,580 101,280 101,970 101,330 107,300 101,292
55to60 107,830 114,460 116,410 116,740 122,610 115,610
60to65 122,090 127,610 131,980 130,980 139,980 130,528
65to70 138,630 142,770 148,980 149,460 158,370 147,642
70to75 156,030 160,510 165,840 169,730 180,100 166,442
75to80 176,810 184,270 189,370 196,430 204,730 190,322
80to85 205,820 211,320 218,370 230,770 233,760 220,008
85to90 247,030 249,630 255,290 279,580 281,290 262,564
90to95 307,710 315,350 330,230 351,270 356,890 332,290
95to100 618,060 570,470 584,420 666,910 669,730 621,918
Average 129,890 131,280 134,750 140,830 145,030 136,356
Median 89,000 95,000 96,000 95,000 100,000 95,000Numberoflawyers 4,750 4,670 4,350 4,560 3,920 4,450
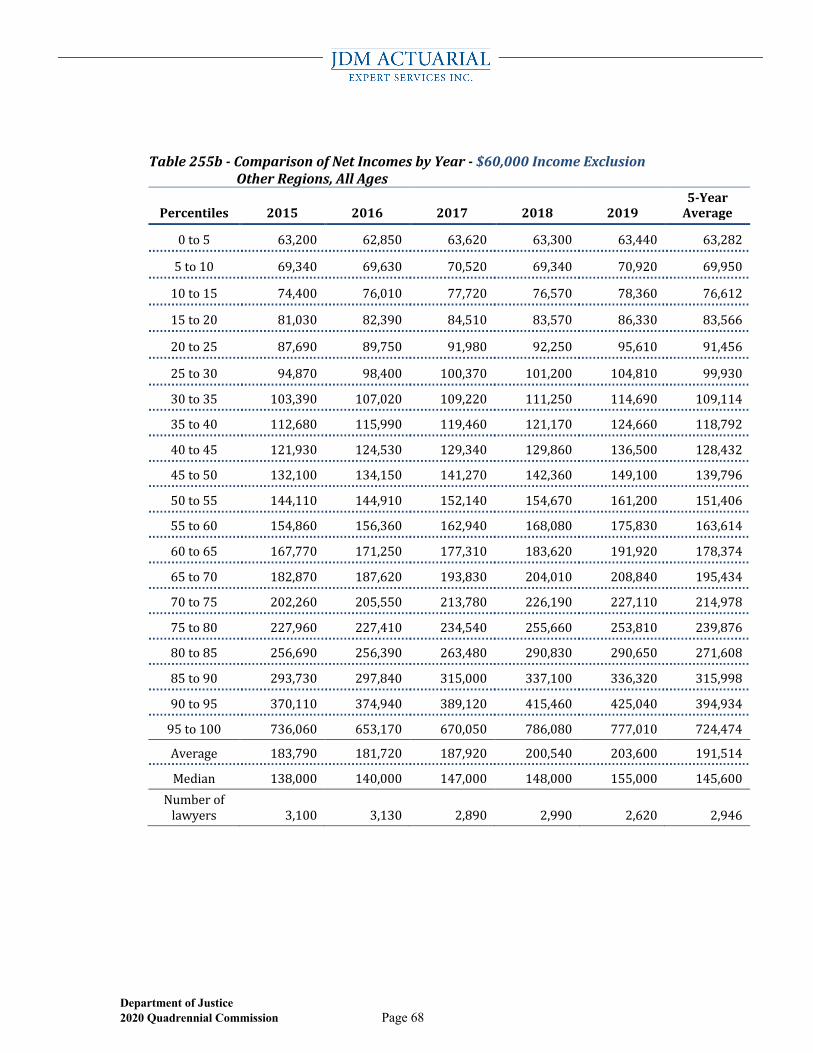
Department of Justice 2020 Quadrennial Commission Page 68
Table255b-ComparisonofNetIncomesbyYear-$60,000IncomeExclusion OtherRegions,AllAges
Percentiles 2015 2016 2017 2018 20195-YearAverage
0to5 63,200 62,850 63,620 63,300 63,440 63,282
5to10 69,340 69,630 70,520 69,340 70,920 69,950
10to15 74,400 76,010 77,720 76,570 78,360 76,612
15to20 81,030 82,390 84,510 83,570 86,330 83,566
20to25 87,690 89,750 91,980 92,250 95,610 91,456
25to30 94,870 98,400 100,370 101,200 104,810 99,930
30to35 103,390 107,020 109,220 111,250 114,690 109,114
35to40 112,680 115,990 119,460 121,170 124,660 118,792
40to45 121,930 124,530 129,340 129,860 136,500 128,432
45to50 132,100 134,150 141,270 142,360 149,100 139,796
50to55 144,110 144,910 152,140 154,670 161,200 151,406
55to60 154,860 156,360 162,940 168,080 175,830 163,614
60to65 167,770 171,250 177,310 183,620 191,920 178,374
65to70 182,870 187,620 193,830 204,010 208,840 195,434
70to75 202,260 205,550 213,780 226,190 227,110 214,978
75to80 227,960 227,410 234,540 255,660 253,810 239,876
80to85 256,690 256,390 263,480 290,830 290,650 271,608
85to90 293,730 297,840 315,000 337,100 336,320 315,998
90to95 370,110 374,940 389,120 415,460 425,040 394,934
95to100 736,060 653,170 670,050 786,080 777,010 724,474
Average 183,790 181,720 187,920 200,540 203,600 191,514
Median 138,000 140,000 147,000 148,000 155,000 145,600Numberoflawyers 3,100 3,130 2,890 2,990 2,620 2,946
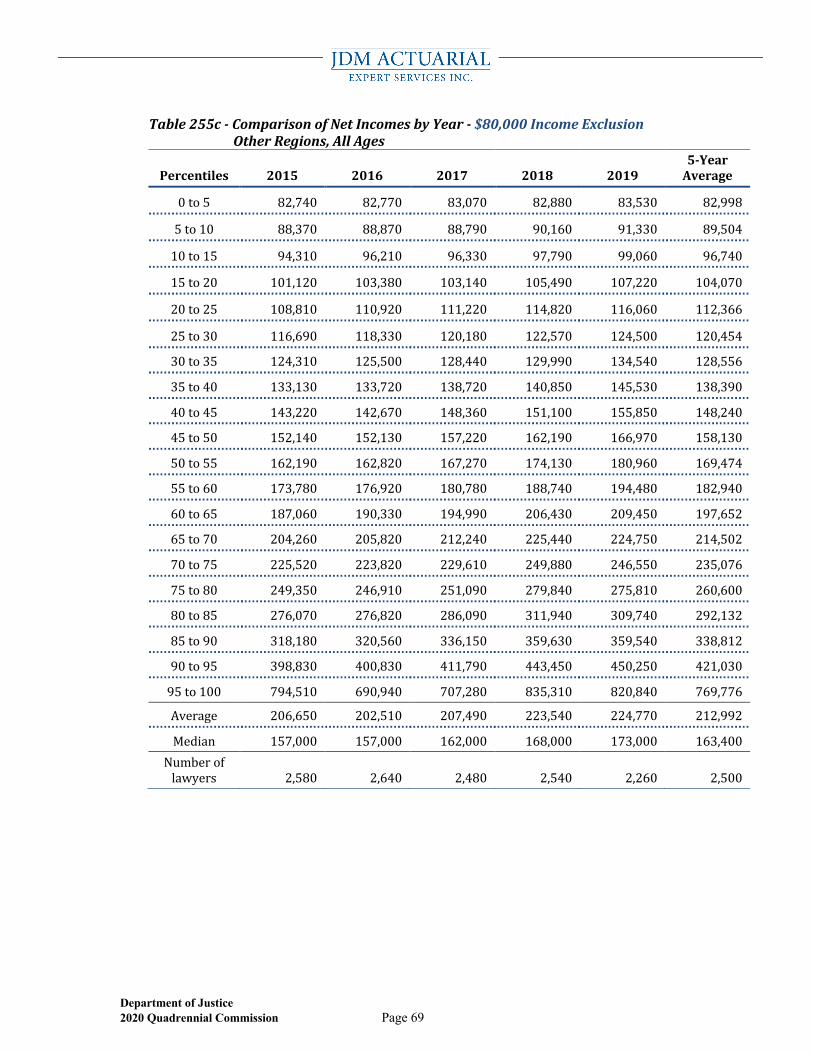
Department of Justice 2020 Quadrennial Commission Page 69
Table255c-ComparisonofNetIncomesbyYear-$80,000IncomeExclusion OtherRegions,AllAges
Percentiles 2015 2016 2017 2018 20195-YearAverage
0to5 82,740 82,770 83,070 82,880 83,530 82,998
5to10 88,370 88,870 88,790 90,160 91,330 89,504
10to15 94,310 96,210 96,330 97,790 99,060 96,740
15to20 101,120 103,380 103,140 105,490 107,220 104,070
20to25 108,810 110,920 111,220 114,820 116,060 112,366
25to30 116,690 118,330 120,180 122,570 124,500 120,454
30to35 124,310 125,500 128,440 129,990 134,540 128,556
35to40 133,130 133,720 138,720 140,850 145,530 138,390
40to45 143,220 142,670 148,360 151,100 155,850 148,240
45to50 152,140 152,130 157,220 162,190 166,970 158,130
50to55 162,190 162,820 167,270 174,130 180,960 169,474
55to60 173,780 176,920 180,780 188,740 194,480 182,940
60to65 187,060 190,330 194,990 206,430 209,450 197,652
65to70 204,260 205,820 212,240 225,440 224,750 214,502
70to75 225,520 223,820 229,610 249,880 246,550 235,076
75to80 249,350 246,910 251,090 279,840 275,810 260,600
80to85 276,070 276,820 286,090 311,940 309,740 292,132
85to90 318,180 320,560 336,150 359,630 359,540 338,812
90to95 398,830 400,830 411,790 443,450 450,250 421,030
95to100 794,510 690,940 707,280 835,310 820,840 769,776
Average 206,650 202,510 207,490 223,540 224,770 212,992
Median 157,000 157,000 162,000 168,000 173,000 163,400Numberoflawyers 2,580 2,640 2,480 2,540 2,260 2,500
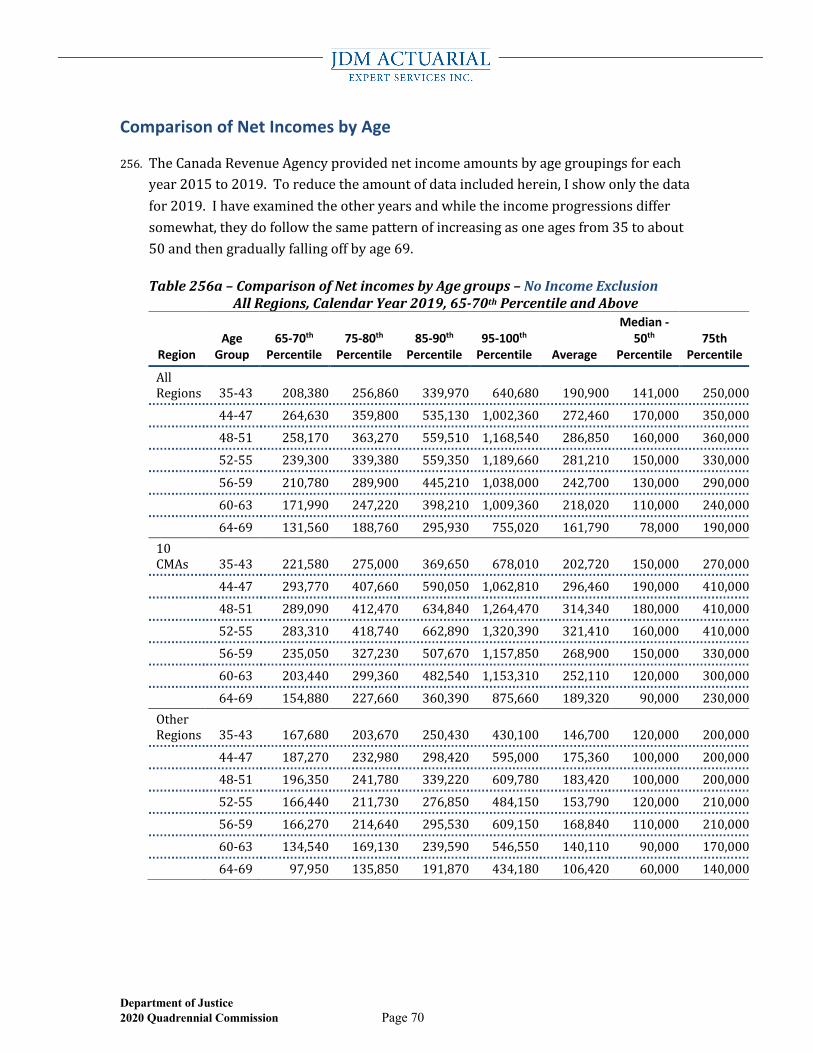
Department of Justice 2020 Quadrennial Commission Page 70
Comparison of Net Incomes by Age
256. TheCanadaRevenueAgencyprovidednetincomeamountsbyagegroupingsforeachyear2015to2019.Toreducetheamountofdataincludedherein,Ishowonlythedatafor2019.Ihaveexaminedtheotheryearsandwhiletheincomeprogressionsdiffersomewhat,theydofollowthesamepatternofincreasingasoneagesfrom35toabout50andthengraduallyfallingoffbyage69.
Table256a–ComparisonofNetincomesbyAgegroups–NoIncomeExclusion AllRegions,CalendarYear2019,65-70thPercentileandAbove
Region Age
Group 65-70th
Percentile 75-80th
Percentile 85-90th
Percentile 95-100th
Percentile Average
Median - 50th
Percentile 75th
Percentile
AllRegions 35-43 208,380 256,860 339,970 640,680 190,900 141,000 250,000 44-47 264,630 359,800 535,130 1,002,360 272,460 170,000 350,000 48-51 258,170 363,270 559,510 1,168,540 286,850 160,000 360,000 52-55 239,300 339,380 559,350 1,189,660 281,210 150,000 330,000
56-59 210,780 289,900 445,210 1,038,000 242,700 130,000 290,000 60-63 171,990 247,220 398,210 1,009,360 218,020 110,000 240,000 64-69 131,560 188,760 295,930 755,020 161,790 78,000 190,00010CMAs 35-43 221,580 275,000 369,650 678,010 202,720 150,000 270,000 44-47 293,770 407,660 590,050 1,062,810 296,460 190,000 410,000 48-51 289,090 412,470 634,840 1,264,470 314,340 180,000 410,000 52-55 283,310 418,740 662,890 1,320,390 321,410 160,000 410,000 56-59 235,050 327,230 507,670 1,157,850 268,900 150,000 330,000 60-63 203,440 299,360 482,540 1,153,310 252,110 120,000 300,000 64-69 154,880 227,660 360,390 875,660 189,320 90,000 230,000OtherRegions 35-43 167,680 203,670 250,430 430,100 146,700 120,000 200,000 44-47 187,270 232,980 298,420 595,000 175,360 100,000 200,000 48-51 196,350 241,780 339,220 609,780 183,420 100,000 200,000 52-55 166,440 211,730 276,850 484,150 153,790 120,000 210,000 56-59 166,270 214,640 295,530 609,150 168,840 110,000 210,000 60-63 134,540 169,130 239,590 546,550 140,110 90,000 170,000 64-69 97,950 135,850 191,870 434,180 106,420 60,000 140,000
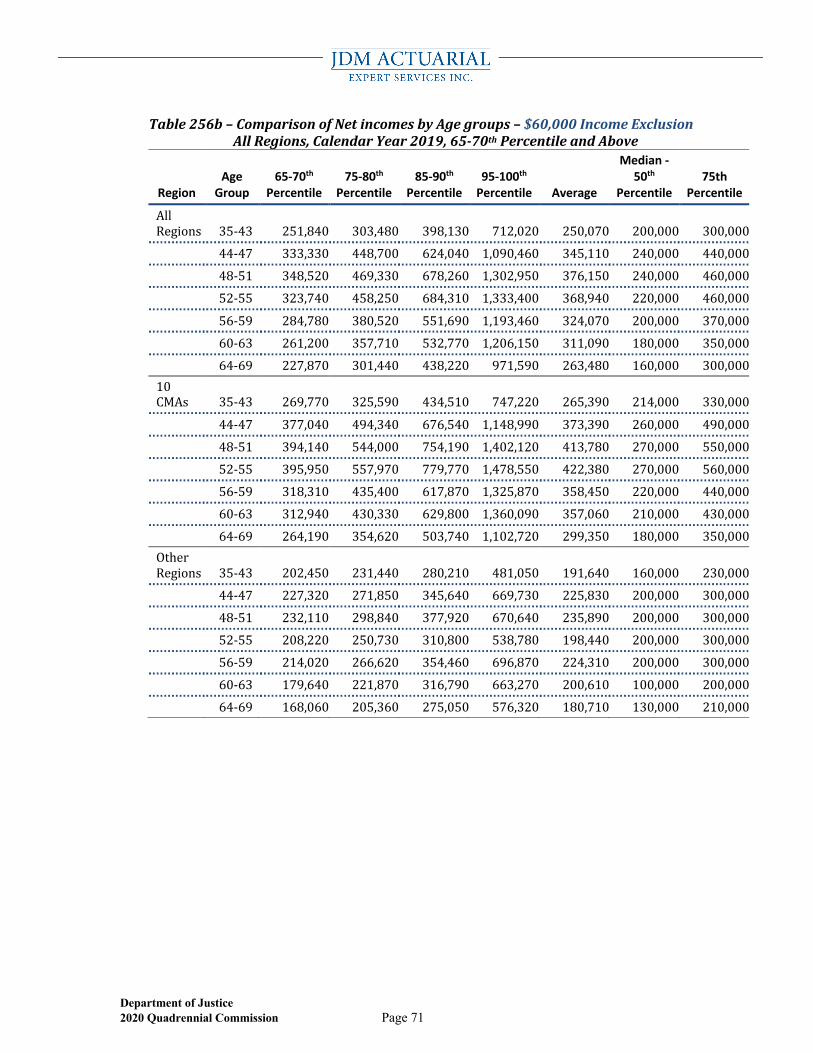
Department of Justice 2020 Quadrennial Commission Page 71
Table256b–ComparisonofNetincomesbyAgegroups–$60,000IncomeExclusion AllRegions,CalendarYear2019,65-70thPercentileandAbove
Region Age
Group 65-70th
Percentile 75-80th
Percentile 85-90th
Percentile 95-100th
Percentile Average
Median - 50th
Percentile 75th
Percentile
AllRegions 35-43 251,840 303,480 398,130 712,020 250,070 200,000 300,000 44-47 333,330 448,700 624,040 1,090,460 345,110 240,000 440,000 48-51 348,520 469,330 678,260 1,302,950 376,150 240,000 460,000 52-55 323,740 458,250 684,310 1,333,400 368,940 220,000 460,000
56-59 284,780 380,520 551,690 1,193,460 324,070 200,000 370,000 60-63 261,200 357,710 532,770 1,206,150 311,090 180,000 350,000 64-69 227,870 301,440 438,220 971,590 263,480 160,000 300,00010CMAs 35-43 269,770 325,590 434,510 747,220 265,390 214,000 330,000
44-47 377,040 494,340 676,540 1,148,990 373,390 260,000 490,000 48-51 394,140 544,000 754,190 1,402,120 413,780 270,000 550,000 52-55 395,950 557,970 779,770 1,478,550 422,380 270,000 560,000 56-59 318,310 435,400 617,870 1,325,870 358,450 220,000 440,000 60-63 312,940 430,330 629,800 1,360,090 357,060 210,000 430,000 64-69 264,190 354,620 503,740 1,102,720 299,350 180,000 350,000OtherRegions 35-43 202,450 231,440 280,210 481,050 191,640 160,000 230,000 44-47 227,320 271,850 345,640 669,730 225,830 200,000 300,000 48-51 232,110 298,840 377,920 670,640 235,890 200,000 300,000 52-55 208,220 250,730 310,800 538,780 198,440 200,000 300,000 56-59 214,020 266,620 354,460 696,870 224,310 200,000 300,000 60-63 179,640 221,870 316,790 663,270 200,610 100,000 200,000 64-69 168,060 205,360 275,050 576,320 180,710 130,000 210,000
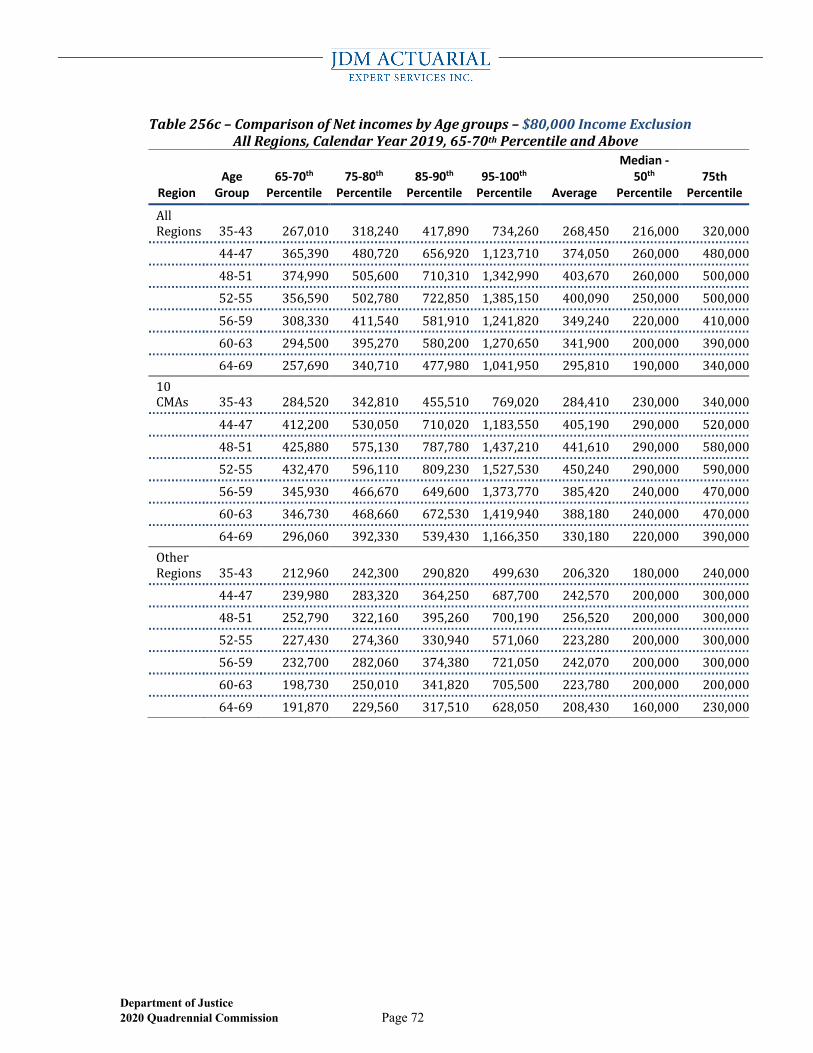
Department of Justice 2020 Quadrennial Commission Page 72
Table256c–ComparisonofNetincomesbyAgegroups–$80,000IncomeExclusion AllRegions,CalendarYear2019,65-70thPercentileandAbove
Region Age
Group 65-70th
Percentile 75-80th
Percentile 85-90th
Percentile 95-100th
Percentile Average
Median - 50th
Percentile 75th
Percentile
AllRegions 35-43 267,010 318,240 417,890 734,260 268,450 216,000 320,000 44-47 365,390 480,720 656,920 1,123,710 374,050 260,000 480,000 48-51 374,990 505,600 710,310 1,342,990 403,670 260,000 500,000 52-55 356,590 502,780 722,850 1,385,150 400,090 250,000 500,000
56-59 308,330 411,540 581,910 1,241,820 349,240 220,000 410,000 60-63 294,500 395,270 580,200 1,270,650 341,900 200,000 390,000 64-69 257,690 340,710 477,980 1,041,950 295,810 190,000 340,00010CMAs 35-43 284,520 342,810 455,510 769,020 284,410 230,000 340,000
44-47 412,200 530,050 710,020 1,183,550 405,190 290,000 520,000 48-51 425,880 575,130 787,780 1,437,210 441,610 290,000 580,000 52-55 432,470 596,110 809,230 1,527,530 450,240 290,000 590,000 56-59 345,930 466,670 649,600 1,373,770 385,420 240,000 470,000 60-63 346,730 468,660 672,530 1,419,940 388,180 240,000 470,000 64-69 296,060 392,330 539,430 1,166,350 330,180 220,000 390,000OtherRegions 35-43 212,960 242,300 290,820 499,630 206,320 180,000 240,000 44-47 239,980 283,320 364,250 687,700 242,570 200,000 300,000 48-51 252,790 322,160 395,260 700,190 256,520 200,000 300,000 52-55 227,430 274,360 330,940 571,060 223,280 200,000 300,000 56-59 232,700 282,060 374,380 721,050 242,070 200,000 300,000 60-63 198,730 250,010 341,820 705,500 223,780 200,000 200,000 64-69 191,870 229,560 317,510 628,050 208,430 160,000 230,000
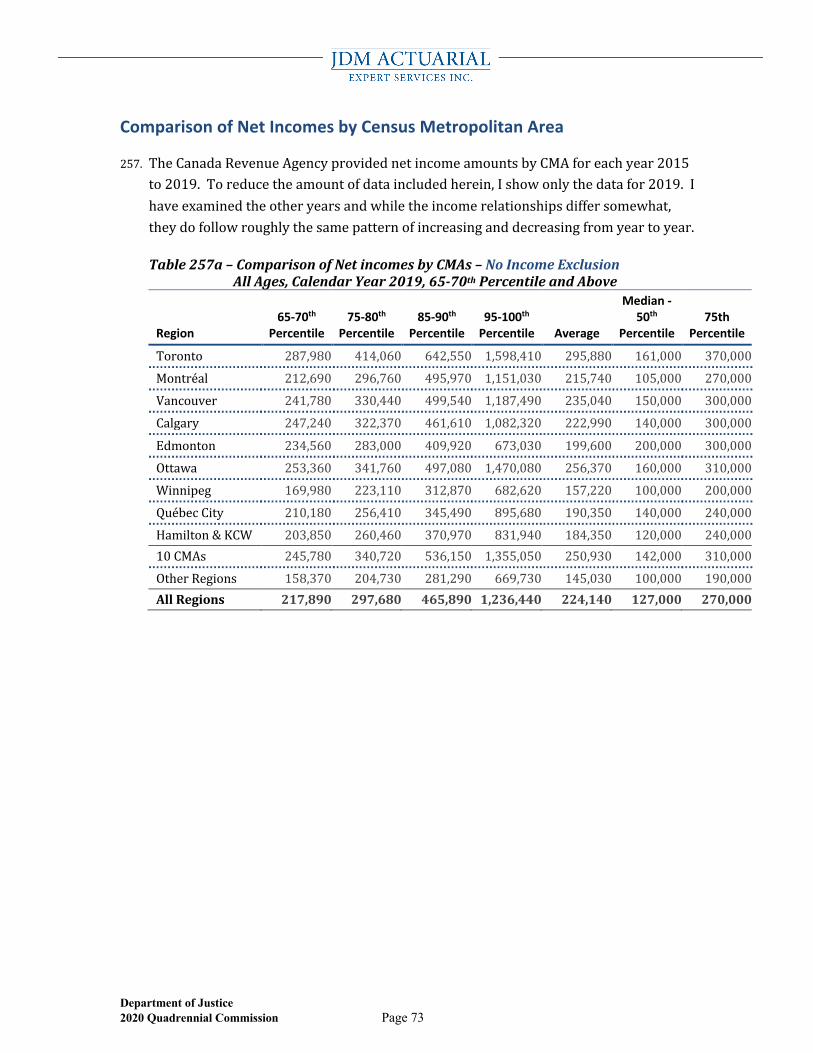
Department of Justice 2020 Quadrennial Commission Page 73
Comparison of Net Incomes by Census Metropolitan Area
257. TheCanadaRevenueAgencyprovidednetincomeamountsbyCMAforeachyear2015to2019.Toreducetheamountofdataincludedherein,Ishowonlythedatafor2019.Ihaveexaminedtheotheryearsandwhiletheincomerelationshipsdiffersomewhat,theydofollowroughlythesamepatternofincreasinganddecreasingfromyeartoyear.
Table257a–ComparisonofNetincomesbyCMAs–NoIncomeExclusion AllAges,CalendarYear2019,65-70thPercentileandAbove
Region 65-70th
Percentile 75-80th
Percentile 85-90th
Percentile 95-100th
Percentile Average
Median - 50th
Percentile 75th
Percentile
Toronto 287,980 414,060 642,550 1,598,410 295,880 161,000 370,000Montréal 212,690 296,760 495,970 1,151,030 215,740 105,000 270,000Vancouver 241,780 330,440 499,540 1,187,490 235,040 150,000 300,000Calgary 247,240 322,370 461,610 1,082,320 222,990 140,000 300,000
Edmonton 234,560 283,000 409,920 673,030 199,600 200,000 300,000Ottawa 253,360 341,760 497,080 1,470,080 256,370 160,000 310,000Winnipeg 169,980 223,110 312,870 682,620 157,220 100,000 200,000QuébecCity 210,180 256,410 345,490 895,680 190,350 140,000 240,000Hamilton&KCW 203,850 260,460 370,970 831,940 184,350 120,000 240,00010CMAs 245,780 340,720 536,150 1,355,050 250,930 142,000 310,000OtherRegions 158,370 204,730 281,290 669,730 145,030 100,000 190,000AllRegions 217,890 297,680 465,890 1,236,440 224,140 127,000 270,000
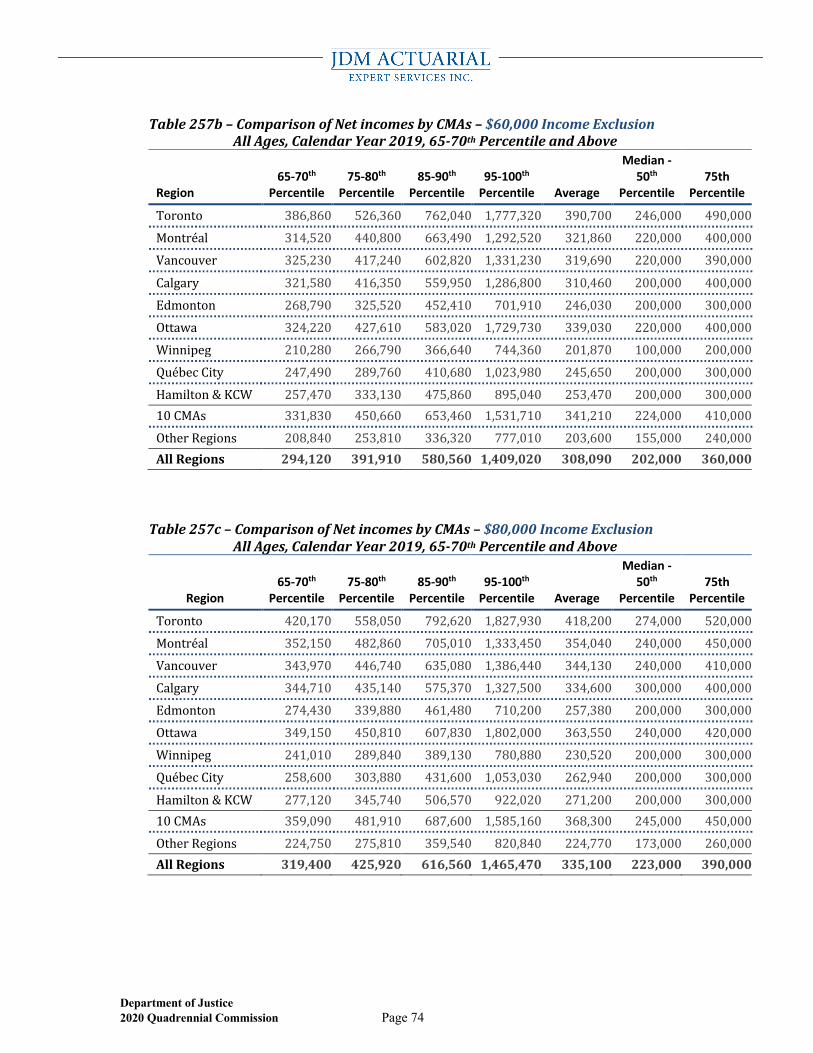
Department of Justice 2020 Quadrennial Commission Page 74
Table257b–ComparisonofNetincomesbyCMAs–$60,000IncomeExclusion AllAges,CalendarYear2019,65-70thPercentileandAbove
Region 65-70th
Percentile 75-80th
Percentile 85-90th
Percentile 95-100th
Percentile Average
Median - 50th
Percentile 75th
Percentile
Toronto 386,860 526,360 762,040 1,777,320 390,700 246,000 490,000Montréal 314,520 440,800 663,490 1,292,520 321,860 220,000 400,000Vancouver 325,230 417,240 602,820 1,331,230 319,690 220,000 390,000
Calgary 321,580 416,350 559,950 1,286,800 310,460 200,000 400,000Edmonton 268,790 325,520 452,410 701,910 246,030 200,000 300,000Ottawa 324,220 427,610 583,020 1,729,730 339,030 220,000 400,000Winnipeg 210,280 266,790 366,640 744,360 201,870 100,000 200,000QuébecCity 247,490 289,760 410,680 1,023,980 245,650 200,000 300,000Hamilton&KCW 257,470 333,130 475,860 895,040 253,470 200,000 300,00010CMAs 331,830 450,660 653,460 1,531,710 341,210 224,000 410,000OtherRegions 208,840 253,810 336,320 777,010 203,600 155,000 240,000AllRegions 294,120 391,910 580,560 1,409,020 308,090 202,000 360,000
Table257c–ComparisonofNetincomesbyCMAs–$80,000IncomeExclusion AllAges,CalendarYear2019,65-70thPercentileandAbove
Region 65-70th
Percentile 75-80th
Percentile 85-90th
Percentile 95-100th
Percentile Average
Median - 50th
Percentile 75th
Percentile
Toronto 420,170 558,050 792,620 1,827,930 418,200 274,000 520,000Montréal 352,150 482,860 705,010 1,333,450 354,040 240,000 450,000Vancouver 343,970 446,740 635,080 1,386,440 344,130 240,000 410,000Calgary 344,710 435,140 575,370 1,327,500 334,600 300,000 400,000Edmonton 274,430 339,880 461,480 710,200 257,380 200,000 300,000Ottawa 349,150 450,810 607,830 1,802,000 363,550 240,000 420,000Winnipeg 241,010 289,840 389,130 780,880 230,520 200,000 300,000QuébecCity 258,600 303,880 431,600 1,053,030 262,940 200,000 300,000
Hamilton&KCW 277,120 345,740 506,570 922,020 271,200 200,000 300,00010CMAs 359,090 481,910 687,600 1,585,160 368,300 245,000 450,000OtherRegions 224,750 275,810 359,540 820,840 224,770 173,000 260,000AllRegions 319,400 425,920 616,560 1,465,470 335,100 223,000 390,000
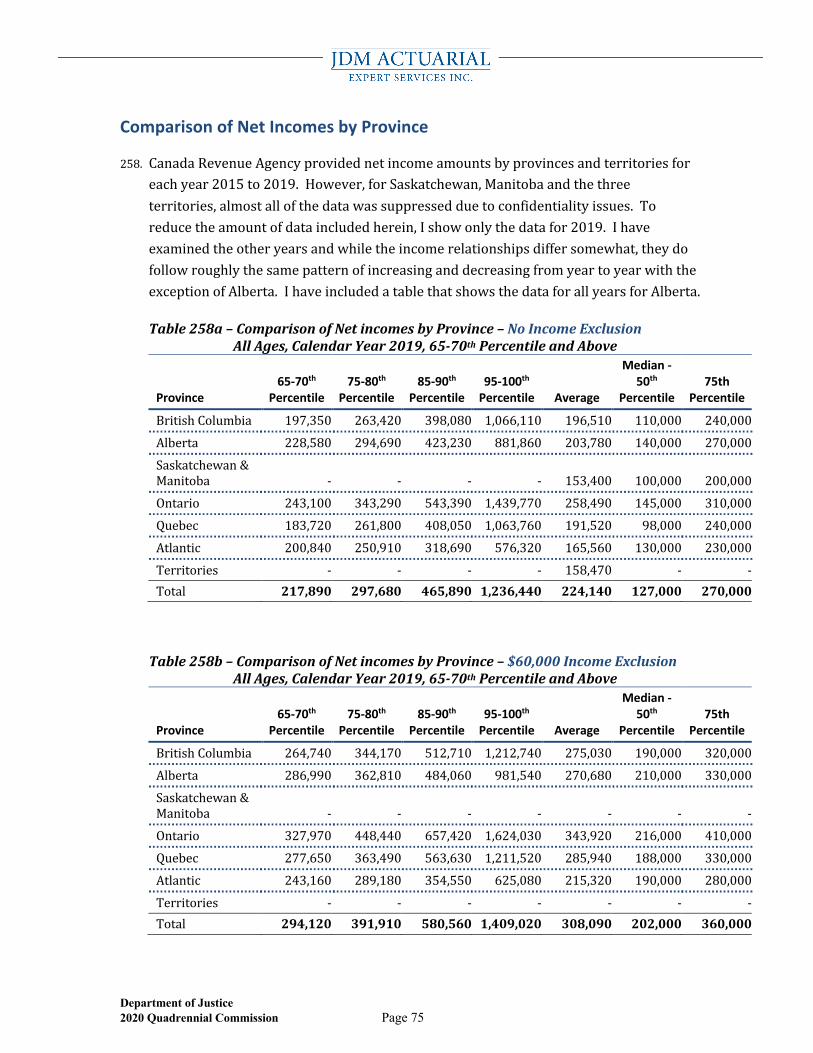
Department of Justice 2020 Quadrennial Commission Page 75
Comparison of Net Incomes by Province
258. CanadaRevenueAgencyprovidednetincomeamountsbyprovincesandterritoriesforeachyear2015to2019.However,forSaskatchewan,Manitobaandthethreeterritories,almostallofthedatawassuppressedduetoconfidentialityissues.Toreducetheamountofdataincludedherein,Ishowonlythedatafor2019.Ihaveexaminedtheotheryearsandwhiletheincomerelationshipsdiffersomewhat,theydofollowroughlythesamepatternofincreasinganddecreasingfromyeartoyearwiththeexceptionofAlberta.IhaveincludedatablethatshowsthedataforallyearsforAlberta.
Table258a–ComparisonofNetincomesbyProvince–NoIncomeExclusion AllAges,CalendarYear2019,65-70thPercentileandAbove
Province 65-70th
Percentile 75-80th
Percentile 85-90th
Percentile 95-100th
Percentile Average
Median - 50th
Percentile 75th
Percentile
BritishColumbia 197,350 263,420 398,080 1,066,110 196,510 110,000 240,000Alberta 228,580 294,690 423,230 881,860 203,780 140,000 270,000Saskatchewan&Manitoba - - - - 153,400 100,000 200,000Ontario 243,100 343,290 543,390 1,439,770 258,490 145,000 310,000Quebec 183,720 261,800 408,050 1,063,760 191,520 98,000 240,000Atlantic 200,840 250,910 318,690 576,320 165,560 130,000 230,000Territories - - - - 158,470 - -Total 217,890 297,680 465,890 1,236,440 224,140 127,000 270,000
Table258b–ComparisonofNetincomesbyProvince–$60,000IncomeExclusion AllAges,CalendarYear2019,65-70thPercentileandAbove
Province 65-70th
Percentile 75-80th
Percentile 85-90th
Percentile 95-100th
Percentile Average
Median - 50th
Percentile 75th
Percentile
BritishColumbia 264,740 344,170 512,710 1,212,740 275,030 190,000 320,000Alberta 286,990 362,810 484,060 981,540 270,680 210,000 330,000Saskatchewan&Manitoba - - - - - - -Ontario 327,970 448,440 657,420 1,624,030 343,920 216,000 410,000Quebec 277,650 363,490 563,630 1,211,520 285,940 188,000 330,000Atlantic 243,160 289,180 354,550 625,080 215,320 190,000 280,000Territories - - - - - - -Total 294,120 391,910 580,560 1,409,020 308,090 202,000 360,000
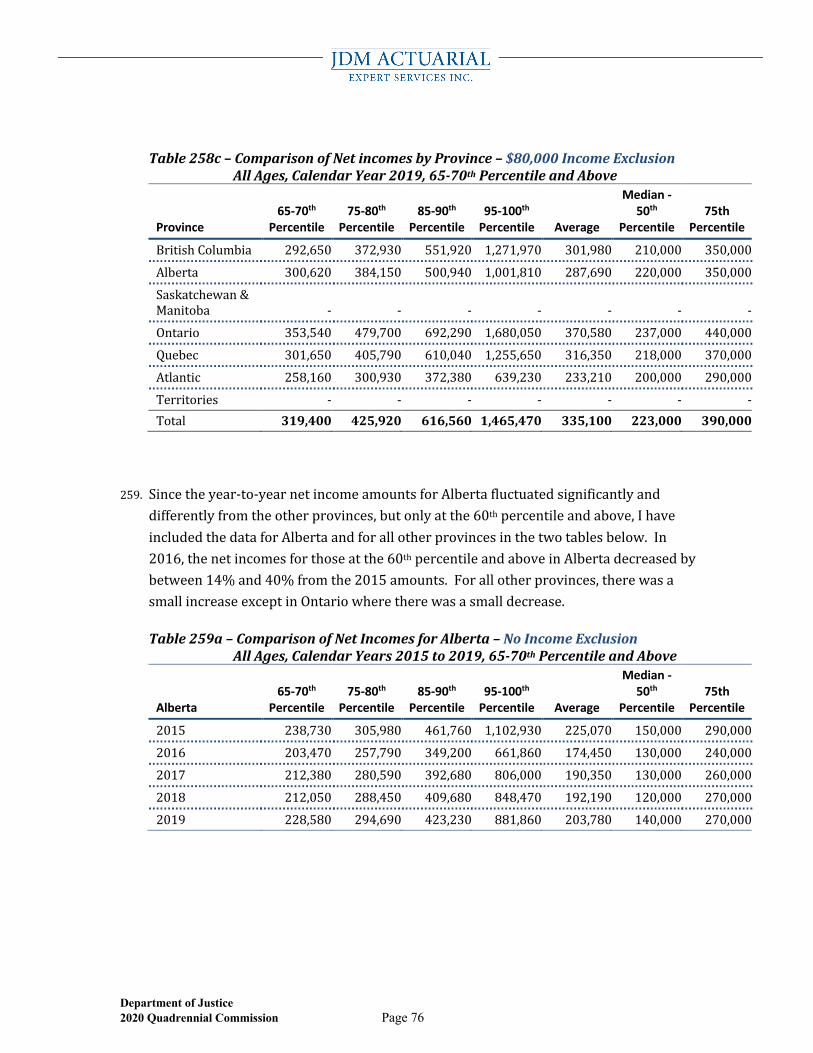
Department of Justice 2020 Quadrennial Commission Page 76
Table258c–ComparisonofNetincomesbyProvince–$80,000IncomeExclusion AllAges,CalendarYear2019,65-70thPercentileandAbove
Province 65-70th
Percentile 75-80th
Percentile 85-90th
Percentile 95-100th
Percentile Average
Median - 50th
Percentile 75th
Percentile
BritishColumbia 292,650 372,930 551,920 1,271,970 301,980 210,000 350,000Alberta 300,620 384,150 500,940 1,001,810 287,690 220,000 350,000Saskatchewan&Manitoba - - - - - - -Ontario 353,540 479,700 692,290 1,680,050 370,580 237,000 440,000Quebec 301,650 405,790 610,040 1,255,650 316,350 218,000 370,000Atlantic 258,160 300,930 372,380 639,230 233,210 200,000 290,000Territories - - - - - - -Total 319,400 425,920 616,560 1,465,470 335,100 223,000 390,000
259. Sincetheyear-to-yearnetincomeamountsforAlbertafluctuatedsignificantlyanddifferentlyfromtheotherprovinces,butonlyatthe60thpercentileandabove,IhaveincludedthedataforAlbertaandforallotherprovincesinthetwotablesbelow.In2016,thenetincomesforthoseatthe60thpercentileandaboveinAlbertadecreasedbybetween14%and40%fromthe2015amounts.Forallotherprovinces,therewasasmallincreaseexceptinOntariowheretherewasasmalldecrease.
Table259a–ComparisonofNetIncomesforAlberta–NoIncomeExclusion AllAges,CalendarYears2015to2019,65-70thPercentileandAbove
Alberta 65-70th
Percentile 75-80th
Percentile 85-90th
Percentile 95-100th
Percentile Average
Median - 50th
Percentile 75th
Percentile
2015 238,730 305,980 461,760 1,102,930 225,070 150,000 290,0002016 203,470 257,790 349,200 661,860 174,450 130,000 240,0002017 212,380 280,590 392,680 806,000 190,350 130,000 260,0002018 212,050 288,450 409,680 848,470 192,190 120,000 270,0002019 228,580 294,690 423,230 881,860 203,780 140,000 270,000
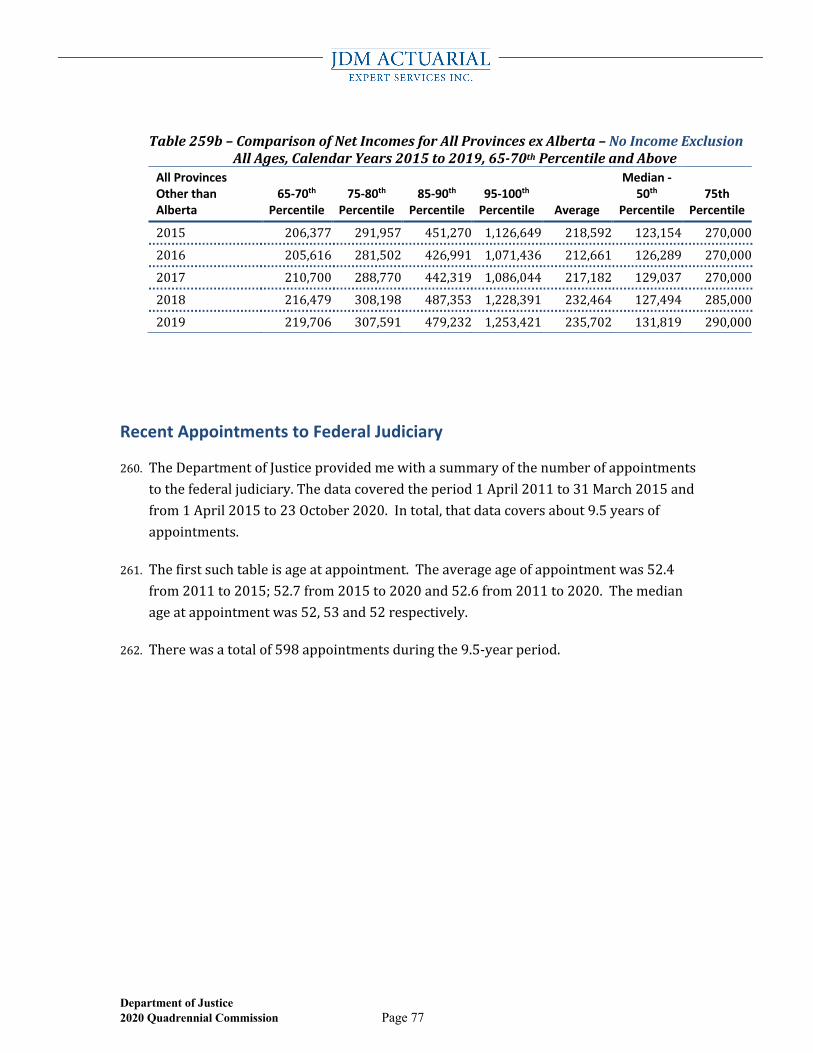
Department of Justice 2020 Quadrennial Commission Page 77
Table259b–ComparisonofNetIncomesforAllProvincesexAlberta–NoIncomeExclusion AllAges,CalendarYears2015to2019,65-70thPercentileandAbove
All Provinces Other than Alberta
65-70th Percentile
75-80th Percentile
85-90th Percentile
95-100th Percentile Average
Median - 50th
Percentile 75th
Percentile
2015 206,377 291,957 451,270 1,126,649 218,592 123,154 270,0002016 205,616 281,502 426,991 1,071,436 212,661 126,289 270,0002017 210,700 288,770 442,319 1,086,044 217,182 129,037 270,0002018 216,479 308,198 487,353 1,228,391 232,464 127,494 285,0002019 219,706 307,591 479,232 1,253,421 235,702 131,819 290,000
Recent Appointments to Federal Judiciary
260. TheDepartmentofJusticeprovidedmewithasummaryofthenumberofappointmentstothefederaljudiciary.Thedatacoveredtheperiod1April2011to31March2015andfrom1April2015to23October2020.Intotal,thatdatacoversabout9.5yearsofappointments.
261. Thefirstsuchtableisageatappointment.Theaverageageofappointmentwas52.4from2011to2015;52.7from2015to2020and52.6from2011to2020.Themedianageatappointmentwas52,53and52respectively.
262. Therewasatotalof598appointmentsduringthe9.5-yearperiod.
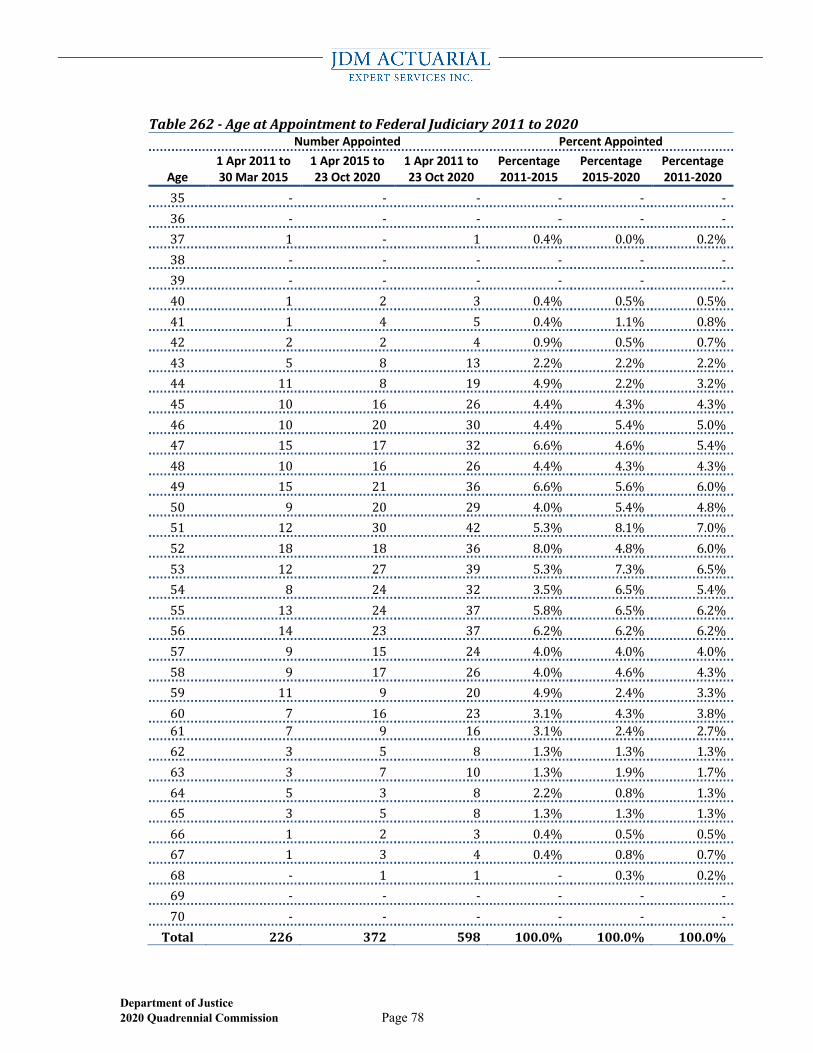
Department of Justice 2020 Quadrennial Commission Page 78
Table262-AgeatAppointmenttoFederalJudiciary2011to2020 Number Appointed Percent Appointed
Age 1 Apr 2011 to 30 Mar 2015
1 Apr 2015 to 23 Oct 2020
1 Apr 2011 to 23 Oct 2020
Percentage 2011-2015
Percentage 2015-2020
Percentage 2011-2020
35 - - - - - -36 - - - - - -37 1 - 1 0.4% 0.0% 0.2%38 - - - - - -39 - - - - - -40 1 2 3 0.4% 0.5% 0.5%41 1 4 5 0.4% 1.1% 0.8%42 2 2 4 0.9% 0.5% 0.7%43 5 8 13 2.2% 2.2% 2.2%44 11 8 19 4.9% 2.2% 3.2%45 10 16 26 4.4% 4.3% 4.3%46 10 20 30 4.4% 5.4% 5.0%47 15 17 32 6.6% 4.6% 5.4%48 10 16 26 4.4% 4.3% 4.3%49 15 21 36 6.6% 5.6% 6.0%50 9 20 29 4.0% 5.4% 4.8%51 12 30 42 5.3% 8.1% 7.0%52 18 18 36 8.0% 4.8% 6.0%53 12 27 39 5.3% 7.3% 6.5%54 8 24 32 3.5% 6.5% 5.4%55 13 24 37 5.8% 6.5% 6.2%56 14 23 37 6.2% 6.2% 6.2%57 9 15 24 4.0% 4.0% 4.0%58 9 17 26 4.0% 4.6% 4.3%59 11 9 20 4.9% 2.4% 3.3%60 7 16 23 3.1% 4.3% 3.8%61 7 9 16 3.1% 2.4% 2.7%62 3 5 8 1.3% 1.3% 1.3%63 3 7 10 1.3% 1.9% 1.7%64 5 3 8 2.2% 0.8% 1.3%65 3 5 8 1.3% 1.3% 1.3%66 1 2 3 0.4% 0.5% 0.5%67 1 3 4 0.4% 0.8% 0.7%68 - 1 1 - 0.3% 0.2%69 - - - - - -70 - - - - - -Total 226 372 598 100.0% 100.0% 100.0%
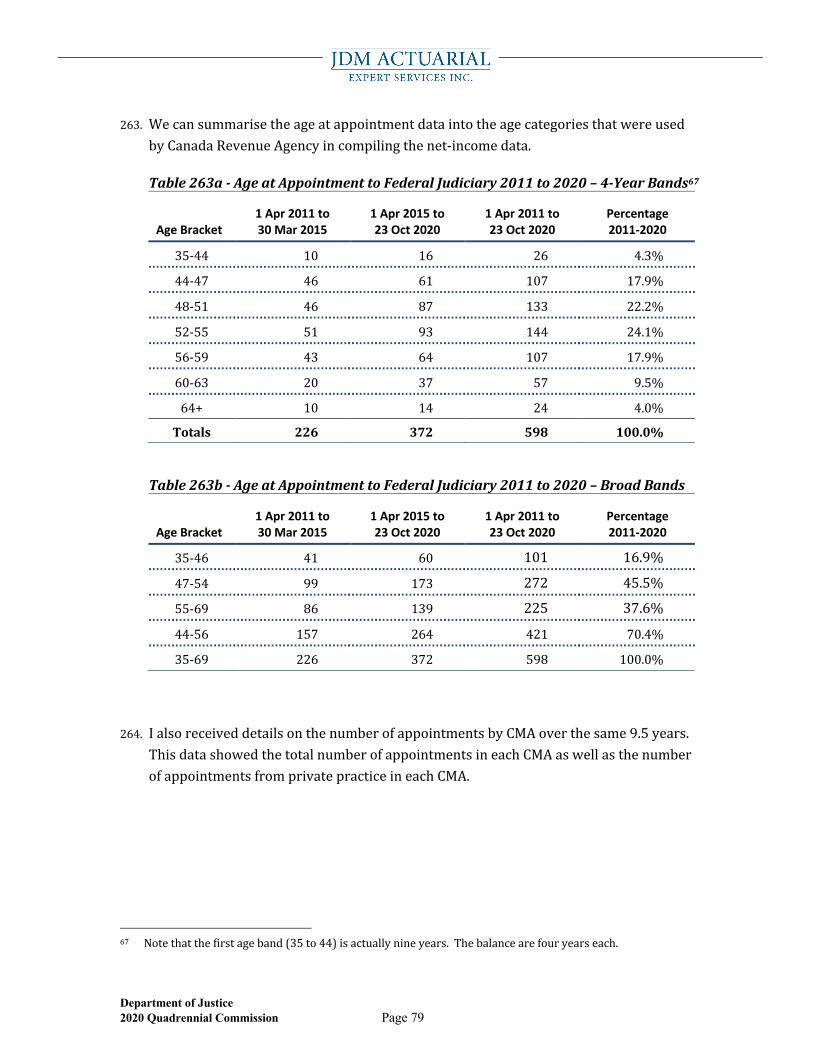
Department of Justice 2020 Quadrennial Commission Page 79
263. WecansummarisetheageatappointmentdataintotheagecategoriesthatwereusedbyCanadaRevenueAgencyincompilingthenet-incomedata.
Table263a-AgeatAppointmenttoFederalJudiciary2011to2020–4-YearBands67
Age Bracket 1 Apr 2011 to 30 Mar 2015
1 Apr 2015 to 23 Oct 2020
1 Apr 2011 to 23 Oct 2020
Percentage 2011-2020
35-44 10 16 26 4.3%
44-47 46 61 107 17.9%
48-51 46 87 133 22.2%
52-55 51 93 144 24.1%
56-59 43 64 107 17.9%
60-63 20 37 57 9.5%
64+ 10 14 24 4.0%
Totals 226 372 598 100.0%
Table263b-AgeatAppointmenttoFederalJudiciary2011to2020–BroadBands
Age Bracket 1 Apr 2011 to 30 Mar 2015
1 Apr 2015 to 23 Oct 2020
1 Apr 2011 to 23 Oct 2020
Percentage 2011-2020
35-46 41 60 101 16.9%
47-54 99 173 272 45.5%
55-69 86 139 225 37.6%
44-56 157 264 421 70.4%
35-69 226 372 598 100.0%
264. IalsoreceiveddetailsonthenumberofappointmentsbyCMAoverthesame9.5years.ThisdatashowedthetotalnumberofappointmentsineachCMAaswellasthenumberofappointmentsfromprivatepracticeineachCMA.
67 Notethatthefirstageband(35to44)isactuallynineyears.Thebalancearefouryearseach.
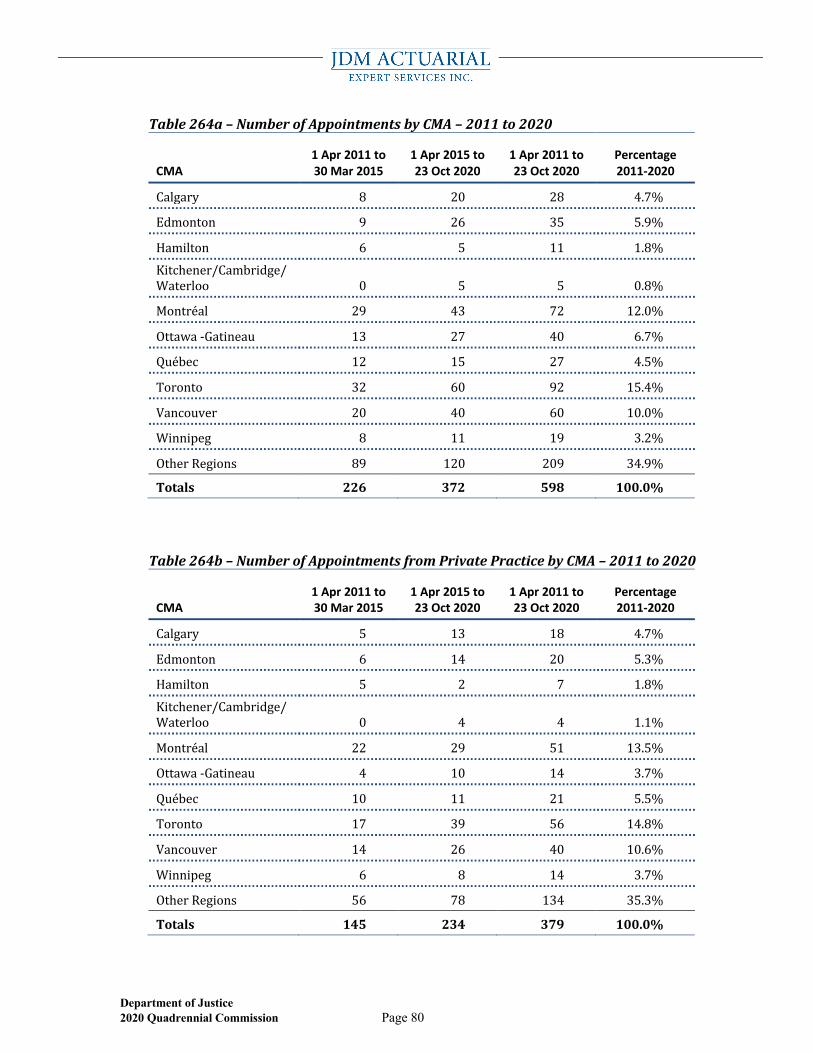
Department of Justice 2020 Quadrennial Commission Page 80
Table264a–NumberofAppointmentsbyCMA–2011to2020
CMA 1 Apr 2011 to 30 Mar 2015
1 Apr 2015 to 23 Oct 2020
1 Apr 2011 to 23 Oct 2020
Percentage 2011-2020
Calgary 8 20 28 4.7%
Edmonton 9 26 35 5.9%
Hamilton 6 5 11 1.8%Kitchener/Cambridge/Waterloo 0 5 5 0.8%
Montréal 29 43 72 12.0%
Ottawa-Gatineau 13 27 40 6.7%
Québec 12 15 27 4.5%
Toronto 32 60 92 15.4%
Vancouver 20 40 60 10.0%
Winnipeg 8 11 19 3.2%
OtherRegions 89 120 209 34.9%
Totals 226 372 598 100.0%
Table264b–NumberofAppointmentsfromPrivatePracticebyCMA–2011to2020
CMA 1 Apr 2011 to 30 Mar 2015
1 Apr 2015 to 23 Oct 2020
1 Apr 2011 to 23 Oct 2020
Percentage 2011-2020
Calgary 5 13 18 4.7%
Edmonton 6 14 20 5.3%
Hamilton 5 2 7 1.8%Kitchener/Cambridge/Waterloo 0 4 4 1.1%
Montréal 22 29 51 13.5%
Ottawa-Gatineau 4 10 14 3.7%
Québec 10 11 21 5.5%
Toronto 17 39 56 14.8%
Vancouver 14 26 40 10.6%
Winnipeg 6 8 14 3.7%
OtherRegions 56 78 134 35.3%
Totals 145 234 379 100.0%
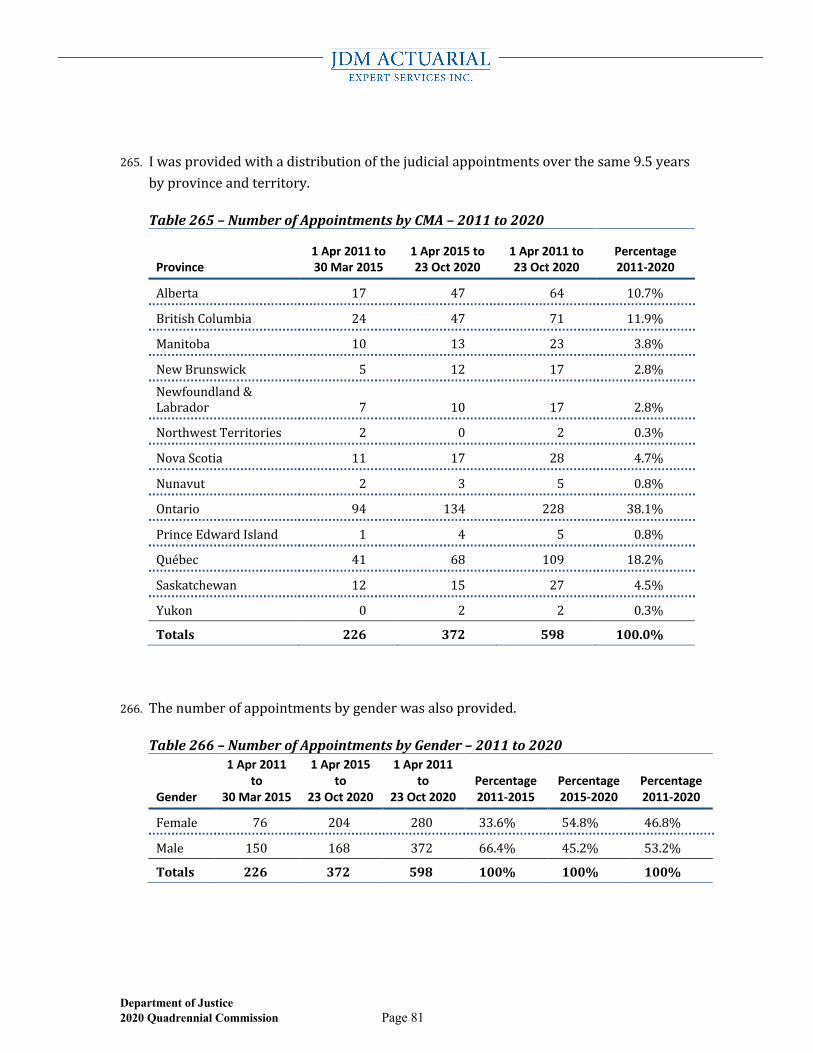
Department of Justice 2020 Quadrennial Commission Page 81
265. Iwasprovidedwithadistributionofthejudicialappointmentsoverthesame9.5yearsbyprovinceandterritory.
Table265–NumberofAppointmentsbyCMA–2011to2020
Province 1 Apr 2011 to 30 Mar 2015
1 Apr 2015 to 23 Oct 2020
1 Apr 2011 to 23 Oct 2020
Percentage 2011-2020
Alberta 17 47 64 10.7%
BritishColumbia 24 47 71 11.9%
Manitoba 10 13 23 3.8%
NewBrunswick 5 12 17 2.8%Newfoundland&Labrador 7 10 17 2.8%
NorthwestTerritories 2 0 2 0.3%
NovaScotia 11 17 28 4.7%
Nunavut 2 3 5 0.8%
Ontario 94 134 228 38.1%
PrinceEdwardIsland 1 4 5 0.8%
Québec 41 68 109 18.2%
Saskatchewan 12 15 27 4.5%
Yukon 0 2 2 0.3%
Totals 226 372 598 100.0%
266. Thenumberofappointmentsbygenderwasalsoprovided.
Table266–NumberofAppointmentsbyGender–2011to2020
Gender
1 Apr 2011 to
30 Mar 2015
1 Apr 2015 to
23 Oct 2020
1 Apr 2011 to
23 Oct 2020 Percentage 2011-2015
Percentage 2015-2020
Percentage 2011-2020
Female 76 204 280 33.6% 54.8% 46.8%
Male 150 168 372 66.4% 45.2% 53.2%
Totals 226 372 598 100% 100% 100%
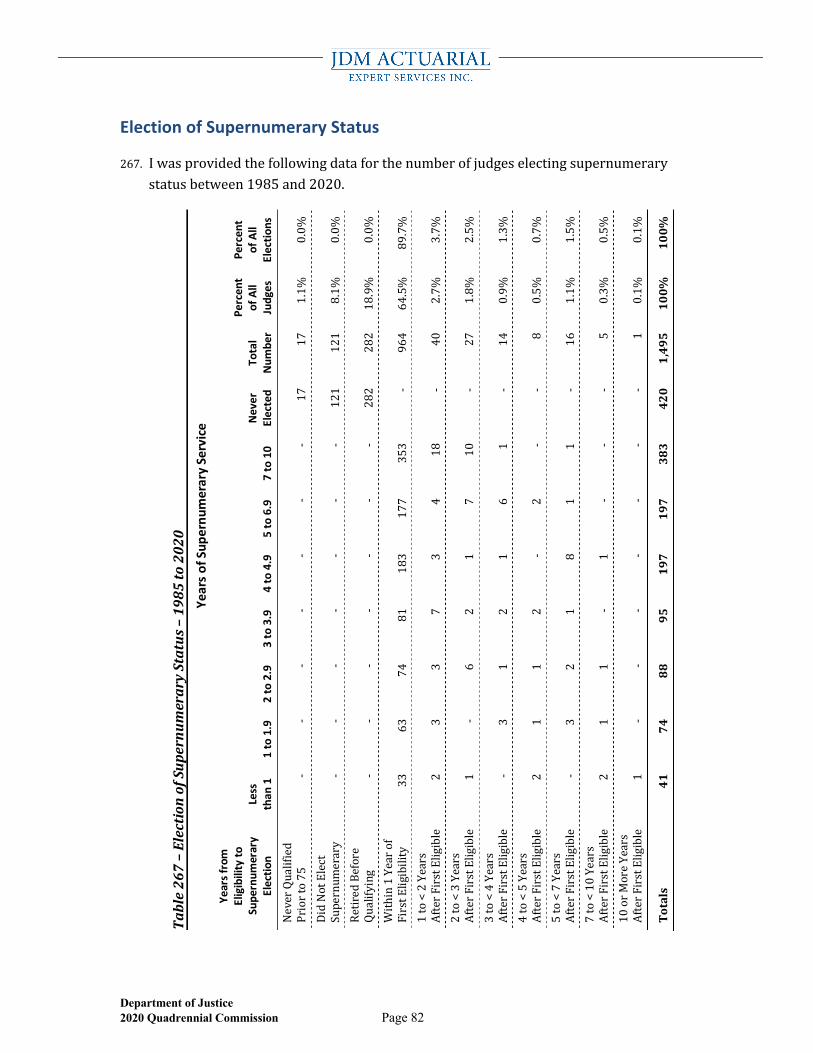
Department of Justice 2020 Quadrennial Commission Page 82
Election of Supernumerary Status
267. Iwasprovidedthefollowingdataforthenumberofjudgeselectingsupernumerarystatusbetween1985and2020.
Table267–ElectionofSupernumeraryStatus–1985to2020
Ye
ars
of S
uper
num
erar
y Se
rvic
e Ye
ars f
rom
El
igib
ility
to
Supe
rnum
erar
y El
ectio
n Le
ss
than
1
1 to
1.9
2
to 2
.9
3 to
3.9
4
to 4
.9
5 to
6.9
7
to 1
0 N
ever
El
ecte
d To
tal
Num
ber
Perc
ent
of A
ll Ju
dges
Perc
ent
of A
ll El
ectio
ns
NeverQualified
Priorto75
--
--
--
-17
17
1.1%
0.0%
DidNotElect
Supernum
erary
--
--
--
-121
121
8.1%
0.0%
RetiredBefore
Qualifying
--
--
--
-282
282
18.9%
0.0%
Within1Yearof
FirstEligibility
33
63
74
81
183
177
353
-964
64.5%
89.7%
1to<2Years
AfterFirstEligible
2
3
3
7
3
4
18
-40
2.7%
3.7%
2to<3Years
AfterFirstEligible
1
-6
2
1
7
10
-27
1.8%
2.5%
3to<4Years
AfterFirstEligible
-3
1
2
1
6
1
-14
0.9%
1.3%
4to<5Years
AfterFirstEligible
2
1
1
2
-2
--
8
0.5%
0.7%
5to<7Years
AfterFirstEligible
-3
2
1
8
1
1
-16
1.1%
1.5%
7to<10Years
AfterFirstEligible
2
1
1
-1
--
-5
0.3%
0.5%
10orM
oreYears
AfterFirstEligible
1
--
--
--
-1
0.1%
0.1%
Totals
41
74
88
95
197
197
383
420
1,495
100%
100%
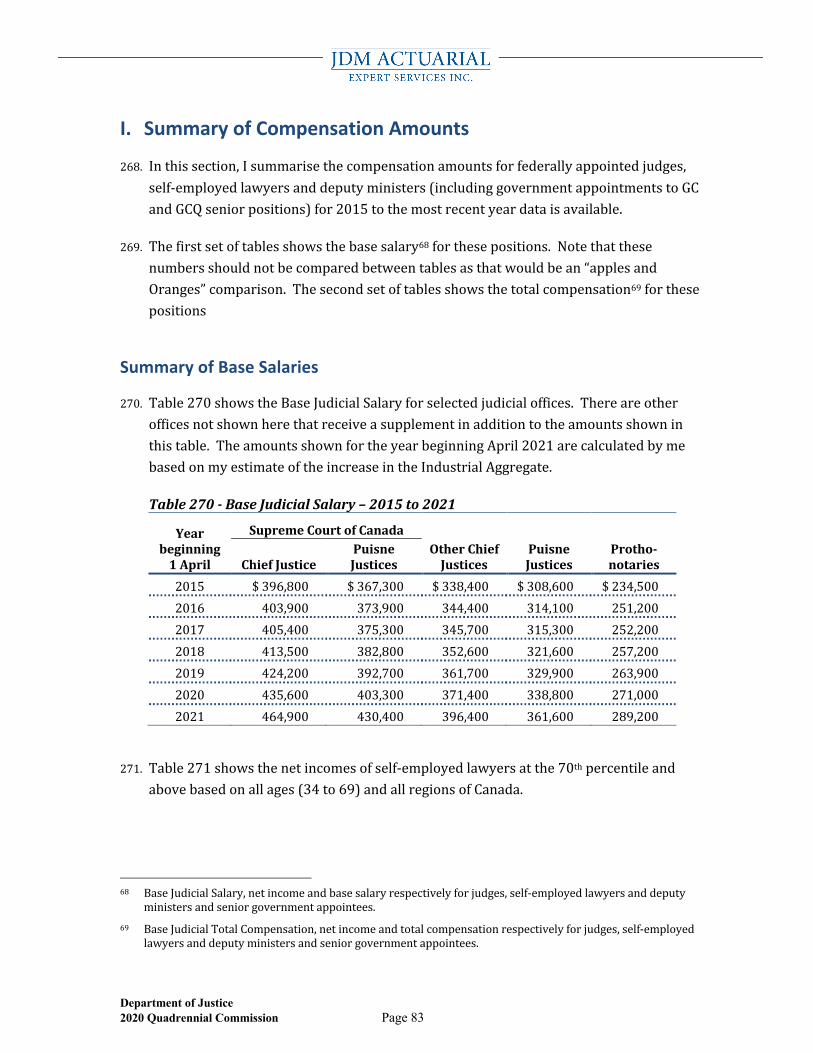
Department of Justice 2020 Quadrennial Commission Page 83
I. Summary of Compensation Amounts
268. Inthissection,Isummarisethecompensationamountsforfederallyappointedjudges,self-employedlawyersanddeputyministers(includinggovernmentappointmentstoGCandGCQseniorpositions)for2015tothemostrecentyeardataisavailable.
269. Thefirstsetoftablesshowsthebasesalary68forthesepositions.Notethatthesenumbersshouldnotbecomparedbetweentablesasthatwouldbean“applesandOranges”comparison.Thesecondsetoftablesshowsthetotalcompensation69forthesepositions
Summary of Base Salaries
270. Table270showstheBaseJudicialSalaryforselectedjudicialoffices.Thereareotherofficesnotshownherethatreceiveasupplementinadditiontotheamountsshowninthistable.TheamountsshownfortheyearbeginningApril2021arecalculatedbymebasedonmyestimateoftheincreaseintheIndustrialAggregate.
Table270-BaseJudicialSalary–2015to2021
Yearbeginning1April
SupremeCourtofCanada
ChiefJusticePuisneJustices
OtherChiefJustices
PuisneJustices
Protho-notaries
2015 $396,800 $367,300 $338,400 $308,600 $234,5002016 403,900 373,900 344,400 314,100 251,2002017 405,400 375,300 345,700 315,300 252,2002018 413,500 382,800 352,600 321,600 257,2002019 424,200 392,700 361,700 329,900 263,9002020 435,600 403,300 371,400 338,800 271,0002021 464,900 430,400 396,400 361,600 289,200
271. Table271showsthenetincomesofself-employedlawyersatthe70thpercentileandabovebasedonallages(34to69)andallregionsofCanada.
68 BaseJudicialSalary,netincomeandbasesalaryrespectivelyforjudges,self-employedlawyersanddeputy
ministersandseniorgovernmentappointees.69 BaseJudicialTotalCompensation,netincomeandtotalcompensationrespectivelyforjudges,self-employed
lawyersanddeputyministersandseniorgovernmentappointees.
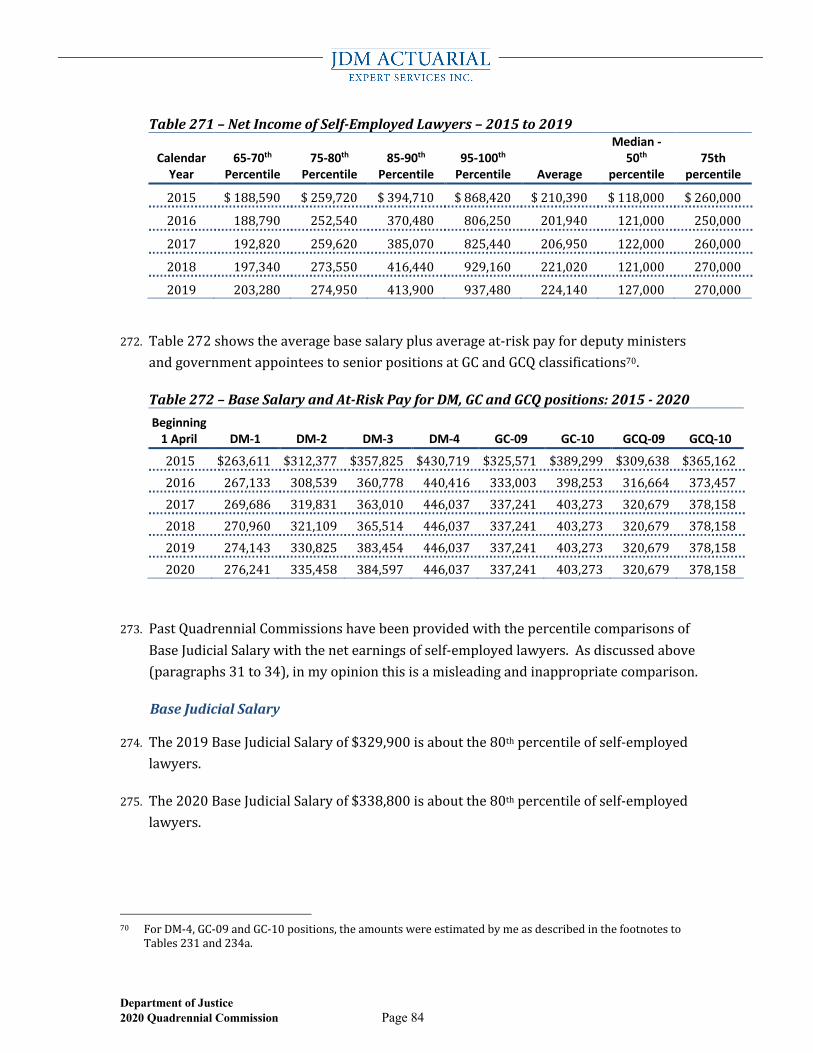
Department of Justice 2020 Quadrennial Commission Page 84
Table271–NetIncomeofSelf-EmployedLawyers–2015to2019
Calendar Year
65-70th Percentile
75-80th Percentile
85-90th Percentile
95-100th Percentile Average
Median - 50th
percentile 75th
percentile
2015 $188,590 $259,720 $394,710 $868,420 $210,390 $118,000 $260,000
2016 188,790 252,540 370,480 806,250 201,940 121,000 250,000
2017 192,820 259,620 385,070 825,440 206,950 122,000 260,000
2018 197,340 273,550 416,440 929,160 221,020 121,000 270,000
2019 203,280 274,950 413,900 937,480 224,140 127,000 270,000
272. Table272showstheaveragebasesalaryplusaverageat-riskpayfordeputyministersandgovernmentappointeestoseniorpositionsatGCandGCQclassifications70.
Table272–BaseSalaryandAt-RiskPayforDM,GCandGCQpositions:2015-2020Beginning
1 April DM-1 DM-2 DM-3 DM-4 GC-09 GC-10 GCQ-09 GCQ-10
2015 $263,611 $312,377 $357,825 $430,719 $325,571 $389,299 $309,638 $365,1622016 267,133 308,539 360,778 440,416 333,003 398,253 316,664 373,4572017 269,686 319,831 363,010 446,037 337,241 403,273 320,679 378,1582018 270,960 321,109 365,514 446,037 337,241 403,273 320,679 378,1582019 274,143 330,825 383,454 446,037 337,241 403,273 320,679 378,1582020 276,241 335,458 384,597 446,037 337,241 403,273 320,679 378,158
273. PastQuadrennialCommissionshavebeenprovidedwiththepercentilecomparisonsofBaseJudicialSalarywiththenetearningsofself-employedlawyers.Asdiscussedabove(paragraphs31to34),inmyopinionthisisamisleadingandinappropriatecomparison.
BaseJudicialSalary
274. The2019BaseJudicialSalaryof$329,900isaboutthe80thpercentileofself-employedlawyers.
275. The2020BaseJudicialSalaryof$338,800isaboutthe80thpercentileofself-employedlawyers.
70 ForDM-4,GC-09andGC-10positions,theamountswereestimatedbymeasdescribedinthefootnotesto
Tables231and234a.
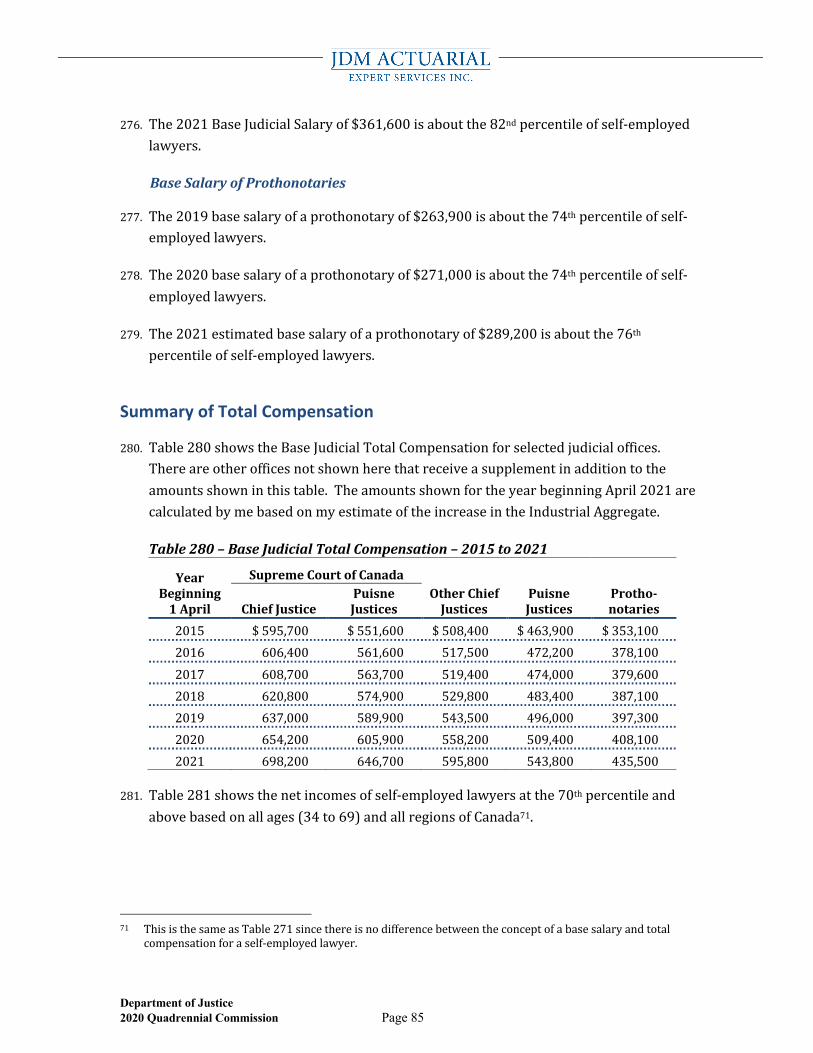
Department of Justice 2020 Quadrennial Commission Page 85
276. The2021BaseJudicialSalaryof$361,600isaboutthe82ndpercentileofself-employedlawyers.
BaseSalaryofProthonotaries
277. The2019basesalaryofaprothonotaryof$263,900isaboutthe74thpercentileofself-employedlawyers.
278. The2020basesalaryofaprothonotaryof$271,000isaboutthe74thpercentileofself-employedlawyers.
279. The2021estimatedbasesalaryofaprothonotaryof$289,200isaboutthe76thpercentileofself-employedlawyers.
Summary of Total Compensation
280. Table280showstheBaseJudicialTotalCompensationforselectedjudicialoffices.Thereareotherofficesnotshownherethatreceiveasupplementinadditiontotheamountsshowninthistable.TheamountsshownfortheyearbeginningApril2021arecalculatedbymebasedonmyestimateoftheincreaseintheIndustrialAggregate.
Table280–BaseJudicialTotalCompensation–2015to2021
YearBeginning1April
SupremeCourtofCanada
ChiefJusticePuisneJustices
OtherChiefJustices
PuisneJustices
Protho-notaries
2015 $595,700 $551,600 $508,400 $463,900 $353,1002016 606,400 561,600 517,500 472,200 378,1002017 608,700 563,700 519,400 474,000 379,6002018 620,800 574,900 529,800 483,400 387,1002019 637,000 589,900 543,500 496,000 397,3002020 654,200 605,900 558,200 509,400 408,1002021 698,200 646,700 595,800 543,800 435,500
281. Table281showsthenetincomesofself-employedlawyersatthe70thpercentileandabovebasedonallages(34to69)andallregionsofCanada71.
71 ThisisthesameasTable271sincethereisnodifferencebetweentheconceptofabasesalaryandtotal
compensationforaself-employedlawyer.
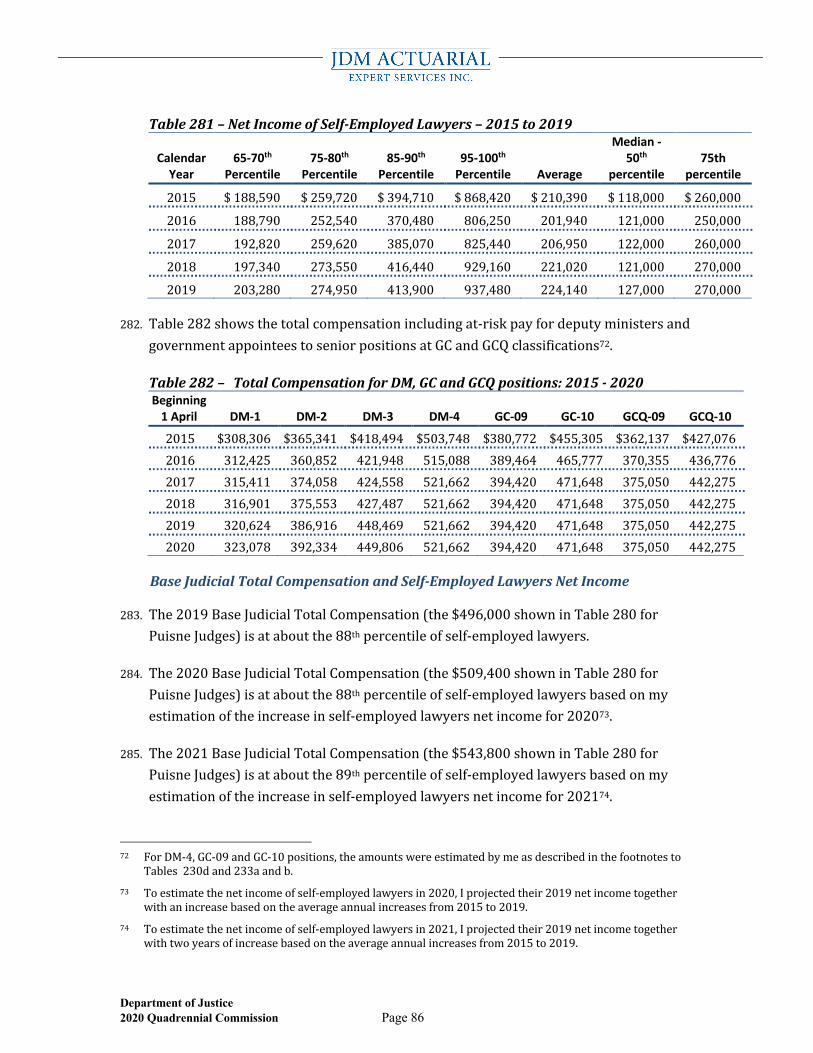
Department of Justice 2020 Quadrennial Commission Page 86
Table281–NetIncomeofSelf-EmployedLawyers–2015to2019
Calendar Year
65-70th Percentile
75-80th Percentile
85-90th Percentile
95-100th Percentile Average
Median - 50th
percentile 75th
percentile
2015 $188,590 $259,720 $394,710 $868,420 $210,390 $118,000 $260,000
2016 188,790 252,540 370,480 806,250 201,940 121,000 250,000
2017 192,820 259,620 385,070 825,440 206,950 122,000 260,000
2018 197,340 273,550 416,440 929,160 221,020 121,000 270,000
2019 203,280 274,950 413,900 937,480 224,140 127,000 270,000
282. Table282showsthetotalcompensationincludingat-riskpayfordeputyministersandgovernmentappointeestoseniorpositionsatGCandGCQclassifications72.
Table282– TotalCompensationforDM,GCandGCQpositions:2015-2020Beginning
1 April DM-1 DM-2 DM-3 DM-4 GC-09 GC-10 GCQ-09 GCQ-10
2015 $308,306 $365,341 $418,494 $503,748 $380,772 $455,305 $362,137 $427,0762016 312,425 360,852 421,948 515,088 389,464 465,777 370,355 436,7762017 315,411 374,058 424,558 521,662 394,420 471,648 375,050 442,2752018 316,901 375,553 427,487 521,662 394,420 471,648 375,050 442,2752019 320,624 386,916 448,469 521,662 394,420 471,648 375,050 442,2752020 323,078 392,334 449,806 521,662 394,420 471,648 375,050 442,275
BaseJudicialTotalCompensationandSelf-EmployedLawyersNetIncome
283. The2019BaseJudicialTotalCompensation(the$496,000showninTable280forPuisneJudges)isataboutthe88thpercentileofself-employedlawyers.
284. The2020BaseJudicialTotalCompensation(the$509,400showninTable280forPuisneJudges)isataboutthe88thpercentileofself-employedlawyersbasedonmyestimationoftheincreaseinself-employedlawyersnetincomefor202073.
285. The2021BaseJudicialTotalCompensation(the$543,800showninTable280forPuisneJudges)isataboutthe89thpercentileofself-employedlawyersbasedonmyestimationoftheincreaseinself-employedlawyersnetincomefor202174.
72 ForDM-4,GC-09andGC-10positions,theamountswereestimatedbymeasdescribedinthefootnotesto
Tables230dand233aandb.73 Toestimatethenetincomeofself-employedlawyersin2020,Iprojectedtheir2019netincometogether
withanincreasebasedontheaverageannualincreasesfrom2015to2019.74 Toestimatethenetincomeofself-employedlawyersin2021,Iprojectedtheir2019netincometogether
withtwoyearsofincreasebasedontheaverageannualincreasesfrom2015to2019.
Department of Justice 2020 Quadrennial Commission Page 87
TotalCompensationofProthonotaries
286. The2019basesalaryofaprothonotarywas$263,900,beginningApril2020itis$271,000andIestimatebeginningApril2021itwillbe$289,200(80%oftheBaseJudicialSalary).
287. Usingthesameadjustmentstoobtaintotalcompensationasusedforpuisnejudges75,Ideterminedthetotalcompensationofaprothonotary.
288. The2019averagetotalcompensationofaprothonotaryis$397,300(Table280).Thatisaboutthe84thpercentileforallself-employedlawyersinCanada.
289. The2020averagetotalcompensationofaprothonotaryis$408,100(Table280).Thatisaboutthe84thpercentileforallself-employedlawyersinCanada.
290. The2021averagetotalcompensationofaprothonotaryisestimatedtobe$435,500.(Table280).Thatisaboutthe86thpercentileforallself-employedlawyersinCanada.
75 Takethebasesalary,addthevalueoftheJudicialAnnuity(basedontheaveragevalueof49.51%)andadd
thevalueofthegovernmentpayinghalfoftheCanadaPensionplancontribution.Thisimplicitlyassumesthatprothonotarieshaveasimilarageprofileatappointmentasdothefederallyappointedjudges.
Department of Justice 2020 Quadrennial Commission Page 88
J. Certification
291. Iherebycertifythat:
a. inmyopinion,thedatausedissufficientandreliableforthepurposesofthereport;
b. inmyopinion,theactuarialmethodsemployedareappropriateforthepurposesofthisreport;
c. inmyopinion,theassumptionsusedare,inaggregate,appropriateforthepurposesofthework;
d. thecalculationswerepreparedinaccordancewiththeCanadianInstituteofActuariesStandardsofPractice;
e. therearenosubsequenteventsotherthanthosediscussedinthisreportthatIamawareofthatwouldhaveanimpactontheresultspresentedherein;and
f. thisreporthasbeenpreparedandmyopinionsgiveninaccordancewithacceptedactuarialpracticeinCanada.
JDMACTUARIALEXPERTSERVICESINC.
_____________________________ _________________________ PeterGorham DateFellow,CanadianInstituteofActuariesFellow,SocietyofActuaries
26 March 2021
Department of Justice 2020 Quadrennial Commission Page 89
Appendix 1 Curriculum Vitae of Peter Gorham, F.S.A, F.C.I.A.
Position&Responsibilities
PeteristhePresidentandActuaryofJDMActuarialExpertServicesInc.(JDMActuarial).Heprovidespensionandactuarialconsultingadvice,experttestimony,retirementplanningandgovernanceservices.
AreasofSpecialization
Peterhasprovidedexpertadviceandtestimonytothelegalprofessionsince1987.Hisexperienceincludesdetermining:
• certificationofcriminalratesofinterest,• lostbenefitsforwrongfuldismissal,• thepresentvalueoffutureincomeandfuturecarecosts,• valuationoflifeestates,• presentvalueoffuturetrustplanbenefitsandpresentvalueofpastfunds
undervariouspossibleinvestmentscenarios,• presentvalueoffuturecontingentevents.
Inthepast,Peterhasalsoprovidedexpertevidencefor:
• familylawpensionvaluations.
HehasprovidedexperttestimonytotheSupremeCourtofBritishColumbia,CourtofQueen’sBenchofAlberta,CourtofQueen’sBenchofManitoba,theOntarioSuperiorCourtofJustice,LaCourSupérieureduQuébec,theOntarioUnifiedFamilyCourt,theHighCourtofJusticeofTrinidadandTobago,theSupremeCourtofBermuda,OntarioEmploymentStandardsTribunal,OntarioWorkplaceSafetyandInsuranceTribunal,CanadaHumanRightsTribunalandtheCanadianInstituteofActuariesDisciplinaryTribunal.
Withinthepensionandactuarialconsultingpractice,Peter’smainareasofexpertiseincludethedesign,financing,administrationandgovernanceofpensionandbenefitplans.Hisstrengthslieinprovidinginnovativeandworkablesolutionsthataddressaclient’sneeds.Heiseffectiveincommunicatingactuarialconceptsinsimpleandunderstandableterms.
Peterisanexperiencedpublicspeakerandanauthorofnumerousarticlesrelatedtopensionsandbenefits.
Background Peterisanactuary,receivinghisfellowshipin1980.HeattendedtheUniversityofToronto,graduatingwithaB.Sc.inActuarialandComputerSciences.PriortofoundingJDMActuarialin2011,Peterspent13yearsasapartneratMorneauShepell,andpriortothat,20yearswithAonConsulting,(formerlyMLH+Ainc),servingclientsintheareaofpensionandemployeebenefits.
Professional&OtherAffiliations
FellowoftheCanadianInstituteofActuariesFellowoftheSocietyofActuariesFaculty,HumberCollegePPACprogramPast-President,RotaryClubofWhitbySunrise

Department of Justice 2020 Quadrennial Commission Page 90
Appendix 2 Documents Utilised
292. Thefollowingdocumentsanddatawereprovidedtomeforuseinpreparingthisreport:
a. “ReportontheEarningsofSelf-EmployedLawyersfortheDepartmentofJusticeCanadainPreparationforthe2015JudicialCompensationandBenefitsCommission”,byHaripaulPannu,25February2016
b. “ReportontheValueoftheJudicialAnnuity”prepareforNortonRoseFulbrightCanadaLLP29March2016byDeanNewell;
c. LetterfromNickLeswick,AssistantDeputyMinister,EconomicandFiscalPolicyBranch,DepartmentofFinancetoChristopherRupardated9December2020summarisingtheprevailingeconomicconditionsinCanada;
d. LetterfromFrancoisLemire,Director,OfficeoftheChiefActuary,toAnnaDekkerdated2November2020settingoutestimatesforfutureincreasesinfederallyappointedjudges’salaries;
e. LetterfromFrancoisLemire,Director,OfficeoftheChiefActuary,toAnnaDekkerdate26February2021settingoutupdatedestimatesforfutureincreasesinfederallyappointedjudges’salaries;
f. Aseriesof96exceldatafilespreparedbyCanadaRevenueAgencywithdataregardingnetincomesofself-employedlawyersinCanada;
g. Anexcelfile“2011-2020AppointmentProfileExtractforPG.xlsx”providingsummarydetails(location,typeofpractice)ofjudicialappointmentsmadefrom1April2011to23October2020;
h. Anexcelfile“AppointmentProfilesForPeterGorhamDec72020.xlsx”providingasummaryanalysis(age,location,typeofpractice)ofjudicialappointmentsmadefrom1April2011to23October2020;
i. Adocument“27-QuadComm2020-DMAverageSalaryMid-PointandCounts.doc”fromtheDepartmentofJusticesettingoutcurrentandhistoricsalarylevelsofdeputyministers;
j. Adocument“22-QuadComm2020-DMDistributionofAt-RiskPay.doc”fromtheDepartmentofJusticesettingoutcurrentandhistoricat-riskpayofdeputyministers;

Department of Justice 2020 Quadrennial Commission Page 91
k. Adocument“28-QuadComm2020-GCandGCQIncomeInformation.doc”fromtheDepartmentofJusticesettingoutcurrentandhistoricsalaryinformationandat-riskpayforthemostseniorpositionsingovernmentagencies;
l. Aspreadsheet“26-QuadComm2020-DMTenure.xlsx”settingoutthepositionsheldbyindividualsovertheircareeratdeputyministerleveltogetherwiththedatesserved.
293. Thefollowingdocumentsanddatawereobtainedbymeandwereutilisedinthepreparationofthisreport:
a. “JudgesAct”,asamendedto12April2019;
b. “GuideforCandidates”,OfficeoftheCommissionerforFederalJudicialAffairsCanada,downloadedfromtheinternet2February2021[www.fja-cmf.gc.ca/appointments-nominations/guideCandidates-eng.html]
c. ActuarialReportonthePensionPlanfortheFederallyAppointedJudgesasat31March2019;
d. ActuarialReportonthePensionPlanfortheFederallyAppointedJudgesasat31March2016;
e. SubmissionoftheGovernmentofCanadatothe2015JudicialCompensationandBenefitsCommission,29February2016;
f. SubmissionoftheCanadianSuperiorCourtsJudgesAssociationandtheCanadianJudicialCounciltothe2015JudicialCompensationandBenefitsCommission,29February2016;
g. LettertoLouiseMeagherfromHaripaulPannuandDeanNewelldated26May2016identifyingthedifferencesintheirrespectivereportsregardingthevalueoftheJudicialannuity;
h. LettertoLouiseMeagherfromHaripaulPannuandDeanNewelldated15June2016providingasupplementtotheir26May2016letter;
i. “ReportandRecommendationsSubmittedtotheMinisterofJusticeofCanada”bytheJudicialCompensationandBenefitsCommission,30June2016;
j. “ResponseofTheGovernmentofCanadatotheReportofthe2015JudicialCompensationandbenefitsCommission”,30November2016;
Department of Justice 2020 Quadrennial Commission Page 92
k. “ReportandRecommendationsSubmittedtotheMinisterofJusticeofCanadapursuanttosection26(4)oftheJudgesAct,R.S.C.1985,c.J-1”bytheJudicialCompensationandBenefitsCommission,28October2019;
l. HistoricdatafortheIndustrialAggregateIndexdownloadedfromStatisticsCanada(Table14-10-0222-01)showingforeachmonthromDecember2001toNovember2020thenumberofworkingCanadiansincludedintheindexalongwiththeiraverageweeklyearnings.
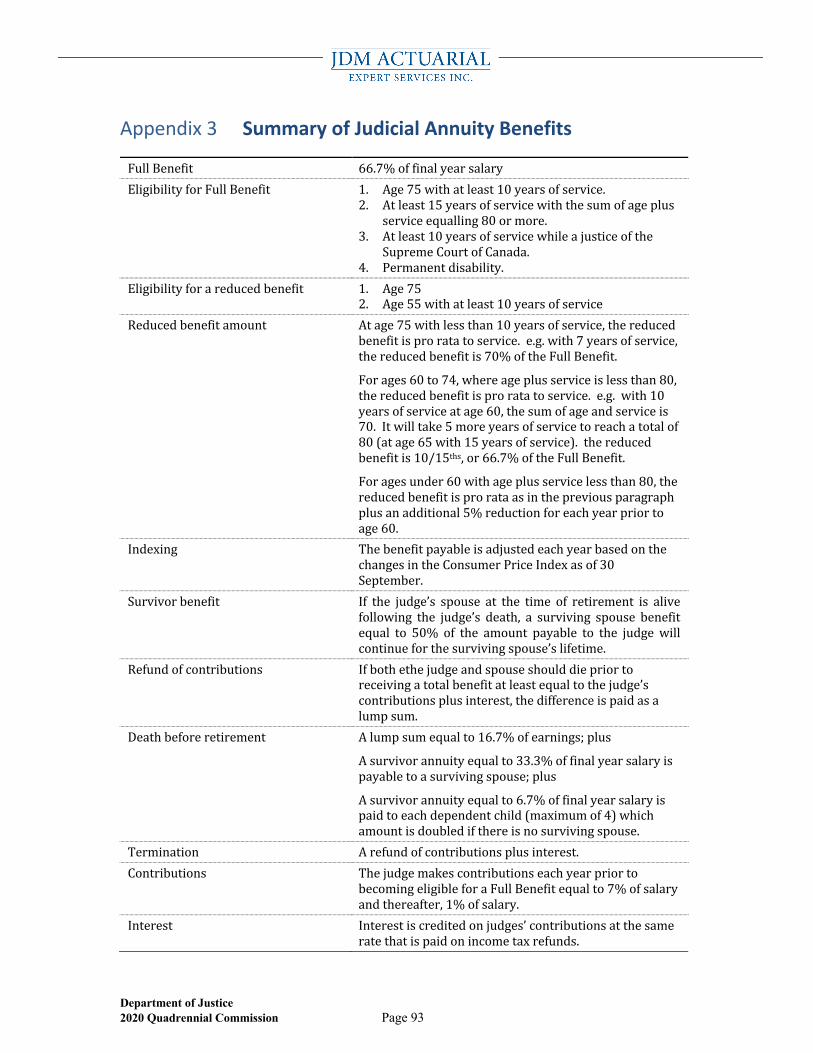
Department of Justice 2020 Quadrennial Commission Page 93
Appendix 3 Summary of Judicial Annuity Benefits
FullBenefit 66.7%offinalyearsalaryEligibilityforFullBenefit 1. Age75withatleast10yearsofservice.
2. Atleast15yearsofservicewiththesumofageplusserviceequalling80ormore.
3. Atleast10yearsofservicewhileajusticeoftheSupremeCourtofCanada.
4. Permanentdisability.Eligibilityforareducedbenefit 1. Age75
2. Age55withatleast10yearsofserviceReducedbenefitamount Atage75withlessthan10yearsofservice,thereduced
benefitisproratatoservice.e.g.with7yearsofservice,thereducedbenefitis70%oftheFullBenefit.
Forages60to74,whereageplusserviceislessthan80,thereducedbenefitisproratatoservice.e.g.with10yearsofserviceatage60,thesumofageandserviceis70.Itwilltake5moreyearsofservicetoreachatotalof80(atage65with15yearsofservice).thereducedbenefitis10/15ths,or66.7%oftheFullBenefit.
Foragesunder60withageplusservicelessthan80,thereducedbenefitisprorataasinthepreviousparagraphplusanadditional5%reductionforeachyearpriortoage60.
Indexing ThebenefitpayableisadjustedeachyearbasedonthechangesintheConsumerPriceIndexasof30September.
Survivorbenefit If the judge’s spouse at the time of retirement is alivefollowing the judge’s death, a surviving spouse benefitequal to 50% of the amount payable to the judge willcontinueforthesurvivingspouse’slifetime.
Refundofcontributions Ifbothethejudgeandspouseshoulddiepriortoreceivingatotalbenefitatleastequaltothejudge’scontributionsplusinterest,thedifferenceispaidasalumpsum.
Deathbeforeretirement Alumpsumequalto16.7%ofearnings;plus
Asurvivorannuityequalto33.3%offinalyearsalaryispayabletoasurvivingspouse;plus
Asurvivorannuityequalto6.7%offinalyearsalaryispaidtoeachdependentchild(maximumof4)whichamountisdoubledifthereisnosurvivingspouse.
Termination Arefundofcontributionsplusinterest.Contributions Thejudgemakescontributionseachyearpriorto
becomingeligibleforaFullBenefitequalto7%ofsalaryandthereafter,1%ofsalary.
Interest Interestiscreditedonjudges’contributionsatthesameratethatispaidonincometaxrefunds.
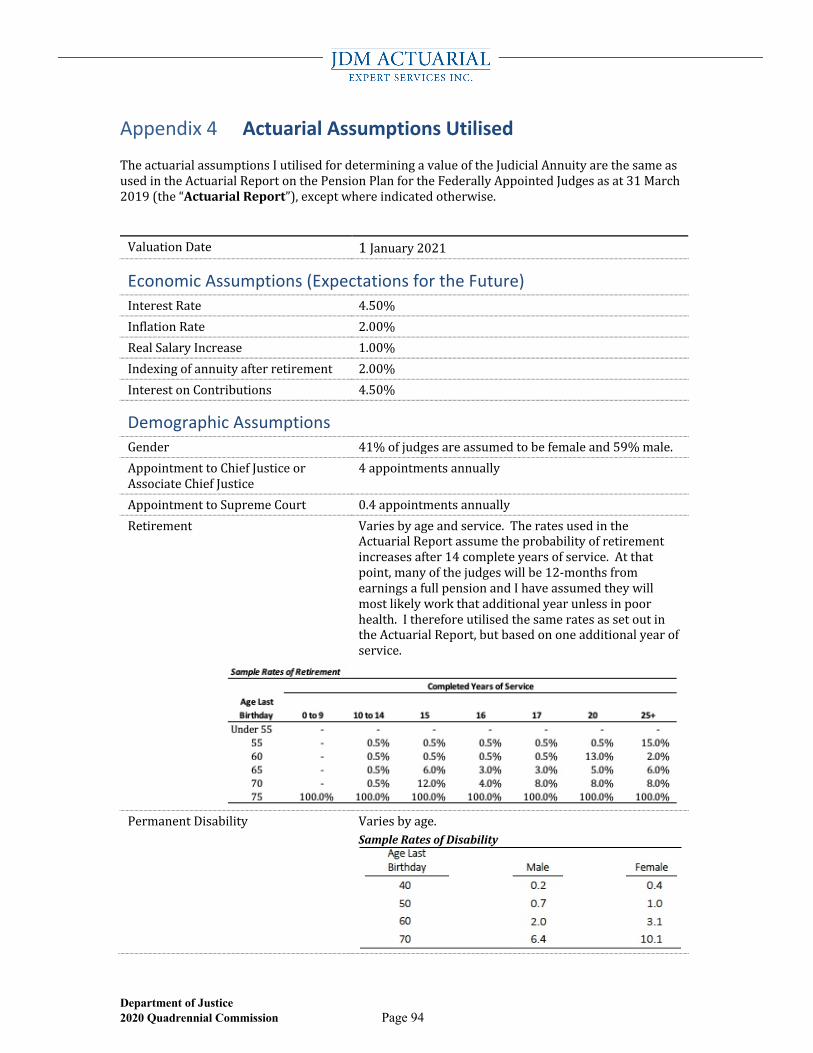
Department of Justice 2020 Quadrennial Commission Page 94
Appendix 4 Actuarial Assumptions Utilised
TheactuarialassumptionsIutilisedfordeterminingavalueoftheJudicialAnnuityarethesameasusedintheActuarialReportonthePensionPlanfortheFederallyAppointedJudgesasat31March2019(the“ActuarialReport”),exceptwhereindicatedotherwise.
ValuationDate 1January2021
Economic Assumptions (Expectations for the Future) InterestRate 4.50%InflationRate 2.00%RealSalaryIncrease 1.00%Indexingofannuityafterretirement 2.00%InterestonContributions 4.50%
Demographic Assumptions Gender 41%ofjudgesareassumedtobefemaleand59%male.AppointmenttoChiefJusticeorAssociateChiefJustice
4appointmentsannually
AppointmenttoSupremeCourt 0.4appointmentsannuallyRetirement Variesbyageandservice.Theratesusedinthe
ActuarialReportassumetheprobabilityofretirementincreasesafter14completeyearsofservice.Atthatpoint,manyofthejudgeswillbe12-monthsfromearningsafullpensionandIhaveassumedtheywillmostlikelyworkthatadditionalyearunlessinpoorhealth.IthereforeutilisedthesameratesassetoutintheActuarialReport,butbasedononeadditionalyearofservice.
PermanentDisability Variesbyage.
SampleRatesofDisability
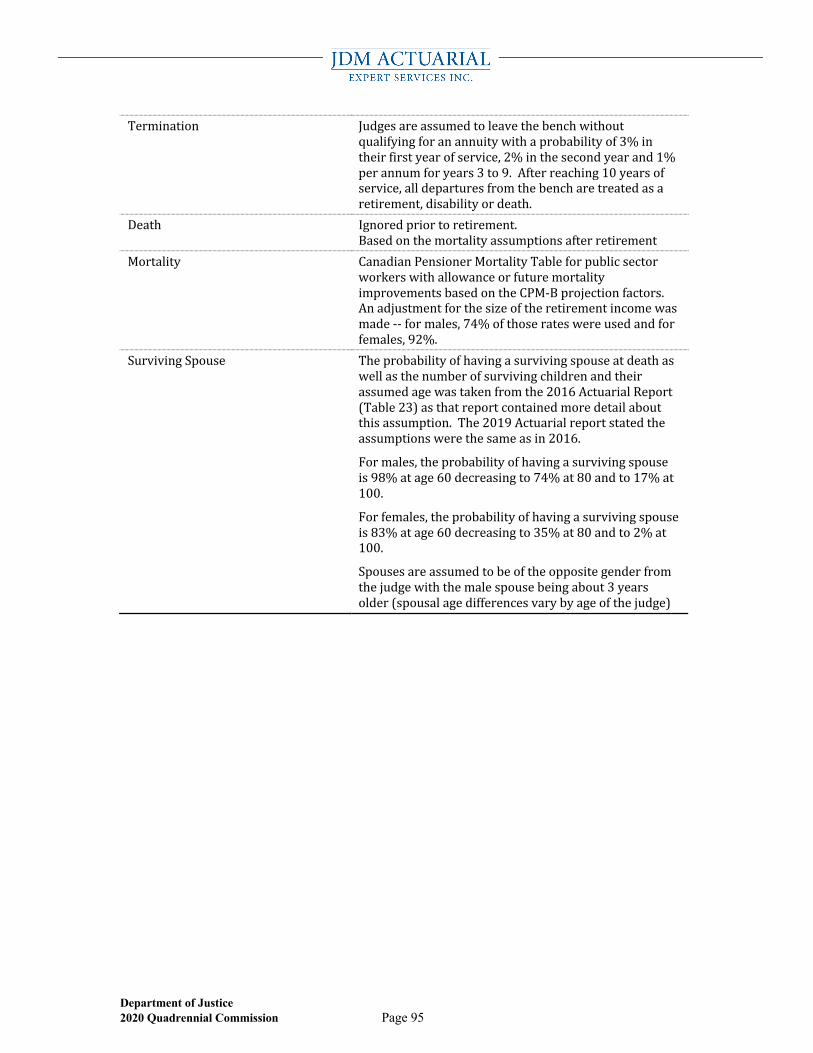
Department of Justice 2020 Quadrennial Commission Page 95
Termination Judgesareassumedtoleavethebenchwithoutqualifyingforanannuitywithaprobabilityof3%intheirfirstyearofservice,2%inthesecondyearand1%perannumforyears3to9.Afterreaching10yearsofservice,alldeparturesfromthebencharetreatedasaretirement,disabilityordeath.
Death Ignoredpriortoretirement.Basedonthemortalityassumptionsafterretirement
Mortality CanadianPensionerMortalityTableforpublicsectorworkerswithallowanceorfuturemortalityimprovementsbasedontheCPM-Bprojectionfactors.Anadjustmentforthesizeoftheretirementincomewasmade--formales,74%ofthoserateswereusedandforfemales,92%.
SurvivingSpouse Theprobabilityofhavingasurvivingspouseatdeathaswellasthenumberofsurvivingchildrenandtheirassumedagewastakenfromthe2016ActuarialReport(Table23)asthatreportcontainedmoredetailaboutthisassumption.The2019Actuarialreportstatedtheassumptionswerethesameasin2016.
Formales,theprobabilityofhavingasurvivingspouseis98%atage60decreasingto74%at80andto17%at100.
Forfemales,theprobabilityofhavingasurvivingspouseis83%atage60decreasingto35%at80andto2%at100.
Spousesareassumedtobeoftheoppositegenderfromthejudgewiththemalespousebeingabout3yearsolder(spousalagedifferencesvarybyageofthejudge)
COLUMBIA PACIFIC CONSULTING LTD.
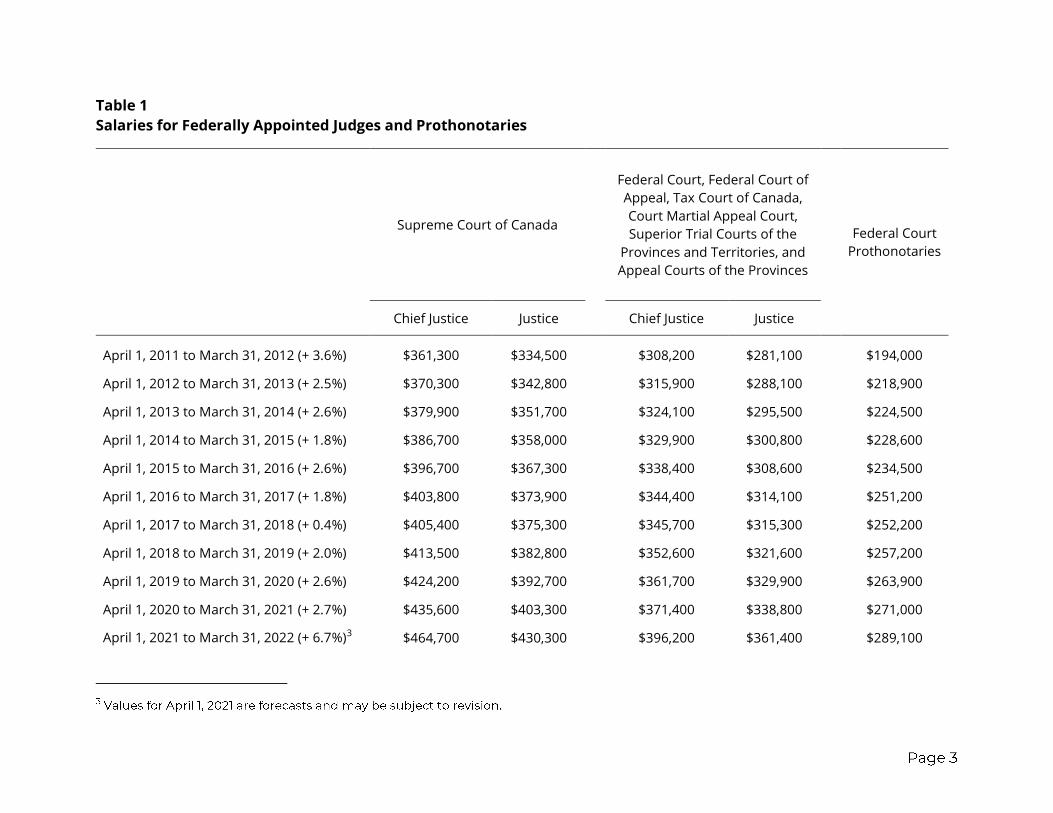
Table 1
Salaries for Federally Appointed Judges and Prothonotaries
Supreme Court of Canada
Federal Court, Federal Court of
Appeal, Tax Court of Canada,
Court Martial Appeal Court,
Superior Trial Courts of the
Provinces and Territories, and
Appeal Courts of the Provinces
Federal Court
Prothonotaries
Chief Justice Justice Chief Justice Justice
April 1, 2011 to March 31, 2012 (+ 3.6%) $361,300 $334,500 $308,200 $281,100 $194,000
April 1, 2012 to March 31, 2013 (+ 2.5%) $370,300 $342,800 $315,900 $288,100 $218,900
April 1, 2013 to March 31, 2014 (+ 2.6%) $379,900 $351,700 $324,100 $295,500 $224,500
April 1, 2014 to March 31, 2015 (+ 1.8%) $386,700 $358,000 $329,900 $300,800 $228,600
April 1, 2015 to March 31, 2016 (+ 2.6%) $396,700 $367,300 $338,400 $308,600 $234,500
April 1, 2016 to March 31, 2017 (+ 1.8%) $403,800 $373,900 $344,400 $314,100 $251,200
April 1, 2017 to March 31, 2018 (+ 0.4%) $405,400 $375,300 $345,700 $315,300 $252,200
April 1, 2018 to March 31, 2019 (+ 2.0%) $413,500 $382,800 $352,600 $321,600 $257,200
April 1, 2019 to March 31, 2020 (+ 2.6%) $424,200 $392,700 $361,700 $329,900 $263,900
April 1, 2020 to March 31, 2021 (+ 2.7%) $435,600 $403,300 $371,400 $338,800 $271,000
April 1, 2021 to March 31, 2022 (+ 6.7%)3 $464,700 $430,300 $396,200 $361,400 $289,100

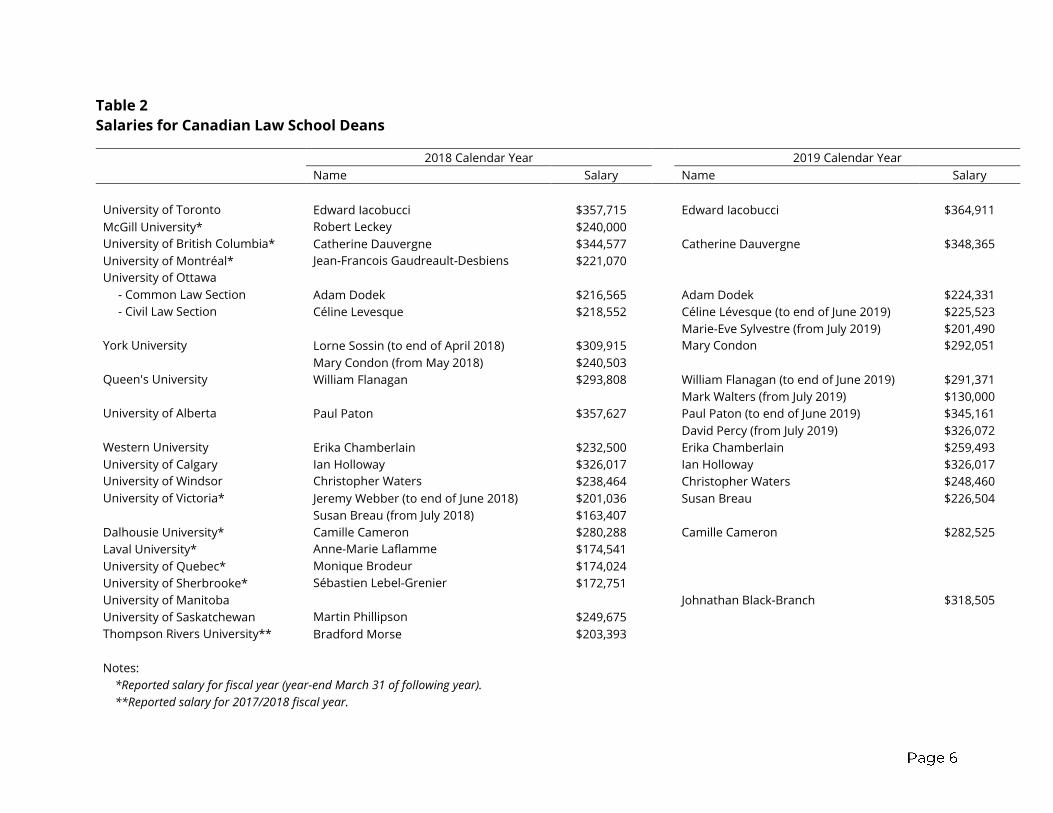
Table 2
Salaries for Canadian Law School Deans
2018 Calendar Year 2019 Calendar Year
Name Salary Name Salary
University of Toronto Edward Iacobucci $357,715 Edward Iacobucci $364,911
McGill University* Robert Leckey $240,000 University of British Columbia* Catherine Dauvergne $344,577 Catherine Dauvergne $348,365
University of Montréal* Jean-Francois Gaudreault-Desbiens $221,070 University of Ottawa
- Common Law Section Adam Dodek $216,565 Adam Dodek $224,331
- Civil Law Section Céline Levesque $218,552 Céline Lévesque (to end of June 2019) $225,523
Marie-Eve Sylvestre (from July 2019) $201,490
York University Lorne Sossin (to end of April 2018) $309,915 Mary Condon $292,051 Mary Condon (from May 2018) $240,503
Queen's University William Flanagan $293,808 William Flanagan (to end of June 2019) $291,371
Mark Walters (from July 2019) $130,000
University of Alberta Paul Paton $357,627 Paul Paton (to end of June 2019) $345,161
David Percy (from July 2019) $326,072
Western University Erika Chamberlain $232,500 Erika Chamberlain $259,493
University of Calgary Ian Holloway $326,017 Ian Holloway $326,017
University of Windsor Christopher Waters $238,464 Christopher Waters $248,460
University of Victoria* Jeremy Webber (to end of June 2018) $201,036 Susan Breau $226,504 Susan Breau (from July 2018) $163,407
Dalhousie University* Camille Cameron $280,288 Camille Cameron $282,525
Laval University* Anne-Marie Laflamme $174,541 University of Quebec* Monique Brodeur $174,024 University of Sherbrooke* Sébastien Lebel-Grenier $172,751 University of Manitoba
Johnathan Black-Branch $318,505
University of Saskatchewan Martin Phillipson $249,675 Thompson Rivers University** Bradford Morse $203,393
Notes: *Reported salary for fiscal year (year-end March 31 of following year). **Reported salary for 2017/2018 fiscal year.
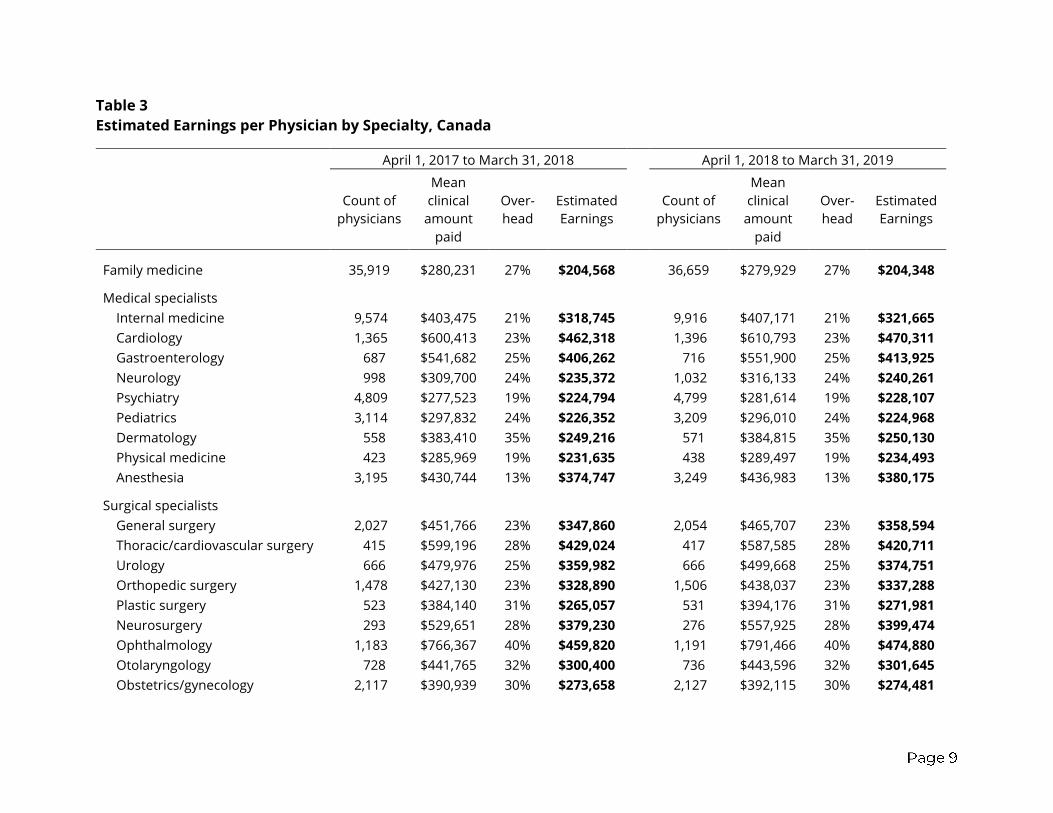
Table 3
Estimated Earnings per Physician by Specialty, Canada
April 1, 2017 to March 31, 2018 April 1, 2018 to March 31, 2019
Count of
physicians
Mean
clinical
amount
paid
Over-
head
Estimated
Earnings
Count of
physicians
Mean
clinical
amount
paid
Over-
head
Estimated
Earnings
Family medicine 35,919 $280,231 27% $204,568 36,659 $279,929 27% $204,348
Medical specialists
Internal medicine 9,574 $403,475 21% $318,745 9,916 $407,171 21% $321,665
Cardiology 1,365 $600,413 23% $462,318 1,396 $610,793 23% $470,311
Gastroenterology 687 $541,682 25% $406,262 716 $551,900 25% $413,925
Neurology 998 $309,700 24% $235,372 1,032 $316,133 24% $240,261
Psychiatry 4,809 $277,523 19% $224,794 4,799 $281,614 19% $228,107
Pediatrics 3,114 $297,832 24% $226,352 3,209 $296,010 24% $224,968
Dermatology 558 $383,410 35% $249,216 571 $384,815 35% $250,130
Physical medicine 423 $285,969 19% $231,635 438 $289,497 19% $234,493
Anesthesia 3,195 $430,744 13% $374,747 3,249 $436,983 13% $380,175
Surgical specialists
General surgery 2,027 $451,766 23% $347,860 2,054 $465,707 23% $358,594
Thoracic/cardiovascular surgery 415 $599,196 28% $429,024 417 $587,585 28% $420,711
Urology 666 $479,976 25% $359,982 666 $499,668 25% $374,751
Orthopedic surgery 1,478 $427,130 23% $328,890 1,506 $438,037 23% $337,288
Plastic surgery 523 $384,140 31% $265,057 531 $394,176 31% $271,981
Neurosurgery 293 $529,651 28% $379,230 276 $557,925 28% $399,474
Ophthalmology 1,183 $766,367 40% $459,820 1,191 $791,466 40% $474,880
Otolaryngology 728 $441,765 32% $300,400 736 $443,596 32% $301,645
Obstetrics/gynecology 2,117 $390,939 30% $273,658 2,127 $392,115 30% $274,481

34.


COLUMBIA PACIFIC CONSULTING LTD.
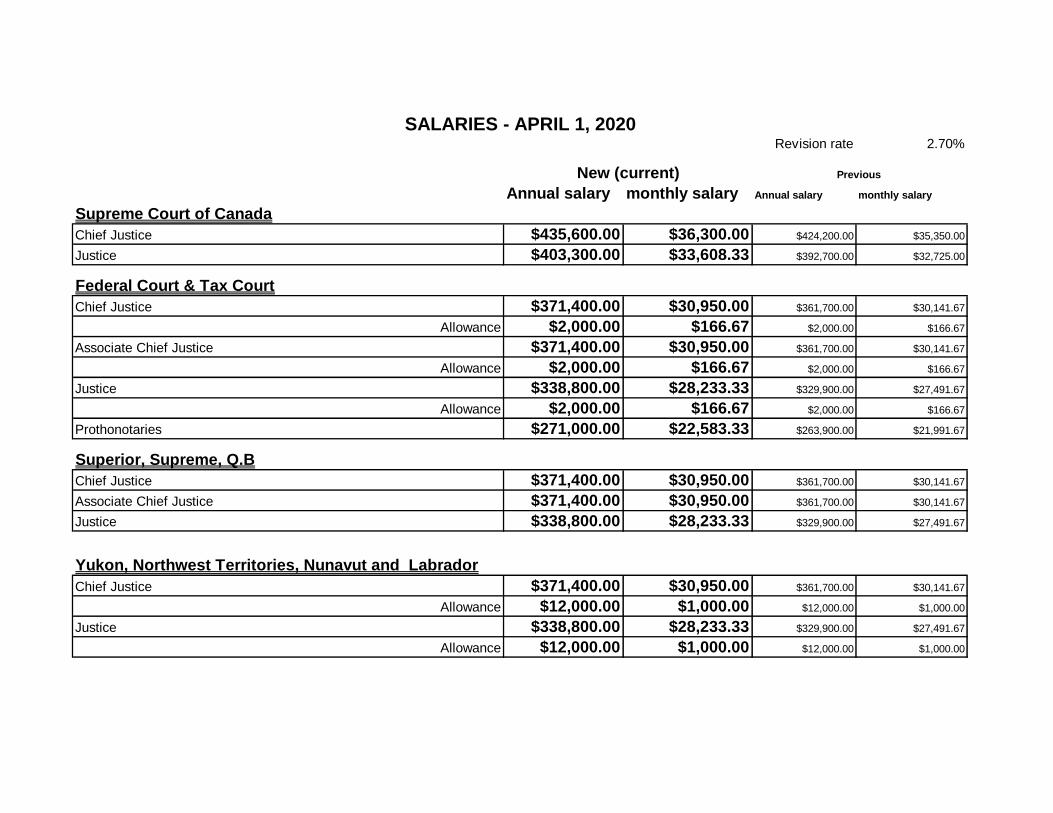
Revision rate 2.70%
Annual salary monthly salary Annual salary monthly salary
Supreme Court of Canada
Chief Justice $435,600.00 $36,300.00 $424,200.00 $35,350.00
Justice $403,300.00 $33,608.33 $392,700.00 $32,725.00
Federal Court & Tax Court
Chief Justice $371,400.00 $30,950.00 $361,700.00 $30,141.67
Allowance $2,000.00 $166.67 $2,000.00 $166.67
Associate Chief Justice $371,400.00 $30,950.00 $361,700.00 $30,141.67
Allowance $2,000.00 $166.67 $2,000.00 $166.67
Justice $338,800.00 $28,233.33 $329,900.00 $27,491.67
Allowance $2,000.00 $166.67 $2,000.00 $166.67
Prothonotaries $271,000.00 $22,583.33 $263,900.00 $21,991.67
Superior, Supreme, Q.B
Chief Justice $371,400.00 $30,950.00 $361,700.00 $30,141.67
Associate Chief Justice $371,400.00 $30,950.00 $361,700.00 $30,141.67
Justice $338,800.00 $28,233.33 $329,900.00 $27,491.67
Yukon, Northwest Territories, Nunavut and Labrador
Chief Justice $371,400.00 $30,950.00 $361,700.00 $30,141.67
Allowance $12,000.00 $1,000.00 $12,000.00 $1,000.00
Justice $338,800.00 $28,233.33 $329,900.00 $27,491.67
Allowance $12,000.00 $1,000.00 $12,000.00 $1,000.00
Previous New (current)
SALARIES - APRIL 1, 2020
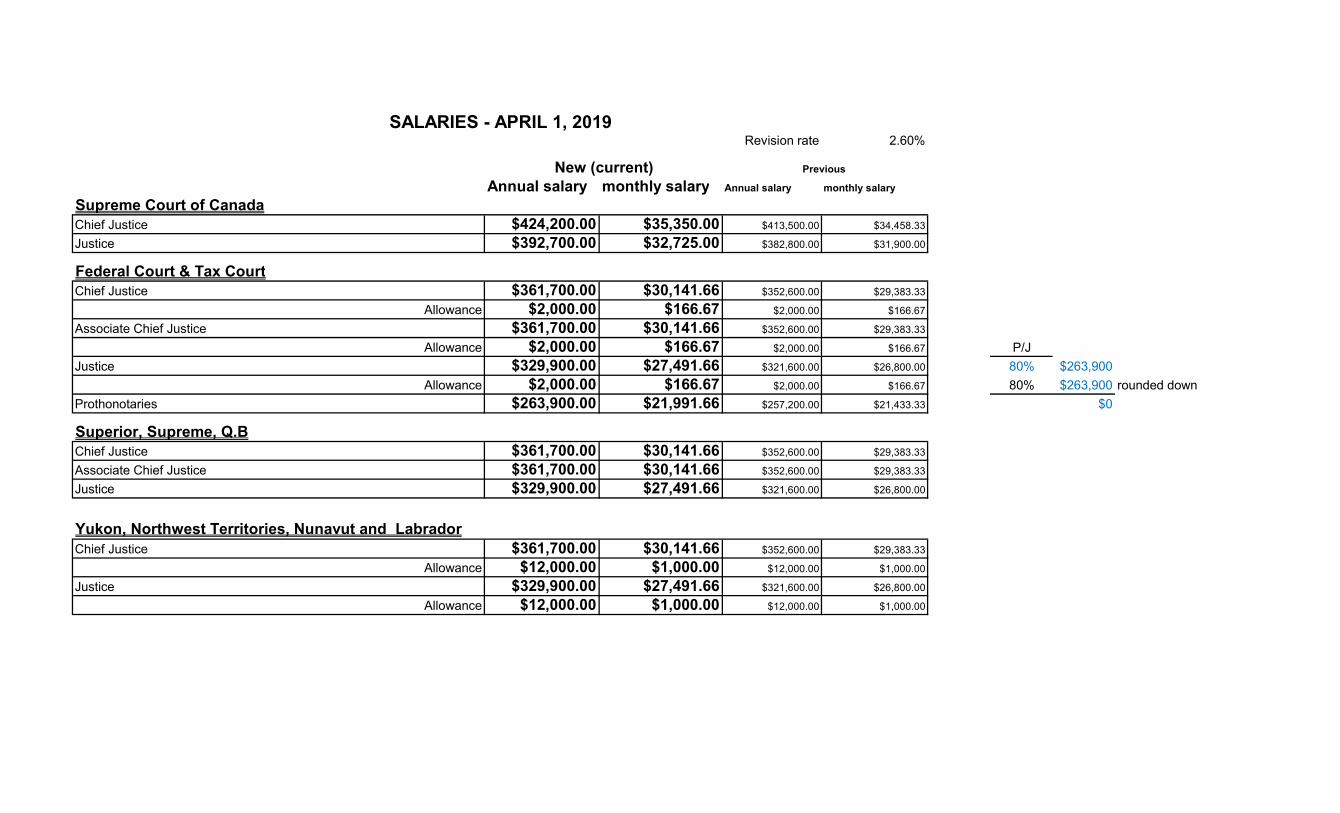
Revision rate 2.60%
Annual salary monthly salary Annual salary monthly salary
Supreme Court of CanadaChief Justice $424,200.00 $35,350.00 $413,500.00 $34,458.33
Justice $392,700.00 $32,725.00 $382,800.00 $31,900.00
Federal Court & Tax CourtChief Justice $361,700.00 $30,141.66 $352,600.00 $29,383.33
Allowance $2,000.00 $166.67 $2,000.00 $166.67
Associate Chief Justice $361,700.00 $30,141.66 $352,600.00 $29,383.33
Allowance $2,000.00 $166.67 $2,000.00 $166.67 P/J
Justice $329,900.00 $27,491.66 $321,600.00 $26,800.00 80% $263,900
Allowance $2,000.00 $166.67 $2,000.00 $166.67 80% $263,900 rounded down
Prothonotaries $263,900.00 $21,991.66 $257,200.00 $21,433.33 $0
Superior, Supreme, Q.BChief Justice $361,700.00 $30,141.66 $352,600.00 $29,383.33
Associate Chief Justice $361,700.00 $30,141.66 $352,600.00 $29,383.33
Justice $329,900.00 $27,491.66 $321,600.00 $26,800.00
Yukon, Northwest Territories, Nunavut and Labrador
Chief Justice $361,700.00 $30,141.66 $352,600.00 $29,383.33
Allowance $12,000.00 $1,000.00 $12,000.00 $1,000.00
Justice $329,900.00 $27,491.66 $321,600.00 $26,800.00
Allowance $12,000.00 $1,000.00 $12,000.00 $1,000.00
Previous New (current)
SALARIES - APRIL 1, 2019
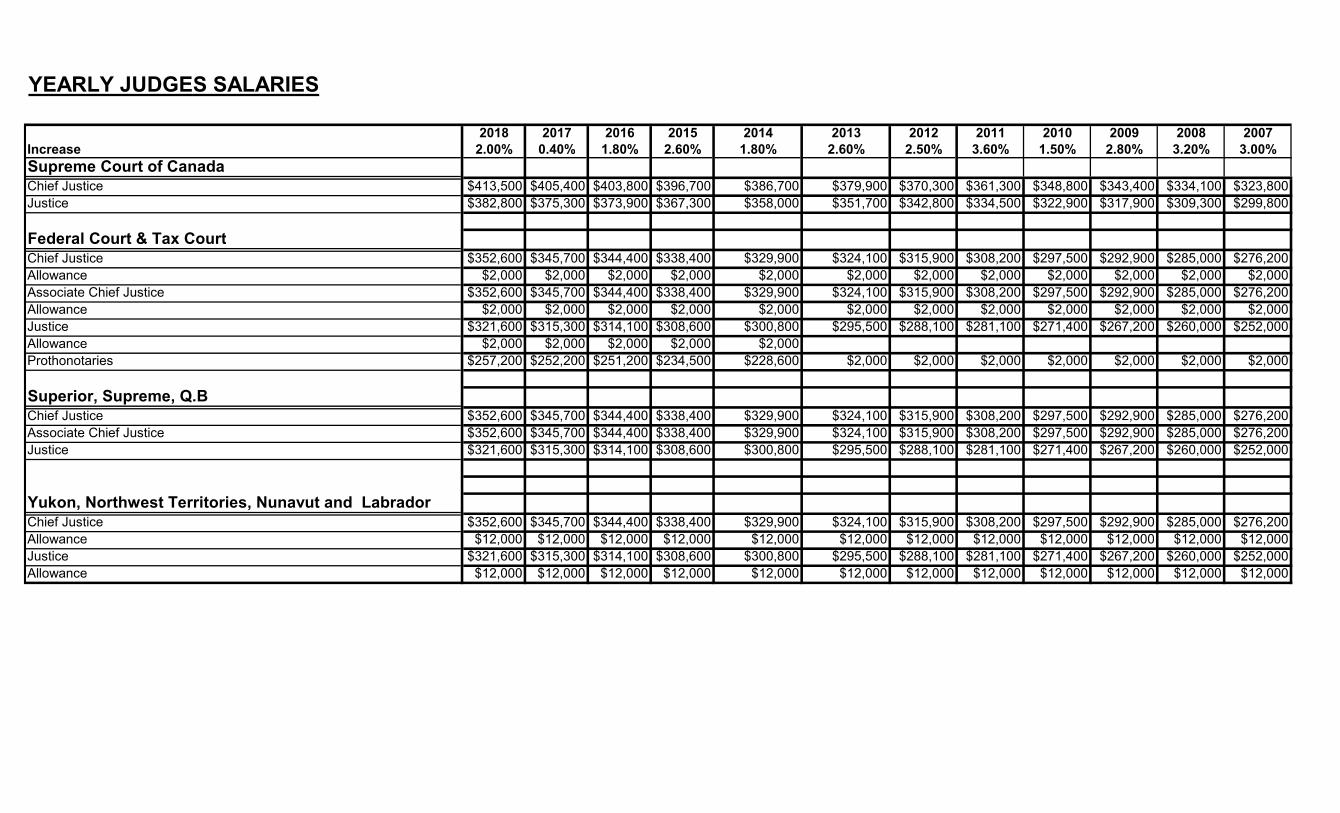
YEARLY JUDGES SALARIES
2018 2017 2016 2015 2014 2013 2012 2011 2010 2009 2008 2007Increase 2.00% 0.40% 1.80% 2.60% 1.80% 2.60% 2.50% 3.60% 1.50% 2.80% 3.20% 3.00%
Supreme Court of CanadaChief Justice $413,500 $405,400 $403,800 $396,700 $386,700 $379,900 $370,300 $361,300 $348,800 $343,400 $334,100 $323,800
Justice $382,800 $375,300 $373,900 $367,300 $358,000 $351,700 $342,800 $334,500 $322,900 $317,900 $309,300 $299,800
Federal Court & Tax CourtChief Justice $352,600 $345,700 $344,400 $338,400 $329,900 $324,100 $315,900 $308,200 $297,500 $292,900 $285,000 $276,200
Allowance $2,000 $2,000 $2,000 $2,000 $2,000 $2,000 $2,000 $2,000 $2,000 $2,000 $2,000 $2,000
Associate Chief Justice $352,600 $345,700 $344,400 $338,400 $329,900 $324,100 $315,900 $308,200 $297,500 $292,900 $285,000 $276,200
Allowance $2,000 $2,000 $2,000 $2,000 $2,000 $2,000 $2,000 $2,000 $2,000 $2,000 $2,000 $2,000
Justice $321,600 $315,300 $314,100 $308,600 $300,800 $295,500 $288,100 $281,100 $271,400 $267,200 $260,000 $252,000
Allowance $2,000 $2,000 $2,000 $2,000 $2,000
Prothonotaries $257,200 $252,200 $251,200 $234,500 $228,600 $2,000 $2,000 $2,000 $2,000 $2,000 $2,000 $2,000
Superior, Supreme, Q.BChief Justice $352,600 $345,700 $344,400 $338,400 $329,900 $324,100 $315,900 $308,200 $297,500 $292,900 $285,000 $276,200
Associate Chief Justice $352,600 $345,700 $344,400 $338,400 $329,900 $324,100 $315,900 $308,200 $297,500 $292,900 $285,000 $276,200
Justice $321,600 $315,300 $314,100 $308,600 $300,800 $295,500 $288,100 $281,100 $271,400 $267,200 $260,000 $252,000
Yukon, Northwest Territories, Nunavut and LabradorChief Justice $352,600 $345,700 $344,400 $338,400 $329,900 $324,100 $315,900 $308,200 $297,500 $292,900 $285,000 $276,200
Allowance $12,000 $12,000 $12,000 $12,000 $12,000 $12,000 $12,000 $12,000 $12,000 $12,000 $12,000 $12,000
Justice $321,600 $315,300 $314,100 $308,600 $300,800 $295,500 $288,100 $281,100 $271,400 $267,200 $260,000 $252,000
Allowance $12,000 $12,000 $12,000 $12,000 $12,000 $12,000 $12,000 $12,000 $12,000 $12,000 $12,000 $12,000
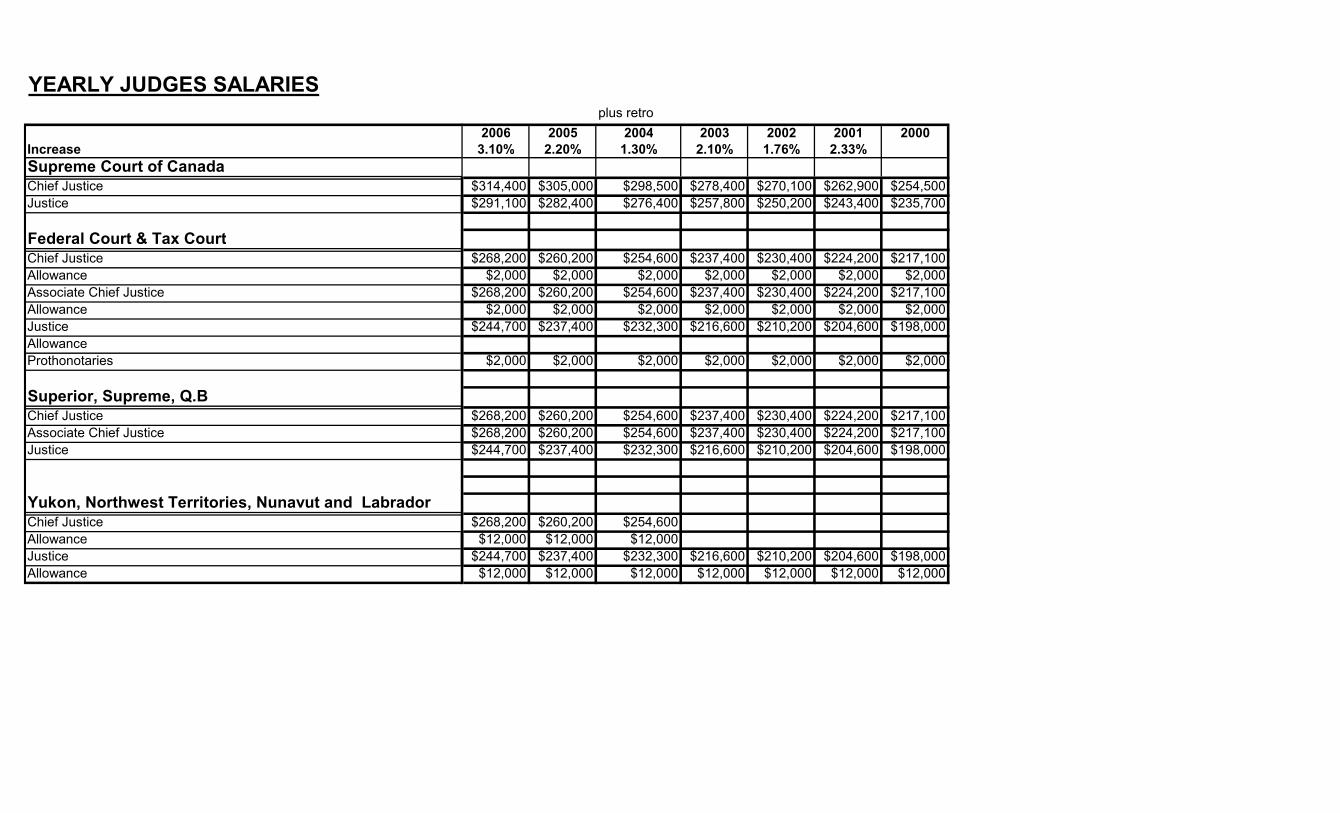
YEARLY JUDGES SALARIES
Increase
Supreme Court of CanadaChief Justice
Justice
Federal Court & Tax CourtChief Justice
Allowance
Associate Chief Justice
Allowance
Justice
Allowance
Prothonotaries
Superior, Supreme, Q.BChief Justice
Associate Chief Justice
Justice
Yukon, Northwest Territories, Nunavut and LabradorChief Justice
Allowance
Justice
Allowance
plus retro
2006 2005 2004 2003 2002 2001 20003.10% 2.20% 1.30% 2.10% 1.76% 2.33%
$314,400 $305,000 $298,500 $278,400 $270,100 $262,900 $254,500
$291,100 $282,400 $276,400 $257,800 $250,200 $243,400 $235,700
$268,200 $260,200 $254,600 $237,400 $230,400 $224,200 $217,100
$2,000 $2,000 $2,000 $2,000 $2,000 $2,000 $2,000
$268,200 $260,200 $254,600 $237,400 $230,400 $224,200 $217,100
$2,000 $2,000 $2,000 $2,000 $2,000 $2,000 $2,000
$244,700 $237,400 $232,300 $216,600 $210,200 $204,600 $198,000
$2,000 $2,000 $2,000 $2,000 $2,000 $2,000 $2,000
$268,200 $260,200 $254,600 $237,400 $230,400 $224,200 $217,100
$268,200 $260,200 $254,600 $237,400 $230,400 $224,200 $217,100
$244,700 $237,400 $232,300 $216,600 $210,200 $204,600 $198,000
$268,200 $260,200 $254,600
$12,000 $12,000 $12,000
$244,700 $237,400 $232,300 $216,600 $210,200 $204,600 $198,000
$12,000 $12,000 $12,000 $12,000 $12,000 $12,000 $12,000
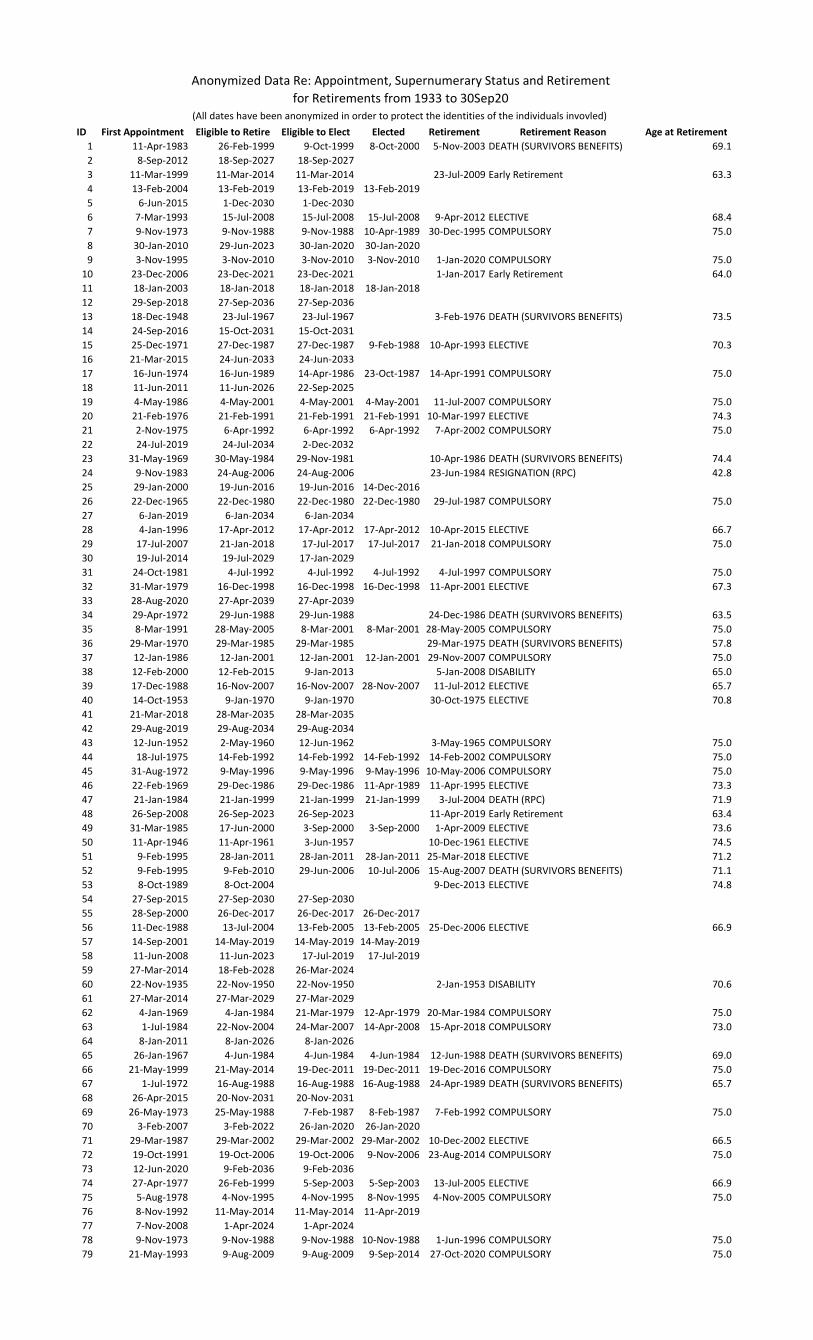
ID First Appointment Eligible to Retire Eligible to Elect Elected Retirement Retirement Reason Age at Retirement
1 11-Apr-1983 26-Feb-1999 9-Oct-1999 8-Oct-2000 5-Nov-2003 DEATH (SURVIVORS BENEFITS) 69.1
2 8-Sep-2012 18-Sep-2027 18-Sep-2027
3 11-Mar-1999 11-Mar-2014 11-Mar-2014 23-Jul-2009 Early Retirement 63.3
4 13-Feb-2004 13-Feb-2019 13-Feb-2019 13-Feb-2019
5 6-Jun-2015 1-Dec-2030 1-Dec-2030
6 7-Mar-1993 15-Jul-2008 15-Jul-2008 15-Jul-2008 9-Apr-2012 ELECTIVE 68.4
7 9-Nov-1973 9-Nov-1988 9-Nov-1988 10-Apr-1989 30-Dec-1995 COMPULSORY 75.0
8 30-Jan-2010 29-Jun-2023 30-Jan-2020 30-Jan-2020
9 3-Nov-1995 3-Nov-2010 3-Nov-2010 3-Nov-2010 1-Jan-2020 COMPULSORY 75.0
10 23-Dec-2006 23-Dec-2021 23-Dec-2021 1-Jan-2017 Early Retirement 64.0
11 18-Jan-2003 18-Jan-2018 18-Jan-2018 18-Jan-2018
12 29-Sep-2018 27-Sep-2036 27-Sep-2036
13 18-Dec-1948 23-Jul-1967 23-Jul-1967 3-Feb-1976 DEATH (SURVIVORS BENEFITS) 73.5
14 24-Sep-2016 15-Oct-2031 15-Oct-2031
15 25-Dec-1971 27-Dec-1987 27-Dec-1987 9-Feb-1988 10-Apr-1993 ELECTIVE 70.3
16 21-Mar-2015 24-Jun-2033 24-Jun-2033
17 16-Jun-1974 16-Jun-1989 14-Apr-1986 23-Oct-1987 14-Apr-1991 COMPULSORY 75.0
18 11-Jun-2011 11-Jun-2026 22-Sep-2025
19 4-May-1986 4-May-2001 4-May-2001 4-May-2001 11-Jul-2007 COMPULSORY 75.0
20 21-Feb-1976 21-Feb-1991 21-Feb-1991 21-Feb-1991 10-Mar-1997 ELECTIVE 74.3
21 2-Nov-1975 6-Apr-1992 6-Apr-1992 6-Apr-1992 7-Apr-2002 COMPULSORY 75.0
22 24-Jul-2019 24-Jul-2034 2-Dec-2032
23 31-May-1969 30-May-1984 29-Nov-1981 10-Apr-1986 DEATH (SURVIVORS BENEFITS) 74.4
24 9-Nov-1983 24-Aug-2006 24-Aug-2006 23-Jun-1984 RESIGNATION (RPC) 42.8
25 29-Jan-2000 19-Jun-2016 19-Jun-2016 14-Dec-2016
26 22-Dec-1965 22-Dec-1980 22-Dec-1980 22-Dec-1980 29-Jul-1987 COMPULSORY 75.0
27 6-Jan-2019 6-Jan-2034 6-Jan-2034
28 4-Jan-1996 17-Apr-2012 17-Apr-2012 17-Apr-2012 10-Apr-2015 ELECTIVE 66.7
29 17-Jul-2007 21-Jan-2018 17-Jul-2017 17-Jul-2017 21-Jan-2018 COMPULSORY 75.0
30 19-Jul-2014 19-Jul-2029 17-Jan-2029
31 24-Oct-1981 4-Jul-1992 4-Jul-1992 4-Jul-1992 4-Jul-1997 COMPULSORY 75.0
32 31-Mar-1979 16-Dec-1998 16-Dec-1998 16-Dec-1998 11-Apr-2001 ELECTIVE 67.3
33 28-Aug-2020 27-Apr-2039 27-Apr-2039
34 29-Apr-1972 29-Jun-1988 29-Jun-1988 24-Dec-1986 DEATH (SURVIVORS BENEFITS) 63.5
35 8-Mar-1991 28-May-2005 8-Mar-2001 8-Mar-2001 28-May-2005 COMPULSORY 75.0
36 29-Mar-1970 29-Mar-1985 29-Mar-1985 29-Mar-1975 DEATH (SURVIVORS BENEFITS) 57.8
37 12-Jan-1986 12-Jan-2001 12-Jan-2001 12-Jan-2001 29-Nov-2007 COMPULSORY 75.0
38 12-Feb-2000 12-Feb-2015 9-Jan-2013 5-Jan-2008 DISABILITY 65.0
39 17-Dec-1988 16-Nov-2007 16-Nov-2007 28-Nov-2007 11-Jul-2012 ELECTIVE 65.7
40 14-Oct-1953 9-Jan-1970 9-Jan-1970 30-Oct-1975 ELECTIVE 70.8
41 21-Mar-2018 28-Mar-2035 28-Mar-2035
42 29-Aug-2019 29-Aug-2034 29-Aug-2034
43 12-Jun-1952 2-May-1960 12-Jun-1962 3-May-1965 COMPULSORY 75.0
44 18-Jul-1975 14-Feb-1992 14-Feb-1992 14-Feb-1992 14-Feb-2002 COMPULSORY 75.0
45 31-Aug-1972 9-May-1996 9-May-1996 9-May-1996 10-May-2006 COMPULSORY 75.0
46 22-Feb-1969 29-Dec-1986 29-Dec-1986 11-Apr-1989 11-Apr-1995 ELECTIVE 73.3
47 21-Jan-1984 21-Jan-1999 21-Jan-1999 21-Jan-1999 3-Jul-2004 DEATH (RPC) 71.9
48 26-Sep-2008 26-Sep-2023 26-Sep-2023 11-Apr-2019 Early Retirement 63.4
49 31-Mar-1985 17-Jun-2000 3-Sep-2000 3-Sep-2000 1-Apr-2009 ELECTIVE 73.6
50 11-Apr-1946 11-Apr-1961 3-Jun-1957 10-Dec-1961 ELECTIVE 74.5
51 9-Feb-1995 28-Jan-2011 28-Jan-2011 28-Jan-2011 25-Mar-2018 ELECTIVE 71.2
52 9-Feb-1995 9-Feb-2010 29-Jun-2006 10-Jul-2006 15-Aug-2007 DEATH (SURVIVORS BENEFITS) 71.1
53 8-Oct-1989 8-Oct-2004 9-Dec-2013 ELECTIVE 74.8
54 27-Sep-2015 27-Sep-2030 27-Sep-2030
55 28-Sep-2000 26-Dec-2017 26-Dec-2017 26-Dec-2017
56 11-Dec-1988 13-Jul-2004 13-Feb-2005 13-Feb-2005 25-Dec-2006 ELECTIVE 66.9
57 14-Sep-2001 14-May-2019 14-May-2019 14-May-2019
58 11-Jun-2008 11-Jun-2023 17-Jul-2019 17-Jul-2019
59 27-Mar-2014 18-Feb-2028 26-Mar-2024
60 22-Nov-1935 22-Nov-1950 22-Nov-1950 2-Jan-1953 DISABILITY 70.6
61 27-Mar-2014 27-Mar-2029 27-Mar-2029
62 4-Jan-1969 4-Jan-1984 21-Mar-1979 12-Apr-1979 20-Mar-1984 COMPULSORY 75.0
63 1-Jul-1984 22-Nov-2004 24-Mar-2007 14-Apr-2008 15-Apr-2018 COMPULSORY 73.0
64 8-Jan-2011 8-Jan-2026 8-Jan-2026
65 26-Jan-1967 4-Jun-1984 4-Jun-1984 4-Jun-1984 12-Jun-1988 DEATH (SURVIVORS BENEFITS) 69.0
66 21-May-1999 21-May-2014 19-Dec-2011 19-Dec-2011 19-Dec-2016 COMPULSORY 75.0
67 1-Jul-1972 16-Aug-1988 16-Aug-1988 16-Aug-1988 24-Apr-1989 DEATH (SURVIVORS BENEFITS) 65.7
68 26-Apr-2015 20-Nov-2031 20-Nov-2031
69 26-May-1973 25-May-1988 7-Feb-1987 8-Feb-1987 7-Feb-1992 COMPULSORY 75.0
70 3-Feb-2007 3-Feb-2022 26-Jan-2020 26-Jan-2020
71 29-Mar-1987 29-Mar-2002 29-Mar-2002 29-Mar-2002 10-Dec-2002 ELECTIVE 66.5
72 19-Oct-1991 19-Oct-2006 19-Oct-2006 9-Nov-2006 23-Aug-2014 COMPULSORY 75.0
73 12-Jun-2020 9-Feb-2036 9-Feb-2036
74 27-Apr-1977 26-Feb-1999 5-Sep-2003 5-Sep-2003 13-Jul-2005 ELECTIVE 66.9
75 5-Aug-1978 4-Nov-1995 4-Nov-1995 8-Nov-1995 4-Nov-2005 COMPULSORY 75.0
76 8-Nov-1992 11-May-2014 11-May-2014 11-Apr-2019
77 7-Nov-2008 1-Apr-2024 1-Apr-2024
78 9-Nov-1973 9-Nov-1988 9-Nov-1988 10-Nov-1988 1-Jun-1996 COMPULSORY 75.0
79 21-May-1993 9-Aug-2009 9-Aug-2009 9-Sep-2014 27-Oct-2020 COMPULSORY 75.0
Anonymized Data Re: Appointment, Supernumerary Status and Retirement
for Retirements from 1933 to 30Sep20(All dates have been anonymized in order to protect the identities of the individuals invovled)
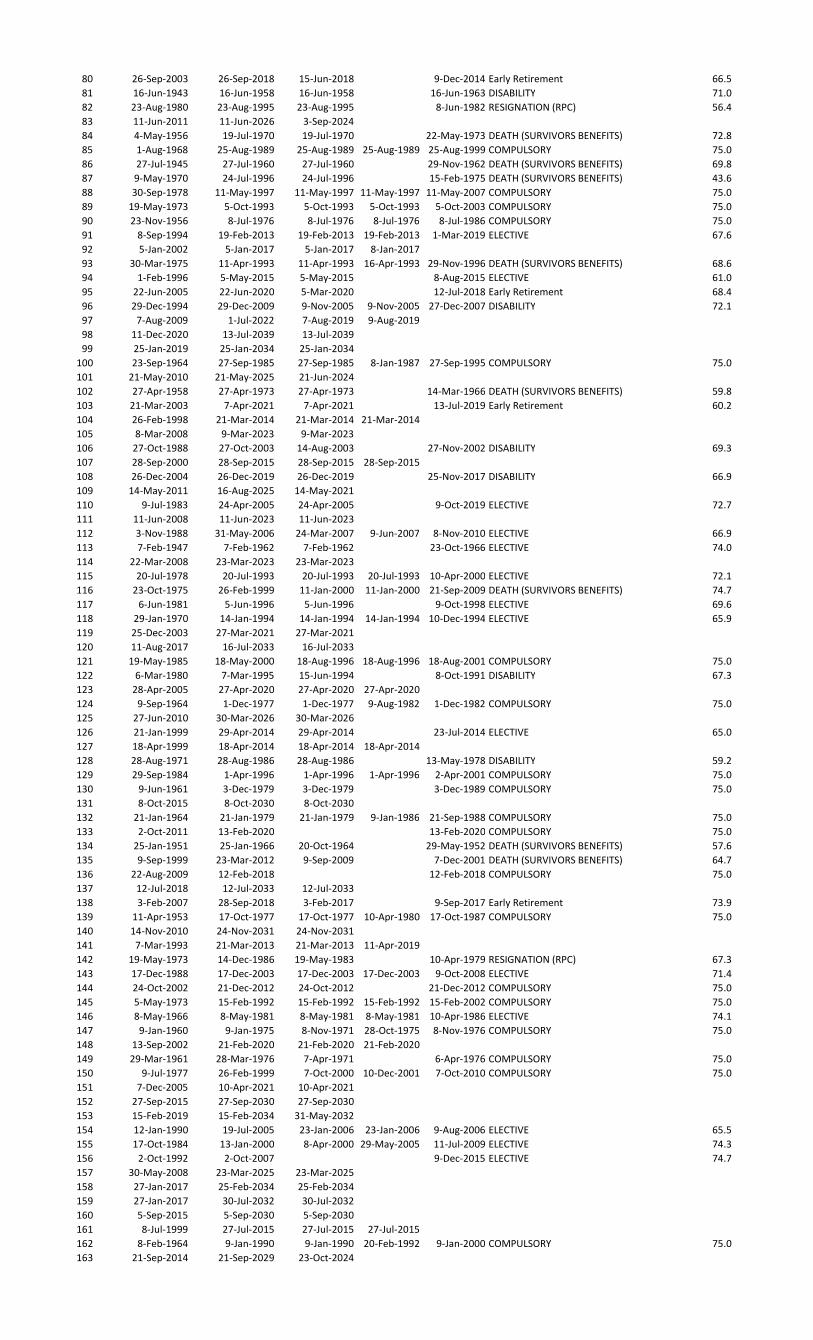
80 26-Sep-2003 26-Sep-2018 15-Jun-2018 9-Dec-2014 Early Retirement 66.5
81 16-Jun-1943 16-Jun-1958 16-Jun-1958 16-Jun-1963 DISABILITY 71.0
82 23-Aug-1980 23-Aug-1995 23-Aug-1995 8-Jun-1982 RESIGNATION (RPC) 56.4
83 11-Jun-2011 11-Jun-2026 3-Sep-2024
84 4-May-1956 19-Jul-1970 19-Jul-1970 22-May-1973 DEATH (SURVIVORS BENEFITS) 72.8
85 1-Aug-1968 25-Aug-1989 25-Aug-1989 25-Aug-1989 25-Aug-1999 COMPULSORY 75.0
86 27-Jul-1945 27-Jul-1960 27-Jul-1960 29-Nov-1962 DEATH (SURVIVORS BENEFITS) 69.8
87 9-May-1970 24-Jul-1996 24-Jul-1996 15-Feb-1975 DEATH (SURVIVORS BENEFITS) 43.6
88 30-Sep-1978 11-May-1997 11-May-1997 11-May-1997 11-May-2007 COMPULSORY 75.0
89 19-May-1973 5-Oct-1993 5-Oct-1993 5-Oct-1993 5-Oct-2003 COMPULSORY 75.0
90 23-Nov-1956 8-Jul-1976 8-Jul-1976 8-Jul-1976 8-Jul-1986 COMPULSORY 75.0
91 8-Sep-1994 19-Feb-2013 19-Feb-2013 19-Feb-2013 1-Mar-2019 ELECTIVE 67.6
92 5-Jan-2002 5-Jan-2017 5-Jan-2017 8-Jan-2017
93 30-Mar-1975 11-Apr-1993 11-Apr-1993 16-Apr-1993 29-Nov-1996 DEATH (SURVIVORS BENEFITS) 68.6
94 1-Feb-1996 5-May-2015 5-May-2015 8-Aug-2015 ELECTIVE 61.0
95 22-Jun-2005 22-Jun-2020 5-Mar-2020 12-Jul-2018 Early Retirement 68.4
96 29-Dec-1994 29-Dec-2009 9-Nov-2005 9-Nov-2005 27-Dec-2007 DISABILITY 72.1
97 7-Aug-2009 1-Jul-2022 7-Aug-2019 9-Aug-2019
98 11-Dec-2020 13-Jul-2039 13-Jul-2039
99 25-Jan-2019 25-Jan-2034 25-Jan-2034
100 23-Sep-1964 27-Sep-1985 27-Sep-1985 8-Jan-1987 27-Sep-1995 COMPULSORY 75.0
101 21-May-2010 21-May-2025 21-Jun-2024
102 27-Apr-1958 27-Apr-1973 27-Apr-1973 14-Mar-1966 DEATH (SURVIVORS BENEFITS) 59.8
103 21-Mar-2003 7-Apr-2021 7-Apr-2021 13-Jul-2019 Early Retirement 60.2
104 26-Feb-1998 21-Mar-2014 21-Mar-2014 21-Mar-2014
105 8-Mar-2008 9-Mar-2023 9-Mar-2023
106 27-Oct-1988 27-Oct-2003 14-Aug-2003 27-Nov-2002 DISABILITY 69.3
107 28-Sep-2000 28-Sep-2015 28-Sep-2015 28-Sep-2015
108 26-Dec-2004 26-Dec-2019 26-Dec-2019 25-Nov-2017 DISABILITY 66.9
109 14-May-2011 16-Aug-2025 14-May-2021
110 9-Jul-1983 24-Apr-2005 24-Apr-2005 9-Oct-2019 ELECTIVE 72.7
111 11-Jun-2008 11-Jun-2023 11-Jun-2023
112 3-Nov-1988 31-May-2006 24-Mar-2007 9-Jun-2007 8-Nov-2010 ELECTIVE 66.9
113 7-Feb-1947 7-Feb-1962 7-Feb-1962 23-Oct-1966 ELECTIVE 74.0
114 22-Mar-2008 23-Mar-2023 23-Mar-2023
115 20-Jul-1978 20-Jul-1993 20-Jul-1993 20-Jul-1993 10-Apr-2000 ELECTIVE 72.1
116 23-Oct-1975 26-Feb-1999 11-Jan-2000 11-Jan-2000 21-Sep-2009 DEATH (SURVIVORS BENEFITS) 74.7
117 6-Jun-1981 5-Jun-1996 5-Jun-1996 9-Oct-1998 ELECTIVE 69.6
118 29-Jan-1970 14-Jan-1994 14-Jan-1994 14-Jan-1994 10-Dec-1994 ELECTIVE 65.9
119 25-Dec-2003 27-Mar-2021 27-Mar-2021
120 11-Aug-2017 16-Jul-2033 16-Jul-2033
121 19-May-1985 18-May-2000 18-Aug-1996 18-Aug-1996 18-Aug-2001 COMPULSORY 75.0
122 6-Mar-1980 7-Mar-1995 15-Jun-1994 8-Oct-1991 DISABILITY 67.3
123 28-Apr-2005 27-Apr-2020 27-Apr-2020 27-Apr-2020
124 9-Sep-1964 1-Dec-1977 1-Dec-1977 9-Aug-1982 1-Dec-1982 COMPULSORY 75.0
125 27-Jun-2010 30-Mar-2026 30-Mar-2026
126 21-Jan-1999 29-Apr-2014 29-Apr-2014 23-Jul-2014 ELECTIVE 65.0
127 18-Apr-1999 18-Apr-2014 18-Apr-2014 18-Apr-2014
128 28-Aug-1971 28-Aug-1986 28-Aug-1986 13-May-1978 DISABILITY 59.2
129 29-Sep-1984 1-Apr-1996 1-Apr-1996 1-Apr-1996 2-Apr-2001 COMPULSORY 75.0
130 9-Jun-1961 3-Dec-1979 3-Dec-1979 3-Dec-1989 COMPULSORY 75.0
131 8-Oct-2015 8-Oct-2030 8-Oct-2030
132 21-Jan-1964 21-Jan-1979 21-Jan-1979 9-Jan-1986 21-Sep-1988 COMPULSORY 75.0
133 2-Oct-2011 13-Feb-2020 13-Feb-2020 COMPULSORY 75.0
134 25-Jan-1951 25-Jan-1966 20-Oct-1964 29-May-1952 DEATH (SURVIVORS BENEFITS) 57.6
135 9-Sep-1999 23-Mar-2012 9-Sep-2009 7-Dec-2001 DEATH (SURVIVORS BENEFITS) 64.7
136 22-Aug-2009 12-Feb-2018 12-Feb-2018 COMPULSORY 75.0
137 12-Jul-2018 12-Jul-2033 12-Jul-2033
138 3-Feb-2007 28-Sep-2018 3-Feb-2017 9-Sep-2017 Early Retirement 73.9
139 11-Apr-1953 17-Oct-1977 17-Oct-1977 10-Apr-1980 17-Oct-1987 COMPULSORY 75.0
140 14-Nov-2010 24-Nov-2031 24-Nov-2031
141 7-Mar-1993 21-Mar-2013 21-Mar-2013 11-Apr-2019
142 19-May-1973 14-Dec-1986 19-May-1983 10-Apr-1979 RESIGNATION (RPC) 67.3
143 17-Dec-1988 17-Dec-2003 17-Dec-2003 17-Dec-2003 9-Oct-2008 ELECTIVE 71.4
144 24-Oct-2002 21-Dec-2012 24-Oct-2012 21-Dec-2012 COMPULSORY 75.0
145 5-May-1973 15-Feb-1992 15-Feb-1992 15-Feb-1992 15-Feb-2002 COMPULSORY 75.0
146 8-May-1966 8-May-1981 8-May-1981 8-May-1981 10-Apr-1986 ELECTIVE 74.1
147 9-Jan-1960 9-Jan-1975 8-Nov-1971 28-Oct-1975 8-Nov-1976 COMPULSORY 75.0
148 13-Sep-2002 21-Feb-2020 21-Feb-2020 21-Feb-2020
149 29-Mar-1961 28-Mar-1976 7-Apr-1971 6-Apr-1976 COMPULSORY 75.0
150 9-Jul-1977 26-Feb-1999 7-Oct-2000 10-Dec-2001 7-Oct-2010 COMPULSORY 75.0
151 7-Dec-2005 10-Apr-2021 10-Apr-2021
152 27-Sep-2015 27-Sep-2030 27-Sep-2030
153 15-Feb-2019 15-Feb-2034 31-May-2032
154 12-Jan-1990 19-Jul-2005 23-Jan-2006 23-Jan-2006 9-Aug-2006 ELECTIVE 65.5
155 17-Oct-1984 13-Jan-2000 8-Apr-2000 29-May-2005 11-Jul-2009 ELECTIVE 74.3
156 2-Oct-1992 2-Oct-2007 9-Dec-2015 ELECTIVE 74.7
157 30-May-2008 23-Mar-2025 23-Mar-2025
158 27-Jan-2017 25-Feb-2034 25-Feb-2034
159 27-Jan-2017 30-Jul-2032 30-Jul-2032
160 5-Sep-2015 5-Sep-2030 5-Sep-2030
161 8-Jul-1999 27-Jul-2015 27-Jul-2015 27-Jul-2015
162 8-Feb-1964 9-Jan-1990 9-Jan-1990 20-Feb-1992 9-Jan-2000 COMPULSORY 75.0
163 21-Sep-2014 21-Sep-2029 23-Oct-2024
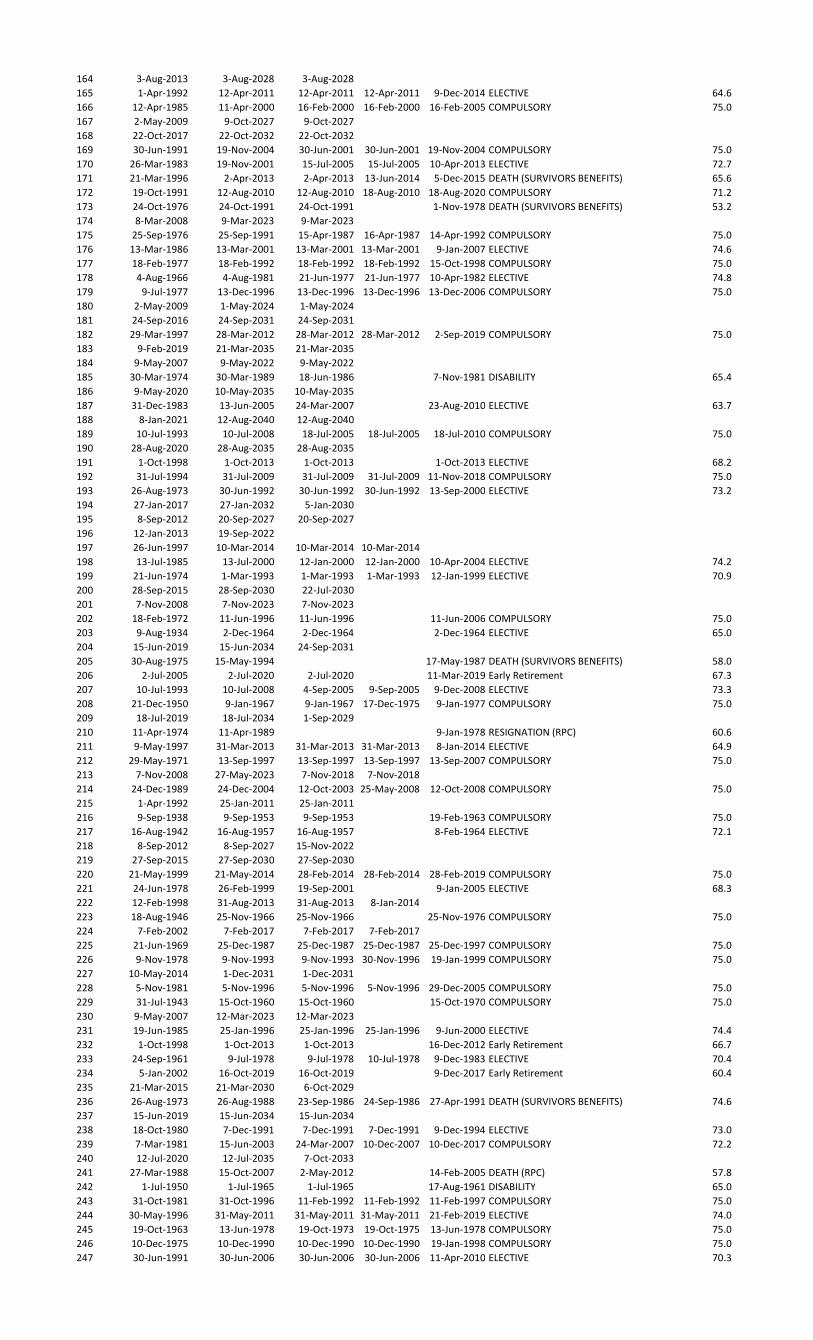
164 3-Aug-2013 3-Aug-2028 3-Aug-2028
165 1-Apr-1992 12-Apr-2011 12-Apr-2011 12-Apr-2011 9-Dec-2014 ELECTIVE 64.6
166 12-Apr-1985 11-Apr-2000 16-Feb-2000 16-Feb-2000 16-Feb-2005 COMPULSORY 75.0
167 2-May-2009 9-Oct-2027 9-Oct-2027
168 22-Oct-2017 22-Oct-2032 22-Oct-2032
169 30-Jun-1991 19-Nov-2004 30-Jun-2001 30-Jun-2001 19-Nov-2004 COMPULSORY 75.0
170 26-Mar-1983 19-Nov-2001 15-Jul-2005 15-Jul-2005 10-Apr-2013 ELECTIVE 72.7
171 21-Mar-1996 2-Apr-2013 2-Apr-2013 13-Jun-2014 5-Dec-2015 DEATH (SURVIVORS BENEFITS) 65.6
172 19-Oct-1991 12-Aug-2010 12-Aug-2010 18-Aug-2010 18-Aug-2020 COMPULSORY 71.2
173 24-Oct-1976 24-Oct-1991 24-Oct-1991 1-Nov-1978 DEATH (SURVIVORS BENEFITS) 53.2
174 8-Mar-2008 9-Mar-2023 9-Mar-2023
175 25-Sep-1976 25-Sep-1991 15-Apr-1987 16-Apr-1987 14-Apr-1992 COMPULSORY 75.0
176 13-Mar-1986 13-Mar-2001 13-Mar-2001 13-Mar-2001 9-Jan-2007 ELECTIVE 74.6
177 18-Feb-1977 18-Feb-1992 18-Feb-1992 18-Feb-1992 15-Oct-1998 COMPULSORY 75.0
178 4-Aug-1966 4-Aug-1981 21-Jun-1977 21-Jun-1977 10-Apr-1982 ELECTIVE 74.8
179 9-Jul-1977 13-Dec-1996 13-Dec-1996 13-Dec-1996 13-Dec-2006 COMPULSORY 75.0
180 2-May-2009 1-May-2024 1-May-2024
181 24-Sep-2016 24-Sep-2031 24-Sep-2031
182 29-Mar-1997 28-Mar-2012 28-Mar-2012 28-Mar-2012 2-Sep-2019 COMPULSORY 75.0
183 9-Feb-2019 21-Mar-2035 21-Mar-2035
184 9-May-2007 9-May-2022 9-May-2022
185 30-Mar-1974 30-Mar-1989 18-Jun-1986 7-Nov-1981 DISABILITY 65.4
186 9-May-2020 10-May-2035 10-May-2035
187 31-Dec-1983 13-Jun-2005 24-Mar-2007 23-Aug-2010 ELECTIVE 63.7
188 8-Jan-2021 12-Aug-2040 12-Aug-2040
189 10-Jul-1993 10-Jul-2008 18-Jul-2005 18-Jul-2005 18-Jul-2010 COMPULSORY 75.0
190 28-Aug-2020 28-Aug-2035 28-Aug-2035
191 1-Oct-1998 1-Oct-2013 1-Oct-2013 1-Oct-2013 ELECTIVE 68.2
192 31-Jul-1994 31-Jul-2009 31-Jul-2009 31-Jul-2009 11-Nov-2018 COMPULSORY 75.0
193 26-Aug-1973 30-Jun-1992 30-Jun-1992 30-Jun-1992 13-Sep-2000 ELECTIVE 73.2
194 27-Jan-2017 27-Jan-2032 5-Jan-2030
195 8-Sep-2012 20-Sep-2027 20-Sep-2027
196 12-Jan-2013 19-Sep-2022
197 26-Jun-1997 10-Mar-2014 10-Mar-2014 10-Mar-2014
198 13-Jul-1985 13-Jul-2000 12-Jan-2000 12-Jan-2000 10-Apr-2004 ELECTIVE 74.2
199 21-Jun-1974 1-Mar-1993 1-Mar-1993 1-Mar-1993 12-Jan-1999 ELECTIVE 70.9
200 28-Sep-2015 28-Sep-2030 22-Jul-2030
201 7-Nov-2008 7-Nov-2023 7-Nov-2023
202 18-Feb-1972 11-Jun-1996 11-Jun-1996 11-Jun-2006 COMPULSORY 75.0
203 9-Aug-1934 2-Dec-1964 2-Dec-1964 2-Dec-1964 ELECTIVE 65.0
204 15-Jun-2019 15-Jun-2034 24-Sep-2031
205 30-Aug-1975 15-May-1994 17-May-1987 DEATH (SURVIVORS BENEFITS) 58.0
206 2-Jul-2005 2-Jul-2020 2-Jul-2020 11-Mar-2019 Early Retirement 67.3
207 10-Jul-1993 10-Jul-2008 4-Sep-2005 9-Sep-2005 9-Dec-2008 ELECTIVE 73.3
208 21-Dec-1950 9-Jan-1967 9-Jan-1967 17-Dec-1975 9-Jan-1977 COMPULSORY 75.0
209 18-Jul-2019 18-Jul-2034 1-Sep-2029
210 11-Apr-1974 11-Apr-1989 9-Jan-1978 RESIGNATION (RPC) 60.6
211 9-May-1997 31-Mar-2013 31-Mar-2013 31-Mar-2013 8-Jan-2014 ELECTIVE 64.9
212 29-May-1971 13-Sep-1997 13-Sep-1997 13-Sep-1997 13-Sep-2007 COMPULSORY 75.0
213 7-Nov-2008 27-May-2023 7-Nov-2018 7-Nov-2018
214 24-Dec-1989 24-Dec-2004 12-Oct-2003 25-May-2008 12-Oct-2008 COMPULSORY 75.0
215 1-Apr-1992 25-Jan-2011 25-Jan-2011
216 9-Sep-1938 9-Sep-1953 9-Sep-1953 19-Feb-1963 COMPULSORY 75.0
217 16-Aug-1942 16-Aug-1957 16-Aug-1957 8-Feb-1964 ELECTIVE 72.1
218 8-Sep-2012 8-Sep-2027 15-Nov-2022
219 27-Sep-2015 27-Sep-2030 27-Sep-2030
220 21-May-1999 21-May-2014 28-Feb-2014 28-Feb-2014 28-Feb-2019 COMPULSORY 75.0
221 24-Jun-1978 26-Feb-1999 19-Sep-2001 9-Jan-2005 ELECTIVE 68.3
222 12-Feb-1998 31-Aug-2013 31-Aug-2013 8-Jan-2014
223 18-Aug-1946 25-Nov-1966 25-Nov-1966 25-Nov-1976 COMPULSORY 75.0
224 7-Feb-2002 7-Feb-2017 7-Feb-2017 7-Feb-2017
225 21-Jun-1969 25-Dec-1987 25-Dec-1987 25-Dec-1987 25-Dec-1997 COMPULSORY 75.0
226 9-Nov-1978 9-Nov-1993 9-Nov-1993 30-Nov-1996 19-Jan-1999 COMPULSORY 75.0
227 10-May-2014 1-Dec-2031 1-Dec-2031
228 5-Nov-1981 5-Nov-1996 5-Nov-1996 5-Nov-1996 29-Dec-2005 COMPULSORY 75.0
229 31-Jul-1943 15-Oct-1960 15-Oct-1960 15-Oct-1970 COMPULSORY 75.0
230 9-May-2007 12-Mar-2023 12-Mar-2023
231 19-Jun-1985 25-Jan-1996 25-Jan-1996 25-Jan-1996 9-Jun-2000 ELECTIVE 74.4
232 1-Oct-1998 1-Oct-2013 1-Oct-2013 16-Dec-2012 Early Retirement 66.7
233 24-Sep-1961 9-Jul-1978 9-Jul-1978 10-Jul-1978 9-Dec-1983 ELECTIVE 70.4
234 5-Jan-2002 16-Oct-2019 16-Oct-2019 9-Dec-2017 Early Retirement 60.4
235 21-Mar-2015 21-Mar-2030 6-Oct-2029
236 26-Aug-1973 26-Aug-1988 23-Sep-1986 24-Sep-1986 27-Apr-1991 DEATH (SURVIVORS BENEFITS) 74.6
237 15-Jun-2019 15-Jun-2034 15-Jun-2034
238 18-Oct-1980 7-Dec-1991 7-Dec-1991 7-Dec-1991 9-Dec-1994 ELECTIVE 73.0
239 7-Mar-1981 15-Jun-2003 24-Mar-2007 10-Dec-2007 10-Dec-2017 COMPULSORY 72.2
240 12-Jul-2020 12-Jul-2035 7-Oct-2033
241 27-Mar-1988 15-Oct-2007 2-May-2012 14-Feb-2005 DEATH (RPC) 57.8
242 1-Jul-1950 1-Jul-1965 1-Jul-1965 17-Aug-1961 DISABILITY 65.0
243 31-Oct-1981 31-Oct-1996 11-Feb-1992 11-Feb-1992 11-Feb-1997 COMPULSORY 75.0
244 30-May-1996 31-May-2011 31-May-2011 31-May-2011 21-Feb-2019 ELECTIVE 74.0
245 19-Oct-1963 13-Jun-1978 19-Oct-1973 19-Oct-1975 13-Jun-1978 COMPULSORY 75.0
246 10-Dec-1975 10-Dec-1990 10-Dec-1990 10-Dec-1990 19-Jan-1998 COMPULSORY 75.0
247 30-Jun-1991 30-Jun-2006 30-Jun-2006 30-Jun-2006 11-Apr-2010 ELECTIVE 70.3
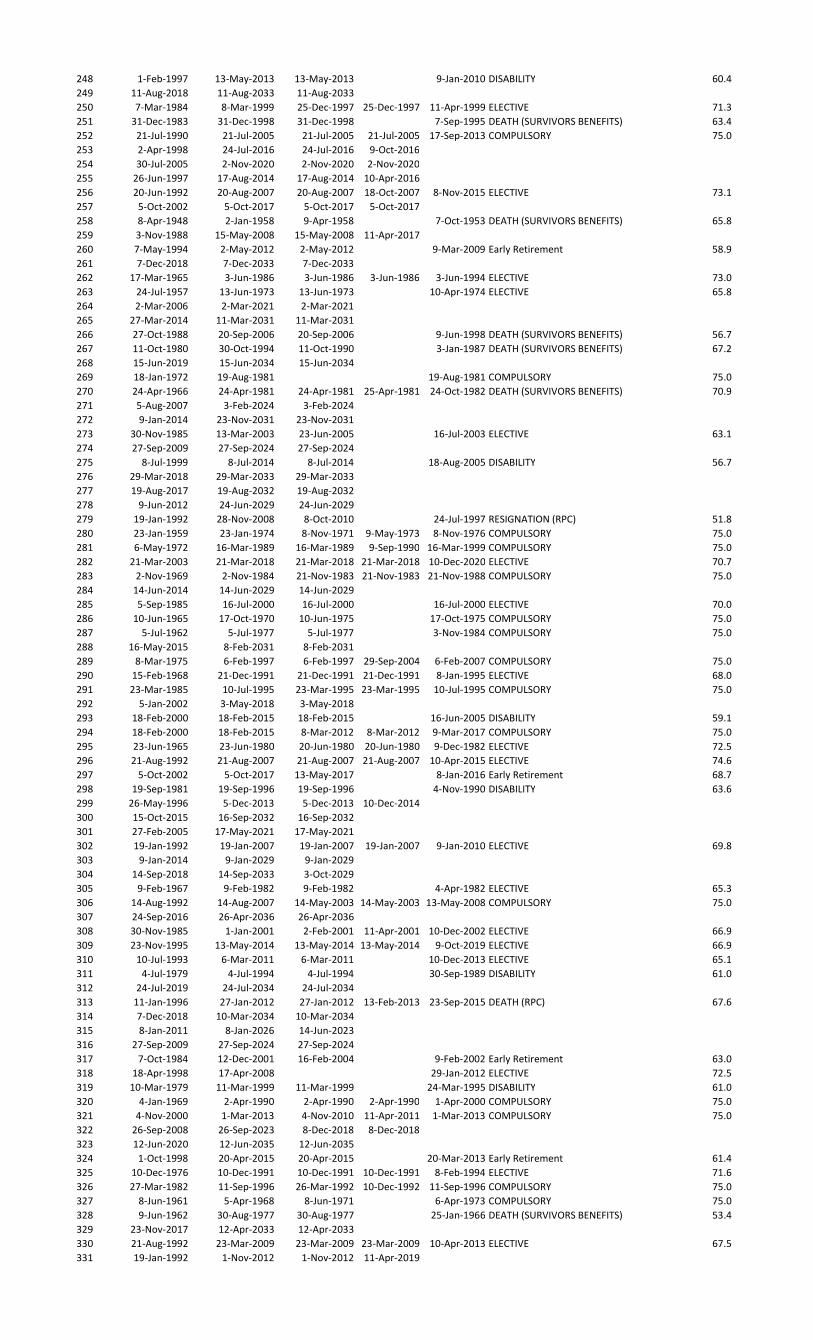
248 1-Feb-1997 13-May-2013 13-May-2013 9-Jan-2010 DISABILITY 60.4
249 11-Aug-2018 11-Aug-2033 11-Aug-2033
250 7-Mar-1984 8-Mar-1999 25-Dec-1997 25-Dec-1997 11-Apr-1999 ELECTIVE 71.3
251 31-Dec-1983 31-Dec-1998 31-Dec-1998 7-Sep-1995 DEATH (SURVIVORS BENEFITS) 63.4
252 21-Jul-1990 21-Jul-2005 21-Jul-2005 21-Jul-2005 17-Sep-2013 COMPULSORY 75.0
253 2-Apr-1998 24-Jul-2016 24-Jul-2016 9-Oct-2016
254 30-Jul-2005 2-Nov-2020 2-Nov-2020 2-Nov-2020
255 26-Jun-1997 17-Aug-2014 17-Aug-2014 10-Apr-2016
256 20-Jun-1992 20-Aug-2007 20-Aug-2007 18-Oct-2007 8-Nov-2015 ELECTIVE 73.1
257 5-Oct-2002 5-Oct-2017 5-Oct-2017 5-Oct-2017
258 8-Apr-1948 2-Jan-1958 9-Apr-1958 7-Oct-1953 DEATH (SURVIVORS BENEFITS) 65.8
259 3-Nov-1988 15-May-2008 15-May-2008 11-Apr-2017
260 7-May-1994 2-May-2012 2-May-2012 9-Mar-2009 Early Retirement 58.9
261 7-Dec-2018 7-Dec-2033 7-Dec-2033
262 17-Mar-1965 3-Jun-1986 3-Jun-1986 3-Jun-1986 3-Jun-1994 ELECTIVE 73.0
263 24-Jul-1957 13-Jun-1973 13-Jun-1973 10-Apr-1974 ELECTIVE 65.8
264 2-Mar-2006 2-Mar-2021 2-Mar-2021
265 27-Mar-2014 11-Mar-2031 11-Mar-2031
266 27-Oct-1988 20-Sep-2006 20-Sep-2006 9-Jun-1998 DEATH (SURVIVORS BENEFITS) 56.7
267 11-Oct-1980 30-Oct-1994 11-Oct-1990 3-Jan-1987 DEATH (SURVIVORS BENEFITS) 67.2
268 15-Jun-2019 15-Jun-2034 15-Jun-2034
269 18-Jan-1972 19-Aug-1981 19-Aug-1981 COMPULSORY 75.0
270 24-Apr-1966 24-Apr-1981 24-Apr-1981 25-Apr-1981 24-Oct-1982 DEATH (SURVIVORS BENEFITS) 70.9
271 5-Aug-2007 3-Feb-2024 3-Feb-2024
272 9-Jan-2014 23-Nov-2031 23-Nov-2031
273 30-Nov-1985 13-Mar-2003 23-Jun-2005 16-Jul-2003 ELECTIVE 63.1
274 27-Sep-2009 27-Sep-2024 27-Sep-2024
275 8-Jul-1999 8-Jul-2014 8-Jul-2014 18-Aug-2005 DISABILITY 56.7
276 29-Mar-2018 29-Mar-2033 29-Mar-2033
277 19-Aug-2017 19-Aug-2032 19-Aug-2032
278 9-Jun-2012 24-Jun-2029 24-Jun-2029
279 19-Jan-1992 28-Nov-2008 8-Oct-2010 24-Jul-1997 RESIGNATION (RPC) 51.8
280 23-Jan-1959 23-Jan-1974 8-Nov-1971 9-May-1973 8-Nov-1976 COMPULSORY 75.0
281 6-May-1972 16-Mar-1989 16-Mar-1989 9-Sep-1990 16-Mar-1999 COMPULSORY 75.0
282 21-Mar-2003 21-Mar-2018 21-Mar-2018 21-Mar-2018 10-Dec-2020 ELECTIVE 70.7
283 2-Nov-1969 2-Nov-1984 21-Nov-1983 21-Nov-1983 21-Nov-1988 COMPULSORY 75.0
284 14-Jun-2014 14-Jun-2029 14-Jun-2029
285 5-Sep-1985 16-Jul-2000 16-Jul-2000 16-Jul-2000 ELECTIVE 70.0
286 10-Jun-1965 17-Oct-1970 10-Jun-1975 17-Oct-1975 COMPULSORY 75.0
287 5-Jul-1962 5-Jul-1977 5-Jul-1977 3-Nov-1984 COMPULSORY 75.0
288 16-May-2015 8-Feb-2031 8-Feb-2031
289 8-Mar-1975 6-Feb-1997 6-Feb-1997 29-Sep-2004 6-Feb-2007 COMPULSORY 75.0
290 15-Feb-1968 21-Dec-1991 21-Dec-1991 21-Dec-1991 8-Jan-1995 ELECTIVE 68.0
291 23-Mar-1985 10-Jul-1995 23-Mar-1995 23-Mar-1995 10-Jul-1995 COMPULSORY 75.0
292 5-Jan-2002 3-May-2018 3-May-2018
293 18-Feb-2000 18-Feb-2015 18-Feb-2015 16-Jun-2005 DISABILITY 59.1
294 18-Feb-2000 18-Feb-2015 8-Mar-2012 8-Mar-2012 9-Mar-2017 COMPULSORY 75.0
295 23-Jun-1965 23-Jun-1980 20-Jun-1980 20-Jun-1980 9-Dec-1982 ELECTIVE 72.5
296 21-Aug-1992 21-Aug-2007 21-Aug-2007 21-Aug-2007 10-Apr-2015 ELECTIVE 74.6
297 5-Oct-2002 5-Oct-2017 13-May-2017 8-Jan-2016 Early Retirement 68.7
298 19-Sep-1981 19-Sep-1996 19-Sep-1996 4-Nov-1990 DISABILITY 63.6
299 26-May-1996 5-Dec-2013 5-Dec-2013 10-Dec-2014
300 15-Oct-2015 16-Sep-2032 16-Sep-2032
301 27-Feb-2005 17-May-2021 17-May-2021
302 19-Jan-1992 19-Jan-2007 19-Jan-2007 19-Jan-2007 9-Jan-2010 ELECTIVE 69.8
303 9-Jan-2014 9-Jan-2029 9-Jan-2029
304 14-Sep-2018 14-Sep-2033 3-Oct-2029
305 9-Feb-1967 9-Feb-1982 9-Feb-1982 4-Apr-1982 ELECTIVE 65.3
306 14-Aug-1992 14-Aug-2007 14-May-2003 14-May-2003 13-May-2008 COMPULSORY 75.0
307 24-Sep-2016 26-Apr-2036 26-Apr-2036
308 30-Nov-1985 1-Jan-2001 2-Feb-2001 11-Apr-2001 10-Dec-2002 ELECTIVE 66.9
309 23-Nov-1995 13-May-2014 13-May-2014 13-May-2014 9-Oct-2019 ELECTIVE 66.9
310 10-Jul-1993 6-Mar-2011 6-Mar-2011 10-Dec-2013 ELECTIVE 65.1
311 4-Jul-1979 4-Jul-1994 4-Jul-1994 30-Sep-1989 DISABILITY 61.0
312 24-Jul-2019 24-Jul-2034 24-Jul-2034
313 11-Jan-1996 27-Jan-2012 27-Jan-2012 13-Feb-2013 23-Sep-2015 DEATH (RPC) 67.6
314 7-Dec-2018 10-Mar-2034 10-Mar-2034
315 8-Jan-2011 8-Jan-2026 14-Jun-2023
316 27-Sep-2009 27-Sep-2024 27-Sep-2024
317 7-Oct-1984 12-Dec-2001 16-Feb-2004 9-Feb-2002 Early Retirement 63.0
318 18-Apr-1998 17-Apr-2008 29-Jan-2012 ELECTIVE 72.5
319 10-Mar-1979 11-Mar-1999 11-Mar-1999 24-Mar-1995 DISABILITY 61.0
320 4-Jan-1969 2-Apr-1990 2-Apr-1990 2-Apr-1990 1-Apr-2000 COMPULSORY 75.0
321 4-Nov-2000 1-Mar-2013 4-Nov-2010 11-Apr-2011 1-Mar-2013 COMPULSORY 75.0
322 26-Sep-2008 26-Sep-2023 8-Dec-2018 8-Dec-2018
323 12-Jun-2020 12-Jun-2035 12-Jun-2035
324 1-Oct-1998 20-Apr-2015 20-Apr-2015 20-Mar-2013 Early Retirement 61.4
325 10-Dec-1976 10-Dec-1991 10-Dec-1991 10-Dec-1991 8-Feb-1994 ELECTIVE 71.6
326 27-Mar-1982 11-Sep-1996 26-Mar-1992 10-Dec-1992 11-Sep-1996 COMPULSORY 75.0
327 8-Jun-1961 5-Apr-1968 8-Jun-1971 6-Apr-1973 COMPULSORY 75.0
328 9-Jun-1962 30-Aug-1977 30-Aug-1977 25-Jan-1966 DEATH (SURVIVORS BENEFITS) 53.4
329 23-Nov-2017 12-Apr-2033 12-Apr-2033
330 21-Aug-1992 23-Mar-2009 23-Mar-2009 23-Mar-2009 10-Apr-2013 ELECTIVE 67.5
331 19-Jan-1992 1-Nov-2012 1-Nov-2012 11-Apr-2019
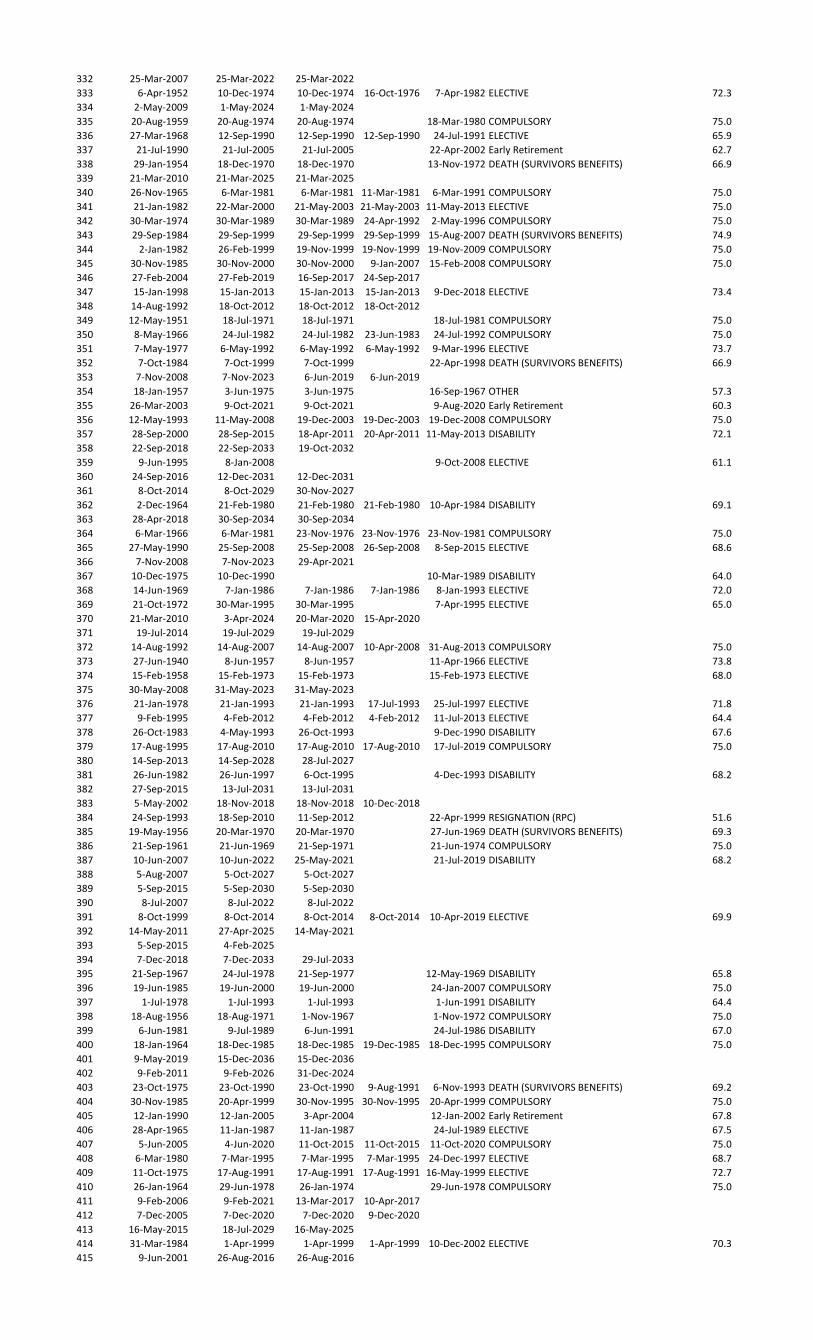
332 25-Mar-2007 25-Mar-2022 25-Mar-2022
333 6-Apr-1952 10-Dec-1974 10-Dec-1974 16-Oct-1976 7-Apr-1982 ELECTIVE 72.3
334 2-May-2009 1-May-2024 1-May-2024
335 20-Aug-1959 20-Aug-1974 20-Aug-1974 18-Mar-1980 COMPULSORY 75.0
336 27-Mar-1968 12-Sep-1990 12-Sep-1990 12-Sep-1990 24-Jul-1991 ELECTIVE 65.9
337 21-Jul-1990 21-Jul-2005 21-Jul-2005 22-Apr-2002 Early Retirement 62.7
338 29-Jan-1954 18-Dec-1970 18-Dec-1970 13-Nov-1972 DEATH (SURVIVORS BENEFITS) 66.9
339 21-Mar-2010 21-Mar-2025 21-Mar-2025
340 26-Nov-1965 6-Mar-1981 6-Mar-1981 11-Mar-1981 6-Mar-1991 COMPULSORY 75.0
341 21-Jan-1982 22-Mar-2000 21-May-2003 21-May-2003 11-May-2013 ELECTIVE 75.0
342 30-Mar-1974 30-Mar-1989 30-Mar-1989 24-Apr-1992 2-May-1996 COMPULSORY 75.0
343 29-Sep-1984 29-Sep-1999 29-Sep-1999 29-Sep-1999 15-Aug-2007 DEATH (SURVIVORS BENEFITS) 74.9
344 2-Jan-1982 26-Feb-1999 19-Nov-1999 19-Nov-1999 19-Nov-2009 COMPULSORY 75.0
345 30-Nov-1985 30-Nov-2000 30-Nov-2000 9-Jan-2007 15-Feb-2008 COMPULSORY 75.0
346 27-Feb-2004 27-Feb-2019 16-Sep-2017 24-Sep-2017
347 15-Jan-1998 15-Jan-2013 15-Jan-2013 15-Jan-2013 9-Dec-2018 ELECTIVE 73.4
348 14-Aug-1992 18-Oct-2012 18-Oct-2012 18-Oct-2012
349 12-May-1951 18-Jul-1971 18-Jul-1971 18-Jul-1981 COMPULSORY 75.0
350 8-May-1966 24-Jul-1982 24-Jul-1982 23-Jun-1983 24-Jul-1992 COMPULSORY 75.0
351 7-May-1977 6-May-1992 6-May-1992 6-May-1992 9-Mar-1996 ELECTIVE 73.7
352 7-Oct-1984 7-Oct-1999 7-Oct-1999 22-Apr-1998 DEATH (SURVIVORS BENEFITS) 66.9
353 7-Nov-2008 7-Nov-2023 6-Jun-2019 6-Jun-2019
354 18-Jan-1957 3-Jun-1975 3-Jun-1975 16-Sep-1967 OTHER 57.3
355 26-Mar-2003 9-Oct-2021 9-Oct-2021 9-Aug-2020 Early Retirement 60.3
356 12-May-1993 11-May-2008 19-Dec-2003 19-Dec-2003 19-Dec-2008 COMPULSORY 75.0
357 28-Sep-2000 28-Sep-2015 18-Apr-2011 20-Apr-2011 11-May-2013 DISABILITY 72.1
358 22-Sep-2018 22-Sep-2033 19-Oct-2032
359 9-Jun-1995 8-Jan-2008 9-Oct-2008 ELECTIVE 61.1
360 24-Sep-2016 12-Dec-2031 12-Dec-2031
361 8-Oct-2014 8-Oct-2029 30-Nov-2027
362 2-Dec-1964 21-Feb-1980 21-Feb-1980 21-Feb-1980 10-Apr-1984 DISABILITY 69.1
363 28-Apr-2018 30-Sep-2034 30-Sep-2034
364 6-Mar-1966 6-Mar-1981 23-Nov-1976 23-Nov-1976 23-Nov-1981 COMPULSORY 75.0
365 27-May-1990 25-Sep-2008 25-Sep-2008 26-Sep-2008 8-Sep-2015 ELECTIVE 68.6
366 7-Nov-2008 7-Nov-2023 29-Apr-2021
367 10-Dec-1975 10-Dec-1990 10-Mar-1989 DISABILITY 64.0
368 14-Jun-1969 7-Jan-1986 7-Jan-1986 7-Jan-1986 8-Jan-1993 ELECTIVE 72.0
369 21-Oct-1972 30-Mar-1995 30-Mar-1995 7-Apr-1995 ELECTIVE 65.0
370 21-Mar-2010 3-Apr-2024 20-Mar-2020 15-Apr-2020
371 19-Jul-2014 19-Jul-2029 19-Jul-2029
372 14-Aug-1992 14-Aug-2007 14-Aug-2007 10-Apr-2008 31-Aug-2013 COMPULSORY 75.0
373 27-Jun-1940 8-Jun-1957 8-Jun-1957 11-Apr-1966 ELECTIVE 73.8
374 15-Feb-1958 15-Feb-1973 15-Feb-1973 15-Feb-1973 ELECTIVE 68.0
375 30-May-2008 31-May-2023 31-May-2023
376 21-Jan-1978 21-Jan-1993 21-Jan-1993 17-Jul-1993 25-Jul-1997 ELECTIVE 71.8
377 9-Feb-1995 4-Feb-2012 4-Feb-2012 4-Feb-2012 11-Jul-2013 ELECTIVE 64.4
378 26-Oct-1983 4-May-1993 26-Oct-1993 9-Dec-1990 DISABILITY 67.6
379 17-Aug-1995 17-Aug-2010 17-Aug-2010 17-Aug-2010 17-Jul-2019 COMPULSORY 75.0
380 14-Sep-2013 14-Sep-2028 28-Jul-2027
381 26-Jun-1982 26-Jun-1997 6-Oct-1995 4-Dec-1993 DISABILITY 68.2
382 27-Sep-2015 13-Jul-2031 13-Jul-2031
383 5-May-2002 18-Nov-2018 18-Nov-2018 10-Dec-2018
384 24-Sep-1993 18-Sep-2010 11-Sep-2012 22-Apr-1999 RESIGNATION (RPC) 51.6
385 19-May-1956 20-Mar-1970 20-Mar-1970 27-Jun-1969 DEATH (SURVIVORS BENEFITS) 69.3
386 21-Sep-1961 21-Jun-1969 21-Sep-1971 21-Jun-1974 COMPULSORY 75.0
387 10-Jun-2007 10-Jun-2022 25-May-2021 21-Jul-2019 DISABILITY 68.2
388 5-Aug-2007 5-Oct-2027 5-Oct-2027
389 5-Sep-2015 5-Sep-2030 5-Sep-2030
390 8-Jul-2007 8-Jul-2022 8-Jul-2022
391 8-Oct-1999 8-Oct-2014 8-Oct-2014 8-Oct-2014 10-Apr-2019 ELECTIVE 69.9
392 14-May-2011 27-Apr-2025 14-May-2021
393 5-Sep-2015 4-Feb-2025
394 7-Dec-2018 7-Dec-2033 29-Jul-2033
395 21-Sep-1967 24-Jul-1978 21-Sep-1977 12-May-1969 DISABILITY 65.8
396 19-Jun-1985 19-Jun-2000 19-Jun-2000 24-Jan-2007 COMPULSORY 75.0
397 1-Jul-1978 1-Jul-1993 1-Jul-1993 1-Jun-1991 DISABILITY 64.4
398 18-Aug-1956 18-Aug-1971 1-Nov-1967 1-Nov-1972 COMPULSORY 75.0
399 6-Jun-1981 9-Jul-1989 6-Jun-1991 24-Jul-1986 DISABILITY 67.0
400 18-Jan-1964 18-Dec-1985 18-Dec-1985 19-Dec-1985 18-Dec-1995 COMPULSORY 75.0
401 9-May-2019 15-Dec-2036 15-Dec-2036
402 9-Feb-2011 9-Feb-2026 31-Dec-2024
403 23-Oct-1975 23-Oct-1990 23-Oct-1990 9-Aug-1991 6-Nov-1993 DEATH (SURVIVORS BENEFITS) 69.2
404 30-Nov-1985 20-Apr-1999 30-Nov-1995 30-Nov-1995 20-Apr-1999 COMPULSORY 75.0
405 12-Jan-1990 12-Jan-2005 3-Apr-2004 12-Jan-2002 Early Retirement 67.8
406 28-Apr-1965 11-Jan-1987 11-Jan-1987 24-Jul-1989 ELECTIVE 67.5
407 5-Jun-2005 4-Jun-2020 11-Oct-2015 11-Oct-2015 11-Oct-2020 COMPULSORY 75.0
408 6-Mar-1980 7-Mar-1995 7-Mar-1995 7-Mar-1995 24-Dec-1997 ELECTIVE 68.7
409 11-Oct-1975 17-Aug-1991 17-Aug-1991 17-Aug-1991 16-May-1999 ELECTIVE 72.7
410 26-Jan-1964 29-Jun-1978 26-Jan-1974 29-Jun-1978 COMPULSORY 75.0
411 9-Feb-2006 9-Feb-2021 13-Mar-2017 10-Apr-2017
412 7-Dec-2005 7-Dec-2020 7-Dec-2020 9-Dec-2020
413 16-May-2015 18-Jul-2029 16-May-2025
414 31-Mar-1984 1-Apr-1999 1-Apr-1999 1-Apr-1999 10-Dec-2002 ELECTIVE 70.3
415 9-Jun-2001 26-Aug-2016 26-Aug-2016
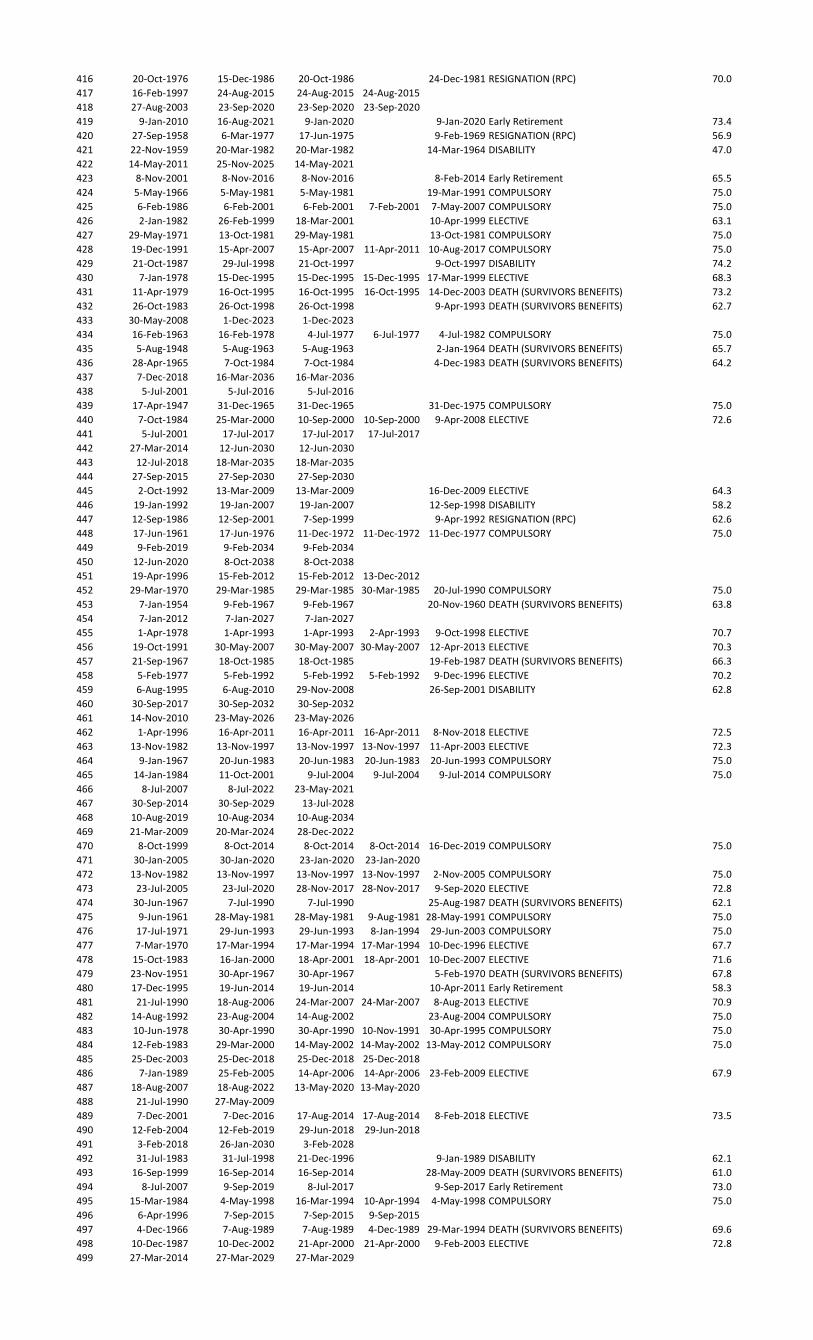
416 20-Oct-1976 15-Dec-1986 20-Oct-1986 24-Dec-1981 RESIGNATION (RPC) 70.0
417 16-Feb-1997 24-Aug-2015 24-Aug-2015 24-Aug-2015
418 27-Aug-2003 23-Sep-2020 23-Sep-2020 23-Sep-2020
419 9-Jan-2010 16-Aug-2021 9-Jan-2020 9-Jan-2020 Early Retirement 73.4
420 27-Sep-1958 6-Mar-1977 17-Jun-1975 9-Feb-1969 RESIGNATION (RPC) 56.9
421 22-Nov-1959 20-Mar-1982 20-Mar-1982 14-Mar-1964 DISABILITY 47.0
422 14-May-2011 25-Nov-2025 14-May-2021
423 8-Nov-2001 8-Nov-2016 8-Nov-2016 8-Feb-2014 Early Retirement 65.5
424 5-May-1966 5-May-1981 5-May-1981 19-Mar-1991 COMPULSORY 75.0
425 6-Feb-1986 6-Feb-2001 6-Feb-2001 7-Feb-2001 7-May-2007 COMPULSORY 75.0
426 2-Jan-1982 26-Feb-1999 18-Mar-2001 10-Apr-1999 ELECTIVE 63.1
427 29-May-1971 13-Oct-1981 29-May-1981 13-Oct-1981 COMPULSORY 75.0
428 19-Dec-1991 15-Apr-2007 15-Apr-2007 11-Apr-2011 10-Aug-2017 COMPULSORY 75.0
429 21-Oct-1987 29-Jul-1998 21-Oct-1997 9-Oct-1997 DISABILITY 74.2
430 7-Jan-1978 15-Dec-1995 15-Dec-1995 15-Dec-1995 17-Mar-1999 ELECTIVE 68.3
431 11-Apr-1979 16-Oct-1995 16-Oct-1995 16-Oct-1995 14-Dec-2003 DEATH (SURVIVORS BENEFITS) 73.2
432 26-Oct-1983 26-Oct-1998 26-Oct-1998 9-Apr-1993 DEATH (SURVIVORS BENEFITS) 62.7
433 30-May-2008 1-Dec-2023 1-Dec-2023
434 16-Feb-1963 16-Feb-1978 4-Jul-1977 6-Jul-1977 4-Jul-1982 COMPULSORY 75.0
435 5-Aug-1948 5-Aug-1963 5-Aug-1963 2-Jan-1964 DEATH (SURVIVORS BENEFITS) 65.7
436 28-Apr-1965 7-Oct-1984 7-Oct-1984 4-Dec-1983 DEATH (SURVIVORS BENEFITS) 64.2
437 7-Dec-2018 16-Mar-2036 16-Mar-2036
438 5-Jul-2001 5-Jul-2016 5-Jul-2016
439 17-Apr-1947 31-Dec-1965 31-Dec-1965 31-Dec-1975 COMPULSORY 75.0
440 7-Oct-1984 25-Mar-2000 10-Sep-2000 10-Sep-2000 9-Apr-2008 ELECTIVE 72.6
441 5-Jul-2001 17-Jul-2017 17-Jul-2017 17-Jul-2017
442 27-Mar-2014 12-Jun-2030 12-Jun-2030
443 12-Jul-2018 18-Mar-2035 18-Mar-2035
444 27-Sep-2015 27-Sep-2030 27-Sep-2030
445 2-Oct-1992 13-Mar-2009 13-Mar-2009 16-Dec-2009 ELECTIVE 64.3
446 19-Jan-1992 19-Jan-2007 19-Jan-2007 12-Sep-1998 DISABILITY 58.2
447 12-Sep-1986 12-Sep-2001 7-Sep-1999 9-Apr-1992 RESIGNATION (RPC) 62.6
448 17-Jun-1961 17-Jun-1976 11-Dec-1972 11-Dec-1972 11-Dec-1977 COMPULSORY 75.0
449 9-Feb-2019 9-Feb-2034 9-Feb-2034
450 12-Jun-2020 8-Oct-2038 8-Oct-2038
451 19-Apr-1996 15-Feb-2012 15-Feb-2012 13-Dec-2012
452 29-Mar-1970 29-Mar-1985 29-Mar-1985 30-Mar-1985 20-Jul-1990 COMPULSORY 75.0
453 7-Jan-1954 9-Feb-1967 9-Feb-1967 20-Nov-1960 DEATH (SURVIVORS BENEFITS) 63.8
454 7-Jan-2012 7-Jan-2027 7-Jan-2027
455 1-Apr-1978 1-Apr-1993 1-Apr-1993 2-Apr-1993 9-Oct-1998 ELECTIVE 70.7
456 19-Oct-1991 30-May-2007 30-May-2007 30-May-2007 12-Apr-2013 ELECTIVE 70.3
457 21-Sep-1967 18-Oct-1985 18-Oct-1985 19-Feb-1987 DEATH (SURVIVORS BENEFITS) 66.3
458 5-Feb-1977 5-Feb-1992 5-Feb-1992 5-Feb-1992 9-Dec-1996 ELECTIVE 70.2
459 6-Aug-1995 6-Aug-2010 29-Nov-2008 26-Sep-2001 DISABILITY 62.8
460 30-Sep-2017 30-Sep-2032 30-Sep-2032
461 14-Nov-2010 23-May-2026 23-May-2026
462 1-Apr-1996 16-Apr-2011 16-Apr-2011 16-Apr-2011 8-Nov-2018 ELECTIVE 72.5
463 13-Nov-1982 13-Nov-1997 13-Nov-1997 13-Nov-1997 11-Apr-2003 ELECTIVE 72.3
464 9-Jan-1967 20-Jun-1983 20-Jun-1983 20-Jun-1983 20-Jun-1993 COMPULSORY 75.0
465 14-Jan-1984 11-Oct-2001 9-Jul-2004 9-Jul-2004 9-Jul-2014 COMPULSORY 75.0
466 8-Jul-2007 8-Jul-2022 23-May-2021
467 30-Sep-2014 30-Sep-2029 13-Jul-2028
468 10-Aug-2019 10-Aug-2034 10-Aug-2034
469 21-Mar-2009 20-Mar-2024 28-Dec-2022
470 8-Oct-1999 8-Oct-2014 8-Oct-2014 8-Oct-2014 16-Dec-2019 COMPULSORY 75.0
471 30-Jan-2005 30-Jan-2020 23-Jan-2020 23-Jan-2020
472 13-Nov-1982 13-Nov-1997 13-Nov-1997 13-Nov-1997 2-Nov-2005 COMPULSORY 75.0
473 23-Jul-2005 23-Jul-2020 28-Nov-2017 28-Nov-2017 9-Sep-2020 ELECTIVE 72.8
474 30-Jun-1967 7-Jul-1990 7-Jul-1990 25-Aug-1987 DEATH (SURVIVORS BENEFITS) 62.1
475 9-Jun-1961 28-May-1981 28-May-1981 9-Aug-1981 28-May-1991 COMPULSORY 75.0
476 17-Jul-1971 29-Jun-1993 29-Jun-1993 8-Jan-1994 29-Jun-2003 COMPULSORY 75.0
477 7-Mar-1970 17-Mar-1994 17-Mar-1994 17-Mar-1994 10-Dec-1996 ELECTIVE 67.7
478 15-Oct-1983 16-Jan-2000 18-Apr-2001 18-Apr-2001 10-Dec-2007 ELECTIVE 71.6
479 23-Nov-1951 30-Apr-1967 30-Apr-1967 5-Feb-1970 DEATH (SURVIVORS BENEFITS) 67.8
480 17-Dec-1995 19-Jun-2014 19-Jun-2014 10-Apr-2011 Early Retirement 58.3
481 21-Jul-1990 18-Aug-2006 24-Mar-2007 24-Mar-2007 8-Aug-2013 ELECTIVE 70.9
482 14-Aug-1992 23-Aug-2004 14-Aug-2002 23-Aug-2004 COMPULSORY 75.0
483 10-Jun-1978 30-Apr-1990 30-Apr-1990 10-Nov-1991 30-Apr-1995 COMPULSORY 75.0
484 12-Feb-1983 29-Mar-2000 14-May-2002 14-May-2002 13-May-2012 COMPULSORY 75.0
485 25-Dec-2003 25-Dec-2018 25-Dec-2018 25-Dec-2018
486 7-Jan-1989 25-Feb-2005 14-Apr-2006 14-Apr-2006 23-Feb-2009 ELECTIVE 67.9
487 18-Aug-2007 18-Aug-2022 13-May-2020 13-May-2020
488 21-Jul-1990 27-May-2009
489 7-Dec-2001 7-Dec-2016 17-Aug-2014 17-Aug-2014 8-Feb-2018 ELECTIVE 73.5
490 12-Feb-2004 12-Feb-2019 29-Jun-2018 29-Jun-2018
491 3-Feb-2018 26-Jan-2030 3-Feb-2028
492 31-Jul-1983 31-Jul-1998 21-Dec-1996 9-Jan-1989 DISABILITY 62.1
493 16-Sep-1999 16-Sep-2014 16-Sep-2014 28-May-2009 DEATH (SURVIVORS BENEFITS) 61.0
494 8-Jul-2007 9-Sep-2019 8-Jul-2017 9-Sep-2017 Early Retirement 73.0
495 15-Mar-1984 4-May-1998 16-Mar-1994 10-Apr-1994 4-May-1998 COMPULSORY 75.0
496 6-Apr-1996 7-Sep-2015 7-Sep-2015 9-Sep-2015
497 4-Dec-1966 7-Aug-1989 7-Aug-1989 4-Dec-1989 29-Mar-1994 DEATH (SURVIVORS BENEFITS) 69.6
498 10-Dec-1987 10-Dec-2002 21-Apr-2000 21-Apr-2000 9-Feb-2003 ELECTIVE 72.8
499 27-Mar-2014 27-Mar-2029 27-Mar-2029
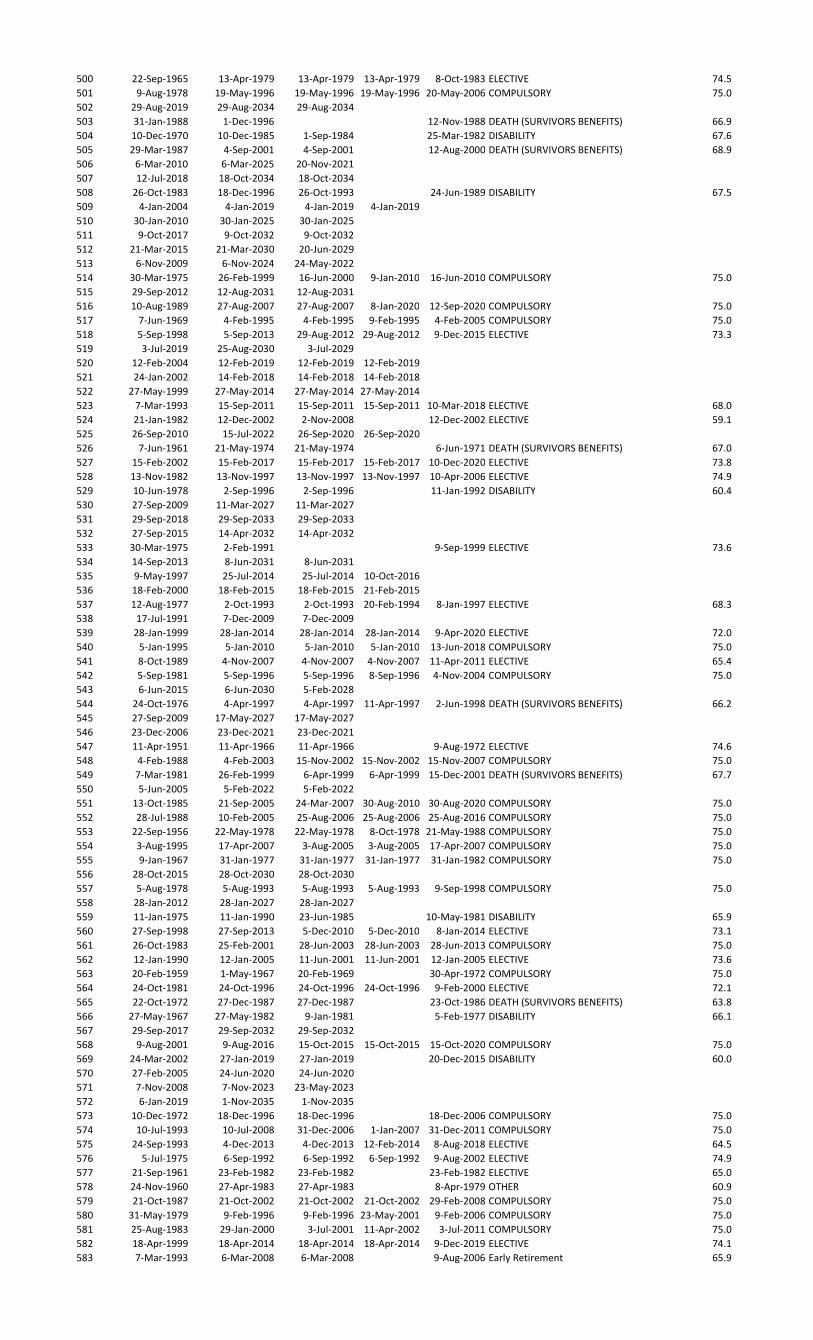
500 22-Sep-1965 13-Apr-1979 13-Apr-1979 13-Apr-1979 8-Oct-1983 ELECTIVE 74.5
501 9-Aug-1978 19-May-1996 19-May-1996 19-May-1996 20-May-2006 COMPULSORY 75.0
502 29-Aug-2019 29-Aug-2034 29-Aug-2034
503 31-Jan-1988 1-Dec-1996 12-Nov-1988 DEATH (SURVIVORS BENEFITS) 66.9
504 10-Dec-1970 10-Dec-1985 1-Sep-1984 25-Mar-1982 DISABILITY 67.6
505 29-Mar-1987 4-Sep-2001 4-Sep-2001 12-Aug-2000 DEATH (SURVIVORS BENEFITS) 68.9
506 6-Mar-2010 6-Mar-2025 20-Nov-2021
507 12-Jul-2018 18-Oct-2034 18-Oct-2034
508 26-Oct-1983 18-Dec-1996 26-Oct-1993 24-Jun-1989 DISABILITY 67.5
509 4-Jan-2004 4-Jan-2019 4-Jan-2019 4-Jan-2019
510 30-Jan-2010 30-Jan-2025 30-Jan-2025
511 9-Oct-2017 9-Oct-2032 9-Oct-2032
512 21-Mar-2015 21-Mar-2030 20-Jun-2029
513 6-Nov-2009 6-Nov-2024 24-May-2022
514 30-Mar-1975 26-Feb-1999 16-Jun-2000 9-Jan-2010 16-Jun-2010 COMPULSORY 75.0
515 29-Sep-2012 12-Aug-2031 12-Aug-2031
516 10-Aug-1989 27-Aug-2007 27-Aug-2007 8-Jan-2020 12-Sep-2020 COMPULSORY 75.0
517 7-Jun-1969 4-Feb-1995 4-Feb-1995 9-Feb-1995 4-Feb-2005 COMPULSORY 75.0
518 5-Sep-1998 5-Sep-2013 29-Aug-2012 29-Aug-2012 9-Dec-2015 ELECTIVE 73.3
519 3-Jul-2019 25-Aug-2030 3-Jul-2029
520 12-Feb-2004 12-Feb-2019 12-Feb-2019 12-Feb-2019
521 24-Jan-2002 14-Feb-2018 14-Feb-2018 14-Feb-2018
522 27-May-1999 27-May-2014 27-May-2014 27-May-2014
523 7-Mar-1993 15-Sep-2011 15-Sep-2011 15-Sep-2011 10-Mar-2018 ELECTIVE 68.0
524 21-Jan-1982 12-Dec-2002 2-Nov-2008 12-Dec-2002 ELECTIVE 59.1
525 26-Sep-2010 15-Jul-2022 26-Sep-2020 26-Sep-2020
526 7-Jun-1961 21-May-1974 21-May-1974 6-Jun-1971 DEATH (SURVIVORS BENEFITS) 67.0
527 15-Feb-2002 15-Feb-2017 15-Feb-2017 15-Feb-2017 10-Dec-2020 ELECTIVE 73.8
528 13-Nov-1982 13-Nov-1997 13-Nov-1997 13-Nov-1997 10-Apr-2006 ELECTIVE 74.9
529 10-Jun-1978 2-Sep-1996 2-Sep-1996 11-Jan-1992 DISABILITY 60.4
530 27-Sep-2009 11-Mar-2027 11-Mar-2027
531 29-Sep-2018 29-Sep-2033 29-Sep-2033
532 27-Sep-2015 14-Apr-2032 14-Apr-2032
533 30-Mar-1975 2-Feb-1991 9-Sep-1999 ELECTIVE 73.6
534 14-Sep-2013 8-Jun-2031 8-Jun-2031
535 9-May-1997 25-Jul-2014 25-Jul-2014 10-Oct-2016
536 18-Feb-2000 18-Feb-2015 18-Feb-2015 21-Feb-2015
537 12-Aug-1977 2-Oct-1993 2-Oct-1993 20-Feb-1994 8-Jan-1997 ELECTIVE 68.3
538 17-Jul-1991 7-Dec-2009 7-Dec-2009
539 28-Jan-1999 28-Jan-2014 28-Jan-2014 28-Jan-2014 9-Apr-2020 ELECTIVE 72.0
540 5-Jan-1995 5-Jan-2010 5-Jan-2010 5-Jan-2010 13-Jun-2018 COMPULSORY 75.0
541 8-Oct-1989 4-Nov-2007 4-Nov-2007 4-Nov-2007 11-Apr-2011 ELECTIVE 65.4
542 5-Sep-1981 5-Sep-1996 5-Sep-1996 8-Sep-1996 4-Nov-2004 COMPULSORY 75.0
543 6-Jun-2015 6-Jun-2030 5-Feb-2028
544 24-Oct-1976 4-Apr-1997 4-Apr-1997 11-Apr-1997 2-Jun-1998 DEATH (SURVIVORS BENEFITS) 66.2
545 27-Sep-2009 17-May-2027 17-May-2027
546 23-Dec-2006 23-Dec-2021 23-Dec-2021
547 11-Apr-1951 11-Apr-1966 11-Apr-1966 9-Aug-1972 ELECTIVE 74.6
548 4-Feb-1988 4-Feb-2003 15-Nov-2002 15-Nov-2002 15-Nov-2007 COMPULSORY 75.0
549 7-Mar-1981 26-Feb-1999 6-Apr-1999 6-Apr-1999 15-Dec-2001 DEATH (SURVIVORS BENEFITS) 67.7
550 5-Jun-2005 5-Feb-2022 5-Feb-2022
551 13-Oct-1985 21-Sep-2005 24-Mar-2007 30-Aug-2010 30-Aug-2020 COMPULSORY 75.0
552 28-Jul-1988 10-Feb-2005 25-Aug-2006 25-Aug-2006 25-Aug-2016 COMPULSORY 75.0
553 22-Sep-1956 22-May-1978 22-May-1978 8-Oct-1978 21-May-1988 COMPULSORY 75.0
554 3-Aug-1995 17-Apr-2007 3-Aug-2005 3-Aug-2005 17-Apr-2007 COMPULSORY 75.0
555 9-Jan-1967 31-Jan-1977 31-Jan-1977 31-Jan-1977 31-Jan-1982 COMPULSORY 75.0
556 28-Oct-2015 28-Oct-2030 28-Oct-2030
557 5-Aug-1978 5-Aug-1993 5-Aug-1993 5-Aug-1993 9-Sep-1998 COMPULSORY 75.0
558 28-Jan-2012 28-Jan-2027 28-Jan-2027
559 11-Jan-1975 11-Jan-1990 23-Jun-1985 10-May-1981 DISABILITY 65.9
560 27-Sep-1998 27-Sep-2013 5-Dec-2010 5-Dec-2010 8-Jan-2014 ELECTIVE 73.1
561 26-Oct-1983 25-Feb-2001 28-Jun-2003 28-Jun-2003 28-Jun-2013 COMPULSORY 75.0
562 12-Jan-1990 12-Jan-2005 11-Jun-2001 11-Jun-2001 12-Jan-2005 ELECTIVE 73.6
563 20-Feb-1959 1-May-1967 20-Feb-1969 30-Apr-1972 COMPULSORY 75.0
564 24-Oct-1981 24-Oct-1996 24-Oct-1996 24-Oct-1996 9-Feb-2000 ELECTIVE 72.1
565 22-Oct-1972 27-Dec-1987 27-Dec-1987 23-Oct-1986 DEATH (SURVIVORS BENEFITS) 63.8
566 27-May-1967 27-May-1982 9-Jan-1981 5-Feb-1977 DISABILITY 66.1
567 29-Sep-2017 29-Sep-2032 29-Sep-2032
568 9-Aug-2001 9-Aug-2016 15-Oct-2015 15-Oct-2015 15-Oct-2020 COMPULSORY 75.0
569 24-Mar-2002 27-Jan-2019 27-Jan-2019 20-Dec-2015 DISABILITY 60.0
570 27-Feb-2005 24-Jun-2020 24-Jun-2020
571 7-Nov-2008 7-Nov-2023 23-May-2023
572 6-Jan-2019 1-Nov-2035 1-Nov-2035
573 10-Dec-1972 18-Dec-1996 18-Dec-1996 18-Dec-2006 COMPULSORY 75.0
574 10-Jul-1993 10-Jul-2008 31-Dec-2006 1-Jan-2007 31-Dec-2011 COMPULSORY 75.0
575 24-Sep-1993 4-Dec-2013 4-Dec-2013 12-Feb-2014 8-Aug-2018 ELECTIVE 64.5
576 5-Jul-1975 6-Sep-1992 6-Sep-1992 6-Sep-1992 9-Aug-2002 ELECTIVE 74.9
577 21-Sep-1961 23-Feb-1982 23-Feb-1982 23-Feb-1982 ELECTIVE 65.0
578 24-Nov-1960 27-Apr-1983 27-Apr-1983 8-Apr-1979 OTHER 60.9
579 21-Oct-1987 21-Oct-2002 21-Oct-2002 21-Oct-2002 29-Feb-2008 COMPULSORY 75.0
580 31-May-1979 9-Feb-1996 9-Feb-1996 23-May-2001 9-Feb-2006 COMPULSORY 75.0
581 25-Aug-1983 29-Jan-2000 3-Jul-2001 11-Apr-2002 3-Jul-2011 COMPULSORY 75.0
582 18-Apr-1999 18-Apr-2014 18-Apr-2014 18-Apr-2014 9-Dec-2019 ELECTIVE 74.1
583 7-Mar-1993 6-Mar-2008 6-Mar-2008 9-Aug-2006 Early Retirement 65.9
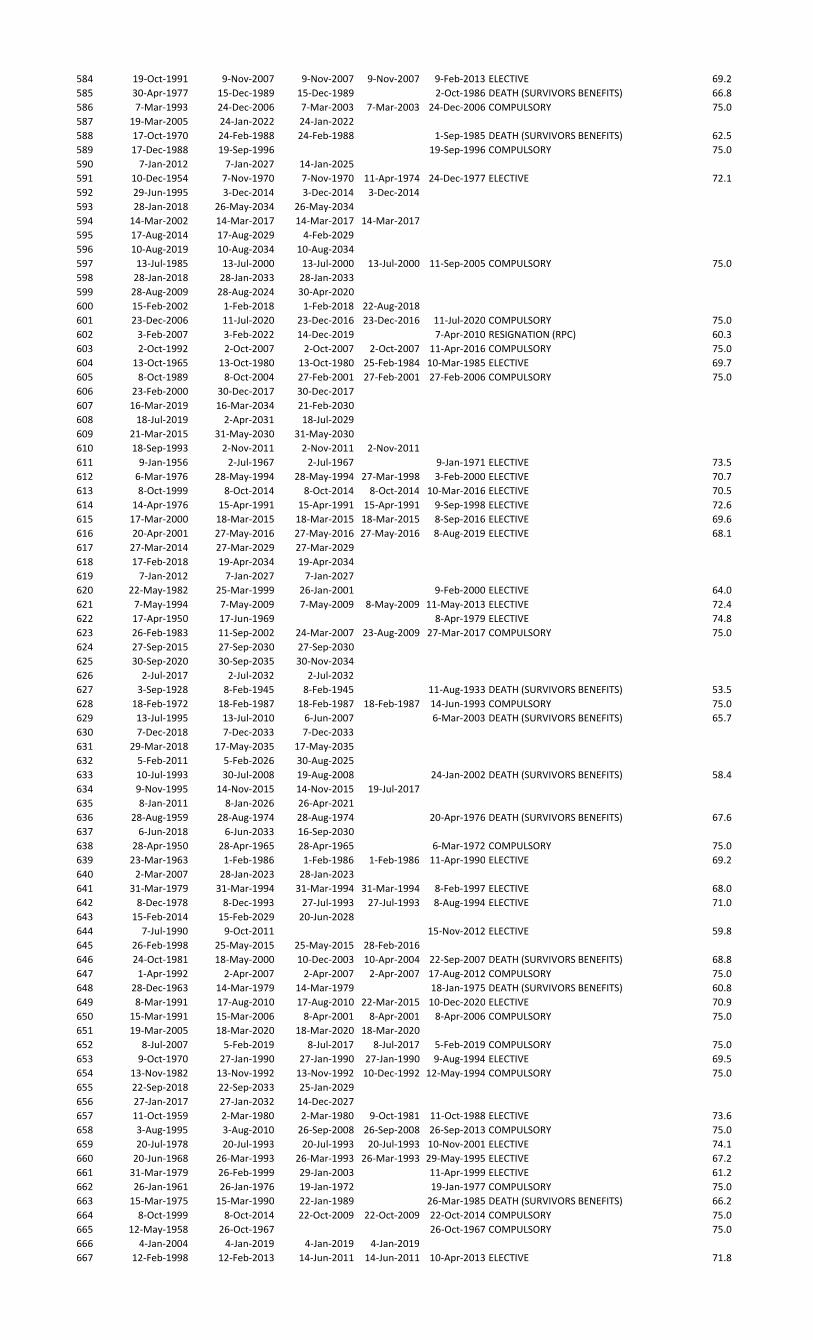
584 19-Oct-1991 9-Nov-2007 9-Nov-2007 9-Nov-2007 9-Feb-2013 ELECTIVE 69.2
585 30-Apr-1977 15-Dec-1989 15-Dec-1989 2-Oct-1986 DEATH (SURVIVORS BENEFITS) 66.8
586 7-Mar-1993 24-Dec-2006 7-Mar-2003 7-Mar-2003 24-Dec-2006 COMPULSORY 75.0
587 19-Mar-2005 24-Jan-2022 24-Jan-2022
588 17-Oct-1970 24-Feb-1988 24-Feb-1988 1-Sep-1985 DEATH (SURVIVORS BENEFITS) 62.5
589 17-Dec-1988 19-Sep-1996 19-Sep-1996 COMPULSORY 75.0
590 7-Jan-2012 7-Jan-2027 14-Jan-2025
591 10-Dec-1954 7-Nov-1970 7-Nov-1970 11-Apr-1974 24-Dec-1977 ELECTIVE 72.1
592 29-Jun-1995 3-Dec-2014 3-Dec-2014 3-Dec-2014
593 28-Jan-2018 26-May-2034 26-May-2034
594 14-Mar-2002 14-Mar-2017 14-Mar-2017 14-Mar-2017
595 17-Aug-2014 17-Aug-2029 4-Feb-2029
596 10-Aug-2019 10-Aug-2034 10-Aug-2034
597 13-Jul-1985 13-Jul-2000 13-Jul-2000 13-Jul-2000 11-Sep-2005 COMPULSORY 75.0
598 28-Jan-2018 28-Jan-2033 28-Jan-2033
599 28-Aug-2009 28-Aug-2024 30-Apr-2020
600 15-Feb-2002 1-Feb-2018 1-Feb-2018 22-Aug-2018
601 23-Dec-2006 11-Jul-2020 23-Dec-2016 23-Dec-2016 11-Jul-2020 COMPULSORY 75.0
602 3-Feb-2007 3-Feb-2022 14-Dec-2019 7-Apr-2010 RESIGNATION (RPC) 60.3
603 2-Oct-1992 2-Oct-2007 2-Oct-2007 2-Oct-2007 11-Apr-2016 COMPULSORY 75.0
604 13-Oct-1965 13-Oct-1980 13-Oct-1980 25-Feb-1984 10-Mar-1985 ELECTIVE 69.7
605 8-Oct-1989 8-Oct-2004 27-Feb-2001 27-Feb-2001 27-Feb-2006 COMPULSORY 75.0
606 23-Feb-2000 30-Dec-2017 30-Dec-2017
607 16-Mar-2019 16-Mar-2034 21-Feb-2030
608 18-Jul-2019 2-Apr-2031 18-Jul-2029
609 21-Mar-2015 31-May-2030 31-May-2030
610 18-Sep-1993 2-Nov-2011 2-Nov-2011 2-Nov-2011
611 9-Jan-1956 2-Jul-1967 2-Jul-1967 9-Jan-1971 ELECTIVE 73.5
612 6-Mar-1976 28-May-1994 28-May-1994 27-Mar-1998 3-Feb-2000 ELECTIVE 70.7
613 8-Oct-1999 8-Oct-2014 8-Oct-2014 8-Oct-2014 10-Mar-2016 ELECTIVE 70.5
614 14-Apr-1976 15-Apr-1991 15-Apr-1991 15-Apr-1991 9-Sep-1998 ELECTIVE 72.6
615 17-Mar-2000 18-Mar-2015 18-Mar-2015 18-Mar-2015 8-Sep-2016 ELECTIVE 69.6
616 20-Apr-2001 27-May-2016 27-May-2016 27-May-2016 8-Aug-2019 ELECTIVE 68.1
617 27-Mar-2014 27-Mar-2029 27-Mar-2029
618 17-Feb-2018 19-Apr-2034 19-Apr-2034
619 7-Jan-2012 7-Jan-2027 7-Jan-2027
620 22-May-1982 25-Mar-1999 26-Jan-2001 9-Feb-2000 ELECTIVE 64.0
621 7-May-1994 7-May-2009 7-May-2009 8-May-2009 11-May-2013 ELECTIVE 72.4
622 17-Apr-1950 17-Jun-1969 8-Apr-1979 ELECTIVE 74.8
623 26-Feb-1983 11-Sep-2002 24-Mar-2007 23-Aug-2009 27-Mar-2017 COMPULSORY 75.0
624 27-Sep-2015 27-Sep-2030 27-Sep-2030
625 30-Sep-2020 30-Sep-2035 30-Nov-2034
626 2-Jul-2017 2-Jul-2032 2-Jul-2032
627 3-Sep-1928 8-Feb-1945 8-Feb-1945 11-Aug-1933 DEATH (SURVIVORS BENEFITS) 53.5
628 18-Feb-1972 18-Feb-1987 18-Feb-1987 18-Feb-1987 14-Jun-1993 COMPULSORY 75.0
629 13-Jul-1995 13-Jul-2010 6-Jun-2007 6-Mar-2003 DEATH (SURVIVORS BENEFITS) 65.7
630 7-Dec-2018 7-Dec-2033 7-Dec-2033
631 29-Mar-2018 17-May-2035 17-May-2035
632 5-Feb-2011 5-Feb-2026 30-Aug-2025
633 10-Jul-1993 30-Jul-2008 19-Aug-2008 24-Jan-2002 DEATH (SURVIVORS BENEFITS) 58.4
634 9-Nov-1995 14-Nov-2015 14-Nov-2015 19-Jul-2017
635 8-Jan-2011 8-Jan-2026 26-Apr-2021
636 28-Aug-1959 28-Aug-1974 28-Aug-1974 20-Apr-1976 DEATH (SURVIVORS BENEFITS) 67.6
637 6-Jun-2018 6-Jun-2033 16-Sep-2030
638 28-Apr-1950 28-Apr-1965 28-Apr-1965 6-Mar-1972 COMPULSORY 75.0
639 23-Mar-1963 1-Feb-1986 1-Feb-1986 1-Feb-1986 11-Apr-1990 ELECTIVE 69.2
640 2-Mar-2007 28-Jan-2023 28-Jan-2023
641 31-Mar-1979 31-Mar-1994 31-Mar-1994 31-Mar-1994 8-Feb-1997 ELECTIVE 68.0
642 8-Dec-1978 8-Dec-1993 27-Jul-1993 27-Jul-1993 8-Aug-1994 ELECTIVE 71.0
643 15-Feb-2014 15-Feb-2029 20-Jun-2028
644 7-Jul-1990 9-Oct-2011 15-Nov-2012 ELECTIVE 59.8
645 26-Feb-1998 25-May-2015 25-May-2015 28-Feb-2016
646 24-Oct-1981 18-May-2000 10-Dec-2003 10-Apr-2004 22-Sep-2007 DEATH (SURVIVORS BENEFITS) 68.8
647 1-Apr-1992 2-Apr-2007 2-Apr-2007 2-Apr-2007 17-Aug-2012 COMPULSORY 75.0
648 28-Dec-1963 14-Mar-1979 14-Mar-1979 18-Jan-1975 DEATH (SURVIVORS BENEFITS) 60.8
649 8-Mar-1991 17-Aug-2010 17-Aug-2010 22-Mar-2015 10-Dec-2020 ELECTIVE 70.9
650 15-Mar-1991 15-Mar-2006 8-Apr-2001 8-Apr-2001 8-Apr-2006 COMPULSORY 75.0
651 19-Mar-2005 18-Mar-2020 18-Mar-2020 18-Mar-2020
652 8-Jul-2007 5-Feb-2019 8-Jul-2017 8-Jul-2017 5-Feb-2019 COMPULSORY 75.0
653 9-Oct-1970 27-Jan-1990 27-Jan-1990 27-Jan-1990 9-Aug-1994 ELECTIVE 69.5
654 13-Nov-1982 13-Nov-1992 13-Nov-1992 10-Dec-1992 12-May-1994 COMPULSORY 75.0
655 22-Sep-2018 22-Sep-2033 25-Jan-2029
656 27-Jan-2017 27-Jan-2032 14-Dec-2027
657 11-Oct-1959 2-Mar-1980 2-Mar-1980 9-Oct-1981 11-Oct-1988 ELECTIVE 73.6
658 3-Aug-1995 3-Aug-2010 26-Sep-2008 26-Sep-2008 26-Sep-2013 COMPULSORY 75.0
659 20-Jul-1978 20-Jul-1993 20-Jul-1993 20-Jul-1993 10-Nov-2001 ELECTIVE 74.1
660 20-Jun-1968 26-Mar-1993 26-Mar-1993 26-Mar-1993 29-May-1995 ELECTIVE 67.2
661 31-Mar-1979 26-Feb-1999 29-Jan-2003 11-Apr-1999 ELECTIVE 61.2
662 26-Jan-1961 26-Jan-1976 19-Jan-1972 19-Jan-1977 COMPULSORY 75.0
663 15-Mar-1975 15-Mar-1990 22-Jan-1989 26-Mar-1985 DEATH (SURVIVORS BENEFITS) 66.2
664 8-Oct-1999 8-Oct-2014 22-Oct-2009 22-Oct-2009 22-Oct-2014 COMPULSORY 75.0
665 12-May-1958 26-Oct-1967 26-Oct-1967 COMPULSORY 75.0
666 4-Jan-2004 4-Jan-2019 4-Jan-2019 4-Jan-2019
667 12-Feb-1998 12-Feb-2013 14-Jun-2011 14-Jun-2011 10-Apr-2013 ELECTIVE 71.8
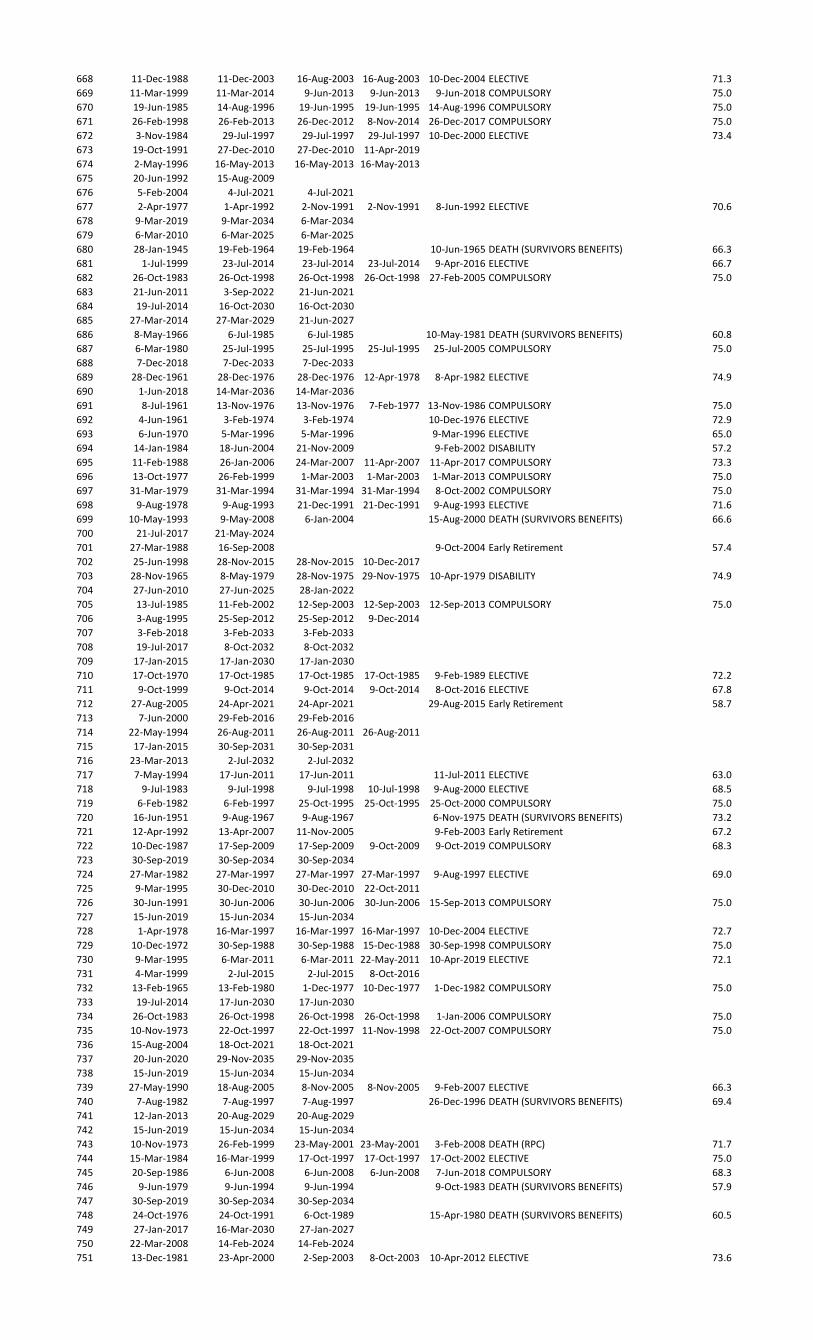
668 11-Dec-1988 11-Dec-2003 16-Aug-2003 16-Aug-2003 10-Dec-2004 ELECTIVE 71.3
669 11-Mar-1999 11-Mar-2014 9-Jun-2013 9-Jun-2013 9-Jun-2018 COMPULSORY 75.0
670 19-Jun-1985 14-Aug-1996 19-Jun-1995 19-Jun-1995 14-Aug-1996 COMPULSORY 75.0
671 26-Feb-1998 26-Feb-2013 26-Dec-2012 8-Nov-2014 26-Dec-2017 COMPULSORY 75.0
672 3-Nov-1984 29-Jul-1997 29-Jul-1997 29-Jul-1997 10-Dec-2000 ELECTIVE 73.4
673 19-Oct-1991 27-Dec-2010 27-Dec-2010 11-Apr-2019
674 2-May-1996 16-May-2013 16-May-2013 16-May-2013
675 20-Jun-1992 15-Aug-2009
676 5-Feb-2004 4-Jul-2021 4-Jul-2021
677 2-Apr-1977 1-Apr-1992 2-Nov-1991 2-Nov-1991 8-Jun-1992 ELECTIVE 70.6
678 9-Mar-2019 9-Mar-2034 6-Mar-2034
679 6-Mar-2010 6-Mar-2025 6-Mar-2025
680 28-Jan-1945 19-Feb-1964 19-Feb-1964 10-Jun-1965 DEATH (SURVIVORS BENEFITS) 66.3
681 1-Jul-1999 23-Jul-2014 23-Jul-2014 23-Jul-2014 9-Apr-2016 ELECTIVE 66.7
682 26-Oct-1983 26-Oct-1998 26-Oct-1998 26-Oct-1998 27-Feb-2005 COMPULSORY 75.0
683 21-Jun-2011 3-Sep-2022 21-Jun-2021
684 19-Jul-2014 16-Oct-2030 16-Oct-2030
685 27-Mar-2014 27-Mar-2029 21-Jun-2027
686 8-May-1966 6-Jul-1985 6-Jul-1985 10-May-1981 DEATH (SURVIVORS BENEFITS) 60.8
687 6-Mar-1980 25-Jul-1995 25-Jul-1995 25-Jul-1995 25-Jul-2005 COMPULSORY 75.0
688 7-Dec-2018 7-Dec-2033 7-Dec-2033
689 28-Dec-1961 28-Dec-1976 28-Dec-1976 12-Apr-1978 8-Apr-1982 ELECTIVE 74.9
690 1-Jun-2018 14-Mar-2036 14-Mar-2036
691 8-Jul-1961 13-Nov-1976 13-Nov-1976 7-Feb-1977 13-Nov-1986 COMPULSORY 75.0
692 4-Jun-1961 3-Feb-1974 3-Feb-1974 10-Dec-1976 ELECTIVE 72.9
693 6-Jun-1970 5-Mar-1996 5-Mar-1996 9-Mar-1996 ELECTIVE 65.0
694 14-Jan-1984 18-Jun-2004 21-Nov-2009 9-Feb-2002 DISABILITY 57.2
695 11-Feb-1988 26-Jan-2006 24-Mar-2007 11-Apr-2007 11-Apr-2017 COMPULSORY 73.3
696 13-Oct-1977 26-Feb-1999 1-Mar-2003 1-Mar-2003 1-Mar-2013 COMPULSORY 75.0
697 31-Mar-1979 31-Mar-1994 31-Mar-1994 31-Mar-1994 8-Oct-2002 COMPULSORY 75.0
698 9-Aug-1978 9-Aug-1993 21-Dec-1991 21-Dec-1991 9-Aug-1993 ELECTIVE 71.6
699 10-May-1993 9-May-2008 6-Jan-2004 15-Aug-2000 DEATH (SURVIVORS BENEFITS) 66.6
700 21-Jul-2017 21-May-2024
701 27-Mar-1988 16-Sep-2008 9-Oct-2004 Early Retirement 57.4
702 25-Jun-1998 28-Nov-2015 28-Nov-2015 10-Dec-2017
703 28-Nov-1965 8-May-1979 28-Nov-1975 29-Nov-1975 10-Apr-1979 DISABILITY 74.9
704 27-Jun-2010 27-Jun-2025 28-Jan-2022
705 13-Jul-1985 11-Feb-2002 12-Sep-2003 12-Sep-2003 12-Sep-2013 COMPULSORY 75.0
706 3-Aug-1995 25-Sep-2012 25-Sep-2012 9-Dec-2014
707 3-Feb-2018 3-Feb-2033 3-Feb-2033
708 19-Jul-2017 8-Oct-2032 8-Oct-2032
709 17-Jan-2015 17-Jan-2030 17-Jan-2030
710 17-Oct-1970 17-Oct-1985 17-Oct-1985 17-Oct-1985 9-Feb-1989 ELECTIVE 72.2
711 9-Oct-1999 9-Oct-2014 9-Oct-2014 9-Oct-2014 8-Oct-2016 ELECTIVE 67.8
712 27-Aug-2005 24-Apr-2021 24-Apr-2021 29-Aug-2015 Early Retirement 58.7
713 7-Jun-2000 29-Feb-2016 29-Feb-2016
714 22-May-1994 26-Aug-2011 26-Aug-2011 26-Aug-2011
715 17-Jan-2015 30-Sep-2031 30-Sep-2031
716 23-Mar-2013 2-Jul-2032 2-Jul-2032
717 7-May-1994 17-Jun-2011 17-Jun-2011 11-Jul-2011 ELECTIVE 63.0
718 9-Jul-1983 9-Jul-1998 9-Jul-1998 10-Jul-1998 9-Aug-2000 ELECTIVE 68.5
719 6-Feb-1982 6-Feb-1997 25-Oct-1995 25-Oct-1995 25-Oct-2000 COMPULSORY 75.0
720 16-Jun-1951 9-Aug-1967 9-Aug-1967 6-Nov-1975 DEATH (SURVIVORS BENEFITS) 73.2
721 12-Apr-1992 13-Apr-2007 11-Nov-2005 9-Feb-2003 Early Retirement 67.2
722 10-Dec-1987 17-Sep-2009 17-Sep-2009 9-Oct-2009 9-Oct-2019 COMPULSORY 68.3
723 30-Sep-2019 30-Sep-2034 30-Sep-2034
724 27-Mar-1982 27-Mar-1997 27-Mar-1997 27-Mar-1997 9-Aug-1997 ELECTIVE 69.0
725 9-Mar-1995 30-Dec-2010 30-Dec-2010 22-Oct-2011
726 30-Jun-1991 30-Jun-2006 30-Jun-2006 30-Jun-2006 15-Sep-2013 COMPULSORY 75.0
727 15-Jun-2019 15-Jun-2034 15-Jun-2034
728 1-Apr-1978 16-Mar-1997 16-Mar-1997 16-Mar-1997 10-Dec-2004 ELECTIVE 72.7
729 10-Dec-1972 30-Sep-1988 30-Sep-1988 15-Dec-1988 30-Sep-1998 COMPULSORY 75.0
730 9-Mar-1995 6-Mar-2011 6-Mar-2011 22-May-2011 10-Apr-2019 ELECTIVE 72.1
731 4-Mar-1999 2-Jul-2015 2-Jul-2015 8-Oct-2016
732 13-Feb-1965 13-Feb-1980 1-Dec-1977 10-Dec-1977 1-Dec-1982 COMPULSORY 75.0
733 19-Jul-2014 17-Jun-2030 17-Jun-2030
734 26-Oct-1983 26-Oct-1998 26-Oct-1998 26-Oct-1998 1-Jan-2006 COMPULSORY 75.0
735 10-Nov-1973 22-Oct-1997 22-Oct-1997 11-Nov-1998 22-Oct-2007 COMPULSORY 75.0
736 15-Aug-2004 18-Oct-2021 18-Oct-2021
737 20-Jun-2020 29-Nov-2035 29-Nov-2035
738 15-Jun-2019 15-Jun-2034 15-Jun-2034
739 27-May-1990 18-Aug-2005 8-Nov-2005 8-Nov-2005 9-Feb-2007 ELECTIVE 66.3
740 7-Aug-1982 7-Aug-1997 7-Aug-1997 26-Dec-1996 DEATH (SURVIVORS BENEFITS) 69.4
741 12-Jan-2013 20-Aug-2029 20-Aug-2029
742 15-Jun-2019 15-Jun-2034 15-Jun-2034
743 10-Nov-1973 26-Feb-1999 23-May-2001 23-May-2001 3-Feb-2008 DEATH (RPC) 71.7
744 15-Mar-1984 16-Mar-1999 17-Oct-1997 17-Oct-1997 17-Oct-2002 ELECTIVE 75.0
745 20-Sep-1986 6-Jun-2008 6-Jun-2008 6-Jun-2008 7-Jun-2018 COMPULSORY 68.3
746 9-Jun-1979 9-Jun-1994 9-Jun-1994 9-Oct-1983 DEATH (SURVIVORS BENEFITS) 57.9
747 30-Sep-2019 30-Sep-2034 30-Sep-2034
748 24-Oct-1976 24-Oct-1991 6-Oct-1989 15-Apr-1980 DEATH (SURVIVORS BENEFITS) 60.5
749 27-Jan-2017 16-Mar-2030 27-Jan-2027
750 22-Mar-2008 14-Feb-2024 14-Feb-2024
751 13-Dec-1981 23-Apr-2000 2-Sep-2003 8-Oct-2003 10-Apr-2012 ELECTIVE 73.6
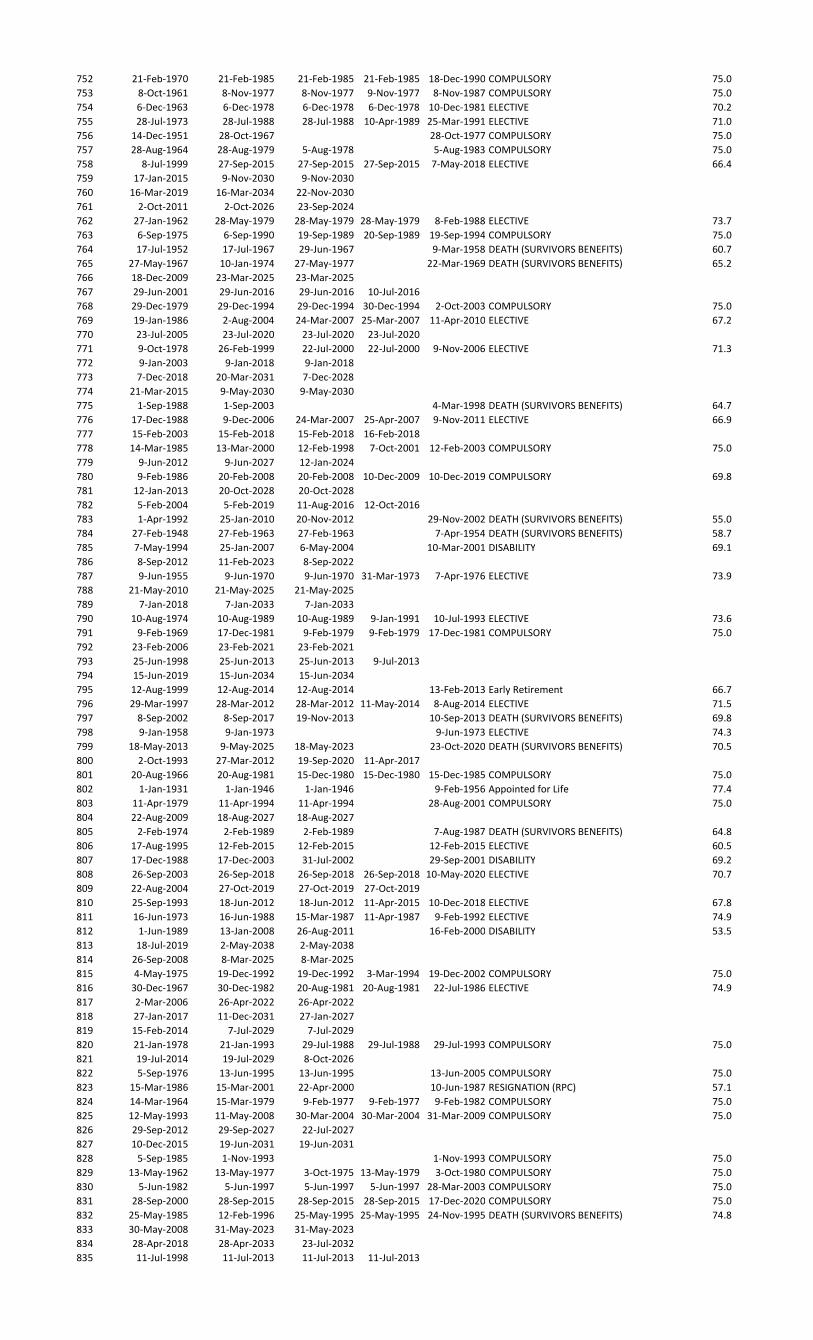
752 21-Feb-1970 21-Feb-1985 21-Feb-1985 21-Feb-1985 18-Dec-1990 COMPULSORY 75.0
753 8-Oct-1961 8-Nov-1977 8-Nov-1977 9-Nov-1977 8-Nov-1987 COMPULSORY 75.0
754 6-Dec-1963 6-Dec-1978 6-Dec-1978 6-Dec-1978 10-Dec-1981 ELECTIVE 70.2
755 28-Jul-1973 28-Jul-1988 28-Jul-1988 10-Apr-1989 25-Mar-1991 ELECTIVE 71.0
756 14-Dec-1951 28-Oct-1967 28-Oct-1977 COMPULSORY 75.0
757 28-Aug-1964 28-Aug-1979 5-Aug-1978 5-Aug-1983 COMPULSORY 75.0
758 8-Jul-1999 27-Sep-2015 27-Sep-2015 27-Sep-2015 7-May-2018 ELECTIVE 66.4
759 17-Jan-2015 9-Nov-2030 9-Nov-2030
760 16-Mar-2019 16-Mar-2034 22-Nov-2030
761 2-Oct-2011 2-Oct-2026 23-Sep-2024
762 27-Jan-1962 28-May-1979 28-May-1979 28-May-1979 8-Feb-1988 ELECTIVE 73.7
763 6-Sep-1975 6-Sep-1990 19-Sep-1989 20-Sep-1989 19-Sep-1994 COMPULSORY 75.0
764 17-Jul-1952 17-Jul-1967 29-Jun-1967 9-Mar-1958 DEATH (SURVIVORS BENEFITS) 60.7
765 27-May-1967 10-Jan-1974 27-May-1977 22-Mar-1969 DEATH (SURVIVORS BENEFITS) 65.2
766 18-Dec-2009 23-Mar-2025 23-Mar-2025
767 29-Jun-2001 29-Jun-2016 29-Jun-2016 10-Jul-2016
768 29-Dec-1979 29-Dec-1994 29-Dec-1994 30-Dec-1994 2-Oct-2003 COMPULSORY 75.0
769 19-Jan-1986 2-Aug-2004 24-Mar-2007 25-Mar-2007 11-Apr-2010 ELECTIVE 67.2
770 23-Jul-2005 23-Jul-2020 23-Jul-2020 23-Jul-2020
771 9-Oct-1978 26-Feb-1999 22-Jul-2000 22-Jul-2000 9-Nov-2006 ELECTIVE 71.3
772 9-Jan-2003 9-Jan-2018 9-Jan-2018
773 7-Dec-2018 20-Mar-2031 7-Dec-2028
774 21-Mar-2015 9-May-2030 9-May-2030
775 1-Sep-1988 1-Sep-2003 4-Mar-1998 DEATH (SURVIVORS BENEFITS) 64.7
776 17-Dec-1988 9-Dec-2006 24-Mar-2007 25-Apr-2007 9-Nov-2011 ELECTIVE 66.9
777 15-Feb-2003 15-Feb-2018 15-Feb-2018 16-Feb-2018
778 14-Mar-1985 13-Mar-2000 12-Feb-1998 7-Oct-2001 12-Feb-2003 COMPULSORY 75.0
779 9-Jun-2012 9-Jun-2027 12-Jan-2024
780 9-Feb-1986 20-Feb-2008 20-Feb-2008 10-Dec-2009 10-Dec-2019 COMPULSORY 69.8
781 12-Jan-2013 20-Oct-2028 20-Oct-2028
782 5-Feb-2004 5-Feb-2019 11-Aug-2016 12-Oct-2016
783 1-Apr-1992 25-Jan-2010 20-Nov-2012 29-Nov-2002 DEATH (SURVIVORS BENEFITS) 55.0
784 27-Feb-1948 27-Feb-1963 27-Feb-1963 7-Apr-1954 DEATH (SURVIVORS BENEFITS) 58.7
785 7-May-1994 25-Jan-2007 6-May-2004 10-Mar-2001 DISABILITY 69.1
786 8-Sep-2012 11-Feb-2023 8-Sep-2022
787 9-Jun-1955 9-Jun-1970 9-Jun-1970 31-Mar-1973 7-Apr-1976 ELECTIVE 73.9
788 21-May-2010 21-May-2025 21-May-2025
789 7-Jan-2018 7-Jan-2033 7-Jan-2033
790 10-Aug-1974 10-Aug-1989 10-Aug-1989 9-Jan-1991 10-Jul-1993 ELECTIVE 73.6
791 9-Feb-1969 17-Dec-1981 9-Feb-1979 9-Feb-1979 17-Dec-1981 COMPULSORY 75.0
792 23-Feb-2006 23-Feb-2021 23-Feb-2021
793 25-Jun-1998 25-Jun-2013 25-Jun-2013 9-Jul-2013
794 15-Jun-2019 15-Jun-2034 15-Jun-2034
795 12-Aug-1999 12-Aug-2014 12-Aug-2014 13-Feb-2013 Early Retirement 66.7
796 29-Mar-1997 28-Mar-2012 28-Mar-2012 11-May-2014 8-Aug-2014 ELECTIVE 71.5
797 8-Sep-2002 8-Sep-2017 19-Nov-2013 10-Sep-2013 DEATH (SURVIVORS BENEFITS) 69.8
798 9-Jan-1958 9-Jan-1973 9-Jun-1973 ELECTIVE 74.3
799 18-May-2013 9-May-2025 18-May-2023 23-Oct-2020 DEATH (SURVIVORS BENEFITS) 70.5
800 2-Oct-1993 27-Mar-2012 19-Sep-2020 11-Apr-2017
801 20-Aug-1966 20-Aug-1981 15-Dec-1980 15-Dec-1980 15-Dec-1985 COMPULSORY 75.0
802 1-Jan-1931 1-Jan-1946 1-Jan-1946 9-Feb-1956 Appointed for Life 77.4
803 11-Apr-1979 11-Apr-1994 11-Apr-1994 28-Aug-2001 COMPULSORY 75.0
804 22-Aug-2009 18-Aug-2027 18-Aug-2027
805 2-Feb-1974 2-Feb-1989 2-Feb-1989 7-Aug-1987 DEATH (SURVIVORS BENEFITS) 64.8
806 17-Aug-1995 12-Feb-2015 12-Feb-2015 12-Feb-2015 ELECTIVE 60.5
807 17-Dec-1988 17-Dec-2003 31-Jul-2002 29-Sep-2001 DISABILITY 69.2
808 26-Sep-2003 26-Sep-2018 26-Sep-2018 26-Sep-2018 10-May-2020 ELECTIVE 70.7
809 22-Aug-2004 27-Oct-2019 27-Oct-2019 27-Oct-2019
810 25-Sep-1993 18-Jun-2012 18-Jun-2012 11-Apr-2015 10-Dec-2018 ELECTIVE 67.8
811 16-Jun-1973 16-Jun-1988 15-Mar-1987 11-Apr-1987 9-Feb-1992 ELECTIVE 74.9
812 1-Jun-1989 13-Jan-2008 26-Aug-2011 16-Feb-2000 DISABILITY 53.5
813 18-Jul-2019 2-May-2038 2-May-2038
814 26-Sep-2008 8-Mar-2025 8-Mar-2025
815 4-May-1975 19-Dec-1992 19-Dec-1992 3-Mar-1994 19-Dec-2002 COMPULSORY 75.0
816 30-Dec-1967 30-Dec-1982 20-Aug-1981 20-Aug-1981 22-Jul-1986 ELECTIVE 74.9
817 2-Mar-2006 26-Apr-2022 26-Apr-2022
818 27-Jan-2017 11-Dec-2031 27-Jan-2027
819 15-Feb-2014 7-Jul-2029 7-Jul-2029
820 21-Jan-1978 21-Jan-1993 29-Jul-1988 29-Jul-1988 29-Jul-1993 COMPULSORY 75.0
821 19-Jul-2014 19-Jul-2029 8-Oct-2026
822 5-Sep-1976 13-Jun-1995 13-Jun-1995 13-Jun-2005 COMPULSORY 75.0
823 15-Mar-1986 15-Mar-2001 22-Apr-2000 10-Jun-1987 RESIGNATION (RPC) 57.1
824 14-Mar-1964 15-Mar-1979 9-Feb-1977 9-Feb-1977 9-Feb-1982 COMPULSORY 75.0
825 12-May-1993 11-May-2008 30-Mar-2004 30-Mar-2004 31-Mar-2009 COMPULSORY 75.0
826 29-Sep-2012 29-Sep-2027 22-Jul-2027
827 10-Dec-2015 19-Jun-2031 19-Jun-2031
828 5-Sep-1985 1-Nov-1993 1-Nov-1993 COMPULSORY 75.0
829 13-May-1962 13-May-1977 3-Oct-1975 13-May-1979 3-Oct-1980 COMPULSORY 75.0
830 5-Jun-1982 5-Jun-1997 5-Jun-1997 5-Jun-1997 28-Mar-2003 COMPULSORY 75.0
831 28-Sep-2000 28-Sep-2015 28-Sep-2015 28-Sep-2015 17-Dec-2020 COMPULSORY 75.0
832 25-May-1985 12-Feb-1996 25-May-1995 25-May-1995 24-Nov-1995 DEATH (SURVIVORS BENEFITS) 74.8
833 30-May-2008 31-May-2023 31-May-2023
834 28-Apr-2018 28-Apr-2033 23-Jul-2032
835 11-Jul-1998 11-Jul-2013 11-Jul-2013 11-Jul-2013
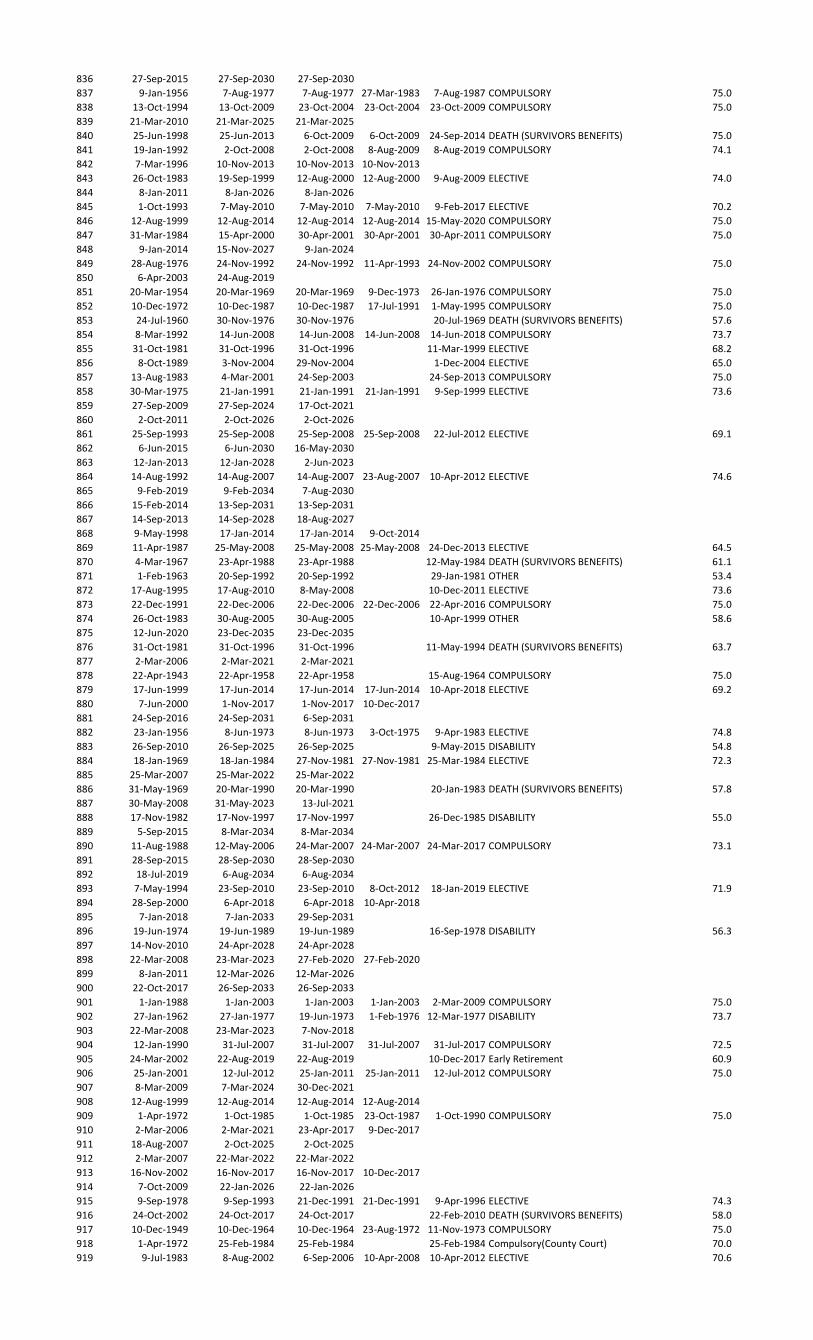
836 27-Sep-2015 27-Sep-2030 27-Sep-2030
837 9-Jan-1956 7-Aug-1977 7-Aug-1977 27-Mar-1983 7-Aug-1987 COMPULSORY 75.0
838 13-Oct-1994 13-Oct-2009 23-Oct-2004 23-Oct-2004 23-Oct-2009 COMPULSORY 75.0
839 21-Mar-2010 21-Mar-2025 21-Mar-2025
840 25-Jun-1998 25-Jun-2013 6-Oct-2009 6-Oct-2009 24-Sep-2014 DEATH (SURVIVORS BENEFITS) 75.0
841 19-Jan-1992 2-Oct-2008 2-Oct-2008 8-Aug-2009 8-Aug-2019 COMPULSORY 74.1
842 7-Mar-1996 10-Nov-2013 10-Nov-2013 10-Nov-2013
843 26-Oct-1983 19-Sep-1999 12-Aug-2000 12-Aug-2000 9-Aug-2009 ELECTIVE 74.0
844 8-Jan-2011 8-Jan-2026 8-Jan-2026
845 1-Oct-1993 7-May-2010 7-May-2010 7-May-2010 9-Feb-2017 ELECTIVE 70.2
846 12-Aug-1999 12-Aug-2014 12-Aug-2014 12-Aug-2014 15-May-2020 COMPULSORY 75.0
847 31-Mar-1984 15-Apr-2000 30-Apr-2001 30-Apr-2001 30-Apr-2011 COMPULSORY 75.0
848 9-Jan-2014 15-Nov-2027 9-Jan-2024
849 28-Aug-1976 24-Nov-1992 24-Nov-1992 11-Apr-1993 24-Nov-2002 COMPULSORY 75.0
850 6-Apr-2003 24-Aug-2019
851 20-Mar-1954 20-Mar-1969 20-Mar-1969 9-Dec-1973 26-Jan-1976 COMPULSORY 75.0
852 10-Dec-1972 10-Dec-1987 10-Dec-1987 17-Jul-1991 1-May-1995 COMPULSORY 75.0
853 24-Jul-1960 30-Nov-1976 30-Nov-1976 20-Jul-1969 DEATH (SURVIVORS BENEFITS) 57.6
854 8-Mar-1992 14-Jun-2008 14-Jun-2008 14-Jun-2008 14-Jun-2018 COMPULSORY 73.7
855 31-Oct-1981 31-Oct-1996 31-Oct-1996 11-Mar-1999 ELECTIVE 68.2
856 8-Oct-1989 3-Nov-2004 29-Nov-2004 1-Dec-2004 ELECTIVE 65.0
857 13-Aug-1983 4-Mar-2001 24-Sep-2003 24-Sep-2013 COMPULSORY 75.0
858 30-Mar-1975 21-Jan-1991 21-Jan-1991 21-Jan-1991 9-Sep-1999 ELECTIVE 73.6
859 27-Sep-2009 27-Sep-2024 17-Oct-2021
860 2-Oct-2011 2-Oct-2026 2-Oct-2026
861 25-Sep-1993 25-Sep-2008 25-Sep-2008 25-Sep-2008 22-Jul-2012 ELECTIVE 69.1
862 6-Jun-2015 6-Jun-2030 16-May-2030
863 12-Jan-2013 12-Jan-2028 2-Jun-2023
864 14-Aug-1992 14-Aug-2007 14-Aug-2007 23-Aug-2007 10-Apr-2012 ELECTIVE 74.6
865 9-Feb-2019 9-Feb-2034 7-Aug-2030
866 15-Feb-2014 13-Sep-2031 13-Sep-2031
867 14-Sep-2013 14-Sep-2028 18-Aug-2027
868 9-May-1998 17-Jan-2014 17-Jan-2014 9-Oct-2014
869 11-Apr-1987 25-May-2008 25-May-2008 25-May-2008 24-Dec-2013 ELECTIVE 64.5
870 4-Mar-1967 23-Apr-1988 23-Apr-1988 12-May-1984 DEATH (SURVIVORS BENEFITS) 61.1
871 1-Feb-1963 20-Sep-1992 20-Sep-1992 29-Jan-1981 OTHER 53.4
872 17-Aug-1995 17-Aug-2010 8-May-2008 10-Dec-2011 ELECTIVE 73.6
873 22-Dec-1991 22-Dec-2006 22-Dec-2006 22-Dec-2006 22-Apr-2016 COMPULSORY 75.0
874 26-Oct-1983 30-Aug-2005 30-Aug-2005 10-Apr-1999 OTHER 58.6
875 12-Jun-2020 23-Dec-2035 23-Dec-2035
876 31-Oct-1981 31-Oct-1996 31-Oct-1996 11-May-1994 DEATH (SURVIVORS BENEFITS) 63.7
877 2-Mar-2006 2-Mar-2021 2-Mar-2021
878 22-Apr-1943 22-Apr-1958 22-Apr-1958 15-Aug-1964 COMPULSORY 75.0
879 17-Jun-1999 17-Jun-2014 17-Jun-2014 17-Jun-2014 10-Apr-2018 ELECTIVE 69.2
880 7-Jun-2000 1-Nov-2017 1-Nov-2017 10-Dec-2017
881 24-Sep-2016 24-Sep-2031 6-Sep-2031
882 23-Jan-1956 8-Jun-1973 8-Jun-1973 3-Oct-1975 9-Apr-1983 ELECTIVE 74.8
883 26-Sep-2010 26-Sep-2025 26-Sep-2025 9-May-2015 DISABILITY 54.8
884 18-Jan-1969 18-Jan-1984 27-Nov-1981 27-Nov-1981 25-Mar-1984 ELECTIVE 72.3
885 25-Mar-2007 25-Mar-2022 25-Mar-2022
886 31-May-1969 20-Mar-1990 20-Mar-1990 20-Jan-1983 DEATH (SURVIVORS BENEFITS) 57.8
887 30-May-2008 31-May-2023 13-Jul-2021
888 17-Nov-1982 17-Nov-1997 17-Nov-1997 26-Dec-1985 DISABILITY 55.0
889 5-Sep-2015 8-Mar-2034 8-Mar-2034
890 11-Aug-1988 12-May-2006 24-Mar-2007 24-Mar-2007 24-Mar-2017 COMPULSORY 73.1
891 28-Sep-2015 28-Sep-2030 28-Sep-2030
892 18-Jul-2019 6-Aug-2034 6-Aug-2034
893 7-May-1994 23-Sep-2010 23-Sep-2010 8-Oct-2012 18-Jan-2019 ELECTIVE 71.9
894 28-Sep-2000 6-Apr-2018 6-Apr-2018 10-Apr-2018
895 7-Jan-2018 7-Jan-2033 29-Sep-2031
896 19-Jun-1974 19-Jun-1989 19-Jun-1989 16-Sep-1978 DISABILITY 56.3
897 14-Nov-2010 24-Apr-2028 24-Apr-2028
898 22-Mar-2008 23-Mar-2023 27-Feb-2020 27-Feb-2020
899 8-Jan-2011 12-Mar-2026 12-Mar-2026
900 22-Oct-2017 26-Sep-2033 26-Sep-2033
901 1-Jan-1988 1-Jan-2003 1-Jan-2003 1-Jan-2003 2-Mar-2009 COMPULSORY 75.0
902 27-Jan-1962 27-Jan-1977 19-Jun-1973 1-Feb-1976 12-Mar-1977 DISABILITY 73.7
903 22-Mar-2008 23-Mar-2023 7-Nov-2018
904 12-Jan-1990 31-Jul-2007 31-Jul-2007 31-Jul-2007 31-Jul-2017 COMPULSORY 72.5
905 24-Mar-2002 22-Aug-2019 22-Aug-2019 10-Dec-2017 Early Retirement 60.9
906 25-Jan-2001 12-Jul-2012 25-Jan-2011 25-Jan-2011 12-Jul-2012 COMPULSORY 75.0
907 8-Mar-2009 7-Mar-2024 30-Dec-2021
908 12-Aug-1999 12-Aug-2014 12-Aug-2014 12-Aug-2014
909 1-Apr-1972 1-Oct-1985 1-Oct-1985 23-Oct-1987 1-Oct-1990 COMPULSORY 75.0
910 2-Mar-2006 2-Mar-2021 23-Apr-2017 9-Dec-2017
911 18-Aug-2007 2-Oct-2025 2-Oct-2025
912 2-Mar-2007 22-Mar-2022 22-Mar-2022
913 16-Nov-2002 16-Nov-2017 16-Nov-2017 10-Dec-2017
914 7-Oct-2009 22-Jan-2026 22-Jan-2026
915 9-Sep-1978 9-Sep-1993 21-Dec-1991 21-Dec-1991 9-Apr-1996 ELECTIVE 74.3
916 24-Oct-2002 24-Oct-2017 24-Oct-2017 22-Feb-2010 DEATH (SURVIVORS BENEFITS) 58.0
917 10-Dec-1949 10-Dec-1964 10-Dec-1964 23-Aug-1972 11-Nov-1973 COMPULSORY 75.0
918 1-Apr-1972 25-Feb-1984 25-Feb-1984 25-Feb-1984 Compulsory(County Court) 70.0
919 9-Jul-1983 8-Aug-2002 6-Sep-2006 10-Apr-2008 10-Apr-2012 ELECTIVE 70.6
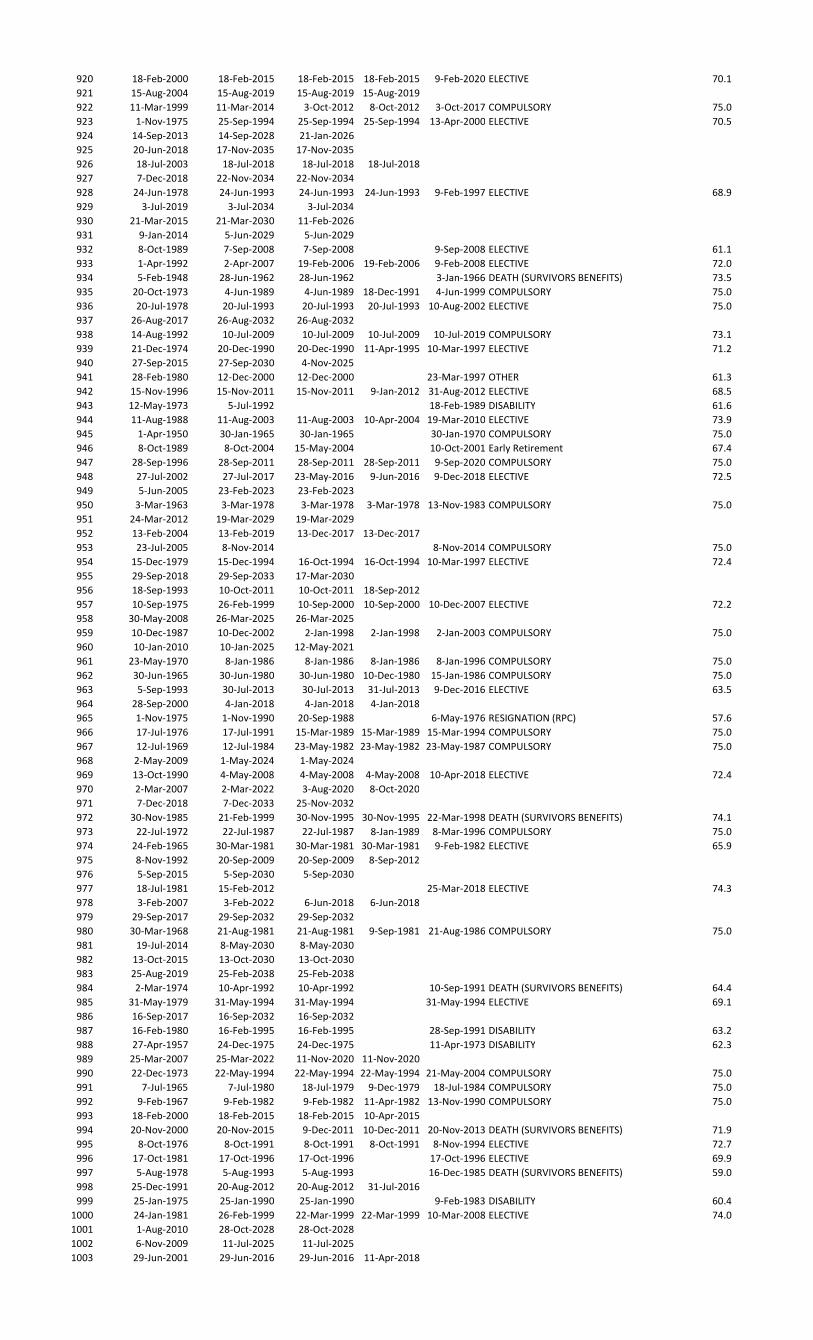
920 18-Feb-2000 18-Feb-2015 18-Feb-2015 18-Feb-2015 9-Feb-2020 ELECTIVE 70.1
921 15-Aug-2004 15-Aug-2019 15-Aug-2019 15-Aug-2019
922 11-Mar-1999 11-Mar-2014 3-Oct-2012 8-Oct-2012 3-Oct-2017 COMPULSORY 75.0
923 1-Nov-1975 25-Sep-1994 25-Sep-1994 25-Sep-1994 13-Apr-2000 ELECTIVE 70.5
924 14-Sep-2013 14-Sep-2028 21-Jan-2026
925 20-Jun-2018 17-Nov-2035 17-Nov-2035
926 18-Jul-2003 18-Jul-2018 18-Jul-2018 18-Jul-2018
927 7-Dec-2018 22-Nov-2034 22-Nov-2034
928 24-Jun-1978 24-Jun-1993 24-Jun-1993 24-Jun-1993 9-Feb-1997 ELECTIVE 68.9
929 3-Jul-2019 3-Jul-2034 3-Jul-2034
930 21-Mar-2015 21-Mar-2030 11-Feb-2026
931 9-Jan-2014 5-Jun-2029 5-Jun-2029
932 8-Oct-1989 7-Sep-2008 7-Sep-2008 9-Sep-2008 ELECTIVE 61.1
933 1-Apr-1992 2-Apr-2007 19-Feb-2006 19-Feb-2006 9-Feb-2008 ELECTIVE 72.0
934 5-Feb-1948 28-Jun-1962 28-Jun-1962 3-Jan-1966 DEATH (SURVIVORS BENEFITS) 73.5
935 20-Oct-1973 4-Jun-1989 4-Jun-1989 18-Dec-1991 4-Jun-1999 COMPULSORY 75.0
936 20-Jul-1978 20-Jul-1993 20-Jul-1993 20-Jul-1993 10-Aug-2002 ELECTIVE 75.0
937 26-Aug-2017 26-Aug-2032 26-Aug-2032
938 14-Aug-1992 10-Jul-2009 10-Jul-2009 10-Jul-2009 10-Jul-2019 COMPULSORY 73.1
939 21-Dec-1974 20-Dec-1990 20-Dec-1990 11-Apr-1995 10-Mar-1997 ELECTIVE 71.2
940 27-Sep-2015 27-Sep-2030 4-Nov-2025
941 28-Feb-1980 12-Dec-2000 12-Dec-2000 23-Mar-1997 OTHER 61.3
942 15-Nov-1996 15-Nov-2011 15-Nov-2011 9-Jan-2012 31-Aug-2012 ELECTIVE 68.5
943 12-May-1973 5-Jul-1992 18-Feb-1989 DISABILITY 61.6
944 11-Aug-1988 11-Aug-2003 11-Aug-2003 10-Apr-2004 19-Mar-2010 ELECTIVE 73.9
945 1-Apr-1950 30-Jan-1965 30-Jan-1965 30-Jan-1970 COMPULSORY 75.0
946 8-Oct-1989 8-Oct-2004 15-May-2004 10-Oct-2001 Early Retirement 67.4
947 28-Sep-1996 28-Sep-2011 28-Sep-2011 28-Sep-2011 9-Sep-2020 COMPULSORY 75.0
948 27-Jul-2002 27-Jul-2017 23-May-2016 9-Jun-2016 9-Dec-2018 ELECTIVE 72.5
949 5-Jun-2005 23-Feb-2023 23-Feb-2023
950 3-Mar-1963 3-Mar-1978 3-Mar-1978 3-Mar-1978 13-Nov-1983 COMPULSORY 75.0
951 24-Mar-2012 19-Mar-2029 19-Mar-2029
952 13-Feb-2004 13-Feb-2019 13-Dec-2017 13-Dec-2017
953 23-Jul-2005 8-Nov-2014 8-Nov-2014 COMPULSORY 75.0
954 15-Dec-1979 15-Dec-1994 16-Oct-1994 16-Oct-1994 10-Mar-1997 ELECTIVE 72.4
955 29-Sep-2018 29-Sep-2033 17-Mar-2030
956 18-Sep-1993 10-Oct-2011 10-Oct-2011 18-Sep-2012
957 10-Sep-1975 26-Feb-1999 10-Sep-2000 10-Sep-2000 10-Dec-2007 ELECTIVE 72.2
958 30-May-2008 26-Mar-2025 26-Mar-2025
959 10-Dec-1987 10-Dec-2002 2-Jan-1998 2-Jan-1998 2-Jan-2003 COMPULSORY 75.0
960 10-Jan-2010 10-Jan-2025 12-May-2021
961 23-May-1970 8-Jan-1986 8-Jan-1986 8-Jan-1986 8-Jan-1996 COMPULSORY 75.0
962 30-Jun-1965 30-Jun-1980 30-Jun-1980 10-Dec-1980 15-Jan-1986 COMPULSORY 75.0
963 5-Sep-1993 30-Jul-2013 30-Jul-2013 31-Jul-2013 9-Dec-2016 ELECTIVE 63.5
964 28-Sep-2000 4-Jan-2018 4-Jan-2018 4-Jan-2018
965 1-Nov-1975 1-Nov-1990 20-Sep-1988 6-May-1976 RESIGNATION (RPC) 57.6
966 17-Jul-1976 17-Jul-1991 15-Mar-1989 15-Mar-1989 15-Mar-1994 COMPULSORY 75.0
967 12-Jul-1969 12-Jul-1984 23-May-1982 23-May-1982 23-May-1987 COMPULSORY 75.0
968 2-May-2009 1-May-2024 1-May-2024
969 13-Oct-1990 4-May-2008 4-May-2008 4-May-2008 10-Apr-2018 ELECTIVE 72.4
970 2-Mar-2007 2-Mar-2022 3-Aug-2020 8-Oct-2020
971 7-Dec-2018 7-Dec-2033 25-Nov-2032
972 30-Nov-1985 21-Feb-1999 30-Nov-1995 30-Nov-1995 22-Mar-1998 DEATH (SURVIVORS BENEFITS) 74.1
973 22-Jul-1972 22-Jul-1987 22-Jul-1987 8-Jan-1989 8-Mar-1996 COMPULSORY 75.0
974 24-Feb-1965 30-Mar-1981 30-Mar-1981 30-Mar-1981 9-Feb-1982 ELECTIVE 65.9
975 8-Nov-1992 20-Sep-2009 20-Sep-2009 8-Sep-2012
976 5-Sep-2015 5-Sep-2030 5-Sep-2030
977 18-Jul-1981 15-Feb-2012 25-Mar-2018 ELECTIVE 74.3
978 3-Feb-2007 3-Feb-2022 6-Jun-2018 6-Jun-2018
979 29-Sep-2017 29-Sep-2032 29-Sep-2032
980 30-Mar-1968 21-Aug-1981 21-Aug-1981 9-Sep-1981 21-Aug-1986 COMPULSORY 75.0
981 19-Jul-2014 8-May-2030 8-May-2030
982 13-Oct-2015 13-Oct-2030 13-Oct-2030
983 25-Aug-2019 25-Feb-2038 25-Feb-2038
984 2-Mar-1974 10-Apr-1992 10-Apr-1992 10-Sep-1991 DEATH (SURVIVORS BENEFITS) 64.4
985 31-May-1979 31-May-1994 31-May-1994 31-May-1994 ELECTIVE 69.1
986 16-Sep-2017 16-Sep-2032 16-Sep-2032
987 16-Feb-1980 16-Feb-1995 16-Feb-1995 28-Sep-1991 DISABILITY 63.2
988 27-Apr-1957 24-Dec-1975 24-Dec-1975 11-Apr-1973 DISABILITY 62.3
989 25-Mar-2007 25-Mar-2022 11-Nov-2020 11-Nov-2020
990 22-Dec-1973 22-May-1994 22-May-1994 22-May-1994 21-May-2004 COMPULSORY 75.0
991 7-Jul-1965 7-Jul-1980 18-Jul-1979 9-Dec-1979 18-Jul-1984 COMPULSORY 75.0
992 9-Feb-1967 9-Feb-1982 9-Feb-1982 11-Apr-1982 13-Nov-1990 COMPULSORY 75.0
993 18-Feb-2000 18-Feb-2015 18-Feb-2015 10-Apr-2015
994 20-Nov-2000 20-Nov-2015 9-Dec-2011 10-Dec-2011 20-Nov-2013 DEATH (SURVIVORS BENEFITS) 71.9
995 8-Oct-1976 8-Oct-1991 8-Oct-1991 8-Oct-1991 8-Nov-1994 ELECTIVE 72.7
996 17-Oct-1981 17-Oct-1996 17-Oct-1996 17-Oct-1996 ELECTIVE 69.9
997 5-Aug-1978 5-Aug-1993 5-Aug-1993 16-Dec-1985 DEATH (SURVIVORS BENEFITS) 59.0
998 25-Dec-1991 20-Aug-2012 20-Aug-2012 31-Jul-2016
999 25-Jan-1975 25-Jan-1990 25-Jan-1990 9-Feb-1983 DISABILITY 60.4
1000 24-Jan-1981 26-Feb-1999 22-Mar-1999 22-Mar-1999 10-Mar-2008 ELECTIVE 74.0
1001 1-Aug-2010 28-Oct-2028 28-Oct-2028
1002 6-Nov-2009 11-Jul-2025 11-Jul-2025
1003 29-Jun-2001 29-Jun-2016 29-Jun-2016 11-Apr-2018
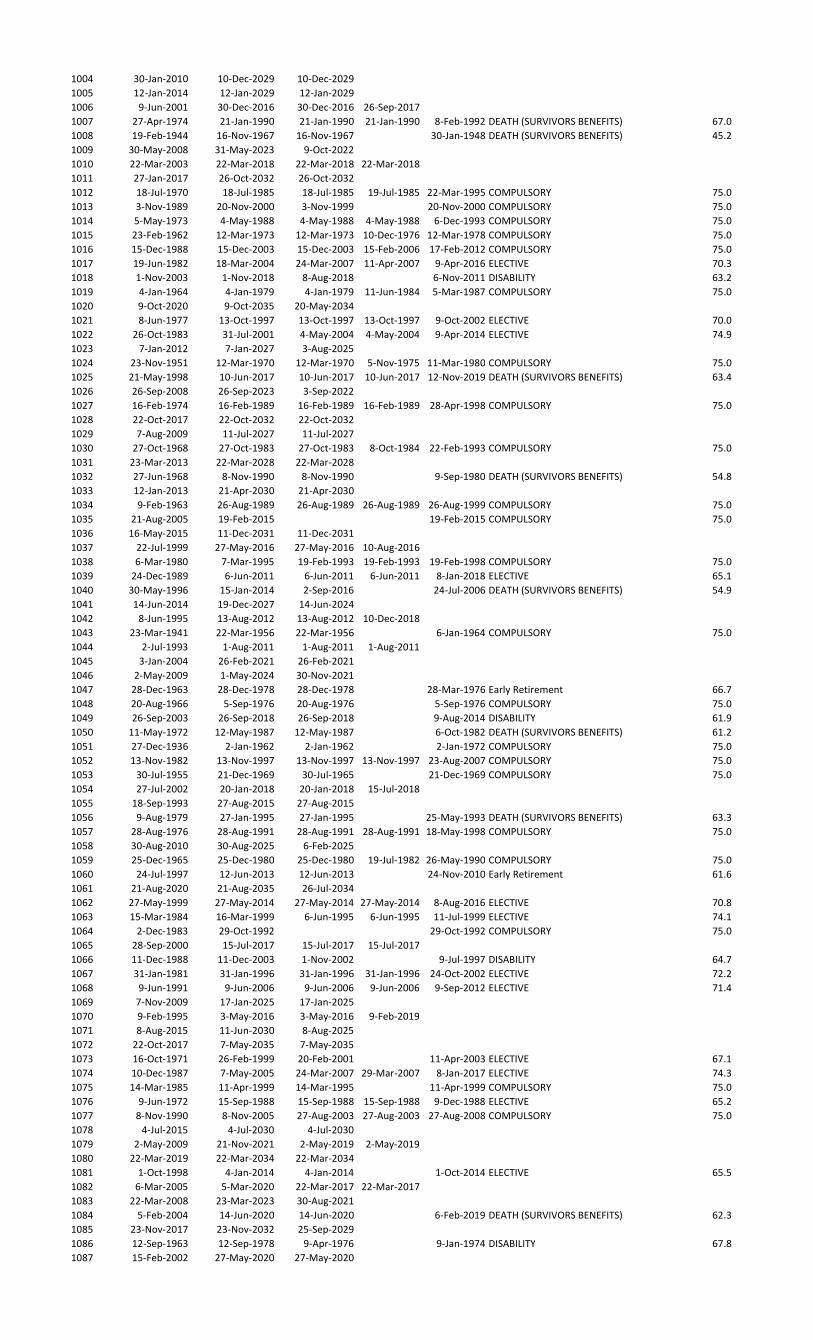
1004 30-Jan-2010 10-Dec-2029 10-Dec-2029
1005 12-Jan-2014 12-Jan-2029 12-Jan-2029
1006 9-Jun-2001 30-Dec-2016 30-Dec-2016 26-Sep-2017
1007 27-Apr-1974 21-Jan-1990 21-Jan-1990 21-Jan-1990 8-Feb-1992 DEATH (SURVIVORS BENEFITS) 67.0
1008 19-Feb-1944 16-Nov-1967 16-Nov-1967 30-Jan-1948 DEATH (SURVIVORS BENEFITS) 45.2
1009 30-May-2008 31-May-2023 9-Oct-2022
1010 22-Mar-2003 22-Mar-2018 22-Mar-2018 22-Mar-2018
1011 27-Jan-2017 26-Oct-2032 26-Oct-2032
1012 18-Jul-1970 18-Jul-1985 18-Jul-1985 19-Jul-1985 22-Mar-1995 COMPULSORY 75.0
1013 3-Nov-1989 20-Nov-2000 3-Nov-1999 20-Nov-2000 COMPULSORY 75.0
1014 5-May-1973 4-May-1988 4-May-1988 4-May-1988 6-Dec-1993 COMPULSORY 75.0
1015 23-Feb-1962 12-Mar-1973 12-Mar-1973 10-Dec-1976 12-Mar-1978 COMPULSORY 75.0
1016 15-Dec-1988 15-Dec-2003 15-Dec-2003 15-Feb-2006 17-Feb-2012 COMPULSORY 75.0
1017 19-Jun-1982 18-Mar-2004 24-Mar-2007 11-Apr-2007 9-Apr-2016 ELECTIVE 70.3
1018 1-Nov-2003 1-Nov-2018 8-Aug-2018 6-Nov-2011 DISABILITY 63.2
1019 4-Jan-1964 4-Jan-1979 4-Jan-1979 11-Jun-1984 5-Mar-1987 COMPULSORY 75.0
1020 9-Oct-2020 9-Oct-2035 20-May-2034
1021 8-Jun-1977 13-Oct-1997 13-Oct-1997 13-Oct-1997 9-Oct-2002 ELECTIVE 70.0
1022 26-Oct-1983 31-Jul-2001 4-May-2004 4-May-2004 9-Apr-2014 ELECTIVE 74.9
1023 7-Jan-2012 7-Jan-2027 3-Aug-2025
1024 23-Nov-1951 12-Mar-1970 12-Mar-1970 5-Nov-1975 11-Mar-1980 COMPULSORY 75.0
1025 21-May-1998 10-Jun-2017 10-Jun-2017 10-Jun-2017 12-Nov-2019 DEATH (SURVIVORS BENEFITS) 63.4
1026 26-Sep-2008 26-Sep-2023 3-Sep-2022
1027 16-Feb-1974 16-Feb-1989 16-Feb-1989 16-Feb-1989 28-Apr-1998 COMPULSORY 75.0
1028 22-Oct-2017 22-Oct-2032 22-Oct-2032
1029 7-Aug-2009 11-Jul-2027 11-Jul-2027
1030 27-Oct-1968 27-Oct-1983 27-Oct-1983 8-Oct-1984 22-Feb-1993 COMPULSORY 75.0
1031 23-Mar-2013 22-Mar-2028 22-Mar-2028
1032 27-Jun-1968 8-Nov-1990 8-Nov-1990 9-Sep-1980 DEATH (SURVIVORS BENEFITS) 54.8
1033 12-Jan-2013 21-Apr-2030 21-Apr-2030
1034 9-Feb-1963 26-Aug-1989 26-Aug-1989 26-Aug-1989 26-Aug-1999 COMPULSORY 75.0
1035 21-Aug-2005 19-Feb-2015 19-Feb-2015 COMPULSORY 75.0
1036 16-May-2015 11-Dec-2031 11-Dec-2031
1037 22-Jul-1999 27-May-2016 27-May-2016 10-Aug-2016
1038 6-Mar-1980 7-Mar-1995 19-Feb-1993 19-Feb-1993 19-Feb-1998 COMPULSORY 75.0
1039 24-Dec-1989 6-Jun-2011 6-Jun-2011 6-Jun-2011 8-Jan-2018 ELECTIVE 65.1
1040 30-May-1996 15-Jan-2014 2-Sep-2016 24-Jul-2006 DEATH (SURVIVORS BENEFITS) 54.9
1041 14-Jun-2014 19-Dec-2027 14-Jun-2024
1042 8-Jun-1995 13-Aug-2012 13-Aug-2012 10-Dec-2018
1043 23-Mar-1941 22-Mar-1956 22-Mar-1956 6-Jan-1964 COMPULSORY 75.0
1044 2-Jul-1993 1-Aug-2011 1-Aug-2011 1-Aug-2011
1045 3-Jan-2004 26-Feb-2021 26-Feb-2021
1046 2-May-2009 1-May-2024 30-Nov-2021
1047 28-Dec-1963 28-Dec-1978 28-Dec-1978 28-Mar-1976 Early Retirement 66.7
1048 20-Aug-1966 5-Sep-1976 20-Aug-1976 5-Sep-1976 COMPULSORY 75.0
1049 26-Sep-2003 26-Sep-2018 26-Sep-2018 9-Aug-2014 DISABILITY 61.9
1050 11-May-1972 12-May-1987 12-May-1987 6-Oct-1982 DEATH (SURVIVORS BENEFITS) 61.2
1051 27-Dec-1936 2-Jan-1962 2-Jan-1962 2-Jan-1972 COMPULSORY 75.0
1052 13-Nov-1982 13-Nov-1997 13-Nov-1997 13-Nov-1997 23-Aug-2007 COMPULSORY 75.0
1053 30-Jul-1955 21-Dec-1969 30-Jul-1965 21-Dec-1969 COMPULSORY 75.0
1054 27-Jul-2002 20-Jan-2018 20-Jan-2018 15-Jul-2018
1055 18-Sep-1993 27-Aug-2015 27-Aug-2015
1056 9-Aug-1979 27-Jan-1995 27-Jan-1995 25-May-1993 DEATH (SURVIVORS BENEFITS) 63.3
1057 28-Aug-1976 28-Aug-1991 28-Aug-1991 28-Aug-1991 18-May-1998 COMPULSORY 75.0
1058 30-Aug-2010 30-Aug-2025 6-Feb-2025
1059 25-Dec-1965 25-Dec-1980 25-Dec-1980 19-Jul-1982 26-May-1990 COMPULSORY 75.0
1060 24-Jul-1997 12-Jun-2013 12-Jun-2013 24-Nov-2010 Early Retirement 61.6
1061 21-Aug-2020 21-Aug-2035 26-Jul-2034
1062 27-May-1999 27-May-2014 27-May-2014 27-May-2014 8-Aug-2016 ELECTIVE 70.8
1063 15-Mar-1984 16-Mar-1999 6-Jun-1995 6-Jun-1995 11-Jul-1999 ELECTIVE 74.1
1064 2-Dec-1983 29-Oct-1992 29-Oct-1992 COMPULSORY 75.0
1065 28-Sep-2000 15-Jul-2017 15-Jul-2017 15-Jul-2017
1066 11-Dec-1988 11-Dec-2003 1-Nov-2002 9-Jul-1997 DISABILITY 64.7
1067 31-Jan-1981 31-Jan-1996 31-Jan-1996 31-Jan-1996 24-Oct-2002 ELECTIVE 72.2
1068 9-Jun-1991 9-Jun-2006 9-Jun-2006 9-Jun-2006 9-Sep-2012 ELECTIVE 71.4
1069 7-Nov-2009 17-Jan-2025 17-Jan-2025
1070 9-Feb-1995 3-May-2016 3-May-2016 9-Feb-2019
1071 8-Aug-2015 11-Jun-2030 8-Aug-2025
1072 22-Oct-2017 7-May-2035 7-May-2035
1073 16-Oct-1971 26-Feb-1999 20-Feb-2001 11-Apr-2003 ELECTIVE 67.1
1074 10-Dec-1987 7-May-2005 24-Mar-2007 29-Mar-2007 8-Jan-2017 ELECTIVE 74.3
1075 14-Mar-1985 11-Apr-1999 14-Mar-1995 11-Apr-1999 COMPULSORY 75.0
1076 9-Jun-1972 15-Sep-1988 15-Sep-1988 15-Sep-1988 9-Dec-1988 ELECTIVE 65.2
1077 8-Nov-1990 8-Nov-2005 27-Aug-2003 27-Aug-2003 27-Aug-2008 COMPULSORY 75.0
1078 4-Jul-2015 4-Jul-2030 4-Jul-2030
1079 2-May-2009 21-Nov-2021 2-May-2019 2-May-2019
1080 22-Mar-2019 22-Mar-2034 22-Mar-2034
1081 1-Oct-1998 4-Jan-2014 4-Jan-2014 1-Oct-2014 ELECTIVE 65.5
1082 6-Mar-2005 5-Mar-2020 22-Mar-2017 22-Mar-2017
1083 22-Mar-2008 23-Mar-2023 30-Aug-2021
1084 5-Feb-2004 14-Jun-2020 14-Jun-2020 6-Feb-2019 DEATH (SURVIVORS BENEFITS) 62.3
1085 23-Nov-2017 23-Nov-2032 25-Sep-2029
1086 12-Sep-1963 12-Sep-1978 9-Apr-1976 9-Jan-1974 DISABILITY 67.8
1087 15-Feb-2002 27-May-2020 27-May-2020
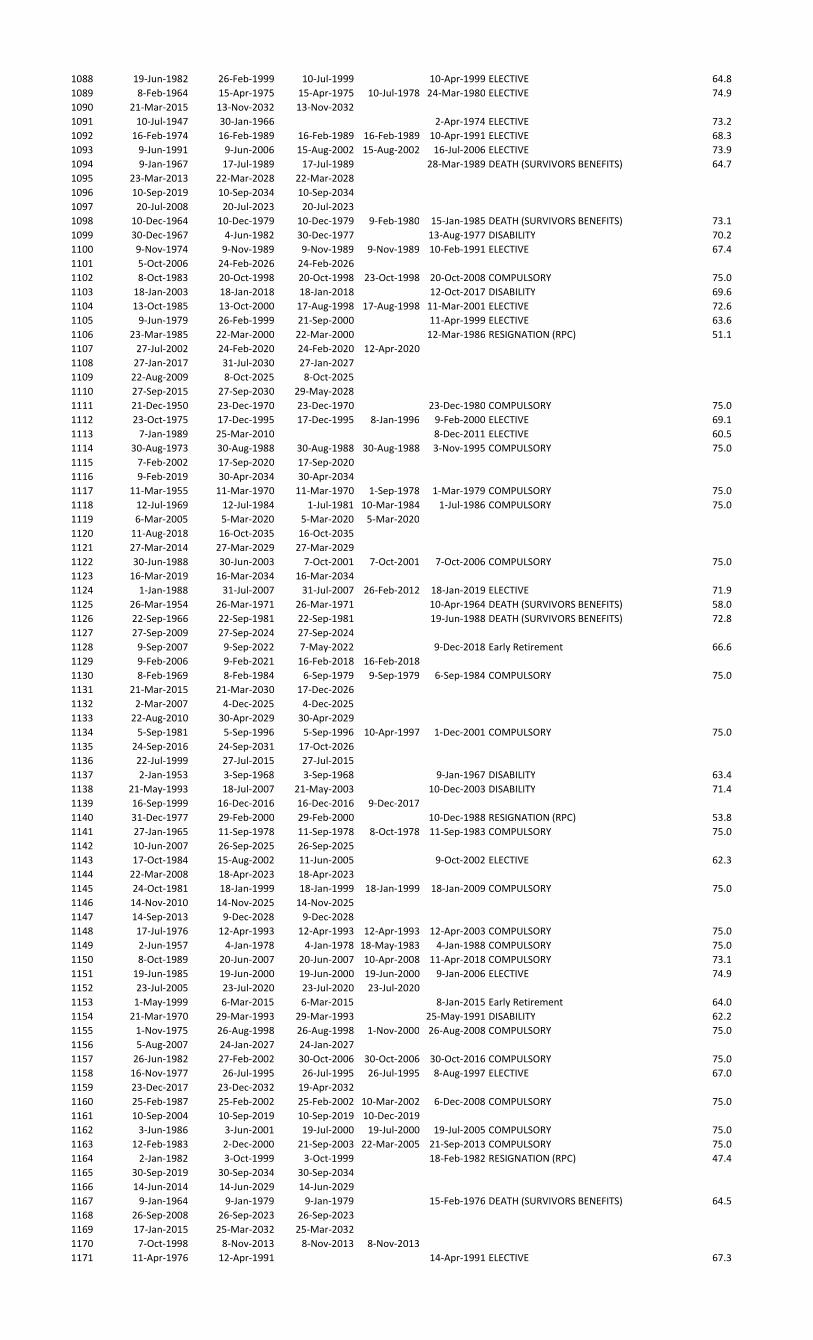
1088 19-Jun-1982 26-Feb-1999 10-Jul-1999 10-Apr-1999 ELECTIVE 64.8
1089 8-Feb-1964 15-Apr-1975 15-Apr-1975 10-Jul-1978 24-Mar-1980 ELECTIVE 74.9
1090 21-Mar-2015 13-Nov-2032 13-Nov-2032
1091 10-Jul-1947 30-Jan-1966 2-Apr-1974 ELECTIVE 73.2
1092 16-Feb-1974 16-Feb-1989 16-Feb-1989 16-Feb-1989 10-Apr-1991 ELECTIVE 68.3
1093 9-Jun-1991 9-Jun-2006 15-Aug-2002 15-Aug-2002 16-Jul-2006 ELECTIVE 73.9
1094 9-Jan-1967 17-Jul-1989 17-Jul-1989 28-Mar-1989 DEATH (SURVIVORS BENEFITS) 64.7
1095 23-Mar-2013 22-Mar-2028 22-Mar-2028
1096 10-Sep-2019 10-Sep-2034 10-Sep-2034
1097 20-Jul-2008 20-Jul-2023 20-Jul-2023
1098 10-Dec-1964 10-Dec-1979 10-Dec-1979 9-Feb-1980 15-Jan-1985 DEATH (SURVIVORS BENEFITS) 73.1
1099 30-Dec-1967 4-Jun-1982 30-Dec-1977 13-Aug-1977 DISABILITY 70.2
1100 9-Nov-1974 9-Nov-1989 9-Nov-1989 9-Nov-1989 10-Feb-1991 ELECTIVE 67.4
1101 5-Oct-2006 24-Feb-2026 24-Feb-2026
1102 8-Oct-1983 20-Oct-1998 20-Oct-1998 23-Oct-1998 20-Oct-2008 COMPULSORY 75.0
1103 18-Jan-2003 18-Jan-2018 18-Jan-2018 12-Oct-2017 DISABILITY 69.6
1104 13-Oct-1985 13-Oct-2000 17-Aug-1998 17-Aug-1998 11-Mar-2001 ELECTIVE 72.6
1105 9-Jun-1979 26-Feb-1999 21-Sep-2000 11-Apr-1999 ELECTIVE 63.6
1106 23-Mar-1985 22-Mar-2000 22-Mar-2000 12-Mar-1986 RESIGNATION (RPC) 51.1
1107 27-Jul-2002 24-Feb-2020 24-Feb-2020 12-Apr-2020
1108 27-Jan-2017 31-Jul-2030 27-Jan-2027
1109 22-Aug-2009 8-Oct-2025 8-Oct-2025
1110 27-Sep-2015 27-Sep-2030 29-May-2028
1111 21-Dec-1950 23-Dec-1970 23-Dec-1970 23-Dec-1980 COMPULSORY 75.0
1112 23-Oct-1975 17-Dec-1995 17-Dec-1995 8-Jan-1996 9-Feb-2000 ELECTIVE 69.1
1113 7-Jan-1989 25-Mar-2010 8-Dec-2011 ELECTIVE 60.5
1114 30-Aug-1973 30-Aug-1988 30-Aug-1988 30-Aug-1988 3-Nov-1995 COMPULSORY 75.0
1115 7-Feb-2002 17-Sep-2020 17-Sep-2020
1116 9-Feb-2019 30-Apr-2034 30-Apr-2034
1117 11-Mar-1955 11-Mar-1970 11-Mar-1970 1-Sep-1978 1-Mar-1979 COMPULSORY 75.0
1118 12-Jul-1969 12-Jul-1984 1-Jul-1981 10-Mar-1984 1-Jul-1986 COMPULSORY 75.0
1119 6-Mar-2005 5-Mar-2020 5-Mar-2020 5-Mar-2020
1120 11-Aug-2018 16-Oct-2035 16-Oct-2035
1121 27-Mar-2014 27-Mar-2029 27-Mar-2029
1122 30-Jun-1988 30-Jun-2003 7-Oct-2001 7-Oct-2001 7-Oct-2006 COMPULSORY 75.0
1123 16-Mar-2019 16-Mar-2034 16-Mar-2034
1124 1-Jan-1988 31-Jul-2007 31-Jul-2007 26-Feb-2012 18-Jan-2019 ELECTIVE 71.9
1125 26-Mar-1954 26-Mar-1971 26-Mar-1971 10-Apr-1964 DEATH (SURVIVORS BENEFITS) 58.0
1126 22-Sep-1966 22-Sep-1981 22-Sep-1981 19-Jun-1988 DEATH (SURVIVORS BENEFITS) 72.8
1127 27-Sep-2009 27-Sep-2024 27-Sep-2024
1128 9-Sep-2007 9-Sep-2022 7-May-2022 9-Dec-2018 Early Retirement 66.6
1129 9-Feb-2006 9-Feb-2021 16-Feb-2018 16-Feb-2018
1130 8-Feb-1969 8-Feb-1984 6-Sep-1979 9-Sep-1979 6-Sep-1984 COMPULSORY 75.0
1131 21-Mar-2015 21-Mar-2030 17-Dec-2026
1132 2-Mar-2007 4-Dec-2025 4-Dec-2025
1133 22-Aug-2010 30-Apr-2029 30-Apr-2029
1134 5-Sep-1981 5-Sep-1996 5-Sep-1996 10-Apr-1997 1-Dec-2001 COMPULSORY 75.0
1135 24-Sep-2016 24-Sep-2031 17-Oct-2026
1136 22-Jul-1999 27-Jul-2015 27-Jul-2015
1137 2-Jan-1953 3-Sep-1968 3-Sep-1968 9-Jan-1967 DISABILITY 63.4
1138 21-May-1993 18-Jul-2007 21-May-2003 10-Dec-2003 DISABILITY 71.4
1139 16-Sep-1999 16-Dec-2016 16-Dec-2016 9-Dec-2017
1140 31-Dec-1977 29-Feb-2000 29-Feb-2000 10-Dec-1988 RESIGNATION (RPC) 53.8
1141 27-Jan-1965 11-Sep-1978 11-Sep-1978 8-Oct-1978 11-Sep-1983 COMPULSORY 75.0
1142 10-Jun-2007 26-Sep-2025 26-Sep-2025
1143 17-Oct-1984 15-Aug-2002 11-Jun-2005 9-Oct-2002 ELECTIVE 62.3
1144 22-Mar-2008 18-Apr-2023 18-Apr-2023
1145 24-Oct-1981 18-Jan-1999 18-Jan-1999 18-Jan-1999 18-Jan-2009 COMPULSORY 75.0
1146 14-Nov-2010 14-Nov-2025 14-Nov-2025
1147 14-Sep-2013 9-Dec-2028 9-Dec-2028
1148 17-Jul-1976 12-Apr-1993 12-Apr-1993 12-Apr-1993 12-Apr-2003 COMPULSORY 75.0
1149 2-Jun-1957 4-Jan-1978 4-Jan-1978 18-May-1983 4-Jan-1988 COMPULSORY 75.0
1150 8-Oct-1989 20-Jun-2007 20-Jun-2007 10-Apr-2008 11-Apr-2018 COMPULSORY 73.1
1151 19-Jun-1985 19-Jun-2000 19-Jun-2000 19-Jun-2000 9-Jan-2006 ELECTIVE 74.9
1152 23-Jul-2005 23-Jul-2020 23-Jul-2020 23-Jul-2020
1153 1-May-1999 6-Mar-2015 6-Mar-2015 8-Jan-2015 Early Retirement 64.0
1154 21-Mar-1970 29-Mar-1993 29-Mar-1993 25-May-1991 DISABILITY 62.2
1155 1-Nov-1975 26-Aug-1998 26-Aug-1998 1-Nov-2000 26-Aug-2008 COMPULSORY 75.0
1156 5-Aug-2007 24-Jan-2027 24-Jan-2027
1157 26-Jun-1982 27-Feb-2002 30-Oct-2006 30-Oct-2006 30-Oct-2016 COMPULSORY 75.0
1158 16-Nov-1977 26-Jul-1995 26-Jul-1995 26-Jul-1995 8-Aug-1997 ELECTIVE 67.0
1159 23-Dec-2017 23-Dec-2032 19-Apr-2032
1160 25-Feb-1987 25-Feb-2002 25-Feb-2002 10-Mar-2002 6-Dec-2008 COMPULSORY 75.0
1161 10-Sep-2004 10-Sep-2019 10-Sep-2019 10-Dec-2019
1162 3-Jun-1986 3-Jun-2001 19-Jul-2000 19-Jul-2000 19-Jul-2005 COMPULSORY 75.0
1163 12-Feb-1983 2-Dec-2000 21-Sep-2003 22-Mar-2005 21-Sep-2013 COMPULSORY 75.0
1164 2-Jan-1982 3-Oct-1999 3-Oct-1999 18-Feb-1982 RESIGNATION (RPC) 47.4
1165 30-Sep-2019 30-Sep-2034 30-Sep-2034
1166 14-Jun-2014 14-Jun-2029 14-Jun-2029
1167 9-Jan-1964 9-Jan-1979 9-Jan-1979 15-Feb-1976 DEATH (SURVIVORS BENEFITS) 64.5
1168 26-Sep-2008 26-Sep-2023 26-Sep-2023
1169 17-Jan-2015 25-Mar-2032 25-Mar-2032
1170 7-Oct-1998 8-Nov-2013 8-Nov-2013 8-Nov-2013
1171 11-Apr-1976 12-Apr-1991 14-Apr-1991 ELECTIVE 67.3
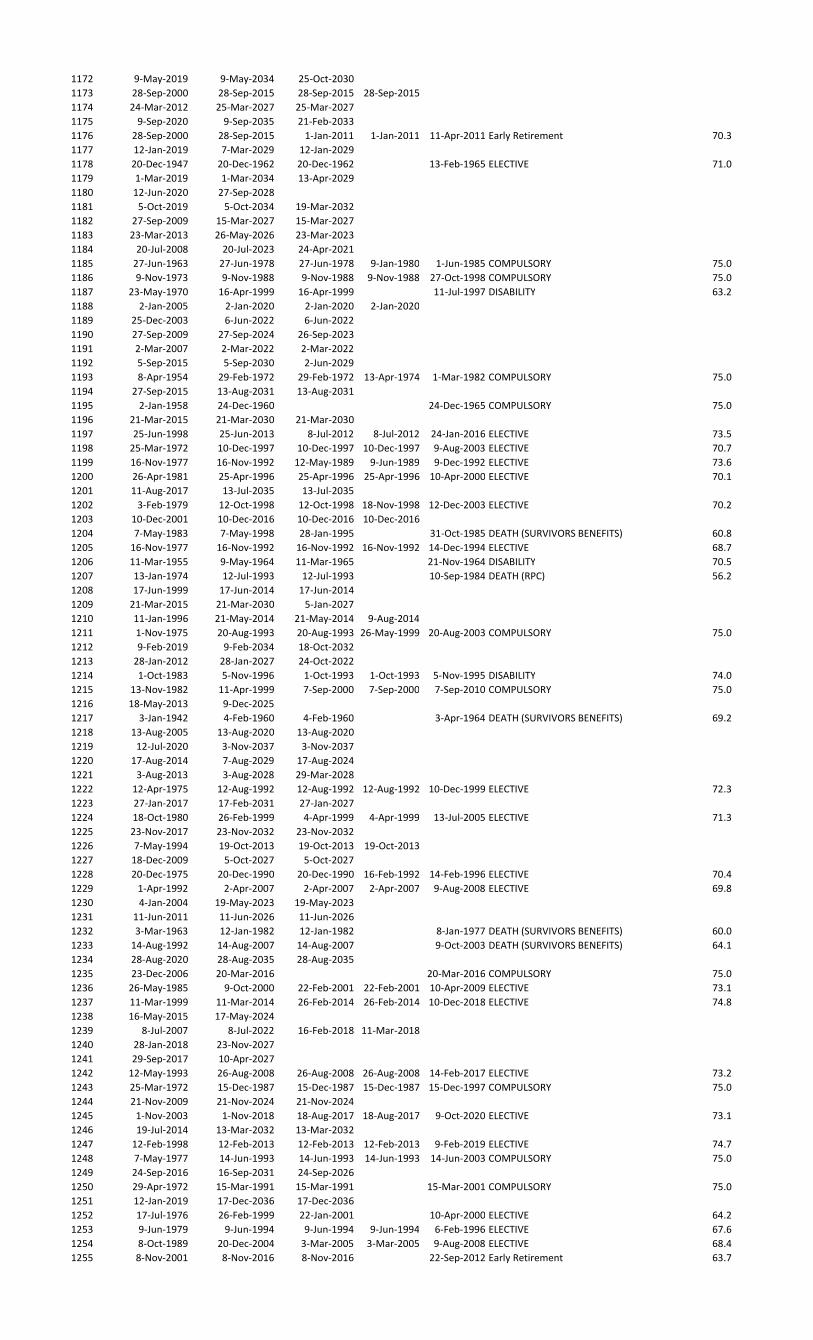
1172 9-May-2019 9-May-2034 25-Oct-2030
1173 28-Sep-2000 28-Sep-2015 28-Sep-2015 28-Sep-2015
1174 24-Mar-2012 25-Mar-2027 25-Mar-2027
1175 9-Sep-2020 9-Sep-2035 21-Feb-2033
1176 28-Sep-2000 28-Sep-2015 1-Jan-2011 1-Jan-2011 11-Apr-2011 Early Retirement 70.3
1177 12-Jan-2019 7-Mar-2029 12-Jan-2029
1178 20-Dec-1947 20-Dec-1962 20-Dec-1962 13-Feb-1965 ELECTIVE 71.0
1179 1-Mar-2019 1-Mar-2034 13-Apr-2029
1180 12-Jun-2020 27-Sep-2028
1181 5-Oct-2019 5-Oct-2034 19-Mar-2032
1182 27-Sep-2009 15-Mar-2027 15-Mar-2027
1183 23-Mar-2013 26-May-2026 23-Mar-2023
1184 20-Jul-2008 20-Jul-2023 24-Apr-2021
1185 27-Jun-1963 27-Jun-1978 27-Jun-1978 9-Jan-1980 1-Jun-1985 COMPULSORY 75.0
1186 9-Nov-1973 9-Nov-1988 9-Nov-1988 9-Nov-1988 27-Oct-1998 COMPULSORY 75.0
1187 23-May-1970 16-Apr-1999 16-Apr-1999 11-Jul-1997 DISABILITY 63.2
1188 2-Jan-2005 2-Jan-2020 2-Jan-2020 2-Jan-2020
1189 25-Dec-2003 6-Jun-2022 6-Jun-2022
1190 27-Sep-2009 27-Sep-2024 26-Sep-2023
1191 2-Mar-2007 2-Mar-2022 2-Mar-2022
1192 5-Sep-2015 5-Sep-2030 2-Jun-2029
1193 8-Apr-1954 29-Feb-1972 29-Feb-1972 13-Apr-1974 1-Mar-1982 COMPULSORY 75.0
1194 27-Sep-2015 13-Aug-2031 13-Aug-2031
1195 2-Jan-1958 24-Dec-1960 24-Dec-1965 COMPULSORY 75.0
1196 21-Mar-2015 21-Mar-2030 21-Mar-2030
1197 25-Jun-1998 25-Jun-2013 8-Jul-2012 8-Jul-2012 24-Jan-2016 ELECTIVE 73.5
1198 25-Mar-1972 10-Dec-1997 10-Dec-1997 10-Dec-1997 9-Aug-2003 ELECTIVE 70.7
1199 16-Nov-1977 16-Nov-1992 12-May-1989 9-Jun-1989 9-Dec-1992 ELECTIVE 73.6
1200 26-Apr-1981 25-Apr-1996 25-Apr-1996 25-Apr-1996 10-Apr-2000 ELECTIVE 70.1
1201 11-Aug-2017 13-Jul-2035 13-Jul-2035
1202 3-Feb-1979 12-Oct-1998 12-Oct-1998 18-Nov-1998 12-Dec-2003 ELECTIVE 70.2
1203 10-Dec-2001 10-Dec-2016 10-Dec-2016 10-Dec-2016
1204 7-May-1983 7-May-1998 28-Jan-1995 31-Oct-1985 DEATH (SURVIVORS BENEFITS) 60.8
1205 16-Nov-1977 16-Nov-1992 16-Nov-1992 16-Nov-1992 14-Dec-1994 ELECTIVE 68.7
1206 11-Mar-1955 9-May-1964 11-Mar-1965 21-Nov-1964 DISABILITY 70.5
1207 13-Jan-1974 12-Jul-1993 12-Jul-1993 10-Sep-1984 DEATH (RPC) 56.2
1208 17-Jun-1999 17-Jun-2014 17-Jun-2014
1209 21-Mar-2015 21-Mar-2030 5-Jan-2027
1210 11-Jan-1996 21-May-2014 21-May-2014 9-Aug-2014
1211 1-Nov-1975 20-Aug-1993 20-Aug-1993 26-May-1999 20-Aug-2003 COMPULSORY 75.0
1212 9-Feb-2019 9-Feb-2034 18-Oct-2032
1213 28-Jan-2012 28-Jan-2027 24-Oct-2022
1214 1-Oct-1983 5-Nov-1996 1-Oct-1993 1-Oct-1993 5-Nov-1995 DISABILITY 74.0
1215 13-Nov-1982 11-Apr-1999 7-Sep-2000 7-Sep-2000 7-Sep-2010 COMPULSORY 75.0
1216 18-May-2013 9-Dec-2025
1217 3-Jan-1942 4-Feb-1960 4-Feb-1960 3-Apr-1964 DEATH (SURVIVORS BENEFITS) 69.2
1218 13-Aug-2005 13-Aug-2020 13-Aug-2020
1219 12-Jul-2020 3-Nov-2037 3-Nov-2037
1220 17-Aug-2014 7-Aug-2029 17-Aug-2024
1221 3-Aug-2013 3-Aug-2028 29-Mar-2028
1222 12-Apr-1975 12-Aug-1992 12-Aug-1992 12-Aug-1992 10-Dec-1999 ELECTIVE 72.3
1223 27-Jan-2017 17-Feb-2031 27-Jan-2027
1224 18-Oct-1980 26-Feb-1999 4-Apr-1999 4-Apr-1999 13-Jul-2005 ELECTIVE 71.3
1225 23-Nov-2017 23-Nov-2032 23-Nov-2032
1226 7-May-1994 19-Oct-2013 19-Oct-2013 19-Oct-2013
1227 18-Dec-2009 5-Oct-2027 5-Oct-2027
1228 20-Dec-1975 20-Dec-1990 20-Dec-1990 16-Feb-1992 14-Feb-1996 ELECTIVE 70.4
1229 1-Apr-1992 2-Apr-2007 2-Apr-2007 2-Apr-2007 9-Aug-2008 ELECTIVE 69.8
1230 4-Jan-2004 19-May-2023 19-May-2023
1231 11-Jun-2011 11-Jun-2026 11-Jun-2026
1232 3-Mar-1963 12-Jan-1982 12-Jan-1982 8-Jan-1977 DEATH (SURVIVORS BENEFITS) 60.0
1233 14-Aug-1992 14-Aug-2007 14-Aug-2007 9-Oct-2003 DEATH (SURVIVORS BENEFITS) 64.1
1234 28-Aug-2020 28-Aug-2035 28-Aug-2035
1235 23-Dec-2006 20-Mar-2016 20-Mar-2016 COMPULSORY 75.0
1236 26-May-1985 9-Oct-2000 22-Feb-2001 22-Feb-2001 10-Apr-2009 ELECTIVE 73.1
1237 11-Mar-1999 11-Mar-2014 26-Feb-2014 26-Feb-2014 10-Dec-2018 ELECTIVE 74.8
1238 16-May-2015 17-May-2024
1239 8-Jul-2007 8-Jul-2022 16-Feb-2018 11-Mar-2018
1240 28-Jan-2018 23-Nov-2027
1241 29-Sep-2017 10-Apr-2027
1242 12-May-1993 26-Aug-2008 26-Aug-2008 26-Aug-2008 14-Feb-2017 ELECTIVE 73.2
1243 25-Mar-1972 15-Dec-1987 15-Dec-1987 15-Dec-1987 15-Dec-1997 COMPULSORY 75.0
1244 21-Nov-2009 21-Nov-2024 21-Nov-2024
1245 1-Nov-2003 1-Nov-2018 18-Aug-2017 18-Aug-2017 9-Oct-2020 ELECTIVE 73.1
1246 19-Jul-2014 13-Mar-2032 13-Mar-2032
1247 12-Feb-1998 12-Feb-2013 12-Feb-2013 12-Feb-2013 9-Feb-2019 ELECTIVE 74.7
1248 7-May-1977 14-Jun-1993 14-Jun-1993 14-Jun-1993 14-Jun-2003 COMPULSORY 75.0
1249 24-Sep-2016 16-Sep-2031 24-Sep-2026
1250 29-Apr-1972 15-Mar-1991 15-Mar-1991 15-Mar-2001 COMPULSORY 75.0
1251 12-Jan-2019 17-Dec-2036 17-Dec-2036
1252 17-Jul-1976 26-Feb-1999 22-Jan-2001 10-Apr-2000 ELECTIVE 64.2
1253 9-Jun-1979 9-Jun-1994 9-Jun-1994 9-Jun-1994 6-Feb-1996 ELECTIVE 67.6
1254 8-Oct-1989 20-Dec-2004 3-Mar-2005 3-Mar-2005 9-Aug-2008 ELECTIVE 68.4
1255 8-Nov-2001 8-Nov-2016 8-Nov-2016 22-Sep-2012 Early Retirement 63.7
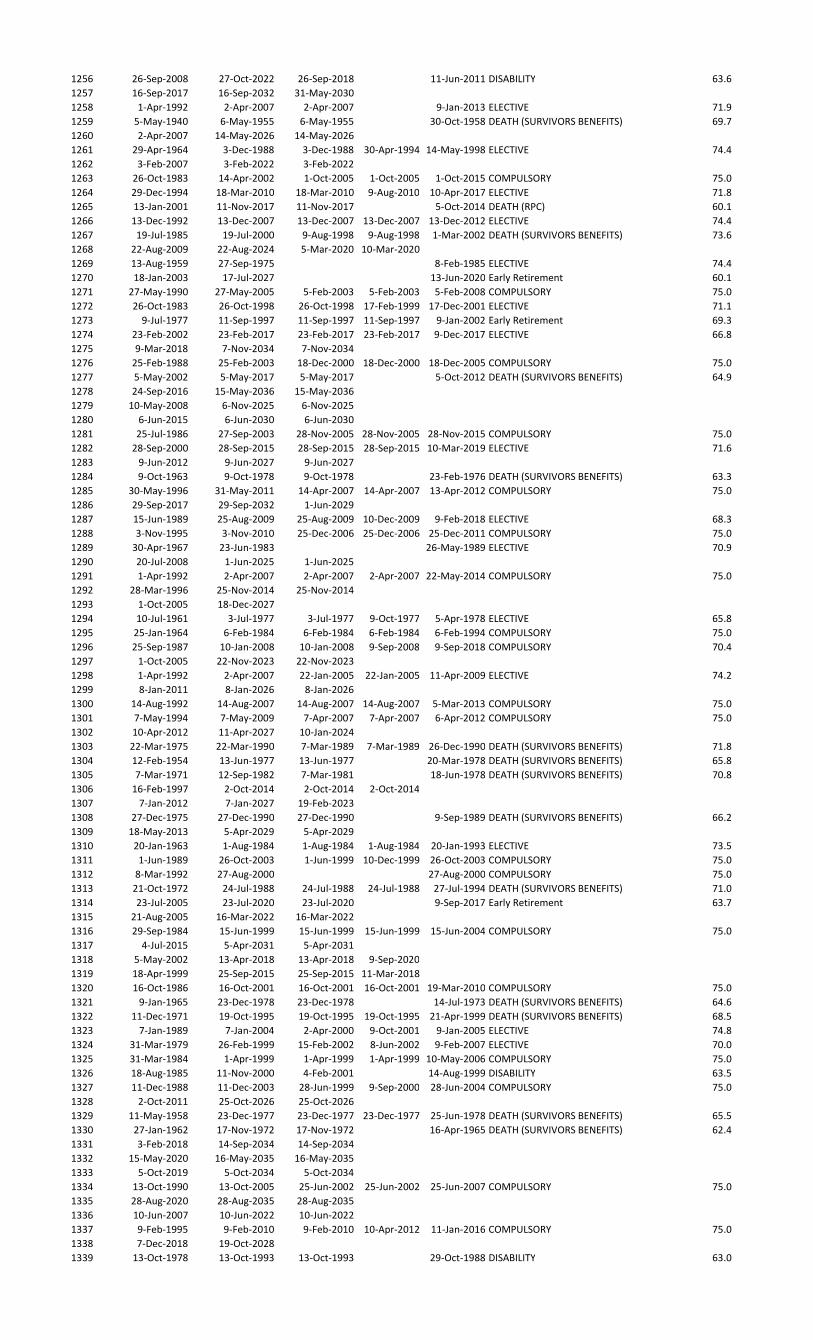
1256 26-Sep-2008 27-Oct-2022 26-Sep-2018 11-Jun-2011 DISABILITY 63.6
1257 16-Sep-2017 16-Sep-2032 31-May-2030
1258 1-Apr-1992 2-Apr-2007 2-Apr-2007 9-Jan-2013 ELECTIVE 71.9
1259 5-May-1940 6-May-1955 6-May-1955 30-Oct-1958 DEATH (SURVIVORS BENEFITS) 69.7
1260 2-Apr-2007 14-May-2026 14-May-2026
1261 29-Apr-1964 3-Dec-1988 3-Dec-1988 30-Apr-1994 14-May-1998 ELECTIVE 74.4
1262 3-Feb-2007 3-Feb-2022 3-Feb-2022
1263 26-Oct-1983 14-Apr-2002 1-Oct-2005 1-Oct-2005 1-Oct-2015 COMPULSORY 75.0
1264 29-Dec-1994 18-Mar-2010 18-Mar-2010 9-Aug-2010 10-Apr-2017 ELECTIVE 71.8
1265 13-Jan-2001 11-Nov-2017 11-Nov-2017 5-Oct-2014 DEATH (RPC) 60.1
1266 13-Dec-1992 13-Dec-2007 13-Dec-2007 13-Dec-2007 13-Dec-2012 ELECTIVE 74.4
1267 19-Jul-1985 19-Jul-2000 9-Aug-1998 9-Aug-1998 1-Mar-2002 DEATH (SURVIVORS BENEFITS) 73.6
1268 22-Aug-2009 22-Aug-2024 5-Mar-2020 10-Mar-2020
1269 13-Aug-1959 27-Sep-1975 8-Feb-1985 ELECTIVE 74.4
1270 18-Jan-2003 17-Jul-2027 13-Jun-2020 Early Retirement 60.1
1271 27-May-1990 27-May-2005 5-Feb-2003 5-Feb-2003 5-Feb-2008 COMPULSORY 75.0
1272 26-Oct-1983 26-Oct-1998 26-Oct-1998 17-Feb-1999 17-Dec-2001 ELECTIVE 71.1
1273 9-Jul-1977 11-Sep-1997 11-Sep-1997 11-Sep-1997 9-Jan-2002 Early Retirement 69.3
1274 23-Feb-2002 23-Feb-2017 23-Feb-2017 23-Feb-2017 9-Dec-2017 ELECTIVE 66.8
1275 9-Mar-2018 7-Nov-2034 7-Nov-2034
1276 25-Feb-1988 25-Feb-2003 18-Dec-2000 18-Dec-2000 18-Dec-2005 COMPULSORY 75.0
1277 5-May-2002 5-May-2017 5-May-2017 5-Oct-2012 DEATH (SURVIVORS BENEFITS) 64.9
1278 24-Sep-2016 15-May-2036 15-May-2036
1279 10-May-2008 6-Nov-2025 6-Nov-2025
1280 6-Jun-2015 6-Jun-2030 6-Jun-2030
1281 25-Jul-1986 27-Sep-2003 28-Nov-2005 28-Nov-2005 28-Nov-2015 COMPULSORY 75.0
1282 28-Sep-2000 28-Sep-2015 28-Sep-2015 28-Sep-2015 10-Mar-2019 ELECTIVE 71.6
1283 9-Jun-2012 9-Jun-2027 9-Jun-2027
1284 9-Oct-1963 9-Oct-1978 9-Oct-1978 23-Feb-1976 DEATH (SURVIVORS BENEFITS) 63.3
1285 30-May-1996 31-May-2011 14-Apr-2007 14-Apr-2007 13-Apr-2012 COMPULSORY 75.0
1286 29-Sep-2017 29-Sep-2032 1-Jun-2029
1287 15-Jun-1989 25-Aug-2009 25-Aug-2009 10-Dec-2009 9-Feb-2018 ELECTIVE 68.3
1288 3-Nov-1995 3-Nov-2010 25-Dec-2006 25-Dec-2006 25-Dec-2011 COMPULSORY 75.0
1289 30-Apr-1967 23-Jun-1983 26-May-1989 ELECTIVE 70.9
1290 20-Jul-2008 1-Jun-2025 1-Jun-2025
1291 1-Apr-1992 2-Apr-2007 2-Apr-2007 2-Apr-2007 22-May-2014 COMPULSORY 75.0
1292 28-Mar-1996 25-Nov-2014 25-Nov-2014
1293 1-Oct-2005 18-Dec-2027
1294 10-Jul-1961 3-Jul-1977 3-Jul-1977 9-Oct-1977 5-Apr-1978 ELECTIVE 65.8
1295 25-Jan-1964 6-Feb-1984 6-Feb-1984 6-Feb-1984 6-Feb-1994 COMPULSORY 75.0
1296 25-Sep-1987 10-Jan-2008 10-Jan-2008 9-Sep-2008 9-Sep-2018 COMPULSORY 70.4
1297 1-Oct-2005 22-Nov-2023 22-Nov-2023
1298 1-Apr-1992 2-Apr-2007 22-Jan-2005 22-Jan-2005 11-Apr-2009 ELECTIVE 74.2
1299 8-Jan-2011 8-Jan-2026 8-Jan-2026
1300 14-Aug-1992 14-Aug-2007 14-Aug-2007 14-Aug-2007 5-Mar-2013 COMPULSORY 75.0
1301 7-May-1994 7-May-2009 7-Apr-2007 7-Apr-2007 6-Apr-2012 COMPULSORY 75.0
1302 10-Apr-2012 11-Apr-2027 10-Jan-2024
1303 22-Mar-1975 22-Mar-1990 7-Mar-1989 7-Mar-1989 26-Dec-1990 DEATH (SURVIVORS BENEFITS) 71.8
1304 12-Feb-1954 13-Jun-1977 13-Jun-1977 20-Mar-1978 DEATH (SURVIVORS BENEFITS) 65.8
1305 7-Mar-1971 12-Sep-1982 7-Mar-1981 18-Jun-1978 DEATH (SURVIVORS BENEFITS) 70.8
1306 16-Feb-1997 2-Oct-2014 2-Oct-2014 2-Oct-2014
1307 7-Jan-2012 7-Jan-2027 19-Feb-2023
1308 27-Dec-1975 27-Dec-1990 27-Dec-1990 9-Sep-1989 DEATH (SURVIVORS BENEFITS) 66.2
1309 18-May-2013 5-Apr-2029 5-Apr-2029
1310 20-Jan-1963 1-Aug-1984 1-Aug-1984 1-Aug-1984 20-Jan-1993 ELECTIVE 73.5
1311 1-Jun-1989 26-Oct-2003 1-Jun-1999 10-Dec-1999 26-Oct-2003 COMPULSORY 75.0
1312 8-Mar-1992 27-Aug-2000 27-Aug-2000 COMPULSORY 75.0
1313 21-Oct-1972 24-Jul-1988 24-Jul-1988 24-Jul-1988 27-Jul-1994 DEATH (SURVIVORS BENEFITS) 71.0
1314 23-Jul-2005 23-Jul-2020 23-Jul-2020 9-Sep-2017 Early Retirement 63.7
1315 21-Aug-2005 16-Mar-2022 16-Mar-2022
1316 29-Sep-1984 15-Jun-1999 15-Jun-1999 15-Jun-1999 15-Jun-2004 COMPULSORY 75.0
1317 4-Jul-2015 5-Apr-2031 5-Apr-2031
1318 5-May-2002 13-Apr-2018 13-Apr-2018 9-Sep-2020
1319 18-Apr-1999 25-Sep-2015 25-Sep-2015 11-Mar-2018
1320 16-Oct-1986 16-Oct-2001 16-Oct-2001 16-Oct-2001 19-Mar-2010 COMPULSORY 75.0
1321 9-Jan-1965 23-Dec-1978 23-Dec-1978 14-Jul-1973 DEATH (SURVIVORS BENEFITS) 64.6
1322 11-Dec-1971 19-Oct-1995 19-Oct-1995 19-Oct-1995 21-Apr-1999 DEATH (SURVIVORS BENEFITS) 68.5
1323 7-Jan-1989 7-Jan-2004 2-Apr-2000 9-Oct-2001 9-Jan-2005 ELECTIVE 74.8
1324 31-Mar-1979 26-Feb-1999 15-Feb-2002 8-Jun-2002 9-Feb-2007 ELECTIVE 70.0
1325 31-Mar-1984 1-Apr-1999 1-Apr-1999 1-Apr-1999 10-May-2006 COMPULSORY 75.0
1326 18-Aug-1985 11-Nov-2000 4-Feb-2001 14-Aug-1999 DISABILITY 63.5
1327 11-Dec-1988 11-Dec-2003 28-Jun-1999 9-Sep-2000 28-Jun-2004 COMPULSORY 75.0
1328 2-Oct-2011 25-Oct-2026 25-Oct-2026
1329 11-May-1958 23-Dec-1977 23-Dec-1977 23-Dec-1977 25-Jun-1978 DEATH (SURVIVORS BENEFITS) 65.5
1330 27-Jan-1962 17-Nov-1972 17-Nov-1972 16-Apr-1965 DEATH (SURVIVORS BENEFITS) 62.4
1331 3-Feb-2018 14-Sep-2034 14-Sep-2034
1332 15-May-2020 16-May-2035 16-May-2035
1333 5-Oct-2019 5-Oct-2034 5-Oct-2034
1334 13-Oct-1990 13-Oct-2005 25-Jun-2002 25-Jun-2002 25-Jun-2007 COMPULSORY 75.0
1335 28-Aug-2020 28-Aug-2035 28-Aug-2035
1336 10-Jun-2007 10-Jun-2022 10-Jun-2022
1337 9-Feb-1995 9-Feb-2010 9-Feb-2010 10-Apr-2012 11-Jan-2016 COMPULSORY 75.0
1338 7-Dec-2018 19-Oct-2028
1339 13-Oct-1978 13-Oct-1993 13-Oct-1993 29-Oct-1988 DISABILITY 63.0
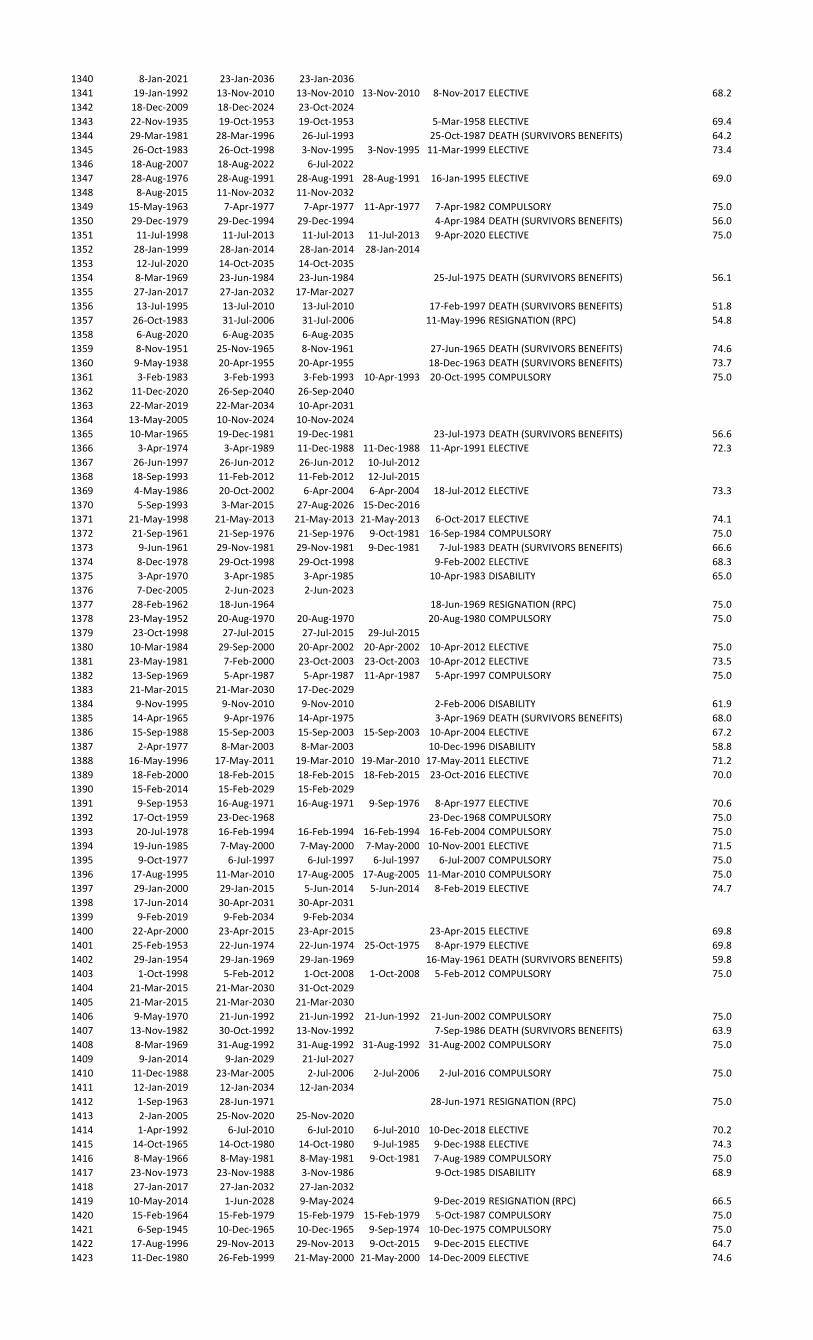
1340 8-Jan-2021 23-Jan-2036 23-Jan-2036
1341 19-Jan-1992 13-Nov-2010 13-Nov-2010 13-Nov-2010 8-Nov-2017 ELECTIVE 68.2
1342 18-Dec-2009 18-Dec-2024 23-Oct-2024
1343 22-Nov-1935 19-Oct-1953 19-Oct-1953 5-Mar-1958 ELECTIVE 69.4
1344 29-Mar-1981 28-Mar-1996 26-Jul-1993 25-Oct-1987 DEATH (SURVIVORS BENEFITS) 64.2
1345 26-Oct-1983 26-Oct-1998 3-Nov-1995 3-Nov-1995 11-Mar-1999 ELECTIVE 73.4
1346 18-Aug-2007 18-Aug-2022 6-Jul-2022
1347 28-Aug-1976 28-Aug-1991 28-Aug-1991 28-Aug-1991 16-Jan-1995 ELECTIVE 69.0
1348 8-Aug-2015 11-Nov-2032 11-Nov-2032
1349 15-May-1963 7-Apr-1977 7-Apr-1977 11-Apr-1977 7-Apr-1982 COMPULSORY 75.0
1350 29-Dec-1979 29-Dec-1994 29-Dec-1994 4-Apr-1984 DEATH (SURVIVORS BENEFITS) 56.0
1351 11-Jul-1998 11-Jul-2013 11-Jul-2013 11-Jul-2013 9-Apr-2020 ELECTIVE 75.0
1352 28-Jan-1999 28-Jan-2014 28-Jan-2014 28-Jan-2014
1353 12-Jul-2020 14-Oct-2035 14-Oct-2035
1354 8-Mar-1969 23-Jun-1984 23-Jun-1984 25-Jul-1975 DEATH (SURVIVORS BENEFITS) 56.1
1355 27-Jan-2017 27-Jan-2032 17-Mar-2027
1356 13-Jul-1995 13-Jul-2010 13-Jul-2010 17-Feb-1997 DEATH (SURVIVORS BENEFITS) 51.8
1357 26-Oct-1983 31-Jul-2006 31-Jul-2006 11-May-1996 RESIGNATION (RPC) 54.8
1358 6-Aug-2020 6-Aug-2035 6-Aug-2035
1359 8-Nov-1951 25-Nov-1965 8-Nov-1961 27-Jun-1965 DEATH (SURVIVORS BENEFITS) 74.6
1360 9-May-1938 20-Apr-1955 20-Apr-1955 18-Dec-1963 DEATH (SURVIVORS BENEFITS) 73.7
1361 3-Feb-1983 3-Feb-1993 3-Feb-1993 10-Apr-1993 20-Oct-1995 COMPULSORY 75.0
1362 11-Dec-2020 26-Sep-2040 26-Sep-2040
1363 22-Mar-2019 22-Mar-2034 10-Apr-2031
1364 13-May-2005 10-Nov-2024 10-Nov-2024
1365 10-Mar-1965 19-Dec-1981 19-Dec-1981 23-Jul-1973 DEATH (SURVIVORS BENEFITS) 56.6
1366 3-Apr-1974 3-Apr-1989 11-Dec-1988 11-Dec-1988 11-Apr-1991 ELECTIVE 72.3
1367 26-Jun-1997 26-Jun-2012 26-Jun-2012 10-Jul-2012
1368 18-Sep-1993 11-Feb-2012 11-Feb-2012 12-Jul-2015
1369 4-May-1986 20-Oct-2002 6-Apr-2004 6-Apr-2004 18-Jul-2012 ELECTIVE 73.3
1370 5-Sep-1993 3-Mar-2015 27-Aug-2026 15-Dec-2016
1371 21-May-1998 21-May-2013 21-May-2013 21-May-2013 6-Oct-2017 ELECTIVE 74.1
1372 21-Sep-1961 21-Sep-1976 21-Sep-1976 9-Oct-1981 16-Sep-1984 COMPULSORY 75.0
1373 9-Jun-1961 29-Nov-1981 29-Nov-1981 9-Dec-1981 7-Jul-1983 DEATH (SURVIVORS BENEFITS) 66.6
1374 8-Dec-1978 29-Oct-1998 29-Oct-1998 9-Feb-2002 ELECTIVE 68.3
1375 3-Apr-1970 3-Apr-1985 3-Apr-1985 10-Apr-1983 DISABILITY 65.0
1376 7-Dec-2005 2-Jun-2023 2-Jun-2023
1377 28-Feb-1962 18-Jun-1964 18-Jun-1969 RESIGNATION (RPC) 75.0
1378 23-May-1952 20-Aug-1970 20-Aug-1970 20-Aug-1980 COMPULSORY 75.0
1379 23-Oct-1998 27-Jul-2015 27-Jul-2015 29-Jul-2015
1380 10-Mar-1984 29-Sep-2000 20-Apr-2002 20-Apr-2002 10-Apr-2012 ELECTIVE 75.0
1381 23-May-1981 7-Feb-2000 23-Oct-2003 23-Oct-2003 10-Apr-2012 ELECTIVE 73.5
1382 13-Sep-1969 5-Apr-1987 5-Apr-1987 11-Apr-1987 5-Apr-1997 COMPULSORY 75.0
1383 21-Mar-2015 21-Mar-2030 17-Dec-2029
1384 9-Nov-1995 9-Nov-2010 9-Nov-2010 2-Feb-2006 DISABILITY 61.9
1385 14-Apr-1965 9-Apr-1976 14-Apr-1975 3-Apr-1969 DEATH (SURVIVORS BENEFITS) 68.0
1386 15-Sep-1988 15-Sep-2003 15-Sep-2003 15-Sep-2003 10-Apr-2004 ELECTIVE 67.2
1387 2-Apr-1977 8-Mar-2003 8-Mar-2003 10-Dec-1996 DISABILITY 58.8
1388 16-May-1996 17-May-2011 19-Mar-2010 19-Mar-2010 17-May-2011 ELECTIVE 71.2
1389 18-Feb-2000 18-Feb-2015 18-Feb-2015 18-Feb-2015 23-Oct-2016 ELECTIVE 70.0
1390 15-Feb-2014 15-Feb-2029 15-Feb-2029
1391 9-Sep-1953 16-Aug-1971 16-Aug-1971 9-Sep-1976 8-Apr-1977 ELECTIVE 70.6
1392 17-Oct-1959 23-Dec-1968 23-Dec-1968 COMPULSORY 75.0
1393 20-Jul-1978 16-Feb-1994 16-Feb-1994 16-Feb-1994 16-Feb-2004 COMPULSORY 75.0
1394 19-Jun-1985 7-May-2000 7-May-2000 7-May-2000 10-Nov-2001 ELECTIVE 71.5
1395 9-Oct-1977 6-Jul-1997 6-Jul-1997 6-Jul-1997 6-Jul-2007 COMPULSORY 75.0
1396 17-Aug-1995 11-Mar-2010 17-Aug-2005 17-Aug-2005 11-Mar-2010 COMPULSORY 75.0
1397 29-Jan-2000 29-Jan-2015 5-Jun-2014 5-Jun-2014 8-Feb-2019 ELECTIVE 74.7
1398 17-Jun-2014 30-Apr-2031 30-Apr-2031
1399 9-Feb-2019 9-Feb-2034 9-Feb-2034
1400 22-Apr-2000 23-Apr-2015 23-Apr-2015 23-Apr-2015 ELECTIVE 69.8
1401 25-Feb-1953 22-Jun-1974 22-Jun-1974 25-Oct-1975 8-Apr-1979 ELECTIVE 69.8
1402 29-Jan-1954 29-Jan-1969 29-Jan-1969 16-May-1961 DEATH (SURVIVORS BENEFITS) 59.8
1403 1-Oct-1998 5-Feb-2012 1-Oct-2008 1-Oct-2008 5-Feb-2012 COMPULSORY 75.0
1404 21-Mar-2015 21-Mar-2030 31-Oct-2029
1405 21-Mar-2015 21-Mar-2030 21-Mar-2030
1406 9-May-1970 21-Jun-1992 21-Jun-1992 21-Jun-1992 21-Jun-2002 COMPULSORY 75.0
1407 13-Nov-1982 30-Oct-1992 13-Nov-1992 7-Sep-1986 DEATH (SURVIVORS BENEFITS) 63.9
1408 8-Mar-1969 31-Aug-1992 31-Aug-1992 31-Aug-1992 31-Aug-2002 COMPULSORY 75.0
1409 9-Jan-2014 9-Jan-2029 21-Jul-2027
1410 11-Dec-1988 23-Mar-2005 2-Jul-2006 2-Jul-2006 2-Jul-2016 COMPULSORY 75.0
1411 12-Jan-2019 12-Jan-2034 12-Jan-2034
1412 1-Sep-1963 28-Jun-1971 28-Jun-1971 RESIGNATION (RPC) 75.0
1413 2-Jan-2005 25-Nov-2020 25-Nov-2020
1414 1-Apr-1992 6-Jul-2010 6-Jul-2010 6-Jul-2010 10-Dec-2018 ELECTIVE 70.2
1415 14-Oct-1965 14-Oct-1980 14-Oct-1980 9-Jul-1985 9-Dec-1988 ELECTIVE 74.3
1416 8-May-1966 8-May-1981 8-May-1981 9-Oct-1981 7-Aug-1989 COMPULSORY 75.0
1417 23-Nov-1973 23-Nov-1988 3-Nov-1986 9-Oct-1985 DISABILITY 68.9
1418 27-Jan-2017 27-Jan-2032 27-Jan-2032
1419 10-May-2014 1-Jun-2028 9-May-2024 9-Dec-2019 RESIGNATION (RPC) 66.5
1420 15-Feb-1964 15-Feb-1979 15-Feb-1979 15-Feb-1979 5-Oct-1987 COMPULSORY 75.0
1421 6-Sep-1945 10-Dec-1965 10-Dec-1965 9-Sep-1974 10-Dec-1975 COMPULSORY 75.0
1422 17-Aug-1996 29-Nov-2013 29-Nov-2013 9-Oct-2015 9-Dec-2015 ELECTIVE 64.7
1423 11-Dec-1980 26-Feb-1999 21-May-2000 21-May-2000 14-Dec-2009 ELECTIVE 74.6
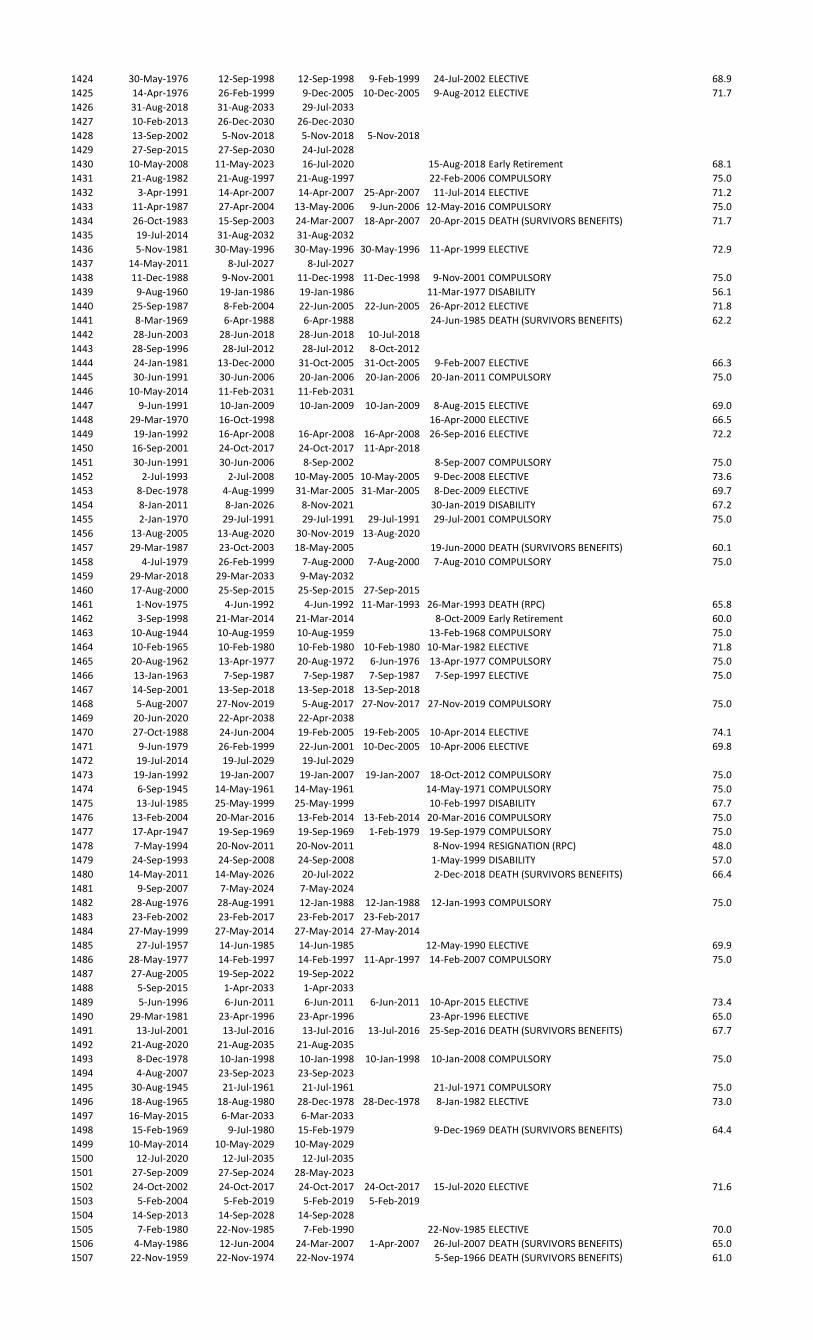
1424 30-May-1976 12-Sep-1998 12-Sep-1998 9-Feb-1999 24-Jul-2002 ELECTIVE 68.9
1425 14-Apr-1976 26-Feb-1999 9-Dec-2005 10-Dec-2005 9-Aug-2012 ELECTIVE 71.7
1426 31-Aug-2018 31-Aug-2033 29-Jul-2033
1427 10-Feb-2013 26-Dec-2030 26-Dec-2030
1428 13-Sep-2002 5-Nov-2018 5-Nov-2018 5-Nov-2018
1429 27-Sep-2015 27-Sep-2030 24-Jul-2028
1430 10-May-2008 11-May-2023 16-Jul-2020 15-Aug-2018 Early Retirement 68.1
1431 21-Aug-1982 21-Aug-1997 21-Aug-1997 22-Feb-2006 COMPULSORY 75.0
1432 3-Apr-1991 14-Apr-2007 14-Apr-2007 25-Apr-2007 11-Jul-2014 ELECTIVE 71.2
1433 11-Apr-1987 27-Apr-2004 13-May-2006 9-Jun-2006 12-May-2016 COMPULSORY 75.0
1434 26-Oct-1983 15-Sep-2003 24-Mar-2007 18-Apr-2007 20-Apr-2015 DEATH (SURVIVORS BENEFITS) 71.7
1435 19-Jul-2014 31-Aug-2032 31-Aug-2032
1436 5-Nov-1981 30-May-1996 30-May-1996 30-May-1996 11-Apr-1999 ELECTIVE 72.9
1437 14-May-2011 8-Jul-2027 8-Jul-2027
1438 11-Dec-1988 9-Nov-2001 11-Dec-1998 11-Dec-1998 9-Nov-2001 COMPULSORY 75.0
1439 9-Aug-1960 19-Jan-1986 19-Jan-1986 11-Mar-1977 DISABILITY 56.1
1440 25-Sep-1987 8-Feb-2004 22-Jun-2005 22-Jun-2005 26-Apr-2012 ELECTIVE 71.8
1441 8-Mar-1969 6-Apr-1988 6-Apr-1988 24-Jun-1985 DEATH (SURVIVORS BENEFITS) 62.2
1442 28-Jun-2003 28-Jun-2018 28-Jun-2018 10-Jul-2018
1443 28-Sep-1996 28-Jul-2012 28-Jul-2012 8-Oct-2012
1444 24-Jan-1981 13-Dec-2000 31-Oct-2005 31-Oct-2005 9-Feb-2007 ELECTIVE 66.3
1445 30-Jun-1991 30-Jun-2006 20-Jan-2006 20-Jan-2006 20-Jan-2011 COMPULSORY 75.0
1446 10-May-2014 11-Feb-2031 11-Feb-2031
1447 9-Jun-1991 10-Jan-2009 10-Jan-2009 10-Jan-2009 8-Aug-2015 ELECTIVE 69.0
1448 29-Mar-1970 16-Oct-1998 16-Apr-2000 ELECTIVE 66.5
1449 19-Jan-1992 16-Apr-2008 16-Apr-2008 16-Apr-2008 26-Sep-2016 ELECTIVE 72.2
1450 16-Sep-2001 24-Oct-2017 24-Oct-2017 11-Apr-2018
1451 30-Jun-1991 30-Jun-2006 8-Sep-2002 8-Sep-2007 COMPULSORY 75.0
1452 2-Jul-1993 2-Jul-2008 10-May-2005 10-May-2005 9-Dec-2008 ELECTIVE 73.6
1453 8-Dec-1978 4-Aug-1999 31-Mar-2005 31-Mar-2005 8-Dec-2009 ELECTIVE 69.7
1454 8-Jan-2011 8-Jan-2026 8-Nov-2021 30-Jan-2019 DISABILITY 67.2
1455 2-Jan-1970 29-Jul-1991 29-Jul-1991 29-Jul-1991 29-Jul-2001 COMPULSORY 75.0
1456 13-Aug-2005 13-Aug-2020 30-Nov-2019 13-Aug-2020
1457 29-Mar-1987 23-Oct-2003 18-May-2005 19-Jun-2000 DEATH (SURVIVORS BENEFITS) 60.1
1458 4-Jul-1979 26-Feb-1999 7-Aug-2000 7-Aug-2000 7-Aug-2010 COMPULSORY 75.0
1459 29-Mar-2018 29-Mar-2033 9-May-2032
1460 17-Aug-2000 25-Sep-2015 25-Sep-2015 27-Sep-2015
1461 1-Nov-1975 4-Jun-1992 4-Jun-1992 11-Mar-1993 26-Mar-1993 DEATH (RPC) 65.8
1462 3-Sep-1998 21-Mar-2014 21-Mar-2014 8-Oct-2009 Early Retirement 60.0
1463 10-Aug-1944 10-Aug-1959 10-Aug-1959 13-Feb-1968 COMPULSORY 75.0
1464 10-Feb-1965 10-Feb-1980 10-Feb-1980 10-Feb-1980 10-Mar-1982 ELECTIVE 71.8
1465 20-Aug-1962 13-Apr-1977 20-Aug-1972 6-Jun-1976 13-Apr-1977 COMPULSORY 75.0
1466 13-Jan-1963 7-Sep-1987 7-Sep-1987 7-Sep-1987 7-Sep-1997 ELECTIVE 75.0
1467 14-Sep-2001 13-Sep-2018 13-Sep-2018 13-Sep-2018
1468 5-Aug-2007 27-Nov-2019 5-Aug-2017 27-Nov-2017 27-Nov-2019 COMPULSORY 75.0
1469 20-Jun-2020 22-Apr-2038 22-Apr-2038
1470 27-Oct-1988 24-Jun-2004 19-Feb-2005 19-Feb-2005 10-Apr-2014 ELECTIVE 74.1
1471 9-Jun-1979 26-Feb-1999 22-Jun-2001 10-Dec-2005 10-Apr-2006 ELECTIVE 69.8
1472 19-Jul-2014 19-Jul-2029 19-Jul-2029
1473 19-Jan-1992 19-Jan-2007 19-Jan-2007 19-Jan-2007 18-Oct-2012 COMPULSORY 75.0
1474 6-Sep-1945 14-May-1961 14-May-1961 14-May-1971 COMPULSORY 75.0
1475 13-Jul-1985 25-May-1999 25-May-1999 10-Feb-1997 DISABILITY 67.7
1476 13-Feb-2004 20-Mar-2016 13-Feb-2014 13-Feb-2014 20-Mar-2016 COMPULSORY 75.0
1477 17-Apr-1947 19-Sep-1969 19-Sep-1969 1-Feb-1979 19-Sep-1979 COMPULSORY 75.0
1478 7-May-1994 20-Nov-2011 20-Nov-2011 8-Nov-1994 RESIGNATION (RPC) 48.0
1479 24-Sep-1993 24-Sep-2008 24-Sep-2008 1-May-1999 DISABILITY 57.0
1480 14-May-2011 14-May-2026 20-Jul-2022 2-Dec-2018 DEATH (SURVIVORS BENEFITS) 66.4
1481 9-Sep-2007 7-May-2024 7-May-2024
1482 28-Aug-1976 28-Aug-1991 12-Jan-1988 12-Jan-1988 12-Jan-1993 COMPULSORY 75.0
1483 23-Feb-2002 23-Feb-2017 23-Feb-2017 23-Feb-2017
1484 27-May-1999 27-May-2014 27-May-2014 27-May-2014
1485 27-Jul-1957 14-Jun-1985 14-Jun-1985 12-May-1990 ELECTIVE 69.9
1486 28-May-1977 14-Feb-1997 14-Feb-1997 11-Apr-1997 14-Feb-2007 COMPULSORY 75.0
1487 27-Aug-2005 19-Sep-2022 19-Sep-2022
1488 5-Sep-2015 1-Apr-2033 1-Apr-2033
1489 5-Jun-1996 6-Jun-2011 6-Jun-2011 6-Jun-2011 10-Apr-2015 ELECTIVE 73.4
1490 29-Mar-1981 23-Apr-1996 23-Apr-1996 23-Apr-1996 ELECTIVE 65.0
1491 13-Jul-2001 13-Jul-2016 13-Jul-2016 13-Jul-2016 25-Sep-2016 DEATH (SURVIVORS BENEFITS) 67.7
1492 21-Aug-2020 21-Aug-2035 21-Aug-2035
1493 8-Dec-1978 10-Jan-1998 10-Jan-1998 10-Jan-1998 10-Jan-2008 COMPULSORY 75.0
1494 4-Aug-2007 23-Sep-2023 23-Sep-2023
1495 30-Aug-1945 21-Jul-1961 21-Jul-1961 21-Jul-1971 COMPULSORY 75.0
1496 18-Aug-1965 18-Aug-1980 28-Dec-1978 28-Dec-1978 8-Jan-1982 ELECTIVE 73.0
1497 16-May-2015 6-Mar-2033 6-Mar-2033
1498 15-Feb-1969 9-Jul-1980 15-Feb-1979 9-Dec-1969 DEATH (SURVIVORS BENEFITS) 64.4
1499 10-May-2014 10-May-2029 10-May-2029
1500 12-Jul-2020 12-Jul-2035 12-Jul-2035
1501 27-Sep-2009 27-Sep-2024 28-May-2023
1502 24-Oct-2002 24-Oct-2017 24-Oct-2017 24-Oct-2017 15-Jul-2020 ELECTIVE 71.6
1503 5-Feb-2004 5-Feb-2019 5-Feb-2019 5-Feb-2019
1504 14-Sep-2013 14-Sep-2028 14-Sep-2028
1505 7-Feb-1980 22-Nov-1985 7-Feb-1990 22-Nov-1985 ELECTIVE 70.0
1506 4-May-1986 12-Jun-2004 24-Mar-2007 1-Apr-2007 26-Jul-2007 DEATH (SURVIVORS BENEFITS) 65.0
1507 22-Nov-1959 22-Nov-1974 22-Nov-1974 5-Sep-1966 DEATH (SURVIVORS BENEFITS) 61.0
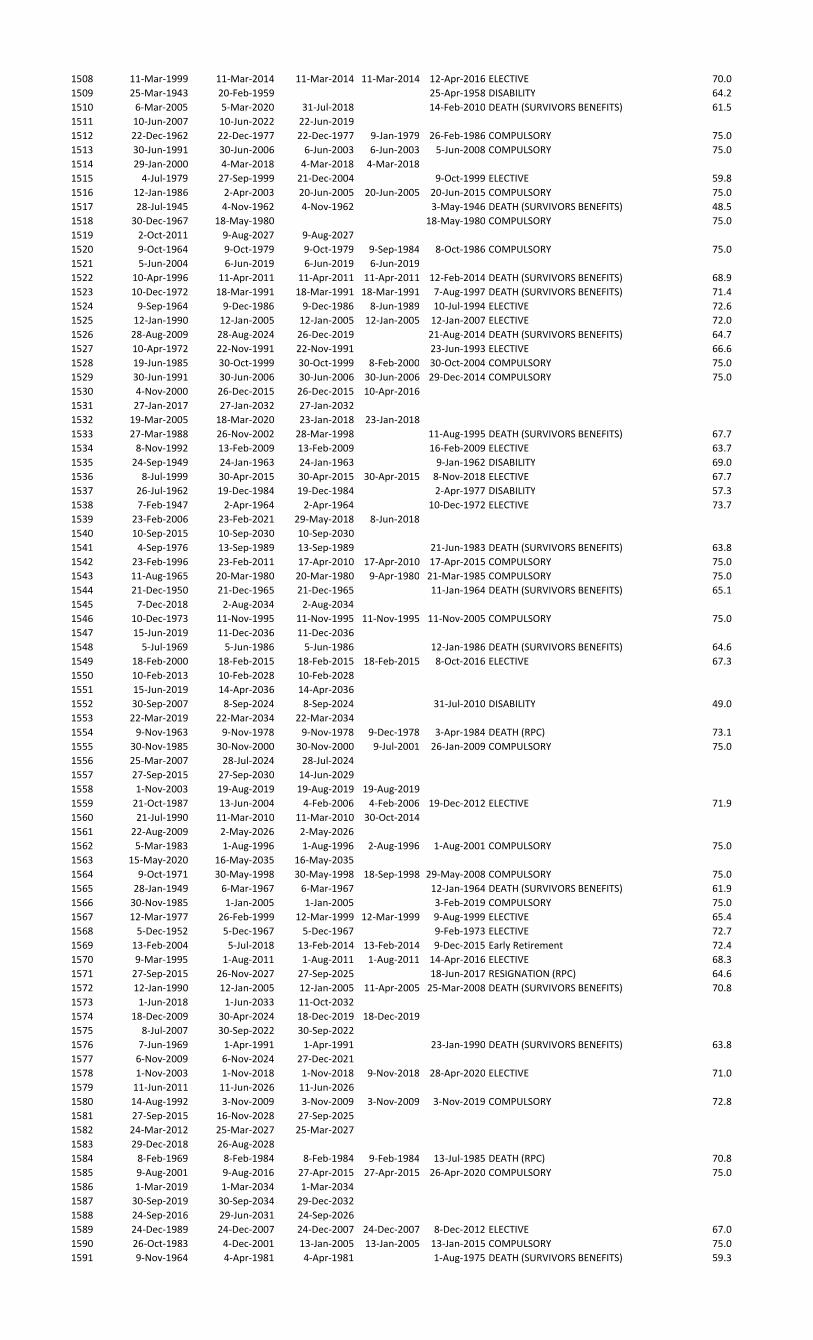
1508 11-Mar-1999 11-Mar-2014 11-Mar-2014 11-Mar-2014 12-Apr-2016 ELECTIVE 70.0
1509 25-Mar-1943 20-Feb-1959 25-Apr-1958 DISABILITY 64.2
1510 6-Mar-2005 5-Mar-2020 31-Jul-2018 14-Feb-2010 DEATH (SURVIVORS BENEFITS) 61.5
1511 10-Jun-2007 10-Jun-2022 22-Jun-2019
1512 22-Dec-1962 22-Dec-1977 22-Dec-1977 9-Jan-1979 26-Feb-1986 COMPULSORY 75.0
1513 30-Jun-1991 30-Jun-2006 6-Jun-2003 6-Jun-2003 5-Jun-2008 COMPULSORY 75.0
1514 29-Jan-2000 4-Mar-2018 4-Mar-2018 4-Mar-2018
1515 4-Jul-1979 27-Sep-1999 21-Dec-2004 9-Oct-1999 ELECTIVE 59.8
1516 12-Jan-1986 2-Apr-2003 20-Jun-2005 20-Jun-2005 20-Jun-2015 COMPULSORY 75.0
1517 28-Jul-1945 4-Nov-1962 4-Nov-1962 3-May-1946 DEATH (SURVIVORS BENEFITS) 48.5
1518 30-Dec-1967 18-May-1980 18-May-1980 COMPULSORY 75.0
1519 2-Oct-2011 9-Aug-2027 9-Aug-2027
1520 9-Oct-1964 9-Oct-1979 9-Oct-1979 9-Sep-1984 8-Oct-1986 COMPULSORY 75.0
1521 5-Jun-2004 6-Jun-2019 6-Jun-2019 6-Jun-2019
1522 10-Apr-1996 11-Apr-2011 11-Apr-2011 11-Apr-2011 12-Feb-2014 DEATH (SURVIVORS BENEFITS) 68.9
1523 10-Dec-1972 18-Mar-1991 18-Mar-1991 18-Mar-1991 7-Aug-1997 DEATH (SURVIVORS BENEFITS) 71.4
1524 9-Sep-1964 9-Dec-1986 9-Dec-1986 8-Jun-1989 10-Jul-1994 ELECTIVE 72.6
1525 12-Jan-1990 12-Jan-2005 12-Jan-2005 12-Jan-2005 12-Jan-2007 ELECTIVE 72.0
1526 28-Aug-2009 28-Aug-2024 26-Dec-2019 21-Aug-2014 DEATH (SURVIVORS BENEFITS) 64.7
1527 10-Apr-1972 22-Nov-1991 22-Nov-1991 23-Jun-1993 ELECTIVE 66.6
1528 19-Jun-1985 30-Oct-1999 30-Oct-1999 8-Feb-2000 30-Oct-2004 COMPULSORY 75.0
1529 30-Jun-1991 30-Jun-2006 30-Jun-2006 30-Jun-2006 29-Dec-2014 COMPULSORY 75.0
1530 4-Nov-2000 26-Dec-2015 26-Dec-2015 10-Apr-2016
1531 27-Jan-2017 27-Jan-2032 27-Jan-2032
1532 19-Mar-2005 18-Mar-2020 23-Jan-2018 23-Jan-2018
1533 27-Mar-1988 26-Nov-2002 28-Mar-1998 11-Aug-1995 DEATH (SURVIVORS BENEFITS) 67.7
1534 8-Nov-1992 13-Feb-2009 13-Feb-2009 16-Feb-2009 ELECTIVE 63.7
1535 24-Sep-1949 24-Jan-1963 24-Jan-1963 9-Jan-1962 DISABILITY 69.0
1536 8-Jul-1999 30-Apr-2015 30-Apr-2015 30-Apr-2015 8-Nov-2018 ELECTIVE 67.7
1537 26-Jul-1962 19-Dec-1984 19-Dec-1984 2-Apr-1977 DISABILITY 57.3
1538 7-Feb-1947 2-Apr-1964 2-Apr-1964 10-Dec-1972 ELECTIVE 73.7
1539 23-Feb-2006 23-Feb-2021 29-May-2018 8-Jun-2018
1540 10-Sep-2015 10-Sep-2030 10-Sep-2030
1541 4-Sep-1976 13-Sep-1989 13-Sep-1989 21-Jun-1983 DEATH (SURVIVORS BENEFITS) 63.8
1542 23-Feb-1996 23-Feb-2011 17-Apr-2010 17-Apr-2010 17-Apr-2015 COMPULSORY 75.0
1543 11-Aug-1965 20-Mar-1980 20-Mar-1980 9-Apr-1980 21-Mar-1985 COMPULSORY 75.0
1544 21-Dec-1950 21-Dec-1965 21-Dec-1965 11-Jan-1964 DEATH (SURVIVORS BENEFITS) 65.1
1545 7-Dec-2018 2-Aug-2034 2-Aug-2034
1546 10-Dec-1973 11-Nov-1995 11-Nov-1995 11-Nov-1995 11-Nov-2005 COMPULSORY 75.0
1547 15-Jun-2019 11-Dec-2036 11-Dec-2036
1548 5-Jul-1969 5-Jun-1986 5-Jun-1986 12-Jan-1986 DEATH (SURVIVORS BENEFITS) 64.6
1549 18-Feb-2000 18-Feb-2015 18-Feb-2015 18-Feb-2015 8-Oct-2016 ELECTIVE 67.3
1550 10-Feb-2013 10-Feb-2028 10-Feb-2028
1551 15-Jun-2019 14-Apr-2036 14-Apr-2036
1552 30-Sep-2007 8-Sep-2024 8-Sep-2024 31-Jul-2010 DISABILITY 49.0
1553 22-Mar-2019 22-Mar-2034 22-Mar-2034
1554 9-Nov-1963 9-Nov-1978 9-Nov-1978 9-Dec-1978 3-Apr-1984 DEATH (RPC) 73.1
1555 30-Nov-1985 30-Nov-2000 30-Nov-2000 9-Jul-2001 26-Jan-2009 COMPULSORY 75.0
1556 25-Mar-2007 28-Jul-2024 28-Jul-2024
1557 27-Sep-2015 27-Sep-2030 14-Jun-2029
1558 1-Nov-2003 19-Aug-2019 19-Aug-2019 19-Aug-2019
1559 21-Oct-1987 13-Jun-2004 4-Feb-2006 4-Feb-2006 19-Dec-2012 ELECTIVE 71.9
1560 21-Jul-1990 11-Mar-2010 11-Mar-2010 30-Oct-2014
1561 22-Aug-2009 2-May-2026 2-May-2026
1562 5-Mar-1983 1-Aug-1996 1-Aug-1996 2-Aug-1996 1-Aug-2001 COMPULSORY 75.0
1563 15-May-2020 16-May-2035 16-May-2035
1564 9-Oct-1971 30-May-1998 30-May-1998 18-Sep-1998 29-May-2008 COMPULSORY 75.0
1565 28-Jan-1949 6-Mar-1967 6-Mar-1967 12-Jan-1964 DEATH (SURVIVORS BENEFITS) 61.9
1566 30-Nov-1985 1-Jan-2005 1-Jan-2005 3-Feb-2019 COMPULSORY 75.0
1567 12-Mar-1977 26-Feb-1999 12-Mar-1999 12-Mar-1999 9-Aug-1999 ELECTIVE 65.4
1568 5-Dec-1952 5-Dec-1967 5-Dec-1967 9-Feb-1973 ELECTIVE 72.7
1569 13-Feb-2004 5-Jul-2018 13-Feb-2014 13-Feb-2014 9-Dec-2015 Early Retirement 72.4
1570 9-Mar-1995 1-Aug-2011 1-Aug-2011 1-Aug-2011 14-Apr-2016 ELECTIVE 68.3
1571 27-Sep-2015 26-Nov-2027 27-Sep-2025 18-Jun-2017 RESIGNATION (RPC) 64.6
1572 12-Jan-1990 12-Jan-2005 12-Jan-2005 11-Apr-2005 25-Mar-2008 DEATH (SURVIVORS BENEFITS) 70.8
1573 1-Jun-2018 1-Jun-2033 11-Oct-2032
1574 18-Dec-2009 30-Apr-2024 18-Dec-2019 18-Dec-2019
1575 8-Jul-2007 30-Sep-2022 30-Sep-2022
1576 7-Jun-1969 1-Apr-1991 1-Apr-1991 23-Jan-1990 DEATH (SURVIVORS BENEFITS) 63.8
1577 6-Nov-2009 6-Nov-2024 27-Dec-2021
1578 1-Nov-2003 1-Nov-2018 1-Nov-2018 9-Nov-2018 28-Apr-2020 ELECTIVE 71.0
1579 11-Jun-2011 11-Jun-2026 11-Jun-2026
1580 14-Aug-1992 3-Nov-2009 3-Nov-2009 3-Nov-2009 3-Nov-2019 COMPULSORY 72.8
1581 27-Sep-2015 16-Nov-2028 27-Sep-2025
1582 24-Mar-2012 25-Mar-2027 25-Mar-2027
1583 29-Dec-2018 26-Aug-2028
1584 8-Feb-1969 8-Feb-1984 8-Feb-1984 9-Feb-1984 13-Jul-1985 DEATH (RPC) 70.8
1585 9-Aug-2001 9-Aug-2016 27-Apr-2015 27-Apr-2015 26-Apr-2020 COMPULSORY 75.0
1586 1-Mar-2019 1-Mar-2034 1-Mar-2034
1587 30-Sep-2019 30-Sep-2034 29-Dec-2032
1588 24-Sep-2016 29-Jun-2031 24-Sep-2026
1589 24-Dec-1989 24-Dec-2007 24-Dec-2007 24-Dec-2007 8-Dec-2012 ELECTIVE 67.0
1590 26-Oct-1983 4-Dec-2001 13-Jan-2005 13-Jan-2005 13-Jan-2015 COMPULSORY 75.0
1591 9-Nov-1964 4-Apr-1981 4-Apr-1981 1-Aug-1975 DEATH (SURVIVORS BENEFITS) 59.3
1592 5-Aug-1972 10-Aug-1991 10-Aug-1991 10-Aug-1991 10-Aug-2001 COMPULSORY 75.0
1593 15-Feb-1987 28-Feb-2007 24-Mar-2007 25-Jul-2007 ELECTIVE 60.4
1594 21-Jul-2017 25-Oct-2032 25-Oct-2032
1595 27-Sep-2015 27-Sep-2030 26-Jan-2026
1596 13-Jul-1985 13-Jul-2000 13-Jan-1998 5-May-1993 DEATH (SURVIVORS BENEFITS) 65.3
1597 25-Feb-1984 6-May-2001 16-Jul-2003 16-Jul-2003 16-Jul-2013 COMPULSORY 75.0
1598 10-Aug-1989 10-Aug-2004 10-Aug-2004 10-Aug-2004 11-Apr-2009 ELECTIVE 70.4
1599 1-Apr-1978 24-May-2005 24-May-2005 9-Sep-1990 DEATH (SURVIVORS BENEFITS) 50.3
1600 12-Jun-2020 12-Jul-2035 12-Jul-2035
1601 28-Apr-1973 27-Apr-1988 27-Apr-1988 25-May-1996 ELECTIVE 74.9
1602 15-Feb-2002 15-Feb-2017 15-Feb-2017 16-Mar-2016 Early Retirement 68.9
1603 11-Mar-1982 11-Mar-1997 11-Mar-1997 11-Mar-1997 9-Feb-2003 ELECTIVE 73.8
1604 4-Jul-1979 4-Jan-2001 8-Jul-2007 15-Jul-2001 ELECTIVE 59.0
1605 18-Feb-1972 2-Feb-1990 2-Feb-1990 18-Feb-1990 2-Feb-2000 COMPULSORY 75.0
1606 4-Jan-1964 24-Jul-1980 24-Jul-1980 3-Aug-1980 8-Oct-1984 DEATH (SURVIVORS BENEFITS) 69.2
1607 21-Mar-2015 14-Dec-2024 9-Aug-2016 RESIGNATION (RPC) 66.7
1608 13-Feb-2004 13-Feb-2019 13-Feb-2019 13-Feb-2019
1609 30-Dec-1967 30-Dec-1982 30-Dec-1982 31-Dec-1982 25-Aug-1990 DEATH (SURVIVORS BENEFITS) 74.9
1610 12-Apr-1984 25-Feb-2002 25-Feb-2002 9-Mar-1996 DISABILITY 59.0
1611 19-Dec-1991 19-Jun-2012 19-Jun-2012 25-Mar-2019
1612 13-May-1978 13-Aug-1995 13-Aug-1995 9-Oct-1983 DISABILITY 53.2
1613 3-Jul-2019 3-Jul-2034 3-Jul-2034
1614 1-Oct-1998 1-Oct-2013 1-Oct-2013 1-Oct-2013
1615 26-Aug-2017 5-Jan-2034 5-Jan-2034
1616 27-Mar-2014 8-Aug-2023
1617 26-Jan-1964 26-Jan-1979 26-Jan-1979 17-Dec-1988 COMPULSORY 75.0
1618 9-Jan-2014 9-Jan-2029 9-Jan-2029
1619 28-May-1985 6-Apr-2000 28-May-1995 8-Jun-1995 6-Apr-2000 COMPULSORY 75.0
1620 26-Sep-2008 8-Nov-2023 8-Nov-2023
1621 30-Jun-1965 23-Sep-1986 23-Sep-1986 18-Dec-1986 24-Sep-1989 DEATH (SURVIVORS BENEFITS) 68.0
1622 5-Mar-1983 5-Mar-1998 5-Mar-1998 11-Apr-1998 11-Apr-2005 ELECTIVE 73.5
1623 27-Jul-1984 27-Jul-1999 27-Jul-1999 9-Aug-1999 ELECTIVE 67.5
1624 10-Sep-2019 10-Sep-2034 10-Sep-2034
1625 18-Jul-2019 30-Nov-2030 18-Jul-2029
1626 29-Mar-1987 29-Mar-2002 15-Jun-1998 15-Jun-1998 15-Jun-2003 COMPULSORY 75.0
1627 5-Jul-2001 5-Jul-2016 5-Jul-2016 10-Apr-2014 Early Retirement 65.6
1628 26-Jan-1961 26-Jan-1976 26-Jan-1976 9-Nov-1979 21-Apr-1984 COMPULSORY 75.0
1629 25-Aug-1973 25-Aug-1988 25-Aug-1988 13-Apr-1991 10-Apr-1994 ELECTIVE 71.2
1630 23-Dec-2006 23-Dec-2021 27-Jan-2019 9-Feb-2019
1631 13-Aug-1993 20-Jan-2009 20-Jan-2009 28-Jun-2019 COMPULSORY 75.0
1632 20-Aug-1995 17-Jul-2014 17-Jul-2014 10-Jul-2018
1633 3-Aug-1995 28-Jan-2013 28-Jan-2013 28-Jan-2013
1634 21-Mar-2003 5-Aug-2019 5-Aug-2019 5-Aug-2019
1635 22-Dec-1991 23-Feb-2011 23-Feb-2011 9-Oct-2011 ELECTIVE 61.5
1636 13-Feb-2004 13-Feb-2019 13-Feb-2019 13-Feb-2019
1637 13-Feb-2004 13-Feb-2019 13-Feb-2019 13-Feb-2019
1638 9-May-1970 22-Apr-1983 22-Apr-1983 22-Apr-1983 21-Apr-1988 COMPULSORY 75.0
1639 31-May-1979 26-Feb-1999 4-Sep-1999 9-Oct-2000 9-Feb-2007 ELECTIVE 72.4
1640 5-Jan-1995 5-Jan-2010 5-Jan-2010 5-Jan-2010 7-Mar-2018 COMPULSORY 75.0
1641 19-Nov-2010 19-Nov-2025 19-Nov-2025
1642 9-Jun-1961 9-Jun-1976 6-Oct-1971 17-Nov-1973 9-Jun-1976 ELECTIVE 74.7
1643 5-Oct-2006 5-Oct-2021 5-Oct-2021
1644 9-Jun-1961 7-Aug-1974 9-Jun-1971 20-Oct-1972 7-Aug-1974 COMPULSORY 75.0
1645 5-Sep-1993 5-Sep-2008 5-Sep-2008 9-Oct-2008 7-Apr-2016 COMPULSORY 75.0
1646 1-Jul-1984 31-Oct-1999 29-Feb-2000 29-Feb-2000 1-Mar-2010 COMPULSORY 75.0
1647 7-Jan-1989 7-Jan-2004 26-Aug-2002 26-Aug-2002 10-Dec-2005 ELECTIVE 73.3
1648 18-Feb-2000 31-Jul-2017 31-Jul-2017 31-Jul-2017
1649 29-Mar-1981 10-Jun-2000 23-Aug-2004 11-Apr-2007 23-Aug-2014 COMPULSORY 75.0
1650 23-Nov-1973 17-Oct-1995 17-Oct-1995 17-Oct-1995 9-Aug-2004 ELECTIVE 73.8
1651 10-Apr-2000 1-Feb-2017 1-Feb-2017 27-Mar-2017
1652 17-Jan-2015 14-Feb-2032 14-Feb-2032
1653 8-Oct-1998 8-Oct-2013 8-Oct-2013 8-Oct-2013
1654 10-Sep-2019 27-Jul-2036 27-Jul-2036
1655 15-Nov-1996 12-Nov-2012 12-Nov-2012 9-Dec-2012
1656 7-May-1994 7-May-2009 20-Aug-2004 20-Aug-2004 20-Aug-2009 COMPULSORY 75.0
1657 2-Jul-2017 5-Feb-2034 5-Feb-2034
1658 9-Sep-2005 25-Dec-2016 9-Sep-2015 10-Dec-2015 25-Dec-2016 COMPULSORY 75.0
1659 12-Jun-2020 19-Mar-2036 19-Mar-2036
1660 15-Jun-2013 15-Jun-2028 24-Oct-2024
1661 13-Jan-1974 17-Aug-1998 17-Aug-1998 17-Aug-1998 17-Aug-2008 COMPULSORY 75.0
1662 25-Feb-1961 14-Dec-1986 14-Dec-1986 14-Dec-1986 25-Feb-1995 ELECTIVE 73.2
1663 21-Mar-1996 6-Sep-2010 22-Mar-2006 22-Mar-2006 6-Sep-2010 COMPULSORY 75.0
1664 10-Sep-2019 12-Feb-2035 12-Feb-2035
1665 16-Jul-2017 21-Jun-2030 16-Jul-2027
1666 10-May-2014 10-May-2029 10-May-2029
1667 16-Jul-1960 17-Jan-1979 17-Jan-1979 10-Dec-1979 17-Jan-1989 COMPULSORY 75.0
1668 8-Nov-1975 15-Aug-1999 13-Sep-1992 DISABILITY 58.1
1669 26-Mar-1955 26-Mar-1970 11-Apr-1969 29-Apr-1972 30-Mar-1974 ELECTIVE 75.0
1670 29-Nov-1963 29-Nov-1978 1-Jun-1977 1-Jun-1977 10-Dec-1978 ELECTIVE 71.5
1671 21-Mar-2003 28-Aug-2020 28-Aug-2020 10-Apr-2017 Early Retirement 59.2
1672 6-Mar-1976 7-Mar-1991 7-Mar-1991 7-Mar-1991 30-Oct-1999 COMPULSORY 75.0
1673 2-Jan-1971 7-Aug-1990 7-Aug-1990 9-Aug-1990 7-Aug-2000 COMPULSORY 75.0
1674 1-Jun-1989 14-Sep-2008 14-Sep-2008 14-Sep-2008 8-Aug-2014 ELECTIVE 66.6
1675 30-May-2008 22-Jun-2024 22-Jun-2024
1676 17-Jul-1997 7-Feb-2011 17-Jul-2007 17-Jul-2007 7-Feb-2011 COMPULSORY 75.0
1677 28-Sep-1996 28-Sep-2011 28-Sep-2011 28-Sep-2011 8-Nov-2017 ELECTIVE 74.9
1678 26-Sep-2008 11-Mar-2026 11-Mar-2026
1679 3-Aug-1995 3-Aug-2010 3-Aug-2010 3-Aug-2010 9-Feb-2018 ELECTIVE 73.8
1680 14-Sep-2000 19-Jul-2018 19-Jul-2018 10-Apr-2020
1681 19-Oct-1991 19-Oct-2006 19-Oct-2006 19-Oct-2006 11-Jul-2011 ELECTIVE 72.5
1682 14-Jul-2012 13-Nov-2025 14-Jul-2022
1683 13-May-1978 26-Feb-1999 15-Jan-2000 16-Apr-2000 15-Jan-2010 COMPULSORY 75.0
1684 21-Sep-2014 21-Sep-2029 21-Sep-2029 11-Oct-2014 RESIGNATION (RPC) 50.9
1685 23-Mar-1985 22-Mar-2000 6-Apr-1996 6-Apr-1996 16-Feb-1998 DEATH (RPC) 71.9
1686 22-Oct-2017 18-Apr-2032 22-Oct-2027
1687 28-Mar-1996 12-Aug-2013 12-Aug-2013 12-Aug-2013 9-Feb-2019 ELECTIVE 68.1
1688 11-Aug-2018 26-Dec-2028 11-Aug-2028
1689 16-Dec-1962 16-Dec-1977 16-Dec-1977 5-Jan-1978 14-Dec-1979 DEATH (SURVIVORS BENEFITS) 71.4
1690 21-Mar-2009 20-Mar-2024 26-Oct-2020 26-Oct-2020
1691 15-Feb-2019 5-Jan-2027
1692 22-Mar-2008 25-Nov-2025 25-Nov-2025
1693 26-Sep-1981 30-Oct-2002 24-Mar-2007 24-Apr-2008 10-Dec-2008 ELECTIVE 65.0
1694 2-Mar-2007 2-Mar-2022 27-Feb-2020 27-Feb-2020
1695 27-Mar-1982 12-Apr-1992 12-Apr-1992 12-Apr-1992 13-Apr-1997 COMPULSORY 75.0
1696 8-Jan-2021 8-Jan-2036 8-Jan-2036
1697 13-Feb-2004 13-Feb-2019 26-Apr-2018 26-Apr-2018
1698 27-Jan-1962 27-Jan-1982 27-Jan-1982 27-Jan-1982 27-Jan-1992 COMPULSORY 75.0
1699 22-Aug-1962 5-May-1977 5-May-1977 5-May-1977 8-Jan-1978 ELECTIVE 70.7
1700 13-Dec-1981 3-Oct-2001 23-Jul-2006 23-Jul-2006 23-Jul-2016 COMPULSORY 75.0
1701 25-Sep-1987 5-Oct-2005 24-Mar-2007 18-Apr-2007 18-Apr-2017 COMPULSORY 73.5
1702 18-May-1995 18-May-2010 18-May-2010 27-Apr-2005 DEATH (SURVIVORS BENEFITS) 62.3
1703 9-Jan-1978 9-Jan-1993 8-Oct-1979 RESIGNATION (RPC) 54.3
1704 1-Jun-2018 17-Mar-2034 17-Mar-2034
1705 29-Sep-2017 29-Sep-2032 29-Sep-2032
1706 26-Sep-2003 24-May-2021 24-May-2021
1707 29-Aug-2019 7-May-2035 7-May-2035
1708 4-Jan-2004 4-Jan-2019 4-Jan-2019 10-Apr-2014 Early Retirement 61.5
1709 26-Aug-2010 26-Aug-2025 26-Aug-2025 21-Aug-2016 DISABILITY 59.2
1710 23-Aug-2018 14-Dec-2036 14-Dec-2036
1711 10-Feb-2013 10-Feb-2028 9-Jun-2023
1712 22-Sep-2017 22-Sep-2032 22-Sep-2032
1713 25-Apr-1958 25-Apr-1973 21-May-1982 COMPULSORY 75.0
1714 22-Mar-1934 5-Jan-1945 5-Jan-1945 28-Mar-1945 DEATH (SURVIVORS BENEFITS) 70.2
1715 30-Dec-1951 18-Mar-1975 18-Mar-1975 18-Mar-1975 25-Oct-1975 ELECTIVE 65.6
1716 29-Mar-2018 29-Mar-2033 31-Aug-2031
1717 24-Jan-1981 15-Jan-1999 15-Jan-1999 15-Jan-1999 15-Jan-2009 COMPULSORY 75.0
1718 7-Oct-1984 26-May-2006 24-Mar-2007 11-Jan-2008 9-Jan-2015 ELECTIVE 67.0
1719 2-Jan-2005 22-Jul-2022 22-Jul-2022
1720 31-Aug-2018 31-Aug-2033 31-Aug-2033
1721 26-Sep-2008 26-Sep-2023 8-Apr-2022
1722 16-Nov-1977 20-Oct-1997 20-Oct-1997 24-Mar-1990 DISABILITY 57.4
1723 26-Oct-1983 7-Jul-2002 17-Mar-2006 20-Mar-2015 16-Mar-2016 COMPULSORY 75.0
1724 8-May-1982 28-Dec-1997 28-Dec-1997 10-Apr-1998 28-Dec-2007 COMPULSORY 75.0
1725 2-Apr-1977 21-Sep-1992 21-Sep-1992 11-Mar-1993 21-Sep-2002 COMPULSORY 75.0
1726 29-Sep-1991 29-Sep-2006 23-May-2002 10-Dec-2002 9-Feb-2007 ELECTIVE 74.7
1727 4-Jul-1979 4-Jul-1994 4-Jul-1994 4-Jul-1994 25-Dec-2002 ELECTIVE 74.3
1728 14-Mar-1964 30-Jan-1990 30-Jan-1990 14-Dec-1990 19-Jan-1999 DEATH (SURVIVORS BENEFITS) 74.0
1729 3-Feb-2007 3-Feb-2022 4-May-2017 10-May-2017
1730 19-Jul-2014 22-Oct-2032 22-Oct-2032
1731 8-Oct-1999 8-Oct-2014 12-Sep-2010 12-Sep-2010 22-Sep-2015 COMPULSORY 75.0
1732 23-Apr-1958 29-Apr-1971 29-Apr-1971 17-Mar-1966 DEATH (SURVIVORS BENEFITS) 64.9
1733 22-Sep-2017 1-Jan-2035 1-Jan-2035
1734 22-Aug-2009 22-Aug-2024 22-Aug-2024
1735 18-Oct-1980 18-Oct-1995 18-Oct-1995 18-Oct-1995 9-Sep-2000 ELECTIVE 73.6
1736 9-May-2007 15-Dec-2023 15-Dec-2023
1737 20-Jan-1963 17-Jul-1969 20-Jan-1973 10-Aug-1968 DISABILITY 69.1
1738 14-Jan-1990 12-May-2010 12-May-2010 12-May-2010 ELECTIVE 59.7
1739 28-Apr-1973 7-Jan-1988 31-Jul-1988 ELECTIVE 68.5
1740 28-Sep-1996 24-Dec-2014 24-Dec-2014 10-Dec-1997 DISABILITY 48.0
1741 28-Aug-2020 28-Aug-2035 28-Aug-2035
1742 14-Sep-2018 14-Sep-2033 14-Sep-2033
1743 21-Jul-1990 21-Jul-2005 21-Jul-2005 13-Feb-1994 DEATH (SURVIVORS BENEFITS) 53.8
1744 7-Dec-1956 13-Aug-1978 13-Aug-1978 13-Aug-1988 COMPULSORY 75.0
1745 18-Jul-2019 18-Jul-2034 18-Jul-2034
1746 15-Sep-1988 6-Jul-2005 24-Mar-2007 24-Mar-2007 11-Jul-2012 ELECTIVE 70.2
1747 5-Oct-2019 5-Nov-2036 5-Nov-2036
1748 9-Aug-2003 1-Jun-2021 1-Jun-2021 8-Jun-2020 DISABILITY 61.2
1749 11-Apr-1995 11-Apr-2010 3-Jul-2008 11-Apr-2003 DISABILITY 64.8
1750 12-Feb-1998 5-Oct-2016 5-Oct-2016
1751 19-Jul-2014 16-Aug-2029 16-Aug-2029
1752 7-Feb-1947 6-Dec-1967 6-Dec-1967 8-Sep-1976 ELECTIVE 73.8
1753 29-Sep-1991 18-Jan-2005 29-Sep-2001 29-Sep-2001 18-Jan-2005 COMPULSORY 75.0
1754 27-Sep-2009 27-Sep-2024 31-Oct-2022
1755 10-Apr-2000 11-Apr-2015 7-Jan-2014 7-Jan-2014 7-Jan-2019 COMPULSORY 75.0
1756 22-Sep-2017 22-Sep-2032 22-Sep-2032
1757 19-Sep-1998 19-Sep-2013 28-Sep-2011 10-Apr-2013 Early Retirement 71.5
1758 7-Mar-1993 7-Aug-2011 7-Aug-2011 15-Dec-2011 ELECTIVE 61.9
1759 16-Feb-1974 16-Feb-1989 16-Feb-1989 23-Feb-1992 24-Sep-1995 DEATH (SURVIVORS BENEFITS) 72.4
1760 8-Jan-2011 8-Jan-2026 8-Jan-2026
1761 26-Jul-1962 30-Jul-1983 30-Jul-1983 27-Jun-1985 DEATH (RPC) 66.9
1762 19-Jun-1982 26-Feb-1999 16-Jan-2000 16-Jan-2000 9-Apr-2007 ELECTIVE 72.2
1763 21-Aug-1982 20-Jun-2000 20-Apr-2003 11-Apr-2007 20-Apr-2013 COMPULSORY 75.0
1764 26-Oct-1983 8-Nov-1998 8-Nov-1998 12-Jul-2000 14-Jul-2004 ELECTIVE 70.7
1765 20-Apr-1977 19-Apr-1992 14-Dec-1991 14-Dec-1991 25-May-1993 DEATH (SURVIVORS BENEFITS) 71.4
1766 12-May-1965 11-May-1980 11-May-1980 11-May-1980 11-Mar-1986 ELECTIVE 74.8
1767 21-Jul-2017 21-Jul-2032 16-Nov-2030
1768 27-Jun-2010 27-Jun-2025 12-Feb-2025
1769 7-Dec-2018 7-Dec-2033 7-Dec-2033
1770 28-Dec-1967 18-Dec-1990 18-Dec-1990 18-Dec-1990 18-Dec-2000 COMPULSORY 75.0
1771 12-Jan-1986 23-Feb-2005 24-Mar-2007 11-Apr-2007 10-Dec-2014 ELECTIVE 70.7
1772 7-May-1972 3-Nov-1998 3-Nov-1998 3-Nov-1998 3-Nov-2008 COMPULSORY 75.0
1773 28-May-1980 12-Jun-1998 12-Jun-1998 12-Jun-1998 ELECTIVE 65.0
1774 2-Oct-2011 2-Oct-2026 23-Sep-2026
1775 13-Oct-1990 30-Jan-2006 19-May-2006 19-May-2006 18-May-2016 COMPULSORY 75.0
1776 21-Jul-2017 21-Jul-2032 21-Jul-2032
1777 27-Feb-2004 8-Mar-2020 8-Mar-2020
1778 3-Aug-1940 30-Jun-1957 30-Jun-1957 30-Jun-1967 COMPULSORY 75.0
1779 9-May-1970 28-May-1991 28-May-1991 20-May-1984 DEATH (SURVIVORS BENEFITS) 58.0
1780 1-Jan-1998 1-Jan-2013 1-Jan-2013 1-Jan-2013 28-Jul-2020 COMPULSORY 75.0
1781 11-Apr-1959 25-Apr-1972 25-Apr-1972 10-Dec-1975 ELECTIVE 73.6
1782 5-Dec-1997 10-Apr-2015 10-Dec-2016 ELECTIVE 64.3
1783 13-Oct-1985 13-Oct-2000 13-Oct-2000 13-Oct-2000 9-Mar-2008 COMPULSORY 75.0
1784 15-Nov-1996 15-Nov-2011 28-Aug-2007 28-Aug-2007 9-Dec-2011 ELECTIVE 74.3
1785 2-Oct-1992 6-Dec-2010 6-Dec-2010
1786 30-May-1959 30-May-1974 12-Dec-1969 21-Sep-1967 DISABILITY 67.8
1787 7-Mar-1996 23-Aug-2018 23-Aug-2018 23-Aug-2018 Early Retirement 57.5
1788 29-Mar-2018 18-Apr-2033 18-Apr-2033
1789 10-Feb-1976 10-Feb-1991 24-Apr-1988 24-Apr-1988 10-Apr-1991 ELECTIVE 73.0
1790 27-Mar-2020 19-Jul-2036 19-Jul-2036
1791 30-May-2008 31-May-2023 31-May-2023 11-Jun-2008 RESIGNATION (RPC) 54.1
1792 25-Sep-1993 22-Jul-2012 22-Jul-2012 18-May-2014
1793 8-Jul-1972 8-Jul-1987 8-Jul-1987 10-Jul-1987 25-Aug-1994 COMPULSORY 75.0
1794 6-Jun-2002 3-Mar-2019 3-Mar-2019 3-Mar-2019 ELECTIVE 63.3
1795 13-Jan-1963 13-Jan-1978 13-Jan-1978 29-Sep-1979 26-Oct-1983 COMPULSORY 75.0
1796 18-Jul-1981 28-Mar-2000 6-Dec-2003 17-Jul-2005 ELECTIVE 66.6
1797 13-Aug-2005 13-Aug-2020 10-Apr-2019 11-Apr-2019
1798 13-Jul-1967 28-Aug-1982 28-Aug-1982 19-Oct-1967 DEATH (SURVIVORS BENEFITS) 50.1
1799 28-Jan-2012 28-Jan-2027 2-Jul-2025
1800 22-Dec-1956 3-Dec-1972 3-Dec-1972 3-Dec-1982 COMPULSORY 75.0
1801 19-Jan-1992 25-Feb-2010 25-Feb-2010 12-May-2009 Early Retirement 61.1
1802 22-Oct-2017 31-Jul-2031 22-Oct-2027
1803 23-Sep-1964 30-Jan-1985 30-Jan-1985 10-Jul-1988 30-Jan-1995 COMPULSORY 75.0
1804 25-Mar-1972 9-Mar-1996 9-Mar-1996 9-Mar-1996 24-Dec-1998 ELECTIVE 67.8
1805 15-May-1974 15-May-1989 15-May-1989 8-Jan-1990 31-Dec-1994 COMPULSORY 75.0
1806 23-Jun-1965 29-Feb-1984 29-Feb-1984 10-Mar-1984 1-Mar-1994 COMPULSORY 75.0
1807 24-Dec-1995 18-Jan-2011 18-Jan-2011 9-Feb-2011
1808 9-Aug-1962 28-Jun-1966 28-Jun-1971 RESIGNATION (RPC) 75.0
1809 26-Sep-2010 4-Apr-2027 4-Apr-2027
1810 11-Oct-2005 1-Jun-2021 1-Jun-2021 16-Mar-2017 Early Retirement 60.2
1811 7-Nov-2008 17-Jul-2023 7-Nov-2018 9-Nov-2018 26-Aug-2020 DISABILITY 72.1
1812 28-Sep-2000 17-Sep-2017 17-Sep-2017 13-Aug-2016 DEATH (SURVIVORS BENEFITS) 61.9
1813 9-May-1997 9-Dec-2012 9-Dec-2012 10-Dec-2012
1814 21-Mar-2003 9-Jun-2020 9-Jun-2020 9-Jun-2020
1815 15-Aug-1996 5-Apr-2011 15-Aug-2006 15-Aug-2006 5-Apr-2011 COMPULSORY 75.0
1816 7-Jul-1990 7-Jul-2005 7-Jul-2005 10-Jul-2005 11-Nov-2014 COMPULSORY 75.0
1817 27-Sep-2015 29-Jul-2032 29-Jul-2032
1818 8-Oct-1989 27-Oct-2006 24-Mar-2007 10-Dec-2009 15-Nov-2018 COMPULSORY 75.0
1819 9-Jun-2001 9-Jun-2016 9-Jun-2016 9-Jun-2016
1820 25-Jan-1975 10-Sep-1989 25-Jan-1985 26-Jan-1985 10-Sep-1989 COMPULSORY 75.0
1821 1-Apr-1979 2-Jan-1993 1-Apr-1989 9-Jan-1990 2-Jan-1993 COMPULSORY 75.0
1822 29-Dec-1977 29-Dec-1992 29-Dec-1992 29-Dec-1992 28-Jun-1999 COMPULSORY 75.0
1823 2-Feb-1974 19-Oct-1995 19-Oct-1995 19-Oct-1995 11-Apr-1999 ELECTIVE 68.5
1824 25-May-1973 24-May-1988 25-Aug-1983 9-Sep-1983 25-Aug-1988 COMPULSORY 75.0
1825 26-Sep-1981 8-May-2002 24-Mar-2007 18-Dec-2007 18-Dec-2017 COMPULSORY 75.0
1826 24-Sep-2016 24-Jul-2034 24-Jul-2034
1827 8-Nov-1992 8-Nov-2007 8-Nov-2007 8-Nov-2007 31-Mar-2012 DEATH (SURVIVORS BENEFITS) 72.2
1828 15-Feb-2002 9-May-2020 9-May-2020 9-May-2020
1829 21-Aug-2020 5-Apr-2038 5-Apr-2038
1830 2-May-2009 1-May-2024 1-May-2024
1831 23-Mar-2013 1-Jul-2029 1-Jul-2029
1832 14-Jul-1965 24-May-1982 24-May-1982 14-Oct-1983 ELECTIVE 66.4
1833 27-Mar-2014 27-Mar-2029 27-Mar-2029
1834 22-Mar-2003 6-Sep-2019 6-Sep-2019 6-Sep-2019
1835 9-Feb-1995 9-Feb-2010 4-Sep-2006 4-Sep-2006 24-Jan-2008 DEATH (SURVIVORS BENEFITS) 71.4
1836 5-Aug-1978 5-Aug-1993 5-Aug-1993 5-Aug-1993 17-Jun-1996 DEATH (SURVIVORS BENEFITS) 68.3
1837 15-Mar-1984 21-May-2000 26-Jul-2001 10-Dec-2002 ELECTIVE 66.4
1838 12-Jan-1990 12-Jan-2005 6-Apr-2003 6-Apr-2003 5-Apr-2008 COMPULSORY 75.0
1839 14-May-1983 24-May-2001 2-Jun-2004 7-Jul-2004 28-Feb-2010 DEATH (SURVIVORS BENEFITS) 70.7
1840 2-Mar-2006 2-Mar-2021 2-Mar-2021
1841 26-Feb-1978 26-Feb-1999 10-Mar-2000 10-Mar-2000 11-Mar-2010 COMPULSORY 75.0
1842 29-Sep-1966 13-Apr-1991 13-Apr-1991 13-Apr-1991 13-Apr-2001 COMPULSORY 75.0
1843 12-May-1993 11-May-2008 11-May-2008 8-Oct-2013 2-Aug-2015 COMPULSORY 75.0
1844 14-Sep-2013 14-Sep-2028 28-Feb-2027
1845 12-Mar-1977 11-Mar-1992 11-Mar-1992 7-May-1989 DISABILITY 65.2
1846 24-Dec-1999 24-Dec-2014 24-Dec-2014 5-Aug-2007 DEATH (SURVIVORS BENEFITS) 61.9
1847 16-Feb-1997 16-Feb-2012 16-Feb-2012 16-Feb-2012 30-Sep-2020 COMPULSORY 75.0
1848 8-Oct-2015 22-Dec-2032 22-Dec-2032
1849 3-Dec-1937 31-Oct-1956 31-Oct-1956 10-Jul-1965 DISABILITY 73.7
1850 1-Oct-1998 20-Jul-2014 20-Jul-2014 20-Jul-2014
1851 9-Sep-1983 9-Sep-1998 9-Sep-1998 24-Dec-1993 DEATH (SURVIVORS BENEFITS) 61.1
1852 9-Jun-1956 13-Aug-1970 16-Oct-1957 DEATH (SURVIVORS BENEFITS) 62.2
1853 9-May-2020 10-May-2035 10-May-2035
1854 1-Feb-1963 10-Jul-1978 10-Jul-1978 12-Jul-1978 5-Dec-1984 DEATH (SURVIVORS BENEFITS) 71.4
1855 9-Jan-1956 9-Jan-1971 9-Jan-1971 12-Dec-1964 DEATH (SURVIVORS BENEFITS) 61.4
1856 15-Dec-1979 10-Feb-1996 10-Feb-1996 10-Feb-1996 9-Aug-2004 ELECTIVE 73.5
1857 16-Nov-1970 29-Apr-1990 29-Apr-1990 14-Feb-1981 DEATH (SURVIVORS BENEFITS) 55.8
1858 28-Sep-2015 17-Mar-2033 17-Mar-2033
1859 27-Jan-2017 28-Oct-2036 28-Oct-2036
1860 10-Feb-2013 10-Feb-2028 23-Jul-2025
1861 1-Nov-1975 3-Feb-1992 3-Feb-1992 3-Feb-1992 3-Feb-2002 COMPULSORY 75.0
1862 27-Jun-2002 25-Nov-2017 25-Nov-2017 25-Nov-2017
1863 28-Aug-1976 18-Aug-1993 18-Aug-1993 18-Aug-1993 18-Aug-2003 COMPULSORY 75.0
1864 15-Mar-1986 18-Sep-2008 18-Sep-2008 18-Sep-2008 8-Sep-2012 ELECTIVE 61.5
1865 6-Sep-1945 10-Jun-1965 10-Jun-1965 10-Dec-1972 ELECTIVE 72.5
1866 11-Dec-2020 7-Sep-2036 7-Sep-2036
1867 8-Oct-1989 29-Nov-2006 24-Mar-2007 11-Apr-2007 9-Apr-2016 ELECTIVE 72.2
1868 18-Apr-1963 1-Feb-1985 1-Feb-1985 1-Feb-1985 8-Sep-1994 ELECTIVE 74.6
1869 8-Mar-1947 21-Apr-1967 21-Apr-1967 9-Nov-1972 ELECTIVE 70.6
1870 3-Aug-1995 3-Aug-2010 3-Aug-2010 6-Oct-2003 RESIGNATION (RPC) 58.6
1871 9-Feb-1995 28-Oct-2015 28-Oct-2015 28-Oct-2015
1872 5-Dec-1997 30-Apr-2017 30-Apr-2017 12-May-2017
1873 8-Nov-1995 8-Nov-2010 8-Nov-2010 8-Nov-2010 10-Nov-2015 COMPULSORY 75.0
1874 2-Apr-1998 7-Apr-2015 7-Apr-2015 11-Apr-2018
1875 29-Sep-2017 29-Sep-2032 29-Sep-2032
1876 5-Feb-2004 15-Jul-2017 5-Feb-2014 9-Feb-2014 15-Nov-2016 DEATH (SURVIVORS BENEFITS) 74.3
1877 26-Nov-1959 26-Nov-1974 26-Nov-1974 19-Jan-1975 6-Apr-1980 ELECTIVE 74.1
1878 24-Sep-1993 24-Sep-2008 24-Sep-2008 20-Mar-2014 COMPULSORY 75.0
1879 26-Aug-2010 26-Aug-2025 26-Aug-2025
1880 5-Feb-1948 4-Dec-1959 4-Dec-1959 25-Nov-1950 DEATH (SURVIVORS BENEFITS) 61.0
1881 31-Jul-1994 9-Feb-2013 9-Feb-2013 9-Feb-2013 1-Mar-2019 ELECTIVE 67.5
1882 6-Jun-2015 28-Feb-2027 6-Jun-2025
1883 9-Nov-1973 9-Nov-1988 8-Sep-1987 22-Oct-1987 8-Sep-1992 COMPULSORY 75.0
1884 22-May-1982 27-Nov-1997 27-Nov-1997 9-Jun-1999 27-Nov-2007 COMPULSORY 75.0
1885 2-Dec-1979 16-Oct-1993 2-Dec-1989 2-Dec-1989 16-Oct-1993 COMPULSORY 75.0
1886 26-Jan-1974 2-Feb-1989 2-Feb-1989 2-Feb-1989 9-Sep-1994 ELECTIVE 70.6
1887 14-Sep-2013 11-Feb-2029 11-Feb-2029
1888 4-Jan-1969 28-Mar-1986 28-Mar-1986 28-Mar-1986 27-Mar-1996 COMPULSORY 75.0
1889 28-Jul-1951 28-Jul-1966 28-Jul-1966 23-Feb-1957 DISABILITY 59.5
1890 9-Sep-1999 9-Sep-2014 19-Mar-2012 10-Apr-2012 20-Mar-2017 COMPULSORY 75.0
1891 14-Jan-1999 17-Jun-2015 17-Jun-2015 12-Jul-2015 10-Dec-2020 ELECTIVE 69.1
1892 15-Oct-1983 4-May-2003 24-Mar-2007 24-Mar-2007 8-Nov-2012 ELECTIVE 70.0
1893 25-Jan-1975 29-May-1991 29-May-1991 10-Jul-1991 29-May-2001 COMPULSORY 75.0
1894 10-Jun-2007 10-Jun-2022 31-Mar-2018 11-Mar-2018 Early Retirement 69.9
1895 12-Jun-1952 2-Feb-1968 2-Feb-1968 9-Mar-1973 2-Feb-1978 COMPULSORY 75.0
1896 17-Nov-1982 17-Nov-1997 16-Dec-1992 16-Dec-1992 16-Dec-1996 DISABILITY 74.0
1897 10-Dec-2009 10-Dec-2024 11-Jan-2023
1898 2-Mar-2007 2-Mar-2022 2-Mar-2022
1899 14-May-1994 12-Nov-2013 12-Nov-2013 12-Nov-2013
1900 10-Jun-1978 10-Jun-1993 10-Jun-1993 14-Sep-1991 DISABILITY 67.1
1901 20-Jul-2003 26-Jun-2021 26-Jun-2021 9-Aug-2019 Early Retirement 60.2
1902 30-Jun-1991 30-Jun-2006 10-Sep-2004 10-Sep-2004 10-Sep-2009 COMPULSORY 75.0
1903 10-Dec-1972 18-Dec-1990 18-Dec-1990 18-Dec-1990 ELECTIVE 65.0
1904 16-May-2015 15-Sep-2033 15-Sep-2033
1905 14-Nov-2010 14-Nov-2025 14-Nov-2025
1906 2-Oct-1992 31-Mar-2012 31-Mar-2012 10-Apr-2012
1907 7-Nov-2008 14-Jun-2025 14-Jun-2025
1908 15-Jul-1965 15-Jan-1972 25-Oct-1968 DISABILITY 71.8
1909 10-Jul-1999 4-May-2016 4-May-2016 4-May-2016
1910 14-Nov-2010 14-Nov-2025 14-Nov-2025
1911 24-Sep-2016 24-Sep-2031 25-Apr-2030
1912 9-Feb-1995 8-Jun-2011 8-Jun-2011 8-Jun-2011 28-Jul-2016 ELECTIVE 68.8
1913 3-Feb-2007 3-Feb-2022 9-Dec-2021 13-Apr-2017 Early Retirement 65.3
1914 28-Sep-2000 14-Apr-2018 14-Apr-2018 30-Jan-2019
1915 9-Jan-1953 9-Jan-1968 9-Jan-1968 9-Nov-1973 ELECTIVE 71.7
1916 10-Jun-1978 10-Sep-1996 10-Sep-1996 10-Sep-1996 9-Feb-2000 ELECTIVE 68.4
1917 23-May-1970 5-Mar-1989 5-Mar-1989 5-Mar-1989 9-Apr-1996 ELECTIVE 72.1
1918 22-Dec-1991 22-Dec-2006 22-Dec-2006 22-Dec-2006 13-Jul-2012 ELECTIVE 72.2
1919 16-Nov-1977 3-Sep-1992 3-Sep-1992 3-Sep-1992 9-Mar-1996 ELECTIVE 73.5
1920 4-Dec-1966 16-May-1982 16-May-1982 21-Nov-1980 DEATH (SURVIVORS BENEFITS) 63.5
1921 25-Feb-1987 17-Apr-2006 24-Mar-2007 11-Apr-2007 8-Oct-2012 ELECTIVE 67.3
1922 16-Jul-1960 21-May-1971 15-Oct-1970 8-Feb-1964 DISABILITY 67.7
1923 16-Feb-1997 5-Feb-2017 5-Feb-2017 10-Dec-2017
1924 9-Mar-2019 9-Mar-2034 5-Aug-2031
1925 10-Mar-2012 30-May-2033 30-May-2033
1926 31-Jul-1968 31-Jul-1983 31-Jul-1983 31-Jul-1983 19-Jun-1986 ELECTIVE 72.0
1927 18-Feb-1972 18-Feb-1987 18-Feb-1987 23-Feb-1987 19-Aug-1995 COMPULSORY 75.0
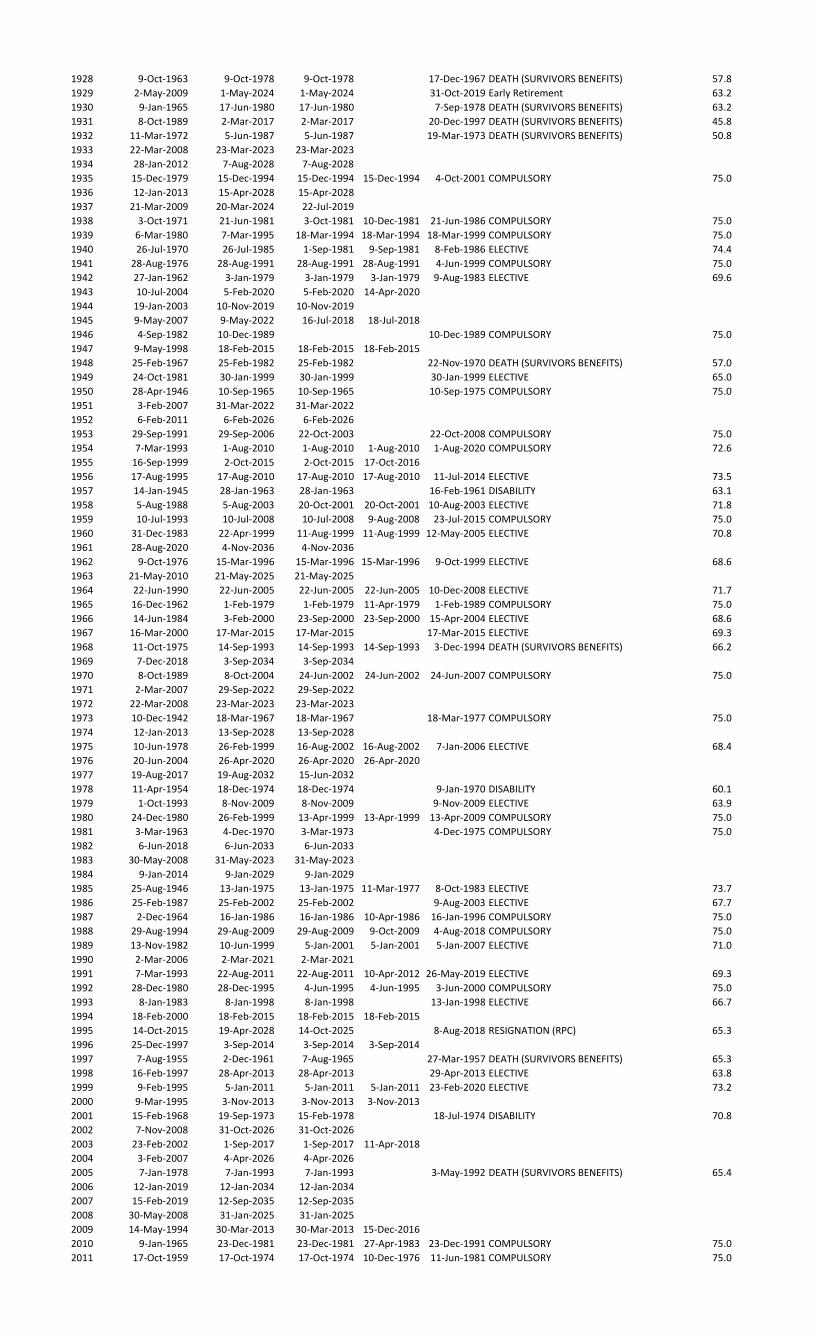
1928 9-Oct-1963 9-Oct-1978 9-Oct-1978 17-Dec-1967 DEATH (SURVIVORS BENEFITS) 57.8
1929 2-May-2009 1-May-2024 1-May-2024 31-Oct-2019 Early Retirement 63.2
1930 9-Jan-1965 17-Jun-1980 17-Jun-1980 7-Sep-1978 DEATH (SURVIVORS BENEFITS) 63.2
1931 8-Oct-1989 2-Mar-2017 2-Mar-2017 20-Dec-1997 DEATH (SURVIVORS BENEFITS) 45.8
1932 11-Mar-1972 5-Jun-1987 5-Jun-1987 19-Mar-1973 DEATH (SURVIVORS BENEFITS) 50.8
1933 22-Mar-2008 23-Mar-2023 23-Mar-2023
1934 28-Jan-2012 7-Aug-2028 7-Aug-2028
1935 15-Dec-1979 15-Dec-1994 15-Dec-1994 15-Dec-1994 4-Oct-2001 COMPULSORY 75.0
1936 12-Jan-2013 15-Apr-2028 15-Apr-2028
1937 21-Mar-2009 20-Mar-2024 22-Jul-2019
1938 3-Oct-1971 21-Jun-1981 3-Oct-1981 10-Dec-1981 21-Jun-1986 COMPULSORY 75.0
1939 6-Mar-1980 7-Mar-1995 18-Mar-1994 18-Mar-1994 18-Mar-1999 COMPULSORY 75.0
1940 26-Jul-1970 26-Jul-1985 1-Sep-1981 9-Sep-1981 8-Feb-1986 ELECTIVE 74.4
1941 28-Aug-1976 28-Aug-1991 28-Aug-1991 28-Aug-1991 4-Jun-1999 COMPULSORY 75.0
1942 27-Jan-1962 3-Jan-1979 3-Jan-1979 3-Jan-1979 9-Aug-1983 ELECTIVE 69.6
1943 10-Jul-2004 5-Feb-2020 5-Feb-2020 14-Apr-2020
1944 19-Jan-2003 10-Nov-2019 10-Nov-2019
1945 9-May-2007 9-May-2022 16-Jul-2018 18-Jul-2018
1946 4-Sep-1982 10-Dec-1989 10-Dec-1989 COMPULSORY 75.0
1947 9-May-1998 18-Feb-2015 18-Feb-2015 18-Feb-2015
1948 25-Feb-1967 25-Feb-1982 25-Feb-1982 22-Nov-1970 DEATH (SURVIVORS BENEFITS) 57.0
1949 24-Oct-1981 30-Jan-1999 30-Jan-1999 30-Jan-1999 ELECTIVE 65.0
1950 28-Apr-1946 10-Sep-1965 10-Sep-1965 10-Sep-1975 COMPULSORY 75.0
1951 3-Feb-2007 31-Mar-2022 31-Mar-2022
1952 6-Feb-2011 6-Feb-2026 6-Feb-2026
1953 29-Sep-1991 29-Sep-2006 22-Oct-2003 22-Oct-2008 COMPULSORY 75.0
1954 7-Mar-1993 1-Aug-2010 1-Aug-2010 1-Aug-2010 1-Aug-2020 COMPULSORY 72.6
1955 16-Sep-1999 2-Oct-2015 2-Oct-2015 17-Oct-2016
1956 17-Aug-1995 17-Aug-2010 17-Aug-2010 17-Aug-2010 11-Jul-2014 ELECTIVE 73.5
1957 14-Jan-1945 28-Jan-1963 28-Jan-1963 16-Feb-1961 DISABILITY 63.1
1958 5-Aug-1988 5-Aug-2003 20-Oct-2001 20-Oct-2001 10-Aug-2003 ELECTIVE 71.8
1959 10-Jul-1993 10-Jul-2008 10-Jul-2008 9-Aug-2008 23-Jul-2015 COMPULSORY 75.0
1960 31-Dec-1983 22-Apr-1999 11-Aug-1999 11-Aug-1999 12-May-2005 ELECTIVE 70.8
1961 28-Aug-2020 4-Nov-2036 4-Nov-2036
1962 9-Oct-1976 15-Mar-1996 15-Mar-1996 15-Mar-1996 9-Oct-1999 ELECTIVE 68.6
1963 21-May-2010 21-May-2025 21-May-2025
1964 22-Jun-1990 22-Jun-2005 22-Jun-2005 22-Jun-2005 10-Dec-2008 ELECTIVE 71.7
1965 16-Dec-1962 1-Feb-1979 1-Feb-1979 11-Apr-1979 1-Feb-1989 COMPULSORY 75.0
1966 14-Jun-1984 3-Feb-2000 23-Sep-2000 23-Sep-2000 15-Apr-2004 ELECTIVE 68.6
1967 16-Mar-2000 17-Mar-2015 17-Mar-2015 17-Mar-2015 ELECTIVE 69.3
1968 11-Oct-1975 14-Sep-1993 14-Sep-1993 14-Sep-1993 3-Dec-1994 DEATH (SURVIVORS BENEFITS) 66.2
1969 7-Dec-2018 3-Sep-2034 3-Sep-2034
1970 8-Oct-1989 8-Oct-2004 24-Jun-2002 24-Jun-2002 24-Jun-2007 COMPULSORY 75.0
1971 2-Mar-2007 29-Sep-2022 29-Sep-2022
1972 22-Mar-2008 23-Mar-2023 23-Mar-2023
1973 10-Dec-1942 18-Mar-1967 18-Mar-1967 18-Mar-1977 COMPULSORY 75.0
1974 12-Jan-2013 13-Sep-2028 13-Sep-2028
1975 10-Jun-1978 26-Feb-1999 16-Aug-2002 16-Aug-2002 7-Jan-2006 ELECTIVE 68.4
1976 20-Jun-2004 26-Apr-2020 26-Apr-2020 26-Apr-2020
1977 19-Aug-2017 19-Aug-2032 15-Jun-2032
1978 11-Apr-1954 18-Dec-1974 18-Dec-1974 9-Jan-1970 DISABILITY 60.1
1979 1-Oct-1993 8-Nov-2009 8-Nov-2009 9-Nov-2009 ELECTIVE 63.9
1980 24-Dec-1980 26-Feb-1999 13-Apr-1999 13-Apr-1999 13-Apr-2009 COMPULSORY 75.0
1981 3-Mar-1963 4-Dec-1970 3-Mar-1973 4-Dec-1975 COMPULSORY 75.0
1982 6-Jun-2018 6-Jun-2033 6-Jun-2033
1983 30-May-2008 31-May-2023 31-May-2023
1984 9-Jan-2014 9-Jan-2029 9-Jan-2029
1985 25-Aug-1946 13-Jan-1975 13-Jan-1975 11-Mar-1977 8-Oct-1983 ELECTIVE 73.7
1986 25-Feb-1987 25-Feb-2002 25-Feb-2002 9-Aug-2003 ELECTIVE 67.7
1987 2-Dec-1964 16-Jan-1986 16-Jan-1986 10-Apr-1986 16-Jan-1996 COMPULSORY 75.0
1988 29-Aug-1994 29-Aug-2009 29-Aug-2009 9-Oct-2009 4-Aug-2018 COMPULSORY 75.0
1989 13-Nov-1982 10-Jun-1999 5-Jan-2001 5-Jan-2001 5-Jan-2007 ELECTIVE 71.0
1990 2-Mar-2006 2-Mar-2021 2-Mar-2021
1991 7-Mar-1993 22-Aug-2011 22-Aug-2011 10-Apr-2012 26-May-2019 ELECTIVE 69.3
1992 28-Dec-1980 28-Dec-1995 4-Jun-1995 4-Jun-1995 3-Jun-2000 COMPULSORY 75.0
1993 8-Jan-1983 8-Jan-1998 8-Jan-1998 13-Jan-1998 ELECTIVE 66.7
1994 18-Feb-2000 18-Feb-2015 18-Feb-2015 18-Feb-2015
1995 14-Oct-2015 19-Apr-2028 14-Oct-2025 8-Aug-2018 RESIGNATION (RPC) 65.3
1996 25-Dec-1997 3-Sep-2014 3-Sep-2014 3-Sep-2014
1997 7-Aug-1955 2-Dec-1961 7-Aug-1965 27-Mar-1957 DEATH (SURVIVORS BENEFITS) 65.3
1998 16-Feb-1997 28-Apr-2013 28-Apr-2013 29-Apr-2013 ELECTIVE 63.8
1999 9-Feb-1995 5-Jan-2011 5-Jan-2011 5-Jan-2011 23-Feb-2020 ELECTIVE 73.2
2000 9-Mar-1995 3-Nov-2013 3-Nov-2013 3-Nov-2013
2001 15-Feb-1968 19-Sep-1973 15-Feb-1978 18-Jul-1974 DISABILITY 70.8
2002 7-Nov-2008 31-Oct-2026 31-Oct-2026
2003 23-Feb-2002 1-Sep-2017 1-Sep-2017 11-Apr-2018
2004 3-Feb-2007 4-Apr-2026 4-Apr-2026
2005 7-Jan-1978 7-Jan-1993 7-Jan-1993 3-May-1992 DEATH (SURVIVORS BENEFITS) 65.4
2006 12-Jan-2019 12-Jan-2034 12-Jan-2034
2007 15-Feb-2019 12-Sep-2035 12-Sep-2035
2008 30-May-2008 31-Jan-2025 31-Jan-2025
2009 14-May-1994 30-Mar-2013 30-Mar-2013 15-Dec-2016
2010 9-Jan-1965 23-Dec-1981 23-Dec-1981 27-Apr-1983 23-Dec-1991 COMPULSORY 75.0
2011 17-Oct-1959 17-Oct-1974 17-Oct-1974 10-Dec-1976 11-Jun-1981 COMPULSORY 75.0
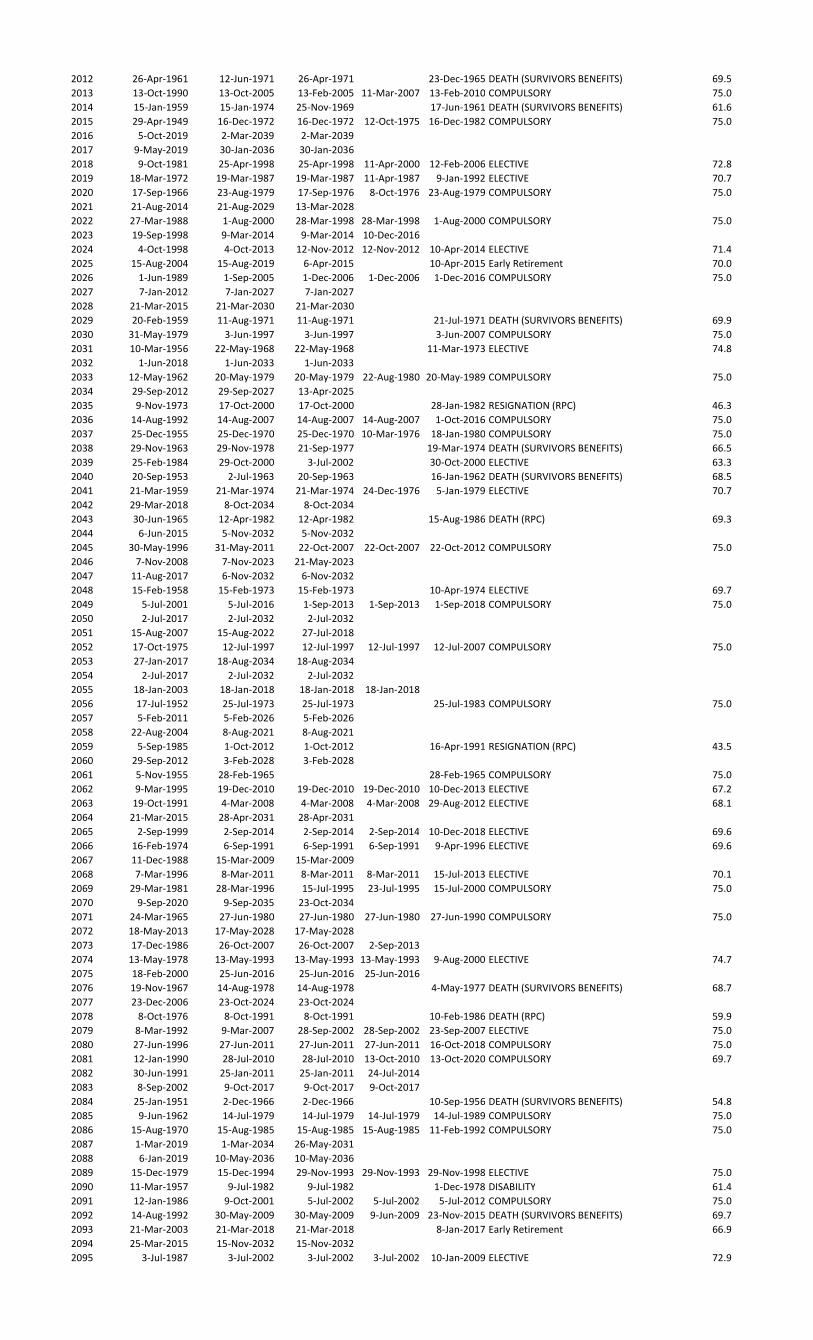
2012 26-Apr-1961 12-Jun-1971 26-Apr-1971 23-Dec-1965 DEATH (SURVIVORS BENEFITS) 69.5
2013 13-Oct-1990 13-Oct-2005 13-Feb-2005 11-Mar-2007 13-Feb-2010 COMPULSORY 75.0
2014 15-Jan-1959 15-Jan-1974 25-Nov-1969 17-Jun-1961 DEATH (SURVIVORS BENEFITS) 61.6
2015 29-Apr-1949 16-Dec-1972 16-Dec-1972 12-Oct-1975 16-Dec-1982 COMPULSORY 75.0
2016 5-Oct-2019 2-Mar-2039 2-Mar-2039
2017 9-May-2019 30-Jan-2036 30-Jan-2036
2018 9-Oct-1981 25-Apr-1998 25-Apr-1998 11-Apr-2000 12-Feb-2006 ELECTIVE 72.8
2019 18-Mar-1972 19-Mar-1987 19-Mar-1987 11-Apr-1987 9-Jan-1992 ELECTIVE 70.7
2020 17-Sep-1966 23-Aug-1979 17-Sep-1976 8-Oct-1976 23-Aug-1979 COMPULSORY 75.0
2021 21-Aug-2014 21-Aug-2029 13-Mar-2028
2022 27-Mar-1988 1-Aug-2000 28-Mar-1998 28-Mar-1998 1-Aug-2000 COMPULSORY 75.0
2023 19-Sep-1998 9-Mar-2014 9-Mar-2014 10-Dec-2016
2024 4-Oct-1998 4-Oct-2013 12-Nov-2012 12-Nov-2012 10-Apr-2014 ELECTIVE 71.4
2025 15-Aug-2004 15-Aug-2019 6-Apr-2015 10-Apr-2015 Early Retirement 70.0
2026 1-Jun-1989 1-Sep-2005 1-Dec-2006 1-Dec-2006 1-Dec-2016 COMPULSORY 75.0
2027 7-Jan-2012 7-Jan-2027 7-Jan-2027
2028 21-Mar-2015 21-Mar-2030 21-Mar-2030
2029 20-Feb-1959 11-Aug-1971 11-Aug-1971 21-Jul-1971 DEATH (SURVIVORS BENEFITS) 69.9
2030 31-May-1979 3-Jun-1997 3-Jun-1997 3-Jun-2007 COMPULSORY 75.0
2031 10-Mar-1956 22-May-1968 22-May-1968 11-Mar-1973 ELECTIVE 74.8
2032 1-Jun-2018 1-Jun-2033 1-Jun-2033
2033 12-May-1962 20-May-1979 20-May-1979 22-Aug-1980 20-May-1989 COMPULSORY 75.0
2034 29-Sep-2012 29-Sep-2027 13-Apr-2025
2035 9-Nov-1973 17-Oct-2000 17-Oct-2000 28-Jan-1982 RESIGNATION (RPC) 46.3
2036 14-Aug-1992 14-Aug-2007 14-Aug-2007 14-Aug-2007 1-Oct-2016 COMPULSORY 75.0
2037 25-Dec-1955 25-Dec-1970 25-Dec-1970 10-Mar-1976 18-Jan-1980 COMPULSORY 75.0
2038 29-Nov-1963 29-Nov-1978 21-Sep-1977 19-Mar-1974 DEATH (SURVIVORS BENEFITS) 66.5
2039 25-Feb-1984 29-Oct-2000 3-Jul-2002 30-Oct-2000 ELECTIVE 63.3
2040 20-Sep-1953 2-Jul-1963 20-Sep-1963 16-Jan-1962 DEATH (SURVIVORS BENEFITS) 68.5
2041 21-Mar-1959 21-Mar-1974 21-Mar-1974 24-Dec-1976 5-Jan-1979 ELECTIVE 70.7
2042 29-Mar-2018 8-Oct-2034 8-Oct-2034
2043 30-Jun-1965 12-Apr-1982 12-Apr-1982 15-Aug-1986 DEATH (RPC) 69.3
2044 6-Jun-2015 5-Nov-2032 5-Nov-2032
2045 30-May-1996 31-May-2011 22-Oct-2007 22-Oct-2007 22-Oct-2012 COMPULSORY 75.0
2046 7-Nov-2008 7-Nov-2023 21-May-2023
2047 11-Aug-2017 6-Nov-2032 6-Nov-2032
2048 15-Feb-1958 15-Feb-1973 15-Feb-1973 10-Apr-1974 ELECTIVE 69.7
2049 5-Jul-2001 5-Jul-2016 1-Sep-2013 1-Sep-2013 1-Sep-2018 COMPULSORY 75.0
2050 2-Jul-2017 2-Jul-2032 2-Jul-2032
2051 15-Aug-2007 15-Aug-2022 27-Jul-2018
2052 17-Oct-1975 12-Jul-1997 12-Jul-1997 12-Jul-1997 12-Jul-2007 COMPULSORY 75.0
2053 27-Jan-2017 18-Aug-2034 18-Aug-2034
2054 2-Jul-2017 2-Jul-2032 2-Jul-2032
2055 18-Jan-2003 18-Jan-2018 18-Jan-2018 18-Jan-2018
2056 17-Jul-1952 25-Jul-1973 25-Jul-1973 25-Jul-1983 COMPULSORY 75.0
2057 5-Feb-2011 5-Feb-2026 5-Feb-2026
2058 22-Aug-2004 8-Aug-2021 8-Aug-2021
2059 5-Sep-1985 1-Oct-2012 1-Oct-2012 16-Apr-1991 RESIGNATION (RPC) 43.5
2060 29-Sep-2012 3-Feb-2028 3-Feb-2028
2061 5-Nov-1955 28-Feb-1965 28-Feb-1965 COMPULSORY 75.0
2062 9-Mar-1995 19-Dec-2010 19-Dec-2010 19-Dec-2010 10-Dec-2013 ELECTIVE 67.2
2063 19-Oct-1991 4-Mar-2008 4-Mar-2008 4-Mar-2008 29-Aug-2012 ELECTIVE 68.1
2064 21-Mar-2015 28-Apr-2031 28-Apr-2031
2065 2-Sep-1999 2-Sep-2014 2-Sep-2014 2-Sep-2014 10-Dec-2018 ELECTIVE 69.6
2066 16-Feb-1974 6-Sep-1991 6-Sep-1991 6-Sep-1991 9-Apr-1996 ELECTIVE 69.6
2067 11-Dec-1988 15-Mar-2009 15-Mar-2009
2068 7-Mar-1996 8-Mar-2011 8-Mar-2011 8-Mar-2011 15-Jul-2013 ELECTIVE 70.1
2069 29-Mar-1981 28-Mar-1996 15-Jul-1995 23-Jul-1995 15-Jul-2000 COMPULSORY 75.0
2070 9-Sep-2020 9-Sep-2035 23-Oct-2034
2071 24-Mar-1965 27-Jun-1980 27-Jun-1980 27-Jun-1980 27-Jun-1990 COMPULSORY 75.0
2072 18-May-2013 17-May-2028 17-May-2028
2073 17-Dec-1986 26-Oct-2007 26-Oct-2007 2-Sep-2013
2074 13-May-1978 13-May-1993 13-May-1993 13-May-1993 9-Aug-2000 ELECTIVE 74.7
2075 18-Feb-2000 25-Jun-2016 25-Jun-2016 25-Jun-2016
2076 19-Nov-1967 14-Aug-1978 14-Aug-1978 4-May-1977 DEATH (SURVIVORS BENEFITS) 68.7
2077 23-Dec-2006 23-Oct-2024 23-Oct-2024
2078 8-Oct-1976 8-Oct-1991 8-Oct-1991 10-Feb-1986 DEATH (RPC) 59.9
2079 8-Mar-1992 9-Mar-2007 28-Sep-2002 28-Sep-2002 23-Sep-2007 ELECTIVE 75.0
2080 27-Jun-1996 27-Jun-2011 27-Jun-2011 27-Jun-2011 16-Oct-2018 COMPULSORY 75.0
2081 12-Jan-1990 28-Jul-2010 28-Jul-2010 13-Oct-2010 13-Oct-2020 COMPULSORY 69.7
2082 30-Jun-1991 25-Jan-2011 25-Jan-2011 24-Jul-2014
2083 8-Sep-2002 9-Oct-2017 9-Oct-2017 9-Oct-2017
2084 25-Jan-1951 2-Dec-1966 2-Dec-1966 10-Sep-1956 DEATH (SURVIVORS BENEFITS) 54.8
2085 9-Jun-1962 14-Jul-1979 14-Jul-1979 14-Jul-1979 14-Jul-1989 COMPULSORY 75.0
2086 15-Aug-1970 15-Aug-1985 15-Aug-1985 15-Aug-1985 11-Feb-1992 COMPULSORY 75.0
2087 1-Mar-2019 1-Mar-2034 26-May-2031
2088 6-Jan-2019 10-May-2036 10-May-2036
2089 15-Dec-1979 15-Dec-1994 29-Nov-1993 29-Nov-1993 29-Nov-1998 ELECTIVE 75.0
2090 11-Mar-1957 9-Jul-1982 9-Jul-1982 1-Dec-1978 DISABILITY 61.4
2091 12-Jan-1986 9-Oct-2001 5-Jul-2002 5-Jul-2002 5-Jul-2012 COMPULSORY 75.0
2092 14-Aug-1992 30-May-2009 30-May-2009 9-Jun-2009 23-Nov-2015 DEATH (SURVIVORS BENEFITS) 69.7
2093 21-Mar-2003 21-Mar-2018 21-Mar-2018 8-Jan-2017 Early Retirement 66.9
2094 25-Mar-2015 15-Nov-2032 15-Nov-2032
2095 3-Jul-1987 3-Jul-2002 3-Jul-2002 3-Jul-2002 10-Jan-2009 ELECTIVE 72.9
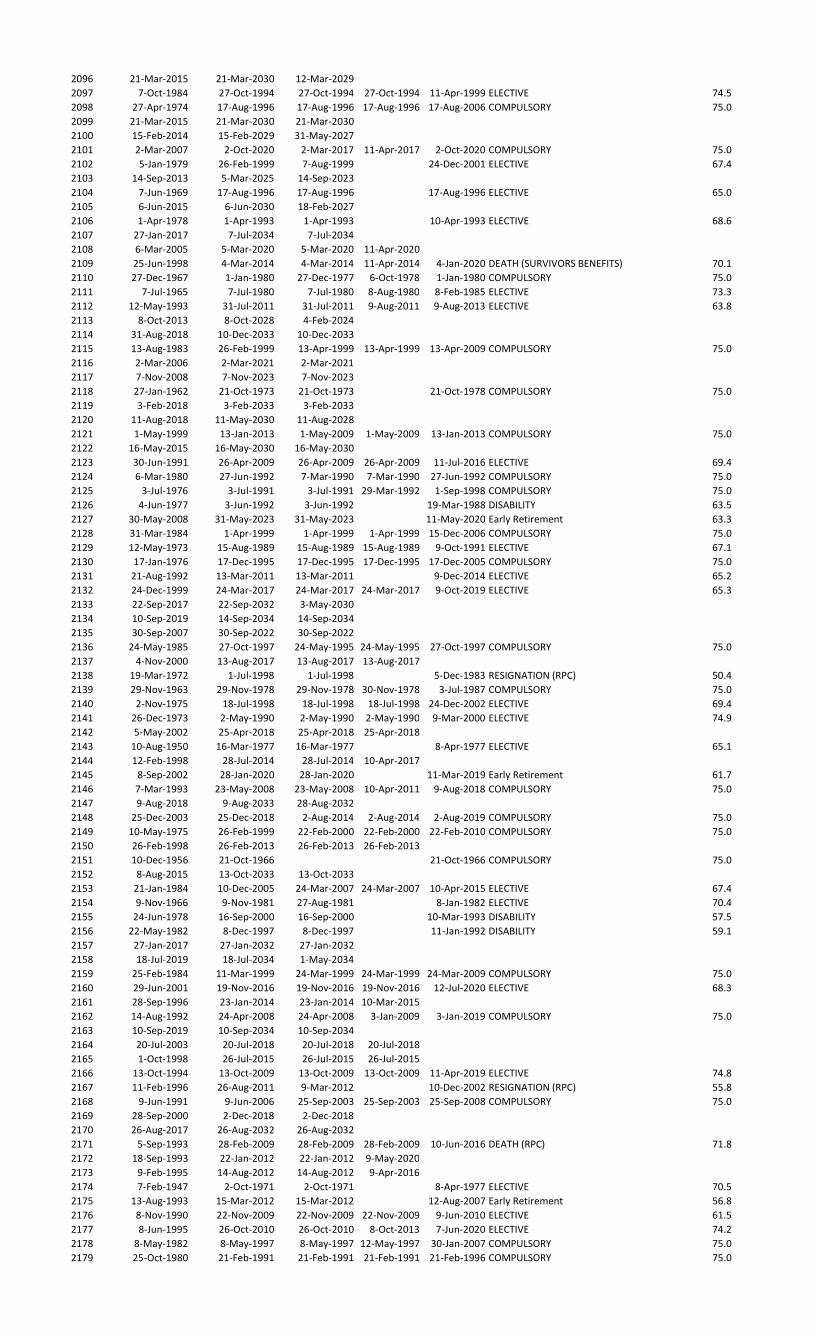
2096 21-Mar-2015 21-Mar-2030 12-Mar-2029
2097 7-Oct-1984 27-Oct-1994 27-Oct-1994 27-Oct-1994 11-Apr-1999 ELECTIVE 74.5
2098 27-Apr-1974 17-Aug-1996 17-Aug-1996 17-Aug-1996 17-Aug-2006 COMPULSORY 75.0
2099 21-Mar-2015 21-Mar-2030 21-Mar-2030
2100 15-Feb-2014 15-Feb-2029 31-May-2027
2101 2-Mar-2007 2-Oct-2020 2-Mar-2017 11-Apr-2017 2-Oct-2020 COMPULSORY 75.0
2102 5-Jan-1979 26-Feb-1999 7-Aug-1999 24-Dec-2001 ELECTIVE 67.4
2103 14-Sep-2013 5-Mar-2025 14-Sep-2023
2104 7-Jun-1969 17-Aug-1996 17-Aug-1996 17-Aug-1996 ELECTIVE 65.0
2105 6-Jun-2015 6-Jun-2030 18-Feb-2027
2106 1-Apr-1978 1-Apr-1993 1-Apr-1993 10-Apr-1993 ELECTIVE 68.6
2107 27-Jan-2017 7-Jul-2034 7-Jul-2034
2108 6-Mar-2005 5-Mar-2020 5-Mar-2020 11-Apr-2020
2109 25-Jun-1998 4-Mar-2014 4-Mar-2014 11-Apr-2014 4-Jan-2020 DEATH (SURVIVORS BENEFITS) 70.1
2110 27-Dec-1967 1-Jan-1980 27-Dec-1977 6-Oct-1978 1-Jan-1980 COMPULSORY 75.0
2111 7-Jul-1965 7-Jul-1980 7-Jul-1980 8-Aug-1980 8-Feb-1985 ELECTIVE 73.3
2112 12-May-1993 31-Jul-2011 31-Jul-2011 9-Aug-2011 9-Aug-2013 ELECTIVE 63.8
2113 8-Oct-2013 8-Oct-2028 4-Feb-2024
2114 31-Aug-2018 10-Dec-2033 10-Dec-2033
2115 13-Aug-1983 26-Feb-1999 13-Apr-1999 13-Apr-1999 13-Apr-2009 COMPULSORY 75.0
2116 2-Mar-2006 2-Mar-2021 2-Mar-2021
2117 7-Nov-2008 7-Nov-2023 7-Nov-2023
2118 27-Jan-1962 21-Oct-1973 21-Oct-1973 21-Oct-1978 COMPULSORY 75.0
2119 3-Feb-2018 3-Feb-2033 3-Feb-2033
2120 11-Aug-2018 11-May-2030 11-Aug-2028
2121 1-May-1999 13-Jan-2013 1-May-2009 1-May-2009 13-Jan-2013 COMPULSORY 75.0
2122 16-May-2015 16-May-2030 16-May-2030
2123 30-Jun-1991 26-Apr-2009 26-Apr-2009 26-Apr-2009 11-Jul-2016 ELECTIVE 69.4
2124 6-Mar-1980 27-Jun-1992 7-Mar-1990 7-Mar-1990 27-Jun-1992 COMPULSORY 75.0
2125 3-Jul-1976 3-Jul-1991 3-Jul-1991 29-Mar-1992 1-Sep-1998 COMPULSORY 75.0
2126 4-Jun-1977 3-Jun-1992 3-Jun-1992 19-Mar-1988 DISABILITY 63.5
2127 30-May-2008 31-May-2023 31-May-2023 11-May-2020 Early Retirement 63.3
2128 31-Mar-1984 1-Apr-1999 1-Apr-1999 1-Apr-1999 15-Dec-2006 COMPULSORY 75.0
2129 12-May-1973 15-Aug-1989 15-Aug-1989 15-Aug-1989 9-Oct-1991 ELECTIVE 67.1
2130 17-Jan-1976 17-Dec-1995 17-Dec-1995 17-Dec-1995 17-Dec-2005 COMPULSORY 75.0
2131 21-Aug-1992 13-Mar-2011 13-Mar-2011 9-Dec-2014 ELECTIVE 65.2
2132 24-Dec-1999 24-Mar-2017 24-Mar-2017 24-Mar-2017 9-Oct-2019 ELECTIVE 65.3
2133 22-Sep-2017 22-Sep-2032 3-May-2030
2134 10-Sep-2019 14-Sep-2034 14-Sep-2034
2135 30-Sep-2007 30-Sep-2022 30-Sep-2022
2136 24-May-1985 27-Oct-1997 24-May-1995 24-May-1995 27-Oct-1997 COMPULSORY 75.0
2137 4-Nov-2000 13-Aug-2017 13-Aug-2017 13-Aug-2017
2138 19-Mar-1972 1-Jul-1998 1-Jul-1998 5-Dec-1983 RESIGNATION (RPC) 50.4
2139 29-Nov-1963 29-Nov-1978 29-Nov-1978 30-Nov-1978 3-Jul-1987 COMPULSORY 75.0
2140 2-Nov-1975 18-Jul-1998 18-Jul-1998 18-Jul-1998 24-Dec-2002 ELECTIVE 69.4
2141 26-Dec-1973 2-May-1990 2-May-1990 2-May-1990 9-Mar-2000 ELECTIVE 74.9
2142 5-May-2002 25-Apr-2018 25-Apr-2018 25-Apr-2018
2143 10-Aug-1950 16-Mar-1977 16-Mar-1977 8-Apr-1977 ELECTIVE 65.1
2144 12-Feb-1998 28-Jul-2014 28-Jul-2014 10-Apr-2017
2145 8-Sep-2002 28-Jan-2020 28-Jan-2020 11-Mar-2019 Early Retirement 61.7
2146 7-Mar-1993 23-May-2008 23-May-2008 10-Apr-2011 9-Aug-2018 COMPULSORY 75.0
2147 9-Aug-2018 9-Aug-2033 28-Aug-2032
2148 25-Dec-2003 25-Dec-2018 2-Aug-2014 2-Aug-2014 2-Aug-2019 COMPULSORY 75.0
2149 10-May-1975 26-Feb-1999 22-Feb-2000 22-Feb-2000 22-Feb-2010 COMPULSORY 75.0
2150 26-Feb-1998 26-Feb-2013 26-Feb-2013 26-Feb-2013
2151 10-Dec-1956 21-Oct-1966 21-Oct-1966 COMPULSORY 75.0
2152 8-Aug-2015 13-Oct-2033 13-Oct-2033
2153 21-Jan-1984 10-Dec-2005 24-Mar-2007 24-Mar-2007 10-Apr-2015 ELECTIVE 67.4
2154 9-Nov-1966 9-Nov-1981 27-Aug-1981 8-Jan-1982 ELECTIVE 70.4
2155 24-Jun-1978 16-Sep-2000 16-Sep-2000 10-Mar-1993 DISABILITY 57.5
2156 22-May-1982 8-Dec-1997 8-Dec-1997 11-Jan-1992 DISABILITY 59.1
2157 27-Jan-2017 27-Jan-2032 27-Jan-2032
2158 18-Jul-2019 18-Jul-2034 1-May-2034
2159 25-Feb-1984 11-Mar-1999 24-Mar-1999 24-Mar-1999 24-Mar-2009 COMPULSORY 75.0
2160 29-Jun-2001 19-Nov-2016 19-Nov-2016 19-Nov-2016 12-Jul-2020 ELECTIVE 68.3
2161 28-Sep-1996 23-Jan-2014 23-Jan-2014 10-Mar-2015
2162 14-Aug-1992 24-Apr-2008 24-Apr-2008 3-Jan-2009 3-Jan-2019 COMPULSORY 75.0
2163 10-Sep-2019 10-Sep-2034 10-Sep-2034
2164 20-Jul-2003 20-Jul-2018 20-Jul-2018 20-Jul-2018
2165 1-Oct-1998 26-Jul-2015 26-Jul-2015 26-Jul-2015
2166 13-Oct-1994 13-Oct-2009 13-Oct-2009 13-Oct-2009 11-Apr-2019 ELECTIVE 74.8
2167 11-Feb-1996 26-Aug-2011 9-Mar-2012 10-Dec-2002 RESIGNATION (RPC) 55.8
2168 9-Jun-1991 9-Jun-2006 25-Sep-2003 25-Sep-2003 25-Sep-2008 COMPULSORY 75.0
2169 28-Sep-2000 2-Dec-2018 2-Dec-2018
2170 26-Aug-2017 26-Aug-2032 26-Aug-2032
2171 5-Sep-1993 28-Feb-2009 28-Feb-2009 28-Feb-2009 10-Jun-2016 DEATH (RPC) 71.8
2172 18-Sep-1993 22-Jan-2012 22-Jan-2012 9-May-2020
2173 9-Feb-1995 14-Aug-2012 14-Aug-2012 9-Apr-2016
2174 7-Feb-1947 2-Oct-1971 2-Oct-1971 8-Apr-1977 ELECTIVE 70.5
2175 13-Aug-1993 15-Mar-2012 15-Mar-2012 12-Aug-2007 Early Retirement 56.8
2176 8-Nov-1990 22-Nov-2009 22-Nov-2009 22-Nov-2009 9-Jun-2010 ELECTIVE 61.5
2177 8-Jun-1995 26-Oct-2010 26-Oct-2010 8-Oct-2013 7-Jun-2020 ELECTIVE 74.2
2178 8-May-1982 8-May-1997 8-May-1997 12-May-1997 30-Jan-2007 COMPULSORY 75.0
2179 25-Oct-1980 21-Feb-1991 21-Feb-1991 21-Feb-1991 21-Feb-1996 COMPULSORY 75.0
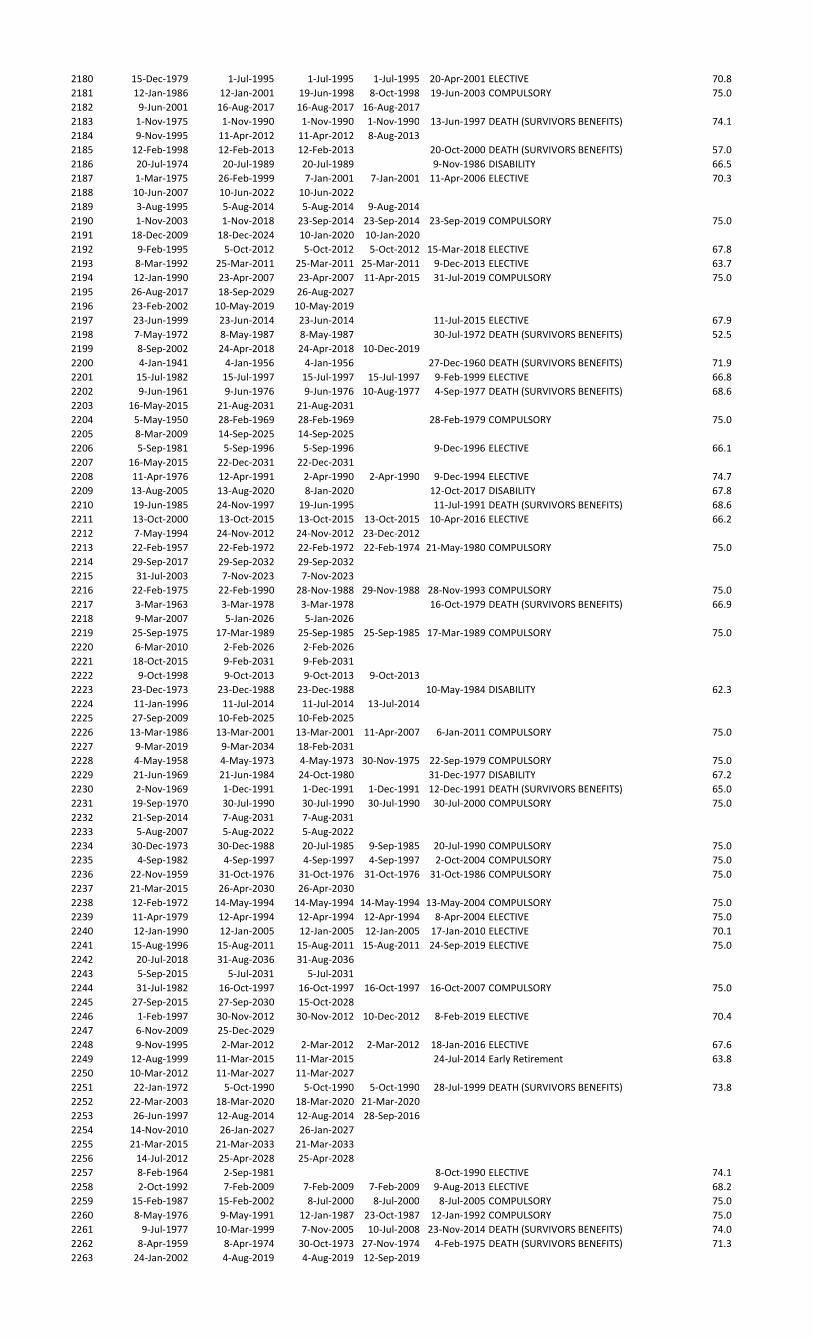
2180 15-Dec-1979 1-Jul-1995 1-Jul-1995 1-Jul-1995 20-Apr-2001 ELECTIVE 70.8
2181 12-Jan-1986 12-Jan-2001 19-Jun-1998 8-Oct-1998 19-Jun-2003 COMPULSORY 75.0
2182 9-Jun-2001 16-Aug-2017 16-Aug-2017 16-Aug-2017
2183 1-Nov-1975 1-Nov-1990 1-Nov-1990 1-Nov-1990 13-Jun-1997 DEATH (SURVIVORS BENEFITS) 74.1
2184 9-Nov-1995 11-Apr-2012 11-Apr-2012 8-Aug-2013
2185 12-Feb-1998 12-Feb-2013 12-Feb-2013 20-Oct-2000 DEATH (SURVIVORS BENEFITS) 57.0
2186 20-Jul-1974 20-Jul-1989 20-Jul-1989 9-Nov-1986 DISABILITY 66.5
2187 1-Mar-1975 26-Feb-1999 7-Jan-2001 7-Jan-2001 11-Apr-2006 ELECTIVE 70.3
2188 10-Jun-2007 10-Jun-2022 10-Jun-2022
2189 3-Aug-1995 5-Aug-2014 5-Aug-2014 9-Aug-2014
2190 1-Nov-2003 1-Nov-2018 23-Sep-2014 23-Sep-2014 23-Sep-2019 COMPULSORY 75.0
2191 18-Dec-2009 18-Dec-2024 10-Jan-2020 10-Jan-2020
2192 9-Feb-1995 5-Oct-2012 5-Oct-2012 5-Oct-2012 15-Mar-2018 ELECTIVE 67.8
2193 8-Mar-1992 25-Mar-2011 25-Mar-2011 25-Mar-2011 9-Dec-2013 ELECTIVE 63.7
2194 12-Jan-1990 23-Apr-2007 23-Apr-2007 11-Apr-2015 31-Jul-2019 COMPULSORY 75.0
2195 26-Aug-2017 18-Sep-2029 26-Aug-2027
2196 23-Feb-2002 10-May-2019 10-May-2019
2197 23-Jun-1999 23-Jun-2014 23-Jun-2014 11-Jul-2015 ELECTIVE 67.9
2198 7-May-1972 8-May-1987 8-May-1987 30-Jul-1972 DEATH (SURVIVORS BENEFITS) 52.5
2199 8-Sep-2002 24-Apr-2018 24-Apr-2018 10-Dec-2019
2200 4-Jan-1941 4-Jan-1956 4-Jan-1956 27-Dec-1960 DEATH (SURVIVORS BENEFITS) 71.9
2201 15-Jul-1982 15-Jul-1997 15-Jul-1997 15-Jul-1997 9-Feb-1999 ELECTIVE 66.8
2202 9-Jun-1961 9-Jun-1976 9-Jun-1976 10-Aug-1977 4-Sep-1977 DEATH (SURVIVORS BENEFITS) 68.6
2203 16-May-2015 21-Aug-2031 21-Aug-2031
2204 5-May-1950 28-Feb-1969 28-Feb-1969 28-Feb-1979 COMPULSORY 75.0
2205 8-Mar-2009 14-Sep-2025 14-Sep-2025
2206 5-Sep-1981 5-Sep-1996 5-Sep-1996 9-Dec-1996 ELECTIVE 66.1
2207 16-May-2015 22-Dec-2031 22-Dec-2031
2208 11-Apr-1976 12-Apr-1991 2-Apr-1990 2-Apr-1990 9-Dec-1994 ELECTIVE 74.7
2209 13-Aug-2005 13-Aug-2020 8-Jan-2020 12-Oct-2017 DISABILITY 67.8
2210 19-Jun-1985 24-Nov-1997 19-Jun-1995 11-Jul-1991 DEATH (SURVIVORS BENEFITS) 68.6
2211 13-Oct-2000 13-Oct-2015 13-Oct-2015 13-Oct-2015 10-Apr-2016 ELECTIVE 66.2
2212 7-May-1994 24-Nov-2012 24-Nov-2012 23-Dec-2012
2213 22-Feb-1957 22-Feb-1972 22-Feb-1972 22-Feb-1974 21-May-1980 COMPULSORY 75.0
2214 29-Sep-2017 29-Sep-2032 29-Sep-2032
2215 31-Jul-2003 7-Nov-2023 7-Nov-2023
2216 22-Feb-1975 22-Feb-1990 28-Nov-1988 29-Nov-1988 28-Nov-1993 COMPULSORY 75.0
2217 3-Mar-1963 3-Mar-1978 3-Mar-1978 16-Oct-1979 DEATH (SURVIVORS BENEFITS) 66.9
2218 9-Mar-2007 5-Jan-2026 5-Jan-2026
2219 25-Sep-1975 17-Mar-1989 25-Sep-1985 25-Sep-1985 17-Mar-1989 COMPULSORY 75.0
2220 6-Mar-2010 2-Feb-2026 2-Feb-2026
2221 18-Oct-2015 9-Feb-2031 9-Feb-2031
2222 9-Oct-1998 9-Oct-2013 9-Oct-2013 9-Oct-2013
2223 23-Dec-1973 23-Dec-1988 23-Dec-1988 10-May-1984 DISABILITY 62.3
2224 11-Jan-1996 11-Jul-2014 11-Jul-2014 13-Jul-2014
2225 27-Sep-2009 10-Feb-2025 10-Feb-2025
2226 13-Mar-1986 13-Mar-2001 13-Mar-2001 11-Apr-2007 6-Jan-2011 COMPULSORY 75.0
2227 9-Mar-2019 9-Mar-2034 18-Feb-2031
2228 4-May-1958 4-May-1973 4-May-1973 30-Nov-1975 22-Sep-1979 COMPULSORY 75.0
2229 21-Jun-1969 21-Jun-1984 24-Oct-1980 31-Dec-1977 DISABILITY 67.2
2230 2-Nov-1969 1-Dec-1991 1-Dec-1991 1-Dec-1991 12-Dec-1991 DEATH (SURVIVORS BENEFITS) 65.0
2231 19-Sep-1970 30-Jul-1990 30-Jul-1990 30-Jul-1990 30-Jul-2000 COMPULSORY 75.0
2232 21-Sep-2014 7-Aug-2031 7-Aug-2031
2233 5-Aug-2007 5-Aug-2022 5-Aug-2022
2234 30-Dec-1973 30-Dec-1988 20-Jul-1985 9-Sep-1985 20-Jul-1990 COMPULSORY 75.0
2235 4-Sep-1982 4-Sep-1997 4-Sep-1997 4-Sep-1997 2-Oct-2004 COMPULSORY 75.0
2236 22-Nov-1959 31-Oct-1976 31-Oct-1976 31-Oct-1976 31-Oct-1986 COMPULSORY 75.0
2237 21-Mar-2015 26-Apr-2030 26-Apr-2030
2238 12-Feb-1972 14-May-1994 14-May-1994 14-May-1994 13-May-2004 COMPULSORY 75.0
2239 11-Apr-1979 12-Apr-1994 12-Apr-1994 12-Apr-1994 8-Apr-2004 ELECTIVE 75.0
2240 12-Jan-1990 12-Jan-2005 12-Jan-2005 12-Jan-2005 17-Jan-2010 ELECTIVE 70.1
2241 15-Aug-1996 15-Aug-2011 15-Aug-2011 15-Aug-2011 24-Sep-2019 ELECTIVE 75.0
2242 20-Jul-2018 31-Aug-2036 31-Aug-2036
2243 5-Sep-2015 5-Jul-2031 5-Jul-2031
2244 31-Jul-1982 16-Oct-1997 16-Oct-1997 16-Oct-1997 16-Oct-2007 COMPULSORY 75.0
2245 27-Sep-2015 27-Sep-2030 15-Oct-2028
2246 1-Feb-1997 30-Nov-2012 30-Nov-2012 10-Dec-2012 8-Feb-2019 ELECTIVE 70.4
2247 6-Nov-2009 25-Dec-2029
2248 9-Nov-1995 2-Mar-2012 2-Mar-2012 2-Mar-2012 18-Jan-2016 ELECTIVE 67.6
2249 12-Aug-1999 11-Mar-2015 11-Mar-2015 24-Jul-2014 Early Retirement 63.8
2250 10-Mar-2012 11-Mar-2027 11-Mar-2027
2251 22-Jan-1972 5-Oct-1990 5-Oct-1990 5-Oct-1990 28-Jul-1999 DEATH (SURVIVORS BENEFITS) 73.8
2252 22-Mar-2003 18-Mar-2020 18-Mar-2020 21-Mar-2020
2253 26-Jun-1997 12-Aug-2014 12-Aug-2014 28-Sep-2016
2254 14-Nov-2010 26-Jan-2027 26-Jan-2027
2255 21-Mar-2015 21-Mar-2033 21-Mar-2033
2256 14-Jul-2012 25-Apr-2028 25-Apr-2028
2257 8-Feb-1964 2-Sep-1981 8-Oct-1990 ELECTIVE 74.1
2258 2-Oct-1992 7-Feb-2009 7-Feb-2009 7-Feb-2009 9-Aug-2013 ELECTIVE 68.2
2259 15-Feb-1987 15-Feb-2002 8-Jul-2000 8-Jul-2000 8-Jul-2005 COMPULSORY 75.0
2260 8-May-1976 9-May-1991 12-Jan-1987 23-Oct-1987 12-Jan-1992 COMPULSORY 75.0
2261 9-Jul-1977 10-Mar-1999 7-Nov-2005 10-Jul-2008 23-Nov-2014 DEATH (SURVIVORS BENEFITS) 74.0
2262 8-Apr-1959 8-Apr-1974 30-Oct-1973 27-Nov-1974 4-Feb-1975 DEATH (SURVIVORS BENEFITS) 71.3
2263 24-Jan-2002 4-Aug-2019 4-Aug-2019 12-Sep-2019
2264 19-Jan-1974 26-Feb-1999 3-Nov-1999 18-Jun-2000 11-Feb-2004 ELECTIVE 69.3
2265 1-Oct-2005 17-Aug-2020 1-Oct-2015 1-Oct-2015 8-Jan-2020 Early Retirement 74.4
2266 11-Apr-1946 4-May-1966 4-May-1966 7-Apr-1976 ELECTIVE 74.9
2267 18-May-2013 17-May-2028 17-May-2028
2268 21-Mar-2009 20-Mar-2024 20-Mar-2024
2269 5-Jun-2005 23-Aug-2023 23-Aug-2023
2270 13-Jul-1995 27-May-2015 27-May-2015 12-May-2019 ELECTIVE 64.1
2271 18-Feb-1972 18-Feb-1987 12-May-1982 12-May-1982 12-May-1987 COMPULSORY 75.0
2272 16-Feb-1997 14-Jul-2015 14-Jul-2015 9-Dec-2013 Early Retirement 60.0
2273 25-Aug-2019 22-Dec-2033 25-Aug-2029
2274 14-Jul-2012 14-Jul-2027 14-Jul-2027
2275 21-Jan-1984 25-Dec-2003 28-Nov-2008 13-Jul-2002 Early Retirement 58.6
2276 20-May-1978 22-Jun-1987 19-May-1988 12-Apr-1988 DEATH (SURVIVORS BENEFITS) 70.8
2277 14-May-2011 14-May-2026 14-Mar-2022
2278 20-Jul-2008 14-Dec-2026 14-Dec-2026
2279 12-Jul-2018 12-Jul-2033 12-Jul-2033
2280 6-Feb-2011 4-Mar-2025 6-Feb-2021
2281 10-Dec-1972 10-Dec-1987 10-Dec-1987 10-Dec-1987 2-Nov-1988 DEATH (SURVIVORS BENEFITS) 68.3
2282 26-Jan-1974 10-Nov-1996 10-Nov-1996 10-Nov-1996 9-Feb-1999 ELECTIVE 67.3
2283 10-Jun-2007 10-Jun-2022 30-Apr-2022
2284 26-Feb-1998 16-Oct-2013 16-Oct-2013 16-Oct-2013
2285 14-Aug-1992 27-Feb-2010 27-Feb-2010 17-Apr-2009 DISABILITY 61.6
2286 18-May-2013 17-May-2028 19-Jul-2026
2287 1-Aug-1984 1-Aug-1999 1-Aug-1999 1-Aug-1999 23-Feb-2005 COMPULSORY 75.0
2288 30-Jun-1988 30-Jun-2003 30-Jun-2003 10-Jul-2003 13-May-2011 COMPULSORY 75.0
2289 9-Jan-2005 9-Jan-2020 9-Jan-2020
2290 11-Mar-2014 11-Mar-2029 29-Nov-2024
2291 10-Sep-2019 10-Sep-2034 10-Sep-2034
2292 10-Aug-2019 28-Jan-2038 28-Jan-2038
2293 14-Jun-2014 14-Jun-2029 14-Jun-2029
2294 27-Sep-2009 14-Dec-2028 14-Dec-2028
2295 22-Jul-1999 22-Jul-2014 22-Jul-2014 31-Jul-2014
2296 9-Mar-1995 22-Nov-2015 22-Nov-2015
2297 17-May-2018 17-May-2033 8-May-2033
2298 27-Oct-1991 9-Oct-1999 9-Oct-1999 COMPULSORY 75.0
2299 14-Mar-1992 15-Mar-2007 15-Mar-2007 15-Mar-2007 11-Sep-2015 COMPULSORY 75.0
2300 9-Apr-2012 23-Sep-2022 10-Apr-2022
2301 15-Apr-1966 15-Apr-1981 15-Apr-1981 8-Jan-1982 9-Jan-1988 ELECTIVE 73.1
2302 21-Nov-2003 21-Nov-2018 13-Jul-2015 5-May-2007 RESIGNATION (RPC) 61.8
2303 16-Jun-2017 30-May-2033 30-May-2033
2304 15-Feb-2014 24-May-2032 24-May-2032
2305 7-Jun-1969 26-Aug-1987 26-Aug-1987 9-Oct-1992 9-Feb-1997 ELECTIVE 74.5
2306 18-Oct-1980 10-Jul-1998 10-Jul-1998 10-Jul-1998 9-Jun-2008 ELECTIVE 74.9
2307 9-Sep-2020 9-Sep-2035 9-Sep-2035
2308 3-Apr-1991 3-Apr-2006 3-Apr-2006 10-Jun-2003 DEATH (SURVIVORS BENEFITS) 66.8
2309 20-Jul-2003 20-Jul-2018 20-Jul-2018 20-Nov-2011 DEATH (SURVIVORS BENEFITS) 60.7
2310 4-Jan-2004 4-Jan-2019 4-Jan-2019 8-Jan-2019
2311 25-Aug-2019 25-Aug-2034 8-Jul-2031
2312 19-Jan-1992 27-Apr-2008 27-Apr-2008 11-Apr-2011 8-Oct-2018 ELECTIVE 74.2
2313 13-Oct-1990 12-Nov-2010 12-Nov-2010 12-Nov-2010 ELECTIVE 59.9
2314 1-Apr-1976 16-May-1992 16-May-1992 16-May-1992 9-Aug-2000 ELECTIVE 73.2
2315 1-Oct-1993 1-Oct-2008 1-Oct-2008 1-Oct-2008 1-Oct-2013 DEATH (SURVIVORS BENEFITS) 74.4
2316 26-Jul-1962 26-Jul-1977 26-Jul-1977 3-Nov-1967 DEATH (SURVIVORS BENEFITS) 60.0
2317 27-Sep-2015 6-Feb-2034 6-Feb-2034
2318 18-Jan-2003 18-Jan-2018 18-Jan-2018 20-Jan-2014 Early Retirement 65.7
2319 18-Feb-2000 18-Feb-2015 18-Feb-2015 18-Feb-2015 15-Sep-2020 COMPULSORY 75.0
2320 14-Jun-1969 14-Jun-1984 5-Mar-1981 23-Dec-1974 DEATH (SURVIVORS BENEFITS) 63.8
2321 14-May-2011 23-Dec-2027 23-Dec-2027
2322 8-Oct-1989 8-Oct-2004 8-Oct-2004 8-Oct-2004 27-Sep-2014 COMPULSORY 75.0
2323 9-May-2020 10-May-2035 10-May-2035
2324 15-Dec-1986 19-May-2005 22-Oct-2008 19-May-1999 RESIGNATION (RPC) 55.6
2325 22-Aug-2009 4-Mar-2018 4-Mar-2018 COMPULSORY 75.0
2326 28-Dec-2007 28-Dec-2022 28-Dec-2022
2327 14-Sep-1983 31-Jan-1997 31-Jan-1997 11-Aug-1999 DEATH (RPC) 72.5
2328 27-May-1967 27-May-1982 27-May-1982 14-Jun-1991 COMPULSORY 75.0
2329 19-Jul-2014 19-Jul-2029 19-Jul-2029
2330 7-Jan-2018 30-May-2025
2331 8-Dec-1978 26-Feb-1999 28-Jun-2001 28-Jun-2001 11-Apr-2010 ELECTIVE 73.8
2332 4-Jul-1979 4-Jul-1994 1-Aug-1992 3-Aug-1994 1-Aug-1997 COMPULSORY 75.0
2333 12-Feb-1972 5-Sep-1981 12-Feb-1982 5-Sep-1981 Compulsory(County Court) 70.0
2334 30-Nov-1985 29-Aug-2001 27-May-2002 6-Jul-2003 26-May-2012 COMPULSORY 75.0
2335 27-Sep-2015 27-Sep-2030 13-Jun-2026
2336 11-Jun-1993 27-Jul-2010 10-Sep-2012 22-Jul-1999 RESIGNATION (RPC) 51.9
2337 22-Jul-1960 28-Jul-1976 28-Jul-1976 2-Feb-1977 28-Jul-1986 COMPULSORY 75.0
2338 1-Apr-1992 18-Jan-2009 18-Jan-2009 18-Jan-2009 8-Aug-2016 ELECTIVE 70.8
2339 17-Jul-1971 20-Aug-1983 20-Aug-1983 10-Jul-1973 DISABILITY 59.9
2340 21-Sep-2014 15-Apr-2026 21-Sep-2024
2341 13-Feb-2004 13-Feb-2019 18-Aug-2018 18-Aug-2018
2342 1-Jun-2018 1-Jun-2033 12-Jan-2031
2343 28-Jan-2018 28-Jan-2033 28-Jan-2033
2344 21-Mar-2009 20-Mar-2024 28-Jan-2022
2345 24-Sep-1993 24-Sep-2008 24-Sep-2008 24-Sep-2008 10-Apr-2014 ELECTIVE 73.3
2346 7-Dec-2018 7-Dec-2033 7-Dec-2033
2347 13-Aug-1993 27-Jan-2006 13-Aug-2003 13-Aug-2003 27-Jan-2006 COMPULSORY 75.0
2348 13-Sep-2007 13-Sep-2022 18-Aug-2019 10-May-2020
2349 7-Oct-1998 7-Oct-2013 6-Sep-2010 28-Sep-2009 DEATH (SURVIVORS BENEFITS) 69.1
2350 30-Jun-1991 30-Jun-2006 11-Dec-2004 11-Dec-2004 11-Dec-2009 COMPULSORY 75.0
2351 26-Aug-2010 26-Aug-2025 26-Aug-2025
2352 6-Mar-2010 6-Mar-2025 6-Mar-2025
2353 19-Jun-1986 8-Dec-2006 24-Mar-2007 30-May-2007 10-Apr-2013 ELECTIVE 65.9
2354 6-Oct-1984 23-Jun-2002 10-Mar-2015 COMPULSORY 75.0
2355 13-Aug-2005 19-May-2022 19-May-2022
2356 2-Apr-2007 21-Oct-2022 21-Oct-2022
2357 18-Oct-1950 25-May-1967 25-May-1967 10-Apr-1958 RESIGNATION (RPC) 55.9
2358 19-Sep-1951 16-Oct-1966 16-Oct-1966 20-Dec-1971 DEATH (SURVIVORS BENEFITS) 70.2
2359 3-Jul-2019 17-Jun-2035 17-Jun-2035
2360 18-Dec-2009 18-Dec-2024 18-Dec-2024
2361 13-May-1962 19-Nov-1972 19-Nov-1972 19-Nov-1977 COMPULSORY 75.0
2362 6-Aug-2020 6-Aug-2035 5-Jun-2035
2363 24-Oct-2002 23-Feb-2019 23-Feb-2019 27-Feb-2019
2364 8-Mar-1992 9-Mar-2007 3-Dec-2003 3-Dec-2003 3-Dec-2008 COMPULSORY 75.0
2365 6-Aug-1981 6-Aug-1996 6-Aug-1996 6-Aug-1996 9-Jan-2004 ELECTIVE 73.4
2366 6-Mar-2010 6-Mar-2025 6-Mar-2025
2367 1-Jul-1972 1-Jul-1987 1-Jul-1987 9-Jan-1974 DISABILITY 55.6
2368 5-Sep-1981 16-May-1998 16-May-1998 16-May-1998 15-May-2008 COMPULSORY 75.0
2369 30-Nov-1985 30-Nov-2000 14-May-2000 15-May-2005 COMPULSORY 75.0
2370 3-Apr-1991 18-Nov-2007 18-Nov-2007 3-Jul-2009 3-Jul-2019 COMPULSORY 75.0
2371 22-May-1940 9-Mar-1957 9-Mar-1957 11-May-1964 ELECTIVE 72.2
2372 28-Feb-1996 28-Feb-2011 28-Feb-2011 18-Apr-2006 DEATH (SURVIVORS BENEFITS) 63.5
2373 8-Dec-1962 8-Dec-1977 8-Dec-1977 27-Aug-1968 DEATH (SURVIVORS BENEFITS) 57.4
2374 25-Sep-1982 25-Sep-1997 25-Sep-1997 9-Oct-1997 12-Sep-2006 DEATH (RPC) 74.2
2375 3-Jul-1968 3-Jul-1983 20-Jul-1981 22-Jul-1981 20-Jul-1986 COMPULSORY 75.0
2376 21-May-1993 20-May-2008 30-Sep-2004 30-Sep-2004 24-Dec-2008 ELECTIVE 74.2
2377 8-Nov-1990 10-Feb-2010 10-Feb-2010 10-Feb-2010 10-Feb-2020 COMPULSORY 70.7
2378 7-Jul-1990 12-Mar-2011 12-Mar-2011 17-Jul-2009 Early Retirement 57.7
2379 29-Jan-2006 28-Jun-2023 28-Jun-2023
2380 8-Jan-1986 8-Jan-2001 21-Jul-1999 21-Jul-1999 21-Jul-2004 COMPULSORY 75.0
2381 18-Feb-2000 18-Feb-2015 25-Dec-2011 25-Dec-2011 25-Dec-2016 COMPULSORY 75.0
2382 15-Jan-1959 15-Jan-1974 24-Apr-1969 8-Sep-1967 DEATH (SURVIVORS BENEFITS) 68.4
2383 18-Oct-2007 10-Jul-2022 18-Oct-2017 18-Oct-2017
2384 5-Aug-2007 4-Jul-2021 5-Aug-2017 5-Aug-2017
2385 19-Jan-1974 25-May-1996 25-May-1996 25-May-1996 26-May-2006 COMPULSORY 75.0
2386 26-Aug-2010 26-Aug-2025 5-Oct-2023
2387 13-May-1978 19-Jun-1997 19-Jun-1997 11-Jul-1997 15-Dec-2003 ELECTIVE 71.5
2388 27-Feb-2005 27-Feb-2020 27-Feb-2020
2389 25-Feb-1999 17-Nov-2014 17-Nov-2014 23-May-2009 DISABILITY 58.8
2390 27-Mar-1988 9-Dec-2003 21-Aug-2004 21-Aug-2004 22-Jul-2010 ELECTIVE 70.9
2391 10-Apr-1974 10-Apr-1989 10-Apr-1989 10-Apr-1989 10-Apr-1993 ELECTIVE 69.1
2392 28-Nov-1965 21-Jan-1982 21-Jan-1982 23-Sep-1973 DISABILITY 56.7
2393 25-May-1985 7-May-2001 19-Apr-2002 19-Apr-2002 9-Jan-2008 ELECTIVE 70.7
2394 14-Jun-1969 6-Dec-1989 6-Dec-1989 6-Dec-1992 6-Dec-1999 COMPULSORY 75.0
2395 27-Sep-2009 27-Sep-2024 6-Mar-2024
2396 12-Jan-2013 22-Sep-2031 22-Sep-2031
2397 29-Mar-1997 26-Sep-2014 26-Sep-2014 10-Dec-2015 9-Apr-2020 ELECTIVE 68.0
2398 3-Apr-1991 8-Apr-2010 8-Apr-2010 10-Apr-2020
2399 31-Jul-1994 31-Jul-2009 31-Jul-2009 31-Jul-2009 21-Apr-2018 COMPULSORY 75.0
2400 17-Oct-1981 23-Oct-1992 23-Oct-1992 23-Oct-1992 23-Oct-1997 COMPULSORY 75.0
2401 23-Mar-1985 27-Aug-1999 23-Mar-1995 11-Apr-1995 27-Aug-1999 COMPULSORY 75.0
2402 9-May-1970 7-May-1981 8-May-1980 7-May-1981 COMPULSORY 75.0
2403 15-Mar-1984 16-Mar-1999 16-Mar-1999 16-Mar-1999 11-Jul-2002 ELECTIVE 70.5
2404 7-Dec-2018 28-Apr-2033 7-Dec-2028
2405 9-Nov-1995 9-Nov-2010 9-Nov-2010 9-Nov-2010 18-Jun-2019 COMPULSORY 75.0
2406 12-Jan-1995 1-May-2013 1-May-2013 1-May-2013
2407 17-Aug-2014 25-Mar-2033 25-Mar-2033
2408 3-Aug-1995 3-Aug-2010 3-Aug-2010 23-Sep-2007 DEATH (RPC) 66.4
2409 15-Jun-2019 15-Jun-2034 15-Jun-2034
2410 14-Aug-1992 14-Aug-2007 14-Aug-2007 15-Aug-2007 18-Jun-2016 COMPULSORY 75.0
2411 13-Oct-1994 24-Oct-2010 24-Oct-2010 8-Nov-2010 ELECTIVE 64.0
2412 23-Oct-1975 8-Oct-1993 8-Oct-1993 8-Oct-1993 8-Oct-2003 COMPULSORY 75.0
2413 8-Mar-1975 8-Mar-1990 17-Dec-1989 25-Mar-1980 DEATH (RPC) 60.3
2414 7-Nov-2008 7-Nov-2023 8-Apr-2020 9-Apr-2020
2415 26-Oct-1983 26-Oct-1998 26-Oct-1998 26-Oct-1998 28-Feb-2003 DEATH (SURVIVORS BENEFITS) 73.6
2416 10-Feb-1968 22-Nov-1989 22-Nov-1989 25-May-1985 DEATH (SURVIVORS BENEFITS) 60.5
2417 14-May-2011 14-May-2026 29-Apr-2022
2418 22-Nov-1963 22-Nov-1978 22-Nov-1978 23-Nov-1978 13-Sep-1986 COMPULSORY 75.0
2419 14-May-2011 15-Oct-2031 15-Oct-2031
2420 2-Dec-1964 2-Dec-1979 2-Dec-1979 10-Dec-1979 6-Apr-1985 COMPULSORY 75.0
2421 23-Jan-1996 23-Dec-2007 23-Jan-2006 9-Aug-2000 RESIGNATION (RPC) 67.6
2422 29-Mar-1981 27-May-2000 25-Jul-2004 11-Apr-2006 25-Jul-2014 COMPULSORY 75.0
2423 26-Feb-1983 26-Feb-1993 26-Feb-1993 26-Feb-1993 10-Jul-1996 COMPULSORY 75.0
2424 28-Jul-1973 28-Jul-1988 28-Jul-1988 15-May-1997 COMPULSORY 75.0
2425 14-Sep-2013 9-Nov-2026 14-Sep-2023 8-Aug-2017 RESIGNATION (RPC) 65.7
2426 10-Feb-1961 5-Mar-1968 24-Aug-1967 DISABILITY 74.5
2427 10-Dec-1976 1-Oct-1997 1-Oct-1997 27-Sep-1982 DEATH (SURVIVORS BENEFITS) 50.0
2428 9-Feb-2006 9-Feb-2021 18-Feb-2016
2429 1-Jun-1989 7-Apr-2010 7-Apr-2010 16-Apr-2010 21-Apr-2013 ELECTIVE 62.2
2430 10-Dec-1965 10-Dec-1980 4-Jul-1984 DEATH (SURVIVORS BENEFITS) 71.5
2431 14-May-1994 14-May-2009 14-May-2009 14-May-2009 9-Dec-2014 ELECTIVE 71.1
2432 16-May-2019 16-Apr-2033 16-May-2029
2433 11-Aug-2018 11-Aug-2033 11-Aug-2033
2434 9-Feb-2019 24-Mar-2036 24-Mar-2036
2435 21-Jun-2001 21-Jun-2016 21-Jun-2016 21-Jun-2016
2436 5-Feb-2004 5-Feb-2019 5-Feb-2019 5-Feb-2019
2437 18-Dec-2009 18-Dec-2024 18-Dec-2024
2438 10-May-2008 11-May-2023 11-May-2023
2439 18-Sep-1993 18-Sep-2008 18-Sep-2008 18-Sep-2008 2-Jul-2015 COMPULSORY 75.0
2440 21-Feb-1976 27-Mar-1996 27-Mar-1996 10-Apr-1996 24-Jul-1997 ELECTIVE 66.3
2441 25-Feb-1999 25-Feb-2014 13-Nov-2013 13-Nov-2013 13-Nov-2018 COMPULSORY 75.0
2442 2-Jan-1997 30-Jul-2012 30-Jul-2012 8-Aug-2012 8-Jan-2019 ELECTIVE 70.9
2443 30-Jun-1991 20-Apr-2007 20-Apr-2007 9-Oct-2013 7-Feb-2018 COMPULSORY 75.0
2444 25-Mar-2007 25-Mar-2022 1-Oct-2020
2445 19-May-1950 19-May-1965 19-May-1965 9-Oct-1964 DEATH (SURVIVORS BENEFITS) 67.2
2446 6-Nov-2009 6-Nov-2024 6-Nov-2024
2447 5-Feb-2004 28-Oct-2020 28-Oct-2020 20-Jul-2019 Early Retirement 62.0
2448 31-Jul-1994 31-Jul-2009 7-Jan-2006 7-Jan-2006 7-Jan-2011 COMPULSORY 75.0
2449 18-Dec-1997 18-Dec-2012 18-Dec-2012 7-Oct-2007 DISABILITY 60.2
2450 19-Jan-1992 6-Apr-2009 6-Apr-2009 6-Apr-2009 6-Apr-2019 COMPULSORY 72.8
2451 22-Oct-2017 22-Oct-2032 31-May-2028
2452 5-Jun-2005 4-Jun-2020 4-Jun-2020 4-Jun-2020
2453 17-Mar-1965 16-Mar-1980 16-Mar-1980 19-Mar-1980 11-Mar-1982 ELECTIVE 71.5
2454 16-Sep-2017 8-Mar-2033 8-Mar-2033
2455 11-Oct-1980 12-Sep-2000 12-Sep-2000 21-Apr-1991 DEATH (SURVIVORS BENEFITS) 55.6
2456 19-Jun-1985 5-Feb-2002 24-Sep-2003 24-Sep-2003 10-Dec-2011 ELECTIVE 73.2
2457 7-Mar-1940 6-Jan-1965 6-Jan-1965 4-Sep-1960 DEATH (SURVIVORS BENEFITS) 60.7
2458 10-Mar-2012 12-Mar-2032 12-Mar-2032
2459 3-Nov-1995 6-Apr-2014 6-Apr-2014 11-Apr-2014 10-Dec-2020 ELECTIVE 68.3
2460 3-Aug-1995 3-Aug-2010 3-Aug-2010 3-Aug-2010 8-Aug-2014 ELECTIVE 71.4
2461 27-Jan-2017 20-Nov-2033 20-Nov-2033
2462 27-Aug-2005 27-Aug-2020 18-Jan-2020 18-Jan-2020
2463 7-Aug-2009 7-Aug-2024 7-Aug-2024
2464 17-Oct-1994 29-Sep-2010 29-Sep-2010 23-Aug-2020
2465 9-Apr-1981 8-Apr-1996 19-Jul-1991 19-Jul-1991 19-Jul-1996 COMPULSORY 75.0
2466 7-May-1994 3-Aug-2013 3-Aug-2013 4-Aug-2013
2467 9-May-2020 10-May-2035 10-May-2035
2468 1-Apr-1992 2-Apr-2007 2-Apr-2007 2-Apr-2007 20-Nov-2016 COMPULSORY 75.0
2469 21-Jul-1990 27-Dec-1999 1-Feb-1995 DEATH (SURVIVORS BENEFITS) 70.1
2470 13-Jun-1968 25-Sep-1991 25-Sep-1991 25-Sep-1991 10-Apr-1997 ELECTIVE 70.5
2471 15-Jun-2019 15-Jun-2034 19-Jul-2033
2472 16-Sep-2017 21-Aug-2035 21-Aug-2035
2473 9-Sep-1988 9-Sep-2003 23-Sep-1999 9-Dec-1999 23-Sep-2004 COMPULSORY 75.0
2474 16-Dec-1962 20-Dec-1970 20-Dec-1972 9-Oct-1968 DISABILITY 67.8
2475 10-Dec-1975 10-Dec-1990 10-Dec-1990 16-Jan-1988 DEATH (SURVIVORS BENEFITS) 62.2
2476 15-Aug-1996 11-May-2012 11-May-2012 11-Mar-2018
2477 23-May-1970 17-Apr-1982 22-May-1980 8-Jun-1980 17-Apr-1982 COMPULSORY 75.0
2478 25-Jun-1977 17-Apr-1995 17-Apr-1995 25-Apr-1994 DISABILITY 64.0
2479 25-Feb-1999 25-Feb-2014 12-Apr-2013 11-Dec-2013 12-Apr-2018 COMPULSORY 75.0
2480 4-Sep-1976 23-Dec-1993 23-Dec-1993 23-Dec-1993 23-Dec-2003 COMPULSORY 75.0
2481 8-Jan-2021 12-Mar-2037 12-Mar-2037
2482 2-May-2009 1-May-2024 1-May-2024
2483 9-Mar-2018 9-Mar-2033 27-Apr-2031
2484 17-Aug-2014 17-Aug-2029 17-Aug-2029
2485 2-Mar-2007 4-Mar-2025 4-Mar-2025
2486 25-Feb-1987 30-Aug-2005 24-Mar-2007 11-Apr-2007 11-Apr-2017 COMPULSORY 73.1
2487 26-Sep-2010 26-Sep-2025 3-Aug-2022
2488 10-Mar-2012 11-Mar-2027 11-Mar-2027
2489 8-Oct-1999 19-Jul-2017 19-Jul-2017 19-Jul-2017
2490 9-Jan-2014 9-Jan-2029 14-May-2027
2491 23-Oct-1975 26-Feb-1999 22-Mar-2001 10-Dec-2002 26-May-2004 ELECTIVE 68.2
2492 5-Feb-2004 5-Feb-2019 5-Feb-2019
2493 21-Mar-2009 20-Mar-2024 25-Feb-2020 11-May-2019 Early Retirement 69.2
2494 19-Sep-1981 19-Sep-1996 8-Jan-1998 ELECTIVE 71.5
2495 12-Jan-2013 12-Jan-2028 5-Mar-2023
2496 1-Aug-2010 1-Aug-2025 1-Aug-2025
2497 12-Jan-1990 19-Jun-2005 23-Nov-2005 9-Mar-2000 DEATH (SURVIVORS BENEFITS) 59.3
2498 19-Aug-2017 7-Jun-2034 7-Jun-2034
2499 23-Feb-2006 31-Mar-2022 31-Mar-2022
2500 29-Dec-1979 20-Dec-1998 20-Dec-1998 20-Dec-1998 11-Apr-1999 ELECTIVE 65.3
2501 9-Oct-1978 30-Nov-1996 30-Nov-1996 30-Nov-1996 11-Mar-2006 ELECTIVE 74.3
2502 12-Jun-2020 11-Jul-2036 11-Jul-2036
2503 9-Jun-1961 11-Apr-1977 11-Apr-1977 11-Apr-1979 8-Aug-1979 ELECTIVE 67.3
2504 7-Nov-2008 7-Nov-2023 7-Nov-2023 16-Dec-2018 Early Retirement 62.3
2505 14-Aug-1992 9-Feb-2010 9-Feb-2010 11-Mar-2018
2506 29-Sep-1984 29-Sep-1999 29-Sep-1999 29-Sep-1999 16-Jul-2007 COMPULSORY 75.0
2507 12-Jan-1974 4-Mar-1987 12-Jan-1984 31-Oct-1981 DISABILITY 69.7
2508 3-Jul-2019 2-Apr-2036 2-Apr-2036
2509 8-Feb-1964 8-Jul-1983 8-Jul-1983 8-Jul-1983 8-Jul-1993 COMPULSORY 75.0
2510 5-May-1973 20-May-1993 20-May-1993 20-May-1993 9-Nov-1998 ELECTIVE 70.5
2511 18-Feb-2000 18-Feb-2015 18-Feb-2015 18-Feb-2015
2512 17-Mar-2000 24-Oct-2016 24-Oct-2016 24-Apr-2017 31-Oct-2020 ELECTIVE 67.4
2513 24-Sep-1986 8-Jan-2002 23-Apr-2002 23-Apr-2002 22-Apr-2012 COMPULSORY 75.0
2514 13-Feb-2004 13-Feb-2019 7-Oct-2017 11-Apr-2019
2515 30-Dec-1951 30-Dec-1966 30-Dec-1966 27-Apr-1973 COMPULSORY 75.0
2516 12-Jan-1990 12-Jan-2005 12-Jan-2005 23-Feb-1992 DEATH (SURVIVORS BENEFITS) 53.2
2517 18-Jul-2003 18-Jul-2018 18-Jul-2018 28-Jul-2018
2518 22-Dec-1973 30-Apr-1994 30-Apr-1994 9-Nov-1994 9-Feb-1995 ELECTIVE 65.8
2519 10-Jun-2007 10-Jun-2022 3-Jul-2019 10-Jul-2019
2520 7-Mar-1981 24-Dec-1997 24-Dec-1997 24-Dec-1997 24-Dec-2007 COMPULSORY 75.0
2521 11-Jun-2011 2-Jul-2028 2-Jul-2028
2522 14-Jun-1995 4-Jun-2012 4-Jun-2012 4-Jun-2012 9-Dec-2013 ELECTIVE 64.5
2523 18-Mar-1980 19-Mar-1995 19-Mar-1995 27-Jan-2001 COMPULSORY 75.0
2524 15-Jun-2019 26-Jul-2032 15-Jun-2029
2525 8-Feb-1964 8-Feb-1979 22-Mar-1976 27-Aug-1971 DEATH (SURVIVORS BENEFITS) 65.4
2526 17-Nov-1982 21-Nov-1999 24-Nov-2001 24-Nov-2001 24-Nov-2011 COMPULSORY 75.0
2527 5-Sep-1993 7-Jul-2011 7-Jul-2011
2528 28-Sep-2000 28-Sep-2015 20-Jul-2014 20-Jul-2014 28-Mar-2019 DEATH (SURVIVORS BENEFITS) 74.7
2529 8-Dec-1978 8-Dec-1993 8-Dec-1993 8-Dec-1993 9-Aug-2000 ELECTIVE 72.4
2530 8-Nov-1992 3-Jan-2009 3-Jan-2009 3-Jan-2009 9-Apr-2016 ELECTIVE 71.1
2531 19-May-1973 16-Dec-1992 9-Oct-2002 ELECTIVE 74.8
2532 23-May-1996 5-Aug-2015 5-Aug-2015 10-Apr-2015 Early Retirement 60.5
2533 23-Sep-1942 28-Nov-1967 28-Nov-1967 23-Jun-1956 DISABILITY 53.6
2534 23-Dec-2006 21-Sep-2022 21-Sep-2022
2535 5-Jun-2005 4-Jun-2020 6-Sep-2016 8-Oct-2016
2536 6-Jul-1991 6-Jul-2006 6-Jul-2006 16-Nov-2002 DISABILITY 66.1
2537 7-Nov-2008 14-Nov-2022 7-Nov-2018 7-Nov-2018
2538 9-Feb-1967 23-Jul-1987 23-Jul-1987 24-Jul-1987 23-Jul-1997 COMPULSORY 75.0
2539 10-Feb-2013 15-Jul-2026 10-Feb-2023
2540 1-Jun-2018 16-Oct-2035 16-Oct-2035
2541 12-Jan-1986 28-Jul-2006 28-Jul-2006
2542 2-Mar-2007 2-Aug-2025 2-Aug-2025
2543 4-Dec-1975 10-Feb-1993 10-Feb-1993 10-Feb-1993 8-Feb-1995 ELECTIVE 67.0
2544 14-Aug-1992 7-Mar-2010 7-Mar-2010 11-Apr-2010 10-Apr-2020 COMPULSORY 72.5
2545 18-Jan-2003 18-Jan-2018 26-Apr-2015 26-Apr-2015 25-Apr-2020 COMPULSORY 75.0
2546 29-Mar-1981 28-Mar-1996 21-Sep-1995 21-Sep-1995 21-Sep-2000 COMPULSORY 75.0
2547 10-Apr-1976 11-Apr-1991 11-Apr-1991 9-Jun-1991 13-Dec-1997 COMPULSORY 75.0
2548 26-Sep-1981 10-Oct-1998 10-Oct-1998 12-Oct-1998 18-Feb-2006 ELECTIVE 72.4
2549 26-May-1977 26-Feb-1999 2-Oct-2002 9-Feb-2000 ELECTIVE 62.4
2550 8-Oct-1971 8-Oct-1986 8-Oct-1986 12-Apr-1993 5-Dec-1994 COMPULSORY 75.0
2551 23-Mar-1958 4-Oct-1971 22-Mar-1968 1-Nov-1963 DISABILITY 67.1
2552 26-Dec-1976 26-Dec-1991 26-Dec-1991 26-Dec-1991 24-May-1997 COMPULSORY 75.0
2553 1-Nov-1975 31-Dec-1993 31-Dec-1993 31-Dec-1993 8-Feb-1996 ELECTIVE 67.1
2554 16-Jun-1973 16-Jun-1988 16-Jun-1988 16-Jun-1988 9-Apr-1992 ELECTIVE 70.3
2555 24-Dec-1989 21-Jul-2006 24-Mar-2007 9-Aug-2009 16-Jul-2014 ELECTIVE 71.4
2556 28-May-1955 18-Feb-1963 28-May-1965 24-Jun-1967 DISABILITY 74.3
2557 17-Feb-2018 24-Jul-2031 17-Feb-2028
2558 26-Mar-2003 26-Mar-2018 26-Mar-2018 10-Apr-2018
2559 12-Feb-1977 26-Feb-1999 2-Oct-1999 8-Oct-1999 2-Oct-2009 COMPULSORY 75.0
2560 17-Aug-2014 17-Aug-2029 17-Aug-2029
2561 2-Feb-1958 2-Feb-1973 2-Feb-1973 22-Oct-1961 DEATH (SURVIVORS BENEFITS) 54.4
2562 11-Jun-2011 11-Jun-2026 8-Jun-2023
2563 9-Nov-1995 9-Nov-2010 9-Nov-2010 9-Nov-2010 8-Oct-2017 ELECTIVE 73.1
2564 25-Mar-2007 8-Feb-2022 25-Mar-2017 26-Mar-2017
2565 8-Oct-1989 8-Oct-2004 19-Nov-2002 9-Jul-2004 19-Nov-2007 COMPULSORY 75.0
2566 8-Jul-2015 8-Jul-2030 8-Jul-2030
2567 30-Jun-1965 30-Jun-1980 30-Jun-1980 29-Sep-1980 4-Apr-1990 COMPULSORY 75.0
2568 19-Jun-1968 19-Jun-1983 8-Jul-1979 8-Oct-1979 8-Jul-1984 COMPULSORY 75.0
2569 30-Dec-1967 30-Dec-1982 30-Dec-1982 10-Dec-1983 6-Jan-1991 COMPULSORY 75.0
2570 10-Apr-1944 21-Oct-1966 21-Oct-1966 8-Nov-1966 DEATH (SURVIVORS BENEFITS) 65.0
2571 7-Oct-1987 6-Nov-2004 7-Dec-2006 10-Dec-2006 12-May-2011 ELECTIVE 69.4
2572 25-Mar-1972 26-Aug-1999 26-Aug-1999 4-Dec-1993 DEATH (SURVIVORS BENEFITS) 59.3
2573 13-Jul-1995 13-Jul-2010 13-Jul-2010 13-Jul-2010 8-Jan-2015 ELECTIVE 72.3
2574 4-Jun-1998 4-Jun-2013 4-Jun-2013 9-Oct-2010 Early Retirement 63.2
2575 7-Nov-2008 7-Nov-2023 3-Feb-2022 10-Dec-2020 Early Retirement 68.9
2576 8-Jul-1990 14-Jan-2007 24-Mar-2007 11-Apr-2007 8-Feb-2017 ELECTIVE 73.6
2577 16-May-2015 11-Aug-2031 11-Aug-2031
2578 28-Sep-2000 23-Feb-2018 23-Feb-2018 23-Feb-2018
2579 10-Jun-2007 23-Nov-2022 23-Nov-2022
2580 26-Jun-1963 26-Jun-1978 26-Jun-1978 9-Feb-1976 DISABILITY 65.0
2581 22-Aug-2009 6-Jun-2028 6-Jun-2028
2582 15-Aug-2004 19-Dec-2021 19-Dec-2021
2583 23-Mar-1958 23-Mar-1973 18-Dec-1970 12-May-1973 8-Apr-1974 ELECTIVE 73.3
2584 28-Jan-2012 20-Jul-2028 20-Jul-2028
2585 10-Jul-1993 10-Jul-2008 10-Jul-2008 10-Jan-2007 Early Retirement 65.1
2586 12-Aug-1999 11-Nov-2016 11-Nov-2016 11-Nov-2016
2587 22-Aug-2009 22-Aug-2024 20-Jun-2023
2588 28-May-1977 27-May-1992 27-May-1992 27-May-1992 9-Jun-1999 COMPULSORY 75.0
2589 6-Jun-2002 6-Jun-2017 6-Jun-2017 6-Jun-2017
2590 28-Apr-2018 28-Apr-2033 28-Apr-2033
2591 11-Jun-2011 11-Jun-2026 11-Jun-2026
2592 28-Aug-2009 28-Aug-2024 28-Aug-2024
2593 9-Nov-1959 9-Nov-1974 9-Nov-1974 12-Jun-1971 DEATH (SURVIVORS BENEFITS) 65.4
2594 22-Nov-1963 19-Jun-1974 22-Nov-1973 19-Jun-1974 COMPULSORY 75.0
2595 28-Aug-1976 28-Aug-1991 28-Aug-1991 28-Aug-1991 11-Apr-1998 ELECTIVE 72.5
2596 31-Mar-1979 7-Nov-1994 7-Nov-1994 7-Nov-1994 7-Nov-2004 COMPULSORY 75.0
2597 27-Jul-1984 13-Nov-2009 13-Nov-2009 24-Nov-1994 DISABILITY 50.0
2598 24-Jun-1967 18-Nov-1989 18-Nov-1989 18-Nov-1989 4-Jan-1994 DEATH (SURVIVORS BENEFITS) 69.1
2599 12-Feb-2013 22-Jan-2031 22-Jan-2031
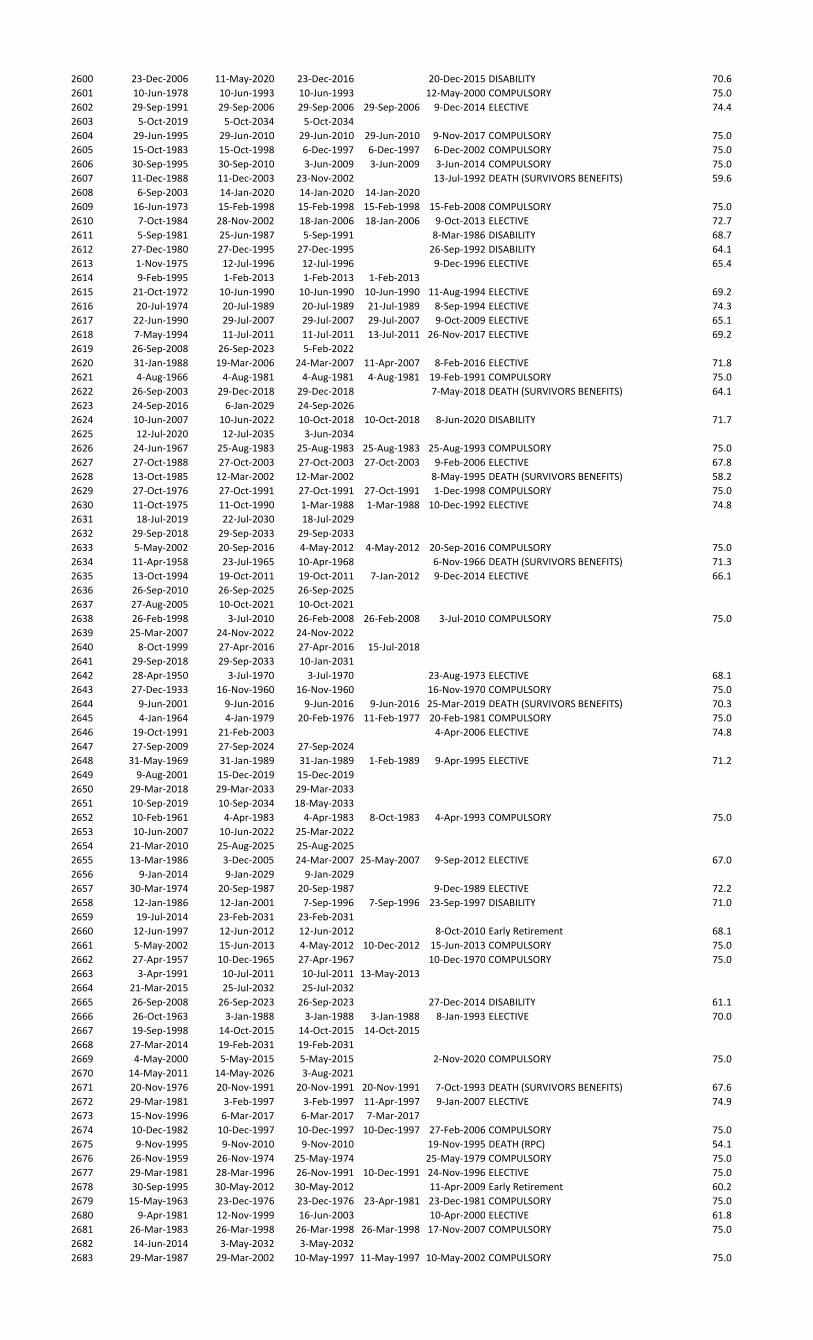
2600 23-Dec-2006 11-May-2020 23-Dec-2016 20-Dec-2015 DISABILITY 70.6
2601 10-Jun-1978 10-Jun-1993 10-Jun-1993 12-May-2000 COMPULSORY 75.0
2602 29-Sep-1991 29-Sep-2006 29-Sep-2006 29-Sep-2006 9-Dec-2014 ELECTIVE 74.4
2603 5-Oct-2019 5-Oct-2034 5-Oct-2034
2604 29-Jun-1995 29-Jun-2010 29-Jun-2010 29-Jun-2010 9-Nov-2017 COMPULSORY 75.0
2605 15-Oct-1983 15-Oct-1998 6-Dec-1997 6-Dec-1997 6-Dec-2002 COMPULSORY 75.0
2606 30-Sep-1995 30-Sep-2010 3-Jun-2009 3-Jun-2009 3-Jun-2014 COMPULSORY 75.0
2607 11-Dec-1988 11-Dec-2003 23-Nov-2002 13-Jul-1992 DEATH (SURVIVORS BENEFITS) 59.6
2608 6-Sep-2003 14-Jan-2020 14-Jan-2020 14-Jan-2020
2609 16-Jun-1973 15-Feb-1998 15-Feb-1998 15-Feb-1998 15-Feb-2008 COMPULSORY 75.0
2610 7-Oct-1984 28-Nov-2002 18-Jan-2006 18-Jan-2006 9-Oct-2013 ELECTIVE 72.7
2611 5-Sep-1981 25-Jun-1987 5-Sep-1991 8-Mar-1986 DISABILITY 68.7
2612 27-Dec-1980 27-Dec-1995 27-Dec-1995 26-Sep-1992 DISABILITY 64.1
2613 1-Nov-1975 12-Jul-1996 12-Jul-1996 9-Dec-1996 ELECTIVE 65.4
2614 9-Feb-1995 1-Feb-2013 1-Feb-2013 1-Feb-2013
2615 21-Oct-1972 10-Jun-1990 10-Jun-1990 10-Jun-1990 11-Aug-1994 ELECTIVE 69.2
2616 20-Jul-1974 20-Jul-1989 20-Jul-1989 21-Jul-1989 8-Sep-1994 ELECTIVE 74.3
2617 22-Jun-1990 29-Jul-2007 29-Jul-2007 29-Jul-2007 9-Oct-2009 ELECTIVE 65.1
2618 7-May-1994 11-Jul-2011 11-Jul-2011 13-Jul-2011 26-Nov-2017 ELECTIVE 69.2
2619 26-Sep-2008 26-Sep-2023 5-Feb-2022
2620 31-Jan-1988 19-Mar-2006 24-Mar-2007 11-Apr-2007 8-Feb-2016 ELECTIVE 71.8
2621 4-Aug-1966 4-Aug-1981 4-Aug-1981 4-Aug-1981 19-Feb-1991 COMPULSORY 75.0
2622 26-Sep-2003 29-Dec-2018 29-Dec-2018 7-May-2018 DEATH (SURVIVORS BENEFITS) 64.1
2623 24-Sep-2016 6-Jan-2029 24-Sep-2026
2624 10-Jun-2007 10-Jun-2022 10-Oct-2018 10-Oct-2018 8-Jun-2020 DISABILITY 71.7
2625 12-Jul-2020 12-Jul-2035 3-Jun-2034
2626 24-Jun-1967 25-Aug-1983 25-Aug-1983 25-Aug-1983 25-Aug-1993 COMPULSORY 75.0
2627 27-Oct-1988 27-Oct-2003 27-Oct-2003 27-Oct-2003 9-Feb-2006 ELECTIVE 67.8
2628 13-Oct-1985 12-Mar-2002 12-Mar-2002 8-May-1995 DEATH (SURVIVORS BENEFITS) 58.2
2629 27-Oct-1976 27-Oct-1991 27-Oct-1991 27-Oct-1991 1-Dec-1998 COMPULSORY 75.0
2630 11-Oct-1975 11-Oct-1990 1-Mar-1988 1-Mar-1988 10-Dec-1992 ELECTIVE 74.8
2631 18-Jul-2019 22-Jul-2030 18-Jul-2029
2632 29-Sep-2018 29-Sep-2033 29-Sep-2033
2633 5-May-2002 20-Sep-2016 4-May-2012 4-May-2012 20-Sep-2016 COMPULSORY 75.0
2634 11-Apr-1958 23-Jul-1965 10-Apr-1968 6-Nov-1966 DEATH (SURVIVORS BENEFITS) 71.3
2635 13-Oct-1994 19-Oct-2011 19-Oct-2011 7-Jan-2012 9-Dec-2014 ELECTIVE 66.1
2636 26-Sep-2010 26-Sep-2025 26-Sep-2025
2637 27-Aug-2005 10-Oct-2021 10-Oct-2021
2638 26-Feb-1998 3-Jul-2010 26-Feb-2008 26-Feb-2008 3-Jul-2010 COMPULSORY 75.0
2639 25-Mar-2007 24-Nov-2022 24-Nov-2022
2640 8-Oct-1999 27-Apr-2016 27-Apr-2016 15-Jul-2018
2641 29-Sep-2018 29-Sep-2033 10-Jan-2031
2642 28-Apr-1950 3-Jul-1970 3-Jul-1970 23-Aug-1973 ELECTIVE 68.1
2643 27-Dec-1933 16-Nov-1960 16-Nov-1960 16-Nov-1970 COMPULSORY 75.0
2644 9-Jun-2001 9-Jun-2016 9-Jun-2016 9-Jun-2016 25-Mar-2019 DEATH (SURVIVORS BENEFITS) 70.3
2645 4-Jan-1964 4-Jan-1979 20-Feb-1976 11-Feb-1977 20-Feb-1981 COMPULSORY 75.0
2646 19-Oct-1991 21-Feb-2003 4-Apr-2006 ELECTIVE 74.8
2647 27-Sep-2009 27-Sep-2024 27-Sep-2024
2648 31-May-1969 31-Jan-1989 31-Jan-1989 1-Feb-1989 9-Apr-1995 ELECTIVE 71.2
2649 9-Aug-2001 15-Dec-2019 15-Dec-2019
2650 29-Mar-2018 29-Mar-2033 29-Mar-2033
2651 10-Sep-2019 10-Sep-2034 18-May-2033
2652 10-Feb-1961 4-Apr-1983 4-Apr-1983 8-Oct-1983 4-Apr-1993 COMPULSORY 75.0
2653 10-Jun-2007 10-Jun-2022 25-Mar-2022
2654 21-Mar-2010 25-Aug-2025 25-Aug-2025
2655 13-Mar-1986 3-Dec-2005 24-Mar-2007 25-May-2007 9-Sep-2012 ELECTIVE 67.0
2656 9-Jan-2014 9-Jan-2029 9-Jan-2029
2657 30-Mar-1974 20-Sep-1987 20-Sep-1987 9-Dec-1989 ELECTIVE 72.2
2658 12-Jan-1986 12-Jan-2001 7-Sep-1996 7-Sep-1996 23-Sep-1997 DISABILITY 71.0
2659 19-Jul-2014 23-Feb-2031 23-Feb-2031
2660 12-Jun-1997 12-Jun-2012 12-Jun-2012 8-Oct-2010 Early Retirement 68.1
2661 5-May-2002 15-Jun-2013 4-May-2012 10-Dec-2012 15-Jun-2013 COMPULSORY 75.0
2662 27-Apr-1957 10-Dec-1965 27-Apr-1967 10-Dec-1970 COMPULSORY 75.0
2663 3-Apr-1991 10-Jul-2011 10-Jul-2011 13-May-2013
2664 21-Mar-2015 25-Jul-2032 25-Jul-2032
2665 26-Sep-2008 26-Sep-2023 26-Sep-2023 27-Dec-2014 DISABILITY 61.1
2666 26-Oct-1963 3-Jan-1988 3-Jan-1988 3-Jan-1988 8-Jan-1993 ELECTIVE 70.0
2667 19-Sep-1998 14-Oct-2015 14-Oct-2015 14-Oct-2015
2668 27-Mar-2014 19-Feb-2031 19-Feb-2031
2669 4-May-2000 5-May-2015 5-May-2015 2-Nov-2020 COMPULSORY 75.0
2670 14-May-2011 14-May-2026 3-Aug-2021
2671 20-Nov-1976 20-Nov-1991 20-Nov-1991 20-Nov-1991 7-Oct-1993 DEATH (SURVIVORS BENEFITS) 67.6
2672 29-Mar-1981 3-Feb-1997 3-Feb-1997 11-Apr-1997 9-Jan-2007 ELECTIVE 74.9
2673 15-Nov-1996 6-Mar-2017 6-Mar-2017 7-Mar-2017
2674 10-Dec-1982 10-Dec-1997 10-Dec-1997 10-Dec-1997 27-Feb-2006 COMPULSORY 75.0
2675 9-Nov-1995 9-Nov-2010 9-Nov-2010 19-Nov-1995 DEATH (RPC) 54.1
2676 26-Nov-1959 26-Nov-1974 25-May-1974 25-May-1979 COMPULSORY 75.0
2677 29-Mar-1981 28-Mar-1996 26-Nov-1991 10-Dec-1991 24-Nov-1996 ELECTIVE 75.0
2678 30-Sep-1995 30-May-2012 30-May-2012 11-Apr-2009 Early Retirement 60.2
2679 15-May-1963 23-Dec-1976 23-Dec-1976 23-Apr-1981 23-Dec-1981 COMPULSORY 75.0
2680 9-Apr-1981 12-Nov-1999 16-Jun-2003 10-Apr-2000 ELECTIVE 61.8
2681 26-Mar-1983 26-Mar-1998 26-Mar-1998 26-Mar-1998 17-Nov-2007 COMPULSORY 75.0
2682 14-Jun-2014 3-May-2032 3-May-2032
2683 29-Mar-1987 29-Mar-2002 10-May-1997 11-May-1997 10-May-2002 COMPULSORY 75.0
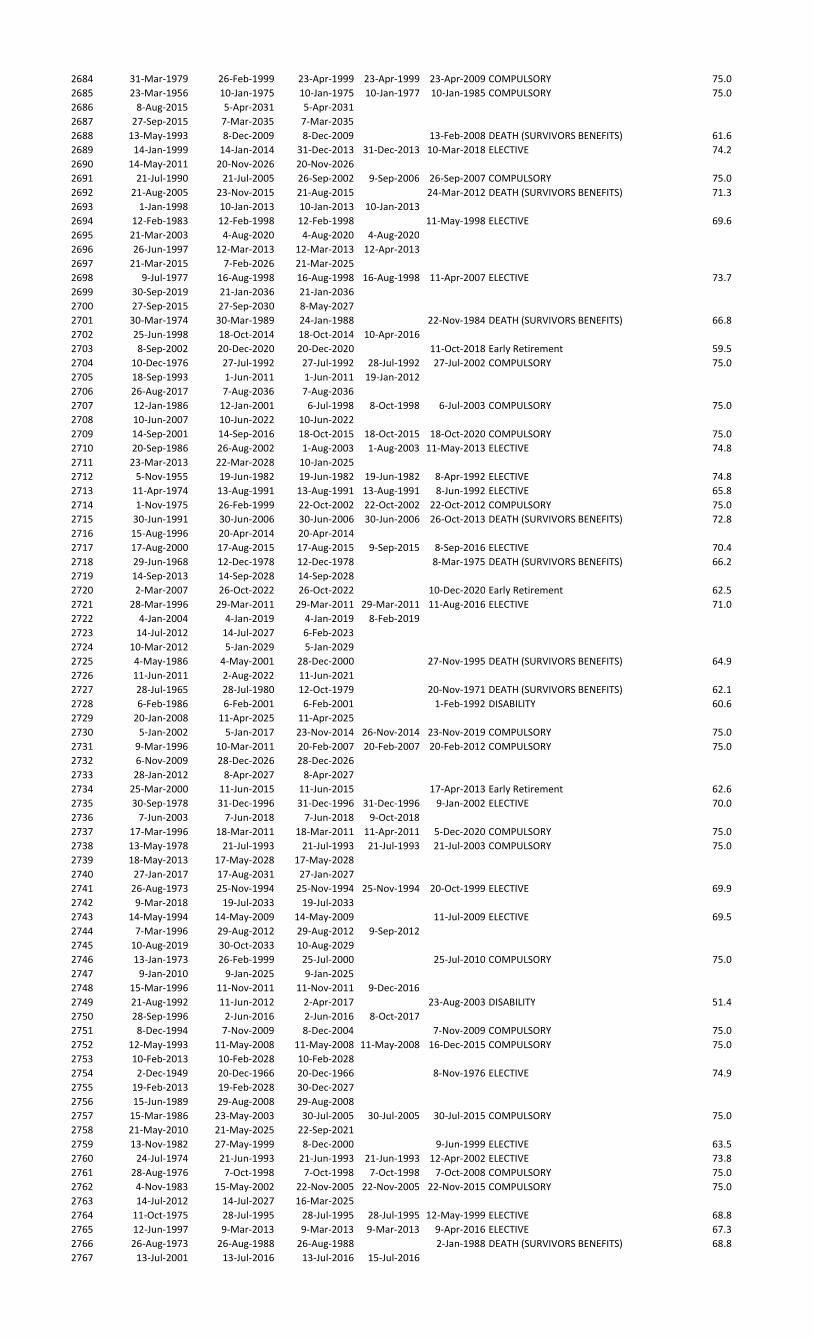
2684 31-Mar-1979 26-Feb-1999 23-Apr-1999 23-Apr-1999 23-Apr-2009 COMPULSORY 75.0
2685 23-Mar-1956 10-Jan-1975 10-Jan-1975 10-Jan-1977 10-Jan-1985 COMPULSORY 75.0
2686 8-Aug-2015 5-Apr-2031 5-Apr-2031
2687 27-Sep-2015 7-Mar-2035 7-Mar-2035
2688 13-May-1993 8-Dec-2009 8-Dec-2009 13-Feb-2008 DEATH (SURVIVORS BENEFITS) 61.6
2689 14-Jan-1999 14-Jan-2014 31-Dec-2013 31-Dec-2013 10-Mar-2018 ELECTIVE 74.2
2690 14-May-2011 20-Nov-2026 20-Nov-2026
2691 21-Jul-1990 21-Jul-2005 26-Sep-2002 9-Sep-2006 26-Sep-2007 COMPULSORY 75.0
2692 21-Aug-2005 23-Nov-2015 21-Aug-2015 24-Mar-2012 DEATH (SURVIVORS BENEFITS) 71.3
2693 1-Jan-1998 10-Jan-2013 10-Jan-2013 10-Jan-2013
2694 12-Feb-1983 12-Feb-1998 12-Feb-1998 11-May-1998 ELECTIVE 69.6
2695 21-Mar-2003 4-Aug-2020 4-Aug-2020 4-Aug-2020
2696 26-Jun-1997 12-Mar-2013 12-Mar-2013 12-Apr-2013
2697 21-Mar-2015 7-Feb-2026 21-Mar-2025
2698 9-Jul-1977 16-Aug-1998 16-Aug-1998 16-Aug-1998 11-Apr-2007 ELECTIVE 73.7
2699 30-Sep-2019 21-Jan-2036 21-Jan-2036
2700 27-Sep-2015 27-Sep-2030 8-May-2027
2701 30-Mar-1974 30-Mar-1989 24-Jan-1988 22-Nov-1984 DEATH (SURVIVORS BENEFITS) 66.8
2702 25-Jun-1998 18-Oct-2014 18-Oct-2014 10-Apr-2016
2703 8-Sep-2002 20-Dec-2020 20-Dec-2020 11-Oct-2018 Early Retirement 59.5
2704 10-Dec-1976 27-Jul-1992 27-Jul-1992 28-Jul-1992 27-Jul-2002 COMPULSORY 75.0
2705 18-Sep-1993 1-Jun-2011 1-Jun-2011 19-Jan-2012
2706 26-Aug-2017 7-Aug-2036 7-Aug-2036
2707 12-Jan-1986 12-Jan-2001 6-Jul-1998 8-Oct-1998 6-Jul-2003 COMPULSORY 75.0
2708 10-Jun-2007 10-Jun-2022 10-Jun-2022
2709 14-Sep-2001 14-Sep-2016 18-Oct-2015 18-Oct-2015 18-Oct-2020 COMPULSORY 75.0
2710 20-Sep-1986 26-Aug-2002 1-Aug-2003 1-Aug-2003 11-May-2013 ELECTIVE 74.8
2711 23-Mar-2013 22-Mar-2028 10-Jan-2025
2712 5-Nov-1955 19-Jun-1982 19-Jun-1982 19-Jun-1982 8-Apr-1992 ELECTIVE 74.8
2713 11-Apr-1974 13-Aug-1991 13-Aug-1991 13-Aug-1991 8-Jun-1992 ELECTIVE 65.8
2714 1-Nov-1975 26-Feb-1999 22-Oct-2002 22-Oct-2002 22-Oct-2012 COMPULSORY 75.0
2715 30-Jun-1991 30-Jun-2006 30-Jun-2006 30-Jun-2006 26-Oct-2013 DEATH (SURVIVORS BENEFITS) 72.8
2716 15-Aug-1996 20-Apr-2014 20-Apr-2014
2717 17-Aug-2000 17-Aug-2015 17-Aug-2015 9-Sep-2015 8-Sep-2016 ELECTIVE 70.4
2718 29-Jun-1968 12-Dec-1978 12-Dec-1978 8-Mar-1975 DEATH (SURVIVORS BENEFITS) 66.2
2719 14-Sep-2013 14-Sep-2028 14-Sep-2028
2720 2-Mar-2007 26-Oct-2022 26-Oct-2022 10-Dec-2020 Early Retirement 62.5
2721 28-Mar-1996 29-Mar-2011 29-Mar-2011 29-Mar-2011 11-Aug-2016 ELECTIVE 71.0
2722 4-Jan-2004 4-Jan-2019 4-Jan-2019 8-Feb-2019
2723 14-Jul-2012 14-Jul-2027 6-Feb-2023
2724 10-Mar-2012 5-Jan-2029 5-Jan-2029
2725 4-May-1986 4-May-2001 28-Dec-2000 27-Nov-1995 DEATH (SURVIVORS BENEFITS) 64.9
2726 11-Jun-2011 2-Aug-2022 11-Jun-2021
2727 28-Jul-1965 28-Jul-1980 12-Oct-1979 20-Nov-1971 DEATH (SURVIVORS BENEFITS) 62.1
2728 6-Feb-1986 6-Feb-2001 6-Feb-2001 1-Feb-1992 DISABILITY 60.6
2729 20-Jan-2008 11-Apr-2025 11-Apr-2025
2730 5-Jan-2002 5-Jan-2017 23-Nov-2014 26-Nov-2014 23-Nov-2019 COMPULSORY 75.0
2731 9-Mar-1996 10-Mar-2011 20-Feb-2007 20-Feb-2007 20-Feb-2012 COMPULSORY 75.0
2732 6-Nov-2009 28-Dec-2026 28-Dec-2026
2733 28-Jan-2012 8-Apr-2027 8-Apr-2027
2734 25-Mar-2000 11-Jun-2015 11-Jun-2015 17-Apr-2013 Early Retirement 62.6
2735 30-Sep-1978 31-Dec-1996 31-Dec-1996 31-Dec-1996 9-Jan-2002 ELECTIVE 70.0
2736 7-Jun-2003 7-Jun-2018 7-Jun-2018 9-Oct-2018
2737 17-Mar-1996 18-Mar-2011 18-Mar-2011 11-Apr-2011 5-Dec-2020 COMPULSORY 75.0
2738 13-May-1978 21-Jul-1993 21-Jul-1993 21-Jul-1993 21-Jul-2003 COMPULSORY 75.0
2739 18-May-2013 17-May-2028 17-May-2028
2740 27-Jan-2017 17-Aug-2031 27-Jan-2027
2741 26-Aug-1973 25-Nov-1994 25-Nov-1994 25-Nov-1994 20-Oct-1999 ELECTIVE 69.9
2742 9-Mar-2018 19-Jul-2033 19-Jul-2033
2743 14-May-1994 14-May-2009 14-May-2009 11-Jul-2009 ELECTIVE 69.5
2744 7-Mar-1996 29-Aug-2012 29-Aug-2012 9-Sep-2012
2745 10-Aug-2019 30-Oct-2033 10-Aug-2029
2746 13-Jan-1973 26-Feb-1999 25-Jul-2000 25-Jul-2010 COMPULSORY 75.0
2747 9-Jan-2010 9-Jan-2025 9-Jan-2025
2748 15-Mar-1996 11-Nov-2011 11-Nov-2011 9-Dec-2016
2749 21-Aug-1992 11-Jun-2012 2-Apr-2017 23-Aug-2003 DISABILITY 51.4
2750 28-Sep-1996 2-Jun-2016 2-Jun-2016 8-Oct-2017
2751 8-Dec-1994 7-Nov-2009 8-Dec-2004 7-Nov-2009 COMPULSORY 75.0
2752 12-May-1993 11-May-2008 11-May-2008 11-May-2008 16-Dec-2015 COMPULSORY 75.0
2753 10-Feb-2013 10-Feb-2028 10-Feb-2028
2754 2-Dec-1949 20-Dec-1966 20-Dec-1966 8-Nov-1976 ELECTIVE 74.9
2755 19-Feb-2013 19-Feb-2028 30-Dec-2027
2756 15-Jun-1989 29-Aug-2008 29-Aug-2008
2757 15-Mar-1986 23-May-2003 30-Jul-2005 30-Jul-2005 30-Jul-2015 COMPULSORY 75.0
2758 21-May-2010 21-May-2025 22-Sep-2021
2759 13-Nov-1982 27-May-1999 8-Dec-2000 9-Jun-1999 ELECTIVE 63.5
2760 24-Jul-1974 21-Jun-1993 21-Jun-1993 21-Jun-1993 12-Apr-2002 ELECTIVE 73.8
2761 28-Aug-1976 7-Oct-1998 7-Oct-1998 7-Oct-1998 7-Oct-2008 COMPULSORY 75.0
2762 4-Nov-1983 15-May-2002 22-Nov-2005 22-Nov-2005 22-Nov-2015 COMPULSORY 75.0
2763 14-Jul-2012 14-Jul-2027 16-Mar-2025
2764 11-Oct-1975 28-Jul-1995 28-Jul-1995 28-Jul-1995 12-May-1999 ELECTIVE 68.8
2765 12-Jun-1997 9-Mar-2013 9-Mar-2013 9-Mar-2013 9-Apr-2016 ELECTIVE 67.3
2766 26-Aug-1973 26-Aug-1988 26-Aug-1988 2-Jan-1988 DEATH (SURVIVORS BENEFITS) 68.8
2767 13-Jul-2001 13-Jul-2016 13-Jul-2016 15-Jul-2016
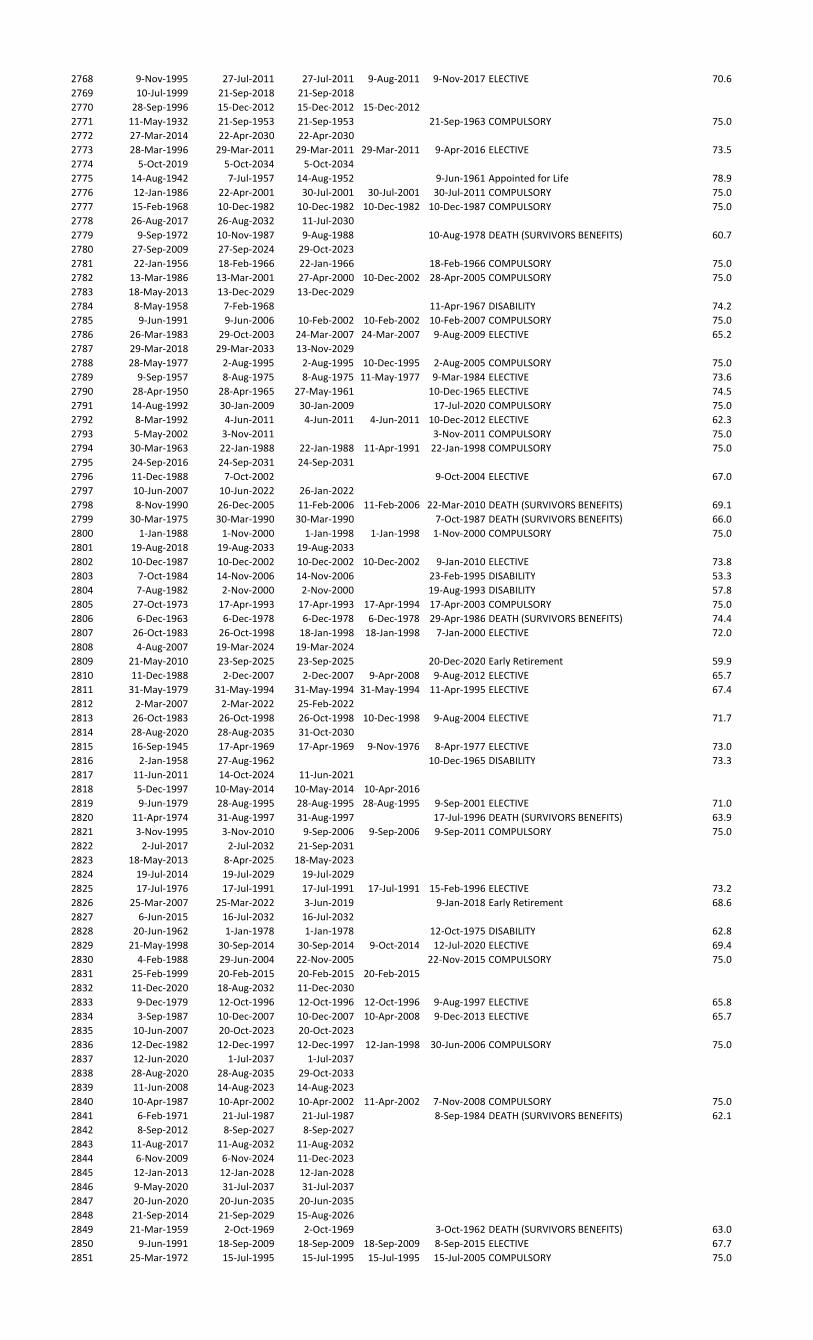
2768 9-Nov-1995 27-Jul-2011 27-Jul-2011 9-Aug-2011 9-Nov-2017 ELECTIVE 70.6
2769 10-Jul-1999 21-Sep-2018 21-Sep-2018
2770 28-Sep-1996 15-Dec-2012 15-Dec-2012 15-Dec-2012
2771 11-May-1932 21-Sep-1953 21-Sep-1953 21-Sep-1963 COMPULSORY 75.0
2772 27-Mar-2014 22-Apr-2030 22-Apr-2030
2773 28-Mar-1996 29-Mar-2011 29-Mar-2011 29-Mar-2011 9-Apr-2016 ELECTIVE 73.5
2774 5-Oct-2019 5-Oct-2034 5-Oct-2034
2775 14-Aug-1942 7-Jul-1957 14-Aug-1952 9-Jun-1961 Appointed for Life 78.9
2776 12-Jan-1986 22-Apr-2001 30-Jul-2001 30-Jul-2001 30-Jul-2011 COMPULSORY 75.0
2777 15-Feb-1968 10-Dec-1982 10-Dec-1982 10-Dec-1982 10-Dec-1987 COMPULSORY 75.0
2778 26-Aug-2017 26-Aug-2032 11-Jul-2030
2779 9-Sep-1972 10-Nov-1987 9-Aug-1988 10-Aug-1978 DEATH (SURVIVORS BENEFITS) 60.7
2780 27-Sep-2009 27-Sep-2024 29-Oct-2023
2781 22-Jan-1956 18-Feb-1966 22-Jan-1966 18-Feb-1966 COMPULSORY 75.0
2782 13-Mar-1986 13-Mar-2001 27-Apr-2000 10-Dec-2002 28-Apr-2005 COMPULSORY 75.0
2783 18-May-2013 13-Dec-2029 13-Dec-2029
2784 8-May-1958 7-Feb-1968 11-Apr-1967 DISABILITY 74.2
2785 9-Jun-1991 9-Jun-2006 10-Feb-2002 10-Feb-2002 10-Feb-2007 COMPULSORY 75.0
2786 26-Mar-1983 29-Oct-2003 24-Mar-2007 24-Mar-2007 9-Aug-2009 ELECTIVE 65.2
2787 29-Mar-2018 29-Mar-2033 13-Nov-2029
2788 28-May-1977 2-Aug-1995 2-Aug-1995 10-Dec-1995 2-Aug-2005 COMPULSORY 75.0
2789 9-Sep-1957 8-Aug-1975 8-Aug-1975 11-May-1977 9-Mar-1984 ELECTIVE 73.6
2790 28-Apr-1950 28-Apr-1965 27-May-1961 10-Dec-1965 ELECTIVE 74.5
2791 14-Aug-1992 30-Jan-2009 30-Jan-2009 17-Jul-2020 COMPULSORY 75.0
2792 8-Mar-1992 4-Jun-2011 4-Jun-2011 4-Jun-2011 10-Dec-2012 ELECTIVE 62.3
2793 5-May-2002 3-Nov-2011 3-Nov-2011 COMPULSORY 75.0
2794 30-Mar-1963 22-Jan-1988 22-Jan-1988 11-Apr-1991 22-Jan-1998 COMPULSORY 75.0
2795 24-Sep-2016 24-Sep-2031 24-Sep-2031
2796 11-Dec-1988 7-Oct-2002 9-Oct-2004 ELECTIVE 67.0
2797 10-Jun-2007 10-Jun-2022 26-Jan-2022
2798 8-Nov-1990 26-Dec-2005 11-Feb-2006 11-Feb-2006 22-Mar-2010 DEATH (SURVIVORS BENEFITS) 69.1
2799 30-Mar-1975 30-Mar-1990 30-Mar-1990 7-Oct-1987 DEATH (SURVIVORS BENEFITS) 66.0
2800 1-Jan-1988 1-Nov-2000 1-Jan-1998 1-Jan-1998 1-Nov-2000 COMPULSORY 75.0
2801 19-Aug-2018 19-Aug-2033 19-Aug-2033
2802 10-Dec-1987 10-Dec-2002 10-Dec-2002 10-Dec-2002 9-Jan-2010 ELECTIVE 73.8
2803 7-Oct-1984 14-Nov-2006 14-Nov-2006 23-Feb-1995 DISABILITY 53.3
2804 7-Aug-1982 2-Nov-2000 2-Nov-2000 19-Aug-1993 DISABILITY 57.8
2805 27-Oct-1973 17-Apr-1993 17-Apr-1993 17-Apr-1994 17-Apr-2003 COMPULSORY 75.0
2806 6-Dec-1963 6-Dec-1978 6-Dec-1978 6-Dec-1978 29-Apr-1986 DEATH (SURVIVORS BENEFITS) 74.4
2807 26-Oct-1983 26-Oct-1998 18-Jan-1998 18-Jan-1998 7-Jan-2000 ELECTIVE 72.0
2808 4-Aug-2007 19-Mar-2024 19-Mar-2024
2809 21-May-2010 23-Sep-2025 23-Sep-2025 20-Dec-2020 Early Retirement 59.9
2810 11-Dec-1988 2-Dec-2007 2-Dec-2007 9-Apr-2008 9-Aug-2012 ELECTIVE 65.7
2811 31-May-1979 31-May-1994 31-May-1994 31-May-1994 11-Apr-1995 ELECTIVE 67.4
2812 2-Mar-2007 2-Mar-2022 25-Feb-2022
2813 26-Oct-1983 26-Oct-1998 26-Oct-1998 10-Dec-1998 9-Aug-2004 ELECTIVE 71.7
2814 28-Aug-2020 28-Aug-2035 31-Oct-2030
2815 16-Sep-1945 17-Apr-1969 17-Apr-1969 9-Nov-1976 8-Apr-1977 ELECTIVE 73.0
2816 2-Jan-1958 27-Aug-1962 10-Dec-1965 DISABILITY 73.3
2817 11-Jun-2011 14-Oct-2024 11-Jun-2021
2818 5-Dec-1997 10-May-2014 10-May-2014 10-Apr-2016
2819 9-Jun-1979 28-Aug-1995 28-Aug-1995 28-Aug-1995 9-Sep-2001 ELECTIVE 71.0
2820 11-Apr-1974 31-Aug-1997 31-Aug-1997 17-Jul-1996 DEATH (SURVIVORS BENEFITS) 63.9
2821 3-Nov-1995 3-Nov-2010 9-Sep-2006 9-Sep-2006 9-Sep-2011 COMPULSORY 75.0
2822 2-Jul-2017 2-Jul-2032 21-Sep-2031
2823 18-May-2013 8-Apr-2025 18-May-2023
2824 19-Jul-2014 19-Jul-2029 19-Jul-2029
2825 17-Jul-1976 17-Jul-1991 17-Jul-1991 17-Jul-1991 15-Feb-1996 ELECTIVE 73.2
2826 25-Mar-2007 25-Mar-2022 3-Jun-2019 9-Jan-2018 Early Retirement 68.6
2827 6-Jun-2015 16-Jul-2032 16-Jul-2032
2828 20-Jun-1962 1-Jan-1978 1-Jan-1978 12-Oct-1975 DISABILITY 62.8
2829 21-May-1998 30-Sep-2014 30-Sep-2014 9-Oct-2014 12-Jul-2020 ELECTIVE 69.4
2830 4-Feb-1988 29-Jun-2004 22-Nov-2005 22-Nov-2015 COMPULSORY 75.0
2831 25-Feb-1999 20-Feb-2015 20-Feb-2015 20-Feb-2015
2832 11-Dec-2020 18-Aug-2032 11-Dec-2030
2833 9-Dec-1979 12-Oct-1996 12-Oct-1996 12-Oct-1996 9-Aug-1997 ELECTIVE 65.8
2834 3-Sep-1987 10-Dec-2007 10-Dec-2007 10-Apr-2008 9-Dec-2013 ELECTIVE 65.7
2835 10-Jun-2007 20-Oct-2023 20-Oct-2023
2836 12-Dec-1982 12-Dec-1997 12-Dec-1997 12-Jan-1998 30-Jun-2006 COMPULSORY 75.0
2837 12-Jun-2020 1-Jul-2037 1-Jul-2037
2838 28-Aug-2020 28-Aug-2035 29-Oct-2033
2839 11-Jun-2008 14-Aug-2023 14-Aug-2023
2840 10-Apr-1987 10-Apr-2002 10-Apr-2002 11-Apr-2002 7-Nov-2008 COMPULSORY 75.0
2841 6-Feb-1971 21-Jul-1987 21-Jul-1987 8-Sep-1984 DEATH (SURVIVORS BENEFITS) 62.1
2842 8-Sep-2012 8-Sep-2027 8-Sep-2027
2843 11-Aug-2017 11-Aug-2032 11-Aug-2032
2844 6-Nov-2009 6-Nov-2024 11-Dec-2023
2845 12-Jan-2013 12-Jan-2028 12-Jan-2028
2846 9-May-2020 31-Jul-2037 31-Jul-2037
2847 20-Jun-2020 20-Jun-2035 20-Jun-2035
2848 21-Sep-2014 21-Sep-2029 15-Aug-2026
2849 21-Mar-1959 2-Oct-1969 2-Oct-1969 3-Oct-1962 DEATH (SURVIVORS BENEFITS) 63.0
2850 9-Jun-1991 18-Sep-2009 18-Sep-2009 18-Sep-2009 8-Sep-2015 ELECTIVE 67.7
2851 25-Mar-1972 15-Jul-1995 15-Jul-1995 15-Jul-1995 15-Jul-2005 COMPULSORY 75.0
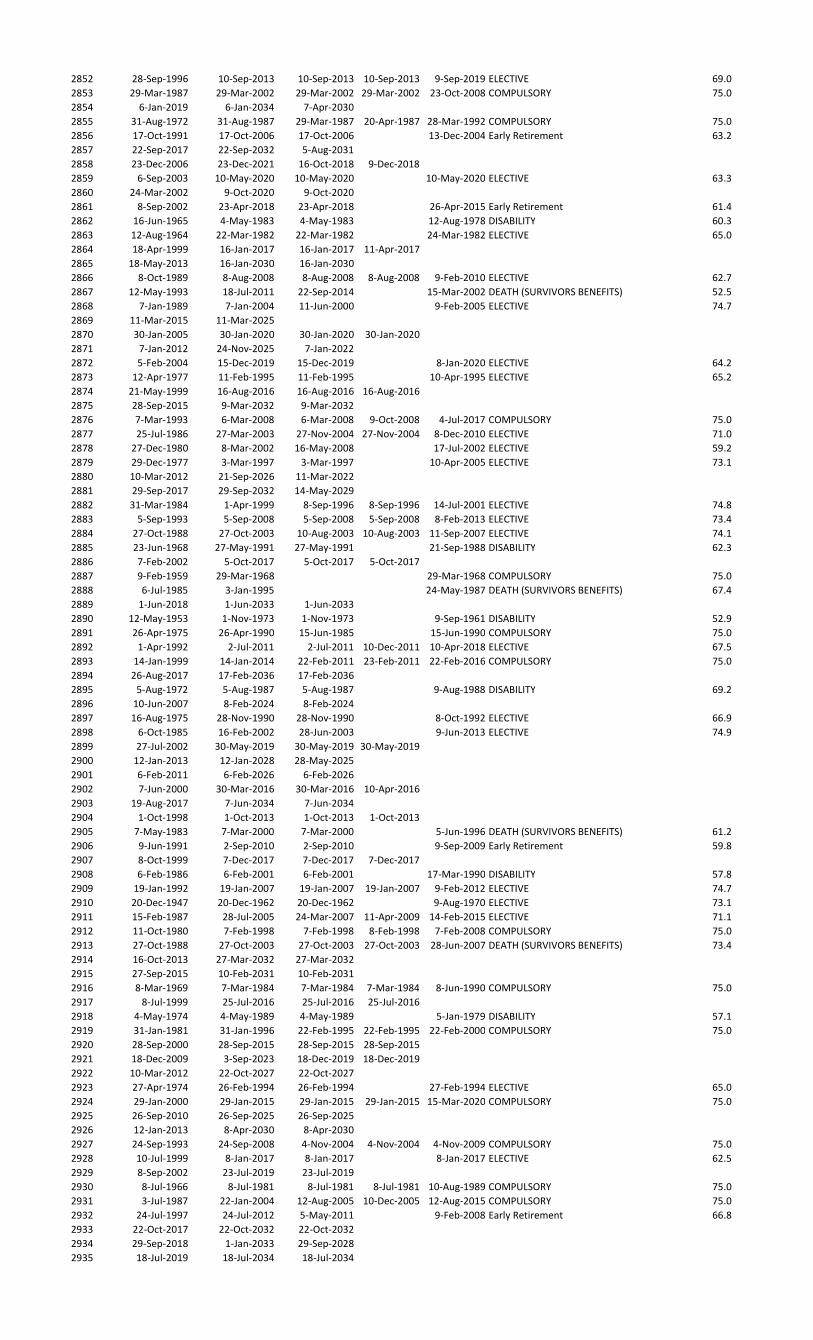
2852 28-Sep-1996 10-Sep-2013 10-Sep-2013 10-Sep-2013 9-Sep-2019 ELECTIVE 69.0
2853 29-Mar-1987 29-Mar-2002 29-Mar-2002 29-Mar-2002 23-Oct-2008 COMPULSORY 75.0
2854 6-Jan-2019 6-Jan-2034 7-Apr-2030
2855 31-Aug-1972 31-Aug-1987 29-Mar-1987 20-Apr-1987 28-Mar-1992 COMPULSORY 75.0
2856 17-Oct-1991 17-Oct-2006 17-Oct-2006 13-Dec-2004 Early Retirement 63.2
2857 22-Sep-2017 22-Sep-2032 5-Aug-2031
2858 23-Dec-2006 23-Dec-2021 16-Oct-2018 9-Dec-2018
2859 6-Sep-2003 10-May-2020 10-May-2020 10-May-2020 ELECTIVE 63.3
2860 24-Mar-2002 9-Oct-2020 9-Oct-2020
2861 8-Sep-2002 23-Apr-2018 23-Apr-2018 26-Apr-2015 Early Retirement 61.4
2862 16-Jun-1965 4-May-1983 4-May-1983 12-Aug-1978 DISABILITY 60.3
2863 12-Aug-1964 22-Mar-1982 22-Mar-1982 24-Mar-1982 ELECTIVE 65.0
2864 18-Apr-1999 16-Jan-2017 16-Jan-2017 11-Apr-2017
2865 18-May-2013 16-Jan-2030 16-Jan-2030
2866 8-Oct-1989 8-Aug-2008 8-Aug-2008 8-Aug-2008 9-Feb-2010 ELECTIVE 62.7
2867 12-May-1993 18-Jul-2011 22-Sep-2014 15-Mar-2002 DEATH (SURVIVORS BENEFITS) 52.5
2868 7-Jan-1989 7-Jan-2004 11-Jun-2000 9-Feb-2005 ELECTIVE 74.7
2869 11-Mar-2015 11-Mar-2025
2870 30-Jan-2005 30-Jan-2020 30-Jan-2020 30-Jan-2020
2871 7-Jan-2012 24-Nov-2025 7-Jan-2022
2872 5-Feb-2004 15-Dec-2019 15-Dec-2019 8-Jan-2020 ELECTIVE 64.2
2873 12-Apr-1977 11-Feb-1995 11-Feb-1995 10-Apr-1995 ELECTIVE 65.2
2874 21-May-1999 16-Aug-2016 16-Aug-2016 16-Aug-2016
2875 28-Sep-2015 9-Mar-2032 9-Mar-2032
2876 7-Mar-1993 6-Mar-2008 6-Mar-2008 9-Oct-2008 4-Jul-2017 COMPULSORY 75.0
2877 25-Jul-1986 27-Mar-2003 27-Nov-2004 27-Nov-2004 8-Dec-2010 ELECTIVE 71.0
2878 27-Dec-1980 8-Mar-2002 16-May-2008 17-Jul-2002 ELECTIVE 59.2
2879 29-Dec-1977 3-Mar-1997 3-Mar-1997 10-Apr-2005 ELECTIVE 73.1
2880 10-Mar-2012 21-Sep-2026 11-Mar-2022
2881 29-Sep-2017 29-Sep-2032 14-May-2029
2882 31-Mar-1984 1-Apr-1999 8-Sep-1996 8-Sep-1996 14-Jul-2001 ELECTIVE 74.8
2883 5-Sep-1993 5-Sep-2008 5-Sep-2008 5-Sep-2008 8-Feb-2013 ELECTIVE 73.4
2884 27-Oct-1988 27-Oct-2003 10-Aug-2003 10-Aug-2003 11-Sep-2007 ELECTIVE 74.1
2885 23-Jun-1968 27-May-1991 27-May-1991 21-Sep-1988 DISABILITY 62.3
2886 7-Feb-2002 5-Oct-2017 5-Oct-2017 5-Oct-2017
2887 9-Feb-1959 29-Mar-1968 29-Mar-1968 COMPULSORY 75.0
2888 6-Jul-1985 3-Jan-1995 24-May-1987 DEATH (SURVIVORS BENEFITS) 67.4
2889 1-Jun-2018 1-Jun-2033 1-Jun-2033
2890 12-May-1953 1-Nov-1973 1-Nov-1973 9-Sep-1961 DISABILITY 52.9
2891 26-Apr-1975 26-Apr-1990 15-Jun-1985 15-Jun-1990 COMPULSORY 75.0
2892 1-Apr-1992 2-Jul-2011 2-Jul-2011 10-Dec-2011 10-Apr-2018 ELECTIVE 67.5
2893 14-Jan-1999 14-Jan-2014 22-Feb-2011 23-Feb-2011 22-Feb-2016 COMPULSORY 75.0
2894 26-Aug-2017 17-Feb-2036 17-Feb-2036
2895 5-Aug-1972 5-Aug-1987 5-Aug-1987 9-Aug-1988 DISABILITY 69.2
2896 10-Jun-2007 8-Feb-2024 8-Feb-2024
2897 16-Aug-1975 28-Nov-1990 28-Nov-1990 8-Oct-1992 ELECTIVE 66.9
2898 6-Oct-1985 16-Feb-2002 28-Jun-2003 9-Jun-2013 ELECTIVE 74.9
2899 27-Jul-2002 30-May-2019 30-May-2019 30-May-2019
2900 12-Jan-2013 12-Jan-2028 28-May-2025
2901 6-Feb-2011 6-Feb-2026 6-Feb-2026
2902 7-Jun-2000 30-Mar-2016 30-Mar-2016 10-Apr-2016
2903 19-Aug-2017 7-Jun-2034 7-Jun-2034
2904 1-Oct-1998 1-Oct-2013 1-Oct-2013 1-Oct-2013
2905 7-May-1983 7-Mar-2000 7-Mar-2000 5-Jun-1996 DEATH (SURVIVORS BENEFITS) 61.2
2906 9-Jun-1991 2-Sep-2010 2-Sep-2010 9-Sep-2009 Early Retirement 59.8
2907 8-Oct-1999 7-Dec-2017 7-Dec-2017 7-Dec-2017
2908 6-Feb-1986 6-Feb-2001 6-Feb-2001 17-Mar-1990 DISABILITY 57.8
2909 19-Jan-1992 19-Jan-2007 19-Jan-2007 19-Jan-2007 9-Feb-2012 ELECTIVE 74.7
2910 20-Dec-1947 20-Dec-1962 20-Dec-1962 9-Aug-1970 ELECTIVE 73.1
2911 15-Feb-1987 28-Jul-2005 24-Mar-2007 11-Apr-2009 14-Feb-2015 ELECTIVE 71.1
2912 11-Oct-1980 7-Feb-1998 7-Feb-1998 8-Feb-1998 7-Feb-2008 COMPULSORY 75.0
2913 27-Oct-1988 27-Oct-2003 27-Oct-2003 27-Oct-2003 28-Jun-2007 DEATH (SURVIVORS BENEFITS) 73.4
2914 16-Oct-2013 27-Mar-2032 27-Mar-2032
2915 27-Sep-2015 10-Feb-2031 10-Feb-2031
2916 8-Mar-1969 7-Mar-1984 7-Mar-1984 7-Mar-1984 8-Jun-1990 COMPULSORY 75.0
2917 8-Jul-1999 25-Jul-2016 25-Jul-2016 25-Jul-2016
2918 4-May-1974 4-May-1989 4-May-1989 5-Jan-1979 DISABILITY 57.1
2919 31-Jan-1981 31-Jan-1996 22-Feb-1995 22-Feb-1995 22-Feb-2000 COMPULSORY 75.0
2920 28-Sep-2000 28-Sep-2015 28-Sep-2015 28-Sep-2015
2921 18-Dec-2009 3-Sep-2023 18-Dec-2019 18-Dec-2019
2922 10-Mar-2012 22-Oct-2027 22-Oct-2027
2923 27-Apr-1974 26-Feb-1994 26-Feb-1994 27-Feb-1994 ELECTIVE 65.0
2924 29-Jan-2000 29-Jan-2015 29-Jan-2015 29-Jan-2015 15-Mar-2020 COMPULSORY 75.0
2925 26-Sep-2010 26-Sep-2025 26-Sep-2025
2926 12-Jan-2013 8-Apr-2030 8-Apr-2030
2927 24-Sep-1993 24-Sep-2008 4-Nov-2004 4-Nov-2004 4-Nov-2009 COMPULSORY 75.0
2928 10-Jul-1999 8-Jan-2017 8-Jan-2017 8-Jan-2017 ELECTIVE 62.5
2929 8-Sep-2002 23-Jul-2019 23-Jul-2019
2930 8-Jul-1966 8-Jul-1981 8-Jul-1981 8-Jul-1981 10-Aug-1989 COMPULSORY 75.0
2931 3-Jul-1987 22-Jan-2004 12-Aug-2005 10-Dec-2005 12-Aug-2015 COMPULSORY 75.0
2932 24-Jul-1997 24-Jul-2012 5-May-2011 9-Feb-2008 Early Retirement 66.8
2933 22-Oct-2017 22-Oct-2032 22-Oct-2032
2934 29-Sep-2018 1-Jan-2033 29-Sep-2028
2935 18-Jul-2019 18-Jul-2034 18-Jul-2034
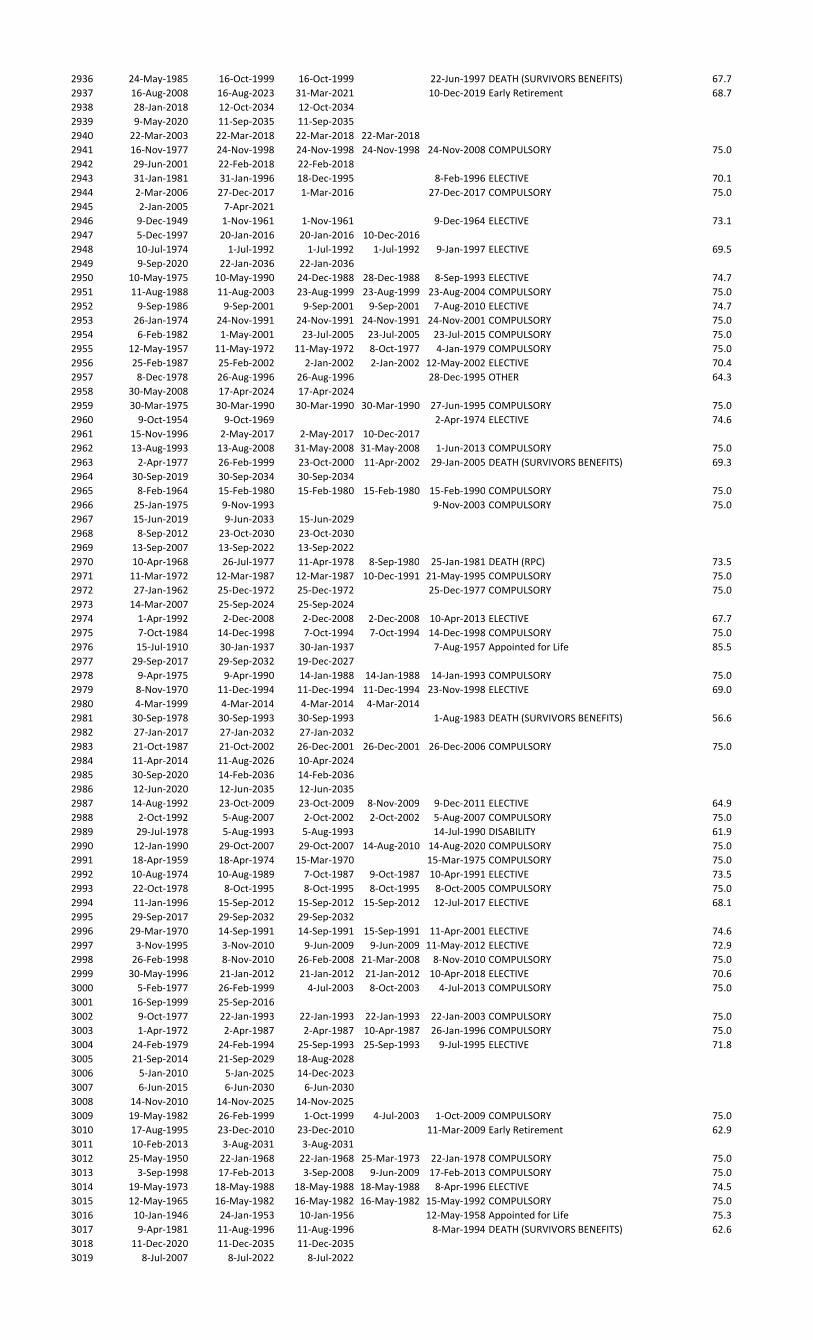
2936 24-May-1985 16-Oct-1999 16-Oct-1999 22-Jun-1997 DEATH (SURVIVORS BENEFITS) 67.7
2937 16-Aug-2008 16-Aug-2023 31-Mar-2021 10-Dec-2019 Early Retirement 68.7
2938 28-Jan-2018 12-Oct-2034 12-Oct-2034
2939 9-May-2020 11-Sep-2035 11-Sep-2035
2940 22-Mar-2003 22-Mar-2018 22-Mar-2018 22-Mar-2018
2941 16-Nov-1977 24-Nov-1998 24-Nov-1998 24-Nov-1998 24-Nov-2008 COMPULSORY 75.0
2942 29-Jun-2001 22-Feb-2018 22-Feb-2018
2943 31-Jan-1981 31-Jan-1996 18-Dec-1995 8-Feb-1996 ELECTIVE 70.1
2944 2-Mar-2006 27-Dec-2017 1-Mar-2016 27-Dec-2017 COMPULSORY 75.0
2945 2-Jan-2005 7-Apr-2021
2946 9-Dec-1949 1-Nov-1961 1-Nov-1961 9-Dec-1964 ELECTIVE 73.1
2947 5-Dec-1997 20-Jan-2016 20-Jan-2016 10-Dec-2016
2948 10-Jul-1974 1-Jul-1992 1-Jul-1992 1-Jul-1992 9-Jan-1997 ELECTIVE 69.5
2949 9-Sep-2020 22-Jan-2036 22-Jan-2036
2950 10-May-1975 10-May-1990 24-Dec-1988 28-Dec-1988 8-Sep-1993 ELECTIVE 74.7
2951 11-Aug-1988 11-Aug-2003 23-Aug-1999 23-Aug-1999 23-Aug-2004 COMPULSORY 75.0
2952 9-Sep-1986 9-Sep-2001 9-Sep-2001 9-Sep-2001 7-Aug-2010 ELECTIVE 74.7
2953 26-Jan-1974 24-Nov-1991 24-Nov-1991 24-Nov-1991 24-Nov-2001 COMPULSORY 75.0
2954 6-Feb-1982 1-May-2001 23-Jul-2005 23-Jul-2005 23-Jul-2015 COMPULSORY 75.0
2955 12-May-1957 11-May-1972 11-May-1972 8-Oct-1977 4-Jan-1979 COMPULSORY 75.0
2956 25-Feb-1987 25-Feb-2002 2-Jan-2002 2-Jan-2002 12-May-2002 ELECTIVE 70.4
2957 8-Dec-1978 26-Aug-1996 26-Aug-1996 28-Dec-1995 OTHER 64.3
2958 30-May-2008 17-Apr-2024 17-Apr-2024
2959 30-Mar-1975 30-Mar-1990 30-Mar-1990 30-Mar-1990 27-Jun-1995 COMPULSORY 75.0
2960 9-Oct-1954 9-Oct-1969 2-Apr-1974 ELECTIVE 74.6
2961 15-Nov-1996 2-May-2017 2-May-2017 10-Dec-2017
2962 13-Aug-1993 13-Aug-2008 31-May-2008 31-May-2008 1-Jun-2013 COMPULSORY 75.0
2963 2-Apr-1977 26-Feb-1999 23-Oct-2000 11-Apr-2002 29-Jan-2005 DEATH (SURVIVORS BENEFITS) 69.3
2964 30-Sep-2019 30-Sep-2034 30-Sep-2034
2965 8-Feb-1964 15-Feb-1980 15-Feb-1980 15-Feb-1980 15-Feb-1990 COMPULSORY 75.0
2966 25-Jan-1975 9-Nov-1993 9-Nov-2003 COMPULSORY 75.0
2967 15-Jun-2019 9-Jun-2033 15-Jun-2029
2968 8-Sep-2012 23-Oct-2030 23-Oct-2030
2969 13-Sep-2007 13-Sep-2022 13-Sep-2022
2970 10-Apr-1968 26-Jul-1977 11-Apr-1978 8-Sep-1980 25-Jan-1981 DEATH (RPC) 73.5
2971 11-Mar-1972 12-Mar-1987 12-Mar-1987 10-Dec-1991 21-May-1995 COMPULSORY 75.0
2972 27-Jan-1962 25-Dec-1972 25-Dec-1972 25-Dec-1977 COMPULSORY 75.0
2973 14-Mar-2007 25-Sep-2024 25-Sep-2024
2974 1-Apr-1992 2-Dec-2008 2-Dec-2008 2-Dec-2008 10-Apr-2013 ELECTIVE 67.7
2975 7-Oct-1984 14-Dec-1998 7-Oct-1994 7-Oct-1994 14-Dec-1998 COMPULSORY 75.0
2976 15-Jul-1910 30-Jan-1937 30-Jan-1937 7-Aug-1957 Appointed for Life 85.5
2977 29-Sep-2017 29-Sep-2032 19-Dec-2027
2978 9-Apr-1975 9-Apr-1990 14-Jan-1988 14-Jan-1988 14-Jan-1993 COMPULSORY 75.0
2979 8-Nov-1970 11-Dec-1994 11-Dec-1994 11-Dec-1994 23-Nov-1998 ELECTIVE 69.0
2980 4-Mar-1999 4-Mar-2014 4-Mar-2014 4-Mar-2014
2981 30-Sep-1978 30-Sep-1993 30-Sep-1993 1-Aug-1983 DEATH (SURVIVORS BENEFITS) 56.6
2982 27-Jan-2017 27-Jan-2032 27-Jan-2032
2983 21-Oct-1987 21-Oct-2002 26-Dec-2001 26-Dec-2001 26-Dec-2006 COMPULSORY 75.0
2984 11-Apr-2014 11-Aug-2026 10-Apr-2024
2985 30-Sep-2020 14-Feb-2036 14-Feb-2036
2986 12-Jun-2020 12-Jun-2035 12-Jun-2035
2987 14-Aug-1992 23-Oct-2009 23-Oct-2009 8-Nov-2009 9-Dec-2011 ELECTIVE 64.9
2988 2-Oct-1992 5-Aug-2007 2-Oct-2002 2-Oct-2002 5-Aug-2007 COMPULSORY 75.0
2989 29-Jul-1978 5-Aug-1993 5-Aug-1993 14-Jul-1990 DISABILITY 61.9
2990 12-Jan-1990 29-Oct-2007 29-Oct-2007 14-Aug-2010 14-Aug-2020 COMPULSORY 75.0
2991 18-Apr-1959 18-Apr-1974 15-Mar-1970 15-Mar-1975 COMPULSORY 75.0
2992 10-Aug-1974 10-Aug-1989 7-Oct-1987 9-Oct-1987 10-Apr-1991 ELECTIVE 73.5
2993 22-Oct-1978 8-Oct-1995 8-Oct-1995 8-Oct-1995 8-Oct-2005 COMPULSORY 75.0
2994 11-Jan-1996 15-Sep-2012 15-Sep-2012 15-Sep-2012 12-Jul-2017 ELECTIVE 68.1
2995 29-Sep-2017 29-Sep-2032 29-Sep-2032
2996 29-Mar-1970 14-Sep-1991 14-Sep-1991 15-Sep-1991 11-Apr-2001 ELECTIVE 74.6
2997 3-Nov-1995 3-Nov-2010 9-Jun-2009 9-Jun-2009 11-May-2012 ELECTIVE 72.9
2998 26-Feb-1998 8-Nov-2010 26-Feb-2008 21-Mar-2008 8-Nov-2010 COMPULSORY 75.0
2999 30-May-1996 21-Jan-2012 21-Jan-2012 21-Jan-2012 10-Apr-2018 ELECTIVE 70.6
3000 5-Feb-1977 26-Feb-1999 4-Jul-2003 8-Oct-2003 4-Jul-2013 COMPULSORY 75.0
3001 16-Sep-1999 25-Sep-2016
3002 9-Oct-1977 22-Jan-1993 22-Jan-1993 22-Jan-1993 22-Jan-2003 COMPULSORY 75.0
3003 1-Apr-1972 2-Apr-1987 2-Apr-1987 10-Apr-1987 26-Jan-1996 COMPULSORY 75.0
3004 24-Feb-1979 24-Feb-1994 25-Sep-1993 25-Sep-1993 9-Jul-1995 ELECTIVE 71.8
3005 21-Sep-2014 21-Sep-2029 18-Aug-2028
3006 5-Jan-2010 5-Jan-2025 14-Dec-2023
3007 6-Jun-2015 6-Jun-2030 6-Jun-2030
3008 14-Nov-2010 14-Nov-2025 14-Nov-2025
3009 19-May-1982 26-Feb-1999 1-Oct-1999 4-Jul-2003 1-Oct-2009 COMPULSORY 75.0
3010 17-Aug-1995 23-Dec-2010 23-Dec-2010 11-Mar-2009 Early Retirement 62.9
3011 10-Feb-2013 3-Aug-2031 3-Aug-2031
3012 25-May-1950 22-Jan-1968 22-Jan-1968 25-Mar-1973 22-Jan-1978 COMPULSORY 75.0
3013 3-Sep-1998 17-Feb-2013 3-Sep-2008 9-Jun-2009 17-Feb-2013 COMPULSORY 75.0
3014 19-May-1973 18-May-1988 18-May-1988 18-May-1988 8-Apr-1996 ELECTIVE 74.5
3015 12-May-1965 16-May-1982 16-May-1982 16-May-1982 15-May-1992 COMPULSORY 75.0
3016 10-Jan-1946 24-Jan-1953 10-Jan-1956 12-May-1958 Appointed for Life 75.3
3017 9-Apr-1981 11-Aug-1996 11-Aug-1996 8-Mar-1994 DEATH (SURVIVORS BENEFITS) 62.6
3018 11-Dec-2020 11-Dec-2035 11-Dec-2035
3019 8-Jul-2007 8-Jul-2022 8-Jul-2022
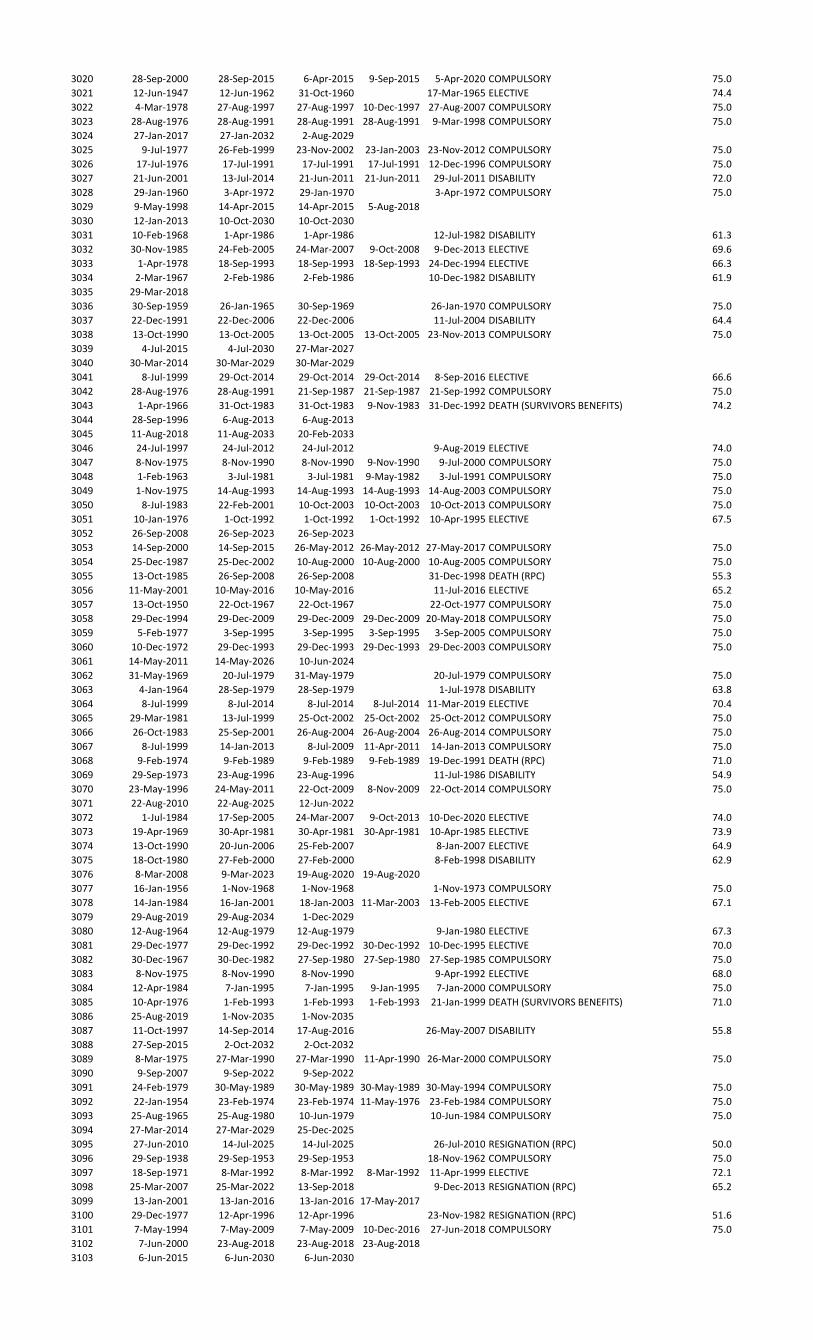
3020 28-Sep-2000 28-Sep-2015 6-Apr-2015 9-Sep-2015 5-Apr-2020 COMPULSORY 75.0
3021 12-Jun-1947 12-Jun-1962 31-Oct-1960 17-Mar-1965 ELECTIVE 74.4
3022 4-Mar-1978 27-Aug-1997 27-Aug-1997 10-Dec-1997 27-Aug-2007 COMPULSORY 75.0
3023 28-Aug-1976 28-Aug-1991 28-Aug-1991 28-Aug-1991 9-Mar-1998 COMPULSORY 75.0
3024 27-Jan-2017 27-Jan-2032 2-Aug-2029
3025 9-Jul-1977 26-Feb-1999 23-Nov-2002 23-Jan-2003 23-Nov-2012 COMPULSORY 75.0
3026 17-Jul-1976 17-Jul-1991 17-Jul-1991 17-Jul-1991 12-Dec-1996 COMPULSORY 75.0
3027 21-Jun-2001 13-Jul-2014 21-Jun-2011 21-Jun-2011 29-Jul-2011 DISABILITY 72.0
3028 29-Jan-1960 3-Apr-1972 29-Jan-1970 3-Apr-1972 COMPULSORY 75.0
3029 9-May-1998 14-Apr-2015 14-Apr-2015 5-Aug-2018
3030 12-Jan-2013 10-Oct-2030 10-Oct-2030
3031 10-Feb-1968 1-Apr-1986 1-Apr-1986 12-Jul-1982 DISABILITY 61.3
3032 30-Nov-1985 24-Feb-2005 24-Mar-2007 9-Oct-2008 9-Dec-2013 ELECTIVE 69.6
3033 1-Apr-1978 18-Sep-1993 18-Sep-1993 18-Sep-1993 24-Dec-1994 ELECTIVE 66.3
3034 2-Mar-1967 2-Feb-1986 2-Feb-1986 10-Dec-1982 DISABILITY 61.9
3035 29-Mar-2018
3036 30-Sep-1959 26-Jan-1965 30-Sep-1969 26-Jan-1970 COMPULSORY 75.0
3037 22-Dec-1991 22-Dec-2006 22-Dec-2006 11-Jul-2004 DISABILITY 64.4
3038 13-Oct-1990 13-Oct-2005 13-Oct-2005 13-Oct-2005 23-Nov-2013 COMPULSORY 75.0
3039 4-Jul-2015 4-Jul-2030 27-Mar-2027
3040 30-Mar-2014 30-Mar-2029 30-Mar-2029
3041 8-Jul-1999 29-Oct-2014 29-Oct-2014 29-Oct-2014 8-Sep-2016 ELECTIVE 66.6
3042 28-Aug-1976 28-Aug-1991 21-Sep-1987 21-Sep-1987 21-Sep-1992 COMPULSORY 75.0
3043 1-Apr-1966 31-Oct-1983 31-Oct-1983 9-Nov-1983 31-Dec-1992 DEATH (SURVIVORS BENEFITS) 74.2
3044 28-Sep-1996 6-Aug-2013 6-Aug-2013
3045 11-Aug-2018 11-Aug-2033 20-Feb-2033
3046 24-Jul-1997 24-Jul-2012 24-Jul-2012 9-Aug-2019 ELECTIVE 74.0
3047 8-Nov-1975 8-Nov-1990 8-Nov-1990 9-Nov-1990 9-Jul-2000 COMPULSORY 75.0
3048 1-Feb-1963 3-Jul-1981 3-Jul-1981 9-May-1982 3-Jul-1991 COMPULSORY 75.0
3049 1-Nov-1975 14-Aug-1993 14-Aug-1993 14-Aug-1993 14-Aug-2003 COMPULSORY 75.0
3050 8-Jul-1983 22-Feb-2001 10-Oct-2003 10-Oct-2003 10-Oct-2013 COMPULSORY 75.0
3051 10-Jan-1976 1-Oct-1992 1-Oct-1992 1-Oct-1992 10-Apr-1995 ELECTIVE 67.5
3052 26-Sep-2008 26-Sep-2023 26-Sep-2023
3053 14-Sep-2000 14-Sep-2015 26-May-2012 26-May-2012 27-May-2017 COMPULSORY 75.0
3054 25-Dec-1987 25-Dec-2002 10-Aug-2000 10-Aug-2000 10-Aug-2005 COMPULSORY 75.0
3055 13-Oct-1985 26-Sep-2008 26-Sep-2008 31-Dec-1998 DEATH (RPC) 55.3
3056 11-May-2001 10-May-2016 10-May-2016 11-Jul-2016 ELECTIVE 65.2
3057 13-Oct-1950 22-Oct-1967 22-Oct-1967 22-Oct-1977 COMPULSORY 75.0
3058 29-Dec-1994 29-Dec-2009 29-Dec-2009 29-Dec-2009 20-May-2018 COMPULSORY 75.0
3059 5-Feb-1977 3-Sep-1995 3-Sep-1995 3-Sep-1995 3-Sep-2005 COMPULSORY 75.0
3060 10-Dec-1972 29-Dec-1993 29-Dec-1993 29-Dec-1993 29-Dec-2003 COMPULSORY 75.0
3061 14-May-2011 14-May-2026 10-Jun-2024
3062 31-May-1969 20-Jul-1979 31-May-1979 20-Jul-1979 COMPULSORY 75.0
3063 4-Jan-1964 28-Sep-1979 28-Sep-1979 1-Jul-1978 DISABILITY 63.8
3064 8-Jul-1999 8-Jul-2014 8-Jul-2014 8-Jul-2014 11-Mar-2019 ELECTIVE 70.4
3065 29-Mar-1981 13-Jul-1999 25-Oct-2002 25-Oct-2002 25-Oct-2012 COMPULSORY 75.0
3066 26-Oct-1983 25-Sep-2001 26-Aug-2004 26-Aug-2004 26-Aug-2014 COMPULSORY 75.0
3067 8-Jul-1999 14-Jan-2013 8-Jul-2009 11-Apr-2011 14-Jan-2013 COMPULSORY 75.0
3068 9-Feb-1974 9-Feb-1989 9-Feb-1989 9-Feb-1989 19-Dec-1991 DEATH (RPC) 71.0
3069 29-Sep-1973 23-Aug-1996 23-Aug-1996 11-Jul-1986 DISABILITY 54.9
3070 23-May-1996 24-May-2011 22-Oct-2009 8-Nov-2009 22-Oct-2014 COMPULSORY 75.0
3071 22-Aug-2010 22-Aug-2025 12-Jun-2022
3072 1-Jul-1984 17-Sep-2005 24-Mar-2007 9-Oct-2013 10-Dec-2020 ELECTIVE 74.0
3073 19-Apr-1969 30-Apr-1981 30-Apr-1981 30-Apr-1981 10-Apr-1985 ELECTIVE 73.9
3074 13-Oct-1990 20-Jun-2006 25-Feb-2007 8-Jan-2007 ELECTIVE 64.9
3075 18-Oct-1980 27-Feb-2000 27-Feb-2000 8-Feb-1998 DISABILITY 62.9
3076 8-Mar-2008 9-Mar-2023 19-Aug-2020 19-Aug-2020
3077 16-Jan-1956 1-Nov-1968 1-Nov-1968 1-Nov-1973 COMPULSORY 75.0
3078 14-Jan-1984 16-Jan-2001 18-Jan-2003 11-Mar-2003 13-Feb-2005 ELECTIVE 67.1
3079 29-Aug-2019 29-Aug-2034 1-Dec-2029
3080 12-Aug-1964 12-Aug-1979 12-Aug-1979 9-Jan-1980 ELECTIVE 67.3
3081 29-Dec-1977 29-Dec-1992 29-Dec-1992 30-Dec-1992 10-Dec-1995 ELECTIVE 70.0
3082 30-Dec-1967 30-Dec-1982 27-Sep-1980 27-Sep-1980 27-Sep-1985 COMPULSORY 75.0
3083 8-Nov-1975 8-Nov-1990 8-Nov-1990 9-Apr-1992 ELECTIVE 68.0
3084 12-Apr-1984 7-Jan-1995 7-Jan-1995 9-Jan-1995 7-Jan-2000 COMPULSORY 75.0
3085 10-Apr-1976 1-Feb-1993 1-Feb-1993 1-Feb-1993 21-Jan-1999 DEATH (SURVIVORS BENEFITS) 71.0
3086 25-Aug-2019 1-Nov-2035 1-Nov-2035
3087 11-Oct-1997 14-Sep-2014 17-Aug-2016 26-May-2007 DISABILITY 55.8
3088 27-Sep-2015 2-Oct-2032 2-Oct-2032
3089 8-Mar-1975 27-Mar-1990 27-Mar-1990 11-Apr-1990 26-Mar-2000 COMPULSORY 75.0
3090 9-Sep-2007 9-Sep-2022 9-Sep-2022
3091 24-Feb-1979 30-May-1989 30-May-1989 30-May-1989 30-May-1994 COMPULSORY 75.0
3092 22-Jan-1954 23-Feb-1974 23-Feb-1974 11-May-1976 23-Feb-1984 COMPULSORY 75.0
3093 25-Aug-1965 25-Aug-1980 10-Jun-1979 10-Jun-1984 COMPULSORY 75.0
3094 27-Mar-2014 27-Mar-2029 25-Dec-2025
3095 27-Jun-2010 14-Jul-2025 14-Jul-2025 26-Jul-2010 RESIGNATION (RPC) 50.0
3096 29-Sep-1938 29-Sep-1953 29-Sep-1953 18-Nov-1962 COMPULSORY 75.0
3097 18-Sep-1971 8-Mar-1992 8-Mar-1992 8-Mar-1992 11-Apr-1999 ELECTIVE 72.1
3098 25-Mar-2007 25-Mar-2022 13-Sep-2018 9-Dec-2013 RESIGNATION (RPC) 65.2
3099 13-Jan-2001 13-Jan-2016 13-Jan-2016 17-May-2017
3100 29-Dec-1977 12-Apr-1996 12-Apr-1996 23-Nov-1982 RESIGNATION (RPC) 51.6
3101 7-May-1994 7-May-2009 7-May-2009 10-Dec-2016 27-Jun-2018 COMPULSORY 75.0
3102 7-Jun-2000 23-Aug-2018 23-Aug-2018 23-Aug-2018
3103 6-Jun-2015 6-Jun-2030 6-Jun-2030
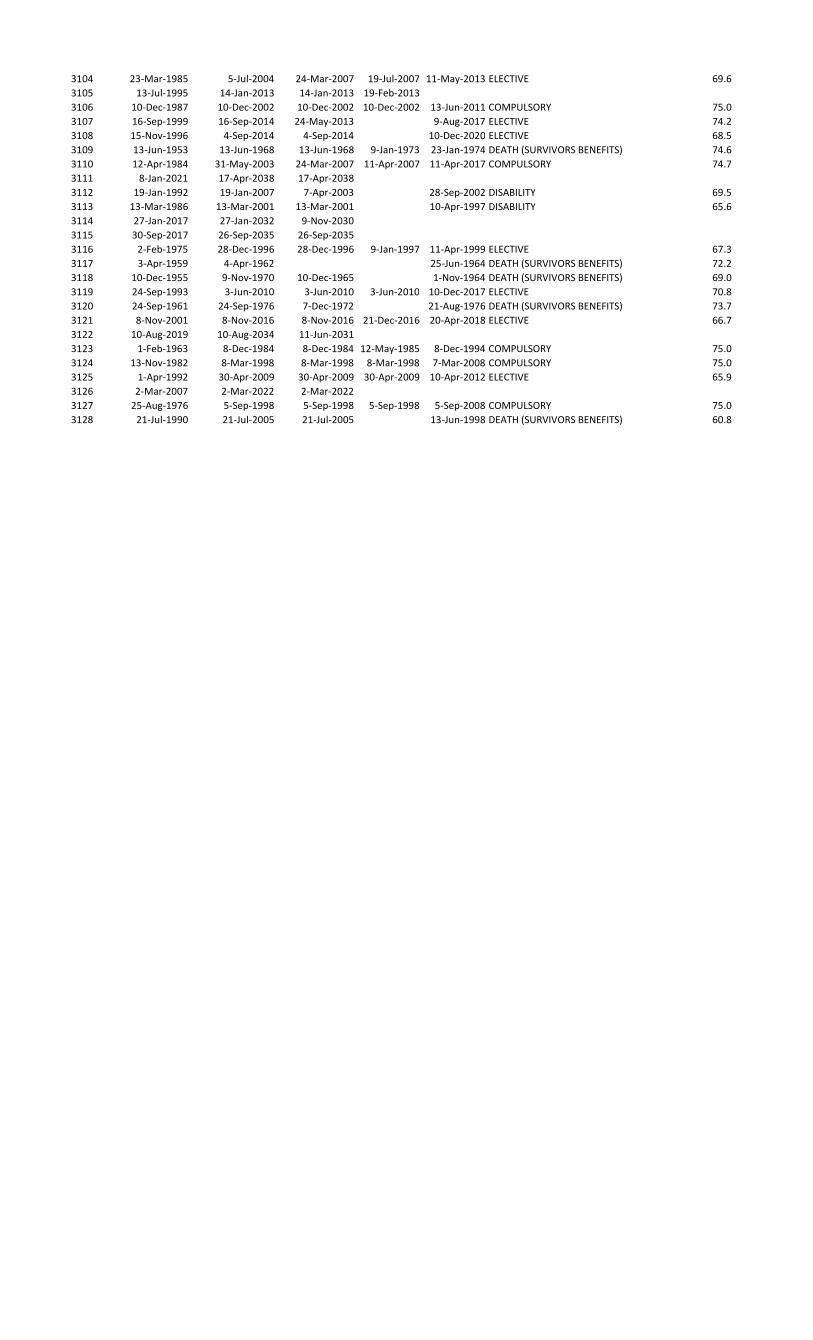
3104 23-Mar-1985 5-Jul-2004 24-Mar-2007 19-Jul-2007 11-May-2013 ELECTIVE 69.6
3105 13-Jul-1995 14-Jan-2013 14-Jan-2013 19-Feb-2013
3106 10-Dec-1987 10-Dec-2002 10-Dec-2002 10-Dec-2002 13-Jun-2011 COMPULSORY 75.0
3107 16-Sep-1999 16-Sep-2014 24-May-2013 9-Aug-2017 ELECTIVE 74.2
3108 15-Nov-1996 4-Sep-2014 4-Sep-2014 10-Dec-2020 ELECTIVE 68.5
3109 13-Jun-1953 13-Jun-1968 13-Jun-1968 9-Jan-1973 23-Jan-1974 DEATH (SURVIVORS BENEFITS) 74.6
3110 12-Apr-1984 31-May-2003 24-Mar-2007 11-Apr-2007 11-Apr-2017 COMPULSORY 74.7
3111 8-Jan-2021 17-Apr-2038 17-Apr-2038
3112 19-Jan-1992 19-Jan-2007 7-Apr-2003 28-Sep-2002 DISABILITY 69.5
3113 13-Mar-1986 13-Mar-2001 13-Mar-2001 10-Apr-1997 DISABILITY 65.6
3114 27-Jan-2017 27-Jan-2032 9-Nov-2030
3115 30-Sep-2017 26-Sep-2035 26-Sep-2035
3116 2-Feb-1975 28-Dec-1996 28-Dec-1996 9-Jan-1997 11-Apr-1999 ELECTIVE 67.3
3117 3-Apr-1959 4-Apr-1962 25-Jun-1964 DEATH (SURVIVORS BENEFITS) 72.2
3118 10-Dec-1955 9-Nov-1970 10-Dec-1965 1-Nov-1964 DEATH (SURVIVORS BENEFITS) 69.0
3119 24-Sep-1993 3-Jun-2010 3-Jun-2010 3-Jun-2010 10-Dec-2017 ELECTIVE 70.8
3120 24-Sep-1961 24-Sep-1976 7-Dec-1972 21-Aug-1976 DEATH (SURVIVORS BENEFITS) 73.7
3121 8-Nov-2001 8-Nov-2016 8-Nov-2016 21-Dec-2016 20-Apr-2018 ELECTIVE 66.7
3122 10-Aug-2019 10-Aug-2034 11-Jun-2031
3123 1-Feb-1963 8-Dec-1984 8-Dec-1984 12-May-1985 8-Dec-1994 COMPULSORY 75.0
3124 13-Nov-1982 8-Mar-1998 8-Mar-1998 8-Mar-1998 7-Mar-2008 COMPULSORY 75.0
3125 1-Apr-1992 30-Apr-2009 30-Apr-2009 30-Apr-2009 10-Apr-2012 ELECTIVE 65.9
3126 2-Mar-2007 2-Mar-2022 2-Mar-2022
3127 25-Aug-1976 5-Sep-1998 5-Sep-1998 5-Sep-1998 5-Sep-2008 COMPULSORY 75.0
3128 21-Jul-1990 21-Jul-2005 21-Jul-2005 13-Jun-1998 DEATH (SURVIVORS BENEFITS) 60.8
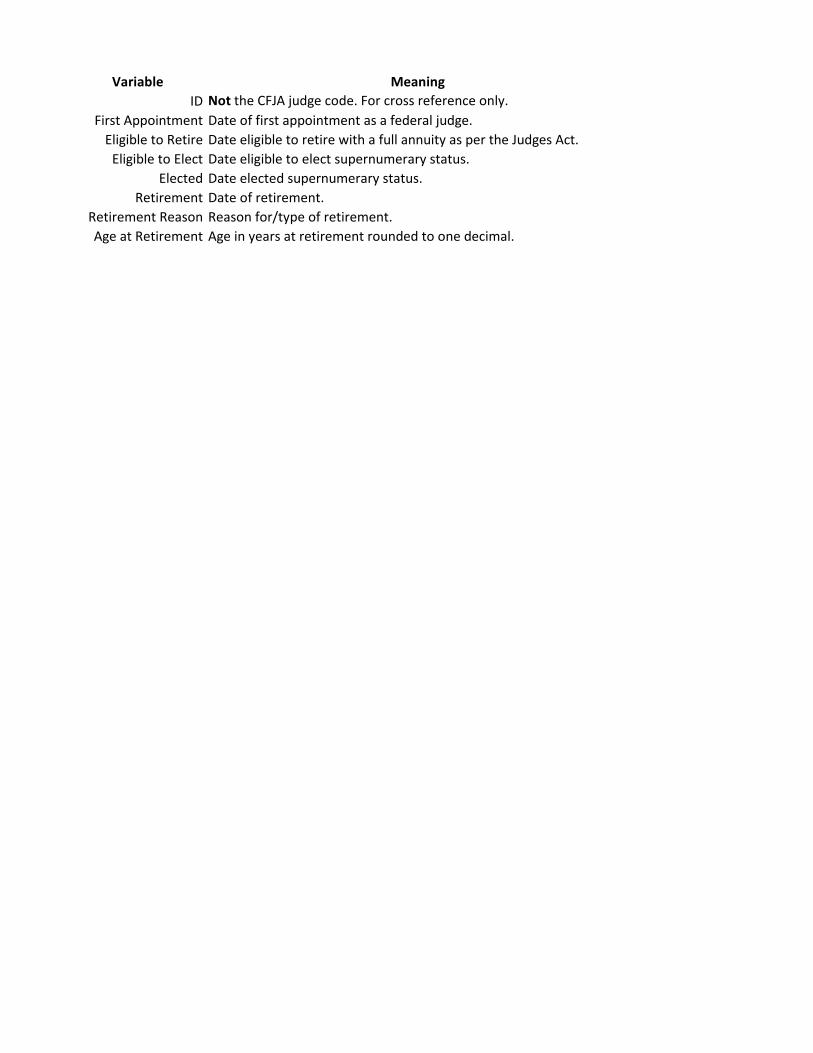
Variable Meaning
ID Not the CFJA judge code. For cross reference only.
First Appointment Date of first appointment as a federal judge.
Eligible to Retire Date eligible to retire with a full annuity as per the Judges Act.
Eligible to Elect Date eligible to elect supernumerary status.
Elected Date elected supernumerary status.
Retirement Date of retirement.
Retirement Reason Reason for/type of retirement.
Age at Retirement Age in years at retirement rounded to one decimal.
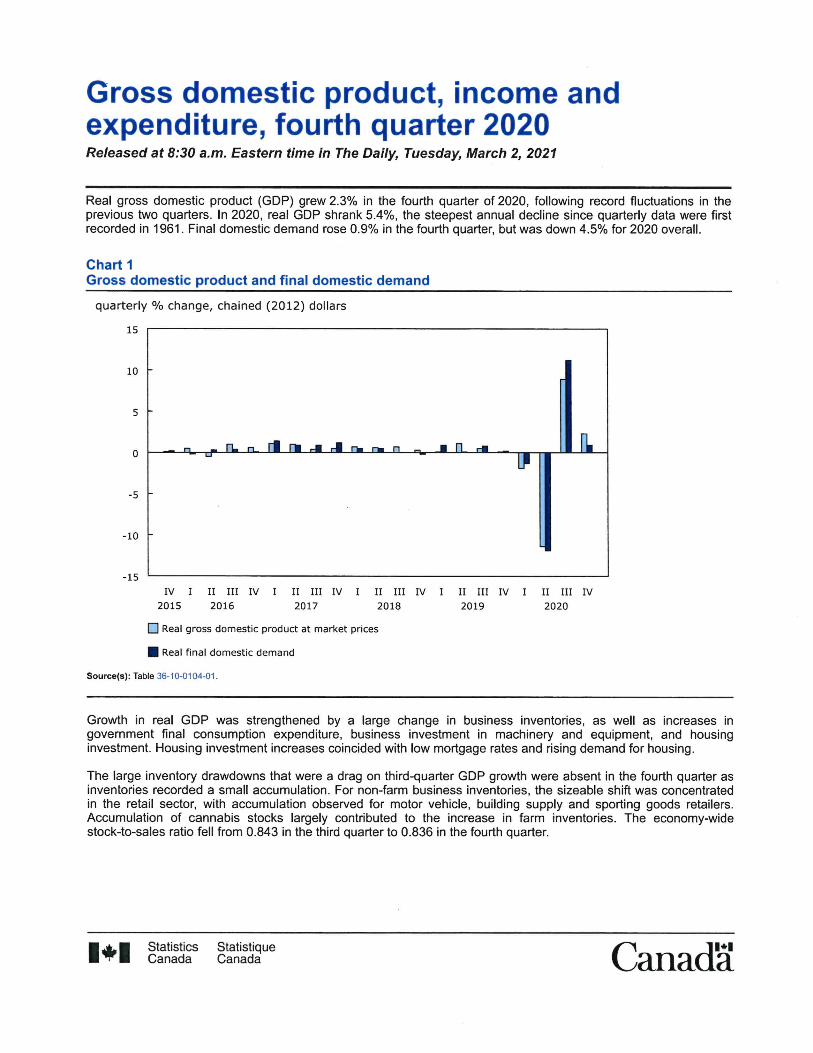
Gross domestic product, income andexpenditure, fourth quarter 2020Released at 8:30 a.m. Eastern time in The Daily, Tuesday, March 2, 2021
Real gross domestic product (GDP) grew 2.3% in the fourth quarter of 2020, following record fluctuations in theprevious two quarters. In 2020, real GDP shrank 5.4%, the steepest annual decline since quarterly data were firstrecorded in 1961. Final domestic demand rose 0.9% in the fourth quarter, but was down 4.5% for 2020 overall.
Chart 1Gross domestic product and final domestic demand
quarterly % change, chained (2012) dollars
15
10
5
0
-5
-10
-15
-cTrLn_rtrBr<rirhr» n n n_ r»
Til_
IV I2015
II III IV I2016
II III IV I2017
II III IV2018
I II III IV I II III IV2019 2020
D Real gross domestic product at market prices
• Real final domestic demand
Source(s): Table 36-10-0104-01.
Growth in real GDP was strengthened by a large change in business inventories, as well as increases ingovernment final consumption expenditure, business investment in machinery and equipment, and housinginvestment. Housing investment increases coincided with low mortgage rates and rising demand for housing.
The large inventory drawdowns that were a drag on third-quarter GDP growth were absent in the fourth quarter asinventories recorded a small accumulation. For non-farm business inventories, the sizeable shift was concentratedin the retail sector, with accumulation observed for motor vehicle, building supply and sporting goods retailers.Accumulation of cannabis stocks largely contributed to the increase in farm inventories. The economy-widestock-to-sales ratio fell from 0.843 in the third quarter to 0.836 in the fourth quarter.
Statistics StatistiqueCanada Canada Canad'a
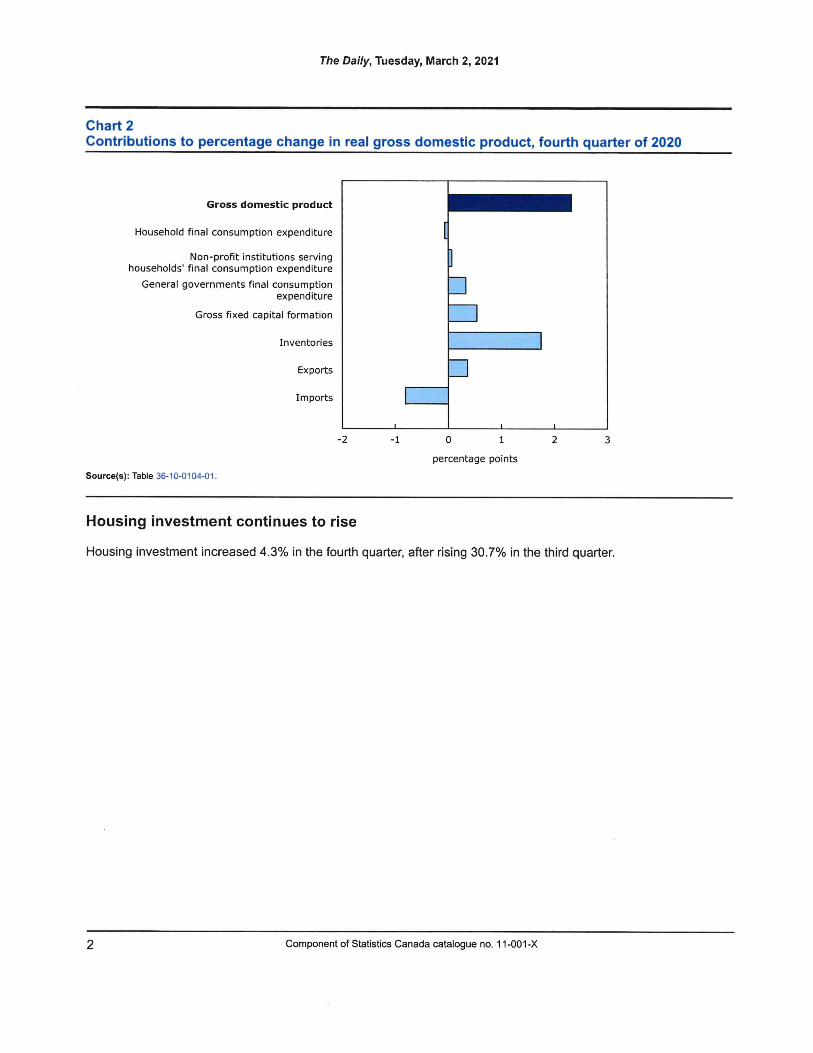
The Daily, Tuesday, March 2, 2021
Chart 2Contributions to percentage change in real gross domestic product, fourth quarter of 2020
Gross domestic product
Household final consumption expenditure
Non-profit institutions servinghouseholds' final consumption expenditure
General governments final consumptionexpenditure
Gross fixed capital formation
Inventories
Exports
Imports
-2 -1
Souree(s): Table 36-10-0104-01.
[
Z]
D
0 1
percentage points
2 3
Housing investment continues to rise
Housing investment increased 4.3% in the fourth quarter, after rising 30.7% in the third quarter.
2 Component of Statistics Canada catalogue no. 11-001-X
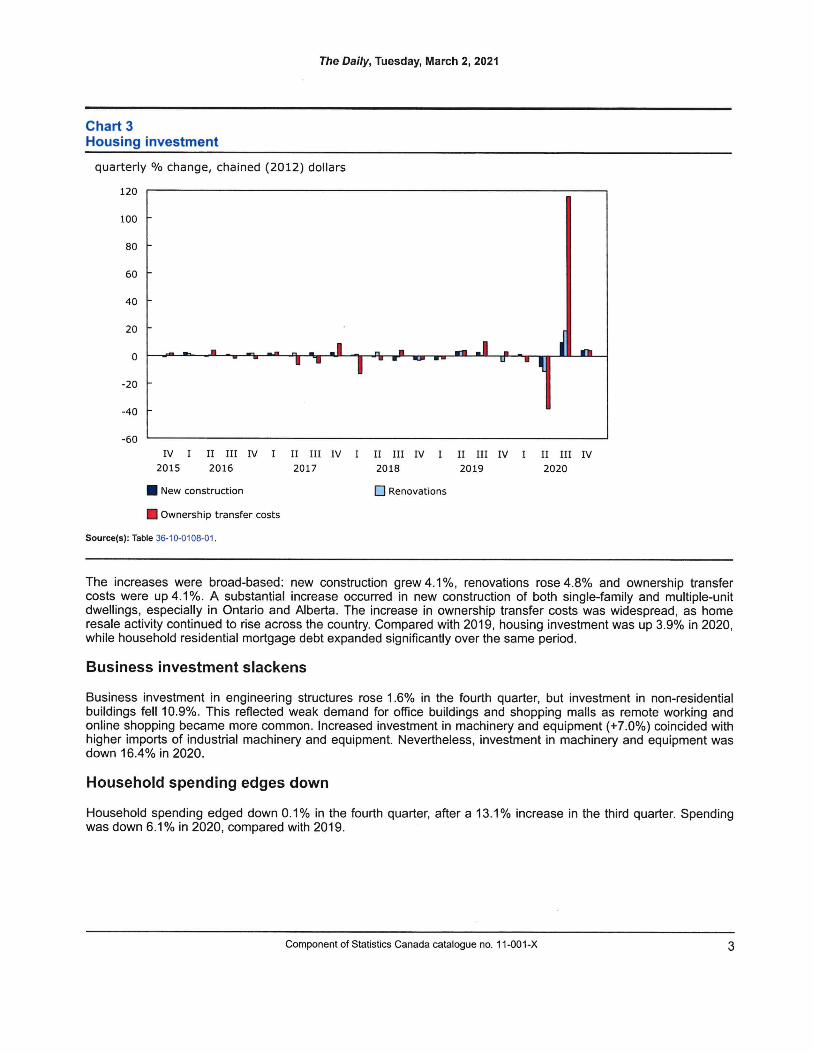
The Daily, Tuesday, March 2, 2021
Chart3Housing investment
quarterly % change, chained (2012) dollars
120
100
80
60
40
20
;1 »jl u •• [f—lTT^I0
1-20
-40
-60
IV I II III IV I II III IV I II III IV I II III IV I II III IV2015 2016 2017 2018 2019 2020
New construction
• Ownership transfer costs
Source(s): Table 36-10-0108-01.
D Renovations
The increases were broad-based: new construction grew 4.1%, renovations rose 4.8% and ownership transfercosts were up 4.1%. A substantial increase occurred in new construction of both single-family and multiple-unitdwellings, especially in Ontario and Alberta. The increase in ownership transfer costs was widespread, as homeresale activity continued to rise across the country. Compared with 2019, housing investment was up 3.9% in 2020,while household residential mortgage debt expanded significantly over the same period.
Business investment slackens
Business investment in engineering structures rose 1.6% in the fourth quarter, but investment in non-residentialbuildings fell 10.9%. This reflected weak demand for office buildings and shopping mails as remote working andonline shopping became more common. Increased investment in machinery and equipment (+7.0%) coincided withhigher imports of industrial machinery and equipment. Nevertheless, investment in machinery and equipment wasdown 16.4% in 2020.
Household spending edges down
Household spending edged down 0.1% in the fourth quarter, after a 13.1% increase in the third quarter. Spendingwas down 6.1% in 2020, compared with 2019.
Component of Statistics Canada catalogue no.11-001-X 3
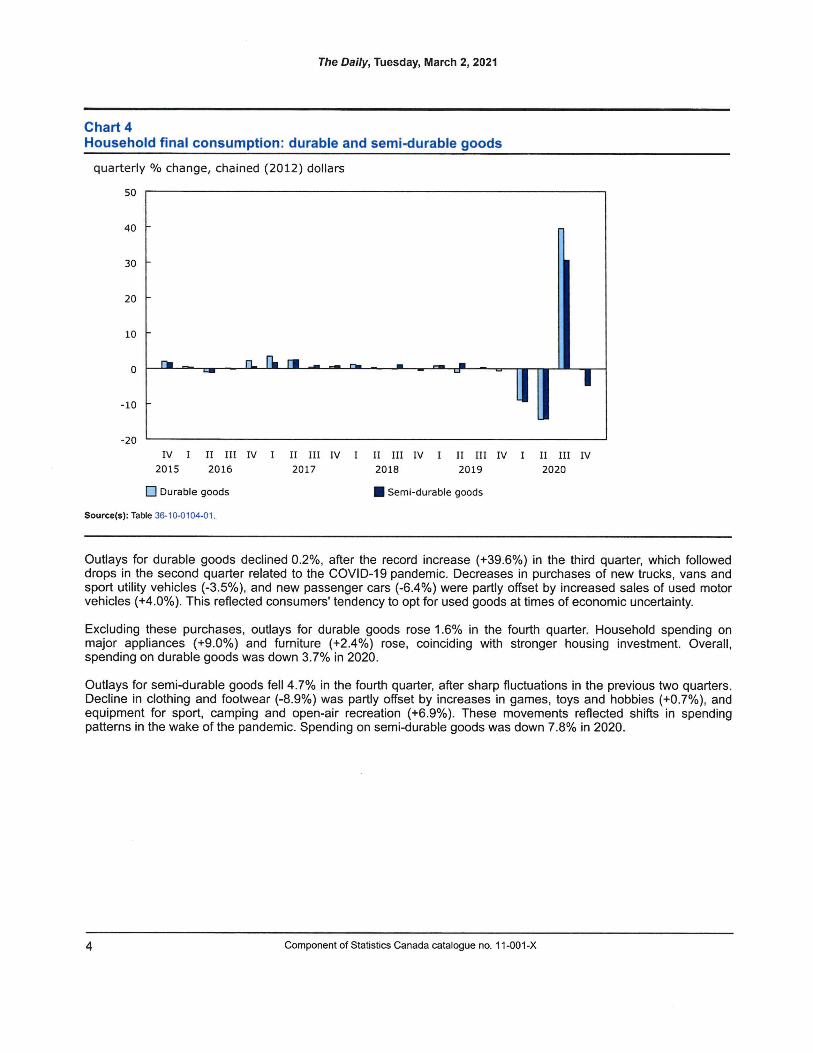
The Daily, Tuesday, March 2, 2021
Chart 4Household final consumption: durable and semi-durable goods
quarterly % change, chained (2012) dollars
50
40
30
20
10
0
-10
-20
rh — n-FL n ^. ^^ ™ L? - -
T"IV I
2015
II III IV I
2016
II III IV I2017
II III IV I
2018
II III IV
2019I II III IV
2020
D Durable goods
Source(s): Table 36-10-0104-01.
Semi-durable goods
Outlays for durable goods declined 0.2%, after the record increase (+39.6%) in the third quarter, which followeddrops in the second quarter related to the COVID-19 pandemic. Decreases in purchases of new trucks, vans andsport utility vehicles (-3.5%), and new passenger cars (-6.4%) were partly offset by increased sales of used motorvehicles (+4.0%). This reflected consumers' tendency to opt for used goods at times of economic uncertainty.
Excluding these purchases, outlays for durable goods rose 1.6% in the fourth quarter. Household spending onmajor appliances (+9.0%) and furniture (+2.4%) rose, coinciding with stronger housing investment. Overall,spending on durable goods was down 3.7% in 2020.
Outlays for semi-durable goods fell 4.7% in the fourth quarter, after sharp fluctuations in the previous two quarters.Decline in clothing and footwear (-8.9%) was partly offset by increases in games, toys and hobbies (+0.7%), andequipment for sport, camping and open-air recreation (+6.9%). These movements reflected shifts in spendingpatterns in the wake of the pandemic. Spending on semi-durable goods was down 7.8% in 2020.
4 Component of Statistics Canada catalogue no. 11-001-X
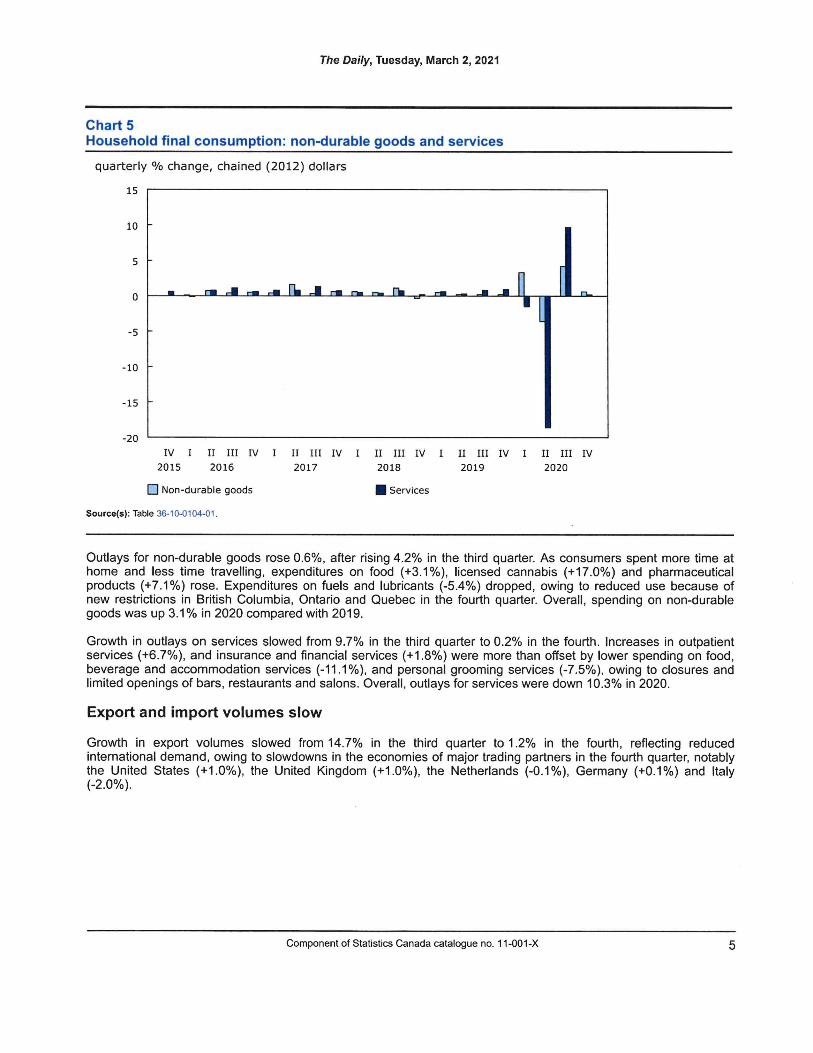
The Daily, Tuesday, March 2, 2021
ChartsHousehold final consumption: non-durable goods and services
quarterly % change, chained (2012) dollars
15
10 h
5 |-
0
-s h
-io h
-is h
-20IV I II III IV I II III IV I II III IV I II III IV I II III IV2015 2016 2017 2018 2019 2020
^r-^n^Brar^n-rh _r»—-•-•
D Non-durable goods
Source(s): Table 36-10-0104-01.
Sen/ices
Outlays for non-durable goods rose 0.6%, after rising 4.2% in the third quarter. As consumers spent more time athome and less time travelling, expenditures on food (+3.1%), licensed cannabis (+17.0%) and pharmaceuticalproducts (+7.1%) rose. Expenditures on fuels and lubricants (-5.4%) dropped, owing to reduced use because ofnew restrictions in British Columbia, Ontario and Quebec in the fourth quarter. Overall, spending on non-durablegoods was up 3.1% in 2020 compared with 2019.
Growth in outlays on services slowed from 9.7% in the third quarter to 0.2% in the fourth. Increases in outpatientservices (+6.7%), and insurance and financial services (+1.8%) were more than offset by lower spending on food,beverage and accommodation services (-11.1%), and personal grooming sen/ices (-7.5%), owing to closures andlimited openings of bars, restaurants and salons. Overall, outlays for services were down 10.3% in 2020.
Export and import volumes slow
Growth in export volumes slowed from 14.7% in the third quarter to 1.2% in the fourth, reflecting reducedinternational demand, owing to slowdowns in the economies of major trading partners in the fourth quarter, notablythe United States (+1.0%), the United Kingdom (+1.0%), the Netherlands (-0.1%), Germany (+0.1%) and Italy(-2.0%).
Component of Statistics Canada catalogue no. 11-001-X 5
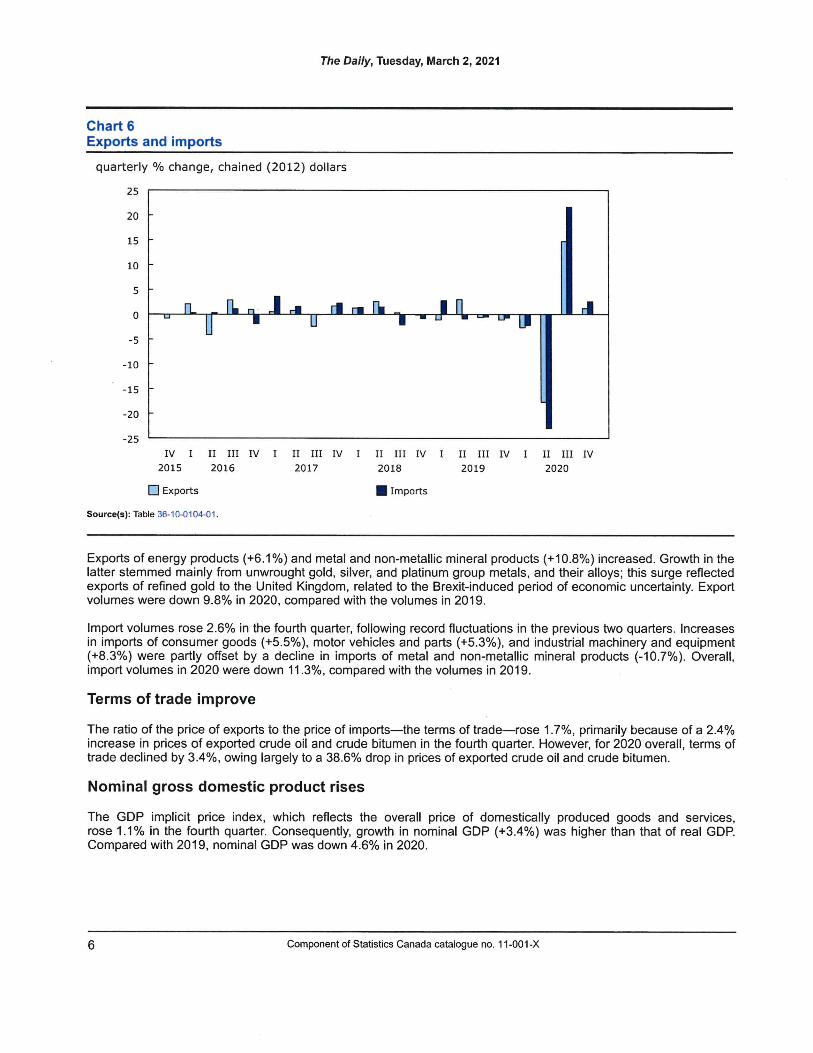
The Daily, Tuesday, March 2, 2021
Chart6Exports and imports
quarterly % change, chained (2012) dollars
25
20
15
10
5
0
-5
-10
-15
-20
-25
SLTT
fL n_ J ^, r1 ^ hT^LJ T
AI?
IV I II III IV I II III IV I II III IV I II III IV I II III IV2015 2016 2017 2018 2019 2020
D Exports
Source(s): Table 36-10-0104-01.
Imports
Exports of energy products (+6.1%) and metal and non-metallic mineral products (+10.8%) increased. Growth in thetatter stemmed mainly from unwrought gold, silver, and platinum group metals, and their alloys; this surge reflectedexports of refined gold to the United Kingdom, related to the Brexit-induced period of economic uncertainty. Exportvolumes were down 9.8% in 2020, compared with the volumes in 2019.
Import volumes rose 2.6% in the fourth quarter, following record fluctuations in the previous two quarters. Increasesin imports of consumer goods (+5.5%), motor vehicles and parts (+5.3%), and industrial machinery and equipment(+8.3%) were partly offset by a decline in imports of metal and non-metallic mineral products (-10.7%). Overall,import volumes in 2020 were down 11.3%, compared with the volumes in 2019.
Terms of trade improve
The ratio of the price of exports to the price of imports—the terms of trade—rose 1 .7%, primarily because of a 2.4%increase in prices of exported crude oil and crude bitumen in the fourth quarter. However, for 2020 overall, terms oftrade declined by 3.4%, owing largely to a 38.6% drop in prices of exported crude oil and crude bitumen.
Nominal gross domestic product rises
The GDP implicit price index, which reflects the overall price of domestically produced goods and services,rose 1.1% in the fourth quarter. Consequently, growth in nominal GDP (+3.4%) was higher than that of real GDP.Compared with 2019, nominal GDP was down 4.6% in 2020.
6 Component of Statistics Canada catalogue no. 11-001-X
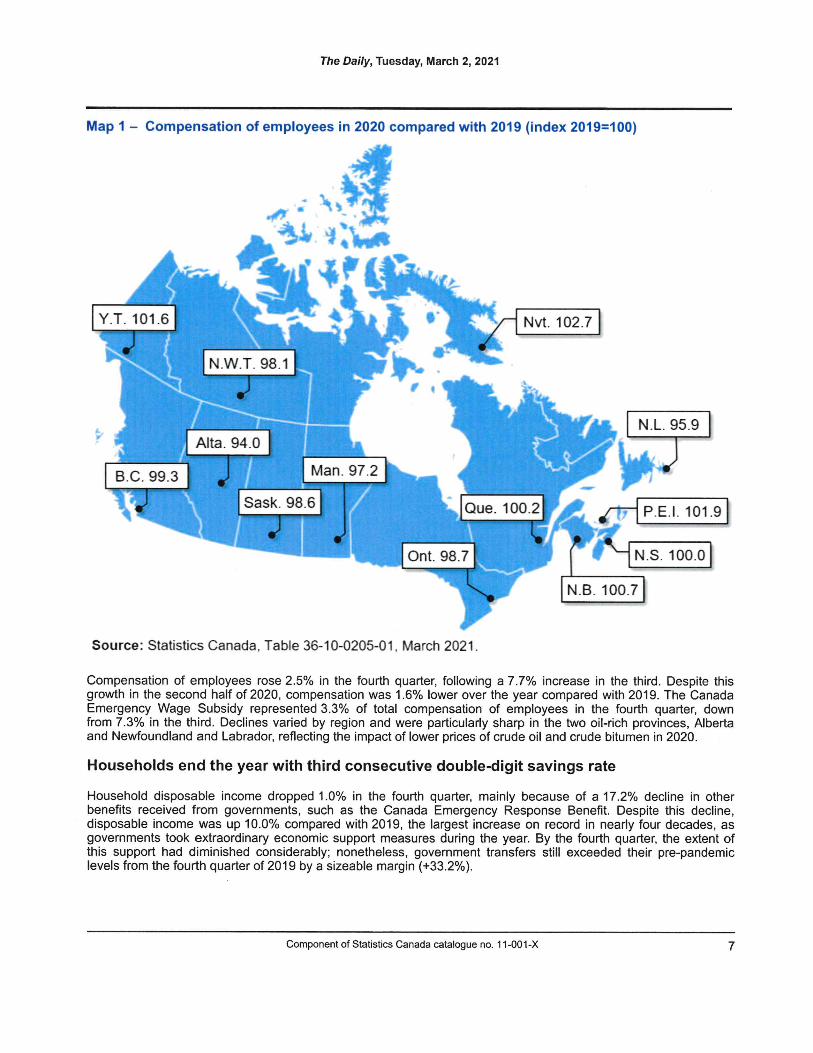
The Daily, Tuesday, March 2, 2021
Map 1 - Compensation of employees in 2020 compared with 2019 (index 2019=100)
^
^ <^A ^?t^
-tY T 101 6 Nvt. 102.7
^-T. 98N w 1
^9
^y^
^Alta 94 0
^JMan 97.2B.C. 99.3
Sask 98.6 Que 100.2 ^~mI
sOnt 98 7
m
N.L. 95.9
P.E.I. 101.9
N.S. 100.0
N.B. 100.7
Source: Statistics Canada, Table 36-10-0205-01, March 2021.
Compensation of employees rose 2.5% in the fourth quarter, following a 7.7% increase in the third. Despite thisgrowth in the second half of 2020, compensation was 1.6% lower over the year compared with 2019. The CanadaEmergency Wage Subsidy represented 3.3% of total compensation of employees in the fourth quarter, downfrom 7.3% in the third. Declines varied by region and were particularly sharp in the two oil-rich provinces, Albertaand Newfoundland and Labrador, reflecting the impact of lower prices of crude oil and crude bitumen in 2020.
Households end the year with third consecutive double-digit savings rate
Household disposable income dropped 1.0% in the fourth quarter, mainly because of a 17.2% decline in otherbenefits received from governments, such as the Canada Emergency Response Benefit. Despite this decline,disposable income was up 10.0% compared with 2019, the largest increase on record in nearly four decades, asgovernments took extraordinary economic support measures during the year. By the fourth quarter, the extent ofthis support had diminished considerably; nonetheless, government transfers still exceeded their pre-pandemiclevels from the fourth quarter of 2019 by a sizeable margin (+33.2%).
Component of Statistics Canada catalogue no.11-001-X 7
The Daily, Tuesday, March 2, 2021
The continued rebound in compensation, albeit at a reduced pace, coupled with still-elevated government transfersand stagnant consumption, kept the savings rate in double-digit territory for the third consecutive quarter.Canadians recorded a similar amount of savings in 2020 as in the previous seven years combined. Some of thissavings made its way into currency and deposits of Canadian households, with growth in this asset nearing$160.0 billion over the first three quarters of the year. The savings rate for the fourth quarter stood at 12.7%, whilethe savings rate for 2020 was 15.1%. Transfers from governments exceeded losses in wages and self-employmentincome, resulting in lower-income and younger households recording some of the largest increases in savings.
Support program expenditures continue to fuel government borrowing
Overall, government revenues were far outstripped by expenditures throughout 2020, with the fourth quartershowing a marked increase from the second-quarter peak in governments' net borrowing of $443.8 billion.
Government revenue remained fairly flat over 2020, the notable exception being the second quarter, when a declinein tax revenue on both income and products reduced government coffers. By the fourth quarter, these componentshad regained lost ground, but annual government revenue was 3.9% lower than the preceding year.
8 Component of Statistics Canada catalogue no. 11-001-X
The Daily, Tuesday, March 2, 2021
Note to readers
Revisions
Gross domestic product (GDP) data for the fourth quarter have been released along with revised data from the first to third quarterof 2020. These releases incorporate new and revised data, as well as updates on seasonal trends. Given the unprecedented economicsituation in 2020, revisions for this period are expected to be higher than normal.
Support measures by governments
To alleviate the economic impact of the COVID-19 pandemic, governments implemented a number of programs, including the CanadaEmergency Wage Subsidy and the Canada Emergency Response Benefit. Fora comprehensive explanation of how government supportmeasures were treated in the compilation of the estimates, see "Recording COVID-19 measures in the national accounts" and "Recordingnew COVID measures in the national accounts."
Details of some of the more significant government measures can be found in the footnotes of tables 36-10-0103-01, 36-10-0112-01,36-10-0115-01, 36-10-0118-01, and 36-10-0477-01.
For information on seasonal adjustment, see Seasonally adjusted data - Frequently asked questions.
For more information on GDP, see the video 'What is Gross Domestic Product (GDP)?'
Percentage change
Percentage changes for expenditure-based statistics (such as household spending, investment, and exports) are calculated from volumemeasures that are adjusted for price variations. Percentage changes for income-based statistics (such as compensation of employeesand operating surplus) are calculated from nominal values: that is, they are not adjusted for price variations.
Un/ess otherwise stated, growth rates represent the percentage change in the series from one quarter to the next; for instance, from thethird quarter of 2020 to the fourth quarter of 2020.
Real-time tables
Real-time tables 36-10-0430-01 and 36-10-0431-01 will be updated on March 8.
Next release
Date on GDP by income and expenditure for the first quarter of 2021 will be released on June 1, 2021.
Sustainable development goals
On January 1, 2016, the world officially began implementing the 2030 Agenda for SustainableDevelopment — the United Nations' transformative plan of action that addresses urgent global challenges overthe following 15 years. The plan is based on 17 specific sustainable development goals.
Data on gross domestic product, income and expenditure are an example of how Statistics Canada supportsthe reporting on the global sustainable development goals. This release will be used to measure the followinggoals:
OECOff WORK ANDECONWDC GROWTH
11
KOJMJTIES
Component of Statistics Canada catalogue no.11-001-X 9
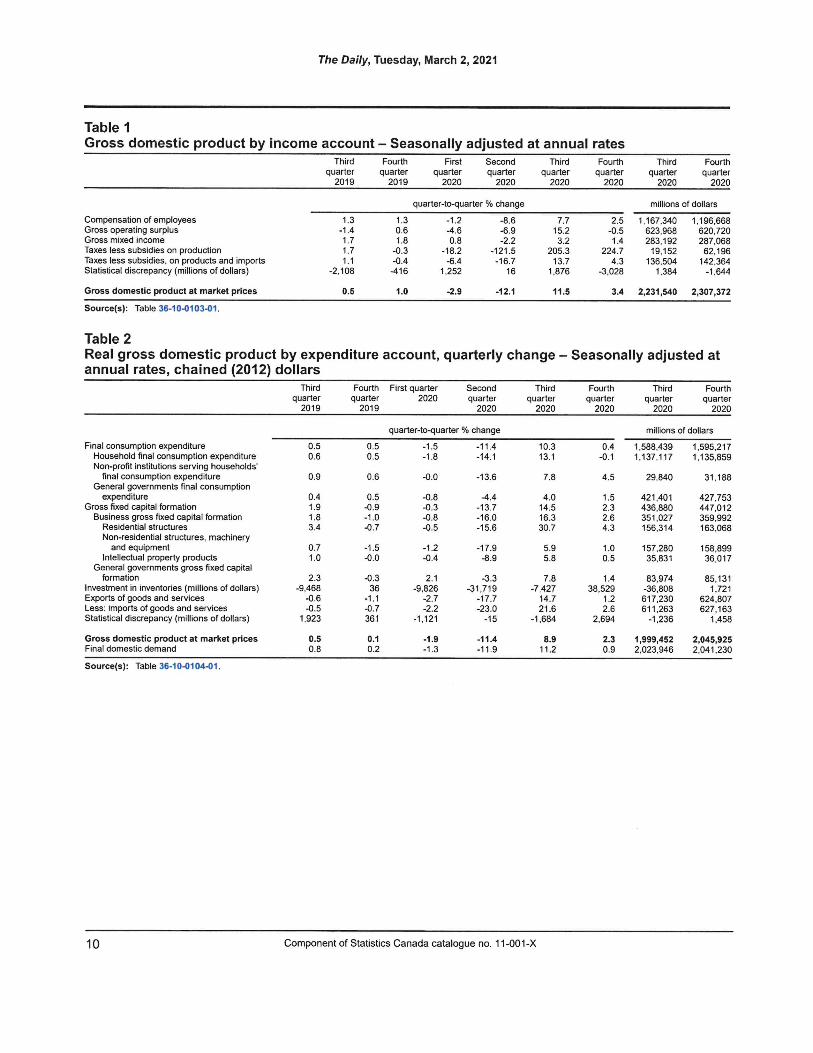
The Daily, Tuesday, March 2, 2021
Table 1Gross domestic product by income account - Seasonally adjusted at annual rates
Thirdquarter
2019
Fourthquarter
2019
Firstquarter
2020
Second
quarter2020
Thirdquarter
2020
Fourthquarter
2020
Thirdquarter
2020
Fourthquarter
2020
quarter-to-quarter % change millions of dollars
Compensation of employeesGross operating surplusGross mixed incomeTaxes less subsidies on productionTaxes less subsidies, on products and importsStatistical discrepancy (millions of dollars)
Gross domestic product at market prices
1.3-1.41.71.71.1
-2,108
0.5
1.30.61.8
-0.3-0.4-416
1.0
-1.2-4.60.8
-18.2-6.4
1,252
-2.9
-8.6-6.9-2,2
-121.5-16.7
16
-12.1
7.715.23.2
205.313.7
1.876
11.5
2.5-0.51.4
224.74.3
-3,028
1,167,340623,968283,19219.152
136.5041,384
1,196,668620.720287,06862.196
142,364-1.644
3.4 2,231,540 2,307,372
Souroe(s): Table 36-10-0103-01.
Table 2Real gross domestic product by expenditure account, quarterly change - Seasonally adjusted atannual rates, chained (2012) dollars
Third Fourth First quarter Second Third Fourth Third Fourthquarter quarter 2020 quarter quarter quarter quarter quarter2019 2019 2020 2020 2020 2020 2020
quarter-to-quarter % change millions of dollars
Final consumption expenditureHousehold final consumption expenditureNon-profit institutions serving households'
final consumption expenditureGeneral governments final consumption
expenditureGross fixed capital formation
Business gross fixed capital formationResidential structuresNon-residential structures, machinery
and equipmentIntellectual property products
General governments gross fixed capitalformation
Investment in inventories (millions of dollars)Exports of goods and servicesLess: imports of goods and servicesStatistical discrepancy (millions of dollars)
Gross domestic product at market pricesFinal domestic demand
0.50.6
0.9
0.41-91,83.4
0.71.0
2.3-9,468
-0.6-0.5
1.923
0.50.8
0.50.5
0.6
0.5-0.9-1.0-0.7
-1.5-0.0
-0.336
-1.1-0.7361
0.10.2
-1.5-1.8
-0.0
-0.8-0.3-0.8-0.5
-1.2-0.4
2.1-9,826
-2.7-2.2
-1,121
-1.9-1.3
-11.4-14.1
-13.6
•4.A-13.7-16.0-15.6
-17.9-8.9
-3.3-31,719
-17.7-23.0
-15
-11.4-11.9
10.313.1
7.8
4.014.516.330.7
5.95.8
7.8-7,427
14.721.6
-1,684
8.911.2
0.4-0.1
4.5
1.52.32.64.3
1.00.5
1.438,529
1.22.6
2,694
2.30.9
1,588,4391,137,117
29,840
421,401436,880351,027156,314
157.28035,831
83,974-36,808617,230611,263
-1,236
1,999,4522,023,946
1,595,2171,135,859
31,188
427,753447,012359,992163,068
158,89936,017
85,1311.721
624.807627,163
1,458
2,045,9252,041,230
Source(s): Table 36-10-0104^)1.
10 Component of Statistics Canada catalogue no.11-001-X
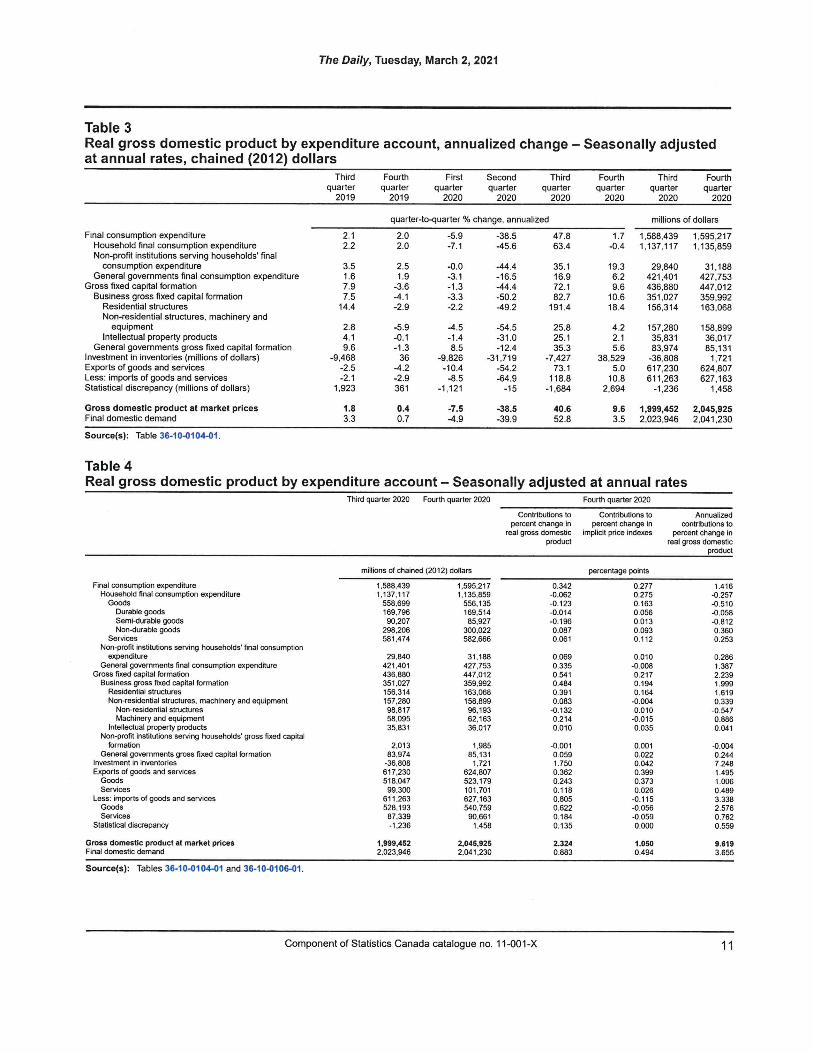
The Daily, Tuesday, March 2, 2021
Table 3Real gross domestic product by expenditure account, annualized change - Seasonally adjustedat annual rates, chained (2012) dollars
Third Fourthquarter quarter2019 2019
Firstquarter
2020
Second
quarter2020
Thirdquarter
2020
Fourthquarter
2020
Third Fourth
quarter quarter2020 2020
quarter-to-quarter % change, annualized millions of dollars
Final consumption expenditureHousehold final consumption expenditureNon-profit institutions serving households' final
consumption expenditureGeneral governments final consumption expenditure
Gross fixed capital formationBusiness gross fixed capital formation
Residential structuresNon-residential structures, machinery and
equipmentIntellectual properly products
General governments gross fixed capital formationInvestment in inventories (millions of dollars)Exports of goods and servicesLess: imports of goods and servicesStatistical discrepancy (millions of dollars)
Gross domestic product at market pricesFinal domestic demand
2.12.2
3.51.67.97.5
14.4
2.84.19.6
-9,468-2.5-2.1
1,923
1.83.3
2.02.0
2.51.9
-3.6-4.1-2.9
-5.9-0.1-1.336
-4.2-2.9361
0.40.7
-5.9-7.1
-0.0-3.1-1.3-3.3-2.2
-4.5-1.48.5
-9,826-10.4-8.5
-1,121
-7.5-4.9
-38.5-45.6
-44.4-16.5-44 A-50.2-49-2
-54.5-31.0-12.4
-31,719-54.2-64.9
-15
-38.5-39.9
47.863.4
35.116.972.182.7
191.4
25.825.135.3
-7.42773.1
118.8-1,684
40.652.8
1.7-0.4
19.36.29.6
10.618.4
4.22.15.6
38,5295.0
10.82.694
9.63.5
1,588,4391,137,117
29,840421,401436,880351,027156,314
157,28035,83183,974
-36.808617,230611,263
-1,236
1,999,4522,023,946
1.595,2171,135,859
31,188427.753447,012359.992163.068
158,89936,01785,1311,721
624,807627,163
1,458
2,045,9252,041,230
Source(s): Table 36-10-0104-01.
Table 4Real gross domestic product by expenditure account - Seasonally adjusted at annual rates
Third quarter 2020 Fourth quarter 2020 Fourth quarter 2020
Contributions topercent change in
real gross domesticproduct
Contributions topercent change in
implicit price indexes
Annualizedcontributions to
percent change inreal gross domestic
product
millions of chained (2012) dollars percentage points
Final consumption expenditureHousehold fina! consumption expenditure
GoodsDurable goodsSemj-durable goodsNon-durable goods
ServicesNon-profit institutions serving households' final consumption
expenditureGeneral governments final consumption expenditure
Gross fixed capital formationBusiness gross fixed capita! formation
Residential structuresNon-residentia) structures, machinery and equipment
Non-residentia) structuresMachinery and equipment
Intellectual property productsNon-profit institutions serving households' gross fixed capital
formationGeneral governments gross fixed capital formation
investment in inventoriesExports of goods and services
GcwdsServices
Less; imports of goods and servicesGoodsServices
Statistical discrepancy
Gross domestic product at market pricesFinal domestic demand
1.58S.4391,137,117
558,699169,79690.207
298,206581,474
29,840421,401436.880351.027156.314157,28098.81758.09535.831
2.01363,974
-36,808617,230518.04799,300
611.26352S.19387,339-1,236
1.999.4522,023,946
1,595,2171.135,859
556,135169.51485.827
300.022582.666
31.188427,753447,012359,992163,068158,89996.19362.16336.017
1.98585,131
1.721624.807523.179101,701627.163540,759
90.6611,458
2,045.9252.041.230
0.342-0.062-0.123-0.014-0.1960.0870.061
0.0690.3350.5410.4840.3910.083-0.1320.2140.010
-0.0010.0591.7500.3620.2430.1180.8050.6220.1840.135
2.324O.S83
0.2770.2750.1630.0560.0130.0930.112
0.010-0.0080.2170.1940.164-0.0040.010-0.0150.035
0.0010.0220.0420.3990.3730.026-0.115-0.056-0.0590.000
1.0500.494
1.416-0.257-0.510-0.058-0.8120.3600.253
0.2861.3872.2391.9991.6190.339-0.5470.8860.041
-0.0040.2447.2481.4951.0060.4893.3382.5760.7620.559
9.6193.655
Source(s): Tables 36-10-0104-01 and 36-10-0106^)1.
Component of Statistics Canada catalogue no. 11-001-X 11
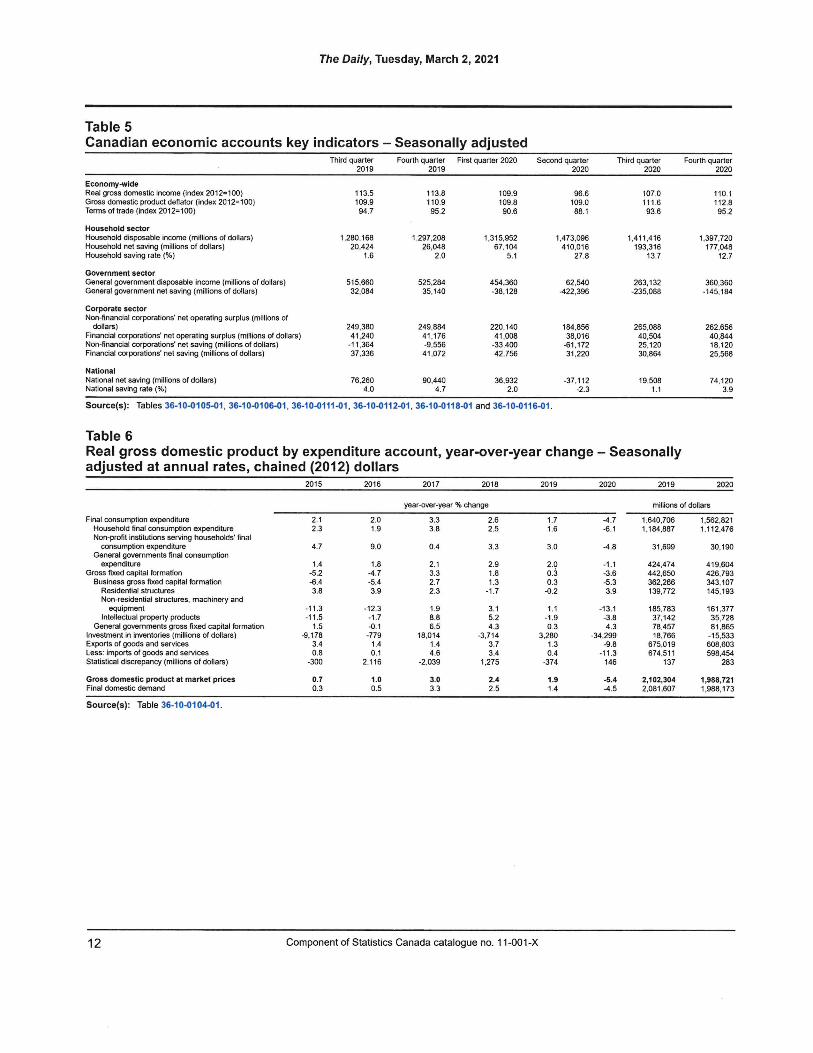
The Daily, Tuesday, March 2, 2021
Table 5Canadian economic accounts key indicators - Seasonally adjusted
Third quarter2019
Fourth quarter First quarter 20202019
Second quarter2020
Third quarter2020
Fourth quarter2020
Economy-wideReal gross domestic income (Index 2012=100) 113.5 113.8 109.9 9S.6 107.0 110.1Gross domestic product deflator (index 2012=100) 109.9 110.9 109.8 109.0 111.6 112.8Terms of trade (index 2012=100) 94.7 95.2 90.6 88.1 93.6 95.2
Household sector
Household disposable income (millions of dollars) 1,280,168 1,297,208 1,315,952 1,473,096 1,411,416 1,397,720Household net saving (millions of dollars) 20,424 26,048 67,104 410,016 193,316 177,048Household saving rate (%) 1.6 2.0 5.1 27.8 13.7 12.7
Government sector
General government disposable Income (millions of dollars) 515,660 525,284 454,360 62,540 263,132 360,360General government net saving (millions of dollars) 32,084 35,140 -38,128 -122,396 -235,088 -145,184
Corporate sectorNon-financial corporations' net operating surplus (mi)lions ofdollars) 249,380 249,884 220.140 184.856 265,088 262.656
Financial corporations'net operating surplus (millions of dollare) 41,240 41,176 41,008 38,016 40,504 40,844Non-Bnancial corporations'net saving (millions of dollars) -11.364 -9,556 -33,400 -61,172 25,120 18,120Financial corporations'net saving (millions of dollars) 37,336 41,072 42,756 31.220 30,864 25,568
NationalNational net saving (millions of dollars) 76,260 90,440 36,932 -37,112 19,508 74,120National saving rate (%) 4.0 4.7 2.0 -2.3 1.1 3.9
Source(s): Tables 36-10-0105-01, 36-10-0106-01, 36.10-0111-01, 36-10-0112-01, 36-10-0118-01 and 36-10-0116^11.
Table 6Real gross domestic product by expenditure account, year-over-year change - Seasonallyadjusted at annual rates, chained (2012) dollars
2015 2016 2017 2018 2019 2020 2019 2020
year-over-year % change millions of dollars
Final consumption expenditureHousehold final consumption expenditureNon-profit institutions serving households' final
consumption expenditureGeneral governments flnal consumption
expenditureGross fixed capital formation
Business gross fixed capital formationResidential structuresNon-residential structures, machinery and
equipmentIntellectual property products
Genera! governments gross fixed capital formationinvestment in inventories (millions of dollars)Exports of goods and servicesLess: imports of goods and servicesStatistical discrepancy (millions of dollars)
Gross domestic product at market pricesFinal domestic demand
2.12.3
4.7
1.4-5.2-6.43.8
-11.3-11.5
1.5-9,178
3.40.8
-300
0.70.3
2.01.9
9.0
1.S-4.7-5.43.9
-12.3-1.7-0.1-7791.40.1
2.116
1.00.5
3.33.8
0.4
2.13.32.72.3
1.98.86.5
18,0141.44.6
-2.039
3.03.3
2.62.5
3.3
2.91.81.3-1.7
3.15.24.3
-3,7143.73.4
1,275
2.42.5
1.71.6
3.0
2.00.30.3-0.2
1.1-1.90.3
3.2801.30.4
-374
1.91.4
-4.7-6.1
-4.8
-1.1-3.6-5.33.9
-13.1-3.84.3
-34,299-9.8
-11.3146
-5.4-4.5
1.640.7061.184.887
31.699
424.474442,650362.266139,772
185.78337,14278.45718,766
675.019674,511
137
2,102,3042,081.607
1,562,8211.112,476
30,190
419.604426.793343,107145.193
161.37735,728B1.865
-15,533608.603598.454
283
1,988,7211,988,173
Source(s): Table 36-10-0104-01.
12 Component of Statistics Canada catalogue no. 11-001-X
The Daily, Tuesday, March 2, 2021
Available tables: 12-10-0134-01, 12-10-0135-01, 34-10-0163-01, 36-10-0103-01 to 36.10-0109-01 ,36-10-0111-01, 36-10-0112-01, 36-10-0114-01 to 36-10-0118-01 , 36-10-0121^)1 to 36-10-0132-01 ,36-10-0135-01, 36-10-0205-01, 36-10-0369-01, 36-10-0477-01, 36-10-0484-01, 36-10-0608-01,36-10-0610-01 and 36-10-0611-01.
Definitions, data sources and methods: survey numbers 1901, 2602, 2820 and 5169.
The document, "Recording new COVID measures in the national accounts," which is part of LatestDevelopments in the Canadian Economic Accounts (13-605-X), is available.
The data visualization product "Infrastructure Statistics Hub," which is part of Statistics Canada - DataVisualization Products (71-607-X), is now available.
The Economic accounts statistics portal, accessible from the Subjects module of our website, features anup-to-date portrait of national and provincial economies and their structure.
The User Guide: Canadian System of Macroeconomic Accounts (13-606-G) is available.
The Methodological Guide: Canadian System of Macroeconomic Accounts (13-607-X) is available.
For more information, or to enquire about the concepts, methods or data quality of this release, contact us(toll-free 1-800-263-1136; 514-283-8300; [email protected]) or MediaRelations (613-951-4636; [email protected]).
Component of Statistics Canada catalogue no.11-001-X 13
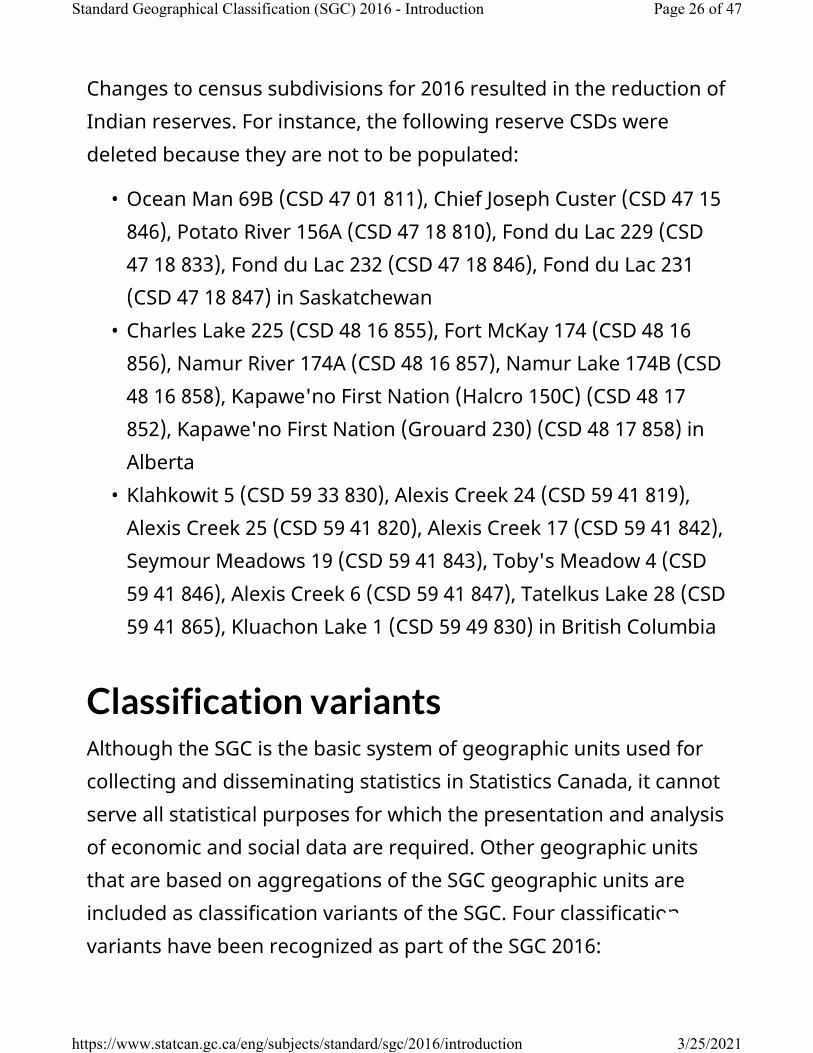
Changes to census subdivisions for 2016 resulted in the reduction of
Indian reserves. For instance, the following reserve CSDs were
deleted because they are not to be populated:
• Ocean Man 69B (CSD 47 01 811), Chief Joseph Custer (CSD 47 15
846), Potato River 156A (CSD 47 18 810), Fond du Lac 229 (CSD
47 18 833), Fond du Lac 232 (CSD 47 18 846), Fond du Lac 231
(CSD 47 18 847) in Saskatchewan
• Charles Lake 225 (CSD 48 16 855), Fort McKay 174 (CSD 48 16
856), Namur River 174A (CSD 48 16 857), Namur Lake 174B (CSD
48 16 858), Kapawe'no First Nation (Halcro 150C) (CSD 48 17
852), Kapawe'no First Nation (Grouard 230) (CSD 48 17 858) in
Alberta
• Klahkowit 5 (CSD 59 33 830), Alexis Creek 24 (CSD 59 41 819),
Alexis Creek 25 (CSD 59 41 820), Alexis Creek 17 (CSD 59 41 842),
Seymour Meadows 19 (CSD 59 41 843), Toby's Meadow 4 (CSD
59 41 846), Alexis Creek 6 (CSD 59 41 847), Tatelkus Lake 28 (CSD
59 41 865), Kluachon Lake 1 (CSD 59 49 830) in British Columbia
Classification variants
Although the SGC is the basic system of geographic units used for
collecting and disseminating statistics in Statistics Canada, it cannot
serve all statistical purposes for which the presentation and analysis
of economic and social data are required. Other geographic units
that are based on aggregations of the SGC geographic units are
included as classification variants of the SGC. Four classification
variants have been recognized as part of the SGC 2016:
Page 26 of 47Standard Geographical Classification (SGC) 2016 - Introduction
3/25/2021https://www.statcan.gc.ca/eng/subjects/standard/sgc/2016/introduction
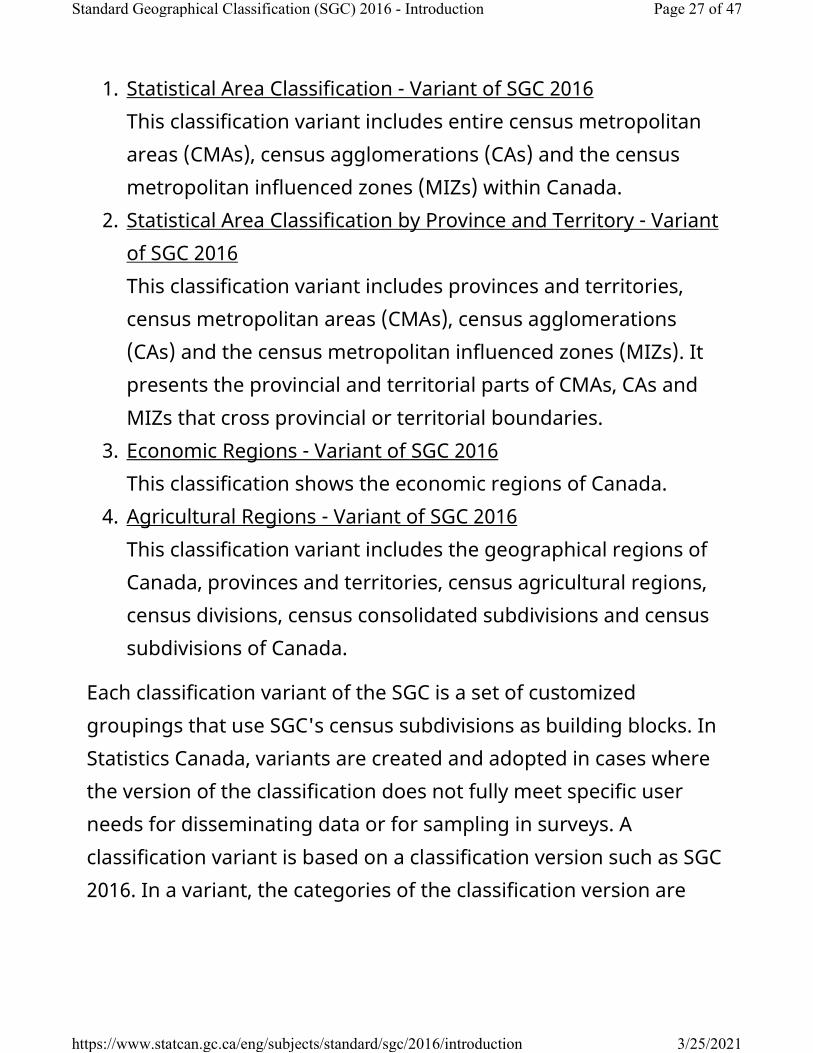
1. Statistical Area Classification - Variant of SGC 2016
This classification variant includes entire census metropolitan
areas (CMAs), census agglomerations (CAs) and the census
metropolitan influenced zones (MIZs) within Canada.
2. Statistical Area Classification by Province and Territory - Variant
of SGC 2016
This classification variant includes provinces and territories,
census metropolitan areas (CMAs), census agglomerations
(CAs) and the census metropolitan influenced zones (MIZs). It
presents the provincial and territorial parts of CMAs, CAs and
MIZs that cross provincial or territorial boundaries.
3. Economic Regions - Variant of SGC 2016
This classification shows the economic regions of Canada.
4. Agricultural Regions - Variant of SGC 2016
This classification variant includes the geographical regions of
Canada, provinces and territories, census agricultural regions,
census divisions, census consolidated subdivisions and census
subdivisions of Canada.
Each classification variant of the SGC is a set of customized
groupings that use SGC's census subdivisions as building blocks. In
Statistics Canada, variants are created and adopted in cases where
the version of the classification does not fully meet specific user
needs for disseminating data or for sampling in surveys. A
classification variant is based on a classification version such as SGC
2016. In a variant, the categories of the classification version are
Page 27 of 47Standard Geographical Classification (SGC) 2016 - Introduction
3/25/2021https://www.statcan.gc.ca/eng/subjects/standard/sgc/2016/introduction
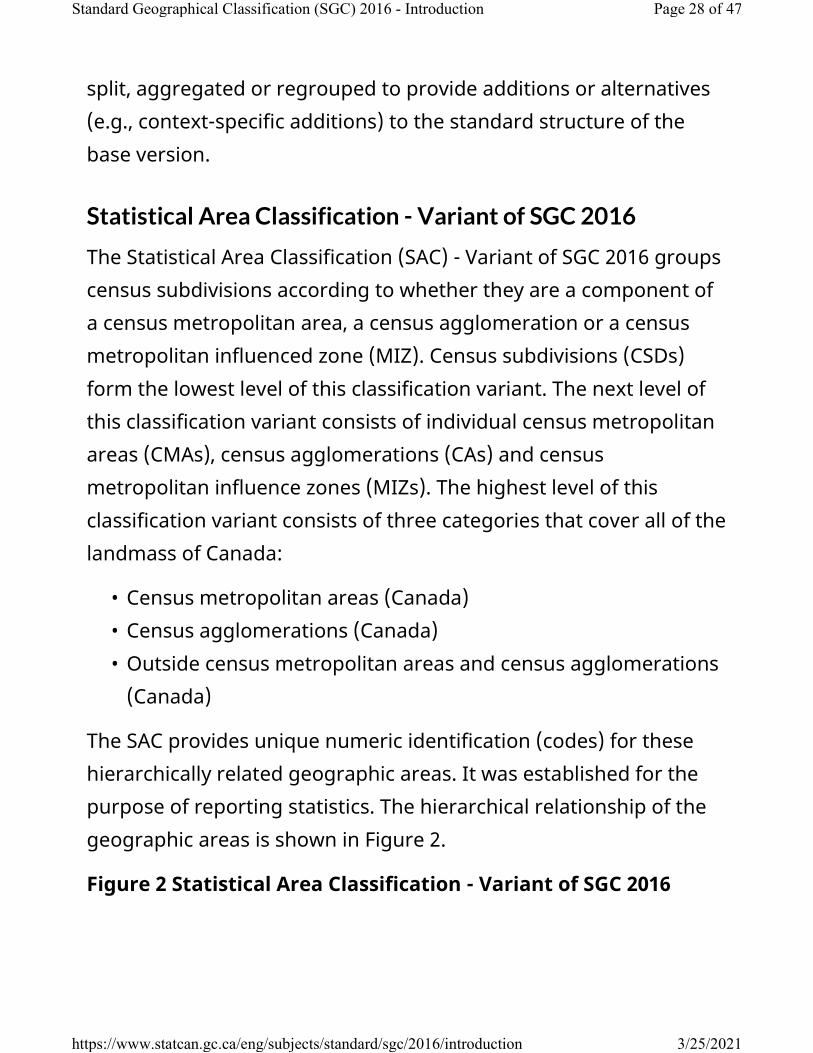
split, aggregated or regrouped to provide additions or alternatives
(e.g., context-specific additions) to the standard structure of the
base version.
Statistical Area Classification - Variant of SGC 2016
The Statistical Area Classification (SAC) - Variant of SGC 2016 groups
census subdivisions according to whether they are a component of
a census metropolitan area, a census agglomeration or a census
metropolitan influenced zone (MIZ). Census subdivisions (CSDs)
form the lowest level of this classification variant. The next level of
this classification variant consists of individual census metropolitan
areas (CMAs), census agglomerations (CAs) and census
metropolitan influence zones (MIZs). The highest level of this
classification variant consists of three categories that cover all of the
landmass of Canada:
• Census metropolitan areas (Canada)
• Census agglomerations (Canada)
• Outside census metropolitan areas and census agglomerations
(Canada)
The SAC provides unique numeric identification (codes) for these
hierarchically related geographic areas. It was established for the
purpose of reporting statistics. The hierarchical relationship of the
geographic areas is shown in Figure 2.
Figure 2 Statistical Area Classification - Variant of SGC 2016
Page 28 of 47Standard Geographical Classification (SGC) 2016 - Introduction
3/25/2021https://www.statcan.gc.ca/eng/subjects/standard/sgc/2016/introduction
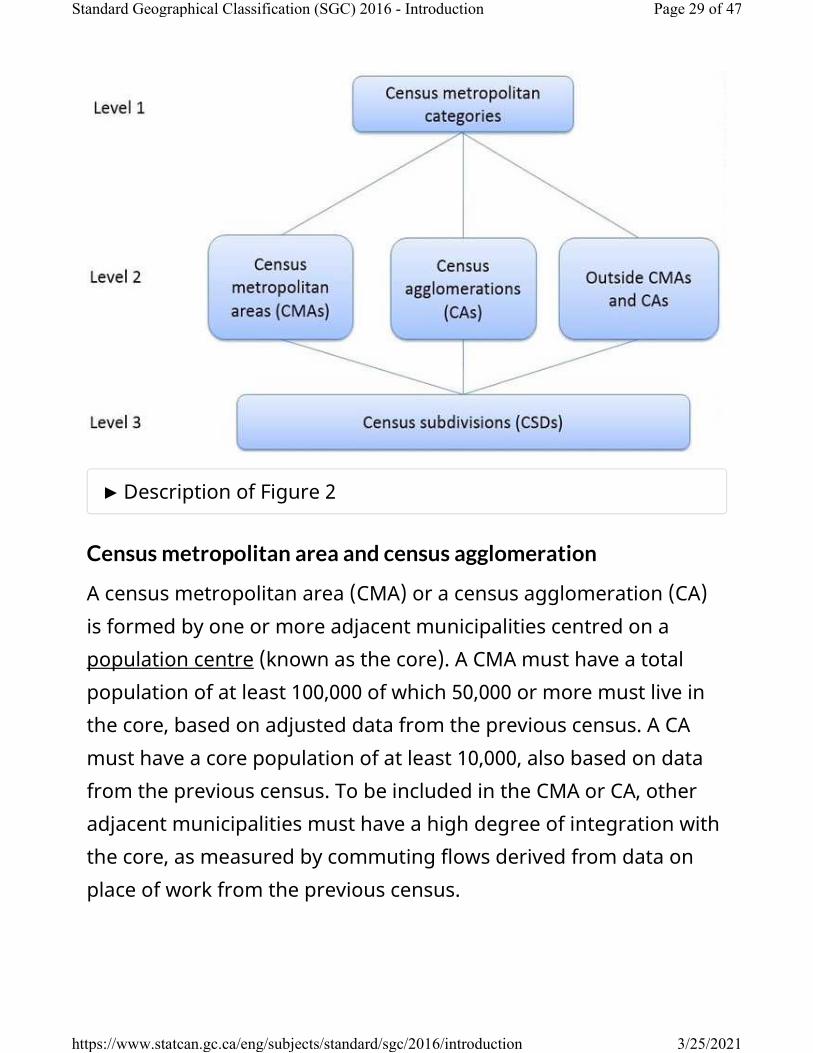
►Description of Figure 2
Census metropolitan area and census agglomeration
A census metropolitan area (CMA) or a census agglomeration (CA)
is formed by one or more adjacent municipalities centred on a
population centre (known as the core). A CMA must have a total
population of at least 100,000 of which 50,000 or more must live in
the core, based on adjusted data from the previous census. A CA
must have a core population of at least 10,000, also based on data
from the previous census. To be included in the CMA or CA, other
adjacent municipalities must have a high degree of integration with
the core, as measured by commuting flows derived from data on
place of work from the previous census.
Page 29 of 47Standard Geographical Classification (SGC) 2016 - Introduction
3/25/2021https://www.statcan.gc.ca/eng/subjects/standard/sgc/2016/introduction
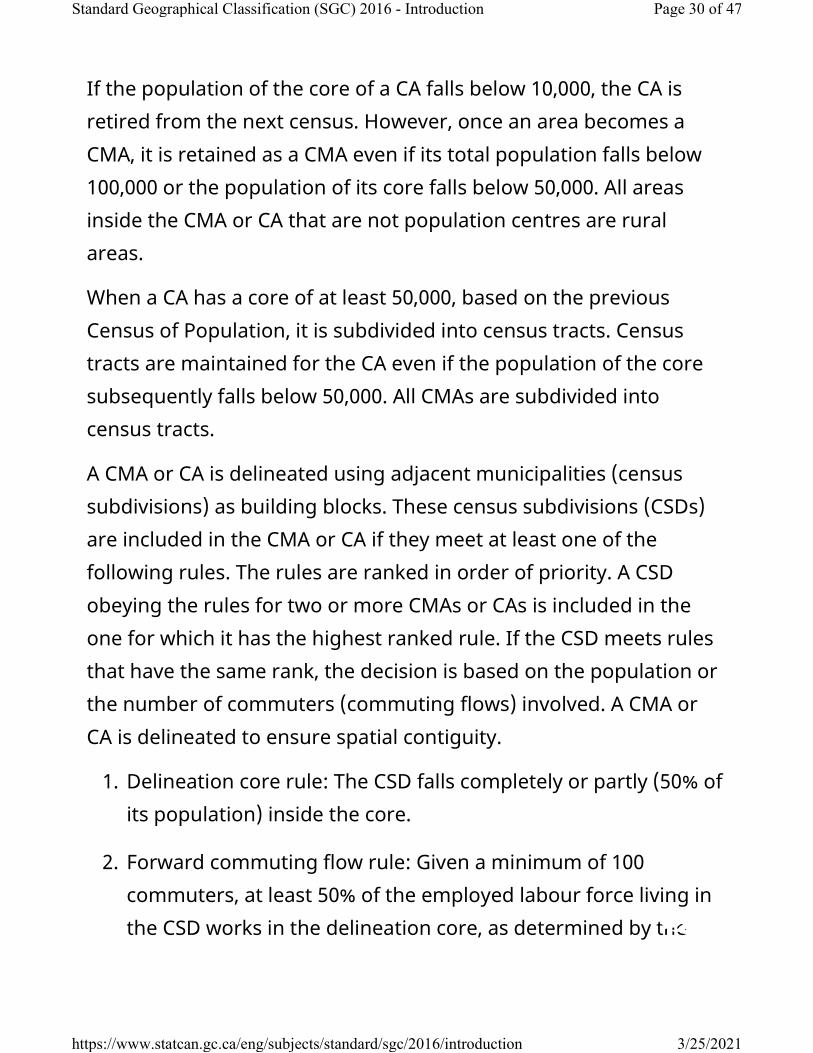
If the population of the core of a CA falls below 10,000, the CA is
retired from the next census. However, once an area becomes a
CMA, it is retained as a CMA even if its total population falls below
100,000 or the population of its core falls below 50,000. All areas
inside the CMA or CA that are not population centres are rural
areas.
When a CA has a core of at least 50,000, based on the previous
Census of Population, it is subdivided into census tracts. Census
tracts are maintained for the CA even if the population of the core
subsequently falls below 50,000. All CMAs are subdivided into
census tracts.
A CMA or CA is delineated using adjacent municipalities (census
subdivisions) as building blocks. These census subdivisions (CSDs)
are included in the CMA or CA if they meet at least one of the
following rules. The rules are ranked in order of priority. A CSD
obeying the rules for two or more CMAs or CAs is included in the
one for which it has the highest ranked rule. If the CSD meets rules
that have the same rank, the decision is based on the population or
the number of commuters (commuting flows) involved. A CMA or
CA is delineated to ensure spatial contiguity.
1. Delineation core rule: The CSD falls completely or partly (50% of
its population) inside the core.
2. Forward commuting flow rule: Given a minimum of 100
commuters, at least 50% of the employed labour force living in
the CSD works in the delineation core, as determined by the
Page 30 of 47Standard Geographical Classification (SGC) 2016 - Introduction
3/25/2021https://www.statcan.gc.ca/eng/subjects/standard/sgc/2016/introduction
previous rule. These numbers are established based on
responses to the place of work question in the previous census.
3. Reverse commuting flow rule: Given a minimum of 100
commuters, at least 50% of the employed labour force working
in the CSD lives in the delineation core as determined from
commuting data based on the place of work question in the
previous census. Before 2016, the percentage was set at 25%.
4. Spatial contiguity rule: CSDs that do not meet a commuting flow
threshold may be included in a CMA or CA, and CSDs that do
meet a commuting flow threshold may be excluded from a CMA
or CA.
5. Historical comparability rule: To maintain historical
comparability for CMAs and larger CAs (those with census tracts
in the previous census), CSDs are retained in the CMA or CA for
at least one other census even if their commuting flow
percentages fall below the commuting flow thresholds (rules 2,
3 and 4). By adjusting the historical comparability rule, users
are warned that a CSD can be excluded from a CMA or from a
larger CA in the next census or the next delineation thereof.
6. Manual adjustments: A CMA or CA represents an area that is
economically and socially integrated. However, there are certain
limitations in the extent to which this ideal can be met. Since
the CSDs that are used as building blocks in CMA and CA
delineation are administrative units, their boundaries do not
always match other statistical units (e.g., population centre
Page 31 of 47Standard Geographical Classification (SGC) 2016 - Introduction
3/25/2021https://www.statcan.gc.ca/eng/subjects/standard/sgc/2016/introduction
cores). There are always situations where the application of the
above rules creates undesirable outcomes, or where the rules
cannot be easily applied. In these circumstances, a manual
override is sometimes applied to ensure that the integrity of the
program is retained. One of these situations is a core hole,
which refers to a CSD located inside another CSD that is part of
the core delineation rule, but at least 50% of its population is
not within the same core and could not qualify according to any
previous delineation rules. Therefore, this core hole must be
included in the CMA or CA to maintain spatial contiguity.
Another example of manual adjustment is when the CSD is
partially inside the core and, based on data from the previous
Census of Population, less than 50% of its population resides in
the core. Furthermore, the CSD could not comply with the other
previous delineation rules.
Finally, the CSDs that consist of several parts or that contain
holes also influence application of the manual adjustment rule.
7. Merging adjacent CMAs and CAs: A CA adjacent to a CMA can be
merged with the CMA if the total percentage commuting
interchange between the CA and CMA is equal to at least 35% of
the employed labour force living in the CA, based on place of
work data from the previous census. The total percentage
commuting interchange is the sum of the commuting flow in
both directions between the CMA and the CA as a percentage of
the labour force living in the CA (i.e., resident employed labour
force, excluding the no fixed workplace address category).
Page 32 of 47Standard Geographical Classification (SGC) 2016 - Introduction
3/25/2021https://www.statcan.gc.ca/eng/subjects/standard/sgc/2016/introduction
A CMA or CA represents an area that is economically and socially
integrated. However, there are certain limitations to the manner in
which this goal can be met. Since the CSDs, which are used as
building blocks in CMA and CA delineation, are administrative units,
their boundaries are not always the most suitable with respect to
CMA and CA delineation. There are always situations where the
application of rules creates undesirable outcomes, or where the
rules cannot be easily applied. In these circumstances, a manual
override is sometimes applied to ensure that the integrity of the
program is retained.
CMAs and CAs are statistically comparable because they are
delineated in the same way across Canada. They differ from other
types of areas, such as trading, marketing, or regional planning
areas designated by regional authorities for planning and other
purposes, and should be used with caution for non-statistical
purposes.
There are 35 CMAs and 117 CAs in 2016. Two new CMAs were
created: Belleville (Ont.) and Lethbridge (Alta.). Eight new CAs were
created: Gander (N.L.), Sainte-Marie (Que.), Arnprior (Ont.), Carleton
Place (Ont.), Wasaga Beach (Ont.), Winkler (Man.), Weyburn (Sask.)
and Nelson (B.C.). The CAs of Amos (Que.) and Temiskaming Shores
(Ont.) were retired because the population of their cores dropped
below 10,000 in 2011.
The naming convention for CMAs and CAs is included in the Naming
geographic units section of this classification manual.
Page 33 of 47Standard Geographical Classification (SGC) 2016 - Introduction
3/25/2021https://www.statcan.gc.ca/eng/subjects/standard/sgc/2016/introduction
Census metropolitan influenced zone
The census metropolitan influenced zone (MIZ) is a concept that
geographically differentiates the area of Canada outside census
metropolitan areas (CMAs) and census agglomerations (CAs).
Census subdivisions (CSDs) within provinces that are outside CMAs
and CAs are assigned to one of four categories according to the
degree of influence (strong, moderate, weak or no influence) that
the CMAs or CAs have on them. CSDs within the territories that are
outside CAs are assigned to a separate category.
A municipality within a province is assigned to a census
metropolitan influenced zone (MIZ) category based on the
percentage of its employed labour force that commutes to work in
one or more of the municipalities (census subdivisions) that are part
of the delineation core of a CMA or CA. The calculation of the
employed labour force excludes the category of no fixed workplace
address CSDs with the same degree of influence tend to be
clustered. CSDs with the same degree of influence tend to be
clustered. They form zones around CMAs and CAs that progress
through the categories from 'strong' to 'no' influence as distance
from the CMAs and CAs increases. As many CSDs in the territories
are very large and sparsely populated, the commuting flow of the
resident employed labour force is unstable. For this reason, CSDs in
the territories that are outside CAs are assigned to a separate
category that is not based on their commuting flows.
CSDs outside CMAs and CAs are assigned to the following MIZ
categories:
Page 34 of 47Standard Geographical Classification (SGC) 2016 - Introduction
3/25/2021https://www.statcan.gc.ca/eng/subjects/standard/sgc/2016/introduction
1. Strong metropolitan influenced zone (Canada): This category
includes CSDs in provinces where at least 30% of the CSD's
resident employed labour force (excluding the category of no
fixed workplace address) commute to work in any CMA or CA. It
excludes CSDs from the previous census with fewer than 40
persons in their resident employed labour force.
2. Moderate metropolitan influenced zone (Canada): This
category includes CSDs in provinces where at least 5% but less
than 30% of the CSD's resident employed labour force
(excluding the category of no fixed workplace address)
commute to work in any CMA or CA. It excludes CSDs from the
previous census with fewer than 40 persons in their resident
employed labour force.
3. Weak metropolitan influenced zone (Canada): This category
includes CSDs in provinces where more than 0% but less than
5% of the CSD's resident employed labour force (excluding the
category of no fixed workplace address) commute to work in
any CMA or CA. It excludes CSDs from the previous census with
fewer than 40 persons in their resident employed labour force.
4. No metropolitan influenced zone (Canada): This category
includes CSDs in provinces where none of the CSD's resident
employed labour force (excluding the category of no fixed
workplace address) commute to work in any CMA or CA. It also
includes CSDs from the previous census in provinces with fewer
than 40 persons in their resident employed labour force.
5. Territories (outside CAs, Canada): This category includes CSDs
in the territories outside CAs.
Page 35 of 47Standard Geographical Classification (SGC) 2016 - Introduction
3/25/2021https://www.statcan.gc.ca/eng/subjects/standard/sgc/2016/introduction

All of the landmass of Canada outside CMAs and CAs are classified
by the five MIZ in the classification variant. For example, all areas in
Canada with no metropolitan influence are classified as "No
metropolitan influenced zone (Canada)". Where "Canada" appears
in brackets, it may be omitted when the context provides
clarification.
The coding structure
Each of the three levels of the classification variant covers all of
Canada. For the first level consisting of the census metropolitan
categories, an alpha code has been introduced:
• A: Census metropolitan areas (Canada)
• B: Census agglomerations (Canada)
• C: Outside census metropolitan areas and census
agglomerations (Canada)
In the second level, three-digit numeric codes are used for
individual CMAs, CAs and MIZs.
The codes for a CMA, a CA and a MIZ are shown in the following
illustration:
Codes for a CMA, a CA and a MIZ
Census
metropolitan
category
CMA/CA/MIZ
code Name
A 001 St. John's
Page 36 of 47Standard Geographical Classification (SGC) 2016 - Introduction
3/25/2021https://www.statcan.gc.ca/eng/subjects/standard/sgc/2016/introduction

3/22/2021 Performance Management Program for Deputy Ministers, Associate Deputy Ministers, and Individuals Paid in the GX Range - Canada.ca
https://www.canada.ca/en/privy-council/programs/appointments/governor-council-appointments/performance-management/senior-public-servants.html 1/23
Canada.ca
About government
How government works
Government appointments
Governor in Council appointments
Performance Management
> >
> >
>
Performance Management Program forDeputy Ministers, Associate DeputyMinisters, and Individuals Paid in the GXRange
Program guidelinesSenior Personnel SecretariatPrivy Council OfficeLast Updated: April 2018
1.0 IntroductionThe purpose of this document is to provide an overview of thePerformance Management Program as it applies to deputy ministers,associate deputy ministers, and individuals paid in the GX salary range.
1.1 Program Objectives
The objectives of the Performance Management Program are:
to encourage excellent performance by setting clear objectives andrigorously evaluating the achievement of results;to recognize and reward strong performance and identify under-performance; and
3/22/2021 Performance Management Program for Deputy Ministers, Associate Deputy Ministers, and Individuals Paid in the GX Range - Canada.ca
https://www.canada.ca/en/privy-council/programs/appointments/governor-council-appointments/performance-management/senior-public-servants.html 2/23
to provide a framework within which a consistent and equitableapproach to performance management can be applied.
1.2 Compensation Plan
The Advisory Committee on Senior Level Retention and Compensation,composed of senior executives from the private and other publicsectors, was established in 1997 to provide independent advice to thegovernment on compensation and overall human resourcesmanagement matters for public service executives and Governor inCouncil appointees.
In February 1998, the government accepted the recommendationscontained in the First Report of the Advisory Committee. As a result, anew compensation plan for deputy ministers, associate deputyministers, and other Governor in Council appointees was introduced.
As per the Committee’s recommendation, cash compensation for seniorpersonnel has two components - base salary and performance pay.Performance pay has two elements - a variable amount (at-risk pay)which must be re-earned each year and a bonus for performance thatsurpasses expectations. As in the private sector, it would be expectedthat most senior personnel would receive some at-risk pay.
An effective performance management program is integral to thesuccess of this compensation plan.
1.3 Eligibility
To be eligible for performance pay, incumbents appointed by theGovernor in Council must normally hold their positions for at least three(3) consecutive months in the performance cycle. This period allows theincumbent sufficient time to achieve measurable results.
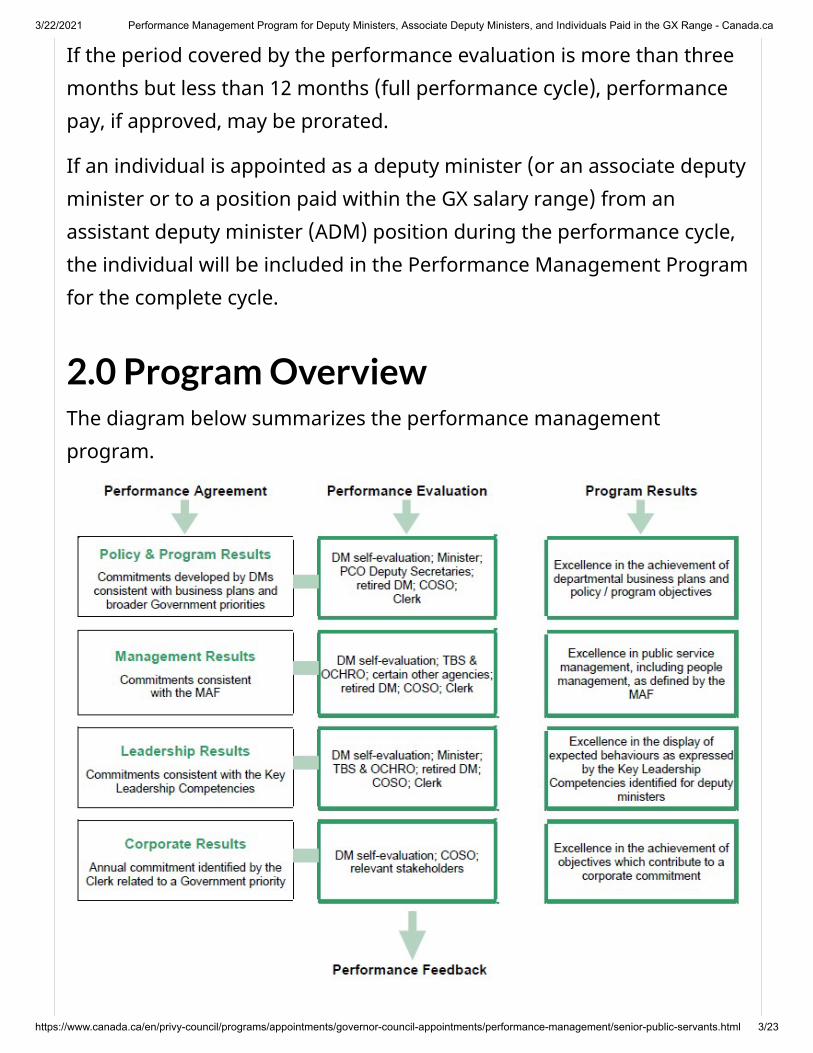
3/22/2021 Performance Management Program for Deputy Ministers, Associate Deputy Ministers, and Individuals Paid in the GX Range - Canada.ca
https://www.canada.ca/en/privy-council/programs/appointments/governor-council-appointments/performance-management/senior-public-servants.html 3/23
If the period covered by the performance evaluation is more than threemonths but less than 12 months (full performance cycle), performancepay, if approved, may be prorated.
If an individual is appointed as a deputy minister (or an associate deputyminister or to a position paid within the GX salary range) from anassistant deputy minister (ADM) position during the performance cycle,the individual will be included in the Performance Management Programfor the complete cycle.
2.0 Program OverviewThe diagram below summarizes the performance managementprogram.

3/22/2021 Performance Management Program for Deputy Ministers, Associate Deputy Ministers, and Individuals Paid in the GX Range - Canada.ca
https://www.canada.ca/en/privy-council/programs/appointments/governor-council-appointments/performance-management/senior-public-servants.html 4/23
Text version
3.0 Performance AgreementsThe performance agreement is a mutual understanding between thedeputy minister and the Clerk of the Privy Council (or the associatedeputy minister/GX and the deputy minister) as to what is expected forthe performance cycle.
The performance agreement is comprised of individual commitments, aswell as the related performance measures:
Individual Commitments:
Policy and Program Results: These commitments reflect theorganization’s priority areas of focus during the performance cycle,related to business plans. They are challenging but achievable witheffort through the individual’s own influence and control. They mustalso be results-oriented and measurable or clearly demonstrable.Commitments must be such that the deputy minister will personallymake a significant contribution to their achievement. Individuals areexpected to develop the following as part of their performanceagreements:
commitments based on the business plans of the organization;andcommitments that reflect priority areas of focus of theGovernment.
Each commitment must be accompanied by related performancemeasures which are observations or data that determine and defineif and how well the commitments are met. They will form the basis

3/22/2021 Performance Management Program for Deputy Ministers, Associate Deputy Ministers, and Individuals Paid in the GX Range - Canada.ca
https://www.canada.ca/en/privy-council/programs/appointments/governor-council-appointments/performance-management/senior-public-servants.html 5/23
of reporting at the end of the performance cycle.
Management Results: Individuals with responsibility andaccountability for the management of an organization will also bemeasured on their progress in implementing the managementconditions described in the Management Accountability Framework(MAF), with emphasis on the priorities identified by the deputyminister and the Secretary of the Treasury Board or the ChiefHuman Resources Officer, including people management.
The management conditions set out in the MAF (ManagementAccountability Framework) translate into generic commitments andserve as benchmarks for expected performance of all deputyministers (see Annex A). As such, there is no need for deputyministers to include management results in their performanceagreements unless they wish to highlight a particular initiative.
Leadership Results: These commitments reflect the expecteddemonstration of the Key Leadership Competencies which arerequired to successfully carry out the responsibilities of the position.The Key Leadership Competencies are generic commitments andserve as a benchmark for expected performance of all deputyministers (see Annex B). As such, there is no need for deputyministers to include leadership results in their performanceagreements unless they wish to highlight a particular initiative.
Corporate Results: This commitment reflects a current Governmentpriority. It will be identified on an annual basis by the Clerk of thePrivy Council and the results will be evaluated and rewarded basedon the contribution of the individual towards the corporate

3/22/2021 Performance Management Program for Deputy Ministers, Associate Deputy Ministers, and Individuals Paid in the GX Range - Canada.ca
https://www.canada.ca/en/privy-council/programs/appointments/governor-council-appointments/performance-management/senior-public-servants.html 6/23
commitment.
Details on the corporate priorities are posted annually on the PrivyCouncil Office website.
3.1 Changes to Performance Agreements
Changes may be made to the performance agreement during theperformance cycle, in consultation with the Clerk (or with the deputyminister in the case of associate deputy ministers and persons paid inthe GX salary range).
4.0 Performance Evaluation
4.1 Input on Performance Evaluation
At the end of the performance cycle, each deputy minister completes aself-evaluation assessing achievements against the agreed uponcommitments. Deputy ministers also complete an evaluation of theirassociate deputy minister(s), as well as those paid in the GX salaryrange, where applicable. A concise summary of each evaluation (i.e.half a page) should also be completed in addition to the full (self)evaluation. Both documents will be submitted for consideration by theCommittee of Senior Officials (COSO).
Additional information is sought by the Privy Council Office tosupplement the self-evaluations including:
the input of the responsible Minister;the comments of central agencies including the Privy Council Office,the Treasury Board Secretariat and the Office of the Chief HumanResources Officer reporting on results in relation to the MAF
3/22/2021 Performance Management Program for Deputy Ministers, Associate Deputy Ministers, and Individuals Paid in the GX Range - Canada.ca
https://www.canada.ca/en/privy-council/programs/appointments/governor-council-appointments/performance-management/senior-public-servants.html 7/23
(Management Accountability Framework) and, if appropriate, theannual corporate commitment;the input gathered by a retired deputy minister from others asappropriate, such as chairpersons of deputy minister committeesand other deputy ministers or deputy heads in the portfolio; andthe input of COSO (Committee of Senior Officials).
4.2 Performance Ratings
Performance ratings depend not only on each deputy ministers’ ownperformance against their commitments, but also on the relative scopeand complexity of the challenges they faced. Ratings will be based onresults achieved, as well as on the manner in which they were achieved.
Overall performance is evaluated with the following possible results:
Did not Meet /Unable to AssessDid not achieve performance expectations or unable to assess theperformance during the cycle (due to leave, training, specialassignment).
Succeeded ‑Did not fully succeed in meeting performance expectations. Or,while succeeded, it was in a position with performance expectationsof less scope and complexity in relation to those of other deputylevel jobs.
SucceededHas fully achieved the performance expectations.
3/22/2021 Performance Management Program for Deputy Ministers, Associate Deputy Ministers, and Individuals Paid in the GX Range - Canada.ca
https://www.canada.ca/en/privy-council/programs/appointments/governor-council-appointments/performance-management/senior-public-servants.html 8/23
Succeeded +Exceeded the performance expectations. Or, fully succeeded in aposition of greater scope and complexity in relation to those ofother deputy level jobs.
SurpassedWent well beyond performance expectations.
4.3 Performance Awards
The Performance Management Program provides the opportunity toearn the following performance-based compensation:
Economic IncreaseAn economic increase can be recommended annually by theAdvisory Committee on Senior Level Retention and Compensation,and if applicable, would reflect a percentage increase in base salary.Eligibility for this increase is normally dependent upon thesuccessful achievement of commitments. An economic increase canalso be awarded in cases where performance is unable to beassessed for reasons such as leave, training, etc. Normally, noeconomic increase is awarded for performance that does notachieve expectations.
In-Range Salary MovementMovement through the salary range, up to the maximum of therange, is earned through the successful achievement ofcommitments. Normal progression for successful performance is 5%per year. Higher or lower percentages may be approved based onthe degree of performance against expectations. No in-range salaryincrease is awarded for performance that does not achieve
3/22/2021 Performance Management Program for Deputy Ministers, Associate Deputy Ministers, and Individuals Paid in the GX Range - Canada.ca
https://www.canada.ca/en/privy-council/programs/appointments/governor-council-appointments/performance-management/senior-public-servants.html 9/23
expectations.
At-Risk PayThe lump sum payment is equivalent to a percentage of base salaryand must be re-earned each year, based on the successfulachievement of commitments. The amount of this lump sum mayvary, depending on the degree of success achieved, as outlinedunder the section on Performance Ratings. This payment does notincrease an individual’s base salary but is included in average salaryfor pension calculations. At-risk pay can be earned regardless of anindividual’s position in the salary range; however, no at-risk pay isawarded for performance that does not achieve expectations.
BonusThis lump sum payment is in addition to at-risk pay and is based onthe individual’s demonstrated performance that has surpassedexpectations. Like at-risk pay, this payment does not increase anindividual’s base salary but is included in average salary for pensioncalculations. Bonuses can be earned regardless of an individual’sposition in the salary range.
In implementing in-range salary increases, at-risk pay and bonuses, thesalary used as the base for calculations is that in effect on the last day ofthe performance cycle; that is, March 31st. Economic increases apply tothe upcoming fiscal year and are based on the salary followingapplication of any in-range salary increase.
4.4 Performance Award

3/22/2021 Performance Management Program for Deputy Ministers, Associate Deputy Ministers, and Individuals Paid in the GX Range - Canada.ca
https://www.canada.ca/en/privy-council/programs/appointments/governor-council-appointments/performance-management/senior-public-servants.html 10/23
The Privy Council Office annually issues information on the range ofperformance awards available, according to performance achieved andthe individual’s classification. This information can be found on the PrivyCouncil Office website.
5.0 Approval and feedback processCompensation for deputy ministers and associate deputy ministers isapproved by the Governor in Council. Copies of the Order in Councilauthorizing payment are provided to the individuals concerned forforwarding to their compensation office for implementation.
Compensation for individuals paid in the GX salary range is approved bythe Prime Minister.
5.1 Feedback
Emphasis is placed on developing and sharing constructive feedback,including any recommendations for strengthening performance. Asappropriate, the Clerk of the Privy Council, the Associate Secretary to theCabinet, or the Deputy Secretary to the Cabinet (Senior Personnel,Business Transformation and Renewal), will provide performancefeedback.
5.2 Recovery of Performance Pay
The Performance Management Program for Governor in Council (GIC)appointees incents performance by linking a portion of compensation tothe achievement of results. A rigorous evaluation process and the abilityto accurately compensate for results are essential to the program’s
3/22/2021 Performance Management Program for Deputy Ministers, Associate Deputy Ministers, and Individuals Paid in the GX Range - Canada.ca
https://www.canada.ca/en/privy-council/programs/appointments/governor-council-appointments/performance-management/senior-public-servants.html 11/23
integrity. On occasion, information may come to light following theevaluation period that is relevant to the assessment and performancepay that was provided to an appointee:
when it has been determined, following due process, that anappointee willfully or recklessly sought to hide or misrepresent theirachievements such that any deficiencies would have been difficult todetect at the time of evaluation;when it has been determined, following due process, that anappointee committed serious breaches of conduct ormismanagement within a particular performance period that wouldhave had such a negative effect on the rating provided that theywould have received a rating of “did not meet”.
In such cases, the GIC may assign a revised performance rating for theperiod in question and recover any performance pay and associatedcompensation provided to the appointee during that period:
the amounts eligible for recovery are deemed under the Terms andConditions for Full-Time Governor in Council Appointees to be anoverpayment under s.155 of the Financial Administration Act; and,the amounts eligible for recovery include any at-risk pay, bonus andin-range movement earned as a result of the initial rating assignedduring the performance cycle in question. This also includes arecalculation of pension entitlements, should the appointee haveretired and recovery of any overpayments as a result.
5.3 Communications
To ensure transparency and understanding of the program objectivesand results, as well as alignment in the organization, individuals areencouraged to share their performance commitments with their
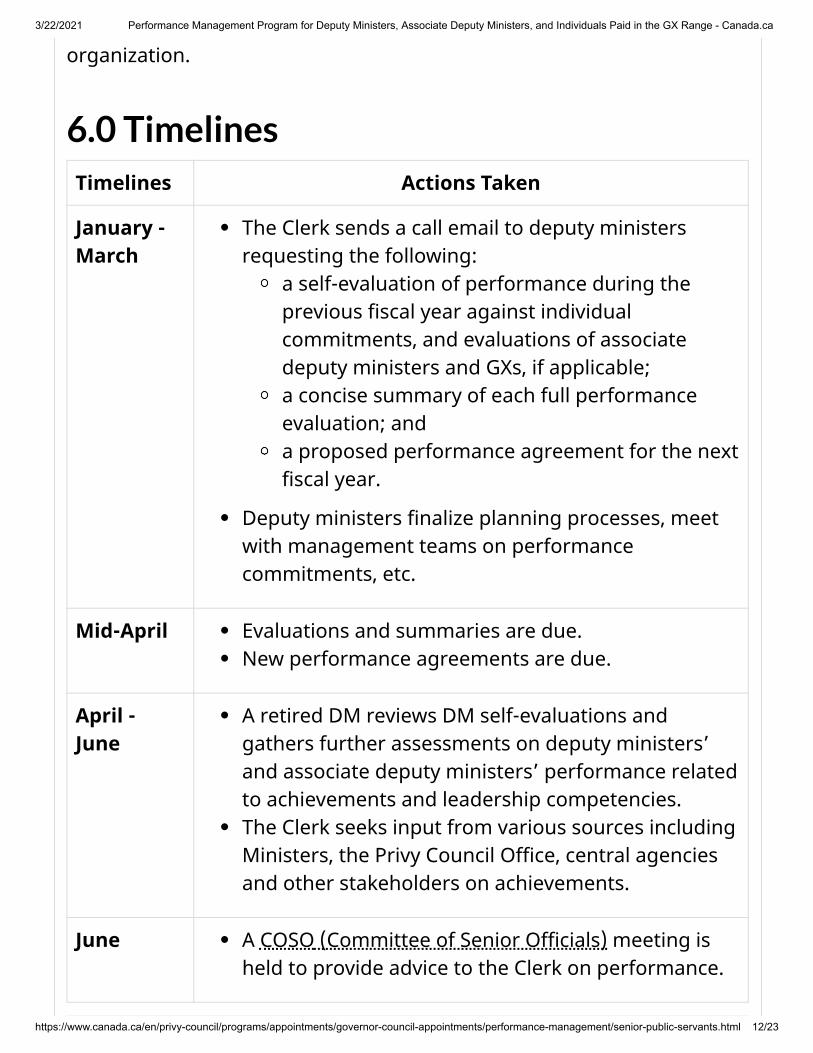
3/22/2021 Performance Management Program for Deputy Ministers, Associate Deputy Ministers, and Individuals Paid in the GX Range - Canada.ca
https://www.canada.ca/en/privy-council/programs/appointments/governor-council-appointments/performance-management/senior-public-servants.html 12/23
organization.
6.0 TimelinesTimelines Actions Taken
January -March
The Clerk sends a call email to deputy ministersrequesting the following:
a self-evaluation of performance during theprevious fiscal year against individualcommitments, and evaluations of associatedeputy ministers and GXs, if applicable;a concise summary of each full performanceevaluation; anda proposed performance agreement for the nextfiscal year.
Deputy ministers finalize planning processes, meetwith management teams on performancecommitments, etc.
Mid-April Evaluations and summaries are due.New performance agreements are due.
April -June
A retired DM reviews DM self-evaluations andgathers further assessments on deputy ministers’and associate deputy ministers’ performance relatedto achievements and leadership competencies.The Clerk seeks input from various sources includingMinisters, the Privy Council Office, central agenciesand other stakeholders on achievements.
June A COSO (Committee of Senior Officials) meeting isheld to provide advice to the Clerk on performance.

3/22/2021 Performance Management Program for Deputy Ministers, Associate Deputy Ministers, and Individuals Paid in the GX Range - Canada.ca
https://www.canada.ca/en/privy-council/programs/appointments/governor-council-appointments/performance-management/senior-public-servants.html 13/23
Timelines Actions Taken
July -August
Performance feedback is provided to deputyministers.
September Performance pay is implemented.
October Final amendments to performance agreements forthe year in progress are due, including any changesrelated to the performance feedback received.
Annex A - Management Results GenericCommitmentsThese commitments reflect the core organizational and managementaccountabilities, as described in the Management AccountabilityFramework.
Leadership and Strategic Direction
Articulates and embodies the vision, mandate and strategic prioritiesthat guide the organization while supporting Ministers and Parliamentin serving the public interest.
Results and Accountability
Uses performance results to ensure accountability and drive ongoingimprovements and efficiencies to policies, programs, and services toCanadians.
Public Sector Values

3/22/2021 Performance Management Program for Deputy Ministers, Associate Deputy Ministers, and Individuals Paid in the GX Range - Canada.ca
https://www.canada.ca/en/privy-council/programs/appointments/governor-council-appointments/performance-management/senior-public-servants.html 14/23
Exemplifies the core values of the public sector by having respect forpeople and democracy, serving with integrity and demonstratingstewardship and excellence.
Continuous Learning and Innovation
Manages through continuous innovation and transformation, topromote organizational learning and improve performance.
Governance and Strategic Management
Maintains effective governance that integrates and aligns priorities,plans, accountabilities and risk management to ensure that internalmanagement functions support and enable high performing policies,programs and services.
People Management
Optimizes the workforce and the work environment to enable highproductivity and performance, effective use of human resources andincreased employee engagement.
Financial and Asset Management
Provides an effective and sustainable financial management functionfounded on sound internal controls, timely and reliable reporting, andfairness and transparency in the management of assets and acquiredservices.
Information Management
Safeguards and manages information and systems as a public trust anda strategic asset that supports effective decision-making and efficientoperations to maximize value in the service of Canadians.

3/22/2021 Performance Management Program for Deputy Ministers, Associate Deputy Ministers, and Individuals Paid in the GX Range - Canada.ca
https://www.canada.ca/en/privy-council/programs/appointments/governor-council-appointments/performance-management/senior-public-servants.html 15/23
Management of Policy and Programs
Designs and manages policies and programs to ensure value for moneyin achieving results.
Management of Service Delivery
Delivers client-centred services while optimizing partnerships andtechnology to meet the needs of stakeholders.
Individuals should consult the Management AccountabilityFramework, available on the Treasury Board of Canada Secretariatwebsite, for a complete understanding of the MAF (ManagementAccountability Framework) elements and performance objectives.
Annex B - Leadership Results GenericCommitmentsThese commitments reflect the expected demonstration of the KeyLeadership Competencies required to successfully carry out theresponsibilities of the position.
Create Vision and Strategy
Leaders define the future and chart a path forward. They are adept atunderstanding and communicating context, factoring in the economic,social and political environment. Intellectually agile, they leverage theirdeep and broad knowledge, build on diverse ideas and perspectives and

3/22/2021 Performance Management Program for Deputy Ministers, Associate Deputy Ministers, and Individuals Paid in the GX Range - Canada.ca
https://www.canada.ca/en/privy-council/programs/appointments/governor-council-appointments/performance-management/senior-public-servants.html 16/23
create consensus around compelling visions. Leaders balanceorganizational and government-wide priorities and improve outcomesfor Canada and Canadians.
Mobilize People
Leaders inspire and motivate the people they lead. They manageperformance, provide constructive and respectful feedback toencourage and enable performance excellence. They lead by example,setting goals for themselves that are more demanding than those thatthey set for others.
Uphold Integrity and Respect
Leaders exemplify ethical practices, professionalism and personalintegrity. They create respectful and trusting work environments wheresound advice is valued. They encourage the expression of diverseopinions and perspectives, while fostering collegiality. Leaders are self-aware and seek out opportunities for personal growth.
Collaborate with Partners and Stakeholders
Leaders are deliberate and resourceful about seeking the widestpossible spectrum of perspectives. They demonstrate openness andflexibility to forge consensus and improve outcomes. They bring awhole-of-government perspective to their interactions. In negotiatingsolutions, they are open to alternatives and skillful at managingexpectations. Leaders share recognition with their teams and partners.
Promote Innovation and Guide Change
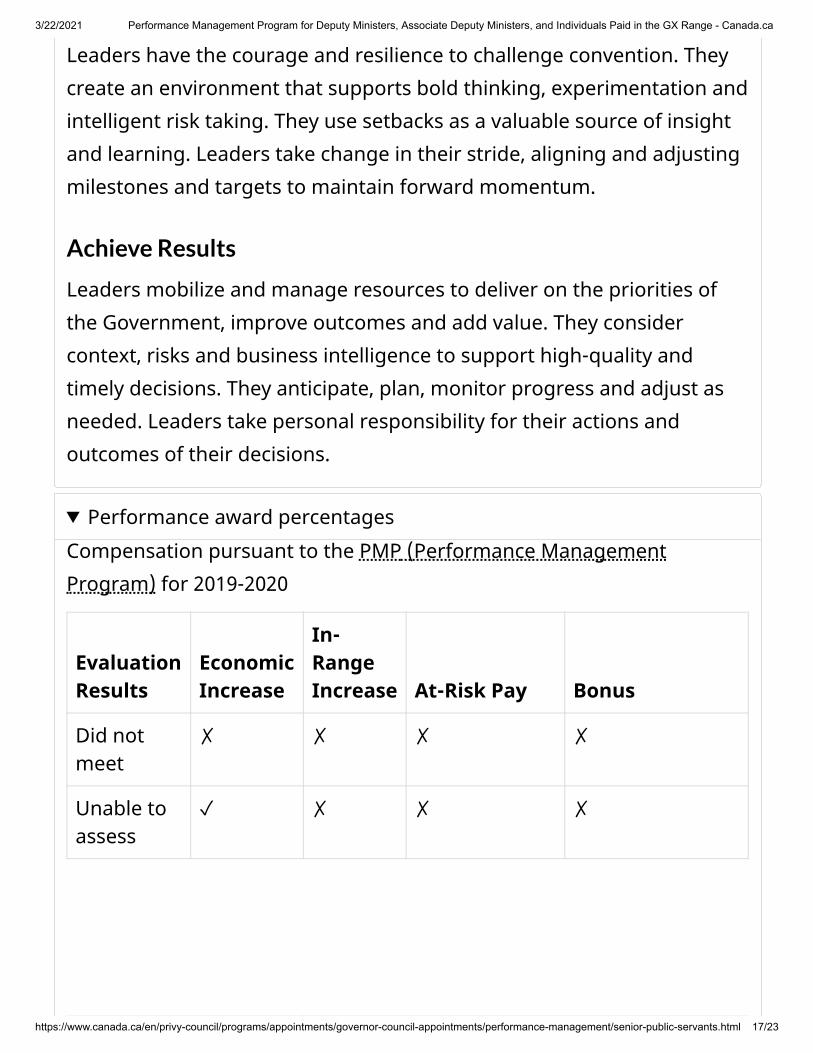
3/22/2021 Performance Management Program for Deputy Ministers, Associate Deputy Ministers, and Individuals Paid in the GX Range - Canada.ca
https://www.canada.ca/en/privy-council/programs/appointments/governor-council-appointments/performance-management/senior-public-servants.html 17/23
Leaders have the courage and resilience to challenge convention. Theycreate an environment that supports bold thinking, experimentation andintelligent risk taking. They use setbacks as a valuable source of insightand learning. Leaders take change in their stride, aligning and adjustingmilestones and targets to maintain forward momentum.
Achieve Results
Leaders mobilize and manage resources to deliver on the priorities ofthe Government, improve outcomes and add value. They considercontext, risks and business intelligence to support high-quality andtimely decisions. They anticipate, plan, monitor progress and adjust asneeded. Leaders take personal responsibility for their actions andoutcomes of their decisions.
Performance award percentagesCompensation pursuant to the PMP (Performance ManagementProgram) for 2019-2020
EvaluationResults
EconomicIncrease
In-RangeIncrease At-Risk Pay Bonus
Did notmeet
✗ ✗ ✗ ✗
Unable toassess
✓ ✗ ✗ ✗
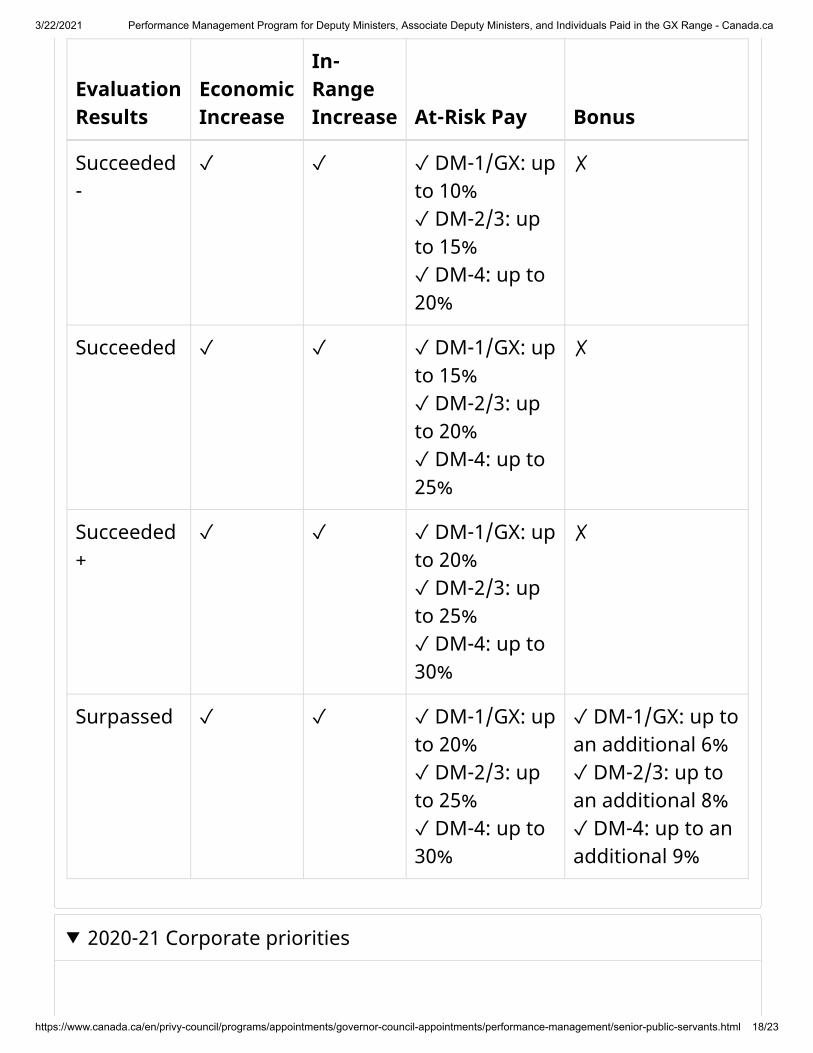
3/22/2021 Performance Management Program for Deputy Ministers, Associate Deputy Ministers, and Individuals Paid in the GX Range - Canada.ca
https://www.canada.ca/en/privy-council/programs/appointments/governor-council-appointments/performance-management/senior-public-servants.html 18/23
EvaluationResults
EconomicIncrease
In-RangeIncrease At-Risk Pay Bonus
Succeeded-
✓ ✓ ✓ DM-1/GX: upto 10%✓ DM-2/3: upto 15%✓ DM-4: up to20%
✗
Succeeded ✓ ✓ ✓ DM-1/GX: upto 15%✓ DM-2/3: upto 20%✓ DM-4: up to25%
✗
Succeeded+
✓ ✓ ✓ DM-1/GX: upto 20%✓ DM-2/3: upto 25%✓ DM-4: up to30%
✗
Surpassed ✓ ✓ ✓ DM-1/GX: upto 20%✓ DM-2/3: upto 25%✓ DM-4: up to30%
✓ DM-1/GX: up toan additional 6%✓ DM-2/3: up toan additional 8%✓ DM-4: up to anadditional 9%
2020-21 Corporate priorities

3/22/2021 Performance Management Program for Deputy Ministers, Associate Deputy Ministers, and Individuals Paid in the GX Range - Canada.ca
https://www.canada.ca/en/privy-council/programs/appointments/governor-council-appointments/performance-management/senior-public-servants.html 19/23
2020 - 2021 Corporate PrioritiesIn the context of the Government’s response to the COVID19 pandemic,our corporate priorities have never been more important in guiding thecollective efforts of senior leaders as they set the tone in advancing themind-sets and behaviours that will result in a more agile, inclusive andequipped public service. Continuing to foster healthy, diverse andinclusive workplaces takes on even greater significance in the currentcontext and will continue to serve us well as a fundamental element ofour leadership responsibilities.
In respect of these unprecedented times and realities, the Public Serviceleadership is expected to carry out the following corporate priorities in2020-21:
Mobilizing in Support of Common Goals in Response to COVID19
For 2020-21, ensure you have performance commitments that enablemeasurable indicators of your leadership in:
Adapting to shifting operational and strategic realities as a result ofthe COVID19 pandemic in order to deliver services and results forCanadians.Promoting the physical health and safety of your organization,particularly in the context of a return to the workplace in 2020-2021.Supporting the psychological health of your employees in thesechallenging times, including the prevention and resolution ofharassment and discrimination.
Fostering Diversity and Inclusion
Continue efforts to increase the diversity of the workforce in yourorganization, and foster the inclusion of a broad range of voices andviews in governance and decision-making. See Deputy Minister

3/22/2021 Performance Management Program for Deputy Ministers, Associate Deputy Ministers, and Individuals Paid in the GX Range - Canada.ca
https://www.canada.ca/en/privy-council/programs/appointments/governor-council-appointments/performance-management/senior-public-servants.html 20/23
Commitments on Diversity and Inclusion.
Supporting Efforts to Address the Pay System (for organizationsserved by Phoenix)
Undertake the necessary initiatives to ensure employees are paidaccurately and on time. This includes efforts to manage peaks andreduce intake of pay actions in order to meet timelines and performancemeasures per the established quantitative methodology and indicatorscommunicated by Public Services and Procurement Canada and theTreasury Board of Canada Secretariat.
2019-20 Corporate priorities
2019 - 2020 Corporate PrioritiesAs the first year of implementation of Beyond2020, it is critical for publicservice leaders to engage their organizations in exploring and advancingthe mindsets and behaviours that will result in greater agility, deeperinclusion, and a better equipped workforce. Success will depend on yourleadership in modelling, enabling and empowering this change acrossyour organizations
Healthy WorkplacesFor 2019-20, continue building and sustaining a healthy workplaceand specifically demonstrate further progress against all threepillars of the Federal Public Service Workplace Mental HealthStrategy; and, take meaningful action on harassment anddiscrimination.
Inclusive workplaces

3/22/2021 Performance Management Program for Deputy Ministers, Associate Deputy Ministers, and Individuals Paid in the GX Range - Canada.ca
https://www.canada.ca/en/privy-council/programs/appointments/governor-council-appointments/performance-management/senior-public-servants.html 21/23
For 2019-20, continue efforts to increase the social and culturaldiversity of the workforce, and foster the inclusion of a broad rangeof voices and views in governance and decision-making.
Pay System (for those organizations served by Phoenix)For 2019-20, continue to undertake and report on activecontributions to HR-to-pay stabilization to ensure employees arepaid accurately and on time. This includes actions within yourorganization, and contributing to the efforts of the Treasury BoardSecretariat (TBS) and Public Services and Procurement Canada inaddressing pay challenges. More specifically, as determined by TBS,human resources transactions leading to a pay action (effective April1, 2019) will meet timelines and performance measures as per TBS-established methodology, and be assessed as part of theManagement Accountability Framework.
ContactsFor more information on the Performance Management Program pleasecontact the following:
Tania SimpsonDeputy-Director, CompensationPrivy Council Office(613) [email protected]
or
Diane Umutesi-GasanaPolicy and Programs AnalystPrivy Council Office
3/22/2021 Performance Management Program for Deputy Ministers, Associate Deputy Ministers, and Individuals Paid in the GX Range - Canada.ca
https://www.canada.ca/en/privy-council/programs/appointments/governor-council-appointments/performance-management/senior-public-servants.html 22/23
(343) [email protected]
Supportive documents
Program Guidelines[PDF (Portable Document Format) - 108 KB(Kilobyte)]
2019 - 2020 Performance Award Percentages[PDF (Portable Document Format) - 40 KB(Kilobyte)]
2020 - 2021 Corporate Priorities[PDF (Portable Document Format) - 18 KB(Kilobyte)]
2019 - 2020 Corporate Priorities[PDF (Portable Document Format) - 13 KB(Kilobyte)]
3/22/2021 Performance Management Program for Deputy Ministers, Associate Deputy Ministers, and Individuals Paid in the GX Range - Canada.ca
https://www.canada.ca/en/privy-council/programs/appointments/governor-council-appointments/performance-management/senior-public-servants.html 23/23
Date modified:2020-10-19
Template Performance Agreement andEvaluation Form[DOC (Microsoft Word document) - 57 KB(Kilobyte)]

Canada.ca About government How government works
Government appointments Governor in Council appointments
Compensation, terms and conditions of employment
> >
> >
>
Remuneration guidelines for part-time GIC appointees in agencies, boards, and commissionsEffective October 1, 2000
Introduction
These guidelines set out the amounts and conditions of payment
for the part-time services of persons appointed to office by the
Governor in Council (GiC). They are not an authority in themselves.
They set out what can be recommended routinely and without
substantiation for the approval of the GiC. Each organization must
obtain its own Order in Council for authority to pay.
Authority
Generally, the statute that creates the organization specifies the
authority to fix remuneration for GiC appointees.
Application
Page 1 of 7Remuneration guidelines for part-time GIC appointees in agencies, boards, and commissi...
3/19/2021https://www.canada.ca/en/privy-council/programs/appointments/governor-council-appoint...

These guidelines apply to all persons appointed to part-time
positions in agencies, boards and commissions for which the GiC
has the authority to fix the rate of remuneration.
They do not apply to full-time employees or appointees of a
Canadian government organization because they are not eligible to
receive additional remuneration for a part-time GiC appointment.
Principles
The Canadian government's compensation policy recognizes the
need to attract and retain well-qualified appointees.
Service to the public and not adherence to market rates influences
the remuneration of the highest executive levels. This principle also
influences remuneration for part-time service. Exceptions are public
practitioners such as lawyers, conciliators, arbitrators, etc. whose
appointment requires them to provide these professional services.
Definitions
Executive Organizations are those whose primary mission is to
make final and binding decisions and/or to produce goods or
services.
Advisory Organizations are those which engage in investigative,
evaluative or research activity to provide opinions or
recommendations.
Amounts and Conditions of Payment
The schedule of per diem rates that follows specifies the maximum
Page 2 of 7Remuneration guidelines for part-time GIC appointees in agencies, boards, and commissi...
3/19/2021https://www.canada.ca/en/privy-council/programs/appointments/governor-council-appoint...
rates that may be submitted for GiC approval on a routine basis.
Submissions requesting rates that exceed those of the schedule
must include justification for exceptional consideration by the GiC.
When a statute by which an organization is created limits payment
to a particular circumstance, such as for attending meetings, no per
diem payment may be made for any other reason.
Only one per diem payment shall be made in respect of a twenty-
four hour calendar day.
A per diem rate is normally payable for the following:
• attendance at meetings of the full organization and of
recognized committees or sub-committees of the organization
(including appointees' participation by electronic means);
• four meetings conducted among a quorum of the organization
or its committees or sub-committees by telephone or other
similar facility;
• traveling time, if the time required to travel between the
meeting place and the normal place of residence exceeds three
hours; and
• special executive, analytical or representational responsibilities
explicitly designated by the governing members of the
organization.
In organizations where the statute establishes a position of vice-
chair, or equivalent, the per diem may be set at a rate higher than
that for members in acknowledgement of additional
responsibilities.
Page 3 of 7Remuneration guidelines for part-time GIC appointees in agencies, boards, and commissi...
3/19/2021https://www.canada.ca/en/privy-council/programs/appointments/governor-council-appoint...
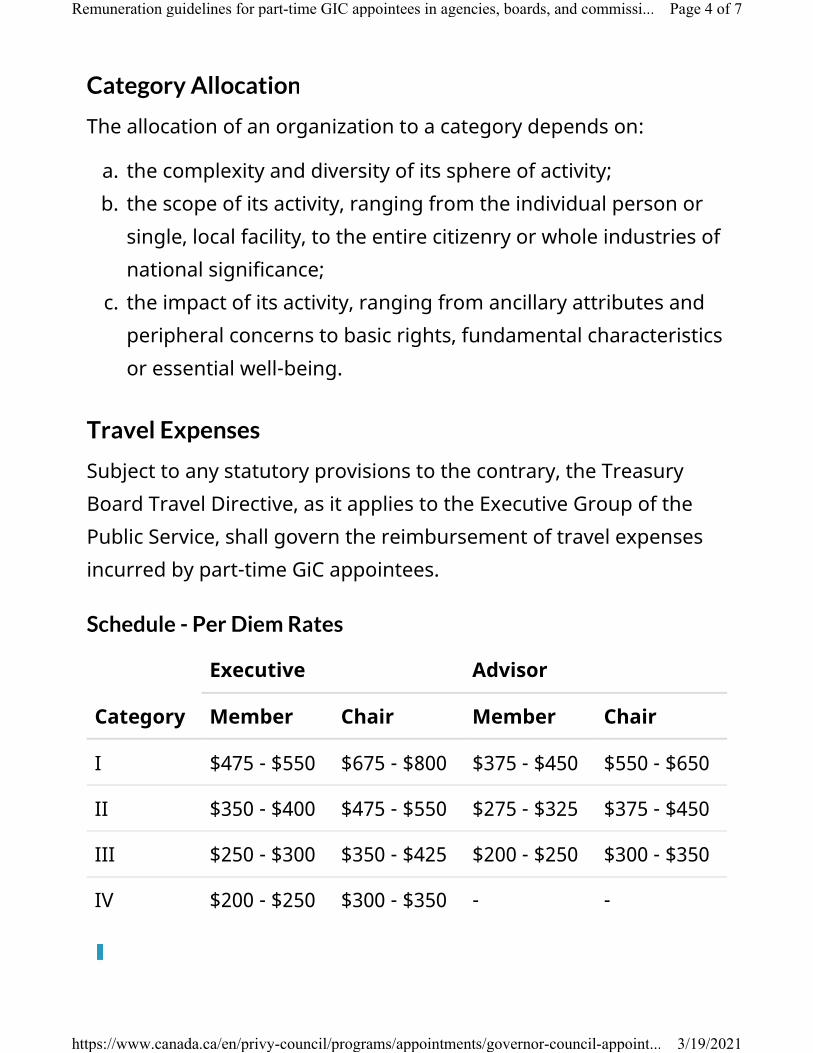
Category Allocation
The allocation of an organization to a category depends on:
a. the complexity and diversity of its sphere of activity;
b. the scope of its activity, ranging from the individual person or
single, local facility, to the entire citizenry or whole industries of
national significance;
c. the impact of its activity, ranging from ancillary attributes and
peripheral concerns to basic rights, fundamental characteristics
or essential well-being.
Travel Expenses
Subject to any statutory provisions to the contrary, the Treasury
Board Travel Directive, as it applies to the Executive Group of the
Public Service, shall govern the reimbursement of travel expenses
incurred by part-time GiC appointees.
Schedule - Per Diem Rates
Category
Executive Advisor
Member Chair Member Chair
I $475 - $550 $675 - $800 $375 - $450 $550 - $650
II $350 - $400 $475 - $550 $275 - $325 $375 - $450
III $250 - $300 $350 - $425 $200 - $250 $300 - $350
IV $200 - $250 $300 - $350 - -
Page 4 of 7Remuneration guidelines for part-time GIC appointees in agencies, boards, and commissi...
3/19/2021https://www.canada.ca/en/privy-council/programs/appointments/governor-council-appoint...

See Annexes A and B for the allocation of organizations to
categories.
Annex A - Executive Agencies, Boards and Commissions
Category I
• Canadian Institutes of Health Research
• Energy Supplies Allocation Board
• Indian Specific Claims Commission
• Oil and Gas Committee
• Patented Medicine Prices Review Board
Category II
• Arbitration Board (Inuvialuit)
• Canadian Cultural Property Export Review Board
• Environmental Impact Review Board
• National Farm Products Council
• Ship-source Oil Pollution Fund
Category III
• Cree Naskapi Commission
• Merchant Seamen Compensation Board
Category IV
• Nunavut Wildlife Management Board
• Oshawa Harbour Commission
Page 5 of 7Remuneration guidelines for part-time GIC appointees in agencies, boards, and commissi...
3/19/2021https://www.canada.ca/en/privy-council/programs/appointments/governor-council-appoint...

• Renewable Resources Board (Sahtu)
• Renewable Resources Board (Gwich'in)
Annex B - Advisory Agencies, Boards and Commissions
Category I
• Canadian Centre for Occupational Health and Safety
• Law Commission of Canada
• National Round Table on the Environment and the Economy
• Security Intelligence Review Committee
Category II
• Atlantic Canada Opportunities Board
• Canadian Polar Commission
• International Centre for Human Rights and Democratic
Development
Category III
• Canada-Norway Sealing Commission
• Environmental Impact Screening Committee
• Historic Sites and Monuments Board
• International Commission for the Conservation of Atlantic
Tunas
• International Council for the Exploration of the Sea
• National Advisory Council on Aging
• National Council of Welfare
• North Pacific Anadromous Fish Commission
Page 6 of 7Remuneration guidelines for part-time GIC appointees in agencies, boards, and commissi...
3/19/2021https://www.canada.ca/en/privy-council/programs/appointments/governor-council-appoint...
• Northwest Atlantic Fisheries Commission
Date modified:
2018-03-07
Page 7 of 7Remuneration guidelines for part-time GIC appointees in agencies, boards, and commissi...
3/19/2021https://www.canada.ca/en/privy-council/programs/appointments/governor-council-appoint...
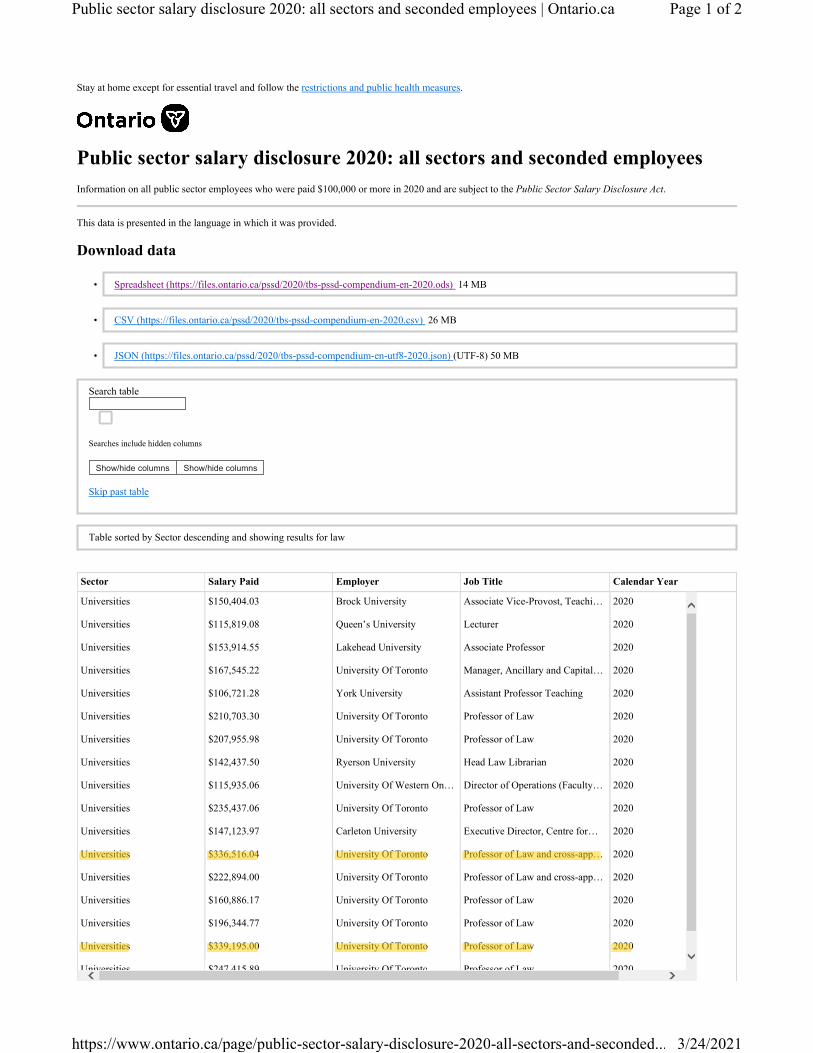
Stay at home except for essential travel and follow the restrictions and public health measures.
Public sector salary disclosure 2020: all sectors and seconded employees
Information on all public sector employees who were paid $100,000 or more in 2020 and are subject to the Public Sector Salary Disclosure Act.
This data is presented in the language in which it was provided.
Download data
• Spreadsheet (https://files.ontario.ca/pssd/2020/tbs-pssd-compendium-en-2020.ods) 14 MB
• CSV (https://files.ontario.ca/pssd/2020/tbs-pssd-compendium-en-2020.csv) 26 MB
• JSON (https://files.ontario.ca/pssd/2020/tbs-pssd-compendium-en-utf8-2020.json) (UTF-8) 50 MB
Search table
Searches include hidden columns
Show/hide columns Show/hide columns
Skip past table
Table sorted by Sector descending and showing results for law
Sector Salary Paid Employer Job Title Calendar Year
Universities $150,404.03 Brock University Associate Vice-Provost, Teachi… 2020
Universities $115,819.08 Queen’s University Lecturer 2020
Universities $153,914.55 Lakehead University Associate Professor 2020
Universities $167,545.22 University Of Toronto Manager, Ancillary and Capital … 2020
Universities $106,721.28 York University Assistant Professor Teaching 2020
Universities $210,703.30 University Of Toronto Professor of Law 2020
Universities $207,955.98 University Of Toronto Professor of Law 2020
Universities $142,437.50 Ryerson University Head Law Librarian 2020
Universities $115,935.06 University Of Western On… Director of Operations (Faculty… 2020
Universities $235,437.06 University Of Toronto Professor of Law 2020
Universities $147,123.97 Carleton University Executive Director, Centre for … 2020
Universities $336,516.04 University Of Toronto Professor of Law and cross-app… 2020
Universities $222,894.00 University Of Toronto Professor of Law and cross-app… 2020
Universities $160,886.17 University Of Toronto Professor of Law 2020
Universities $196,344.77 University Of Toronto Professor of Law 2020
Universities $339,195.00 University Of Toronto Professor of Law 2020
Universities $247,415.89 University Of Toronto Professor of Law 2020
Page 1 of 2Public sector salary disclosure 2020: all sectors and seconded employees | Ontario.ca
3/24/2021https://www.ontario.ca/page/public-sector-salary-disclosure-2020-all-sectors-and-seconded...
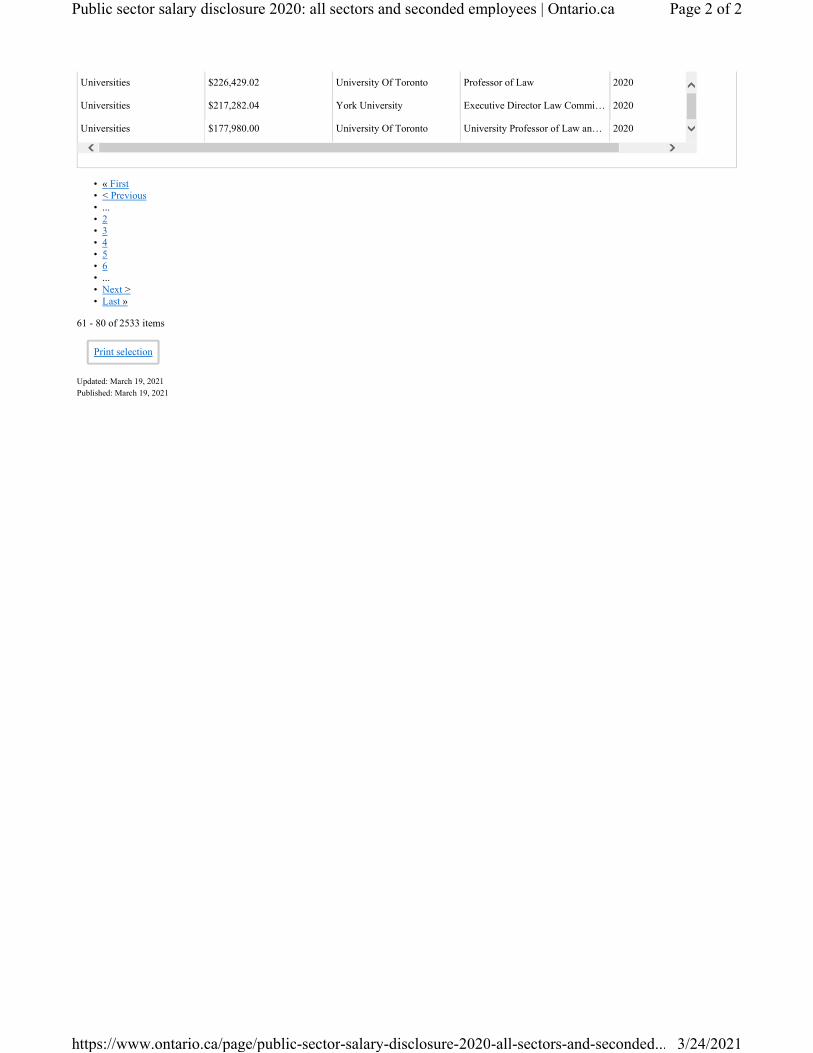
• « First• < Previous• ...• 2• 3• 4• 5• 6• ...• Next >• Last »
61 - 80 of 2533 items
Print selection
Updated: March 19, 2021
Published: March 19, 2021
Universities $226,429.02 University Of Toronto Professor of Law 2020
Universities $217,282.04 York University Executive Director Law Commi… 2020
Universities $177,980.00 University Of Toronto University Professor of Law an… 2020
Page 2 of 2Public sector salary disclosure 2020: all sectors and seconded employees | Ontario.ca
3/24/2021https://www.ontario.ca/page/public-sector-salary-disclosure-2020-all-sectors-and-seconded...