global wind energy outlook 2006 - greenpeace
TRANSCRIPT
2
S E P T E M B E R 2 0 0 6
GLOBAL WIND ENERGY OUTLOOK 2006
2
Contents
EXECUTIVE SUMMARY 4The Global Status of Wind Power | Drivers for Wind Energy | The World’s Wind Resources and Grid Integration |
The Environmental Impacts of Wind Power | Global Wind Energy Outlook Scenario | Energy Policy Issues and Recommendations
THE GLOBAL STATUS OF WIND POWER 8Record Year in 2005 | Europe | North America | Asia / Latin America | Australasia | Africa | Offshore
DRIVERS FOR WIND ENERGY 16Security of Supply | Environmental Concerns | Economics | Employment and local Development |
Technology and Industrial Development
THE WORLD’S WIND RESOURCES AND GRID INTEGRATION 22Wind Resource Assessments | Variability and Grid Integration | Issues for Integrating Wind Power | Recent Studies
THE ENVIRONMENTAL IMPACTS OF WIND POWER 28Visual Impact | Noise | Wildlife – Birds | Wildlife – Bats | Offshore Wind Farms
THE “GLOBAL WIND ENERGY OUTLOOK” SCENARIO 36The Scenarios | Energy Efficiency Projections | Core Results | Detailed Results | Regional Breakdown |
Main Assumptions and Parameters | Costs and Benefits | Global Wind Energy Outlook – Research Background
ENERGY POLICY ISSUES AND RECOMMENDATIONS 50Legally binding Targets for Renewable Energy | Specific Policy Mechanisms | Electricity Market Reform |
International Action on Climate Change | Reform of International Financing | Action by International Bodies | Policy Summary
ANNEX 58
3
Foreword
IN MANY PARTS OF THE WORLD , wind energy has already
grown to be a mainstream energy source. This growth has long
been driven by concerns about global climate change, mainly
in the developed world and especially in Europe.
Climate change is a complicated and alarming predicament.
As devastating as Hurricanes Katrina and Rita may have been,
their wrath is nothing compared to the devastation that
climate change will wreak on our planet if governments fail to
address the world‘s fossil fuel addiction. Cutting greenhouse
gas emissions makes both environmental and economic
sense. The goal of climate policy should be to keep global
mean temperature rise to less than 2 ºC above pre-industrial
levels in order to avoid dramatic damage to ecosystems and
disruption to the climate system. To meet these targets, the world needs to fundamentally change the way it
generates and uses energy in the coming decade.
However, other challenges such as energy supply security and the volatility of fossil fuel prices have become just as
pressing, both in the OECD and in emerging market. Global energy needs are growing at a staggering rate world
wide. Over-reliance on energy imports from few, mostly politically unstable countries and volatile oil and gas
prices make for a shaky supply situation that is already inflicting massive drains on the global economy.
Wind energy is the most attractive solution to the world’s energy challenges. It is clean and fuel-free. Moreover, wind
is indigenous and enough wind blows across the globe to cope with the ever increasing electricity demand. This report
demonstrates that wind technology is not a dream for the future – it is real, it is mature and it can be deployed on a
large scale. Thanks to twenty years of technological progress, wind turbines have come a long way and a wind farm
today acts much more like a conventional power station. Moreover, wind power generation is increasingly competi-
tive with conventional fossil fuel sources and already today is on a par with new coal or gas fired power stations.
Already now, wind energy is rapidly developing into a mainstream power source in many countries of the world,
with over 60,000 MW of installed capacity world wide and an average annual market growth rate of 28%. Wind
energy could provide as much as 29% of the world’s electricity needs by 2030, given the political will to promote
its large scale deployment paired with far-reaching energy efficiency measures.
The political choices of the coming years will determine the world’s environmental and economic situation for
many decades to come. While the industrialised world urgently needs to rethink its energy strategy, the developing
world should learn from past mistakes and build their economies on the strong foundation of sustainable energy
supply. For the sake of a sound environment, political stability and thriving economies, now is the time to commit
to a truly secure and sustainable energy future, built on clean technologies and promoting regional development
and the creation of millions of new jobs. The world cannot afford to stick to the ‘conventional’ energy development
path, relying on fossil fuels, nuclear and other outdated technologies from past centuries. Wind can and has to play
a leading role in the world’s energy future.
ARTHOUROS ZERVOS SVEN TESKE
Chairman – Global Wind Energy Council Renewable Director – Greenpeace International
4
EXECUTIVE SUMMARY
5
The Global Status of Wind Power
The global market for wind power has been expanding faster
than any other source of renewable energy. From just
4,800 MW in 1995 the world total has multiplied more than
twelve-fold to reach over 59,000 MW at the end of 2005.
The international market is expected to have an annual
turnover in 2006 of more than € 13 billion, with an estimated
150,000 people employed around the world. The success of
the industry has attracted investors from the mainstream
finance and traditional energy sectors.
In a number of countries the proportion of electricity
generated by wind power is now challenging conventional
fuels. In Denmark, 20% of the country’s electricity is
currently supplied by the wind. In Spain, the contribution has
reached 8%, and is set to rise to 15% by the end of the
decade. These figures show that wind power is already able to
provide a significant input of carbon-free electricity. In 2005,
the global wind energy sector registered another record year,
with a total of 11,531 MW of new capacity installed. This
represented a 40.5% increase on an annual basis and a 24%
cumulative growth.
Wind power is now established as an energy source in over
50 countries around the world. Those with the highest totals
in 2005 were Germany (18,428 MW), Spain (10,027 MW),
the USA (9,149 MW), India (4,430 MW) and Denmark
(3,122 MW). A number of other countries, including Italy, the
UK, the Netherlands, China, Japan and Portugal, have reached
the 1,000 MW mark.
Although the wind power industry has up to now been most
dynamic in the countries of the European Union, this is
changing. The United States and Canada are both ex-
periencing a surge of activity, whilst new markets are opening
up in Asia and South America. A new frontier for wind power
development has also been established in the sea, with
offshore wind parks beginning to make a contribution.
Drivers for Wind Energy
The growth of the market for wind energy is being driven by a
number of factors. These have combined in a number of
regions of the world to encourage political support for the
industry’s development.
Security of supply: In the absence of committed energy
efficiency measures, the International Energy Agency (IEA)
predicts that by 2030, the world’s energy needs will be
almost 60% higher than now. At the same time, supplies of
fossil fuels are dwindling. Some of the major economies of
the world are having to rely increasingly on imported fuel,
sometimes from regions of the world where conflict and
political instability threaten the security of that supply. By
contrast, wind energy is a massive indigenous power source
which is permanently available, with no fuel costs, in virtually
every country in the world.
Environmental concerns: The impetus behind wind power
expansion has come increasingly from the urgent need to
combat global climate change. This is now accepted to be the
greatest environmental threat facing the world. Under the
1997 Kyoto Protocol, OECD member states are committed to
cut their CO₂ emissions by an average of 5.2%. In the
developing world, more immediate concern comes from the
direct environmental effects of burning fossil fuels, particu-
larly air pollution.
Other environmental effects resulting from the range of fuels
currently used to generate electricity include the dangers of
fossil fuel exploration and mining, pollution caused by
accidental oil spills and the health risks associated with
radiation. Exploiting renewable sources of energy such as
wind power avoids these risks and hazards.
Economics: As the global market has grown, wind power has
seen a dramatic fall in cost. A modern wind turbine annually
produces 180 times more electricity at less than half the cost
per unit (kWh) than its equivalent twenty years ago. At good
locations wind can compete with the cost of both coal and
gas-fired power. The competitiveness of wind power has been
further enhanced by the recent rise in the price of fossil fuels.
If the “external costs” associated with the pollution and
health effects resulting from fossil fuel and nuclear genera-
tion were fully taken into account, wind power would work
out even cheaper.
EXECUTIVE SUMMARY
6
Wind energy also provides economic benefit through the
employment which the industry generates. In the developing
world, off-grid wind power opens up economic opportunities
to dispersed communities.
Technology and industry: Since the 1980s, when the first
commercial wind turbines were deployed, their capacity,
efficiency and visual design have all improved dramatically. A
modern wind turbine annually produces 180 times more elec-
tricity at less than half the cost per unit (kWh) than its
equivalent twenty years ago. The largest turbines being
manufactured now are of more than 5 MW capacity, with
rotor diameters of over 100 metres. Modern turbines are
modular and quick to install, whilst wind farms vary in size
from a few megawatts up to several hundred.
Wind energy has become big business. The major wind
turbine manufacturers are commissioning multi-million
dollar factories around the world in order to satisfy demand.
The World’s Wind Resources and Grid Integration
Studies of the world’s wind resources have confirmed that
these are extremely large and well distributed across almost
all regions and countries. Lack of wind is unlikely to be a
limiting factor on global wind power development.
As the industry expands, large quantities of wind powered
electricity will need to be integrated into the global grid
network. The variability of the wind is not an issue which will
hinder this development, however.
The already established control methods and backup capacity
available for dealing with variable demand and supply are more
than adequate to handle the additional variable supply of wind
power at penetration levels up to around 20%. Above that, some
changes may be needed in power systems and their method of
operation. Improved forecasting techniques and increased
geographical dispersion of wind farms - ensuring that the wind is
always blowing somewhere - will both help integration.
The potential for incorporating large amounts of wind power
generation can be seen from the example of Denmark, where
20% of total electricity consumption can already be met by
the wind. The DENA study in Germany concluded that wind
power could triple its power production by 2015, providing
14% of net electricity consumption, without any additional
need for reserve or balancing power stations.
The Environmental Impacts of Wind Power
The construction and operation of wind power, often in areas
of open countryside, raises issues of visual impact, noise and
the effect on local wildlife. These issues are usually addressed
through an environmental impact assessment.
Visual impact: Wind turbines are tall structures likely to be
visible over a relatively wide area. While some people express
concern about the effect wind turbines have on the land-
scape, others see them as elegant and graceful, symbols of a
less polluted future.
Birds: Can be affected by wind energy development through
loss of habitat, disturbance to their breeding areas and by
death or injury caused by the rotating turbine blades. Studies
from Europe and the United States have shown, however,
that the average rate of collision has been no more than two
birds per turbine per year. These figures should be set against
the millions of birds killed each year by power lines, pesti-
cides and road vehicles.
Noise: Compared to road traffic, trains, construction
activities and other sources of industrial noise, the sound
generated by wind turbines in operation is comparatively low.
Better design and better insulation have made more recent
wind turbine models much quieter. The approach of regula-
tory authorities has been to ensure that the turbines are
positioned far enough away from nearby homes to avoid
unacceptable disturbance.
Global Wind Energy Outlook Scenario
The Global Wind Energy Outlook Scenario examines the
future potential for wind power up to the year 2050. Three
different scenarios for wind power are assumed – a Reference
scenario based on figures from the International Energy
Agency, a Moderate version assuming that current targets for
renewable energy are successful, and an Advanced version
7
assuming that all policy options in favour of renewables have
been adopted. These are then set against two scenarios for
global energy demand. Under the Reference scenario, growth
in demand is again based on IEA projections; under the High
Energy Efficiency version, a range of energy efficiency
measures result in a substantial reduction in demand.
The results show that wind energy can make a major
contribution towards satisfying the global need for clean,
renewable electricity within the next 30 years and that its
penetration in the supply system can be substantially
increased if serious energy efficiency measures are imple-
mented at the same time. Under the Reference wind power
scenario, wind energy would supply 5 % of the world’s
electricity by 2030 and 6.6 % by 2050. Under the Moderate
scenario, wind energy’s contribution would range from
15.6 % in 2030 to 17.7 % by 2050. Under the Advanced
scenario, wind energy’s contribution to world electricity
demand would range from 29.1 % in 2030 up to 34.2 % by
2050.
All three scenarios assume that an increasing proportion of
new wind power capacity is installed in growing markets such
as South America, China, the Pacific and South Asia.
THE COSTS AND BENEFITS OF THESE SCENARIOS
INCLUDE:
Investment: The annual investment value of the wind energy
market in 2030 will range from €21.2 billion under the
Reference scenario to €45 bn under the Moderate scenario
and up to €84.8 bn under the Advanced scenario.
Generation costs: The cost of producing electricity from
wind energy is expected to fall to 3-3.8 €cents/kWh at a
good site and 4-6 €cents/kWh at a site with low average
wind speeds by 2020.
Employment: The number of jobs created by the wind energy
market will range from 480,000 in 2030 under the Reference
scenario to 1.1 million under the Moderate scenario and to
2.1 million under the Advanced scenario.
Carbon dioxide savings: Savings will range from an annual
535 million tonnes CO₂ in 2030 under the Reference
scenario to 1,661 million tonnes under the Moderate scenario
to 3,100 million tonnes under the Advanced scenario.
Energy Policy Issues and Recommendations
Renewable technologies are disadvantaged by the failure to
penalise conventional fuels for the economic cost of their
pollution and other hazards - and by distortions in the world’s
electricity markets created by massive financial and struc-
tural support to conventional technologies. Without political
support, wind power cannot establish its positive contribu-
tion towards environmental goals and security of supply.
ACTION IS NEEDED IN THE FOLLOWING AREAS:
Targets for renewable energy: Setting targets will encourage
governments to develop the necessary regulatory frame-
works to expand renewables, including financial frameworks,
grid access regulation, planning and administrative proce-
dures.
Specific policy mechanisms: The market for generated
power needs to be clearly defined in national laws, including
stable, long term fiscal measures that minimise investor risk
and ensure an adequate return on investment.
Electricity market reform: Reforms needed in the electricity
sector to encourage renewable energy include the removal of
barriers to market entry, removing subsidies to fossil fuels
and nuclear and internalising the social and environmental
costs of polluting energy.
International action on climate change: Targets for a
continuing reduction in greenhouse gas emissions must be
established beyond the present Kyoto period of 2008-12.
Reform of international financing: Multi-lateral financing
mechanisms should include a defined and increasing
percentage of lending directed to renewable energy projects,
coupled with a rapid phase out of support for conventional,
polluting energy projects.
Action by international bodies: The G8 bloc of countries and
the UN Commission on Sustainable Development should
support global renewables development.
EXECUTIVE SUMMARY
8
THE GLOBAL STATUS OF WIND POWER
9
THE GLOBAL STATUS OF WIND POWER
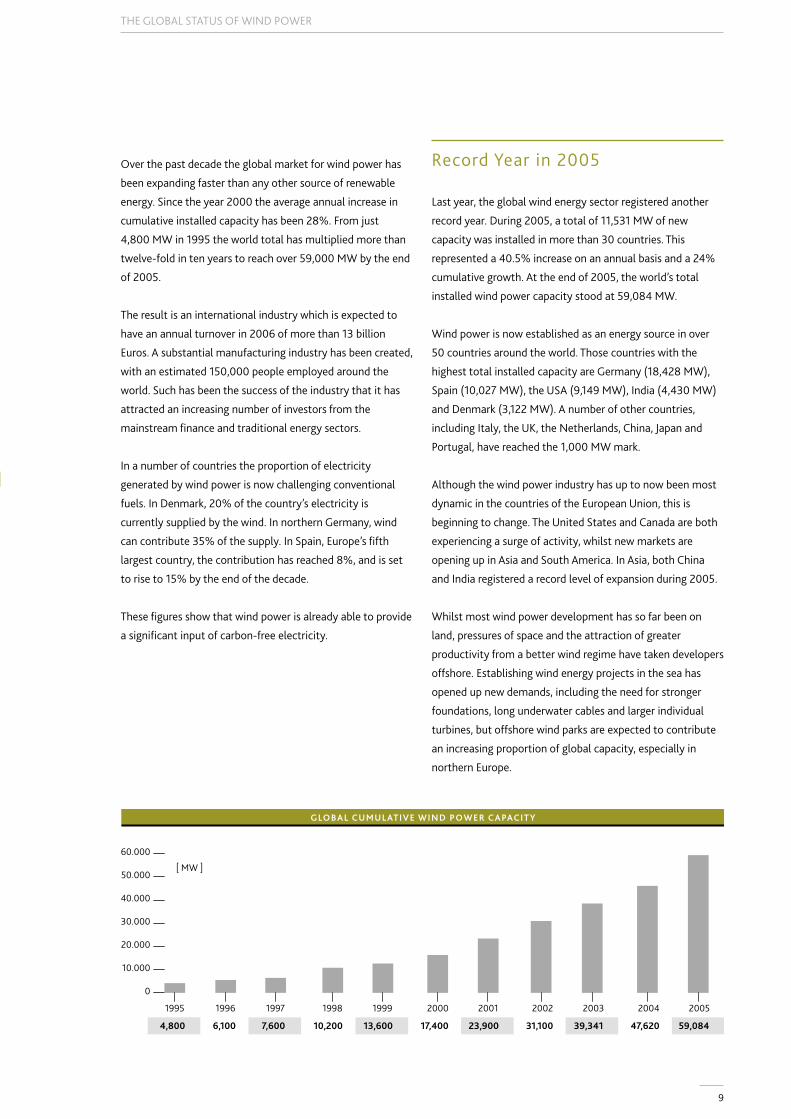
Over the past decade the global market for wind power has
been expanding faster than any other source of renewable
energy. Since the year 2000 the average annual increase in
cumulative installed capacity has been 28%. From just
4,800 MW in 1995 the world total has multiplied more than
twelve-fold in ten years to reach over 59,000 MW by the end
of 2005.
The result is an international industry which is expected to
have an annual turnover in 2006 of more than 13 billion
Euros. A substantial manufacturing industry has been created,
with an estimated 150,000 people employed around the
world. Such has been the success of the industry that it has
attracted an increasing number of investors from the
mainstream finance and traditional energy sectors.
In a number of countries the proportion of electricity
generated by wind power is now challenging conventional
fuels. In Denmark, 20% of the country’s electricity is
currently supplied by the wind. In northern Germany, wind
can contribute 35% of the supply. In Spain, Europe’s fifth
largest country, the contribution has reached 8%, and is set
to rise to 15% by the end of the decade.
These figures show that wind power is already able to provide
a significant input of carbon-free electricity.
Record Year in 2005
Last year, the global wind energy sector registered another
record year. During 2005, a total of 11,531 MW of new
capacity was installed in more than 30 countries. This
represented a 40.5% increase on an annual basis and a 24%
cumulative growth. At the end of 2005, the world’s total
installed wind power capacity stood at 59,084 MW.
Wind power is now established as an energy source in over
50 countries around the world. Those countries with the
highest total installed capacity are Germany (18,428 MW),
Spain (10,027 MW), the USA (9,149 MW), India (4,430 MW)
and Denmark (3,122 MW). A number of other countries,
including Italy, the UK, the Netherlands, China, Japan and
Portugal, have reached the 1,000 MW mark.
Although the wind power industry has up to now been most
dynamic in the countries of the European Union, this is
beginning to change. The United States and Canada are both
experiencing a surge of activity, whilst new markets are
opening up in Asia and South America. In Asia, both China
and India registered a record level of expansion during 2005.
Whilst most wind power development has so far been on
land, pressures of space and the attraction of greater
productivity from a better wind regime have taken developers
offshore. Establishing wind energy projects in the sea has
opened up new demands, including the need for stronger
foundations, long underwater cables and larger individual
turbines, but offshore wind parks are expected to contribute
an increasing proportion of global capacity, especially in
northern Europe.
0
10.000
20.000
30.000
40.000
50.000
60.000
[ MW ]
1995
4,800
1996
6,100
1997
7,600
1998
10,200
1999
13,600
2000
17,400
2001
23,900
2002
31,100
2003
39,341
2004
47,620
2005
59,084
GLOBAL CUMULATIVE WIND POWER CAPACITY
10
Another way to manage the growth in demand for wind
energy in areas with limited available land has been through
“repowering”. This involves replacing older, less efficient wind
turbines with a smaller number of more powerful recent
models. Repowering is already gaining pace in a number of
countries in which the wind industry has been established for
ten years or more. These include Denmark, the UK, Germany
and the US.
Europe
The European Union still leads the world, with over
40,500 MW of installed wind capacity at the end of 2005,
representing 69% of the global total. This has already
achieved, five years ahead of time, the target set by the
European Commission for 40,000 MW by 2010.
Wind energy expansion in the EU has been driven by individu-
al member states’ policies to encourage renewable energy.
These incorporate a range of financial incentives, including
investment grants and premium tariffs, with the aim of
making a contribution towards the reduction of greenhouse
gas emissions. In 2001 an EU directive on renewable energy
set each member state a target for the proportion of
renewable energy it should achieve by 2010. The overall
European target is for 21% of electricity supply.
The European Wind Energy Association (EWEA) predicts that
by 2010, wind energy alone will save enough greenhouse gas
emissions to meet one third of the European Union’s Kyoto
obligation. EWEA’s current targets are for 75,000 MW of wind
capacity in Europe by 2010, 180,000 MW by 2020 and
300,000 MW by 2030.
The leading country for wind energy in Europe is Germany.
Encouraged by successive laws, most recently the 2000
Renewable Energy Sources Act (updated in 2004), generators
of wind power have been paid a premium tariff for their
output, gradually reducing over a 20 year contract period.
This policy mechanism has proved extremely successful,
attracting a large number of small business investors, and
resulting in double digit annual growth rates since the 1990s.
Wind projects also receive preferential treatment under
German land planning law, with each local authority
expected to designate zones where wind parks will be encour-
aged. Wind power currently provides about 5.5% of German
electricity, with an installed capacity at the end of 2005 of
18,428 MW.
Although the rate of development on land in Germany has
already started to slow down, mainly due to a shortage of
available sites, this will be compensated for by the repower-
ing of older turbines and by a new offshore market in the
North and Baltic Seas. A study by the German Environment
Ministry (BMU) estimates that offshore wind power could
reach a level of 12,000-15,000 MW by 2020.
Spain has rapidly increased its wind power capacity since the
mid-1990s, encouraged by a national premium tariff and
policy based on regional industrial regeneration. In many
provinces prospective developers have only been able to
access project sites if they first commit to establishing a
manufacturing base in the region. This has resulted in the
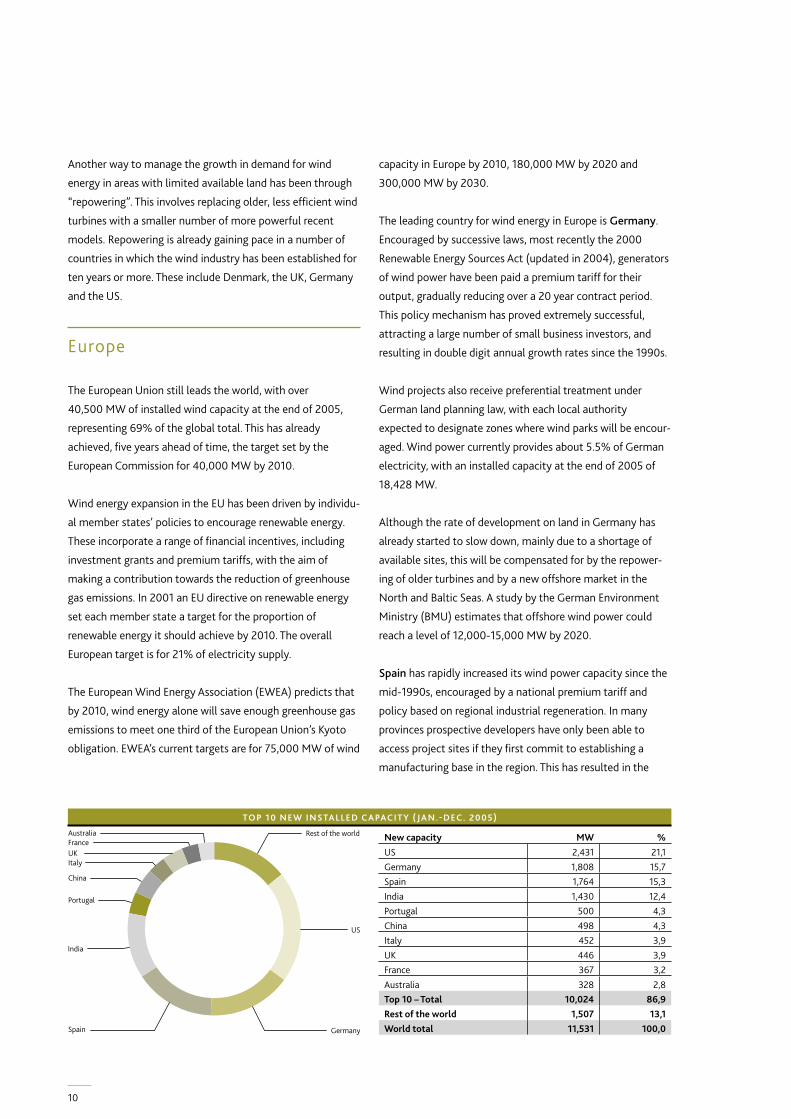
TOP 10 NEW INSTALLED CAPACITY ( JAN.-DEC. 2005)
Germany
US
Spain
India
Portugal
China
ItalyUKFranceAustralia Rest of the world
TOP 10 NEW INSTALLED CAPACITY ( JAN.-DEC. 2005)
New capacity MW %US 2,431 21,1Germany 1,808 15,7Spain 1,764 15,3India 1,430 12,4Portugal 500 4,3China 498 4,3Italy 452 3,9UK 446 3,9France 367 3,2Australia 328 2,8Top 10 – Total 10,024 86,9Rest of the world 1,507 13,1World total 11,531 100,0
11
relatively poor but windy province of Navarra, for example,
achieving major economic development and a contribution
from wind power now approaching 60% of its electricity
supply. In both the more densely populated provinces of
Castilla la Mancha and Galicia, the level has reached more
than 20%.
Most of the wind turbines deployed in Spain are manufac-
tured domestically. Last year a near record 1,764 MW of wind
turbines were commissioned, a 20% increase on 2004, and
saving the emission of an additional 19 million tonnes of carbon
dioxide. This took the Spanish total to just over 10,000 MW,
enough to satisfy 8.25% of the country’s electricity demand. The
Spanish government’s target is to reach more than 20,000 MW
by 2010.
Denmark has been the pioneer of the European wind turbine
manufacturing industry and continues to have the highest
penetration of wind power in its supply system. More than
3,000 MW of capacity was operating by the end of 2005.
When the wind blows strongly, wind energy supplies more
than half the electricity in the western half of the country.
Projections by the national Transmission System Operator
Energinet show that by 2010, electricity consumption in
western Denmark could be regularly satisfied by a mixture of
wind and small combined heat and power stations, without
the need for centralised generation. In the 1990s, Denmark
also pioneered the development of offshore wind farms, and
still has the largest sea-based wind park in the world.
These market leaders are now being joined by a second wave
of countries, including Portugal, France, the UK, Italy, the
Netherlands and Austria. In Portugal, strong government
policy supported by a fixed tariff payment system has seen
wind capacity grow from 100 MW in 2000 to over 1,000 MW
by the end of 2005. In Italy, which introduced a national
target for renewable energy linked to a green certificate
trading system in 2001, wind capacity grew by 452 MW in
2005 to reach more than 1,700 MW.
The potential of the ten new states which joined the
European Union in 2004 has still to be realised, but a number
of them, including Poland, Hungary and the Baltic States,
are expected to take off in the next few years.
North America
In 2005, nearly a quarter of new global capacity was installed
in North America, where the total increased by 37%. Wind
energy gained momentum in both the United States and
Canada.
The birthplace of large scale wind power deployment in
California during the 1980s and early 1990s, the
United States is experiencing a revival which could soon see
it match the success of the European market leaders. With
large open spaces available for development, many US states
have an excellent wind regime and a growing demand for
energy that avoids the volatility of fossil fuel prices.
The US industry shattered all previous annual records in 2005
to install nearly 2,500 MW of new capacity. This brought the
country’s total wind generating capacity up to more than
9,100 MW. The industry is expected to turn in an even better
performance in 2006, with new installations likely to top
3,000 MW.
Spreading out from its Californian base, there are now utility-
scale developments across 31 US states. New wind farms
completed in 2005 include twelve projects of 100 MW or
more, ranging geographically from the 140 MW Maple Ridge
project in New York to the 150 MW Hopkins Ridge project in
Washington state, in the Pacific Northwest. The largest single
project completed last year was the 210 MW Horse Hollow
wind energy center in Texas. Texas added some 700 MW of
wind in 2005 – the largest amount of any state – bringing it
close to long-time national leader California.
Growth in the US market is largely due to the current three
year window of stability provided by the federal incentive for
wind energy, the Production Tax Credit (PTC). For the first
time in the credit’s history, the US Congress extended the
PTC before it expired, taking it through to the end of 2007.
As a result, the wind industry is looking forward to several
record-breaking years in a row.
THE GLOBAL STATUS OF WIND POWER
12
Failure to renew the PTC on time has previously seen a
“roller-coaster” US market, with fallow years of falling
investor confidence followed by brief boom periods. The
American Wind Energy Association (AWEA) is currently
lobbying for a longer term extension of the incentive. With
stable, supportive policies, wind energy could provide at least
6% of US electricity by 2020, according to the AWEA, a share
similar to that of hydropower today. However a share of
more than 20% wind power is possible in the longer term.
Thanks to a mixture of federal incentives and initiatives by
individual provinces to increase the contribution from
renewable energy, wind capacity in Canada increased by an
impressive 54% in 2005 and now stands at 683 MW. This is
enough to power more than 200,000 Canadian homes.
An important contributor to Canada’s vibrant market has
been the federal government’s Wind Power Production
Incentive (WPPI). In 2005, the WPPI was extended to 2010,
and with the funds available increased to support up to
4,000 MW of capacity. Several provinces have also imple-
mented policies to encourage wind projects, including utility
mandates for up to 2,000 MW of new wind farms.
As a result of these policy measures, 2006 is expected to see
at least 500 MW of wind projects commissioned. The
Canadian Wind Energy Association estimates that more than
8,000 MW could be in place by 2015.
Asia
The Asian continent is developing into one of the main power-
houses of wind energy development, accounting for 19% of new
installations in 2005. With a growth rate of over 46%, total
capacity in the region reached nearly 7,000 MW.
The strongest Asian market remains India, with the installation of
over 1,430 MW of new capacity last year taking its total to
4,430 MW. This pushed it into fourth position in the international
wind power league table. The Indian Wind Turbine Manufacturers
Association (IWTMA) expects between 1,500 and 1,800 MW to
be commissioned every year for the next three years.
Incentives are provided to the wind energy sector by the
Indian government in the form of tax breaks and tax
reductions. The 2003 Electricity Act also established State
Electricity Regulatory Commissions in most states with a
mandate to promote renewable energy through preferential
tariffs and a minimum obligation on distribution companies
to source a certain share of their electricity supply from
renewables. Tariffs for grid connected wind farms vary from
state to state.
Over the past few years, both the government and the wind
power industry have succeeded in injecting greater stability
into the Indian market. This has encouraged larger private
and public sector enterprises to invest. It has also stimulated
a stronger domestic manufacturing sector; some companies
now source more than 80% of the components for their
turbines in India. This has resulted in both more cost effective
production and additional local employment.
The geographical spread of Indian wind power has so far been
concentrated in a few regions, especially the southern state
of Tamil Nadu, which accounts for more than half of all
installations. This is beginning to change, with other states,
including Maharashtra, Gujarat, Rajasthan and Andhra
Pradesh, starting to catch up. With the potential for up to
65,000 MW of wind capacity across the country (IWTMA
estimate), progress in India should be further accelerated
over the next decade.
With its large land mass and long coastline, China is rich in
wind energy potential. The Chinese Meteorology Research
Institute estimates the land-based exploitable wind resource
to have the potential for 253 GW of capacity. A further 750
GW could be provided by offshore projects.
13
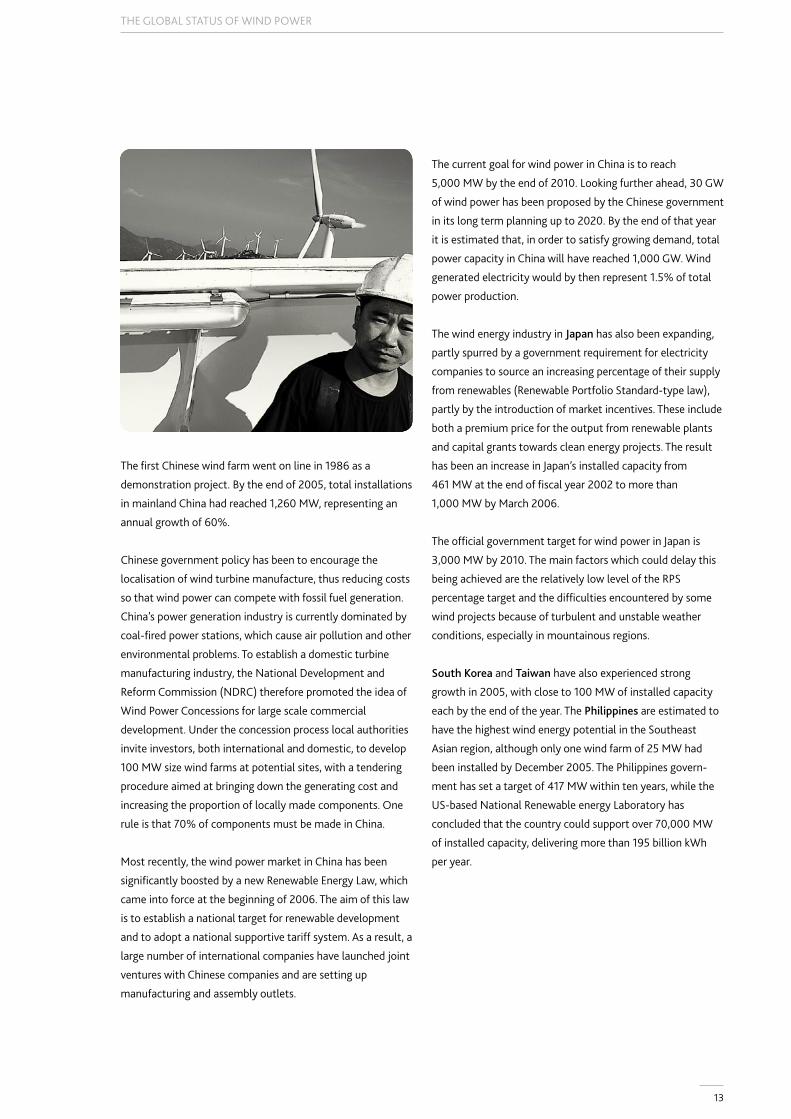
The first Chinese wind farm went on line in 1986 as a
demonstration project. By the end of 2005, total installations
in mainland China had reached 1,260 MW, representing an
annual growth of 60%.
Chinese government policy has been to encourage the
localisation of wind turbine manufacture, thus reducing costs
so that wind power can compete with fossil fuel generation.
China’s power generation industry is currently dominated by
coal-fired power stations, which cause air pollution and other
environmental problems. To establish a domestic turbine
manufacturing industry, the National Development and
Reform Commission (NDRC) therefore promoted the idea of
Wind Power Concessions for large scale commercial
development. Under the concession process local authorities
invite investors, both international and domestic, to develop
100 MW size wind farms at potential sites, with a tendering
procedure aimed at bringing down the generating cost and
increasing the proportion of locally made components. One
rule is that 70% of components must be made in China.
Most recently, the wind power market in China has been
significantly boosted by a new Renewable Energy Law, which
came into force at the beginning of 2006. The aim of this law
is to establish a national target for renewable development
and to adopt a national supportive tariff system. As a result, a
large number of international companies have launched joint
ventures with Chinese companies and are setting up
manufacturing and assembly outlets.
The current goal for wind power in China is to reach
5,000 MW by the end of 2010. Looking further ahead, 30 GW
of wind power has been proposed by the Chinese government
in its long term planning up to 2020. By the end of that year
it is estimated that, in order to satisfy growing demand, total
power capacity in China will have reached 1,000 GW. Wind
generated electricity would by then represent 1.5% of total
power production.
The wind energy industry in Japan has also been expanding,
partly spurred by a government requirement for electricity
companies to source an increasing percentage of their supply
from renewables (Renewable Portfolio Standard-type law),
partly by the introduction of market incentives. These include
both a premium price for the output from renewable plants
and capital grants towards clean energy projects. The result
has been an increase in Japan’s installed capacity from
461 MW at the end of fiscal year 2002 to more than
1,000 MW by March 2006.
The official government target for wind power in Japan is
3,000 MW by 2010. The main factors which could delay this
being achieved are the relatively low level of the RPS
percentage target and the difficulties encountered by some
wind projects because of turbulent and unstable weather
conditions, especially in mountainous regions.
South Korea and Taiwan have also experienced strong
growth in 2005, with close to 100 MW of installed capacity
each by the end of the year. The Philippines are estimated to
have the highest wind energy potential in the Southeast
Asian region, although only one wind farm of 25 MW had
been installed by December 2005. The Philippines govern-
ment has set a target of 417 MW within ten years, while the
US-based National Renewable energy Laboratory has
concluded that the country could support over 70,000 MW
of installed capacity, delivering more than 195 billion kWh
per year.
THE GLOBAL STATUS OF WIND POWER
14
Latin America
Although there has been little activity in Latin America to
date, a number of governments are in the process of
implementing renewable energy laws or programmes, and
wind energy is expected to develop at a strong rate in the
coming years.
High oil prices, electricity shortages and air pollution
problems have put pressure on the government in Brazil to
look for sustainable solutions through ethanol, biomass,
hydroelectricity, wind and solar power. Wind power matches
well the profile of the country’s existing hydroelectric plants,
especially in the north-east, where high winds coincide with
low rainfall and provide a high load factor. According to a
wind atlas published by the Brazilian Ministry for Mines and
Energy (MME) in 2001,,the country’s total wind potential is
estimated at 143 GW, even when only sites with wind speeds
above 7 m/s (metres per second) are considered.
In 2002 the Brazilian government introduced the PROINFA
programme to stimulate the development of biomass, wind
and small hydro generation. Its initial target was to imple-
ment 3,300 MW of projects by the end of 2006. Power from
renewable generators is bought by the Brazilian state-
controlled electricity utility Eletrobrás under 20 year power
purchase agreements, with a guaranteed purchase price and
project financing available through the Brazilian National
Development Bank (BNDES). Domestic suppliers must
account for 60% of the equipment and construction costs.
Due to its limited market perspective, with a short timescale
for the programme and no follow-up in sight, PROINFA did
not, however, trigger the desired investment in additional
manufacturing plants. With an effective monopoly in
electricity supply, considerable bureaucracy and lack of
infrastructure, the cost of installing wind power has been
relatively high (about US$2,000/kW). Progress has therefore
been slow, and the first PROINFA wind farms are only now
beginning to be built. Total wind power capacity in Brazil is
expected to increase from 28 MW in 2005 to about 200 MW
in 2006.
Despite having only two small wind farms in operation, the
Mexican Wind Energy Association projects that Mexico could
see at least 3,000 MW of capacity installed over the period
2006-2014. One reason is the passage through the Mexican
Congress in December 2005 of a Renewable Energy Utilisa-
tion Law aimed at establishing a programme with a target for
renewables to supply 8% of national power production by
2012 (excluding large hydro). The law also provides for the
creation of a trust to support renewable energy projects, rural
electrification, biofuels and technological R&D.
Other countries with potential for wind energy in Latin
America and the Caribbean are Argentina, Chile, Costa Rica,
Nicaragua, Uruguay, Colombia, the Dominican Republic and
Jamaica.
Australasia
Australia enjoys one of the best wind resources in the world,
resulting in phenomenal capacity factors in many regions
with predominantly open farmland. Growth of the country’s
installed capacity almost doubled in 2005, with the addition
of 328 MW, taking the total to 708 MW. At the same time
approximately 6,000 MW of projects are in various stages of
pre-construction development.
The main national incentive for wind energy is the Mandatory
Renewable Energy Target, which has a modest goal for 9,500
GWh of renewables generation by 2010 – a little over 1% of
Australia’s electricity demand. The Australian Wind Energy
Association (Auswind) has called for this to be increased to
10%.
Although some individual states are planning to introduce
more ambitious incentive schemes, such as the Victoria state
government’s target for 10% of renewable energy capacity by
2010, Auswind argues that federal policy needs to recognise
that wind energy is a mature technology which requires
specific mechanisms to address the price gap between it and
that of conventional fossil fuel generation. The industry
believes that nationally, at least 600 MW of new annual
capacity is required for the renewable energy industry to
continue growing and for Australia to maintain a wind energy
manufacturing base.
Although only 168 MW of wind capacity was installed by the
end of 2005, New Zealand is equally poised to become a
dynamic market. After a quiet period, almost 1,000 MW of
projects have consent to start construction, with the
potential for 2,000 MW of future capacity to follow on.
15
Africa
The potential for large scale wind power development in
Africa is concentrated in the north and the south, with
relatively low wind speeds experienced in the central belt.
In the north, there has been development in Morocco, with
64 MW installed and a national action plan to install
600 MW by 2010, whilst Tunisia is waiting for its first 60 MW
project to come to fruition. The most successful country has
been Egypt, where several large wind farms have been
constructed within an 80 km2 designated zone at Zafarana on
the Gulf of Suez. Most of these have been completed with
the support of European government aid agencies. A further
area of 700 km2 at Gabal El-Zayt on the Gulf has now been
earmarked to host a 3,000 MW wind farm. This site enjoys an
excellent average wind speed of 10.5 metres/sec.
From a current level of 145 MW, the Egyptian government’s
New and Renewable Energy Authority is looking for the
country to install 850 MW by 2010. By 2020-25 the total
could have reached 2,750 MW.
In the south, South Africa saw its first small installation in
2002, but larger projects have yet to be encouraged by the
right market incentives.
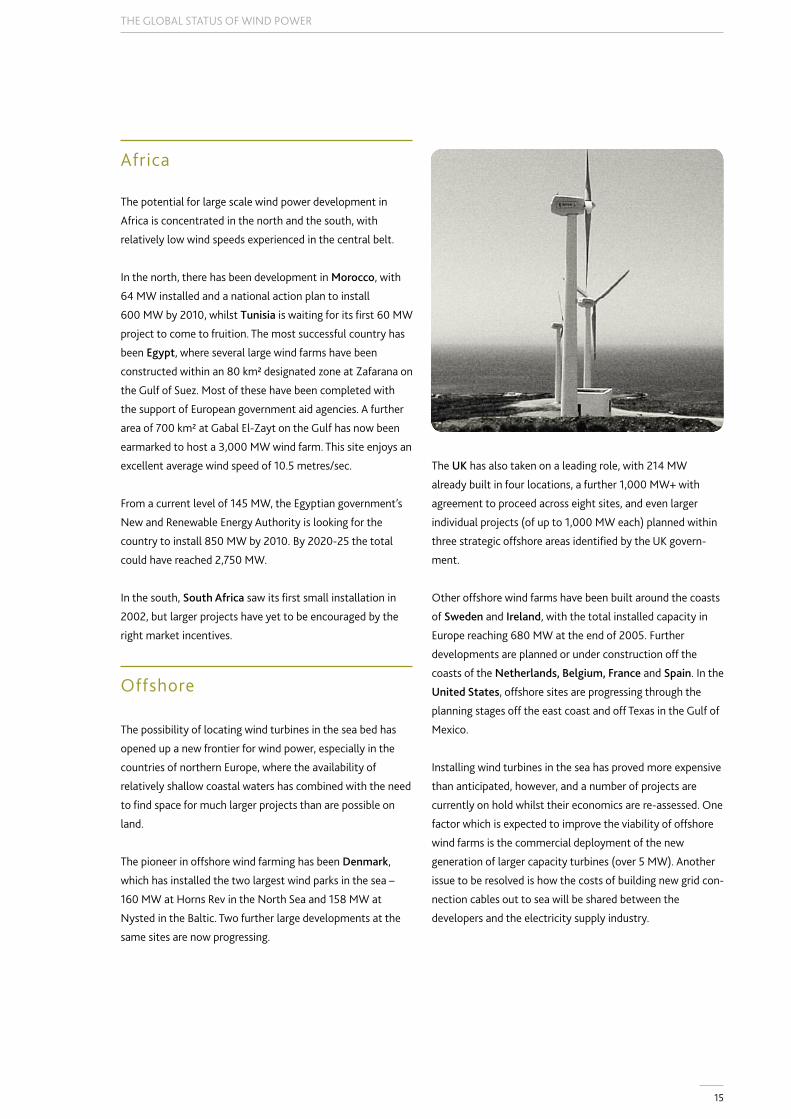
Offshore
The possibility of locating wind turbines in the sea bed has
opened up a new frontier for wind power, especially in the
countries of northern Europe, where the availability of
relatively shallow coastal waters has combined with the need
to find space for much larger projects than are possible on
land.
The pioneer in offshore wind farming has been Denmark,
which has installed the two largest wind parks in the sea –
160 MW at Horns Rev in the North Sea and 158 MW at
Nysted in the Baltic. Two further large developments at the
same sites are now progressing.
The UK has also taken on a leading role, with 214 MW
already built in four locations, a further 1,000 MW+ with
agreement to proceed across eight sites, and even larger
individual projects (of up to 1,000 MW each) planned within
three strategic offshore areas identified by the UK govern-
ment.
Other offshore wind farms have been built around the coasts
of Sweden and Ireland, with the total installed capacity in
Europe reaching 680 MW at the end of 2005. Further
developments are planned or under construction off the
coasts of the Netherlands, Belgium, France and Spain. In the
United States, offshore sites are progressing through the
planning stages off the east coast and off Texas in the Gulf of
Mexico.
Installing wind turbines in the sea has proved more expensive
than anticipated, however, and a number of projects are
currently on hold whilst their economics are re-assessed. One
factor which is expected to improve the viability of offshore
wind farms is the commercial deployment of the new
generation of larger capacity turbines (over 5 MW). Another
issue to be resolved is how the costs of building new grid con-
nection cables out to sea will be shared between the
developers and the electricity supply industry.
THE GLOBAL STATUS OF WIND POWER
16
LOS PRINCIPALES FACTORES DEL
DESARROLLO DE LA ENERGÍA EÓLICA
17
DRIVERS FOR WIND ENERGY
The growth of the market for wind energy is being driven by a
number of factors, including the wider context of energy
supply and demand, the rising profile of environmental issues
and the impressive improvements in the technology itself.
These factors have combined in a number of regions of the
world to encourage political support for the industry’s
development.
Security of Supply
Global demand for energy is increasing at a breathtaking
pace. The International Energy Agency (IEA) predicts that by
2030, the world’s energy needs will be almost 60% higher
than now. Two-thirds of this increase will occur in China, India
and other rapidly developing economies; these countries will
account for almost half of global energy consumption by
2030.
If this sharp increase in world energy demand actually takes
place, it would require significant investment in new
generating capacity and grid infrastructure, especially in the
developing world. The IEA estimates that the global power
sector will need to build some 4,800 GW of new capacity
between now and 2030. This will require investment of
approximately US$2 trillion (€1.7 trillion) in power generation
and US$1.8 trillion in transmission and distribution networks.
Industrialised countries face a different but parallel situation.
Whilst demand is increasing, the days of overcapacity in
electricity production are coming to an end. Many older
power plants will soon reach the end of their working lives.
The IEA predicts that by 2030, over 2,000 GW of power
generation capacity will need to be built in the OECD
countries, including the replacement of retiring plants.
Without energy efficiency measures, electricity demand in
the European Union is expected to increase by 51% between
2000 and 2030, requiring investments in power generation
of around €625 billion (US$ 760 billion). About half of this is
needed for the replacement of existing power plants.
The potential effect of energy saving on global demand could
be considerable, however. According to the study by Ecofys
and DLR used in this report, electricity demand could increase
by only 30% by 2030, if a wide range of technologies and
initiatives were introduced. Although this ‘High energy
efficiency’ scenario recognises the limitations set by cost and
other obstacles, global electricity demand would be 39%
lower in 2030 than currently estimated by the IEA’s Reference
scenario.
Just as energy demand continues to increase, in the absence
of such efficiency measures, supplies of the main fossil fuels
used in power generation, especially gas, are dwindling. One
result is that some of the major economies of the world are
having to rely increasingly on imported fuel, sometimes from
regions of the world where conflict and political instability
threaten the security of that supply.
In Europe, sources of indigenous oil and gas, mainly from the
North Sea, are in rapid decline. At present, 50% of Europe’s
energy supplies are imported. Within two decades this is
expected to increase to 70%. Even uranium, which currently
supplies the fuel for over 30% of European electricity, has a
global lifetime estimated at no more than 40 years, whilst
the EU countries contain less than 2% of the world’s uranium
reserves.
Driven by these pressures, the last two years have seen
unprecedented increases in the prices of both oil and gas. Oil
has risen from a range of $25 - $35 a barrel in 2004 to a peak
of more than $70, with the expectation that the price will
remain high for some years to come. Rising gas wholesale
costs have seen domestic electricity prices increase across
Europe; in the UK average domestic energy bills have risen
since 2003 by 63% for gas and 44% for electricity.
Analysts point out that the cumulative increase in real crude
oil prices since 2002 is close to that of the oil shocks of the
1970s, which produced two global recessions and an
unprecedented surge in inflation. Increasingly, governments
around the world are waking up to the threat that the current
shaky supply situation is posing to their economic growth.
18
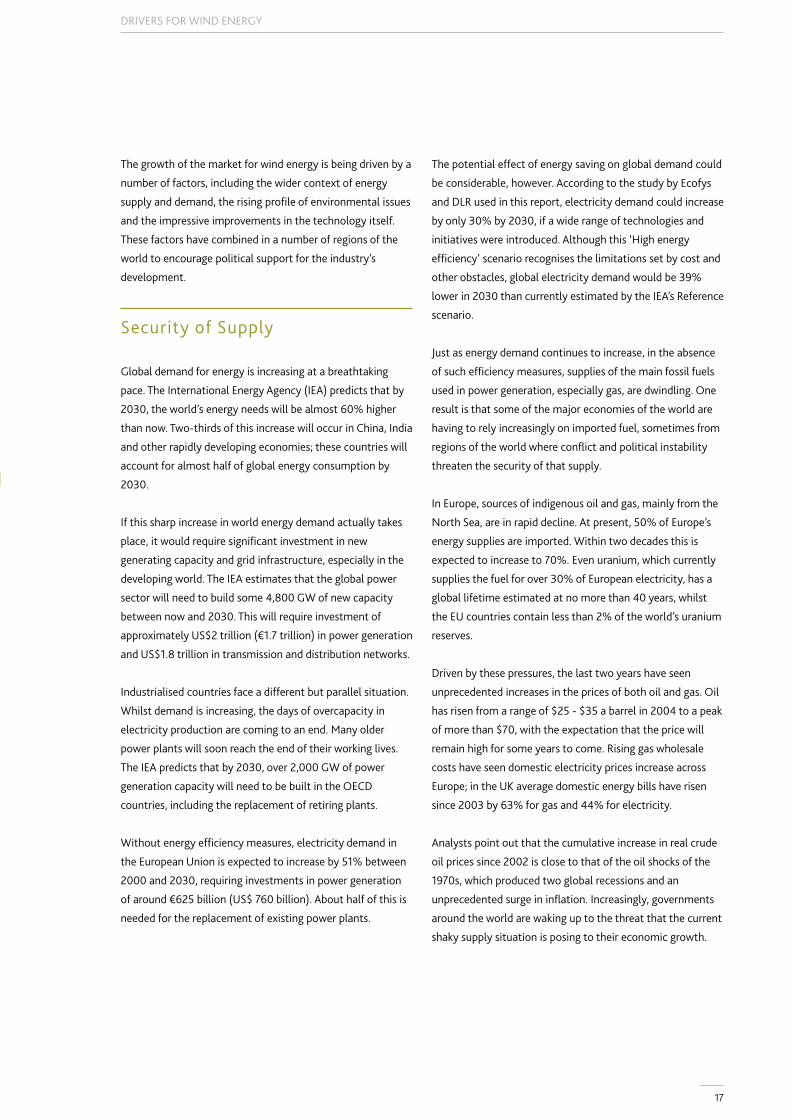
By contrast to the uncertainties surrounding supplies of
conventional fuels, and volatile prices, wind energy is a
massive indigenous power source which is permanently
available in virtually every country in the world. There are no
fuel costs, no geo-political risk and no supply dependence on
imported fuels from politically unstable regions.
Environmental Concerns
The impetus behind wind power expansion has come increas-
ingly from the urgent need to combat global climate change.
This is now accepted to be the greatest environmental threat
facing the world. The UN’s Intergovernmental Panel on Climate
Change projects that average temperatures around the world
will increase by up to 5.8°C over the coming century. This is
predicted to result in a wide range of climate shifts, including
melting of the polar ice caps, flooding of low-lying land, storms,
droughts and violent changes in weather patterns. Responsibility
for climate change lies with the excessive build-up of green-
house gases in the atmosphere, a trend encouraged by the
world’s growing industrialisation. Within energy use, the main
culprit is fossil fuels, whose combustion produces carbon dioxide,
one of the main greenhouse gases.
A shift in the way the world produces and consumes energy is
therefore essential. Alongside more efficient use of energy,
renewable sources of energy offer the potential for deep cuts
in carbon dioxide emissions.
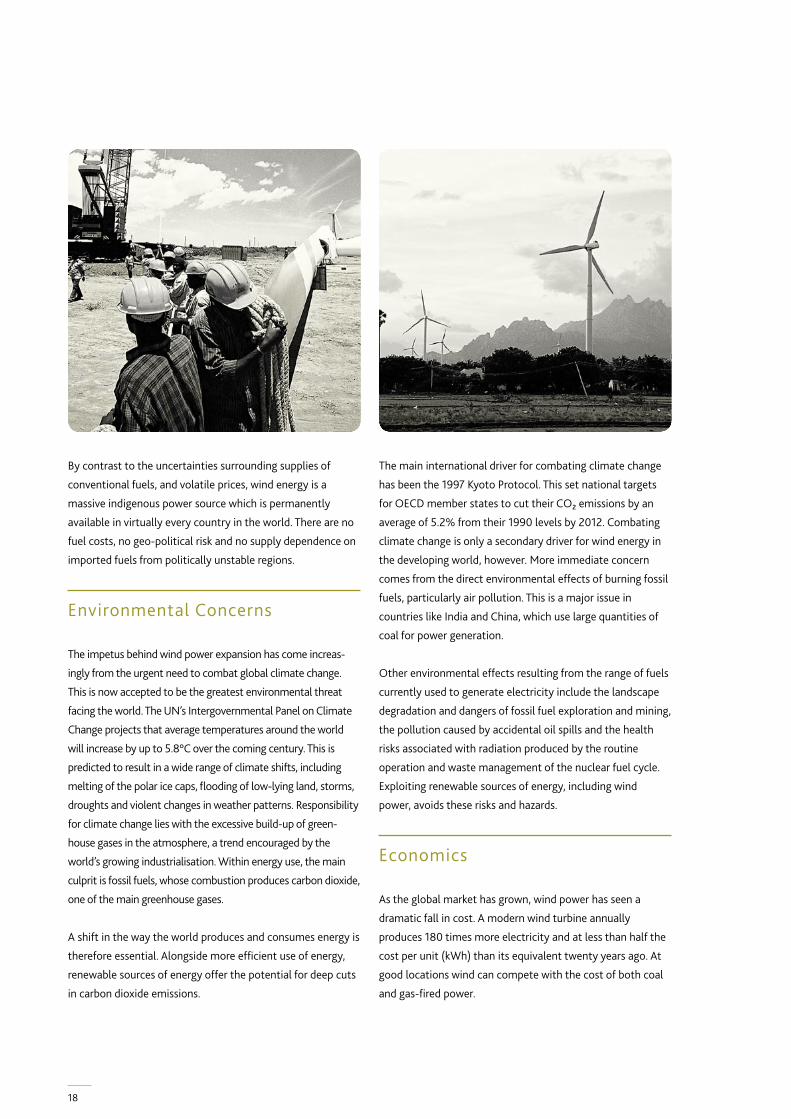
The main international driver for combating climate change
has been the 1997 Kyoto Protocol. This set national targets
for OECD member states to cut their CO₂ emissions by an
average of 5.2% from their 1990 levels by 2012. Combating
climate change is only a secondary driver for wind energy in
the developing world, however. More immediate concern
comes from the direct environmental effects of burning fossil
fuels, particularly air pollution. This is a major issue in
countries like India and China, which use large quantities of
coal for power generation.
Other environmental effects resulting from the range of fuels
currently used to generate electricity include the landscape
degradation and dangers of fossil fuel exploration and mining,
the pollution caused by accidental oil spills and the health
risks associated with radiation produced by the routine
operation and waste management of the nuclear fuel cycle.
Exploiting renewable sources of energy, including wind
power, avoids these risks and hazards.
Economics
As the global market has grown, wind power has seen a
dramatic fall in cost. A modern wind turbine annually
produces 180 times more electricity and at less than half the
cost per unit (kWh) than its equivalent twenty years ago. At
good locations wind can compete with the cost of both coal
and gas-fired power.

19
The cost of wind power generation falls as the average wind
speed rises. Analysis by industry magazine Windpower
Monthly (Jan 2006) shows that at a site with an average
wind speed of more than 7 metres per second, and a capital
cost per installed kilowatt of approximately € 1,000, wind is
already cheaper than gas, coal and nuclear.
The competitiveness of wind power has been further
enhanced by the recent rise in the price of fossil fuels, in
particular the gas used to fuel power stations. In the United
States, this has made wind generated electricity an increas-
ingly attractive option for power utilities faced with rising
costs. Against the volatility of conventional electricity costs,
wind offers an energy source which has no fuel element and
is unaffected by world trade issues.
Direct cost comparisons between wind power and other
generation technologies are misleading, however, because
they do not account for the “external costs” to society and
the environment derived from burning fossil fuels or from
nuclear generation. These external costs, including the effects
of air pollution and radiation emissions, are not included in
electricity prices.
The pan-European study, known as the “ExternE” project,
conducted across all 15 original EU member states, has
assessed these costs for a range of fuels. Its latest results,
published in 2002, showed wind power as having the lowest
range of these hidden costs - 0.15 to 0.25 € cents/kWh –
compared to 2 to 15 € cents/kWh for coal. The study
concluded that the cost of electricity from coal or oil would
double, and that from gas increase by 30%, if their external
costs associated with the environment and health were taken
into account.
The polluting effect of fossil fuels has now been reflected
through carbon reduction measures such as the European
Union’s emissions trading scheme, which sets a limit on the
amount of carbon dioxide which can be emitted by all major
industrial enterprises.
Employment and Local Development
Wind energy also provides economic benefit through the
employment which the industry generates. Manufacturing
wind turbines and their components offers major job
opportunities, often building on existing engineering skills
and raw materials. In rural areas, wind energy can bring
investment and jobs to isolated communities; hosting wind
farms provides farmers with a steady income whilst they
continue to graze or crop their land.
Employment levels vary from country to country, but the
German Wind Energy Association (BWE) estimates the
number of jobs created in Germany by the end of 2005 at
64,000. The Global Wind Energy Council estimates total
worldwide employment at more than 150,000.
A recent study in the US by the government’s National
Renewable Energy Laboratory concluded that investment in
DRIVERS FOR WIND ENERGY
20
wind power had a greater economic impact on the rural
regions where it was developed - through new jobs, income
and taxes - than a fossil fuel power station.
In the developing world, wind power is attractive as a means
of providing a cheap and flexible electricity supply to
dispersed communities, often through off-grid stand-alone
systems. Its effect on economic development can be
dramatic. Supplying enough power for just basic lighting and
a television or computer can make a substantial difference to
domestic life, educational opportunities and the viability of
small businesses.
Technology and Industrial Development
Since the 1980s, when the first commercial wind turbines
were deployed, their capacity, efficiency and visual design
have all improved enormously.
The most dramatic improvement has been in the increasing
size and performance of wind turbines. From machines of just
25 kW twenty-five years ago, the commercial size range sold
today is typically from 750 up to 2,500 kW (2.5 MW). Each
2 MW turbine produces more energy than 200 of the 1980s
vintage machines.
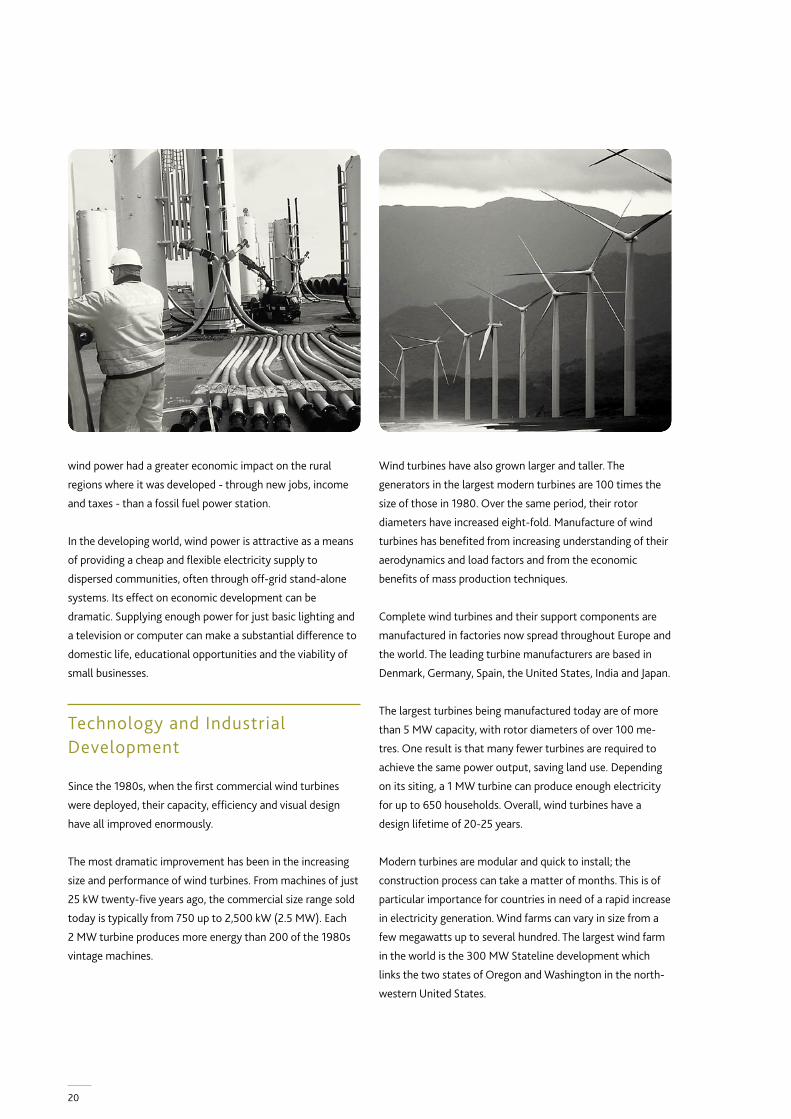
Wind turbines have also grown larger and taller. The
generators in the largest modern turbines are 100 times the
size of those in 1980. Over the same period, their rotor
diameters have increased eight-fold. Manufacture of wind
turbines has benefited from increasing understanding of their
aerodynamics and load factors and from the economic
benefits of mass production techniques.
Complete wind turbines and their support components are
manufactured in factories now spread throughout Europe and
the world. The leading turbine manufacturers are based in
Denmark, Germany, Spain, the United States, India and Japan.
The largest turbines being manufactured today are of more
than 5 MW capacity, with rotor diameters of over 100 me-
tres. One result is that many fewer turbines are required to
achieve the same power output, saving land use. Depending
on its siting, a 1 MW turbine can produce enough electricity
for up to 650 households. Overall, wind turbines have a
design lifetime of 20-25 years.
Modern turbines are modular and quick to install; the
construction process can take a matter of months. This is of
particular importance for countries in need of a rapid increase
in electricity generation. Wind farms can vary in size from a
few megawatts up to several hundred. The largest wind farm
in the world is the 300 MW Stateline development which
links the two states of Oregon and Washington in the north-
western United States.
21
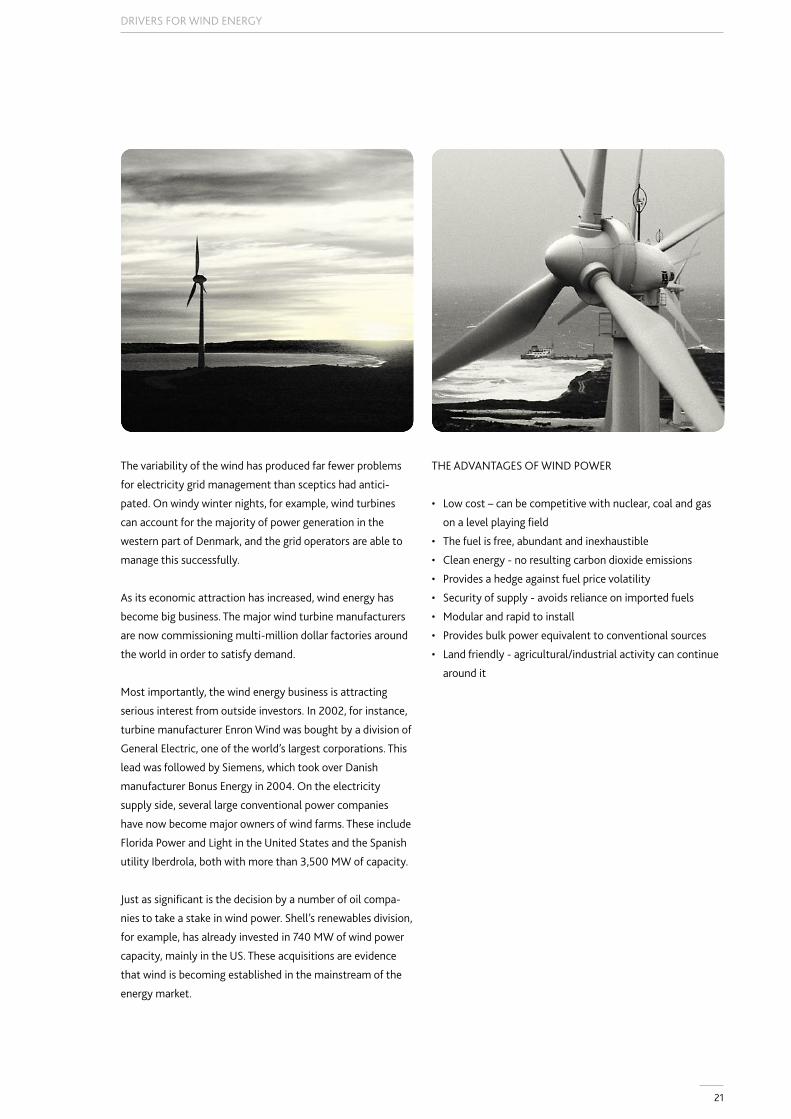
The variability of the wind has produced far fewer problems
for electricity grid management than sceptics had antici-
pated. On windy winter nights, for example, wind turbines
can account for the majority of power generation in the
western part of Denmark, and the grid operators are able to
manage this successfully.
As its economic attraction has increased, wind energy has
become big business. The major wind turbine manufacturers
are now commissioning multi-million dollar factories around
the world in order to satisfy demand.
Most importantly, the wind energy business is attracting
serious interest from outside investors. In 2002, for instance,
turbine manufacturer Enron Wind was bought by a division of
General Electric, one of the world’s largest corporations. This
lead was followed by Siemens, which took over Danish
manufacturer Bonus Energy in 2004. On the electricity
supply side, several large conventional power companies
have now become major owners of wind farms. These include
Florida Power and Light in the United States and the Spanish
utility Iberdrola, both with more than 3,500 MW of capacity.
Just as significant is the decision by a number of oil compa-
nies to take a stake in wind power. Shell’s renewables division,
for example, has already invested in 740 MW of wind power
capacity, mainly in the US. These acquisitions are evidence
that wind is becoming established in the mainstream of the
energy market.
THE ADVANTAGES OF WIND POWER
• Low cost – can be competitive with nuclear, coal and gas
on a level playing field
• The fuel is free, abundant and inexhaustible
• Clean energy - no resulting carbon dioxide emissions
• Provides a hedge against fuel price volatility
• Security of supply - avoids reliance on imported fuels
• Modular and rapid to install
• Provides bulk power equivalent to conventional sources
• Land friendly - agricultural/industrial activity can continue
around it
DRIVERS FOR WIND ENERGY
22
THE WORLD’S WIND RESOURCES
AND GRID INTEGRATION
23
Wind Resource Assessments
Few studies have been made of the world’s wind resources,
with the most detailed research confined to the continent of
Europe and the US. However, those assessments which have
been carried out confirm that the world’s wind resources are
extremely large and well distributed across almost all regions
and countries. Lack of wind is unlikely to be a limiting factor
on global wind power development. When specific analysis
has been produced on individual countries or regions, this has
often shown an even greater resource than the global picture
suggests.
According to Michael Grubb and Neils Meyer in “Renewable
Energy Sources for Fuels and Electricity” (1994), the world’s
wind resources have the capacity to generate 53,000 TWh of
electricity per year. This is almost three times the Interna-
tional Energy Agency’s (IEA) figure for global electricity
consumption in 2003 (13,663 TWh).
A study by the German Advisory Council on Global Change
(WBGU), “World in Transition – Towards Sustainable Energy
Systems” (2003) calculated that the global technical
potential for energy production from both onshore and
offshore wind installations was 278,000 TWh per year. The
report then assumed that only 10–15% of this potential
would be realisable in a sustainable fashion, and arrived at a
figure of approximately 39,000 TWh per year as the
contribution from wind energy in the long term. This
represented 35% of the 1998 figure for total world primary
energy demand (112,000 TWh) used by the study.
The WBGU calculations of the technical potential were based
on average values of wind speeds from meteorological data
collected over a 14 year period (1979–1992). They also
assumed that advanced multi-megawatt wind energy
converters would be used. Limitations to the potential came
through excluding all urban areas and natural features such
as forests, wetlands, nature reserves, glaciers and sand dunes.
Agriculture, on the other hand, was not regarded as competi-
tion for wind energy in terms of land use.
More recently, researchers from the Global Climate and
Energy Project at Stanford University, California estimated
that the world’s wind resources can generate more than
enough power to satisfy total global energy demand. After
collecting measurements from 7,500 surface and 500
balloon-launch monitoring stations to determine global wind
speeds at 80 metres above ground level, they found that
nearly 13% had an average wind speed above 6.9 metres per
second (Class 3), more than adequate for power generation.
North America was found to have the greatest wind power
potential, although some of the strongest winds were
observed in Northern Europe, whilst the southern tip of
South America and the Australian island of Tasmania also
recorded significant and sustained strong winds.
The study did not take into account uncertainties such as
long-term variations and climatic effects, or practical
considerations such as site availability, access and transmis-
sion. Translated into electricity output, however, and using as
little as 20% of the potential resource for power generation,
the report concluded that wind energy could satisfy the
world’s electricity demand seven times over.
Looking in more detail at the solar and wind resource in 13
developing countries, the SWERA (Solar and Wind Energy
Resource Assessment) project, supported by the United
Nations Environment Programme, has found the potential,
among other examples, for 7,000 MW of wind capacity in
Guatemala and 26,000 MW in Sri Lanka. Neither country has
yet started to seriously exploit this large resource.
Variability and Grid Integration
Wind power is often described as an “intermittent” energy
source, and therefore unreliable. In fact, at a system level,
wind does not start and stop at irregular intervals, so the
term “intermittent” is misleading. The output of the
aggregated wind power capacity is variable, just as the power
system itself is inherently variable.
Electricity flows – both supply and demand – are influenced by
a large number of planned and unplanned factors. Changing
weather makes people switch their heating and lighting on and
off, millions of consumers expect instant power for TVs and
computers. On the supply side, when a large power station
goes offline, whether by accident or planned shutdown, it does
so instantaneously, causing an immediate loss of many
hundreds of megawatts. By contrast, wind energy does not
suddenly trip off the system. Variations are smoother because
there are hundreds or thousands of units rather than a few
THE WORLD’S WIND RESOURCES AND GRID INTEGRATION
24
large power stations, making it easier for the system operator
to predict and manage changes in supply. There is little overall
impact if the wind stops blowing in one particular place,
because it is always blowing somewhere else.
Power systems have always had to deal with these sudden
output variations from large power plants, and the proce-
dures put in place can be applied to deal with variations in
wind power production as well. The issue is therefore not one
of variability in itself, but how to predict, manage and
ameliorate this variability, and what tools can be used to
improve efficiency.
The challenge in many parts of the world is that there is no
regulatory or physical grid structure in place to allow the full
exploitation of the vast global wind reserves. These will have
to be developed at significant cost, although large invest-
ment would be involved whichever generation option was
chosen.
In the present situation wind power is disadvantaged in
relation to conventional sources, whose infrastructure has
been largely developed under national vertically integrated
monopolies which were able to finance grid network
improvements through state subsidies and levies on
electricity bills. But whilst a more liberalised market has
closed off those options in some countries, numerous
distortions continue to disadvantage renewable generators in
the power market – from discriminatory connection charges
to potential abuse of their dominant power by major
companies.
Grid Integration
One of the biggest mistakes often made during public
discussion about integrating wind energy into the electricity
network is that it is treated in isolation. An electricity system
is in practice much like a massive bath tub, with hundreds of
taps (power stations) providing the input and millions of plug
holes (consumers) draining the output. The taps and plugs are
opening and closing all the time. For the grid operators, the
task is to make sure there is enough water in the bath to
maintain system security. It is therefore the combined effects
of all technologies, as well as the demand patterns, that
matter.
The present levels of wind power connected to electricity
systems already show that it is feasible to integrate the
technology to a significant extent. Experience with more than
40 GW installed in Europe, for example, has shown where
areas of high, medium and low penetration levels take place
in different conditions, and which bottlenecks and challenges
occur.
For small penetration levels, grid operation will not be
affected to any significant extent. Wind power supplies less
than 3% of overall EU electricity demand at present,
although there are large regional and national variations. The
already established control methods and backup capacity
available for dealing with variable demand and supply are
more than adequate to handle the additional variable supply
of wind power at penetration levels up to around 20%. Above
that, some changes may be needed in power systems and
their method of operation.
The integration of large amounts of wind power is often
dismissed as impossible, and many grid operators are
reluctant to make changes to their long established proce-
dures. In Denmark, however, 21% of total electricity
consumption was met by wind power in 2004. In the western
half of the country, up to 25% of demand is met by wind
power and, on some occasions, it has been able to cover
100% of instantaneous demand.
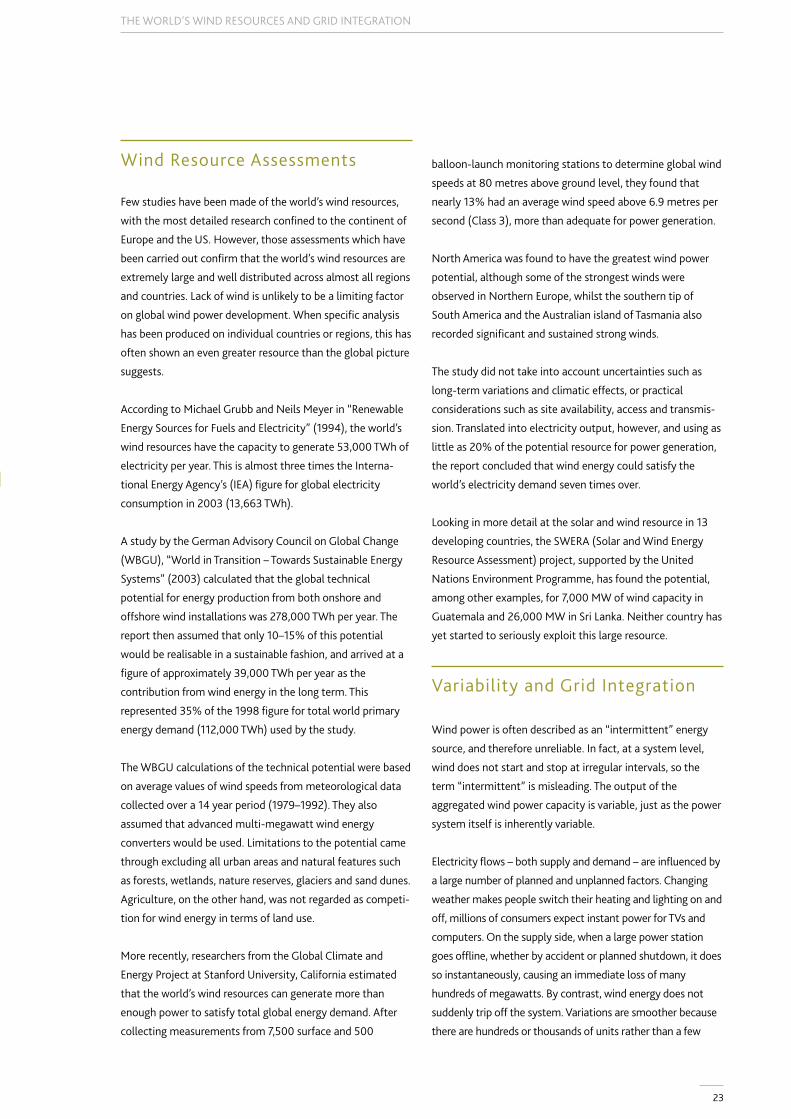
“Seven or eight years ago, we said that the electricity
system could not function if wind power increased above
500 MW. Now we are handling almost five times as much.
And I would like to tell the government and the parliament
that we are ready to handle even more, but it requires that
we are allowed to use the right tools to manage the
system.“
HANS SCHIØTT, CHAIRMAN OF ELTRA,
THE TSO (TRANSMISSION SYSTEM OPERATOR)
FOR WEST DENMARK, IN 2003
25
THE WORLD’S WIND RESOURCES AND GRID INTEGRATION
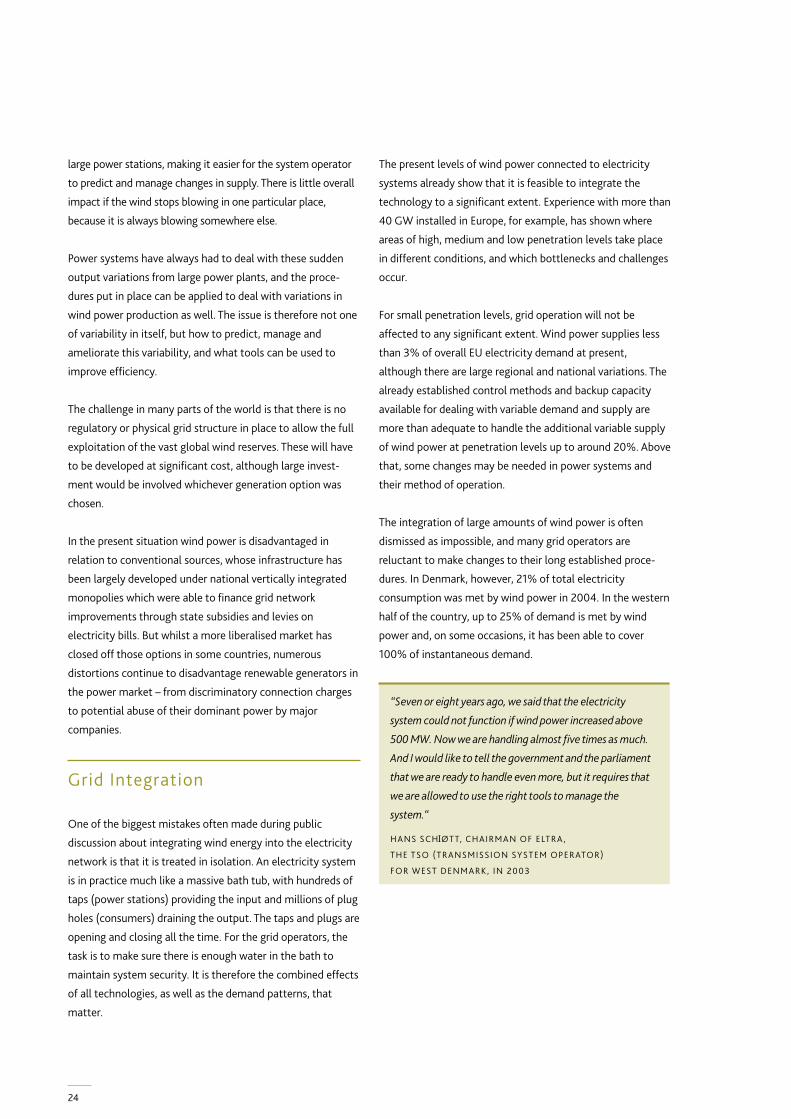
Issues for Integrating Wind Power
Despite these successful experiences, a number of issues still
have to be addressed if large quantities of wind power are to
be successfully integrated into the grid network. These issues
relate to system operation, grid connection, system stability
and infrastructure improvements.
SYSTEM OPERATION
At first sight wind energy appears to present a difficult
challenge for the power system, often resulting in high
estimates for ancillary service costs or assumptions that wind
capacity must be “backed up” with large amounts of
conventional generation. However, such assessments often
overlook key factors. These include:
• Grid systems are designed to routinely cope with varying
and uncertain demand, and unexpected transmission and
generation outages.
• Wind power output can be aggregated at a system level,
resulting in significant smoothing effects, which increase
with large scale geographic distribution of wind farms.
• Forecasting of wind power output in both hourly and day
ahead timeframes.
Wind power will still have an impact on power system
reserves, the magnitude of which will depend on the power
system size, generation mix, load variations, demand size
management and degree of grid interconnection. Large
power systems can take advantage of the natural diversity of
variable sources, however. They have flexible mechanisms to
follow the varying load and plant outages that cannot always
be accurately predicted.
The need for additional reserve capacity with growing wind
penetration is in practice very modest, and up to significant
wind power penetrations, unpredicted imbalances can be
countered with reserves existing in the system. Several
national and regional studies indicate additional balancing
costs in the order of 0 to 3 €/MWh for levels of wind power
up to 20%.
In Germany, the level of reserve capacity being kept available
has decreased at the same time as wind power has increased.
Between 2002 and 2004, the level of “control power” kept
available fell from 8.3 GW to 7.3 GW. Over the same period an
additional 6 GW of wind capacity was installed.
SOURCE: “OFFSHORE WIND ENERGY:
IMPLEMENTING A NEW POWERHOUSE FOR EUROPE”,
GREENPEACE INTERNATIONAL 2005
Steady improvements are being made in forecasting tech-
niques. Using increasingly sophisticated weather forecasts,
wind power generation models and statistical analysis, it is
possible to predict generation from five minute to hourly
intervals over timescales up to 72 hours in advance, and for
seasonal and annual periods. Using current tools, the forecast
error1 in predicted wind power for a single wind farm is
between 10 and 20 % for a forecast horizon of 36 hours. For
regionally aggregated wind farms the forecast error is in the
order of 10% for a day ahead and 5% for 1-4 hours in advance.
The effects of geographical distribution can also be signifi-
cant. Whereas a single turbine can experience power swings
from hour to hour of up to 60% of its capacity, monitoring by
the German ISET research institute has shown that the
maximum hourly variation across 350 MW of aggregated
wind farms in Germany does not exceed 20%. Across a larger
area, such as the Nordel system covering four countries
(Finland, Sweden, Norway and Eastern Denmark), the
greatest hourly variations would be less than 10%.
1 RMSE normalised to installed wind power capacity
26
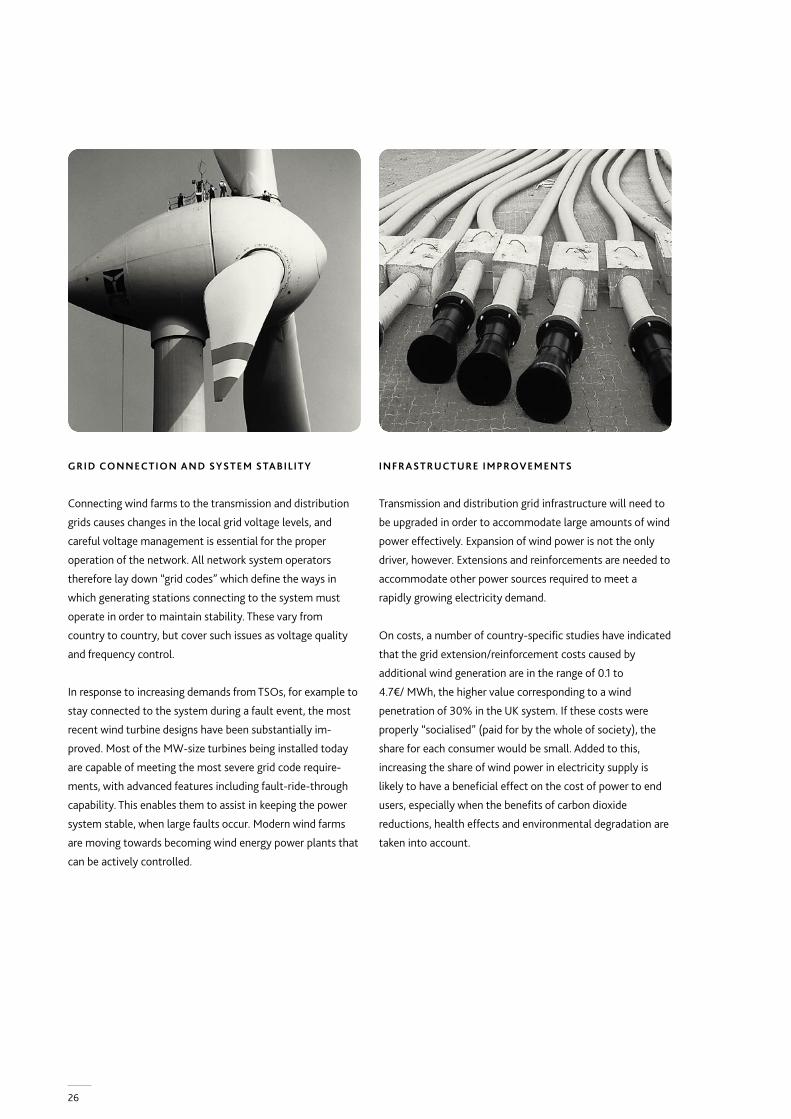
GRID CONNECTION AND SYSTEM STABILITY
Connecting wind farms to the transmission and distribution
grids causes changes in the local grid voltage levels, and
careful voltage management is essential for the proper
operation of the network. All network system operators
therefore lay down “grid codes” which define the ways in
which generating stations connecting to the system must
operate in order to maintain stability. These vary from
country to country, but cover such issues as voltage quality
and frequency control.
In response to increasing demands from TSOs, for example to
stay connected to the system during a fault event, the most
recent wind turbine designs have been substantially im-
proved. Most of the MW-size turbines being installed today
are capable of meeting the most severe grid code require-
ments, with advanced features including fault-ride-through
capability. This enables them to assist in keeping the power
system stable, when large faults occur. Modern wind farms
are moving towards becoming wind energy power plants that
can be actively controlled.
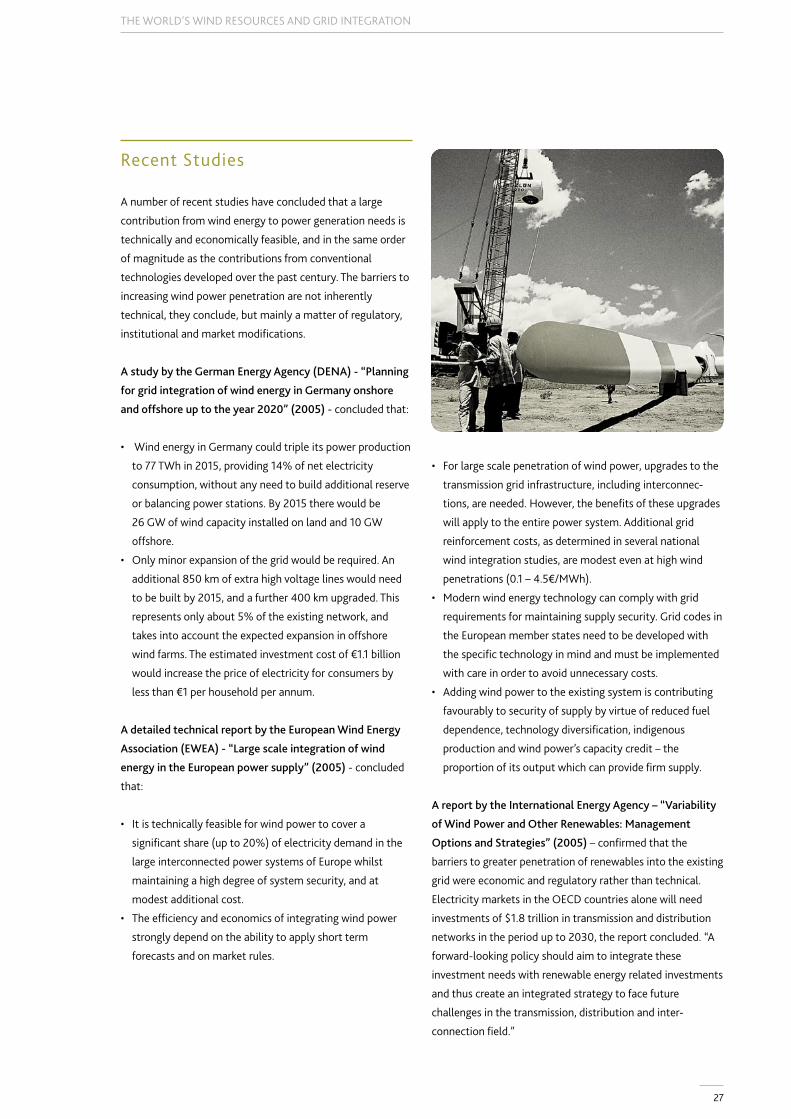
INFRASTRUCTURE IMPROVEMENTS
Transmission and distribution grid infrastructure will need to
be upgraded in order to accommodate large amounts of wind
power effectively. Expansion of wind power is not the only
driver, however. Extensions and reinforcements are needed to
accommodate other power sources required to meet a
rapidly growing electricity demand.
On costs, a number of country-specific studies have indicated
that the grid extension/reinforcement costs caused by
additional wind generation are in the range of 0.1 to
4.7€/ MWh, the higher value corresponding to a wind
penetration of 30% in the UK system. If these costs were
properly “socialised” (paid for by the whole of society), the
share for each consumer would be small. Added to this,
increasing the share of wind power in electricity supply is
likely to have a beneficial effect on the cost of power to end
users, especially when the benefits of carbon dioxide
reductions, health effects and environmental degradation are
taken into account.
27
THE WORLD’S WIND RESOURCES AND GRID INTEGRATION
Recent Studies
A number of recent studies have concluded that a large
contribution from wind energy to power generation needs is
technically and economically feasible, and in the same order
of magnitude as the contributions from conventional
technologies developed over the past century. The barriers to
increasing wind power penetration are not inherently
technical, they conclude, but mainly a matter of regulatory,
institutional and market modifications.
A study by the German Energy Agency (DENA) - “Planning
for grid integration of wind energy in Germany onshore
and offshore up to the year 2020” (2005) - concluded that:
• Wind energy in Germany could triple its power production
to 77 TWh in 2015, providing 14% of net electricity
consumption, without any need to build additional reserve
or balancing power stations. By 2015 there would be
26 GW of wind capacity installed on land and 10 GW
offshore.
• Only minor expansion of the grid would be required. An
additional 850 km of extra high voltage lines would need
to be built by 2015, and a further 400 km upgraded. This
represents only about 5% of the existing network, and
takes into account the expected expansion in offshore
wind farms. The estimated investment cost of €1.1 billion
would increase the price of electricity for consumers by
less than €1 per household per annum.
A detailed technical report by the European Wind Energy
Association (EWEA) - “Large scale integration of wind
energy in the European power supply” (2005) - concluded
that:
• It is technically feasible for wind power to cover a
significant share (up to 20%) of electricity demand in the
large interconnected power systems of Europe whilst
maintaining a high degree of system security, and at
modest additional cost.
• The efficiency and economics of integrating wind power
strongly depend on the ability to apply short term
forecasts and on market rules.
• For large scale penetration of wind power, upgrades to the
transmission grid infrastructure, including interconnec-
tions, are needed. However, the benefits of these upgrades
will apply to the entire power system. Additional grid
reinforcement costs, as determined in several national
wind integration studies, are modest even at high wind
penetrations (0.1 – 4.5€/MWh).
• Modern wind energy technology can comply with grid
requirements for maintaining supply security. Grid codes in
the European member states need to be developed with
the specific technology in mind and must be implemented
with care in order to avoid unnecessary costs.
• Adding wind power to the existing system is contributing
favourably to security of supply by virtue of reduced fuel
dependence, technology diversification, indigenous
production and wind power’s capacity credit – the
proportion of its output which can provide firm supply.
A report by the International Energy Agency – “Variability
of Wind Power and Other Renewables: Management
Options and Strategies” (2005) – confirmed that the
barriers to greater penetration of renewables into the existing
grid were economic and regulatory rather than technical.
Electricity markets in the OECD countries alone will need
investments of $1.8 trillion in transmission and distribution
networks in the period up to 2030, the report concluded. “A
forward-looking policy should aim to integrate these
investment needs with renewable energy related investments
and thus create an integrated strategy to face future
challenges in the transmission, distribution and inter-
connection field.”
28
The construction and operation of wind power installations, often in areas of open countryside, raises issues of visual impact, noise and the potential effects on local ecology and wildlife. Many of these issues are addressed during consultation with the local planning authority, from whom consent must be obtained to proceed with a development, and in most cases through a detailed environmental impact assessment.
THE ENVIRONMENTAL IMPACTS
OF WIND POWER
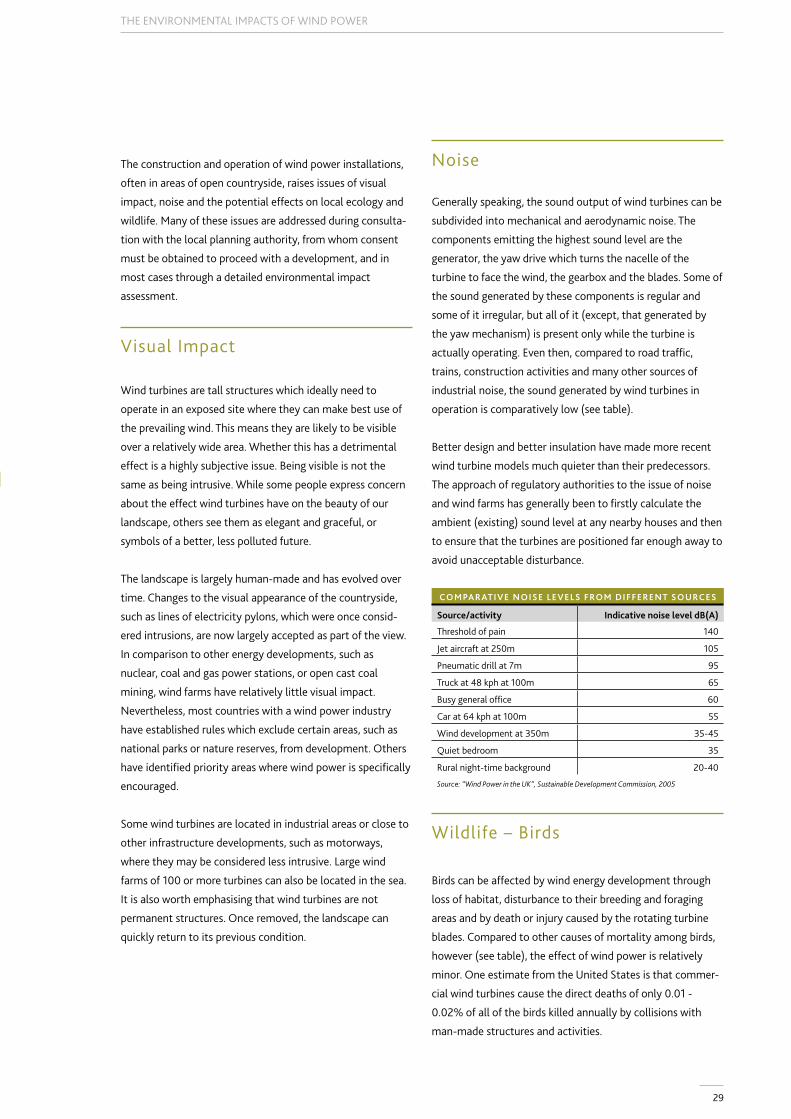
29
THE ENVIRONMENTAL IMPACTS OF WIND POWER
The construction and operation of wind power installations,
often in areas of open countryside, raises issues of visual
impact, noise and the potential effects on local ecology and
wildlife. Many of these issues are addressed during consulta-
tion with the local planning authority, from whom consent
must be obtained to proceed with a development, and in
most cases through a detailed environmental impact
assessment.
Visual Impact
Wind turbines are tall structures which ideally need to
operate in an exposed site where they can make best use of
the prevailing wind. This means they are likely to be visible
over a relatively wide area. Whether this has a detrimental
effect is a highly subjective issue. Being visible is not the
same as being intrusive. While some people express concern
about the effect wind turbines have on the beauty of our
landscape, others see them as elegant and graceful, or
symbols of a better, less polluted future.
The landscape is largely human-made and has evolved over
time. Changes to the visual appearance of the countryside,
such as lines of electricity pylons, which were once consid-
ered intrusions, are now largely accepted as part of the view.
In comparison to other energy developments, such as
nuclear, coal and gas power stations, or open cast coal
mining, wind farms have relatively little visual impact.
Nevertheless, most countries with a wind power industry
have established rules which exclude certain areas, such as
national parks or nature reserves, from development. Others
have identified priority areas where wind power is specifically
encouraged.
Some wind turbines are located in industrial areas or close to
other infrastructure developments, such as motorways,
where they may be considered less intrusive. Large wind
farms of 100 or more turbines can also be located in the sea.
It is also worth emphasising that wind turbines are not
permanent structures. Once removed, the landscape can
quickly return to its previous condition.
Noise
Generally speaking, the sound output of wind turbines can be
subdivided into mechanical and aerodynamic noise. The
components emitting the highest sound level are the
generator, the yaw drive which turns the nacelle of the
turbine to face the wind, the gearbox and the blades. Some of
the sound generated by these components is regular and
some of it irregular, but all of it (except, that generated by
the yaw mechanism) is present only while the turbine is
actually operating. Even then, compared to road traffic,
trains, construction activities and many other sources of
industrial noise, the sound generated by wind turbines in
operation is comparatively low (see table).
Better design and better insulation have made more recent
wind turbine models much quieter than their predecessors.
The approach of regulatory authorities to the issue of noise
and wind farms has generally been to firstly calculate the
ambient (existing) sound level at any nearby houses and then
to ensure that the turbines are positioned far enough away to
avoid unacceptable disturbance.
COMPARATIVE NOISE LEVELS FROM DIFFERENT SOURCES
Source/activity Indicative noise level dB(A)
Threshold of pain 140
Jet aircraft at 250m 105
Pneumatic drill at 7m 95
Truck at 48 kph at 100m 65
Busy general office 60
Car at 64 kph at 100m 55
Wind development at 350m 35-45
Quiet bedroom 35
Rural night-time background 20-40
Source: “Wind Power in the UK”, Sustainable Development Commission, 2005
Wildlife – Birds
Birds can be affected by wind energy development through
loss of habitat, disturbance to their breeding and foraging
areas and by death or injury caused by the rotating turbine
blades. Compared to other causes of mortality among birds,
however (see table), the effect of wind power is relatively
minor. One estimate from the United States is that commer-
cial wind turbines cause the direct deaths of only 0.01 -
0.02% of all of the birds killed annually by collisions with
man-made structures and activities.
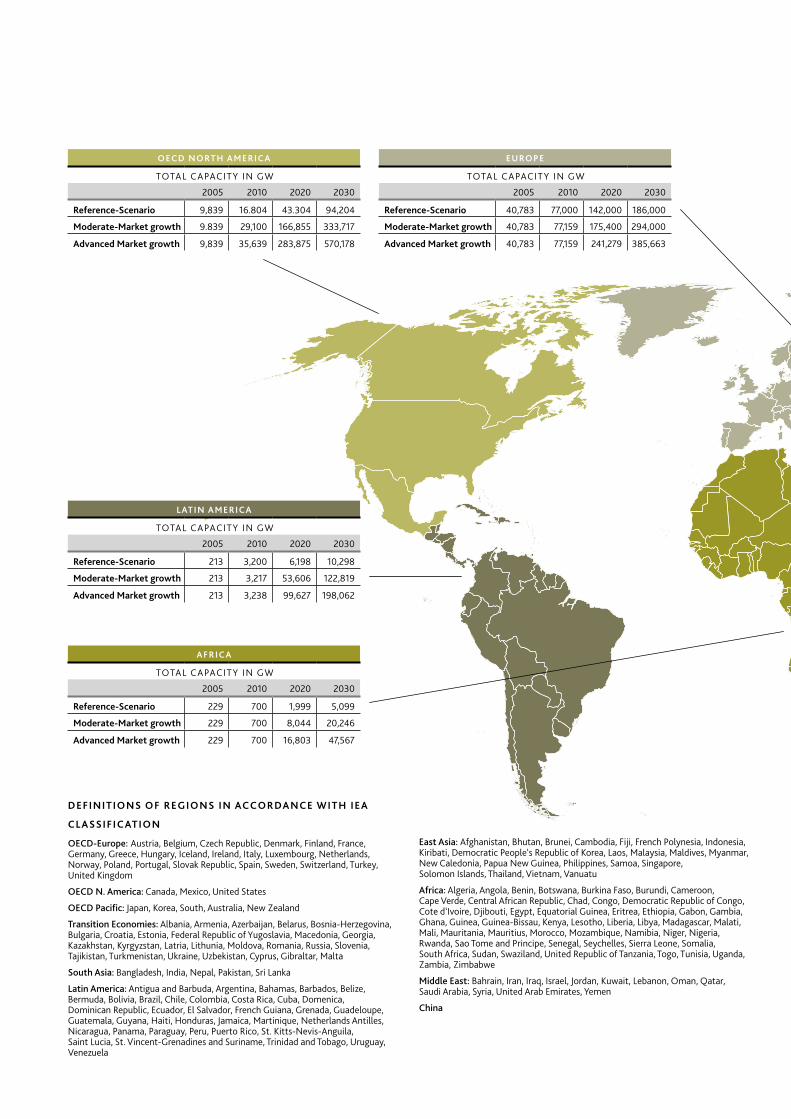
30
OECD NORTH AMERICA
TOTAL CAPACITY IN GW
2005 2010 2020 2030
Reference-Scenario 9,839 16.804 43.304 94,204
Moderate-Market growth 9.839 29,100 166,855 333,717
Advanced Market growth 9,839 35,639 283,875 570,178
LATIN AMERICA
TOTAL CAPACITY IN GW
2005 2010 2020 2030
Reference-Scenario 213 3,200 6,198 10,298
Moderate-Market growth 213 3,217 53,606 122,819
Advanced Market growth 213 3,238 99,627 198,062
AFRICA
TOTAL CAPACITY IN GW
2005 2010 2020 2030
Reference-Scenario 229 700 1,999 5,099
Moderate-Market growth 229 700 8,044 20,246
Advanced Market growth 229 700 16,803 47,567
EUROPE
TOTAL CAPACITY IN GW
2005 2010 2020 2030
Reference-Scenario 40,783 77,000 142,000 186,000
Moderate-Market growth 40,783 77,159 175,400 294,000
Advanced Market growth 40,783 77,159 241,279 385,663
DEFINITIONS OF REGIONS IN ACCORDANCE WITH IEA
CLASSIFICATION
OECD-Europe: Austria, Belgium, Czech Republic, Denmark, Finland, France, Germany, Greece, Hungary, Iceland, Ireland, Italy, Luxembourg, Netherlands, Norway, Poland, Portugal, Slovak Republic, Spain, Sweden, Switzerland, Turkey, United Kingdom
OECD N. America: Canada, Mexico, United States
OECD Pacific: Japan, Korea, South, Australia, New Zealand
Transition Economies: Albania, Armenia, Azerbaijan, Belarus, Bosnia-Herzegovina, Bulgaria, Croatia, Estonia, Federal Republic of Yugoslavia, Macedonia, Georgia, Kazakhstan, Kyrgyzstan, Latria, Lithunia, Moldova, Romania, Russia, Slovenia, Tajikistan, Turkmenistan, Ukraine, Uzbekistan, Cyprus, Gibraltar, Malta
South Asia: Bangladesh, India, Nepal, Pakistan, Sri Lanka
Latin America: Antigua and Barbuda, Argentina, Bahamas, Barbados, Belize, Bermuda, Bolivia, Brazil, Chile, Colombia, Costa Rica, Cuba, Domenica, Dominican Republic, Ecuador, El Salvador, French Guiana, Grenada, Guadeloupe, Guatemala, Guyana, Haiti, Honduras, Jamaica, Martinique, Netherlands Antilles, Nicaragua, Panama, Paraguay, Peru, Puerto Rico, St. Kitts-Nevis-Anguila, Saint Lucia, St. Vincent-Grenadines and Suriname, Trinidad and Tobago, Uruguay, Venezuela
East Asia: Afghanistan, Bhutan, Brunei, Cambodia, Fiji, French Polynesia, Indonesia, Kiribati, Democratic People‘s Republic of Korea, Laos, Malaysia, Maldives, Myanmar, New Caledonia, Papua New Guinea, Philippines, Samoa, Singapore, Solomon Islands, Thailand, Vietnam, Vanuatu
Africa: Algeria, Angola, Benin, Botswana, Burkina Faso, Burundi, Cameroon, Cape Verde, Central African Republic, Chad, Congo, Democratic Republic of Congo, Cote d‘Ivoire, Djibouti, Egypt, Equatorial Guinea, Eritrea, Ethiopia, Gabon, Gambia, Ghana, Guinea, Guinea-Bissau, Kenya, Lesotho, Liberia, Libya, Madagascar, Malati, Mali, Mauritania, Mauritius, Morocco, Mozambique, Namibia, Niger, Nigeria, Rwanda, Sao Tome and Principe, Senegal, Seychelles, Sierra Leone, Somalia, South Africa, Sudan, Swaziland, United Republic of Tanzania, Togo, Tunisia, Uganda, Zambia, Zimbabwe
Middle East: Bahrain, Iran, Iraq, Israel, Jordan, Kuwait, Lebanon, Oman, Qatar, Saudi Arabia, Syria, United Arab Emirates, Yemen
China
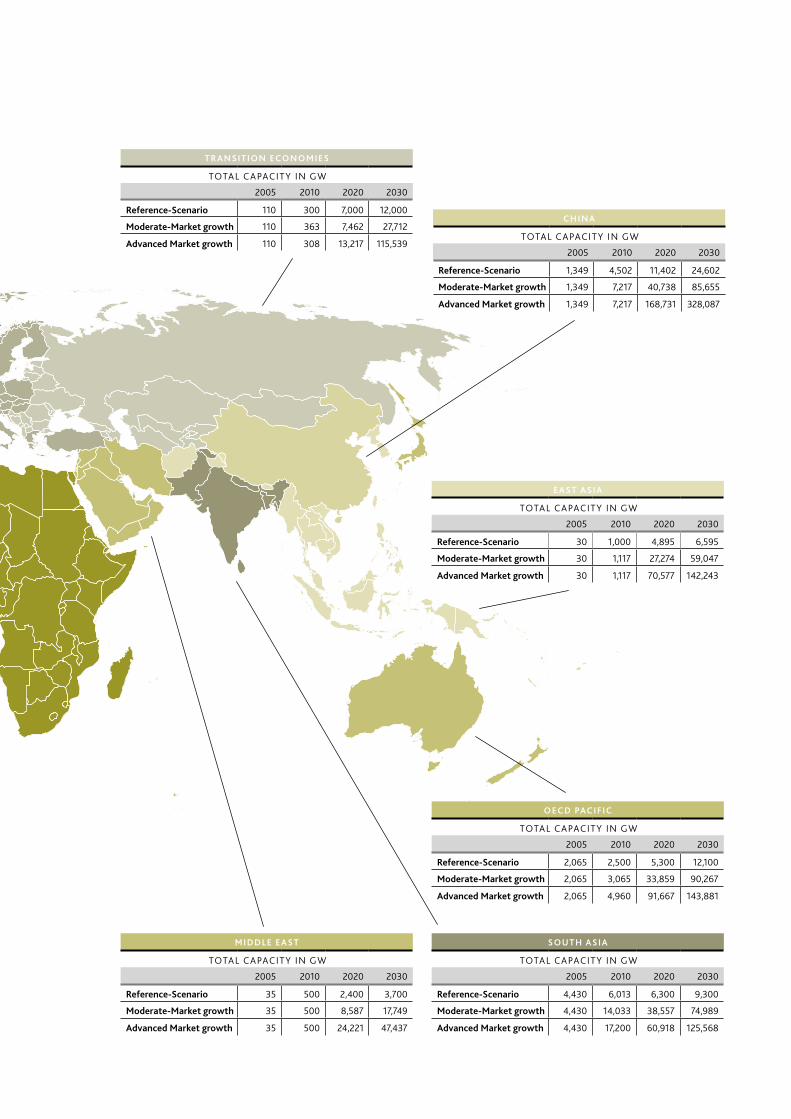
31
MIDDLE EAST
TOTAL CAPACITY IN GW
2005 2010 2020 2030
Reference-Scenario 35 500 2,400 3,700
Moderate-Market growth 35 500 8,587 17,749
Advanced Market growth 35 500 24,221 47,437
SOUTH ASIA
TOTAL CAPACITY IN GW
2005 2010 2020 2030
Reference-Scenario 4,430 6,013 6,300 9,300
Moderate-Market growth 4,430 14,033 38,557 74,989
Advanced Market growth 4,430 17,200 60,918 125,568
TRANSITION ECONOMIES
TOTAL CAPACITY IN GW
2005 2010 2020 2030
Reference-Scenario 110 300 7,000 12,000
Moderate-Market growth 110 363 7,462 27,712
Advanced Market growth 110 308 13,217 115,539
CHINA
TOTAL CAPACITY IN GW
2005 2010 2020 2030
Reference-Scenario 1,349 4,502 11,402 24,602
Moderate-Market growth 1,349 7,217 40,738 85,655
Advanced Market growth 1,349 7,217 168,731 328,087
EAST ASIA
TOTAL CAPACITY IN GW
2005 2010 2020 2030
Reference-Scenario 30 1,000 4,895 6,595
Moderate-Market growth 30 1,117 27,274 59,047
Advanced Market growth 30 1,117 70,577 142,243
OECD PACIFIC
TOTAL CAPACITY IN GW
2005 2010 2020 2030
Reference-Scenario 2,065 2,500 5,300 12,100
Moderate-Market growth 2,065 3,065 33,859 90,267
Advanced Market growth 2,065 4,960 91,667 143,881
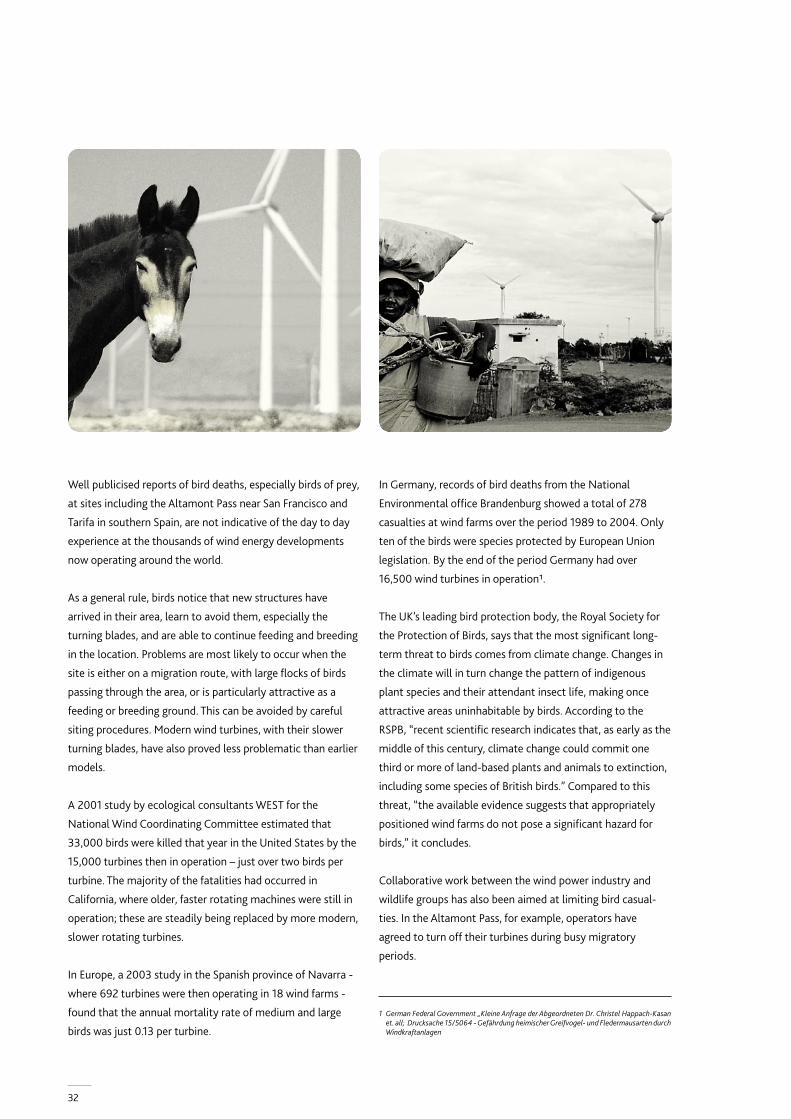
32
Well publicised reports of bird deaths, especially birds of prey,
at sites including the Altamont Pass near San Francisco and
Tarifa in southern Spain, are not indicative of the day to day
experience at the thousands of wind energy developments
now operating around the world.
As a general rule, birds notice that new structures have
arrived in their area, learn to avoid them, especially the
turning blades, and are able to continue feeding and breeding
in the location. Problems are most likely to occur when the
site is either on a migration route, with large flocks of birds
passing through the area, or is particularly attractive as a
feeding or breeding ground. This can be avoided by careful
siting procedures. Modern wind turbines, with their slower
turning blades, have also proved less problematic than earlier
models.
A 2001 study by ecological consultants WEST for the
National Wind Coordinating Committee estimated that
33,000 birds were killed that year in the United States by the
15,000 turbines then in operation – just over two birds per
turbine. The majority of the fatalities had occurred in
California, where older, faster rotating machines were still in
operation; these are steadily being replaced by more modern,
slower rotating turbines.
In Europe, a 2003 study in the Spanish province of Navarra -
where 692 turbines were then operating in 18 wind farms -
found that the annual mortality rate of medium and large
birds was just 0.13 per turbine.
In Germany, records of bird deaths from the National
Environmental office Brandenburg showed a total of 278
casualties at wind farms over the period 1989 to 2004. Only
ten of the birds were species protected by European Union
legislation. By the end of the period Germany had over
16,500 wind turbines in operation1.
The UK’s leading bird protection body, the Royal Society for
the Protection of Birds, says that the most significant long-
term threat to birds comes from climate change. Changes in
the climate will in turn change the pattern of indigenous
plant species and their attendant insect life, making once
attractive areas uninhabitable by birds. According to the
RSPB, “recent scientific research indicates that, as early as the
middle of this century, climate change could commit one
third or more of land-based plants and animals to extinction,
including some species of British birds.” Compared to this
threat, “the available evidence suggests that appropriately
positioned wind farms do not pose a significant hazard for
birds,” it concludes.
Collaborative work between the wind power industry and
wildlife groups has also been aimed at limiting bird casual-
ties. In the Altamont Pass, for example, operators have
agreed to turn off their turbines during busy migratory
periods.
1 German Federal Government „Kleine Anfrage der Abgeordneten Dr. Christel Happach-Kasan et. all; Drucksache 15/5064 - Gefährdung heimischer Greifvogel- und Fledermausarten durch Windkraftanlagen
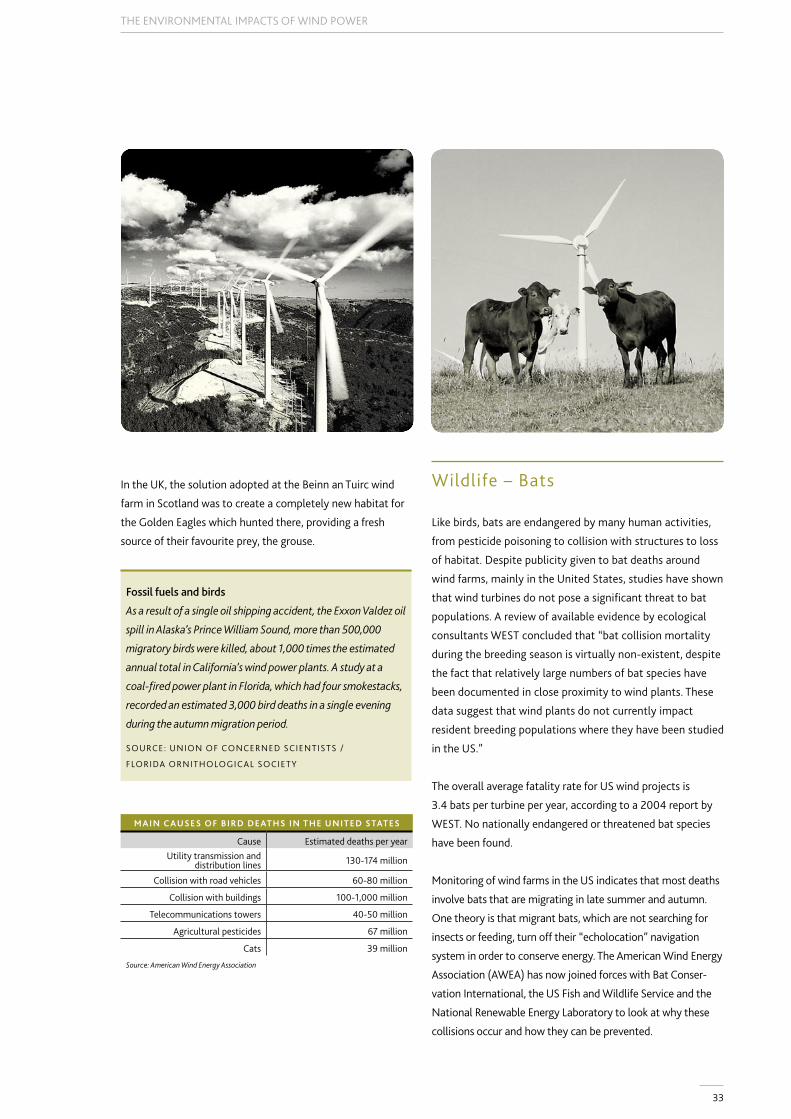
33
THE ENVIRONMENTAL IMPACTS OF WIND POWER
In the UK, the solution adopted at the Beinn an Tuirc wind
farm in Scotland was to create a completely new habitat for
the Golden Eagles which hunted there, providing a fresh
source of their favourite prey, the grouse.
Fossil fuels and birds
As a result of a single oil shipping accident, the Exxon Valdez oil
spill in Alaska’s Prince William Sound, more than 500,000
migratory birds were killed, about 1,000 times the estimated
annual total in California’s wind power plants. A study at a
coal-fired power plant in Florida, which had four smokestacks,
recorded an estimated 3,000 bird deaths in a single evening
during the autumn migration period.
SOURCE: UNION OF CONCERNED SCIENTISTS /
FLORIDA ORNITHOLOGICAL SOCIETY
MAIN CAUSES OF BIRD DEATHS IN THE UNITED STATES
Cause Estimated deaths per yearUtility transmission and
distribution lines 130-174 million
Collision with road vehicles 60-80 million
Collision with buildings 100-1,000 million
Telecommunications towers 40-50 million
Agricultural pesticides 67 million
Cats 39 million
Source: American Wind Energy Association
Wildlife – Bats
Like birds, bats are endangered by many human activities,
from pesticide poisoning to collision with structures to loss
of habitat. Despite publicity given to bat deaths around
wind farms, mainly in the United States, studies have shown
that wind turbines do not pose a significant threat to bat
populations. A review of available evidence by ecological
consultants WEST concluded that “bat collision mortality
during the breeding season is virtually non-existent, despite
the fact that relatively large numbers of bat species have
been documented in close proximity to wind plants. These
data suggest that wind plants do not currently impact
resident breeding populations where they have been studied
in the US.”
The overall average fatality rate for US wind projects is
3.4 bats per turbine per year, according to a 2004 report by
WEST. No nationally endangered or threatened bat species
have been found.
Monitoring of wind farms in the US indicates that most deaths
involve bats that are migrating in late summer and autumn.
One theory is that migrant bats, which are not searching for
insects or feeding, turn off their “echolocation” navigation
system in order to conserve energy. The American Wind Energy
Association (AWEA) has now joined forces with Bat Conser-
vation International, the US Fish and Wildlife Service and the
National Renewable Energy Laboratory to look at why these
collisions occur and how they can be prevented.
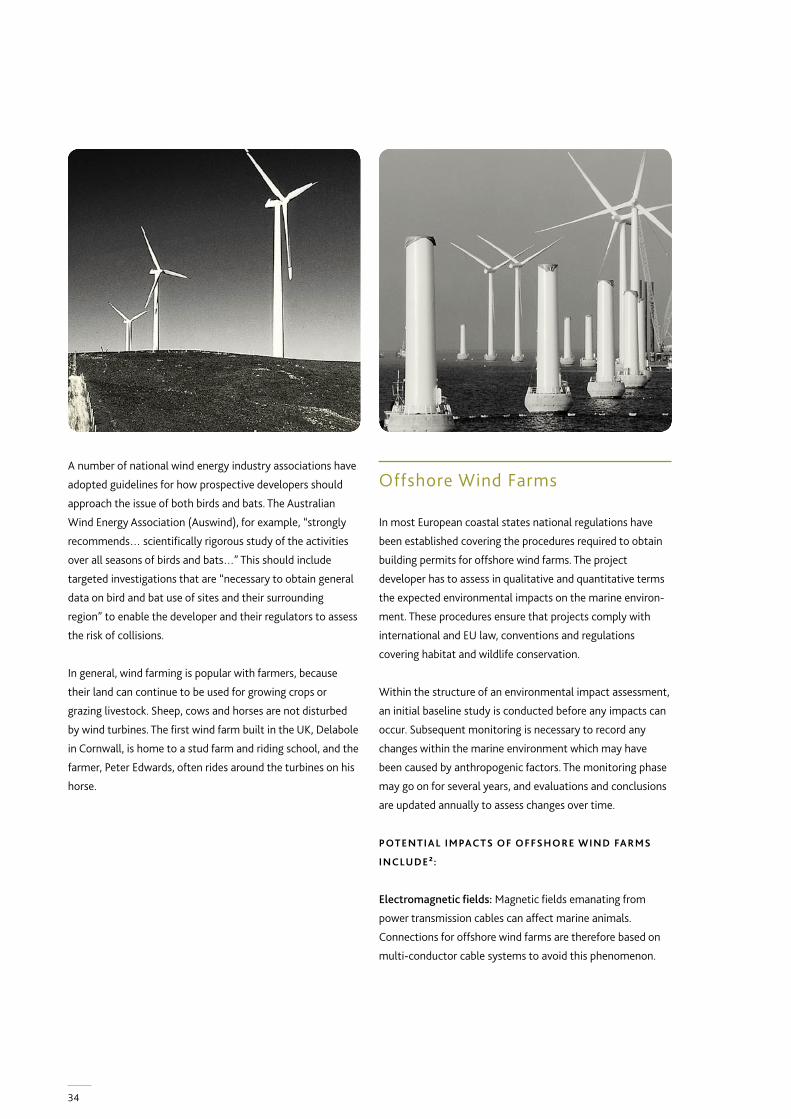
34
A number of national wind energy industry associations have
adopted guidelines for how prospective developers should
approach the issue of both birds and bats. The Australian
Wind Energy Association (Auswind), for example, “strongly
recommends… scientifically rigorous study of the activities
over all seasons of birds and bats…” This should include
targeted investigations that are “necessary to obtain general
data on bird and bat use of sites and their surrounding
region” to enable the developer and their regulators to assess
the risk of collisions.
In general, wind farming is popular with farmers, because
their land can continue to be used for growing crops or
grazing livestock. Sheep, cows and horses are not disturbed
by wind turbines. The first wind farm built in the UK, Delabole
in Cornwall, is home to a stud farm and riding school, and the
farmer, Peter Edwards, often rides around the turbines on his
horse.
Offshore Wind Farms
In most European coastal states national regulations have
been established covering the procedures required to obtain
building permits for offshore wind farms. The project
developer has to assess in qualitative and quantitative terms
the expected environmental impacts on the marine environ-
ment. These procedures ensure that projects comply with
international and EU law, conventions and regulations
covering habitat and wildlife conservation.
Within the structure of an environmental impact assessment,
an initial baseline study is conducted before any impacts can
occur. Subsequent monitoring is necessary to record any
changes within the marine environment which may have
been caused by anthropogenic factors. The monitoring phase
may go on for several years, and evaluations and conclusions
are updated annually to assess changes over time.
POTENTIAL IMPACTS OF OFFSHORE WIND FARMS
INCLUDE²:
Electromagnetic fields: Magnetic fields emanating from
power transmission cables can affect marine animals.
Connections for offshore wind farms are therefore based on
multi-conductor cable systems to avoid this phenomenon.

35
THE ENVIRONMENTAL IMPACTS OF WIND POWER
Noise: Construction operations, especially the ramming of
turbine foundations into the sea bed, can disturb marine
wildlife. However at the Horns Rev site in the North Sea off
Denmark, for example, monitoring has shown that neither
seals nor harbour porpoises, both active in the area, have
been forced to make any substantial changes to their
behaviour. Both fish and benthic communities have in fact
been attracted to the foundations of the wind turbines after
their construction, the latter using them as hatchery or
nursery grounds.
On the noise produced by operating offshore wind turbines,
information currently available indicates that this lies in the
same range of frequencies as that generated by sources such
as shipping, fishing vessels, the wind and waves.
Birds: As on land, sea birds have generally learned to live with
the presence of offshore wind turbines. At the Utgrunden and
Yttre Stengrund wind farms off Sweden, for example,
research shows that very few waterfowl, including Eider
ducks, fly close enough to the turbines to risk collision. One
estimate is that one waterfowl is killed per wind turbine per
year.
At the much larger Nysted wind farm off the coast of
Denmark, radar plotting research found that flocks of
migrating sea birds mostly flew round the outside of the
block of 72 turbines.
At a nine turbine development along the sea wall at Blyth in
Northumbria, UK, 1-2 collisions have been recorded per
turbine per year.
ENVIRONMENTAL BENEFITS
Against the potential negative effects of wind power develop-
ment must be set the benefits resulting from switching to a
renewable source of energy. Wind energy is one of the most
environmentally benign ways of producing the electricity we
need to power our daily lives. If we don’t switch to cleaner
forms of energy, climate change will severely and irrevocably
alter much of our landscape as well as the animal and plant
life it contains.
2 Offshore Wind - Implementing a new Power House for Europe is a strategic blueprint that out-lines how offshore wind farms will be able to supply about 10% of Europe‘s electricity sector by 2020. The report represents a crucial tool in the race to cut greenhouse emissions. It also high-lights the urgency for political, technical and environmental actions to build up an environ-mental friendly powerhouse. The full report is available under: http://www.greenpeace.org/international/press/reports/offshore-wind-implementing-a#
36
THE “GLOBAL WIND ENERGY OUTLOOK”
SCENARIO
37
THE “GLOBAL WIND ENERGY OUTLOOK” SCENARIO
The initial sections of this report have described the current
status of wind energy development around the world, the
range of drivers behind its expansion, and the environmental
and grid supply issues which need to be resolved in order for
this expansion to continue. Although the progress of wind
power has been driven most strongly by the urgent need to
combat the dangers of global climate change, this is now
being supported by increasing concerns over security of
energy supply, in particular the rising cost of fossil fuels. In
the developing world, a further attraction of wind energy is
that it can help satisfy the pressing requirement for new
electricity supply with speed and flexibility.
Against that background this second part of the report now
examines the future potential of wind power. Through the
Global Wind Energy Outlook scenario the horizon is opened
up to the year 2050 against a range of projections for both
the wind energy industry’s expected development and the
anticipated global growth in demand for electricity.
This exercise has been carried out as a collaboration between
the Global Wind Energy Council (GWEC), Greenpeace
International and the German Aerospace Centre (DLR), the
largest engineering research organisation in Germany (see
“Global Wind Energy Outlook – Research Background”).
Projections on the future pattern of wind energy develop-
ment have been extrapolated from a larger study of global
sustainable energy pathways up to 2050 conducted by DLR
for Greenpeace and the European Renewable Energy Council
(EREC).
The Scenarios
Three different scenarios are outlined for the future growth of
wind energy around the world. The most conservative
“Reference” scenario is based on the projection in the (2004)
World Energy Outlook report from the International Energy
Agency (IEA). This projects the growth of all renewables,
including wind power, up to 2030. The IEA assessment has
then been extended up to 2050 using input from the DLR
study.
The “Moderate” scenario takes into account all policy
measures to support renewable energy either under way or
planned around the world. It also assumes that the targets
set by many countries for either renewables or wind energy
are successfully implemented. The assumption here is that
the success achieved in Europe in meeting the goals for wind
energy implementation set by the European Union will be
repeated globally.
The most ambitious scenario, the “Advanced” version,
follows a similar development path to that outlined in the
series of Wind Force 10 and 12 reports produced since 1999
by the European Wind Energy Association (EWEA), the Global
Wind Energy Council (GWEC) and Greenpeace. These
examined how feasible it would be for 10%, and later 12%, of
the world’s electricity to come from wind power by 2020.
The assumption here is that all policy options in favour of
renewable energy, along the lines of this report’s recommen-
dations, have been selected, and the political will is there to
carry them out.
Up to 2010 the figures for installed capacity are closer to
being predictions than scenarios. This is because the data
available from the wind energy industry shows the expected
growth of worldwide markets over the next five years.
After 2010 the pattern of development is clearly much more
difficult to anticipate. Nonetheless, the scenarios still show
what could be achieved if the wind energy market is given the
encouragement it deserves.
Energy Efficiency Projections
These three scenarios for the global wind energy market are
then set against two trajectories for the future growth of
electricity demand. Most importantly, these projections do
not just assume that growing demand by consumers will
inevitably need to be matched by supply options. On the
basis that demand will have to be reduced if the threat of
climate change is to be seriously tackled, they take into
account an increasing element of energy efficiency.
The more conservative of the two global electricity demand
projections is again based on data from the IEA’s 2004 World
Energy Outlook, extrapolated forwards to 2050. This is the
“Reference” projection. It does not take into account any
possible or likely future policy initiatives, and assumes, for
instance, that there will be no change in national policies on
nuclear power. The IEA’s assumption is that “in the absence of
new government policies, the world’s energy needs will rise
inexorably”. Global demand would therefore almost double
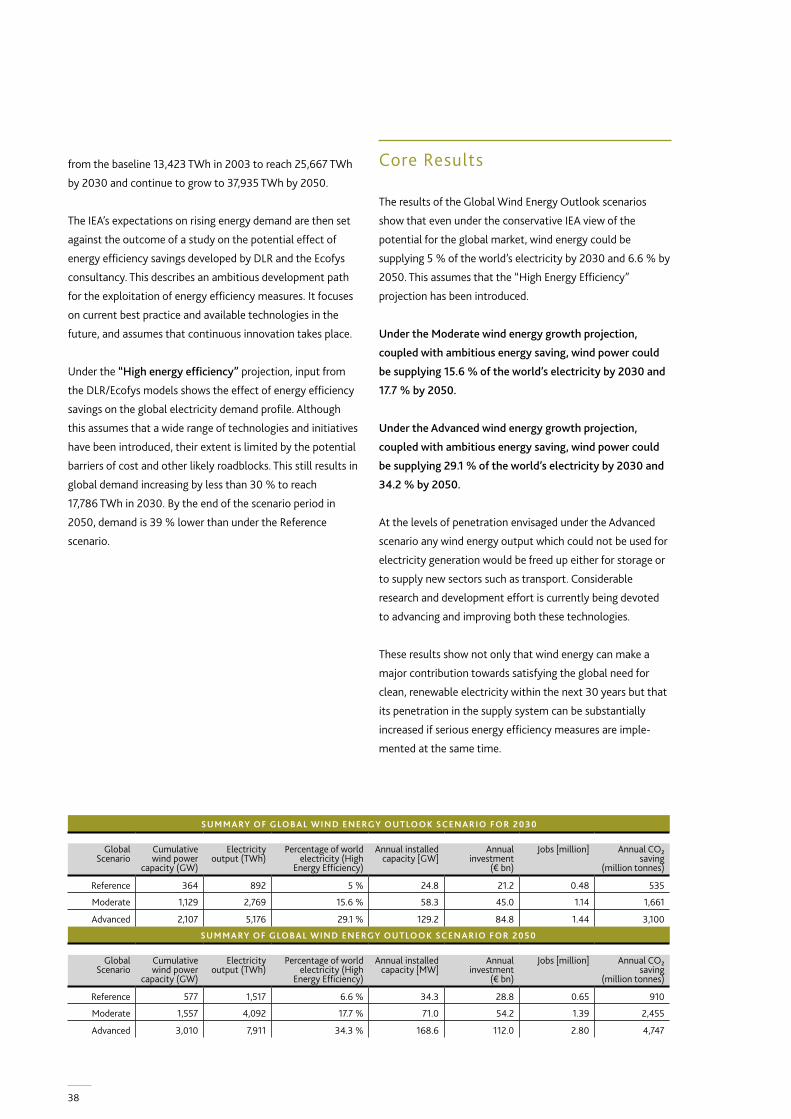
38
from the baseline 13,423 TWh in 2003 to reach 25,667 TWh
by 2030 and continue to grow to 37,935 TWh by 2050.
The IEA’s expectations on rising energy demand are then set
against the outcome of a study on the potential effect of
energy efficiency savings developed by DLR and the Ecofys
consultancy. This describes an ambitious development path
for the exploitation of energy efficiency measures. It focuses
on current best practice and available technologies in the
future, and assumes that continuous innovation takes place.
Under the “High energy efficiency” projection, input from
the DLR/Ecofys models shows the effect of energy efficiency
savings on the global electricity demand profile. Although
this assumes that a wide range of technologies and initiatives
have been introduced, their extent is limited by the potential
barriers of cost and other likely roadblocks. This still results in
global demand increasing by less than 30 % to reach
17,786 TWh in 2030. By the end of the scenario period in
2050, demand is 39 % lower than under the Reference
scenario.
Core Results
The results of the Global Wind Energy Outlook scenarios
show that even under the conservative IEA view of the
potential for the global market, wind energy could be
supplying 5 % of the world’s electricity by 2030 and 6.6 % by
2050. This assumes that the “High Energy Efficiency”
projection has been introduced.
Under the Moderate wind energy growth projection,
coupled with ambitious energy saving, wind power could
be supplying 15.6 % of the world’s electricity by 2030 and
17.7 % by 2050.
Under the Advanced wind energy growth projection,
coupled with ambitious energy saving, wind power could
be supplying 29.1 % of the world’s electricity by 2030 and
34.2 % by 2050.
At the levels of penetration envisaged under the Advanced
scenario any wind energy output which could not be used for
electricity generation would be freed up either for storage or
to supply new sectors such as transport. Considerable
research and development effort is currently being devoted
to advancing and improving both these technologies.
These results show not only that wind energy can make a
major contribution towards satisfying the global need for
clean, renewable electricity within the next 30 years but that
its penetration in the supply system can be substantially
increased if serious energy efficiency measures are imple-
mented at the same time.
SUMMARY OF GLOBAL WIND ENERGY OUTLOOK SCENARIO FOR 2030
Global Scenario
Cumulative wind power
capacity (GW)
Electricity output (TWh)
Percentage of world electricity (High
Energy Efficiency)
Annual installed capacity [GW]
Annual investment
(€ bn)
Jobs [million] Annual CO₂ saving
(million tonnes)
Reference 364 892 5 % 24.8 21.2 0.48 535
Moderate 1,129 2,769 15.6 % 58.3 45.0 1.14 1,661
Advanced 2,107 5,176 29.1 % 129.2 84.8 1.44 3,100
SUMMARY OF GLOBAL WIND ENERGY OUTLOOK SCENARIO FOR 2050
Global Scenario
Cumulative wind power
capacity (GW)
Electricity output (TWh)
Percentage of world electricity (High
Energy Efficiency)
Annual installed capacity [MW]
Annual investment
(€ bn)
Jobs [million] Annual CO₂ saving
(million tonnes)
Reference 577 1,517 6.6 % 34.3 28.8 0.65 910
Moderate 1,557 4,092 17.7 % 71.0 54.2 1.39 2,455
Advanced 3,010 7,911 34.3 % 168.6 112.0 2.80 4,747
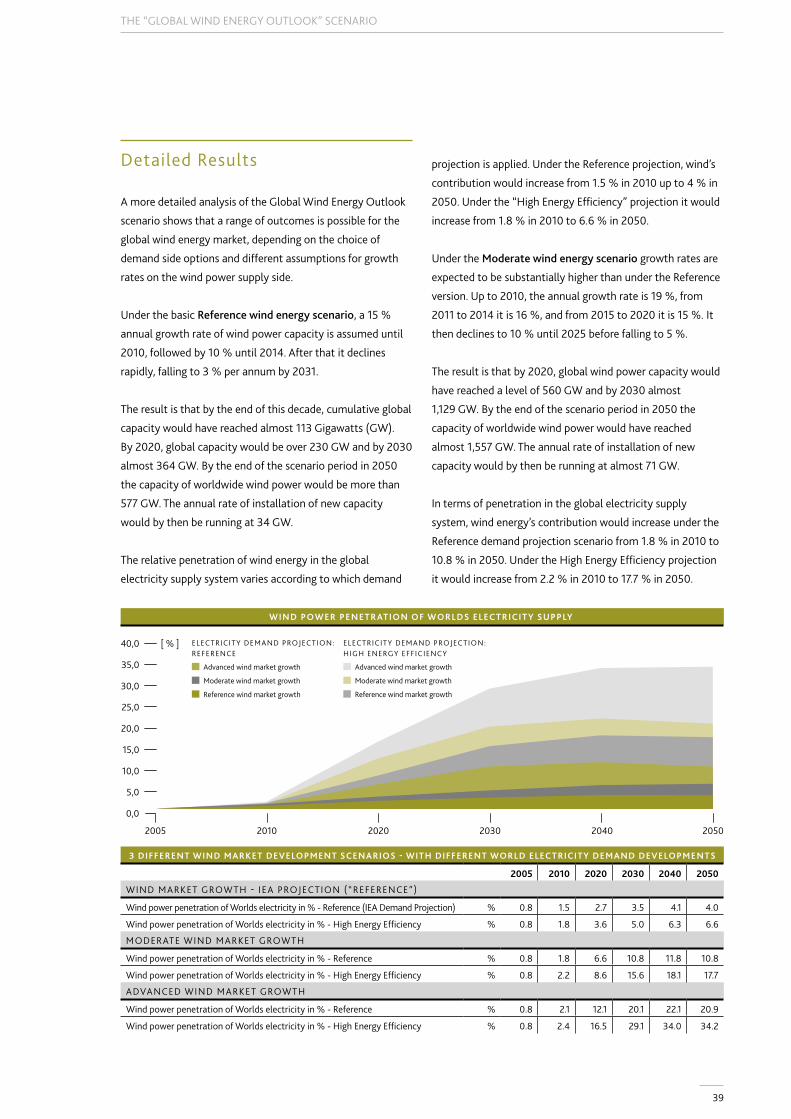
39
THE “GLOBAL WIND ENERGY OUTLOOK” SCENARIO
Detailed Results
A more detailed analysis of the Global Wind Energy Outlook
scenario shows that a range of outcomes is possible for the
global wind energy market, depending on the choice of
demand side options and different assumptions for growth
rates on the wind power supply side.
Under the basic Reference wind energy scenario, a 15 %
annual growth rate of wind power capacity is assumed until
2010, followed by 10 % until 2014. After that it declines
rapidly, falling to 3 % per annum by 2031.
The result is that by the end of this decade, cumulative global
capacity would have reached almost 113 Gigawatts (GW).
By 2020, global capacity would be over 230 GW and by 2030
almost 364 GW. By the end of the scenario period in 2050
the capacity of worldwide wind power would be more than
577 GW. The annual rate of installation of new capacity
would by then be running at 34 GW.
The relative penetration of wind energy in the global
electricity supply system varies according to which demand
projection is applied. Under the Reference projection, wind’s
contribution would increase from 1.5 % in 2010 up to 4 % in
2050. Under the “High Energy Efficiency” projection it would
increase from 1.8 % in 2010 to 6.6 % in 2050.
Under the Moderate wind energy scenario growth rates are
expected to be substantially higher than under the Reference
version. Up to 2010, the annual growth rate is 19 %, from
2011 to 2014 it is 16 %, and from 2015 to 2020 it is 15 %. It
then declines to 10 % until 2025 before falling to 5 %.
The result is that by 2020, global wind power capacity would
have reached a level of 560 GW and by 2030 almost
1,129 GW. By the end of the scenario period in 2050 the
capacity of worldwide wind power would have reached
almost 1,557 GW. The annual rate of installation of new
capacity would by then be running at almost 71 GW.
In terms of penetration in the global electricity supply
system, wind energy’s contribution would increase under the
Reference demand projection scenario from 1.8 % in 2010 to
10.8 % in 2050. Under the High Energy Efficiency projection
it would increase from 2.2 % in 2010 to 17.7 % in 2050.
3 DIFFERENT WIND MARKET DEVELOPMENT SCENARIOS - WITH DIFFERENT WORLD ELECTRICITY DEMAND DEVELOPMENTS
2005 2010 2020 2030 2040 2050
WIND MARKET GROWTH - IEA PROJECTION (“REFERENCE”)
Wind power penetration of Worlds electricity in % - Reference (IEA Demand Projection) % 0.8 1.5 2.7 3.5 4.1 4.0
Wind power penetration of Worlds electricity in % - High Energy Efficiency % 0.8 1.8 3.6 5.0 6.3 6.6
MODERATE WIND MARKET GROWTH
Wind power penetration of Worlds electricity in % - Reference % 0.8 1.8 6.6 10.8 11.8 10.8
Wind power penetration of Worlds electricity in % - High Energy Efficiency % 0.8 2.2 8.6 15.6 18.1 17.7
ADVANCED WIND MARKET GROWTH
Wind power penetration of Worlds electricity in % - Reference % 0.8 2.1 12.1 20.1 22.1 20.9
Wind power penetration of Worlds electricity in % - High Energy Efficiency % 0.8 2.4 16.5 29.1 34.0 34.2
0,0
5,0
10,0
15,0
20,0
25,0
30,0
35,0
40,0 [ % ]
2005 2010 2020 2030 2040 2050
ELECTRICITY DEMAND PROJECTION: HIGH ENERGY EFFICIENCY
ELECTRICITY DEMAND PROJECTION: REFERENCE
Reference wind market growth
Moderate wind market growth
Advanced wind market growth
Reference wind market growth
Moderate wind market growth
Advanced wind market growth
WIND POWER PENETRATION OF WORLDS ELECTRICITY SUPPLY
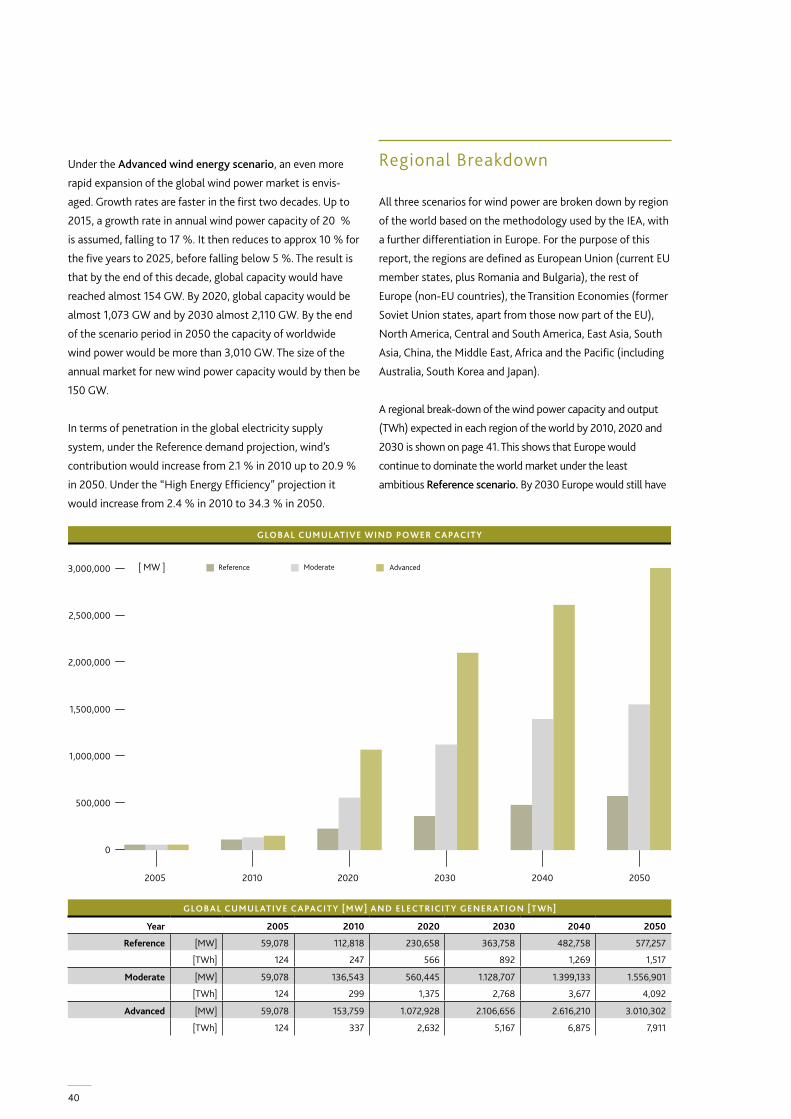
40
Under the Advanced wind energy scenario, an even more
rapid expansion of the global wind power market is envis-
aged. Growth rates are faster in the first two decades. Up to
2015, a growth rate in annual wind power capacity of 20 %
is assumed, falling to 17 %. It then reduces to approx 10 % for
the five years to 2025, before falling below 5 %. The result is
that by the end of this decade, global capacity would have
reached almost 154 GW. By 2020, global capacity would be
almost 1,073 GW and by 2030 almost 2,110 GW. By the end
of the scenario period in 2050 the capacity of worldwide
wind power would be more than 3,010 GW. The size of the
annual market for new wind power capacity would by then be
150 GW.
In terms of penetration in the global electricity supply
system, under the Reference demand projection, wind’s
contribution would increase from 2.1 % in 2010 up to 20.9 %
in 2050. Under the “High Energy Efficiency” projection it
would increase from 2.4 % in 2010 to 34.3 % in 2050.
Regional Breakdown
All three scenarios for wind power are broken down by region
of the world based on the methodology used by the IEA, with
a further differentiation in Europe. For the purpose of this
report, the regions are defined as European Union (current EU
member states, plus Romania and Bulgaria), the rest of
Europe (non-EU countries), the Transition Economies (former
Soviet Union states, apart from those now part of the EU),
North America, Central and South America, East Asia, South
Asia, China, the Middle East, Africa and the Pacific (including
Australia, South Korea and Japan).
A regional break-down of the wind power capacity and output
(TWh) expected in each region of the world by 2010, 2020 and
2030 is shown on page 41. This shows that Europe would
continue to dominate the world market under the least
ambitious Reference scenario. By 2030 Europe would still have
GLOBAL CUMULATIVE CAPACITY [MW] AND ELECTRICITY GENERATION [TWh]
Year 2005 2010 2020 2030 2040 2050
Reference [MW] 59,078 112,818 230,658 363,758 482,758 577,257
[TWh] 124 247 566 892 1,269 1,517
Moderate [MW] 59,078 136,543 560,445 1.128,707 1.399,133 1.556,901
[TWh] 124 299 1,375 2,768 3,677 4,092
Advanced [MW] 59,078 153,759 1.072,928 2.106,656 2.616,210 3.010,302
[TWh] 124 337 2,632 5,167 6,875 7,911
0
500,000
1,000,000
1,500,000
2,000,000
2,500,000
3,000,000
2005 2010 2020 2030 2040 2050
Reference Moderate Advanced[ MW ]
GLOBAL CUMULATIVE WIND POWER CAPACITY
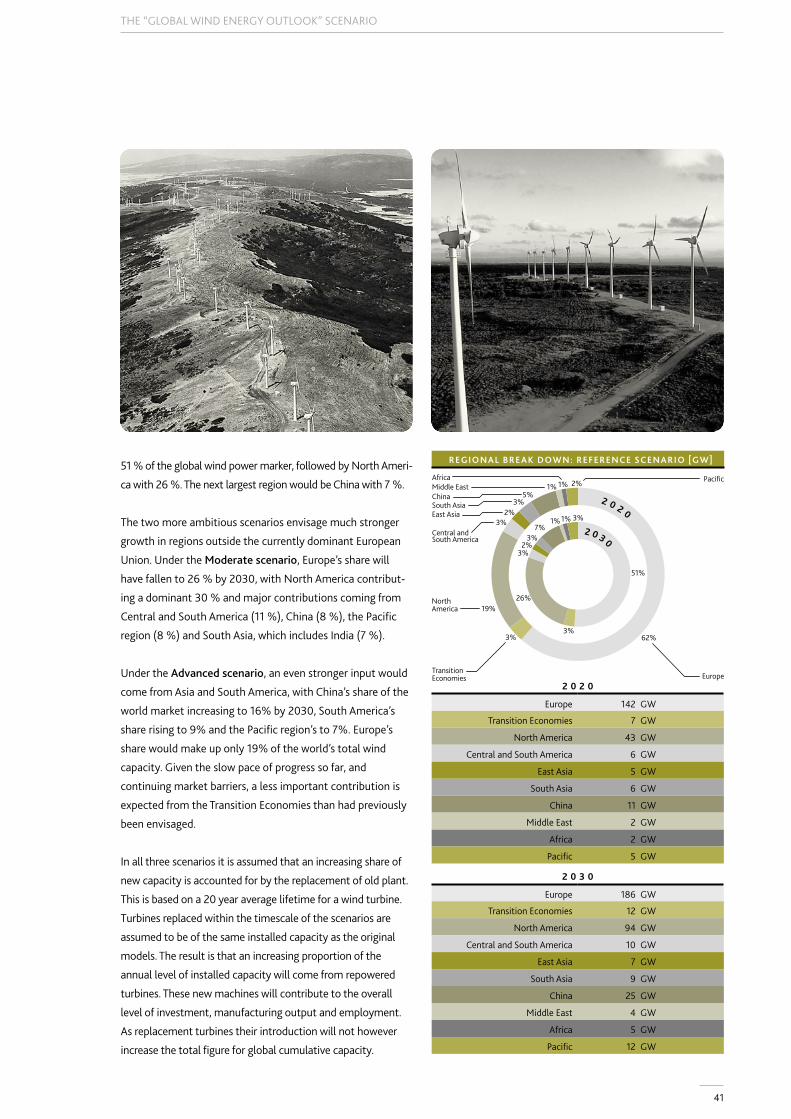
41
THE “GLOBAL WIND ENERGY OUTLOOK” SCENARIO
51 % of the global wind power marker, followed by North Ameri-
ca with 26 %. The next largest region would be China with 7 %.
The two more ambitious scenarios envisage much stronger
growth in regions outside the currently dominant European
Union. Under the Moderate scenario, Europe’s share will
have fallen to 26 % by 2030, with North America contribut-
ing a dominant 30 % and major contributions coming from
Central and South America (11 %), China (8 %), the Pacific
region (8 %) and South Asia, which includes India (7 %).
Under the Advanced scenario, an even stronger input would
come from Asia and South America, with China’s share of the
world market increasing to 16% by 2030, South America’s
share rising to 9% and the Pacific region’s to 7%. Europe’s
share would make up only 19% of the world’s total wind
capacity. Given the slow pace of progress so far, and
continuing market barriers, a less important contribution is
expected from the Transition Economies than had previously
been envisaged.
In all three scenarios it is assumed that an increasing share of
new capacity is accounted for by the replacement of old plant.
This is based on a 20 year average lifetime for a wind turbine.
Turbines replaced within the timescale of the scenarios are
assumed to be of the same installed capacity as the original
models. The result is that an increasing proportion of the
annual level of installed capacity will come from repowered
turbines. These new machines will contribute to the overall
level of investment, manufacturing output and employment.
As replacement turbines their introduction will not however
increase the total figure for global cumulative capacity.
REGIONAL BREAK DOWN: REFERENCE SCENARIO [GW]
EuropeTransitionEconomies
North America
Central and South America
East AsiaSouth AsiaChinaMiddle EastAfrica Pacific 2%
3%
1%1%5%
3%2%
3%
19%
3% 62%
51%
1%1%7%
3%2%
3%
26%
3%
2 0 2 0
2 0 3 0
REFERENCE SCENARIO (GW) 2020 / 2030
2 0 2 0
Europe 142 GW
Transition Economies 7 GW
North America 43 GW
Central and South America 6 GW
East Asia 5 GW
South Asia 6 GW
China 11 GW
Middle East 2 GW
Africa 2 GW
Pacific 5 GW
2 0 3 0
Europe 186 GW
Transition Economies 12 GW
North America 94 GW
Central and South America 10 GW
East Asia 7 GW
South Asia 9 GW
China 25 GW
Middle East 4 GW
Africa 5 GW
Pacific 12 GW
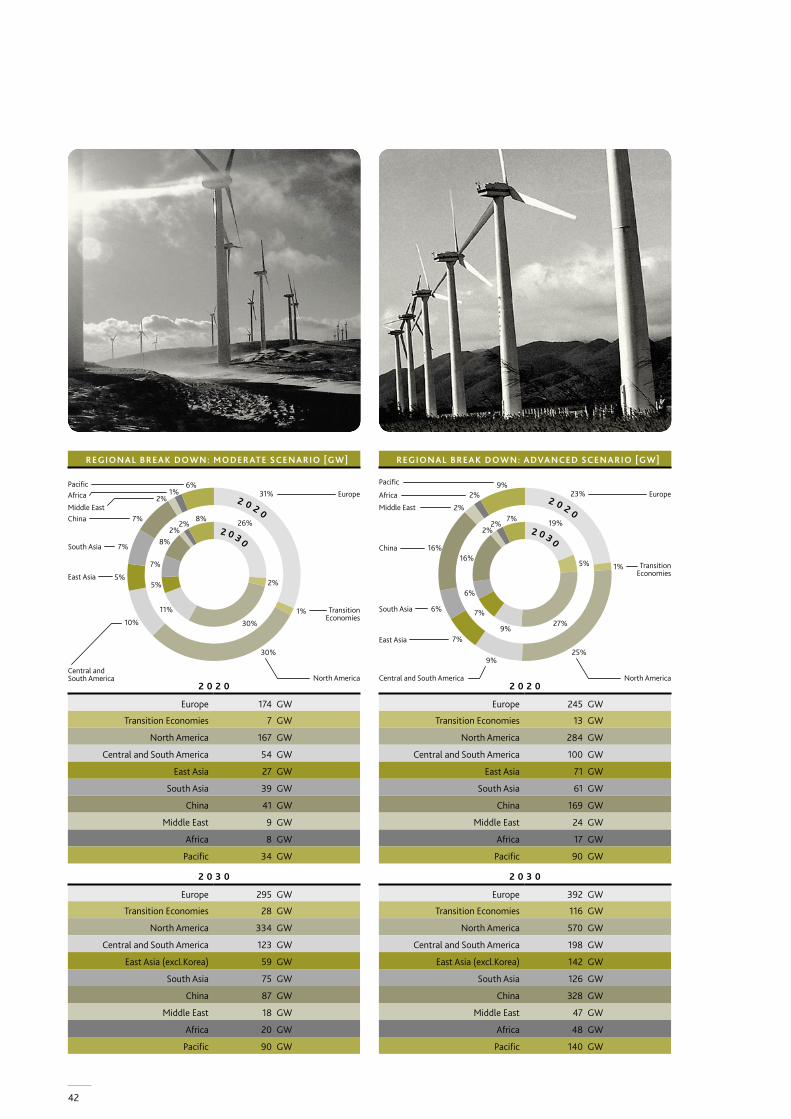
42
REGIONAL BREAK DOWN: MODERATE SCENARIO [GW]
Europe
TransitionEconomies
North AmericaCentral and South America
East Asia
South Asia
ChinaMiddle East
AfricaPacific 6%
8%
1%2%
7%
7%
5%
10%
30%
1%
31%
26%2%2%
8%
7%
5%
11%
30%
2%
2 0 2 0
2 0 3 0
MODERATE SCENARIO (GW) 2020 / 2030
2 0 2 0
Europe 174 GW
Transition Economies 7 GW
North America 167 GW
Central and South America 54 GW
East Asia 27 GW
South Asia 39 GW
China 41 GW
Middle East 9 GW
Africa 8 GW
Pacific 34 GW
2 0 3 0
Europe 295 GW
Transition Economies 28 GW
North America 334 GW
Central and South America 123 GW
East Asia (excl.Korea) 59 GW
South Asia 75 GW
China 87 GW
Middle East 18 GW
Africa 20 GW
Pacific 90 GW
REGIONAL BREAK DOWN: ADVANCED SCENARIO [GW]
Europe
TransitionEconomies
North AmericaCentral and South America
East Asia
South Asia
China
Middle East
Africa
Pacific 9%
7%
2%
2%
16%
6%
7%
9%25%
1%
23%
19%2%2%
16%
6%
7%
9%27%
5%
2 0 2 0
2 0 3 0
ADVANCED SCENARIO (GW) 2020 / 2030
2 0 2 0
Europe 245 GW
Transition Economies 13 GW
North America 284 GW
Central and South America 100 GW
East Asia 71 GW
South Asia 61 GW
China 169 GW
Middle East 24 GW
Africa 17 GW
Pacific 90 GW
2 0 3 0
Europe 392 GW
Transition Economies 116 GW
North America 570 GW
Central and South America 198 GW
East Asia (excl.Korea) 142 GW
South Asia 126 GW
China 328 GW
Middle East 47 GW
Africa 48 GW
Pacific 140 GW
43
THE “GLOBAL WIND ENERGY OUTLOOK” SCENARIO
Main Assumptions and Parameters
1. GROWTH RATES
Market growth rates in this scenario are based on a mixture
of historical figures and information obtained from analysts
of the wind turbine market. Growth rates of up to 20 % per
annum, as envisaged in the Advanced version of the scenario,
are high for an industry which manufactures heavy equip-
ment. The wind industry has experienced much higher growth
rates in recent years, however. Since the year 2000 the
average annual increase in global cumulative installed
capacity has been 28 %.
It should also be borne in mind that whilst growth rates
eventually decline to single figures across the range of
scenarios, the level of wind power capacity envisaged in 30
years’ time means that even small percentage growth rates
will by then translate into large figures in terms of annually
installed megawatts.
2. TURBINE CAPACITY
Individual wind turbines have been steadily growing in terms
of their installed capacity – the maximum electricity output
they could achieve when operating at full power. The average
capacity of wind turbines installed globally in 2005 was
1.2 MW. At the same time the largest turbines being prepared
for the market are now reaching more than 5 MW in capacity.
This scenario makes the conservative assumption that the
average size will gradually increase from today’s figure to
2 MW in 2013 and then level out. It is possible however that
this figure will turn out to be greater in practice. As the
average capacity of turbines increases, fewer will be needed
in total to satisfy a given penetration of global electricity
demand.
3. CAPACITY FACTOR
The capacity factor of a wind turbine is an indication of how
efficiently it is operating. The percentage refers to the
average proportion of the year during which they will be
generating electricity at the equivalent of full capacity. From
an average capacity factor today of 24 %, the scenario
assumes that improvements in both wind turbine technology
and the siting of wind farms will result in a steady increase.
Capacity factors are also much higher out to sea, where
winds are stronger and more predictable. The growing size of
the offshore wind market, especially in Europe, will therefore
contribute to an increase in the average.
The scenario projects that the average global capacity factor
will increase to 28 % by 2012 and then 30 % by 2036.
4. CAPITAL COSTS AND PROGRESS RATIOS
The capital cost of producing wind turbines has fallen steadily
over the past 20 years as manufacturing techniques have
been optimised, turbine design has been largely concentrated
on the three-bladed downwind model with variable speed
and pitch blade regulation, and mass production and
automation have resulted in economies of scale.
The general conclusion from industrial learning curve theory
is that costs decrease by some 20 % each time the number of
units produced doubles. A 20 % decline is equivalent to a
progress ratio of 0.80.
Studies of the past development of the wind power industry
show that progress through R&D efforts and by learning have
already resulted in a 15-20 % price reduction – equivalent to
a progress ratio of 0.85 to 0.80. In the calculation of cost
reductions in this report, experience has been related to num-
bers of units, i.e. turbines and not megawatt capacity. The
increase in average unit size is therefore also taken into
account.
The progress ratio assumed in this study starts at 0.90 up
until 2010. After that it is reduced to 0.92. Beyond 2025,
when production processes are assumed to have been
optimised and the level of global manufacturing output has
reached a peak, it goes down to 0.98.
The reason for this graduated assumption, particularly in the
early years, is that the manufacturing industry has not so far
gained the full benefits from series production, especially due
to the rapid upscaling of products. Neither has the full
potential of future design optimisations been utilised. Even
so, the cost of wind turbine generators has still fallen
significantly, and the industry is recognised as having entered
the “commercialisation phase”, as understood in learning
curve theories.
44
Capital costs per kilowatt of installed capacity are taken as an
average of € 1,000 in 2005. They are then assumed to fall
steadily to € 912 in 2010 and to € 784 by 2025. From then
onwards the scenario assumes a leveling out of costs. All
figures are given at 2005 prices.
Costs and Benefits
1. INVESTMENT
The relative attraction to investors of the wind energy market
is dependent on a number of factors. These include the
capital cost of installation, the availability of finance, the
pricing regime for the power output generated and the
expected rate of return.
The investment value of the future wind energy market
envisaged in this scenario has been assessed on an annual
basis. This is based on the assumption of a gradually
decreasing capital cost per kilowatt of installed capacity, as
already explained.
In the Reference scenario the annual value of global
investment in the wind power industry reaches € 10.7 billion
in 2010, increases to € 21.2 bn by 2030, with a peak at
€ 28.8 bn in 2050.
In the Moderate scenario the annual value of global
investment in the wind power industry reaches € 18.2 billion
in 2010, increases to € 62.4 bn by 2020 with a peak at
€ 74.9 bn in 2040.
In the Advanced scenario the annual value of global
investment reaches € 23.2 billion in 2010, peaks at € 141 bn
by 2020 and decreases slowly to € 112.1 bn until 2050.
All these figures take into account the value of repowering
older turbines.
Although these figures may appear large, they should be seen
in the context of the total level of investment in the global
power industry. During the 1990s, for example, annual invest-
ment in the power sector was running at some € 158-186
billion each year.
2. GENERATION COSTS
Various parameters need to be taken into account when
calculating the generation costs of wind power. The most
important of these are the capital cost of wind turbines (see
above) and the expected electricity production. The second is
highly dependent on the wind conditions at a given site,
making selection of a good location essential to achieving
economic viability. Other important factors include operation
and maintenance (O&M) costs, the lifetime of the turbine
and the discount rate (the cost of capital).
The total cost per generated kWh of electricity is traditionally
calculated by discounting and levelising investment and
O&M costs over the lifetime of a wind turbine, then dividing
this by the annual electricity production. The unit cost of
generation is thus calculated as an average cost over the
lifetime of a turbine, which is normally estimated at 20 years.
In reality, however, the actual costs will be lower at the
beginning of a turbine’s operation, due to lower O&M costs,
and increase over the lifespan of the machine.
Taking into account all these factors, the cost of generating
electricity from wind energy currently ranges from approxi-
mately 4-5 €cents/kWh at high wind speed sites up to
approximately 6-8 €cents/kWh at sites with low average
wind speeds.
However, over the past 15 years the efficiency of wind
turbines has improved considerably thanks to better
equipment design, better siting and taller turbines. As a
result, efficiency has been increasing by 2% to 3% annually.
Furthermore, it can be assumed that as a result of optimised
production processes, the investment costs for wind turbines
will decrease as described above.
As a result, it is expected that by 2020, the costs of producing
electricity will have fallen to 3-3.8 €cents/kWh at a good site
and 4-6 €cents/kWh at a site with low average wind speeds.
By 2050, these costs could be as low as 2.8-3.5 €cents/kWh
and 4.2-5.6 €cents/kWh respectively.
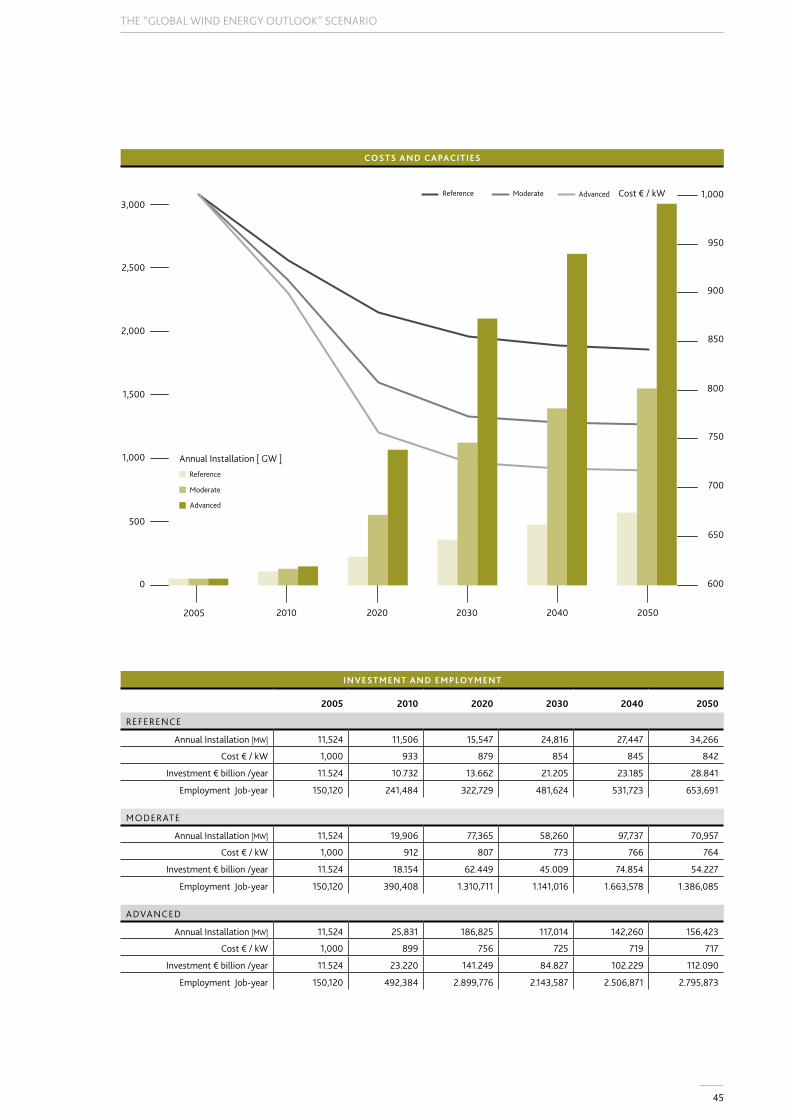
45
THE “GLOBAL WIND ENERGY OUTLOOK” SCENARIO
Annual Installation [ GW ]
Reference
Moderate
Advanced
Cost € / kWReference Moderate Advanced
COSTS AND CAPACITIES
600
650
700
750
800
850
900
950
1,000
0
500
1,000
1,500
2,000
2,500
3,000
2005 2010 2050204020302020
INVESTMENT AND EMPLOYMENT
2005 2010 2020 2030 2040 2050
REFERENCE
Annual Installation [MW] 11,524 11,506 15,547 24,816 27,447 34,266
Cost € / kW 1,000 933 879 854 845 842
Investment € billion /year 11.524 10.732 13.662 21.205 23.185 28.841
Employment Job-year 150,120 241,484 322,729 481,624 531,723 653,691
MODERATE
Annual Installation [MW] 11,524 19,906 77,365 58,260 97,737 70,957
Cost € / kW 1,000 912 807 773 766 764
Investment € billion /year 11.524 18.154 62.449 45.009 74.854 54.227
Employment Job-year 150,120 390,408 1.310,711 1.141,016 1.663,578 1.386,085
ADVANCED
Annual Installation [MW] 11,524 25,831 186,825 117,014 142,260 156,423
Cost € / kW 1,000 899 756 725 719 717
Investment € billion /year 11.524 23.220 141.249 84.827 102.229 112.090
Employment Job-year 150,120 492,384 2.899,776 2.143,587 2.506,871 2.795,873
46
These calculations do not take into account the so-called
‘external costs’ of electricity production. It is generally agreed
that renewable energy sources such as wind have environ-
mental and social benefits compared to conventional energy
sources such as coal, gas, oil and nuclear. These benefits can
be translated into costs for society, which should be reflected
in the cost calculations for electricity output. Only then can a
fair comparison of different means of power production be
established. The ExternE project, funded by the European
Commission, has estimated the external cost of gas at
around 1.1-3.0 €cents/kWh and that for coal at as much as
3.5-7.7 €cents/kWh.
Furthermore, these calculations do not take into account the
fuel cost risk related to conventional technologies. Since wind
energy does not require any fuel, it eliminates the risk of fuel
price volatility which characterises other generating
technologies such as gas, coal and oil. As a result, a generat-
ing portfolio containing substantial amounts of wind energy
will reduce the risks of future higher energy costs by reducing
society’s exposure to price increases for fossil fuels. In an age
of limited fuel resources and high fuel price volatility, the
benefits of this are immediately obvious.
In addition, the avoided costs for the installation of conven-
tional power production plant and avoided fossil fuel costs
are not taken into consideration. This would further improve
the cost analysis for wind energy.
3. EMPLOYMENT
The employment effect of this scenario is a crucial factor to
weigh alongside its other costs and benefits. High unemploy-
ment rates continue to be a drain on the economies of many
countries in the world. Any technology which demands a
substantial level of both skilled and unskilled labour is
therefore of considerable economic importance, and likely to
feature strongly in any political decision-making over
different energy options.
A number of assessments of the employment effects of wind
power have been carried out in Germany, Denmark and the
Netherlands. The assumption made in this scenario is that for
every megawatt of new capacity, the annual market for wind
energy will create employment at the rate of 16 jobs through
manufacture and component supply. A further 5 jobs will be
contributed by wind farm development, installation and
indirect employment. As production processes are optimised,
this level will decrease, falling to 11 manufacturing jobs and 5
in development and installation by 2030. In addition,
employment in regular operations and maintenance work at
wind farms will contribute a further 0.33 jobs for every mega-
watt of cumulative capacity.
Under the Reference scenario this means that more than
241,000 jobs would be created by 2010, over 481,000 jobs
by 2030 and almost 653,000 jobs by 2050. In the Moderate
scenario these numbers would increase to more than
390,000 jobs by 2010, almost 1.1 million by 2030 and then
leveling out at about 1.4 million by 2050. Under the
Advanced scenario, the results show increases in the
employment level to 2.9 million jobs by 2020, leveling out to
2.8 million by 2050.
4. CARBON DIOXIDE SAVINGS
A reduction in the levels of carbon dioxide being emitted into
the global atmosphere is the most important environmental
benefit from wind power generation. Carbon dioxide is the
gas largely responsible for exacerbating the greenhouse
effect, leading to the disastrous consequences of global
climate change.
At the same time, modern wind technology has an extremely
good energy balance. The CO₂ emissions related to the
manufacture, installation and servicing over the average
20 year lifecycle of a wind turbine are “paid back” after the
first three to six months of operation.
The benefit to be obtained from carbon dioxide reductions is
dependent on which other fuel, or combination of fuels, any
increased generation from wind power will displace.
Calculations by the World Energy Council show a range of
carbon dioxide emission levels for different fossil fuels. On
the assumption that coal and gas will still account for the
majority of electricity generation in 20 years’ time – with a
continued trend for gas to take over from coal – it makes
sense to use a figure of 600 tonnes per GWh as an average
value for the carbon dioxide reduction to be obtained from
wind generation.
This assumption is further justified by the fact that more than
50 % of the cumulative wind generation capacity expected
by 2020 will be installed in the OECD regions (North
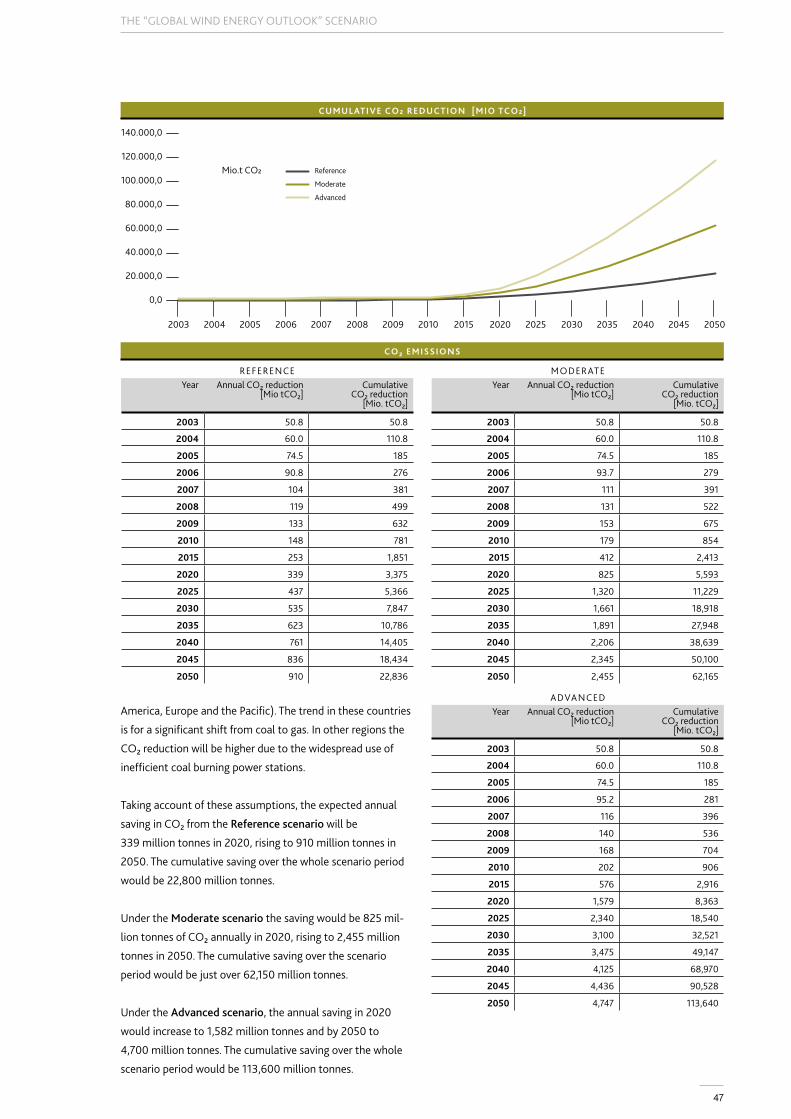
47
THE “GLOBAL WIND ENERGY OUTLOOK” SCENARIO
America, Europe and the Pacific). The trend in these countries
is for a significant shift from coal to gas. In other regions the
CO₂ reduction will be higher due to the widespread use of
inefficient coal burning power stations.
Taking account of these assumptions, the expected annual
saving in CO₂ from the Reference scenario will be
339 million tonnes in 2020, rising to 910 million tonnes in
2050. The cumulative saving over the whole scenario period
would be 22,800 million tonnes.
Under the Moderate scenario the saving would be 825 mil-
lion tonnes of CO₂ annually in 2020, rising to 2,455 million
tonnes in 2050. The cumulative saving over the scenario
period would be just over 62,150 million tonnes.
Under the Advanced scenario, the annual saving in 2020
would increase to 1,582 million tonnes and by 2050 to
4,700 million tonnes. The cumulative saving over the whole
scenario period would be 113,600 million tonnes.
0,0
20.000,0
40.000,0
60.000,0
80.000,0
100.000,0
120.000,0
140.000,0
2003 2004 2005 2006 2007 2008 2009 2010 2015 2020 2025 2030 2035 2040 2045 2050
Reference
Moderate
Advanced
Mio.t CO2
CUMULATIVE CO2 REDUCTION [MIO TCO2]
CO₂ EMISSIONS
REFERENCEYear Annual CO₂ reduction
[Mio tCO₂]Cumulative
CO₂ reduction [Mio. tCO₂]
2003 50.8 50.8
2004 60.0 110.8
2005 74.5 185
2006 90.8 276
2007 104 381
2008 119 499
2009 133 632
2010 148 781
2015 253 1,851
2020 339 3,375
2025 437 5,366
2030 535 7,847
2035 623 10,786
2040 761 14,405
2045 836 18,434
2050 910 22,836
MODERATEYear Annual CO₂ reduction
[Mio tCO₂]Cumulative
CO₂ reduction [Mio. tCO₂]
2003 50.8 50.8
2004 60.0 110.8
2005 74.5 185
2006 93.7 279
2007 111 391
2008 131 522
2009 153 675
2010 179 854
2015 412 2,413
2020 825 5,593
2025 1,320 11,229
2030 1,661 18,918
2035 1,891 27,948
2040 2,206 38,639
2045 2,345 50,100
2050 2,455 62,165
ADVANCEDYear Annual CO₂ reduction
[Mio tCO₂]Cumulative
CO₂ reduction [Mio. tCO₂]
2003 50.8 50.8
2004 60.0 110.8
2005 74.5 185
2006 95.2 281
2007 116 396
2008 140 536
2009 168 704
2010 202 906
2015 576 2,916
2020 1,579 8,363
2025 2,340 18,540
2030 3,100 32,521
2035 3,475 49,147
2040 4,125 68,970
2045 4,436 90,528
2050 4,747 113,640
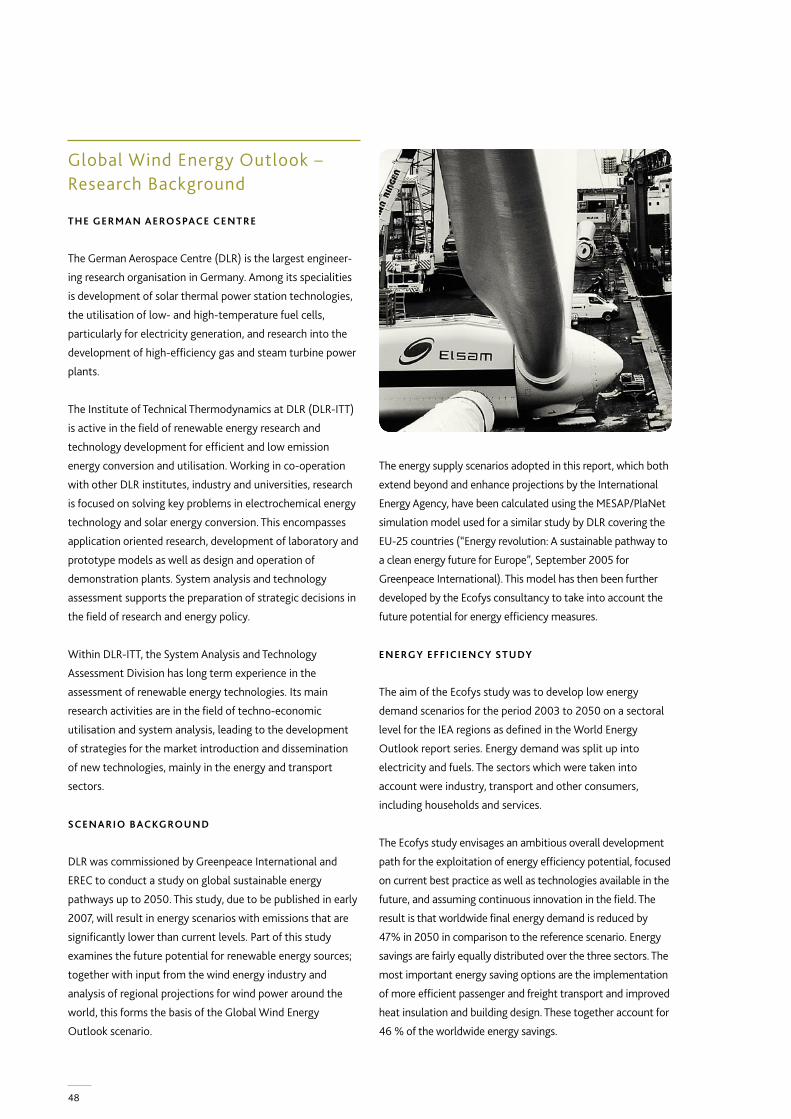
48
Global Wind Energy Outlook – Research Background
THE GERMAN AEROSPACE CENTRE
The German Aerospace Centre (DLR) is the largest engineer-
ing research organisation in Germany. Among its specialities
is development of solar thermal power station technologies,
the utilisation of low- and high-temperature fuel cells,
particularly for electricity generation, and research into the
development of high-efficiency gas and steam turbine power
plants.
The Institute of Technical Thermodynamics at DLR (DLR-ITT)
is active in the field of renewable energy research and
technology development for efficient and low emission
energy conversion and utilisation. Working in co-operation
with other DLR institutes, industry and universities, research
is focused on solving key problems in electrochemical energy
technology and solar energy conversion. This encompasses
application oriented research, development of laboratory and
prototype models as well as design and operation of
demonstration plants. System analysis and technology
assessment supports the preparation of strategic decisions in
the field of research and energy policy.
Within DLR-ITT, the System Analysis and Technology
Assessment Division has long term experience in the
assessment of renewable energy technologies. Its main
research activities are in the field of techno-economic
utilisation and system analysis, leading to the development
of strategies for the market introduction and dissemination
of new technologies, mainly in the energy and transport
sectors.
SCENARIO BACKGROUND
DLR was commissioned by Greenpeace International and
EREC to conduct a study on global sustainable energy
pathways up to 2050. This study, due to be published in early
2007, will result in energy scenarios with emissions that are
significantly lower than current levels. Part of this study
examines the future potential for renewable energy sources;
together with input from the wind energy industry and
analysis of regional projections for wind power around the
world, this forms the basis of the Global Wind Energy
Outlook scenario.
The energy supply scenarios adopted in this report, which both
extend beyond and enhance projections by the International
Energy Agency, have been calculated using the MESAP/PlaNet
simulation model used for a similar study by DLR covering the
EU-25 countries (“Energy revolution: A sustainable pathway to
a clean energy future for Europe”, September 2005 for
Greenpeace International). This model has then been further
developed by the Ecofys consultancy to take into account the
future potential for energy efficiency measures.
ENERGY EFFICIENCY STUDY
The aim of the Ecofys study was to develop low energy
demand scenarios for the period 2003 to 2050 on a sectoral
level for the IEA regions as defined in the World Energy
Outlook report series. Energy demand was split up into
electricity and fuels. The sectors which were taken into
account were industry, transport and other consumers,
including households and services.
The Ecofys study envisages an ambitious overall development
path for the exploitation of energy efficiency potential, focused
on current best practice as well as technologies available in the
future, and assuming continuous innovation in the field. The
result is that worldwide final energy demand is reduced by
47% in 2050 in comparison to the reference scenario. Energy
savings are fairly equally distributed over the three sectors. The
most important energy saving options are the implementation
of more efficient passenger and freight transport and improved
heat insulation and building design. These together account for
46 % of the worldwide energy savings.

49
THE “GLOBAL WIND ENERGY OUTLOOK” SCENARIO
In this report, the “Reference” energy demand projection is
based on the IEA’s World Energy Outlook 2004, including its
assumptions on population and GDP growth, extrapolated
forward to 2050. It takes account of policies and measures
that were enacted or adopted by mid-2004, but does not
include possible or likely future policy initiatives. It is
assumed that there will be no changes in national policies on
nuclear power.
Two low energy demand projections are then developed
based on the IEA reference scenario - an “Ambitious” energy
efficiency scenario (which is not used in this report) and a
more economic “Constraint” version (descripted as the “High
Energy Efficiency” projection for the purposes of this report).
The first takes into account the technical potential whilst the
second introduces an economic element. In the Ambitious
version the assumption is made that the best available
technologies are introduced and there is continuous
innovation in the field of energy efficiency. In the Constraint
version the potential for advanced energy saving measures is
tempered by the constraints of cost and other barriers to
implementation.
ECOFYS ENERGY EFFICIENCY MODEL
STEP 1 : REFERENCE SCENARIO
Development of a reference energy demand scenario for the
period 2003-2050 per region and per sector.
STEP 2: L IST OF MEASURES
Establishment of possible energy savings options per sector.
STEP 3: ENERGY SAVINGS POTENTIAL
Determination of the energy savings potential per year (2010,
2020, 2030, 2040 and 2050) and per sector. A distinction is
made between the economic and the technical energy savings
potential, leading to two low energy demand scenarios:
Ambitious: This is an ambitious energy efficiency scenario
focused on current best practice and technologies available in
the future. It assumes continuous innovation in the field of
energy efficiency.
Constraint (=“High Energy Efficiency” Scenario): This
scenario assumes more moderate energy savings, taking into
account the implementation constraints of energy efficient
technologies in terms of costs and other barriers.
50
ENERGY POLICY ISSUES
AND RECOMMENDATIONS
51
ENERGY POLICY ISSUES AND RECOMMENDATIONS
At a time when governments around the world are in the
process of liberalising their electricity markets, wind power’s
increasing competitiveness should lead to a higher demand
for wind turbines. Distortions in the world’s electricity
markets, however, created by decades of massive financial,
political and structural support to conventional technologies,
have placed wind power at a competitive disadvantage. New
wind projects have to compete with old nuclear and fossil
fuel power stations producing electricity at marginal cost,
because the interest and depreciation on the investment has
already been paid for by consumers and taxpayers. Renew-
able technologies are also disadvantaged by the failure to
penalise conventional fuels for the economic cost of their
pollution and other hazards. Without political support,
therefore, wind power cannot establish its positive contribu-
tion towards environmental goals and security of supply.
This chapter presents a summary of the current political
frameworks which support wind power and the barriers that
need to be overcome in order to unlock the technology’s
potential to become a major contributor to future global
energy supply. Over 48 countries have already introduced
some kind of policy or law to promote renewables, including
14 developing countries.
More than 25 years of wind power experience around the
world has shown that successful frameworks for the
development and deployment of wind energy must include
appropriate measures in each of these five vital areas:
• Legally binding targets for renewable energy
• Well designed payment mechanisms
• Grid access and strategic development of grids
• Appropriate administrative procedures
• Public acceptance and support
Legally binding Targets for Renewable Energy
Setting targets serves as an important catalyst for govern-
ments to develop the necessary regulatory frameworks to
expand renewables, including financial frameworks, grid
access regulation, planning and administrative procedures.
However, targets have little value if they are not accompa-
nied by policies which compensate for distortions in
electricity markets, eliminate market barriers and create an
environment which attracts investment capital.
An increasing number of countries have established targets
for renewable energy as part of their greenhouse gas
reduction policies. To date, 49 countries have set targets,
including eleven developing countries. These are either
expressed as specific quantities of installed capacity or as a
percentage of energy consumption.
The most ambitious target has been set by the European
Union. In 1997, a White Paper on Renewable Sources of
Energy set the goal of doubling the share of renewable energy
in the EU from 6% to 12% by 2010. This was followed by the
2001 Renewable Electricity Directive, which detailed the aim
(within the White Paper goal) of increasing the amount of
renewable electricity from 14% in 1997 to 21% by 2010. Each
European Union member state was allocated its own
individual target. Although these targets are indicative (not
binding), they have served as an important incentive for
political initiatives throughout Europe to increase renewable
energy’s share of electricity supply. Wind power is expected
to contribute a substantial part of this increase.
The next step would be for these targets to be made manda-
tory, and for their horizon to be extended beyond 2010. But
although the European Parliament has proposed a mandatory
target for 20% of EU energy by 2020, with a linked target for
33% of electricity supply, this has not yet been accepted by
the European Commission or the 25 member state govern-
ments. A first step in this direction was taken in March 2006
with reference by the EU Heads of State and Government to a
15% target for renewable energy by the year 2015.
Specific Policy Mechanisms
A clear market for wind generated power must be defined in
order for a project developer to get involved. As with any
other investment, the lower the risk to the investor, the lower
the costs of supplying the product. The most important
measures for establishing new wind power markets are
therefore those where the market for generated power is
clearly defined in national laws, including stable, long term
fiscal measures that minimise investor risk and ensure an
adequate return on investment.
The main purpose of the wide range of available economic
measures to encourage renewable energy is to provide
incentives for improvements and cost reductions in environ-
52
mental technologies. Markets need to be strong, stable and
reliable, with a clear commitment to long-term expansion. A
number of mechanisms have been introduced in different
countries to further these aims.
Overall, there are two main types of incentives to promote
deployment of renewable energy:
Fixed Price Systems where the government sets the electric-
ity price (or premium) paid to the developer/producer and
lets the market determine the amount of capacity which will
be built. Examples of countries which have adopted this
system in Europe are Germany, Spain, France and Portugal.
Payments can be made to developers or producers in the
form of:
1. Investment subsidies
2. Fixed feed-in tariffs
3. Fixed premium payments
4. Tax credits
Renewable Quota Systems where the government or other
authority sets the quantity of renewable electricity it would
like to see produced, and leaves it to the market to determine
the price. This system operates in some states in the USA,
where it is referred to as a Renewable Portfolio Standard, and
in a number of EU countries, including the UK, Sweden,
Belgium and Italy.
Two types of renewable quota systems have been employed
in national wind power markets: tendering systems and green
certificate systems. Under the former, developers compete on
price to construct projects within an allocated quota of
capacity. Under the latter, operating projects are issued with
green certificates according to their power output, the price
of which varies according to supply and demand.
Any policy measure adopted by a government, however,
needs to be acceptable to the requirements of the invest-
ment community in order to be effective. There are two key
issues here:
• The price for renewable power must allow for risk return
profiles that are competitive with other investment
options.
• The duration of a project must allow investors to recoup
their investment.
53
ENERGY POLICY ISSUES AND RECOMMENDATIONS
Electricity Market Reform
Essential reforms in the electricity sector are necessary if new
renewable energy technologies are to be accepted on a larger
scale. These reforms include:
REMOVAL OF ELECTRICITY SECTOR BARRIERS
Current energy legislation on planning, certification and grid access
has been built around the existence of large centralised power
plants, including extensive licensing requirements and specifica-
tions for access to the grid. This favours existing large scale
electricity production and represents a significant market barrier to
renewables. It also fails to recognise the value of not having to
transport decentralised power generation over long distances.
Distortions in the conventional power market include:
1. Institutional and legal barriers
2. Regional and national dominant players
3. Barriers to third party grid access
4. Limited interconnection between regional and national
markets
5. Discriminatory grid connection tariffs
6. Lack of effective “unbundling” by companies of their
production and transmission interests.
One major challenge is to implement the necessary redesigns of
the grid infrastructure, system management, grid regulation and
grid codes so that they reflect the characteristics of renewable
energy technologies. Cross-border electricity interconnectors are
also vital for those markets that are not geographically isolated.
The reforms needed to address market barriers to renewables
include:
• Streamlined and uniform planning procedures and permitting
systems and integrated least cost network planning;
• Access to the grid at fair, transparent prices and removal of
discriminatory access and transmission tariffs;
• Fair and transparent pricing for power throughout a network,
with recognition and remuneration for the benefits of
embedded generation;
• Unbundling of utilities into separate generation and distribu-
tion companies;
• The costs of grid infrastructure development and reinforce-
ment must be carried by the grid management authority
rather than individual renewable energy projects;
• Disclosure of fuel mix and environmental impact to end users to
enable consumers to make an informed choice of power source.
REMOVAL OF MARKET DISTORTIONS
In addition to market barriers there are also market distortions
which block the expansion of renewable energy. These come in
the form of direct and indirect subsidies, and the fact that the
social and environmental effects of different generation
technologies are currently excluded from the costs of electricity
production.
A major barrier preventing wind power from reaching its full
potential is the lack of pricing structures in the energy markets
that reflect the full costs to society of producing energy.
Furthermore, the overall electricity market framework is very
different today from the one that existed when coal, gas, and
nuclear technologies were introduced. For almost a century,
power generation has been characterised by national monopo-
lies with mandates to finance investments in new production
capacity through state subsidies and/or levies on electricity bills.
As many countries move in the direction of more liberalised
electricity markets, those options are no longer available. This
places new generating technologies such as wind power at a
competitive disadvantage.
54
Two developments could ease this situation:
Removal of subsidies to fossil fuel and nuclear power sources
Subsidies to fully competitive and polluting technologies are
highly unproductive, seriously distort markets and increase the
need to support renewables. Removing subsidies to conventional
electricity would not only save taxpayers’ money and reduce
current market distortions in the electricity market. It would also
dramatically reduce the need for renewables support. Wind
power would not need special provisions if markets were not
distorted by the fact that it is still virtually free for electricity
producers to pollute.
Subsidies artificially reduce the price of power, keep renewables
out of the market place, and prop up increasingly uncompetitive
technologies and fuels. Eliminating direct and indirect subsidies
to fossil fuels and nuclear power would help move towards a
level playing field across the energy sector.
Conventional energy sources currently receive an estimated
$250 billion in subsidies per year worldwide, according to the
United Nations Development Programme. This heavily distorts
markets. The UNDP World Energy Assessment gives the annual
cost of global subsidies for fossil fuels and nuclear energy
between 1995 and 1998 as $215 billion, compared with
$9 billion for renewables and energy efficiency.
Research and development funding can make a crucial difference
as to whether a technology becomes commercially viable,
particularly at the early stage of development. It also accounts
for about 40% of continued cost reductions in the technology.
According to the International Energy Agency report “Renewable
Energy: Market and Policy Trends in IEA Countries” (2004),
between 1974 and 2002, 92% of all R&D funding ($267 billion)
was spent on non-renewables, largely fossil fuel and nuclear
technologies, compared to 8% ($23 billion) for all renewable
technologies.
Internalising the social and environmental costs
of polluting energy
The real cost of energy production by conventional energy
includes expenses absorbed by society, such as health impacts
and local and regional environmental degradation – from
mercury pollution to acid rain – as well as the global impact of
climate change.
Hidden costs also include the waiving of nuclear accident
insurance, which is either unavailable or too expensive to be
covered by the nuclear operators. The costs of decommissioning
nuclear plants, storage of high level nuclear waste and the health
costs associated with mining, drilling and transportation are
equally not added to the real economics of fossil and nuclear
power.
Environmental damage should be avoided at source. Translated
into energy generation that would mean that, ideally, produc-
tion of energy should not pollute and it is the energy producers’
responsibility to prevent it. If they do pollute they should pay an
amount equal to the damage their production causes to society
as a whole.
55
ENERGY POLICY ISSUES AND RECOMMENDATIONS
The European Commission – through the ExternE project – has
attempted to quantify the true costs, including environmental
costs, of electricity generation. ExternE estimates that the cost
of producing electricity from coal or oil would double, and from
gas increase by 30%, if their external costs, in the form of
damage to the environment and health, were taken into
account. The study further estimates that these costs amount to
1-2% of EU GDP, or between €85 billion and €170 billion/
annum, not including the additional costs of the impacts of
human-induced climate change on human health, agriculture
and ecosystems. If those environmental costs were levied on
electricity generation, many renewables, including wind power,
would not need any support to successfully compete in the
marketplace.
As with other subsidies, such external costs must be factored
into energy pricing if competition in the market is to be truly fair.
This requires that governments apply a “polluter pays” system
that charges the emitters accordingly, or applies suitable
compensation to non-emitters. Adoption of polluter pays
taxation to polluting electricity sources, or equivalent compen-
sation to renewable energy sources, and exclusion of renewables
from environment-related energy taxation, is essential to help
achieve fairer competition in the world’s electricity markets.
International Action on Climate Change
Final ratification of the Kyoto Protocol to the United Nations
Framework Convention on Climate Change (UNFCC) in
February 2005 was a vital first step towards protecting the
climate from dangerous anthropogenic climate change. As a
legally binding international instrument, the Protocol heralds
the beginning of carbon constrained economies. In time, this
will mean an increased demand for low and carbon-free
power production. Protecting the climate will demand more
and deeper cuts in greenhouse gas emissions, which will
further increase the market for renewable energy technolo-
gies such as wind power.
The international issue now is what objectives for reduction
in greenhouse gases will follow on from the present 2008-12
Kyoto target period. Meeting in March 2005, EU heads of
state recommended that “reduction pathways… in the order
of 15-30% by 2020, compared to the baseline envisaged in
the Kyoto Protocol… should be considered.” At the Montreal
UNFCC conference (COP-11) in December 2005 delegates
agreed to start “a process to consider further commitments”.
It is critical that the next round of emissions reductions be
agreed soon, so that the market is clear that the strong signal
sent by the entry into force of the Kyoto Protocol will
continue beyond 2012.
Emissions trading in the form it currently operates, both at a
European level and through the international mechanisms
(Clean Development and Joint Implementation) established
under Kyoto, is unlikely to provide a major boost for wind
energy in the short term. The first steps in emissions trading
within the European Union have sent a good signal to
markets about the costs of carbon-intensive energy produc-
tion, but they do not go far enough and need to be strength-
ened in the next round. In particular, free allocation of
allowances should be replaced by 100% auctioning - to avoid
market distortions and apply the polluter pays principle.
Emissions trading should not be seen as a substitute for
environmental taxes or policies to support renewable energy.
56
Reform of International Financing
Demand for energy, particularly electricity, is increasing
worldwide. This is especially the case in developing countries,
which also rely heavily on export credit agencies (ECAs) and
multi-lateral development banks to provide financing for
energy and other industrial projects.
To be consistent with the emerging international regime for
limiting greenhouse gas emissions, ECAs and other interna-
tional financial institutions which support or underwrite
projects around the world must have policies consistent with
the need for limiting greenhouse gas emissions and climate
change protection. At the same time there needs to be a
transition plan and flexible timeframes to avoid undue
hardships on developing country economies overly reliant on
conventional energy sources and exports, whilst also
recognising that meeting the development goals for the
world’s poorest nations will require subsidies for the
foreseeable future.
Policies to address these issues must include:
• A defined and increasing percentage of overall energy
sector lending directed to renewable energy projects.
• A rapid phase out of support for conventional, polluting
energy projects.
Action by International Bodies
Against the backdrop of ever rising oil prices, political leaders
have slowly started to acknowledge that the global energy
challenge requires urgent action in three areas: securing
global energy supply, meeting rising energy demand and
tackling the threat of climate change. These issues are now
higher on the political agenda than ever before. Moreover, a
better understanding of energy issues and dramatic advances
in modern technologies provide the opportunity for tackling
the energy challenge in an efficient and sustainable way.
An opportunity for action is provided by international
government meetings such as the G8 Summits, bringing
together the leaders of the United States, Russia, Italy, Japan,
Germany, France, Canada and the UK, and the UN’s Commis-
sion on Sustainable Development (CSD).
In July 2005, the G8 members, plus Brazil, China, India,
Mexico and South Africa, agreed a dialogue on climate
change, clean energy and sustainable development. These
Partners, along with the World Bank and IEA, agreed to work
together on a number of issues, including the deployment of
renewable energy technology. The IEA has outlined a G8
Gleneagles Programme, which focuses on the following areas:
Alternative energy scenarios and strategies; Energy efficiency
in buildings, appliances, transport and industry; Cleaner fossil
fuels; Carbon capture and storage; Renewable energy; and
Enhanced international co-operation.
The IEA is to publish a report on Alternative Energy Technolo-
gies, and a report on progress on the work programme is to
be provided at the G8 Summit in St Petersburg in July 2006
and at the Gleneagles Dialogue Ministerial in Mexico in the
autumn.
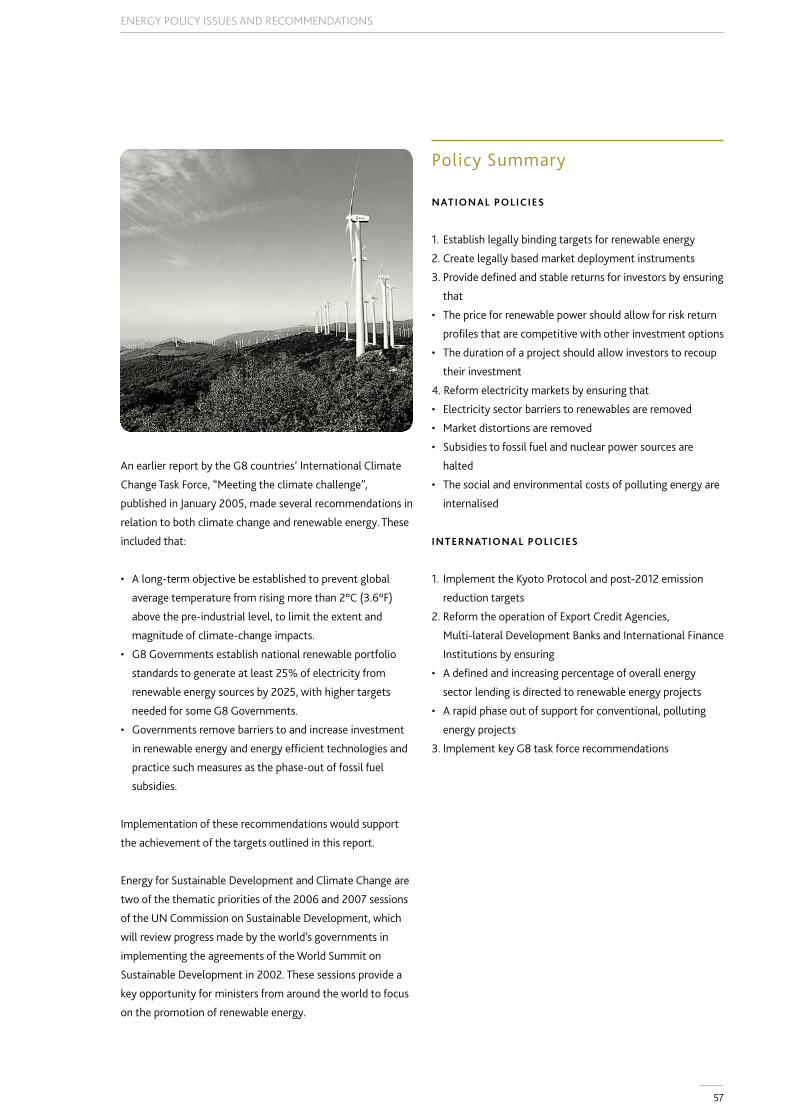
57
ENERGY POLICY ISSUES AND RECOMMENDATIONS
An earlier report by the G8 countries’ International Climate
Change Task Force, “Meeting the climate challenge”,
published in January 2005, made several recommendations in
relation to both climate change and renewable energy. These
included that:
• A long-term objective be established to prevent global
average temperature from rising more than 2°C (3.6°F)
above the pre-industrial level, to limit the extent and
magnitude of climate-change impacts.
• G8 Governments establish national renewable portfolio
standards to generate at least 25% of electricity from
renewable energy sources by 2025, with higher targets
needed for some G8 Governments.
• Governments remove barriers to and increase investment
in renewable energy and energy efficient technologies and
practice such measures as the phase-out of fossil fuel
subsidies.
Implementation of these recommendations would support
the achievement of the targets outlined in this report.
Energy for Sustainable Development and Climate Change are
two of the thematic priorities of the 2006 and 2007 sessions
of the UN Commission on Sustainable Development, which
will review progress made by the world’s governments in
implementing the agreements of the World Summit on
Sustainable Development in 2002. These sessions provide a
key opportunity for ministers from around the world to focus
on the promotion of renewable energy.
Policy Summary
NATIONAL POLICIES
1. Establish legally binding targets for renewable energy
2. Create legally based market deployment instruments
3. Provide defined and stable returns for investors by ensuring
that
• The price for renewable power should allow for risk return
profiles that are competitive with other investment options
• The duration of a project should allow investors to recoup
their investment
4. Reform electricity markets by ensuring that
• Electricity sector barriers to renewables are removed
• Market distortions are removed
• Subsidies to fossil fuel and nuclear power sources are
halted
• The social and environmental costs of polluting energy are
internalised
INTERNATIONAL POLICIES
1. Implement the Kyoto Protocol and post-2012 emission
reduction targets
2. Reform the operation of Export Credit Agencies,
Multi-lateral Development Banks and International Finance
Institutions by ensuring
• A defined and increasing percentage of overall energy
sector lending is directed to renewable energy projects
• A rapid phase out of support for conventional, polluting
energy projects
3. Implement key G8 task force recommendations
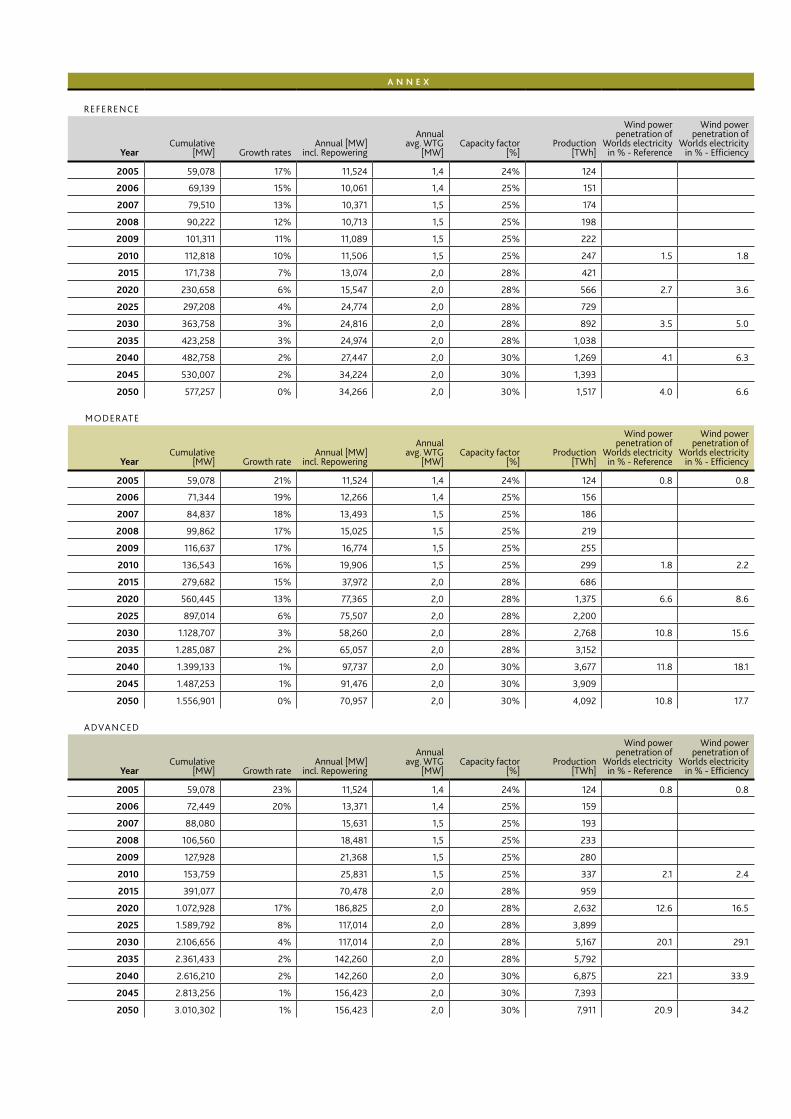
58
A N N E X
REFERENCE
YearCumulative
[MW] Growth ratesAnnual [MW]
incl. Repowering
Annual avg. WTG
[MW]Capacity factor
[%]Production
[TWh]
Wind power penetration of
Worlds electricity in % - Reference
Wind power penetration of
Worlds electricity in % - Efficiency
2005 59,078 17% 11,524 1,4 24% 124
2006 69,139 15% 10,061 1,4 25% 151
2007 79,510 13% 10,371 1,5 25% 174
2008 90,222 12% 10,713 1,5 25% 198
2009 101,311 11% 11,089 1,5 25% 222
2010 112,818 10% 11,506 1,5 25% 247 1.5 1.8
2015 171,738 7% 13,074 2,0 28% 421
2020 230,658 6% 15,547 2,0 28% 566 2.7 3.6
2025 297,208 4% 24,774 2,0 28% 729
2030 363,758 3% 24,816 2,0 28% 892 3.5 5.0
2035 423,258 3% 24,974 2,0 28% 1,038
2040 482,758 2% 27,447 2,0 30% 1,269 4.1 6.3
2045 530,007 2% 34,224 2,0 30% 1,393
2050 577,257 0% 34,266 2,0 30% 1,517 4.0 6.6
MODERATE
YearCumulative
[MW] Growth rateAnnual [MW]
incl. Repowering
Annual avg. WTG
[MW]Capacity factor
[%]Production
[TWh]
Wind power penetration of
Worlds electricity in % - Reference
Wind power penetration of
Worlds electricity in % - Efficiency
2005 59,078 21% 11,524 1,4 24% 124 0.8 0.8
2006 71,344 19% 12,266 1,4 25% 156
2007 84,837 18% 13,493 1,5 25% 186
2008 99,862 17% 15,025 1,5 25% 219
2009 116,637 17% 16,774 1,5 25% 255
2010 136,543 16% 19,906 1,5 25% 299 1.8 2.2
2015 279,682 15% 37,972 2,0 28% 686
2020 560,445 13% 77,365 2,0 28% 1,375 6.6 8.6
2025 897,014 6% 75,507 2,0 28% 2,200
2030 1.128,707 3% 58,260 2,0 28% 2,768 10.8 15.6
2035 1.285,087 2% 65,057 2,0 28% 3,152
2040 1.399,133 1% 97,737 2,0 30% 3,677 11.8 18.1
2045 1.487,253 1% 91,476 2,0 30% 3,909
2050 1.556,901 0% 70,957 2,0 30% 4,092 10.8 17.7
ADVANCED
YearCumulative
[MW] Growth rateAnnual [MW]
incl. Repowering
Annual avg. WTG
[MW]Capacity factor
[%]Production
[TWh]
Wind power penetration of
Worlds electricity in % - Reference
Wind power penetration of
Worlds electricity in % - Efficiency
2005 59,078 23% 11,524 1,4 24% 124 0.8 0.8
2006 72,449 20% 13,371 1,4 25% 159
2007 88,080 15,631 1,5 25% 193
2008 106,560 18,481 1,5 25% 233
2009 127,928 21,368 1,5 25% 280
2010 153,759 25,831 1,5 25% 337 2.1 2.4
2015 391,077 70,478 2,0 28% 959
2020 1.072,928 17% 186,825 2,0 28% 2,632 12.6 16.5
2025 1.589,792 8% 117,014 2,0 28% 3,899
2030 2.106,656 4% 117,014 2,0 28% 5,167 20.1 29.1
2035 2.361,433 2% 142,260 2,0 28% 5,792
2040 2.616,210 2% 142,260 2,0 30% 6,875 22.1 33.9
2045 2.813,256 1% 156,423 2,0 30% 7,393
2050 3.010,302 1% 156,423 2,0 30% 7,911 20.9 34.2
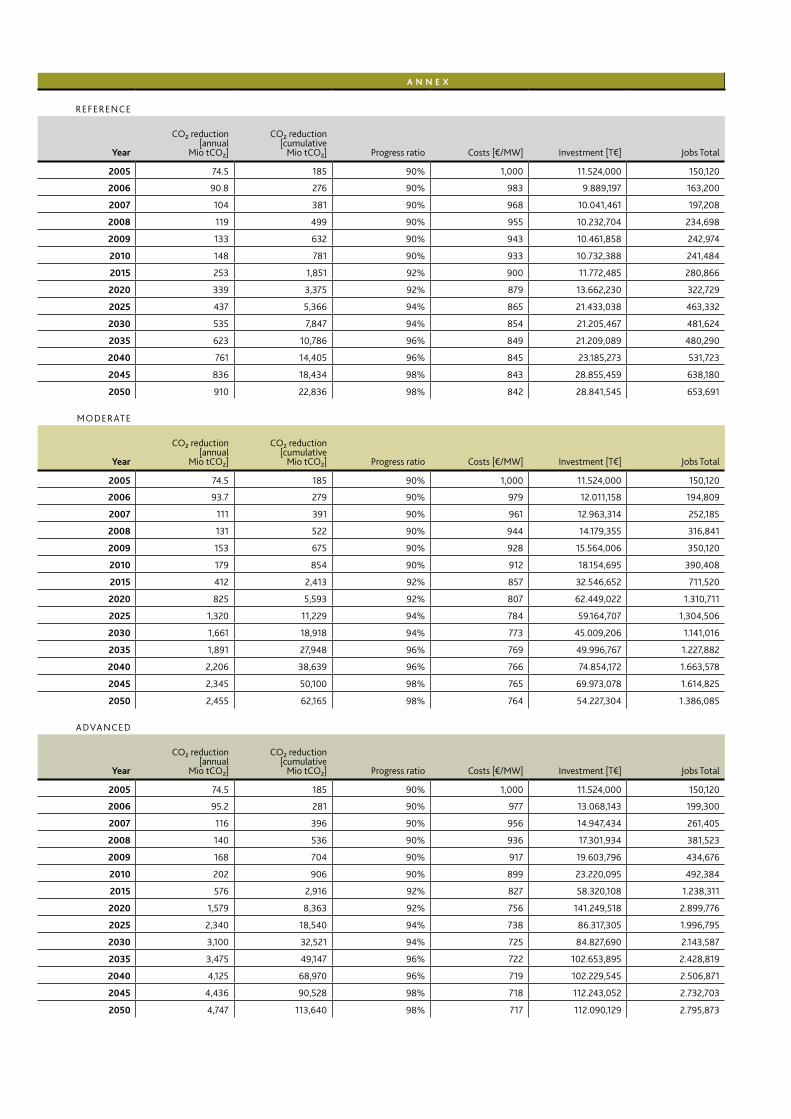
59
A N N E X
REFERENCE
Year
CO₂ reduction [annual
Mio tCO₂]
CO₂ reduction [cumulative
Mio tCO₂] Progress ratio Costs [€/MW] Investment [T€] Jobs Total
2005 74.5 185 90% 1,000 11.524,000 150,120
2006 90.8 276 90% 983 9.889,197 163,200
2007 104 381 90% 968 10.041,461 197,208
2008 119 499 90% 955 10.232,704 234,698
2009 133 632 90% 943 10.461,858 242,974
2010 148 781 90% 933 10.732,388 241,484
2015 253 1,851 92% 900 11.772,485 280,866
2020 339 3,375 92% 879 13.662,230 322,729
2025 437 5,366 94% 865 21.433,038 463,332
2030 535 7,847 94% 854 21.205,467 481,624
2035 623 10,786 96% 849 21.209,089 480,290
2040 761 14,405 96% 845 23.185,273 531,723
2045 836 18,434 98% 843 28.855,459 638,180
2050 910 22,836 98% 842 28.841,545 653,691
MODERATE
Year
CO₂ reduction [annual
Mio tCO₂]
CO₂ reduction [cumulative
Mio tCO₂] Progress ratio Costs [€/MW] Investment [T€] Jobs Total
2005 74.5 185 90% 1,000 11.524,000 150,120
2006 93.7 279 90% 979 12.011,158 194,809
2007 111 391 90% 961 12.963,314 252,185
2008 131 522 90% 944 14.179,355 316,841
2009 153 675 90% 928 15.564,006 350,120
2010 179 854 90% 912 18.154,695 390,408
2015 412 2,413 92% 857 32.546,652 711,520
2020 825 5,593 92% 807 62.449,022 1.310,711
2025 1,320 11,229 94% 784 59.164,707 1,304,506
2030 1,661 18,918 94% 773 45.009,206 1.141,016
2035 1,891 27,948 96% 769 49.996,767 1.227,882
2040 2,206 38,639 96% 766 74.854,172 1.663,578
2045 2,345 50,100 98% 765 69.973,078 1.614,825
2050 2,455 62,165 98% 764 54.227,304 1.386,085
ADVANCED
Year
CO₂ reduction [annual
Mio tCO₂]
CO₂ reduction [cumulative
Mio tCO₂] Progress ratio Costs [€/MW] Investment [T€] Jobs Total
2005 74.5 185 90% 1,000 11.524,000 150,120
2006 95.2 281 90% 977 13.068,143 199,300
2007 116 396 90% 956 14.947,434 261,405
2008 140 536 90% 936 17.301,934 381,523
2009 168 704 90% 917 19.603,796 434,676
2010 202 906 90% 899 23.220,095 492,384
2015 576 2,916 92% 827 58.320,108 1.238,311
2020 1,579 8,363 92% 756 141.249,518 2.899,776
2025 2,340 18,540 94% 738 86.317,305 1.996,795
2030 3,100 32,521 94% 725 84.827,690 2.143,587
2035 3,475 49,147 96% 722 102.653,895 2.428,819
2040 4,125 68,970 96% 719 102.229,545 2.506,871
2045 4,436 90,528 98% 718 112.243,052 2.732,703
2050 4,747 113,640 98% 717 112.090,129 2.795,873
1
ABOUT GWEC
GLOBAL REPRESENTATION FOR THE WIND ENERGY SECTOR
GWEC is the voice of the global wind energy sector. GWEC brings
together the major national, regional and continental associations
representing the wind power sector, and the leading international
wind energy companies and institutions. With a combined
membership of over 1,500 organisations involved in hardware
manufacture, project development, power generation, finance and
consultancy, as well as researchers, academics and associations,
GWEC’s member associations represent the entire wind energy
community.
THE MEMBERS OF GWEC REPRESENT:
• Over 1,500 companies, organisations and institutions in more than
50 countries
• All the world’s major wind turbine manufacturers
• 99 % of the world’s nearly 60,000 MW of installed wind power
capacity
GLOBAL WIND ENERGY COUNCIL (GWEC )
Renewable Energy House
63-65 Rue d’Arlon
1040 Brussels
Belgium
T: 32 2 100 4029
F: 32 2 546 1944
www.gwec.net
Greenpeace is a global organisation that uses non-violent direct
action to tackle the most crucial threats to our planet‘s biodiversity
and environment. Greenpeace is a non-profit organisation, present in
40 countries across Europe, the Americas, Asia and the Pacific. It
speaks for 2.8 million supporters worldwide, and inspires many
millions more to take action every day. To maintain its independence,
Greenpeace does not accept donations from governments or
corporations but relies on contributions from individual supporters
and foundation grants.
Greenpeace has been campaigning against environmental degrada-
tion since 1971 when a small boat of volunteers and journalists sailed
into Amchitka, an area north of Alaska, where the US Government
was conducting underground nuclear tests. This tradition of ‘bearing
witness’ in a non-violent manner continues today, and ships are an
important part of all its campaign work.
GREENPEACE INTERNATIONAL
Ottho Heldringstraat 5
1066 AZ Amsterdam
The Netherlands
T: 31 20 7182000
F: 31 20 5148151
www.greenpeace.org
Scenario by GWEC, Greenpeace International, DLR and EcofysText edited by Crispin Aubrey, Angelika Pullen, Arthouros Zervos, Sven Teske Design by bitter Grafik & Illustration, HamburgPhotos courtesy of Elsam; Enercon; EWEA; Gamesa; Greenpeace; IVPC; JWEA; Lucky Wind; Npower Renewables Ltd; Petitjean; Shell Wind Energy;Vestas; Vicson Chua; Vision Quest Windelectric; Winter.
Printed on recycled paper