global atlas on cardiovascular disease prevention and control
TRANSCRIPT
Published by the World Health Organization in collaboration with the World Heart Federation
and the World Stroke Organization.
Global Atlas on cardiovascular disease preventionand controlPublished by the World Health Organization in collaboration with the World Heart Federation and the World Stroke Organization.
ISBN 978 92 4 156437 3
Glo
bal A
tlas
on
card
iova
scul
ar d
isea
se p
reve
ntio
n an
d co
ntro
l Global Atlas on cardiovascular disease
prevention and control
CVDs
20 Avenue AppiaCH-1211 Geneva 27Switzerlandwww.who.int/
International efforts aimed at poverty reduction will be
derailed if the rapidly growing global
cardiovascular disease burden is ignored.
In the absence of prevention strategies, increasing numbers of people will succumb
to heart attacks and strokes due to
continuing exposure to risk factors.
Millions of premature deaths due to
cardiovascular disease can be prevented by scaling up the
implementation of affordable, high impact
interventions, which already exist.

Global Atlason cardiovascular disease
prevention and control
Published by the World Health Organization in collaboration with the World Heart Federation and the World Stroke Organization .
editors: Shanthi Mendis, Pekka Puska and Bo Norrving
WHO library Cataloguing-in-Publication Data
Global atlas on cardiovascular disease prevention and control 2011/ edited by Shanthi Mendis …[et al].
1.Cardiovascular diseases - prevention and control. 2.Cardiovascular diseases - epidemiology. 3.Cardiovascular diseases - economics. 4.Cardiovascular diseases - mortality. 5.Health promotion. 6.Atlases. I.Mendis, Shanthi. II.Puska, Pekka. III.Norrving, B. IV.World Health Organization. V.World Heart Federation. VI.World Stroke Organization.
ISBN 978 92 4 156437 3 (NLM classification: WG 120)
Suggested citation: Global Atlas on Cardiovascular Disease Prevention and Control. Mendis S, Puska P, Norrving B editors. World Health Organization, Geneva 2011.
This document was developed by the World Health Organization (Shanthi Mendis) in collaboration with the World Heart Federation (Pekka Puska) and the World Stroke Organization (Bo Norrving)
Contributions were made by A. Alwan, T. Armstrong, D. Bettcher, T. Boerma, F. Branca, J. C.Y. Ho, C. Mathers, R. Martinez, V. Poznyak, G. Roglic, L. Riley, E. d`Espaignet, G. Stevens, K.Taubert and G. Xuereb. Others who provided assistance in various ways in the compilation of this document include A. Ayinla, X. Bi, F. Besson, L. Bhatti, A. Enyioma, N. Christenson, F. Lubega, P. Nordet, M. Osekre-Amey and J. Tarel.
© World Health Organization 2011
All rights reserved. Publications of the World Health Organization are available on the WHO web site (www.who.int) or can be purchased from WHO Press, World Health Organization, 20 Avenue Appia, 1211 Geneva 27, Switzerland (tel.: +41 22 791 3264; fax: +41 22 791 4857; e-mail: [email protected]).
Requests for permission to reproduce or translate WHO publications – whether for sale or for noncommercial distribution – should be addressed to WHO Press through the WHO web site (http://www.who.int/about/licensing/copyright_form/en/index.html).
The designations employed and the presentation of the material in this publication do not imply the expression of any opinion whatsoever on the part of the World Health Organization concerning the legal status of any country, territory, city or area or of its authorities, or concerning the delimitation of its frontiers or boundaries. Dotted lines on maps represent approximate border lines for which there may not yet be full agreement.
The mention of specific companies or of certain manufacturers’ products does not imply that they are endorsed or recommended by the World Health Organization in preference to others of a similar nature that are not mentioned. Errors and omissions excepted, the names of proprietary products are distinguished by initial capital letters.
All reasonable precautions have been taken by the World Health Organization to verify the information contained in this publication. However, the published material is being distributed without warranty of any kind, either expressed or implied. The responsibility for the interpretation and use of the material lies with the reader. In no event shall the World Health Organization be liable for damages arising from its use.
Printed in France
III Global Atlas on Cardiovascular Diseases Prevention and Control
Table of contents
Abbreviations and Measurements V
Foreword VI
Section A – Cardiovascular diseases (CVDs) due to atherosclerosis 1
1. What are cardiovascular diseases (CVDs)? 2
2. Death and disability due to CVDs (heart attacks and strokes) 8
3. The underlying pathology of heart attacks and strokes 14
4. Evidence for prevention of heart attacks and strokes 16
5. Reducing cardiovascular risk to prevent heart attacks and strokes 18
6. Tobacco: The totally avoidable risk factor of CVDs 26
7. Physical inactivity: A preventable risk factor of CVDs 28
8. Harmful use of alcohol: A preventable risk factor of CVDs 30
9. Unhealthy diet: A preventable risk factor of CVDs 32
10. Obesity: A risk factor of CVDs 36
11. Raised blood pressure (hypertension): A major risk factor of CVDs 38
12. Raised blood sugar (diabetes): A major risk factor of CVDs 40
13. Raised blood cholesterol: A major risk factor of CVDs 42
14. Social determinants and CVDs 44
15. Risk factors take root in the womb, childhood and youth 46
16. Heart attacks and strokes in women 48
17. Other determinants of CVDs: Ageing, globalization and urbanization 50
18. Inequities and CVDs 54
Section B – Other cardiovascular diseases 57
19. Cardiac arrhythmia 58
20. Congenital heart disease 60
21. Rheumatic heart disease: A neglected heart disease of the poor 62
22. Chagas disease (American trypanosomiasis): A neglected disease of the poor 66
IV Global Atlas on Cardiovascular Diseases Prevention and Control
Section C – Prevention and control of CVDs: Policies, strategies and interventions 69
23. Prevention and control of CVDs: How do we know what works? 70
24. Prevention and control of CVDs: The need for integrated and complimentary strategies 72
25. Prevention and control of CVDs: Health in All Policies 74
26. Prevention and control of CVDs: The need for a national NCD policy framework 76
27. Policies and strategies for tobacco control 78
28. Policies and strategies to facilitate healthy eating 80
29. Policies and strategies to facilitate physical activity 84
30. Policies and strategies to address the harmful use of alcohol 88
31. Individual interventions for prevention and control of CVDs 92
32. Role of primary health care in prevention and control of CVDs 94
33. Best buys for cardiovascular disease (CVD) prevention and control 96
34. Bridging the implementation gap for prevention and control of CVDs 100
35. Monitoring CVDs 102
36. Social mobilization for prevention and control of CVDs 104
37. Prevention and control of CVDs and socioeconomic development 106
38. Generating resources for CVD prevention and control 108
39. CVD prevention and control: Why it should not be ignored any longer? 110
40. CVD prevention and control : Vision, roadmap and a landmark event 114
World Health Organization, World Heart Federation and World Stroke Organization 118
References 119
List of figures 127
References for figures 131
Annexes 133
Annex I – World Health Assembly resolution A64/61 134
Annex II – Moscow Declaration 136
Annex III – Regional Declarations on NCDs 139
Annex IV – Contact information 144
Annex V – Age-standardized death rates per 100,000 both sexes by cause and Member State, 2008 (1) 148
Index 153
V Global Atlas on Cardiovascular Diseases Prevention and Control
AbbreviationsAIDS acquired immunodeficiency syndrome
BMI body mass index
CVD cardiovascular disease
DALY disability-adjusted life year
FCTC Framework Convention on Tobacco Control
GDP gross domestic product
GNP gross national product
G20 Group of 20 countries
HDL cholesterol high-density lipoprotein cholesterol
HIV human immunodeficiency virus
ISH International Society of Hypertension
LDL cholesterol low-density lipoprotein cholesterol
LMIC low- and middle-income country
MDG Millennium Development Goal
NCD noncommunicable disease
NGO nongovernmental organization
UN United Nations
USA United States of America
WHA World Health Assembly
WHO World Health Organization
WHO Global NCD Action Plan WHO 2008–2013 Action Plan for the Global Strategy for Prevention and Control of Noncommunicable Diseases
WHO NCD Research Agenda WHO Prioritized Research Agenda for Prevention and Control of Major Noncommunicable Diseases
YLD years living with disability
Measurementsdl decilitreg gramkg kilograml litreM/m metremg milligrammmHg millimetre of mercurymmol millimole
VI Global Atlas on Cardiovascular Diseases Prevention and Control
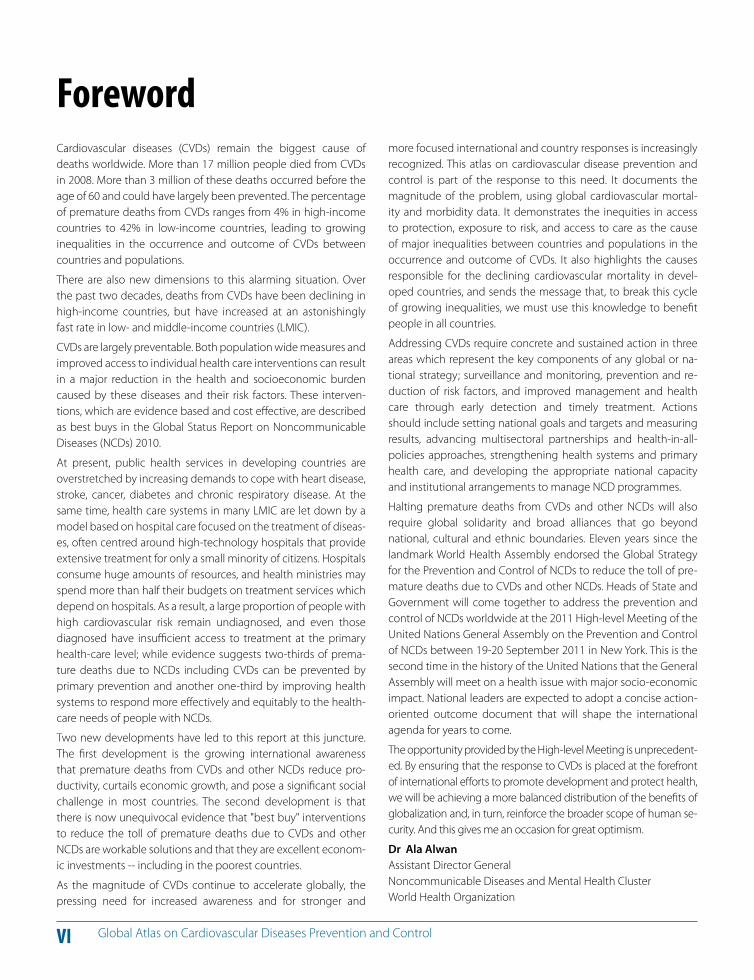
Cardiovascular diseases (CVDs) remain the biggest cause of deaths worldwide. More than 17 million people died from CVDs in 2008. More than 3 million of these deaths occurred before the age of 60 and could have largely been prevented. The percentage of premature deaths from CVDs ranges from 4% in high-income countries to 42% in low-income countries, leading to growing inequalities in the occurrence and outcome of CVDs between countries and populations.
There are also new dimensions to this alarming situation. Over the past two decades, deaths from CVDs have been declining in high-income countries, but have increased at an astonishingly fast rate in low- and middle-income countries (LMIC).
CVDs are largely preventable. Both population wide measures and improved access to individual health care interventions can result in a major reduction in the health and socioeconomic burden caused by these diseases and their risk factors. These interven-tions, which are evidence based and cost e!ective, are described as best buys in the Global Status Report on Noncommunicable Diseases (NCDs) 2010.
At present, public health services in developing countries are overstretched by increasing demands to cope with heart disease, stroke, cancer, diabetes and chronic respiratory disease. At the same time, health care systems in many LMIC are let down by a model based on hospital care focused on the treatment of diseas-es, often centred around high-technology hospitals that provide extensive treatment for only a small minority of citizens. Hospitals consume huge amounts of resources, and health ministries may spend more than half their budgets on treatment services which depend on hospitals. As a result, a large proportion of people with high cardiovascular risk remain undiagnosed, and even those diagnosed have insu"cient access to treatment at the primary health-care level; while evidence suggests two-thirds of prema-ture deaths due to NCDs including CVDs can be prevented by primary prevention and another one-third by improving health systems to respond more e!ectively and equitably to the health-care needs of people with NCDs.
Two new developments have led to this report at this juncture. The first development is the growing international awareness that premature deaths from CVDs and other NCDs reduce pro-ductivity, curtails economic growth, and pose a significant social challenge in most countries. The second development is that there is now unequivocal evidence that "best buy" interventions to reduce the toll of premature deaths due to CVDs and other NCDs are workable solutions and that they are excellent econom-ic investments -- including in the poorest countries.
As the magnitude of CVDs continue to accelerate globally, the pressing need for increased awareness and for stronger and
more focused international and country responses is increasingly recognized. This atlas on cardiovascular disease prevention and control is part of the response to this need. It documents the magnitude of the problem, using global cardiovascular mortal-ity and morbidity data. It demonstrates the inequities in access to protection, exposure to risk, and access to care as the cause of major inequalities between countries and populations in the occurrence and outcome of CVDs. It also highlights the causes responsible for the declining cardiovascular mortality in devel-oped countries, and sends the message that, to break this cycle of growing inequalities, we must use this knowledge to benefit people in all countries.
Addressing CVDs require concrete and sustained action in three areas which represent the key components of any global or na-tional strategy; surveillance and monitoring, prevention and re-duction of risk factors, and improved management and health care through early detection and timely treatment. Actions should include setting national goals and targets and measuring results, advancing multisectoral partnerships and health-in-all-policies approaches, strengthening health systems and primary health care, and developing the appropriate national capacity and institutional arrangements to manage NCD programmes.
Halting premature deaths from CVDs and other NCDs will also require global solidarity and broad alliances that go beyond national, cultural and ethnic boundaries. Eleven years since the landmark World Health Assembly endorsed the Global Strategy for the Prevention and Control of NCDs to reduce the toll of pre-mature deaths due to CVDs and other NCDs. Heads of State and Government will come together to address the prevention and control of NCDs worldwide at the 2011 High-level Meeting of the United Nations General Assembly on the Prevention and Control of NCDs between 19-20 September 2011 in New York. This is the second time in the history of the United Nations that the General Assembly will meet on a health issue with major socio-economic impact. National leaders are expected to adopt a concise action-oriented outcome document that will shape the international agenda for years to come.
The opportunity provided by the High-level Meeting is unprecedent-ed. By ensuring that the response to CVDs is placed at the forefront of international e!orts to promote development and protect health, we will be achieving a more balanced distribution of the benefits of globalization and, in turn, reinforce the broader scope of human se-curity. And this gives me an occasion for great optimism.
Dr Ala Alwan Assistant Director General Noncommunicable Diseases and Mental Health ClusterWorld Health Organization
Foreword
Section A
Cardiovascular diseases (CVDs) due to atherosclerosis
2 Global Atlas on Cardiovascular Diseases Prevention and Control
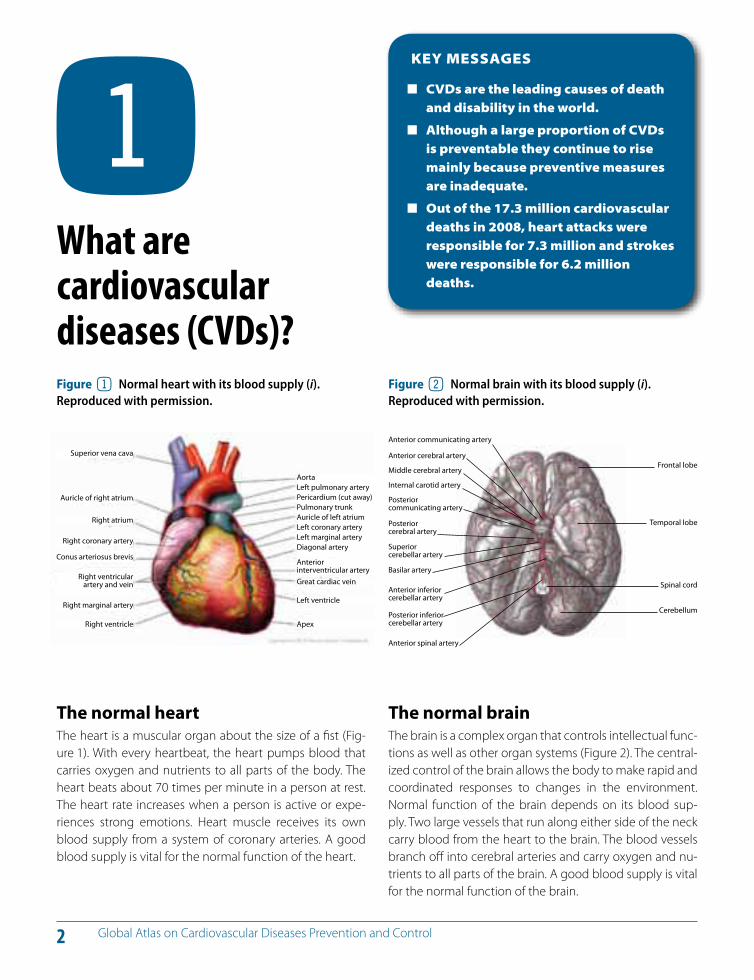
The normal heart The heart is a muscular organ about the size of a fist (Fig-ure 1). With every heartbeat, the heart pumps blood that carries oxygen and nutrients to all parts of the body. The heart beats about 70 times per minute in a person at rest. The heart rate increases when a person is active or expe-riences strong emotions. Heart muscle receives its own blood supply from a system of coronary arteries. A good blood supply is vital for the normal function of the heart.
KEY MESSAGES
CVDs are the leading causes of death and disability in the world.
Although a large proportion of CVDs is preventable they continue to rise mainly because preventive measures are inadequate.
Out of the 17.3 million cardiovascular deaths in 2008, heart attacks were responsible for 7.3 million and strokes were responsible for 6.2 million deaths.
! What are cardiovascular diseases (CVDs)?
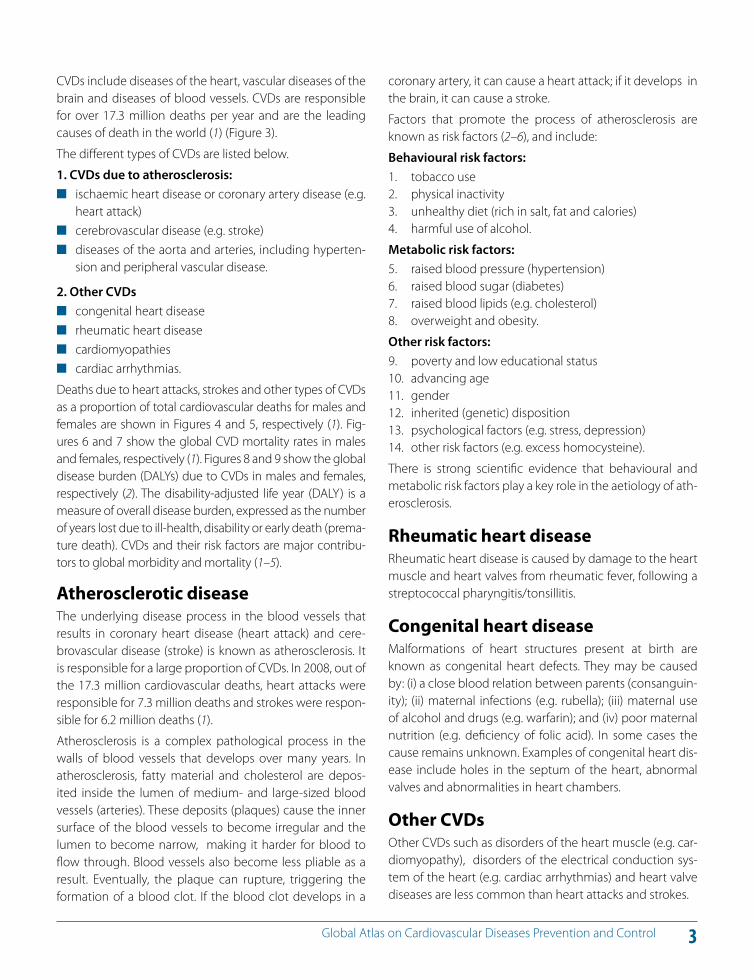
The normal brain The brain is a complex organ that controls intellectual func-tions as well as other organ systems (Figure 2). The central-ized control of the brain allows the body to make rapid and coordinated responses to changes in the environment. Normal function of the brain depends on its blood sup-ply. Two large vessels that run along either side of the neck carry blood from the heart to the brain. The blood vessels branch o! into cerebral arteries and carry oxygen and nu-trients to all parts of the brain. A good blood supply is vital for the normal function of the brain.
Figure 1 Normal heart with its blood supply (i). Reproduced with permission.
Figure 2 Normal brain with its blood supply (i). Reproduced with permission.
Superior vena cava Anterior cerebral artery
Middle cerebral artery
Internal carotid artery
Posterior communicating artery
Posterior cerebral artery
Superior cerebellar artery
Basilar artery
Anterior inferior cerebellar artery
Posterior inferior cerebellar artery
Anterior spinal artery
Frontal lobe
Temporal lobe
Spinal cord
Cerebellum
Auricle of right atrium
Right atrium
Right coronary artery
Conus arteriosus brevis
Right ventricularartery and vein
Right marginal artery
Right ventricle
AortaLeft pulmonary arteryPericardium (cut away)Pulmonary trunkAuricle of left atriumLeft coronary arteryLeft marginal arteryDiagonal artery
Anterior interventricular arteryGreat cardiac vein
Left ventricle
Apex
Anterior communicating artery
3 Global Atlas on Cardiovascular Diseases Prevention and Control
CVDs include diseases of the heart, vascular diseases of the brain and diseases of blood vessels. CVDs are responsible for over 17.3 million deaths per year and are the leading causes of death in the world (1) (Figure 3).
The di!erent types of CVDs are listed below.
1. CVDs due to atherosclerosis: ischaemic heart disease or coronary artery disease (e.g.
heart attack) cerebrovascular disease (e.g. stroke) diseases of the aorta and arteries, including hyperten-
sion and peripheral vascular disease.
2. Other CVDs congenital heart disease rheumatic heart disease cardiomyopathies cardiac arrhythmias.
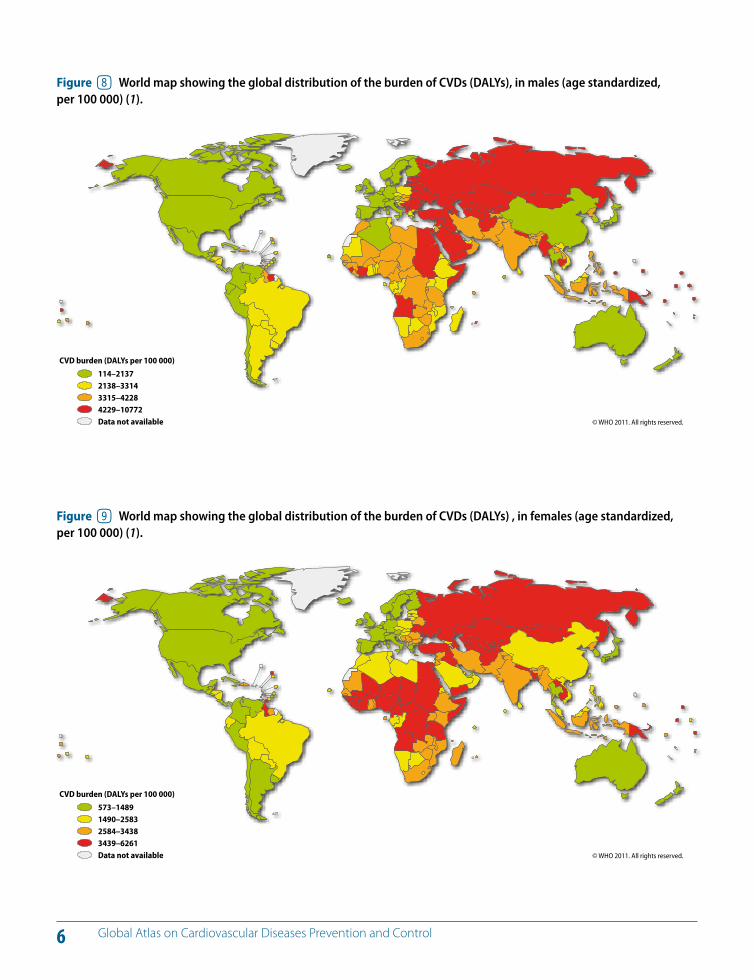
Deaths due to heart attacks, strokes and other types of CVDs as a proportion of total cardiovascular deaths for males and females are shown in Figures 4 and 5, respectively (1). Fig-ures 6 and 7 show the global CVD mortality rates in males and females, respectively (1). Figures 8 and 9 show the global disease burden (DALYs) due to CVDs in males and females, respectively (2). The disability-adjusted life year (DALY) is a measure of overall disease burden, expressed as the number of years lost due to ill-health, disability or early death (prema-ture death). CVDs and their risk factors are major contribu-tors to global morbidity and mortality (1 –5).
Atherosclerotic disease The underlying disease process in the blood vessels that results in coronary heart disease (heart attack) and cere-brovascular disease (stroke) is known as atherosclerosis. It is responsible for a large proportion of CVDs. In 2008, out of the 17.3 million cardiovascular deaths, heart attacks were responsible for 7.3 million deaths and strokes were respon-sible for 6.2 million deaths (1).
Atherosclerosis is a complex pathological process in the walls of blood vessels that develops over many years. In atherosclerosis, fatty material and cholesterol are depos-ited inside the lumen of medium- and large-sized blood vessels (arteries). These deposits (plaques) cause the inner surface of the blood vessels to become irregular and the lumen to become narrow, making it harder for blood to flow through. Blood vessels also become less pliable as a result. Eventually, the plaque can rupture, triggering the formation of a blood clot. If the blood clot develops in a
coronary artery, it can cause a heart attack; if it develops in the brain, it can cause a stroke.
Factors that promote the process of atherosclerosis are known as risk factors (2–6), and include:
Behavioural risk factors: 1. tobacco use2. physical inactivity3. unhealthy diet (rich in salt, fat and calories)4. harmful use of alcohol.
Metabolic risk factors: 5. raised blood pressure (hypertension)6. raised blood sugar (diabetes)7. raised blood lipids (e.g. cholesterol)8. overweight and obesity.
Other risk factors:9. poverty and low educational status10. advancing age11. gender12. inherited (genetic) disposition13. psychological factors (e.g. stress, depression)14. other risk factors (e.g. excess homocysteine).
There is strong scientific evidence that behavioural and metabolic risk factors play a key role in the aetiology of ath-erosclerosis.
Rheumatic heart diseaseRheumatic heart disease is caused by damage to the heart muscle and heart valves from rheumatic fever, following a streptococcal pharyngitis/tonsillitis.
Congenital heart diseaseMalformations of heart structures present at birth are known as congenital heart defects. They may be caused by: (i) a close blood relation between parents (consanguin-ity); (ii) maternal infections (e.g. rubella); (iii) maternal use of alcohol and drugs (e.g. warfarin); and (iv) poor maternal nutrition (e.g. deficiency of folic acid). In some cases the cause remains unknown. Examples of congenital heart dis-ease include holes in the septum of the heart, abnormal valves and abnormalities in heart chambers.
Other CVDsOther CVDs such as disorders of the heart muscle (e.g. car-diomyopathy), disorders of the electrical conduction sys-tem of the heart (e.g. cardiac arrhythmias) and heart valve diseases are less common than heart attacks and strokes.
4 Global Atlas on Cardiovascular Diseases Prevention and Control
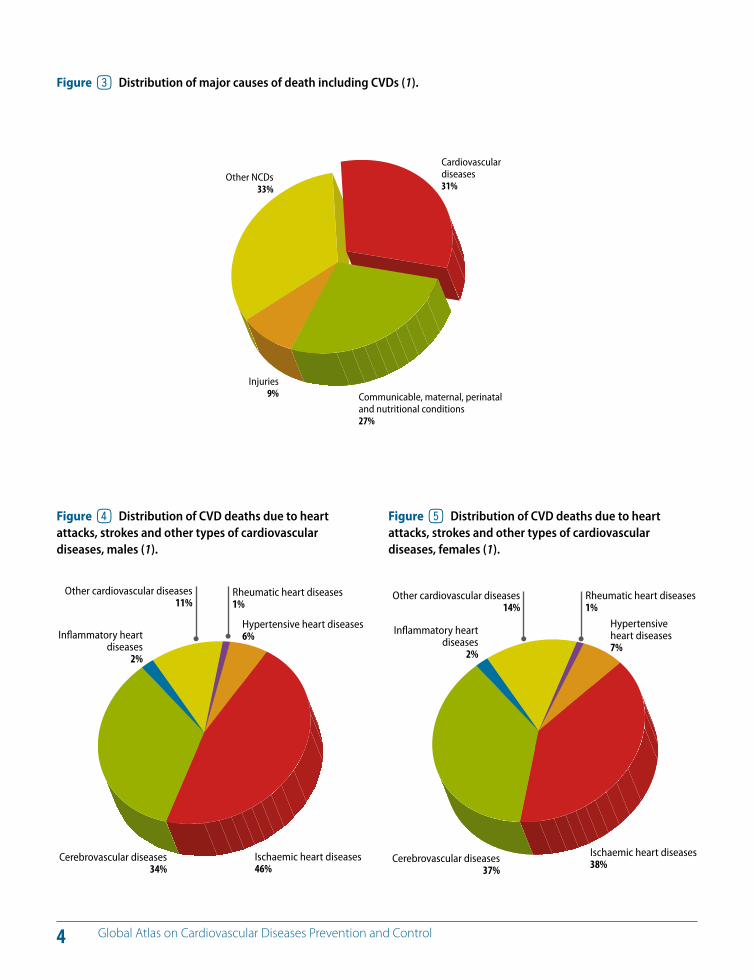
Figure 3 Distribution of major causes of death including CVDs (1).
Other NCDs33%
Cardiovascular diseases31%
Injuries9% Communicable, maternal, perinatal
and nutritional conditions27%
Figure 4 Distribution of CVD deaths due to heart attacks, strokes and other types of cardiovascular diseases, males (1).
Figure 5 Distribution of CVD deaths due to heart attacks, strokes and other types of cardiovascular diseases, females (1).
Inflammatory heart diseases
2%
Other cardiovascular diseases11%
Rheumatic heart diseases1%
Hypertensive heart diseases6%
Cerebrovascular diseases34%
Ischaemic heart diseases46%
Inflammatory heart diseases
2%
Other cardiovascular diseases14%
Rheumatic heart diseases1%
Hypertensive heart diseases7%
Cerebrovascular diseases37%
Ischaemic heart diseases38%
5 Global Atlas on Cardiovascular Diseases Prevention and Control
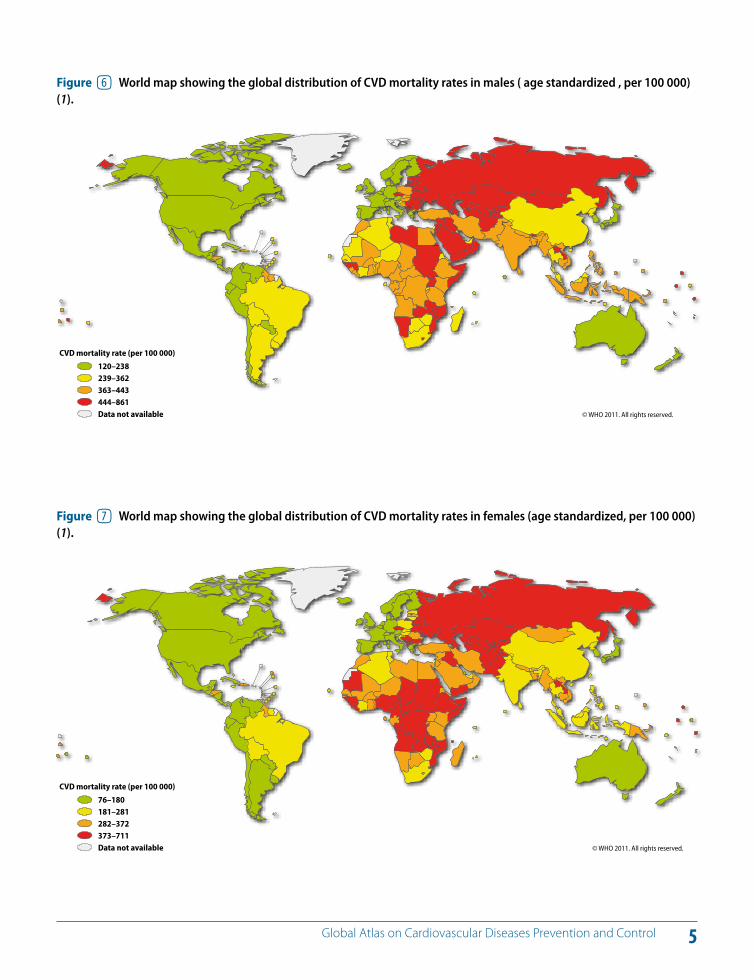
Figure 6 World map showing the global distribution of CVD mortality rates in males ( age standardized , per 100 000) (1).
© WHO 2011. All rights reserved.
CVD mortality rate (per 100 000)
120–238239–362363–443444–861Data not available
Figure 7 World map showing the global distribution of CVD mortality rates in females (age standardized, per 100 000) (1).
© WHO 2011. All rights reserved.
CVD mortality rate (per 100 000)
76–180181–281282–372373–711Data not available
6 Global Atlas on Cardiovascular Diseases Prevention and Control
Figure 8 World map showing the global distribution of the burden of CVDs (DALYs), in males (age standardized, per 100 000) (1).
© WHO 2011. All rights reserved.
CVD burden (DALYs per 100 000)
114–21372138–33143315–42284229–10772Data not available
Figure 9 World map showing the global distribution of the burden of CVDs (DALYs) , in females (age standardized, per 100 000) (1).
© WHO 2011. All rights reserved.
CVD burden (DALYs per 100 000)
573–14891490–25832584–34383439–6261Data not available
7 Global Atlas on Cardiovascular Diseases Prevention and Control
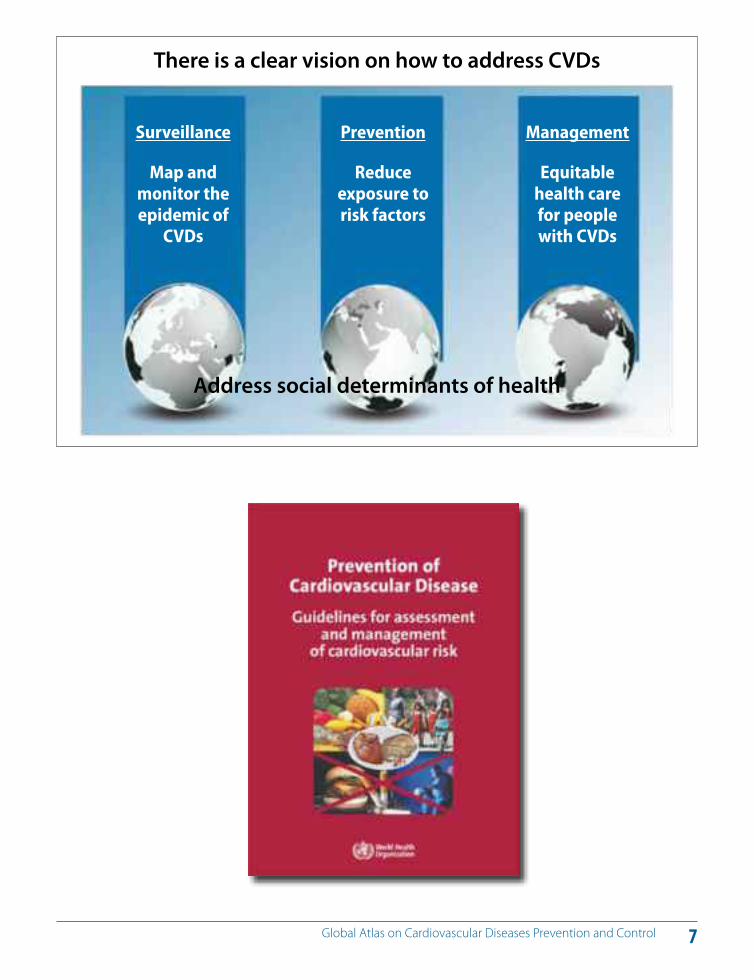
There is a clear vision on how to address CVDs
Surveillance
Map and monitor the epidemic of
CVDs
Prevention
Reduce exposure to risk factors
Management
Equitable health care for people with CVDs
Address social determinants of health
8 Global Atlas on Cardiovascular Diseases Prevention and Control
Tobacco smoking, physical inactivity, unhealthy diets and the harmful use of alcohol are the main behavioural risk factors of CVDs. These risk factors are shared by other major NCDs such as cancer, diabetes and chronic respiratory dis-ease. Long-term exposure to behavioural risk factors results in raised blood pressure (hypertension), raised blood sugar (diabetes), raised and abnormal blood lipids (dyslipidae-mia) and obesity. Major cardiovascular risk factors such as hypertension and diabetes link CVD to renal disease.
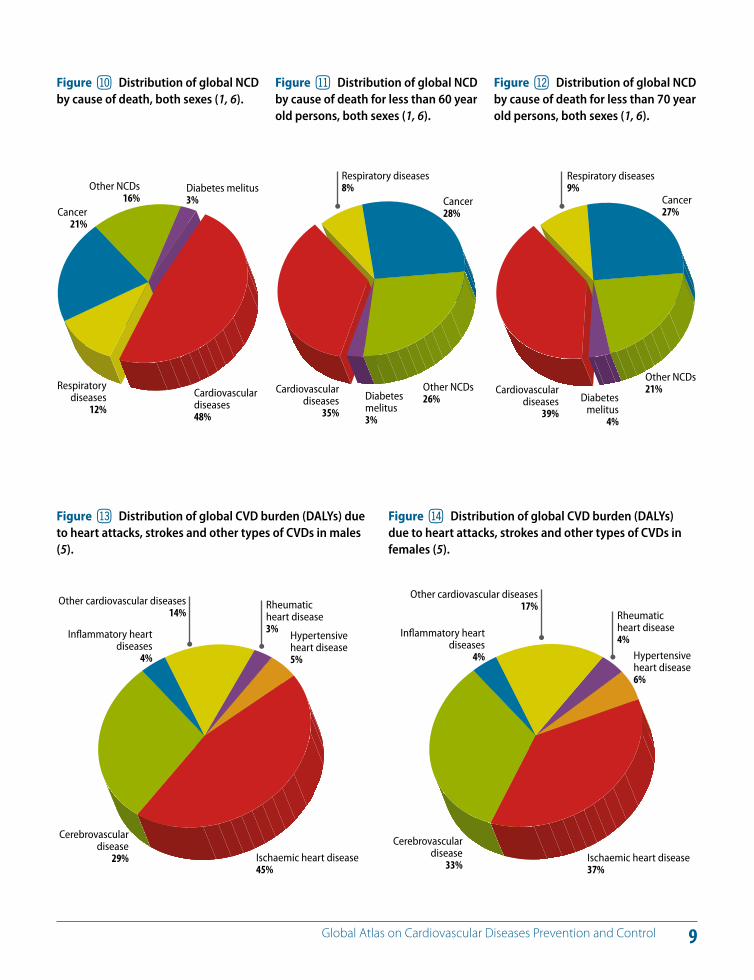
Of the 57 million global deaths in 2008, 36 million (63%) were due to NCDs (Figure 10) and 17.3 million (30%) were due to CVDs. Nearly 80% of NCD deaths occur in LMICs and is the most frequent cause of death in most countries, ex-cept in Africa (1). In Africa, NCDs are rising rapidly and are projected to exceed communicable, maternal, perinatal and nutritional diseases as the most common causes of death in another two decades. Over 80% of cardiovascular and diabetes deaths occur in LMICs.
While 29% of NCD deaths occurs among people below the age of 60 in LMICs, in high-income countries only 13% of deaths occur below the age of 60 (1, 6) (Figure 11). Among people below the age of 70, CVDs were responsible for the largest proportion (39%) of NCD deaths (Figure 12). There has been a doubling of CVD rates in LMICs during recent
decades, with rates, for example, for stroke and heart attack exceeding those in high-income countries (1, 6, 7).
According to the Global Burden of Disease estimates (5), 68% of the 751 million years living with disability (YLD) worldwide is attributable to NCDs, and 84% of this burden of NCD disability arises in LMICs. Heart disease is one of the five leading contributors to YLD in elderly people in LMICs. Stroke is also reported as a leading cause of disability in LMICs, second only to dementia. CVDs are responsible for 151 377 million DALYs, of which 62 587 million are due to coronary heart disease and 46 591 million to cerebrovascu-lar disease (2, 5).
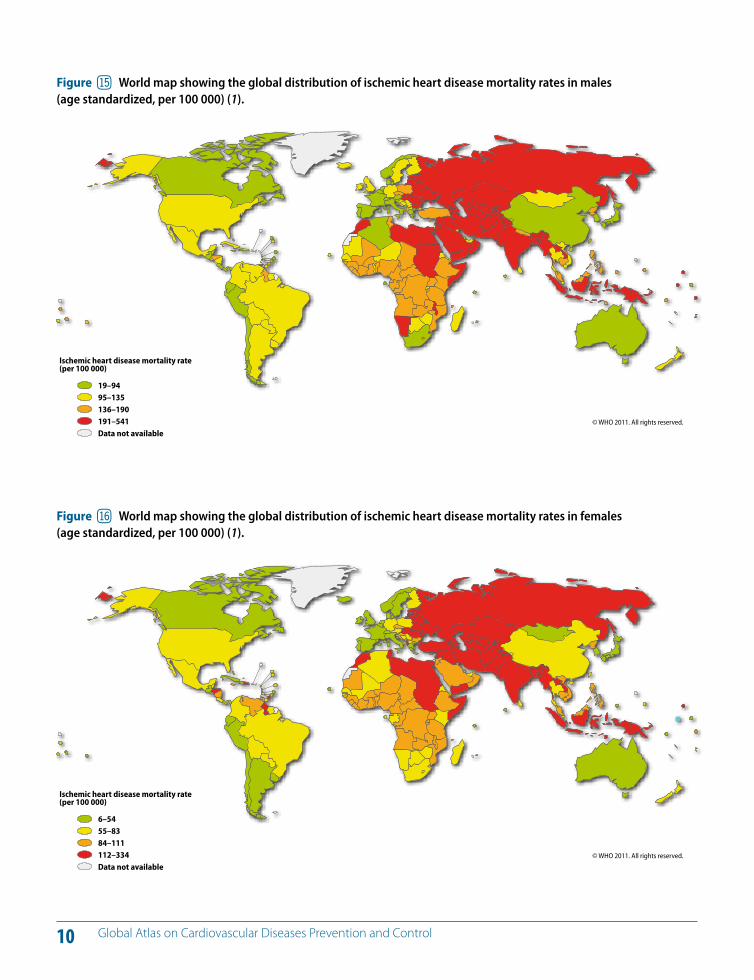
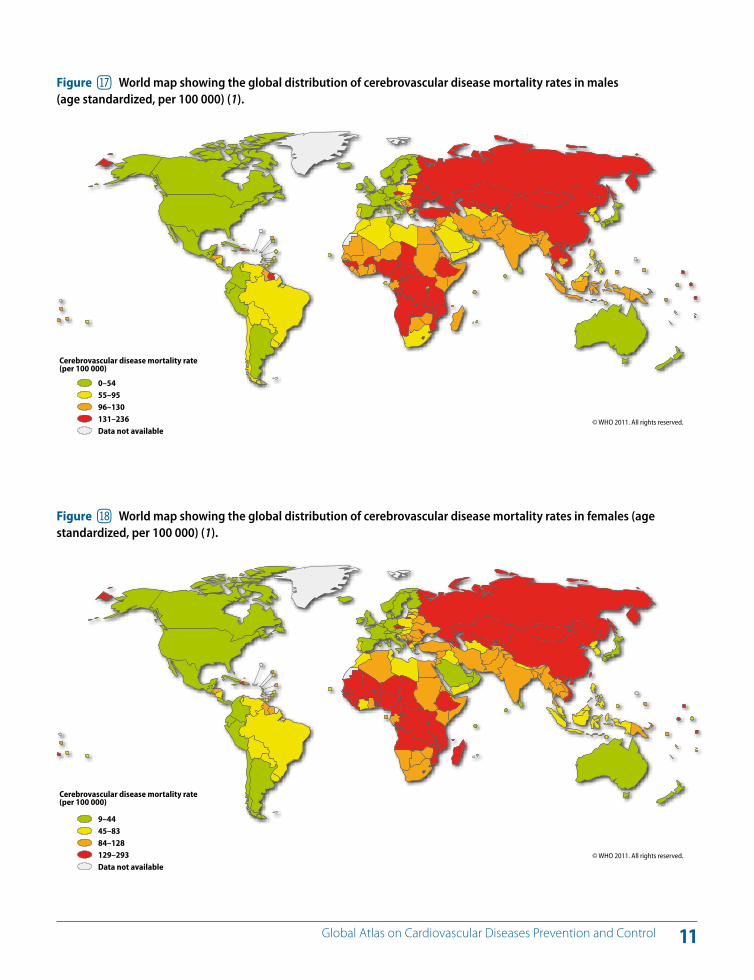
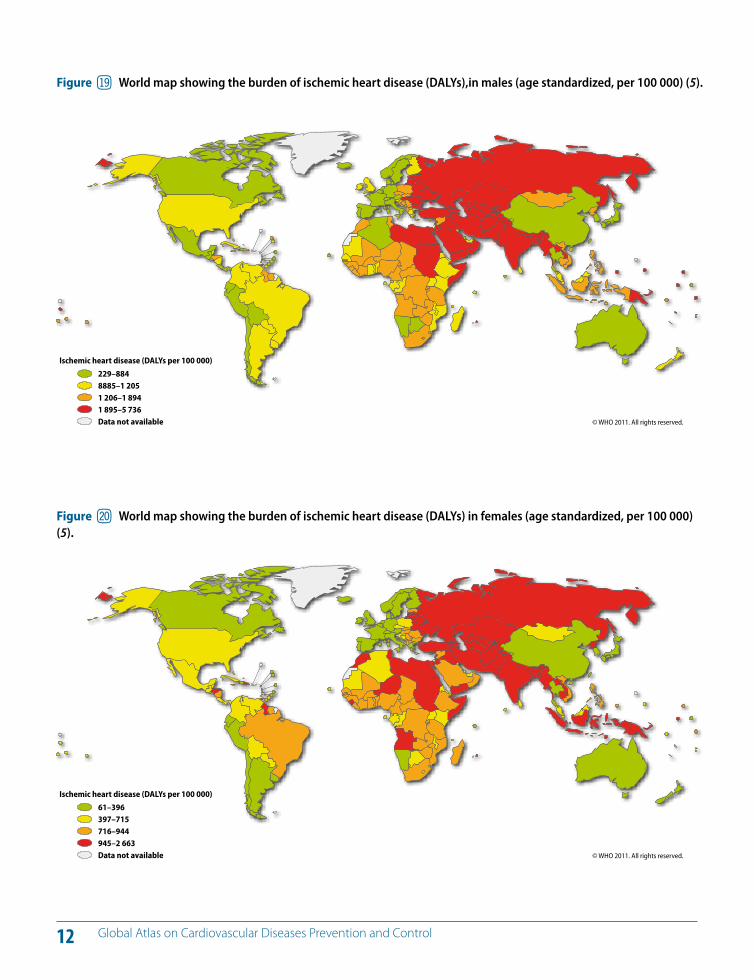
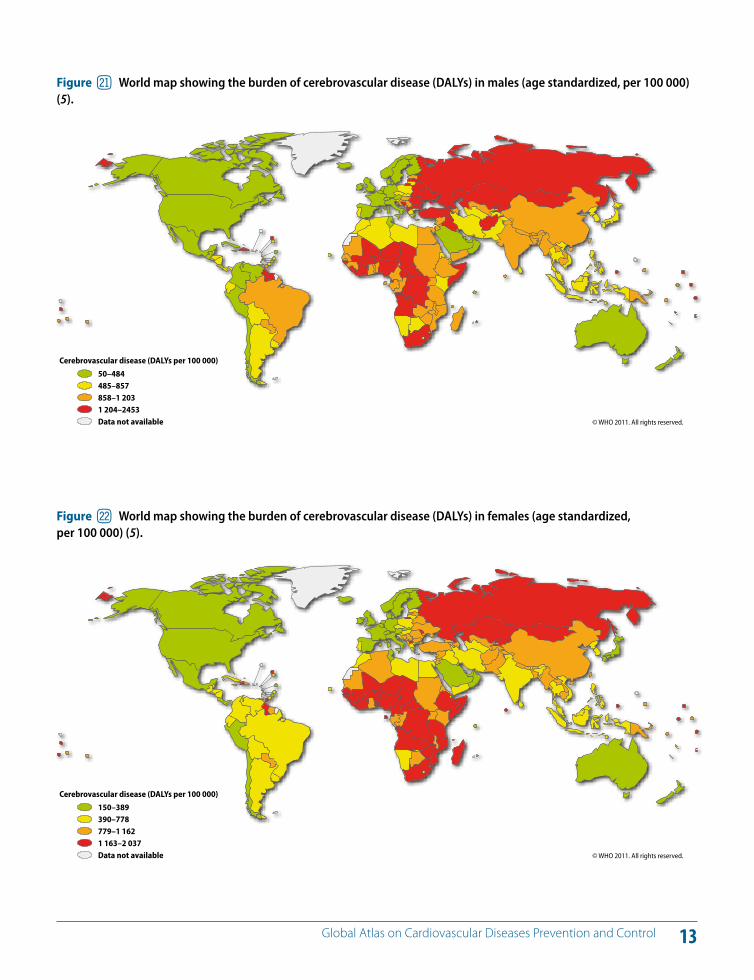
The contribution of di!erent CVDs to the global CVDs bur-den in males and females is shown in Figures 13 and 14, re-spectively. Figures 15–18 show mortality rates of ischaemic heart disease (Figures 15 and 16) and stroke (Figures 17 and 18) for males and females, respectively. Figures 19–22 show healthy years of life lost due to ischaemic heart dis-ease (Figures 19 and 20) and stroke (Figures 21 and 22) for males and females, respectively.
KEY MESSAGES
CVD is the leading noncommunicable disease ; nearly half of the 36 million deaths due to noncommunicable diseases (NCDs) are caused by CVDs.
In 2008, nine million people died of NCDs prematurely before the age of 60; some eight million of these premature deaths occurred in low- and middle-income countries (LMICs).
10% of the global disease burden (DALYs) is attributed to CVD.
Tobacco smoking, physical inactivity, unhealthy diets and the harmful use of alcohol are the shared causative risk factors of heart disease, stroke, cancer, diabetes and respiratory disease.
@ Death and disability due to CVDs (heart attacks and strokes)
9 Global Atlas on Cardiovascular Diseases Prevention and Control
Figure bo Distribution of global CVD burden (DALYs) due to heart attacks, strokes and other types of CVDs in males (5).
Figure bp Distribution of global CVD burden (DALYs) due to heart attacks, strokes and other types of CVDs in females (5).
Inflammatory heart diseases
4%
Other cardiovascular diseases14%
Rheumatic heart disease3%
Hypertensive heart disease5%
Cerebrovascular disease
29% Ischaemic heart disease45%
Inflammatory heart diseases
4%
Other cardiovascular diseases17%
Rheumatic heart disease4%
Hypertensive heart disease6%
Cerebrovascular disease
33%Ischaemic heart disease37%
Figure bl Distribution of global NCD by cause of death, both sexes (1, 6).
Cancer21%
Other NCDs16%
Diabetes melitus3%
Respiratory diseases
12%Cardiovascular diseases48%
Figure bm Distribution of global NCD by cause of death for less than 60 year old persons, both sexes (1, 6).
Cancer28%
Other NCDs26%Diabetes
melitus3%
Respiratory diseases8%
Cardiovascular diseases
35%
Figure bn Distribution of global NCD by cause of death for less than 70 year old persons, both sexes (1, 6).
Cancer27%
Other NCDs21%
Diabetes melitus
4%
Respiratory diseases9%
Cardiovascular diseases
39%
10 Global Atlas on Cardiovascular Diseases Prevention and Control
Figure bq World map showing the global distribution of ischemic heart disease mortality rates in males (age standardized, per 100 000) (1).
© WHO 2011. All rights reserved.
Ischemic heart disease mortality rate (per 100 000)
19–9495–135136–190191–541Data not available
Figure br World map showing the global distribution of ischemic heart disease mortality rates in females (age standardized, per 100 000) (1).
© WHO 2011. All rights reserved.
Ischemic heart disease mortality rate (per 100 000)
6–5455–8384–111112–334Data not available
11 Global Atlas on Cardiovascular Diseases Prevention and Control
Figure bs World map showing the global distribution of cerebrovascular disease mortality rates in males (age standardized, per 100 000) (1).
© WHO 2011. All rights reserved.
Cerebrovascular disease mortality rate (per 100 000)
0–5455–9596–130131–236Data not available
Figure bt World map showing the global distribution of cerebrovascular disease mortality rates in females (age standardized, per 100 000) (1).
© WHO 2011. All rights reserved.
Cerebrovascular disease mortality rate (per 100 000)
9–4445–8384–128129–293Data not available
12 Global Atlas on Cardiovascular Diseases Prevention and Control
Figure bu World map showing the burden of ischemic heart disease (DALYs),in males (age standardized, per 100 000) (5).
© WHO 2011. All rights reserved.
Ischemic heart disease (DALYs per 100 000)
229–8848885–1 2051 206–1 8941 895–5 736Data not available
Figure cl World map showing the burden of ischemic heart disease (DALYs) in females (age standardized, per 100 000) (5).
© WHO 2011. All rights reserved.
Ischemic heart disease (DALYs per 100 000)
61–396397–715716–944945–2 663Data not available
13 Global Atlas on Cardiovascular Diseases Prevention and Control
Figure cm World map showing the burden of cerebrovascular disease (DALYs) in males (age standardized, per 100 000) (5).
© WHO 2011. All rights reserved.
Cerebrovascular disease (DALYs per 100 000)
50–484485–857858–1 2031 204–2453Data not available
Figure cn World map showing the burden of cerebrovascular disease (DALYs) in females (age standardized, per 100 000) (5).
© WHO 2011. All rights reserved.
Cerebrovascular disease (DALYs per 100 000)
150–389390–778779–1 1621 163–2 037Data not available
14 Global Atlas on Cardiovascular Diseases Prevention and Control
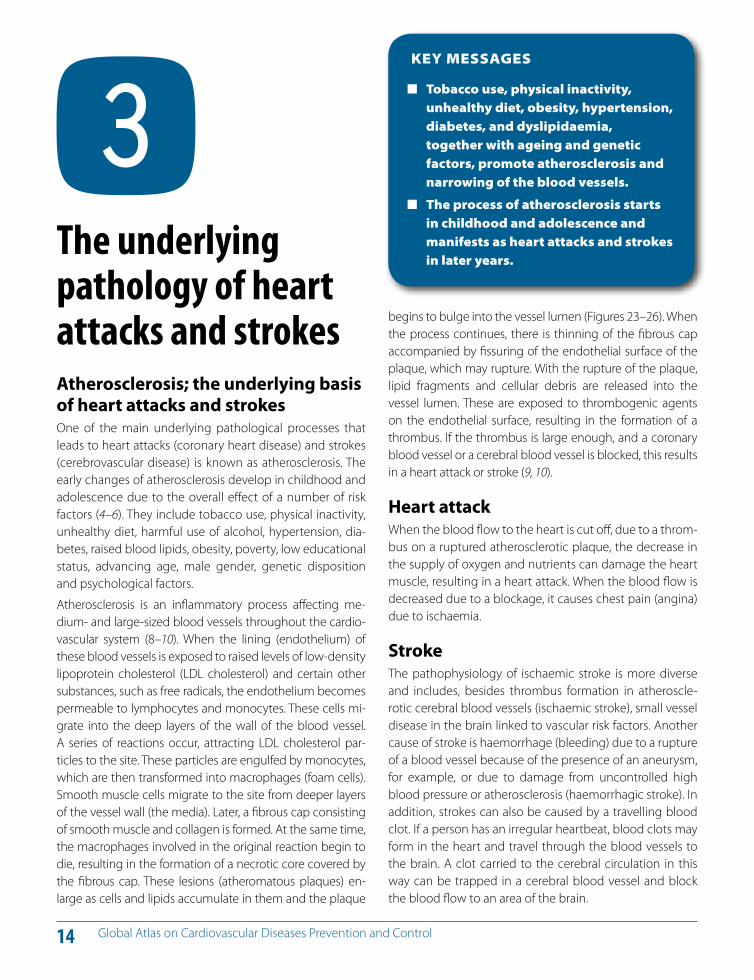
Atherosclerosis; the underlying basis of heart attacks and strokes One of the main underlying pathological processes that leads to heart attacks (coronary heart disease) and strokes (cerebrovascular disease) is known as atherosclerosis. The early changes of atherosclerosis develop in childhood and adolescence due to the overall e!ect of a number of risk factors (4–6). They include tobacco use, physical inactivity, unhealthy diet, harmful use of alcohol, hypertension, dia-betes, raised blood lipids, obesity, poverty, low educational status, advancing age, male gender, genetic disposition and psychological factors.
Atherosclerosis is an inflammatory process a!ecting me-dium- and large-sized blood vessels throughout the cardio-vascular system (8–10). When the lining (endothelium) of these blood vessels is exposed to raised levels of low-density lipoprotein cholesterol (LDL cholesterol) and certain other substances, such as free radicals, the endothelium becomes permeable to lymphocytes and monocytes. These cells mi-grate into the deep layers of the wall of the blood vessel. A series of reactions occur, attracting LDL cholesterol par-ticles to the site. These particles are engulfed by monocytes, which are then transformed into macrophages (foam cells). Smooth muscle cells migrate to the site from deeper layers of the vessel wall (the media). Later, a fibrous cap consisting of smooth muscle and collagen is formed. At the same time, the macrophages involved in the original reaction begin to die, resulting in the formation of a necrotic core covered by the fibrous cap. These lesions (atheromatous plaques) en-large as cells and lipids accumulate in them and the plaque
KEY MESSAGES
Tobacco use, physical inactivity, unhealthy diet, obesity, hypertension, diabetes, and dyslipidaemia, together with ageing and genetic factors, promote atherosclerosis and narrowing of the blood vessels.
The process of atherosclerosis starts in childhood and adolescence and manifests as heart attacks and strokes in later years.
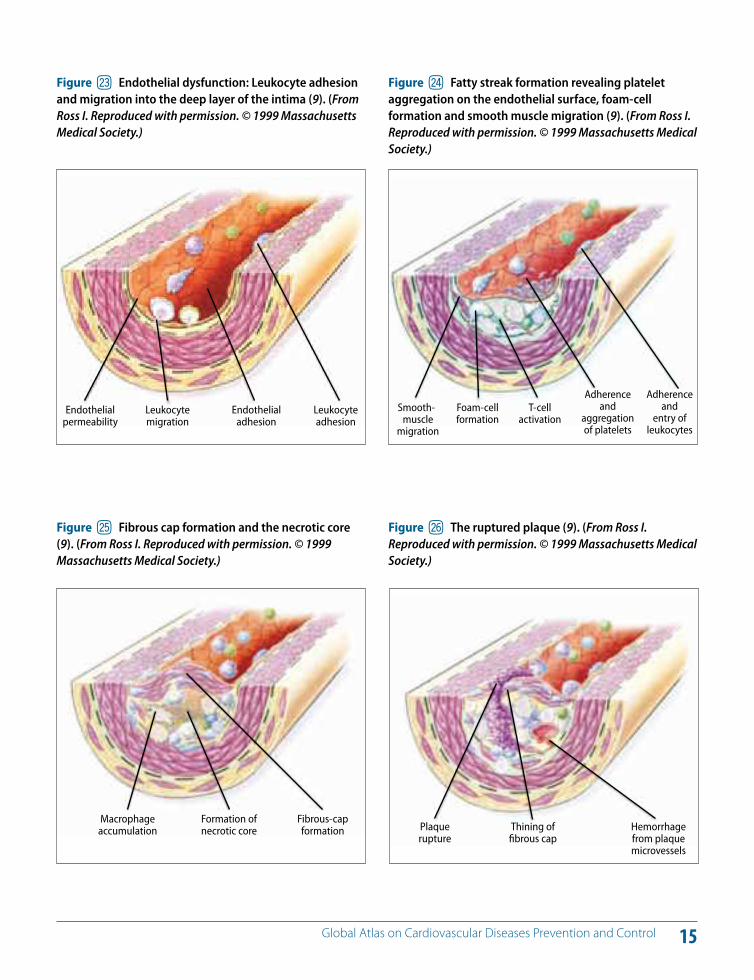
# The underlying pathology of heart attacks and strokes begins to bulge into the vessel lumen (Figures 23–26). When
the process continues, there is thinning of the fibrous cap accompanied by fissuring of the endothelial surface of the plaque, which may rupture. With the rupture of the plaque, lipid fragments and cellular debris are released into the vessel lumen. These are exposed to thrombogenic agents on the endothelial surface, resulting in the formation of a thrombus. If the thrombus is large enough, and a coronary blood vessel or a cerebral blood vessel is blocked, this results in a heart attack or stroke (9, 10).
Heart attackWhen the blood flow to the heart is cut o!, due to a throm-bus on a ruptured atherosclerotic plaque, the decrease in the supply of oxygen and nutrients can damage the heart muscle, resulting in a heart attack. When the blood flow is decreased due to a blockage, it causes chest pain (angina) due to ischaemia.
Stroke The pathophysiology of ischaemic stroke is more diverse and includes, besides thrombus formation in atheroscle-rotic cerebral blood vessels (ischaemic stroke), small vessel disease in the brain linked to vascular risk factors. Another cause of stroke is haemorrhage (bleeding) due to a rupture of a blood vessel because of the presence of an aneurysm, for example, or due to damage from uncontrolled high blood pressure or atherosclerosis (haemorrhagic stroke). In addition, strokes can also be caused by a travelling blood clot. If a person has an irregular heartbeat, blood clots may form in the heart and travel through the blood vessels to the brain. A clot carried to the cerebral circulation in this way can be trapped in a cerebral blood vessel and block the blood flow to an area of the brain.
15 Global Atlas on Cardiovascular Diseases Prevention and Control
Figure co Endothelial dysfunction: Leukocyte adhesion and migration into the deep layer of the intima (9). (From Ross I. Reproduced with permission. © 1999 Massachusetts Medical Society.)
Endothelialpermeability
Leukocyte migration
Endothelialadhesion
Leukocyte adhesion
Figure cq Fibrous cap formation and the necrotic core (9). (From Ross I. Reproduced with permission. © 1999 Massachusetts Medical Society.)
Figure cr The ruptured plaque (9). (From Ross I. Reproduced with permission. © 1999 Massachusetts Medical Society.)
Macrophage accumulation
Formation of necrotic core
Fibrous-cap formation Plaque
ruptureThining of fibrous cap
Hemorrhage from plaque microvessels
Figure cp Fatty streak formation revealing platelet aggregation on the endothelial surface, foam-cell formation and smooth muscle migration (9). (From Ross I. Reproduced with permission. © 1999 Massachusetts Medical Society.)
Smooth-muscle
migration
Foam-cellformation
T-cellactivation
Adherence and
entry of leukocytes
Adherence and
aggregation of platelets
16 Global Atlas on Cardiovascular Diseases Prevention and Control
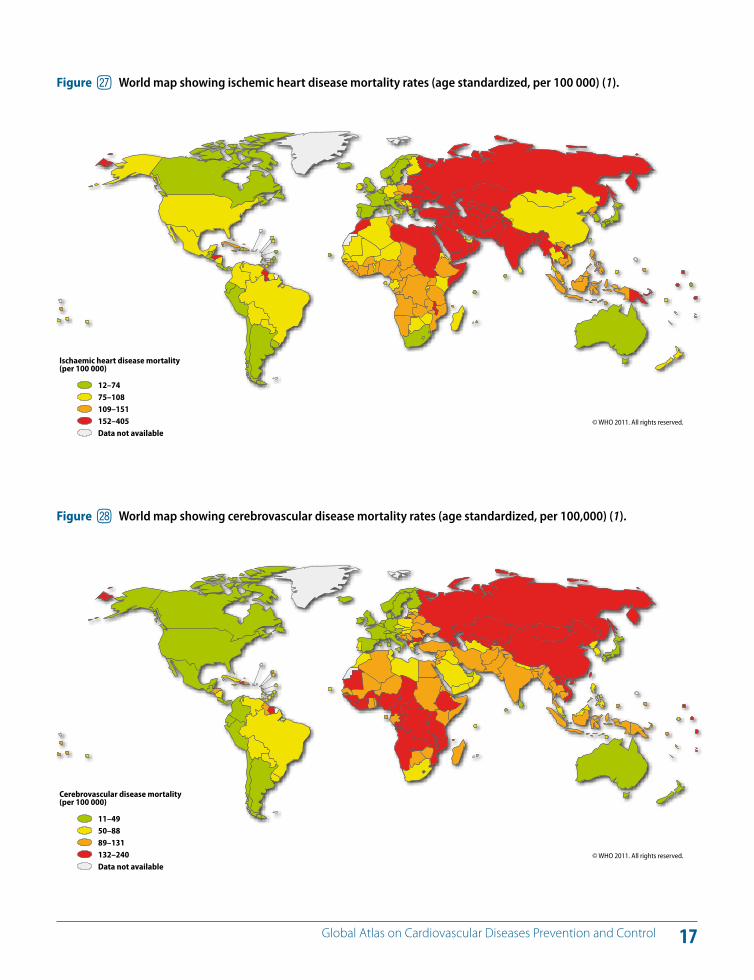
Figures 27 and 28 show mortality rates of ischemic heart disease and cerebrovascular disease. Over the past two decades, cardiovascular mortality rates have declined substantially in high-income countries (6, 11–13). There is clear evidence that population-wide primary prevention and individual health-care intervention strategies have both contributed to these declining mortality trends. For example, during the 10-year period covered by the World Health Organization (WHO) Multinational Monitoring of Trends and Determinants of Cardiovascular Disease initia-tive (WHO MONICA Project), mortality from coronary heart disease and stroke declined dramatically in many of the 38 MONICA populations (13).
The decline in mortality has been attributed to reduced incidence rates and/or improved survival after cardiovas-cular events due to prevention and treatment interven-tions. Across all populations with declining coronary heart disease mortality, reduced cardiovascular risk contributed to 75% and 66% of the change in men and women, respec-tively; the remainder being attributed to providing health care resulting in improved survival in the first four weeks after the event. For stroke, about one third of the changes in populations with declining mortality was attributed to reduced incidence and 66% to improved survival.
There has been a dramatic decline in coronary heart dis-ease mortality in the United Kingdom from 1981 to 2000 (14). Nearly 42% of this decrease has been attributed to treatment (including 11% to secondary prevention, 13% to heart failure treatment, 8% to initial treatment of acute myocardial infarction and 3% to hypertension treatment). About 58% of the decline has been attributed to popula-tion-wide risk factor reductions (14).
The above data and similar experiences in Finland (15) and other countries (16, 17) strongly support the view that pop-ulation-wide primary prevention and individual health-care approaches go hand-in-hand to reduce the popula-tion burden of CVDs (6).
KEY MESSAGES
CVDs are eminently preventable.
Investment in prevention is the most sustainable solution for the CVD epidemic.
Over the last two decades, CVD mortality has declined in developed countries due to a combination of prevention and control measures.
$ Evidence for prevention of heart attacks and strokes
17 Global Atlas on Cardiovascular Diseases Prevention and Control
Figure cs World map showing ischemic heart disease mortality rates (age standardized, per 100 000) (1).
© WHO 2011. All rights reserved.
Ischaemic heart disease mortality(per 100 000)
12–7475–108109–151152–405Data not available
Figure ct World map showing cerebrovascular disease mortality rates (age standardized, per 100,000) (1).
© WHO 2011. All rights reserved.
Cerebrovascular disease mortality(per 100 000)
11–4950–8889–131132–240Data not available
18 Global Atlas on Cardiovascular Diseases Prevention and Control
A large percentage of CVDs (and other NCDs) is prevent-able through the reduction of behavioural risk factors (to-bacco use, unhealthy diet, physical inactivity and harmful use of alcohol) (3, 6).
Unhealthy behaviours lead to metabolic/physiologi-cal changes: raised blood pressure (hypertension); over-weight/obesity; raised blood sugar (diabetes); and raised blood lipids (dyslipidaemia). These intermediate risk factors cause damage to coronary and cerebral blood vessels due to atherosclerosis, a process that develops over many years, starting in childhood and manifesting as heart attacks and strokes in people of middle age. Since the underlying path-ological process that causes heart attacks and strokes is similar, common approaches that address behavioural risk factors and metabolic risk factors are e!ective for preven-tion of both conditions.
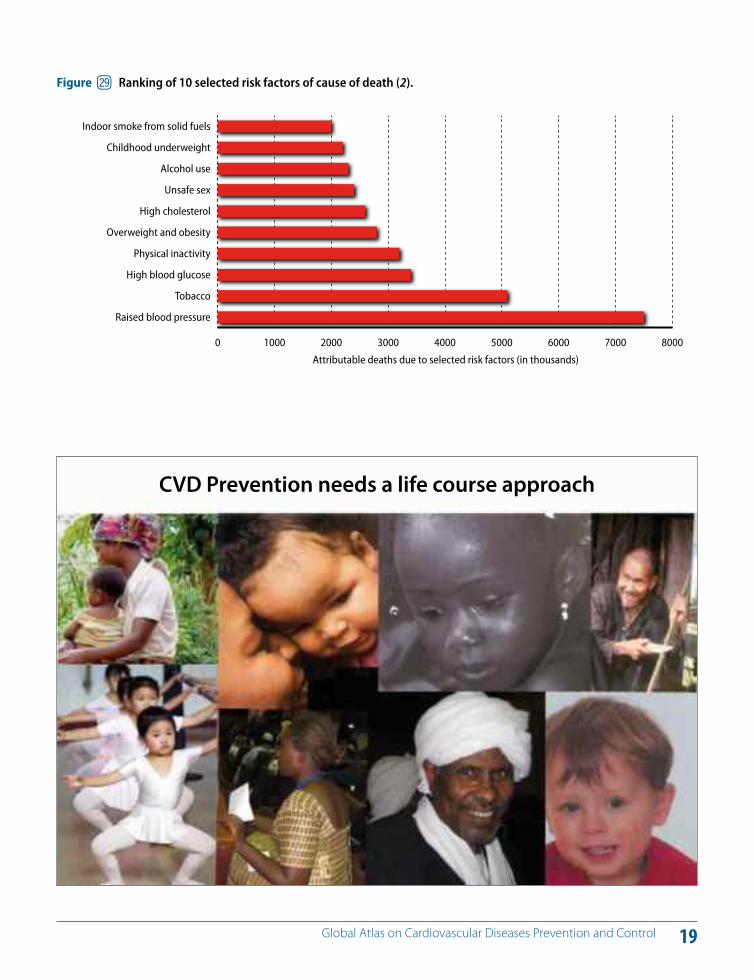
In terms of attributable deaths, the leading cardiovascular risk factor globally is raised blood pressure (to which 13% of global deaths is attributed), followed by tobacco use (9%), raised blood glucose (6%), physical inactivity (6%) and overweight and obesity (5%) (2) (Figure 29).
These behavioural and metabolic risk factors often coexist in the same person and act synergistically to increase the individual’s total risk of developing acute vascular events such as heart attacks and strokes. Strong scientific evi-
dence demonstrates that reducing total cardiovascular risk results in the prevention of heart attacks and strokes (4).
Pioneering work conducted by the Framingham Heart Study project in the United States (18, 19) and the Seven Countries study (20) in the 1960s and many other studies since then, including the WHO MONICA Project (13) and the INTERHEART study (21), have provided further insights into the risk factors and determinants of CVDs.
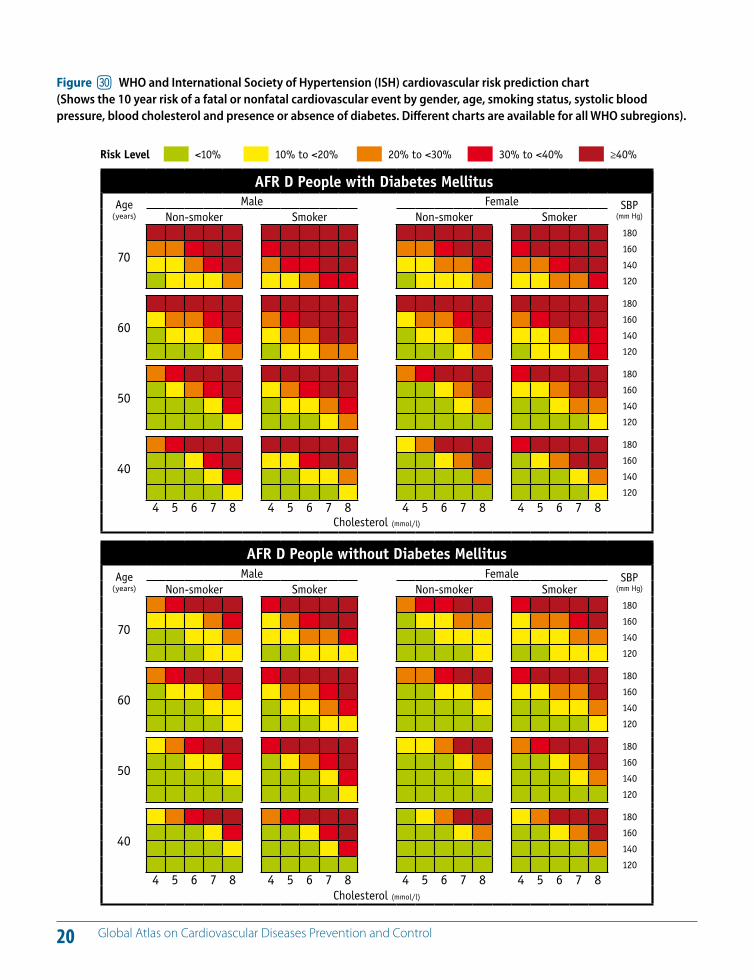
If people at risk of developing myocardial infarctions and strokes can be identified and measures taken to reduce their cardiovascular risk, a vast majority of fatal and non-fa-tal cardiovascular events can be prevented (4, 21, 22). WHO ISH (International Society of Hypertension) risk prediction charts and other risk prediction tools can be used to assess the risk of developing heart attacks and strokes (Figure 30).
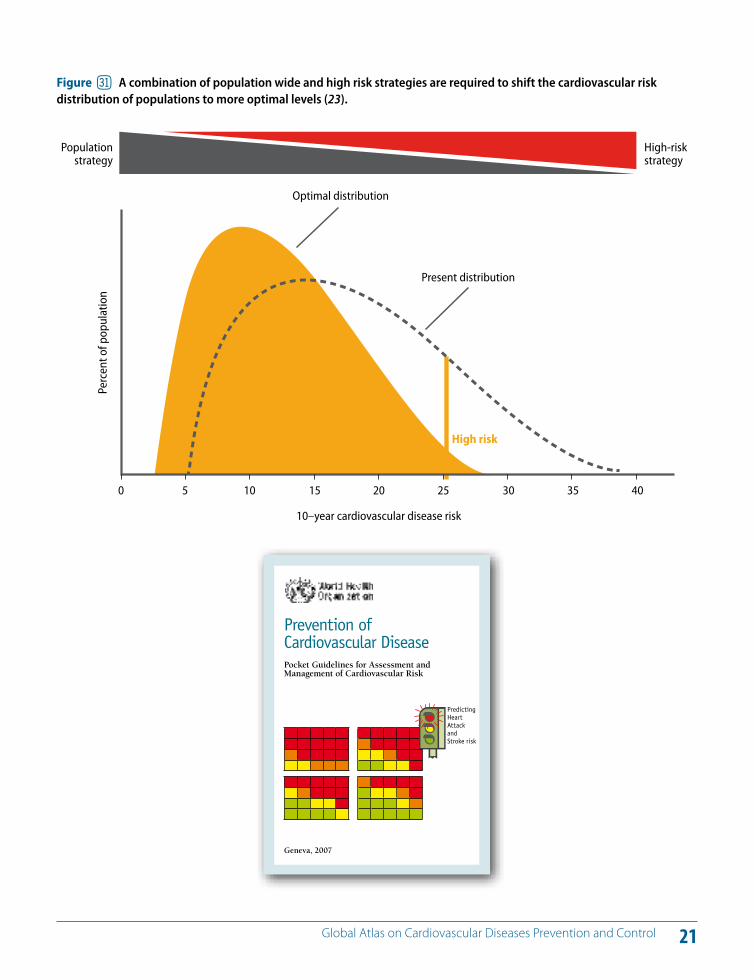
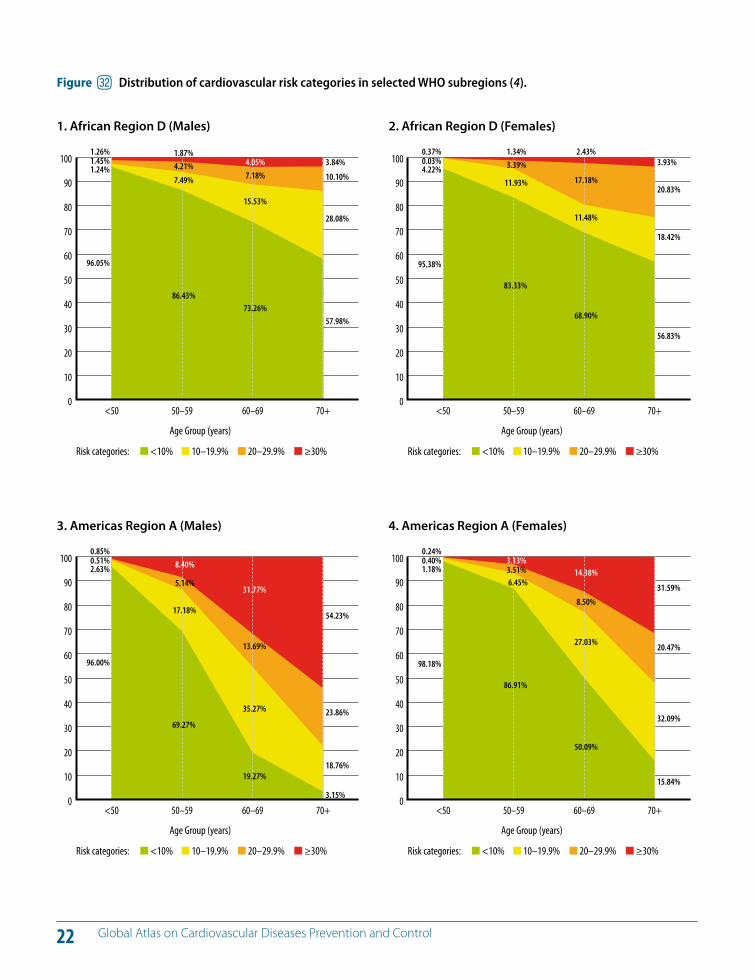
Cardiovascular risk distribution of the population can be lowered through national health policies targeting the whole population as well as those at high risk (Figure 31). Population-wide strategies should address behavioural risk factors. Simultaneously, those at high risk need to be identified and targeted through health systems using inte-grated risk assessment and management approaches that are cost e!ective (4, 6, 23). Figure 32 shows the distribution of the population across di!erent levels of cardiovascular risk in all WHO regions.
KEY MESSAGES
Cardiovascular risk factors such as hypertension, diabetes and hyperlipidaemia cluster together and are major risk factors for strokes and heart attacks.
To prevent heart attacks and strokes, the total cardiovascular risk needs to be reduced by lowering all modifiable risk factors.
Prevention of heart attacks and strokes by reducing the total cardiovascular risk is cost e!ective.
% Reducing cardiovascular risk to prevent heart attacks and strokes
19 Global Atlas on Cardiovascular Diseases Prevention and Control
0 1000 2000 3000 4000 5000 6000 7000 8000
Raised blood pressure
Tobacco
High blood glucose
Physical inactivity
Overweight and obesity
High cholesterol
Unsafe sex
Alcohol use
Childhood underweight
Indoor smoke from solid fuels
Attributable deaths due to selected risk factors (in thousands)
Figure cu Ranking of 10 selected risk factors of cause of death (2).
CVD Prevention needs a life course approach
20 Global Atlas on Cardiovascular Diseases Prevention and Control
WHO/ISH Risk prediction chartsfor 14 WHO epidemiological sub-regions
8Figure 1. WHO/ISH risk prediction chart for AFR D. 10-year risk of a fatal or non-fatal cardiovascular event by gender, age, systolic blood pressure, total blood cholesterol, smoking status and presence or absence of diabetes mellitus.
AFR D People with Diabetes MellitusAge
(years)
Male Female SBP(mm Hg)Non-smoker Smoker Non-smoker Smoker
70
180
160
140
120
60
180
160
140
120
50
180
160
140
120
40
180
160
140
120
4 5 6 7 8 4 5 6 7 8 4 5 6 7 8 4 5 6 7 8Cholesterol (mmol/l)
Risk Level <10% 10% to <20% 20% to <30% 30% to <40% !40%
AFR D People without Diabetes MellitusAge
(years)
Male Female SBP(mm Hg)Non-smoker Smoker Non-smoker Smoker
70
180
160
140
120
60
180
160
140
120
50
180
160
140
120
40
180
160
140
120
4 5 6 7 8 4 5 6 7 8 4 5 6 7 8 4 5 6 7 8Cholesterol (mmol/l)
This chart can only be used for countries of the WHO Region of Africa, sub-region D, in settings where blood cholesterol can be measured (Algeria, Angola, Benin, Burkina Faso, Cameroon, Cape Verde, Chad, Comoros, Equatorial Guinea, Gabon, Gambia, Ghana, Guinea, Guinea-Bissau, Liberia, Madagascar, Mali, Mauritania, Mauritius, Niger, Nigeria, Sao Tome And Principe, Senegal, Seychelles, Sierra Leone, Togo).
WHO ISH Risk_CS3_def.indd 8 01/07/11 07:25
Figure dl WHO and International Society of Hypertension (ISH) cardiovascular risk prediction chart (Shows the 10 year risk of a fatal or nonfatal cardiovascular event by gender, age, smoking status, systolic blood pressure, blood cholesterol and presence or absence of diabetes. Di!erent charts are available for all WHO subregions).
21 Global Atlas on Cardiovascular Diseases Prevention and Control
Populationstrategy
Optimal distribution
10–year cardiovascular disease risk
Present distribution
Perc
ent o
f pop
ulat
ion
High risk
High-riskstrategy
0 5 10 15 20 25 30 35 40
Figure dm A combination of population wide and high risk strategies are required to shift the cardiovascular risk distribution of populations to more optimal levels (23).
Prevention of Cardiovascular DiseasePocket Guidelines for Assessment and Management of Cardiovascular Risk
Geneva, 2007
PredictingHeart AttackandStroke risk
22 Global Atlas on Cardiovascular Diseases Prevention and Control
Figure dn Distribution of cardiovascular risk categories in selected WHO subregions (4).
0
10
20
30
40
50
60
70
80
90
100
70+60–6950–59<50
Risk categories: <10% 10–19.9% 20–29.9% !30%
1.26%1.45%1.24%
96.05%
1.87%4.21%
7.49%
86.43%
4.05%7.18%
15.53%
73.26%
3.84%
10.10%
28.08%
57.98%
Age Group (years)
1. African Region D (Males) 2. African Region D (Females)
0
10
20
30
40
50
60
70
80
90
100
70+60–6950–59<50
Risk categories: <10% 10–19.9% 20–29.9% !30%
0.37%0.03%4.22%
95.38%
1.34%3.39%
11.93%
83.33%
2.43%
17.18%
11.48%
68.90%
3.93%
20.83%
18.42%
56.83%
Age Group (years)
0
10
20
30
40
50
60
70
80
90
100
70+60–6950–59<50
Risk categories: <10% 10–19.9% 20–29.9% !30%
0.85%0.51%2.63%
96.00%
8.40%
5.14%
17.18%
69.27%
31.77%
13.69%
35.27%
19.27%
54.23%
23.86%
18.76%
3.15%
Age Group (years)
3. Americas Region A (Males) 4. Americas Region A (Females)
0
10
20
30
40
50
60
70
80
90
100
70+60–6950–59<50
Risk categories: <10% 10–19.9% 20–29.9% !30%
0.24%0.40%1.18%
98.18%
3.13%3.51%6.45%
86.91%
14.38%
8.50%
27.03%
50.09%
31.59%
20.47%
32.09%
15.84%
Age Group (years)
23 Global Atlas on Cardiovascular Diseases Prevention and Control
0
10
20
30
40
50
60
70
80
90
100
70+60–6950–59<50
Risk categories: <10% 10–19.9% 20–29.9% !30%
0.19%0.29%0.89%
98.63%
4.65%3.95%
9.31%
82.09%
18.73%
15.73%
35.33%
30.20%
38.46%
27.76%
28.35%
5.44%
Age Group (years)
5. Eastern Mediterranean Region D (Males) 6. Eastern Mediterranean Region D (Females)
0
10
20
30
40
50
60
70
80
90
100
70+60–6950–59<50
Risk categories: <10% 10–19.9% 20–29.9% !30%
0.16%0.16%0.67%
99.01%
2.60%
3.79%
9.18%
84.43%
15.49%
11.35%
26.62%
46.54%
31.91%
19.32%
34.28%
14.49%
Age Group (years)
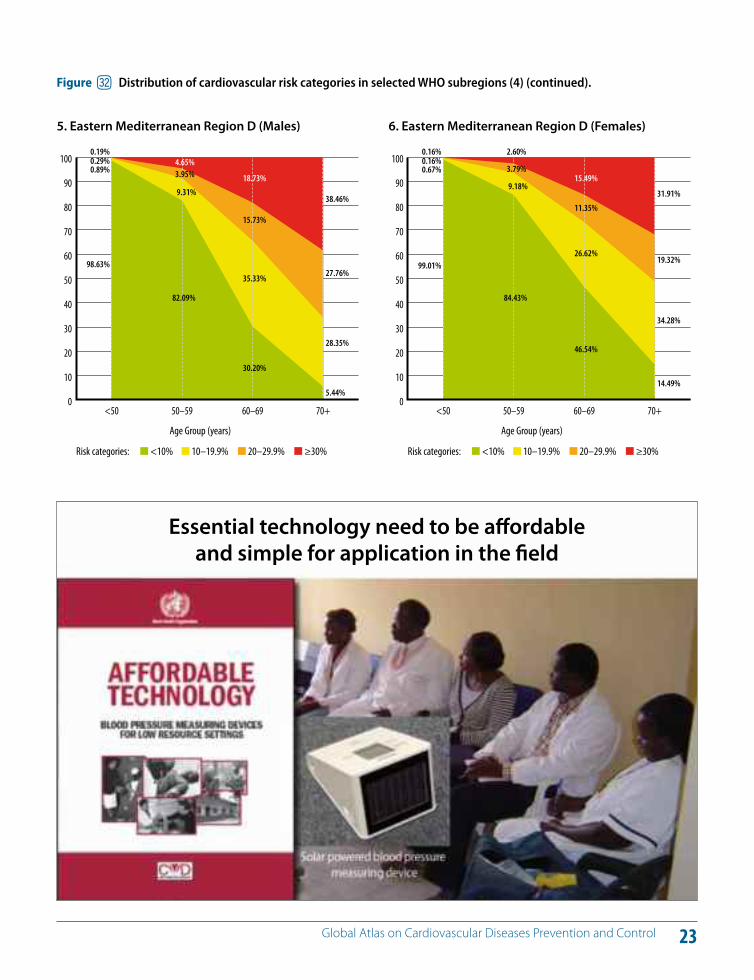
Figure dn Distribution of cardiovascular risk categories in selected WHO subregions (4) (continued).
Essential technology need to be a!ordable and simple for application in the field
24 Global Atlas on Cardiovascular Diseases Prevention and Control
0
10
20
30
40
50
60
70
80
90
100
70+60–6950–59<50
Risk categories: <10% 10–19.9% 20–29.9% !30%
0.47%0.25%1.30%
97.99%
5.12%4.41%7.45%
83.02%
22.23%
14.32%
27.48%
35.97%
31.39%
14.42%
44.02%
10.17%
Age Group (years)
9. South-East Asia Region C (Males) 10. South-East Asia Region C (Females)
0
10
20
30
40
50
60
70
80
90
100
70+60–6950–59<50
Risk categories: <10% 10–19.9% 20–29.9% !30%
0.22%0.74%0.65%
98.39%
3.31%3.39%
8.72%
84.58%
19.23%
12.45%
38.52%
29.80%
29.75%
22.95%
40.66%
6.64%
Age Group (years)
0
10
20
30
40
50
60
70
80
90
100
70+60–6950–59<50
Risk categories: <10% 10–19.9% 20–29.9% !30%
1.31%1.05%5.06%
92.57%
13.70%
6.07%
10.54%
69.69%
40.29%
18.10%
28.02%
13.59%
58.69%
22.81%
14.20%
4.30%
Age Group (years)
7. European Region C (Males) 8. European Region C (Females)
0
10
20
30
40
50
60
70
80
90
100
70+60–6950–59<50
Risk categories: <10% 10–19.9% 20–29.9% !30%
0.50%0.47%1.73%
97.30%
3.16%5.66%
11.68%
79.51%
22.48%
13.26%
16.24%
48.02%
51.89%
7.10%
24.24%
16.78%
Age Group (years)
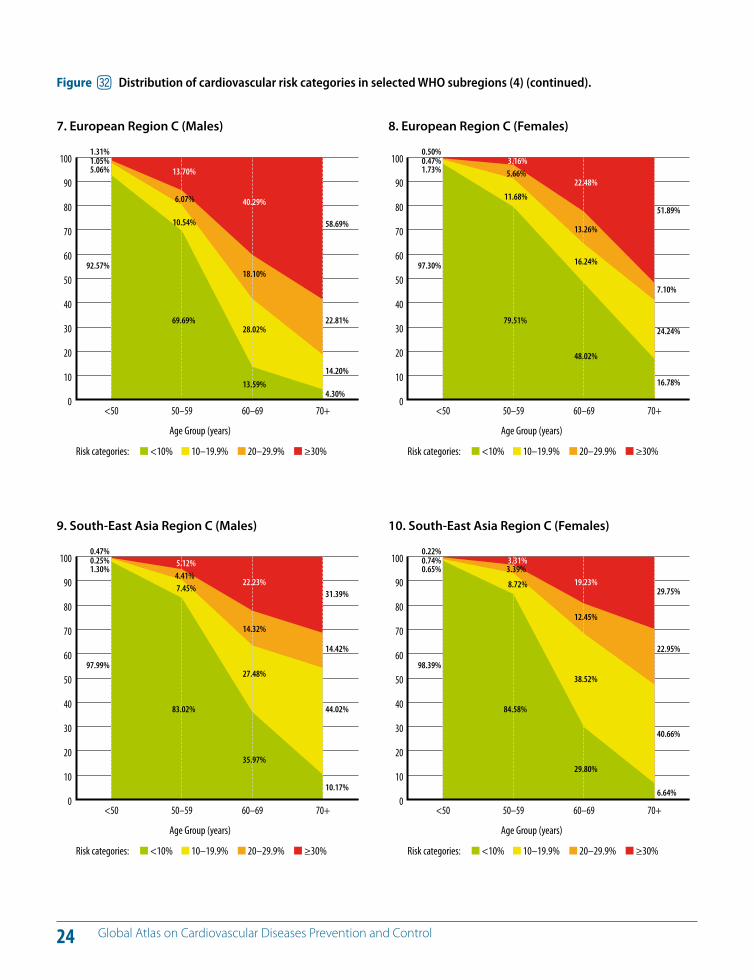
Figure dn Distribution of cardiovascular risk categories in selected WHO subregions (4) (continued).
25 Global Atlas on Cardiovascular Diseases Prevention and Control
0
10
20
30
40
50
60
70
80
90
100
70+60–6950–59<50
Risk categories: <10% 10–19.9% 20–29.9% !30%
0.16%0.40%0.52%
97.86%
3.78%2.51%
8.72%
84.99%
15.06%
10.03%
25.37%
49.54%
21.63%
14.25%
39.98%
24.15%
Age Group (years)
11. Western Pacific Region B (Males) 12. Western Pacific Region B (Females)
0
10
20
30
40
50
60
70
80
90
100
70+60–6950–59<50
Risk categories: <10% 10–19.9% 20–29.9% !30%
0.10%0.16%0.58%
99.16%
1.99%
2.29%4.33%
91.39%
6.74%
13.00%
7.54%
72.72%
15.28%
10.08%
26.53%
48.11%
Age Group (years)
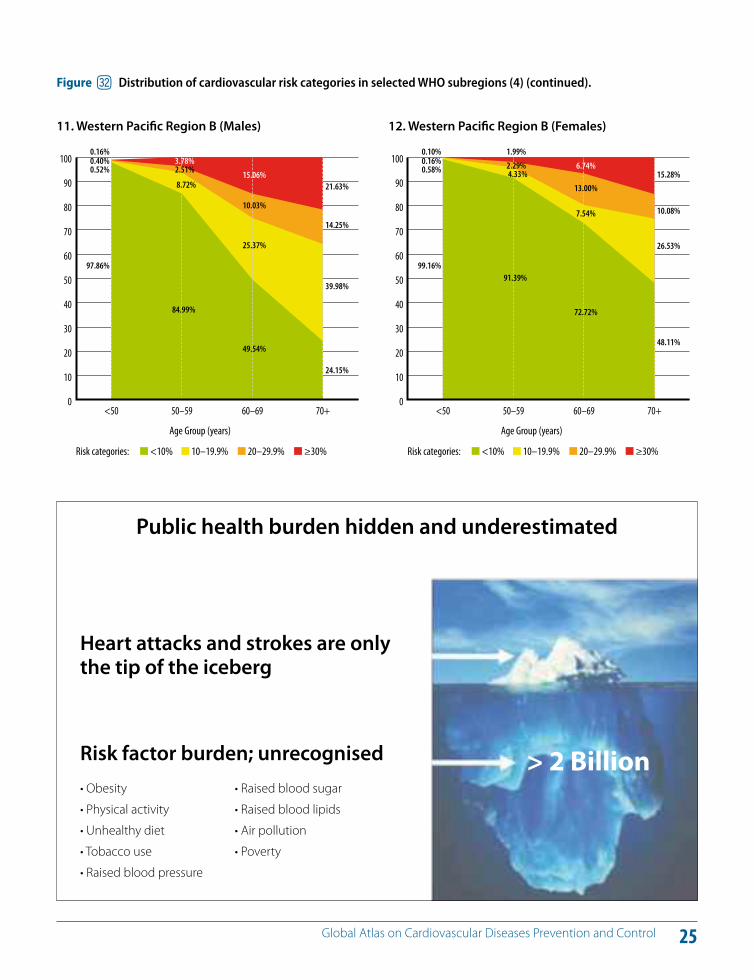
Figure dn Distribution of cardiovascular risk categories in selected WHO subregions (4) (continued).
Public health burden hidden and underestimated
Heart attacks and strokes are only the tip of the iceberg
Risk factor burden; unrecognised > 2 Billion
26 Global Atlas on Cardiovascular Diseases Prevention and Control
There are currently about one billion smokers in the world. Manufactured cigarettes represent the major form of smoked tobacco; other forms of tobacco consumed include “bidis” (a type of filter-less hand-rolled cigarette), cigars, hookahs and chewed tobacco (24, 25). Figure 33 and 34 show the prevalence rates of current daily tobacco smoking. The prevalence of daily tobacco smoking varied widely among the six WHO regions in 2009.
The highest overall prevalence for smoking is estimated at nearly 31% in the WHO European Region, while the lowest is in the WHO African Region at 10% (26).
Risks to health from tobacco use result not only from di-rect consumption of tobacco, but also from exposure to second-hand smoke (24, 25). Nearly six million people die from tobacco use and exposure to second hand smoke each year, accounting for 6% of all female and 12% of all male deaths in the world (1, 6). By 2030, tobacco-related deaths are projected to increase to more than 8 million deaths every year (2, 6).
Smoking is estimated to cause nearly 10% of CVD (2). There is a large body of evidence from prospective cohort stud-ies regarding the beneficial e!ect of smoking cessation on coronary heart disease mortality (4). A 50-year follow-up of British doctors demonstrated that, among ex-smokers, the age of quitting has a major impact on survival prospects:
those who quit between 35 and 44 years of age had the same survival rates as those who had never smoked (27).
There is an inverse relationship between income level and prevalence of tobacco use and its related consequences. In addition, tobacco consumption inflicts a greater harm among disadvantaged groups due to tobacco-related ill-ness and the impact on household expenditure. There-fore, policies and interventions focusing on prevention of tobacco use, promotion of smoke free environments and smoking cessation should be important components of national and international e!orts to improve the health and well being of populations, especially the less a#uent (28).
KEY MESSAGES
Tobacco use is a principal contributor to the development of heart attacks, strokes, sudden death, heart failure, aortic aneurysm and peripheral vascular disease.
Smoking cessation and avoidance of second-hand smoke reduce the cardiovascular risk and thereby help to prevent CVDs.
^ Tobacco: The totally avoidable risk factor of CVDs
27 Global Atlas on Cardiovascular Diseases Prevention and Control
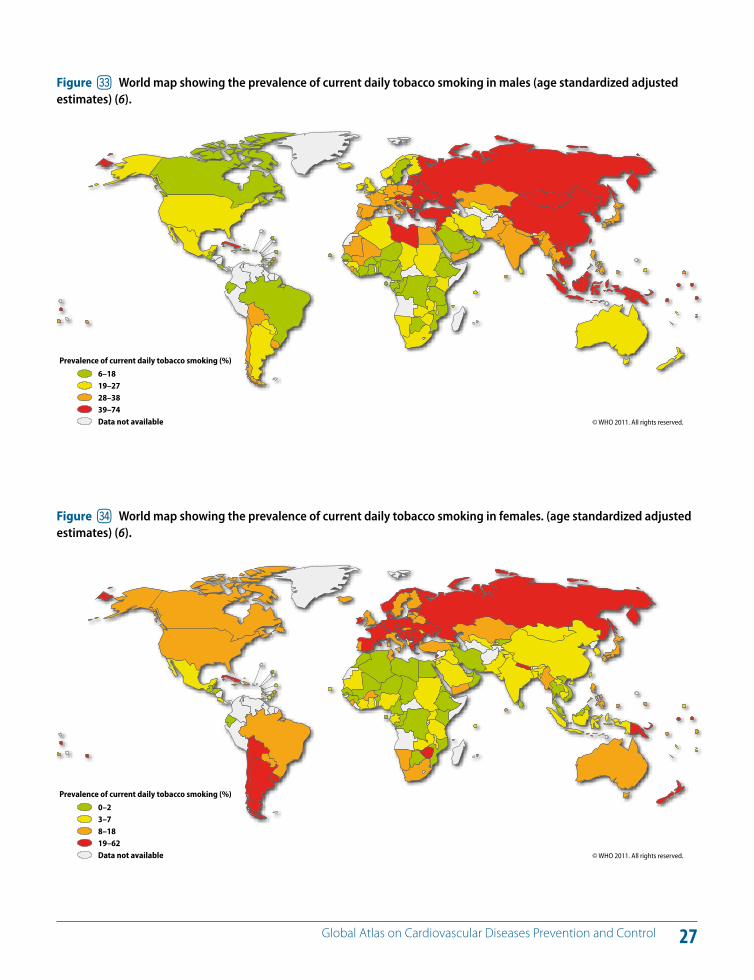
Figure do World map showing the prevalence of current daily tobacco smoking in males (age standardized adjusted estimates) (6).
© WHO 2011. All rights reserved.
Prevalence of current daily tobacco smoking (%)
6–1819–2728–3839–74Data not available
Figure dp World map showing the prevalence of current daily tobacco smoking in females. (age standardized adjusted estimates) (6).
© WHO 2011. All rights reserved.
Prevalence of current daily tobacco smoking (%)
0–23–78–1819–62Data not available
28 Global Atlas on Cardiovascular Diseases Prevention and Control
Insu"cient physical activity can be defined as less than 5 times 30 minutes of moderate activity per week, or less than 3 times 20 minutes of vigorous activity per week, or equivalent. Insu"cient physical activity is the fourth leading risk factor for mortality. Approximately 3.2 million deaths and 32.1 million DALYs – representing about 2.1% of global DALYs – each year are attributable to insu"cient physical activity (2). People who are insu"ciently physically active have a 20% to 30% increased risk of all-cause mortal-ity compared to those who engage in at least 30 minutes of moderate intensity physical activity most days of the week. In 2008, 31.3% of adults aged 15 or older (28.2% men and 34.4% women) were insu"ciently physically active (6).
In adults, participation in 150 minutes of moderate physical activity each week (or equivalent) is estimated to reduce the risk of ischaemic heart disease by approximately 30% and the risk of diabetes by 27% (4).
Many studies that have examined the association between physical activity and CVDs (4, 6, 29–32) have reported re-duced risk of death from coronary heart disease and re-duced risk of overall CVDs, coronary heart disease and stroke, in a dose–response fashion. Physical activity is a key determinant of energy expenditure and thus fundamen-tal to energy balance and weight control. Physical activity improves endothelial function, which enhances vasodilata-
tion and vasomotor function in the blood vessels (33). In addition, physical activity contributes to weight loss, gly-caemic control, improved blood pressure, lipid profile and insulin sensitivity (34, 35). The beneficial e!ects of physical activity on cardiovascular risk may be mediated, at least in part, through these e!ects on intermediate risk factors.
The Global Status Report on NCD (6) showed that the prev-alence of insu"cient physical activity was highest in the WHO Region of the Americas and the WHO Eastern Medi-terranean Region. In all WHO regions, men are more active than women, with the biggest di!erence in prevalence between males and females in the WHO Eastern Mediter-ranean Region (Figures 35 and 36).
The prevalence of insu"cient physical activity is higher in high-income countries compared to low-income countries due to increased automation of work and use of vehicles for transport in high-income countries. High-income coun-tries have more than double the prevalence of insu"cient physical activity compared to low-income countries for both men and women, with 41% of men and 48% of wom-en being insu"ciently physically active in high-income countries compared to 18% of men and 21% of women in low-income countries (6).
KEY MESSAGES
Regular physical activity reduces the risk of heart attacks and strokes.
Physical activity is a key determinant of energy expenditure and thus fundamental to energy balance and weight control.
& Physical inactivity: A preventable risk factor of CVDs
29 Global Atlas on Cardiovascular Diseases Prevention and Control
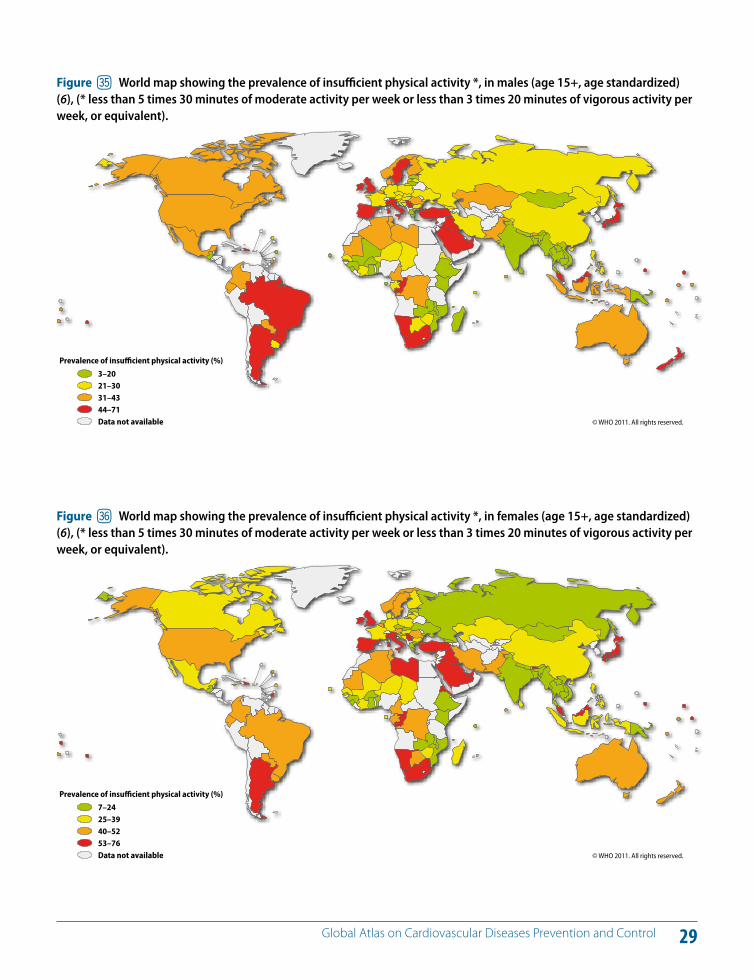
Figure dq World map showing the prevalence of insu"cient physical activity *, in males (age 15+, age standardized) (6), (* less than 5 times 30 minutes of moderate activity per week or less than 3 times 20 minutes of vigorous activity per week, or equivalent).
© WHO 2011. All rights reserved.
* Less than 5 times 30 minutes of moderate activity per week or less than 3 times 20 minutes of vigorous activity per week, or equivalent.
Prevalence of insu!cient physical activity (%)
3–2021–3031–4344–71Data not available
Figure dr World map showing the prevalence of insu"cient physical activity *, in females (age 15+, age standardized) (6), (* less than 5 times 30 minutes of moderate activity per week or less than 3 times 20 minutes of vigorous activity per week, or equivalent).
© WHO 2011. All rights reserved.
Prevalence of insu!cient physical activity (%)
7–2425–3940–5253–76Data not available
* Less than 5 times 30 minutes of moderate activity per week or less than 3 times 20 minutes of vigorous activity per week, or equivalent.
30 Global Atlas on Cardiovascular Diseases Prevention and Control
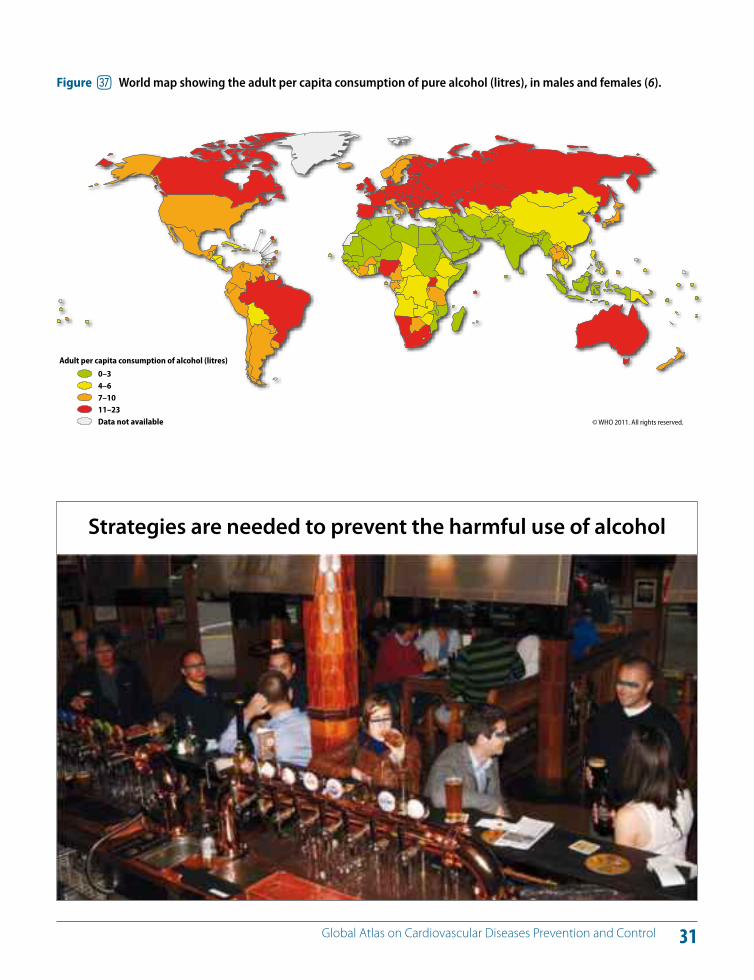
The harmful use of alcohol is a risk factor for multiple ad-verse health and social outcomes, including hypertension, acute myocardial infarction, cardiomyopathy, cardiac ar-rhythmia, cirrhosis of the liver, pancreatitis, neuropathy, en-cephalopathy, sexually transmitted diseases, unintended pregnancy, fetal alcohol spectrum disorders, sudden infant death syndrome, violence, suicide and unintentional inju-ries (e.g. motor vehicle crashes). In addition, people are af-fected by other people's drinking, including that of their families, friends, co-workers and strangers. These harms range in magnitude from noise and fear to physical abuse, sexual coercion and social isolation (2–6, 36). The adult per capita consumption of pure alcohol (litres) is shown in Fig-ure 37.
Hazardous and harmful drinking was responsible for 2.5 million (3.8%) deaths worldwide in 2004 (2,37,38). More than 50% of these deaths were due to CVDs, liver cirrho-sis and cancer. An estimated 4.5% of the global burden of disease – as measured in DALYs – is caused by the harmful use of alcohol (2).
The relationship between alcohol consumption and coro-nary heart disease and cerebrovascular diseases is complex. It depends on both the level and the pattern of alcohol consumption. There is a direct relationship between high-er levels of alcohol consumption and the pattern of binge
drinking (defined as 60 or more grams of pure alcohol per day) with the risk of CVD. Drinking at low levels without ep-isodes of heavy drinking may be associated with a reduced risk of multiple cardiovascular outcomes (overall mortality from CVDs, incidence of and mortality from coronary heart disease and incidence of and mortality from stroke) in some segments of the population (36–38). However, these e!ects tend to disappear if the patterns of drinking are characterized by heavy episodic drinking (39, 40).
Various mechanisms have been proposed for the protec-tive e!ect of light to moderate alcohol consumption, in-cluding the beneficial e!ects of alcohol on the HDL cho-lesterol level, thrombolytic profile and platelet aggregation (39–42).
Overall alcohol consumption is associated with multiple health risks that, at the population level, clearly outweigh potential benefits.
KEY MESSAGES
14% of alcohol-attributable deaths globally are due to CVD and diabetes mellitus.
There is a direct causal relationship between levels and patterns of alcohol consumption and risk of CVD.
High levels of alcohol consumption and heavy episodic (binge) drinking are associated with increased risk of CVD.
Harmful use of alcohol damages the heart muscle, increases the risk of stroke and promotes cardiac arrhythmia.
* Harmful use of alcohol: A preventable risk factor of CVDs
31 Global Atlas on Cardiovascular Diseases Prevention and Control
Figure ds World map showing the adult per capita consumption of pure alcohol (litres), in males and females (6).
© WHO 2011. All rights reserved.
Adult per capita consumption of alcohol (litres)
0–34–67–1011–23Data not available
Strategies are needed to prevent the harmful use of alcohol
32 Global Atlas on Cardiovascular Diseases Prevention and Control
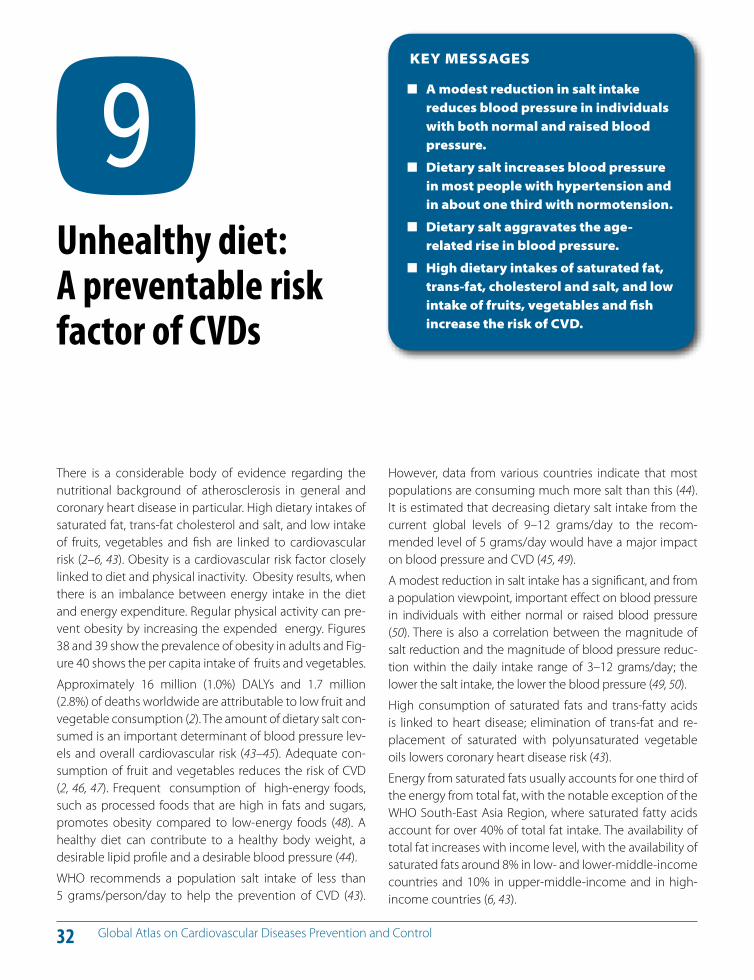
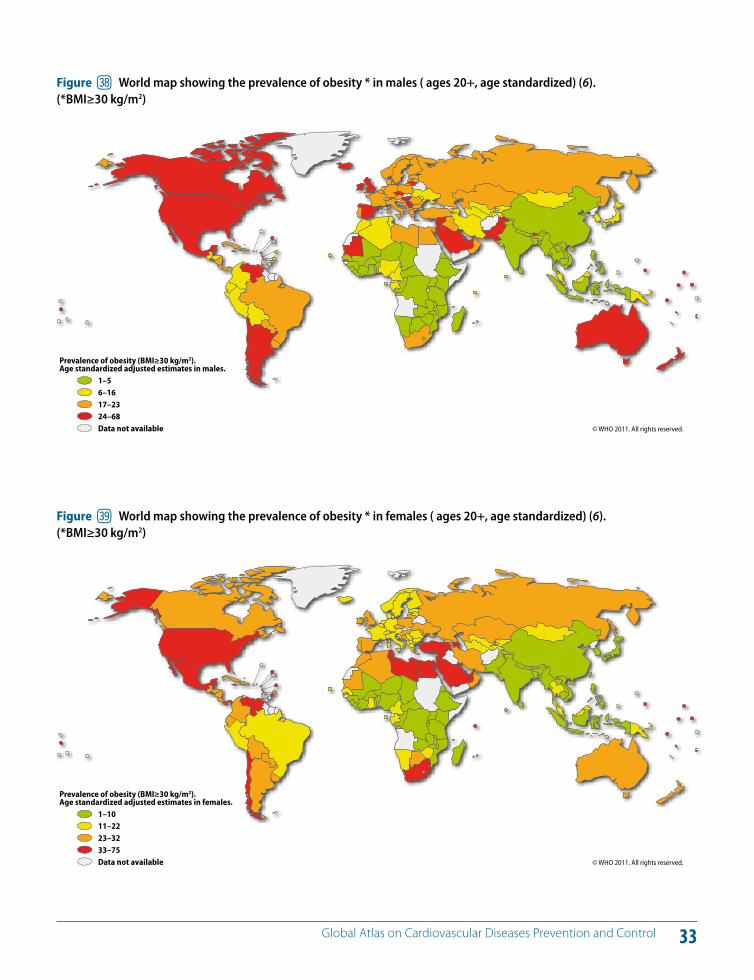
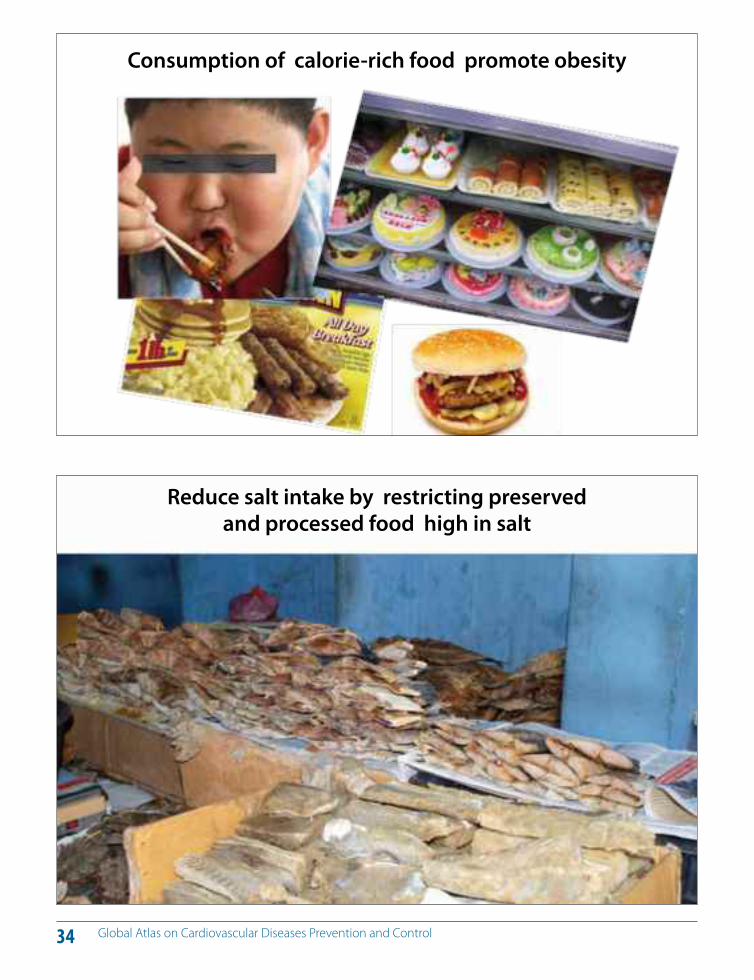
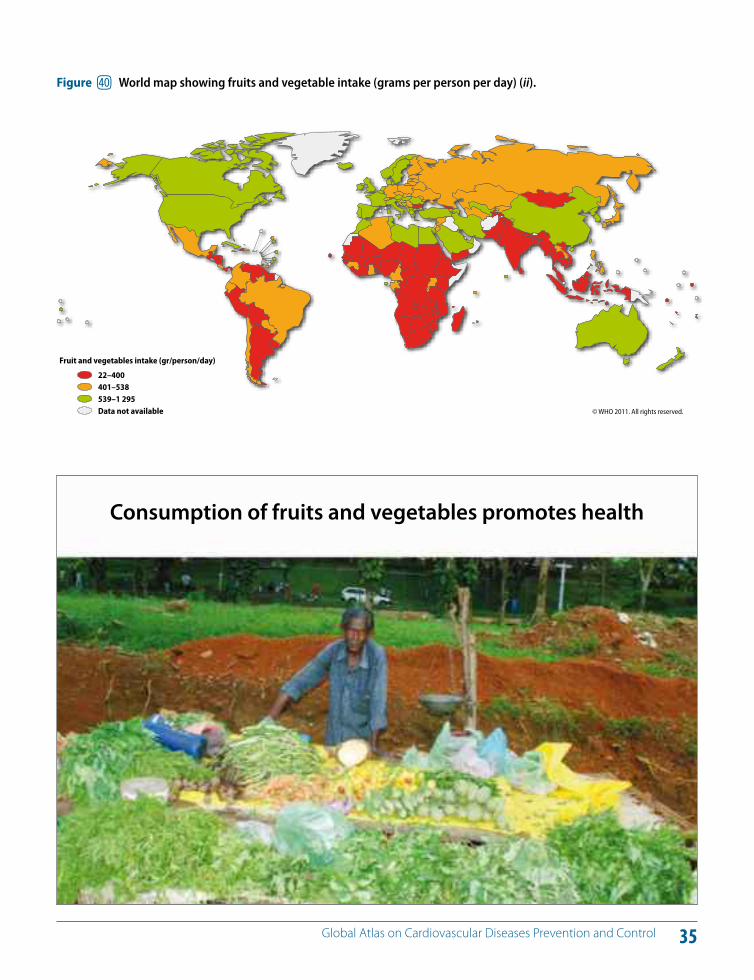
There is a considerable body of evidence regarding the nutritional background of atherosclerosis in general and coronary heart disease in particular. High dietary intakes of saturated fat, trans-fat cholesterol and salt, and low intake of fruits, vegetables and fish are linked to cardiovascular risk (2–6, 43). Obesity is a cardiovascular risk factor closely linked to diet and physical inactivity. Obesity results, when there is an imbalance between energy intake in the diet and energy expenditure. Regular physical activity can pre-vent obesity by increasing the expended energy. Figures 38 and 39 show the prevalence of obesity in adults and Fig-ure 40 shows the per capita intake of fruits and vegetables.
Approximately 16 million (1.0%) DALYs and 1.7 million (2.8%) of deaths worldwide are attributable to low fruit and vegetable consumption (2). The amount of dietary salt con-sumed is an important determinant of blood pressure lev-els and overall cardiovascular risk (43–45). Adequate con-sumption of fruit and vegetables reduces the risk of CVD (2, 46, 47). Frequent consumption of high-energy foods, such as processed foods that are high in fats and sugars, promotes obesity compared to low-energy foods (48). A healthy diet can contribute to a healthy body weight, a desirable lipid profile and a desirable blood pressure (44).
WHO recommends a population salt intake of less than 5 grams/person/day to help the prevention of CVD (43).
However, data from various countries indicate that most populations are consuming much more salt than this (44). It is estimated that decreasing dietary salt intake from the current global levels of 9–12 grams/day to the recom-mended level of 5 grams/day would have a major impact on blood pressure and CVD (45, 49).
A modest reduction in salt intake has a significant, and from a population viewpoint, important e!ect on blood pressure in individuals with either normal or raised blood pressure (50). There is also a correlation between the magnitude of salt reduction and the magnitude of blood pressure reduc-tion within the daily intake range of 3–12 grams/day; the lower the salt intake, the lower the blood pressure (49, 50).
High consumption of saturated fats and trans-fatty acids is linked to heart disease; elimination of trans-fat and re-placement of saturated with polyunsaturated vegetable oils lowers coronary heart disease risk (43).
Energy from saturated fats usually accounts for one third of the energy from total fat, with the notable exception of the WHO South-East Asia Region, where saturated fatty acids account for over 40% of total fat intake. The availability of total fat increases with income level, with the availability of saturated fats around 8% in low- and lower-middle-income countries and 10% in upper-middle-income and in high-income countries (6, 43).
KEY MESSAGES
A modest reduction in salt intake reduces blood pressure in individuals with both normal and raised blood pressure.
Dietary salt increases blood pressure in most people with hypertension and in about one third with normotension.
Dietary salt aggravates the age-related rise in blood pressure.
High dietary intakes of saturated fat, trans-fat, cholesterol and salt, and low intake of fruits, vegetables and fish increase the risk of CVD.
( Unhealthy diet: A preventable risk factor of CVDs
33 Global Atlas on Cardiovascular Diseases Prevention and Control
Figure dt World map showing the prevalence of obesity * in males ( ages 20+, age standardized) (6). (*BMI#30 kg/m2)
© WHO 2011. All rights reserved.
Prevalence of obesity (BMI!30 kg/m2). Age standardized adjusted estimates in males.
1–56–1617–2324–68Data not available
Figure du World map showing the prevalence of obesity * in females ( ages 20+, age standardized) (6). (*BMI#30 kg/m2)
© WHO 2011. All rights reserved.
Prevalence of obesity (BMI!30 kg/m2). Age standardized adjusted estimates in females.
1–1011–2223–3233–75Data not available
34 Global Atlas on Cardiovascular Diseases Prevention and Control
Consumption of calorie-rich food promote obesity
Reduce salt intake by restricting preserved and processed food high in salt
35 Global Atlas on Cardiovascular Diseases Prevention and Control
Figure el World map showing fruits and vegetable intake (grams per person per day) (ii).
© WHO 2011. All rights reserved.
Fruit and vegetables intake (gr/person/day)
22–400401–538539–1 295Data not available
Consumption of fruits and vegetables promotes health
36 Global Atlas on Cardiovascular Diseases Prevention and Control
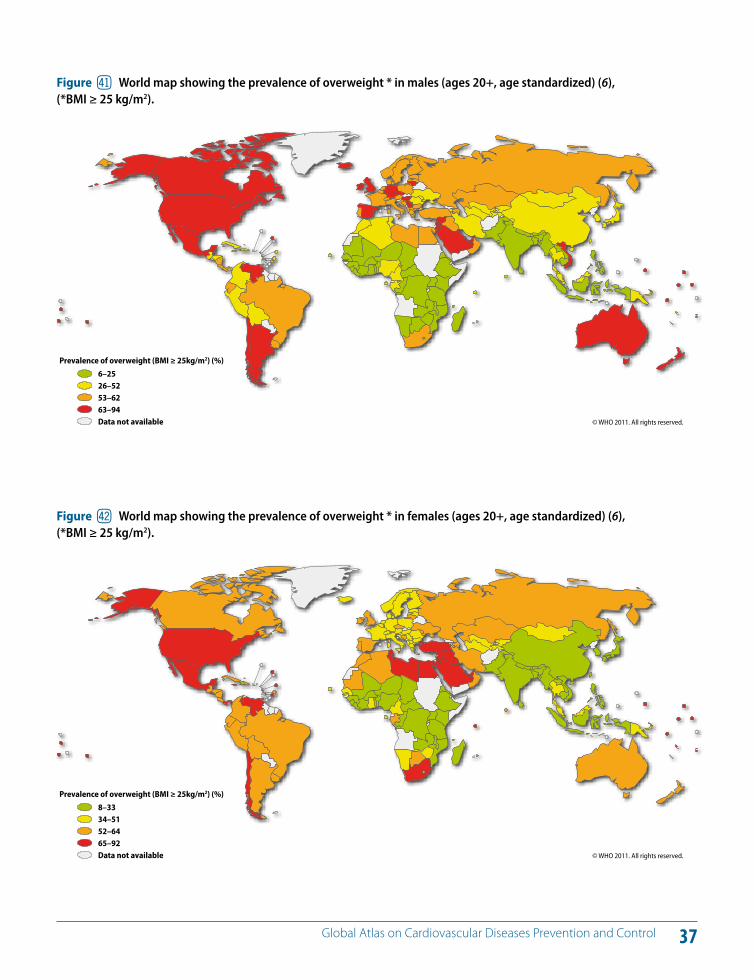
Worldwide, at least 2.8 million people die each year as a result of being overweight or obese, and an estimated 35.8 million (2.3%) of global DALYs are caused by over-weight or obesity (6). In 2008, 34% of adults over the age of 20 were overweight with a body mass index (BMI, a mea-sure of weight relative to height) greater than or equal to 25 kg/m2 (33.6% of men and 35% of women). In 2008, 9.8% of men and 13.8% of women were obese (with a BMI great-er than or equal to 30 kg/m2), compared to 4.8% for men and 7.9% for women in 1980 (6).
Obesity is a growing health problem in both developed and developing countries (6). Figures 41 and 42 show the world distribution of the prevalence of overweight. Pro-spective epidemiological studies have shown a relation-ship between overweight or obesity and cardiovascular morbidity, CVD mortality and total mortality. Obesity is strongly related to major cardiovascular risk factors such as raised blood pressure, glucose intolerance, type 2 diabetes and dyslipidaemia (4, 6, 51–53).
Overweight and obesity cause adverse metabolic e!ects on blood pressure, cholesterol, triglycerides and insu-lin resistance. Risks of coronary heart disease, ischaemic stroke and type 2 diabetes mellitus increase steadily with an increasing BMI (54). To achieve optimal health, the me-dian BMI for adult populations should be in the range of
21–23 kg/m2, while the goal for individuals should be to maintain a BMI in the range 18.5–24.9 kg/m2 (4).
The prevalence of raised BMI increases with income level of countries, up to upper-middle-income levels. The preva-lence of overweight in high-income and upper-middle-income countries was more than double that of low- and lower-middle-income countries. For obesity, the di!erence more than triples from 7% obesity for both males and fe-males in lower-middle-income countries to 24% in upper-middle-income countries (6). Rising income is associated with rising rates of overweight among infants and young children. In high-income countries, such as the United Kingdom and the United States, lower socioeconomic sta-tus is associated with a higher prevalence of obesity (55, 56). In contrast, in medium- and low-income countries a positive relationship between socioeconomic status and obesity in men, women and children has been observed.
KEY MESSAGES
Obesity is strongly related to major cardiovascular risk factors such as hypertension, type 2 diabetes and dyslipidaemia.
Imbalance between increased energy intake (diet) and energy expenditure (physical activity) is the major cause of obesity.
Obesity is a growing health problem worldwide.
BL Obesity: A risk factor of CVDs
37 Global Atlas on Cardiovascular Diseases Prevention and Control
Figure em World map showing the prevalence of overweight * in males (ages 20+, age standardized) (6), (*BMI # 25 kg/m2).
© WHO 2011. All rights reserved.
Prevalence of overweight (BMI ! 25kg/m2) (%)
6–2526–5253–6263–94Data not available
*BMI ! 25 kg/m2
Figure en World map showing the prevalence of overweight * in females (ages 20+, age standardized) (6), (*BMI # 25 kg/m2).
© WHO 2011. All rights reserved.
Prevalence of overweight (BMI ! 25kg/m2) (%)
8–3334–5152–6465–92Data not available
*BMI ! 25 kg/m2
38 Global Atlas on Cardiovascular Diseases Prevention and Control
Worldwide, raised blood pressure is estimated to cause 7.5 million deaths, about 12.8% of the total of all annual deaths (2, 6). This accounts for 57 million DALYS or 3.7% of total DALYS. Raised blood pressure is a major risk fac-tor for coronary heart disease and cerebrovascular disease (4). Blood pressure levels have been shown to be positively and progressively related to the risk of stroke and coronary heart disease. In some age groups, the risk of CVD doubles for each incremental increase of 20/10 mmHg of blood pressure, starting as low as 115/75 mmHg. In addition to coronary heart disease and cerebrovascular disease, un-controlled blood pressure causes heart failure, renal impair-ment, peripheral vascular disease and damage to retinal blood vessels and visual impairment (1–6, 57).
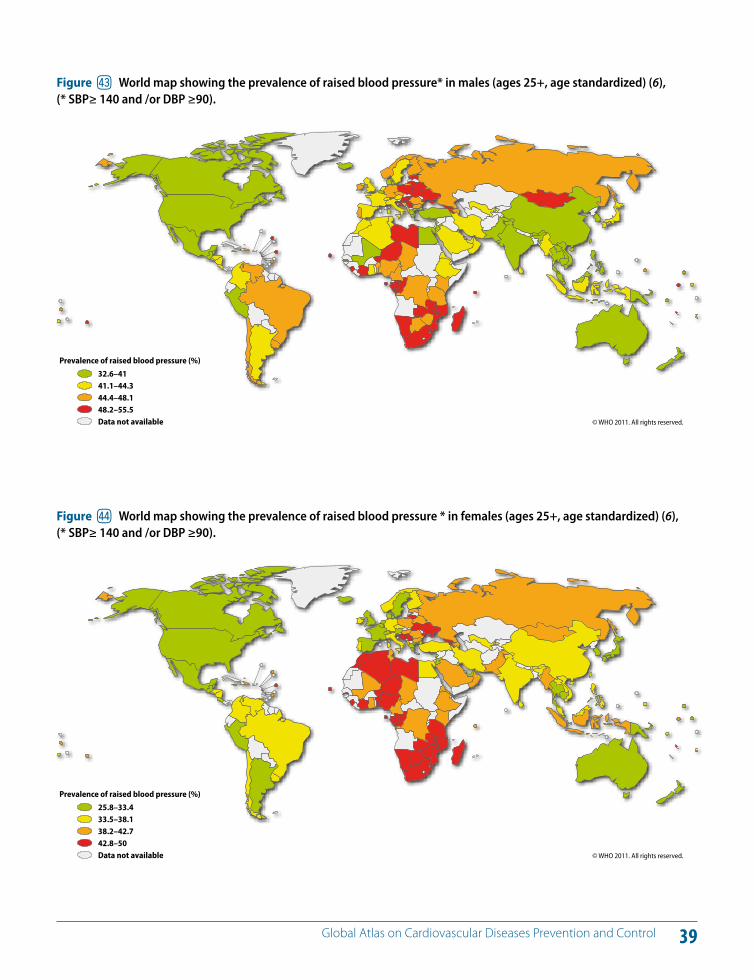
Figures 43 and 44 show the distribution of prevalence of raised blood pressure in the world in adult males and females, respectively. Globally, the overall prevalence of raised blood pressure in adults aged 25 and over was around 40% in 2008. The number of people with uncon-trolled hypertension has risen from 600 million in 1980 to nearly one billion in 2008 (6). Undetected and uncontrolled hypertension that increases the cardiovascular risk is a ma-jor contributor to stroke worldwide (6).
The prevalence of raised blood pressure was highest in the WHO African Region, where it was 46% for males and
females combined. The lowest prevalence of raised blood pressure was in the WHO Region of the Americas, with 35% for both males and females. Across the income groups of countries, the prevalence of raised blood pressure was con-sistently high, with low-, lower-middle- and upper-middle-income countries all having rates of around 40% for males and females. The prevalence in high-income countries was lower, at 35% for both genders (6).
Policies to reduce salt consumption can shift the popula-tion distribution of blood pressure so that there is a reduc-tion in cardiovascular risk (4). The stroke and heart attack risk of people with high cardiovascular risk and/or raised blood pressure can be reduced through non-pharmaco-logical (e.g. low salt diet, physical activity) and pharmaco-logical measures. These measures are very important for people with diabetes as they are particularly vulnerable to heart attacks and strokes. Primary care access to cardiovas-cular risk assessment and essential medicines for reduc-ing cardiovascular risk can improve health outcomes of people with hypertension (6).
KEY MESSAGES
Raised blood pressure is a major risk factor for strokes and heart attacks as well as heart failure, renal impairment, peripheral vascular disease and blindness.
There is a continuous relationship between blood pressure and cardiovascular risk (risk of developing heart attacks and strokes).
Early detection of hypertension and treatment to reduce cardiovascular risk in people with hypertension is vital for prevention of strokes and heart attacks.
BM Raised blood pressure (hypertension): A major risk factor of CVDs
39 Global Atlas on Cardiovascular Diseases Prevention and Control
Figure eo World map showing the prevalence of raised blood pressure* in males (ages 25+, age standardized) (6), (* SBP# 140 and /or DBP #90).
© WHO 2011. All rights reserved.
Prevalence of raised blood pressure (%)
32.6–4141.1–44.344.4–48.148.2–55.5Data not available
* SBP! 140 and/or DBP !90
Figure ep World map showing the prevalence of raised blood pressure * in females (ages 25+, age standardized) (6), (* SBP# 140 and /or DBP #90).
© WHO 2011. All rights reserved.
Prevalence of raised blood pressure (%)
25.8–33.433.5–38.138.2–42.742.8–50Data not available
* SBP! 140 and/or DBP !90
40 Global Atlas on Cardiovascular Diseases Prevention and Control
Diabetes is a major risk factor of CVD. Diabetes is defined as having a fasting plasma glucose value $ 7.0 mmol/l (126 mg/dl). Impaired glucose tolerance and impaired fast-ing glycaemia are risk categories for future development of diabetes and CVD (4).
In 2008, diabetes was responsible for 1.3 million deaths globally. The magnitude of diabetes and other abnormali-ties of glucose tolerance would be considerably higher than the above estimate if the categories of “impaired fast-ing” and “impaired glucose tolerance” were included. In 2008, the global prevalence of diabetes was estimated to be 10% (6).
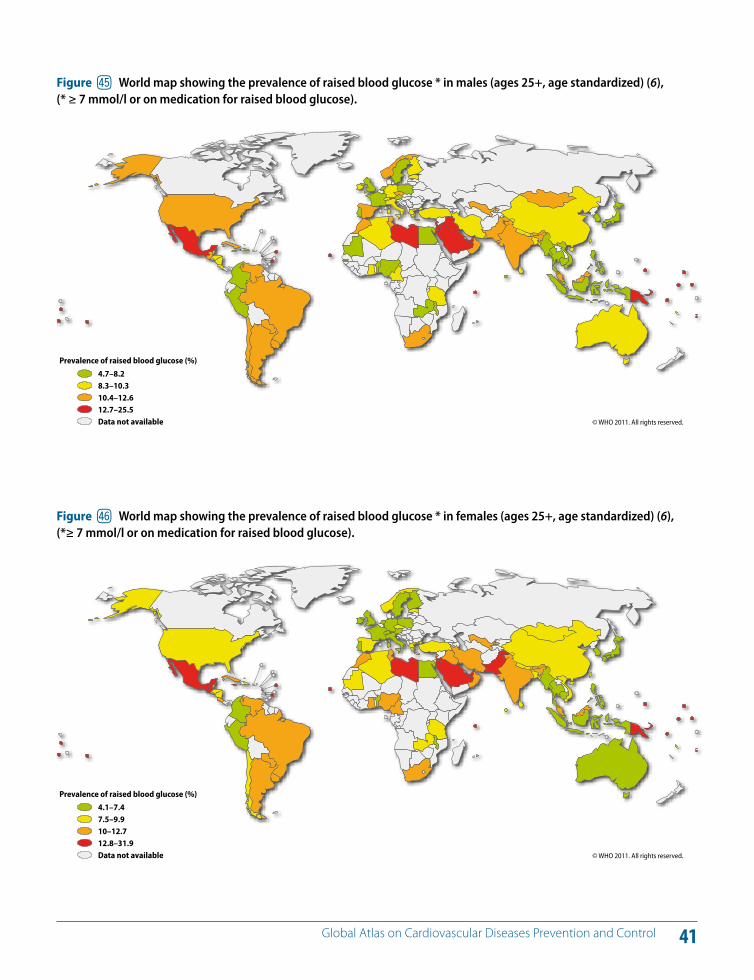
The estimated prevalence of diabetes is relatively con-sistent across the income groupings of countries. Low-income countries showed the lowest prevalence (8% for both males and females), and the upper-middle-income countries showed the highest prevalence (10% for both males and females). The prevalence of raised blood glu-cose worldwide is shown in Figures 45 and 46).
CVD accounts for about 60% of all mortality in people with diabetes. The risk of cardiovascular events is from two to three times higher in people with type 1 or type 2 diabetes and the risk is disproportionately higher in women (58–60). In some age groups, people with diabetes have a twofold increase in the risk of stroke (4). Patients with diabetes also
have a poorer prognosis after cardiovascular events com-pared to people without diabetes.
Cardiovascular risk increases with raised glucose values (61, 62). Furthermore, abnormal glucose regulation tends to occur together with other known cardiovascular risk fac-tors such as central obesity, elevated blood pressure, low HDL cholesterol and a high triglyceride level (63–66).
Lack of early detection and care for diabetes results in se-vere complications, including heart attacks, strokes, renal failure, amputations and blindness. Primary care access to measurement of blood glucose and cardiovascular risk as-sessment as well as essential medicines including insulin can improve health outcomes of people with diabetes (6).
KEY MESSAGES
The risk of cardiovascular events is two to threefold higher in people with diabetes and the risk is disproportionately higher in women.
Impaired glucose tolerance and impaired fasting glycaemia increase the risk for future development of diabetes and CVD.
Early detection and treatment of diabetes, including reduction of cardiovascular risk in people with diabetes, is vital for prevention of heart attacks and strokes and other complications of diabetes.
BN Raised blood sugar (diabetes): A major risk factor of CVDs
41 Global Atlas on Cardiovascular Diseases Prevention and Control
Figure eq World map showing the prevalence of raised blood glucose * in males (ages 25+, age standardized) (6), (* # 7 mmol/l or on medication for raised blood glucose).
© WHO 2011. All rights reserved.
Prevalence of raised blood glucose (%)
4.7–8.28.3–10.310.4–12.612.7–25.5Data not available
* !7 mmol/l or on medication for raised blood glucose.
Figure er World map showing the prevalence of raised blood glucose * in females (ages 25+, age standardized) (6), (*# 7 mmol/l or on medication for raised blood glucose).
© WHO 2011. All rights reserved.
Prevalence of raised blood glucose (%)
4.1–7.47.5–9.910–12.712.8–31.9Data not available
* !7 mmol/l or on medication for raised blood glucose.

42 Global Atlas on Cardiovascular Diseases Prevention and Control
The lipoprotein profile includes: (i) low density lipoprotein cholesterol (LDL), also called “bad” cholesterol); (ii) high density lipoprotein cholesterol (HDL), also called “good” cholesterol); and (iii) triglycerides. Excess calories in the body are converted into triglycerides and stored in fat cells throughout the body.
LDL cholesterol is deposited in the walls of arteries and causes atherosclerosis. In general, lower LDL cholesterol numbers are better for vascular health. HDL cholesterol protects against vascular disease by removing the “bad” cholesterol out of the walls of arteries. Total blood choles-terol is a measure of LDL cholesterol, HDL cholesterol and other lipid components. High triglycerides increase the risk of atherosclerotic CVD.
Raised blood cholesterol increases the risk of heart disease and stroke (4). Globally, one third of ischaemic heart dis-ease is attributable to high cholesterol (2, 5). Overall, raised cholesterol is estimated to cause 2.6 million deaths (4.5% of total) and 29.7 million DALYS, or 2% of total DALYS glob-ally (2). In 2008, the prevalence of raised total cholesterol among adults – defined as total cholesterol $ 6.2 mmol/l (240 mg/dl) – was 9.7% (8.5% for males and 10.7% for fe-males) (6).
Lowering raised serum cholesterol reduces the risk of heart disease. For example, a 10% reduction in serum cholesterol
in 40-year old men has been reported to result in a 50% re-duction in heart disease within five years; the same serum cholesterol reduction for 70-year old men can result in an average 20% reduction in heart disease occurrence within five years (6).
In 2008, the global prevalence of raised total cholesterol among adults was 39% (37% for males and 40% for fe-males). The prevalence of raised cholesterol in males and females in di!erent parts of the world is shown in Figures 47 and 48, respectively. Globally, mean total cholesterol changed little between 1980 and 2008, falling by less than 0.1 mmol/l per decade in males and females. The preva-lence of elevated total cholesterol was highest in the WHO European Region (54% for both genders), followed by the WHO Region of the Americas (48% for both genders). The WHO African Region and the WHO South-East Asia Region showed the lowest percentages (23% and 30%, respec-tively) (6).
The prevalence of raised total cholesterol noticeably in-creases according to the income level of the country (6). In low-income countries, around 25% of adults have raised total cholesterol, while in high-income countries, over 50% of adults have raised total cholesterol (6, 67).
KEY MESSAGES
Hypercholesterolaemia is a major cardiovascular risk factor.
There is continuous association between total cholesterol and cardiovascular risk.
Lowering cholesterol in people with moderate-high cardiovascular risk prevents heart attacks and strokes.
BO Raised blood cholesterol: A major risk factor of CVDs
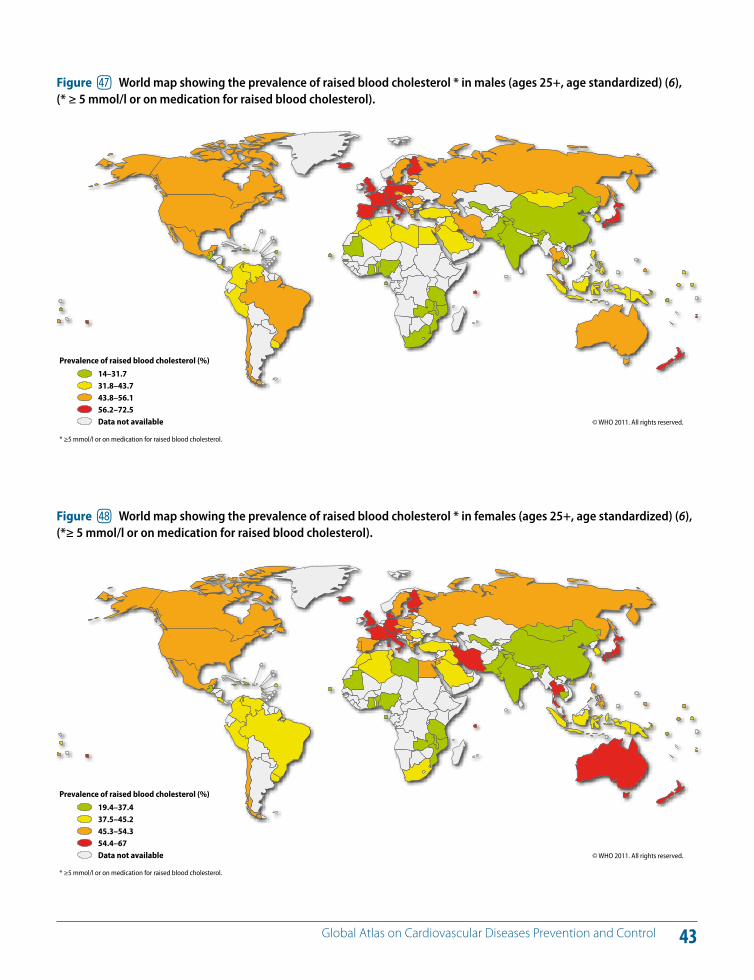
43 Global Atlas on Cardiovascular Diseases Prevention and Control
Figure es World map showing the prevalence of raised blood cholesterol * in males (ages 25+, age standardized) (6), (* # 5 mmol/l or on medication for raised blood cholesterol).
© WHO 2011. All rights reserved.
Prevalence of raised blood cholesterol (%)
14–31.731.8–43.743.8–56.156.2–72.5Data not available
* !5 mmol/l or on medication for raised blood cholesterol.
Figure et World map showing the prevalence of raised blood cholesterol * in females (ages 25+, age standardized) (6), (*# 5 mmol/l or on medication for raised blood cholesterol).
© WHO 2011. All rights reserved.
Prevalence of raised blood cholesterol (%)
19.4–37.437.5–45.245.3–54.354.4–67Data not available
* !5 mmol/l or on medication for raised blood cholesterol.
44 Global Atlas on Cardiovascular Diseases Prevention and Control
Social determinants such as the distribution of income or the level of education indirectly influence cardiovascular health as well as health in general. These determinants shape a set of socioeconomic positions within hierarchies of power, prestige and access to resources. Several struc-tural mechanisms are responsible for creating the di!eren-tial social positions of individuals, including governance, education systems, labour market structures and the pres-ence or absence of redistributive welfare policies. Social stratification shapes individual health status as well as CVD outcomes by impacting behavioural and metabolic cardio-vascular risk factors, psychosocial status, living conditions and the health system (68).
In 2005, WHO convened the Commission on Social De-terminants of Health to provide advice on how to reduce health inequities. The final report of the Commission (69) made three overarching recommendations: (i) to improve daily living conditions; (ii) to tackle the unequal distribution of power, money and resources; and (iii) to monitor health inequities. WHO Member States discussed the report and passed a resolution urging action on social determinants at the 2009 World Health Assembly (WHA) (70). The resolution called for a “Health in All Policies” approach and a renewed commitment to intersectoral action to reduce health ineq-
uities as well as the implementation of a social determi-nants approach across public health programmes.
Poverty, low rates of literacy (Figure 49), environmental degradation, poor housing and unplanned urbanization have a negative impact on health (68, 69, 71, 72). For exam-ple, children from lower socioeconomic strata have a high prevalence of rheumatic heart disease and people living in poor housing develop Chagas cardiomyopathy. The poor, have limited opportunities for healthy choices and have a high prevalence of smoking (Figure 50).
To mount an e!ective response to address social determi-nants that impact health, governance and systems need to be put in place that deliver a wide range of intersectoral ac-tions. Promoting participation and leadership of commu-nities and civil society groups in decision-making are key aspects of the governance necessary for action on social determinants. Such an inclusive and responsible approach would contribute to the implementation of coherent poli-cies that increase opportunities for people and create a fairer society and healthier populations.
KEY MESSAGES
Choices that people make regarding behaviour (tobacco use, use of alcohol, physical activity or diet) are shaped by the “opportunities” that society o!ers to them.
Poverty, lack of education and unplanned urbanization have a negative impact on cardiovascular health.
Unfair distribution of power, money and resources increases exposure to cardiovascular risk factors.
BP Social determinants and CVDs
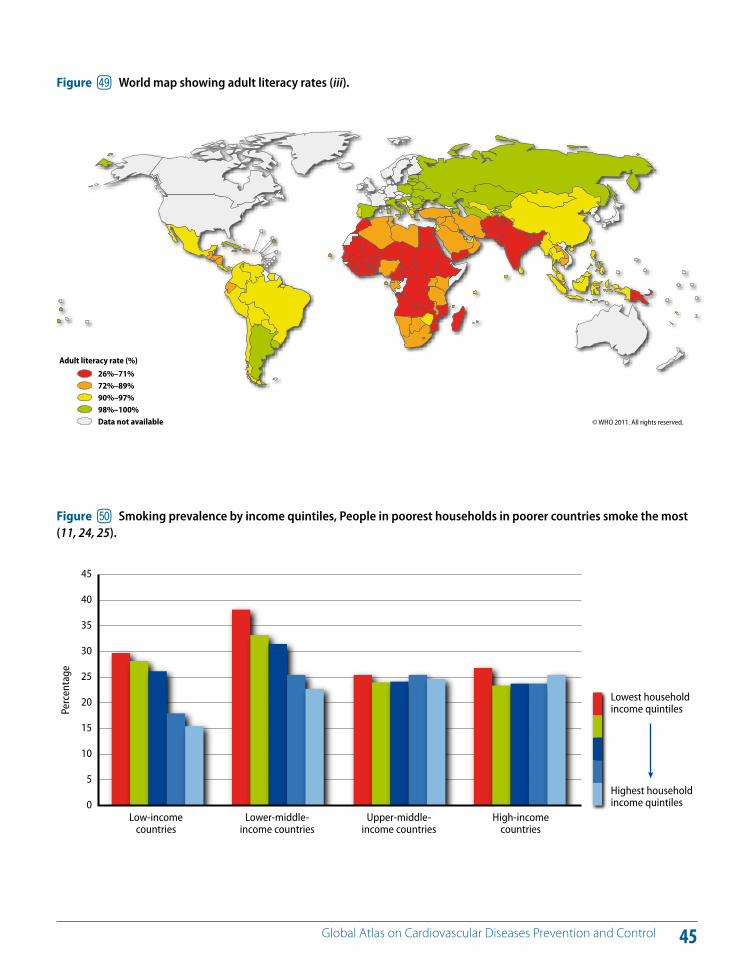
45 Global Atlas on Cardiovascular Diseases Prevention and Control
Figure eu World map showing adult literacy rates (iii).
© WHO 2011. All rights reserved.
Adult literacy rate (%)
26%–71%72%–89%90%–97%98%–100%Data not available
Perc
enta
ge
45
40
35
30
25
20
15
10
5
0Low-income
countriesLower-middle-
income countriesUpper-middle-
income countriesHigh-income
countries
Lowest household income quintiles
Highest household income quintiles
Figure fl Smoking prevalence by income quintiles, People in poorest households in poorer countries smoke the most (11, 24, 25).
46 Global Atlas on Cardiovascular Diseases Prevention and Control
Low birth weight is associated with an increased risk of adult diabetes and CVD. There is increasing evidence that exposure to undernutrition in early life increases an indi-vidual’s vulnerability to these disorders by “programming” permanent metabolic changes (73–75). The fetus depends on the mother for its nutrition and adapts to inadequate nutrition by prioritization of brain growth at the expense of other tissues such as the abdominal organs and by altered secretion and sensitivity to the fetal growth hormones, insulin and upregulation of the hypothalamo-pituitary-adrenal “stress” axis. The fetus sacrifices tissues that require high-quality building blocks, such as muscle or bone, and instead lays down less demanding tissue, such as fat. These changes can become “programmed” because they occur during critical periods of early development and can lead to adult CVD, or render the individual more susceptible to the e!ects of environmental and behavioural risk factors.
Behavioural risk factors such as tobacco use and dietary habits are learned in childhood and continue into adult-hood. In many countries, metabolic risk factors such as obesity and diabetes are starting to appear at early ages (76, 77). In 2008, global estimates for overweight among infants and young children indicated that there were 40 million (or 6%) preschool children with a weight-for-height above more than two standard deviations of the WHO child growth standards median (6). Children spend a substantial portion of their time watching television, which can contribute to obesity through displacement of physical activity and increased calorie consumption while watching or caused by the e!ects of advertising (Figures
51 and 52). Children also have no control over exposure to passive cigarette smoke.
When exposed to risk factors, changes of atherosclerosis within blood vessels have been shown to begin in the first decade of life as fatty streaks and plaques (7). These lesions have been shown to regress through modification of be-havioural risk factors.
Many WHA resolutions address the protection of children and youth from health risks (3, 78–81):
WHO Framework Convention on Tobacco Control (FCTC); resolution WHA56.1;
Global Strategy to Reduce the Harmful Use of Alcohol, resolution WHA63.13;
Global Strategy on Diet, Physical Activity and Health, resolution WHA57.17;
recommendations on the marketing of foods and non-alcoholic beverages to children; endorsed in resolution WHA63.14;
2008–2013 Action Plan for the Global Strategy for Pre-vention and Control of Noncommunicable Diseases (WHO Global NCD Action Plan); resolution WHA61.14.
However, development and implementation of policies and strategies at the country level to protect the health and well-being of pregnant women, children and youth remain inadequate. Undernutrition in fetal life and infancy increases an individual’s vulnerability to CVD. Healthy be-haviours such as physical activity are learned in childhood and continue into adulthood.
KEY MESSAGES
Improving the nutrition of girls and women could prevent CVD in future generations.
Implementation of policies to promote healthy lifestyles in children and youth is essential for prevention of CVD.
Undernutrition in fetal life and infancy increases an individual’s vulnerability to CVD.
Healthy behaviours are learned in childhood and continue into adulthood.
BQ Risk factors take root in the womb, childhood and youth
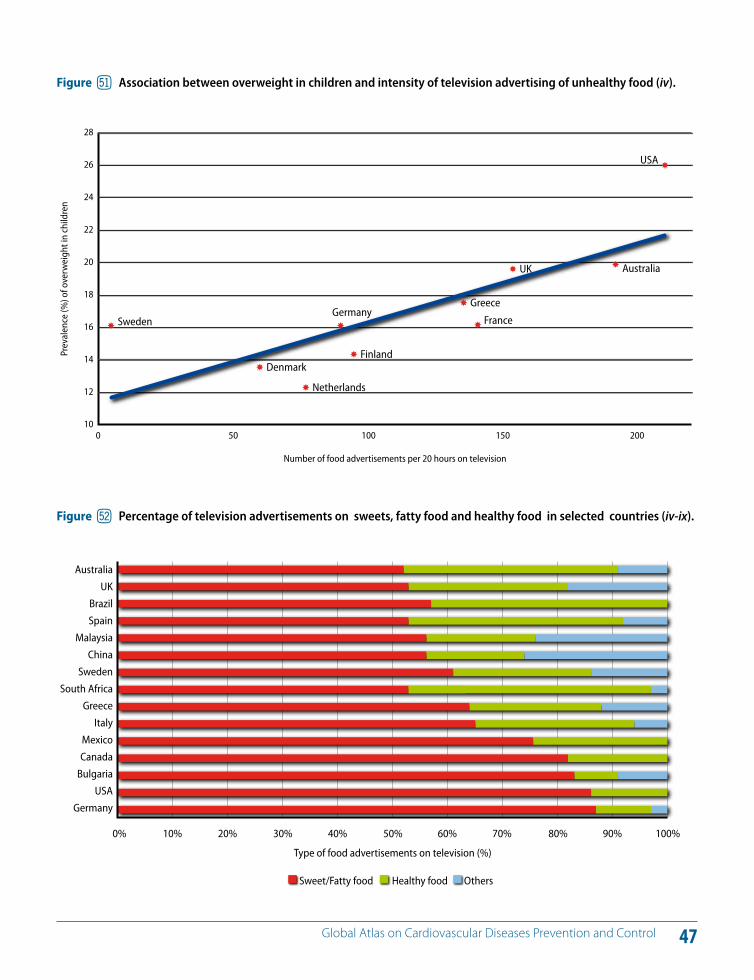
47 Global Atlas on Cardiovascular Diseases Prevention and Control
Sweden
Denmark
Netherlands
Germany
Finland
France
Greece
UK Australia
USA
Number of food advertisements per 20 hours on television
0 50 100 150 200
Prev
alen
ce (%
) of o
verw
eigh
t in
child
ren
28
26
24
22
20
18
16
14
12
10
Figure fm Association between overweight in children and intensity of television advertising of unhealthy food (iv).
Australia
UK
Brazil
Spain
Malaysia
China
Sweden
South Africa
Greece
Italy
Mexico
Canada
Bulgaria
USA
Germany
0% 10% 20% 30% 40% 50% 60% 70% 80% 90% 100%
Type of food advertisements on television (%)
Sweet/Fatty food Healthy food Others
Figure fn Percentage of television advertisements on sweets, fatty food and healthy food in selected countries (iv-ix).
48 Global Atlas on Cardiovascular Diseases Prevention and Control
There are many misconceptions about CVDs in women. In reality, CVDs a!ect as many men as women. However, women loose less years of life due to CVDs as the disease develops about 7-10 years later in women compared to men (4, 6) (Figure 53). Risk factors of CVDs are similar for men and women. Every year, 3.3 million women die of heart attacks and 3.2 million die of strokes globally.
Gender norms and roles influence these risk factors as wom-en, in some contexts, do not have access to and control over resources that can diminish their exposure to the risk factors. For example, women’s multiple roles in the household and workplace community may diminish their ability to engage in meaningful physical activity. Social expectations relating to mobility and norms about permitted clothing influence the ability of girls and women to participate in sports and developing a lifelong habit that values physical activity.
In the developing world, tobacco use rates for adult fe-males remain relatively low, but could rise quickly among teenage females (25). Aggressive campaigns by the tobac-co industry, which targeted women and girls increasingly over the years, have contributed to such increases and are of great public health concern.
The risk of heart disease and stroke in women are often un-derestimated because of the mistaken notion that females are protected from CVDs. There may be certain di!erences
in the clinical presentation of CVD in women leading to inadequate diagnostic and treatment interventions (82). Better self-awareness in women regarding identification of their cardiovascular risk factors and symptoms can improve early detection. There is evidence that CVD is underdetect-ed in women and that there are delays in referral, hospital-ization, diagnosis and invasive treatment compared to men (83–86). Women with CVD living in developing countries experience specific challenges in accessing cost-e!ective prevention, early detection and treatment due to gender inequality, family responsibilities and the costs of seeking care. These factors are made worse by health systems that fail to respond to specific needs of women.
Women, although responsible for household food pro-curement and preparation in most societies, may not have access to the requisite information about healthy food. Women are responsible for rearing children, including how time is used and development of health promoting hab-its. Such habits are often not passed along if women are not specifically targeted as both beneficiaries and signifi-cant gatekeepers for health promotion to other members of their families. Their potential role as “change agents” of families and communities with respect to healthy behav-iours is often underutilized.
KEY MESSAGES
Risk factors of CVDs are similar for men and women.
Every year 8.6 million women die from CVDs.
CVD a!ects as many women as men.BR Heart attacks and strokes in women
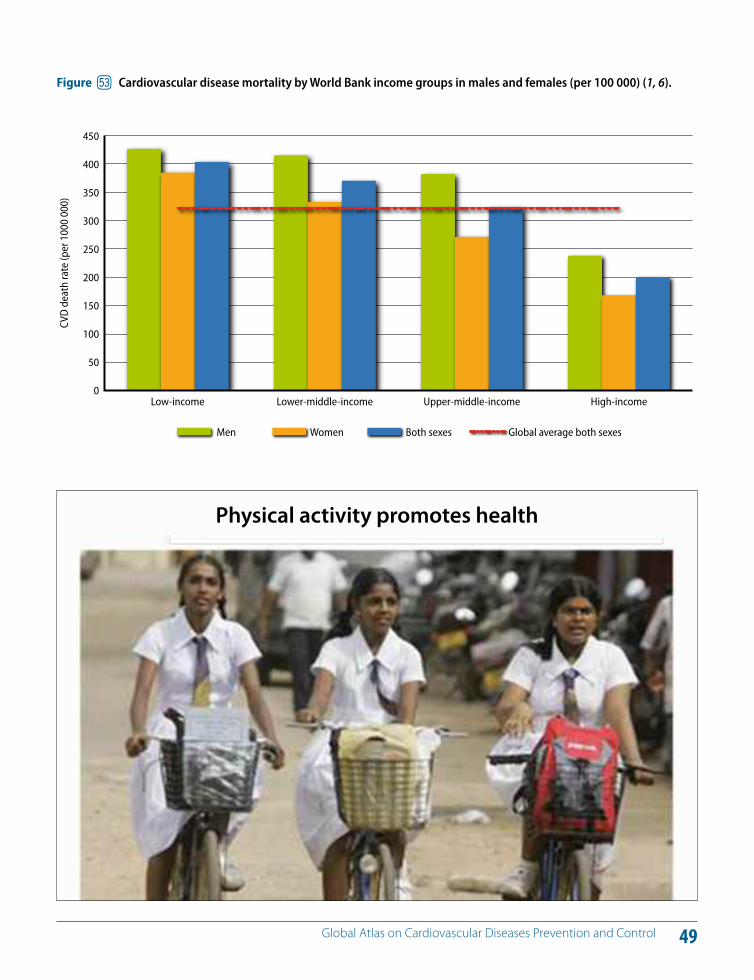
49 Global Atlas on Cardiovascular Diseases Prevention and Control
Upper-middle-incomeLower-middle-incomeLow-income
CVD
dea
th ra
te (p
er 1
000
000)
Men Women Both sexes Global average both sexes
High-income
450
400
350
300
250
200
150
100
50
0
Figure fo Cardiovascular disease mortality by World Bank income groups in males and females (per 100 000) (1, 6).
Physical activity promotes health

50 Global Atlas on Cardiovascular Diseases Prevention and Control
Mortality due to CVD has declined in high-income coun-tries during the last three decades, while the cardiovascular epidemic continues to increase in other countries to the extent that the majority of the disease burden from CVD is found in LMICs. This situation primarily results from tre-mendous global shifts in demographics with the ageing of populations (Figure 54) and accompanied by urbanization (Figure 55) and the globalization of unhealthy behaviours, producing an explosive increase in the population preva-lence of cardiovascular risk factors and subsequent disease (1, 2, 6).
Age is a powerful cardiovascular risk factor. The rapidly growing burden of CVD in LMICs is accelerated by popula-tion ageing. According to United Nations (UN) projections, in 2025 there will be 1.2 billion elderly people worldwide, with 71% of them likely to be in developing countries (87).
CVD is also driven by the negative e!ects of unregulated globalization and unplanned urbanization (88, 89). For ex-ample, irresponsible marketing supported by multination-al food cooperations is targeting children and adolescents to promote consumption of “junk” food with high levels of energy, fat and salt. Similarly, well-funded advertising campaigns of tobacco companies are targeting women to promote tobacco smoking. Financial and economic glo-balization also has an influence on trade, national income,
national economic performance and household income. National income is particularly important for prevention and control of CVD because of its impact on public sector resources available for health care.
Rapid, unplanned urbanization also promotes unhealthy behaviours i) by limiting healthy food choices ii) by not providing environments conducive to physical activity iii) by causing exposure to air pollutants (including tobacco smoke) and the harmful use of alcohol (90). Many govern-ments and municipalities are unable to keep pace with rapidly expanding needs for infrastructure and services and overlook the fact that urban planning is needed to support health behaviours. As a consequence, people are exposed to risks and denied healthy choices in terms of diet and physical activity.
KEY MESSAGES
Ageing, globalization and urbanization drive the cardiovascular epidemic that is shaped by the rise of behavioural risk factors.
Unregulated globalization and unplanned urbanization increase the risk of exposure to cardiovascular risk factors and are detrimental to cardiovascular health.
BS Other determinants of CVDs: Ageing, globalization and urbanization
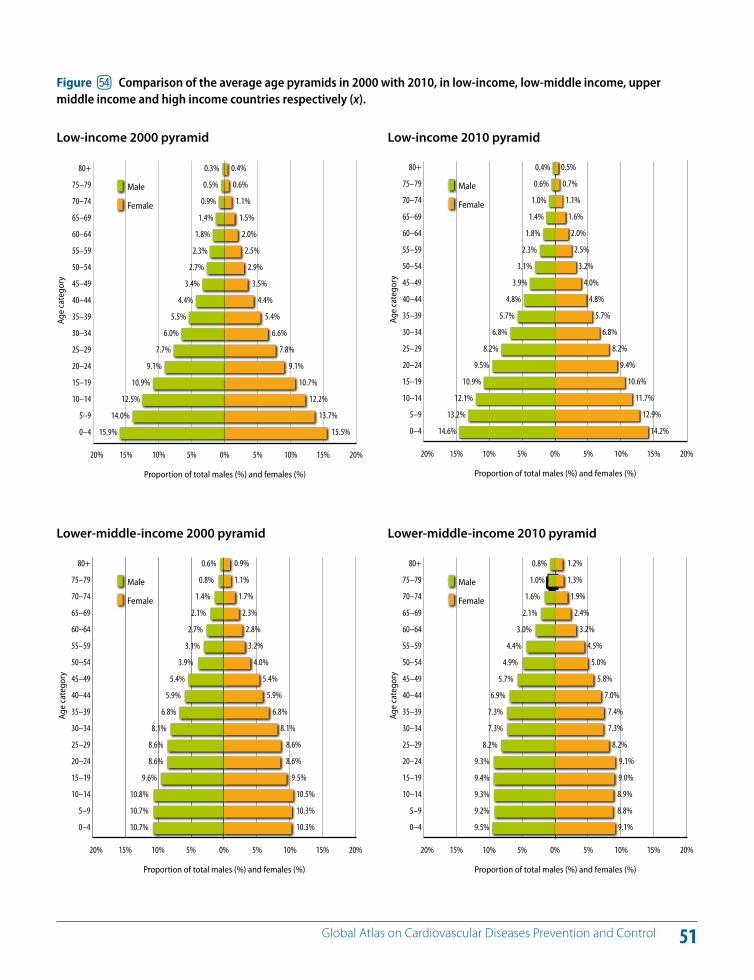
51 Global Atlas on Cardiovascular Diseases Prevention and Control
-0,20 -0,15 -0,10 -0,05 0,000,00 0,05 0,10 0,15 0,20
0.3%
0.5%
0.9%
1.4%
1.8%
2.3%
2.7%
3.4%
4.4%
5.5%
6.0%
7.7%
9.1%
10.9%
12.5%
14.0%
15.9%
80+
75–79
70–74
65–69
60–64
55–59
50–54
45–49
40–44
35–39
30–34
25–29
20–24
15–19
10–14
5–9
0–4
0.4%
0.6%
1.1%
1.5%
2.0%
2.5%
2.9%
3.5%
4.4%
5.4%
6.6%
7.8%
9.1%
10.7%
12.2%
13.7%
15.5%
20% 15% 10% 5% 0% 5% 10% 15% 20%
Proportion of total males (%) and females (%)
Male
Female
Age
cate
gory
Figure fp Comparison of the average age pyramids in 2000 with 2010, in low-income, low-middle income, upper middle income and high income countries respectively (x).
Low-income 2000 pyramid
-0,20 -0,15 -0,10 -0,05 0,000,00 0,05 0,10 0,15 0,20
0.4%
0.6%
1.0%
1.4%
1.8%
2.3%
3.1%
3.9%
4.8%
5.7%
6.8%
8.2%
9.5%
10.9%
12.1%
13.2%
14.6%
80+
75–79
70–74
65–69
60–64
55–59
50–54
45–49
40–44
35–39
30–34
25–29
20–24
15–19
10–14
5–9
0–4
0.5%
0.7%
1.1%
1.6%
2.0%
2.5%
3.2%
4.0%
4.8%
5.7%
6.8%
8.2%
9.4%
10.6%
11.7%
12.9%
14.2%
20% 15% 10% 5% 0% 5% 10% 15% 20%
Proportion of total males (%) and females (%)
Age
cate
gory
Male
Female
Low-income 2010 pyramid
-0,20 -0,15 -0,10 -0,05 -0,000,00 0,05 0,10 0,15 0,20
0.6%
0.8%
1.4%
2.1%
2.7%
3.1%
3.9%
5.4%
5.9%
6.8%
8.1%
8.6%
8.6%
9.6%
10.8%
10.7%
10.7%
80+
75–79
70–74
65–69
60–64
55–59
50–54
45–49
40–44
35–39
30–34
25–29
20–24
15–19
10–14
5–9
0–4
0.9%
1.1%
1.7%
2.3%
2.8%
3.2%
4.0%
5.4%
5.9%
6.8%
8.1%
8.6%
8.6%
9.5%
10.5%
10.3%
10.3%
20% 15% 10% 5% 0% 5% 10% 15% 20%
Proportion of total males (%) and females (%)
Age
cate
gory
Male
Female
Lower-middle-income 2000 pyramid
-0,20 -0,15 -0,10 -0,05 -0,000,00 0,05 0,10 0,15 0,20
0.8%
1.0%
1.6%
2.1%
3.0%
4.4%
4.9%
5.7%
6.9%
7.3%
7.3%
8.2%
9.3%
9.4%
9.3%
9.2%
9.5%
80+
75–79
70–74
65–69
60–64
55–59
50–54
45–49
40–44
35–39
30–34
25–29
20–24
15–19
10–14
5–9
0–4
1.2%
1.3%
1.9%
2.4%
3.2%
4.5%
5.0%
5.8%
7.0%
7.4%
7.3%
8.2%
9.1%
9.0%
8.9%
8.8%
9.1%
20% 15% 10% 5% 0% 5% 10% 15% 20%
Proportion of total males (%) and females (%)
Age
cate
gory
Male
Female
Lower-middle-income 2010 pyramid
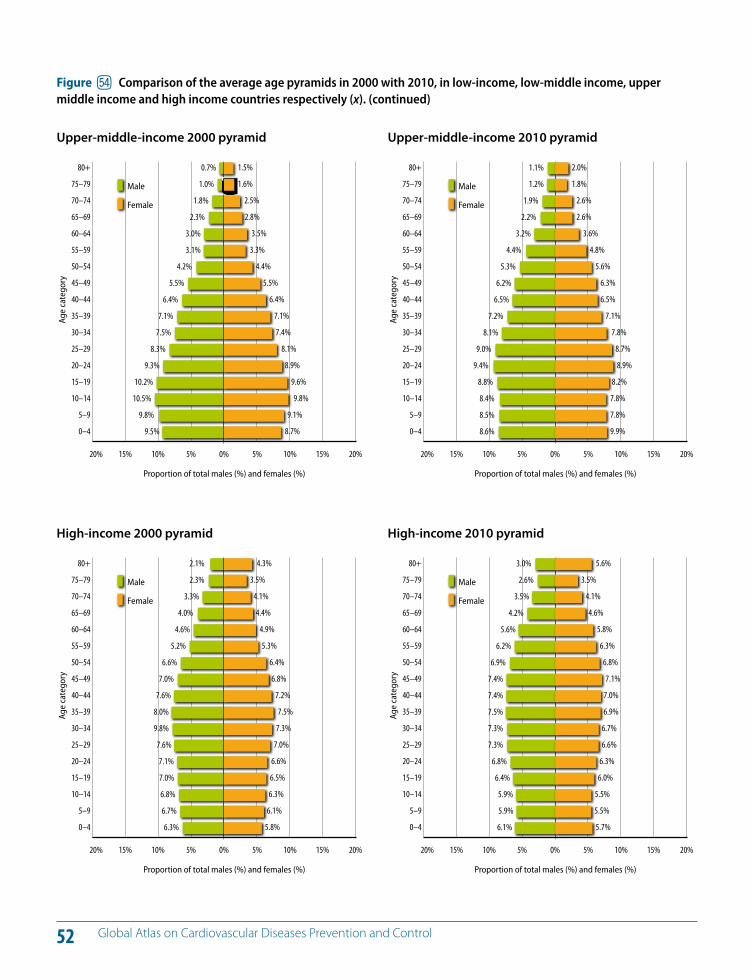
52 Global Atlas on Cardiovascular Diseases Prevention and Control
-0,20 -0,15 -0,10 -0,05 -0,000,00 0,05 0,10 0,15 0,20
0.7%
1.0%
1.8%
2.3%
3.0%
3.1%
4.2%
5.5%
6.4%
7.1%
7.5%
8.3%
9.3%
10.2%
10.5%
9.8%
9.5%
80+
75–79
70–74
65–69
60–64
55–59
50–54
45–49
40–44
35–39
30–34
25–29
20–24
15–19
10–14
5–9
0–4
1.5%
1.6%
2.5%
2.8%
3.5%
3.3%
4.4%
5.5%
6.4%
7.1%
7.4%
8.1%
8.9%
9.6%
9.8%
9.1%
8.7%
20% 15% 10% 5% 0% 5% 10% 15% 20%
Proportion of total males (%) and females (%)
Age
cate
gory
Male
Female
Upper-middle-income 2000 pyramid
-0,20 -0,15 -0,10 -0,05 -0,000,00 0,05 0,10 0,15 0,20
1.1%
1.2%
1.9%
2.2%
3.2%
4.4%
5.3%
6.2%
6.5%
7.2%
8.1%
9.0%
9.4%
8.8%
8.4%
8.5%
8.6%
80+
75–79
70–74
65–69
60–64
55–59
50–54
45–49
40–44
35–39
30–34
25–29
20–24
15–19
10–14
5–9
0–4
2.0%
1.8%
2.6%
2.6%
3.6%
4.8%
5.6%
6.3%
6.5%
7.1%
7.8%
8.7%
8.9%
8.2%
7.8%
7.8%
9.9%
20% 15% 10% 5% 0% 5% 10% 15% 20%
Proportion of total males (%) and females (%)
Age
cate
gory
Male
Female
Upper-middle-income 2010 pyramid
-0,20 -0,15 -0,10 -0,05 -0,000,00 0,05 0,10 0,15 0,20
2.1%
2.3%
3.3%
4.0%
4.6%
5.2%
6.6%
7.0%
7.6%
8.0%
9.8%
7.6%
7.1%
7.0%
6.8%
6.7%
6.3%
80+
75–79
70–74
65–69
60–64
55–59
50–54
45–49
40–44
35–39
30–34
25–29
20–24
15–19
10–14
5–9
0–4
4.3%
3.5%
4.1%
4.4%
4.9%
5.3%
6.4%
6.8%
7.2%
7.5%
7.3%
7.0%
6.6%
6.5%
6.3%
6.1%
5.8%
20% 15% 10% 5% 0% 5% 10% 15% 20%
Proportion of total males (%) and females (%)
Age
cate
gory
Male
Female
High-income 2000 pyramid
-0,20 -0,15 -0,10 -0,05 -0,000,00 0,05 0,10 0,15 0,20
3.0%
2.6%
3.5%
4.2%
5.6%
6.2%
6.9%
7.4%
7.4%
7.5%
7.3%
7.3%
6.8%
6.4%
5.9%
5.9%
6.1%
80+
75–79
70–74
65–69
60–64
55–59
50–54
45–49
40–44
35–39
30–34
25–29
20–24
15–19
10–14
5–9
0–4
5.6%
3.5%
4.1%
4.6%
5.8%
6.3%
6.8%
7.1%
7.0%
6.9%
6.7%
6.6%
6.3%
6.0%
5.5%
5.5%
5.7%
20% 15% 10% 5% 0% 5% 10% 15% 20%
Proportion of total males (%) and females (%)
Age
cate
gory
Male
Female
High-income 2010 pyramid
Figure fp Comparison of the average age pyramids in 2000 with 2010, in low-income, low-middle income, upper middle income and high income countries respectively (x). (continued)
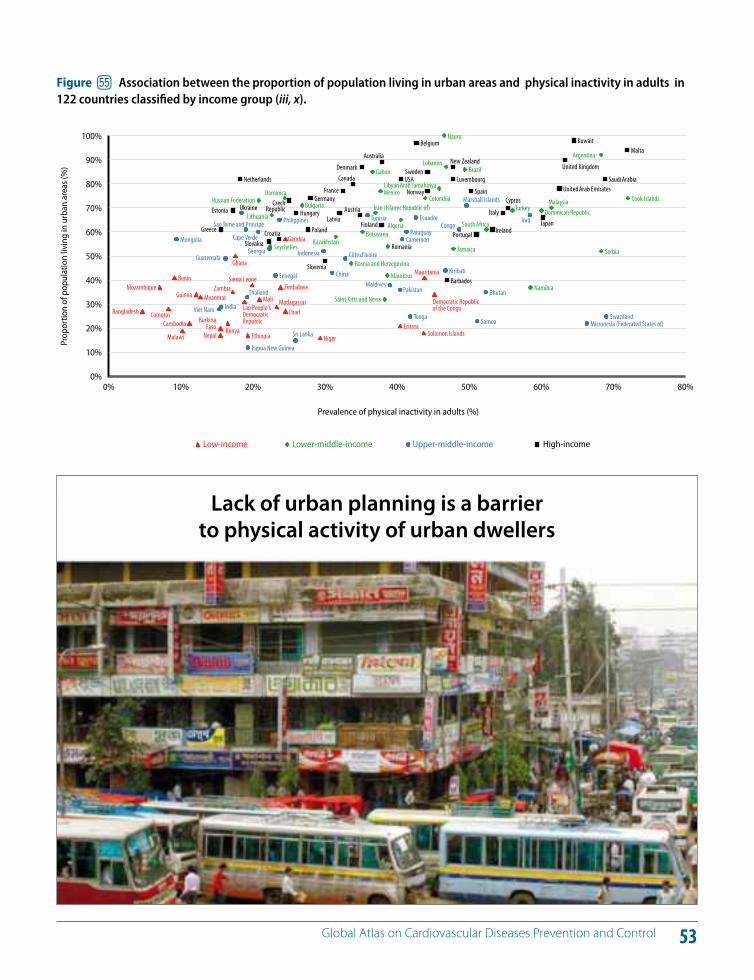
53 Global Atlas on Cardiovascular Diseases Prevention and Control
70%60%50%40%30%20%10% 80%0%
Greece
Estonia
Netherlands
Slovakia Croatia
Czech Republic Hungary
Poland
Germany
Slovenia
Latvia
France
Canada
Austria
Denmark
Finland
Australia
USA
Belgium
Norway
Sweden
Barbados
Luxembourg
New Zealand
Spain
Portugal Ireland
Italy
Cyprus
Japan
United Arab Emirates
United Kingdom
Kuwait
Saudi Arabia
Malta
Russian Federation
Seychelles
Lithuania
Dominica
Bulgaria
Kazakhstan
Bosnia and Herzegovina
Botswana
Gabon
Iran (Islamic Republic of)
Mexico
Saint Kitts and Nevis
Mauritius
Romania
Algeria
Colombia
Libyan Arab Jamahiriya
Nauru
Lebanon
Jamaica
Brazil
South Africa
Turkey
Namibia
Dominican Republic Malaysia
Argentina
Serbia
Cook Islands
Mongolia
Viet Nam India
Guatemala
Ukraine
Sao Tome and Principe
Thailand
Papua New Guinea
Cape Verde
Georgia
Senegal
Philippines
Sri Lanka
Indonesia
China
Côte d'Ivoire
Tunisia
Maldives Pakistan
Cameroon Paraguay
Tonga
Ecuador
Kiribati
Congo
Marshall Islands
Samoa
Bhutan
Iraq
Micronesia (Federated States of) Swaziland
Bangladesh
Mozambique
Comoros
Benin
Malawi
Cambodia
Guinea Myanmar
BurkinaFaso
Nepal Kenya
Zambia
Ghana
Lao People'sDemocraticRepublic
Ethiopia
Sierra Leone
Mali Madagascar
Zimbabwe
Chad
Gambia
Niger
Eritrea Solomon Islands
Mauritania
Democratic Republicof the Congo
100%
90%
80%
70%
60%
50%
40%
30%
20%
10%
0%
Prevalence of physical inactivity in adults (%)
Prop
ortio
n of
pop
ulat
ion
livin
g in
urb
an a
reas
(%)
High-incomeLower-middle-income Upper-middle-incomeLow-income
Figure fq Association between the proportion of population living in urban areas and physical inactivity in adults in 122 countries classified by income group (iii, x).
Lack of urban planning is a barrier to physical activity of urban dwellers
54 Global Atlas on Cardiovascular Diseases Prevention and Control
Socioeconomic stratification has been consistently associ-ated with di!erences in prevalence of cardiovascular risk factors, CVD incidence and mortality across multiple popu-lations (91–96). CVD and its risk factors were originally more common in upper socioeconomic groups in the devel-oped world, but this pattern has reversed over the last 50 years. Those in low socioeconomic positions have a poorer risk factor profile, including greater levels of hypertension and diabetes and a trend towards higher rates of smoking compared to those of higher socioeconomic positions (6, 97). The inverse association between socioeconomic status and CVD is strongest for incidence and mortality of stroke, with low socioeconomic groups showing lower survival and higher stroke incidence in many populations in devel-oped countries (93, 95, 96).
From the moment of conception, during intrauterine life and over the course of a lifetime, the cumulative risk of cor-onary heart disease and cerebrovascular disease develops by way of a complex interplay of genetics, in utero environ-ment, biological risk factors and social determinants. Disad-vantaged populations are more exposed to risks (tobacco use, use of alcohol, physical activity or diet). The extent of exposure is shaped by the “opportunities” that society o!ers to individuals (97). In addition to unhealthy behaviours, dis-advantaged groups have limited access to social support, lack of perception of control and greater job stress, lower health-seeking behaviours, less access to medical care and greater comorbidity (98).
There are di!erences in exposure to health risks and health outcomes between di!erent population groups that are avoidable, unfair and remediable (99–107). Unfair policy choices are often the root causes of these di!erences. Even in countries where the conditions for universal health cov-erage are broadly achieved, inequities persist between dif-ferent socioeconomic, ethnic and geographic groups.
Figure 56 shows the Gini index of national income distri-bution around the world. The Gini index is a measure of the inequality of a distribution (0 = equality and 100 = in-equality). Figure 57 shows the CVD mortality by World Bank income groups and the higher Gini index (higher income inequality)in low income countries compared to high in-come countries. Figure 58 shows the association between stroke mortality rates and national income.
Several complementary approaches in health and other sectors are required to address inequities. First, policy and structural interventions must address root social causes such as poverty, illiteracy, unemployment and deprived neigh-bourhoods. Second, protecting the cardiovascular health of lower socioeconomic groups through population-based prevention strategies needs to be a priority. Third, health sys-tem delivery of primary and secondary prevention interven-tions must pay special attention to disadvantaged groups. And fourth, resources need to be earmarked for improving the health of disadvantaged groups who may lack political power for making the case for su"cient funding.
KEY MESSAGES
CVD a!ect the poor as well as the rich.
Inequities of power, money and resources impact the health status and the development of CVD.
Disadvantaged populations are more exposed to cardiovascular risk due to lack of power and knowledge.
Unfair policy choices are the root causes of health inequities.
BT Inequities and CVDs
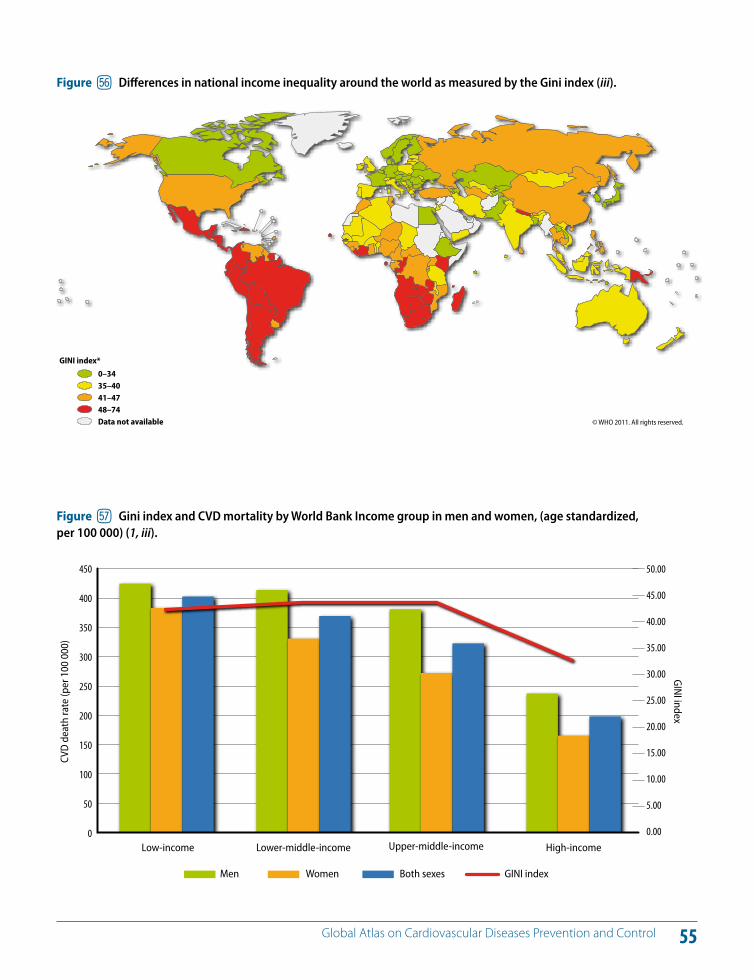
55 Global Atlas on Cardiovascular Diseases Prevention and Control
Figure fr Di!erences in national income inequality around the world as measured by the Gini index (iii).
Upper-middle-incomeLower-middle-incomeLow-income High-income
450
400
350
300
250
200
150
100
50
0
50.00
45.00
40.00
35.00
30.00
25.00
20.00
15.00
10.00
5.00
0.00
CVD
dea
th ra
te (p
er 1
00 0
00)
GINI index
Men Women Both sexes GINI index
Figure fs Gini index and CVD mortality by World Bank Income group in men and women, (age standardized, per 100 000) (1, iii).
© WHO 2011. All rights reserved.
GINI index*
0–3435–4041–4748–74Data not available
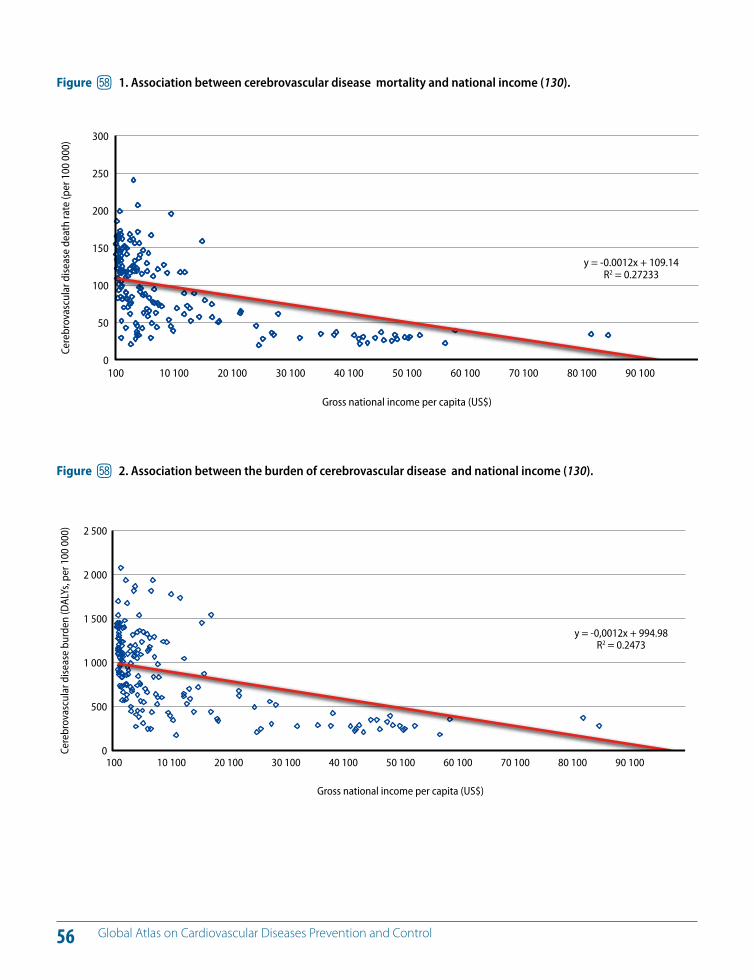
56 Global Atlas on Cardiovascular Diseases Prevention and Control
Figure ft 1. Association between cerebrovascular disease mortality and national income (130).
2 500
2 000
1 500
1 000
500
070 10060 10050 10040 10030 10020 10010 100 80 100100
y = -0,0012x + 994.98R2 = 0.2473
Cere
brov
ascu
lar d
iseas
e bu
rden
(DAL
Ys, p
er 1
00 0
00)
Gross national income per capita (US$)
90 100
300
250
200
150
100
50
070 10060 10050 10040 10030 10020 10010 100 80 100 90 100100
y = -0.0012x + 109.14R2 = 0.27233
Cere
brov
ascu
lar d
iseas
e de
ath
rate
(per
100
000
)
Gross national income per capita (US$)
Figure ft 2. Association between the burden of cerebrovascular disease and national income (130).

Section B
Other CVDs

58 Global Atlas on Cardiovascular Diseases Prevention and Control
Each heartbeat originates as an electrical impulse in the right atrium of the heart in the area called the sino atrial node. The impulse initially causes both of the atria to con-tract, then activates the atrioventricular node and the elec-trical impulse spreads through both ventricles via the bun-dle of His and the Purkinje fibres causing a synchronized contraction of the ventricles of the heart.
Abnormal electrical activity in the heart is known as car-diac arrhythmia; the heartbeat may be too fast or too slow, and may be regular or irregular. It may originate from the region of the atria or ventricles. Sometimes cardiac ar-rhythmia is life threatening and causes medical emergen-cies, sometimes it may not cause symptoms or it may give rise to palpitations. Atrial fibrillation is one of the common tachyarrhythmias arising from the atria (Figure 59). It is characterized by predominantly uncoordinated atrial acti-vation with consequent deterioration of mechanical func-tion of the heart (108).
The prevalence of atrial fibrillation increases with advanc-ing age to a prevalence of about 9% for ages 80–89 (108). Other risk factors of atrial fibrillation include hypertension, diabetes, thyroid overactivity and cardiac valve abnormali-ties. Atrial fibrillation is commonly associated with, and complicated by, stroke and congestive heart failure. Atrial fibrillation increases the risk of stroke fivefold. The incidence
of stroke attributable to atrial fibrillation increases from 1.5% for ages 50–59 to 23.5% for ages 80–89 (108, 109). If electrocardiography facilities are available, atrial fibrillation can be diagnosed by opportunistic and targeted screening in primary care. Once atrial fibrillation is diagnosed, drugs are given to control the heart rate and anticoagulants are given to prevent stroke (110).
Heart attacks may present as ventricular arrhythmias. Sud-den cardiac death due to such arrhythmias is an important cause of cardiovascular mortality. Electrical defibrillation is required to restore coordinated activity of the heart in these cases and even short delays in defibrillation signifi-cantly deteriorate outcome. To enable early out-of-hospital defibrillation, automated external defibrillators are increas-ingly made available for public use in highly frequented places in developed countries (111, 112).
However, public access defibrillation programmes are ex-pensive and the marginal improvements in survival do not justify spending the limited financial resources for wide-scale deployment of automated external defibrillation in resource-constrained settings. In such settings, more funds need to be diverted to strengthening programmes for pre-vention of CVD in order to reduce the need for defibrilla-tion programmes (112–114).
KEY MESSAGES
The percentage of strokes attributable to atrial fibrillation increases with age, and in the elderly it accounts for about one fifth of all strokes.
Coronary artery disease is a cause of cardiac arrhythmia.
Sudden death due to a cardiac arrhythmia may be the first sign of coronary artery disease.
BU Cardiac arrhythmia
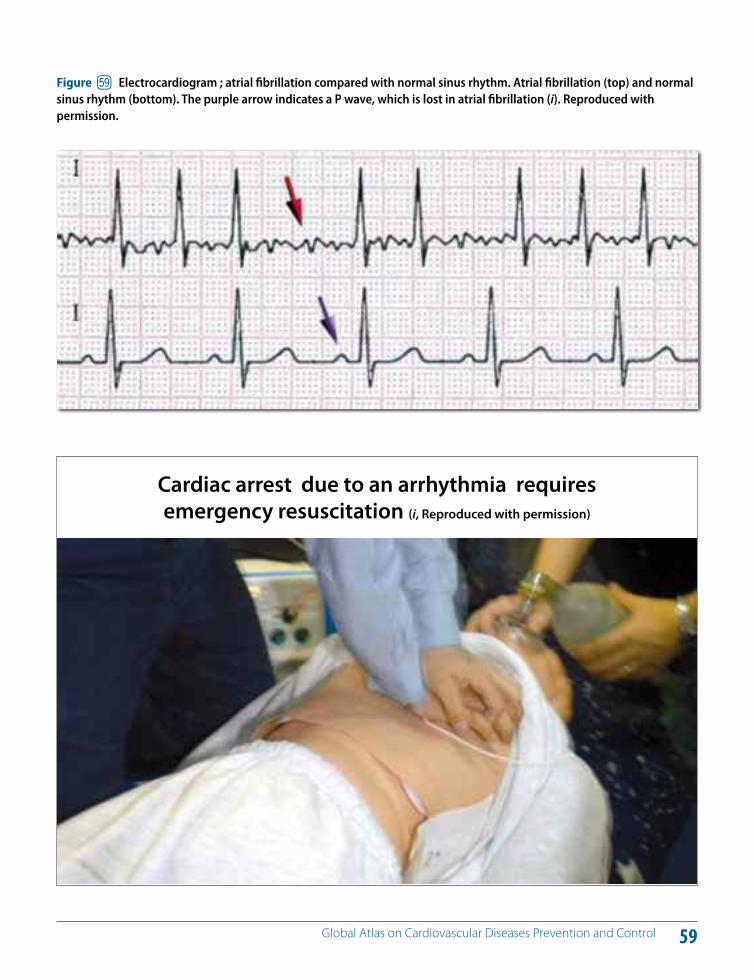
59 Global Atlas on Cardiovascular Diseases Prevention and Control
Figure fu Electrocardiogram ; atrial fibrillation compared with normal sinus rhythm. Atrial fibrillation (top) and normal sinus rhythm (bottom). The purple arrow indicates a P wave, which is lost in atrial fibrillation (i). Reproduced with permission.
Cardiac arrest due to an arrhythmia requires emergency resuscitation (i, Reproduced with permission)
60 Global Atlas on Cardiovascular Diseases Prevention and Control
Congenital heart disease is a defect in the structure and function of the heart due to abnormal heart development before birth. With an incidence ranging from 19 to 75 per 1000 live births, congenital heart disease is an important cause of childhood morbidity and mortality worldwide (115). Congenital heart disease is the leading cause of birth defects. When infectious diseases are excluded, congenital heart disease accounts for more deaths in the first year of life than any other condition (1, 116).
Birth defects can be caused by single gene defects, chro-mosomal disorders, multifactorial inheritance, environ-mental teratogens and micronutrient deficiencies (115, 116). Maternal infectious diseases such as syphilis and ru-bella are also significant causes of birth defects in LMICs. Diabetes mellitus and iodine and folic acid deficiency in the mother as well as exposure to medicines and recre-ational drugs, including alcohol and tobacco, certain envi-ronmental chemicals and high doses of radiation, are other factors that cause birth defects (116).
The majority of congenital heart diseases presents as an isolated defect and is not associated with other diseases. They can also be a part of various genetic and chromosom-al syndromes such as Down syndrome, Turner syndrome, Marfan syndrome, trisomy 13 and Noonan syndrome.
Congenital heart disease can be cyanotic (Figure 60) or non-cyanotic (Figure 61) depending on whether the defect in
the heart causes mixing of blood from the right and left sides of the heart. Non-cyanotic congenital heart diseases include ventricular septal defect, atrial septal defect, patent ductus arteriosus, aortic stenosis, pulmonary stenosis, coarc-tation of the aorta and atrioventricular canal (endocardial cushion defect).
Symptoms depend on the specific defect. While cyanotic congenital heart disease such as Fallots tetrology (Fig-ure 60) features are present at birth, some other defects may not be immediately obvious. Defects such as coarcta-tion of the aorta may not cause problems for many years. People with small ventricular septal defects may have no symptoms and can have a normal lifespan. Many congeni-tal heart defects are amenable to cost-e!ective surgery that can be life saving and improve long-term prognosis.
A portfolio of prevention approaches are available for pre-vention of congenital heart disease and other birth defects (117). Most birth defects of environmental origin can be prevented by public health approaches, including preven-tion of sexually transmitted infections, legislation controlling management of toxic chemicals (e.g. certain agricultural chemicals), vaccination against rubella and fortification of basic foods with micronutrients (iodine and folic acid). Poli-cies to optimize women’s diet before and throughout preg-nancy are critical for prevention of birth defects, including congenital heart and nervous system defects (117, 118).
KEY MESSAGES
A significant proportion of congenital heart disease can be prevented by public health measures such as rubella vaccination, promotion of universal use of salt fortified with iodine and promotion of staple food fortified with folic acid.
Policies to optimize women’s diet before and throughout pregnancy are critical for prevention of congenital heart disease.
CL Congenital heart disease
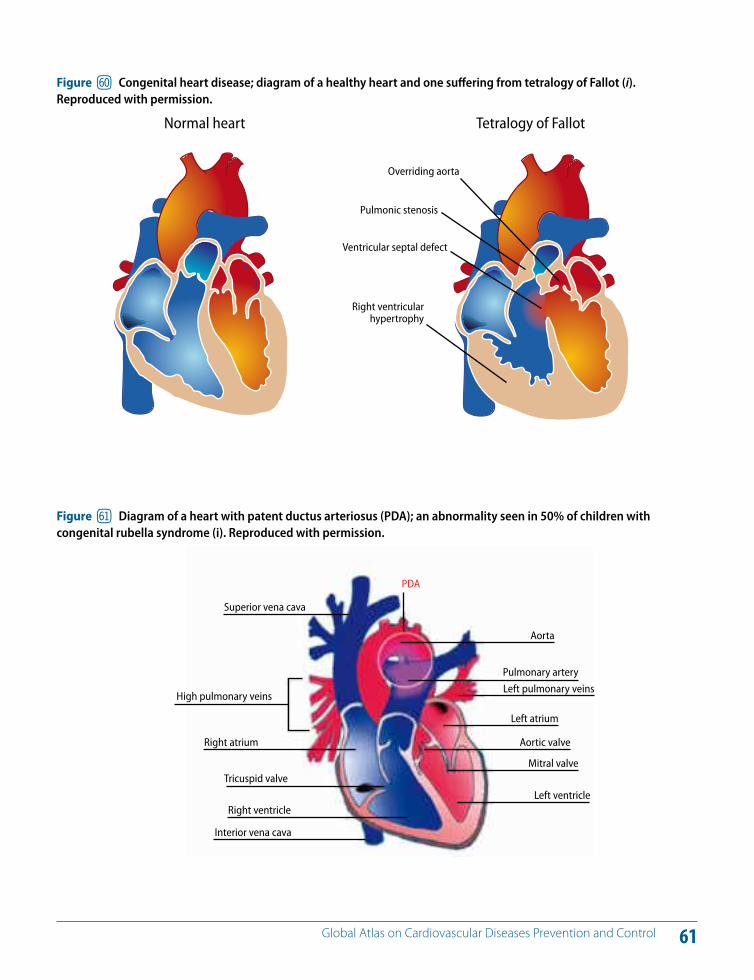
61 Global Atlas on Cardiovascular Diseases Prevention and Control
Figure gl Congenital heart disease; diagram of a healthy heart and one su!ering from tetralogy of Fallot (i). Reproduced with permission.
Heart cross section with patent ductus arteriosus
Superior vena cava
PDA
Aorta
Pulmonary arteryLeft pulmonary veins
Left atrium
Aortic valve
Mitral valve
Left ventricle
Right atrium
Tricuspid valve
Right ventricle
Interior vena cava
High pulmonary veins
Figure gm Diagram of a heart with patent ductus arteriosus (PDA); an abnormality seen in 50% of children with congenital rubella syndrome (i). Reproduced with permission.
Normal heart Tetralogy of Fallot
Overriding aorta
Pulmonic stenosis
Ventricular septal defect
Right ventricular hypertrophy
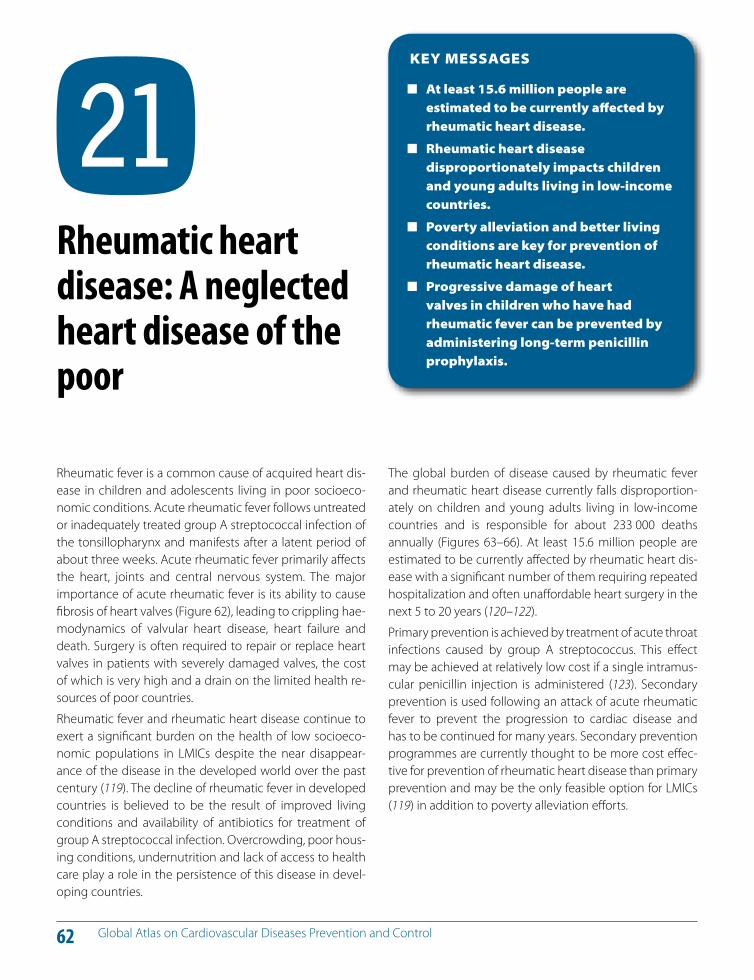
62 Global Atlas on Cardiovascular Diseases Prevention and Control
Rheumatic fever is a common cause of acquired heart dis-ease in children and adolescents living in poor socioeco-nomic conditions. Acute rheumatic fever follows untreated or inadequately treated group A streptococcal infection of the tonsillopharynx and manifests after a latent period of about three weeks. Acute rheumatic fever primarily a!ects the heart, joints and central nervous system. The major importance of acute rheumatic fever is its ability to cause fibrosis of heart valves (Figure 62), leading to crippling hae-modynamics of valvular heart disease, heart failure and death. Surgery is often required to repair or replace heart valves in patients with severely damaged valves, the cost of which is very high and a drain on the limited health re-sources of poor countries.
Rheumatic fever and rheumatic heart disease continue to exert a significant burden on the health of low socioeco-nomic populations in LMICs despite the near disappear-ance of the disease in the developed world over the past century (119). The decline of rheumatic fever in developed countries is believed to be the result of improved living conditions and availability of antibiotics for treatment of group A streptococcal infection. Overcrowding, poor hous-ing conditions, undernutrition and lack of access to health care play a role in the persistence of this disease in devel-oping countries.
The global burden of disease caused by rheumatic fever and rheumatic heart disease currently falls disproportion-ately on children and young adults living in low-income countries and is responsible for about 233 000 deaths annually (Figures 63–66). At least 15.6 million people are estimated to be currently a!ected by rheumatic heart dis-ease with a significant number of them requiring repeated hospitalization and often una!ordable heart surgery in the next 5 to 20 years (120–122).
Primary prevention is achieved by treatment of acute throat infections caused by group A streptococcus. This e!ect may be achieved at relatively low cost if a single intramus-cular penicillin injection is administered (123). Secondary prevention is used following an attack of acute rheumatic fever to prevent the progression to cardiac disease and has to be continued for many years. Secondary prevention programmes are currently thought to be more cost e!ec-tive for prevention of rheumatic heart disease than primary prevention and may be the only feasible option for LMICs (119) in addition to poverty alleviation e!orts.
KEY MESSAGES
At least 15.6 million people are estimated to be currently a!ected by rheumatic heart disease.
Rheumatic heart disease disproportionately impacts children and young adults living in low-income countries.
Poverty alleviation and better living conditions are key for prevention of rheumatic heart disease.
Progressive damage of heart valves in children who have had rheumatic fever can be prevented by administering long-term penicillin prophylaxis.
CM Rheumatic heart disease: A neglected heart disease of the poor
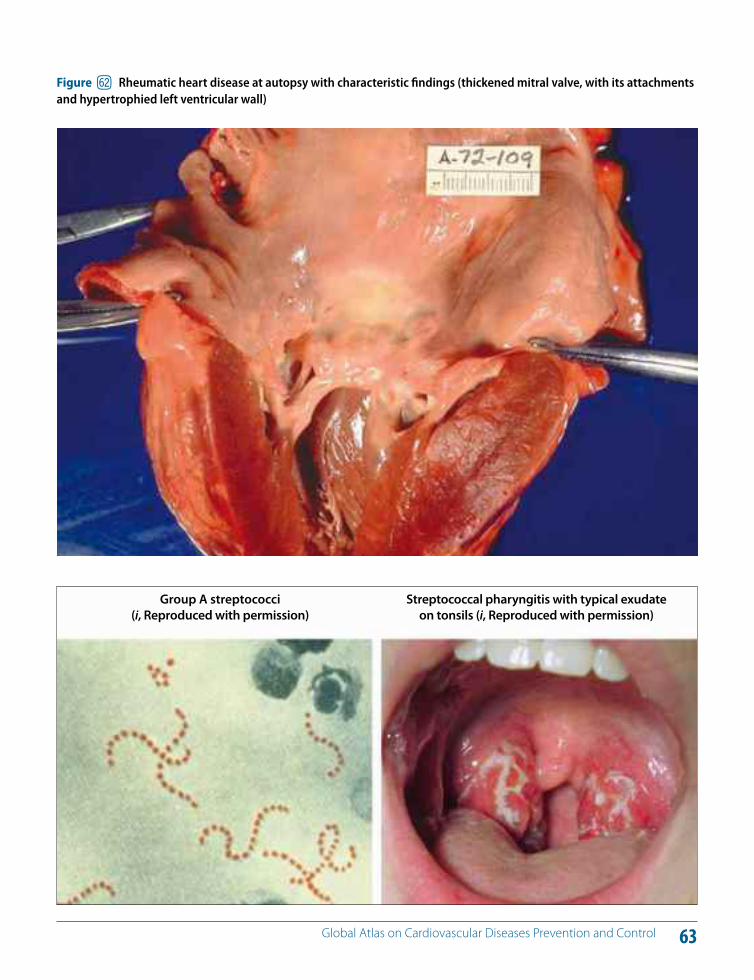
63 Global Atlas on Cardiovascular Diseases Prevention and Control
Figure gn Rheumatic heart disease at autopsy with characteristic findings (thickened mitral valve, with its attachments and hypertrophied left ventricular wall)
Group A streptococci (i, Reproduced with permission)
Streptococcal pharyngitis with typical exu date on tonsils (i, Reproduced with permission)
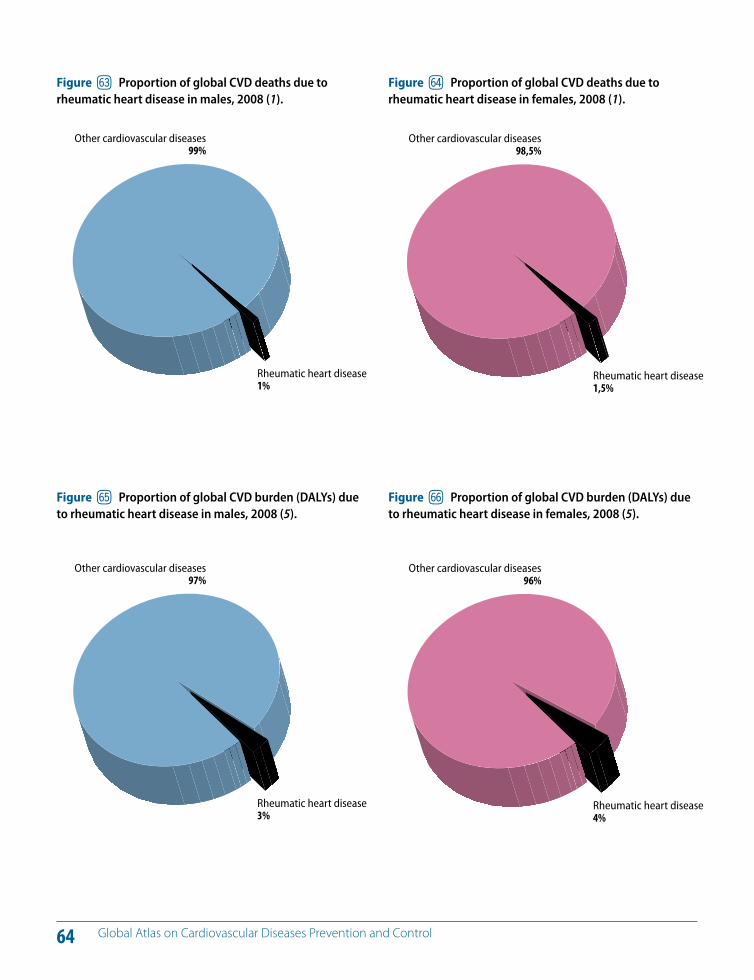
64 Global Atlas on Cardiovascular Diseases Prevention and Control
Figure go Proportion of global CVD deaths due to rheumatic heart disease in males, 2008 (1).
Figure gp Proportion of global CVD deaths due to rheumatic heart disease in females, 2008 (1).
Rheumatic heart disease1%
Other cardiovascular diseases99%
Rheumatic heart disease1,5%
Other cardiovascular diseases98,5%
Figure gq Proportion of global CVD burden (DALYs) due to rheumatic heart disease in males, 2008 (5).
Figure gr Proportion of global CVD burden (DALYs) due to rheumatic heart disease in females, 2008 (5).
Rheumatic heart disease3%
Other cardiovascular diseases97%
Rheumatic heart disease4%
Other cardiovascular diseases96%
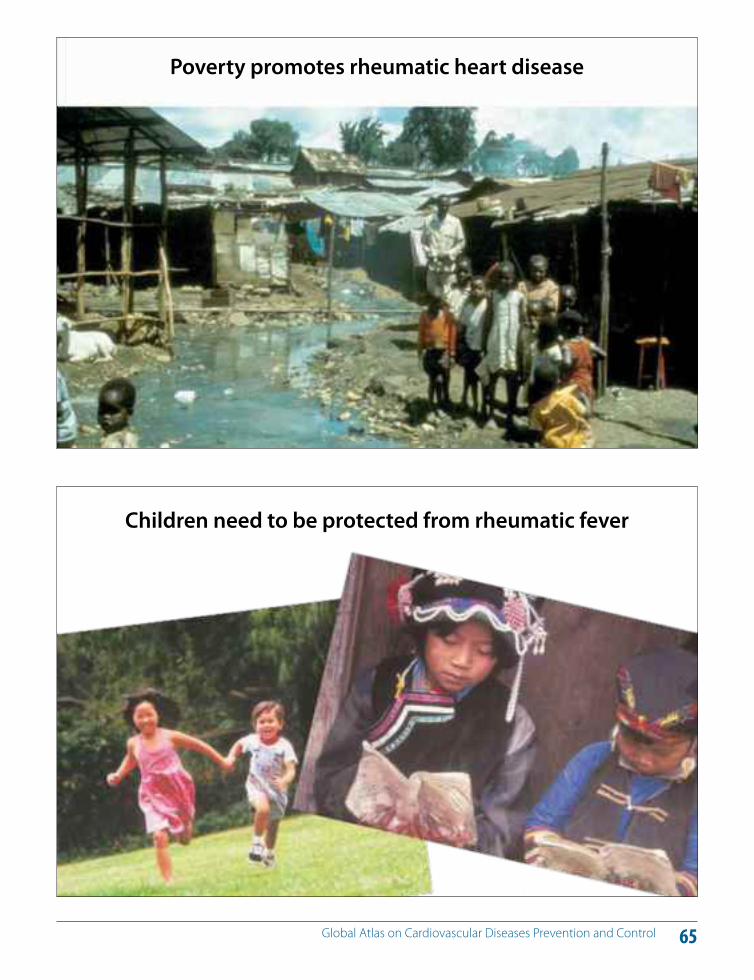
65 Global Atlas on Cardiovascular Diseases Prevention and Control
Poverty promotes rheumatic heart disease
Children need to be protected from rheumatic fever
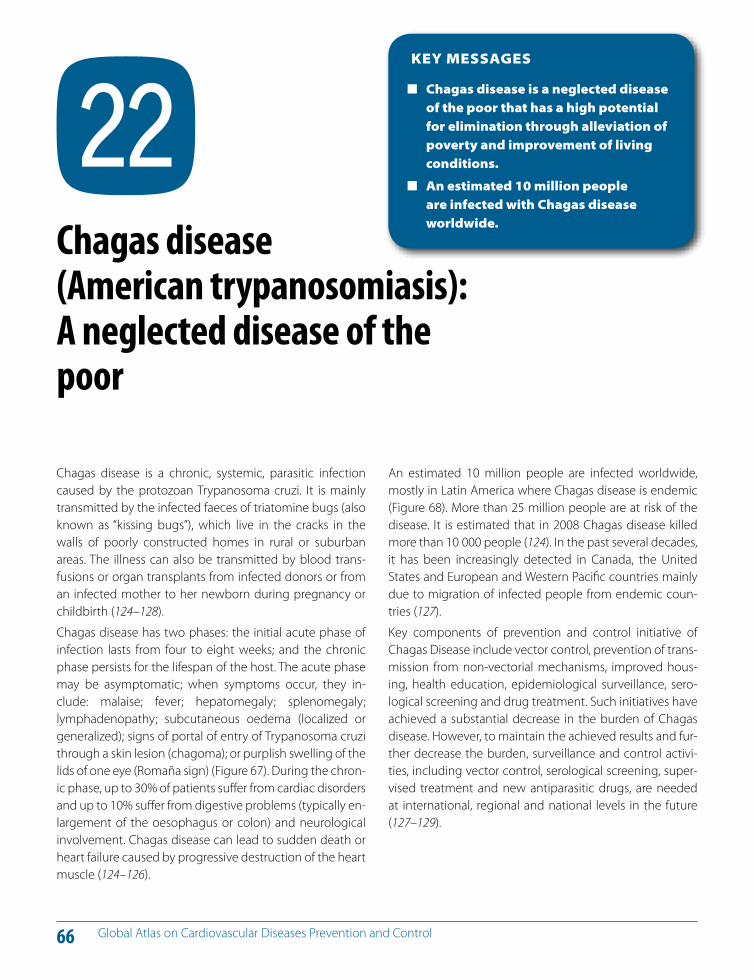
66 Global Atlas on Cardiovascular Diseases Prevention and Control
Chagas disease is a chronic, systemic, parasitic infection caused by the protozoan Trypanosoma cruzi. It is mainly transmitted by the infected faeces of triatomine bugs (also known as “kissing bugs”), which live in the cracks in the walls of poorly constructed homes in rural or suburban areas. The illness can also be transmitted by blood trans-fusions or organ transplants from infected donors or from an infected mother to her newborn during pregnancy or childbirth (124–128).
Chagas disease has two phases: the initial acute phase of infection lasts from four to eight weeks; and the chronic phase persists for the lifespan of the host. The acute phase may be asymptomatic; when symptoms occur, they in-clude: malaise; fever; hepatomegaly; splenomegaly; lymphadenopathy; subcutaneous oedema (localized or generalized); signs of portal of entry of Trypanosoma cruzi through a skin lesion (chagoma); or purplish swelling of the lids of one eye (Romaña sign) (Figure 67). During the chron-ic phase, up to 30% of patients su!er from cardiac disorders and up to 10% su!er from digestive problems (typically en-largement of the oesophagus or colon) and neurological involvement. Chagas disease can lead to sudden death or heart failure caused by progressive destruction of the heart muscle (124–126).
An estimated 10 million people are infected worldwide, mostly in Latin America where Chagas disease is endemic (Figure 68). More than 25 million people are at risk of the disease. It is estimated that in 2008 Chagas disease killed more than 10 000 people (124). In the past several decades, it has been increasingly detected in Canada, the United States and European and Western Pacific countries mainly due to migration of infected people from endemic coun-tries (127).
Key components of prevention and control initiative of Chagas Disease include vector control, prevention of trans-mission from non-vectorial mechanisms, improved hous-ing, health education, epidemiological surveillance, sero-logical screening and drug treatment. Such initiatives have achieved a substantial decrease in the burden of Chagas disease. However, to maintain the achieved results and fur-ther decrease the burden, surveillance and control activi-ties, including vector control, serological screening, super-vised treatment and new antiparasitic drugs, are needed at international, regional and national levels in the future (127–129).
KEY MESSAGES
Chagas disease is a neglected disease of the poor that has a high potential for elimination through alleviation of poverty and improvement of living conditions.
An estimated 10 million people are infected with Chagas disease worldwide.
CN Chagas disease (American trypanosomiasis): A neglected disease of the poor
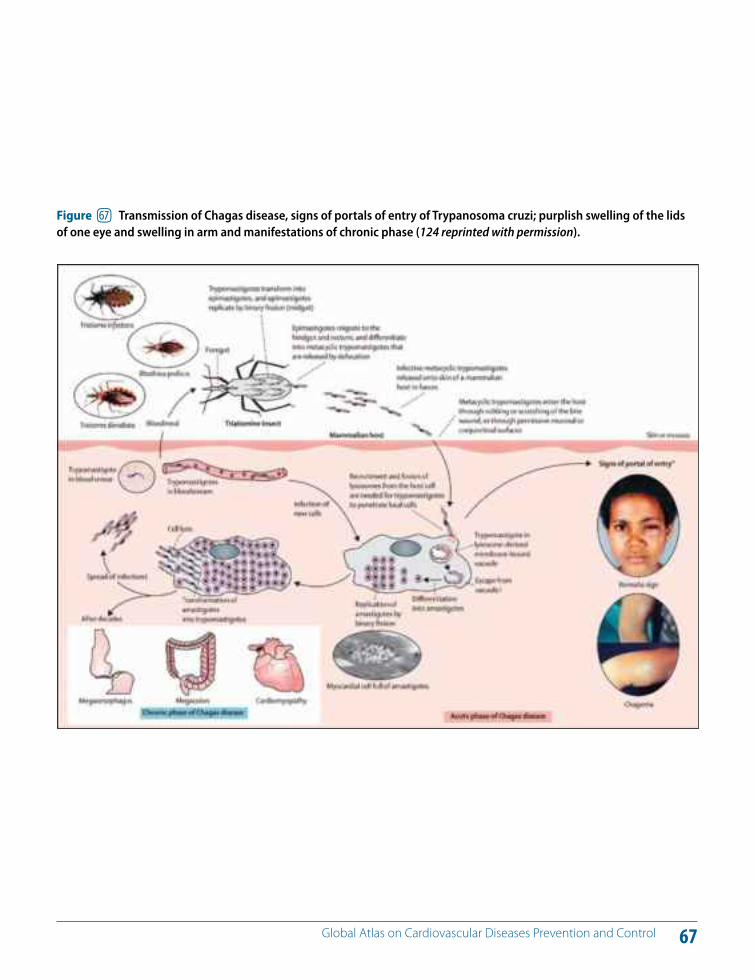
67 Global Atlas on Cardiovascular Diseases Prevention and Control
Figure gs Transmission of Chagas disease, signs of portals of entry of Trypanosoma cruzi; purplish swelling of the lids of one eye and swelling in arm and manifestations of chronic phase (124 reprinted with permission).
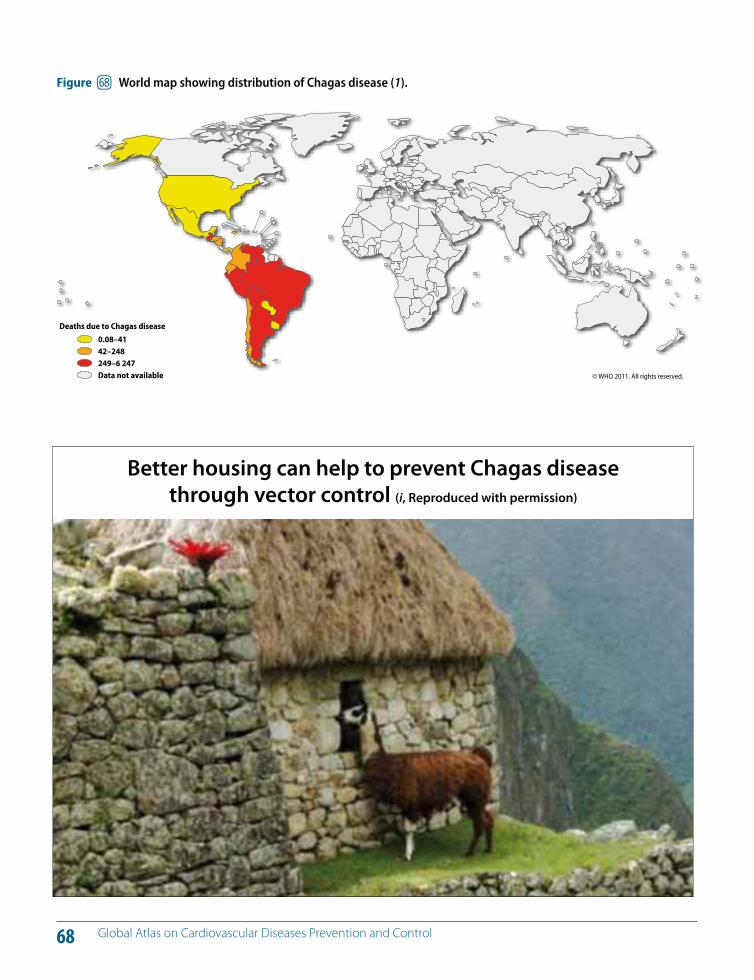
68 Global Atlas on Cardiovascular Diseases Prevention and Control
Figure gt World map showing distribution of Chagas disease (1).
© WHO 2011. All rights reserved.
Deaths due to Chagas disease
0.08–4142–248249–6 247Data not available
Better housing can help to prevent Chagas disease through vector control (i, Reproduced with permission)
Section C
Prevention and control of CVDs; policies, strategies and interventions
70 Global Atlas on Cardiovascular Diseases Prevention and Control
Over the last two decades, cardiovascular mortality rates have declined in many high-income countries (13, 14, 130, 131). A combination of population-wide primary preven-tion and individual health-care intervention strategies have contributed to these declining mortality trends (4–6, 13, 14). Figure 69 shows the declining trends in CVD mortality rates in some developed countries. This decline in mortal-ity has been attributed to reduced incidence rates and/or improved survival after cardiovascular events due to health care interventions (13).
The North Karelia project in Finland began in 1972. A com-prehensive community intervention was designed and im-plemented to achieve population-wide changes in dietary habits to shift the population distribution of cardiovascular risk factors. By 1995, the project reported an impressive 73% reduction in age-adjusted coronary heart disease mortality rate (Figure 70.1). The framework for the project incorporated behaviour change and communication and community organization principles; and the intervention itself included media campaigns, partnership with the food industry, involvement of local health-care and community organizations, agricultural reforms and providing health care for those at high cardiovascular risk among other components (15).
The cardiovascular mortality rate in right-bank Warsaw in-habitants in Poland declined between 1991 and 2002 by
over 50% (132, 133). It is thought that changes in dietary patterns explain, at least in part, this marked reduction in cardiovascular mortality observed in Poland. During this period, a decrease in the consumption of butter by 52%, other animal fats by 20%, milk by 27%, beef by 57% and po-tatoes by 8% was noted. On the other hand, the consump-tion of vegetable fat increased by 100%, poultry by 70% and fruit by 64%. A decrease of 19% in the consumption of saturated fatty acids and an increase of 32% in the intake of the polyunsaturated fatty acids were reported (13, 133).
Coronary heart disease mortality in the United Kingdom has also declined sharply between 1981 and 2000 (14) (Fig-ure 70.2). About 42% of this decrease has been attributed to treatment and the rest to population-wide risk factor reductions.
Population wide strategies for tobacco and alcohol control and salt reduction in diet are very cost e!ective. They are af-fordable even for low and middle income countries. Some individual interventions are also cost e!ective, a!ordable and scalable in LMIC. Multidrug therapy in primary care for people at high risk of developing heart attacks and strokes and aspirin for acute myocardial infarction (heart attacks) are two such interventions which are further elaborated in chapter 33.
KEY MESSAGES
The decline in cardiovascular mortality seen in many developed countries over the last two decades has been attributed to reduced incidence rates and/or improved survival after cardiovascular events due to a combination of prevention and treatment interventions.
To reverse CVD trends, a significant increase in the investment in prevention strategies is required.
CO Prevention and control of CVDs: How do we know what works?
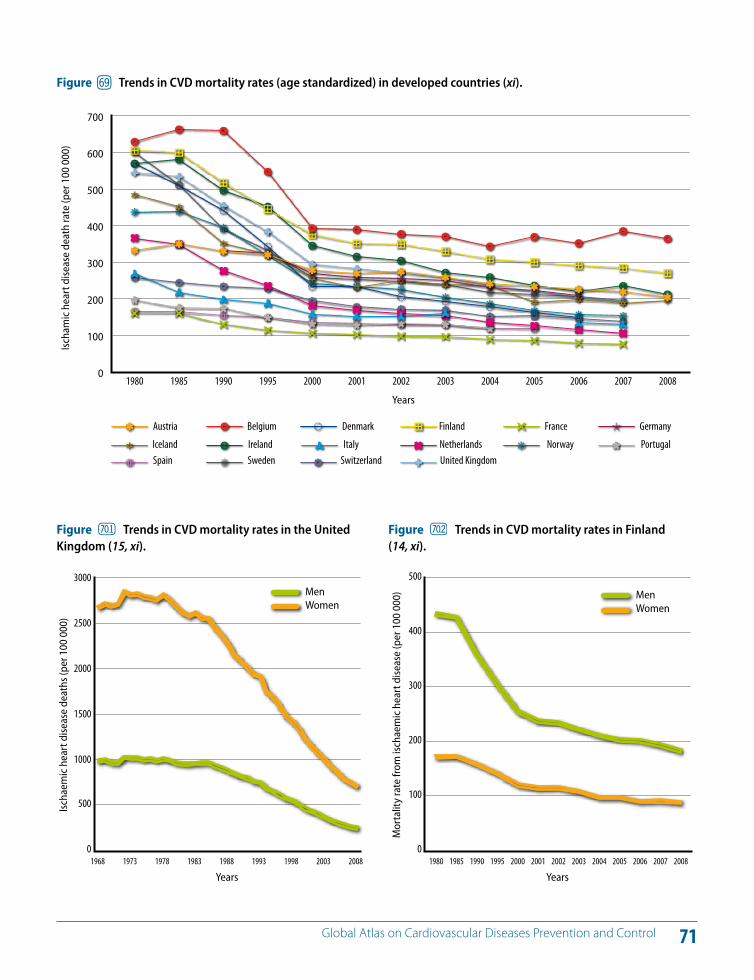
71 Global Atlas on Cardiovascular Diseases Prevention and Control
Figure gu Trends in CVD mortality rates (age standardized) in developed countries (xi).
20031998199319881983197819731968
Years
Ischa
emic
hea
rt d
iseas
e de
aths
(per
100
000
)
20080
500
1000
1500
2000
2500
3000MenWomen
Figure Trends in CVD mortality rates in the United Kingdom (15, xi).
0
100
200
300
400
500
600
700
United KingdomSwitzerlandSwedenSpainPortugalNorwayNetherlandsItalyIrelandIceland
GermanyFranceFinlandDenmarkBelgiumAustria
200720062005200420032002200120001995199019851980
Ischa
mic
hea
rt d
iseas
e de
ath
rate
(per
100
000
)
Years
2008
200720062005200420032002200120001995199019851980
Years
Mor
talit
y ra
te fr
om is
chae
mic
hea
rt d
iseas
e (p
er 1
00 0
00)
20080
100
200
300
400
500
MenWomen
Figure Trends in CVD mortality rates in Finland (14, xi).

72 Global Atlas on Cardiovascular Diseases Prevention and Control
In all populations, it is essential that individual health care targeting people at raised cardiovascular risk and people with disease is complemented by population-wide public health strategies (Figure 31) (4, 6). Although cardiovascu-lar events are less likely to occur in people with low lev-els of risk, no level of risk can be considered “safe”. Without population-wide public health prevention e!orts, cardio-vascular events will continue to occur in people with low and moderate levels of risk, and who are the majority in any population. Furthermore, public health approaches can e!ectively slow down the development of atheroscle-rosis (and also reduce the incidence of some cancers and chronic respiratory diseases) in young people, thereby re-ducing the likelihood of future epidemics of cardiovascular events such as were seen in the period 1960–1990 in most high-income countries. Population-wide strategies would also support lifestyle modification in those at high risk. The extent to which one strategy is emphasized over the other depends on achievable e!ectiveness, cost e!ective-ness and resource considerations. Prevention and control of strokes and heart attacks require integrated strategies because they share common risk factors and a common pathogenesis (atherosclerosis) (134–136).
The appropriate threshold of an individual’s total risk at which intensive lifestyle interventions and drug treatment
are initiated depends on the availability of resources and the impact of specific interventions. The cost e!ectiveness of pharmacological treatment for high blood pressure and blood cholesterol depends on the total cardiovascular risk of the individual before treatment (4, 137–141); long-term drug treatment is justified only in high-risk individuals with a low risk–benefit ratio. If resources allow, the target population can be expanded to include those with mod-erate levels of risk; however, lowering the threshold for treatment will increase not only the benefits, but also the costs and potential harm. Everyone with low levels of risk will benefit from population-based public health strategies and, if resources allow, individual counselling to motivate behavioural change.
State-funded health systems have the di"cult task of set-ting a risk threshold for treatment that balances the health-care resources in the public sector, the wishes of clinicians and the expectations of the public. These decisions are par-ticularly challenging when public expenditure for health is inadequate (Figures 71 and 72). As the threshold for inter-vention is lowered, the number of individuals eligible to benefit increases, but so do the costs and the number of adverse events caused by drug treatments (2, 4, 6).
KEY MESSAGES
For prevention and control of CVD a combination of population-wide and individual health-care strategies is required.
The total-risk approach for controlling cardiovascular risk factors is more cost e!ective than a single-risk factor approach.
CP Prevention and control of CVDs: The need for integrated and complimentary strategies
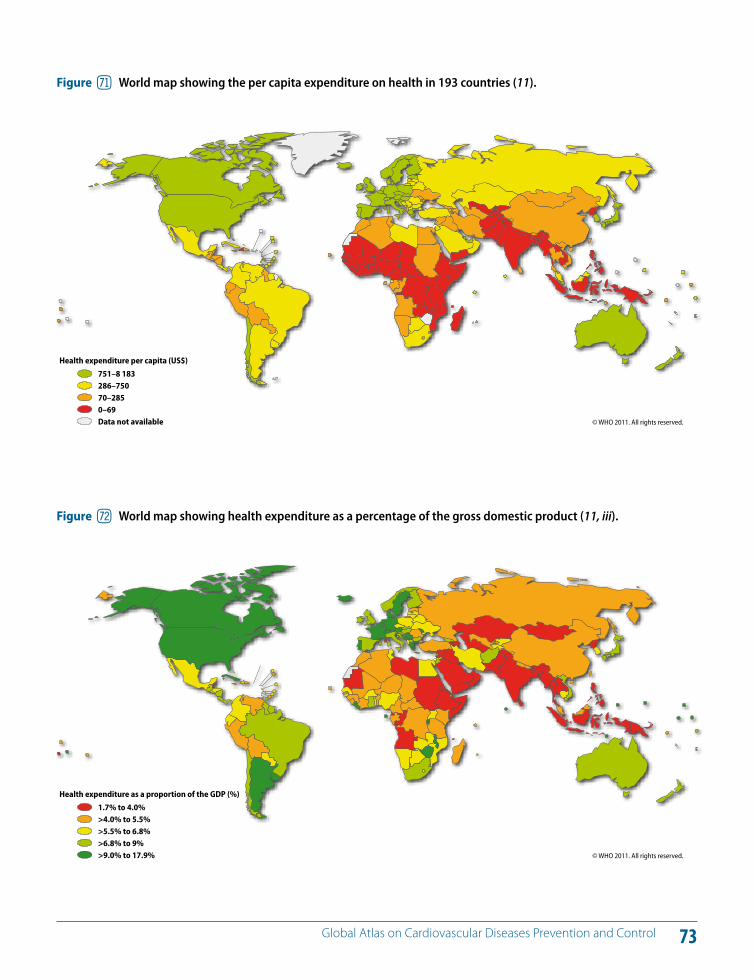
73 Global Atlas on Cardiovascular Diseases Prevention and Control
Figure hm World map showing the per capita expenditure on health in 193 countries (11).
© WHO 2011. All rights reserved.
Health expenditure per capita (US$)
751–8 183286–75070–2850–69Data not available
Figure hn World map showing health expenditure as a percentage of the gross domestic product (11, iii).
© WHO 2011. All rights reserved.
Health expenditure as a proportion of the GDP (%)
1.7% to 4.0%>4.0% to 5.5%>5.5% to 6.8%>6.8% to 9%>9.0% to 17.9%
74 Global Atlas on Cardiovascular Diseases Prevention and Control
Determinants of cardiovascular risk factors (tobacco use, unhealthy diet and physical inactivity) lie outside the health sector in many other domains, including finance, educa-tion, transport, agriculture, food, trade, environment and urban planning (4, 142, 143). Prevention and control of CVD require a coherent policy response across all these sectors. Ministries of health have the challenging task of providing leadership to navigate stakeholders in these multiple sec-tors who have di!ering interests by setting shared respon-sibilities for improvements in health that are linked to other development priorities.
Health in All Policies highlights the important links be-tween health and broader economic and social goals in modern societies. It is a political choice and highly context specific. It requires strategies to support the required gov-ernance and implementation of integrated policies. Health in All Policies needs to be viewed as a shared goal across di!erent government departments, and be used as an in-novative approach to intersectoral action.
While implementation of policies across di!erent sectors is essential to improve cardiovascular health, the health sec-tor remains vital for progress. It has an important role in the governance required for intersectoral action, although it should not expect to lead all activities in other sectors. Instead, the health sector needs to construct a dialogue on
why health is a shared goal across society and identify how other sectors can benefit from action to protect health, in terms of their own priorities. The health sector also has an important role in working with other sectors to reduce dif-ferences in exposure and vulnerability to cardiovascular risk factors.
Despite new insights into the impact on health of poor housing, built-up environment, lack of education and un-employment, systems in all countries remain inadequate to coherently implement whole-of-government strategies working between di!erent sectors to address these issues (68, 69, 144). As no single sector on its own can mount an e!ective response, new systems and governance are re-quired to deliver a range of actions for protection of car-diovascular health. The lack of development of the nec-essary governance and systems to implement coherent policies across government has been a significant obstacle to progress. The response needs to consider the impact of intersectoral policies on health as well as the benefits of improvements in health for the goals of other sectors.
KEY MESSAGES
Determinants of CVD lie outside the health sector in many other domains.
Prevention and control of CVD require a coherent policy response and intersectoral collaboration.CQ
Prevention and control of CVDs: Health in All Policies
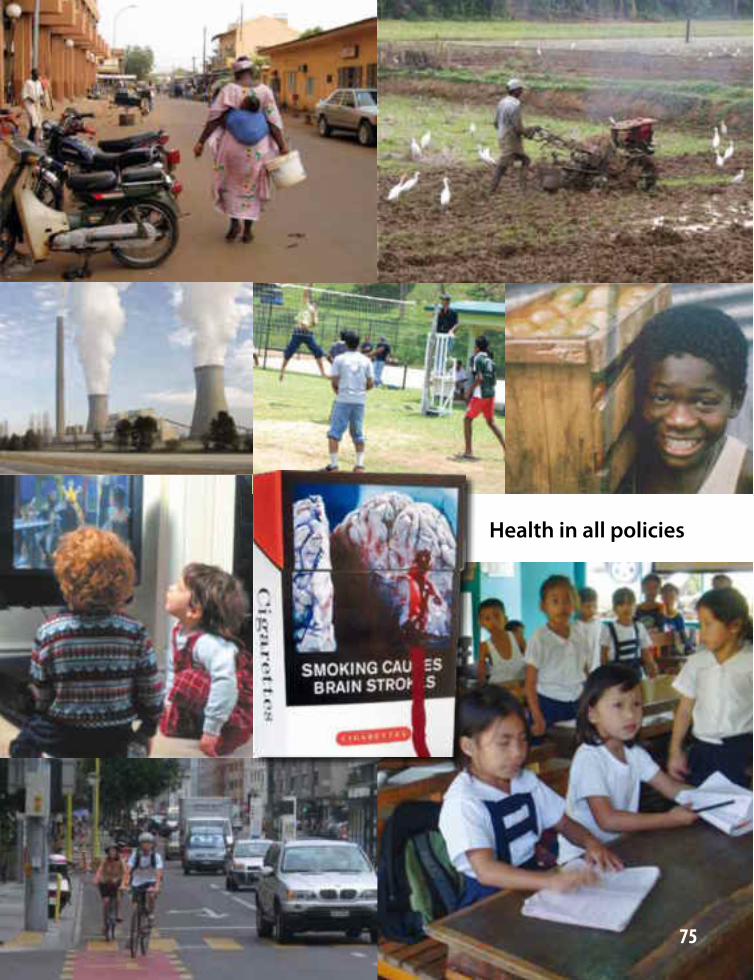
75
Health in all policies
76 Global Atlas on Cardiovascular Diseases Prevention and Control
For prevention and control of CVD, unhealthy behaviours of people, including tobacco use, unhealthy diet, physical inactivity and the harmful use of alcohol, need to be modi-fied. These behaviours are shaped by economic growth, globalization, urbanization, social determinants and corpo-rate influences. Health literacy, individual e!orts and health education by health professionals can play an important role in modifying these behaviours. However, changing the be-haviour of people is di"cult and cannot be accomplished by such e!orts alone. An enabling policy environment is funda-mental for modifying and sustaining healthy behaviour.
Environments conducive to healthy behaviours can be cre-ated if health is a key consideration of sector-wide public policies in domains that have an influence on health; such as transport, agriculture, education, finance, social services and trade. Only such a policy environment can provide people opportunities and a!ordable choices to change and maintain healthy behaviours in relation to diet, physi-cal activity and tobacco and alcohol use. A national NCD policy can serve as a tool for coordinated action if relevant ministries outside health collaborate in the development process and have a co-responsibility in implementing mul-tisectoral policy actions. Figure 73 shows WHO Member States reporting the presence of an NCD policy.
Most NCDs have long incubation periods and require long-haul policy actions to bring about change. The long incuba-tion periods also provide windows of opportunity for control
of behavioural as well as metabolic risk factors of NCDs (e.g. obesity, raised blood sugar, hypertension, hyperlipidaemia) and thereby prevent complications of CVD (e.g. heart attacks, strokes, heart failure, renal disease). Health systems should catalyse, coordinate and coherently integrate policies across other relevant health sectors to create conducive environ-ments that enable people to make and maintain healthy liv-ing choices (4, 6 ,68, 142–144). Such policies are integral to the promotion of tobacco and alcohol avoidance, healthy diet and regular physical activity for reducing risk factors in the whole population. Complimentary health-care policies need to target early detection and treatment of risk factors and diseases through a primary health care approach. One of the key objectives of a national NCD policy framework should be to reduce unfair social gradients related to NCDs and their risk factors (68, 69). In this respect, comparing the impact of all NCD policies on a#uent and disadvantaged groups can help to identify areas of public policy that require greater attention in respect of social gradients.
Strategies and policies that support tobacco control, healthy nutrition, physical activity and prevention of the harmful use of alcohol play a key role in NCD prevention and control and require multi-stakeholder e!orts (4, 6, 26, 29, 41, 43). Policy making and planning in all aspects of NCD prevention and control need to be inclusive and involve a broad range of relevant stakeholders including the civil society, nongovern-mental organizations and the private sector.
CR Prevention and control of CVDs: The need for a national NCD policy framework
KEY MESSAGES
Healthy public policies are essential for prevention and control of CVD.
A national NCD policy enables governments to take coherent and sustained macrolevel action on intersectoral and health system issues that are key for prevention and control of all NCDs, including CVD.
Multiple stakeholders need to be engaged in monitoring and evaluation of intersectoral action for prevention of CVD.
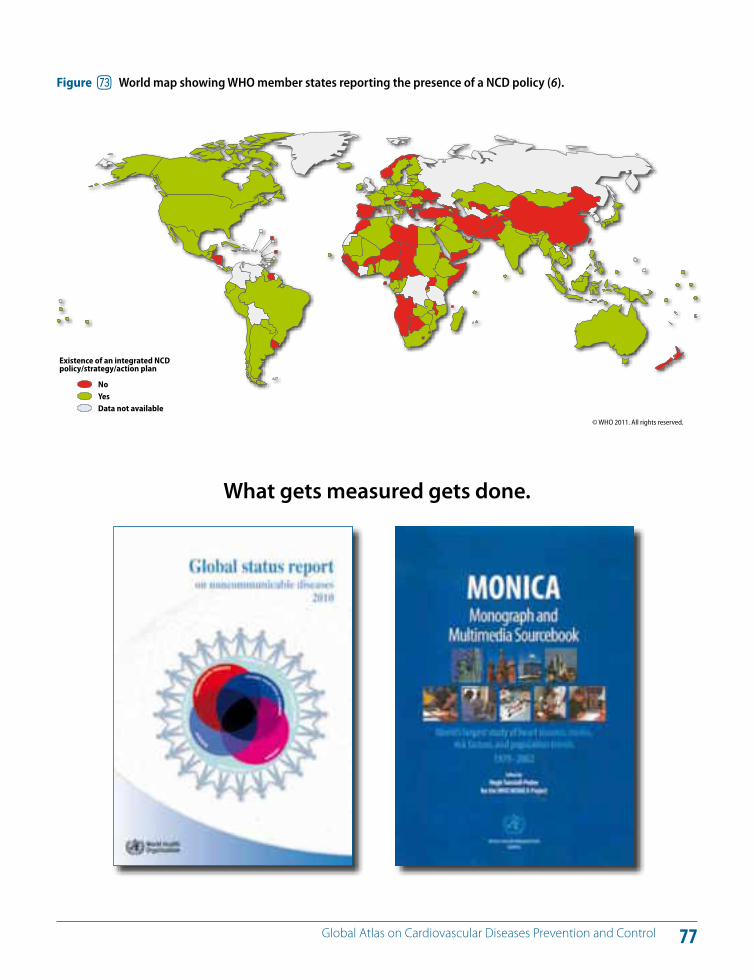
77 Global Atlas on Cardiovascular Diseases Prevention and Control
Figure ho World map showing WHO member states reporting the presence of a NCD policy (6).
© WHO 2011. All rights reserved.
Existence of an integrated NCD policy/strategy/action plan
NoYesData not available
What gets measured gets done.
78 Global Atlas on Cardiovascular Diseases Prevention and Control
To counter the global threat of the growing tobacco epi-demic, WHO Member States have negotiated the WHO Framework Convention on Tobacco Control (FCTC), which has been ratified by over 170 countries representing about 90% of the world's population (145–147). The reports from Parties indicate massive progress worldwide, with strong achievements by Parties and the Conference of Parties. Countries can take advantage of the significant progress in implementing the WHO FCTC and remarkable global momentum for tobacco control created by the treaty to further advance its implementation.
Preliminary new evidence indicates that total expenditure for implementation of tobacco control demand reduction strategies would range from US$ 0.10 to US$ 0.23/person/year in low-income and lower-middle-income countries, and from US$ 0.11 to US$ 0.72/person/year in upper-mid-dle-income countries. An important portion of this expen-diture is attributed to educational media campaigns, while other measures come at a lower cost (e.g. increasing taxes, complete smoke-free indoor environments, health warn-ings, banning tobacco advertising, promotion and spon-sorship) (6, 145, 148, 149).
Experiences in several countries show that implementing the demand reduction measures of the WHO FCTC can be accomplished in a short time and at very reasonable cost. Scaling up the implementation of the WHO FCTC is feasi-ble and would bring immense health, social and economic benefits (25, 78, 150–157).
Many countries have successfully implemented the follow-ing articles of the WHO FCTC:
Article 6: Increasing tobacco taxes and prices (Figure 74);
Article 8: Creating completely smoke-free environ-ments in indoor workplaces, public places and trans-portation;
Articles 11 and 12: Warning the population about the dangers of tobacco;
Article 13: Banning tobacco advertising, promotion and sponsorship;
Article 5.2: Creating strong national tobacco control programmes as a mechanism to exert governmental leadership in tobacco control;
Article 5.3: Protecting public health policies from com-mercial and other vested interests of the tobacco in-dustry.
More recently, the tobacco industry has been shifting its focus to LMICs, with a particular emphasis on marketing to the young and to women in these countries. This has resulted in an increase in tobacco use among the young (Figure 75) and in women. The size and reach of the to-bacco industry activities alone can, if left unchecked, undo much of the health gains achieved by many LMICs in the last 20 or so years.
CS Policies and strategies for tobacco control
KEY MESSAGES
Tobacco control interventions are best buys.
Implementing specific tobacco demand reduction measures is possible in a short time.
Accelerating progress in tobacco control requires leadership of national authorities, political commitment, e"cient governance mechanisms and investment.
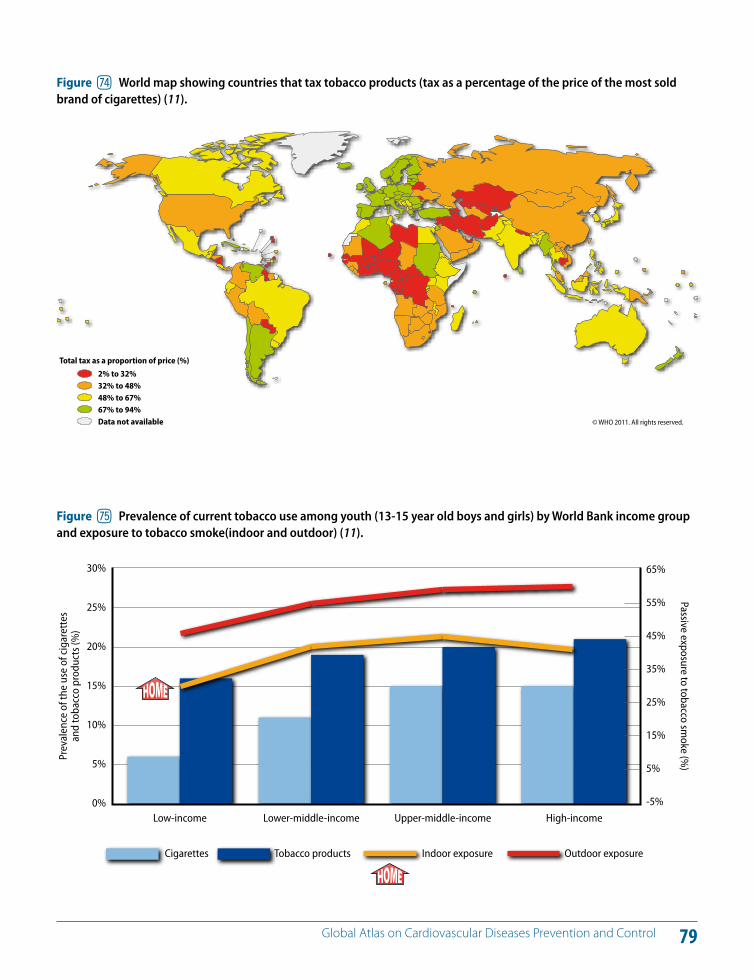
79 Global Atlas on Cardiovascular Diseases Prevention and Control
Figure hp World map showing countries that tax tobacco products (tax as a percentage of the price of the most sold brand of cigarettes) (11).
© WHO 2011. All rights reserved.
Total tax as a proportion of price (%)
2% to 32%32% to 48%48% to 67%67% to 94%Data not available
0%
5%
10%
15%
20%
25%
30%
-5%
5%
15%
25%
35%
45%
55%
65%
Upper-middle-incomeLower-middle-incomeLow-income
Prev
alen
ce o
f the
use
of c
igar
ette
s an
d to
bacc
o pr
oduc
ts (%
)Passive exposure to tobacco sm
oke (%)
High-income
Cigarettes Tobacco products Indoor exposure Outdoor exposure
Figure hq Prevalence of current tobacco use among youth (13-15 year old boys and girls) by World Bank income group and exposure to tobacco smoke(indoor and outdoor) (11).
80 Global Atlas on Cardiovascular Diseases Prevention and Control
In response to global nutrition challenges, the 63rd World Health Assembly requested WHO to develop a compre-hensive implementation plan on maternal, young child and infant nutrition that would boost the implementation of food and nutrition policies and programmes worldwide (158). In addition, to counteract the extensive advertising and other forms of food marketing to children, the 63rd World Health Assembly endorsed a set of recommenda-tions on the marketing of foods and non-alcoholic bever-ages to children (81). The document calls for national and international action to reduce the impact on children of marketing of foods high in saturated fats, trans-fatty acids, free sugars or salt.
The maximum benefit of a life-course approach to improv-ing nutrition would be achieved from interventions target-ing early stages of life as well as actions towards older chil-dren and adolescents (80, 159–163). There is evidence that poor nutrition during pregnancy and early life increases the predisposition to NCDs later in life (72–74). Television advertising is associated with increased consumption of snacks and drinks high in sugar, consumption of nutrient-poor foods and increased caloric intake. Figures 76 and 77 show trans-fatty acids as a percentage of total fat in fast foods sold in selected countries. Improvement of infant and young child feeding and the reduction in marketing of foods and non-alcoholic beverages high in salt, fats and sugar to children are cost-e!ective actions to reduce CVDs and other NCDs. Figure 78 shows countries that have taken regulatory action to reduce trans-fats.
There is evidence to suggest that multipronged interven-tion strategies have the potential to achieve greater health gains than individual interventions, and often with greater cost e!ectiveness. Additionally, a combination of national and local-level actions in di!erent sectors is beneficial to the implementation of food and nutrition policies. They in-clude maternity protection at work, improvement of family and community practices, improving skills in health work-ers, communication and information strategies, product labelling to help consumers make the right food choices and improving school food in combination with educa-tional activities and interventions in workplace settings (3, 25, 80, 151–163).
Figure 79 shows the salt consumption per capita and salt consumption surplus in selected countries. WHO has set a global target for maximum intake of salt for adults at 5 grams/day (i.e. 2000 mg/day of sodium) or lower if speci-fied by national targets (43, 49, 50, 159). High-income coun-tries are taking steps to reduce population salt intake by reducing salt in processed food (45). In rural areas in LMICs, where most of the salt consumed comes from salt added during cooking or from sauces and additives, a public edu-cation campaign is needed to encourage people to use less salt. In urban areas in LMICs, there is increasing con-sumption of processed and prepared food. In these areas, a combination of measures, including a food industry re-sponse to reduce the amount of salt added to food, food labelling and consumer education, will be required to re-duce the population intake of sodium.
CT Policies and strategies to facilitate healthy eating
KEY MESSAGES
Reduction of saturated and trans-fatty acids, reduction of salt from industrially processed food, reduction of marketing of food and non-alcoholic beverages to children and improvement of availability of fruits and vegetables are interventions that can have a high impact in preventing CVDs.
Accelerating progress in reducing diet-related NCDs/CVDs requires the leadership of national authorities, political commitment, e"cient governance mechanisms and adequate investment.
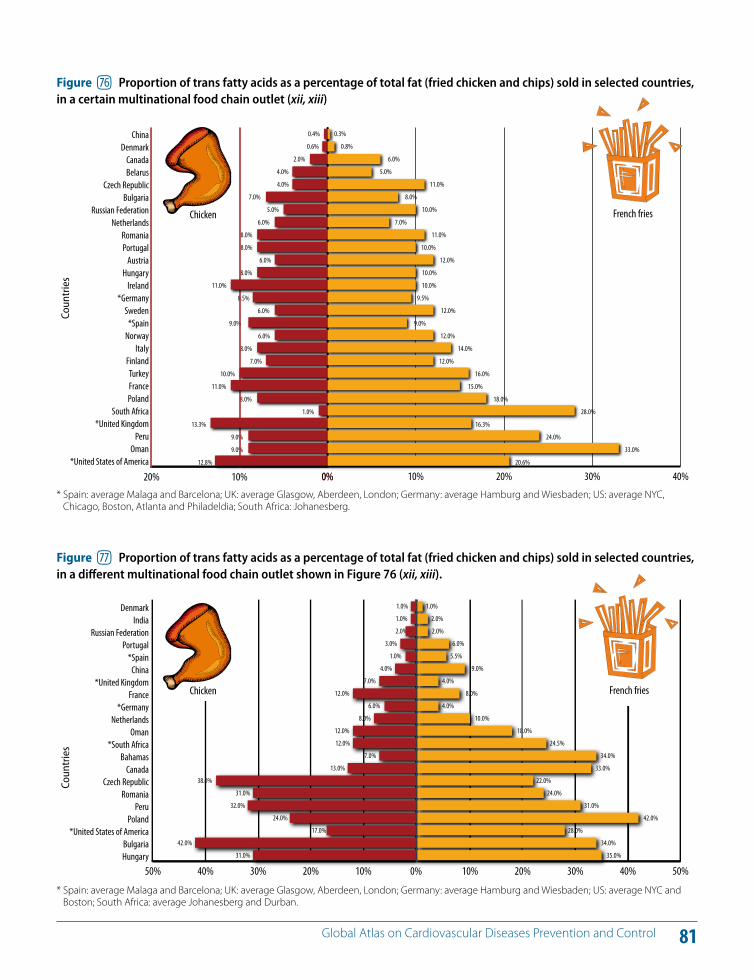
81 Global Atlas on Cardiovascular Diseases Prevention and Control
0.4%
0.6%
2.0%
4.0%
4.0%
7.0%
5.0%
6.0%
8.0%
8.0%
6.0%
8.0%
11.0%
8.5%
6.0%
9.0%
6.0%
8.0%
7.0%
10.0%
11.0%
8.0%
1.0%
13.3%
9.0%
9.0%
12.8%
0.3%
0.8%
6.0%
5.0%
11.0%
8.0%
10.0%
7.0%
11.0%
10.0%
12.0%
10.0%
10.0%
9.5%
12.0%
9.0%
12.0%
14.0%
12.0%
16.0%
15.0%
18.0%
28.0%
16.3%
24.0%
33.0%
20.6%
20% 10% 0%*United States of America
OmanPeru
*United KingdomSouth Africa
PolandFranceTurkey
FinlandItaly
Norway*Spain
Sweden*Germany
IrelandHungary
AustriaPortugalRomania
NetherlandsRussian Federation
BulgariaCzech Republic
BelarusCanada
DenmarkChina
0% 10% 20% 30% 40%
Coun
trie
s
Figure hr Proportion of trans fatty acids as a percentage of total fat (fried chicken and chips) sold in selected countries, in a certain multinational food chain outlet (xii, xiii)
1.0%
1.0%
2.0%
3.0%
1.0%
4.0%
7.0%
12.0%
6.0%
8.0%
12.0%
12.0%
7.0%
13.0%
38.0%
31.0%
32.0%
24.0%
17.0%
42.0%
31.0%
1.0%
2.0%
2.0%
6.0%
5.5%
9.0%
4.0%
8.0%
4.0%
10.0%
18.0%
24.5%
34.0%
33.0%
22.0%
24.0%
31.0%
42.0%
28.0%
34.0%
35.0%
Proportion of trans-fatty acids as a percentage of total fat
Coun
trie
s
50% 40% 30% 20% 10% 0%HungaryBulgaria
*United States of AmericaPoland
PeruRomania
Czech RepublicCanada
Bahamas*South Africa
OmanNetherlands
*GermanyFrance
*United KingdomChina
*SpainPortugal
Russian FederationIndia
Denmark
10% 20% 30% 40% 50%
Proportion of trans-fatty acids as a percentage of total fat
Figure hs Proportion of trans fatty acids as a percentage of total fat (fried chicken and chips) sold in selected countries, in a di!erent multinational food chain outlet shown in Figure 76 (xii, xiii).
* Spain: average Malaga and Barcelona; UK: average Glasgow, Aberdeen, London; Germany: average Hamburg and Wiesbaden; US: average NYC, Chicago, Boston, Atlanta and Philadeldia; South Africa: Johanesberg.
* Spain: average Malaga and Barcelona; UK: average Glasgow, Aberdeen, London; Germany: average Hamburg and Wiesbaden; US: average NYC and Boston; South Africa: average Johanesberg and Durban.
Chicken
Chicken
French fries
French fries
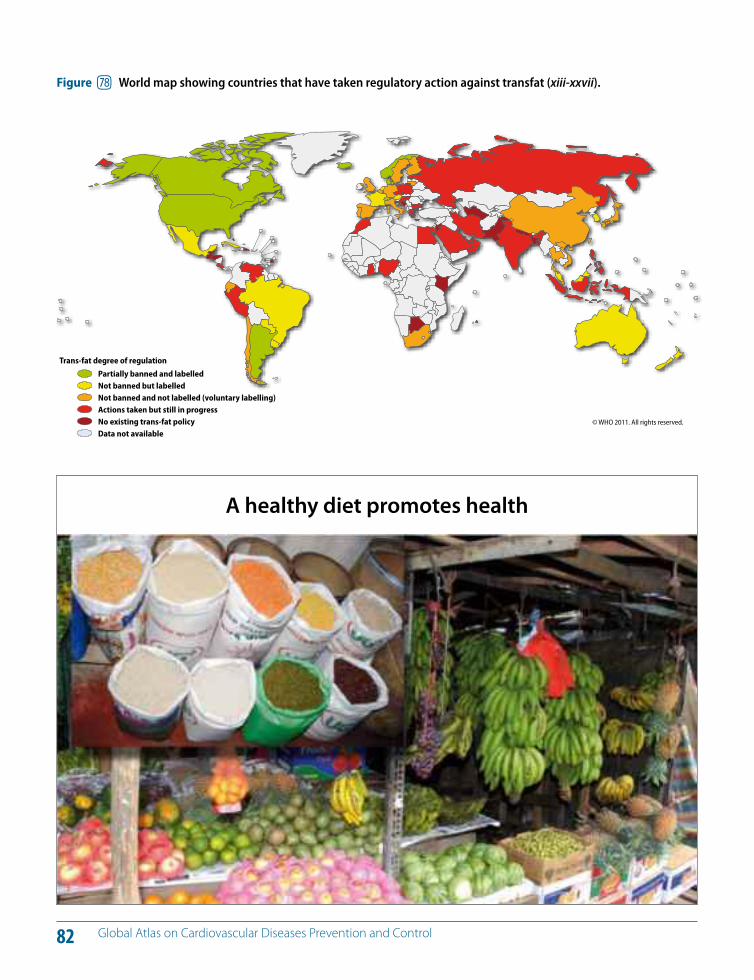
82 Global Atlas on Cardiovascular Diseases Prevention and Control
Figure ht World map showing countries that have taken regulatory action against transfat (xiii-xxvii).
© WHO 2011. All rights reserved.
Trans-fat degree of regulation
Partially banned and labelledNot banned but labelledNot banned and not labelled (voluntary labelling)Actions taken but still in progressNo existing trans-fat policyData not available
A healthy diet promotes health
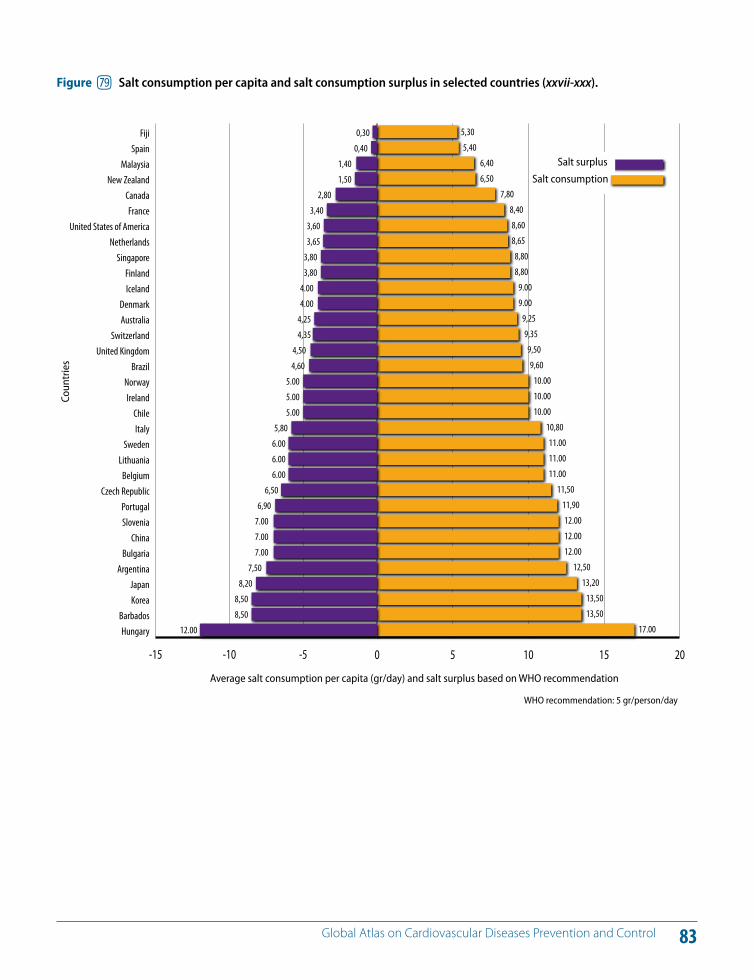
83 Global Atlas on Cardiovascular Diseases Prevention and Control
0,300,40
1,401,50
2,803,40
3,603,65
3,803,80
4.004.00
4,254,35
4,504,60
5.005.005.00
5,806.006.006.00
6,506,90
7.007.007.00
7,508,20
8,508,50
12.00
5,305,40
6,406,50
7,808,408,608,658,808,80
9.009.00
9,259,359,509,60
10.0010.0010.00
10,8011.0011.0011.00
11,5011,9012.0012.0012.00
12,5013,20
13,5013,50
17.00
Average salt consumption per capita (gr/day) and salt surplus based on WHO recommendation
WHO recommendation: 5 gr/person/day
Coun
trie
s
0 5 10 15 20-15 -10 -5
HungaryBarbados
KoreaJapan
ArgentinaBulgaria
ChinaSloveniaPortugal
Czech RepublicBelgium
LithuaniaSweden
ItalyChile
IrelandNorway
BrazilUnited Kingdom
SwitzerlandAustraliaDenmark
IcelandFinland
SingaporeNetherlands
United States of AmericaFrance
CanadaNew Zealand
MalaysiaSpain
Fiji
Salt surplus
Salt consumption
Figure hu Salt consumption per capita and salt consumption surplus in selected countries (xxvii-xxx).
84 Global Atlas on Cardiovascular Diseases Prevention and Control
Physical activity can play a significant role in the preven-tion and control of CVD and in addressing overweight and obesity (Figures 80–82). There are many gaps and chal-lenges encountered in improving physical activity levels, and intersectoral action is required to address them. Areas for action on physical activity promotion include: (i) school-based programmes; (ii) transport policies that prioritize walking and cycling; (iii) urban design; (iv) primary health care; (v) public awareness and mass media; (vi) communi-ty-wide programmes; and (vii) sports system/programmes. An e!ective approach requires the implementation of mul-tiple concurrent strategies, therefore, the participation of the sectors and leaders corresponding to each of these ar-eas of action is critical. In many countries, the first step has been to engage these key sectors to raise their awareness about how their policies and actions are a!ecting health.
Adequate levels of physical activity, including moderate intensity physical activity such as everyday walking and cycling as a means of transportation, can best be achieved through an enabling environment. Thus, increasing physi-cal activity is a societal and not just an individual undertak-ing. As such, it demands a population-based, multisectoral, multidisciplinary and culturally relevant approach (163,164).
In urban settings, the changing environment is reducing opportunities for physical activity. City dwellers are also
likely to have sedentary occupations, to use motorized means of transportation and be less likely to engage in physical activity during their leisure and recreation time.
The WHO Global NCD Action Plan (2008) urges Member States to promote physical activity through the implemen-tation of school-based interventions and the provision of physical environments that support safe active commut-ing, safe transport and the creation of space for recreation-al activity (3).
All the evidence on changing physical activity habits shows that creating an enabling environment, providing appropriate information and ensuring wide accessibility are critical to influencing behaviour change, regardless of the setting.
CU Policies and strategies to facilitate physical activity
KEY MESSAGES
An enabling environment facilitates regular physical activity.
Physical activity is influenced by policies and practices in many sectors, including transport, sport, education, environment, urban design and the media.
It is critical to engage all stakeholders as part of the solution for physical inactivity.
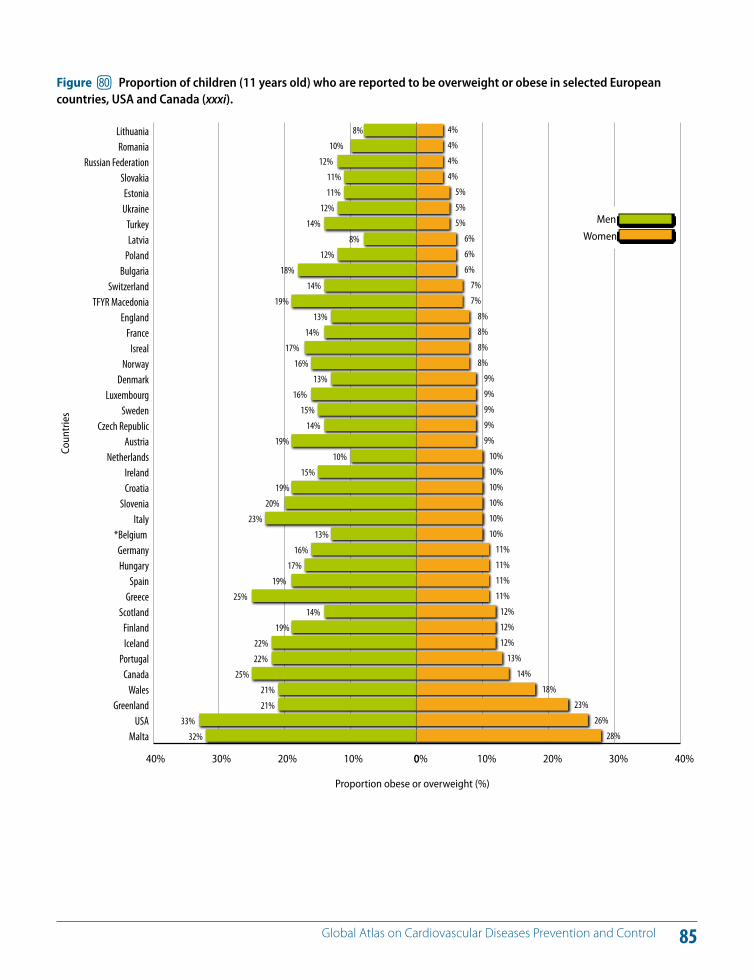
85 Global Atlas on Cardiovascular Diseases Prevention and Control
4%
4%
4%
4%
5%
5%
5%
6%
6%
6%
7%
7%
8%
8%
8%
8%
9%
9%
9%
9%
9%
10%
10%
10%
10%
10%
10%
11%
11%
11%
11%
12%
12%
12%
13%
14%
18%
23%
26%
28%
Proportion obese or overweight (%)
Coun
trie
s
40% 30% 20% 10% 0
MaltaUSA
GreenlandWales
CanadaPortugal
IcelandFinland
ScotlandGreece
SpainHungaryGermany
*Belgium Italy
SloveniaCroatiaIreland
NetherlandsAustria
Czech RepublicSweden
LuxembourgDenmark
NorwayIsreal
FranceEngland
TFYR MacedoniaSwitzerland
BulgariaPolandLatviaTurkey
UkraineEstonia
SlovakiaRussian Federation
RomaniaLithuania
0% 10% 20% 30% 40%
Men
Women
8%
10%
12%
11%
11%
12%
14%
8%
12%
18%
14%
19%
13%
14%
17%
16%
13%
16%
15%
14%
19%
10%
15%
19%
20%
23%
13%
16%
17%
19%
25%
14%
19%
22%
22%
25%
21%
21%
33%
32%
Figure il Proportion of children (11 years old) who are reported to be overweight or obese in selected European countries, USA and Canada (xxxi).
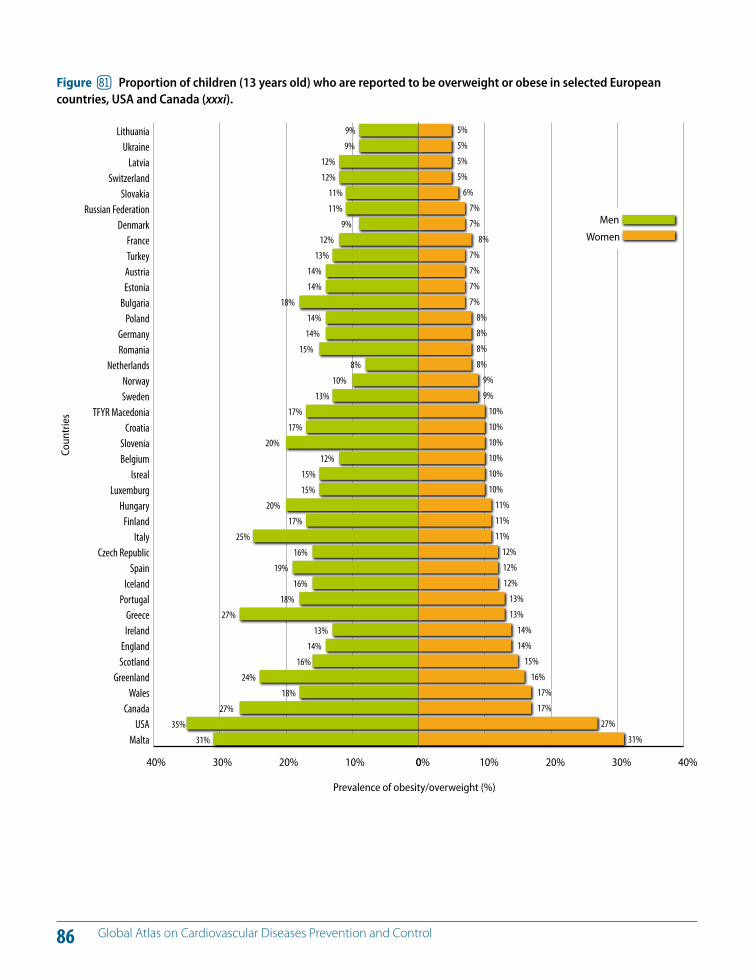
86 Global Atlas on Cardiovascular Diseases Prevention and Control
Prevalence of obesity/overweight (%)
Coun
trie
s
40% 30% 20% 10% 0
MaltaUSA
CanadaWales
GreenlandScotlandEngland
IrelandGreece
PortugalIceland
SpainCzech Republic
ItalyFinland
HungaryLuxemburg
IsrealBelgiumSlovenia
CroatiaTFYR Macedonia
SwedenNorway
NetherlandsRomaniaGermany
PolandBulgaria
EstoniaAustriaTurkeyFrance
DenmarkRussian Federation
SlovakiaSwitzerland
LatviaUkraine
Lithuania
0% 10% 20% 30% 40%
Men
Women
9%
9%
12%
12%
11%
11%
9%
12%
13%
14%
14%
18%
14%
14%
15%
8%
10%
13%
17%
17%
20%
12%
15%
15%
20%
17%
25%
16%
19%
16%
18%
27%
13%
14%
16%
24%
18%
27%
35%
31%
5%
5%
5%
5%
6%
7%
7%
8%
7%
7%
7%
7%
8%
8%
8%
8%
9%
9%
10%
10%
10%
10%
10%
10%
11%
11%
11%
12%
12%
12%
13%
13%
14%
14%
15%
16%
17%
17%
27%
31%
Figure im Proportion of children (13 years old) who are reported to be overweight or obese in selected European countries, USA and Canada (xxxi).
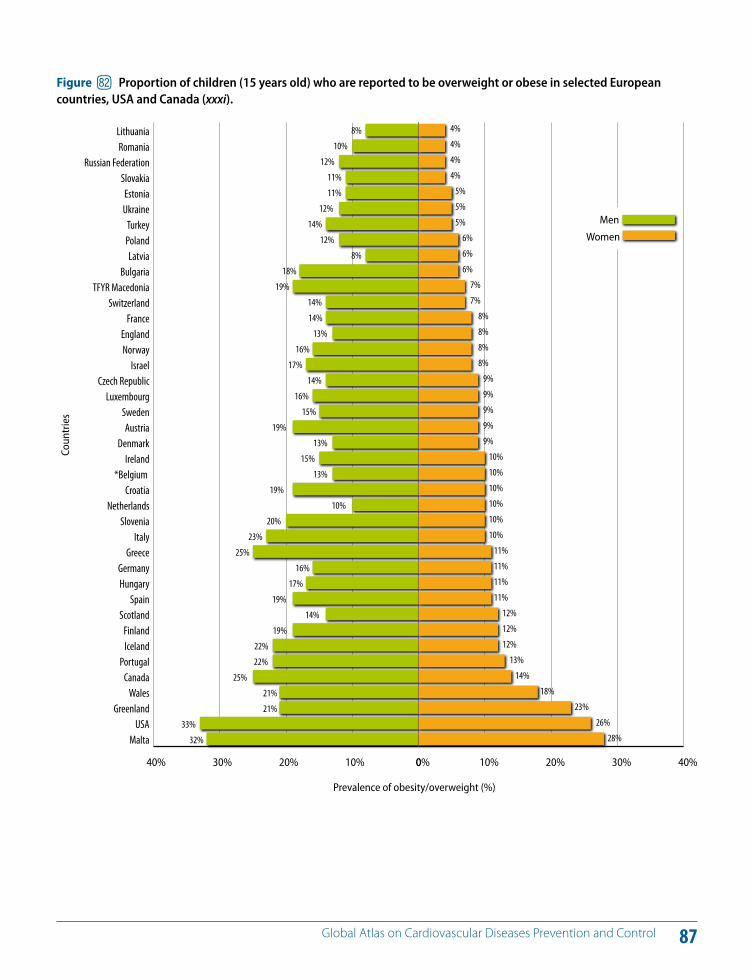
87 Global Atlas on Cardiovascular Diseases Prevention and Control
Prevalence of obesity/overweight (%)
Coun
trie
s
40% 30% 20% 10% 0
MaltaUSA
GreenlandWales
CanadaPortugal
IcelandFinland
ScotlandSpain
HungaryGermany
GreeceItaly
SloveniaNetherlands
Croatia*Belgium
IrelandDenmark
AustriaSweden
LuxembourgCzech Republic
IsraelNorwayEngland
FranceSwitzerland
TFYR MacedoniaBulgaria
LatviaPolandTurkey
UkraineEstonia
SlovakiaRussian Federation
RomaniaLithuania
0% 10% 20% 30% 40%
Men
Women
8%
10%
12%
11%
11%
12%
14%
12%
8%
18%
19%
14%
14%
13%
16%
17%
14%
16%
15%
19%
13%
15%
13%
19%
10%
20%
23%
25%
16%
17%
19%
14%
19%
22%
22%
25%
21%
21%
33%
32%
4%
4%
4%
4%
5%
5%
5%
6%
6%
6%
7%
7%
8%
8%
8%
8%
9%
9%
9%
9%
9%
10%
10%
10%
10%
10%
10%
11%
11%
11%
11%
12%
12%
12%
13%
14%
18%
23%
26%
28%
Figure in Proportion of children (15 years old) who are reported to be overweight or obese in selected European countries, USA and Canada (xxxi).
88 Global Atlas on Cardiovascular Diseases Prevention and Control
The Global Strategy to Reduce the Harmful Use of Alco-hol, endorsed by the World Health Assembly in May 2010 and the WHA resolutions WHA61.4, WHA63.13 (79) and WHA58.26 (165) as well as the regional and subregional strategies and action plans provide the necessary policy and implementation frameworks for reducing the harmful use of alcohol. The reduction of alcohol-related harm en-tails a range of e!ective measures implemented at all lev-els, including population-based measures and adequate health services responses such as early identification of people at risk and subsequent interventions (166–169). Fig-ures 83 and 84 show the prevalence of alcohol consump-tion of students (13–15 years) from selected countries. Special attention needs to be paid for preventing alcohol consumption in children.
The following strategies and interventions have the high-est level of e!ectiveness to prevent the harmful use of al-cohol:
increasing excise taxes on alcoholic beverages; regulating physical availability of alcoholic beverages,
including minimum legal purchase age, restrictions on outlet density and time and place of sales, public health oriented licensing systems and governmental monop-olies of retail sales;
drink-driving countermeasures such as lowered blood alcohol concentration limits and “zero tolerance” for young drivers, random breath testing and sobriety check points;
legal-based comprehensive restrictions on bans on ad-vertising and promotion of alcoholic beverages;
treatment of alcohol use disorders and brief interven-tions for hazardous and harmful drinking.
The challenge to the implementation of these e!ective strategies is to ensure mobilization of political will and the necessary resources for sustainable multisectoral action to guarantee the necessary resources and establish appropri-ate monitoring and evaluation mechanisms.
The French alcohol and tobacco policy law – La Loi Évin (formally Loi n°91–32 du 10 janvier 1991 relative à la lutte contre le tabagisme etl'alcoolisme) – provides examples of restrictions on alcohol advertising and marketing (170). This policy bans the advertising of all alcoholic beverages containing over 1.2% alcohol by volume on television or in cinemas, and prohibits sponsorship of sports or cultural events by alcohol companies. La Loi Évin also prohibits the targeting of young people and controls the content of alcohol advertisements. Messages and images must refer only to the characteristics of the products and a health warning must be included in each advertisement. In 2008, this legislation was extended to apply to alcohol advertis-ing on the Internet and in newspaper and magazine edi-torials. Alcohol advertising is only permitted in the press for adults, on billboards, on radio channels (under certain conditions) and at some special events or places. There are significant monetary sanctions for infringements of the law, which have ensured its implementation.
DL Policies and strategies to address the harmful use of alcohol
KEY MESSAGES
Addressing the harmful use of alcohol is one of the key components of NCD/CVD prevention and control.
There are cost-e!ective interventions with good return (best buys) for addressing the harmful use of alcohol.
Best buys include increasing alcoholic beverage excise taxes, restricting access to alcoholic beverages and comprehensive restrictions and bans on advertising and promotion of alcoholic beverages.
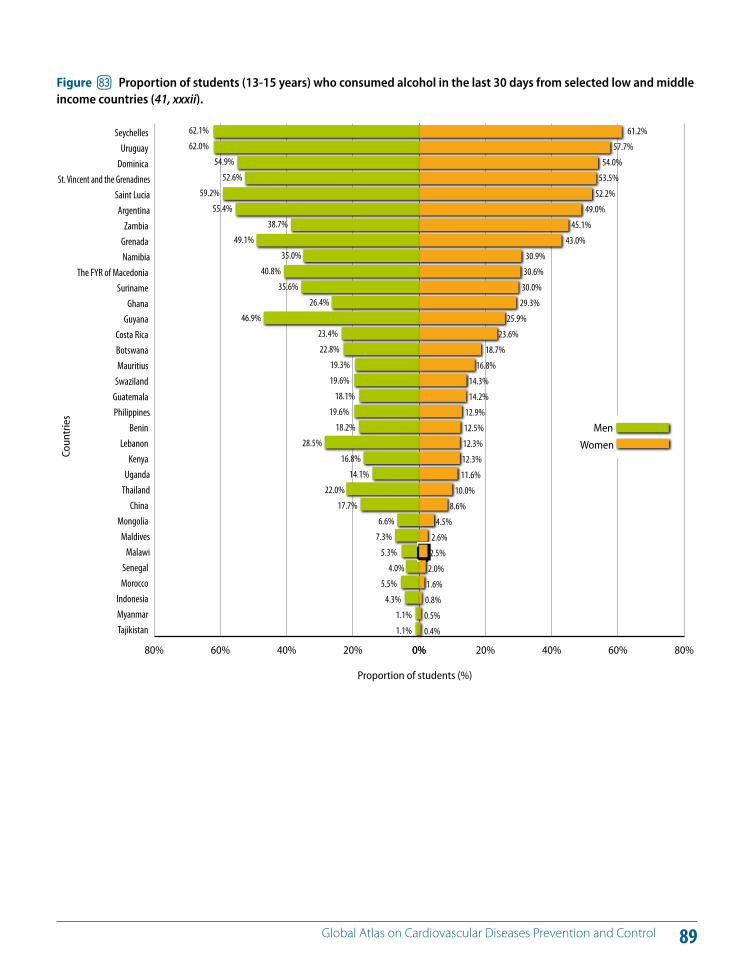
89 Global Atlas on Cardiovascular Diseases Prevention and Control
Proportion of students (%)
Coun
trie
s
80% 60% 40% 20% 0%
Tajikistan Myanmar Indonesia
Morocco Senegal
MalawiMaldives
Mongolia China
ThailandUganda
Kenya Lebanon
Benin PhilippinesGuatemala Swaziland Mauritius Botswana Costa Rica
Guyana Ghana
Suriname The FYR of Macedonia
NamibiaGrenada Zambia
ArgentinaSaint Lucia
St. Vincent and the GrenadinesDominica Uruguay
Seychelles 62.1%
62.0%
54.9%
52.6%
59.2%
55.4%
38.7%
49.1%
35.0%
40.8%
35.6%
26.4%
46.9%
23.4%
22.8%
19.3%
19.6%
18.1%
19.6%
18.2%
28.5%
16.8%
14.1%
22.0%
17.7%
6.6%
7.3%
5.3%
4.0%
5.5%
4.3%
1.1%
1.1%
0% 20% 40% 60% 80%
61.2%
57.7%
54.0%
53.5%
52.2%
49.0%
45.1%
43.0%
30.9%
30.6%
30.0%
29.3%
25.9%
23.6%
18.7%
16.8%
14.3%
14.2%
12.9%
12.5%
12.3%
12.3%
11.6%
10.0%
8.6%
4.5%
2.6%
2.5%
2.0%
1.6%
0.8%
0.5%
0.4%
Men
Women
Figure io Proportion of students (13-15 years) who consumed alcohol in the last 30 days from selected low and middle income countries (41, xxxii).
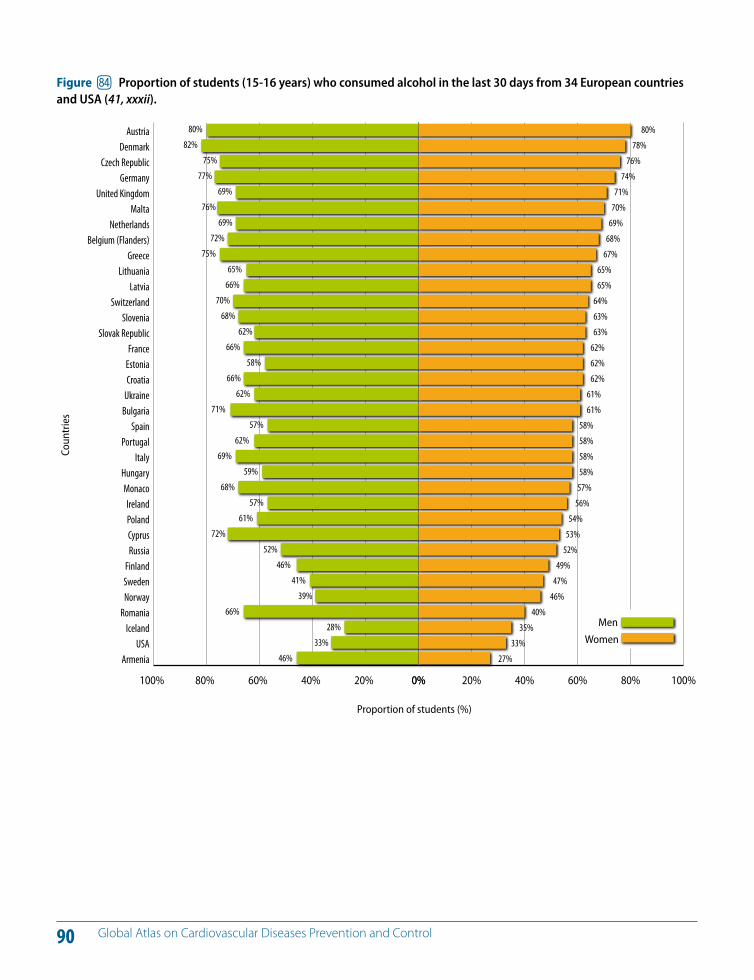
90 Global Atlas on Cardiovascular Diseases Prevention and Control
Proportion of students (%)
Coun
trie
s
100% 80% 60% 40% 20% 0%
ArmeniaUSA
IcelandRomania
NorwaySwedenFinland
RussiaCyprusPolandIreland
MonacoHungary
ItalyPortugal
SpainBulgariaUkraineCroatiaEstoniaFrance
Slovak RepublicSlovenia
SwitzerlandLatvia
LithuaniaGreece
Belgium (Flanders)Netherlands
MaltaUnited Kingdom
GermanyCzech Republic
DenmarkAustria 80%
82%75%
77%69%
76%69%
72%75%
65%66%
70%68%
62%66%
58%66%
62%71%
57%62%
69%59%
68%57%
61%72%
52%46%
41%39%
66%28%
33%46%
0% 20% 40% 60% 80% 100%
80%78%
76%74%
71%70%
69%68%
67%65%65%
64%63%63%
62%62%62%
61%61%
58%58%58%58%
57%56%
54%53%
52%49%
47%46%
40%35%
33%27%
Men
Women
Figure ip Proportion of students (15-16 years) who consumed alcohol in the last 30 days from 34 European countries and USA (41, xxxii).
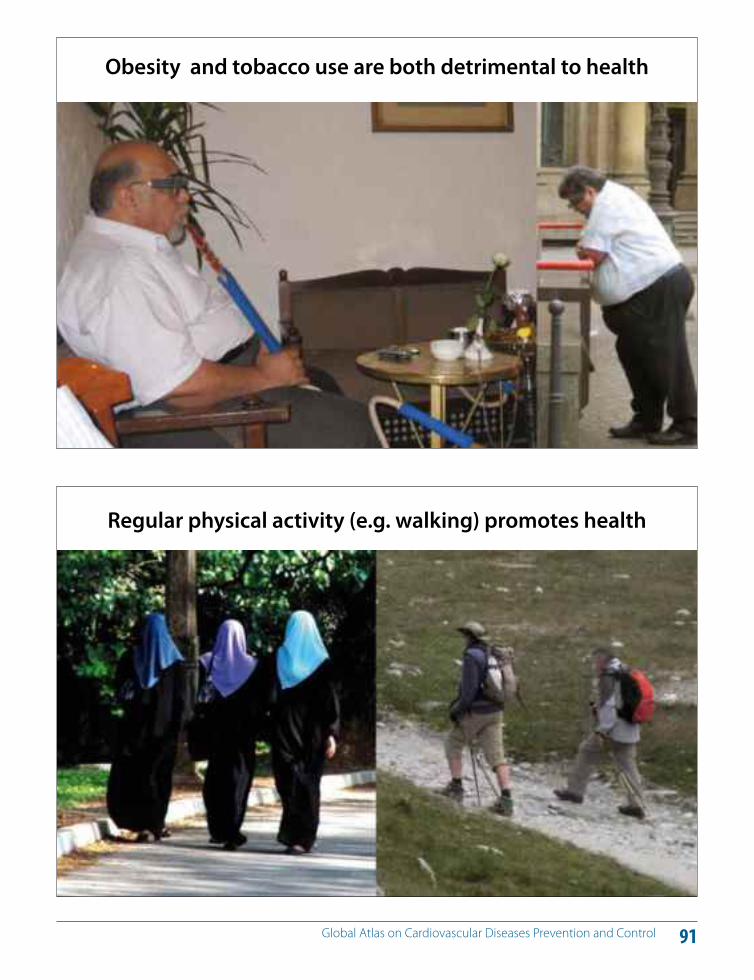
91 Global Atlas on Cardiovascular Diseases Prevention and Control
Obesity and tobacco use are both detrimental to health
Regular physical activity (e.g. walking) promotes health

92 Global Atlas on Cardiovascular Diseases Prevention and Control
Simultaneous actions to reduce the cardiovascular risk of the entire population and high-risk individuals are required to address the burgeoning CVD epidemic (Figures 85–88). E!ective individual interventions developed and applied during the last two decades fall into three di!erent catego-ries (4, 6, 171–175). One category of health service interven-tions pertains to acute events and should ideally be deliv-ered in special units dealing with coronary care, stroke care or intensive care. A second category of interventions such as coronary bypass surgery, deals with complications and advanced stages of disease. They both require health work-ers with specific skills, high technology equipment, costly treatment and tertiary hospital infrastructure. The third cat-egory of interventions, by contrast, can be applied at the first contact level. These primary health care interventions are crucial for providing the essential standards of care for the four major groups of NCDs and for reducing the de-mand for the first two categories of interventions (173). Im-proved access to highly cost-e!ective interventions at the primary health care level will have the greatest potential in reversing the progression of the disease, preventing com-plications and in reducing hospitalizations, health-care costs and out-of-pocket expenditures.
For prevention of coronary heart disease and stroke, indi-vidual interventions need to be targeted to those at high total cardiovascular risk based on the presence of combi-nations of risk factors. If interventions are aimed at single-risk factor levels above traditional thresholds such as hy-pertension and hypercholesterolaemia (4, 6) they become
less cost e!ective. The former approach also has a higher potential to reduce cardiovascular events (4, 6). Further-more, it is also feasible to apply the approach to assess and treat cardiovascular risk in primary care in low-resource settings even by non-physician health workers (176, 177). It has been estimated that a regimen of aspirin, statins and two blood pressure lowering agents could significantly re-duce the risk of death from CVD in people at high cardio-vascular risk (4, 22, 174, 178, 179). Providing such a regimen to those eligible between 40 and 79 years of age has been estimated to avert about one fifth of cardiovascular deaths in the next 10 years, with 56% of deaths averted in people younger than 70 (174, 179–181).
For secondary prevention of CVD (prevention of recurrenc-es and complications in those with established disease), aspirin, beta-blockers, angiotensin converting enzyme in-hibitors and lipid-lowering therapies lower the risk of recur-rent cardiovascular events by about 25% each, including for those with diabetes (4, 6, 48, 171). The benefits of these interventions are largely independent so that when used together with smoking cessation about 75% of recurrent vascular events could be prevented (171). Currently, there are major gaps in the implementation of primary and sec-ondary prevention interventions that could be delivered in primary care (6, 182).
DM Individual interventions for prevention and control of CVDs
KEY MESSAGES
There is a range of evidence-based personal interventions that have been demonstrated to have a significant impact on the health outcomes of people with established disease or at high risk of CVD.
Due to limited resources and weak health systems most of these interventions are not available or accessible to people who need them.
Unless the resource availability and limitations in health systems improve dramatically, a commitment to universal coverage seems unrealistic and unsustainable from an NCD perspective for low-income and lower-middle-income countries.
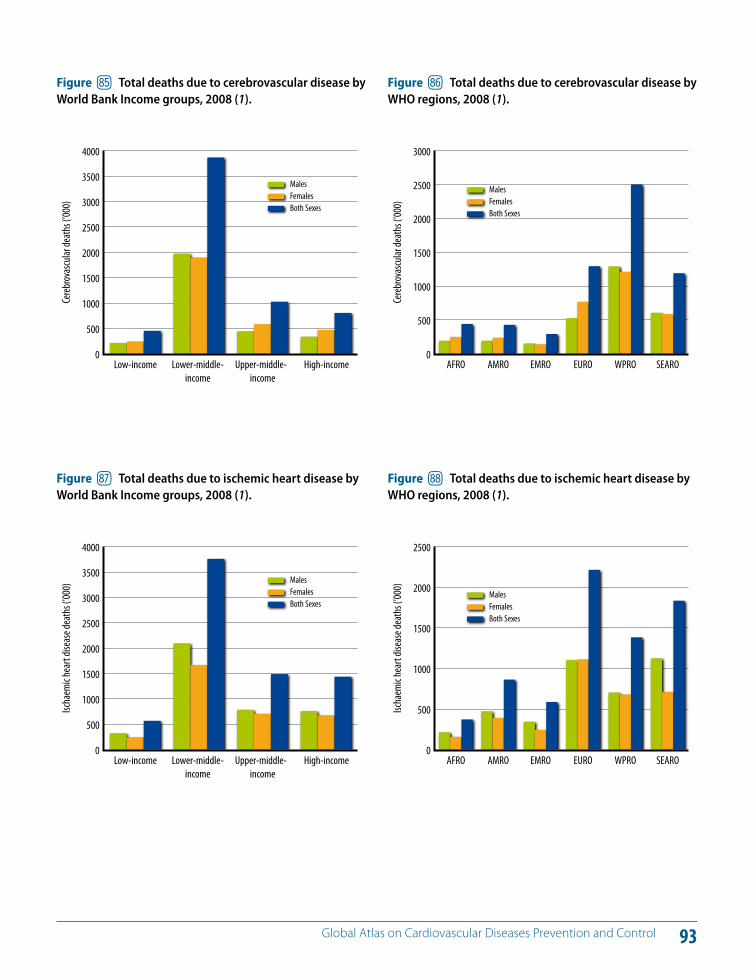
93 Global Atlas on Cardiovascular Diseases Prevention and Control
0
500
1000
1500
2000
2500
3000
3500
4000
Upper-middle-income
Lower-middle-income
Low-income
Cereb
rovas
cular
death
s (’00
0)
High-income
MalesFemalesBoth Sexes
Figure iq Total deaths due to cerebrovascular disease by World Bank Income groups, 2008 (1).
0
500
1000
1500
2000
2500
3000
WPROEUROEMROAMROAFRO SEARO
Cereb
rovas
cular
death
s (’00
0)
MalesFemalesBoth Sexes
Figure ir Total deaths due to cerebrovascular disease by WHO regions, 2008 (1).
0
500
1000
1500
2000
2500
3000
3500
4000
Upper-middle-income
Lower-middle-income
Low-income
Ischa
emic
hear
t dise
ase d
eath
s (’00
0)
High-income
MalesFemalesBoth Sexes
Figure is Total deaths due to ischemic heart disease by World Bank Income groups, 2008 (1).
0
500
1000
1500
2000
2500
WPROEUROEMROAMROAFRO SEARO
Ischa
emic
hear
t dise
ase d
eath
s (’00
0)
MalesFemalesBoth Sexes
Figure it Total deaths due to ischemic heart disease by WHO regions, 2008 (1).
94 Global Atlas on Cardiovascular Diseases Prevention and Control
If rising trends of CVDs are to be halted and reversed, cur-rent approaches to addressing them need to be reformed. At present, the main focus of health care for CVD in many LMICS is tertiary care based. Tertiary care, including stroke units, coronary care units and rehabilitation units, play an important role in improving outcomes of people who suf-fer CVD events. However, balancing investment in primary, secondary and tertiary care is vital for sustainability of CVD programmes.
Currently, a large proportion of people with high cardio-vascular risk remains undiagnosed and often even those diagnosed have insu"cient access to treatment. When diagnosis is made, it is frequently at a late stage of the dis-ease, when people become symptomatic and are admit-ted to hospitals with acute myocardial infarction or stroke and when costly high-technology interventions are re-quired for treatment. Examples of such costly health-care interventions include coronary artery bypass surgery and other types of vascular surgery for unstable angina and cerebrovascular disease (6, 106, 171).
Early detection is key to improving outcomes of CVDs. Af-fordable tools (e.g. clinical measurements, laboratory in-vestigations, cardiovascular risk assessment charts, a!ord-able blood pressure measurement devices) are available for early detection of people with disease and those at high risk (4, 6, 183). Since CVDs are asymptomatic in early stages, such tools need to be proactively utilized to detect those at risk of developing heart attacks or strokes. As pop-
ulation-wide screening is not a!ordable for LMICs, targeted screening of people in di!erent settings (e.g. adults over a certain age screened at primary care facilities, worksites and community settings) is an approach used for early de-tection and diagnosis. Addressing cardiovascular risk has been demonstrated to be more e"cient when a total-risk approach is used (178, 184, 185).
The primary health care approach places equity as a cen-tral value across all health system functions: governance, health information, workforce, service delivery, providing essential medicines and technologies (186, 187). Universal health coverage is receiving increasing priority as part of the agendas of health systems strengthening. The health sector could address health inequities related to CVD by taking steps towards universal health coverage, starting with the implementation of a set of high-impact essential CVD interventions (6, 173). Strengthening primary health care also requires ensuring performance, quality and e!ec-tiveness of service delivery. Equitable health system financ-ing and the location of health-care services as well as the motivation and training of the health workforce (Figures 89 and 90) are crucial to positively impact health inequi-ties (188, 189). The shortfall of physicians in many parts of the world call for engaging non-physician health workers in service delivery for NCD/CVD, particularly in primary care (Figures 89 and 90). A participatory approach by communi-ties in service delivery is also important for reducing health inequities.
DN Role of primary health care in prevention and control of CVDs
KEY MESSAGES
A balanced investment between primary care and other levels of care is vital for prevention and control of CVD.
Prevention and control of CVD cannot be addressed without strengthening primary care.
Prioritizing, financing and strengthening the health systems to deliver a realistic set of high-impact personal CVD/NCD interventions may be a pragmatic first step to achieve the long-term vision of universal coverage.
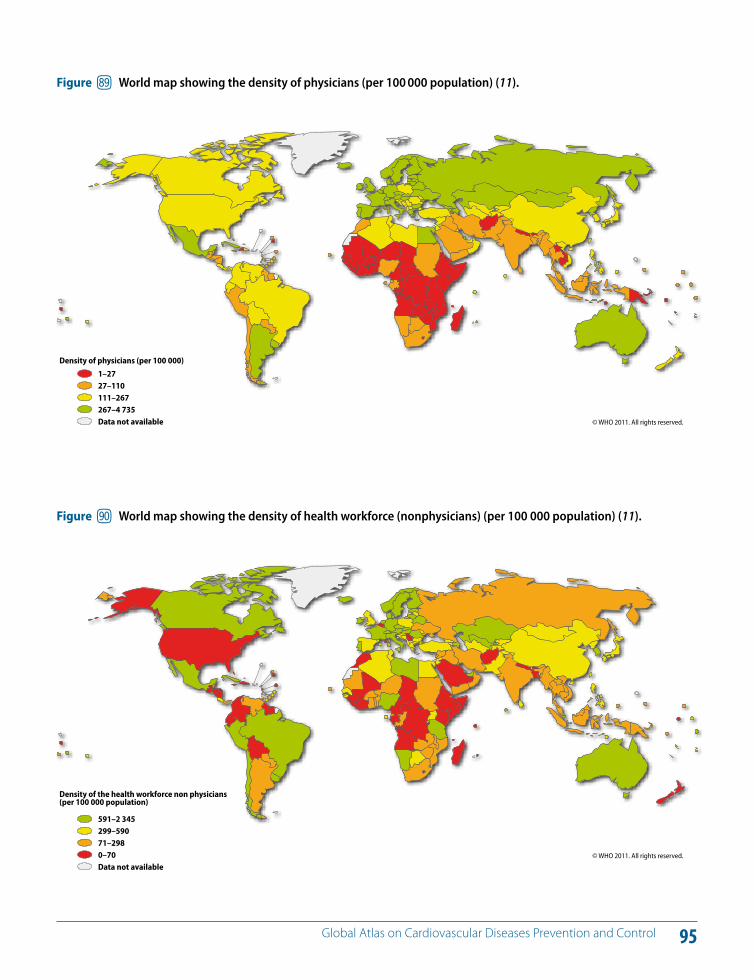
95 Global Atlas on Cardiovascular Diseases Prevention and Control
Figure iu World map showing the density of physicians (per 100 000 population) (11).
© WHO 2011. All rights reserved.
Density of physicians (per 100 000)
1–2727–110111–267267–4 735Data not available
Figure jl World map showing the density of health workforce (nonphysicians) (per 100 000 population) (11).
© WHO 2011. All rights reserved.
Density of the health workforce non physicians (per 100 000 population)
591–2 345299–59071–2980–70Data not available

96 Global Atlas on Cardiovascular Diseases Prevention and Control
The CVD epidemic is progressing relentlessly in LMICs. As shown in the world maps (Figures 91 and 92), there is a large disease burden worldwide attributable to heart at-tacks and strokes. Policy-makers and investors often ask whether CVD can be tackled and, if so, where the focus of attention should be. There is clear evidence that pre-vention interventions work and that improved access to health care can reduce the burden of morbidity, disability and premature mortality. However, in making a decision, policy-makers also want to know what evidence there is to show that interventions will represent a cost-e!ective use of resources in the settings in which they are to be imple-mented and that scaling up these interventions is appro-priate, a!ordable and feasible.
Cost e!ectiveness summarizes the e"ciency with which an intervention produces health outcomes. Feasibility of an intervention depends on: (i) reach (the capacity of the health system to deliver an intervention to the targeted population); (ii) technical complexity; (iii) capital intensity (the amount of capital required for an intervention); and (iv) cultural acceptability.
A set of interventions exists for the prevention and control of CVD that has a significant public health impact and is highly cost e!ective, inexpensive and feasible to imple-ment; these interventions can be considered as “best buys” for investors (Table 1). A range of other interventions that constitute “good buys” can also be identified (6, 160, 173).
Implementing population-wide interventions for tobacco control, control of the harmful use of alcohol, reduction of salt content in processed foods and substitution of partially hydrogenated trans-fat with polyunsaturated fats have the potential to prevent millions of deaths per year. In addition, promoting physical activity through the media (in combi-nation with a healthy diet) has been estimated to be a low-cost and highly feasible option.
The above population-wide preventive strategies can be combined with more targeted approaches to improve health gains. Individual interventions that are best buys in-clude (4, 6, 160, 171, 173): (i) providing aspirin to people with an acute heart attack – this saves the lives of one in five of those with a heart attack; (ii) providing a simple multidrug treatment to people following a heart attack or stroke (or transient ischaemic attack or angina) in order to prevent recurrent ischaemic events – this results in a reduction in recurrent heart attacks and strokes of up to 75% – and also decrease mortality; (iii) reducing the cardiovascular risk (controlling blood pressure, blood cholesterol and blood sugar; tobacco use) in people, including those with diabe-tes, who are at high risk of heart attacks and strokes; and (iv) controlling glucose levels in people with diabetes – this investment reduces cardiovascular complications, blind-ness and kidney failure in people with diabetes. Financing tools are available to assist countries to cost resources re-quired for implementing the best buys (160).
DO Best buys for cardiovascular disease (CVD) prevention and control
KEY MESSAGES
A pragmatic approach to address CVDs in resource-constrained settings is to implement and scale up very cost-e!ective, feasible and high-impact interventions (best buys).
Best buys can be implemented even in low-income countries if there is a modest increase in investment in health.
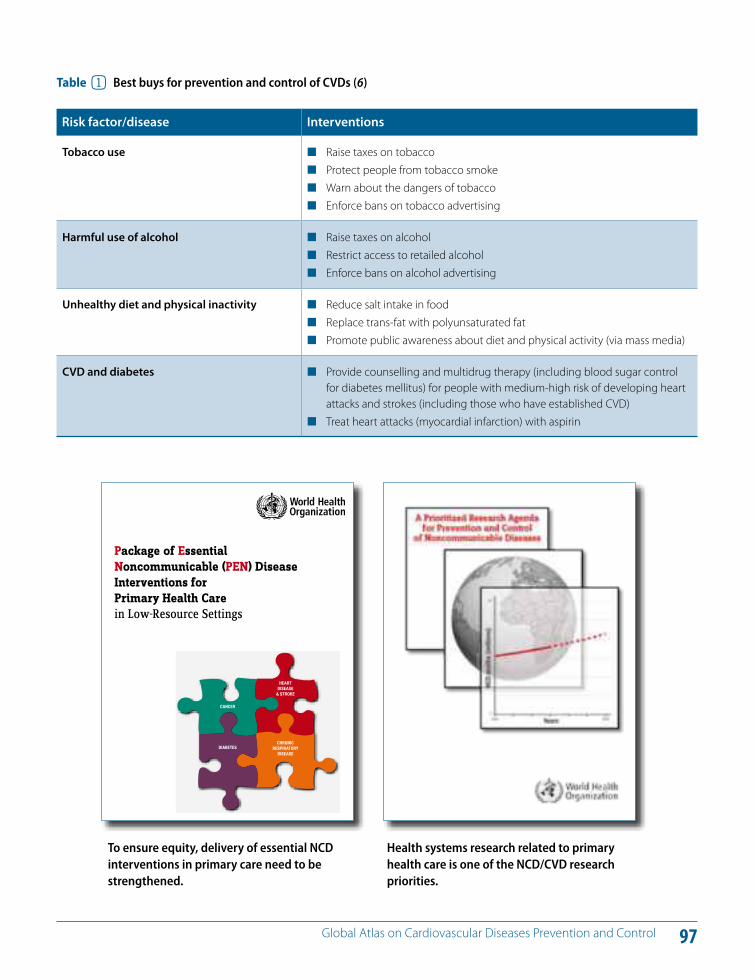
97 Global Atlas on Cardiovascular Diseases Prevention and Control
Table 1 Best buys for prevention and control of CVDs (6)
Risk factor/disease Interventions
Tobacco use Raise taxes on tobacco Protect people from tobacco smoke Warn about the dangers of tobacco Enforce bans on tobacco advertising
Harmful use of alcohol Raise taxes on alcohol Restrict access to retailed alcohol Enforce bans on alcohol advertising
Unhealthy diet and physical inactivity Reduce salt intake in food Replace trans-fat with polyunsaturated fat Promote public awareness about diet and physical activity (via mass media)
CVD and diabetes Provide counselling and multidrug therapy (including blood sugar control for diabetes mellitus) for people with medium-high risk of developing heart attacks and strokes (including those who have established CVD)
Treat heart attacks (myocardial infarction) with aspirin
Package of Essential Noncommunicable (PEN) Disease Interventions for Primary Health Carein Low-Resource Settings
CANCER
HEART DISEASE
& STROKE
DIABETESCHRONIC
RESPIRATORY DISEASE
To ensure equity, delivery of essential NCD interventions in primary care need to be strengthened.
Health systems research related to primary health care is one of the NCD/CVD research priorities.
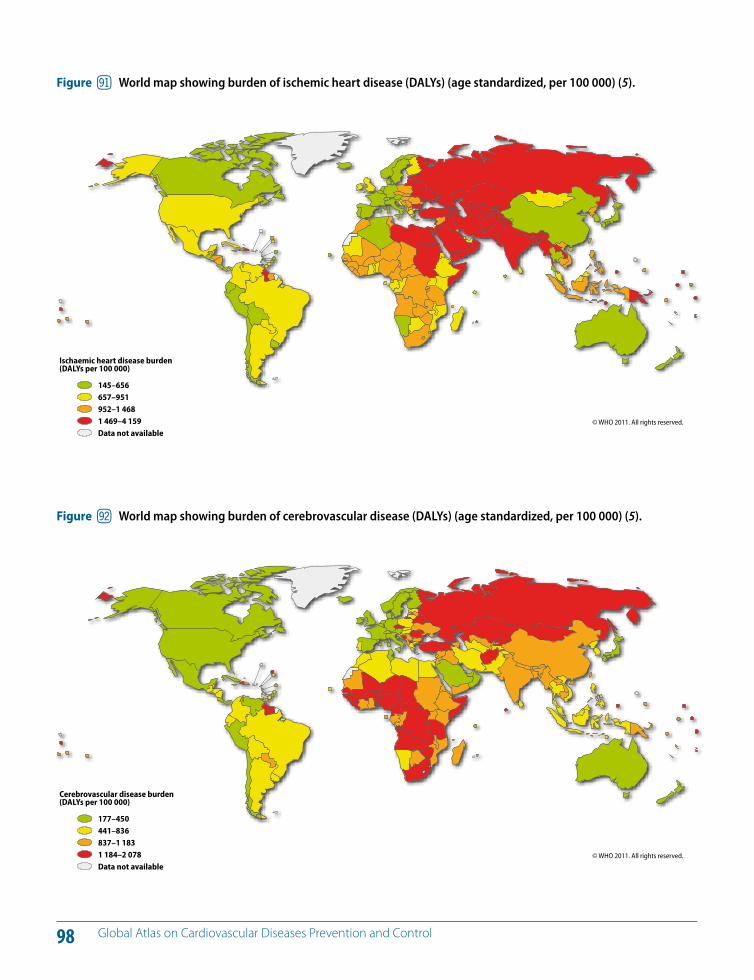
98 Global Atlas on Cardiovascular Diseases Prevention and Control
Figure jm World map showing burden of ischemic heart disease (DALYs) (age standardized, per 100 000) (5).
© WHO 2011. All rights reserved.
Ischaemic heart disease burden(DALYs per 100 000)
145–656657–951952–1 4681 469–4 159Data not available
Figure jn World map showing burden of cerebrovascular disease (DALYs) (age standardized, per 100 000) (5).
© WHO 2011. All rights reserved.
Cerebrovascular disease burden(DALYs per 100 000)
177–450441–836837–1 1831 184–2 078Data not available
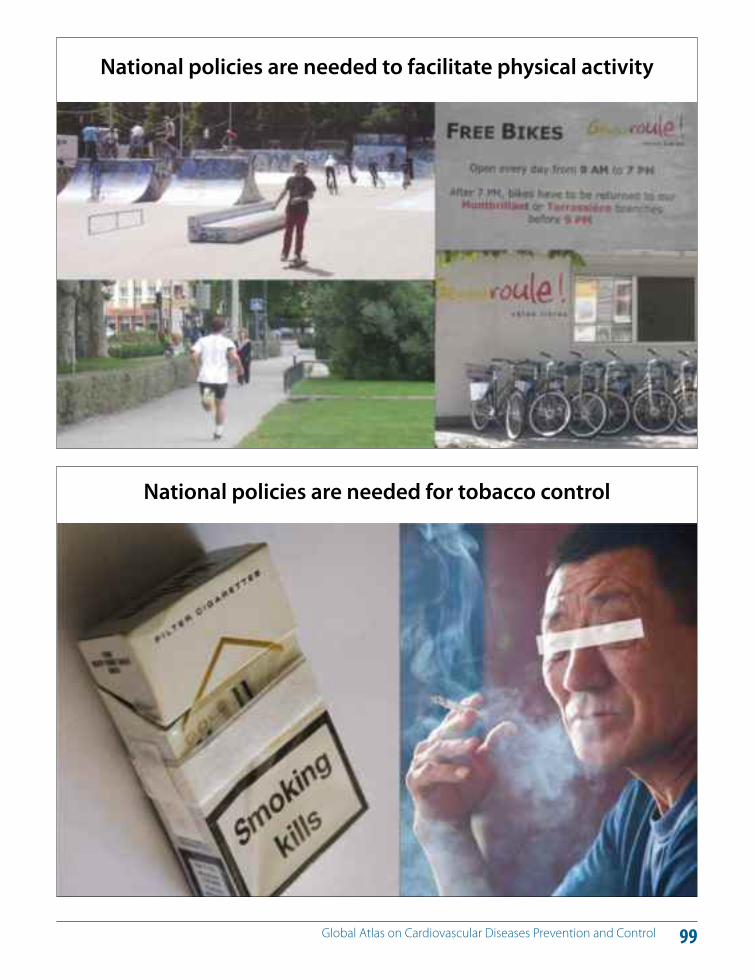
99 Global Atlas on Cardiovascular Diseases Prevention and Control
National policies are needed to facilitate physical activity
National policies are needed for tobacco control

100 Global Atlas on Cardiovascular Diseases Prevention and Control
Cost-e!ective interventions that have the potential to halve the NCD burden over the next two decades and lead to large health and economic benefits are available. Imple-mentation and dissemination of these interventions have resulted in the decline of, for example, CVD in many de-veloped countries (13, 14). Research is essential in order to understand and to demonstrate how these interventions can be implemented e!ectively in LMICs, despite resource constraints and other competing health priorities.
Particularly in resource-constrained settings, available re-sources need to be invested in NCD programmes and in-terventions that have a sound scientific basis so that there is a good return on investment. Although we already know “what has worked” in developed countries, “how” these interventions can be applied in resource-constrained set-tings needs to be researched. At the country level, there-fore, implementation research focused on high-impact and a!ordable interventions (best buys) needs to be strength-ened to generate the required insight.
Implementation research seeks to understand how to ef-fectively deliver e"cacious interventions in a specific con-text, thus filling this gap between knowledge and practice. LMICs stand to benefit enormously from promoting and supporting this type of research so that resources are not wasted on programmes that are not appropriate to the context.
At present, there is a major mismatch between country de-mands for conducting research on prevention and control
of NCDs and the human resource and financial capacity to respond to these demands. Therefore, global and national NCD research agendas require prioritization with the aim of focusing on key research issues that are likely to have the greatest potential to impact prevention and control of NCDs.
To address this need, the WHO NCD Research Agenda was developed from 2008 to 2010 and identified 20 top priority research areas that are likely to have a high impact on na-tional NCD policies and programmes, with a special focus on LMICs (190). The WHO NCD Research Agenda provides guidance to Member States in understanding and identify-ing the key public health research needs related to NCDs (186).
Figures 93 and 94 show the annual research and devel-opment expenditure as a proportion of gross domestic product (GDP) and national health expenditure, respec-tively. Adequate resources for research are crucial – both financial and technical – through strengthened national, regional and international cooperation and collaboration (191). The WHO NCD Research Agenda provides a basis for improved cooperation among research funders and other key partners to align aid with NCD research priorities. This would help to strengthen the research capacity of LMICs and enable them to develop national NCD research plans that articulate clear research priorities focused on national public health needs.
DP Bridging the implementation gap for prevention and control of CVDs
KEY MESSAGES
Research is essential to bridge the “knowledge translation” and “implementation” gaps in prevention and control of NCDs.
In the long run, investment in implementation research and impact evaluation can save resources.
The WHO Prioritized Research Agenda for Prevention and Control of Major Noncommunicable Diseases (WHO NCD Research Agenda) provides a basis for improved cooperation among research funders and other key partners.
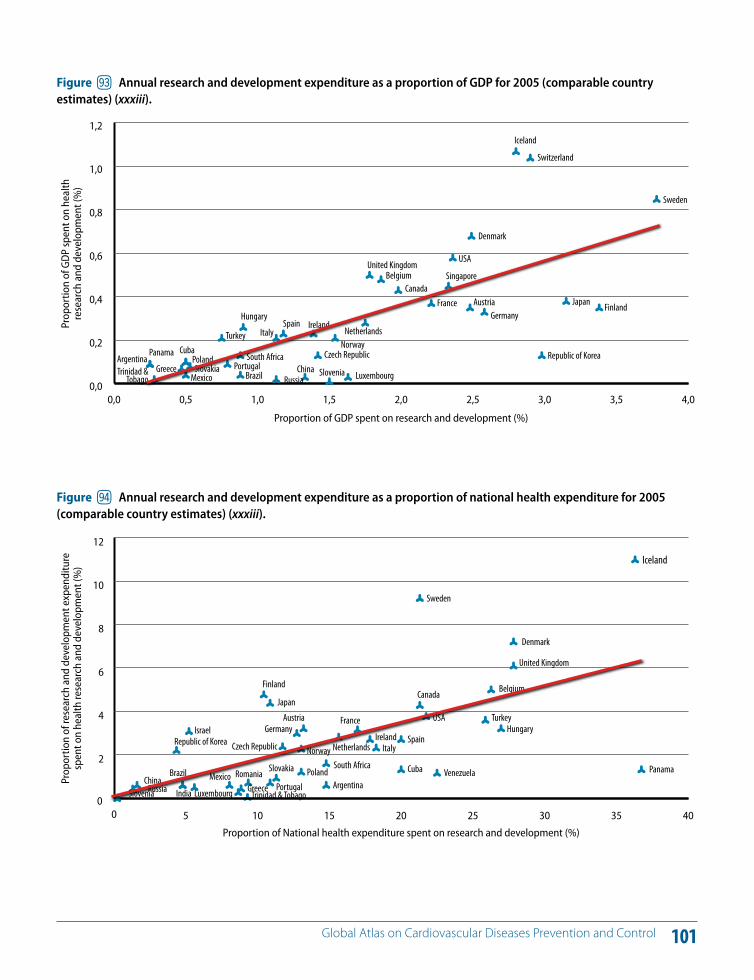
101 Global Atlas on Cardiovascular Diseases Prevention and Control
0,0 0,5 1,0 1,5 2,0 2,5 3,0 3,5 4,00,0
0,2
0,4
0,6
0,8
1,0
1,2Iceland
Switzerland
Japan Finland
Republic of Korea
Denmark
USA
Singapore
AustriaGermany
FranceCanada
BelgiumUnited Kingdom
Netherlands
LuxembourgChina Slovenia
Russia
NorwayCzech Republic
IrelandSpainItalyTurkey
CubaPoland
MexicoSlovakiaGreece
PanamaArgentinaTrinidad &
TobagoPortugal
Brazil
South Africa
Hungary
Sweden
Proportion of GDP spent on research and development (%)
Prop
ortio
n of
GD
P sp
ent o
n he
alth
re
sear
ch a
nd d
evel
opm
ent (
%)
Figure jo Annual research and development expenditure as a proportion of GDP for 2005 (comparable country estimates) (xxxiii).
0 5 10 15 20 25 30 35 400
2
4
6
8
10
12
Iceland
Japan
Finland
Republic of Korea
Denmark
USAAustriaGermany
France
Canada Belgium
United Kingdom
Netherlands
Venezuela
LuxembourgChina
IndiaSloveniaRussia
NorwayCzech RepublicIreland Spain
Israel
Italy
Turkey
CubaPolandMexico Romania Slovakia
Greece
Panama
ArgentinaTrinidad & Tobago
PortugalBrazil
South Africa
Hungary
Sweden
Proportion of National health expenditure spent on research and development (%)
Prop
ortio
n of
rese
arch
and
dev
elop
men
t exp
endi
ture
sp
ent o
n he
alth
rese
arch
and
dev
elop
men
t (%
)
Figure jp Annual research and development expenditure as a proportion of national health expenditure for 2005 (comparable country estimates) (xxxiii).
102 Global Atlas on Cardiovascular Diseases Prevention and Control
Monitoring CVDs and their risk factors provides the foun-dation for advocacy, policy development and programme implementation. Collection of mortality and risk factor data helps to assess the magnitude, track the trends of CVDs and their risks over time, and evaluate the e!ectiveness and impact of interventions. Figure 95 shows countries with surveillance data for risk factors. Lack of reliable data on cardiovascular mortality, risk factors and their determi-nants is a major obstacle to the progress of e!orts aimed at addressing the cardiovascular epidemic. High-quality data can only be generated by adequate investment in civil reg-istration and in surveillance systems (6, 192).
About one third of the countries in the world still do not have vital registration systems that capture the total num-ber of deaths. Accurate reporting of the cause of death on the death certificate is a challenge. Although total all-cause mortality may be reported reasonably well, significant ac-curacy problems exist for cause-specific certification and coding in a large number of countries. In these countries, national initiatives to strengthen vital registration systems and cause-specific mortality are a key priority.
Sustainable NCD surveillance systems need to be formal-ized as a key component of the national public health in-frastructure and become part of a country's health infor-mation system. They should be seen as more than a data collection exercise and mechanisms must be set in place for the analysis and dissemination of collected data to inform policy-making. Clearly, the capacity to undertake
NCD surveillance varies considerably among countries. For countries with little existing NCD surveillance activity, the development of the system should be an incrementally evolving process. In low-resource settings with limited ca-pacity, a viable and sustainable system needs to be simple and, at a minimum, gather data periodically on cardiovas-cular risk factors.
Quality risk factor surveillance is possible even in the least resourced countries. Such surveillance remains the prior-ity within a more comprehensive NCD surveillance frame-work, as it predicts the future of the NCD burden and gives impetus for action.
There is also a need for measurable process and output indicators to permit accurate monitoring and evaluation of actions taken and their impact. The indicators cited in Table 2 are examples of measurements that can be used for monitoring and reporting on the national status of the prevention and control of CVD.
DQ Monitoring CVDs
KEY MESSAGES
Monitoring major cardiovascular risk factors and CVD death rates is a key component of CVD prevention and control.
Monitoring and evaluation are tools for improving the accountability of di!erent stakeholders.
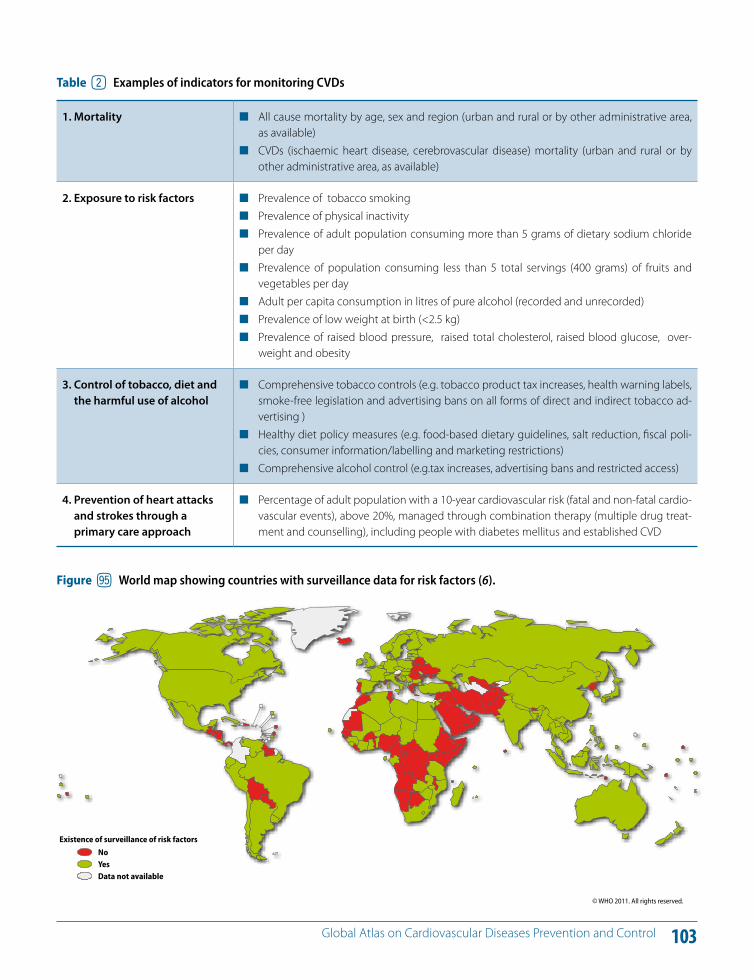
103 Global Atlas on Cardiovascular Diseases Prevention and Control
Figure jq World map showing countries with surveillance data for risk factors (6).
© WHO 2011. All rights reserved.
Existence of surveillance of risk factorsNoYesData not available
Table 2 Examples of indicators for monitoring CVDs
1. Mortality All cause mortality by age, sex and region (urban and rural or by other administrative area, as available)
CVDs (ischaemic heart disease, cerebrovascular disease) mortality (urban and rural or by other administrative area, as available)
2. Exposure to risk factors Prevalence of tobacco smoking Prevalence of physical inactivity Prevalence of adult population consuming more than 5 grams of dietary sodium chloride
per day Prevalence of population consuming less than 5 total servings (400 grams) of fruits and
vegetables per day Adult per capita consumption in litres of pure alcohol (recorded and unrecorded) Prevalence of low weight at birth (<2.5 kg) Prevalence of raised blood pressure, raised total cholesterol, raised blood glucose, over-
weight and obesity
3. Control of tobacco, diet and the harmful use of alcohol
Comprehensive tobacco controls (e.g. tobacco product tax increases, health warning labels, smoke-free legislation and advertising bans on all forms of direct and indirect tobacco ad-vertising )
Healthy diet policy measures (e.g. food-based dietary guidelines, salt reduction, fiscal poli-cies, consumer information/labelling and marketing restrictions)
Comprehensive alcohol control (e.g.tax increases, advertising bans and restricted access)
4. Prevention of heart attacks and strokes through a primary care approach
Percentage of adult population with a 10-year cardiovascular risk (fatal and non-fatal cardio-vascular events), above 20%, managed through combination therapy (multiple drug treat-ment and counselling), including people with diabetes mellitus and established CVD
104 Global Atlas on Cardiovascular Diseases Prevention and Control
Civil society institutions, in particular NGOs, academia and professional associations, have a major role to play in the prevention and control of NCDs at both country and global levels (193). Within countries, these groups help to shape the policy response and also support or deliver prevention and treatment programmes. In addition, these institutions provide important support to WHO technical and norma-tive functions and for the implementation of regional- and country-level initiatives.
Civil society institutions have a number of roles that they are uniquely placed to fulfil. They have a high degree of “legitimacy” that comes from their separation from gov-ernment and the commercial interests of the marketplace, combined with grassroots networks of committed citizens. Thus, advocacy is central to their role and they are well placed to raise political awareness and mobilize the society for wide support for NCD/CVD prevention and control. This is of particular importance in addressing the common risk factors of tobacco use, unhealthy diet, physical inactivity and the harmful use of alcohol where complex commer-cial, trade, political and social factors are at play. In particu-lar, civil society institutions act as a political counterbalance to strong commercial and private sector interests in the for-mation and implementation of NCD/CVD prevention and control policies at the national level.
In many countries, civil society institutions also play a sig-nificant role in delivering prevention and treatment ser-vices for CVD. Partnerships between NGOs and academia can bring together the expertise and resources needed to build both workforce capacity and the skills of individuals, families and communities. A further role that civil society institutions are best placed to undertake is the indepen-dent monitoring and evaluation of progress in delivering on commitments, and in achieving outcomes, by both governments and the private sector.
Recently, a number of civil society institutions, in particular NGOs, have come together to coordinate more e!ectively their contribution to global NCD prevention and control. A significant milestone was the establishment of the NCD Alliance, a formal association of four international federa-tions of NGOs representing the four main NCDs outlined in the WHO Global NCD Action Plan – CVD, diabetes, cancer and chronic respiratory disease – as a mutual platform for collaboration and joint advocacy. The value of these “col-lective” civil society organizations is considerable (194).
DR Social mobilization for prevention and control of CVDs
KEY MESSAGES
Civil society institutions are uniquely placed to mobilize political awareness and support for addressing CVD.
Civil society institutions can play a key role in advocating for a higher priority given to CVDs/NCDs in health and development strategies and programmes.
Civil society institutions are significant providers of prevention and health-care services and often fill gaps in services and training provided to the public and private sectors.
Civil society institutions and nongovernmental organizations (NGOs) have an important role in strengthening capacity to address NCD prevention at the national level.
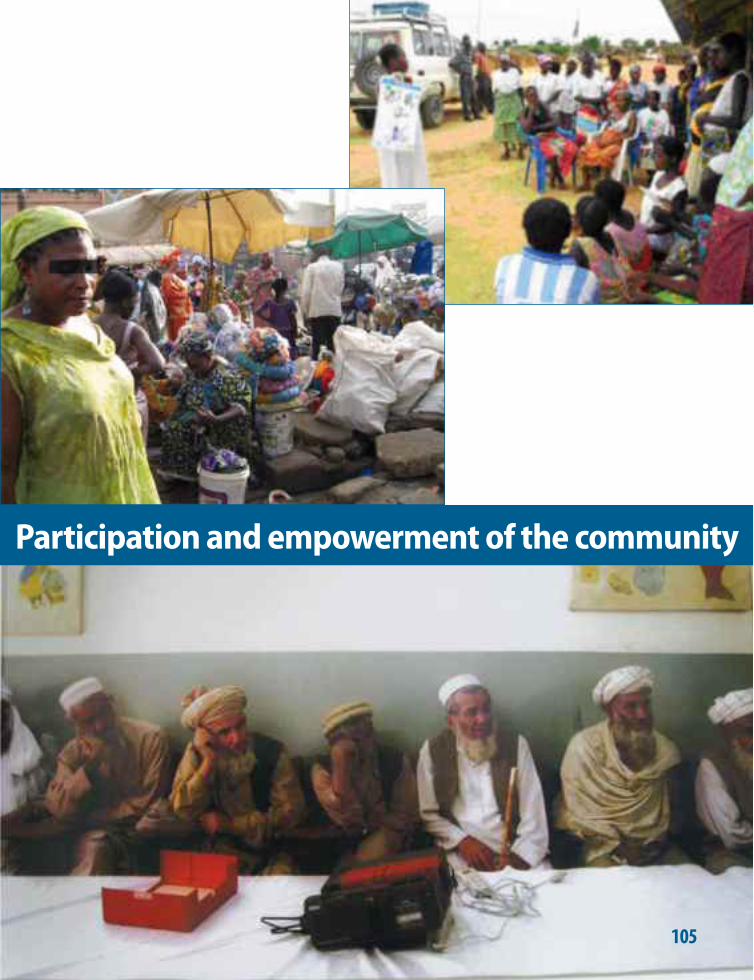
105
Participation and empowerment of the community
106 Global Atlas on Cardiovascular Diseases Prevention and Control
Underpinning a multisectoral approach to prevention and control of CVD is also a claim for the broader value of health to society. The contributions of health to other important societal priorities such as social and economic develop-ment are now well understood. The rationale for all sectors to adopt a Health in All Policies approach is also linked to these benefits (6).
CVD entrenches people in poverty due to many reasons, including:
loss of productivity due to illness and premature mor-tality;
expenditure on health creating opportunity costs for other programmes such as education;
e!ect of household poverty on family and the educa-tion of children;
catastrophic health expenditure worsening poverty and debt situation.
In LMICs, 40% of deaths from NCDs are below the age of 60, whereas as in high-income countries, only 11% are in this age group (6). In LMIC, many families with family members su!ering from heart attacks and strokes experi-ence catastrophic spending and loss of household income which drive them below the poverty line. In addition, CVD reduces productivity due to premature deaths and sick-ness. Increasing amounts of national resources are spent on health budgets because of escalating health-care de-mands caused by CVD. The highest burden of CVDs and prevalence of risk factors such as tobacco use is seen in the poorest segments of the population, and who also su!er
from communicable diseases. This situation imposes risks in the economies of LMICs.
Evidence of the association between NCD/CVDs and po-tential impoverishment of households is growing. For ex-ample, a World Bank study in India showed that 25% of families with a member with CVD experiences catastrophic expenditure and 10% is driven into poverty (195).
LMICs facing the double burden of disease receive little development assistance that could help them to address both. The UN General Assembly resolution 65/1: Keeping the promise; united to achieve the Millennium Develop-ment Goals (MDGs) (196) highlighted the importance of tackling NCDs to achieve the MDGs. Specifically, the reso-lution calls for commitment to achieve MDG 6 (Combating HIV/AIDS, tuberculosis and malaria) by tackling NCDs.
Figure 96 shows the proportions of O"cial Development Assistance and other o"cial flows committed by health sector disciplines by all donors from 2002 to 2009. As the death, disability and economic degradation caused by NCDs surpass the impact of infectious diseases, country leaders will be increasingly compelled to turn their atten-tion to NCDs (197). Consequently, O"cial Development As-sistance to prevent and control NCDs should increase (198). This would facilitate investment in health systems and the development and implementation of wider government policies that support the prevention and control of CVD in LMICs.
DS Prevention and control of CVDs and socioeconomic development
KEY MESSAGES
The priority accorded to NCD/CVDs in development work at global and national levels needs to be raised.
Prevention of CVDs needs to be a priority of o"cial development assistance in high-burden LMICs.
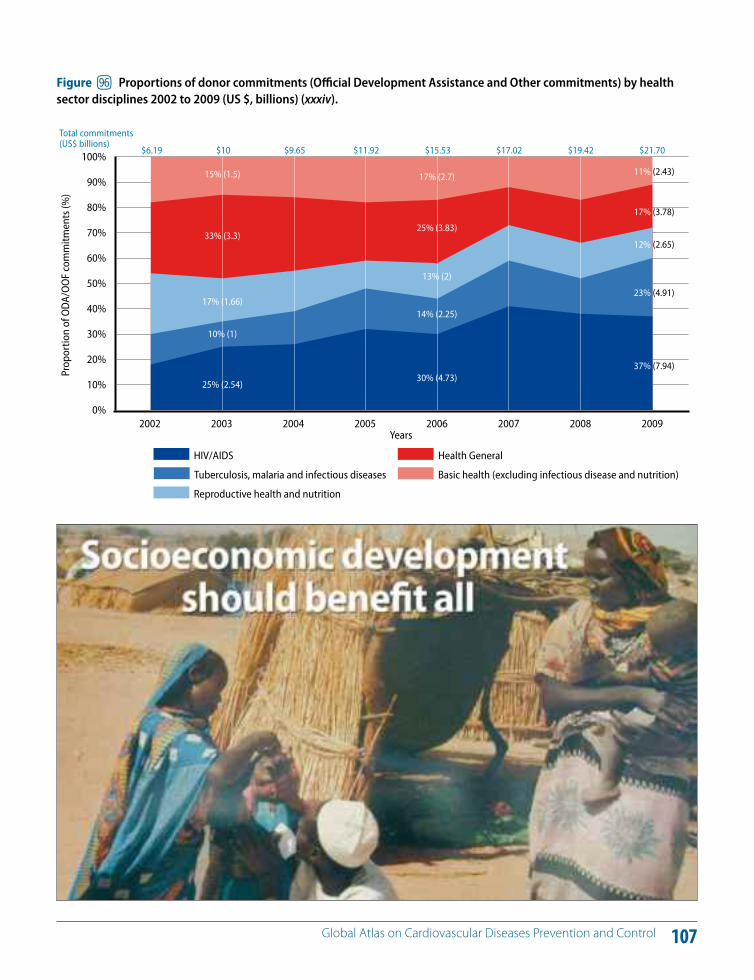
107 Global Atlas on Cardiovascular Diseases Prevention and Control
0%
10%
20%
30%
40%
50%
60%
70%
80%
90%
100%
Basic health (excluding infectious disease and nutrition)
Health General
Reproductive health and nutrition
Tuberculosis, malaria and infectious diseases
HIV/AIDS
2008200720062005200420032002
Total commitments(US$ billions)
Prop
ortio
n of
ODA
/OO
F co
mm
itmen
ts (%
)
Years2009
$19.42$17.02$15.53$11.92$9.65$10$6.19 $21.70
17% (2.7)15% (1.5) 11% (2.43)
25% (3.83)33% (3.3)
17% (3.78)
13% (2)
17% (1.66)
12% (2.65)
14% (2.25)
10% (1)
23% (4.91)
30% (4.73)25% (2.54)
37% (7.94)
Figure jr Proportions of donor commitments (O"cial Development Assistance and Other commitments) by health sector disciplines 2002 to 2009 (US $, billions) (xxxiv).
108 Global Atlas on Cardiovascular Diseases Prevention and Control
E!orts to achieve fairness in financing and financial risk protection through conventional and innovative means of financing are vital for protection against the risk of cata-strophic expenditures on health, which are predominantly attributed to cardiovascular and other NCD-related health care (Figures 97 and 98).
As stated in the recent WHO World Health Report (99), innovative financing will be key to supplement national health budgets. Innovative financing for development is the principle of generating new predictable and sustain-able funds, in addition to O"cial Development Assistance, for international developing financing purposes (197–201).
Figure 97 shows the change in poverty level by out-of-pocket payments in 11 countries in Asia. Figure 98 shows the out-of-pocket payments as a proportion of total health expenditure by average percentage of households selling assets or borrowing money to finance health.
NCD financing has been relatively absent from the global debate on innovative financing for health. Many examples exist at the national level as listed in the World Health Report: special levies on profitable companies; diaspora bonds; mobile phone voluntary solidarity contributions; digital taxes; tobacco excise taxes; excise tax on unhealthy food. Most of these systems do not produce large amounts of funds and additional revenue generated is not always used to support national health budgets (99).
However, evidence of countries using additional national innovative financing to support their health budget ex-ists. For example, Thailand has been successfully funding
its ThaiHealth Promotion Foundation since 2001 with 2% of the total national tax revenue on alcohol and tobacco products (202). The foundation is providing key support for advancing public health in the country.
Following the 2009 recommendations of the High-level Task Force on Innovative Financing, one of the new con-cepts to assess and develop was a global levy on tobacco products. As a consequence, WHO rose to the challenge to develop this concept, which has now become known as the Solidarity Tobacco Levy. The principle of the Solidar-ity Tobacco Levy is to build upon the recommendations of the WHO FCTC to increase national excise taxes on tobac-co products via a micro-levy in all G20 (Group of Twenty) countries and to use the totality or a proportion of addi-tional proceeds that are generated for intentional health fi-nancing purposes through a pooled funding system (203).
WHO calculates that in excess of US$ 7 billion could be raised each year if the Solidarity Tobacco Levy were to be fully applied in all G20 (plus1) countries and hence rep-resent a significant new source of additional funding for health (203).
WHO estimates that a 50% increase in tobacco excise taxes would generate US$ 1.42 billion in additional funds in 22 low-income countries for which data are available. If all of this were allocated to health, it would allow government health spending to increase by more than 25% in several countries and, at the extreme level, by 50% (203).
DT Generating resources for CVD prevention and control
KEY MESSAGES
There are di!erent approaches to raise additional resources for health and reduce financial risks and barriers to accessing essential health-care interventions to address CVD.
An innovative financing mechanism based on a global solidarity tobacco levy is feasible to promote sustainable health financing.
A solidarity tobacco levy has the dual benefit of improving the health of the population by dissuading the use of a product dangerous to health, while raising more domestic funds for health.
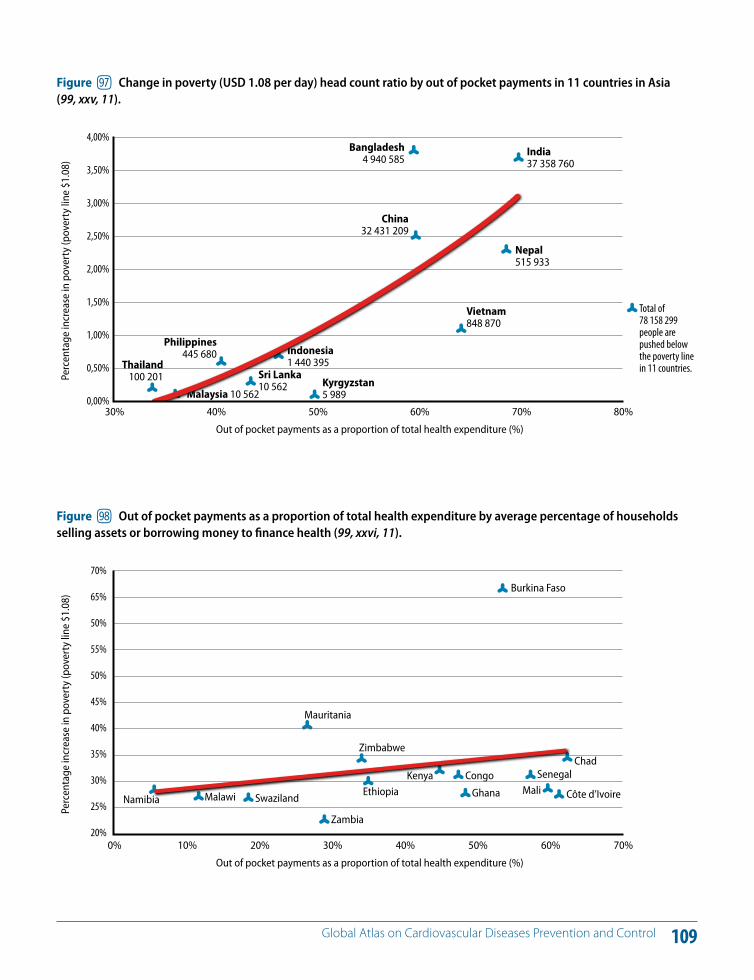
109 Global Atlas on Cardiovascular Diseases Prevention and Control
India37 358 760
Nepal515 933
Vietnam848 870
Indonesia1 440 395
Kyrgyzstan5 989
Sri Lanka10 562
Malaysia 10 562
Philippines445 680
Thailand100 201
China32 431 209
Bangladesh4 940 585
70%60%50%40%30%
Total of 78 158 299people are pushed below the poverty line in 11 countries.
Out of pocket payments as a proportion of total health expenditure (%)
Perc
enta
ge in
crea
se in
pov
erty
(pov
erty
line
$1.
08)
80%
4,00%
3,50%
3,00%
2,50%
2,00%
1,50%
1,00%
0,50%
0,00%
Figure js Change in poverty (USD 1.08 per day) head count ratio by out of pocket payments in 11 countries in Asia (99, xxv, 11).
Burkina Faso
Mauritania
ChadSenegal
Mali Côte d’IvoireGhana
CongoKenya
Zimbabwe
Ethiopia
Zambia
SwazilandMalawiNamibia
60%50%40%30%20%10%0%
Out of pocket payments as a proportion of total health expenditure (%)
Perc
enta
ge in
crea
se in
pov
erty
(pov
erty
line
$1.
08)
70%
70%
65%
50%
55%
50%
45%
40%
35%
30%
25%
20%
Figure jt Out of pocket payments as a proportion of total health expenditure by average percentage of households selling assets or borrowing money to finance health (99, xxvi, 11).
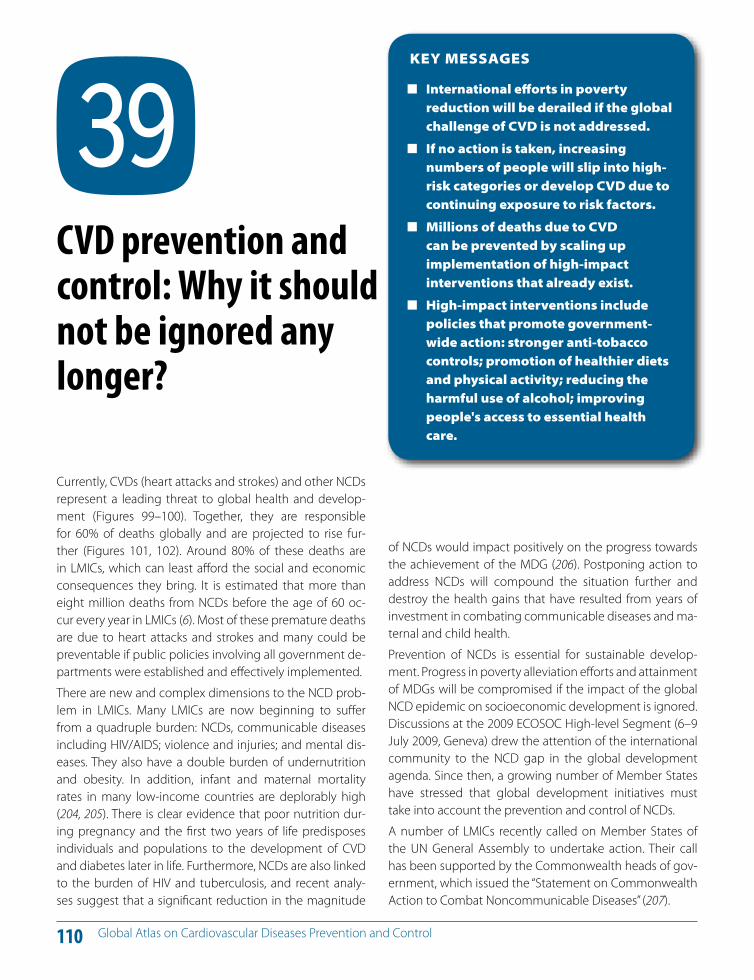
110 Global Atlas on Cardiovascular Diseases Prevention and Control
Currently, CVDs (heart attacks and strokes) and other NCDs represent a leading threat to global health and develop-ment (Figures 99–100). Together, they are responsible for 60% of deaths globally and are projected to rise fur-ther (Figures 101, 102). Around 80% of these deaths are in LMICs, which can least a!ord the social and economic consequences they bring. It is estimated that more than eight million deaths from NCDs before the age of 60 oc-cur every year in LMICs (6). Most of these premature deaths are due to heart attacks and strokes and many could be preventable if public policies involving all government de-partments were established and e!ectively implemented.
There are new and complex dimensions to the NCD prob-lem in LMICs. Many LMICs are now beginning to su!er from a quadruple burden: NCDs, communicable diseases including HIV/AIDS; violence and injuries; and mental dis-eases. They also have a double burden of undernutrition and obesity. In addition, infant and maternal mortality rates in many low-income countries are deplorably high (204, 205). There is clear evidence that poor nutrition dur-ing pregnancy and the first two years of life predisposes individuals and populations to the development of CVD and diabetes later in life. Furthermore, NCDs are also linked to the burden of HIV and tuberculosis, and recent analy-ses suggest that a significant reduction in the magnitude
of NCDs would impact positively on the progress towards the achievement of the MDG (206). Postponing action to address NCDs will compound the situation further and destroy the health gains that have resulted from years of investment in combating communicable diseases and ma-ternal and child health.
Prevention of NCDs is essential for sustainable develop-ment. Progress in poverty alleviation e!orts and attainment of MDGs will be compromised if the impact of the global NCD epidemic on socioeconomic development is ignored. Discussions at the 2009 ECOSOC High-level Segment (6–9 July 2009, Geneva) drew the attention of the international community to the NCD gap in the global development agenda. Since then, a growing number of Member States have stressed that global development initiatives must take into account the prevention and control of NCDs.
A number of LMICs recently called on Member States of the UN General Assembly to undertake action. Their call has been supported by the Commonwealth heads of gov-ernment, which issued the “Statement on Commonwealth Action to Combat Noncommunicable Diseases” (207).
DU CVD prevention and control: Why it should not be ignored any longer?
KEY MESSAGES
International e!orts in poverty reduction will be derailed if the global challenge of CVD is not addressed.
If no action is taken, increasing numbers of people will slip into high-risk categories or develop CVD due to continuing exposure to risk factors.
Millions of deaths due to CVD can be prevented by scaling up implementation of high-impact interventions that already exist.
High-impact interventions include policies that promote government-wide action: stronger anti-tobacco controls; promotion of healthier diets and physical activity; reducing the harmful use of alcohol; improving people's access to essential health care.
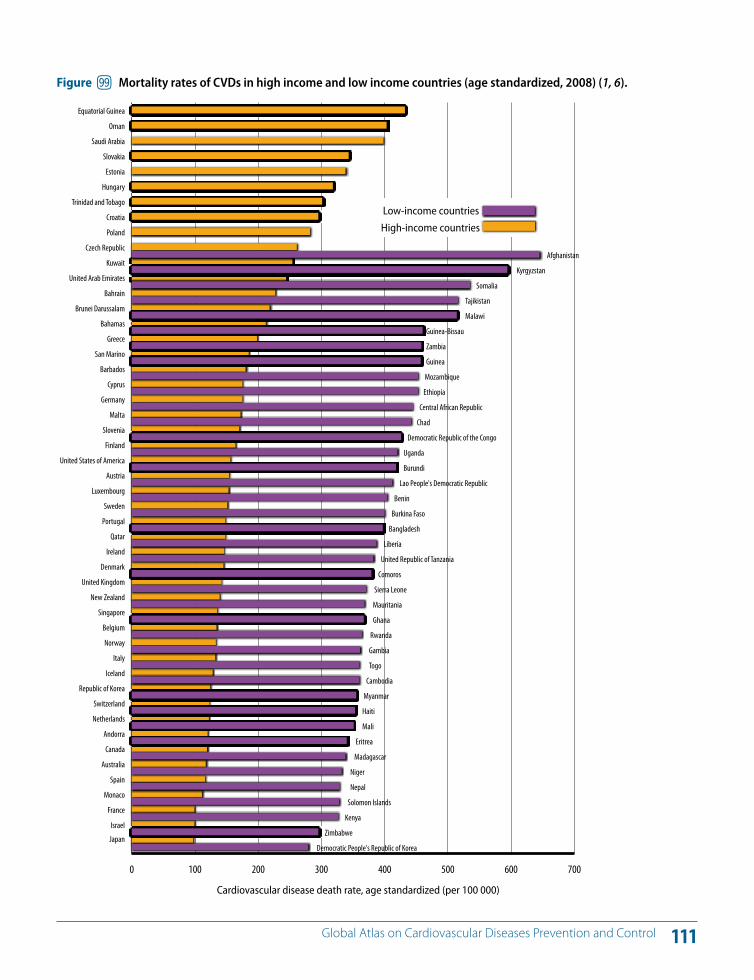
111 Global Atlas on Cardiovascular Diseases Prevention and Control
0 100 200 300 400 500 600 700
Japan
Israel
France
Monaco
Spain
Australia
Canada
Andorra
Netherlands
Switzerland
Republic of Korea
Iceland
Italy
Norway
Belgium
Singapore
New Zealand
United Kingdom
Denmark
Ireland
Qatar
Portugal
Sweden
Luxembourg
Austria
United States of America
Finland
Slovenia
Malta
Germany
Cyprus
Barbados
San Marino
Greece
Bahamas
Brunei Darussalam
Bahrain
United Arab Emirates
Kuwait
Czech Republic
Poland
Croatia
Trinidad and Tobago
Hungary
Estonia
Slovakia
Saudi Arabia
Oman
Equatorial Guinea
Cardiovascular disease death rate, age standardized (per 100 000)
Democratic People's Republic of Korea
Zimbabwe
Kenya
Solomon Islands
Nepal
Niger
Madagascar
Eritrea
Mali
Haiti
Myanmar
Cambodia
Togo
Gambia
Rwanda
Ghana
Mauritania
Sierra Leone
Comoros
United Republic of Tanzania
Liberia
Bangladesh
Burkina Faso
Benin
Lao People's Democratic Republic
Burundi
Uganda
Democratic Republic of the Congo
Chad
Central African Republic
Ethiopia
Mozambique
Guinea
Zambia
Guinea-Bissau
Malawi
Tajikistan
Somalia
Kyrgyzstan
Afghanistan
Low-income countries
High-income countries
Figure ju Mortality rates of CVDs in high income and low income countries (age standardized, 2008) (1, 6).
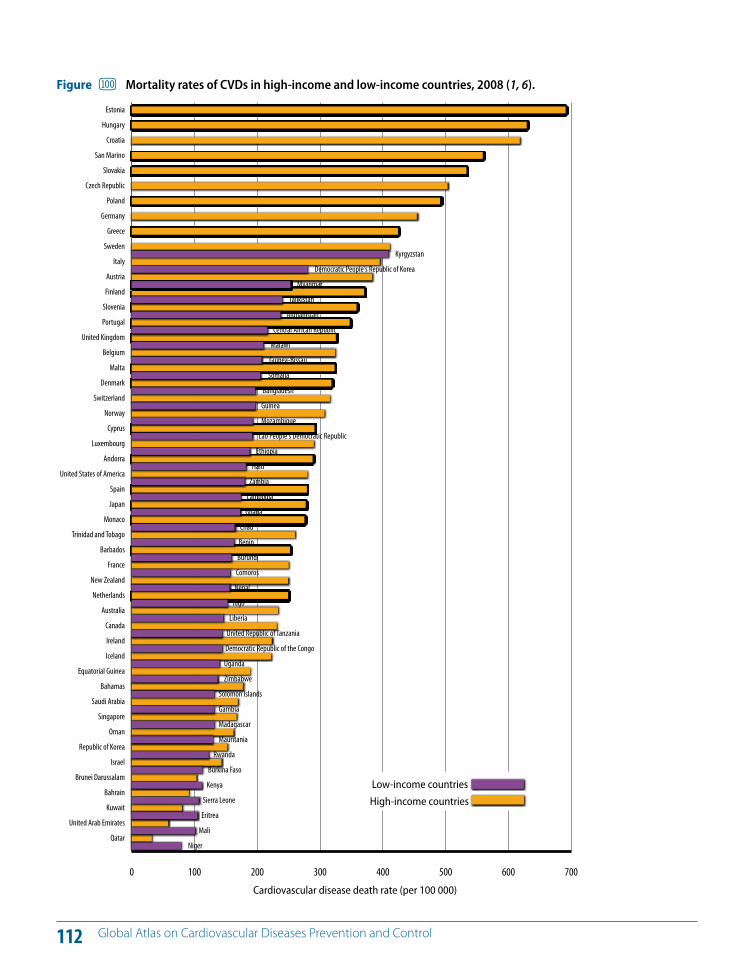
112 Global Atlas on Cardiovascular Diseases Prevention and Control
0 100 200 300 400 500 600 700
Qatar
United Arab Emirates
Kuwait
Bahrain
Brunei Darussalam
Israel
Republic of Korea
Oman
Singapore
Saudi Arabia
Bahamas
Equatorial Guinea
Iceland
Ireland
Canada
Australia
Netherlands
New Zealand
France
Barbados
Trinidad and Tobago
Monaco
Japan
Spain
United States of America
Andorra
Luxembourg
Cyprus
Norway
Switzerland
Denmark
Malta
Belgium
United Kingdom
Portugal
Slovenia
Finland
Austria
Italy
Sweden
Greece
Germany
Poland
Czech Republic
Slovakia
San Marino
Croatia
Hungary
Estonia
Niger
Mali
Eritrea
Sierra Leone
Kenya
Burkina Faso
Rwanda
Mauritania
Madagascar
Gambia
Solomon Islands
Zimbabwe
Uganda
Democratic Republic of the Congo
United Republic of Tanzania
Liberia
Togo
Nepal
Comoros
Burundi
Benin
Chad
Ghana
Cambodia
Zambia
Haiti
Ethiopia
Lao People's Democratic Republic
Mozambique
Guinea
Bangladesh
Somalia
Guinea-Bissau
Malawi
Central African Republic
Afghanistan
Tajikistan
Myanmar
Democratic People's Republic of Korea
Kyrgyzstan
Cardiovascular disease death rate (per 100 000)
Low-income countries
High-income countries
Figure Mortality rates of CVDs in high-income and low-income countries, 2008 (1, 6).
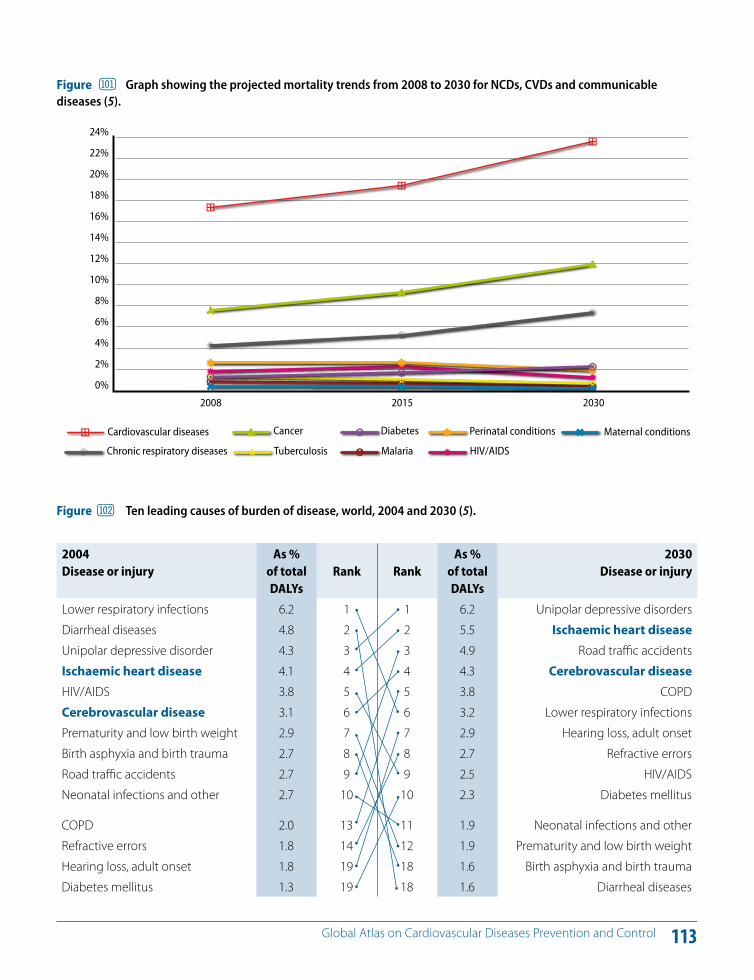
113 Global Atlas on Cardiovascular Diseases Prevention and Control
0%
2%
4%
6%
8%
10%
12%
14%
16%
18%
20%
22%
24%
HIV/AIDS Malaria TuberculosisChronic respiratory diseases
Maternal conditionsPerinatal conditionsDiabetesCancerCardiovascular diseases
2008 2015 2030
Figure Graph showing the projected mortality trends from 2008 to 2030 for NCDs, CVDs and communicable diseases (5).
2004 Disease or injury
As % of total DALYs
Rank
Rank
As % of total DALYs
2030 Disease or injury
Lower respiratory infections 6.2 1 1 6.2 Unipolar depressive disorders
Diarrheal diseases 4.8 2 2 5.5 Ischaemic heart diseaseUnipolar depressive disorder 4.3 3 3 4.9 Road tra!c accidents
Ischaemic heart disease 4.1 4 4 4.3 Cerebrovascular diseaseHIV/AIDS 3.8 5 5 3.8 COPD
Cerebrovascular disease 3.1 6 6 3.2 Lower respiratory infections
Prematurity and low birth weight 2.9 7 7 2.9 Hearing loss, adult onset
Birth asphyxia and birth trauma 2.7 8 8 2.7 Refractive errors
Road tra!c accidents 2.7 9 9 2.5 HIV/AIDS
Neonatal infections and other 2.7 10 10 2.3 Diabetes mellitus
COPD 2.0 13 11 1.9 Neonatal infections and other
Refractive errors 1.8 14 12 1.9 Prematurity and low birth weight
Hearing loss, adult onset 1.8 19 18 1.6 Birth asphyxia and birth trauma
Diabetes mellitus 1.3 19 18 1.6 Diarrheal diseases
Figure Ten leading causes of burden of disease, world, 2004 and 2030 (5).
114 Global Atlas on Cardiovascular Diseases Prevention and Control
The WHO Global NCD Action Plan (3), endorsed by the World Health Assembly in May 2000, focuses on three main areas: (i) mapping the NCD epidemic and determinants; (ii) reducing the level of exposure of individuals and commu-nities to the common risk factors; and (iii) strengthening health care for people with NCDs.
In 2007, the WHA adopted resolution WHA60.23, entitled Prevention and Control of Noncommunicable Diseases: Implementation of the Global Strategy, which requested the Director-General to prepare an action plan for the pre-vention and control of NCDs. Called the WHO Global NCD Action Plan, it was approved by the 61st World Health As-sembly in 2008. The Action Plan urges Member States to continue to implement the actions agreed by the WHA in resolution WHA60.23 (3).
The WHO Global NCD Action Plan (3) is intended to sup-port coordinated, comprehensive and integrated imple-mentation of strategies and evidence-based interventions across individual NCDs and their risk factors and determi-nants, both at the global and national levels through the elaboration of six broad objectives that outline a series of activities for Members States, the WHO Secretariat and in-ternational partners.
Objective 1. To raise the priority accorded to NCDs in de-velopment work at global and national levels, and to inte-grate prevention and control of NCDs into policies across all government departments.
Objective 2. To establish and strengthen national policies and plans for the prevention and control of NCDs.
Objective 3. To promote interventions to reduce the pri-mary shared modifiable risk factors for NCDs: tobacco use, unhealthy diets, physical inactivity and the harmful use of alcohol.
Objective 4. To promote research for the prevention and control of NCDs.
Objective 5. To promote partnerships for the prevention and control of NCDs.
Objective 6. To monitor NCDs and their determinants and evaluate progress at the national, regional and global lev-els.
The progress in implementation of the WHO Global NCD Action Plan in 2008–2009 has been reported to the 126th Executive Board (208) and the 63rd World Health Assembly (209).
A landmark event for prevention and control of CVD/NCD: High-level Meeting of the UN General Assembly on Noncommunicable Diseases, New York, 19–20 September 2011In consecutive sessions, in May and December 2010, the UN General Assembly adopted resolution 64/265 (Preven-tion and control of noncommunicable diseases) (210) and
EL CVD Prevention and control: Vision, roadmap and a landmark event
KEY MESSAGES
The WHO Global NCD Action Plan endorsed by the WHA for prevention and control of NCDs, in 2008, provides a clear vision and road map to address the cardiovascular epidemic.
A public health framework that incorporates the objectives of the Global NCD Action Plan is essential for prevention and control of CVD at the national level.
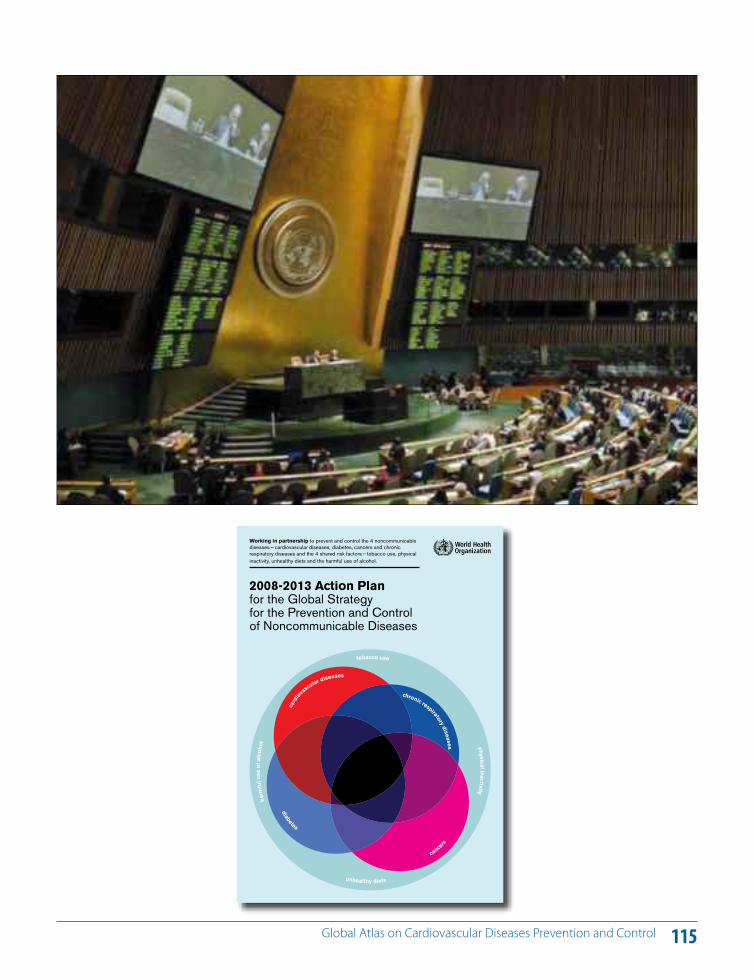
115 Global Atlas on Cardiovascular Diseases Prevention and Control
2008-2013 Action Planfor the Global Strategyfor the Prevention and Controlof Noncommunicable Diseases
Working in partnership to prevent and control the 4 noncommunicablediseases — cardiovascular diseases, diabetes, cancers and chronicrespiratory diseases and the 4 shared risk factors — tobacco use, physicalinactivity, unhealthy diets and the harmful use of alcohol.
chronic respiratory diseases
ca
rdio
vascular diseases
tobacco use physical inactivity
har
mfu
l use
of
alco
hol
cance
rs
diabetes
unhealthy diets
116 Global Atlas on Cardiovascular Diseases Prevention and Control
resolution 65/238 (Scope, modalities, format and organi-zation of the High-level Meeting on Noncommunicable Diseases) (211). The resolutions related, respectively, to the convening of and detailed organizational arrangements for a High-level Meeting of the UN General Assembly on the prevention and control of NCDs.
In support of the implementation of resolution 64/265, a side event was organized on 20 September 2010 by WHO, jointly with Member States, on the High-level Meeting and the links between the MDGs and NCDs (210).
The General Assembly provided further support for the High-level Meeting with resolutions 65/1 (Keeping the promise: United to achieve the Millennium Development Goals) and 65/95 (Global health and foreign policy) (196, 212).
In September 2010, the General Assembly also adopted resolution 65/1, which includes the Outcome Document of the 2010 Millennium Development Goal Summit. In the Document, heads of state and government committed themselves to achieving the MDGs by, inter alia, strength-ening the e!ectiveness of health systems and proven in-terventions to address evolving health challenges such as NCDs, and to undertaking concerted action and a coordi-nated response at the national, regional and global levels in order to adequately address the developmental and other challenges posed by NCDs.
As mandated by resolution 65/238, the High-level Meeting would result in a concise action-oriented Outcome Docu-ment. The Outcome Document is intended to generate global momentum and commitment both in implement-ing the WHO Global NCD Action Plan (WHA53.17) and it's Action Plan (WHA61.14) and to the “inclusion of the pre-vention and control of NCDs as an integral part of the glob-al development agenda and related investment decisions” (quoted from proposed action 17.a included in the Action Plan), building on the 2010 commitment from heads of state and government to “undertake concerted action and a coordinated response in order to adequately address the developmental challenges posed by NCDs” (quoted from operative paragraph 76.i of the MDG Outcome Document included in resolution 65/1, which was adopted by the General Assembly on 22 September 2010) (196, 211).
At the 64th World Health Assembly, Member States unani-mously endorsed a resolution on the preparations for the UN General Assembly High-level Meeting on the Preven-tion and Control of Noncommunicable Diseases (213).
The High-level Meeting is a unique opportunity to end years of neglect of the CVD epidemic and save the lives of many millions who continue to die, particularly in LMICs (Figures 101 and 102), despite the availability of high-im-pact interventions. The expectation of the world is that heads of state will, at this landmark event, spearhead con-certed action that will mitigate this global public health crisis.
Global and Regional Milestones; chronology of events culminating in the adoption of United Nations General Assembly Resoultions 64/265, 65/1, 65/95 AND 65/238May 2000 - The World Health Assembly adopts resolu-tion WHA53.17, rea"rming that the global strategy for the prevention and control of noncommunicable diseases is directed at reducing premature mortality and improving quality of life, and providing a global vision for tackling noncommunicable diseases.
May 2003 – The Health Assembly adopts the WHO Framework Convention on Tobacco Control.
May 2004 – The Health Assembly endorses the Global Strategy on Diet, Physical Activity and Health.
December 2006 – United Nations General Assembly adopts resolution 61/225, encouraging Member States to develop national policies for the prevention, treat-ment and care of diabetes.
September 2007 – Heads of Government of the Carib-bean Community, meeting at a special CARICOM Sum-mit on NCDs in Port-of- Spain issues a NCDs declaration.
May 2008 – The World Health Assembly endorses the action plan for the global strategy for the prevention and control of NCDs, which provides a roadmap for Member States, the Secretariat and international part-ners.
April 2009 – A regional ministerial meeting held in Bei-jing issues recommendations that include accelerating actions to combat NCDs through health literacy, in-cluding the use of low-cost, simple but e!ective health education interventions.
May 2009 – The ECOSOC/UNESCWA/UNDESA/WHO Western Asia Ministerial Meeting is held in Doha on 10 and 11 May. Participants adopt the Doha Declaration on NCDs and Injuries.
117 Global Atlas on Cardiovascular Diseases Prevention and Control
July 2009 – During the general debate of the United Nations Economic and Social Council’s High-level Seg-ment (Geneva, 6–9 July) national and international leaders call on global development initiatives to take into account the prevention and control of NCDs. A Ministerial Declaration is subsequently adopted, in which there is a call for urgent action to implement the global strategy for the prevention and control of NCDs and the action plan.
November 2009 – The Commonwealth Heads of State and Government, gathered at the Commonwealth Heads of Government Meeting in Port-of-Spain from 27 to 29 November, issue a statement on Commonwealth action to combat noncommunicable diseases.
8 May 2010 – The United Nations General Assembly, at its sixty-fourth session, unanimously adopts resolu-tion 64/265 on the prevention and control of NCDs. The resolution is cosponsored by 78 Member States, as well as by Cameroon on behalf of the Group of African States.
May 2010 – The World Health Assembly adopts reso-lution WHA63.13 on the global strategy to reduce the harmful use of alcohol, as well as WHA63.14 on the mar-keting of food and non-alcoholic beverages to children.
July 2010 – The United Nations Economic and Social Council adopts resolution 2010/8 on tobacco use and maternal and child health, urging Member States to consider the importance of tobacco control in improv-ing maternal and child health as part of their public health policies and in their development cooperation programmes.
September 2010 – The High-level Plenary Meeting of the sixty-fifth session of the United Nations General As-sembly on the Millennium Development Goals adopts resolution 65/1. In the resolution, Heads of State and Government commit themselves to strengthening “the e!ectiveness of health systems and proven interven-tions to address evolving health challenges, such as the increased incidence of NCDs”.
November 2010 – The note by the Secretary-General transmitting the report by the Director-General on the global status on NCDs, with a particular focus on the developmental challenges faced by developing coun-tries is discussed on 23 November 2010 at the United Nations General Assembly (document A/65/362).
December 2010 – The United Nations General Assem-bly, at its sixty-fifth session, unanimously adopts reso-
lution 65/238 on the scope, modalities, format and organization of the high-level meeting of the United Nations General Assembly on the prevention and con-trol of NCDs.
December 2010 – The United Nations General As-sembly, at its sixty-fifth session, unanimously adopts resolution 65/95 on global health and foreign policy, which inter alia welcomes the decision of the United Nations General Assembly to convene a high-level meeting in September 2011, with the participation of Heads of State and Government, on the prevention and control of NCDs, and also welcomes plans to hold the First Global Ministerial Conference on Healthy Lifestyles and Noncommunicable Disease Control, in Moscow, on 28 and 29 April 2011.
118 Global Atlas on Cardiovascular Diseases Prevention and Control
The World Health Organization World Health Organization is the United Nations Health Agency founded in 1948. It plays a critical role as the worlds leading technical authority on health. WHO has served the health needs of the world over the last 60 odd years, through its many constitutional functions including the con-vening of experts, normative and standard setting work, monitoring and surveillance of health and disease, shaping the health research agenda and technical cooperation with countries. WHO’s role in tackling diseases is unparalleled. WHO promotes evidence-based debate, and has numer-ous formal and informal networks around the world. WHO’s regionalized structure provides it with multiple opportunities for engaging with coun-tries. WHO’s strengths lie in its neutral status and nearly universal mem-bership, its impartiality and its strong convening power. WHOs mandated role in global health as set out in its constitutional objectives addresses right to health, social justice and equity for all.
World Heart FederationThe World Heart Federation is dedicated to leading the global fight against heart disease and stroke with a focus on low- and middle-income countries via a united community of more than 200 member organiza-tions. With its members, the World Heart Federation works to build glob-al commitment to addressing cardiovascular health at the policy level, generates and exchanges ideas, shares best practice, advances scientific knowledge and promotes knowledge transfer to tackle cardiovascular disease – the world’s number one killer. It is a growing membership orga-nization that brings together the strength of cardiac societies and heart foundations from more than 100 countries. Through our collective e!orts we can help people all over the world to lead longer and better heart-healthy lives.
World Stroke OrganizationThe World Stroke Organization (WSO) was established in October 2006, and is based on membership from individual scientists as well as scientific and stroke support societies. Its mission is to provide access to stroke care, promote research and knowledge by (1) promoting prevention and care for persons with stroke and vascular dementia (2) fostering the best stan-dards of practice (3) education, in collaboration with other international, public, and private organizations and (4) facilitating clinical research. The WSO World Stroke Congresses are held biannually. The WSO Journal, the International Journal of Stroke, launched in 2005, is a clinically-oriented journal with a rapidly increasing impact factor. WSO organizes the World Stroke Campaign and the World Stroke Day (held every year on October 29). WSO is an international NGO in o"cial relations with the WHO, and is involved in preparations of the ICD-11. WSO is the global voice for stroke.
119 Global Atlas on Cardiovascular Diseases Prevention and Control
1. Causes of death 2008, World Health Organization, Geneva, http://www.who.int/healthinfo/ global_burden_disease/cod_2008_sources_methods.pdf.
2. World Health Organization. Global health risks: Mortality and burden of disease attributable to selected major risks. Ge-neva, WHO, 2009.
3. Resolution WHA61.14. WHO 2008–2013 Action plan for the global strategy for prevention and control of noncommuni-cable diseases. Geneva, World Health Organization, 2008.
4. World Health Organization. Prevention of cardiovascular disease: Guidelines for assessment and management of car-diovascular risk. Geneva, WHO, 2007.
5. World Health Organization. The global burden of dis-ease:2004 update. Geneva World Health Organization, 2008.
6. World Health Organization. Global status report on non-communicable diseases 2010. Geneva, WHO, 2010.
7. Feigin VL et al. Worldwide stroke incidence and early case fatality reported in 56 population-based studies: A system-atic review. Lancet Neurology, 2009, April, 8(4):355–369. Epub 21 February 2009. Review.
8. Mendis S et al. Report for the Pathobiological Determi-nants of Atherosclerosis in Youth (PBDAY) Research Group: Atherosclerosis in children and young adults: An overview of the World Health Organization and International Soci-ety and Federation of Cardiology Study on Pathobiologi-cal Determinants of Atherosclerosis in Youth Study (1985–1995). Prevention and Control, 2005, 1:3–15.
9. Ross R. Mechanisms of disease: Atherosclerosis – an in-flammatory disease. New England Journal of Medicine, 1999, 340:115–126.
10. Davis NE. Atherosclerosis: An inflammatory process. Jour-nal of Insurance Medicine, 2005, 37:72–75.
11. Global Health Observatory Data Repository, Geneva, World Health Organization, 2008 (http://apps.who.int/ghodata/, accessed 23.8.11).
12. Levi F, Chatenoud L, Bertuccio P, Lucchini F, Negri E, La Vec-chia C. Mortality from cardiovascular and cerebrovascular diseases in Europe and other areas of the world: an up-date. Eur J Cardiovasc Prev Rehabil. 2009 Jun;16(3):333-50
13. Tunstall-Pedoe H, ed. World largest study of heart disease, stroke, risk factors and population trends, 1979–2002. MON-ICA Monograph and Multimedia Sourcebook, MONICA Project. Geneva, World Health Organization, 2003.
14. Unal B, Critchley JA, Capewell S. Explaining the decline in coronary heart disease mortality in England and Wales be-tween 1981 and 2000. Circulation, 2004, 9:1101–1107.
15. Puska P. From Framingham to North Karelia: From descrip-tive epidemiology to public health action. Progress in Car-diovascular Diseases, 2010, July–August, 53(1):15–20.
16. Kita Y et al. Trend of stroke incidence in a Japanese population: Takashima stroke registry, 1990–2001. International Journal of Stroke, 2009, August, 4(4):241–249.
17. Galus DF, Zejda JE. Decreasing trend of cardiovascular mortality in Poland in the years 1980–2001. Wiad Lek, 2004, 57(Suppl. 1):85–86.
18. Dawber TR. The Framingham Study: The epidemiology of atherosclerotic disease. Cambridge, MA, Harvard University Press, 1980.
19. Mendis S. The contribution of the Framingham Heart Study to the prevention of cardiovascular disease: A global perspective. Progress in Cardiovascular Diseases, 2010, July–August, 53(1):10–14.
20. Keys A. Seven countries: A multivariate analysis of death and coronary heart disease. Cambridge, MA and London, Har-vard University Press, 1980.
21. Yusuf S et al. E!ect of potentially modifiable risk factors associated with myocardial infarction in 52 countries (the INTERHEART study): Case-control study. Lancet, 2004, 364(9438):937–952.
22. Wald NJ, Law MR. A strategy to reduce cardiovascular dis-ease by more than 80%. British Medical Journal, 2003, 28 June, 326(7404):1419. Erratum in: British Medical Journal, 2003, 13 September, 327(7415):586; British Medical Journal, 2006, September, 60(9):823.
23. Mendis S. Cardiovascular risk assessment and manage-ment in developing countries. Vascular Health and Risk Management, 2005, 1(1):15–18.
24. World Health Organization. Global estimate of the burden of disease from second-hand smoke. Geneva, WHO, 2010.
References
120 Global Atlas on Cardiovascular Diseases Prevention and Control
40. Roerecke M, Rehm J. Irregular heavy drinking occasions and risk of ischemic heart disease: A systematic review and meta-analysis. American Journal of Epidemiology, 2010, 171:633–644.
41. World Health Organization. Global status report on alcohol and health. Geneva, WHO, 2011.
42. World Health Organization. Comparative quantification of health risks: Global and regional burden of disease attribut-able to selected major risk factors. Geneva, WHO, 2004.
43. World Health Organization. Diet, nutrition and the preven-tion of chronic diseases. Report of a joint WHO/FAO expert consultation. Geneva, WHO, 2003.
44. Strazzullo P et al. Salt intake, stroke, and cardiovascular dis-ease: Meta-analysis of prospective studies. British Medical Journal, 2009, 24 November, 339:b4567. doi: 10.1136/bmj.b4567.
45. Creating an enabling environment for population-based salt reduction strategies. Report of a WHO and United Kingdom Food Standards Agency joint technical meeting, 1–2 July 2010, London. Geneva, World Health Organization, 2010.
46. Bazzano LA, Serdula MK, Liu S. Dietary intake of fruits and vegetables and risk of cardiovascular disease. Current Ath-erosclerosis Reports, 2003, 5:492–499.
47. Kotseva R et al. EUROASPIRE Study Group. EUROASPIRE III. Management of cardiovascular risk factors in asymptom-atic high-risk patients in general practice: Cross-sectional survey in 12 European countries. European Journal of Car-diovascular Prevention and Rehabilitation, 2010, October, 17(5):530–540.
48. World Health Organization. Prevention of cardiovascular dis-ease: Pocket guidelines for assessment and management of cardiovascular risk. Geneva, WHO, 2007.
49. Brown IJ et al. Salt intakes around the world: Implications for public health. International Journal of Epidemiology, 2009, 38:791–813.
50. He FJ, MacGregor GA. A comprehensive review on salt and health and current experience of worldwide salt reduc-tion programmes. Journal of Human Hypertension, 2009, 23:363–384.
51. Finucane MM et al. National, regional, and global trends in body-mass index since 1980: Systematic analysis of health examination surveys and epidemiological studies with 960 country-years and 9.1 million participants. Lancet, 2011, 337(9765):557–567.
52. Government of Great Britain. Obesity: Third report of session 2003–2004. Volume 1: Report, together with formal minutes. Document HC 23–1. London, House of Commons, 2004.
53. Ezzati M et al. Selected major risk factors and global and regional burden of disease. Lancet, 2002, 360:1347–1360.
25. World Health Organization. WHO report on the global to-bacco epidemic: The MPOWER Package. Geneva, WHO, 2008.
26. World Health Organization . WHO Report on the Global To-bacco Epidemic, 2011: warning about the dangers of tobac-co, WHO, Geneva, 2011
27. Doll R et al. Mortality in relation to smoking: 50 years' ob-servations on male British doctors. British Medical Journal, 2004, 328(7455):1519. Epub 22 June 2004.
28. World Health Organization. Systematic review of the link be-tween tobacco and poverty. Geneva, WHO, 2011.
29. World Health Organization. Global recommendations on physical activity for health. Geneva, WHO, 2010.
30. Oguma Y, Shinoda-Tagawa T. Physical activity decreases cardiovascular disease risk in women: Review and meta-analysis. American Journal of Preventative Medicine, 2004, 26(5):407–418.
31. Wendel-Vos GC et al. Physical activity and stroke: A meta-analysis of observational data. International Journal of Epi-demiology, 2004, 33(4):787–798. Epub 27 May 2004.
32. Berlin JA, Colditz GA. A meta-analysis of physical activity in the prevention of coronary heart disease. American Journal of Epidemiology, 1990, 132(4):612–628.
33. Cornelissen VA, Fagard RH. E!ects of endurance training on blood pressure, blood pressure-regulating mecha-nisms, and cardiovascular risk factors. Hypertension, 2005, 46(4):667–675.
34. Cornelissen VA, Fagard RH. E!ect of resistance training on resting blood pressure: A meta-analysis of randomized controlled trials. Journal of Hypertension, 2005, 23(2):251–259.
35. Kelley GA, Kelley KS, Vu Tran Z. Aerobic exercise, lipids and lipoproteins in overweight and obese adults: A meta-anal-ysis of randomized controlled trials. International Journal of Obesity Related Metabolic Disorders, 2005, 29(8):881–893.
36. Corrao G et al. A meta-analysis of alcohol consumption and the risk of 15 diseases. Preventive Medicine, 2004, 38:613–619.
37. Mukamal KJ et al. Alcohol consumption and cardiovascu-lar mortality among U.S. adults, 1987 to 2020. Journal of the American College of Cardiology, 2010, 55:1328–1335.
38. Rehm J et al. The relation between di!erent dimensions of alcohol consumption and burden of disease: An overview. Addiction, 2010, 105:817–843.
39. Ronksley PE et al. Association of alcohol consumption with selected cardiovascular disease outcomes: A system-atic review and meta-analysis. British Medical Journal, 2011, 342:d671.
121 Global Atlas on Cardiovascular Diseases Prevention and Control
65. UK Prospective Diabetes Study (UKPDS) Group. Intensive blood-glucose control with sulphonylureas or insulin compared with conventional treatment and risk of com-plications in patients with type 2 diabetes (UKPDS 33). Lan-cet, 1998, 352:837–853.
66. Simmons RK et al. The metabolic syndrome: Useful con-cept or clinical tool? Report of a WHO Expert Consultation. Diabetologia, 2010, April, 53(4):600–605. Epub 11 Decem-ber 2009.
67. Farzadfar F et al. National, regional, and global trends in serum total cholesterol since 1980: Systematic analysis of health examination surveys and epidemiological studies with 321 country-years and 3.0 million participants. Lancet, 2011, 337(9765):578–586.
68. World Health Organization. Equity, social determinants and public health programmes. Geneva, WHO, 2010.
69. World Health Organization. Closing the gap in generation: Health equality through action on the social determinants of health. Final Report of the Commission on Social Determi-nants of Health. Geneva, WHO, 2008.
70. Resolution WHA62.14. Reducing health inequities through action on the social determinants of health. Geneva, World Health Organization, 2009 (http://apps.who.int/gb/eb-wha/pdf_files/WHA62-REC1/WHA62_REC1-en-P2.pdf ).
71 Fong CW et al. Educational inequalities associated with health-related behaviours in the adult population of Sin-gapore. Singapore Medical Journal, 2007, 48:1091–1099.
72. Tamayo T, Christian H, Rathmann W. Impact of early psy-chosocial factors (childhood socioeconomic factors and adversities) on future risk of type 2 diabetes, metabolic disturbances and obesity: A systematic review. Biomedical Central Public Health, 2010, 10:525–528.
73. Barker DJP et al. Weight in infancy and death from isch-aemic heart disease. Lancet, 1989, ii:577–580.
74. EARLYREAD Collaboration. Birth weight and risk of type 2 diabetes: A quantitative systematic review of published evidence. Journal of the American Medical Association, 2008, 300:2885–2897.
75. Kinra S et al. E!ect of integration of supplemental nutri-tion with public health programmes in pregnancy and early childhood on cardiovascular risk in rural Indian ado-lescents: Long-term follow-up of Hyderabad nutrition trial. British Medical Journal, 2008, 337:1–10.
76. Krishnaveni GV et al. Anthropometry, glucose tolerance and insulin concentrations in Indian children: Relation-ships to maternal glucose and insulin concentrations dur-ing pregnancy. Diabetes Care, 2005, 28:2919–2925.
54. Obesity: Preventing and managing the global epidemic. Re-port of a WHO Consultation. Geneva, World Health Orga-nization, 2000 (WHO Technical Report Series, No. 894).
55. McGee DL. Diverse Populations Collaboration. Body mass index and mortality: A meta-analysis based on person-level data from twenty-six observational studies. Annals of Epidemiology, 2005, 15(2):87–97.
56. Wang Y. Cross-national comparison of childhood obesity: The epidemic and the relationship between obesity and socioeconomic status. International Journal of Epidemiol-ogy, 2001, 30:1129–1136.
57. Danaei G et al. National, regional, and global trends in systolic blood pressure since 1980: Systematic analysis of health examination surveys and epidemiological studies with 786 country-years and 54 million participants. Lancet, 2011, 377(9765):568–577.
58. Levitan B et al. Is non-diabetic hyperglycaemia a risk factor for cardiovascular disease? A meta-analysis of prospective studies. Archives of Internal Medicine, 2004, 164(19):2147–2155.
59. Eberly LE et al. Intervention Trial Research Group. Impact of incident diabetes and incident nonfatal cardiovascular disease on 18-year mortality: The multiple risk factor inter-vention trial experience. Diabetes Care, 2003, 26:848–854.
60. Laing SP et al. Mortality from heart disease in a cohort of 23,000 patients with insulin-treated diabetes. Diabetologia, 2003, 46(6):760–765.
61. The DECODE Study Group on behalf of the European Dia-betes Epidemiology Group. Is the current definition for diabetes relevant to mortality risk from all causes and car-diovascular and noncardiovascular disease? Diabetes Care, 2003, 26:688–696.
62. Boden-Albala B et al. Diabetes, fasting glucose levels, and risk of ischemic stroke and vascular events: Findings from the Northern Manhattan Study (NOMAS). Diabetes Care, 2008, 31:1132–1137.
63. Lakka HM et al. The metabolic syndrome and total and car-diovascular disease mortality in middle-aged men. Journal of the American Medical Association, 2002, 288:2709–2716.
64. The Diabetes Control and Complications Trial/Epidmiol-ogy of Diabetes Interventions and Complications (DCCT/EDIC) Study Research Group. Intensive diabetes treatment and cardiovascular disease in patients with type 1 diabe-tes. New England Journal of Medicine, 2005, 353(25):2643–2653.
122 Global Atlas on Cardiovascular Diseases Prevention and Control
91. Hayes DK et al. Racial/ethnic and socioeconomic di!er-ences in multiple risk factors for heart disease and stroke in women: Behavioral risk factor surveillance system, 2003. Journal of Women’s Health (Larchmont), 2006, 15(9):1000–1008.
92. Martikainen P et al. Income di!erences in mortality: A register-based follow-up study of three million men and women. International Journal of Epidemiology, 2001, 30:1397–1405.
93. Kuper H et al. The socioeconomic gradient in the incidence of stroke: A prospective study in middle-aged women in Sweden. Stroke, 2007, 38:27–33.
94. Hart CL, Hole DJ, Smith GD. The contribution of risk fac-tors to stroke di!erentials, by socioeconomic position in adulthood: The Renfrew/Paisley study. American Journal of Public Health, 2000, 90(11):1788–1791.
95. Jakovljevic D et al. Socioeconomic status and ischemic stroke: The FINMONICA stroke register. Stroke, 2001, 32:1492–1498.
96. Avendano M et al. Trends in socioeconomic disparities in stroke mortality in six European countries between 1981–1985 and 1991–1995. American Journal of Epidemiology, 2005, 161:52–61.
97. Mendis S, Banerjee A. Cardiovascular disease: Equity and so-cial determinants. In: Blas E, Kurup AS, eds. Equity, social de-terminants and public health programmes. Geneva, World Health Organization, 2010:31–48.
98. James PD et al. Avoidable mortality by neighbourhood income in Canada: 25 years after the establishment of uni-versal health insurance. Journal of Epidemiology and Com-munity Health, 2007, 61(4):287–296.
99. World Health Organization. World Health Report 2010: Health systems financing: The path to universal coverage. Ge-neva, WHO, 2010.
100. Xu K. Household catastrophic health expenditure: A multi-country analysis. Lancet, 2003, 362:111–117.
101. Xu K et al. Protecting households from catastrophic health spending. Health A!airs, 2007, 26(4):972–983.
102. Knaul FC, Frenk J. Health insurance in Mexico: Achieving universal coverage through structural reform. Health Af-fairs, 2005, 24:1467–1476.
103. Mahal A, Karan A, Engelgau M. The economic implications of non-communicable disease for India. HNP Discussion Pa-per. Washington DC, World Bank, 2010.
104. Kruk ME, Goldmann E, Galea S. Borrowing and selling to pay for health care in low- and middle-income countries. Health A!airs, 2009, 28:1056–1066.
77. McMurray RG et al. The influence of physical activity, so-cioeconomic status, and ethnicity on the weight status of adolescents. Obesity Research, 2000, 8:130–139.
78. Resolution WHA56.1. WHO framework convention on to-bacco control. Geneva, World Health Organization, 2003.
79. Resolution WHA63.13. Global strategy to reduce the harmful use of alcohol. Geneva, World Health Organization, 2010.
80. Resolution WHA57.17. Global strategy on diet, physical activ-ity and health. Geneva, World Health Organization, 2004.
81. Resolution WHA63.14. Marketing of food and non-alcoholic beverages to children. In: Sixty-third World Health Assembly. Geneva, World Health Organization, 21 May 2010.
82. Maas AH, Appelman YE. Gender di!erences in coronary heart disease. Neth Heart J., 2010 Nov;18(12):598-603
83. Ciambrone G, Kaski JC. The importance of gender di!er-ences in the diagnosis and management of cardiovascular disease. Current Pharmaceutical Design, 2011, 17(11):1079–1081.
84. Anand SS et al. Di!erences in the management and prog-nosis of women and men who su!er from acute coronary syndromes. Journal of the American College of Cardiology, 2005, 46:1845–1851.
85. Levit RD, Reynolds HR, Hochman JS. Cardiovascular dis-ease in young women: A population at risk. Cardiology in Review, 2011, March–April, 19(2):60–65.
86. Zhang Y. Cardiovascular diseases in American women. Nu-trition, Metabolism, and Cardiovascular Diseases, 2010, July, 20(6):386–393. Epub 2 June 2010.
87. Population Division of the Department of Economic and Social A!airs of the United Nations Secretariat (UNDESA). World Population Prospects: The 2006 Revision and World Ur-banization Prospects: The 2007 Revision. New York, United Nations, 26 February 2008 (http://esa.un.org/unup).
88. Mathenge W, Foster A, Kuper H. Urbanization, ethnicity and cardiovascular risk in a population in transition in Na-kuru, Kenya: A population-based survey. BMC Public Health, 2010, September, 22(10):569.
89. Vorster HH. The emergence of cardiovascular disease dur-ing urbanisation of Africans. Public Health Nutrition, 2002, 5(1A):239–243.
90. WHO Centre for Health Development. Our cities, our health, our future. Report to the WHO Commission on Social De-terminants of Health from the Knowledge Network on Urban Settings. Kobe, Japan, World Health Organization, 2008.
123 Global Atlas on Cardiovascular Diseases Prevention and Control
120. Carapetis JR, McDonald M, Wilson NJ. Acute rheumatic fe-ver. Lancet, 2005, 366:155%168.
121. Carapetis JR et al. The global burden of Group A strepto-coccal diseases. Lancet Infectious Diseases, 2005, 5:685%694.
122. Seckeler MD, Hoke TR. The worldwide epidemiology of acute rheumatic fever and rheumatic heart disease. Clini-cal Epedimiology, 2011, February, 22(3):67–84.
123. Robertson KA, Volmink JA, Mayosi BM. Antibiotics for the primary prevention of acute rheumatic fever: A meta-anal-ysis. BMC Cardiovascular Disorders, 2005, 31 May, 5(1):11.
124. Rassi A Jr, Rassi A, Marin-Neto JA. Chagas disease. Lancet, 2010, April, 375(9723):1388–1402.
125. Moncayo A, Silveira AC. Current epidemiological trends for Chagas disease in Latin America and future challenges in epidemiology, surveillance and health policy. Memorias do Instituto Oswald Cruz, 2009, 104(Suppl. 1):17–30.
126. Control of Chagas disease. Second report of the WHO Ex-pert Committee. Geneva, World Health Organization, 2002. (Technical Report Series, No. 905).
127. Schmunis GA. Epidemiology of Chagas disease in non-en-demic countries: The role of international migration. Me-morias do Instituto Oswald Cruz, 2007, 102(Suppl. 1):75–85.
128. Moncayo A. Chagas disease: Current epidemiological trends after the interruption of vectorial and transfusional transmission in the Southern Cone countries. Memorias do Instituto Oswald Cruz, 2003, 98:577–591.
129. Dias JC, Silveira AC, Schofield CJ. The impact of Chagas disease control in Latin America: A review. Memorias do Instituto Oswald Cruz, 2002, July, 97(5):603–612.
130. Johnston SC, Mendis S, Mathers CD. Global variation in stroke burden and mortality: Estimates from monitor-ing, surveillance, and modelling. Lancet Neurology, 2009, 8:345–354.
131. Mathers CD, Loncar D. Projections of global mortality and burden of disease from 2002 to 2030. PLoS Medicine, 2006, 3:e442.
132. Szostak WB, Seku&a W, Figurska K. Reduction of cardiovas-cular mortality in Poland and changes in dietary patterns. Kardiologia Polska, 2003, March, 58(3):173–181 (discussion 180–181).
133. Rywik SL et al. Is the decrease of cardiovascular mortality in Poland associated with the reduction of global cardiovas-cular risk related to changes in life style? Kardiologia Polska, 2003, May, 58(5):344–355 (discussion 355).
134. Mendis S. Prevention and care of stroke in low- and middle-income countries; the need for a public health perspective. International Journal of Stroke, 2010, April, 5(2):86–91.
105. Abegunde DO, Stanciole AE. The economic impact of chronic diseases: How do households respond to shocks? Evidence from Russia. Social Science and Medicine, 2008, 66(11):2296–3307.
106. Mendis S et al. The availability and a!ordability of selected essential medicines for chronic diseases in six low- and middle-income countries. Bulletin of the World Health Or-ganization, 2007, 85:279–288.
107. Ramachandran A et al. Increasing expenditure on health care incurred by diabetic subjects in a developing country: A study from India. Diabetes Care, 2007, 30:252–256.
108. Sierra C, Coca A, Schi!rin EL. Vascular mechanisms in the pathogenesis of stroke. Current Hypertension Reports, 2011, June, 13(3):200–207.
109. Kannel WB et al. Prevalence, incidence, prognosis, and predisposing conditions for atrial fibrillation: Population-based estimates. American Journal of Cardiology, 1998, 82(8A):2N–9N.
110. Wolf PA, Abbott RD, Kannel WB. Atrial fibrillation as an in-dependent risk factor for stroke: The Framingham Study. Stroke, 1991, 22(8):983–988.
111. Holmes DR. Atrial fibrillation and stroke management: Present and future. Seminars in Neurology, 2010, Novem-ber, 30(5):528–536. Epub 4 January 2011. Review.
112. Weisfeldt ML et al. Survival after application of automatic external defibrillators before arrival of the emergency medical system: Evaluation in the Resuscitation Outcomes Consortium population of 21 million. Journal of the Ameri-can College of Cardiology, 2010, 55:1713–1720.
113. Pell JP, Walker A, Cobbe SM. Cost-e!ectiveness of auto-mated external defibrillators in public places. Curr Opin Cardiol., 2007 Jan;22(1):5-10.
114. Pell JP, Walker A, Cobbe SM. Cost-e!ectiveness of auto-mated external defibrillators in public places: con. Current Opinion in Cardiology, 2007, 22:5–10.
115. Ho!man JI, Kaplan S. The incidence of congenital heart disease. Journal of the American College of Cardiology, 2002, 39(12):1890–1900. PubMed.
116. Bruneau BG. The developmental genetics of congenital heart disease. Nature, 2008, 451(7181):943–948.
117. Mendis S. The policy agenda for prevention and control of non-communicable diseases. British Medical Bulletin, 2010, 96:23–43.
118. Resolution WHA63.17. Birth defects. Geneva, World Health Organization, 2010.
119. Rheumatic fever and rheumatic heart disease. Report of a WHO Expert Consultation, 29 October–1 November 2001. Geneva, World Health Organization, 2004 (Technical Re-port Series, No. 923).
124 Global Atlas on Cardiovascular Diseases Prevention and Control
148. Asaria P et al. Chronic disease prevention: Health e!ects and financial costs of strategies to reduce salt intake and control tobacco use. Lancet, 2007, 370:2044–2053.
149. Jha P et al. Tobacco addiction. In: Jamison DT et al., eds. Disease control priorities in developing countries, 2nd edition. Washington DC, World Bank, 2006.
150. World Health Organization. WHO technical manual on to-bacco tax administration. Geneva, WHO, 2010.
151. World Health Organization. Protection from exposure to sec-ond-hand tobacco smoke: Policy recommendations. Geneva, WHO, 2007.
152. International Tobacco Control Project. International Tobac-co Control Policy Evaluation Project: Key findings. Waterloo, Ontario, ITC, 2010.
153. Hoek J et al. Lessons from New Zealand’s introduction of pictorial health warnings on tobacco packaging. Bulletin of the World Health Organization, 2010, 88:861–866.
154. National Bureau of Economic Research. Tobacco adver-tising: Economic theory and international evidence. Cam-bridge, MA, NBER, 1999.
155. World Health Organization. WHO report on the global to-bacco epidemic: Implementing smoke-free environments. Geneva, WHO, 2009.
156. International Tobacco Evidence Network. Economics of tobacco control international evidence for tobacco control network. University of Illinois at Chicago, ITEN, 2002.
157. Centers for Disease Control and Prevention. Best practices for comprehensive tobacco control programs. Atlanta, CDC, 2007.
158. Resolution WHA63.23. Maternal, young child and infant nu-trition: Implementation plan. Geneva, World Health Organi-zation, May 2010.
159. Reducing salt intake in populations. Report of a WHO forum and technical meeting, Paris, 5–7 October 2006. Geneva, WHO, 2007.
160. World Health Organization. Estimation of resource needs and costs for scaling-up a core noncommunicable disease intervention package in low and middle income countries, Geneva, WHO 2011.
161. World Health Organization. Interventions on diet and physi-cal activity: What works: Summary report. Geneva, WHO, 2009.
162. Ramachandran A et al. The Indian Diabetes Prevention Programme shows that lifestyle modification and metfor-min prevent type 2 diabetes in Asian Indian subjects with impaired glucose tolerance (IDPP). Diabetologia, 2006, 49:289–297.
135. Hachinski V et al. Stroke: Working toward a prioritized world agenda. International Journal of Stroke, 2010, August, 5(4):238–256.
136. Norrving B. The World Stroke Organization and the World Stroke Day. International Journal of Stroke, 2009, October, 4(5):314.
137. Jackson R et al. Treatment with drugs to lower blood pres-sure and blood cholesterol based on an individual's abso-lute cardiovascular risk. Lancet, 2005, 365(9457):434–441.
138. British Heart Foundation. Updated guidelines on CVD risk as-sessment. Factfile 08/2004 (http://www.bhf.org.uk/profes-sionals/index.asp?secID=15&secondlevel=471&thirdlevel=970&artID=5446).
139. Assmann G, Cullen P, Schulte H. Simple scoring scheme for calculating the risk of acute coronary events based on the 10-year follow-up of the prospective cardiovascular Mun-ster (PROCAM) study. Circulation, 2002, 105(3):310–315.
140. Conroy RM et al. SCORE Project Group. Estimation of ten-year risk of fatal cardiovascular disease in Europe: The SCORE Project. European Heart Journal, 2003, 24(11):987–1003.
141. Mendis S et al. World Health Organization (WHO) and In-ternational Society of Hypertension (ISH) risk prediction charts: Assessment of cardiovascular risk for prevention and control of cardiovascular disease in low- and middle-income countries. Journal of Hypertension, 2007, August, 25(8):1578–1582.
142. Puska P, Ståhl T. Health in All Policies – the Finnish initiative: Background, principles, and current issues. Annual Review of Public Health, 2010, 21 April, 31:315–328. Review.
143. Mendis S, Fuster V. National policies and strategies for non-communicable diseases. Nature Reviews Cardiology, 2009, November, 6(11):723–727. Review.
144. World Bank. Public policy and the challenge of chronic non-communicable diseases. Executive summary. Washington, DC, WB, 2007 (http://siteresources.worldbank.org/INTPH/Resources/ PublicPolicyandNCDsWorldBank2007FullRe-port.pdf ).
145. World Health Organization. Guidelines for implementation of the WHO Framework Convention on Tobacco Control. Ge-neva, WHO, 2011.
146. World Health Organization. History of the WHO Framework Convention on Tobacco Control. Geneva, WHO, 2009.
147. Ranson MK et al. Global and regional estimates of the ef-fectiveness and cost-e!ectiveness of price increases and other tobacco control policies. Nicotine & Tobacco Re-search, 2002, 4:311–319.
125 Global Atlas on Cardiovascular Diseases Prevention and Control
178. Mendis S et al. Total cardiovascular risk approach to im-prove e"ciency of cardiovascular prevention in resource-constrained settings. Journal of Clinical Epidiomology, 27 April 2011. Epub ahead of print.
179. Lonn E et al. The polypill in the prevention of cardiovas-cular diseases: Key concepts, current status, challenges, and future directions. Circulation, 2010, 16 November, 122(20):2078–2088.
180. Yusuf S et al. E!ects of a polypill (Polycap) on risk fac-tors in middle-aged individuals without cardiovascular disease (TIPS): A phase II, double-blind, randomised trial. Indian Polycap Study (TIPS). Lancet, 2009, 18 April 18, 373(9672):1341–1351.
181. Soliman EZ et al. A Polypill for primary prevention of cardio-vascular disease: A feasibility study of the World Health Orga-nization. Trials, 2011, 5 January, 12:3.
182. Mendis S et al. WHO study on Prevention of Recurrences of Myocardial Infarction and StrokE (WHOPREMISE). Bulletin of the World Health Organization, 2005, 83(11):820–829.
183. Parati G et al. A new solar-powered blood pressure mea-suring device for low-resource settings. Hypertension, 2010, December, 56(6):1047–1053. Epub 8 November 2010.
184. Ndindjock R et al. Potential impact of single-risk factor versus total risk management for the prevention of cardio-vascular events in Seychelles. Bulletin of the World Health Organization, 2011, 85:286–295.
185. Murray CJ et al. E!ectiveness and costs of interventions to lower systolic blood pressure and cholesterol: A global and regional analysis on reduction of cardiovascular-dis-ease risk. Lancet, 2003, 361:717–725.
186. Mendis S, Alwan A, eds. A prioritized research agenda for prevention and control of noncommunicable diseases. Ge-neva, World Health Organization, 2011.
187. World Health Organization. World Health Report 2008: Pri-mary health care – now more than ever. Geneva, WHO, 2008.
188. Evans DB, Etienne C. Health systems financing and the path to universal coverage. Bulletin of the World Health Or-ganization, 2010, 88:402.
189. WHO Framework for Action. Everybody’s business: Strength-ening health systems to improve health outcomes. Geneva, World Health Organization, 2007.
190. Wood D et al. Research priorities: Prevention and control of cardiovascular diseases, with a focus on low- and middle-income countries. Paper 1. In: Mendis S, Alwan A, eds. A prioritized research agenda for prevention and control of noncommunicable diseases. Geneva, World Health Organi-zation, 2011.
163. Cecchini M et al. Tackling of unhealthy diets, physical in-activity, and obesity: Health e!ects and cost e!ectiveness. Lancet, 2010, 376:1775–1784.
164. World Health Organization. WHO Global recommendations on physical activity for health. Geneva, WHO, 2010.
165. Resolution WHA58.26. Public health problems caused by harmful use of alcohol. Geneva, World Health Organization, 2005.
166. Babor TF et al. Alcohol: No ordinary commodity, 2nd edition. Oxford, Oxford University Press, 2010.
167. World Health Organization. Problems Related to Alcohol Consumption. Second report of the expert committee. Ge-neva, WHO, 2007.
168. Anderson P, Chisholm D, Fuhr D. E!ectiveness and cost-e!ectiveness of policies and programmes to reduce the harm caused by alcohol. Lancet, 2009, 373:2234–2246.
169. World Health Organization Regional O"ce for Europe. Evi-dence for the e!ectiveness and cost-e!ectiveness of interven-tions to reduce alcohol-related harm. Copenhagen, WHO, 2009.
170. Bergeron H. Qualifying policy: Taking the example of the alcohol problem. Santé Publique, 2008 July–August, 20(4):341–352.
171. World Health Organization. Prevention of recurrent heart attacks and strokes in low- and middle-income populations: Evidence-based recommendations for policy-makers and health professionals. Geneva, WHO, 2003.
172. Jamison DT et al., eds. Disease control priorities in developing countries, 2nd edition. Washington DC, World Bank, 2006.
173. World Health Organization. Package of essential noncom-municable disease interventions for primary health care in low-resource settings. Geneva, WHO, 2010.
174. Lim SS et al. Prevention of cardiovascular disease in high-risk individuals in low-income and middle-income coun-tries: Health e!ects and costs. Lancet, 2007, 370:2054–2062.
175. Yusuf S. Two decades of progress in preventing vascular disease. Lancet, 2002, 360:2–3.
176. Abegunde DO et al. Can non-physician health-care work-ers assess and manage cardiovascular risk in primary care? Bulletin of the World Health Organization, 2007, 85:432–440.
177. Mendis S et al. Cardiovascular risk management and its impact on hypertension control in primary care in low-resource settings: A cluster-randomized trial. Bulletin of the World Health Organization, 2010, June, 88(6):412–419.
126 Global Atlas on Cardiovascular Diseases Prevention and Control
205. Rajaratnam JK et al. Neonatal, postneonatal, childhood, and under-5 mortality for 187 countries, 1970–2010: A sys-tematic analysis of progress towards Millennium Develop-ment Goal 4. Lancet, 2010, 5 June, 375(9730):1988–2008. Epub 27 May 2010. Erratum in: Lancet, 2010, 28 August, 376(9742):686; Lancet, 2010, 19 June, 375(9732):2142.
206. United Nations resolution 2010/8. ECOSOC resolution on tobacco use and maternal and child health. Adopted by the UN Economic and Social Council, 22 July 2010. New York, United Nations.
207. Statement on Commonwealth Action to Combat Noncom-municable Diseases, 27–29 November 2009 (http://www.uicc.org/sites/clonesource.agenceinovae.com/files/pri-vate/statementoncommonwealthactiontocombatnon-communicablediseases.pdf ).
208. The progress in implementation of the WHO Global NCD Action Plan in 2008–2009 reported to the 126th Executive Board, 18–23 January 2010. Geneva, World Health Organi-zation.
209. The progress in implementation of the WHO Global NCD Action Plan in 2008–2009 reported to the 63rd World Health Assembly, 17–21 May 2010. Geneva, World Health Organization.
210. United Nations resolution 64/265. Prevention and control of noncommunicable diseases. Adopted by the General As-sembly, 10 May 2010. New York, United Nations.
211. United Nations resolution 65/238. Scope, modalities, format and organization of the high-level meeting of the General Assembly on the prevention and control of NCDs. Adopted by the General Assembly, 13 December 2010. New York, United Nations.
212. United Nations resolution 65/95. Global health and foreign policy. Adopted by the General Assembly, 10 February 2011. New York, United Nations.
213. Resolution WHA64/21. Prevention and control of noncom-municable diseases: WHO’s role in the preparation, imple-mentation and follow-up to the high-level meeting of the United Nations General Assembly on the prevention and con-trol of noncommunicable diseases, September 2011. Geneva, WHO, 2011.
191. World Health Organization. World Health Report 2012: No health without research. Geneva, WHO (in preparation).
192. Alwan A et al. Monitoring and surveillance of chronic non-communicable diseases: Progress and capac-ity in high-burden countries. Lancet, 2010, 27 November, 376(9755):1861–1868.
193. Collie-Akers V et al. Evaluating mobilization strategies with neighborhood and faith organizations to reduce risk for health disparities. Health Promotion Practice, 2009 April, 10(Suppl. 2):118S–127S.
194. The NCD Alliance web site (http://www.ncdalliance.org/unspg).
195. Engelgau MM et al. Capitalizing on the demographic tran-sition: Tackling noncommunicable diseases in South Asia. Washington, DC, World Bank, 2011.
196. United Nations resolution 65/1. Keeping the promise: United to achieve the Millennium Development Goals. Adopted by the General Assembly, 19 October 2010. New York, United Nations.
197. McCoy D, Chand S, Sridhar D. Global health funding: How much, where it comes from and where it goes. Health Pol-icy Plan, 2009, November, 24(6):407–417.
198. Taskforce on Innovative International Financing for Health Systems. Constraints to scaling up and costs: Working group 1 report. Geneva, International Health Partnership, 2009 (http://www.internationalhealthpartnership.net//CMS_files/documents/working_group_1_-_report_EN.pdf ).
199. Taskforce on Innovative International Financing for Health Systems. Raising and channelling funds: Working group 2 report. Geneva, International Health Partnership, 2009 (http://www.internationalhealthpartnership.net//CMS_files/documents/working_group_2_-_report_EN.pdf ).
200. Taskforce on Innovative International Financing for Health Systems. More money for health, and more health for the money: Final report. Geneva, International Health Partner-ship, 2009 (http://www.internationalhealthpartnership.net//CMS_files/documents/taskforce_report_EN.pdf ).
201. Schmidt R. The currency transaction tax: Rate and revenue estimates. Ottawa, North-South Institute, 2007 (www.nsi-ins.ca).
202. Thai Health Promotion Foundation web site (http://en.thaihealth.or.th/).
203. Nam EW et al. Sustainable funding of health initiatives in Wonju Republic of Korea via a tobacco consumption tax. Health Promotion International, 2011, 14 March.
204. Bhutta ZA et al. Countdown to 2015 decade report (2000–2010): Taking stock of maternal, newborn, and child sur-vival. Lancet, 2010, 5 June, 375(9730):2032–2044. Review. Erratum in: Lancet, 2010, 4 September, 376(9743):772.
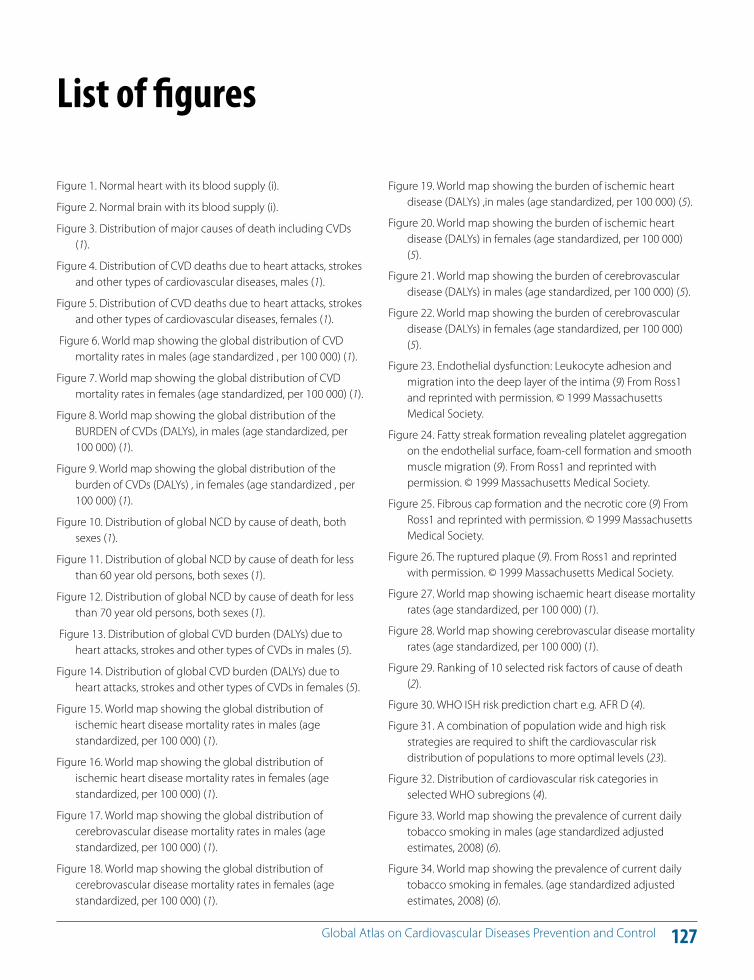
127 Global Atlas on Cardiovascular Diseases Prevention and Control
Figure 19. World map showing the burden of ischemic heart disease (DALYs) ,in males (age standardized, per 100 000) (5).
Figure 20. World map showing the burden of ischemic heart disease (DALYs) in females (age standardized, per 100 000) (5).
Figure 21. World map showing the burden of cerebrovascular disease (DALYs) in males (age standardized, per 100 000) (5).
Figure 22. World map showing the burden of cerebrovascular disease (DALYs) in females (age standardized, per 100 000) (5).
Figure 23. Endothelial dysfunction: Leukocyte adhesion and migration into the deep layer of the intima (9) From Ross1 and reprinted with permission. © 1999 Massachusetts Medical Society.
Figure 24. Fatty streak formation revealing platelet aggregation on the endothelial surface, foam-cell formation and smooth muscle migration (9). From Ross1 and reprinted with permission. © 1999 Massachusetts Medical Society.
Figure 25. Fibrous cap formation and the necrotic core (9) From Ross1 and reprinted with permission. © 1999 Massachusetts Medical Society.
Figure 26. The ruptured plaque (9). From Ross1 and reprinted with permission. © 1999 Massachusetts Medical Society.
Figure 27. World map showing ischaemic heart disease mortality rates (age standardized, per 100 000) (1).
Figure 28. World map showing cerebrovascular disease mortality rates (age standardized, per 100 000) (1).
Figure 29. Ranking of 10 selected risk factors of cause of death (2).
Figure 30. WHO ISH risk prediction chart e.g. AFR D (4).
Figure 31. A combination of population wide and high risk strategies are required to shift the cardiovascular risk distribution of populations to more optimal levels (23).
Figure 32. Distribution of cardiovascular risk categories in selected WHO subregions (4).
Figure 33. World map showing the prevalence of current daily tobacco smoking in males (age standardized adjusted estimates, 2008) (6).
Figure 34. World map showing the prevalence of current daily tobacco smoking in females. (age standardized adjusted estimates, 2008) (6).
Figure 1. Normal heart with its blood supply (i).
Figure 2. Normal brain with its blood supply (i).
Figure 3. Distribution of major causes of death including CVDs (1).
Figure 4. Distribution of CVD deaths due to heart attacks, strokes and other types of cardiovascular diseases, males (1).
Figure 5. Distribution of CVD deaths due to heart attacks, strokes and other types of cardiovascular diseases, females (1).
Figure 6. World map showing the global distribution of CVD mortality rates in males (age standardized , per 100 000) (1).
Figure 7. World map showing the global distribution of CVD mortality rates in females (age standardized, per 100 000) (1).
Figure 8. World map showing the global distribution of the BURDEN of CVDs (DALYs), in males (age standardized, per 100 000) (1).
Figure 9. World map showing the global distribution of the burden of CVDs (DALYs) , in females (age standardized , per 100 000) (1).
Figure 10. Distribution of global NCD by cause of death, both sexes (1).
Figure 11. Distribution of global NCD by cause of death for less than 60 year old persons, both sexes (1).
Figure 12. Distribution of global NCD by cause of death for less than 70 year old persons, both sexes (1).
Figure 13. Distribution of global CVD burden (DALYs) due to heart attacks, strokes and other types of CVDs in males (5).
Figure 14. Distribution of global CVD burden (DALYs) due to heart attacks, strokes and other types of CVDs in females (5).
Figure 15. World map showing the global distribution of ischemic heart disease mortality rates in males (age standardized, per 100 000) (1).
Figure 16. World map showing the global distribution of ischemic heart disease mortality rates in females (age standardized, per 100 000) (1).
Figure 17. World map showing the global distribution of cerebrovascular disease mortality rates in males (age standardized, per 100 000) (1).
Figure 18. World map showing the global distribution of cerebrovascular disease mortality rates in females (age standardized, per 100 000) (1).
List of !gures
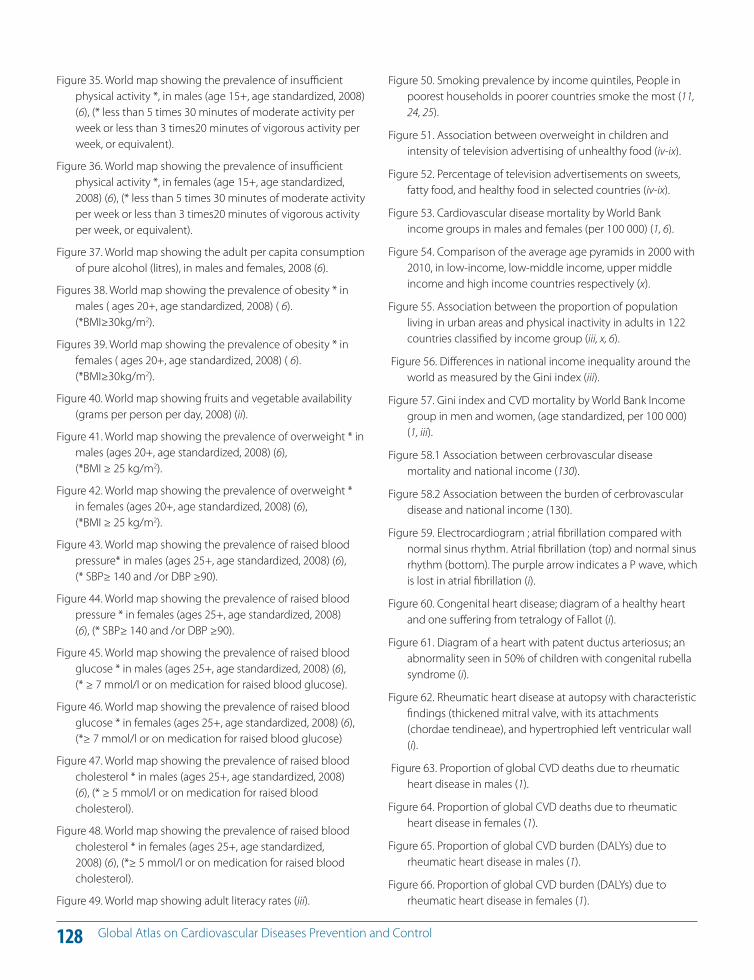
128 Global Atlas on Cardiovascular Diseases Prevention and Control
Figure 50. Smoking prevalence by income quintiles, People in poorest households in poorer countries smoke the most (11, 24, 25).
Figure 51. Association between overweight in children and intensity of television advertising of unhealthy food (iv-ix).
Figure 52. Percentage of television advertisements on sweets, fatty food, and healthy food in selected countries (iv-ix).
Figure 53. Cardiovascular disease mortality by World Bank income groups in males and females (per 100 000) (1, 6).
Figure 54. Comparison of the average age pyramids in 2000 with 2010, in low-income, low-middle income, upper middle income and high income countries respectively (x).
Figure 55. Association between the proportion of population living in urban areas and physical inactivity in adults in 122 countries classified by income group (iii, x, 6).
Figure 56. Di!erences in national income inequality around the world as measured by the Gini index (iii).
Figure 57. Gini index and CVD mortality by World Bank Income group in men and women, (age standardized, per 100 000) (1, iii).
Figure 58.1 Association between cerbrovascular disease mortality and national income (130).
Figure 58.2 Association between the burden of cerbrovascular disease and national income (130).
Figure 59. Electrocardiogram ; atrial fibrillation compared with normal sinus rhythm. Atrial fibrillation (top) and normal sinus rhythm (bottom). The purple arrow indicates a P wave, which is lost in atrial fibrillation (i).
Figure 60. Congenital heart disease; diagram of a healthy heart and one su!ering from tetralogy of Fallot (i).
Figure 61. Diagram of a heart with patent ductus arteriosus; an abnormality seen in 50% of children with congenital rubella syndrome (i).
Figure 62. Rheumatic heart disease at autopsy with characteristic findings (thickened mitral valve, with its attachments (chordae tendineae), and hypertrophied left ventricular wall (i).
Figure 63. Proportion of global CVD deaths due to rheumatic heart disease in males (1).
Figure 64. Proportion of global CVD deaths due to rheumatic heart disease in females (1).
Figure 65. Proportion of global CVD burden (DALYs) due to rheumatic heart disease in males (1).
Figure 66. Proportion of global CVD burden (DALYs) due to rheumatic heart disease in females (1).
Figure 35. World map showing the prevalence of insu"cient physical activity *, in males (age 15+, age standardized, 2008) (6), (* less than 5 times 30 minutes of moderate activity per week or less than 3 times20 minutes of vigorous activity per week, or equivalent).
Figure 36. World map showing the prevalence of insu"cient physical activity *, in females (age 15+, age standardized, 2008) (6), (* less than 5 times 30 minutes of moderate activity per week or less than 3 times20 minutes of vigorous activity per week, or equivalent).
Figure 37. World map showing the adult per capita consumption of pure alcohol (litres), in males and females, 2008 (6).
Figures 38. World map showing the prevalence of obesity * in males ( ages 20+, age standardized, 2008) ( 6). (*BMI#30kg/m2).
Figures 39. World map showing the prevalence of obesity * in females ( ages 20+, age standardized, 2008) ( 6). (*BMI#30kg/m2).
Figure 40. World map showing fruits and vegetable availability (grams per person per day, 2008) (ii).
Figure 41. World map showing the prevalence of overweight * in males (ages 20+, age standardized, 2008) (6), (*BMI # 25 kg/m2).
Figure 42. World map showing the prevalence of overweight * in females (ages 20+, age standardized, 2008) (6), (*BMI # 25 kg/m2).
Figure 43. World map showing the prevalence of raised blood pressure* in males (ages 25+, age standardized, 2008) (6), (* SBP# 140 and /or DBP #90).
Figure 44. World map showing the prevalence of raised blood pressure * in females (ages 25+, age standardized, 2008) (6), (* SBP# 140 and /or DBP #90).
Figure 45. World map showing the prevalence of raised blood glucose * in males (ages 25+, age standardized, 2008) (6), (* # 7 mmol/l or on medication for raised blood glucose).
Figure 46. World map showing the prevalence of raised blood glucose * in females (ages 25+, age standardized, 2008) (6), (*# 7 mmol/l or on medication for raised blood glucose)
Figure 47. World map showing the prevalence of raised blood cholesterol * in males (ages 25+, age standardized, 2008) (6), (* # 5 mmol/l or on medication for raised blood cholesterol).
Figure 48. World map showing the prevalence of raised blood cholesterol * in females (ages 25+, age standardized, 2008) (6), (*# 5 mmol/l or on medication for raised blood cholesterol).
Figure 49. World map showing adult literacy rates (iii).
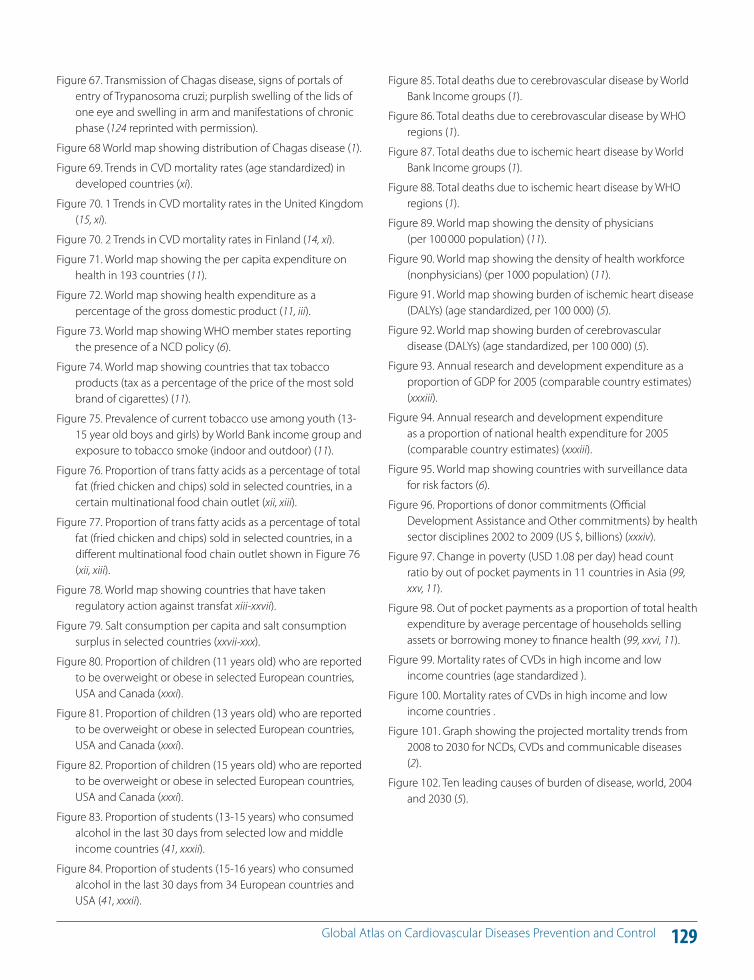
129 Global Atlas on Cardiovascular Diseases Prevention and Control
Figure 85. Total deaths due to cerebrovascular disease by World Bank Income groups (1).
Figure 86. Total deaths due to cerebrovascular disease by WHO regions (1).
Figure 87. Total deaths due to ischemic heart disease by World Bank Income groups (1).
Figure 88. Total deaths due to ischemic heart disease by WHO regions (1).
Figure 89. World map showing the density of physicians (per 100 000 population) (11).
Figure 90. World map showing the density of health workforce (nonphysicians) (per 1000 population) (11).
Figure 91. World map showing burden of ischemic heart disease (DALYs) (age standardized, per 100 000) (5).
Figure 92. World map showing burden of cerebrovascular disease (DALYs) (age standardized, per 100 000) (5).
Figure 93. Annual research and development expenditure as a proportion of GDP for 2005 (comparable country estimates) (xxxiii).
Figure 94. Annual research and development expenditure as a proportion of national health expenditure for 2005 (comparable country estimates) (xxxiii).
Figure 95. World map showing countries with surveillance data for risk factors (6).
Figure 96. Proportions of donor commitments (O!cial Development Assistance and Other commitments) by health sector disciplines 2002 to 2009 (US $, billions) (xxxiv).
Figure 97. Change in poverty (USD 1.08 per day) head count ratio by out of pocket payments in 11 countries in Asia (99, xxv, 11).
Figure 98. Out of pocket payments as a proportion of total health expenditure by average percentage of households selling assets or borrowing money to finance health (99, xxvi, 11).
Figure 99. Mortality rates of CVDs in high income and low income countries (age standardized ).
Figure 100. Mortality rates of CVDs in high income and low income countries .
Figure 101. Graph showing the projected mortality trends from 2008 to 2030 for NCDs, CVDs and communicable diseases (2).
Figure 102. Ten leading causes of burden of disease, world, 2004 and 2030 (5).
Figure 67. Transmission of Chagas disease, signs of portals of entry of Trypanosoma cruzi; purplish swelling of the lids of one eye and swelling in arm and manifestations of chronic phase (124 reprinted with permission).
Figure 68 World map showing distribution of Chagas disease (1).
Figure 69. Trends in CVD mortality rates (age standardized) in developed countries (xi).
Figure 70. 1 Trends in CVD mortality rates in the United Kingdom (15, xi).
Figure 70. 2 Trends in CVD mortality rates in Finland (14, xi).
Figure 71. World map showing the per capita expenditure on health in 193 countries (11).
Figure 72. World map showing health expenditure as a percentage of the gross domestic product (11, iii).
Figure 73. World map showing WHO member states reporting the presence of a NCD policy (6).
Figure 74. World map showing countries that tax tobacco products (tax as a percentage of the price of the most sold brand of cigarettes) (11).
Figure 75. Prevalence of current tobacco use among youth (13-15 year old boys and girls) by World Bank income group and exposure to tobacco smoke (indoor and outdoor) (11).
Figure 76. Proportion of trans fatty acids as a percentage of total fat (fried chicken and chips) sold in selected countries, in a certain multinational food chain outlet (xii, xiii).
Figure 77. Proportion of trans fatty acids as a percentage of total fat (fried chicken and chips) sold in selected countries, in a di"erent multinational food chain outlet shown in Figure 76 (xii, xiii).
Figure 78. World map showing countries that have taken regulatory action against transfat xiii-xxvii).
Figure 79. Salt consumption per capita and salt consumption surplus in selected countries (xxvii-xxx).
Figure 80. Proportion of children (11 years old) who are reported to be overweight or obese in selected European countries, USA and Canada (xxxi).
Figure 81. Proportion of children (13 years old) who are reported to be overweight or obese in selected European countries, USA and Canada (xxxi).
Figure 82. Proportion of children (15 years old) who are reported to be overweight or obese in selected European countries, USA and Canada (xxxi).
Figure 83. Proportion of students (13-15 years) who consumed alcohol in the last 30 days from selected low and middle income countries (41, xxxii).
Figure 84. Proportion of students (15-16 years) who consumed alcohol in the last 30 days from 34 European countries and USA (41, xxxii).

130 Global Atlas on Cardiovascular Diseases Prevention and Control
131 Global Atlas on Cardiovascular Diseases Prevention and Control
xiv) Unnevehr LJ, Jagmanaite E. Getting rid of trans fats in the US diet: Policies, incentives and progress. Food Policy, 2008, 33(6):497–503.
xv) Oboh HA, Olumese FE. E!ects of low carbohydrate, high fat Nigerian-like diet on biochemical indices in rabbits. Pakistan Journal of Nutrition, 2010, 9(3):245–249.
xvi) Castro MA et al. Trans fatty acid intake among the popula-tion of the city of São Paulo Brazil. Revista Saúde Pública, 2009, 43(6):991–997.
xvii) Tan AS. An approach to building the case for nutrition policies to limit trans-fat intake: A Singapore study. Health Policy, 2011, 100(2–3):264–272.
xviii) L'Abbe MR et al. Approaches to removing trans fats from the food supply in industrialized and developing coun-tries. European Journal of Clinical Nutrition, 2009, 63:S50–S67.
xix) Resnik D. Trans fat bans and human freedom. The American Journal of Bioethics, 2010, 10(3):27–32.
xx) Pan American Health Organization. Trans fat-free Americas, 2007 (http://www.paho.org/english/dd/pin/pr070607.htm).
xxi) Pérez-Ferrer C, Lock K, Rivera JA. Learning from interna-tional policies on trans fatty acids to reduce cardiovascu-lar disease in low- and middle-income countries, using Mexico as a case study. Health Policy and Planning, 2010, 25(1):39–49.
xxii) Skea! CM. Feasibility of recommending certain replace-ment or alternative fats. European Journal of Clinical Nutri-tion, 2009, 63:S34–S49.
xxiii) Park HK. Nutrition policy in South Korea. Asia Pacific Journal of Clinical Nutrition, 2008, 17(Suppl. 1):343–345.
xxiv) Agence nationale de sécurité sanitaire de l’alimen tation, de l’environnement et du travail. The populations intake of trans fatty acids. Paris, Maisons-Alfort, ANSES, 2009.
xxv) Consumer A!airs Agency, Food Labelling Division. Regula-tory trends of nutrition labelling and trans fatty acid labelling. Tokyo, Government of Japan, 2010.
xxvi) National Council for Nutrition. Strategy plan for 2005–2009, including proposed courses of action, under the auspices of the Norwegian Directorate for Health and Social A!airs: A Healthy Diet for good health. Oslo, 2005.
i) Wikipedia the free encyclopedia (www.wikipedia.org).
ii) FAOSTAT statistical food database (http://faostat.fao.org/site/609/default.aspx#ancor, accessed on 25 March 2011; United States Department of Agriculture (USDA). What's in the foods you eat search tool (http://reedir.arsnet.usda.gov/codesearchwebapp/%28bbdsco55mrfivq45xiod5svm%29/codesearch.aspx, accessed on 30 March 2011).
iii) World Development Indicators | Data (data.worldbank.org/data.../world-development-indicators).
iv) Lobstein T, Dibb S. Evidence of a possible link between obesogenic food advertising and child overweight. Inter-national Association for the Study of Obesity. Obesity Re-views, 2005, 6:203–208.
v) Kelly B et al. Television food advertising to children: A global perspective. American Journal of Public Health, 2011, 100(9):1730–1736.
vi) Galcheva SV, Iotova VM, Stratev VK. Television food ad-vertising directed towards Bulgarian children. Archives of Disease in Childhood, 2008, 93:857–861. doi:10.1136/adc.2007.134437.
vii) Temple NJ, Steyn NP, Nadomane Z. Food adverts on chil-dren’s programs on TV in South Africa. Nutrition, 2008, 24:781–782.
viii) Ramirez-Ley K et al. Food-related advertising geared to-ward Mexican children. Journal of Public Health, 2009, 31(3):383–388.
ix) Karupaiah T et al. What's on Malaysian television? A survey on food advertising targeting children. Asia Pacific Journal of Clinical Nutrition, 2008, 17(3):483–491.
x) Department of Economic and Social A!airs, Population Division. World population prospects: The 2010 revision, CD-ROM edition. New York, United Nations, 2011.
xi) British Heart Foundation Statistics Database. Statistics on mortality from coronary heart disease statistics 2010 (http://www.bhf.org.uk/heart-health/statistics/mortality.aspx, ac-cessed 16 June 2011).
xii) Steen S et al. A trans world journey. Atherosclerosis Supple-ments, 2006, 7(2):47– 52.
xiii) Steen S, Dyerberg J, Astrup A. Consumer protection through a legislative ban on industrially produced trans fatty acids in food in Denmark. Scandinavian Journal of Food and Nutrition, 2006, 50(4):155–160.
References for figures
132 Global Atlas on Cardiovascular Diseases Prevention and Control
xxvii) Hawkes C. Nutrition labels and health claims: The global reg-ulatory environment. Geneva, World Health Organization, 2004.
xxviii) Webster JL et al. Salt reduction initiatives around the world. Journal of Hypertension, 2011, 29(6):1043–1050.
xxix) World Action on Salt and Health, 2008 (http://www.worlda-ctiononsalt.com/action/europe.htm).
xxx) European Commission. Collated information on salt reduc-tion in the EU, 2008 (http://ec.europa.eu/health/ph_de-terminants/life_style/nutrition/documents/compilation_salt_en.pdf ).
xxxi) WHO Regional O"ce for Europe. Inequalities in young peo-ple's health: HBSC international report from the 2005/2006 survey. Health policy for children and adolescents, No. 5. Copenhagen, World Health Organization, 2008.
xxxii) Hibell E et al. 2007 ESPAD Report: Substance use among students in 35 European countries. Stockholm, European School Survey Project on Alcohol and Other Drugs, 2009.
xxxiii) Burke M, Matlin S. Monitoring financial flows for health re-search: Prioritizing research for health equity. Geneva, Global Forum for Health Research, 2008 (www.globalforum-health.org).
xxxiv) All O"cial Development Assistance (ODA)/other o"cial flows (OOF) commitments donations were obtained from QWIDS OECD statistics database (http://stats.oecd.org/qwids/, accessed on 1 March 2011).
xxxv) van Doorslaer E et al. E!ect of payments for health care on poverty estimates in 11 countries in Asia: An analy-sis of household survey data. Lancet, 2006, 14 October, 368(9544):1357–1364.
xxxvi) Leive A, Xu K. Figure 1: Coping with out-of-pocket health payments: Empirical evidence from 15 African countries. Bulletin of the World Health Organization, 2008, 86:849–856.

Annexes
134 Global Atlas on Cardiovascular Diseases Prevention and Control
In May 2011, countries unanimously endorsed a resolution (Annexure II) on the preparations for the United Nations General Assembly high-level meeting on the prevention and control of noncommunicable diseases to be held this September.
The World Health Assembly resolution (agenda item 13.12) recognized WHO’s leading role as the primary specialized agency for health and rea"rmed its leadership in pro-moting global action against NCDs. The resolution urges Member States to prepare for the UN General Assembly High-level Meeting on noncommunicable diseases and be represented at the heads of state and government level. The resolution called for addressing the NCDs challenge through an action-oriented outcome document.
The resolution also urged the WHO Director-General to work together with the wide range of UN and non-UN stakeholders to address the NCD challenges and highlight the social, economic and financial impacts of the diseases, particularly in developing countries.
Before the WHA, WHO has collaborated with countries worldwide to stage six regional consultations on NCDs and to prepare for the UN high-level meeting, as well as orga-nizing the First Global Ministerial Conference on Healthy Lifestyles and NCD Control, which was hosted by the Rus-sian Federation in Moscow in late April 2011.
Preparations for the High-level Meet-ing of the United Nations General Assembly on the prevention and con-trol of noncommunicable diseases, following on the Moscow Conference (*)
The Sixty-fourth World Health Assembly,
Having considered the report on WHO’s role in the preparation, implementation and follow-up to the high-level meeting of the United Nations General As-sembly on the prevention and control of noncommu-nicable diseases2 (high-level meeting);
Deeply concerned that the global burden and threat of noncommunicable diseases continues to grow, in particular in developing countries, and convinced that global action is necessary and urgent response is needed, including by e!ectively addressing the key risk factors for noncommunicable diseases;
Rea"rming its commitment to the aim of the global strategy for the prevention and control of noncommu-nicable diseases to reduce premature mortality and im-prove quality of life (resolution WHA53.17);
Further recalling United Nations General Assembly resolution 64/265 in which the General Assembly de-cided to convene a high-level meeting of the General Assembly in September 2011, with the participation of Heads of State and Government, on the prevention and control of noncommunicable diseases, as well as reso-lution 65/238 on the scope, modalities, format and or-ganization of the high-level meeting; Recognizing the leading role of the World Health Organization as the primary specialized agency for health, and rea"rming the leadership role of WHO in promoting global action against noncommunicable diseases;
Noting with appreciation the first WHO Global status report on noncommunicable diseases launched on 27 April 2011, which may serve as an input into the pre-paratory process for the high-level meeting; Noting the outcomes of the regional consultations which were held by WHO in collaboration with Member States, with the support of relevant United Nations agencies and entities, which will serve to provide inputs to the preparations for the high-level meeting, as well as to the meeting itself; Welcoming the outcome of the First Global Ministerial Conference on Healthy Lifestyles and Noncommunicable Disease Control, which was orga-nized by the Russian Federation and WHO from 28 to 29 April 2011 in Moscow,
1 First Global Ministerial Conference on Healthy Lifestyles and Noncommunicable Disease Control (Moscow, Russian Federation, 28–29 April 2011).
2 Resolution 64/265 – Prevention and control of noncom-municable diseases.
Annex I World Health Assembly resolution A64/61
135 Global Atlas on Cardiovascular Diseases Prevention and Control
1. ENDORSES the Moscow Declaration, annexed to the present resolution, including as a key input for the preparations leading to the High-level Meeting;
2. URGES Member States:1
(1) to continue to support the preparations at national, re-gional and international levels for the high-level meeting, including, where feasible and relevant, situation analysis of noncommunicable diseases and their risk factors, as well as an assessment of national capacity and health system response to address noncommunicable diseases;
(2) to be represented at the level of Heads of State and Gov-ernment at the high-level meeting and to call for action through a concise action-oriented outcome document;
(3) to consider, as appropriate and where relevant, includ-ing in their national delegations to the high-level meeting parliamentarians, representatives of civil society, including nongovernmental organizations, academia and networks working on the control and prevention of noncommuni-cable diseases;
3. REQUESTS the Director-General:
(1) to continue exercising the leading role of WHO as the primary specialized agency for health working together in a coordinated way with the United Nations, its specialized agencies, funds and programmes, and other relevant in-tergovernmental organizations and international financial institutions, in supporting Member States, including:
(i) in undertaking concerted action and a coordinated re-sponse in order to promptly and appropriately address the challenges posed by noncommunicable diseases, includ-ing further building on available situation analyses on non-communicable diseases and risk factors; and
(ii) in highlighting the social and economic impact of non-communicable diseases, including financial challenges, in particular in developing countries;
(2) to take into account the outcomes from the Moscow Conference into the preparations for the high-level meet-ing;
(3) to ensure adequate financial and human resources within the WHO to prepare for the high-level meeting and to respond swiftly to its recommendations;
(4) to report to the Sixty-fifth World Health Assembly, through the Executive Board, on the outcomes of the first Global Ministerial Conference on Healthy Lifestyles and Noncommunicable Disease Control and the high-level meeting, and to develop, together with relevant United
Nations agencies and entities, an implementation and follow-up plan for the outcomes, including its financial im-plications, for submission to the Sixty-sixth World Health Assembly, through the Executive Board.
1 And, where applicable, regional economic integration organizations.
136 Global Atlas on Cardiovascular Diseases Prevention and Control
VI. Recognize that a paradigm shift is imperative in dealing with NCD challenges, as NCDs are caused not only by bio-medical factors, but also caused or strongly influenced by behavioural, environmental, social and economic factors.
VII. A"rm our commitment to addressing the challenges posed by NCDs, including, as appropriate, strengthened and reoriented policies and programmes that emphasize multi-sectoral action on the behavioural, environmental, social and economic factors.
VIII. Express our belief that NCDs should be considered in partnerships for health; that they should be integrated into health and other sectors’ planning and programming in a coordinated manner, particularly in low- and middle income countries; that they should be part of the global research agenda and that the impact and sustainability of approaches to prevent and control NCDs will be enhanced through health systems strengthening and strategic coor-dination with existing global health programs.
Rationale for action1. NCDs, principally cardiovascular diseases, diabetes, cancers and chronic respiratory diseases, are the leading causes of preventable morbidity and disability, and cur-rently cause over 60% of global deaths, 80% of which oc-cur in developing countries. By 2030, NCDs are estimated to contribute to 75% of global deaths.
2. In addition, other NCDs such as mental disorders also significantly contribute to the global disease burden.
3. NCDs have substantial negative impacts on human de-velopment and may impede progress towards the Millen-nium Development Goals (MDGs).
4. NCDs now impact significantly on all levels of health ser-vices, health care costs, and the health workforce, as well as national productivity in both emerging and established economies.
5. Worldwide, NCDs are important causes of premature death, striking hard among the most vulnerable and poor-est populations. Globally they impact on the lives of bil-lions of people and can have devastating financial impacts
First Global Ministerial Conference on Healthy Lifestyles and Noncom-municable Disease Control, Moscow, 28-29 April 2011
Moscow Declaration PreambleWe, the participants in the First Global Ministerial Confer-ence on Healthy Lifestyles and Noncommunicable Disease (NCDs) Control, gathered in Moscow on 28-29 April 2011.
I. Express appreciation for the leading role of the World Health Organization and the Government of the Russian Federation in the preparation and holding of the Ministe-rial Conference.
II. Recognize that the right of everyone to the enjoyment of the highest attainable standards of physical and mental health cannot be achieved without greater measures at global and national levels to prevent and control NCDs.
III. Acknowledge the existence of significant inequities in the burden of NCDs and in access to NCD prevention and control, both between countries, as well as within countries.
IV. Note that policies that address the behavioural, so-cial, economic and environmental factors associated with NCDs should be rapidly and fully implemented to ensure the most e!ective responses to these diseases, while in-creasing the quality of life and health equity.
V. Emphasize that prevention and control of NCDs requires leadership at all levels, and a wide range of multi-level, multi-sectoral measures aimed at the full spectrum of NCD deter-minants (from individual-level to structural) to create the necessary conditions for leading healthy lives. This includes promoting and supporting healthy lifestyles and choices, relevant legislation and policies; preventing and detecting disease at the earliest possible moment to minimize su!er-ing and reduce costs; and providing patients with the best possible integrated health care throughout the life cycle in-cluding empowerment, rehabilitation and palliation.
Annex II Moscow Declaration
137 Global Atlas on Cardiovascular Diseases Prevention and Control
Commitment to actionWe, therefore, commit to act by:
At the Whole of Government level:
1. Developing multi-sectoral public policies that create eq-uitable health promoting environments that enable indi-viduals, families and communities to make healthy choices and lead healthy lives;
2. Strengthening policy coherence to maximize positive and minimize negative impacts on NCD risk factors and the burden resulting from policies of other sectors;
3. Giving priority to NCD prevention and control accord-ing to need, ensuring complementarity with other health objectives and mainstreaming multi-sectoral policies to strengthen the engagement of other sectors;
4. Engaging civil society to harness its particular capacities for NCD prevention and control;
5. Engaging the private sector in order to strengthen its contribution to NCD prevention and control according to international and national NCD priorities;
6. Developing and strengthening the ability of health systems to coordinate, implement, monitor and evaluate national and sub-national strategies and programmes on NCDs;
7. Implementing population-wide health promotion and disease prevention strategies, complemented by individ-ual interventions, according to national priorities. These should be equitable and sustainable and take into account gender, cultural and community perspectives in order to reduce health inequities;
8. Implementing cost-e!ective policies, such as fiscal poli-cies, regulations and other measures to reduce common risk factors such as tobacco use, unhealthy diet, physical inactivity and the harmful use of alcohol;
9. Accelerating implementation by States Parties of the provisions of the WHO Framework Convention on Tobacco Control (WHO FCTC) and encouraging other countries to ratify the Convention;
10. Implementing e!ective policies for NCD prevention and control at national and global levels, including those relevant to achieving the goals of the 2008-2013 Action Plan for the Global Strategy for the Prevention and Control of Noncommunicable Diseases, the WHO Global Strategy to Reduce the Harmful Use of Alcohol and the Global Strat-egy on Diet, Physical Activity and Health;
that impoverish individuals and their families, especially in low- and middle-income countries.
6. NCDs can a!ect women and men di!erently, hence pre-vention and control of NCDs should take gender into ac-count.
7. Many countries are now facing extraordinary chal-lenges from the double burden of disease: communicable diseases and noncommunicable diseases. This requires adapting health systems and health policies, and a shift from disease-centred to people-centred approaches and population health measures. Vertical initiatives are insuf-ficient to meet complex population needs, so integrated solutions that engage a range of disciplines and sectors are needed. Strengthening health systems in this way results in improved capacity to respond to a range of diseases and conditions.
8. Evidence-based and cost-e!ective interventions exist to prevent and control NCDs at global, regional, national and local levels. These interventions could have profound health, social, and economic benefits throughout the world.
9. Examples of cost-e!ective interventions to reduce the risk of NCDs, which are a!ordable in low-income countries and could prevent millions of premature deaths every year, include measures to control tobacco use, reduce salt intake and reduce the harmful use of alcohol.
10. Particular attention should be paid to the promotion of healthy diets (low consumption of saturated fats, trans fats, salt and sugar, and high consumption of fruits and vegeta-bles) physical activity in all aspects of daily living.
11. E!ective NCD prevention and control require leader-ship and concerted “whole of government” action at all lev-els (national, sub-national and local) and across a number of sectors, such as health, education, energy, agriculture, sports, transport and urban planning, environment, labour, industry and trade, finance and economic development.
12. E!ective NCD prevention and control require the ac-tive and informed participation and leadership of individu-als, families and communities, civil society organizations, private sector where appropriate, employers, health care providers and the international community.
138 Global Atlas on Cardiovascular Diseases Prevention and Control
3. Strengthening international support for the full and ef-fective implementation of the WHO FCTC, the Action Plan for the Global Strategy for the Prevention and Control of Noncommunicable Diseases, the WHO Global Strategy to Reduce the Harmful Use of Alcohol, the Global Strategy on Diet, Physical Activity and Health and other relevant inter-national strategies to address NCDs.
4. Investigating all possible means to identify and mobilize the necessary financial, human and technical resources in ways that do not undermine other health objectives.
5. Supporting the WHO in developing a comprehensive global monitoring framework on NCDs.
6. Examining possible means to continue facilitating the access of low- and middle income countries to a!ordable, safe, e!ective and high quality medicines in this area con-sistent with the WHO Model Lists of Essential Medicines, based on needs and resource assessments, including by implementing the WHO Global Strategy and Plan of Action on Public Health, Innovation and Intellectual Property.
Way forwardWith a view to securing an ambitious and sustainable out-come, we commit to actively engaging with all relevant sectors of Government, on the basis of this Moscow Dec-laration, in the preparation of and the follow-up to the United Nations General Assembly High-level Meeting on the Prevention and Control of noncommunicable diseases in September 2011 in New York.
11. Promoting recognition of the rising incidence and burden of NCDs on national as well as international devel-opment agendas, and encouraging countries and interna-tional development partners to consider the level of prior-ity accorded to NCDs.
At Ministry of Health level:
1. Strengthening health information systems to moni-tor the evolving burden of NCDs, their risk factors, their determinants and the impact and e!ectiveness of health promotion, prevention and control policies and other in-terventions;
2. According to national priorities, strengthening public health systems at the country level to scale up evidence-based health promotion and NCD prevention strategies and actions;
3. Integrating NCD-related services into primary health care services through health systems strengthening, ac-cording to capacities and priorities;
4. Promoting access to comprehensive and cost-e!ective prevention, treatment and care for integrated manage-ment of NCDs, including access to a!ordable, safe, e!ec-tive and high quality medicines based on needs and re-source assessments;
5. According to country-led prioritization, ensuring the scaling-up of e!ective, evidence-based and cost-e!ective interventions that demonstrate the potential to treat indi-viduals with NCDs, protect those at high risk of developing them and reduce risk across populations.
6. Promoting, translating and disseminating research to identify the causes of NCDs, e!ective approaches for NCD prevention and control, and strategies appropriate to dis-tinct cultural and health care settings.
At the International level:
1. Calling upon the World Health Organization, as the lead UN specialized agency for health, and all other relevant UN system agencies, development banks, and other key inter-national organizations to work together in a coordinated manner to address NCDs;
2. Working through WHO in consultation with other multi-lateral organizations, international nongovernmental orga-nizations, the private sector and civil society stakeholders to strengthen normative guidance, pool technical exper-tise, coordinate policy to achieve the best possible results and capitalize on synergies among existing global health initiatives.
139 Global Atlas on Cardiovascular Diseases Prevention and Control
identify and harness existing health initiatives, includ-ing Global initiatives, to accelerate the prevention and control of NCDs and address integrated care in the context of primary health care and health systems strengthening;
support and encourage partnerships, alliances and net-works bringing together national, regional and global players including academic and research institutions, public and private sectors, and civil society in order to collaborate in NCD prevention and control and to conduct innovative research relevant to the African context;
allocate, from national budgets, financial resources that are commensurate to the burden of NCDs to support NCD primary prevention and case management using primary health care approach and establish sustainable innovative and new financing mechanisms at national and international levels.
In the Declaration, the ministers also committed to devel-op national NCD action plans and strengthening institu-tional capacities for NCD prevention an d control; urged the United Nations to include NCD prevention and control in all future global development goals, and called on WHO, partners and civil society organizations to provide techni-cal support to Member States for implementing, monitor-ing, and evaluating recommendations contained in the Declaration.
The Declaration specifically requested Heads of State and Government in the region to endorse the Declaration, and present it to the upcoming September 2011 UN General Assembly High-Level Summit on NCDs as the position of the region on NCDs.
The Ministers also requested the UN Secretary General to establish a mechanism to monitor progress of the commit-ments taken at the UN High-level Summit ion NCDs , and called on the WHO Regional Director for Africa to include the regional NCD strategic plan in the agenda of the 62nd session of the WHO Regional Committee for Africa and re-port progress made in the implementation of the Declara-tion to Regional Committee in 2014.
Brazzaville Declaration on Noncommunicable DiseasesThe first Africa Regional Ministerial Consultation on non-communicable diseases (NCDs) ended in the Congolese capital on 6 April 2011 with the adoption of the Brazza-ville Declaration on Noncommunicable Diseases .
The Declaration urged urgent action by various stakehold-ers to address major NCDs and priority conditions which represent “a significant challenge” to people in the African region: cardiovascular diseases, diabetes, cancer and chronic respiratory diseases, diseases of blood disorder (in particular sickle cell disease), mental health, violence and injuries.
Highlights of the Declaration include commitment by the Ministers to:
strengthen and standardize national health systems to generate disaggregated data on NCDs, their risk factors and determinants and monitor their magnitude, trends, and impact ;
use all appropriate means including information and communication technologies to promote, intensify and increase health awareness and empowerment of individuals and communities;
develop and implement NCD prevention and control strategies, guidelines, policies, legislations and regula-tory frameworks including the WHO FCTC to protect individuals, families and communities from unhealthy diets, harmful use of alcohol, tobacco use and exposure to tobacco smoke and unsafe food; and from violence and injuries, advertising of unhealthy products;
reorient national health systems towards the promotion and support of healthy lifestyles by individuals, families and communities within the primary health care context in order to e!ectively respond to complex social, cultural and behavioral aspects associated with NCDs;
further strengthen health systems with appropriate at-tention to, among other things, health financing; train-ing and retaining the health workforce; procurement and distribution of medicines, vaccines, medical supplies and equipment; improving infrastructure; and, evidence-based and cost-e!ective service delivery for NCDs;
Annex III Regional Declarations on NCDs
140 Global Atlas on Cardiovascular Diseases Prevention and Control
That we strongly encourage the establishment of Na-tional Commissions on NCDs or analogous bodies to plan and coordinate the comprehensive prevention and control of chronic NCDs;
Our commitment to pursue immediately a legislative agenda for passage of the legal provisions related to the International Framework Convention on Tobacco Control; urge its immediate ratification in all States which have not already done so and support the im-mediate enactment of legislation to limit or eliminate smoking in public places, ban the sale, advertising and promotion of tobacco products to children, insist on ef-fective warning labels and introduce such fiscal mea-sures as will reduce accessibility of tobacco;
That public revenue derived from tobacco, alcohol or other such products should be employed, inter alia for preventing chronic NCDs, promoting health and sup-porting the work of the Commissions;
That our Ministries of Health, in collaboration with oth-er sectors, will establish by mid-2008 comprehensive plans for the screening and management of chronic diseases and risk factors so that by 2012, 80% of people with NCDs would receive quality care and have access to preventive education based on regional guidelines;
That we will mandate the re-introduction of physical education in our schools where necessary, provide incentives and resources to e!ect this policy and en-sure that our education sectors promote programmes aimed at providing healthy school meals and promot-ing healthy eating;
Our endorsement of the e!orts of the Caribbean Food and Nutrition Institute (CFNI), Caribbean Agricultural Research and Development Institute (CARDI) and the regional inter-governmental agencies to enhance food security and our strong support for the elimination of trans-fats from the diet of our citizens, using the CFNI as a focal point for providing guidance and public educa-tion designed toward this end;
Our support for the e!orts of the Caribbean Regional Negotiating Machinery (CRNM) to pursue fair trade pol-icies in all international trade negotiations thereby pro-moting greater use of indigenous agricultural products and foods by our populations and reducing the nega-tive e!ects of globalisation on our food supply;
Our support for mandating the labelling of foods or such measures as are necessary to indicate their nutri-
Declaration of port-of -spain: uniting to stop the epidemic of chronic ncds We, the Heads of Government of the Caribbean Commu-nity (CARICOM), meeting at the Crowne Plaza Hotel, Port-of-Spain, Trinidad and Tobago on 15 September 2007 on the occasion of a special Regional Summit on Chronic Non-Communicable Diseases (NCDs);
Conscious of the collective actions which have in the past fuelled regional integration, the goal of which is to en-hance the well-being of the citizens of our countries;
Recalling the Nassau Declaration (2001), that “the health of the Region is the wealth of Region”, which underscored the importance of health to development;
Inspired by the successes of our joint and several e!orts that resulted in the Caribbean being the first Region in the world to eradicate poliomyelitis and measles;
A"rming the main recommendations of the Caribbean Commission on Health and Development which included strategies to prevent and control heart disease, stroke, dia-betes, hypertension, obesity and cancer in the Region by addressing their causal risk factors of unhealthy diets, phys-ical inactivity, tobacco use and alcohol abuse and strength-ening our health services;
Impelled by a determination to reduce the su!ering and burdens caused by NCDs on the citizens of our Region which is the one worst a!ected in the Americas;
Fully convinced that the burdens of NCDs can be re-duced by comprehensive and integrated preventive and control strategies at the individual, family, community, na-tional and regional levels and through collaborative pro-grammes, partnerships and policies supported by govern-ments, private sectors, NGOs and our other social, regional and international partners;
Declare -
Our full support for the initiatives and mechanisms aimed at strengthening regional health institutions, to provide critical leadership required for implementing our agreed strategies for the reduction of the burden of Chronic, Non-Communicable Diseases as a central pri-ority of the Caribbean Cooperation in Health Initiative Phase III (CCH III), being coordinated by the CARICOM Secretariat, with able support from the Pan American Health Organisation/World Health Organisation (PAHO/WHO) and other relevant partners;
141 Global Atlas on Cardiovascular Diseases Prevention and Control
Seoul declaration on noncommunicable disease prevention and control in the western pacific region Recognizing the serious and rapidly increasing adverse im-pact of noncommunicable diseases (NCDs), including car-diovascular diseases, cancers, diabetes and chronic respira-tory diseases, on individuals, families, communities, health systems and national economies, and the high prevalence of the risk factors, the countries and areas of the WHO West-ern Pacific Region participating at the Regional High-level Meeting on Scaling Up Multisectoral Action for Noncom-municable Disease Prevention and Control, declare their commitment to:
1. provide strong and sustained high-level political sup-port for NCD prevention and control programmes to re-duce premature NCD death and disability and health in-equalities;
2. ensure a supportive multisectoral whole-of-government policy environment and a coordinating process to main-stream the response to NCDs involving all stakeholders, including civil society and, where appropriate, the private sector to protect health and to ensure that healthy choices are the easier choices;
3. reduce the common NCD risk factors (tobacco use; diets high in total fat, saturated and or trans-fats, salt and sugar; the harmful use of alcohol; and physical inactivity); and
1. in line with WHO action plans and using the full range of options including legislation, regulation, fiscal measures and healthy public policies and, in particu-lar, accelerate towards the full implementation of the Framework Convention on Tobacco Control; and
2. by addressing the social determinants of health and by leveraging the power of local governments and civil society actions;
3. (4) strengthen and integrate health systems, based on primary health care to ensure that NCD prevention and control is part of a funded, coherent, balanced, re-alistic and comprehensive health planning process that is financially feasible and to:
4. deliver services for NCD and their risk factors utilising team based care and the most appropriate health pro-fessional for the patient’s needs and including a!ord-able and cost-e!ective drugs, technologies and ser-vices to support evidence-based priority interventions;
tional content through the establishment of the appro-priate regional capability;
That we will promote policies and actions aimed at in-creasing physical activity in the entire population, e.g. at work sites, through sport, especially mass activities, as vehicles for improving the health of the population and conflict resolution and in this context we commit to increasing adequate public facilities such as parks and other recreational spaces to encourage physical activity by the widest cross-section of our citizens;
Our commitment to take account of the gender di-mension in all our programmes aimed at the preven-tion and control of NCDs;
That we will provide incentives for comprehensive public education programmes in support of wellness, healthy life-style changes, improved self-management of NCDs and embrace the role of the media as a re-sponsible partner in all our e!orts to prevent and con-trol NCDs;
That we will establish, as a matter of urgency, the pro-grammes necessary for research and surveillance of the risk factors for NCDs with the support of our Universities and the Caribbean Epidemiology Centre/Pan American Health Organisation (CAREC/PAHO);
Our continuing support for CARICOM and PAHO as the joint Secretariat for the Caribbean Cooperation in Health (CCH) Initiative to be the entity responsible for revision of the regional plan for the prevention and control of NCDs, and the monitoring and evaluation of this Declaration.
We hereby declare the second Saturday in September “Caribbean Wellness Day,” in commemoration of this landmark Summit.
142 Global Atlas on Cardiovascular Diseases Prevention and Control
Latin American Declaration on the health emergency due to Non-Communicable Diseases (NCDs). March 2011The civil society organizations working on the promotion of health and human rights, within the framework of the United Nations resolution that calls forth States to a sum-mit of the General Assembly for the prevention and control of NCDs in September 2011, do hereby declare that:
The WHO has identified the following chronic diseases as the main threats to human health: cardiovascular dis-eases, cancer, diabetes and chronic respiratory diseases.
These four diseases are the main causes of death and dis-ability worldwide, representing about 60% of deaths and 44% of early deaths (35 Million deaths every year, 80% of which occur in low- and middle-income countries).
NCDs represent a serious public health issue and are a health emergency worldwide. In spite of the severity of the situation, the funding to fight NCDs is only 1% of the total funding dedicated to development.
The main risk factors of NCDs are tobacco use, inade-quate eating habits, physical inactivity and alcohol mis-use, all of which are avoidable and preventable social determinants that also increase high blood pressure, dyslipidemia and obesity.
The impact of NCDs has increased due to the modifica-tions of lifestyles, economic power of corporations that promote the use of harmful substances (tobacco, alco-hol and unhealthy food), social inequality and poverty, di"culty in access to health systems, and political and social inaction.
NCDs deepen social inequality since they have a great-er impact on poor, less educated people, members of certain ethnic groups and women, all of whom have lower access to health services, thus hindering human development, counteracting the e!orts in the fight against poverty and increasing health inequalities.
Despite this, NCDs are still not part of the political agen-da of most countries and the Millennium
Development Goals
Prevention and control of NCDs is a key action in ensur-ing sustainable human rights and human development. There are several international treaties where States have assumed obligations and commitments to guarantee es-sential human rights that are directly connected to the pre-
5. work towards continuity of quality care from preven-tion to palliative care across the whole health system and promote a people-centred approach with syner-gies with other programmes;
6. (5) prioritise human and financial resources and in-frastructure to ensure equitable coverage of priority evidence-based NCD programmes; and
7. (6) provide integrated but practical monitoring and accountability systems based on strengthened health information systems and, as appropriate, a small num-ber of quantified and timed targets and indicators to assess progress nationally to be reported publicly and to WHO and, if appropriate, the United Nations General Assembly.
In support of these commitments, participating countries and areas request the global community, through the UN High-level Meeting on the Prevention and Control of NCDs, to act in a coordinated way to support global and national multisectoral e!orts by:
1. raising the priority of NCDs on their agendas
2. strengthening synergies between NCD programmes and other development priorities, including the Millen-nium Development Goals and the future global develop-ment agenda; and
3. mobilising additional resources and supporting innova-tive approaches to financing NCD prevention and control.
143 Global Atlas on Cardiovascular Diseases Prevention and Control
5. To inform the community by means of large mass me-dia campaigns about the prevention, early detection and treatment of NCDs
Recommendations on population-based public policies for the prevention of NCDs
6. To ratify and accelerate the implementation process of the Framework Convention on Tobacco Control through-out the region, following the recommendations of the Conference of the Parties.
7. To promote healthy eating habits by means of legisla-tion and policies that guarantee an adequate sodium, sugar and trans fat reduction in processed foods, that re-quire labeling and packaging providing accurate content information and orientation, that restrict unhealthy foods and drinks advertising targeted to young, that guarantee healthy eating environments for children and that promote fruit, vegetable, and whole-grain cereal consumption and water consumption, among other measures.
8. To promote physical activity by means of community-based actions, evidence-based legislation and public poli-cies that reduce barriers to physical activity.
9. To promote the reduction of harmful alcohol use by means of e!ective public policies reducing access and restricting ad-vertising, promotion and sponsorship, among others.
10. To eliminate the interference of corporations that pro-mote tobacco use, the consumption of alcohol and un-healthy foods by reducing access to such products and protecting the health of the population beyond the com-mercial interests of such corporations.
Health care policy recomendations
11. To guarantee the availability of accessible, a!ordable and e!ective services for the prevention, early detection and treatment of NCDs and their risk factors, with special emphasis on primary health care. Also, it is crucial to guar-antee access and universal coverage to essential technol-ogy and medication which are cost-e!ective for the treat-ment of NCDs to all the population with special focus on the vulnerable groups.
12. To guarantee education and training to health profes-sionals regarding the comprehensive treatment of NCDs with special focus on health promotion and disease prevention.
13. To strengthen urgency and emergency networking to provide care of acute events that are a consequence of NCDs and are frequently causes of death or disability.
vention and control of NCDs. However, implementation of the treaties is insu"cient.In addition to the prevention and control of NCDs, treat-ment and access to e!ective and accessible health systems of people su!ering from these diseases is essential to re-duce morbid-mortality and to improve quality of life.Policies required to reduce and control NCDs demand ef-forts and contributions from all sectors of society includ-ing governments, civil society, and the private sector, mass media, health professionals and the education sector, among other social stakeholders.In accordance with the statements mentioned above, the undersigned organizations do hereby decide to create the Health Latin American Coalition (Coalición Latinoamérica Saludable - CLAS) for the prevention and control of NCDs.1. Although PAHO has established these four disease groups as priorities for reducing and controlling NCD, there are other contributing diseases such as severe mental ill-ness, chronic osteopathy, chronic renal disease which also require an integrated health response.2. Framework Convention on Tobacco Control, Interna-tional Agreement for Economic, Social and Cultural rights. Treaty for the prevention of discrimination against women, Interamerican Convention on Human Rights, International Treaty for Children’s Rights.Due to the magnitude and severity of the health, social and economic problems caused by NCDs in our countries, we urge Heads of State and Governments to participate in the September 2011 NCD Summit, in accordance with General Assembly resolution 64/265 adopted on 20 May 2010. We request the Assembly of the United Nations gathered in New York on September 2011 to include the following rec-ommendations in the resolution it may adopt.
General recommendations1. To implement NCD promotion, prevention and control policies and actions in all governmental sectors and levels thus guaranteeing allocation of resources to that purpose, as an essential strategy to reduce poverty and promote de-velopment2. To develop and implement a plan of action and execute appropriate surveillance mechanisms of NCDs, its conse-quences and risk factors and to evaluate policy impact.3. To Foster the creation of intersectoral bodies for the pre-vention and control of NCDs.4. To incorporate civil society organizations in formal par-ticipation stages before, during and after the summit in or-der to guarantee e!ective intersectoral cooperation.
144 Global Atlas on Cardiovascular Diseases Prevention and Control
International and Regional Organisations
African Medical and Research Foundation (AMREF) http://www.amref.org/
African Networks for Health Research and Development http://www.afronets.org/
American Association of Cardiovascular and Pulmonary Rehabilitation http://www.aacvpr.org/
American College of Cardiology http://www.cardiosource.org/Science-And-Quality.aspx
American Heart Association http://www.heart.org/HEARTORG/
Bill and Melinda Gates Foundation: Global Health Program http://www.gatesfoundation.org/global-health/Pages/overview.aspx
British Heart Foundation http://www.bhf.org.uk/heart-health/conditions/cardiovascular-disease.aspx
Campaign for Tobacco-Free Kids http://www.tobaccofreekids.org/
Chain of Hope http://www.chainofhope.org/
Childrens Heartlink http://www.childrensheartlink.org/
Childrens Hearts http://www.childrenshearts.org.uk
Children's Heart Foundation http://chfn.org/
Coeurs pour Tous (Hearts for All) http://www.cptg.ch/fr/start.htm
Congenital Heart Information Network http://www.tchin.org/
Council on Health Research for Development http://www.cohred.org/
World Health Organization http://www.who.int
Cardiovascular disease http://www5.who.int/cardiovascular-diseases/
http://www.afro.who.int/
http://new.paho.org/
http://www.emro.who.int/index.asp
http://www.euro.who.int/en/home
http://www.searo.who.int/
http://www.wpro.who.int/
World Heart Federation http://www.worldheart.org/
World Stroke Organization http://www.world-stroke.org/
Centers for Disease Control and Prevention, USA http://www.cdc.gov/
Annex IV Contact information
145 Global Atlas on Cardiovascular Diseases Prevention and Control
Globalink, Global Tobacco Control http://www.globalink.org/
Healing the Children http://www.healingthechildren.org/
Heart Care International http://www.heartcareintl.org
HeartGift Foundation http://www.heartgift.org/
Heart Foundation http://www.heartfoundation.org.au/Pages/default.aspx
The Heart of Child Foundation- Little Hearts of the Mend http://www.heartofachild.org/
Heart-to-Heart International http://www.hearttoheart.org/
The Heart of a Child Foundation- Little Hearts of the Mend http://www.heartofachild.org/
Heart-to-Heart International http://www.hearttoheart.org/
InterAmerican Heart Foundation http://www.interamericanheart.org
InterAmerican Society of Cardiology http://www.siacardio.org/default.asp
International Academy of Cardiology http://www.cardiologyonline.com
International Cardiovascular Health Alliance http://www.ichaonline.org/
International Children's Heart Foundation http://www.ichf.org/
International Children's Heart Fund http://www.ichfund.org/
International Diabetes Federation http://www.idf.org/
International Network of Women against Tobacco (INWAT) http://www.inwat.org/
International Obesity Task Force http://www.iotf.org/
International Society for Adult Congenital Cardiac Disease http://www.isaccd.org/
Eastern Mediterranean Network on Heart Health, (EMNHH) http://emnhh.homestead.com/!les/index.htm
European Heart Institute http://www.euro-acad.eu/
European Heart Network http://www.ehnheart.org/
EMASH European Medical Association on Smoking and Health http://emash.globalink.org/
ENSP European Network for Smoking Prevention http://www.ensp.org
European Network of Young People and Tobacco http://www.ktl.!/enypat/
European Network of Quitlines http://www.enqonline.org/public/index.php
European Society of Cardiology http://www.escardio.org/
European Society of Hypertension http://www.eshonline.org/
European Union of Non-smokers http://www.globalink.org/tobacco/docs/eu-docs/uene.htm
Framework Convention Alliance (FCA) http://www.fctc.org/
Gift of Life International Inc. http://www.gifto"ifeinternational.org/
Global Connection International http://www.gciworld.org
Global Cardiovascular Infobase (in English and Spanish) http://www.cvdinfobase.ca/
Global Healing http://www.globalhealing.org
Global Health Information Network http://www.healthnet.org/
Global Partnerships for Tobacco Control http://www.essentialaction.org/tobacco/
Global Youth Action on Tobacco Network http://gyatnetwork.blogspot.com/
146 Global Atlas on Cardiovascular Diseases Prevention and Control
Save A Child's Heart Foundation http://www.saveachildsheart.com
Society for Research on Nicotine and Tobacco (SRNT) http://www.srnt.org/
Spanish Heart Foundation http://www.fundaciondelcorazon.com/
Southeast Asian Tobacco Control Alliance http://www.tobaccofreeasia.net/
Support for Analysis and Research in Africa (SARA) (Focus on Low-Income Countries) http://sara.aed.org/
The Stroke Association http://www.stroke.org.uk/
Stroke Awareness for Everyone http://www.strokesafe.org/
Stroke Net http://www.strokenet.info/resources/stroke/internationalsites.htm
The Congenital Heart Foundation http://www.supportcongenitalheart.org/index.htm
The European Atherosclerosis Society http://www.eas-society.org/
The Primary Care Cardiovascular Society http://www.pccs.org.uk/
Tobacco Control journal http://www.tobaccocontrol.com
Tobacco Control Resource Center/Tobacco Products Liability Project (TCRC/TPLT) http://tobacco.neu.edu/
TCRC Tobacco Control Resource Centre, BMA, UK http://www.tobacco-control.org/
Tobacco Control Supersite http://www.health.usyd.edu.au/tobacco/
Union for International Cancer Control http://www.uicc.org/
WomenHeart: The National Coalition for Women and Heart Disease http://www.womenheart.org/
International Society of Hypertension http://www.ish-world.com/Default.aspx?Home
International Society of Nephrology http://www.isn-online.org/
International Society on Hypertension in Blacks (ISHIB) http://www.ishib.org/AI_index.asp
International Task Force for the Prevention of Coronary Heart Disease http://www.chd-taskforce.de/
International Tobacco Evidence Network (ITEN) http://www.tobaccoevidence.net/
Medical Research Council of South Africa (Focus on Low-Income Countries) http://www.mrc.ac.za/home.htm
The NCD Alliance http://www.ncdalliance.org/
Network for Equality in Health for Southern Africa (EQUINET): http://www.equinetafrica.org/
Partners in Health http://www.pih.org/
Physicians for Peace http://www.physiciansforpeace.org
ProCOR:Conference on Cardiovascular Health http://www.procor.org/
Project Hope http://www.projecthope.org
Project Kids Worldwide http://www.projectkidsworldwide.org
Project Open Hearts http://www.poh.org
Quality Assurance (QA) Project http://www.qaproject.org/
RedR (Focus on Low-Income Countries) http://www.redr.org.uk/
Repace's site, especially on passive smoking (Jim Repace) http://www.repace.com/
Research Center for Stroke and Heart Disease http://www.strokeheart.org/
147 Global Atlas on Cardiovascular Diseases Prevention and Control
World Federation of Neurology http://www.wfneurology.org/
World Heart Failure Society http://www.worldheartfailure.org/
World Heart Foundation http://www.world-heart.org/
World Hypertension League http://www.worldhypertensionleague.org/Pages/Home.aspx
World Kidney Foundation http://www.worldkidneyfund.org/
World Medical Association http://www.wma.net/
World Society for Pediatric and Congenital Heart Surgery http://www.wspchs.org/
Vascular Disease Foundation http://www.vdf.org/
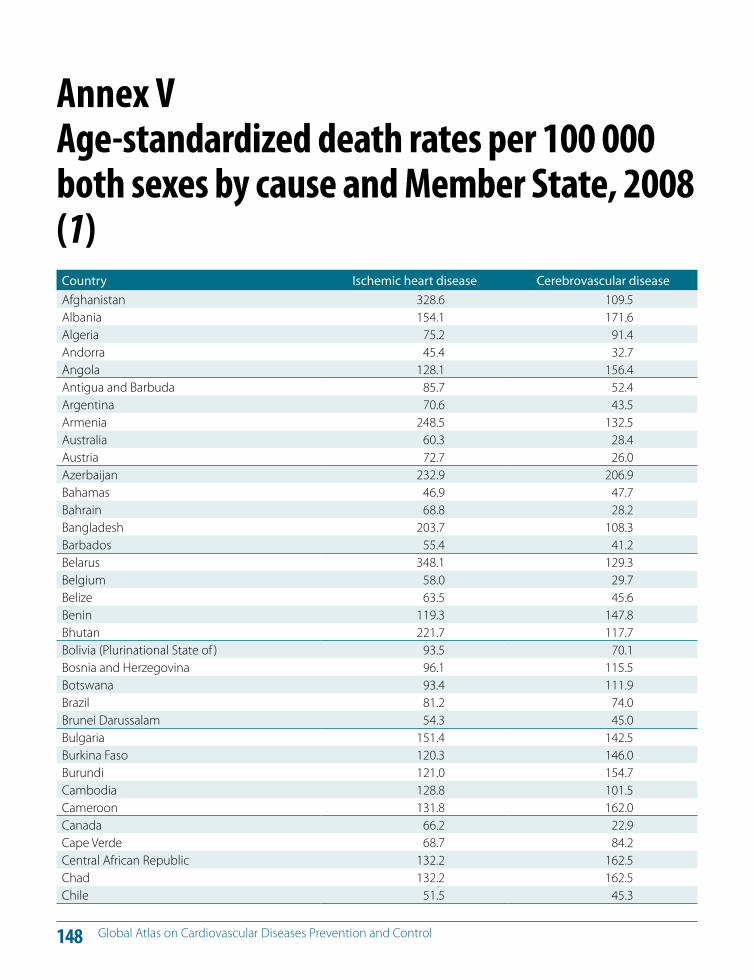
148 Global Atlas on Cardiovascular Diseases Prevention and Control
Country Ischemic heart disease Cerebrovascular diseaseAfghanistan 328.6 109.5Albania 154.1 171.6Algeria 75.2 91.4Andorra 45.4 32.7Angola 128.1 156.4Antigua and Barbuda 85.7 52.4Argentina 70.6 43.5Armenia 248.5 132.5Australia 60.3 28.4Austria 72.7 26.0Azerbaijan 232.9 206.9Bahamas 46.9 47.7Bahrain 68.8 28.2Bangladesh 203.7 108.3Barbados 55.4 41.2Belarus 348.1 129.3Belgium 58.0 29.7Belize 63.5 45.6Benin 119.3 147.8Bhutan 221.7 117.7Bolivia (Plurinational State of ) 93.5 70.1Bosnia and Herzegovina 96.1 115.5Botswana 93.4 111.9Brazil 81.2 74.0Brunei Darussalam 54.3 45.0Bulgaria 151.4 142.5Burkina Faso 120.3 146.0Burundi 121.0 154.7Cambodia 128.8 101.5Cameroon 131.8 162.0Canada 66.2 22.9Cape Verde 68.7 84.2Central African Republic 132.2 162.5Chad 132.2 162.5Chile 51.5 45.3
Annex V Age-standardized death rates per 100 000 both sexes by cause and Member State, 2008 (1)
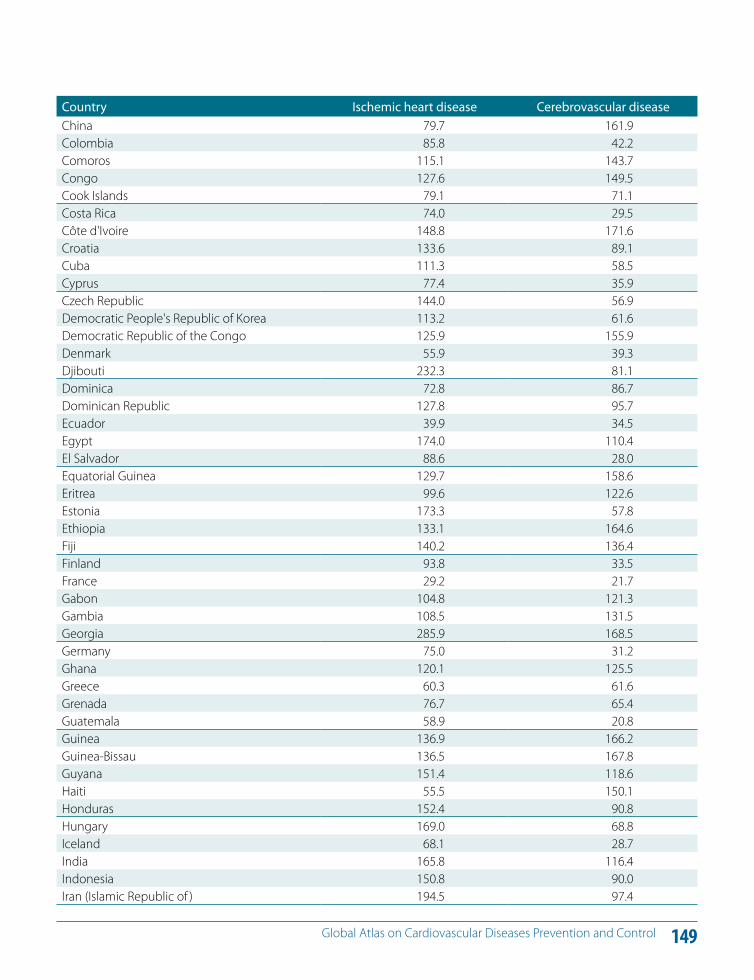
149 Global Atlas on Cardiovascular Diseases Prevention and Control
Country Ischemic heart disease Cerebrovascular diseaseChina 79.7 161.9Colombia 85.8 42.2Comoros 115.1 143.7Congo 127.6 149.5Cook Islands 79.1 71.1Costa Rica 74.0 29.5Côte d'Ivoire 148.8 171.6Croatia 133.6 89.1Cuba 111.3 58.5Cyprus 77.4 35.9Czech Republic 144.0 56.9Democratic People's Republic of Korea 113.2 61.6Democratic Republic of the Congo 125.9 155.9Denmark 55.9 39.3Djibouti 232.3 81.1Dominica 72.8 86.7Dominican Republic 127.8 95.7Ecuador 39.9 34.5Egypt 174.0 110.4El Salvador 88.6 28.0Equatorial Guinea 129.7 158.6Eritrea 99.6 122.6Estonia 173.3 57.8Ethiopia 133.1 164.6Fiji 140.2 136.4Finland 93.8 33.5France 29.2 21.7Gabon 104.8 121.3Gambia 108.5 131.5Georgia 285.9 168.5Germany 75.0 31.2Ghana 120.1 125.5Greece 60.3 61.6Grenada 76.7 65.4Guatemala 58.9 20.8Guinea 136.9 166.2Guinea-Bissau 136.5 167.8Guyana 151.4 118.6Haiti 55.5 150.1Honduras 152.4 90.8Hungary 169.0 68.8Iceland 68.1 28.7India 165.8 116.4Indonesia 150.8 90.0Iran (Islamic Republic of ) 194.5 97.4
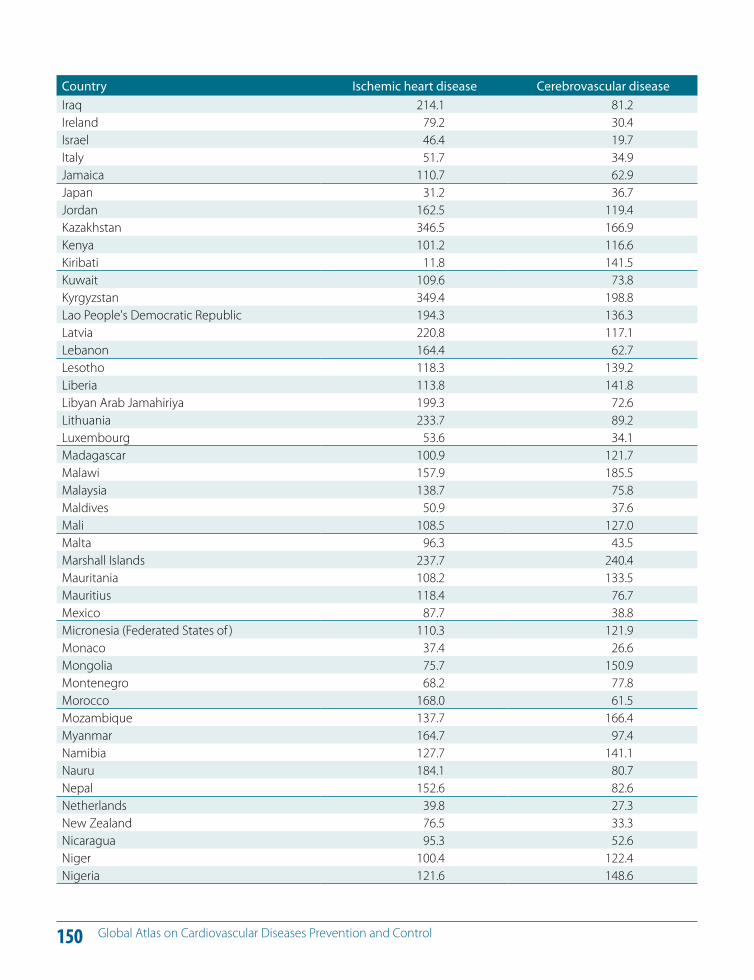
150 Global Atlas on Cardiovascular Diseases Prevention and Control
Country Ischemic heart disease Cerebrovascular diseaseIraq 214.1 81.2Ireland 79.2 30.4Israel 46.4 19.7Italy 51.7 34.9Jamaica 110.7 62.9Japan 31.2 36.7Jordan 162.5 119.4Kazakhstan 346.5 166.9Kenya 101.2 116.6Kiribati 11.8 141.5Kuwait 109.6 73.8Kyrgyzstan 349.4 198.8Lao People's Democratic Republic 194.3 136.3Latvia 220.8 117.1Lebanon 164.4 62.7Lesotho 118.3 139.2Liberia 113.8 141.8Libyan Arab Jamahiriya 199.3 72.6Lithuania 233.7 89.2Luxembourg 53.6 34.1Madagascar 100.9 121.7Malawi 157.9 185.5Malaysia 138.7 75.8Maldives 50.9 37.6Mali 108.5 127.0Malta 96.3 43.5Marshall Islands 237.7 240.4Mauritania 108.2 133.5Mauritius 118.4 76.7Mexico 87.7 38.8Micronesia (Federated States of ) 110.3 121.9Monaco 37.4 26.6Mongolia 75.7 150.9Montenegro 68.2 77.8Morocco 168.0 61.5Mozambique 137.7 166.4Myanmar 164.7 97.4Namibia 127.7 141.1Nauru 184.1 80.7Nepal 152.6 82.6Netherlands 39.8 27.3New Zealand 76.5 33.3Nicaragua 95.3 52.6Niger 100.4 122.4Nigeria 121.6 148.6
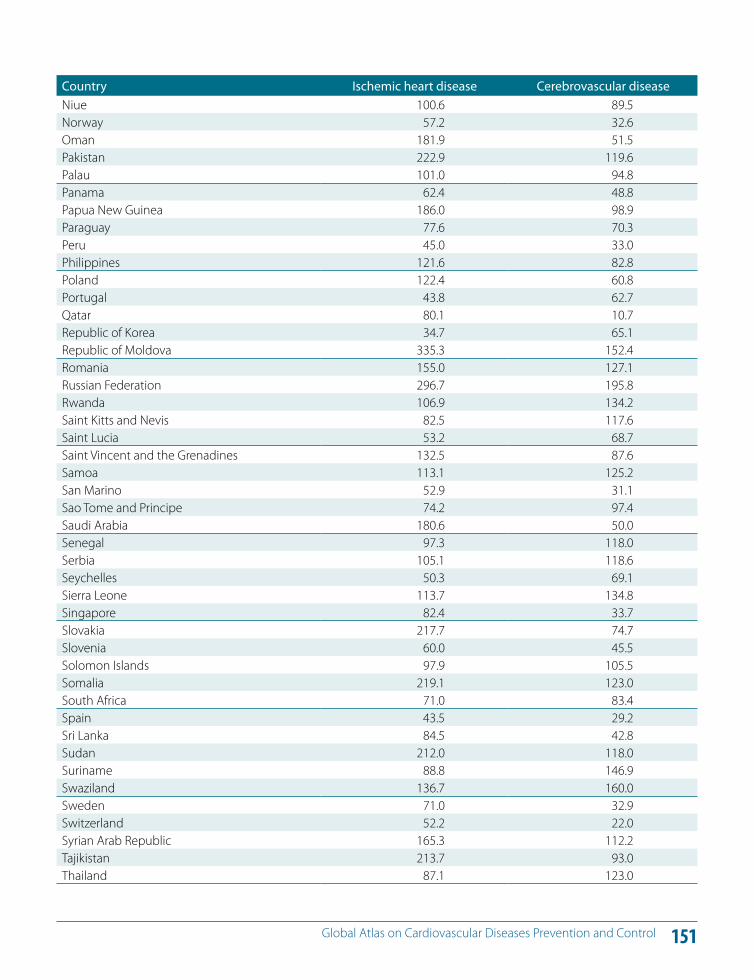
151 Global Atlas on Cardiovascular Diseases Prevention and Control
Country Ischemic heart disease Cerebrovascular diseaseNiue 100.6 89.5Norway 57.2 32.6Oman 181.9 51.5Pakistan 222.9 119.6Palau 101.0 94.8Panama 62.4 48.8Papua New Guinea 186.0 98.9Paraguay 77.6 70.3Peru 45.0 33.0Philippines 121.6 82.8Poland 122.4 60.8Portugal 43.8 62.7Qatar 80.1 10.7Republic of Korea 34.7 65.1Republic of Moldova 335.3 152.4Romania 155.0 127.1Russian Federation 296.7 195.8Rwanda 106.9 134.2Saint Kitts and Nevis 82.5 117.6Saint Lucia 53.2 68.7Saint Vincent and the Grenadines 132.5 87.6Samoa 113.1 125.2San Marino 52.9 31.1Sao Tome and Principe 74.2 97.4Saudi Arabia 180.6 50.0Senegal 97.3 118.0Serbia 105.1 118.6Seychelles 50.3 69.1Sierra Leone 113.7 134.8Singapore 82.4 33.7Slovakia 217.7 74.7Slovenia 60.0 45.5Solomon Islands 97.9 105.5Somalia 219.1 123.0South Africa 71.0 83.4Spain 43.5 29.2Sri Lanka 84.5 42.8Sudan 212.0 118.0Suriname 88.8 146.9Swaziland 136.7 160.0Sweden 71.0 32.9Switzerland 52.2 22.0Syrian Arab Republic 165.3 112.2Tajikistan 213.7 93.0Thailand 87.1 123.0
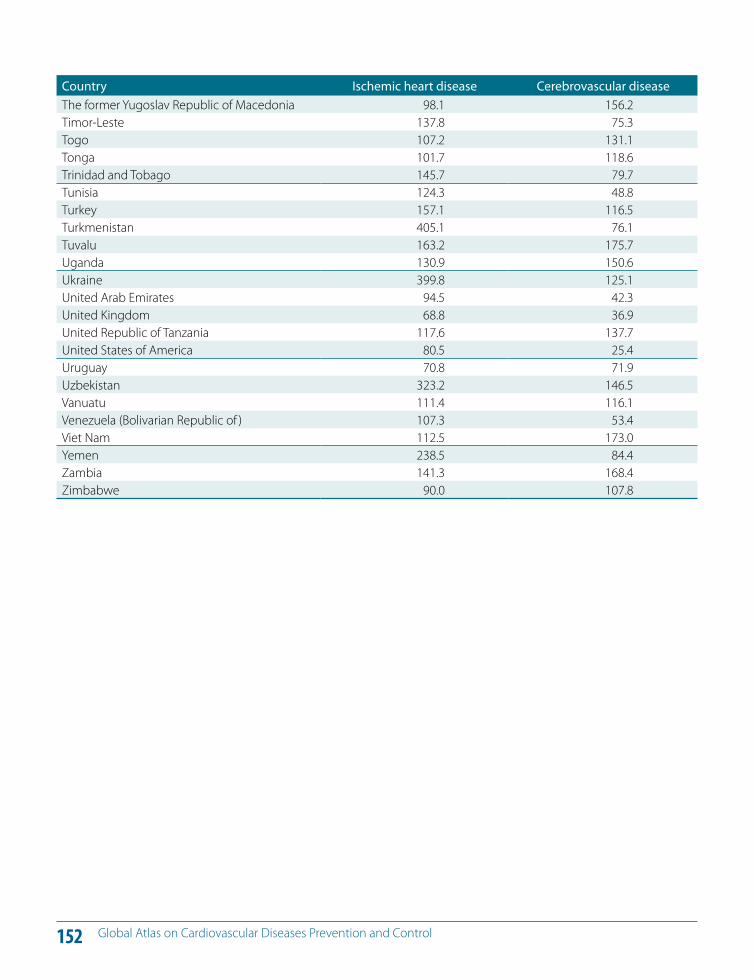
152 Global Atlas on Cardiovascular Diseases Prevention and Control
Country Ischemic heart disease Cerebrovascular diseaseThe former Yugoslav Republic of Macedonia 98.1 156.2Timor-Leste 137.8 75.3Togo 107.2 131.1Tonga 101.7 118.6Trinidad and Tobago 145.7 79.7Tunisia 124.3 48.8Turkey 157.1 116.5Turkmenistan 405.1 76.1Tuvalu 163.2 175.7Uganda 130.9 150.6Ukraine 399.8 125.1United Arab Emirates 94.5 42.3United Kingdom 68.8 36.9United Republic of Tanzania 117.6 137.7United States of America 80.5 25.4Uruguay 70.8 71.9Uzbekistan 323.2 146.5Vanuatu 111.4 116.1Venezuela (Bolivarian Republic of ) 107.3 53.4Viet Nam 112.5 173.0Yemen 238.5 84.4Zambia 141.3 168.4Zimbabwe 90.0 107.8
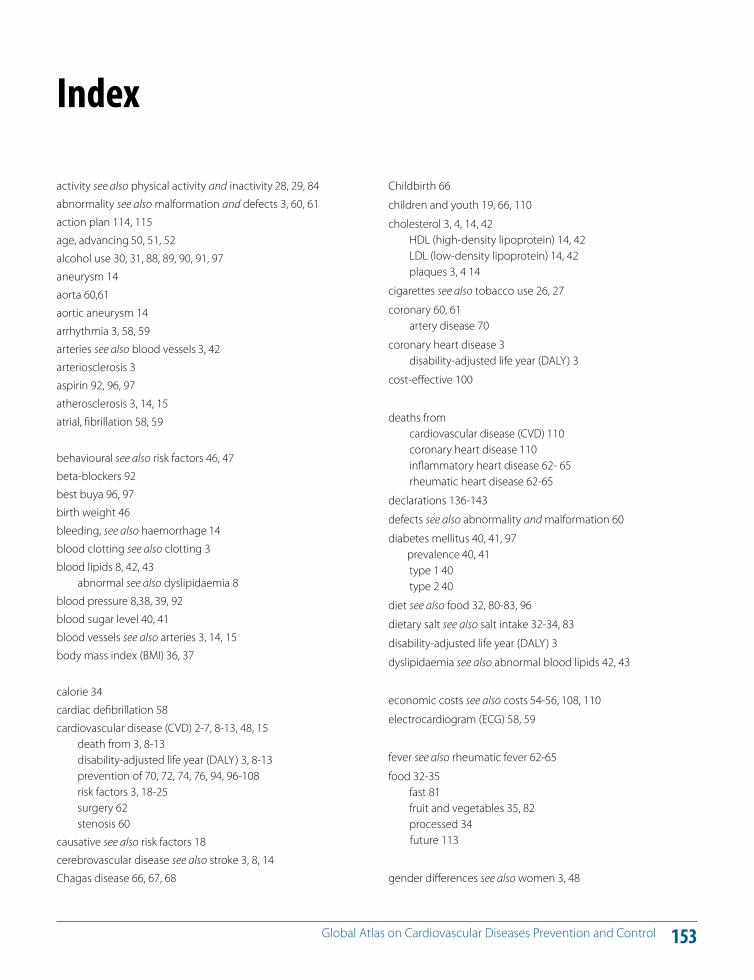
153 Global Atlas on Cardiovascular Diseases Prevention and Control
Childbirth 66
children and youth 19, 66, 110
cholesterol 3, 4, 14, 42 HDL (high-density lipoprotein) 14, 42 LDL (low-density lipoprotein) 14, 42 plaques 3, 4 14
cigarettes see also tobacco use 26, 27
coronary 60, 61 artery disease 70
coronary heart disease 3 disability-adjusted life year (DALY) 3
cost-e!ective 100
deaths from cardiovascular disease (CVD) 110 coronary heart disease 110 inflammatory heart disease 62- 65 rheumatic heart disease 62-65
declarations 136-143
defects see also abnormality and malformation 60
diabetes mellitus 40, 41, 97 prevalence 40, 41 type 1 40 type 2 40
diet see also food 32, 80-83, 96
dietary salt see also salt intake 32-34, 83
disability-adjusted life year (DALY) 3
dyslipidaemia see also abnormal blood lipids 42, 43
economic costs see also costs 54-56, 108, 110
electrocardiogram (ECG) 58, 59
fever see also rheumatic fever 62-65
food 32-35 fast 81 fruit and vegetables 35, 82 processed 34 future 113
gender di!erences see also women 3, 48
activity see also physical activity and inactivity 28, 29, 84
abnormality see also malformation and defects 3, 60, 61
action plan 114, 115
age, advancing 50, 51, 52
alcohol use 30, 31, 88, 89, 90, 91, 97
aneurysm 14
aorta 60,61
aortic aneurysm 14
arrhythmia 3, 58, 59
arteries see also blood vessels 3, 42
arteriosclerosis 3
aspirin 92, 96, 97
atherosclerosis 3, 14, 15
atrial, fibrillation 58, 59
behavioural see also risk factors 46, 47
beta-blockers 92
best buya 96, 97
birth weight 46
bleeding, see also haemorrhage 14
blood clotting see also clotting 3
blood lipids 8, 42, 43 abnormal see also dyslipidaemia 8
blood pressure 8,38, 39, 92
blood sugar level 40, 41
blood vessels see also arteries 3, 14, 15
body mass index (BMI) 36, 37
calorie 34
cardiac defibrillation 58
cardiovascular disease (CVD) 2-7, 8-13, 48, 15 death from 3, 8-13 disability-adjusted life year (DALY) 3, 8-13 prevention of 70, 72, 74, 76, 94, 96-108 risk factors 3, 18-25 surgery 62 stenosis 60
causative see also risk factors 18
cerebrovascular disease see also stroke 3, 8, 14
Chagas disease 66, 67, 68
Index
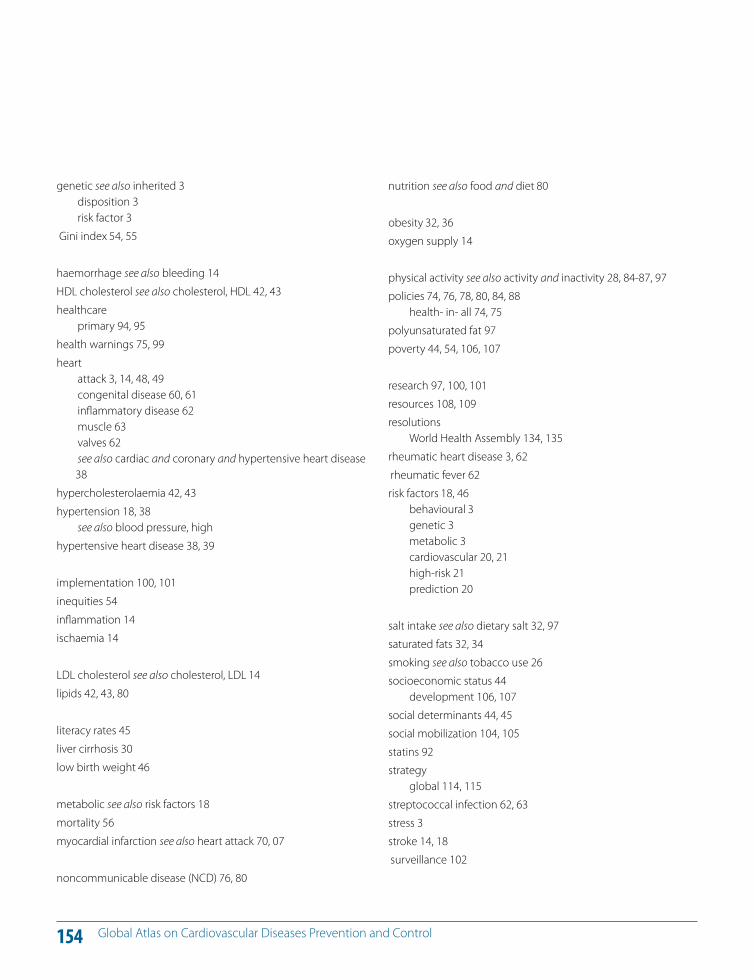
154 Global Atlas on Cardiovascular Diseases Prevention and Control
nutrition see also food and diet 80
obesity 32, 36
oxygen supply 14
physical activity see also activity and inactivity 28, 84-87, 97
policies 74, 76, 78, 80, 84, 88 health- in- all 74, 75
polyunsaturated fat 97
poverty 44, 54, 106, 107
research 97, 100, 101
resources 108, 109
resolutions World Health Assembly 134, 135
rheumatic heart disease 3, 62
rheumatic fever 62
risk factors 18, 46 behavioural 3 genetic 3 metabolic 3 cardiovascular 20, 21 high-risk 21 prediction 20
salt intake see also dietary salt 32, 97
saturated fats 32, 34
smoking see also tobacco use 26
socioeconomic status 44 development 106, 107
social determinants 44, 45
social mobilization 104, 105
statins 92
strategy global 114, 115
streptococcal infection 62, 63
stress 3
stroke 14, 18
surveillance 102
genetic see also inherited 3 disposition 3 risk factor 3
Gini index 54, 55
haemorrhage see also bleeding 14
HDL cholesterol see also cholesterol, HDL 42, 43
healthcare primary 94, 95
health warnings 75, 99
heart attack 3, 14, 48, 49 congenital disease 60, 61 inflammatory disease 62 muscle 63 valves 62 see also cardiac and coronary and hypertensive heart disease 38
hypercholesterolaemia 42, 43
hypertension 18, 38 see also blood pressure, high
hypertensive heart disease 38, 39
implementation 100, 101
inequities 54
inflammation 14
ischaemia 14
LDL cholesterol see also cholesterol, LDL 14
lipids 42, 43, 80
literacy rates 45
liver cirrhosis 30
low birth weight 46
metabolic see also risk factors 18
mortality 56
myocardial infarction see also heart attack 70, 07
noncommunicable disease (NCD) 76, 80
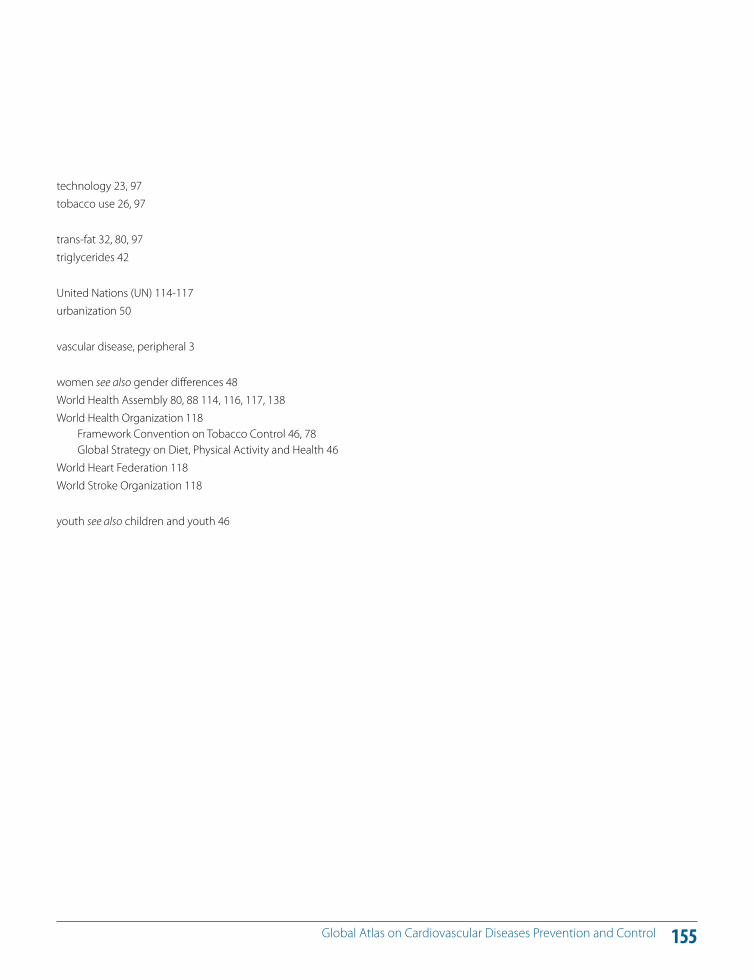
155 Global Atlas on Cardiovascular Diseases Prevention and Control
technology 23, 97tobacco use 26, 97 trans-fat 32, 80, 97triglycerides 42
United Nations (UN) 114-117urbanization 50
vascular disease, peripheral 3
women see also gender di!erences 48World Health Assembly 80, 88 114, 116, 117, 138World Health Organization 118
Framework Convention on Tobacco Control 46, 78 Global Strategy on Diet, Physical Activity and Health 46
World Heart Federation 118 World Stroke Organization 118
youth see also children and youth 46
Published by the World Health Organization in collaboration with the World Heart Federation
and the World Stroke Organization.
Global Atlas on cardiovascular disease preventionand controlPublished by the World Health Organization in collaboration with the World Heart Federation and the World Stroke Organization.
ISBN 978 92 4 156437 3
Glo
bal A
tlas
on
card
iova
scul
ar d
isea
se p
reve
ntio
n an
d co
ntro
l Global Atlas on cardiovascular disease
prevention and control
CVDs
20 Avenue AppiaCH-1211 Geneva 27Switzerlandwww.who.int/
International efforts aimed at poverty reduction will be
derailed if the rapidly growing global
cardiovascular disease burden is ignored.
In the absence of prevention strategies, increasing numbers of people will succumb
to heart attacks and strokes due to
continuing exposure to risk factors.
Millions of premature deaths due to
cardiovascular disease can be prevented by scaling up the
implementation of affordable, high impact
interventions, which already exist.