glimpseii - v1.0 data products and data delivery
TRANSCRIPT
GLIMPSEII - v1.0 Data Products and Data Delivery
by Marilyn R. Meade, Barbara A. Whitney, Brian L. Babler, Remy Indebetouw, Steve
Bracker, Martin Cohen, Tom Robitaille, Bob Benjamin, Ed Churchwell
Version 1.0
February 15, 2007
Contents
1 Quick Start 2
2 Overview 2
2.1 GLIMPSEII Survey and Data Products . . . . . . . . . . . . . . . . . . . . . . . . . 2
2.2 v1.0 Data Release . . . . . . . . . . . . . . . . . . . . . . . . . . . . . . . . . . . . . 5
2.3 v2.0 Data Release . . . . . . . . . . . . . . . . . . . . . . . . . . . . . . . . . . . . . 5
3 Pipeline Processing 5
3.1 Image Processing, Photometry, and Bandmerging . . . . . . . . . . . . . . . . . . . . 5
3.2 Source Selection for Catalog and Archive . . . . . . . . . . . . . . . . . . . . . . . . 7
4 Source List Validation 8
4.1 False sources . . . . . . . . . . . . . . . . . . . . . . . . . . . . . . . . . . . . . . . . 8
4.2 Astrometric Accuracy . . . . . . . . . . . . . . . . . . . . . . . . . . . . . . . . . . . 8
4.3 Photometric Accuracy . . . . . . . . . . . . . . . . . . . . . . . . . . . . . . . . . . . 8
4.4 Color-Color and Color-Magnitude Plots . . . . . . . . . . . . . . . . . . . . . . . . . 10
4.5 Other checks . . . . . . . . . . . . . . . . . . . . . . . . . . . . . . . . . . . . . . . . 12
5 Data Products Description 13
5.1 Catalog and Archive Fields and Flags . . . . . . . . . . . . . . . . . . . . . . . . . . 13
5.2 GLIMPSEII Image Atlas . . . . . . . . . . . . . . . . . . . . . . . . . . . . . . . . . . 17
6 Product Formats 18
6.1 Catalog and Archive . . . . . . . . . . . . . . . . . . . . . . . . . . . . . . . . . . . . 18
6.2 GLIMPSEII Image Atlas . . . . . . . . . . . . . . . . . . . . . . . . . . . . . . . . . . 20
7 GLIMPSEII Data Delivery Schedule 23
8 APPENDIX A - Source Quality Flag Bit Descriptions 24
1
1 Quick Start
GLIMPSEI and GLIMPSEII data products are available at the Spitzer Science Center (SSC) (seehttp://ssc.spitzer.caltech.edu/legacy/) and the Infrared Science Archive (IRSA)(e.g. http://irsa.ipac.caltech.edu/data/SPITZER/). For scientists who want to immediately usethe GLIMPSEII data, §6 describes the source list entries and the images.
2 Overview
2.1 GLIMPSEII Survey and Data Products
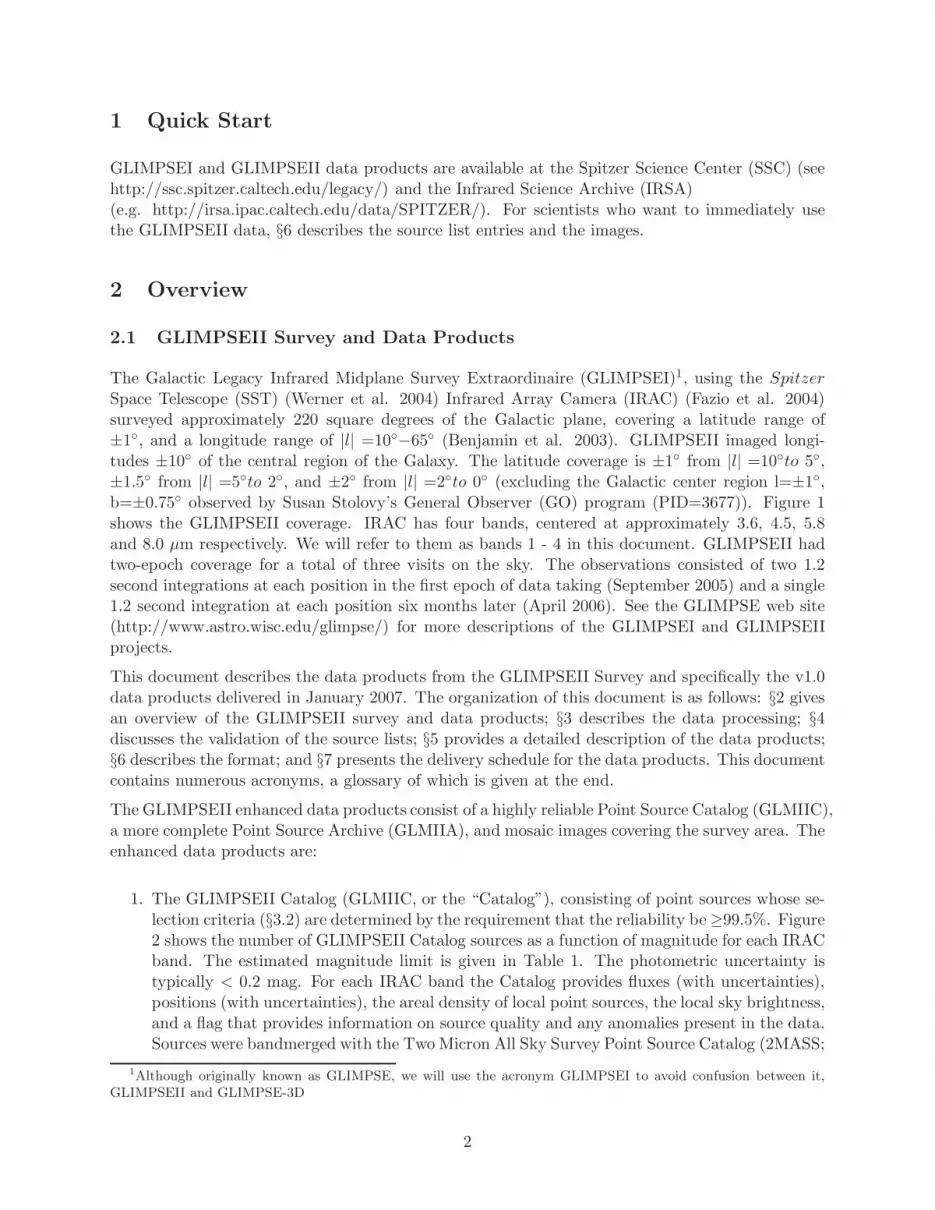
The Galactic Legacy Infrared Midplane Survey Extraordinaire (GLIMPSEI)1, using the SpitzerSpace Telescope (SST) (Werner et al. 2004) Infrared Array Camera (IRAC) (Fazio et al. 2004)surveyed approximately 220 square degrees of the Galactic plane, covering a latitude range of±1◦, and a longitude range of |l| =10◦−65◦ (Benjamin et al. 2003). GLIMPSEII imaged longi-tudes ±10◦ of the central region of the Galaxy. The latitude coverage is ±1◦ from |l| =10◦to 5◦,±1.5◦ from |l| =5◦to 2◦, and ±2◦ from |l| =2◦to 0◦ (excluding the Galactic center region l=±1◦,b=±0.75◦ observed by Susan Stolovy’s General Observer (GO) program (PID=3677)). Figure 1shows the GLIMPSEII coverage. IRAC has four bands, centered at approximately 3.6, 4.5, 5.8and 8.0 µm respectively. We will refer to them as bands 1 - 4 in this document. GLIMPSEII hadtwo-epoch coverage for a total of three visits on the sky. The observations consisted of two 1.2second integrations at each position in the first epoch of data taking (September 2005) and a single1.2 second integration at each position six months later (April 2006). See the GLIMPSE web site(http://www.astro.wisc.edu/glimpse/) for more descriptions of the GLIMPSEI and GLIMPSEIIprojects.
This document describes the data products from the GLIMPSEII Survey and specifically the v1.0data products delivered in January 2007. The organization of this document is as follows: §2 givesan overview of the GLIMPSEII survey and data products; §3 describes the data processing; §4discusses the validation of the source lists; §5 provides a detailed description of the data products;§6 describes the format; and §7 presents the delivery schedule for the data products. This documentcontains numerous acronyms, a glossary of which is given at the end.
The GLIMPSEII enhanced data products consist of a highly reliable Point Source Catalog (GLMIIC),a more complete Point Source Archive (GLMIIA), and mosaic images covering the survey area. Theenhanced data products are:
1. The GLIMPSEII Catalog (GLMIIC, or the “Catalog”), consisting of point sources whose se-lection criteria (§3.2) are determined by the requirement that the reliability be ≥99.5%. Figure2 shows the number of GLIMPSEII Catalog sources as a function of magnitude for each IRACband. The estimated magnitude limit is given in Table 1. The photometric uncertainty istypically < 0.2 mag. For each IRAC band the Catalog provides fluxes (with uncertainties),positions (with uncertainties), the areal density of local point sources, the local sky brightness,and a flag that provides information on source quality and any anomalies present in the data.Sources were bandmerged with the Two Micron All Sky Survey Point Source Catalog (2MASS;
1Although originally known as GLIMPSE, we will use the acronym GLIMPSEI to avoid confusion between it,GLIMPSEII and GLIMPSE-3D
2
Figure 1: GLIMPSEII areal coverage of the inner Galactic plane.
Egan et al. 2001), providing images at similar resolution to IRAC, in the J (1.25 µm), H (1.65µm), and Ks (2.17 µm) bands. The 2MASS information we include from the 2MASS PSCis designation, counter (a unique identification number), fluxes, signal-to-noise, and a lim-ited source quality flag. Users should refer back to the 2MASS Point Source Catalog for thecomplete 2MASS information about the source. The format of the Catalog is ASCII, using theIPAC Tables convention (http://irsa.ipac.caltech.edu/applications/DDGEN/Doc/ipac tbl.html).The v1.0 GLIMPSEII Catalog contains about 16 million sources.
2. The GLIMPSEII Archive (GLMIIA or the “Archive”), consisting of point sources with asignal to noise > 5 in at least one band and less stringent selection critera than the Catalog(§3.2). The photometric uncertainty is typically < 0.3 mag. The information provided is inthe same format as the Catalog. The number of GLIMPSEII Archive sources as a functionof magnitude for each IRAC band is shown in Figure 2. The estimated magnitude limit isgiven in Table 1. The v1.0 GLIMPSEII Archive contains about 21 million sources. TheGLIMPSEII Catalog is a subset of the Archive, but note that the entries for a particularsource might not be the same due to additional nulling of magnitudes in the Catalog becauseof the more stringent requirements (§3.2).
3. The GLIMPSEII Image Atlas: Mosaicked Images for each band, each covering 1.1◦×0.8◦,1.1◦×1.2◦, or 1.1◦×1.6◦, depending on the latitude coverage. These are 32-bit IEEE floatingpoint single extension FITS formatted images covering the entire survey area. These images,in units of surface brightness MJy/sr, have a pixel size of 0.6′′ . Mosaics of each band will bemade for larger (e.g. 3.1◦×2.4◦) areas, with a pixel size of 1.2′′ . Also included are quicklook
3

3-color jpeg images of the same size as the FITS images.
Table 1. Estimated Magnitude Limits for GLIMPSEII sources
Band (µm) [3.6] [4.5] [5.8] [8.0]
Catalog/Archive 13.0 13.0 11.5 11.0
Figure 2: GLIMPSEII source counts versus magnitude. Plotted is the logarithm of the source countsin the GLIMPSEII Catalog (dashed lines) and Archive (solid lines) binned every 0.1 magnitudes.Each of the 4 bands is plotted, showing the effective limiting magnitude for each band. The band1 & 2 distributions are very similar since most sources that make it into the Archive or Cataloghave data in those bands. Sources from the entire GLIMPSEII region were used in these plots.
4

2.2 v1.0 Data Release
v1.0 data products consist of a point source Catalog and Archive and mosaics for the entire GLIMP-SEII survey region using the epoch 1 data taken in September 2005, processed with SSC pipelineversion S12.4. This dataset is the two-visit survey of the entire GLIMPSEII area, similar to thetwo-visit GLIMPSEI survey. (The third pass data (epoch 2) were taken in April 2006). There werea few frames that were missing or bad. These areas have been re-observed and the data will beincluded in future data releases. The older SSC S12.4 processing does not include the new fluxcalibration (Reach et al. 2005) and position refinement improvements. Photometry is performedon individual IRAC frames using a modified version of DAOPHOT (Stetson 1987) and combinedin the bandmerger stage to produce the source lists. v1.0 data products incorporate some of theWisconsin IRAC pipeline improvements, such as muxbleed correction and implementing a closesource flag. We are providing 2MASS fluxes with the IRAC data, when available. We did notattempt to match instrumental background variations between the images in the mosaics but hopeto for the v2.0 mosaics if we are satisfied we are not removing real sky variations.
2.3 v2.0 Data Release
This document describes the v1.0 products that are currently available. Here we give a briefdescription of the v2.0 data products that will be available starting in the Fall of 2007. v2.0 dataproducts will use data processed with SSC pipeline version S13.2 and later and will include bothepochs of the GLIMPSEII survey data. Source lists for each epoch will be provided along withsource lists for the combined epochs. v2.0 products will also include GO time data for the onedegree around the Galactic Center (PI: Stolovy), as processed by the Wisconsin IRAC pipeline,and will include any overlaps with the GLIMPSEI data. We plan to take some short exposure datato recover photometry from saturated sources and diffuse regions and these data will be deliveredas well.
3 Pipeline Processing
3.1 Image Processing, Photometry, and Bandmerging
The GLIMPSE Pipeline Description document (GPD) will describe in detail the GLIMPSE (GLIMP-SEI, GLIMPSEII, GLIMPSE-3D) pipeline processing, including photometry and bandmerging toproduce source lists. We note here some steps that are relevant to the final data products. Imageprocessing steps for photometry include masking hot, dead, and missing data pixels (using SSCsupplied flags). Pixels associated with saturated stars are masked using an algorithm generated byGLIMPSE; this algorithm finds most of the saturated stars. Pixels within a 24-pixel radius of asaturated source are flagged. Several image artifacts (described in Hora et al (2004) and the IRACData Handbook2) are corrected for in the GLIMPSE pipeline. We correct for column pulldown3
in bands 1 & 2, using an algorithm written by Lexi Moustakas (GOODS team) and modified by
2http://ssc.spitzer.caltech.edu/irac/dh/.3Column pulldown is a reduction in intensity of the columns in which bright sources are found in Bands 1 and 2.
See Spitzer Observer’s Manual (SOM) at http://ssc.spitzer.caltech.edu/documents/som/.
5

GLIMPSE to handle variable backgrounds. We correct for muxbleed4 in bands 1 & 2 using a mod-ified version of the IRAC Bright Source Artifact Corrector5. We correct for banding6 in bands 3 &4 using an exponential function. (For the v2.0 data release we will implement an improved bandingcorrection for band 3 which uses an algorithm fitting each incidence of banding individually.)
We use a modified version of DAOPHOT as our point source extractor, performing Point SpreadFunction (PSF) fitting on individual IRAC frames. We repeat the photometry calculations on theresidual (point-source removed) images (referred to as “tweaking” in Table 5), which has been shownto improve the flux estimates in these regions substantially. Cosmic rays are removed from thesource list based on an algorithm that operates on the residual images. More details about the pho-tometry steps can be found at http://www.astro.wisc.edu/glimpse/glimpse photometry v1.0.pdf.The array-location-dependent photometric corrections7 were not applied to these source lists butwill in the v2.0 source lists.
Prior to the bandmerge stage, we cull all sources with signal-to-noise less than 3. As a result, nosources in the Catalog or Archive will have signal-to-noise less than 3 in any band. We use the SSC-supplied bandmerger8 (modified by the GLIMPSE team) in two stages, first to combine detections ofthe same source in the same band (in-band merge), and then to cross-correlate detections in differentbands (cross-band merge). Signal-to-noise and flux information is used as well as position duringthe in-band merge, but only position is used for the cross-band merge (to avoid any systematiceffects dependent on source color). Sources from the 2MASS All-Sky Point Source Catalog aremerged with the IRAC fluxes in the cross-band merge stage only if it has a Ks detection.
Image processing for the mosaic image products include the column pulldown, muxbleed, and band-ing corrections mentioned above. Hot, dead, and missing pixels are masked. The SSC mosaicerMOPEX9 is run to obtain the outlier mask (rmask; generally due to cosmic rays). Both the dual out-lier bit and the temporal bit of the rmask are masked during the mosaicing. Stray light from brightsources outside the field of view scatters onto the detector and can appear in the images. To removethem, we use the SSC IRAC Stray Light Masker10 modified to use the IRAC magnitudes from theGLIMPSEII source lists to predict the positions of the stray light. It creates a mask (smask) for eachinput IRAC frame. Not all of the stray light areas are found by the SSC Stray Light Masker. Mostof the remaining stray light areas are removed by visual inspection. Artifacts that have only single-frame coverage (outside the nominal latitude range of ±1◦) are left in the mosaic. If there are areasof overlapping image artifacts that cause a gap in coverage, we do not mask that area. In bands 3 and4 stray light areas can repeat (particularly along rows) and remain in the images because maskingthem would cause gaps in coverage. See SSC’s IRAC image features web site11 and the IRAC DataHandbook for more information about the detector artifacts. See also the GLIMPSE IRAC In-strument Artifact Gallery (http://www.astro.wisc.edu/glimpse/glimpse artifact gallery v1.0.pdf)which gives examples of artifacts in the GLIMPSEI and GLIMPSEII images that are correctedfor and examples of artifacts that remain in the GLIMPSEI and GLIMPSEII images. We use the
4The multiplexer bleed effect is a series of bright pixels along the horizontal direction on both sides of a brightsource in Bands 1 and 2
5http://spider.ipac.caltech.edu/staff/carey/irac artifacts6Banding refers to streaks that appear in the rows and columns radiating away from bright sources in Bands 3
and 4. See the SOM.7http://ssc.spitzer.caltech.edu/irac/locationcolor/8http//ssc.spitzer.caltech.edu/postbcd/bandmerge.html9http://ssc.spitzer.caltech.edu/postbcd/
10http://ssc.spitzer.caltech.edu/irac/straylight/11http://ssc.spitzer.caltech.edu/irac/features.html
6
Montage12 package v2.2 to mosaic and project to Galactic coordinates.
3.2 Source Selection for Catalog and Archive
Now we describe the selection criteria for the Catalog and Archive once photometry and bandmerg-ing have been completed.
CatalogThe Catalog selection criteria are identical to those used for the GLIMPSEI Catalog which wasdetermined to be ≥99.5% reliable from simulated data and study of the GLIMPSEI ObservationStrategy Validation (OSV) data of the RCW49 region. A source must be detected at least twicein one band and at least once in an adjacent band for the general GLIMPSEI observing strategyof two visits on the sky, described in detail in the GLIMPSE Quality Assurance (GQA) document(http://www.astro.wisc.edu/glimpse/GQA-master.pdf). We call this the “2+1” criterion. The2MASS Ks magnitude, when present, is used for the “2+1” criterion for IRAC band 1. To allow forthe more general case of M detections out of N possible observations, we require that M/N ≥ 0.6in one band and M/N ≥ 0.4 in an adjacent band.
In the two bands that satisfy the 2+1 criterion, only sources with flux greater than 0.6 mJy (<14.2mag), 0.4 mJy (<14.1 mag), 2 mJy (<11.9 mag), and 10 mJy (<9.5 mag) in bands 1 through 4,respectively, are allowed in the Catalog. Similarly, the bright limit fluxes are 439 mJy (7 mag), 450mJy (6.5 mag), 2930 mJy (4 mag) and 1590 mJy (4 mag) for bands 1 through 4, respectively, toremove sources at nonlinear response levels. The signal-to-noise in the band with the two detectionssatisfying the 2+1 criterion is required to be greater than 5. Sources with hot or dead pixels within3 pixels of source center, those in wings of saturated stars, and those within 3 pixels of the frameedge are culled from the Catalog.
Once a source satisfies the 2+1 criterion, the requirements for the other 2 bands of the same sourceare less stringent. Flux values above the bright limit flux are nulled, but values below the low-limitflux are allowed. Signal-to-noise <5 (down to a lower limit of 3) is allowed. Bands with hot ordead pixels and in wings of saturated stars are nulled, but those within 3 pixels of the frame edgeare allowed.
Finally, sources are removed from the Catalog if there are Archive sources within 2′′ of the sourcebecause we found that the neighboring source could influence the flux for that source.
ArchiveRequirements for source selection in the Archive are less stringent than for the Catalog. Thereforethe Archive is less reliable than the Catalog but more complete. We require M/N ≥ 0.6 in oneband (N ≥ 2) or M/N ≥ 0.4 in any two bands. For a typical source observed two times, thistranslates to a detection twice in one band or once in two bands. The 2MASS Ks magnitude isallowed in the “1+1” criterion. We require that the signal-to-noise be greater than 5 in the bandor bands used for source selection. The lower limit of the signal-to-noise for all bands is 3. Sourcesare removed from the Archive if there are Archive sources within 0.5′′ of the source. There are nofurther culls, leaving it to the user to cull or null based on values of the fluxes and flags (describedin §5.1).
12http://montage.ipac.caltech.edu/
7

4 Source List Validation
We summarize here analysis we use to validate the Catalog and Archive point source lists. TheGLIMPSE Quality Assurance document describes the v1.0 GLIMPSEI data validation in moredetail. Much of it also applies to the GLIMPSEII data.
4.1 False sources
Verification of our source selection criteria (§3.2) was done with a Reliability study of the GLIMPSEIOSV data. See http://www.astro.wisc.edu/glimpse/cr manuscript.pdf (Reliability and Complete-ness for the GLIMPSE Survey), http://www.astro.wisc.edu/glimpse/val.20040130.pdf (ObservationStrategy Validation Report), and http://www.astro.wisc.edu/glimpse/addendum4.pdf (Addendumto the Validation Report). One cause of false sources in the source lists is imperfect muxbleed cor-rection leaving faint point-like sources every four pixels along a row from a bright source in bands1 and 2. We estimate about 90% of the muxbleed has been well corrected by the Bright SourceArtifact Corrector but the muxbleed remaining in the images can cause false sources. Most of themuxbleed sources have signal-to-noise less than 5 and do not make it into the source lists. Very fewfalse sources due to muxbleed are found in high background areas (e.g. in the inner Galaxy). Weestimate that < 0.04% of the Catalog sources may be due to muxbleed. We estimate that < 0.2%of the Archive sources may be due to muxbleed because of our less stringent selection criteria. Thefalse detections due to muxbleed will be in only bands 1 and 2. An instance of false detections inthe Archive occurs in regions surrounding saturated stars where the GLIMPSE source extractormay find false sources in the wings of the PSF. These sources are culled from the Catalog but onlyflagged in the Archive. Our source selection criteria remove the vast majority of other potentialfalse detections, such as cosmic rays and stray light. In addition, our photometry iteration onresidual images reduces false source detections in variable backgrounds caused by both real skyvariations as well as instrumental artifacts such as banding, stray light, muxbleed, and columnpulldown.
4.2 Astrometric Accuracy
Sources bright enough to have 2MASS associations are typically within 0.3′′ of the corresponding2MASS position, as discussed in §5.1. Figure 3 shows a comparison of GLIMPSEII source positionsto the 2MASS PSC positions, in 0.05′′ bins, for a one degree longitude, 4 degrees of latitude areain the GLIMPSEII survey. The peak of the plot is at 0.15′′ and the majority of the sources havepositional differences less than 0.3′′ , similar to the GLIMPSEI v1.0 source lists. See Section VIIof the GQA for a more detailed discussion of positional accuracy.
4.3 Photometric Accuracy
Photometric accuracy was originally verified with simulated images consisting of known point sourcefluxes placed on residual images (IRAC images with point sources removed giving realistic back-grounds). The point source accuracy depends on background level. A table of photometric accuracyas a function of background level is given in the Addendum to the GLIMPSE Validation Report(http://www.astro.wisc.edu/glimpse/addendum4.pdf). For average background levels, the photo-metric accuracy is ≤ 0.2m at magnitudes brighter than ∼ 14,∼ 12,∼ 10.5,∼ 9.0 for bands 1 - 4
8

Figure 3: Comparison of GLIMPSEII source positions to their corresponding 2MASS PSC positionsfrom sources of longitudes between 1 and 2 degrees and latitudes ± 2 degrees. The astrometricdiscrepancy plotted is the angular separation in arcseconds between the GLIMPSEII position andthe 2MASS position.
respectively.
Our goal was to achieve point source photometry accuracy of ≤0.2 mag. Table 2 shows a summaryof the fraction of sources in both the Catalog and Archive that achieve this level. Band 3 showsa higher percentage of sources with photometric accuracy >0.2 mag, most likely due to its lowersensitivity.
9
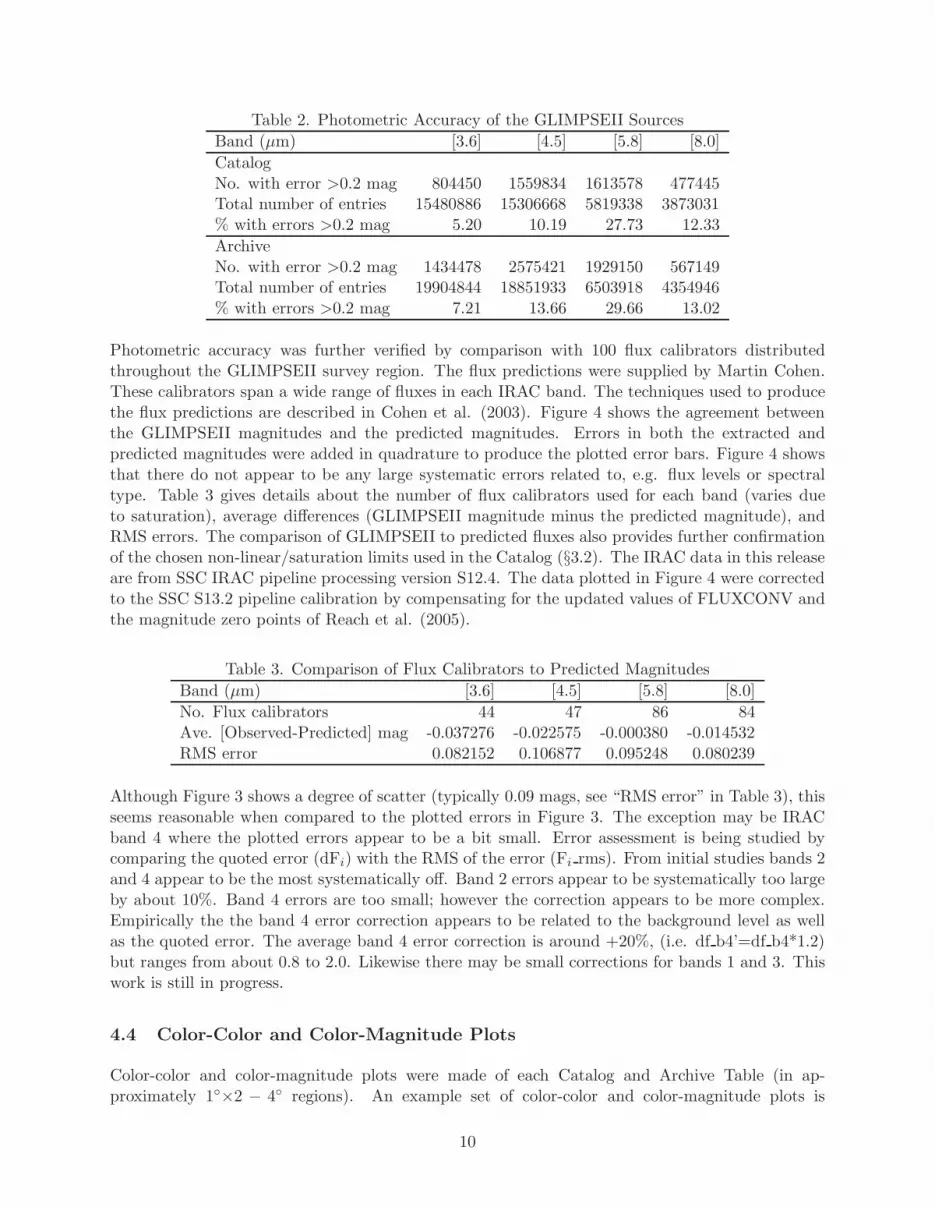
Table 2. Photometric Accuracy of the GLIMPSEII Sources
Band (µm) [3.6] [4.5] [5.8] [8.0]
CatalogNo. with error >0.2 mag 804450 1559834 1613578 477445Total number of entries 15480886 15306668 5819338 3873031% with errors >0.2 mag 5.20 10.19 27.73 12.33
ArchiveNo. with error >0.2 mag 1434478 2575421 1929150 567149Total number of entries 19904844 18851933 6503918 4354946% with errors >0.2 mag 7.21 13.66 29.66 13.02
Photometric accuracy was further verified by comparison with 100 flux calibrators distributedthroughout the GLIMPSEII survey region. The flux predictions were supplied by Martin Cohen.These calibrators span a wide range of fluxes in each IRAC band. The techniques used to producethe flux predictions are described in Cohen et al. (2003). Figure 4 shows the agreement betweenthe GLIMPSEII magnitudes and the predicted magnitudes. Errors in both the extracted andpredicted magnitudes were added in quadrature to produce the plotted error bars. Figure 4 showsthat there do not appear to be any large systematic errors related to, e.g. flux levels or spectraltype. Table 3 gives details about the number of flux calibrators used for each band (varies dueto saturation), average differences (GLIMPSEII magnitude minus the predicted magnitude), andRMS errors. The comparison of GLIMPSEII to predicted fluxes also provides further confirmationof the chosen non-linear/saturation limits used in the Catalog (§3.2). The IRAC data in this releaseare from SSC IRAC pipeline processing version S12.4. The data plotted in Figure 4 were correctedto the SSC S13.2 pipeline calibration by compensating for the updated values of FLUXCONV andthe magnitude zero points of Reach et al. (2005).
Table 3. Comparison of Flux Calibrators to Predicted Magnitudes
Band (µm) [3.6] [4.5] [5.8] [8.0]
No. Flux calibrators 44 47 86 84Ave. [Observed-Predicted] mag -0.037276 -0.022575 -0.000380 -0.014532RMS error 0.082152 0.106877 0.095248 0.080239
Although Figure 3 shows a degree of scatter (typically 0.09 mags, see “RMS error” in Table 3), thisseems reasonable when compared to the plotted errors in Figure 3. The exception may be IRACband 4 where the plotted errors appear to be a bit small. Error assessment is being studied bycomparing the quoted error (dFi) with the RMS of the error (Fi rms). From initial studies bands 2and 4 appear to be the most systematically off. Band 2 errors appear to be systematically too largeby about 10%. Band 4 errors are too small; however the correction appears to be more complex.Empirically the the band 4 error correction appears to be related to the background level as wellas the quoted error. The average band 4 error correction is around +20%, (i.e. df b4’=df b4*1.2)but ranges from about 0.8 to 2.0. Likewise there may be small corrections for bands 1 and 3. Thiswork is still in progress.
4.4 Color-Color and Color-Magnitude Plots
Color-color and color-magnitude plots were made of each Catalog and Archive Table (in ap-proximately 1◦×2 − 4◦ regions). An example set of color-color and color-magnitude plots is
10
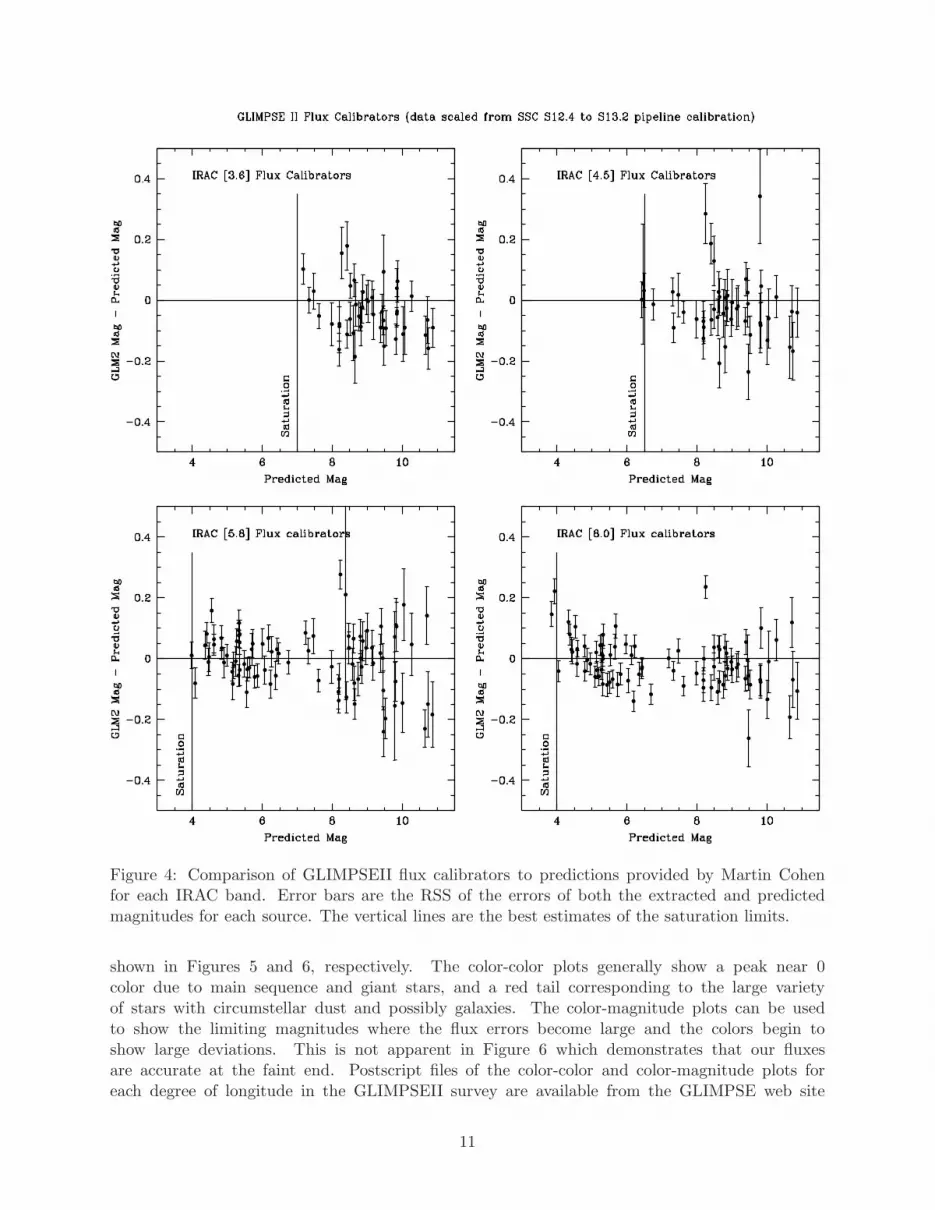
Figure 4: Comparison of GLIMPSEII flux calibrators to predictions provided by Martin Cohenfor each IRAC band. Error bars are the RSS of the errors of both the extracted and predictedmagnitudes for each source. The vertical lines are the best estimates of the saturation limits.
shown in Figures 5 and 6, respectively. The color-color plots generally show a peak near 0color due to main sequence and giant stars, and a red tail corresponding to the large varietyof stars with circumstellar dust and possibly galaxies. The color-magnitude plots can be usedto show the limiting magnitudes where the flux errors become large and the colors begin toshow large deviations. This is not apparent in Figure 6 which demonstrates that our fluxesare accurate at the faint end. Postscript files of the color-color and color-magnitude plots foreach degree of longitude in the GLIMPSEII survey are available from the GLIMPSE web site
11
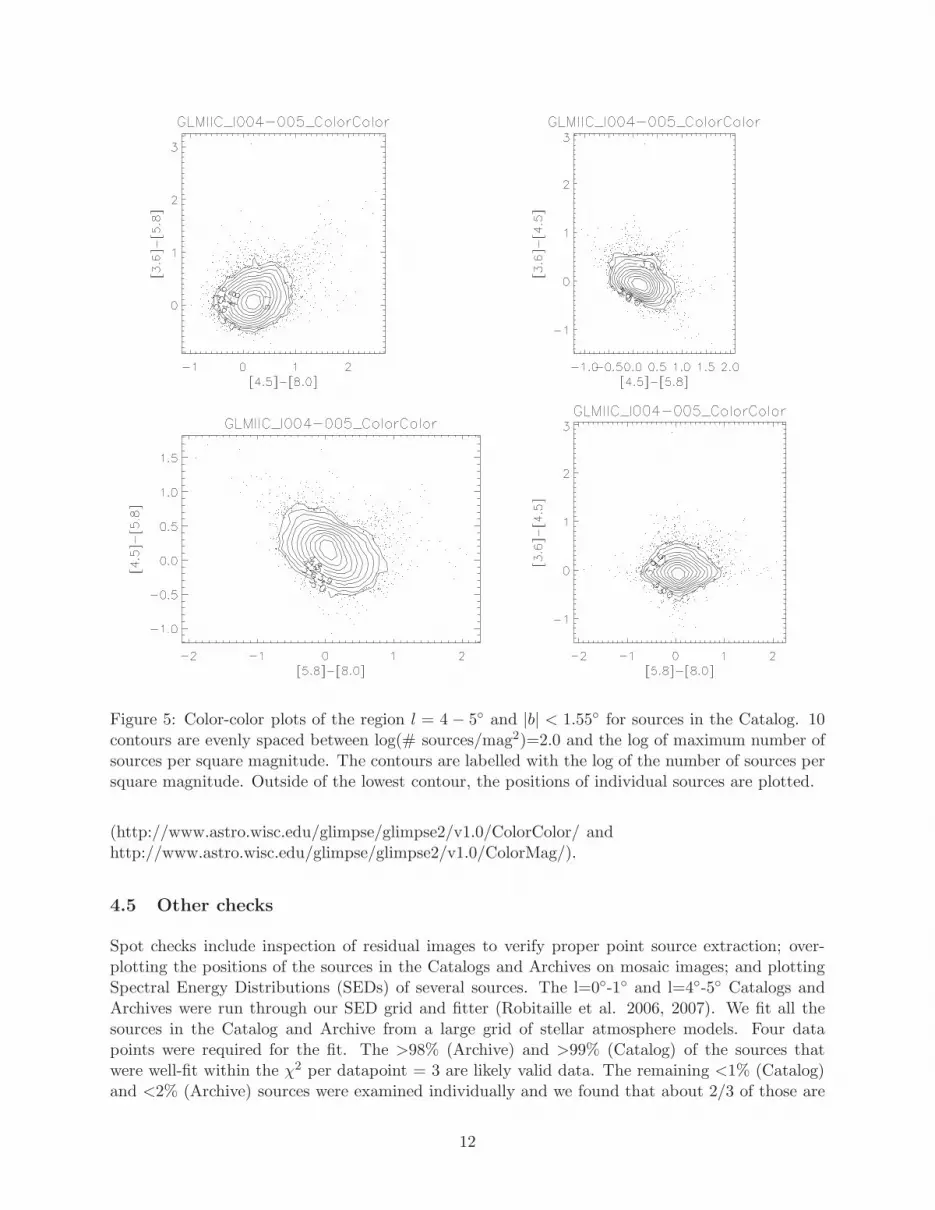
Figure 5: Color-color plots of the region l = 4 − 5◦ and |b| < 1.55◦ for sources in the Catalog. 10contours are evenly spaced between log(# sources/mag2)=2.0 and the log of maximum number ofsources per square magnitude. The contours are labelled with the log of the number of sources persquare magnitude. Outside of the lowest contour, the positions of individual sources are plotted.
(http://www.astro.wisc.edu/glimpse/glimpse2/v1.0/ColorColor/ andhttp://www.astro.wisc.edu/glimpse/glimpse2/v1.0/ColorMag/).
4.5 Other checks
Spot checks include inspection of residual images to verify proper point source extraction; over-plotting the positions of the sources in the Catalogs and Archives on mosaic images; and plottingSpectral Energy Distributions (SEDs) of several sources. The l=0◦-1◦ and l=4◦-5◦ Catalogs andArchives were run through our SED grid and fitter (Robitaille et al. 2006, 2007). We fit all thesources in the Catalog and Archive from a large grid of stellar atmosphere models. Four datapoints were required for the fit. The >98% (Archive) and >99% (Catalog) of the sources thatwere well-fit within the χ2 per datapoint = 3 are likely valid data. The remaining <1% (Catalog)and <2% (Archive) sources were examined individually and we found that about 2/3 of those are
12
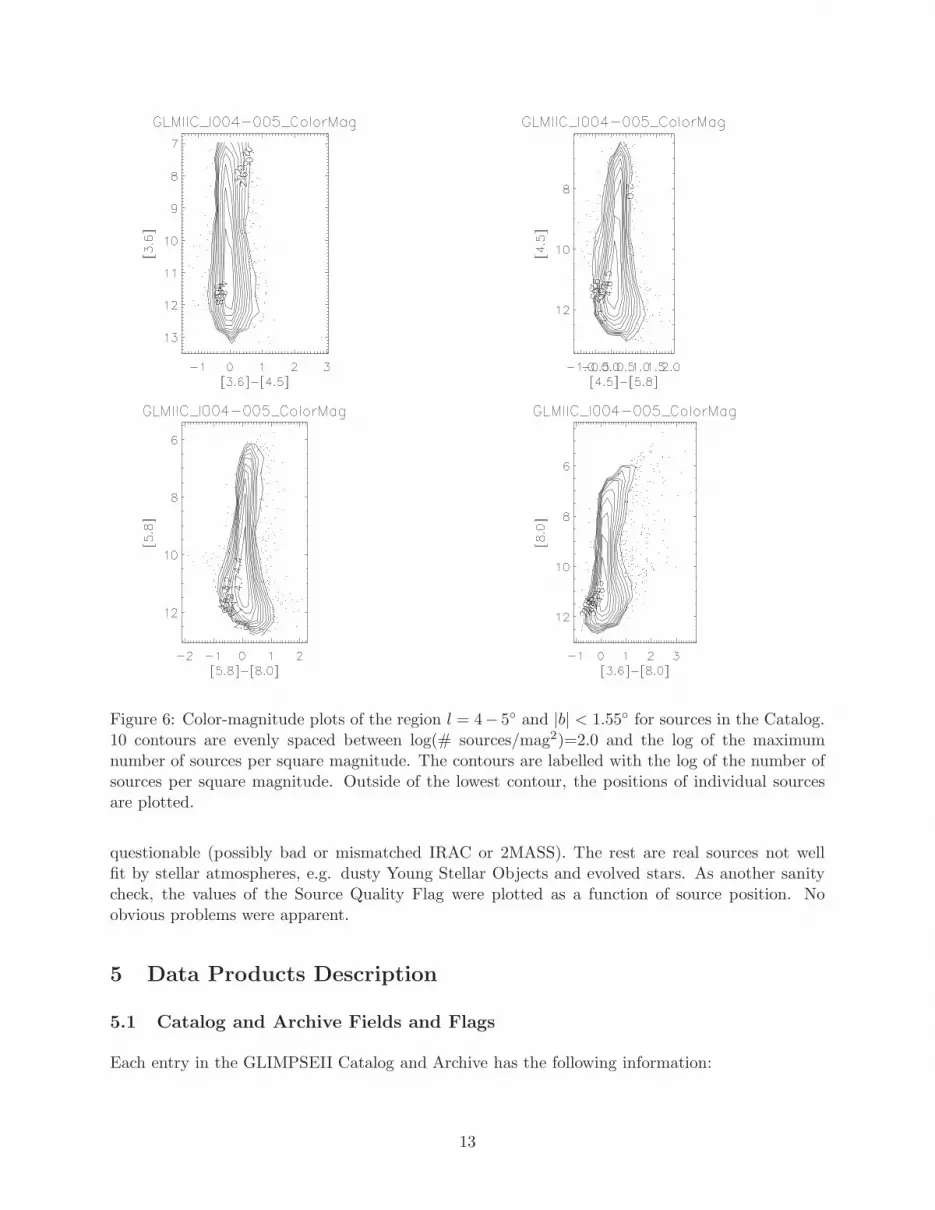
Figure 6: Color-magnitude plots of the region l = 4− 5◦ and |b| < 1.55◦ for sources in the Catalog.10 contours are evenly spaced between log(# sources/mag2)=2.0 and the log of the maximumnumber of sources per square magnitude. The contours are labelled with the log of the number ofsources per square magnitude. Outside of the lowest contour, the positions of individual sourcesare plotted.
questionable (possibly bad or mismatched IRAC or 2MASS). The rest are real sources not wellfit by stellar atmospheres, e.g. dusty Young Stellar Objects and evolved stars. As another sanitycheck, the values of the Source Quality Flag were plotted as a function of source position. Noobvious problems were apparent.
5 Data Products Description
5.1 Catalog and Archive Fields and Flags
Each entry in the GLIMPSEII Catalog and Archive has the following information:
13
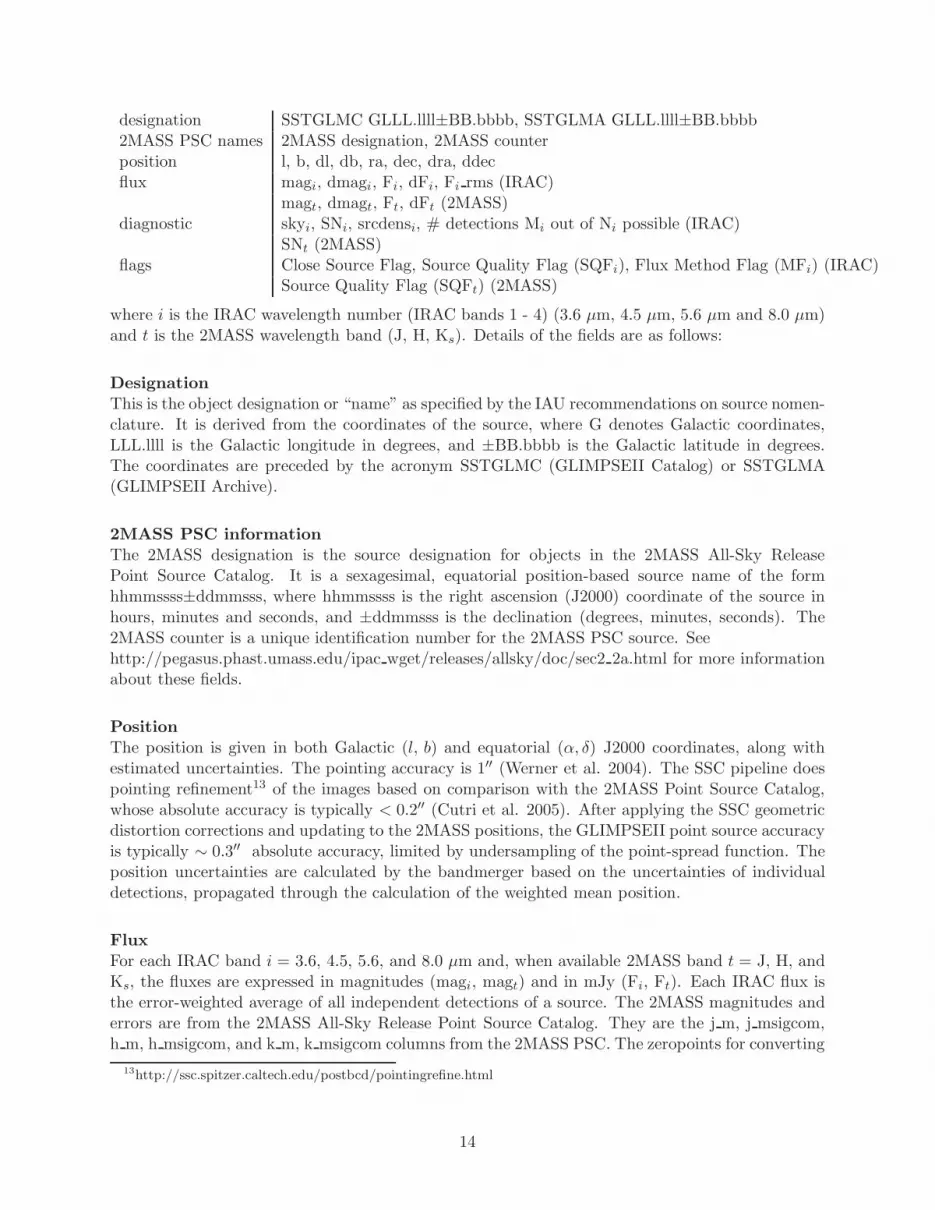
designation SSTGLMC GLLL.llll±BB.bbbb, SSTGLMA GLLL.llll±BB.bbbb2MASS PSC names 2MASS designation, 2MASS counterposition l, b, dl, db, ra, dec, dra, ddecflux magi, dmagi, Fi, dFi, Fi rms (IRAC)
magt, dmagt, Ft, dFt (2MASS)diagnostic skyi, SNi, srcdensi, # detections Mi out of Ni possible (IRAC)
SNt (2MASS)flags Close Source Flag, Source Quality Flag (SQFi), Flux Method Flag (MFi) (IRAC)
Source Quality Flag (SQFt) (2MASS)
where i is the IRAC wavelength number (IRAC bands 1 - 4) (3.6 µm, 4.5 µm, 5.6 µm and 8.0 µm)and t is the 2MASS wavelength band (J, H, Ks). Details of the fields are as follows:
DesignationThis is the object designation or “name” as specified by the IAU recommendations on source nomen-clature. It is derived from the coordinates of the source, where G denotes Galactic coordinates,LLL.llll is the Galactic longitude in degrees, and ±BB.bbbb is the Galactic latitude in degrees.The coordinates are preceded by the acronym SSTGLMC (GLIMPSEII Catalog) or SSTGLMA(GLIMPSEII Archive).
2MASS PSC informationThe 2MASS designation is the source designation for objects in the 2MASS All-Sky ReleasePoint Source Catalog. It is a sexagesimal, equatorial position-based source name of the formhhmmssss±ddmmsss, where hhmmssss is the right ascension (J2000) coordinate of the source inhours, minutes and seconds, and ±ddmmsss is the declination (degrees, minutes, seconds). The2MASS counter is a unique identification number for the 2MASS PSC source. Seehttp://pegasus.phast.umass.edu/ipac wget/releases/allsky/doc/sec2 2a.html for more informationabout these fields.
PositionThe position is given in both Galactic (l, b) and equatorial (α, δ) J2000 coordinates, along withestimated uncertainties. The pointing accuracy is 1′′ (Werner et al. 2004). The SSC pipeline doespointing refinement13 of the images based on comparison with the 2MASS Point Source Catalog,whose absolute accuracy is typically < 0.2′′ (Cutri et al. 2005). After applying the SSC geometricdistortion corrections and updating to the 2MASS positions, the GLIMPSEII point source accuracyis typically ∼ 0.3′′ absolute accuracy, limited by undersampling of the point-spread function. Theposition uncertainties are calculated by the bandmerger based on the uncertainties of individualdetections, propagated through the calculation of the weighted mean position.
FluxFor each IRAC band i = 3.6, 4.5, 5.6, and 8.0 µm and, when available 2MASS band t = J, H, andKs, the fluxes are expressed in magnitudes (magi, magt) and in mJy (Fi, Ft). Each IRAC flux isthe error-weighted average of all independent detections of a source. The 2MASS magnitudes anderrors are from the 2MASS All-Sky Release Point Source Catalog. They are the j m, j msigcom,h m, h msigcom, and k m, k msigcom columns from the 2MASS PSC. The zeropoints for converting
13http://ssc.spitzer.caltech.edu/postbcd/pointingrefine.html
14
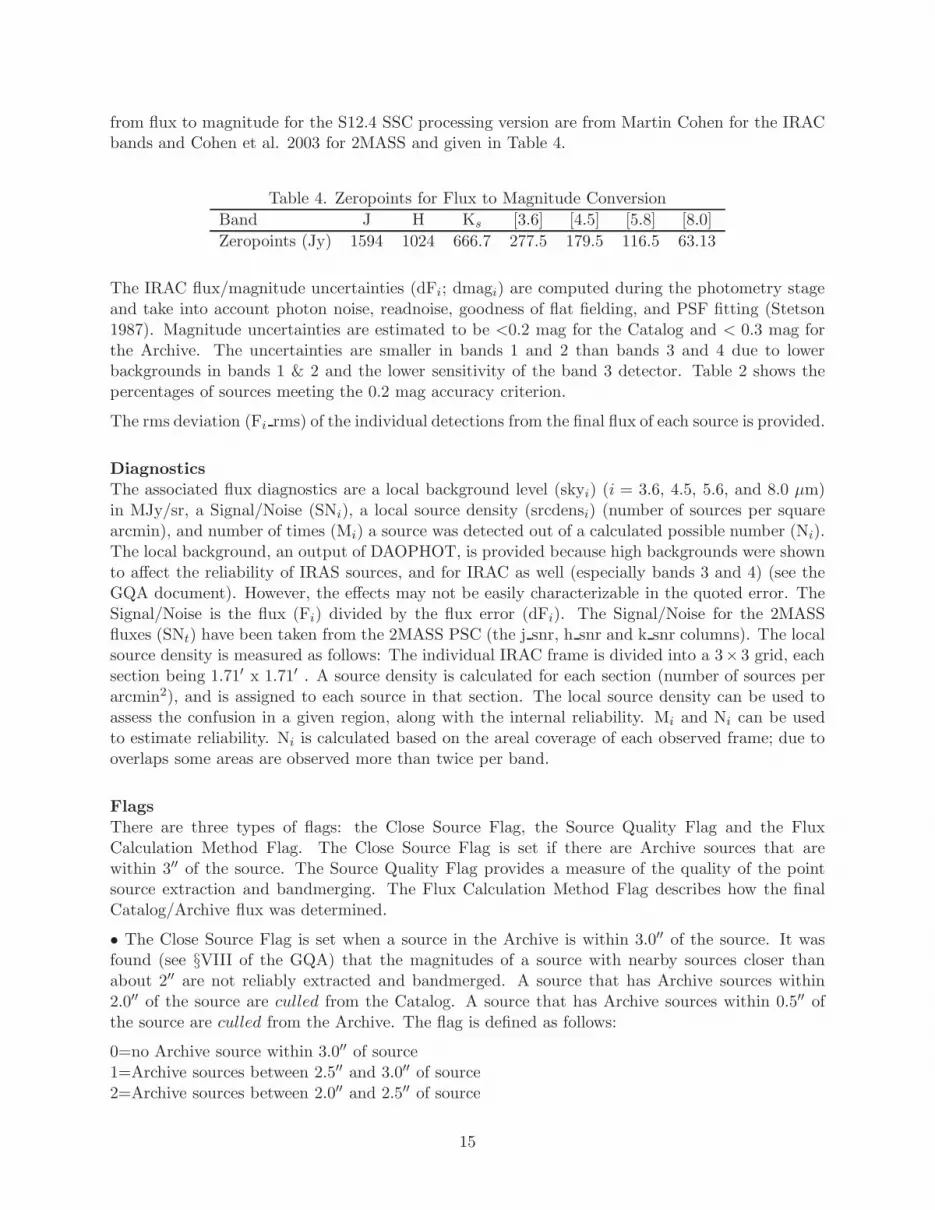
from flux to magnitude for the S12.4 SSC processing version are from Martin Cohen for the IRACbands and Cohen et al. 2003 for 2MASS and given in Table 4.
Table 4. Zeropoints for Flux to Magnitude Conversion
Band J H Ks [3.6] [4.5] [5.8] [8.0]
Zeropoints (Jy) 1594 1024 666.7 277.5 179.5 116.5 63.13
The IRAC flux/magnitude uncertainties (dFi; dmagi) are computed during the photometry stageand take into account photon noise, readnoise, goodness of flat fielding, and PSF fitting (Stetson1987). Magnitude uncertainties are estimated to be <0.2 mag for the Catalog and < 0.3 mag forthe Archive. The uncertainties are smaller in bands 1 and 2 than bands 3 and 4 due to lowerbackgrounds in bands 1 & 2 and the lower sensitivity of the band 3 detector. Table 2 shows thepercentages of sources meeting the 0.2 mag accuracy criterion.
The rms deviation (Fi rms) of the individual detections from the final flux of each source is provided.
DiagnosticsThe associated flux diagnostics are a local background level (skyi) (i = 3.6, 4.5, 5.6, and 8.0 µm)in MJy/sr, a Signal/Noise (SNi), a local source density (srcdensi) (number of sources per squarearcmin), and number of times (Mi) a source was detected out of a calculated possible number (Ni).The local background, an output of DAOPHOT, is provided because high backgrounds were shownto affect the reliability of IRAS sources, and for IRAC as well (especially bands 3 and 4) (see theGQA document). However, the effects may not be easily characterizable in the quoted error. TheSignal/Noise is the flux (Fi) divided by the flux error (dFi). The Signal/Noise for the 2MASSfluxes (SNt) have been taken from the 2MASS PSC (the j snr, h snr and k snr columns). The localsource density is measured as follows: The individual IRAC frame is divided into a 3× 3 grid, eachsection being 1.71′ x 1.71′ . A source density is calculated for each section (number of sources perarcmin2), and is assigned to each source in that section. The local source density can be used toassess the confusion in a given region, along with the internal reliability. Mi and Ni can be usedto estimate reliability. Ni is calculated based on the areal coverage of each observed frame; due tooverlaps some areas are observed more than twice per band.
FlagsThere are three types of flags: the Close Source Flag, the Source Quality Flag and the FluxCalculation Method Flag. The Close Source Flag is set if there are Archive sources that arewithin 3′′ of the source. The Source Quality Flag provides a measure of the quality of the pointsource extraction and bandmerging. The Flux Calculation Method Flag describes how the finalCatalog/Archive flux was determined.
• The Close Source Flag is set when a source in the Archive is within 3.0′′ of the source. It wasfound (see §VIII of the GQA) that the magnitudes of a source with nearby sources closer thanabout 2′′ are not reliably extracted and bandmerged. A source that has Archive sources within2.0′′ of the source are culled from the Catalog. A source that has Archive sources within 0.5′′ ofthe source are culled from the Archive. The flag is defined as follows:
0=no Archive source within 3.0′′ of source1=Archive sources between 2.5′′ and 3.0′′ of source2=Archive sources between 2.0′′ and 2.5′′ of source
15

3=Archive sources between 1.5′′ and 2.0′′ of source4=Archive sources between 1.0′′ and 1.5′′ of source5=Archive sources between 0.5′′ and 1.0′′ of source6=Archive sources within 0.5′′ of source
• The Source Quality Flag (SQF) is generated from SSC-provided masks and the GLIMPSEpipeline, after point source extraction on individual IRAC frames. Each source quality flag isa binary number allowing combinations of flags (bits) in the same number. Flags are set if anartifact (e.g., a hot or dead pixel) occurs near the core of a source - i.e. within ∼3 pixels. Anon-zero SQF will in most cases decrease the reliability of the source. Some of the bits, such as theDAOPHOT tweaks, will not compromise the source’s reliability, and has likely increased the errorassigned to the source flux. If just one of the IRAC detections has the condition requiring a bitto be set in the SQF, then the bit is set even if the other detections did not have this condition.Sources with hot or dead pixels within 3 pixels of source center (bit 8), those in wings of saturatedstars (bit 20), and those within 3 pixels of the frame edge (bit 30) are culled from the Catalog. Weare continuing to study the effects of various SQF bits on data quality.
Table 5 shows the SQF sequence for the January 2007 v1.0 GLIMPSEII data release. The stray lightflag has not been implemented, but will be in future data releases. We have determined that falsesources from such regions do not make it into the Catalog due to our 2+1 source selection criterion(§3.2). In addition, our photometry algorithm has been modified substantially to find sources inhigh background regions that gives it the ability to find sources in stray light and banded regionsas well, increasing the photometric uncertainties accordingly.
The value of the SQF is∑
2(bit−1). For example, a source with bits 1 and 4 set will have SQF =20 + 23 = 9. If the SQF is 0, the source has no detected problems. More information about theseflags and a bit value key can be found in Appendix A.
16
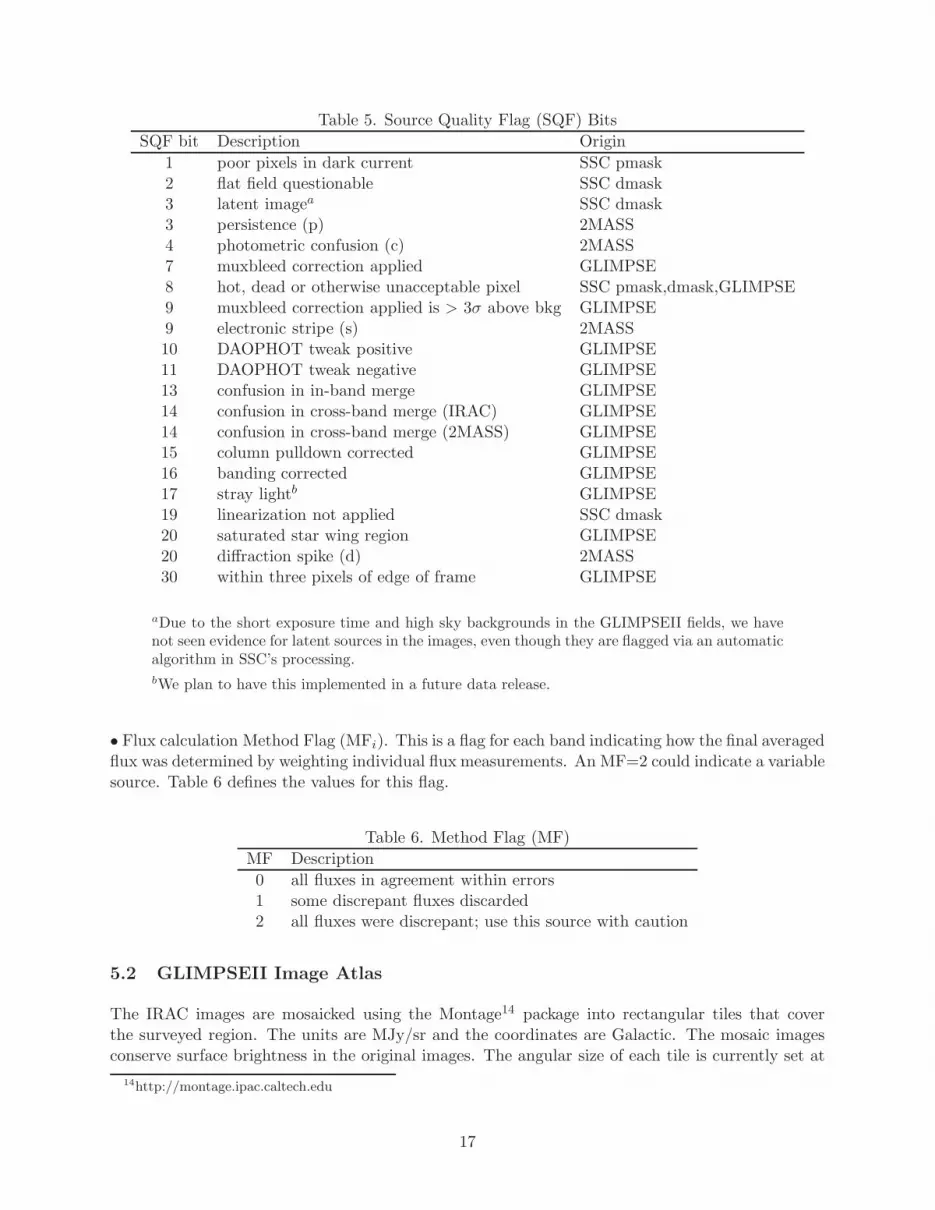
Table 5. Source Quality Flag (SQF) Bits
SQF bit Description Origin
1 poor pixels in dark current SSC pmask2 flat field questionable SSC dmask3 latent imagea SSC dmask3 persistence (p) 2MASS4 photometric confusion (c) 2MASS7 muxbleed correction applied GLIMPSE8 hot, dead or otherwise unacceptable pixel SSC pmask,dmask,GLIMPSE9 muxbleed correction applied is > 3σ above bkg GLIMPSE9 electronic stripe (s) 2MASS10 DAOPHOT tweak positive GLIMPSE11 DAOPHOT tweak negative GLIMPSE13 confusion in in-band merge GLIMPSE14 confusion in cross-band merge (IRAC) GLIMPSE14 confusion in cross-band merge (2MASS) GLIMPSE15 column pulldown corrected GLIMPSE16 banding corrected GLIMPSE17 stray lightb GLIMPSE19 linearization not applied SSC dmask20 saturated star wing region GLIMPSE20 diffraction spike (d) 2MASS30 within three pixels of edge of frame GLIMPSE
aDue to the short exposure time and high sky backgrounds in the GLIMPSEII fields, we havenot seen evidence for latent sources in the images, even though they are flagged via an automaticalgorithm in SSC’s processing.
bWe plan to have this implemented in a future data release.
• Flux calculation Method Flag (MFi). This is a flag for each band indicating how the final averagedflux was determined by weighting individual flux measurements. An MF=2 could indicate a variablesource. Table 6 defines the values for this flag.
Table 6. Method Flag (MF)
MF Description
0 all fluxes in agreement within errors1 some discrepant fluxes discarded2 all fluxes were discrepant; use this source with caution
5.2 GLIMPSEII Image Atlas
The IRAC images are mosaicked using the Montage14 package into rectangular tiles that coverthe surveyed region. The units are MJy/sr and the coordinates are Galactic. The mosaic imagesconserve surface brightness in the original images. The angular size of each tile is currently set at
14http://montage.ipac.caltech.edu
17
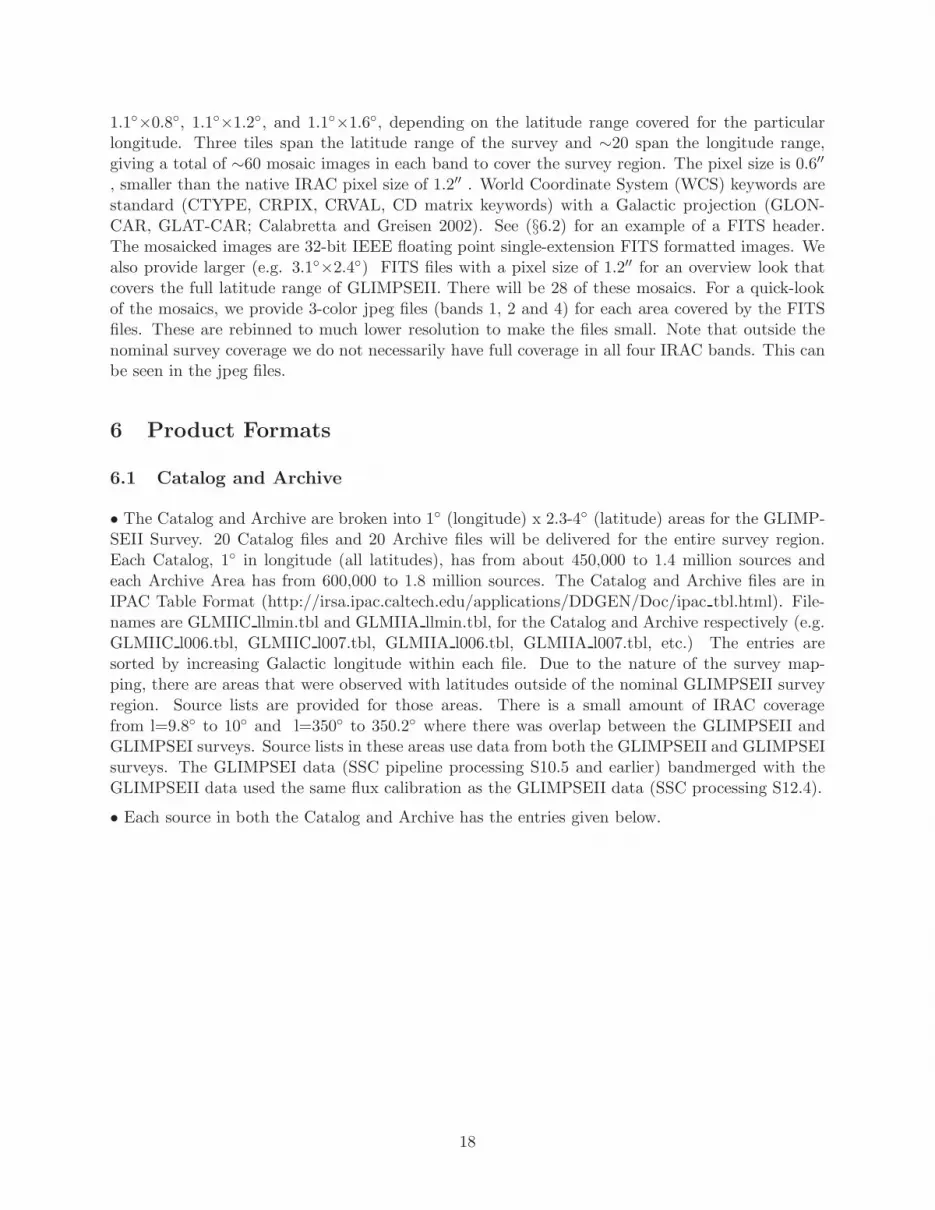
1.1◦×0.8◦, 1.1◦×1.2◦, and 1.1◦×1.6◦, depending on the latitude range covered for the particularlongitude. Three tiles span the latitude range of the survey and ∼20 span the longitude range,giving a total of ∼60 mosaic images in each band to cover the survey region. The pixel size is 0.6′′
, smaller than the native IRAC pixel size of 1.2′′ . World Coordinate System (WCS) keywords arestandard (CTYPE, CRPIX, CRVAL, CD matrix keywords) with a Galactic projection (GLON-CAR, GLAT-CAR; Calabretta and Greisen 2002). See (§6.2) for an example of a FITS header.The mosaicked images are 32-bit IEEE floating point single-extension FITS formatted images. Wealso provide larger (e.g. 3.1◦×2.4◦) FITS files with a pixel size of 1.2′′ for an overview look thatcovers the full latitude range of GLIMPSEII. There will be 28 of these mosaics. For a quick-lookof the mosaics, we provide 3-color jpeg files (bands 1, 2 and 4) for each area covered by the FITSfiles. These are rebinned to much lower resolution to make the files small. Note that outside thenominal survey coverage we do not necessarily have full coverage in all four IRAC bands. This canbe seen in the jpeg files.
6 Product Formats
6.1 Catalog and Archive
• The Catalog and Archive are broken into 1◦ (longitude) x 2.3-4◦ (latitude) areas for the GLIMP-SEII Survey. 20 Catalog files and 20 Archive files will be delivered for the entire survey region.Each Catalog, 1◦ in longitude (all latitudes), has from about 450,000 to 1.4 million sources andeach Archive Area has from 600,000 to 1.8 million sources. The Catalog and Archive files are inIPAC Table Format (http://irsa.ipac.caltech.edu/applications/DDGEN/Doc/ipac tbl.html). File-names are GLMIIC llmin.tbl and GLMIIA llmin.tbl, for the Catalog and Archive respectively (e.g.GLMIIC l006.tbl, GLMIIC l007.tbl, GLMIIA l006.tbl, GLMIIA l007.tbl, etc.) The entries aresorted by increasing Galactic longitude within each file. Due to the nature of the survey map-ping, there are areas that were observed with latitudes outside of the nominal GLIMPSEII surveyregion. Source lists are provided for those areas. There is a small amount of IRAC coveragefrom l=9.8◦ to 10◦ and l=350◦ to 350.2◦ where there was overlap between the GLIMPSEII andGLIMPSEI surveys. Source lists in these areas use data from both the GLIMPSEII and GLIMPSEIsurveys. The GLIMPSEI data (SSC pipeline processing S10.5 and earlier) bandmerged with theGLIMPSEII data used the same flux calibration as the GLIMPSEII data (SSC processing S12.4).
• Each source in both the Catalog and Archive has the entries given below.
18
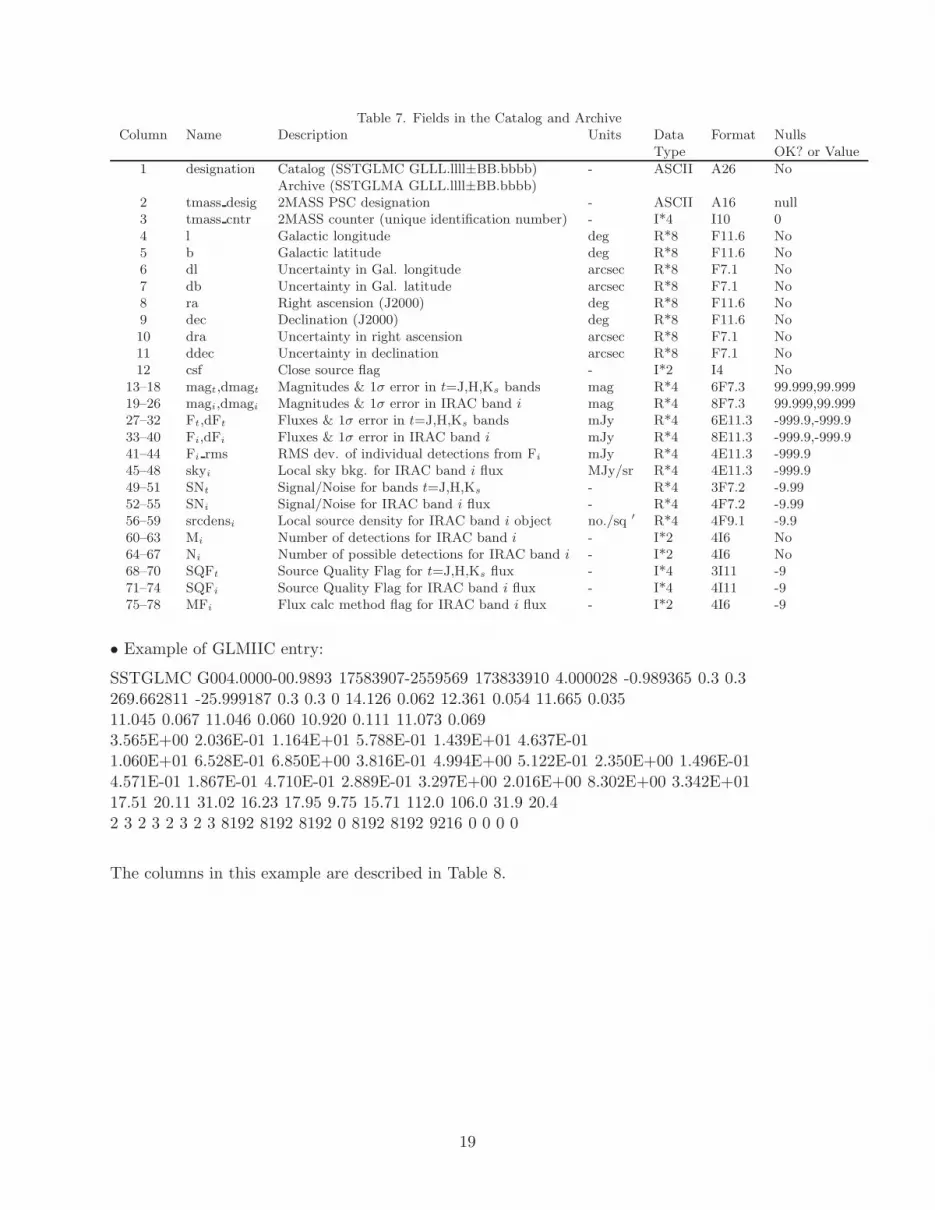
Table 7. Fields in the Catalog and ArchiveColumn Name Description Units Data Format Nulls
Type OK? or Value
1 designation Catalog (SSTGLMC GLLL.llll±BB.bbbb) - ASCII A26 NoArchive (SSTGLMA GLLL.llll±BB.bbbb)
2 tmass desig 2MASS PSC designation - ASCII A16 null3 tmass cntr 2MASS counter (unique identification number) - I*4 I10 04 l Galactic longitude deg R*8 F11.6 No5 b Galactic latitude deg R*8 F11.6 No6 dl Uncertainty in Gal. longitude arcsec R*8 F7.1 No7 db Uncertainty in Gal. latitude arcsec R*8 F7.1 No8 ra Right ascension (J2000) deg R*8 F11.6 No9 dec Declination (J2000) deg R*8 F11.6 No10 dra Uncertainty in right ascension arcsec R*8 F7.1 No11 ddec Uncertainty in declination arcsec R*8 F7.1 No12 csf Close source flag - I*2 I4 No
13–18 magt,dmagt Magnitudes & 1σ error in t=J,H,Ks bands mag R*4 6F7.3 99.999,99.99919–26 magi,dmagi Magnitudes & 1σ error in IRAC band i mag R*4 8F7.3 99.999,99.99927–32 Ft,dFt Fluxes & 1σ error in t=J,H,Ks bands mJy R*4 6E11.3 -999.9,-999.933–40 Fi,dFi Fluxes & 1σ error in IRAC band i mJy R*4 8E11.3 -999.9,-999.941–44 Fi rms RMS dev. of individual detections from Fi mJy R*4 4E11.3 -999.945–48 skyi Local sky bkg. for IRAC band i flux MJy/sr R*4 4E11.3 -999.949–51 SNt Signal/Noise for bands t=J,H,Ks - R*4 3F7.2 -9.9952–55 SNi Signal/Noise for IRAC band i flux - R*4 4F7.2 -9.9956–59 srcdensi Local source density for IRAC band i object no./sq ′ R*4 4F9.1 -9.960–63 Mi Number of detections for IRAC band i - I*2 4I6 No64–67 Ni Number of possible detections for IRAC band i - I*2 4I6 No68–70 SQFt Source Quality Flag for t=J,H,Ks flux - I*4 3I11 -971–74 SQFi Source Quality Flag for IRAC band i flux - I*4 4I11 -975–78 MFi Flux calc method flag for IRAC band i flux - I*2 4I6 -9
• Example of GLMIIC entry:
SSTGLMC G004.0000-00.9893 17583907-2559569 173833910 4.000028 -0.989365 0.3 0.3269.662811 -25.999187 0.3 0.3 0 14.126 0.062 12.361 0.054 11.665 0.03511.045 0.067 11.046 0.060 10.920 0.111 11.073 0.0693.565E+00 2.036E-01 1.164E+01 5.788E-01 1.439E+01 4.637E-011.060E+01 6.528E-01 6.850E+00 3.816E-01 4.994E+00 5.122E-01 2.350E+00 1.496E-014.571E-01 1.867E-01 4.710E-01 2.889E-01 3.297E+00 2.016E+00 8.302E+00 3.342E+0117.51 20.11 31.02 16.23 17.95 9.75 15.71 112.0 106.0 31.9 20.42 3 2 3 2 3 2 3 8192 8192 8192 0 8192 8192 9216 0 0 0 0
The columns in this example are described in Table 8.
19

Table 8. Example of Catalog/Archive Entry
designation SSTGLMC G004.0000-00.9893 Nametmass desig 17583907-2559569 2MASS designationtmass cntr 173833910 2MASS counterl,b 4.000028 -0.989365 Galactic Coordinates (deg)dl,db 0.3 0.3 Uncertainty in Gal. Coordinates (arcsec)ra,dec 269.662811 -25.999187 RA and Dec (J2000.0) (deg)dra,ddec 0.3 0.3 Uncertainty in RA and Dec (arcsec)csf 0 Close source flagmag,dmag 14.126 12.361 11.665 Magnitudes (2MASS J,H,Ks) (mag)
0.062 0.054 0.035 Uncertainties (2MASS) (mag)mag,dmag 11.045 11.046 10.920 11.073 Magnitudes (IRAC bands 1-4) (mag)
0.067 0.060 0.111 0.069 Uncertainties (IRAC) (mag)F,dF 3.565E+00 1.164E+01 1.439E+01 2MASS Fluxes (mJy)
2.036E-01 5.788E-01 4.637E-01 Uncertainties in 2MASS fluxes (mJy)F,dF 1.060E+01 6.850E+00 4.994E+00 2.350E+00 IRAC Fluxes (mJy)
6.528E-01 3.816E-01 5.122E-01 1.496E-01 Uncertainties in IRAC fluxes (mJy)F rms 4.571E-01 1.867E-01 4.710E-01 2.889E-01 RMS flux (mJy) (IRAC)sky 3.297E+00 2.016E+00 8.302E+00 3.342E+01 Sky Bkg (MJy/sr) (IRAC)SN 17.51 20.11 31.02 Signal to Noise (2MASS)SN 16.23 17.95 9.75 15.71 Signal to Noise (IRAC)srcdens 112.0 106.0 31.9 20.4 Local Source Density (IRAC) (#/sq arcmin)M 2 3 2 3 Number of detections (IRAC)N 2 3 2 3 Number of possible detections (IRAC)SQF 8192 8192 8192 Source Quality Flag (2MASS)SQF 0 8192 8192 9216 Source Quality Flag (IRAC)MF 0 0 0 0 Flux Calculation Method Flag (IRAC)
6.2 GLIMPSEII Image Atlas
The mosaicked images for each IRAC band are standard 32-bit IEEE floating point single-extensionFITS files in Galactic coordinates. Pixels that have no flux estimate have the value NaN. The FITSheaders contain relevant information from both the SSC pipeline processing and the GLIMPSEIIprocessing such as IRAC frames included in the mosaicked image and coordinate information.
The mosaic images are each 1.1◦x 0.8◦, 1.1◦x 1.2◦, and 1.1◦x 1.6◦, depending on the latitudecoverage, with 0.6′′ pixels. The 1.1◦x 0.8◦ mosaics are 128 Megabytes in size. The 1.1◦x 1.2◦ mosaicsare 192 Megabytes in size and the 1.1◦x 1.6◦ mosaics are 255 MB. There are three mosaics per onedegree galactic longitude interval with 0.05◦ overlap in longitude between mosaics. For example,for the Galactic longitude of 8◦, the centers of the three mosaics will be (8.5◦, +0.75◦), (8.5◦,0.0◦), and (8.5◦, -0.75◦). The longitude range is 7.95◦ to 9.05◦ for each of the three mosaics.The latitude ranges are 0.35◦ to 1.15◦, -0.40◦ to +0.40◦, and -1.15◦ to -0.35◦, also overlappingby 0.05◦. Filenames are GLM lcbc mosaic Ich.fits, where lc and bc are the Galactic longitude andlatitude of the center of the mosaic image, I denotes IRAC, and ch is the IRAC channel number.For example, GLM 00850+0075 mosaic I1.fits is a 1.1◦x 0.8◦ IRAC channel 1 mosaic centered onl=8.50◦, b=0.75◦. We provide low-resolution 3-color jpeg images for each area, combining bands1, 2, and 4 to be used for quick-look purposes. The filename for this jpeg file is similar to themosaic FITS file: e.g. GLM 00850+0000.jpg We also provide larger (e.g. 3.1◦x 2.4◦ & 3.1◦x 3.45◦)mosaic FITS files (1.2′′ pixels) for each band, along with low resolution 3-color jpegs. Each 3.1◦x2.4◦ mosaic is about 269 Megabytes in size. The 3.1◦x 3.45◦ mosaic is 388 Megabytes in size. Thefilenames are similar to the other FITS and jpeg images: e.g. GLM 00900+0000 mosaic I1.fits,GLM 00900+0000 3x2.jpg.
Here is an example of the FITS header for a 1.1◦x 0.8◦ file, GLM 00850+0000 mosaic I1.fits:
20

SIMPLE = T / file does conform to FITS standard
BITPIX = -32 / number of bits per data pixel
NAXIS = 2 / number of data axes
NAXIS1 = 6640 / length of data axis 1
NAXIS2 = 4840 / length of data axis 2
COMMENT FITS (Flexible Image Transport System) format is defined in ’Astronomy
COMMENT and Astrophysics’, volume 376, page 359; bibcode: 2001A&A...376..359H
TELESCOP= ’SPITZER ’ / Telescope
INSTRUME= ’IRAC ’ / Instrument ID
ORIGIN = ’UW Astronomy Dept’ / Installation where FITS file written
CREATOR = ’GLIMPSE Pipeline’ / SW that created this FITS file
CREATOR1= ’S12.4.0 ’ / SSC pipeline that created the BCD
PIPEVERS= ’1v04 ’ / GLIMPSE pipeline version
MOSAICER= ’Montage V2.2’ / SW that originally created the Mosaic Image
FILENAME= ’GLM_00850+0000_mosaic_I1.fits’ / Name of this file
PROJECT = ’GLIMPSEIIA’ / Project ID
FILETYPE= ’mosaic ’ / Calibrated image(mosaic)/residual image(resid)
CHNLNUM = 1 / 1 digit Instrument Channel Number
DATE = ’2006-11-06T18:33:32’ / file creation date (YYYY-MM-DDThh:mm:ss UTC)
COMMENT --------------------
COMMENT Proposal Information
COMMENT --------------------
OBSRVR = ’Ed Churchwell’ / Observer Name
OBSRVRID= 90 / Observer ID of Principal Investigator
PROCYCLE= 5 / Proposal Cycle
PROGID = 20201 / Program ID
PROTITLE= ’GLIMPSE II: Imaging the Centra’ / Program Title
PROGCAT = 30 / Program Category
COMMENT -----------------------------
COMMENT Time and Exposure Information
COMMENT -----------------------------
SAMPTIME= 0.2 / [sec] Sample integration time
FRAMTIME= 2.0 / [sec] Time spent integrating (whole array)
EXPTIME = 1.2 / [sec] Effective integration time per pixel
COMMENT DN per pixel=flux(photons/sec/pixel)/gain*EXPTIME
AFOWLNUM= 4 / Fowler number
COMMENT --------------------
COMMENT Pointing Information
COMMENT --------------------
CRPIX1 = 3320.5000 / Reference pixel for x-position
CRPIX2 = 2420.5000 / Reference pixel for y-position
CTYPE1 = ’GLON-CAR’ / Projection Type
CTYPE2 = ’GLAT-CAR’ / Projection Type
CRVAL1 = 8.50000000 / [Deg] Galactic Longtitude at reference pixel
CRVAL2 = 0.00000000 / [Deg] Galactic Latitude at reference pixel
EQUINOX = 2000.0 / Equinox for celestial coordinate system
DELTA-X = 1.10666668 / [Deg] size of image in axis 1
21

DELTA-Y = 0.80666667 / [Deg] size of image in axis 2
BORDER = 0.00333333 / [Deg] mosaic grid border
CD1_1 = -1.66666665E-04
CD1_2 = 0.00000000E+00
CD2_1 = 0.00000000E+00
CD2_2 = 1.66666665E-04
PIXSCAL1= 0.600 / [arcsec/pixel] pixel scale for axis 1
PIXSCAL2= 0.600 / [arcsec/pixel] pixel scale for axis 2
OLDPIXSC= 1.221 / [arcsec/pixel] pixel scale of single IRAC frame
RA = 271.15618896 / [Deg] Right ascension at mosaic center
DEC = -21.59907150 / [Deg] Declination at mosaic center
COMMENT ----------------------
COMMENT Photometry Information
COMMENT ----------------------
BUNIT = ’MJy/sr ’ / Units of image data
GAIN = 3.3 / e/DN conversion
JY2DN = 310192.375 / Average Jy to DN Conversion
ETIMEAVE= 1.2000 / [sec] Average exposure time
PA_AVE = 89.89 / [deg] Average position angle
ZODY_AVE= 0.09187 / [Mjy/sr] Average ZODY_EST-SKYDRKZB
COMMENT Flux conversion (FLUXCONV) for this mosaic =
COMMENT Average of FLXC from each frame*(old pixel scale/new pixel scale)**2
FLUXCONV= 0.457191199 / Average MJy/sr to DN/s Conversion
COMMENT -----------------------------
COMMENT AORKEYS/ADS Ident Information
COMMENT -----------------------------
AOR001 = ’0014347776’ / AORKEYS used in this mosaic
AOR002 = ’0014348032’ / AORKEYS used in this mosaic
AOR003 = ’0014347520’ / AORKEYS used in this mosaic
AOR004 = ’0014347264’ / AORKEYS used in this mosaic
AOR005 = ’0014347008’ / AORKEYS used in this mosaic
DSID001 = ’ads/sa.spitzer#0014347776’ / Data Set Identification for ADS/journals
DSID002 = ’ads/sa.spitzer#0014348032’ / Data Set Identification for ADS/journals
DSID003 = ’ads/sa.spitzer#0014347520’ / Data Set Identification for ADS/journals
DSID004 = ’ads/sa.spitzer#0014347264’ / Data Set Identification for ADS/journals
DSID005 = ’ads/sa.spitzer#0014347008’ / Data Set Identification for ADS/journals
NIMAGES = 334 / Number of IRAC Frames in Mosaic
END
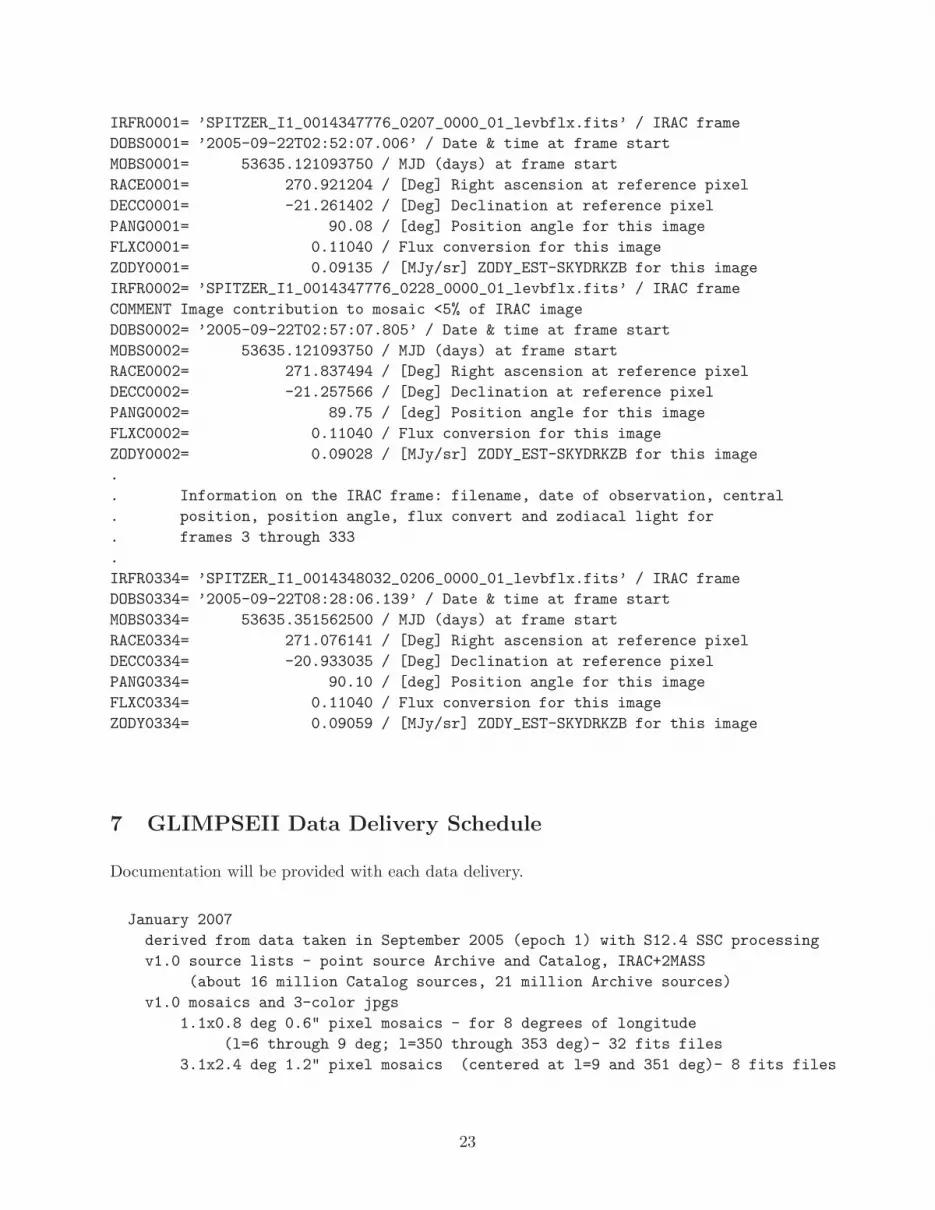
In addition to the FITS header information given above, the associated ASCII .hdr file includes in-formation about each IRAC frame used in the mosaic image. For example, GLM 00850+0000 mosaic I1.hdrincludes:
COMMENT ----------------------------------------
COMMENT Info on Individual Frames in Mosaic
COMMENT ----------------------------------------
22
IRFR0001= ’SPITZER_I1_0014347776_0207_0000_01_levbflx.fits’ / IRAC frame
DOBS0001= ’2005-09-22T02:52:07.006’ / Date & time at frame start
MOBS0001= 53635.121093750 / MJD (days) at frame start
RACE0001= 270.921204 / [Deg] Right ascension at reference pixel
DECC0001= -21.261402 / [Deg] Declination at reference pixel
PANG0001= 90.08 / [deg] Position angle for this image
FLXC0001= 0.11040 / Flux conversion for this image
ZODY0001= 0.09135 / [MJy/sr] ZODY_EST-SKYDRKZB for this image
IRFR0002= ’SPITZER_I1_0014347776_0228_0000_01_levbflx.fits’ / IRAC frame
COMMENT Image contribution to mosaic <5% of IRAC image
DOBS0002= ’2005-09-22T02:57:07.805’ / Date & time at frame start
MOBS0002= 53635.121093750 / MJD (days) at frame start
RACE0002= 271.837494 / [Deg] Right ascension at reference pixel
DECC0002= -21.257566 / [Deg] Declination at reference pixel
PANG0002= 89.75 / [deg] Position angle for this image
FLXC0002= 0.11040 / Flux conversion for this image
ZODY0002= 0.09028 / [MJy/sr] ZODY_EST-SKYDRKZB for this image
.
. Information on the IRAC frame: filename, date of observation, central
. position, position angle, flux convert and zodiacal light for
. frames 3 through 333
.
IRFR0334= ’SPITZER_I1_0014348032_0206_0000_01_levbflx.fits’ / IRAC frame
DOBS0334= ’2005-09-22T08:28:06.139’ / Date & time at frame start
MOBS0334= 53635.351562500 / MJD (days) at frame start
RACE0334= 271.076141 / [Deg] Right ascension at reference pixel
DECC0334= -20.933035 / [Deg] Declination at reference pixel
PANG0334= 90.10 / [deg] Position angle for this image
FLXC0334= 0.11040 / Flux conversion for this image
ZODY0334= 0.09059 / [MJy/sr] ZODY_EST-SKYDRKZB for this image
7 GLIMPSEII Data Delivery Schedule
Documentation will be provided with each data delivery.
January 2007
derived from data taken in September 2005 (epoch 1) with S12.4 SSC processing
v1.0 source lists - point source Archive and Catalog, IRAC+2MASS
(about 16 million Catalog sources, 21 million Archive sources)
v1.0 mosaics and 3-color jpgs
1.1x0.8 deg 0.6" pixel mosaics - for 8 degrees of longitude
(l=6 through 9 deg; l=350 through 353 deg)- 32 fits files
3.1x2.4 deg 1.2" pixel mosaics (centered at l=9 and 351 deg)- 8 fits files
23
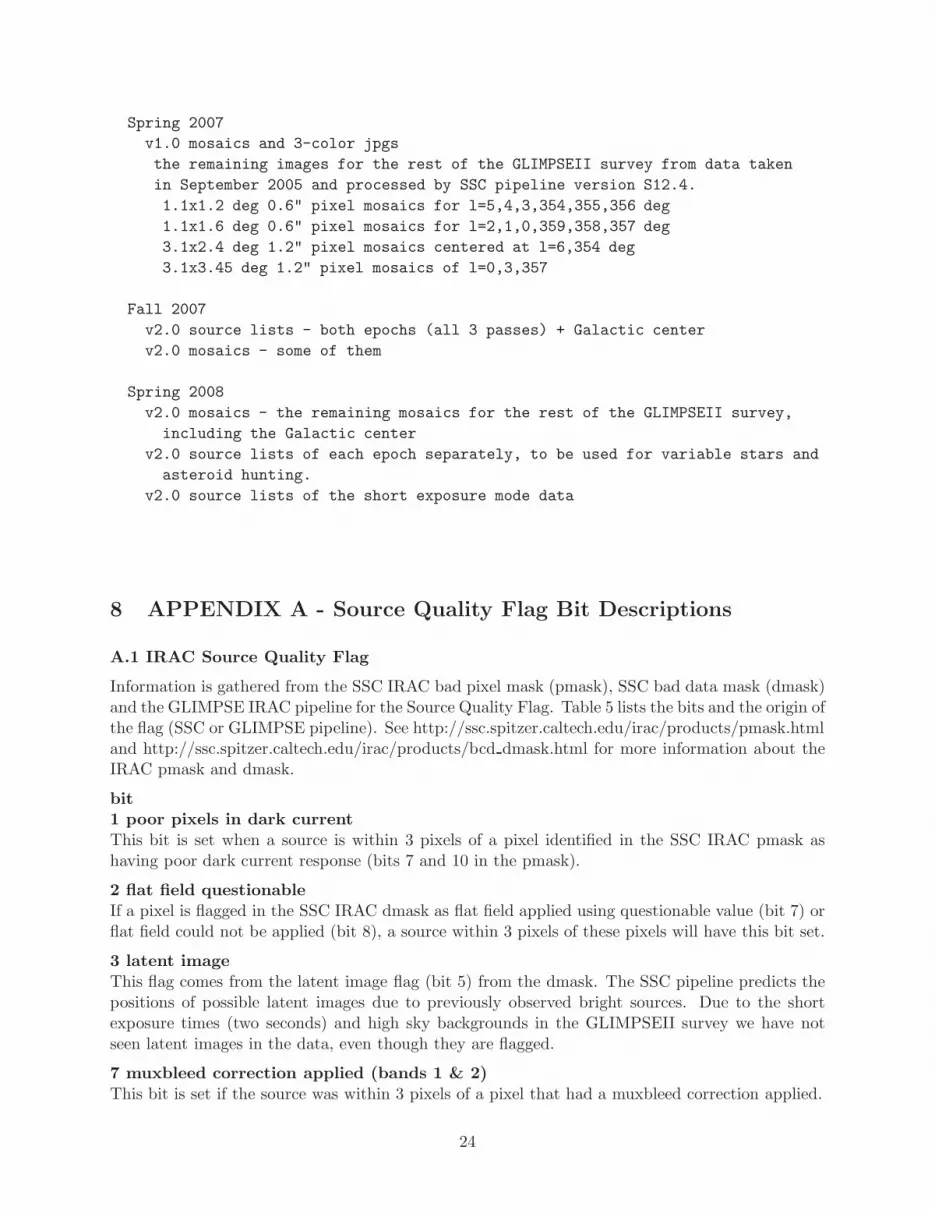
Spring 2007
v1.0 mosaics and 3-color jpgs
the remaining images for the rest of the GLIMPSEII survey from data taken
in September 2005 and processed by SSC pipeline version S12.4.
1.1x1.2 deg 0.6" pixel mosaics for l=5,4,3,354,355,356 deg
1.1x1.6 deg 0.6" pixel mosaics for l=2,1,0,359,358,357 deg
3.1x2.4 deg 1.2" pixel mosaics centered at l=6,354 deg
3.1x3.45 deg 1.2" pixel mosaics of l=0,3,357
Fall 2007
v2.0 source lists - both epochs (all 3 passes) + Galactic center
v2.0 mosaics - some of them
Spring 2008
v2.0 mosaics - the remaining mosaics for the rest of the GLIMPSEII survey,
including the Galactic center
v2.0 source lists of each epoch separately, to be used for variable stars and
asteroid hunting.
v2.0 source lists of the short exposure mode data
8 APPENDIX A - Source Quality Flag Bit Descriptions
A.1 IRAC Source Quality Flag
Information is gathered from the SSC IRAC bad pixel mask (pmask), SSC bad data mask (dmask)and the GLIMPSE IRAC pipeline for the Source Quality Flag. Table 5 lists the bits and the origin ofthe flag (SSC or GLIMPSE pipeline). See http://ssc.spitzer.caltech.edu/irac/products/pmask.htmland http://ssc.spitzer.caltech.edu/irac/products/bcd dmask.html for more information about theIRAC pmask and dmask.
bit1 poor pixels in dark currentThis bit is set when a source is within 3 pixels of a pixel identified in the SSC IRAC pmask ashaving poor dark current response (bits 7 and 10 in the pmask).
2 flat field questionableIf a pixel is flagged in the SSC IRAC dmask as flat field applied using questionable value (bit 7) orflat field could not be applied (bit 8), a source within 3 pixels of these pixels will have this bit set.
3 latent imageThis flag comes from the latent image flag (bit 5) from the dmask. The SSC pipeline predicts thepositions of possible latent images due to previously observed bright sources. Due to the shortexposure times (two seconds) and high sky backgrounds in the GLIMPSEII survey we have notseen latent images in the data, even though they are flagged.
7 muxbleed correction applied (bands 1 & 2)This bit is set if the source was within 3 pixels of a pixel that had a muxbleed correction applied.
24
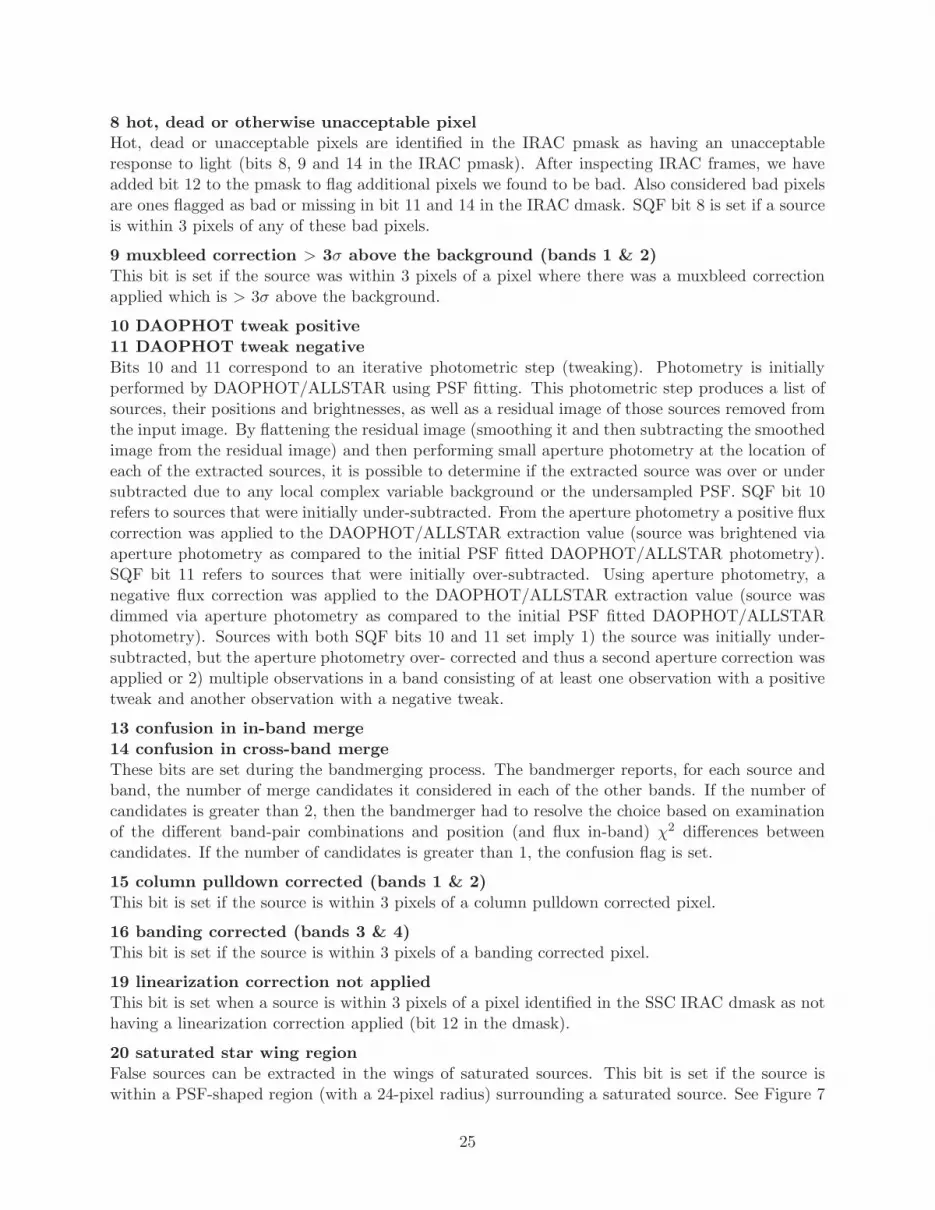
8 hot, dead or otherwise unacceptable pixelHot, dead or unacceptable pixels are identified in the IRAC pmask as having an unacceptableresponse to light (bits 8, 9 and 14 in the IRAC pmask). After inspecting IRAC frames, we haveadded bit 12 to the pmask to flag additional pixels we found to be bad. Also considered bad pixelsare ones flagged as bad or missing in bit 11 and 14 in the IRAC dmask. SQF bit 8 is set if a sourceis within 3 pixels of any of these bad pixels.
9 muxbleed correction > 3σ above the background (bands 1 & 2)This bit is set if the source was within 3 pixels of a pixel where there was a muxbleed correctionapplied which is > 3σ above the background.
10 DAOPHOT tweak positive11 DAOPHOT tweak negativeBits 10 and 11 correspond to an iterative photometric step (tweaking). Photometry is initiallyperformed by DAOPHOT/ALLSTAR using PSF fitting. This photometric step produces a list ofsources, their positions and brightnesses, as well as a residual image of those sources removed fromthe input image. By flattening the residual image (smoothing it and then subtracting the smoothedimage from the residual image) and then performing small aperture photometry at the location ofeach of the extracted sources, it is possible to determine if the extracted source was over or undersubtracted due to any local complex variable background or the undersampled PSF. SQF bit 10refers to sources that were initially under-subtracted. From the aperture photometry a positive fluxcorrection was applied to the DAOPHOT/ALLSTAR extraction value (source was brightened viaaperture photometry as compared to the initial PSF fitted DAOPHOT/ALLSTAR photometry).SQF bit 11 refers to sources that were initially over-subtracted. Using aperture photometry, anegative flux correction was applied to the DAOPHOT/ALLSTAR extraction value (source wasdimmed via aperture photometry as compared to the initial PSF fitted DAOPHOT/ALLSTARphotometry). Sources with both SQF bits 10 and 11 set imply 1) the source was initially under-subtracted, but the aperture photometry over- corrected and thus a second aperture correction wasapplied or 2) multiple observations in a band consisting of at least one observation with a positivetweak and another observation with a negative tweak.
13 confusion in in-band merge14 confusion in cross-band mergeThese bits are set during the bandmerging process. The bandmerger reports, for each source andband, the number of merge candidates it considered in each of the other bands. If the number ofcandidates is greater than 2, then the bandmerger had to resolve the choice based on examinationof the different band-pair combinations and position (and flux in-band) χ2 differences betweencandidates. If the number of candidates is greater than 1, the confusion flag is set.
15 column pulldown corrected (bands 1 & 2)This bit is set if the source is within 3 pixels of a column pulldown corrected pixel.
16 banding corrected (bands 3 & 4)This bit is set if the source is within 3 pixels of a banding corrected pixel.
19 linearization correction not appliedThis bit is set when a source is within 3 pixels of a pixel identified in the SSC IRAC dmask as nothaving a linearization correction applied (bit 12 in the dmask).
20 saturated star wing regionFalse sources can be extracted in the wings of saturated sources. This bit is set if the source iswithin a PSF-shaped region (with a 24-pixel radius) surrounding a saturated source. See Figure 7
25
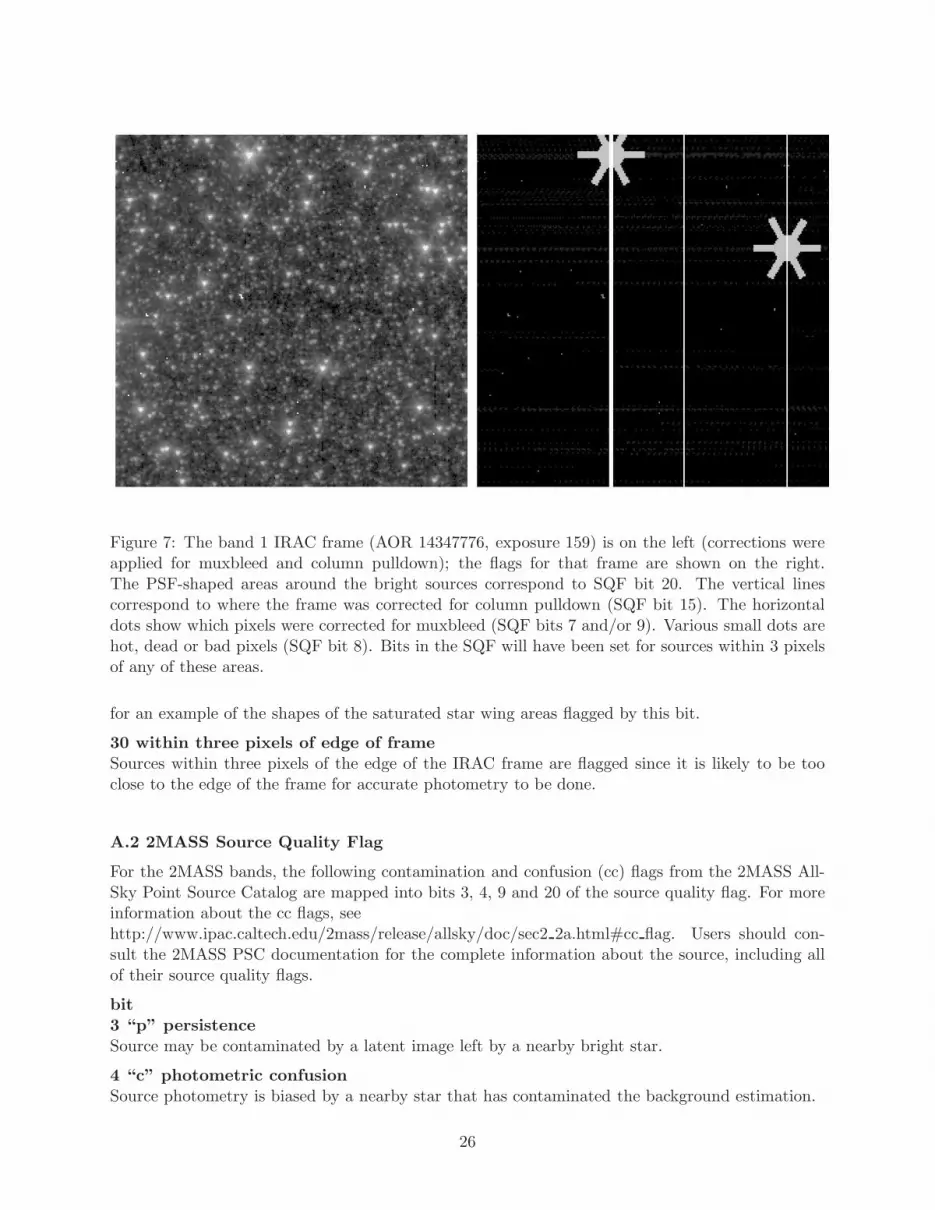
Figure 7: The band 1 IRAC frame (AOR 14347776, exposure 159) is on the left (corrections wereapplied for muxbleed and column pulldown); the flags for that frame are shown on the right.The PSF-shaped areas around the bright sources correspond to SQF bit 20. The vertical linescorrespond to where the frame was corrected for column pulldown (SQF bit 15). The horizontaldots show which pixels were corrected for muxbleed (SQF bits 7 and/or 9). Various small dots arehot, dead or bad pixels (SQF bit 8). Bits in the SQF will have been set for sources within 3 pixelsof any of these areas.
for an example of the shapes of the saturated star wing areas flagged by this bit.
30 within three pixels of edge of frameSources within three pixels of the edge of the IRAC frame are flagged since it is likely to be tooclose to the edge of the frame for accurate photometry to be done.
A.2 2MASS Source Quality Flag
For the 2MASS bands, the following contamination and confusion (cc) flags from the 2MASS All-Sky Point Source Catalog are mapped into bits 3, 4, 9 and 20 of the source quality flag. For moreinformation about the cc flags, seehttp://www.ipac.caltech.edu/2mass/release/allsky/doc/sec2 2a.html#cc flag. Users should con-sult the 2MASS PSC documentation for the complete information about the source, including allof their source quality flags.
bit3 “p” persistenceSource may be contaminated by a latent image left by a nearby bright star.
4 “c” photometric confusionSource photometry is biased by a nearby star that has contaminated the background estimation.
26

9 “s” electronic stripeSource measurement may be contaminated by a stripe from a nearby bright star.
14 confusion in cross-band mergeThis bit is set during the bandmerging process. The bandmerger reports, for each source andband, the number of merge candidates it considered in each of the other bands. If the number ofcandidates is greater than 2, then the bandmerger had to resolve the choice based on examination ofthe different band-pair combinations and position χ2 differences between candidates. If the numberof candidates is greater than 1, the confusion flag is set.
20 “d” diffraction spike confusionSource may be contaminated by a diffraction spike from a nearby star.
A.3 Key to Bit Values
This section describes how to determine the bit values of a Source Quality Flag.
bt = bit in sqfvalue = 2(bit−1) i.e. bit 3 corresponds to 22=4
bit values: bt 1 => 1; 2 => 2; 3 => 4; 4 => 8; 5 => 16; 6 => 32; 7 => 64; 8 => 128 bt 9=> 256; 10 => 512; 11 => 1024; 12 => 2048; 13 => 4096; 14 => 8192; 15 => 16384; bt 16 =>32768; 17 => 65536; 18 => 131072; 19 => 262144; 20 => 524288; bt 30 => 536870912
For example, the Source Quality Flags in the example in Table 8 are 8192 for all three 2MASSbands and IRAC bands 2 and 3. This translates to bit 14 being set, which means the bandmergerreported confusion in the cross-band merge step. IRAC band 4 has a SQF of 9216. This means bit14 (cross-band merge confusion) has been set (value=8192). We subtract 8192 from 9216 and get1024. This means bit 11 has been set (the DAOPHOT tweak negative bit).
REFERENCESBenjamin, R.A., et al, 2003, PASP, 115, 953.Calabretta, M.R. and Greisen, E.W. 2002, A & A, 395, 1077.Cohen, M., Wheaton, W.A., and Megeath, S.T. 2003, AJ, 126, 1090.Cutri, R. et al. 2005,http://pegasus.phast.umass.edu/ipac wget/releases/allsky/doc/sec2 2.html#pscastrprop.Egan, M.P., van Dyk, S.D., & Price, S.D. 2001, AJ, 122, 1844.Fazio et al., 2004, ApJS, 154, 10.Hora, J. et al, 2004, Proc SPIE, 5487, 77.Reach, W. et al, 2005, PASP, 117, 978.Robitaille, T., Whitney, B., Indebetouw, R., Wood, K. & Denzmore, P. 2006, ApJS, 167, 256.Robitaille, T., Whitney, B., Indebetouw, R., & Wood, K. 2007, ApJS, in press (astro-ph/061269)Stetson, P. 1987, PASP, 99, 191.Werner et al. 2004, ApJS, 154, 1.
27
GLOSSARY
2MASS Two Micron All Sky SurveyBCD Basic Calibrated Data, released by the SSCdmask A data quality mask supplied by the SSC for the BCDGLIMPSEI Galactic Legacy Infrared Midplane Survey ExtraordinaireGLMIIC GLIMPSEII Point Source CatalogGLMIIA GLIMPSEII Point Source ArchiveGPD GLIMPSE Pipeline DescriptionGQA GLIMPSE Quality AssuranceIPAC Infrared Processing and Analysis CenterIRAC Spitzer Infrared Array CameraIRS Spitzer Infrared SpectrometerIRSA InfraRed Science ArchiveMF Method Flag used to indicate method of weighting fluxesMIPS Spitzer Multiband Imaging PhotometerOSV Observation Strategy Validationpmask A bad pixel mask supplied by the SSC for the BCDPSF Point Spread Functionrmask Outlier (radiation hit) maskSOM Spitzer Observer’s ManualSSC Spitzer Science CenterSED Spectral energy distributionSQF Source Quality FlagSST Spitzer Space Telescopesmask Stray light mask
28