design of solution v1.0 - the interflex project
TRANSCRIPT

D6.1 Design of solution
1
Design of solution V1.0
Deliverable D6.1
31/12/2017
Ref. Ares(2017)6387317 - 30/12/2017
D6.1 Design of solution
2
ID & Title : D6.1 Design of solution
Version : V1.0 Number of pages :
48 +210
Short Description
Deliverable 6.1 contains detail design of technical solutions of all WP6 use cases, results of customer’s recruitment, lab tests results and KPIs definition.
Revision history
Version Date Modifications’ nature Author
V0.1 8.9.2017 First concept Stanislav Hes
V0.2 04.12.2017 Draft for TC review Stanislav Hes
V1.0 13.12.2017 Final version for EC Stanislav Hes
Accessibility
☒Public ☐ Consortium + EC ☐ Restricted to a specific group + EC
☐ Confidential + EC
Owner/Main responsible
Name(s) Function Company Visa
Stanislav Hes WP6 leader CEZ Distribuce
Czech Republic
Author(s)/contributor(s): company name(s)
CEZ Distribuce: Stanislav Hes, Jan Kůla, Jan Švec, Pavel Derner
Reviewer(s): company name(s)
Company Name(s)
Enexis Willems
Approver(s): company name(s)
Company Name(s)
Enexis
Enedis
Willems
Dumbs
Work Package ID WP 6 Task ID T6.1 – T6.10
D6.1 Design of solution
3
EXECUTIVE SUMMARY This report (deliverable) named D6.1 Design of solution is deliverable of WP6 within InterFlex H2020 (project co-founded by the European Commission). CEZ Distribuce as WP6 leader aims to perform demonstrations of innovative smart grid solutions in order to increase DER hosting capacity, integrate EV charging stations and home energy storage systems more effectively and thus cover important challenges of European DSOs. The use cases demonstration is performed under the coordination and management of CEZ Distribuce. Partners involved in the WP6 are Austrian Institute of Technology (AIT), CEZ Solarni, Fronius, Schneider Electric and Siemens. As it is stated in GA in Description of Work (DoW), D6_1 Design of solutions contains detail design of technical solutions of all WP6 use cases, results of customer’s recruitment, lab tests results and KPIs definition. This report describes in detail the design of solutions for WP6 that will be implemented in next stage of the project and then reported in D6.2 Implementation of solution (deliverable due date 12/2018). After the evaluation phase of the project, WP6 results will be reported in D6.3Demonstration activities results (due date 12/2019). This final deliverable of WP6 will also contain CBA and SRA of demonstrated solutions together with the regulatory framework update recommendations.
D6.1 Design of solution
4
TABLE OF CONTENT
1. INTRODUCTION .........................................................................................8
1.1. Scope of the document ...........................................................................8
1.2. Notations, abbreviations and acronyms .......................................................8
2. DESIGN OF SOLUTIONS ................................................................................9
2.1. Use case WP6_1 - Increase DER hosting capacity of LV distribution networks by smart PV inverters................................................................................................ 10
2.2. Use case WP6_2 - Increase DER hosting capacity in MV networks by volt-var control 16
2.3. Use case WP6_3 - Smart EV charging ........................................................ 19
2.4. Use case WP6_4 - Smart energy storage .................................................... 24
3. WP6 KPI DEFINITION ................................................................................. 30
3.1. Increasing DER hosting capacity .............................................................. 30
3.2. Power quality (according to the standard EN 50160)..................................... 31
3.3. EV charging stations load curtailment in emergency situations ....................... 33
3.4. PV feed-in peak shaving ........................................................................ 34
4. CUSTOMERS RECRUITMENT ......................................................................... 37
4.1. Use case WP6_1 smart PV inverters .......................................................... 37
4.2. Use case WP6_2 – volt var control of DER on MV ......................................... 38
4.3. Use case WP6_4 – smarsmart energy storage.............................................. 40
5. LAB TESTS ............................................................................................. 42
5.1. WP6_1: Increase the DER hosting capacity of LV distribution networks by combining smart PV inverter functions (demonstration of Q(U) and P(U)) ................................ 42
5.1.1. Implemented functions and functions to be tested ............................... 42
5.1.2. Scope of the lab tests / equipment under test..................................... 42
5.2. WP6_3: Smart EV charging ..................................................................... 43
5.2.1. Implemented functions and functions to be tested ............................... 43
5.2.2. Scope of the lab tests / equipment under test..................................... 43
5.3. WP6_4: Smart energy storage ................................................................. 45
5.3.1. Implemented functions and functions to be tested ............................... 45
5.3.2. Scope of the lab tests / equipment under test..................................... 46
5.4. Lab tests – results ................................................................................ 48

D6.1 Design of solution
5
6. ANNEXES ............................................................................................... 49
Annex 6.1 .................................................................................................. 50
Annex 6.2 .................................................................................................128
Annex 6.3 .................................................................................................164
Annex 6.4 .................................................................................................174
Annex 6.5 .................................................................................................213
D6.1 Design of solution
6
LIST OF FIGURES Figure 1 – List of acronyms 8
Figure 2 – WP6 demonstration areas in Czech Republic (CEZ Distribuce regions are coloured in orange) 9
Figure 3 - Autonomous Q(U) function with set points used in WP6 11
Figure 4 - Autonomous P(U) function with set points used in WP6 11
Figure 5 – Use case WP6_1 – LV grid topology in Divisov area with marked places for installation power quality measurement devices (red arrows) 12
Figure 6 – Use case WP6_1 – LV grid topology in Teptin area with marked places for installation power quality measurement devices (red arrows) 13
Figure 7 – Meg38 power quality measurement device 13
Figure 8 – SGAM for WP6_1 use case (component layer) – Fronius 14
Figure 9 - PV inverter used in WP6_1 – Fronius Symo Hybrid serie (three - phase) 14
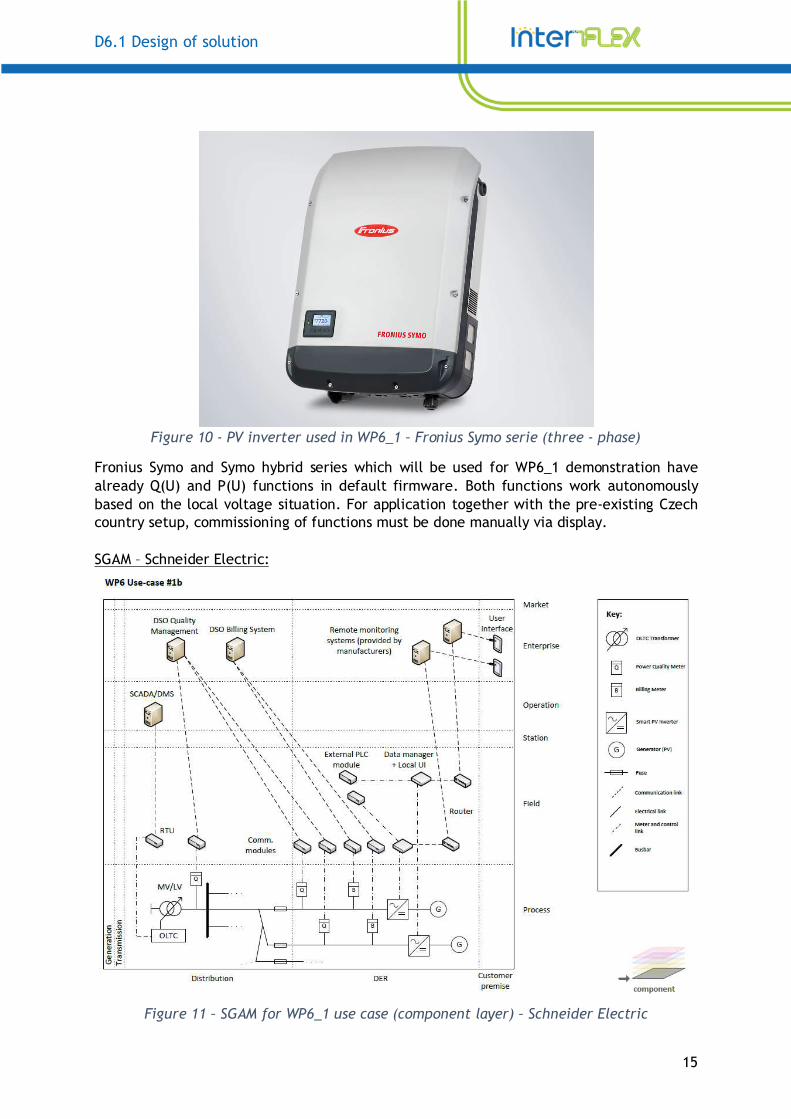
Figure 10 - PV inverter used in WP6_1 – Fronius Symo serie (three - phase) 15
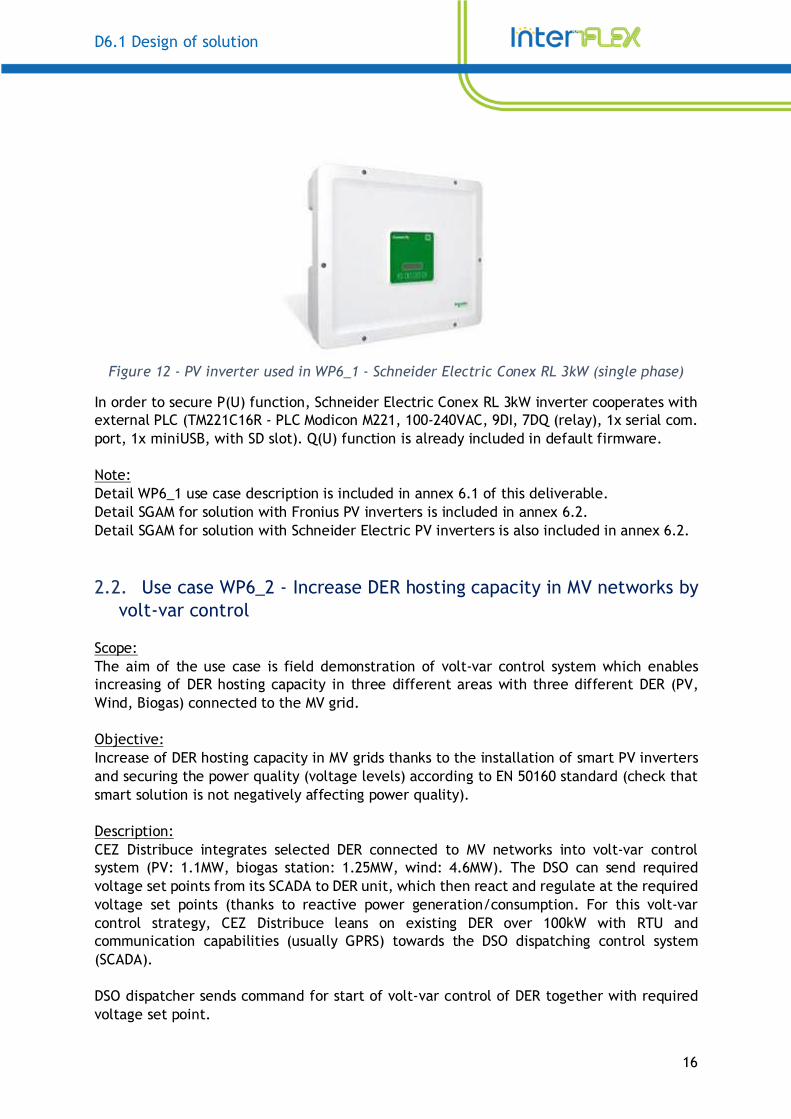
Figure 11 – SGAM for WP6_1 use case (component layer) – Schneider Electric 15
Figure 12 - PV inverter used in WP6_1 - Schneider Electric Conex RL 3kW (single phase) 16
Figure 13 - Example of volt-var control with CHP unit 1,6 MW connected to MV grid 17
Figure 14 - Block scheme of volt-var control concept 18
Figure 15 – SGAM for WP6_2 use case (component layer) 18
Figure 16 - Example of connection of narrow band simple one way PLC communication system used in CEZ Distribuce areas 20
Figure 17- Example of charging process (left – DC connector powered symetricaly from 3 phases AC grid; right – AC connector powered symetricaly from 3 phase AC grid where EV contains single phase AC charger only; axis x = time, axis y = active power in kW) 20
Figure 18 – SGAM for WP6_3 use case (component layer) – Schneider Electric 21
Figure 19 - Schneider Electric EV link parking charging station 21
Figure 20 - Schneider Electric EV Smart Wallbox charging station 22
Figure 21 – SGAM for WP6_3 use case (component layer) – Siemens 22
Figure 22 - Siemens EV charging station (with configuration 2x22kW Mennekes connectors) 23
Figure 23 - Siemens EV smart charging solution 23
Figure 24 – Use case WP6_4 – LV grid topology in Luzany area with marked places for installation power quality measurement devices (red arrows) 25
Figure 25 – SGAM for WP6_4 use case (component layer) – Fronius 26
Figure 26 - Fronius energy storage system (PV inverter, battery and smart meter) – base for smart energy storage solution 26
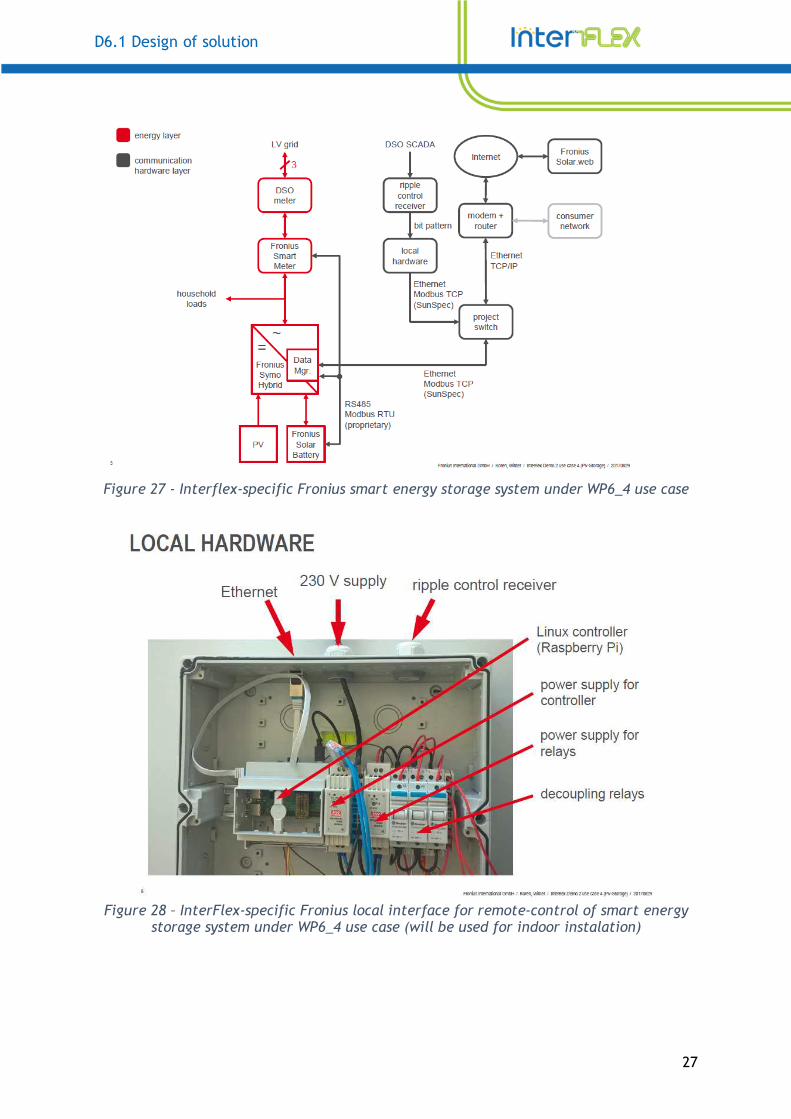
Figure 27 - Interflex-specific Fronius smart energy storage system under WP6_4 use case 27
Figure 28 – InterFlex-specific Fronius local interface for remote-control of smart energy storage system under WP6_4 use case (will be used for indoor instalation) 27
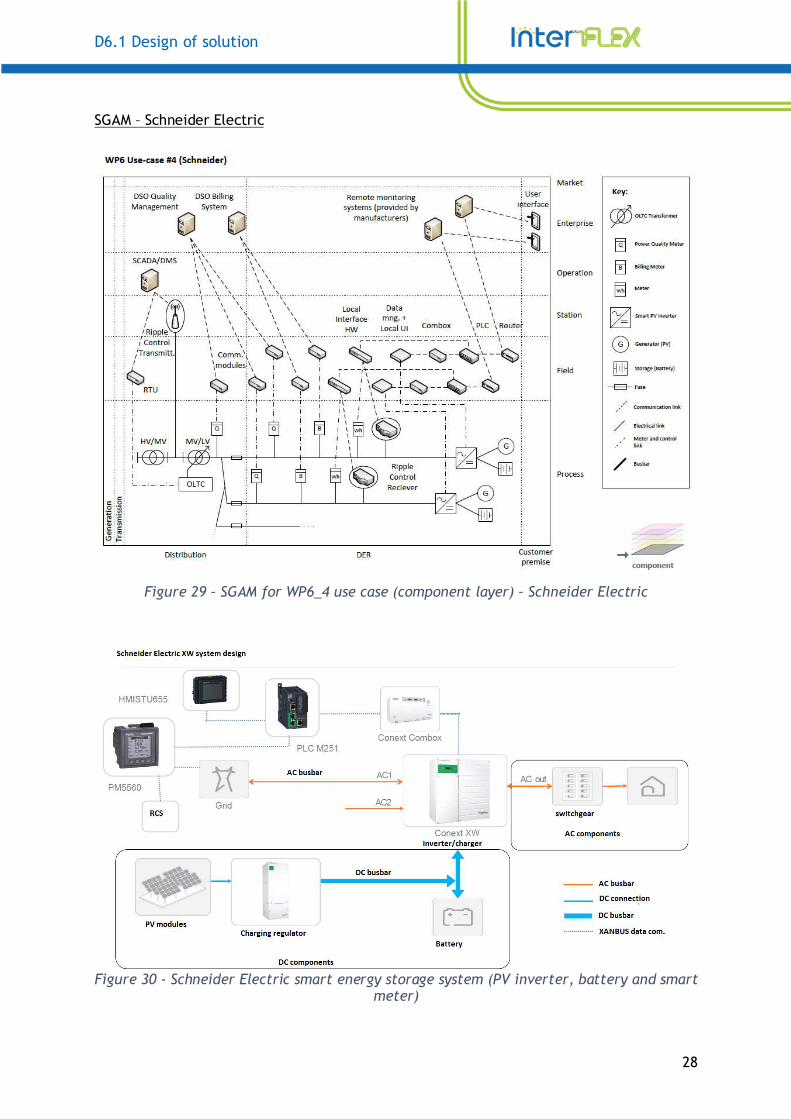
Figure 29 – SGAM for WP6_4 use case (component layer) – Schneider Electric 28
Figure 30 - Schneider Electric smart energy storage system (PV inverter, battery and smart meter) 28
Figure 31 - Comparison of DER hosting capacity for baseline and after smart grid solution implementation 30
Figure 32 - Example of voltage limits according to the EN 50160 standard 32
D6.1 Design of solution
7
Figure 33 - Example of EV charging station charging power decrease. 33
Figure 34 - Example of PV feed-in peak shaving. 35
Figure 35 - Customers recruited in Divisov area 37
Figure 36 - Selected locations for PVinstallations in Divisov area 37
Figure 37 - Customers recruited in Divisov area 38
Figure 38 - Selected locations for PVinstallations in Teptin area 38
Figure 39 - DER recruited for volt var control 39
Figure 40 - PV park Zamberk – 1.1 MWp of installed capacity 39
Figure 41 - Biogas station Detenice – 1.25 MW of installed capacity 39
Figure 42 - Wind park Koprivna – 4.6MW of installed capacity 40
Figure 43 - Customers recruited in Luzany area 41
Figure 44 - Selected locations for PV+energy storage installations in Luzany area 41
Figure 45 – EUT for WP6_1 42
Figure 46 – Scope of lab tests shown on the SGAM description of WP6_1 (red: Equipment Under Test / blue: emulated part) 43
Figure 47– Scope of lab tests shown on the SGAM description of 3a (Schneider Electric) (red: Equipment Under Test / blue: emulated part) 44
Figure 48– EUT for WP6_1 44
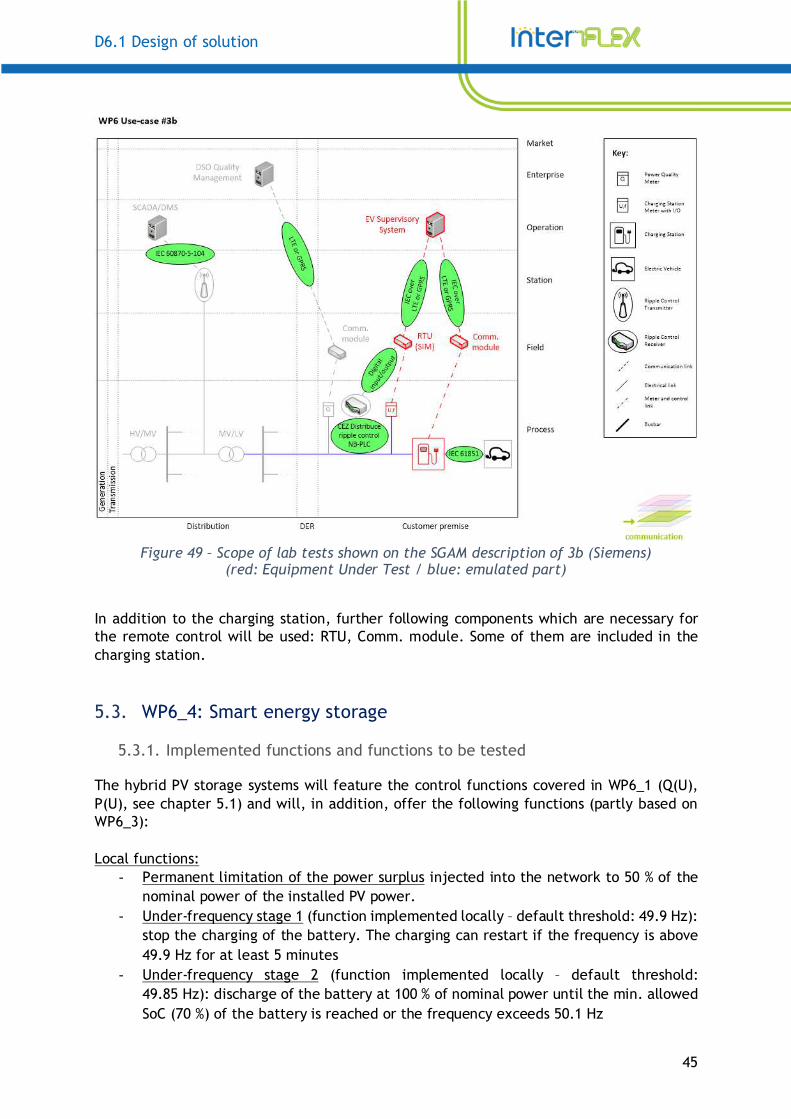
Figure 49 – Scope of lab tests shown on the SGAM description of 3b (Siemens) (red: Equipment Under Test / blue: emulated part) 45
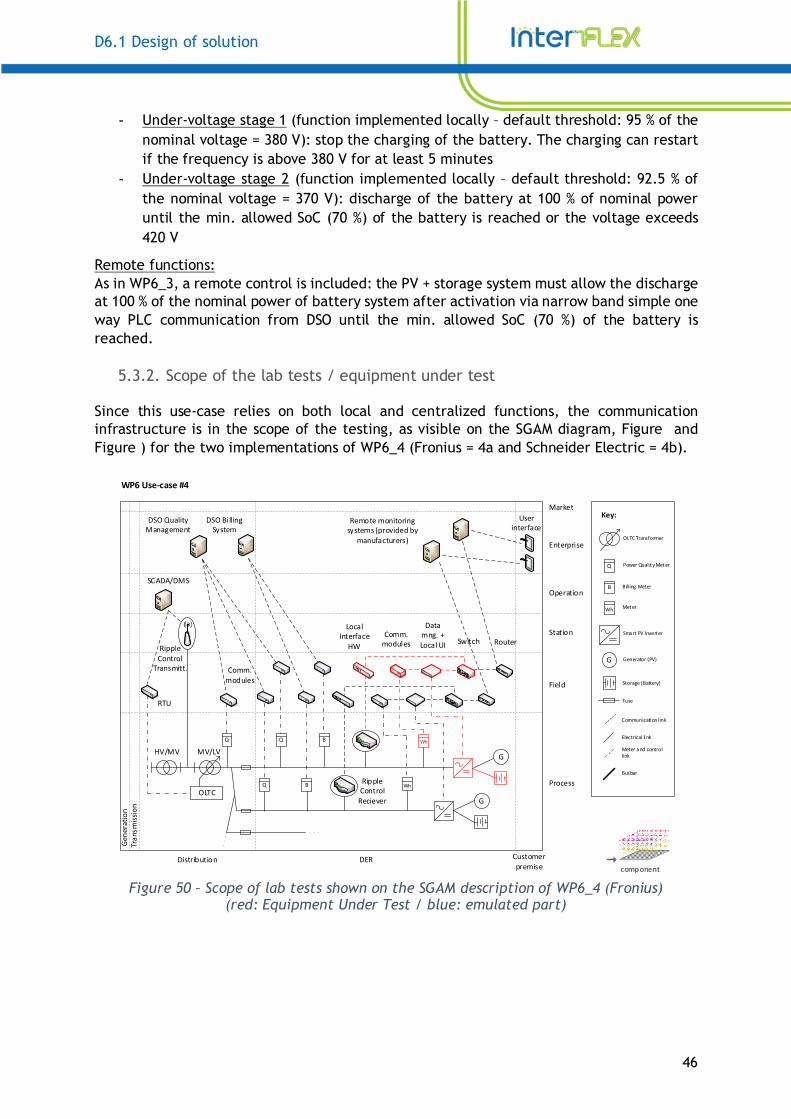
Figure 50 – Scope of lab tests shown on the SGAM description of WP6_4 (Fronius) (red: Equipment Under Test / blue: emulated part) 46
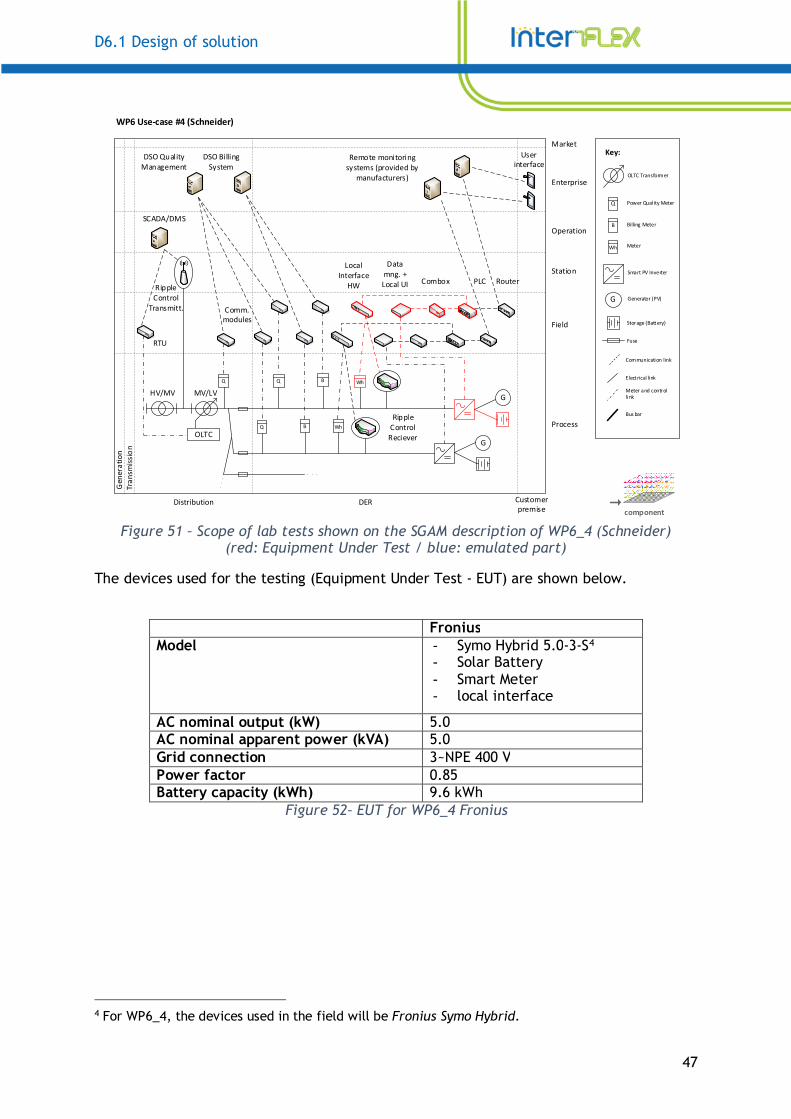
Figure 51 – Scope of lab tests shown on the SGAM description of WP6_4 (Schneider) (red: Equipment Under Test / blue: emulated part) 47
Figure 52– EUT for WP6_4 Fronius 47
Figure 53 – EUT for WP6_4 Schneider Electric 48
D6.1 Design of solution
8
1. INTRODUCTION
1.1. Scope of the document
This document named D6_1_Design of solution contains detail design of technical solutions of all WP6 use cases (WP6_1, WP6_2, WP6_3, WP6_4) including use cases description and SGAMs, results of customer’s recruitment, lab tests results and KPIs definition. Use cases detailed description, full SGAMs, detailed KPIs definition and Lab tests complex report are included in separate annexes.
1.2. Notations, abbreviations and acronyms
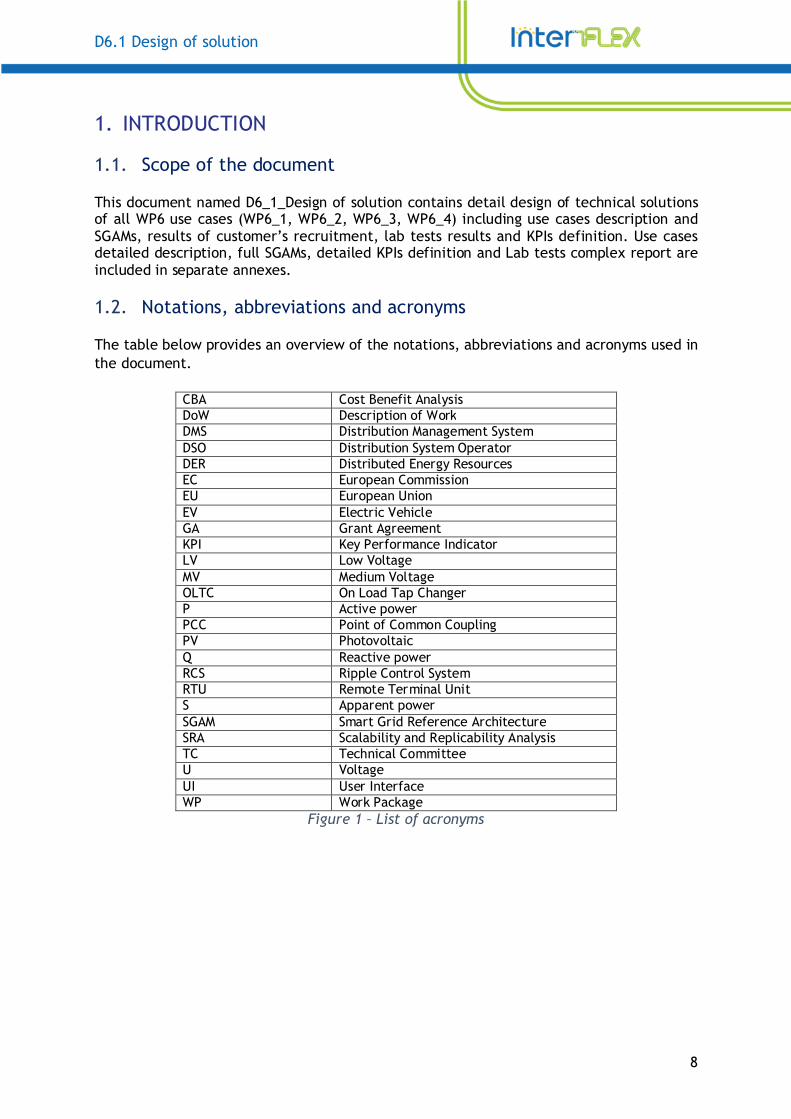
The table below provides an overview of the notations, abbreviations and acronyms used in the document.
CBA Cost Benefit Analysis DoW Description of Work DMS Distribution Management System DSO Distribution System Operator DER Distributed Energy Resources EC European Commission EU European Union EV Electric Vehicle GA Grant Agreement KPI Key Performance Indicator LV Low Voltage MV Medium Voltage OLTC On Load Tap Changer P Active power PCC Point of Common Coupling PV Photovoltaic Q Reactive power RCS Ripple Control System RTU Remote Terminal Unit S Apparent power SGAM Smart Grid Reference Architecture SRA Scalability and Replicability Analysis TC Technical Committee U Voltage UI User Interface WP Work Package
Figure 1 – List of acronyms
D6.1 Design of solution
9
2. DESIGN OF SOLUTIONS
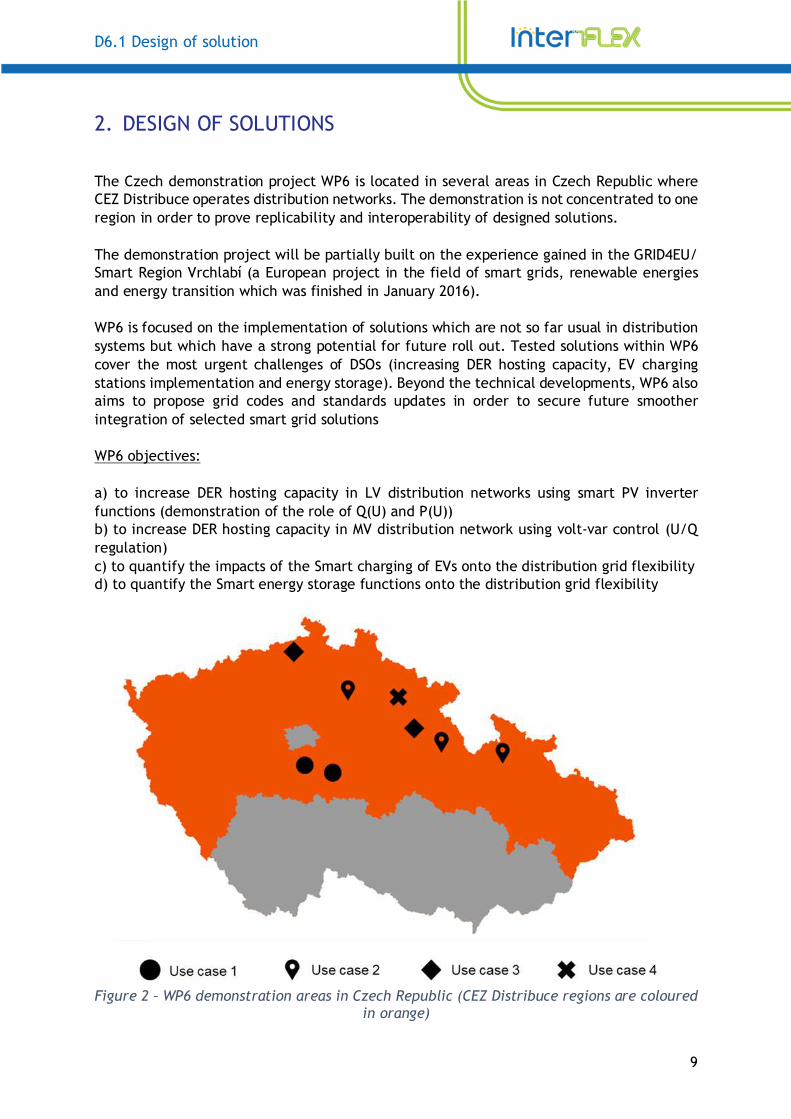
The Czech demonstration project WP6 is located in several areas in Czech Republic where CEZ Distribuce operates distribution networks. The demonstration is not concentrated to one region in order to prove replicability and interoperability of designed solutions. The demonstration project will be partially built on the experience gained in the GRID4EU/ Smart Region Vrchlabí (a European project in the field of smart grids, renewable energies and energy transition which was finished in January 2016). WP6 is focused on the implementation of solutions which are not so far usual in distribution systems but which have a strong potential for future roll out. Tested solutions within WP6 cover the most urgent challenges of DSOs (increasing DER hosting capacity, EV charging stations implementation and energy storage). Beyond the technical developments, WP6 also aims to propose grid codes and standards updates in order to secure future smoother integration of selected smart grid solutions WP6 objectives: a) to increase DER hosting capacity in LV distribution networks using smart PV inverter functions (demonstration of the role of Q(U) and P(U)) b) to increase DER hosting capacity in MV distribution network using volt-var control (U/Q regulation) c) to quantify the impacts of the Smart charging of EVs onto the distribution grid flexibility d) to quantify the Smart energy storage functions onto the distribution grid flexibility
Figure 2 – WP6 demonstration areas in Czech Republic (CEZ Distribuce regions are coloured
in orange)
D6.1 Design of solution
10
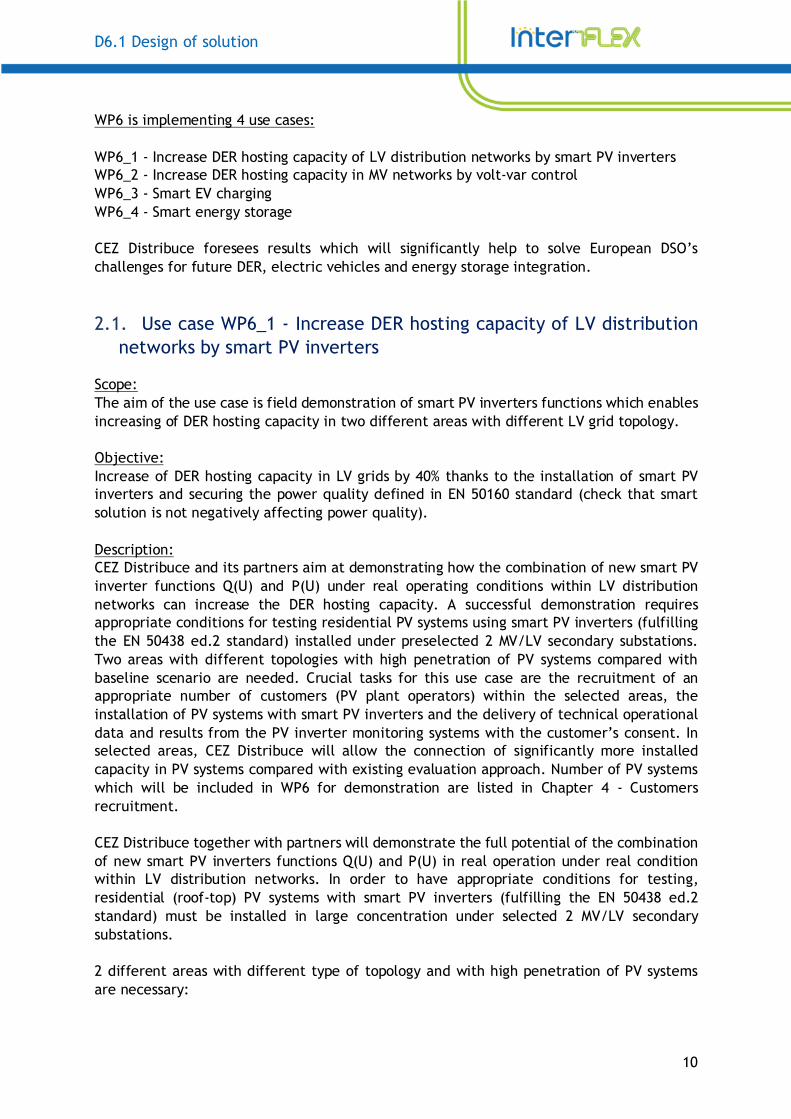
WP6 is implementing 4 use cases: WP6_1 - Increase DER hosting capacity of LV distribution networks by smart PV inverters WP6_2 - Increase DER hosting capacity in MV networks by volt-var control WP6_3 - Smart EV charging WP6_4 - Smart energy storage CEZ Distribuce foresees results which will significantly help to solve European DSO’s challenges for future DER, electric vehicles and energy storage integration.
2.1. Use case WP6_1 - Increase DER hosting capacity of LV distribution networks by smart PV inverters
Scope: The aim of the use case is field demonstration of smart PV inverters functions which enables increasing of DER hosting capacity in two different areas with different LV grid topology. Objective: Increase of DER hosting capacity in LV grids by 40% thanks to the installation of smart PV inverters and securing the power quality defined in EN 50160 standard (check that smart solution is not negatively affecting power quality). Description: CEZ Distribuce and its partners aim at demonstrating how the combination of new smart PV inverter functions Q(U) and P(U) under real operating conditions within LV distribution networks can increase the DER hosting capacity. A successful demonstration requires appropriate conditions for testing residential PV systems using smart PV inverters (fulfilling the EN 50438 ed.2 standard) installed under preselected 2 MV/LV secondary substations. Two areas with different topologies with high penetration of PV systems compared with baseline scenario are needed. Crucial tasks for this use case are the recruitment of an appropriate number of customers (PV plant operators) within the selected areas, the installation of PV systems with smart PV inverters and the delivery of technical operational data and results from the PV inverter monitoring systems with the customer’s consent. In selected areas, CEZ Distribuce will allow the connection of significantly more installed capacity in PV systems compared with existing evaluation approach. Number of PV systems which will be included in WP6 for demonstration are listed in Chapter 4 - Customers recruitment. CEZ Distribuce together with partners will demonstrate the full potential of the combination of new smart PV inverters functions Q(U) and P(U) in real operation under real condition within LV distribution networks. In order to have appropriate conditions for testing, residential (roof-top) PV systems with smart PV inverters (fulfilling the EN 50438 ed.2 standard) must be installed in large concentration under selected 2 MV/LV secondary substations. 2 different areas with different type of topology and with high penetration of PV systems are necessary:
D6.1 Design of solution
11
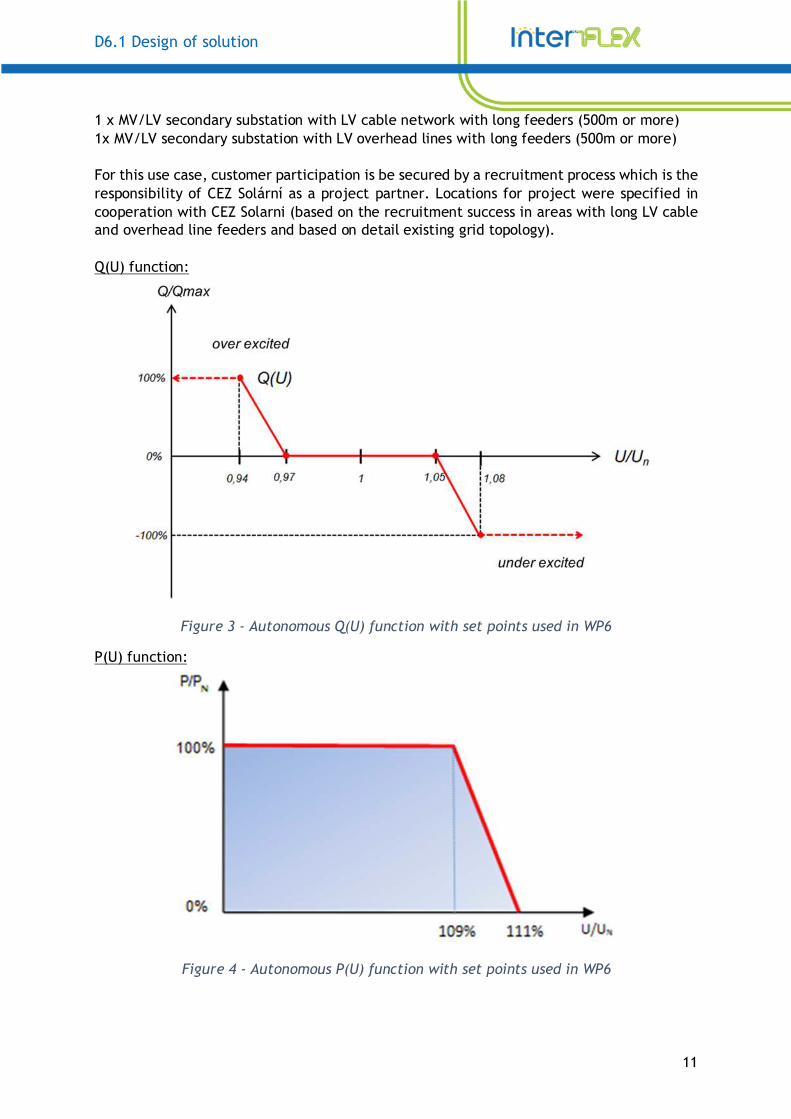
1 x MV/LV secondary substation with LV cable network with long feeders (500m or more) 1x MV/LV secondary substation with LV overhead lines with long feeders (500m or more) For this use case, customer participation is be secured by a recruitment process which is the responsibility of CEZ Solární as a project partner. Locations for project were specified in cooperation with CEZ Solarni (based on the recruitment success in areas with long LV cable and overhead line feeders and based on detail existing grid topology). Q(U) function:
Figure 3 - Autonomous Q(U) function with set points used in WP6
P(U) function:
Figure 4 - Autonomous P(U) function with set points used in WP6
D6.1 Design of solution
12
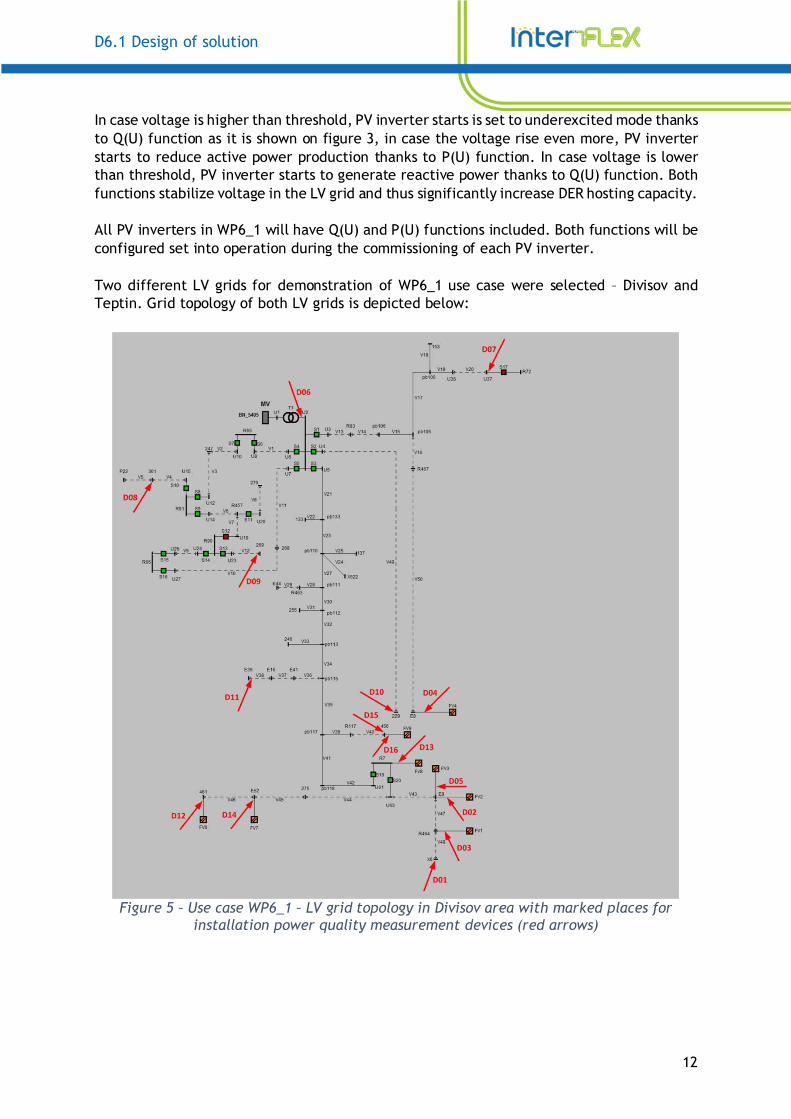
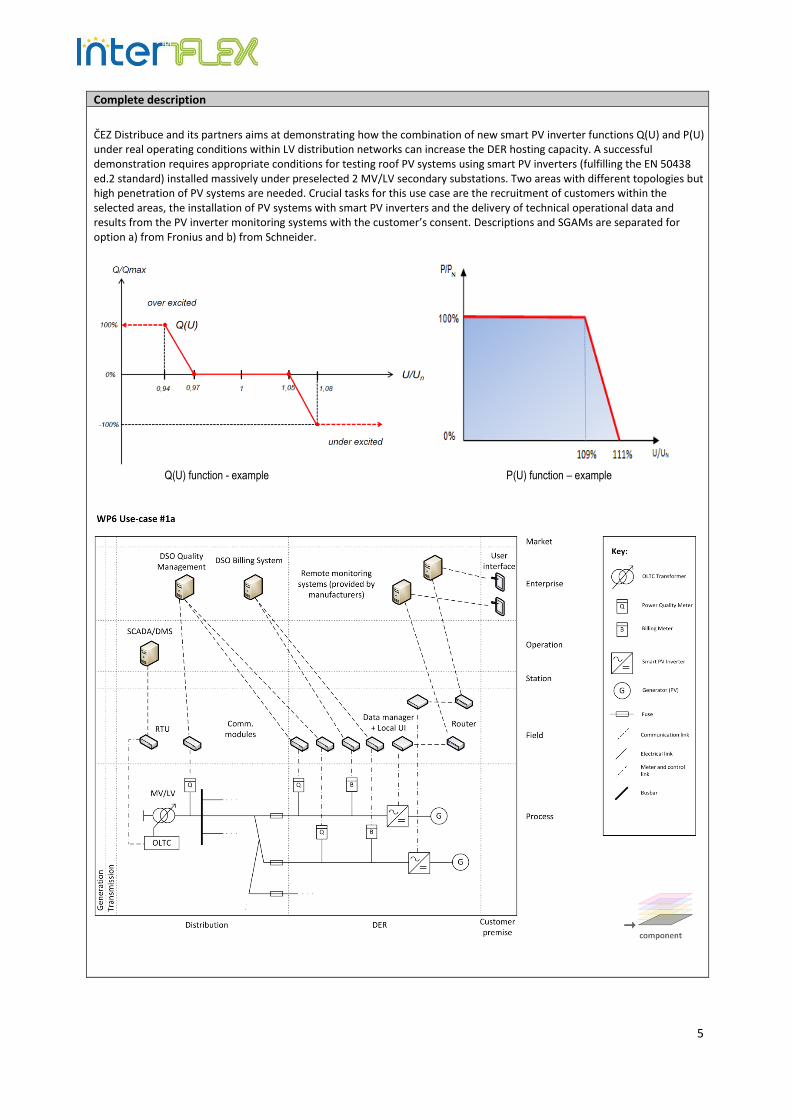
In case voltage is higher than threshold, PV inverter starts is set to underexcited mode thanks to Q(U) function as it is shown on figure 3, in case the voltage rise even more, PV inverter starts to reduce active power production thanks to P(U) function. In case voltage is lower than threshold, PV inverter starts to generate reactive power thanks to Q(U) function. Both functions stabilize voltage in the LV grid and thus significantly increase DER hosting capacity. All PV inverters in WP6_1 will have Q(U) and P(U) functions included. Both functions will be configured set into operation during the commissioning of each PV inverter. Two different LV grids for demonstration of WP6_1 use case were selected – Divisov and Teptin. Grid topology of both LV grids is depicted below:
Figure 5 – Use case WP6_1 – LV grid topology in Divisov area with marked places for
installation power quality measurement devices (red arrows)
D6.1 Design of solution
13
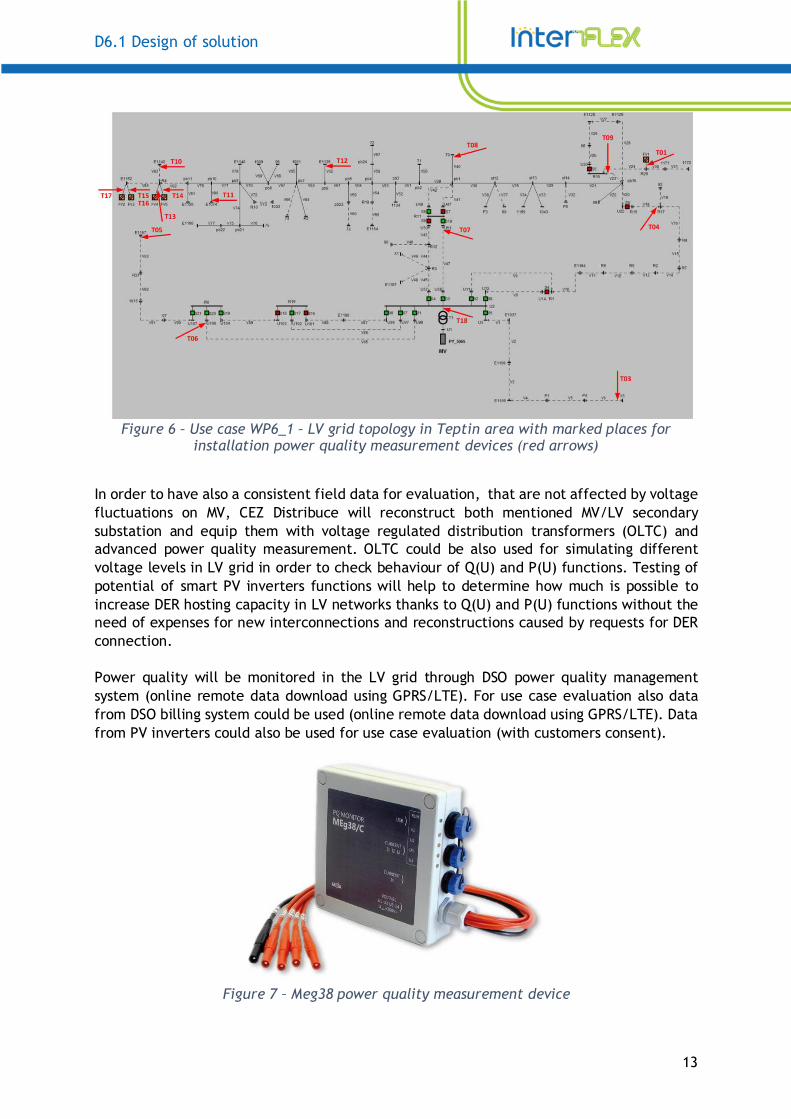
Figure 6 – Use case WP6_1 – LV grid topology in Teptin area with marked places for
installation power quality measurement devices (red arrows)
In order to have also a consistent field data for evaluation, that are not affected by voltage fluctuations on MV, CEZ Distribuce will reconstruct both mentioned MV/LV secondary substation and equip them with voltage regulated distribution transformers (OLTC) and advanced power quality measurement. OLTC could be also used for simulating different voltage levels in LV grid in order to check behaviour of Q(U) and P(U) functions. Testing of potential of smart PV inverters functions will help to determine how much is possible to increase DER hosting capacity in LV networks thanks to Q(U) and P(U) functions without the need of expenses for new interconnections and reconstructions caused by requests for DER connection. Power quality will be monitored in the LV grid through DSO power quality management system (online remote data download using GPRS/LTE). For use case evaluation also data from DSO billing system could be used (online remote data download using GPRS/LTE). Data from PV inverters could also be used for use case evaluation (with customers consent).
Figure 7 – Meg38 power quality measurement device
D6.1 Design of solution
14
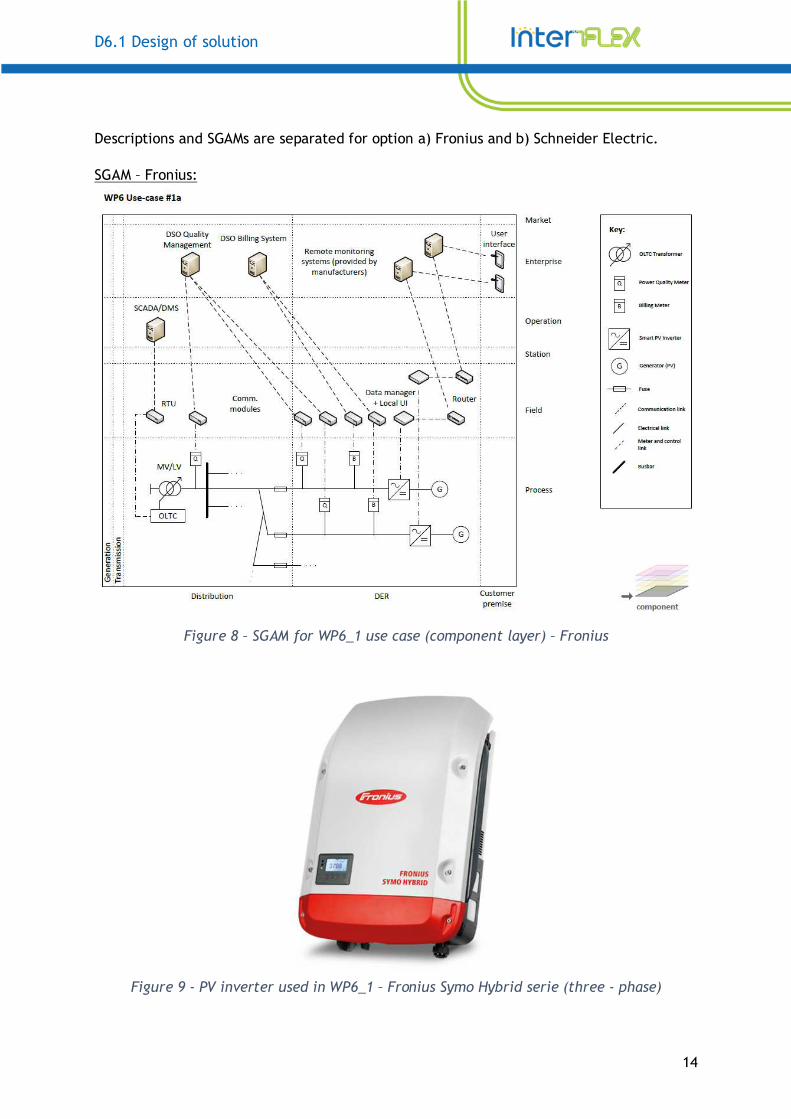
Descriptions and SGAMs are separated for option a) Fronius and b) Schneider Electric. SGAM – Fronius:
Figure 8 – SGAM for WP6_1 use case (component layer) – Fronius
Figure 9 - PV inverter used in WP6_1 – Fronius Symo Hybrid serie (three - phase)
D6.1 Design of solution
15
Figure 10 - PV inverter used in WP6_1 – Fronius Symo serie (three - phase)
Fronius Symo and Symo hybrid series which will be used for WP6_1 demonstration have already Q(U) and P(U) functions in default firmware. Both functions work autonomously based on the local voltage situation. For application together with the pre-existing Czech country setup, commissioning of functions must be done manually via display. SGAM – Schneider Electric:
Figure 11 – SGAM for WP6_1 use case (component layer) – Schneider Electric
D6.1 Design of solution
16
Figure 12 - PV inverter used in WP6_1 - Schneider Electric Conex RL 3kW (single phase)
In order to secure P(U) function, Schneider Electric Conex RL 3kW inverter cooperates with external PLC (TM221C16R - PLC Modicon M221, 100-240VAC, 9DI, 7DQ (relay), 1x serial com. port, 1x miniUSB, with SD slot). Q(U) function is already included in default firmware. Note: Detail WP6_1 use case description is included in annex 6.1 of this deliverable. Detail SGAM for solution with Fronius PV inverters is included in annex 6.2. Detail SGAM for solution with Schneider Electric PV inverters is also included in annex 6.2.
2.2. Use case WP6_2 - Increase DER hosting capacity in MV networks by volt-var control
Scope: The aim of the use case is field demonstration of volt-var control system which enables increasing of DER hosting capacity in three different areas with three different DER (PV, Wind, Biogas) connected to the MV grid. Objective: Increase of DER hosting capacity in MV grids thanks to the installation of smart PV inverters and securing the power quality (voltage levels) according to EN 50160 standard (check that smart solution is not negatively affecting power quality). Description: CEZ Distribuce integrates selected DER connected to MV networks into volt-var control system (PV: 1.1MW, biogas station: 1.25MW, wind: 4.6MW). The DSO can send required voltage set points from its SCADA to DER unit, which then react and regulate at the required voltage set points (thanks to reactive power generation/consumption. For this volt-var control strategy, CEZ Distribuce leans on existing DER over 100kW with RTU and communication capabilities (usually GPRS) towards the DSO dispatching control system (SCADA). DSO dispatcher sends command for start of volt-var control of DER together with required voltage set point.
D6.1 Design of solution
17
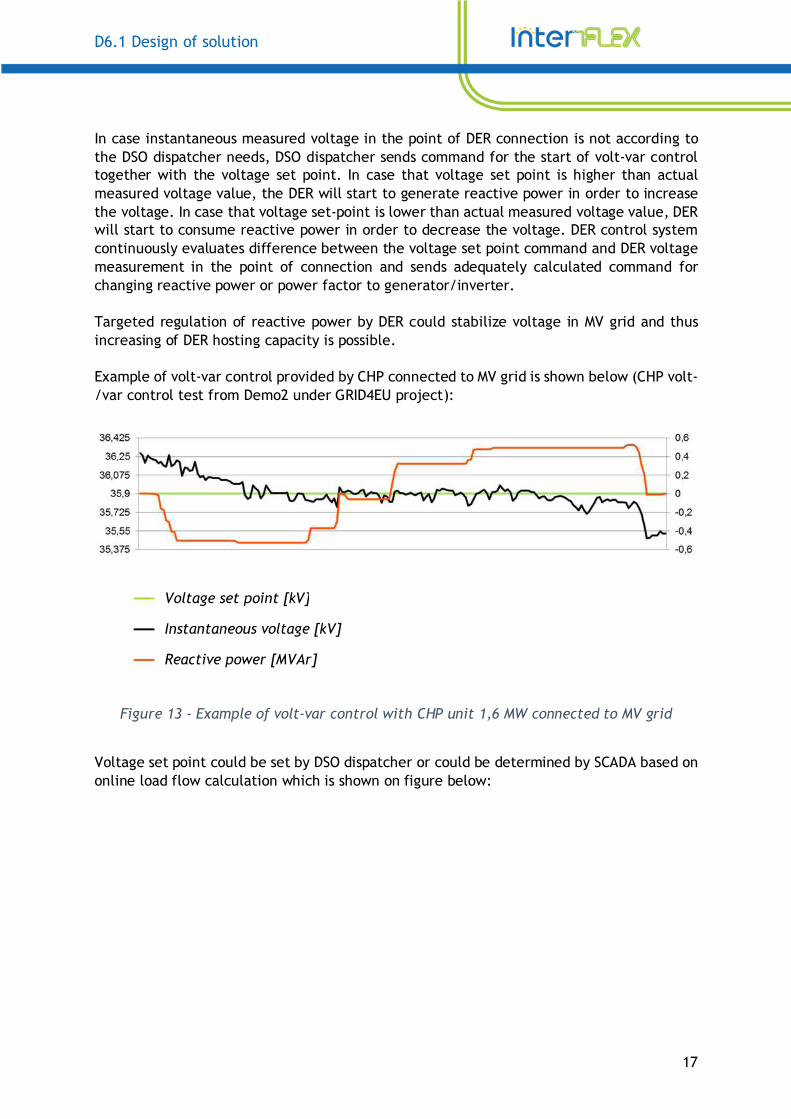
In case instantaneous measured voltage in the point of DER connection is not according to the DSO dispatcher needs, DSO dispatcher sends command for the start of volt-var control together with the voltage set point. In case that voltage set point is higher than actual measured voltage value, the DER will start to generate reactive power in order to increase the voltage. In case that voltage set-point is lower than actual measured voltage value, DER will start to consume reactive power in order to decrease the voltage. DER control system continuously evaluates difference between the voltage set point command and DER voltage measurement in the point of connection and sends adequately calculated command for changing reactive power or power factor to generator/inverter. Targeted regulation of reactive power by DER could stabilize voltage in MV grid and thus increasing of DER hosting capacity is possible. Example of volt-var control provided by CHP connected to MV grid is shown below (CHP volt-/var control test from Demo2 under GRID4EU project):
Figure 13 - Example of volt-var control with CHP unit 1,6 MW connected to MV grid
Voltage set point could be set by DSO dispatcher or could be determined by SCADA based on online load flow calculation which is shown on figure below:
Voltage set point [kV] Instantaneous voltage [kV] Reactive power [MVAr]
D6.1 Design of solution
18
Figure 14 - Block scheme of volt-var control concept
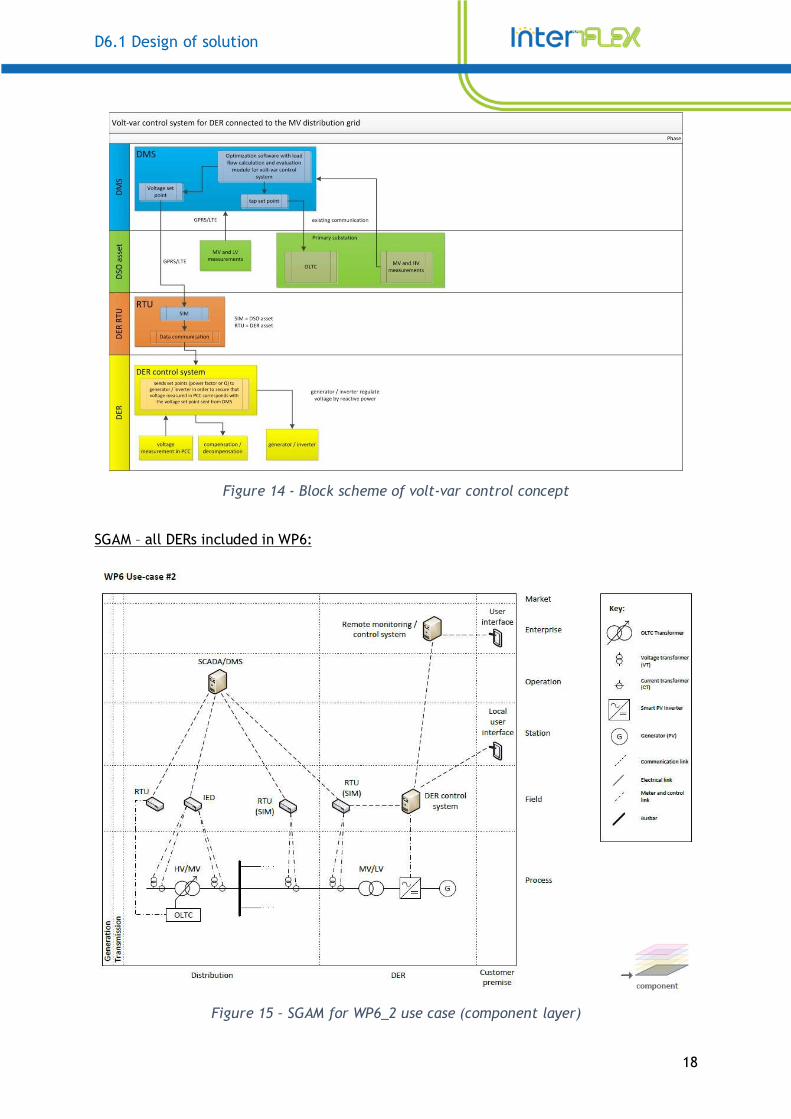
SGAM – all DERs included in WP6:
Figure 15 – SGAM for WP6_2 use case (component layer)
D6.1 Design of solution
19
Note: Detail WP6_2 use case description is included in annex 6.1 of this deliverable. Detail SGAM for solution with all DER (PV, Wind, and Biogas) is included in annex 6.2.
2.3. Use case WP6_3 - Smart EV charging
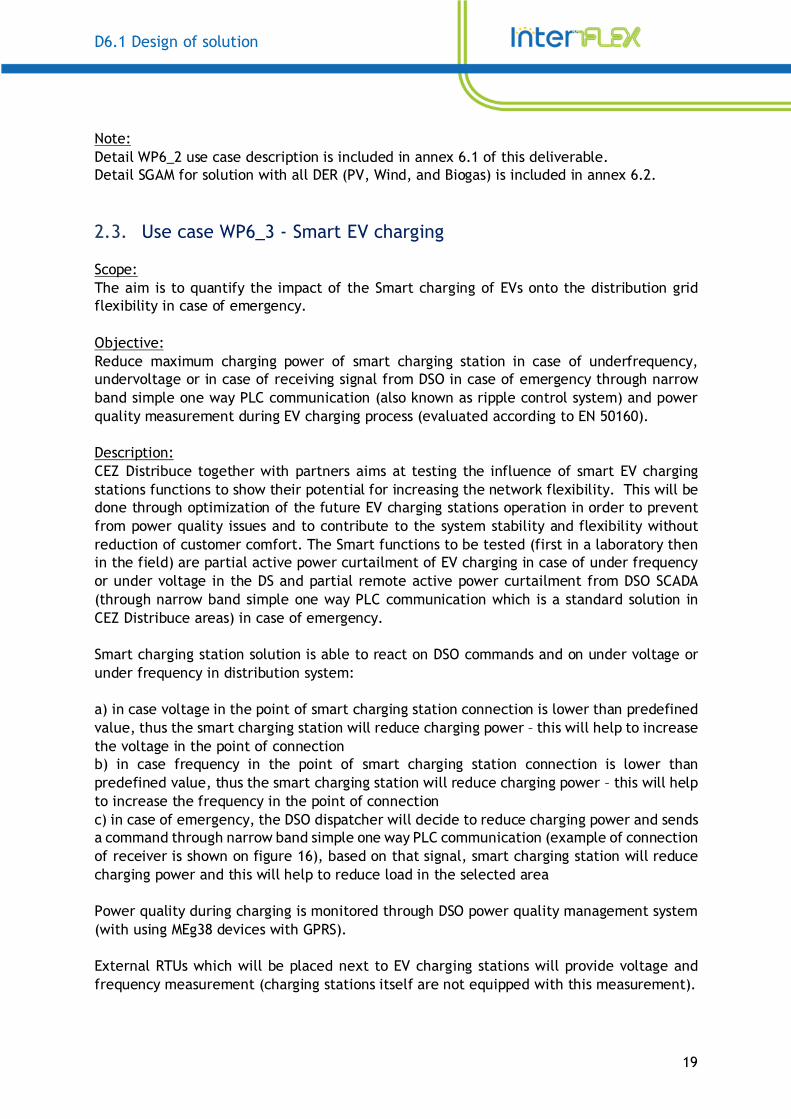
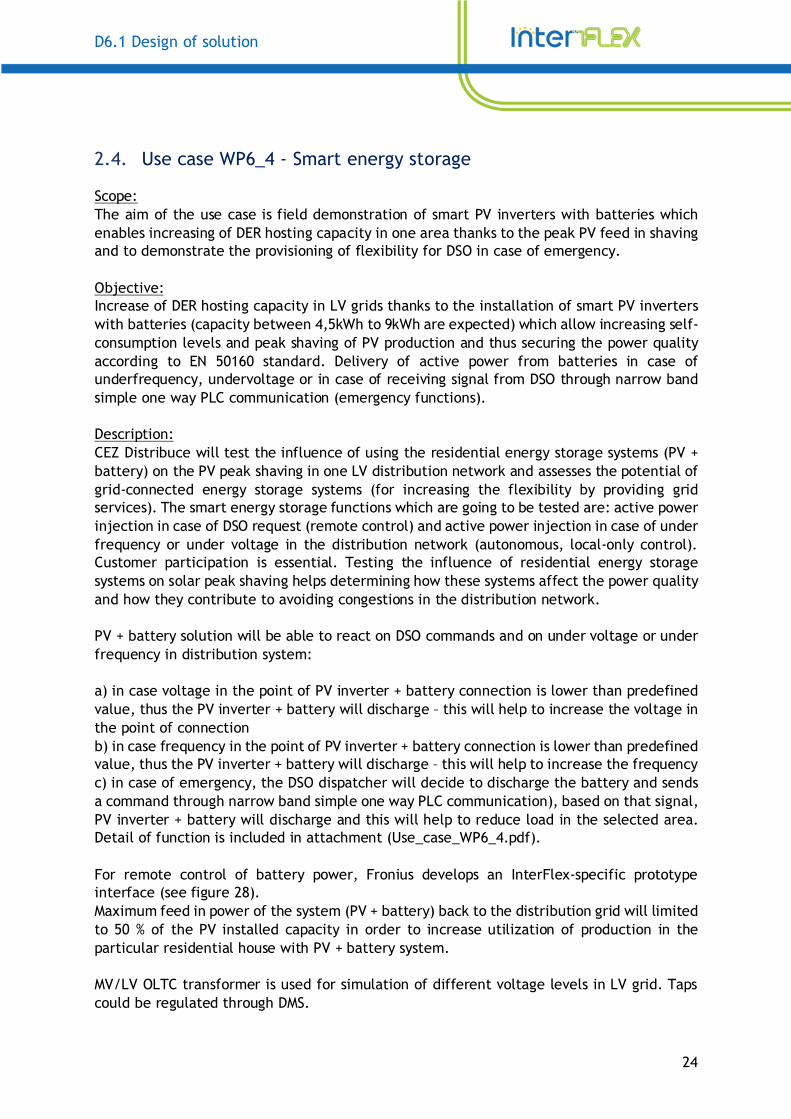
Scope: The aim is to quantify the impact of the Smart charging of EVs onto the distribution grid flexibility in case of emergency. Objective: Reduce maximum charging power of smart charging station in case of underfrequency, undervoltage or in case of receiving signal from DSO in case of emergency through narrow band simple one way PLC communication (also known as ripple control system) and power quality measurement during EV charging process (evaluated according to EN 50160). Description: CEZ Distribuce together with partners aims at testing the influence of smart EV charging stations functions to show their potential for increasing the network flexibility. This will be done through optimization of the future EV charging stations operation in order to prevent from power quality issues and to contribute to the system stability and flexibility without reduction of customer comfort. The Smart functions to be tested (first in a laboratory then in the field) are partial active power curtailment of EV charging in case of under frequency or under voltage in the DS and partial remote active power curtailment from DSO SCADA (through narrow band simple one way PLC communication which is a standard solution in CEZ Distribuce areas) in case of emergency. Smart charging station solution is able to react on DSO commands and on under voltage or under frequency in distribution system: a) in case voltage in the point of smart charging station connection is lower than predefined value, thus the smart charging station will reduce charging power – this will help to increase the voltage in the point of connection b) in case frequency in the point of smart charging station connection is lower than predefined value, thus the smart charging station will reduce charging power – this will help to increase the frequency in the point of connection c) in case of emergency, the DSO dispatcher will decide to reduce charging power and sends a command through narrow band simple one way PLC communication (example of connection of receiver is shown on figure 16), based on that signal, smart charging station will reduce charging power and this will help to reduce load in the selected area Power quality during charging is monitored through DSO power quality management system (with using MEg38 devices with GPRS). External RTUs which will be placed next to EV charging stations will provide voltage and frequency measurement (charging stations itself are not equipped with this measurement).
D6.1 Design of solution
20
In terms of interoperability – WP6 will prove that flexibility provided by 2 different types of EV charging stations (together with auxiliary equipment) from 2 different manufactures will fullfill DSOs needs (curtailment of charging in case of under voltage, under frequency or in case of receiving signal form DMS). This will confirm interoperability (more manufactures are able to fulfill required functions), scalability (this solution could be integrated for every EV charging station) and replicability (could be installed anywhere). Protocols used for the Siemens solution are described in SGAM – please check annex 6.2.
Figure 16 - Example of connection of narrow band simple one way PLC communication system used in CEZ Distribuce areas
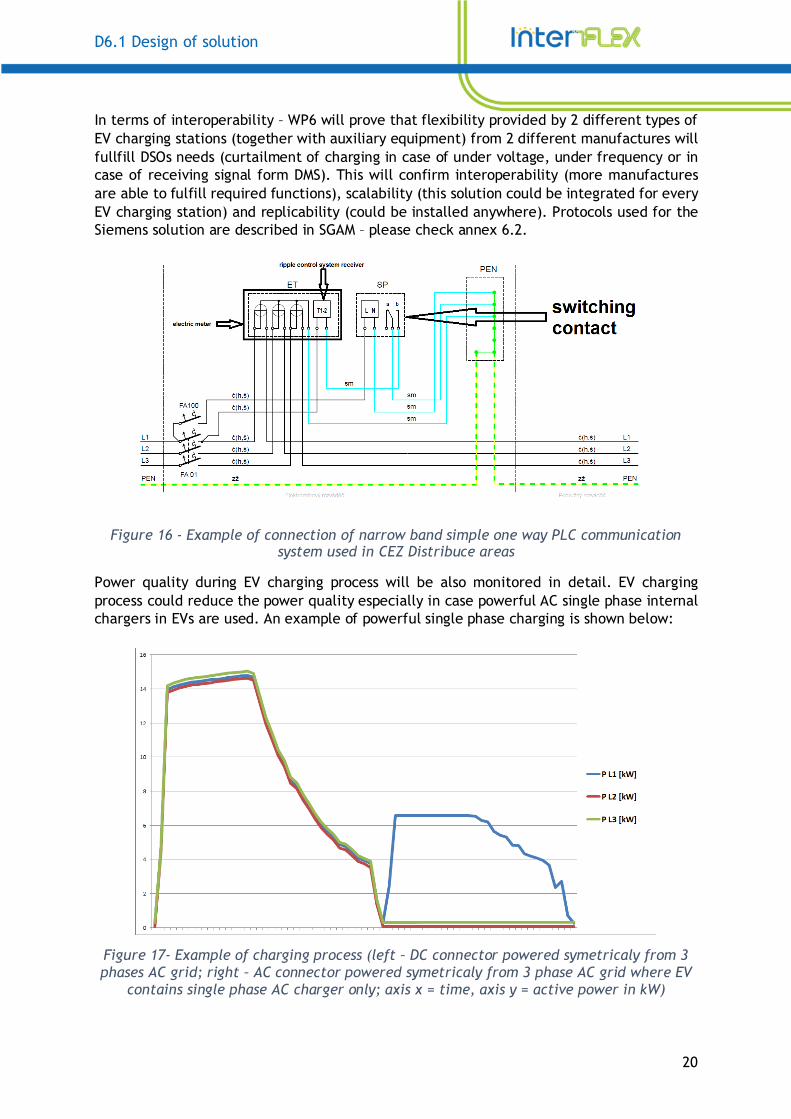
Power quality during EV charging process will be also monitored in detail. EV charging process could reduce the power quality especially in case powerful AC single phase internal chargers in EVs are used. An example of powerful single phase charging is shown below:
Figure 17- Example of charging process (left – DC connector powered symetricaly from 3 phases AC grid; right – AC connector powered symetricaly from 3 phase AC grid where EV
contains single phase AC charger only; axis x = time, axis y = active power in kW)
D6.1 Design of solution
21
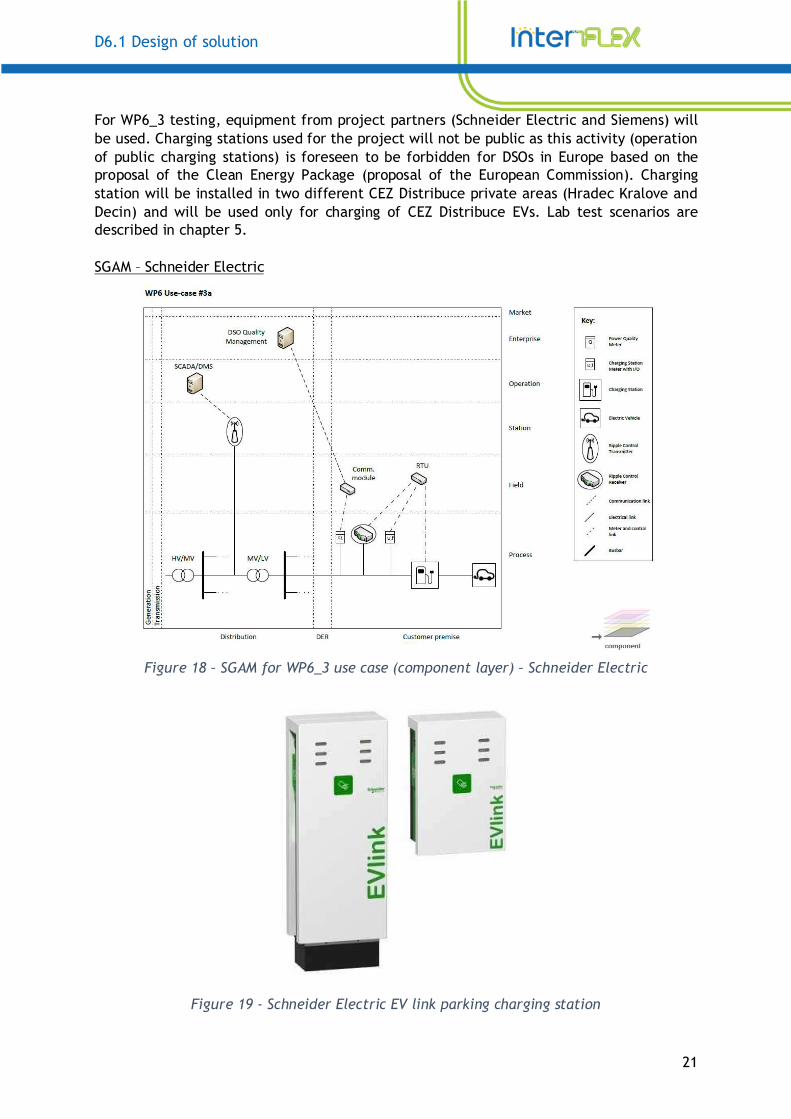
For WP6_3 testing, equipment from project partners (Schneider Electric and Siemens) will be used. Charging stations used for the project will not be public as this activity (operation of public charging stations) is foreseen to be forbidden for DSOs in Europe based on the proposal of the Clean Energy Package (proposal of the European Commission). Charging station will be installed in two different CEZ Distribuce private areas (Hradec Kralove and Decin) and will be used only for charging of CEZ Distribuce EVs. Lab test scenarios are described in chapter 5. SGAM – Schneider Electric
Figure 18 – SGAM for WP6_3 use case (component layer) – Schneider Electric
Figure 19 - Schneider Electric EV link parking charging station
D6.1 Design of solution
22
Figure 20 - Schneider Electric EV Smart Wallbox charging station
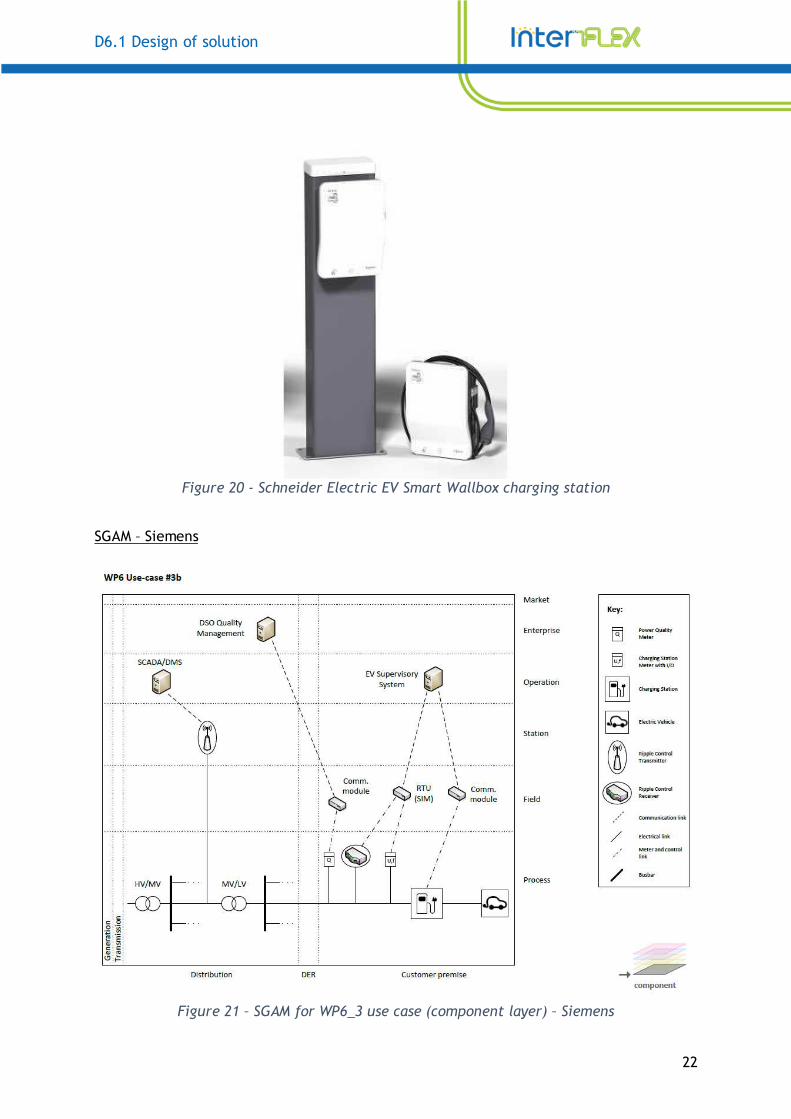
SGAM – Siemens
Figure 21 – SGAM for WP6_3 use case (component layer) – Siemens
D6.1 Design of solution
23
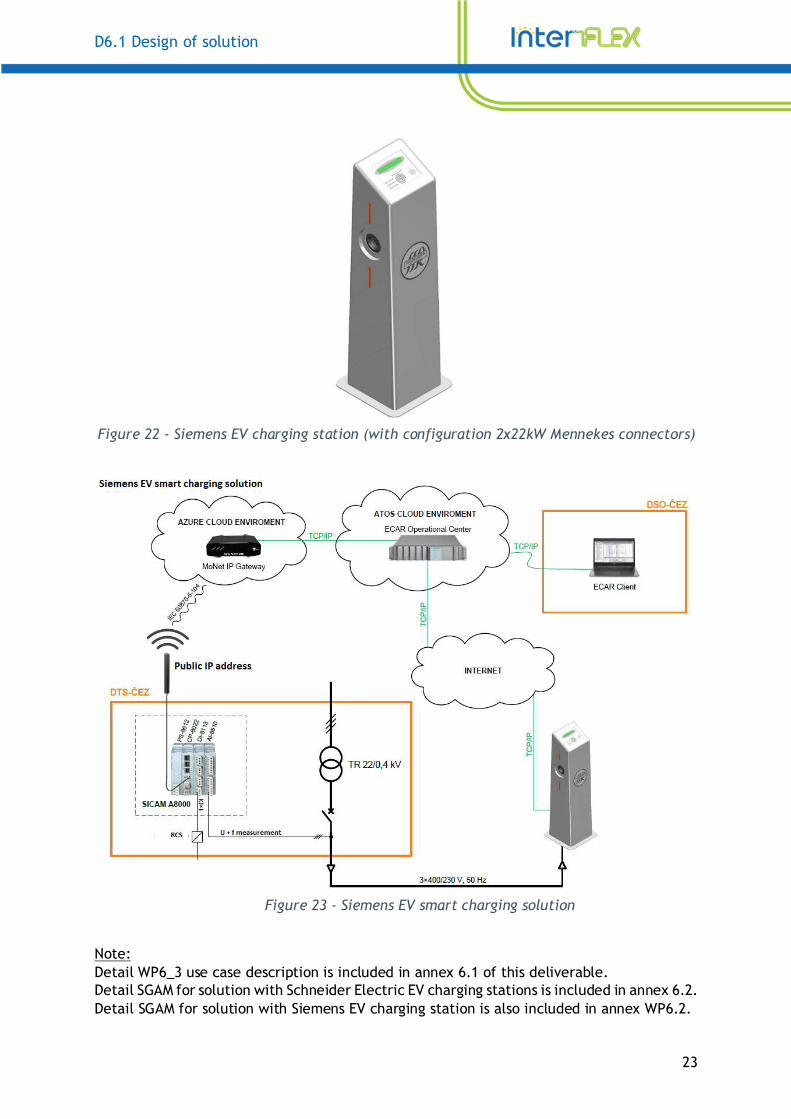
Figure 22 - Siemens EV charging station (with configuration 2x22kW Mennekes connectors)
Figure 23 - Siemens EV smart charging solution
Note: Detail WP6_3 use case description is included in annex 6.1 of this deliverable. Detail SGAM for solution with Schneider Electric EV charging stations is included in annex 6.2. Detail SGAM for solution with Siemens EV charging station is also included in annex WP6.2.
D6.1 Design of solution
24
2.4. Use case WP6_4 - Smart energy storage
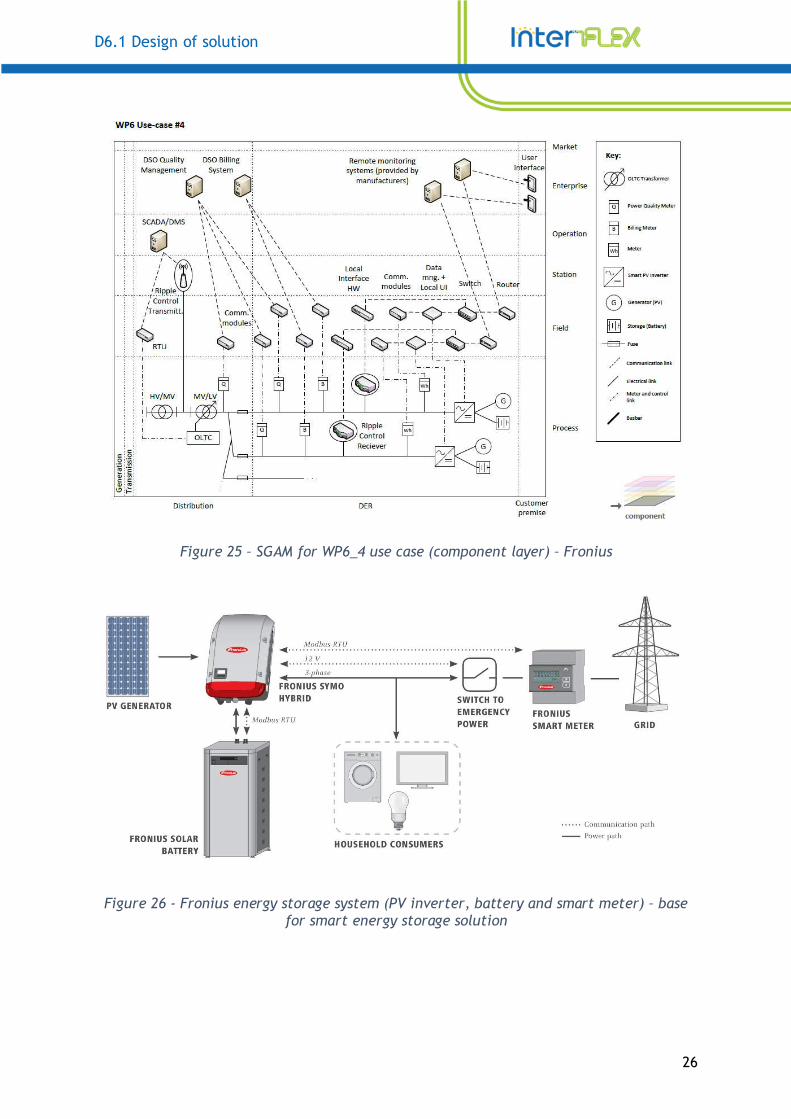
Scope: The aim of the use case is field demonstration of smart PV inverters with batteries which enables increasing of DER hosting capacity in one area thanks to the peak PV feed in shaving and to demonstrate the provisioning of flexibility for DSO in case of emergency. Objective: Increase of DER hosting capacity in LV grids thanks to the installation of smart PV inverters with batteries (capacity between 4,5kWh to 9kWh are expected) which allow increasing self-consumption levels and peak shaving of PV production and thus securing the power quality according to EN 50160 standard. Delivery of active power from batteries in case of underfrequency, undervoltage or in case of receiving signal from DSO through narrow band simple one way PLC communication (emergency functions). Description: CEZ Distribuce will test the influence of using the residential energy storage systems (PV + battery) on the PV peak shaving in one LV distribution network and assesses the potential of grid-connected energy storage systems (for increasing the flexibility by providing grid services). The smart energy storage functions which are going to be tested are: active power injection in case of DSO request (remote control) and active power injection in case of under frequency or under voltage in the distribution network (autonomous, local-only control). Customer participation is essential. Testing the influence of residential energy storage systems on solar peak shaving helps determining how these systems affect the power quality and how they contribute to avoiding congestions in the distribution network. PV + battery solution will be able to react on DSO commands and on under voltage or under frequency in distribution system: a) in case voltage in the point of PV inverter + battery connection is lower than predefined value, thus the PV inverter + battery will discharge – this will help to increase the voltage in the point of connection b) in case frequency in the point of PV inverter + battery connection is lower than predefined value, thus the PV inverter + battery will discharge – this will help to increase the frequency c) in case of emergency, the DSO dispatcher will decide to discharge the battery and sends a command through narrow band simple one way PLC communication), based on that signal, PV inverter + battery will discharge and this will help to reduce load in the selected area. Detail of function is included in attachment (Use_case_WP6_4.pdf). For remote control of battery power, Fronius develops an InterFlex-specific prototype interface (see figure 28). Maximum feed in power of the system (PV + battery) back to the distribution grid will limited to 50 % of the PV installed capacity in order to increase utilization of production in the particular residential house with PV + battery system. MV/LV OLTC transformer is used for simulation of different voltage levels in LV grid. Taps could be regulated through DMS.
D6.1 Design of solution
25
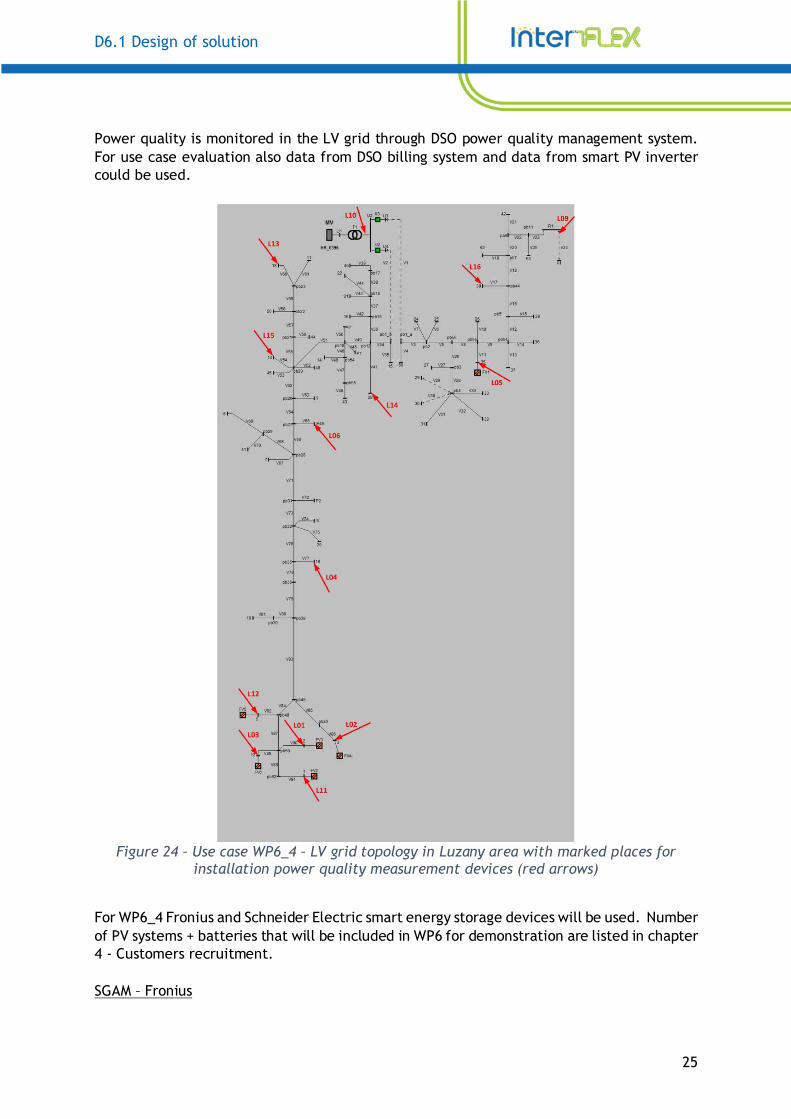
Power quality is monitored in the LV grid through DSO power quality management system. For use case evaluation also data from DSO billing system and data from smart PV inverter could be used.
Figure 24 – Use case WP6_4 – LV grid topology in Luzany area with marked places for
installation power quality measurement devices (red arrows)
For WP6_4 Fronius and Schneider Electric smart energy storage devices will be used. Number of PV systems + batteries that will be included in WP6 for demonstration are listed in chapter 4 - Customers recruitment. SGAM – Fronius
D6.1 Design of solution
26
Figure 25 – SGAM for WP6_4 use case (component layer) – Fronius
Figure 26 - Fronius energy storage system (PV inverter, battery and smart meter) – base for smart energy storage solution
D6.1 Design of solution
27
Figure 27 - Interflex-specific Fronius smart energy storage system under WP6_4 use case
Figure 28 – InterFlex-specific Fronius local interface for remote-control of smart energy
storage system under WP6_4 use case (will be used for indoor instalation)
D6.1 Design of solution
28
SGAM – Schneider Electric
Figure 29 – SGAM for WP6_4 use case (component layer) – Schneider Electric
Figure 30 - Schneider Electric smart energy storage system (PV inverter, battery and smart
meter)

D6.1 Design of solution
29
Note: Detail WP6_4 use case description is included in annex 6.1 of this deliverable. Detail SGAM for solution with Fronius PV inverter+battery system is included in annex 6.2. Detail SGAM for solution with Schneider Electric PV inverter+battery system is also included in annex 6.2.
D6.1 Design of solution
30
3. WP6 KPI DEFINITION
The purpose of KPIs is to measure and evaluate the potential of smart solutions implemented in WP6. KPIs defined in chapter 3 are internal for WP6. According to DoW, WP6 KPIs will be evaluated at the end of InterFlex project. The full KPI definition is defined in Annex 6.3.
3.1. Increasing DER hosting capacity
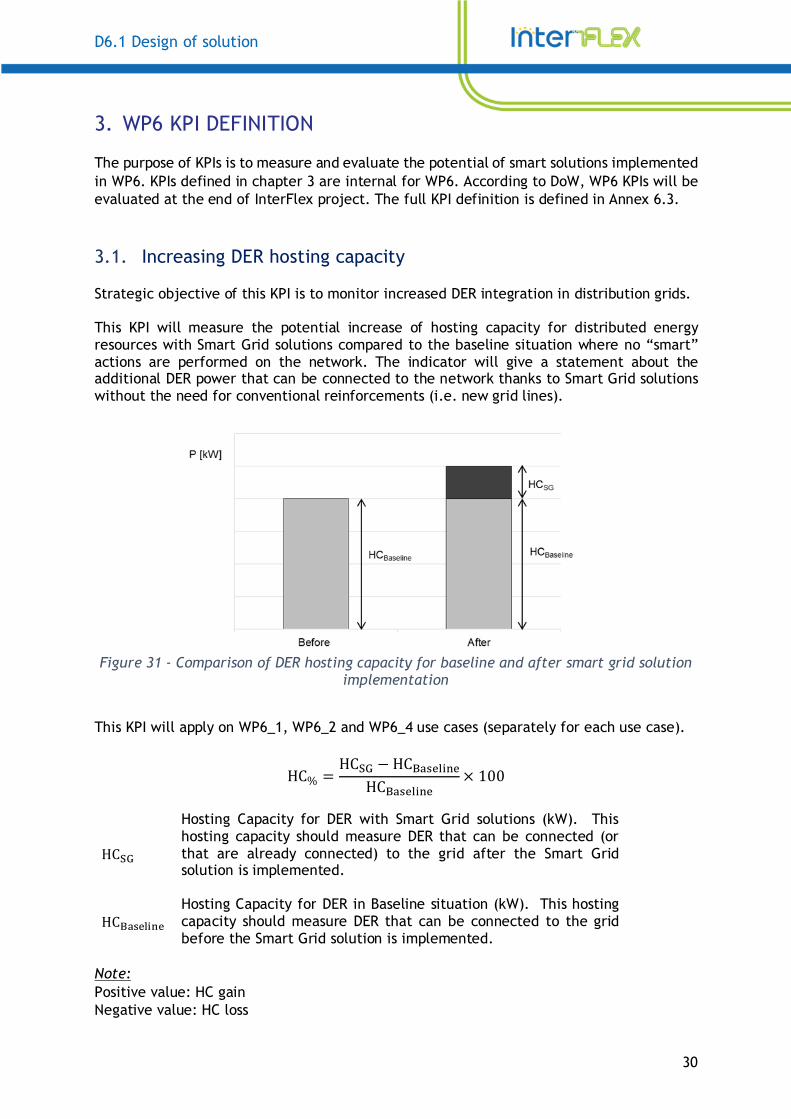
Strategic objective of this KPI is to monitor increased DER integration in distribution grids. This KPI will measure the potential increase of hosting capacity for distributed energy resources with Smart Grid solutions compared to the baseline situation where no “smart” actions are performed on the network. The indicator will give a statement about the additional DER power that can be connected to the network thanks to Smart Grid solutions without the need for conventional reinforcements (i.e. new grid lines).
Figure 31 - Comparison of DER hosting capacity for baseline and after smart grid solution
implementation
This KPI will apply on WP6_1, WP6_2 and WP6_4 use cases (separately for each use case).
HC% �HC�� �HC��� ��
HC��� ��� 100
HC��
Hosting Capacity for DER with Smart Grid solutions (kW). This hosting capacity should measure DER that can be connected (or that are already connected) to the grid after the Smart Grid solution is implemented.
HC��� �� Hosting Capacity for DER in Baseline situation (kW). This hosting capacity should measure DER that can be connected to the grid before the Smart Grid solution is implemented.
Note:
Positive value: HC gain Negative value: HC loss
D6.1 Design of solution
31
Expectations: Increase of DER hosting capacity for WP6 use cases: WP6_1: +25% WP6_2: +25% WP6_4: +5% Increasing of DER hosting capacity in WP6 will not cause power quality issues (power quality limits are defined in EN 50160). Methodology: Evaluation of baseline DER hosting capacity will be performed by simulation in DNCalc software by using baseline grid topology data from GIS system according to the standard rules for calculation of DER hosting capacity (standard approach). After smart solution implementation - evaluation of DER hosting capacity will be performed by simulation in DNCalc software by using grid topology data from GIS system (standard approach) and with new rules for calculation of DER hosting capacity or installed power of DER physically connected to the grid after smart solution implementation. Data collection: For KPI evaluation, following data will be used: 1) Number of DER which is possible to connect to the grid before smart solution implementation 2) Number of DER connected physically to the grid after smart solution implementation or hosting capacity calculated with new rules for DER hosting capacity calculation 3) Baseline grid topology for use cases WP6_1, WP6_2 and WP6_4 downloaded from GIS system.
3.2. Power quality (according to the standard EN 50160)
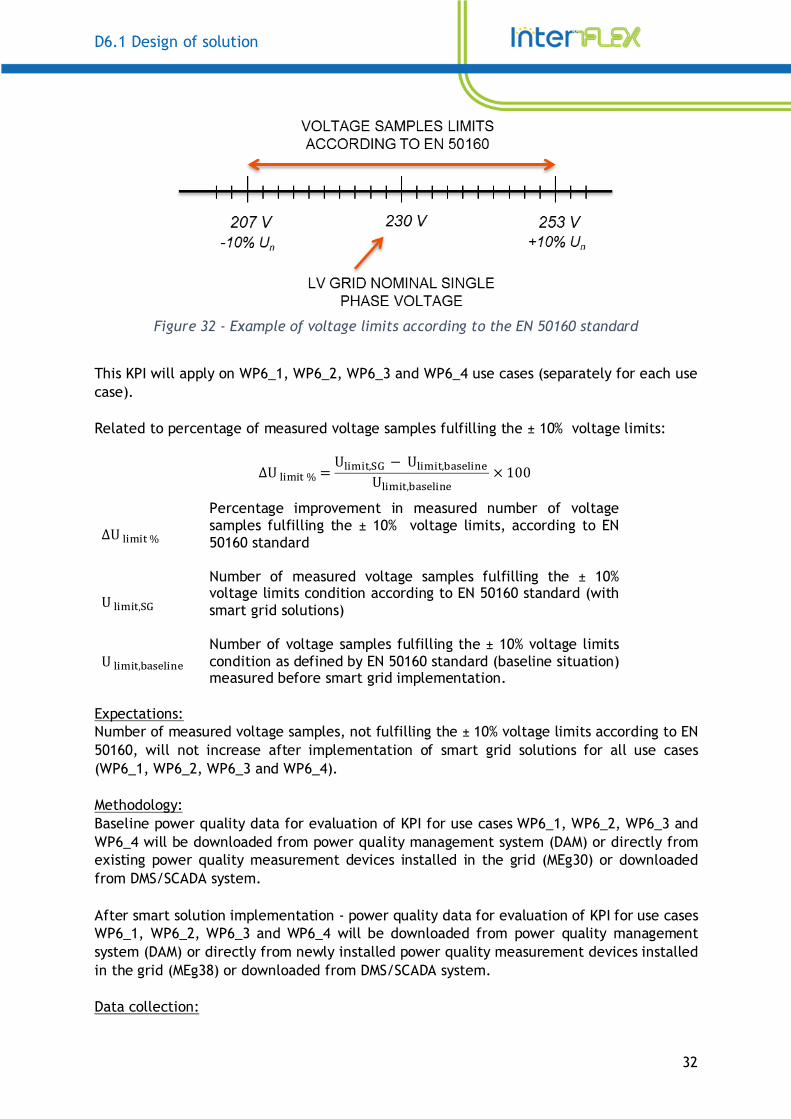
Strategic objective of this KPI is to monitor that power quality (voltage levels) will not be negatively affected by smart solution implementations and have to sustain within tolerance given by EN 50160 power quality standard. With an increasing presence of DER in the LV network, line voltage profiles will vary not only because of the presence of different loads along the grid, but also the introduction of variable generation. This phenomenon must be clearly monitored and it must be ensured that desired voltage levels are kept within the defined standard limits according to the EN 50160 standard. In this way this KPI measures the number of voltage samples fulfilling the ± 10% voltage limits, as defined in EN 50160 standard before and after the smart grid solution implementation.
D6.1 Design of solution
32
Figure 32 - Example of voltage limits according to the EN 50160 standard
This KPI will apply on WP6_1, WP6_2, WP6_3 and WP6_4 use cases (separately for each use case). Related to percentage of measured voltage samples fulfilling the ± 10% voltage limits:
∆U� � �% �U� � �,�� � U� � �,��� ��
U� � �,��� ��
� 100
∆U� � �%
Percentage improvement in measured number of voltage samples fulfilling the ± 10% voltage limits, according to EN 50160 standard
U� � �,��
Number of measured voltage samples fulfilling the ± 10% voltage limits condition according to EN 50160 standard (with smart grid solutions)
U� � �,��� �� Number of voltage samples fulfilling the ± 10% voltage limits condition as defined by EN 50160 standard (baseline situation) measured before smart grid implementation.
Expectations: Number of measured voltage samples, not fulfilling the ± 10% voltage limits according to EN 50160, will not increase after implementation of smart grid solutions for all use cases (WP6_1, WP6_2, WP6_3 and WP6_4). Methodology: Baseline power quality data for evaluation of KPI for use cases WP6_1, WP6_2, WP6_3 and WP6_4 will be downloaded from power quality management system (DAM) or directly from existing power quality measurement devices installed in the grid (MEg30) or downloaded from DMS/SCADA system. After smart solution implementation - power quality data for evaluation of KPI for use cases WP6_1, WP6_2, WP6_3 and WP6_4 will be downloaded from power quality management system (DAM) or directly from newly installed power quality measurement devices installed in the grid (MEg38) or downloaded from DMS/SCADA system. Data collection:
D6.1 Design of solution
33
For KPI evaluation, following data will be used: 1) Number of voltage samples fulfilling the ± 10% voltage limits condition as defined by EN 50160 standard (baseline situation) measured before smart grid implementation 2) Power quality measurements (from MEg30 devices through DAM or downloaded directly; or from DMS/SCADA ) 3) Number of measured voltage samples fulfilling the ± 10% voltage limits condition according to EN 50160 standard (with smart grid solutions) 4) Power quality measurements (from MEg38 devices through DAM or downloaded directly; or from DMS/SCADA )
3.3. EV charging stations load curtailment in emergency situations
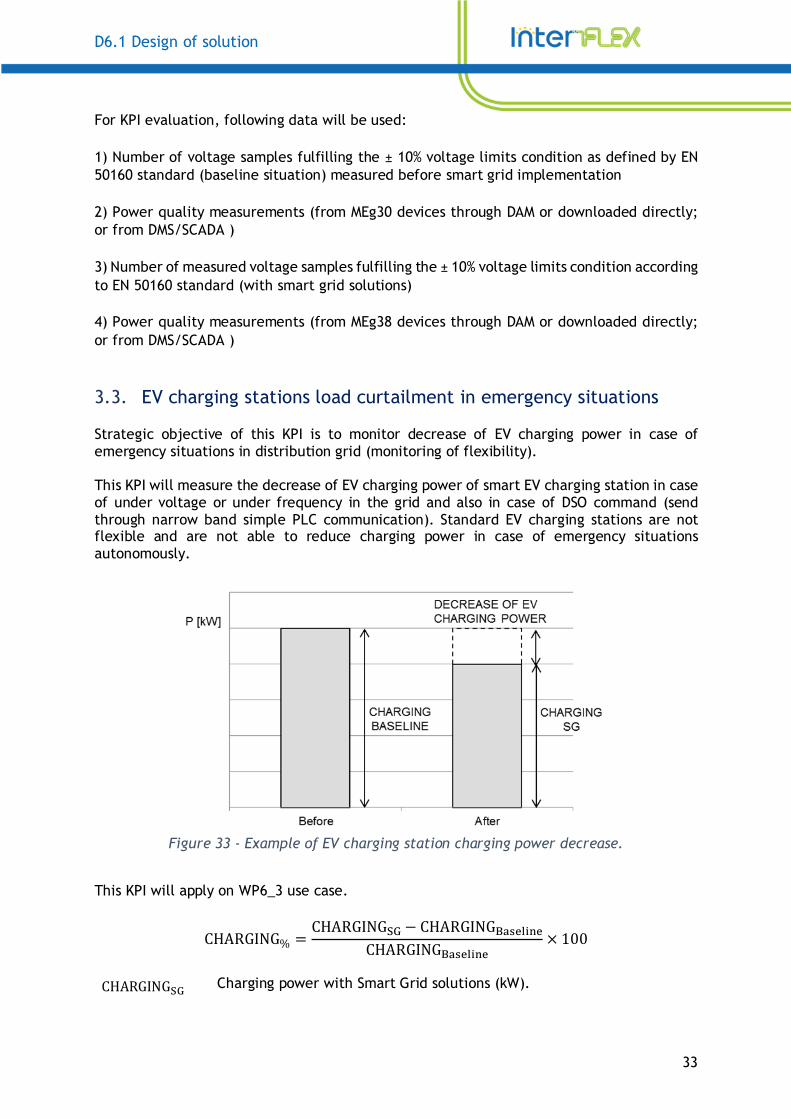
Strategic objective of this KPI is to monitor decrease of EV charging power in case of emergency situations in distribution grid (monitoring of flexibility). This KPI will measure the decrease of EV charging power of smart EV charging station in case of under voltage or under frequency in the grid and also in case of DSO command (send through narrow band simple PLC communication). Standard EV charging stations are not flexible and are not able to reduce charging power in case of emergency situations autonomously.
Figure 33 - Example of EV charging station charging power decrease.
This KPI will apply on WP6_3 use case.
CHARGING% �CHARGING�� � CHARGING��� ��
CHARGING��� ��� 100
CHARGING�� Charging power with Smart Grid solutions (kW).
D6.1 Design of solution
34
CHARGING��� ��
Charging power in Baseline situation (kW) – without any curtailment.
Note:
Positive value: charging power increase Negative value: charging power decrease Expectations: Decrease of EV charging power in case of emergency situations in distribution: WP6_3: -40% Methodology: Evaluation of nominal EV charging station power will be checked from the device specification (manufactures datasheet). After smart solution implementation - evaluation of EV charging station charging power curtailment in case of under frequency or in case of under voltage or in case of DSO command will be evaluated by field tests. Data collection: For KPI evaluation, following data will be used: 1) Nominal charging power of EV charging station 2) Manufacturer of EV charging station 3) Charging power of EV charging station in emergency situation (or during field test) 4) Meg38 power quality device 5) Baseline EV charging stations charging power values will be checked from manufactures datasheets
3.4. PV feed-in peak shaving
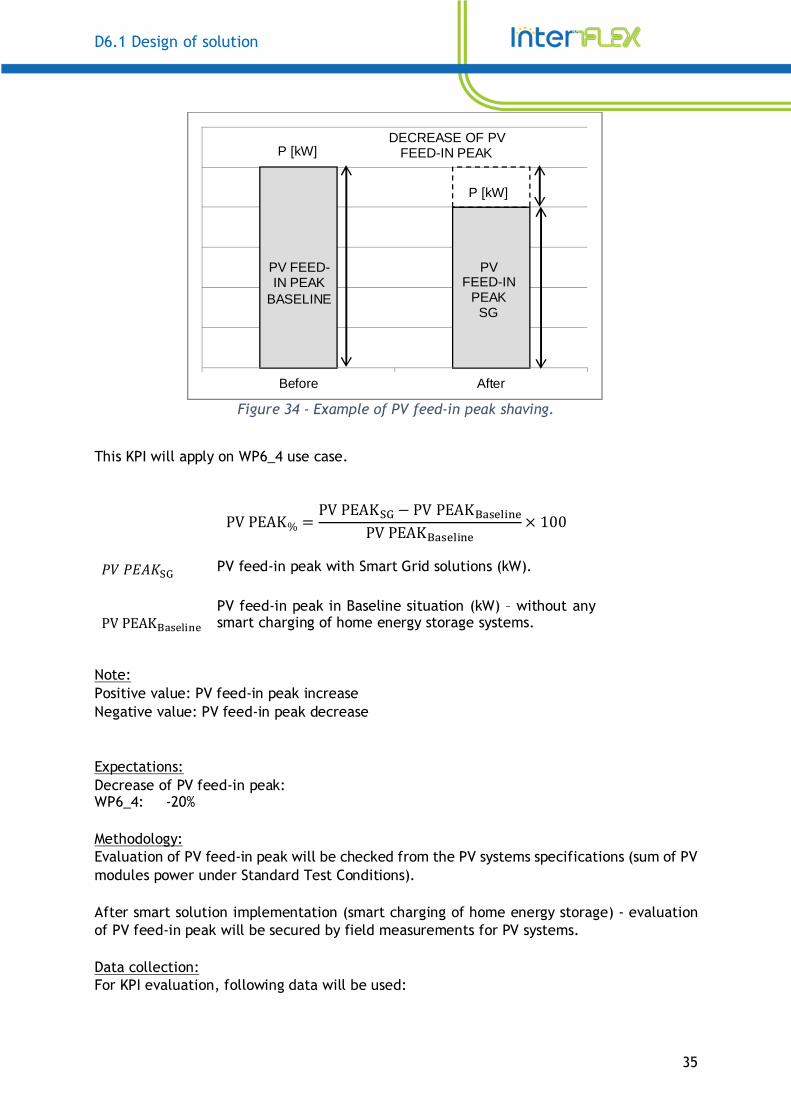
Strategic objective of this KPI is to monitor decrease of PV feed-in peak thanks to the installation of home energy storage systems/batteries (monitoring of flexibility). This KPI will measure the decrease of PV feed-in peak which overflow to the distribution grid thanks to the installation of PV together with home energy storage systems. PV + home energy storage systems will secure lower surplus of solar power to the distribution grid thanks to the smart control.
D6.1 Design of solution
35
Figure 34 - Example of PV feed-in peak shaving.
This KPI will apply on WP6_4 use case.
PVPEAK% �PVPEAK�� � PVPEAK��� ��
PVPEAK��� ��
� 100
"#"$%&�� PV feed-in peak with Smart Grid solutions (kW).
PVPEAK��� �� PV feed-in peak in Baseline situation (kW) – without any smart charging of home energy storage systems.
Note: Positive value: PV feed-in peak increase Negative value: PV feed-in peak decrease Expectations: Decrease of PV feed-in peak: WP6_4: -20% Methodology: Evaluation of PV feed-in peak will be checked from the PV systems specifications (sum of PV modules power under Standard Test Conditions). After smart solution implementation (smart charging of home energy storage) - evaluation of PV feed-in peak will be secured by field measurements for PV systems. Data collection: For KPI evaluation, following data will be used:
Before After
DECREASE OF PV FEED-IN PEAK P [kW]
PV FEED-IN
PEAK SG
PV FEED-IN PEAK
BASELINE
P [kW]

D6.1 Design of solution
36
1) PV feed-in peak determined as a sum of installed PV power 2) Manufacturer of PV modules 3) PV feed-in peak after smart charging of home energy storage is implemented 4) Meg38 power quality device
5) Baseline PV module power values under Standard Test Conditions will be checked from manufactures datasheets
D6.1 Design of solution
37
4. CUSTOMERS RECRUITMENT
For demonstration of WP6 solutions, specific customers are needed in order to prove use cases under real operation conditions. In use case WP6_1, residential customers with PV are needed for testing of smart PV inverters. In use case WP6_2, owners of large DER installations are needed for testing volt-var control on MV. In use case WP6_4, residential customers with PV and home energy storage systems are needed in order to test smart energy storage functions. CEZ Solarní company as a project partner is responsible for recruitment of customers for WP6_1, WP6_4 and partially for WP6_2 (recruitment of large PV system owner). Customers recruitment is key part of the project, otherwise demonstration of WP6 solution under real distribution grid conditions is not possible. Customers who are recruited and listed in following chapters cooperate on voluntary basis. Equipment for demonstration of use cases WP6_1, WP6_4 and partially WP6_2 is delivered by CEZ Solarni as a project partner. PV systems and batteries under use case WP6_1 and WP6_4 are not cofinanced by InterFlex H2020 project.
4.1. Use case WP6_1 smart PV inverters
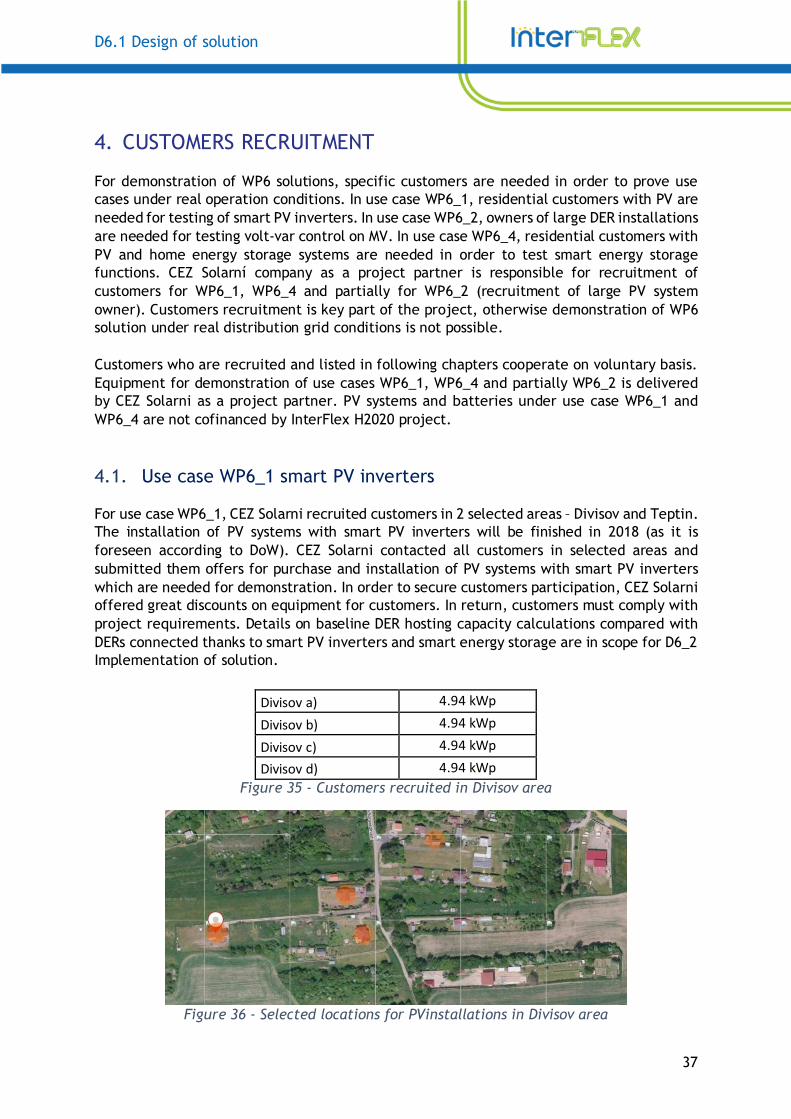
For use case WP6_1, CEZ Solarni recruited customers in 2 selected areas – Divisov and Teptin. The installation of PV systems with smart PV inverters will be finished in 2018 (as it is foreseen according to DoW). CEZ Solarni contacted all customers in selected areas and submitted them offers for purchase and installation of PV systems with smart PV inverters which are needed for demonstration. In order to secure customers participation, CEZ Solarni offered great discounts on equipment for customers. In return, customers must comply with project requirements. Details on baseline DER hosting capacity calculations compared with DERs connected thanks to smart PV inverters and smart energy storage are in scope for D6_2 Implementation of solution.
Divisov a) 4.94 kWp
Divisov b) 4.94 kWp
Divisov c) 4.94 kWp
Divisov d) 4.94 kWp
Figure 35 - Customers recruited in Divisov area
Figure 36 - Selected locations for PVinstallations in Divisov area
D6.1 Design of solution
38
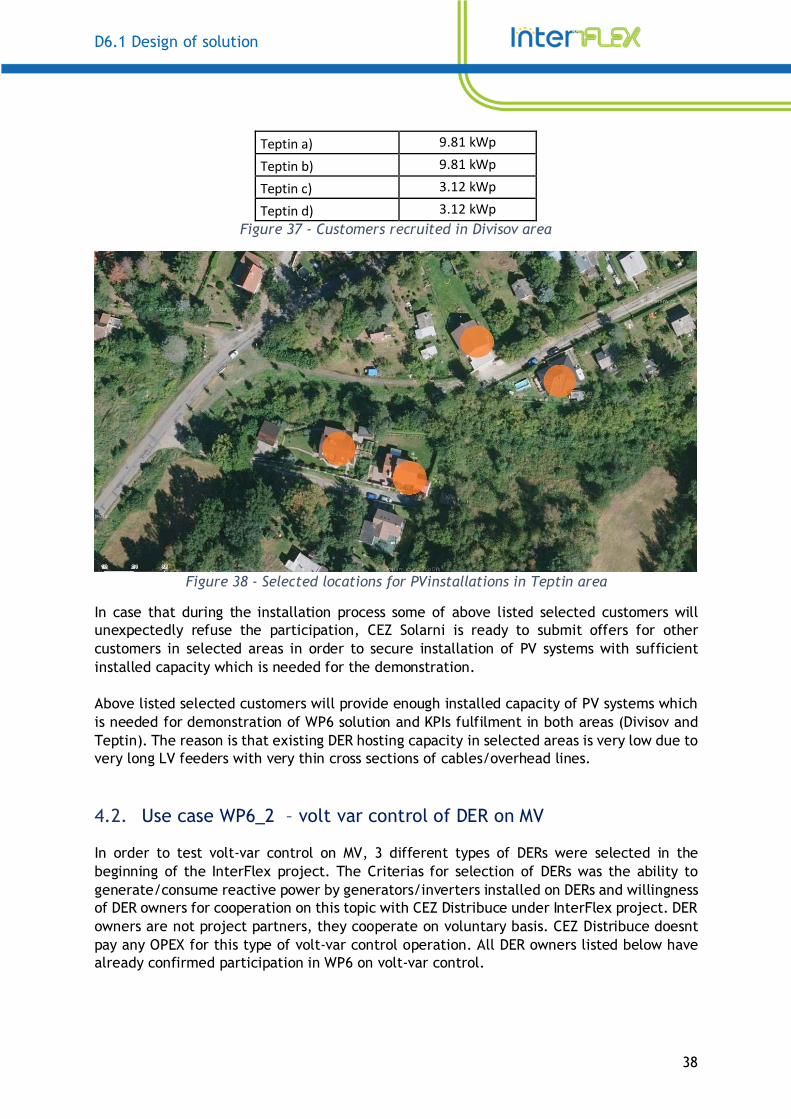
Teptin a) 9.81 kWp
Teptin b) 9.81 kWp
Teptin c) 3.12 kWp
Teptin d) 3.12 kWp
Figure 37 - Customers recruited in Divisov area
Figure 38 - Selected locations for PVinstallations in Teptin area
In case that during the installation process some of above listed selected customers will unexpectedly refuse the participation, CEZ Solarni is ready to submit offers for other customers in selected areas in order to secure installation of PV systems with sufficient installed capacity which is needed for the demonstration. Above listed selected customers will provide enough installed capacity of PV systems which is needed for demonstration of WP6 solution and KPIs fulfilment in both areas (Divisov and Teptin). The reason is that existing DER hosting capacity in selected areas is very low due to very long LV feeders with very thin cross sections of cables/overhead lines.
4.2. Use case WP6_2 – volt var control of DER on MV
In order to test volt-var control on MV, 3 different types of DERs were selected in the beginning of the InterFlex project. The Criterias for selection of DERs was the ability to generate/consume reactive power by generators/inverters installed on DERs and willingness of DER owners for cooperation on this topic with CEZ Distribuce under InterFlex project. DER owners are not project partners, they cooperate on voluntary basis. CEZ Distribuce doesnt pay any OPEX for this type of volt-var control operation. All DER owners listed below have already confirmed participation in WP6 on volt-var control.
D6.1 Design of solution
39
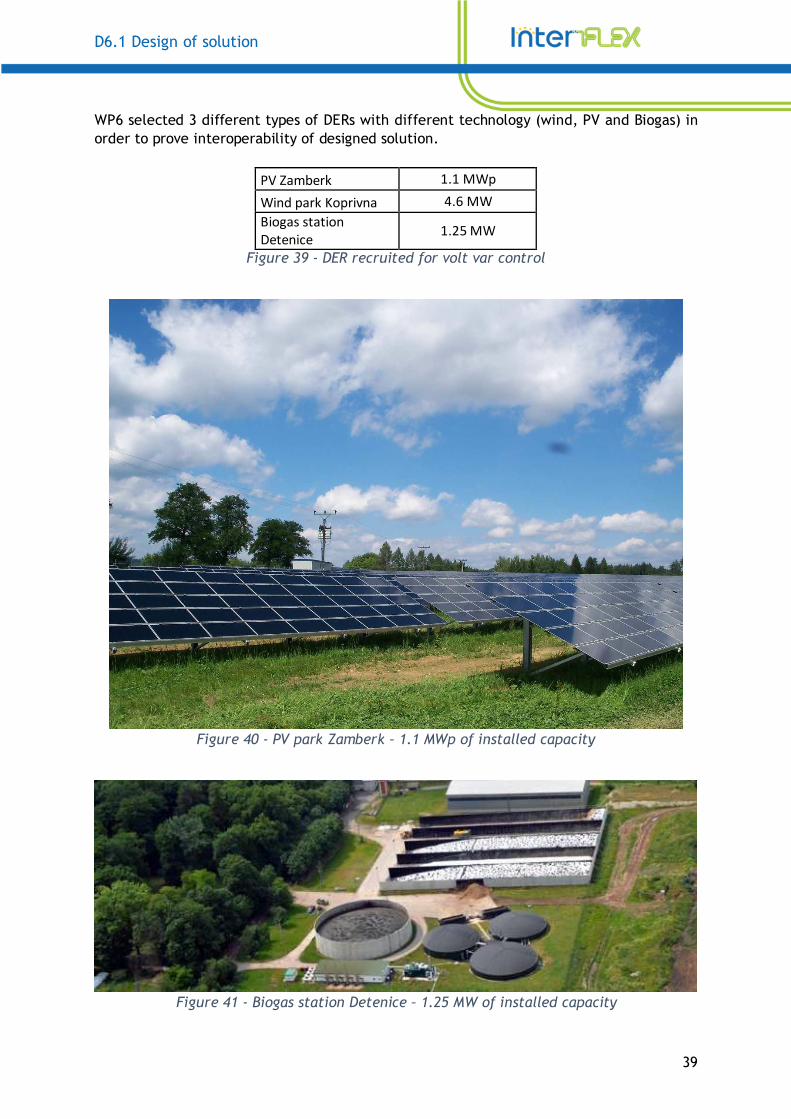
WP6 selected 3 different types of DERs with different technology (wind, PV and Biogas) in order to prove interoperability of designed solution.
PV Zamberk 1.1 MWp
Wind park Koprivna 4.6 MW
Biogas station
Detenice 1.25 MW
Figure 39 - DER recruited for volt var control
Figure 40 - PV park Zamberk – 1.1 MWp of installed capacity
Figure 41 - Biogas station Detenice – 1.25 MW of installed capacity
D6.1 Design of solution
40
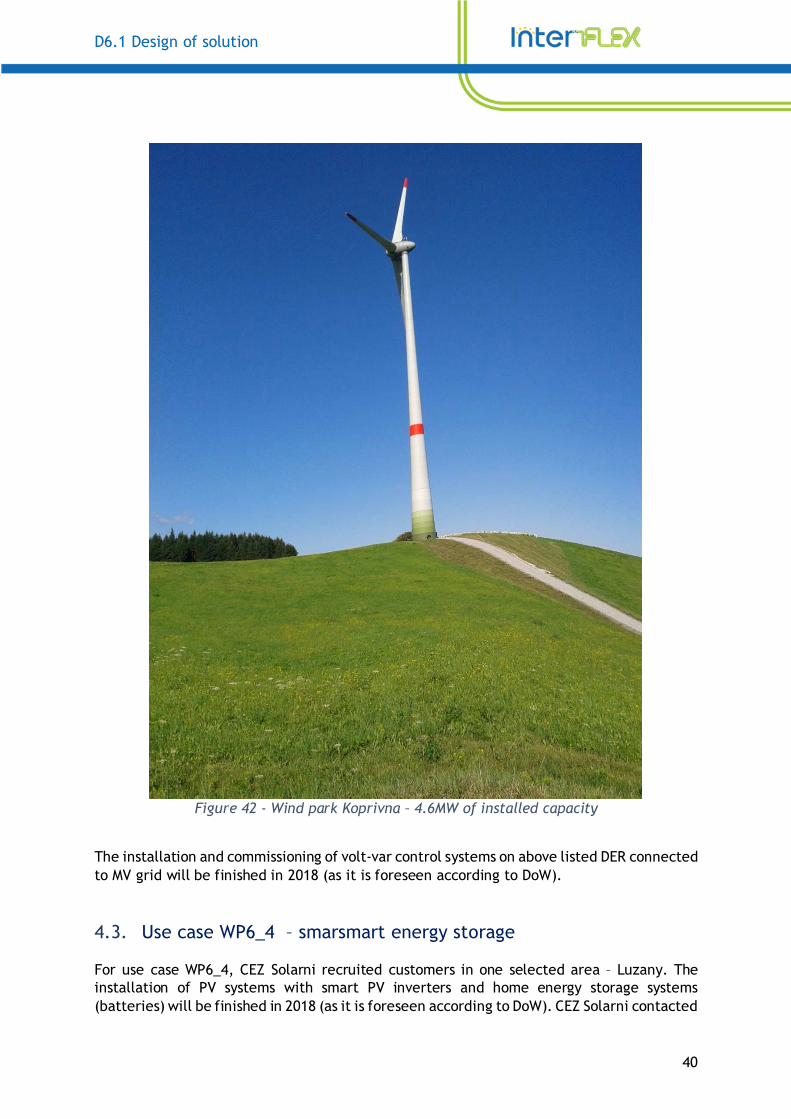
Figure 42 - Wind park Koprivna – 4.6MW of installed capacity
The installation and commissioning of volt-var control systems on above listed DER connected to MV grid will be finished in 2018 (as it is foreseen according to DoW).
4.3. Use case WP6_4 – smarsmart energy storage
For use case WP6_4, CEZ Solarni recruited customers in one selected area – Luzany. The installation of PV systems with smart PV inverters and home energy storage systems (batteries) will be finished in 2018 (as it is foreseen according to DoW). CEZ Solarni contacted
D6.1 Design of solution
41
all customers in selected area and submitted them offers for purchase and installation of PV systems with smart PV inverters and batteries which are needed for demonstration. In order to secure customers participation, CEZ Solarni offered great discounts on equipment for customers. In return, customers must comply with project requirements. Details on baseline DER hosting capacity calculations compared with DERs connected thanks to smart PV inverters and smart energy storage are in scope for D6_2 Implementation of solution.
Luzany a) 5.2 kWp
Luzany b) 4.94 kWp
Luzany c) 4.94 kWp
Luzany d) 4.94 kWp
Luzany e) 4.94 kWp
Figure 43 - Customers recruited in Luzany area
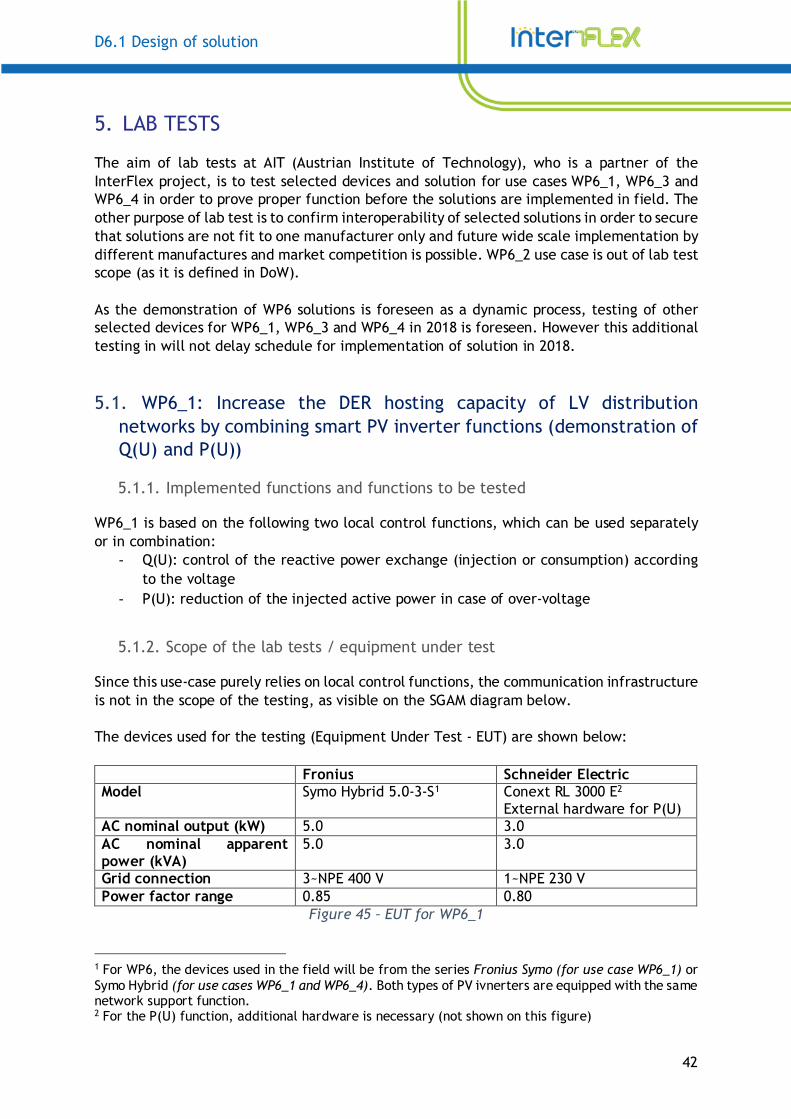
Figure 44 - Selected locations for PV+energy storage installations in Luzany area
In case that during the installation process some of above listed selected customers will unexpectedly refuse the participation, CEZ Solarni is ready to submit offers for other customers in selected area in order to secure installation of PV systems and batteries with sufficient installed capacity which is needed for the demonstration. Above listed selected customers will provide enough installed capacity of PV systems and batteries which is needed for demonstration of WP6 solution and KPIs fulfilment in area Luzany. The reason is that existing DER hosting capacity in selected area is very low due to very long LV feeders with very thin cross sections of cables/overhead lines.
D6.1 Design of solution
42
5. LAB TESTS
The aim of lab tests at AIT (Austrian Institute of Technology), who is a partner of the InterFlex project, is to test selected devices and solution for use cases WP6_1, WP6_3 and WP6_4 in order to prove proper function before the solutions are implemented in field. The other purpose of lab test is to confirm interoperability of selected solutions in order to secure that solutions are not fit to one manufacturer only and future wide scale implementation by different manufactures and market competition is possible. WP6_2 use case is out of lab test scope (as it is defined in DoW). As the demonstration of WP6 solutions is foreseen as a dynamic process, testing of other selected devices for WP6_1, WP6_3 and WP6_4 in 2018 is foreseen. However this additional testing in will not delay schedule for implementation of solution in 2018.
5.1. WP6_1: Increase the DER hosting capacity of LV distribution networks by combining smart PV inverter functions (demonstration of Q(U) and P(U))
5.1.1. Implemented functions and functions to be tested
WP6_1 is based on the following two local control functions, which can be used separately or in combination:
- Q(U): control of the reactive power exchange (injection or consumption) according to the voltage
- P(U): reduction of the injected active power in case of over-voltage
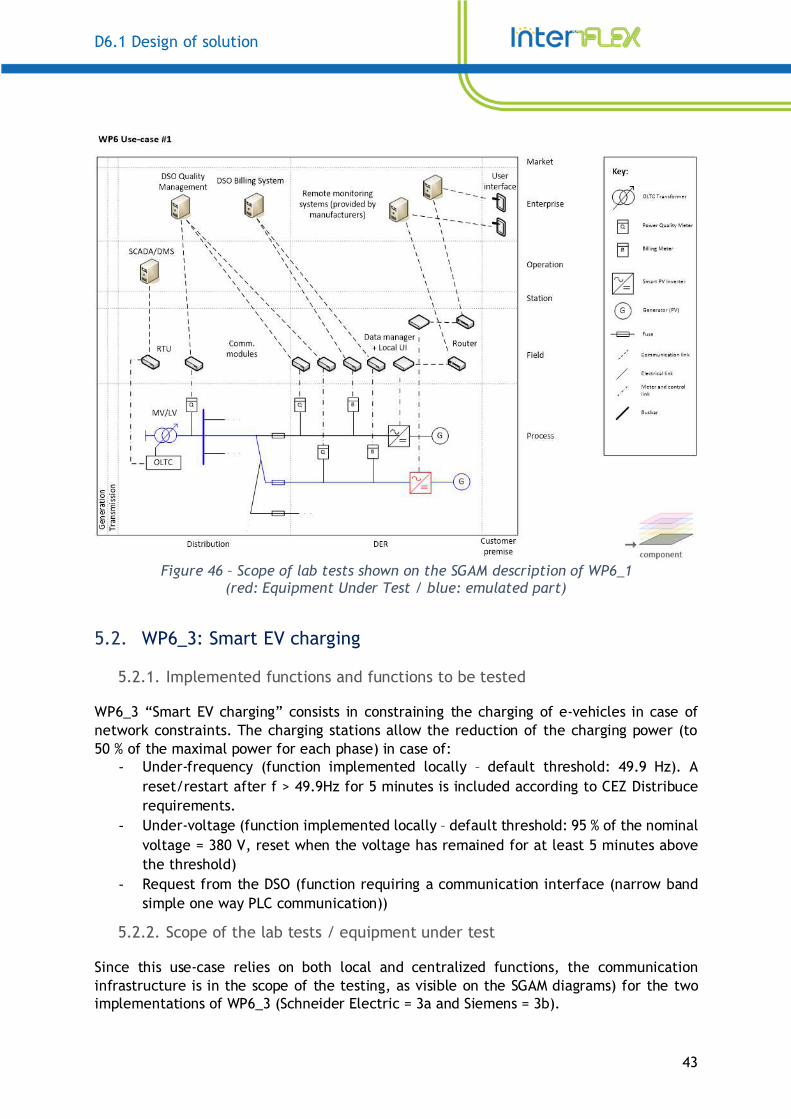
5.1.2. Scope of the lab tests / equipment under test
Since this use-case purely relies on local control functions, the communication infrastructure is not in the scope of the testing, as visible on the SGAM diagram below. The devices used for the testing (Equipment Under Test - EUT) are shown below: Fronius Schneider Electric Model Symo Hybrid 5.0-3-S1 Conext RL 3000 E2
External hardware for P(U) AC nominal output (kW) 5.0 3.0 AC nominal apparent power (kVA)
5.0 3.0
Grid connection 3~NPE 400 V 1~NPE 230 V Power factor range 0.85 0.80
Figure 45 – EUT for WP6_1
1 For WP6, the devices used in the field will be from the series Fronius Symo (for use case WP6_1) or Symo Hybrid (for use cases WP6_1 and WP6_4). Both types of PV ivnerters are equipped with the same network support function. 2 For the P(U) function, additional hardware is necessary (not shown on this figure)
D6.1 Design of solution
43
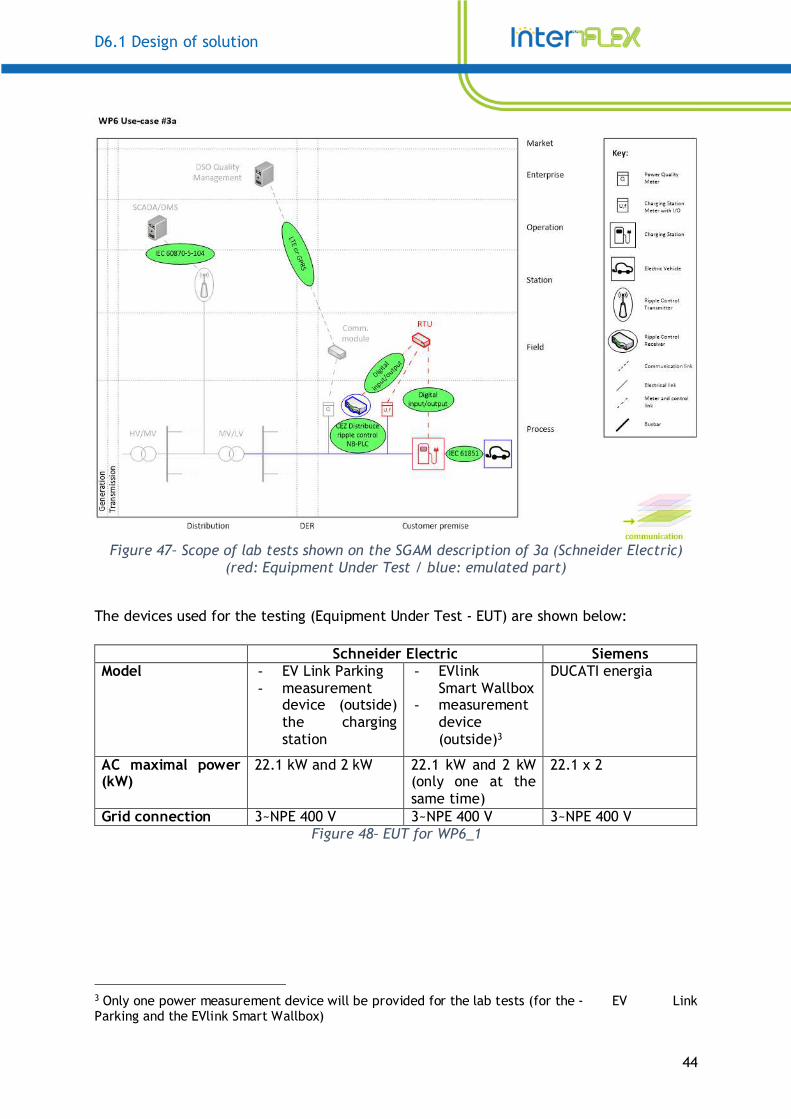
Figure 46 – Scope of lab tests shown on the SGAM description of WP6_1
(red: Equipment Under Test / blue: emulated part)
5.2. WP6_3: Smart EV charging
5.2.1. Implemented functions and functions to be tested
WP6_3 “Smart EV charging” consists in constraining the charging of e-vehicles in case of network constraints. The charging stations allow the reduction of the charging power (to 50 % of the maximal power for each phase) in case of:
- Under-frequency (function implemented locally – default threshold: 49.9 Hz). A reset/restart after f > 49.9Hz for 5 minutes is included according to CEZ Distribuce requirements.
- Under-voltage (function implemented locally – default threshold: 95 % of the nominal voltage = 380 V, reset when the voltage has remained for at least 5 minutes above the threshold)
- Request from the DSO (function requiring a communication interface (narrow band simple one way PLC communication))
5.2.2. Scope of the lab tests / equipment under test
Since this use-case relies on both local and centralized functions, the communication infrastructure is in the scope of the testing, as visible on the SGAM diagrams) for the two implementations of WP6_3 (Schneider Electric = 3a and Siemens = 3b).
D6.1 Design of solution
44
Figure 47– Scope of lab tests shown on the SGAM description of 3a (Schneider Electric)
(red: Equipment Under Test / blue: emulated part)
The devices used for the testing (Equipment Under Test - EUT) are shown below: Schneider Electric Siemens Model - EV Link Parking
- measurement device (outside) the charging station
- EVlink Smart Wallbox
- measurement device (outside)3
DUCATI energia
AC maximal power (kW)
22.1 kW and 2 kW 22.1 kW and 2 kW (only one at the same time)
22.1 x 2
Grid connection 3~NPE 400 V 3~NPE 400 V 3~NPE 400 V Figure 48– EUT for WP6_1
3 Only one power measurement device will be provided for the lab tests (for the - EV Link Parking and the EVlink Smart Wallbox)
D6.1 Design of solution
45
Figure 49 – Scope of lab tests shown on the SGAM description of 3b (Siemens)
(red: Equipment Under Test / blue: emulated part)
In addition to the charging station, further following components which are necessary for the remote control will be used: RTU, Comm. module. Some of them are included in the charging station.
5.3. WP6_4: Smart energy storage
5.3.1. Implemented functions and functions to be tested
The hybrid PV storage systems will feature the control functions covered in WP6_1 (Q(U), P(U), see chapter 5.1) and will, in addition, offer the following functions (partly based on WP6_3): Local functions:
- Permanent limitation of the power surplus injected into the network to 50 % of the nominal power of the installed PV power.
- Under-frequency stage 1 (function implemented locally – default threshold: 49.9 Hz): stop the charging of the battery. The charging can restart if the frequency is above 49.9 Hz for at least 5 minutes
- Under-frequency stage 2 (function implemented locally – default threshold: 49.85 Hz): discharge of the battery at 100 % of nominal power until the min. allowed SoC (70 %) of the battery is reached or the frequency exceeds 50.1 Hz
D6.1 Design of solution
46
- Under-voltage stage 1 (function implemented locally – default threshold: 95 % of the nominal voltage = 380 V): stop the charging of the battery. The charging can restart if the frequency is above 380 V for at least 5 minutes
- Under-voltage stage 2 (function implemented locally – default threshold: 92.5 % of the nominal voltage = 370 V): discharge of the battery at 100 % of nominal power until the min. allowed SoC (70 %) of the battery is reached or the voltage exceeds 420 V
Remote functions: As in WP6_3, a remote control is included: the PV + storage system must allow the discharge at 100 % of the nominal power of battery system after activation via narrow band simple one way PLC communication from DSO until the min. allowed SoC (70 %) of the battery is reached.
5.3.2. Scope of the lab tests / equipment under test
Since this use-case relies on both local and centralized functions, the communication infrastructure is in the scope of the testing, as visible on the SGAM diagram, Figure and Figure ) for the two implementations of WP6_4 (Fronius = 4a and Schneider Electric = 4b).
Figure 50 – Scope of lab tests shown on the SGAM description of WP6_4 (Fronius)
(red: Equipment Under Test / blue: emulated part)
Ge
ne
rati
on
Tra
ns
mis
sio
n
Distribution DER Customer
premise
Process
Field
Station
Operation
Enterprise
MarketKey:
component
WP6 Use-case #4
MV/LV
OLTC
RTU
SCADA/DMS
G
DSO Quality
Management
DSO Billing
System
Comm.
modules
Remote monitoring
systems (provided by
manufacturers)
User
interface
Q
G
Electrical link
Communication link
Meter and control
link
OLTC Transformer
Power Qual it y Met er
Smart PV Invert er
Generator (PV)
Fuse
G
Busbar
B Billing Meter
Router
Storage (Battery)
Met erWh
HV/MV
Ripple
Control
Transmitt.
Wh
Data
mng. +
Local UI
Ripple
Control
Reciever
Local
Interface
HWSwitch
Wh
Q Q B
Q B
Comm.
modules
D6.1 Design of solution
47
Figure 51 – Scope of lab tests shown on the SGAM description of WP6_4 (Schneider)
(red: Equipment Under Test / blue: emulated part)
The devices used for the testing (Equipment Under Test - EUT) are shown below.
Fronius
Model - Symo Hybrid 5.0-3-S4 - Solar Battery - Smart Meter - local interface
AC nominal output (kW) 5.0 AC nominal apparent power (kVA) 5.0 Grid connection 3~NPE 400 V Power factor 0.85 Battery capacity (kWh) 9.6 kWh
Figure 52– EUT for WP6_4 Fronius
4 For WP6_4, the devices used in the field will be Fronius Symo Hybrid.
Ge
ne
rati
on
Tra
nsm
iss
ion
Distribution DER Customer
premise
Process
Field
Station
Operation
Enterprise
MarketKey:
component
WP6 Use-case #4 (Schneider)
MV/LV
OLTC
RTU
SCADA/DMS
G
DSO Quality
Management
DSO Billing
System
Comm.
modules
Remote monitoring
systems (provided by
manufacturers)
User
interface
Q
G
Elect rical link
Communication link
Meter and control link
OLTC Transformer
Power Qual ity Meter
Smart PV Inverter
Generator (PV)
Fuse
G
Bus bar
B Billing Meter
Storage (Battery)
MeterWh
HV/MV
Ripple
Control
Transmitt.
Wh
Data
mng. +
Local UI
Ripple
Control
Reciever
Local
Interface
HW
Wh
Q Q B
Q B
Combox RouterPLC
D6.1 Design of solution
48
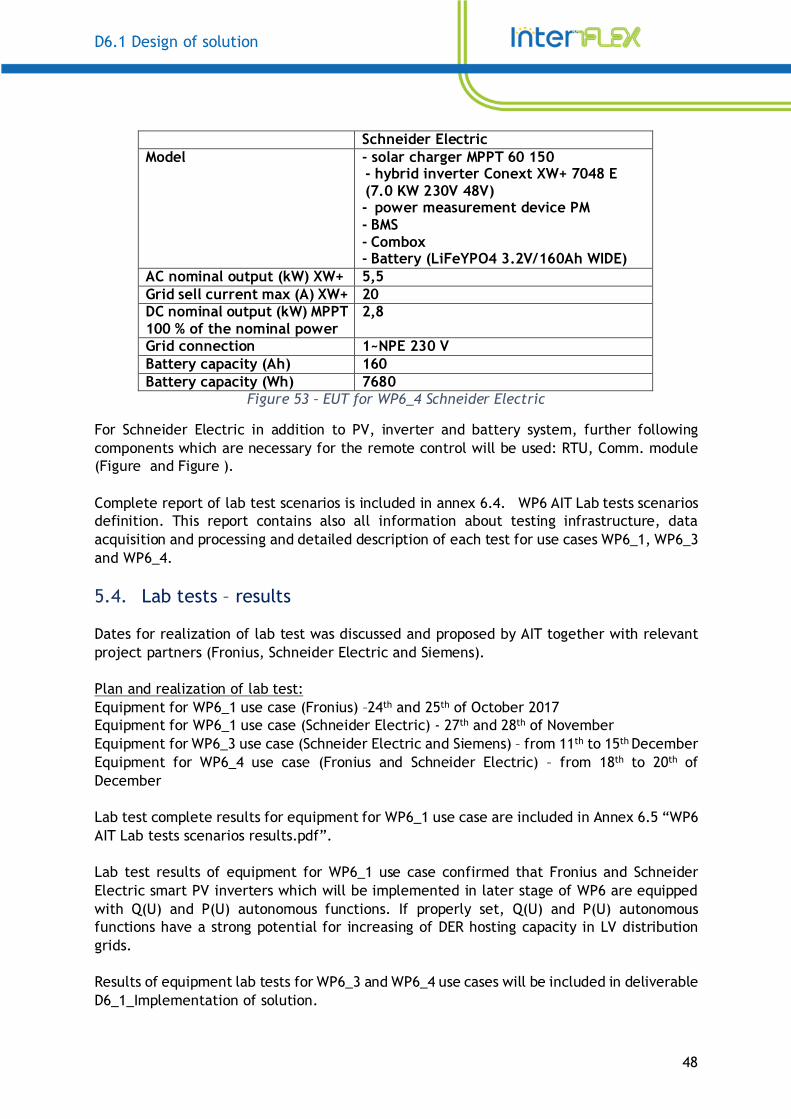
Schneider Electric
Model - solar charger MPPT 60 150 - hybrid inverter Conext XW+ 7048 E (7.0 KW 230V 48V) - power measurement device PM - BMS - Combox - Battery (LiFeYPO4 3.2V/160Ah WIDE)
AC nominal output (kW) XW+ 5,5
Grid sell current max (A) XW+ 20 DC nominal output (kW) MPPT 100 % of the nominal power
2,8
Grid connection 1~NPE 230 V
Battery capacity (Ah) 160
Battery capacity (Wh) 7680 Figure 53 – EUT for WP6_4 Schneider Electric
For Schneider Electric in addition to PV, inverter and battery system, further following components which are necessary for the remote control will be used: RTU, Comm. module (Figure and Figure ). Complete report of lab test scenarios is included in annex 6.4. WP6 AIT Lab tests scenarios definition. This report contains also all information about testing infrastructure, data acquisition and processing and detailed description of each test for use cases WP6_1, WP6_3 and WP6_4.
5.4. Lab tests – results
Dates for realization of lab test was discussed and proposed by AIT together with relevant project partners (Fronius, Schneider Electric and Siemens). Plan and realization of lab test: Equipment for WP6_1 use case (Fronius) –24th and 25th of October 2017 Equipment for WP6_1 use case (Schneider Electric) - 27th and 28th of November Equipment for WP6_3 use case (Schneider Electric and Siemens) – from 11th to 15th December Equipment for WP6_4 use case (Fronius and Schneider Electric) – from 18th to 20th of December Lab test complete results for equipment for WP6_1 use case are included in Annex 6.5 “WP6 AIT Lab tests scenarios results.pdf”. Lab test results of equipment for WP6_1 use case confirmed that Fronius and Schneider Electric smart PV inverters which will be implemented in later stage of WP6 are equipped with Q(U) and P(U) autonomous functions. If properly set, Q(U) and P(U) autonomous functions have a strong potential for increasing of DER hosting capacity in LV distribution grids. Results of equipment lab tests for WP6_3 and WP6_4 use cases will be included in deliverable D6_1_Implementation of solution.
D6.1 Design of solution
49
6. ANNEXES
6.1 Use case descriptions p.50 - 127 � Use_case_WP6_1.pdf � Use_case_WP6_2. pdf � Use_case_WP6_3. pdf � Use_case_WP6_4. Pdf
6.2 SGAM diagrams p.128 - 163 � SGAM_WP6_1a_final.pdf � SGAM_WP6_1b_final.pdf � SGAM_WP6_2_final.pdf � SGAM_WP6_3a_final.pdf � SGAM_WP6_3b_final.pdf � SGAM_WP6_4a_final.pdf � SGAM_WP6_4b_final.pdf
6.3 WP6 KPI_final. Pdf p.164 - 173
6.4 InterFlex CZ Demo Lab tests definition.pdf p.174 - 212
6.5 InterFlex CZ Demo Lab tests - Results.docx.pdf p.213 - 258
D6.1 Design of solution
50
Annex 6.1
Use case descriptions p.50 - 127
� Use_case_WP6_1.pdf � Use_case_WP6_2. pdf � Use_case_WP6_3. pdf � Use_case_WP6_4. Pdf
1
Use Case Description
UC WP6_1 – Increase DER hosting capacity of LV
distribution networks by smart PV inverters

2
Scope ......................................................................................................................................................................... 3
1. Description of the Use Case ............................................................................................................................ 4
2. Diagrams of the Use Case ................................................................................................................................. 8
3. Technical details of the Use Case - Actors....................................................................................................... 11
4. Step by Step Analysis of the Use Case ............................................................................................................. 13
5. Information exchanged ................................................................................................................................... 14
Annex A – List of Actor Subcategories .................................................................................................................... 16
Annex B – List of Information Subcategories .......................................................................................................... 17

3
Scope
This document describes the Use Case UC WP6_1 – Increase DER hosting capacity of LV distribution networks by smart PV inverters. The Use Case description within is divided in to five areas:
1. Description of the Use Case 2. Diagrams of the Use Case 3. Technical data - Actors 4. Step by Step Analysis of Use Case (can be extended by detailed info on “information exchanged”) 5. Information exchanged
4
1. Description of the Use Case
1.1. Use Case Identification
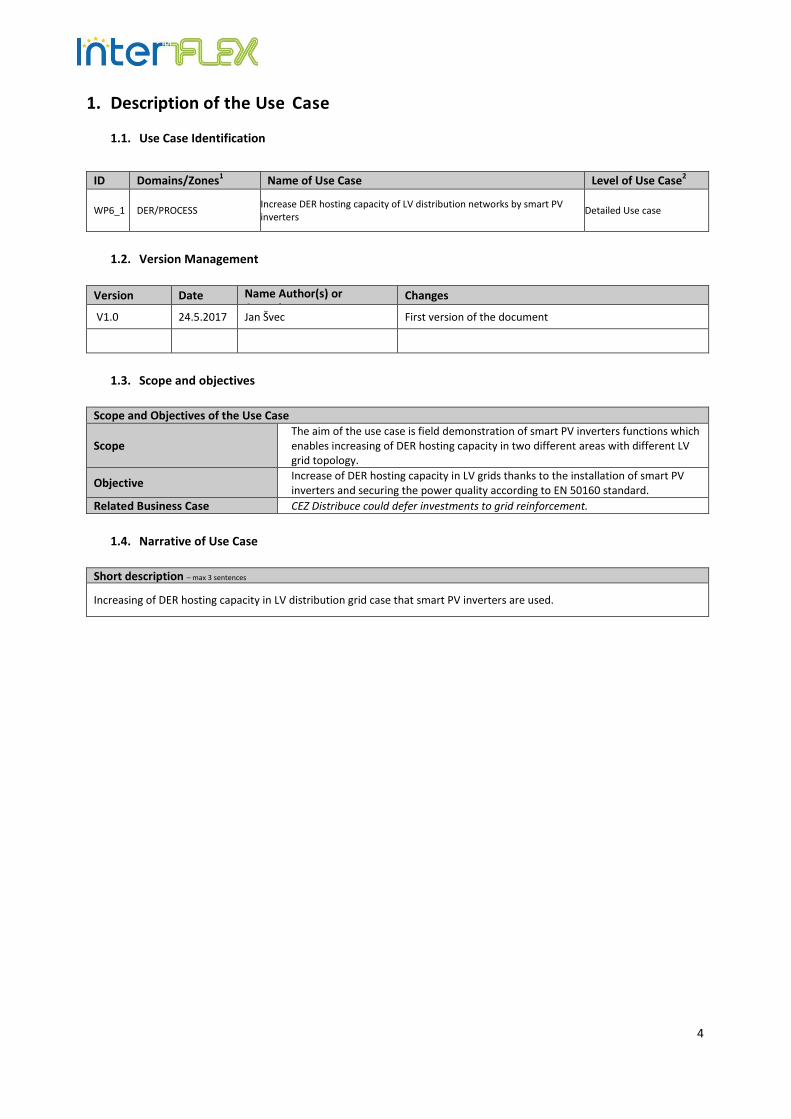
ID Domains/Zones1 Name of Use Case Level of Use Case2
WP6_1 DER/PROCESS Increase DER hosting capacity of LV distribution networks by smart PV inverters
Detailed Use case
1.2. Version Management
Version Date Name Author(s) or Committee
Changes
V1.0 24.5.2017 Jan Švec First version of the document
1.3. Scope and objectives
Scope and Objectives of the Use Case
Scope The aim of the use case is field demonstration of smart PV inverters functions which enables increasing of DER hosting capacity in two different areas with different LV grid topology.
Objective Increase of DER hosting capacity in LV grids thanks to the installation of smart PV inverters and securing the power quality according to EN 50160 standard.
Related Business Case CEZ Distribuce could defer investments to grid reinforcement.
1.4. Narrative of Use Case
Short description – max 3 sentences
Increasing of DER hosting capacity in LV distribution grid case that smart PV inverters are used.
5
Complete description
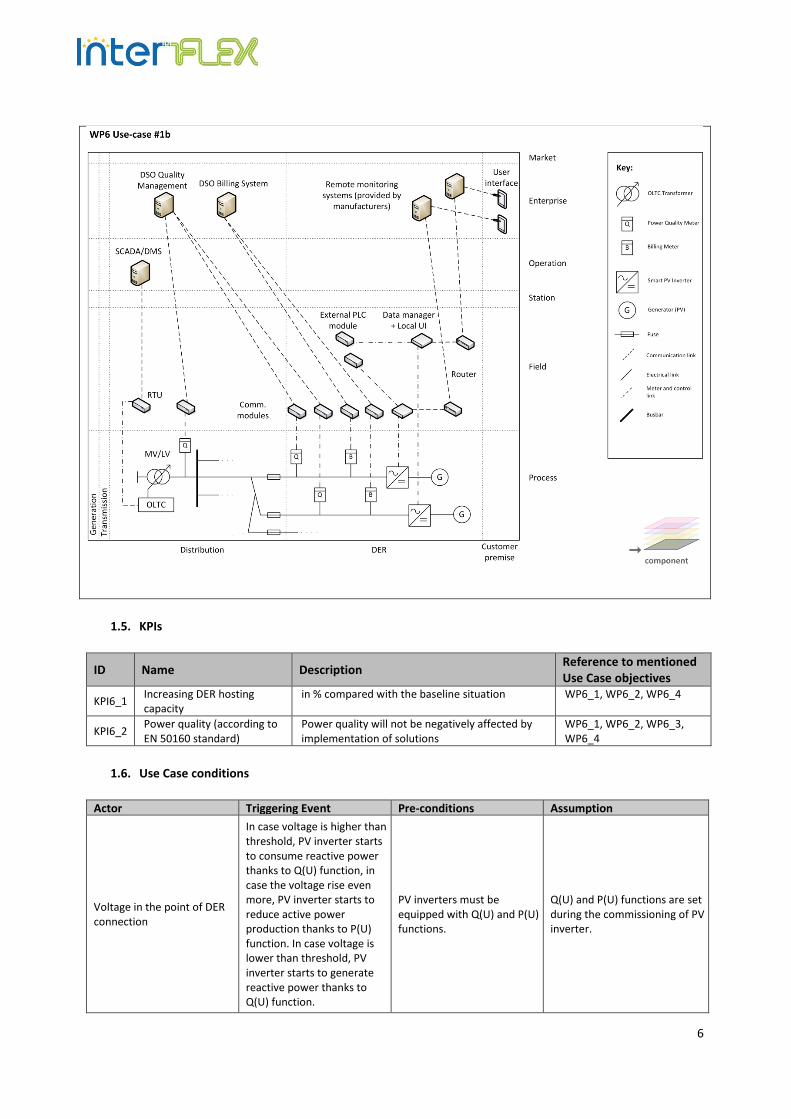
ČEZ Distribuce and its partners aims at demonstrating how the combination of new smart PV inverter functions Q(U) and P(U) under real operating conditions within LV distribution networks can increase the DER hosting capacity. A successful demonstration requires appropriate conditions for testing roof PV systems using smart PV inverters (fulfilling the EN 50438 ed.2 standard) installed massively under preselected 2 MV/LV secondary substations. Two areas with different topologies but high penetration of PV systems are needed. Crucial tasks for this use case are the recruitment of customers within the selected areas, the installation of PV systems with smart PV inverters and the delivery of technical operational data and results from the PV inverter monitoring systems with the customer’s consent. Descriptions and SGAMs are separated for option a) from Fronius and b) from Schneider.
Q(U) function - example P(U) function – example
6
1.5. KPIs
ID Name Description Reference to mentioned Use Case objectives
KPI6_1 Increasing DER hosting capacity
in % compared with the baseline situation WP6_1, WP6_2, WP6_4
KPI6_2 Power quality (according to EN 50160 standard)
Power quality will not be negatively affected by implementation of solutions
WP6_1, WP6_2, WP6_3, WP6_4
1.6. Use Case conditions
Actor Triggering Event Pre-conditions Assumption
Voltage in the point of DER connection
In case voltage is higher than threshold, PV inverter starts to consume reactive power thanks to Q(U) function, in case the voltage rise even more, PV inverter starts to reduce active power production thanks to P(U) function. In case voltage is lower than threshold, PV inverter starts to generate reactive power thanks to Q(U) function.
PV inverters must be equipped with Q(U) and P(U) functions.
Q(U) and P(U) functions are set during the commissioning of PV inverter.

7
1.7. Classification information
Relation to Other Use Cases in the same project or area
Associate – use cases WP6_1, WP6_2, WP6_4 aim to increase DER hosting capacity of distribution grids.
Level of Depth - the degree of specialization of the Use Case
Detailed Use Case
Prioritization
Very important
Generic, Regional or National Regional relation
Generic
Nature of the viewpoint- describes the viewpoint and field of attention
Technical point of view
Further Keywords for Classification
PV inverter, EN 50160, EN 50438:2013, hosting capacity, DER, LV grid, Q(U), P(U)
Maturity of Use Case
Realized in demonstration project
8
2. Diagrams of the Use Case
2.1. Diagram of the Use Case
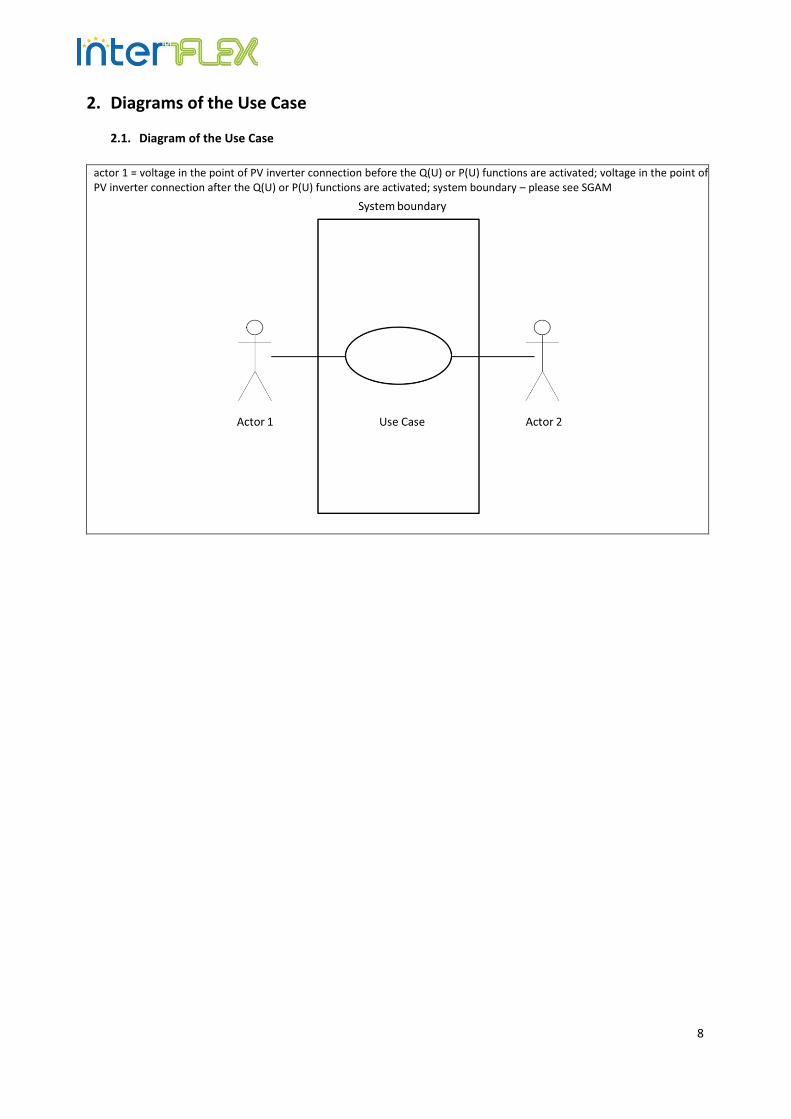
actor 1 = voltage in the point of PV inverter connection before the Q(U) or P(U) functions are activated; voltage in the point of PV inverter connection after the Q(U) or P(U) functions are activated; system boundary – please see SGAM
9
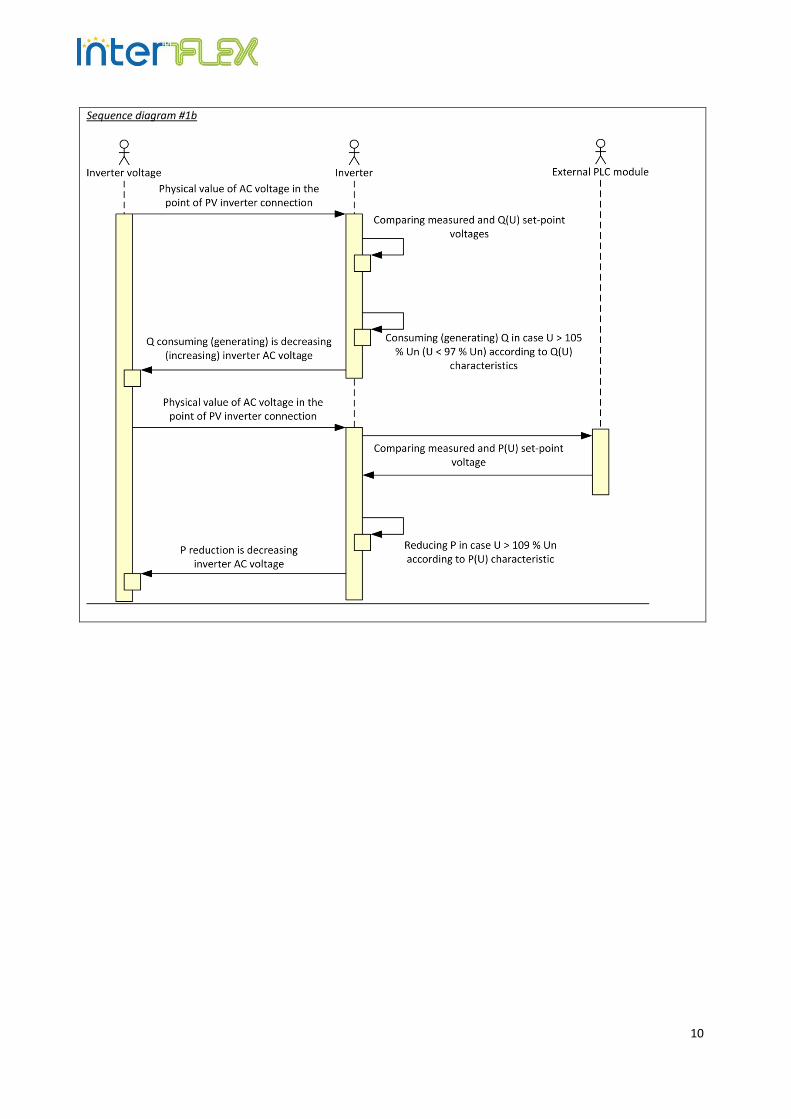
2.2. Sequence diagram of the Use Case
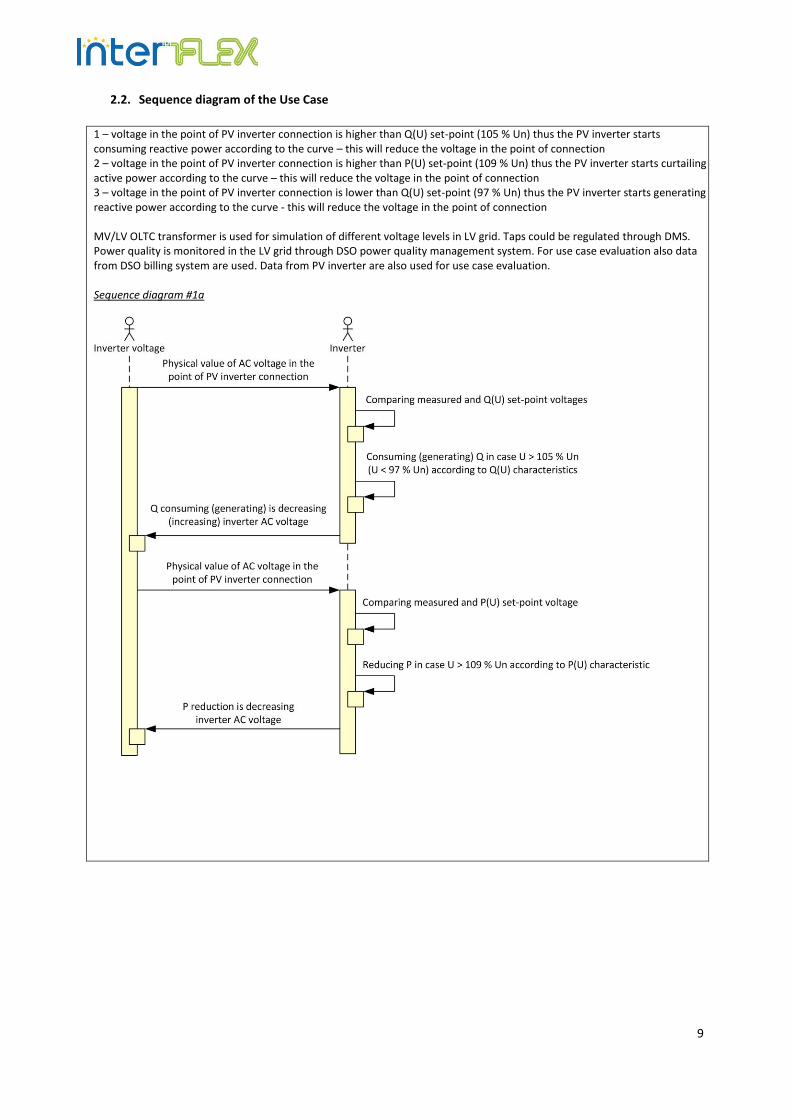
1 – voltage in the point of PV inverter connection is higher than Q(U) set-point (105 % Un) thus the PV inverter starts consuming reactive power according to the curve – this will reduce the voltage in the point of connection 2 – voltage in the point of PV inverter connection is higher than P(U) set-point (109 % Un) thus the PV inverter starts curtailing active power according to the curve – this will reduce the voltage in the point of connection 3 – voltage in the point of PV inverter connection is lower than Q(U) set-point (97 % Un) thus the PV inverter starts generating reactive power according to the curve - this will reduce the voltage in the point of connection MV/LV OLTC transformer is used for simulation of different voltage levels in LV grid. Taps could be regulated through DMS. Power quality is monitored in the LV grid through DSO power quality management system. For use case evaluation also data from DSO billing system are used. Data from PV inverter are also used for use case evaluation. Sequence diagram #1a
10
Sequence diagram #1b
11
3. Technical details of the Use Case – Actors
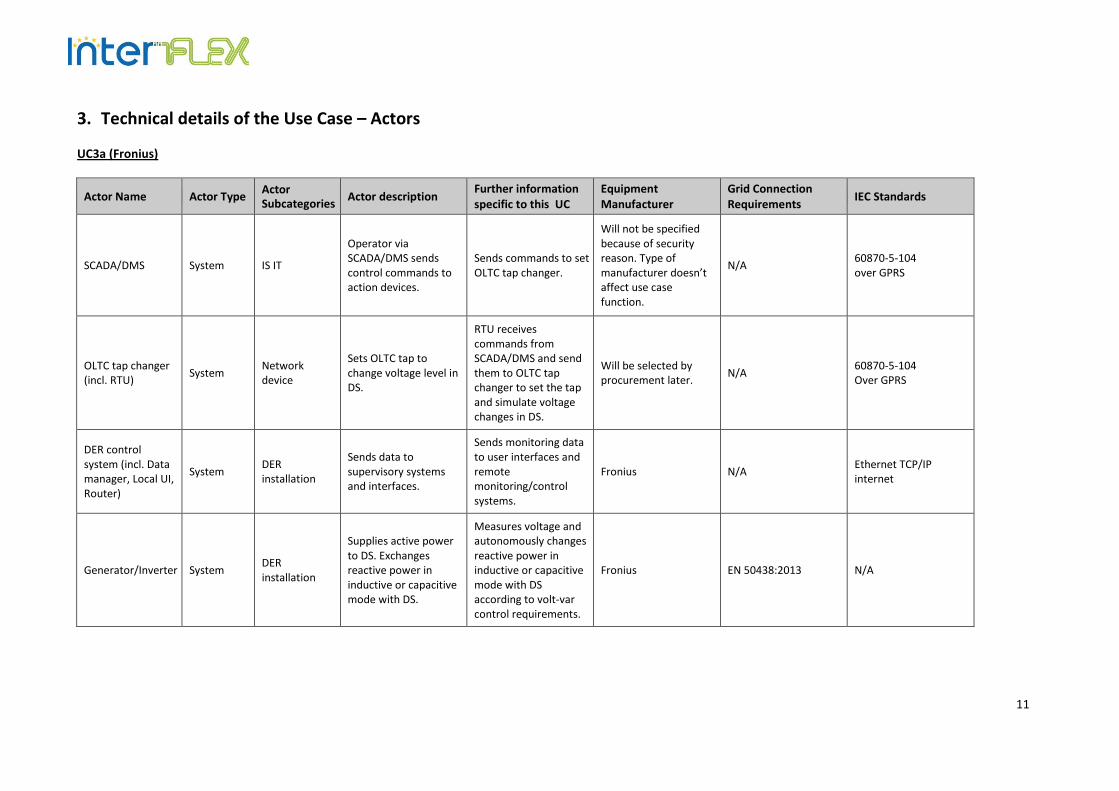
UC3a (Fronius)
Actor Name Actor Type Actor Subcategories
Actor description Further information specific to this UC
Equipment Manufacturer
Grid Connection Requirements
IEC Standards
SCADA/DMS System IS IT
Operator via SCADA/DMS sends control commands to action devices.
Sends commands to set OLTC tap changer.
Will not be specified because of security reason. Type of manufacturer doesn’t affect use case function.
N/A 60870-5-104 over GPRS
OLTC tap changer (incl. RTU)
System Network device
Sets OLTC tap to change voltage level in DS.
RTU receives commands from SCADA/DMS and send them to OLTC tap changer to set the tap and simulate voltage changes in DS.
Will be selected by procurement later.
N/A 60870-5-104 Over GPRS
DER control system (incl. Data manager, Local UI, Router)
System DER installation
Sends data to supervisory systems and interfaces.
Sends monitoring data to user interfaces and remote monitoring/control systems.
Fronius N/A Ethernet TCP/IP internet
Generator/Inverter System DER installation
Supplies active power to DS. Exchanges reactive power in inductive or capacitive mode with DS.
Measures voltage and autonomously changes reactive power in inductive or capacitive mode with DS according to volt-var control requirements.
Fronius EN 50438:2013 N/A
12
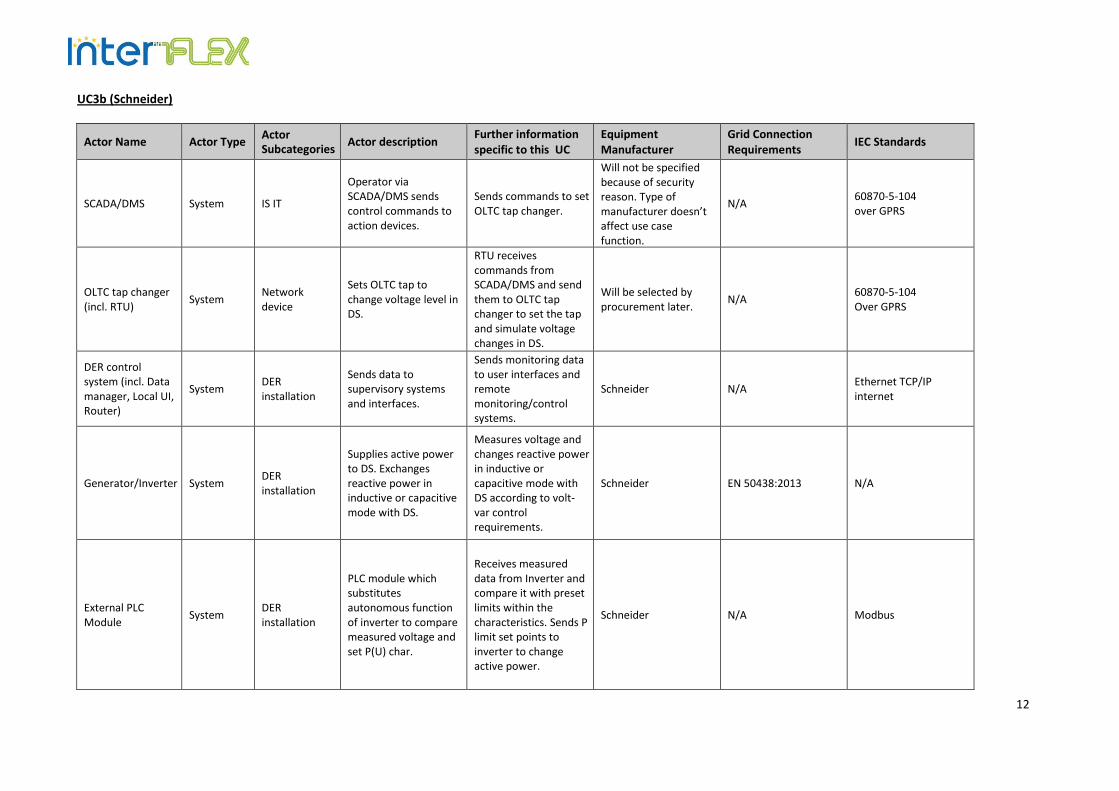
UC3b (Schneider)
Actor Name Actor Type Actor Subcategories
Actor description Further information specific to this UC
Equipment Manufacturer
Grid Connection Requirements
IEC Standards
SCADA/DMS System IS IT
Operator via SCADA/DMS sends control commands to action devices.
Sends commands to set OLTC tap changer.
Will not be specified because of security reason. Type of manufacturer doesn’t affect use case function.
N/A 60870-5-104 over GPRS
OLTC tap changer (incl. RTU)
System Network device
Sets OLTC tap to change voltage level in DS.
RTU receives commands from SCADA/DMS and send them to OLTC tap changer to set the tap and simulate voltage changes in DS.
Will be selected by procurement later.
N/A 60870-5-104 Over GPRS
DER control system (incl. Data manager, Local UI, Router)
System DER installation
Sends data to supervisory systems and interfaces.
Sends monitoring data to user interfaces and remote monitoring/control systems.
Schneider N/A Ethernet TCP/IP internet
Generator/Inverter System DER installation
Supplies active power to DS. Exchanges reactive power in inductive or capacitive mode with DS.
Measures voltage and changes reactive power in inductive or capacitive mode with DS according to volt-var control requirements.
Schneider EN 50438:2013 N/A
External PLC Module
System DER installation
PLC module which substitutes autonomous function of inverter to compare measured voltage and set P(U) char.
Receives measured data from Inverter and compare it with preset limits within the characteristics. Sends P limit set points to inverter to change active power.
Schneider N/A Modbus
13
4. Step by Step Analysis of the Use Case
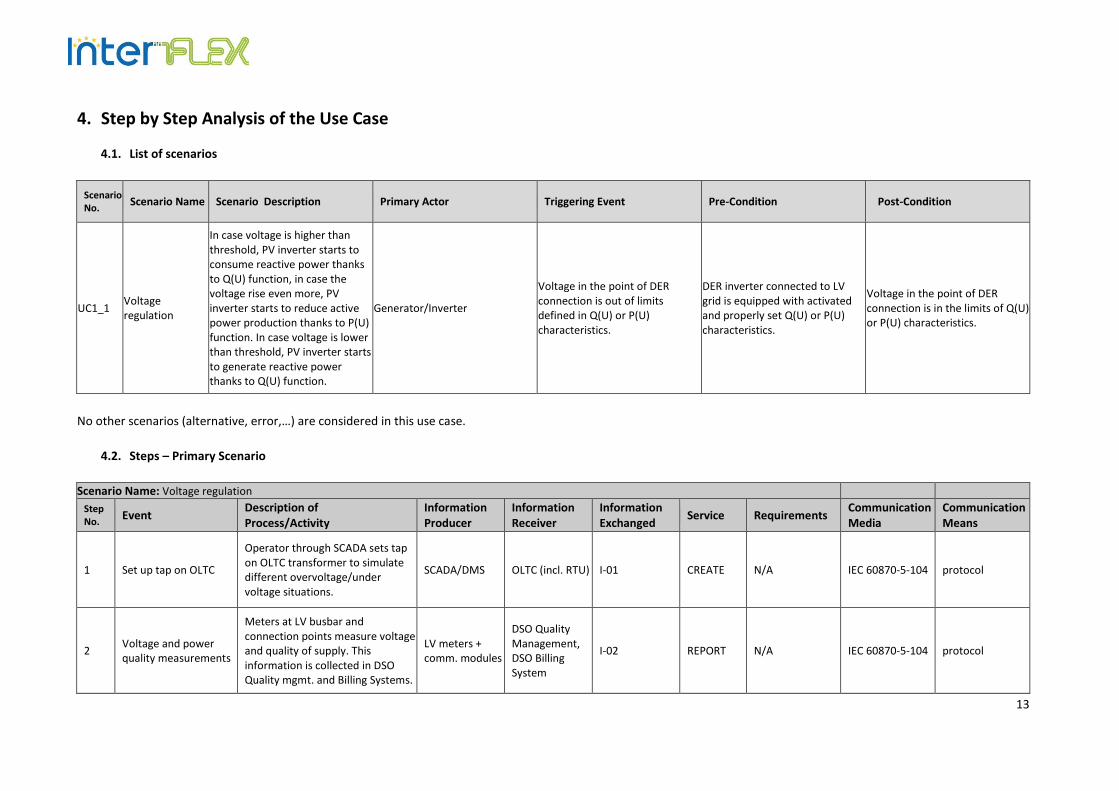
4.1. List of scenarios
Scenario No.
Scenario Name Scenario Description Primary Actor Triggering Event Pre-Condition Post-Condition
UC1_1 Voltage regulation
In case voltage is higher than threshold, PV inverter starts to consume reactive power thanks to Q(U) function, in case the voltage rise even more, PV inverter starts to reduce active power production thanks to P(U) function. In case voltage is lower than threshold, PV inverter starts to generate reactive power thanks to Q(U) function.
Generator/Inverter
Voltage in the point of DER connection is out of limits defined in Q(U) or P(U) characteristics.
DER inverter connected to LV grid is equipped with activated and properly set Q(U) or P(U) characteristics.
Voltage in the point of DER connection is in the limits of Q(U) or P(U) characteristics.
No other scenarios (alternative, error,…) are considered in this use case.
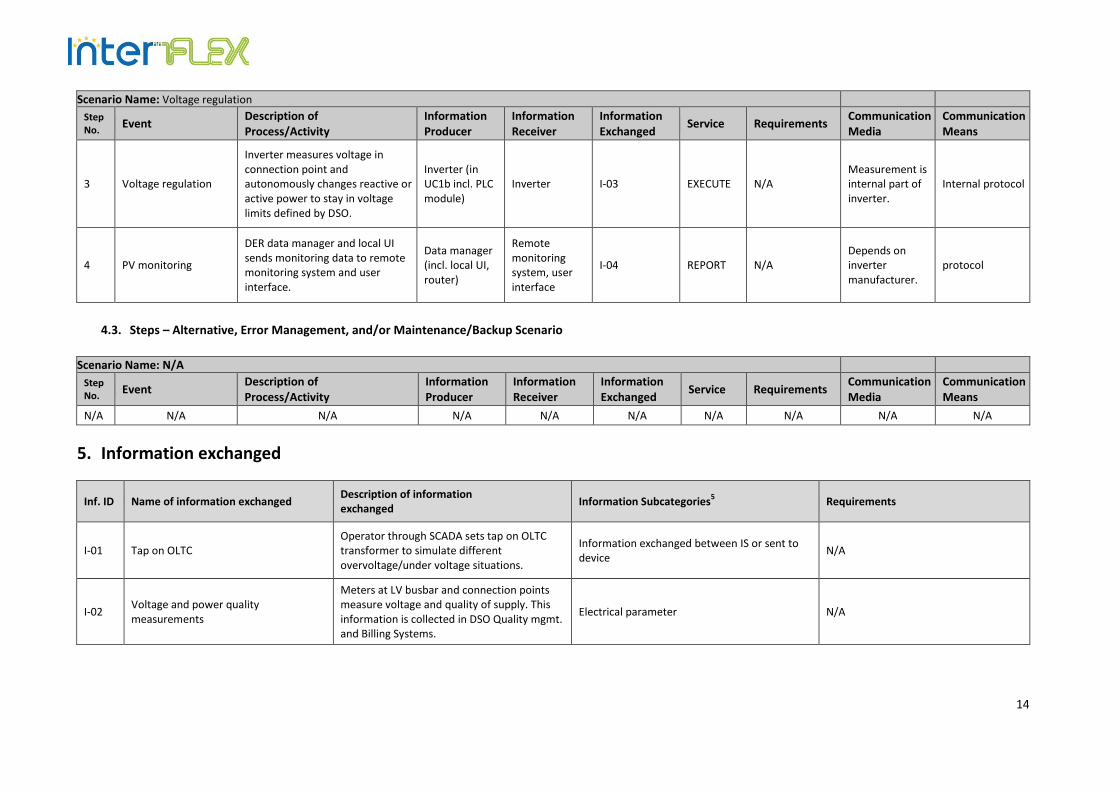
4.2. Steps – Primary Scenario
Scenario Name: Voltage regulation
Step No.
Event Description of Process/Activity
Information Producer
Information Receiver
Information Exchanged
Service Requirements Communication Media
Communication Means
1 Set up tap on OLTC
Operator through SCADA sets tap on OLTC transformer to simulate different overvoltage/under voltage situations.
SCADA/DMS OLTC (incl. RTU) I-01 CREATE N/A IEC 60870-5-104 protocol
2 Voltage and power quality measurements
Meters at LV busbar and connection points measure voltage and quality of supply. This information is collected in DSO Quality mgmt. and Billing Systems.
LV meters + comm. modules
DSO Quality Management, DSO Billing System
I-02 REPORT N/A IEC 60870-5-104 protocol
14
Scenario Name: Voltage regulation
Step No.
Event Description of Process/Activity
Information Producer
Information Receiver
Information Exchanged
Service Requirements Communication Media
Communication Means
3 Voltage regulation
Inverter measures voltage in connection point and autonomously changes reactive or active power to stay in voltage limits defined by DSO.
Inverter (in UC1b incl. PLC module)
Inverter I-03 EXECUTE N/A Measurement is internal part of inverter.
Internal protocol
4 PV monitoring
DER data manager and local UI sends monitoring data to remote monitoring system and user interface.
Data manager (incl. local UI, router)
Remote monitoring system, user interface
I-04 REPORT N/A Depends on inverter manufacturer.
protocol
4.3. Steps – Alternative, Error Management, and/or Maintenance/Backup Scenario
Scenario Name: N/A
Step No.
Event Description of Process/Activity
Information Producer
Information Receiver
Information Exchanged
Service Requirements Communication Media
Communication Means
N/A N/A N/A N/A N/A N/A N/A N/A N/A N/A
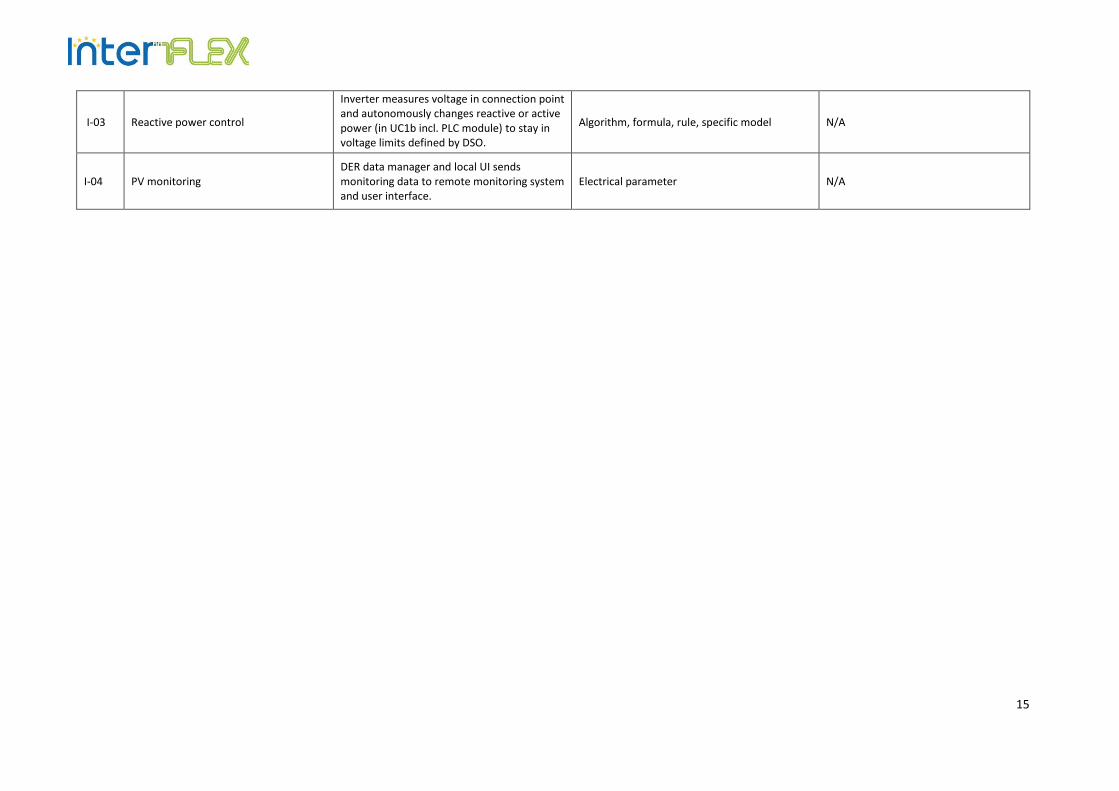
5. Information exchanged
Inf. ID Name of information exchanged Description of information exchanged
Information Subcategories5 Requirements
I-01 Tap on OLTC Operator through SCADA sets tap on OLTC transformer to simulate different overvoltage/under voltage situations.
Information exchanged between IS or sent to device
N/A
I-02 Voltage and power quality measurements
Meters at LV busbar and connection points measure voltage and quality of supply. This information is collected in DSO Quality mgmt. and Billing Systems.
Electrical parameter N/A
15
I-03 Reactive power control
Inverter measures voltage in connection point and autonomously changes reactive or active power (in UC1b incl. PLC module) to stay in voltage limits defined by DSO.
Algorithm, formula, rule, specific model N/A
I-04 PV monitoring DER data manager and local UI sends monitoring data to remote monitoring system and user interface.
Electrical parameter N/A

16
Annex A – List of Actor Subcategories
Category Type Subcategory Definition Example
Actors Role DSO Responsible for operating, ensuring the maintenance of and, if necessary, developing the distribution system in a given area
Avacon, CEZ, E.ON, Enexis, Enedis
Actors Role Industrial partner All industrial partners involved in InterFlex project at a DEMO level
- GE - Siemens - Schneider …
Actors Role University and research partner All university or research partners involved in InterFlex project at a DEMO level
- RWTH - AIT etc
Actors Role Retailer Licensed supplier of electricity to an end-user - EDF - Engie...
Actors Role Legal Client A legal client of a DSO that is involved at Demo scale - Company producer - Municipalities - Tertiary service providers
Actors Role Physical client A physical client of a DSO that is involved at Demo scale - Residential client
Actors System Charging facilities Facilities to charge electrical vehicles - Charging facilities
Actors System DER installation Power plant that use renewable technology and are owned by a legal person
- Photovoltaics panels - Biomass farm - Wind power, …
Actors System In house device All devices working on electricity that can be find in a customer's dwelling.
- Heater - Meter - Local display - Customer's battery
Actors System Communication infrastructure All the infrastructure that are used for communication at all level (from customer's place to power command)
- Modem - Routers
Actors System Network device All devices placed on MV/LV network for monitoring or gathering information on grid's situation or electrical parameters values. It also include the IS associated
- Secondary Substation control infrastructure - RTU : Remote terminal units - Circuits breakers - sensors
Actors System IS IT All the hardware and software associated, used at power command to control and monitor the network
- SCADA - Central database - Control operation center
Actors System Interactive communication device All device used to interact with customers in order to involved him in the Demo
- Web portal - Display used for communication

17
Annex B – List of Information Subcategories
Category Type Subcategory Definition Example
Data Document Internal document All the documentation made by Demo to run operation, to monitor and conduct the project's good development
- Meeting minutes - Report on the cost's impact of selected flexibility plans
Data Document InterFlex deliverable All the deliverables that Demo have to produce during the project's time as agreed in the DOW
- Risk analysis - Documentation on KPI - Detailed Use Case - Report on technical experimentation, market research, …
Data Document Communication material All the documentation that describe the project to the public and can be put on the future website
- Purpose of the DEMO (leaflet) - Brief description of Use Case - Location of Use Case
Data Financial data Project financial data All the financial data that are produced during the project and that are used to make financial report for European Commission and internal report
- Invoices - Cost and time imputation
Data Financial data Solution cost and selling price All the financial data that can be made concerning estimation prices of solution for replication
- Unit product cost of hardware developed by Demo - Sell price of the solution develop (software,…)
Data Parameter Condition parameter All the external parameters that may influence the success of the Use Case
- Weather - Time of day - Day of week …
Data Parameter Scenario assumption All the stated parameters that are necessary to determinate a scenario for the Use Case
- Location of islanding - Experiment's location
Data Parameter Electrical parameter All the electrical parameters that are used to supervise the network and its good state
- Intensity - Voltage - Frequency - Quality
Data Parameter Algorithm, formula, rule, specific model
All the intellectual data that are created during the project to made software's contents
- Algorithm to optimize flexibility plan - Simulation to determine location of circuit breaker - Voltage regulation algorithm
Data Parameter Optimized value Values of parameters that optimized the Use Case or the demo‘s performance
- Optimization time of islanding
Data Parameter Forecast data All the data used to forecast consumption or production of customer
- Forecast customer's consumption - Forecast photovoltaic panels' production
Data Facility data Network topology All information on network devices and their location and interaction, mainly coming from GIS (Geographic Information System)
- Map of the network - Substations location - All the other data found in the GIS (Geographical Information System)
Data Facility data Network state All information concerning the network's status (global or local) at a precise moment useful to monitor the network
- Feeding situation in a distribution area - State of network regarding Limit value violation - Location of constraint - Flexibility needs of DSO

18
Category Type Subcategory Definition Example
Data Facility data Customer's meter state and output
All the information concerning customer’s meter state and outputs information
- Customer’s consumption or production
Data Facility data Other device state and output All the information concerning device's state and outputs information
- State of charge of batteries - Consumption data coming from meter - Production data coming from meter - State of charge of storage components
Data Parameter Information exchanged between IS or sent to device
All automated information sent between facilities in order to send information or order for monitoring
- Order sent to breaker devices (open, close,…) - Information on local network status coming from sensors - Order and roadmap sent to network devices (batteries, aggregator,…)
Data Parameter Detailed specification on devices
All detailed information (reference components, specification, process,…) useful to build the devices
- Detailed specification of the telecommunication infrastructure - Detailed specification of interactive sensor network
Data Network data Network topology All information on network devices and their location and interaction, mainly coming from GIS (Geographic Information System)
- Map of the network - Substations location - All the other data found in the GIS (Geographical Information System)
Data Network data Network state All information concerning the network's status (global or local) at a precise moment useful to monitor the network
- Feeding situation in a distribution area - State of network regarding Limit value violation - Location of constraint - Flexibility needs of DSO
Data KPI Data for KPI (input raw data) All raw data that are used to calculate the final KPI - Duration of experiment - Customer response to DSO's demand - Electrical parameter used for KPI
Data KPI KPI (KPI values) All the KPI values and the way to calculate them - Economic KPI - System Efficiency KPI
Data Customer data Customer contract’s data All the data in customer's contact that are used for contact or make payment
- Address - Phone number - Bank account details
Data Customer data Information sent to /received from customer
All the information and data that are exchanged between the DEMO and the customer in order to involve customer in the experiment
- Customer's response to DSO's request to reduce consumption - Information and data available to customer in order to visualize its consumption - Advices and encouragement sent to encourage a smart consumption
Data Customer data Customer analysis (profile analysis, studies on client reactivity,…)
All the data that are produced in order to better understand the customer's behaviour regarding the possibility to adopt smarter habits in their electricity consumption
- Customer's typology and behaviour patterns - Analysis on customer's response to DSO's request
1
Use Case Description
UC WP6_2 – Increase DER hosting capacity in MV
networks by volt-var control

2
Scope ......................................................................................................................................................................... 3
1. Description of the Use Case ............................................................................................................................ 4
2. Diagrams of the Use Case ................................................................................................................................. 7
3. Technical details of the Use Case - Actors......................................................................................................... 9
4. Step by Step Analysis of the Use Case ............................................................................................................. 11
5. Information exchanged ................................................................................................................................... 12
Annex A – List of Actor Subcategories .................................................................................................................... 14
Annex B – List of Information Subcategories .......................................................................................................... 15

3
Scope
This document describes the Use Case UC WP6_2 – Increase DER hosting capacity in MV networks by volt-var control. The Use Case description within is divided in to five areas:
1. Description of the Use Case 2. Diagrams of the Use Case 3. Technical data - Actors 4. Step by Step Analysis of Use Case (can be extended by detailed info on “information exchanged”) 5. Information exchanged
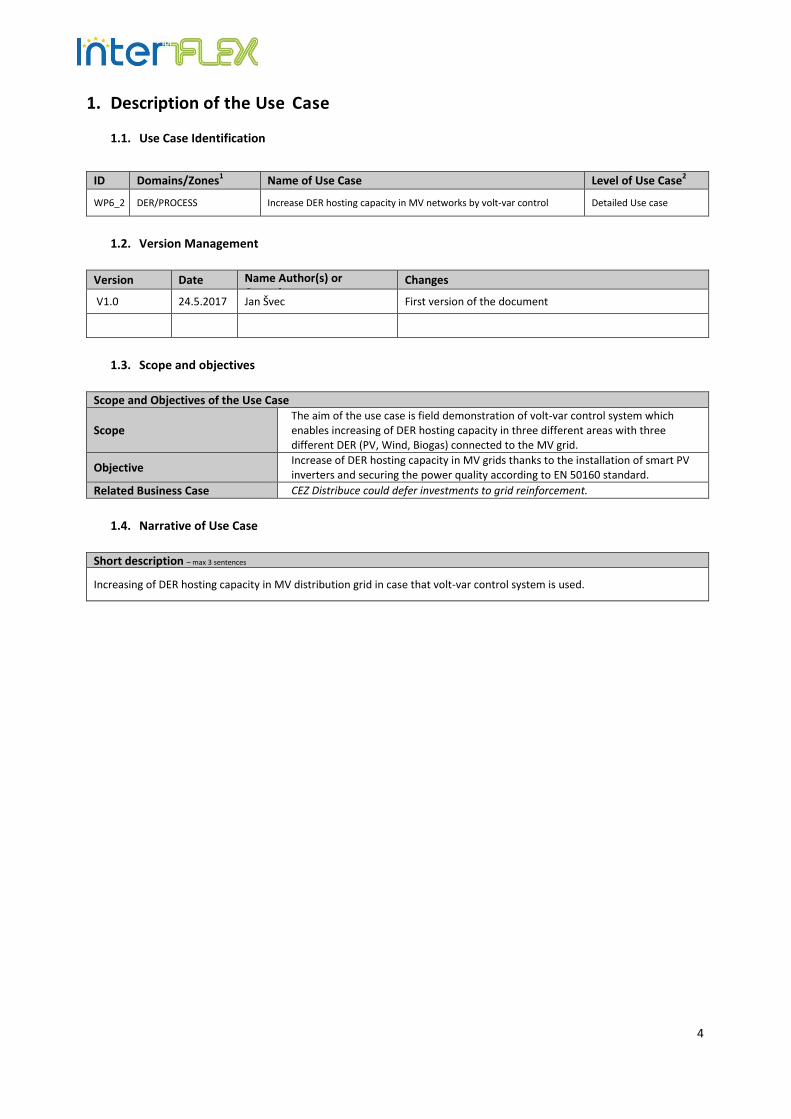
4
1. Description of the Use Case
1.1. Use Case Identification
ID Domains/Zones1 Name of Use Case Level of Use Case2
WP6_2 DER/PROCESS Increase DER hosting capacity in MV networks by volt-var control Detailed Use case
1.2. Version Management
Version Date Name Author(s) or Committee
Changes
V1.0 24.5.2017 Jan Švec First version of the document
1.3. Scope and objectives
Scope and Objectives of the Use Case
Scope The aim of the use case is field demonstration of volt-var control system which enables increasing of DER hosting capacity in three different areas with three different DER (PV, Wind, Biogas) connected to the MV grid.
Objective Increase of DER hosting capacity in MV grids thanks to the installation of smart PV inverters and securing the power quality according to EN 50160 standard.
Related Business Case CEZ Distribuce could defer investments to grid reinforcement.
1.4. Narrative of Use Case
Short description – max 3 sentences
Increasing of DER hosting capacity in MV distribution grid in case that volt-var control system is used.
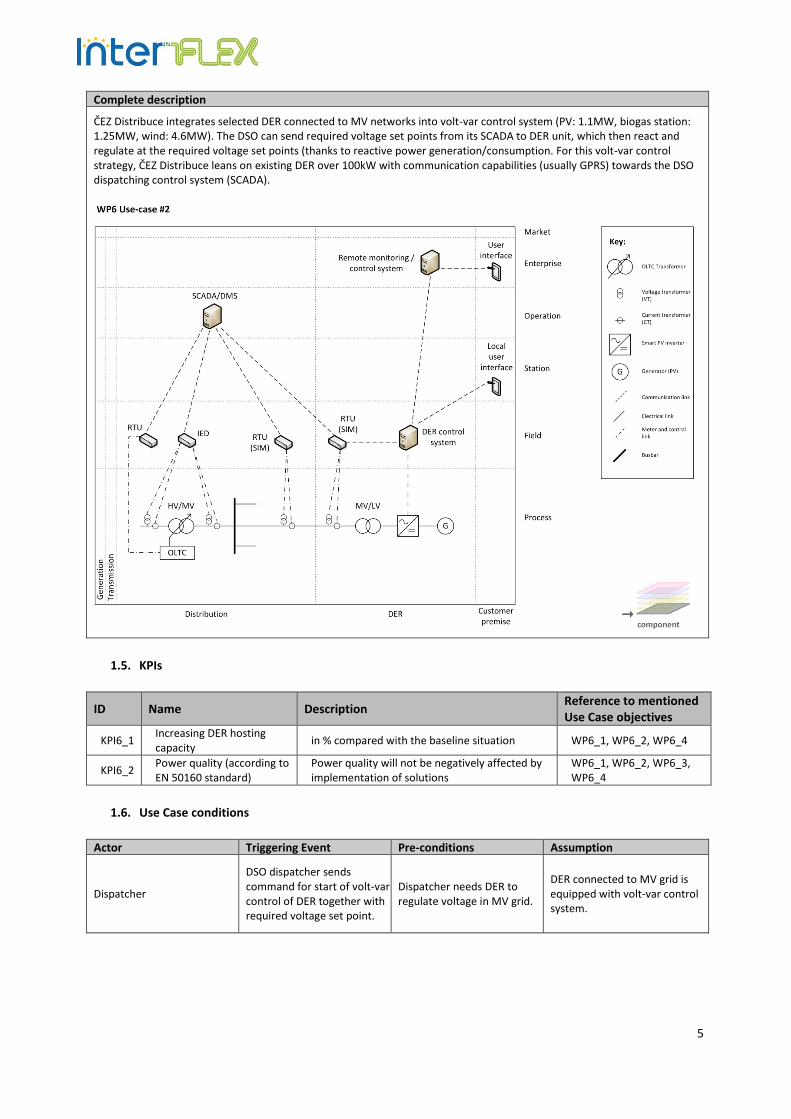
5
Complete description
ČEZ Distribuce integrates selected DER connected to MV networks into volt-var control system (PV: 1.1MW, biogas station: 1.25MW, wind: 4.6MW). The DSO can send required voltage set points from its SCADA to DER unit, which then react and regulate at the required voltage set points (thanks to reactive power generation/consumption. For this volt-var control strategy, ČEZ Distribuce leans on existing DER over 100kW with communication capabilities (usually GPRS) towards the DSO dispatching control system (SCADA).
1.5. KPIs
ID Name Description Reference to mentioned Use Case objectives
KPI6_1 Increasing DER hosting capacity
in % compared with the baseline situation WP6_1, WP6_2, WP6_4
KPI6_2 Power quality (according to EN 50160 standard)
Power quality will not be negatively affected by implementation of solutions
WP6_1, WP6_2, WP6_3, WP6_4
1.6. Use Case conditions
Actor Triggering Event Pre-conditions Assumption
Dispatcher
DSO dispatcher sends command for start of volt-var control of DER together with required voltage set point.
Dispatcher needs DER to regulate voltage in MV grid.
DER connected to MV grid is equipped with volt-var control system.
6
1.7. Classification information
Relation to Other Use Cases in the same project or area
Associate – use cases WP6_1, WP6_2, WP6_4 aim to increase DER hosting capacity of distribution grids.
Level of Depth - the degree of specialization of the Use Case
Detailed Use Case
Prioritization
Very important
Generic, Regional or National Regional relation
Generic
Nature of the viewpoint- describes the viewpoint and field of attention
Technical point of view
Further Keywords for Classification
EN 50160, hosting capacity, DER, MV grid, volt-var control, reactive power
Maturity of Use Case
Realized in demonstration project
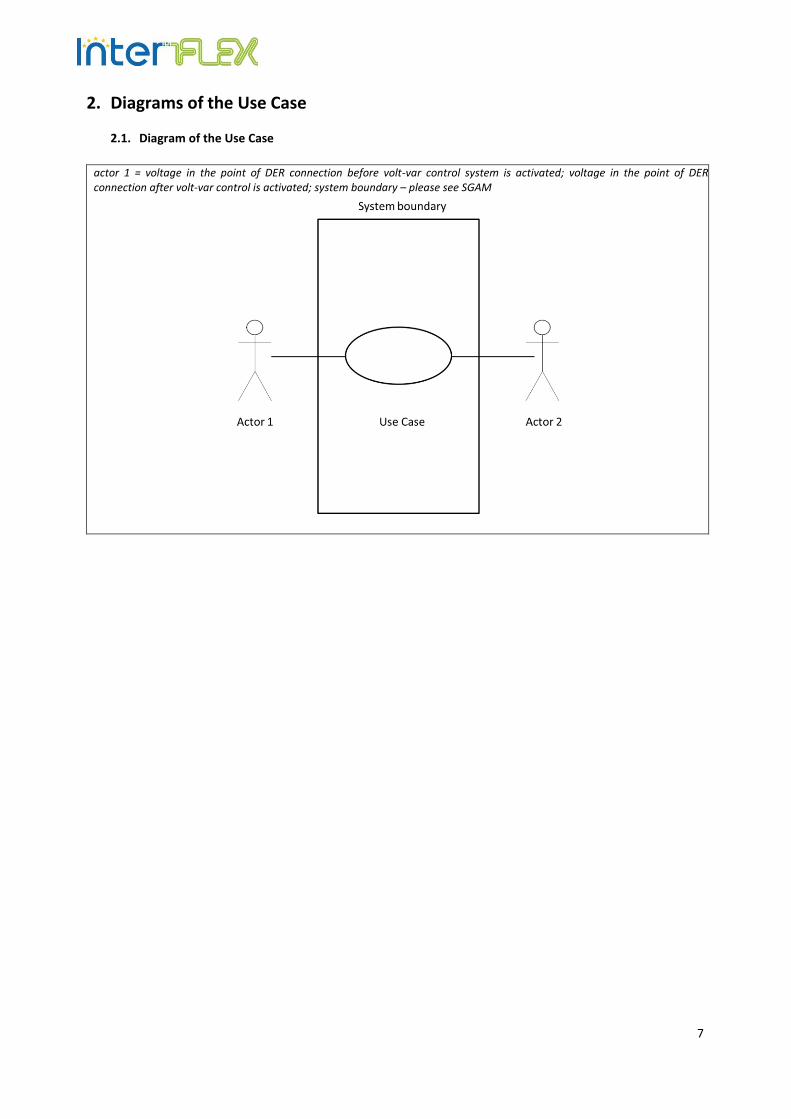
7
2. Diagrams of the Use Case
2.1. Diagram of the Use Case
actor 1 = voltage in the point of DER connection before volt-var control system is activated; voltage in the point of DER connection after volt-var control is activated; system boundary – please see SGAM
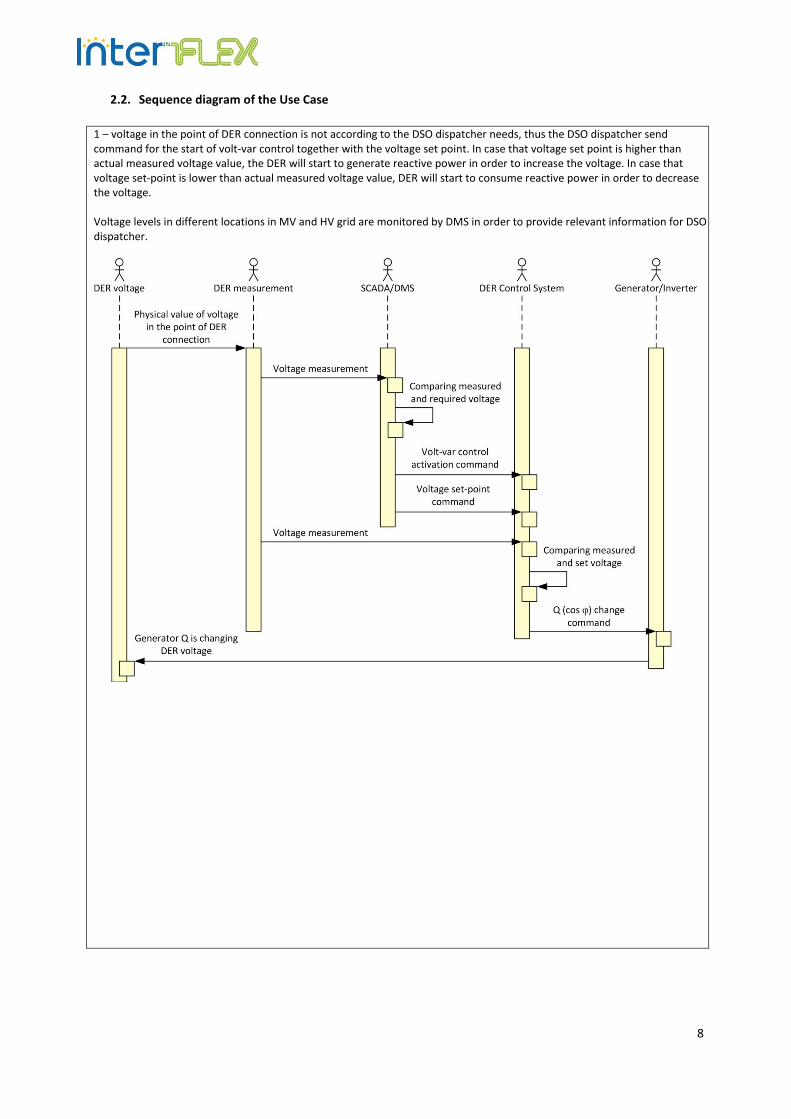
8
2.2. Sequence diagram of the Use Case
1 – voltage in the point of DER connection is not according to the DSO dispatcher needs, thus the DSO dispatcher send command for the start of volt-var control together with the voltage set point. In case that voltage set point is higher than actual measured voltage value, the DER will start to generate reactive power in order to increase the voltage. In case that voltage set-point is lower than actual measured voltage value, DER will start to consume reactive power in order to decrease the voltage. Voltage levels in different locations in MV and HV grid are monitored by DMS in order to provide relevant information for DSO dispatcher.
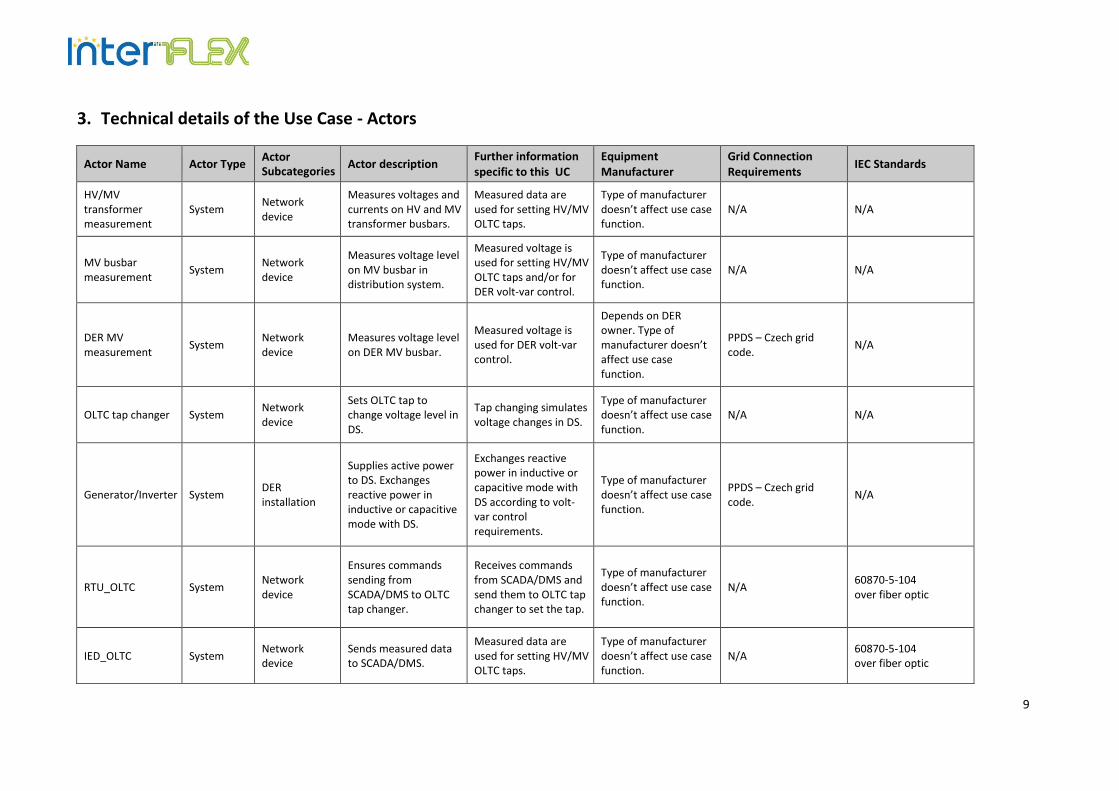
9
3. Technical details of the Use Case - Actors
Actor Name Actor Type Actor Subcategories
Actor description Further information specific to this UC
Equipment Manufacturer
Grid Connection Requirements
IEC Standards
HV/MV transformer measurement
System Network device
Measures voltages and currents on HV and MV transformer busbars.
Measured data are used for setting HV/MV OLTC taps.
Type of manufacturer doesn’t affect use case function.
N/A N/A
MV busbar measurement
System Network device
Measures voltage level on MV busbar in distribution system.
Measured voltage is used for setting HV/MV OLTC taps and/or for DER volt-var control.
Type of manufacturer doesn’t affect use case function.
N/A N/A
DER MV measurement
System Network device
Measures voltage level on DER MV busbar.
Measured voltage is used for DER volt-var control.
Depends on DER owner. Type of manufacturer doesn’t affect use case function.
PPDS – Czech grid code.
N/A
OLTC tap changer System Network device
Sets OLTC tap to change voltage level in DS.
Tap changing simulates voltage changes in DS.
Type of manufacturer doesn’t affect use case function.
N/A N/A
Generator/Inverter System DER installation
Supplies active power to DS. Exchanges reactive power in inductive or capacitive mode with DS.
Exchanges reactive power in inductive or capacitive mode with DS according to volt-var control requirements.
Type of manufacturer doesn’t affect use case function.
PPDS – Czech grid code.
N/A
RTU_OLTC System Network device
Ensures commands sending from SCADA/DMS to OLTC tap changer.
Receives commands from SCADA/DMS and send them to OLTC tap changer to set the tap.
Type of manufacturer doesn’t affect use case function.
N/A 60870-5-104 over fiber optic
IED_OLTC System Network device
Sends measured data to SCADA/DMS.
Measured data are used for setting HV/MV OLTC taps.
Type of manufacturer doesn’t affect use case function.
N/A 60870-5-104 over fiber optic
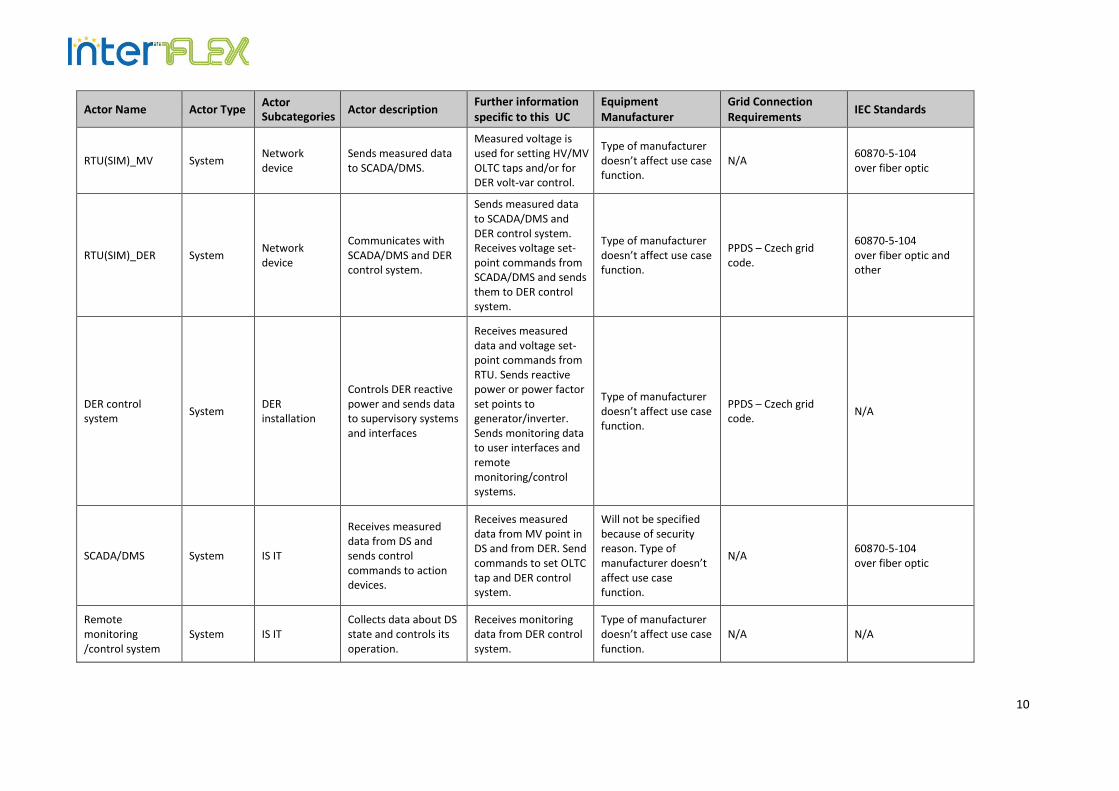
10
Actor Name Actor Type Actor Subcategories
Actor description Further information specific to this UC
Equipment Manufacturer
Grid Connection Requirements
IEC Standards
RTU(SIM)_MV System Network device
Sends measured data to SCADA/DMS.
Measured voltage is used for setting HV/MV OLTC taps and/or for DER volt-var control.
Type of manufacturer doesn’t affect use case function.
N/A 60870-5-104 over fiber optic
RTU(SIM)_DER System Network device
Communicates with SCADA/DMS and DER control system.
Sends measured data to SCADA/DMS and DER control system. Receives voltage set-point commands from SCADA/DMS and sends them to DER control system.
Type of manufacturer doesn’t affect use case function.
PPDS – Czech grid code.
60870-5-104 over fiber optic and other
DER control system
System DER installation
Controls DER reactive power and sends data to supervisory systems and interfaces
Receives measured data and voltage set-point commands from RTU. Sends reactive power or power factor set points to generator/inverter. Sends monitoring data to user interfaces and remote monitoring/control systems.
Type of manufacturer doesn’t affect use case function.
PPDS – Czech grid code.
N/A
SCADA/DMS System IS IT
Receives measured data from DS and sends control commands to action devices.
Receives measured data from MV point in DS and from DER. Send commands to set OLTC tap and DER control system.
Will not be specified because of security reason. Type of manufacturer doesn’t affect use case function.
N/A 60870-5-104 over fiber optic
Remote monitoring /control system
System IS IT Collects data about DS state and controls its operation.
Receives monitoring data from DER control system.
Type of manufacturer doesn’t affect use case function.
N/A N/A
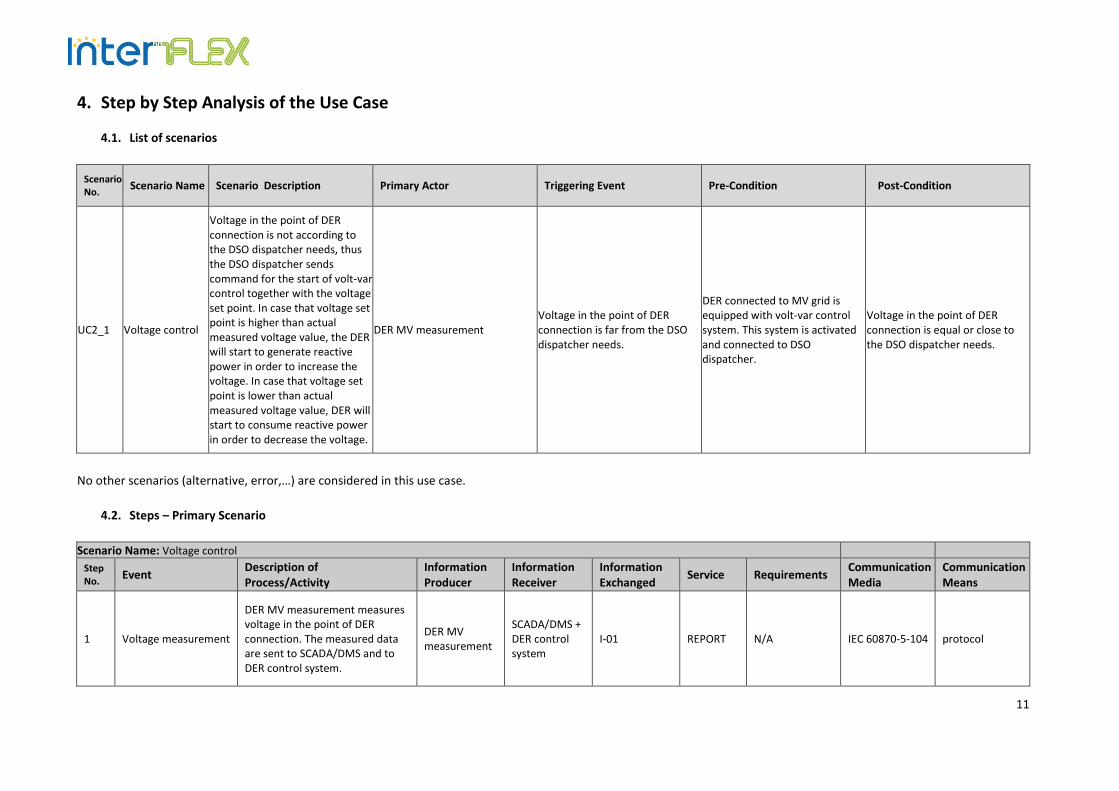
11
4. Step by Step Analysis of the Use Case
4.1. List of scenarios
Scenario No.
Scenario Name Scenario Description Primary Actor Triggering Event Pre-Condition Post-Condition
UC2_1 Voltage control
Voltage in the point of DER connection is not according to the DSO dispatcher needs, thus the DSO dispatcher sends command for the start of volt-var control together with the voltage set point. In case that voltage set point is higher than actual measured voltage value, the DER will start to generate reactive power in order to increase the voltage. In case that voltage set point is lower than actual measured voltage value, DER will start to consume reactive power in order to decrease the voltage.
DER MV measurement Voltage in the point of DER connection is far from the DSO dispatcher needs.
DER connected to MV grid is equipped with volt-var control system. This system is activated and connected to DSO dispatcher.
Voltage in the point of DER connection is equal or close to the DSO dispatcher needs.
No other scenarios (alternative, error,…) are considered in this use case.
4.2. Steps – Primary Scenario
Scenario Name: Voltage control
Step No.
Event Description of Process/Activity
Information Producer
Information Receiver
Information Exchanged
Service Requirements Communication Media
Communication Means
1 Voltage measurement
DER MV measurement measures voltage in the point of DER connection. The measured data are sent to SCADA/DMS and to DER control system.
DER MV measurement
SCADA/DMS + DER control system
I-01 REPORT N/A IEC 60870-5-104 protocol
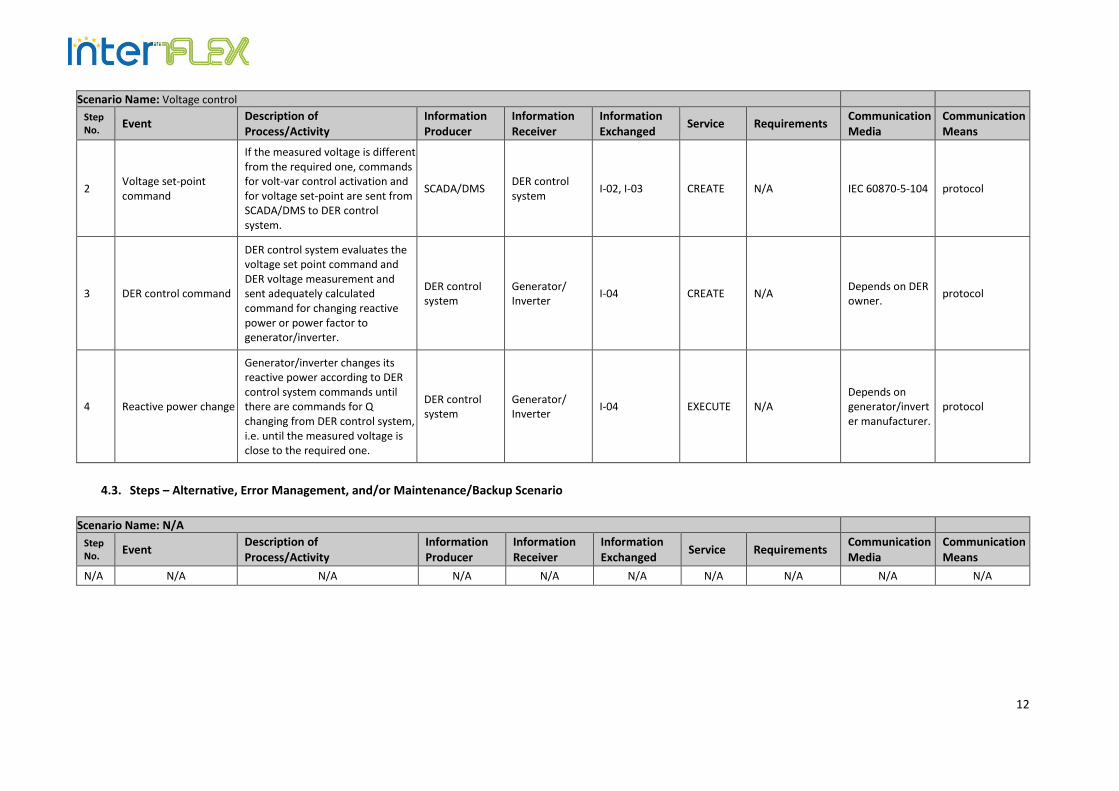
12
Scenario Name: Voltage control
Step No.
Event Description of Process/Activity
Information Producer
Information Receiver
Information Exchanged
Service Requirements Communication Media
Communication Means
2 Voltage set-point command
If the measured voltage is different from the required one, commands for volt-var control activation and for voltage set-point are sent from SCADA/DMS to DER control system.
SCADA/DMS DER control system
I-02, I-03 CREATE N/A IEC 60870-5-104 protocol
3 DER control command
DER control system evaluates the voltage set point command and DER voltage measurement and sent adequately calculated command for changing reactive power or power factor to generator/inverter.
DER control system
Generator/ Inverter
I-04 CREATE N/A Depends on DER owner.
protocol
4 Reactive power change
Generator/inverter changes its reactive power according to DER control system commands until there are commands for Q changing from DER control system, i.e. until the measured voltage is close to the required one.
DER control system
Generator/ Inverter
I-04 EXECUTE N/A Depends on generator/inverter manufacturer.
protocol
4.3. Steps – Alternative, Error Management, and/or Maintenance/Backup Scenario
Scenario Name: N/A
Step No.
Event Description of Process/Activity
Information Producer
Information Receiver
Information Exchanged
Service Requirements Communication Media
Communication Means
N/A N/A N/A N/A N/A N/A N/A N/A N/A N/A
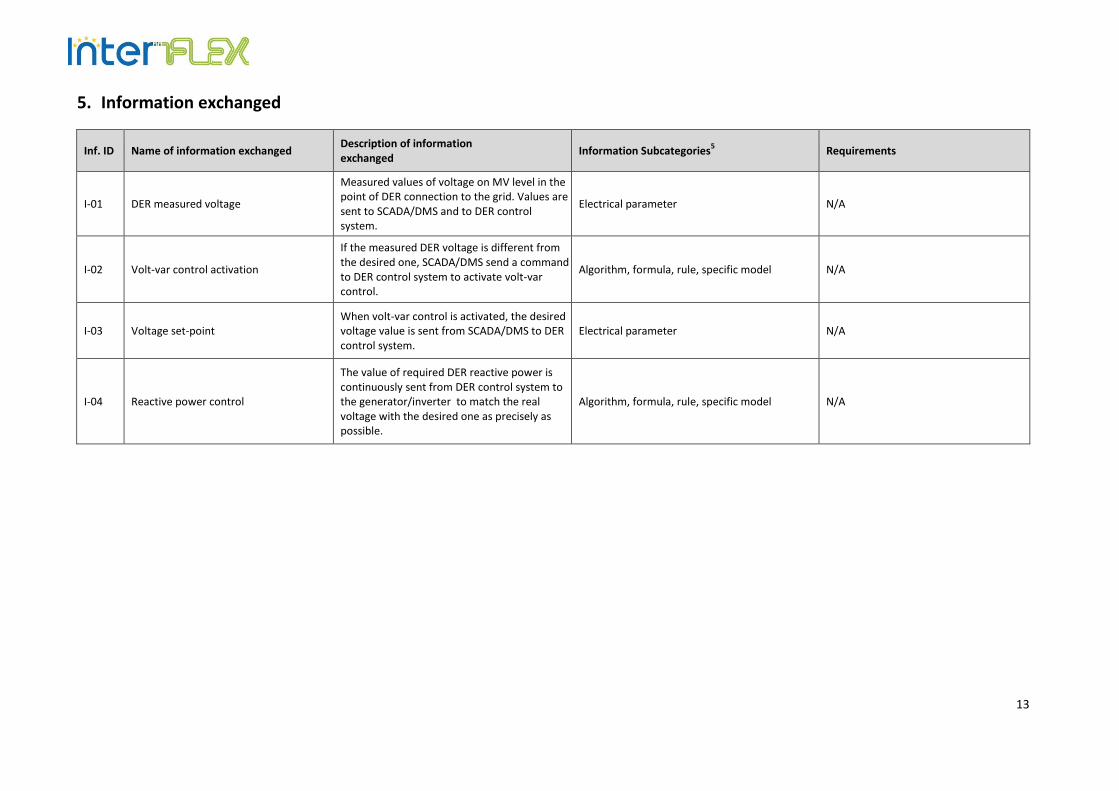
13
5. Information exchanged
Inf. ID Name of information exchanged Description of information exchanged
Information Subcategories5 Requirements
I-01 DER measured voltage
Measured values of voltage on MV level in the point of DER connection to the grid. Values are sent to SCADA/DMS and to DER control system.
Electrical parameter N/A
I-02 Volt-var control activation
If the measured DER voltage is different from the desired one, SCADA/DMS send a command to DER control system to activate volt-var control.
Algorithm, formula, rule, specific model N/A
I-03 Voltage set-point When volt-var control is activated, the desired voltage value is sent from SCADA/DMS to DER control system.
Electrical parameter N/A
I-04 Reactive power control
The value of required DER reactive power is continuously sent from DER control system to the generator/inverter to match the real voltage with the desired one as precisely as possible.
Algorithm, formula, rule, specific model N/A
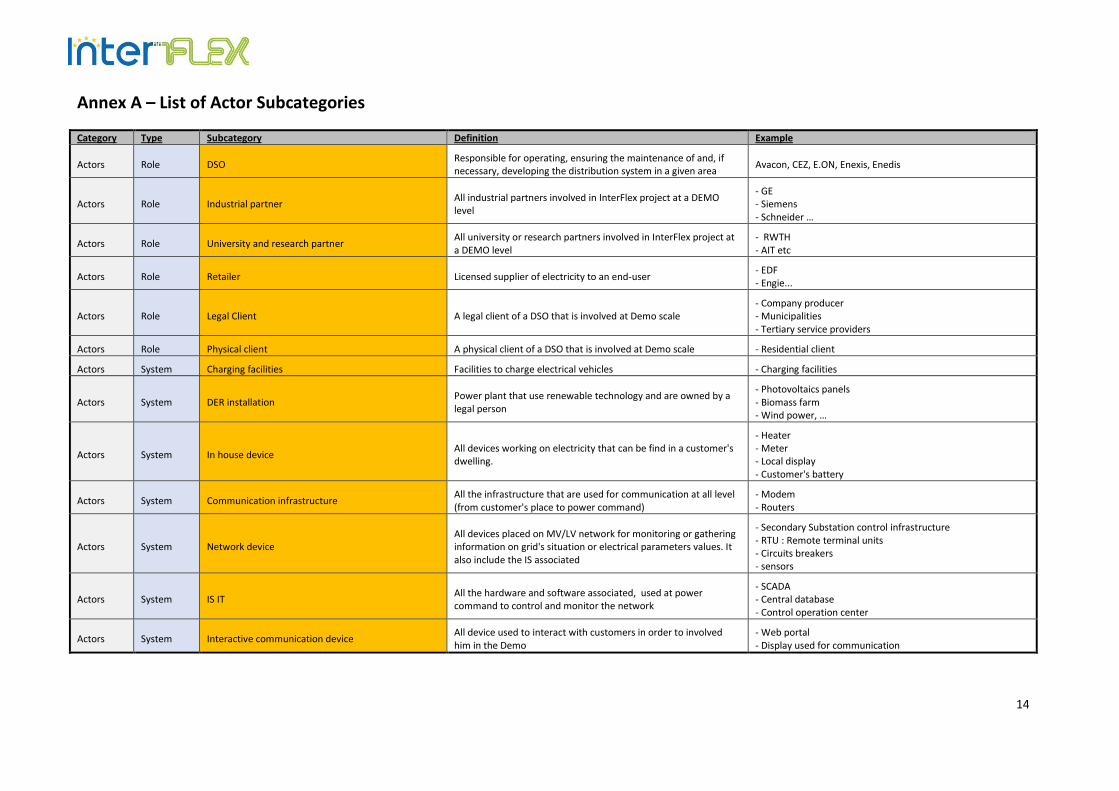
14
Annex A – List of Actor Subcategories
Category Type Subcategory Definition Example
Actors Role DSO Responsible for operating, ensuring the maintenance of and, if necessary, developing the distribution system in a given area
Avacon, CEZ, E.ON, Enexis, Enedis
Actors Role Industrial partner All industrial partners involved in InterFlex project at a DEMO level
- GE - Siemens - Schneider …
Actors Role University and research partner All university or research partners involved in InterFlex project at a DEMO level
- RWTH - AIT etc
Actors Role Retailer Licensed supplier of electricity to an end-user - EDF - Engie...
Actors Role Legal Client A legal client of a DSO that is involved at Demo scale - Company producer - Municipalities - Tertiary service providers
Actors Role Physical client A physical client of a DSO that is involved at Demo scale - Residential client
Actors System Charging facilities Facilities to charge electrical vehicles - Charging facilities
Actors System DER installation Power plant that use renewable technology and are owned by a legal person
- Photovoltaics panels - Biomass farm - Wind power, …
Actors System In house device All devices working on electricity that can be find in a customer's dwelling.
- Heater - Meter - Local display - Customer's battery
Actors System Communication infrastructure All the infrastructure that are used for communication at all level (from customer's place to power command)
- Modem - Routers
Actors System Network device All devices placed on MV/LV network for monitoring or gathering information on grid's situation or electrical parameters values. It also include the IS associated
- Secondary Substation control infrastructure - RTU : Remote terminal units - Circuits breakers - sensors
Actors System IS IT All the hardware and software associated, used at power command to control and monitor the network
- SCADA - Central database - Control operation center
Actors System Interactive communication device All device used to interact with customers in order to involved him in the Demo
- Web portal - Display used for communication

15
Annex B – List of Information Subcategories
Category Type Subcategory Definition Example
Data Document Internal document All the documentation made by Demo to run operation, to monitor and conduct the project's good development
- Meeting minutes - Report on the cost's impact of selected flexibility plans
Data Document InterFlex deliverable All the deliverables that Demo have to produce during the project's time as agreed in the DOW
- Risk analysis - Documentation on KPI - Detailed Use Case - Report on technical experimentation, market research, …
Data Document Communication material All the documentation that describe the project to the public and can be put on the future website
- Purpose of the DEMO (leaflet) - Brief description of Use Case - Location of Use Case
Data Financial data Project financial data All the financial data that are produced during the project and that are used to make financial report for European Commission and internal report
- Invoices - Cost and time imputation
Data Financial data Solution cost and selling price All the financial data that can be made concerning estimation prices of solution for replication
- Unit product cost of hardware developed by Demo - Sell price of the solution develop (software,…)
Data Parameter Condition parameter All the external parameters that may influence the success of the Use Case
- Weather - Time of day - Day of week …
Data Parameter Scenario assumption All the stated parameters that are necessary to determinate a scenario for the Use Case
- Location of islanding - Experiment's location
Data Parameter Electrical parameter All the electrical parameters that are used to supervise the network and its good state
- Intensity - Voltage - Frequency - Quality
Data Parameter Algorithm, formula, rule, specific model
All the intellectual data that are created during the project to made software's contents
- Algorithm to optimize flexibility plan - Simulation to determine location of circuit breaker - Voltage regulation algorithm
Data Parameter Optimized value Values of parameters that optimized the Use Case or the demo‘s performance
- Optimization time of islanding
Data Parameter Forecast data All the data used to forecast consumption or production of customer
- Forecast customer's consumption - Forecast photovoltaic panels' production
Data Facility data Network topology All information on network devices and their location and interaction, mainly coming from GIS (Geographic Information System)
- Map of the network - Substations location - All the other data found in the GIS (Geographical Information System)
Data Facility data Network state All information concerning the network's status (global or local) at a precise moment useful to monitor the network
- Feeding situation in a distribution area - State of network regarding Limit value violation - Location of constraint - Flexibility needs of DSO

16
Category Type Subcategory Definition Example
Data Facility data Customer's meter state and output
All the information concerning customer’s meter state and outputs information
- Customer’s consumption or production
Data Facility data Other device state and output All the information concerning device's state and outputs information
- State of charge of batteries - Consumption data coming from meter - Production data coming from meter - State of charge of storage components
Data Parameter Information exchanged between IS or sent to device
All automated information sent between facilities in order to send information or order for monitoring
- Order sent to breaker devices (open, close,…) - Information on local network status coming from sensors - Order and roadmap sent to network devices (batteries, aggregator,…)
Data Parameter Detailed specification on devices
All detailed information (reference components, specification, process,…) useful to build the devices
- Detailed specification of the telecommunication infrastructure - Detailed specification of interactive sensor network
Data Network data Network topology All information on network devices and their location and interaction, mainly coming from GIS (Geographic Information System)
- Map of the network - Substations location - All the other data found in the GIS (Geographical Information System)
Data Network data Network state All information concerning the network's status (global or local) at a precise moment useful to monitor the network
- Feeding situation in a distribution area - State of network regarding Limit value violation - Location of constraint - Flexibility needs of DSO
Data KPI Data for KPI (input raw data) All raw data that are used to calculate the final KPI - Duration of experiment - Customer response to DSO's demand - Electrical parameter used for KPI
Data KPI KPI (KPI values) All the KPI values and the way to calculate them - Economic KPI - System Efficiency KPI
Data Customer data Customer contract’s data All the data in customer's contact that are used for contact or make payment
- Address - Phone number - Bank account details
Data Customer data Information sent to /received from customer
All the information and data that are exchanged between the DEMO and the customer in order to involve customer in the experiment
- Customer's response to DSO's request to reduce consumption - Information and data available to customer in order to visualize its consumption - Advices and encouragement sent to encourage a smart consumption
Data Customer data Customer analysis (profile analysis, studies on client reactivity,…)
All the data that are produced in order to better understand the customer's behaviour regarding the possibility to adopt smarter habits in their electricity consumption
- Customer's typology and behaviour patterns - Analysis on customer's response to DSO's request
1
Use Case Description
UC WP6_3 – Smart EV charging
2
Scope ......................................................................................................................................................................... 3
1. Description of the Use Case ............................................................................................................................ 4
2. Diagrams of the Use Case ................................................................................................................................. 8
3. Technical details of the Use Case - Actors....................................................................................................... 11
4. Step by Step Analysis of the Use Case ............................................................................................................. 15
5. Information exchanged ................................................................................................................................... 20
Annex A – List of Actor Subcategories .................................................................................................................... 23
Annex B – List of Information Subcategories .......................................................................................................... 24

3
Scope
This document describes the Use Case UC WP6_3 – Smart EV charging. The Use Case description within is divided in to five areas:
1. Description of the Use Case 2. Diagrams of the Use Case 3. Technical data - Actors 4. Step by Step Analysis of Use Case (can be extended by detailed info on “information exchanged”) 5. Information exchanged
4
1. Description of the Use Case
1.1. Use Case Identification
ID Domains/Zones1 Name of Use Case Level of Use Case2
WP6_3 CUSTOMER PREMISES/PROCESS
Smart EV charging Detailed Use case
1.2. Version Management
Version Date Name Author(s) or Committee
Changes
V1.0 24.5.2017 Jan Švec First version of the document
1.3. Scope and objectives
Scope and Objectives of the Use Case
Scope The aim is to quantify the impact of the Smart charging of EVs onto the distribution grid flexibility in case of emergency.
Objective
Reduce maximum charging power of smart charging station in case of underfrequency, undervoltage or in case of receiving signal from DSO through ripple control system (emergency functions) and power quality measurement during EV charging process (evaluated according to EN 50160).
Related Business Case CEZ Distribuce could defer investments to grid reinforcement.
1.4. Narrative of Use Case
Short description – max 3 sentences
Curtailment of EV charging power in case of under voltage, under frequency or in case of DSO needs.
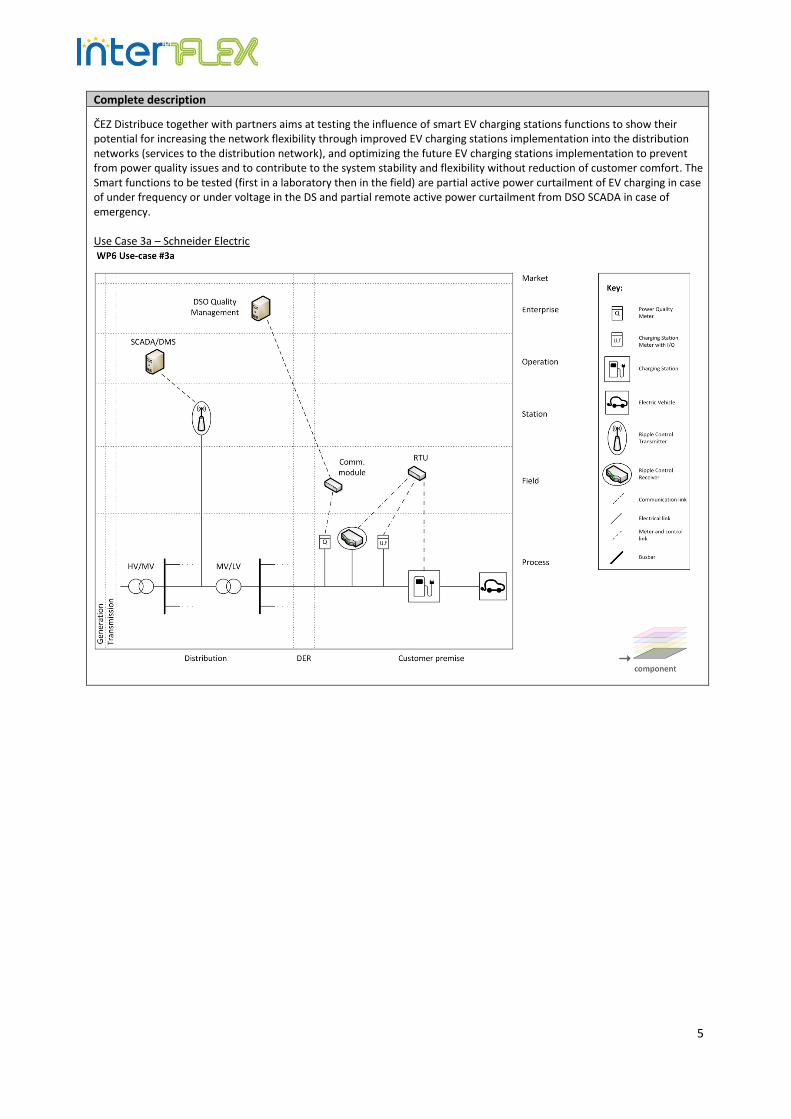
5
Complete description
ČEZ Distribuce together with partners aims at testing the influence of smart EV charging stations functions to show their potential for increasing the network flexibility through improved EV charging stations implementation into the distribution networks (services to the distribution network), and optimizing the future EV charging stations implementation to prevent from power quality issues and to contribute to the system stability and flexibility without reduction of customer comfort. The Smart functions to be tested (first in a laboratory then in the field) are partial active power curtailment of EV charging in case of under frequency or under voltage in the DS and partial remote active power curtailment from DSO SCADA in case of emergency. Use Case 3a – Schneider Electric
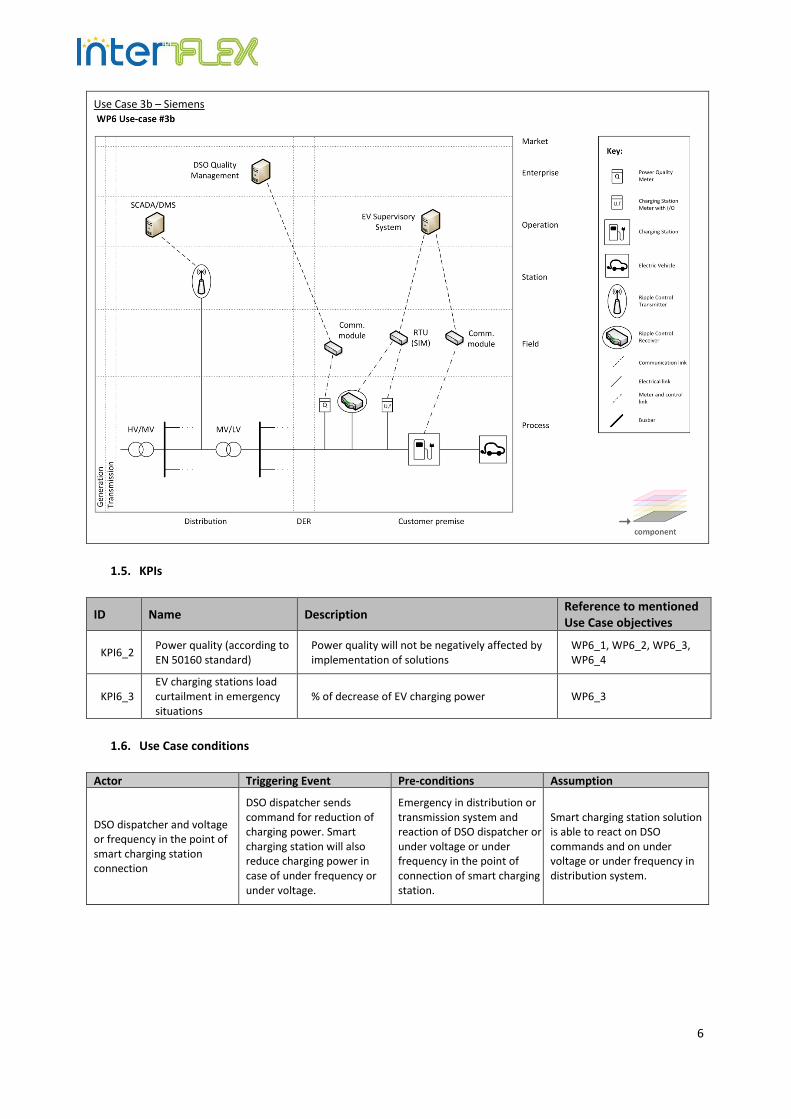
6
Use Case 3b – Siemens
1.5. KPIs
ID Name Description Reference to mentioned Use Case objectives
KPI6_2 Power quality (according to EN 50160 standard)
Power quality will not be negatively affected by implementation of solutions
WP6_1, WP6_2, WP6_3, WP6_4
KPI6_3 EV charging stations load curtailment in emergency situations
% of decrease of EV charging power WP6_3
1.6. Use Case conditions
Actor Triggering Event Pre-conditions Assumption
DSO dispatcher and voltage or frequency in the point of smart charging station connection
DSO dispatcher sends command for reduction of charging power. Smart charging station will also reduce charging power in case of under frequency or under voltage.
Emergency in distribution or transmission system and reaction of DSO dispatcher or under voltage or under frequency in the point of connection of smart charging station.
Smart charging station solution is able to react on DSO commands and on under voltage or under frequency in distribution system.
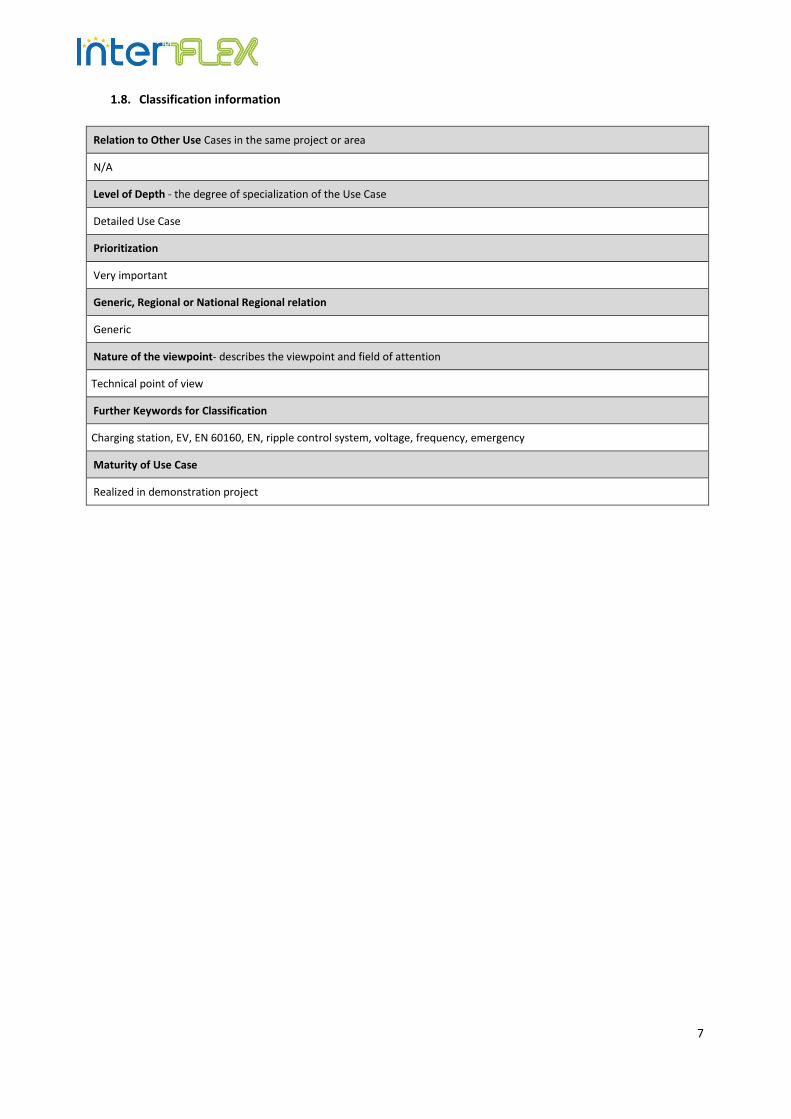
7
1.8. Classification information
Relation to Other Use Cases in the same project or area
N/A
Level of Depth - the degree of specialization of the Use Case
Detailed Use Case
Prioritization
Very important
Generic, Regional or National Regional relation
Generic
Nature of the viewpoint- describes the viewpoint and field of attention
Technical point of view
Further Keywords for Classification
Charging station, EV, EN 60160, EN, ripple control system, voltage, frequency, emergency
Maturity of Use Case
Realized in demonstration project
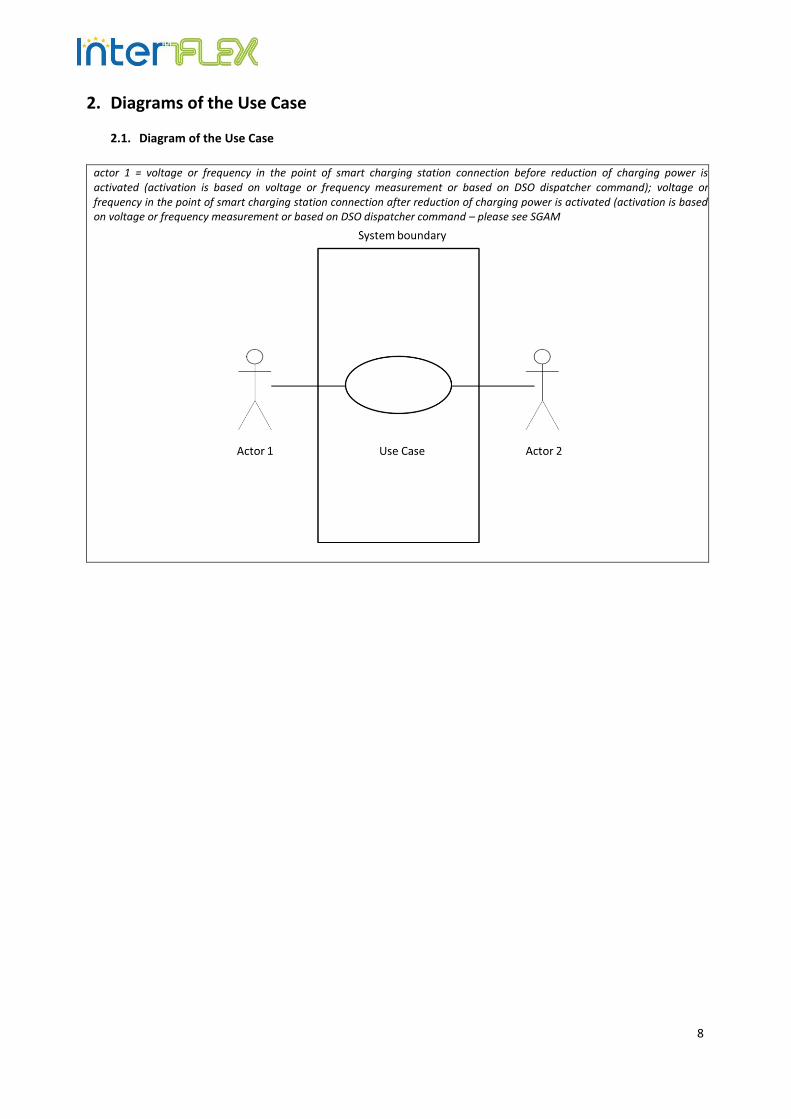
8
2. Diagrams of the Use Case
2.1. Diagram of the Use Case
actor 1 = voltage or frequency in the point of smart charging station connection before reduction of charging power is activated (activation is based on voltage or frequency measurement or based on DSO dispatcher command); voltage or frequency in the point of smart charging station connection after reduction of charging power is activated (activation is based on voltage or frequency measurement or based on DSO dispatcher command – please see SGAM
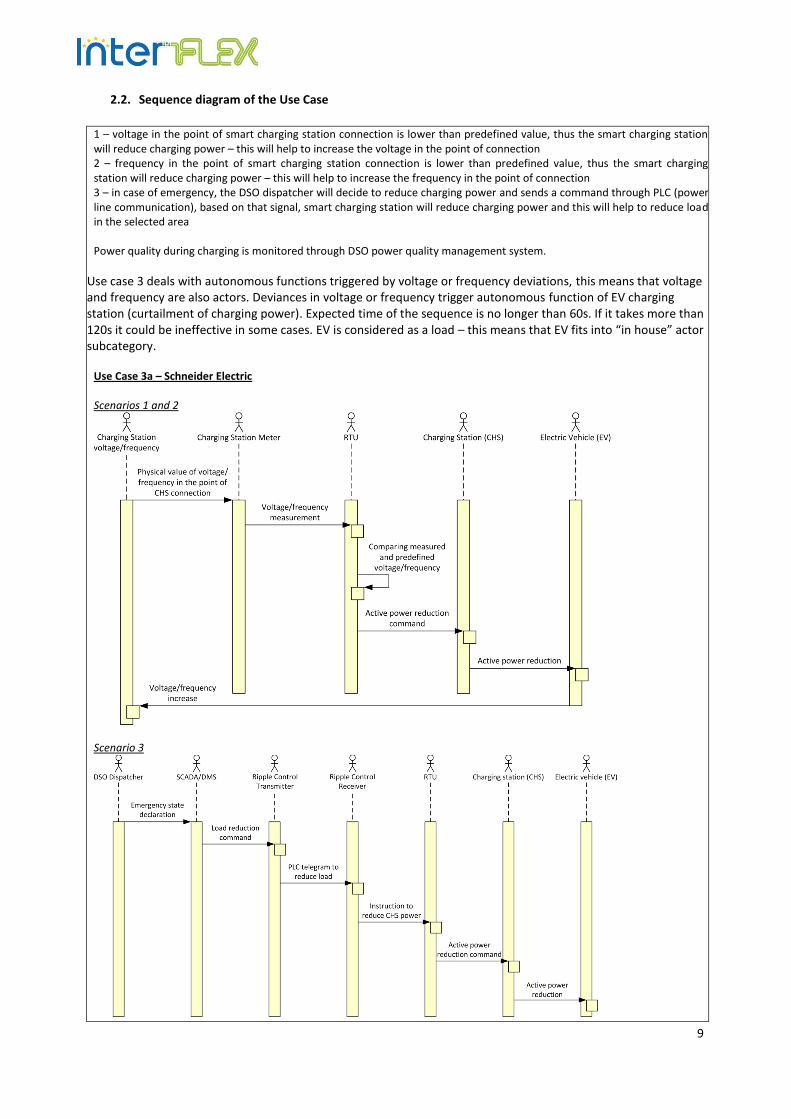
9
2.2. Sequence diagram of the Use Case
1 – voltage in the point of smart charging station connection is lower than predefined value, thus the smart charging station will reduce charging power – this will help to increase the voltage in the point of connection 2 – frequency in the point of smart charging station connection is lower than predefined value, thus the smart charging station will reduce charging power – this will help to increase the frequency in the point of connection 3 – in case of emergency, the DSO dispatcher will decide to reduce charging power and sends a command through PLC (power line communication), based on that signal, smart charging station will reduce charging power and this will help to reduce load in the selected area Power quality during charging is monitored through DSO power quality management system.
Use case 3 deals with autonomous functions triggered by voltage or frequency deviations, this means that voltage and frequency are also actors. Deviances in voltage or frequency trigger autonomous function of EV charging station (curtailment of charging power). Expected time of the sequence is no longer than 60s. If it takes more than 120s it could be ineffective in some cases. EV is considered as a load – this means that EV fits into “in house” actor subcategory.
Use Case 3a – Schneider Electric Scenarios 1 and 2
Scenario 3
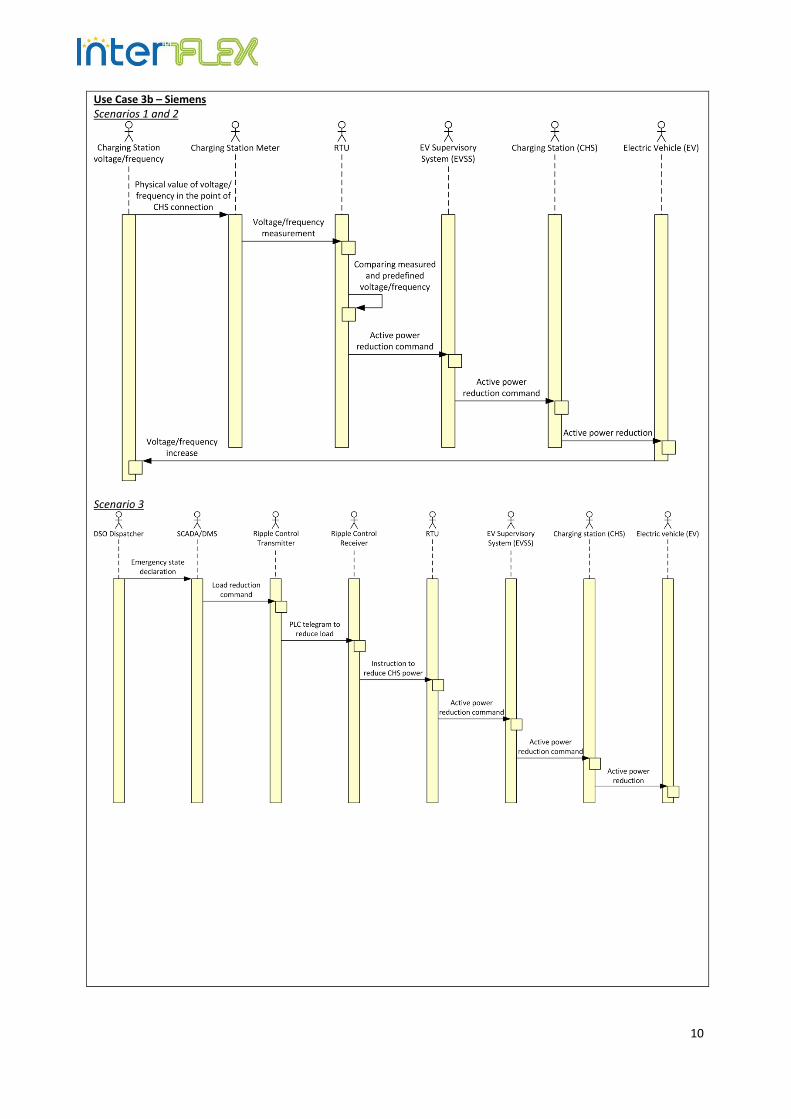
10
Use Case 3b – Siemens Scenarios 1 and 2
Scenario 3
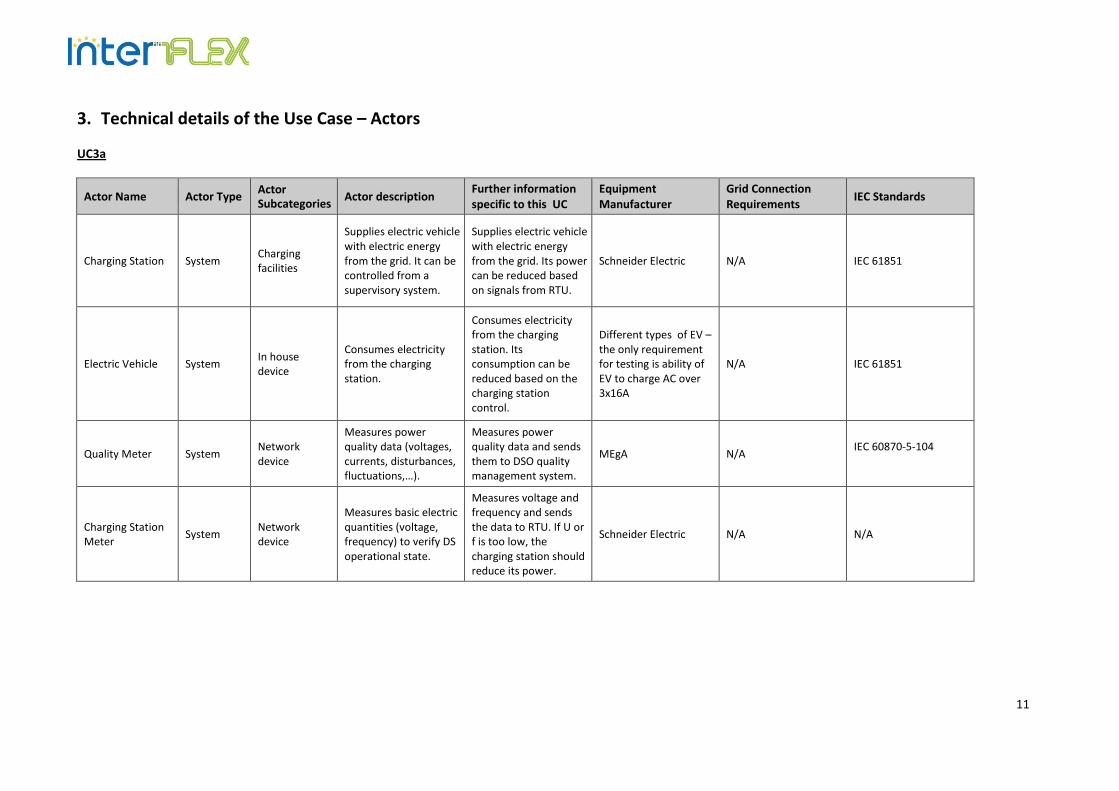
11
3. Technical details of the Use Case – Actors
UC3a
Actor Name Actor Type Actor Subcategories
Actor description Further information specific to this UC
Equipment Manufacturer
Grid Connection Requirements
IEC Standards
Charging Station System Charging facilities
Supplies electric vehicle with electric energy from the grid. It can be controlled from a supervisory system.
Supplies electric vehicle with electric energy from the grid. Its power can be reduced based on signals from RTU.
Schneider Electric N/A IEC 61851
Electric Vehicle System In house device
Consumes electricity from the charging station.
Consumes electricity from the charging station. Its consumption can be reduced based on the charging station control.
Different types of EV – the only requirement for testing is ability of EV to charge AC over 3x16A
N/A IEC 61851
Quality Meter System Network device
Measures power quality data (voltages, currents, disturbances, fluctuations,…).
Measures power quality data and sends them to DSO quality management system.
MEgA N/A IEC 60870-5-104
Charging Station Meter
System Network device
Measures basic electric quantities (voltage, frequency) to verify DS operational state.
Measures voltage and frequency and sends the data to RTU. If U or f is too low, the charging station should reduce its power.
Schneider Electric N/A N/A
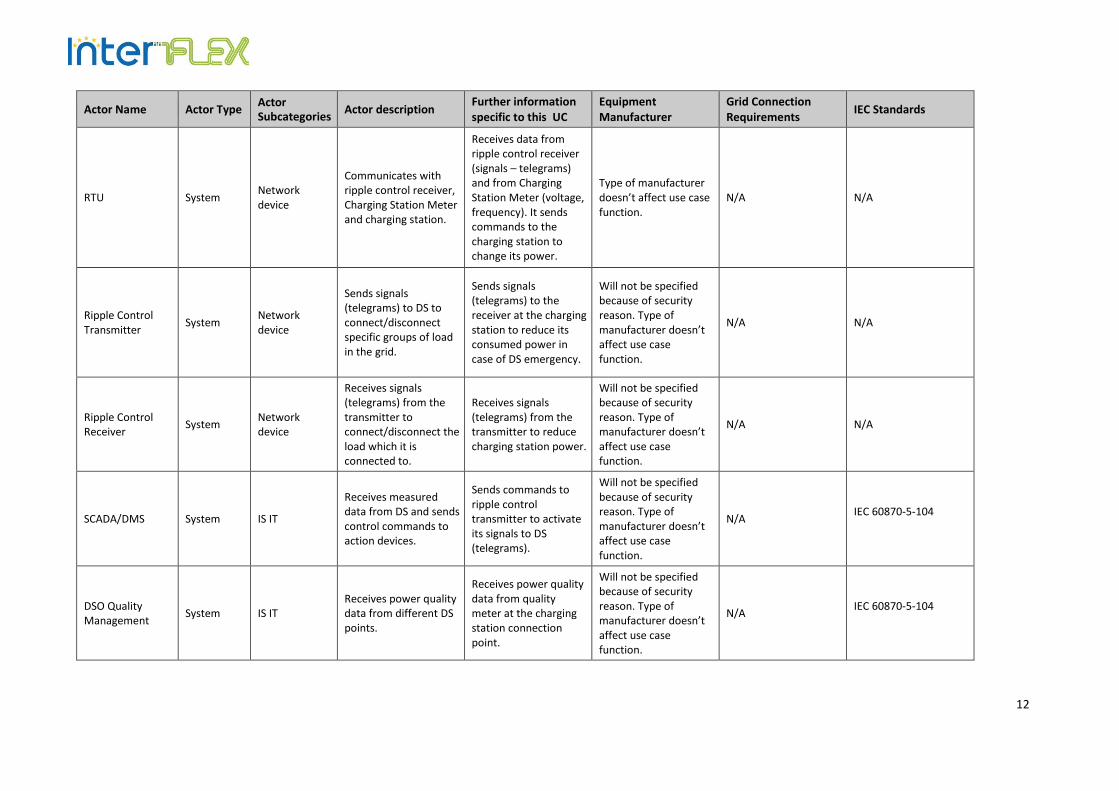
12
Actor Name Actor Type Actor Subcategories
Actor description Further information specific to this UC
Equipment Manufacturer
Grid Connection Requirements
IEC Standards
RTU System Network device
Communicates with ripple control receiver, Charging Station Meter and charging station.
Receives data from ripple control receiver (signals – telegrams) and from Charging Station Meter (voltage, frequency). It sends commands to the charging station to change its power.
Type of manufacturer doesn’t affect use case function.
N/A N/A
Ripple Control Transmitter
System Network device
Sends signals (telegrams) to DS to connect/disconnect specific groups of load in the grid.
Sends signals (telegrams) to the receiver at the charging station to reduce its consumed power in case of DS emergency.
Will not be specified because of security reason. Type of manufacturer doesn’t affect use case function.
N/A N/A
Ripple Control Receiver
System Network device
Receives signals (telegrams) from the transmitter to connect/disconnect the load which it is connected to.
Receives signals (telegrams) from the transmitter to reduce charging station power.
Will not be specified because of security reason. Type of manufacturer doesn’t affect use case function.
N/A N/A
SCADA/DMS System IS IT
Receives measured data from DS and sends control commands to action devices.
Sends commands to ripple control transmitter to activate its signals to DS (telegrams).
Will not be specified because of security reason. Type of manufacturer doesn’t affect use case function.
N/A IEC 60870-5-104
DSO Quality Management
System IS IT Receives power quality data from different DS points.
Receives power quality data from quality meter at the charging station connection point.
Will not be specified because of security reason. Type of manufacturer doesn’t affect use case function.
N/A IEC 60870-5-104
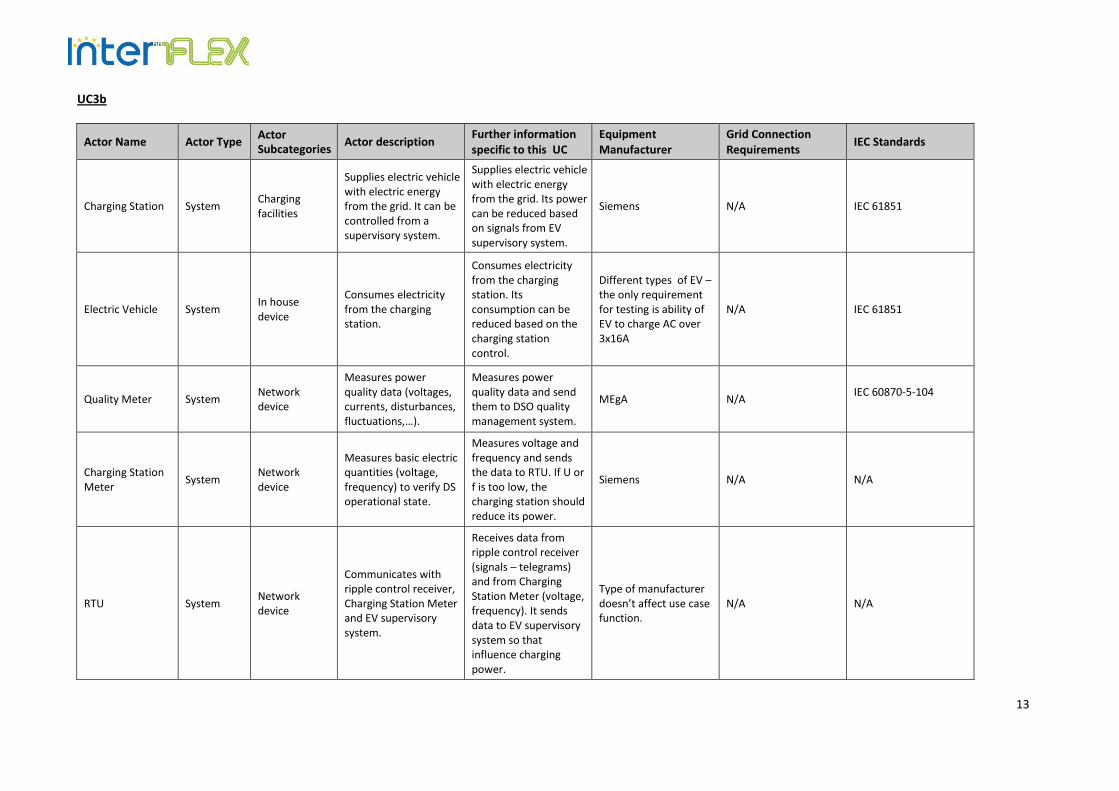
13
UC3b
Actor Name Actor Type Actor Subcategories
Actor description Further information specific to this UC
Equipment Manufacturer
Grid Connection Requirements
IEC Standards
Charging Station System Charging facilities
Supplies electric vehicle with electric energy from the grid. It can be controlled from a supervisory system.
Supplies electric vehicle with electric energy from the grid. Its power can be reduced based on signals from EV supervisory system.
Siemens N/A IEC 61851
Electric Vehicle System In house device
Consumes electricity from the charging station.
Consumes electricity from the charging station. Its consumption can be reduced based on the charging station control.
Different types of EV – the only requirement for testing is ability of EV to charge AC over 3x16A
N/A IEC 61851
Quality Meter System Network device
Measures power quality data (voltages, currents, disturbances, fluctuations,…).
Measures power quality data and send them to DSO quality management system.
MEgA N/A IEC 60870-5-104
Charging Station Meter
System Network device
Measures basic electric quantities (voltage, frequency) to verify DS operational state.
Measures voltage and frequency and sends the data to RTU. If U or f is too low, the charging station should reduce its power.
Siemens N/A N/A
RTU System Network device
Communicates with ripple control receiver, Charging Station Meter and EV supervisory system.
Receives data from ripple control receiver (signals – telegrams) and from Charging Station Meter (voltage, frequency). It sends data to EV supervisory system so that influence charging power.
Type of manufacturer doesn’t affect use case function.
N/A N/A
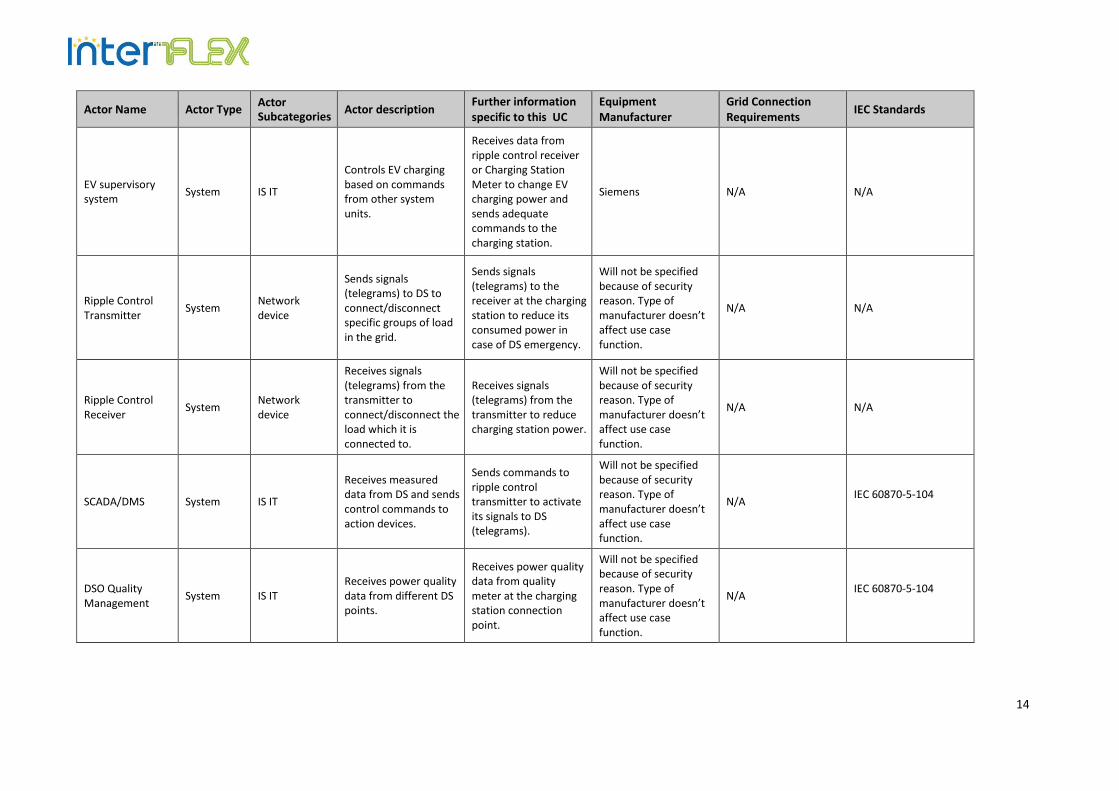
14
Actor Name Actor Type Actor Subcategories
Actor description Further information specific to this UC
Equipment Manufacturer
Grid Connection Requirements
IEC Standards
EV supervisory system
System IS IT
Controls EV charging based on commands from other system units.
Receives data from ripple control receiver or Charging Station Meter to change EV charging power and sends adequate commands to the charging station.
Siemens N/A N/A
Ripple Control Transmitter
System Network device
Sends signals (telegrams) to DS to connect/disconnect specific groups of load in the grid.
Sends signals (telegrams) to the receiver at the charging station to reduce its consumed power in case of DS emergency.
Will not be specified because of security reason. Type of manufacturer doesn’t affect use case function.
N/A N/A
Ripple Control Receiver
System Network device
Receives signals (telegrams) from the transmitter to connect/disconnect the load which it is connected to.
Receives signals (telegrams) from the transmitter to reduce charging station power.
Will not be specified because of security reason. Type of manufacturer doesn’t affect use case function.
N/A N/A
SCADA/DMS System IS IT
Receives measured data from DS and sends control commands to action devices.
Sends commands to ripple control transmitter to activate its signals to DS (telegrams).
Will not be specified because of security reason. Type of manufacturer doesn’t affect use case function.
N/A IEC 60870-5-104
DSO Quality Management
System IS IT Receives power quality data from different DS points.
Receives power quality data from quality meter at the charging station connection point.
Will not be specified because of security reason. Type of manufacturer doesn’t affect use case function.
N/A IEC 60870-5-104
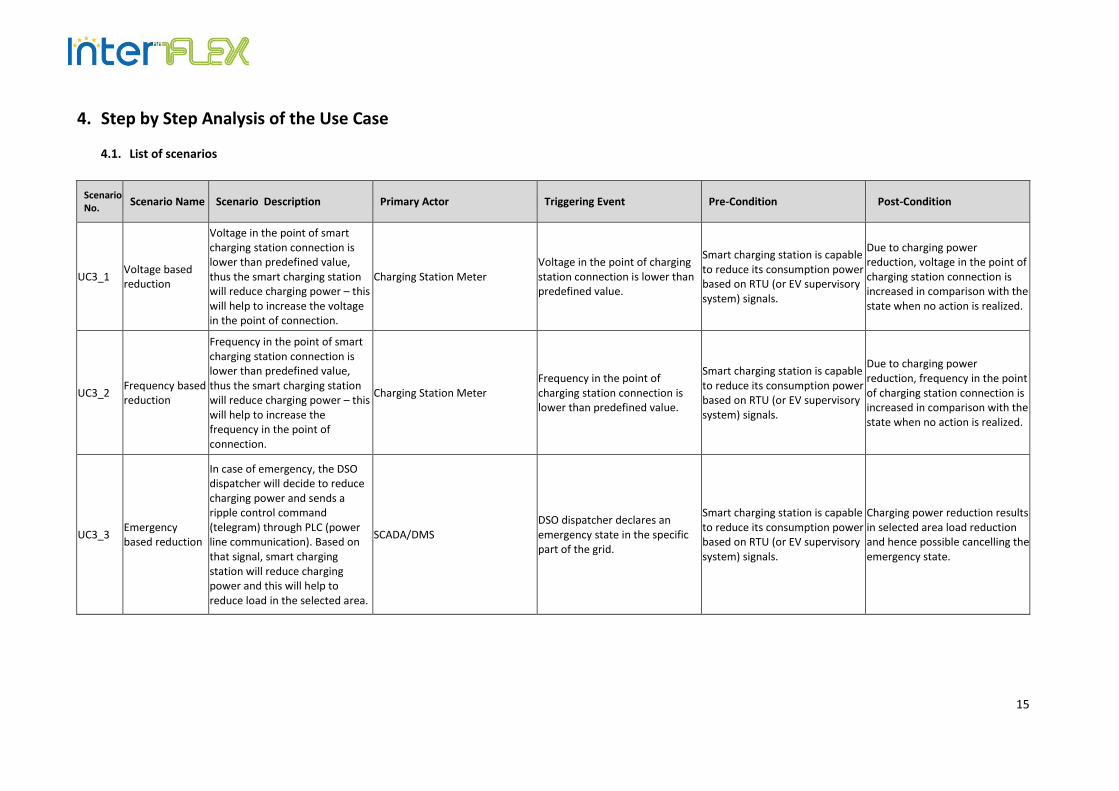
15
4. Step by Step Analysis of the Use Case
4.1. List of scenarios
Scenario No.
Scenario Name Scenario Description Primary Actor Triggering Event Pre-Condition Post-Condition
UC3_1 Voltage based reduction
Voltage in the point of smart charging station connection is lower than predefined value, thus the smart charging station will reduce charging power – this will help to increase the voltage in the point of connection.
Charging Station Meter Voltage in the point of charging station connection is lower than predefined value.
Smart charging station is capable to reduce its consumption power based on RTU (or EV supervisory system) signals.
Due to charging power reduction, voltage in the point of charging station connection is increased in comparison with the state when no action is realized.
UC3_2 Frequency based reduction
Frequency in the point of smart charging station connection is lower than predefined value, thus the smart charging station will reduce charging power – this will help to increase the frequency in the point of connection.
Charging Station Meter Frequency in the point of charging station connection is lower than predefined value.
Smart charging station is capable to reduce its consumption power based on RTU (or EV supervisory system) signals.
Due to charging power reduction, frequency in the point of charging station connection is increased in comparison with the state when no action is realized.
UC3_3 Emergency based reduction
In case of emergency, the DSO dispatcher will decide to reduce charging power and sends a ripple control command (telegram) through PLC (power line communication). Based on that signal, smart charging station will reduce charging power and this will help to reduce load in the selected area.
SCADA/DMS DSO dispatcher declares an emergency state in the specific part of the grid.
Smart charging station is capable to reduce its consumption power based on RTU (or EV supervisory system) signals.
Charging power reduction results in selected area load reduction and hence possible cancelling the emergency state.
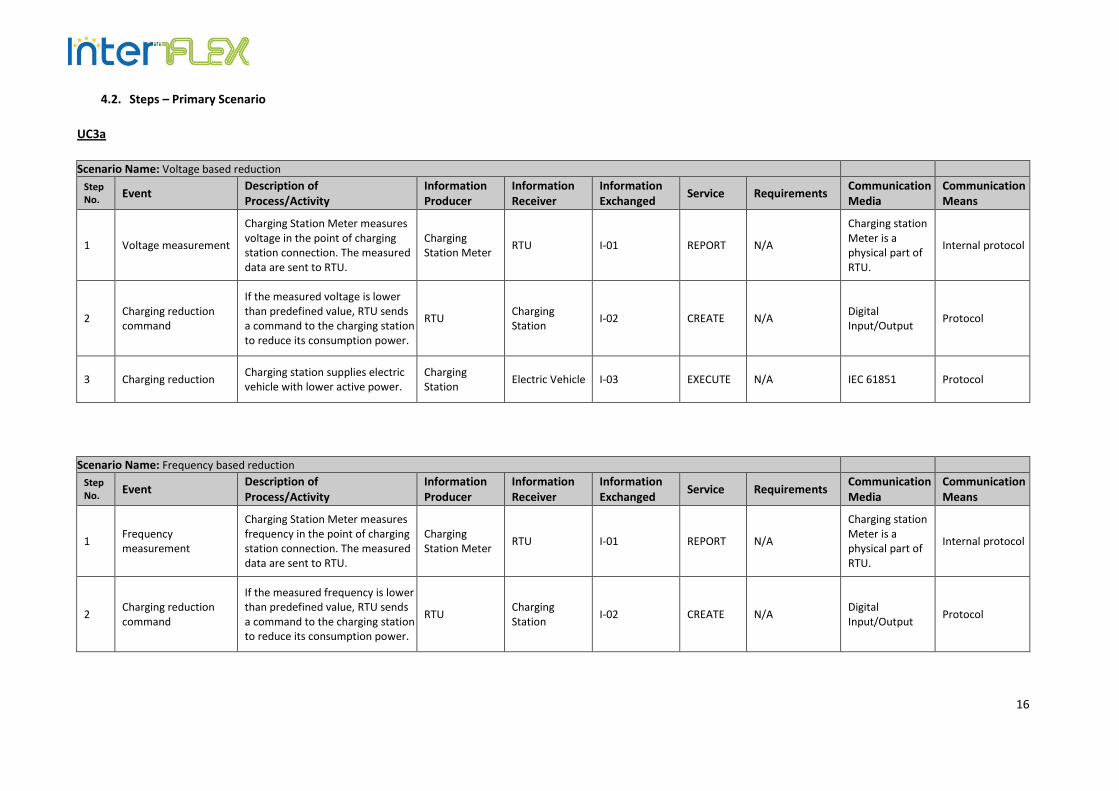
16
4.2. Steps – Primary Scenario
UC3a
Scenario Name: Voltage based reduction
Step No.
Event Description of Process/Activity
Information Producer
Information Receiver
Information Exchanged
Service Requirements Communication Media
Communication Means
1 Voltage measurement
Charging Station Meter measures voltage in the point of charging station connection. The measured data are sent to RTU.
Charging Station Meter
RTU I-01 REPORT N/A
Charging station Meter is a physical part of RTU.
Internal protocol
2 Charging reduction command
If the measured voltage is lower than predefined value, RTU sends a command to the charging station to reduce its consumption power.
RTU Charging Station
I-02 CREATE N/A Digital Input/Output
Protocol
3 Charging reduction Charging station supplies electric vehicle with lower active power.
Charging Station
Electric Vehicle I-03 EXECUTE N/A IEC 61851 Protocol
Scenario Name: Frequency based reduction
Step No.
Event Description of Process/Activity
Information Producer
Information Receiver
Information Exchanged
Service Requirements Communication Media
Communication Means
1 Frequency measurement
Charging Station Meter measures frequency in the point of charging station connection. The measured data are sent to RTU.
Charging Station Meter
RTU I-01 REPORT N/A
Charging station Meter is a physical part of RTU.
Internal protocol
2 Charging reduction command
If the measured frequency is lower than predefined value, RTU sends a command to the charging station to reduce its consumption power.
RTU Charging Station
I-02 CREATE N/A Digital Input/Output
Protocol
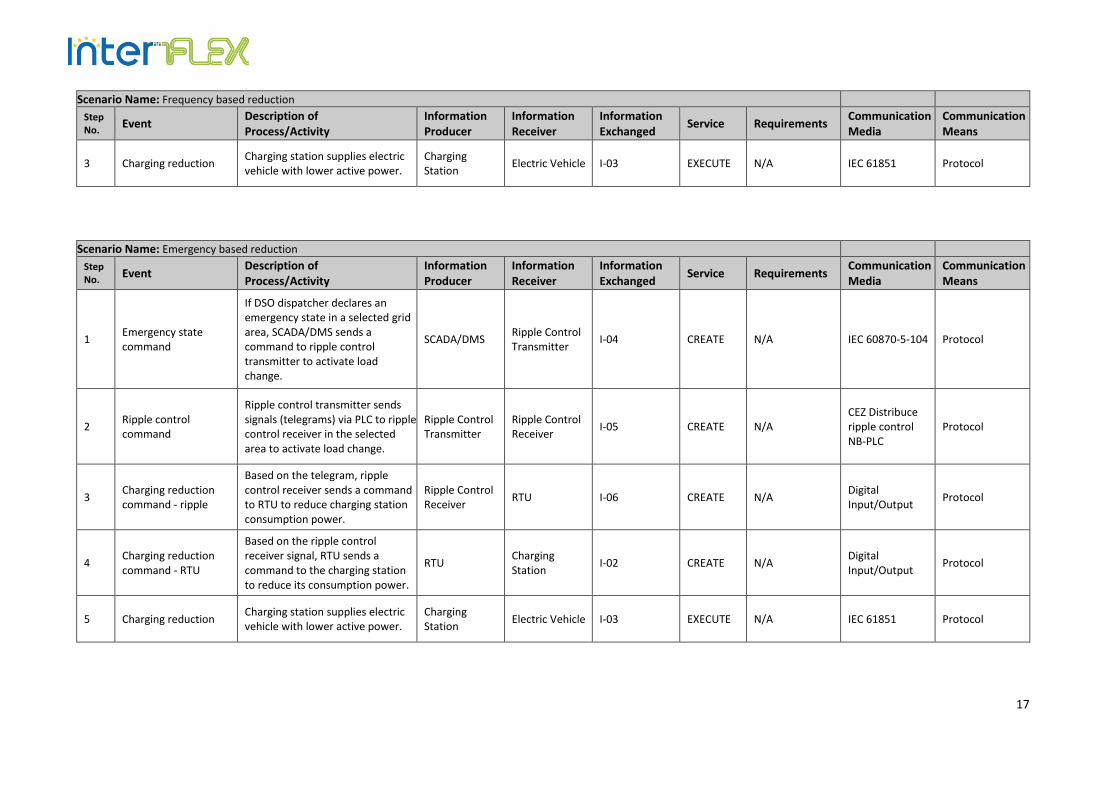
17
Scenario Name: Frequency based reduction
Step No.
Event Description of Process/Activity
Information Producer
Information Receiver
Information Exchanged
Service Requirements Communication Media
Communication Means
3 Charging reduction Charging station supplies electric vehicle with lower active power.
Charging Station
Electric Vehicle I-03 EXECUTE N/A IEC 61851 Protocol
Scenario Name: Emergency based reduction
Step No.
Event Description of Process/Activity
Information Producer
Information Receiver
Information Exchanged
Service Requirements Communication Media
Communication Means
1 Emergency state command
If DSO dispatcher declares an emergency state in a selected grid area, SCADA/DMS sends a command to ripple control transmitter to activate load change.
SCADA/DMS Ripple Control Transmitter
I-04 CREATE N/A IEC 60870-5-104 Protocol
2 Ripple control command
Ripple control transmitter sends signals (telegrams) via PLC to ripple control receiver in the selected area to activate load change.
Ripple Control Transmitter
Ripple Control Receiver
I-05 CREATE N/A CEZ Distribuce ripple control NB-PLC
Protocol
3 Charging reduction command - ripple
Based on the telegram, ripple control receiver sends a command to RTU to reduce charging station consumption power.
Ripple Control Receiver
RTU I-06 CREATE N/A Digital Input/Output
Protocol
4 Charging reduction command - RTU
Based on the ripple control receiver signal, RTU sends a command to the charging station to reduce its consumption power.
RTU Charging Station
I-02 CREATE N/A Digital Input/Output
Protocol
5 Charging reduction Charging station supplies electric vehicle with lower active power.
Charging Station
Electric Vehicle I-03 EXECUTE N/A IEC 61851 Protocol
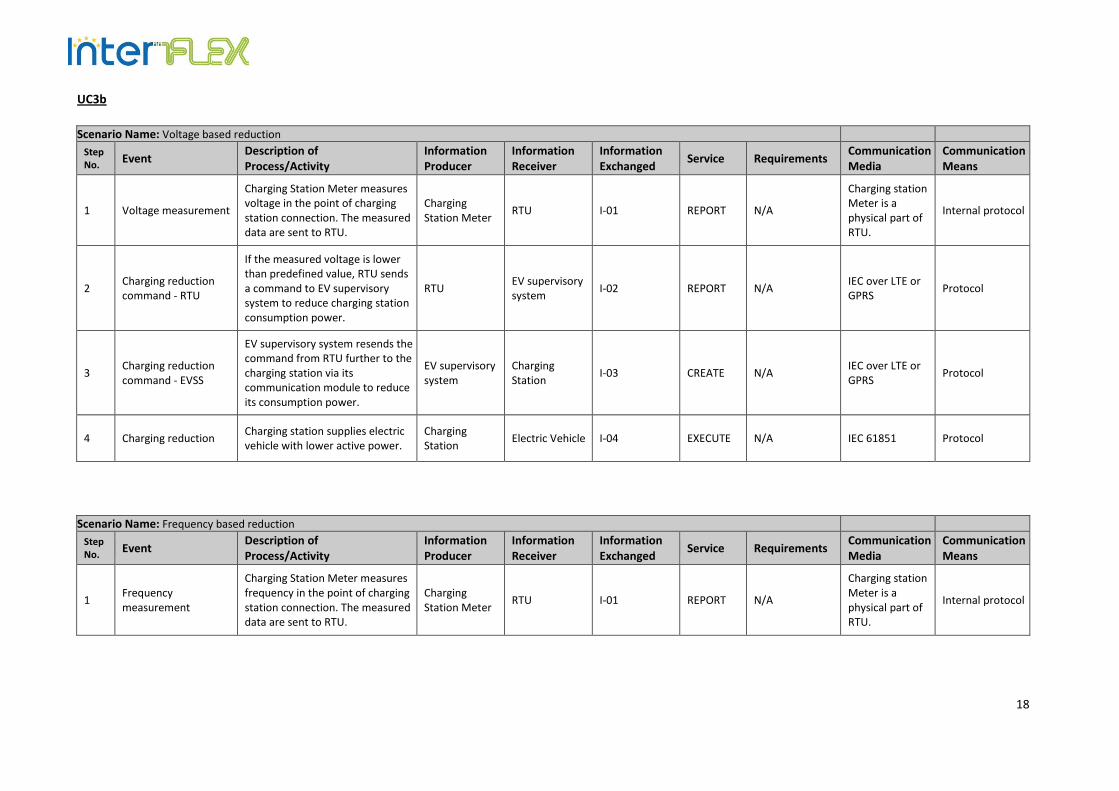
18
UC3b
Scenario Name: Voltage based reduction
Step No.
Event Description of Process/Activity
Information Producer
Information Receiver
Information Exchanged
Service Requirements Communication Media
Communication Means
1 Voltage measurement
Charging Station Meter measures voltage in the point of charging station connection. The measured data are sent to RTU.
Charging Station Meter
RTU I-01 REPORT N/A
Charging station Meter is a physical part of RTU.
Internal protocol
2 Charging reduction command - RTU
If the measured voltage is lower than predefined value, RTU sends a command to EV supervisory system to reduce charging station consumption power.
RTU EV supervisory system
I-02 REPORT N/A IEC over LTE or GPRS
Protocol
3 Charging reduction command - EVSS
EV supervisory system resends the command from RTU further to the charging station via its communication module to reduce its consumption power.
EV supervisory system
Charging Station
I-03 CREATE N/A IEC over LTE or GPRS
Protocol
4 Charging reduction Charging station supplies electric vehicle with lower active power.
Charging Station
Electric Vehicle I-04 EXECUTE N/A IEC 61851 Protocol
Scenario Name: Frequency based reduction
Step No.
Event Description of Process/Activity
Information Producer
Information Receiver
Information Exchanged
Service Requirements Communication Media
Communication Means
1 Frequency measurement
Charging Station Meter measures frequency in the point of charging station connection. The measured data are sent to RTU.
Charging Station Meter
RTU I-01 REPORT N/A
Charging station Meter is a physical part of RTU.
Internal protocol
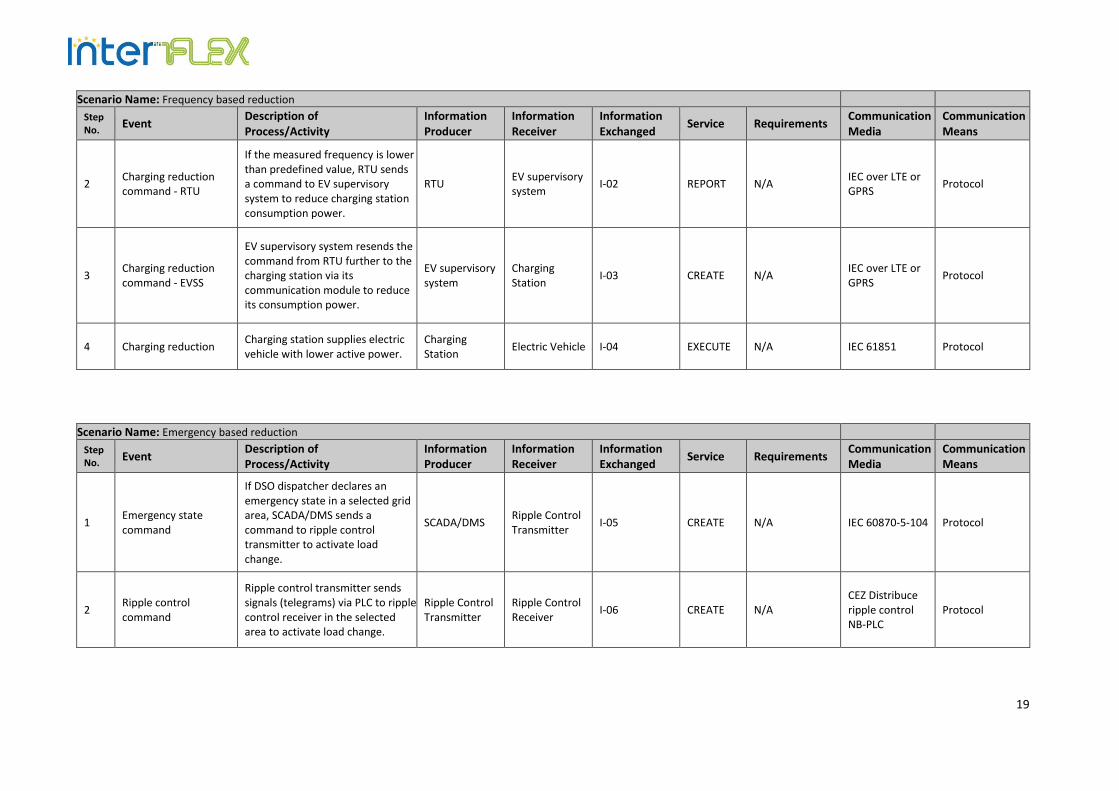
19
Scenario Name: Frequency based reduction
Step No.
Event Description of Process/Activity
Information Producer
Information Receiver
Information Exchanged
Service Requirements Communication Media
Communication Means
2 Charging reduction command - RTU
If the measured frequency is lower than predefined value, RTU sends a command to EV supervisory system to reduce charging station consumption power.
RTU EV supervisory system
I-02 REPORT N/A IEC over LTE or GPRS
Protocol
3 Charging reduction command - EVSS
EV supervisory system resends the command from RTU further to the charging station via its communication module to reduce its consumption power.
EV supervisory system
Charging Station
I-03 CREATE N/A IEC over LTE or GPRS
Protocol
4 Charging reduction Charging station supplies electric vehicle with lower active power.
Charging Station
Electric Vehicle I-04 EXECUTE N/A IEC 61851 Protocol
Scenario Name: Emergency based reduction
Step No.
Event Description of Process/Activity
Information Producer
Information Receiver
Information Exchanged
Service Requirements Communication Media
Communication Means
1 Emergency state command
If DSO dispatcher declares an emergency state in a selected grid area, SCADA/DMS sends a command to ripple control transmitter to activate load change.
SCADA/DMS Ripple Control Transmitter
I-05 CREATE N/A IEC 60870-5-104 Protocol
2 Ripple control command
Ripple control transmitter sends signals (telegrams) via PLC to ripple control receiver in the selected area to activate load change.
Ripple Control Transmitter
Ripple Control Receiver
I-06 CREATE N/A CEZ Distribuce ripple control NB-PLC
Protocol
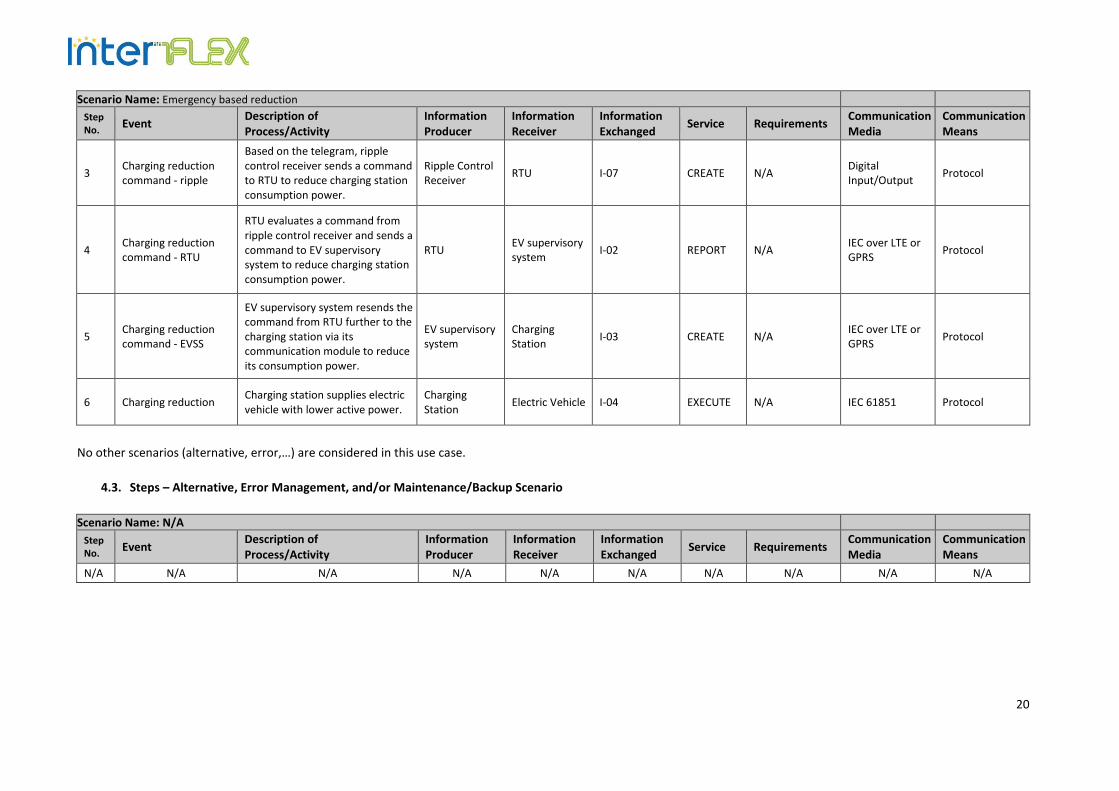
20
Scenario Name: Emergency based reduction
Step No.
Event Description of Process/Activity
Information Producer
Information Receiver
Information Exchanged
Service Requirements Communication Media
Communication Means
3 Charging reduction command - ripple
Based on the telegram, ripple control receiver sends a command to RTU to reduce charging station consumption power.
Ripple Control Receiver
RTU I-07 CREATE N/A Digital Input/Output
Protocol
4 Charging reduction command - RTU
RTU evaluates a command from ripple control receiver and sends a command to EV supervisory system to reduce charging station consumption power.
RTU EV supervisory system
I-02 REPORT N/A IEC over LTE or GPRS
Protocol
5 Charging reduction command - EVSS
EV supervisory system resends the command from RTU further to the charging station via its communication module to reduce its consumption power.
EV supervisory system
Charging Station
I-03 CREATE N/A IEC over LTE or GPRS
Protocol
6 Charging reduction Charging station supplies electric vehicle with lower active power.
Charging Station
Electric Vehicle I-04 EXECUTE N/A IEC 61851 Protocol
No other scenarios (alternative, error,…) are considered in this use case.
4.3. Steps – Alternative, Error Management, and/or Maintenance/Backup Scenario
Scenario Name: N/A
Step No.
Event Description of Process/Activity
Information Producer
Information Receiver
Information Exchanged
Service Requirements Communication Media
Communication Means
N/A N/A N/A N/A N/A N/A N/A N/A N/A N/A
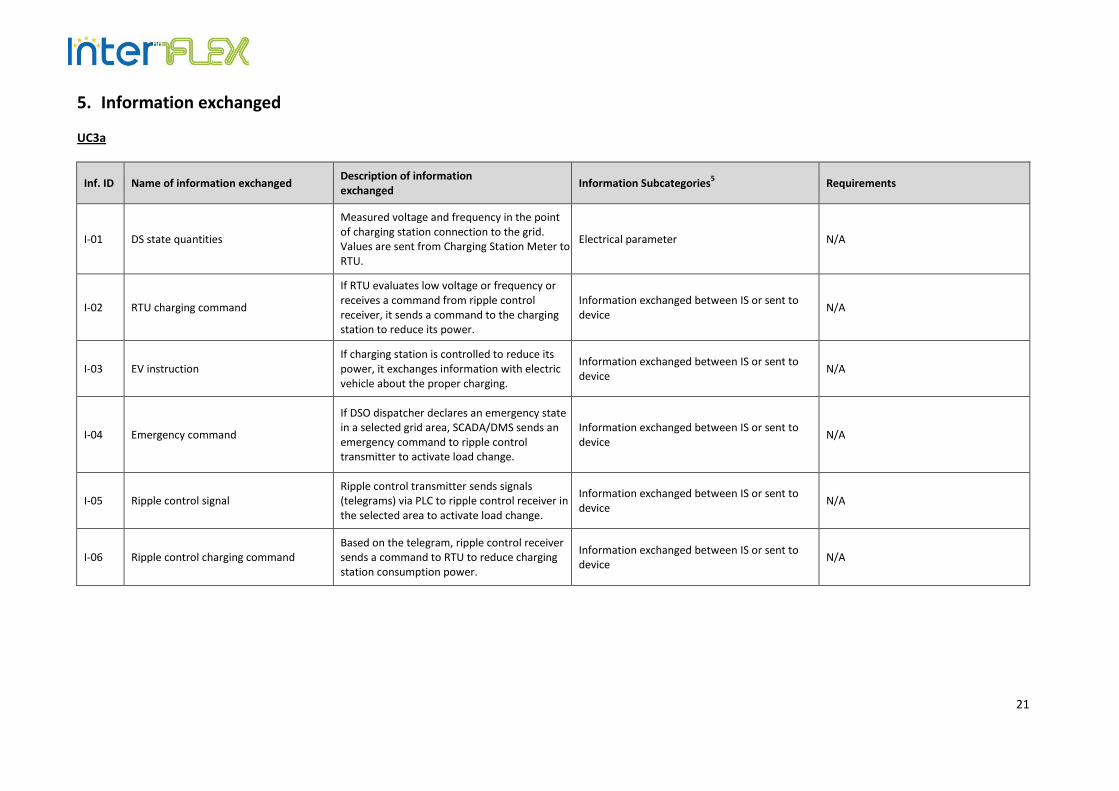
21
5. Information exchanged
UC3a
Inf. ID Name of information exchanged Description of information exchanged
Information Subcategories5 Requirements
I-01 DS state quantities
Measured voltage and frequency in the point of charging station connection to the grid. Values are sent from Charging Station Meter to RTU.
Electrical parameter N/A
I-02 RTU charging command
If RTU evaluates low voltage or frequency or receives a command from ripple control receiver, it sends a command to the charging station to reduce its power.
Information exchanged between IS or sent to device
N/A
I-03 EV instruction If charging station is controlled to reduce its power, it exchanges information with electric vehicle about the proper charging.
Information exchanged between IS or sent to device
N/A
I-04 Emergency command
If DSO dispatcher declares an emergency state in a selected grid area, SCADA/DMS sends an emergency command to ripple control transmitter to activate load change.
Information exchanged between IS or sent to device
N/A
I-05 Ripple control signal Ripple control transmitter sends signals (telegrams) via PLC to ripple control receiver in the selected area to activate load change.
Information exchanged between IS or sent to device
N/A
I-06 Ripple control charging command Based on the telegram, ripple control receiver sends a command to RTU to reduce charging station consumption power.
Information exchanged between IS or sent to device
N/A
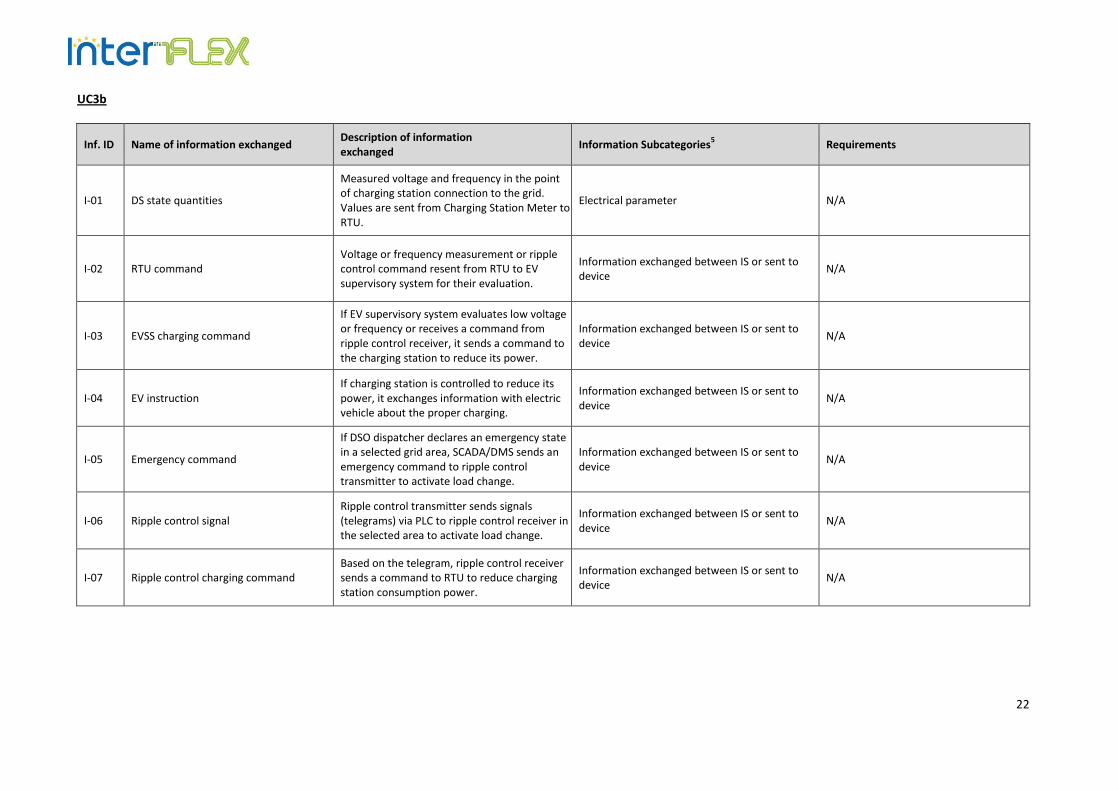
22
UC3b
Inf. ID Name of information exchanged Description of information exchanged
Information Subcategories5 Requirements
I-01 DS state quantities
Measured voltage and frequency in the point of charging station connection to the grid. Values are sent from Charging Station Meter to RTU.
Electrical parameter N/A
I-02 RTU command Voltage or frequency measurement or ripple control command resent from RTU to EV supervisory system for their evaluation.
Information exchanged between IS or sent to device
N/A
I-03 EVSS charging command
If EV supervisory system evaluates low voltage or frequency or receives a command from ripple control receiver, it sends a command to the charging station to reduce its power.
Information exchanged between IS or sent to device
N/A
I-04 EV instruction If charging station is controlled to reduce its power, it exchanges information with electric vehicle about the proper charging.
Information exchanged between IS or sent to device
N/A
I-05 Emergency command
If DSO dispatcher declares an emergency state in a selected grid area, SCADA/DMS sends an emergency command to ripple control transmitter to activate load change.
Information exchanged between IS or sent to device
N/A
I-06 Ripple control signal Ripple control transmitter sends signals (telegrams) via PLC to ripple control receiver in the selected area to activate load change.
Information exchanged between IS or sent to device
N/A
I-07 Ripple control charging command Based on the telegram, ripple control receiver sends a command to RTU to reduce charging station consumption power.
Information exchanged between IS or sent to device
N/A

23
Annex A – List of Actor Subcategories
Category Type Subcategory Definition Example
Actors Role DSO Responsible for operating, ensuring the maintenance of and, if necessary, developing the distribution system in a given area
Avacon, CEZ, E.ON, Enexis, Enedis
Actors Role Industrial partner All industrial partners involved in InterFlex project at a DEMO level
- GE - Siemens - Schneider …
Actors Role University and research partner All university or research partners involved in InterFlex project at a DEMO level
- RWTH - AIT etc
Actors Role Retailer Licensed supplier of electricity to an end-user - EDF - Engie...
Actors Role Legal Client A legal client of a DSO that is involved at Demo scale - Company producer - Municipalities - Tertiary service providers
Actors Role Physical client A physical client of a DSO that is involved at Demo scale - Residential client
Actors System Charging facilities Facilities to charge electrical vehicles - Charging facilities
Actors System DER installation Power plant that use renewable technology and are owned by a legal person
- Photovoltaics panels - Biomass farm - Wind power, …
Actors System In house device All devices working on electricity that can be find in a customer's dwelling.
- Heater - Meter - Local display - Customer's battery
Actors System Communication infrastructure All the infrastructure that are used for communication at all level (from customer's place to power command)
- Modem - Routers
Actors System Network device All devices placed on MV/LV network for monitoring or gathering information on grid's situation or electrical parameters values. It also include the IS associated
- Secondary Substation control infrastructure - RTU : Remote terminal units - Circuits breakers - sensors
Actors System IS IT All the hardware and software associated, used at power command to control and monitor the network
- SCADA - Central database - Control operation center
Actors System Interactive communication device All device used to interact with customers in order to involved him in the Demo
- Web portal - Display used for communication
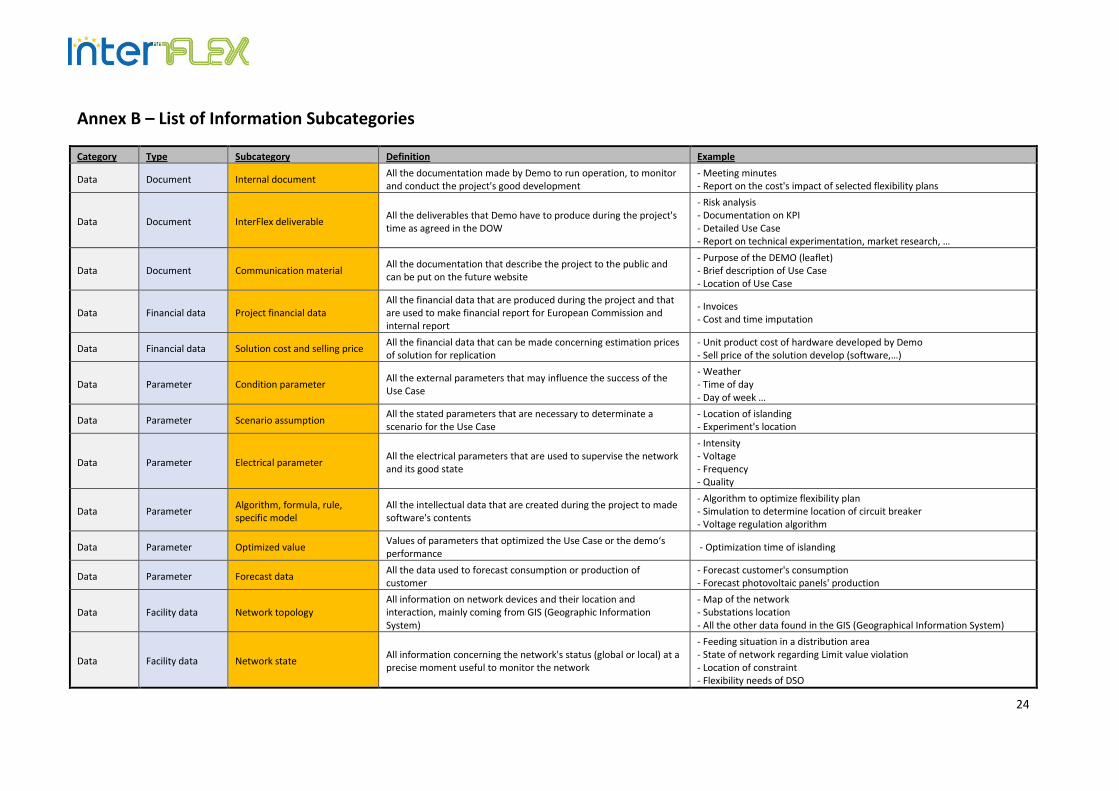
24
Annex B – List of Information Subcategories
Category Type Subcategory Definition Example
Data Document Internal document All the documentation made by Demo to run operation, to monitor and conduct the project's good development
- Meeting minutes - Report on the cost's impact of selected flexibility plans
Data Document InterFlex deliverable All the deliverables that Demo have to produce during the project's time as agreed in the DOW
- Risk analysis - Documentation on KPI - Detailed Use Case - Report on technical experimentation, market research, …
Data Document Communication material All the documentation that describe the project to the public and can be put on the future website
- Purpose of the DEMO (leaflet) - Brief description of Use Case - Location of Use Case
Data Financial data Project financial data All the financial data that are produced during the project and that are used to make financial report for European Commission and internal report
- Invoices - Cost and time imputation
Data Financial data Solution cost and selling price All the financial data that can be made concerning estimation prices of solution for replication
- Unit product cost of hardware developed by Demo - Sell price of the solution develop (software,…)
Data Parameter Condition parameter All the external parameters that may influence the success of the Use Case
- Weather - Time of day - Day of week …
Data Parameter Scenario assumption All the stated parameters that are necessary to determinate a scenario for the Use Case
- Location of islanding - Experiment's location
Data Parameter Electrical parameter All the electrical parameters that are used to supervise the network and its good state
- Intensity - Voltage - Frequency - Quality
Data Parameter Algorithm, formula, rule, specific model
All the intellectual data that are created during the project to made software's contents
- Algorithm to optimize flexibility plan - Simulation to determine location of circuit breaker - Voltage regulation algorithm
Data Parameter Optimized value Values of parameters that optimized the Use Case or the demo‘s performance
- Optimization time of islanding
Data Parameter Forecast data All the data used to forecast consumption or production of customer
- Forecast customer's consumption - Forecast photovoltaic panels' production
Data Facility data Network topology All information on network devices and their location and interaction, mainly coming from GIS (Geographic Information System)
- Map of the network - Substations location - All the other data found in the GIS (Geographical Information System)
Data Facility data Network state All information concerning the network's status (global or local) at a precise moment useful to monitor the network
- Feeding situation in a distribution area - State of network regarding Limit value violation - Location of constraint - Flexibility needs of DSO

25
Category Type Subcategory Definition Example
Data Facility data Customer's meter state and output
All the information concerning customer’s meter state and outputs information
- Customer’s consumption or production
Data Facility data Other device state and output All the information concerning device's state and outputs information
- State of charge of batteries - Consumption data coming from meter - Production data coming from meter - State of charge of storage components
Data Parameter Information exchanged between IS or sent to device
All automated information sent between facilities in order to send information or order for monitoring
- Order sent to breaker devices (open, close,…) - Information on local network status coming from sensors - Order and roadmap sent to network devices (batteries, aggregator,…)
Data Parameter Detailed specification on devices
All detailed information (reference components, specification, process,…) useful to build the devices
- Detailed specification of the telecommunication infrastructure - Detailed specification of interactive sensor network
Data Network data Network topology All information on network devices and their location and interaction, mainly coming from GIS (Geographic Information System)
- Map of the network - Substations location - All the other data found in the GIS (Geographical Information System)
Data Network data Network state All information concerning the network's status (global or local) at a precise moment useful to monitor the network
- Feeding situation in a distribution area - State of network regarding Limit value violation - Location of constraint - Flexibility needs of DSO
Data KPI Data for KPI (input raw data) All raw data that are used to calculate the final KPI - Duration of experiment - Customer response to DSO's demand - Electrical parameter used for KPI
Data KPI KPI (KPI values) All the KPI values and the way to calculate them - Economic KPI - System Efficiency KPI
Data Customer data Customer contract’s data All the data in customer's contact that are used for contact or make payment
- Address - Phone number - Bank account details
Data Customer data Information sent to /received from customer
All the information and data that are exchanged between the DEMO and the customer in order to involve customer in the experiment
- Customer's response to DSO's request to reduce consumption - Information and data available to customer in order to visualize its consumption - Advices and encouragement sent to encourage a smart consumption
Data Customer data Customer analysis (profile analysis, studies on client reactivity,…)
All the data that are produced in order to better understand the customer's behaviour regarding the possibility to adopt smarter habits in their electricity consumption
- Customer's typology and behaviour patterns - Analysis on customer's response to DSO's request
1
Use Case Description
UC WP6_4 – Smart energy storage

2
Scope ......................................................................................................................................................................... 3
1. Description of the Use Case ............................................................................................................................ 4
2. Diagrams of the Use Case ................................................................................................................................. 8
3. Technical details of the Use Case - Actors....................................................................................................... 11
4. Step by Step Analysis of the Use Case ............................................................................................................. 12
5. Information exchanged ................................................................................................................................... 15
Annex A – List of Actor Subcategories .................................................................................................................... 16
Annex B – List of Information Subcategories .......................................................................................................... 17

3
Scope
This document describes the Use Case UC WP6_4 – Smart energy storage. The Use Case description within is divided in to five areas:
1. Description of the Use Case 2. Diagrams of the Use Case 3. Technical data - Actors 4. Step by Step Analysis of Use Case (can be extended by detailed info on “information exchanged”) 5. Information exchanged
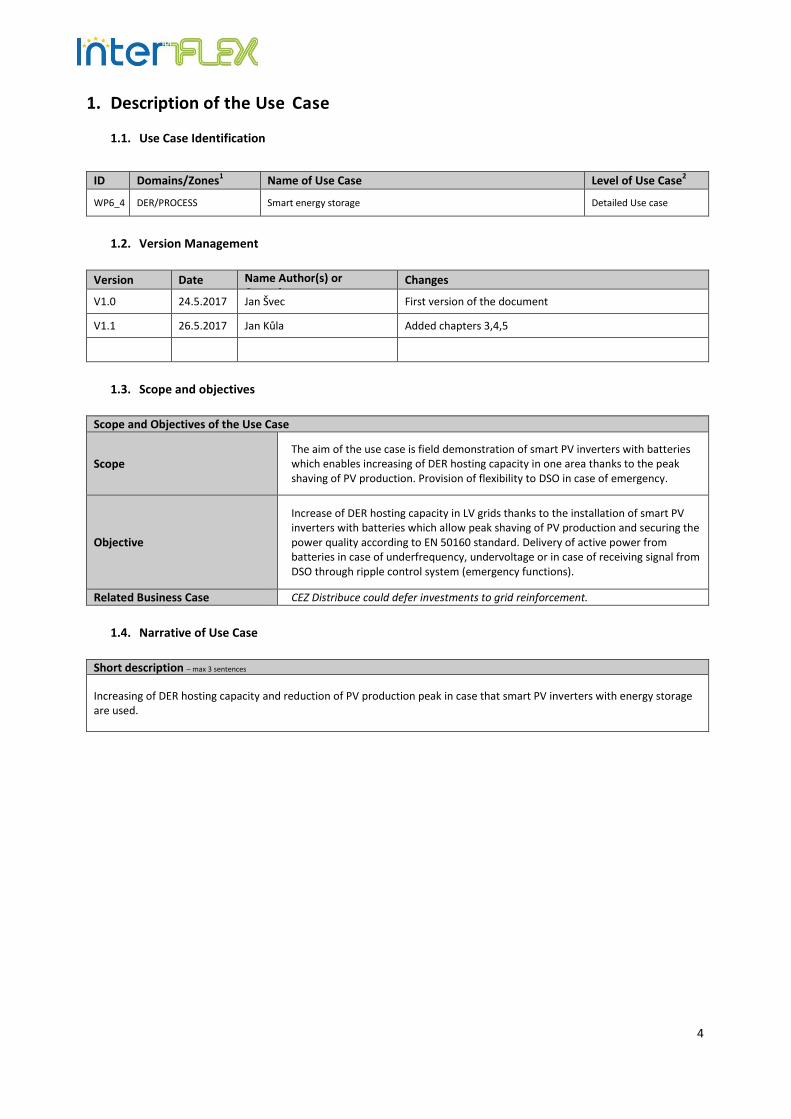
4
1. Description of the Use Case
1.1. Use Case Identification
ID Domains/Zones1 Name of Use Case Level of Use Case2
WP6_4 DER/PROCESS Smart energy storage Detailed Use case
1.2. Version Management
Version Date Name Author(s) or Committee
Changes
V1.0 24.5.2017 Jan Švec First version of the document
V1.1 26.5.2017 Jan Kůla Added chapters 3,4,5
1.3. Scope and objectives
Scope and Objectives of the Use Case
Scope The aim of the use case is field demonstration of smart PV inverters with batteries which enables increasing of DER hosting capacity in one area thanks to the peak shaving of PV production. Provision of flexibility to DSO in case of emergency.
Objective
Increase of DER hosting capacity in LV grids thanks to the installation of smart PV inverters with batteries which allow peak shaving of PV production and securing the power quality according to EN 50160 standard. Delivery of active power from batteries in case of underfrequency, undervoltage or in case of receiving signal from DSO through ripple control system (emergency functions).
Related Business Case CEZ Distribuce could defer investments to grid reinforcement.
1.4. Narrative of Use Case
Short description – max 3 sentences
Increasing of DER hosting capacity and reduction of PV production peak in case that smart PV inverters with energy storage are used.
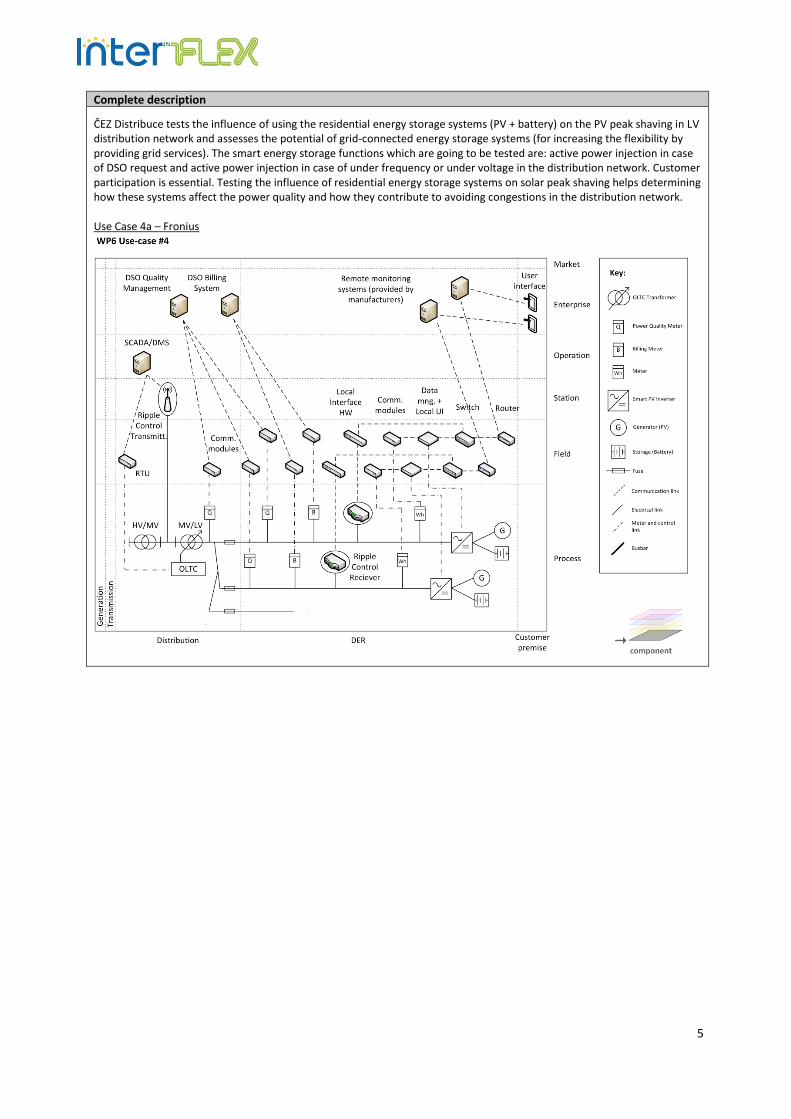
5
Complete description
ČEZ Distribuce tests the influence of using the residential energy storage systems (PV + battery) on the PV peak shaving in LV distribution network and assesses the potential of grid-connected energy storage systems (for increasing the flexibility by providing grid services). The smart energy storage functions which are going to be tested are: active power injection in case of DSO request and active power injection in case of under frequency or under voltage in the distribution network. Customer participation is essential. Testing the influence of residential energy storage systems on solar peak shaving helps determining how these systems affect the power quality and how they contribute to avoiding congestions in the distribution network. Use Case 4a – Fronius
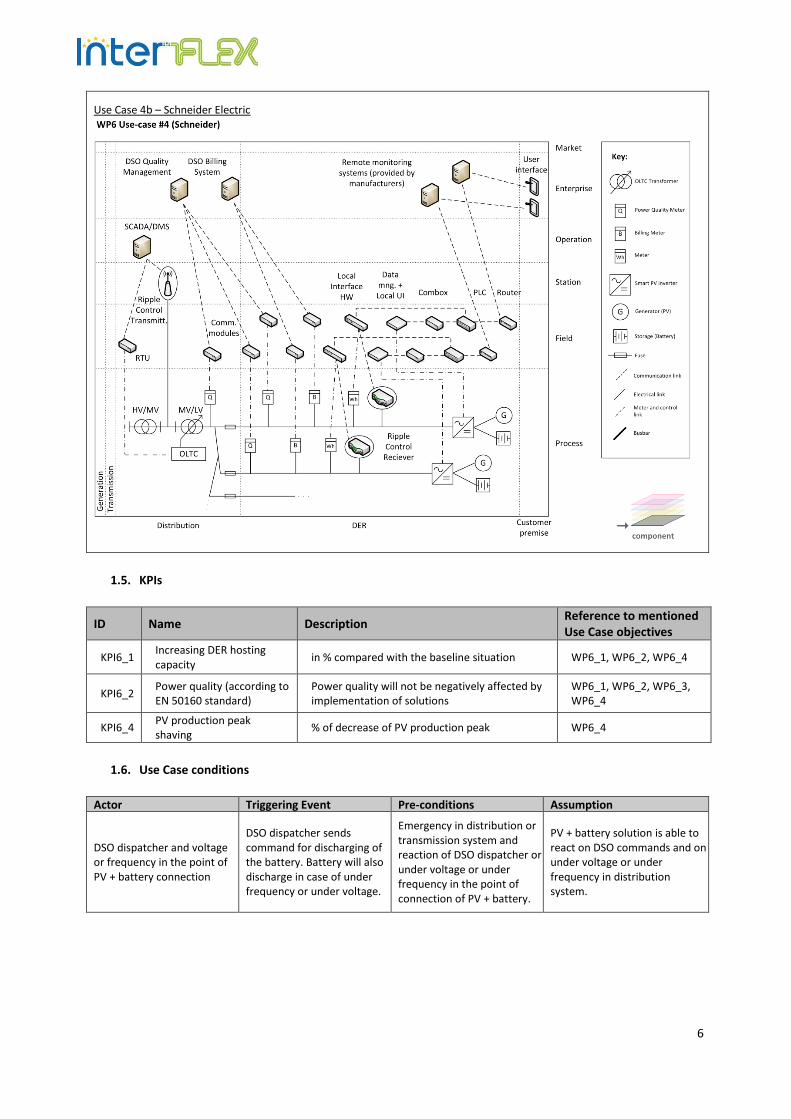
6
Use Case 4b – Schneider Electric
1.5. KPIs
ID Name Description Reference to mentioned Use Case objectives
KPI6_1 Increasing DER hosting capacity
in % compared with the baseline situation WP6_1, WP6_2, WP6_4
KPI6_2 Power quality (according to EN 50160 standard)
Power quality will not be negatively affected by implementation of solutions
WP6_1, WP6_2, WP6_3, WP6_4
KPI6_4 PV production peak shaving
% of decrease of PV production peak WP6_4
1.6. Use Case conditions
Actor Triggering Event Pre-conditions Assumption
DSO dispatcher and voltage or frequency in the point of PV + battery connection
DSO dispatcher sends command for discharging of the battery. Battery will also discharge in case of under frequency or under voltage.
Emergency in distribution or transmission system and reaction of DSO dispatcher or under voltage or under frequency in the point of connection of PV + battery.
PV + battery solution is able to react on DSO commands and on under voltage or under frequency in distribution system.
7
1.7. Classification information
Relation to Other Use Cases in the same project or area
Associate – use cases WP6_1, WP6_2, WP6_4 aim to increase DER hosting capacity of distribution grids.
Level of Depth - the degree of specialization of the Use Case
Detailed Use Case
Prioritization
Very important
Generic, Regional or National Regional relation
Generic
Nature of the viewpoint- describes the viewpoint and field of attention
Technical point of view
Further Keywords for Classification
PV inverter, EN 50160, hosting capacity, DER, energy storage, peak shaving, ripple control system, LV grid, Q(U), P(U), voltage, frequency, emergency
Maturity of Use Case
Realized in demonstration project
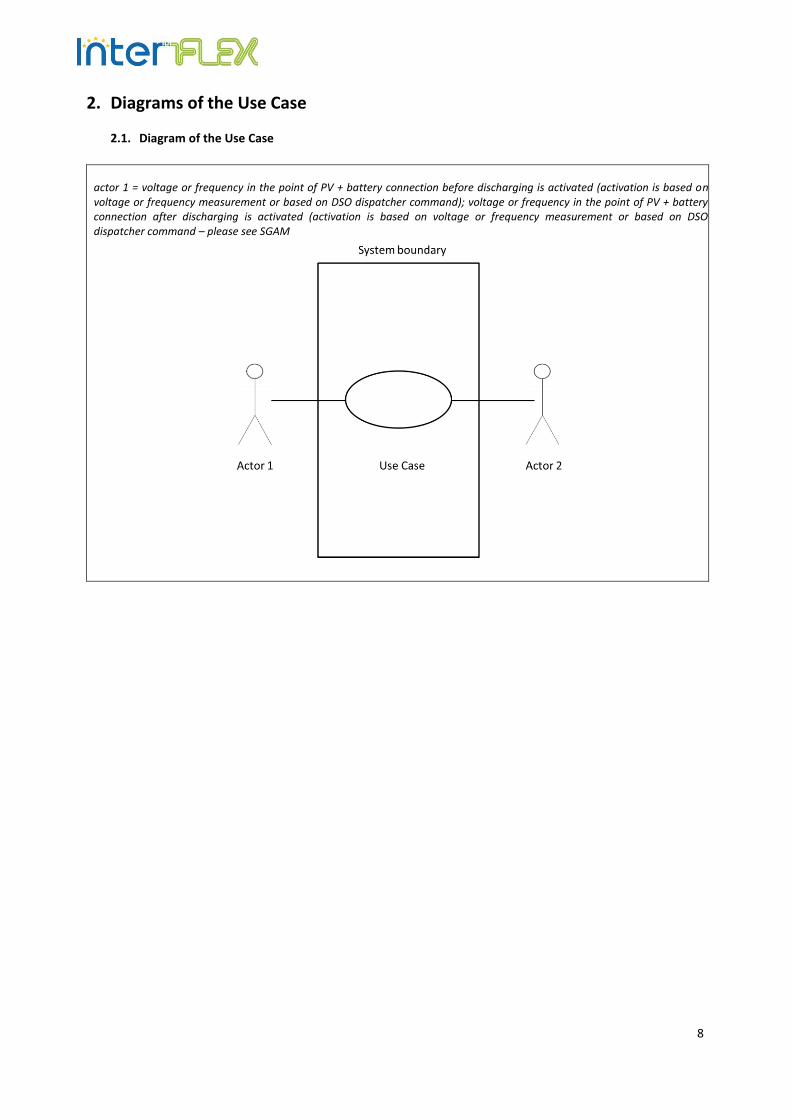
8
2. Diagrams of the Use Case
2.1. Diagram of the Use Case
actor 1 = voltage or frequency in the point of PV + battery connection before discharging is activated (activation is based on voltage or frequency measurement or based on DSO dispatcher command); voltage or frequency in the point of PV + battery connection after discharging is activated (activation is based on voltage or frequency measurement or based on DSO dispatcher command – please see SGAM
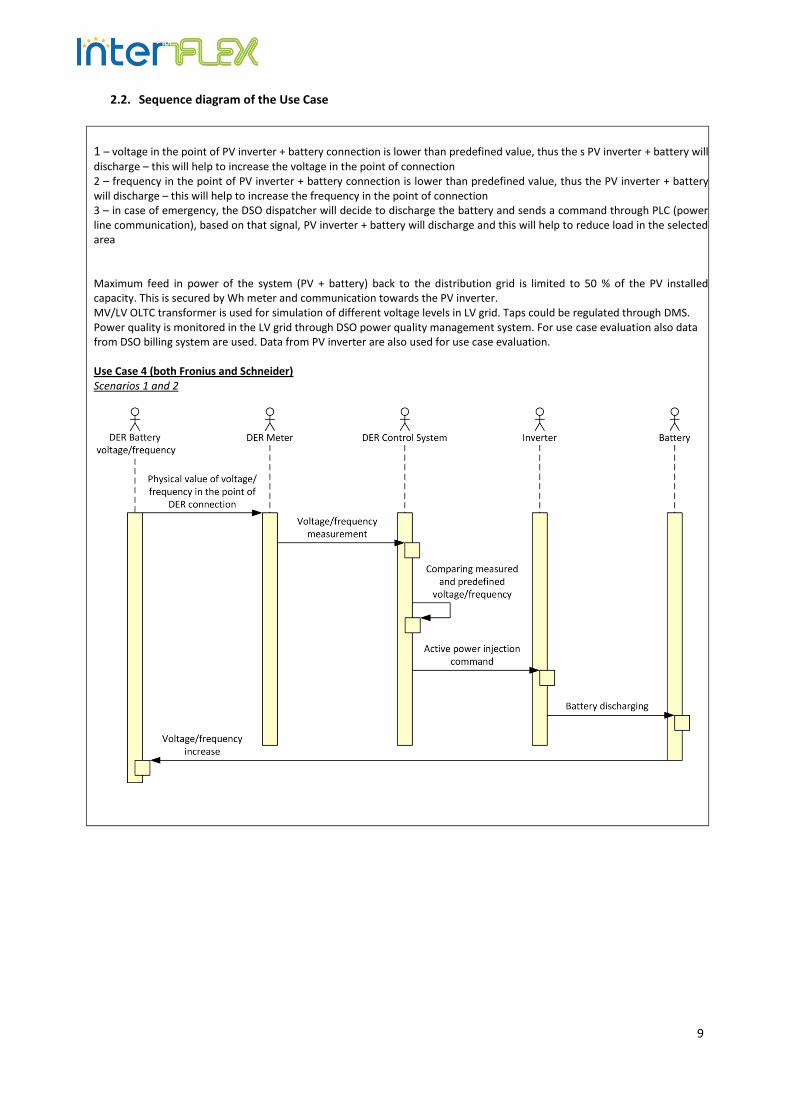
9
2.2. Sequence diagram of the Use Case
1 – voltage in the point of PV inverter + battery connection is lower than predefined value, thus the s PV inverter + battery will discharge – this will help to increase the voltage in the point of connection 2 – frequency in the point of PV inverter + battery connection is lower than predefined value, thus the PV inverter + battery will discharge – this will help to increase the frequency in the point of connection 3 – in case of emergency, the DSO dispatcher will decide to discharge the battery and sends a command through PLC (power line communication), based on that signal, PV inverter + battery will discharge and this will help to reduce load in the selected area Maximum feed in power of the system (PV + battery) back to the distribution grid is limited to 50 % of the PV installed capacity. This is secured by Wh meter and communication towards the PV inverter. MV/LV OLTC transformer is used for simulation of different voltage levels in LV grid. Taps could be regulated through DMS. Power quality is monitored in the LV grid through DSO power quality management system. For use case evaluation also data from DSO billing system are used. Data from PV inverter are also used for use case evaluation. Use Case 4 (both Fronius and Schneider) Scenarios 1 and 2
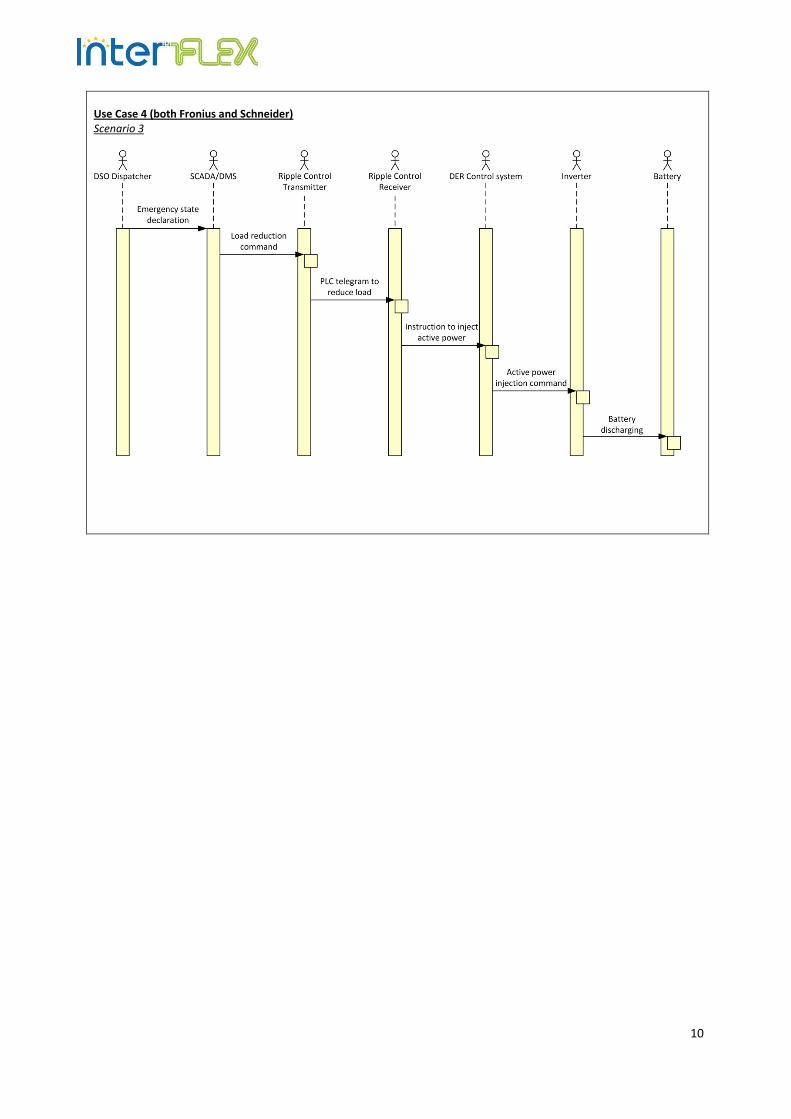
10
Use Case 4 (both Fronius and Schneider) Scenario 3
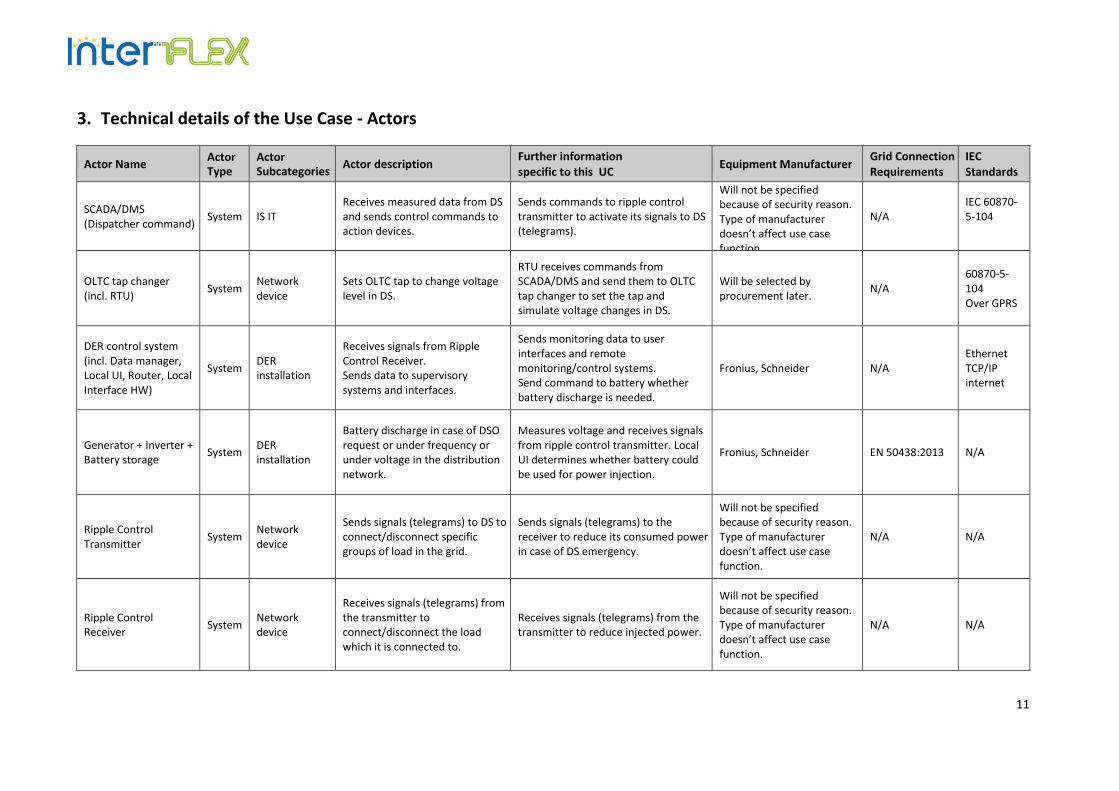
11
3. Technical details of the Use Case - Actors
Actor Name Actor Type
Actor Subcategories
Actor description Further information specific to this UC
Equipment Manufacturer Grid Connection Requirements
IEC Standards
SCADA/DMS (Dispatcher command)
System IS IT Receives measured data from DS and sends control commands to action devices.
Sends commands to ripple control transmitter to activate its signals to DS (telegrams).
Will not be specified because of security reason. Type of manufacturer doesn’t affect use case function.
N/A IEC 60870-5-104
OLTC tap changer (incl. RTU)
System Network device
Sets OLTC tap to change voltage level in DS.
RTU receives commands from SCADA/DMS and send them to OLTC tap changer to set the tap and simulate voltage changes in DS.
Will be selected by procurement later.
N/A 60870-5-104 Over GPRS
DER control system (incl. Data manager, Local UI, Router, Local Interface HW)
System DER installation
Receives signals from Ripple Control Receiver. Sends data to supervisory systems and interfaces.
Sends monitoring data to user interfaces and remote monitoring/control systems. Send command to battery whether battery discharge is needed.
Fronius, Schneider N/A Ethernet TCP/IP internet
Generator + Inverter + Battery storage
System DER installation
Battery discharge in case of DSO request or under frequency or under voltage in the distribution network.
Measures voltage and receives signals from ripple control transmitter. Local UI determines whether battery could be used for power injection.
Fronius, Schneider EN 50438:2013 N/A
Ripple Control Transmitter
System Network device
Sends signals (telegrams) to DS to connect/disconnect specific groups of load in the grid.
Sends signals (telegrams) to the receiver to reduce its consumed power in case of DS emergency.
Will not be specified because of security reason. Type of manufacturer doesn’t affect use case function.
N/A N/A
Ripple Control Receiver
System Network device
Receives signals (telegrams) from the transmitter to connect/disconnect the load which it is connected to.
Receives signals (telegrams) from the transmitter to reduce injected power.
Will not be specified because of security reason. Type of manufacturer doesn’t affect use case function.
N/A N/A
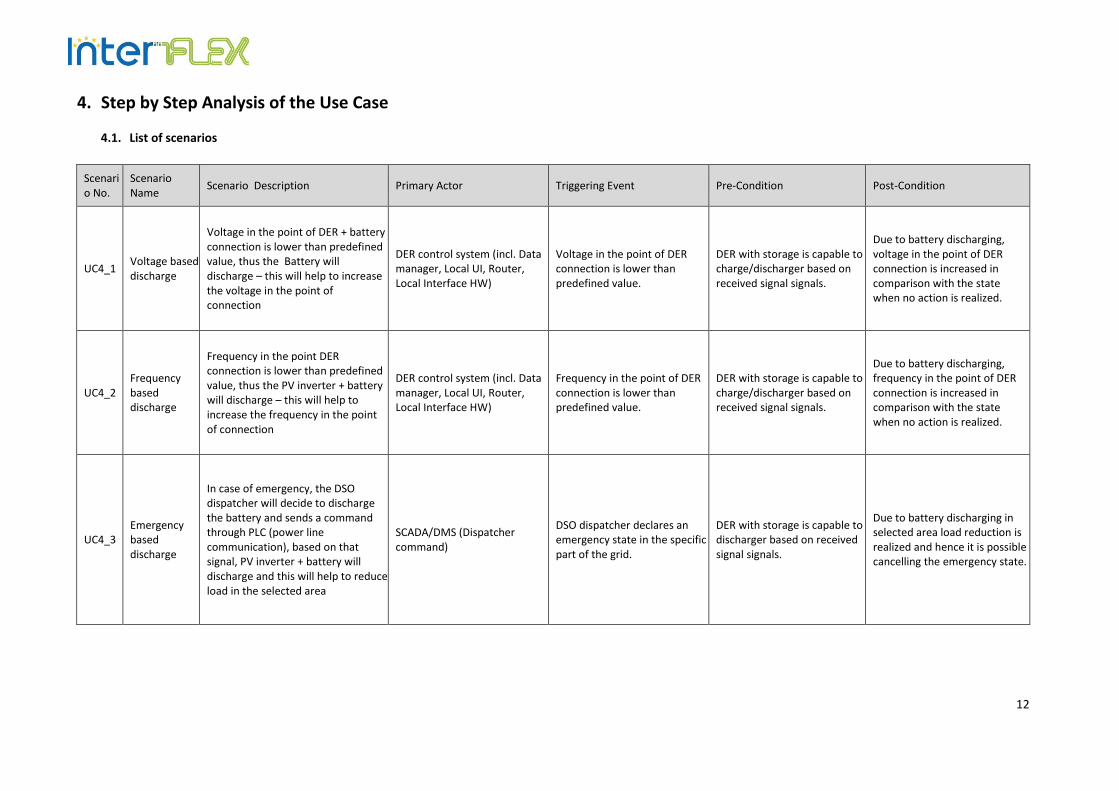
12
4. Step by Step Analysis of the Use Case
4.1. List of scenarios
Scenario No.
Scenario Name
Scenario Description Primary Actor Triggering Event Pre-Condition Post-Condition
UC4_1 Voltage based discharge
Voltage in the point of DER + battery connection is lower than predefined value, thus the Battery will discharge – this will help to increase the voltage in the point of connection
DER control system (incl. Data manager, Local UI, Router, Local Interface HW)
Voltage in the point of DER connection is lower than predefined value.
DER with storage is capable to charge/discharger based on received signal signals.
Due to battery discharging, voltage in the point of DER connection is increased in comparison with the state when no action is realized.
UC4_2 Frequency based discharge
Frequency in the point DER connection is lower than predefined value, thus the PV inverter + battery will discharge – this will help to increase the frequency in the point of connection
DER control system (incl. Data manager, Local UI, Router, Local Interface HW)
Frequency in the point of DER connection is lower than predefined value.
DER with storage is capable to charge/discharger based on received signal signals.
Due to battery discharging, frequency in the point of DER connection is increased in comparison with the state when no action is realized.
UC4_3 Emergency based discharge
In case of emergency, the DSO dispatcher will decide to discharge the battery and sends a command through PLC (power line communication), based on that signal, PV inverter + battery will discharge and this will help to reduce load in the selected area
SCADA/DMS (Dispatcher command)
DSO dispatcher declares an emergency state in the specific part of the grid.
DER with storage is capable to discharger based on received signal signals.
Due to battery discharging in selected area load reduction is realized and hence it is possible cancelling the emergency state.
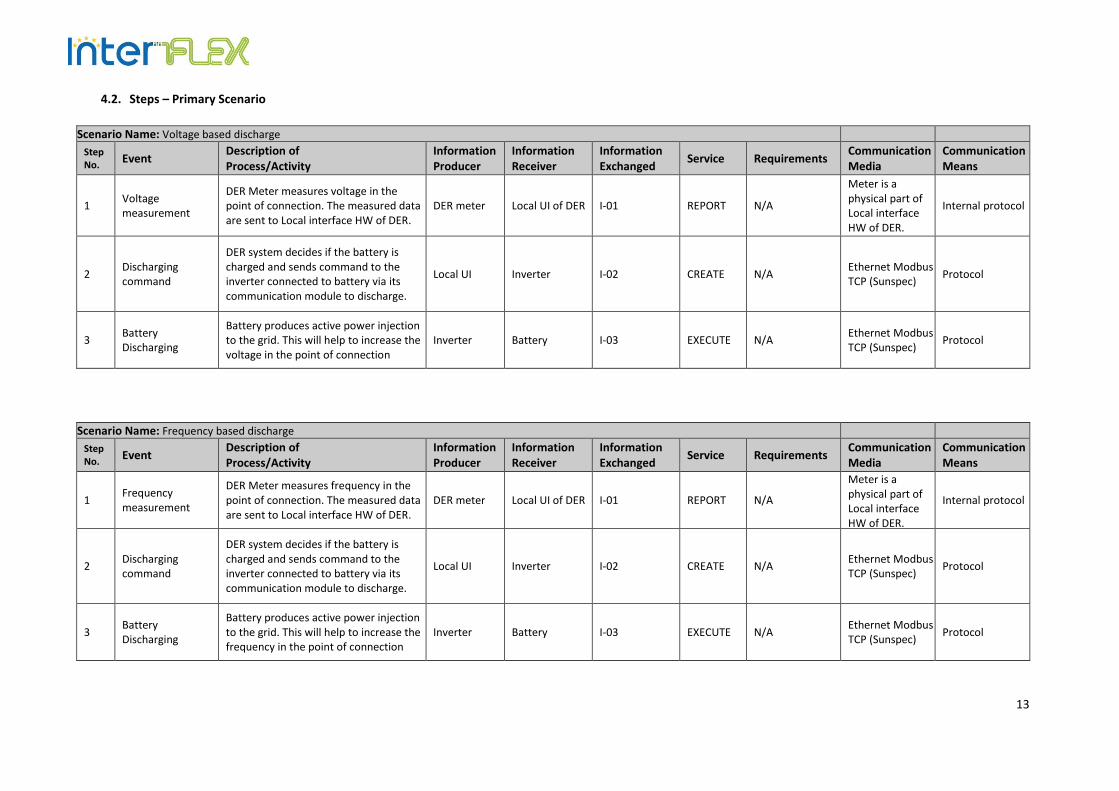
13
4.2. Steps – Primary Scenario
Scenario Name: Voltage based discharge
Step No.
Event Description of Process/Activity
Information Producer
Information Receiver
Information Exchanged
Service Requirements Communication Media
Communication Means
1 Voltage measurement
DER Meter measures voltage in the point of connection. The measured data are sent to Local interface HW of DER.
DER meter Local UI of DER I-01 REPORT N/A
Meter is a physical part of Local interface HW of DER.
Internal protocol
2 Discharging command
DER system decides if the battery is charged and sends command to the inverter connected to battery via its communication module to discharge.
Local UI Inverter I-02 CREATE N/A Ethernet Modbus TCP (Sunspec)
Protocol
3 Battery Discharging
Battery produces active power injection to the grid. This will help to increase the voltage in the point of connection
Inverter Battery I-03 EXECUTE N/A Ethernet Modbus TCP (Sunspec)
Protocol
Scenario Name: Frequency based discharge
Step No.
Event Description of Process/Activity
Information Producer
Information Receiver
Information Exchanged
Service Requirements Communication Media
Communication Means
1 Frequency measurement
DER Meter measures frequency in the point of connection. The measured data are sent to Local interface HW of DER.
DER meter Local UI of DER I-01 REPORT N/A
Meter is a physical part of Local interface HW of DER.
Internal protocol
2 Discharging command
DER system decides if the battery is charged and sends command to the inverter connected to battery via its communication module to discharge.
Local UI Inverter I-02 CREATE N/A Ethernet Modbus TCP (Sunspec)
Protocol
3 Battery Discharging
Battery produces active power injection to the grid. This will help to increase the frequency in the point of connection
Inverter Battery I-03 EXECUTE N/A Ethernet Modbus TCP (Sunspec)
Protocol
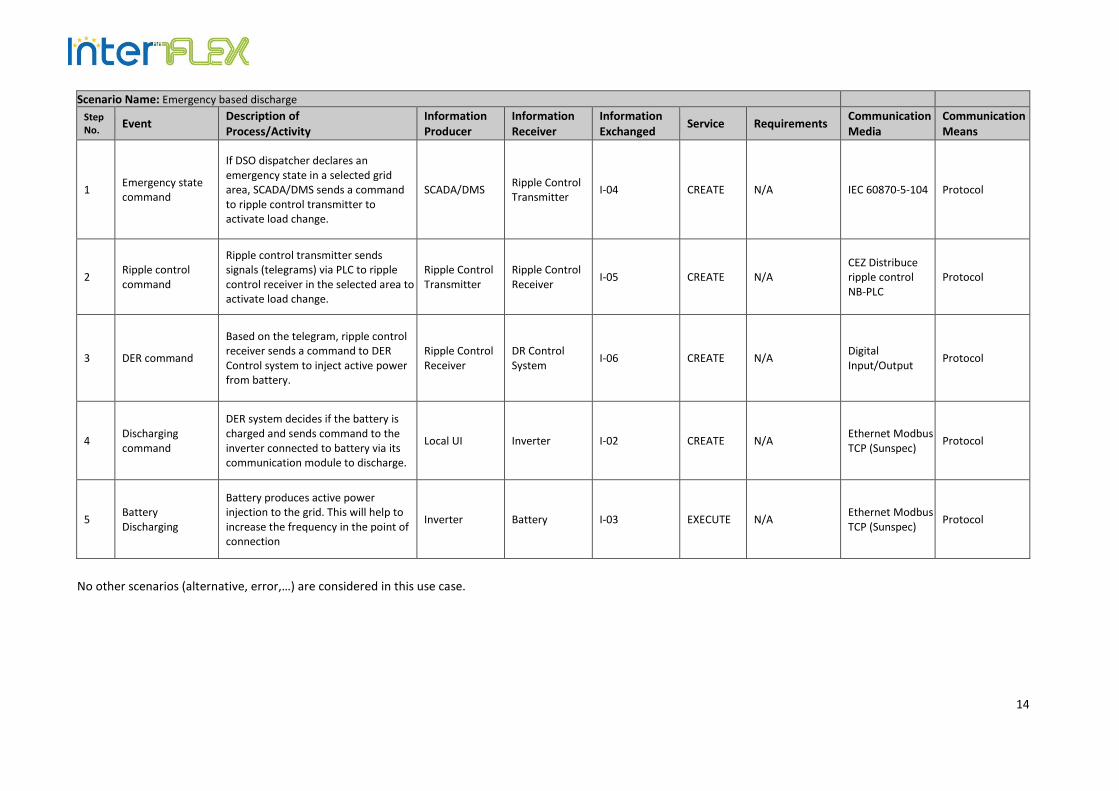
14
Scenario Name: Emergency based discharge
Step No.
Event Description of Process/Activity
Information Producer
Information Receiver
Information Exchanged
Service Requirements Communication Media
Communication Means
1 Emergency state command
If DSO dispatcher declares an emergency state in a selected grid area, SCADA/DMS sends a command to ripple control transmitter to activate load change.
SCADA/DMS Ripple Control Transmitter
I-04 CREATE N/A IEC 60870-5-104 Protocol
2 Ripple control command
Ripple control transmitter sends signals (telegrams) via PLC to ripple control receiver in the selected area to activate load change.
Ripple Control Transmitter
Ripple Control Receiver
I-05 CREATE N/A CEZ Distribuce ripple control NB-PLC
Protocol
3 DER command
Based on the telegram, ripple control receiver sends a command to DER Control system to inject active power from battery.
Ripple Control Receiver
DR Control System
I-06 CREATE N/A Digital Input/Output
Protocol
4 Discharging command
DER system decides if the battery is charged and sends command to the inverter connected to battery via its communication module to discharge.
Local UI Inverter I-02 CREATE N/A Ethernet Modbus TCP (Sunspec)
Protocol
5 Battery Discharging
Battery produces active power injection to the grid. This will help to increase the frequency in the point of connection
Inverter Battery I-03 EXECUTE N/A Ethernet Modbus TCP (Sunspec)
Protocol
No other scenarios (alternative, error,…) are considered in this use case.
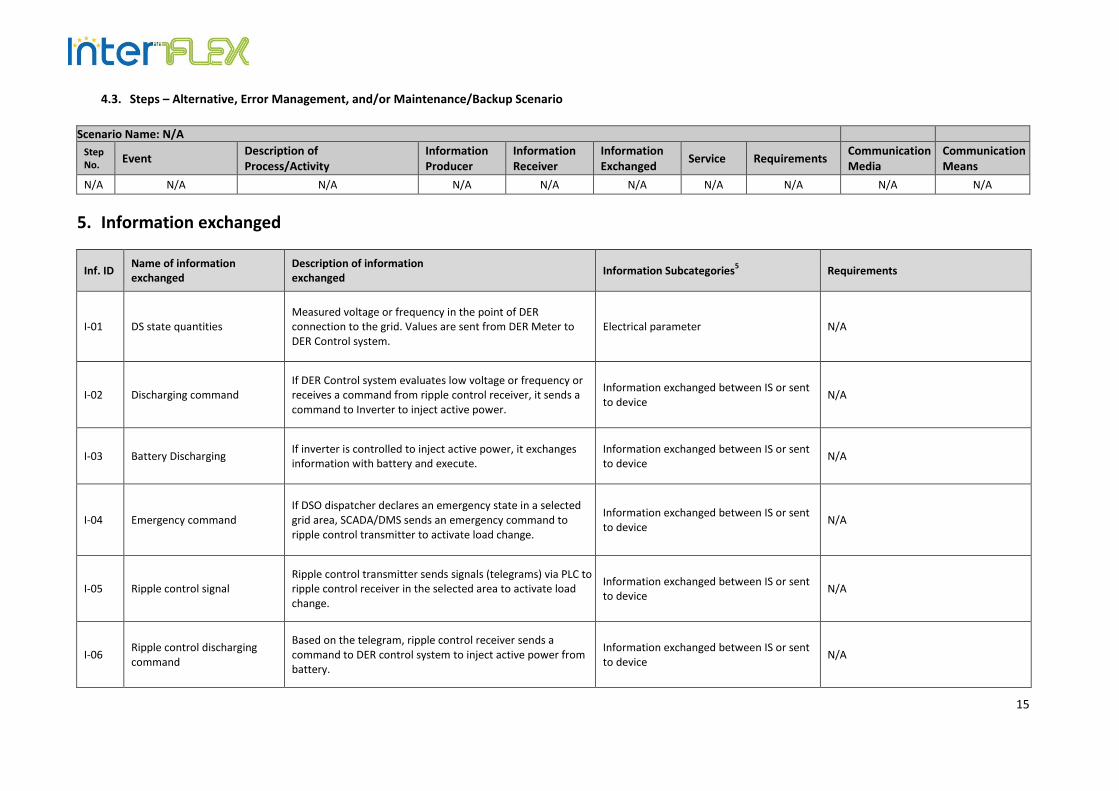
15
4.3. Steps – Alternative, Error Management, and/or Maintenance/Backup Scenario
Scenario Name: N/A
Step No.
Event Description of Process/Activity
Information Producer
Information Receiver
Information Exchanged
Service Requirements Communication Media
Communication Means
N/A N/A N/A N/A N/A N/A N/A N/A N/A N/A
5. Information exchanged
Inf. ID Name of information exchanged
Description of information exchanged
Information Subcategories5 Requirements
I-01 DS state quantities Measured voltage or frequency in the point of DER connection to the grid. Values are sent from DER Meter to DER Control system.
Electrical parameter N/A
I-02 Discharging command If DER Control system evaluates low voltage or frequency or receives a command from ripple control receiver, it sends a command to Inverter to inject active power.
Information exchanged between IS or sent to device
N/A
I-03 Battery Discharging If inverter is controlled to inject active power, it exchanges information with battery and execute.
Information exchanged between IS or sent to device
N/A
I-04 Emergency command If DSO dispatcher declares an emergency state in a selected grid area, SCADA/DMS sends an emergency command to ripple control transmitter to activate load change.
Information exchanged between IS or sent to device
N/A
I-05 Ripple control signal Ripple control transmitter sends signals (telegrams) via PLC to ripple control receiver in the selected area to activate load change.
Information exchanged between IS or sent to device
N/A
I-06 Ripple control discharging command
Based on the telegram, ripple control receiver sends a command to DER control system to inject active power from battery.
Information exchanged between IS or sent to device
N/A

16
Annex A – List of Actor Subcategories
Category Type Subcategory Definition Example
Actors Role DSO Responsible for operating, ensuring the maintenance of and, if necessary, developing the distribution system in a given area
Avacon, CEZ, E.ON, Enexis, Enedis
Actors Role Industrial partner All industrial partners involved in InterFlex project at a DEMO level
- GE - Siemens - Schneider …
Actors Role University and research partner All university or research partners involved in InterFlex project at a DEMO level
- RWTH - AIT etc
Actors Role Retailer Licensed supplier of electricity to an end-user - EDF - Engie...
Actors Role Legal Client A legal client of a DSO that is involved at Demo scale - Company producer - Municipalities - Tertiary service providers
Actors Role Physical client A physical client of a DSO that is involved at Demo scale - Residential client
Actors System Charging facilities Facilities to charge electrical vehicles - Charging facilities
Actors System DER installation Power plant that use renewable technology and are owned by a legal person
- Photovoltaics panels - Biomass farm - Wind power, …
Actors System In house device All devices working on electricity that can be find in a customer's dwelling.
- Heater - Meter - Local display - Customer's battery
Actors System Communication infrastructure All the infrastructure that are used for communication at all level (from customer's place to power command)
- Modem - Routers
Actors System Network device All devices placed on MV/LV network for monitoring or gathering information on grid's situation or electrical parameters values. It also include the IS associated
- Secondary Substation control infrastructure - RTU : Remote terminal units - Circuits breakers - sensors
Actors System IS IT All the hardware and software associated, used at power command to control and monitor the network
- SCADA - Central database - Control operation center
Actors System Interactive communication device All device used to interact with customers in order to involved him in the Demo
- Web portal - Display used for communication

17
Annex B – List of Information Subcategories
Category Type Subcategory Definition Example
Data Document Internal document All the documentation made by Demo to run operation, to monitor and conduct the project's good development
- Meeting minutes - Report on the cost's impact of selected flexibility plans
Data Document InterFlex deliverable All the deliverables that Demo have to produce during the project's time as agreed in the DOW
- Risk analysis - Documentation on KPI - Detailed Use Case - Report on technical experimentation, market research, …
Data Document Communication material All the documentation that describe the project to the public and can be put on the future website
- Purpose of the DEMO (leaflet) - Brief description of Use Case - Location of Use Case
Data Financial data Project financial data All the financial data that are produced during the project and that are used to make financial report for European Commission and internal report
- Invoices - Cost and time imputation
Data Financial data Solution cost and selling price All the financial data that can be made concerning estimation prices of solution for replication
- Unit product cost of hardware developed by Demo - Sell price of the solution develop (software,…)
Data Parameter Condition parameter All the external parameters that may influence the success of the Use Case
- Weather - Time of day - Day of week …
Data Parameter Scenario assumption All the stated parameters that are necessary to determinate a scenario for the Use Case
- Location of islanding - Experiment's location
Data Parameter Electrical parameter All the electrical parameters that are used to supervise the network and its good state
- Intensity - Voltage - Frequency - Quality
Data Parameter Algorithm, formula, rule, specific model
All the intellectual data that are created during the project to made software's contents
- Algorithm to optimize flexibility plan - Simulation to determine location of circuit breaker - Voltage regulation algorithm
Data Parameter Optimized value Values of parameters that optimized the Use Case or the demo‘s performance
- Optimization time of islanding
Data Parameter Forecast data All the data used to forecast consumption or production of customer
- Forecast customer's consumption - Forecast photovoltaic panels' production
Data Facility data Network topology All information on network devices and their location and interaction, mainly coming from GIS (Geographic Information System)
- Map of the network - Substations location - All the other data found in the GIS (Geographical Information System)
Data Facility data Network state All information concerning the network's status (global or local) at a precise moment useful to monitor the network
- Feeding situation in a distribution area - State of network regarding Limit value violation - Location of constraint - Flexibility needs of DSO
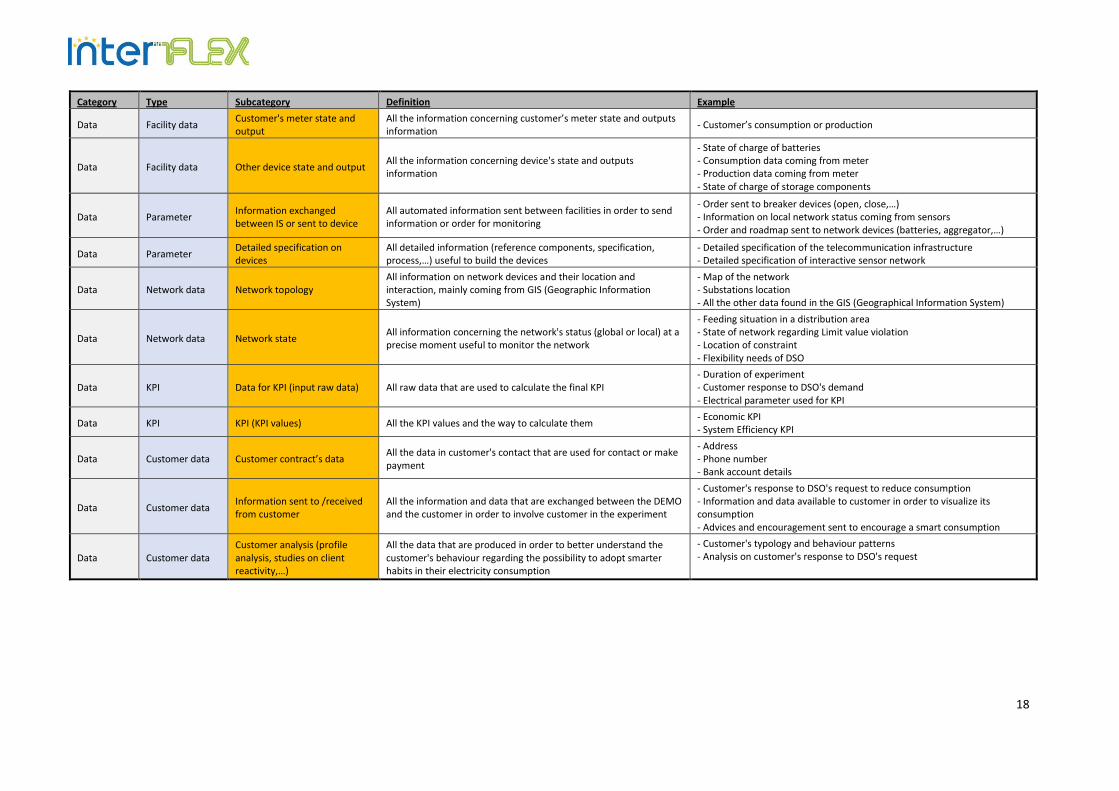
18
Category Type Subcategory Definition Example
Data Facility data Customer's meter state and output
All the information concerning customer’s meter state and outputs information
- Customer’s consumption or production
Data Facility data Other device state and output All the information concerning device's state and outputs information
- State of charge of batteries - Consumption data coming from meter - Production data coming from meter - State of charge of storage components
Data Parameter Information exchanged between IS or sent to device
All automated information sent between facilities in order to send information or order for monitoring
- Order sent to breaker devices (open, close,…) - Information on local network status coming from sensors - Order and roadmap sent to network devices (batteries, aggregator,…)
Data Parameter Detailed specification on devices
All detailed information (reference components, specification, process,…) useful to build the devices
- Detailed specification of the telecommunication infrastructure - Detailed specification of interactive sensor network
Data Network data Network topology All information on network devices and their location and interaction, mainly coming from GIS (Geographic Information System)
- Map of the network - Substations location - All the other data found in the GIS (Geographical Information System)
Data Network data Network state All information concerning the network's status (global or local) at a precise moment useful to monitor the network
- Feeding situation in a distribution area - State of network regarding Limit value violation - Location of constraint - Flexibility needs of DSO
Data KPI Data for KPI (input raw data) All raw data that are used to calculate the final KPI - Duration of experiment - Customer response to DSO's demand - Electrical parameter used for KPI
Data KPI KPI (KPI values) All the KPI values and the way to calculate them - Economic KPI - System Efficiency KPI
Data Customer data Customer contract’s data All the data in customer's contact that are used for contact or make payment
- Address - Phone number - Bank account details
Data Customer data Information sent to /received from customer
All the information and data that are exchanged between the DEMO and the customer in order to involve customer in the experiment
- Customer's response to DSO's request to reduce consumption - Information and data available to customer in order to visualize its consumption - Advices and encouragement sent to encourage a smart consumption
Data Customer data Customer analysis (profile analysis, studies on client reactivity,…)
All the data that are produced in order to better understand the customer's behaviour regarding the possibility to adopt smarter habits in their electricity consumption
- Customer's typology and behaviour patterns - Analysis on customer's response to DSO's request
D6.1 Design of solution
128
Annex 6.2
SGAM diagrams p.128 - 163
� SGAM_WP6_1a_final.pdf � SGAM_WP6_1b_final.pdf � SGAM_WP6_2_final.pdf � SGAM_WP6_3a_final.pdf � SGAM_WP6_3b_final.pdf � SGAM_WP6_4a_final.pdf � SGAM_WP6_4b_final.pdf
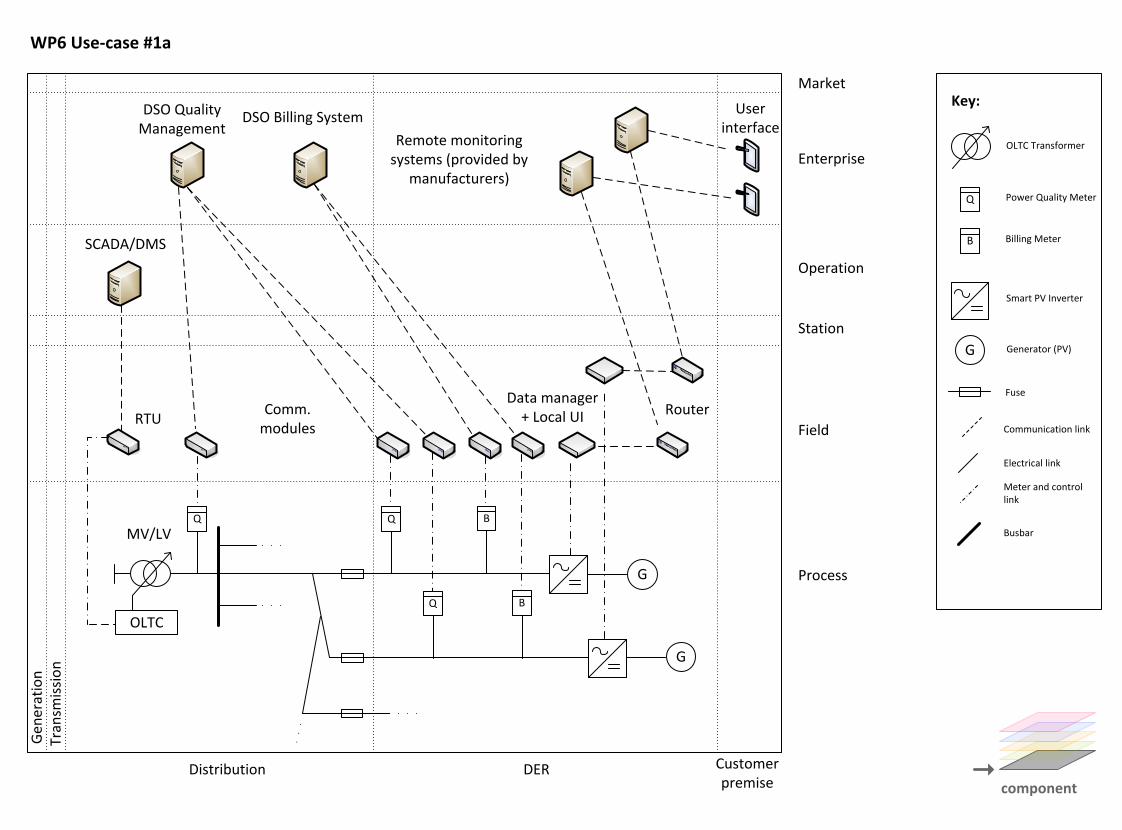
Gen
erat
ion
Tran
smis
sio
n
Distribution DER Customer premise
Process
Field
Station
Operation
Enterprise
MarketKey:
component
WP6 Use-case #1a
MV/LV
OLTC
RTU
SCADA/DMS
G
Q Q B
Data manager + Local UI
DSO Quality Management
DSO Billing System
Comm. modules
Remote monitoring systems (provided by
manufacturers)
User interface
Q
G
Electrical link
Communication link
Meter and control link
OLTC Transformer
Power Quality Meter
Smart PV Inverter
Generator (PV)
Fuse
G
Busbar
B Billing Meter
Q B
Router
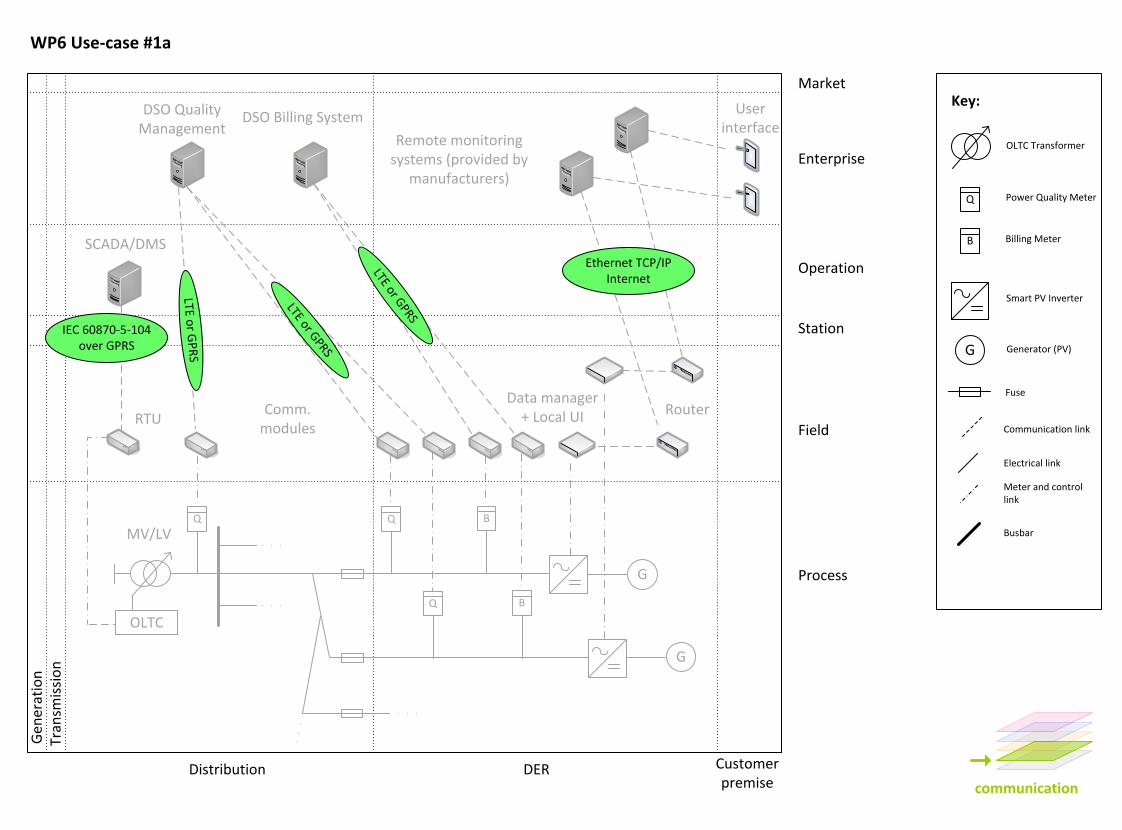
communication
Key:
Q
G
Electrical link
Communication link
Meter and control link
OLTC Transformer
Fuse
Busbar
B
Power Quality Meter
Billing Meter
Smart PV Inverter
Generator (PV)
Gen
erat
ion
Tran
smis
sio
n
Distribution DER Customer premise
Process
Field
Station
Operation
Enterprise
Market
WP6 Use-case #1a
MV/LV
OLTC
RTU
SCADA/DMS
G
Q Q B
Data manager + Local UI
DSO Quality Management
DSO Billing System
Comm. modules
Remote monitoring systems (provided by
manufacturers)
User interface
G
Q B
Router
LTE or G
PR
S
IEC 60870-5-104 over GPRS
LTE or GPRS
LTE or GPRS
Ethernet TCP/IPInternet
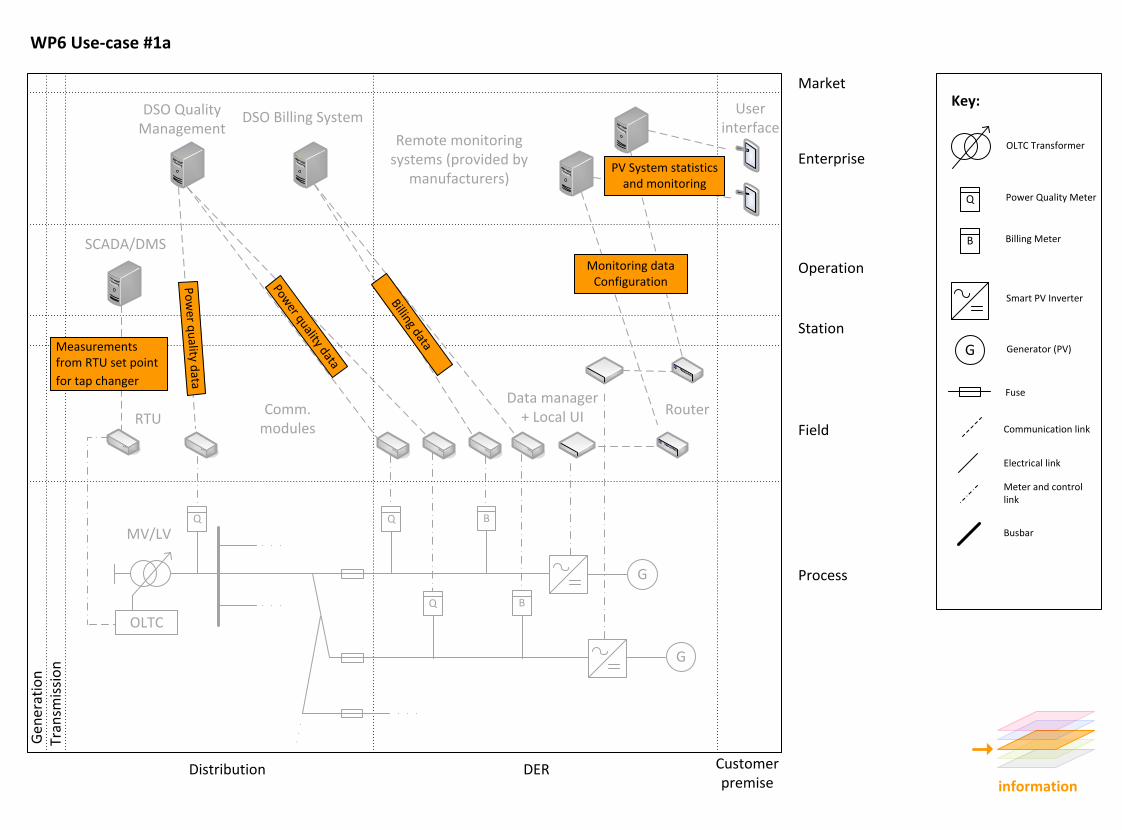
Key:
Q
G
Electrical link
Communication link
Meter and control link
OLTC Transformer
Fuse
Busbar
B
Power Quality Meter
Billing Meter
Smart PV Inverter
Generator (PV)
Gen
erat
ion
Tran
smis
sio
n
Distribution DER Customer premise
Process
Field
Station
Operation
Enterprise
Market
WP6 Use-case #1a
MV/LV
OLTC
RTU
SCADA/DMS
G
Q Q B
Data manager + Local UI
DSO Quality Management
DSO Billing System
Comm. modules
Remote monitoring systems (provided by
manufacturers)
User interface
G
Q B
Router
information
Po
wer q
uality d
ata
Power quality data
Billing data
Monitoring data Configuration
PV System statistics and monitoring
Measurements from RTU set point
for tap changer
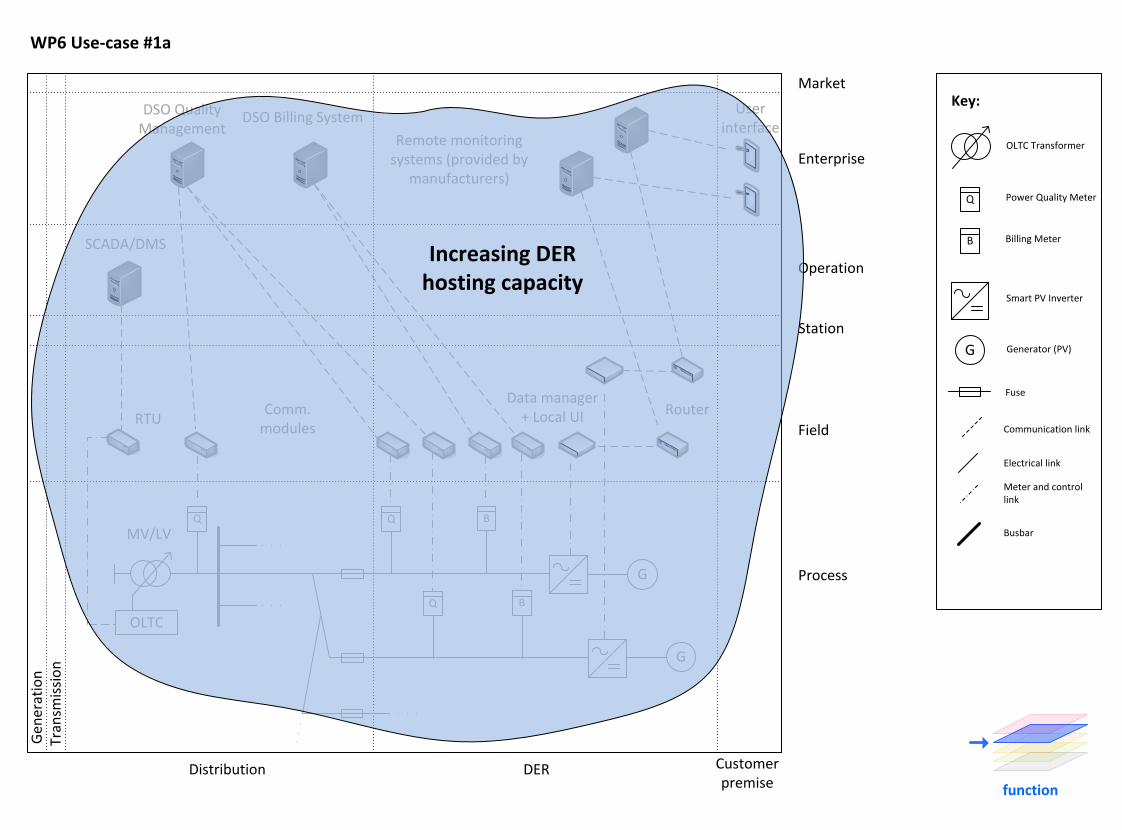
Key:
Q
G
Electrical link
Communication link
Meter and control link
OLTC Transformer
Fuse
Busbar
B
Power Quality Meter
Billing Meter
Smart PV Inverter
Generator (PV)
Gen
erat
ion
Tran
smis
sio
n
Distribution DER Customer premise
Process
Field
Station
Operation
Enterprise
Market
WP6 Use-case #1a
MV/LV
OLTC
RTU
SCADA/DMS
G
Q Q B
Data manager + Local UI
DSO Quality Management
DSO Billing System
Comm. modules
Remote monitoring systems (provided by
manufacturers)
User interface
G
Q B
Router
function
Increasing DER hosting capacity
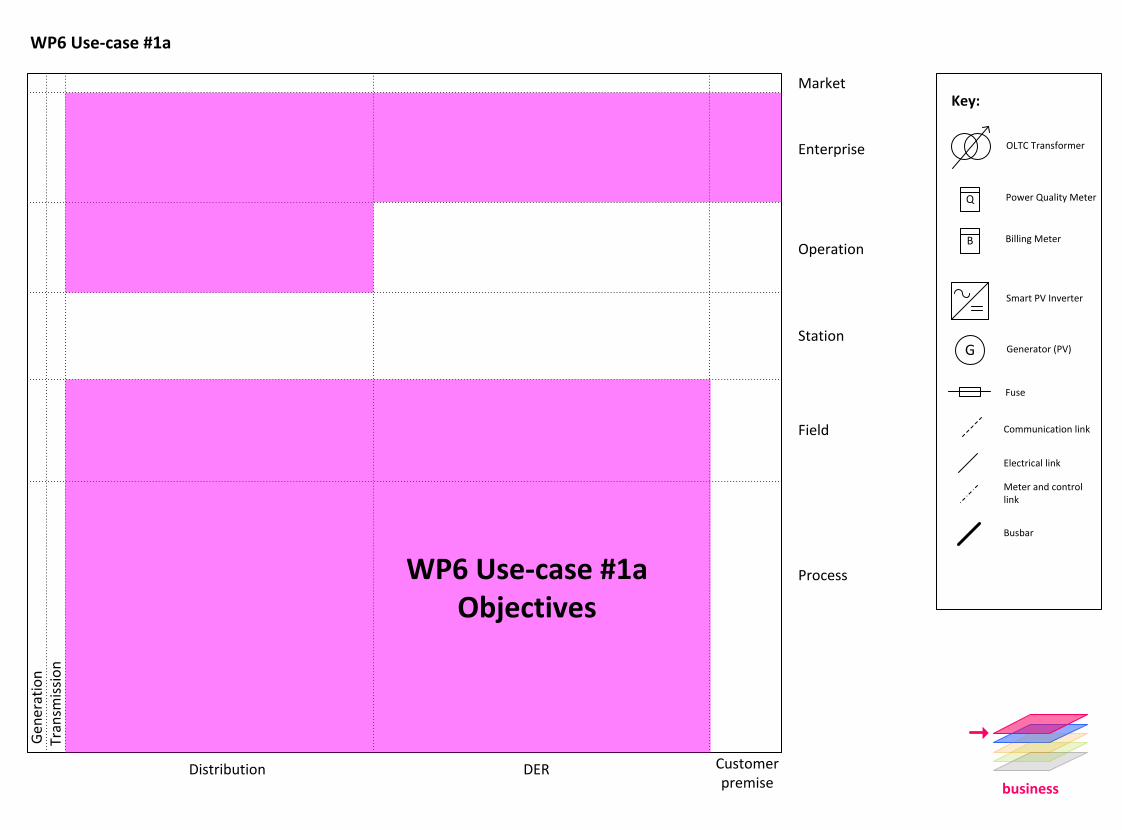
Gen
erat
ion
Tran
smis
sio
n
Distribution DER Customer premise
Process
Field
Station
Operation
Enterprise
Market
WP6 Use-case #1a
business
WP6 Use-case #1a Objectives
Key:
Q
G
Electrical link
Communication link
Meter and control link
OLTC Transformer
Fuse
Busbar
B
Power Quality Meter
Billing Meter
Smart PV Inverter
Generator (PV)
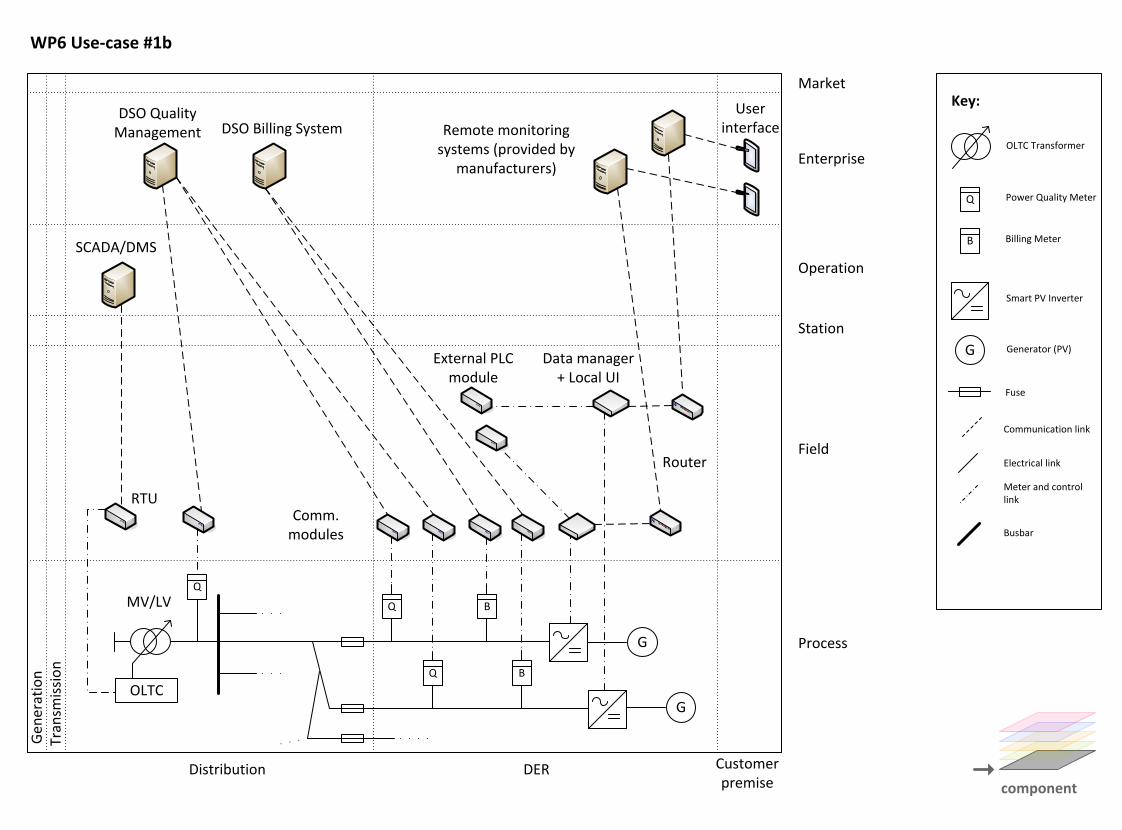
Gen
erat
ion
Tran
smis
sio
n
Distribution DER Customer premise
Process
Field
Station
Operation
Enterprise
MarketKey:
component
WP6 Use-case #1b
MV/LV
OLTC
RTU
SCADA/DMS
G
Q
Data manager + Local UI
DSO Quality Management DSO Billing System
Comm. modules
Remote monitoring systems (provided by
manufacturers)
User interface
Q
G
Electrical link
Communication link
Meter and control link
OLTC Transformer
Power Quality Meter
Smart PV Inverter
Generator (PV)
Fuse
G
Busbar
B Billing Meter
Q B
Q B
External PLC module
Router
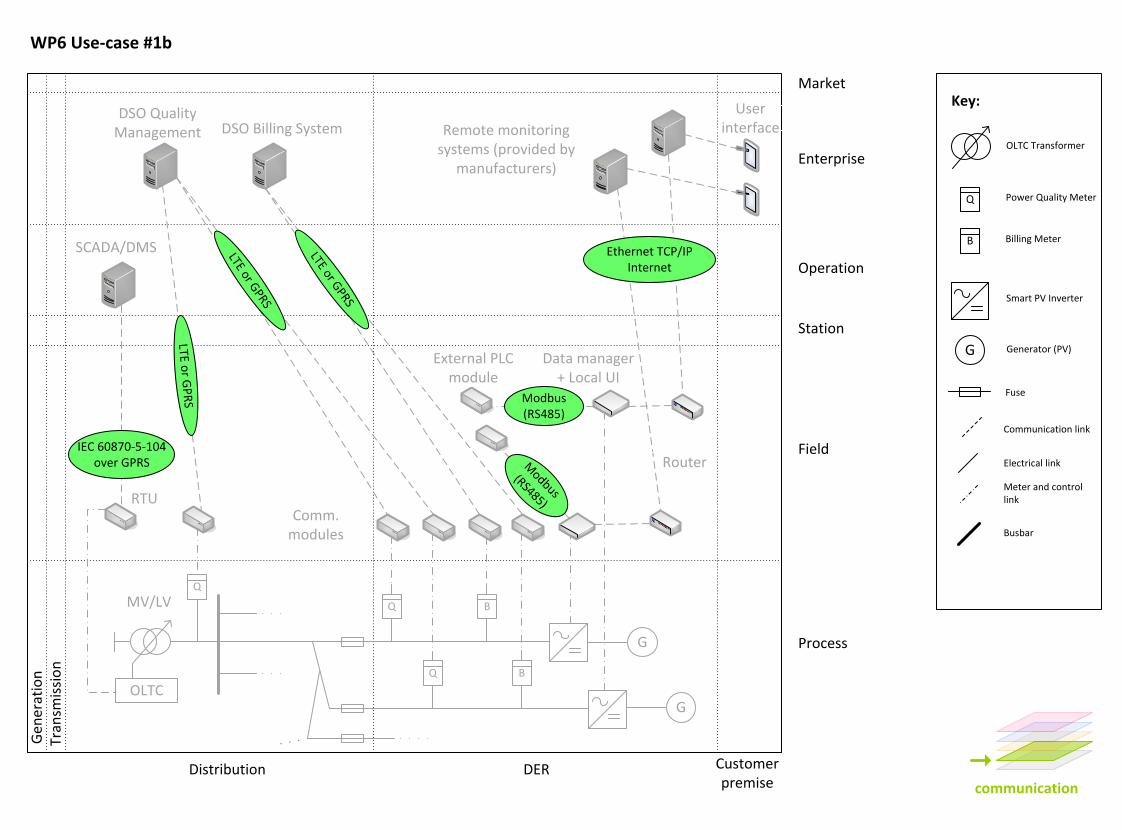
communication
Key:
Q
G
Electrical link
Communication link
Meter and control link
OLTC Transformer
Fuse
Busbar
B
Power Quality Meter
Billing Meter
Smart PV Inverter
Generator (PV)
WP6 Use-case #1bG
ener
atio
nTr
ansm
issi
on
Distribution DER Customer premise
Process
Field
Station
Operation
Enterprise
Market
MV/LV
OLTC
RTU
SCADA/DMS
G
Q
Data manager + Local UI
DSO Quality Management DSO Billing System
Comm. modules
Remote monitoring systems (provided by
manufacturers)
User interface
G
Q B
Q B
External PLC module
Router
LTE or G
PR
S
IEC 60870-5-104 over GPRS
LTE or GPRS
LTE or GPRS
Ethernet TCP/IPInternet
Modbus(RS485)
Modbus
(RS485)
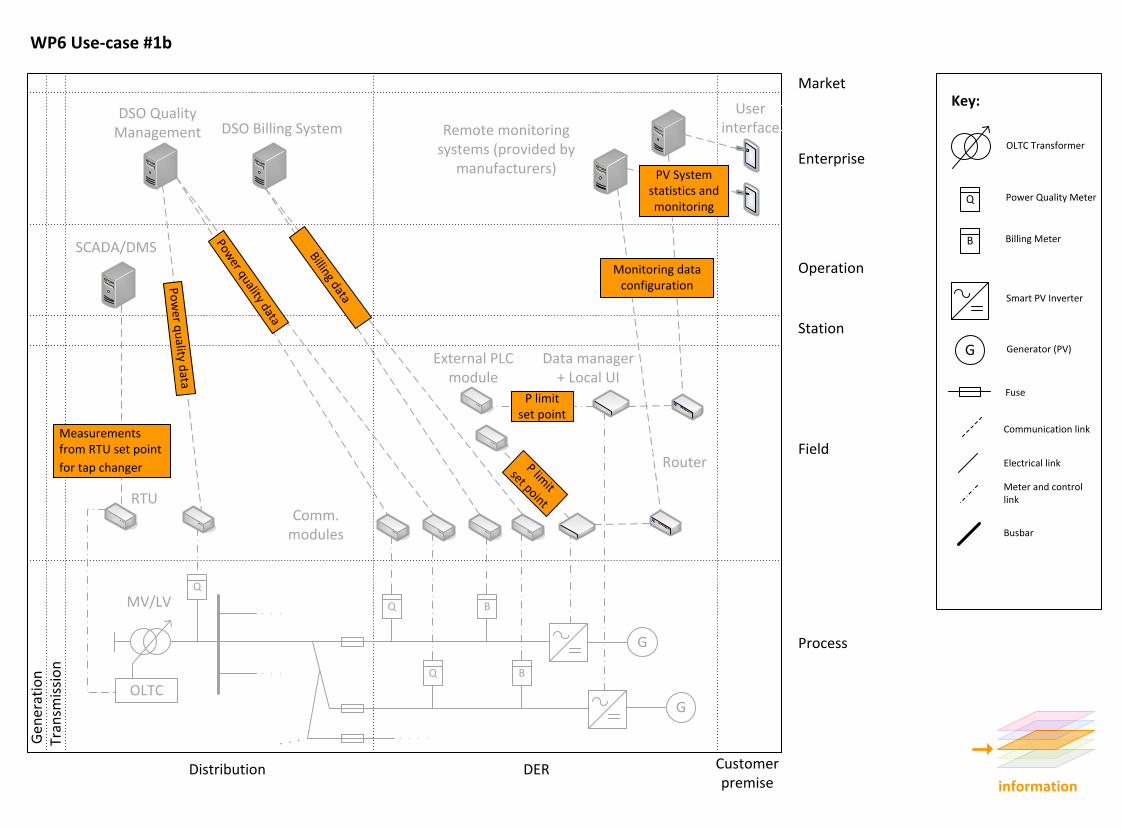
Key:
Q
G
Electrical link
Communication link
Meter and control link
OLTC Transformer
Fuse
Busbar
B
Power Quality Meter
Billing Meter
Smart PV Inverter
Generator (PV)
WP6 Use-case #1bG
ener
atio
nTr
ansm
issi
on
Distribution DER Customer premise
Process
Field
Station
Operation
Enterprise
Market
MV/LV
OLTC
RTU
SCADA/DMS
G
Q
Data manager + Local UI
DSO Quality Management DSO Billing System
Comm. modules
Remote monitoring systems (provided by
manufacturers)
User interface
G
Q B
Q B
External PLC module
Router
information
Po
wer q
uality d
ata
Power quality data
Billing data
Monitoring data configuration
PV Systemstatistics and monitoring
Measurements from RTU set point
for tap changer
P limitset point
P limit
set point
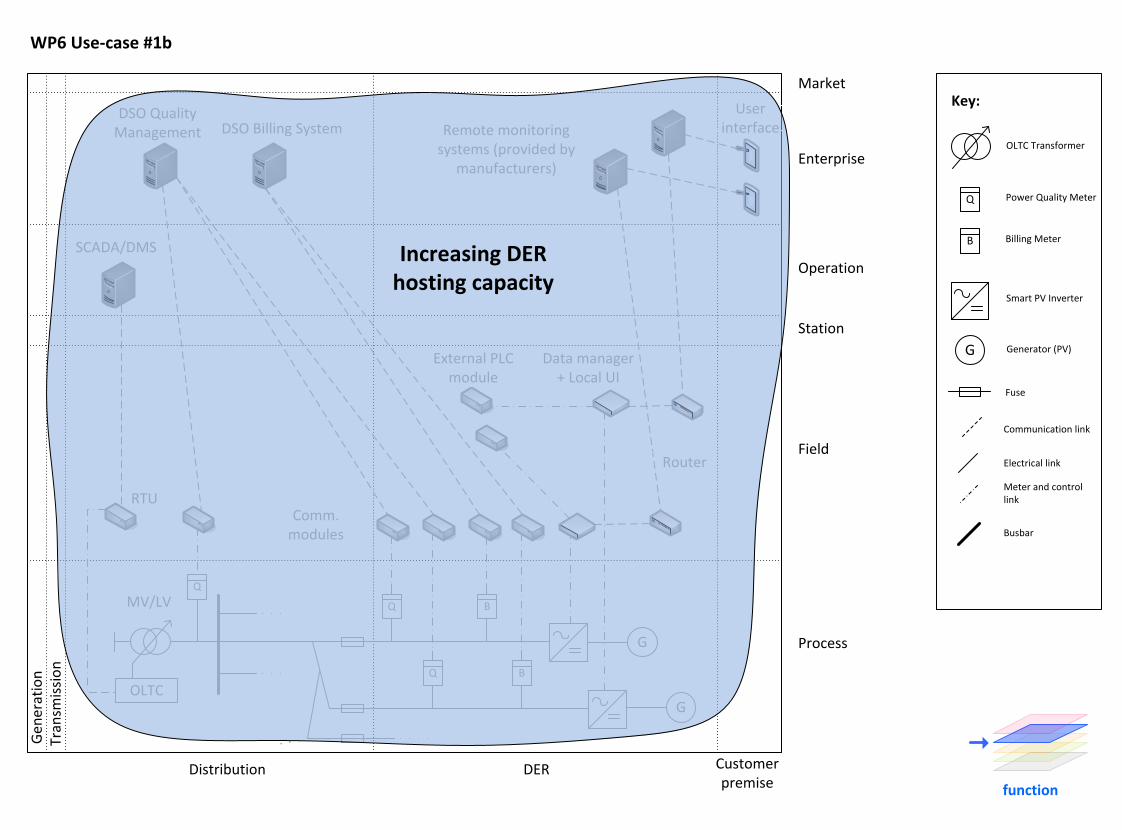
Key:
Q
G
Electrical link
Communication link
Meter and control link
OLTC Transformer
Fuse
Busbar
B
Power Quality Meter
Billing Meter
Smart PV Inverter
Generator (PV)
WP6 Use-case #1bG
ener
atio
nTr
ansm
issi
on
Distribution DER Customer premise
Process
Field
Station
Operation
Enterprise
Market
MV/LV
OLTC
RTU
SCADA/DMS
G
Q
Data manager + Local UI
DSO Quality Management DSO Billing System
Comm. modules
Remote monitoring systems (provided by
manufacturers)
User interface
G
Q B
Q B
External PLC module
Router
function
Increasing DER hosting capacity
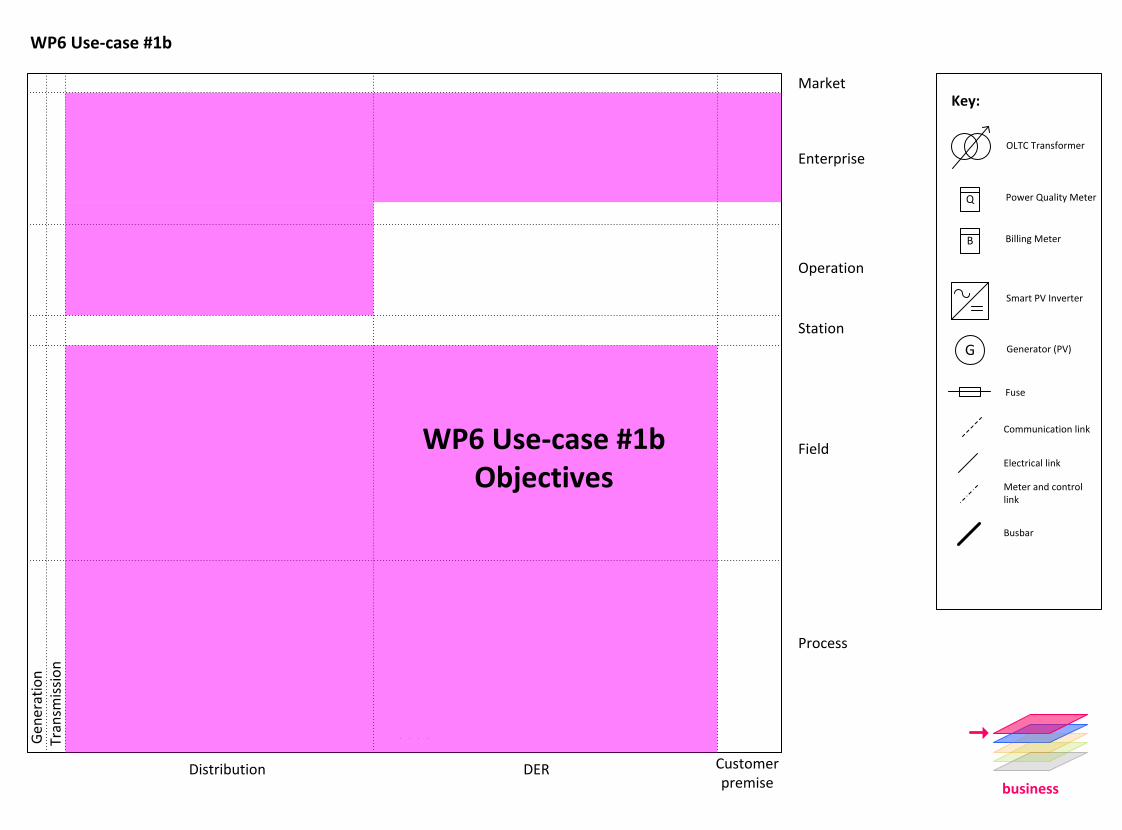
Key:
Q
G
Electrical link
Communication link
Meter and control link
OLTC Transformer
Fuse
Busbar
B
Power Quality Meter
Billing Meter
Smart PV Inverter
Generator (PV)
WP6 Use-case #1bG
ener
atio
nTr
ansm
issi
on
Distribution DER Customer premise
Process
Field
Station
Operation
Enterprise
Market
business
WP6 Use-case #1b Objectives
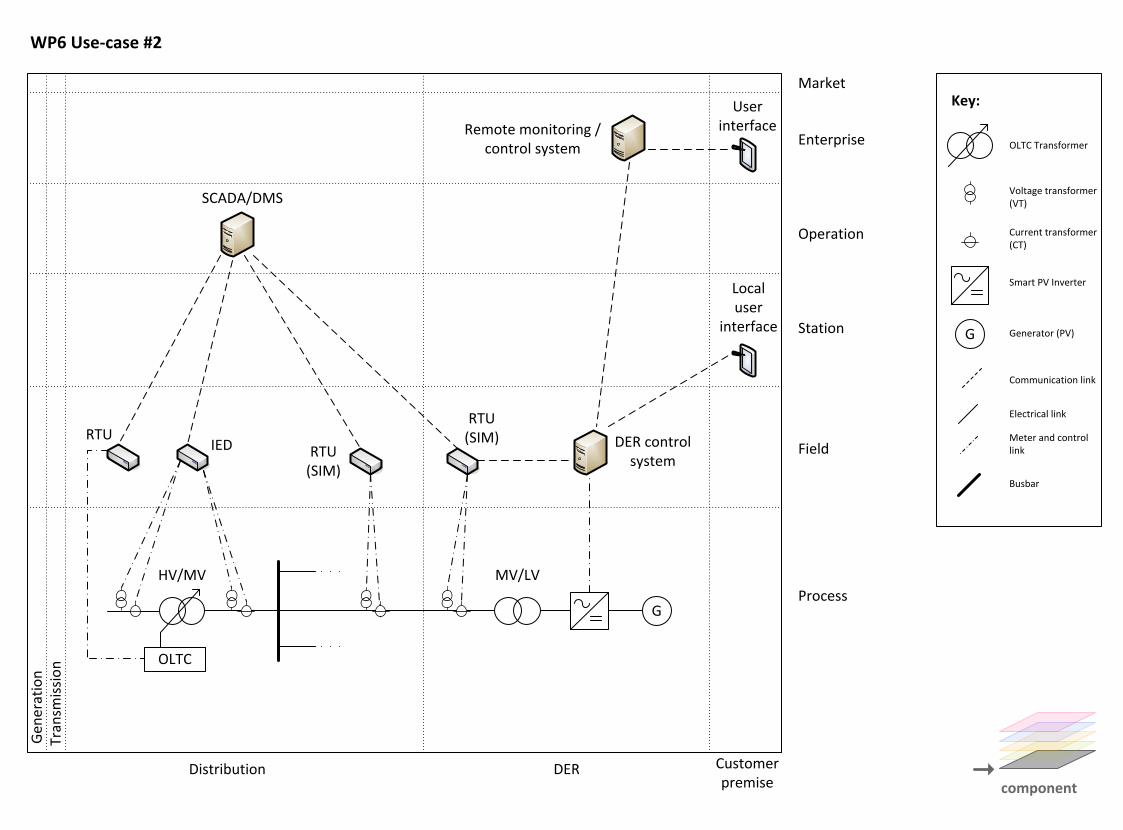
Gen
erat
ion
Tran
smis
sio
n
Distribution DER Customer premise
Process
Field
Station
Operation
Enterprise
MarketKey:
component
WP6 Use-case #2
HV/MV
OLTC
RTU
SCADA/DMS
G
DER control system
Remote monitoring / control system
User interface
G
Electrical link
Communication link
Meter and control link
OLTC Transformer
Voltage transformer (VT)
Smart PV Inverter
Generator (PV)
Busbar
Current transformer (CT)
MV/LV
IED RTU(SIM)
RTU(SIM)
Local user
interface
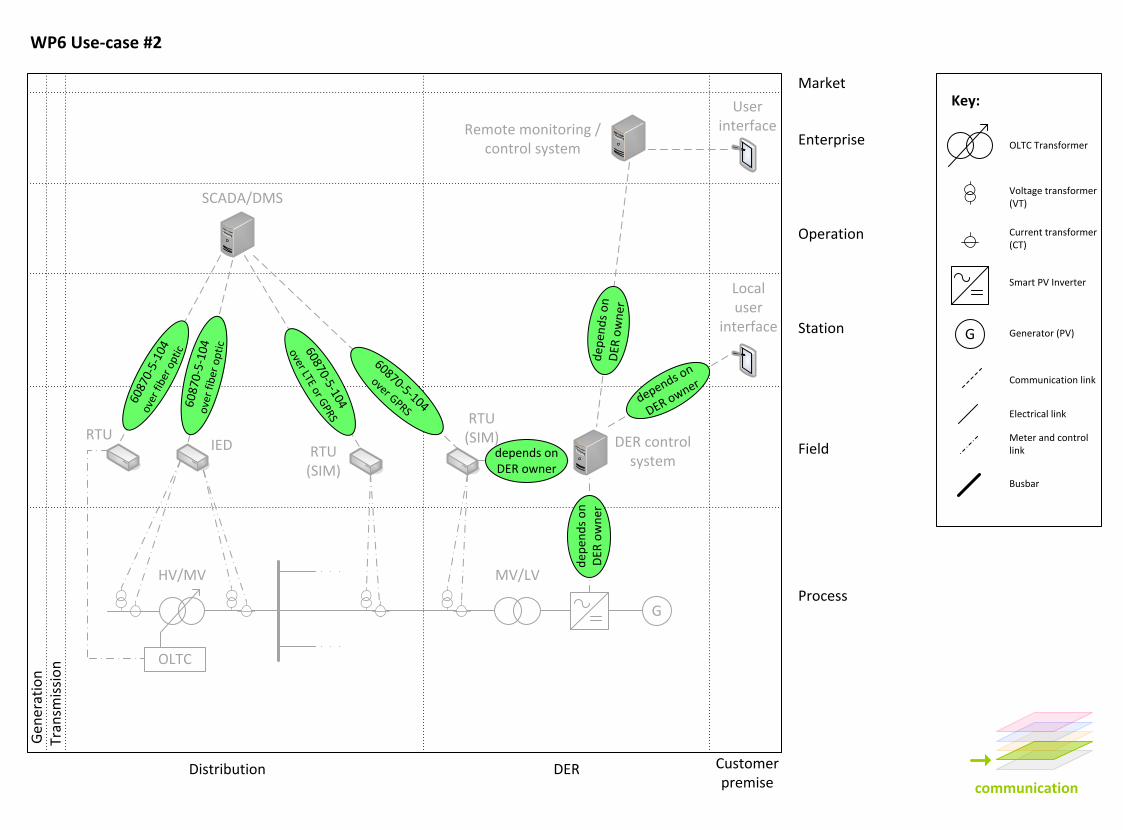
Gen
erat
ion
Tran
smis
sio
n
Distribution DER Customer premise
Process
Field
Station
Operation
Enterprise
MarketKey:
WP6 Use-case #2
HV/MV
RTU
SCADA/DMS
DER control system
Remote monitoring / control system
User interface
G
Electrical link
Communication link
Meter and control link
OLTC Transformer
Voltage transformer (VT)
Smart PV Inverter
Generator (PV)
Busbar
Current transformer (CT)
MV/LV
IED RTU(SIM)
RTU(SIM)
Local user
interface
OLTC
G
communication
6087
0-5-
104
over
fibe
r op
tic60
870-
5-10
4o
ver
fib
er o
pti
c 60870-5-104
over LTE or GPRS
60870-5-104
over GPRSdepends o
n
DER owner
dep
end
s o
n
DER
ow
ner
depends onDER owner
dep
end
s o
nD
ER o
wn
er
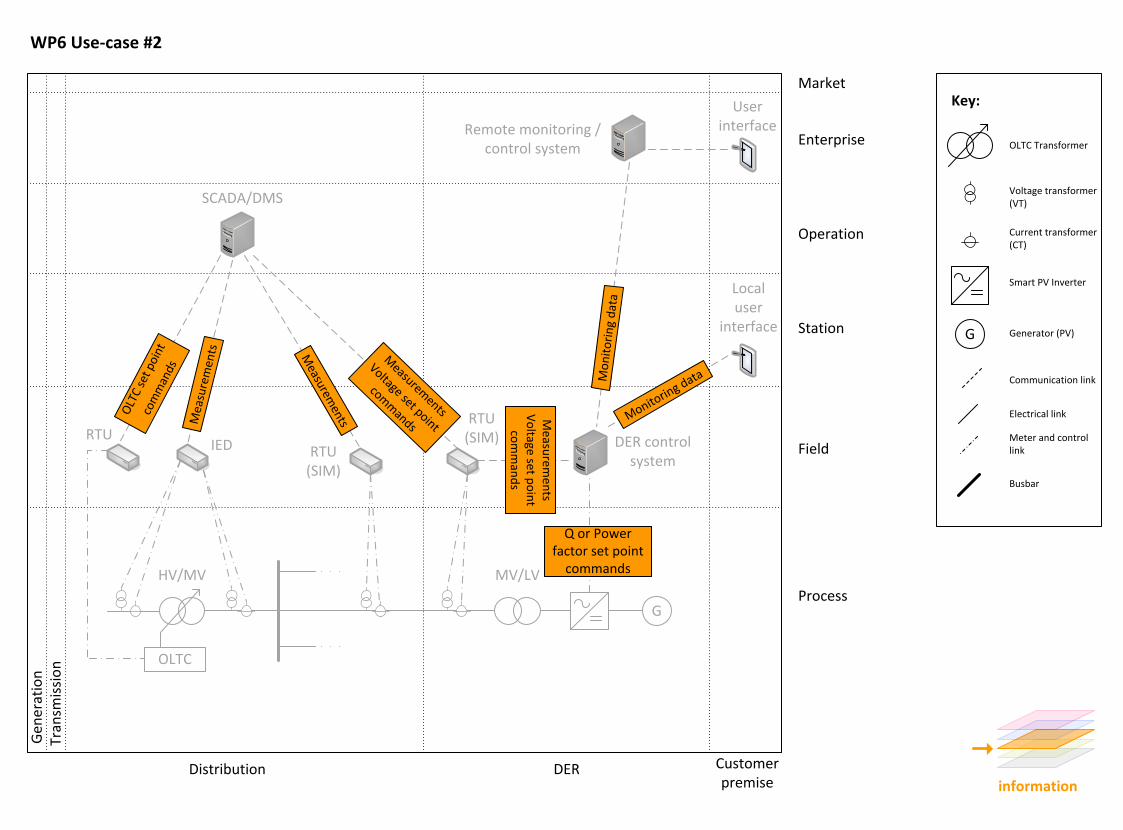
Gen
erat
ion
Tran
smis
sio
n
Distribution DER Customer premise
Process
Field
Station
Operation
Enterprise
MarketKey:
WP6 Use-case #2
HV/MV
RTU
SCADA/DMS
DER control system
Remote monitoring / control system
User interface
G
Electrical link
Communication link
Meter and control link
OLTC Transformer
Voltage transformer (VT)
Smart PV Inverter
Generator (PV)
Busbar
Current transformer (CT)
MV/LV
IED RTU(SIM)
RTU(SIM)
Local user
interface
OLTC
G
information
Mea
sure
men
ts
OLT
C se
t poi
ntco
mm
ands
Measurem
ents
Measurem
ents
Voltage set point
comm
ands
Mo
nit
ori
ng
dat
a
Monitorin
g data
Measu
remen
tsV
oltage set p
oin
t co
mm
and
s
Q or Power factor set point
commands
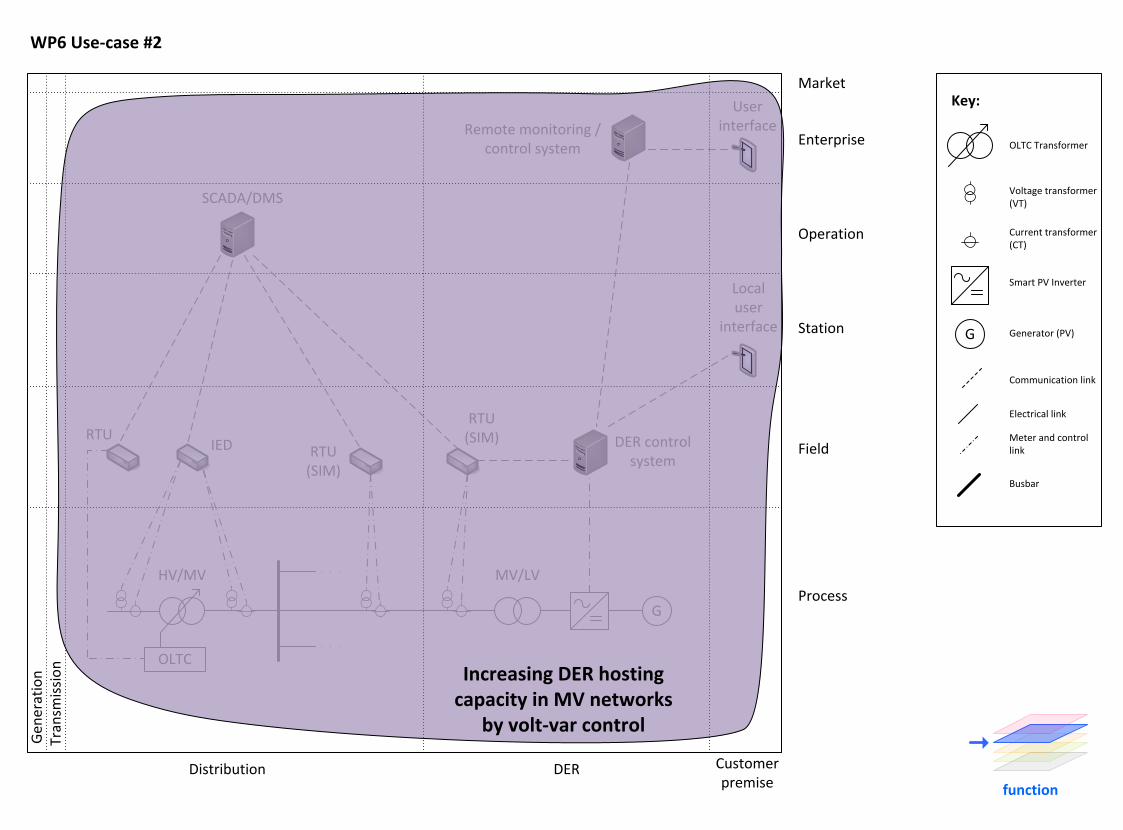
Gen
erat
ion
Tran
smis
sio
n
Distribution DER Customer premise
Process
Field
Station
Operation
Enterprise
MarketKey:
WP6 Use-case #2
HV/MV
RTU
SCADA/DMS
DER control system
Remote monitoring / control system
User interface
G
Electrical link
Communication link
Meter and control link
OLTC Transformer
Voltage transformer (VT)
Smart PV Inverter
Generator (PV)
Busbar
Current transformer (CT)
MV/LV
IED RTU(SIM)
RTU(SIM)
Local user
interface
OLTC
G
function
Increasing DER hosting capacity in MV networks
by volt-var control
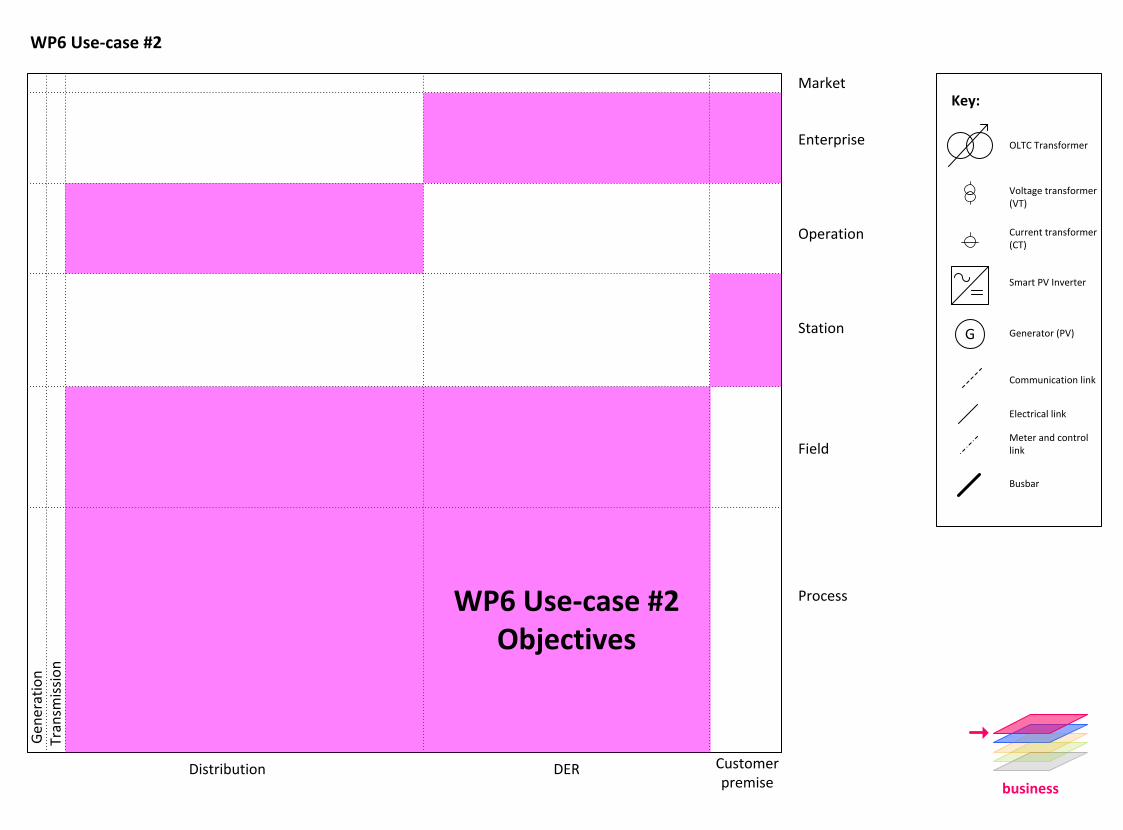
Gen
erat
ion
Tran
smis
sio
n
Distribution DER Customer premise
Process
Field
Station
Operation
Enterprise
MarketKey:
WP6 Use-case #2
G
Electrical link
Communication link
Meter and control link
OLTC Transformer
Voltage transformer (VT)
Smart PV Inverter
Generator (PV)
Busbar
Current transformer (CT)
business
WP6 Use-case #2 Objectives
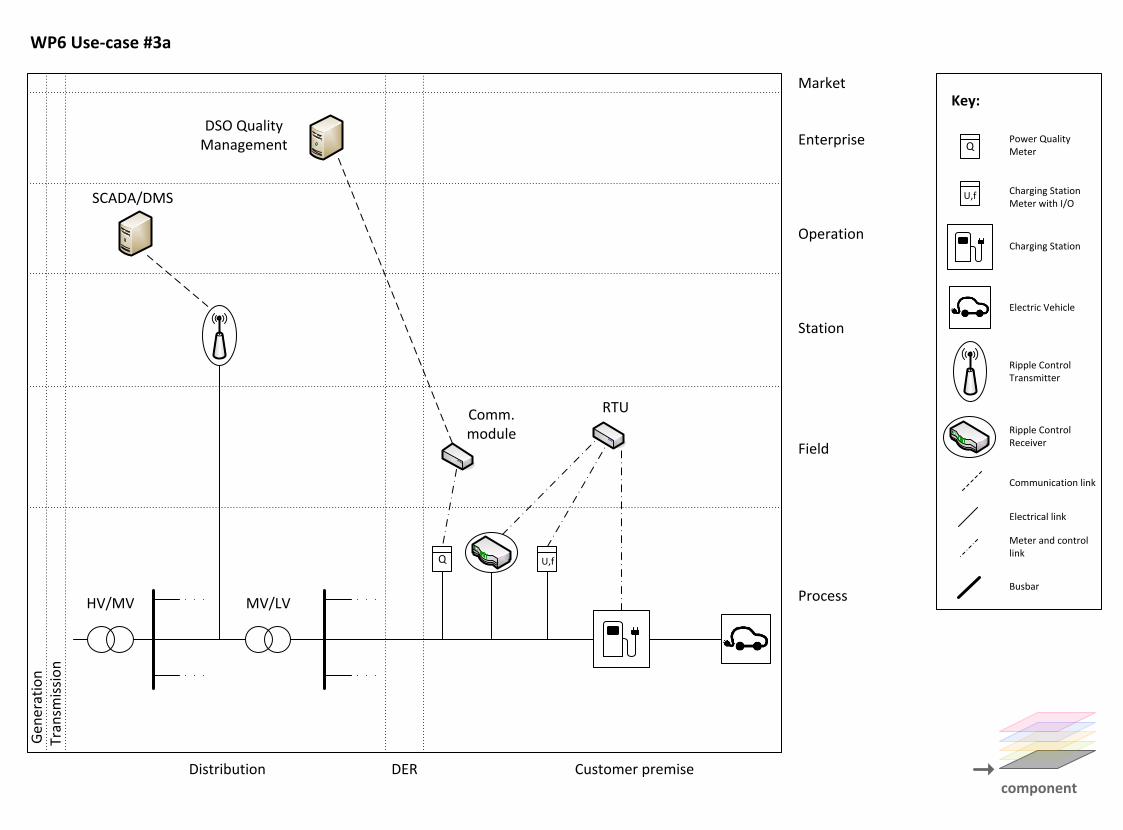
Gen
erat
ion
Tran
smis
sio
n
Distribution DER Customer premise
Process
Field
Station
Operation
Enterprise
MarketKey:
component
WP6 Use-case #3a
HV/MV
SCADA/DMS
Electrical link
Communication link
Meter and control link
Power Quality Meter
Charging Station Meter with I/O
Electric Vehicle
Busbar
Charging Station
MV/LV
Q
Ripple Control Receiver
Comm. module
Ripple Control Transmitter
DSO Quality Management
U,f
RTU
Q
U,f
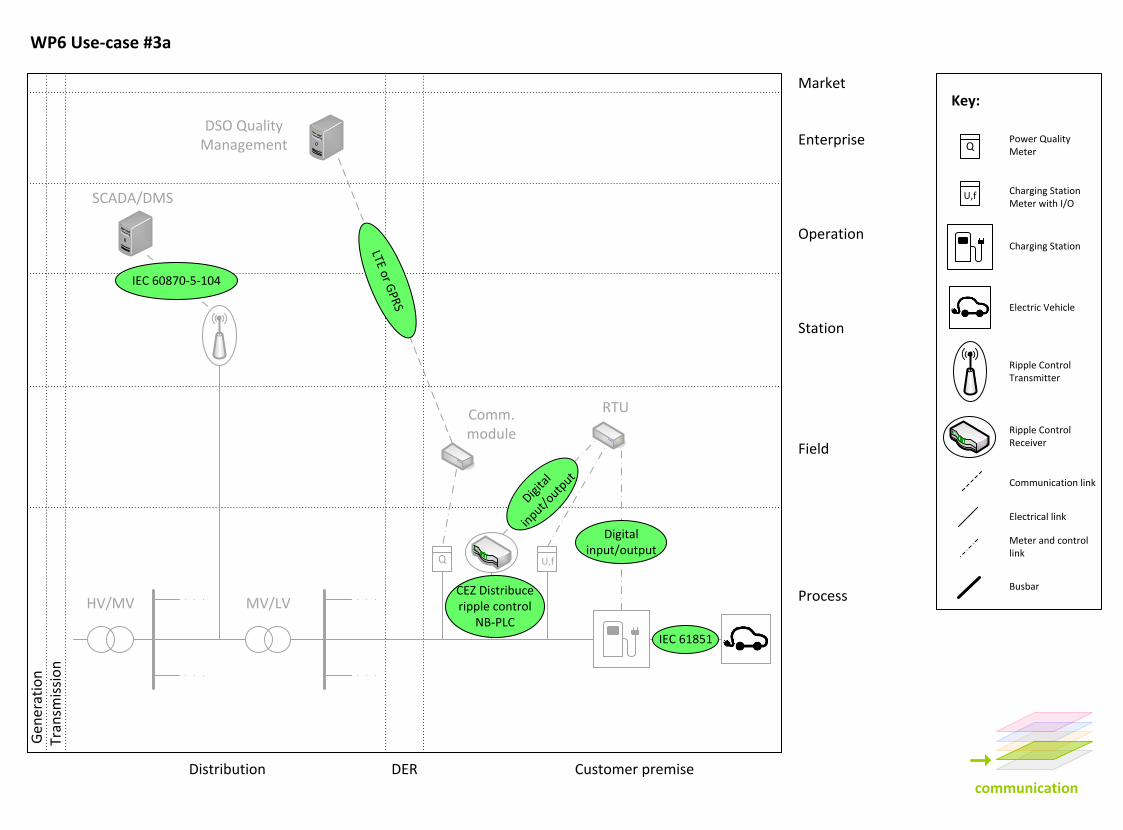
Key:
WP6 Use-case #3a
Electrical link
Communication link
Meter and control link
Power Quality Meter
Charging Station Meter with I/O
Electric Vehicle
Busbar
Charging Station
Ripple Control Receiver
Ripple Control Transmitter
Q
U,f
communication
Gen
erat
ion
Tran
smis
sio
n
Distribution DER Customer premise
Process
Field
Station
Operation
Enterprise
Market
HV/MV
SCADA/DMS
MV/LV
Comm. module
DSO Quality Management
RTU
Q U,f
IEC 60870-5-104
LTE or GPR
S
CEZ Distribuce ripple control
NB-PLC
IEC 61851
Digital input/output
Digita
l
input/
output
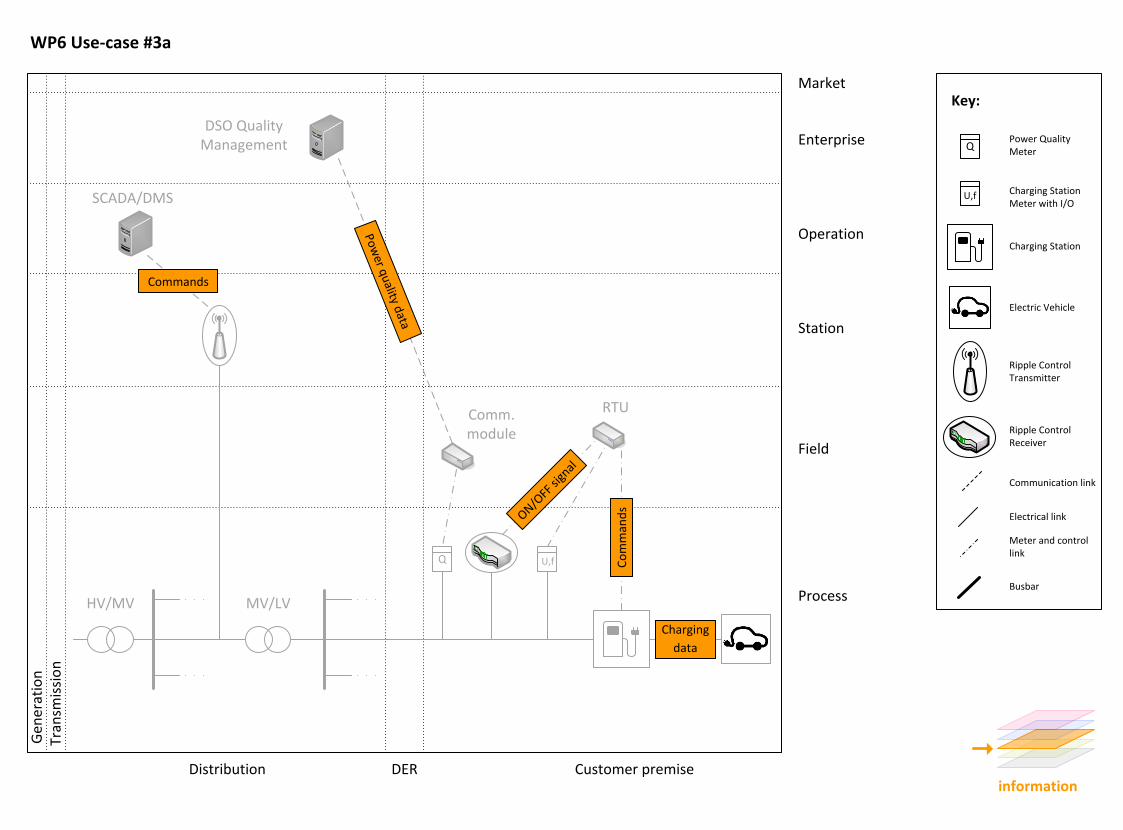
Key:
WP6 Use-case #3a
Electrical link
Communication link
Meter and control link
Power Quality Meter
Charging Station Meter with I/O
Electric Vehicle
Busbar
Charging Station
Ripple Control Receiver
Ripple Control Transmitter
Q
U,f
information
Gen
erat
ion
Tran
smis
sio
n
Distribution DER Customer premise
Process
Field
Station
Operation
Enterprise
Market
HV/MV
SCADA/DMS
MV/LV
Comm. module
DSO Quality Management
RTU
Q U,f
Commands
Power quality data
ON/OFF
sign
al
Co
mm
and
sCharging
data
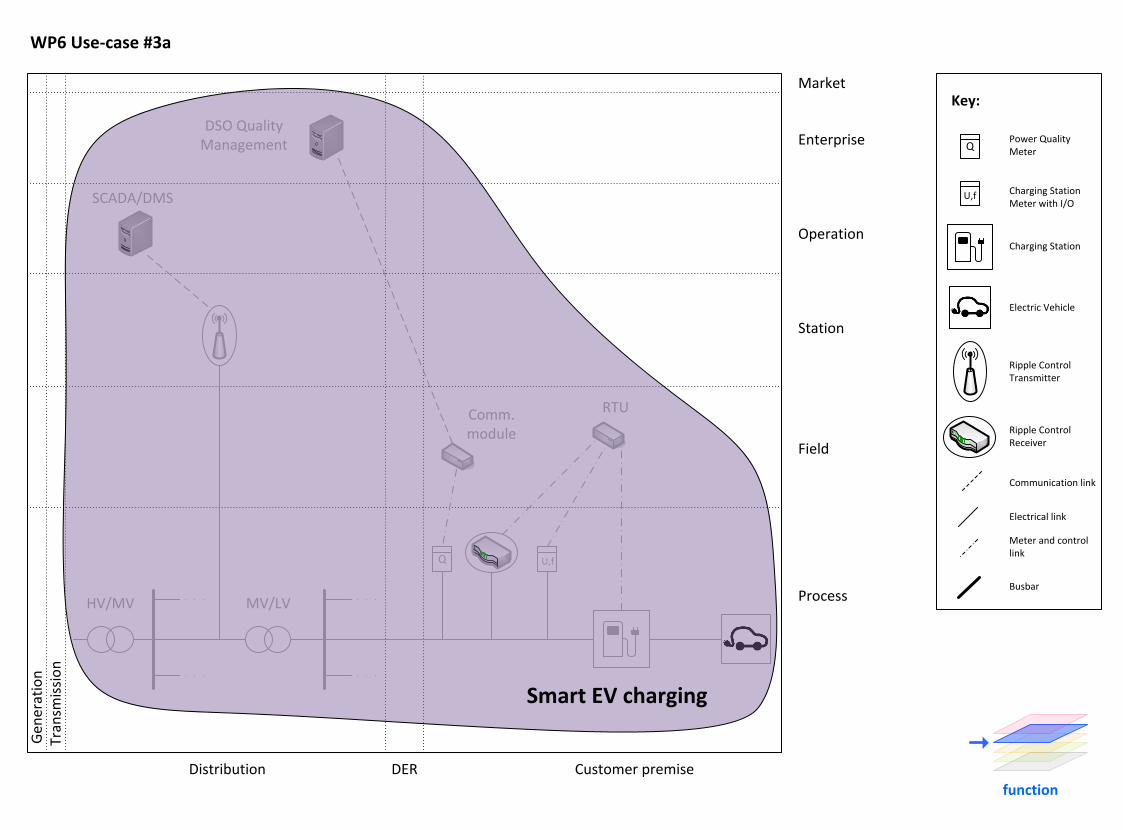
Key:
WP6 Use-case #3a
Electrical link
Communication link
Meter and control link
Power Quality Meter
Charging Station Meter with I/O
Electric Vehicle
Busbar
Charging Station
Ripple Control Receiver
Ripple Control Transmitter
Q
U,f
function
Gen
erat
ion
Tran
smis
sio
n
Distribution DER Customer premise
Process
Field
Station
Operation
Enterprise
Market
HV/MV
SCADA/DMS
MV/LV
Comm. module
DSO Quality Management
RTU
Q U,f
Smart EV charging
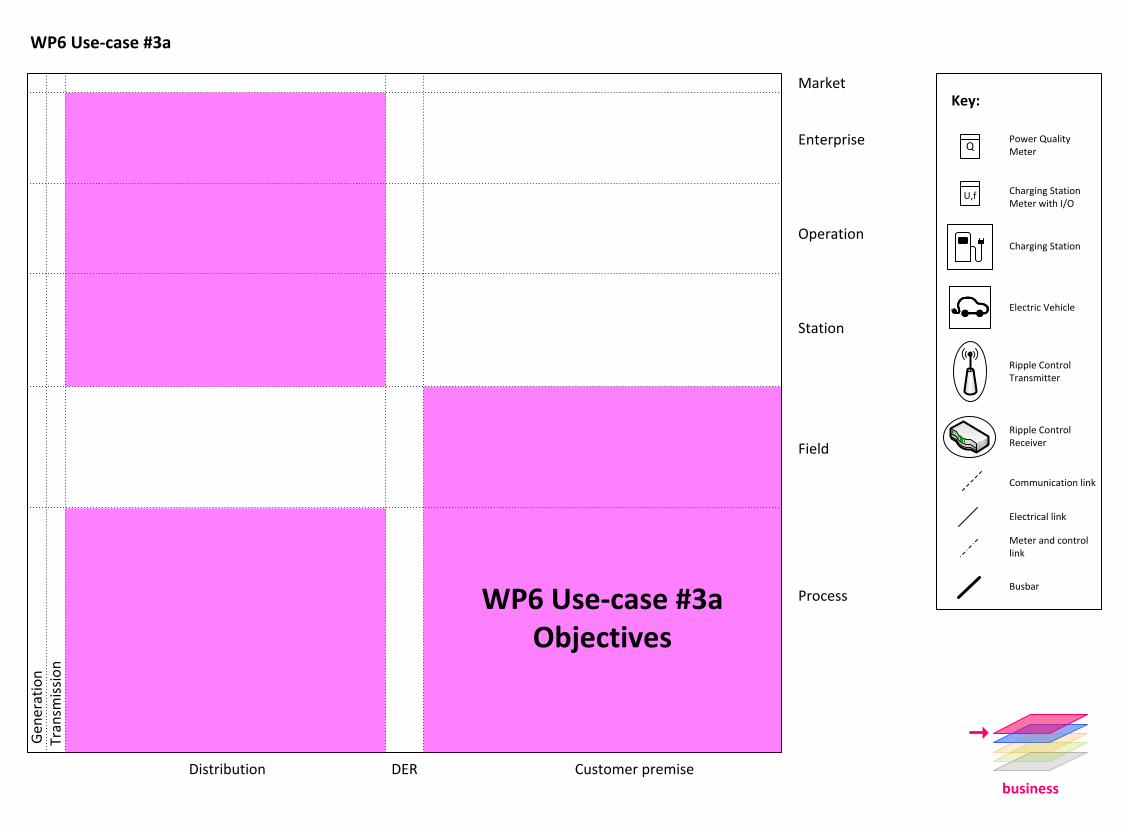
Key:
WP6 Use-case #3a
Electrical link
Communication link
Meter and control link
Power Quality Meter
Charging Station Meter with I/O
Electric Vehicle
Busbar
Charging Station
Ripple Control Receiver
Ripple Control Transmitter
Q
U,f
business
Gen
erat
ion
Tran
smis
sio
n
Distribution DER Customer premise
Process
Field
Station
Operation
Enterprise
Market
WP6 Use-case #3a Objectives
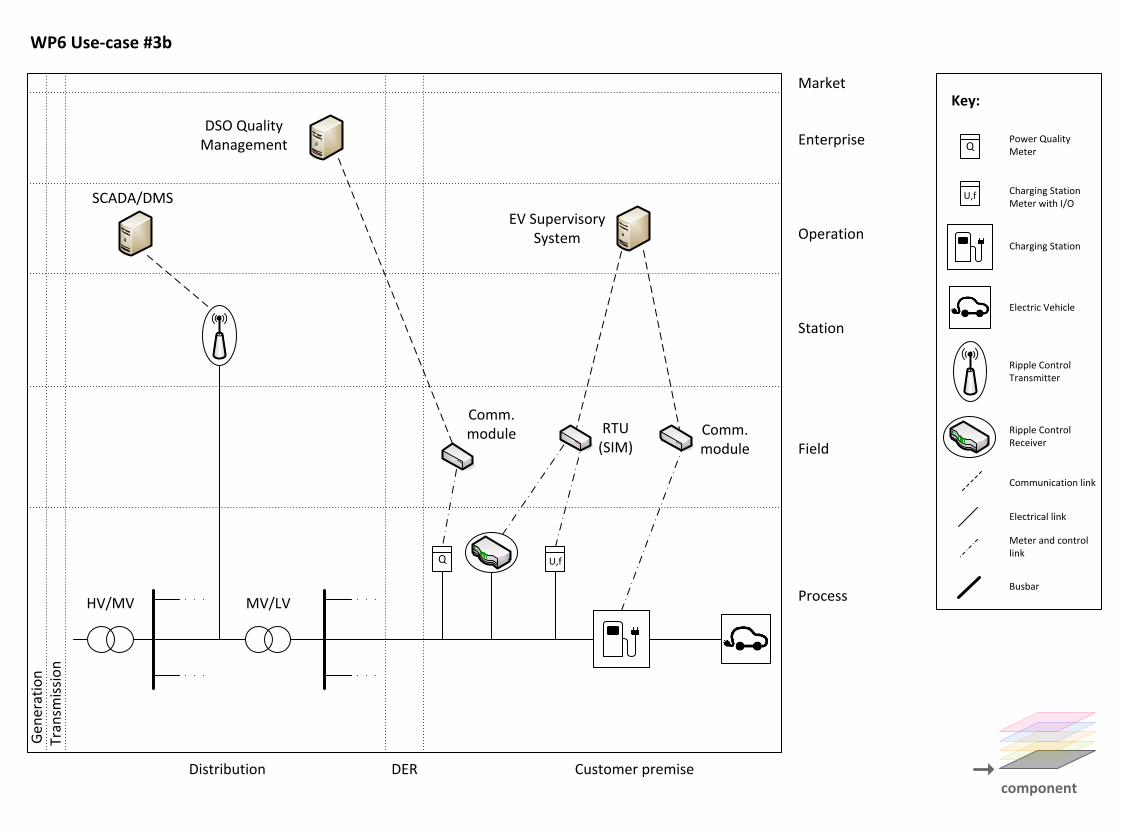
Gen
erat
ion
Tran
smis
sio
n
Distribution DER Customer premise
Process
Field
Station
Operation
Enterprise
MarketKey:
component
WP6 Use-case #3b
HV/MV
SCADA/DMS
Electrical link
Communication link
Meter and control link
Power Quality Meter
Charging Station Meter with I/O
Electric Vehicle
Busbar
Charging Station
MV/LV
Q
Ripple Control Receiver
Comm. module
Ripple Control Transmitter
DSO Quality Management
U,f
RTU(SIM)
Q
U,f
EV Supervisory System
Comm. module
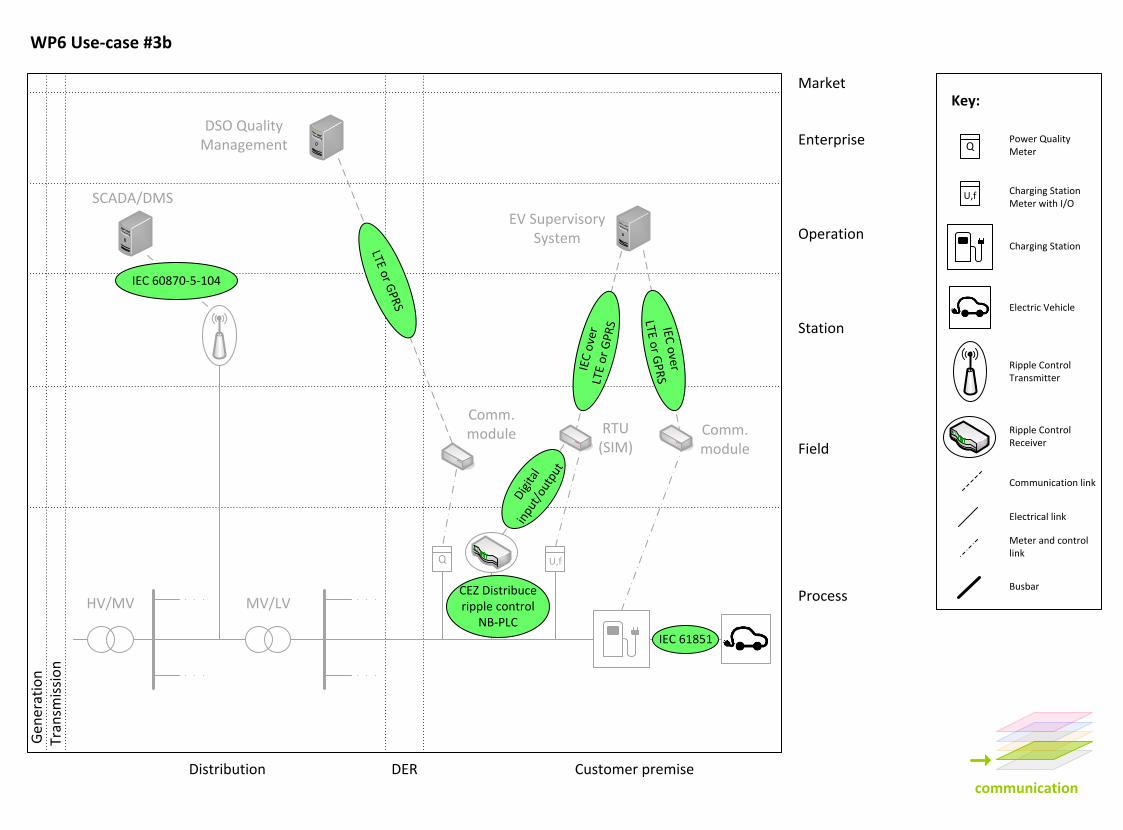
Key:
Electrical link
Communication link
Meter and control link
Power Quality Meter
Charging Station Meter with I/O
Electric Vehicle
Busbar
Charging Station
Ripple Control Receiver
Ripple Control Transmitter
Q
U,f
communication
Gen
erat
ion
Tran
smis
sio
n
Distribution DER Customer premise
Process
Field
Station
Operation
Enterprise
Market
WP6 Use-case #3b
HV/MV
SCADA/DMS
MV/LV
Comm. module
DSO Quality Management
RTU(SIM)
EV Supervisory System
Q U,f
IEC 60870-5-104
LTE or GPR
S
CEZ Distribuce ripple control
NB-PLC
IEC 61851
Dig
ital
inpu
t/ou
tput
IEC o
ver
LTE or G
PR
S
IEC
ove
rLT
E o
r G
PR
S
Comm. module
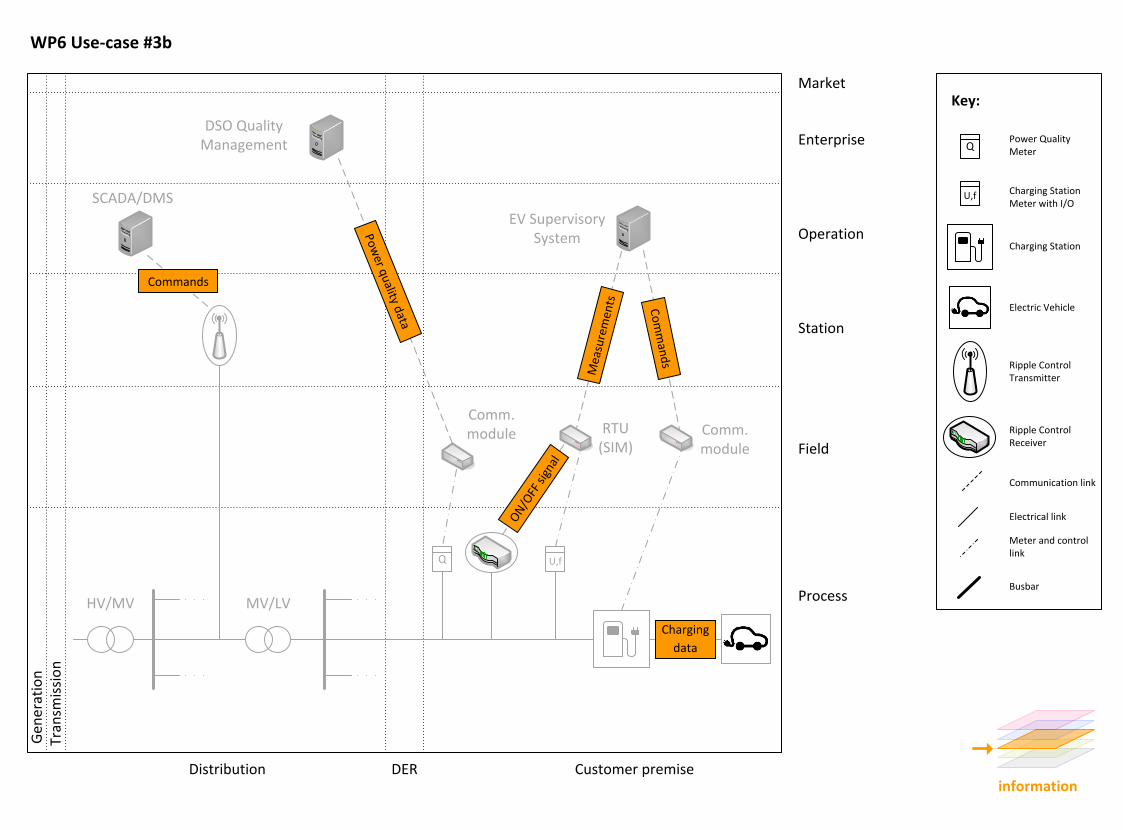
Key:
Electrical link
Communication link
Meter and control link
Power Quality Meter
Charging Station Meter with I/O
Electric Vehicle
Busbar
Charging Station
Ripple Control Receiver
Ripple Control Transmitter
Q
U,f
information
Gen
erat
ion
Tran
smis
sio
n
Distribution DER Customer premise
Process
Field
Station
Operation
Enterprise
Market
WP6 Use-case #3b
HV/MV
SCADA/DMS
MV/LV
Comm. module
DSO Quality Management
RTU(SIM)
EV Supervisory System
Q U,f
Commands
Power quality data
ON
/OFF
sig
nal
Co
mm
and
s
Charging
data
Mea
sure
men
ts
Comm. module
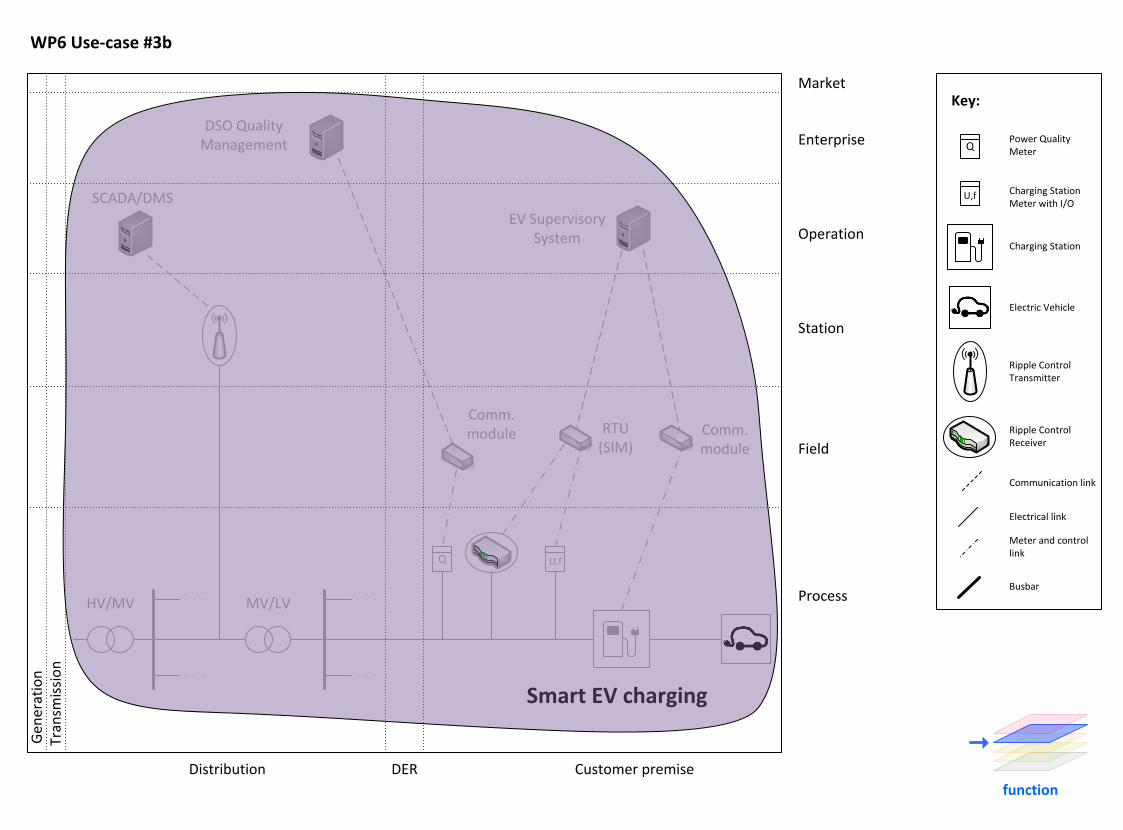
Comm. module
Key:
Electrical link
Communication link
Meter and control link
Power Quality Meter
Charging Station Meter with I/O
Electric Vehicle
Busbar
Charging Station
Ripple Control Receiver
Ripple Control Transmitter
Q
U,f
function
Gen
erat
ion
Tran
smis
sio
n
Distribution DER Customer premise
Process
Field
Station
Operation
Enterprise
Market
WP6 Use-case #3b
HV/MV
SCADA/DMS
MV/LV
Comm. module
DSO Quality Management
RTU(SIM)
EV Supervisory System
Q U,f
Smart EV charging
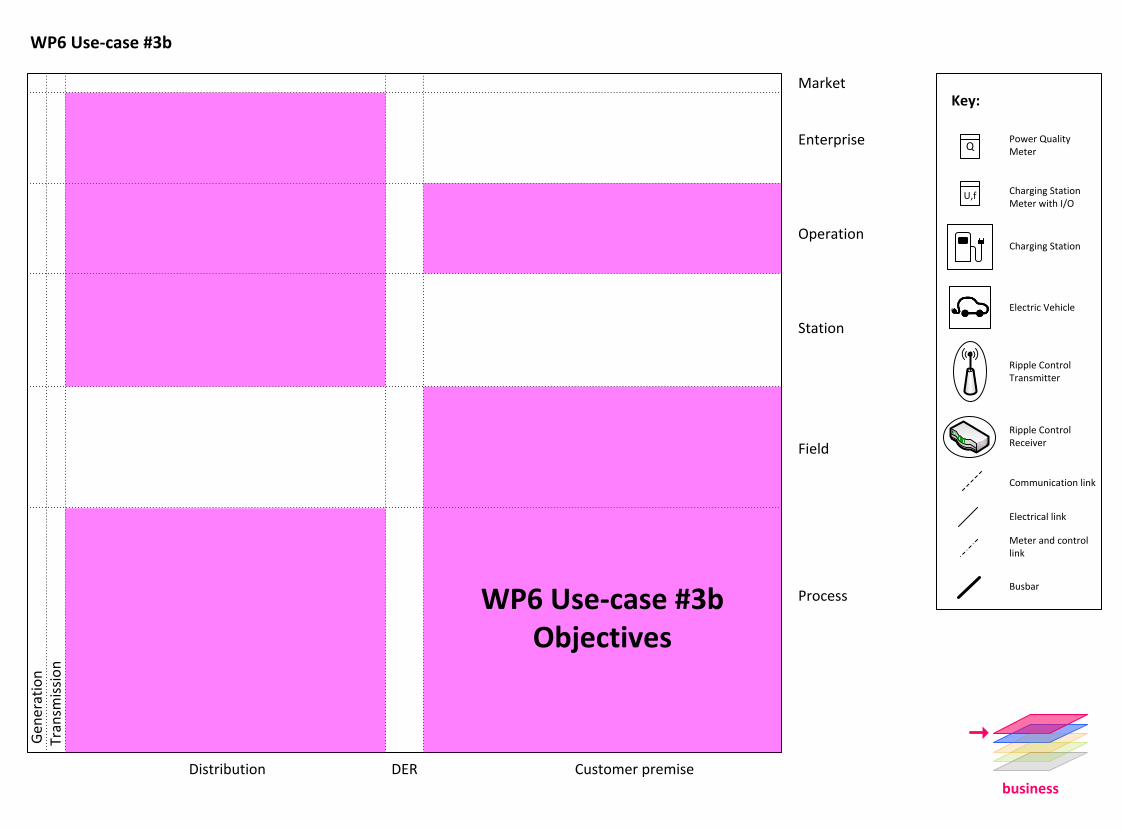
Key:
Electrical link
Communication link
Meter and control link
Power Quality Meter
Charging Station Meter with I/O
Electric Vehicle
Busbar
Charging Station
Ripple Control Receiver
Ripple Control Transmitter
Q
U,f
business
WP6 Use-case #3bG
ener
atio
nTr
ansm
issi
on
Distribution DER Customer premise
Process
Field
Station
Operation
Enterprise
Market
WP6 Use-case #3b Objectives
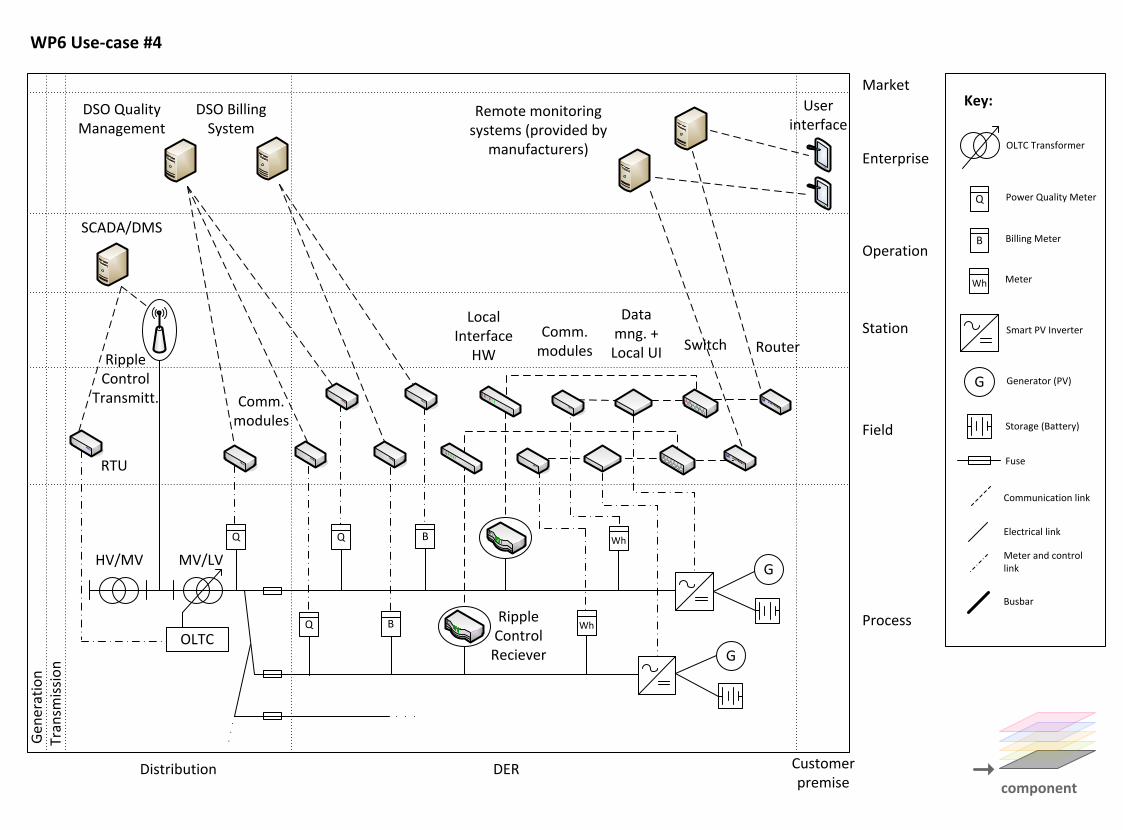
Gen
erat
ion
Tran
smis
sio
n
Distribution DER Customer premise
Process
Field
Station
Operation
Enterprise
MarketKey:
component
WP6 Use-case #4
MV/LV
OLTC
RTU
SCADA/DMS
G
DSO Quality Management
DSO Billing System
Comm. modules
Remote monitoring systems (provided by
manufacturers)
User interface
Q
G
Electrical link
Communication link
Meter and control link
OLTC Transformer
Power Quality Meter
Smart PV Inverter
Generator (PV)
Fuse
G
Busbar
B Billing Meter
Router
Storage (Battery)
MeterWh
HV/MV
Ripple Control
Transmitt.
Wh
Data mng. + Local UI
Ripple Control
Reciever
Local Interface
HWSwitch
Wh
Q Q B
Q B
Comm. modules
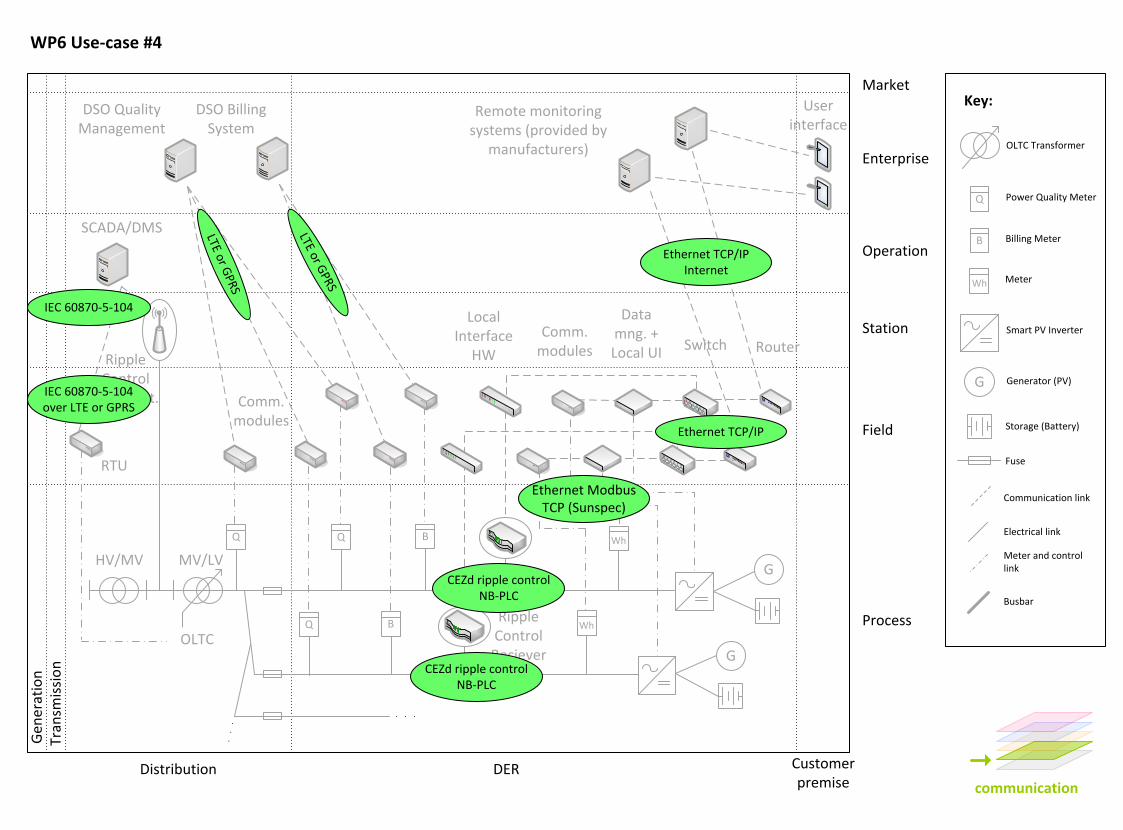
communication
Gen
erat
ion
Tran
smis
sio
n
Distribution DER Customer premise
Process
Field
Station
Operation
Enterprise
MarketKey:
WP6 Use-case #4
MV/LV
OLTC
RTU
SCADA/DMS
DSO Quality Management
DSO Billing System
Comm. modules
Remote monitoring systems (provided by
manufacturers)
User interface
Q
G
Electrical link
Communication link
Meter and control link
OLTC Transformer
Power Quality Meter
Smart PV Inverter
Generator (PV)
Fuse
Busbar
B Billing Meter
Storage (Battery)
MeterWh
HV/MV
Ripple Control
Transmitt.
Q Q
Q
LTE or GPRS
LTE or GPRS
IEC 60870-5-104 over LTE or GPRS
IEC 60870-5-104
Ethernet TCP/IPInternet
Router
Data mng. + Local UI
Ripple Control
Reciever
Local Interface
HWSwitch
B
B
Comm. modules
CEZd ripple control NB-PLC
CEZd ripple control NB-PLC
Ethernet TCP/IP
G
G
Wh
Wh
Ethernet Modbus TCP (Sunspec)
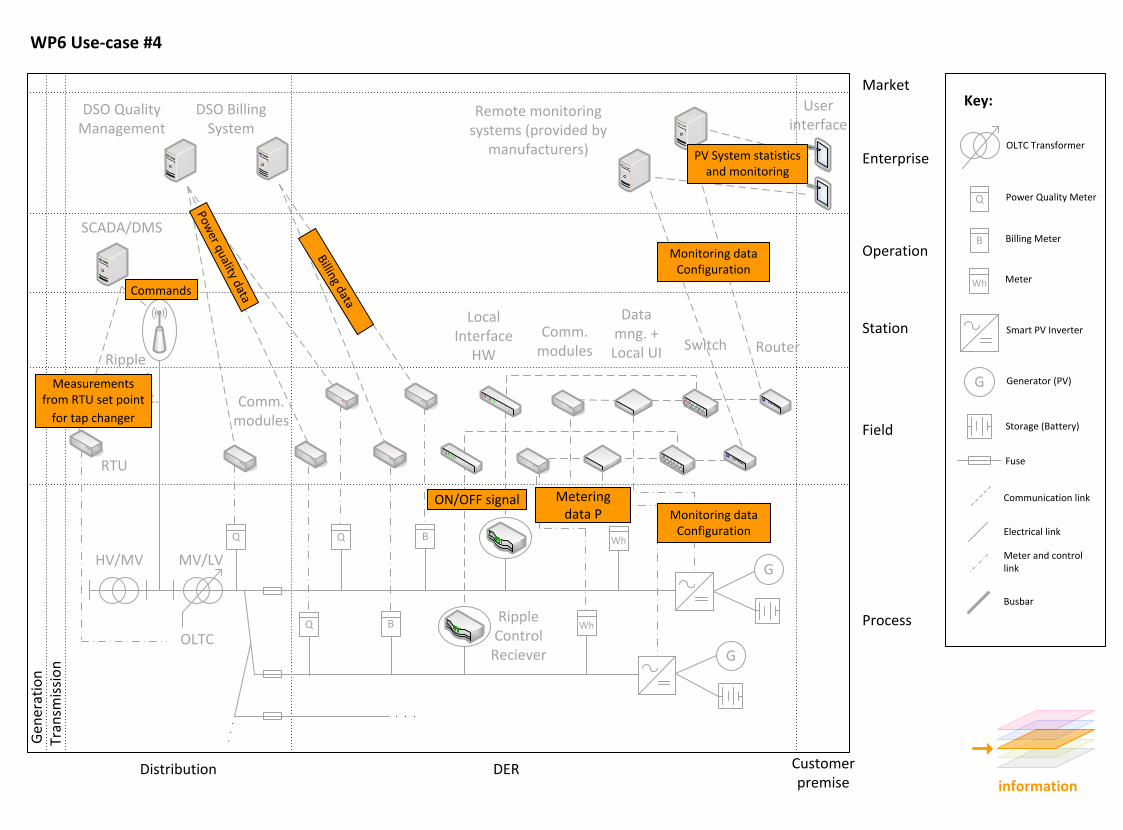
Gen
erat
ion
Tran
smis
sio
n
Distribution DER Customer premise
Process
Field
Station
Operation
Enterprise
MarketKey:
WP6 Use-case #4
MV/LV
OLTC
RTU
SCADA/DMS
DSO Quality Management
DSO Billing System
Comm. modules
Remote monitoring systems (provided by
manufacturers)
User interface
Q
G
Electrical link
Communication link
Meter and control link
OLTC Transformer
Power Quality Meter
Smart PV Inverter
Generator (PV)
Fuse
Busbar
B Billing Meter
Storage (Battery)
MeterWh
HV/MV
Ripple Control
Transmitt.
Q Q
Q
Router
Data mng. + Local UI
Ripple Control
Reciever
Local Interface
HWSwitch
B
B
Comm. modules
information
Measurements from RTU set point
for tap changer
Commands
Billing data
Power quality data
Monitoring data Configuration
PV System statistics and monitoring
ON/OFF signal
G
G
Wh
Wh
Metering data P Monitoring data
Configuration
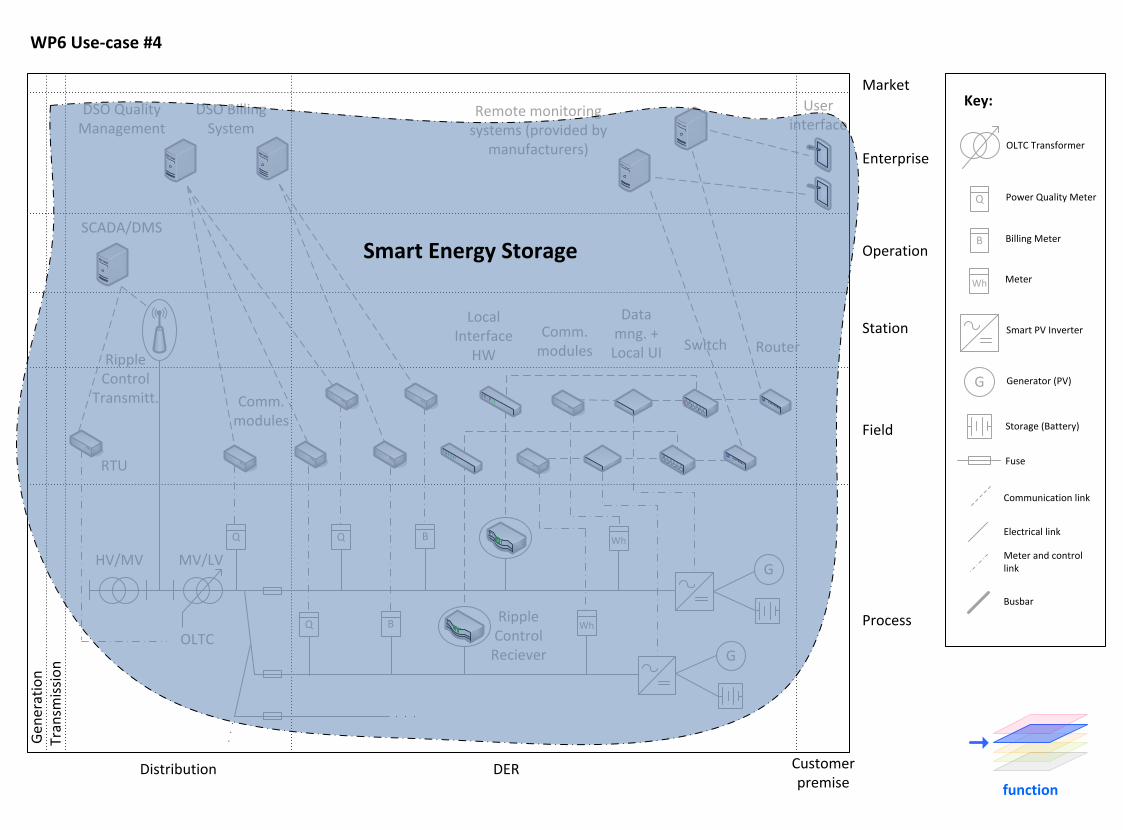
Gen
erat
ion
Tran
smis
sio
n
Distribution DER Customer premise
Process
Field
Station
Operation
Enterprise
MarketKey:
WP6 Use-case #4
MV/LV
OLTC
RTU
SCADA/DMS
DSO Quality Management
DSO Billing System
Comm. modules
Remote monitoring systems (provided by
manufacturers)
User interface
Q
G
Electrical link
Communication link
Meter and control link
OLTC Transformer
Power Quality Meter
Smart PV Inverter
Generator (PV)
Fuse
Busbar
B Billing Meter
Storage (Battery)
MeterWh
HV/MV
Ripple Control
Transmitt.
Q Q
Q
Router
Data mng. + Local UI
Ripple Control
Reciever
Local Interface
HWSwitch
B
B
Comm. modules
function
G
G
Wh
Wh
Smart Energy Storage

Gen
erat
ion
Tran
smis
sio
n
Distribution DER Customer premise
Process
Field
Station
Operation
Enterprise
MarketKey:
WP6 Use-case #4
Q
G
Electrical link
Communication link
Meter and control link
OLTC Transformer
Power Quality Meter
Smart PV Inverter
Generator (PV)
Fuse
Busbar
B Billing Meter
Storage (Battery)
MeterWh
business
WP6 Use-case #4 Objectives
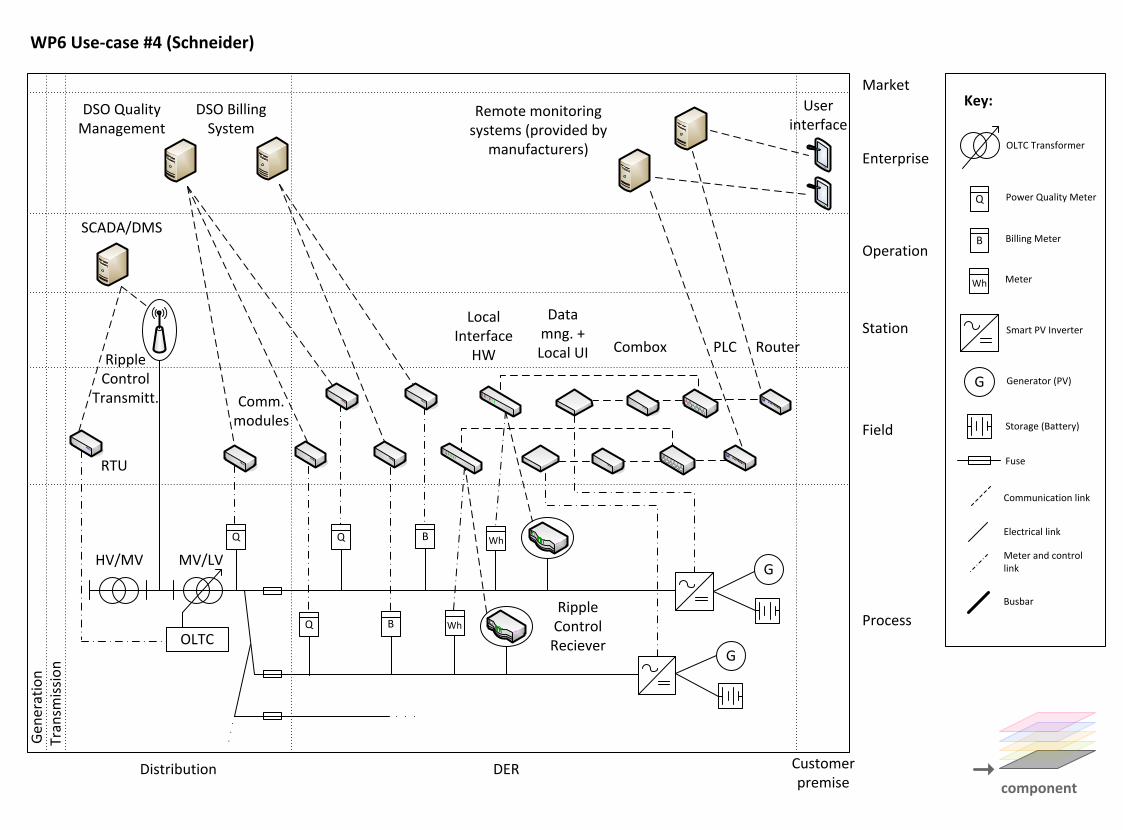
Gen
erat
ion
Tran
smis
sio
n
Distribution DER Customer premise
Process
Field
Station
Operation
Enterprise
MarketKey:
component
WP6 Use-case #4 (Schneider)
MV/LV
OLTC
RTU
SCADA/DMS
G
DSO Quality Management
DSO Billing System
Comm. modules
Remote monitoring systems (provided by
manufacturers)
User interface
Q
G
Electrical link
Communication link
Meter and control link
OLTC Transformer
Power Quality Meter
Smart PV Inverter
Generator (PV)
Fuse
G
Busbar
B Billing Meter
Storage (Battery)
MeterWh
HV/MV
Ripple Control
Transmitt.
Wh
Data mng. + Local UI
Ripple Control
Reciever
Local Interface
HW
Wh
Q Q B
Q B
Combox RouterPLC
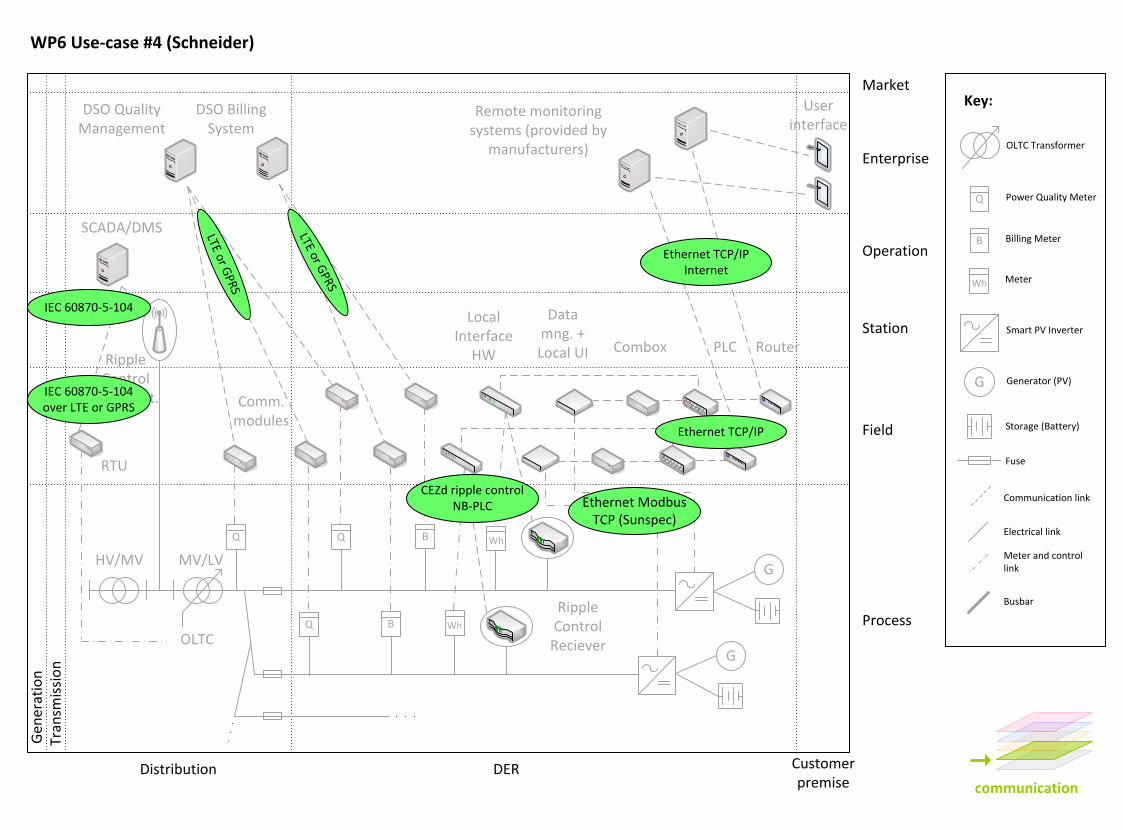
communication
Gen
erat
ion
Tran
smis
sio
n
Distribution DER Customer premise
Process
Field
Station
Operation
Enterprise
MarketKey:
WP6 Use-case #4 (Schneider)
MV/LV
OLTC
RTU
SCADA/DMS
DSO Quality Management
DSO Billing System
Comm. modules
Remote monitoring systems (provided by
manufacturers)
User interface
Q
G
Electrical link
Communication link
Meter and control link
OLTC Transformer
Power Quality Meter
Smart PV Inverter
Generator (PV)
Fuse
Busbar
B Billing Meter
Storage (Battery)
MeterWh
HV/MV
Ripple Control
Transmitt.
Q Q
Q
LTE or GPRS
LTE or GPRS
IEC 60870-5-104 over LTE or GPRS
IEC 60870-5-104
B
B
G
G
Wh
Data mng. + Local UI
Ripple Control
Reciever
Wh
Combox RouterPLC
Local Interface
HW
Ethernet TCP/IPInternet
CEZd ripple control NB-PLC
Ethernet TCP/IP
Ethernet Modbus TCP (Sunspec)
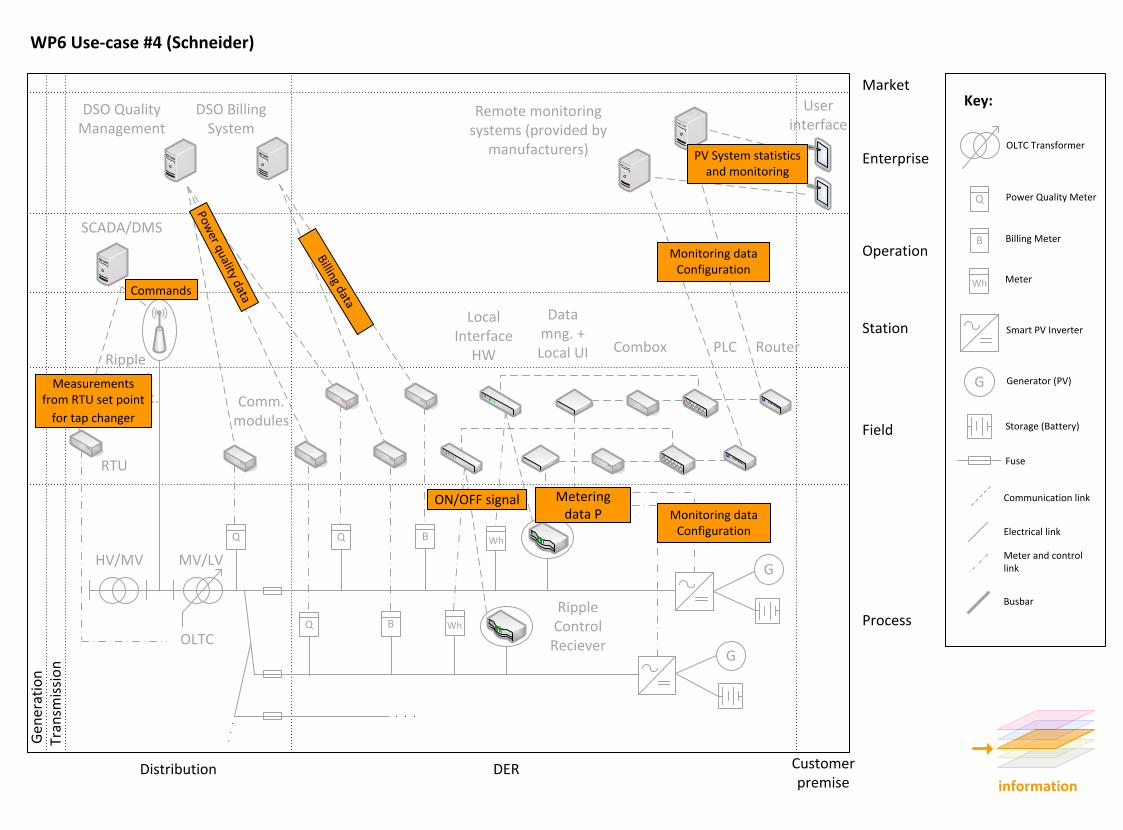
Gen
erat
ion
Tran
smis
sio
n
Distribution DER Customer premise
Process
Field
Station
Operation
Enterprise
MarketKey:
WP6 Use-case #4 (Schneider)
MV/LV
OLTC
RTU
SCADA/DMS
DSO Quality Management
DSO Billing System
Comm. modules
Remote monitoring systems (provided by
manufacturers)
User interface
Q
G
Electrical link
Communication link
Meter and control link
OLTC Transformer
Power Quality Meter
Smart PV Inverter
Generator (PV)
Fuse
Busbar
B Billing Meter
Storage (Battery)
MeterWh
HV/MV
Ripple Control
Transmitt.
Q Q
Q
B
B
G
G
Wh
Data mng. + Local UI
Ripple Control
Reciever
Wh
Combox RouterPLC
Local Interface
HW
information
Measurements from RTU set point
for tap changer
Commands
Billing data
Power quality data
Monitoring data Configuration
PV System statistics and monitoring
ON/OFF signal Metering data P Monitoring data
Configuration
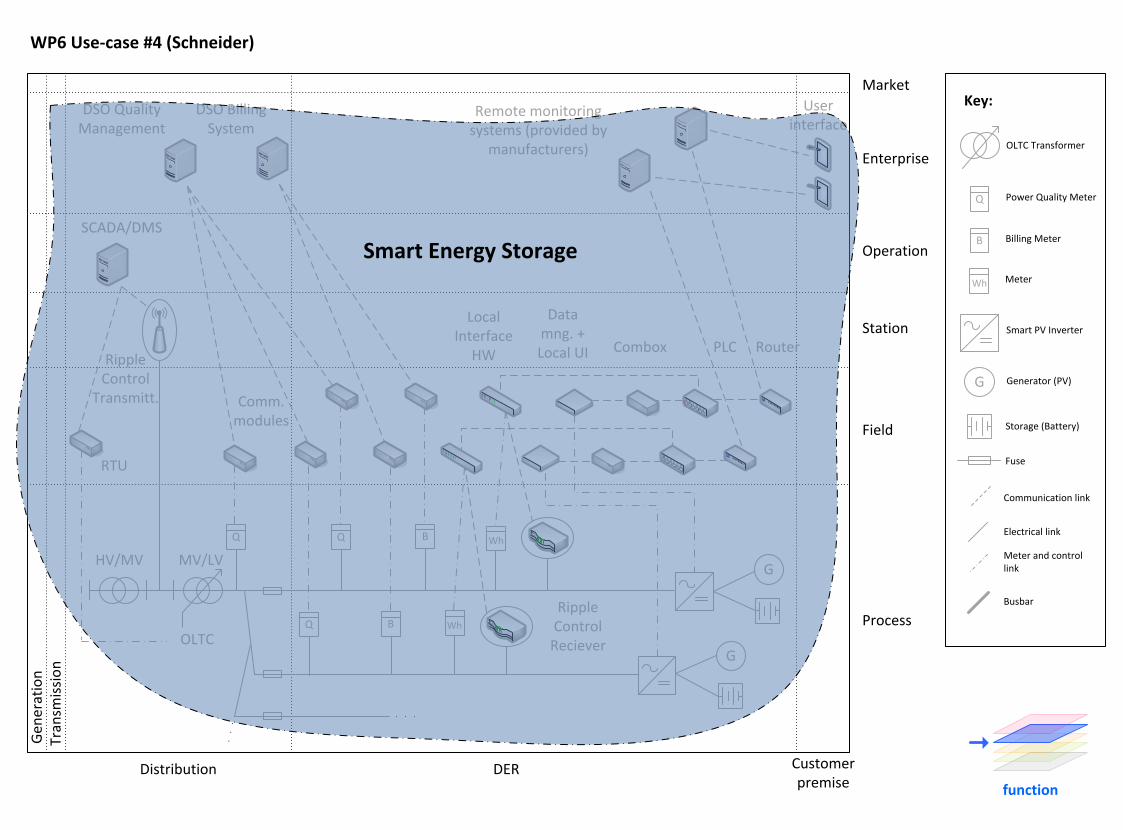
Gen
erat
ion
Tran
smis
sio
n
Distribution DER Customer premise
Process
Field
Station
Operation
Enterprise
MarketKey:
WP6 Use-case #4 (Schneider)
MV/LV
OLTC
RTU
SCADA/DMS
DSO Quality Management
DSO Billing System
Comm. modules
Remote monitoring systems (provided by
manufacturers)
User interface
Q
G
Electrical link
Communication link
Meter and control link
OLTC Transformer
Power Quality Meter
Smart PV Inverter
Generator (PV)
Fuse
Busbar
B Billing Meter
Storage (Battery)
MeterWh
HV/MV
Ripple Control
Transmitt.
Q Q
Q
B
B
G
G
Wh
Data mng. + Local UI
Ripple Control
Reciever
Wh
Combox RouterPLC
Local Interface
HW
function
Smart Energy Storage
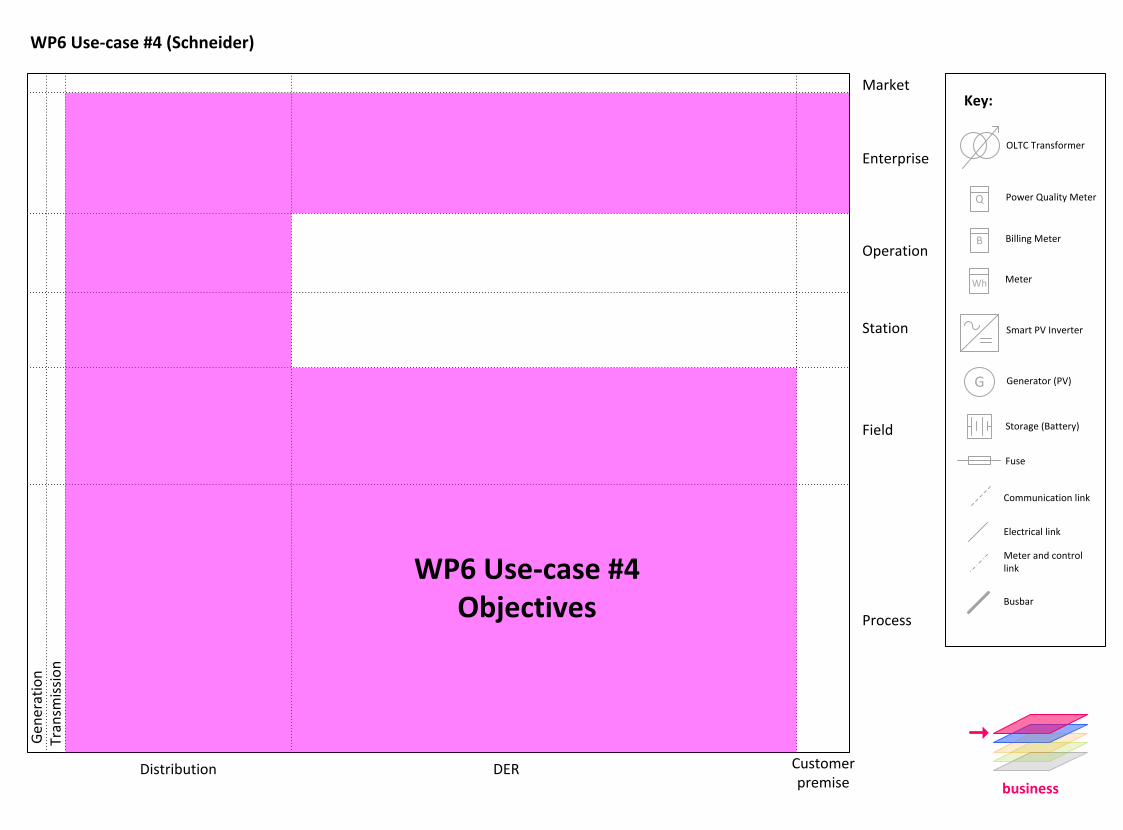
Gen
erat
ion
Tran
smis
sio
n
Distribution DER Customer premise
Process
Field
Station
Operation
Enterprise
MarketKey:
WP6 Use-case #4 (Schneider)
Q
G
Electrical link
Communication link
Meter and control link
OLTC Transformer
Power Quality Meter
Smart PV Inverter
Generator (PV)
Fuse
Busbar
B Billing Meter
Storage (Battery)
MeterWh
business
WP6 Use-case #4 Objectives

D6.1 Design of solution
164
Annex 6.3
WP6 Key Performance Indictors p.164 - 173
1
Interflex (Demo2): Key Performance Indicators
Internal Demo2 KPIs (defined in DoW)
May 2017
Version Author
1.0 Stanislav Hes and Jan Kůla - CEZ Distribuce
2
BASIC KPI INFORMATION
KPI Name Increasing DER hosting capacity KPI ID KPI6_1
Strategic Objective Increased DER integration in distribution grids
Owner Stanislav Hes, CEZ Distribuce
KPI Description
This KPI will measure the potential increase hosting capacity for distributed energy resources with Smart Grid solutions compared to the baseline situation where no “smart” actions are performed on the network. The indicator will give a statement about the additional DER that can be installed in the network thanks to Smart Grid solutions without the need for conventional reinforcements (i.e. new grid lines).
Figure 1: Comparison of DER hosting capacity for baseline and after smart grid solution implementation
This KPI will apply on WP6_1, WP6_2 and WP6_4 use cases (separately for each use case).
KPI Formula
HC% =HCSG − HCBaseline
HCBaseline× 100
HCSG
Hosting Capacity for DER with Smart Grid solutions (kW). This hosting capacity should measure DER that can be connected (or that are already connected) to the grid after the Smart Grid solution is implemented.
HCBaseline Hosting Capacity for DER in Baseline situation (kW). This hosting capacity should measure DER that can be connected to the grid before the Smart Grid solution is implemented.
Note: Positive value: HC gain Negative value: HC loss
Unit of measurement % percentage base
Expectations
Increase of DER hosting capacity: WP6_1: +25% WP6_2: +25% WP6_4: +5%
Reporting Period Once a year
Relevant Standards EN 50438:2013, EN 50160
Connection / Link with other relevant defined KPIs
Linked with KPI6_2 (which has to confirm that increasing of DER hosting capacity doesn’t cause voltage profile power quality issue) and KPI6_4 (which evaluate decrease of PV production peak of caused by PV + storage systems).
Reporting Audience and Access Rights
PUBLIC
INTERFLEX PARTNERS
DEMO PARTNERS
OTHER (please
specify)
OTHER N/A
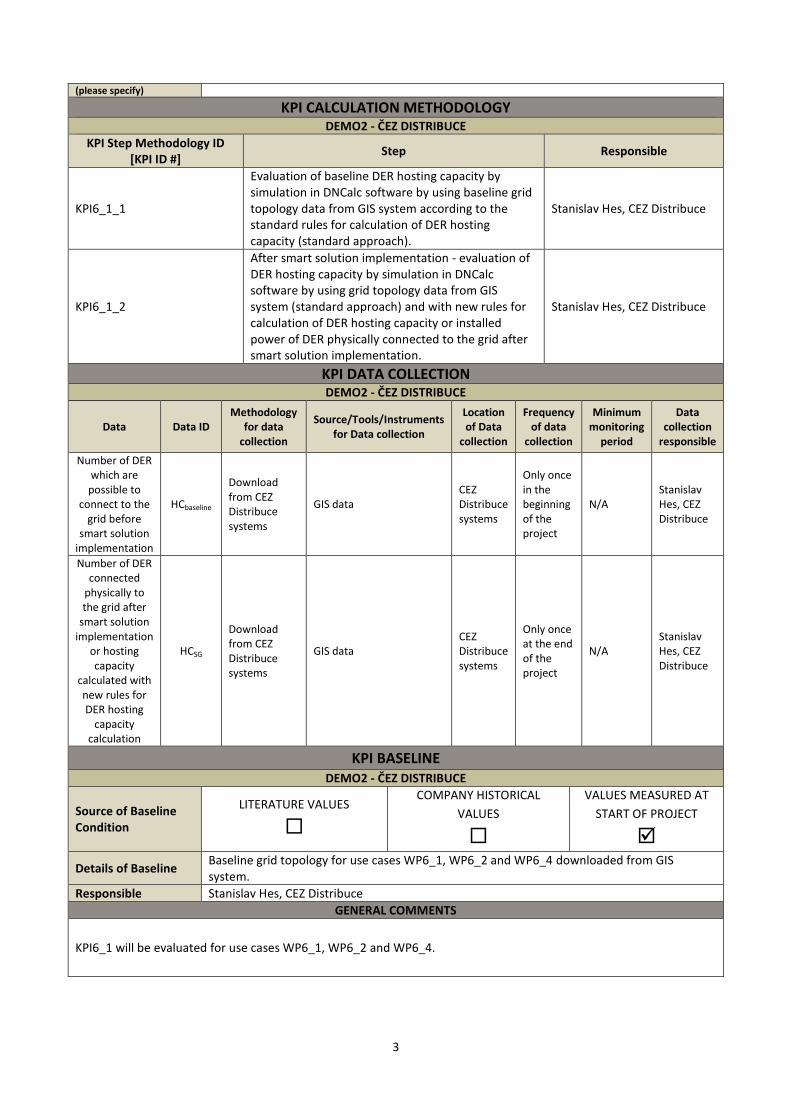
3
(please specify)
KPI CALCULATION METHODOLOGY DEMO2 - ČEZ DISTRIBUCE
KPI Step Methodology ID [KPI ID #]
Step Responsible
KPI6_1_1
Evaluation of baseline DER hosting capacity by simulation in DNCalc software by using baseline grid topology data from GIS system according to the standard rules for calculation of DER hosting capacity (standard approach).
Stanislav Hes, CEZ Distribuce
KPI6_1_2
After smart solution implementation - evaluation of DER hosting capacity by simulation in DNCalc software by using grid topology data from GIS system (standard approach) and with new rules for calculation of DER hosting capacity or installed power of DER physically connected to the grid after smart solution implementation.
Stanislav Hes, CEZ Distribuce
KPI DATA COLLECTION DEMO2 - ČEZ DISTRIBUCE
Data Data ID Methodology
for data collection
Source/Tools/Instruments for Data collection
Location of Data
collection
Frequency of data
collection
Minimum monitoring
period
Data collection
responsible
Number of DER which are possible to
connect to the grid before
smart solution implementation
HCbaseline
Download from CEZ Distribuce systems
GIS data CEZ Distribuce systems
Only once in the beginning of the project
N/A Stanislav Hes, CEZ Distribuce
Number of DER connected
physically to the grid after
smart solution implementation
or hosting capacity
calculated with new rules for DER hosting
capacity calculation
HCSG
Download from CEZ Distribuce systems
GIS data CEZ Distribuce systems
Only once at the end of the project
N/A Stanislav Hes, CEZ Distribuce
KPI BASELINE DEMO2 - ČEZ DISTRIBUCE
Source of Baseline Condition
LITERATURE VALUES
COMPANY HISTORICAL
VALUES
VALUES MEASURED AT
START OF PROJECT
Details of Baseline Baseline grid topology for use cases WP6_1, WP6_2 and WP6_4 downloaded from GIS system.
Responsible Stanislav Hes, CEZ Distribuce
GENERAL COMMENTS
KPI6_1 will be evaluated for use cases WP6_1, WP6_2 and WP6_4.
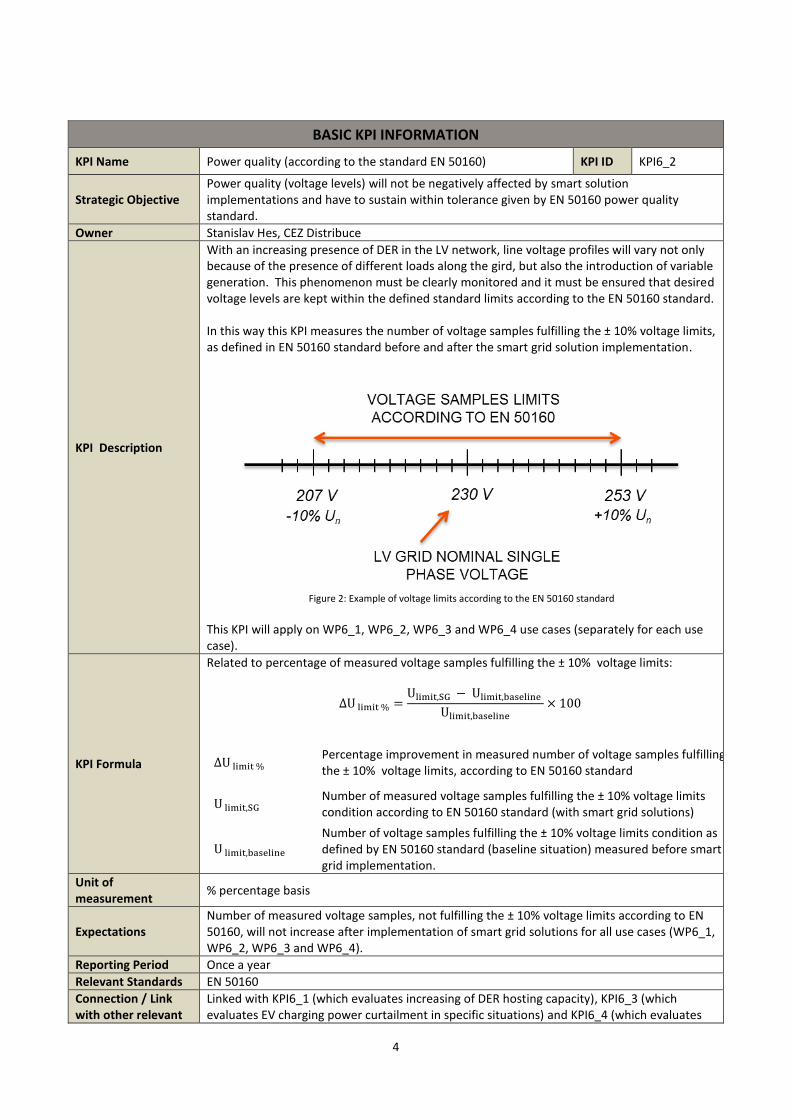
4
BASIC KPI INFORMATION
KPI Name Power quality (according to the standard EN 50160) KPI ID KPI6_2
Strategic Objective Power quality (voltage levels) will not be negatively affected by smart solution implementations and have to sustain within tolerance given by EN 50160 power quality standard.
Owner Stanislav Hes, CEZ Distribuce
KPI Description
With an increasing presence of DER in the LV network, line voltage profiles will vary not only because of the presence of different loads along the gird, but also the introduction of variable generation. This phenomenon must be clearly monitored and it must be ensured that desired voltage levels are kept within the defined standard limits according to the EN 50160 standard. In this way this KPI measures the number of voltage samples fulfilling the ± 10% voltage limits, as defined in EN 50160 standard before and after the smart grid solution implementation.
Figure 2: Example of voltage limits according to the EN 50160 standard
This KPI will apply on WP6_1, WP6_2, WP6_3 and WP6_4 use cases (separately for each use case).
KPI Formula
Related to percentage of measured voltage samples fulfilling the ± 10% voltage limits:
∆U limit % =Ulimit,SG − Ulimit,baseline
Ulimit,baseline
× 100
∆U limit % Percentage improvement in measured number of voltage samples fulfilling the ± 10% voltage limits, according to EN 50160 standard
U limit,SG Number of measured voltage samples fulfilling the ± 10% voltage limits condition according to EN 50160 standard (with smart grid solutions)
U limit,baseline Number of voltage samples fulfilling the ± 10% voltage limits condition as defined by EN 50160 standard (baseline situation) measured before smart grid implementation.
Unit of measurement
% percentage basis
Expectations Number of measured voltage samples, not fulfilling the ± 10% voltage limits according to EN 50160, will not increase after implementation of smart grid solutions for all use cases (WP6_1, WP6_2, WP6_3 and WP6_4).
Reporting Period Once a year
Relevant Standards EN 50160
Connection / Link with other relevant
Linked with KPI6_1 (which evaluates increasing of DER hosting capacity), KPI6_3 (which evaluates EV charging power curtailment in specific situations) and KPI6_4 (which evaluates
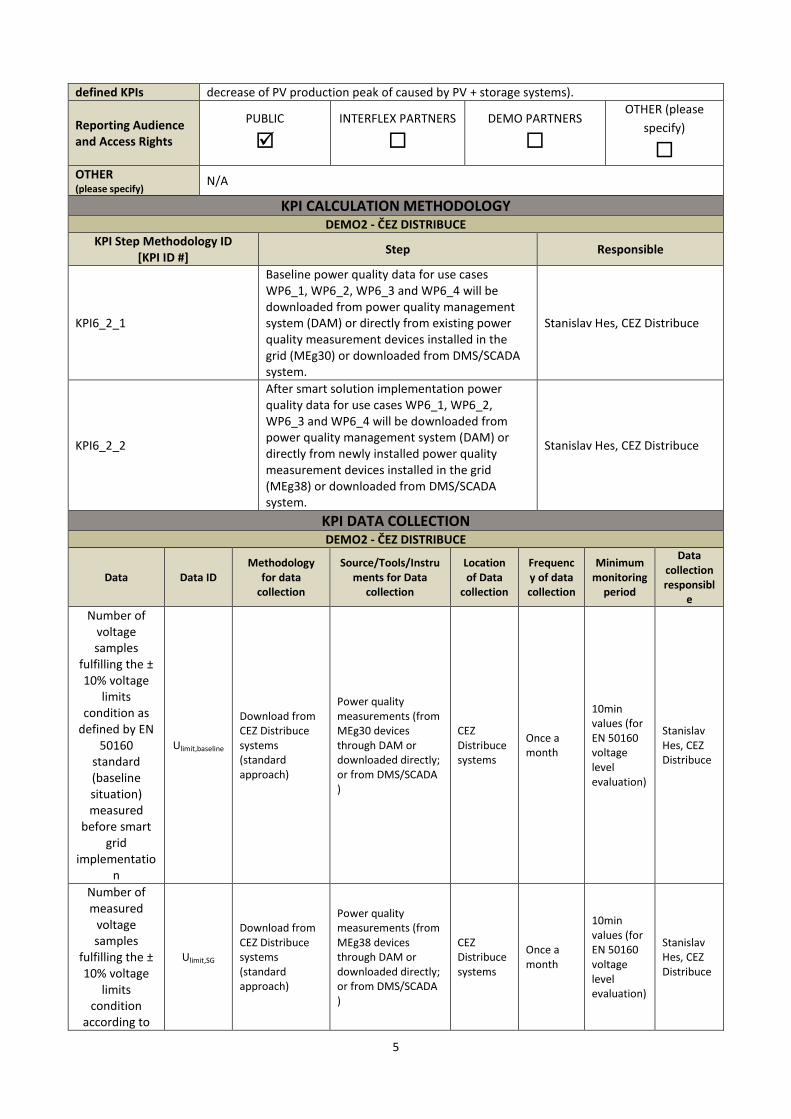
5
defined KPIs decrease of PV production peak of caused by PV + storage systems).
Reporting Audience and Access Rights
PUBLIC
INTERFLEX PARTNERS
DEMO PARTNERS
OTHER (please
specify)
OTHER (please specify)
N/A
KPI CALCULATION METHODOLOGY DEMO2 - ČEZ DISTRIBUCE
KPI Step Methodology ID [KPI ID #]
Step Responsible
KPI6_2_1
Baseline power quality data for use cases WP6_1, WP6_2, WP6_3 and WP6_4 will be downloaded from power quality management system (DAM) or directly from existing power quality measurement devices installed in the grid (MEg30) or downloaded from DMS/SCADA system.
Stanislav Hes, CEZ Distribuce
KPI6_2_2
After smart solution implementation power quality data for use cases WP6_1, WP6_2, WP6_3 and WP6_4 will be downloaded from power quality management system (DAM) or directly from newly installed power quality measurement devices installed in the grid (MEg38) or downloaded from DMS/SCADA system.
Stanislav Hes, CEZ Distribuce
KPI DATA COLLECTION DEMO2 - ČEZ DISTRIBUCE
Data Data ID Methodology
for data collection
Source/Tools/Instruments for Data
collection
Location of Data
collection
Frequency of data collection
Minimum monitoring
period
Data collection responsibl
e
Number of voltage samples
fulfilling the ± 10% voltage
limits condition as
defined by EN 50160
standard (baseline situation) measured
before smart grid
implementation
Ulimit,baseline
Download from CEZ Distribuce systems (standard approach)
Power quality measurements (from MEg30 devices through DAM or downloaded directly; or from DMS/SCADA )
CEZ Distribuce systems
Once a month
10min values (for EN 50160 voltage level evaluation)
Stanislav Hes, CEZ Distribuce
Number of measured
voltage samples
fulfilling the ± 10% voltage
limits condition
according to
Ulimit,SG
Download from CEZ Distribuce systems (standard approach)
Power quality measurements (from MEg38 devices through DAM or downloaded directly; or from DMS/SCADA )
CEZ Distribuce systems
Once a month
10min values (for EN 50160 voltage level evaluation)
Stanislav Hes, CEZ Distribuce
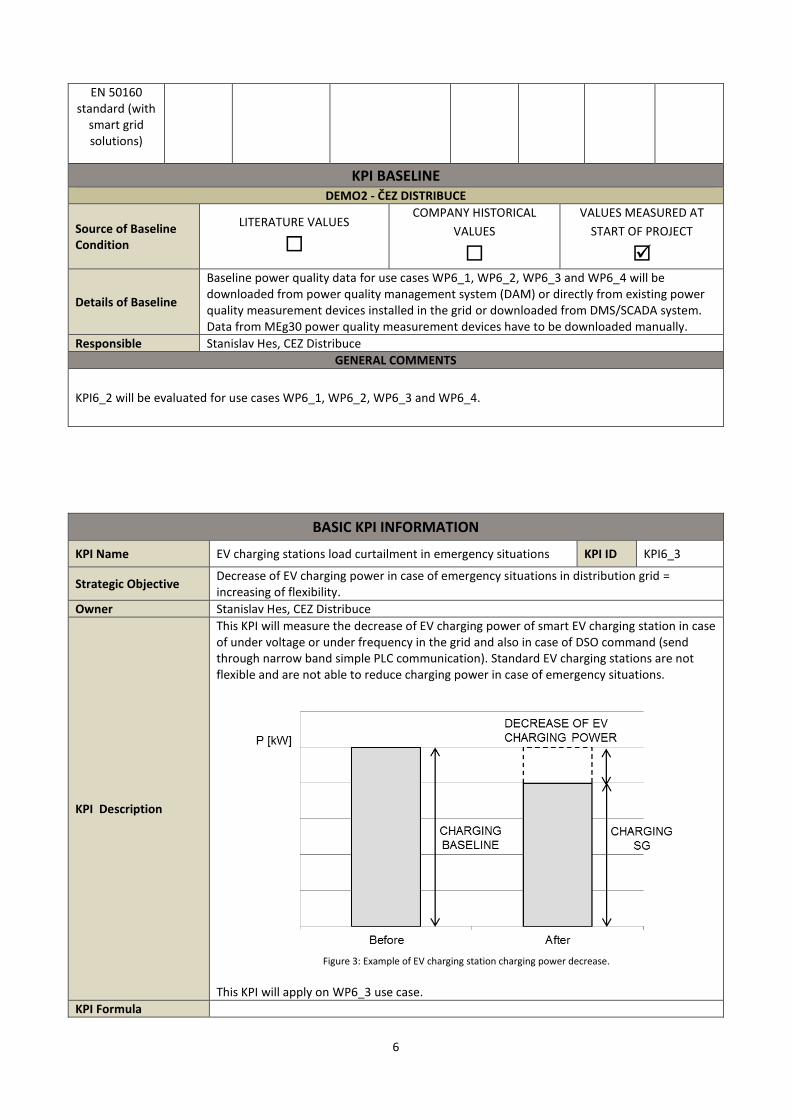
6
EN 50160 standard (with
smart grid solutions)
KPI BASELINE DEMO2 - ČEZ DISTRIBUCE
Source of Baseline Condition
LITERATURE VALUES
COMPANY HISTORICAL
VALUES
VALUES MEASURED AT
START OF PROJECT
Details of Baseline
Baseline power quality data for use cases WP6_1, WP6_2, WP6_3 and WP6_4 will be downloaded from power quality management system (DAM) or directly from existing power quality measurement devices installed in the grid or downloaded from DMS/SCADA system. Data from MEg30 power quality measurement devices have to be downloaded manually.
Responsible Stanislav Hes, CEZ Distribuce
GENERAL COMMENTS
KPI6_2 will be evaluated for use cases WP6_1, WP6_2, WP6_3 and WP6_4.
BASIC KPI INFORMATION
KPI Name EV charging stations load curtailment in emergency situations KPI ID KPI6_3
Strategic Objective Decrease of EV charging power in case of emergency situations in distribution grid = increasing of flexibility.
Owner Stanislav Hes, CEZ Distribuce
KPI Description
This KPI will measure the decrease of EV charging power of smart EV charging station in case of under voltage or under frequency in the grid and also in case of DSO command (send through narrow band simple PLC communication). Standard EV charging stations are not flexible and are not able to reduce charging power in case of emergency situations.
Figure 3: Example of EV charging station charging power decrease.
This KPI will apply on WP6_3 use case.
KPI Formula
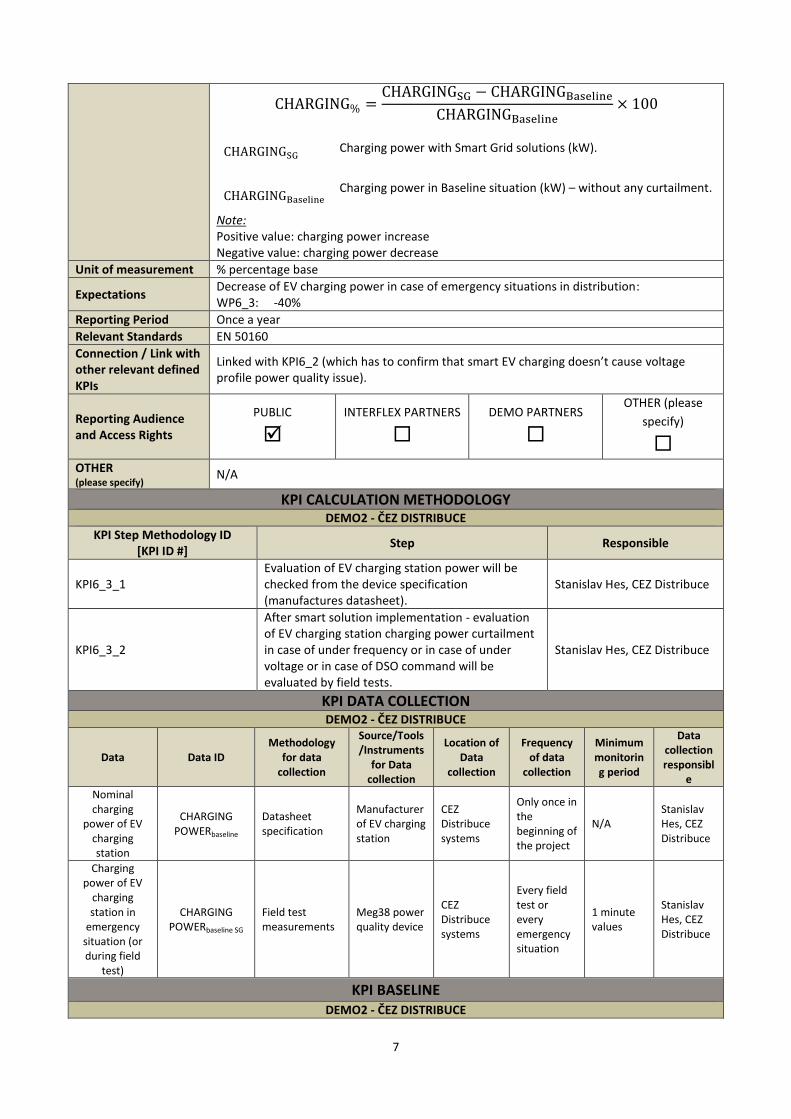
7
CHARGING% =CHARGINGSG − CHARGINGBaseline
CHARGINGBaseline× 100
CHARGINGSG
Charging power with Smart Grid solutions (kW).
CHARGINGBaseline Charging power in Baseline situation (kW) – without any curtailment.
Note: Positive value: charging power increase Negative value: charging power decrease
Unit of measurement % percentage base
Expectations Decrease of EV charging power in case of emergency situations in distribution: WP6_3: -40%
Reporting Period Once a year
Relevant Standards EN 50160
Connection / Link with other relevant defined KPIs
Linked with KPI6_2 (which has to confirm that smart EV charging doesn’t cause voltage profile power quality issue).
Reporting Audience and Access Rights
PUBLIC
INTERFLEX PARTNERS
DEMO PARTNERS
OTHER (please
specify)
OTHER (please specify)
N/A
KPI CALCULATION METHODOLOGY DEMO2 - ČEZ DISTRIBUCE
KPI Step Methodology ID [KPI ID #]
Step Responsible
KPI6_3_1 Evaluation of EV charging station power will be checked from the device specification (manufactures datasheet).
Stanislav Hes, CEZ Distribuce
KPI6_3_2
After smart solution implementation - evaluation of EV charging station charging power curtailment in case of under frequency or in case of under voltage or in case of DSO command will be evaluated by field tests.
Stanislav Hes, CEZ Distribuce
KPI DATA COLLECTION DEMO2 - ČEZ DISTRIBUCE
Data Data ID Methodology
for data collection
Source/Tools/Instruments
for Data collection
Location of Data
collection
Frequency of data
collection
Minimum monitoring period
Data collection responsibl
e Nominal charging
power of EV charging station
CHARGING POWERbaseline
Datasheet specification
Manufacturer of EV charging station
CEZ Distribuce systems
Only once in the beginning of the project
N/A Stanislav Hes, CEZ Distribuce
Charging power of EV
charging station in
emergency situation (or during field
test)
CHARGING POWERbaseline SG
Field test measurements
Meg38 power quality device
CEZ Distribuce systems
Every field test or every emergency situation
1 minute values
Stanislav Hes, CEZ Distribuce
KPI BASELINE DEMO2 - ČEZ DISTRIBUCE
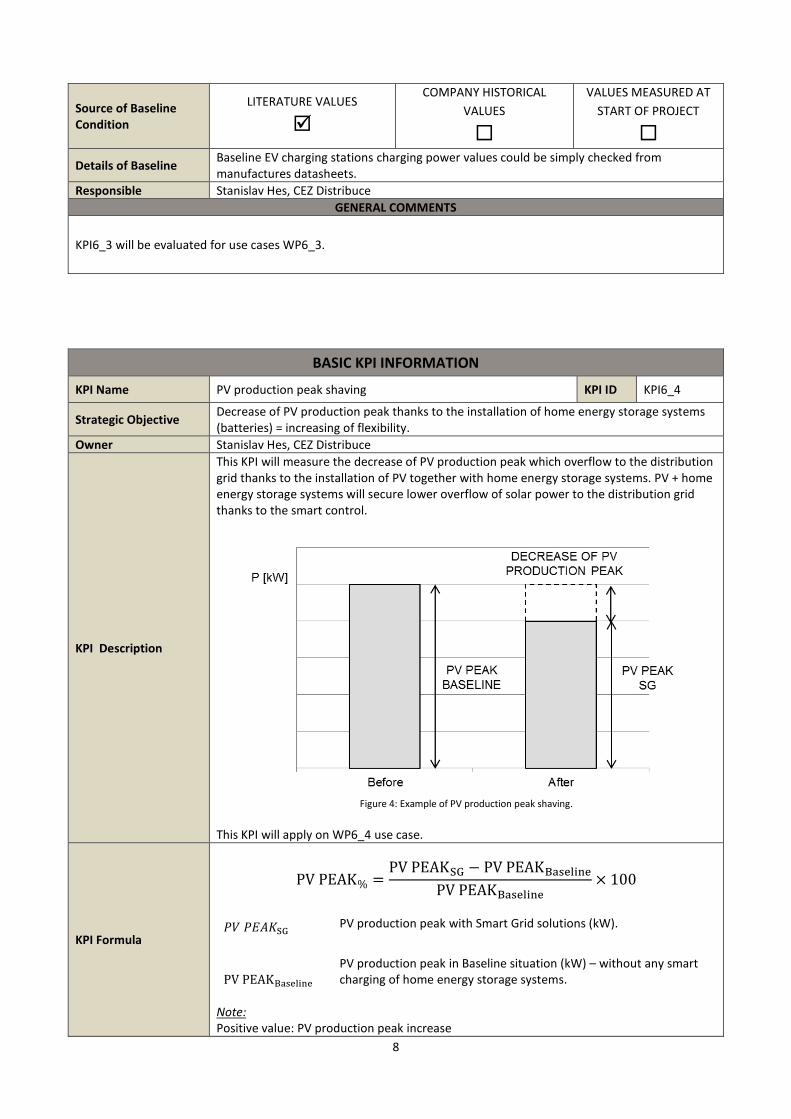
8
Source of Baseline Condition
LITERATURE VALUES
COMPANY HISTORICAL
VALUES
VALUES MEASURED AT
START OF PROJECT
Details of Baseline Baseline EV charging stations charging power values could be simply checked from manufactures datasheets.
Responsible Stanislav Hes, CEZ Distribuce
GENERAL COMMENTS
KPI6_3 will be evaluated for use cases WP6_3.
BASIC KPI INFORMATION
KPI Name PV production peak shaving KPI ID KPI6_4
Strategic Objective Decrease of PV production peak thanks to the installation of home energy storage systems (batteries) = increasing of flexibility.
Owner Stanislav Hes, CEZ Distribuce
KPI Description
This KPI will measure the decrease of PV production peak which overflow to the distribution grid thanks to the installation of PV together with home energy storage systems. PV + home energy storage systems will secure lower overflow of solar power to the distribution grid thanks to the smart control.
Figure 4: Example of PV production peak shaving.
This KPI will apply on WP6_4 use case.
KPI Formula
PV PEAK% =PV PEAKSG − PV PEAKBaseline
PV PEAKBaseline× 100
𝑃𝑉 𝑃𝐸𝐴𝐾SG
PV production peak with Smart Grid solutions (kW).
PV PEAKBaseline PV production peak in Baseline situation (kW) – without any smart charging of home energy storage systems.
Note: Positive value: PV production peak increase
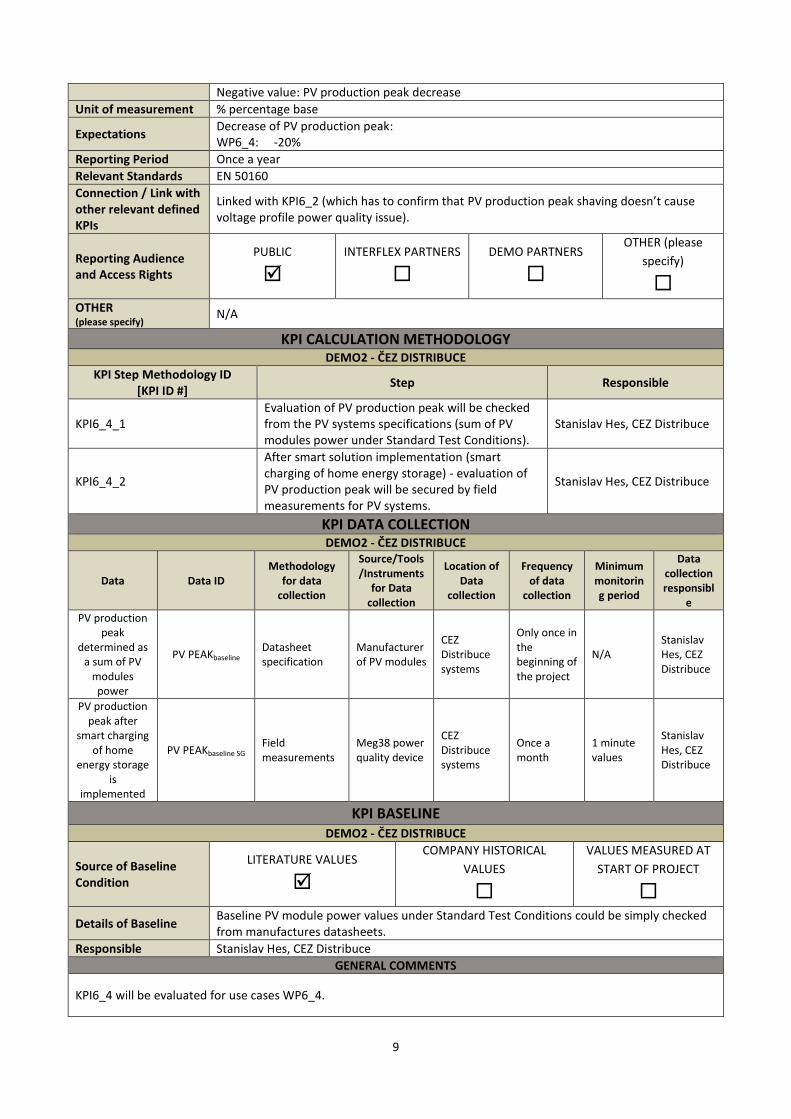
9
Negative value: PV production peak decrease
Unit of measurement % percentage base
Expectations Decrease of PV production peak: WP6_4: -20%
Reporting Period Once a year
Relevant Standards EN 50160
Connection / Link with other relevant defined KPIs
Linked with KPI6_2 (which has to confirm that PV production peak shaving doesn’t cause voltage profile power quality issue).
Reporting Audience and Access Rights
PUBLIC
INTERFLEX PARTNERS
DEMO PARTNERS
OTHER (please
specify)
OTHER (please specify)
N/A
KPI CALCULATION METHODOLOGY DEMO2 - ČEZ DISTRIBUCE
KPI Step Methodology ID [KPI ID #]
Step Responsible
KPI6_4_1 Evaluation of PV production peak will be checked from the PV systems specifications (sum of PV modules power under Standard Test Conditions).
Stanislav Hes, CEZ Distribuce
KPI6_4_2
After smart solution implementation (smart charging of home energy storage) - evaluation of PV production peak will be secured by field measurements for PV systems.
Stanislav Hes, CEZ Distribuce
KPI DATA COLLECTION DEMO2 - ČEZ DISTRIBUCE
Data Data ID Methodology
for data collection
Source/Tools/Instruments
for Data collection
Location of Data
collection
Frequency of data
collection
Minimum monitoring period
Data collection responsibl
e PV production
peak determined as
a sum of PV modules power
PV PEAKbaseline Datasheet specification
Manufacturer of PV modules
CEZ Distribuce systems
Only once in the beginning of the project
N/A Stanislav Hes, CEZ Distribuce
PV production peak after
smart charging of home
energy storage is
implemented
PV PEAKbaseline SG Field measurements
Meg38 power quality device
CEZ Distribuce systems
Once a month
1 minute values
Stanislav Hes, CEZ Distribuce
KPI BASELINE DEMO2 - ČEZ DISTRIBUCE
Source of Baseline Condition
LITERATURE VALUES
COMPANY HISTORICAL
VALUES
VALUES MEASURED AT
START OF PROJECT
Details of Baseline Baseline PV module power values under Standard Test Conditions could be simply checked from manufactures datasheets.
Responsible Stanislav Hes, CEZ Distribuce
GENERAL COMMENTS
KPI6_4 will be evaluated for use cases WP6_4.

D6.1 Design of solution
174
Annex 6.4
InterFlex CZ Demo Lab tests definition p.174 - 212
Project InterFlex CZ Demo
Test procedure for the lab tests
Authors: Benoit Bletterie ([email protected])
Stefanie Kaser ([email protected])
Paul Zehetbauer ([email protected])
Friederich Kupzog ([email protected])
Date: 30.11.2017
Version: 1.0

I
Revison Date Author Change
0.1 29.05.2017 Benoît Bletterie First version (structure and first content in chapter 2)
0.2 21.06.2017 Stefanie Kaser, Be-noît Bletterie
Update of chapter 3
0.3 22.08.2017 … Completion of chapter 4.3
0.4 29.08.2017 … Completion of chapter 0
0.5 31.08.2017 … Update with comments from meeting on 30.08.2017
1.0 30.11.2017 Stefanie Kaser Update with comments from meeting on 30.08.2017 and learnings from first lab tests
II
Content
1 Content & Scope ............................................................................................................ 6
2 Overview of the use-cases ............................................................................................. 6
2.1 UC1: Increase the DER hosting capacity of LV distribution networks by combining
smart PV inverter functions (demonstration of Q(U) and P(U)) ........................................... 6
2.1.1 Implemented functions and functions to be tested ............................................ 6
2.1.2 Scope of the lab tests / equipment under test ................................................... 6
2.2 UC2: Increase the DER hosting capacity in MV distribution network by volt-var
control (V/Q regulation) ...................................................................................................... 7
2.3 UC3: Smart EV charging ......................................................................................... 7
2.3.1 Implemented functions and functions to be tested ............................................ 7
2.3.2 Scope of the lab tests / equipment under test ................................................... 7
2.4 UC4: Smart energy storage ..................................................................................... 9
2.4.1 Implemented functions and functions to be tested ............................................ 9
2.4.2 Scope of the lab tests / equipment under test ..................................................10
3 Testing infrastructure .....................................................................................................12
3.1 Overview ................................................................................................................12
3.2 AC side ..................................................................................................................13
3.3 DC side for PV and storage systems ......................................................................14
3.4 Load for testing charging stations ...........................................................................15
3.5 Data acquisition and processing .............................................................................16
3.5.1 Measurement devices .....................................................................................16
3.5.2 Software ..........................................................................................................17
3.5.3 Measurement accuracy ...................................................................................17
4 Description of the tests ..................................................................................................18
4.1 UC1: reactive power control - Q(U) ........................................................................18
4.1.1 Control function to be tested ............................................................................18
4.1.2 Purpose ...........................................................................................................18
4.1.3 Activated function(s) and test conditions .........................................................18
4.1.4 Test procedure ................................................................................................20
4.2 UC1: active power control - P(U) ............................................................................27
4.2.1 Control function to be tested ............................................................................27
4.2.2 Purpose ...........................................................................................................27
4.2.3 Activated function(s) and test conditions .........................................................28
4.2.4 Test procedure ................................................................................................29
4.3 UC3: Smart EV charging ........................................................................................32
III
4.3.1 Control function to be tested ............................................................................32
4.3.2 Purpose ...........................................................................................................32
4.3.3 Activated function(s) and test conditions .........................................................33
4.3.4 Test procedure ................................................................................................33
4.4 UC4: Smart energy storage ....................................................................................35
4.4.1 Control function to be tested ............................................................................35
4.4.2 Purpose ...........................................................................................................35
4.4.3 Activated function(s) and test conditions .........................................................35
4.4.4 Test procedure ................................................................................................35
5 Analysis and documentation of the results.....................................................................36
IV
List of Figures
Figure 1 – Scope of lab tests shown on the SGAM description of UC1 (red: Equipment Under
Test / blue: emulated part) ..................................................................................................... 7
Figure 2 – Scope of lab tests shown on the SGAM description of UC3a (Schneider) (red:
Equipment Under Test / blue: emulated part) ........................................................................ 8
Figure 3 – Scope of lab tests shown on the SGAM description of UC3b (Siemens) (red:
Equipment Under Test / blue: emulated part) ........................................................................ 8
Figure 4 – Scope of lab tests shown on the SGAM description of UC4a (Fronius) (red:
Equipment Under Test / blue: emulated part) .......................................................................10
Figure 5 – Scope of lab tests shown on the SGAM description of UC4b (Schneider) (red:
Equipment Under Test / blue: emulated part) .......................................................................11
Figure 6 – Overview of AIT SmartEST research test stand ...................................................13
Figure 7 –Measurement surface as shown in ScadaBR .......................................................13
Figure 8 – Default Q(U)-curve for ČEZ Distribuce .............................................................18
Figure 9 – Test signal for the evaluation of the accuracy of the Q(U)-control p0.80: active
power curve for an available PV power from 80 % of the maximal apparent power p1.00: active
power curve for an available PV power from 100 % of the maximal apparent power ............21
Figure 10 – Test signal for the evaluation of the step response ............................................22
Figure 11 – Test signal for the evaluation of the stability under worst-case conditions..........25
Figure 12 – Default P(U)-curve for ČEZ Distribuce ...............................................................27
Figure 13 – Test signal for the evaluation of the step response ............................................31
Figure 14 – Test signal for the evaluation of the stability under worst-case conditions..........32
Figure 15 – Test signal for the evaluation of the accuracy of the reduction of the charging
power in case of under-frequency ........................................................................................33
Figure 16 – Test signal for the evaluation of the accuracy of the reduction of the charging
power in case of under-voltage .............................................................................................34
List of Tables
Table 1 – EUT for UC1 .......................................................................................................... 7
Table 2 – EUT for UC1 .......................................................................................................... 9
Table 3 – EUT for UC4 .........................................................................................................11
Table 4 – Specification of AC source 1 – Public Grid ............................................................14
Table 5 – Specification of AC source 2 – grid simulator ........................................................14
Table 6 – Specification of AC load ........................................................................................14
Table 7 – Specification of DC source 1 – PV simulator .........................................................14
Table 8 – Specification of DC source 2 - TC.GSS.20.130.4WR.S ........................................15
Table 9 – Specification of DC source 3 - TC.GSS.32.600.4WR.S ........................................15
Table 10 – Overview of the used test equipment ..................................................................16
Table 11 – Software used for measurement, data analysis and control ................................17
Table 12 – Settings for the Q(U) control - Fronius ................................................................19
Table 13 – Settings for the Q(U) control – Schneider............................................................19
Table 14 – Reactance to be used for the worst-case stability evaluation ..............................24
Table 15 – Default and maximal Q(U) droop factors in selected countries using a Q(U)
control ..................................................................................................................................24
Table 16 – Default and minimal response time in selected countries using a Q(U) control ...25
The overview of the available parameters is provided in Table 17 and Table 18 for both
manufacturers.Table 17 – Settings for the Q(U) control - Fronius ....................................28

V
Table 18 – Settings for the P(U) control – Schneider ............................................................29
Table 19 – Setting fort he P(U) control – Schneider (2) ........................................................29
List of Abbreviations
DAQ Data Acquisition
EUT Equipment Under Test
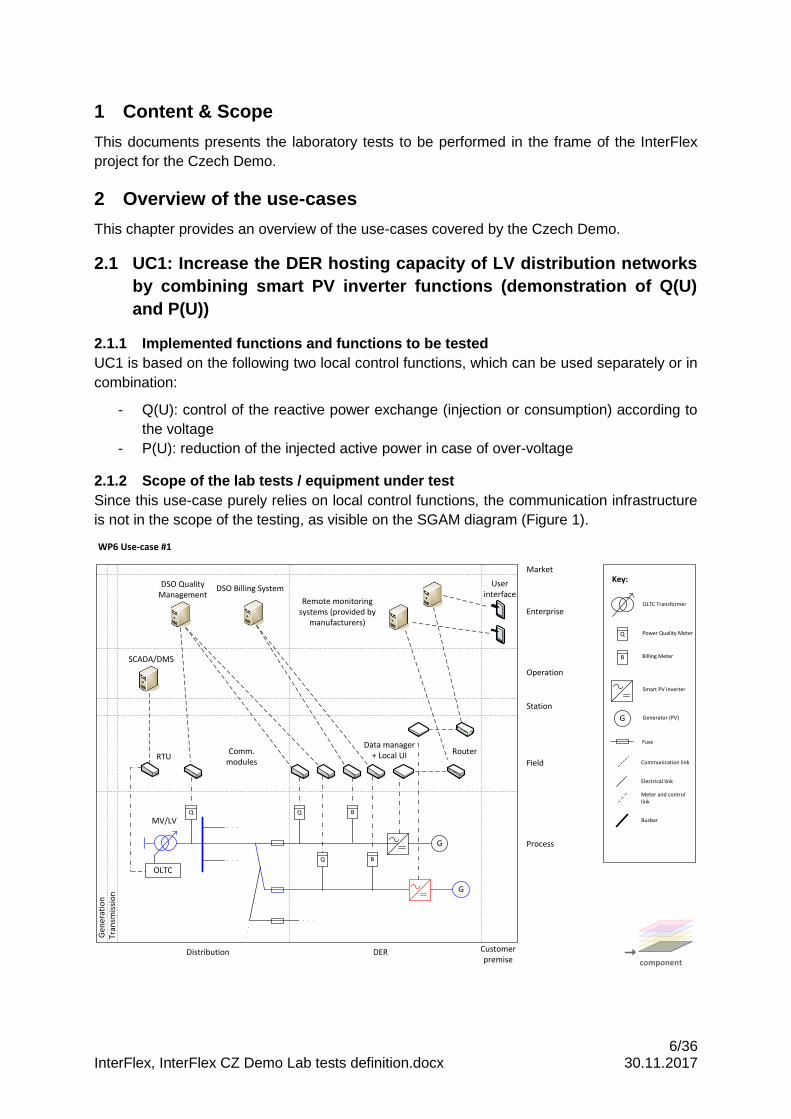
6/36 InterFlex, InterFlex CZ Demo Lab tests definition.docx 30.11.2017
1 Content & Scope
This documents presents the laboratory tests to be performed in the frame of the InterFlex
project for the Czech Demo.
2 Overview of the use-cases
This chapter provides an overview of the use-cases covered by the Czech Demo.
2.1 UC1: Increase the DER hosting capacity of LV distribution networks
by combining smart PV inverter functions (demonstration of Q(U)
and P(U))
2.1.1 Implemented functions and functions to be tested
UC1 is based on the following two local control functions, which can be used separately or in
combination:
- Q(U): control of the reactive power exchange (injection or consumption) according to
the voltage
- P(U): reduction of the injected active power in case of over-voltage
2.1.2 Scope of the lab tests / equipment under test
Since this use-case purely relies on local control functions, the communication infrastructure
is not in the scope of the testing, as visible on the SGAM diagram (Figure 1).
Gen
erat
ion
Tran
smis
sio
n
Distribution DER Customer premise
Process
Field
Station
Operation
Enterprise
MarketKey:
component
WP6 Use-case #1
MV/LV
OLTC
RTU
SCADA/DMS
G
Q Q B
Data manager + Local UI
DSO Quality Management
DSO Billing System
Comm. modules
Remote monitoring systems (provided by
manufacturers)
User interface
Q
G
Electrical link
Communication link
Meter and control link
OLTC Transformer
Power Quality Meter
Smart PV Inverter
Generator (PV)
Fuse
G
Busbar
B Billing Meter
Q B
Router
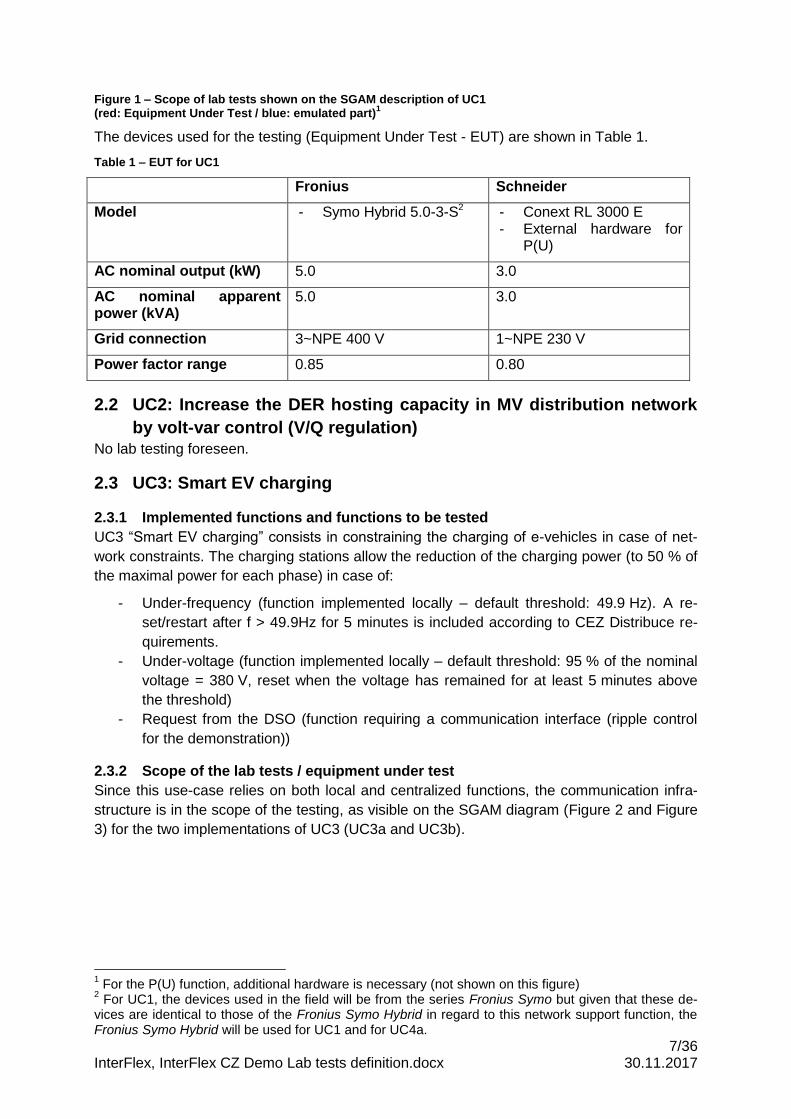
7/36 InterFlex, InterFlex CZ Demo Lab tests definition.docx 30.11.2017
Figure 1 – Scope of lab tests shown on the SGAM description of UC1 (red: Equipment Under Test / blue: emulated part)
1
The devices used for the testing (Equipment Under Test - EUT) are shown in Table 1.
Table 1 – EUT for UC1
Fronius Schneider
Model - Symo Hybrid 5.0-3-S2 - Conext RL 3000 E - External hardware for
P(U)
AC nominal output (kW) 5.0 3.0
AC nominal apparent power (kVA)
5.0 3.0
Grid connection 3~NPE 400 V 1~NPE 230 V
Power factor range 0.85 0.80
2.2 UC2: Increase the DER hosting capacity in MV distribution network
by volt-var control (V/Q regulation)
No lab testing foreseen.
2.3 UC3: Smart EV charging
2.3.1 Implemented functions and functions to be tested
UC3 “Smart EV charging” consists in constraining the charging of e-vehicles in case of net-
work constraints. The charging stations allow the reduction of the charging power (to 50 % of
the maximal power for each phase) in case of:
- Under-frequency (function implemented locally – default threshold: 49.9 Hz). A re-
set/restart after f > 49.9Hz for 5 minutes is included according to CEZ Distribuce re-
quirements.
- Under-voltage (function implemented locally – default threshold: 95 % of the nominal
voltage = 380 V, reset when the voltage has remained for at least 5 minutes above
the threshold)
- Request from the DSO (function requiring a communication interface (ripple control
for the demonstration))
2.3.2 Scope of the lab tests / equipment under test
Since this use-case relies on both local and centralized functions, the communication infra-
structure is in the scope of the testing, as visible on the SGAM diagram (Figure 2 and Figure
3) for the two implementations of UC3 (UC3a and UC3b).
1 For the P(U) function, additional hardware is necessary (not shown on this figure)
2 For UC1, the devices used in the field will be from the series Fronius Symo but given that these de-
vices are identical to those of the Fronius Symo Hybrid in regard to this network support function, the Fronius Symo Hybrid will be used for UC1 and for UC4a.
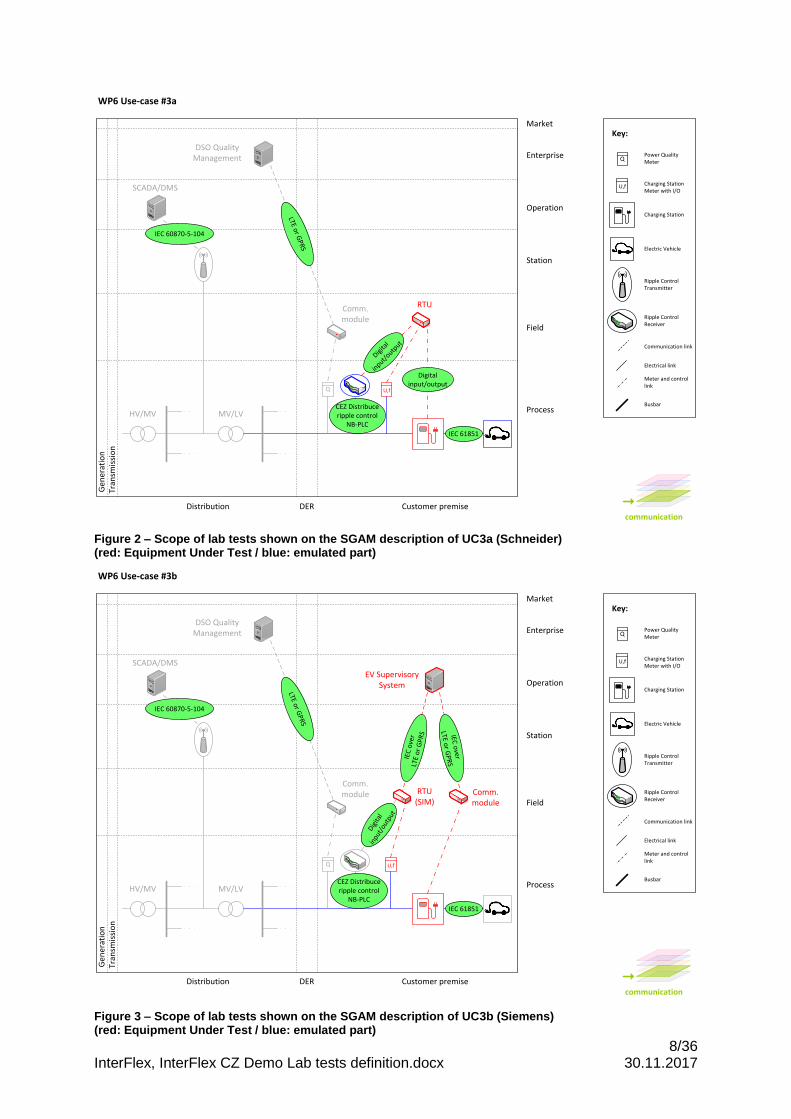
8/36 InterFlex, InterFlex CZ Demo Lab tests definition.docx 30.11.2017
Figure 2 – Scope of lab tests shown on the SGAM description of UC3a (Schneider) (red: Equipment Under Test / blue: emulated part)
Figure 3 – Scope of lab tests shown on the SGAM description of UC3b (Siemens) (red: Equipment Under Test / blue: emulated part)
Key:
WP6 Use-case #3a
Electrical link
Communication link
Meter and control link
Power Quality Meter
Charging Station Meter with I/O
Electric Vehicle
Busbar
Charging Station
Ripple Control Receiver
Ripple Control Transmitter
Q
U,f
communication
Gen
erat
ion
Tran
smis
sio
n
Distribution DER Customer premise
Process
Field
Station
Operation
Enterprise
Market
HV/MV
SCADA/DMS
MV/LV
Comm. module
DSO Quality Management
RTU
Q U,f
IEC 60870-5-104
LTE or GPR
S
CEZ Distribuce ripple control
NB-PLC
IEC 61851
Digital input/output
Digita
l
input/
output
Key:
Electrical link
Communication link
Meter and control link
Power Quality Meter
Charging Station Meter with I/O
Electric Vehicle
Busbar
Charging Station
Ripple Control Receiver
Ripple Control Transmitter
Q
U,f
communication
Gen
erat
ion
Tran
smis
sio
n
Distribution DER Customer premise
Process
Field
Station
Operation
Enterprise
Market
WP6 Use-case #3b
HV/MV
SCADA/DMS
MV/LV
Comm. module
DSO Quality Management
RTU(SIM)
EV Supervisory System
Q U,f
IEC 60870-5-104
LTE or GPR
S
CEZ Distribuce ripple control
NB-PLC
IEC 61851
Dig
ital
inpu
t/ou
tput
IEC o
ver
LTE or G
PR
S
IEC
ove
rLT
E o
r G
PR
S
Comm. module
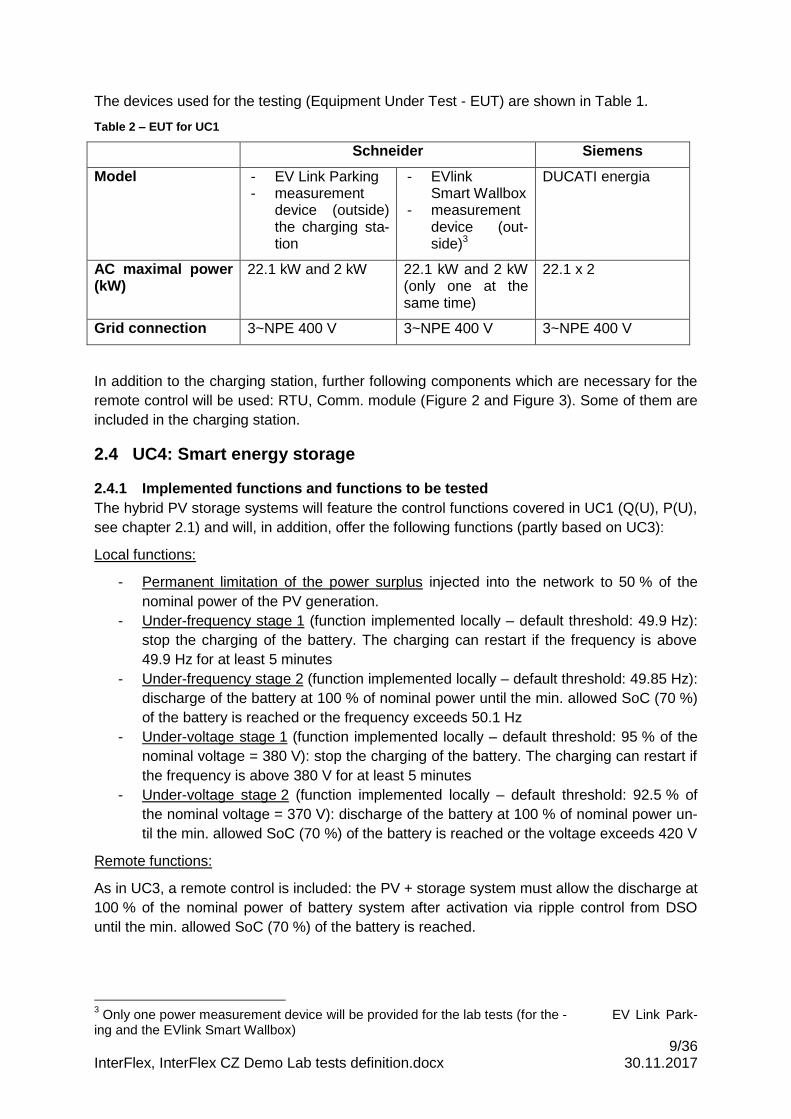
9/36 InterFlex, InterFlex CZ Demo Lab tests definition.docx 30.11.2017
The devices used for the testing (Equipment Under Test - EUT) are shown in Table 1.
Table 2 – EUT for UC1
Schneider Siemens
Model - EV Link Parking - measurement
device (outside) the charging sta-tion
- EVlink Smart Wallbox
- measurement device (out-side)3
DUCATI energia
AC maximal power (kW)
22.1 kW and 2 kW 22.1 kW and 2 kW (only one at the same time)
22.1 x 2
Grid connection 3~NPE 400 V 3~NPE 400 V 3~NPE 400 V
In addition to the charging station, further following components which are necessary for the
remote control will be used: RTU, Comm. module (Figure 2 and Figure 3). Some of them are
included in the charging station.
2.4 UC4: Smart energy storage
2.4.1 Implemented functions and functions to be tested
The hybrid PV storage systems will feature the control functions covered in UC1 (Q(U), P(U),
see chapter 2.1) and will, in addition, offer the following functions (partly based on UC3):
Local functions:
- Permanent limitation of the power surplus injected into the network to 50 % of the
nominal power of the PV generation.
- Under-frequency stage 1 (function implemented locally – default threshold: 49.9 Hz):
stop the charging of the battery. The charging can restart if the frequency is above
49.9 Hz for at least 5 minutes
- Under-frequency stage 2 (function implemented locally – default threshold: 49.85 Hz):
discharge of the battery at 100 % of nominal power until the min. allowed SoC (70 %)
of the battery is reached or the frequency exceeds 50.1 Hz
- Under-voltage stage 1 (function implemented locally – default threshold: 95 % of the
nominal voltage = 380 V): stop the charging of the battery. The charging can restart if
the frequency is above 380 V for at least 5 minutes
- Under-voltage stage 2 (function implemented locally – default threshold: 92.5 % of
the nominal voltage = 370 V): discharge of the battery at 100 % of nominal power un-
til the min. allowed SoC (70 %) of the battery is reached or the voltage exceeds 420 V
Remote functions:
As in UC3, a remote control is included: the PV + storage system must allow the discharge at
100 % of the nominal power of battery system after activation via ripple control from DSO
until the min. allowed SoC (70 %) of the battery is reached.
3 Only one power measurement device will be provided for the lab tests (for the - EV Link Park-
ing and the EVlink Smart Wallbox)
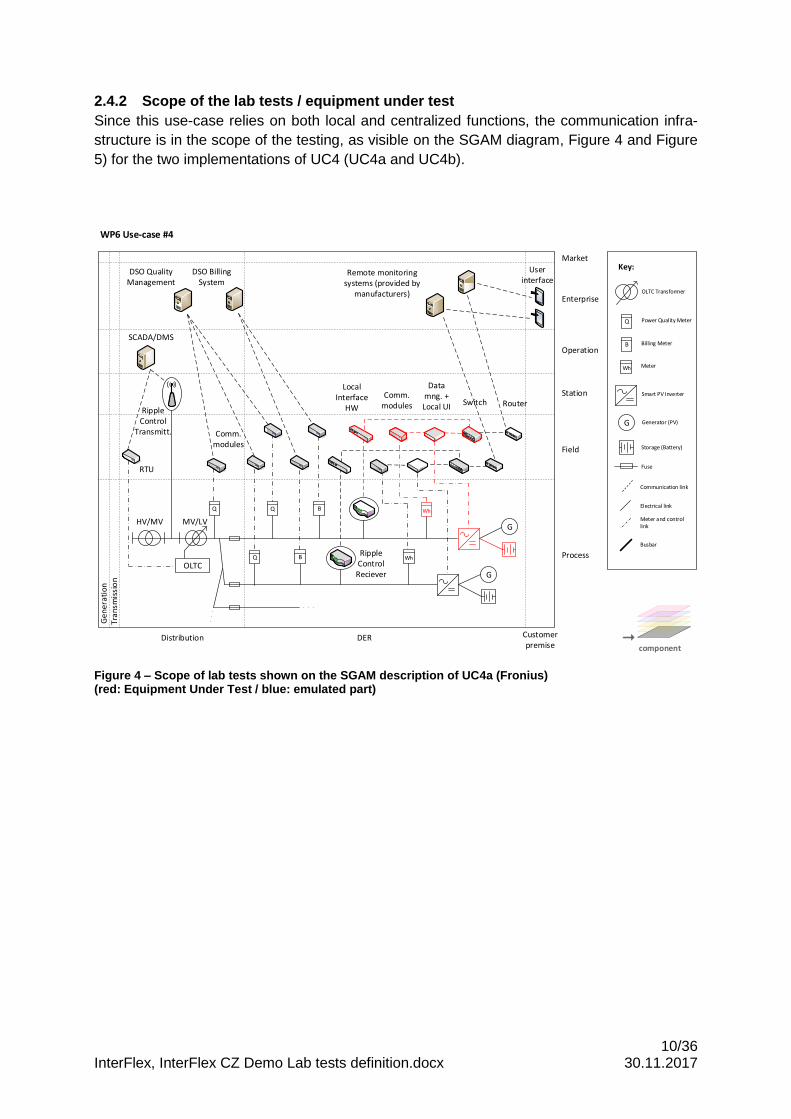
10/36 InterFlex, InterFlex CZ Demo Lab tests definition.docx 30.11.2017
2.4.2 Scope of the lab tests / equipment under test
Since this use-case relies on both local and centralized functions, the communication infra-
structure is in the scope of the testing, as visible on the SGAM diagram, Figure 4 and Figure
5) for the two implementations of UC4 (UC4a and UC4b).
Figure 4 – Scope of lab tests shown on the SGAM description of UC4a (Fronius) (red: Equipment Under Test / blue: emulated part)
Ge
ne
rati
on
Tran
smis
sio
n
Distribution DER Customer premise
Process
Field
Station
Operation
Enterprise
MarketKey:
component
WP6 Use-case #4
MV/LV
OLTC
RTU
SCADA/DMS
G
DSO Quality Management
DSO Billing System
Comm. modules
Remote monitoring systems (provided by
manufacturers)
User interface
Q
G
Electrical link
Communication link
Meter and control link
OLTC Transformer
Power Quality Meter
Smart PV Inverter
Generator (PV)
Fuse
G
Busbar
B Billing Meter
Router
Storage (Battery)
MeterWh
HV/MV
Ripple Control
Transmitt.
Wh
Data mng. + Local UI
Ripple Control
Reciever
Local Interface
HWSwitch
Wh
Q Q B
Q B
Comm. modules
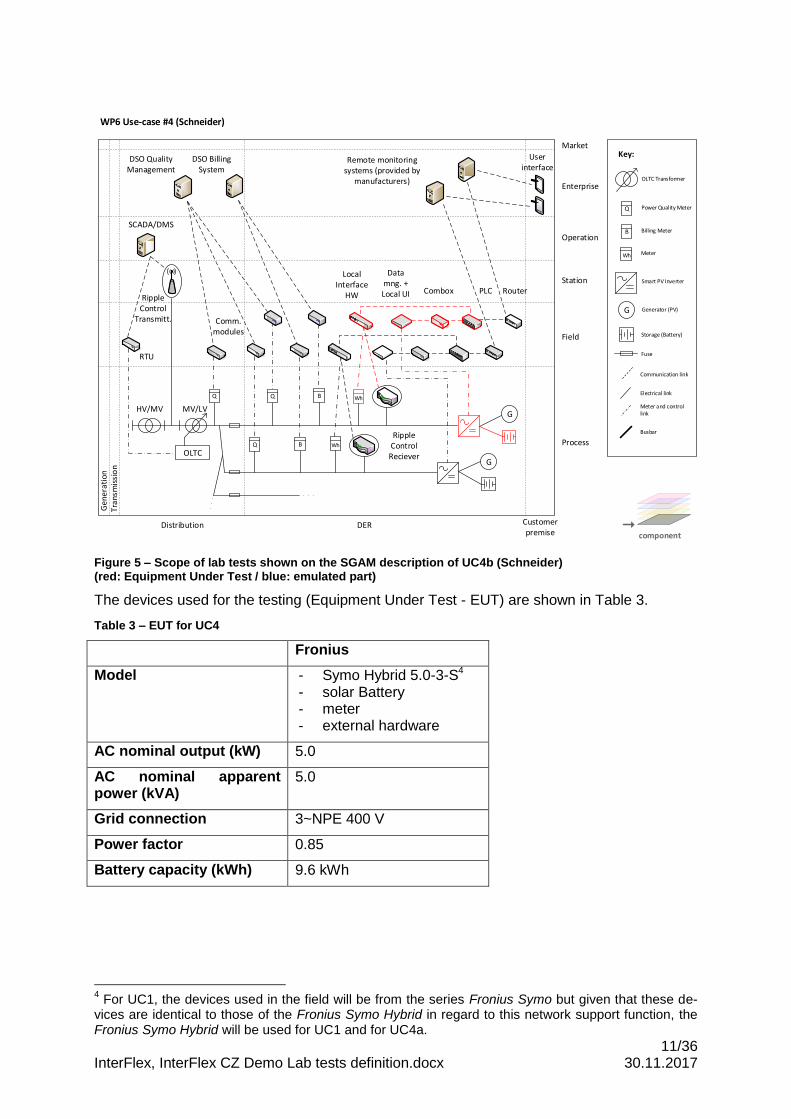
11/36 InterFlex, InterFlex CZ Demo Lab tests definition.docx 30.11.2017
Figure 5 – Scope of lab tests shown on the SGAM description of UC4b (Schneider) (red: Equipment Under Test / blue: emulated part)
The devices used for the testing (Equipment Under Test - EUT) are shown in Table 3.
Table 3 – EUT for UC4
Fronius
Model - Symo Hybrid 5.0-3-S4 - solar Battery - meter - external hardware
AC nominal output (kW) 5.0
AC nominal apparent power (kVA)
5.0
Grid connection 3~NPE 400 V
Power factor 0.85
Battery capacity (kWh) 9.6 kWh
4 For UC1, the devices used in the field will be from the series Fronius Symo but given that these de-
vices are identical to those of the Fronius Symo Hybrid in regard to this network support function, the Fronius Symo Hybrid will be used for UC1 and for UC4a.
Ge
ne
rati
on
Tran
smis
sio
n
Distribution DER Customer premise
Process
Field
Station
Operation
Enterprise
MarketKey:
component
WP6 Use-case #4 (Schneider)
MV/LV
OLTC
RTU
SCADA/DMS
G
DSO Quality Management
DSO Billing System
Comm. modules
Remote monitoring systems (provided by
manufacturers)
User interface
Q
G
Electrical link
Communication link
Meter and control link
OLTC Transformer
Power Quality Meter
Smart PV Inverter
Generator (PV)
Fuse
G
Busbar
B Billing Meter
Storage (Battery)
MeterWh
HV/MV
Ripple Control
Transmitt.
Wh
Data mng. + Local UI
Ripple Control
Reciever
Local Interface
HW
Wh
Q Q B
Q B
Combox RouterPLC
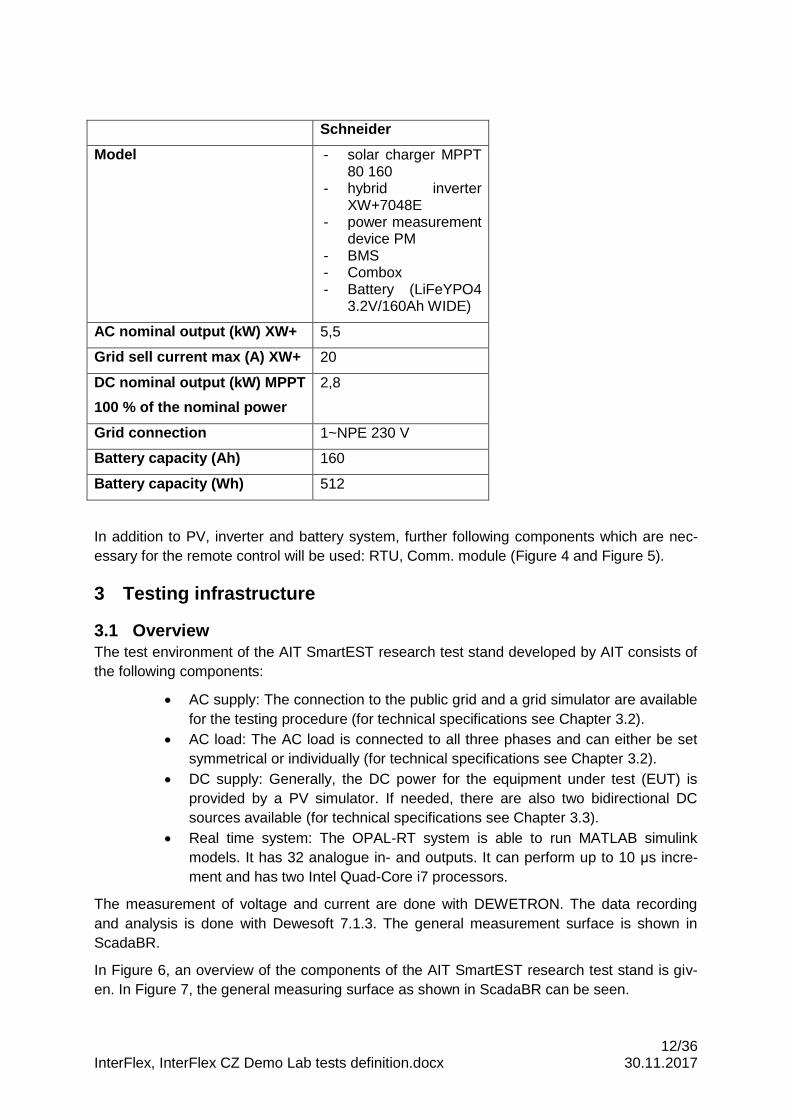
12/36 InterFlex, InterFlex CZ Demo Lab tests definition.docx 30.11.2017
Schneider
Model - solar charger MPPT 80 160
- hybrid inverter XW+7048E
- power measurement device PM
- BMS - Combox - Battery (LiFeYPO4
3.2V/160Ah WIDE)
AC nominal output (kW) XW+ 5,5
Grid sell current max (A) XW+ 20
DC nominal output (kW) MPPT
100 % of the nominal power
2,8
Grid connection 1~NPE 230 V
Battery capacity (Ah) 160
Battery capacity (Wh) 512
In addition to PV, inverter and battery system, further following components which are nec-
essary for the remote control will be used: RTU, Comm. module (Figure 4 and Figure 5).
3 Testing infrastructure
3.1 Overview
The test environment of the AIT SmartEST research test stand developed by AIT consists of
the following components:
AC supply: The connection to the public grid and a grid simulator are available
for the testing procedure (for technical specifications see Chapter 3.2).
AC load: The AC load is connected to all three phases and can either be set
symmetrical or individually (for technical specifications see Chapter 3.2).
DC supply: Generally, the DC power for the equipment under test (EUT) is
provided by a PV simulator. If needed, there are also two bidirectional DC
sources available (for technical specifications see Chapter 3.3).
Real time system: The OPAL-RT system is able to run MATLAB simulink
models. It has 32 analogue in- and outputs. It can perform up to 10 µs incre-
ment and has two Intel Quad-Core i7 processors.
The measurement of voltage and current are done with DEWETRON. The data recording
and analysis is done with Dewesoft 7.1.3. The general measurement surface is shown in
ScadaBR.
In Figure 6, an overview of the components of the AIT SmartEST research test stand is giv-
en. In Figure 7, the general measuring surface as shown in ScadaBR can be seen.
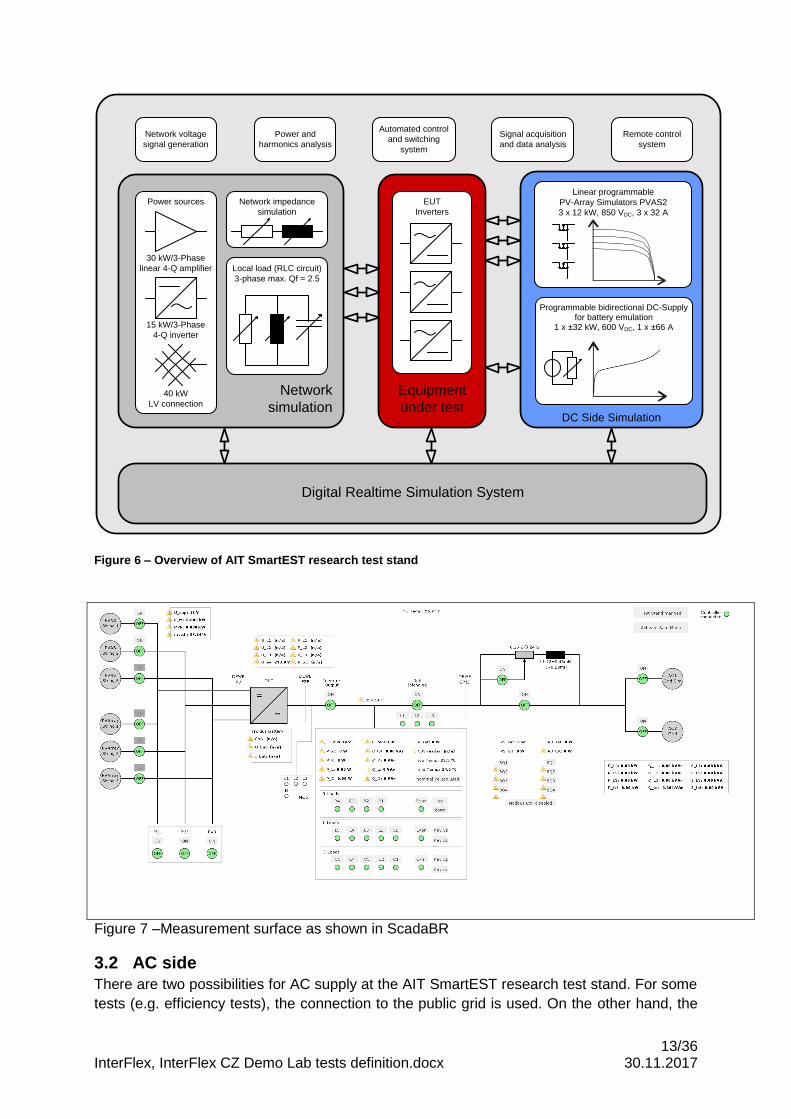
13/36 InterFlex, InterFlex CZ Demo Lab tests definition.docx 30.11.2017
Figure 6 – Overview of AIT SmartEST research test stand
Figure 7 –Measurement surface as shown in ScadaBR
3.2 AC side
There are two possibilities for AC supply at the AIT SmartEST research test stand. For some
tests (e.g. efficiency tests), the connection to the public grid is used. On the other hand, the
DC Side Simulation
Linear programmable
PV-Array Simulators PVAS2
3 x 12 kW, 850 VDC, 3 x 32 A
Equipment
under test
Network
simulation
Power sources
15 kW/3-Phase
4-Q inverter
30 kW/3-Phase
linear 4-Q amplifier
40 kW
LV connection
Local load (RLC circuit)
3-phase max. Qf = 2.5
Network impedance
simulation
EUT
Inverters
Network voltage
signal generation
Power and
harmonics analysis
Automated control
and switching
system
Signal acquisition
and data analysis
Remote control
system
Programmable bidirectional DC-Supply for battery emulation
1 x ±32 kW, 600 VDC, 1 x ±66 A
Digital Realtime Simulation System
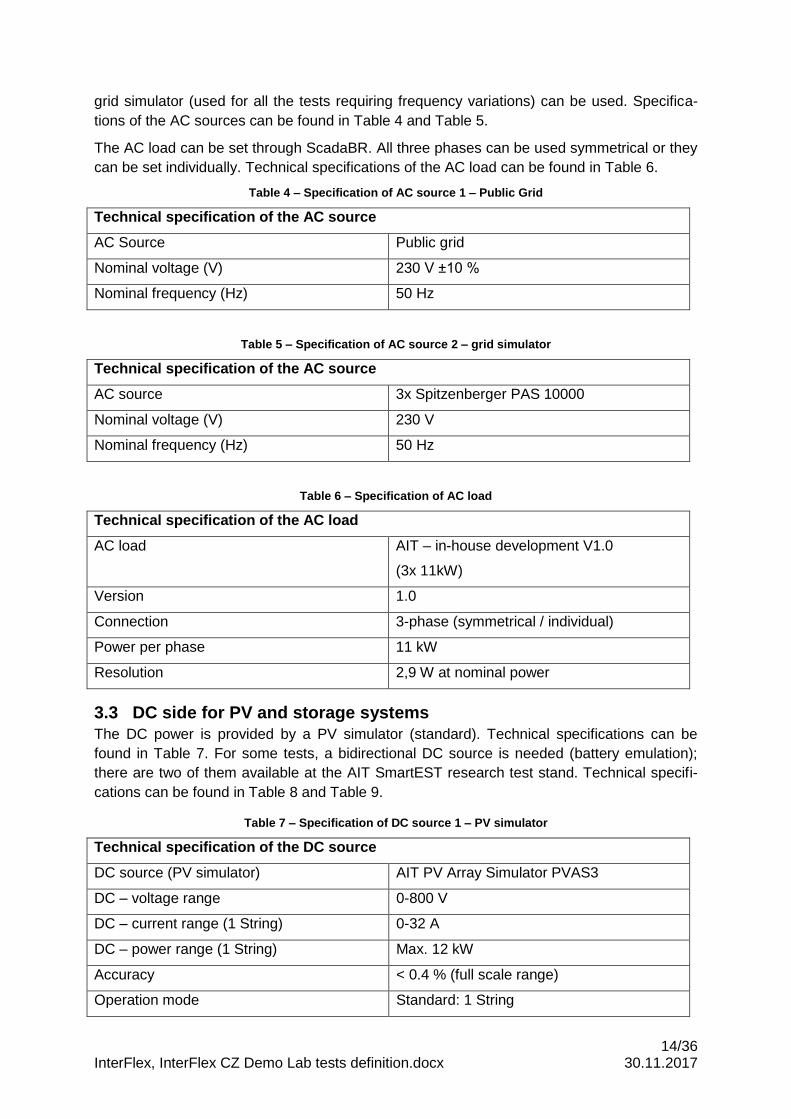
14/36 InterFlex, InterFlex CZ Demo Lab tests definition.docx 30.11.2017
grid simulator (used for all the tests requiring frequency variations) can be used. Specifica-
tions of the AC sources can be found in Table 4 and Table 5.
The AC load can be set through ScadaBR. All three phases can be used symmetrical or they
can be set individually. Technical specifications of the AC load can be found in Table 6.
Table 4 – Specification of AC source 1 – Public Grid
Technical specification of the AC source
AC Source Public grid
Nominal voltage (V) 230 V ±10 %
Nominal frequency (Hz) 50 Hz
Table 5 – Specification of AC source 2 – grid simulator
Technical specification of the AC source
AC source 3x Spitzenberger PAS 10000
Nominal voltage (V) 230 V
Nominal frequency (Hz) 50 Hz
Table 6 – Specification of AC load
Technical specification of the AC load
AC load AIT – in-house development V1.0
(3x 11kW)
Version 1.0
Connection 3-phase (symmetrical / individual)
Power per phase 11 kW
Resolution 2,9 W at nominal power
3.3 DC side for PV and storage systems
The DC power is provided by a PV simulator (standard). Technical specifications can be
found in Table 7. For some tests, a bidirectional DC source is needed (battery emulation);
there are two of them available at the AIT SmartEST research test stand. Technical specifi-
cations can be found in Table 8 and Table 9.
Table 7 – Specification of DC source 1 – PV simulator
Technical specification of the DC source
DC source (PV simulator) AIT PV Array Simulator PVAS3
DC – voltage range 0-800 V
DC – current range (1 String) 0-32 A
DC – power range (1 String) Max. 12 kW
Accuracy < 0.4 % (full scale range)
Operation mode Standard: 1 String
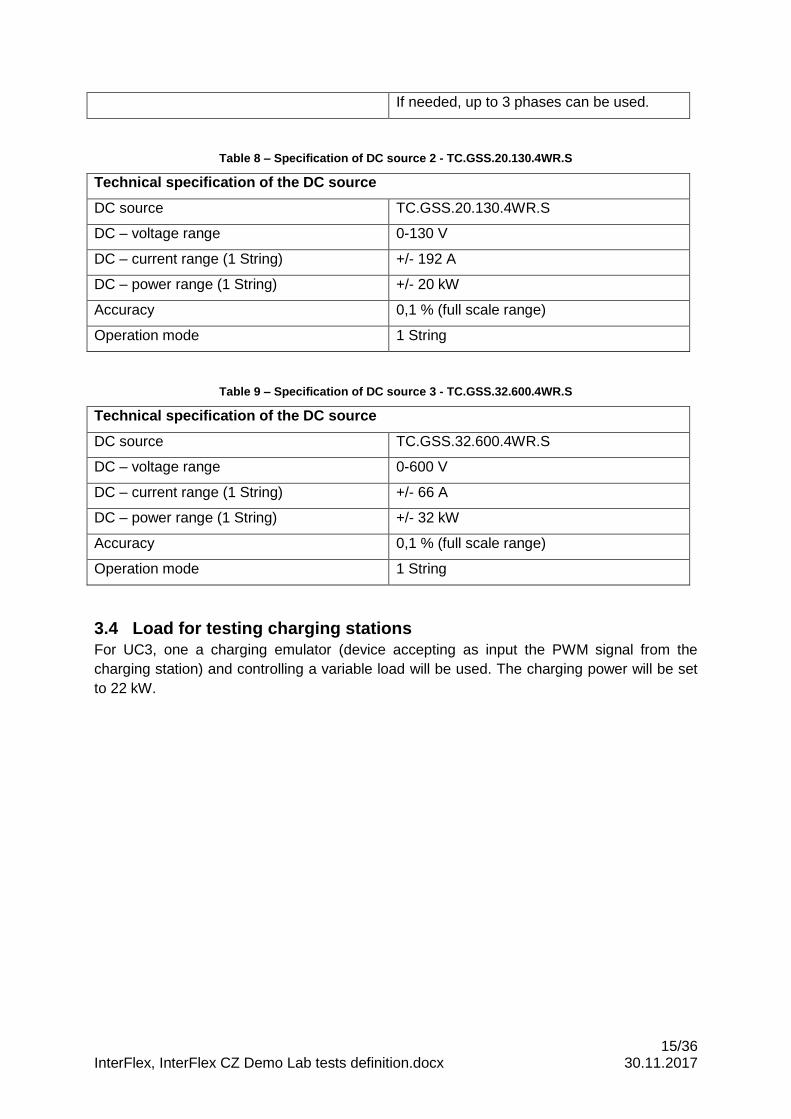
15/36 InterFlex, InterFlex CZ Demo Lab tests definition.docx 30.11.2017
If needed, up to 3 phases can be used.
Table 8 – Specification of DC source 2 - TC.GSS.20.130.4WR.S
Technical specification of the DC source
DC source TC.GSS.20.130.4WR.S
DC – voltage range 0-130 V
DC – current range (1 String) +/- 192 A
DC – power range (1 String) +/- 20 kW
Accuracy 0,1 % (full scale range)
Operation mode 1 String
Table 9 – Specification of DC source 3 - TC.GSS.32.600.4WR.S
Technical specification of the DC source
DC source TC.GSS.32.600.4WR.S
DC – voltage range 0-600 V
DC – current range (1 String) +/- 66 A
DC – power range (1 String) +/- 32 kW
Accuracy 0,1 % (full scale range)
Operation mode 1 String
3.4 Load for testing charging stations
For UC3, one a charging emulator (device accepting as input the PWM signal from the
charging station) and controlling a variable load will be used. The charging power will be set
to 22 kW.
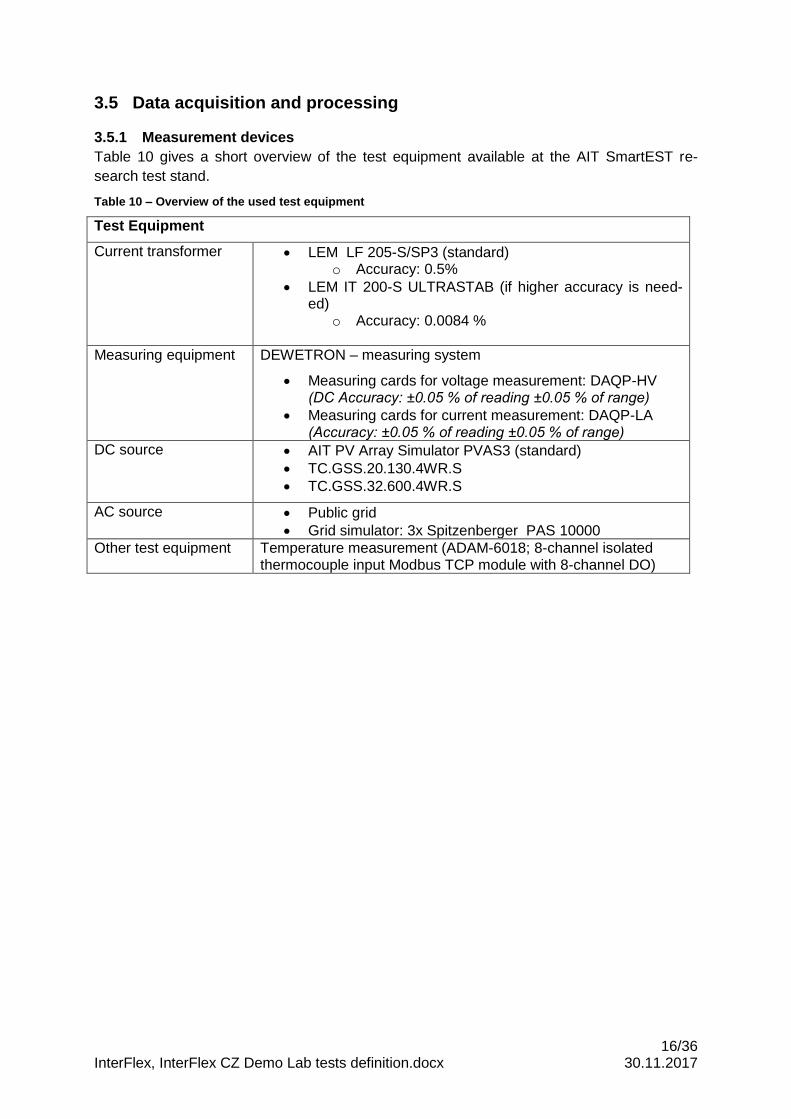
16/36 InterFlex, InterFlex CZ Demo Lab tests definition.docx 30.11.2017
3.5 Data acquisition and processing
3.5.1 Measurement devices
Table 10 gives a short overview of the test equipment available at the AIT SmartEST re-
search test stand.
Table 10 – Overview of the used test equipment
Test Equipment
Current transformer LEM LF 205-S/SP3 (standard) o Accuracy: 0.5%
LEM IT 200-S ULTRASTAB (if higher accuracy is need-ed)
o Accuracy: 0.0084 %
Measuring equipment DEWETRON – measuring system
Measuring cards for voltage measurement: DAQP-HV (DC Accuracy: ±0.05 % of reading ±0.05 % of range)
Measuring cards for current measurement: DAQP-LA (Accuracy: ±0.05 % of reading ±0.05 % of range)
DC source AIT PV Array Simulator PVAS3 (standard)
TC.GSS.20.130.4WR.S
TC.GSS.32.600.4WR.S
AC source Public grid
Grid simulator: 3x Spitzenberger PAS 10000
Other test equipment Temperature measurement (ADAM-6018; 8-channel isolated thermocouple input Modbus TCP module with 8-channel DO)
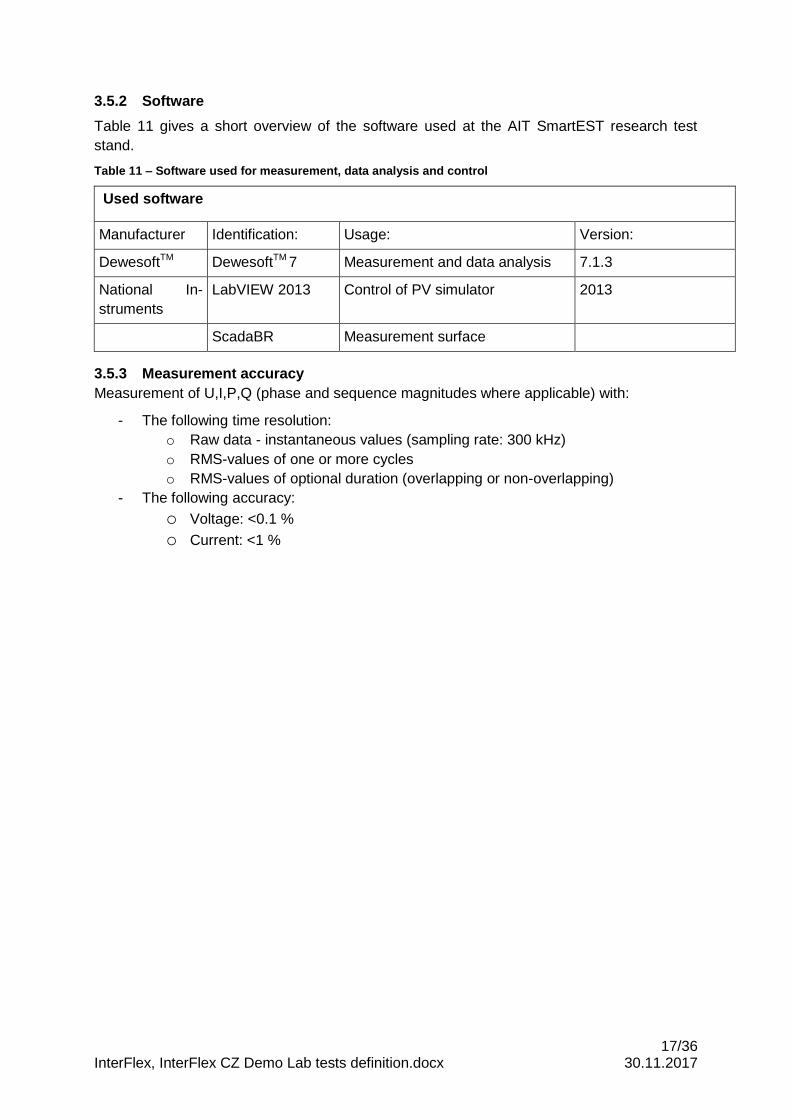
17/36 InterFlex, InterFlex CZ Demo Lab tests definition.docx 30.11.2017
3.5.2 Software
Table 11 gives a short overview of the software used at the AIT SmartEST research test
stand.
Table 11 – Software used for measurement, data analysis and control
Used software
Manufacturer Identification: Usage: Version:
DewesoftTM DewesoftTM 7 Measurement and data analysis 7.1.3
National In-
struments
LabVIEW 2013 Control of PV simulator 2013
ScadaBR Measurement surface
3.5.3 Measurement accuracy
Measurement of U,I,P,Q (phase and sequence magnitudes where applicable) with:
- The following time resolution:
o Raw data - instantaneous values (sampling rate: 300 kHz)
o RMS-values of one or more cycles
o RMS-values of optional duration (overlapping or non-overlapping)
- The following accuracy:
o Voltage: <0.1 % o Current: <1 %
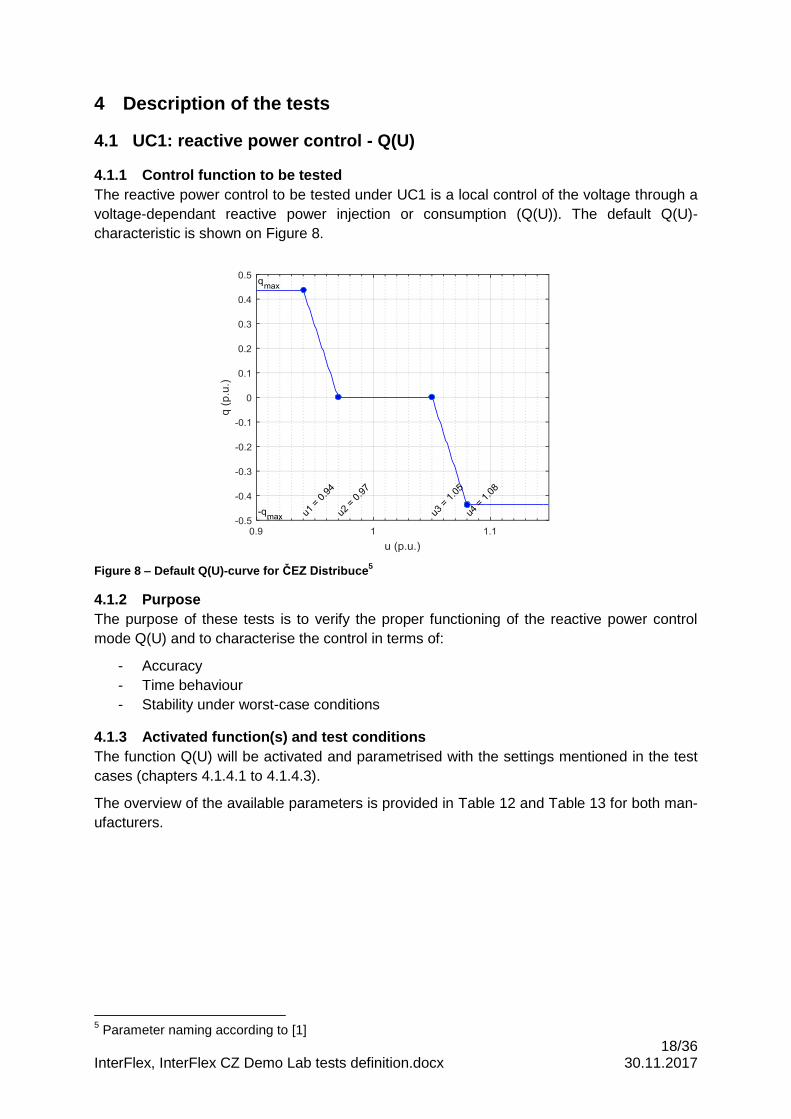
18/36 InterFlex, InterFlex CZ Demo Lab tests definition.docx 30.11.2017
4 Description of the tests
4.1 UC1: reactive power control - Q(U)
4.1.1 Control function to be tested
The reactive power control to be tested under UC1 is a local control of the voltage through a
voltage-dependant reactive power injection or consumption (Q(U)). The default Q(U)-
characteristic is shown on Figure 8.
Figure 8 – Default Q(U)-curve for ČEZ Distribuce5
4.1.2 Purpose
The purpose of these tests is to verify the proper functioning of the reactive power control
mode Q(U) and to characterise the control in terms of:
- Accuracy
- Time behaviour
- Stability under worst-case conditions
4.1.3 Activated function(s) and test conditions
The function Q(U) will be activated and parametrised with the settings mentioned in the test
cases (chapters 4.1.4.1 to 4.1.4.3).
The overview of the available parameters is provided in Table 12 and Table 13 for both man-
ufacturers.
5 Parameter naming according to [1]
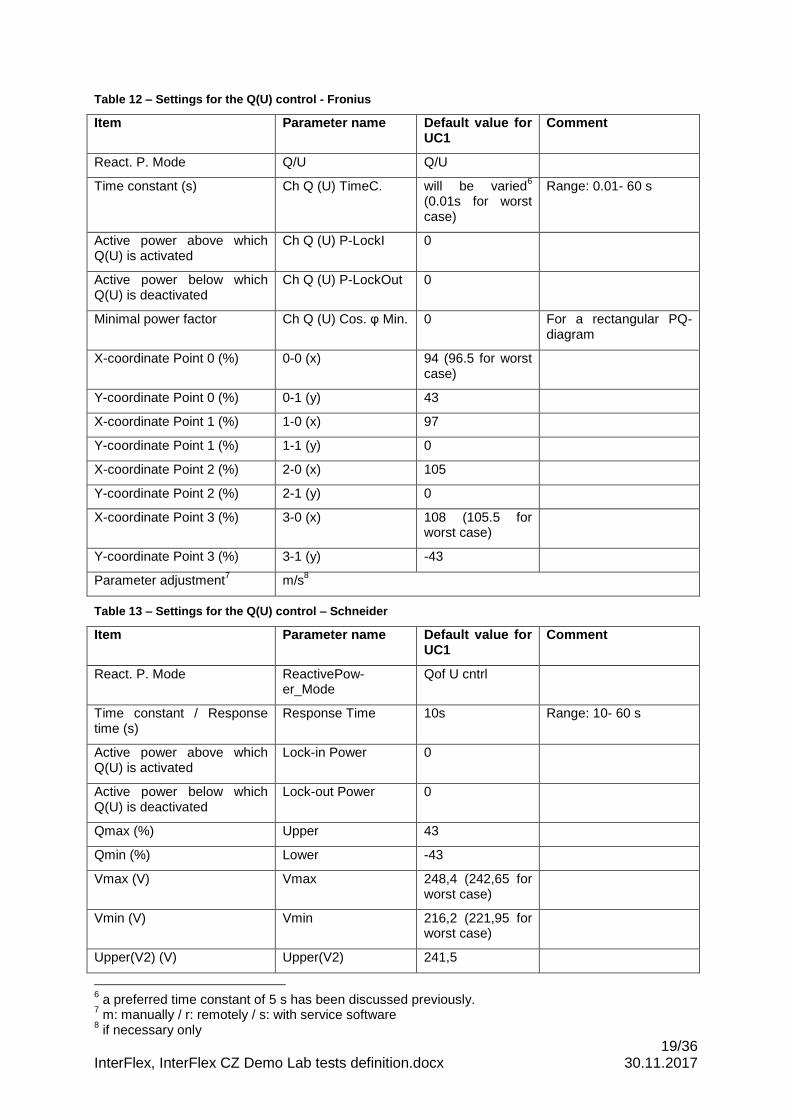
19/36 InterFlex, InterFlex CZ Demo Lab tests definition.docx 30.11.2017
Table 12 – Settings for the Q(U) control - Fronius
Item Parameter name Default value for UC1
Comment
React. P. Mode Q/U Q/U
Time constant (s) Ch Q (U) TimeC. will be varied6
(0.01s for worst case)
Range: 0.01- 60 s
Active power above which Q(U) is activated
Ch Q (U) P-LockI 0
Active power below which Q(U) is deactivated
Ch Q (U) P-LockOut 0
Minimal power factor Ch Q (U) Cos. φ Min. 0 For a rectangular PQ-diagram
X-coordinate Point 0 (%) 0-0 (x) 94 (96.5 for worst case)
Y-coordinate Point 0 (%) 0-1 (y) 43
X-coordinate Point 1 (%) 1-0 (x) 97
Y-coordinate Point 1 (%) 1-1 (y) 0
X-coordinate Point 2 (%) 2-0 (x) 105
Y-coordinate Point 2 (%) 2-1 (y) 0
X-coordinate Point 3 (%) 3-0 (x) 108 (105.5 for worst case)
Y-coordinate Point 3 (%) 3-1 (y) -43
Parameter adjustment7 m/s
8
Table 13 – Settings for the Q(U) control – Schneider
Item Parameter name Default value for UC1
Comment
React. P. Mode ReactivePow-er_Mode
Qof U cntrl
Time constant / Response time (s)
Response Time 10s Range: 10- 60 s
Active power above which Q(U) is activated
Lock-in Power 0
Active power below which Q(U) is deactivated
Lock-out Power 0
Qmax (%) Upper 43
Qmin (%) Lower -43
Vmax (V) Vmax 248,4 (242,65 for worst case)
Vmin (V) Vmin 216,2 (221,95 for worst case)
Upper(V2) (V) Upper(V2) 241,5
6 a preferred time constant of 5 s has been discussed previously.
7 m: manually / r: remotely / s: with service software
8 if necessary only
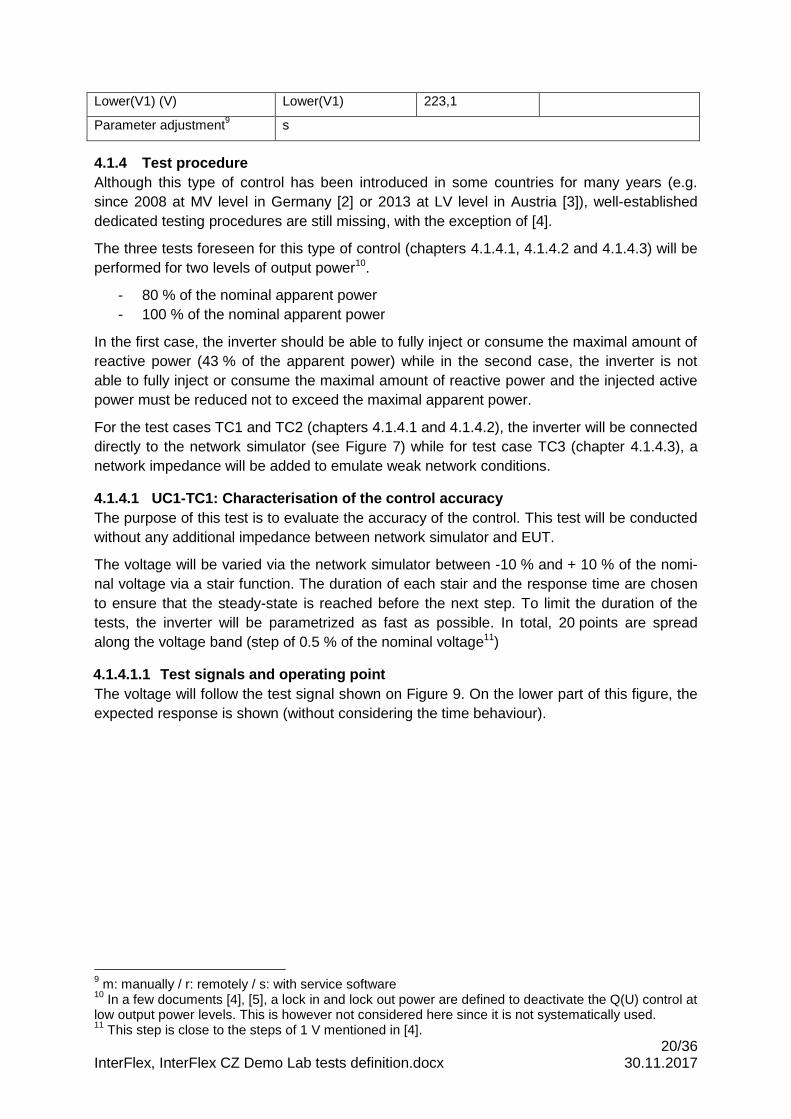
20/36 InterFlex, InterFlex CZ Demo Lab tests definition.docx 30.11.2017
Lower(V1) (V) Lower(V1) 223,1
Parameter adjustment9 s
4.1.4 Test procedure
Although this type of control has been introduced in some countries for many years (e.g.
since 2008 at MV level in Germany [2] or 2013 at LV level in Austria [3]), well-established
dedicated testing procedures are still missing, with the exception of [4].
The three tests foreseen for this type of control (chapters 4.1.4.1, 4.1.4.2 and 4.1.4.3) will be
performed for two levels of output power10.
- 80 % of the nominal apparent power
- 100 % of the nominal apparent power
In the first case, the inverter should be able to fully inject or consume the maximal amount of
reactive power (43 % of the apparent power) while in the second case, the inverter is not
able to fully inject or consume the maximal amount of reactive power and the injected active
power must be reduced not to exceed the maximal apparent power.
For the test cases TC1 and TC2 (chapters 4.1.4.1 and 4.1.4.2), the inverter will be connected
directly to the network simulator (see Figure 7) while for test case TC3 (chapter 4.1.4.3), a
network impedance will be added to emulate weak network conditions.
4.1.4.1 UC1-TC1: Characterisation of the control accuracy
The purpose of this test is to evaluate the accuracy of the control. This test will be conducted
without any additional impedance between network simulator and EUT.
The voltage will be varied via the network simulator between -10 % and + 10 % of the nomi-
nal voltage via a stair function. The duration of each stair and the response time are chosen
to ensure that the steady-state is reached before the next step. To limit the duration of the
tests, the inverter will be parametrized as fast as possible. In total, 20 points are spread
along the voltage band (step of 0.5 % of the nominal voltage11)
4.1.4.1.1 Test signals and operating point
The voltage will follow the test signal shown on Figure 9. On the lower part of this figure, the
expected response is shown (without considering the time behaviour).
9 m: manually / r: remotely / s: with service software
10 In a few documents [4], [5], a lock in and lock out power are defined to deactivate the Q(U) control at
low output power levels. This is however not considered here since it is not systematically used. 11
This step is close to the steps of 1 V mentioned in [4].
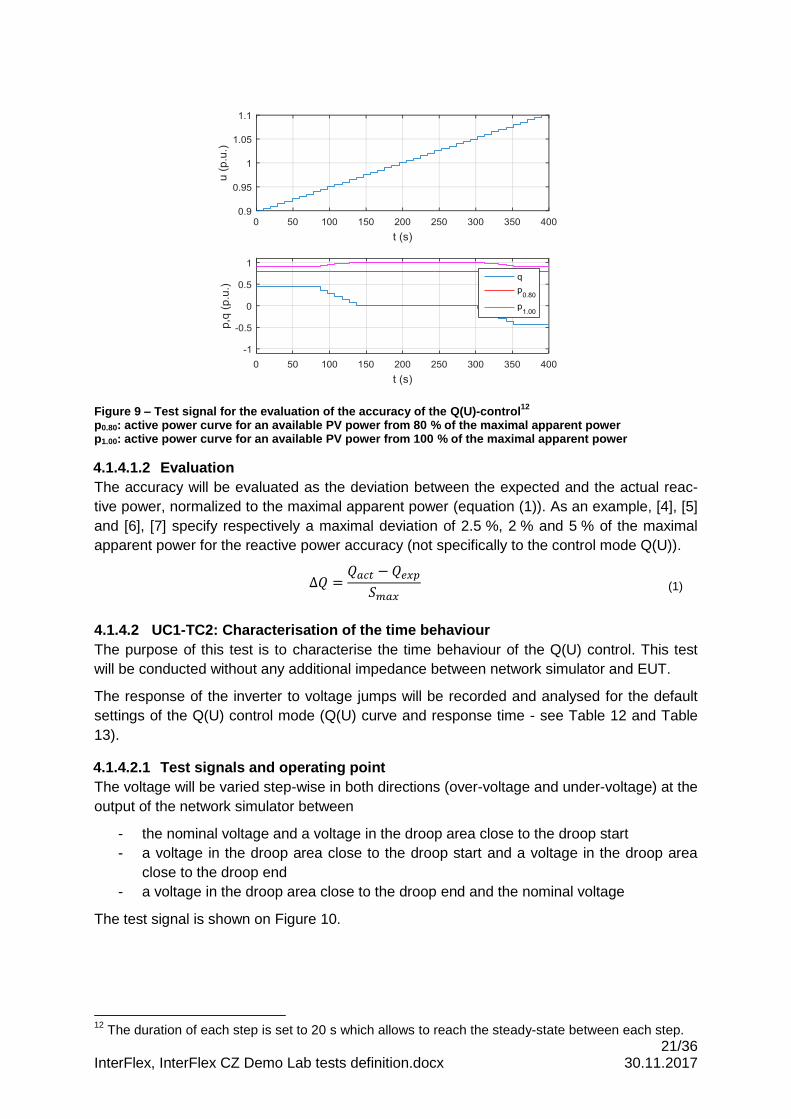
21/36 InterFlex, InterFlex CZ Demo Lab tests definition.docx 30.11.2017
Figure 9 – Test signal for the evaluation of the accuracy of the Q(U)-control12
p0.80: active power curve for an available PV power from 80 % of the maximal apparent power p1.00: active power curve for an available PV power from 100 % of the maximal apparent power
4.1.4.1.2 Evaluation
The accuracy will be evaluated as the deviation between the expected and the actual reac-
tive power, normalized to the maximal apparent power (equation (1)). As an example, [4], [5]
and [6], [7] specify respectively a maximal deviation of 2.5 %, 2 % and 5 % of the maximal
apparent power for the reactive power accuracy (not specifically to the control mode Q(U)).
∆𝑄 =𝑄𝑎𝑐𝑡 − 𝑄𝑒𝑥𝑝
𝑆𝑚𝑎𝑥 (1)
4.1.4.2 UC1-TC2: Characterisation of the time behaviour
The purpose of this test is to characterise the time behaviour of the Q(U) control. This test
will be conducted without any additional impedance between network simulator and EUT.
The response of the inverter to voltage jumps will be recorded and analysed for the default
settings of the Q(U) control mode (Q(U) curve and response time - see Table 12 and Table
13).
4.1.4.2.1 Test signals and operating point
The voltage will be varied step-wise in both directions (over-voltage and under-voltage) at the
output of the network simulator between
- the nominal voltage and a voltage in the droop area close to the droop start
- a voltage in the droop area close to the droop start and a voltage in the droop area
close to the droop end
- a voltage in the droop area close to the droop end and the nominal voltage
The test signal is shown on Figure 10.
12
The duration of each step is set to 20 s which allows to reach the steady-state between each step.
22/36 InterFlex, InterFlex CZ Demo Lab tests definition.docx 30.11.2017
Figure 10 – Test signal for the evaluation of the step response13
4.1.4.2.2 Evaluation
The response time will be determined using a tolerance band of 5 % of the maximal reac-
tive power around the expected value. This value will be compared to the target response
time adjusted prior the tests.
13
The duration of each step is set to 20 s which allows to reach the steady-state between each step.
23/36 InterFlex, InterFlex CZ Demo Lab tests definition.docx 30.11.2017
4.1.4.3 UC1-TC3: Investigation of the stability under worst-case conditions
The purpose of this test is to evaluate the stability of the control under worst-case conditions.
This test will be conducted with an additional impedance between network simulator and
EUT, adjusted to represent the worst-case conditions (see below).
Since most of the standards do not specify a default Q(U) curve (except [6] and [4]), the sta-
bility will be evaluated for a worst-case.
4.1.4.3.1 Definition of the worst-case
The purpose of this test is to evaluate the stability of the control under worst-case conditions.
The stability of a Q(U) control has been investigated and presented in a number of papers. In
[8], a stability criterion has been established and the authors have come to the conclusion
that the stability is mainly influenced by the following factors:
- Maximal reactive power compared to the network impedance or short-circuit power at
the point of connection
- Slope of the Q(U) curve
- Response time of the control
- (unwanted) time delay in the control
A brief discussion on these factors and their selection is given below.
1. Maximal reactive power compared to the network impedance or short-circuit
power at the point of connection
The worst case is given by the maximal ratio between maximal reactive power and maximal
expectable network impedance (or minimal expectable short-circuit power).
The open-loop gain of the transfer function determining the stability of one or several invert-
ers operating in Q(U) control mode is given by (2) [8].
𝐾𝑜𝑙 =∆𝑈𝑃𝑉0
∆𝑈𝑑𝑟𝑜𝑜𝑝×
tan 𝜑𝑚𝑎𝑥
𝑅/𝑋 (2)
Where ∆𝑈𝑃𝑉0 is the voltage rise caused by the PV inverter without Q(U) control (depending
on the maximal active power and on the network impedance), ∆𝑈𝑑𝑟𝑜𝑜𝑝 is the droop area,
tan 𝜑𝑚𝑎𝑥 is the maximal tan 𝜑 (corresponding to the maximal reactive power in p.u.) and R/X
is the ratio between real and imaginary part of the network impedance at the point of connec-
tion.
The worst case is therefore obtained for networks in which reactive power control is very ef-
fective and leads to a large increase of the hosting capacity. This is obtained for small R/X
ratios (overhead lines with a large cross-section). For an overhead line with 70 mm2 cross-
section (70/11_AlFe6), the R/X ratio is 0.401/0.28=1.43. The effective R/X ratio at the con-
nection point might even be smaller, in particular small distribution transformer (e.g. 100 kVA
with a short circuit voltage uk = 6 %). In such cases, the R/X ration might even fall to values
close to 1. Under such conditions, the voltage rise caused by the PV infeed can be reduced
by a factor of about 2 (easily estimated by (3) [9]) and the hosting capacity can increased by
about +100 % (considering , tan 𝜑𝑚𝑎𝑥=0.48 (cos 𝜑 = 0.90) and R/X=1), which corresponds to
the objective of UC1 (significant increase of the hosting capacity).
∆𝑈𝑃𝑉−𝑄(𝑈) ≈ ∆𝑈𝑃𝑉0 × (1 −tan 𝜑𝑚𝑎𝑥
𝑅/𝑋) ≈ 0.5 × ∆𝑈𝑃𝑉0 (3)
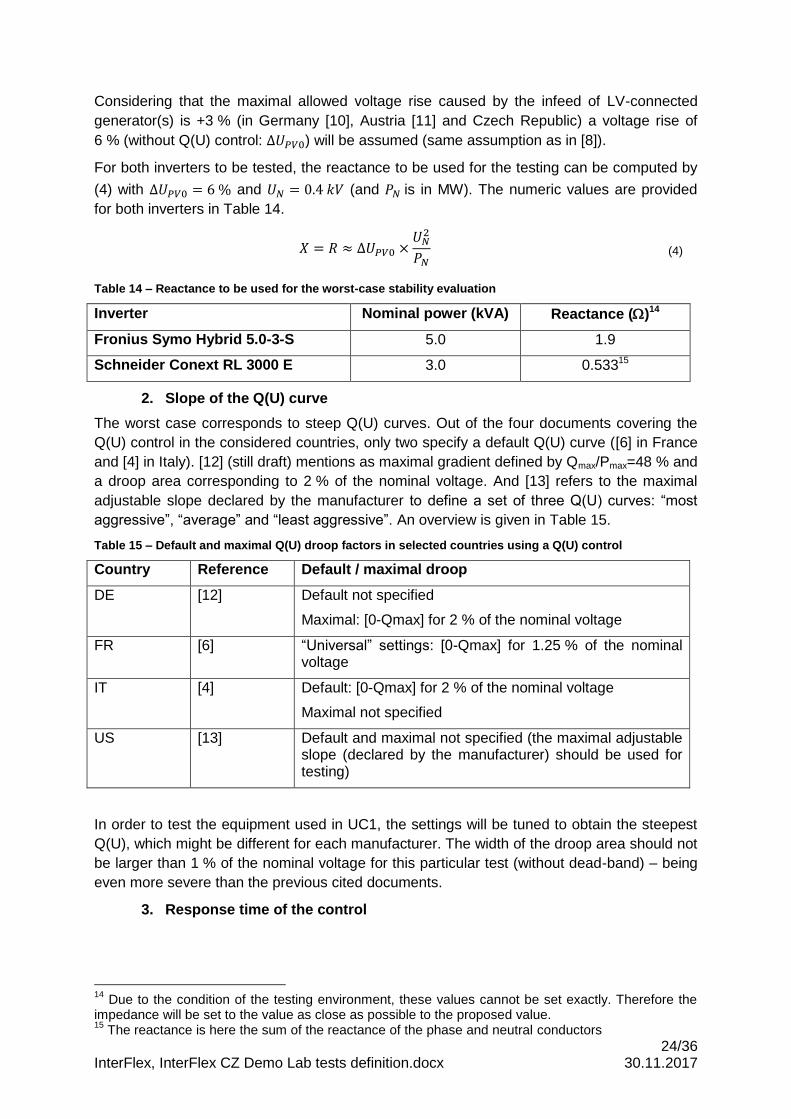
24/36 InterFlex, InterFlex CZ Demo Lab tests definition.docx 30.11.2017
Considering that the maximal allowed voltage rise caused by the infeed of LV-connected
generator(s) is +3 % (in Germany [10], Austria [11] and Czech Republic) a voltage rise of
6 % (without Q(U) control: ∆𝑈𝑃𝑉0) will be assumed (same assumption as in [8]).
For both inverters to be tested, the reactance to be used for the testing can be computed by
(4) with ∆𝑈𝑃𝑉0 = 6 % and 𝑈𝑁 = 0.4 𝑘𝑉 (and 𝑃𝑁 is in MW). The numeric values are provided
for both inverters in Table 14.
𝑋 = 𝑅 ≈ ∆𝑈𝑃𝑉0 ×𝑈𝑁
2
𝑃𝑁 (4)
Table 14 – Reactance to be used for the worst-case stability evaluation
Inverter Nominal power (kVA) Reactance ()14
Fronius Symo Hybrid 5.0-3-S 5.0 1.9
Schneider Conext RL 3000 E 3.0 0.53315
2. Slope of the Q(U) curve
The worst case corresponds to steep Q(U) curves. Out of the four documents covering the
Q(U) control in the considered countries, only two specify a default Q(U) curve ([6] in France
and [4] in Italy). [12] (still draft) mentions as maximal gradient defined by Qmax/Pmax=48 % and
a droop area corresponding to 2 % of the nominal voltage. And [13] refers to the maximal
adjustable slope declared by the manufacturer to define a set of three Q(U) curves: “most
aggressive”, “average” and “least aggressive”. An overview is given in Table 15.
Table 15 – Default and maximal Q(U) droop factors in selected countries using a Q(U) control
Country Reference Default / maximal droop
DE [12] Default not specified
Maximal: [0-Qmax] for 2 % of the nominal voltage
FR [6] “Universal” settings: [0-Qmax] for 1.25 % of the nominal voltage
IT [4] Default: [0-Qmax] for 2 % of the nominal voltage
Maximal not specified
US [13] Default and maximal not specified (the maximal adjustable slope (declared by the manufacturer) should be used for testing)
In order to test the equipment used in UC1, the settings will be tuned to obtain the steepest
Q(U), which might be different for each manufacturer. The width of the droop area should not
be larger than 1 % of the nominal voltage for this particular test (without dead-band) – being
even more severe than the previous cited documents.
3. Response time of the control
14
Due to the condition of the testing environment, these values cannot be set exactly. Therefore the impedance will be set to the value as close as possible to the proposed value. 15
The reactance is here the sum of the reactance of the phase and neutral conductors
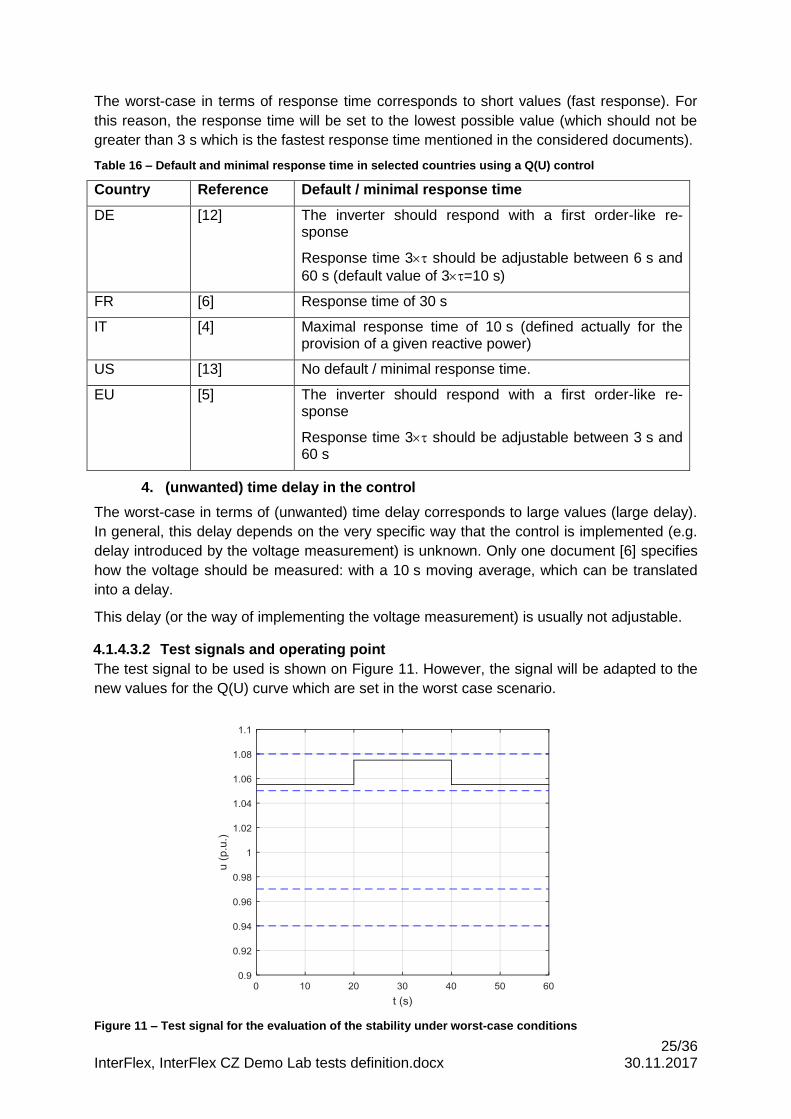
25/36 InterFlex, InterFlex CZ Demo Lab tests definition.docx 30.11.2017
The worst-case in terms of response time corresponds to short values (fast response). For
this reason, the response time will be set to the lowest possible value (which should not be
greater than 3 s which is the fastest response time mentioned in the considered documents).
Table 16 – Default and minimal response time in selected countries using a Q(U) control
Country Reference Default / minimal response time
DE [12] The inverter should respond with a first order-like re-sponse
Response time 3 should be adjustable between 6 s and
60 s (default value of 3=10 s)
FR [6] Response time of 30 s
IT [4] Maximal response time of 10 s (defined actually for the provision of a given reactive power)
US [13] No default / minimal response time.
EU [5] The inverter should respond with a first order-like re-sponse
Response time 3 should be adjustable between 3 s and 60 s
4. (unwanted) time delay in the control
The worst-case in terms of (unwanted) time delay corresponds to large values (large delay).
In general, this delay depends on the very specific way that the control is implemented (e.g.
delay introduced by the voltage measurement) is unknown. Only one document [6] specifies
how the voltage should be measured: with a 10 s moving average, which can be translated
into a delay.
This delay (or the way of implementing the voltage measurement) is usually not adjustable.
4.1.4.3.2 Test signals and operating point
The test signal to be used is shown on Figure 11. However, the signal will be adapted to the
new values for the Q(U) curve which are set in the worst case scenario.
Figure 11 – Test signal for the evaluation of the stability under worst-case conditions

26/36 InterFlex, InterFlex CZ Demo Lab tests definition.docx 30.11.2017
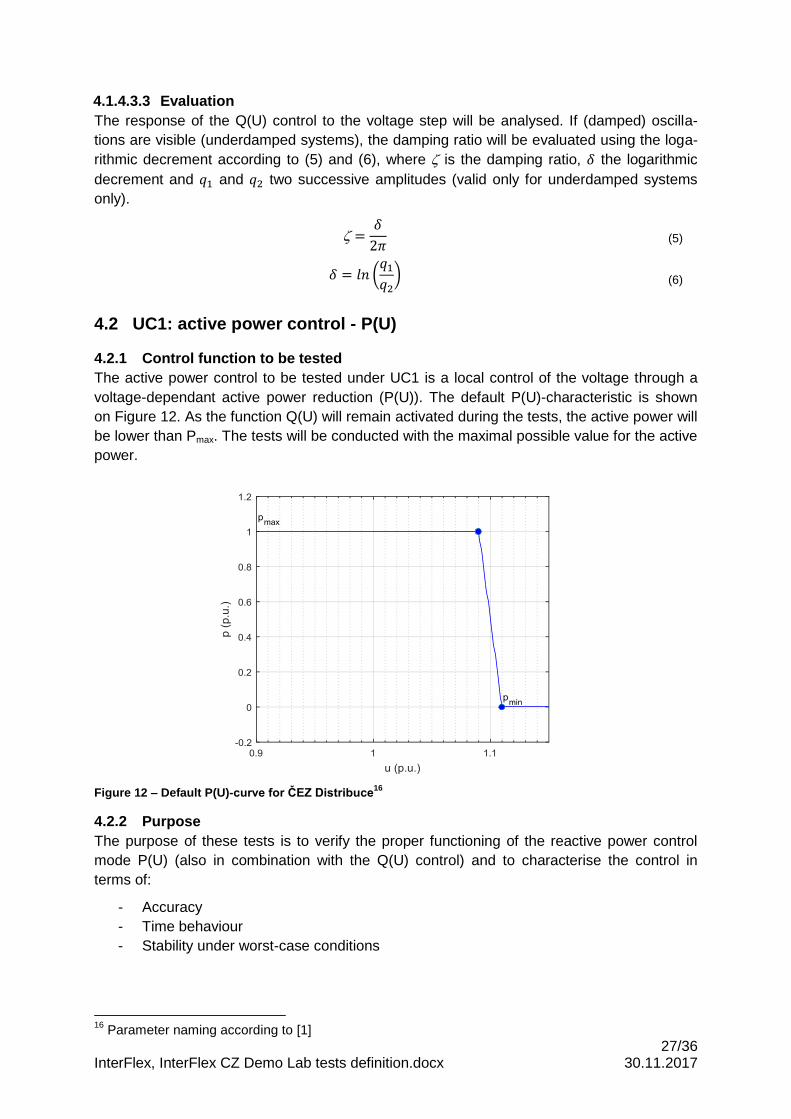
27/36 InterFlex, InterFlex CZ Demo Lab tests definition.docx 30.11.2017
4.1.4.3.3 Evaluation
The response of the Q(U) control to the voltage step will be analysed. If (damped) oscilla-
tions are visible (underdamped systems), the damping ratio will be evaluated using the loga-
rithmic decrement according to (5) and (6), where is the damping ratio, 𝛿 the logarithmic
decrement and 𝑞1 and 𝑞2 two successive amplitudes (valid only for underdamped systems
only).
=𝛿
2𝜋 (5)
𝛿 = 𝑙𝑛 (𝑞1
𝑞2) (6)
4.2 UC1: active power control - P(U)
4.2.1 Control function to be tested
The active power control to be tested under UC1 is a local control of the voltage through a
voltage-dependant active power reduction (P(U)). The default P(U)-characteristic is shown
on Figure 12. As the function Q(U) will remain activated during the tests, the active power will
be lower than Pmax. The tests will be conducted with the maximal possible value for the active
power.
Figure 12 – Default P(U)-curve for ČEZ Distribuce16
4.2.2 Purpose
The purpose of these tests is to verify the proper functioning of the reactive power control
mode P(U) (also in combination with the Q(U) control) and to characterise the control in
terms of:
- Accuracy
- Time behaviour
- Stability under worst-case conditions
16
Parameter naming according to [1]

28/36 InterFlex, InterFlex CZ Demo Lab tests definition.docx 30.11.2017
4.2.3 Activated function(s) and test conditions
The function Q(U) will be activated and parametrised with the settings mentioned in the test
cases (chapters 4.1.4.1 to 4.1.4.3). The tests will only be done at Pmax; this power will how-
ever be reduced due to the activated Q(U) control.
The overview of the available parameters is provided in Table 17 and Table 18 for both manu-
facturers.
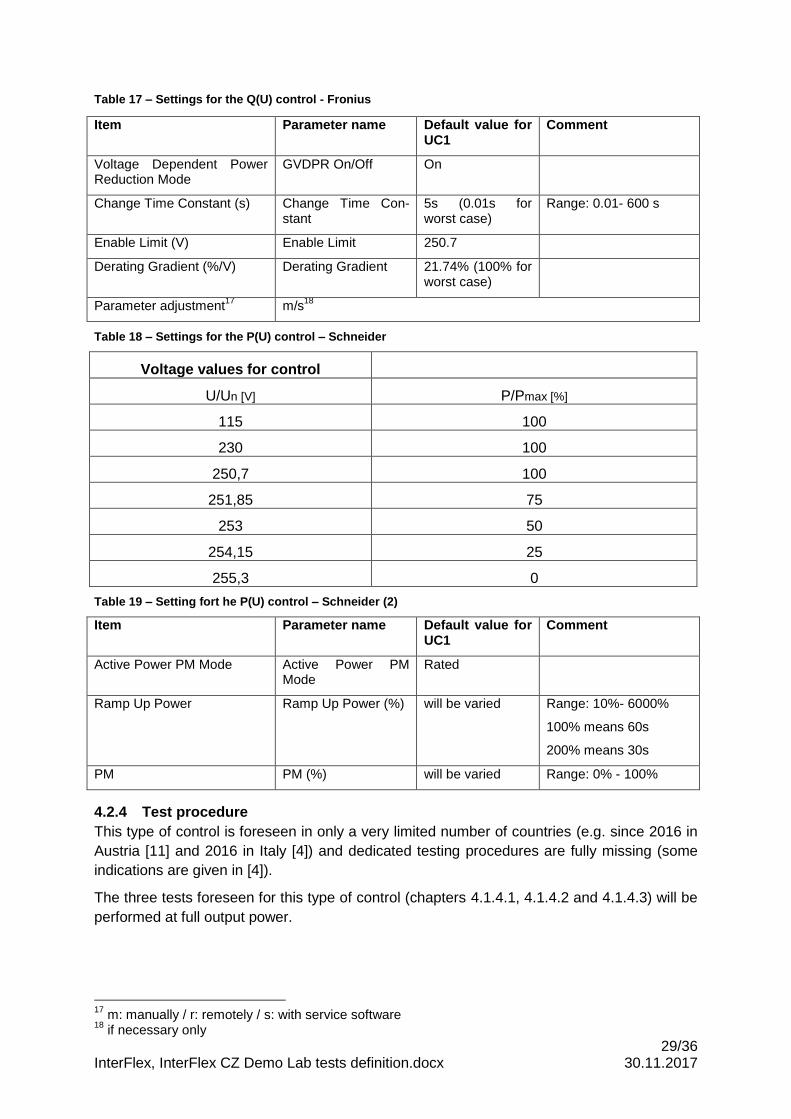
29/36 InterFlex, InterFlex CZ Demo Lab tests definition.docx 30.11.2017
Table 17 – Settings for the Q(U) control - Fronius
Item Parameter name Default value for UC1
Comment
Voltage Dependent Power Reduction Mode
GVDPR On/Off On
Change Time Constant (s) Change Time Con-stant
5s (0.01s for worst case)
Range: 0.01- 600 s
Enable Limit (V) Enable Limit 250.7
Derating Gradient (%/V) Derating Gradient 21.74% (100% for worst case)
Parameter adjustment17
m/s18
Table 18 – Settings for the P(U) control – Schneider
Voltage values for control
U/Un [V] P/Pmax [%]
115 100
230 100
250,7 100
251,85 75
253 50
254,15 25
255,3 0
Table 19 – Setting fort he P(U) control – Schneider (2)
Item Parameter name Default value for UC1
Comment
Active Power PM Mode Active Power PM Mode
Rated
Ramp Up Power Ramp Up Power (%) will be varied Range: 10%- 6000%
100% means 60s
200% means 30s
PM PM (%) will be varied Range: 0% - 100%
4.2.4 Test procedure
This type of control is foreseen in only a very limited number of countries (e.g. since 2016 in
Austria [11] and 2016 in Italy [4]) and dedicated testing procedures are fully missing (some
indications are given in [4]).
The three tests foreseen for this type of control (chapters 4.1.4.1, 4.1.4.2 and 4.1.4.3) will be
performed at full output power.
17
m: manually / r: remotely / s: with service software 18
if necessary only
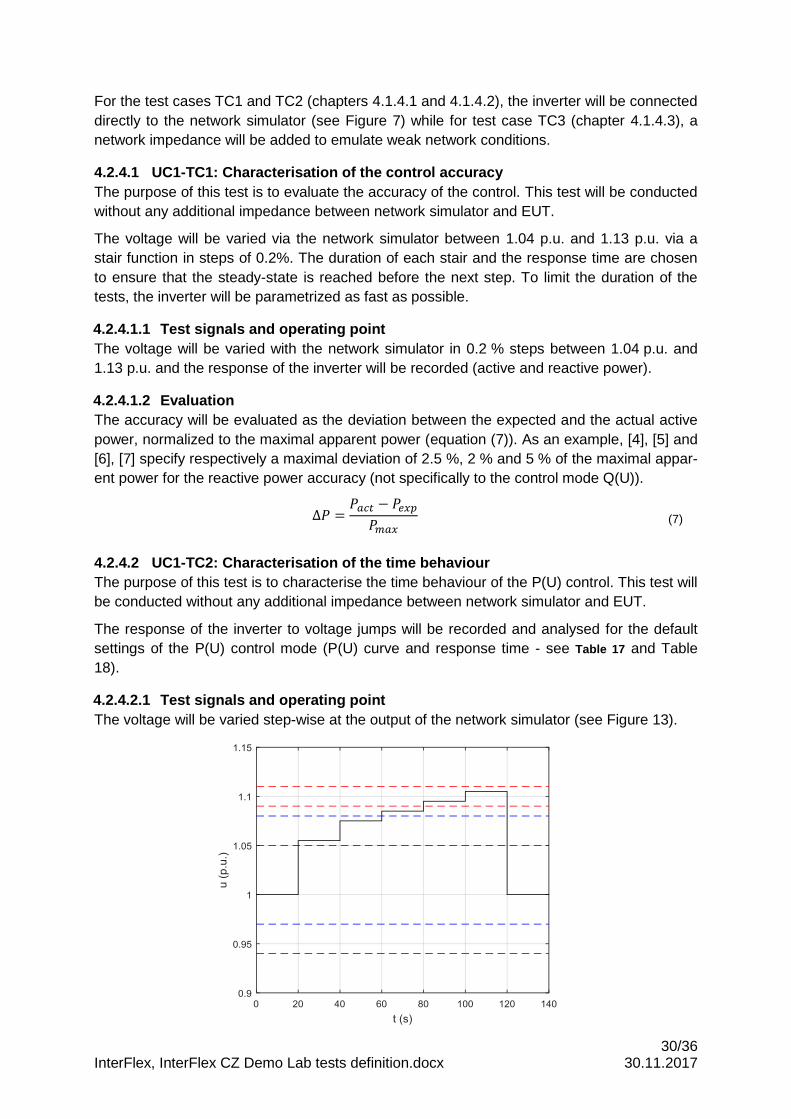
30/36 InterFlex, InterFlex CZ Demo Lab tests definition.docx 30.11.2017
For the test cases TC1 and TC2 (chapters 4.1.4.1 and 4.1.4.2), the inverter will be connected
directly to the network simulator (see Figure 7) while for test case TC3 (chapter 4.1.4.3), a
network impedance will be added to emulate weak network conditions.
4.2.4.1 UC1-TC1: Characterisation of the control accuracy
The purpose of this test is to evaluate the accuracy of the control. This test will be conducted
without any additional impedance between network simulator and EUT.
The voltage will be varied via the network simulator between 1.04 p.u. and 1.13 p.u. via a
stair function in steps of 0.2%. The duration of each stair and the response time are chosen
to ensure that the steady-state is reached before the next step. To limit the duration of the
tests, the inverter will be parametrized as fast as possible.
4.2.4.1.1 Test signals and operating point
The voltage will be varied with the network simulator in 0.2 % steps between 1.04 p.u. and
1.13 p.u. and the response of the inverter will be recorded (active and reactive power).
4.2.4.1.2 Evaluation
The accuracy will be evaluated as the deviation between the expected and the actual active
power, normalized to the maximal apparent power (equation (7)). As an example, [4], [5] and
[6], [7] specify respectively a maximal deviation of 2.5 %, 2 % and 5 % of the maximal appar-
ent power for the reactive power accuracy (not specifically to the control mode Q(U)).
∆𝑃 =𝑃𝑎𝑐𝑡 − 𝑃𝑒𝑥𝑝
𝑃𝑚𝑎𝑥 (7)
4.2.4.2 UC1-TC2: Characterisation of the time behaviour
The purpose of this test is to characterise the time behaviour of the P(U) control. This test will
be conducted without any additional impedance between network simulator and EUT.
The response of the inverter to voltage jumps will be recorded and analysed for the default
settings of the P(U) control mode (P(U) curve and response time - see Table 17 and Table
18).
4.2.4.2.1 Test signals and operating point
The voltage will be varied step-wise at the output of the network simulator (see Figure 13).
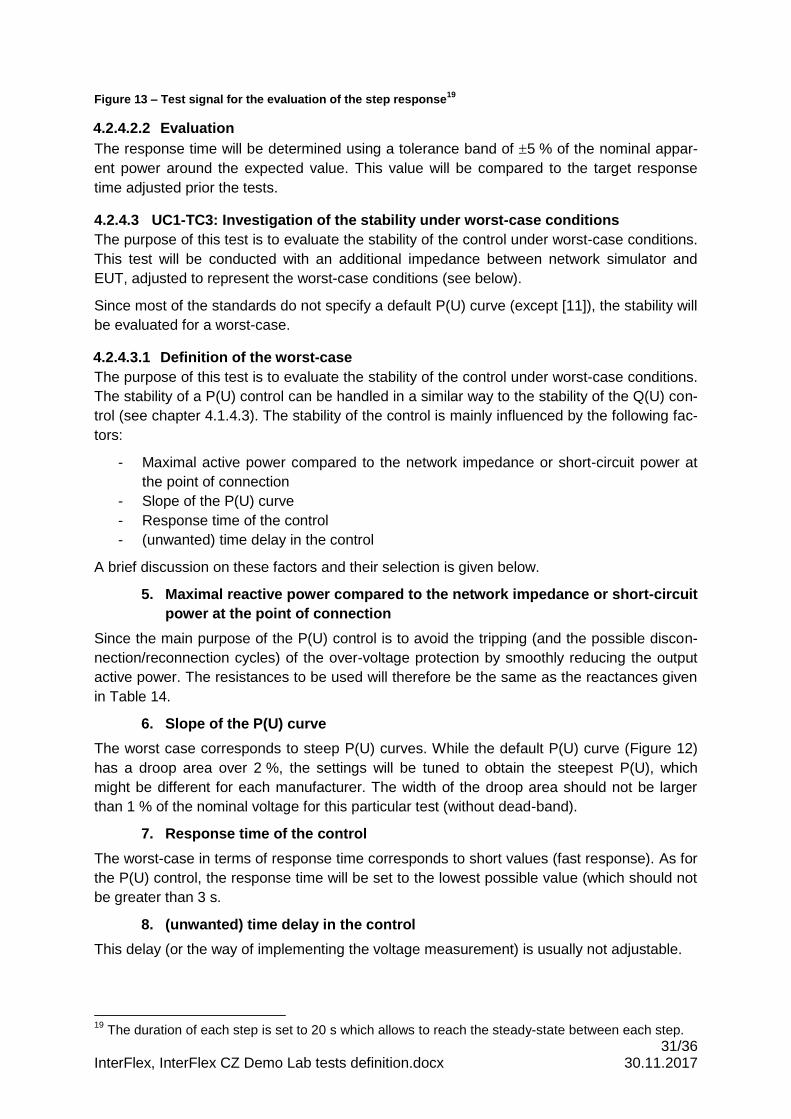
31/36 InterFlex, InterFlex CZ Demo Lab tests definition.docx 30.11.2017
Figure 13 – Test signal for the evaluation of the step response19
4.2.4.2.2 Evaluation
The response time will be determined using a tolerance band of 5 % of the nominal appar-
ent power around the expected value. This value will be compared to the target response
time adjusted prior the tests.
4.2.4.3 UC1-TC3: Investigation of the stability under worst-case conditions
The purpose of this test is to evaluate the stability of the control under worst-case conditions.
This test will be conducted with an additional impedance between network simulator and
EUT, adjusted to represent the worst-case conditions (see below).
Since most of the standards do not specify a default P(U) curve (except [11]), the stability will
be evaluated for a worst-case.
4.2.4.3.1 Definition of the worst-case
The purpose of this test is to evaluate the stability of the control under worst-case conditions.
The stability of a P(U) control can be handled in a similar way to the stability of the Q(U) con-
trol (see chapter 4.1.4.3). The stability of the control is mainly influenced by the following fac-
tors:
- Maximal active power compared to the network impedance or short-circuit power at
the point of connection
- Slope of the P(U) curve
- Response time of the control
- (unwanted) time delay in the control
A brief discussion on these factors and their selection is given below.
5. Maximal reactive power compared to the network impedance or short-circuit
power at the point of connection
Since the main purpose of the P(U) control is to avoid the tripping (and the possible discon-
nection/reconnection cycles) of the over-voltage protection by smoothly reducing the output
active power. The resistances to be used will therefore be the same as the reactances given
in Table 14.
6. Slope of the P(U) curve
The worst case corresponds to steep P(U) curves. While the default P(U) curve (Figure 12)
has a droop area over 2 %, the settings will be tuned to obtain the steepest P(U), which
might be different for each manufacturer. The width of the droop area should not be larger
than 1 % of the nominal voltage for this particular test (without dead-band).
7. Response time of the control
The worst-case in terms of response time corresponds to short values (fast response). As for
the P(U) control, the response time will be set to the lowest possible value (which should not
be greater than 3 s.
8. (unwanted) time delay in the control
This delay (or the way of implementing the voltage measurement) is usually not adjustable.
19
The duration of each step is set to 20 s which allows to reach the steady-state between each step.
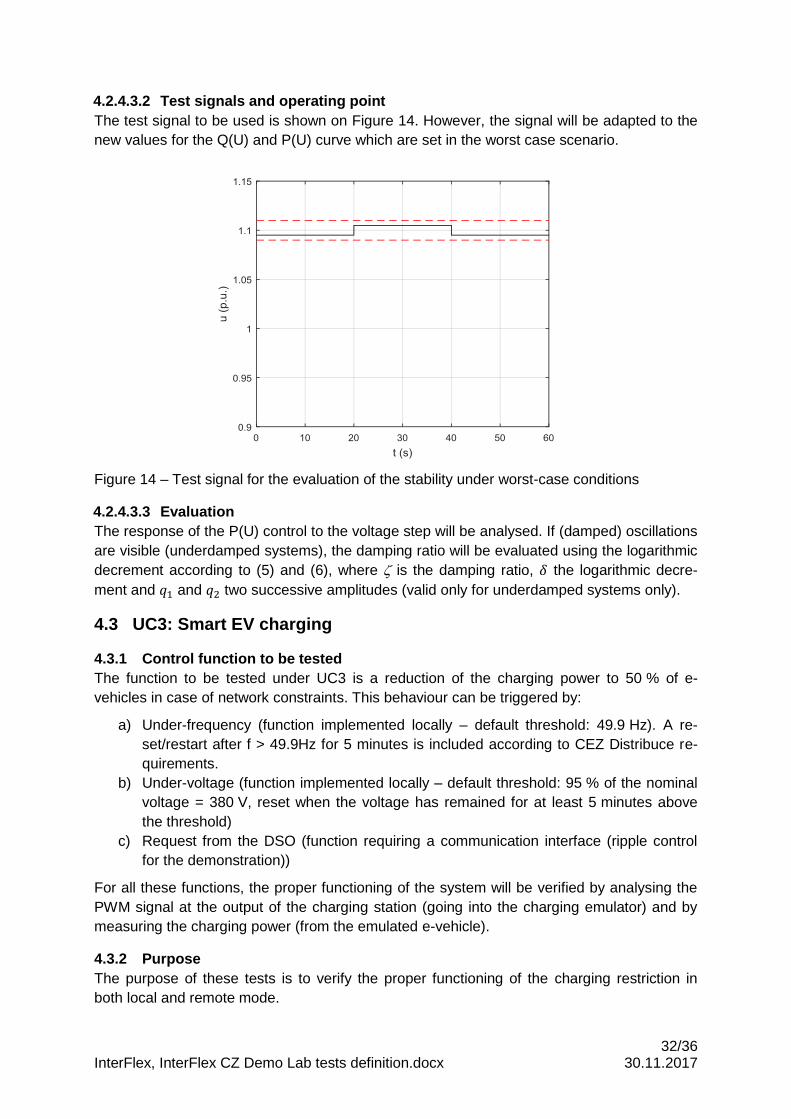
32/36 InterFlex, InterFlex CZ Demo Lab tests definition.docx 30.11.2017
4.2.4.3.2 Test signals and operating point
The test signal to be used is shown on Figure 14. However, the signal will be adapted to the
new values for the Q(U) and P(U) curve which are set in the worst case scenario.
Figure 14 – Test signal for the evaluation of the stability under worst-case conditions
4.2.4.3.3 Evaluation
The response of the P(U) control to the voltage step will be analysed. If (damped) oscillations
are visible (underdamped systems), the damping ratio will be evaluated using the logarithmic
decrement according to (5) and (6), where is the damping ratio, 𝛿 the logarithmic decre-
ment and 𝑞1 and 𝑞2 two successive amplitudes (valid only for underdamped systems only).
4.3 UC3: Smart EV charging
4.3.1 Control function to be tested
The function to be tested under UC3 is a reduction of the charging power to 50 % of e-
vehicles in case of network constraints. This behaviour can be triggered by:
a) Under-frequency (function implemented locally – default threshold: 49.9 Hz). A re-
set/restart after f > 49.9Hz for 5 minutes is included according to CEZ Distribuce re-
quirements.
b) Under-voltage (function implemented locally – default threshold: 95 % of the nominal
voltage = 380 V, reset when the voltage has remained for at least 5 minutes above
the threshold)
c) Request from the DSO (function requiring a communication interface (ripple control
for the demonstration))
For all these functions, the proper functioning of the system will be verified by analysing the
PWM signal at the output of the charging station (going into the charging emulator) and by
measuring the charging power (from the emulated e-vehicle).
4.3.2 Purpose
The purpose of these tests is to verify the proper functioning of the charging restriction in
both local and remote mode.
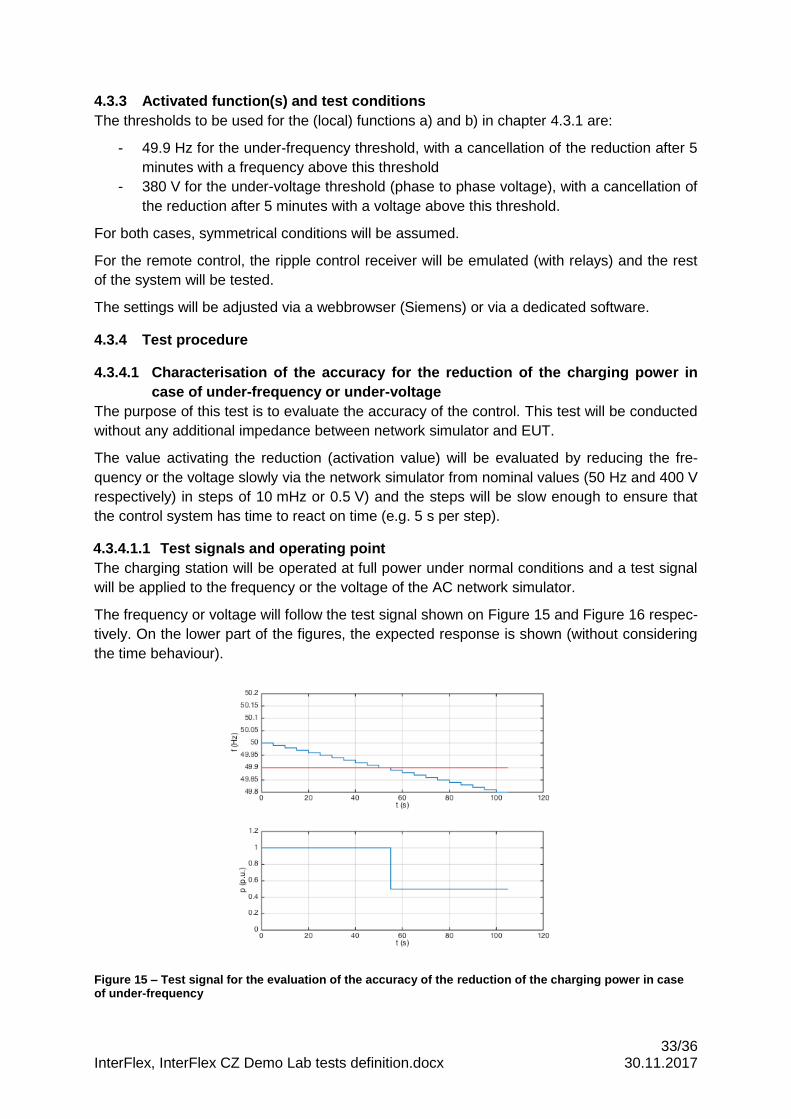
33/36 InterFlex, InterFlex CZ Demo Lab tests definition.docx 30.11.2017
4.3.3 Activated function(s) and test conditions
The thresholds to be used for the (local) functions a) and b) in chapter 4.3.1 are:
- 49.9 Hz for the under-frequency threshold, with a cancellation of the reduction after 5
minutes with a frequency above this threshold
- 380 V for the under-voltage threshold (phase to phase voltage), with a cancellation of
the reduction after 5 minutes with a voltage above this threshold.
For both cases, symmetrical conditions will be assumed.
For the remote control, the ripple control receiver will be emulated (with relays) and the rest
of the system will be tested.
The settings will be adjusted via a webbrowser (Siemens) or via a dedicated software.
4.3.4 Test procedure
4.3.4.1 Characterisation of the accuracy for the reduction of the charging power in
case of under-frequency or under-voltage
The purpose of this test is to evaluate the accuracy of the control. This test will be conducted
without any additional impedance between network simulator and EUT.
The value activating the reduction (activation value) will be evaluated by reducing the fre-
quency or the voltage slowly via the network simulator from nominal values (50 Hz and 400 V
respectively) in steps of 10 mHz or 0.5 V) and the steps will be slow enough to ensure that
the control system has time to react on time (e.g. 5 s per step).
4.3.4.1.1 Test signals and operating point
The charging station will be operated at full power under normal conditions and a test signal
will be applied to the frequency or the voltage of the AC network simulator.
The frequency or voltage will follow the test signal shown on Figure 15 and Figure 16 respec-
tively. On the lower part of the figures, the expected response is shown (without considering
the time behaviour).
Figure 15 – Test signal for the evaluation of the accuracy of the reduction of the charging power in case of under-frequency
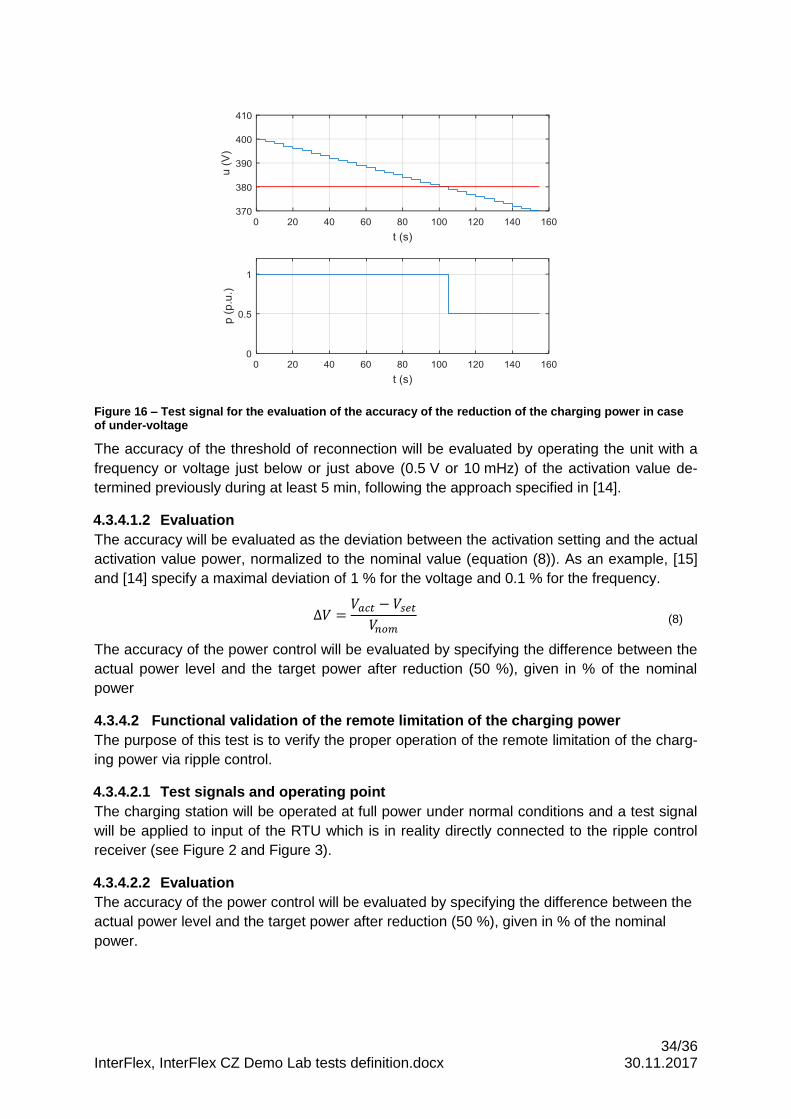
34/36 InterFlex, InterFlex CZ Demo Lab tests definition.docx 30.11.2017
Figure 16 – Test signal for the evaluation of the accuracy of the reduction of the charging power in case of under-voltage
The accuracy of the threshold of reconnection will be evaluated by operating the unit with a
frequency or voltage just below or just above (0.5 V or 10 mHz) of the activation value de-
termined previously during at least 5 min, following the approach specified in [14].
4.3.4.1.2 Evaluation
The accuracy will be evaluated as the deviation between the activation setting and the actual
activation value power, normalized to the nominal value (equation (8)). As an example, [15]
and [14] specify a maximal deviation of 1 % for the voltage and 0.1 % for the frequency.
∆𝑉 =𝑉𝑎𝑐𝑡 − 𝑉𝑠𝑒𝑡
𝑉𝑛𝑜𝑚 (8)
The accuracy of the power control will be evaluated by specifying the difference between the
actual power level and the target power after reduction (50 %), given in % of the nominal
power
4.3.4.2 Functional validation of the remote limitation of the charging power
The purpose of this test is to verify the proper operation of the remote limitation of the charg-
ing power via ripple control.
4.3.4.2.1 Test signals and operating point
The charging station will be operated at full power under normal conditions and a test signal
will be applied to input of the RTU which is in reality directly connected to the ripple control
receiver (see Figure 2 and Figure 3).
4.3.4.2.2 Evaluation
The accuracy of the power control will be evaluated by specifying the difference between the
actual power level and the target power after reduction (50 %), given in % of the nominal
power.
35/36 InterFlex, InterFlex CZ Demo Lab tests definition.docx 30.11.2017
4.4 UC4: Smart energy storage
4.4.1 Control function to be tested
The function to be tested under UC4 include local and remote control of the battery system
(see chapter 2.4.1).
4.4.2 Purpose
The purpose of these tests is to verify the proper functioning of the charging/discharging be-
haviour in both local and remote mode.
4.4.3 Activated function(s) and test conditions
The thresholds to be used for the (local) in chapter 2.4.1 are:
- Permanent limitation of the power surplus injected into the network to 50 % of the
nominal power of the PV generation.
- Under-frequency stage 1 (function implemented locally – default threshold: 49.9 Hz):
stop the charging of the battery. The charging can restart if the frequency is above
49.9 Hz for at least 5 minutes
- Under-frequency stage 2 (function implemented locally – default threshold: 49.85 Hz):
discharge of the battery at 100 % of nominal power until the min. allowed SoC (70 %)
of the battery is reached or the frequency exceeds 50.1 Hz
- Under-voltage stage 1 (function implemented locally – default threshold: 95 % of the
nominal voltage = 380 V): stop the charging of the battery. The charging can restart if
the frequency is above 380 V for at least 5 minutes
- Under-voltage stage 2 (function implemented locally – default threshold: 92.5 % of
the nominal voltage = 370 V): discharge of the battery at 100 % of nominal power un-
til the min. allowed SoC (70 %) of the battery is reached or the voltage exceeds 420 V
- Remote functions: As in UC3, a remote control is included: the PV + storage system
must allow the discharge at 100 % of the nominal power of battery system after acti-
vation via ripple control from DSO until the min. allowed SoC (70 %) of the battery is
reached.
For all cases, symmetrical conditions will be assumed. Additional tests could be performed
with unsymmetrical conditions.
For the remote control, the ripple control receiver will be emulated (with relays) and the rest
of the system will be tested.
Information to be provided by Schneider and Fronius on how to adjust the settings (if neces-
sary).
4.4.4 Test procedure
4.4.4.1 Characterisation of the accuracy for the under-frequency control (stage 1 and
stage 2)
The test will follow the approach specified for UC3 (see chapter 4.3.4.1).
4.4.4.2 Characterisation of the accuracy for the under-voltage control (stage 1 and
stage 2)
The test will follow the approach specified for UC3 (see chapter 4.3.4.1).
36/36 InterFlex, InterFlex CZ Demo Lab tests definition.docx 30.11.2017
4.4.4.3 Functional validation of the remote control of the storage system
The purpose of this test is to verify the proper operation of the remote limitation of the stor-
age system via ripple control.
4.4.4.3.1 Test signals and operating point
The storage system will be operated in idle state, as well as charging and discharging mode
at full power, and a test signal will be applied to input of the RTU which is in reality directly
connected to the ripple control receiver.
4.4.4.3.2 Evaluation
The accuracy of the power control will be evaluated by specifying the difference between the
actual power level and the target power given in % of the nominal power.
5 Analysis and documentation of the results
The results will be analysed (post-processing) in details during and after the lab tests and
summarised in a dedicated internal report, which can be used for deliverable D6.1.
37/36 InterFlex, InterFlex CZ Demo Lab tests definition.docx 30.11.2017
Literature
[1] IEC, ‘IEC TR 61850-90-7:2013 Communication networks and systems for power utility automation - Part 90-7: Object models for power converters in distributed energy re-sources (DER) systems’. 21-Feb-2013.
[2] ‘Generating Plants Connected to the Medium-Voltage Network’, Jun. 2008.
[3] E-CONTROL, ‘Technische und organisatorische Regeln für Betreiber und Benutzer von Netzen. Teil D: Besondere technische Regeln. Hauptabschnitt D4: Parallelbetrieb von Erzeugungsanlagen mit Verteilernetzen’. 2013.
[4] CEI, ‘CEI 0-21 - Reference technical rules for the connection of active and passive users to the LV electrical Utilities’. Jul-2016.
[5] CENELEC, ‘CLC/TS 50549-1:2014-10 Requirements for the connection of a generating plant to a distribution system - Part 1: Connection to a LV distribution system and above 16A’. Oct-2014.
[6] ENEDIS, ‘Principe et conditions de mise en oeuvre d’une régulation locale de puissance réactive pour les Installations de Production raccordées au Réseau Public de Distribution HTA’. 01-Mar-2017.
[7] CENELEC, ‘EN 50438:2013 Requirements for micro-generating plants to be connected in parallel with public low-voltage distribution networks’. 2013.
[8] F. Andren, B. Bletterie, S. Kadam, P. Kotsampopoulos, and C. Bucher, ‘On the Stability of local Voltage Control in Distribution Networks with a High Penetration of Inverter-Based Generation’, IEEE Trans. Ind. Electron., pp. 1–1, 2014.
[9] B. Bletterie, A. Gorsek, A. Abart, and M. Heidl, ‘Understanding the effects of unsymmet-rical infeed on the voltage rise for the design of suitable voltage control algorithms with PV inverters’, in Proc. 26th European Photovoltaic Solar Energy Conference and Exhibi-tion, Hamburg, 2011, pp. 4469–4478.
[10] VDE-FNN, ‘VDE-AR-N 4105:2011-08 Power generation systems connected to the low-voltage distribution network’. Aug-2011.
[11] E-CONTROL, ‘Technische und organisatorische Regeln für Betreiber und Benutzer von Netzen. Teil D: Besondere technische Regeln. Hauptabschnitt D4: Parallelbetrieb von Erzeugungsanlagen mit Verteilernetzen’. 22-Feb-2016.
[12] FNN - Forum Netztechnik/Netzbetrieb im VDE, ‘VDE-AR-N 4110 Technische Regeln für den Anschluss von Kundenanlagen an das Mittelspannungsnetz und deren Betrieb (TAR Mittelspannung)’. Mar-2017.
[13] UL, ‘UL 1741 - Standard for safety - Inverters, converters, controllers and Interconnection System Quipment for Use With Distributed Energy Resources’. 07-Sep-2016.
[14] VDE V 0124-100, ‘Grid integration of generator plants – Low-voltage – Test requirements for generator units to be connected to and operated in parallel with low-voltage distribu-tion networks’. Jul-2012.
[15] ‘VDE-AR-N 4105:2011-08 - Power generation systems connected to the low-voltage dis-tribution network - Technical minimum requirements for the connection to and parallel operation with low-voltage distribution networks’. .

D6.1 Design of solution
213
Annex 6.5
InterFlex CZ Demo Lab tests - Results p.213 - 258
Project InterFlex WP6 CZ Demo
Lab test results
UC1: Increase the DER hosting capacity of LV dis-tribution networks by combining smart PV inverter
functions (demonstration of Q(U) and P(U))
Authors: Stefanie Kaser ([email protected])
Friederich Kupzog ([email protected])
Christian Seitl ([email protected])
Date: 13.12.2017
Version: 1.0

I
Revison Date Author Change
0.5 7.12.17 Stefanie Kaser First version with test results
1.0 11.12.17 Stefanie Kaser Update of the chapters
2.0 13.12.17 Stefanie Kaser, Friederich Kupzog
Update with comments
II
Content
1 Documents ..................................................................................................................... 3
2 Testing infrastructure ...................................................................................................... 3
3 Equipment under test ..................................................................................................... 3
3.1 Settings – Q(U) ....................................................................................................... 3
3.2 Settings – P(U) ........................................................................................................ 4
4 Results ........................................................................................................................... 5
4.1 Reactive Power Control - Q(U) ................................................................................ 5
4.1.1 Test Case 1 ...................................................................................................... 5
4.1.2 Test Case 2 .....................................................................................................15
4.1.3 Test Case 3 .....................................................................................................20
4.2 Active Power Control – P(U) ...................................................................................30
4.2.1 Test Case 1 .....................................................................................................30
4.2.2 Test Case 2 .....................................................................................................37
4.2.3 Test Case 3 .....................................................................................................39
5 Conclusion ....................................................................................................................43
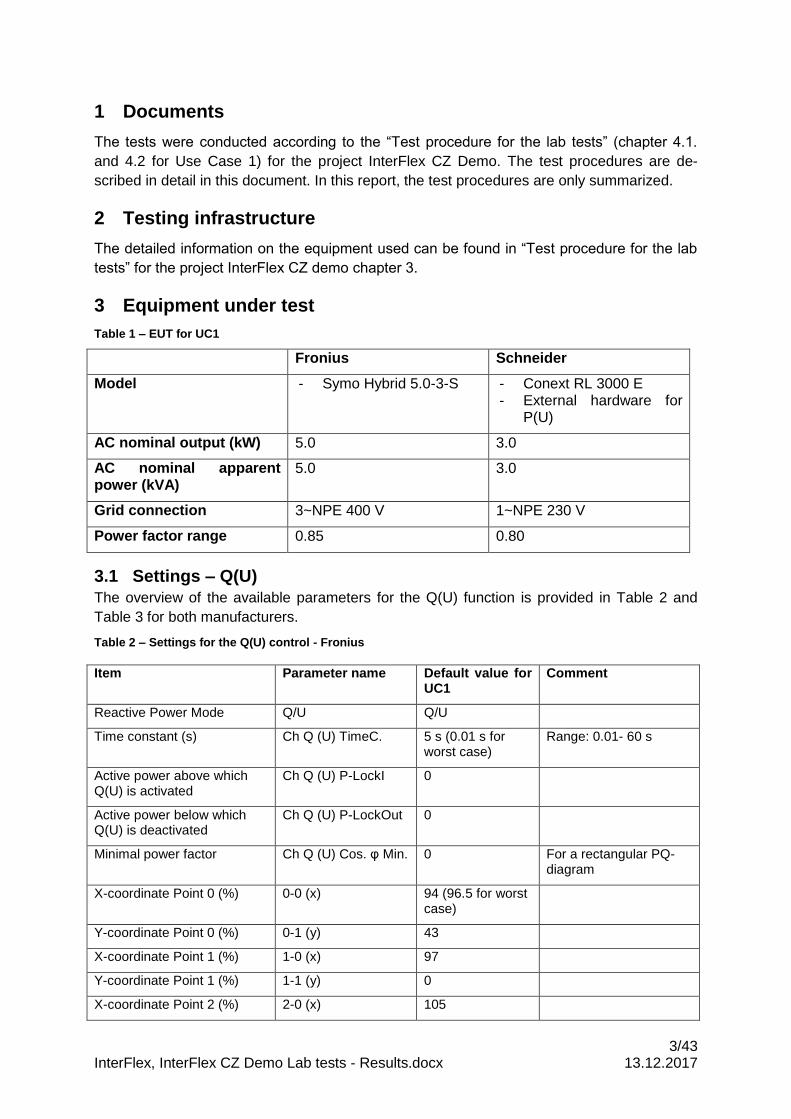
3/43 InterFlex, InterFlex CZ Demo Lab tests - Results.docx 13.12.2017
1 Documents
The tests were conducted according to the “Test procedure for the lab tests” (chapter 4.1.
and 4.2 for Use Case 1) for the project InterFlex CZ Demo. The test procedures are de-
scribed in detail in this document. In this report, the test procedures are only summarized.
2 Testing infrastructure
The detailed information on the equipment used can be found in “Test procedure for the lab
tests” for the project InterFlex CZ demo chapter 3.
3 Equipment under test
Table 1 – EUT for UC1
Fronius Schneider
Model - Symo Hybrid 5.0-3-S - Conext RL 3000 E - External hardware for
P(U)
AC nominal output (kW) 5.0 3.0
AC nominal apparent power (kVA)
5.0 3.0
Grid connection 3~NPE 400 V 1~NPE 230 V
Power factor range 0.85 0.80
3.1 Settings – Q(U)
The overview of the available parameters for the Q(U) function is provided in Table 2 and
Table 3 for both manufacturers.
Table 2 – Settings for the Q(U) control - Fronius
Item Parameter name Default value for UC1
Comment
Reactive Power Mode Q/U Q/U
Time constant (s) Ch Q (U) TimeC. 5 s (0.01 s for worst case)
Range: 0.01- 60 s
Active power above which Q(U) is activated
Ch Q (U) P-LockI 0
Active power below which Q(U) is deactivated
Ch Q (U) P-LockOut 0
Minimal power factor Ch Q (U) Cos. φ Min. 0 For a rectangular PQ-diagram
X-coordinate Point 0 (%) 0-0 (x) 94 (96.5 for worst case)
Y-coordinate Point 0 (%) 0-1 (y) 43
X-coordinate Point 1 (%) 1-0 (x) 97
Y-coordinate Point 1 (%) 1-1 (y) 0
X-coordinate Point 2 (%) 2-0 (x) 105
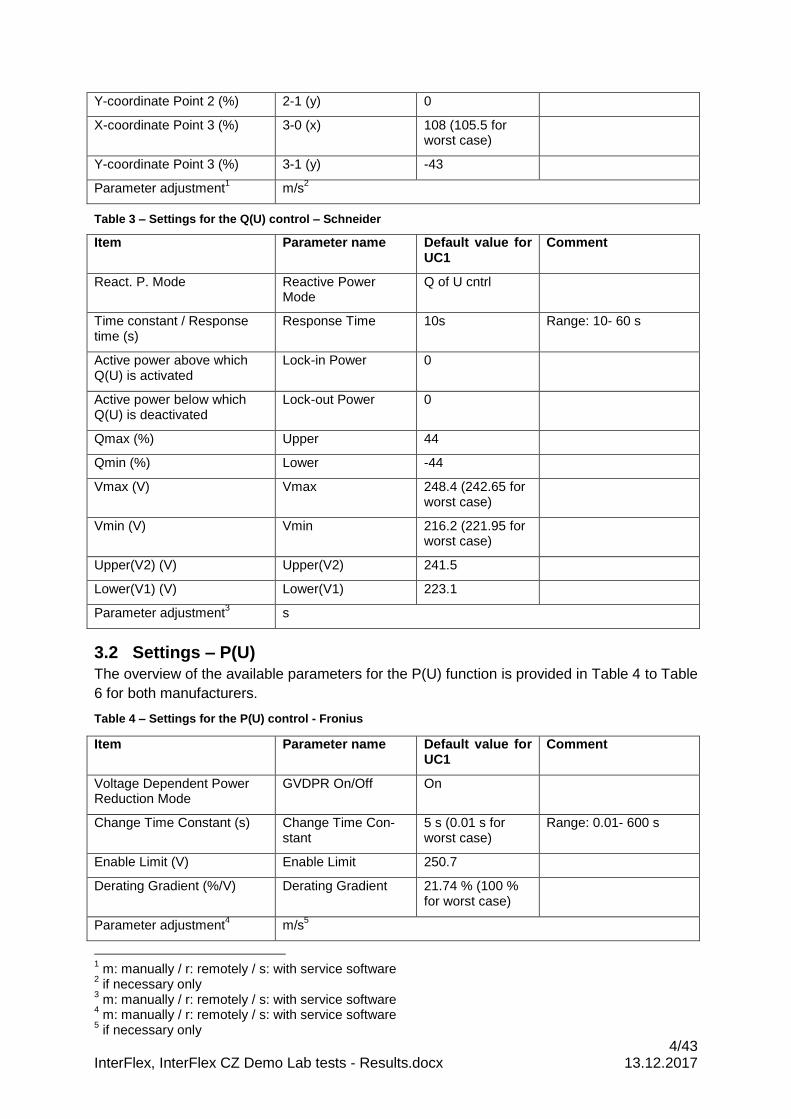
4/43 InterFlex, InterFlex CZ Demo Lab tests - Results.docx 13.12.2017
Y-coordinate Point 2 (%) 2-1 (y) 0
X-coordinate Point 3 (%) 3-0 (x) 108 (105.5 for worst case)
Y-coordinate Point 3 (%) 3-1 (y) -43
Parameter adjustment1 m/s
2
Table 3 – Settings for the Q(U) control – Schneider
Item Parameter name Default value for UC1
Comment
React. P. Mode Reactive Power Mode
Q of U cntrl
Time constant / Response time (s)
Response Time 10s Range: 10- 60 s
Active power above which Q(U) is activated
Lock-in Power 0
Active power below which Q(U) is deactivated
Lock-out Power 0
Qmax (%) Upper 44
Qmin (%) Lower -44
Vmax (V) Vmax 248.4 (242.65 for worst case)
Vmin (V) Vmin 216.2 (221.95 for worst case)
Upper(V2) (V) Upper(V2) 241.5
Lower(V1) (V) Lower(V1) 223.1
Parameter adjustment3 s
3.2 Settings – P(U)
The overview of the available parameters for the P(U) function is provided in Table 4 to Table
6 for both manufacturers.
Table 4 – Settings for the P(U) control - Fronius
Item Parameter name Default value for UC1
Comment
Voltage Dependent Power Reduction Mode
GVDPR On/Off On
Change Time Constant (s) Change Time Con-stant
5 s (0.01 s for worst case)
Range: 0.01- 600 s
Enable Limit (V) Enable Limit 250.7
Derating Gradient (%/V) Derating Gradient 21.74 % (100 % for worst case)
Parameter adjustment4 m/s
5
1 m: manually / r: remotely / s: with service software
2 if necessary only
3 m: manually / r: remotely / s: with service software
4 m: manually / r: remotely / s: with service software
5 if necessary only
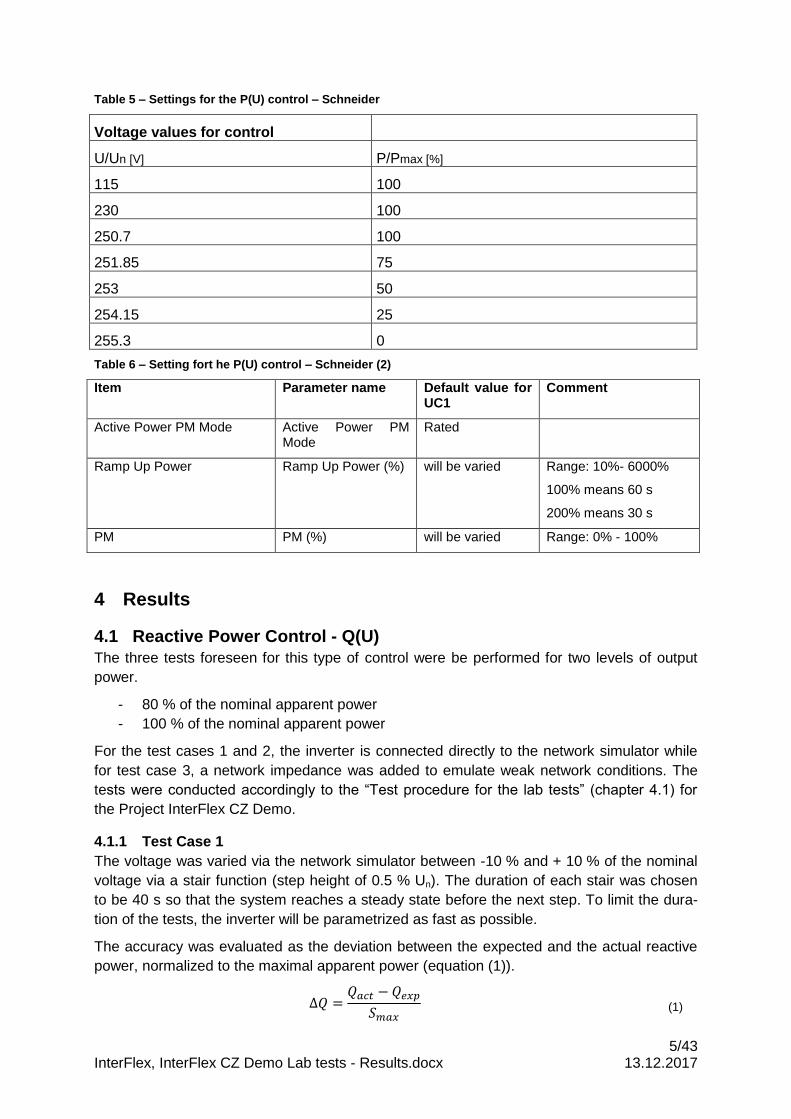
5/43 InterFlex, InterFlex CZ Demo Lab tests - Results.docx 13.12.2017
Table 5 – Settings for the P(U) control – Schneider
Voltage values for control
U/Un [V] P/Pmax [%]
115 100
230 100
250.7 100
251.85 75
253 50
254.15 25
255.3 0
Table 6 – Setting fort he P(U) control – Schneider (2)
Item Parameter name Default value for UC1
Comment
Active Power PM Mode Active Power PM Mode
Rated
Ramp Up Power Ramp Up Power (%) will be varied Range: 10%- 6000%
100% means 60 s
200% means 30 s
PM PM (%) will be varied Range: 0% - 100%
4 Results
4.1 Reactive Power Control - Q(U)
The three tests foreseen for this type of control were be performed for two levels of output
power.
- 80 % of the nominal apparent power
- 100 % of the nominal apparent power
For the test cases 1 and 2, the inverter is connected directly to the network simulator while
for test case 3, a network impedance was added to emulate weak network conditions. The
tests were conducted accordingly to the “Test procedure for the lab tests” (chapter 4.1) for
the Project InterFlex CZ Demo.
4.1.1 Test Case 1
The voltage was varied via the network simulator between -10 % and + 10 % of the nominal
voltage via a stair function (step height of 0.5 % Un). The duration of each stair was chosen
to be 40 s so that the system reaches a steady state before the next step. To limit the dura-
tion of the tests, the inverter will be parametrized as fast as possible.
The accuracy was evaluated as the deviation between the expected and the actual reactive
power, normalized to the maximal apparent power (equation (1)).
∆𝑄 =𝑄𝑎𝑐𝑡 − 𝑄𝑒𝑥𝑝
𝑆𝑚𝑎𝑥 (1)
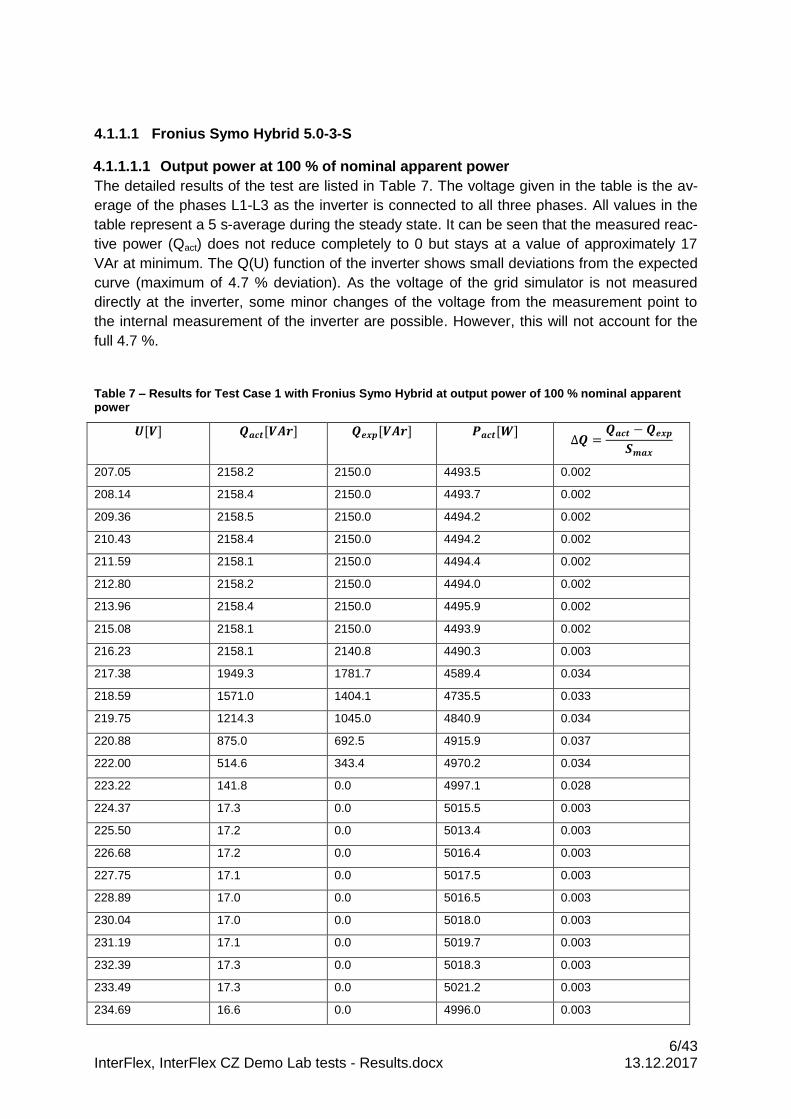
6/43 InterFlex, InterFlex CZ Demo Lab tests - Results.docx 13.12.2017
4.1.1.1 Fronius Symo Hybrid 5.0-3-S
4.1.1.1.1 Output power at 100 % of nominal apparent power
The detailed results of the test are listed in Table 7. The voltage given in the table is the av-
erage of the phases L1-L3 as the inverter is connected to all three phases. All values in the
table represent a 5 s-average during the steady state. It can be seen that the measured reac-
tive power (Qact) does not reduce completely to 0 but stays at a value of approximately 17
VAr at minimum. The Q(U) function of the inverter shows small deviations from the expected
curve (maximum of 4.7 % deviation). As the voltage of the grid simulator is not measured
directly at the inverter, some minor changes of the voltage from the measurement point to
the internal measurement of the inverter are possible. However, this will not account for the
full 4.7 %.
Table 7 – Results for Test Case 1 with Fronius Symo Hybrid at output power of 100 % nominal apparent power
𝑼[𝑽] 𝑸𝒂𝒄𝒕[𝑽𝑨𝒓] 𝑸𝒆𝒙𝒑[𝑽𝑨𝒓] 𝑷𝒂𝒄𝒕[𝑾] ∆𝑸 =
𝑸𝒂𝒄𝒕 − 𝑸𝒆𝒙𝒑
𝑺𝒎𝒂𝒙
207.05 2158.2 2150.0 4493.5 0.002
208.14 2158.4 2150.0 4493.7 0.002
209.36 2158.5 2150.0 4494.2 0.002
210.43 2158.4 2150.0 4494.2 0.002
211.59 2158.1 2150.0 4494.4 0.002
212.80 2158.2 2150.0 4494.0 0.002
213.96 2158.4 2150.0 4495.9 0.002
215.08 2158.1 2150.0 4493.9 0.002
216.23 2158.1 2140.8 4490.3 0.003
217.38 1949.3 1781.7 4589.4 0.034
218.59 1571.0 1404.1 4735.5 0.033
219.75 1214.3 1045.0 4840.9 0.034
220.88 875.0 692.5 4915.9 0.037
222.00 514.6 343.4 4970.2 0.034
223.22 141.8 0.0 4997.1 0.028
224.37 17.3 0.0 5015.5 0.003
225.50 17.2 0.0 5013.4 0.003
226.68 17.2 0.0 5016.4 0.003
227.75 17.1 0.0 5017.5 0.003
228.89 17.0 0.0 5016.5 0.003
230.04 17.0 0.0 5018.0 0.003
231.19 17.1 0.0 5019.7 0.003
232.39 17.3 0.0 5018.3 0.003
233.49 17.3 0.0 5021.2 0.003
234.69 16.6 0.0 4996.0 0.003
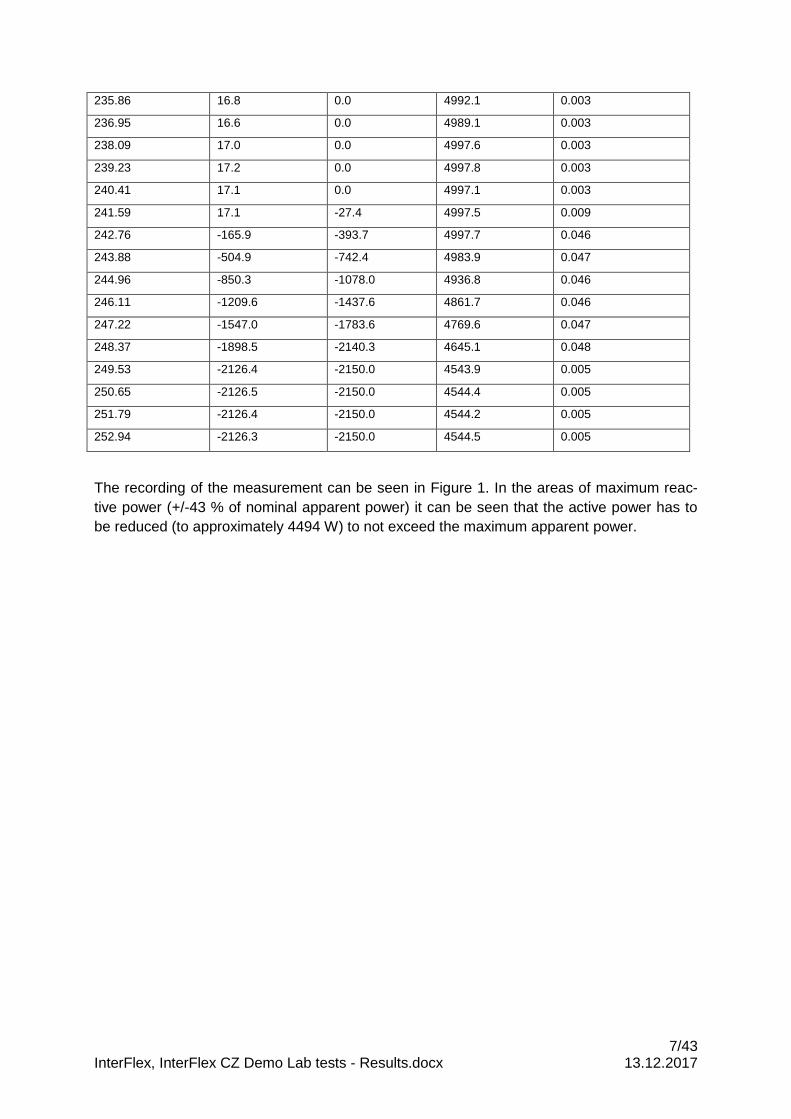
7/43 InterFlex, InterFlex CZ Demo Lab tests - Results.docx 13.12.2017
235.86 16.8 0.0 4992.1 0.003
236.95 16.6 0.0 4989.1 0.003
238.09 17.0 0.0 4997.6 0.003
239.23 17.2 0.0 4997.8 0.003
240.41 17.1 0.0 4997.1 0.003
241.59 17.1 -27.4 4997.5 0.009
242.76 -165.9 -393.7 4997.7 0.046
243.88 -504.9 -742.4 4983.9 0.047
244.96 -850.3 -1078.0 4936.8 0.046
246.11 -1209.6 -1437.6 4861.7 0.046
247.22 -1547.0 -1783.6 4769.6 0.047
248.37 -1898.5 -2140.3 4645.1 0.048
249.53 -2126.4 -2150.0 4543.9 0.005
250.65 -2126.5 -2150.0 4544.4 0.005
251.79 -2126.4 -2150.0 4544.2 0.005
252.94 -2126.3 -2150.0 4544.5 0.005
The recording of the measurement can be seen in Figure 1. In the areas of maximum reac-
tive power (+/-43 % of nominal apparent power) it can be seen that the active power has to
be reduced (to approximately 4494 W) to not exceed the maximum apparent power.
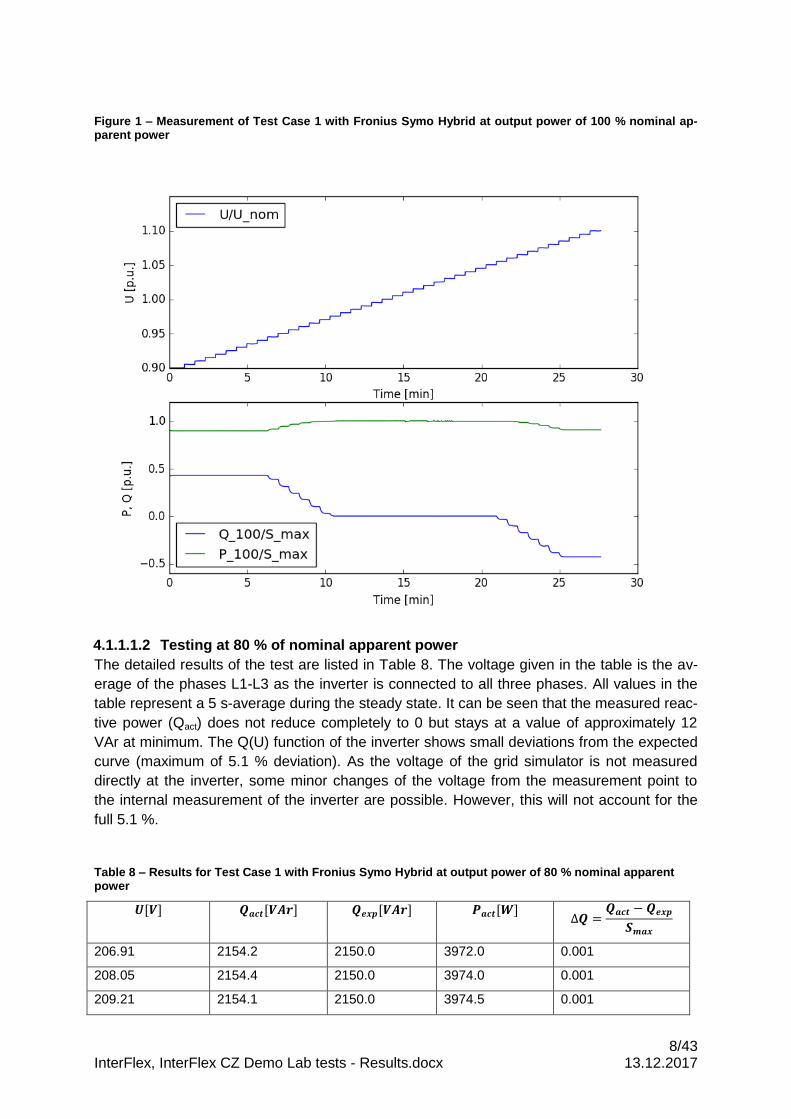
8/43 InterFlex, InterFlex CZ Demo Lab tests - Results.docx 13.12.2017
Figure 1 – Measurement of Test Case 1 with Fronius Symo Hybrid at output power of 100 % nominal ap-parent power
4.1.1.1.2 Testing at 80 % of nominal apparent power
The detailed results of the test are listed in Table 8. The voltage given in the table is the av-
erage of the phases L1-L3 as the inverter is connected to all three phases. All values in the
table represent a 5 s-average during the steady state. It can be seen that the measured reac-
tive power (Qact) does not reduce completely to 0 but stays at a value of approximately 12
VAr at minimum. The Q(U) function of the inverter shows small deviations from the expected
curve (maximum of 5.1 % deviation). As the voltage of the grid simulator is not measured
directly at the inverter, some minor changes of the voltage from the measurement point to
the internal measurement of the inverter are possible. However, this will not account for the
full 5.1 %.
Table 8 – Results for Test Case 1 with Fronius Symo Hybrid at output power of 80 % nominal apparent power
𝑼[𝑽] 𝑸𝒂𝒄𝒕[𝑽𝑨𝒓] 𝑸𝒆𝒙𝒑[𝑽𝑨𝒓] 𝑷𝒂𝒄𝒕[𝑾] ∆𝑸 =
𝑸𝒂𝒄𝒕 − 𝑸𝒆𝒙𝒑
𝑺𝒎𝒂𝒙
206.91 2154.2 2150.0 3972.0 0.001
208.05 2154.4 2150.0 3974.0 0.001
209.21 2154.1 2150.0 3974.5 0.001
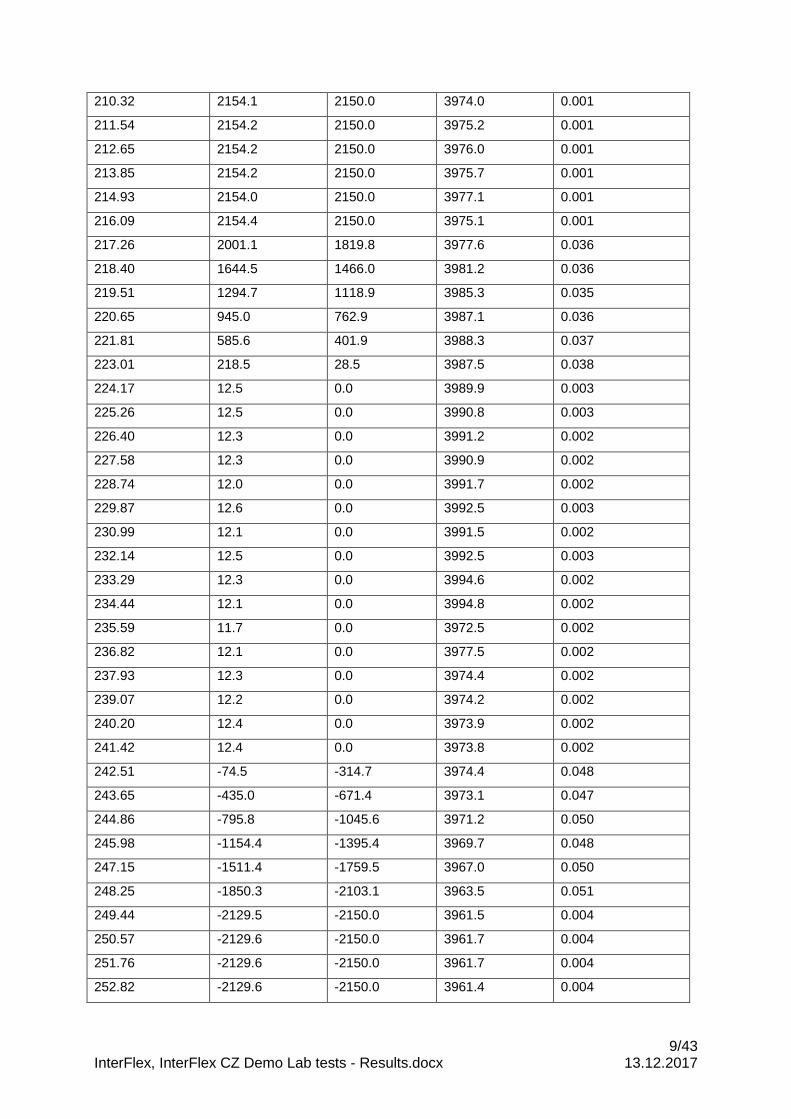
9/43 InterFlex, InterFlex CZ Demo Lab tests - Results.docx 13.12.2017
210.32 2154.1 2150.0 3974.0 0.001
211.54 2154.2 2150.0 3975.2 0.001
212.65 2154.2 2150.0 3976.0 0.001
213.85 2154.2 2150.0 3975.7 0.001
214.93 2154.0 2150.0 3977.1 0.001
216.09 2154.4 2150.0 3975.1 0.001
217.26 2001.1 1819.8 3977.6 0.036
218.40 1644.5 1466.0 3981.2 0.036
219.51 1294.7 1118.9 3985.3 0.035
220.65 945.0 762.9 3987.1 0.036
221.81 585.6 401.9 3988.3 0.037
223.01 218.5 28.5 3987.5 0.038
224.17 12.5 0.0 3989.9 0.003
225.26 12.5 0.0 3990.8 0.003
226.40 12.3 0.0 3991.2 0.002
227.58 12.3 0.0 3990.9 0.002
228.74 12.0 0.0 3991.7 0.002
229.87 12.6 0.0 3992.5 0.003
230.99 12.1 0.0 3991.5 0.002
232.14 12.5 0.0 3992.5 0.003
233.29 12.3 0.0 3994.6 0.002
234.44 12.1 0.0 3994.8 0.002
235.59 11.7 0.0 3972.5 0.002
236.82 12.1 0.0 3977.5 0.002
237.93 12.3 0.0 3974.4 0.002
239.07 12.2 0.0 3974.2 0.002
240.20 12.4 0.0 3973.9 0.002
241.42 12.4 0.0 3973.8 0.002
242.51 -74.5 -314.7 3974.4 0.048
243.65 -435.0 -671.4 3973.1 0.047
244.86 -795.8 -1045.6 3971.2 0.050
245.98 -1154.4 -1395.4 3969.7 0.048
247.15 -1511.4 -1759.5 3967.0 0.050
248.25 -1850.3 -2103.1 3963.5 0.051
249.44 -2129.5 -2150.0 3961.5 0.004
250.57 -2129.6 -2150.0 3961.7 0.004
251.76 -2129.6 -2150.0 3961.7 0.004
252.82 -2129.6 -2150.0 3961.4 0.004
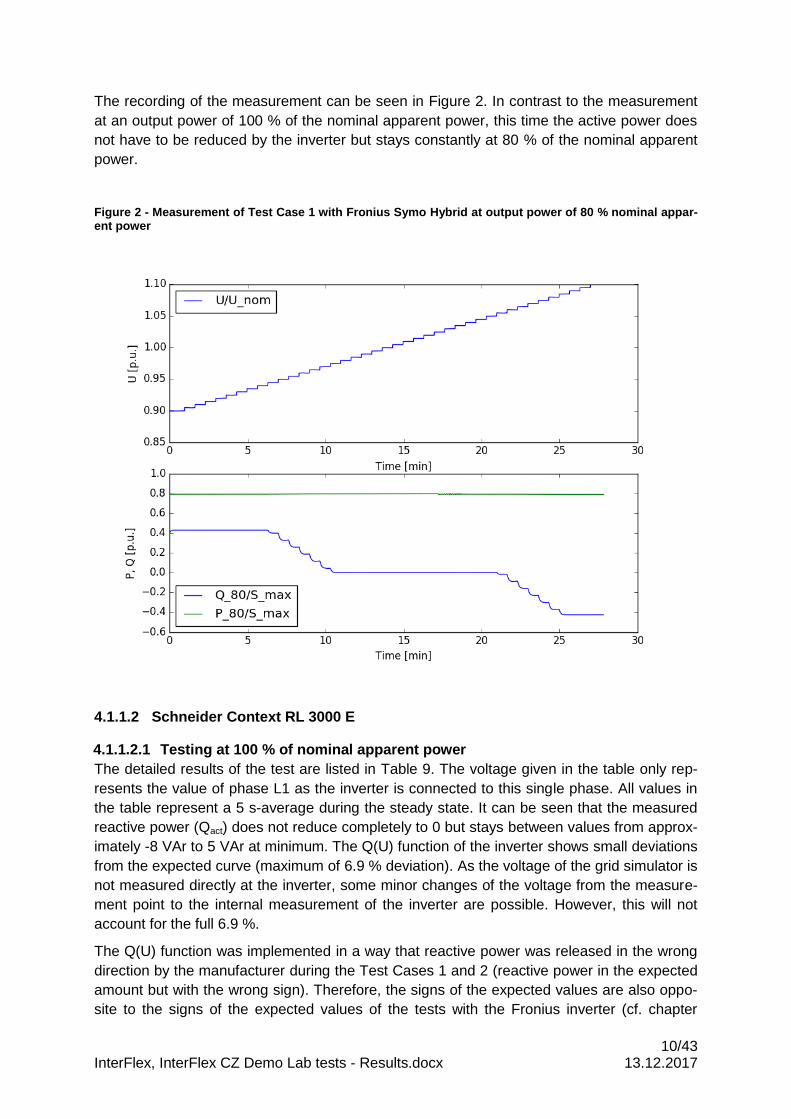
10/43 InterFlex, InterFlex CZ Demo Lab tests - Results.docx 13.12.2017
The recording of the measurement can be seen in Figure 2. In contrast to the measurement
at an output power of 100 % of the nominal apparent power, this time the active power does
not have to be reduced by the inverter but stays constantly at 80 % of the nominal apparent
power.
Figure 2 - Measurement of Test Case 1 with Fronius Symo Hybrid at output power of 80 % nominal appar-ent power
4.1.1.2 Schneider Context RL 3000 E
4.1.1.2.1 Testing at 100 % of nominal apparent power
The detailed results of the test are listed in Table 9. The voltage given in the table only rep-
resents the value of phase L1 as the inverter is connected to this single phase. All values in
the table represent a 5 s-average during the steady state. It can be seen that the measured
reactive power (Qact) does not reduce completely to 0 but stays between values from approx-
imately -8 VAr to 5 VAr at minimum. The Q(U) function of the inverter shows small deviations
from the expected curve (maximum of 6.9 % deviation). As the voltage of the grid simulator is
not measured directly at the inverter, some minor changes of the voltage from the measure-
ment point to the internal measurement of the inverter are possible. However, this will not
account for the full 6.9 %.
The Q(U) function was implemented in a way that reactive power was released in the wrong
direction by the manufacturer during the Test Cases 1 and 2 (reactive power in the expected
amount but with the wrong sign). Therefore, the signs of the expected values are also oppo-
site to the signs of the expected values of the tests with the Fronius inverter (cf. chapter
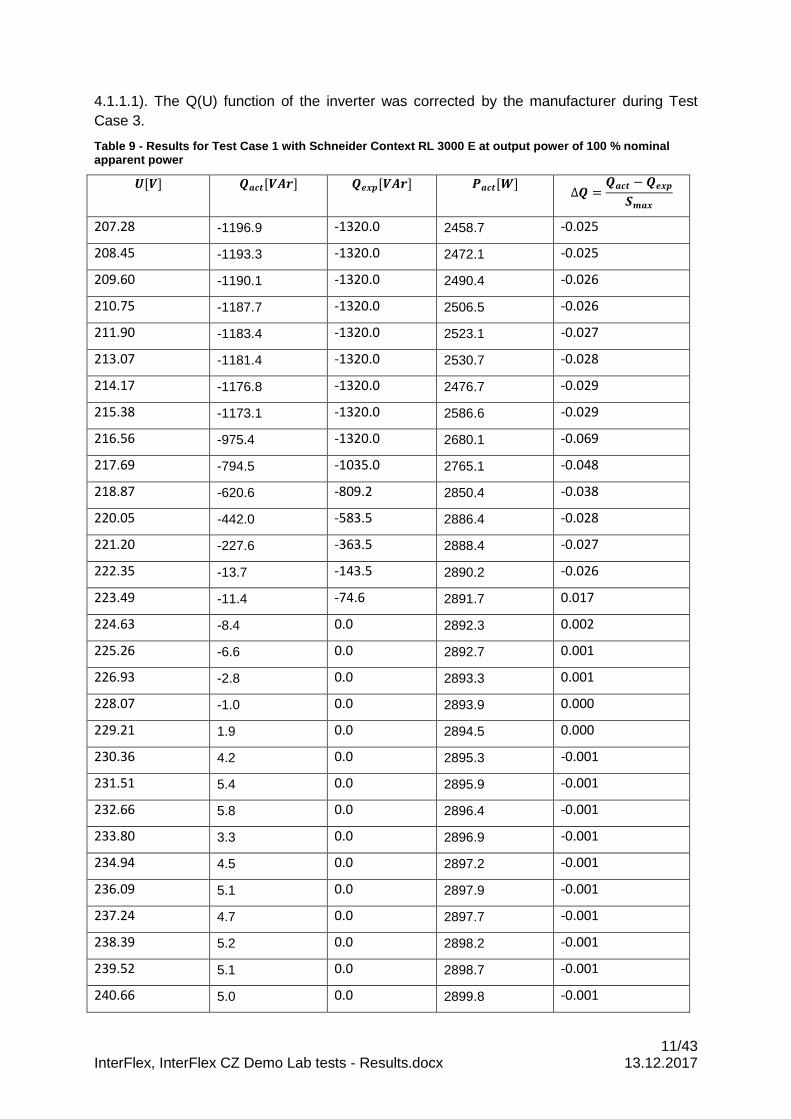
11/43 InterFlex, InterFlex CZ Demo Lab tests - Results.docx 13.12.2017
4.1.1.1). The Q(U) function of the inverter was corrected by the manufacturer during Test
Case 3.
Table 9 - Results for Test Case 1 with Schneider Context RL 3000 E at output power of 100 % nominal apparent power
𝑼[𝑽] 𝑸𝒂𝒄𝒕[𝑽𝑨𝒓] 𝑸𝒆𝒙𝒑[𝑽𝑨𝒓] 𝑷𝒂𝒄𝒕[𝑾] ∆𝑸 =
𝑸𝒂𝒄𝒕 − 𝑸𝒆𝒙𝒑
𝑺𝒎𝒂𝒙
207.28 -1196.9 -1320.0 2458.7 -0.025
208.45 -1193.3 -1320.0 2472.1 -0.025
209.60 -1190.1 -1320.0 2490.4 -0.026
210.75 -1187.7 -1320.0 2506.5 -0.026
211.90 -1183.4 -1320.0 2523.1 -0.027
213.07 -1181.4 -1320.0 2530.7 -0.028
214.17 -1176.8 -1320.0 2476.7 -0.029
215.38 -1173.1 -1320.0 2586.6 -0.029
216.56 -975.4 -1320.0 2680.1 -0.069
217.69 -794.5 -1035.0 2765.1 -0.048
218.87 -620.6 -809.2 2850.4 -0.038
220.05 -442.0 -583.5 2886.4 -0.028
221.20 -227.6 -363.5 2888.4 -0.027
222.35 -13.7 -143.5 2890.2 -0.026
223.49 -11.4 -74.6 2891.7 0.017
224.63 -8.4 0.0 2892.3 0.002
225.26 -6.6 0.0 2892.7 0.001
226.93 -2.8 0.0 2893.3 0.001
228.07 -1.0 0.0 2893.9 0.000
229.21 1.9 0.0 2894.5 0.000
230.36 4.2 0.0 2895.3 -0.001
231.51 5.4 0.0 2895.9 -0.001
232.66 5.8 0.0 2896.4 -0.001
233.80 3.3 0.0 2896.9 -0.001
234.94 4.5 0.0 2897.2 -0.001
236.09 5.1 0.0 2897.9 -0.001
237.24 4.7 0.0 2897.7 -0.001
238.39 5.2 0.0 2898.2 -0.001
239.52 5.1 0.0 2898.7 -0.001
240.66 5.0 0.0 2899.8 -0.001
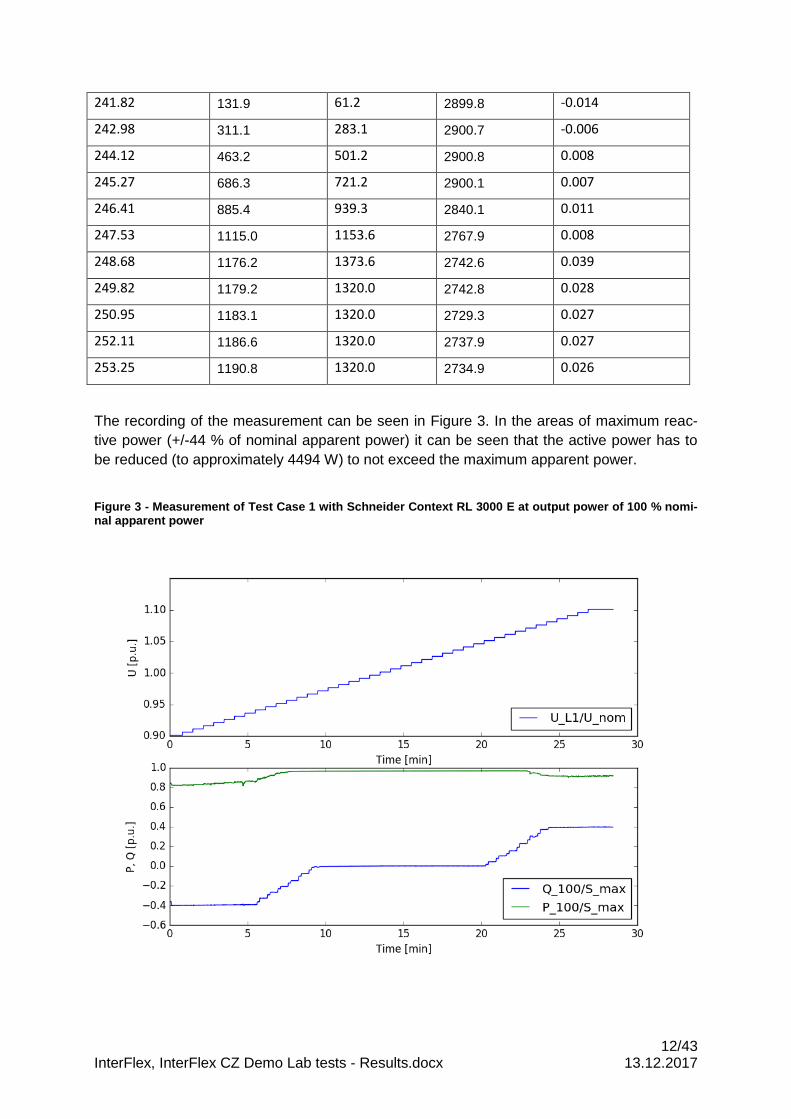
12/43 InterFlex, InterFlex CZ Demo Lab tests - Results.docx 13.12.2017
241.82 131.9 61.2 2899.8 -0.014
242.98 311.1 283.1 2900.7 -0.006
244.12 463.2 501.2 2900.8 0.008
245.27 686.3 721.2 2900.1 0.007
246.41 885.4 939.3 2840.1 0.011
247.53 1115.0 1153.6 2767.9 0.008
248.68 1176.2 1373.6 2742.6 0.039
249.82 1179.2 1320.0 2742.8 0.028
250.95 1183.1 1320.0 2729.3 0.027
252.11 1186.6 1320.0 2737.9 0.027
253.25 1190.8 1320.0 2734.9 0.026
The recording of the measurement can be seen in Figure 3. In the areas of maximum reac-
tive power (+/-44 % of nominal apparent power) it can be seen that the active power has to
be reduced (to approximately 4494 W) to not exceed the maximum apparent power.
Figure 3 - Measurement of Test Case 1 with Schneider Context RL 3000 E at output power of 100 % nomi-nal apparent power
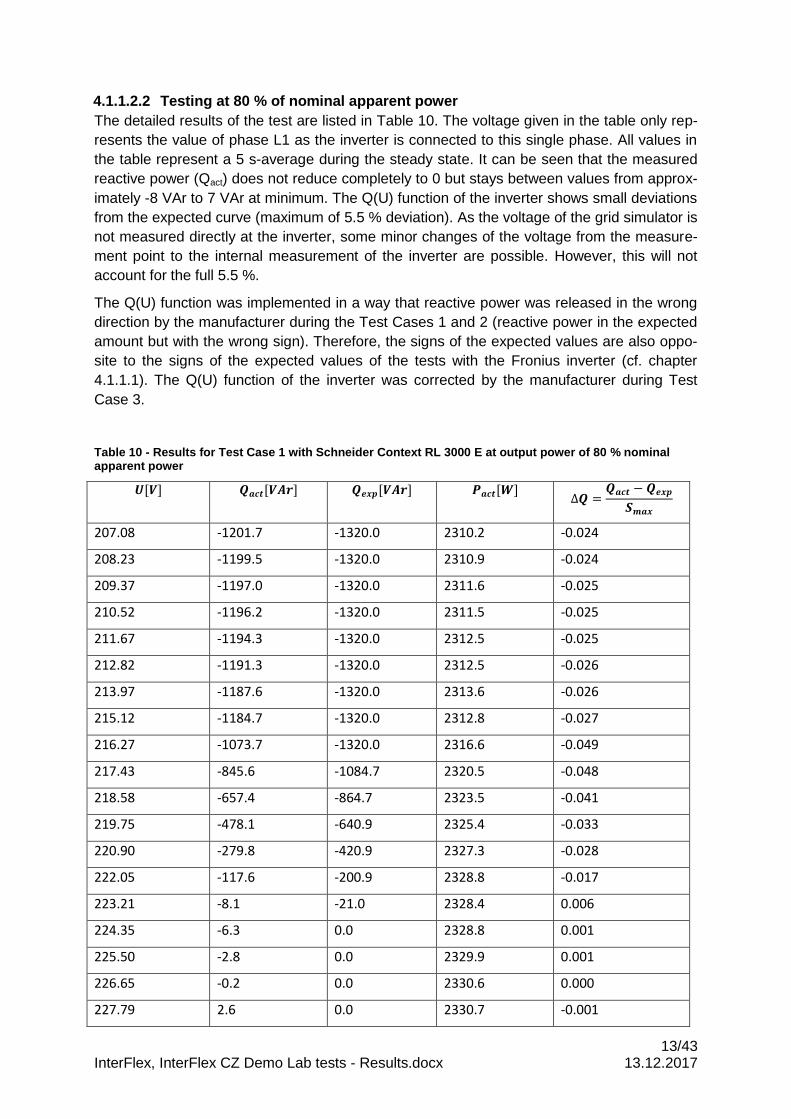
13/43 InterFlex, InterFlex CZ Demo Lab tests - Results.docx 13.12.2017
4.1.1.2.2 Testing at 80 % of nominal apparent power
The detailed results of the test are listed in Table 10. The voltage given in the table only rep-
resents the value of phase L1 as the inverter is connected to this single phase. All values in
the table represent a 5 s-average during the steady state. It can be seen that the measured
reactive power (Qact) does not reduce completely to 0 but stays between values from approx-
imately -8 VAr to 7 VAr at minimum. The Q(U) function of the inverter shows small deviations
from the expected curve (maximum of 5.5 % deviation). As the voltage of the grid simulator is
not measured directly at the inverter, some minor changes of the voltage from the measure-
ment point to the internal measurement of the inverter are possible. However, this will not
account for the full 5.5 %.
The Q(U) function was implemented in a way that reactive power was released in the wrong
direction by the manufacturer during the Test Cases 1 and 2 (reactive power in the expected
amount but with the wrong sign). Therefore, the signs of the expected values are also oppo-
site to the signs of the expected values of the tests with the Fronius inverter (cf. chapter
4.1.1.1). The Q(U) function of the inverter was corrected by the manufacturer during Test
Case 3.
Table 10 - Results for Test Case 1 with Schneider Context RL 3000 E at output power of 80 % nominal apparent power
𝑼[𝑽] 𝑸𝒂𝒄𝒕[𝑽𝑨𝒓] 𝑸𝒆𝒙𝒑[𝑽𝑨𝒓] 𝑷𝒂𝒄𝒕[𝑾] ∆𝑸 =
𝑸𝒂𝒄𝒕 − 𝑸𝒆𝒙𝒑
𝑺𝒎𝒂𝒙
207.08 -1201.7 -1320.0 2310.2 -0.024
208.23 -1199.5 -1320.0 2310.9 -0.024
209.37 -1197.0 -1320.0 2311.6 -0.025
210.52 -1196.2 -1320.0 2311.5 -0.025
211.67 -1194.3 -1320.0 2312.5 -0.025
212.82 -1191.3 -1320.0 2312.5 -0.026
213.97 -1187.6 -1320.0 2313.6 -0.026
215.12 -1184.7 -1320.0 2312.8 -0.027
216.27 -1073.7 -1320.0 2316.6 -0.049
217.43 -845.6 -1084.7 2320.5 -0.048
218.58 -657.4 -864.7 2323.5 -0.041
219.75 -478.1 -640.9 2325.4 -0.033
220.90 -279.8 -420.9 2327.3 -0.028
222.05 -117.6 -200.9 2328.8 -0.017
223.21 -8.1 -21.0 2328.4 0.006
224.35 -6.3 0.0 2328.8 0.001
225.50 -2.8 0.0 2329.9 0.001
226.65 -0.2 0.0 2330.6 0.000
227.79 2.6 0.0 2330.7 -0.001
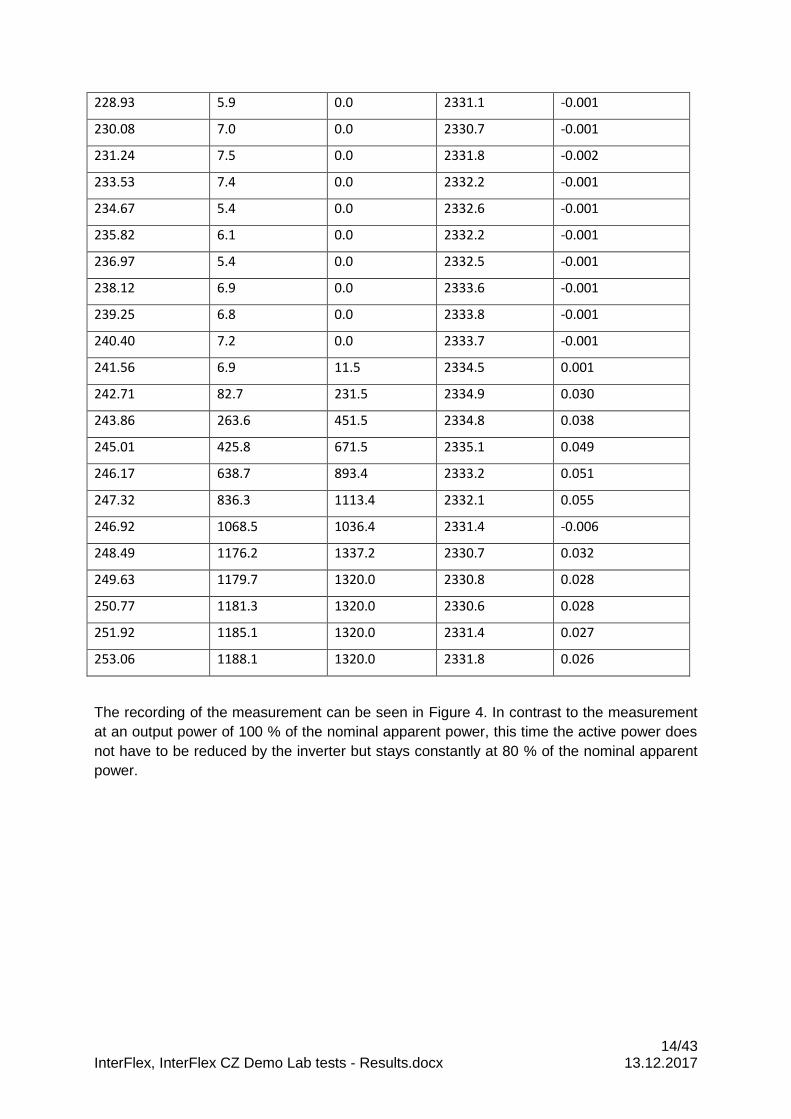
14/43 InterFlex, InterFlex CZ Demo Lab tests - Results.docx 13.12.2017
228.93 5.9 0.0 2331.1 -0.001
230.08 7.0 0.0 2330.7 -0.001
231.24 7.5 0.0 2331.8 -0.002
233.53 7.4 0.0 2332.2 -0.001
234.67 5.4 0.0 2332.6 -0.001
235.82 6.1 0.0 2332.2 -0.001
236.97 5.4 0.0 2332.5 -0.001
238.12 6.9 0.0 2333.6 -0.001
239.25 6.8 0.0 2333.8 -0.001
240.40 7.2 0.0 2333.7 -0.001
241.56 6.9 11.5 2334.5 0.001
242.71 82.7 231.5 2334.9 0.030
243.86 263.6 451.5 2334.8 0.038
245.01 425.8 671.5 2335.1 0.049
246.17 638.7 893.4 2333.2 0.051
247.32 836.3 1113.4 2332.1 0.055
246.92 1068.5 1036.4 2331.4 -0.006
248.49 1176.2 1337.2 2330.7 0.032
249.63 1179.7 1320.0 2330.8 0.028
250.77 1181.3 1320.0 2330.6 0.028
251.92 1185.1 1320.0 2331.4 0.027
253.06 1188.1 1320.0 2331.8 0.026
The recording of the measurement can be seen in Figure 4. In contrast to the measurement
at an output power of 100 % of the nominal apparent power, this time the active power does
not have to be reduced by the inverter but stays constantly at 80 % of the nominal apparent
power.
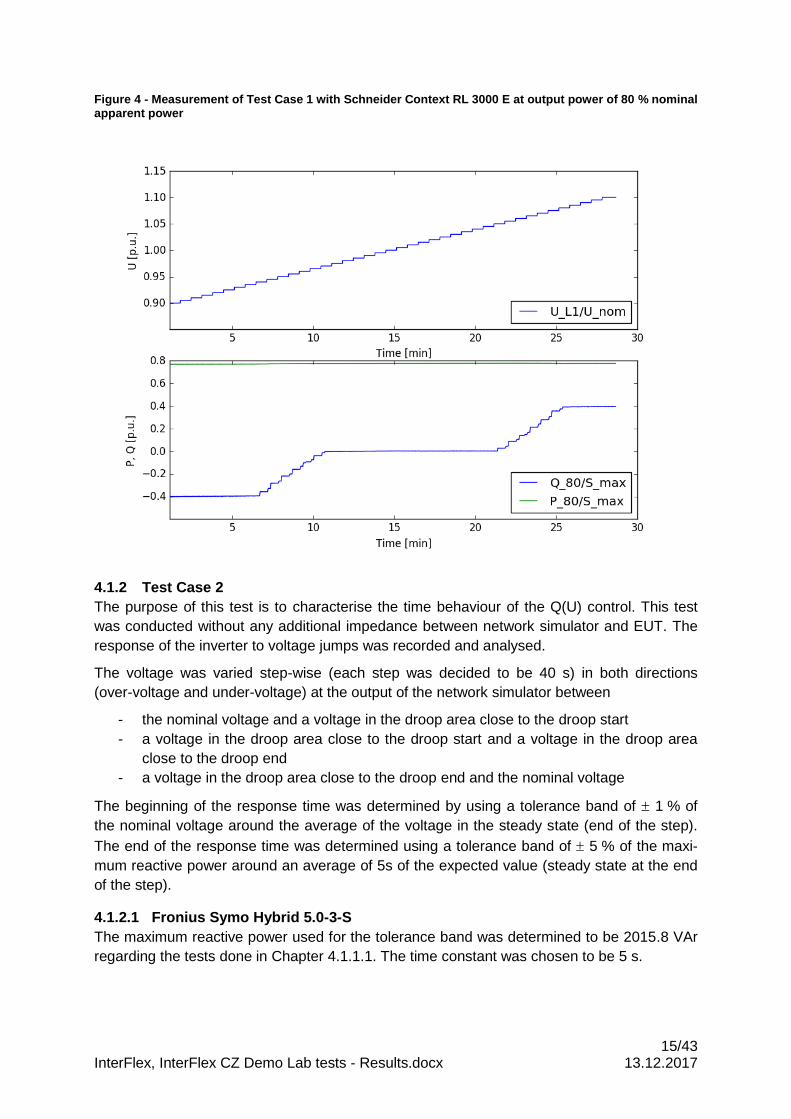
15/43 InterFlex, InterFlex CZ Demo Lab tests - Results.docx 13.12.2017
Figure 4 - Measurement of Test Case 1 with Schneider Context RL 3000 E at output power of 80 % nominal apparent power
4.1.2 Test Case 2
The purpose of this test is to characterise the time behaviour of the Q(U) control. This test
was conducted without any additional impedance between network simulator and EUT. The
response of the inverter to voltage jumps was recorded and analysed.
The voltage was varied step-wise (each step was decided to be 40 s) in both directions
(over-voltage and under-voltage) at the output of the network simulator between
- the nominal voltage and a voltage in the droop area close to the droop start
- a voltage in the droop area close to the droop start and a voltage in the droop area
close to the droop end
- a voltage in the droop area close to the droop end and the nominal voltage
The beginning of the response time was determined by using a tolerance band of 1 % of
the nominal voltage around the average of the voltage in the steady state (end of the step).
The end of the response time was determined using a tolerance band of 5 % of the maxi-
mum reactive power around an average of 5s of the expected value (steady state at the end
of the step).
4.1.2.1 Fronius Symo Hybrid 5.0-3-S
The maximum reactive power used for the tolerance band was determined to be 2015.8 VAr
regarding the tests done in Chapter 4.1.1.1. The time constant was chosen to be 5 s.
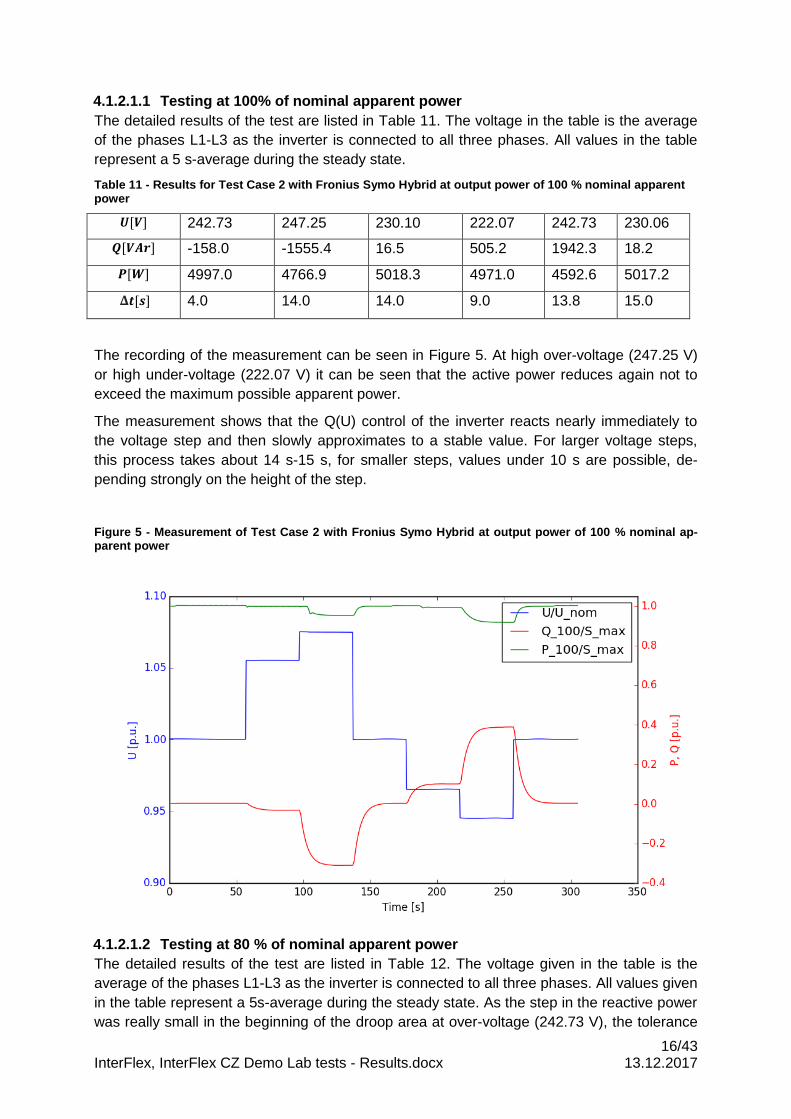
16/43 InterFlex, InterFlex CZ Demo Lab tests - Results.docx 13.12.2017
4.1.2.1.1 Testing at 100% of nominal apparent power
The detailed results of the test are listed in Table 11. The voltage in the table is the average
of the phases L1-L3 as the inverter is connected to all three phases. All values in the table
represent a 5 s-average during the steady state.
Table 11 - Results for Test Case 2 with Fronius Symo Hybrid at output power of 100 % nominal apparent power
𝑼[𝑽] 242.73 247.25 230.10 222.07 242.73 230.06
𝑸[𝑽𝑨𝒓] -158.0 -1555.4 16.5 505.2 1942.3 18.2
𝑷[𝑾] 4997.0 4766.9 5018.3 4971.0 4592.6 5017.2
𝚫𝒕[𝒔] 4.0 14.0 14.0 9.0 13.8 15.0
The recording of the measurement can be seen in Figure 5. At high over-voltage (247.25 V)
or high under-voltage (222.07 V) it can be seen that the active power reduces again not to
exceed the maximum possible apparent power.
The measurement shows that the Q(U) control of the inverter reacts nearly immediately to
the voltage step and then slowly approximates to a stable value. For larger voltage steps,
this process takes about 14 s-15 s, for smaller steps, values under 10 s are possible, de-
pending strongly on the height of the step.
Figure 5 - Measurement of Test Case 2 with Fronius Symo Hybrid at output power of 100 % nominal ap-parent power
4.1.2.1.2 Testing at 80 % of nominal apparent power
The detailed results of the test are listed in Table 12. The voltage given in the table is the
average of the phases L1-L3 as the inverter is connected to all three phases. All values given
in the table represent a 5s-average during the steady state. As the step in the reactive power
was really small in the beginning of the droop area at over-voltage (242.73 V), the tolerance
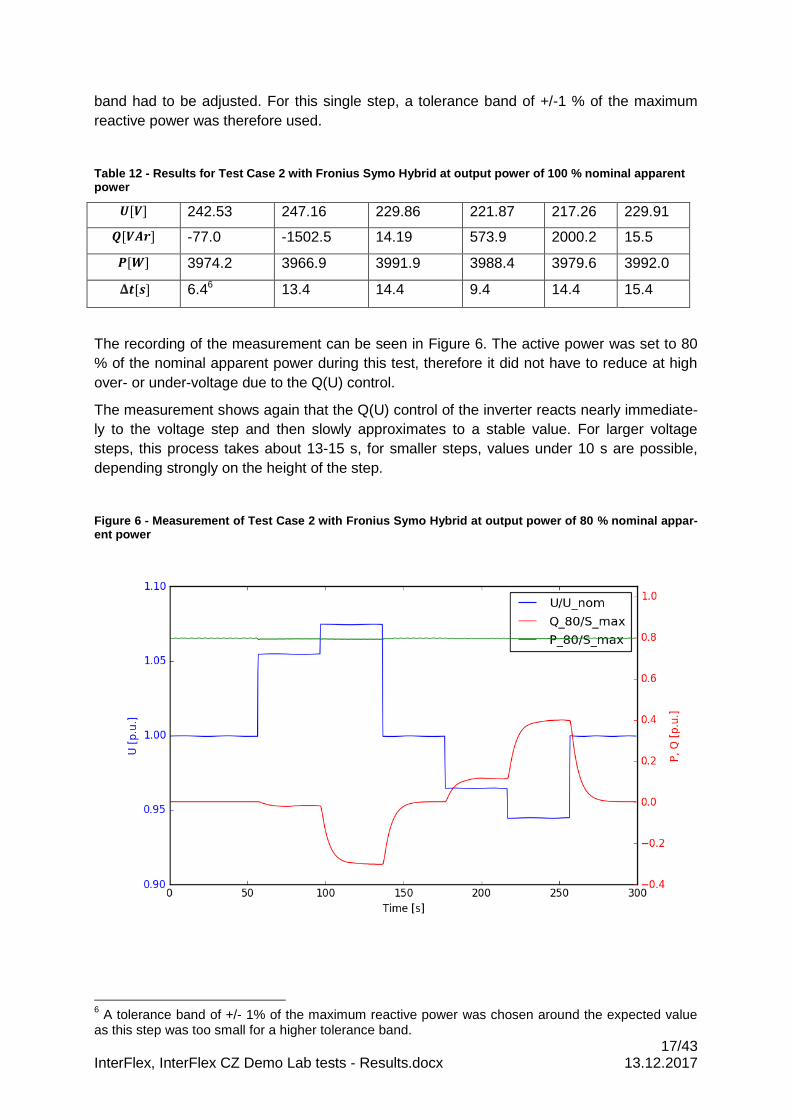
17/43 InterFlex, InterFlex CZ Demo Lab tests - Results.docx 13.12.2017
band had to be adjusted. For this single step, a tolerance band of +/-1 % of the maximum
reactive power was therefore used.
Table 12 - Results for Test Case 2 with Fronius Symo Hybrid at output power of 100 % nominal apparent power
𝑼[𝑽] 242.53 247.16 229.86 221.87 217.26 229.91
𝑸[𝑽𝑨𝒓] -77.0 -1502.5 14.19 573.9 2000.2 15.5
𝑷[𝑾] 3974.2 3966.9 3991.9 3988.4 3979.6 3992.0
𝚫𝒕[𝒔] 6.46 13.4 14.4 9.4 14.4 15.4
The recording of the measurement can be seen in Figure 6. The active power was set to 80
% of the nominal apparent power during this test, therefore it did not have to reduce at high
over- or under-voltage due to the Q(U) control.
The measurement shows again that the Q(U) control of the inverter reacts nearly immediate-
ly to the voltage step and then slowly approximates to a stable value. For larger voltage
steps, this process takes about 13-15 s, for smaller steps, values under 10 s are possible,
depending strongly on the height of the step.
Figure 6 - Measurement of Test Case 2 with Fronius Symo Hybrid at output power of 80 % nominal appar-ent power
6 A tolerance band of +/- 1% of the maximum reactive power was chosen around the expected value
as this step was too small for a higher tolerance band.
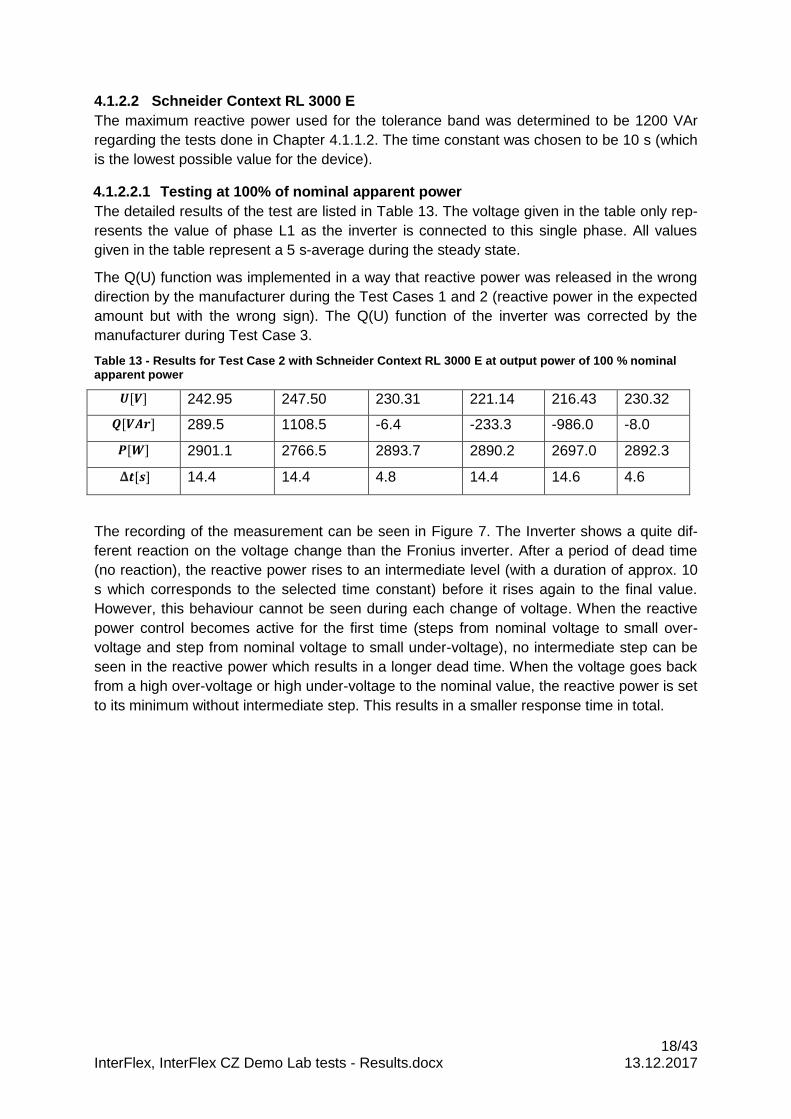
18/43 InterFlex, InterFlex CZ Demo Lab tests - Results.docx 13.12.2017
4.1.2.2 Schneider Context RL 3000 E
The maximum reactive power used for the tolerance band was determined to be 1200 VAr
regarding the tests done in Chapter 4.1.1.2. The time constant was chosen to be 10 s (which
is the lowest possible value for the device).
4.1.2.2.1 Testing at 100% of nominal apparent power
The detailed results of the test are listed in Table 13. The voltage given in the table only rep-
resents the value of phase L1 as the inverter is connected to this single phase. All values
given in the table represent a 5 s-average during the steady state.
The Q(U) function was implemented in a way that reactive power was released in the wrong
direction by the manufacturer during the Test Cases 1 and 2 (reactive power in the expected
amount but with the wrong sign). The Q(U) function of the inverter was corrected by the
manufacturer during Test Case 3.
Table 13 - Results for Test Case 2 with Schneider Context RL 3000 E at output power of 100 % nominal apparent power
𝑼[𝑽] 242.95 247.50 230.31 221.14 216.43 230.32
𝑸[𝑽𝑨𝒓] 289.5 1108.5 -6.4 -233.3 -986.0 -8.0
𝑷[𝑾] 2901.1 2766.5 2893.7 2890.2 2697.0 2892.3
𝚫𝒕[𝒔] 14.4 14.4 4.8 14.4 14.6 4.6
The recording of the measurement can be seen in Figure 7. The Inverter shows a quite dif-
ferent reaction on the voltage change than the Fronius inverter. After a period of dead time
(no reaction), the reactive power rises to an intermediate level (with a duration of approx. 10
s which corresponds to the selected time constant) before it rises again to the final value.
However, this behaviour cannot be seen during each change of voltage. When the reactive
power control becomes active for the first time (steps from nominal voltage to small over-
voltage and step from nominal voltage to small under-voltage), no intermediate step can be
seen in the reactive power which results in a longer dead time. When the voltage goes back
from a high over-voltage or high under-voltage to the nominal value, the reactive power is set
to its minimum without intermediate step. This results in a smaller response time in total.
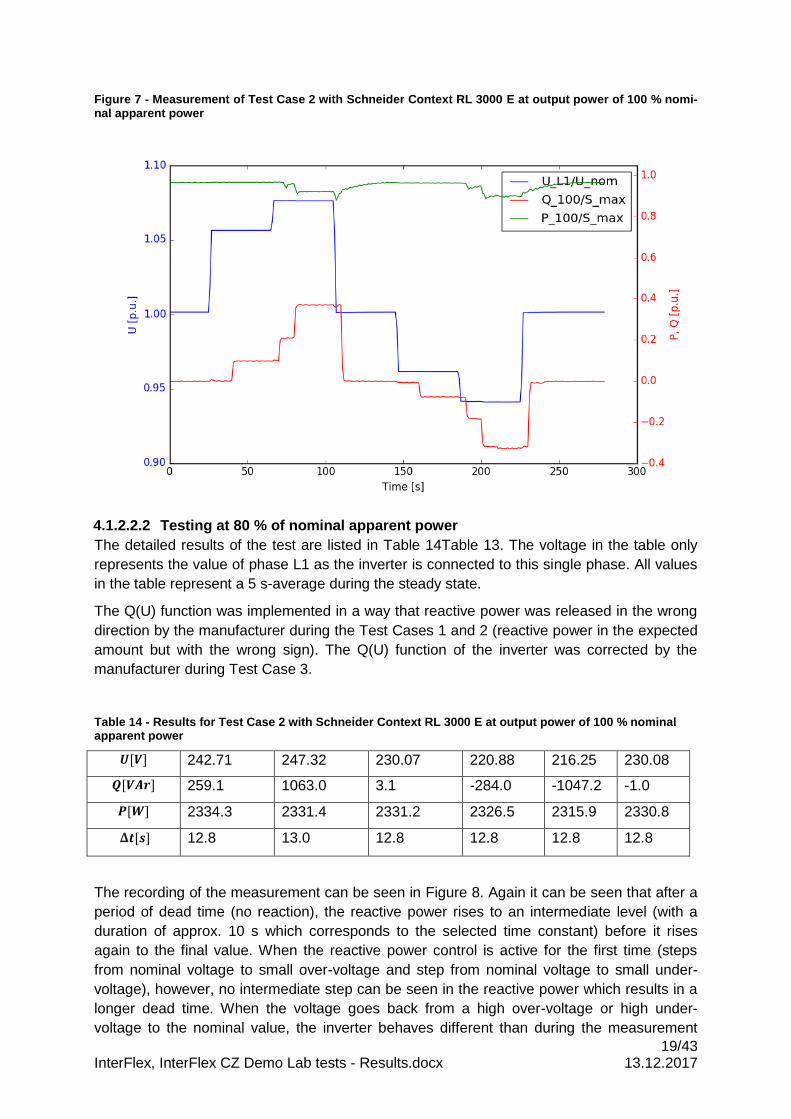
19/43 InterFlex, InterFlex CZ Demo Lab tests - Results.docx 13.12.2017
Figure 7 - Measurement of Test Case 2 with Schneider Context RL 3000 E at output power of 100 % nomi-nal apparent power
4.1.2.2.2 Testing at 80 % of nominal apparent power
The detailed results of the test are listed in Table 14Table 13. The voltage in the table only
represents the value of phase L1 as the inverter is connected to this single phase. All values
in the table represent a 5 s-average during the steady state.
The Q(U) function was implemented in a way that reactive power was released in the wrong
direction by the manufacturer during the Test Cases 1 and 2 (reactive power in the expected
amount but with the wrong sign). The Q(U) function of the inverter was corrected by the
manufacturer during Test Case 3.
Table 14 - Results for Test Case 2 with Schneider Context RL 3000 E at output power of 100 % nominal apparent power
𝑼[𝑽] 242.71 247.32 230.07 220.88 216.25 230.08
𝑸[𝑽𝑨𝒓] 259.1 1063.0 3.1 -284.0 -1047.2 -1.0
𝑷[𝑾] 2334.3 2331.4 2331.2 2326.5 2315.9 2330.8
𝚫𝒕[𝒔] 12.8 13.0 12.8 12.8 12.8 12.8
The recording of the measurement can be seen in Figure 8. Again it can be seen that after a
period of dead time (no reaction), the reactive power rises to an intermediate level (with a
duration of approx. 10 s which corresponds to the selected time constant) before it rises
again to the final value. When the reactive power control is active for the first time (steps
from nominal voltage to small over-voltage and step from nominal voltage to small under-
voltage), however, no intermediate step can be seen in the reactive power which results in a
longer dead time. When the voltage goes back from a high over-voltage or high under-
voltage to the nominal value, the inverter behaves different than during the measurement
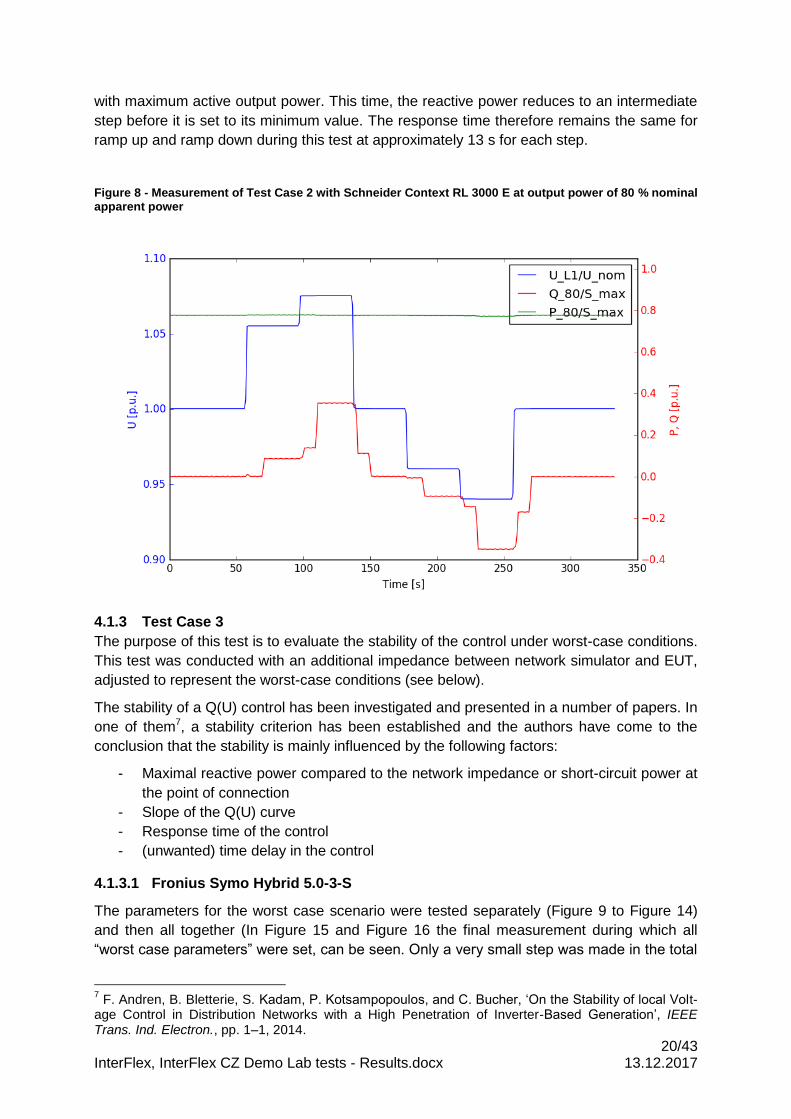
20/43 InterFlex, InterFlex CZ Demo Lab tests - Results.docx 13.12.2017
with maximum active output power. This time, the reactive power reduces to an intermediate
step before it is set to its minimum value. The response time therefore remains the same for
ramp up and ramp down during this test at approximately 13 s for each step.
Figure 8 - Measurement of Test Case 2 with Schneider Context RL 3000 E at output power of 80 % nominal apparent power
4.1.3 Test Case 3
The purpose of this test is to evaluate the stability of the control under worst-case conditions.
This test was conducted with an additional impedance between network simulator and EUT,
adjusted to represent the worst-case conditions (see below).
The stability of a Q(U) control has been investigated and presented in a number of papers. In
one of them7, a stability criterion has been established and the authors have come to the
conclusion that the stability is mainly influenced by the following factors:
- Maximal reactive power compared to the network impedance or short-circuit power at
the point of connection
- Slope of the Q(U) curve
- Response time of the control
- (unwanted) time delay in the control
4.1.3.1 Fronius Symo Hybrid 5.0-3-S
The parameters for the worst case scenario were tested separately (Figure 9 to Figure 14)
and then all together (In Figure 15 and Figure 16 the final measurement during which all
“worst case parameters” were set, can be seen. Only a very small step was made in the total
7 F. Andren, B. Bletterie, S. Kadam, P. Kotsampopoulos, and C. Bucher, ‘On the Stability of local Volt-
age Control in Distribution Networks with a High Penetration of Inverter-Based Generation’, IEEE Trans. Ind. Electron., pp. 1–1, 2014.
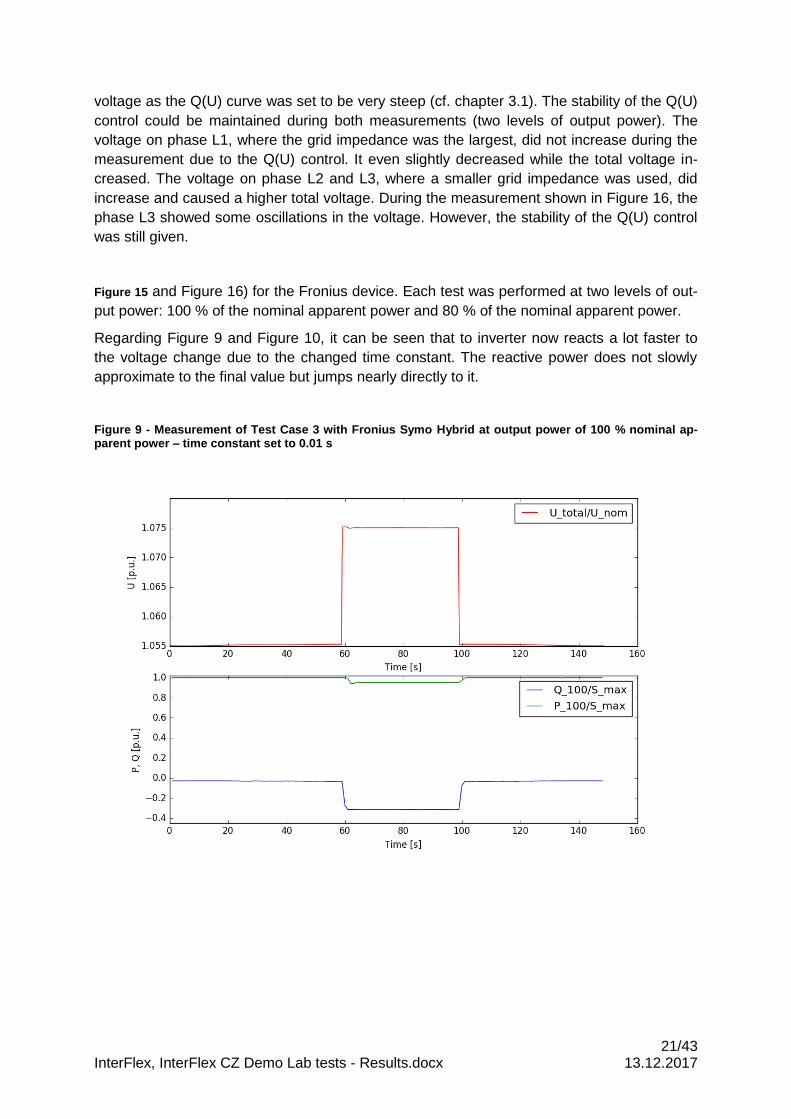
21/43 InterFlex, InterFlex CZ Demo Lab tests - Results.docx 13.12.2017
voltage as the Q(U) curve was set to be very steep (cf. chapter 3.1). The stability of the Q(U)
control could be maintained during both measurements (two levels of output power). The
voltage on phase L1, where the grid impedance was the largest, did not increase during the
measurement due to the Q(U) control. It even slightly decreased while the total voltage in-
creased. The voltage on phase L2 and L3, where a smaller grid impedance was used, did
increase and caused a higher total voltage. During the measurement shown in Figure 16, the
phase L3 showed some oscillations in the voltage. However, the stability of the Q(U) control
was still given.
Figure 15 and Figure 16) for the Fronius device. Each test was performed at two levels of out-
put power: 100 % of the nominal apparent power and 80 % of the nominal apparent power.
Regarding Figure 9 and Figure 10, it can be seen that to inverter now reacts a lot faster to
the voltage change due to the changed time constant. The reactive power does not slowly
approximate to the final value but jumps nearly directly to it.
Figure 9 - Measurement of Test Case 3 with Fronius Symo Hybrid at output power of 100 % nominal ap-parent power – time constant set to 0.01 s
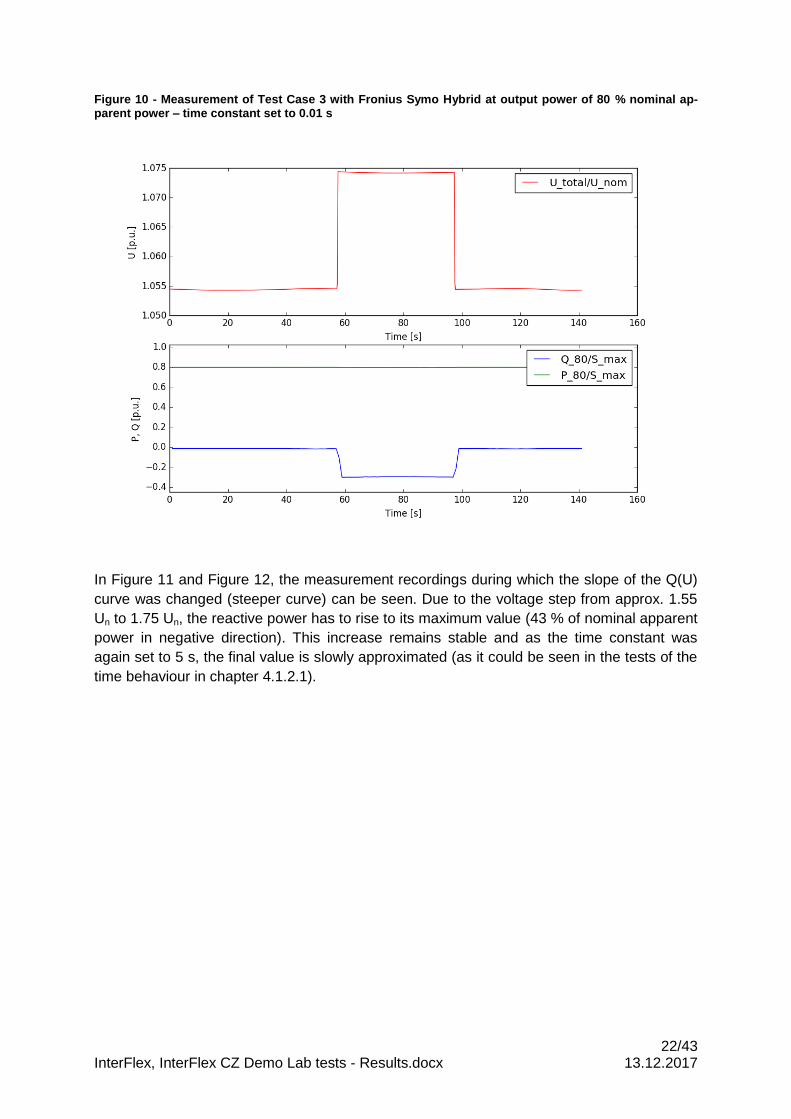
22/43 InterFlex, InterFlex CZ Demo Lab tests - Results.docx 13.12.2017
Figure 10 - Measurement of Test Case 3 with Fronius Symo Hybrid at output power of 80 % nominal ap-parent power – time constant set to 0.01 s
In Figure 11 and Figure 12, the measurement recordings during which the slope of the Q(U)
curve was changed (steeper curve) can be seen. Due to the voltage step from approx. 1.55
Un to 1.75 Un, the reactive power has to rise to its maximum value (43 % of nominal apparent
power in negative direction). This increase remains stable and as the time constant was
again set to 5 s, the final value is slowly approximated (as it could be seen in the tests of the
time behaviour in chapter 4.1.2.1).
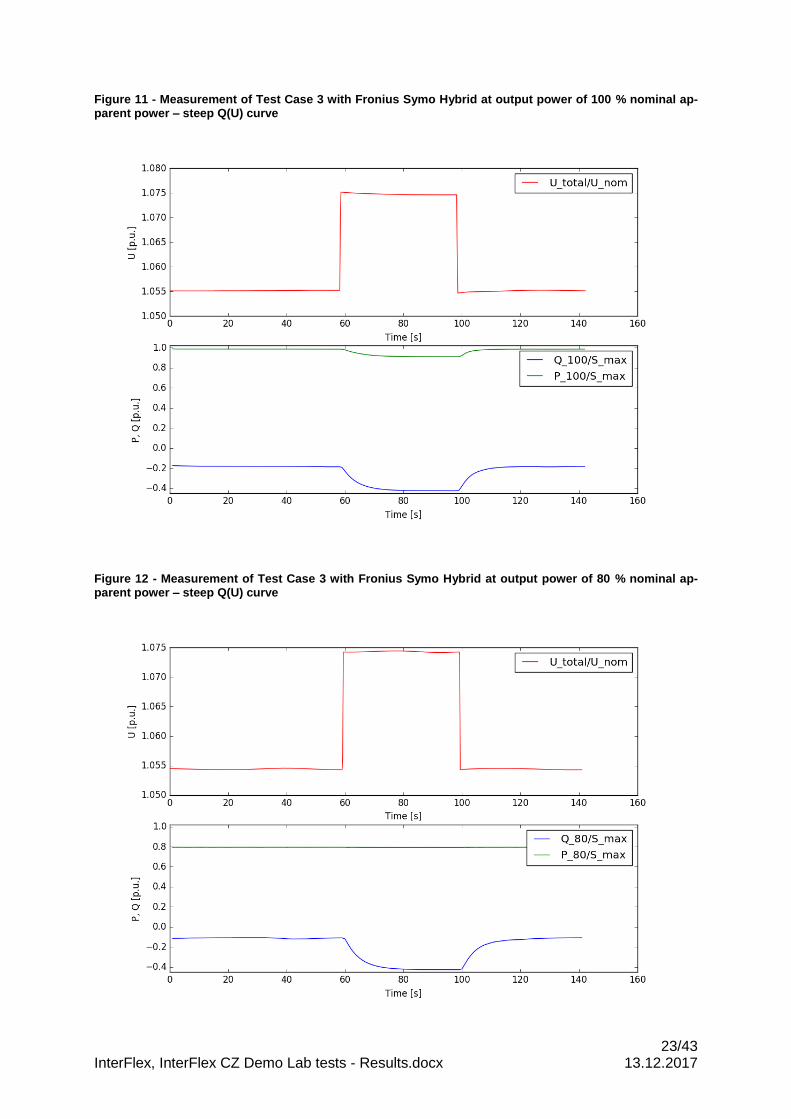
23/43 InterFlex, InterFlex CZ Demo Lab tests - Results.docx 13.12.2017
Figure 11 - Measurement of Test Case 3 with Fronius Symo Hybrid at output power of 100 % nominal ap-parent power – steep Q(U) curve
Figure 12 - Measurement of Test Case 3 with Fronius Symo Hybrid at output power of 80 % nominal ap-parent power – steep Q(U) curve
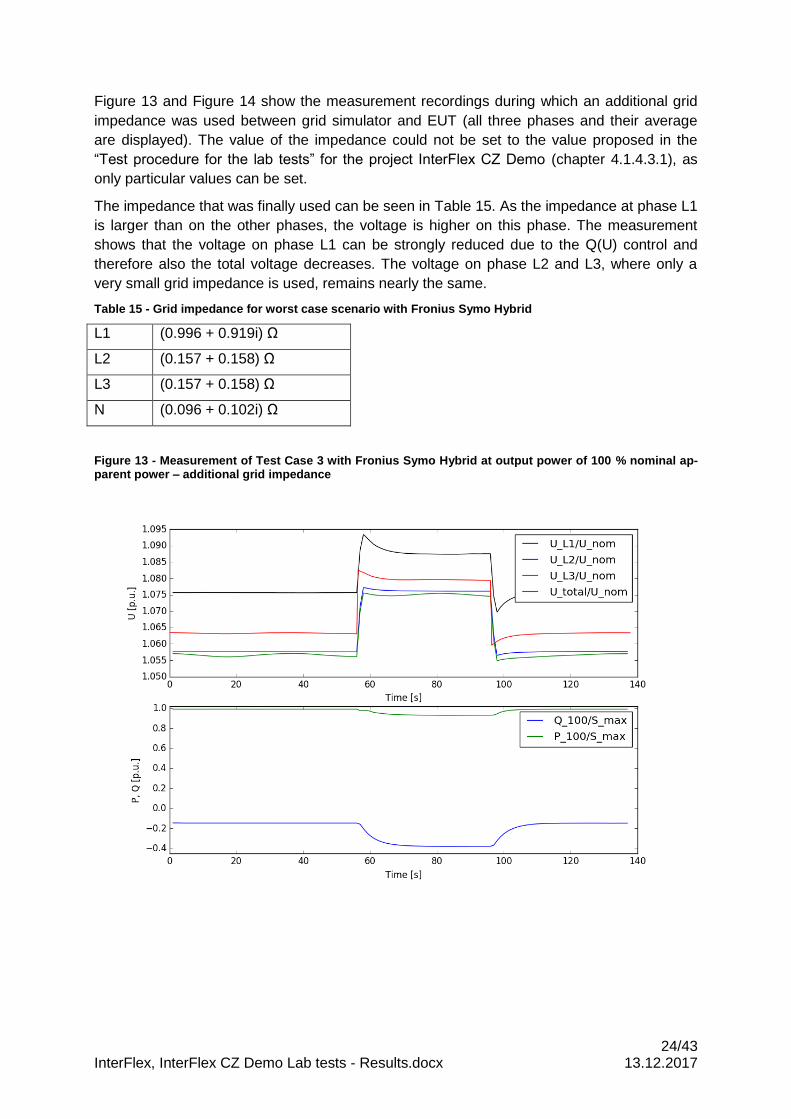
24/43 InterFlex, InterFlex CZ Demo Lab tests - Results.docx 13.12.2017
Figure 13 and Figure 14 show the measurement recordings during which an additional grid
impedance was used between grid simulator and EUT (all three phases and their average
are displayed). The value of the impedance could not be set to the value proposed in the
“Test procedure for the lab tests” for the project InterFlex CZ Demo (chapter 4.1.4.3.1), as
only particular values can be set.
The impedance that was finally used can be seen in Table 15. As the impedance at phase L1
is larger than on the other phases, the voltage is higher on this phase. The measurement
shows that the voltage on phase L1 can be strongly reduced due to the Q(U) control and
therefore also the total voltage decreases. The voltage on phase L2 and L3, where only a
very small grid impedance is used, remains nearly the same.
Table 15 - Grid impedance for worst case scenario with Fronius Symo Hybrid
L1 (0.996 + 0.919i) Ω
L2 (0.157 + 0.158) Ω
L3 (0.157 + 0.158) Ω
N (0.096 + 0.102i) Ω
Figure 13 - Measurement of Test Case 3 with Fronius Symo Hybrid at output power of 100 % nominal ap-parent power – additional grid impedance
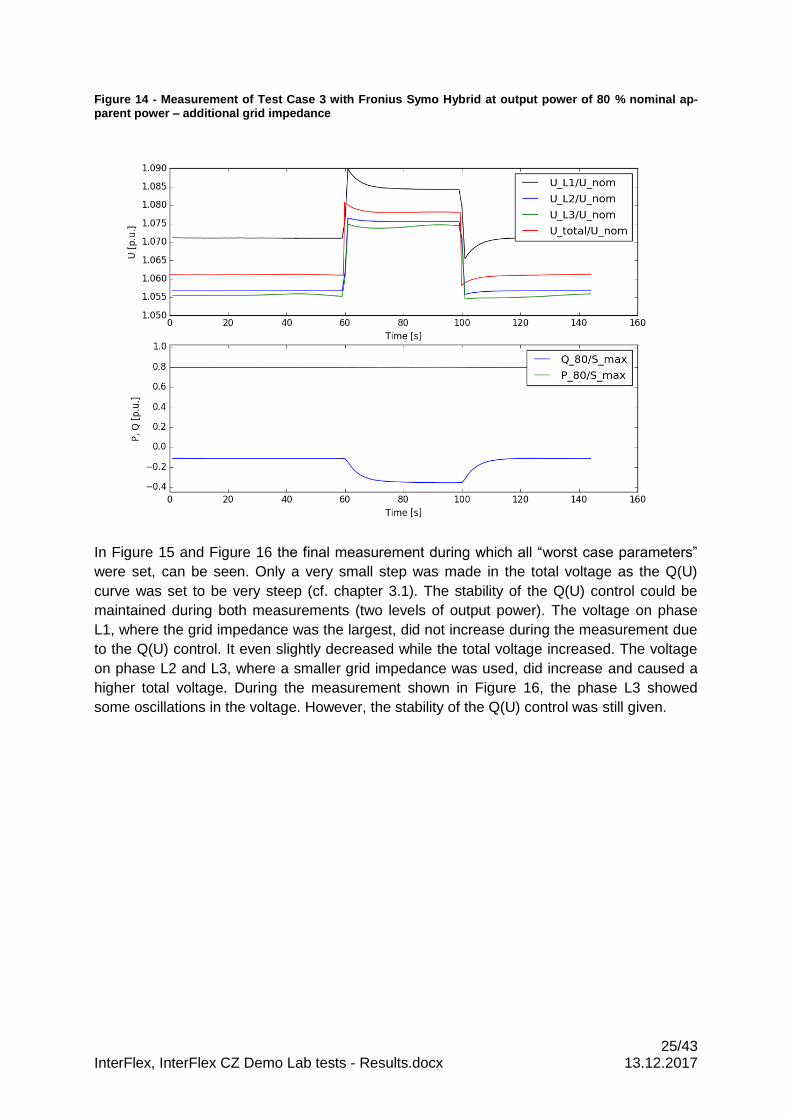
25/43 InterFlex, InterFlex CZ Demo Lab tests - Results.docx 13.12.2017
Figure 14 - Measurement of Test Case 3 with Fronius Symo Hybrid at output power of 80 % nominal ap-parent power – additional grid impedance
In Figure 15 and Figure 16 the final measurement during which all “worst case parameters”
were set, can be seen. Only a very small step was made in the total voltage as the Q(U)
curve was set to be very steep (cf. chapter 3.1). The stability of the Q(U) control could be
maintained during both measurements (two levels of output power). The voltage on phase
L1, where the grid impedance was the largest, did not increase during the measurement due
to the Q(U) control. It even slightly decreased while the total voltage increased. The voltage
on phase L2 and L3, where a smaller grid impedance was used, did increase and caused a
higher total voltage. During the measurement shown in Figure 16, the phase L3 showed
some oscillations in the voltage. However, the stability of the Q(U) control was still given.
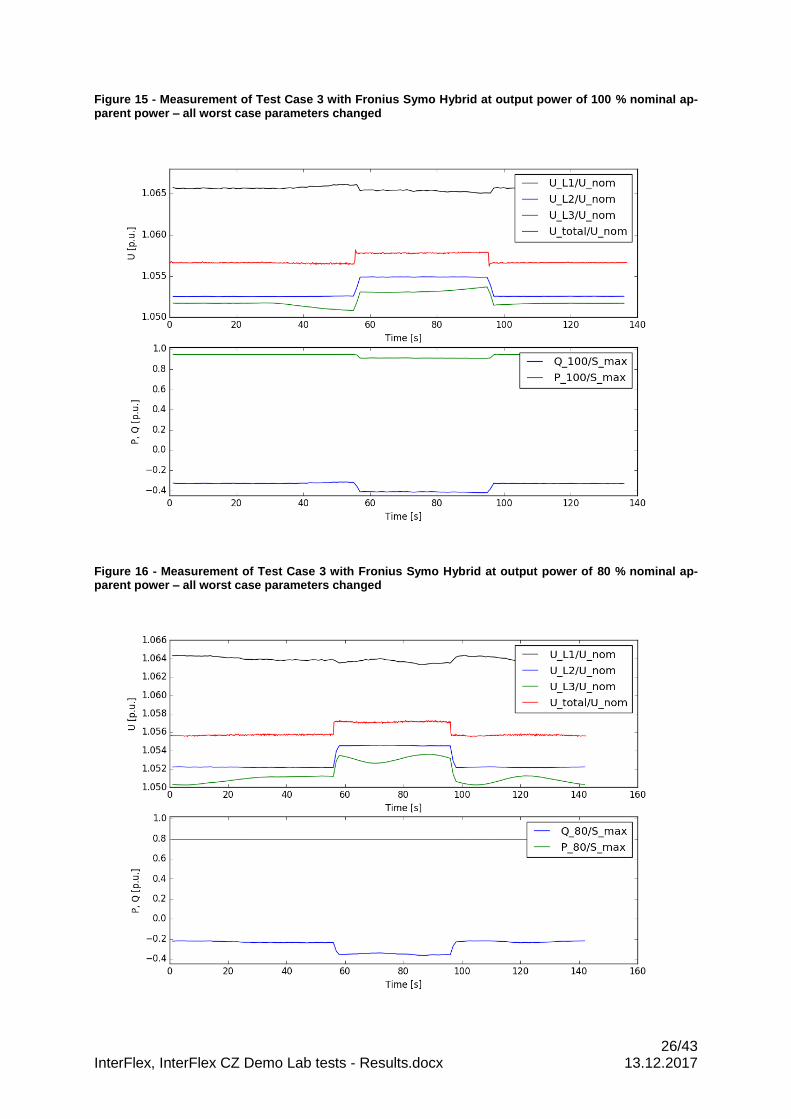
26/43 InterFlex, InterFlex CZ Demo Lab tests - Results.docx 13.12.2017
Figure 15 - Measurement of Test Case 3 with Fronius Symo Hybrid at output power of 100 % nominal ap-parent power – all worst case parameters changed
Figure 16 - Measurement of Test Case 3 with Fronius Symo Hybrid at output power of 80 % nominal ap-parent power – all worst case parameters changed
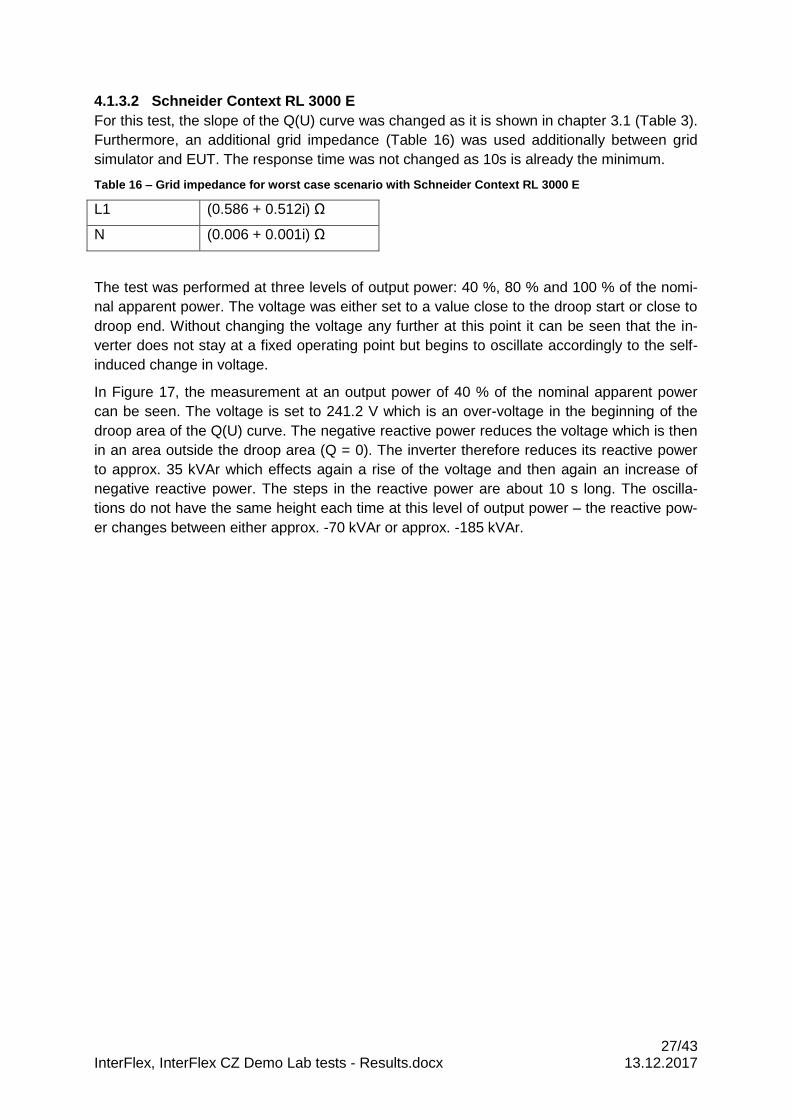
27/43 InterFlex, InterFlex CZ Demo Lab tests - Results.docx 13.12.2017
4.1.3.2 Schneider Context RL 3000 E
For this test, the slope of the Q(U) curve was changed as it is shown in chapter 3.1 (Table 3).
Furthermore, an additional grid impedance (Table 16) was used additionally between grid
simulator and EUT. The response time was not changed as 10s is already the minimum.
Table 16 – Grid impedance for worst case scenario with Schneider Context RL 3000 E
L1 (0.586 + 0.512i) Ω
N (0.006 + 0.001i) Ω
The test was performed at three levels of output power: 40 %, 80 % and 100 % of the nomi-
nal apparent power. The voltage was either set to a value close to the droop start or close to
droop end. Without changing the voltage any further at this point it can be seen that the in-
verter does not stay at a fixed operating point but begins to oscillate accordingly to the self-
induced change in voltage.
In Figure 17, the measurement at an output power of 40 % of the nominal apparent power
can be seen. The voltage is set to 241.2 V which is an over-voltage in the beginning of the
droop area of the Q(U) curve. The negative reactive power reduces the voltage which is then
in an area outside the droop area (Q = 0). The inverter therefore reduces its reactive power
to approx. 35 kVAr which effects again a rise of the voltage and then again an increase of
negative reactive power. The steps in the reactive power are about 10 s long. The oscilla-
tions do not have the same height each time at this level of output power – the reactive pow-
er changes between either approx. -70 kVAr or approx. -185 kVAr.
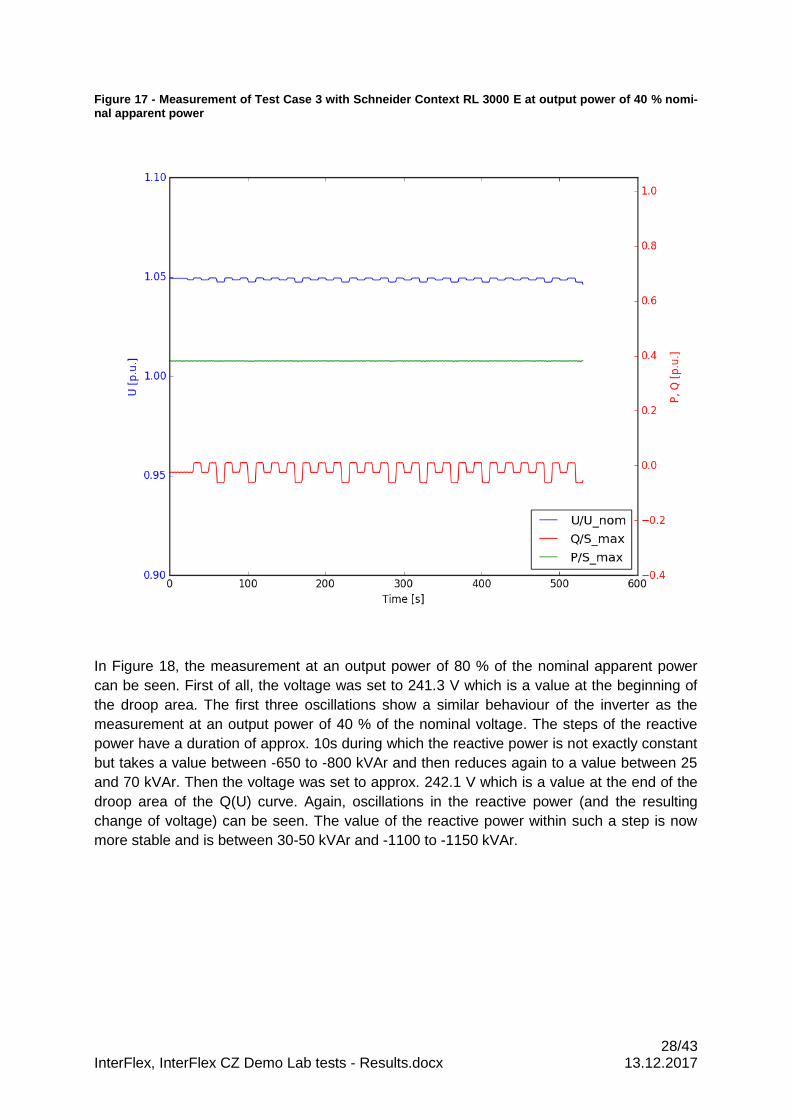
28/43 InterFlex, InterFlex CZ Demo Lab tests - Results.docx 13.12.2017
Figure 17 - Measurement of Test Case 3 with Schneider Context RL 3000 E at output power of 40 % nomi-nal apparent power
In Figure 18, the measurement at an output power of 80 % of the nominal apparent power
can be seen. First of all, the voltage was set to 241.3 V which is a value at the beginning of
the droop area. The first three oscillations show a similar behaviour of the inverter as the
measurement at an output power of 40 % of the nominal voltage. The steps of the reactive
power have a duration of approx. 10s during which the reactive power is not exactly constant
but takes a value between -650 to -800 kVAr and then reduces again to a value between 25
and 70 kVAr. Then the voltage was set to approx. 242.1 V which is a value at the end of the
droop area of the Q(U) curve. Again, oscillations in the reactive power (and the resulting
change of voltage) can be seen. The value of the reactive power within such a step is now
more stable and is between 30-50 kVAr and -1100 to -1150 kVAr.
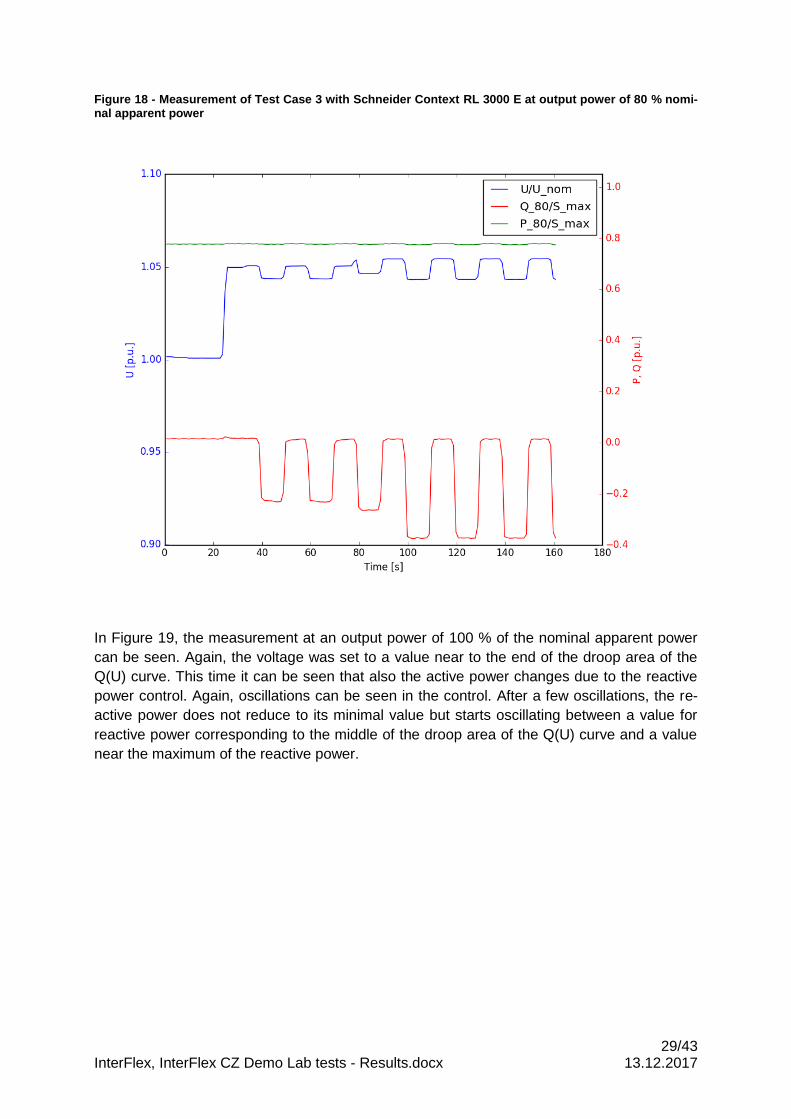
29/43 InterFlex, InterFlex CZ Demo Lab tests - Results.docx 13.12.2017
Figure 18 - Measurement of Test Case 3 with Schneider Context RL 3000 E at output power of 80 % nomi-nal apparent power
In Figure 19, the measurement at an output power of 100 % of the nominal apparent power
can be seen. Again, the voltage was set to a value near to the end of the droop area of the
Q(U) curve. This time it can be seen that also the active power changes due to the reactive
power control. Again, oscillations can be seen in the control. After a few oscillations, the re-
active power does not reduce to its minimal value but starts oscillating between a value for
reactive power corresponding to the middle of the droop area of the Q(U) curve and a value
near the maximum of the reactive power.
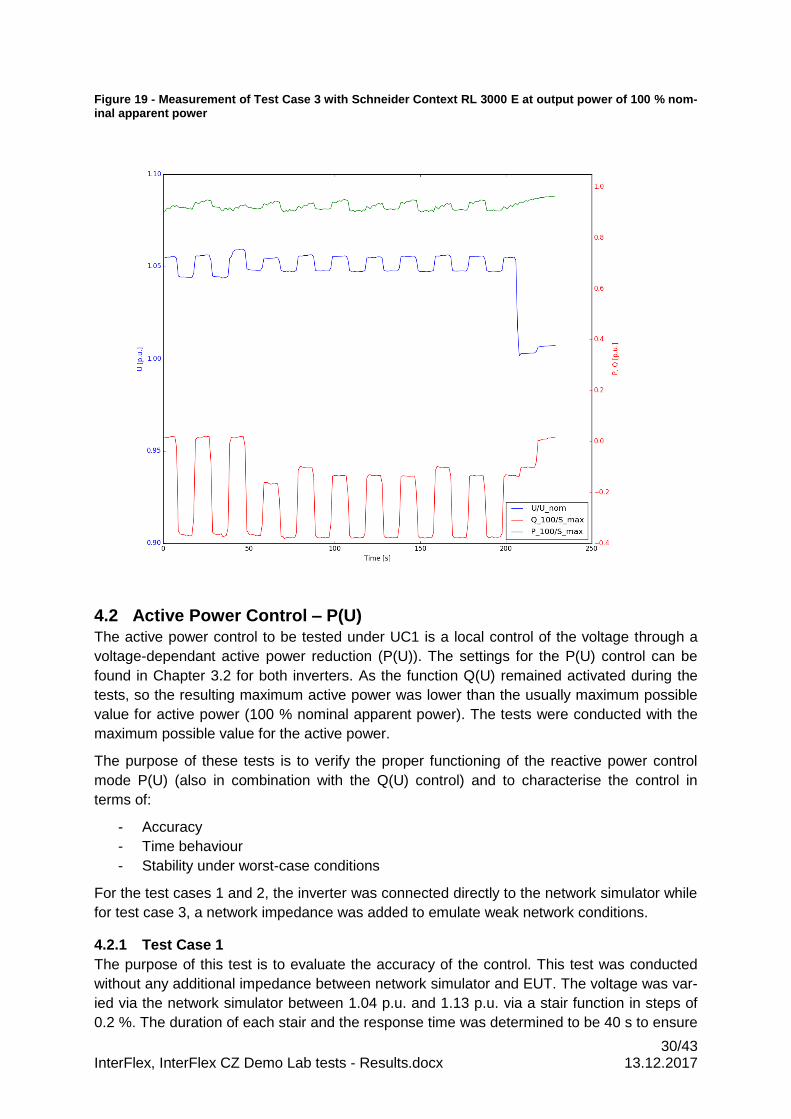
30/43 InterFlex, InterFlex CZ Demo Lab tests - Results.docx 13.12.2017
Figure 19 - Measurement of Test Case 3 with Schneider Context RL 3000 E at output power of 100 % nom-inal apparent power
4.2 Active Power Control – P(U)
The active power control to be tested under UC1 is a local control of the voltage through a
voltage-dependant active power reduction (P(U)). The settings for the P(U) control can be
found in Chapter 3.2 for both inverters. As the function Q(U) remained activated during the
tests, so the resulting maximum active power was lower than the usually maximum possible
value for active power (100 % nominal apparent power). The tests were conducted with the
maximum possible value for the active power.
The purpose of these tests is to verify the proper functioning of the reactive power control
mode P(U) (also in combination with the Q(U) control) and to characterise the control in
terms of:
- Accuracy
- Time behaviour
- Stability under worst-case conditions
For the test cases 1 and 2, the inverter was connected directly to the network simulator while
for test case 3, a network impedance was added to emulate weak network conditions.
4.2.1 Test Case 1
The purpose of this test is to evaluate the accuracy of the control. This test was conducted
without any additional impedance between network simulator and EUT. The voltage was var-
ied via the network simulator between 1.04 p.u. and 1.13 p.u. via a stair function in steps of
0.2 %. The duration of each stair and the response time was determined to be 40 s to ensure
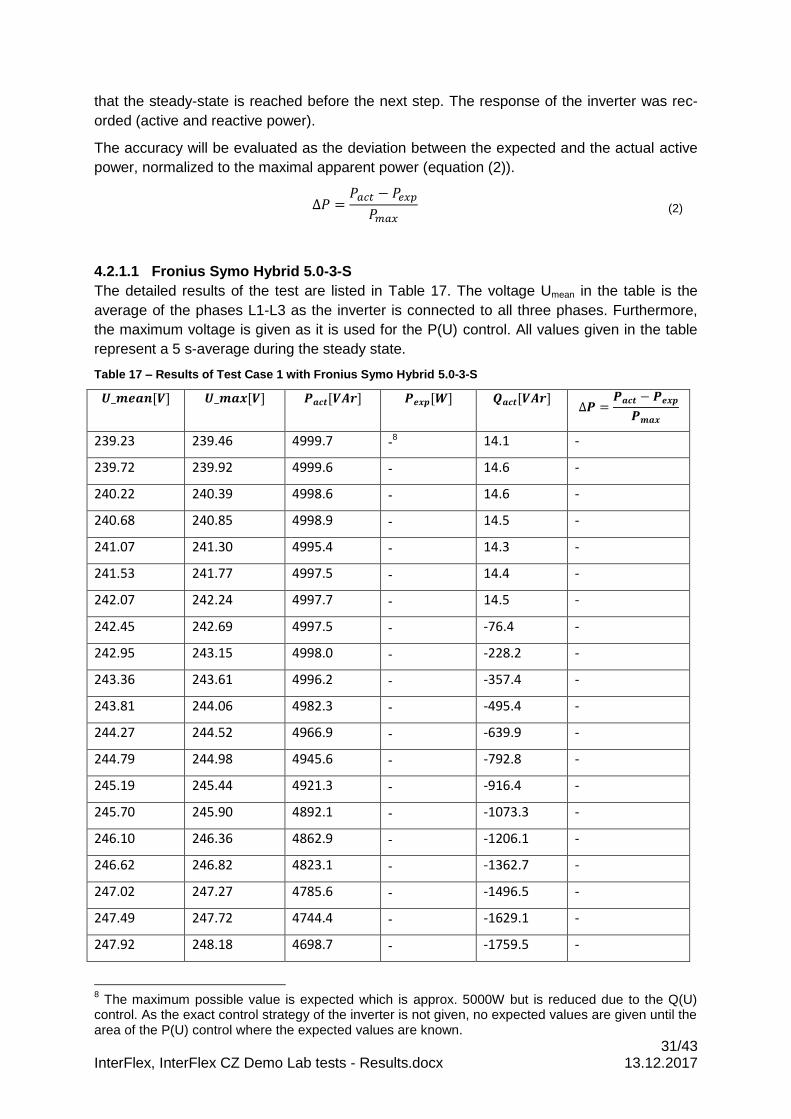
31/43 InterFlex, InterFlex CZ Demo Lab tests - Results.docx 13.12.2017
that the steady-state is reached before the next step. The response of the inverter was rec-
orded (active and reactive power).
The accuracy will be evaluated as the deviation between the expected and the actual active
power, normalized to the maximal apparent power (equation (2)).
∆𝑃 =𝑃𝑎𝑐𝑡 − 𝑃𝑒𝑥𝑝
𝑃𝑚𝑎𝑥 (2)
4.2.1.1 Fronius Symo Hybrid 5.0-3-S
The detailed results of the test are listed in Table 17. The voltage Umean in the table is the
average of the phases L1-L3 as the inverter is connected to all three phases. Furthermore,
the maximum voltage is given as it is used for the P(U) control. All values given in the table
represent a 5 s-average during the steady state.
Table 17 – Results of Test Case 1 with Fronius Symo Hybrid 5.0-3-S
𝑼_𝒎𝒆𝒂𝒏[𝑽] 𝑼_𝒎𝒂𝒙[𝑽] 𝑷𝒂𝒄𝒕[𝑽𝑨𝒓] 𝑷𝒆𝒙𝒑[𝑾] 𝑸𝒂𝒄𝒕[𝑽𝑨𝒓] ∆𝑷 =
𝑷𝒂𝒄𝒕 − 𝑷𝒆𝒙𝒑
𝑷𝒎𝒂𝒙
239.23 239.46 4999.7 -8 14.1 -
239.72 239.92 4999.6 - 14.6 -
240.22 240.39 4998.6 - 14.6 -
240.68 240.85 4998.9 - 14.5 -
241.07 241.30 4995.4 - 14.3 -
241.53 241.77 4997.5 - 14.4 -
242.07 242.24 4997.7 - 14.5 -
242.45 242.69 4997.5 - -76.4 -
242.95 243.15 4998.0 - -228.2 -
243.36 243.61 4996.2 - -357.4 -
243.81 244.06 4982.3 - -495.4 -
244.27 244.52 4966.9 - -639.9 -
244.79 244.98 4945.6 - -792.8 -
245.19 245.44 4921.3 - -916.4 -
245.70 245.90 4892.1 - -1073.3 -
246.10 246.36 4862.9 - -1206.1 -
246.62 246.82 4823.1 - -1362.7 -
247.02 247.27 4785.6 - -1496.5 -
247.49 247.72 4744.4 - -1629.1 -
247.92 248.18 4698.7 - -1759.5 -
8 The maximum possible value is expected which is approx. 5000W but is reduced due to the Q(U)
control. As the exact control strategy of the inverter is not given, no expected values are given until the area of the P(U) control where the expected values are known.
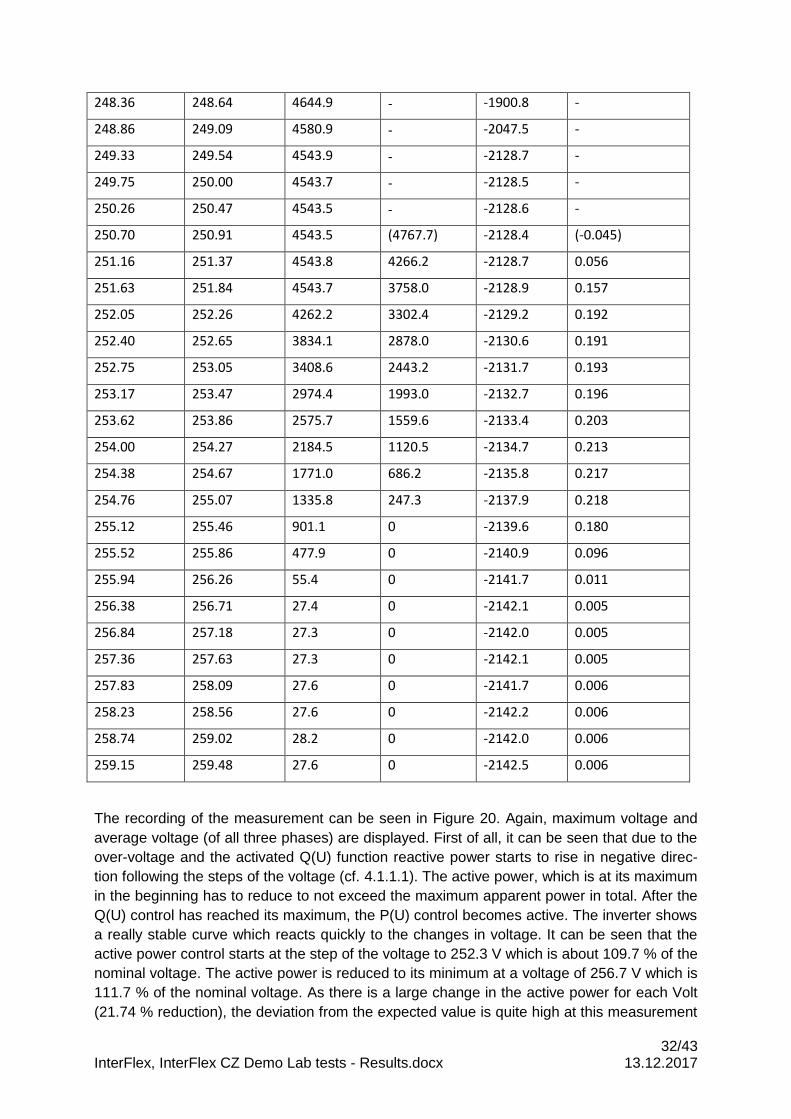
32/43 InterFlex, InterFlex CZ Demo Lab tests - Results.docx 13.12.2017
248.36 248.64 4644.9 - -1900.8 -
248.86 249.09 4580.9 - -2047.5 -
249.33 249.54 4543.9 - -2128.7 -
249.75 250.00 4543.7 - -2128.5 -
250.26 250.47 4543.5 - -2128.6 -
250.70 250.91 4543.5 (4767.7) -2128.4 (-0.045)
251.16 251.37 4543.8 4266.2 -2128.7 0.056
251.63 251.84 4543.7 3758.0 -2128.9 0.157
252.05 252.26 4262.2 3302.4 -2129.2 0.192
252.40 252.65 3834.1 2878.0 -2130.6 0.191
252.75 253.05 3408.6 2443.2 -2131.7 0.193
253.17 253.47 2974.4 1993.0 -2132.7 0.196
253.62 253.86 2575.7 1559.6 -2133.4 0.203
254.00 254.27 2184.5 1120.5 -2134.7 0.213
254.38 254.67 1771.0 686.2 -2135.8 0.217
254.76 255.07 1335.8 247.3 -2137.9 0.218
255.12 255.46 901.1 0 -2139.6 0.180
255.52 255.86 477.9 0 -2140.9 0.096
255.94 256.26 55.4 0 -2141.7 0.011
256.38 256.71 27.4 0 -2142.1 0.005
256.84 257.18 27.3 0 -2142.0 0.005
257.36 257.63 27.3 0 -2142.1 0.005
257.83 258.09 27.6 0 -2141.7 0.006
258.23 258.56 27.6 0 -2142.2 0.006
258.74 259.02 28.2 0 -2142.0 0.006
259.15 259.48 27.6 0 -2142.5 0.006
The recording of the measurement can be seen in Figure 20. Again, maximum voltage and
average voltage (of all three phases) are displayed. First of all, it can be seen that due to the
over-voltage and the activated Q(U) function reactive power starts to rise in negative direc-
tion following the steps of the voltage (cf. 4.1.1.1). The active power, which is at its maximum
in the beginning has to reduce to not exceed the maximum apparent power in total. After the
Q(U) control has reached its maximum, the P(U) control becomes active. The inverter shows
a really stable curve which reacts quickly to the changes in voltage. It can be seen that the
active power control starts at the step of the voltage to 252.3 V which is about 109.7 % of the
nominal voltage. The active power is reduced to its minimum at a voltage of 256.7 V which is
111.7 % of the nominal voltage. As there is a large change in the active power for each Volt
(21.74 % reduction), the deviation from the expected value is quite high at this measurement
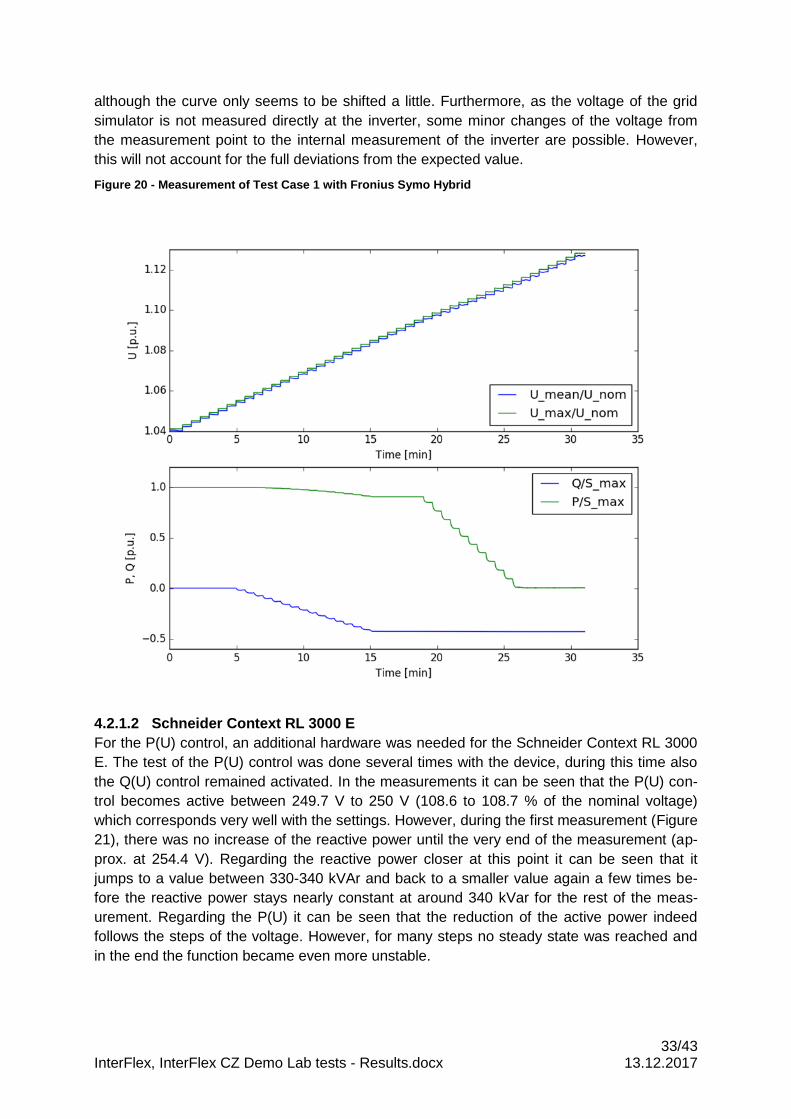
33/43 InterFlex, InterFlex CZ Demo Lab tests - Results.docx 13.12.2017
although the curve only seems to be shifted a little. Furthermore, as the voltage of the grid
simulator is not measured directly at the inverter, some minor changes of the voltage from
the measurement point to the internal measurement of the inverter are possible. However,
this will not account for the full deviations from the expected value.
Figure 20 - Measurement of Test Case 1 with Fronius Symo Hybrid
4.2.1.2 Schneider Context RL 3000 E
For the P(U) control, an additional hardware was needed for the Schneider Context RL 3000
E. The test of the P(U) control was done several times with the device, during this time also
the Q(U) control remained activated. In the measurements it can be seen that the P(U) con-
trol becomes active between 249.7 V to 250 V (108.6 to 108.7 % of the nominal voltage)
which corresponds very well with the settings. However, during the first measurement (Figure
21), there was no increase of the reactive power until the very end of the measurement (ap-
prox. at 254.4 V). Regarding the reactive power closer at this point it can be seen that it
jumps to a value between 330-340 kVAr and back to a smaller value again a few times be-
fore the reactive power stays nearly constant at around 340 kVar for the rest of the meas-
urement. Regarding the P(U) it can be seen that the reduction of the active power indeed
follows the steps of the voltage. However, for many steps no steady state was reached and
in the end the function became even more unstable.
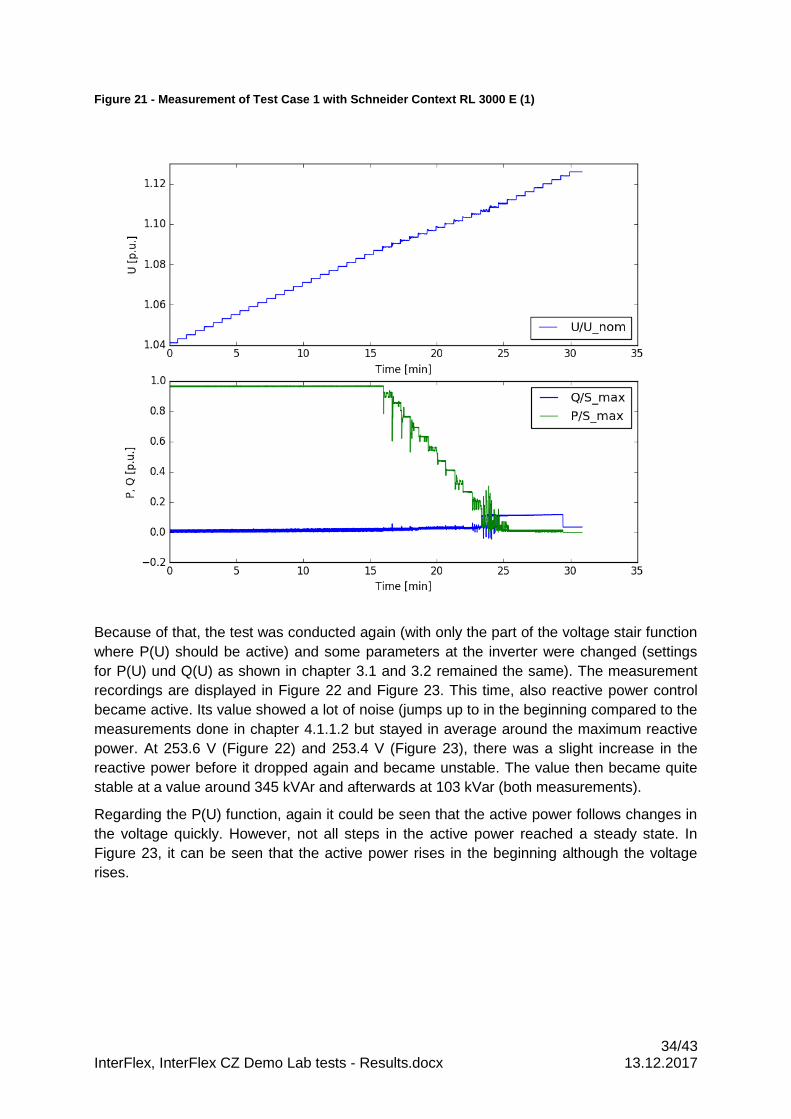
34/43 InterFlex, InterFlex CZ Demo Lab tests - Results.docx 13.12.2017
Figure 21 - Measurement of Test Case 1 with Schneider Context RL 3000 E (1)
Because of that, the test was conducted again (with only the part of the voltage stair function
where P(U) should be active) and some parameters at the inverter were changed (settings
for P(U) und Q(U) as shown in chapter 3.1 and 3.2 remained the same). The measurement
recordings are displayed in Figure 22 and Figure 23. This time, also reactive power control
became active. Its value showed a lot of noise (jumps up to in the beginning compared to the
measurements done in chapter 4.1.1.2 but stayed in average around the maximum reactive
power. At 253.6 V (Figure 22) and 253.4 V (Figure 23), there was a slight increase in the
reactive power before it dropped again and became unstable. The value then became quite
stable at a value around 345 kVAr and afterwards at 103 kVar (both measurements).
Regarding the P(U) function, again it could be seen that the active power follows changes in
the voltage quickly. However, not all steps in the active power reached a steady state. In
Figure 23, it can be seen that the active power rises in the beginning although the voltage
rises.
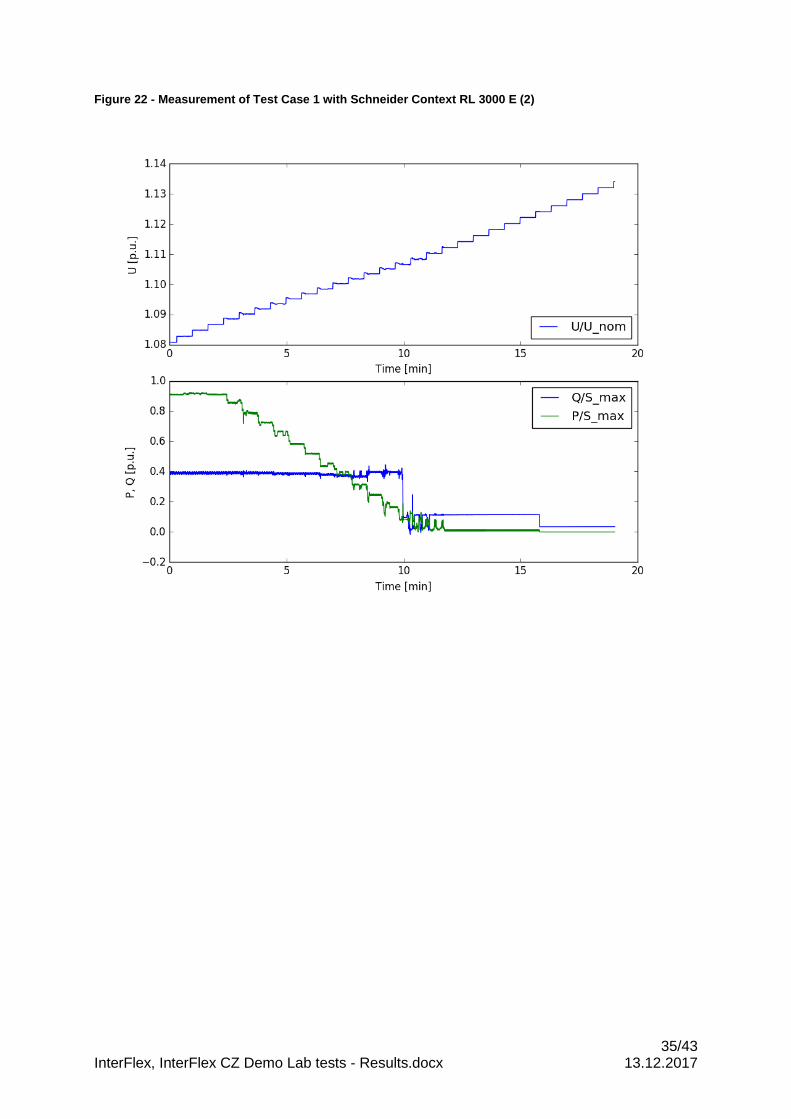
35/43 InterFlex, InterFlex CZ Demo Lab tests - Results.docx 13.12.2017
Figure 22 - Measurement of Test Case 1 with Schneider Context RL 3000 E (2)
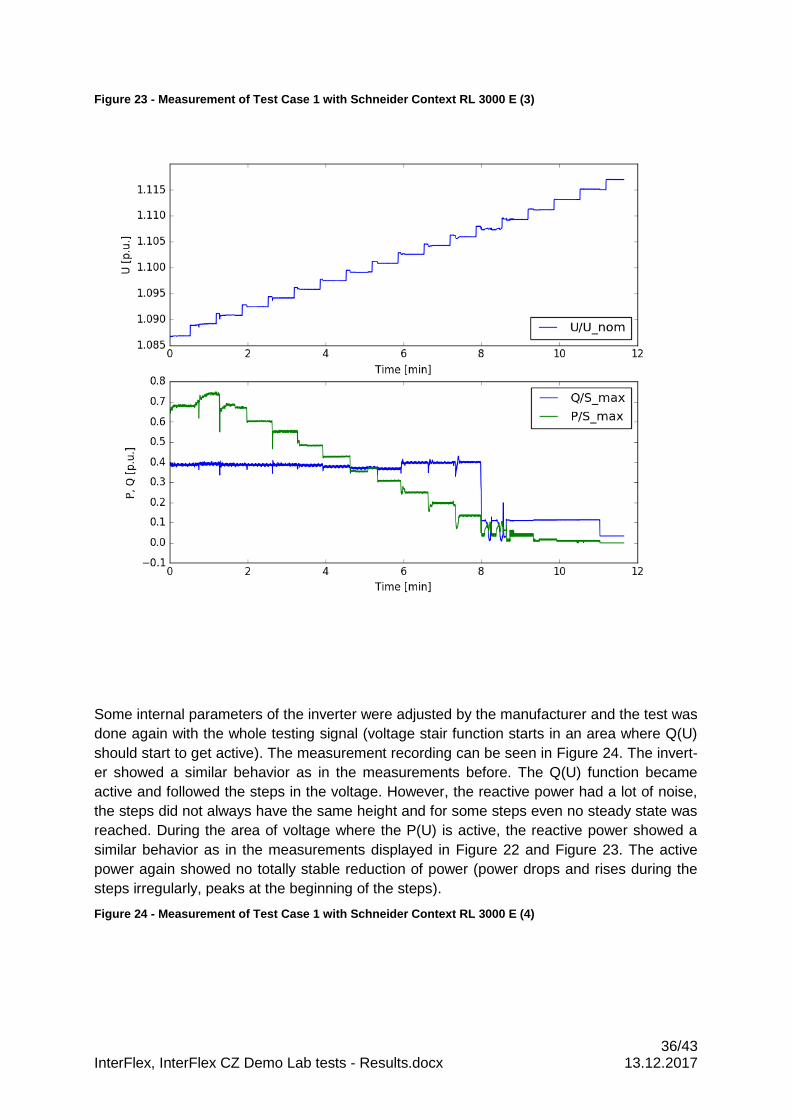
36/43 InterFlex, InterFlex CZ Demo Lab tests - Results.docx 13.12.2017
Figure 23 - Measurement of Test Case 1 with Schneider Context RL 3000 E (3)
Some internal parameters of the inverter were adjusted by the manufacturer and the test was
done again with the whole testing signal (voltage stair function starts in an area where Q(U)
should start to get active). The measurement recording can be seen in Figure 24. The invert-
er showed a similar behavior as in the measurements before. The Q(U) function became
active and followed the steps in the voltage. However, the reactive power had a lot of noise,
the steps did not always have the same height and for some steps even no steady state was
reached. During the area of voltage where the P(U) is active, the reactive power showed a
similar behavior as in the measurements displayed in Figure 22 and Figure 23. The active
power again showed no totally stable reduction of power (power drops and rises during the
steps irregularly, peaks at the beginning of the steps).
Figure 24 - Measurement of Test Case 1 with Schneider Context RL 3000 E (4)
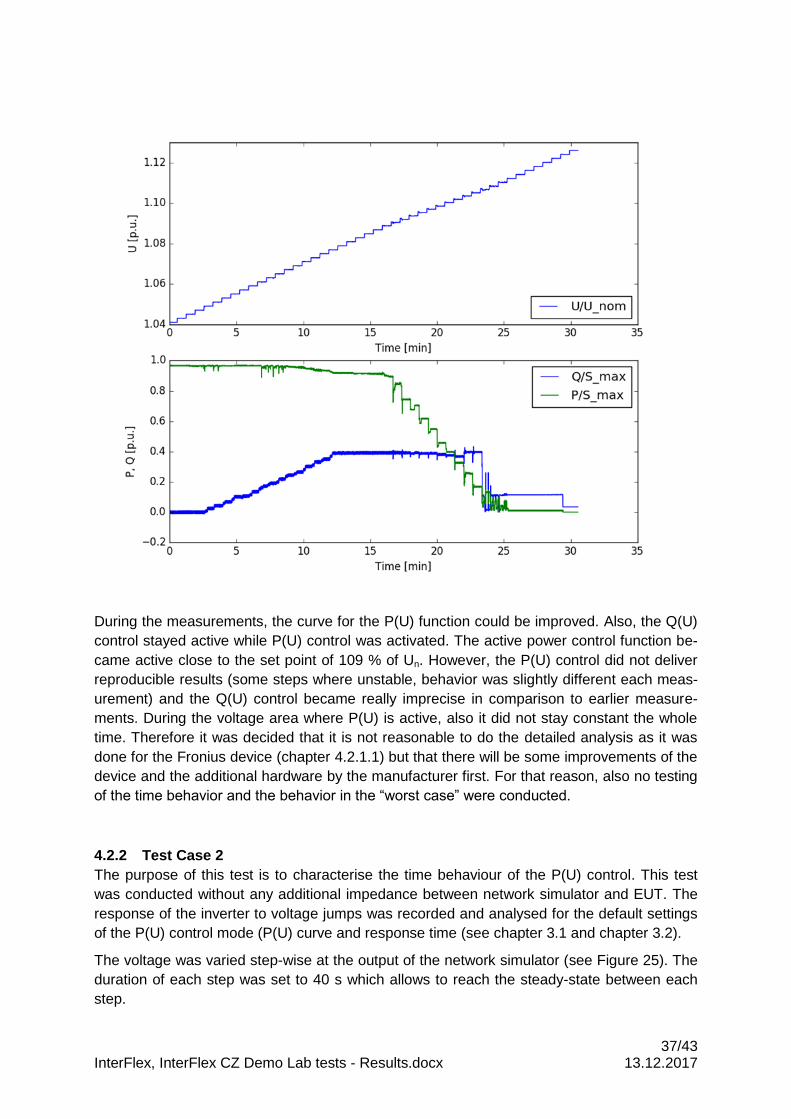
37/43 InterFlex, InterFlex CZ Demo Lab tests - Results.docx 13.12.2017
During the measurements, the curve for the P(U) function could be improved. Also, the Q(U)
control stayed active while P(U) control was activated. The active power control function be-
came active close to the set point of 109 % of Un. However, the P(U) control did not deliver
reproducible results (some steps where unstable, behavior was slightly different each meas-
urement) and the Q(U) control became really imprecise in comparison to earlier measure-
ments. During the voltage area where P(U) is active, also it did not stay constant the whole
time. Therefore it was decided that it is not reasonable to do the detailed analysis as it was
done for the Fronius device (chapter 4.2.1.1) but that there will be some improvements of the
device and the additional hardware by the manufacturer first. For that reason, also no testing
of the time behavior and the behavior in the “worst case” were conducted.
4.2.2 Test Case 2
The purpose of this test is to characterise the time behaviour of the P(U) control. This test
was conducted without any additional impedance between network simulator and EUT. The
response of the inverter to voltage jumps was recorded and analysed for the default settings
of the P(U) control mode (P(U) curve and response time (see chapter 3.1 and chapter 3.2).
The voltage was varied step-wise at the output of the network simulator (see Figure 25). The
duration of each step was set to 40 s which allows to reach the steady-state between each
step.
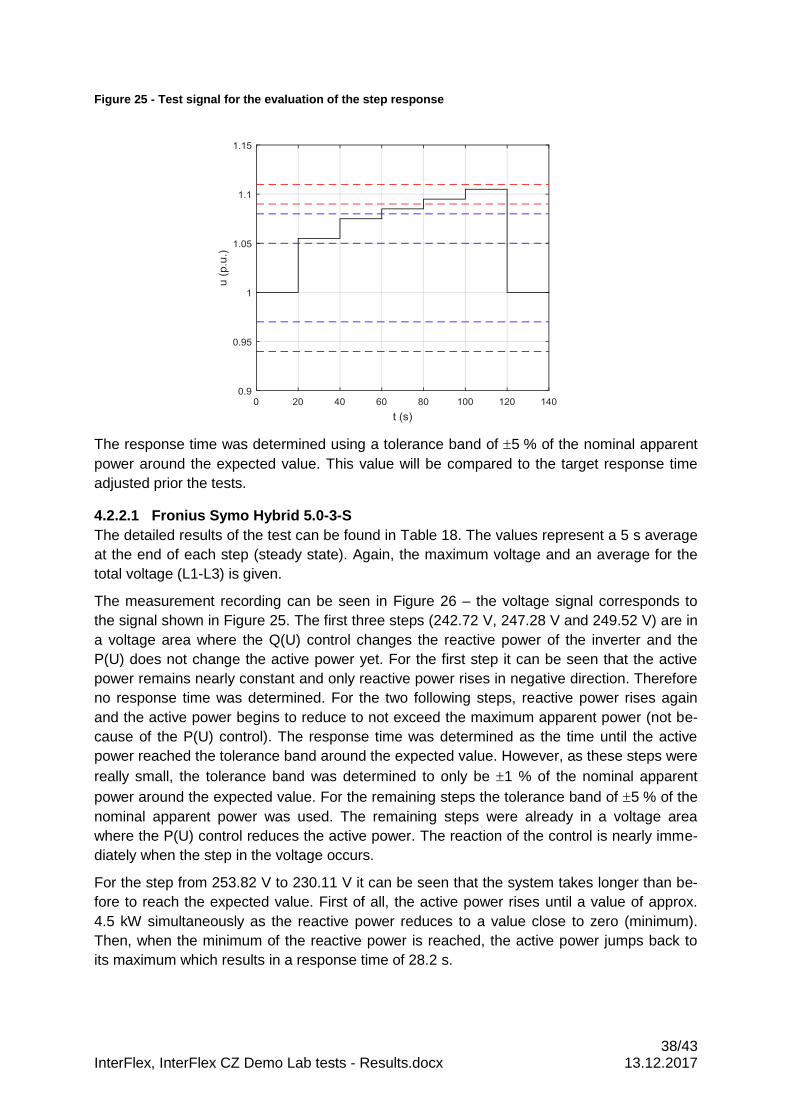
38/43 InterFlex, InterFlex CZ Demo Lab tests - Results.docx 13.12.2017
Figure 25 - Test signal for the evaluation of the step response
The response time was determined using a tolerance band of 5 % of the nominal apparent
power around the expected value. This value will be compared to the target response time
adjusted prior the tests.
4.2.2.1 Fronius Symo Hybrid 5.0-3-S
The detailed results of the test can be found in Table 18. The values represent a 5 s average
at the end of each step (steady state). Again, the maximum voltage and an average for the
total voltage (L1-L3) is given.
The measurement recording can be seen in Figure 26 – the voltage signal corresponds to
the signal shown in Figure 25. The first three steps (242.72 V, 247.28 V and 249.52 V) are in
a voltage area where the Q(U) control changes the reactive power of the inverter and the
P(U) does not change the active power yet. For the first step it can be seen that the active
power remains nearly constant and only reactive power rises in negative direction. Therefore
no response time was determined. For the two following steps, reactive power rises again
and the active power begins to reduce to not exceed the maximum apparent power (not be-
cause of the P(U) control). The response time was determined as the time until the active
power reached the tolerance band around the expected value. However, as these steps were
really small, the tolerance band was determined to only be 1 % of the nominal apparent
power around the expected value. For the remaining steps the tolerance band of 5 % of the
nominal apparent power was used. The remaining steps were already in a voltage area
where the P(U) control reduces the active power. The reaction of the control is nearly imme-
diately when the step in the voltage occurs.
For the step from 253.82 V to 230.11 V it can be seen that the system takes longer than be-
fore to reach the expected value. First of all, the active power rises until a value of approx.
4.5 kW simultaneously as the reactive power reduces to a value close to zero (minimum).
Then, when the minimum of the reactive power is reached, the active power jumps back to
its maximum which results in a response time of 28.2 s.

39/43 InterFlex, InterFlex CZ Demo Lab tests - Results.docx 13.12.2017
Table 18 - Results of Test Case 1 with Fronius Symo Hybrid 5.0-3-S
𝑼_𝒎𝒆𝒂𝒏[𝑽] 242.72 247.28 249.52 252.36 253.82 230.11
𝑼_𝒎𝒂𝒙[𝑽] 242.91 247.46 249.74 252.63 254.05 230.27
𝑸[𝑽𝑨𝒓] 15.6 -158.7 -1565.0 -2125.8 -2132.3 16.5
𝑷[𝑾] 5018.2 4997.5 4764.1 3839.7 2416.4 5019.1
𝚫𝒕[𝒔] Only Q(U) 8.29 9.09 6.0 8.0 28.2
Figure 26 - Measurement of Test Case 2 with Fronius Symo Hybrid
4.2.2.2 Schneider Context RL 3000 E
No tests were conducted (cf. chapter 4.2.1.2).
4.2.3 Test Case 3
The purpose of this test is to evaluate the stability of the control under worst-case conditions.
This test was conducted with an additional impedance between network simulator and EUT,
adjusted to represent the worst-case conditions (see below).
The stability of a P(U) control can be handled in a similar way to the stability of the Q(U) con-
trol (see chapter 4.1.3). The stability of the control is mainly influenced by the following fac-
tors:
9 Power reduction due to Q(U) function not because of P(U) control. As these steps were very small,
the tolerance band was set to +/- 1% of the nominal apparent power around the expected value.
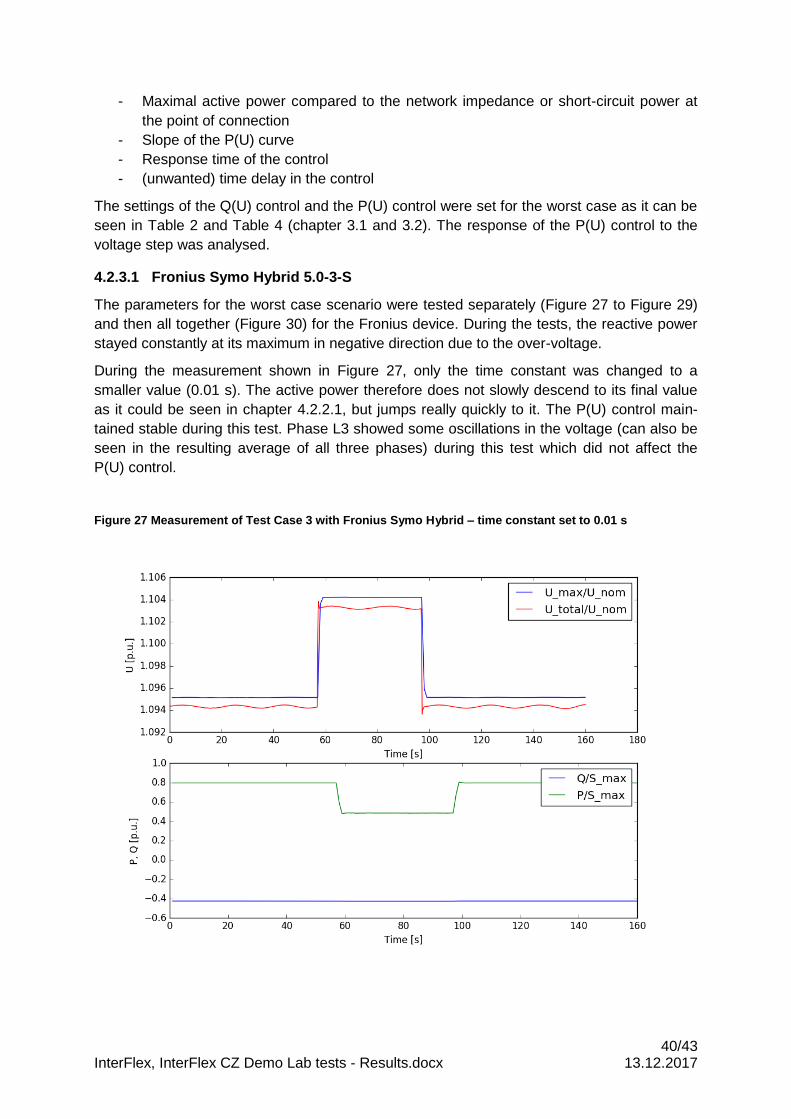
40/43 InterFlex, InterFlex CZ Demo Lab tests - Results.docx 13.12.2017
- Maximal active power compared to the network impedance or short-circuit power at
the point of connection
- Slope of the P(U) curve
- Response time of the control
- (unwanted) time delay in the control
The settings of the Q(U) control and the P(U) control were set for the worst case as it can be
seen in Table 2 and Table 4 (chapter 3.1 and 3.2). The response of the P(U) control to the
voltage step was analysed.
4.2.3.1 Fronius Symo Hybrid 5.0-3-S
The parameters for the worst case scenario were tested separately (Figure 27 to Figure 29)
and then all together (Figure 30) for the Fronius device. During the tests, the reactive power
stayed constantly at its maximum in negative direction due to the over-voltage.
During the measurement shown in Figure 27, only the time constant was changed to a
smaller value (0.01 s). The active power therefore does not slowly descend to its final value
as it could be seen in chapter 4.2.2.1, but jumps really quickly to it. The P(U) control main-
tained stable during this test. Phase L3 showed some oscillations in the voltage (can also be
seen in the resulting average of all three phases) during this test which did not affect the
P(U) control.
Figure 27 Measurement of Test Case 3 with Fronius Symo Hybrid – time constant set to 0.01 s
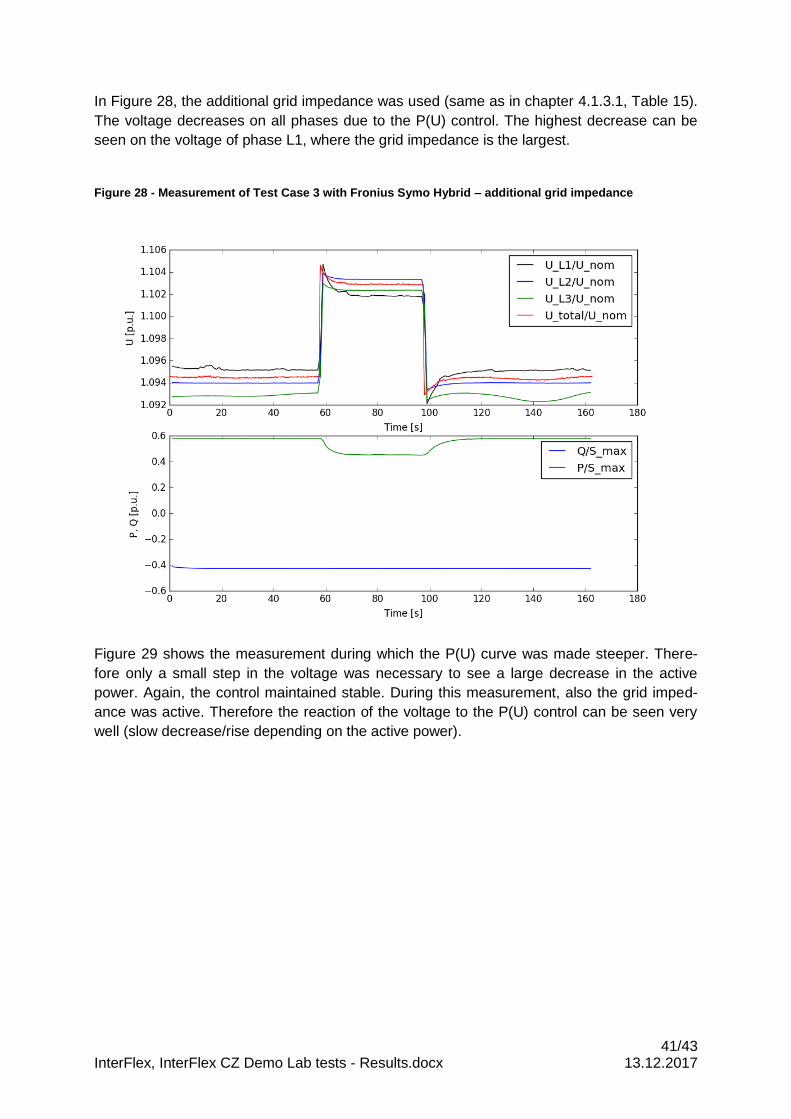
41/43 InterFlex, InterFlex CZ Demo Lab tests - Results.docx 13.12.2017
In Figure 28, the additional grid impedance was used (same as in chapter 4.1.3.1, Table 15).
The voltage decreases on all phases due to the P(U) control. The highest decrease can be
seen on the voltage of phase L1, where the grid impedance is the largest.
Figure 28 - Measurement of Test Case 3 with Fronius Symo Hybrid – additional grid impedance
Figure 29 shows the measurement during which the P(U) curve was made steeper. There-
fore only a small step in the voltage was necessary to see a large decrease in the active
power. Again, the control maintained stable. During this measurement, also the grid imped-
ance was active. Therefore the reaction of the voltage to the P(U) control can be seen very
well (slow decrease/rise depending on the active power).
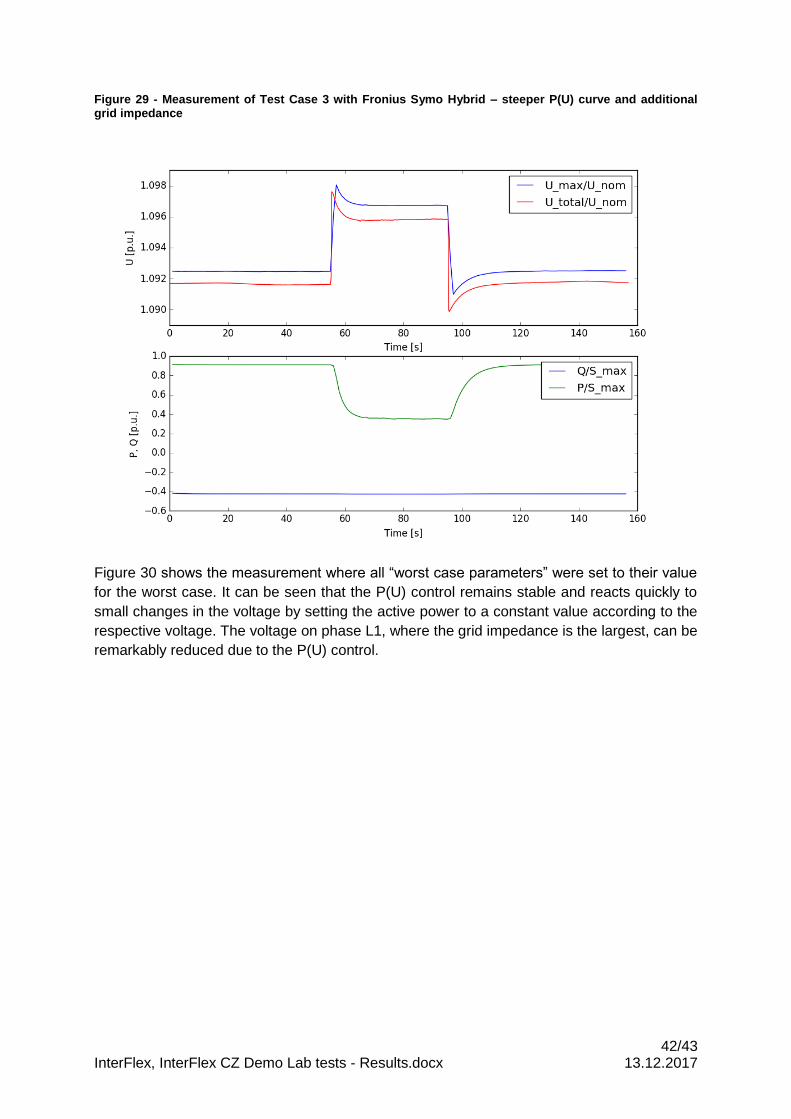
42/43 InterFlex, InterFlex CZ Demo Lab tests - Results.docx 13.12.2017
Figure 29 - Measurement of Test Case 3 with Fronius Symo Hybrid – steeper P(U) curve and additional grid impedance
Figure 30 shows the measurement where all “worst case parameters” were set to their value
for the worst case. It can be seen that the P(U) control remains stable and reacts quickly to
small changes in the voltage by setting the active power to a constant value according to the
respective voltage. The voltage on phase L1, where the grid impedance is the largest, can be
remarkably reduced due to the P(U) control.
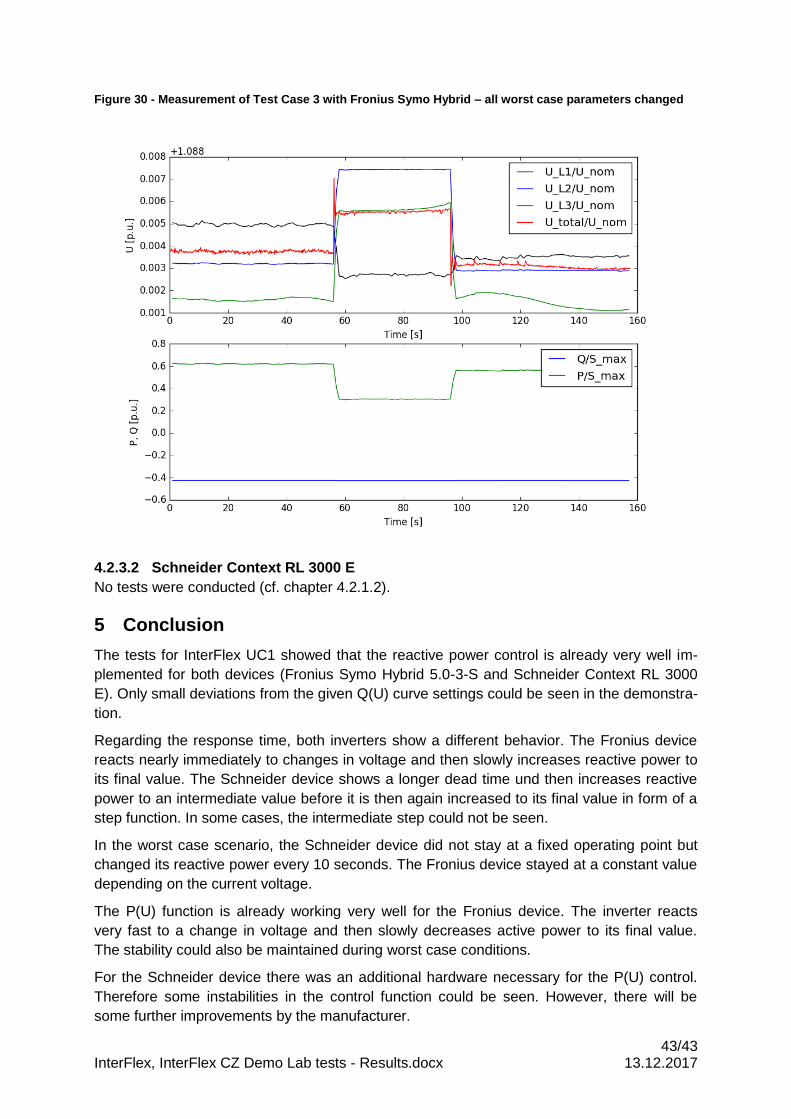
43/43 InterFlex, InterFlex CZ Demo Lab tests - Results.docx 13.12.2017
Figure 30 - Measurement of Test Case 3 with Fronius Symo Hybrid – all worst case parameters changed
4.2.3.2 Schneider Context RL 3000 E
No tests were conducted (cf. chapter 4.2.1.2).
5 Conclusion
The tests for InterFlex UC1 showed that the reactive power control is already very well im-
plemented for both devices (Fronius Symo Hybrid 5.0-3-S and Schneider Context RL 3000
E). Only small deviations from the given Q(U) curve settings could be seen in the demonstra-
tion.
Regarding the response time, both inverters show a different behavior. The Fronius device
reacts nearly immediately to changes in voltage and then slowly increases reactive power to
its final value. The Schneider device shows a longer dead time und then increases reactive
power to an intermediate value before it is then again increased to its final value in form of a
step function. In some cases, the intermediate step could not be seen.
In the worst case scenario, the Schneider device did not stay at a fixed operating point but
changed its reactive power every 10 seconds. The Fronius device stayed at a constant value
depending on the current voltage.
The P(U) function is already working very well for the Fronius device. The inverter reacts
very fast to a change in voltage and then slowly decreases active power to its final value.
The stability could also be maintained during worst case conditions.
For the Schneider device there was an additional hardware necessary for the P(U) control.
Therefore some instabilities in the control function could be seen. However, there will be
some further improvements by the manufacturer.

44/43 InterFlex, InterFlex CZ Demo Lab tests - Results.docx 13.12.2017