getting the stormwater message across:
TRANSCRIPT
Getting the Stormwater Message Across
Supporting Information on the Effects of Selected Residential
Activities on Stormwater Quality
WCFM Report 2011-004
REPORT: WCFM Report 2011-004
TITLE: Getting the Stormwater Message Across:
Supporting Information on the Effects of Selected Residential
Activities on Stormwater Quality
(with particular reference to the aquatic ecosystems of the Avon
River/Ōtākaro and Heathcote River/Ōpāwaho in Christchurch)
PREPARED FOR: Environment Canterbury (ECan)
PREPARED BY: Sean Waters MSc Geology, MSc Applied Science
REVIEWED BY: Professor Jenny Webster-Brown (Waterways Centre) and Leila
Chrystall (ECan)
AFFILIATION: Waterways Centre for Freshwater Management
University of Canterbury & Lincoln University
Private Bag 4800
Christchurch
New Zealand
DATE: 12 December, 2011
Executive Summary
The Avon River/Ōtākaro and Heathcote River/Ōpāwaho drain catchments which are predominantly urbanised, and stormwater has a major effect on the water quality of these rivers. The activities carried out by residents within these urban catchments have the potential to significantly impact stormwater quality, and increasing community awareness and responsibility is a goal of the Canterbury Regional Council (Environment Canterbury). This report was initiated under Environment Canterbury’s Improving Urban Waterway Health programme (IUWH) and aims to provide supporting information for a public marketing campaign intended to promote responsible stormwater behaviour in four selected residential activities; car washing, use of outdoor cleaners and moss treatments, disposal of cigarette butts, and the disposal of DIY-type hazardous waste. Specifically the objectives of this review were to:
Review local and international research pertaining to the effects of these common residential activities on freshwater aquatic ecosystems;
Predict the likely effects of these activities on the Avon/Ōtākaro and Heathcote /Ōpāwaho rivers and their tributaries in Christchurch;
Assess whether the available information is sufficient to support the suggested ‘impact’ messages designed to change residential behaviour; and
Identify gaps in the information available on the effects of the selected activities.
The availability of information required to accurately predict the ecological impact of the selected activities is highly variable. However, initial approximations indicate that car washing, roof cleaning and inappropriate disposal of engine lubricants can potentially result in contaminant concentrations which exceed reported ecotoxicity levels and/or environmental guidelines for the protection of aquatic life. Cigarette butt litter appears unlikely to result in toxic concentrations of contaminant compounds, as does the washing of painting equipment, although a significant point source spill may result in toxic concentrations. In addition to direct toxicity, indirect impacts such as a reduction in dissolved oxygen levels and/or habitat modification are likely in some cases. Insufficient information is available to enable the prediction of specific species mortality rates resulting from the studied residential activities.
Significant information gaps currently exist and include; a lack of reliable data on the number of residents engaging in these activities, the absence of testing for many of the contaminants investigated in this report in the waterways of Christchurch, the lack of ecotoxicity data for many New Zealand native aquatic species, and an absence of data on the cumulative impacts of multiple contaminants.
Contents
Section 1 Introduction 1
1.1 Background 1 1.2 Research objectives 1 1.3 Report structure 2
Section 2 Research Methodology 3
2.1 Local setting 3 2.2 Literature review 4 2.3 Prediction of contaminant concentrations and effects 5 2.4 Limitations 5
Section 3 Residential Car washing 7
3.1 Introduction 7 3.2 Car washing; what’s the problem? 7 3.2.1 Petroleum Hydrocarbons 10 3.2.2 Metals 11 3.2.3 Detergents and surfactants 11 3.3 Predicted contaminant concentrations from residential Car washing 15 3.3.1 Discharge concentrations 15 3.3.2 Catchment concentrations 17 3.4 Does the research support the message “Washing the car on the drive can kill our fish”? 20 3.5 Suggested alternative car washing practises 22 Section 4 Residential Outdoor Cleaning/Moss Treatments 23
4.1 Introduction 23 4.2 What’s in outdoor cleaning products? 23 4.2.1 Sodium hypochlorite 25 4.2.2 Didecyldimethylammonium chloride (DDAC) 25 4.2.3 Benzalkonium chloride (BAC) 26 4.2.4 Ethylenediamintetraacetic tetrasodium salt (EDTA) 27 4.3 Predicted concentrations of active ingredients 28 4.3.1 Discharge concentrations 29 4.3.2 Catchment concentrations 29 4.4 Does the research support the message “Cleaning your roof and outdoor areas with chemicals, can kill our fish”? 31 4.5 Suggested alternative outdoor cleaning practises 32
Section 5 Cigarette Butt Litter 34
5.1 Introduction 34 5.2 Environmental impacts and toxicity of cigarette butts 35
5.3 Predicted concentrations of littered cigarette butts 36 5.4 Does the research support the message “Ditching your butt can kill our rivers too”? 39 5.5 Alternative practises and measures 39
Section 6 Inappropriate Disposal of Selected DIY Hazardous Waste 40
6.1 Introduction 40 6.2 Used engine lubricants; what’s the problem? 40 6.2.1 Predicted concentrations of contaminants from used engine lubricants. 42 6.2.2 Does the research support the suggested DIY message? 45 6.2.3 Suggested alternative practises 47 6.3 Paint waste and equipment washing 48 6.3.1 Predicted concentrations of contaminants from paint wash water 52 6.3.2 Does the research support the suggested DIY message? 54 6.3.3 Suggested alternative practises 56 Section 7 Summary 57
Section 8 Gaps and Recommendations 59
Section 9 Glossary 61
Section 10 References 63
Appendix 1 Background Information on Detergents and Surfactants 74
1
Section 1 Introduction
1.1 Background
The Canterbury Regional Council (Environment Canterbury) is currently engaged in a programme entitled Improving Urban Waterway Health (IUWH), which is included in the Long Term Council Community Plan and is intended to focus initially on Christchurch urban waterways and then move on to other urban waterways throughout Canterbury.
The objective of the IUWH programme is to improve the ecological health of urban waterways by:
Increasing the level and effectiveness of urban community involvement in management and care of urban waterways.
Increasing community knowledge, environmental awareness and responsibility with regards to the effects of individual and cumulative actions on urban waterways.
More effective and proactive agency management of urban waterways through increased coordination and appropriate regulatory enforcement.
As part of this project Environment Canterbury has been conducting marketing campaigns in Christchurch which have targeted some common residential activities that are thought to adversely affect water quality in the Avon/Ōtākaro and Heathcote/Ōpāwaho rivers and their tributaries. However questions have been raised by members of the community as to the nature, extent and effects of these activities. This report has been commissioned by Environment Canterbury in an attempt to answer these types of questions and to provide supporting information for future marketing campaigns.
Various studies have been conducted previously as part of the IUWH programme. These have focussed on traditionally monitored water quality trends, levels and sources of contaminants, and community perceptions and behaviours. This report assesses and attempts to quantify the possible impacts of several selected residential activities, namely; car washing, the use of outdoor cleaning products, and the inappropriate disposal of cigarette butts and some ‘DIY”-type hazardous wastes, on the Avon/Ōtākaro and Heathcote/Ōpāwaho river catchments.
1.2 Research Objectives
The primary objectives of this research are to:
Review local and international research pertaining to the effects of these common residential activities on freshwater aquatic ecosystems;
Predict the likely effects of these activities on the Avon/Ōtākaro and Heathcote/Ōpāwaho rivers and their tributaries in Christchurch;
Assess whether the available information is sufficient to support the suggested ‘impact’ messages designed to change residential behaviour;
Identify gaps in the information available on the effects of the selected activities.
2
Initial meetings between Environment Canterbury, the Waterways Centre and representatives from Civil and Natural Resources Engineering (CNRE) from the University of Canterbury, produced a shortlist of residential activities with the potential to contaminate stormwater. This shortlist was discussed at a project meeting with Environment Canterbury’s Community Education and Engagement - External Advisory Group, and a final list of four activities for investigation in this report was decided upon. These residential activities are;
1. Car washing 2. The use of outdoor cleaners and moss treatments 3. Littering with cigarette butts 4. Inappropriate disposal of DIY-type hazardous waste (from changes of vehicle
lubricants and cleaning of painting equipment)
1.3 Report Structure
This report is set out as follows:
Section 2: Research Methodology. This section summarises the main sources of information used in the literature review for this study.
Sections 3 to 6: Residential activity-specific impact assessment. Each section begins with a possible public marketing message targeting the residential activity in question. The validity of this message is then examined, with respect to the available supporting scientific information on contaminants, their environmental effects and ecotoxicity data. The probable frequency of the activity in Christchurch is used to predict likely contaminant concentrations in the Avon/Ōtākaro and Heathcote/Ōpāwaho rivers. Where possible the estimated contaminant loadings from the activity are compared with those from other known urban sources of the contaminant, and the relative effects of the activity are assessed. The degree to which the original marketing message can be supported by the research is reviewed, and alternative practises for the activity presented.
Section 7: Gaps in the reviewed research are presented and further research recommended.
Section 8: References are presented for each section.
Appendix 1: Background information on detergents and surfactants is presented.
3
Section 2 Research Methodology
2.1 Local Setting
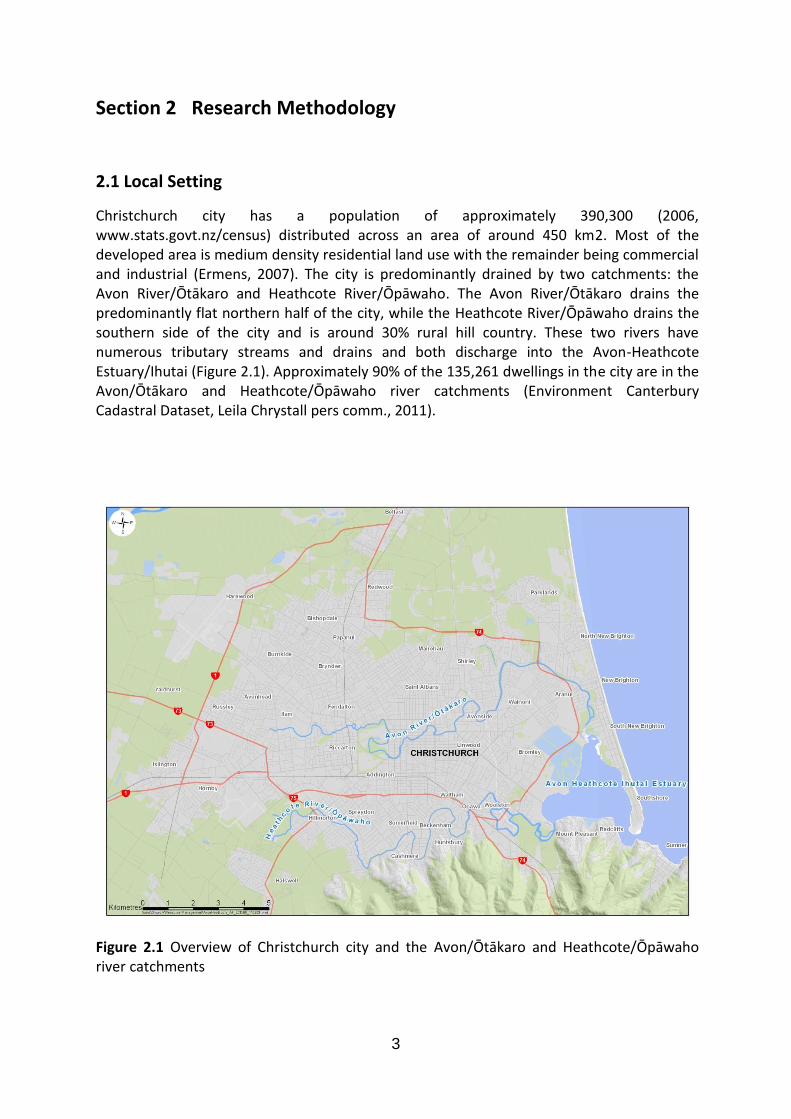
Christchurch city has a population of approximately 390,300 (2006, www.stats.govt.nz/census) distributed across an area of around 450 km2. Most of the developed area is medium density residential land use with the remainder being commercial and industrial (Ermens, 2007). The city is predominantly drained by two catchments: the Avon River/Ōtākaro and Heathcote River/Ōpāwaho. The Avon River/Ōtākaro drains the predominantly flat northern half of the city, while the Heathcote River/Ōpāwaho drains the southern side of the city and is around 30% rural hill country. These two rivers have numerous tributary streams and drains and both discharge into the Avon-Heathcote Estuary/Ihutai (Figure 2.1). Approximately 90% of the 135,261 dwellings in the city are in the Avon/Ōtākaro and Heathcote/Ōpāwaho river catchments (Environment Canterbury Cadastral Dataset, Leila Chrystall pers comm., 2011).
Figure 2.1 Overview of Christchurch city and the Avon/Ōtākaro and Heathcote/Ōpāwaho river catchments
4
2.2 Literature Review
Keyword literature searches were carried out for each residential activity, using the following key data sources:
New Zealand local and regional authority reports;
Scientific literature accessed through the University of Canterbury library databases, primarily; Proquest, Web of Science, Science Direct and Google scholar;
General internet searches using the Google search engine;
International Agency databases from other countries, primarily;
United States Environmental Protection Agency EcoTox database (cfpub.epa.gov/ecotox),
International Uniform Chemical Information Database of the European Commission, European Chemical Bureau. (www.esis.jrc.ec.europa.eu),
United States National Library of Medicine (www.toxnet.nlm.nih.govt),
Human and Environmental Risk Assessment Project (www.heraproject.com)
The results of the literature reviews were assessed for relevance and summarised into the introductory and environmental effects sections, for each residential activity.
For the contaminants reviewed, ecotoxicity data is presented for each activity as reported. Often reported toxicities use different measures of toxicity and or different organisms making direct comparison difficult. The data is generally presented in this report with some or all of the following components (as available);
EC50, Effect Concentration; The concentration at which 50% of the test population has a specified reaction such as immobility, or;
LC50, Lethal Concentration; The concentration at which 50% of the population are killed.
NOEC, No Observable Effect Concentration. The highest concentration at which no effect (specified e.g.: immobility) was observed.
PNEC, Predicted No Effect Concentration. As for NOEC but extrapolated from other observations.
Time, e.g. 48hr. The time frame for exposure to the given contaminant concentration.
Effect, e.g. bioluminescence. The reported effect for EC, NOEC etc.
For example eco-toxicity research may report a contaminant EC50 concentration of 4.1mg/L and a NOEC concentration of 1.4mg/L for the water flea Daphnia magna, using mobility as the measured effect and a time of exposure of 21 days. Hence 50% of the test population of the water flea Daphnia magna displayed a threshold effect on mobility after 21 days exposure to a concentration of 4.1 mg/L and 0% of the population showed the effect in 1.4 mg/L. Other research on the same contaminant may report a LC50 of 6.0 mg/L for a 14 day exposure, indicating a concentration of 6.0 mg/L resulted in mortality in 50% of the test population after 14 days.
5
2.3 Prediction of contaminant concentrations and effects
Product research was undertaken in Christchurch retail outlets, online, and through phone conversations with commercial suppliers to ascertain the ingredients of products utilised in the residential activities investigated. Where sufficient information was available regarding product ingredients, an attempt has been made to predict the possible concentrations of contaminants that may enter into Christchurch waterways through stormwater discharges as a result of the described residential activity. Various assumptions have had to made, reflecting the quality of information available. These assumptions are listed in each relevant section.
The complex modelling required to accurately predict contaminant fate and bioavailability in receiving waters is beyond the scope of this research. Instead a highly simplified ‘first order’ estimation of contaminant concentrations is attempted by the use of a ‘pooled river flow’ scenario. In this approach concentrations are calculated, as they would be if all the flow of the Avon/Ōtākaro and Heathcote/Ōpāwaho rivers were pooled for the specified time frame (12 and 24hrs), and the predicted volumes of contaminants from the respective residential activities, were mixed into it.
A graph of 2009 freshwater flows for the Avon/Ōtākaro and Heathcote/Ōpāwaho rivers was provided by Environment Canterbury (Leila Chrystall pers comm, 2011). From this data, low flows from late December 2009, of 118,000 m3/day for the Avon/Ōtākaro (recorded from Gloucester Street bridge) and 50,000 m3/day for the Heathcote/Ōpāwaho (recorded from Buxton Terrace), were selected to give a total 24 hour ‘pool’ of 168,000 m3 and a 12 hour ‘pool’ of 84,000 m3. Low flows were selected in order to give an indication of the higher potential contaminant concentrations that may be achieved during a dry period in Christchurch, i.e. the worst case scenario. These pooled flow volumes are used for all residential activities, except for cigarette butt littering which used an alternative approach explained in section 5.3. The pooled flow volumes used to predict concentrations for this activity are discussed in the relevant section.
2.4 Limitations
The literature search has attempted to access as much relevant information as possible, however it is likely that not all research relevant to this report has been reviewed.
As mentioned previously the detailed investigation into actual in-river concentrations of the contaminants investigated, as well as the environmental fate and bioavailability of those contaminants is beyond the scope of this research and is discussed further in Section 7. Many of the contaminants which may result from some of the residential activities investigated are poorly studied and rarely included in water quality monitoring programmes. As such the information on their environmental effects is often sparse or non-existent. In addition, information on the ingredients of commercial products is often difficult to obtain due to commercial sensitivities and hence contaminant information may be incomplete. This review has concentrated on the contaminants for which there is information on both the concentration in commercial products, and on environmental
6
effects. There may well be contaminants produced by the activities discussed which are not included in this report.
One of the initial aims of this review was to provide quantifiable estimates of organism-specific effects (e.g. effects on plant, animal, bacteria etc), in order to craft specific public marketing messages, such as, “Washing X number of cars creates X amount of contaminants, which kills X fish in our rivers”. It quickly became apparent during this research that while a reasonable attempt could be made at predicting contaminant concentrations, an estimation of the specific numbers of organisms affected was highly problematic. While fish surveys in the Avon/Ōtākaro and Heathcote/Ōpāwaho rivers provide data which may allow fish populations of the ‘pooled’ Avon/Ōtākaro and Heathcote/Ōpāwaho rivers to be estimated (e.g. average of 55 fish/100m2 in the Avon/Ōtākaro (McMurtrie 2009) and 125 fish/100m2 in the Heathcote/Ōpāwaho (Taylor, 2005)), in reality this exercise seems unlikely to provide meaningful data.
Furthermore, none of the ecotoxicity work cited in this report has been conducted on indigenous species or species that are specific to the Avon/Ōtākaro and Heathcote/Ōpāwaho rivers. The complexities of estimating specific impacts on aquatic populations from environmental contaminants are highlighted in various studies (e.g., Barnthouse et al, 1987; Johnson and Landahl, 1994; Thompson, et al 1999) and include all the complexities of individual species behaviour and adaptation, ecosystem responses and the intricacies of contaminant dispersal, fate and interactions with other contaminants.
It is possible, or even likely, that the residential activities investigated in this research, have a limited effect on the current degraded river populations as the more sensitive species have already been impacted by a long history of urban development. The main species present are tolerant of degraded habitat and hence are usually common in urban waterways (McMurtrie, 2009). This is supported by an Auckland study of intergenerational responses of aquatic biota to stormwater exposure (Phillips et al, 2009) which provided evidence for changes in genetic diversity and associated diversity in species and ecological processes and interactions. Therefore, continuing to discharge stormwater contaminated by residential activities seems more likely to prevent the return of Christchurch waterways to a more healthy state, rather than result in spikes of fish deaths, although contaminant spills of abnormal scale may well result in wide scale mortality.
However, even in the absence of enough evidence to accurately estimate specific ecological impacts, it has proved possible to provide sufficient information to support more general public marketing messages, and this is the approach that has been taken here.
7
Section 3 Residential Car Washing
Possible overall message: “Stormwater goes direct to our rivers, chemicals and all”
Possible car wash specific message: “Washing your car on the drive can kill our fish”
3.1 Introduction
Washing the car is a time honoured practise and a common suburban sight on a sunny weekend. While commercial car washes, which commonly discharge pre-treated water to city sewerage treatment plants, continue to increase in popularity, washing the car at home is still a common practise for many residents. However there has been growing concern over the contribution of car washing to the pollution of urban waterways, and local authorities now commonly encourage residents to modify their car washing behaviour to minimise the impact (e.g.: City of Federal Way www.cityoffederalway.com, Wellington http://www.gw.govt.nz/car-washing, Auckland http://www.arc.govt.nz, Christchurch, http://ECan.govt.nz/publications/General/save-our-stream-okeover-stream-brochure).
3.2 Car wash water - what’s the problem?
Car wash effluent commonly contains a range of contaminants which may be detrimental to aquatic ecosystems. The washing solution will generally contain detergents and surfactants which are designed to make dirt and contaminants on the surface of the car more miscible in water (i.e. more easily carried in the water) and hence removable (see Appendix 1 for a more detailed discussion of surfactants). As a result the effluent will also contain hydrocarbons, heavy metals, and suspended solids washed from the car’s surface, all of which have direct and indirect effects on aquatic environments (ICA, 2002; Smith, 2009; Wen-Kai et al, 2009; Bhatti et al, 2010). This literature review concentrates largely on the detergents and surfactants contained in car wash water, however comments are also made below on the contribution made to petroleum hydrocarbon and heavy metal pollution.
3.2.1 Petroleum hydrocarbons
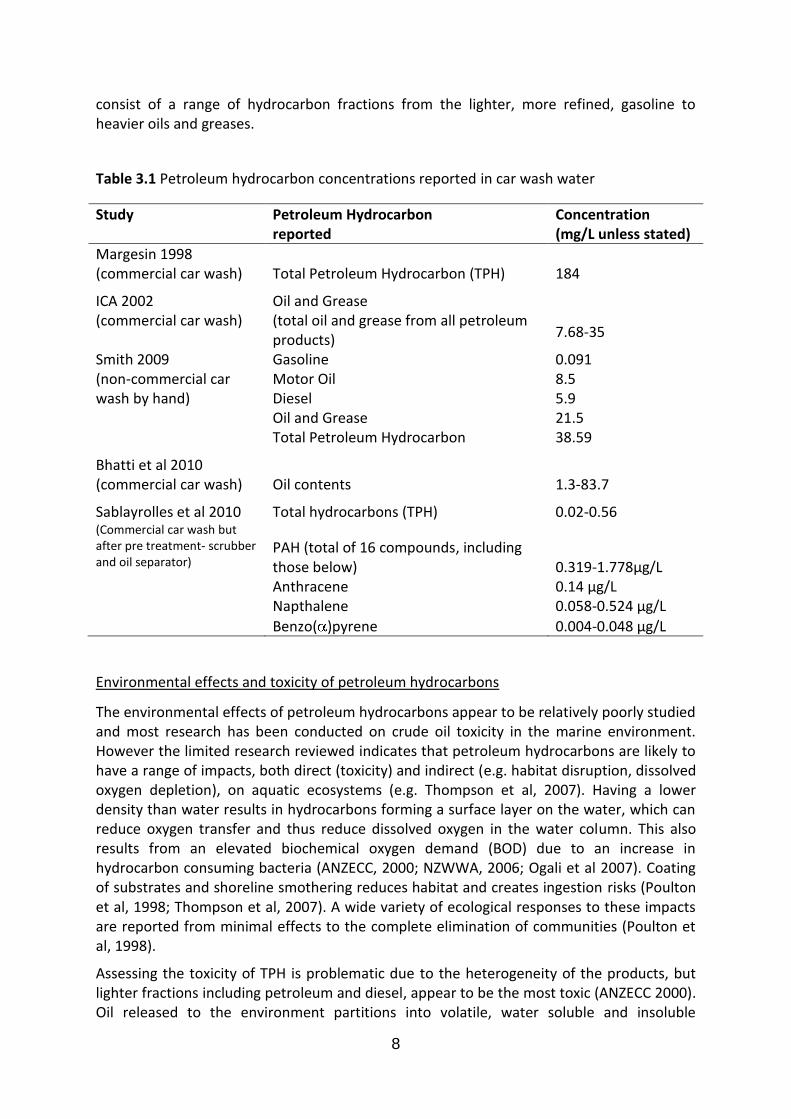
Car wash water has been shown to contain petroleum products such as gasoline, motor oil, diesel and other greases, oils and lubricants which are washed from the car surface and the engine (e.g.: Margesin, 1998; ICA, 2002 Smith, 2009; Bhatti et al, 2010; Sablayrolles et al, 2010). In addition polycyclic aromatic hydrocarbons (PAH) are also reported in car wash water (Sablayrolles et al, 2010). These are a contaminant of considerable concern (Ermens, 2007) as many are carcinogenic, environmentally persistent and/or toxic (Dupree & Aherns, 2005). They result from the incomplete combustion of hydrocarbon fuels and are emitted to the atmosphere from vehicle exhausts where they are subsequently deposited on the exterior surfaces of vehicles. A number of studies have analysed contaminants in car wash effluents and Table 3.1 presents selected concentrations reported in these studies. Hydrocarbon contaminants are generally reported as Total Petroleum Hydrocarbons (TPH). The data from Smith (2009) presented in Table 3.1, illustrates that reported TPH are likely to
8
consist of a range of hydrocarbon fractions from the lighter, more refined, gasoline to heavier oils and greases.
Table 3.1 Petroleum hydrocarbon concentrations reported in car wash water
Study Petroleum Hydrocarbon reported
Concentration (mg/L unless stated)
Margesin 1998 (commercial car wash) Total Petroleum Hydrocarbon (TPH) 184
ICA 2002 (commercial car wash)
Oil and Grease (total oil and grease from all petroleum products) 7.68-35
Smith 2009 (non-commercial car wash by hand)
Gasoline 0.091 Motor Oil 8.5 Diesel 5.9 Oil and Grease 21.5 Total Petroleum Hydrocarbon 38.59
Bhatti et al 2010 (commercial car wash) Oil contents 1.3-83.7
Sablayrolles et al 2010 (Commercial car wash but after pre treatment- scrubber and oil separator)
Total hydrocarbons (TPH) 0.02-0.56
PAH (total of 16 compounds, including those below) 0.319-1.778µg/L
Anthracene 0.14 µg/L Napthalene 0.058-0.524 µg/L Benzo( )pyrene 0.004-0.048 µg/L
Environmental effects and toxicity of petroleum hydrocarbons
The environmental effects of petroleum hydrocarbons appear to be relatively poorly studied and most research has been conducted on crude oil toxicity in the marine environment. However the limited research reviewed indicates that petroleum hydrocarbons are likely to have a range of impacts, both direct (toxicity) and indirect (e.g. habitat disruption, dissolved oxygen depletion), on aquatic ecosystems (e.g. Thompson et al, 2007). Having a lower density than water results in hydrocarbons forming a surface layer on the water, which can reduce oxygen transfer and thus reduce dissolved oxygen in the water column. This also results from an elevated biochemical oxygen demand (BOD) due to an increase in hydrocarbon consuming bacteria (ANZECC, 2000; NZWWA, 2006; Ogali et al 2007). Coating of substrates and shoreline smothering reduces habitat and creates ingestion risks (Poulton et al, 1998; Thompson et al, 2007). A wide variety of ecological responses to these impacts are reported from minimal effects to the complete elimination of communities (Poulton et al, 1998).
Assessing the toxicity of TPH is problematic due to the heterogeneity of the products, but lighter fractions including petroleum and diesel, appear to be the most toxic (ANZECC 2000). Oil released to the environment partitions into volatile, water soluble and insoluble
9
fractions and the insoluble component is likely to contaminate aquatic sediments (Ort, 1995). Thompson et al (2007) reported significant changes in marine benthic community structures from exposure to contaminated sediments with reduced species richness and community diversity. Beyram et al (2010) found a significant effect of petroleum products on marine nematode (Roundworm) assemblages. Few studies have considered the effects of hydrocarbons on freshwater ecology (e.g. Green and Trett, 1989). Poulton et al (1998) investigated the effects on freshwater macroinvertebrates of a significant light oil spill and found that the light crude oil almost eliminated communities downstream of the spill although at least some recovery was evident within one year. Ort et al (1995) found significant mayfly mortality from 21 day exposures to sediment which had been contaminated with crude oil up to six weeks previously, while Ogali et al (2007) found lubricant oils to be toxic to freshwater African Catfish.
PAH compounds have varying toxicities and are generally more toxic but less water-soluble with increasing molecular weight. All share a ‘baseline toxicity’, due to non-polar narcosis (a behavioural response) which interferes with transport processes in cell membranes (Dupree and Aherns, 2007). Due to the tendency of PAHs to accumulate in sediments the concentration in sediment may be 1000-10000 times higher than in the water column, and as such benthic organisms (i.e. those that live on the stream bed) are much more exposed to PAH toxicity than organisms inhabiting the water column (Dupree and Aherns, 2007).
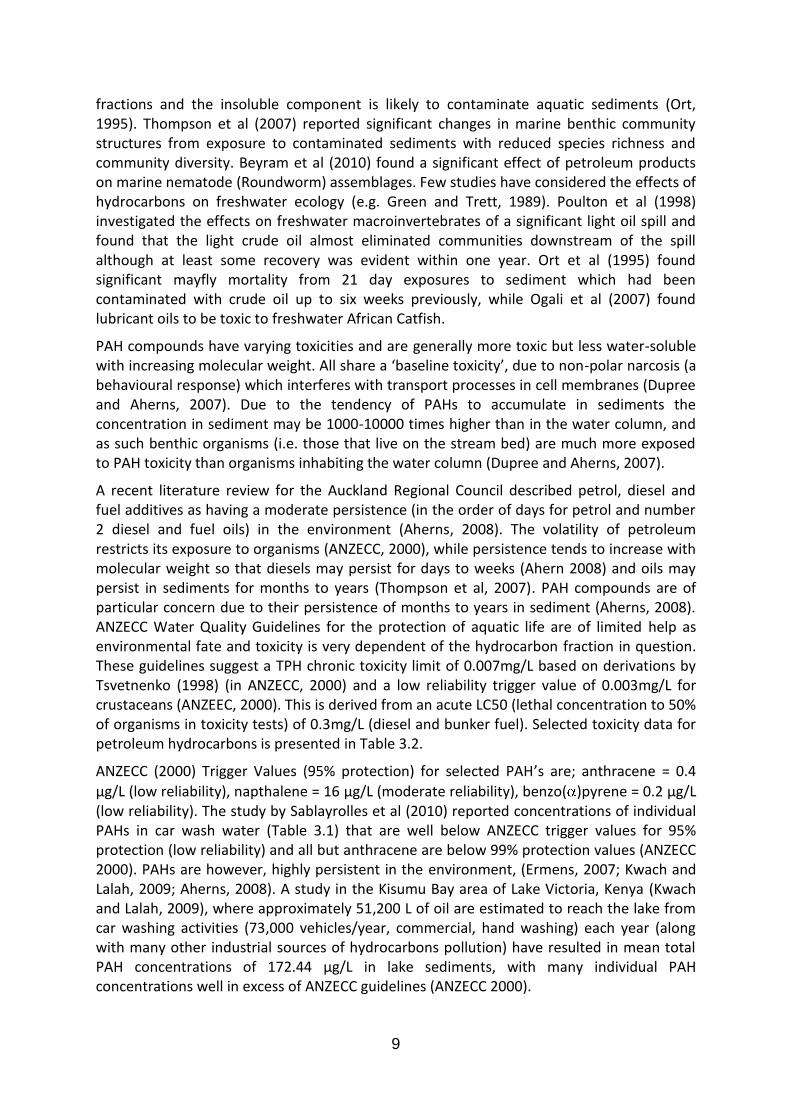
A recent literature review for the Auckland Regional Council described petrol, diesel and fuel additives as having a moderate persistence (in the order of days for petrol and number 2 diesel and fuel oils) in the environment (Aherns, 2008). The volatility of petroleum restricts its exposure to organisms (ANZECC, 2000), while persistence tends to increase with molecular weight so that diesels may persist for days to weeks (Ahern 2008) and oils may persist in sediments for months to years (Thompson et al, 2007). PAH compounds are of particular concern due to their persistence of months to years in sediment (Aherns, 2008). ANZECC Water Quality Guidelines for the protection of aquatic life are of limited help as environmental fate and toxicity is very dependent of the hydrocarbon fraction in question. These guidelines suggest a TPH chronic toxicity limit of 0.007mg/L based on derivations by Tsvetnenko (1998) (in ANZECC, 2000) and a low reliability trigger value of 0.003mg/L for crustaceans (ANZEEC, 2000). This is derived from an acute LC50 (lethal concentration to 50% of organisms in toxicity tests) of 0.3mg/L (diesel and bunker fuel). Selected toxicity data for petroleum hydrocarbons is presented in Table 3.2.
ANZECC (2000) Trigger Values (95% protection) for selected PAH’s are; anthracene = 0.4
µg/L (low reliability), napthalene = 16 µg/L (moderate reliability), benzo( )pyrene = 0.2 µg/L (low reliability). The study by Sablayrolles et al (2010) reported concentrations of individual PAHs in car wash water (Table 3.1) that are well below ANZECC trigger values for 95% protection (low reliability) and all but anthracene are below 99% protection values (ANZECC 2000). PAHs are however, highly persistent in the environment, (Ermens, 2007; Kwach and Lalah, 2009; Aherns, 2008). A study in the Kisumu Bay area of Lake Victoria, Kenya (Kwach and Lalah, 2009), where approximately 51,200 L of oil are estimated to reach the lake from car washing activities (73,000 vehicles/year, commercial, hand washing) each year (along with many other industrial sources of hydrocarbons pollution) have resulted in mean total PAH concentrations of 172.44 µg/L in lake sediments, with many individual PAH concentrations well in excess of ANZECC guidelines (ANZECC 2000).
10
Table 3.2 Some reported toxicities for petroleum hydrocarbon products
Hydrocarbon Fraction
Acute Toxicity (EC50 or LC50 with exposure timeframe)
(mg/L)
ANZECC (2000) Guideline trigger
value (mg/L)
Invertebrates Daphnia magna
Fish
Crude oil 24hr exposure= 750-2,110 mg/L
24hr exposure= 12µL/L Pimephales promelas
Petrol
48hr exposure= 91 mg/L Alosa sapidissima
Diesel
48hr exposure= 167 mg/L Alosa sapidissima
TPH 0.0031 All data sourced from ANZECC (2000).
1=based on diesel and bunker fuel acute toxicities
3.2.2 Metals
Metals occur naturally in most freshwater systems and are important to many biological processes, however elevated concentrations, often as a result of anthropogenic activities, can be detrimental to aquatic ecosystems (Brown & Peake, 2006). The most common metal contaminants in urban waterways are copper (Cu), lead (Pb) and zinc (Zn) (Ermens, 2007), and these are also the highest metal contaminants reported in car wash water, derived mainly from vehicle tyres (zinc) and brakepads (copper) respectively (Armstrong, 1994; Barrios, 2000; Moores, 2010). Additional metals are variously reported and all metals are presented in Table 3.3. ANZECC (2000) water quality guideline trigger values are presented in Table 3.4.
Table 3.3. Metal concentration (mg/L) reported in car wash waters from two studies.
Metal ICA (2002) commercial
Smith (2009) domestic
Copper 0.235 0.532 total 0.168 dissolved
Zinc 0.97 0.502 total 0.206 dissolved
Antimony 0.018 - Arsenic 0.007 Non detect Cadmium 0.0075 Non detect Chromium 0.006 0.028 Lead 0.016 0.051 Nickel 0.03 0.089 total
0.025 dissolved
11
The United States Environmental Protection Agency (USEPA) (1999) conducted a study producing results similar to those expected from domestic washing of a vehicle, which found that antimony, arsenic, beryllium, cadmium, lead and thallium concentration in wash water exceeded primary maximum contaminant levels. Ongeri et al (2009) found elevated levels of cadmium (Cd), iron (Fe), Zn, Cu and Pb in the sediments in Lake Victoria close to an area of intensive commercial car wash activity which allowed untreated car wash water to drain to the lake. The high levels of metals were attributed to the car wash activities.
Toxicity of metals
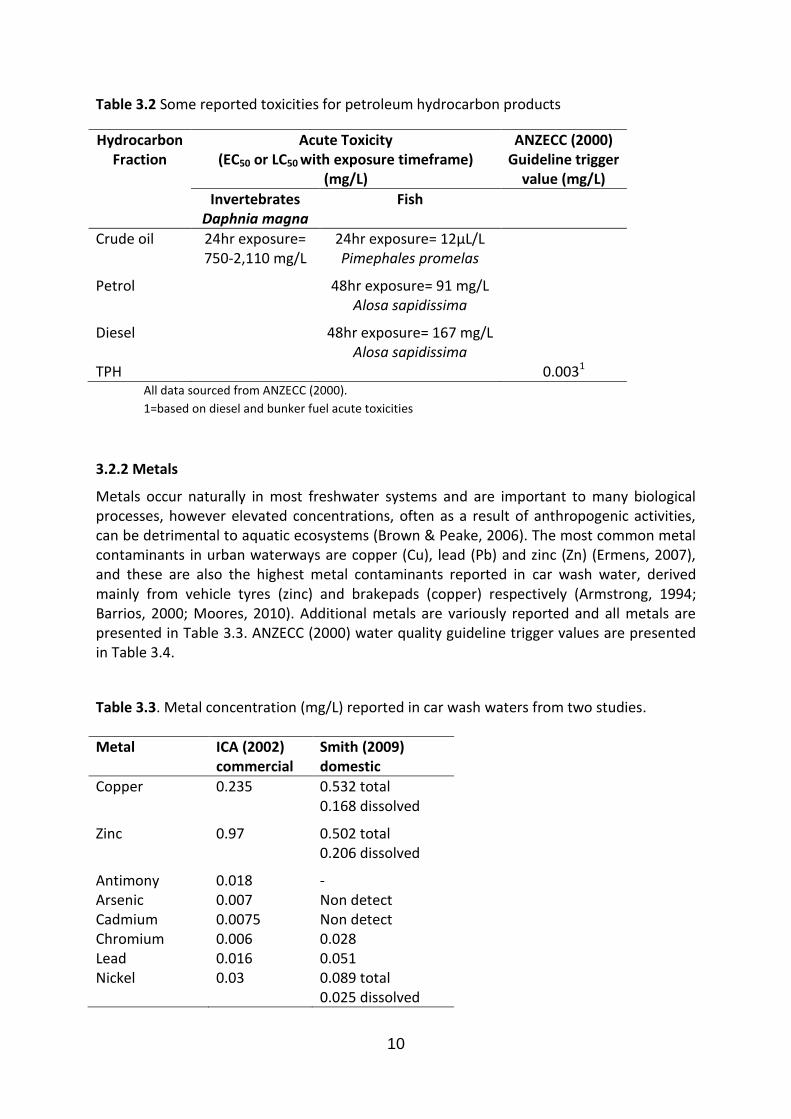
The toxicity of metals in the aquatic environment is highly dependent on a variety of factors in addition to concentration. The speciation (or chemical form) of the metal affects its bioavailability (Roy and Campbell, 1997), and is controlled by many factors including concentration, temperature and water chemistry such as pH, hardness and the concentrations of complexing ligands (Webster-Brown, 2005). Metals often adsorb to sediments and may accumulate and persist in the environment for prolonged periods (Ermens, 2007). Selected toxicities for the three primary metal contaminants are presented in Table 3.4 along with ANZECC (2000) Guideline Trigger Values.
Table 3.4 Selected freshwater toxicities reported for metal contaminants.
Metal Acute Toxicities (EC50 or LC50 with exposure timeframe)
(mg/L)
ANZECC (2000) Guideline trigger value (TV) (mg/L)
Invertebrates (Daphnia magna)
Fish
Copper 48 hr exposure range=0.0025-0.755
96hr exposure range=0.0094-0.900
High reliability TV= 0.0014
Lead 48hr exposure= 4.4 -
High reliability TV= 0.0034
Zinc 48hr exposure range= 0.068-3.290
96hr exposure range= 0.238-2.66
High reliability TV=0.008
All data from USEPA ecotox database at http://cfpub.epa.gov/ecotox
3.2.3 Detergents and Surfactants
Car washing on driveways and on the street, generally involves the detergents used in the washing process being flushed into the stormwater system. Unlike petroleum products and heavy metals, detergents are not introduced to the environment by everyday use of motor vehicles. Given that detergent-contaminated water from commercial cleaning operations, as well as that from most domestic applications (e.g. from kitchens and laundries), is discharged to sewerage treatment plants, residential car washing may be a significant source of detergents draining to urban waterways. Surfactants are compounds that act as
12
detergents, emulsifiers, foaming agents, wetting agents and dispersants by lowering the surface tension between two liquids, or that between a liquid and a solid and thus increasing the cleaning ability of a detergent. A more detailed discussion of detergents and surfactants is provided in Appendix 1.
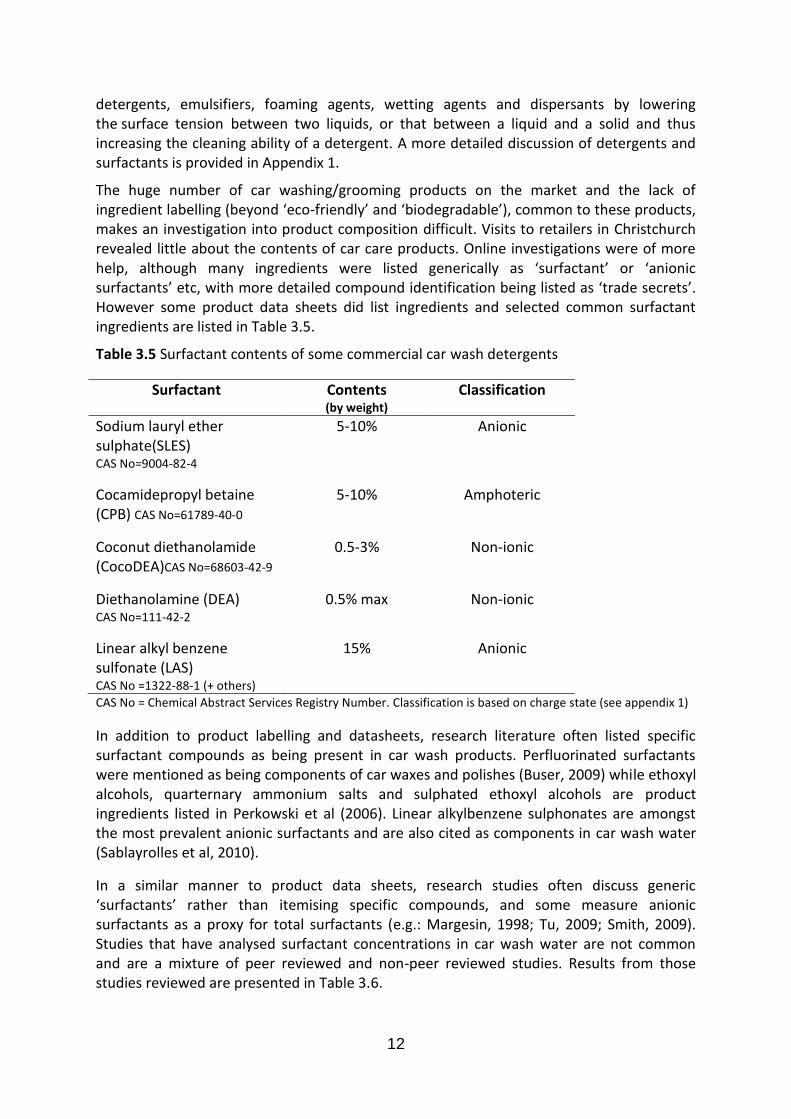
The huge number of car washing/grooming products on the market and the lack of ingredient labelling (beyond ‘eco-friendly’ and ‘biodegradable’), common to these products, makes an investigation into product composition difficult. Visits to retailers in Christchurch revealed little about the contents of car care products. Online investigations were of more help, although many ingredients were listed generically as ‘surfactant’ or ‘anionic surfactants’ etc, with more detailed compound identification being listed as ‘trade secrets’. However some product data sheets did list ingredients and selected common surfactant ingredients are listed in Table 3.5.
Table 3.5 Surfactant contents of some commercial car wash detergents
Surfactant Contents (by weight)
Classification
Sodium lauryl ether sulphate(SLES) CAS No=9004-82-4
5-10% Anionic
Cocamidepropyl betaine (CPB) CAS No=61789-40-0
5-10% Amphoteric
Coconut diethanolamide (CocoDEA)CAS No=68603-42-9
0.5-3% Non-ionic
Diethanolamine (DEA) CAS No=111-42-2
0.5% max Non-ionic
Linear alkyl benzene sulfonate (LAS) CAS No =1322-88-1 (+ others)
15% Anionic
CAS No = Chemical Abstract Services Registry Number. Classification is based on charge state (see appendix 1)
In addition to product labelling and datasheets, research literature often listed specific surfactant compounds as being present in car wash products. Perfluorinated surfactants were mentioned as being components of car waxes and polishes (Buser, 2009) while ethoxyl alcohols, quarternary ammonium salts and sulphated ethoxyl alcohols are product ingredients listed in Perkowski et al (2006). Linear alkylbenzene sulphonates are amongst the most prevalent anionic surfactants and are also cited as components in car wash water (Sablayrolles et al, 2010).
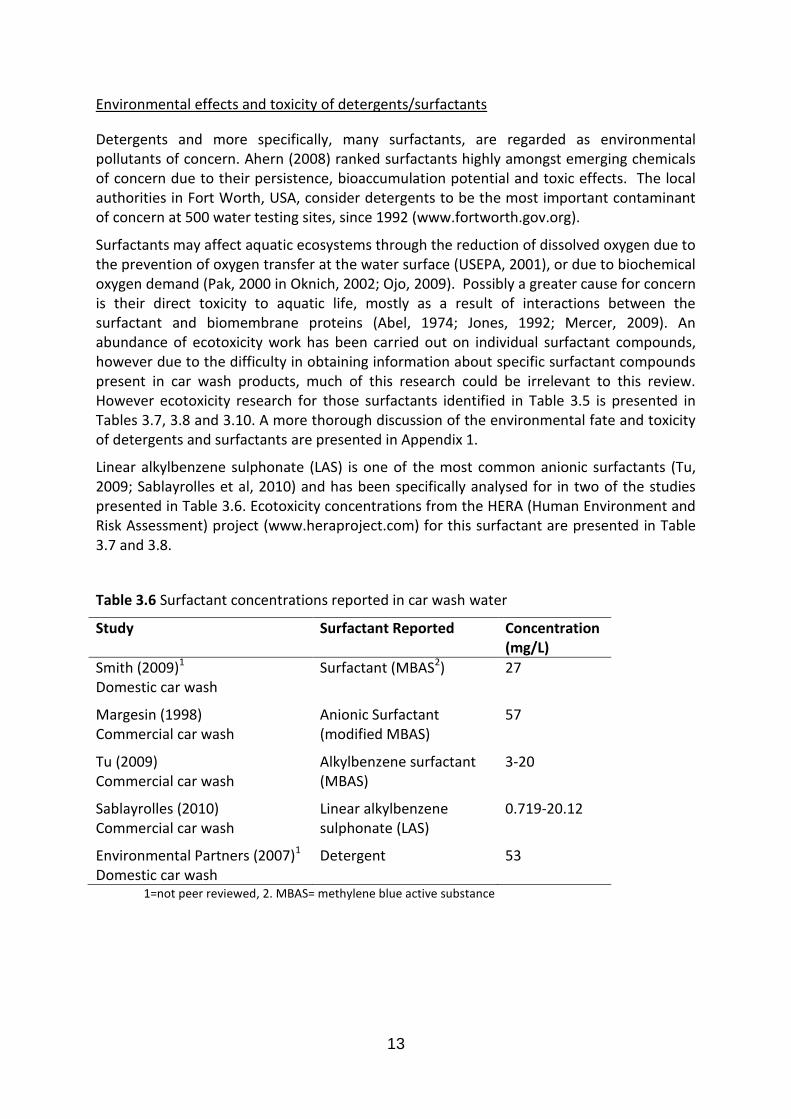
In a similar manner to product data sheets, research studies often discuss generic ‘surfactants’ rather than itemising specific compounds, and some measure anionic surfactants as a proxy for total surfactants (e.g.: Margesin, 1998; Tu, 2009; Smith, 2009). Studies that have analysed surfactant concentrations in car wash water are not common and are a mixture of peer reviewed and non-peer reviewed studies. Results from those studies reviewed are presented in Table 3.6.
13
Environmental effects and toxicity of detergents/surfactants
Detergents and more specifically, many surfactants, are regarded as environmental pollutants of concern. Ahern (2008) ranked surfactants highly amongst emerging chemicals of concern due to their persistence, bioaccumulation potential and toxic effects. The local authorities in Fort Worth, USA, consider detergents to be the most important contaminant of concern at 500 water testing sites, since 1992 (www.fortworth.gov.org).
Surfactants may affect aquatic ecosystems through the reduction of dissolved oxygen due to the prevention of oxygen transfer at the water surface (USEPA, 2001), or due to biochemical oxygen demand (Pak, 2000 in Oknich, 2002; Ojo, 2009). Possibly a greater cause for concern is their direct toxicity to aquatic life, mostly as a result of interactions between the surfactant and biomembrane proteins (Abel, 1974; Jones, 1992; Mercer, 2009). An abundance of ecotoxicity work has been carried out on individual surfactant compounds, however due to the difficulty in obtaining information about specific surfactant compounds present in car wash products, much of this research could be irrelevant to this review. However ecotoxicity research for those surfactants identified in Table 3.5 is presented in Tables 3.7, 3.8 and 3.10. A more thorough discussion of the environmental fate and toxicity of detergents and surfactants are presented in Appendix 1.
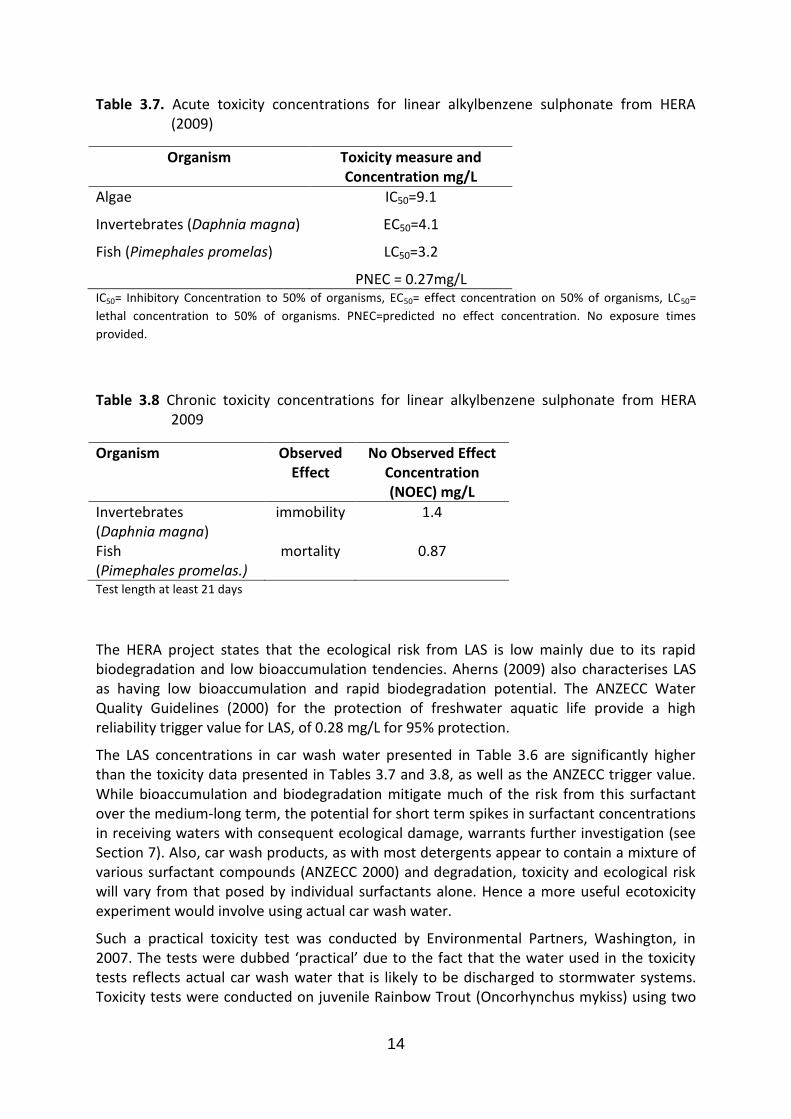
Linear alkylbenzene sulphonate (LAS) is one of the most common anionic surfactants (Tu, 2009; Sablayrolles et al, 2010) and has been specifically analysed for in two of the studies presented in Table 3.6. Ecotoxicity concentrations from the HERA (Human Environment and Risk Assessment) project (www.heraproject.com) for this surfactant are presented in Table 3.7 and 3.8.
Table 3.6 Surfactant concentrations reported in car wash water
Study Surfactant Reported Concentration (mg/L)
Smith (2009)1 Domestic car wash
Surfactant (MBAS2) 27
Margesin (1998) Commercial car wash
Anionic Surfactant (modified MBAS)
57
Tu (2009) Commercial car wash
Alkylbenzene surfactant (MBAS)
3-20
Sablayrolles (2010) Commercial car wash
Linear alkylbenzene sulphonate (LAS)
0.719-20.12
Environmental Partners (2007)1
Domestic car wash Detergent 53
1=not peer reviewed, 2. MBAS= methylene blue active substance
14
Table 3.7. Acute toxicity concentrations for linear alkylbenzene sulphonate from HERA (2009)
Organism Toxicity measure and Concentration mg/L
Algae IC50=9.1
Invertebrates (Daphnia magna) EC50=4.1
Fish (Pimephales promelas) LC50=3.2
PNEC = 0.27mg/L IC50= Inhibitory Concentration to 50% of organisms, EC50= effect concentration on 50% of organisms, LC50=
lethal concentration to 50% of organisms. PNEC=predicted no effect concentration. No exposure times
provided.
Table 3.8 Chronic toxicity concentrations for linear alkylbenzene sulphonate from HERA 2009
Organism Observed Effect
No Observed Effect Concentration (NOEC) mg/L
Invertebrates (Daphnia magna)
immobility 1.4
Fish (Pimephales promelas.)
mortality 0.87
Test length at least 21 days
The HERA project states that the ecological risk from LAS is low mainly due to its rapid biodegradation and low bioaccumulation tendencies. Aherns (2009) also characterises LAS as having low bioaccumulation and rapid biodegradation potential. The ANZECC Water Quality Guidelines (2000) for the protection of freshwater aquatic life provide a high reliability trigger value for LAS, of 0.28 mg/L for 95% protection.
The LAS concentrations in car wash water presented in Table 3.6 are significantly higher than the toxicity data presented in Tables 3.7 and 3.8, as well as the ANZECC trigger value. While bioaccumulation and biodegradation mitigate much of the risk from this surfactant over the medium-long term, the potential for short term spikes in surfactant concentrations in receiving waters with consequent ecological damage, warrants further investigation (see Section 7). Also, car wash products, as with most detergents appear to contain a mixture of various surfactant compounds (ANZECC 2000) and degradation, toxicity and ecological risk will vary from that posed by individual surfactants alone. Hence a more useful ecotoxicity experiment would involve using actual car wash water.
Such a practical toxicity test was conducted by Environmental Partners, Washington, in 2007. The tests were dubbed ‘practical’ due to the fact that the water used in the toxicity tests reflects actual car wash water that is likely to be discharged to stormwater systems. Toxicity tests were conducted on juvenile Rainbow Trout (Oncorhynchus mykiss) using two
15
solutions of car wash water. The first was actual wash water collected from a fundraising car wash conducted in a carpark where the wash water had run over approximately 10 meters of asphalt surface before collection. While the detergent concentration was unknown, this water presented the most realistic scenario and was likely to contain heavy metals, petroleum hydrocarbons and PAHs from both vehicles and the carpark surface. The second solution (simulated) was mixed up from a commercially available car wash detergent according to manufacturer’s instructions and diluted with what was understood to be an average quantity of rinse water (300 L). 96hour acute effluent toxicity bioassay tests were conducted according to USEPA protocol. The calculated LC50 (concentration expected to cause mortality to 50% of exposed organisms) was 3.125% wash water for the carpark water and 3.046% wash water for the simulated solution. In the simulated solution this equated to a detergent concentrate concentration of 1.6mg/L.
This Environmental Partners (2007) study also undertook a gross calculation using flow data for local catchment streams and assumptions regarding car wash behaviours, to estimate potential detergent concentrations in local streams. Results indicated a range of estimated concentrations of 0.2-1.5 mg/L indicating that in-stream concentrations approaching the LC50 values are plausible. A similar calculation approach has been undertaken in this study for Christchurch’s Avon/Ōtākaro and Heathcote/Ōpāwaho catchments as detailed below.
3.3 Predicted contaminant concentrations from residential car washing.
To estimate the potential discharge of such car wash contaminants to the stormwater system, it is necessary to have individual and catchment scale information on residential car washing behaviour. United States surveys indicate that around 38-40% of households wash their cars at home (Franz, J.D., ICA 2005), however a recent survey in the Okeover Stream catchment in Christchurch indicated 65% of respondents wash their own car at home (Bond, 2010). Where this home car washing is conducted on impervious surfaces such as driveways or the street, the wash water will drain to urban waterways via the stormwater system. In a Washington State survey 91% of home car washers indicate that their effluent drains directly to pavement (Schueler, 2000) while in San Diego the figure is 72%. In the Okeover survey 86% of home car washers wash their car on the driveway or street (Bond, 2010). Reported water usage during car washing varies considerably. Commercial usage is reported as around 100-375 L/car (Odwani 2007, Bhatti et al 2010) while home car washing estimates vary between 75L/car (Smith 2009), 300L/car (Environmental Partners 2007) or 440L/car (Mercer 2002).
3.3.1 Discharge concentrations (surfactant)
An attempt is made here to predict the concentrations of surfactants at the ‘end of pipe’ discharge points of stormwater to Christchurch streams and rivers. Surfactant ingredients in one car wash detergent available in New Zealand are used in this prediction and are presented in Table 3.9. Ingredients were obtained from an online accessed Material Safety Data Sheet and concentrations in the detergent were assumed to be the arithmetic mean of the % weight range given. Mixing instructions were obtained from the New Zealand distributor who specified ‘just over a capful in a bucket of water’. The calculations used 40mls of detergent concentrate mixed in 9 litres of water to obtain ‘mixed detergent’ concentration, and then mixed this up to 300 litres of water to simulate rinse water. The
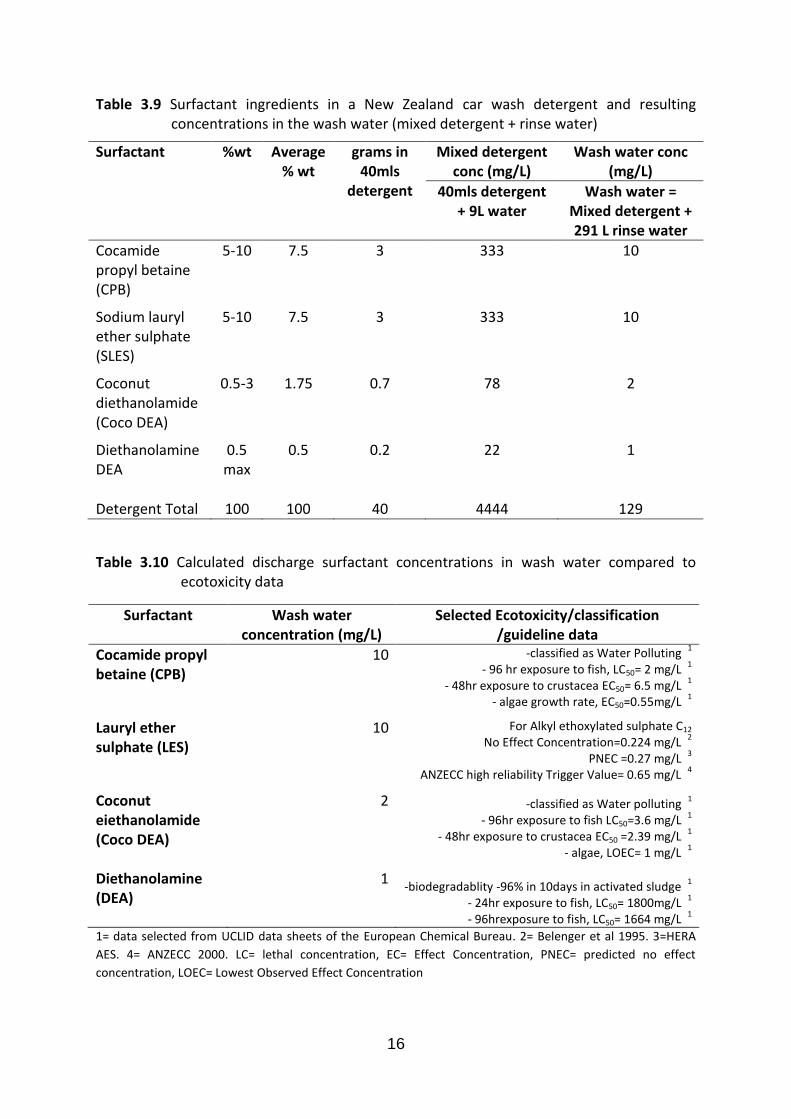
16
Table 3.9 Surfactant ingredients in a New Zealand car wash detergent and resulting concentrations in the wash water (mixed detergent + rinse water)
Surfactant %wt Average % wt
grams in 40mls
detergent
Mixed detergent conc (mg/L)
Wash water conc (mg/L)
40mls detergent + 9L water
Wash water = Mixed detergent + 291 L rinse water
Cocamide propyl betaine (CPB)
5-10 7.5 3 333 10
Sodium lauryl ether sulphate (SLES)
5-10 7.5 3 333 10
Coconut diethanolamide (Coco DEA)
0.5-3 1.75 0.7 78 2
Diethanolamine DEA
0.5 max
0.5 0.2 22 1
Detergent Total 100 100 40 4444 129
Table 3.10 Calculated discharge surfactant concentrations in wash water compared to ecotoxicity data
Surfactant Wash water concentration (mg/L)
Selected Ecotoxicity/classification /guideline data
Cocamide propyl betaine (CPB)
10 -classified as Water Polluting 1
- 96 hr exposure to fish, LC50= 2 mg/L 1
- 48hr exposure to crustacea EC50= 6.5 mg/L 1
- algae growth rate, EC50=0.55mg/L 1
Lauryl ether sulphate (LES)
10 For Alkyl ethoxylated sulphate C12
No Effect Concentration=0.224 mg/L 2
PNEC =0.27 mg/L 3
ANZECC high reliability Trigger Value= 0.65 mg/L 4
Coconut eiethanolamide (Coco DEA)
2 -classified as Water polluting 1
- 96hr exposure to fish LC50=3.6 mg/L 1
- 48hr exposure to crustacea EC50 =2.39 mg/L 1
- algae, LOEC= 1 mg/L 1
Diethanolamine (DEA)
1 -biodegradablity -96% in 10days in activated sludge
1
- 24hr exposure to fish, LC50= 1800mg/L 1
- 96hrexposure to fish, LC50= 1664 mg/L 1
1= data selected from UCLID data sheets of the European Chemical Bureau. 2= Belenger et al 1995. 3=HERA
AES. 4= ANZECC 2000. LC= lethal concentration, EC= Effect Concentration, PNEC= predicted no effect
concentration, LOEC= Lowest Observed Effect Concentration
17
resulting solution is referred to as wash water. The concentrations obtained from these calculations are presented in Table 3.9 and are similar to analysed surfactant concentrations obtained in other studies (see Table 3.6), suggesting the figures used here have some validity. The calculated wash water concentrations are compared with available ecotoxicity data in Table 3.10.
It can be seen that calculated wash water concentration of surfactants are significantly higher than LC50/EC50/PNEC/Trigger Values for cocamide propyl betaine and sodium lauryl ether sulphate, around similar concentrations for coconut diethanolamide and well below LC50 values for diethanolamine. It seems likely then that if this detergent formulation is used and the wash water drained to the stormwater system, concentrations at the immediate ‘end of pipe’, where the stormwater pipe drains into the stream, could have significant ecological effects. However this wash water will be immediately diluted further by the river water and the concentrations presented in Tables 3.9 and 3.10 should decrease rapidly. No research was found which conducted ecotoxicity work for short term exposure. In order to gain insight into possible longer term exposures a ‘pooled river flow’ approach was taken to calculate potential surfactant concentrations which could accumulate over a short term period in the Avon/Ōtākaro and Heathcote /Ōpāwaho river catchments.
3.3.2 Catchment concentrations
An attempt is made here to determine potential car wash water contaminant concentrations in Christchurch’s urban waterways. A ‘pooled river flow’ scenario is used to calculate concentrations that may occur if all the flow of the Avon River/Ōtākaro and Heathcote River/Ōpāwaho were pooled for the specified time frame (12 and 24hrs), and the wash water from the calculated number of car wash events was mixed into it. Calculating this potential loading necessitates a number of assumptions. These include the ingredients and their concentration in the wash water, the potential amount of wash water reaching the receiving environment (= number of car wash events per unit time x volume of wash water), and the dilution that occurs in the receiving environment (river flows). The assumptions made and references used are discussed below.
Ingredients and their concentration in wash water
Wash water contaminant concentration figures for initial calculations are taken from Table 3.9 above. The concentration is based on a rinse water volume of 291 litres. The average water volume used in domestic car washing is reported from several surveys (see Section 3.2.3). 300 litres was chosen for use in this review as it is close to the arithmetic mean from the surveys reviewed and enables direct comparison with the only study which conducted ecotoxicity work with actual wash water (Environmental Partners, 2007).
In addition, calculations are carried out utilising detergent concentrations from the Environmental Partners study (2007), and Smith (2009) for comparative purposes.
18
Wash water concentrations/volume and dilution in the receiving environment.
Assumptions made;
- 250,000 registered light vehicles in Christchurch City area (NZTA 2005).
- 90% of these are in the Avon/Ōtākaro and Heathcote/Ōpāwaho river catchments = 225,000 (Environment Canterbury, Leila Chrystall pers comm. 2011)
- 56% of residents wash cars at home on the driveway or street (Bond, 2010) = 126,000 home/driveway washed vehicles.
- The frequency with which these vehicles are washed is consistent with the results of the washing frequency survey conducted by Hardwick (1997) (figures retrieved from Smith (2007) and presented in Table 3.11)
- 80% of annual home car washes in Christchurch occur on the weekend or public holiday = 114 days. Therefore an average of 16,671 car washes occur on each of these days (based on car wash frequency figures discussed below and presented in Table 3.11 (0.8 x annual car washes/114)).
- 40mls of detergent and 300 L of water are used for each car washed.
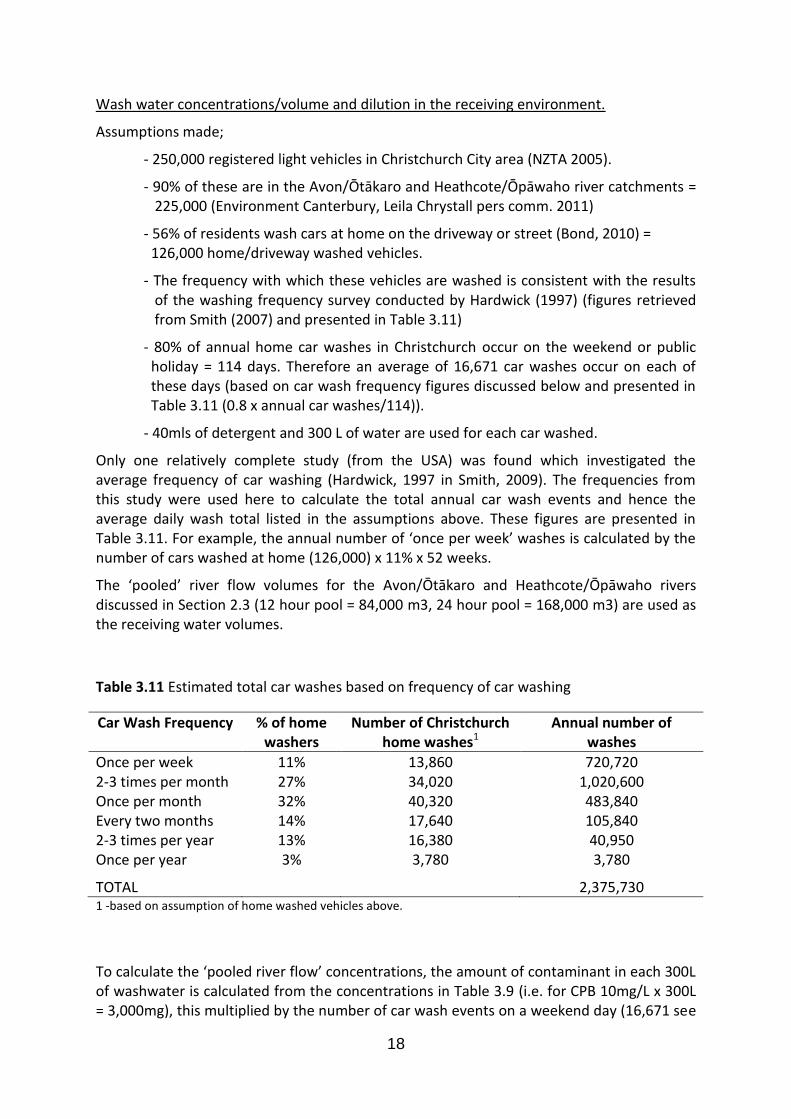
Only one relatively complete study (from the USA) was found which investigated the average frequency of car washing (Hardwick, 1997 in Smith, 2009). The frequencies from this study were used here to calculate the total annual car wash events and hence the average daily wash total listed in the assumptions above. These figures are presented in Table 3.11. For example, the annual number of ‘once per week’ washes is calculated by the number of cars washed at home (126,000) x 11% x 52 weeks.
The ‘pooled’ river flow volumes for the Avon/Ōtākaro and Heathcote/Ōpāwaho rivers discussed in Section 2.3 (12 hour pool = 84,000 m3, 24 hour pool = 168,000 m3) are used as the receiving water volumes.
Table 3.11 Estimated total car washes based on frequency of car washing
Car Wash Frequency % of home washers
Number of Christchurch home washes1
Annual number of washes
Once per week 11% 13,860 720,720 2-3 times per month 27% 34,020 1,020,600 Once per month 32% 40,320 483,840 Every two months 14% 17,640 105,840 2-3 times per year 13% 16,380 40,950 Once per year 3% 3,780 3,780
TOTAL 2,375,730 1 -based on assumption of home washed vehicles above.
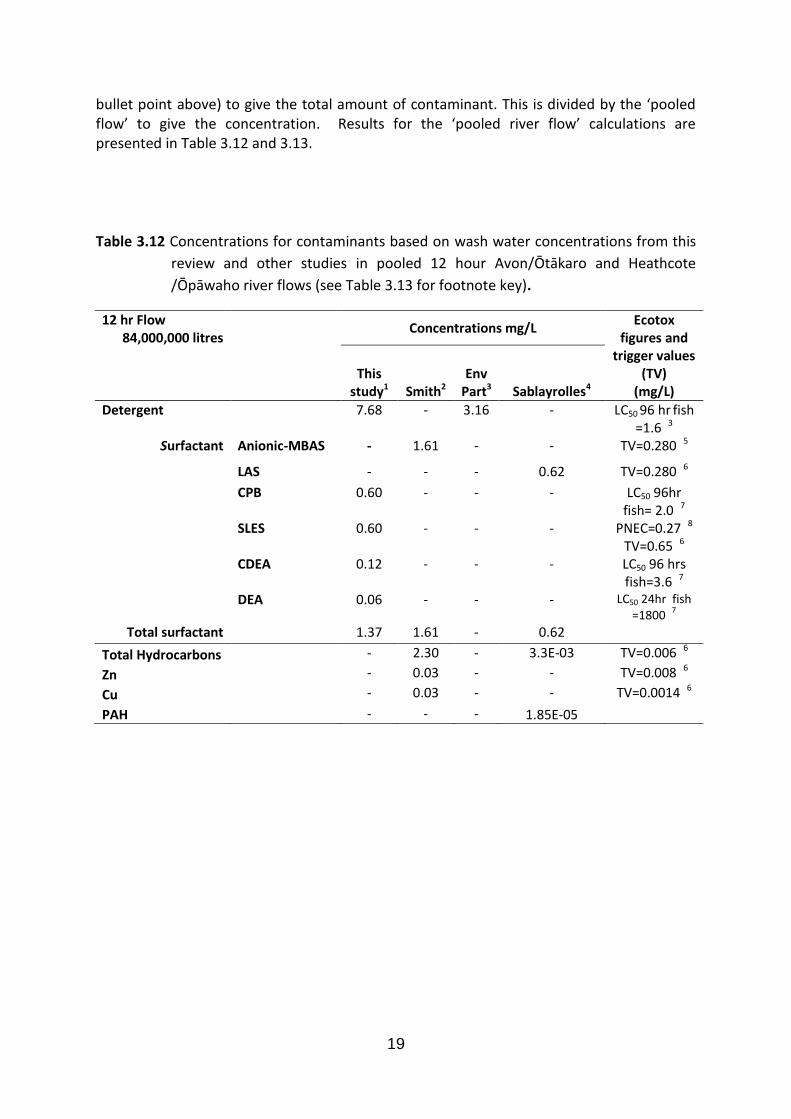
To calculate the ‘pooled river flow’ concentrations, the amount of contaminant in each 300L of washwater is calculated from the concentrations in Table 3.9 (i.e. for CPB 10mg/L x 300L = 3,000mg), this multiplied by the number of car wash events on a weekend day (16,671 see
19
bullet point above) to give the total amount of contaminant. This is divided by the ‘pooled flow’ to give the concentration. Results for the ‘pooled river flow’ calculations are presented in Table 3.12 and 3.13.
Table 3.12 Concentrations for contaminants based on wash water concentrations from this
review and other studies in pooled 12 hour Avon/Ōtākaro and Heathcote
/Ōpāwaho river flows (see Table 3.13 for footnote key).
12 hr Flow 84,000,000 litres Concentrations mg/L
Ecotox figures and
trigger values (TV)
(mg/L) This
study1 Smith2 Env
Part3 Sablayrolles4
Detergent
7.68 - 3.16 - LC50 96 hr fish =1.6 3
Surfactant Anionic-MBAS - 1.61 - - TV=0.280 5
LAS - - - 0.62 TV=0.280 6
CPB 0.60 - - - LC50 96hr fish= 2.0 7
SLES 0.60 - - - PNEC=0.27 8
TV=0.65 6
CDEA 0.12 - - - LC50 96 hrs fish=3.6 7
DEA 0.06 - - - LC50 24hr fish =1800
7
Total surfactant 1.37 1.61 - 0.62
Total Hydrocarbons - 2.30 - 3.3E-03 TV=0.006 6
Zn - 0.03 - - TV=0.008 6
Cu - 0.03 - - TV=0.0014 6
PAH - - - 1.85E-05
20
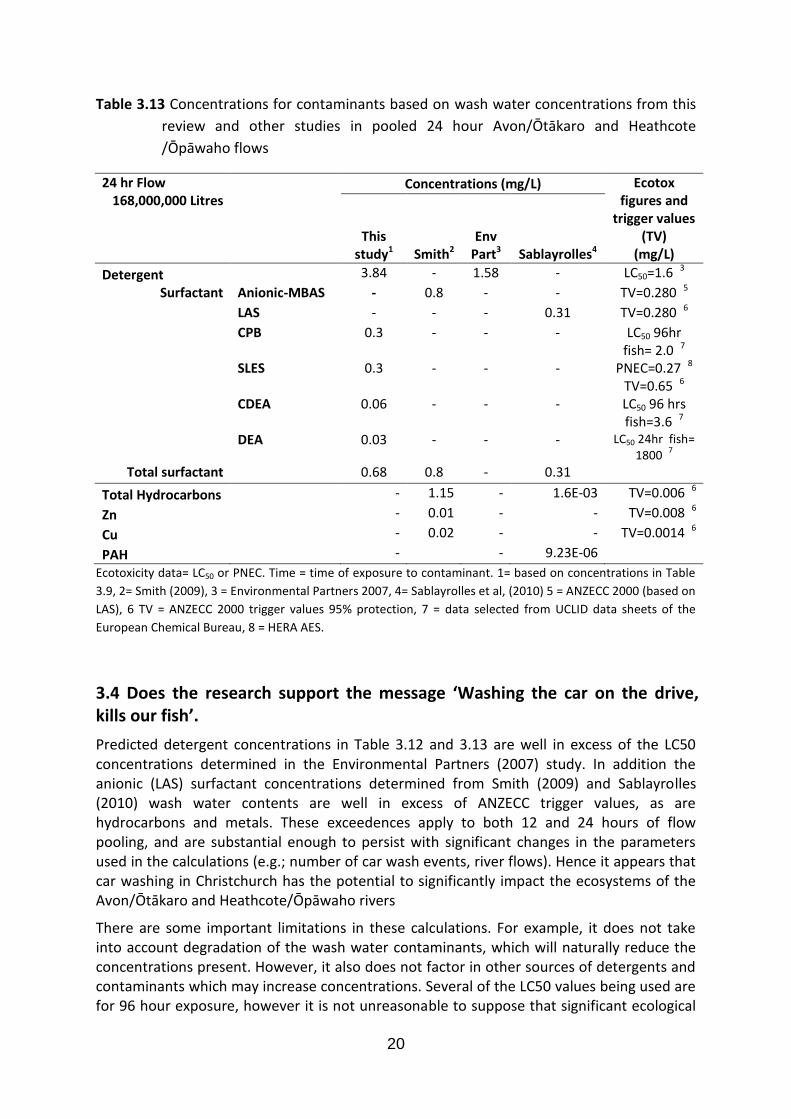
Table 3.13 Concentrations for contaminants based on wash water concentrations from this
review and other studies in pooled 24 hour Avon/Ōtākaro and Heathcote
/Ōpāwaho flows
24 hr Flow 168,000,000 Litres
Concentrations (mg/L) Ecotox figures and
trigger values (TV)
(mg/L) This
study1 Smith2
Env Part3
Sablayrolles4
Detergent 3.84 - 1.58 - LC50=1.6 3
Surfactant Anionic-MBAS - 0.8 - - TV=0.280 5
LAS - - - 0.31 TV=0.280 6
CPB 0.3 - - - LC50 96hr fish= 2.0 7
SLES 0.3 - - - PNEC=0.27 8
TV=0.65 6
CDEA 0.06 - - - LC50 96 hrs fish=3.6 7
DEA 0.03 - - - LC50 24hr fish= 1800
7
Total surfactant 0.68 0.8 - 0.31
Total Hydrocarbons - 1.15 - 1.6E-03 TV=0.006 6
Zn - 0.01 - - TV=0.008 6
Cu - 0.02 - - TV=0.0014 6
PAH - - 9.23E-06 Ecotoxicity data= LC50 or PNEC. Time = time of exposure to contaminant. 1= based on concentrations in Table
3.9, 2= Smith (2009), 3 = Environmental Partners 2007, 4= Sablayrolles et al, (2010) 5 = ANZECC 2000 (based on
LAS), 6 TV = ANZECC 2000 trigger values 95% protection, 7 = data selected from UCLID data sheets of the
European Chemical Bureau, 8 = HERA AES.
3.4 Does the research support the message ‘Washing the car on the drive, kills our fish’.
Predicted detergent concentrations in Table 3.12 and 3.13 are well in excess of the LC50 concentrations determined in the Environmental Partners (2007) study. In addition the anionic (LAS) surfactant concentrations determined from Smith (2009) and Sablayrolles (2010) wash water contents are well in excess of ANZECC trigger values, as are hydrocarbons and metals. These exceedences apply to both 12 and 24 hours of flow pooling, and are substantial enough to persist with significant changes in the parameters used in the calculations (e.g.; number of car wash events, river flows). Hence it appears that car washing in Christchurch has the potential to significantly impact the ecosystems of the Avon/Ōtākaro and Heathcote/Ōpāwaho rivers
There are some important limitations in these calculations. For example, it does not take into account degradation of the wash water contaminants, which will naturally reduce the concentrations present. However, it also does not factor in other sources of detergents and contaminants which may increase concentrations. Several of the LC50 values being used are for 96 hour exposure, however it is not unreasonable to suppose that significant ecological
21
impacts may occur from shorter period exposures especially at higher concentrations. In addition the indirect impact on dissolved oxygen levels, as well as possible synergistic effects with other contaminants, are not accounted for. However enough research information is available to enable valid estimates of car wash numbers and wash water volumes. So, although the ‘pooling’ approach used above to calculate potential contaminant concentrations in the Avon/Ōtākaro and Heathcote /Ōpāwaho rivers is a very simplistic model of a complex, flowing system, the concentrations derived do reliably indicate that fish kills and other ecological impacts are a very possible outcome of car wash water entering the stormwater system in realistic volumes.
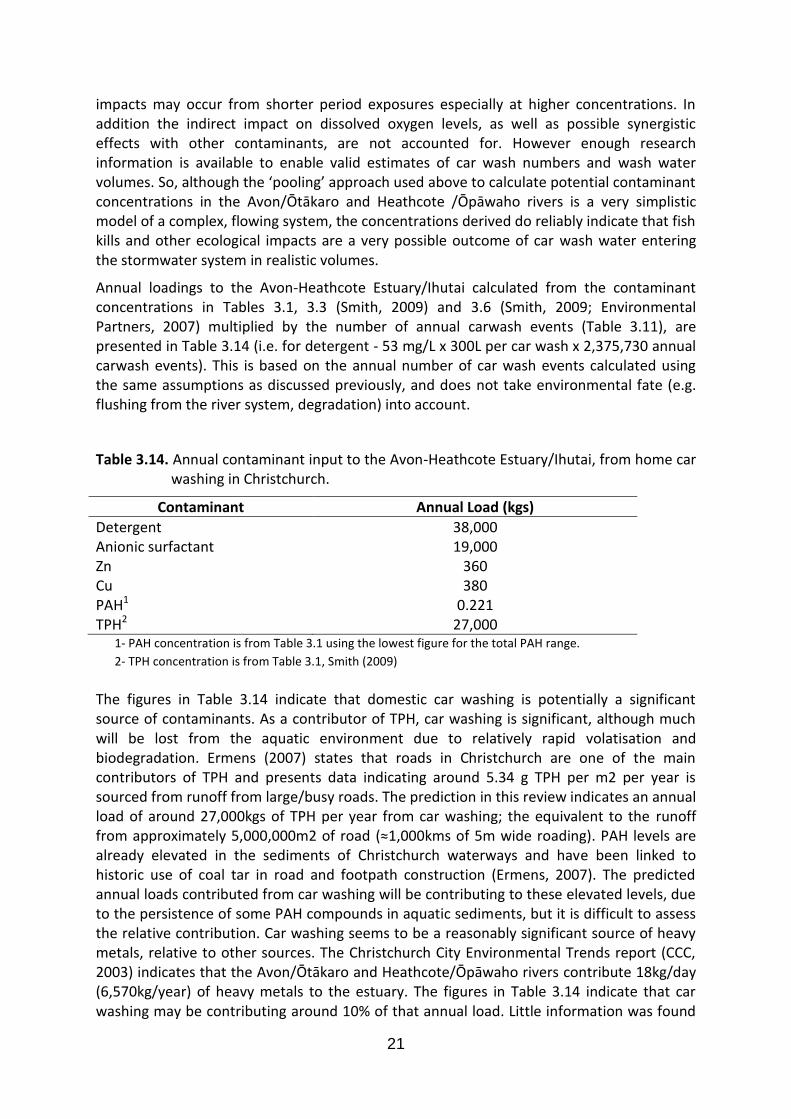
Annual loadings to the Avon-Heathcote Estuary/Ihutai calculated from the contaminant concentrations in Tables 3.1, 3.3 (Smith, 2009) and 3.6 (Smith, 2009; Environmental Partners, 2007) multiplied by the number of annual carwash events (Table 3.11), are presented in Table 3.14 (i.e. for detergent - 53 mg/L x 300L per car wash x 2,375,730 annual carwash events). This is based on the annual number of car wash events calculated using the same assumptions as discussed previously, and does not take environmental fate (e.g. flushing from the river system, degradation) into account.
Table 3.14. Annual contaminant input to the Avon-Heathcote Estuary/Ihutai, from home car washing in Christchurch.
Contaminant Annual Load (kgs)
Detergent 38,000 Anionic surfactant 19,000 Zn 360 Cu 380 PAH1 0.221 TPH2 27,000
1- PAH concentration is from Table 3.1 using the lowest figure for the total PAH range.
2- TPH concentration is from Table 3.1, Smith (2009)
The figures in Table 3.14 indicate that domestic car washing is potentially a significant source of contaminants. As a contributor of TPH, car washing is significant, although much will be lost from the aquatic environment due to relatively rapid volatisation and biodegradation. Ermens (2007) states that roads in Christchurch are one of the main contributors of TPH and presents data indicating around 5.34 g TPH per m2 per year is sourced from runoff from large/busy roads. The prediction in this review indicates an annual load of around 27,000kgs of TPH per year from car washing; the equivalent to the runoff from approximately 5,000,000m2 of road (≈1,000kms of 5m wide roading). PAH levels are already elevated in the sediments of Christchurch waterways and have been linked to historic use of coal tar in road and footpath construction (Ermens, 2007). The predicted annual loads contributed from car washing will be contributing to these elevated levels, due to the persistence of some PAH compounds in aquatic sediments, but it is difficult to assess the relative contribution. Car washing seems to be a reasonably significant source of heavy metals, relative to other sources. The Christchurch City Environmental Trends report (CCC, 2003) indicates that the Avon/Ōtākaro and Heathcote/Ōpāwaho rivers contribute 18kg/day (6,570kg/year) of heavy metals to the estuary. The figures in Table 3.14 indicate that car washing may be contributing around 10% of that annual load. Little information was found
22
on detergent/surfactant concentrations or sources within New Zealand waterways and it is difficult to assess the relative contribution from car washing although it seems likely that 37,000kgs of detergent is a significant annual load. The degradation of surfactants in this detergent is likely to be highly variable (see Appendix 1).
Despite the simplistic approach taken, this review indicates that domestic washing of vehicles has the potential to adversely impact the ecology of the Avon/Ōtākaro and Heathcote/Ōpāwaho rivers through the direct toxicity of wash water contaminants, as well as via the indirect impact of reduced dissolved oxygen. It also highlights the fact that single car wash events may seem of minor importance at the individual level, but the cumulative effects of car washing across an urban catchment have significant implications for waterways.
In conclusion, the research supports a message regarding the detrimental impact of car washing activities and is sufficient to enable reasonable quantitative predictions of contaminant loadings, however there is insufficient information available to predict species specific effects. In particular more information on car washing frequency across the catchment would be useful.
3.5 Suggested alternative car washing practises.
Residents have various choices that can reduce the impact of car washing on local waterways;
use a commercial car wash. These discharge wastewater to the sewerage/wastewater treatment system.
wash the car on the lawn or other permeable surface. Many surfactants (as well as metals) will be retained by soils/sediments where they will degrade over time.
block off the flow of wash water to the stormwater drain. Adsorption by ‘sediment socks’ or redirection toward soils/permeable surfaces will reduce the flow of contaminants to the rivers.
reduce water use by utilising a bucket and/or a hose with a nozzle that can be turned off when not in immediate use.
use drywash methods
do not use detergents
the relevant local authority could consider having a pool of ‘drain inserts’ that could be lent/hired to community car wash fundraising events. These inserts block the stormwater drain and may have a small submersible pump to pump the wash water elsewhere (sewerage or permeable ground).
23
Section 4 Residential Outdoor Cleaning/Moss Treatment
Possible overall message: “Stormwater goes direct to our rivers, chemicals and all”
Possible outdoor cleaner specific message: “Cleaning your roof and outdoor areas with
chemicals can kill our fish”
4.1 Introduction
General outdoor cleaners for use on paved surfaces, walls, driveways and roofs are prominent on the shelves of local hardware stores. They are commonly targeted at controlling moss, algae and lichen and are usually diluted and applied with water onto hard surfaces where they may runoff to stormwater. Applications to roofs in particular are likely to run to downpipes which, unless they are disconnected or run to soakpits, drain directly to stormwater systems. Commercial cleaning of tile and metal roofs may comprise the largest component of outdoor cleaning and moss treatments likely to impact on stormwater quality.
4.2 What’s in outdoor cleaning products?
The active ingredients of common cleaning products were determined by product research both online and at local hardware stores, as well as by phone conversations with a significant commercial roof treatment provider in the Christchurch area. Of the nine products investigated, sodium hypochlorite was the active ingredient in two, while quaternary ammonium compounds (QAC) were the active ingredients in the rest; didecyldimethyl ammonium chloride (DDAC) in two of those and benzalkonium chloride (BAC) in the remaining five. Ethylenediamintetraacetic tetrasodium salt (EDTA) was present in one. These active ingredients and their environmental effects are discussed below.
In addition to these active ingredients, several of the outdoor cleaners contained significant amounts of phosphate-bearing chemicals. Excess concentrations of phosphate, an important plant nutrient, stimulate excess algae growth in waterways, leading to fluctuations in oxygen concentrations, aerobic decomposition and the reduction in dissolved oxygen available for aquatic biota. This is a major issue in New Zealand’s lowland waterways (e.g., Abell, 2011). Dissolved phosphorous in the Avon/Ōtākaro and Heathcote/Ōpāwaho rivers already exceeds ANZECC (2000) guideline of 0.01g/m3 at most sites (Ermens, 2007).
4.2.1 Sodium hypochlorite
Sodium hypochlorite (NaClO, CAS number = 7681-52-9) is a strongly oxidising agent known primarily to consumers as ‘bleach’. It is used as a disinfectant, laundry bleaching agent, cleaning agent and as a biocide (i.e.; a chemical that can destroy living organisms) for mould, algae and moss removal. Bleach solutions range from 3-6% NaClO for household cleaning and bleaching, to 15% NaClO for biocidal applications. The two outdoor cleaners identified with NaClO as their active ingredients had 6.25% and 4% (25% of a 15% solution) respectively. The European Union Directive 2001/59/EC Nature of special risks attributed to dangerous substances and preparations, assigns a R Phrase = R50 which means “very toxic
24
to aquatic organisms”, to NaClO. Prior to 2008 this R-phrase was restricted to solutions greater than 25% NaClO, however on the basis of new toxicity data which indicated 0.010 < LC50 < 0.10mg/L for aquatic organisms, this was applied to all solutions greater than 2.5 mg/L NaClO (www.eurochlor.org).
The strongly oxidising nature of NaClO means that it is readily reduced in the environment to chloride ions and other reaction products. Due to these rapid reactions the direct toxicity of hypochlorite is of less relevance than that of the reaction products (Madsen, 2001). These reaction products, as well as chloride ions, may include chloroamines and halogenated organic compounds such as chloroform (Madsen, 2001). In hard surface cleaning where soil or organic matter is present, the production of organohalogen byproducts may be significant (AISEN, 1997). Some organohalogens are known to be of particular environmental concern due to their persistence, bioaccumulation and toxicity (PBT), however there is little evidence of the production of these type of organohalogen compounds from domestic type bleach products (AISEN, 1997).
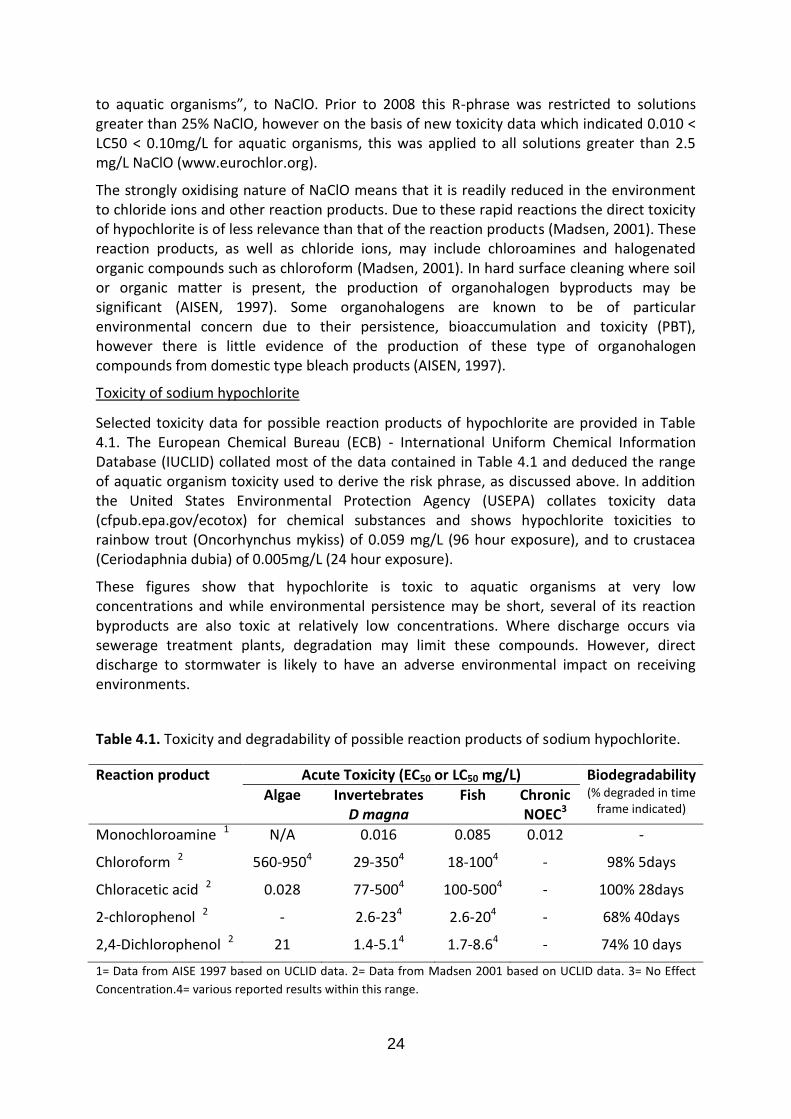
Toxicity of sodium hypochlorite
Selected toxicity data for possible reaction products of hypochlorite are provided in Table 4.1. The European Chemical Bureau (ECB) - International Uniform Chemical Information Database (IUCLID) collated most of the data contained in Table 4.1 and deduced the range of aquatic organism toxicity used to derive the risk phrase, as discussed above. In addition the United States Environmental Protection Agency (USEPA) collates toxicity data (cfpub.epa.gov/ecotox) for chemical substances and shows hypochlorite toxicities to rainbow trout (Oncorhynchus mykiss) of 0.059 mg/L (96 hour exposure), and to crustacea (Ceriodaphnia dubia) of 0.005mg/L (24 hour exposure).
These figures show that hypochlorite is toxic to aquatic organisms at very low concentrations and while environmental persistence may be short, several of its reaction byproducts are also toxic at relatively low concentrations. Where discharge occurs via sewerage treatment plants, degradation may limit these compounds. However, direct discharge to stormwater is likely to have an adverse environmental impact on receiving environments.
Table 4.1. Toxicity and degradability of possible reaction products of sodium hypochlorite.
Reaction product Acute Toxicity (EC50 or LC50 mg/L) Biodegradability (% degraded in time
frame indicated) Algae Invertebrates
D magna Fish Chronic
NOEC3
Monochloroamine 1 N/A 0.016 0.085 0.012 -
Chloroform 2 560-9504 29-3504 18-1004 - 98% 5days
Chloracetic acid 2 0.028 77-5004 100-5004 - 100% 28days
2-chlorophenol 2 - 2.6-234 2.6-204 - 68% 40days
2,4-Dichlorophenol 2 21 1.4-5.14 1.7-8.64 - 74% 10 days
1= Data from AISE 1997 based on UCLID data. 2= Data from Madsen 2001 based on UCLID data. 3= No Effect
Concentration.4= various reported results within this range.
25
4.2.2 Didecyldimethyl ammonium chloride (DDAC)
DDAC (CAS number = 7173-51-5) is a cationic surfactant of the quaternary ammonium compound (QAC) group. QACs are used extensively as disinfectants, laundry detergents and household cleaning products. In addition DDAC is used in fungicides, molluscicide (e.g. snail baits and snail pellets) and in cooling towers. A significant amount of work has been conducted in Canada where DDAC is used extensively as a fungicide in antisapstain formulations in the timber industry (sapstain is a fungal infection of wood causing staining). It is listed as the active ingredient in two of the outdoor cleaners investigated in this research, one of which was advertised as ‘bleach free’ presumably due to the use of DDAC rather than sodium hypochlorite while the other was advertised as non-toxic and biodegradable. DDAC comprises up to 2% in one of these cleaners and up to 5% in the other.
DDAC has a high affinity for adsorption to sediments, which may reduce its bioavailability. However the extent of this adsorption is poorly constrained (Szenasy, 1998; Kreuzinger 2007). Reported degradation rates of DDAC vary with CCME (1999) reporting a half life of < 2.1 days, Madsen (2000) a 50% degradation over 10 days, while Teh (2002) and Sutterlin et al (2008) report negligible degradation in the water column. DDAC was found to reduce the degradation rates of anionic surfactants (Sutterlin et al, 2008) resulting in longer environmental persistence. Bioaccumulation appears to be limited (Hendersen, 1992; CCME, 1999).
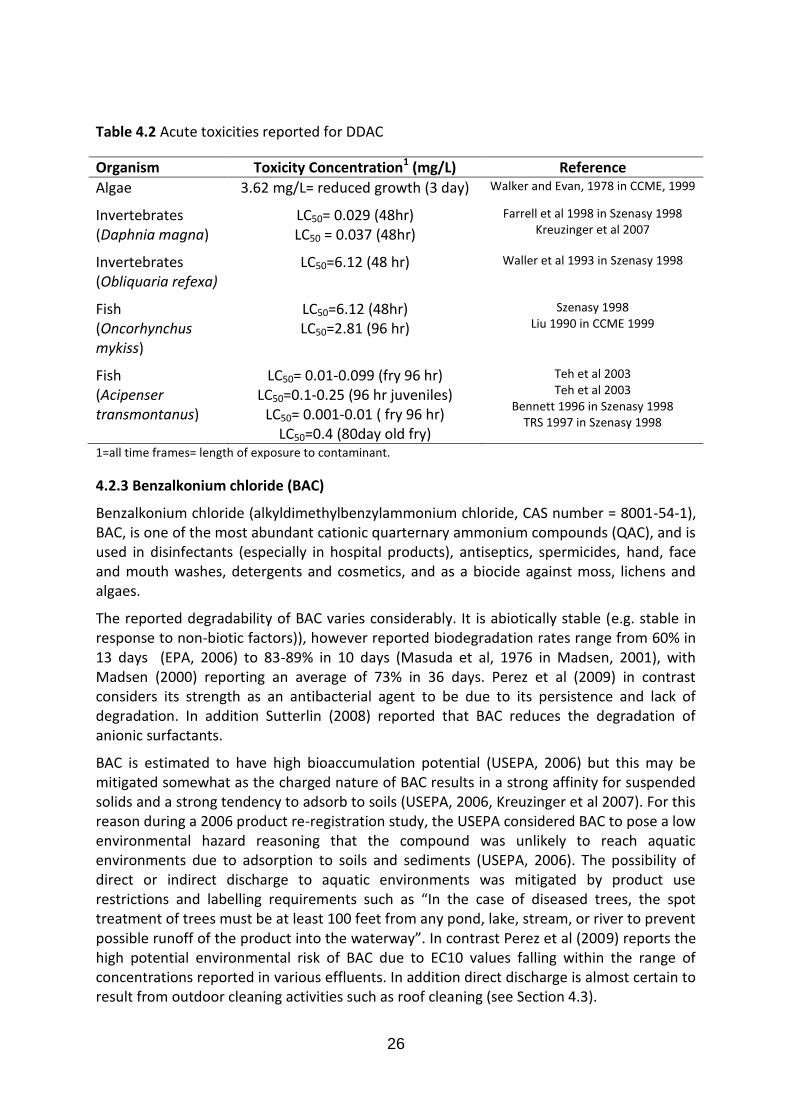
Toxicity of DDAC
DDAC is considered to be moderately to highly toxic to aquatic organisms (Hendersen, 1992). Selected acute toxicities are presented in Table 4.2. In addition to these acute toxicities, chronic effects were seen in impaired swimming performance in Rainbow trout (Oncorhynchus mykiss) and in an increase in plasma lactate in the marine flatfish Platichthys stellatus at 0.00125 mg/L. Post exposure effects were investigated by Teh et al (2003) who reported 18-21 day post exposure LC50=0.02-0.1 mg/L for the freshwater fish Acipenser transmontanus. This is a rare study of post exposure effects and may provide insight as to the effects of ‘pulses’ of contamination as might be expected from domestic cleaning type activities. A Canadian Water Quality Guideline for the Protection of Aquatic Life was set for DDAC in 1998 at 0.0015 mg/L (CCME, 1999). ANZECC (2000) does not specify a trigger value for DDAC but does mention that cationic surfactants such as QACs have greater toxicities than other surfactants.
26
Table 4.2 Acute toxicities reported for DDAC
Organism Toxicity Concentration1 (mg/L) Reference
Algae 3.62 mg/L= reduced growth (3 day) Walker and Evan, 1978 in CCME, 1999
Invertebrates (Daphnia magna)
LC50= 0.029 (48hr) LC50 = 0.037 (48hr)
Farrell et al 1998 in Szenasy 1998 Kreuzinger et al 2007
Invertebrates (Obliquaria refexa)
LC50=6.12 (48 hr) Waller et al 1993 in Szenasy 1998
Fish (Oncorhynchus mykiss)
LC50=6.12 (48hr) LC50=2.81 (96 hr)
Szenasy 1998 Liu 1990 in CCME 1999
Fish (Acipenser transmontanus)
LC50= 0.01-0.099 (fry 96 hr) LC50=0.1-0.25 (96 hr juveniles)
LC50= 0.001-0.01 ( fry 96 hr) LC50=0.4 (80day old fry)
Teh et al 2003
Teh et al 2003 Bennett 1996 in Szenasy 1998
TRS 1997 in Szenasy 1998
1=all time frames= length of exposure to contaminant.
4.2.3 Benzalkonium chloride (BAC)
Benzalkonium chloride (alkyldimethylbenzylammonium chloride, CAS number = 8001-54-1), BAC, is one of the most abundant cationic quarternary ammonium compounds (QAC), and is used in disinfectants (especially in hospital products), antiseptics, spermicides, hand, face and mouth washes, detergents and cosmetics, and as a biocide against moss, lichens and algaes.
The reported degradability of BAC varies considerably. It is abiotically stable (e.g. stable in response to non-biotic factors)), however reported biodegradation rates range from 60% in 13 days (EPA, 2006) to 83-89% in 10 days (Masuda et al, 1976 in Madsen, 2001), with Madsen (2000) reporting an average of 73% in 36 days. Perez et al (2009) in contrast considers its strength as an antibacterial agent to be due to its persistence and lack of degradation. In addition Sutterlin (2008) reported that BAC reduces the degradation of anionic surfactants.
BAC is estimated to have high bioaccumulation potential (USEPA, 2006) but this may be mitigated somewhat as the charged nature of BAC results in a strong affinity for suspended solids and a strong tendency to adsorb to soils (USEPA, 2006, Kreuzinger et al 2007). For this reason during a 2006 product re-registration study, the USEPA considered BAC to pose a low environmental hazard reasoning that the compound was unlikely to reach aquatic environments due to adsorption to soils and sediments (USEPA, 2006). The possibility of direct or indirect discharge to aquatic environments was mitigated by product use restrictions and labelling requirements such as “In the case of diseased trees, the spot treatment of trees must be at least 100 feet from any pond, lake, stream, or river to prevent possible runoff of the product into the waterway”. In contrast Perez et al (2009) reports the high potential environmental risk of BAC due to EC10 values falling within the range of concentrations reported in various effluents. In addition direct discharge is almost certain to result from outdoor cleaning activities such as roof cleaning (see Section 4.3).
27
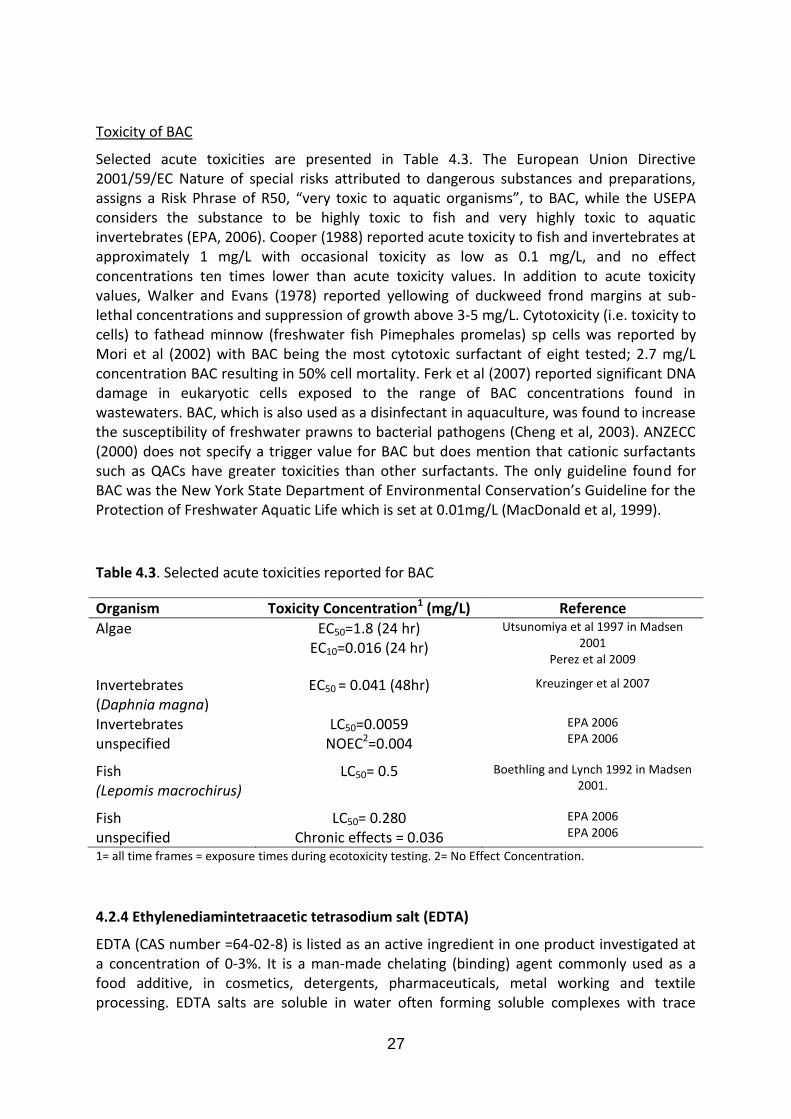
Toxicity of BAC
Selected acute toxicities are presented in Table 4.3. The European Union Directive 2001/59/EC Nature of special risks attributed to dangerous substances and preparations, assigns a Risk Phrase of R50, “very toxic to aquatic organisms”, to BAC, while the USEPA considers the substance to be highly toxic to fish and very highly toxic to aquatic invertebrates (EPA, 2006). Cooper (1988) reported acute toxicity to fish and invertebrates at approximately 1 mg/L with occasional toxicity as low as 0.1 mg/L, and no effect concentrations ten times lower than acute toxicity values. In addition to acute toxicity values, Walker and Evans (1978) reported yellowing of duckweed frond margins at sub-lethal concentrations and suppression of growth above 3-5 mg/L. Cytotoxicity (i.e. toxicity to cells) to fathead minnow (freshwater fish Pimephales promelas) sp cells was reported by Mori et al (2002) with BAC being the most cytotoxic surfactant of eight tested; 2.7 mg/L concentration BAC resulting in 50% cell mortality. Ferk et al (2007) reported significant DNA damage in eukaryotic cells exposed to the range of BAC concentrations found in wastewaters. BAC, which is also used as a disinfectant in aquaculture, was found to increase the susceptibility of freshwater prawns to bacterial pathogens (Cheng et al, 2003). ANZECC (2000) does not specify a trigger value for BAC but does mention that cationic surfactants such as QACs have greater toxicities than other surfactants. The only guideline found for BAC was the New York State Department of Environmental Conservation’s Guideline for the Protection of Freshwater Aquatic Life which is set at 0.01mg/L (MacDonald et al, 1999).
Table 4.3. Selected acute toxicities reported for BAC
Organism Toxicity Concentration1 (mg/L) Reference
Algae EC50=1.8 (24 hr) EC10=0.016 (24 hr)
Utsunomiya et al 1997 in Madsen 2001
Perez et al 2009
Invertebrates (Daphnia magna)
EC50 = 0.041 (48hr) Kreuzinger et al 2007
Invertebrates unspecified
LC50=0.0059 NOEC2=0.004
EPA 2006 EPA 2006
Fish (Lepomis macrochirus)
LC50= 0.5
Boethling and Lynch 1992 in Madsen 2001.
Fish unspecified
LC50= 0.280 Chronic effects = 0.036
EPA 2006 EPA 2006
1= all time frames = exposure times during ecotoxicity testing. 2= No Effect Concentration.
4.2.4 Ethylenediamintetraacetic tetrasodium salt (EDTA)
EDTA (CAS number =64-02-8) is listed as an active ingredient in one product investigated at a concentration of 0-3%. It is a man-made chelating (binding) agent commonly used as a food additive, in cosmetics, detergents, pharmaceuticals, metal working and textile processing. EDTA salts are soluble in water often forming soluble complexes with trace
28
metals and alkaline earth metals. They do not tend to adsorb to soils/sediments, are slow to degrade in the environment with a biodegradation half life of weeks to months and are not expected to bioaccumulate. EDTA tetrasodium salts have low toxicities, with acute toxicities of LC50 (96 hr fish) of 430mg/L, LC50 (48hr D magnia invertebrate) 100 mg/L, and chronic toxicities of 10-23 mg/L (fish-D magnia). Algae is more sensitive with a chronic toxicity of 0.88 mg/L reported (USEPA, 2004).
4.3 Predicted concentrations of active ingredients
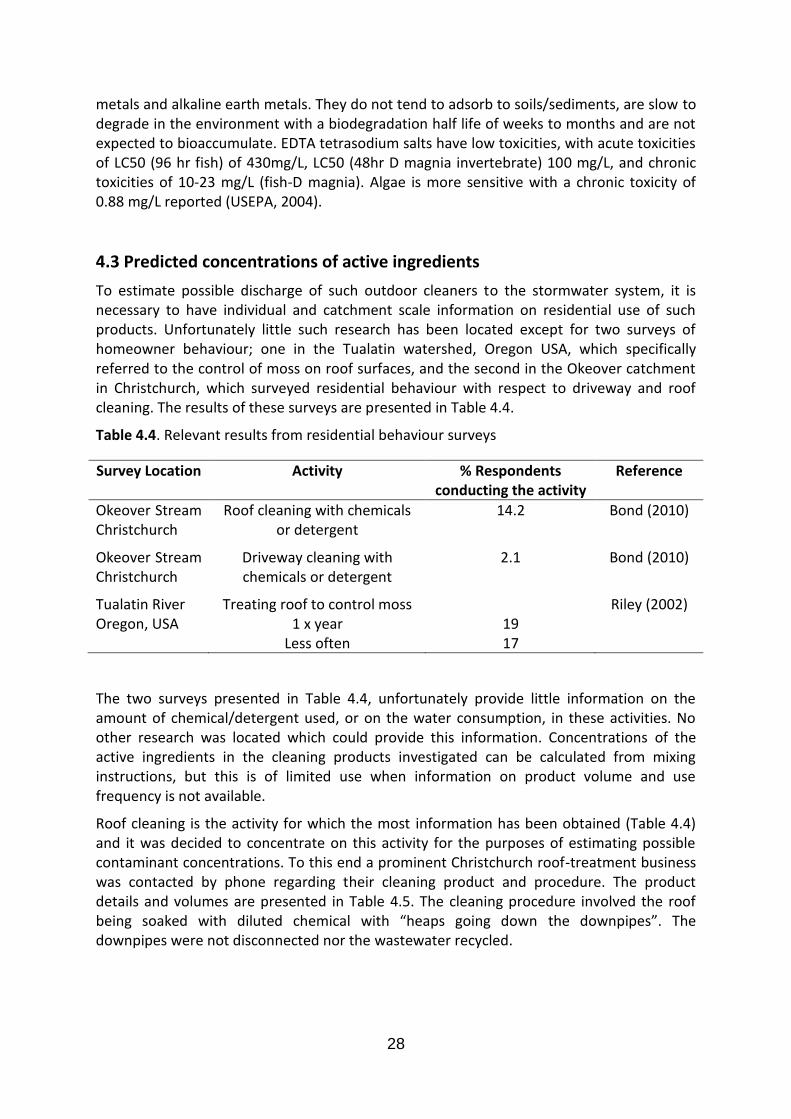
To estimate possible discharge of such outdoor cleaners to the stormwater system, it is necessary to have individual and catchment scale information on residential use of such products. Unfortunately little such research has been located except for two surveys of homeowner behaviour; one in the Tualatin watershed, Oregon USA, which specifically referred to the control of moss on roof surfaces, and the second in the Okeover catchment in Christchurch, which surveyed residential behaviour with respect to driveway and roof cleaning. The results of these surveys are presented in Table 4.4.
Table 4.4. Relevant results from residential behaviour surveys
Survey Location Activity % Respondents conducting the activity
Reference
Okeover Stream Christchurch
Roof cleaning with chemicals or detergent
14.2 Bond (2010)
Okeover Stream Christchurch
Driveway cleaning with chemicals or detergent
2.1 Bond (2010)
Tualatin River Oregon, USA
Treating roof to control moss 1 x year
Less often 19 17
Riley (2002)
The two surveys presented in Table 4.4, unfortunately provide little information on the amount of chemical/detergent used, or on the water consumption, in these activities. No other research was located which could provide this information. Concentrations of the active ingredients in the cleaning products investigated can be calculated from mixing instructions, but this is of limited use when information on product volume and use frequency is not available.
Roof cleaning is the activity for which the most information has been obtained (Table 4.4) and it was decided to concentrate on this activity for the purposes of estimating possible contaminant concentrations. To this end a prominent Christchurch roof-treatment business was contacted by phone regarding their cleaning product and procedure. The product details and volumes are presented in Table 4.5. The cleaning procedure involved the roof being soaked with diluted chemical with “heaps going down the downpipes”. The downpipes were not disconnected nor the wastewater recycled.
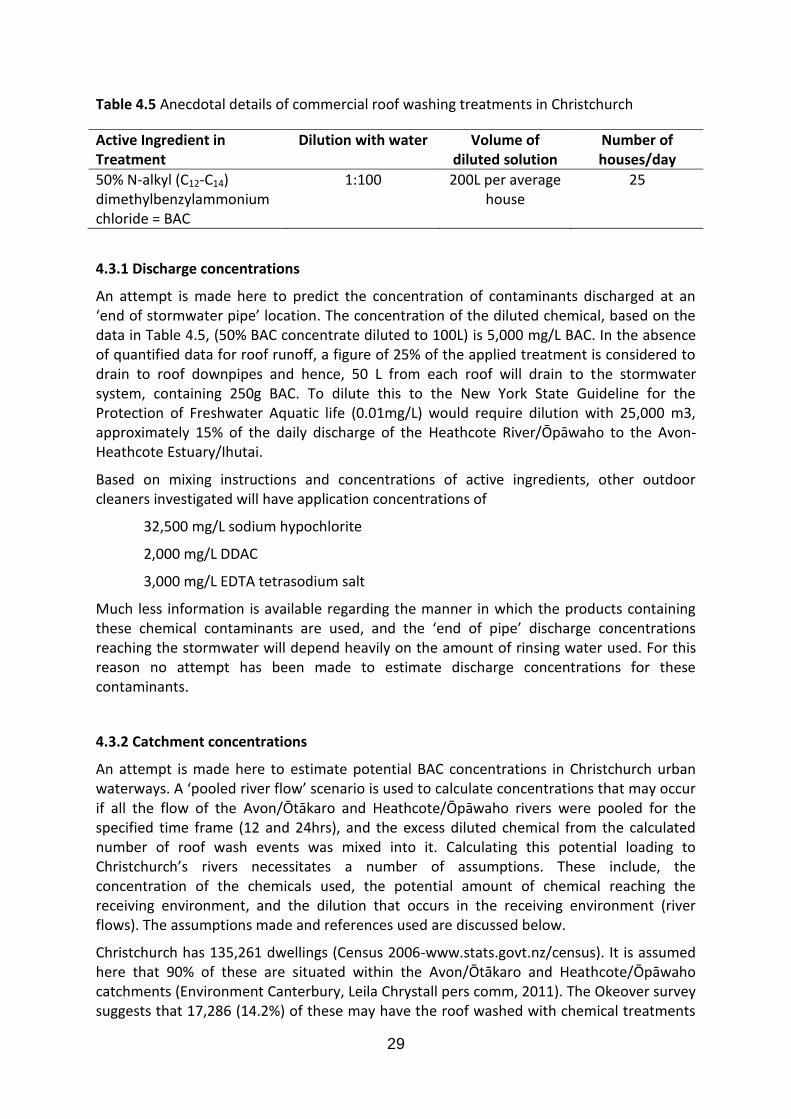
29
Table 4.5 Anecdotal details of commercial roof washing treatments in Christchurch
Active Ingredient in Treatment
Dilution with water Volume of diluted solution
Number of houses/day
50% N-alkyl (C12-C14) dimethylbenzylammonium chloride = BAC
1:100 200L per average house
25
4.3.1 Discharge concentrations
An attempt is made here to predict the concentration of contaminants discharged at an ‘end of stormwater pipe’ location. The concentration of the diluted chemical, based on the data in Table 4.5, (50% BAC concentrate diluted to 100L) is 5,000 mg/L BAC. In the absence of quantified data for roof runoff, a figure of 25% of the applied treatment is considered to drain to roof downpipes and hence, 50 L from each roof will drain to the stormwater system, containing 250g BAC. To dilute this to the New York State Guideline for the Protection of Freshwater Aquatic life (0.01mg/L) would require dilution with 25,000 m3, approximately 15% of the daily discharge of the Heathcote River/Ōpāwaho to the Avon-Heathcote Estuary/Ihutai.
Based on mixing instructions and concentrations of active ingredients, other outdoor cleaners investigated will have application concentrations of
32,500 mg/L sodium hypochlorite
2,000 mg/L DDAC
3,000 mg/L EDTA tetrasodium salt
Much less information is available regarding the manner in which the products containing these chemical contaminants are used, and the ‘end of pipe’ discharge concentrations reaching the stormwater will depend heavily on the amount of rinsing water used. For this reason no attempt has been made to estimate discharge concentrations for these contaminants.
4.3.2 Catchment concentrations
An attempt is made here to estimate potential BAC concentrations in Christchurch urban waterways. A ‘pooled river flow’ scenario is used to calculate concentrations that may occur if all the flow of the Avon/Ōtākaro and Heathcote/Ōpāwaho rivers were pooled for the specified time frame (12 and 24hrs), and the excess diluted chemical from the calculated number of roof wash events was mixed into it. Calculating this potential loading to Christchurch’s rivers necessitates a number of assumptions. These include, the concentration of the chemicals used, the potential amount of chemical reaching the receiving environment, and the dilution that occurs in the receiving environment (river flows). The assumptions made and references used are discussed below.
Christchurch has 135,261 dwellings (Census 2006-www.stats.govt.nz/census). It is assumed here that 90% of these are situated within the Avon/Ōtākaro and Heathcote/Ōpāwaho catchments (Environment Canterbury, Leila Chrystall pers comm, 2011). The Okeover survey suggests that 17,286 (14.2%) of these may have the roof washed with chemical treatments
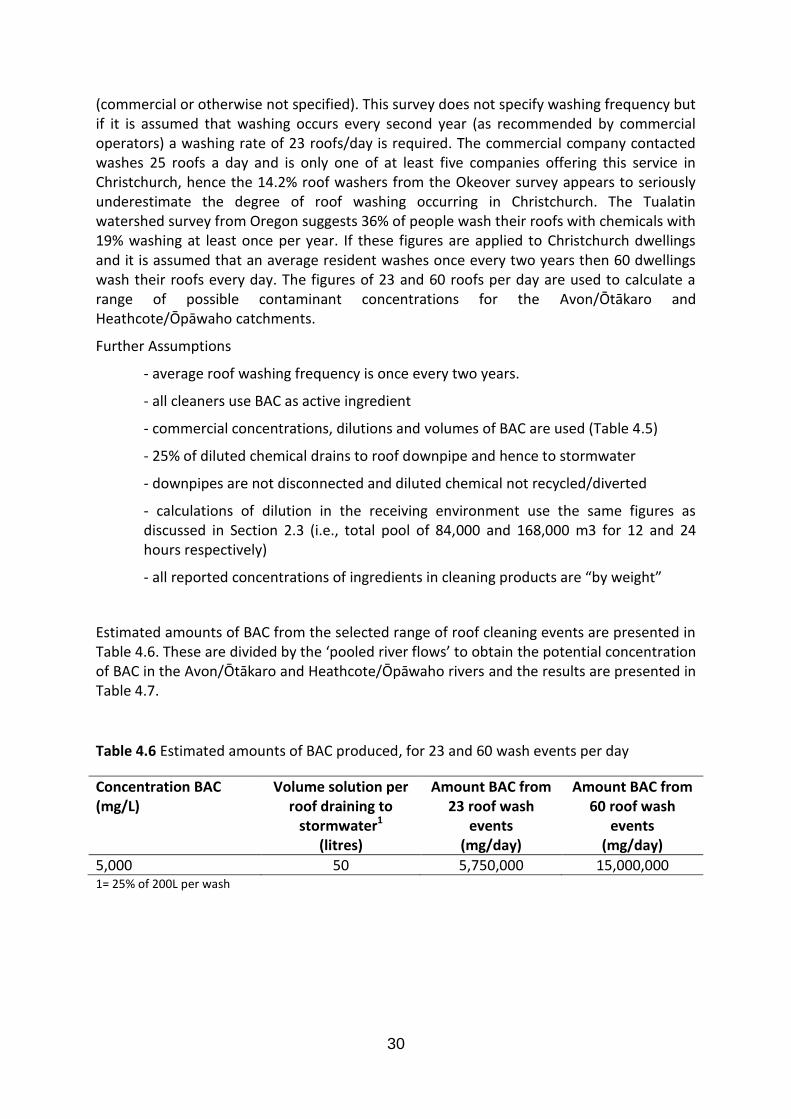
30
(commercial or otherwise not specified). This survey does not specify washing frequency but if it is assumed that washing occurs every second year (as recommended by commercial operators) a washing rate of 23 roofs/day is required. The commercial company contacted washes 25 roofs a day and is only one of at least five companies offering this service in Christchurch, hence the 14.2% roof washers from the Okeover survey appears to seriously underestimate the degree of roof washing occurring in Christchurch. The Tualatin watershed survey from Oregon suggests 36% of people wash their roofs with chemicals with 19% washing at least once per year. If these figures are applied to Christchurch dwellings and it is assumed that an average resident washes once every two years then 60 dwellings wash their roofs every day. The figures of 23 and 60 roofs per day are used to calculate a range of possible contaminant concentrations for the Avon/Ōtākaro and Heathcote/Ōpāwaho catchments.
Further Assumptions
- average roof washing frequency is once every two years.
- all cleaners use BAC as active ingredient
- commercial concentrations, dilutions and volumes of BAC are used (Table 4.5)
- 25% of diluted chemical drains to roof downpipe and hence to stormwater
- downpipes are not disconnected and diluted chemical not recycled/diverted
- calculations of dilution in the receiving environment use the same figures as discussed in Section 2.3 (i.e., total pool of 84,000 and 168,000 m3 for 12 and 24 hours respectively)
- all reported concentrations of ingredients in cleaning products are “by weight”
Estimated amounts of BAC from the selected range of roof cleaning events are presented in Table 4.6. These are divided by the ‘pooled river flows’ to obtain the potential concentration of BAC in the Avon/Ōtākaro and Heathcote/Ōpāwaho rivers and the results are presented in Table 4.7.
Table 4.6 Estimated amounts of BAC produced, for 23 and 60 wash events per day
Concentration BAC (mg/L)
Volume solution per roof draining to
stormwater1
(litres)
Amount BAC from 23 roof wash
events (mg/day)
Amount BAC from 60 roof wash
events (mg/day)
5,000 50 5,750,000 15,000,000 1= 25% of 200L per wash
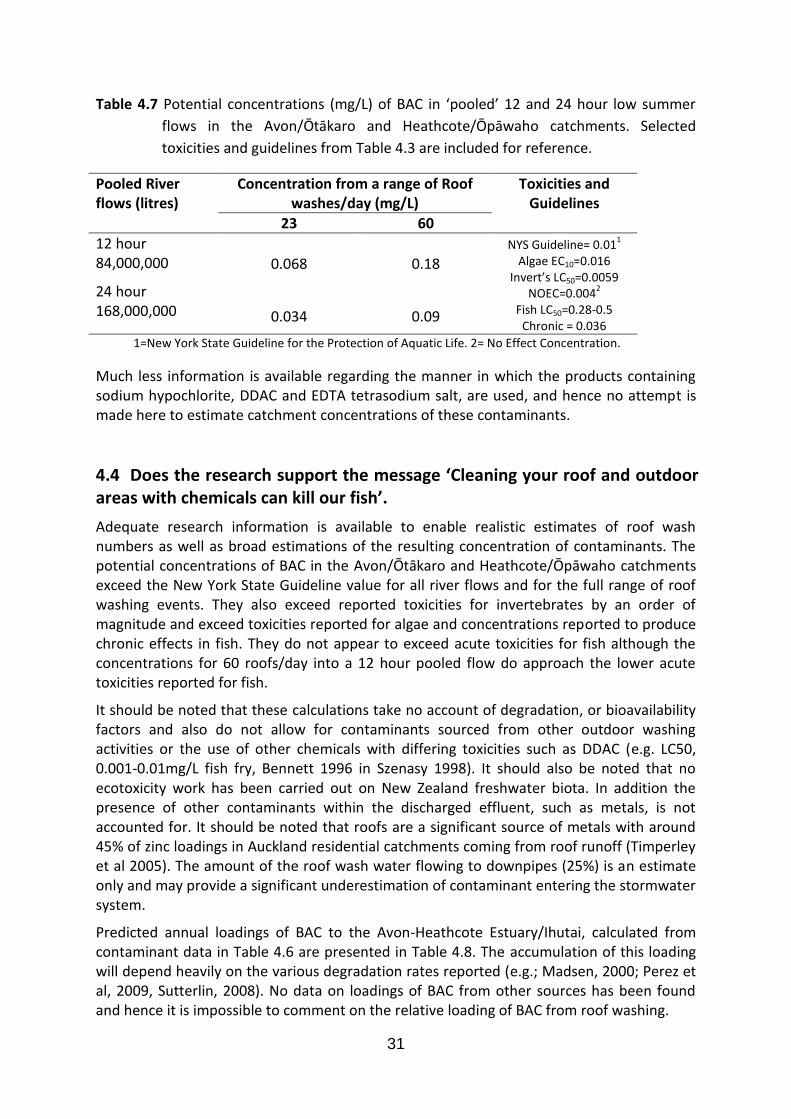
31
Table 4.7 Potential concentrations (mg/L) of BAC in ‘pooled’ 12 and 24 hour low summer
flows in the Avon/Ōtākaro and Heathcote/Ōpāwaho catchments. Selected
toxicities and guidelines from Table 4.3 are included for reference.
Pooled River flows (litres)
Concentration from a range of Roof washes/day (mg/L)
Toxicities and Guidelines
23 60
12 hour 84,000,000 0.068 0.18
NYS Guideline= 0.011
Algae EC10=0.016 Invert’s LC50=0.0059
NOEC=0.0042
Fish LC50=0.28-0.5 Chronic = 0.036
24 hour 168,000,000 0.034 0.09
1=New York State Guideline for the Protection of Aquatic Life. 2= No Effect Concentration.
Much less information is available regarding the manner in which the products containing sodium hypochlorite, DDAC and EDTA tetrasodium salt, are used, and hence no attempt is made here to estimate catchment concentrations of these contaminants.
4.4 Does the research support the message ‘Cleaning your roof and outdoor areas with chemicals can kill our fish’.
Adequate research information is available to enable realistic estimates of roof wash numbers as well as broad estimations of the resulting concentration of contaminants. The potential concentrations of BAC in the Avon/Ōtākaro and Heathcote/Ōpāwaho catchments exceed the New York State Guideline value for all river flows and for the full range of roof washing events. They also exceed reported toxicities for invertebrates by an order of magnitude and exceed toxicities reported for algae and concentrations reported to produce chronic effects in fish. They do not appear to exceed acute toxicities for fish although the concentrations for 60 roofs/day into a 12 hour pooled flow do approach the lower acute toxicities reported for fish.
It should be noted that these calculations take no account of degradation, or bioavailability factors and also do not allow for contaminants sourced from other outdoor washing activities or the use of other chemicals with differing toxicities such as DDAC (e.g. LC50, 0.001-0.01mg/L fish fry, Bennett 1996 in Szenasy 1998). It should also be noted that no ecotoxicity work has been carried out on New Zealand freshwater biota. In addition the presence of other contaminants within the discharged effluent, such as metals, is not accounted for. It should be noted that roofs are a significant source of metals with around 45% of zinc loadings in Auckland residential catchments coming from roof runoff (Timperley et al 2005). The amount of the roof wash water flowing to downpipes (25%) is an estimate only and may provide a significant underestimation of contaminant entering the stormwater system.
Predicted annual loadings of BAC to the Avon-Heathcote Estuary/Ihutai, calculated from contaminant data in Table 4.6 are presented in Table 4.8. The accumulation of this loading will depend heavily on the various degradation rates reported (e.g.; Madsen, 2000; Perez et al, 2009, Sutterlin, 2008). No data on loadings of BAC from other sources has been found and hence it is impossible to comment on the relative loading of BAC from roof washing.
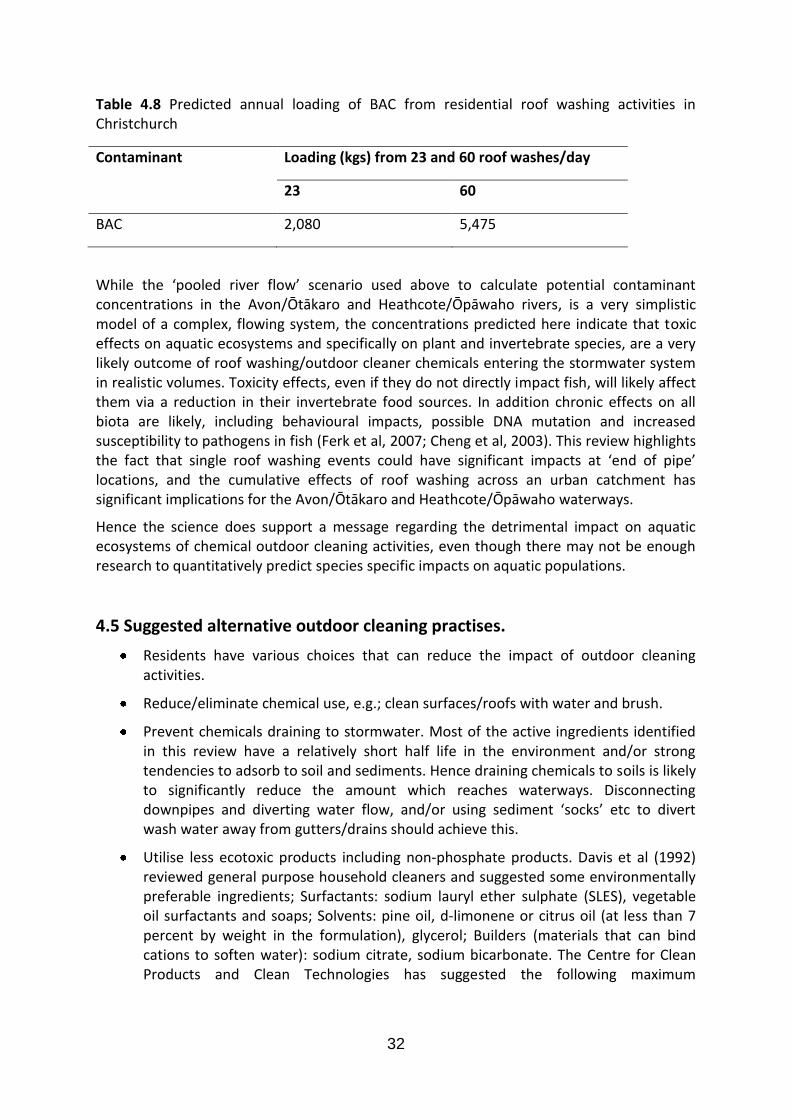
32
Table 4.8 Predicted annual loading of BAC from residential roof washing activities in Christchurch
Contaminant Loading (kgs) from 23 and 60 roof washes/day
23 60
BAC 2,080 5,475
While the ‘pooled river flow’ scenario used above to calculate potential contaminant concentrations in the Avon/Ōtākaro and Heathcote/Ōpāwaho rivers, is a very simplistic model of a complex, flowing system, the concentrations predicted here indicate that toxic effects on aquatic ecosystems and specifically on plant and invertebrate species, are a very likely outcome of roof washing/outdoor cleaner chemicals entering the stormwater system in realistic volumes. Toxicity effects, even if they do not directly impact fish, will likely affect them via a reduction in their invertebrate food sources. In addition chronic effects on all biota are likely, including behavioural impacts, possible DNA mutation and increased susceptibility to pathogens in fish (Ferk et al, 2007; Cheng et al, 2003). This review highlights the fact that single roof washing events could have significant impacts at ‘end of pipe’ locations, and the cumulative effects of roof washing across an urban catchment has significant implications for the Avon/Ōtākaro and Heathcote/Ōpāwaho waterways.
Hence the science does support a message regarding the detrimental impact on aquatic ecosystems of chemical outdoor cleaning activities, even though there may not be enough research to quantitatively predict species specific impacts on aquatic populations.
4.5 Suggested alternative outdoor cleaning practises.
Residents have various choices that can reduce the impact of outdoor cleaning activities.
Reduce/eliminate chemical use, e.g.; clean surfaces/roofs with water and brush.
Prevent chemicals draining to stormwater. Most of the active ingredients identified in this review have a relatively short half life in the environment and/or strong tendencies to adsorb to soil and sediments. Hence draining chemicals to soils is likely to significantly reduce the amount which reaches waterways. Disconnecting downpipes and diverting water flow, and/or using sediment ‘socks’ etc to divert wash water away from gutters/drains should achieve this.
Utilise less ecotoxic products including non-phosphate products. Davis et al (1992) reviewed general purpose household cleaners and suggested some environmentally preferable ingredients; Surfactants: sodium lauryl ether sulphate (SLES), vegetable oil surfactants and soaps; Solvents: pine oil, d-limonene or citrus oil (at less than 7 percent by weight in the formulation), glycerol; Builders (materials that can bind cations to soften water): sodium citrate, sodium bicarbonate. The Centre for Clean Products and Clean Technologies has suggested the following maximum
33
concentration by weight in cleaning products; BAC 0.2%, linear alkylbenzene sulphonate 2.5%, ammonia 7%, phenylphenol 4-5% (Swansen et al 1995)
The appropriate local authority should ensure that commercial operators are not conducting illegal discharges to stormwater.
34
Section 5 Cigarette Butt Litter
Possible overall message: “Litter in our city fouls our rivers”
Possible outdoor cleaner specific message: “Ditching your butt can kill our rivers too”
5.1 Introduction
Cigarette butt litter is prevalent in many environments around the world and has been accepted by the tobacco industry as a litter and environmental problem (Phillip Morris Internal Memo, 1992). In the early 1990’s an industry research organisation (CORESTA) began investigating the potential for a new biodegradable cigarette filter but the organisation was disbanded in 2000 after little progress (Novotny et al, 2009). Consequently most cigarette filters are still made of cellulose acetate, a non-biodegradable plastic (Register, 2000), although some moves to bio-degradable starch filters have been reported (Novotny et al, 2009). The cigarette butts containing cellulose acetate filters are consistently one of the most common items identified in litter surveys around the world. Of 10 million pieces of litter collected during the International Coastal Cleanup campaign, 21% (by number) were cigarette butts (Moerman & Potts, 2011). On the beaches of Brazil (Santos et al, 2005) and New Jersey (Cutter et al, 1991) cigarette butts were the most common form of litter, while the United States National Oceanic and Atmospheric Administration lists cigarette butts and lighters at the top of a list of marine debris in the Gulf of Mexico (NOAA, 2006). While most of these litter surveys are conducted on marine debris picked up from beaches, urban stormwater is recognised as a major source of this debris. Melbourne Water, the utility company responsible for management of Melbourne’s waterways and water supply, estimates that 95% of beach litter is sourced from the city’s stormwater system, while in Sydney, Cunningham and Wilson (2003) have estimated the figure is 62%. Hence the numbers of cigarette butts being picked up on beaches is an indication of significant, inappropriate disposal in the urban environment.
Urban litter profiles support this conclusion with cigarette butts generally featuring prominently in litter statistics. The Victoria Litter Report (2009) indicates that 45% of all litter in this region of Australia was reported as cigarette butts, as is 25-50% of all litter on roads and streets in the USA (Novotny et al, 2009). Littering by smokers appears pervasive with 45-95% reported as littering their butts (Smith & Novotny, 2011). In Hobart, Tasmania, behavioural observations indicated 70% of smokers littered in the CBD (HCC) and butts are the most common form of litter (Curnow & Chrispijn, 2006). Several reports mention increased littering as a result of tightening anti-smoking legislation which forces smokers outside (Novotny et al, 2009; Smith and Novotny, 2011). It has been estimated that in Australia alone 24-32 billion butts are littered annually with around 2.4-3.2 billion of those reaching the nations waterways (Micevska et al, 2006). Melbourne Water also estimate 10% of all butts smoked in Melbourne catchments end up in waterways (www.melbournewater.com.au). No data on New Zealand or Christchurch cigarette butt littering was located for this study although some estimates can be made through the use of international data. This is discussed further in Section 5.3
35
Cigarette butts consist of unsmoked tobacco remnants, a filter and the surrounding paper, as well as chemicals absorbed during the smoking process. The filter consists of packed, fine fibres of cellulose acetate plastic. These filters are non-biodegradable but do degrade through photo and mechanical degradation. As such they are ultimately non-degradable but do break into smaller and smaller pieces of plastic (Phillip Morris Internal Memo, 1992; CORESTA, 2000; Novotny et al, 2009; Smith and Novotny; 2011, Marah, 2011). The time frame of photo-mechanical degradation is variously reported but is generally months to years (CORESTA, 2000). Reported figures include 3-5 years in seawater (TAP, 2009; www.litter.vic.au) and 12 months in freshwater (www.litter.vic.au). Biodegradable starch based filters have been reported as having degradation times of 2 months (Novotney et al, 2009).
Analyses have identified more than 4,000 chemicals in cigarette particulate matter, including polycyclic aromatic hydrocarbons (PAH), hydrogen cyanide, acetaldehyde, benzene, arsenic, cadmium, lead, nickel and toluene. More than 50 of these substances are known to be carcinogenic (Micevska, 2006; Kadir, 2009; Moerman, 2009; Novotny et al, 2011; Smith & Novotny, 2011; Slaughter et al, 2011). These chemicals are derived from the soil in which tobacco is grown, horticultural additives such as fertilisers and pesticides, treatments during tobacco processing and cigarette manufacturing, as well as from the smoking process itself (Micevska, 2006; Moerman, 2009; Moerman & Potts, 2011).
5.2 Environmental impacts and toxicity of cigarette butts
The global environmental impact of the large number of butts littered has been poorly studied and the significance of their direct (toxicity) and indirect impacts are poorly described (Smith & Novotny, 2011).
Many studies have reported physical ingestion of marine debris by sea creatures and birds, as a serious environmental consequence of littering behaviour (Cooper et al, 2004; TAP, 2009; UNEP Yearbook, 2009). This may result in toxic effects, choking and/or nutritional impacts due to food replacement, but it has proved difficult to verify a direct relationship with mortality. In addition none of the studies reviewed itemised debris to an extent which allowed identification of cigarette butts, and plastics were lumped together or divided into hard/soft/sheet type categories. Plastic ingestion has been linked with reduction in fledgling mass in North Pacific Albatross and the impact of smoking activities is demonstrated by the many thousands of coloured cigarette lighters that have been collected from breeding colonies where they have been regurgitated by fledglings (Cooper et al, 2004). No studies were found which specifically discussed ingestion of cigarette butts and none were found which examined plastic ingestion in freshwater species.
Direct toxicity effects from chemical contaminants leached from cigarette butts in water, are better researched. Cigarette butts have been shown to leach a variety of chemicals including heavy metals, especially lead and cadmium (Moerman, 2009), as well as nicotine and ethylphenol (Moerman, 2009; Novotny et al, 2011). The possible toxic effects of this leaching have been demonstrated in several studies. Register (2000) investigated the toxicity of cigarette butts to the freshwater cladoceran water flea, Daphnia magna and tested the difference between tobacco, and unsmoked and smoked filters. Warne et al (in prep, cited in Slaughter 2011) also examined the toxicity of smoked and unsmoked butts
36
and filters to freshwater cladoceran (Ceriodaphnia dubia) and to marine bacterium (Vibrio fischeri). Micevska et al (2006) examined the toxicity of various cigarette brands to C. dubia and V. fischeri, while Slaughter et al (2011) was the first study to examine toxicity to vertebrates, namely freshwater fish (Pimephales promelas) and marine fish (Atherinops affinis). Results from these studies are presented in Table 5.1.
It appears that the cigarette filters themselves are of low toxicity but the presence of remnant tobacco and especially the after-effect of smoking, increases the toxicity of cigarette butts enormously. Micevska et al (2006) reported significant differences between brands tested, and determined that it was the organic compounds transferred to water during leaching, especially nicotine and ethylphenol, that caused the majority of the toxicity. A study of metal leaching (Moerman & Potts, 2011), indicated that each cigarette butt is likely to be a point source for metals for at least a month, however no data was presented for toxicity trends over that period.
The United Nations Yearbook for 2011 has highlighted the growing concern over the ability for small, photo- or mechanically-degraded plastic fragments to concentrate through adsorption, and then release, persistent, bio-accumulative and toxic compounds such as DDT, polychlorinated biphenols, polycyclic aromatic hydrocarbons and nonylphenol (UNEP, 2011). These are compounds of great concern but no study was located which examined the ability of cigarette butt plastic to concentrate and release such compounds.
5.3 Predicted concentrations of littered cigarette butts
An attempt is made here to calculate the possible concentration of cigarette butt litter in the Avon/Ōtākaro and Heathcote/Ōpāwaho rivers. A ‘pooled river flow scenario’ approach is once again taken, calculating the concentrations that may occur if all the flow of the Avon /Ōtākaro and Heathcote/Ōpāwaho rivers were pooled for a 24 hour period and the calculated number of cigarette butts discharged to waterways were mixed in. To calculate such a concentration accurately it is necessary to estimate the number of butts being littered within a certain time period in the river catchments, the number of those butts reaching the waterways and also the volume of water in the receiving environment. Very limited data seems to be available for cigarette butt litter in Christchurch or indeed New Zealand. However, various New Zealand council websites support overseas statements regarding an increase in cigarette litter since 2004 regulations restricted smoking to outdoor locations (e.g.: www.hastingdc.govt.nz, www.knzb.co.nz). Enquiries were sent to Christchurch City Council and to the ‘Keep New Zealand Beautiful’ campaign, but no more quantitative information was available.
Therefore, in lieu of Christchurch/New Zealand specific studies on cigarette butt litter and waterway contamination, a number of assumptions have had to be made in order to estimate possible butt concentrations in the waterways of Christchurch. These assumptions outlined below, rely heavily on the results of a study of New Zealand smoking habits by Tobias & Huang (2007) and on statistics from the New Zealand Ministry of Health. Micevska et al (2006) and Melbourne Water, estimate that 10% of all smoked cigarette butts end up in urban waterways. Based on the similar cultural and regulatory environments, this estimate is used to calculate waterway contamination.
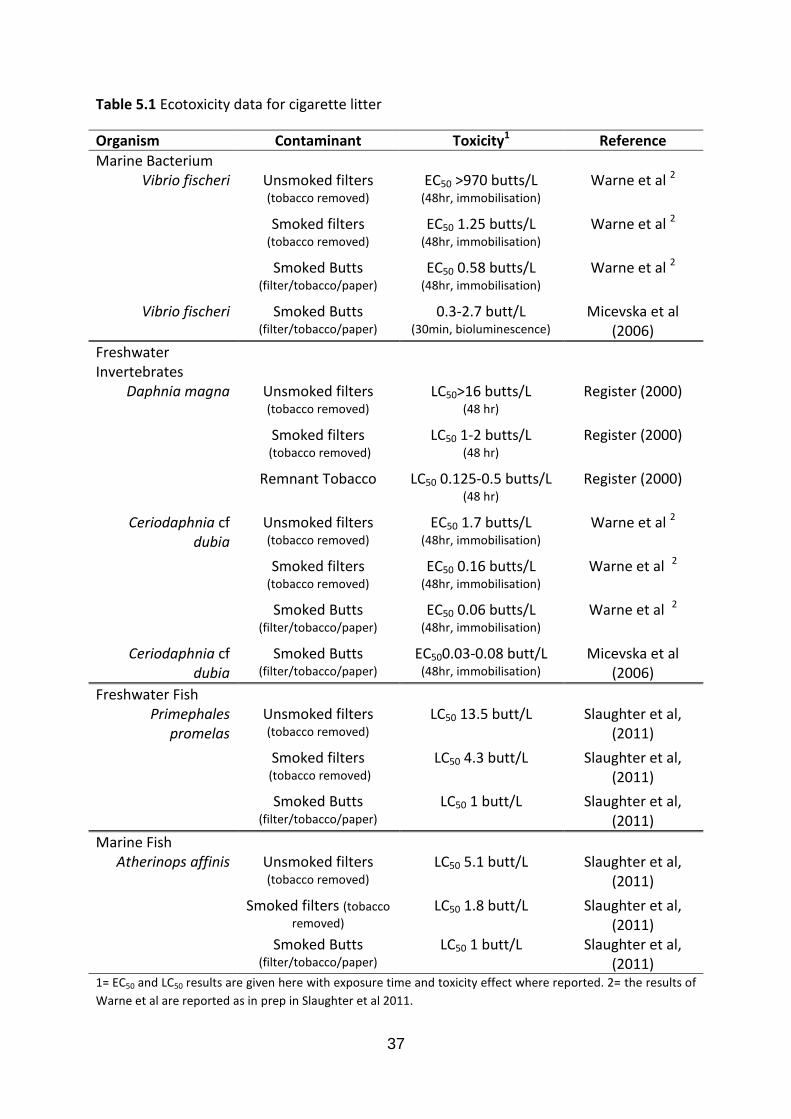
37
Table 5.1 Ecotoxicity data for cigarette litter
Organism Contaminant Toxicity1 Reference
Marine Bacterium Vibrio fischeri Unsmoked filters
(tobacco removed) EC50 >970 butts/L
(48hr, immobilisation)
Warne et al 2
Smoked filters (tobacco removed)
EC50 1.25 butts/L (48hr, immobilisation)
Warne et al 2
Smoked Butts (filter/tobacco/paper)
EC50 0.58 butts/L (48hr, immobilisation)
Warne et al 2
Vibrio fischeri Smoked Butts (filter/tobacco/paper)
0.3-2.7 butt/L (30min, bioluminescence)
Micevska et al (2006)
Freshwater Invertebrates
Daphnia magna Unsmoked filters (tobacco removed)
LC50>16 butts/L (48 hr)
Register (2000)
Smoked filters (tobacco removed)
LC50 1-2 butts/L (48 hr)
Register (2000)
Remnant Tobacco LC50 0.125-0.5 butts/L (48 hr)
Register (2000)
Ceriodaphnia cf dubia
Unsmoked filters (tobacco removed)
EC50 1.7 butts/L (48hr, immobilisation)
Warne et al 2
Smoked filters (tobacco removed)
EC50 0.16 butts/L (48hr, immobilisation)
Warne et al 2
Smoked Butts (filter/tobacco/paper)
EC50 0.06 butts/L (48hr, immobilisation)
Warne et al 2
Ceriodaphnia cf dubia
Smoked Butts (filter/tobacco/paper)
EC500.03-0.08 butt/L (48hr, immobilisation)
Micevska et al (2006)
Freshwater Fish Primephales
promelas Unsmoked filters (tobacco removed)
LC50 13.5 butt/L Slaughter et al, (2011)
Smoked filters (tobacco removed)
LC50 4.3 butt/L Slaughter et al, (2011)
Smoked Butts (filter/tobacco/paper)
LC50 1 butt/L Slaughter et al, (2011)
Marine Fish Atherinops affinis Unsmoked filters
(tobacco removed) LC50 5.1 butt/L Slaughter et al,
(2011)
Smoked filters (tobacco
removed) LC50 1.8 butt/L Slaughter et al,
(2011) Smoked Butts
(filter/tobacco/paper) LC50 1 butt/L Slaughter et al,
(2011) 1= EC50 and LC50 results are given here with exposure time and toxicity effect where reported. 2= the results of
Warne et al are reported as in prep in Slaughter et al 2011.
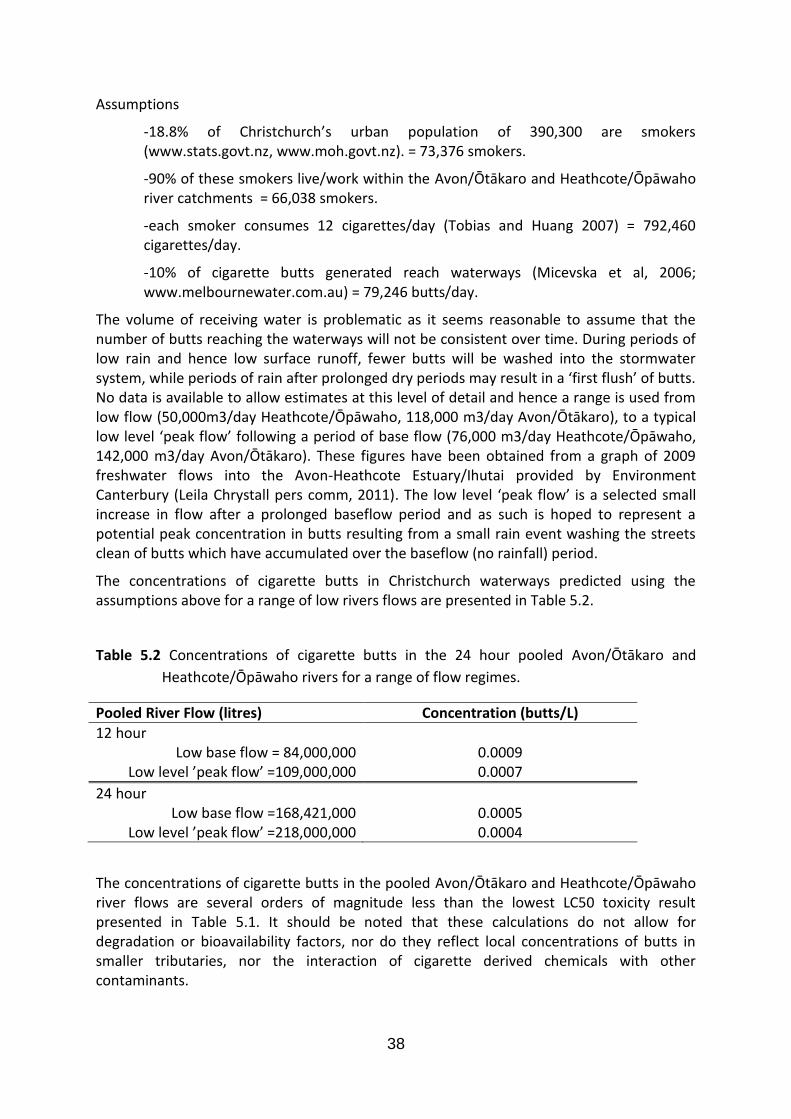
38
Assumptions
-18.8% of Christchurch’s urban population of 390,300 are smokers (www.stats.govt.nz, www.moh.govt.nz). = 73,376 smokers.
-90% of these smokers live/work within the Avon/Ōtākaro and Heathcote/Ōpāwaho river catchments = 66,038 smokers.
-each smoker consumes 12 cigarettes/day (Tobias and Huang 2007) = 792,460 cigarettes/day.
-10% of cigarette butts generated reach waterways (Micevska et al, 2006; www.melbournewater.com.au) = 79,246 butts/day.
The volume of receiving water is problematic as it seems reasonable to assume that the number of butts reaching the waterways will not be consistent over time. During periods of low rain and hence low surface runoff, fewer butts will be washed into the stormwater system, while periods of rain after prolonged dry periods may result in a ‘first flush’ of butts. No data is available to allow estimates at this level of detail and hence a range is used from low flow (50,000m3/day Heathcote/Ōpāwaho, 118,000 m3/day Avon/Ōtākaro), to a typical low level ‘peak flow’ following a period of base flow (76,000 m3/day Heathcote/Ōpāwaho, 142,000 m3/day Avon/Ōtākaro). These figures have been obtained from a graph of 2009 freshwater flows into the Avon-Heathcote Estuary/Ihutai provided by Environment Canterbury (Leila Chrystall pers comm, 2011). The low level ‘peak flow’ is a selected small increase in flow after a prolonged baseflow period and as such is hoped to represent a potential peak concentration in butts resulting from a small rain event washing the streets clean of butts which have accumulated over the baseflow (no rainfall) period.
The concentrations of cigarette butts in Christchurch waterways predicted using the assumptions above for a range of low rivers flows are presented in Table 5.2.
Table 5.2 Concentrations of cigarette butts in the 24 hour pooled Avon/Ōtākaro and
Heathcote/Ōpāwaho rivers for a range of flow regimes.
Pooled River Flow (litres) Concentration (butts/L)
12 hour Low base flow = 84,000,000 0.0009
Low level ’peak flow’ =109,000,000 0.0007
24 hour Low base flow =168,421,000 0.0005
Low level ’peak flow’ =218,000,000 0.0004
The concentrations of cigarette butts in the pooled Avon/Ōtākaro and Heathcote/Ōpāwaho river flows are several orders of magnitude less than the lowest LC50 toxicity result presented in Table 5.1. It should be noted that these calculations do not allow for degradation or bioavailability factors, nor do they reflect local concentrations of butts in smaller tributaries, nor the interaction of cigarette derived chemicals with other contaminants.
39
5.4 Does the research support the message “Ditching your butt can kill our rivers too”?
The concentrations predicted here do not appear to support a specific message around cigarette butts causing lethal effects in Christchurch waterways. While the ‘pooling’ approach used to calculate the butt concentrations in Table 5.2 is a very simplistic model of a complex flowing system, the derived concentrations do not indicate that a chemical toxicity effect is likely in the major waterways. This does not discount the possibility of localised concentrations being much greater than those calculated, however currently there is no data to assess the likelihood of this premise. In addition there appears to be no literature which enables assessment of the indirect effects of cigarette butts, such as via physical ingestion or habitat modification.
The data could support a message that is less specific about lethal effects. All studies reviewed indicate that cigarette butts do leach toxic chemicals to the waterways and no NOEC (no effect concentration) was reported. A message such as “Ditching your butts puts chemicals in our rivers” is supported by the research.
An annual load of 28,924,790 cigarette butts to the Christchurch waterways is predicted
from the daily loads calculated in Section 5.3. Based on the figures in Moerman & Potts
(2011) this load will leach 32 mg/yr, 19.5 mg/yr and 0.7mg/yr of zinc, copper and lead.
These are very small quantities compared to the 18 kg/day heavy metal load reported for
the Avon-Heathcote Estuary/Ihutai (Christchurch City Environmental Trends Report, 2003, in
Ermens, 2007). The research reviewed for this study does not allow calculation of the
loadings of other individual contaminants such as nicotine or ethylphenol.
5.5 Alternative practises and measures
The simple alternative for residents who smoke is to dispose of their cigarette butts in an appropriate manner i.e., in a windproof ashtray or rubbish bin.
40
Section 6 Inappropriate Disposal of Selected ‘Do It Yourself’ (DIY) Waste Products
Possible overall message: “Stormwater goes direct to our rivers, chemicals and all”
Possible DIY waste specific messages: “DIY for river health; pouring used oil, paint and
solvents down the drain can kill our rivers”
6.1 Introduction
New Zealanders have traditionally prided themselves on their ability to turn their hand to most activities and the ‘Do It Yourself’ (DIY) ethos has always been a large part of our culture. Decorating the house and maintaining the car are two activities which residents often undertake at home, but when care is not taken these activities can result in the contamination of stormwater systems and the city’s rivers. Inappropriate disposal of used vehicle fluids, in particular engine oil, and the inappropriate washing of painting equipment both have the potential to result in hazardous waste draining directly into the rivers of Christchurch. These two activities are investigated further in this section.
6.2 Used engine lubricants; what’s the problem?
Lubrication oils are an essential component of most machinery and as such are integral to our vehicular transport system. Modern vehicle manufacturers recommend regular replacement of engine lubricants due to their loss of performance and engine protection characteristics over time. While the majority of vehicle owners now have their lubricant changed by qualified automotive service centres, some still choose to perform this operation at home. Disposal of the used engine lubricant has the potential to contaminate waterways and many local authorities include information about appropriate disposal methods for home and businesses in their public outreach information (e.g.: www.ecan.govt.nz, www.arc.govt.nz).
Lubricating engine oils consist of base fluids into which performance enhancing additives are blended. The majority of base fluids are petroleum mineral oils containing a complex mixture of aliphatic, cycloaliphatic and aromatic hydrocarbons (Maxam et al, 2002) and typical motor oils are refined from crude oil to include the C18-34 fraction. Synthetic base fluids are increasingly popular and mainly consist of alpha-olefins, esters and alkylated naphthalenes (Thompson etal, 2007; Beyram et al, 2010). Additives vary greatly between products and are used to improve such characteristics as oxidation resistance, viscosity, corrosion and load carrying capacity (Ogali et al, 2007). The additives and base fluids used will be dependent on intended use but additives in vehicle engine lubricants may include compounds such as the antioxidant alkylated diphenylamine (+octylated and butylated diphenylamines), zinc alkyl dithiophosphate and heptyl, phenol derivatives (Maxam et al, 2002, Beyram et al, 2010; USEPA, 2006; Thompson et al 2007). In addition engine lubricant oils change composition during use, with used lubricants containing significant concentrations of heavy metals from engine wear, and polycyclic aromatic hydrocarbons
41
(PAH) from incomplete hydrocarbon combustion (Ogali et al, 2007; Thompson et al, 2007; Lopes et al, 2010).
The environmental effects and toxicity of engine lubricants
Lubricant oils used in vehicle engines are variously reported as having detrimental effects on aquatic ecology (e.g.; Ort et al 1995; Poulton et al, 1998; Ogali et al, 2007; Bayram et al 2010). Used engine lubricant is known to be carcinogenic and mutagenic (Mckee & Plutnick, 1989; Drzyzga, 2003; Thompson, 2007) and is considered to have higher potential for detrimental effects on aquatic ecology than unused lubricant (Maxam et al, 2002, Ogali et al, 2007; Lopes et al 2010). Used lubricants may affect aquatic communities via a range of mechanisms. Direct toxicity effects are reported (e.g.; Vazquez-Duhalt, 1989; Beyram et al, 2010) and may occur from a water-soluble fraction (e.g.; Ogali et al, 2007; LC50=513-690 mg/L) or from oil contaminated sediments. Nematode (Roundworm) abundance, and number of species decreased significantly in lubricant contaminated Tunisian marine sediments (Beyram et al, 2010) while Thompson et al (2007) found organism abundance was much reduced 56 weeks after contamination of marine sediment with lubricant oils. Hydrocarbons may also coat water surfaces reducing oxygen exchange (NZWWA, 2006; Ogali et al 2007) and coat substrates reducing habitat and creating ingestion risks (Poulton et al, 1998; Thompson et al, 2007). In addition, the biochemical oxygen demand (BOD) is increased due to the increase in hydrocarbon-consuming bacteria. This results in reduced dissolved oxygen available for aquatic organisms (Ogali et al, 2007; Thompson et al, 2007).
Base fluids, both mineral oils and synthetic, are generally considered to have negligible direct toxicity (Thompson et al, 2007; USUSEPA, 2011) although they will contribute to aquatic effects via the indirect mechanisms discussed above. However lubricant additives such as alkylated diphenylamine, zinc alkyl dithiophosphate and heptyl phenol derivatives, have toxic effects on aquatic organisms, and lubricant oil additives in general are commonly detrimental to aquatic ecosystems (Vazquez-Duhalt, 1989; Maxam et al, 2002, Drzyzga, 2003; Beyram, 2010), as are the heavy metal and PAH components of used lubricants (Maxam et al, 2002; Thompson et al, 2007; Lopes et al, 2010). Much work on the ecological effects of oils has concentrated on crude oil spills into marine environments and little work has been conducted on lighter, lubricant oils. Thompson et al (2007) reported significant changes in benthic community structures from exposure to contaminated sediments but found little difference between used and unused oils. Ogali et al (2007) in contrast found used oils to be much more toxic to freshwater African Catfish, while Beyram et al (2010) also found the effect of used lubricants on nematode assemblages to be greater than that of unused oil, as was synthetic lubricant as compared to mineral oil based lubricant. Even fewer studies have considered the effects of lubricant oils on freshwater ecology. A study by Poulton et al (1998) on the effects of light oil on freshwater macroinvertebrates, found that a significant oil spill almost eliminated downstream communities although at least some recovery was evident within one year. In another study significant mayfly mortality was found from 21 day exposures to 6 week old, crude oil contaminated sediment (Ort et al, 1995).
Most studies have noted general community effects of oil contamination but have not been specific regarding composition or concentration of oils resulting in toxicity effects. This is no doubt due to the wide range of lubricant compositions. Ort et al (1995) found mayfly
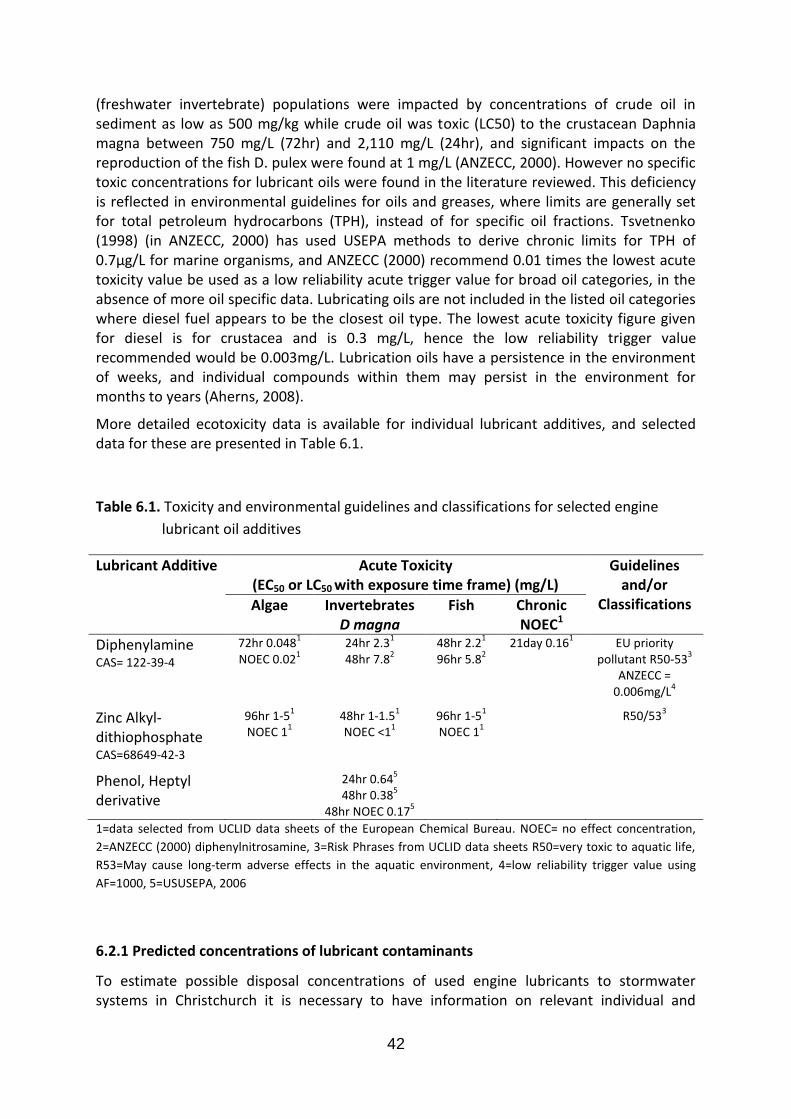
42
(freshwater invertebrate) populations were impacted by concentrations of crude oil in sediment as low as 500 mg/kg while crude oil was toxic (LC50) to the crustacean Daphnia magna between 750 mg/L (72hr) and 2,110 mg/L (24hr), and significant impacts on the reproduction of the fish D. pulex were found at 1 mg/L (ANZECC, 2000). However no specific toxic concentrations for lubricant oils were found in the literature reviewed. This deficiency is reflected in environmental guidelines for oils and greases, where limits are generally set for total petroleum hydrocarbons (TPH), instead of for specific oil fractions. Tsvetnenko (1998) (in ANZECC, 2000) has used USEPA methods to derive chronic limits for TPH of 0.7µg/L for marine organisms, and ANZECC (2000) recommend 0.01 times the lowest acute toxicity value be used as a low reliability acute trigger value for broad oil categories, in the absence of more oil specific data. Lubricating oils are not included in the listed oil categories where diesel fuel appears to be the closest oil type. The lowest acute toxicity figure given for diesel is for crustacea and is 0.3 mg/L, hence the low reliability trigger value recommended would be 0.003mg/L. Lubrication oils have a persistence in the environment of weeks, and individual compounds within them may persist in the environment for months to years (Aherns, 2008).
More detailed ecotoxicity data is available for individual lubricant additives, and selected data for these are presented in Table 6.1.
Table 6.1. Toxicity and environmental guidelines and classifications for selected engine
lubricant oil additives
Lubricant Additive Acute Toxicity (EC50 or LC50 with exposure time frame) (mg/L)
Guidelines and/or
Classifications Algae Invertebrates D magna
Fish Chronic NOEC1
Diphenylamine CAS= 122-39-4
72hr 0.0481
NOEC 0.021
24hr 2.31
48hr 7.82
48hr 2.21
96hr 5.82
21day 0.161
EU priority pollutant R50-53
3
ANZECC = 0.006mg/L
4
Zinc Alkyl-dithiophosphate CAS=68649-42-3
96hr 1-51
NOEC 11
48hr 1-1.51
NOEC <11
96hr 1-51
NOEC 11
R50/533
Phenol, Heptyl derivative
24hr 0.645
48hr 0.385
48hr NOEC 0.175
1=data selected from UCLID data sheets of the European Chemical Bureau. NOEC= no effect concentration,
2=ANZECC (2000) diphenylnitrosamine, 3=Risk Phrases from UCLID data sheets R50=very toxic to aquatic life,
R53=May cause long-term adverse effects in the aquatic environment, 4=low reliability trigger value using
AF=1000, 5=USUSEPA, 2006
6.2.1 Predicted concentrations of lubricant contaminants
To estimate possible disposal concentrations of used engine lubricants to stormwater systems in Christchurch it is necessary to have information on relevant individual and
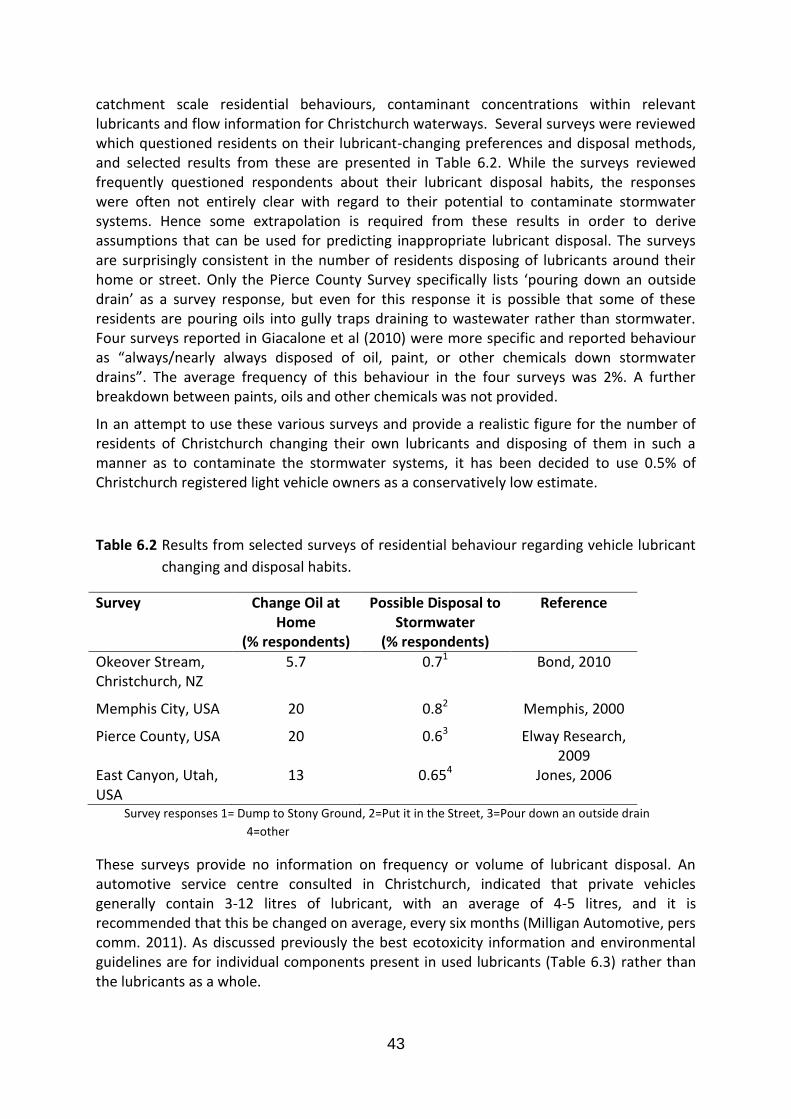
43
catchment scale residential behaviours, contaminant concentrations within relevant lubricants and flow information for Christchurch waterways. Several surveys were reviewed which questioned residents on their lubricant-changing preferences and disposal methods, and selected results from these are presented in Table 6.2. While the surveys reviewed frequently questioned respondents about their lubricant disposal habits, the responses were often not entirely clear with regard to their potential to contaminate stormwater systems. Hence some extrapolation is required from these results in order to derive assumptions that can be used for predicting inappropriate lubricant disposal. The surveys are surprisingly consistent in the number of residents disposing of lubricants around their home or street. Only the Pierce County Survey specifically lists ‘pouring down an outside drain’ as a survey response, but even for this response it is possible that some of these residents are pouring oils into gully traps draining to wastewater rather than stormwater. Four surveys reported in Giacalone et al (2010) were more specific and reported behaviour as “always/nearly always disposed of oil, paint, or other chemicals down stormwater drains”. The average frequency of this behaviour in the four surveys was 2%. A further breakdown between paints, oils and other chemicals was not provided.
In an attempt to use these various surveys and provide a realistic figure for the number of residents of Christchurch changing their own lubricants and disposing of them in such a manner as to contaminate the stormwater systems, it has been decided to use 0.5% of Christchurch registered light vehicle owners as a conservatively low estimate.
Table 6.2 Results from selected surveys of residential behaviour regarding vehicle lubricant
changing and disposal habits.
Survey Change Oil at Home
(% respondents)
Possible Disposal to Stormwater
(% respondents)
Reference
Okeover Stream, Christchurch, NZ
5.7 0.71 Bond, 2010
Memphis City, USA 20 0.82 Memphis, 2000
Pierce County, USA 20 0.63 Elway Research, 2009
East Canyon, Utah, USA
13 0.654 Jones, 2006
Survey responses 1= Dump to Stony Ground, 2=Put it in the Street, 3=Pour down an outside drain
4=other
These surveys provide no information on frequency or volume of lubricant disposal. An automotive service centre consulted in Christchurch, indicated that private vehicles generally contain 3-12 litres of lubricant, with an average of 4-5 litres, and it is recommended that this be changed on average, every six months (Milligan Automotive, pers comm. 2011). As discussed previously the best ecotoxicity information and environmental guidelines are for individual components present in used lubricants (Table 6.3) rather than the lubricants as a whole.
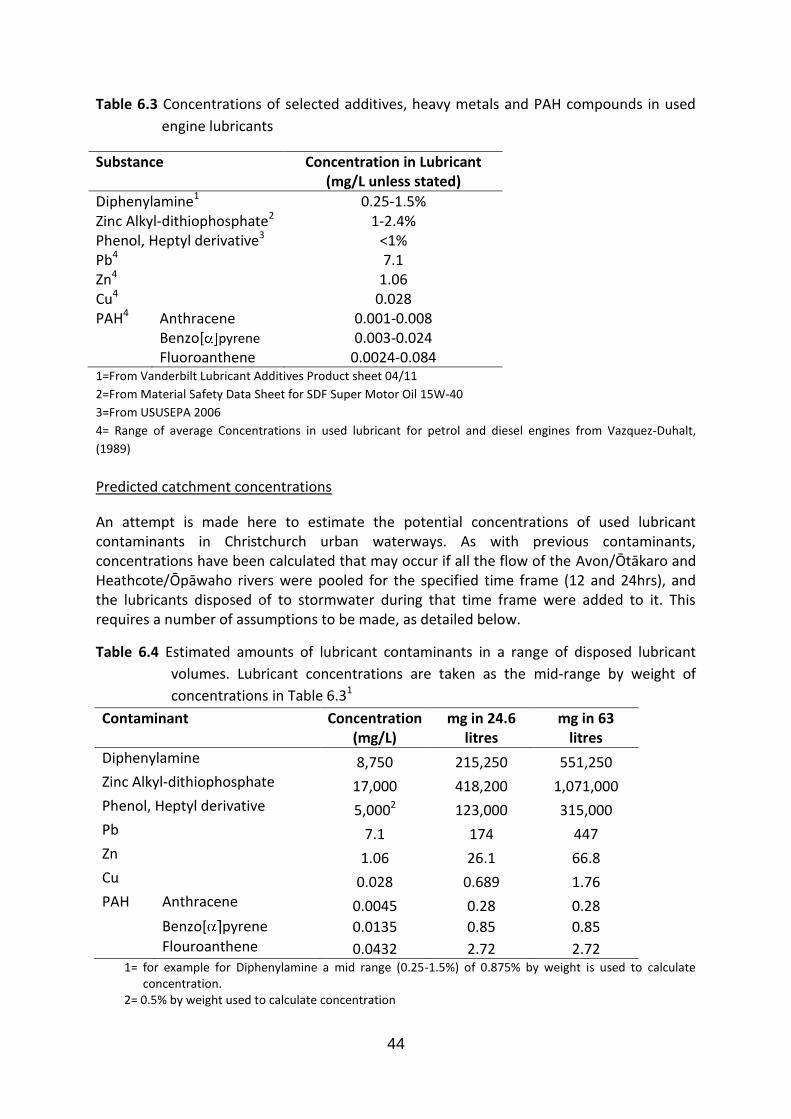
44
Table 6.3 Concentrations of selected additives, heavy metals and PAH compounds in used
engine lubricants
Substance Concentration in Lubricant (mg/L unless stated)
Diphenylamine1 0.25-1.5% Zinc Alkyl-dithiophosphate2 1-2.4% Phenol, Heptyl derivative3 <1% Pb4 7.1 Zn4 1.06 Cu4 0.028 PAH4 Anthracene 0.001-0.008 Benzo[ pyrene 0.003-0.024 Fluoroanthene 0.0024-0.084 1=From Vanderbilt Lubricant Additives Product sheet 04/11
2=From Material Safety Data Sheet for SDF Super Motor Oil 15W-40
3=From USUSEPA 2006
4= Range of average Concentrations in used lubricant for petrol and diesel engines from Vazquez-Duhalt,
(1989)
Predicted catchment concentrations
An attempt is made here to estimate the potential concentrations of used lubricant contaminants in Christchurch urban waterways. As with previous contaminants, concentrations have been calculated that may occur if all the flow of the Avon/Ōtākaro and Heathcote/Ōpāwaho rivers were pooled for the specified time frame (12 and 24hrs), and the lubricants disposed of to stormwater during that time frame were added to it. This requires a number of assumptions to be made, as detailed below.
Table 6.4 Estimated amounts of lubricant contaminants in a range of disposed lubricant
volumes. Lubricant concentrations are taken as the mid-range by weight of
concentrations in Table 6.31
Contaminant Concentration (mg/L)
mg in 24.6 litres
mg in 63 litres
Diphenylamine 8,750 215,250 551,250 Zinc Alkyl-dithiophosphate 17,000 418,200 1,071,000 Phenol, Heptyl derivative 5,0002 123,000 315,000 Pb 7.1 174 447 Zn 1.06 26.1 66.8 Cu 0.028 0.689 1.76 PAH Anthracene 0.0045 0.28 0.28 Benzo[ pyrene 0.0135 0.85 0.85 Flouroanthene 0.0432 2.72 2.72
1= for example for Diphenylamine a mid range (0.25-1.5%) of 0.875% by weight is used to calculate concentration.
2= 0.5% by weight used to calculate concentration
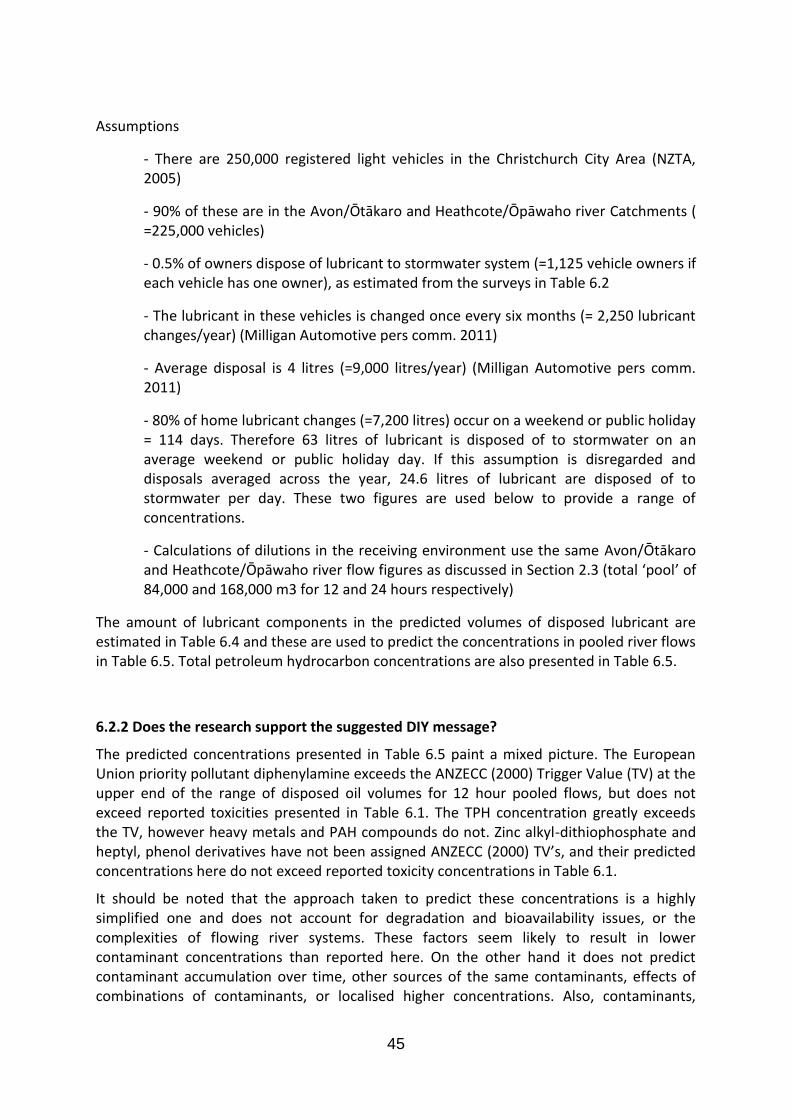
45
Assumptions
- There are 250,000 registered light vehicles in the Christchurch City Area (NZTA, 2005)
- 90% of these are in the Avon/Ōtākaro and Heathcote/Ōpāwaho river Catchments ( =225,000 vehicles)
- 0.5% of owners dispose of lubricant to stormwater system (=1,125 vehicle owners if each vehicle has one owner), as estimated from the surveys in Table 6.2
- The lubricant in these vehicles is changed once every six months (= 2,250 lubricant changes/year) (Milligan Automotive pers comm. 2011)
- Average disposal is 4 litres (=9,000 litres/year) (Milligan Automotive pers comm. 2011)
- 80% of home lubricant changes (=7,200 litres) occur on a weekend or public holiday = 114 days. Therefore 63 litres of lubricant is disposed of to stormwater on an average weekend or public holiday day. If this assumption is disregarded and disposals averaged across the year, 24.6 litres of lubricant are disposed of to stormwater per day. These two figures are used below to provide a range of concentrations.
- Calculations of dilutions in the receiving environment use the same Avon/Ōtākaro and Heathcote/Ōpāwaho river flow figures as discussed in Section 2.3 (total ‘pool’ of 84,000 and 168,000 m3 for 12 and 24 hours respectively)
The amount of lubricant components in the predicted volumes of disposed lubricant are estimated in Table 6.4 and these are used to predict the concentrations in pooled river flows in Table 6.5. Total petroleum hydrocarbon concentrations are also presented in Table 6.5.
6.2.2 Does the research support the suggested DIY message?
The predicted concentrations presented in Table 6.5 paint a mixed picture. The European Union priority pollutant diphenylamine exceeds the ANZECC (2000) Trigger Value (TV) at the upper end of the range of disposed oil volumes for 12 hour pooled flows, but does not exceed reported toxicities presented in Table 6.1. The TPH concentration greatly exceeds the TV, however heavy metals and PAH compounds do not. Zinc alkyl-dithiophosphate and heptyl, phenol derivatives have not been assigned ANZECC (2000) TV’s, and their predicted concentrations here do not exceed reported toxicity concentrations in Table 6.1.
It should be noted that the approach taken to predict these concentrations is a highly simplified one and does not account for degradation and bioavailability issues, or the complexities of flowing river systems. These factors seem likely to result in lower contaminant concentrations than reported here. On the other hand it does not predict contaminant accumulation over time, other sources of the same contaminants, effects of combinations of contaminants, or localised higher concentrations. Also, contaminants,
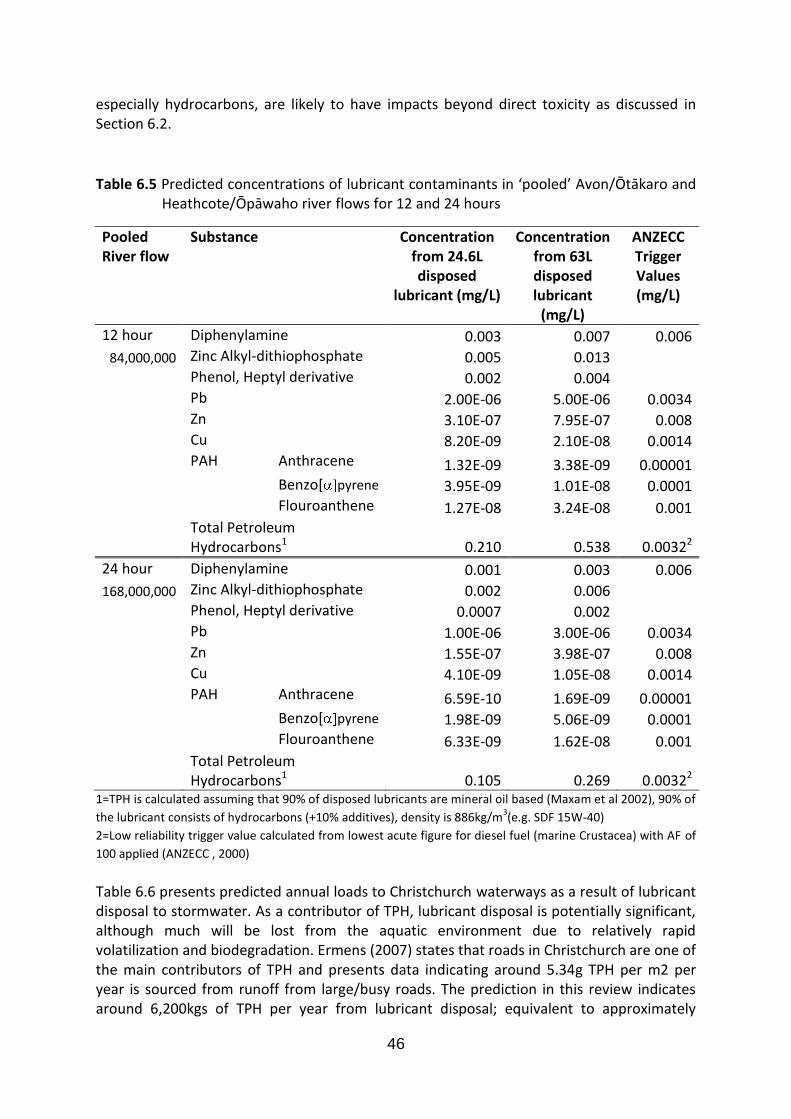
46
especially hydrocarbons, are likely to have impacts beyond direct toxicity as discussed in Section 6.2.
Table 6.5 Predicted concentrations of lubricant contaminants in ‘pooled’ Avon/Ōtākaro and Heathcote/Ōpāwaho river flows for 12 and 24 hours
Pooled River flow
Substance Concentration from 24.6L disposed
lubricant (mg/L)
Concentration from 63L disposed lubricant
(mg/L)
ANZECC Trigger Values (mg/L)
12 hour Diphenylamine 0.003 0.007 0.006
84,000,000 Zinc Alkyl-dithiophosphate 0.005 0.013
Phenol, Heptyl derivative 0.002 0.004
Pb 2.00E-06 5.00E-06 0.0034
Zn 3.10E-07 7.95E-07 0.008
Cu 8.20E-09 2.10E-08 0.0014
PAH Anthracene 1.32E-09 3.38E-09 0.00001
Benzo[ pyrene 3.95E-09 1.01E-08 0.0001
Flouroanthene 1.27E-08 3.24E-08 0.001
Total Petroleum Hydrocarbons1 0.210 0.538 0.00322
24 hour Diphenylamine 0.001 0.003 0.006
168,000,000 Zinc Alkyl-dithiophosphate 0.002 0.006
Phenol, Heptyl derivative 0.0007 0.002
Pb 1.00E-06 3.00E-06 0.0034
Zn 1.55E-07 3.98E-07 0.008
Cu 4.10E-09 1.05E-08 0.0014
PAH Anthracene 6.59E-10 1.69E-09 0.00001
Benzo[ pyrene 1.98E-09 5.06E-09 0.0001
Flouroanthene 6.33E-09 1.62E-08 0.001
Total Petroleum Hydrocarbons1 0.105 0.269 0.00322
1=TPH is calculated assuming that 90% of disposed lubricants are mineral oil based (Maxam et al 2002), 90% of
the lubricant consists of hydrocarbons (+10% additives), density is 886kg/m3(e.g. SDF 15W-40)
2=Low reliability trigger value calculated from lowest acute figure for diesel fuel (marine Crustacea) with AF of
100 applied (ANZECC , 2000)
Table 6.6 presents predicted annual loads to Christchurch waterways as a result of lubricant disposal to stormwater. As a contributor of TPH, lubricant disposal is potentially significant, although much will be lost from the aquatic environment due to relatively rapid volatilization and biodegradation. Ermens (2007) states that roads in Christchurch are one of the main contributors of TPH and presents data indicating around 5.34g TPH per m2 per year is sourced from runoff from large/busy roads. The prediction in this review indicates around 6,200kgs of TPH per year from lubricant disposal; equivalent to approximately
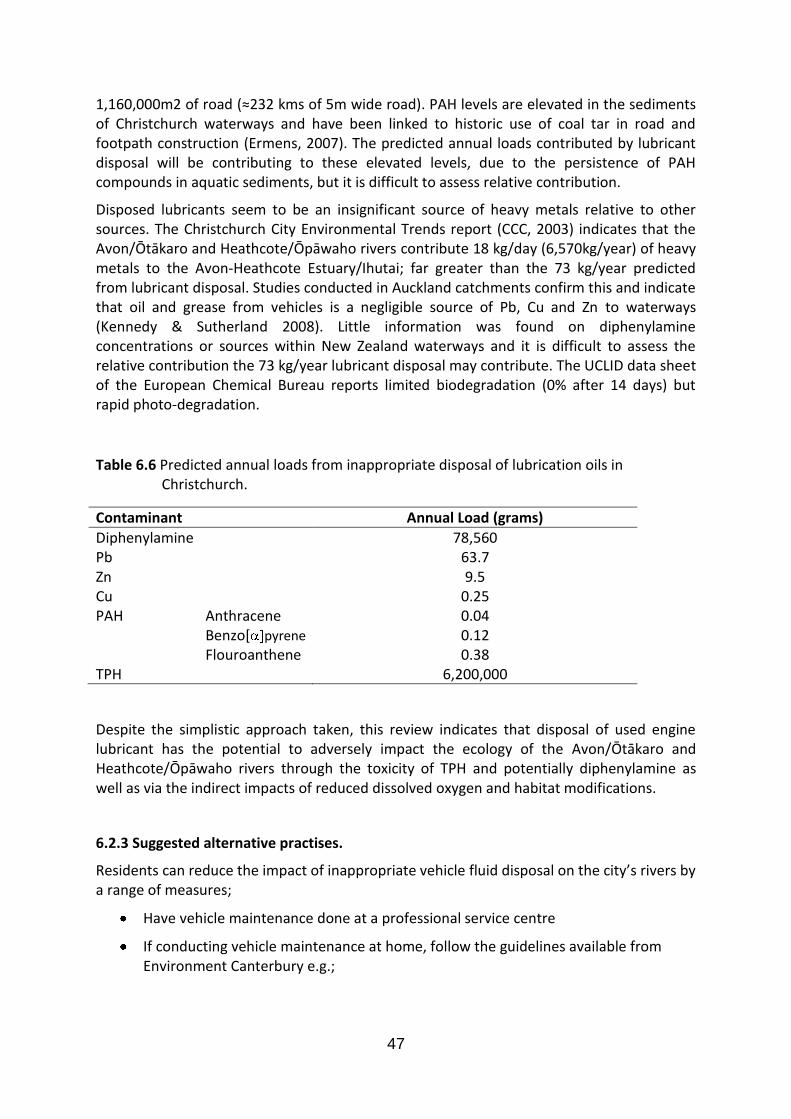
47
1,160,000m2 of road (≈232 kms of 5m wide road). PAH levels are elevated in the sediments of Christchurch waterways and have been linked to historic use of coal tar in road and footpath construction (Ermens, 2007). The predicted annual loads contributed by lubricant disposal will be contributing to these elevated levels, due to the persistence of PAH compounds in aquatic sediments, but it is difficult to assess relative contribution.
Disposed lubricants seem to be an insignificant source of heavy metals relative to other sources. The Christchurch City Environmental Trends report (CCC, 2003) indicates that the Avon/Ōtākaro and Heathcote/Ōpāwaho rivers contribute 18 kg/day (6,570kg/year) of heavy metals to the Avon-Heathcote Estuary/Ihutai; far greater than the 73 kg/year predicted from lubricant disposal. Studies conducted in Auckland catchments confirm this and indicate that oil and grease from vehicles is a negligible source of Pb, Cu and Zn to waterways (Kennedy & Sutherland 2008). Little information was found on diphenylamine concentrations or sources within New Zealand waterways and it is difficult to assess the relative contribution the 73 kg/year lubricant disposal may contribute. The UCLID data sheet of the European Chemical Bureau reports limited biodegradation (0% after 14 days) but rapid photo-degradation.
Table 6.6 Predicted annual loads from inappropriate disposal of lubrication oils in Christchurch.
Contaminant Annual Load (grams)
Diphenylamine 78,560 Pb 63.7 Zn 9.5 Cu 0.25 PAH Anthracene 0.04 Benzo[ pyrene 0.12 Flouroanthene 0.38 TPH 6,200,000
Despite the simplistic approach taken, this review indicates that disposal of used engine lubricant has the potential to adversely impact the ecology of the Avon/Ōtākaro and Heathcote/Ōpāwaho rivers through the toxicity of TPH and potentially diphenylamine as well as via the indirect impacts of reduced dissolved oxygen and habitat modifications.
6.2.3 Suggested alternative practises.
Residents can reduce the impact of inappropriate vehicle fluid disposal on the city’s rivers by a range of measures;
Have vehicle maintenance done at a professional service centre
If conducting vehicle maintenance at home, follow the guidelines available from Environment Canterbury e.g.;
48
Use an oil drain pan to prevent spills and make it clean and easy (oil pan can be purchased from the local car parts or oil retailer).
Drain as much oil as possible from the oil filter. Spin it off and leave it upside-down in an ice cream container to drain for 24 hours.
Recycle used filters through a local scrap metal dealer.
Pour the used oil into a clean, empty container with a tight lid (e.g., the plastic container the clean oil was supplied in).
Return all used engine fluids to a hazardous waste drop off point at a local transfer station/resource recovery parks.
Do not pour used fluids down the drain or into the gutter. Don't mix used oil with other materials, such as paint or solvents as this makes recycling difficult.
Do not throw used fluids in the rubbish.
Do not bury used fluids.
Do not leave used fluids lying around indefinitely.
Do not burn used fluids - waste oil must be re-refined before it can be burnt in Canterbury.
6.3 Paint waste and equipment washing
Painting around the home is a common DIY activity and has the potential to generate a significant amount of waste product, both in the form of unused paint and from the washing of painting equipment such as brushes, rollers and trays. Inappropriate disposal of excess paint and washing of equipment in areas which drain to stormwater has the potential to contaminate waterways and affect their ecosystems.
Paint is a liquid colloidal suspension which when applied to substrates for protective or decorative purposes, dries to form a thin film. The following discussion on paint composition and characteristics is largely based on Scheurman & Bruzen (1989) and ‘What’s in a Can of Paint’ (www.resene.co.nz/homeown/probsolv/Whatsinacanofpaint.pdf retrieved July 2011). There are a huge number of sophisticated products for many different applications and most consist of complex mixtures of compounds; binders which hold the paint together, pigments which provide colour and gloss properties, solvents (thinners) and additives such as thickeners and biocides. The specifics and proportions of these ingredients will be highly dependent on the intended use of the product. Residents are likely to be most commonly dealing with paints for around the home, and these may be divided into two broad categories; water-based (latex) or oil-based (solvent based), depending on the binders and thinners used. The most common binders in oil-based paints are alkyd resins made from vegetable oils such as soya bean, safflower and linseed, while the solvents tend to be hydrocarbon-based. Water-based paints often consist of latex binders made up of particles of acrylic resins suspended in water. Pigments are usually metal oxides and traditionally many pigments were highly toxic, however compounds based on lead (Pb), chromium (Cr) and cadmium (Cd) have been highly regulated and massively reduced, if not eliminated,
49
from most modern paints. These have largely been replaced with organic substances, although titanium dioxide (TiO2) remains a common pigment to create an opaque finish.
Solvents generally make the paints easy to apply due to their thinning characteristics, but also have a range of other purposes. Hydrocarbon solvents include xylene, naphtha, kerosene and mineral turpentine and blends of these products are commonly used in oil- based paints, while water and glycol are common in water-based paints. Volatile organic compounds (VOC) such as dibutyl and diethyl phthalate, have been used extensively as solvents but have been widely implicated in the formation of ground level ozone which is known to produce respiratory problems in humans (Carter 1994; Kampa, 2008). As a result these compounds have been heavily reduced in many modern paints and low to zero VOC paints are increasingly popular. Other additives are added for their specific properties and traditionally these have often been toxic compounds such as mercury (Hg) and polychlorinated biphenyls (PCB). However these additives are also highly regulated and have been eliminated from modern products.
Equipment used with water-based paint is usually cleaned with soapy water while oil-based paint equipment require solvent based cleaners such as mineral turpentine or a specifically formulated brush cleaning compound. This is one of the reasons water-based paint has become increasingly popular for most domestic building applications. Enquiries to a paint retailer and a decorating business indicate that 80-100% of paints used in new domestic painting activities are water-based (Resene colorshop; Still Design pers comm, 2011).
Environmental effects and toxicity of paint
The environmental impacts of household paint substances in waterways are extensively commented on in industry and local authority publications (e.g.; www.greenpainters.com; UPC01, www.arc.govt.nz; NTG, No 6), but appear to be rarely reported in the scientific literature. Instead peer-reviewed research appears to focus largely on industry specific paints such as anti-fouling and antisapstain treatments, or the individual components of these preparations. The impacts of domestic paints must largely be gleaned from research into the toxicities of the individual compounds, although this is also problematic due to the difficulties in obtaining paint-specific information on ingredients, due to commercial sensitivities.
In his review of emerging organic contaminants in Auckland, Aherns (2008) assigns a high persistence, moderate bioaccumulation and moderate toxicity potential to paints and coatings in general. The impacts reported may be divided into indirect and direct (toxicity) mechanisms. Indirect impacts may include increasing turbidity in waterways reducing photosynthesis and impacting on biota’s feeding habits, suspended solids impacting physical habitats and clogging fish gills, and biodegradation decreasing dissolved oxygen in the water column. Oil-based paints may also reduce oxygen transfer at the water surface (UPC01; NTG, No 6; Brown et al, 1982).
The toxicities of individual components are better documented, but the combined effects of compound mixtures in paints appear to be very poorly studied. Historically concerns about paints have centred on heavy metals and PCBs but, as discussed above, these have been significantly reduced or eliminated in modern paints. However the toxicity of these substances remains a legacy issue as many houses are coated in paints containing these
50
substances and DIY activities such as sanding and scraping off old paint have the potential to contaminate waterways via paint dust (e.g., Zarcinas & Rogers, 2002; Ruus et al, 2006; Jartun et al 2009). The potential of this pathway is illustrated by a study showing that sand blasting of boat hulls treated with antifouling paints can produce dust-borne copper at the rate of 100mg/hour (Turner & Radford, 2010), enough to raise 70,000 litres of water above the ANZECC trigger value of 0.0014mg/L. Modern paints still contain a cocktail of substances, many of which are not identifiable from chemical data (Vaajasaari et al, 2004), and the remainder are of variable concern in aquatic environments. Most binders are considered to be of low toxicity (Viguri et al, 2005) but some pigments and many of the biocidal additives have much greater documented toxicities.
Titanium dioxide (TiO2) is a white pigment which is very common in modern paints. The reported solubility of this compound tends to be low (Anliker & Moser, 1987; Bai et al, 2010), however the environmental loading may be high due to the release of significant amounts of the pigment during the normal weathering of painted surfaces (Kaegi et al, 2008). Variable toxicities are reported (Table 6.7), possibly related to varying physicochemical factors (i.e. physical and chemical properties) that influence toxicity such as nano-particle size, shape and aggregation (Bai et al, 2010). Adams et al (2006) reported that TiO2 concentrations of 1,000 and 500 mg/L caused 75% and 15% growth inhibition respectively in the bacteria Bacillus subtilis and Escherichia coli. Toxicities to macroinvertebrates and fish are presented in Table 6.7.
Another metal oxide, zinc oxide (ZnO), is a common paint additive used for its pigmenting, UV adsorbing and solubility controlling properties as well as its ability to enhance biocide performance. While ZnO has high reported toxicity (Table 6.7) its low solubility may be expected to mitigate its aquatic impacts (IUCLID). However Bai et al (2010) reported that dissolved Zn was only partly contributing to the toxic effect of nano-ZnO, illustrating the complexities of nano-particle toxicity. Adams et al (2006) considered the release of ZnO nano-particles to surface or groundwater would be likely to have detrimental environmental effects. Bai et al (2010) reported the death of the freshwater zebrafish (Danio rerio) at ZnO concentrations of 50-100mg/L and retarded embryo hatching at 1-25mg/L while Adams et al (2006) observed that concentrations of 10 mg/L resulted in 90% and 14% growth inhibition respectively in the bacteria Bacillus subtilis and Escherichia coli. Further ecotoxicity results are presented in Table 6.7.
Biocidal additives are commonly added to domestic paints, especially latex paints, in small quantities and usually have very high toxicity. The specifics of paint additives are difficult to track down due to commercial sensitivities but the toxicities of a selection of paint additives are presented in Table 6.7. Oil-based paints in particular are likely to contain hydrocarbon-based solvents such as naphtha, xylene, methoxy-propanol and other additives such as propane-diol, although these paints are becoming less commonly used in domestic painting. ANZECC (2000) does not provide trigger values for any of the substances in Table 6.7 and guidelines from any jurisdiction were only found for two of the substances (Canadian Water Quality Guidelines for the Protection of Aquatic Life, 1999).
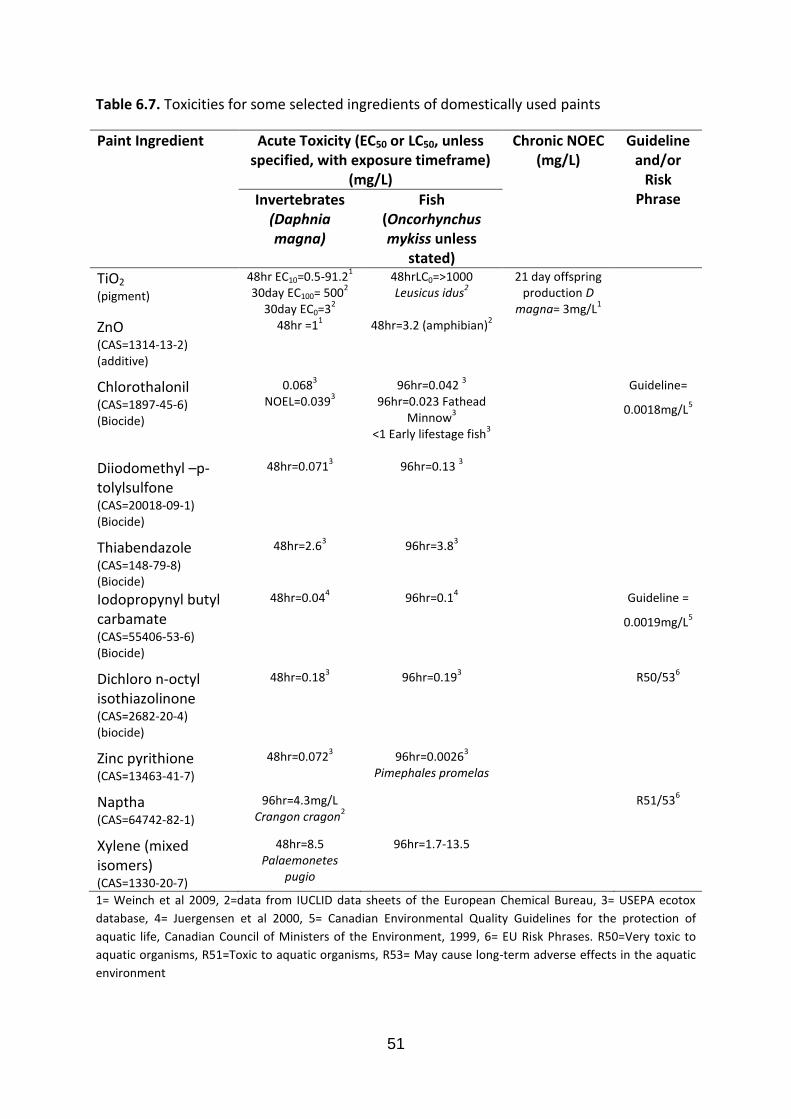
51
Table 6.7. Toxicities for some selected ingredients of domestically used paints
Paint Ingredient Acute Toxicity (EC50 or LC50, unless specified, with exposure timeframe)
(mg/L)
Chronic NOEC (mg/L)
Guideline and/or
Risk Phrase Invertebrates
(Daphnia magna)
Fish (Oncorhynchus mykiss unless
stated)
TiO2
(pigment)
48hr EC10=0.5-91.21
30day EC100= 5002
30day EC0=32
48hrLC0=>1000 Leusicus idus
2 21 day offspring
production D magna= 3mg/L
1
ZnO (CAS=1314-13-2) (additive)
48hr =11
48hr=3.2 (amphibian)2
Chlorothalonil (CAS=1897-45-6) (Biocide)
0.0683
NOEL=0.0393
96hr=0.042 3
96hr=0.023 Fathead Minnow
3
<1 Early lifestage fish3
Guideline=
0.0018mg/L5
Diiodomethyl –p-tolylsulfone (CAS=20018-09-1) (Biocide)
48hr=0.0713
96hr=0.13
3
Thiabendazole (CAS=148-79-8) (Biocide)
48hr=2.63
96hr=3.83
Iodopropynyl butyl carbamate (CAS=55406-53-6) (Biocide)
48hr=0.044
96hr=0.14
Guideline =
0.0019mg/L5
Dichloro n-octyl isothiazolinone (CAS=2682-20-4) (biocide)
48hr=0.183
96hr=0.193
R50/536
Zinc pyrithione (CAS=13463-41-7)
48hr=0.0723
96hr=0.00263
Pimephales promelas
Naptha (CAS=64742-82-1)
96hr=4.3mg/L Crangon cragon
2 R51/53
6
Xylene (mixed isomers) (CAS=1330-20-7)
48hr=8.5 Palaemonetes
pugio
96hr=1.7-13.5
1= Weinch et al 2009, 2=data from IUCLID data sheets of the European Chemical Bureau, 3= USEPA ecotox
database, 4= Juergensen et al 2000, 5= Canadian Environmental Quality Guidelines for the protection of
aquatic life, Canadian Council of Ministers of the Environment, 1999, 6= EU Risk Phrases. R50=Very toxic to
aquatic organisms, R51=Toxic to aquatic organisms, R53= May cause long-term adverse effects in the aquatic
environment
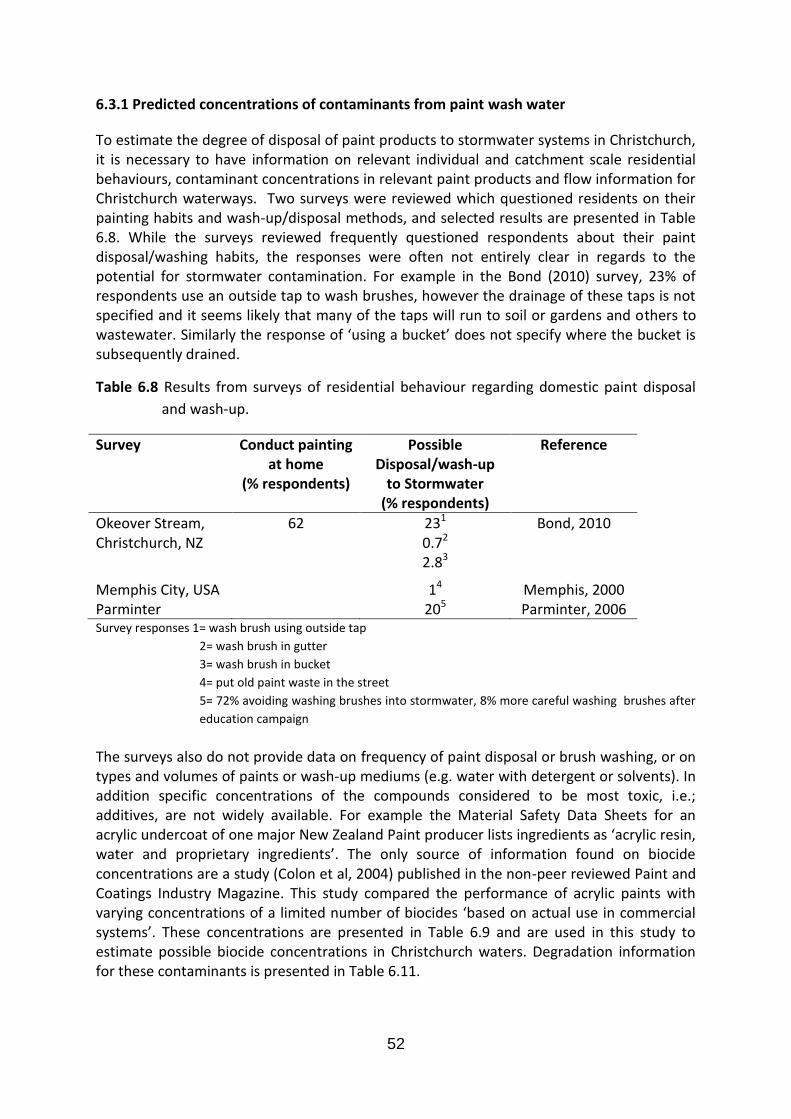
52
6.3.1 Predicted concentrations of contaminants from paint wash water
To estimate the degree of disposal of paint products to stormwater systems in Christchurch, it is necessary to have information on relevant individual and catchment scale residential behaviours, contaminant concentrations in relevant paint products and flow information for Christchurch waterways. Two surveys were reviewed which questioned residents on their painting habits and wash-up/disposal methods, and selected results are presented in Table 6.8. While the surveys reviewed frequently questioned respondents about their paint disposal/washing habits, the responses were often not entirely clear in regards to the potential for stormwater contamination. For example in the Bond (2010) survey, 23% of respondents use an outside tap to wash brushes, however the drainage of these taps is not specified and it seems likely that many of the taps will run to soil or gardens and others to wastewater. Similarly the response of ‘using a bucket’ does not specify where the bucket is subsequently drained.
Table 6.8 Results from surveys of residential behaviour regarding domestic paint disposal
and wash-up.
Survey Conduct painting at home
(% respondents)
Possible Disposal/wash-up
to Stormwater (% respondents)
Reference
Okeover Stream, Christchurch, NZ
62 231 0.72 2.83
Bond, 2010
Memphis City, USA 14 Memphis, 2000 Parminter 205 Parminter, 2006 Survey responses 1= wash brush using outside tap
2= wash brush in gutter
3= wash brush in bucket
4= put old paint waste in the street
5= 72% avoiding washing brushes into stormwater, 8% more careful washing brushes after
education campaign
The surveys also do not provide data on frequency of paint disposal or brush washing, or on types and volumes of paints or wash-up mediums (e.g. water with detergent or solvents). In addition specific concentrations of the compounds considered to be most toxic, i.e.; additives, are not widely available. For example the Material Safety Data Sheets for an acrylic undercoat of one major New Zealand Paint producer lists ingredients as ‘acrylic resin, water and proprietary ingredients’. The only source of information found on biocide concentrations are a study (Colon et al, 2004) published in the non-peer reviewed Paint and Coatings Industry Magazine. This study compared the performance of acrylic paints with varying concentrations of a limited number of biocides ‘based on actual use in commercial systems’. These concentrations are presented in Table 6.9 and are used in this study to estimate possible biocide concentrations in Christchurch waters. Degradation information for these contaminants is presented in Table 6.11.
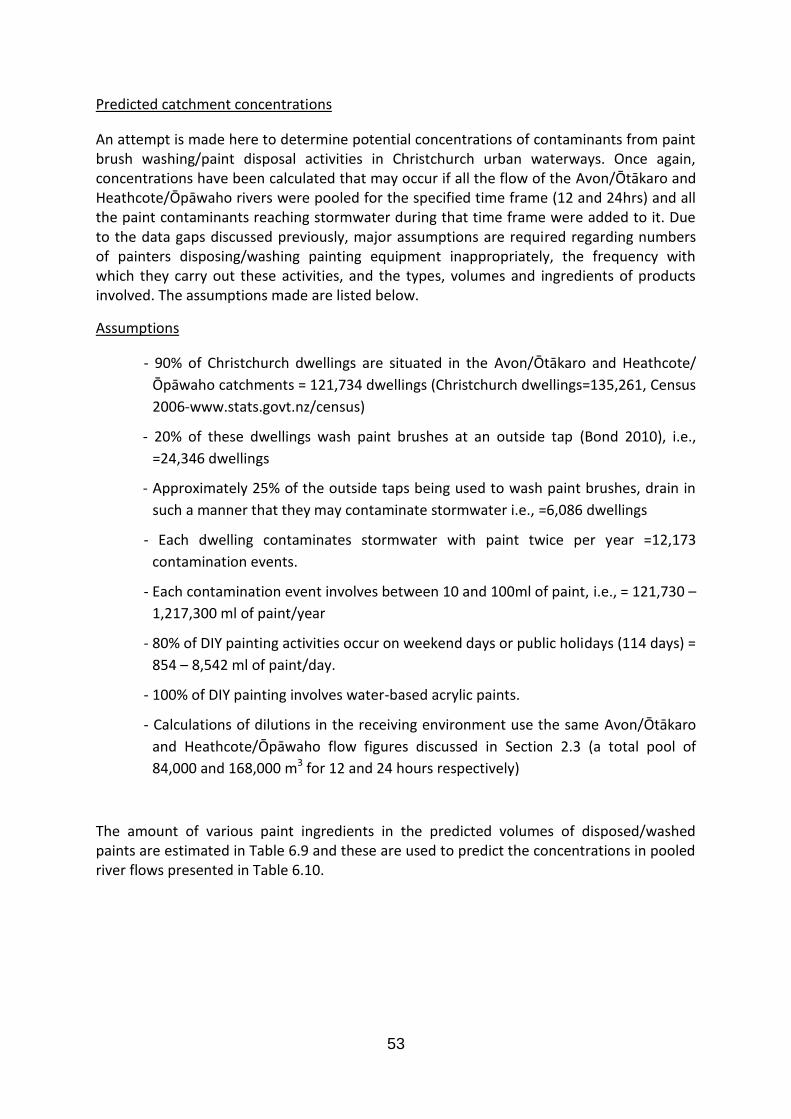
53
Predicted catchment concentrations
An attempt is made here to determine potential concentrations of contaminants from paint brush washing/paint disposal activities in Christchurch urban waterways. Once again, concentrations have been calculated that may occur if all the flow of the Avon/Ōtākaro and Heathcote/Ōpāwaho rivers were pooled for the specified time frame (12 and 24hrs) and all the paint contaminants reaching stormwater during that time frame were added to it. Due to the data gaps discussed previously, major assumptions are required regarding numbers of painters disposing/washing painting equipment inappropriately, the frequency with which they carry out these activities, and the types, volumes and ingredients of products involved. The assumptions made are listed below.
Assumptions
- 90% of Christchurch dwellings are situated in the Avon/Ōtākaro and Heathcote/
Ōpāwaho catchments = 121,734 dwellings (Christchurch dwellings=135,261, Census
2006-www.stats.govt.nz/census)
- 20% of these dwellings wash paint brushes at an outside tap (Bond 2010), i.e.,
=24,346 dwellings
- Approximately 25% of the outside taps being used to wash paint brushes, drain in
such a manner that they may contaminate stormwater i.e., =6,086 dwellings
- Each dwelling contaminates stormwater with paint twice per year =12,173
contamination events.
- Each contamination event involves between 10 and 100ml of paint, i.e., = 121,730 –
1,217,300 ml of paint/year
- 80% of DIY painting activities occur on weekend days or public holidays (114 days) =
854 – 8,542 ml of paint/day.
- 100% of DIY painting involves water-based acrylic paints.
- Calculations of dilutions in the receiving environment use the same Avon/Ōtākaro
and Heathcote/Ōpāwaho flow figures discussed in Section 2.3 (a total pool of
84,000 and 168,000 m3 for 12 and 24 hours respectively)
The amount of various paint ingredients in the predicted volumes of disposed/washed paints are estimated in Table 6.9 and these are used to predict the concentrations in pooled river flows presented in Table 6.10.
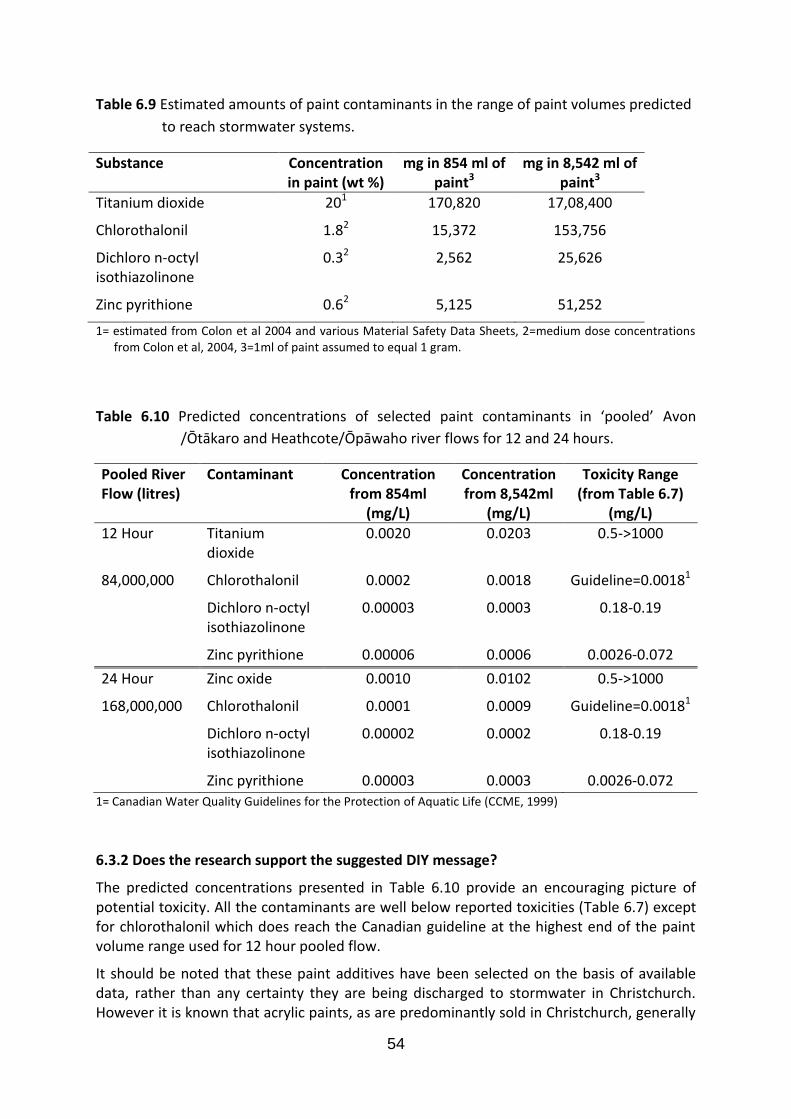
54
Table 6.9 Estimated amounts of paint contaminants in the range of paint volumes predicted
to reach stormwater systems.
Substance Concentration in paint (wt %)
mg in 854 ml of paint3
mg in 8,542 ml of paint3
Titanium dioxide 201 170,820 17,08,400
Chlorothalonil 1.82 15,372 153,756
Dichloro n-octyl isothiazolinone
0.32 2,562 25,626
Zinc pyrithione 0.62 5,125 51,252
1= estimated from Colon et al 2004 and various Material Safety Data Sheets, 2=medium dose concentrations from Colon et al, 2004, 3=1ml of paint assumed to equal 1 gram.
Table 6.10 Predicted concentrations of selected paint contaminants in ‘pooled’ Avon
/Ōtākaro and Heathcote/Ōpāwaho river flows for 12 and 24 hours.
Pooled River Flow (litres)
Contaminant Concentration from 854ml
(mg/L)
Concentration from 8,542ml
(mg/L)
Toxicity Range (from Table 6.7)
(mg/L)
12 Hour Titanium dioxide
0.0020 0.0203 0.5->1000
84,000,000 Chlorothalonil 0.0002 0.0018 Guideline=0.00181
Dichloro n-octyl isothiazolinone
0.00003 0.0003 0.18-0.19
Zinc pyrithione 0.00006 0.0006 0.0026-0.072
24 Hour Zinc oxide 0.0010 0.0102 0.5->1000
168,000,000 Chlorothalonil 0.0001 0.0009 Guideline=0.00181
Dichloro n-octyl isothiazolinone
0.00002 0.0002 0.18-0.19
Zinc pyrithione 0.00003 0.0003 0.0026-0.072
1= Canadian Water Quality Guidelines for the Protection of Aquatic Life (CCME, 1999)
6.3.2 Does the research support the suggested DIY message?
The predicted concentrations presented in Table 6.10 provide an encouraging picture of potential toxicity. All the contaminants are well below reported toxicities (Table 6.7) except for chlorothalonil which does reach the Canadian guideline at the highest end of the paint volume range used for 12 hour pooled flow.
It should be noted that these paint additives have been selected on the basis of available data, rather than any certainty they are being discharged to stormwater in Christchurch. However it is known that acrylic paints, as are predominantly sold in Christchurch, generally
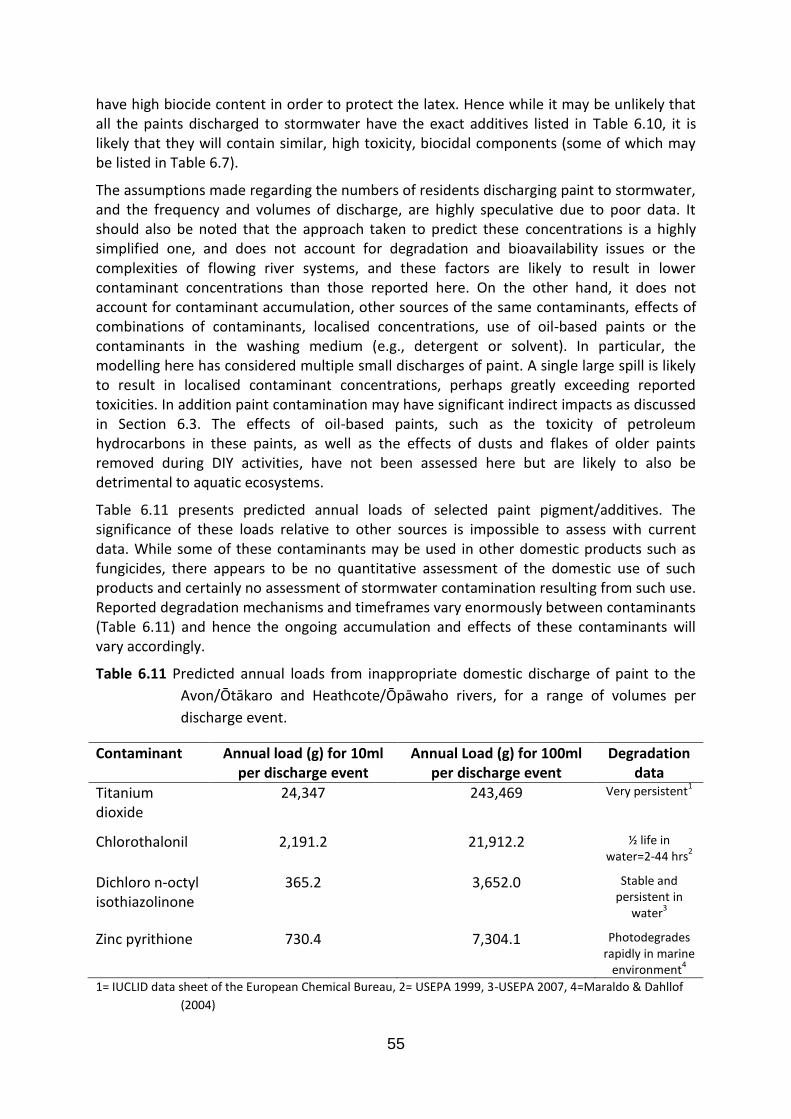
55
have high biocide content in order to protect the latex. Hence while it may be unlikely that all the paints discharged to stormwater have the exact additives listed in Table 6.10, it is likely that they will contain similar, high toxicity, biocidal components (some of which may be listed in Table 6.7).
The assumptions made regarding the numbers of residents discharging paint to stormwater, and the frequency and volumes of discharge, are highly speculative due to poor data. It should also be noted that the approach taken to predict these concentrations is a highly simplified one, and does not account for degradation and bioavailability issues or the complexities of flowing river systems, and these factors are likely to result in lower contaminant concentrations than those reported here. On the other hand, it does not account for contaminant accumulation, other sources of the same contaminants, effects of combinations of contaminants, localised concentrations, use of oil-based paints or the contaminants in the washing medium (e.g., detergent or solvent). In particular, the modelling here has considered multiple small discharges of paint. A single large spill is likely to result in localised contaminant concentrations, perhaps greatly exceeding reported toxicities. In addition paint contamination may have significant indirect impacts as discussed in Section 6.3. The effects of oil-based paints, such as the toxicity of petroleum hydrocarbons in these paints, as well as the effects of dusts and flakes of older paints removed during DIY activities, have not been assessed here but are likely to also be detrimental to aquatic ecosystems.
Table 6.11 presents predicted annual loads of selected paint pigment/additives. The significance of these loads relative to other sources is impossible to assess with current data. While some of these contaminants may be used in other domestic products such as fungicides, there appears to be no quantitative assessment of the domestic use of such products and certainly no assessment of stormwater contamination resulting from such use. Reported degradation mechanisms and timeframes vary enormously between contaminants (Table 6.11) and hence the ongoing accumulation and effects of these contaminants will vary accordingly.
Table 6.11 Predicted annual loads from inappropriate domestic discharge of paint to the
Avon/Ōtākaro and Heathcote/Ōpāwaho rivers, for a range of volumes per
discharge event.
Contaminant Annual load (g) for 10ml per discharge event
Annual Load (g) for 100ml per discharge event
Degradation data
Titanium dioxide
24,347 243,469 Very persistent1
Chlorothalonil 2,191.2 21,912.2 ½ life in water=2-44 hrs
2
Dichloro n-octyl isothiazolinone
365.2 3,652.0 Stable and persistent in
water3
Zinc pyrithione 730.4 7,304.1 Photodegrades rapidly in marine
environment4
1= IUCLID data sheet of the European Chemical Bureau, 2= USEPA 1999, 3-USEPA 2007, 4=Maraldo & Dahllof
(2004)
56
This review indicates that the inappropriate discharge of paint wastes to stormwater in Christchurch has limited potential for direct (toxic) effects on the ecosystems of the Avon/Ōtākaro and Heathcote/Ōpāwaho rivers. However, the data used for paint discharge volumes, frequencies and contaminant contents is highly subjective, and isolated large discharges are likely to result in toxic concentrations of contaminants. In addition indirect impacts as discussed in Section 6.3 are possible.
6.3.3 Suggested alternative practises
Residents can reduce the impact of washing paint equipment by some simple measures;
Plan ahead
- buy appropriate volumes of paint for the job at hand.
- prepare to contain paint dust/flakes as well as potential spills.
- do not paint outside if it is likely to rain.
Brush out excess paint onto cardboard, leave to dry and dispose to general rubbish.
Wash water-based paint from brushes so that wash water drains to wastewater
(inside drains) or at least, to soil.
Wash oil-based paints in solvent and wait for paint to settle and drain off solvent for
reuse.
Save and reuse excess paint, return to a recycling programme (e.g., Resene
Paintwise), or drop off to a household hazwaste facility.
57
Section 7 Summary
Residential activities have the potential to impact on stormwater quality via direct toxicity and indirect effects such as habitat modification and dissolved oxygen reduction. The four behaviours researched in this report can produce contaminants which can impact aquatic ecosystems, but the actual impact is likely to depend on the concentrations achieved in the waterways of Christchurch as well as catchment loadings and the ecological state of the receiving ecosystems. There is insufficient data to accurately assess the actual levels of many of the contaminants in the Avon/Ōtākaro and Heathcote/Ōpāwaho rivers, neither is there enough data to make predictions of indirect impacts or organism specific impacts. However there is enough data to make some broad estimates of contaminant concentrations and loadings that will result from realistic estimates of the nature and frequency of residential activities, and then to make comparisons of those concentrations and loadings with published toxicity data and environmental guidelines. A summary of these for each activity researched is provided below. Car Washing
Waterway Concentrations; Concentrations of detergent, the surfactant LAS, total petroleum hydrocarbons (TPH) and heavy metals (Zn, Cu) resulting from residential car washing activities are likely to exceed ANZECC guidelines and reported toxicity values. Concentrations of other surfactants and PAH fall below ANZECC guidelines and toxicities. Annual Catchment Loading; Car washing activities appear to be significant contributors of TPH producing the equivalent annual load of around 1,000km of road. The contribution of around 10% of heavy metals to the Avon-Heathcote Estuary/Ihutai is also significant. The contribution of detergents and surfactants relative to other sources cannot be estimated due to lack of data, however it seems likely that car washing is a significant source.
Residential Outdoor Cleaning/Moss Treatment
Waterway Concentrations; Roof cleaning is the only activity for which enough data was available to make estimates of waterway concentrations. Predicted concentrations of benzalkonium chloride (BAC) exceed environmental guidelines as well as acute and chronic toxicities for a range of organisms. Annual Catchment Loading; The contribution of 2,000-5,500 kg/year of BAC cannot be assessed relative to other sources due to a lack of data, however it seems likely that roof cleaning is a significant source of this contaminant.
Cigarette Butt Litter
Waterway Concentrations; The estimated concentrations of cigarette butts resulting from littering appears unlikely to cause toxic effects. No data was found which would enable indirect effects such as ingestion to be assessed.
58
Annual Catchment Loading; Littering is likely to be the major contributor of cigarette butts to the Avon/Ōtākaro and Heathcote/Ōpāwaho rivers. The predicted annual load of approximately 29 million butts is not a significant source of heavy metals.
Inappropriate Disposal of DIY Waste
Vehicle Lubricant Waterway Concentrations; the inappropriate disposal of vehicle lubricant oil is likely to result in concentrations of TPH which greatly exceed ANZECC guidelines. Heavy metals and PAH concentrations do not exceed guidelines. The European Union priority pollutant diphenylamine may exceed guidelines at the upper end of the activity frequency range. Annual Catchment Loading; the contribution to catchment loading is potentially significant for TPH with a contribution equivalent to approximately 230 km of road. The contribution of heavy metals seems to be insignificant relative to other sources while it is impossible to assess the relative contribution of lubricant additives such as diphenylamine. Paint Waste and Equipment Washing Waterway Concentrations; Concentrations of paint additives are unlikely to reach reported toxicity concentrations, however chlorothalonil may reach Canadian water quality guidelines. Annual Catchment Loading; The relative contribution of paint additives to catchment loadings are unable to be assessed due to lack of data.
A great deal of further work is required to accurately assess the present levels of many of the contaminants discussed in this report, the actual contributions from the residential activities described and the ecosystem impacts of these contaminants. This is discussed further in the following section, however it became generally apparent during this research that the residential activities examined contribute a significant volume of contaminants to the waterways of Christchurch and that these contaminants are highly likely to contribute to the degraded nature of the aquatic ecosystems of the Avon/Ōtākaro and Heathcote /Ōpāwaho rivers.
59
Section 8 Gaps and Recommendations
Significant gaps in the information required to accurately assess the environmental effects of the selected residential activities, became apparent during the course of this research. The key gaps and recommended research are outlined below:
Many of the contaminants discussed in this report can be considered as chemicals of emerging environmental concern, and have been poorly studied. Their toxicity, environmental fate and bioavailability in New Zealand aquatic environments are largely unknown. In addition many of these contaminants, especially those resulting from car washing, outdoor cleaning/moss treatments and paint disposal/washing, do not have environmental guidelines , and most of the contaminants in this report other than metals, TPH and PAH, are not routinely included in water quality assessments. As an example, Aherns (2009) ranked surfactants high on his list of concerning compounds due to their persistence, bioaccumulation potential and toxicity. However Stewart et al (2009), who conducted one of the only New Zealand investigations into environmental levels of chemicals of emerging environmental concern, did not analyse for any of the contaminants discussed in this report. This is an area that requires significant research and a baseline study could be conducted to assess actual environmental levels of some of the key contaminants in the waterways of Christchurch. Specifically;
a) Assess environmental concentrations of key contaminants of emerging
environmental concern in the Avon/Ōtākaro and Heathcote/Ōpāwaho rivers. b) Assess environmental concentrations of key contaminants at ‘end of pipe’ locations
where stormwater drains enter the rivers. c) Assess toxicity of contaminants found to be present to key indigenous aquatic
organisms. d) Assess persistence and factors affecting bioavailability of contaminants.
Detailed information regarding residential activities that may contaminate stormwater in Christchurch is scarce. Further information is required on types of activities undertaken, the manner in which they are conducted, frequency of activity as well as type and volumes of contaminating products used. Survey questions should be designed to provide information that is specific and useful in assessing waterway impacts.
61
Section 9 Glossary
ANZECC Guidelines Australian and New Zealand Guidelines for Fresh and Marine Water Quality (2000); provides a summary of the water quality guidelines proposed to protect and manage the environmental values supported by water resources.
Trigger Values: concentrations that, if exceeded, would indicate a potential environmental problem, and so ‘trigger’ a management response, e.g. further investigation and subsequent refinement of the guidelines according to local conditions.
High/moderate/low reliability: High reliability trigger values are calculated from chronic ‘no observable effect concentration’ (NOEC) data. However the majority of trigger values are moderate reliability trigger values, derived from short-term acute toxicity data (from tests ≤96 h duration) by applying acute-to-chronic conversion factors. Low reliability guideline trigger values were derived, in the absence of a data set of sufficient quantity, using larger assessment factors to account for greater uncertainty. These are considered as interim or indicative working levels subject to more test data becoming available
AF = Application Factor (also known as assessment factor or safety factors): Application of a ‘safety margin’ to toxicity data. This is a traditional approach to using single species toxicity data to protect ecosystems. The magnitude of the applied factor depends on nature (acute/chronic) of toxicity data and the degree of confidence on has in whether the figures represent the field situation.
Bioaccumulation
The accumulation of a substance, such as a toxic chemical, in various tissues of a living organism
Bioavailability
Amount of a substance that becomes available to an organism's body for bioactivity when introduced through ingestion, inhalation, injection, or skin contact
Biocide
A chemical agent, such as a pesticide, that is capable of destroying living organisms
Degradation
Breakdown of a substance into new compounds caused by exposure to a degrading mechanism e.g.; biodegradation- biochemical reactions or the actions of microorganisms such as bacteria; photodegradation- chemical responses as a result of exposure to light.
Detergent
Cleansing substance that acts similarly to soap but is made from chemical compounds rather than fats and lye
Ecotoxicity
The ability of a chemical or physical agent to have an adverse effect on the environment and the organisms living in it, such as fish, wildlife, insects, plants and microorganisms.
62
Terminology for measurements of ecotoxicity
Acute, harmful effects in an organism through a single or short-term exposure (usually up to 96 hours)
Chronic, harmful effects in an organism through long term or repeated exposure
ECx, Effect Concentration; The concentration at which X % of the test population has a specified reaction such as immobility, or;
LCx, Lethal Concentration; The concentration at which X% of the population are killed.
NOEC, No Observable Effect Concentration. The highest concentration at which no effect (specified e.g.: immobility) was observed.
PNEC, Predicted No Effect Concentration. As for NOEC but extrapolated from other observations.
Time, e.g. 48hr. The time frame for exposure to the given contaminant concentration.
Effect, e.g. bioluminescence. The reported effect for EC, NOEC etc.
Ligand
An ion, a molecule, or a molecular group that binds to another chemical entity to form a larger complex
Nano-particle
Particles sized between 100 and 1 nanometres that behaves as a whole unit in terms of its transport and properties. Nano-particles may or may not exhibit size-related properties that differ significantly from those observed in fine particles or bulk materials. Individual molecules are usually not referred to as nano-particles
R- phase
Risk phrase; defined in Annex III of European Union Directive 67/548/EEC: Nature of special risks attributed to dangerous substances and preparations. The list was consolidated and republished in Directive 2001/59/EC,
R50: Very toxic to aquatic organisms
R51: Toxic to aquatic organisms
R52: Harmful to aquatic organisms
R53: May cause long-term adverse effects in the aquatic environment
Surfactant
A shortened form of "surface-active agent", a surfactant is a chemical that stabilises mixtures of liquids, or liquids and solids, by reducing the surface tension at the interface between the molecules. Surfactants are commonly used as;
Detergents
Wetting agents
Foaming agents
Emulsifiers
63
Section 10 References
10.1 References for Section 3; Residential Car washing
Aherns, M., 2008. Review of Organic Chemicals of Potential Environmental Concern in Use in
Auckland. Prepared by NIWA for Auckland Regional Council. Auckland Regional Council
Technical Report 2008/028.
ANZECC 2000. Water Quality Guidelines. Accessed from http://www.mfe.govt.nz/publications/
water/anzecc-water-quality-guide-02/anzecc-water-quality-guide-02-pdfs.html 2 February
2011
Belenger, S.E., Davidson, D.H., Farris, J.L., Reed, D., Cherry, D.S. 1993. Effects of cationic surfactant
exposure to bivalve mollusc in stream mesocosms. Environmental Toxicology & Chemistry 12
1789-1802.
Belenger, S.E, Meiers, E.M., Bausch, R.G. 1995. Direct and indirect ecotoxicological effects of alkyl
sulphate and alkyl ethoxysulfate on macroinvertebrates in stream mesocosms. Aquatic
Toxicology 33. 65-87.
Bhatti, Z.A., Mahmood, Q., Raja, I.A., Malik, A.H., Khan, M.S., Wu, D. 2010. Chemical oxidation of car
wash industry wastewater as an effort to decrease water pollution. Physics and Chemistry of
the Earth. pg1-5.
Bond, J., Arbouw, P. 2010 Improving Urban Waterway Health: local public perceptions of
stormwater and the Okeover Stream, Christchurch. Environment Canterbury No. R10/40
Buser A, Morf L., 2009. Substance flow analysis for Switzerland Perfluorinated surfactants
perfluorooctanesulfonate (PFOS) and perfluorooctanoic acid (PFOA). Federal Office for the
Environment, Switzerland Accessed from http://www.bafu.admin.ch/publikationen/
publikation/01066/index.html?lang=en
Environmental Partners 2007. “Practical” fish toxicity test report. Prepared by Environmental
Partners Washington USA for Car Wash Enterprises. Retrieved from
http://www.carwash.org/SiteCollectionDocuments/Fish%20Toxicity.pdf June 2011.
Ermens, R. 2007. Literature Review: Urban River Contaminants. Prepared by URS New Zealand for
Environment Canterbury. Environment Canterbury Report No. U07/100
EU Dir 91. European Commission Urban Waste Water Treatment Directive 91/271/EEC. Discharge
from Urban Waste Water Treatment Plants to Receiving Waters. Retrieved from http://eur-
lex.europa.eu/LexUriServ/site/en/consleg/1991/L/01991L0271-19980327-en.pdf June 2011.
Franz, J.D., Bailey, D.T. 2003. City of San Diego Stormwater Pollution Program, 2003 Follow-Up
Survey of City Residents. Final Report. J.D.Franz Research Incorporated. Retrieved from
www.cfpub.epa.gov/npstbx/surveys June 2011.
HERA 2009. Human & Environmental Risk Assessment on ingredients of European household
cleaning products. Linear Alkylbenzene Sulphonate. Accessed from
http://www.heraproject.com/ retrieved June 2011.
HERA AES. Human & Environmental Risk Assessment on ingredients of European household cleaning
products. Alcohol Ethoxysulphates. Accessed from http://www.heraproject.com/ retrieved
June 2011
64
Hoffman, E.J., Latimer, J.S., Hunt, C.D., Mills G.L., Quinn, J.G. 1984. Stormwater runoff from
highways. Water, air, & soil pollution 25 (4)
Ibrahim, M., Anionic Surfactants as MBAS; SOP for analysing MBAS using the spectrophotometer.
North Carolina Division of Water Quality Laboratory Section.
ICA 2005. Study of Consumer Car Washing Attitudes and Habits. Retrieved from
http://www.carwash.org/operatorinformation/research/Pages/ConsumerCar
washingAttitudesandHabits.aspx May 2011.
IUCLID. International Uniform Chemical Information Database- substance specific datasheets
retrieved from the European Chemical Bureau. esis.jrc.ec.europa.eu
Mercer, K. 2002. Take me out to the car wash: successful residential and community based nonpoint
source pollution prevention. Stormwater; May-June.
Moores, J., Pattinson, P., Hyde, C. 2010. Enhancing the control of contaminants from New Zealand’s
roads: results of a road runoff sampling programme. New Zealand Transport Agency research
report 39 retrieved from
http://www.nzta.govt.nz/resources/research/reports/395/docs/395.pdf June 2011.
Mori, M., Kawakubo, N., Wakabayashi, M. 2002. Cytotoxicity of Surfactants to the FHM-sp Cell-Line.
Fisheries Science 68. 1124-1128.
NZWWA 2006. Keep it Clean, Preventing Stormwater Pollution. Stormwater pollution brochure from
New Zealand Water and Waste Association, Wellington. Retrieved from www.waternz.org.nz
June 2011.
Ojo, O.A., Oso, B.A. 2009. Biodegradation of synthetic detergents in wastewater. African Journal of
Biotechnology 8 (6).
Ongeri, D.M.K., Lalah, J.O., Wandiga, S.O., Schramm, K.W., Michalke, B. 2009. Levels of Toxic Metals
in Multisectoral Samples from Winam Gulf of Lake Victoria. Bulletin of Environmental
Contamination & Toxicology 82. 64-69.
Pak, D., Chang, W. 2000. Factors affecting phosphorous removal in two biofilter system treating
wastewater from car washing facility. Water Science and Technology 41(4-5)
PDP 2007. Avon/Ötakaro and Heathcote/Opawaho rivers: analysis of water quality data from 1992-
2006. Environment Canterbury Technical Report U07/42 prepared by Pattle Delamore Partners
Ltd for Environment Canterbury
Phillips, N., Croker, G., Albert, A. and Rijkenberg, M. (2009). Intergenerational responses of aquatic
biota to low level contamination in urban streams. Prepared by NIWA for Auckland Regional
Council. Auckland Regional Council Technical Publication 2009/085.
Sablayrolles, C., Vialle, C., Vignoles, C., Montrejaud-Vignoles, M. 2010. Impact of Car wash Discharge
on Stormwater Quality (Toulouse, France). Water Science and Technology 62(12).
Schueler, T. 2000. Understanding Watershed behaviour. Watershed Protection Techniques 3(3) 671-
679)
Schroder, F.R. 1995. Concentrations of anionic surfactants in receiving riverine water. Tenside
Surfactants and Detergents 32(6)
Smith, D.J., Shilley, H. 2009. Residential Car Wash water Monitoring Study. City of Federal Way,
Washington, Public Works, Surface Water Management.
65
Stewart, M.; Aherns, M.; Olsen, G., 2009. Analysis of Chemicals of Emerging Environmental Concern
in Auckland’s Aquatic Sediments. Prepared by NIWA for Auckland Regional Council. Auckland
Regional Council Technical Report 2009/021.
Tu, W.K., Chang, C.C., C., Chang, C.Y., Ji, D.R., Tseng, J.Y., Chiu, C.Y., Chen, Y.H., Chang, C.F., Yu, Y.H.,
Treatment for Car Wastewater via novel technologies for recycling and reutilisation. Journal of
Environmental Management 19(1) 49-57
Timperley, M., Williamson, B., Mills, G., Horne, B., Hasan, M.Q., Sources and loads of metals in
urban stormwater. Auckland Regional Council Technical Publication No. ARC04104,
USEPA 2001. National Management measure to control nonpoint source pollution from marinas and
recreational boating. United States Environmental Protection Agency Report 841-B-01-005.
Retrieved from www.epa.gov/owow/NPS/mmsp/marinas.pdf. May 2011.
Williamson, B., Mills, G., 2009. The Impacts of Stormwater in Auckland’s Aquatic Receiving
Environment. A Review of Information 2005-2008. Prepared by Diffuse Sources Ltd for
Auckland Regional Council. Auckland Regional Council Technical Report 2009/111.
10.2 References for Section 4 –Residential Outdoor Cleaning and Moss Treatments
Abell, J.M., Ozkundakcia, D., Hamilton, D.P., Miller, S.D. 2011. Relationships between land use and
nitrogen and phosphorus in New Zealand lakes. Marine and Freshwater Research, 62, 162–175
AISEN 1997. Benefits and Safety Aspects of Hypochlorite Formulated in Domestic Products.
Association Internationale De La Savonnerie, De La Détergence Et Des Produits d'Entretien
Technical Task Force Hypochlorite, Belgium
Aherns, M., 2008. Review of Organic Chemicals of Potential Environmental Concern in Use in
Auckland. Prepared by NIWA for Auckland Regional Council. Auckland Regional Council
Technical Report 2008/028.
ANZECC 2000. Water Quality Guidelines. Accessed from
http://www.mfe.govt.nz/publications/water/anzecc-water-quality-guide-02/anzecc-water-
quality-guide-02-pdfs.html 2 February 2011
Bond, J., Arbouw, P. 2010 Improving Urban Waterway Health: local public perceptions of
stormwater and the Okeover Stream, Christchurch. Environment Canterbury No. R10/40
CCME 1999. Canadian Water Quality Guidelines for the Protection of Aquatic Life. DDAC. Canadian
Council of Ministers of the Environment.
Cheng, W., Wang, C-H., Chen, J-C. 2003. Effect of Benzalkonium Chloride Stress on Immune
Resistance and Susceptibility to Lactococcus garvieae in the giant freshwater prawn
Macrobrachium rosen bergii. Diseases of Aquatic Organisms 53. 223-229.
Cooper, J.C. 1988. Review of the Environmental Toxicity of Quaternary Ammonium Halides.
Ecotoxicology and Environmental Safety 16. 65-71
USEPA 2004. Memorandum on Ethylenediamiinetetraacetic acid (EDTA) and the salts of EDTA:
Science Assessment Document for Tolerance Reassessment. Retrieved from
www.epa.gov/opprd001/inerts/edta.pdf. June 2011.
66
USEPA 2006. Reregistration Eligibility Decision for Alkyl Dimethyl Benzyl Ammonium Chloride
(ADBAC). EPA739-R-06-009.
Ermens, R. 2007. Literature Review: Urban River Contaminants. Prepared by URS New Zealand for
Environment Canterbury. Environment Canterbury Report No. U07/100
Ferk, F., Misik, M., Hoelzl, C., Uhl, M., Fuerhacker, M., Grillitsch, B., Parzefall, W., Nerseyan, A.,
Micieta, K., Grummt, T., Ehrlich, V., Knasmuller, S. 2007. Benzalkonium Chloride (BAC) and
Dimethyldioctadecyl-ammonium bromide (DDAB), Two Common Quaternary Ammonium
Compounds, Cause Genotoxic Effects in Mammalian and Plant Cells at Environmentally
Relevant Concentrations. Mutagensis 22 (6).363-370.
Henderson, N.D. 1992. A Review of the Environmental Impact and Toxic Effects of DDAC. Prepared
for Environmental Protection Division, BC Environment, Ministry of Environment, British
Colombia.
IUCLID. International Uniform Chemical Information Database- substance specific datasheets
retrieved from the European Chemical Bureau. esis.jrc.ec.europa.eu
Kreuzinger, N., Fuerhacker, M., Scharf, S., Uhl, M., Gans, O., Grillitsch, B. 2007. Methodological
Approach Towards the Environmental Significance of Uncharacterised Substances- Quaternary
Ammonium Compounds as an Example. Desalination 215. 209-222.
Madsen, T., Boyd, H.B., Nylén, D., Rathmann Pedersen, A., Petersen,G.I., Simonsen, F. 2001.
Environmental and Health Assessment of Substances in Household Detergents and Cosmetic
Detergent Products. Danish EPA Environmental Project No. 615
Macdonald, D.D., Berger, T., Wood, K., Brown, J., Johnson, T., Haines, M.L., Brydges, K., Macdonald,
M.J., Smith, S.L. Shaw, D.P. 1999. A Compendium of Environmental Quality Benchmarks.
Report GBEI/EC-99-001 Prepared for Environment Canada
Mori, M., Kawakubo, N., Wakabayashi, M. 2002. Cytotoxicity of Surfactants to the FHM-sp Cell-Line.
Fisheries Science 68. 1124-1128.
Perez, P., Fernandez, E., Beiras,R. 2009. Toxicity of Benzalkonium Chloride on Monoalgal Cultures
and Natural Assemblages of Marine Phytoplankton. Water Air and Soil Pollution 201. 319-330.
Phillips, N., Croker, G., Albert, A. and Rijkenberg, M. (2009). Intergenerational responses of aquatic
biota to low level contamination in urban streams. Prepared by NIWA for Auckland Regional
Council. Auckland Regional Council Technical Publication 2009/085.
Riley 2002. Do Clean Rivers Begin at Home? Exploring the Obstacles and Motivations of Homeowner
Behaviour. Riley Research Associates for the Tualatin Basin Public Awareness Committee.
Sutterlin, H., Alexy, R., Kummerer, K. 2008. Mixtures of Quaternary Ammonium Compounds and
Anionic Organic Compounds in the Aquatic Environment: Elimination and Biodegradability in
the Closed Bottle Test Monitored by LC-MS/MS. Chemosphere 72. 479-484
Sutterlin, H., Alexy, R., Kummerer, K. 2008. The Toxicity of Quaternary Ammonium Compound
Benzalkonium Chloride Alone and in Mixtures with Other Anionic Compounds to Bacteria in
Test Systems with Virio fischeri and Pseudomonas putida. Ecotoxicology and Environmental
Safety 71. 498-505.
Swanson, M.B.,Davis, G.A., Perhac, D.G. 1995. Environmentally Preferable Cleaners: All Purpose
Cleaners, Glass Cleaners, and Dishwashing Liquids. Center for Clean Products and Clean
Technologies University of Tennessee, Knoxville
67
Szenasy, E. 1998. Assessing the Potential Impact of the Antisapstain Chemicals DDAC and IPBC, in the
Fraser River. ESB Consulting for Environment Canada Aquatic and Atmospheric Science Branch.
Timperley, M., Williamson, B., Mills, G., Horne, B., Hasan, M.Q., Sources and loads of metals in
urban stormwater. Auckland Regional Council Technical Publication No. ARC04104,
Teh, S.J., Wong, C., Furtula,V., Teh, F-C. 2003. Lethal and Sublethal Toxicity of
Didecyldimethylammonium Chloride in Early Life Stages of White Sturgeon, Acipenser
transmontanus. Environmental Toxicology and Chemistry 22 (9) 2152-2158.
Walker, J.R.L., Evans, S. Effect of Quaternary Ammonium Compounds on Some Aquatic Plants.
Marine Pollution Bulletin 9. 136-137.
10.3 References for Section 5; Cigarette Butt Litter
Armitage, N., Roosebaum, A. The removal of urban litter from stormwater conduits and streams.
Part 1: The quantities involved and catchment litter management options. 2000. Water South
Africa 26(2) 181-188
Cooper, J., Aumen, H.J., Klavitter, J. 2004. Do the Albatrosses of Midway Atoll Select Cigarette
Lighters by Colour? Pacific Seabirds 31(1)
CORESTA 2000. Cigarette Butt Degradability Task Force Final Report. Retrieved from
http://legacy.library.ucsf.edu/tid/qtg33a00/pdf June 2011.
Cunningham, D.J., Wilson, S.P., 2003. Marine Debris on Beaches of the Greater Sydney Region.
Journal of Coastal Research, Vol. 19(2), 421-430
Curnow, R., Chrispijn, J. (2006) Hobart CBD Stormwater Improvement Program, Paper 2: Non
Structural BMP’s to Improve Stormwater Quality. A joint paper by Community Change and
Hobart City Council at the 4th South Pacific Conference on Stormwater and Aquatic Protection
New Directions conducted by New Zealand Wastes and Water Association, Auckland.
Cutter, S.L., Tiefenhacher,J., Birnhaum, S., Wiley, J., Solecki, W.D. 1991. Throwaway societies: a field
survey of the quantity, nature and distribution of litter in New Jersey. Applied Geography, II,
125-141
HCC. Hobart City Council in www.litter.vic.gov.au retrieved June 2011.
Kadir, A.A., Mohajerani, A., Roddick, F., Buckeridge, J. 2009. Density, Strength, Thermal Conductivity
and Leachate Characteristics of Light-Weight Fired Clay Bricks Incorporating Cigarette Butts.
World Academy of Science, Engineering and Technology 53.
Marah. M., Novotny, T.E. 2011. Geographic Patterns of Cigarette Butt Waste in the Urban
Environment. Tobacco Control 20(1)
Micevska, T,. Warne, M.St.J., Pablo, F., Patra, R. 2006. Variation in , and Causes of, Toxicity of
Cigarette Butts to a Cladoceran and Microtox. Arch. Environ. Contam. Toxicol 50. 205-212.
Moerman, J.W. 2009. Not Just an Eyesore: Analysis of Metals Leached from Smoked Cigarette Litter
by ICP-OES. Departmental Honours Thesis. University of Tennesesse at Chattanooga.
Moerman, J.W., Potts, G.E. 2011. Analysis of Metals Leached from Smoked Cigarette Litter. Tobacco
Control 20(1).
NOAA 2006. Marine Debris; Impacts in the Gulf of Mexico. Presentation retrieved from
http://marinedebris.noaa.gov.html June 2011
68
Novotny, T.E., Lum, K., Smith, E., Wang, V., Barnes, R. 2009. Cigarette Butts and the Case for an
Environmental Policy on Hazardous Cigarette Waste. International Journal of Environmental
Research and Public Health 6. 1691-1705.
Phillip Morris Internal Memo 1992. Retrieved from http://legacy.library.ucsf.edu/tid/ahh48e00. pdf
June 2011.
Register, K.M. 2000. Cigarette Butts as Litter- Toxic as Well as Ugly. Underwater Naturalist; Bulletin
of the American Littoral Society 25(2)
Santos, I.R., Claudia, A., Friedrich, M.W-K., Fillmann, G., 2005. Influence of socio-economic
characteristics of beach users on litter generation. Ocean & Coastal Management 48 742-752
Slaughter, E., Gersberg, R.M., Watanabe, K., Rudolph, J., Stransky, C., Novotny, T.E. 2011. Toxicity of
Cigarette Butts, and Their Chemical Components, to Marine and Freshwater Fish. Tobacco
Control 2011(1)
Smith, E.A., Novotny, T.E. 2011.Whose Butt is it? Tobacco Industry Research About Smokers and
Cigarette Butt Waste. Tobacco Control 20(2).
TAP 2009. Background Paper for the Threat Abatement Plan for the impacts of marine debris on
vertebrate marine life. Department of the Environment, Water, Heritage and the Arts ©
Commonwealth of Australia. Retrieved from http://www.environment.gov.au/biodiversity
/threatened/publications/tap/marine-debris. June 2011.
Tobias, M., Huang, K. 2007. Tobacco Consumption in New Zealand. Why Did it Fall? Australian New
Zealand Journal of Public Health 31(4) 344-347
UNEP 2011. United Nation Environment Program Yearbook 2011. Emerging Issues in Our Global
Environment. Retrieved from http://www.unep.org/yearbook/2011/ June 2011.
Victorian Litter Report, 2009. Published by Sustainability Victoria retrieved from
http://www.sustainability.vic.gov.au/resources/documents/Victorian_Litter_Report_20091.pd
f June 2011
10.4 References for Section 6; Inappropriate disposal of selected DIY hazardous wastes
10.4.1 Used Engine Lubricants
Aherns, M., 2008. Review of Organic Chemicals of Potential Environmental Concern in Use in
Auckland. Prepared by NIWA for Auckland Regional Council. Auckland Regional Council
Technical Report 2008/028.
ANZECC 2000. Water Quality Guidelines. Accessed from
http://www.mfe.govt.nz/publications/water/anzecc-water-quality-guide-02/anzecc-water-
quality-guide-02-pdfs.html 2 February 2011
Beyram, H., Louati, H., Essid, N., Aissa, P., Mahmoudi, E. 2010. Effects of two lubricant oils on
nematode assemblages in a laboratory microcosm experiment. Marine Environmental
Research 69. 248-253.
Bond, J., Arbouw, P. 2010 Improving Urban Waterway Health: local public perceptions of
stormwater and the Okeover Stream, Christchurch. Environment Canterbury Report No.
R10/40
69
CCC. 2003. Christchurch City Environmental Trends Report 2003. Environmental Trends Report
prepared for the Long Term Council Community Plan Christchurch City Council.
Drzyzga, O. 2003. Diphenylamine and derivatives in the environment: a review. Chemosphere 53.
809-818.
Elway Research, 2009. Stormwater runoff: Pierce county public attitudes, Awareness and behaviour.
Conducted by Elway Research for Pierce County (USA)Public Works and Utilities.
Ermens, R. 2007. Literature Review: Urban River Contaminants. Prepared by URS New Zealand for
Environment Canterbury. Environment Canterbury Report No. U07/100.
Giacalone, K., Sawyer, C., Mobley, C., Witte, J., Eidson, G. 2010. Is stormwater treated? A survey of
awareness and behaviours that may impact nonpoint source education. Proceedings of the
2010 South Carolina Water Resources Conference. Oct 13-14 2010.
IUCLID. International Uniform Chemical Information Database- substance specific datasheets
retrieved from the European Chemical Bureau. esis.jrc.ec.europa.eu
Jones, D. 2006. Stantec consulting East Canyon study. Conducted by Dan Jones Associates (Utah
USA).
Kennedy, P.; Sutherland, S. (2008). Urban Sources of Copper, Lead and Zinc. Prepared by
Organisation for Auckland Regional Council. Auckland Regional Council Technical Report
2008/023.
Lopes, P.R.M., Montagnolli, R.N., Domingues, RdF., Bidoia, E.D. 2010. Toxicity and biodegradation in
sandy soil contaminated by lubricant oils. Bulletin of Environmental Contamination &
Toxicology 84. 454-458.
Maraldo K, Dahllöf I. Indirect estimation of degradation time for zinc pyrithione and copper
pyrithione in seawater. Marine Pollution Bulletin.48(9-10). 894-901.
Maxam, G., Hahn, S., Dott, W., Eisentraeger, A. 2002. Assessment of the influence of use on
ecotoxicological characteristics of synthetic ester lubricants. Ecotoxicology 1. 349-355.
Mckee, R.H., Plutnick, R.T. 1989. Carcinogenic Potential of Gasoline and Diesel Engine Oils.
Toxicological Sciences 13 (3) 545-553
Memphis, 2000. Survey of Memphis Consumers' Opinions About Stormwater Pollution. Marketing
research study for city of Memphis (USA) environmental engineering.
NZWWA 2006. Keep it Clean, Preventing Stormwater Pollution. Stormwater pollution brochure from
New Zealand Water and Waste Association, Wellington. Retrieved from www.waternz.org.nz
June 2011.
NZTA. 2005. New Zealand Transport Authority, vehicle registration numbers. Accessed from
www.nzta.govt.nz retrieved June 2011
Ogali, R.E., Osuji, L.C., Ayodele, O. 2007. Acute toxicity of the water-soluble fraction of spent
lubricating oil on the African catfish Clarias gariepinus. Chemistry and Biodiversity 4. 2755-2765
Ort, M.P., Finger, S.E., Jones, J.R. Toxicity of crude oil to the mayfly, Hexagenia bilineata
(Ephemeroptera: Ephemeridae). Environmental Pollution 90(1) 105-110.
Poulton, B.C., Callahan, E.V., Hurtubise, R.D., Mueller, B.G. 1998. Effects of an oil spill on leafpack-
inhabiting macroinvertebrates in the Chariton River, Missouri. Environmental Pollution 99.
115-122
70
Thompson, B.A.W., Goldsworthy, P.M., Riddle, M.J., Snape, I., Stark, J.S. 2007. Contamination effects
by a ‘conventional’ and a ‘biodegradable’ lubricant oil on infaunal recruitment to Antarctic
sediments: A field experiment. Journal of Experimental Marine Biology and Ecology 340. 213-
226.
USEPA, 1999. Reregistration Eligibility Decision (RED) Chlorothalonil. EPA 738-R-99-004
USEPA 2006. Final Submission for phenol Heptyl derivatives. High Production Volume Chemical
Challenge Programme. Consortium Registration Number 201-16475A
USEPA 2007. Reregistration Eligibility Decision for 2-Octyl-3 (2H)-isothiazolone (OIT). EPA 739-R-07-
008
USEPA 2011. Lubricating Oil Basestocks, Category Assessment Document. High Production Volume
Chemical Challenge Programme. Consortium Registration Number 201-16858A
Vazquez-Duhalt, R. 1989. Environmental impact of used oil. The Science of the Total Environment 79.
1-23.
10.4.2 Paint waste and equipment washing
Aherns, M., 2008. Review of Organic Chemicals of Potential Environmental Concern in Use in
Auckland. Prepared by NIWA for Auckland Regional Council. Auckland Regional Council
Technical Report 2008/028.
Adams, L.K., Lyon, D.Y., Alvarez, P.J.J. 2006. Comparative eco-toxicity of nanoscale TiO2, SiO2, and
ZnO water suspensions. Water Research 40. 3527 – 3532
Anliker, R., Moser, A. 1987. The limits of bioaccumulation of organic pigments in fish: their relation
to the partition coefficient and the solubility in water and octanol’ Ecotoxicology and
Environmental Safety 13. 43-52
ANZECC 2000. Water Quality Guidelines. Accessed from
http://www.mfe.govt.nz/publications/water/anzecc-water-quality-guide-02/anzecc-water-
quality-guide-02-pdfs.html 2 February 2011
Bai,W., Zhang, Z., Tian, W., He, H., Ma, Y., Zhao, Y., Chai, Z. Toxicity of zinc oxide nanoparticles to
zebrafish embryo: a physicochemical study of toxicity mechanism. Journal of Nanoparticle
Research 12. 1645–1654
Bond, J., Arbouw, P. 2010 Improving Urban Waterway Health: local public perceptions of
stormwater and the Okeover Stream, Christchurch. Environment Canterbury Report No.
R10/40
Brown, J.A. Jr., Weintraub, M. 1982. Biooxidation of Paint Process Wastewater. Journal Water
Pollution Control Federation 54 (7) 1127-113
Carter, P.L. 1994. Development of ozone reactivity scales for volatile organic compounds. Journal of
the Air and Waste Management Association 44, 881-899
CCME, 1999. Canadian Water Quality Guidelines for the Protection of Aquatic Life. Chlorothalonil.
Canadian Council of Ministers of the Environment.
Colon, I., Kuusisto, E.L., Hansen, K. Location Affects Performance of Biocide-Containing Paints. Paint
and Coatings Industry Magazine. Retrieved from
http://www.pcimag.com/HTML/BNP_GUID_9-5-2006_A_10000000000000548226 July 2011.
IUCLID. International Uniform Chemical Information Database- substance specific datasheets
retrieved from the European Chemical Bureau. esis.jrc.ec.europa.eu
71
Jartun, M., Ottesen, R.T., Steinnes, E., Volden, T. 2009. Painted surfaces- important sources of
polychlorinated biphenyls (PCBs) contamination to the urban and marine environment.
Environmental Pollution 157. 295-302.
Juergensen, L., Busnarda, J., Caux, P., Kent, R. 2000. Fate, behaviour, and aquatic toxicity of the
fungicide IPBC in the Canadian environment. Environmental Toxicology 15 (3). 201-213
Kaegi, R., Ulrich, A., Sinnet, B., Vonbank, R., Wichser, A., Zuleeg, S., Simmler, H., Brunner, S.,
Vonmont, H., Burkhardt, M., Boller, M. 2008. Synthetic TiO2 nanoparticle emission from
exterior facades into the aquatic environment. Environmental Pollution 156. 233-239.
Kampa, M., Castanas, E. 2008. Human health effects of air pollution. Environmental Pollution 151 (2)
362-367.
Maraldo. K., Dahllof. I. 2004. Indirect estimation of degradation time for Zinc Pyrithione and Copper
Pyrithione in seawater. Marine Pollution Bulletin 48(9-10) 894-901.
NTG 2006. Disposal of paint wastes. Environmental Guidance No 6. Paint Wastes. Waste
Management and Pollution Control Branch, Northern Territory Government, Australia.
Parminter, T., Waters, C., Mortimer, C.2006. Examples of extension and policy strategies developed
using theories of human behaviour and social marketing. Australasia Pacific Extension
Network . http://www.regional.org.au/au/apen/2006/refereed/4/3034_parminter.htm
retrieved July 2011.
Ruus, A., Green, N.W., Maage, A., Skei, J. 2006. PCB-containing paint and plaster caused extreme
PCB-concentrations in biota from Sorfjord (Western Norway)- A case study. Marine Pollution
Bulletin 52 100-103.
Schuerman. G., Bruzan. R. 1989. Chemistry of Paint. Journal of Chemical Education 66 (4)
Turner, A., Radford, A. 2010. Bioaccessibility of trace metals in boat paint particles. Ecotoxicology
and Environmental Safety 73. 817-824.
UPC01. Pollution and the Auckland Region. Pollution Facts brochure from the Auckland Regional
Council. Available from www.arc.govt.nz, retrieved July 2011.
Vaajasaari, K., Kulovaara, M., Joutti, A., Schultz, E., Soljamo, K. 2004. Hazardous properties of paint
residues from the furniture industry. Journal of Hazardous Materials 106A. 71-79.
Viguri, J., Onandia, R., Arce, R., Irabien, A. 2005. Alkyd paint waste characterisation and distillation.
Chemical Engineering Communications 192 (11) 1490-1504.
Wiench, K., Wohlleben, W., Hisgen, V., Radke, K., Salinas, E., Zok, S., Landsiedel, R. 2009. Acute and
chronic effects of nano- and non-nano-scale TiO2 and ZnO particles on mobility and
reproduction of the freshwater invertebrate Daphnia magna. Chemosphere 76. 1356–1365
Zarcinas, B.A.; Rogers, S.L. 2002. Copper, lead and zinc mobility and bioavailability in a river sediment
contaminated with paint stripping residue. Environmental Geochemistry and Health 24(3):
191-203.
72
10.5 References for Section 7; Gaps and Recommendations
Aherns, M., 2008. Review of Organic Chemicals of Potential Environmental Concern in Use in
Auckland. Prepared by NIWA for Auckland Regional Council. Auckland Regional Council
Technical Report 2008/028.
Stewart, M.; Aherns, M.; Olsen, G., 2009. Analysis of Chemicals of Emerging Environmental Concern
in Auckland’s Aquatic Sediments. Prepared by NIWA for Auckland Regional Council. Auckland
Regional Council Technical Report 2009/021.
10.6 References for Appendix 1
Abel, P.D. 1974. Toxicity of synthetic detergents to fish and aquatic invertebrates. Journal of Fish
Biology 6 (3). 279-298.
Aherns, M., 2008. Review of Organic Chemicals of Potential Environmental Concern in Use in
Auckland. Prepared by NIWA for Auckland Regional Council. Auckland Regional Council
Technical Report 2008/028.
ANZECC 2000. Water Quality Guidelines. Accessed from
http://www.mfe.govt.nz/publications/water/anzecc-water-quality-guide-02/anzecc-water-
quality-guide-02-pdfs.html 2 February 2011
Barsh, R., Bell, J., Halliday, H., Clifford, M., Mottet, G. 2008. Preliminary Survey of Pyrethroid
Pesticides and Surfactants in San Juan County Surface Waters. Center for the Historical Ecology
of the Salish Sea, Lopez, Washington, USA. Retrieved from http://www.kwiaht.org/
Education/WaterQuality/HerbicidesPesticides/assets/Final%20pesticides%20report.pdf May
2011.
Belenger, S.E., Davidson, D.H., Cherry, D.S., Farris, J.L., Reed, D. 1993. Effects of cationic surfactant
exposure to a bivalve mollusc in stream mesocosms. Environmental Toxicology and Chemistry
12 (19) 1789-1802.
Bromage, N.R., Fuchs, A. 1976. A histological study of the response of the interregnal cells of goldfish
(Carassius auratus) to treatment with sodium lauryl sulphate. Journal of Fish Biology 9 (6) 529-
535.
Environmental Partners 2007. “Practical” fish toxicity test report. Prepared by Environmental
Partners Washington USA for Car Wash Enterprises. Retrieved from
http://www.carwash.org/SiteCollectionDocuments/Fish%20Toxicity.pdf June 2011
HERA 2009. Human & Environmental Risk Assessment on ingredients of European household
cleaning products. Linear Alkylbenzene Sulphonate. Accessed from
http://www.heraproject.com/ retrieved June 2011
Ibrahim, M. 2007. Anionic surfactants as MBAS. SOP for analyzing MBAS using the
spectrophotometer. North Carolina Division of Water Quality, Laboratory Section. Retrieved
from h2o.enr.state.nc.us/lab/qa/MBAS_000.pdf May 2011.
Jones, M.N. 1992. Surfactant Interactions with Biomembranes and Proteins. Chemistry Society
Review 21. 127-136.
Margesin, R., Schinner, F., Low-temperature Bioremediation of a waste water contaminated with
anionic surfactants and fuel oil. Applied Microbiology and Biotechnology 49. 482-486.
73
Mercer, K. 2002. Take me out to the car wash: successful residential and community based nonpoint
source pollution prevention. Stormwater; May-June.
NZWWA 2006. Keep it Clean, Preventing Stormwater Pollution. Stormwater pollution brochure from
New Zealand Water and Waste Association, Wellington. Retrieved from www.waternz.org.nz
June 2011.
Ojo, O.A., Oso, B.A. 2009. Biodegradation of synthetic detergents in wastewater. African Journal of
Biotechnology 8 (6).
Oknich, J. 2002. The perceived environmental impact of car washing. Retrieved from
http://sharepoint.snoqualmie.k12.wa.us/ckms/spiesse/Lists/Announcements/Attachments/4
3/carwash.pdf
Okpokwasili, G.C., Olisa, A.O. 1991. River water biodegradation of surfactants in liquid detergents
and shampoos. Water Research 25 (11). 1425-1429.
Sablayrolles, C., Vialle, C., Vignoles, C., Montrejaud-Vignoles, M. 2010. Impact of Car wash Discharge
on Stormwater Quality (Toulouse, France). Water Science and Technology 62(12).
Schroder, F.R. 1995. Concentrations of anionic surfactants in receiving riverine water. Tenside
Surfactant Detergents 32(6) 492-497.
Stewart, M.; Aherns, M.; Olsen, G., 2009. Analysis of Chemicals of Emerging Environmental Concern
in Auckland’s Aquatic Sediments. Prepared by NIWA for Auckland Regional Council. Auckland
Regional Council Technical Report 2009/021.
Tu, W.K., Chang, C.C., C., Chang, C.Y., Ji, D.R., Tseng, J.Y., Chiu, C.Y., Chen, Y.H., Chang, C.F., Yu, Y.H.,
Treatment for Car Wastewater via novel technologies for recycling and reutilisation. Journal of
Environmental Management 19(1) 49-57
USEPA 2001. National Management measure to control nonpoint source pollution from marinas and
recreational boating. United States Environmental Protection Agency Report 841-B-01-005.
Retrieved from www.epa.gov/owow/NPS/mmsp/marinas.pdf. May 2011.
Wong, D.C.L., Toy, R., Dorn, P.B. 2004. A stream mesocosm study on the ecological effects of a C12-
15 linear alcohol ethoxylate surfactant. Ecotoxicology and Environmental Safety 58. 173-186.
Xie, L., Thrippleton, K., Irwin, M.A., Siemering, G.S., Mekebri, A., Crane, D., Berry, B., Schlenk, D.
2005. Evaluation of estrogenic activities of aquatic herbicides and surfactants using an
Rainbow trout vitellogenin assay. Toxicological Sciences 87 (2) 391-398.
74
Appendix 1 Background Information on Detergents and Surfactants
Introduction
Three of the four selected residential behaviours that form the subject of this research may
involve the use of detergents and/or surfactants. As such a brief background is given here
on surfactant chemistry, classification, analysis and environmental impact.
Detergents are complex mixtures of compounds including surface active ingredients
(surfactants), abrasives, caustics, stabilisers, softeners, builders, enzymes and other non-
surfactant materials (ANZECC 2000; Aherns 2008) which are designed to achieve specific
performance characteristics. Concern with the effects of detergents in the environment
initially focussed on phosphate and the mounting evidence that its addition to aquatic
environments could lead to excess algal growth (eutrophication). In response, the
phosphate contents of many detergents has decreased and many products are advertised as
phosphate-free (Barsh 2008). Increasingly environmental concerns are now focussing on
surfactants, some of which have been developed to replace the role which phosphates
played in earlier detergents.
Surfactants are now widespread in everyday products such as medicines, paints, adhesives,
fire retardants, foods, colourings, plastics and rubbers, disinfectants, pesticides, herbicides
shampoos soaps and detergents. (Barsh, 2008; Aherns, 2008). In detergents they make up
the highest proportion of active ingredients (Jones, 1992; Aherns, 2008). A general
background to the classification and environmental effects is provided here but a detailed
description of all possible surfactants is beyond the scope of this review and readers are
referred to Aherns (2008) which gives an excellent description of the properties of many of
the surfactants of increasing environmental concern.
Surfactant Chemistry and Classification
Surfactants are organic molecules, typically long-chain hydrocarbons, comprising a
hydrophilic (water loving) head and hydrophobic lipophilic (water hating/fat loving) tail.
These properties effectively bridge water and fat molecules and hence make fats and oils
miscible in water (Jones, 1992; Aherns, 2008; Barsh, 2008). Surfactants are formally
classified by the charge associated with the hydrophilic domain and most common
surfactants fall into three groups: non-ionic with no charge, anionic with a negative charge
and cationic with a positive charge. An additional group, the amphoteric surfactants have
two oppositely charged groups at the hydrophilic head. The bulk of modern surfactants in
detergents and soaps are anionic or non-ionic (Barsh, 2008; Tu, 2009), with industry
estimates and freshwater analyses indicating that non-ionics have recently become more
prevalent than anionics (Barsh, 2008). Examples of different surfactants are given in Table A.
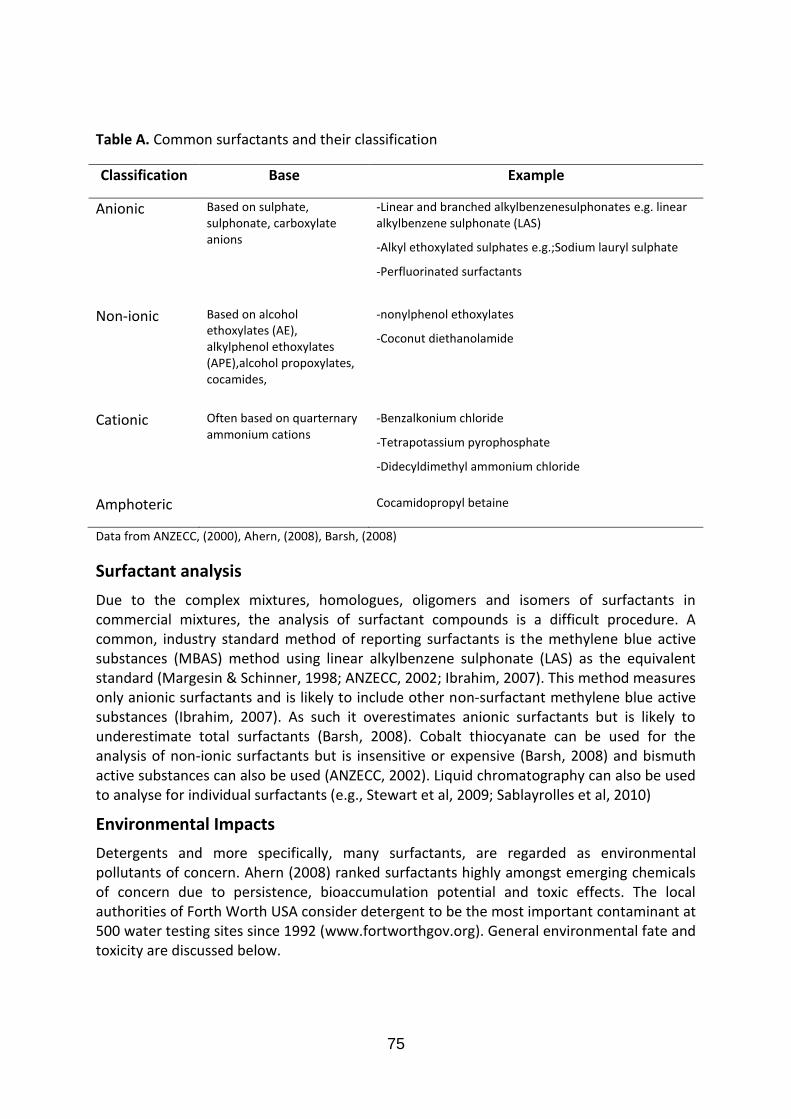
75
Table A. Common surfactants and their classification
Classification Base Example
Anionic Based on sulphate, sulphonate, carboxylate anions
-Linear and branched alkylbenzenesulphonates e.g. linear alkylbenzene sulphonate (LAS)
-Alkyl ethoxylated sulphates e.g.;Sodium lauryl sulphate
-Perfluorinated surfactants
Non-ionic Based on alcohol ethoxylates (AE), alkylphenol ethoxylates (APE),alcohol propoxylates, cocamides,
-nonylphenol ethoxylates
-Coconut diethanolamide
Cationic Often based on quarternary ammonium cations
-Benzalkonium chloride
-Tetrapotassium pyrophosphate
-Didecyldimethyl ammonium chloride
Amphoteric Cocamidopropyl betaine
Data from ANZECC, (2000), Ahern, (2008), Barsh, (2008)
Surfactant analysis
Due to the complex mixtures, homologues, oligomers and isomers of surfactants in commercial mixtures, the analysis of surfactant compounds is a difficult procedure. A common, industry standard method of reporting surfactants is the methylene blue active substances (MBAS) method using linear alkylbenzene sulphonate (LAS) as the equivalent standard (Margesin & Schinner, 1998; ANZECC, 2002; Ibrahim, 2007). This method measures only anionic surfactants and is likely to include other non-surfactant methylene blue active substances (Ibrahim, 2007). As such it overestimates anionic surfactants but is likely to underestimate total surfactants (Barsh, 2008). Cobalt thiocyanate can be used for the analysis of non-ionic surfactants but is insensitive or expensive (Barsh, 2008) and bismuth active substances can also be used (ANZECC, 2002). Liquid chromatography can also be used to analyse for individual surfactants (e.g., Stewart et al, 2009; Sablayrolles et al, 2010)
Environmental Impacts
Detergents and more specifically, many surfactants, are regarded as environmental pollutants of concern. Ahern (2008) ranked surfactants highly amongst emerging chemicals of concern due to persistence, bioaccumulation potential and toxic effects. The local authorities of Forth Worth USA consider detergent to be the most important contaminant at 500 water testing sites since 1992 (www.fortworthgov.org). General environmental fate and toxicity are discussed below.
76
Environmental Fate
Surfactants tend to be highly soluble in water but may also adsorb to fine sediment and hence they are found in both the water column and aquatic sediments (Barsh, 2008; Stewart et al, 2009). Persistence in the environment is a key factor in environmental impact and is highly variable for surfactants with half lives (the time taken to degrade to half the original concentration) varying from hours to years. Linear alkylbenzene sulphonate (LAS), is among the most important anionic surfactants, being a primary component of many detergents. LAS has a reported half life of 3hrs (Schroder, 1995; HERA, 2009) with Aherns (2008) suggesting complete degradation in the order of days. On the other hand, Tu (2009) reports LAS as being environmentally persistent. Alkyl sulphates such as sodium lauryl sulphate are described as moderately persistent with 80-100% degradation within 30 days (Aherns, 2008). On the other hand perfluorinated surfactants, which are contained in some car waxes and polishes, show high environmental persistence with no degradation over 28 days (Aherns, 2008). Margesin & Schinner (1998) consider many biodegradation studies to have been carried out at temperatures which are not representative of actual environmental conditions (25-300 C). Their experiments on non-specified anionic surfactants demonstrated degradation from 57 mg/L to 3 mg/L over 35 days. Okpokwasili & Olisa (1991) measured the degradation of anionic surfactants from detergents in river waters and found between 59-79% degradation over 12 days. Where surfactants/detergents are discharged to sewerage treatment plants, these degradation timeframes may be sufficient to limit environmental impact. However where discharge is direct to stormwater systems and hence waterways, these degradation timeframes may be more problematic. A survey in San Juan County, Washington (USA) found the general level of anionic surfactants in freshwater streams to be 0.69 mg/L (0.57 mg/L in all freshwater bodies) and the level of non-ionic surfactants to be 3.6 mg/L in streams (1.27 mg/L in all freshwater bodies) indicating that degradation rates are not fast enough to lower surfactant rates significantly below USEPA national secondary drinking water standards (Barsh, 2008)
Toxicity
The ecological impacts of specific surfactants are the topic of a large body of literature. Most impacts seem to be the result of interactions between the surfactants and the proteins of biomembranes (Abel, 1974; Jones, 1992; Mercer, 2009). Acute toxicity in fish is widely reported (Abel, 1974; Muller, 1980; Tu, 2009) and gill damage is the most obvious effect causing toxicity due to asphyxiation (Abel, 1974). Mercer (2009) reports that most fish die when detergent concentrations reach 15 mg/L with concentrations as low as 5 mg/L causing the death of fish eggs. Macroinvertebrate (mayflies) and mollusc populations were significantly impaired by concentrations of 0.582 to 1.586 mg/L of alkyl sulphates and alkyl ethoxylate sulphates and growth impairment has been reported in these organisms from quarternary ammonium surfactants (Belenger, 1993). Abel (1974) considered invertebrates to be extremely sensitive to detergents and reported that concentrations below 0.1mg/L could interfere with growth and development.
Cytotoxicity (cell death) to fish cells is reported by Mori et al (2002) who ranked surfactant classes according to their cytotoxic effect. His ranking was cationic>anionic>non-ionic>amphoteric. More specifically benzalkonium chloride was more toxic than LAS which was more toxic than betaines. Renal cell changes were reported in fish exposed to sub lethal concentrations of sodium lauryl sulphate by Bromage & Fuchs (1976). Stream mesocosm studies (experimental ecosystems which attempt to reproduce natural conditions and
77
processes) attempt to investigate toxicity effects under more environmentally realistic conditions. Wong et al (2004) reported behavioural and growth effects on stream communities from exposure to C12-15 alcohol ethoxylate surfactant and suggested a No Observable Effect Concentration (NOEC) of 0.160 mg/L. This surfactant has been suggested as a replacement for nonylphenol ethoxylate due to environmental concerns.
Synergistic effects have been suggested whereby surfactants increase an organism’s susceptibility to other contaminants. Xie et al (2005) reported increased estrogenicity due to pesticides in the presence of alkyl ethoxylate surfactants while other reports suggest that detergent impacts on fish gill membranes increase the vulnerability to other contaminants (Environmental Partners, 2007; Mercer, 2009).
In addition to direct toxicity effects surfactants impact the aquatic environment in other ways. Surfactants have been shown to accumulate at the water surface and prevent gas exchange between the aqueous environment and the atmosphere (USEPA, 2001). In addition, the degradation of surfactant compounds contributes biochemical oxygen demand (BOD) and chemical oxygen demand (COD) thus reducing dissolved oxygen available for aquatic life (Pak 2000 in Oknich 2002; Ojo & Oso, 2009). The New Zealand Water and Waste Association state that the degradation of one litre of wash water containing detergent requires the oxygen from 70 litres of river, lake or sea water (NZWWA, 2006).
Waterways Centre for Freshwater Management University of Canterbury & Lincoln University Private Bag 4800 Christchurch New Zealand
Phone +64 3 364 2330 Fax: +64 3 364 2365
www.waterways.ac.nz