gepco sop 2020-21 2024-25.pdf - nepra
TRANSCRIPT
V
L
C4''. )i tw'
- /Y) &t/ c-A
.-
(Muhammad Ayub) Chief Executive Officer Ci 7
GUJRANWALA ELECTRIC POWER COMPANY LTD.
0rect: 055- 9200507 PABX :055-9200519-26/201 FAX :055-9200122
No GEPCO/CEO/FD/3V
Office of the Chief Executive Officer
GEPCO Ltd., 565-A Model Town 0.1. Road, Gujranwala.
Dated:
The Registrar, National Electric Power Regulatory Authority, NEPRA Tower, Ataturk Avenue, G-5/1, islama bad
SUBJECT:- Multi -Year Tariff Petition In Respect Of GEPCO Power Supply Business For The FY 2020-2 Ito FY 2024-25 For Determinaton Of Consumer End Tariff Alonq With Annual Revenue Requirement For The FY 2020-21 to FY 2024-25.
1. Enclosed please find herewith the GEPCO Power Supply Business
Tariff Petition pertaining to the FY 2020-21 to FY 2024-25 along with
Annual Revenue Requrement in rescect o Guiran\vala Electric Power Company Umitea (GEPCG), Guranwoia.
2. t is req uestea that subjecied petition may please be admitted, the
petitioner may be given an opportunity for hearing and "The
Consumer End Tariff" may kindly be determined as per petitioner's pray in the instant tariff petition.
DA: 677L
1. Cheque for Petition Fee bearing No.-------------------------(BOP Trust Plaza Gujranwaia) Dated-3d 4 amounting to Rs. after withholding of income tax @ ... % of gross amounting to Rs )/2l k
2. AsperAnnex- to
0
0
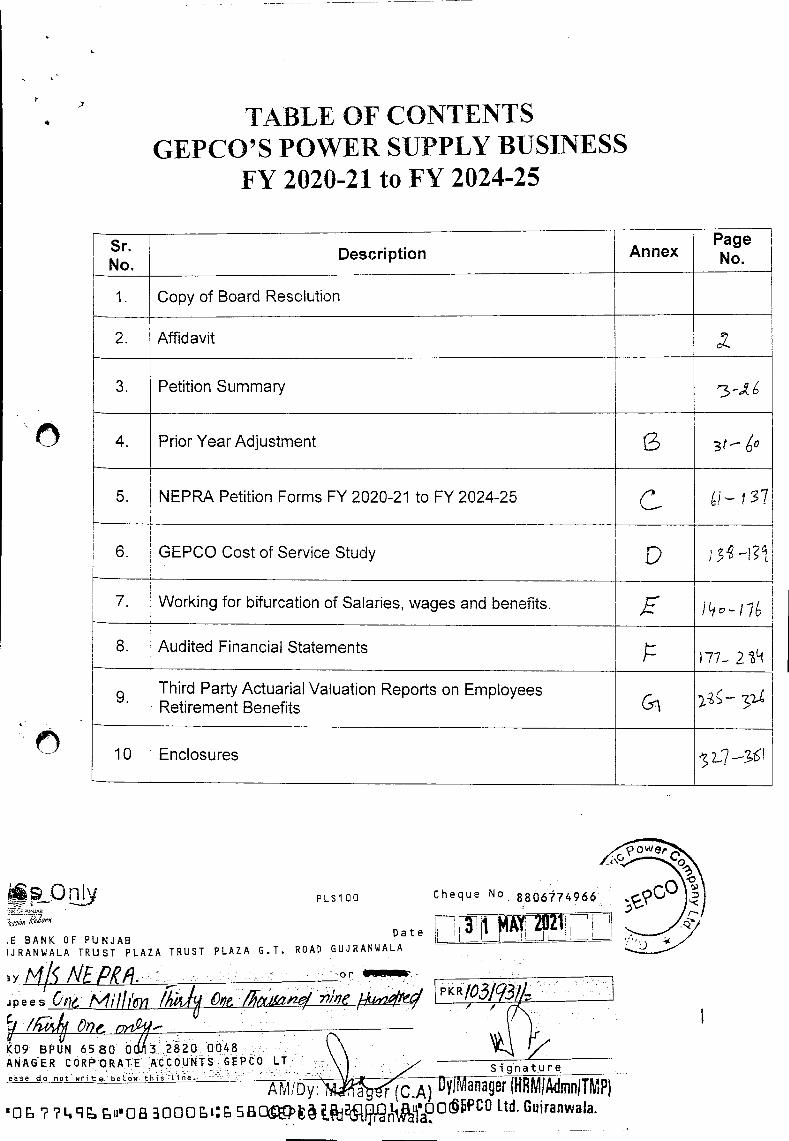
Sr. LNo.
Description Annex Page No.
1. Copy of Board Resolution
2. L
Affidavit
3. Petition Summary
4. Prior Year Adjustment 3t- o
5. NEPRA Petition Forms FY 2020-21 to FY 2024-25 1 7
6. GEPCO Cost of Service Study V ) 2
7. Working for bifurcation of Salaries, wages and benefits. i L - /
8. Audited Financial Statements 177- 2i
Third Party Actuarial Valuation Reports on Employees Retirement Benefits 2
10 Enclosures
4 TABLE OF CONTENTS GEPCO'S POWER SUPPLY BUSINESS
FY 2020-21 to FY 2024-25
Qrjy PLS1 00
zS'
E BANK OF PUNJAB IJRANtALA TRUST PLAZA TRUST PLAZA G.T. ROAD GUJRANWALA
Cheque No 8806774966
Date -
t'1Lc NEPP'P ipees &t
E, /ch 2?7.
-or L..-_-
PKR103/'3
/ K09 BPUN 65 80 od.3.282O 0048 ANAGER CORPORATE ACCOUI'4TS GEPCO LI
ease do not wrte below thitie. -
A tvll Dy :M'ic .A DylManager 1RRM-JMninjTMP ? 7L, "o 3000: SO Ltd. Gujranwaja.
Signature
1JI H U 1i II L.00ZO
uhammad Ayub, Chief Executive Officer Gujranwala Electric Power
AFFIDAVIT
Company Limited (Distribution License No. 4/DL/2002 dated 23rd April 2002)
being duly authorized representative /attorney of Gujranwala Electric Power
Company Limited (GEPCO), 565-A Model Town, Gujranwala, Pakistan,
hereby solemnly affirm and declare that the contents of the accompanying
Multi-Year Tariff Petition of GEPCO Power Supply Business along with Annual
Revenue Requirement for the FY 2020-21to FY 2024-25 for determination of
Consumer- End tariff vide application No. CEO/GEPCO/3 DatedJ-
including all supporting documents are true and correct to the best of my
knowledge and belief that nothing has been concealed. I also affirm that all
further documentation and information to be provided by me in connection
with the accompanying petition shall be true to the best of my knowledge
and belief.
Deponent
(Muhammad Ayub) Chief Executive Officer
MULTI YEAR TARIFF PETITION
FOR THE DETERMINATION OF TARIFF
ALONG WITH REVENUE REQUIREMENT
GEPCO'S POWER SUPPLY BUSINESS
PERTAINING TO: FINANCIAL YEAR 2020-21 TO 2024-25
GUJRANWALA ELECTRIC POWER COMPANY LIMITED
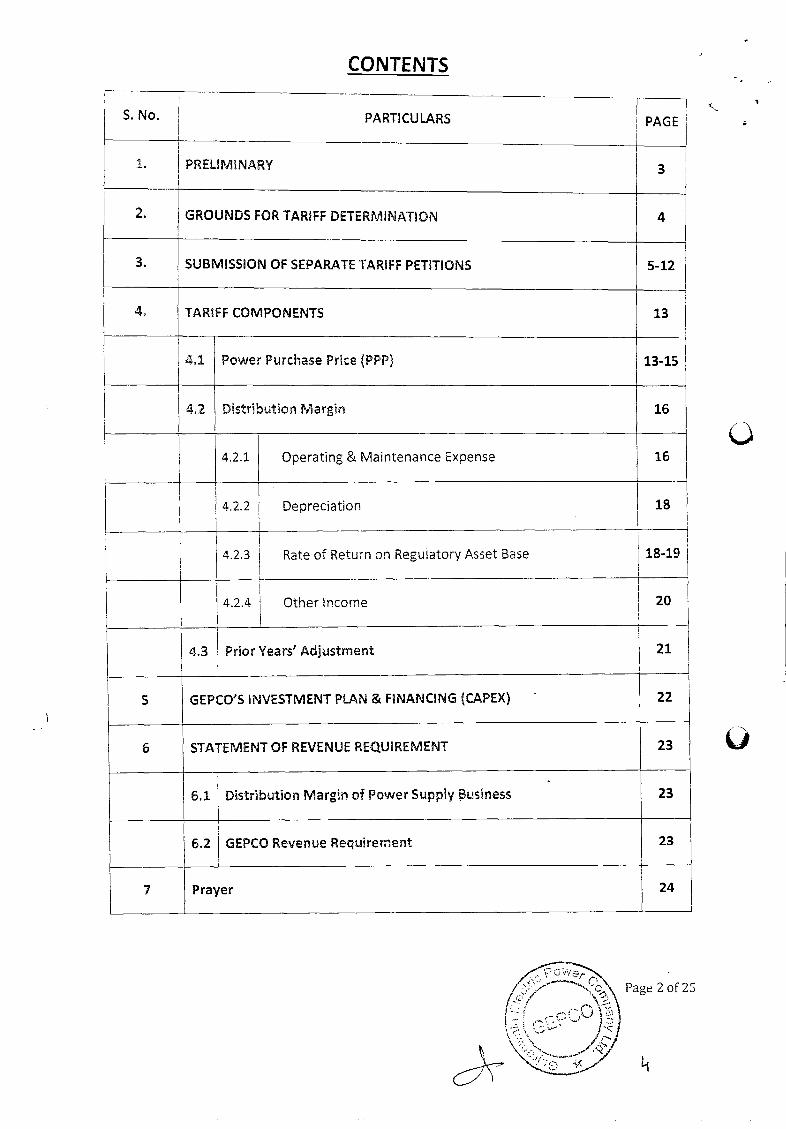
CONTENTS
S. No. PARTICULARS PAGE
1. PRELIMiNARY 3
2. GROUNDS FOR TARIFF DETERMINATION 4
3. SUBMISSION OF SEPARATE TARIFF PETiTIONS 5-12
4. TARIFF COMPONENTS 13
4.1 Power Purchase Price (PPP) 13-15
4.2 Distribution Margin 16
4.2.1 Operating & Maintenance Expense 16
4.2.2 Depreciation 18
4.2.3 Rate of Return on Regulatory Asset Base 18-19
4.2.4 Other Income 20
4.3 Prior Years' Adjustment 21
5 GEPCO'S INVESTMENT PLAN & FINANCING (CAPEX) 22
6 STATEMENT OF REVENUE REQUIREMENT 23
6.1 Distribution Margin of Power Supply usiness 23
6.2 GEPCO Revenue Requirement 23
7 Prayer 24
Page 3 of 25
E3FORE THE NATIONA ELECTRIC POWER
REGULATORYAUTHCRiTY NEPRA), iSLAMABAD.
PETITION FOR THE DETERMINATION OF TARIFF ALONG WITH
REVENUE REQUIREMENT OF 4'GEPCO'S POWER SUPPLY BUSINESS" FOR FY 2020-21 TO 2024-2025
RE: GUJRANWALA ELECTRIC POWERCOMPANY LIMITED
PETITION UNDER RULE 3 AND RULE 4 (7) OF NEPRA (TARIFF STANDARDS AND
PROCEDURE) RULES, 1998 READ WITH SECTION 7 (3) (a) AND SECTiON 31 OF THE
REGULATION OF GENERATION, TRANSMISSION AND DISTRIBUTION OF ELECTRIC
POWER ACT, 1997 AMENDED VIDE THE REGULATION OF GENERATION, TRANSMISSION
AND DISTRIBUTION OF ELECTRIC POWER (AMENDMENT) ACT, 2018 AND ALL OTHER
ENABLING PROVISIONS AND GUIDELINES
Respectfully Sheweth: -
1. PRELIMINARY:
Gujranwala Electric Power Company Limited (GEPCO) is a power distribution
licensee pursuant to Distribution License No.04/DL/2002 dated 23 April 2002
granted by National Electric Power Regulatory Authority (NEPRA) under the
National Electric Power Regulatory Authority Licensing (Distribution) Rules, 1991,
(the "Licensing Rules").
Moreover, under Section 23E of NEPRA (Amendment) Act, 2018 GEPCO has been
deemed to hold the license of "Power Supply Business" for a period of 5 years up
to May 01, 2023.
In view of the foregoing, this separate Petition for GEPCO's Power Supply
Business is being submitted by the Petitioner through Mr. Muhammad Ayub, its
Chief Executive Officer who has been duly authorized by its Board of Directors
vide Minutes of Meeting No. 1 dated o 1— o— k . A certified true copy
of the Board authorization is attached as Annex- to this Petition.
The details of the Petitioner are:
1.1 Name and Address:
Gujranwala Electric Power Company Limited.
565-A Model Town, Gujranwala
Page 4 of 25
6
1.2 Representatives of GEPCO:
(I) Muhammad Ayub, Chief Executive Officer
(ii) lyaz Ahmad-FCA, Chief Financial Officer
(iii) Muhammad Akram, General Manager (Tech. Director)
(iv) Muhammad Latif, General Manager (Operation)
(v) Muhammad Siddique Malik Addl. DG (Legal &Labor)
(vi) Fazal Masud, Chief Engr. (Dev)
(vii) Aziz ur Rehman, Customer Services Director
(viii) Ahmed Fawad, Chief Engr. (P&E)/ (O&M/Distr.)
(ix) llyas Ghumman Chief Engr.(T&G)
2. GROUNDS FOR TARIFF PETITION:
Under the Amended Regulation Act, 2018, the National Electric Power Regulatory
Authority (the "Authority" and/or "NEPRA") is responsible for determining tariffs
and other terms and conditions for the supply of electricity by the generation,
transmission and distribution companies and to recommend these to the Federal
Government, subject to the need to comply with guidelines, not inconsistent with
the Amended Regulation Act, 2018, laid down by the Federal Government.
NEPRA is also responsible for determining the process and procedures for
reviewing tariffs and recommending tariff adjustments.
The Petitioner being a vibrant Distribution & Power Supply Licensee requires
adequate funding in order to perform its obligatory duties prescribed by the
Authority, under the Amended Regulation Act, 2018, NEPRA Performance
Standards (Distribution) Rules 2005, NEPRA Consumer Eligibility Criteria 2003,
the Distribution License of GEPCO and other obligations as determined by NEPRA
from time to time. The only source of funding available with the Petitioner's
Power Supply Business is adequate revenue through tariff. GEPCO s' Tariff for its
Power Supply Business is a very important component of its cost recovery in
order to pay its prudent costs on regular basis to ensure continuous flow of
power to end consumers.
NEPRA through GEPCO Tariff Determination FY 2019-20 has directed the
petitioner to file Multi Year Tariff Petition for the period of five years to avoid any
delay in tariff determinations and accordingly in compliance to the aforesaid
direction, the instant Tariff Petition is being filed for a tariff control period of five
years i.e. FY 2020-2 1 to FY 2024-25 with base year 2019-20 and test year as 2020-
21.
6
3. SUBMISSION OF SEPARATE TARIFF PETITIONS:
After amendments in NEPRA Act, 1997, GEPCO has to submit separate Tariff
Petitions for each licensed activity, i.e. Distribution Business and Power Supply
Business as discussed earlier. Accordingly, GEPCO is required to obtain separate
tariffs for each licensed activity i.e. Power Supply (performing the function of sale
of electric power) under Section 23E and Distribution (ownership, operation,
management or control of distribution facilities for the movement or delivery to
consumers of electric power) under Section 20 of NEPRA (Amendment) Act,
2018.
Complying with aforesaid, GEPCO submitted to NEPRA Separate Tariff Petitions
for its Power Supply Business and Distribution Business for the FY 2018-19 &
2019-20 in the light of consultative session of NEPRA with all DISCOs for filing of
tariff petitions in accordance with NEPRA (Amendment) Act, 2018 and the NEPRA
Templates and Guidelines.
GEPCO in Tariff Petition FY 2019-20, submitted to the Authority all the detailed
calculations based on Audited Figures of FY 2018-19 for allocation of costs into
Power Supply & Distribution Business. The Authority in the determination
accepted by endorsing the basis used by GEPCO for bifurcation of costs into
Power Supply and Distribution Business and accordingly made cost allocations to
both businesses.
Now, in the instant tariff petition, the audited figures of FY 2019-20 are being
used for projections and apportionment of projected costs into Power Supply &
Distribution Business are being made on the same basis as accepted by NEPRA.
However, the basis used by GEPCO for apportionment of costs into Distribution
and Power Supply Business are based on the Audited Figures for the year 2018-
19 as elaborated below:
3.1 BAS1S FOR APPORTIONMENT OF COSTS:
3.1.1 Power Purchase Price:
Distribution Business = NIL
Power Supply Business = 100%
Being Pass Through hence, nothing allocated to GEPCO's
Distribution Business and entire Power Purchase Price allocated to
the GEPCO's Power Supply Business.
PageS of 25
-7
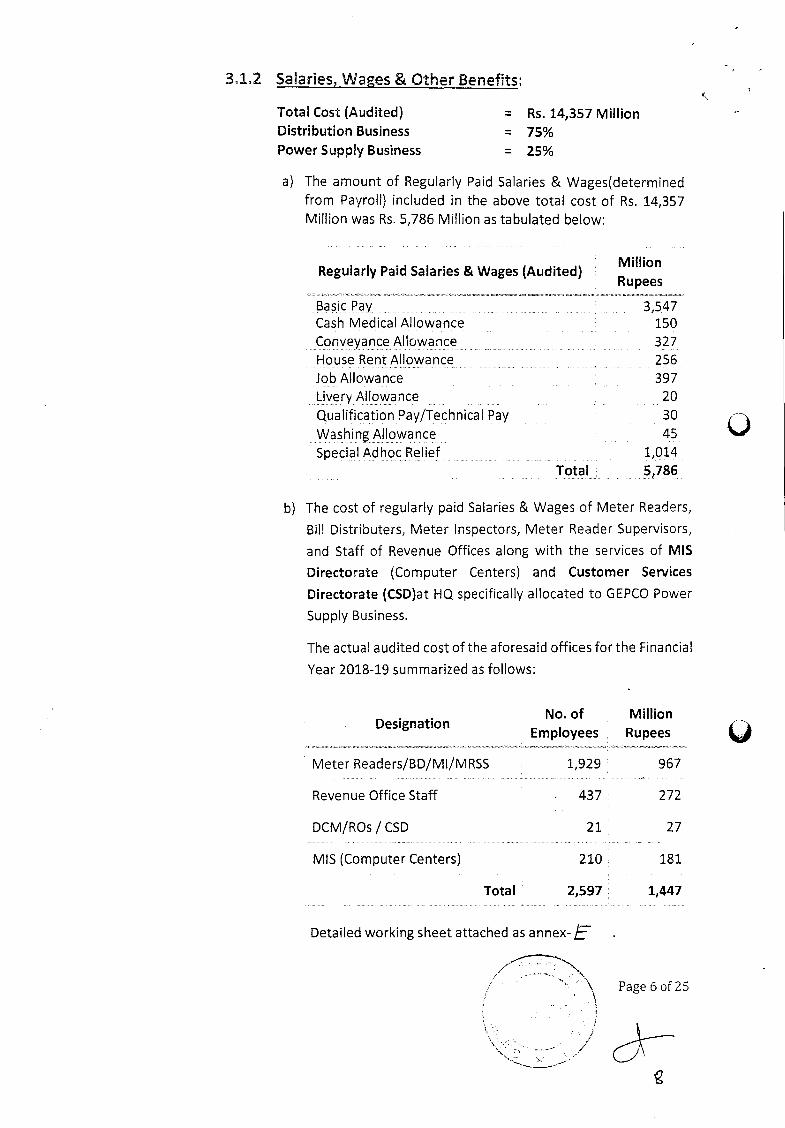
3,1.2 Salaries, Wages & Other Benefits:
Total Cost (Audited) = Distribution Business = Power Supply Business =
Rs. 14,357 Million
75%
25%
a) The amount of Regularly Paid Salaries & Wages(determined
from Payroll) included in the above total cost of Rs. 14,357
Million was Rs. 5,786 Million as tabulated below:
Basic Pay Cash Medical Allowance
Conveyance Allowance
House Rent Allowance
Job Allowance
Livery Allowance
Qualification Pay/Technical Pay
Washing Allowance
Special Ad hoc Relief
Million
Rupees
3,547 150
327
256
397
20
30
45
1,014
Total 5,786
Regularly Paid Salaries & Wages (Audited)
b) The cost of regularly paid Salaries & Wages of Meter Readers,
Bill Distributers, Meter Inspectors, Meter Reader Supervisors,
and Staff of Revenue Offices along with the services of MIS
Directorate (Computer Centers) and Customer Services
Directorate (CSD)at HQ specifically allocated to GEPCO Power
Supply Business.
The actual audited cost of the aforesaid offices for the Financial
Year 2018-19 summarized as follows:
Designation No. of
Employees
Million
Rupees
Meter Readers/BD/Ml/MRSS 1,929 967
Revenue Office Staff 437 272
DCM/ROs / CSD 21 27
MIS (Computer Centers) 210 181
Total 2,597 1,447
Detailed working sheet attached as annex-
Page 6 of 25
c) The total number of GEPCO's employees = 12,256
% of employees of Power Supply = 2,597/12,256 = 21%
% of employees of Distribution Business = 79%
The total cost of GEPCO's employees 5,786 Million
% of cost of employees of Power Supply = 1,447/ 5,786 = 25%
% of cost of employees of Distribution Business = 75%
In view of the above, the following uniform principle
established and adopted for apportionment of costs:
"Specific Identifiable Costs relating to Distribution Business
to be taken at actual rupee value whereas, Other Common
Costs* to be apportioned on the basis of 75% (worked out as
above)." *These costs pertain to the services of GEPCO Head Quarter staff including HR Directorate, GEPCO Regional Training Centre, Internal Audit, and Finance Directorate.
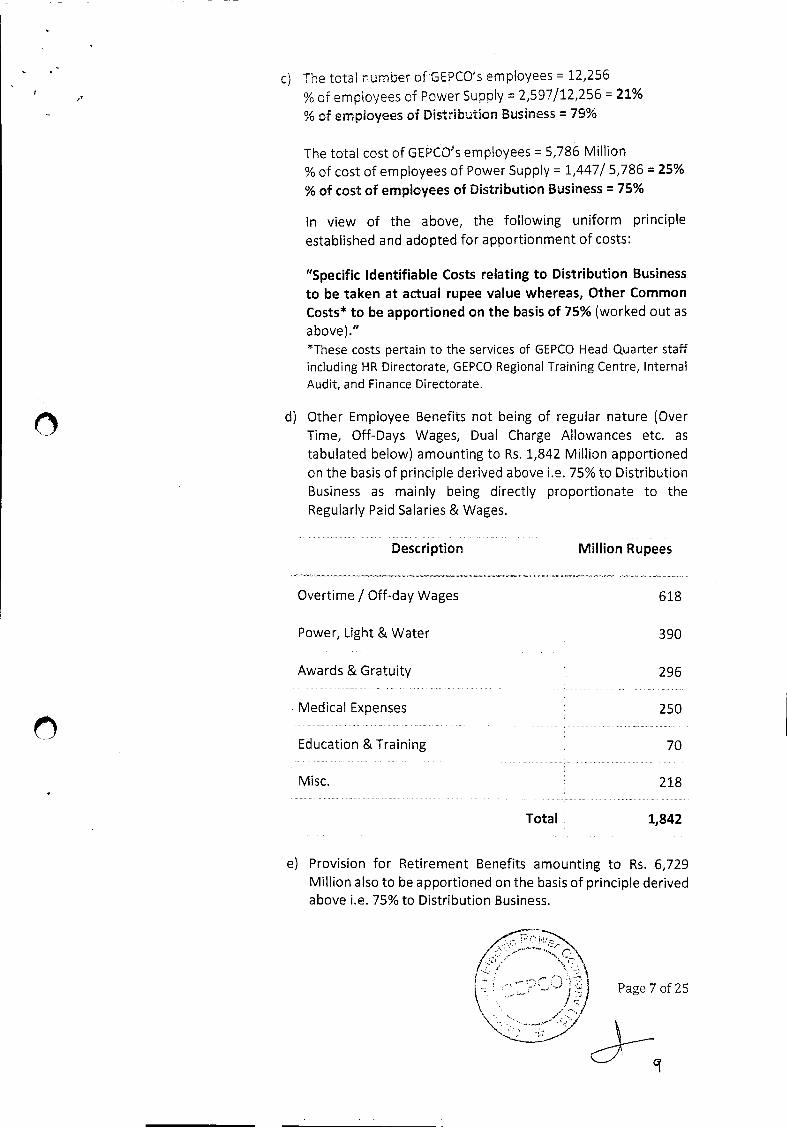
d) Other Employee Benefits not being of regular nature (Over
Time, Off-Days Wages, Dual Charge Allowances etc. as
tabulated below) amounting to Rs. 1,842 Million apportioned
on the basis of principle derived above i.e. 75% to Distribution
Business as mainly being directly proportionate to the
Regularly Paid Salaries & Wages.
Description Million Rupees
Overtime I Off-day Wages 618
Power, Light & Water 390
Awards & Gratuity 296
Medical Expenses 250
Education & Training 70
Misc. 218
Total 1,842
e) Provision for Retirement Benefits amounting to Rs. 6,729
Million also to be apportioned on the basis of principle derived above i.e. 75% to Distribution Business.
3.1.3 Travelling Expenses:
Distribution Business = 75% Power Supply Business = 25%
Travelling Expenses apportioned on the basis of principle derived
at Para 3.1.2 (c) above i.e. 75% to Distribution Business because
being paid on the basis of BPS having direct proportionate
relationship to the employees' regularly paid salaries & wages.
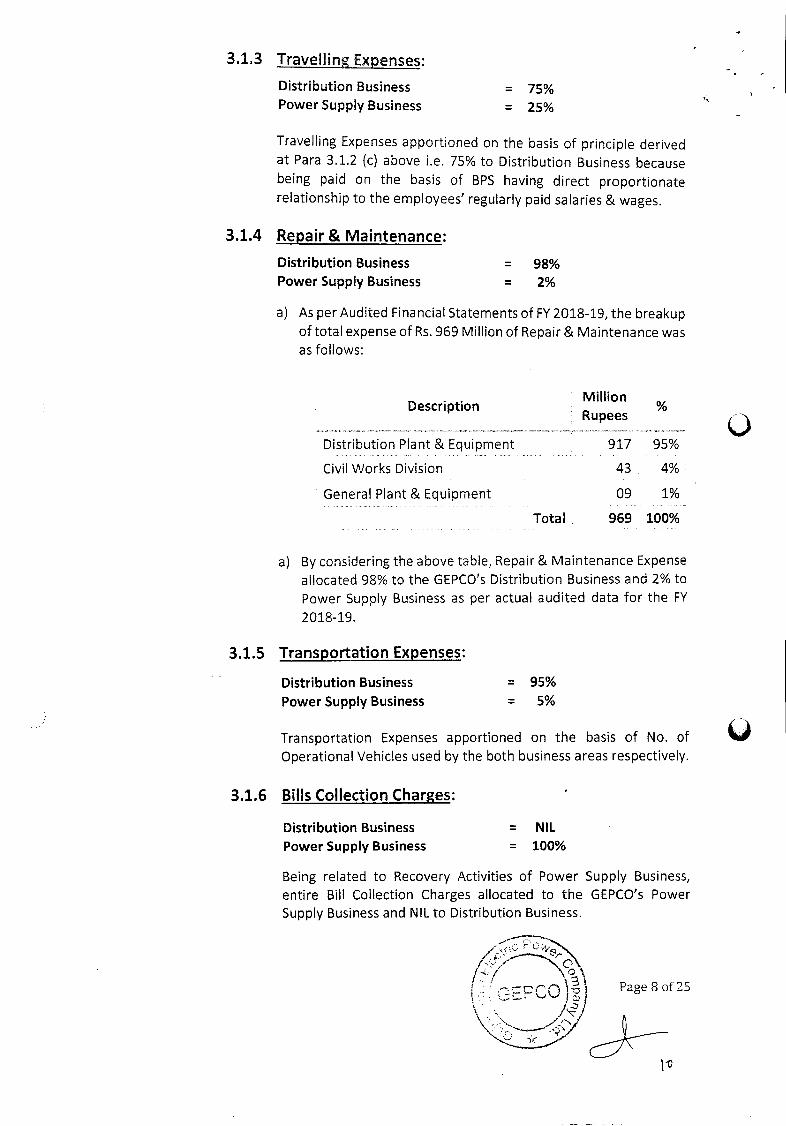
3.1.4 Repair & Maintenance:
Distribution Business = 98% Power Supply Business = 2%
a) As per Audited Financial Statements of FY 2018-19, the breakup
of total expense of Rs. 969 Million of Repair & Maintenance was
as follows:
Description
Distribution Plant & Equipment
Civil Works Division
General Plant & Equipment
Million
Rupees
917 95%
43 4%
09 1%
Total 969 100%
%
a) By considering the above table, Repair & Maintenance Expense
allocated 98% to the GEPCO's Distribution Business and 2% to
Power Supply Business as per actual audited data for the FY
2018-19.
3.1.5 Transportation Expenses:
Distribution Business = 95%
Power Supply Business = 5%
Transportation Expenses apportioned on the basis of No. of
Operational Vehicles used by the both business areas respectively.
3.1.6 Bills Collection Charges:
Distribution Business = NIL
Power Supply Business = 100%
Being related to Recovery Activities of Power Supply Business,
entire Bill Collection Charges allocated to the GEPCO's Power
Supply Business and NIL to Distribution Business.
10
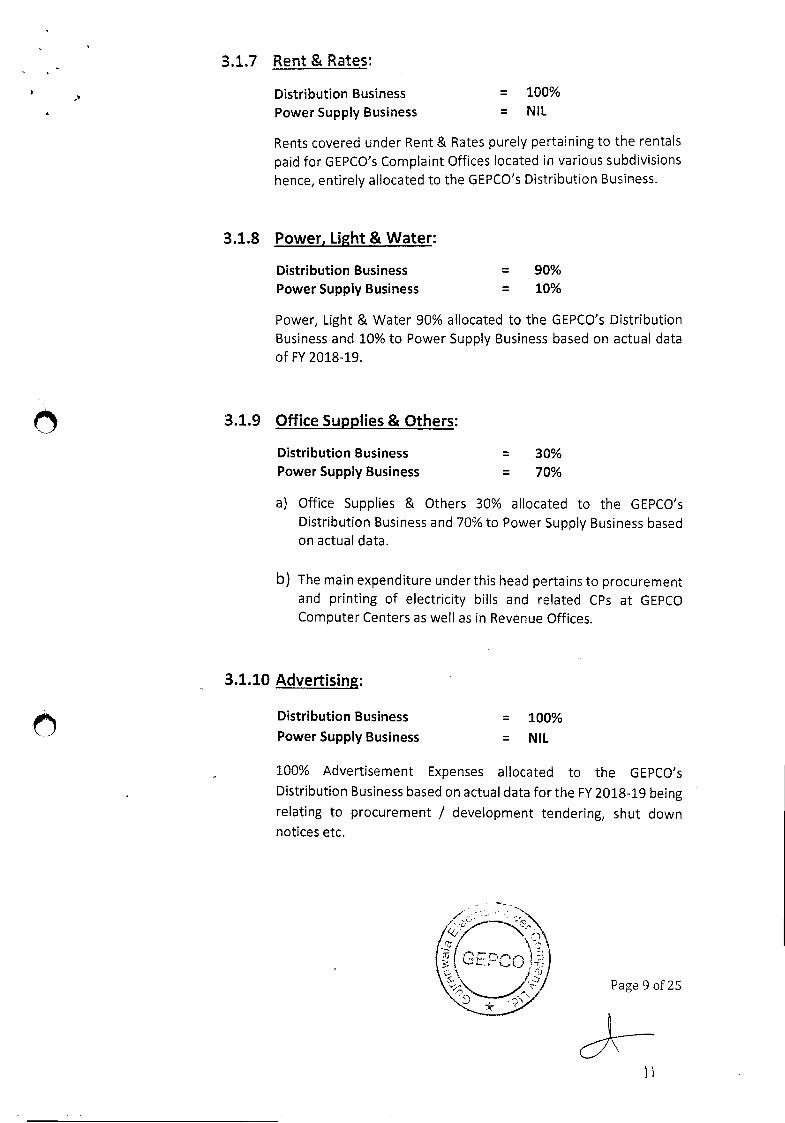
3.1.7 Rent & Rates:
Distribution Business = 100%
Power Supply Business = NIL
Rents covered under Rent & Rates purely pertaining to the rentals
paid for GEPCO's Complaint Offices located in various subdivisions
hence, entirely allocated to the GEPCO's Distribution Business.
3.1.8 Power, Light & Water:
Distribution Business = 90%
Power Supply Business = 10%
Power, Light & Water 90% allocated to the GEPCO's Distribution
Business and 10% to Power Supply Business based on actual data
of FY 20 18-19.
3.1.9 Office Supplies & Others:
Distribution Business = 30%
Power Supply Business = 70%
a) Office Supplies & Others 30% allocated to the GEPCO's
Distribution Business and 70% to Power Supply Business based
on actual data.
b) The main expenditure under this head pertains to procurement
and printing of electricity bills and related CPs at GEPCO
Computer Centers as well as in Revenue Offices.
3.1.10 Advertising:
Distribution Business = 100%
Power Supply Business = NIL
100% Advertisement Expenses allocated to the GEPCO's
Distribution Business based on actual data for the FY 2018-19 being
relating to procurement / development tendering, shut down
notices etc.
Page 9 of 25
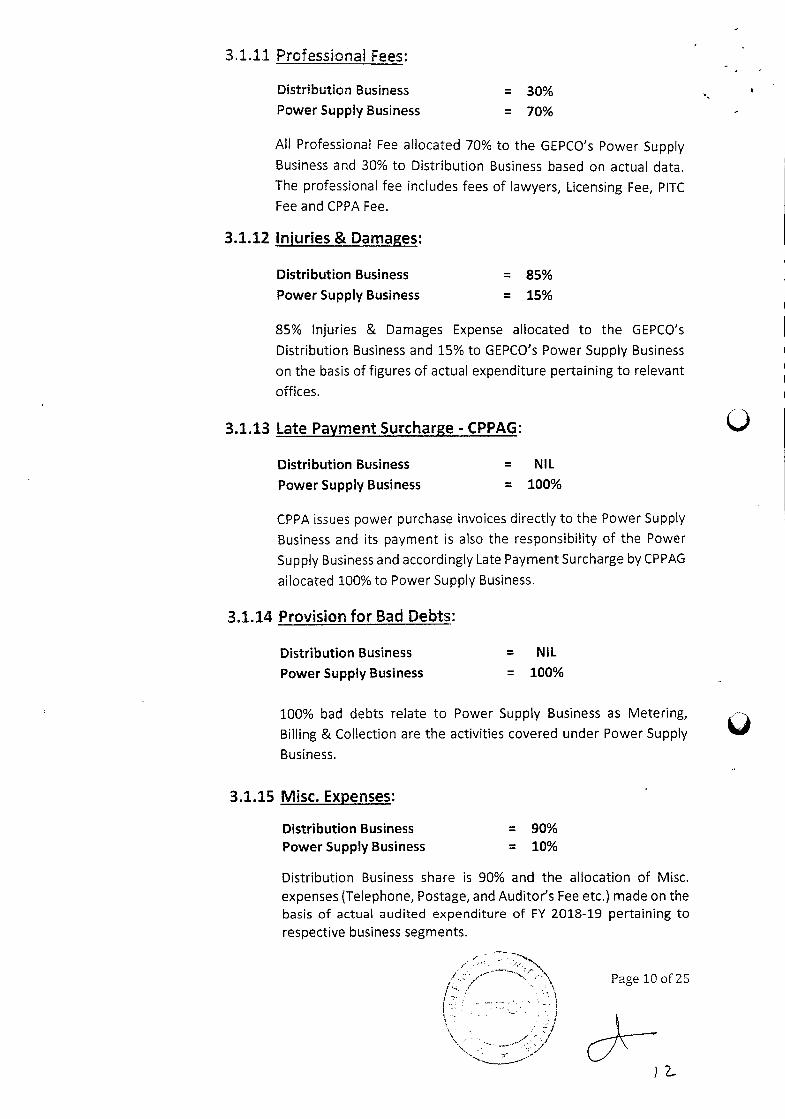
3.li.1 Professionai Fees:
Distribution Business = 30%
Power Supply Business = 70%
All Professional Fee allocated 70% to the GEPCO's Power Supply
Business and 30% to Distribution Business based on actual data.
The professional fee includes fees of lawyers, Licensing Fee, PlTC
Fee and CPPA Fee.
3.1.12 Injuries & Damages:
Distribution Business = 85% Power Supply Business = 15%
85% Injuries & Damages Expense allocated to the GEPCO's
Distribution Business and 15% to GEPCO's Power Supply Business
on the basis of figures of actual expenditure pertaining to relevant
offices.
3.1.13 Late Payment Surcharge - CPPAG:
Distribution Business = NIL
Power Supply Business = 100%
CPPA issues power purchase invoices directly to the Power Supply
Business and its payment is also the responsibility of the Power
Supply Business and accordingly Late Payment Surcharge by CPPAG
allocated 100% to Power Supply Business.
3.1.14 Provision for Bad Debts:
Distribution Business = NIL
Power Supply Business = 100%
100% bad debts relate to Power Supply Business as Metering,
Billing & Collection are the activities covered under Power Supply
Business.
3.1.15 Misc. Expenses:
Distribution Business = 90%
Power Supply Business = 10%
Distribution Business share is 90% and the allocation of Misc.
expenses (Telephone, Postage, and Auditor's Fee etc.) made on the basis of actual audited expenditure of FY 2018-19 pertaining to
respective business segments.
Page 10 of 25
r3
Page 11 of 25
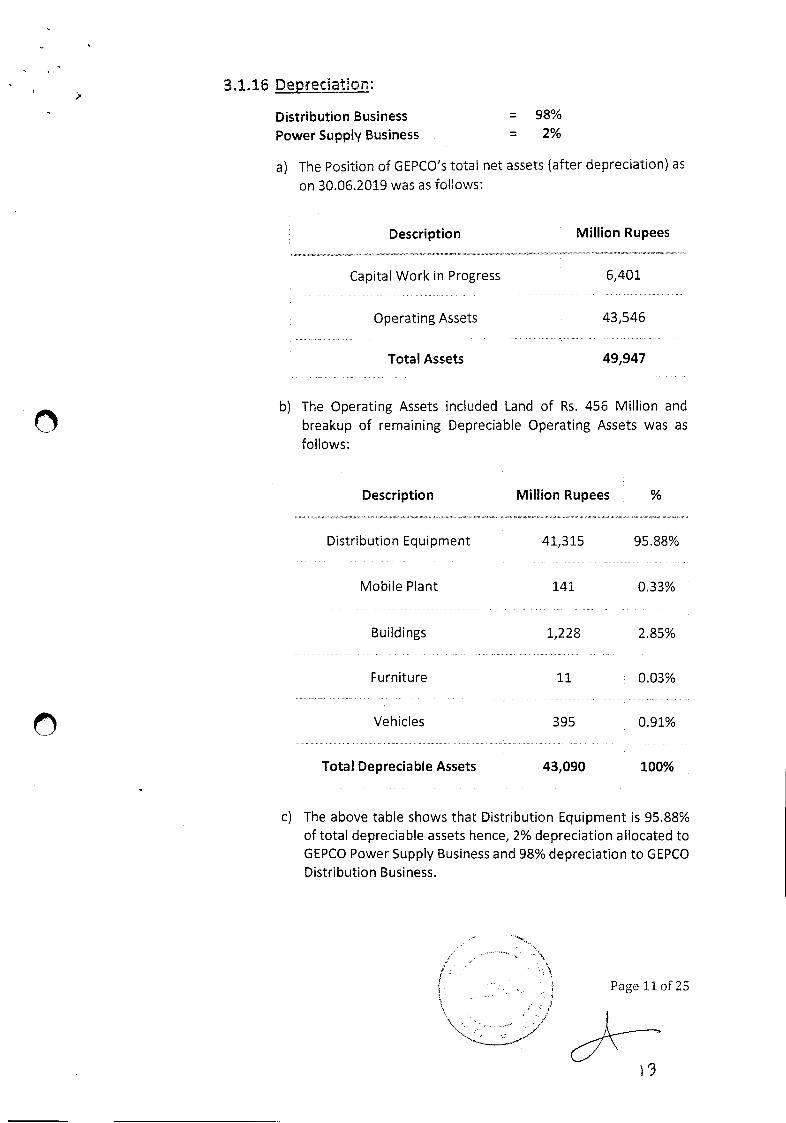
3.1.16 Depreciato•n:
Distribution Business = 98%
Power Supply Business = 2%
a) The Position of GEPCO's total net assets (after depreciation) as
on 30.06.2019 was as follows:
Description Million Rupees
Capital Work in Progress 6,401
Operating Assets 43,546
Total Assets 49,947
b) The Operating Assets included Land of Rs. 456 Million and
breakup of remaining Depreciable Operating Assets was as
follows:
Description Million Rupees %
Distribution Equipment 41,315 95.88%
Mobile Plant 141 0.33%
Buildings 1,228 2.85%
Furniture 11 0.03%
Vehicles 395 0.91%
Total Depreciable Assets 43,090 100%
c) The above table shows that Distribution Equipment is 95.88%
of total depreciable assets hence, 2% depreciation allocated to
GEPCO Power Supply Business and 98% depreciation to GEPCO
Distribution Business.
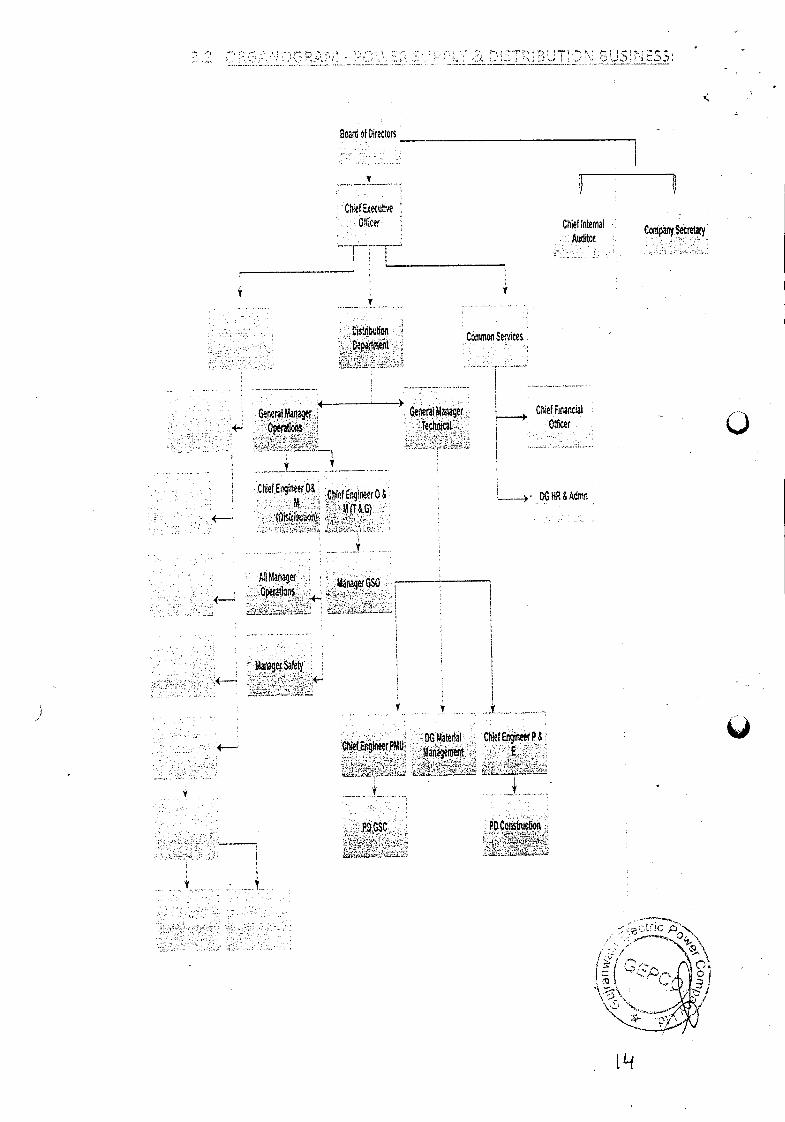
V 'V
thfEogineer.O& Chree(O&
- M. .: •.
'V
Distbufion. artm
Ci mm erofces
• AtManaer Ope1tion .
Maiager.Saféty -.
V
UGUäteral • • chietEnyineerP& Manament E;.
PD Construction
V
GerraI Manager Technical.
Chief Financial Oflker
_----* DCHR&Admn
-[Lf
N US
c
Soard of Directors
Checotive O(er Chef Internat Company Seretary
Page 13 of 25
4. TARIFF COMPONENTS:
As per the NEPRA Determination of Consumer-end-Tariff (Methodology & Process)
Guidelines, 2015, the Components of Tariff for GEPCO are as follows:
1) Power Purchase Price
2) Distribution Margin
3) Prior Year Adjustment (if any)
Each of the above components along with the apportionment of each component to
Power Supply Business is described hereunder:
4.1 Power Purchase Price:
The Power Purchase Price is a pass-through item and consists of the following four
components:
i. Energy Charges
ii. Variable Operating and Maintenance (O& M) Charges
iii. Capacity Charges
iv. NTDC Use of System Charges & CPPAG Market Operations Fee
This office vide letter No. 1250 dated 23-02-2021 requested CPPAG for the provision of Power
Purchase Price (PPP) Data and the CPPAG has provided projected GEPCO PPP for FY 2020-21
to 2024-25 vide its letter No. 6161-62 dated 22-03-2021 which is shown below.
However, as the units purchased of GEPCO for the FY 2020-21 during July-20 to April-21 are
on greater side than CPPAG projections, the units purchased and sold based on five percent
average growth for FY 2021-22 to 2024-25 have been considered in the instant tariff petition.
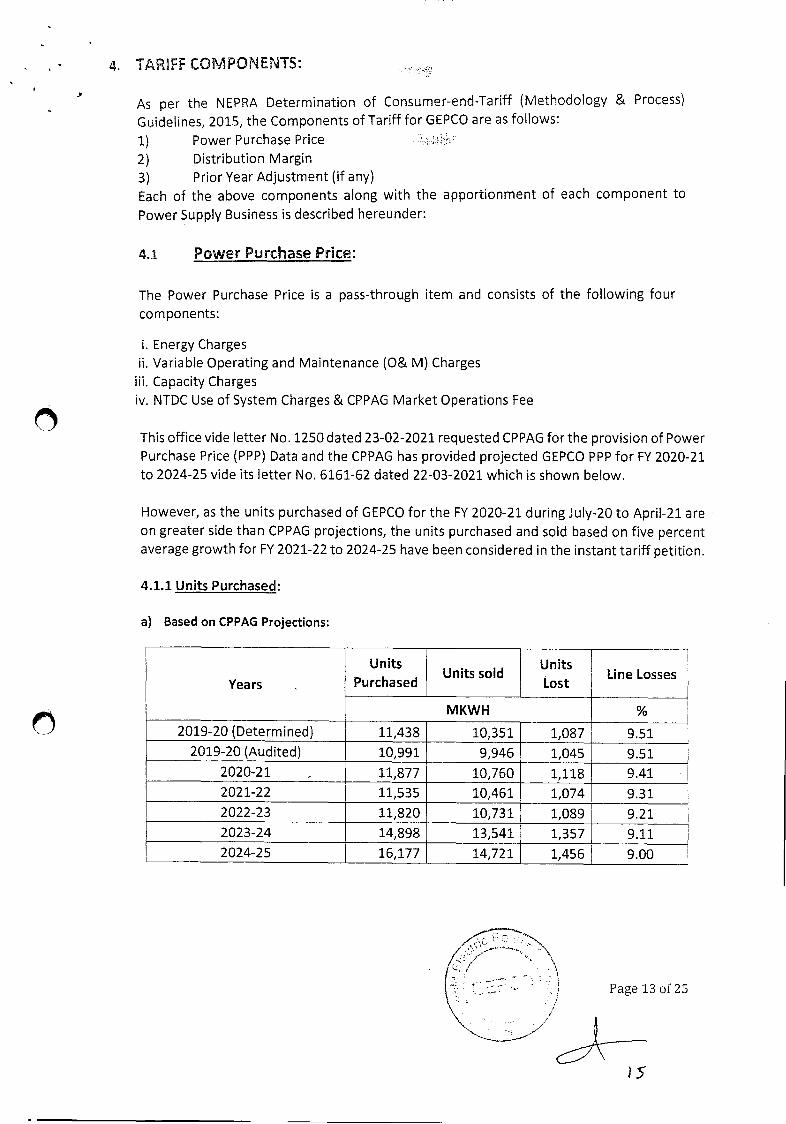
4.1.1 Units Purchased:
a) Based on CPPAG Projections:
Years
Units
Purchased
. Units sold
Units
Lost Line Losses
MKWH %
2019-20 (Determined) 11,438 10,351 1,087 9.51
2019-20 (Audited) 10,991 9,946 1,045 9.51
2020-21 11,877 10,760 1,118 9.41
2021-22 11,535 10,461 1,074 9.31
2022-23 11,820 10,731 1,089 9.21
2023-24 14,898 13,541 1,357 9.11
2024-25 16,177 14,721 1,456 9.00
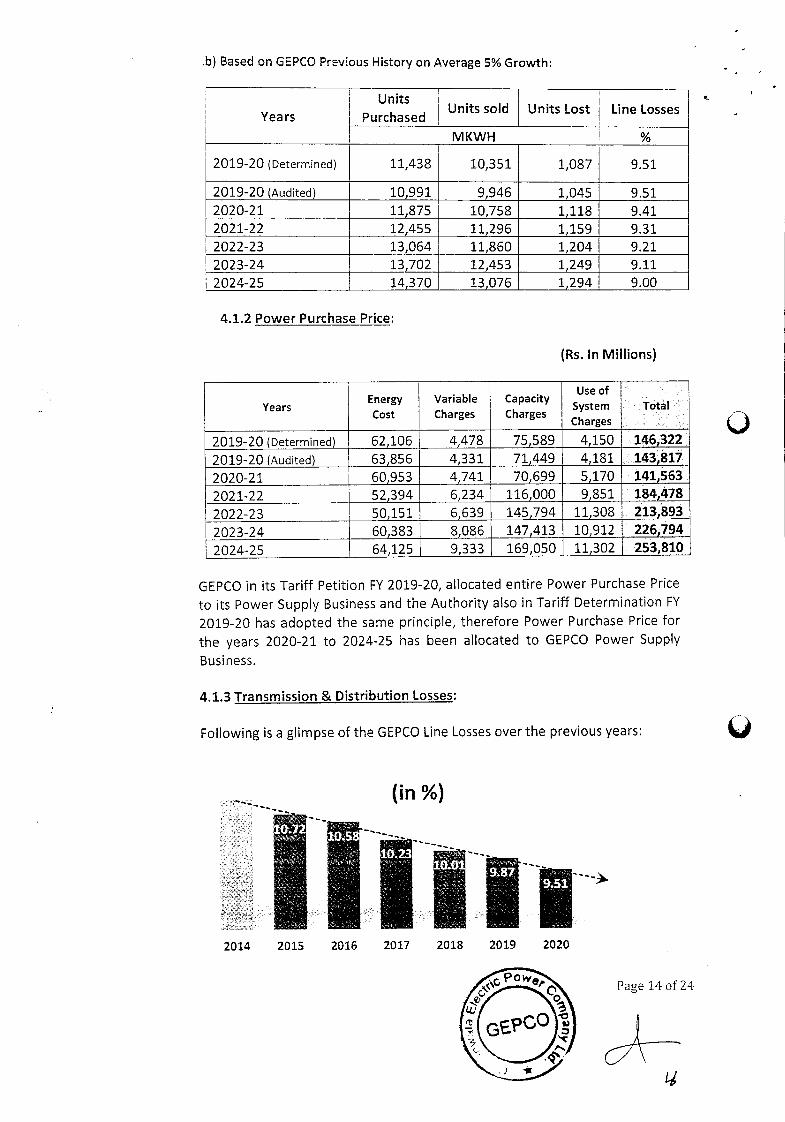
b) Based on GEPCO Previous History on Average 5% Growth:
Years Units
Purchased Units sold Units Lost Line Losses
MKWH %
2019-20 (Determined) 11,438 10,351 1,087 9.51
2019-20 (Audited) 10,991 9,946 1,045 9.51 2020-21 11,875 10,758 1,118 9.41 2021-22 12,455 11,296 1,159 9.31 2022-23 13,064 11,860 1,204 9.21 2023-24 13,702 12,453 1,249 9.11 2024-25 14,370 13,076 1,294 9.00
4.1.2 Power Purchase Price:
(Rs. In Millions)
Years Energy Cost
Variable Charges
Capacity Charges
Use of System Charges
Total
2019-20 (Determined) 62,106 4,478 75,589 4,150 146,322
2019-20 (Audited) 63,856 4,331 71,449 4,181 143,817
2020-21 60,953 4,741 70,699 5,170 141,563
2021-22 52,394 6,234 116,000 145,794
9,851 11,308
184,478 213,893 2022-23 50,151 6,639
2023-24 60,383 8,086 147,413 10,912 226,794
2024-25 64,125 9,333 169,050 11,302 253,810
GEPCO in its Tariff Petition FY 2019-20, allocated entire Power Purchase Price to its Power Supply Business and the Authority also in Tariff Determination FY
2019-20 has adopted the same principle, therefore Power Purchase Price for
the years 2020-21 to 2024-25 has been allocated to GEPCO Power Supply
Business.
4.1.3 Transmission & Distribution Losses:
Following is a glimpse of the GEPCO Line Losses over the previous years:
2014 2015 2016 2017 2018 2019 2020
Page 14 of 24
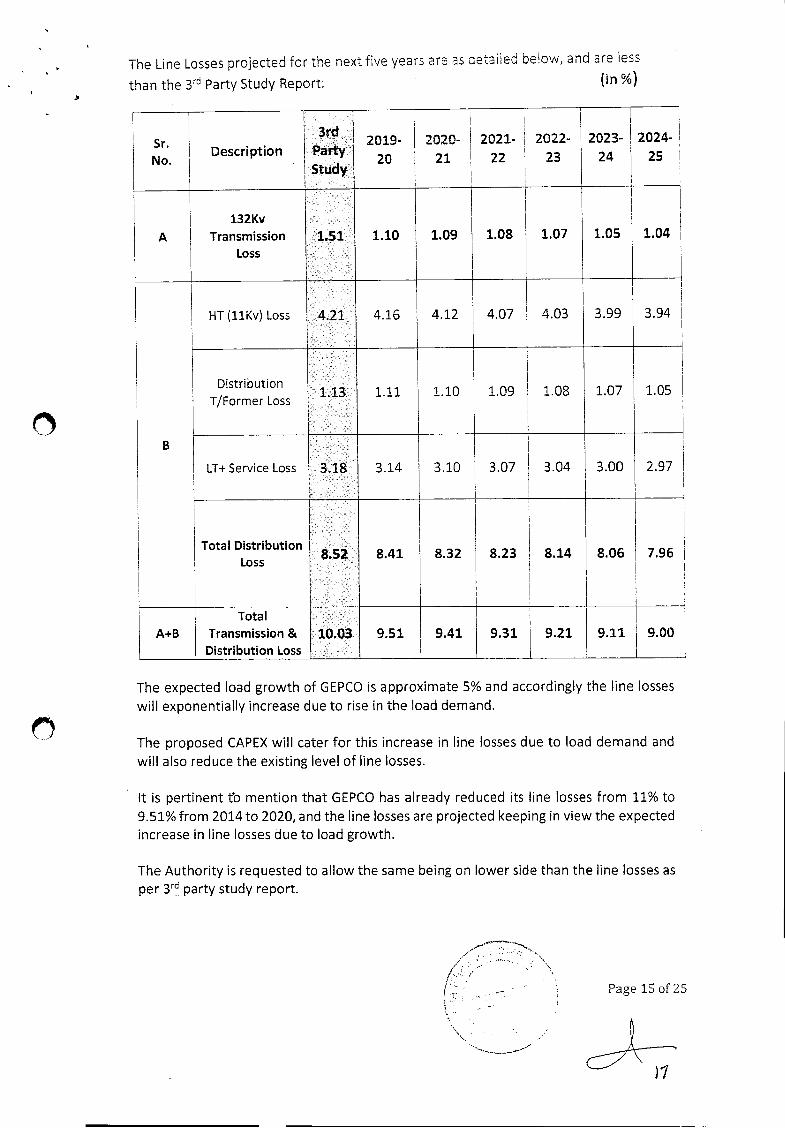
The Line Losses projected for the next five years are as detailed below, and are less
than the 3 Party Study Report: (In %)
Sr. No.
. Description
3rd Party Study
2019- 20
2020- 21
2021- 22
2022- 23
2023- 24
2024-
25
A 132Kv
Transmission Loss
1.51 1.10 1.09 1.08 1.07 1.05 1.04
B
HT (11Kv) Loss 4.21 4.16 4.12 4.07 4.03 3.99 3.94
Distribution T/Former Loss
1.13 1.11 1.10 1.09 1.08 1.07 1.05
LT+ Service Loss 3.18 3.14 3.10 3.07 3.04 3.00 2.97
Total Distribution Loss 8.52 8.41 8.32 8.23 8.14 8.06 7.96
A+B Total
Transmission & Distribution Loss
10.03 9.51 9.41 9.31 9.21 9.11 9.00
The expected load growth of GEPCO is approximate 5% and accordingly the line losses
will exponentially increase due to rise in the load demand.
The proposed CAPEX will cater for this increase in line losses due to load demand and
will also reduce the existing level of line losses.
It is pertinent to mention that GEPCO has already reduced its line losses from 11% to
9.51% from 2014 to 2020, and the line losses are projected keeping in view the expected
increase in line losses due to load growth.
The Authority is requested to allow the same being on lower side than the line losses as
per 3 party study report.
Page 15 of 25
42 Distribution Margin:
The Distribution Margin consists of Operating & Maintenance (0 & M) Expense, t
Depreciation, Return on Rate Base and Other Income.
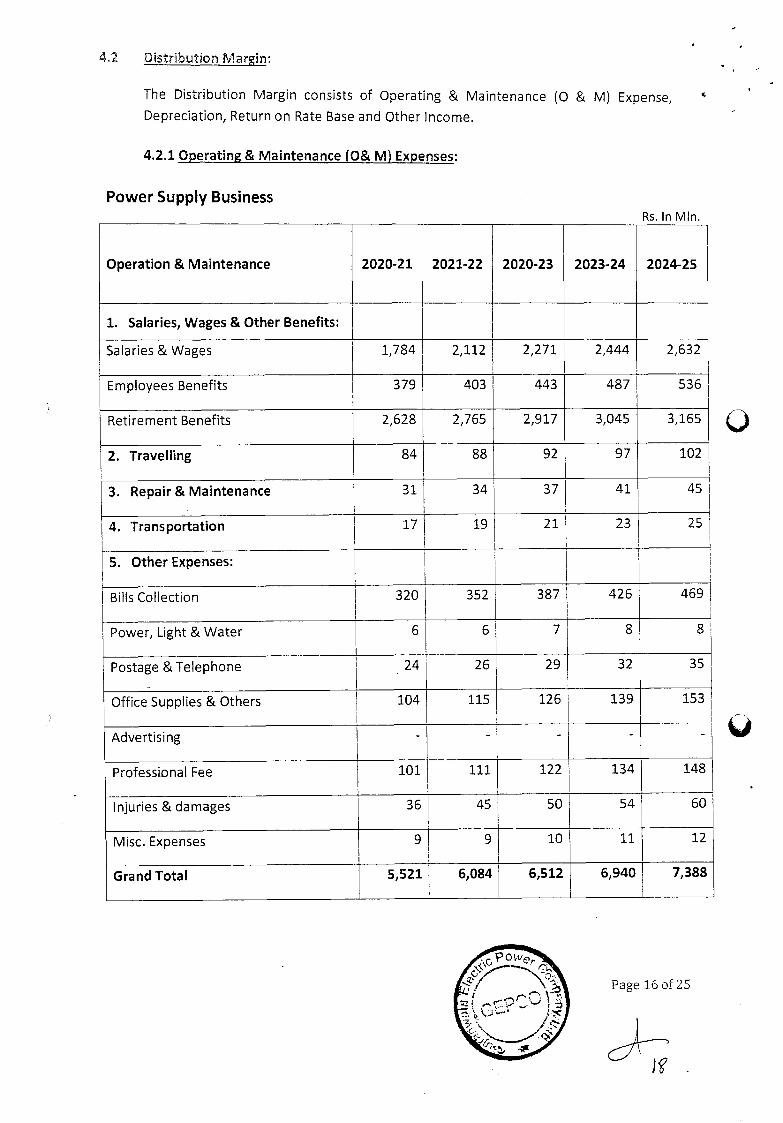
4.2.1 Operating & Maintenance (O& M) Expenses:
Power Supply Business
Rs. In MIn.
Operation & Maintenance 2020-21 2021-22 2020-23 2023-24 2024-25
1. Salaries, Wages & Other Benefits:
Salaries & Wages 1,784 i 2,112 2,271 2,444 2,632
Employees Benefits 379 403 443 487 536
Retirement Benefits 2,628 2,765 2,917 3,045 3,165
2. Travelling 84 88 92 97 102
3. Repair & Maintenance 31 34 37 41 45
4. Transportation 17 19 21 23 25
5. Other Expenses:
Bills Collection 320 352 387 426 469
Power, Light & Water 6 6 7 8 8
Postage & Telephone 24 26 29 32 35
Office Supplies & Others 104 115 126 139 153
Advertising - - - - -
Professional Fee 101 111 122 134 148
Injuries & damages 36 45 50 54 60
Misc. Expenses 9 9 10 11 12
Grand Total 5,521 6,084 6,512 6,940 7,388
Page 16 of 25
4.2.1.1 Provision for Post-Retirement Benefits:
GEPCO fully understands its legal obligation to record and pay Post Retirement Benefits
Liabilities and has been making payments to its all retired employees. The Authority in
previous tariff determinations of GEPCO allowed only the amount of actual payments made
for the Post Retirement Benefits rather than provision charged to Profit & Loss Account. The
Authority's denial of retirement benefits is inconsistent with the requirements of International
Accounting Standard 19(IAS-19). As per audited accounts for the FY 2019-20, there is liability
of Rs. 80 Billion on account of Post Retirement Benefits. Due to liquidity position, GEPCO is
unable to transfer this amount to a separate fund, therefore, it is proposed that by considering
the proposed privatization of GEPCO, dynamics of multi-year tariff regime and the fact that
GEPCO has created a separate account for Post-Retirement Benefits in compliance to NEPRA
direction, the Authority is requested to allow the Provision for Post-Retirement Benefits as per
Audited Financial Statements based on Independent Actuarial Report in accordance with AS-
19.
GEPCO will deposit the whole amount allowed into separate account and in case of failure to
transfer the whole amount, the Authority may adjust the deficit payment in next year's
provision and from thereon, only actual amounts paid and amount transferred into the fund
to be allowed.
4.2.1. Indexation of 0 & M Expenses:
As per the NEPRA Determination of Consumer-end-Tariff (Methodology & Process) Guidelines,
2015, the O&M part of Distribution Margin shall be indexed with CPI subject to adjustment for
efficiency gains (X factor). Accordingly, the O&M will be indexed every year according to the
following formula:
o & M (Rev) 0 & M (Ref) X [1 + (CP-X)]
Where
o &M (Rev) = Revised O&M Expense for the Current Year
o &M (Ref)= Reference O&M Expense for the Reference Year
ACPI = Change in Consumer Price Index published by Pakistan Bureau of Statistics
latest available on 1st July against the CPI as on 1st July of the Reference
Year in terms of percentage
X = Efficiency factor
Page 17 of 25
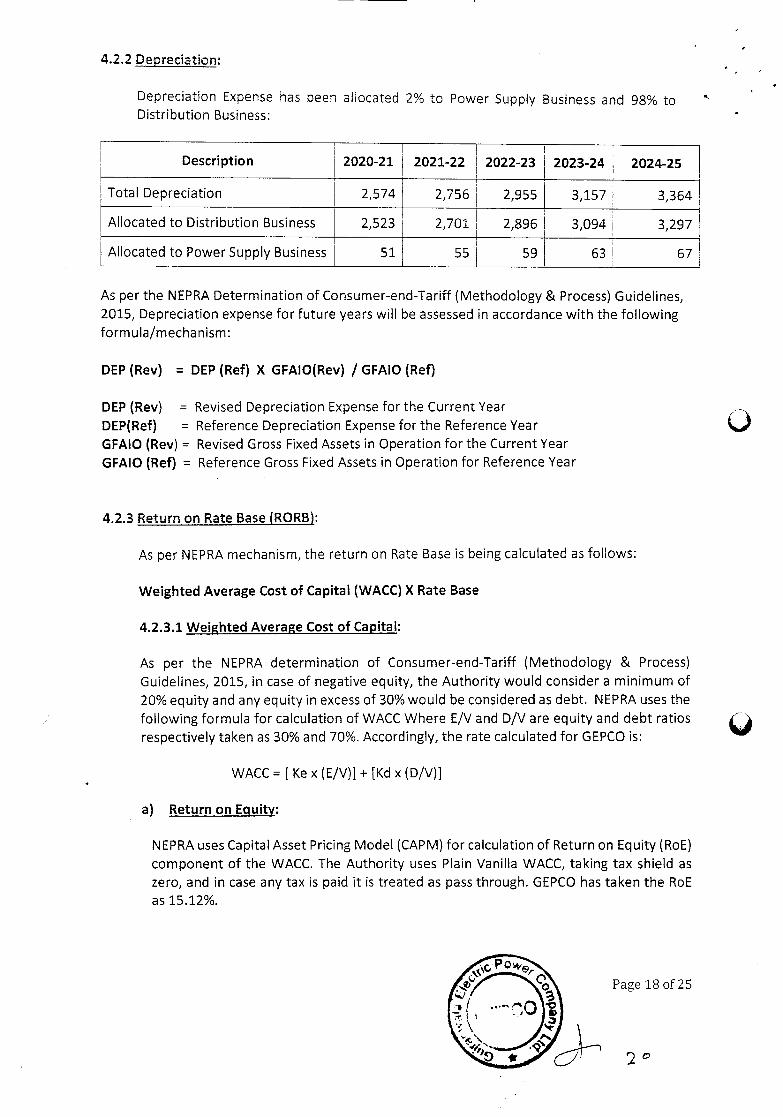
4.2.2 Depreciation:
Depreciation Expense has been allocated 2% to Power Supply Business and 98% to Distribution Business:
Description 2020-21 2021-22 2022-23 2023-24 2024-25
Total Depreciation 2,574 2,756 2,955 3,157 3,364
Allocated to Distribution Business 2,523 2,701 2,896 3,094 3,297
Allocated to Power Supply Business 51 55 59 63 67
As per the NEPRA Determination of Consumer-end-Tariff (Methodology & Process) Guidelines,
2015, Depreciation expense for future years will be assessed in accordance with the following
formula/mechanism:
DEP (Rev) = DEP (Ref) X GFAIO(Rev) / GFAIO (Ref)
DEP (Rev) = Revised Depreciation Expense for the Current Year
DEP(Ref) = Reference Depreciation Expense for the Reference Year
GFAIO (Rev) = Revised Gross Fixed Assets in Operation for the Current Year
GFAIO (Ref) = Reference Gross Fixed Assets in Operation for Reference Year
4.2.3 Return on Rate Base (RORB):
As per NEPRA mechanism, the return on Rate Base is being calculated as follows:
Weighted Average Cost of Capital (WACC) X Rate Base
4.2.3.1 Weighted Average Cost of Capital:
As per the NEPRA determination of Consumer-end-Tariff (Methodology & Process)
Guidelines, 2015, in case of negative equity, the Authority would consider a minimum of
20% equity and any equity in excess of 30% would be considered as debt. NEPRA uses the
following formula for calculation of WACC Where Ely and D/V are equity and debt ratios
respectively taken as 30% and 70%. Accordingly, the rate calculated for GEPCO is:
WACC = [Ke x (Ely)] + [Kd x (D/V)]
a) Return on Equity:
NEPRA uses Capital Asset Pricing Model (CAPM) for calculation of Return on Equity (RoE)
component of the WACC. The Authority uses Plain Vanilla WACC, taking tax shield as
zero, and in case any tax is paid it is treated as pass through. GEPCO has taken the RoE
as 15.12%.
0
Page 18 of 25
2
Page 19 of 25
2,1
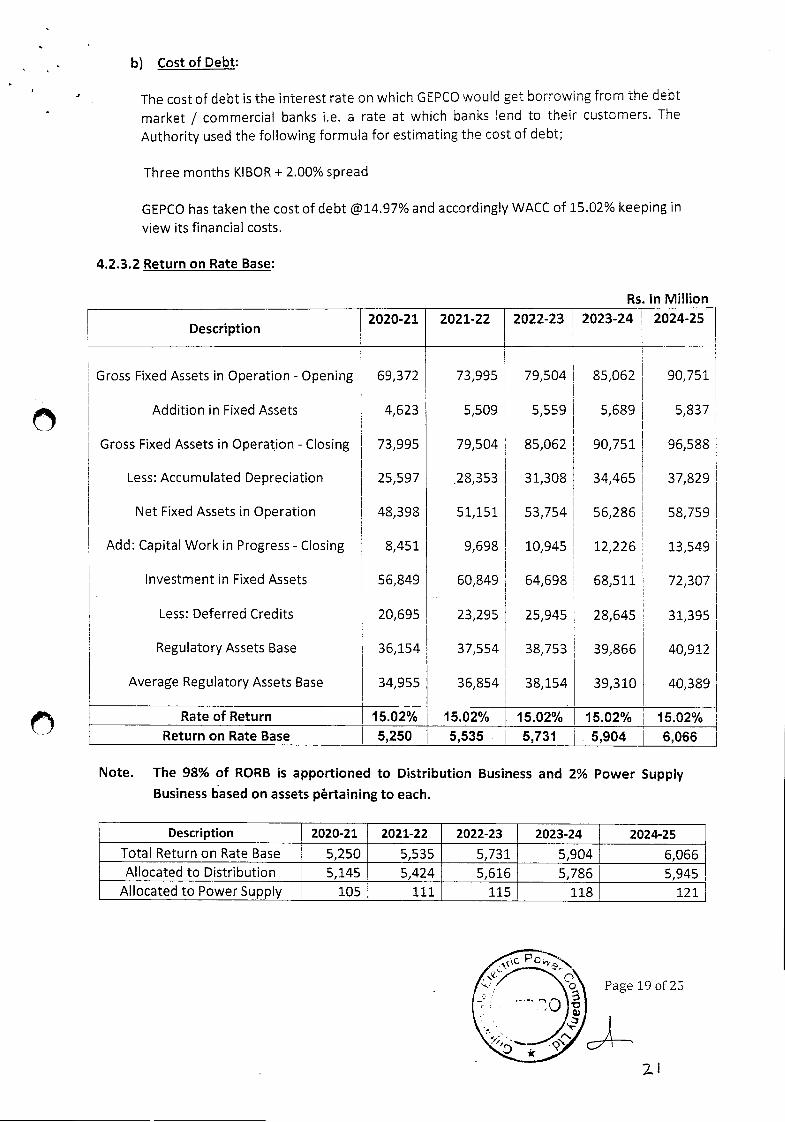
b) Cost of Debt:
The cost of debt is the interest rate on which GEPCO would get borrowing from the debt
market / commercial banks i.e. a rate at which banks lend to their customers. The
Authority used the following formula for estimating the cost of debt;
Three months KIBOR + 2.00% spread
GEPCO has taken the cost of debt @14.97% and accordingly WACC of 15.02% keeping in
view its financial costs.
4.2.3.2 Return on Rate Base:
Rs. In Million
Description 2020-21 2021-22 2022-23 2023-24 2024-25
Gross Fixed Assets in Operation - Opening 69,372 73,995 79,504 85,062 90,751
Addition in Fixed Assets 4,623 5,509 5,559 5,689 5,837
Gross Fixed Assets in Operation - Closing 73,995 79,504 85,062 90,751 96,588
Less: Accumulated Depreciation 25,597 .28,353 31,308 34,465 37,829
Net Fixed Assets in Operation 48,398 51,151 53,754 56,286 58,759
Add: Capital Work in Progress - Closing 8,451 9,698 10,945 12,226 13,549
Investment in Fixed Assets 56,849 60,849 64,698 68,511 72,307
Less: Deferred Credits 20,695 23,295 25,945 28,645 31,395
Regulatory Assets Base 36,154 37,554 38,753 39,866 40,912
Average Regulatory Assets Base 34,955 36,854 38,154 39,310 40,389
Rate of Return 15.02% 15.02% 15.02% 15.02% 15.02% Return on Rate Base 5,250 5,535 5,731 5,904 6,066
Note. The 98% of RORB is apportioned to Distribution Business and 2% Power Supply
Business based on assets pertaining to each.
Description 2020-21 2021-22 2022-23 2023-24 2024-25 Total Return on Rate Base 5,250 5,535 5,731 5,904 6,066 Allocated to Distribution 5,145 5,424 5,616 5,786 5,945
Allocated to Power Supply 105 111 115 118 121
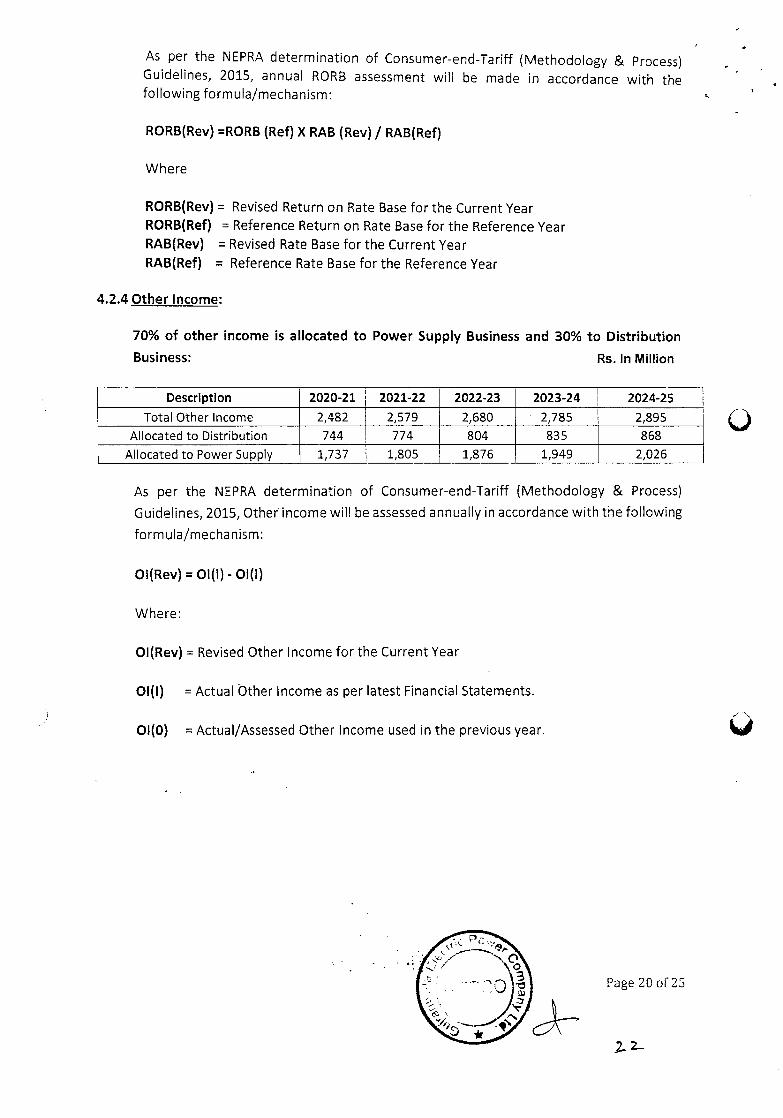
As per the NEPRA determination of Consumer-end-Tariff (Methodology & Process)
Guidelines, 2015, annual RORB assessment will be made in accordance with the following formula/mechanism:
RORB(Rev) =RORB (Ref) X RAB (Rev) / RAB(Ref)
Where
RORB(Rev) = Revised Return on Rate Base for the Current Year RORB(Ref) = Reference Return on Rate Base for the Reference Year RAB(Rev) = Revised Rate Base for the Current Year
RAB(Ref) = Reference Rate Base for the Reference Year
4.2.4 Other Income:
70% of other income is allocated to Power Supply Business and 30% to Distribution
Business: Rs. In Million
Description 2020-21 2021-22 2022-23 2023-24 2024-25
Total Other Income 2,482 2,579 2,680 2,785 2,895
Allocated to Distribution 744 774 804 835 868
Allocated to Power Supply 1,737 1,805 1,876 1,949 2,026
As per the NEPRA determination of Consumer-end-Tariff (Methodology & Process)
Guidelines, 2015, Other income will be assessed annually in accordance with the following
formula/mechanism:
Ol(Rev) = 01(1) - 01(l)
Where:
Ol(Rev) = Revised Other Income for the Current Year
01(1) = Actual Other Income as per latest Financial Statements.
01(0) = Actual/Assessed Other Income used in the previous year.
Page 20 of 25
2-
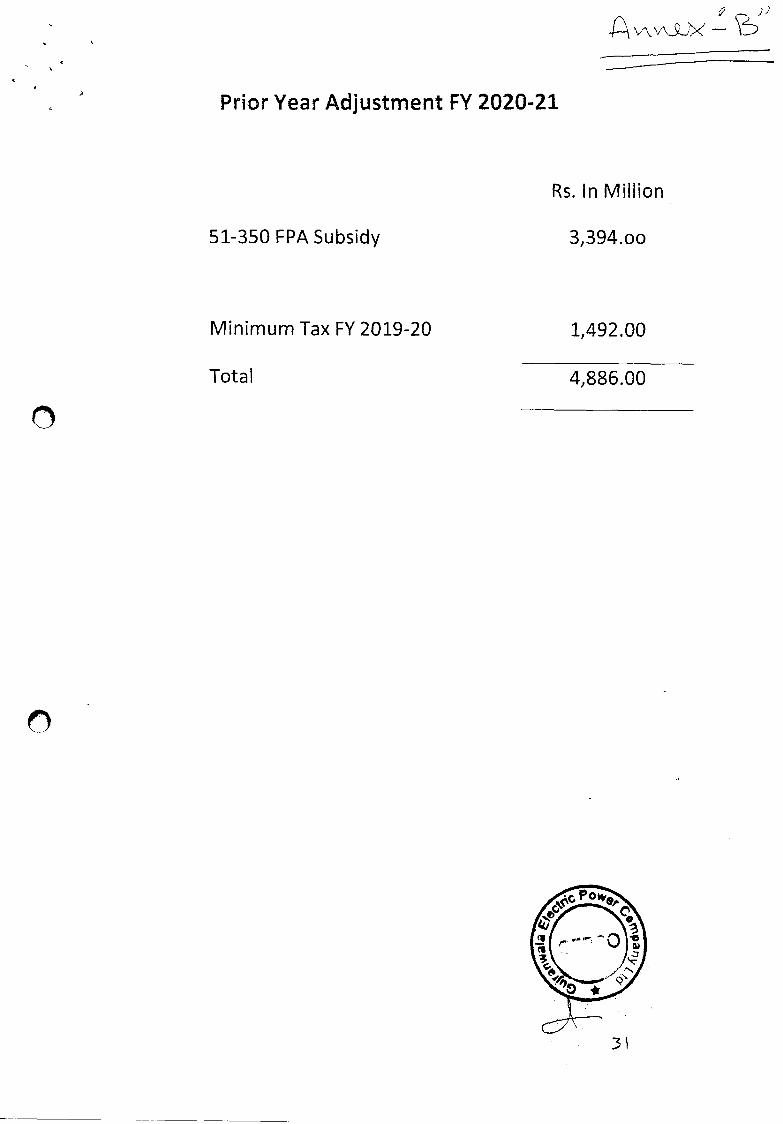
4,3 PRIOR YEARS ADJUSTMENT (PYA').:
The prior year adjustment is addressed to less I over recovery of actual- revenue earned
by the petitioner in comparison to NEPRA determined Revenue Requirement for a
particular year or any other legitimate cost which does not covered by NEPRA while
assessing the revenue requirement, is adjusted by NEPRA in the next year tariff
determination as Prior Year Adjustment.
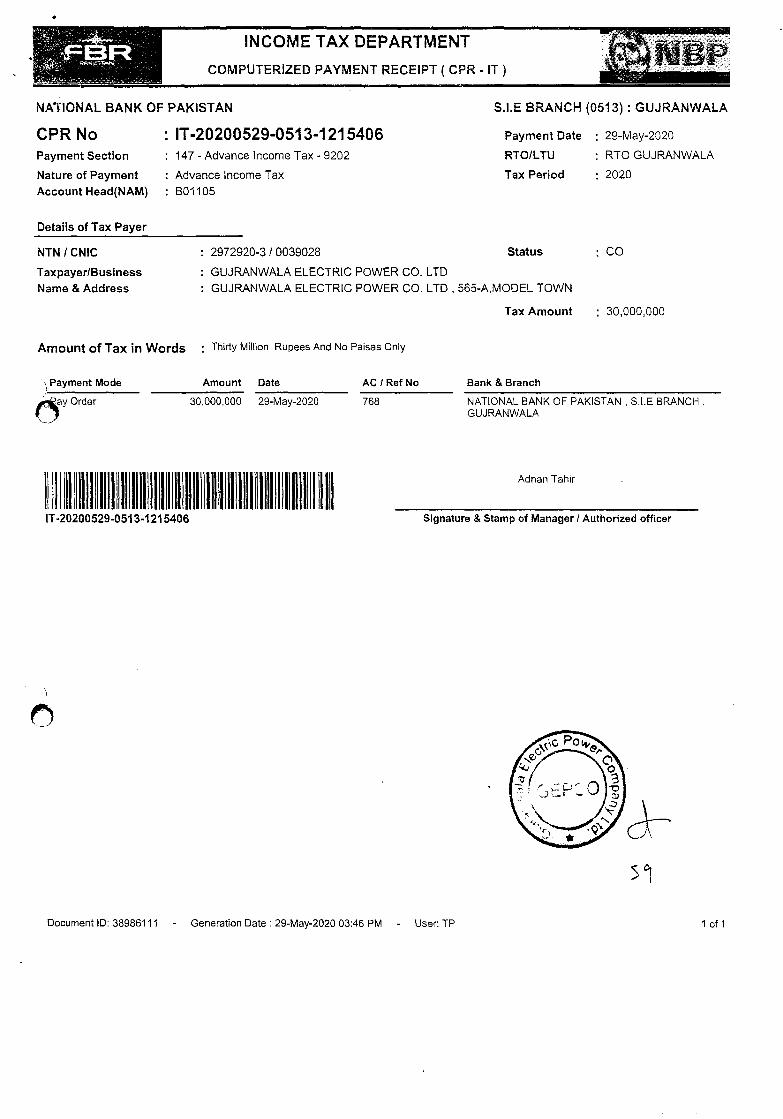
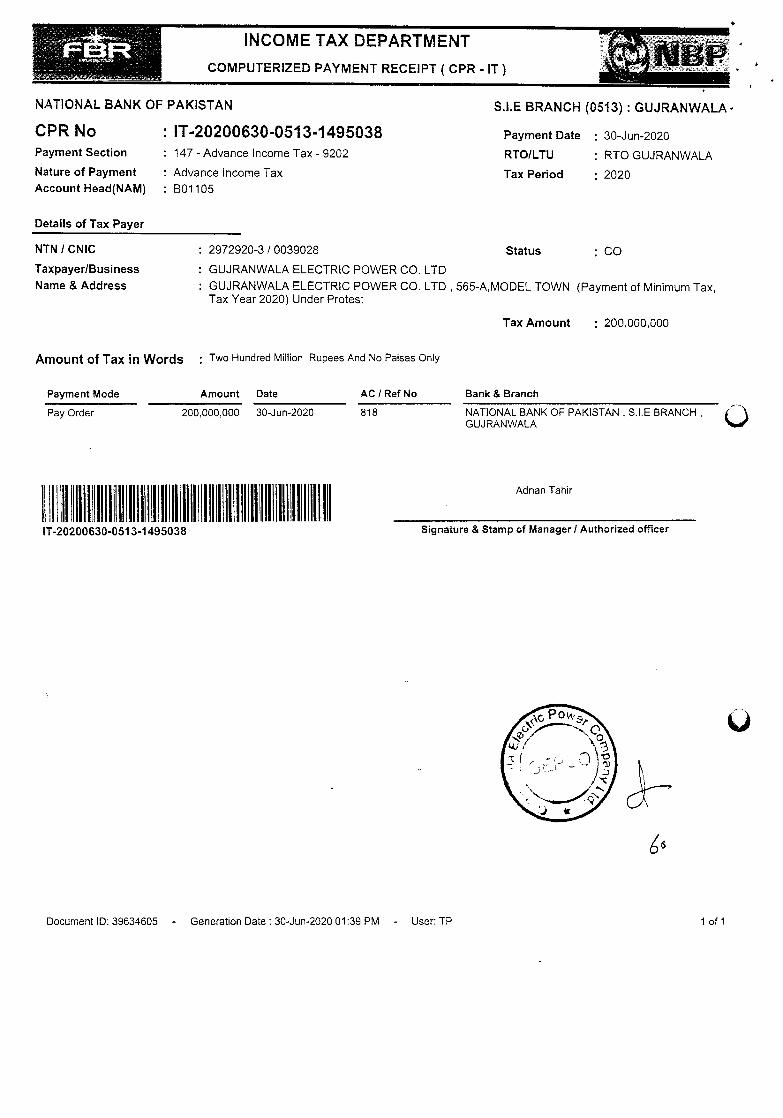
For the FY 2020-21, the Prior Year Adjustment requested from NEPRA includes the
Minimum Tax paid by GEPCO to FBR for the FY 2020 amounting to Rs. 1,492 Million and
the whole amount is allocated to Power Supply Business (Computerized Paid Receipts are
attached as Annex- 13).
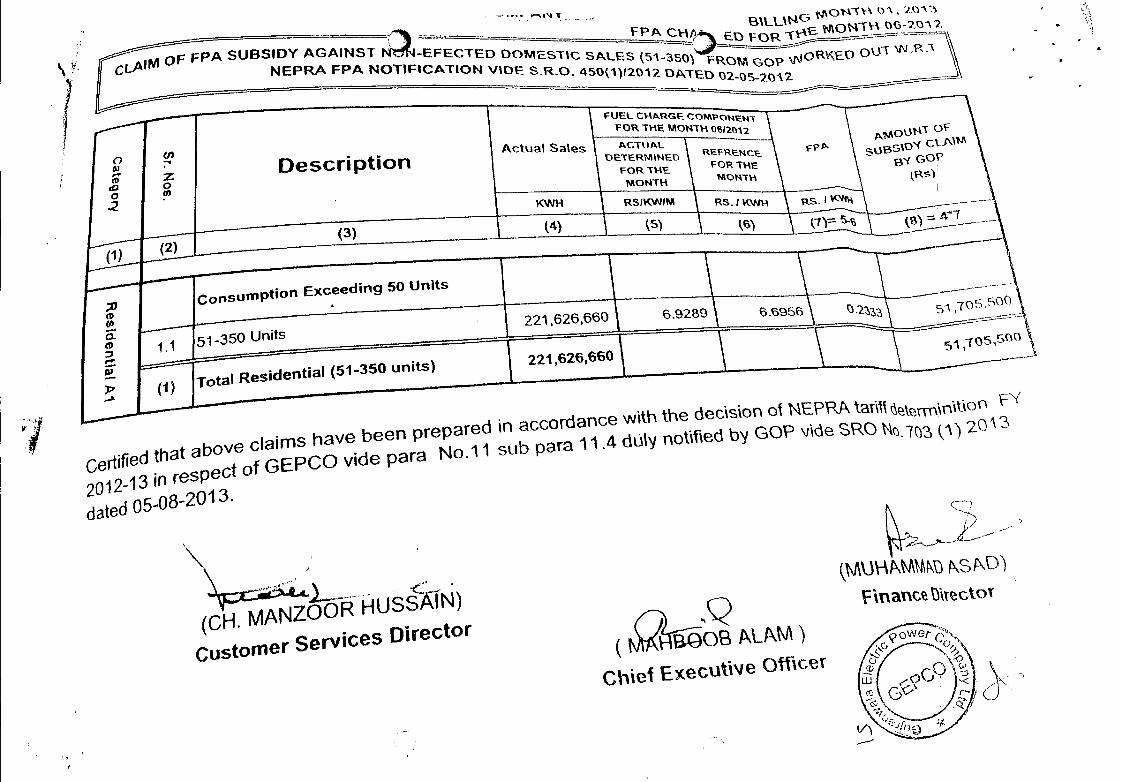
The other PYA claimed is of Rs. 3,394 Million of FPA Subsidy as during the Financial Year
2013, in compliance to Honorable Lahore High Court Lahore Decision dated 28th January
2013, FPA was not passed on to domestic consumers having consumption up to 350 units
per month. Consequently, the matter was taken up with NEPRA through GEPCO Tariff
Petition for FY 2012-13.
NEPRA while determining the tariff petition 2012-13 directed GEPCO to claim the
aforesaid FPA which was not passed to domestic consumers (51-350 units) as a separate
subsidy from Govt. of Pakistan.
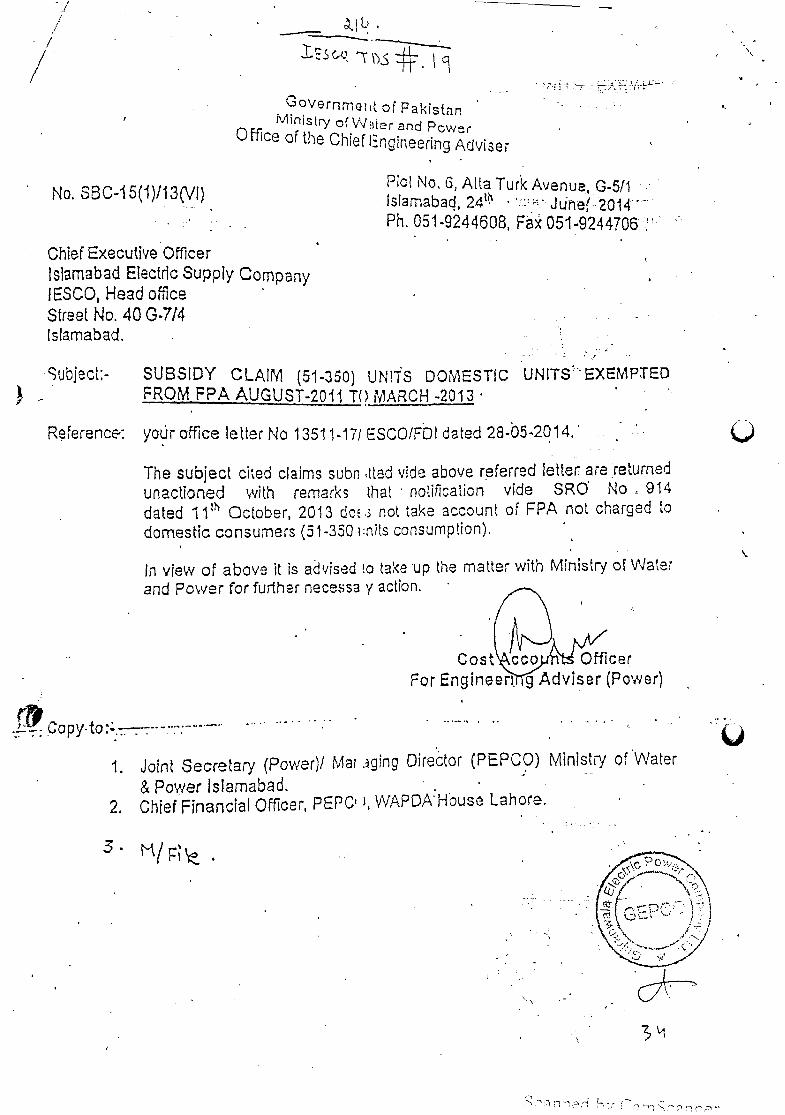
GEPCO made compliance of NEPRA and lodged separate claims before Ministry of Water
& Power through the office of the Engineering Advisor (Power) lslamabad.
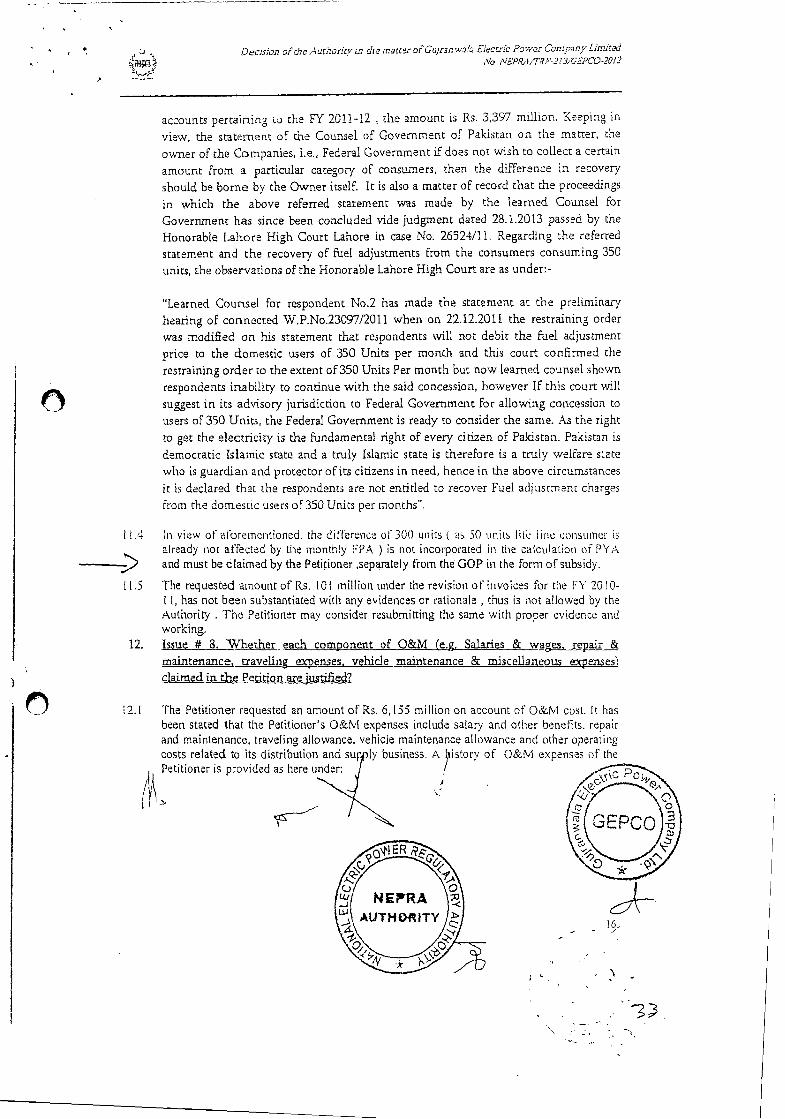
On visiting the office of the Engineering Advisor (Power) lslamabad, it came to the notice
that aforesaid claims of all DISCOs including GEPCO were returned unactioned with the
remarks that respective Tariff Notification vide SRO No. 914 dated 11-10-2013 does not
take account FPA not charged to domestic consumers (51-350 units consumption) and to
take up the matter with MOW & P. Complete case of IESCO provided as reference case by
the office of the Engineering Advisor (Power) Islamabad. IESCO has taken up the matter
with the Ministry, however, no outcome is received yet. Complete case of IESCO provided
as reference case by the office of the Engineering Advisor (Power) Islamabad attached as
Annex-J3 . The Authority is requested to kindly consider the case and allow this amount
as Prior Years Adjustment.
All the Prior Years Adjustment is allocated to Power Supply Business.
Page 21 of 25
7-,
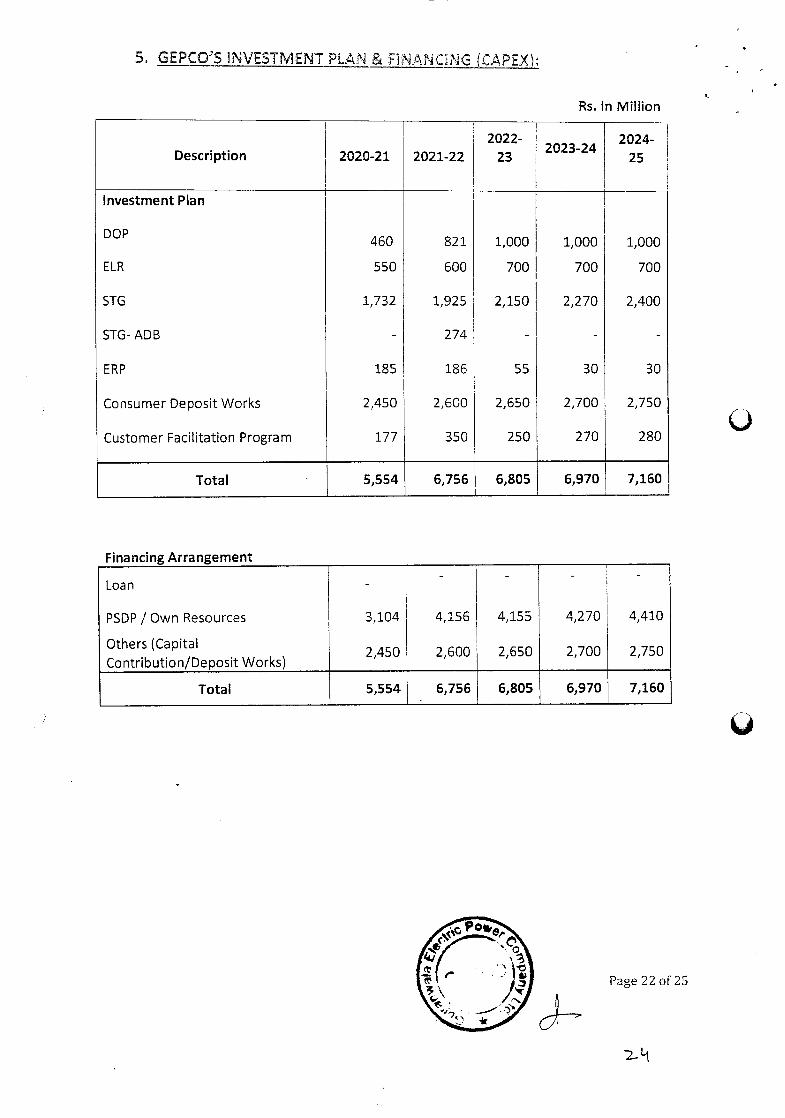
5. GEPCO'S INVESTMENT PLAN .& ]NANCNG (CAPEX):
Rs. In Million
Description 2020-21 2021-22 2022-
23 2023-24
2024-
25
Investment Plan
DOP 460 821 1,000 1,000 1,000
ELR 550 600 700 700 700
STG 1,732 1,925 2,150 2,270 2,400
STG-ADB - 274 - - -
ERP 185 186 55 30 30
Consumer Deposit Works 2,450 2,600 2,650 2,700 2,750
Customer Facilitation Program 177 350 250 270 280
Total 5,554 6,756 6,805 6,970 7,160
Financing Arrangement
Loan - - - - -
PSDP / Own Resources
Others (Capital
Contribution/Deposit Works)
3,104
2,450
4,156
2,600
4,155
2,650
4,270
2,700
4,410
2,750
Total 5,554 6,756 6,805 6,970 7,160
Page 22 of 25
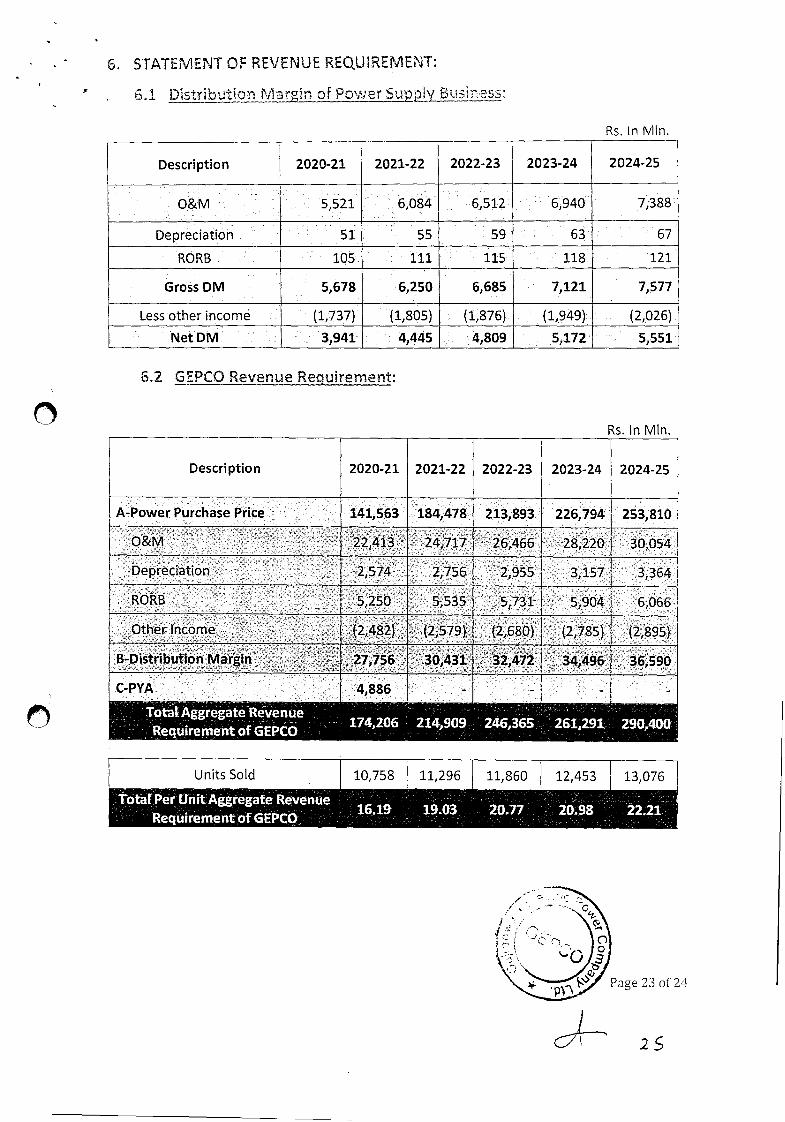
6, STATEMENT OF REVENUE REQUIREMENT:
6.1 Dstrbution Mrgn of Power Suppjy Buiness:
Rs. In Mm.
Description 2020-21 2021-22 2022-23 2023-24 2024-25
O&M 5,521 6,084 6,512 6,940 7,388
Depreciation 51 55 59 63 67
RORB 105 111 115 118 121
Gross DM 5,678 6,250 6,685 7,121 7,577
Less other income (1,737) (1,805) (1,876) (1,949) (2,026)
NetDM 3,941 4,445 4,809 5,172 5,551
6.2 GEPCO Revenue Requirement:
Rs. In Mm.
Description 2020-21 2021-22 2022-23 2023-24 2024-25
A-Power Purchase Price 141,563 184,478 213,893 226,794 253,810
O&M 22,413 24,717 26,466 28,220 30,054
Depreciation 2,574 2,756 2,955 3,157 3,34
RORB 5,250 5,535 5,731 5,904 6,066
Other Income (2,482) (2,579) (2,680) (2,785) (2,895)
B-Distribution Margin 27,756 30,431 32,472 34,496 36,590
C-PYA 4,886 - - -
Total Aggregate Revenue
Requirement of GEPCO 174,206 214,909 246,365 261,291 290,400
Total Per tJnit Aggregate Revenue16 19 1903 2077
Requirement of GEPCO
Page 23 of 24
25
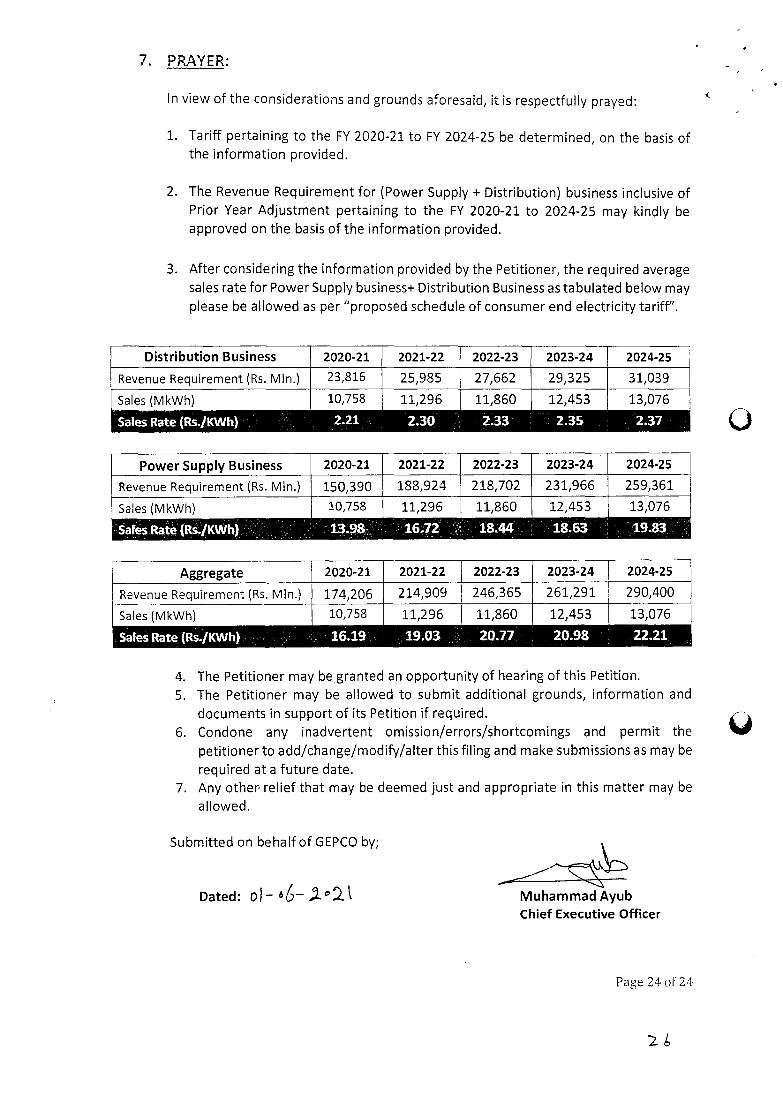
7. PRAYER:
In view of the considerations and grounds aforesaid, it is respectfully prayed:
1. Tariff pertaining to the FY 2020-21 to FY 2024-25 be determined, on the basis of the information provided.
2. The Revenue Requirement for (Power Supply + Distribution) business inclusive of
Prior Year Adjustment pertaining to the FY 2020-21 to 2024-25 may kindly be
approved on the basis of the information provided.
3. After considering the information provided by the Petitioner, the required average
sales rate for Power Supply business+ Distribution Business as tabulated below may
please be allowed as per "proposed schedule of consumer end electricity tariff".
Distribution Business 2020-21 2021-22 2022-23 2023-24 2024-25
Revenue Requirement (Rs. MIn.) 23,816 25,985 27,662 29,325 31,039
Sales (MkWh)
Sales Rate (Rs /KWh}
10,758
2 21
11,296
2 30
11,860
2 33
12,453
2 35
13,076
2 37
Power Supply Business 2020-21 2021-22 2022-23 2023-24 2024-25
Revenue Requirement (Rs. Mm.) 150,390 188,924 218,702 231,966 259,361
Sales (MkWh) 10,758 11,296 11,860 12,453 13,076
Sales Rate (Rs /KWh) 1393 16.72 18 44 18 63 19 83
Aggregate 2020-21 2021-22 2022-23 2023-24 2024-25
Revenue Requirement (Rs. Mm.) 174,206 214,909 246,365 261,291 290,400
Sales (MkWh) 10,758 11,296 11,860 12,453 13,076
Sales Rate (Rs /KWh) 16 19 19 03 20 77 20 98 22 21
4. The Petitioner may be. granted an opportunity of hearing of this Petition.
5. The Petitioner may be allowed to submit additional grounds, information and
documents in support of its Petition if required.
6. Condone any inadvertent omission/errors/shortcomings and permit the
petitioner to add/change/modify/after this filing and make submissions as may be
required at a future date.
7. Any other relief that may be deemed just and appropriate in this matter may be
allowed.
Submitted on behalf of GEPCO by;
Dated: Muhammad Ayub Chief Executive Officer
Page 24 of 24
0
1'
\I-\\AJ -
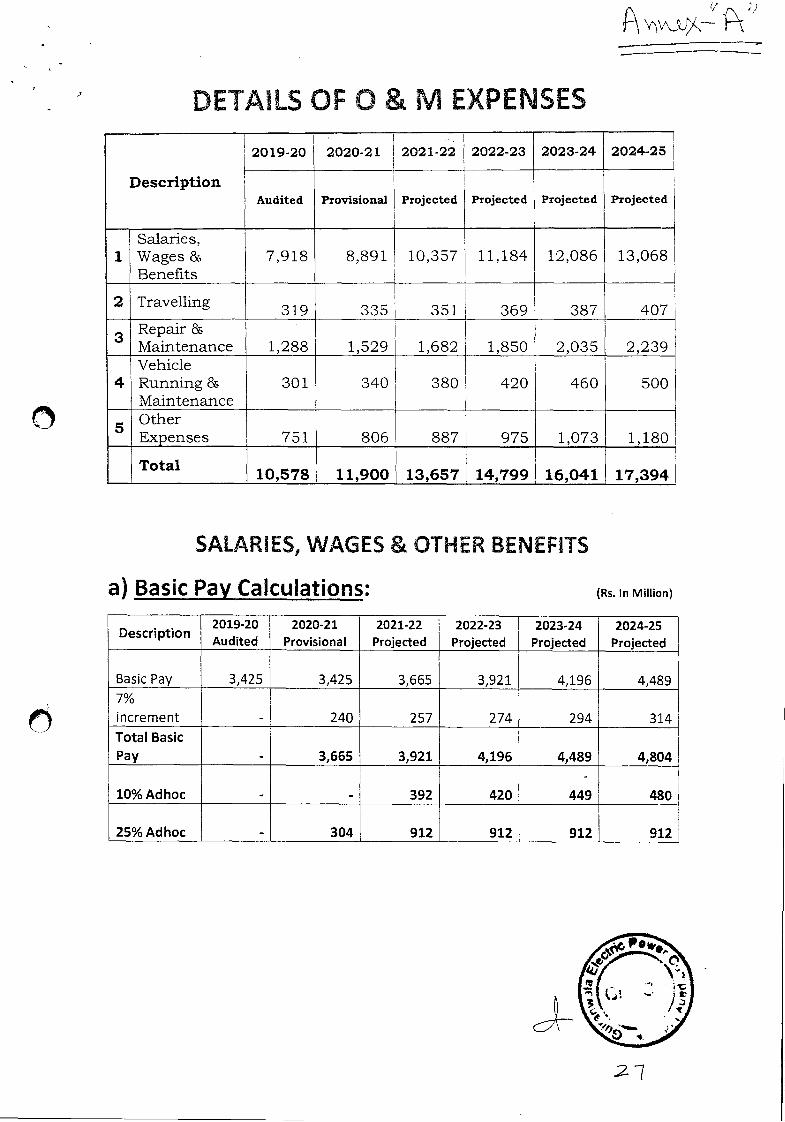
DETAILS OF 0 & M EXPENSES
Description
2019-20 2020-21 2021-22 2022-23 2023-24 2024-25
Audited Provisional Projected Projected Projected Projected
1 Salaries, Wages & Benefits
7,918 8,891 10,357 11,184 12,086 13,068
2 Travelling 319 335 351 369 387 407
Repair & Maintenance 1,288 1,529 1,682 1,850 2,035 2,239
4 Vehicle Running& Maintenance
301 340 380 420 460 500
Other Expenses 751 806 887 975 1,073 1,180
Total 10,578 11,900 13,657 14,799 16,041 17,394
SALARIES, WAGES & OTHER BENEFITS
a) Basic Pay Calculations: (Rs. In Million)
Description 2019-20 Audited
2020-21 Provisional
2021-22 Projected
2022-23 Projected
2023-24 Projected
2024-25 Projected
Basic Pay 3,425 3,425 3,665 3,921 4,196 4,489 7% increment - 240 257 274 294 314 Total Basic Pay - 3,665 3,921 4,196 4,489 4,804
10%Adhoc - - 392 420 449 480
25%Adhoc - 304 912 912 912 912
27
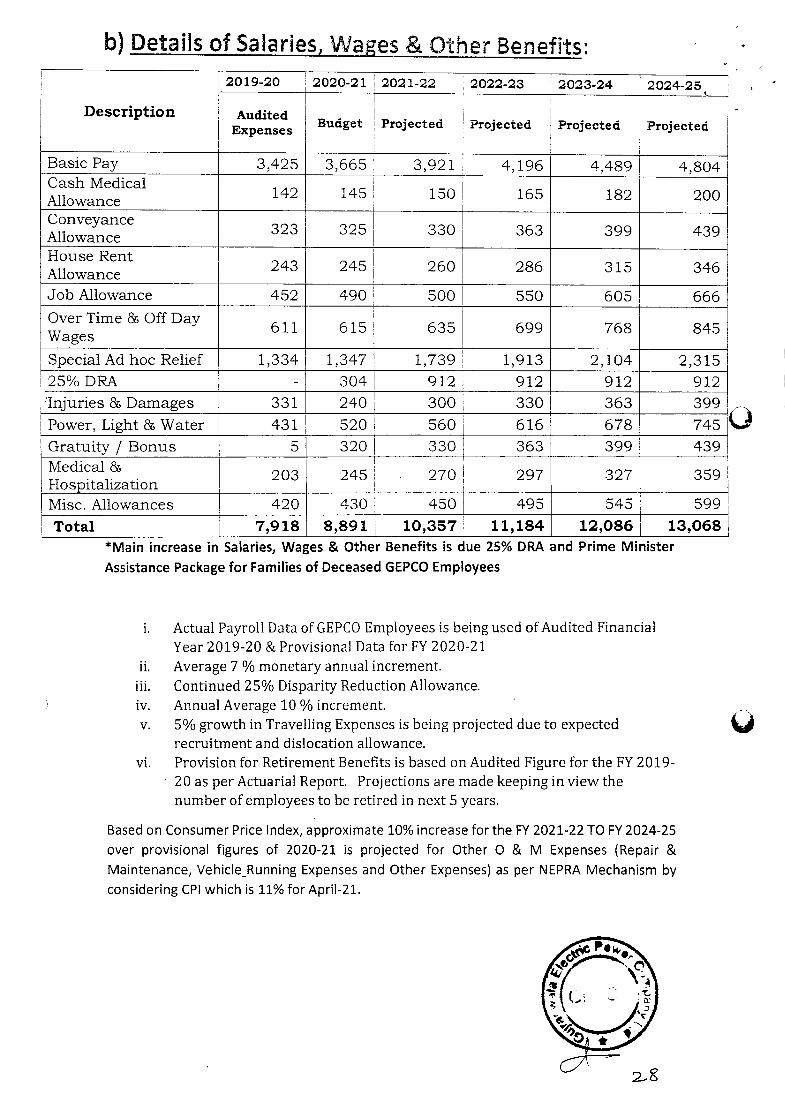
b) Details of Salaries, Wages & Other Benefits:
Description
2019-20 2020-21 2021-22 2022-23 2023-24 2024-25
Audited Expenses Budget Projected Projected Projected
• 1
Projected
Basic Pay 3,425 3,665 3,921 4,196 4,489 4,804 Cash Medical Allowance 142 145 150 165 182 200
Conveyance Allowance 323 325 330 363 399 439
House Rent Allowance 243 245 260 286 315 346
Job Allowance 452 490 500 550 605 666
OverTime&Off Day Wages
611 615 635 699 768 845
SpecialAd hoc Relief 1,334 1,347 1,739 1,913 2,104 2,315 25%DRA - 304 912 912 912 912 Injuries & Damages 331 240 300 330 363 399
Power, Light&Water 431 520 560 616 678 745
Gratuity / Bonus 5 320 330 363 399 439 Medical & Hospitalization
203 245 270 297 327 359
Misc. Allowances 420 430 450 495 545 599
Total j 7,918 8,891 10,357 11,184 12,086 13,068 *Main increase in Salaries, Wages & Other Benefits is due 25% DRA and Prime Minister
Assistance Package for Families of Deceased GEPCO Employees
i. Actual Payroll Data of GEPCO Employees is being used of Audited Financial Year 2019-20 & Provisional Data for FY 2020-2 1
ii. Average 7 % monetary annual increment. iii. Continued 25% Disparity Reduction Allowance. iv. Annual Average 10 % increment. - v. 5% growth in Travelling Expenses is being projected due to expected
recruitment and dislocation allowance. vi. Provision for Retirement Benefits is based on Audited Figure for the FY 2019-
20 as per Actuarial Report. Projections are made keeping in view the number of employees to be retired in next 5 years.
Based on Consumer Price Index, approximate 10% increase for the FY 2021-22 TO FY 2024-25 over provisional figures of 2020-21 is projected for Other 0 & M Expenses (Repair & Maintenance, Vehicle_Running Expenses and Other Expenses) as per NEPRA Mechanism by considering CPI which is 11% for April-21.
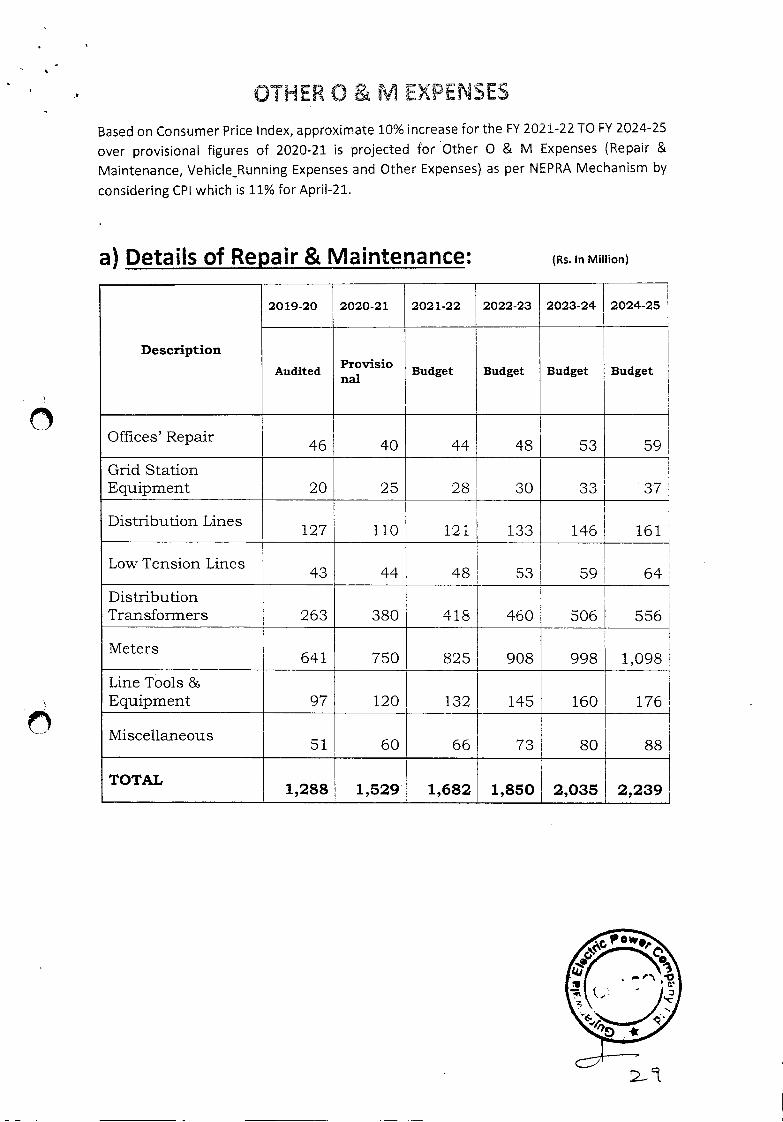
OTHER 0 & M EXPENSES
Based on Consumer Price Index, approximate 10% increase for the FY 2021-22 TO FY 2024-25
over provisional figures of 2020-21 is projected for Other 0 & M Expenses (Repair &
Maintenance, Vehicle_Running Expenses and Other Expenses) as per NEPRA Mechanism by
considering CPI which is 11% for April-21.
a) Details of Repair & Maintenance: (Rs. In Million)
Description
2019-20 2020-21 2021-22 2022-23 2023-24 2024-25
Audited Provisio nal
Budget Budget Budget Budget
Offices' Repair 46 40 44 48 53 59
Grid Station Equipment 20 25 28 30 33 37
Distribution Lines 127 110 121 133 146 161
Low Tension Lines 43 44 48 53 59 64
Distribution Transformers 263 380 418 460 506 556
Meters 641 750 825 908 998 1,098
Line Tools & Equipment 97 120 132 145 160 176
Miscellaneous 51 60 66 73 80 88
TOTAL 1,288 1,529 1,682 1,850 2,035 2,239
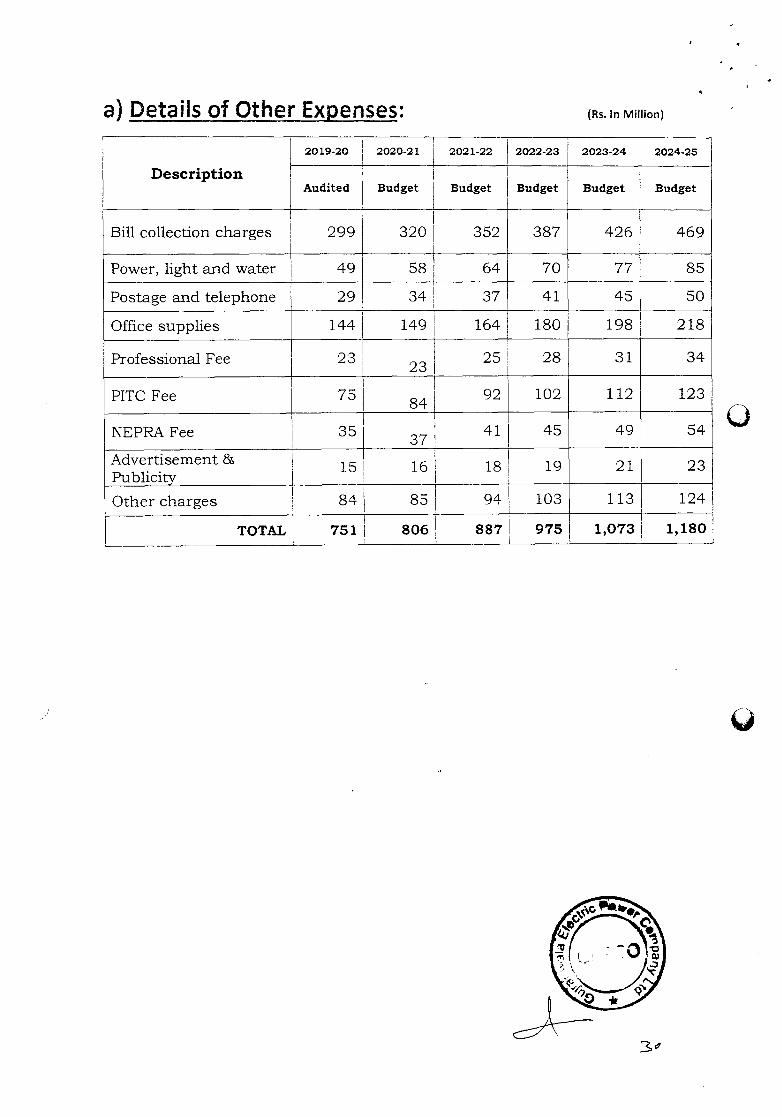
a) Details of Other Expenses: (Rs. In Million)
Description
2019-20 2020-21 2021-22 2022-23 2023-24 2024-25
Audited Budget Budget Budget Budget Budget
Bill collection charges 299 320 352 387 426 469
Power, light and water 49 58 64 70 77 85
Postage and telephone 29 34 37 41 45 50
Office supplies 144 149 164 180 198 218
Professional Fee 23 23
25 28 31 34
PITC Fee 84 92 102 112 123
NEPRA Fee 35 41 45 49 54
Advertisement & Publicity
15 16 18 19 21 23
Other charges 84 85 94 103 113 124
TOTAL 751 806 887 975 1,073 1,180
\,
j)
Prior Year Adjustment FY 2020-21
Rs. In Million
5 1-350 FPA Subsidy 3,394.00
Minimum Tax FY 2019-20 1,492.00
Total 4,886.00
3
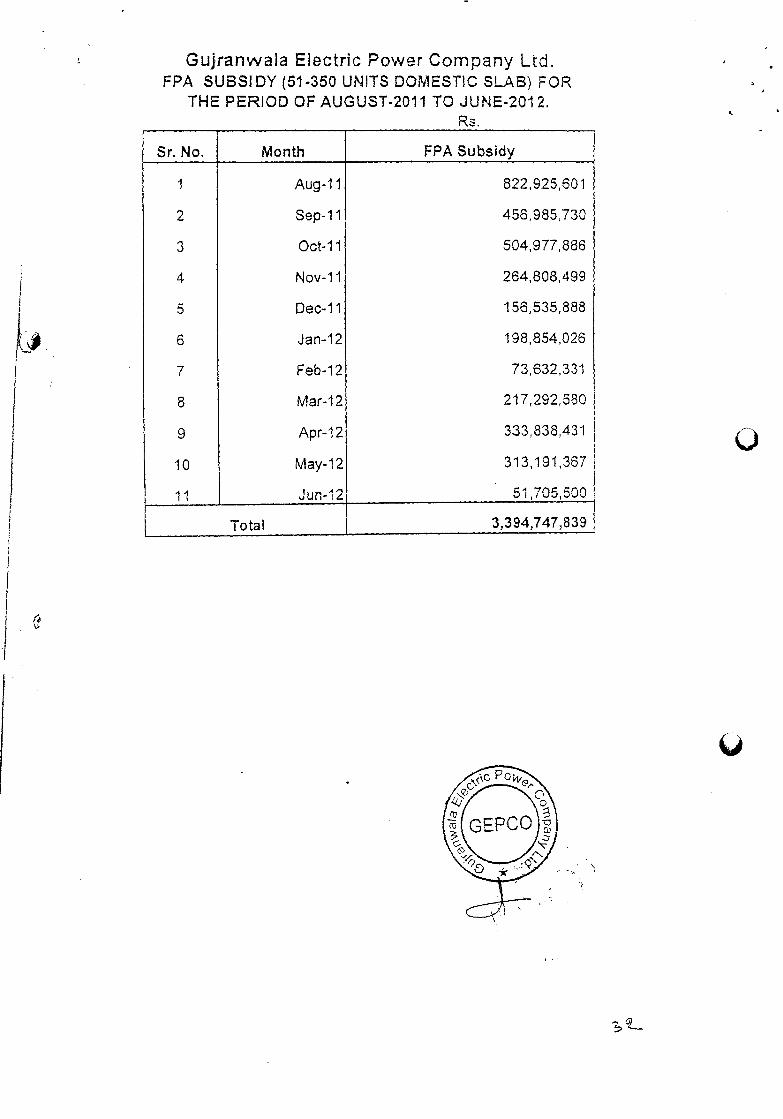
Guj•ranwala Electric Power Company Ltd. FPA SUBSIDY (51-350 UNITS DOMESTIC SLAB) FOR
THE PERIOD OF AUGUST-201 I TO .JUNE-201 2. Ra.
Sr. No. Month FPA Subsidy
1 Aug-11 822925601
2 Sep-lI 456,985,730
3 Oct-11 504,977,886
4 Nov-11 264,808,499
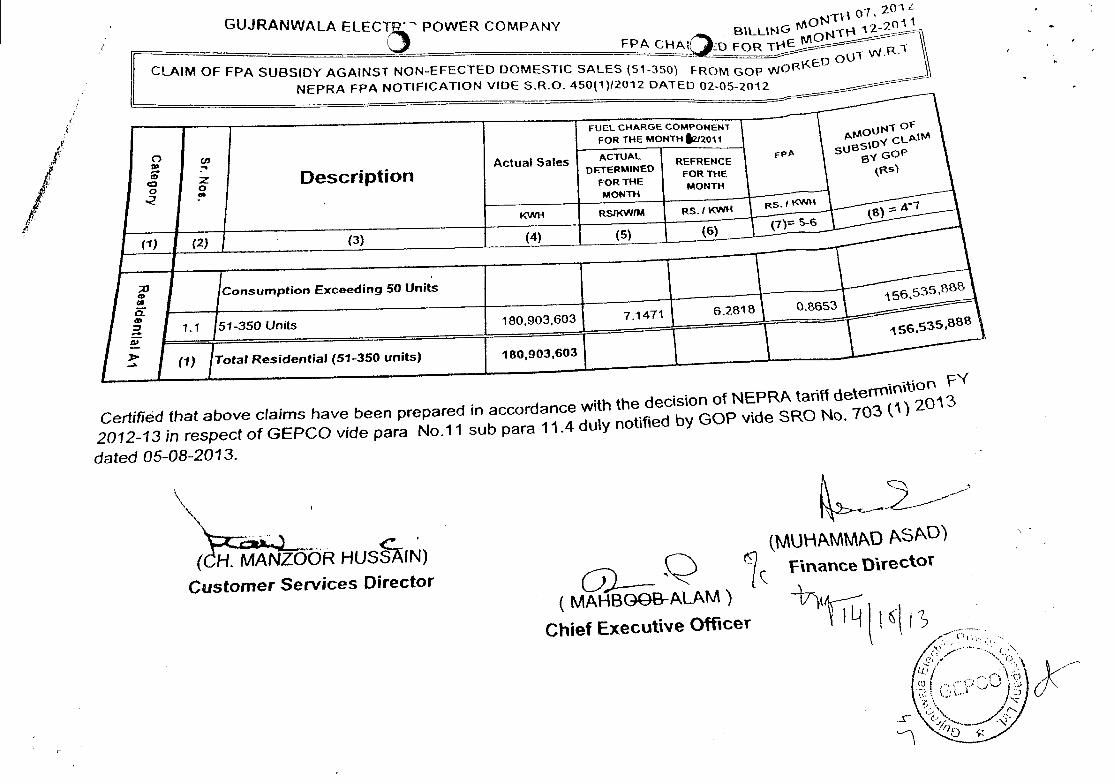
5 Dec-11 156,535,888
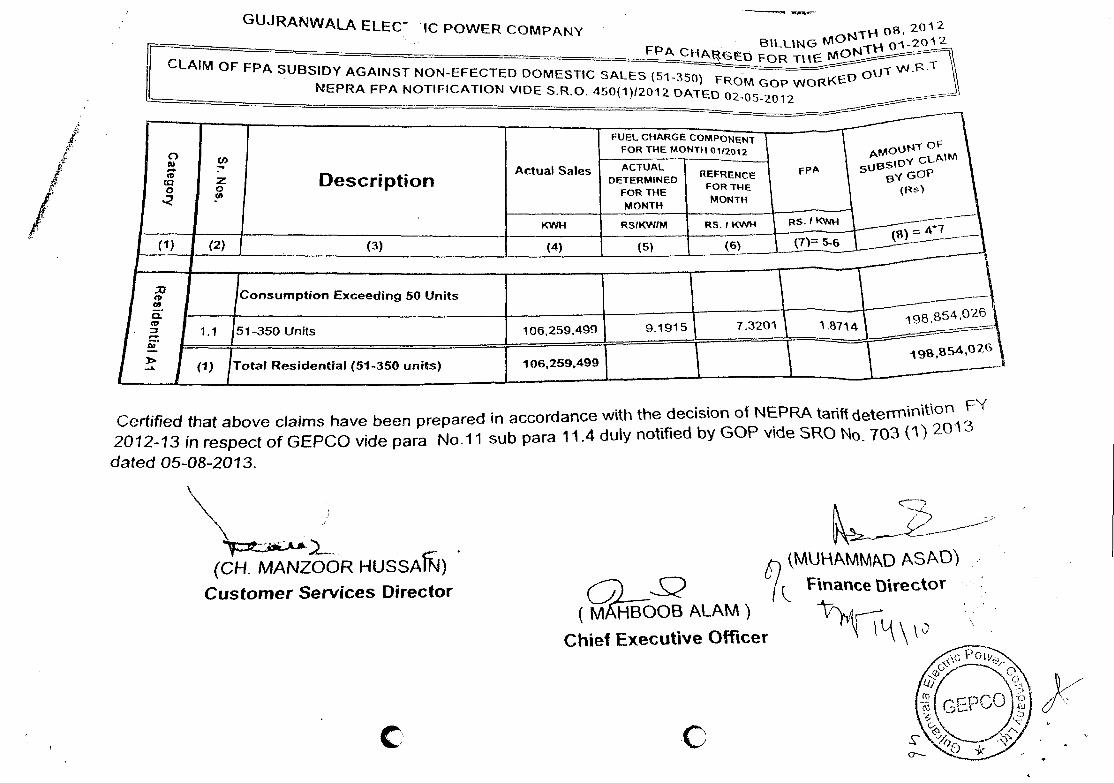
6 Jan-12 198,854,026
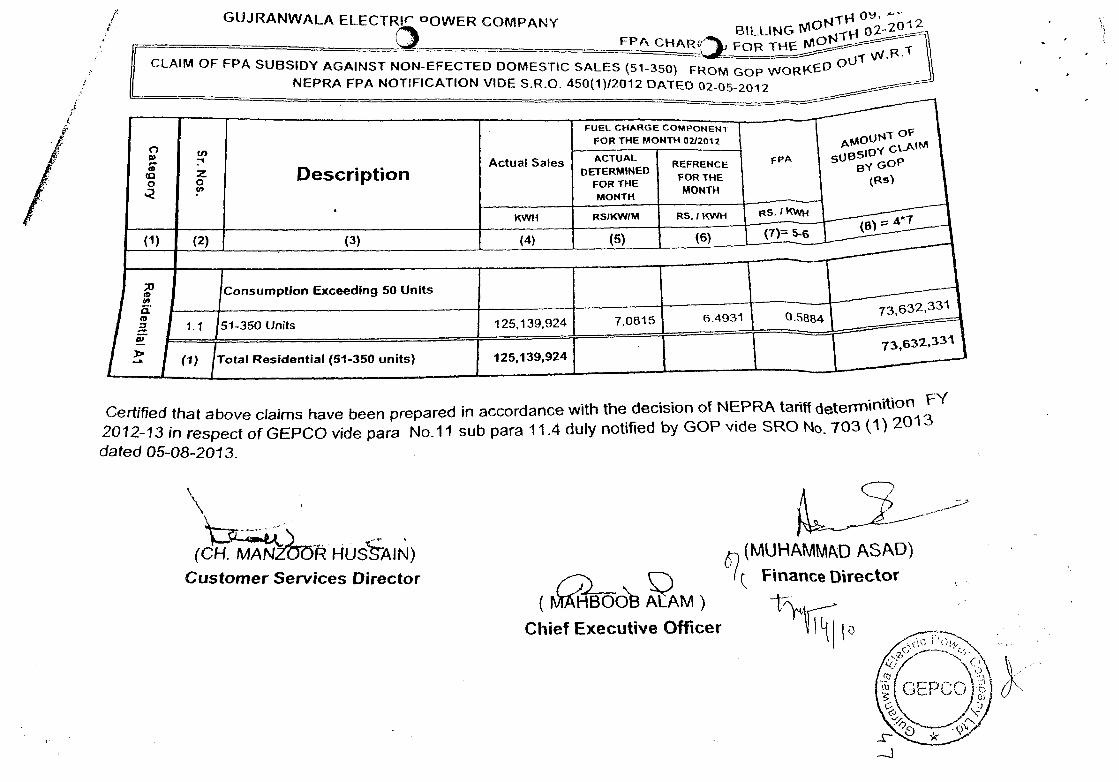
7 Feb-12 73,632,331
8 Mar-12 217292,580
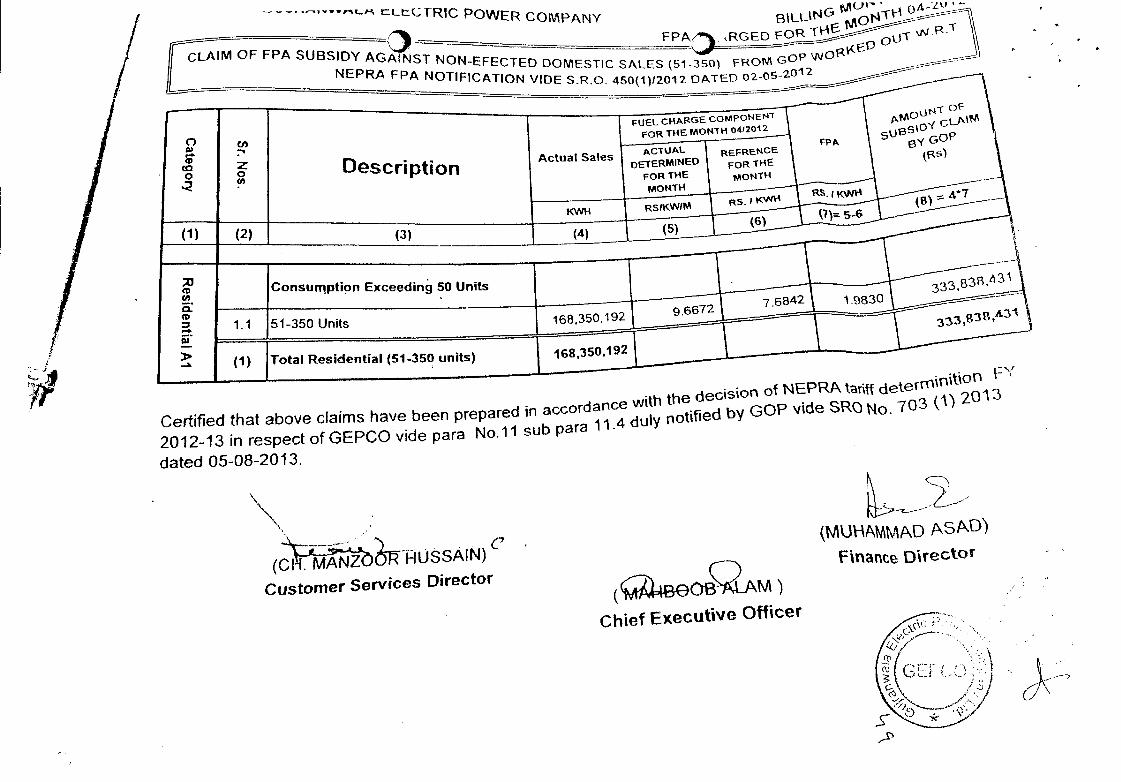
9 Apr-12 333,838,431
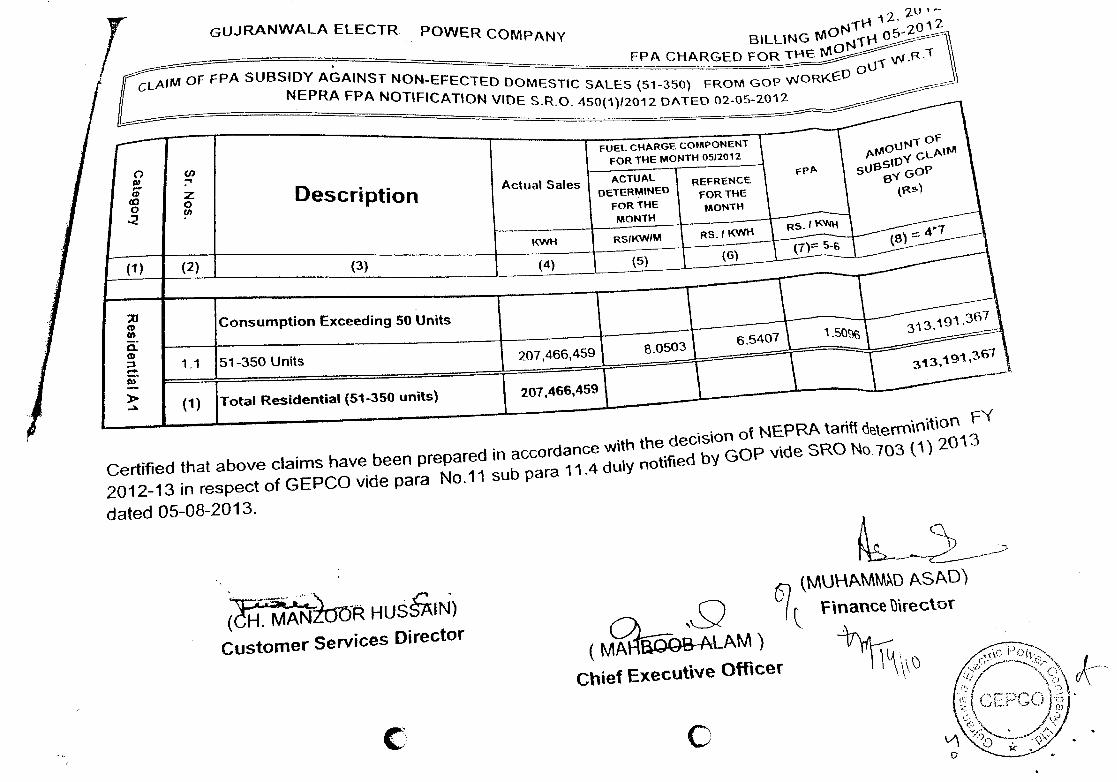
10 May-12 313,191,367
11 Jun-12 51,705,500
Total 3,394,747,839
(4,
Decisian of che Authoricy in the narrer of'Gujran wale Elecrric Power Company L;mired Va NEPp1/TRP2l3,G.t'PCO-2O/2
accounts pertaining to the FY 2011-12 the amount is Rs. 3397 million. Keeping in view, the statement of the Counsel of Government of Pakistan on the matter, the owner of the Companies, i.e., Federal Government if does not wish to collect a Certain
amount from a particular category of consumers, then the difference in recovery
should be borne by the Owner itself. It is also a matter of record that the proceedings in which the above referred statement was made by the learned Counsel for Government has since been concluded vide judgment dated 23.1.2013 passed by the Honorable Lahore High Court Lahore in case No. 26524/11. Regarding the referred statement and the recovery of fuel adjustments from the consumers consuming 350 units, the observations of the Honorable Lahore High Court are as under:-
'Learned Counsel for respondent No.2 has made the statement at the preliminary hearing of connected W,P.No.23097/2011 when on 22.12.2011 the restraining order was modified on his statement that respondents will not debit the fuel adjustment price to the domestic users of 350 Units per month and this court confirmed the restraining order to the extent of 350 Units Per month but now learned counsel shown respondents inability to continue with the said concession, however If this court Will
suggest in its advisory jurisdiction to Federal Government for allowing concession to users of 350 Units, the Federal Government is ready to consider the same. As the right to get the electricity is the fundamental right of every citizen of Pakistan. Pakistan is democratic Islamic state and a truly Islamic state is therefore is a truly welfare state who is guardian and protector of its citizens in need, hence in the above circumstances it is declared that the respondents are not entitled to recover Fuel adjustment charges from the domestic users of 350 Units per months.
11.4 In view of aforementioned, the difference of 300 units ( as 50 units life line consumer is already not affected by the monthly EPA ) is not incorporated in the calculation or PYA
and must be claimed by the Petitioner ,separately from the GOP in the form of subsidy.
11.5 The requested amount of Rs. 101 million under the revision of invoices for the FY 2010-11, has not been substantiated with any evidences or rationale , thus is not allowed by the Authority . The Petitioner may consider resubmitting the same with proper evidence and working.
12. Issue # 8. Whether each component of O&M e.g. Salaries & wages, repair & maintenance, traveling expenses, vehicie maintenance & miscellaneous expenses' claimed in the Petition are justified?
12.1 The Petitioner requested an amount of Rs. 6,155 million on account of O&M cost. It has been stated that the Petitioner's O&M expenses include salary and other benefits, repair and maintenance, traveling allowance, vehicle maintenance allowance and other operating costs related to its distribution and su1y business. A sistory of 08CM expenses of the Petitioner is provided as here under: I
/
C 05 t Officer
J
/
No. SBC-'15(1)/13(VI)
--------
9
Governç 1 of Pakistan Mnis -y of Wr and Power
Office of the Chief lEngineering Adviser
Plot No, 6, Atta Turk Avenue, G-5!1 Isiamabad,
Ph. 051-9244608, Fa051-9244706,
Chief Executive Officer Islamabad EIectc Supply Company ZESCO, Head office Street No. 40 G-714 (slamabad,
Subject:- SUBSIDY CLAIM (51-350) UNS DOMESTIC UNITSEXEMPTED FROM FPA AUGUST-zojj T( MARCH -2013
Reference: yoüroffice letter No 13511-17/ ESCO/FD! dated 28-05-2014.
The subject cited claims subn tted vide above referred letter are returned unactioned with remarks that notiflcation vide SRO No 914 dated October, 2013 do.3 not take account of FPA not charged to domestic consumers (51-350 i :fliS consumption).
In view of above it Is advised o take up the matter with Ministry of Water and Power for further necessa y action.
For Engineert g Adviser (Power)
-: opy•to:--:-:-'
1. Joint Secretary (Power)! Maf ging Director (PEPCO) Ministry ofWater
& Power Islamabad. . 2. Chief Financial Officer, PEPC' i, WAPDAHus Lahoce.
3.
3
) 1SLAMABD ELCTR1C SUppLy COMPANY LIMITED
1: PcbX 051-9252937-3 Ext; Direct: 051-9253235 Fax: 051-9252393
No: ''-- IESCOIFDI
The Engineering Adviser (Power),
Ministry of Water & Power, Government of paldstan, Plot # 6 Atta TurkAvenue, G-sf 1
isiamabad.
Office Of Chief Executive Officer IESCO Hcid omc, 1
SrccL 40, G-7/4 IsIamabad Datcd:/JJ/O 12014
Attention:- Cost A/Cs Officer
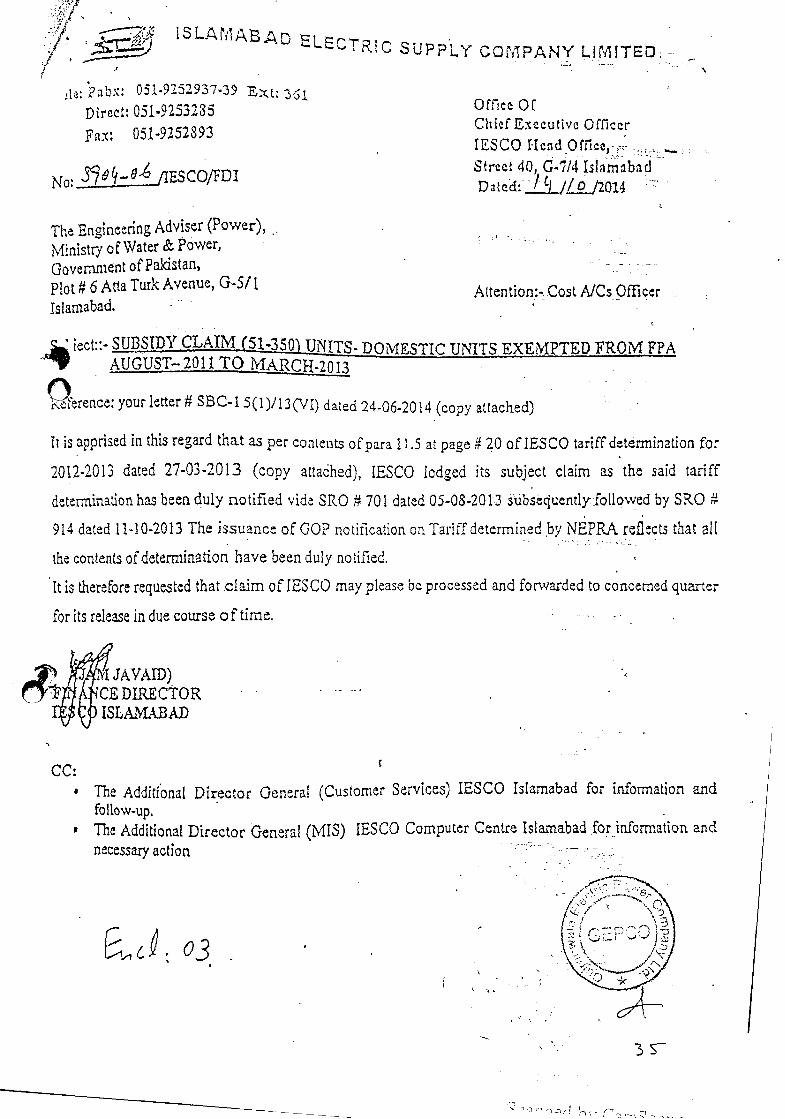
iect::- SUBSIDY CLAIM (51-350') urITS- DOMESTIC UNITS EXEMPTED FROM FPA AUGUST— 2011 TO MARCH.2013
Lence: your letter# SBC-1 5(1)/t31) dated 24-06-2014 (copy attached)
It is apprised in this regard that as per conteuts ofpara 11.5 at page 20 of IESCO tariff determination for
2012-2013 dated 27-03-2013 (copy attahed), IESCO lodged its subject claim as the said tariff
deterrrtinationhas been duly notified vide SRO # 701 dated 05-08-201:3 ,ubseuent1yfol1owed by SRO
914 dated 11-10-2013 The issuance of GOP notification on Tariff determined byNEPRA reflects that all
the contents of determination have been duly notified.
It is therefore requested that claim of IESCO may please be processed and forwarded to concerned quarter
for its release in due course oftime.
"tJAYAID) ?jCEDIRECtOR
ISLAMA.BAD
CC:c
• The Additional Director Genera! (Customer Services) IESCO IsIarnabad for information and fol1w-up.
• The Additional Director General (MIS) IESCO Computer Centre Islamabad for information and necessary action -
a1
3S
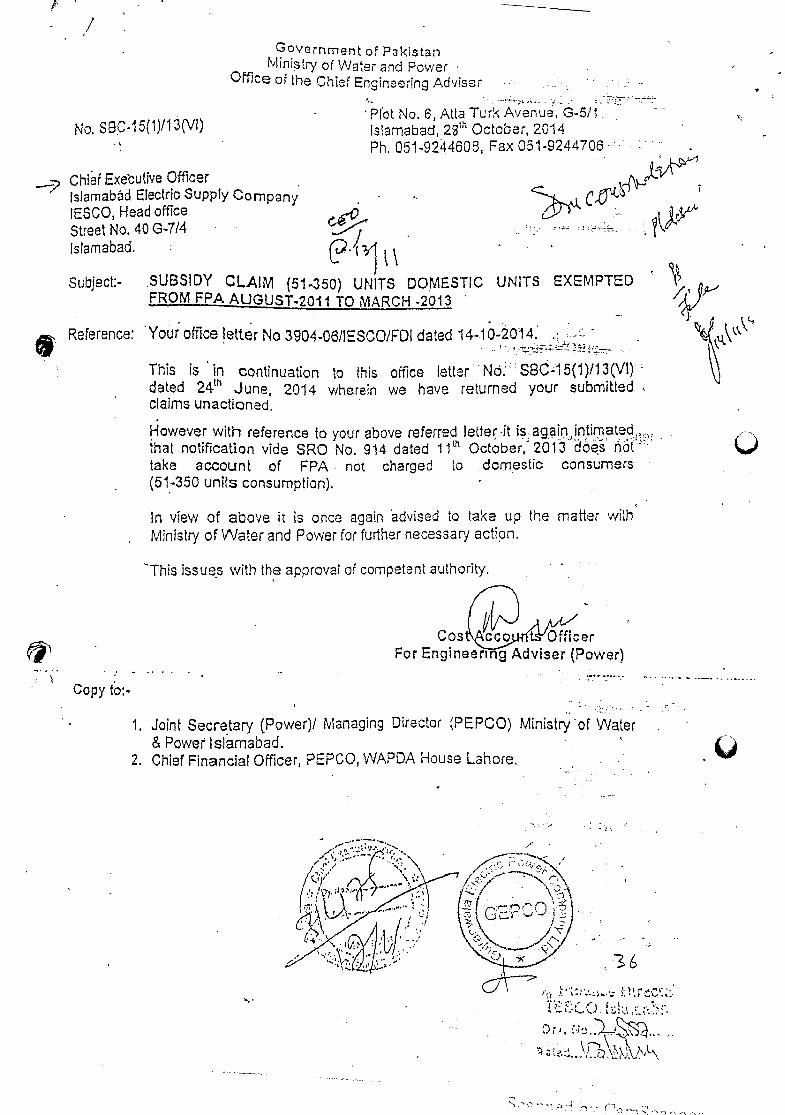
No. S8-15(I)/l3l)
Govornment of Pakistan Ministry of Water and Power
Office of the Chief Engineering Adviser
Plot No. 6, Atta Turk Avenue, G-5/1 Istamabad, 2 October, 2014 Ph. 051-924460, Fax 051-9244706
-7 Chief Executive Officer tslarnabàd Electric Supply Corripany !ESCOI Head office Street No, 40 G-7/4 Is1amabad.
Subject:- SUBSIDY CLAIM (51-350) UNTS DOMESTiC FROM FPA AUGUST2011 TO MARCH -2013
Reference: Your office setter No 3904-06/IESCO/FDI dated 14-1O-2Oi4.-
This is 'in continuation to this office letter NO. ssc-15(1)n3(Vl) dated 24 June, 2014 wherein we have returned your submitted claims unactioneci.
However with reference to your above referred letter it is. again.Jntirnated that notification vide SRO No. 914 dated 11th October, 2013 dÔe ñôt take account of FPA not charged to. domestic consumers (51-350 units consumption).
In view of above it is once again advised to take up the matter with Ministry of Water and Power for further necessary action.
This issues with the approval of competent authority.
Cos 'cco Officer For Engineering Adviser (Power)
Copy to:-
1. Joint Secretary (Power)! Managing Director (PEPCO) Ministry of Water & Power Islamabad.
2. Chief Financial Officer, PEPCO, WAPDA House Lahore.
UNITS EXEMPTED
OffIce Of Chief EccuUVe OlTicer 1ESCO Fiend Offle}
Street 40, G1I4 Islamahad
• Daed/J7_/2Ol4.
1SLAMBAD ELECTRiC SUPPLY c0MLID
Tele: pabx; 051-925237-39 E Direct 051-9232902
Fax Si-9252S93
No: '1ESCO/lDI
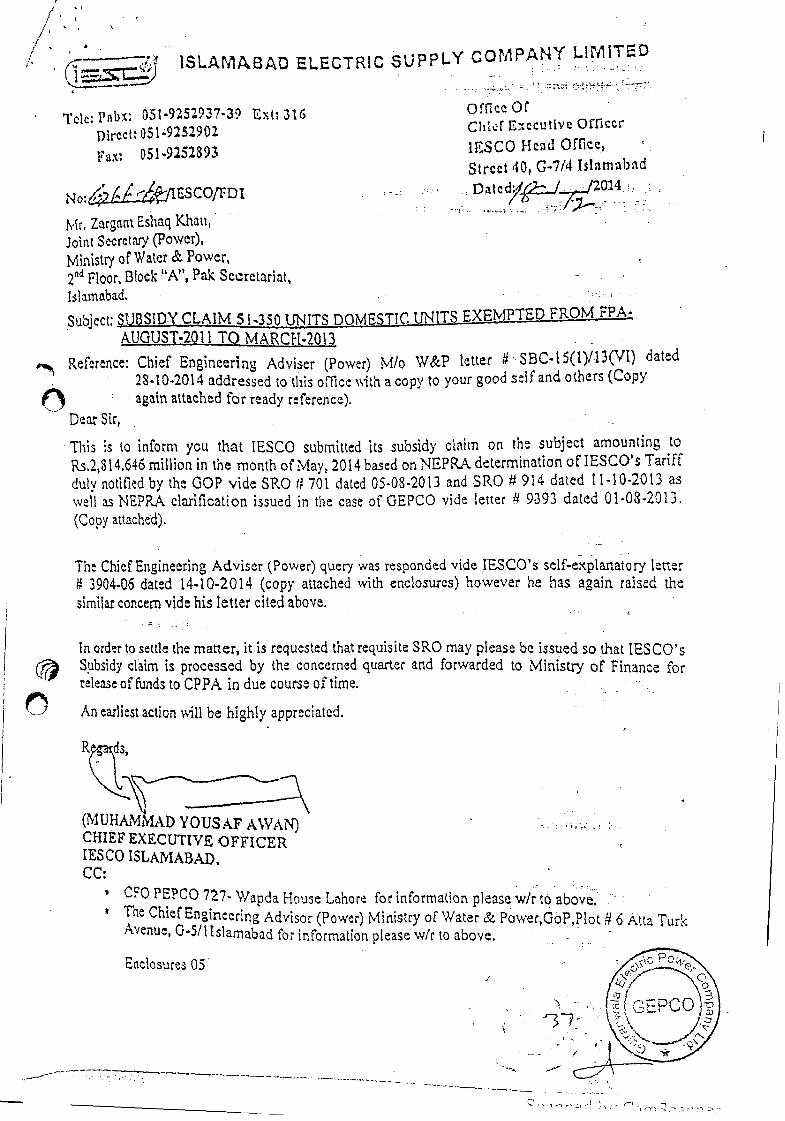
Mr. ZargaU Eshaq Khan, JoInt Secretary (Power), Ministry of Water & Power, 2' Ploor Block "A" Pak Secretariat, 1s1anuibad.
Subject: SUBSIDY CLAIM 5l.35tD UNITS DOMEST! AUGUST-201 I TO MARC20l3
TS_EXEMPTED FROM FPA
0
&P letter / -SBC-15(1)/13(V1) dated to your good self and others (Copy
Reference: Chief Engineerthg Adviser (Power) Mb W 28.10-2014 addressed to thIs office \\jth a CO)'
- again attached for ready reference). Dear Sic,
This is to inform you that IESCO submitted its subsidy claim on the subject amounting to Rs.2,81 4.646 million in the month of May, 2014 based on NEPRA determination of 1ESCO's Tariff duly notified by the GOP vide SRO 1? 701 dated 05-08-2013 and SRO #914 dated 11-10-2013 as well as NEPRA clarification issued in the case of GEPCO vide letter b 9393 dated 01-08-2013. (Copy attached).
The Chief Engineering Adviser (Power) query was responded vide IESCO's self-explanatory letter 3904-06 dated 14-10-2014 (copy attached with enclosures) however he has again raised the
similar concern 'vide his letter cited above.
In order to settle the matter, it is requested that requisite SRO may please be issued so that IES CO's Subsidy claim is processed by the concerned quarter and forwarded to Ministry of Finance for release of funds to CPPA in due course of time.
An earliest action will be highly appreciated.
R
(MUHAMD YOUSS AWAN) CHIEF EXECUTIVE OFFICER IESCO ISLAMABAD. CC:
CFO PEPCO 727- Wepda House Lahore for inforrrtation please w/r to abov. 1
The Chief Engineering Advisor (Power) Ministry of Water & Power,GóP,Plot 6 Atta Turk Avenue, G-Slllslamabad for information please wfr to above.
Enclosures 05
1SLAMABAD ELECTRIC SUPPLY COMPANy L1MIT
The: PtbI-9252937.39 F't 11(
Direct 051-9252902
Fax: 051-9252893
No: JESCO/PDI
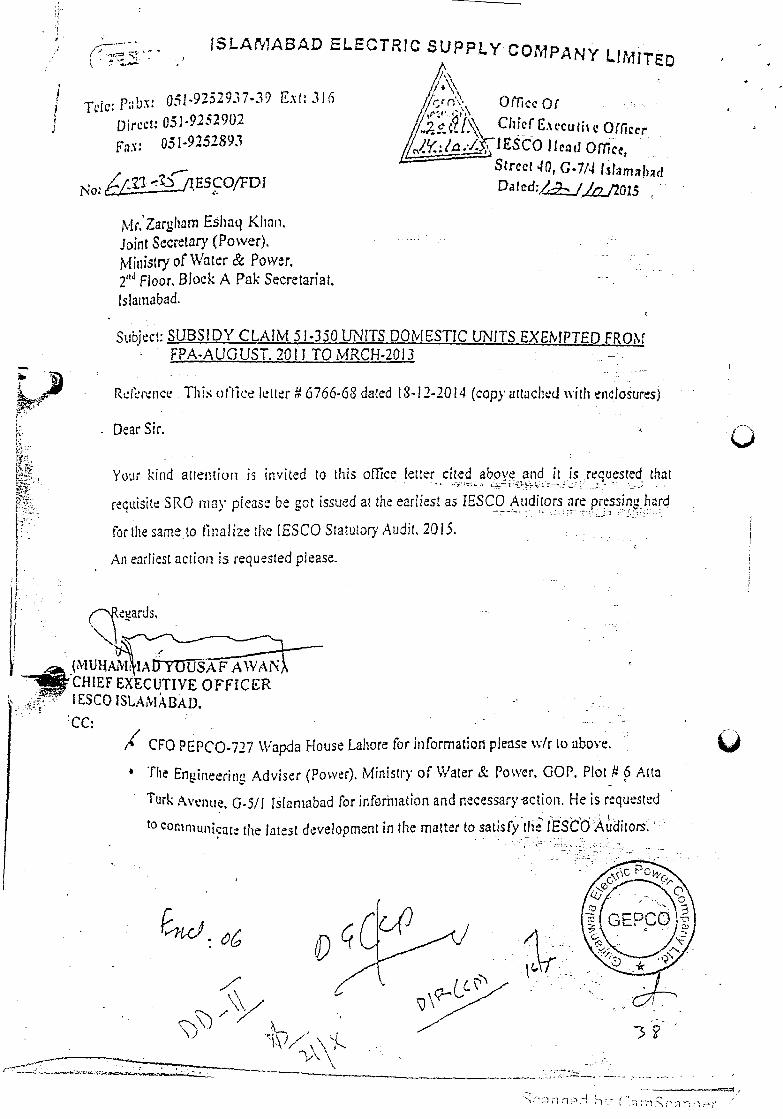
Mr. ZaQzham Eshaq Khan. Joint Secretary (Power). MUUSIFY of Water & Power.
Floor, Block A Pak Secretariat. lslamabad.
Office Of
Chief Cectjj Office J1y';/1ESCO I lead Offlc,
Street 40, G..7/4 Imbd Dated:/IJp, /2015
Subject: SUBSIDY CLAIM 51.350 UNiTS DOMESTIC UNITS EXEMPTED FROM FPA-AUGUST. 2011 TO MRCH-2013
Re1'crnce This otiice tter 6766-ó8 dated 18-12-2014 (copy attuchd with enclosures)
Dear Sir.
Your kind attention is invited to this office letter cited abQ' and itis requested that
requisite SRO may please be got issued at the earliest as JESCO Auditors are pressing hard
for the same to finalize the [ESCO Statutory Audit, 2015.
An earliest action 15 requested please.
IUHAM\1AflYUU AWAN • CHIEF EXECUTIVE OFFICER
I ESCO ISLAMAI3AD. :CC.
A' CEO PEPCO-727 Wapda House Lahore for information please wfr to above.
• The Enineerw Adviser (Power). Ministry of Water & Power. GOP. Plot 6 Acta
Turk Avei e G5/! Ishaniabad for infortuation and necessary acti0n. He is requested
to COflinlulitcate the latest development in the matter to sats1y th IESC0 Auditors
Li.
(T2
C)
GUJRANWALA ELECTRIC POWER COM?AN LTD. QfhcLi°
'' 92r05 26/700
cniei ExeCUhJf'
" 97c!22GEPCO Ltd. 565-A \Od&
ToVfl
G.T. Road. OUji0flWC10
P(,O/ SUSI1) ' s r
Doled i-?'
rrJIn enng Adviser (Power), ...'ffce of Chief Engineering Adviser. M;r;' try of Wafer and Power, (,)VornrnEnl of Pakistan.
No. 6. Aftci Turk Avenue, G-5/l. I lj Area, lslamabad
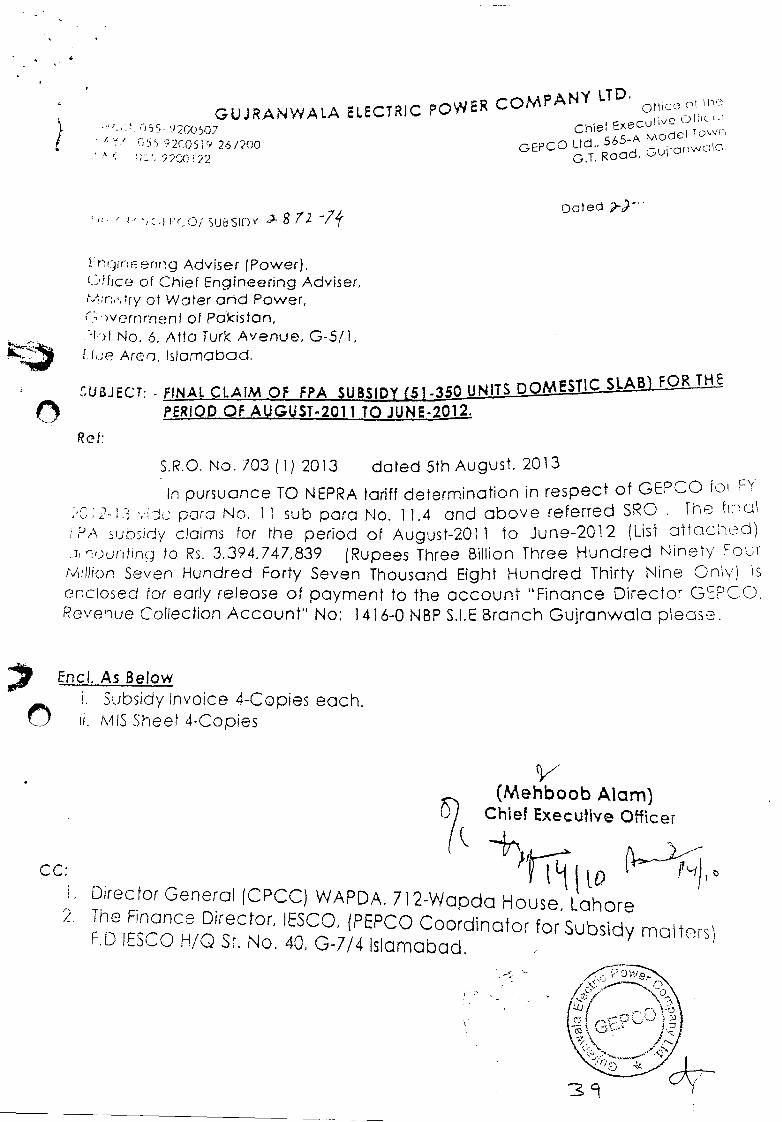
U&JECT: - NAL CLAIM QF FASUBIDY (51 -350 UNITS DOMJI1C SLAB FOR THE FERIOD OF AUGUST-201 110 . j2O12.
Ret:
S.R.0. No. '703 (I) 2013 dated 5th August 2013
In pursuance TO NEPRA tariff determination in respect of GEPCO fo FY c para No. II sub para No. 11.4 and above referred SRO . The hnal
PA suody claims for the period of August-2011 to June-2012 (List atlachLd) .ruritinq to Rs. 3,394.747,839 (Rupees Three Billion Three Hundred Ninefy Four MlJion Seven Hundred Forty Seven Thousand Eight Hundred Thirty Nine Only) s cnc)os'ed for early release of payment to the account 'Finance Director GEF'CO, Revenue Collection AccounY' No: 1416-0 NBP S.LE Branch Gujranwala please.
End. As Below
Subsidy Invoice 4-Copies each. ii. MIS Sheet 4-Copies
V (Mehboob AIam)
Chief Executive Officer
—
t1w •pJ
I. Director General (CPCC) WAPDA, 712-Wapda House, Lahore 2, The Finance Director, ESCO, (PEPCO Coordinator for Subsidy maters)
F,D JESCO H/Q St. No. 40, G-7/4 Islamabad.
CC:
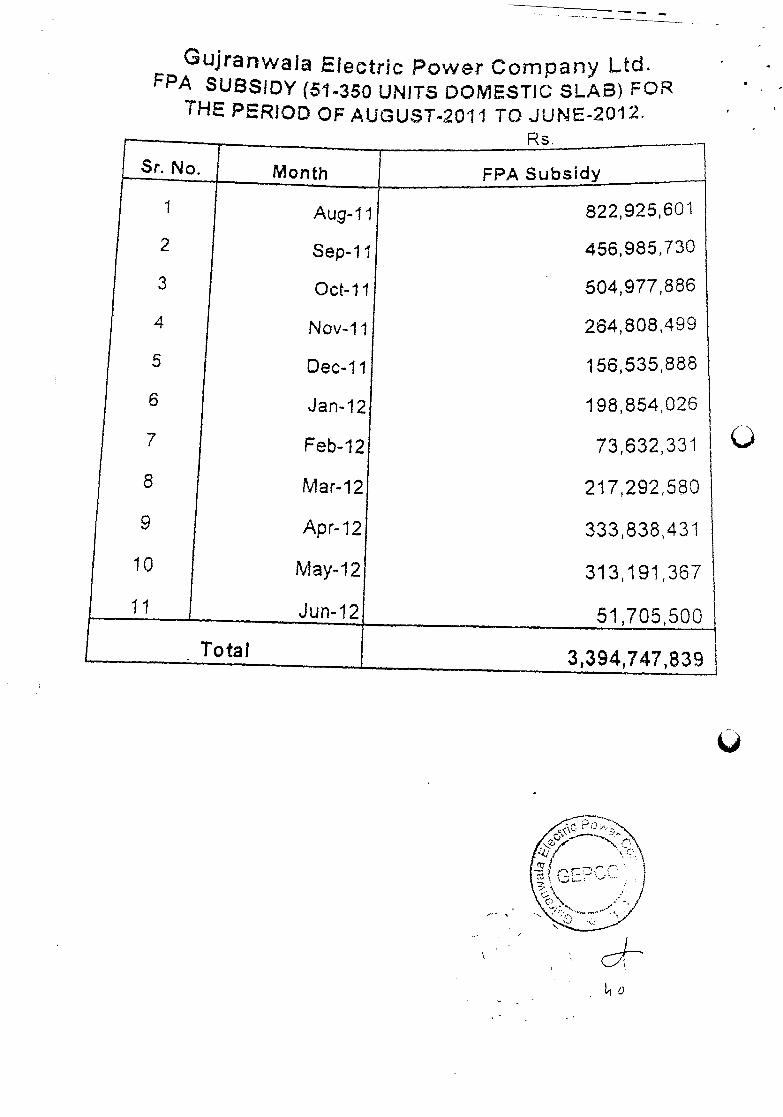
Gujranwaja Electric Power Company Ltd. FPA SUBSIDY (51-350 UNITS DOMESTIC SLAB) FOR
THE PERiOD OFAUGUST-2011 TO JUNE-2012. Rs.
Sr. No. Month FPA Subsidy
822,925,601
456,985,730
504,977,886
264,808,499
156,535888
198,854,026
73,632,331
217,292,580
333,838,431
313,191,367
51,705,500
1 Aug-I 1
2 Sep-il
3 Oct-il
4 Nov-il
5 Dec-il
6 Jan-12
7 Feb-12
8 Mar-12
9 Apr-12
10 May-12
11 Jun-12
Total 1 3,394,747,839
0
RSIKWIM RS. I IWH Rs,I0NH . 4.7 *cwl-4
FUEL CHARGE COMPONENT FOR THE MONTH OWZOII
ACTUAL DETERMINED
FOR THE MONTH
pMOUWT O 5UBSY CLAM
VR&
Actual Salos REFRENCE FOR THE MONTH
(I, -I
0 (n
(2)
( (I
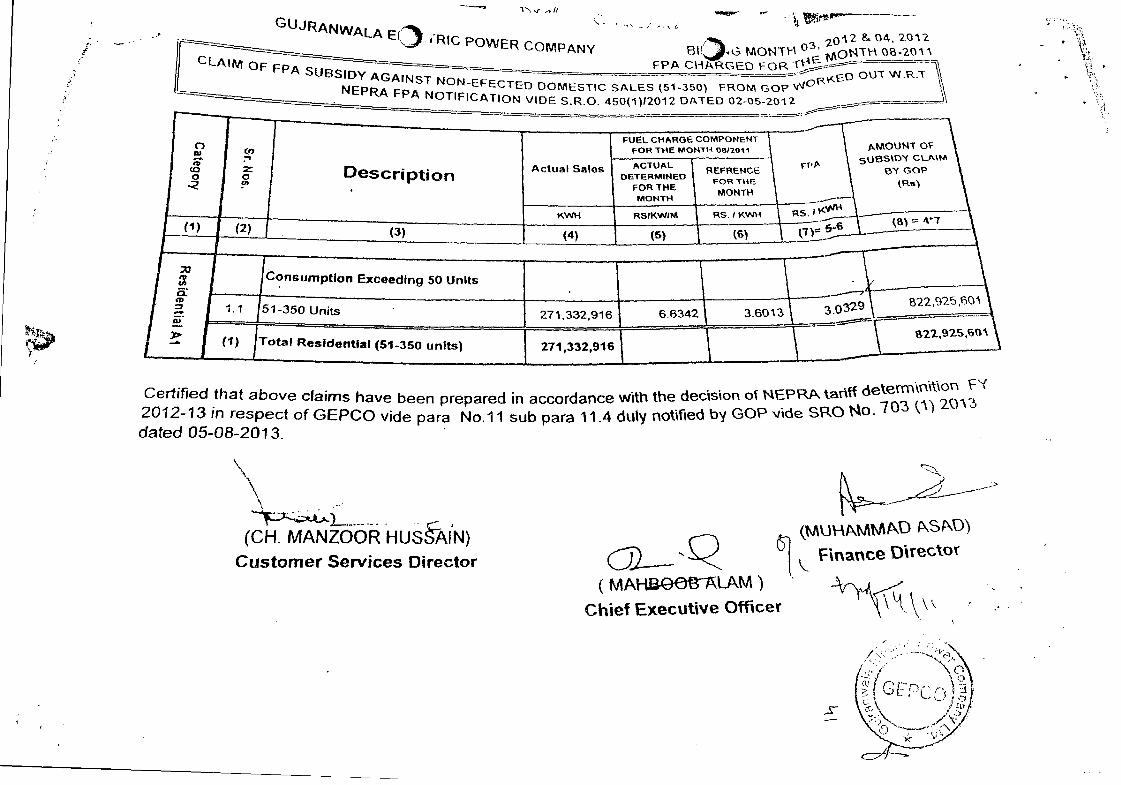
G(JJRANWAL E)2012 & 04,
dRIC POWER COMPANY EU' MONT o t4m 0-201' F P A Ct1
FPA SUBSIDY AGAINST NONEFECTED DOMESTIC SALES (51350 FROM GOP
OUT W.RT
NEpp FPA NOTIFICATION VIDE S.R.O. 450(1)12012 DATED 02-05-2012
(3) (4) (5) (6)
Consumption ExceedIng 50 Units
Description
Total ResIdential (51-350 units) 271,332,916
3.0329 622,925601
622,925,6'
1.1 51-350 Units 271,332,916 6.6342 3.6013
Certified that above daims have been prepared in accordance with the decision D MEP eterm.'°
2012-13 in respect of GEPCO vide para No.11 sub para 11.4 duty notified tj GOP ftde SRO ts40. 703 ( 20 dated 05-08-2013.
(CR MANZOOR HUS7LIN) Customer Services Director
(MUHPMMf\O PSI\D5)
Ftnance Onectoc
(M/\HOO1LAM) Chief Executive Officer
(3) (4)
KWH RS RSIKWIM RS.IKW1-1
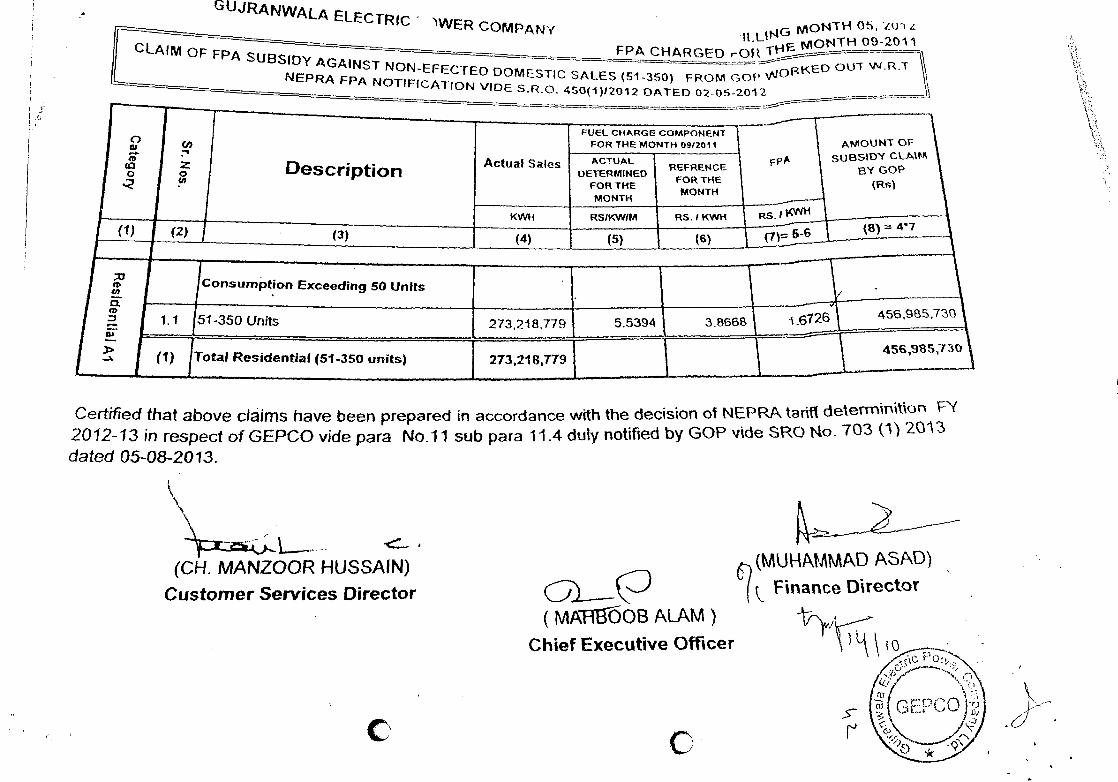
G(JJRANWALA ELECTRIC- WER COMPANY
CLAIM OF FPA SUBSIDY AGAINST NONEFECTED
DOMESTIC SALES NEpRA FPA NOTIFICATION VIDE S.RO. 450(1)12 - -
iNG MONTH 05, L(J MONTH OJ-2O11
FPA CHARGED rOI1j
(51-350) FROM GOI' ORKE0 OUT .R.T 012 DATED 02-05-2012
FUEL CHARGE COMPONENT FOR THE MONTH O.oi1
ACTUM. DETERMINED
FOR THE MONTH
AMOUNT OF SUBSIDY CLAIM
BY GOP (RsI
REFRENCE FOR THE MONTH
(1)
Consumption Exceeding 50 Units
51-350 Units
Total ResidentIal (51-350 units)
273,218,779
213,218,779
456,985,70
456,955,730
(D
- (1)
1.1 5.5394 38668
(7) 56 (8) 47 I
Description Actual Sates
Certified that above claims have been prepared in accordance with the decision of NEPRA. tanf deterrn1\tOfl 1 20 12-13 in respect of GEPCO vide para No.11 sub para 11.4 duly notified by GOP v;de SRO No. 703 (1') 2013
dated 05-08-2013.
(MUHAMMAD ,t\SAD)
U ( ç Finance Director
(CH. MANZOOR HUSSAtN)
Customer Services Director
C
(MABOOB ALAM)
Chief Executive Officer
Actual Sales
FUEL CHARGE COMPONEHI FOR THE MONTH iQI2O1
ACTUALREFRENCE
ORTERMINEDFOR TilE
FOR THE MONTH MONTh
RSul(WIM RS.IKWil
(5) (6)
OF
SUBS0 Ct-MM 8"( GoP
(7) 5-6 (8) 4*7
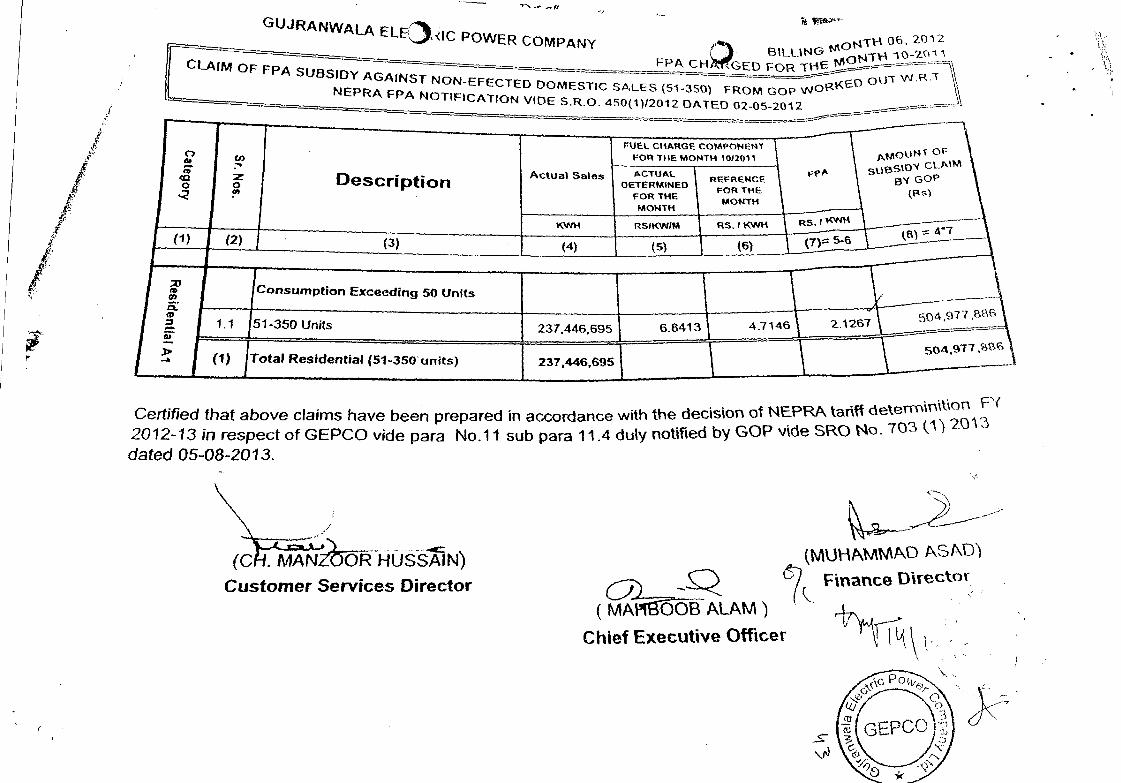
51-350 Units 237.446,695 68413 4.7148 2.1267 594,977 ,656
Total Residential (51-350 units) 237,446,695
Consumption Exceeding 50 Units
Description
-.a
TH 06, 2012 GUJRANWA ELE)C POWER COMPANYBft1IG ON
FP G F CIM OF FPA SUBSIDY AGAINST NONEFECTED DOMESTIC
SALES (35 FROM GOP 0gEO OUI NEPRA FPA NOTIF)CATION VIDE S.R.O. 450(1)/2012 DATED 02-05-2012
Certified that above claims have been prepared in accordance with the decision 01 NEPRA tarit deter flttOf f"'
2012-13 in respect of GEPCO vide para No.11 sub para 11.4 duty notified by GOP vide SRO No. 70 () 2O3 dated 05-08-2013.
(C .MANZ5HUSS'IN)
Customer Services Director
(MA11öALAM)
Chief Executive Officer
(MUPMW\PD /SPD')
Finance Director
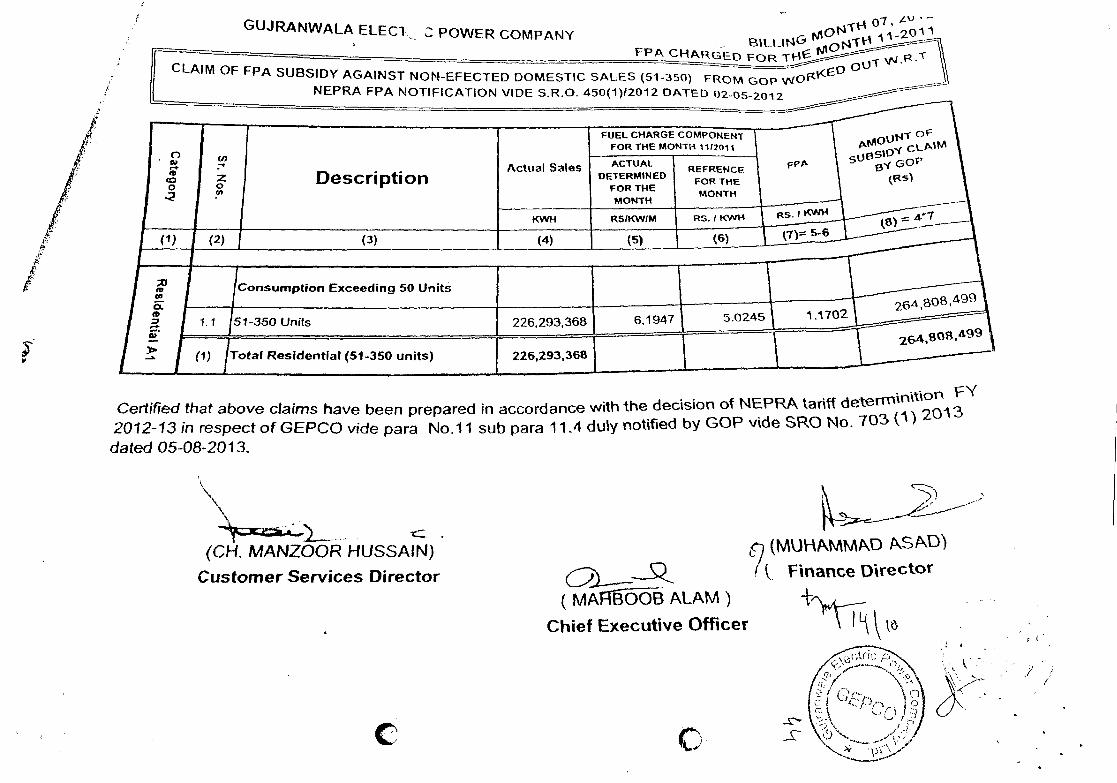
226,293,368 Total Residential (51-350
FUEL CHARGE COMPONENT FOR THE MONTH 1112011
ACTUAL DETERMINED
FOR THE MONTH
RSIKWIM
5 1-350 Units 226,293,368 6.1947
I (V1 . I.'' - ' 12011
- BIW -____ _____ - FPACHAI R
CLAIM OF FPA SUBSIDy AGAINST NON-EFECTED DOMESTIC SALES (51-350) FROM GOP NEPRA FPA NOTIFICATION VIDE S.R.O. 450(1)12012 DATED 02-052012
CeiGed that above claims have been prepared in accordance with the decision of NEP tariff deter
2012-13 in respect of GEPCO vide para No.11 sub para 11.4 duiy notified by GOP vicle SRO No. 703 (i') 203 dated 05-08-2013.
g) (MU-PMMAD SPD)
( Finance Director
(MARö LPM)
Chief Executive Officer ' Lj
(CH. MIANZOOR HUSSAN)
Customer Services Director
GUJR.ANWALA ELEC1 C POWER COMPANY
o 0U1•
FUEL CHARGE COMPONENT FOR THE MONTH 2JO11
Consumption Exceeding 50 Units
201 L
011 GUJRANWALA ELECT,I' POWER COMPANY BILLiNG F PA CH
N R -
CLAIM OF FPA SUBSIDY AGAINST NON-EFECTED DOMESTIC SALES (51-350) FROM GOP WO NEPRA FPA NOTIFICATION VIDE S.R.O. 450(1)12012 DATED 02-05-2012
Certified that above claims have been prepared
2012-13 in respect of GEPCO vide para No.11
dated 05-08-2013.
in accordance with the deciston of NEPRA tanti de 2O1 sub para 11.4 duly notified by GOP vide SRO Mo.
(~frO R HUSN) Customer Services Director
(UW\MPD /\SI\D')
çfinance 0j1ect0t
(MAHBO@&AAM')
Chief Executive Officer
FUEL CHARGE COMPONENT FOR THE MONTH 01r2012
Description Actual Sales ACTUAL
OETERMNE0 FOR THE MONTH
RSIkWIM
REFRENCE FOR mc MONTH
106,259.499 9.1915 73201 1 B714 198,854 026
Total ResidentIal (51-350 units) 106,259,499
(7')= 5-6
Consumption Exceeding 50 Units
p0
C
GUJRANWA ELEC 'IC POWER COMPANY BLUNG
FPAFOR TH2 RT
CLAIM OF FPA SUBSIDY AGAINST NON-EFECTED DOMESTIC SALES (51-350> FROM GOP' NEPRA FPA NOTIFICATION VIDE S.R.O. 450(1)/2012 DATED 02.05-2012
Certified that above c'aims have been prepared in accordance with the decision of NEPRA tari detem uitiOfl
2012-13 in respect of GEPCO vide para No.11 sub para 11.4 duly notified by GOP vide SRO N 703(1) 2013
dated 05-08-2013.
L
(CH. MANZOOR HUSSAIJ)
Customer Services Director
(M - PMMf\D SAD)
S7 Finance Oirector
(MbOB ALAM)
Chief Executive Officer "k \ \
GUJRANWALA ELECTRV °OWER COMPANY
ii
- 0, BILLING 'O 4 O220i
FPACHAR FOR THE
CLAIM OF FPA SUBSIDY AGAINST NON-EFECTED DOMESTIC SALES (51-350) FROM GOP WOR( O' NEPRA EPA NOTIFICATION VIDE S.R.O. 450(1)/2012 DATED 02-05-2012
FUEL CHARGE COMPONENT FOR THE MONTH O2J2O12
ACTUAL DETERMINED FOR THE MONTH
REFRENCE FOR THE MONTH
Description Actual Sales
RSIKWIM
51-350 Units 125, 139.924 7.0615 6.4931
Total Residential (51 -350 unitS) 125,139,924
(7)= 5-6
Consumption Exceeding 50 UnIts
Certified that above claims have been prepared in accordance with the decision of NEPRA tarii deten -'°'
2012-13 in respect of GEPCO vide para Nio11 sub para 11.4 duly notified by GOP vide SRO No 703(1) 2013
dated 05-08-2013.
(CH. MANZO HUSAIN) Customer Services Director
(MUHAMM!\D ASPD)
1T Chief Executive Officer ) 'j,
(de M)Finance Director
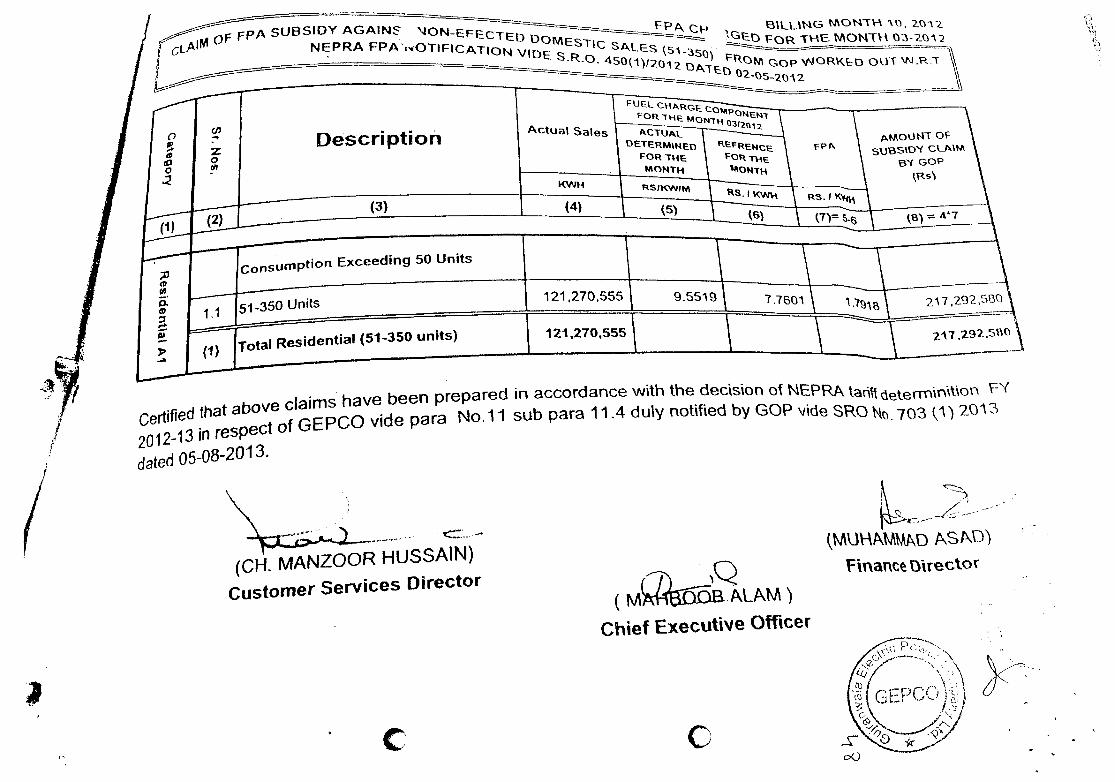
A SUBSIDY AGAIN \IONEFECTEFp NOW fl-k , 2012
)DOMESTI NEPRA FPAIOTIFICATION VIDE S R C SES
OR ThE MONTh 3-2O2
cop 'N OR Et)
211\
Total Residential (51-350 units) 121,270,555
(MUW\W\D A.SFTh Finant Ojrector (CFLMANZ0OR i-IUSSAIN)
Customer Services Director
Chief Executive Officer
FUEL CHARcE FOR THE MoNTh PCTUAL
OETERMNEO FOR MONTH
ANO%JNT OF SUBS1O'' CL13M
'( GOP Rs
FP
RS.
j350 Units 121,270,555 9.5519 7.7601 217
Certified that above claims have been prepared 'n accordance w%th the decision O NEPRA. tan (
2012-13 if') respect of GEPCO vide para No.11 sub para 11.4 duly notified by GOP '1de SRO . 703
dated O5O82013.
47
ConsumPtb0hT Exceeding 50 Units
Description
EO oU LR
I (NO --1 O-- -1LFPOWER COMPANY
9 6672
-
CLAIM OF FPA SUBSIDY AGAINST NON-EFECTED DOMESTIC SALES (S1-350'I FROM GOP WO NEPRA FPA NOTIFICATION VIDE SR.O. 450(1)12012 DATED O20520
ACTUAL DETERMINED
FOR THE MONTH
FUEL CHARGE COMPONE FOR THE MONTH 0412012
REFRENCE FOR THE MoHcH
Consumption Exceeding 50 Units
51-350 Units 168,350.192 1830
333
Total Residential (SI -350 units) 168,350,192
RS. r cw'4
Description Actual Sales
Ceified that above claims have been prepared in accordance with the deCisi00 NEPR tar deter
2012-13 in respect of GEPCO vide para No.11 sub para 11.4 duLy notified by GOP vide SRO o. 703 (1 20
3
dated 05-08-2013.
N,
Customer Services Director
( OPLAM)
Chief ExeCUt%ve Officer
(MU1-NM1\D pSPD)
Fnarv.e DireCt0'
ctt07
3j3,19t
Total Residential (51-350 units)
tANJOR HUSIN)
Customer Services Director (MA M')
Chief ExecUtiVe Officer
Frnance irectOr (
I GUJRANWALA ELECTR
juM0F FPA SUBSIDY AGAINST NON-EFECTED DOMESTIC SALES (51-350) FRONGOPIOR° V
NEPRA FPA NOTIFICATION VIDE SR.O. 450(1)12012 DATED 02052012
FUEL CHARGE COMPONENT FOR THE MONTH 0512012
POWER COMPANY BILLING FPA CHARGED
Description Actual Sales ACTUAL
OETERMNED FOR THE MONTH
REFRENCE FOR THE MONTH
Consumption Exceeding 50 Units
51-350 Units
Certified that above claims have been prepared 2012-13 in respect of GEPCO vide para No.11 dated 05-08-2013.
207,466,459 8.0503
207,466,459
the deCiSO' of 4EPPA tar nitor'
in notified by GOP vtde SRO no.703 (1') 20t3 sub para 11.4 dUly
(MUHc\MMD S!D
SPD)
%inancc 1ctOr
(CM O rector
hExcue0th Gusto
- .
DOMESTtc sP&Es(51 OR%SEO 0t \ culM° NEPRA FPA NOTWICATION vr S.RO. 450(1)12012 DPTE O2-OS202
r-i I
Description
(3)
Actua' Sates
KWH
(4)
FUEL CHPRGE COMPo -T FOR THE MONTh OI22
PCTiPl OETERMHEO
FOR ThE MONTH
RSIKWIM
oF
B"( 00%'
(8)
REFRENCE FOR THE
MONTh
(5)
0
C. 0 ______________
(1) -
that above claims have been prepared n accordance With the decision NEP tar\W
2012-13 ifl
respect of GEPCO vide para No.11 sub para 11.4 duty notied b GOPSRO (
dated 05082013.
1.1
C-,
0
(1)
ConsUmPtott Exceedg 50 Units
51350 Units
Total Residential (51 -350 unitS) 221,626,660
221,626,660 6.9280 705500
':3 6.6956
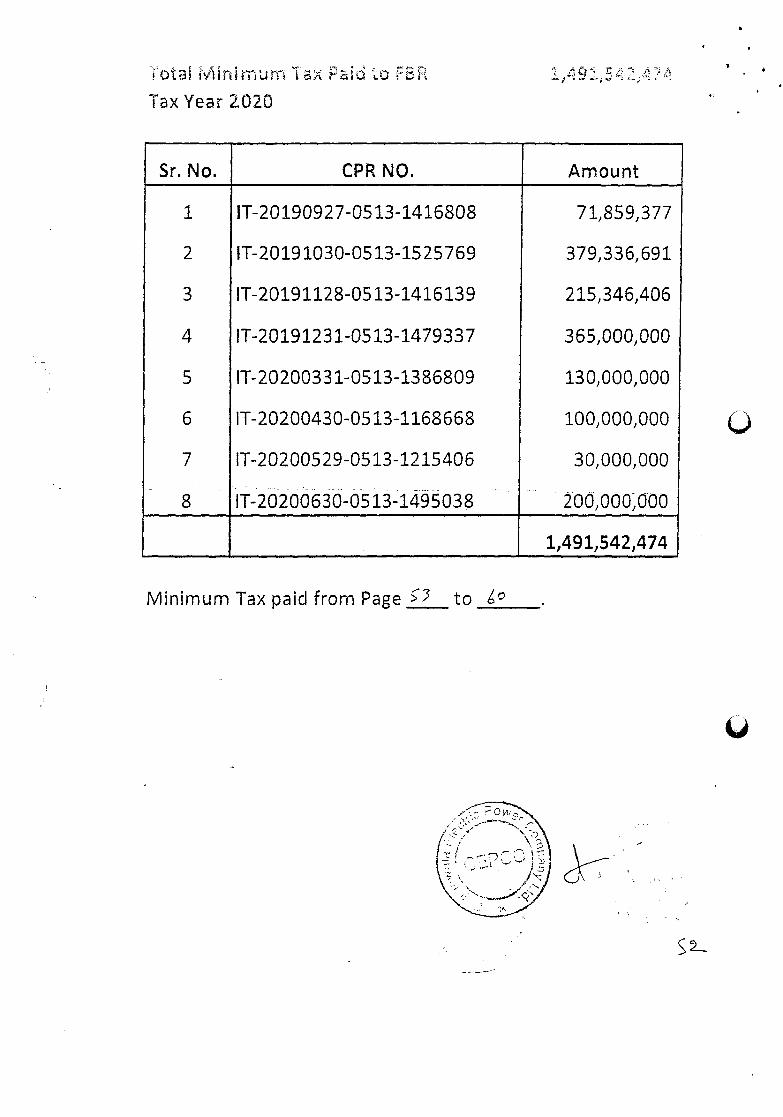
1ot Minimum x P Tax Year 2.020
Sr. No. CPR NO. Amount
1 IT-20190927-05 13-1416808 71,859,377
2 IT-2019 1030-05 13-15 25769 379,336,691
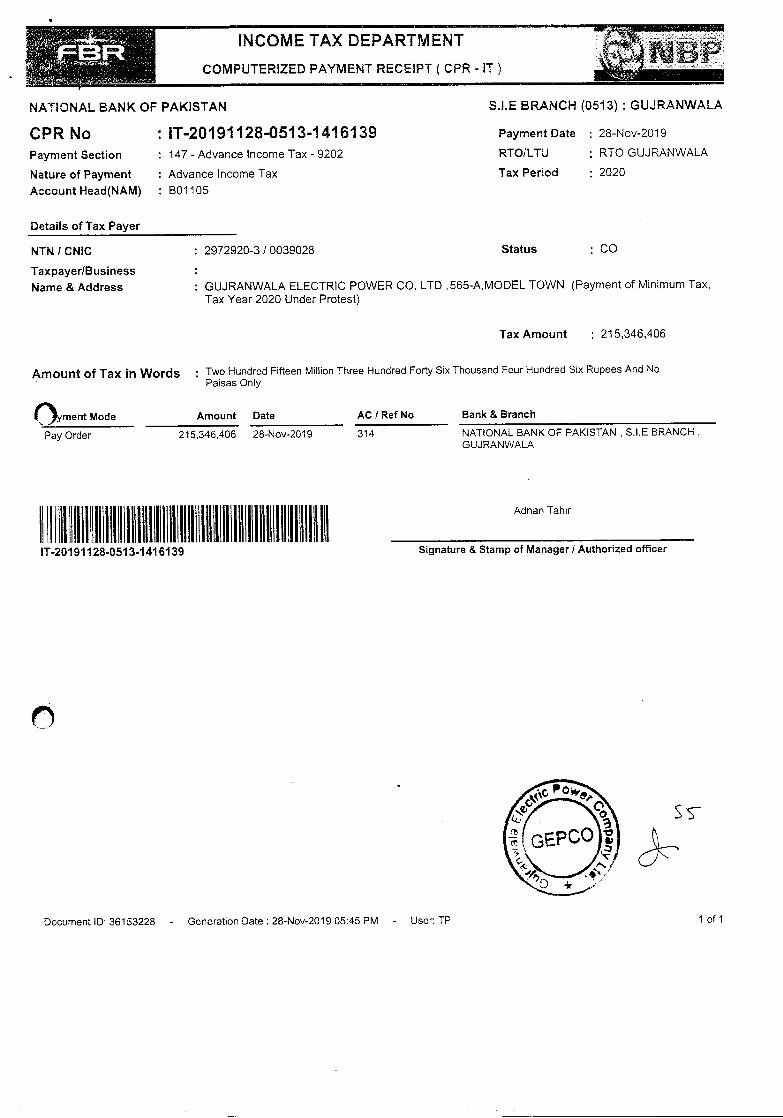
3 IT-2019 1128-0513-1416139 215,346,406
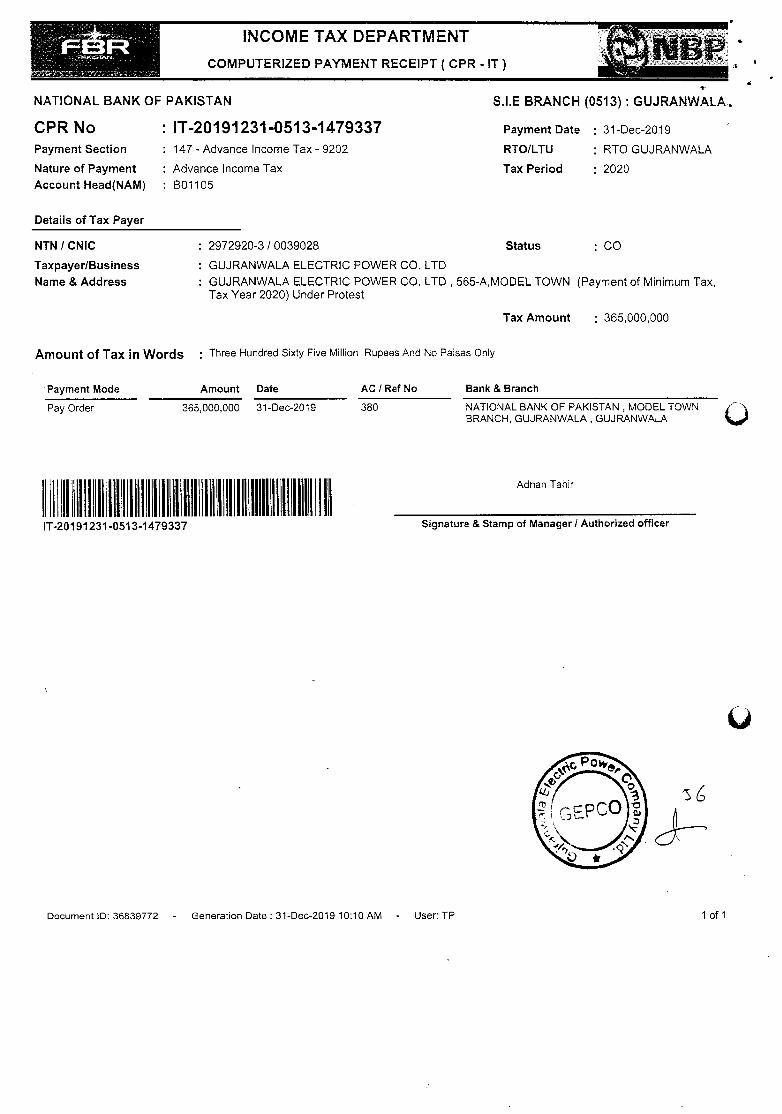
4 IT-2019 1231-05 13-1479337 365,000,000
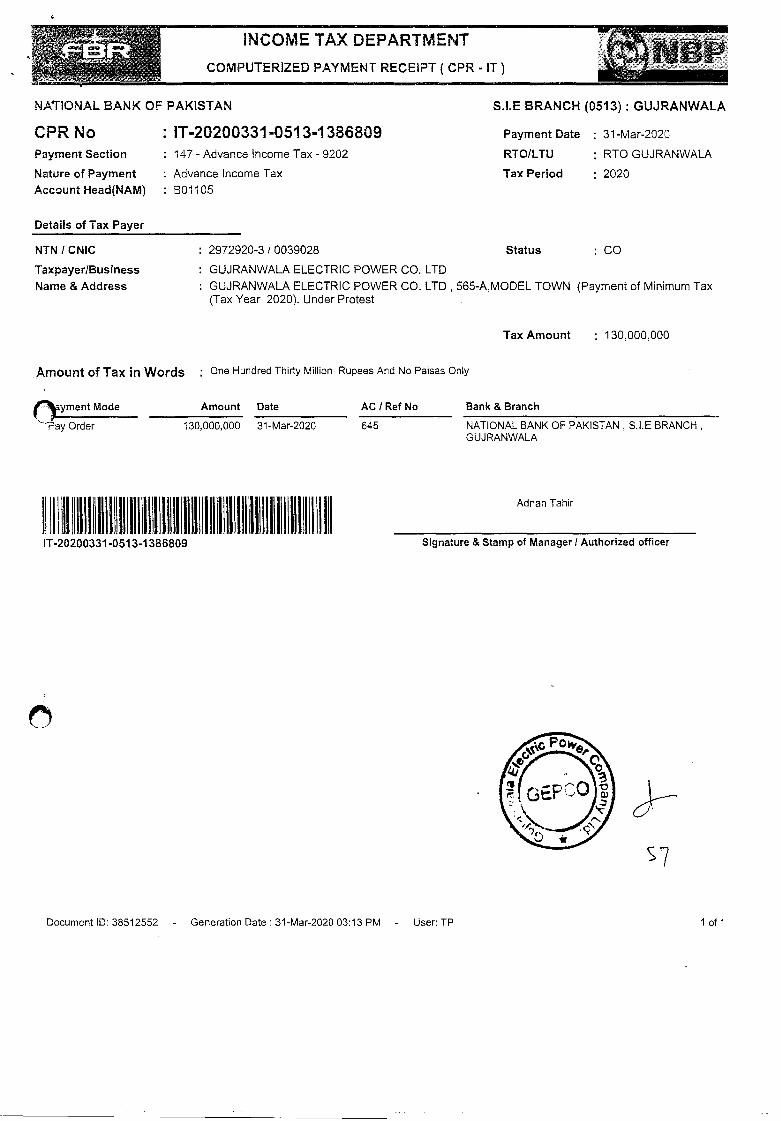
5 IT-2020033 1-0513-1386809 130,000,000
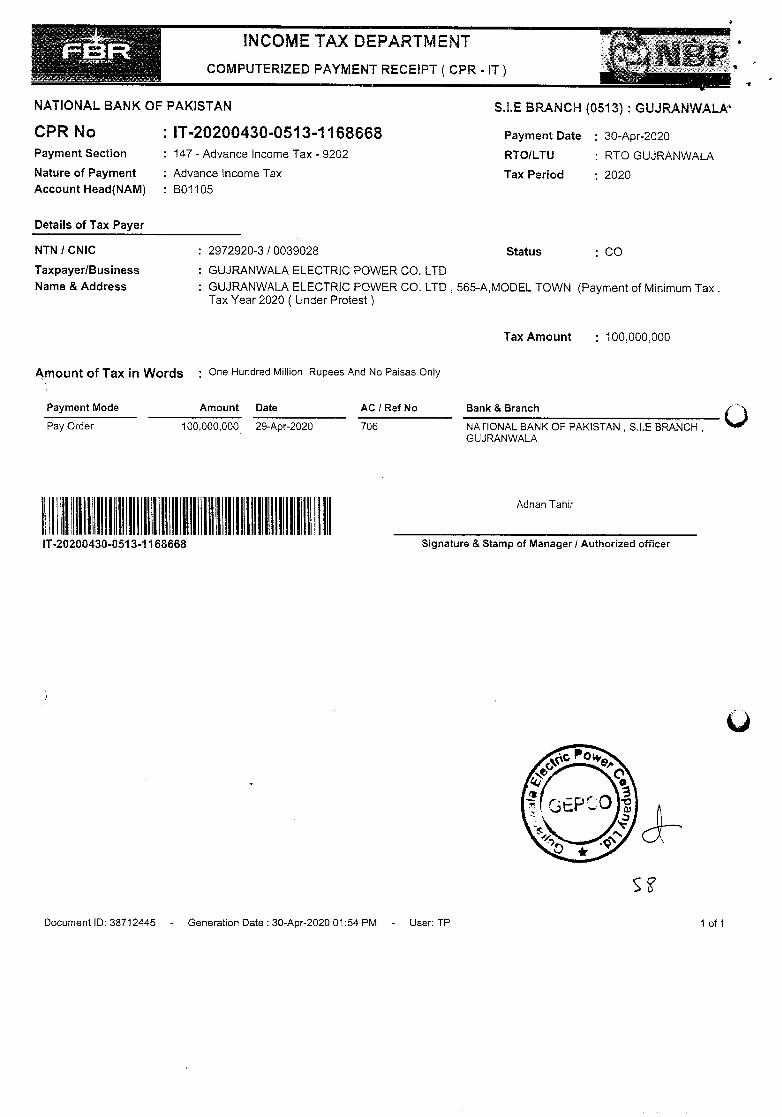
6 IT-20200430-05 13-1168668 100,000,000
7 IT-20200529-05 13-1215406 30,000,000
8 ,112020063005131495038 20O000,000
1,491,542,474
Minimum Tax paid from Page to °
S
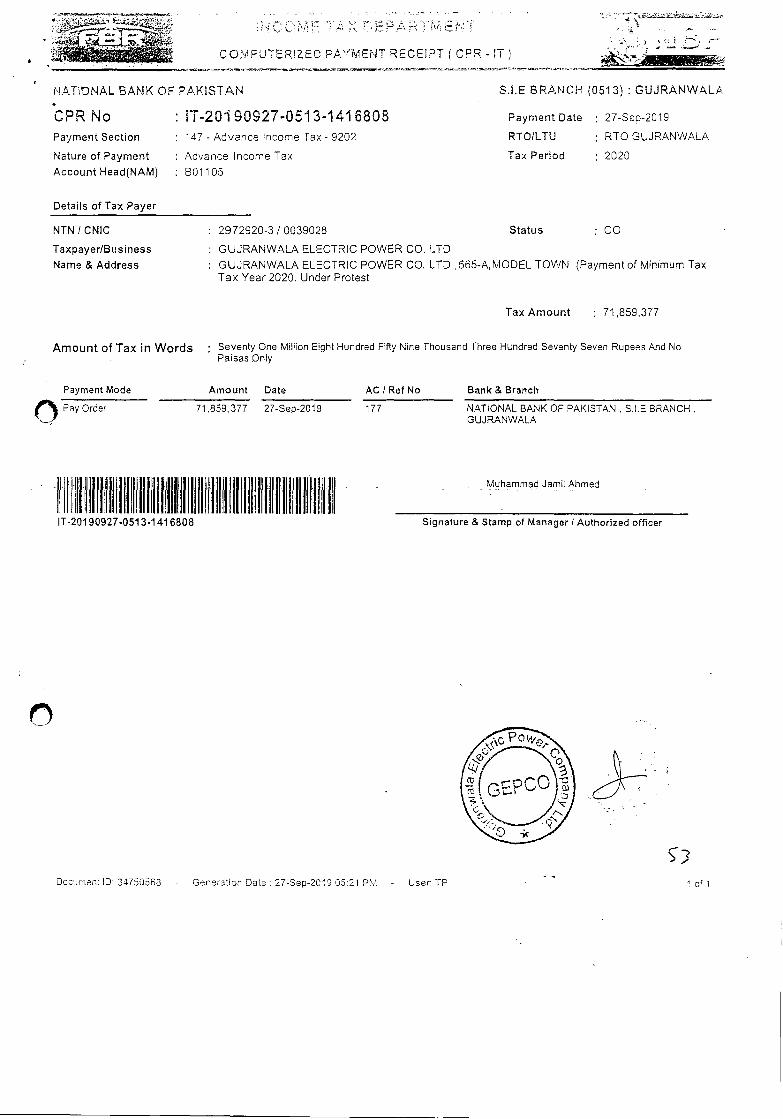
COMPUTERIZED PAYMENT RECEIPT ( CPR - IT)
NATNAL BANK OF PAKISTAN S.LE BRANCH (0513) : GUJRANWALA
CPR No IT-201 90927-051 3-141 6808 Payment Date 27-Sep-20 19
Payment Section 147 - Advance Income Tax - 9202 RTO/LTU RTOGUJRANWALA
Nature of Payment Advance Income Tax Tax Period 2020
Account Head(NAM) 801105
Details of Tax Payer
NTN / CNIC 2972920-3 /0039028 Status CO
Taxpayer/Business GUJRANWALA ELECTRIC POWER CO. LTD
Name & Address GUJRANWALA ELECTRIC POWER CO. LTD , 565-AMODEL TOWN (Payment of Minimum Tax, Tax Year 2020. Under Protest
Tax Amount : 71,859,377
Amount of Tax in Words Seventy One Mition Eight Hundred Fifty Nine Thousand Three Hundred Seventy Seven Rupees And No Paisas Only
Payment Mode
Amount Date AC I Ref No
Bank & Branch
Pay Order 71,859,377 27-Sep-2019 177 NATIONAL BANK OF PAKISTAN , S.I.E BRANCH, GUJRANWALA
I
1111
III
III I
I I
I
11 U Muhammad Jamil Ahmed
T 20190927-0513- 416808 Signature & Stamp of Manager I Authorized officer
S3 Document ID: 34750558 - Generation Date 27-Sep-2019 05:21 PM - User TP 1 of 1
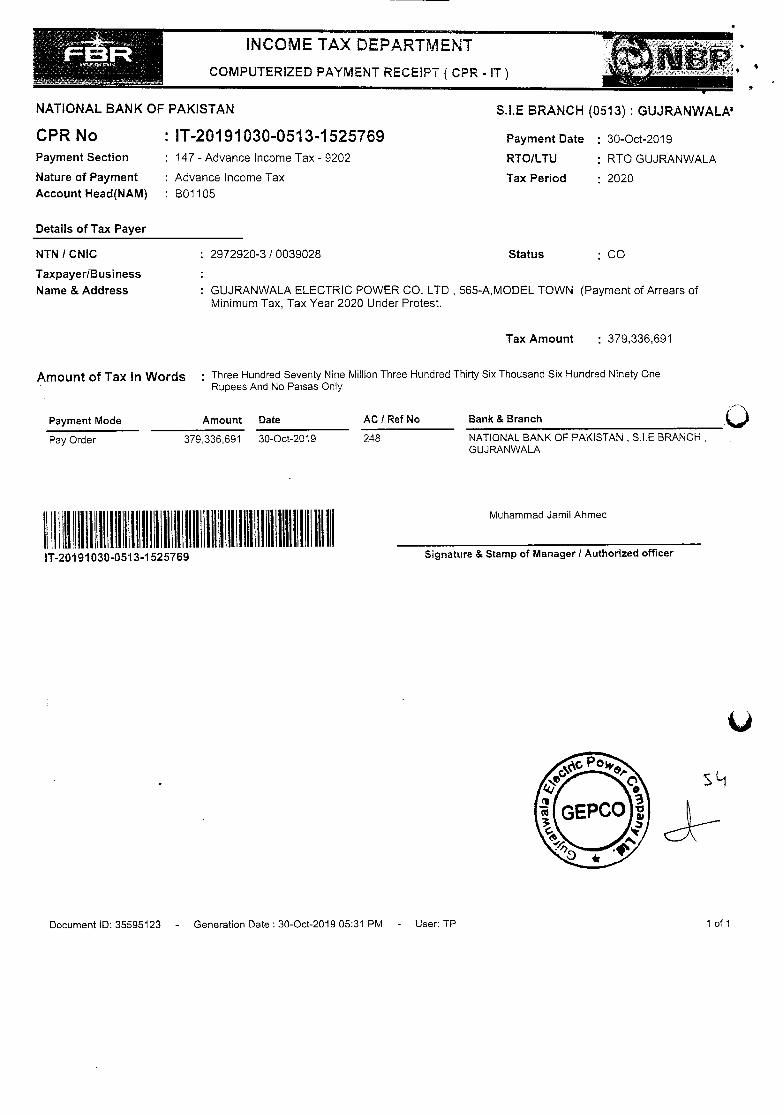
INCOME TAX DEPARTMENT
COMPUTERIZED PAYMENT RECEIPT (CPR - IT)
NATIONAL BANK OF PAKISTAN S.I.E BRANCH (0513): GUJRANWALA
CPR No IT-201 91030-0513-1525769 Payment Date 30-Oct-20 19
Payment Section 147 - Advance Income Tax - 9202 RTO/LTU RTO GUJRANWALA
Nature of Payment Advance Income Tax Tax Period 2020 Account Head(NAM) B01105
Details of Tax Payer
NTN I CNIC 2972920-3 / 0039028 Status CO
Taxpayer/Business Name & Address GUJRANWALA ELECTRIC POWER CO. LTD 565-A,MODEL TOWN (Payment of Arrears of
Minimum Tax, Tax Year 2020 Under Protest.
Tax Amount : 379,336,691
Amount of Tax in Words : Three Hundred Seventy Nine Million Three Hundred Thirty Six Thousand Six Hundred Ninety One Rupees And No Paisas Only
Payment Mode
Amount Date AC I Ref No Bank & Branch ()
Pay Order
379,336,691 30-Oct-2019 248 NATIONAL BANK OF PAKISTAN , S.I.E BRANCH GUJ RAN WALA
'HI III II 'III 9 I'll' I 'III
II I'll II III II Ill I II II Muhammad Jamil Ahmed
IT 20191030-0513-1525769 Signature & Stamp of Manager / Authorized officer
Document ID: 35595123 - Generation Date : 30-Oct-2019 05:31 PM - User: TP I of 1
COMPUTERIZED PAYMENT RECEIPT ( CPR - IT)
NATiONAL BANK OF PAKISTAN S.I.E BRANCH (0513) : GUJRANWALA
CPR No IT-20191 128-0513-1416139 Payment Date 28-Nov-20 19
Payment Section 147 - Advance Income Tax - 9202 RTOILTU RTO GUJRANWALA
Nature of Payment Advance Income Tax Tax Period 2020
Account Head(NAM) B01105
Details of Tax Payer
NTN I CNIC 2972920-3 I 0039028 Status CO
TaxpayerlBusiness Name & Address GUJRANWALA ELECTRIC POWER CO. LTD 565-A,MODEL TOWN (Payment of Minimum Tax,
Tax Year 2020 Under Protest)
Tax Amount 215,346,406
Amount of Tax in Words Two Hundred Fifteen Million Three Hundred Forty Six Thousand Four Hundred Six Rupees And No Paisas Only
(iment Mode
Pay Order
Amount Date AC I Ref No Bank & Branch
215,346,406 28-Nov.2019 314 NATIONAL BANK OF PAKISTAN , S.I.E BRANCH, GUJRANWALA
II III' II III II III' I II tIll III II III I 'III III H "U
Adnan Tahir
11-20191128-0513-1416139 Signature & Stamp of Manager I Authorized officer
Document ID: 36153228 - Generation Date : 28-Nov-2019 05:45 PM - User: TP 1 of 1
INCOME TAX DEPARTMENT
COMPUTERIZED PAYMENT RECEIPT ( CPR - IT)
t
NATIONAL BANK OF PAKISTAN S.I.E BRANCH (0513): GUJRANWALA..
Adnan Tahir
U I "UI "II IA H I III U III H H U I U III
CPR No : IT-20191231-0513-1479337 Payment Section : 147 - Advance Income Tax - 9202
Nature of Payment Advance Income Tax
Account Head(NAM) B01105
Details of Tax Payer
Payment Date : 31-Dec-2019
RTO/LTU : RTO GUJRANWALA
Tax Period : 2020
NTN I CNIC : 2972920-3 / 0039028 Status : CO
Taxpayer/Business : GUJRANWALA ELECTRIC POWER CO. LTD
Name & Address GUJRANWALA ELECTRIC POWER CO. LTD 565-A,MODEL TOWN (Payment of Minimum Tax, Tax Year 2020) Under Protest
Tax Amount : 365,000000
Amount of Tax in Words : Three Hundred Sixty Five Million Rupees And No Paisas Only
Payment Mode
Amount Date
AC / Ref No Bank & Branch
Pay Order
365000,000 31-Dec-2019
380 NATIONAL BANK OF PAKISTAN , MODEL TOWN BRANCH, GUJRANWALA, GUJRANWALA
IT 20191231-0513 1479337 Signature & Stamp of Manager! Authorized officer
Document ID: 36839772 - Generation Date : 31-Dec-2019 10:10 AM - User: TP 1 of 1
COMPUTERIZED PAYMENT RECEIPT ( CPR - IT)
NATIONAL BANK OF PAKISTAN S.LE BRANCH (0513): GUJRANWALA
CPR No IT-20200331 -0513-1386809 Payment Date 31-Mar-2020
Payment Section 147 - Advance Income Tax - 9202 RTO/LTU RTOGUJRANWALA
Nature of Payment Advance Income Tax Tax Period 2020
Account Head(NAM) B01105
Details of Tax Payer
NTN I CNIC 2972920-3 I 0039028 Status : CO
Taxpayer/Business GUJRANWALA ELECTRIC POWER CO. LTD
Name & Address GUJRANWALA ELECTRIC POWER CO. LTD 565-A,MODEL TOWN (Payment of Minimum Tax (Tax Year 2020). Under Protest
Tax Amount : 130,000,000
Amount of Tax in Words : One Hundred Thirty Million Rupees And No Paisas Only
()aYment Mode
Pay Order
Amount Date AC / Ref No
130,000,000 31-Mar-2020 645 NATIONAL BANK OF PAKISTAN, S.I.E BRANCH, GUJ RAN WALA
Bank & Branch
I' III III' II III I II II 'III III I II II II III I III
II Adnan Tahir
IT-20200331 -0513-1386809 Signature & Stamp of Manager 1 Authorized officer
Document ID: 38512552 - Generation Date 31-Mar-2020 03:13 PM - User: TP 1 of 1
INCOME TAX DEPARTMENT
COMPUTERIZED PAYMENT RECEiPT ( CPR - IT)
NATIONAL BANK OF PAKISTAN S.I.E BRANCH (0513) GUJRANWALk
CPR No IT-20200430-051 3-1168668 Payment Date 30-Apr-2020
Payment Section 147 - Advance Income Tax - 9202 RTO/LTU RTO GUJRANWALA
Nature of Payment Advance Income Tax Tax Period 2020 Account Head(NAM) B01105
Details of Tax Payer
NTN I CNIC 2972920-3 I 0039028 Status : CO
Taxpayer/Business GUJRANWALA ELECTRIC POWER CO. LTD
Name & Address GUJRANWALA ELECTRIC POWER CO. LTD 565-A,MODEL TOWN (Payment of Minimum Tax. Tax Year 2020 ( Under Protest)
Tax Amount 100,000,000
Amount of Tax in Words : One Hundred Million Rupees And No Paisas Only
Payment Mode
Pay Order
Amount Date AC I Ref No
100,000,000 29-Apr-2020 706 NATIONAL BANK OF PAKISTAN , S.I.E BRANCH, GUJRANWALA
0 Bank & Branch
I III IH I
In I II II 'HI I
I HI I' I H
Adnan Tahir
IT 20200430-0513-1168668 Signature & Stamp of Manager! Authorized officer
Document ID: 38712445 - Generation Date: 30-Apr-2020 01:54 PM - User: TP 1 of I
II liii III II II I 1111 'UI III' 'U' 'III II I I
INCOME TAX DEPARTMENT
COMPUTERIZED PAYMENT RECEIPT ( CPR - IT)
NATIONAL BANK OF PAKISTAN S.I.E BRANCH (0513) : GUJRANWALA
CPR No : IT-20200529-051 3-1 215406 Payment Section 147 - Advance Income Tax - 9202
Nature of Payment Advance Income Tax Account Head(NAM) B01105
Details of Tax Payer
Payment Date 29-May-2020
RTO/LTU RTO GUJRANWALA
Tax Period 2020
NTN I CNIC 2972920-3/0039028 Status : CO
Taxpayer/Business : GUJRANWALA ELECTRIC POWER CO. LTD Name & Address GUJRANWALA ELECTRIC POWER CO. LTD , 565-A,MODEL TOWN
Tax Amount : 30,000,000
Amount of Tax in Words : Thirty Million Rupees And No Paisas Only
\Payment Mode Amount Date
AC I Ref No Bank & Branch
ay Order 30,000,000 29-May-2020 768 NATIONAL BANK OF PAKISTAN , S.I.E BRANCH, GUJRANWALA
Adnan Tahir
IT 20200529-0513-1215406 Signature & Stamp of Manager I Authorized officer
Si
Document ID: 38986111 - Generation Date: 29-May-2020 03:46 PM - User: TP I of 1
INCOME TAX DEPARTMENT
COMPUTERIZED PAYMENT RECEIPT ( CPR - IT)
NATIONAL BANK OF PAKISTAN S.I.E BRANCH (0513) GUJRANWALA-
CPR No IT-20200630-051 3-1495038 Payment Date 30-Jun-2020
Payment Section 147 - Advance Income Tax - 9202 RTO/LTU RTO GUJRANWALA
Nature of Payment Advance Income Tax Tax Period 2020 Account Head(NAM) B01105
Details of Tax Payer
NTN/CNIC 2972920-3 / 0039028 Status : CO
Taxpayer/Business GUJRANWALA ELECTRIC POWER CO. LTD
Name & Address GUJRANWALA ELECTRIC POWER CO. LTD , 565-A,MODEL TOWN (Payment of Minimum Tax, Tax Year 2020) Under Protest
Tax Amount : 200,000,000
Amount of Tax in Words : Two Hundred Million Rupees And No Paisas Only
Payment Mode
Amount Date AC I Ref No
Bank & Branch
Pay Order
200,000,000 30-Jun-2020 818
NATIONAL BANK OF PAKISTAN , S.I.E BRANCH, GUJRANWALA
UI' II
II 'I I I II II II I I
II I II II In II
Adnan Tahir
IT 20200630-0513-1495038 Signature & Stamp of Manager! Authorized officer
Document ID: 39634605 - Generation Date : 30-Jun-2020 01:39 PM - User: TP 1 of 1
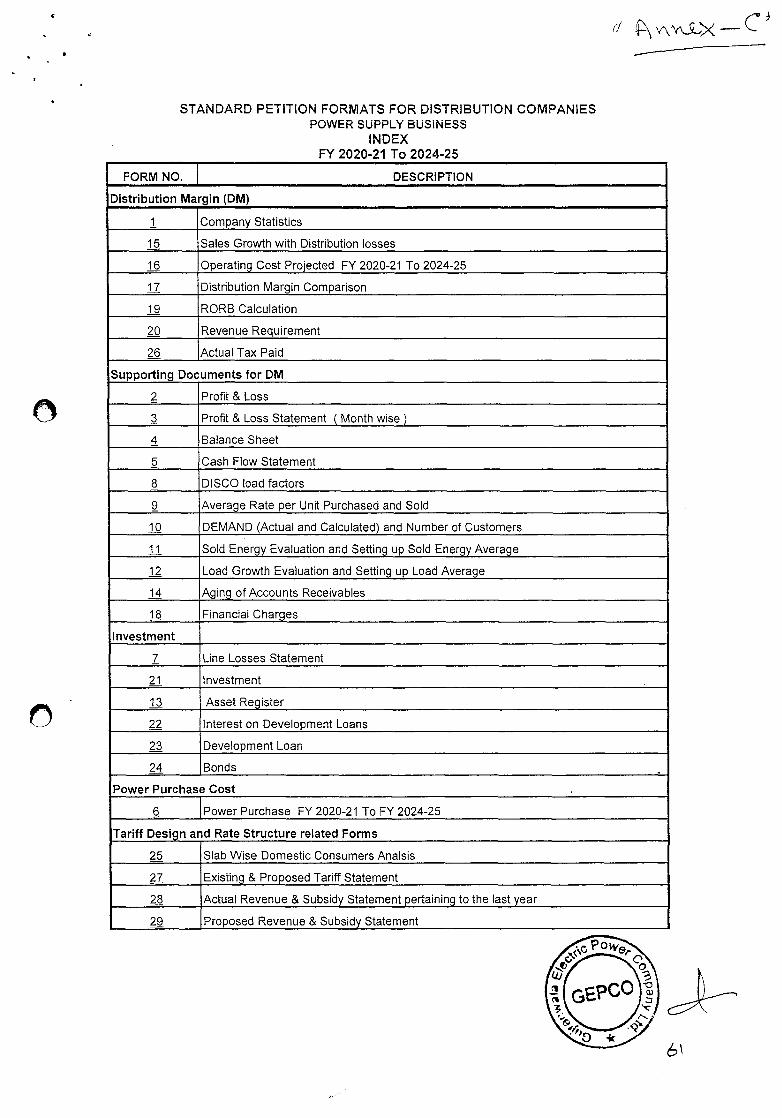
STANDARD PETITION FORMATS FOR DISTRIBUTION COMPANIES POWER SUPPLY BUSINESS
I N DEX FY 2020-21 To 2024-25
FORM NO. DESCRIPTION
Distribution Margin (DM)
1 Company Statistics
15 Sales Growth with Distribution losses
16 Operating Cost Projected FY 2020-21 To 2024-25
11 Distribution Margin Comparison
19 RORB Calculation
20 Revenue Requirement
26 Actual Tax Paid
Supporting Documents for DM
2 Profit & Loss
3 Profit & Loss Statement (Month wise)
4 Balance Sheet
5 Cash Flow Statement
8 DISCO load factors
Average Rate per Unit Purchased and Sold
10 DEMAND (Actual and Calculated) and Number of Customers
ii Sold Energy Evaluation and Setting up Sold Energy Average
12 Load Growth Evaluation and Setting up Load Average
Aging of Accounts Receivables
18 Financial Charges
Investment
7 Line Losses Statement
21 Investment
Asset Register
22 Interest on Development Loans
23 Development Loan
24 Bonds
Power Purchase Cost
6 Power Purchase FY 2020-21 To FY 2024-25
Tariff Design and Rate Structure related Forms
25 Slab Wise Domestic Consumers Analsis
27 Existing & Proposed Tariff Statement
28 Actual Revenue & Subsidy Statement pertaining to the last year
29 Proposed Revenue & Subsidy Statement
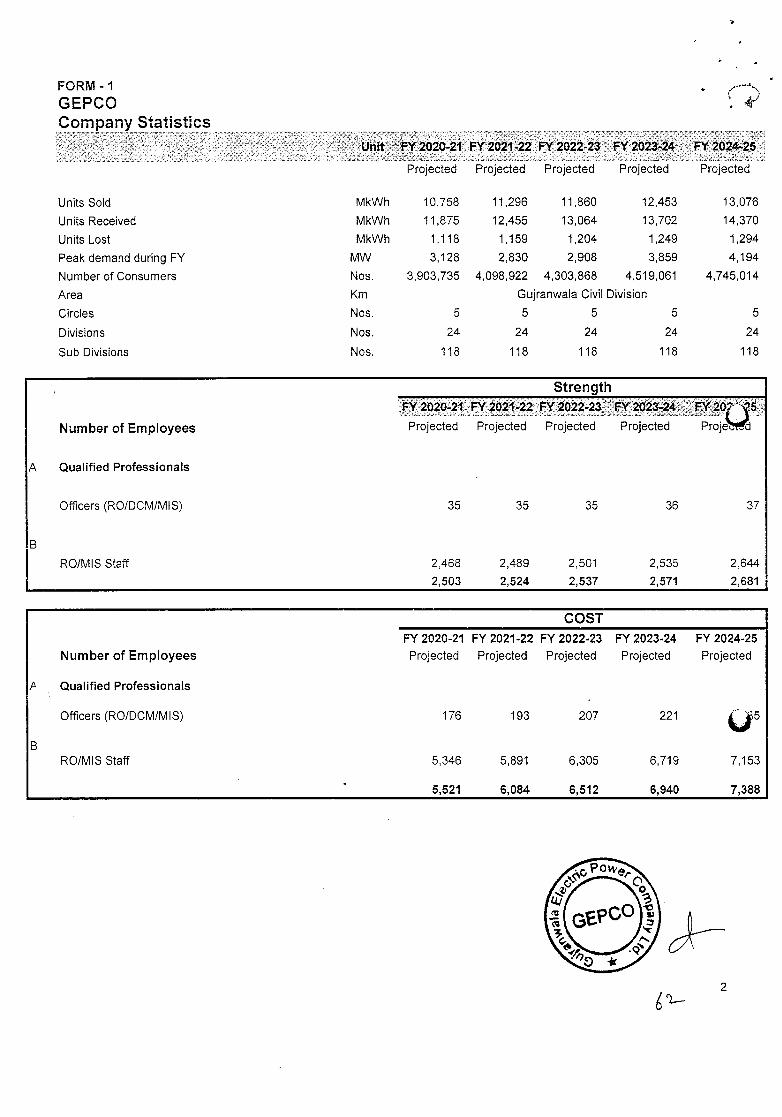
Projected Projected
5
24
118
MkWh 10,758 11,296
MkWh 11,875 12,455
MkWh 1,118 1,159
MW 3,128 2,830
Nos. 3,903,735 4,098,922
Km Gujranwala Civil Division
Nos. 5 5 5
Nos. 24 24 24
Nos. 118 118 118
FY2023-24. FY 2O2425
Projected
13.076
14,370
1,294
4,194
4,745,014
5
24
118
Units Sold
Units Received
Units Lost
Peak demand during FY
Number of Consumers
Area
Circles
Divisions
Sub Divisions
Projected Projected
11,860 12,453
13,064 13,702
1,204 1,249
2,908 3,859
4,303,868 4,519,061
Qualified Professionals
Officers (RO/DCM/MIS) 35 35 35 36 37
2,489 2,501
2,524 2,537
2,535 2,644
2,571 2,681
RO/MIS Staff 2,468
2,503
Strength FY 2020-21 FY 2021 22 P12022-23 P12023-24 FY 207
Number of Employees Projected Projected Projected Projected Proje'd
COST FY 2020-21 FY 2021-22 FY 2022-23 FY 2023-24
Number of Employees Projected Projected Projected Projected
Qualified Professionals
Officers (RO/DCM/MIS) 176 193 207 221
RO/MIS Staff 5,346 5,891 6,305 6,719
5,521 6,084 6,512 6,940
FY 2024-25
Projected
U 7,153
7,388
2
FORM -1
GEPCO Company Statistics
FY2020-21 FY2021 22 P1202223
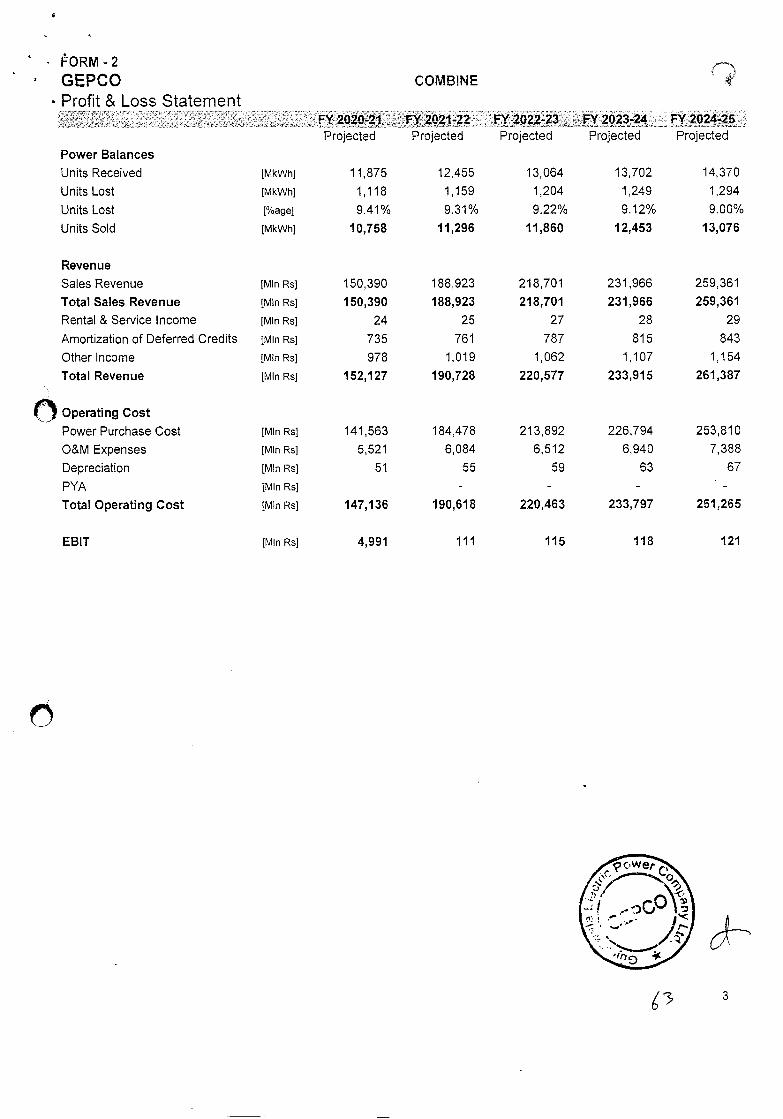
0
IORM-2
GEPCO Profit & Loss Statement
Power Balances
Units Received
Units Lost
Units Lost
[MkWh
[MkWh1
[%agel
Y 2020-21 Projected
11,875
1,118
9.41%
COMBINE
FY 2021-22 Projected
12,455
1,159
9.31%
P12022-23 Projected
13,064
1,204
9.22%
FY 2023-24 Projected
13,702
1,249
9.12%
FY 2024-25 Projected
14,370
1,294
9.00%
Units Sold 1MkWh] 10,758 11,296 11,860 12,453 13,076
Revenue
Sales Revenue [Mm RS] 150,390 188,923 218,701 231,966 259,361
Total Sales Revenue [Mm Rs] 150,390 188,923 218,701 231,966 259,361
Rental & Service Income [Mm RsI 24 25 27 28 29
Amortization of Deferred Credits [Mm Rs1 735 761 787 815 843
Other Income [Mm Rs1 978 1,019 1,062 1,107 1,154
Total Revenue [Mm Rs] 152,127 190,728 220,577 233,915 261,387
Operating Cost
PowerPurchaseCost IMmnRs1 141,563 184,478 213,892 226,794 253,810
O&M Expenses [Mmn Rs] 5,521 6,084 6,512 6,940 7,388
Depreciation [Mmn Rs] 51 55 59 63 67
PYA [Mm Rs1 -
Total Operating Cost [Mm Rs] 147,136 190,618 220,463 233,797 261,265
EBIT [Mm Rs] 4,991 111 115 118 121
3 3
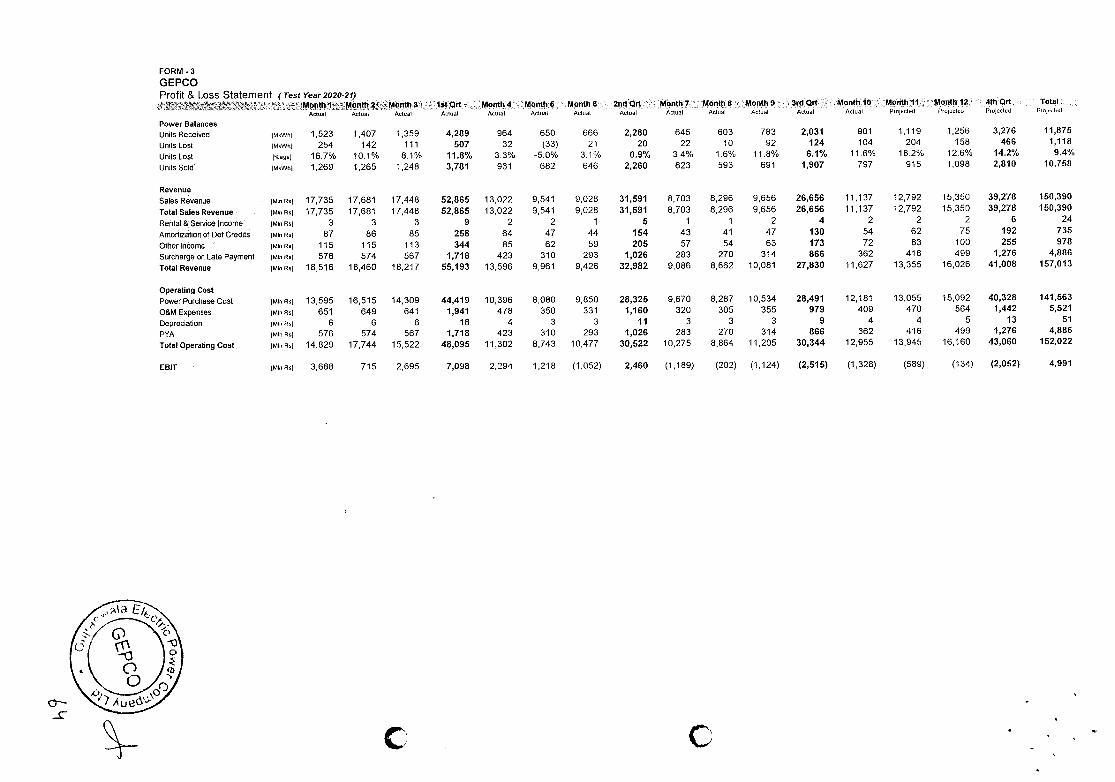
FORM .3 GEPCO Profit & Loss Statement (Test Year 2020-21)
AcI,aI AcWI Month 3
Ad,,el 1stQrt .
A,.rvvl Month 4
Actual : Month 6
Actual Month B
Actual 2ndQrt ...Month 7
Actual Actual Mon.t8'.,Month 9 .
Actual Actual
3rd Q. . Month 1O:Month11 Actual Actual Ptojacted
Month 12 Pruicutcu
4th Qrt . 'u,juctcd
Total PrcctcJ
Power Balances Units Received tMkWhl 1,523 1,407 1,359 4,289 964 650 666 2,280 645 603 783 2,031 901 1,119 1,256 3,276 11,875
Units Lost lMkWht 254 142 111 507 32 (33) 21 20 22 10 92 124 104 204 158 466 1,118
Units Lost l%agnl 16.7% 10.1% 8.1% 11.8% 3.3% -5.0% 3.1% 0.9% 34% 1.6% 11.8% 6.1% 11.6% 18.2% 12.6% 14.2% 9.4%
Units Sold lMkJht 1269 1,265 1,248 3,781 931 682 646 2,260 623 593 691 1,907 797 915 1,098 2,810 10,758
Revenue SalesRevenue lMnRt 17,735 17,681 17,448 52,865 13,022 9,541 9,028 31,591 8,703 8,296 9,656 26,656 11,137 12,792 15,350 39,278 150,390
TotatSalesRevenue lMlnRtt 17,735 17,681 17,448 52,865 13,022 9,541 9,028 31,591 8,703 8,296 9,656 26,656 11,137 12,792 15,350 39,278 150,390
Rental & Service Income tu vt 3 3 3 9 2 2 1 5 1 1 2 4 2 2 2 6 24
AmortizationofDefCredita Mlnest 87 86 85 258 64 47 44 154 43 41 47 130 54 62 75 192 735
Otherincome Mlnnul 115 115 113 344 85 62 59 205 57 54 63 173 72 83 100 255 978
SurchargeonLatnPayrnertt Mlnesl 576 574 567 1,718 423 310 293 1,026 283 270 314 866 362 416 499 1,276 4,886
Total Revenue IMIORvI 18,516 18,460 18,217 55,193 13,596 9,961 9,426 32,982 9,086 8,662 10,081 27,830 11,627 13,355 16,026 41,008 157,013
Operating Cost PowerPurcttaseCost lulnesl 13,595 16,515 14,309 44,419 10,396 8,080 9,850 28,325 9,670 8,287 10,534 28,491 12,181 13,055 15,092 40,328 141,563
O&MExpensns ennuI 651 649 641 1,941 478 350 331 1,160 320 305 355 979 409 470 564 1,442 5,521
Depreciation IMinnul 6 6 6 18 4 3 3 11 3 3 3 9 4 4 5 13 51
PYA IMInRul 576 574 567 1,718 423 310 293 1,026 283 270 314 866 362 416 499 1,276 4,886
TotalOperatingCost elnnul 14,829 17,744 15,522 48,095 11,302 8,743 10,477 30,622 10,275 8,864 11,205 30,344 12,955 13,945 16,160 43,060 152,022
EBIT lMInRsl 3,688 715 2,695 7,098 2,294 1,218 (1,052) 2,460 (1,189) (202) (1,124) (2,515) (1,328) (589) (134) (2,052) 4,991
C
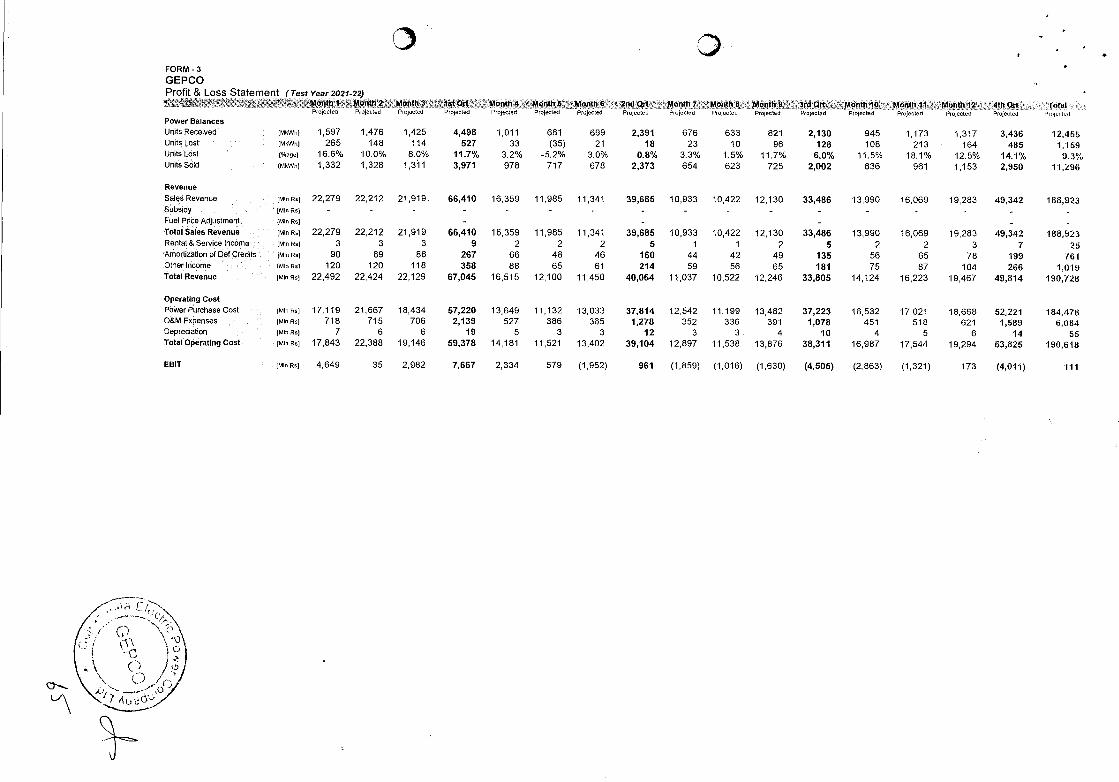
FORM -3
GEPCO Profit P Locs Stntment (Tnsf Year 2021-22)
Power Balances
Month I P,ojecta
Month t',oJe,eo
Month 3 Pjocted
1st Qrt Hojected
Month 4 Projecteo
Month Projected
Month 6 Projected
2nd Qrt Projected
Month 7 Projected
Month 6 Projected
Month 9 Projected
3rd Ort Projectod
Month 10 Projected
Month 11 Projected
Month 12 P,ojccted
4tfri Ott P o:e.hrd
Total
UnjtsRecelved [MkWhl 1,597 1476 1425 4,498 1,011 681 699 2,391 676 633 821 2,130 945 1,173 1,317 3,436 l2,455 UnitsLost [MkWhJ 265 148 114 527 33 (35) 21 18 23 10 96 128 108 213 164 485 1,159 UnitsLost (%age] 16.6% 10.0% 8.0% 11.7% 3.2% -5.2% 3.0% 0.8% 3.3% 1.5% 11.7% 6.0% 11.5% 18.1% 12.5% 14.1% 9.3% UnitsSold (MkWh] 1,332 1,328 1,311 3,971 978 717 678 2,373 654 623 725 2,002 836 961 1,153 2,950 11,296
Revenue SalesRevenue [MtnR] 22,279 22,212 21,919 66,410 16,359 11,985 11,341 39,685 10,933 10,422 12,130 33,486 13,990 16,069 19,283 49,342 188,923 Subsidy [Mm Ret - - - - - - - - - - - - Fuel Price Adjustment [Mm Re] . - - lotalSalesRevenue [MmnRe] 22,279 22,212 21,919 66,410 16,359 11,985 11,341 39,685 10,933 10,422 12,130 33,486 13,990 16,069 19,283 49,342 188,923 Rental & Service Incomu [Mm Rj 3 3 3 9 2 2 2 5 1 1 2 5 2 2 3 7 25 Amortiiatlonof Def Credits [MinRo] 90 89 88 267 66 48 46 160 44 42 49 135 56 65 78 199 761 Otherincome MinRet 120 120 118 358 88 65 61 214 59 56 65 181 75 87 104 266 1,019 TotaiRevenue MInRe[ 22,492 22,424 22,129 67,045 16,515 12,100 11,450 40,064 11,037 10,522 12,246 33,805 14,124 16,223 19,467 49,814 190,728
OperatIng Cost PowerPurchaseCost MICRo] 17,119 21,667 18,434 57,220 13,649 11,132 13,033 37,814 12,542 11,199 13,482 37,223 16,532 17,021 18,668 52,221 184,478 O&MExpenses MmnRsj 718 715 706 2,139 527 386 365 1,278 352 336 391 1,078 451 518 621 1,589 6,084 Depreciation lMmnsot 7 6 6 19 5 3 3 12 3 3 4 10 4 5 6 14 55 TotalOperatlngCost ]MInRo] 17,843 22,388 19,146 59,378 14,181 11,521 13,402 39,104 12,897 11,538 13,876 38,311 16,987 17,544 19,294 63,825 190,618
[BIT [MicRo] 4,649 35 2,982 7,667 2,334 579 (1,952) 961 (1,859) (1,016) (1,630) (4,505) (2,863) (1,321) 173 (4,011) III
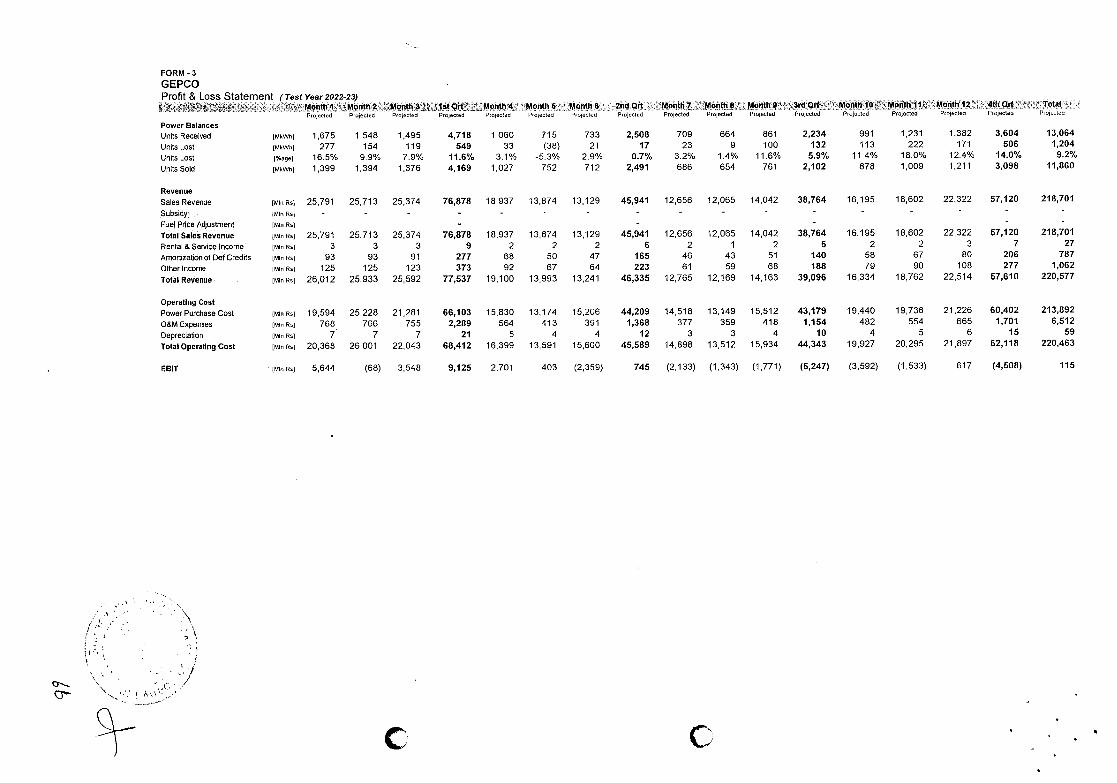
FORM -3
GEPCO Profit & Loss Statement (Test Year2O22-23)
Monthi Month2 P, j.,ctcd P,oj.t.d
Month3 F',oa,t,a,
1strt Projoctod
Month4 Projoctd
Month6 Projected
Month6 Projoctod
2ndQrt Projoctod
Month7 Projected
Month8 Projected
Moflth9 ProjeOted
3rdQit t'rcjectod
Monthlo Projected
Monthil Projected
Monthl2 Projected
4thQrt Prrr jeeteo
Total PrcjctoO
Power Balances Units Received [MkWtrt 1,675 1548 1,495 4,718 1,060 715 733 2,508 709 664 861 2,234 991 1,231 1,382 3,604 13,064
Units Lost tMkWht 277 154 119 549 33 (38) 21 17 23 9 100 132 113 222 171 506 1,204
Units Lost %age] 16.5% 9.9% 7.9% 11.6% 3.1% -5.3% 2.9% 0.7% 3.2% 1.4% 11.6% 5.9% 11.4% 18.0% 12.4% 14.0% 9.2%
Units Sold (MkWhJ 1,399 1,394 1,376 4,169 1027 752 712 2,491 686 654 761 2,102 878 1,009 1,211 3,098 11,860
Revenue SalesRavenjie MoRal 25,791 25,713 25,374 76,878 18,937 13,874 13,129 45,941 12,656 12,065 14,042 38,764 16,195 18,602 22,322 57,120 218,701
Subsidy Mir, Rat - - - - - - - - - - - - - - Fuel Price Adjustment Mm Rat - - - - TotaiSalesRevenue MInRs) 25,791 25,713 25,374 76,878 18,937 13,874 13,129 45,941 12,656 12,065 14,042 38,764 16,195 18,602 22,322 57,120 218,701
Rental & Service Income [Mn Re] 3 3 3 9 2 2 2 6 2 1 2 5 2 2 3 7 27
Amortizationof Del Credits [MicRa] 93 93 91 277 68 50 47 165 46 43 51 140 58 67 80 206 787
Otherinconie MmnRa] 125 125 123 373 92 67 64 223 61 59 68 188 79 90 108 277 1,062
lotaiRevenue ]MmnRa] 26,012 25,933 25,592 77,537 19,100 13,993 13,241 46,335 12,765 12,169 14,163 39,096 16,334 18,762 22,514 67,610 220,577
Operating Cost PowerPurchaseCost ]MInRS] 19,594 25,228 21,281 66,103 15,830 13,174 15,206 44,209 14,518 13,149 15,512 43,179 19,440 19,736 21,226 60,402 213,892
O&MExpenses [MicRa] 768 766 755 2,289 564 413 391 1,368 377 359 418 1,154 482 554 665 1,701 6,512
Depreciation MicRa] 7 7 7 21 5 4 4 12 3 3 4 10 4 5 6 15 69
lotatOperatlngCost MicRa] 20,368 26,001 22,043 68,412 16,399 13,591 15,600 45,589 14,898 13,512 15,934 44,343 19,927 20,295 21,897 62,118 220,463
EBIT ]MmORa] 5,644 (68) 3,548 9,125 2,701 403 (2,359) 745 (2,133) (1,343) (1,771) (5,247) (3,592) (1,533) 617 (4,508) 115
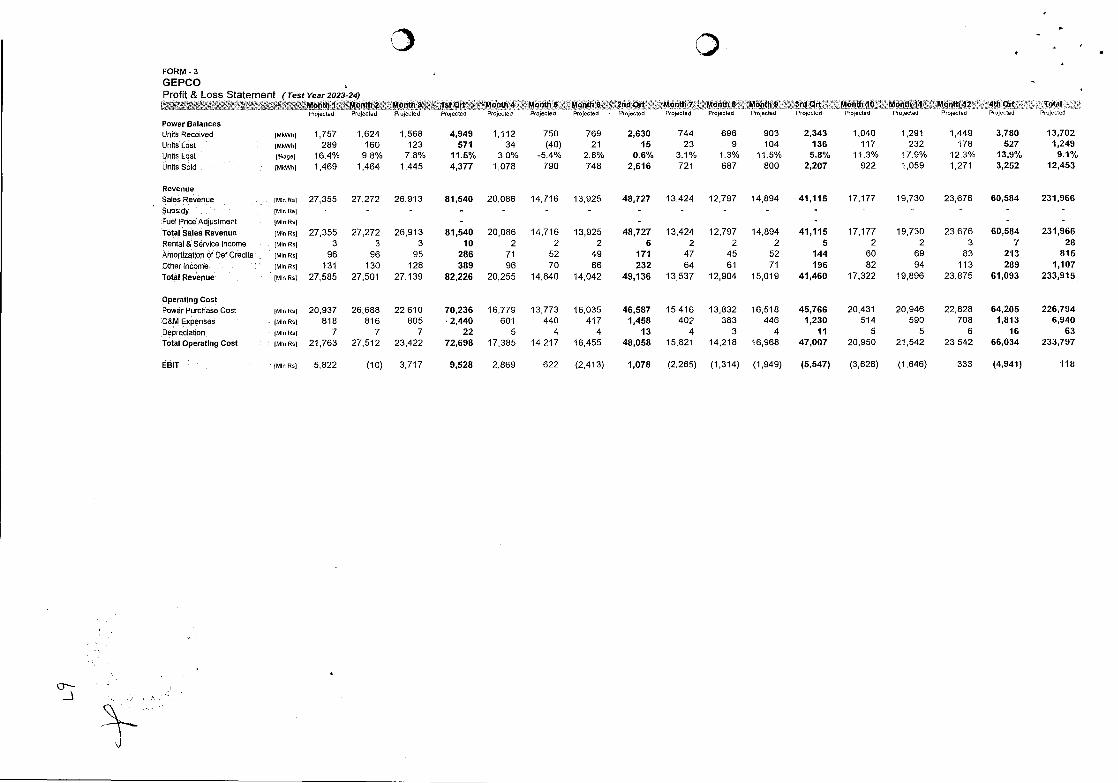
FORM -3 GEPCO Profit & Loss Statement (Test Year 2023-24)
Month 1 Month 2 Projected Projected
Month 3 Projected
1st Ort Projected
Month 4 Projected
Month 5 Projected
MonthS Projected
2nd Qrt Projected
Month 7 Projected
Month B Proprctee
M08th 9 Projected
3rd Ort Projected
Month 10 Projected
Month 11 Projected
Month 12 Projected
4th Qrt Prc j c..ted
Total Prejtt;t
Power Balances Units Received ]Mkwhj 1757 1,624 1,568 4,949 1,112 750 769 2,630 744 696 903 2,343 1,040 1,291 1,449 3,780 13,702 UnitsLost [MkWh] 289 160 123 571 34 (40) 21 15 23 9 104 136 117 232 178 527 1,249 UrlitSLost %ege] 16.4% 9.8% 7.8% 11.5% 3.0% -5.4% 2.8% 0.6% 3.1% 1.3% 11.5% 5.8% 11.3% 17.9% 12.3% 13.9% 9.1% UnitsSold ]MkWh] 1,469 1,464 1,445 4,377 1,078 790 748 2,616 721 687 800 2,207 922 1,059 1,271 3,262 12,453
Revenue SalesRevenue ]MtoRe] 27,355 27,272 26,913 81,540 20,086 14,716 13,925 48,727 13,424 12,797 14,894 41,115 17,177 19,730 23,676 60,584 231,966 Subsidy ]Mto Re] - - - - - - - - - - - -
Fuel Price Adjustment lute Re] - - -
TotalSalesRevenue ]MtnRo] 27,355 27,272 26,913 81,540 20,086 14,716 13,925 48,727 13,424 12,797 14,894 41,115 17,177 19,730 23,676 60,584 231,966 Rental & Setvice Income [MR Re] 3 3 3 10 2 2 2 6 2 2 2 5 2 2 3 7 28 AmortizationotDefCredits ]MtnRs] 96 96 95 286 71 52 49 171 47 45 52 144 60 69 83 213 815 other]ncon,e ]MtoRs] 131 130 128 389 96 70 66 232 64 61 71 196 82 94 113 289 1,107
Total Revenue ]MtnRe] 27,585 27,501 27,139 82,226 20,255 14,840 14,042 49,136 13,537 12,904 15,019 41,460 17,322 19,896 23,875 61,093 233,915
Operating Cost PowerpurchaseCost (MtoRel 20,937 26,688 22,610 70,236 16,779 13,773 16,035 46,587 15,416 13,832 16,518 45,766 20,431 20,946 22,828 64,205 226,794 0&M Expenses IMtnRe] 818 816 805 .2,440 601 440 417 1,458 402 383 446 1,230 514 590 708 1,813 6,940 Depreciation Euro Re] 7 7 7 22 5 4 4 13 4 3 4 11 5 5 6 16 63 TotalOperatlngCost lMtoRo] 21,763 27,512 23,422 72,698 17,385 14217 16,455 48,058 15,821 14,218 16,968 47,007 20,950 21,542 23,542 66,034 233,797
EBIT MtnRe] 5,822 (10) 3,717 9,628 2,869 622 (2,413) 1,078 (2,285) (1,314) (1,949) (5,547) (3,628) (1,646) 333 (4,941) 118
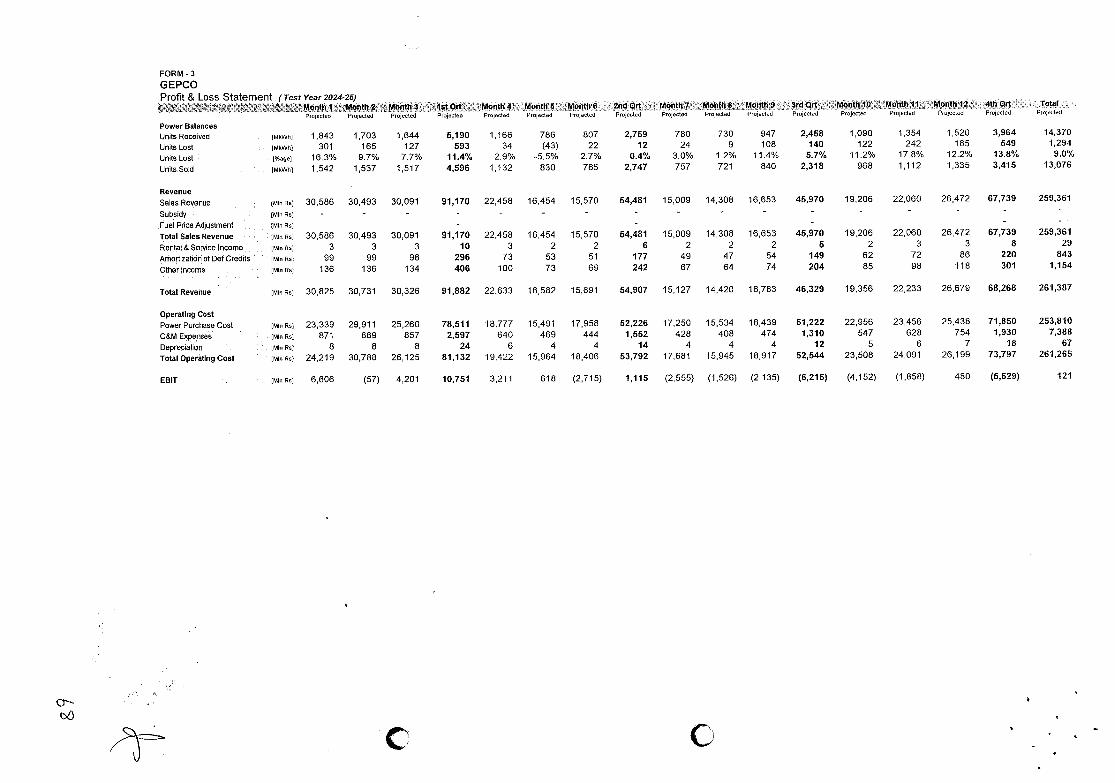
FORM -3 GEPCO Profit & Loss Statement (Test Year 2024-25)
Month 1 Month 2 Prj,ct.d P,oj5d
Month 3 1st Qrt F,ojeteO
Month 4 Pjued
Month 6 Projected
Month 6 ProjcLcd
2nd Ort Pthd
Month 7 Projected
Month B Projtd
MonthS -',oieced
3rd Qrt Poitd
Month 10 Projected
Month 11 Prjtd
Month 17 P,ct._-d
4th Ort Pri,cxd
Total Ie,I,J
Power Balances UnitsReceivod MkWhI 1843 1703 1,644 6,190 1,166 786 807 2,759 780 730 947 2,458 1,090 1,354 1,520 3,964 14,370
Units Lost tMkwh) 301 165 127 593 34 (43) 22 12 24 9 108 140 122 242 185 549 1,294
UnhtsLont (%age] 16.3% 9.7% 7.7% 11.4% 2.9% -5.5% 2.7% 0.4% 3.0% 1.2% 11.4% 5.7% 11.2% 17.8% 12.2% 13.8% 9.0%
UnitsSold tMkWhi 1,542 1,537 1517 4,596 1,132 830 785 2,747 757 721 840 2,318 968 1,112 1,335 3,415 13,076
Revenue SalesRevenue (MuRn) 30,586 30,493 30,091 91,170 22,458 16,454 15,570 54,481 15,009 14,308 16,653 45,970 19,206 22,060 26,472 67,739 259,361
Subsidy Mm Rn) - - - - - - - - Fuel Price Adiusiment Mm Rs] - - - TotalSatesRevenue )MInR] 30,586 30,493 30,091 91,170 22,458 16,454 15,570 54,481 15,009 14,308 16,653 45,970 19,206 22,060 26,472 67,739 259,361
Rentat&Semvicelncome [MmnR] 3 3 3 10 3 2 2 6 2 2 2 5 2 3 3 8 29
AmortizationotDef Credits [MInRs) 99 99 98 296 73 53 51 177 49 47 54 149 62 72 86 220 843
Otherincome [MInR) 136 136 134 406 100 73 69 242 67 64 74 204 85 98 118 301 1,154
TotatRevenue )MmnRj 30,825 30,731 30,326 91,882 22,633 16,582 15,691 54,907 15,127 14,420 16,783 46,329 19,356 22,233 26,679 68,268 261,387
Operating Cost PowerPurchoseCost [MmnR) 23,339 29,911 25,260 78,511 18,777 15,491 17,958 52,226 17,250 15,534 18,439 51,222 22,956 23,456 25,438 71,850 253,810
0&M Expenses )MInRs) 871 869 857 2597 640 469 444 1,552 428 408 474 1,310 547 628 754 1,930 7,388
Depreciation IMmnRI 8 8 8 24 6 4 4 14 4 4 4 12 5 6 7 18 67
TotalOperatingCost )MInRsj 24,219 30,788 26,125 81,132 19,422 15,964 18,406 53,792 17,681 15,945 18,917 52,544 23,508 24,091 26,199 73,797 261,265
EBIT [MInR) 6,606 (57) 4,201 10,751 3,211 618 (2,715) 1,115 (2,555) (1,526) (2,135) (6,215) (4,152) (1,858) 480 (5,529) 121
C C
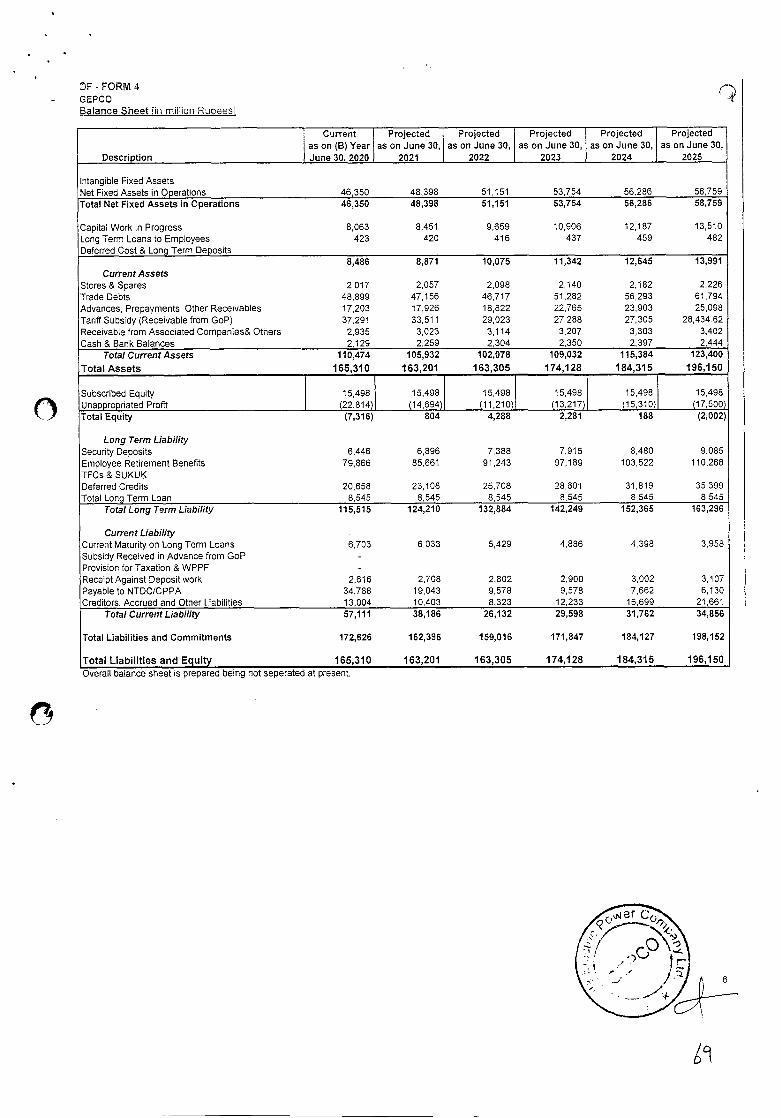
- FORM 4
- GEPCO Balance Sheet fin million Rupeesi
1
Description
Current as on (B) Year
June 30, 2020
Projected as on June 30,
2021
Projected as on June 30,
2022
Projected as on June 30,
2023
Projected
as on June 30, 2024
Projected as on June 30,
2025
Intangible Fixed Assets Net Fixed Assets in Operations 46,350 48,398 51,151 53,754 56.286 58,759
Total Net Fixed Assets in Operations 46,350 48,398 51,151 53,754 56,286 58,759
Capital Work in Progress 8,063 8,451 9,659 10,906 12,187 13,510
Long Term Loans to Employees 423 420 416 437 459 482
Deferred Cost & Long Term Deposits 8,486 8,871 10,075 11,342 12,645 13,991
Current Assets Stores & Spares 2,017 2,057 2,098 2,140 2,182 2,226
Trade Debts 48,899 47,156 46,717 51,282 56,293 61,794
Advances, Prepayments, Other Receivables 17,203 17,926 18,822 22,765 23,903 25,098
Tariff Subsidy (Receivable from GoP) 37,291 33,511 29,023 27288 27.305 28,434.62
Receivable from Associated Companies& Others 2,935 3,023 3,114 3,207 3,303 3,402
Cash & Bank Balances 2,129 2.259 2,304 2,350 2,397 2,444
Total Current Assets 110,474 105,932 102,078 109,032 115,384 123,400
Total Assets 165,310 163,201 163,305 174,128 184,315 196,150
Subscribed Equity 15,498 15,498 15,498 15,498 15,498 15,498
Unappropriated Profit (22,814) (14,694) (11,210) (13,217) (15,310) (17,500)
Total Equity (7,316) 804 4,288 2,281 188 (2,002)
Long Term Liability Security Deposits 6,446 6,896 7,388 7,915 8,480 9,085
Employee Retirement Benefits 79,866 85,661 91,243 97,189 103,522 110,268
TFCs & SUKUt Deferred Credits 20,658 23,108 25,708 28,601 31,819 35.399
Total Long Term Loan 8,545 8,545 8,545 8,545 8,545 8,545
Total Long Term Liability 115,515 124,210 132,884 142,249 152,365 163,296
Current Liability Current Maturity on Long Term Loans 6,703 6,033 5,429 4,886 4,398 3,958
Subsidy Received in Advance from GoP -
Provision for Taxation & WPPF - Receipt Against Deposit work 2,616 2,708 2,802 2,900 3.002 3,107
Payable to NTDC/CPPA 34,788 19,043 9,578 9,578 7,662 6,130
Creditors, Accrued and Other Liabilities 13,004 10,403 8,323 12,233 16,699 21,661
Total Current Liability 57,111 38,186 26,132 29,598 31,762 34,856
Total Liabilities and Commitments 172,626 162,396 169,016 171,847 184,127 198,152
Total Liabilities and Equity 165,310 163,201 163,305 174,128 184,315 196,150
Overall balance sheet is prepared being not seperated at present.
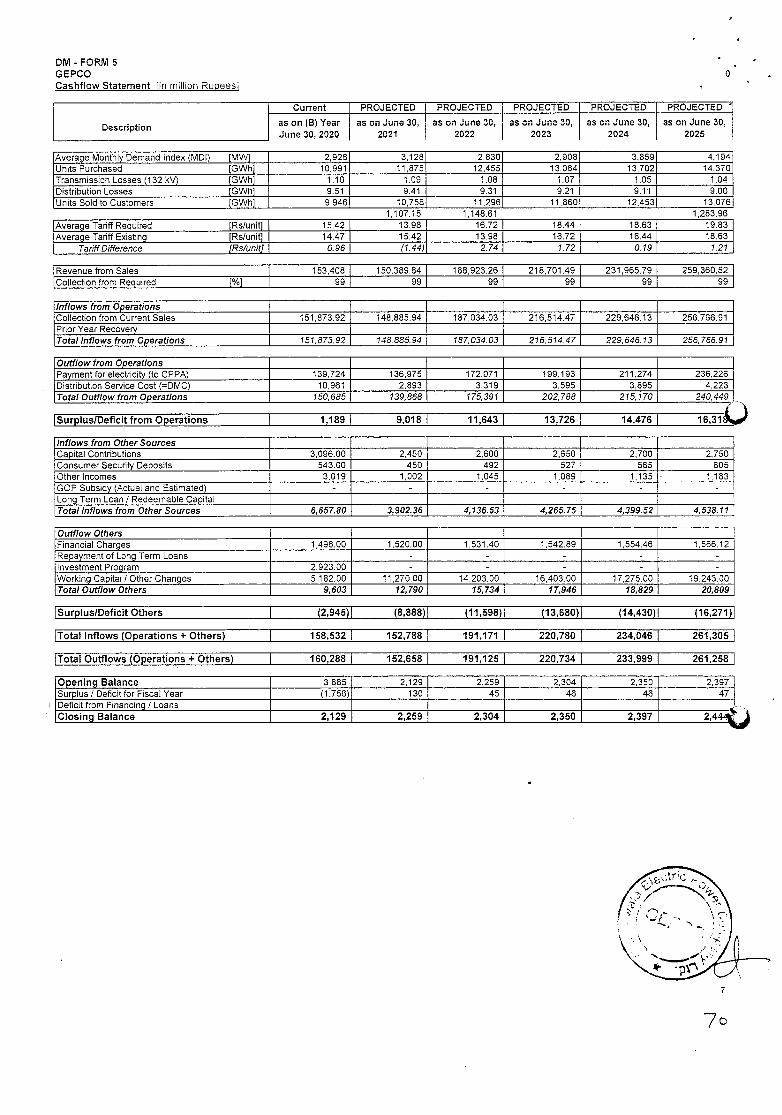
PROJECTED
as on June 30, as on June 30, as on June 30, as or June 30, as on June 30, 2021 2022 2023 2024 2025
Description
Current
as on (B) Year June 30, 2020
PROJECTED PROJECTED PROJECTED PROJECTED
DM - FORM 5 GEPCO 0 Cashflow Statement No milion Rupees)
Average Monthly Demand Index (MDI) [MW) 2,926 3,128 2,830 2,908 3,859 4,194 Units Purchased [GWh1 10,991 11,875 12,455 13,064 13,702 14370 Transmission Losses (132 kV) (GWh[ 1.10 1.09 1.06 1.07 1.05 1.04 Distribution Losses [GWh] 9.51 9.41 9.31 9.21 9.11 9.00 Units Sold to Customers [GWh[ 9,946 10,758 11,296 11,860 12,453 13,076
1,107.15 1,148.61 1,263.96 Average Tariff Required [Rslunit] 15.42 13.98 16.72 18.44 18.63 19.83 Average Tariff Existing [Rs/unit] 14.47 15.42 13.98 16.72 18.44 18.63
Tariff Difference (Rs/unitJ 0.96 (1.44) 2.74 1.72 0.19 1.21
Revenuefrom Sales 153,408 150,389.84 188,923.26 218,701.49 231,965.79 259,360.52 Collection from Required [%[ 99 99 99 99 99 99
In flows from Operations Collection from Current Sales 151,873.92 148,885.94 187,034.03 216,514.47 229,646.13 256,766.91 Prior Year Recovery Total Inflows from Operations 151,873.92 148,885.94 187,034.03 216,514.47 229,646.13 256,766.91
Outflow from Operations Payment for electricity (to CPPA) 139,724 136,975 172,071 199,193 211,274 236,226 Distribution Service Cost (=DMC) 10,961 2,893 3,319 3,595 3,895 4,223 Total Outflow from Operations 150,685 139,868 175,391 202,788 215, 170 240,449
Surplus/Deficit from Operations 1,189 9,018 11,643 13,726 14,476 16,31
In flows from Other Sources Capital Contributions 3,096.00 2,450 2,600 2,650 2,700 2,750 Consumer Security Deposits 543.00 450 492 527 565 605 Other Incomes 3,019 1,002 1,045 1,089 1,135 1,183 GOP Subsidy (Actual and Estimated) - - - - - - Long Term Loan! Redeemable Capital Total Inflows from OtherSources 6,657.80 3,902.36 4,136.53 4,265.75 4,399.52 4,538.11
Outflow Others Financial Charges 1,496.00 1,520.00 1,531.40 1,542.89 1,554.46 1,566.12 Repayment of Long Term Loans - - - - - Investment Program 2,923.00 - - - - - Working Capital / Other Changes 5,182.00 11,270.00 14,203.00 16,403.00 17,275.00 19,243.00 Total Outflow Others 9,603 12,790 15,734 17,946 18,829 20,809
Surplus/Deficit Others (2,945) (8,888) (11,598) (13,680) (14,430) (16,271)
Total Inflows Operations + Others) 158,532 152,788 191,171 220,780 234,046 261,305
Total Outflows Operations + Others) 160,288 152,658 191,125 220,734 233,999 261,258
Opening Balance 3,885 2,129 2,259 2,304 2,350 2,397 Surplus I Deficit for Fiscal Year (1,756) 130 45 46 46 47 Deficit from Financing! Loans Closing Balance 2,129 2,259 2,304 2,350 2,397 2,444
7
7c
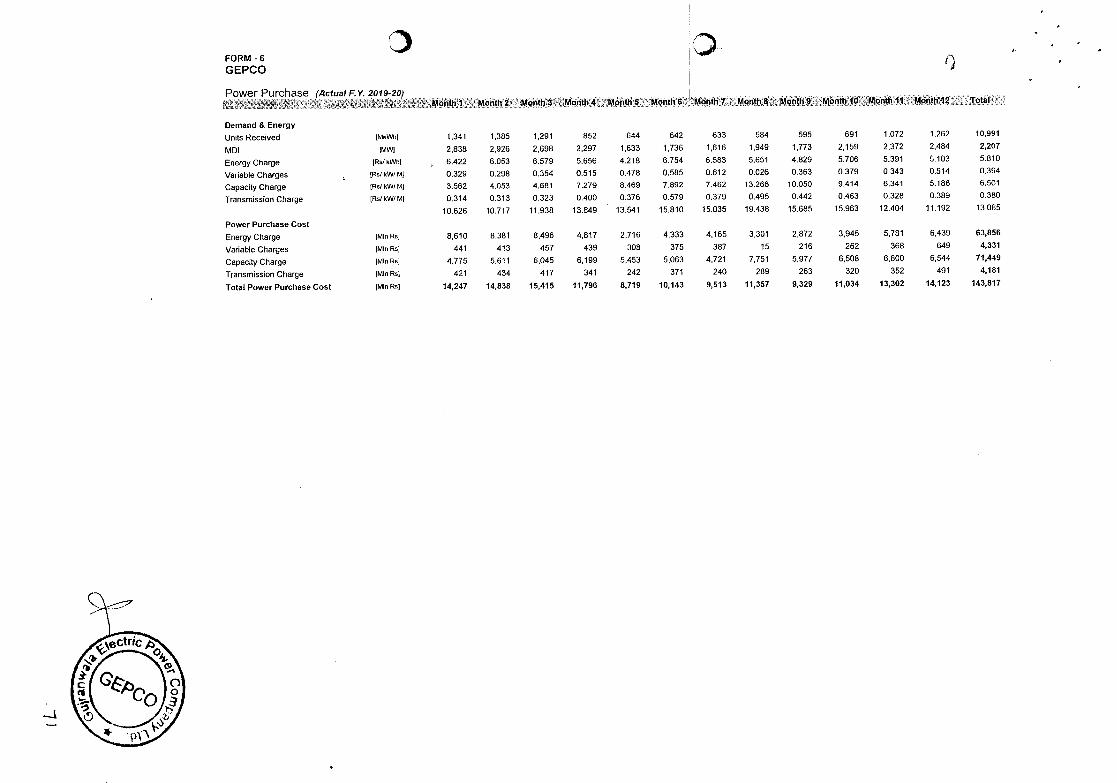
FORM -6
GEPCO 1)
Power Purchase (.ctua! F.Y. 2019-20)
Demand & Energy
Mi4h1.Mànth2 Month3.:Month4Moflth.6.. Month6 .Moflth7. MonthS Moit:MthMon*!1 11:• Mnh:12 TotI•.
Units Received [MkWh[ 1,341 1,385 1,291 852 644 642 633 584 595 691 1,072 1,262 10.991
MDI [MW) 2,838 2,926 2.698 2,297 1,633 1.736 1,616 1,949 1,773 2,159 2,372 2,484 2,207
Energy Charge fRs/kWh[ , 6.422 6.053 6.579 5.656 4.218 6.754 6.583 5.651 4.829 5.706 5.391 5.103 5.810
Variable Charges )Rs/kWfMl 0.329 0.298 0.354 0.515 0.478 0.585 0.612 0.026 0.363 0.379 0.343 0.514 0.394
CapacityCharge [Rs/kW/Ml 3.562 4.053 4.681 7.279 8.469 7.892 7.462 13.266 10.050 9.414 6.341 5.186 6.501
Transmission Charge (RsfkW/Ml 0.314 0.313 0.323 0.400 0.376 0.579 0.379 0.495 0.442 0.463 0.328 0.389 0.380
10.626 10.717 11.938 13.849 13.541 15.810 15.035 19.438 15.685 15.963 12.404 11.192 13.085
Power Purchase Cost
Energy Charge [Mm Rs] 8,610 8,381 8,496 4,817 2,716 4,333 4,165 3,301 2,872 3,945 5,781 6,439 63,856
Variable Charges [MIs RsJ 441 413 457 439 308 375 387 15 216 262 368 649 4,331
CapacityCharge [MInRs] 4,775 5,611 6,045 6,199 5,453 5,063 4,721 7,751 5,977 6,508 6,800 6,544 71,449
Transmission Charge Mm Rs[ 421 434 417 341 242 371 240 289 263 320 352 491 4,181
Total Power Purchase Cost [Mm Rs) 14,247 14,838 15,415 11,796 8,719 10,143 9,513 11,357 9,329 11,034 13,302 14,123 143,817
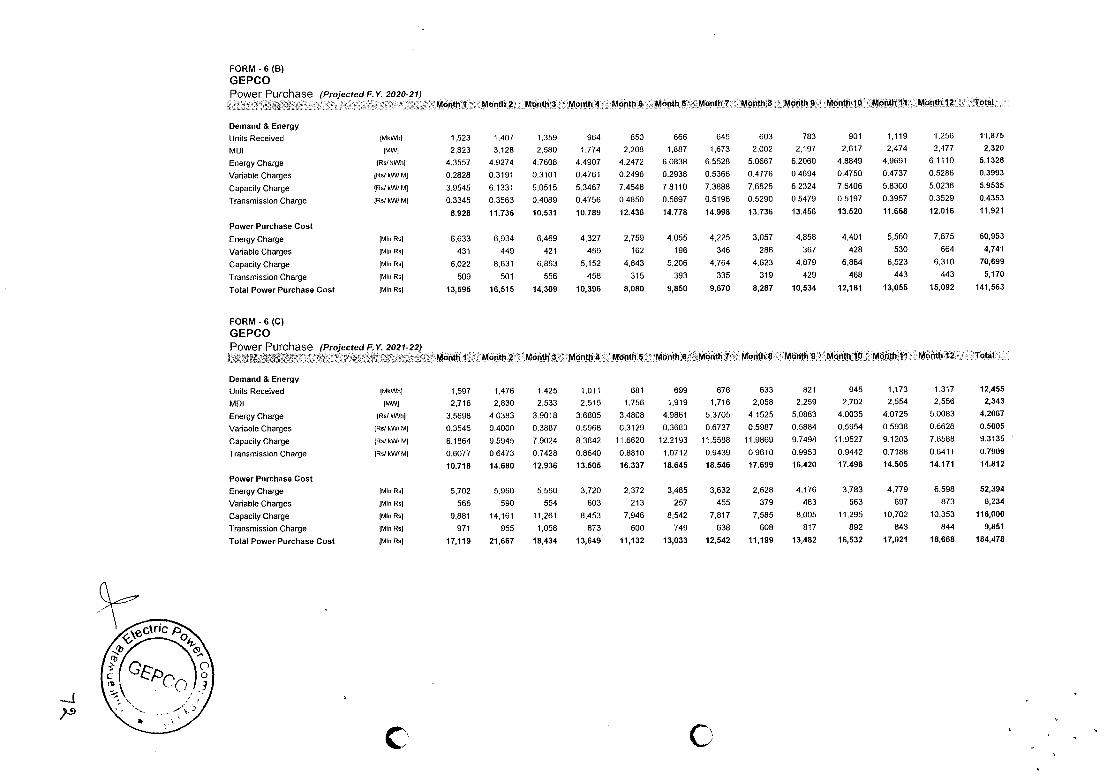
FORM -6 (B)
GEPCO Power PurChase (ProjectedF.Y. 2020-21)
Demand & Energy
Month I Month 2 Month 3 Month '4 .: Month 5 •Mbnth 6'i Month 7 , . Month 8 ' Month 9 Month'IO '. Month 11'.. Month .12 Total
Units Received fMkWhl 1,523 1407 1,359 964 650 666 645 603 783 901 1,119 1.256 11,875
MDt (MW] 2,823 3,128 2,580 1,774 2,208 1,887 1,673 2,002 2,197 2,617 2,474 2.477 2,320
Energy Charge ]R/kWh] 4.3557 4.9274 4.7608 4.4907 4.2472 6.0838 6.5528 5.0667 6.2060 4.8849 4.9691 6.1110 5.1328
Vanabte Charges Rs/kW/M] 0.2828 0.3191 0.3101 0.4761 0.2496 0.2938 0.5366 0.4776 0.4694 0.4750 0.4737 0.5286 0.3993
Capacity Charge (Re/kW/M] 3,9545 6,1331 5.0515 5,3467 7.4548 7.8110 7.3888 7.6625 6.2324 7.6406 5.8300 5.0236 5.9535
Transmission Charge ]Rs/kW/M] 0.3345 0.3563 0.4089 0.4756 0.4850 0.5897 0.5196 0.5290 0.5479 0.5197 0.3957 0.3529 0.4353
8.928 11.736 10.531 10.789 12.436 14.778 14.998 13.736 13.456 13.520 11.668 12.016 11.921
Power Purchase Cost
Energy Charge Mis Rs] 6.633 6934 6,469 4,327 2,759 4,055 4,225 3,057 4,858 4,401 5,560 7,675 60,953
Variable Charges Mis Rs] 431 449 421 459 162 196 346 288 367 428 530 664 4,741
Capacity Charge ]MInRs] 6,022 8,631 6,863 5,152 4,843 5,206 4.764 4,623 4,879 6.884 6,523 6,310 70,699
Transmission Charge Mis RsI 509 501 556 458 315 393 335 319 429 468 443 443 5,170
Total Power Purchase Cost [MIs Rs] 13,595 16,515 14,309 10,396 8,080 9,850 9.670 8,287 10,534 12,181 13,055 15,092 141,563
FORM -6 (C)
GEPCO Power Pttrchase (ProjectedF.Y. 2021-22)
Month 1 Month .Mortlt3 Mont)4 Mtth.5 '. Month6 Month 7'. MonthS 'Moflth 9 Mqnth'i0Mópth II Month 12' ', Total
Demand & Energy
Units Received tMkWh] 1,597 1.476 1,425 1,011 681 699 676 633 821 945 1,173 1,317 12,455
MOt MW] 2,718 2,830 2,533 2,515 1,756 1,919 1,716 2,058 2,259 2,702 2.554 2,556 2,343
Energy Charge tRs/kWhJ 3.5698 40383 3.9018 3.6805 3.4808 4.9861 5.3705 4.1525 5.0863 4.0035 4.0725 50083 4.2067
Variable Charges [Rs/kWiMt 0.3545 0.400]) 0.3887 0.5968 0.3129 0.3683 0.6727 0.5987 0.5884 0.5954 0.5938 0.6626 0.5005
Capacity Char9e ]Rs(kW/Ml 6.1864 9.5945 7.9024 8.3642 11.6620 12.2193 11.5588 11.9869 9.7498 11.0527 9.1203 7.8588 9.3135
Transmission Charge tRs/kWfMt 0.6077 06473 0.7428 0.8640 0,8810 1.0712 0.9439 0.9610 0.9953 0.9442 0.7188 0.6411 0.7909
10.718 14.680 12.936 13.505 16.337 18.645 18.546 17.699 16.420 17.496 14.505 14.171 14.812
Power Purchase Cost
Energy Charge [Mis Rs] 5,702 5.960 5,560 3,720 2.372 3,485 3,632 2,628 4,176 3,783 4,779 6,598 52,394
Variable Charges [Mm Rs[ 566 590 554 603 213 257 455 379 483 563 697 873 6,234
CapacityCharge (MinRs( 9,881 14,161 11,261 8,453 7,946 8,542 7,817 7,585 8,005 11,295 10,702 10,353 116,000
Transmission Charge [Mis R] 971 955 1,058 873 600 749 638 608 817 892 843 844 9,851
Total Power Purchase Cost ]MinRs] 17,119 21,667 18,434 13,649 11,132 13,033 12,542 11,199 13,482 16,532 17.021 18,668 184,478
-J
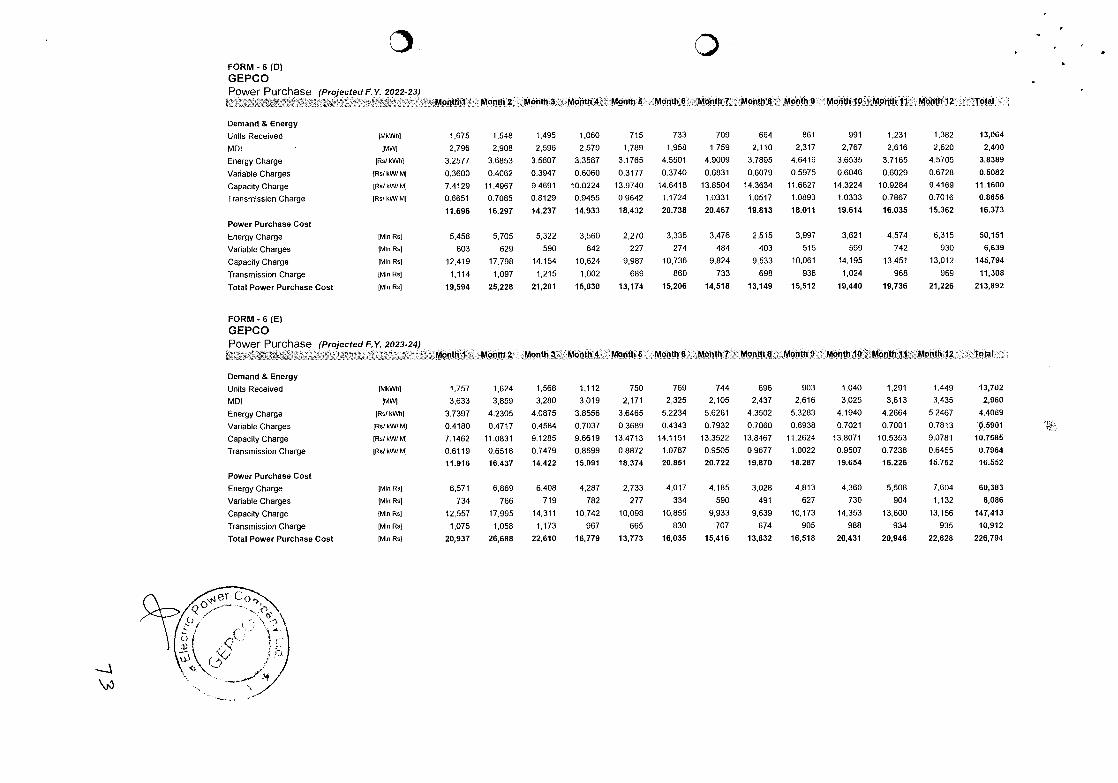
FORM -6 (D)
GEPCO Power Purchase 'Projected F.Y. 2022-23)
Demand & Energy
Moth1::. Month 2:,Month 3: :Moñth4•• Mgflttr8 9YMOR!h .iO.MOnth.1.1. •,Mohth 12 Total
Units Received tMkwht 1,675 1,548 1,495 1,060 715 733 709 664 861 991 1,231 1,382 13,064
MDI [MWJ 2.796 2,908 2,596 2,570 1,789 1,958 1,759 2,110 2,317 2,767 2,616 2,620 2,400
Energy Charge jRs/ kWhl 3.2577 3.6853 3.5607 3.3587 3.1765 4.5501 4.9009 3.7895 4.6418 3.6535 3.7165 4.5705 3.8389
Variable Charges [Rs/ kW/ MI 0.3600 0.4062 0.3947 0.6060 0.3177 0.3740 0.6831 0.6079 0.5975 0.6046 0.6029 0.8728 0.5082
Capacity Charge [Rs/ kJ/ M] 7.4129 11.4967 9.4691 10.0224 13.9740 14.6418 13.8504 14.3634 11.6827 14.3224 10.9284 9.4169 11.1600
Transmission Charge [Rs/ kW/ Mj 0.6651 0.7085 0.8129 0.9455 0.9642 1.1724 1.0331 1.0517 1.0893 1.0333 0.7867 0 7016 0.8656
11.696 16.297 14.237 14.933 18.432 20.738 20.467 19.813 18.011 19.614 16.035 15.362 16.373
Power Purchase Cost
Energy Charge (Mm Rs( 5,458 5,705 5,322 3,560 2,270 3,336 3,476 2,515 3,997 3,621 4,574 6.315 50,151
Variable Charges Mm R( 603 629 590 642 227 274 484 403 515 599 742 930 6,639
CapacityCharge (MInRs) 12,419 17,798 14,154 10.624 9,987 10,736 9,824 9,533 10,061 14,195 13,451 13,012 145,794
Transmission Charge (MmnR) 1,114 1,097 1,215 1,002 689 860 733 698 938 1,024 968 969 11,308
Total Power Purchase Cost (Mm R( 19,594 25,228 21,281 15,830 13,174 15,206 14,518 13,149 15,512 19,440 19,736 21,226 213,892
FORM - 6 (E)
GEPCO Power Purchase (ProjectedF.Y. 2023-24)
Mouth I Month 2 Month 3 Month 4 Month 5 Month 6 Month 7 Mpth 8 Month 9 Month 10 Month 1 Month 12 Total
Demand & Energy
Units Received [MkWhl 1,757 1,624 1,568 1,112 750 769 744 696 903 1,040 1,291 1,449 13,702
MDI (MWI 3,633 3,859 3,280 3,019 2,171 2,325 2,105 2,437 2,616 3,025 3,613 3,435 2,960
Energy Charge IRs! kWh( 3.7397 4.2305 4.0875 3.8556 3.6465 5.2234 5.6261 4.3502 5.3283 4.1940 4.2664 5.2467 4.4069
Variable Charges (Rs/kW!Mt 0.4180 0.4717 0.4584 0.7037 0.3689 0.4343 0.7932 0.7060 0.6938 0.7021 0.7001 0.7813 0.5901
CapacityCharge (RIkvvmM] 7.1462 11.0831 9.1285 9.6619 13.4713 14.1151 13.3522 13.8467 11.2624 13.8071 10.5353 9.0781 10.7585
Transmission Charge lRs/kW/MI 0.6119 0.6518 0.7479 0.8699 0.8872 1.0787 0.9505 0.9677 1.0022 0.9507 0.7238 0.6455 0.7964
11.916 16.437 14.422 15.091 18.374 20.851 20.722 19.870 18.287 19.654 16.226 15.752 16.552
Power Purchase Cost
Energy Charge (MInR( 6,571 6,869 6,408 4.287 2,733 4,017 4,185 3,028 4,813 4,360 5,508 7,604 60,383
VanableCharges (MInRs] 734 766 719 782 277 334 590 491 627 730 904 1.132 8,086
CapacityCharge (MInRs] 12,557 17,995 14,311 10,742 10,098 10,855 9,933 9,639 10,173 14,353 13,600 13,156 147,413
Transmission Charge (MInRs( 1,075 1,058 1,173 967 665 830 707 674 905 988 934 935 10,912
Total Power Purchase Cost [Mm Rs} 20,937 26,688 22,610 16,779 13,773 16,035 15,416 13,832 16,518 20,431 20,946 22,828 226,794
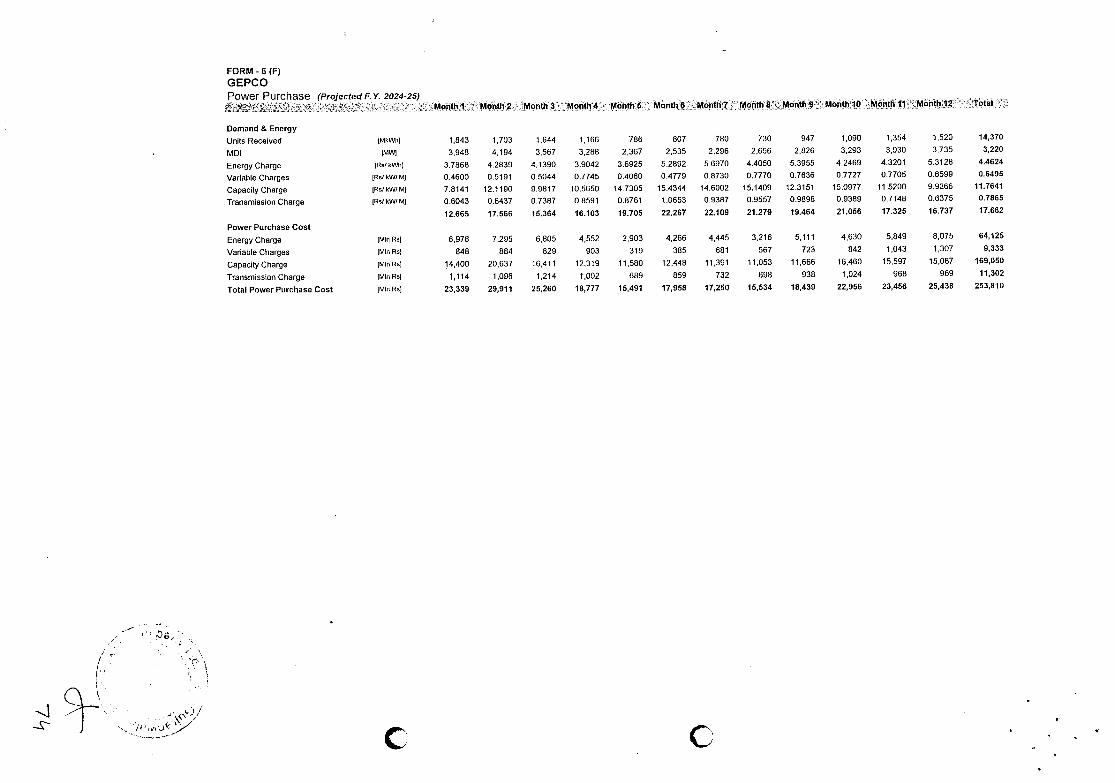
FORM - 6 (F)
GEPCO Power Purchase (Projected F. V. 2024-25)
Demand & Energy
Mor!thl Month2 Month3 Month4 Month5 Month6 Month7 MonthS Month9 MonthlO Monthil Month12 Total
Units Received IMkWh1 1,843 1.703 1,644 1,166 786 807 780 730 947 1.090 1,354 1520 14,370
MDI IM] 3,948 4,194 3,567 3,288 2,367 2,535 2,296 2,656 2,826 3,293 3,930 3,735 3,220
Energy Charge [Re/kWh] 37868 4.2839 4.1390 3.9042 3.6925 5.2892 5.6970 4.4050 5.3955 4.2469 4.3201 5.3128 4.4624
Variable Charges lRelkW/Mj 0.4600 0.5191 0.5044 0.7745 0.4060 0.4779 0.8730 0.7770 0.7636 0.7727 0.7705 0.8599 0.6495
CapacityCharge lR/kW/Ml 7.8141 12.1190 9.9817 10.5650 14.7305 15.4344 14.6002 15.1409 12,3151 15.0977 11.5200 9.9266 11.7641
Transmission Charge IR/kW/MJ 0.6043 0.6437 0.7387 0.8591 0.8761 1.0653 0.9387 0.9557 0.9898 0.9389 0.7148 0.6375 0.7865
12.665 17.566 15.364 16.103 19.705 22.267 22.109 21.279 19.464 21.056 17.325 16.737 17.662
Power Purchase Cost
EnergyCharge [MInRsI 6.978 7,295 6.805 4,552 2,903 4,266 4,445 3,216 5,111 4,630 5,849 8,075 64,125
Variable Charges [MIs Rt 848 884 829 903 319 385 681 567 723 842 1,043 1307 9,333
CapacityCharge [MInR] 14,400 20.637 16,411 12,319 11,580 12,448 11,391 11,053 11,666 16,460 15,597 15.087 169,050
Transmission Charge [MlnRsI 1,114 1,096 1,214 1,002 689 859 732 698 938 1,024 968 969 11,302
Total Power Purchase Cost [Mm R] 23,339 29,911 25,260 18,777 15,491 17,958 17,250 15,534 18,439 22,956 23,456 25,438 253,810

FORM -7 (A) GEPCO Line Losses (Actual T.Year. 2019-20)
Power Balances
Month I Actual
Month 2 Actual
Month 3 Actual
Month 4 Actual
Month 5 Actual
Month 6 Actual
Month 7 Actual
Month 8 Actual
Month 9 Actual
Month 10 Actual
Month 11 Actual
Month 12 Actual
Total Actual
Units Received [MkWh] 1,341 1,385 1,291 852 644 642 633 584 595 691 1,072 1,262 10,991
Units Sold [MkWh] 1,113 1,238 1,180 818 674 619 609 572 520 605 898 1,099 9946
Units Lost IMkWt11 228 147 111 33 (30) 22 24 12 74 87 175 163 1,045
Units Lost [%age] 17.01 10.62 8.58 3.91 0.00 3.49 3.72 2.07 12.49 12.53 16.28 12.91 9.51
Technical Losses [%ago] 17.01 10.62 8.58 3.91 0.00 3.49 3.72 2.07 12.49 12.53 16.28 12.91 9.51
Administrative Losses [%age] 0.00 0.00 0.00 0.00 0.00 0.00 0.00 0.00 0.00 0.00 0.00 0.00 0.00
Technical Losses at Different Levels Transmission Losses 132kV [%agej 1.97 1.23 0.99 0.45 0.00 0.40 0.43 0.24 1.44 1.45 1.88 1.49 1.10
11 kVLosses [%age] 9.42 5.88 4.76 2.17 0.00 1.94 2.06 1.15 6.92 6.94 9.02 7.15 5.27
LTLosses [%age] 5.61 3.51 2.83 1.29 0.00 1.15 1.23 0.68 4.12 4.14 5.38 4.26 3.14
Total Technical Losses [%age] 17.00 10.62 8.58 3.91 0.00 3.49 3.72 2.07 12.49 12.53 16.28 12.91 9.51
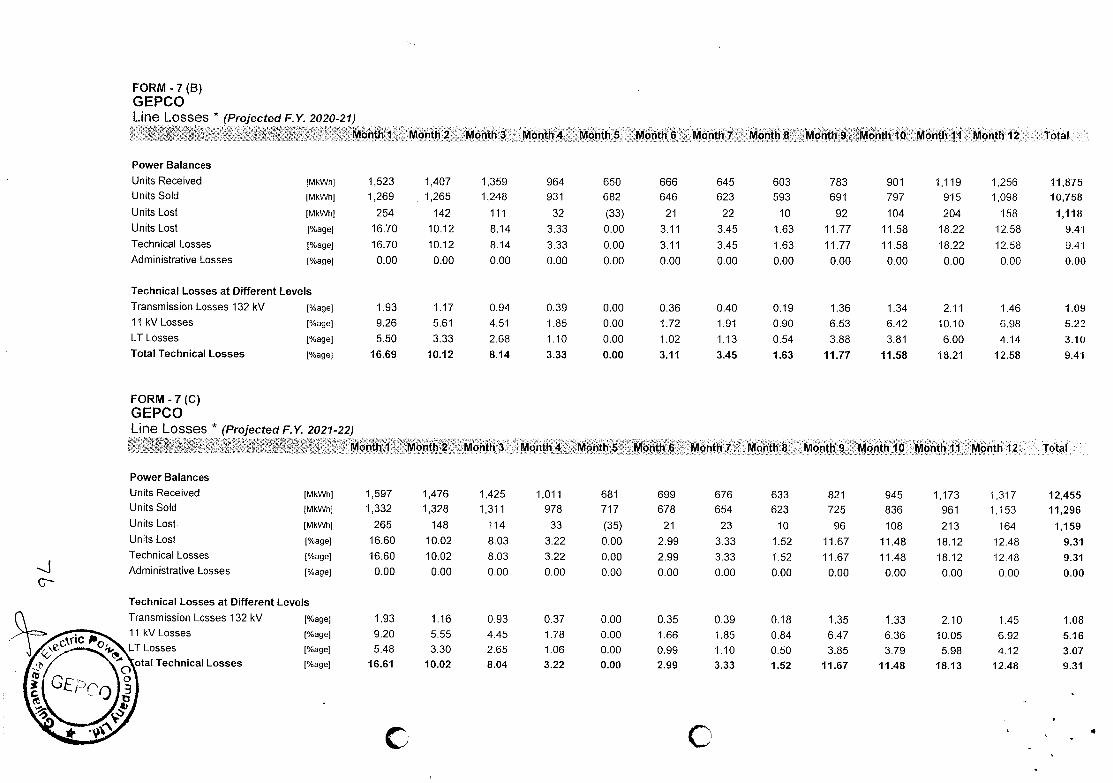
Power Balances
Units Received [MkWh]
Units Sold EMkWh]
Units Lost [MkWh]
Units Lost [%age]
Technical Losses [%age]
Administrative Losses [%age]
Technical Losses at Different Levels
Transmission Losses 132 kV [%age]
11 kVLosses (%agel
LTLosses [%age)
otal Technical Losses [%age]
FORM -7 (B) GEPCO Line Losses * (Projected F.Y, 2020-21)
Power Balances
Month I Month 2 Month 3 Month 4 Month 5 Month 6 Month 7 Month 8 Month 9 Month 10 Month II Month 12 Total
Units Received LMkWh] 1,523 1407 1359 964 650 666 645 603 783 901 1119 1,256 11,875 Units Sold [MkWh] 1,269 1,265 1,248 931 682 646 623 593 691 797 915 1,098 10,758
Units Lost LMkWlil 254 142 111 32 (33) 21 22 10 92 104 204 158 1,118
Units Lost [%agel 16.70 10.12 8.14 3.33 0.00 3.11 3.45 1.63 11.77 11.58 18,22 12.58 9.41
Technical Losses [%age] 16.70 10.12 8.14 3.33 0.00 3.11 3.45 1.63 11.77 11.58 18.22 12.58 9.41 Administrative Losses [%age] 0.00 0.00 0.00 0.00 0.00 0.00 0.00 0.00 0.00 0.00 0.00 0.00 0.00
Technical Losses at Different Levels
Transmission Losses 132 kV [%age) 1.93 1.17 0.94 0.39 0.00 0.36 0.40 0.19 1.36 1.34 2.11 1.46 1.09 11 kVLosses [%agel 9.26 5.61 4.51 1.85 0.00 1.72 1.91 0.90 6.53 6.42 10.10 6.98 5.22 LlLosses (%ge] 5.50 3.33 2.68 1.10 0.00 1.02 1.13 0.54 3.88 3.81 6.00 4.14 3.10 Total Technical Losses [%age) 16.69 10.12 8.14 3.33 0.00 3.11 3.45 1.63 11.77 11.58 '18.21 12.58 9.41
FORM -7(C)
GEPCO Line Losses * (Projected F. V. 2021-22
4
Month I Month 2 Month 3 Month 4 Month 5 Month 6 Month 7 Month 8 Month 9 Month 10 Month 11 Month 12 Total
1,597 1,476 1,425 1,011 681 699 676 633 821 945 1,173 1,317 12,455 1,332 1,328 1,311 978 717 678 654 623 725 836 961 1,153 11,296
265 148 114 33 (35) 21 23 10 96 108 213 164 1,159 16.60 10.02 8.03 3.22 0.00 2.99 3.33 1.52 11.67 11.48 18.12 12.48 9.31 16.60 10.02 8.03 3.22 0.00 2.99 3.33 1.52 11.67 11.48 18.12 12.48 9.31
0.00 0.00 0.00 0.00 0.00 0.00 0.00 0.00 0.00 0.00 0.00 0.00 0.00
1.93 1.16 0.93 0.37 0.00 0.35 0.39 0.18 1.35 1.33 2.10 1.45 1.08 9.20 5.55 4.45 1.78 0.00 1.66 1.85 0.84 6.47 6.36 10.05 6.92 5.16 5.48 3.30 2.65 1.06 0.00 0.99 1.10 0.50 3.85 3.79 5.98 4.12 3.07
16.61 10.02 8.04 3.22 0.00 2.99 3.33 1.52 11.67 11.48 18.13 12.48 9.31
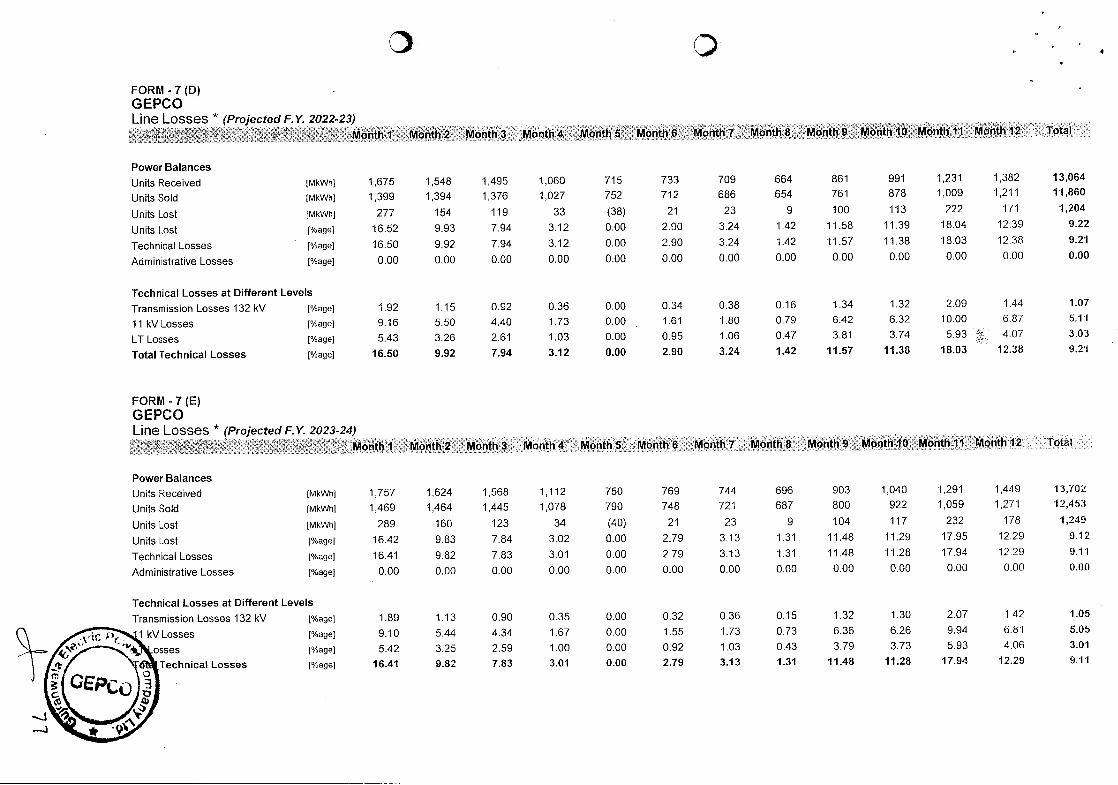
Power Balances
Units Received
Units Sold
Units Lost
Units Lost
Technical Losses
Administrative Losses
lMkWhl 1,757
[MkWh] 1,469
[MkWhl 289
[%agel 16.42
[%age] 16.41
[%age] 0.00
Technical Losses at Different Levels
Transmission Losses 132 kV [%agej 1.89
I kVLosses [%agel 9.10
osses L%age] 5.42
Technical Losses l%age] 16.41
FORM -7 (D)
GEPCO Line Losses * (Projected F.Y. 2022-23)
Month I
Power Balances
Month 2 Month 3 .
Month 4 . .
Month 5 ..
Month 6 . .
Month 7 . Month 8 Month 9
.: Month 10 Month 11 Month 12 Total
Units Received [MkWh] 1,675 1,548 1,495 1,060 715 733 709 664 861 991 1,231 1,382 13,064
Units Sold [MkW] 1,399 1,394 1,376 1,027 752 712 686 654 761 878 1,009 1,211 11,860
Units Lost [MkWh] 277 154 119 33 (38) 21 23 9 100 113 222 171 1,204
Units Lost [%age] 16.52 9.93 7.94 3.12 0.00 2.90 3.24 1.42 11.58 11.39 18.04 12.39 9.22
Technical Losses [%age] 16.50 9.92 7.94 3.12 0.00 2.90 3.24 1.42 11.57 11.38 18.03 12.38 9.21
Administrative Losses [%age] 0.00 0.00 0.00 0.00 0.00 0.00 0.00 0.00 0.00 0.00 0.00 0.00 0.00
Technical Losses at Different Levels
Transmission Losses 132 kV [%agel 1.92 1.15 0.92 0.36 0.00 0.34 0.38 0.16 1.34 1.32 2.09 1.44 1.07
11 kVLosses [%age] 9.16 5.50 4.40 1.73 0.00 1.61 1.80 0.79 6.42 6.32 10.00 6.87 5.11
LT Losses [%age] 5.43 3.26 2.61 1.03 0.00 0.95 1.06 0.47 3.81 3.74 5.93 . 4.07 3.03
Total Technical Losses 1%age] 16.50 9.92 7.94 3.12 0.00 2.90 3.24 1.42 11.57 11.38 18.03 12.38 9.21
FORM -7 (E)
GEPCO Line Losses * (Projected F,Y. 2023-24)
Month I Month 2 Month 3 Month 4 Month 5 Month 6 Month 7 Month 8 Month 9 Month 10 Month 11 Month 12 Tot
4
1,624 1,568 1,112 750 769 744 696 903 1,040 1,291 1,449 13,702
1,464 1,445 1,078 790 748 721 687 800 922 1,059 1,271 12,453
160 123 34 (40) 21 23 9 104 117 232 178 1,249
9.83 7.84 3.02 0.00 2.79 3.13 1.31 11.48 11.29 17.95 12.29 9.12
9.82 783 3.01 0.00 2.79 3.13 1.31 11.48 11.28 17.94 12.29 9.11
0.00 0.00 0.00 0.00 0.00 0.00 0.00 0.00 0.00 0.00 0.00 0.00
1.13 0.90 0.35 0.00 0.32 0.36 0.15 1.32 1.30 2.07 1.42 1.05
5.44 4.34 1.67 0.00 1.55 1.73 0.73 6.36 6.26 9.94 6.81 5.05
3.25 2.59 1.00 0.00 0.92 1.03 0.43 3.79 3.73 5.93 4.06 3.01
9.82 7.83 3.01 0.00 2.79 3.13 1.31 11.48 11.28 17.94 12.29 9.11
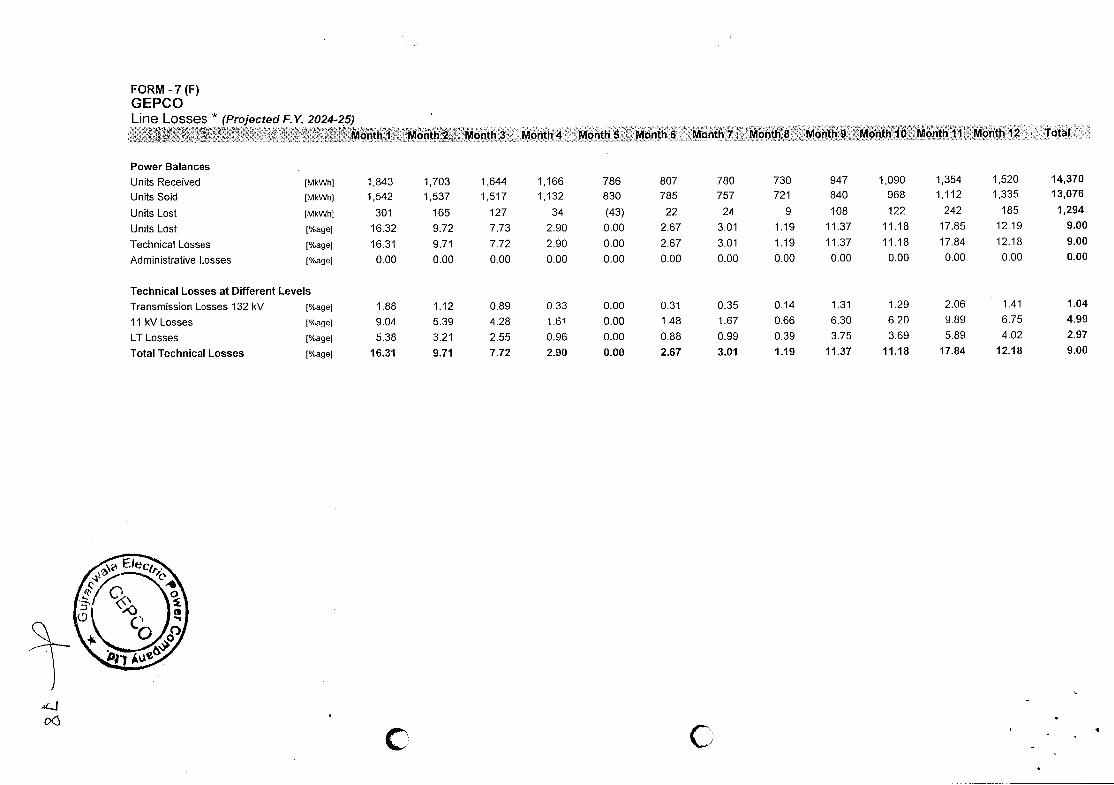
FORM -7 (F) GEPCO Line Losses * (Projected F.Y. 2024-25)
Month I
Power Balances
'
Month 2 Month 3 Month 4 Month 5 Month 6 Month 7 Month 8 Month 9 Month 10 ..
Month II Month 12 Total
Units Received [MkWhl 1843 1703 1644 1166 786 807 780 730 947 1,090 1,354 1,520 14,370
Units Sold [MkWh] 1,542 1,537 1,517 1,132 830 785 757 721 840 968 1,112 1,335 13,076
Units Lost [MkWh] 301 165 127 34 (43) 22 24 9 108 122 242 185 1,294
Units Lost [%age] 16.32 9.72 7.73 2.90 0.00 2.67 3.01 1.19 11.37 11.18 17.85 12.19 9.00
Technical Losses [%age] 16.31 9.71 7.72 2.90 0.00 2.67 3.01 1.19 11.37 11.18 17.84 12.18 9.00
Administrative Losses [%age] 0.00 0.00 0.00 0.00 0.00 0.00 0.00 0.00 0.00 0.00 0.00 0.00 0.00
Technical Losses at Different Levels
Transmission Losses 132 kV [%age] 1.88 1.12 0.89 0.33 0.00 0.31 0.35 0.14 1.31 1.29 2.06 1.41 1.04
11 kVLosses l%age] 9.04 5.39 4.28 1.61 0.00 1.48 1.67 0.66 6.30 6.20 9.89 6.75 4.99
LT Losses l%aoe] 5.38 3.21 2.55 0.96 0.00 0.88 0.99 0.39 3.75 3.69 5.89 4.02 2.97
Total Technical Losses j%age) 16.31 9.71 7.72 2.90 0.00 2.67 3.01 1.19 11.37 11.18 17.84 12.18 9.00
C I
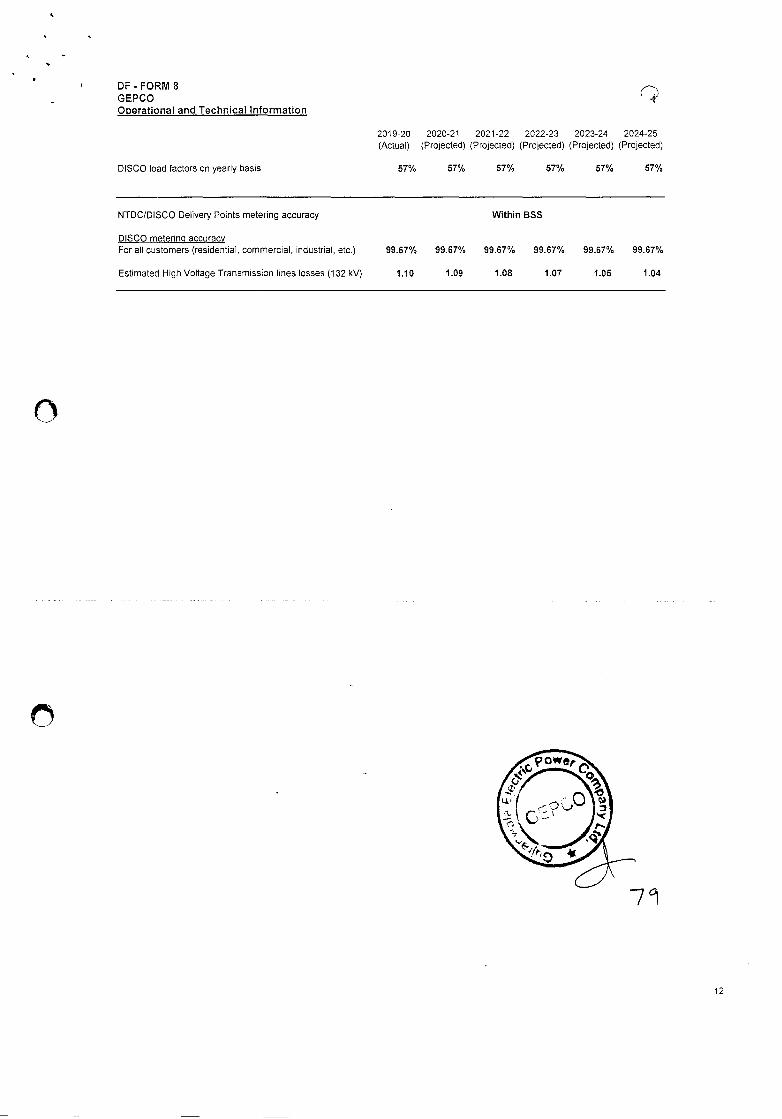
OF - FORM 8 GEPCO Operational and Technical Information
DISCO load factors on yearly basis
2019-20 (Actual)
57%
2020-21 2021-22 2022-23 2023-24 2024-25 (Projected) (Projected) (Projected) (Projected) (Projected)
57% 57% 57% 57% 57%
NTDC/DISCO Delivery Points metering accuracy Within BSS
DISCO metering accuracy For all customers (residential, commercial, industrial, etc.) 99.67% 99.67% 99.67% 99.67% 9967% 99.67%
Estimated High Voltage Transmission lines losses (132 kV) 1.10 1.09 1.08 1.07 1.05 1.04
79
12
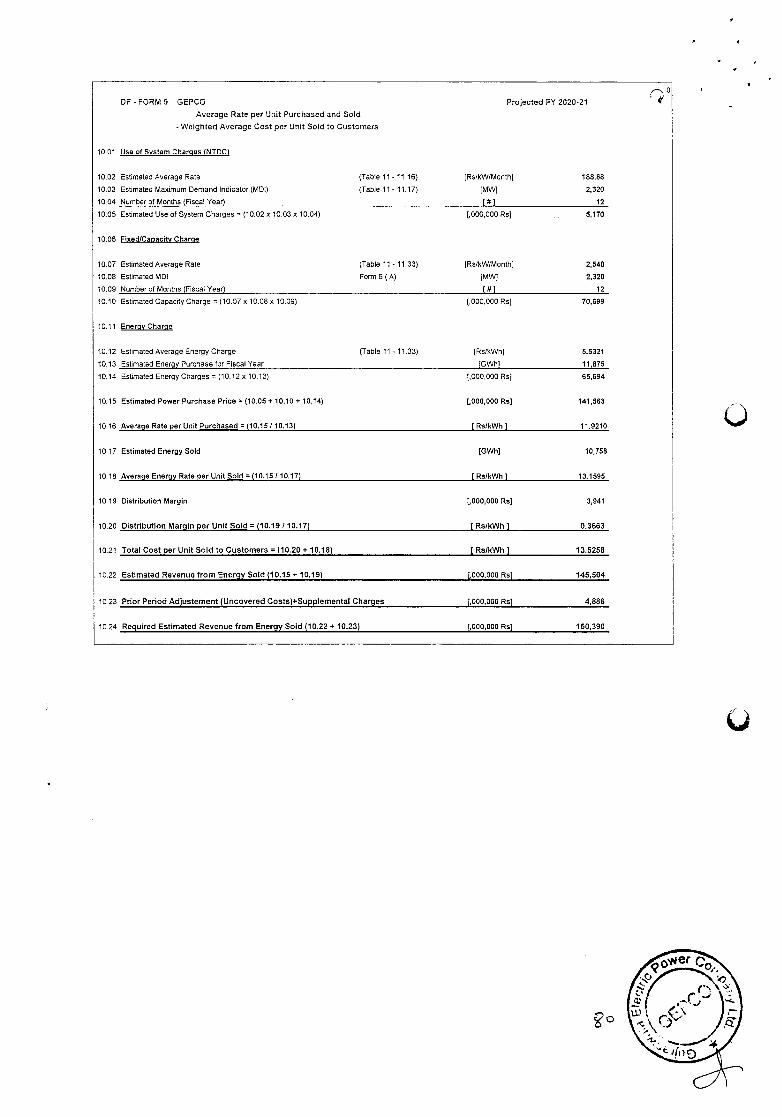
OF-FORM 9 GEPCO
Average Rate per Unit Purchased and
- Weighted Average Cost per Unit Sold to Customers
10.01 Use of System Charqes INTDC(
Sold
Projected FY 2020-21
10.02 Estimated Average Rate (Table 11- 11,16) [RslkW/Month( 188.88
10.03 Estimated Maximum Demand Indicator (MDI) (Table 11- 11.17) [MW] 2,320
10.04 Number of Months (Fiscal Year) [#1 12
10.05 Estimated Use of System Charges = (10.02x 10.03 x 10.04) (.000,000 Ro) 5170
10.06 Fixed/Capacity Charge
10.07 Estimated Average Rate (Table 11- 11.33) [Rs1kW/Month[ 2,540
10.08 Estimated MDI Form 6 (A) (MW] 2,320
10.09 Number of Months (Fiscal Year) [6] 12
10.10 Estimated Capacity Charge = (10.070 10.08 x 10.09) [000.000 Rs[ 70,699
1011 EneroyCharqe
10.12 Estimated Average Energy Charge (Table 11- 11.33) [Rs/kWhJ 5.5321
10.13 Estimated Energy Purchase for Fiscal Year (GWh1 11,875
10.14 Estimated Energy Charges = (10,120 10,13) [000,000 Rs( 65,694
10,15 Estimated Power Purchase Price (10.05 + 10.10 * 10.14) [,000,000 Rs] 141,563
10 16 Average Rate per Unit Purchased = (10.15 / 10.13) [RsIkWh] 11.9210
10 17 Estimated Energy Sold [GWh3 10,758
10,18 Average Energy Rate per Unit Sold = (10.15 / 10.17) IRs/kWh] 13.1595
10 19 Distribution Margin [,000,000 RsJ 3,941
10.20 Distribution Margin per Unit Sold = (10.19 / 10.17) IRs/kWh] 0.3663
1021 Total Cost per Unit Sold to Customers = (10.20 + 10.18) (Rs/kWh] 13.5258
10.22 Estimated Revenue from Energy Sold (10.15 + 10.19) 000,000 Rs] 145,504
1023 Prior Period Adjustement (Uncovered Costs)+Supplemental Charges (000,000 Rs] 4,886
1024 Required Estimated Revenue from Energy Sold (10.22 + 10.23) 000,000 Rs) 150,390
0
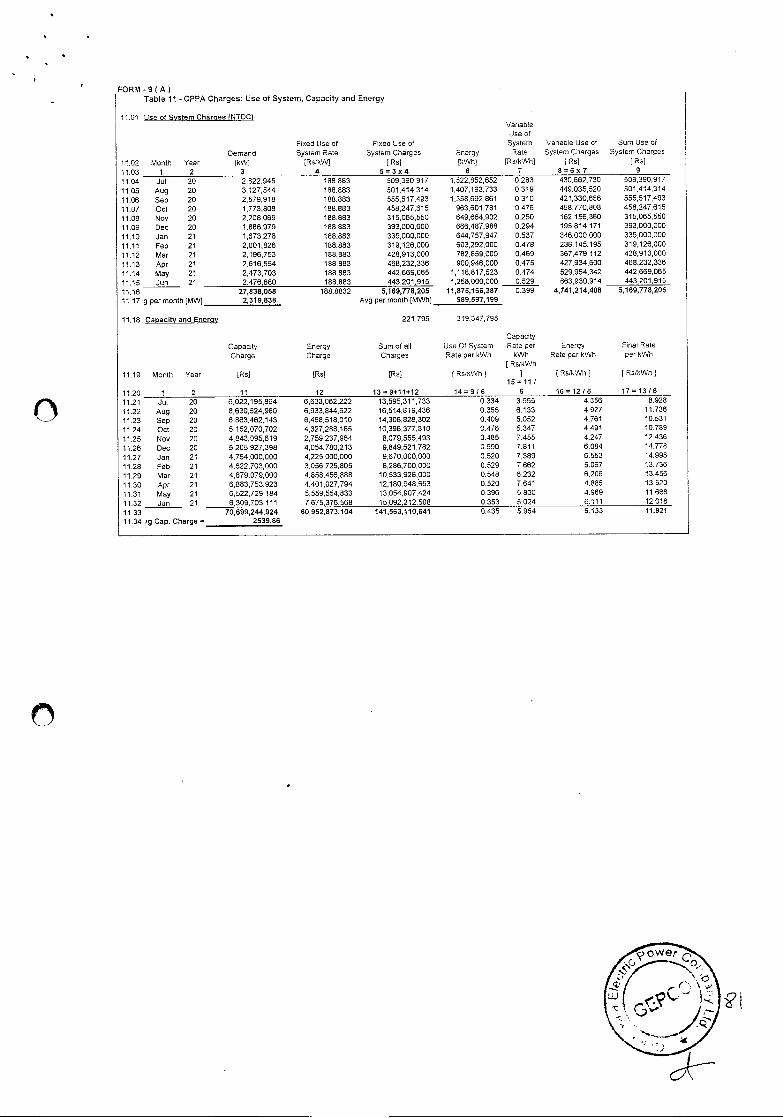
FORM -9) A) Table 11 - CPPA Charges: Use of System, Capacity and Energy
1101
11.02 11.03
Use of System Charqes INTDC)
Fixed Use of System Rate
(Rs/kVV1 4
Fixed Use of System Charges
[Rs] 5=3x4
Energy lkVdh]
6
Vaeable Use of System
Rate [RsikWh[
7
Uariable Use of System Charges
[Rn) 8=6x7
Sum Use of System Charges
[ RsJ 9
Month 1
Year 2
Demand [kW)
3 11.04 Jal 20 2,922945 188.883 509,390,917 1,522,852,652 0.283 430,662,730 509,390,917
11.05 Aug 20 3,127,644 188.883 501,414,314 1,407,193,733 0.319 449,035,520 501,414,314
11.06 Sep 20 2,579,918 188.883 555,517,493 1,358,692,861 0.310 421,330,656 555,517,493
11.07 Oct 20 1,773,808 188.883 458,247,615 963,601,781 0.476 458,770,808 458,247,615
11.08 Nov 20 2,208,069 188.883 315,065,550 649,664902 0.250 162,156360 315,066,550
11.09 Dec 20 1,886,979 188.883 393,000,000 666,487,988 0.294 195,614,171 393,000,000
11.10 Jan 21 1,673,278 188.883 335,000,000 644,757,947 0.537 346,000,000 335,000,000
11.11 Feb 21 2,001,826 188.883 319,126.000 603,292,000 0.478 288,145,195 319,126,000
11.12 Mar 21 2.196,753 188.883 428,913,000 782,859,000 0.469 367.479,112 428,913,000
11.13 Apr 21 2,616,554 188.883 468.232,336 900,946,000 0.475 427,934,600 468,232,336
11.14 May 21 2,473,703 188.883 442,669,065 1,118,817,523 0.474 529,954,342 442,669,065
11.15 Jun 21 2,476,680 188.883 443,201,915 1,256,000,000 0.529 663,930,914 443,201,915
11.16 27,838,058 188.8832 5,169,778,205 11,875,166,387 0.399 4,741,214,408 5,169,778,205
11.17 per month [MW) 2,319,838 Avg per month [MWh[ 989,597,199
11.18 Capacity and Enerciy 221,795 310,347,795
Capacity Capacity Energy Sure of all Use Of System Rate per Energy Final Rate
Charge Charge Charges Rate per kWh kWh Rate per kWh per CWS Rs/kWh
11,19 Month Year [Rn) [Rs) [Re) [ RsrkWh) [ [Rn/kWh) ( Rs,kkVh 15=111
11,20 1 2 11 12 13=9+11+12 14=9/6 6 161216 1713/6
11.21 Jul 20 6,022,195,864 6,633,062,222 13,595,311,733 0,334 3.955 4.356 8,928
11.22 Aug 20 8,630,524,980 6,933,944,622 16,514,819,436 0.356 6.133 4.927 11.736
11,23 Sep 20 6,863.462,143 6,468,518,010 14,308,828,302 0.409 5,052 4.761 10,531
11.24 Oct 20 5,152.070,702 4,327,298,185 10,396,377,310 0.476 5.347 4.491 10.789
11.25 Nov 20 4,843,095,619 2,759,237,964 8,079,555,493 0.485 7.455 4.247 12.436
11.26 Dec 20 5205,927,398 4,054,780,213 9,849.521,782 0.590 7.811 6.084 14.778
11.27 Jan 21 4,764,000,000 4,225,000,000 9,570,000,000 0.520 7.389 6.553 14.990
11.28 Feb 21 4,622.703,000 3,056,725,805 8,286,700.000 0.529 7.662 5.067 13,736
11.29 Mar 21 4,879,079,000 4.858,456,888 10,533,928,000 0.548 6.232 6.206 13.456
11,30 Apr 21 6,883.753,923 4,401,027,794 12,180,948,653 0.520 7.641 4.885 13.520
11,31 May 21 6,522,729,184 5,559,554,833 13,054.907,424 0.396 5,830 4.969 11.668
11.32 Jun 21 6,309,703,111 7,675,376,568 15,092,212.508 0.353 5,024 6.111 12.016
11.33 70,699,244,924 60,952,873,104 141,563,110,641 0.435 5.954 5.133 11.921
11.34 rg Cap. Charge = 2539.66
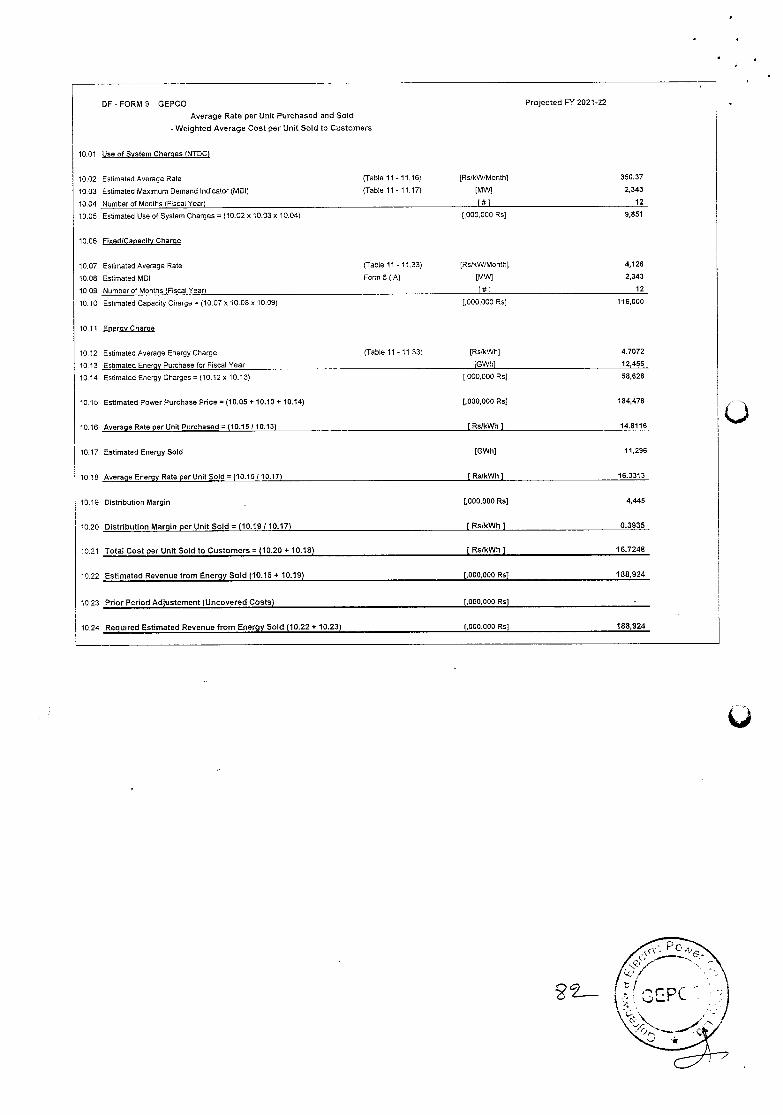
CF - FORMS GEPCO
Average Rate per Unit Purchased and Sold
- Weighted Average Cost per Unit Sold to Customers
1001 Use of System Charges (NTDC(
Projected FY 2021-22
10.02 Estimated Average Rate )Tabte 11-11.16) [Rs/kW/Month] 350.37
10.03 Estimated Maximum Demand Indicator (MDI) (Tabte 11-11.17) (MW] 2,343
10.04 Number of Months (Fiscal Year) [#1 12
10.05 Estimated Use of System Charges (10.02 x 10.03 x 10.04) (000000 Rs] a,851
10.06 Fixed/Capacity Charge
10.07 Estimated Aoerage Rate (Table 11 -11.33) [Rs/kW/Monttr] 4,126
10.08 Estimated MDt Form 6 (A( [MW] 2,343
10.09 Number of Months (Fiscal Year) [S [ 12
10.10 Estimated Capacity Charge = (10.07x 10.08 x 10.09) [.000000 Rs[ 116,000
10.11 Energy Charqe
10.12 Estimated Average Energy Charge (Table 11 -11.33) [Rs/kWh[ 4.7072
10.13 Estimated Energy Purchase for Fiscal Year (GWhI 12,455
10.14 Estimated Exergy Charges = (10.12x 10.13) [000,000 Rn] 58,628
10 15 Estimated Power Purchase Price = (10.05 + 10.10 * 10.14) (,000,000 Rs3 184,478
10.16 Average Rate per Unit Purchased (10.15/10.13) (RstkWh] 14.8116
1017 Estimated Energy Sotd (GWh] 11,296
10.18 Average Energy Rate per Unit Sold = (10.15/10.17) (Rs/kWh] 16.3313
10.19 Distribution Margin . (000,000 RS] 4,445
10.20 Distribution Margtn per Unit Sold = (10.19 / 10.17) (Rs/kWtt] 0.3935
10.21 Total Cost per Unit Sold to Customers = (10.20 + 10.18) [Rs/kWh] 16.7248
1022 Estimated Revenue from Energy Sold (10.15 + 10.19) (000,000 Rs[ 188,924
1023 Prior Period Adjustennent (Uncovered Costs) [000,000 Rs]
10.24 Required Estimated Revenue from Energy Sold (10.22 + 10.23) (.000.000 Rn] 188,924
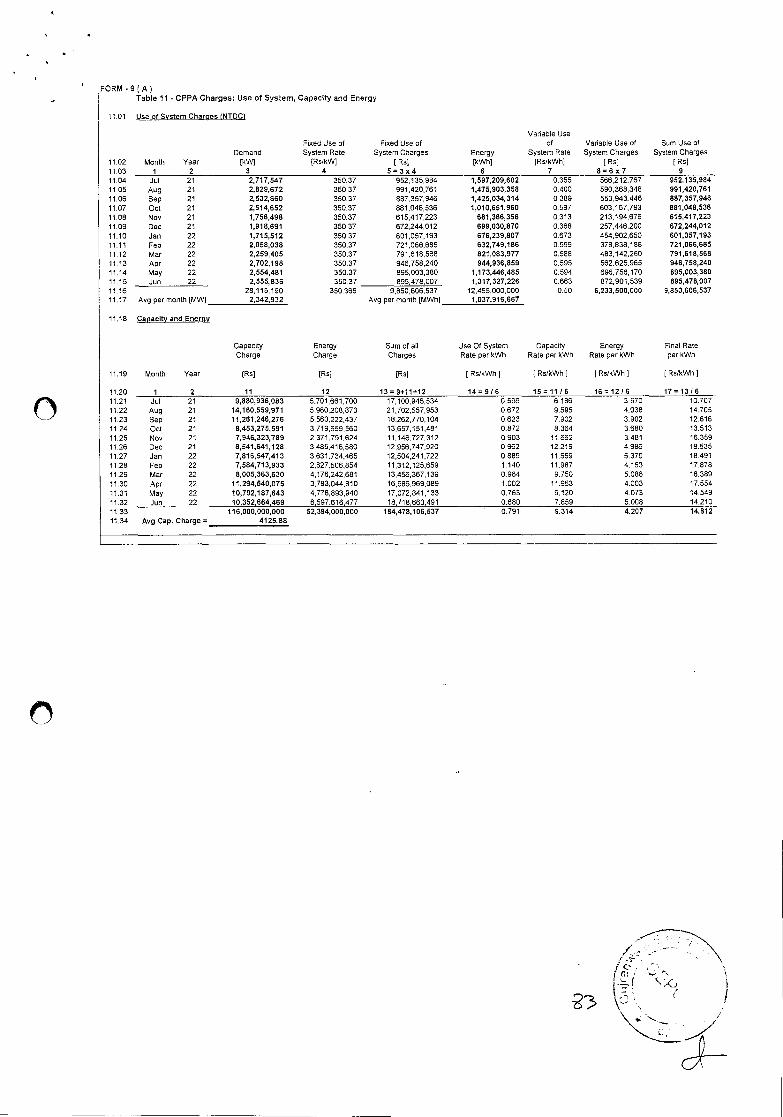
FORM -9 A) Table 11 - CPPA Charges: Use of System, Capacity and Energy
1101 Use of System Charqes INTOC)
Variable Use Fixed Use of Fixed Use of of Variable Use of Sum Use of
Demand System Rate System Charges Energy System Rate System Charges System Charges 1102 Month Year [kW] (RsIkW] (Rs) [kWh] [Rs/kWh[ [Rs) [Rs] 11.03 1 2 3 4 53x4 6 7 86x7 9 11.04 Jul 21 2,717547 350.37 952135984 1,597,209,602 0.355 566212,767 952,135,984 11.05 Aug 21 2,829,672 350.37 991,420,701 1,475,903,358 0.400 590,308,348 991,420,761 11.06 Sep 21 2,532,660 350.37 887,357,946 1,425,034,314 0.389 553,943,446 887,357,946 11.07 Oct 21 2,514,652 350.37 881,048,536 1,010,651,960 0.597 603,167,793 881,048,536 11.08 Nov 21 1,756,498 350.37 615,417,223 681,386,356 0.313 213,194,676 615,417,223 11.09 Dec 21 1,918,691 350.37 672,244,012 699,030,870 0.368 257,446,200 672,244,012 11.10 Jan 22 1,715,512 350.37 601,057,193 676,239,807 0.673 454,902.650 601,057,193 11.11 Feb 22 2,058,038 350.37 721,066.685 632,749,186 0.599 378,838,188 721,066,685 11.12 Mar 22 2,259,405 350.37 791.618,568 821,083,977 0.588 483,142,260 791,618,568 11.13 Apr 22 2,702,198 350.37 946,758,240 944,936,859 0.595 562.625,965 946,758,240 11.14 May 22 2,554,481 350.37 895,003,380 1,173,446,485 0.594 696,755,170 895,003,380 11.15 Jun 22 2,555,836 350.37 895,478,007 1,317,327,226 0.663 872,901,539 895,478,007 11.16 28,115,190 350,366 9,850,606,537 12,455,000,000 0.50 6,233,500,000 9,850,606,537 11,17 Avg per month [MVV] 2,342,932 Avg per month [MWh] 1,037,916,667
11.18 Capacity and Enerqy
Capacity Energy Sum of all Use Of System Capacrty Energy Final Rate Charge Charge Charges Rate per kWh Rate per kwh Rate per kwh per kWh
11.19 Month Year [Rs] (Ra] (Ru] [ Rs/kWh ( ( RofkWh (Rs/kWh( ) Rs/kWh I
11.20 1 2 11 12 139v11+12 14 = 9 / 6 15=11/6 16=12/6 17=13/6 11,21 Jul 21 9,880,936,083 5,701,661,700 17,100,946,534 0.596 6.186 3.570 10.707 11.22 Aug 21 14,160,559,971 5,960,208,873 21,702,557,953 0 672 9.595 4.038 14.705 11.23 Sep 21 11,261,246,276 5,560,222,437 18,262,770,104 0.623 7.902 3.902 12.816 11 24 Oct 21 8,453,275,591 3,719,659,560 13,657,151,481 0.872 8.364 3680 13.513 11.25 Nov 21 7,946,323,789 2,371,791,624 11,146,727,312 0.903 11.662 3.481 16.359 11.26 Dec 21 8,541,641,128 3,485,416,580 12,956,747,920 0.962 12.219 4.986 18.635 11.27 Jan 22 7,816,547,413 3,631,734,465 12,504,241,722 0.889 11.559 5.370 18.491 11.28 Feb 22 7,584,713,933 2.627,506,854 11,312,125,659 1.140 11.987 4.153 17.878 11.29 Mar 22 8,005,363,630 4,176,242,581 13,456,367,139 0.964 9.750 5.080 16.389 11.30 Apr 22 11,294,540,075 3,783,044,810 16,566.969.089 1.002 11.953 4.003 17,554 11.31 May 22 10,702,187,643 4.778,893,940 17,072,841,133 0.763 9.120 4.073 14.549 11.32 Jun 22 10,352,664,469 6,597.616.477 18.718,660,491 0.680 7.659 5.008 14.210 11 33 116,000,000,000 52,394,000,000 184,478,106,537 0.79 1 9.314 4.207 14.812 11.34 Avg Cap. Charge 4125.88
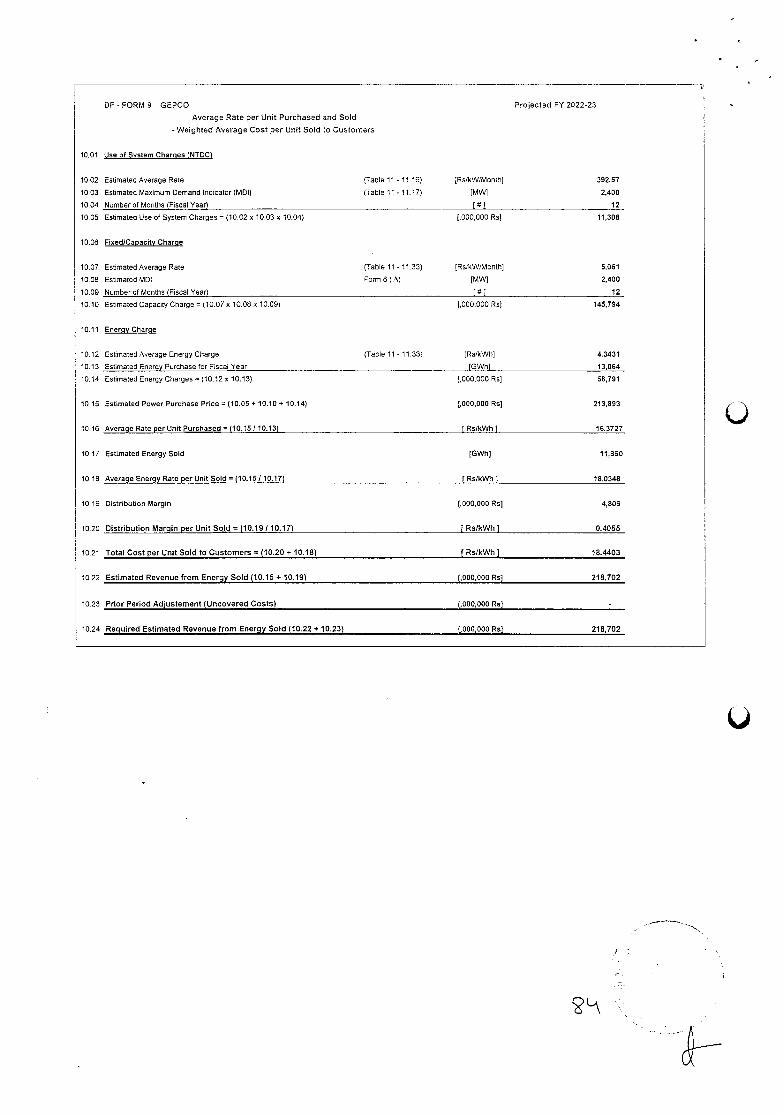
DF-FORM9 GEPCO
Average Rate per Unit Purchased and Sold
- Weighted Average Cost per Unit Sold to Customers
10.01 Use of System Charoes (NTDC)
Projected FY 2022-23
10.02 Estimated Average Rate )Table 11- tile) (Rs/kW/Month[ 392.57
10.03 Estimated Maximum Demand Indicator (MDI) (Table 11- 11.17) [MV/I 2,400
10.04 Number of Months (Fiscal Year) [6) 12
10.05 Estimated Use of System Charges = (10.02 X 10.030 10.04) [000,000 Rs[ 11,308
10.06 Fixed/Capacity Charcte
10.07 Estimated Average Rate (Table 11 -11.33) (Rs/kWlMonth] 5,061
10.08 Estimated MDI form S(A) [MW) 2,400
10.09 Number of Months (Fiscal Year) [5) 12
10.10 Estimated Capacity Charge = (10.07x 10.08 x 10.09) [000,000 Rs[ 145,794
10.11 Enemy Charge
10.12 Estimated Average Energy Charge (Table 11- 11.33) [RslkWh[ 4.3431
10.13 Estimated Energy Purchase for Fiscal Year [GWh[ 13,064
10.14 Estimated Energy Charges = (10.120 10.13) .000,000 Rs[ 56,791
10 15 Estimated Power Purchase Price (10.05 + 10.10 + 10.14) (000,000 Rs[ 213,893
10.16 Average Rate per Unit Purchased = (10,15110.13) Rs/kWh] 16.3727
10.17 Estimated Energy Sold [GWh) 11,860
10.18 Average Energy Rate per Unit Sold [10.15 / 10,17) (Rs/kWh [ 18.0348
10.19 Distribution Margin (000,000 Rs) 4,809
10.20 Distribution Margin per Unit Sold = (10.19 / 1017) [Rs/kWh] 0.4055
1021 Total Cost per Unit Sold to Customers = (1020 + 10.18) (Rs/kWh] 184403
10.22 Estimated Revenue from Energy Sold (10.15 + 10,19) [000,000 Rs] 218,702
10.23 Prior Period Adjustement (Uncovered Costs) 1,000,000 Rs[
10.24 Required Estimated Revenue from Energy Sold (10.22 + 10.23) (000,000 Rs[ 218,702
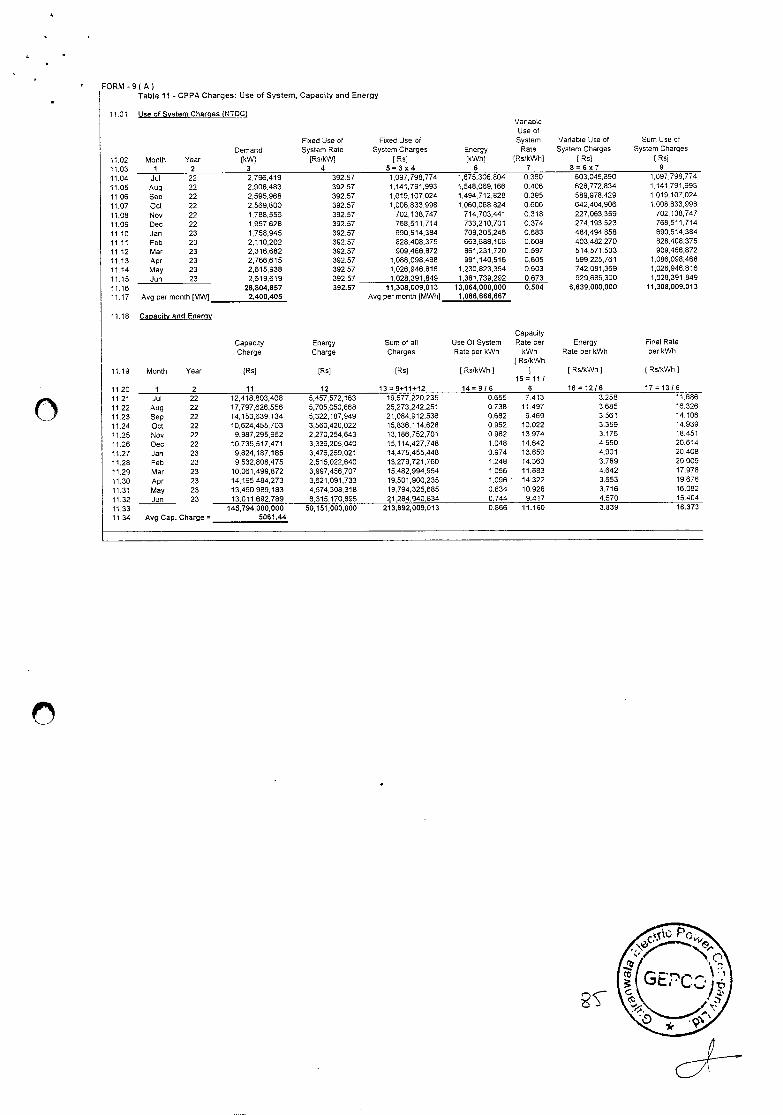
FORM - 9) A) Table 11 - CPPA Charges: Use of System, Capacity and Energy
11.01 Use of System Charoes INTDCI 'Jariable Use of
Fixed Joe of Fixed Use of System 'Janable Use of Sum Use of
Demand System Rate System Charges Energy Rate System Charges System Charges
1102 Month Year [SW) [RsIkW] ( Es] [kWh] [Rs/kWh] [ Ru) ( Rsj
11.03 1 2 3 4 53x4 6 7 86x7 9
11.04 Jul 22 2,796419 392.57 1,097,798,774 1,675,306,804 0.360 603,045,890 1,097798,774
11.05 Aug 22 2,908,483 392.57 1,141,791,993 1,548,069,166 0.406 628,772,834 1,141,791,993
11.06 Sep 22 2,595,968 392.57 1,019,107,024 1,494,712,828 0.395 589,978429 1,019,107,024
11.07 Oct 22 2,569,800 392.57 1,008,833,998 1,060,068,824 0.606 642,404,906 1,008,833,998
11.08 Nov 22 1,788,556 392.57 702,138,747 714,703,441 0.318 227,063,359 702,139,747
11.09 Dec 22 1,957,628 392.57 768,511,714 733,210,701 0.374 274,193,523 769,511,714
11.10 Jan 23 1,758,945 392.57 690,514,384 709,305,246 0.683 484,494,958 690,514,384
11.11 Feb 23 2,110,202 392.57 828,408,375 663,688,106 0.608 403,482,270 828,408,375
11.12 Mar 23 2,316,682 392.57 909,466,872 861,231,720 0.597 514,571,503 909,466.872
11.13 Apr 23 2,766,615 392.57 1,086,098,468 991,140,516 0.605 599,225,761 1,086,098,468
11,14 May 23 2,615,938 392.57 1,026,946,816 1,230.823.354 0.603 742,081,369 1,026,946,816
11.15 Jun 23 2.619,619 392.57 1.028,391,849 1,381.739,292 0.673 929,685,300 1,028,391,849
11.16 28,804,857 392.57 11,308,009,013 13,064,000,000 0.504 6,639,000,000 11,308,009,013
11.17 Avg per month [MW) 2,400,405 Avg per month [MWh] 1,088,666,667
11.18 Capacity and Energy
Capacity Capacity Energy Sum of all Use Of System Rate per Energy Final Rate Charge Charge Charges Rate per kWh kWh Rate per kWh per kWh
[Ru/kWh 11.19 Month Year [Ro] [Rn] [Rn] ] Rs/kWh [ ] [ RslkWh] ] Ru/kWh
15 11/
1120 1 2 11 12 13=9*11+12 14=9/6 6 16=12/6 17=13/6
11.21 Jul 22 12,418,803,408 5,457,572,163 19,577,220,235 0.655 7.413 3.258 11.686
11.22 Aug 22 17,797,626,556 5,705,050,868 25,273,242,251 0.738 11.497 3.685 16.326
11.23 Sep 22 14,153,639,134 5.322,187.949 21,084,912,536 0.682 9.469 3.561 14.106
11.24 Oct 22 10.624,455,703 3,560,420,022 15,836.114,628 0.952 10.022 3.359 14.939
11.25 Nov 22 9,987,295,952 2,270,254,643 13,186,752,701 0.982 13.974 3.176 18.451
11.26 Dec 22 10.735,517,471 3.336,205,040 15,114.427.748 1,048 14.642 4.550 20.614
11.27 Jan 23 9,824,187,185 3,476,259,021 14,475,455,448 0.974 13.850 4.901 20.408
11.28 Feb 23 9,532.808,475 2,515,022,640 13,279,721,760 1248 14.363 3.789 20,009
11.29 Mar 23 10,061,499,872 3,997,456,707 15,482,994,954 1.056 11.683 4.642 17.978
11.30 Apr 23 14,195,484,273 3,621,091,733 19,501,900,235 1.096 ' 14,322 3.653 19.676
11,31 May 23 13,450.989.183 4,574,308,318 19,794,325.685 0.834 10.928 3,716 16.082
11.32 Jun 23 13,011,692.789 6,316,170,896 21.284.940.834 0.744 9.417 4.570 15.404
11.33 145,794,000.000 50,151,660,000 213,892,009.013 0.866 11.160 3.839 16.373
11.34 Avg Cap. Charge = 5061.44
tçC Pop.
\1
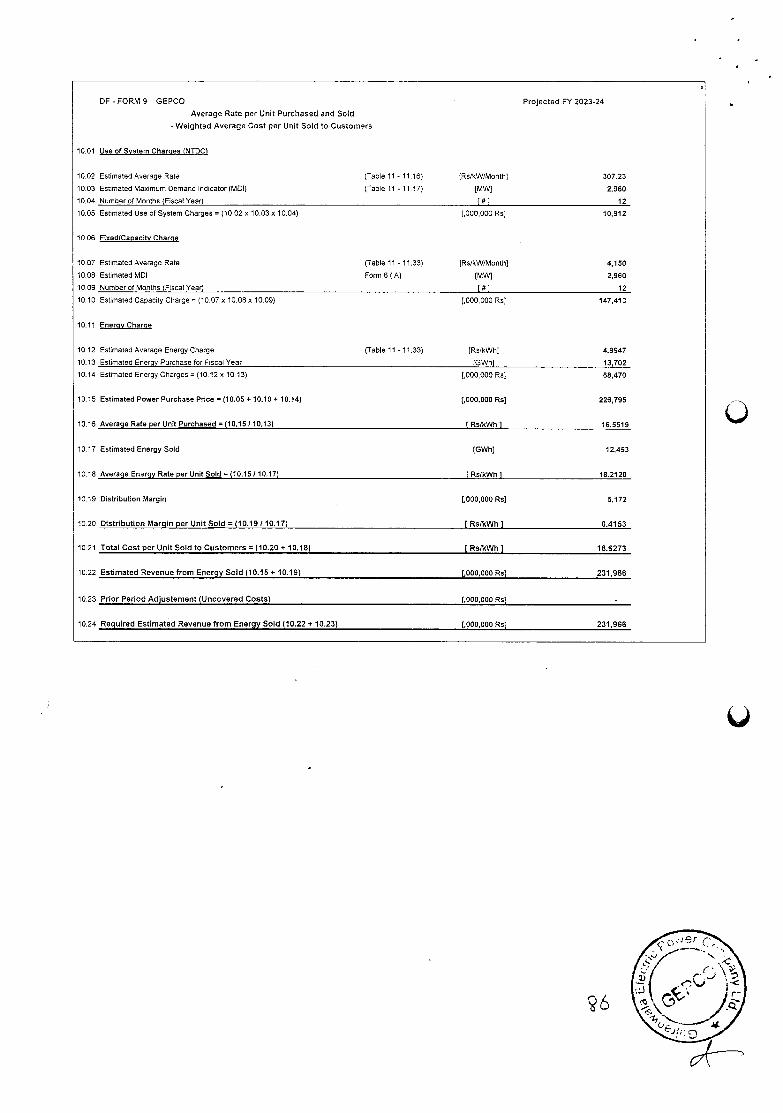
OF-FORM 9 GEPCO
Average Rate per Unit Purchased and Sold
- Weighted Average Cost per Unit Sold to Customers
10.01 Use of System Charges )NTDC(
Projected FY 2023-24
10.02 Estimated Average Rate (Table 11 - 11.16) (RslkW/Month( 307.23
1003 Estimated Maximum Demand Indicator (MDI) (Table 11 -11.17) [MW) 2,960
10.04 Number of Months (Fiscal Year) [9) 12
10.05 Estimated Use of System Charges = (10.02 x 10.03x 10.04) (000,000 Rs( 10,912
10 06 Fixed/Capacity Charqe
10.07 Estimated Average Rate (Table 11 -11.33) (Rs/kW/Month[ 4,150
10.08 Estimated MDI Form 6 (A) [MW) 2,960
10.09 Number of Months (Fiscal Year) [9] 12
10.10 Estimated Capacity Charge = (10.07 x 10.08s 10.09) [000,000 Ru) 147,413
10.11 Enemy Charqe
10 12 Estimated Average Energy Charge (Table 11 - 11.33) [Rn/kWh) 4.9947
10.13 Estimated Enerqy Purchase for Fiscal Year (OWN) 13,702
10.14 Estimated Energy Charges = (10.12 x 10,13) [000,000 Ru) 68,470
10.15 Estimated Power Purchase Price (10.05 + 10.10 * 10.14) [000,000 Rs] 226,795
10,16 Average Rate per Unit Purchased (10.15/10.13) (Rs/kWh] 16.5519
10 17 Estimated Energy Sold (GWh] 12,453
10,18 Average Esergy Rate per Usit Sold = (10.15 / 10.17) [Rs/kWh 1 18.2120
10 19 Distributisn Margin (000,000 Rs) 5,172
10.20 Distribution Margin per Unit Sold e (10.19 / 10.17) [Rs/kWh] 0.4163
10.21 Total Cost per Unit Sold to Customers = (10.20 + 10.18) (Rs/kWh] 18.6273
10.22 Estimated Revenue from Energy Sold (10.15 + 10.19) [000,000 Rs] 231,966
10.23 Prior Period Adjustement (Uncovered Costs) [000,000 RS)
10.24 Required Estimated Revenue from Energy Sold (10.22 + 10.23) [000,000 Rs] 231,966
2ct
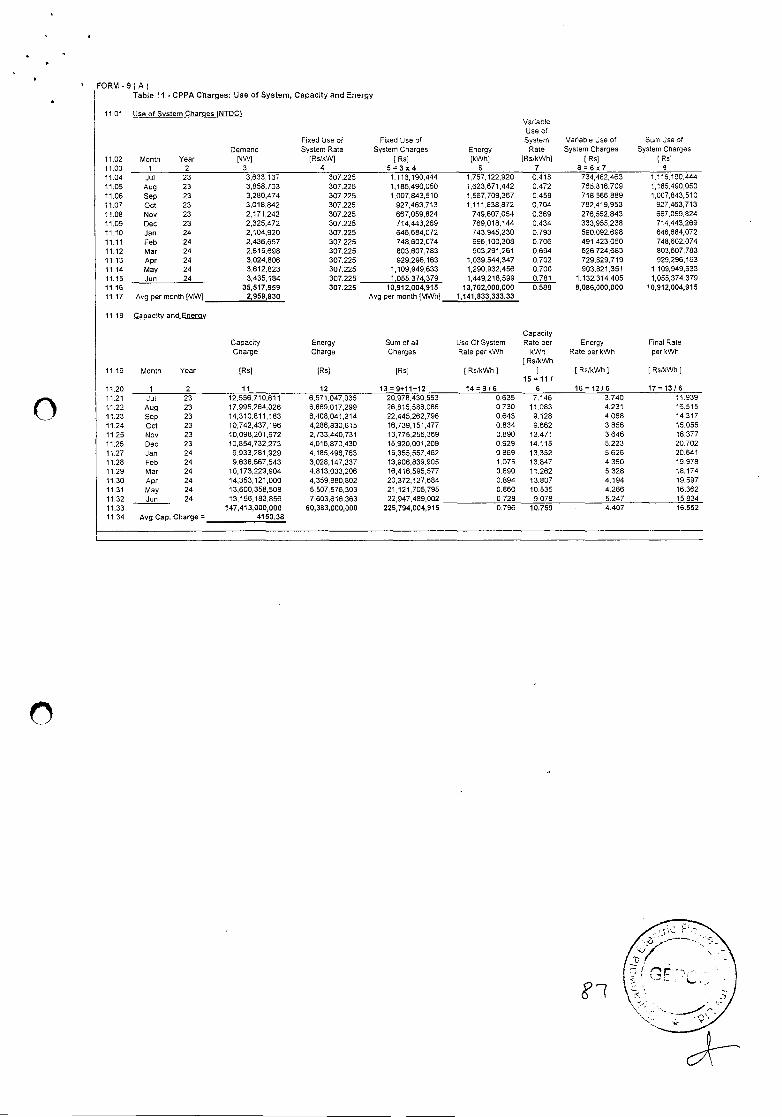
C)
FORM -9 ( A) Table 11 - CPPA Charges: Use of System, Capacity and Energy
11.01
11.02 11.03
Use of System Charges INTDCI
Fixed Use xi System Rate
[Rslk'N] 4
Fixed Use of System Charges
[Rs] 53x4
Energy (kWh]
6
Variable Use of System
Rate [RslkWh]
7
Variable Use of System Charges
Rs] 86x7
Sum Use of System Charges
Rs] 9
Month 1
Year 2
Demend [kWl
3 11.04 Jul 23 3,633,137 307.225 1,116,190.444 1.757,122920 0416 734,462,463 1,116,190,444 11.05 Aug 23 3.858.703 307.225 1,185,490,050 1,623,671.442 0.472 765,816,709 1.185.490,050 11.06 Sep 23 3,280,474 307.225 1,007,843,510 1,567,709.367 0,458 718,566,889 1,007,643,510 11.07 Oct 23 3,018,842 307.225 927,463,713 1,111,838,872 0.704 782,419,953 927,463,713 11.08 Nov 23 2,171,242 307.225 667,059.824 749,607,064 0.369 276,552,843 667,059,824 11.09 Dec 23 2,325.472 307.225 714,443,269 769,018,144 0.434 333,955,238 714,443.269 11.10 Jan 24 2,104,920 307.225 646,684,072 743.946.230 0.793 590,092,698 646,684,072 11.11 Feb 24 2,436,657 307.225 748,602074 696,100,308 0,706 491,423,050 748,602,074 11.12 Mar 24 2.615.698 307.225 803,607,783 903,291,261 0.694 628,724.683 803,607,783 11.13 Apr 24 3,024,806 307.225 929,296.163 1,039.544,347 0.702 729.829,719 929,296.163 11.14 May 24 3,612.823 307.225 1,109,949,633 1,290,932,456 0.700 903,821,351 1,109,949,633 11.15 Jun 24 3,435,184 307.225 1,055,374,379 1,449,218.599 0.781 1,132,314,405 1,055,374,379 11.16 35517,959 307.225 10,912,004,915 13,702,000,000 0.588 8,086,000,000 10,912,004,915 11.17 Avg per month [MW] 2,959,830 Avg per month [MWh] 1,141,833,333.33
11.18 Capacity and Enemy
Capacity Capacity Energy Sum of all Use Of System Rate per Energy Final Rate Charge Charge Charges Rate per kWh kwh Rate per kWh per kWh
]RslkWh 11.19 Month Year ]Rs1 [Ru] ]Rs] [ Rs/kWh] I [ Ro/kWh] [Rs/k'Nh I
15 11 / 11.20 1 2 11 12 13=9*11*12 14=9(6 6 16=12(6 17=13/6 11.21 Jul 23 12,556,710,611 6,571,047036 20,978.430,553 0.635 7.146 3.740 11.939 11.22 Aug 23 17,996.264,026 6869,017,299 26,815,588,086 0.730 11,083 4.231 16.515 11.23 Sep 23 14.310,811,183 6,408,041,214 22,445,262,796 0.643 9.128 4.088 14.317 11.24 Oct 23 10,742.437,196 4,286.830,615 16,739.151.477 0.834 9.862 3.856 15.055 11.25 Nov 23 10,098201,972 2,733,440,731 13,775,255,369 0.890 13.471 3.646 18,377 11.26 Dec 23 10,864,732,273 4,016,870,430 15,920,001,209 0.929 14.115 5.223 20.702 11.27 Jan 24 9,933,281,929 4.185,498,763 15,355,557,462 0.869 13.352 5.626 20.641 11.28 Feb 24 9.638.667,543 3,028,147,237 13.906.839.905 1.075 13.847 4.360 19.978 11.29 Mar 24 10,173,229,904 4,813,033,206 16,416,595,577 0.890 11.262 5.328 18.174 11.30 Apr 24 14,353,121,000 4.359,880,802 20,372,127,684 0.894 13.807 4.194 19.597 11.31 May 24 13,600,358,508 5,507,576,303 21,121,705,795 0.860 10.535 4.266 16.362 11.32 Jun 24 13,156,183,856 7,603,616,363 22,947,489,002 0728 9.078 5.247 15.834 11.33 147,413,000,000 60,383,000,000 226,794,004,915 0.786 10.759 . 4.407 16.552 11 34 Avg Cap. Charge = 4150.38
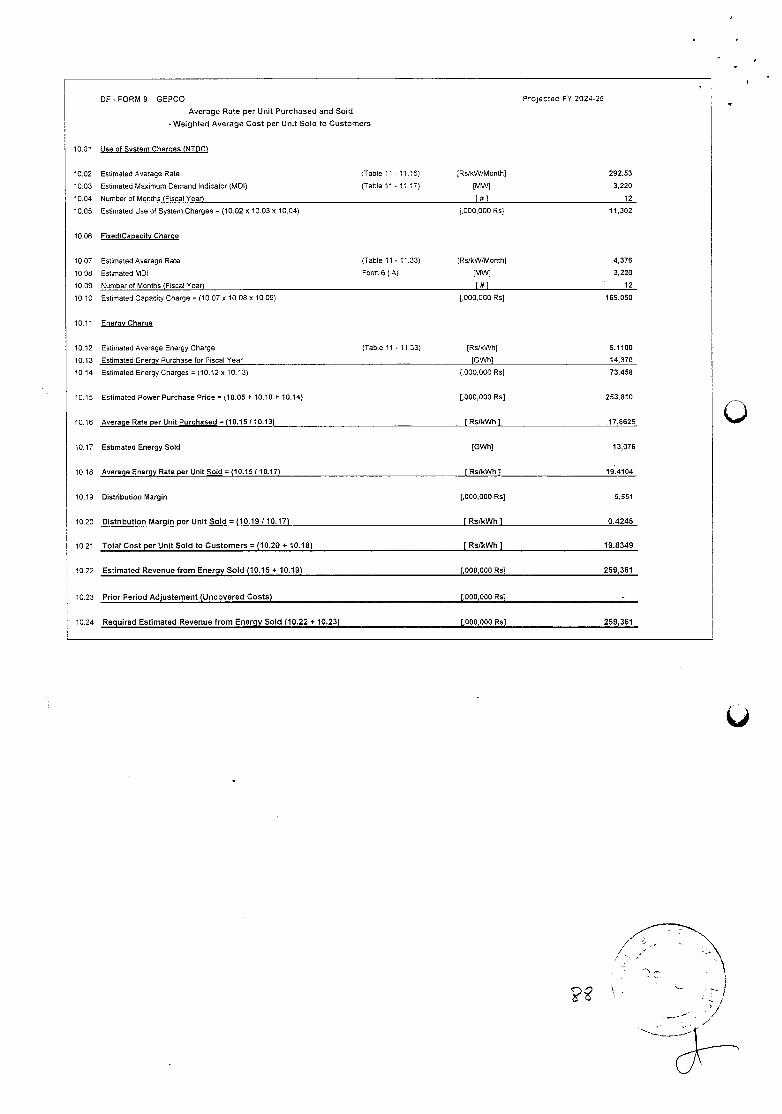
OF-FORM 9 GEPCO
Average Rate per Unit Purchased and Sold
- Weighted Average Cost per Unit Sold to Customers
10.01 Use of System Charqes INTOC)
Projected FY 2024-25
10.02 Estimated Average Rate (Table 11 -11.16) [Rs/kWfMonth[ 292.53
10.03 Estimated Maximum Demand Indicator (MDI) (Table 11 -11.17) (MW] 3,220
10.04 Number of Mouths (Fiscal Year) [4] 12
10.05 Eshmated Use of System Charges = (10.02 X 10.030 10.04) (.000000 Rs[ 11,302
10,06 Fixed/Capacity Charge
10.07 Estimated Average Rate (Table 11 -11.33) [Rs/kW/Month[ 4,376
10.08 Estimated MDI Form 6 (A( [MW] 3,220
10.09 Number of Months (Fiscal Year( [#3 12
10.10 Estimated Capacity Charge = (10.07010.08 X 10.09) [000,000 Ru] 169,050
10.11 Energy Charge
10.12 Estimated Average Energy Charge (Table 11 -11 33) ]Rs/kWh] 5.1100
10.13 Estimated Energy Purchase for Fiscal Year ]GWh) 14,370
10.14 Estimated Energy Charges = (10.12s 10.13) (.000.000 Rs] 73,458
10.15 Estimated Power Purchase Price = (10.05 + 10.10+ 10.14) 3,000,000 Rs] 253,810
10.16 Average Rate per Unit Purchased = (10.15(10.13) (Rs/kWh 1 17.6625
10.17 Estimated Energy Sold (GWh) 13,076
10.18 Average Energy Rate per Unit Sold = (10.15/10.17) [Rs/kWh( 19.4104
10.19 Distribution Margin (000,000 Ru] 5,551
10.20 Distribution Margin per Unit Sold = (10.19(10.17) (Rs/kWh] 0.4245
10.21 Total Cost per Unit Sold to Customers = (10.20 + 10.18) [Ru/kWh) 19.8349
1022 Estimated Revenue from Energy Sold (10.15 + 10.19) 3,000,000 Rs) 259,361
10.23 Prior Period Adjustement (Uncovered Costs) (000,000 RS]
10.24 Required Estimated Revenue from Energy Sold (10.22 + 10.23) (000,000 Ru) 259,361
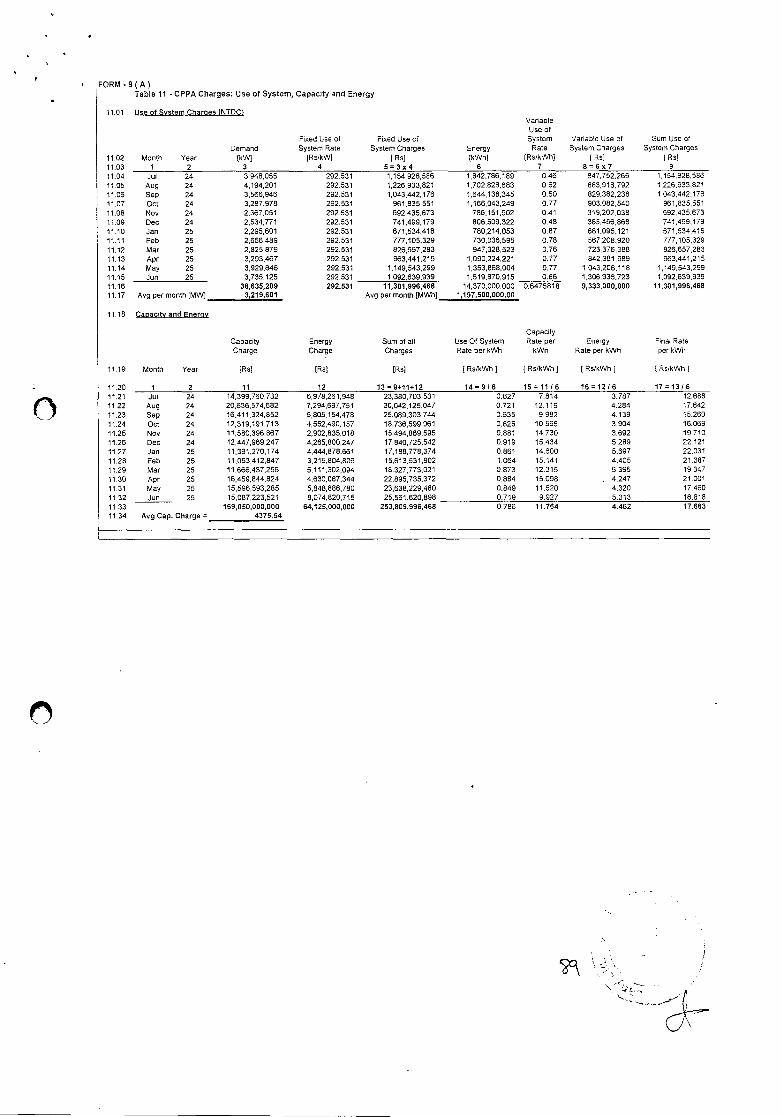
FORM -9 (A) Table 11 - CPPA Charges: Use of System, Capacity and Energy
11.01
11.02 11.03
Use of System Charges INTOC)
Fixed Use of System Rate
[Rs/kW] 4
Fixed Use of System Charges
[195] 5=3x4
Energy [k'Nh)
6
Variable Use of System Rate
[Rn/kWh] 7
Variable Use of System Charges
[Ru) 86x7
Sum Use of System Charges
[Es) 9
Month 1
Year 2
Demand [k'N)
3 11.04 Jul 24 3,948,055 292.531 1,154,928,586 1,842,786,189 0.46 847,752,266 1,154,928,586 11.05 Aug 24 4,194,201 292.531 1,226,933,821 1,702,828,683 0.52 883,918,792 1,226,933,821 11.06 Sep 24 3,566,946 292.531 1,043,442,176 1,644138,345 0.50 829,382,238 1,043,442,176 11.07 Oct 24 3,287,978 292.531 961,835,551 1.166,043,249 0.77 903,082,540 961,835,551 11.08 Nov 24 2,367,051 292.531 692,435,673 786,151,902 0.41 319,202,038 692,435,673 11.09 Dec 24 2,534,771 292.531 741,499,179 806,509,322 0.48 385,456,868 741499,179 11.10 Jan 25 2,295,601 292.531 671,534,418 780,214,053 0.87 681,095,121 671,534,418 11.11 Feb 25 2,656,489 292.531 777,105,329 730.036,595 0.78 567,208,920 777,105,329 11.12 Mar 25 2825,879 292.531 826,657,283 947,328,523 0.76 723,376,388 826,657,283 11.13 Apr 25 3,293,467 292.531 963,441,215 1,090,224,221 0.77 842,381,989 963,441,215 11.14 May 25 3,929,646 292.531 1,149,543,299 1,353,868.004 0,77 1,043,206,118 1,149.543,299 11,15 Jun 25 3,735,125 292.531 1,092,639,939 1,619,870,915 0.86 1,306,936.723 1,092.639,939 11.16 38,635,209 292.531 11,301,996,468 14.370,000,000 0.6475818 9,333,000,800 11,301,996,468 11.17 Avg per month [MW] 3,219,601 Avg per month [MWh] 1,197,500,000.00
11.18 Capacity and Energy
Capacity Capacity Energy Sum of all Use Of System Rate per Energy Final Rate Charge Charge Charges Rate per kWh kWh Rate per kwh per kWh
11.19 Month Year (Rs] [Rs[ [Rs] ] Rs/kWh [ ) Rs/kWh [ [ Rs/kWh ] [Es/kWh)
11.20 1 2 11 12 13=9+11*12 14=916 15=11/6 1612/6 17=13/6 11.21 Jul 24 14,399,760,732 6,978,261,948 23,380,703,531 0.627 7,814 3.787 12.688 11.22 Aug 24 20,636,574,682 7,294,597,751 30,042,125.047 0.721 12.119 4.284 17.642 11.23 Sep 24 16,411,324,852 6,805,154,478 25,089,303,744 0.635 9.982 4.139 15.260 11.24 Oct 24 12,319,191,713 4,552,490,157 18,736,599,961 0,825 10.565 3.904 16,069 11.25 Nov 24 11,580,396,867 2,902,835,018 15,494,869,595 0,881 14.730 3.692 19.710 11.26 Dec 24 12,447,969,247 4,265,800,247 17,840,725,542 0.919 15.434 5.289 22.121 11.27 Jan 25 11,391,270,174 4,444,878,661 17,188,778,374 0.861 14.600 5.697 22,031 11.28 Feb 25 11,053,412,847 3,215,804,806 15,613,531,902 1.064 15.141 4.405 21 .387 11.29 Mar 25 11,666,437,256 5,111,302,094 18,327,773,021 0.873 12,315 5.395 19.347 11.30 Apr 25 16,459,844,824 4,630,067,344 22,895,735,372 0.884 15.098 4.247 21.001 11.31 May 25 15,596,593,285 5,848,886,780 23,638,229,480 0.849 11.520 4,320 17.460 11.32 Jun 25 15,067,223,521 8,074,820,715 25,561,620,898 0.719 9.927 5,313 16.818 11.33 169,050,080,000 64,125,000,too 253,8t9,996,468 0.786 11.764 4.462 17.663 11.34 Avg Cap. Charge 4375.54
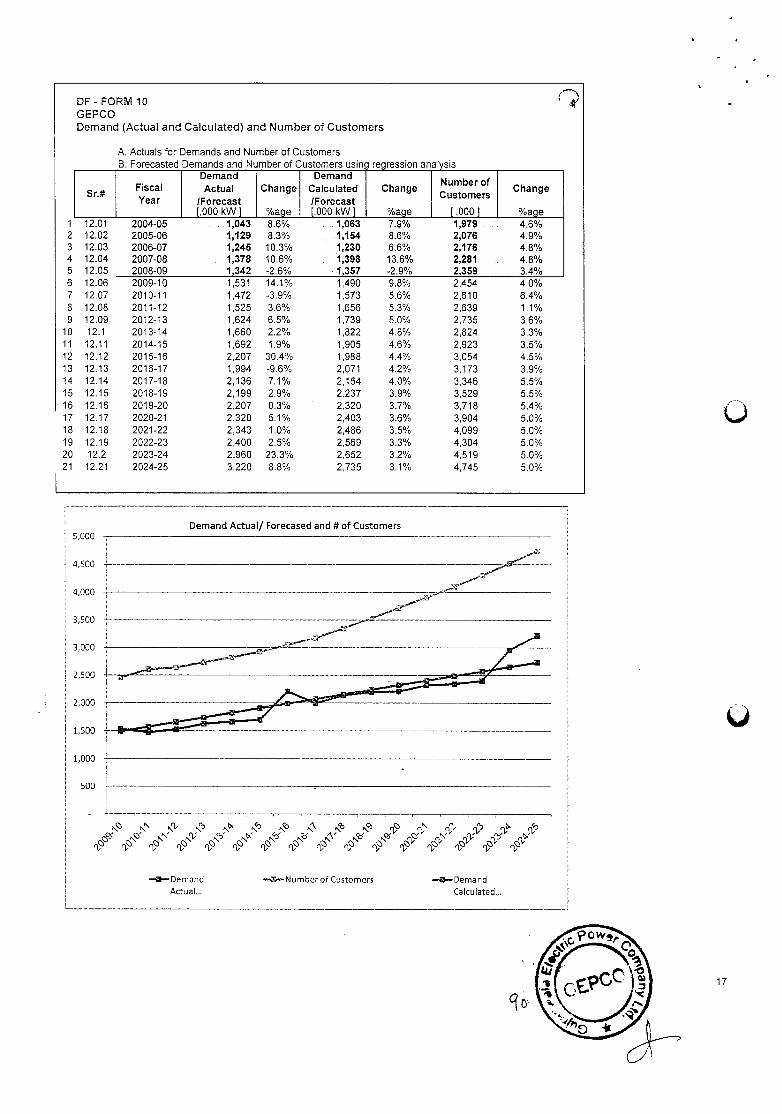
5,000
4,500
4,000
3,500
3,000
l 2,500
2,000
1,500
1,000
500
-- Demand '-'.Number of Customers --- Demand Actual... Calculated...
DF - FORM 10 GEPCO Demand (Actual and Calculated) and Number of Customers
A. Actuals for Demands and Number of Customers B. Forecasted Demands and Number of Customers using regression analysis
Sr.# Fiscal Year
Demand Actual
/Forecast [.000 kW]
Change
%age
Demand Calculated /Forecast [000 kW]
Change
%age
Number of Customers
[0001
Change
%age 1 12.01 2004-05 1,043 8.6% 1,063 7.9% 1,979 4.6% 2 12.02 2005-06 1,129 8.3% 1,154 8.6% 2,076 4.9% 3 12.03 2006-07 1,245 10.3% 1,230 6.6% 2,176 4.8% 4 12.04 2007-08 1,378 10.6% 1,398 13.6% 2,281 4.8% 5 12.05 2008-09 1,342 -2.6% 1,357 -2.9% 2,359 3.4% 6 12.06 2009-10 1,531 14.1% 1,490 9.8% 2,454 4.0% 7 12.07 2010-11 1,472 -3.9% 1,573 5.6% 2,610 6.4% 8 12.08 2011-12 1,525 3.6% 1,656 5.3% 2,639 1.1% 9 12.09 2012-13 1,624 6.5% 1,739 5.0% 2,735 3.6%
10 12.1 2013-14 1,660 2.2% 1,822 4.8% 2,824 3.3% 11 12.11 2014-15 1,692 1.9% 1,905 4.6% 2,923 3.5% 12 12.12 2015-16 2,207 30.4% 1,988 4.4% 3,054 4.5% 13 12.13 2016-17 1,994 -9.6% 2,071 4.2% 3,173 3.9% 14 12.14 2017-18 2,136 7.1% 2,154 4.0% 3,346 5.5% 15 12.15 2018-19 2,199 2.9% 2.237 3.9% 3,529 5.5% 16 12.16 2019-20 2,207 0.3% 2,320 3.7% 3,718 5.4% 17 12.17 2020-21 2,320 5.1% 2,403 3.6% 3,904 5.0% 18 12.18 2021-22 2,343 1.0% 2,486 3.5% 4,099 5.0% 19 12.19 2022-23 2,400 2.5% 2,569 3.3% 4,304 5.0% 20 12.2 2023-24 2,960 23.3% 2,652 3.2% 4,519 5.0% 21 12.21 2024-25 3,220 8.8% 2,735 3.1% 4,745 5.0%
Demand Actual! Forecased and U of Customers
17
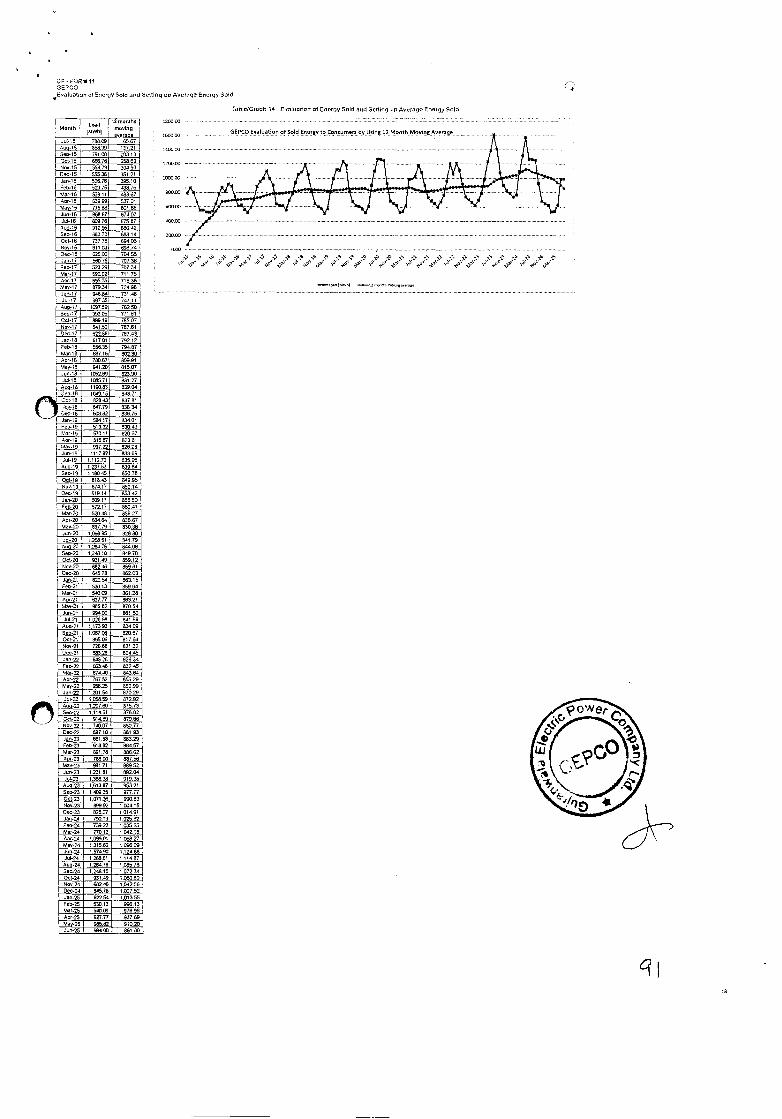
MOnIS [915505
12 months
our-IS 78809 6567 Au9-IS 15839 13721 Sep-IS 791 Cdl 20313 301-15 88676 25869 Soy-IS 05479 30093 3m-IS 95538 391 21 Jan.10 52676 305.10
1000.60
Feb-16 07975 43875 Mel-id 939111 48367 Abr-I6 63999 537.01 Mar.16 77580 801.66 Jun.16 66867 67407 Jul-16 60976 57587 Au9-I6 91256 68842 Sen-IS 68370 688.14 001-16 73776 664.00 lupn.I6 SIlO) 69874 090-16 52590 76955 Jan-17 54075 70728 Feb-17 52325 707.34 Mar-17 59102 711 75
60535 71636 May-17 879.341 72498 Jun.17 946.84 721 48 Jul-17 99735 7*7.11 *uo.17 109759 76250 A to. 17 99305 771 dl 001.17 899.19 78507
54196 76751 Dec-17 679.68 717*3
an-I8 91701 79212 Feb-19 55635 76087 M4r.18 88719 80280
760.67 60991 May-18 54120 81507 Jun.18 105289 80290
190571 831 27 Auq-I6 115083 83904
1049.15 84371 82843 93791 84779 93834 60382 83675 58417 83401 51332 13043 57011 82067 61587 82361 99722 62626
Jun-19 ¶117921 633.99 Jul.19 1.11272 835.95 Auq-I9 102753 83984 Sen-IS 1.160 *5 65078 001.19 I 81843 64995 NOv.15 874.17 85214 Dec.19 51914 85342 Jan-20 60017 95550 Feb-20 572.17 96041 Mar.20 52048 85627 Apr-25 55464 83967 Mar-25 89779 93038 Jun-20 09895 92860 Jul.39 1.28861 64179 009-20 I 39476 86806 513-20 I 1.24610 84970 001-25 I 881*9 859.12 Nov.ZO 582*6 65981 089-20 69578 86203 Jan-21 67954 86316 Feb-21 57013 05904 1441-21 I 540001 85128 *00.21 62777 86321 Mar-21 90982 87004 Jun-21 99426 86180 Jul-21 02680 14190
446.21 117393 589.21 09700 83987 001-21 89690 817.64 994-31 73868 821 32 Dec-21 68328 62445 Jan.02 58526 82604 Feb-22 60340 632*5
67440 68364 4 81-02 70792 65529 May-22 90825 85299 Jun-fl 1.39154 870.29
- Jul-fl 09859 87292 449-22 1.39766 87572
1.114 01 878.02 !_, 91*69 87966
Nov-02 7*607 88077 Dec-79 98710 881 93 Jan.23 66108 883.29 Feb-02 61982 894.57 1401- 02 091.78 90602 Apr-02 78855 88706 May-23 96171 69952 Jun-23 1 021 81 09204 Jul.02 138638 91935
A 09-23 1.513 87 95321 Deo.23 160635 977.77 001-02 1071.36 990.83 991.23 89992 I 80418 Dec.02 83627 101491 Jan.24 79619 1.02582 789-24 73922 L03565 Mar-24 77012 I 94218 Apr.24 1.99901 1 56827 May-24 1.315 62 1.05609 Jun-24 1 57498 1.12468 Jul-24 1268.61 111487 Auq.24 1 26476 I 085 78 500-24 1.24810 107234 001.24 93140 1.98059 594- 24 682*6 1042.18 089.24 805.79 1 .027 52 Jee.25 622.54 101355 Feb-25 52613 996.13 1450.29 54009 976.96 Apr-25 623.77 93769 May-25 96982 91039 Jun-25 96806 89180
GEPCO Evalu4tiee of Sold Energy 89 Caneurnems by Uere 12 Month MIning Soerage
7070 - ' v 70 v°70 7031 70 nu v y 5 70 70 70 70 70 81 70 yr 51 57' u 1 17 50' 1 17 57
55 57 709
IF- II SEP 00
,Ev4ioallon or EndS? Sold and Selling up Average Energy Sold
74615131866 14 - Evaluollon 66000197 Sold cod Sprung up Suorygo 080107 Sold
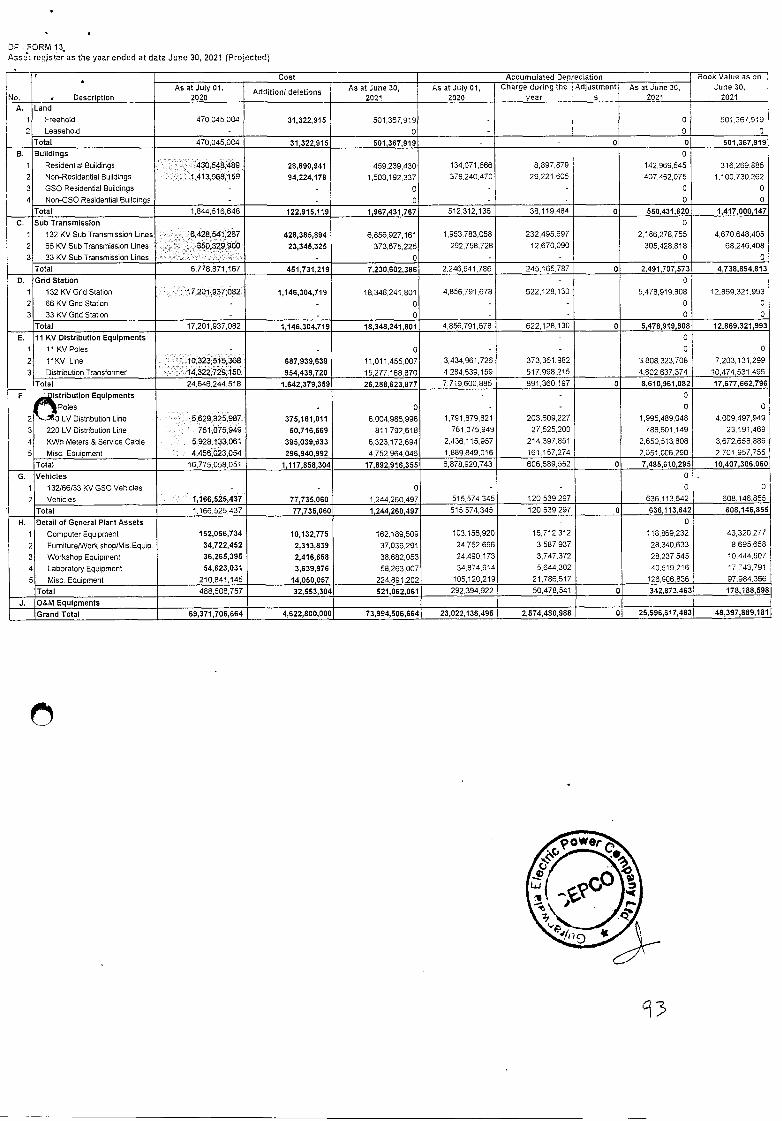
DF - FORM 13 Aasat reOjoter as the year ended at date June 30, 2021 (Projected)
No. Description
Cost Accumulated Depreciation Book Value as on June 30,
2021 As at July 01.
2020 Addition! deletons As at June 30,
2021 As at July 01,
2020 Charge during the
year Adjustment
S
As at June 30, 2021
A. Land
1 Freehold 470,045004 31,322,915 501,367,010 . 0 501,367,919 2 Leasehold . 0 - 0 0
Total 470,045.004 31,322,915 501,367,919 - - 0 0 501,367,919 B. Buildings 0
1 Residential Buildings 430.540,489 28,690,541 459,239,430 134,071,666 8,897.879 142,969,545 316,269.885 2 Non-Residential Buildings 1,413,963,159 94,224,178 1,508,192,337 378,240,470 29,221,805 407,462,075 1,100,730.262 3 GSO Residential Buildings . - 0 - - 0 0
4 Non-GSO Residential Buildings - - U - . 0 0
Total 1,844,516,648 122,915,119 1,967,431,767 512,312,136 38,119,484 0 550,431,620 1,417,000,147
C. Sub Transmission 0
1 132 <V Sub Transmission Lines 6,42a541,267 428,385,894 6.856,927,161 1,953.783,058 232,495,697 2,186,278,755 4,670,648.405
2 66 Ky Sub Transmission Lines , 350,329,900 23,345,325 373,675,225 292,758,728 12,670,090 305,428,818 68,246.408
3 33 KV Sub Transrniasion Lines - - 0 - - 0 U
Total 6,778,871,167 451,731,219 7,230,602,386 2.246,541,786 245,165.787 0 2,491,707,573 4,738,894,813
D. Grid Station - 0
1 132 KVGrid Station 17,201,937,082 1,146,304,719 18,348,241,801 4,856,791678 622,128,130 5,478,919,808 12,869,321.993
2 66 KV Grid Station - - 0 - 0 0
3 33 <V Grid Station - - 0 - 0 0
Total 17,201,937,082 1,146,304,719 18,348,241,801 4,856,791,678 622,128,130 0 5,478,919,808 12,869,321,993
E. 11 KV Distribution Equipments - 0
1 11 KVPoleu . - 0 - - 0 0
2 11KV Line 10,323,515,368 687,939,539 11,011,455,007 3,434,961,726 373.361,982 3.808.323.708 7,203,131,299
3 DiutributionTransformer 14,322,729,150 954,439,720 15,277,168870 4254,639,159 517.998,215 4.802,637,374 10,474,531.496
— Total 24,646,244,518 1,642,379,359 26,288,623,877 7,719,600,885 891,360,197 0 8,610,961,082 17,677,662,796
F istribution Equipments . . 0
Poles - 0 . - 0 0
2 3 LV Distribution Line 5.629.825,987 375,161,011 6,004,986,998 1,791,879,821 203,609,227 1,995,489,048 4,009.497,949
3 220 LV Distribution Line 761.075,949 50,716,669 811,792.618 761,075.949 27,525,200 788,601.149 23,191,469
4 KWh Meters & Service Cable 5928,133,061 395,039,633 6,323.172,694 2,436.115957 214,397.851 2,650.513,808 3.672.658,836
5 Misc. Equipment 4.458,023,054 296,940,992 4,752964,046 1,889,849.016 161,157.274 2.051.006,290 2701.957.755
Total 16,775,058,051 1,117,558,304 17,892,916,355 6,878.920,743 606.689,552 0 7,485,610,295 10,407,306,060
G. Vehicles 0
1 132)66/33 <V GSO Vehicles - - 0 - - 0 3
2 Velucles 1,166,525,437 77,735,060 1244,260,497 515574,345 120,539,297 636113,642 608,146.855
Total 1,166525,437 77,735,060 1,244,260,497 515 574345 120.539297 0 636,113,642 608,146,855
H. Detail of General Plant Assets - 0
1 ComputerEquipment 152,056,734 10,132,775 162,189,509 103,156920 15,712312 118,869,232 43320277
2 FumitureNVork shop/Mis.Equip 34,722,452 2,313,839 37,036,291 24,752,696 3,587.937 28,340,633 8.695,658
3 Workshop Equipment 36,265,395 2,416,658 38682,053 24,490,173 3747,372 26,237545 10,444,507
4 Laboratory Equipment 54,623,031 3,639,976 58,263,007 34,874.914 5.644,302 40519216 17.743,791
5 Misc. Equipment 210,841145 14,050,057 224,891.202 105,120,219 21 .786,617 126,906,836 97984,366
Total 488508,757 32,553,304 521,062,061 292394922 50,478541 0 342,873,463 178,188,598
J. O&M Equipments Grand Total 69,371,706,664 4,622,800,000 73,994,505,664 23,022,136,495 2,574,480,988 0 25,596,017,483 48,397,889,181
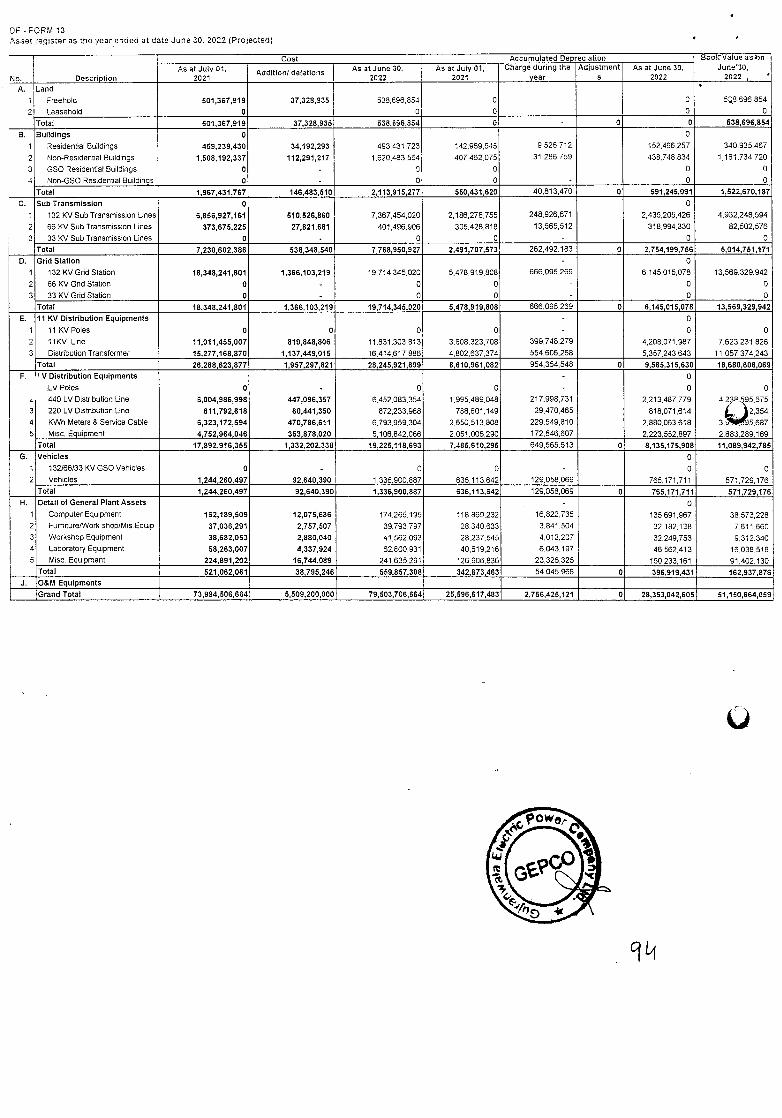
OF -FORM 13 Asset reqister an the year ended at date June 30. 2022 (Projected)
No. Description
Cost Accumulated Depreciation Boo/I' Value asAn June'30,
2022 As at July 01.
2021 Add Ton/ del tons ii e
As at June 30. 2022
As at July 01, 2021
Charge during the year
Adjustment s
As at June 30, 2022
A. Land
1 Freehold 501,367,919 37,328,935 538698,854 0 0 54,696,654
2 Leasehold 0 0 0 0 0
Total 501,367,919 37,328,935 538,596,854 0 0 0 538,696,854
B. Buildings 0 0
1 Reoidential Bui/dings 459,239,430 34,192,293 493,431,723 142,969,545 9,526,712 152,496,257 340,935,467
2 Non-Residential Buildings 1,508,192,337 112,291,217 1.620,483,554 407.462,075 31.286,759 438,748,834 1,181.734 720
3 GSO Residential Build/ngs 0 - o - 0 /)
4 Non-GSO Residential Buildings 0 - 0 0 - 0 0
Total 1,967,431,767 146,483,510 2,113,915,277 550,431,620 40,813,470 0 591,245,091 1,522,670,187
C. Sub Transmission 0 0
1 132 <V Sub Transmission Lines 6,856,927,161 510,526,860 7,367,454,020 2,186,278,755 248,926,671 2,435,205,426 4,932,248,594
2 68KV Sub Transmission Lines 373,675,225 27,621,681 401,496,906 305.428,816 13,565,512 316,994,330 82,502,576
3 33 KV Sub Transmission Lines 0 0 0 - 0 0
Total 7,230,602,386 538,348,540 7,768,950,927 2,491,707,573 262,492.183 0 2,754,199,756 5,014,751,171
0. Grid Station - 0
1 132KV Gnd Station 18,348,241,801 1,366,103,219 19,714.345,020 5,478,919,606 666,095,269 6,145,015,078 13,569,329,942
2 66 Ky Grid Stat/on 0 - 0 0 - 0 o 3 33 Ky Grid Station 0 - 0 0 - 0 0
Total 18,348,241,801 1,366,103,219 19,714,345,020 5,478,919,808 666,095,269 0 6,145,015,078 13,569,329,942
E. 11 KV Distribution Equipments - 0
1 11 KVPoles 0 0 0 0 - 0 0
2 11KV Line 11,011,455,007 819,848,806 11,831,303,613 3,808,323,708 399.748,279 4,208,071,987 7.623,231,826
3 Distribution Transformer 15,277,168,870 1,137,449,015 16,414,617,866 4,802,637,374 554,606,268 5,357.243,643 11,057,374,243
Total 26,288,623,877 1,957,297,821 28,245,921,699 8,610,961,082 954.354.548 0 9,565,315,630 15,680,606,069
F. V Distribution Equipments - 0
.LVPotes 0 - 0 0 - 0 0
440 LV Distribution Line 6,004,986,998 447,096,357 6,452,083,354 1,995,469.048 217,998,731 2.213,487,779 4,238 '95,575
3 220 LV Distnbution Line 811,792,618 60,441,350 872,233,968 788,601.149 29,470,465 818,071,614 , 2,354
4 KWh Meters & Service Cable 6,323,172,694 470,786,611 6,793,959.304 2,650,513.808 229,549,810 2,880,003,618 3, . ,.. 5,687
5 Misc. Equipment 4,752,964,046 353,878,020 5,106,842,066 2.051,006,290 172,546.607 2.223.552.897 2,863.289,169
Total 17,892,916,355 1,332,202,338 19,225,118,663 7,485,610,295 649,565,613 0 8,135,175,908 11,089,942,785
G. Vehicles 0
1 132/66/33KV GSO Vehic/es 0 - 0 0 - 0 0
2 Vehicles 1,244,260,497 92,640,390 1,336.900,087 636,113,642 129,058.069 765,171,711 571.729,176
Total 1,244,260,497 92,640,390 1,336,900,887 636,113,642 129.058,069 0 765,171,711 571,729,176
H. Detail of General Plant Assets , - 0
1 Computer Equipment 162,189,509 12,075,686 174.265,195 118,869,232 16.822,735 135,691,967 38,573,228
2 Fumiture/OVork shop/Mis.Equip. 37,036,291 2,757,507 39.793,797 28340,633 3,841 504 32.182.138 7,611,660
3 Workshop Equipment 38,682,053 2,880,040 41,562.093 28.237.545 4,012,207 32,249,753 9,312.340
4 Laboratory Equipment 58,263,007 4,337,924 62,600,931 40,519,216 6,043,197 46,562,413 16,038,518
5 Misc. Equipment 224,891,202 16,744,089 241,635.291 126,906,836 23,326,325 150,233,161 91,402,130
Total 521,062,061 38,795,246 559,857,308 342.873,463 54045,968 0 396,919,431 162,937,876
J. 0&M Equipments
Grand Total 73,994,506,664 5,509,200,000 79,503,706,664 25,596,617,483 2,756,425,121 0 28,353,042,605 51,150,664,059
U
9L1
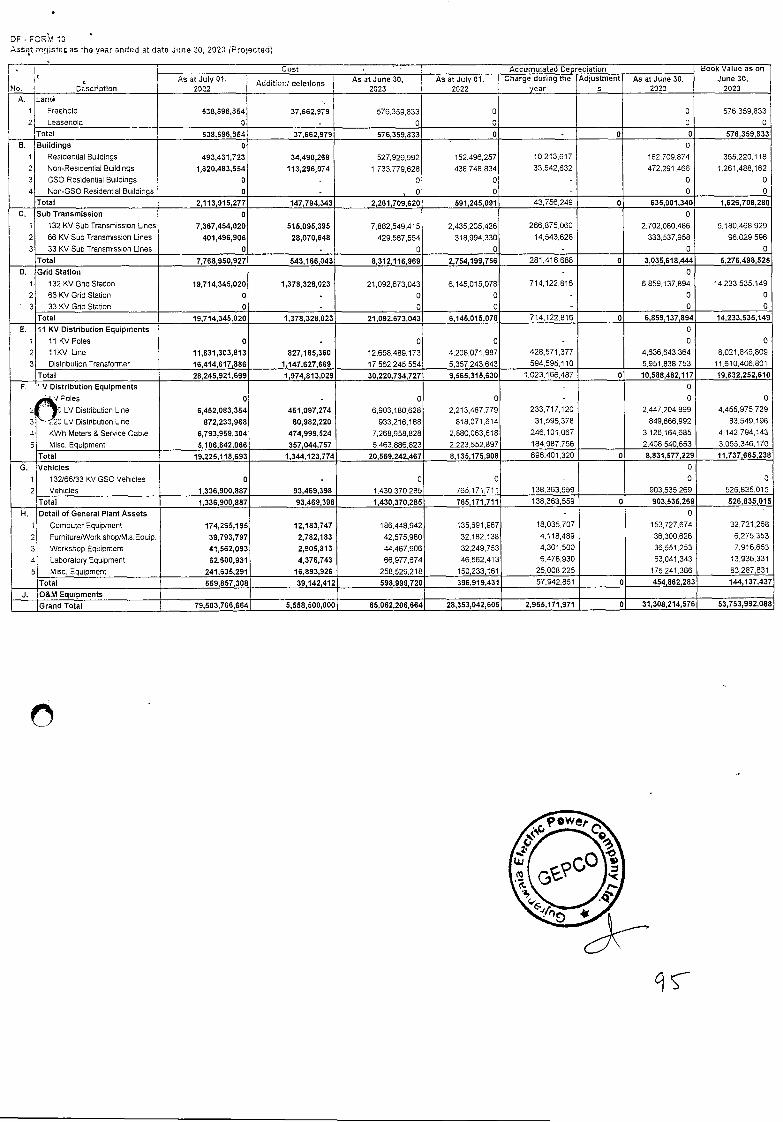
DF - FORI1 13 Asset roqistec as the year ended at date June 30, 2023 Projected)
No. 0escrition
Cost Accumulated Depreciation Book Value as on June 30,
2023 As at July 01,
2022 Additon' deletions As at June 30,
2023 As at July 01.
2022 Charge during the
year Adjustment
a As at June 30,
2023 A. Lam..
1 Freehold 538,696,854 37,662,979 576,359,833 0 0 576,359.833 2 Leasehold 0 . 0 o o o
Total 538,696,854 37,662,979 576,359,833 0 0 0 576.359,833 F-
c'
r
Buildings 0 0 Residential Buildings 493,431,723 34,498,269 527,929,992 152,496,257 10,213,617 162.709.874 365,220,118 Non-Residential Buildings 1,620,483,554 113,296,074 1,733,779,628 436,748,834 33.542,632 472.291.466 1.261.488,162
GSO Residenbal Buildings 0 . o 0 - 0 0 Nsn-GSQ Residential Buildings 0 - , 0 0 - 0 0
Total 2,113,915,277 147,794,343 2,261,709,620 591,245,091 43,756,249 0 635,001,340 1,626,708,280 C. Sub Transmission 0 0
1 132KV Sub Transmission Lines 7,367,454,020 515,095,395 7.862,549,415 2,435,205.426 266,875,060 2,702,080.486 5.180.468.929
2 68KV Sub Transmission Lines 401,496,906 28,070,648 429.567.554 318,994,330 14.543,628 333,537.958 96,029,596
3 33 KV Sub Transmissisn Lines 0 - 0 0 - 0 0 Total 7,768,950,927 543,166,043 8,312,116,969 2,754,199,756 281,418,688 0 3,035,618,444 5,276,498,525
D. Grid Station - 0 1 132 KVGnd Station 19,714,345,020 1,378,328,023 21.092,673,043 8,145,015,078 714,122.816 6,859,137,894 14.233.535.149
2 66 KV Grid Station 0 - 0 0 - 0 0
3 33 KV Gnd Slabon 0 - 0 0 - 0 0 Total 19,714,345,020 1,378,328,023 21,092,673,043 6,145,015,078 714,122.816 0 6,859,137,894 14,233,535,149
E. 11 KM Distribution Equipments - 0
1 11 KVPoles 0 - 0 0 - 0 0
2 11KV Line 11,831,303,813 827,185,360 12.658,489,173 4,208,071,987 428,571,377 4,636,643,364 8,021,845,809
3 DistnbutiosTrsnsformer 16,414,617,886 1,147,627,669 17.562.245,554 5.357.243.643 594,595,110 5,951,838.753 11,610,406.801
Total 28,245,921,699 1,974,813,029 30,220,734,727 9,565,315,630 1,023.168,487 0 10,588,482,117 19,632,252,610
F. ' V Distribution Equipments - 0
,,VPoles 0 - 0 0 - 0
LV Distribution Line 6,452,083,354 451,097,274 6.903.180,628 2,213,487.779 233,717,120 2.447,204,899 4,455,975,729
3' .23 LV Distnbutisn Line 872,233,968 60,982,220 933,216,188 818,071,614 31,595,378 849.666.992 83,549,196
4 KWh Meters & Service Cable 6,793,959,304 474,999,524 7,268,958,828 2.880,063,618 246,101.067 3,126,164,685 4.142,794,143
5 Misc. Equipment 5,106,842,066 357,044,757 5,463,886.823 2.223.552,897 184,987,756 2.408,540,653 3,055,346,170
Total 19,225,118,693 1,344,123,774 20,569,242,467 8,135,175,908 696,401,320 0 8,831,577,229 11,737,665,238
G. Vehicles 0
1 132/66/33 KV GSO Vehicles 0 - 0 0 - 0 0
2 Vehicles 1,336,900,887 93,469,398 1.430.370,285 765.171,711 138,363,559 903.535,269 526.835,015
Total 1,336,900,887 93,469,398 1,430,370,285 765,171,711 138,363,559 0 903,535,269 526,835,015
H. Detail of General Plant Assets - 0
I Computer Equipment 174,265,195 12,183,747 186,448.942 135,591,967 18,035.707 153,727,674 32.721,268
2 Furniture/Work shsp/Mis.Equip. 39,793,797 2,782,183 42,575,980 32.182.138 4,118,489 36,300.626 6,275,353
3 Workshop Equipment 41,562,093 2,905,813 44,467,906 32,249,753 4,301 .500 36,551,253 7,916,653
4 Laboratory Equipment 62,600,931 4,376,743 66,977,574 46,562,413 6,478.930 53.041.343 13.936,331
5 Misc. Equipment 241,635,291 16,893,926 258,529.218 150.233.161 25,008.225 175,241,386 83,287.831
Total 559,857,308 39,142,412 598,999,720 396,919,431 57,942.851 0 454,862,283 144,137,437
J. O&M Equipments Grand Total 79,503,706,664 5,558,500,000 85,062,206,664 28,353,042,605 2,955,171,971 0 31,308,214,576 53,753,992,088
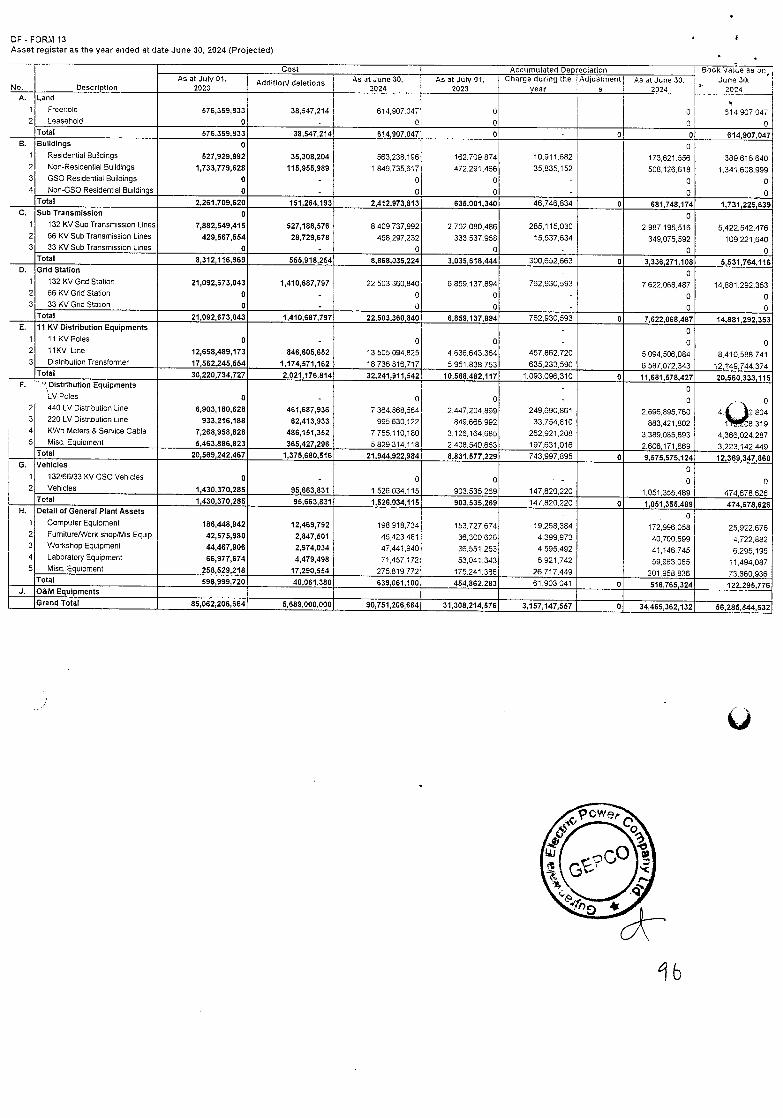
OF - FORM 13 Asset register as the year ended at date June 30, 2024 (Projected)
No. Description
Cost Accumulated Depreciation Bock Vaite as orr June 3(9.
2024 As at July 01.
2023 Addition/ deletions As at June 30,
2024 As at July 01,
2023 Charge during the
year Adjustment
5 As at June 30.
2024 A. Land
1 Freehold 576,359,833 38,547,214 614,907,047 0 0 614 907047 2 Leasehold 0 - 0 0 0 0
Total 576,359,833 38,547,214 614,907,047 0 - 0 0 614,907,047 B. Buildings o 0
1 Residential Buildings 527,929,992 35,308,204 563,238.196 162,709,874 10,911,682 173,621,556 369,616,640 2 Non-Residential Buildings 1,733,779,628 115,955,989 1,849,735,617 472,291,466 35.835.152 508.126,618 1,341,608,999 3 GSO Residential Buildings 0 - 0 0 - 0 0 4 Non-GSO Residential Buildings 0 - 0 0 - 0 0
Total 2,261,709,620 151,264,193 2,412,973,813 635,001,340 46,746,834 0 681,748,174 1,731,225,639
(N (N
0 Sub Transmission o 0
132 KV Sub Transmission Lines 7,882,549,415 527,188,576 8,409,737,992 2,702,080,486 285,115,030 2,987,195,516 5,422,542,476 66KV Sub Transmission Lines 429,567,554 28729,678 458,297,232 333,537,958 15,537,634 349,075,592 109,221,540 33 Ky Sub Transmission Lines 0 - 0 0 - 0 0
Total 8,312,116,969 555,918,254 8,868,035,224 3,035,618,444 300,652,663 0 3,336,271,108 5,531,764,116 D. Grid Station - 0
1 132 KV Grid Station 21,092,673,043 1,410,687,797 22,503,360,840 6,859,137,594 762,930,593 7,622,068,487 14,881,292,353 2 66 KV Grid Station o - 0 0 - 0 0 3 33 KV Ghd Statorr 0 - 0 0 - 0 0
Total 21,092,673,043 1,410,687,797 22,503,360,840 6,859,137,894 762,930,593 0 7,622,068,487 14,881,292,353 E. 11 KV Distribution Equipments - 0
1 11 KVPcles 0 - 0 0 - 0 0 2 11KV Line 12,658,449,173 846,605,652 13,505,094,825 4636,643,364 457,862,720 5,094,506,084 8,410,588,741 3 Distribution Transformer 17,562.245,554 1,174,571,162 18,736,816.717 5,951,838,753 635,233,590 6.587.072,343 12,149,744,374
Total 30,220,734,727 2,021,176,814 32,241,911,542 10,588,482,117 1,093,096,310 0 11,681,578,427 20,560,333,115 F. ', Distribution Equipments - 0
'LV Poles 0 - 0 0 - 0 - 0 ,,.- 2 440 LV Distribution Line 6,903,180,628 461,687,936 7,364,868,564 2,447,204.899 249,690.861 2,996,895,760 4, ,804 3 220 LV Distnbutio Line 933,216,188 62,413,933 995.630.122 849,666.992 33,754,810 883.421.802 1 ...08,319 4 KWh Meters & Seraice Cable 7,268,958,828 486,151,352 7,755,110,180 3,126.164,885 262,921,208 3.389,085,893 4.366,024,287 5 Misc. Equipment 5,463,886,823 365,427,296 5,829,314.118 2.408,540,663 197,631,016 2.606,171,669 3.223,142,449
Total 20,569,242,467 1,375,680,516 21,944,922,984 8,831,577,229 743,997,895 0 9,575,575,124 12,369,347,860 G. Vehicles
0 1 132/66/33 KVGSO Vehicles o - 0 0 - 0 0 2 Vehicles 1,430,370,285 95,663,831 1,526,034,115 903,535.269 147,820,220 1,051,355.489 474.878,626
Total 1,430,370,285 95,663,831 1,526,034,115 903,535,269 147,820.220 0 1,051,359,489 474,678,626 H. Detail of General Plant Assets
- 0 1 Computer Equipmenl 186,448,942 12,469,792 198,918.734 153.727.674 19,268,384 172,996.058 25,922,676 2 Fumituretwort shop/Mis.Equip. 42,575,980 2,847,501 45,423 481 36,300,626 4,399,973 40,700,599 4,722.882 3 iNorksh p Eqjjprry 44,467,906 2,974,034 47,441,940 36.551.253 4,595,492 41,146.745 6.295,195 4 LaboratoryEquipment 66,977,674 4,479,498 71,457,172 53,041,343 6,921,742 59,963,085 11,494,087 5 Misc. Equipment 258,529,218 17,290,554 275,819,772 175,241,386 26,717,449 201,958,836 73,860,936
Total 598,999,720 40,061,380 639,061,100 454,862,283 61,903,041 0 516,765,324 122,295,776 J. O&M Equipments
Grand Total 85,062,206,664 5,689,000,000 90,751,206,664 31,308,214,576 3,157,147,557 0 34.465,362,132 56,285,844,532
lb
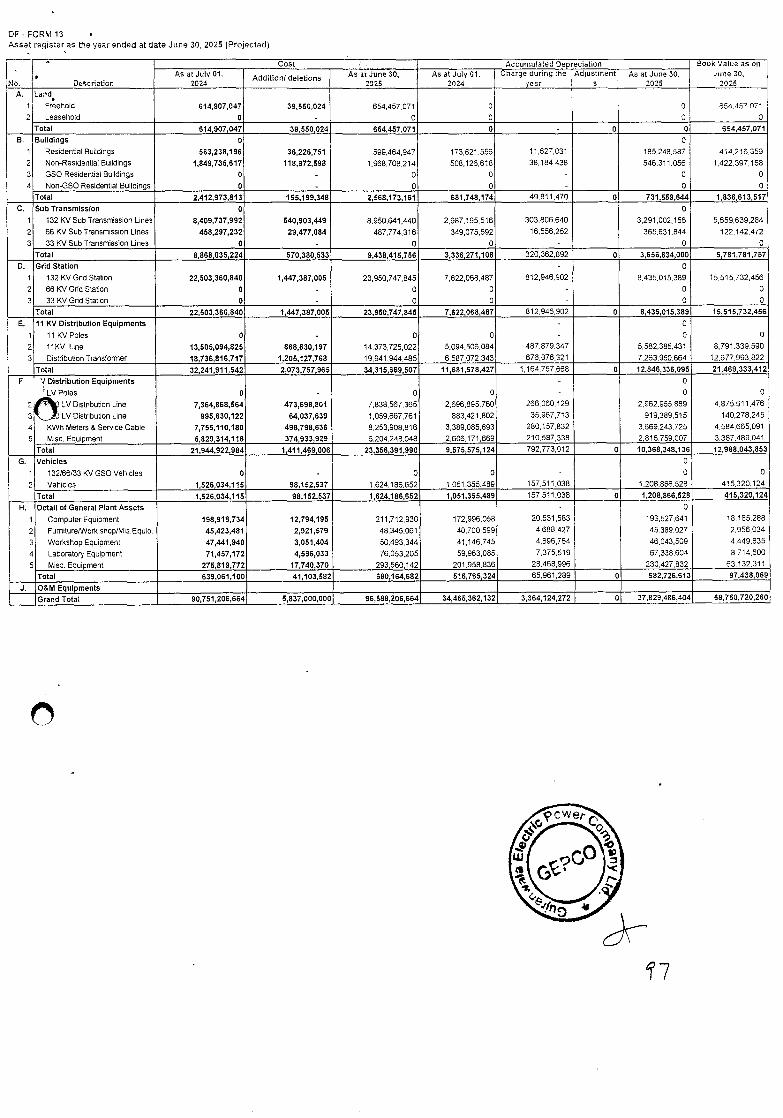
OF FORM 13 Asset register as the year ended at date June 30, 2025 (Projected)
No. Decription
Cost Accumulated Depreciation 000k Value as on June 30,
2025 As at July 01.
2024 Addition! deletions As at June 30,
2025 As at July 01.
2024 Charge during the
year Adjustment
5 As at June 30,
2025 A. Land
1 Freehold 614,907,047 39550,024 654.407,071 0 0 554 457 071
2 Leasehold 0 - 0 0 0 0 Total 614,907,047 39550,024 654,457,071 0 - 0 0 654,457,071
B. Buildings 0 0 1 Residential Buildings 563,238,196 36,226,751 599,404,947 173,621,556 11,627,031 185,248.587 414.216.359
2 Non-ResidentialBuildirigs 1,849,735,617 118,972,598 1,968,708,214 508,126,618 38,184,438 546,311,056 1.422,397,158 3 GSO Residential Buildings 0 - 0 0 - 0 0 4 Non-GSO Residenhal Buildings 0 - 0 0 - 0 0
Total 2,412,973,813 155,199,348 2,568,173,161 681,748,174 49,811,470 0 731,559,644 1,836,613,517 C. Sub Transmission 0 0
1 132 KV Sub Transmission Lines 8,409,737,992 540,903,449 8,950,641,440 2,987,195,516 303,806,640 3,291,002,156 5,659,639,284
2 06 KVSubTransmissiort Lines 458,297,232 29,477,084 487,774,316 349,075,592 16,556,252 365,631.844 122,142,472
3 33 NV Sub Transmission Lines 0 - 0 0 - 0 0 Total 8,868,035,224 570,380,533 9,438,415,756 3,336,271,108 320.362,892 0 3,656,634,000 5,781,781,757
0. Grid Station - 0 1 132 KVGrid Stalion 22,503,360,840 1,447,387,005 23,950,747,845 7,622,068,487 812,946.902 8.435,015,389 15,515,732.456
2 66KVGrid5tahorr 0 - 0 0 - 0 0
3 33 NV Grid Station 0 - 0 0 - o 0 Total 22,503,360,840 1,447,387,005 23,950,747,845 7,622,068,487 812,946,902 0 8,435,015,389 15,515,732,456
E. 11 KV Distribution Equipments - 0
1 11 KV Poles 0 - 0 0 - 0 0
2 11KV Line 13,505,094,825 868,630,197 14,373,725,022 5,094.506,084 487.879,347 5,582,385,431 8,791,339,590
3 DistribulionTransforrner 18,736,816,717 1,205,127,768 19,941.944,485 6,587,072,343 676,878,321 7,263,950.664 12,677.993,822
Total 32,241,911,542 2,073,757,965 34,315,669,507 11,681,578,427 1,164.757,668 0 12,846,336,095 21,469,333,412
F ' 'J Distribution Equipments - 0
'LVPoles 0 - 0 0 - 0 0
2 n LV Distribution Line 7,364,868,564 473,698,801 7,838,567,365 2,696,895.760 266.060,129 2,962.955,889 4,875,511,476
3 LV Distnbuton Line 995,630,122 64,037,639 1,059,667,761 883,421.802 35.967,713 919,389,515 140,278.245
4 KVVPt Meters & Service Cable 7,755,110,180 498,798,636 8,253,908.816 3.389.085,893 280,157,832 3.669,243,725 4.584.665.091
5 Misc. Equipment 5,829,314,118 374,933,929 6,204.248,048 2.606.171,669 210,587,338 2.816.759,007 3,387.489,041
Total 21,944,922,984 1,411,469,006 23,356,391,990 9,575,575,124 792,773.012 0 10,368,348,136 12,988,043,853
G. Vehicles 0
1 132/66133KV GSO Vehicles 0 0 0 - 0 0
2 Vehicles 1,526,034,115 98,152,537 1.624,186,652 1.051.355,489 157,511,038 1,208,866,528 415,320,124
Total 1,526,034,115 98,152,537 1,624,186,652 1,051,355,489 157,511,038 0 1,208,866,528 415,320,124
H. Detail of GeneralPlant Assets - 0
1 ComputerEquiprnent 198,918,734 12,794,195 211,712,930 172.996,058 20,531.583 193.527.641 18,185,288
2 Furniture/Work shcp/Mis.Equip. 45,423,481 2,921,579 48.345,061 40,700,599 4,688.427 45.389.027 2.956.034
3 Workshop Equipment 47,441,940 3,051,404 50,493,344 41,146,745 4,896,764 46,043.509 4 449.835
4 Laboratory Equipment 71,457,172 4,596,033 76,053,205 59.963,085 7,375.519 67,338,604 8714,600
5 Misc. Equipment 275,819,772 17,740,370 293,560,142 201,958.836 28,468,996 230.427,832 63.132,311
Total 639,061,100 41,103,582 680,164,682 516,765,324 65,961,289 0 582,726,613 97,438,069
J. O&M Equipments Grand Total 90,751,206,664 5,837,000,000 96,588,206,664 34,465,362,132 3,364,124,272 0 37,829,486,404 58,758,720,260
¶7
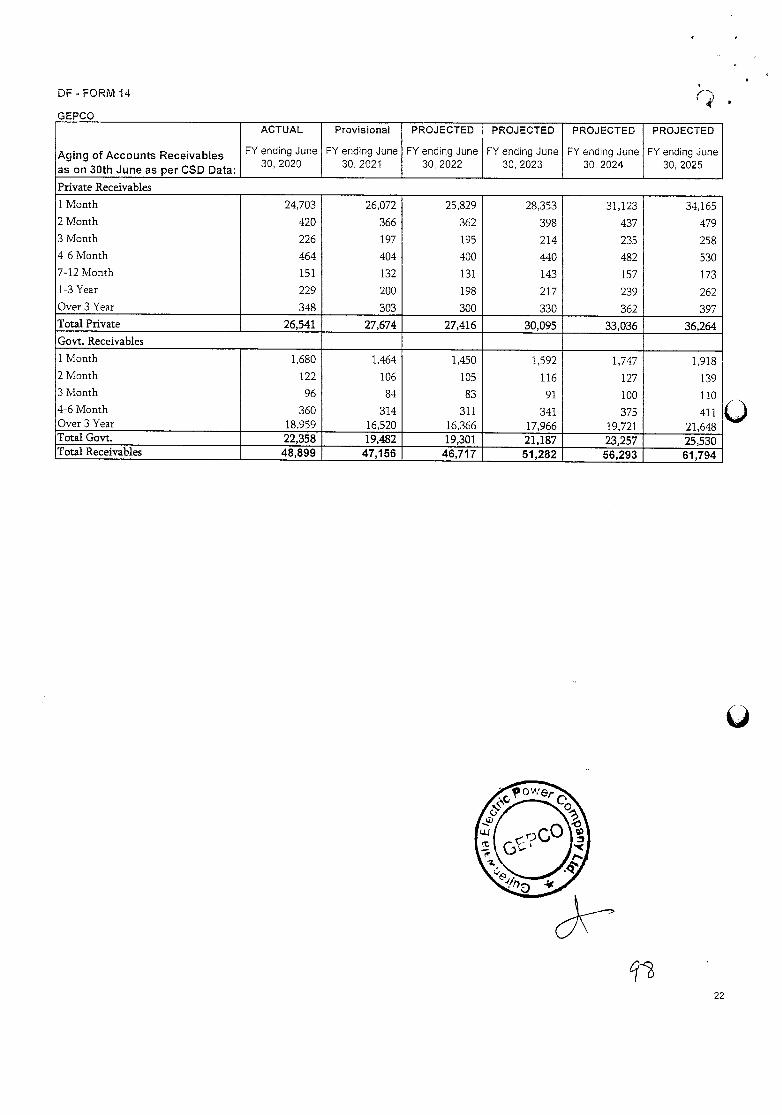
OF - FORM 14
GEPCO
A rn of Accounts Receivab'es 9 as on 30th June as per CSD Data:
ACTUAL
FY ending June 30, 2020
ProvisonaI
FY ending June 30, 2021
PROJECTED
FY ending June 30, 2022
PROJECTED
FY ending June 30, 2023
PROJECTED
FY ending June 30, 2024
PROJECTED
FY ending June 30, 2025
Private Receivables
1 Month 24,703 26,072 25,829 28,353 31,123 34,165 2 Month 420 366 362 398 437 479 3 Month 226 197 195 214 235 258 4-6 Month 464 404 400 440 482 530 7-12 Month 151 132 131 143 157 173 1-3 Year 229 200 198 217 239 262 Over 3 Year 348 303 300 330 362 397 Total Private 26,541 27,674 27,416 30,095 33,036 36,264 Govt. Receivables
1 Month 1,680 1,464 1,450 1,592 1,747 1,918 2 Month 122 106 105 116 127 139 3 Month 96 84 83 91 100 110 4-6 Month 360 314 311 341 375 411 Over 3 Year 18,959 16,520 16,366 17,966 19,721 21,648 Total Govt. 22,358 19,482 19,301 21,187 23,257 25,530 Total Receivables 48,899 47,156 46,717 51,282 56,293 61,794
22
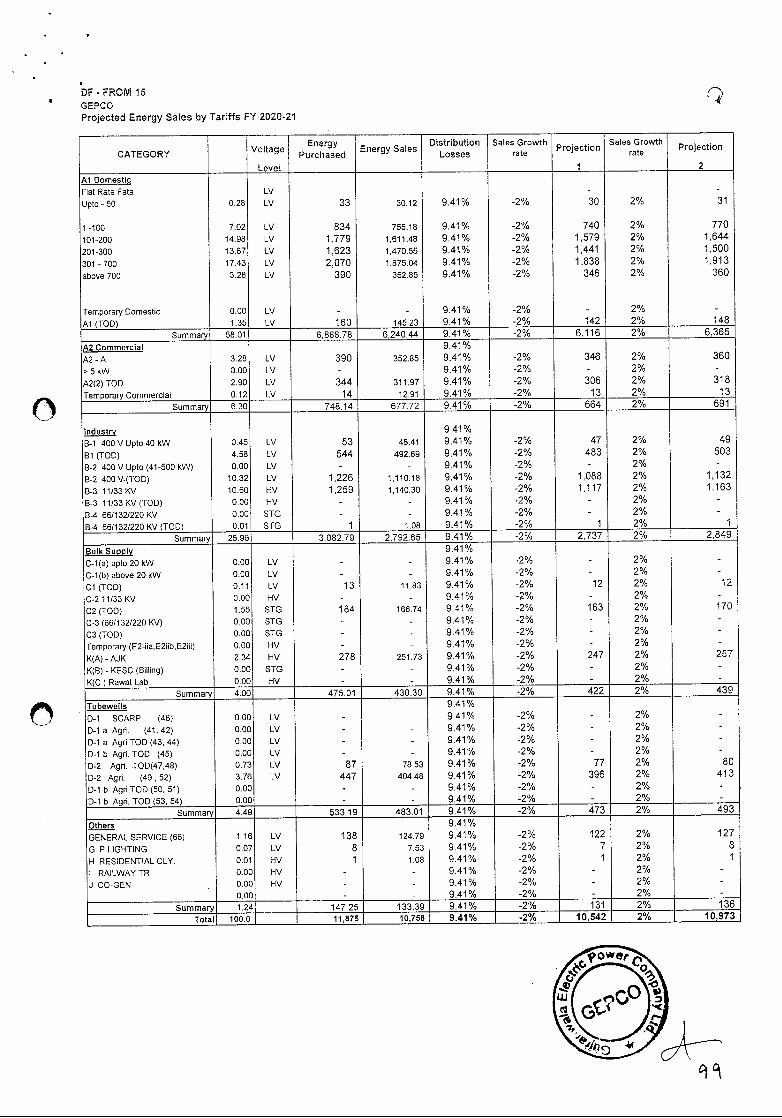
DF -FROM 15 *
GEPCO Projected Energy Sales by Tariffs FY 2020-21
CATEGORY Voltage
Level
Energy Purchased
Energy Sales Distribution
Losses Sales Growth
rate .
Projection
1
Sales Growth rate
Projection
2
Al Domestic Flat Rate Fats LV - -
Upto-50 0.28 Lv 33 30.12 9.41% -2% 30 2% 31
1 -too 7.02 LV 834 755.18 9.41% -2% 740 2% 770
101-200 14.98 LV 1,779 1,611.48 9.41% -2% 1,579 2% 1,644
201-300 13.67 LV 1623 1,47055 9.41% -2% 1441 2% 1,500
301 -700 17.43 LV 2,070 1875.04 9.41% -2% 1,838 2% 1,913
above 700 3.28 LV 390 35285 9.41% -2% 346 2% 360
Temporary Domestic 0.00 LV - - 9.41% -2% - 2% -
Al (TOO) 1.35 LV 160 145.23 9.41% -2% 142 2% 148
Summary 58.01 6,888.78 6,240.44 9.41% -2% 6,116 2% 6,365
A2 Commercial 9.41%
A2 - A 3.28 LV 390 352.85 9.41% -2% 346 2% 360
>5kW 0.00 LV - - 9.41% -2% - 2% -
A2(2) TOO 2.90 LV 344 311.97 9.41% -2% 306 2% 318
TemporaryCommercial 0.12 LV 14 12.91 9.41% -2% 13 2% 13
Summary 6.30 748.14 677.72 9.41% -2% 664 2% 691
lndustr 9.41%
B-i 400 V Upto 40kW 0.45 LV 53 48.41 9.41% -2% 47 2% 49
Bi (TOO) 4.58 LV 544 492.69 9.41% -2% 483 2% 503
5-2 400VUpto(41-500 kW) 0.00 LV - - 9.41% -2% - 2% -
5-2 400 V.(TOO) 10.32 LV 1,226 1,110.18 9.41% -2% 1,088 2% 1,132
5-3 11/33KV 10.60 HV 1,259 1,140.30 9.41 9/a -2% 1,117 2% 1,163
B-3 11/33KV (TOO) 000 HV - - 9.41% -2% - 2% -
8-4 66/132/220KV 0.00 STG - - 9.41% -2% - 2% -
B-4 66/132/220 KV (TOO) 0.01 STG 1 1.08 9.41% -2% 1 2%
Summary 25.96 3,082.79 2,792.65 9.41% -2% 2,737 2% 2,849
Bulk Supply 9.41%
C-i(s) uplo 20kW 0.00 LV - - 9.41% -2% - 2% -
C-l)b) above 20kW 0.00 LV - - 9.41% -2% - 2% -
Cl (TOO) 0.11 LV 13 11.83 9.41% -2% 12 2% 12
C-211/33KV 0.00 HV - - 9.41% -2% - 2% -
C2 (TOO) 1.55 STG 184 166.74 9.41% -2% 163 2% 170
C-3 (66/132/220KV) 0.00 STG - - 9.41% -2% - 2% -
C3(TOO( 0.00 STG - - 9.41% -2% - 2% -
Temporary (E2-iia.E2Hb,E2iil) 0.00 HV - - 9.41% -2% - 2% -
K(A)-AJK 234 HV 278 251.73 9.41% -2% 247 2% 257
K(S) - KESC (Billing) 0.00 STG - - 9.41% -2% - 2% -
K(C ) Rawat Lab 0.00 HV - - 9.41% -2% - 2% -
Summary 4.00 475.01 430.30 9.41% -2% 422 2% 439
Tubewells
b b
C C
C C
n n
fl, 6
) 0
0 0 0
9.41%
0-1 SCARP (46) LV - - 9.41% -2% - 2% -
D-1 a Agri. (41,42) LV - - 9.41% -2% - 2% -
0-1 a Agri TOO (43, 44) LV - - 9.41% -2% - 2% -
0-1 b Agri. TOO (45) I LV - - 9.41% -2% - 2% -
0-2 Agri. TOO(47,48) LV 87 78.53 9.41% -2% 77 2% 80
0-2 Agri. (49.52) LV 447 404.48 9.41% -2% 396 2% 413
0-i b AgrLTOO (50, 51) - - 9.41% -2% - 2% -
0-1 b Agri. TOO (53, 54) - - 9.41% -2% - 2% -
Summary 4.49 533.19 483.01 9.41% -2% 473 2% 493
Others
00
0P
P
b0
00
0- 9.41%
GENERAL SERVICE (66) LV 138 124.79 9.41% -2% 122 2% 127
G P LIGHTING ' LV 8 7.53 9.41% -2% 7 2% 8
H RESIDENTIAL CLY. HV 1 1.08 9.41% -2% 1 2% 1
I RAILWAYTR I HV - - 9.41% -2% - 2% -
CO-GEN ) NV - - 9.41% -2% - 2% - - - 9.41% -2% - 2% -
Summary 1.24 147.25 133.39 9.41% -2% 131 2% 136
Total 100.0 11,875 10,758 9.41% -2% 10,542 2% 10,973
c1O
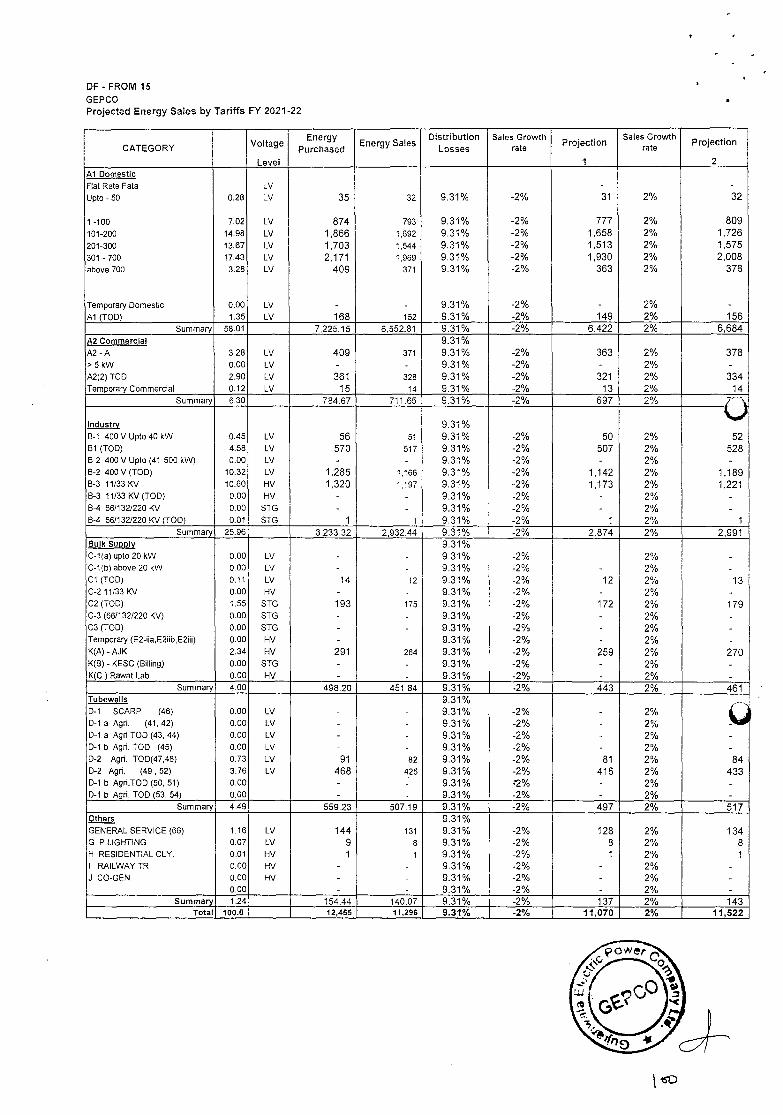
DF - FROM 15 GEPCO Projected Energy Sales by Tariffs FY 2021 -22
CATEGORY Voltage
Level
Energy Purchased
Energy Sales Distribution
Losses Sales Growth
rate Projection
1
Sales Growth rate
Projection
2 Al Domestic
LV - - Flat Rate Fats Upto-50 0.28 LV 35 32 9.31% -2% 31 2% 32
1-100 7.02 LV 874 793 9.31% -2% 777 2% 809 101-200 14.98 LV 1866 1692 9.31% -2% 1658 2% 1,726 201-300 13.67 LV 1,703 1,544 9.31% -2% 1,513 2% 1,575 301 -700 17.43 LV 2,171 1969 9.31% -2% 1,930 2% 2,008 above 700 3.28 LV 409 371 9.31% -2% 363 2% 378
Temporaryoomestic 0.00 LV - - 9.31% -2% - 2% - Al (TOO) 1.35 LV 168 152 9.31% -2% 149 2% 156
Summary 58.01 7.22515 6,552.81 9.31% -2% 6,422 2% 6,684 A2 Commercial 9.31% A2-A 3.28 LV 409 371 9.31% -2% 363 2% 378 '5kw 0.00 LV - - 9.31% -2% - 2% - A2(2)TOD 2.90 LV 361 328 9.31% -2% 321 2% 334 TemporaryCommercial 0.12 LV 15 14 9.31% -2% 13 2% 14
Summary 6.30 784.67 711.65 9.31% -2% 697 2%
Industry 9.31% 8-1 400 V Upto 40 kW 0.45 LV 56 51 9.31% -2% 50 2% 52 61 (TOO) 4.58 LV 570 517 9.31% -2% 507 2% 528 8-2 400 V Uplo (41-500 kW) 0.00 LV - - 9.31% -2% - 2% - 8-2 400V(TOD) 10.32 LV 1,285 1,166 9.31% -2% 1,142 2% 1,189 8-3 11/33KV 10.60 HV 1,320 1,197 9.31% -2% 1,173 2% 1,221 8-3 11/33 Ks' (TOO) 0.00 NV - - 9.31% -2% - 2% - B-4 66/132/220KV 0.00 STG - - 9.31% -2% - 2% - B-4 66/132/220KV (TOO) 0.01 STG 1 1 9.31% -2% 1 2% 1
Summary 25.96 3.23332 2,932.44 9.31% -2% 2,874 2% 2.991 Bulk Supply 9.31% C-1(a) upto 20kw 0.00 LV - - 9.31% -2% - 2% - C-1(b) above 20 kW 0.00 LV - - 9.31% -2% - 2% - Cl (TOO) 0.11 LV 14 l2 9.31% -2% 12 2% 13 C-2 11/33KV 0.00 HV - - 9.31% -2% - 2% - C2 (TOO) 1.55 SIC 193 175 9.31% -2% 172 2% 179 C-3 (66/132/220KV) 0.00 STG - - 9.31% -2% - 2% - C3(TOO) 0.00 STG - - 9.31% -2% - 2% - Temporary (E2-/a,E2iib,E2)i) 0.00 HV - - 9.31% -2% - 2% - K(A)-AJK 2.34 HV 291 264 9.31% -2% 259 2% 270 K(B)-KESC(Billing) 0.00 STG - - 9.31% -2% - 2% - K(C ) Rawal Lab 0.00 HV - - 9.31% -2% - 2% -
Summary 4.00 498.20 451.84 9.31% -2% 443 2% 461 Tubewells 9.31% 0-I SCARP (46) 0.00 LV - - 9.31% -2% - 2% D-1 a Agn. (41, 42) 0.00 LV - - 9.31% -2% - 2% - 0-1 a Agri TOO (43, 44) 0.00 LV - - 9.31% -2% - 2% - 0-1 b Agñ. TOO (45) 0.00 LV - - 9.31% -2% - 2% - 0-2 Agn. TOO(47,48) 0.73 LV 91 82 9.31% -2% 81 2% 84 0-2 Agn. (49,52) 3.76 LV 468 425 9.31% -2% 416 2% 433 0-1 b Agri.TOO(50, 51) 0.00 - - 9.31% -'2% - 2% - 0-1 b Agn. TOO (53, 54) 0,00 - - 9.31% -2% - 2% -
Summary 4.49 559.23 507.19 9.31% -2% 497 2% 517 Others 9.31% GENERALSERVICE(66) 1.16 LV 144 131 9.31% -2% 128 2% 134 G P LIGHTING 0.07 LV 9 8 9.31% -2% 8 2% 8 H RESIDENTIAL CLY. 0.01 HV 1 1 9.31% -2% 1 2% 1 I RAILWAYTR 0.00 HV - - 9.31% -2% - 2% - J CO-GEN 0.00 HV - - 9.31% -2% - 2% -
0.00 - - 9.31% -2% - 2% - Summary 1.24 154.44 140.07 9.31% -2% 137 2% 143
Total 100.0 12,455 11,296 9.31% -2% 11,070 2% 11,522
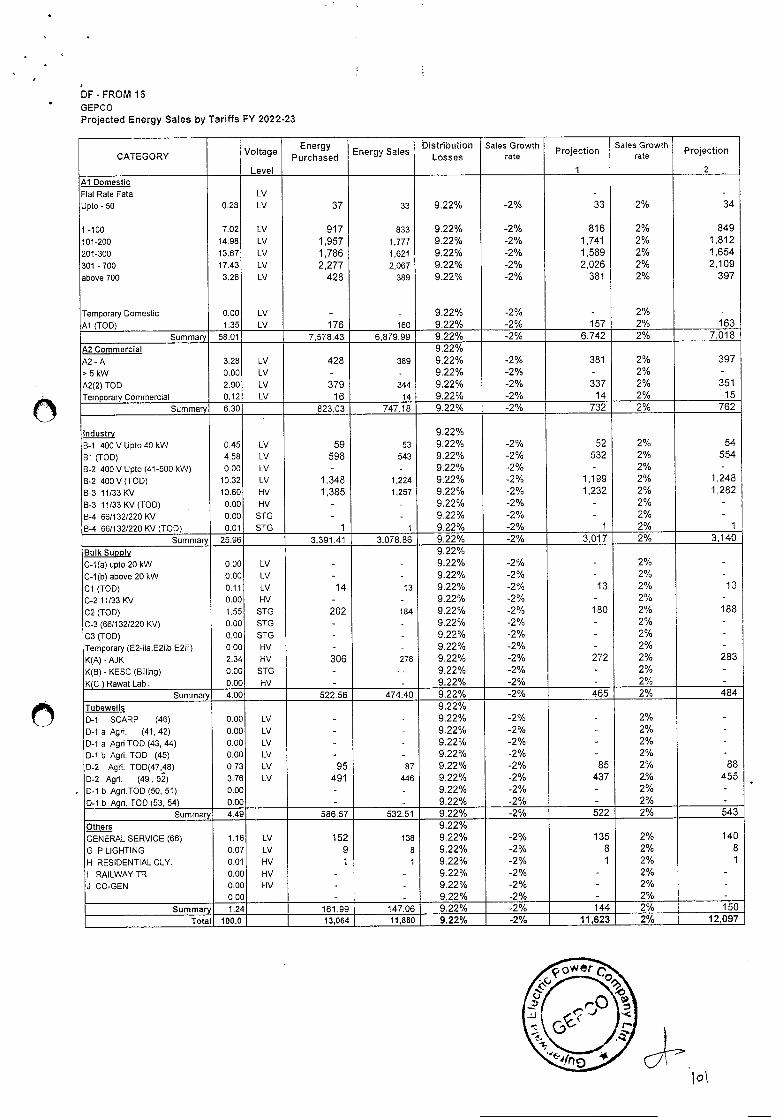
DF - FROM 15 GEPCO Projected Energy Sales by Tariffs FY 2022-23
CATEGORY Voltage
Level
Energy Purchased
Energy Sales Distribution
Losses Sales Growth
rate ..
Projechon
1
Sales Growth rate Projection
2 Al Domestic
LV - - Flat Rate Fata Upto -50 0.28 LV 37 33 9.22% -2% 33 2% 34
1 -100 7.02 LV 917 833 9.22% -2% 816 2% 849 101-200 14.98 LV 1,957 1,777 9.22% -2% 1,741 2% 1,812 201-300 13.67 LV 1,786 1,621 9.22% -2% 1,589 2% 1,654
301 -700 17.43 LV 2,277 2,067 9.22% -2% 2,026 2% 2,109 above 700 3.28 LV 428 389 9.22% -2% 381 2% 397
Temporary Domestic 0.00 LV - - 9.22% -2% - 2% - Al (TOO) 1.35 LV 176 160 9.22% -2% 157 2% 163
Summary 58.01 7,578.43 6,879.99 9.22% -2% 6,742 2% 7,018
A2 Commercial 9.22% A2-A 3,28 LV 428 389 9.22% -2% 381 2% 397
'5kW 0.00 LV - - 9.22% -2% - 2% - A2(2) TOO 2.90 LV 379 344 9.22% -2% 337 2% 351
TemporaryCommercial 0.12 LV 16 14 9.22% -2% 14 2% 15
Summary 6.30 823.03 747.18 9.22% -2% 732 2% 762
Industry 9.22% B-i 400 V Upto 40 kW 0.45 LV 59 53 9.22% -2% 52 2% 54
BI (TOO) 4.58 LV 598 543 9.22% -2% 532 2% 554
B-2 400 V Upto (41-500 kW) 0.00 LV - - 9.22% -2% - 2% -
B-2 400V(TOD) 10.32 LV 1,348 1,224 9.22% -2% 1,199 2% 1,248
B-3 11/33KV 10.60 HV 1,385 1,257 9.22% -2% 1,232 2% 1,282
B-3 11/33KV(TOD) , 0.00 NV - - 9.22% -2% - 2% -
B-4 66/132/220KV 0.00 STG - - 9.22% -2% - 2% -
B-4 66/132/220KV (TOO) 0.01 STG 1 1 9.22% -2% 1 2% 1
Summary 25.98 3,391.41 3,078.86 9.22% -2% 3,017 2% 3,140
Bulk Supply 9.22% C-i(s) upto 20kW 0,00 LV - - 9.22% -2% - 2% -
C-1(b) above 20kW 0.00 LV - - 9.22% -2% - 2% -
Ci (TOO) 0.11 LV 14 13 9.22% -2% 13 2% 13
0-2 11/33KV 0.00 HV - - 9.22% -2% - 2% -
C2 (TOO) 1.55 STG 202 184 9.22% -2% 180 2% 188
C-3 (66/132/220 KV) 0.00 STG - - 9.22% -2% - 2% -
C3 (TOO) 0,00 STG - - 9.22% -2% - 2% -
Temporary (E2-iia,E2iib,E2iii) 0.00 NV - - 9.22% -2% - 2% -
K(A)-AJK 2.34 HV 306 278 9.22% -2% 272 2% 283
K(B) - KESC (Billing) 0,00 STG - - 9.22% -2% - 2%
K(C ) Rawat Lab.. 0.00 NV - - 9.22% -2% - 2% -
Summary 4.00 522.56 474.40 9.22% -2% 465 2% 484
Tubewetts 9.22% 0-1 SCARP (46) 0.00 LV - - 9.22% -2% - 2% -
0-1 a Agri. (41, 42) 0.00 LV - - 9.22% -2% - 2% -
D-i a Agri TOO (43, 44) 0.00 LV - - 9.22% -2% - 2% -
0-1 b Agn. TOO (45) 0.00 LV - - 9.22% -2% - 2% -
0-2 Agri. TOO(47,48) 0.73 LV 95 87 9.22% -2% 85 2% 88
0-2 Agri. (49, 52) 3.76 LV 491 446 9.22% -2% 437 2.% 455
D-1 b Agri.TOD (50, 51) 0.00 - - 9.22% -2% - 2% -
0-1 b Ago. TOO (53, 54) 0.00 - - 9.22% -2% - 2% - Summary 4.49 586.57 532.51 9.22% -2% 522 2% 543
Others 9.22% GENERALSERVICE(66) 1.16 LV 152 138 9.22% -2% 135 2% 140
G P LIGHTING 0.07 LV 9 8 9.22% -2% 8 2% 8
H RESIDENTIAL CLY. 0.01 NV 1 1 9.22% -2% 1 2% 1
I RAILWAYTR 0.00 NV - - 9.22% -2% - 2% - J CO-GEN 0.00 HV - - 9.22% -2% - 2% -
0.00 - - 9.22% -2% - 2% - Summary 1.24 161.99 147.06 9.22% -2% 144 2% 150
Totat 100,0 13,064 11,860 9.22% -2% 11,623 2% 12,097
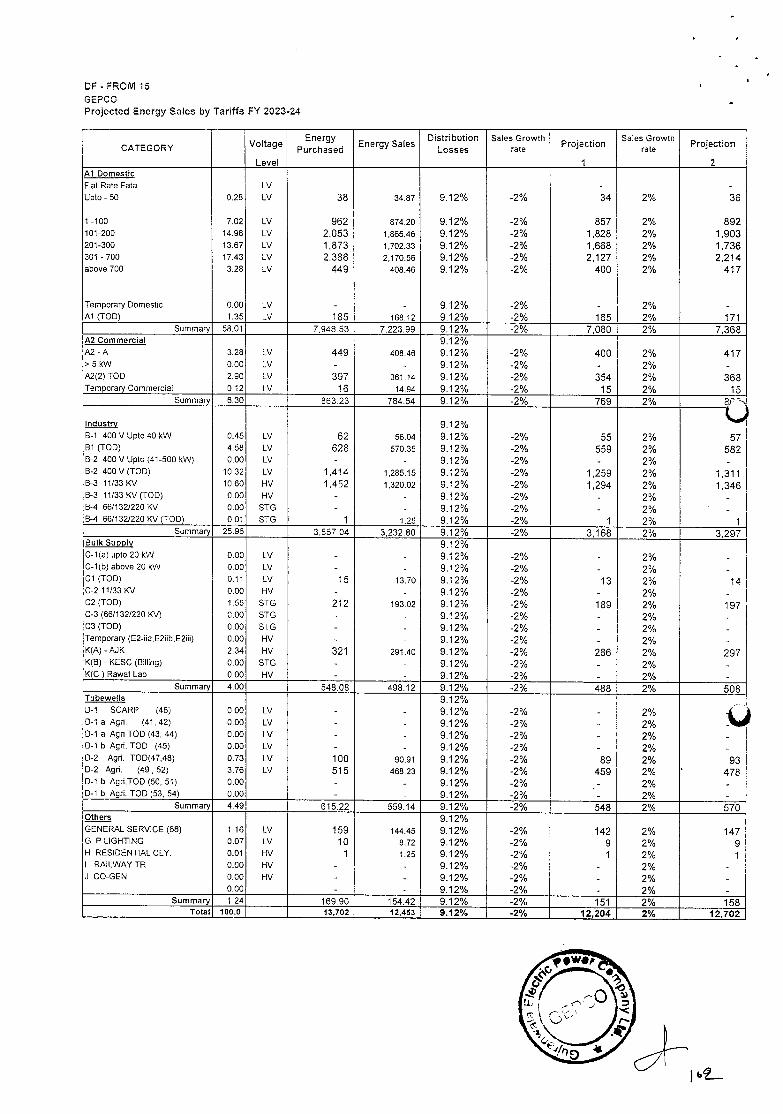
DF - FROM 15
GEPCO Projected Energy Sales by Tariffs FY 2023-24
CATEGORY Voltage
Level
Energy Purchased
Energy Sales Distribution
Losses Sales Growth
rate Projection
1
Sales Growth rate
Projection
2 Al Domestic
LV - - Flat Rate Fata Upto-50 028 LV 38 34.87 9.12% -2% 34 2% 36
1 -100 7.02 LV 962 874.20 9.12% -2% 857 2% 892 101-200 14.98 LV 2,053 1,865.46 9.12% -2% 1,828 2% 1,903 201-300 13.67 LV 1,873 1,702.33 9.12% -2% 1,668 2% 1,736 301 -700 17.43 LV 2.388 2,170.56 9.12% -2% 2,127 2% 2,214 above 700 3.28 LV 449 408.46 9.12% -2% 400 2% 417
Temporary Domestic 0.00 LV - - 9.12% -2% - 2% - Al (TOO) 1.35 LV 185 168.12 9.12% -2% 165 2% 171
Summary 58.01 7,948.53 7,223.99 9.12% -2% 7,080 2% 7,368 A2 Commercial 9.12% A2-A 3.28 LV 449 408.46 9.12% -2% 400 2% 417 >5kw o.00 LV - - 9.12% -2% - 2% - A2(2)TOO 2.90 LV 397 361.14 9.12% -2% 354 2% 368 Temporary Commercial 0.12 LV 16 14.94 9.12% -2% 15 2% 15
Summary 6.30 863.23 784.54 9.12% -2% 769 2%
Industry 9.12% 8-1 400 V Upto 40 kW 0.45 LV 62 56.04 9.12% -2% 55 2% 57 81 (TOD) 4.58 LV 628 570.35 9.12% -2% 559 2% 582 B-2 400V Upto (41-500 kW) 0.00 LV - - 9.12% -2% - 2% - 8-2 400 V (TOO) 10.32 LV 1,414 1,285.15 9.12% -2% 1,259 2% 1,311 B-3 11/33KV 10.60 HV 1,452 1,320.02 9.12% -2% 1,294 2% 1,346 B-3 11/33 <V (TOO) 0.00 HV - - 9.12% -2% - 2% - 8-4 66/132/220KV 0.00 STG - - 9.12% -2% - 2% - 8-4 66/132/220KV(TOD( 0.01 STG 1 1.25 9.12% -2% 1 2% 1
Summary 25.96 3,557.04 3,232.80 9.12% -2% 3,168 2% 3,297 8ulk Supply 9.12% C-1(a( upto 20kW 0.00 LV - - 9.12% -2% - 2% - C-1(b) above 20 kW 0.00 LV - - 9.12% -2% - 2% - Cl (TOO) 0.11 LV 15 13.70 9.12% -2% 13 2% 14 C-2 11/33KV 0.00 HV - - 9.12% -2% - 2% - C2 (TOD) 1.55 STG 212 193.02 9.12% -2% 189 2% 197 C-3 (66/132/220KV) 0.00 STG - - 9.12% -2% - 2% - C3(TOD) 0.00 STG - - 9.12% -2% - 2% - Temporary (E2-/a,E2iib,E2iii) 0.00 HV - - 9.12% -2% - 2% - K(A)-AJK 2.34 HV 321 291.40 9.12% -2% 286 2% 297 <(8)- KESC (Billing) 0.00 STG - - 9.12% -2% - 2% - K(C ) Rawat Lab 0.00 HV - - 9.12% -2% - 2% -
Summary 4.00 548.08 498.12 9.12% -2% 488 2% 508 lubewells 9.12% D-1 SCARP (46) 0.00 LV - - 9.12% -2% - 2% 0-1 a Agri. (41, 42) 0.00 LV - - 9.12% -2% - 2% - 0-1 a Agri TOD (43, 44) 0.00 LV - - 9.12% -2% - 2% - 0-1 b Agri. TOO (45) 0.00 LV - - 9.12% -2% - 2% - D-2 Agri. TOD(47,48) 0.73 LV 100 90.91 9.12% -2% 89 2% 93 D-2 Agn. (49,52) 3.76 LV 515 468.23 9.12% -2% 459 2% 478 D-1 b Agn,TOD (50, 51) 0.00 - - 9.12% -2% - 2% - 0-1 b Agri. TOO (53, 54) 0.00 - - 9.12% -2% - 2% -
Summary 4.49 615.22 559.14 9.12% -2% 548 2% 570 Others 9.12% GENERALSERVICE(66) 1.16 LV 159 144.45 9.12% -2% 142 2% 147 G P LIGHTING 0.07 LV 10 8.72 9.12% -2% 9 2% 9 H RESIDENTIAL CLY 0.01 HV 1 1.25 9.12% -2% 1 2% 1 I RAILWAYTR 0.00 HV - - 9.12% -2% - 2% -
CO-GEN 0.00 HV - - 9.12% -2% - 2% - 0.00 - - 9.12% -2% - 2% -
Summary 1.24 169.90 154.42 9.12% -2% 151 2% 158 Total 100.0 13,702 12,453 9.12% -2% 12,204 2% 12,702
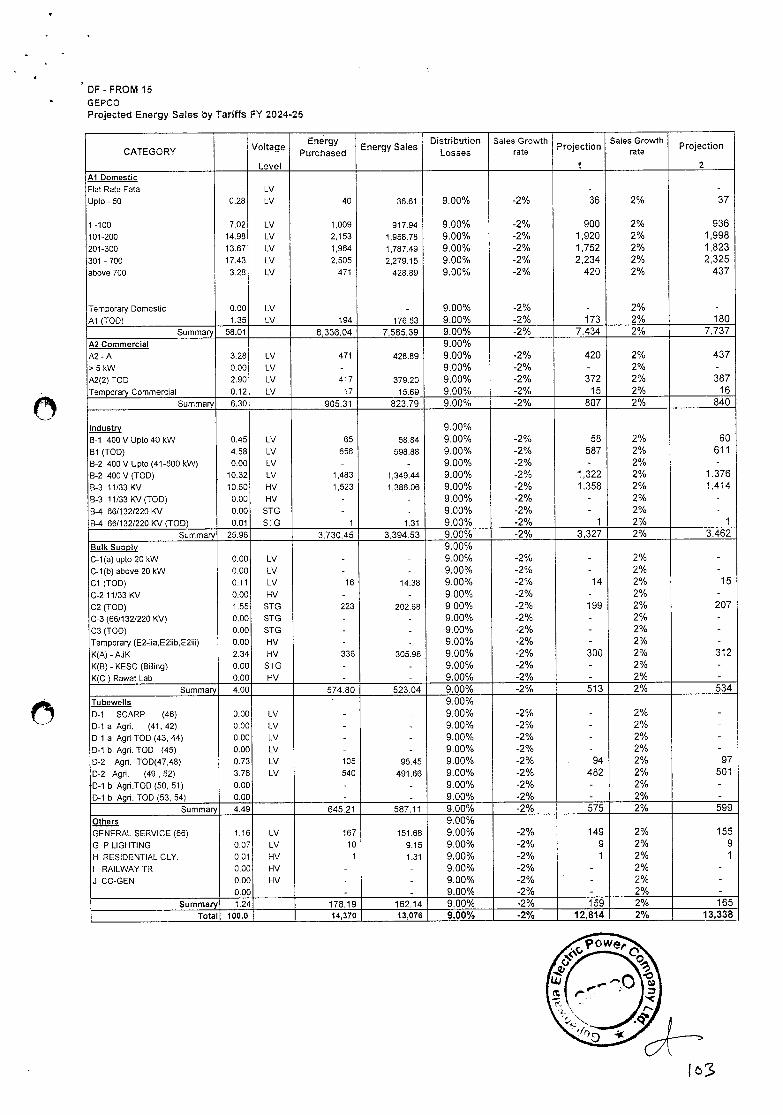
DF - FROM 15 GE PC 0 Projected Energy Sales by Tariffs FY 2024-25
CATEGORY Voltage
Level
Energy Purchased
Energy Sales Distribution
Losses Sales Growth
rate . .
Projection
1
Sales Growth rate
Projection
2 Al Domestic Flat Rate Fata LV - - Upto -50 0.28 LV 40 36.61 9.00% -2% 36 2% 37
1-100 7.02 LV 1,009 917.94 9.00% -2% 900 2% 936 101-200 14.98 LV 2,153 1,958.78 9.00% -2% 1,920 2% 1,998 201-300 13.67 LV 1,964 1,787.49 9.00% -2% 1,752 2% 1,823 301 -700 17.43 LV 2,505 2,279.15 9.00% -2% 2,234 2% 2.325 above 700 3.28 LV 471 428.89 9.00% -2% 420 2% 437
Temporary Domestic 0.00 LV - - 9.00% -2% - 2% - Al (TOO) 1.35 LV 194 176.53 9.00% -2% 173 2% 180
Summary 58.01 8,336.04 7,585.39 9.00% -2% 7,434 2% 7,737 A2 Commercial 9.00% A2 - A 3.28 LV 471 428.89 9.00% -2% 420 2% 437 >5kW 0.00 LV - - 9.00% -2% - 2% - A2(2) TOO 2.90 LV 417 379.20 9.00% -2% 372 2% 387 Temporary Commercial 0.12 LV 17 15.69 9.00% -2% 15 2% 16
Summary 6.30 905.31 823.79 9.00% -2% 807 2% 840
Industry 9.00% B-i 400 V Upto 40 kW 0.45 LV 65 58.84 9.00% -2% 58 2% 60 B1 (TOO) 4.58 LV 658 598.88 9.00% -2% 587 2% 611 8-2 400V Upto (41-500 kW) 0.00 LV - - 9.00% -2% - 2% - B-2 400V(TOD) 10.32 LV 1,483 1,349.44 9.00% -2% 1,322 2% 1.376 B-3 11/33KV 10.60 HV 1,523 1,386.06 9.00% -2% 1,358 2% 1,414
8-3 11/331KV (TOD) 0.00 HV - - 9.00% -2% - 2% - 8-4 66/132/220 <V 0.00 STG - - 9.00% -2% - 2% - 8-4 66/132/220KV(TOD) 0.01 STG 1 1.31 9.00% -2% 1 2% 1
Summary 25.96 3.730,45 3,394.53 9.00% -2% 3,327 2% 3.462
Bulk Supply 9.00% C-1(a) uplo 20 kW 0.00 LV - - 9.00% -2% - 2% - C-1(b) above 20kW 0.00 LV - - 9.00% -2% - 2% - Cl (TOD) 0.11 LV 16 14.38 9.00% -2% 14 2% 15
C-2 11/33KV 0.00 HV - - 9.00% -2% - 2% - C2 (TOO) 1.55 STG 223 202.68 9.00% -2% 199 2% 207
C-3 (66/132/220KV) 0.00 STG - - 9.00% -2% - 2% - C3 (TOO) 0.00 STG - - 9.00% -2% - 2% - Temporary (E2-/a,E2iib,E2ti) 0.00 HV - - 9.00% -2% - 2% - K(A)-AJK 2.34 HV 336 305.98 9.00% -2% 300 2% 312
K(B) - KESC (Billing) 0.00 STG - - 9.00% -2% - 2% - K(C) Rawat Lab 0.00 HV - - 9.00% -2% - 2% -
Summary 4.00 574,80 523.04 9.00% -2% 513 2% 534
Tubewells ' 9.00% 0-1 SCARF (46) 0.00 LV - - 9.00% -2% - 2% - 0-1 a Agn. (41, 42) 0.00 LV - - 9.00% -2% - 2% - 0-1 a Agri TOO (43, 44) 0.00 LV - - 9.00% -2% - 2% - 0-1 b Agn. TOO (45) 0.00 LV - - 9.00% -2% - 2% - 0-2 Agn. TOO(47,48) 0.73 LV 105 95,45 9.00% -2% 94 2% 97
0-2 Agri. (49, 52) 3,76 LV 540 491.66 9.00% -2% 482 2% 501 0-1 b Agri.TOO (50, 51) 0.00 - - 9.00% -2% - 2% - 0-1 b Agri. TOD (53, 54) 0.00 - - 9.00% -2% - 2% -
Summary 4.49 645.21 587.11 9.00% -2% 575 2% 599 Others 9.00% GENERAL SERVICE (66) 1.16 LV 167 151.68 9.00% -2% 149 2% 155
G P LIGHTING 0.07 LV 10 9.15 9.00% -2% 9 2% 9 H RESIDENTIAL CLY. 0.01 HV 1 1.31 9.00% -2% 1 2% 1 I RAILWAYTR 0.00 HV - - 9.00% -2% - 2% - J CO-GEN 0.00 HV - - 9.00% -2% - 2% -
0.00 - - 9.00% -2% - 2% - Summary 1.24 178.19 162.14 9.00% -2% 159 2% 165
Total 100.0 14,370 13,076 9.00% -2% 12,814 2% 13,338
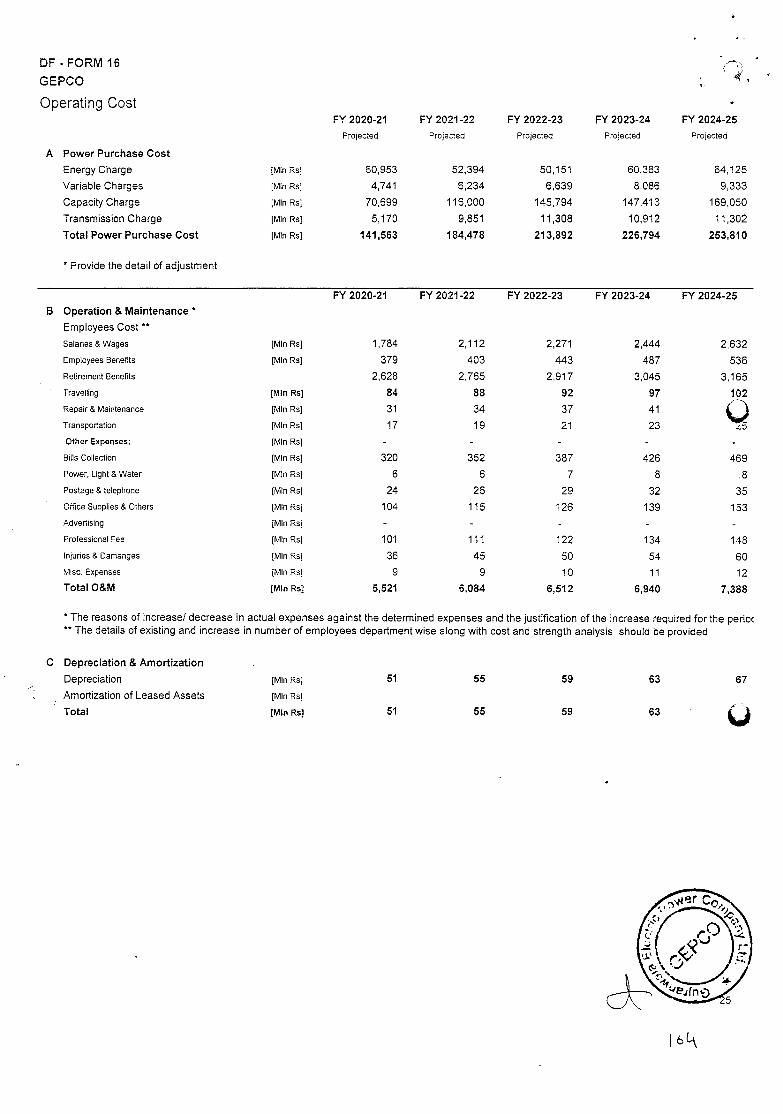
DF - FORM 16
GEPCO
Operating Cost
A Power Purchase Cost
FY 2020-21
Projected
FY 2021 -22
Projected
FY 2022-23
Projected
FY 2023-24
Projected
FY 2024-25
Projected
Energy Charge [Mm Ps] 60,953 52,394 50,151 60.383 64,125
Variable Charges [Mm Rs] 4,741 6,234 6,639 8,086 9,333
Capacity Charge [MInRs[ 70,699 116,000 145,794 147,413 169,050
Transmission Charge [MlnRs] 5,170 9,851 11,308 10,912 11,302
Total Power Purchase Cost [Mm Rs] 141,563 184,478 213,892 226,794 253,810
* Provide the detail of adjustment
FY 2020-21 FY 2021 -22 FY 2022-23 FY 2023-24 FY 2024-25
B Operation & Maintenance *
Employees Cost **
Salanes&Wages [MlnRs1 1,784 2,112 2,271 2,444 2,632
Employees Benefits [Mm Rs[ 379 403 443 487 536
Retirement Benefits 2,628 2,765 2,917 3,045 3,165
Travelling [Mtn Rn] 84 88 92 97 102
Repair & Maintenance [Mb Rs] 31 34 37 41
Transportation [Mm Rs] 17 19 21 23 cS
Other Expenses: [Mm Rn]
Bills Collection [Mm Rn] 320 352 387 426 469
Power, Light & Water [Mm Rs] 6 6 7 8 .8
Postage & telephone [MIn Rs[ 24 26 29 32 35 Office Supplies & Others [Mm Rn] 104 115 126 139 153 Advertising [Mm Rs[ - -
Professional Fee [Mm Rn] 101 111 122 134 1.48
Injuries & Damangea [Mm Rs] 36 45 50 54 60 Misc. Expenses [Mm Rn] 9 9 1 0 11 12
Total O&M [Mm Rn] 5,521 6,084 6,512 6,940 7,388
* The reasons of jncrease/ decrease in actual expenses against the determined expenses and the justification of the increase required for the perioc ** The details of existing and increase in number of employees department wise along with cost and strength analysis should be provided
C Depreciation & Amortization
Depreciation [Mmn Rs] 51 55 59
Amortization of Leased Assets [Mbn Rn]
Total [Mtn Rn] 51 55 59
63 67
63
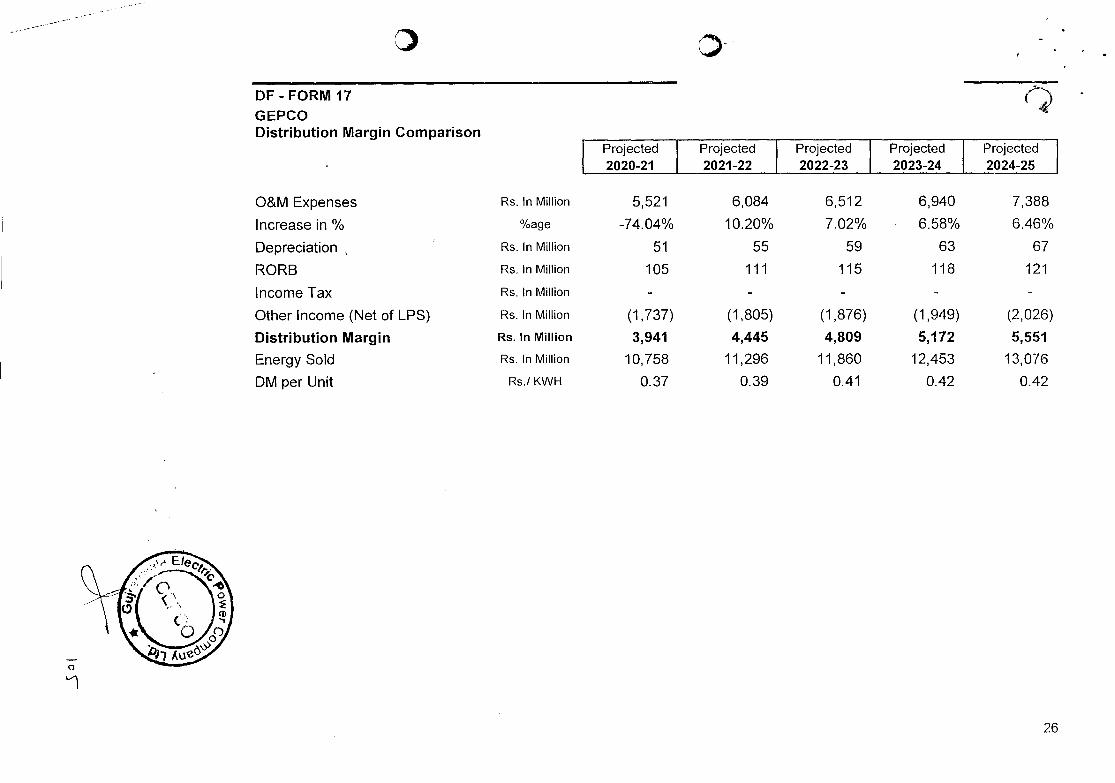
DF - FORM 17 GEPCO Distribution Margin Comparison
O&M Expenses
Increase in %
Depreciation
RORB
Income Tax
Other Income (Net of LPS)
Distribution Margin
Energy Sold
DM per Unit
Projected Projected Projected Projected Projected
2020-21 2021 -22 2022-23 2023-24 2024-25
Rs. In Million
%age
5,521
-74.04%
6,084
10.20%
6,512
7.02%
6,940
6.58%
7,388
6.46%
Rs. In Million 51 55 59 63 67
Rs. In Million 105 111 115 118 121
Rs. In Million -
Rs. In Million (1,737) (1,805) (1,876) (1,949) (2,026)
Rs. In Million 3,941 4,445 4,809 5,172 5,551
Rs. In Million 10,758 11,296 11,860 12,453 13,076
Rs./KWH 0.37 0.39 0.41 0.42 0.42
0
Li
26
DF - FORM 18 GEPCO Financial Charges
FY 201 9-20 Audited
FY 2020-21 Projected
FY 2021 -22 Projected
FY 2022-23 Projected
FY 2023-24 Projected
FY 2024-25 Projected
A
B
LJterlrie5I ates to Istr lb uti on
C
27
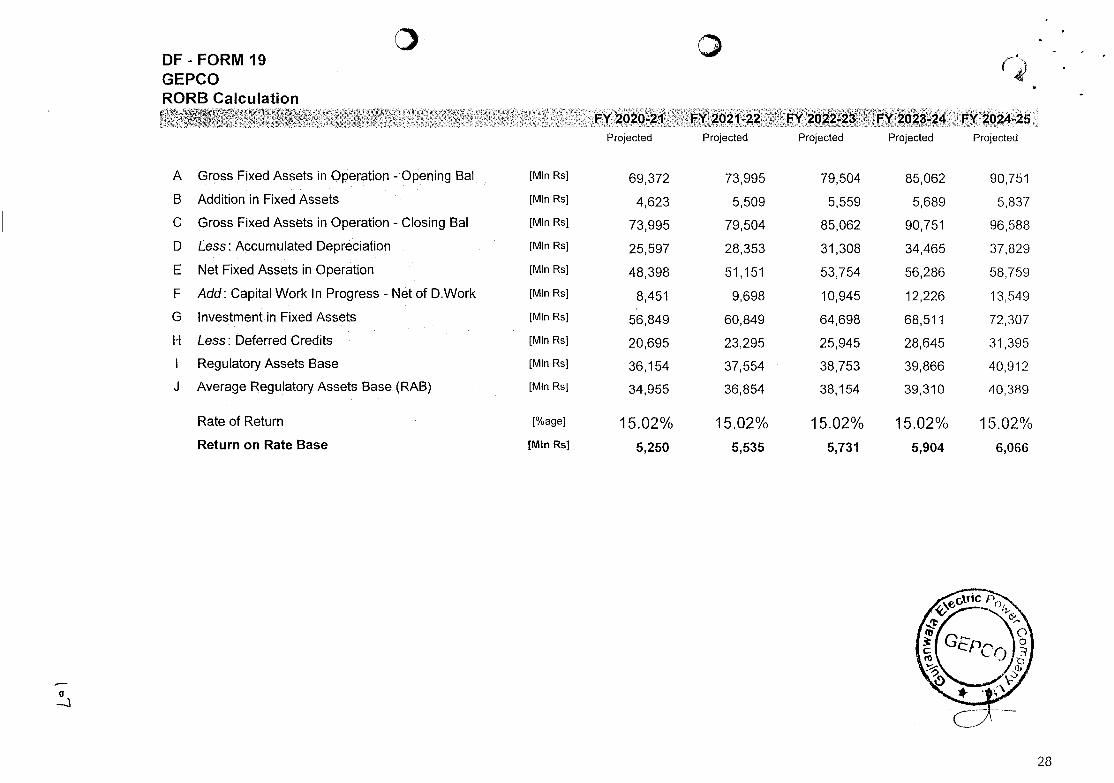
DF - FORM 19 GEPCO RORB Calculation
FY 2020-21 Projected
FY 2021-22 Projected
FY 2022-23 Projected
FY 2023-24 Projected
FY 2024-25 Projected
A Gross Fixed Assets in Operation - Opening Bal [Mm Rs] 69,372 73,995 79,504 85,062 90,751
B Addition in Fixed Assets [Mm Rs] 4,623 5,509 5,559 5,689 5,837
C Gross Fixed Assets in Operation - Closing Bal [Mm RS} 73,995 79,504 85,062 90,751 96,588
D Less: Accumulated Depreciation [Mm RS] 25,597 28,353 31,308 34,465 37,829
E Net Fixed Assets in Operation [Mm RsI 48,398 51,151 53,754 56,286 58,759
F Add: Capital Work In Progress - Net of D.Work [Mm Rs] 8,451 9,698 10,945 12,226 13,549
G Investment in Fixed Assets [Mm Rs] 56,849 60,849 64,698 68,511 72,307
H Less: Deferred Credits [Mm Rs] 20,695 23,295 25,945 28,645 31,395
I Regulatory Assets Base [MInRs] 36,154 37,554 38,753 39,866 40,912
J Average Regulatory Assets Base (RAB) [Mm RSI 34,955 36,854 38,154 39,310 40,389
Rateof Return [%age] 15.02% 15.02% 15.02% 15.02% 15.02% Return on Rate Base [Mm RS] 5,250 5,535 5,731 5,904 6,066
28
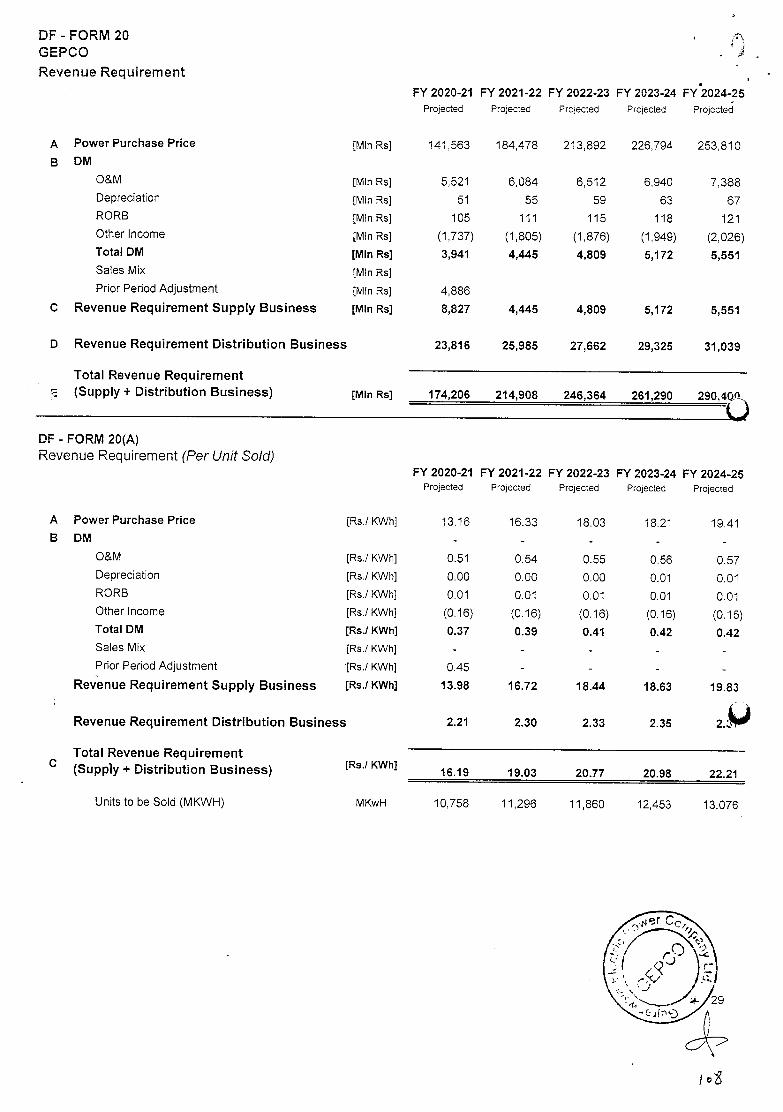
DF - FORM 20
GEPCO
Revenue Requirement
FY 2020-21 Projected
FY 2021-22 FY 2022-23 FY 2023-24 Projected Projected Prcjected
FY2024-25 Projected
A Power Purchase Price [Mm Rs] 141563 184478 213892 226794 253,810
B DM
O&M [Mm Rs1 5,521 6,084 6,512 6,940 7,388 Depreciation [Mm Rs1 51 55 59 63 67 RORB [MlnRs] 105 111 115 118 121 Otherincome [MInRs] (1,737) (1,805) (1,876) (1,949) (2,026) Total DM [Mlii Rs] 3,941 4,445 4,809 5,172 5,551 Sales Mix [Mm Rs] Prior Period Adjustment [MIn Rs] 4,886
C Revenue Requirement Supply Business [Mm Rs] 8,827 4,445 4,809 5,172 5,551
D Revenue Requirement Distribution Business 23,816 25,985 27,662 29,325 31,039
Total Revenue Requirement (Supply + Distribution Business) [Mlii Rs] 174,206 214,908 246,364 261,290 290,40P
DF - FORM 20(A)
Revenue Requirement (Per Unit Sold) FY 2020-21
Projected FY 2021 -22 FY 2022-23 FY 2023-24 FY 2024-25
Projected Projected Projected Projected
A Power Purchase Price [Rs./ KWhJ 13.16 16.33 18.03 18.21 19.41 B DM
O&M [Rs./KWh] 0.51 0.54 0.55 0.56 0.57 Depreciation [Rs.I KWh] 0.00 0.00 0.00 0.01 0.01 RORB [Rs./ KWh] 0.01 0.01 0.01 0.01 0.01 Other Income [Rs./ KWh] (0.16) (0.16) (0.16) (0.16) (0.15) Total DM [Rs.I KWh] 0.37 0.39 0.41 0.42 0.42 Sales Mix [Rs./ KWh]
Prior Period Adjustment [Rs.I KWh] 0.45
Revenue Requirement Supply Business [Rs.I KWh] 13.98 16.72 18.44 18.63 19.83
Revenue Requirement Distribution Business 2.21 2.30 2.33 2.35
Total Revenue Requirement C (Supp'y + Distribution Business) [Rs.I KWh]
16.19 19.03 20J7 20.98 22.21
Unjtsto be Sold (MKWH) MKwH 10,758 11,296 11,860 12,453 13,076
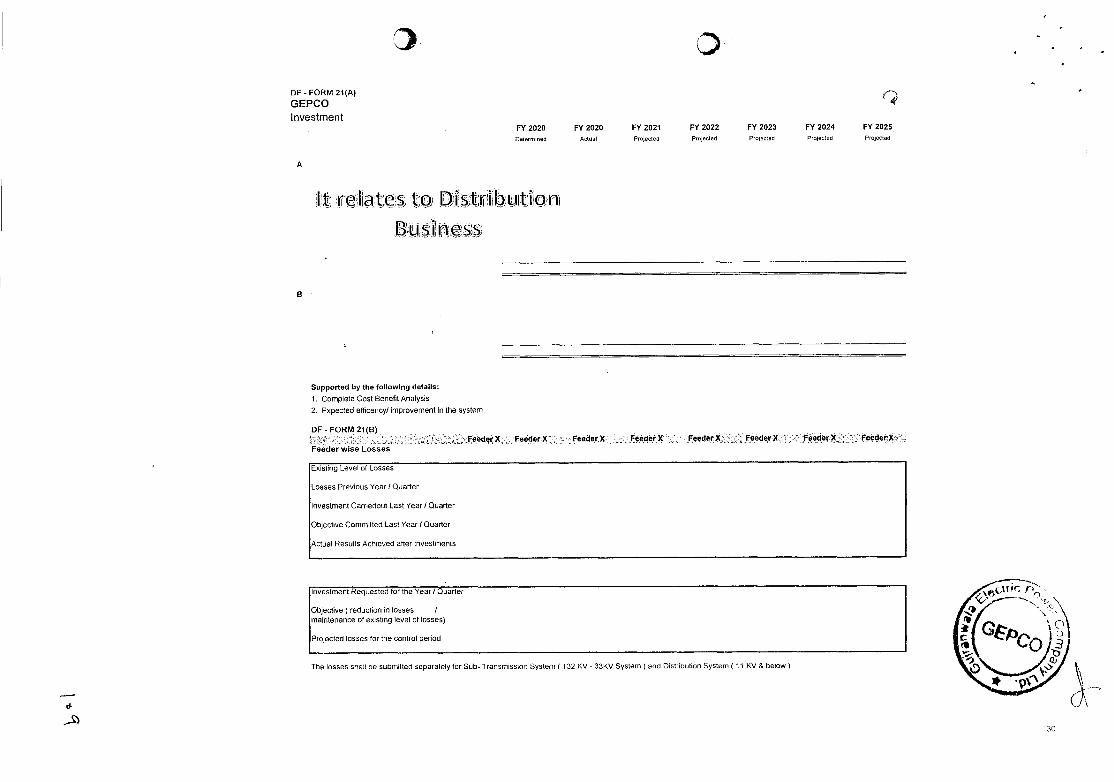
Existing Level of Losses
Losses Previous Year / Quarter
Investment Carriedout Last Year / Quatter
Objective Committed Last Yesr I Quarter
Actual Results Achieved after Investments
InvesImenI Requested tar the Year / Quarter
Objective (reduction in losses / maintenance of existing level ot losses)
Projected losses for the control period
The losses shall be submitted separately for Sub- Transmission System(132 KV - 33KV System) and Distribuliort System (11 Ky & below)
BE - FORM 21(A)
GEPCO )nvestment
Q FY 2020 FY2020 FY2021 FY2022 FY2023 FY2024 FY2025
Determined AtrieI Projected Projected Protected Projected Projected
A
Jit; & t
B
Supported by the following details:
I. Complete Cost Benefit Analysis
2. Expected efticency/ improvement in the system
DF - FORM 21(B)
Feeder wise Losses FeedorX . FeoderX . FeederX FeederX. ....FeederX ; . FeederX ....... Fe.4erX . FeederX.
30
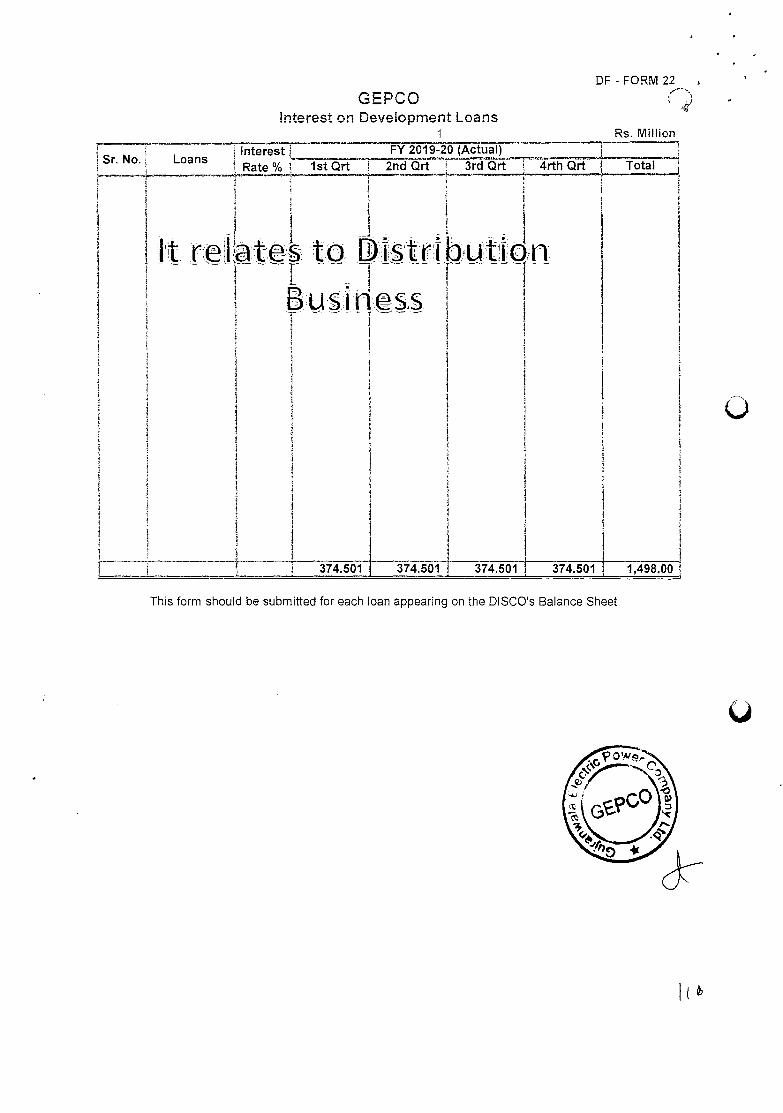
Interest _____ FY 2019-20 (Actual) 1 Sr No Loans
Rate % lstQrt 2nd Qrt 3rd Qrt iTF1
374.501 374.501 374.501 374.501 1,498.00
DF-FORM22
GEPCO !nterest on Development Loans
Rs. Mullen
This form should be submitted for each loan appearing on the DISCO's Balance Sheet
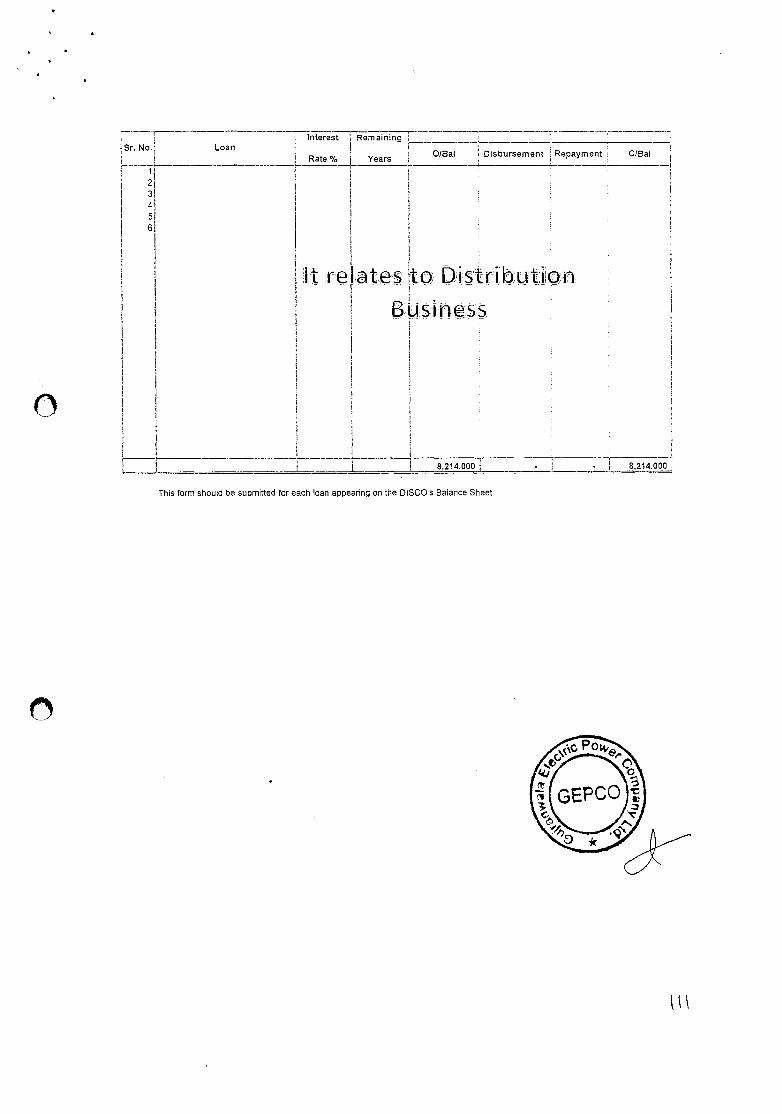
Interest Remaining
Rate % Years
Sr. No.: Loan OIBaI Disbursement Repayment C/Bal
3
41 1 51
61I
It :reI.tes ito istiIbut1in
8,214.000 8,214.000
This form should be submitted for each loan appearing on the DISCOs Balance Sheet
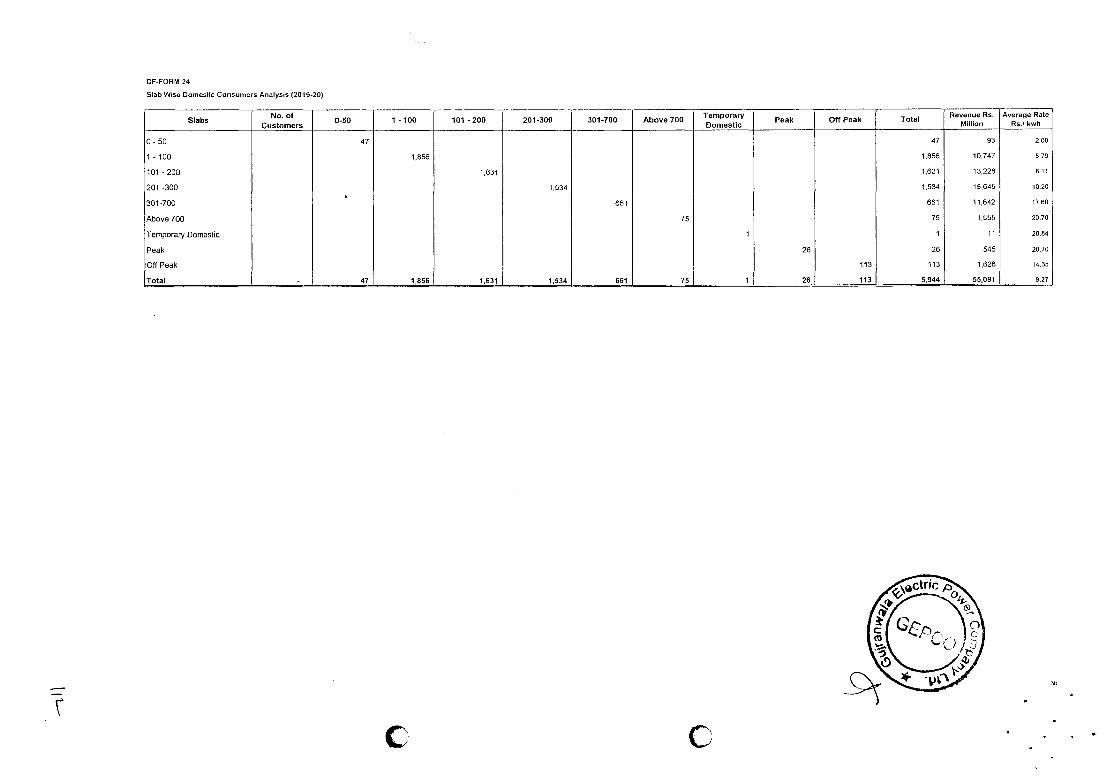
OF-FORM 24
Slab Wise Domestic Consumers Analysis (2019 20)
Slabs No. of
Customers 0-50 1 - 100 101 -200 201 .300 301-700 Above 700
Temporary Domestic
Peak Off Peak Total Revenue Rs.
Million Average Rate
Rs. kwh
0-50 47 47 93 2.00
1 -100 1,856 1.856 10747 5,79
101 -200 1.631 1,631 13.228 8.11
201 -300 1,534 1,534 15,645 0.20
301-700 661 661 11,642 17.50
Above 700 75 75 1,555 20.70
Temporary Domestic 1 1 11 20 84
Peak 26 26 545 2070
Off Peak 113 113 1,625 14.38
Total - 47 1,856 1,631 1,534 661 75 1 26 113 5,944 55,091 9.27
35
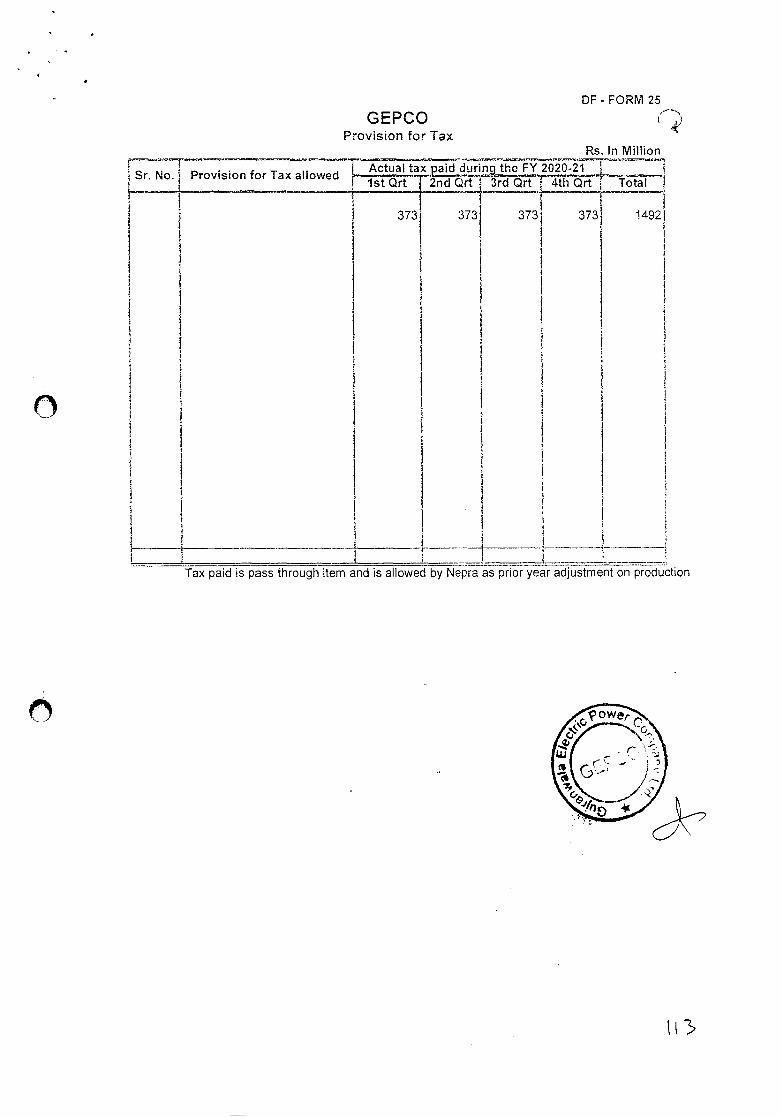
DF - FORM 25
GEPCO Provision for Tax
Rs. In Million
Sr. No. Provision for Tax allowed
I
Actual tax Edur ng the FY 2020-21
373 373 373
4th Qrt
373
I
Tota
14921
Tax paid is pass through item and is allowed by Nepra as prior year adjustment on production
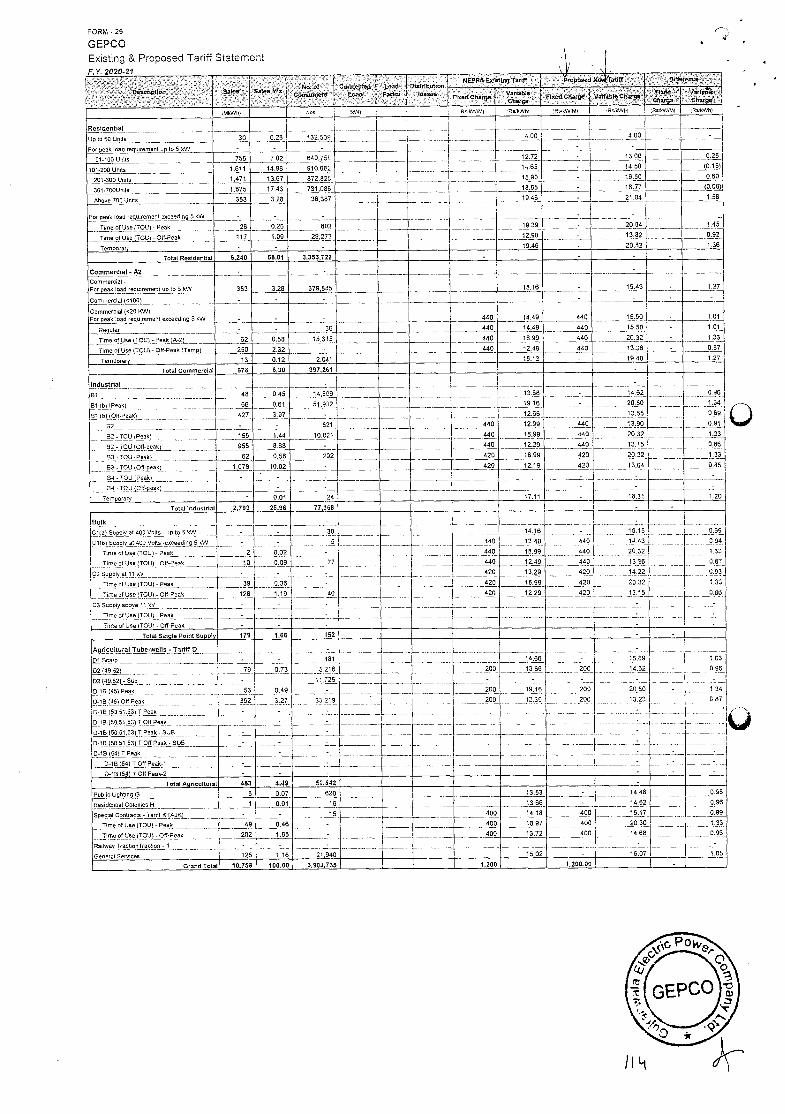
FORM - 25
GEPCO
Existing & Proposed Tariff Statement • '
- ......... ......
120n5e5pt1ao Sates
.
Same Se
. T
__ __
. . C e
. . . Led -
. St ataen
NEPRA Exiatieg PasO 8
P'apened Nscst5titi., . OtNOcetee.'
r •4 C 0 Charge Ft ed CIt 9 V Steele Ceorge
MWVfll Sos -kOP .Rs,kyj,Ml Rs.5Wfll '55,00kM) 'RSn100h) RsOSrUM) 11sIn/Vhl
Residential
0.26 132.509 4.00 Up to 50 UnIts 30 - 4.00
pe load repulnelnernt SW .!s - - - - -
01.100 Units 755 7,02 640,750 12.72 13.00 0,28
101-200 UnIts 1,611 14,90 910.092 14.65 - 14.50 (0.15)
201-300 Units 1,471 13.67 872.525 15.90 - 16.50 0.60
l0 301.700Ult4s 1,875 17.43 731,086 18.85 - 18.77
Abooe 700 UnIts 353 3.28 36,387 19.46 - 21.04 1.58
For peak load requireotent exoendlng S kW - - - - -
- 20.84 untie of Use (TOO)- Peak 28 0.26 803 18.39 1.45
TinneofUse,jç)i(-O5.Peak 117 1.09 28,277 12.90 - 13.82
20.92
0.92
1,36 ue0000ren9 - - - 19.46 -
Total Residential 6,240 58,01 3,3532 - - - -
Commercial - A2 - - -
Corn rneroial- For peak load requlretneal up loS 6W 353 3.28 379,845 18.16 - 19.43 - 1.27
Carnrnerolal 0100) - - -
14.49
-
440
-
1.01 COrnrnetolal (020 OW) For peak load requirement eeoeeding5 kW - - - 440 15,50 -
Regular - - 30 440 14.49 440 15.50 -
-
1.01
linen of Use (TOO) - Peak ),2) 62 0,58 15,315 440 18.99 440 20.32 1.33
Tirne of Usg4TOU) - 00-Peek Tamp) 250 2,32 - 440 12.49 440 13.30 - 0.67
Ternponary 13 9.12 2,0-li 10.13 - 19.40 I 1.27
Total Corrrrnenoial 670 6,30 397,261 -
ladustnal - 096 81
71151 (Peak)
52
48 0.45
0.61
Ti97
14.009
440
13,66
, 19.16
12.99
-
-- -.
14.82
20.50
13.55
13.90
66
- 427
-
51,932 - 1,34
369
0,91
1.33
- __ 12.66 -
440
440
440
- 521
42 -IOU Peek) 155 1.44 10,021
440
440 18.99
12.29
20,32
13.15 82-IOU Oft-peek) 955 8,88 - 0.8'
8.33
0,85 93-IOU (Peek) 62 0.50 292 420 18.99 420 20,32 I
- 53-7001011.53001 1.078 10.02 • 420 12,19 420 13.04
54 -IOU (Peak) - . - . -
- -
.
-------18,31
54-IOU (Otl.peek) - - - 1.20
,,,,j3ponatv I 0.91 24 87.11
Tetel Industrial 2.793 25.96 77,348 . -
Bulk .
- 440 )
440
14.16
13.40
- 15,15
,
.
, ,
0,99
394
1.32
0.87
p.93
- 1.33
3,84
C'leJSoeoloet40070lts-uPto5kW -
-
- 30
llib)Exoplyei400800s-eoceedlngs'0W
lisle ofselTOU)-°aaK -- ,
-
0,02
S , 440
440
440
1J.43
-, 20.32
1336
14.22
20.32
13.15
- 2
IC
-
10,99
Tim 01 USc (IOU) - Ott-Peak 3,09
0,36
1,19
77
40
,
440
420 ,
12,49
C2Supplyeti1kV , 13,29 420
T:rneot Use IOU) - Peon 39 420 18,99 420
TinneotUse(IOU)-Oft-Peek 128 420 12.29 420
11 ItT V - -
-
-
Title clOse (IOU) - Peak - - -
TIme of Use ITOUl - 05-Peak V -
Intel Snegle Peiet Supplp 179 1.66 52 - -
Agricultural Tube-wells - Tariff 0 - -
-
-
--
-
1.53
0.96
1,34
0.57
-
Di Soeno - - 481
200
14.86
1356
-
-
2CC
-
200
200
,,,. -
15,59
14,62
- 20.50
13.23
-
.._,,rJ________
-
02(4952) 79
-
0.73 5016
-
-
-
_,, -
D2,j9.52(-Sub
...._.:......
11,725 -
........
0-18 45) Peek
D-16iO3,51,5311 Peak
0-i5)5U.,13(TPeak-SU5
53
-
0.49
-
-
200 19.16
.?Cc.....
,,, ,,,
12.35
-
D-10150,5t53(TOnPeak-SUO - - --
D-19154)TPna'O - - -
0-lB (54) TOO Peak-i -- - - -
0-101511) 100 Peak-2 - - - -
Total Agricultural 483 4.49 52,342 -
PublioLightllrgG
Residerillal ColonIes I-I
8 9.07 620 - 13.53 - 84,48 0,95
I 0.01 16 13,68 - 14,62
15.17
0,96
Cpeolel CoetraeIs_.p)l)_
llrne of Use)TO)Peak
- - - 15 400 14,15 400 0,99
1.33
0,96
- 1,05
--.-- ---------,-.-,,
49 0,46 - 400 1997 400 20.30
14.68 Tlele of Use TOO) -Ott-Peek
RaIlway lreotlonhraotlon - 1
202 1.88 - 400 13.72 400
- - V
21940
,. -,-- 15.92
__..___,,_._: _,,,-,_,,,,-__ -
-. ,_-._ - 16.07 General SaMoan 125 1.16
Grand Tet,al 90,758 100.00 3,903.735 9.200 1,200.00
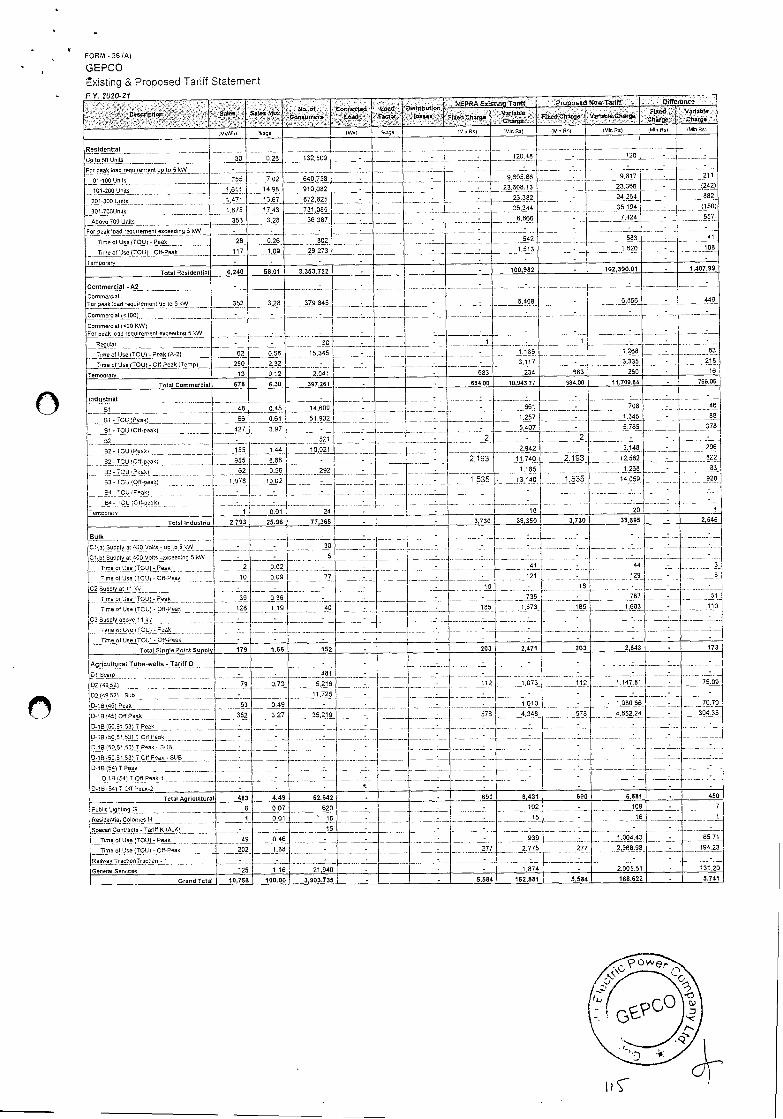
FORM- 25(A)
GEPCO
xistirg & Proposed Tariff Statement It'. UZtZ'I
13a e S Sal M a No at Co eaterl
FlwC
NEPRA Existing 1'anff Praposd i4wTrarrff Oiffereacm 0lsteibatloe
I e F 409 F wed CS V lebl 06 eg 4F3:0e80 Vabl
Mki.Vni 'lace I IV1) 'Sage MO Os) Mm Os) I (Mn 56- Mm Os) Mis Os) (Mm Os)
Residential -- 30 - -
-
- -
-------- - 23.362
120.48
23.608,13
6,866
- 960596 -
-
_,:..,, - -- - 9st7
23,366
24,264
120 - -
- -
- - -- -
--
- 211
U2to500mO 0.29 132,509 -
F5)peakioad neqiimninentup,,lo5kW -
750
-
7.02
- 14.65
1347
3.25 --
- -
01-100Umt 540753 -
-
- -
',
-
-
-
101-200Uirml5 -- 1.611
LL1_
353
910052
072,825
36,387 --
-
-
.
L - -- - 882
301.70000i15 -- -
-------- .......-_--- -3 -
7.424
1,520
-
--------- - -------- Aboce 700 Units
Forpeakioadneqreerenl eooeedingSkW - - .
802
29,273
- . . 1- -
-
....... 542
1.513 laoeofUse(IOUi-Peek 28
117
26
1.09 _.
41
- 1PQ. 'flrneofUso9U)- 08-Peak
Temporary - - - - -
Total Rasideflllal 6.240 58.81 3,353,722 I - - - 100,982 - 102,390.01 - 1,407.99
Commercial - A2 -
353
-
- -
- -
,
4, I
-
-
-
- - - - - -
Commarcial - For peak Sad neqmrmreme(ir 'me ro5kW 3,2,
- 379,045
- f
-
............-
.
4.408
-
-
-
-
6,856 - 449
CommercialmnlOC) . - - - Commercial (<20 OW) For peak load requirement eacoeitin9 5 'oW - - -
Re5u)ar C - 1 - I ' - -
03
218 Tiara of Use IOU) - Peak (5-21 62 0,58 15,345 -
-
-
-
-
- - - 1,105 - 1.268
TinrootUse(I).Ctt-PeaklTem6l 250 2,32 -
2.061
- -
603
3.117 — 583
- ---------3.335 250
-
lerrroorary 13 0,12 234 - 16
Total Commercial 678 6.36 397,261 - - 684,00 10.943,77 584,00 11.709,84 - 766.06
ustrial -
-------------,
91-ICU)PeaO(
40
L - I
- -
-
---------- .
-
-
1,257J
5,407
56i - 708 [ -
- -
-
-
1,345
-
-
- -
-46
58
378
- 206
- 62?
03
-
0.45 14,609 -
66 0,61 51.902
- -
-
- Jce-F881L._..
82
02-TCUmCtl-peac) -
63'TCU'POOk)
427
-
3,97 - - 5,705
- 521 -
-
-
-
2 - 2,942
2
2.193
- -
- 3.148
12.562
- 1.265
- -
-
-
- -
155 144 10.021
955
62
5.00
0.561
- -
- '
- 2.193
ls3SL.
11,740
1.105
- 10
292
53-TOU)Olt-poaUi
6-4 - <CU (C'lr-poaki
Temocra"c
-
1
- -
.
'
-
-- . .. ........- L j< 35 _1-,9!_
' 20
- - 0.01 24
Total Indcstniai 2.793 25.96 77.365 - - 3,730 36,350 3,730 38.095 - 2,445
Balk - - -
-
-
-
-
.
,
-
- . -- --------------------,.
-
-
-
41
121
735
-
, -
-
' -
-
. -
185
' -
-
- -
- 3
5
51 ----------
c1lL99P.FMPt 450 SpiN -eocoeOnir S <W
lime ci Use TOO) - Peak
- -
30 -
-
44
129
787
1.683
-
-
5 -
-
-
2
10
:... 39
128
0,02
0,09
-
-
77 <ma 0) Usa TOT, - CO-Peer
C2 Scpoiyar 12V, -------------------
Time aluM ilCU) - Peak
TmeotUsalTCU)- On-Pear
T.meolUne(TOU)-Fnak
Tme,eolUseiTCU)-01t-Fenk
-
40
., '
-
- ,. -
-
-- .__ 0,36
1,19 105 1,573
. - -
- 110
- -
- - - . - '
-- - -
- -
-
- - - - - -
-
- -
- - ' - - - -
Total 01rr51a Point Smipoly 179 1,66 152 - - 203 2,471 253 2,543 ) - 173
ricrmlturaITube-wells-TaniffD
DtScarp
02)40,52)
- - -
-
- -----
'
112
-
1,147,81
'
. -
75.09
- 70.70
304,35
-
-
-
-
.---'. ------------
79
- 451 -
0,73 5,216 - 112
-
1,073
DJ952(Sob . .
0-16 l45)Tac
- 11.725 -
-
-
53 0.49 - - 1.010 1.08055
0.18 )4( CO Peak 352 3,27 35,219 578
-
..--------.:__.
4,348
..... -------------------------
578
'
-
.
4,652,24
D1BJ505r,S3)jPaak
0-18 00,51,531 T Oft Fork
,
-
-
-
'
- - -. __.
-
. -
.
.
-
.
,
-
-
- D-10)50,5',iNlPnac-SUS - ,
-
- 0.1550,51,53)1 CII Peak - SUB ,
-- -
- 0.16)54)708 Peak-)
0-16m54)T0ltFeo'e-2
- . -
__:_.,... -
._:_ - -
- - - -
Total Ageiccltoral 483 4.49 52.642 - 690 6,431 690 6.881 450
PmmblioLightifl9 S 5 0,07 620 -
-
-
-102
15 --
-
109 7
Residenria) Colonies H I 0.01 - ' 16 - 16 -
3pci6-Contrecln-TauItK(AJl<l
Time of Use (TCU)2eak
'- -
49
202
-
15 - -
1,004,43
-
- - - 939 - - 65.71
'flme olijs9JT0Ul.011.Peak 1.88 -
'
-, - 277 2.775 - ---------277
-
2.96598
-
- 794.23 -
Railway lraolionTracm:un - t
-
-
r125
- - - - - -
Genoral Services 1,16 21,940 - - - 1.574 - 2.005 51 - 131,20
Graed Total I, 10,758 100.00 3,903,735 - - 0,584 162.881 5,584 168,622 - 5,740
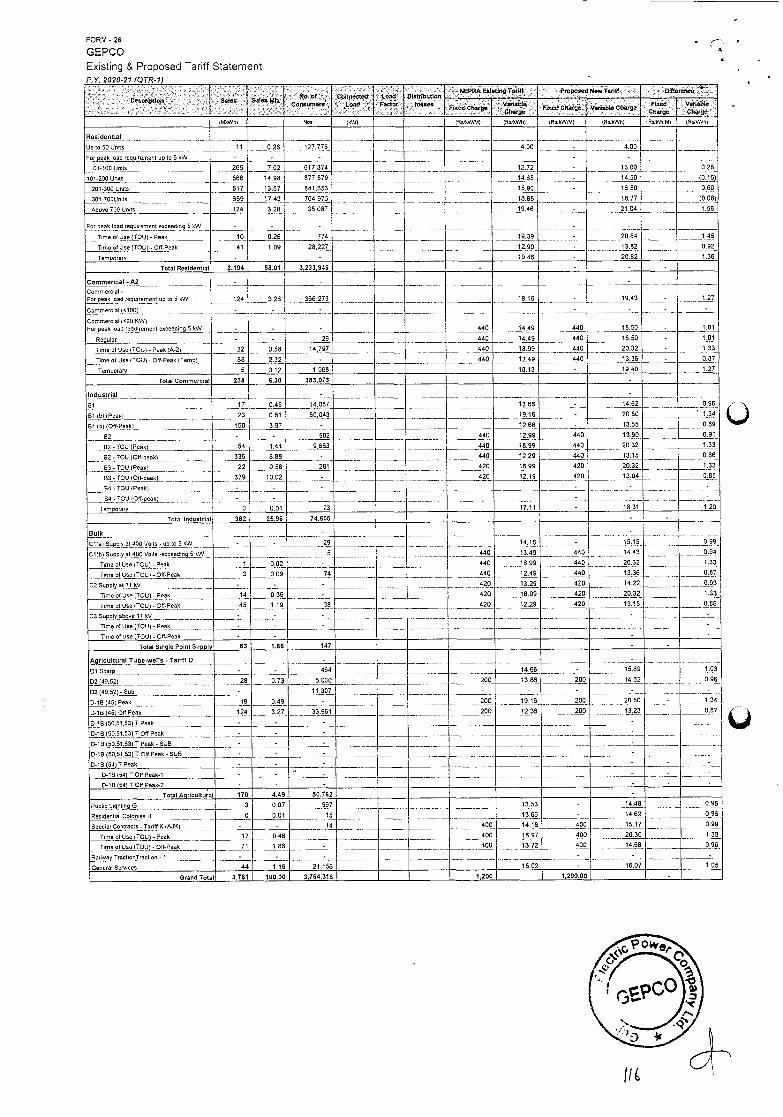
FORM - 26
GEPCO Existing & Proposed Tariff Statement F.Y. 2020-21 (QTR-1)
Ge -'''' Pt Safe S I 'Ne. 01.
C e amen, Cueeeicted
bed Least
Facto, D'steibstlar,
flgaletlegTarff Proposed New Taettf
106005 F dOn go
bt F edCh gO VwlableCh ,
Flad V tab)
005551 503 (kV'fl RsViWiV) (RS,t(cVhl tRvkWAll lOSAWh( )Rs5VV,1rl )Rs,l(Whl
Residential
Up to 50 Units ii 028 127776 4.00 - 4.00 -
For peak load reqyirernent up,)p 5 SW - - - - -
01-100 Units 265 7.02 617.874 12.72 - 13.00 0.28
101-203 Units 566 14.98 877,579 14.65 - 14.50 (0.1)
0,60 201-300 Units 517 13.67 841,653 15,90 - 16,50
301-700Urrits 659 17.43 704.975 15.95 - 18,77 (.O8)
1.58 Above 700 Units 124 3.28 35.087 19.46 - 21.04
For peak toad requiram ent conceding S SW - - - - -
20.84 1.45 TirrreotUse(TOU(-Peak 10 0.26 774 19.39 -
lirrre ot050_LIOIJ( - Op-peak 41 1.09 28.227 12.90 - 13.82 0.92
Terrrporary - - - 19.46 - 20.82 1.36
Total Residential 2,194 58,01 3,233,946 - - - -
Commercial -A2 - - -
Commercial - For peak toad requirement spIn 5kW 124 3,25 366,279 - 18.06 - 19.43 - 1.27
Corneieroial (0100) - - - - - -
Comnmneroial (020 4W) For peak load iequirerrment e000ediog 0kW - - - 440 14.49 440 15.50 - 1.01
Regular - - 29 440 14.49 440 15.50 - 101
'Tree of Use (TOO)- Peak )A-2) 22 0.58 14.797 440 18.99 440 20.32 - 1,33
TAre of Use (TOU)- Op-Peak )Temnp) 88 2.32 - 440 12.49 440 13.36 - 0.87
Temporary 5 0.12 1,968 18.13 - 19.40 1.27
Total Commercial 238 6.30 383.073 -
Iodsstrial - -
Br 17 0.45 14,087 ' 1366 - 14.62 0.06,, -
B1lb( )Pak) 23 0.61 50,040 19,16 - 20.50 - 1.34
Br )b)(Off.Poak) 150 3.97 - 12.66 - 13.55 0.89
82 - - 502 440 12.99 440 13,90 0.91
62-IOU (Peak) 54 1.44 9,663 440 18.99 440 20,32 1.33
62- '500 (0t1 P7P) 336 8.98 - 440 12,29 440 13.15 0,06
03-TOO (Peak) 22 058 201 420 18.99 420 20,32 1.33
63-000 )Otfypuk) 379 10.02 - 420 12.19 420 13.04 2,85
94-IOU )Pnakl - - - - - -
..............
Trmncorory 0 0.01 -
17.11
----------.---:---- -
........
19,31 23 1.20
Total ledustrial 982 25.96 74.605 - -
Bulk
CO)a)Sup3yat400'iolts-upio5'cW - -
-
440 03.49
19,99
12.49
- l,5,5 99
- - ....
1.33
0,87
0.93
1.33
- , 29 14.16 -
440
440
14.43 C1)bj_SuppLy cr400 Volts -eoceedinq 5kW - - 5
Time St Use,(TOU) - Peak 1 0.02 - 440 20.32
lime ot Use (TOOl-Off-Peak 3 0,09 74 440 440 13,36
02 Suoply_at 11kV - - - 420 13.29 420 14.22
Tone or Use (TOO) - peak 14 0.35 - 420 18.99 420 20.32
Trrrre oboe LTCU) - CO-Peak 45 1.19 38 420 12.29 420 13.15 0,06
- C3 030p)p,4bove 11 kV - - - -
here 01 Use )TOU) -Peak - - - - -
Time of Use TOO) - OP-Peak - - - - -
Total Single Poiel Supply 63 1.66 147 - -
Agricultural Tube-wells - Tariff 0 , - -
1,03
0.96
-
olSoarp - - 464 14.56 - 15.69
02)49.62) 28 0.73 5.030 200 13.66 200 14.62 -
02)49.52)-Sob - 11.307 - -
200
- 20.50
-- -
0-10 (45) Peak 19 0.49 - , , 200
200
09,16 - .....- 1.34
0.67 D-16J1!( Off Peak 124 3.27 33.961 12.36 200 13.23
- I Peak ,,S0.51,53( - - -
D-1B (50.51.531 TOP Peak - - - -
0-10 lS0.5t0 j]Peak - SUB - - - -
0-16 (00.51.53)109 Peek - SUB - - - -. -------------.. - - - - - - -
0-15(94)1 OP Pnak-r - - -. -. - - -
0-lB (84) TOP Peek-2 - - - - - -
Total Agricultural 170 4.49 50.762 -
Public Lighbng G 3 0.07 597 13.53 -
-
14.40 0.95
0.96 Residential Colonies I-I S 0.01 05 . 13.65 14,62
15.17 Speoial Contracts _TariffK(AJK),.,, - - 14 400 04.15 400 - 0.99
1.33 Time 01 (lee (100)-Peak 17 0.46 - 400 18.97 405 25,30
TirrrnOt Use (TOO) - Op-Peak 71 1,05 - 400 13,72 455 14.68 0.96
Railway TractionTractron - 1 - - - - - -
General Sessions 44 1.16 21,156 15.02 - 16.57 1,05
Grand Tetal 3.781 100.00 3,764.316 - 1200 1,200.00 -
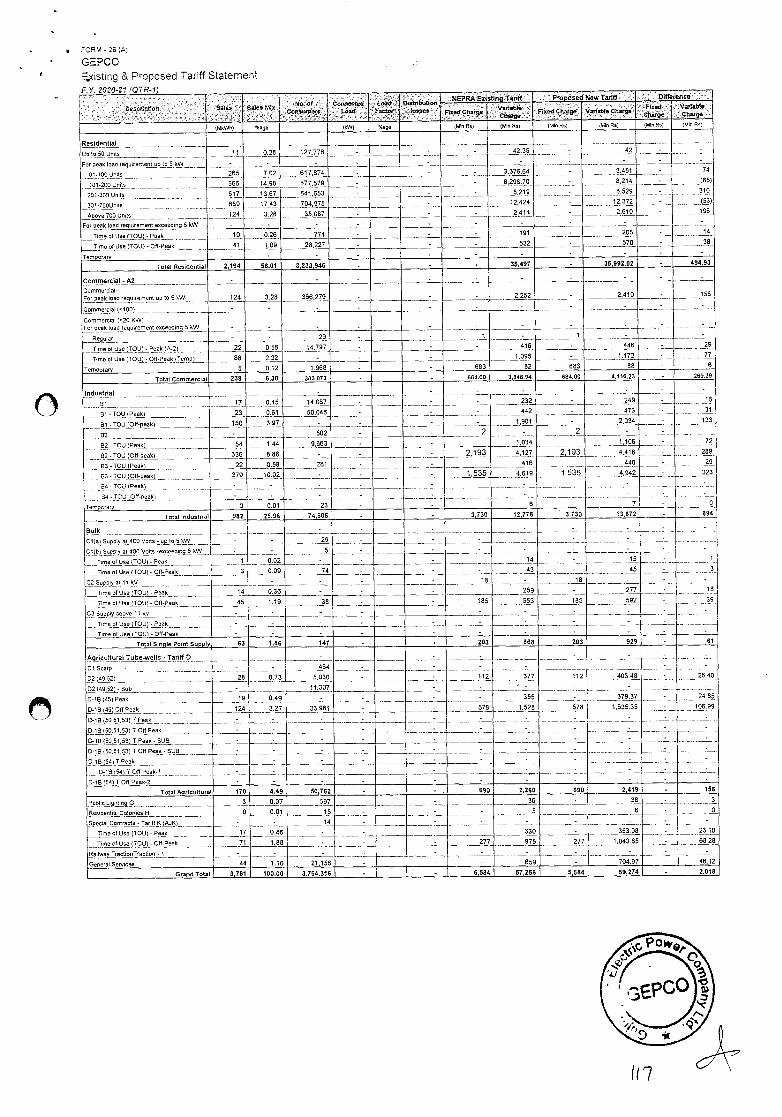
3 pCO
FORM - 26 (A)
GEPCO istng & Proposed Tariff Statement
p1' S 50 C nO ro L 8
• ' Fat80
NEPRASoisl100Tariff' PIop850o9N000Tatif3 .• DiffaeflCe
0 F eeOCh g F 04 Chaagn V cot Choaff F.ond tte
MkWh) Sage (6W) Sage (MIr Os) (Mm Rn) (Mm So) Sin Rot (Mir Rot (Idle R(
Residential - - - -
-
-
14p to 50 UnIts ii
-
0,20 027.776 . - 42.35 - 42
- For neaR laW requirement up to 5 6W - - . . - -
-
- 3,376.64
6,298.70
8,219
12.424
2,414
-
- -
- -
- -
01.100 5055 265 -- -
7.02 617,874 -
-
- 3,451 - 74
- - - ),85)
310
_,(53)
196
- 14
101.2C0 UnIts 566 14 88 077.579 - - 8,214
8.529
-- 1.72 2,610
- - - - -
-
-
201.300 Undo
301-laounmto
517 13.67 841,653 - -
-
-
- -
659 - 1743 704.975 -
AbOue 700 srmds 124
-
3.28 35.067 . -
For peak tood ruIrement exceeding 5kW - - - - - .
-
TmrneorU9e)T0147-Peak 00 0.26 774 - - 191
532
' 205 -
TUrn of Use TOW - OR-Peak 41 0.09 28.227 - - - - 570 - 38
Temporary - - - - - - - - - -
Total Reoidentil 2,194 58.01 3,233.946 - - - 35,497 - 35,992,02 - 494.93
commercial -62 - - - - - - - - - - Commercial- For peak load requmreRmenr upto 55W 124 3.28 366,279 - - - 2,252 - 2,410 - 158
Commercial )<129L_ -
-
- - - - - -
- -
29 --
Commercial (<20 CuT) For peak toad requmremenreccee4iflg 56W - - - - - - -
Regular - - 29 - - I ----- 1
-
- -
Time of rice (IOU)- Peak )A-2) 22 0.58 14.797 - - - 416 446
Tore Use .OR-Peek (Tempt of (TOUt 68 2.32 - . - - 0.096 - _.t72 - 77
6 Temrrcomary 5 0.12 1.968 - - 683 62 603 86 -
Total Commercial 238 6,30 383.073 - - 984.00 3.046,94 684.00 4,116.23 - 269.29
ledusirial
91 17
23
0.45 - - - - -
232 - - -
16 14,087 - - - - 249
91 -TOU (Peak)
- 0.61 50,048 - - - 442 - 473 - - -------------31
133 Bi-TOUlO47p7ak) iSO 3.97 - - - - 1,901 - 2.034
92
82-Tori (Peek)
- 54
-
1.44 -
502
9.663
- - 2 -
1,034
2 - - - 72
269
-- 29
323
-
- - 1.108 -
02-TOU)25peak) B2-TOU47PTy5
336 8.88 - - - 2,193 4.127 2,193 4,416 -
22 0.58 281 - -
-
416
1,535
446
4,942
-
- 53-TOUl47R-peak) 379
-
-
10.02 - - 1,535 4,619
-
- 6
04 - IOU )Peak(
0.4 - TOri (OR-oeok(
-
- 0.01
- -
-
- -
- 7
-
- - -
Temporary 0 23 - -
Total lodastrial 982 25.96 74,605 - . 3,730 12.778 - 3,730 13,672 - 894
Bolk
-
- - - - - - -
- - -
3
10 ___'.._ -
01)0) Supp(4p)_4C0 volts u to 55W - 29 - - - - - -
1Lb(. 2.P500vc1t0±0aWPFlT947.'0W - - - 5 - -
- 15 - TimneofUce(TOU)-Peak 1
3
0.02 - - - - 14 -
Omoaf Use )TOU).Off-Peak 0.09 74 - - . 473 -
18
45 -
'RV - - - - - 10 ' -
110,0 RI Uco (TOW -Peak 14 0.36 - - - - 259 h,,,, - 277 -
(TOUr COP 6 45 119 38 _______ 553 185 592
C3plyb
Total Single Point Sooply 63 1,66 147 - - 203 868 203 929 - 61
Agricultural Tube-wells - TarrRf 0
Di Scamp -
- - - - - - 377
"-
- -
-
-
- -
-
-
379.57-
-
26.40
- 24.55
10699
-
-
-
- 28
-
0.73
464 - . - 112
- 72149,52)_ 5,030 - - 112
. -- 578
403.45
- 02)49.52)-Sub - 11,307 - -
0-19(49 Peak 09
124
0,49
3.27
- - - - 355
1,528 - -.
0-rB 49 09 Peak 33.961 - - 578 1,635.35
- 0-165)0,51.53)7 Peak
0-19 (50.51.53) TOO Peak
- - - - - -
-
-
-
- . - - - - - -
0-18470.51,53) T Peek - SUB - - - - - - - - -
D-15 155,01,53) TOO Peak - SUB - -
-
- - - - - -
-
-
- D-1B)54)TPeak - - - - - -
C-S (54) T Off Peak-i
D-1B (541 TOO <eac-2
-
-
- - - - - - - - - . - - - - - - - - -
Totar Ageleoltaral 170 4.49 00,762 . - . 690 2.260 695 2,419 . ISO
Public uyhtle5 0 3 0.07 597 - - - 36 - - 38 - 3
S
- 23.10
65.28
- 48.12
Residential Colceioc H 0 0.01 15 - - - 5 6 -
Special Camtracfs - Tariff K (AiR) -
- - 14 - - - - - - - Tima Of UseJI5)5)47oak 17 0.46 - - - - 330 353.08 .
Time of Use )TOUJ - 0ff-Peak 71 1.88 - - - 277 975
- 659
277
- -
1,043.85 -
. -
Romtwagj47ctionTrac500 - I - - - - - - - - - 754.97 Gerroro) ServiceS 44 1.16 21 .156 - - -
- Grand 70101 3,781 100.00 3.764.316 - - 5,584 57,256 5,504 59,274 - 2.018
a-S
H 7
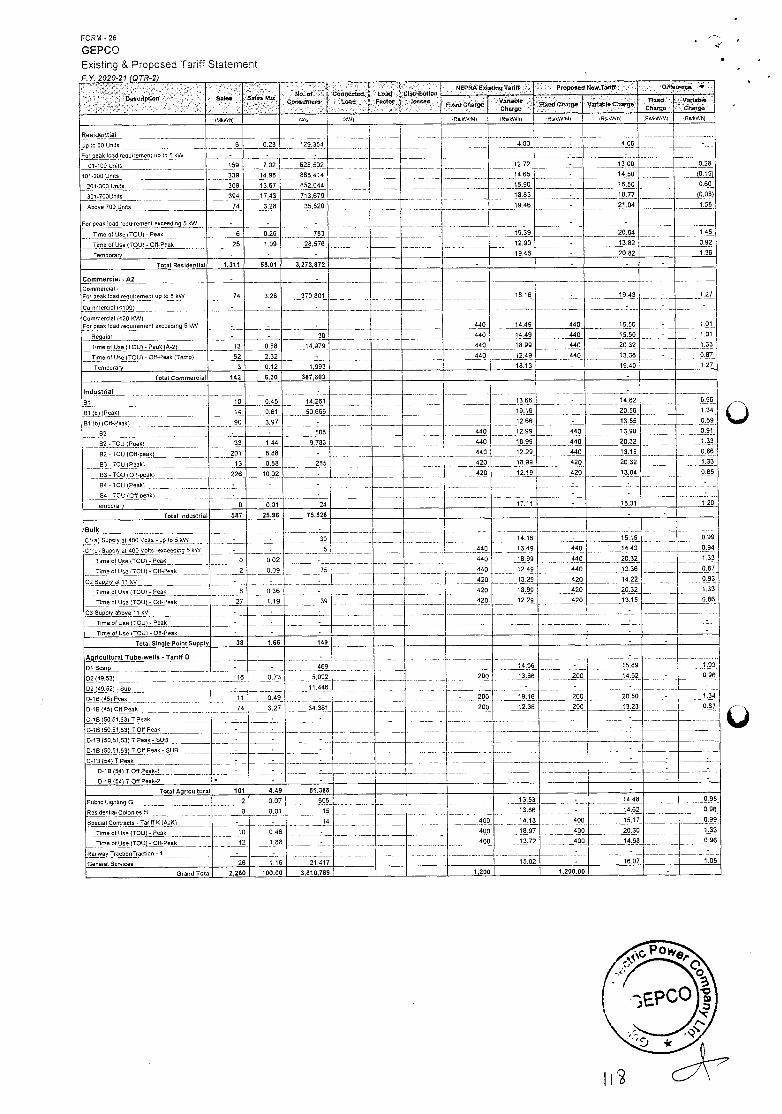
FORM -26
GEPCO
Existing & Proposed Tariff Statement P V 7fl0fl2'f I()TP.7l
-- •-
Ce IFs
:'
S les
:-
S M
. . . CC 0 5- 10u448
NEgTuri0 PpoNTff .- 0ifleren
V. 090,9
ivWuhl doo 1kv/I I TRs,kWi9tl P5,0//fl) 'Rs,kW.Ml AsP//hi -05,0//MI OS/kWh)
Residential
,I
-
- ----- -
- - Up to 50 Ue,ts 6 0.28 129,354 I 4.00 4.00
FLakloadreqrerhentupto5kW - - -- ------------------ 12.72
-
or-tOO un,ts 159 7.02 625,502 .
-
13.00 0.28
101-200 Units 339 14.98 888.414 - 14.65 14.50 (0.55)
201.300 Ur,05 309 13.67 852,044 15.90 - 16.50 0.60
301-7000n45 394 17.43 713,679 18.85 - 18.77 (0.08)
Above 700 Units 74 3.28 35.520 19.46 - 21,04 1 58
For peak load requirement exceeding 5 kG) - . - - . . -
TUne of Use IT0UI - peak 6 0.26 783 19.39 - 20.84 1.45
Time olUse ITOUl -011-Peek 25 1.09 28,576 12.90 - 13.82 0.92
Terrrporary - - . 19.46 - 20.82 1.36
Total Residential 1,311 55,01 3,273,872 - - -
Commercial - A2 - - c -
Cominerolal- For peakloaarequ,rer000tuptOlkW
-
-- ----
- -
-- - - --
-
18,16 - 19.43 - 1.27
Conrioeroial 101001 -
440
-
15.50
-
-
-
5.01 Canrnreroiel 1020 (GIl For peak load tequirervent eeceeding 5kW - _ - 440 14,48
Regular - - 30 440
440
14.49 440 15,55 - 1.01 -
llmeofUse lT0(jpek IA-21 53 0.58 14,979
-
18.99 440
440
20,32 - 1.33
Time 01 Use IT0U) .00-Peak ITemol 52 2.32 440 12.49 53,36 - 0.87
lemoorary 3 0.52 1.993 10,13 - 19.40 1.27
Total Carenxeraial 142 6.30 387,803 -
Industrial
BS 13.66 -
-
10
14
0.45
0.65
14,261 54,62 0.96
- 50.066 - 19,16 20,50 1,34
GlIb) 100-Peak) 90
-
3.87
-
- 12.66
12.99
- 13.55 089
0.91 62 508 - 440 440 13.90
82 -TOU lPeakl 33 5.44 9,783 440 10.98 440 20.32 1.33
82 -TOU 101t-peakl 205 8.08 - - 440 12.29 440 13.15 0.06 --
03 -lOU (Peak) 13 0.58 285
- .
420
420
18.99 420 20.32 1.33
03-TOp fl-Wok) 226
-
0
10.02 12.19 420 13.04 0.85
1 20
- -- 84.T00(Peokj
04-TOO Oft-peaki
Temporary
------.7--.-
-
-
0.01
-. -
-
- -
- -
24 17.11 I - 18.31
Total Industrial 587 25.96 75,526 - -
Bulk
--
- -
-
440
- 15.15
- 0.99
0.94 CtlalSupp(Lat 400 VoLr5-/ptod kG) 30
5
-- 14.15 - -
01(b) Supply at 400 Volts .nooeeo,15 5 (// 53,49 440 14.43
Time of Use ITOUl -Peak 0 0.02 - 440
440
420
420
420
18,99
52.49
440 20.32 1.33
0,87
- 0.93
1,33
Tinreot Use ITCUl - 00-Peak 2 0.09 75 440 53,36
C2 suopik at iii,v -
8
--
0.36
- 1329 420 1422
Time 05 Use lT0Ul - Peao - 18.99
12.29
420 20.32
Time ofUse ITOUI - OtI-Poak 27 5.19 39 -- 420 13.15 086
-- - . - - C3 Supply above 11 kV - - - -
Time of UseJT0UI - Peak - - - - -
- Time olUse iTOUl - 00-Peak - - - -
Total Single Point Sapply 38 1.66 549 - -
Ag,ricultarel Tube-wells -Tariff C - -.
- -
54.56 ---13.66
-
9.j5,
200
-
200
200
- 15.69
14.62 Dl Scalp.,,,,, - 469
11,446
0.73 5.092 -
.73
0,96 02149,521 16
11 0.49
205 _,,,,._
D2149,52)-Sue
D-iB14StPeak -
D-to)4510tfPeak 0.18150.SI.53(TPeak
-
20.50
-
-
-----------------------
200
200
- 1.34
74 3,27 34,381 12.38 13,23 0,87
-
- -
-
-- -- -
5-18 lS0.5r.53aof7a(o -
0-lB 150.51,53) T Peak -SUB - -
5-18150.51.53)708 Peak - SUB - - -
0-1B)54)lPeak - - - - -
0-18 (5,5) T OIl Peek-i - -
-
- - - -
0-18 1041 T Off Peek-2 - - -
Tatat Agricultural 101 4.49 51,385 -
PuUicU5y)179G 2 0.07 605
15
- 14 -
-
400
400
53.53 - 14.48
14,62
15.17
0.95
096
0.99 flesidenbel Colonies II 0 0.01 13.66
14.18
-
400 SpncieiContneots-TariftK)AJKl - -
- - Time or Use,)_T0t.,) - Peak 50 0.48 - 1097 400 2030 1,33
TimaorUse)Ick)I-00-Peak 42
-
1.08 400 13.72 400 - 14,58
-
.96
- 1.05
Railway TreotianTraOrion - 1 -
21.417
-
General Services 28 1.16 15.02 - 16.07
Grand Total 2,260 100,00 3.810,789 1,200 9,200,00 -
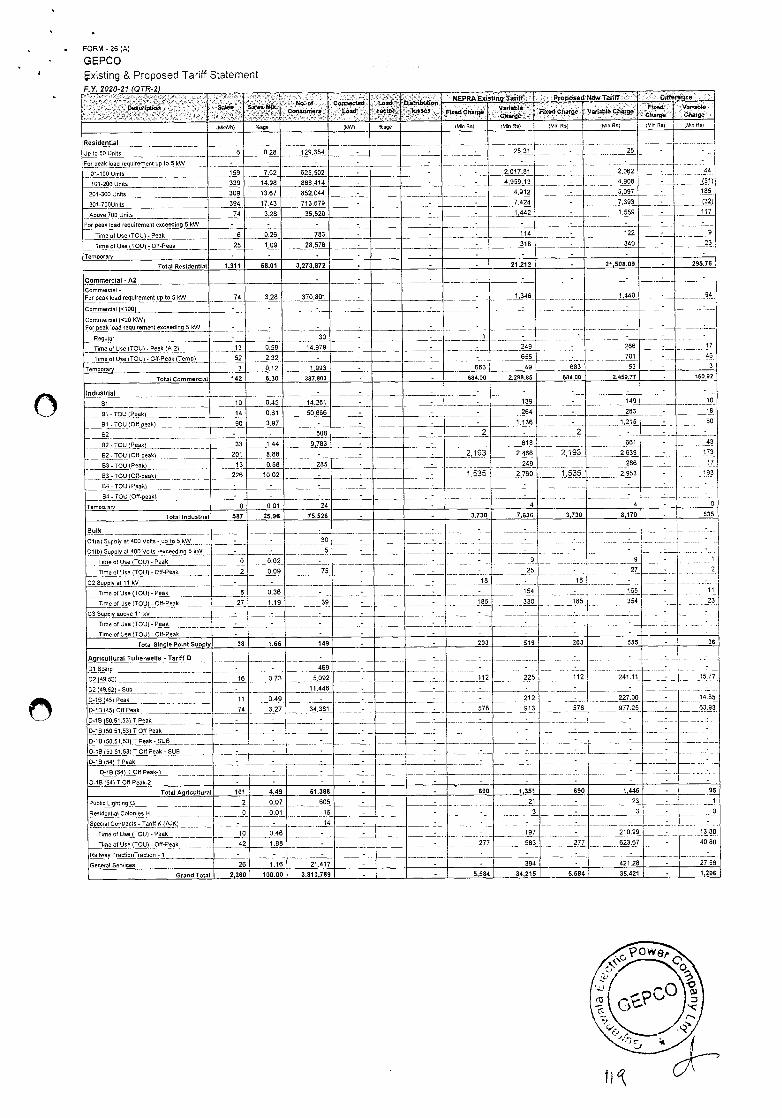
FORM -26 A)
GEPCO
xisting & Proposed Tariff Statement
s NO of
Cons m Conee
Lead 4
Fact
NEPRA E 155mg Thrttf Proposed Nw Tar-if Drff8roflcs M.bSd 8 Sn d CS on F sO CC g V 0)0 CS e
(10)00) %age (1(W) Sage (Mn OS) M)n 05) (SIn Os) (Mm Os) (Sin Os) (Sin Os)
Residential - 25.31 -
- -
-
25
-- - -
---
- 44
(SI)
985
(32)
)1o40Un0s 6 0.26 129,354 -
For peak)oadre umrernentuptO6kW - - - - - - -
-
2,0)7.81 0)f00 units 159 7.02 625,502 - - 2,062
- - 4905
-
- -
101.200 Units 339 14.98 888,4)4 - - 4,959.13
201-300 Units 309 13.67 852.044 - - - 4,912 - 5,097
301-700Urimts 394 17.43 713,679 - - - 7.424 - 7,393 -
AbOve 700 Usfs 74 3.20 35,520 - - - 1.442 - 1.559 - , 117
- For peak icCd requirerrremrt ecceoding 5 kW - - - - - - - - -
T(nrre of Use (TOU)-Peek 6 0.26 783 - - - 114 - 122 - 9
23 TinreolUseçT0U)-off-Peek 25 1.09 28.576 - . - 315 - 340 -
lerrrpofery - - - - - - - - -
Total Residential 1,311 58.81 3,273,872 - - 21.212 - 29508,09 - 295,78
Commercial - A2 - - - - - - - - - - Commercial - For peek )oad reqoirecoerit up 105 kW 74 3.28 370.801 - - - 1,346 -
..............-
-
1,440 . - 04
cvmmercmc))nroo) - - - . - - - - .
Cerrrrrrercmel (<20 OVd) For peek Iced requirement concedIng 5 kW - . - - - . - .......- -
59901er - - 30 - - 1 - I . -
. :.. - ....._ --
3 -6
llmeofUse)TOU)- Peek )A-2) 13 0.58 14,979 - - - 249 - 266
Time of Use (TOU) -Co-peek (Temp)
lemocrory
52 2.32 - - - - 655 - 701 - 3 0,12 1,993 - - 683 49 683 53
Total Commercial 942 6.30 387,003 - - 684.00 2,298.80 604.00 2.409,71 - 160.92
10do5t6a1 - - - - - - - -
61 10 0.45 14.26) - - - 139 - 149 - 10
B1-T0LHPeek) 94 0.61 50,666 - - - 264 - 283 - 18
50
- 43
173
0
B) - ioUj0ff.pyek) 90 3.97 - - - - 1.136 - 1.215 -
82 - - 508 - - 2 - 2 - -
- 82-IOU Peek) 33 1.44 9.783 - - 6)8 661
02 .TOU(peak) 201 8.08 - - - 2j,3 2.466 2,193 2,639 -
-
2,953 - 193 B3TCUlPy95( 13 0,56 285 - -
1,535
249 - ....... 266
-
S3TOU lOP-peak) 226 10.02 . - - 2,760 1,535
64. TOO Peek) - - - - - -
- 04.T)Of0peek) - . - - .__._.:_.._..__-
Temcorary 0 0.01 24 - - 4
Total )ndusteiei 587 25,96 75,526 - - 3.730 7.636 3.730 0.970 - 535
Balk . -
-
-
- -;_
.
- .........i:_ -
-__,._,- .............
- ...-........1
2
. 11
Clie)Syppjyet400Vcits.up)c5kW
C))b,,Supplye)400VoItS-evcnedin95kW
- - 30 - - ........,_
- - -...............,,._._....._...:.
--
- - 5 - -
TimeotUse)TOU)-Peak 0 0,02 - - - - 9
25 'flmeorUce(OU(-O0-Peak 2 0.09 75 - - - 27 -
C2 Supply alli kV - - - - - 10 -
104
18 - -
Time of Use (TOU)- Peek 9 0.36 - - - - - 155 -
TimeolUse)TOU)-Ctf-Peek 27 1,19 39 - - 105 330 195 , 354
-
- =
-
C3Suppiyecove)1kV - - - .
.
-
-----------------.._.._:_
.
-
Time edUce TOIJI 'Peek - - - - _
Time of Use IOU) - CO-Peek - - - - - -
Tote) Sieole Peint Supply 38 1,66 149 - - 203 519 203 555 - 36
Agcicoltural Tube-wells - Tariff 0 - - - . -
112
- -
- -
.
.
-
225 112
-
241,11
. -
-
-
-1517
14.65
'63,93
olSvarp . - 469 - -
02 49.02) 16 0.73 5,092 - -
- 22)40.52)_Sub - 11,446 - -
o.rs)45) Peek 11 0.49 - - - 2)2 - 227,00
977.25 - 0.15 (45) Off Peek 74 3.27 34,351 - - 578 913 578
D_1j9.5r.53(,3Peek
0-15 50,51,53) lOft Peek
- - - - - - - - - - -- .
- - - - - - - - -
-
-
- D-18 (50,51.53)1 Peek- SUB - - - - - - - -
0-rB )SO,51,53) TOrt Peak - SUe - - - - -
-
- -
0-1B)54l1Peek - - - - - - -
0-15 94) T011 Peak-f - - - - - - - - -
0-15)64)1 Off Peek-2 - - - , - - - - - -
Tetel Agriculture) 101 4.49 51.388 - - 690 1.35) 690 9446 95
Public Lighting 0 2 0.07 605 - - -
-
-,
21 23 - . 5
- 13.80
40,80
- 27,66
9e5der1i01 Colonies H S 0,01 15 - - 3 3
. SpeMelCcnSec)S-Toriffj(l<) - - 14 - - - lime of pp,(0U)-Peek
- 15 0,46 - - - - 197 210,99
llme of Use )TOU) - 00-Peak 42 1.58 - - -
-
277
-
583 277 623,67
- I Rei)way lroctienlrecnion - 1 - - - -
GenerelSer-uices 26 1,16 21.417 - - - 394 421,28
Greed Total 2,260 100.00 3.810,789 - - 8.584 34,215 5.504 35,421 - 1,206
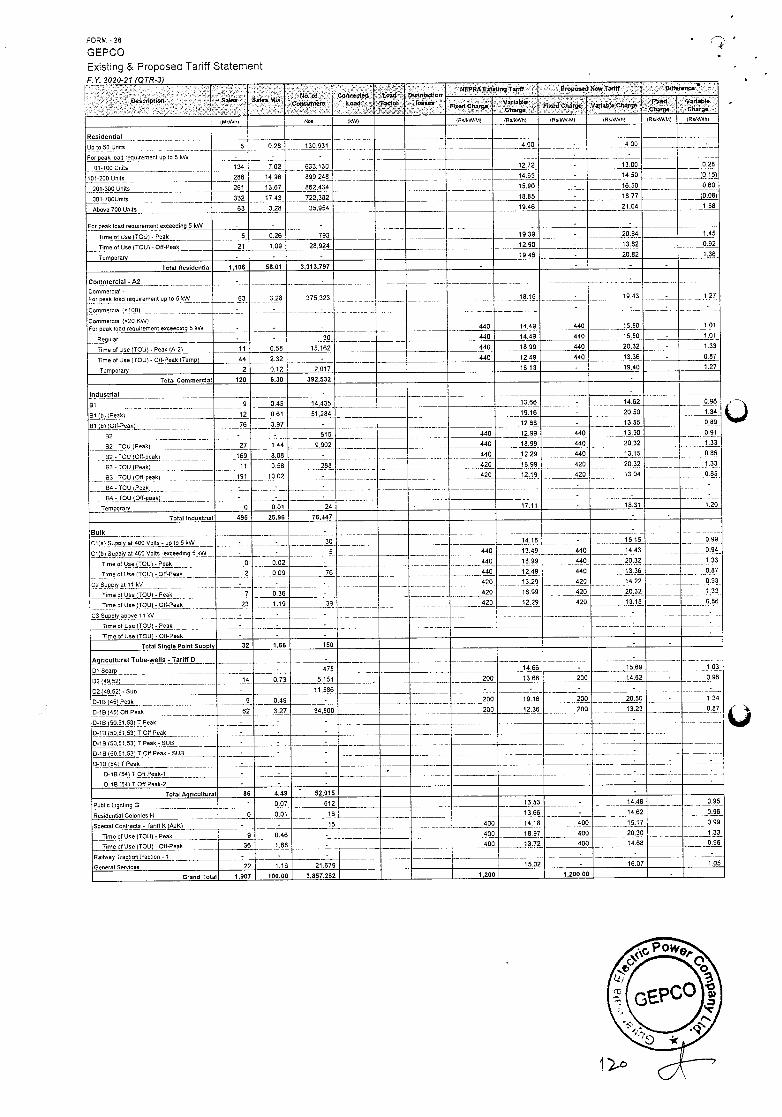
FORM -26
GEPCQ
Existing & Proposed Tariff Statement
0 4 I Pt Oct S S MI No. of
C S rner Connected
to teed Fact
Oietr,betion SIEPRA Eat leg TeedO Prnpneed New lentIl 0 tIck nne
I Fixed Ott e Ft Rd CIte g Vetlebi CIt p5
)MkWflj Non 'oN'S Ps.SWIPA( lRsIkWtrl lRsWV,rtl (RslrWh) )ROkWdA) (flsalrwfl)
Residential -
Up 050 Unds 5 028 130,931 4.00 4.00 -
For peak load req rorrre7(,57 to 5 kw - - - - -
01-100 SOils 134 7.02 633,130
899.248
12.72 - 0300 0.28
101-200 Uo,ts 286 1498 14.65 -
-
14.50 (p.15)
201-200 5045 261 13.67 862.434 15,90 16.50 0.60
301-700Urrrts 332 17.43 722.3a2 18,65 - 18,77
Above 700 Undo 63 3.28 35,954 19.48 - 21.04 1.58
For peak load requrrerrrent eoceeding 5 kW - - - - -
Tiore of Use (TO).)) - Peak 5 0,26 793 19,39 - 20.84 1.45
Time of Use ITOUl-011-Peak 21 1.08 28.924 12.90 - 13.82 0,92
Terrrpnrery - - - 19,46 - 20,82 1.36
Intel Residential 1,106 58.01 3,313.797 - -
Cemmercral - A2 -
3,26
-
....
-
- 127 Commeroca) - Forpeak load meqvrmomnerrtupte 5kW 63
-
_..._____i__
-
375,323 ,
...........
18.06
14.49
-- -
-
440
19.43
- ........"'
05,50
Corrrrrremoralj7tU0l . ._,,_,_
440 -
........
1,01 Cormrmeercmal 020 SoS) For peak load meqormerrmnrrt e0000airrg 5 'aw
Rngrrler - - 30 440 14.49 440 15.50 - 1,51
TUne of Use (IOU)- Peek A-2) Ii 0,58 15.162 440 18.99 440 20.32 - 1.33
Tern of Use (IOU) - On-Peek )Terrrp( 44 2.32 - 440 12.49 440 13.36 . 0.87
lerrrporary 2 0.12 2,017 18.13 - 19.40 1.27
Tetal Cemerneroial 120 6,30 392,532
Industrial - -
6). 9 0.45 14.435 13.66 . 14,62 0,96
Br )b( Peek) 12 0.61 51.284 19,16 - 20,50 1.34
Btj),),9fI-0eak) 76 3.97 - 12,66 - 13.55 0.89
0.91 02 . 515 440 12.99 440 13.90
82- TOO Peak) 27 1.44 9.902 440 18.99 440 20.32 1.33
B2TOU(Off-peek( 169 8.88 . 440 12,29
18.99
440 13.05 8.86
- ..33
0.85 63-005 (Peak) II 0.58 288 420 420 20.32
03.04 --
03 -TOU )Oft.Beak) 191 10,02 - 420 12.19 420
54 - TOU (Peak) - - - -
-
-
64 -TOU (001-peek) - -
Terrroorary 0 0,01 24 ' 17,11 - 16.31 1.20
Intel rrdutttniel 495 25.96 76.447 -
Balk - -
01(a) Supe)y at 400 Volts - op Ins 'ow . - 30 14,16 - 15.05 0,99
C,5) Svpp)y 014CC VeIls -eoceed(o9 'oW - - 5 440 13.49 440 14.43 0.94
.0.33
0.87 Imnoo1UsajT0U( - Peak 0 0.02 - 440 18.99 440 20,32
03.36 Trrrme of Use (705) - 00-Peak
at 11 kV '
2
--
7
0,09 76 440 12,49 440
-
0,36
-
-
420 13.29
18.99
420 14.22 0.93
1.33 Irma olSOn )30U) - Peek 420 420 20.32
TrreeofUse )TOU( - OP-Peak 23 1.19 39 420 12.29 420 13,15 , 8.86
CO Sop,p,Iy above Ii by
-
. . - -
'SOre 01 Use (IOU) - Peak - - -
Tirrme of Use (IOU) - OP-Peek . - -
TaInt Single Feint Supply 32 1,66 150
Agricultural Tube-wells -Tariff D - -
DlSopfp
,
- -
-
475 . 1466 . 15,69
-
1.03
0.96 02(49.52) 14 0,73 5,154 . . 200 13,66 200 14,62
02)49.52)-Sun - 11,586 -
D-1B (45) Peak 9 0.49 - 200 19,16 200 20.50 - 1,34
D1B,(5( Off Peak 62 3.27 34,000 , 200 12.36 200 03,23 0.07
0-tB(50.5f.,(,jPeak - - - - .
0-10(50.51.53)700 Peek - -
0.18(50,51.53(1 Peak - SUB - -
0-18 (0,U1.53) TOIl Peak - SUB
O-18(54(lPeak - - - - -
D-tB (54) TOP Peak-I - - -. -
D-1 8)54) 10ff Pnnk-2 - -
TntOI Agemueltunal 86 4.49 52,015
Pubic Lr5(39 3 1 0,07 612 13.53 - 14,48 0.95
Rnsrdenfiol Colorrres 4 0 0.01 16 13,66 - 14.62 0.98
Speoial Controcts _TerrBl<(5( - - 15 400 14,18 400 15,17 0,99
1.33
0.96 TiemealUse(TOU( -Peak 9 0.46 - 400 18.97 400 20.30
Trree of Use (TOU) - OS-Peak 36 1.88 - 400 13,72 400 14.68
Railway Tracliorrl'rootion - 1 - - - - -
General Sor4cne 22 1.16 21,679 05.02 - 16.07 1,05
GrandTotel 1,907 100,00 3.857.262 1,200 1,200.00
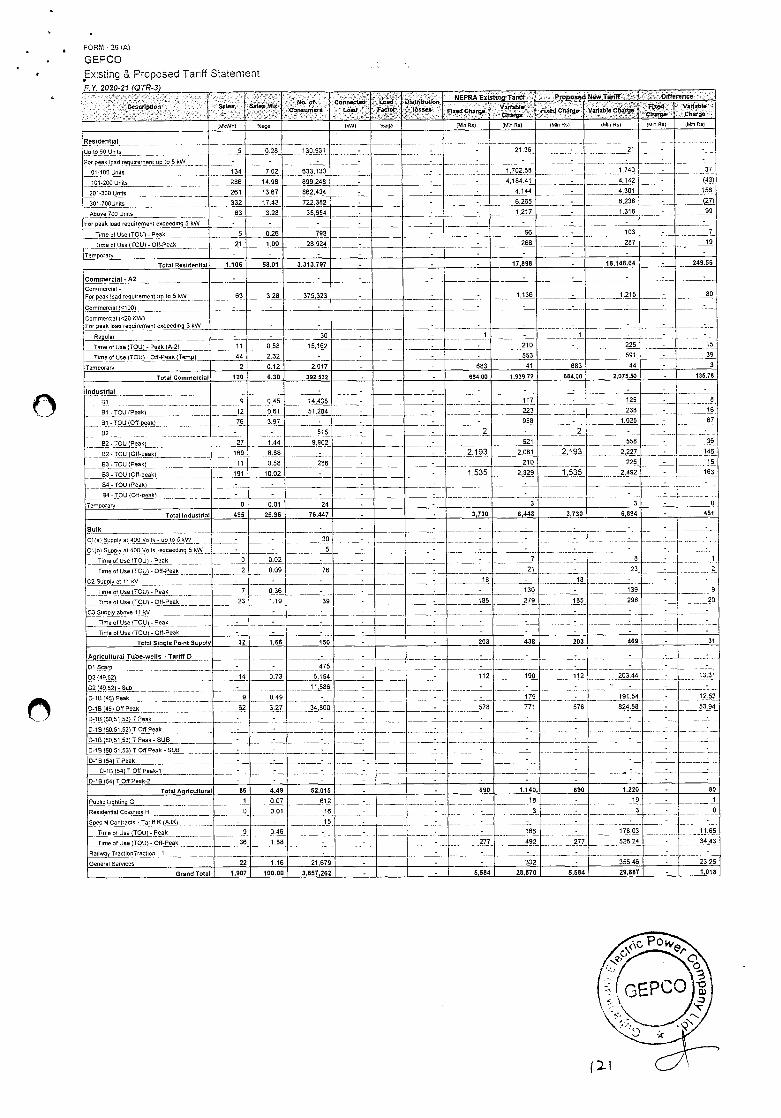
FORM -26 A)
GEPCO Existing & Proposed Tariff Statement
. C n en C I. 0 1<051
NEPI9.8 E stoeo Tarrff ProPosed New Tanff Diffaronce , -
°' ad Cha Charga ad CO Co V able C0005
(MIrWh( %a04 (604) Saga (Ole Pal (MO Oc) (Mile Os) flr Re) (Ole Re) (Ole Re)
Rogadeetial -
-
- -
-
- - -
-
-
21 -
- - 37
Uot0500rrtr 5
-
025 130931 21.36
- -
- 1,702.56
4,184.41
Forpeakoodreyuiroreontupto5kW - - - - - 01-100 Ucla 534 7.02 633,130 - -
-
-
- -- 1,740
4,142
4,301 101-200 Umtc 256
251
14.98
13.67
899,248 - - - (43)
156 201.300 SeW 862,434 . - - 4.144 - -
301-70051'lts 332 07.43 722,382 - - - 6,265 - 5,238 -
Above 700 0000 63 3.28 35.954 . . - 1,217 - 1.315 - 99
For peak load requiromorrt e000e4109 5 kW - - - - - - - - - - -
Tone of Joe (TOO) - Peck 5 0.26 793 - - - 95 - 103 - 7
Tiore of Use) CU) - Oft-Peak 21 1.09 28,924 - - - 268 - 287 - 19 -
Temporary - - - - - - - - - - -
Total ResIdential 1.106 58.01 3.313.797 - - - 17.896 - 18.548,04 - 249.56
Commercial - A2 - . - - - . - - -
-
- CommercIal - For peak load roquiremeirt up to 56W 63
-
3.28 375,323 - . - 1,036 -
-
1,215 80
COmmercial (<100) - - - - - - - - -
Corrrrrrerciat 1<20 (SW) For peak load requirement exceeding 56W - - - - - - - - - -
5py41ar - - 30 - - I - 1 - - - - 05 T,meofUco)TOU) - Peak )A-21 11 0.58 15.162 . . 210 . 225
Time 01 Uce (TOO) - Ott-Peak (Tamp) 44 2.32 - - . - 553 - 595 - 39
Ternporar'c 2 0.52 2.007 - - 683 41 683 44 - 3
Total Commercial 120 6.30 392.532 - - 684.00 1,939.72 684.00 2,075.50 - 135.70
lodustrial - - - - - - - - 8 Bi 9 045 14,435 - - - 117 - 125 -
61 - TOU )Peok) 12 -- 0.61 51.284 - - - 223 - 238 - r5
67 01.TOUJOf1-peo) 76 3.97 - - - - 958 - 1.025 -
52 - - 515 - - 2 - 2 - -
- - - 36
145
15
02- TOU (Peekl 27 1.44 9.902 - - 521 558
02- TOO (Ott-peak) 169 8.05 - - - 2,193 2.001 2,193 2.227 -
B3 -TOO Peak) 11 0.55 288 - - 210 225 -
03-TOU)O1f-poak( 191 10.02 - - - 1,535 2.329 1,535 2,492
-
- 163
-
- 0
84-TOUlPed6) - - - - - - -
94-TOO Oft-oeakl - - - - - - . 3
- - Temoorero 0 0.01 24 - - 3
Total Industrial 495 25.56 76.447 - - 3,730 6.443 3,730 6.594 - 451
Balk - - - - - - - -
-
-. - - -
-
-
-,. -
- - 1,
2
Cr)a( Scpclot 400 VoIle - up 1<5 kW - - 30
5
- - - -
-
-
- -- .- 0
Cilbi SupplLyt 400 Volts -eoccedinq 514W - - - - -
Time <I Use (TOO) - Peak 0 0.02 - . - - 7 -
limo clOse (TOO) - Oft-Peak 2 0.09 76 - - - 21 - 23 -
C2Supffyatr1KV - - - - - 18 - 18 - - -
9 lime of 0001700)- Peak 7 0.36 - - - - 130 - 139 -
Time of 0cc TOO) -Off-Peak 23 1.59 39 - - 105 279 105 298 - 20
C3 Supply above 11 141/ - . - - - - - - - -
Time 01000)700) - Pock - - - - - - . - . -
lime 010cr (70U1 - Ott-Pock - - - - - - - - . -
Total Single Point Supply 32 1.66 150 - - 203 438 203 469 - 31
A,95,caltaral Take-wells - Tariff D - - - - - - - - ....
- 010c0rp - - 475 - - - - - -
52(40.52) 14 0.73 5,054
11,586
- -
-
112 190 912
-
20344 -
-
03.31
- 12.53
02 L49.52) - Sub . - -
0-16l45lPeqk 9 0.49 - - - - 179 - 191.54 -
0.lBJj Off Peak 62
-
3.27 34,500
-
- - 570 771 576 824.55 - 53.94
0-10(50.51.53)7 Peek - - - -
-
-
0-15150.51,53) TOO Peak - - - - - - -
0-16 (50.51,53) T Peak - SUB - - - - - -
0.15 (50.51.53)1 Off Peak - SOS - - - - -
-
- - - - -
D-1B)54)TPeak - - - - - - _ _ . -
0.10)54)7011 Peek-i - - - - - - - . - -
D-16 )54)lolfPeak-2 - - - - - - - - - - TotalAgrlcoltaral 06 4.49 52,055 - . 690 1,140. 690 1,220 - 80
P456< Lighfin_5 G 1 007 652 - - - 15 - 19 - 1
B 005ldon5el Colociec H 0 0.01 16 - - - 3 - 3 -
SpeoiolContraols_Taritlo),AJI(l - - 15 - - . -
- -
277
- 166
492
- -
277
- (1.65
3443
..--- - 23.25
Time oloso)TOU)-Peak 9 0.46 - . -
-
17603
526.24
-
- Time xl Use (TOO) - Oft-Peak 36 1.80 - -
Railway TractionTraction - 1 - - - - - - - - - -
General Serurcns 22 1.16 29.679 - - - 332 - 355.46 -
GeandTotal 1,907 100.00 3,057,262 - - 5684 28870 5,584 29,087 - 1,058
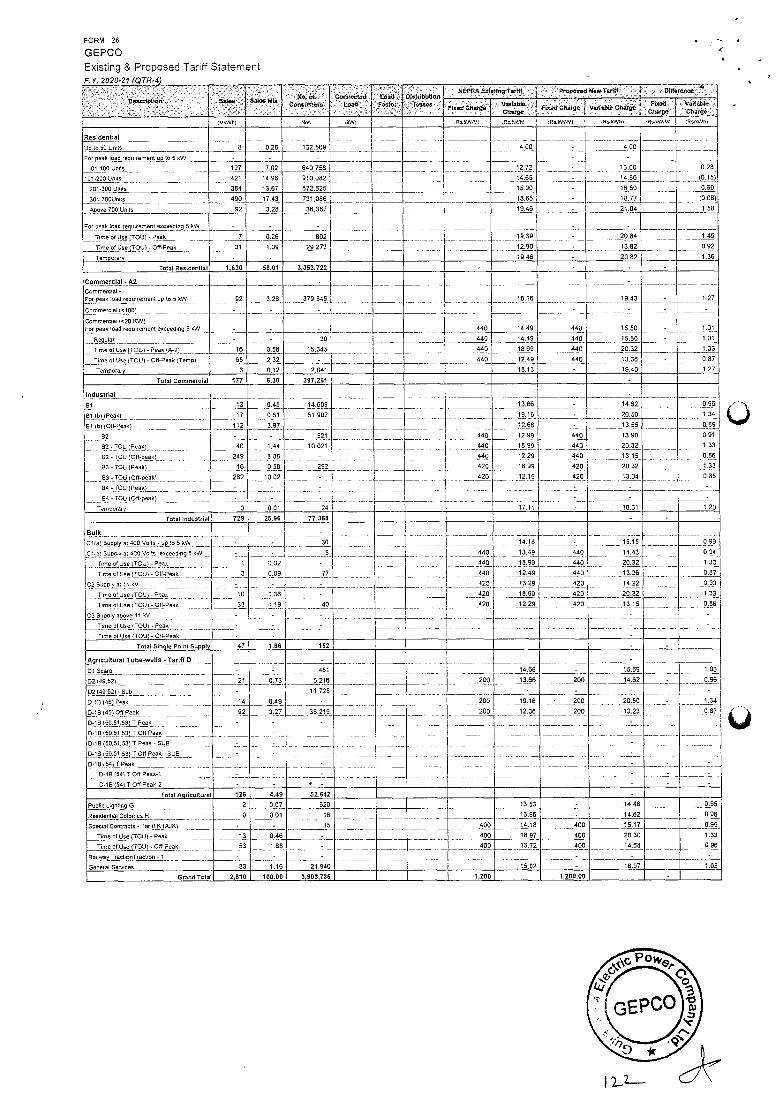
FORM -26
GEPCO Existing & Proposed Tariff Statement F.Y. 2020-21 (QTR-4)
0 p1 Sates S Ion Si Ne. oF
Cots tone Cefleesed teed
toe F O DisTribution
50
a40, BA So I gT rOIl rtapnead 4 wI 10 0100nren *
F' err Ct'aegn Pond CS g Vonbie Charge '
)UkWh) SOS 1(W) R201.niiRS/iiWr) S4iWW) ,Os,uWfli 'Rs,Wi,Mi I IRS/Win)
Residential 4.00 - UnitS 8 028 132509 4.00 -
Fory7ok load re))iiirernen)yp 0 5 kW - - - - -
01-100 UnitS 197 7.02 640.758 - 12.72
14.65
15.90
18.85
- 13.00 0.28
(0.15) 101-200 loiS 421 14.98 910,082
872,825
-
-
-
14.50
15.55
18,77 201-300 Units 384 13.67 0.60
(0.08) 301-700linits 490 17.43 731.086
Above 700 Units 92 3.26 36,367 19.46 - 21.04 1.58
For peak load requirement exceeding 5 1(20 - - - - -
Tinre 00 UsejIUl - Peak 7 0.26 802 19,39
12.90
- 20.84 1.45
Time Of Use (T011 - 010-Peak 31 0.09 29.273
-
- 13.82 0.92
Temporary - - 19.46 - 20.82 1.36
Tetal Resideelial 1.630 58.01 3,353,722 . - - -
Commercial -42 - - - Commercial - porpeaklxadreevirennertvptos'oW 92 3.26 379,645 8.16 -
-
19.43 - 1.27
Commercial (cr53) - - - - - -
Commerolal ('20 9W) For peek load requirement exceeding 5kW - - - 440 14.49 440 15.50 - 1.01
Regular - - - 30 440 14.49 440 15.50 - 1,01
Time or Use lTOLll - Peak IA-21 16 0.58 15,345 440 19.99 440 20.32 - 1.33
Time ot USekTOUl - CR-Fear lTenrpl 55 2.32 - 440 12.49 440 13.36 - 0.87
Temporary 3 0.12 2,041 18.13 - 19.40 1.27
Total Camrneroial 177 5,30 397,261
ledastrial - -
81 13 0.45 14,609 13.66 - 14.62 0.96
OtbllPeakl 17 0.61 51 .902 19.15
12,66
- 20.50 1.34
0.89
0.91
1,33
0.86
1.33
-
B1b)lOff-Pea) 112 3.97 - - 13,55
82
62- TOO Peak)
52-IOU (Otf.peak(
B3-I2U(Pqk)._.___ __1c_._9 83TOUjOtr.ppy)
94 -101 (Peak) .
- 40 1.44
521
10,021
440 12.99 440
440
440
420
13.90
20,32
13.15
20,32
440
440
420
18.99
12.29
18.99
249
282
-
9.88
10.02
-
-
24
6_2_ -.
-- ------- 420
-
, 03.04 __-
54 -TOO ioro-peak) - -
Ternoorari 0 0.01 17.11 - 08.31 1.20
Total Industriol 729 25.96 77,365 -
Bulk - 0108 Supply at 400 Volts-v0,to 5k/u - -
- 30 14.16
73.49
- -
15,15 0.90
440
440
420
420
11)5) Supply at 000 Volts -e'rxeenrngo 920 -- Time 0)0cc TOO) - Peas
lime000selTOUl-Off-Peok 3
- 1
-
2.22
5
- -
440 14,43
20.32
13.26
0.94
1.33
............. 440
16.99
12,49
13.29
440
440
420 -
tO
0.39 0.87
TirriextjseilOUl -Peak .
20.32 _. - -
1.33
0.85
-
3,36 . 18.99 420
420 TimnorUselTOUl-Orr-Pnar
Time of Use (TOO) - Peak
Time of Use ITOUl - OR-Peek
33 119 40
................
420 12.29 13,15
- .'.
-
-
. . ------------- -
Tetal Sinqle Point Supply 47 1.66 152 - -
Agricultural Tube-wells - Tariff D - - ctsoarp - - - 481 14.66 - 15.69 1.03
0.96
1.34
D2 (Ts952) 21 0.73 5,216 200 13.66 200 14.62 -
O2.52l- Sub - 11.725 - - - . -
Dt!Jit5( Peek 14 0.49 .P_ 200 12.36
- ....-
200
200
...............................----.
20.50 -
D-18(45(ORPeek
D.1B)50,51,53(TPeqe
92 3.27 35.219 13.23 7
-- ......
-
- -
.....---.-. -
-............--
-- ..-- ..-.-
........._,:
--.--.
-
-----------------___ -----------------
-----------------------
- .....................................................-. -
--------- --
-----
-
0-rB) TtrPes ._ D-1B(S051,53jTPn9k-SIJB - 0-16 50.5) 53) TOO Peak-SOB
i6(54LT Peak - 0-rB 1041 T Cr1 Peax-)
C-lB 1541 TOO Peali-2
-----------------------------------
- -
- -
-
-
-
-
-
-
-
-
Iota) Agtrculturel 126 4.49 52,642 -
Public Li9htirr1G - 2
0
0,07 620 13.53 - 14.48 0.95
Residential Colonies 14 0.01 16 13,66 - - 04,62 0.56
Special Contracts. Tariff 9)4.29) - - 15 - 400 14,18 400 15,17 0.99
Time of Use (TOUl - Peak 13 0,46 - 400 18,97 400 20,30 1,33
0.95 Time of Us9,)TOUl -Ott-Peak 53 1.68 - - - - - 400 13,72 450 14.68
Raitwa0Tracr,onTraotion -1 - - - - - -
General Senuines 33 1,16 21,940 15,02 - 16,07 1,05
GnandTotel 2,010 100,00 3903,735 1,200 1,200,00 -
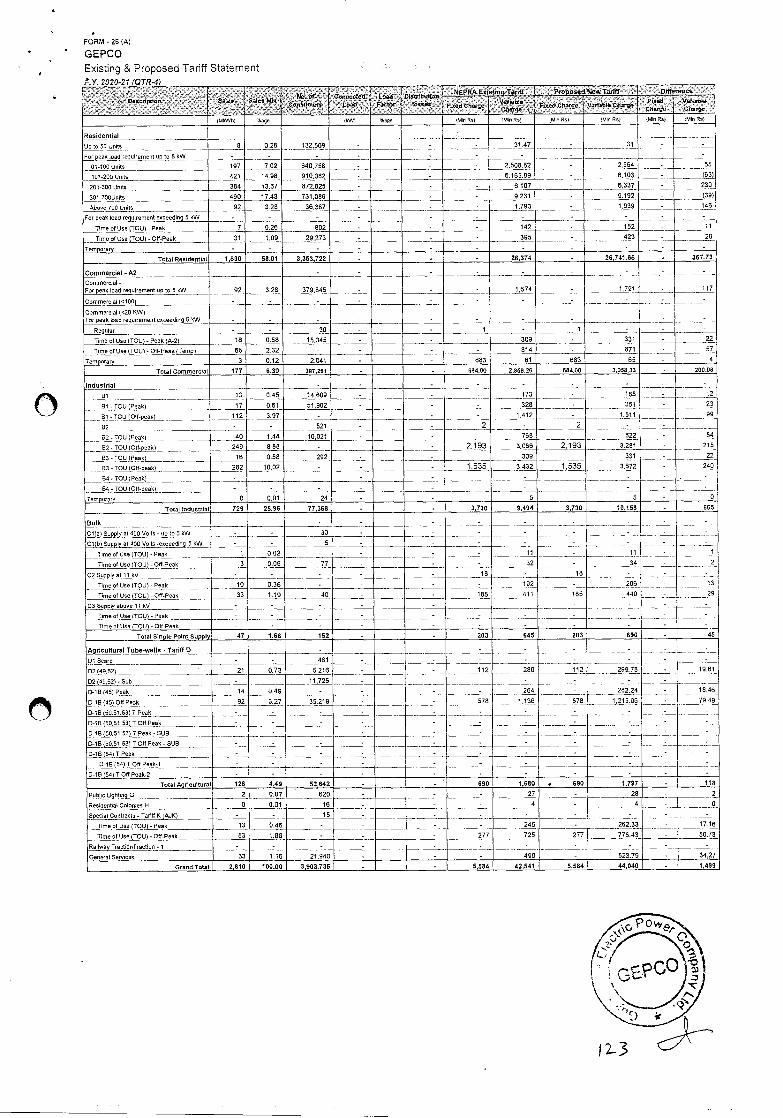
FORM - 26(A)
GEPCO Existing & Proposed Tariff Statement
0 N Opel .4 Sal Mm N of
, Comm d Load
P0090
NEPRAE sogTantf P eposedffteucTanff DfIercac S
I- 04ff, 01mg F ndCk g Il aM Chae
in d '5 Se'
Va ada SIr cc
(00,50) Sage (777 Soon lOin nO win Rsi Mm PSI lOIn Os) I Mm os> lOin Rem
Residential -
-
31.47 -
-
31
-
- pSO units 8 0.28 132,509 - -
7peak load inquirernent up to 5kW - - - - - - -
Dc-lao units 197 7.02 640,758 - - - 2.508,82 - 2,564 - -
-
- 55
(63) -
101.200 Units 421 14.98 910.082 - - - 6,165.89 - 6.103
201-300 UnitS 384 13.67 872,825 . - 6.107 - 6,337 - 230
301-7000ri1s 490 17.43 731,086 - . 9,231 . 9,192 - (39)
Above 700 Units 92 3.28 36,387 - - - 1,793 . 1,939 - 146
For peak load nequirerrrent conceding 5 kW - - - - - - - - - - -
Tlrnne otUse (TO))) - Peak 7 0.26 802 - - - 142 - 152 - ii
Time at Use (Tout - 0ff-Peak 31 1.09 29,273 - - - 395 - 423 - 28
Temoonany - - - - - - - - - - - -
Total Residential 1,630 58.01 3,383,722 - - 26,374 - 26,741.85 . 367.73
Commercial - A2 - - - - - - - - - Commercial- Fon peak load requirement upto 5kW 92 3.28 379,845 - - - 1,674 - 1.781 - 117
Commercial (01051 - - . - - - - - -
-
-
_
-
-
- - -
- Commercial (v20 (OW) For paak load requjrernonteoceodirrg 8 kW - - - _ . - -
Regular - . 30 - - 1 - I - -
Time of Use )TOU)- Peak )A-2) 16 0.58 15,345 - - - 309 - 331 - 22
Timent0so(TOLI)-Ott-Peak)Temp) 65 2.32 - - - - 814 - 871 - 57
Temporary 3 0.12 - 2.041 - - 683 61 683 65 - 4
Total Coesecercial 177 6.30 397.261 - - 664.00 2,858.26 684.00 3,058.33 - 200.08
Industrial - - - - - - . -
81 13 0.45 14,609 - - - 173 185 - 12
0t.TOO),Pea) 17 0.61 51,902 - - - 328 351 -
-
23
99 P1-To 1(08-peak) 112 3.97 - - - - 1.412 1,511
52 - - 521 . - 2 - 2 - -
84.TOUo))eelrl 40 1.44 10,021 - - 768 822 -
-
54
215 82-TOO (On-peakl 249 8.88 - - - 2,193 3.066 2.193 3.281
83-TOO lPeak( 16 0.58 292 - - 309 331 - 22
83-TOO 10ff-cook) 282 - 10.02 - - - 1,535 3432 1,535 3.672
-
- 245
84- TOO IPpyk) - - - - - -
-
- -
- -
84-TOO >08-peak) - - - - - - -
Temporonv 0 0.01 24 - - 5 5 - S
Total Industrial 729 25.96 77,368 - . 3,730 9.494 3,730 10,158 - 665
Bulk - - - - - - -
- -
-
- 400 Volts - up toO kW - - 30 - - - - - -
01(b) Supply at 400 Vol5 .oxcnq))n 5kW - - 5 - - - - - -
Time of Use TOO) - Peak 1 0.02 - - - - 11 - 11
Time of 050 (TOO) - OR-Peak 3 0.09 77 - - - 32 - 34 2
02 Supoly at It kV - - - - - 18 - 18 - -
TmmeofOseLToO).Peok 10 0.36 - - - - 192 - 206 13
29
-
Timed Use(TOU) -off.Peok 33 1.19 40 - - 185 411
-
185 440
- 03 Supply above 11 kV - - - - - - -
Time otUse (TOO) - Peak - - - - - - - - - -
Time ot 0cc (TOO) - 08-Peak - - - - - - - - - -
Total Single Point Supply 47 1.66 152 - - 203 645 203 090 - 45
Agricultural Tube-wells - Tariff 0 - - - - - - -
- -
-
- -
-
- - 19.61
-
Dl 50an8 - - 481 - - - -
02L49,52( - 21 0.73 5,216 - - 112 290 112 299.78
02)49,52)-Sub - 11,725 - - -
-
- - - -
0-18(45) Peak 14 0.49 - - -
-
264 - - 282,24
-
-
---------- 18,46
7949 0-t))5)00Feak 92 3.27 35,219 - 578 1.136
- ----
576 1,215.06
D-1B(5C.S1,S3)jeak - - - - -. -
--------- - --
D.j))J0.51,S) TOO Peak - - - - -
-
- - - - - - D-lB (50,51,83(7 Peek - SOB - - - - - - -
-
- - -
0-18)50,51.53) TOIl Peak - SOS - -
- - - - - - - -
-
-
- 0-1B)54)T Peak - - - - - - - - -
0-10 (54) TOO Paak-1 - - - - - - - - - - -
D-18)54)T00Peak-2 - - - - - - - - - - -
Total Agricultural 126 4.49 52,642 - - . ' 690 1,080 • 690 5,797 - 118
Publmo Lrg)inq 0 2 0.07 020 - - - 27 - 20 - 2
Residen5al Colonies H 0 5.01 10 - - - 4 - 4 - 0
Spevrai Coetradts - Tarm0 K (P0K) - - 15 - - - - - - -
Time of Use (TOU) - Peak 13 0.46 - - - - 245 - 262.33 - 17.16
Time 010cc (TOO) - 00-Peak 53 1.08 - - - 277 725 277 775.43 - 50.73
Railway Tract)onTnactlon - 1 - - - - - - - - - -
General Services 33 1.16 21,940 - - - 490 - 523.79 - 34.27
tsraedT010l 2,810 100.00 3,903,735 - - 5,584 42,541 5,584 44,040 - 1,499
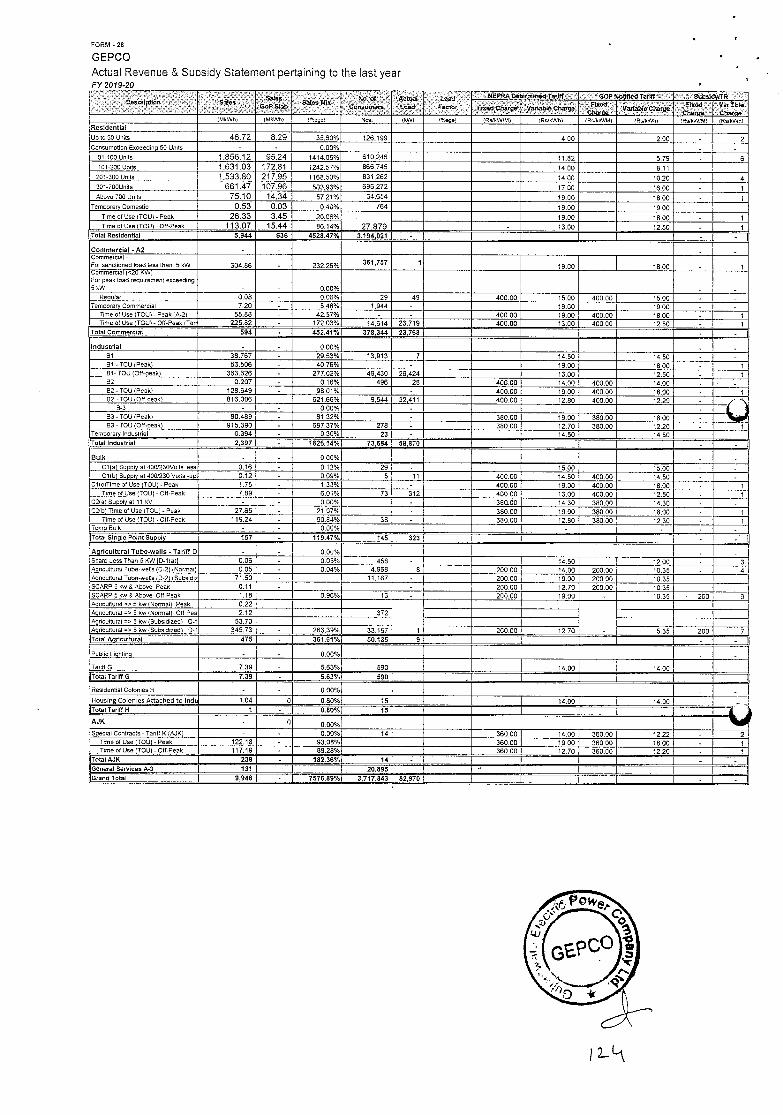
FORM - 28
GEPCO
Actual Revenue & Subsidy Statement pertaining to the last year FY 2019-20
Des P6 Sates Sates
0 P SI 6 -
Sole N 0 lie, of
C e Actual L 4
Loud NEPRA Demtmined Tariff GOP Notified Tofu Subsldrifl,,, ed V SI F F ued c a go v iot coo go
Fed varmto coo go
IMkWI'.I IMkWhI (%o<e' r40< kArl 'own' (95kW/MI RolkWhl lec/kWlMl (R5kWhl p51kW/MI I leo/kWh Residential Upto50lJn0o 46.72 8.29 35.60% 126,199 4.00 2.00 - 2 Corrsurnoticn 000eed/nq 50 Urots - - 0.00% - -
ol-ecounts 1,856.12 95.24 1414.05% 610.246 11.82 5.79 ' 6 101-200 Unto 1,631.03 172.81 1242.57% 866.745 14.00 8.11 201-300 unIts 1,533.80 217.95 1168.50% 831.262 1400 10.20 - 4 301-bOUnds 661.47 107.96 503.93% 696,272 17.00 16.00 - 1 AbOve 700 Urros 75.10 14.34 57.21% 34,654 19.00 18.00 1
Tenreoraryooerestic 0.53 0.03 0.40% 764 19.00 19.00 TinreotUse)TOU)-Peak 26.33 3.45 20.06%
27,879 - 19.00 18.00 - 1
TnneolUoe(TOUl-Otf-Peak 113.07 15.44 86.14% - 13.00 12,50 - 1 Total RecidesBol 5,944 636 4528,47% 3,194,021 - - - I Commercial - A2 - - - -
For sa0000ned load less than 5kW 304.86 - 232.26% 361,757 1 19.00 18.00 - 1
CommercIal (<20 1kW) For peak load requrement 0000eding 5kW - - 0.00% - -
RequIem 0.08 - 006% 29 49 400.00 15.00 400.00 15.00 - - Terrrporary Commercial 7.20 - 5.48% 1,944 - 19.00 19.00 - -
Time 01 lice IOU) - Peak IA-21 55.88 - 42.57% - - 400 00 19.00 400,00 18.00 - 1 Time 011.100 TOUI- Off-Peak lTerrf 225.82 - 172.03% 14,614 23.719 400.00 13.00 400.00 12.50 - 1
Total Coemerercial 594 - 452.41% 378,344 23.708 - -
Industrial - - 0.00% - - 81 38.767 - 29.53% 13,913 7 14.50 14.50 - - 81-IOU (Peak) 53.506 - 40.76% - 19.00 18.00 - 1 81-TOU lOft-peak) 363.626 - 277.02% 49,430 26.424 13.00 12.50 - 1 82 0.207 - 0.16% 496 20 400.00 14.00 400.00 14.00 - - 02. TOU Peak) 128.649 - 90.01% - 400.00 19.00 400.00 18.00 - 1 82-101jlOff-oeakl 816.006 - 621.66% 9.544 32,411 400.00 12.80 400.00 12.29 -
8-3 - . 0.00% - - 93-IOU (Peakl 80.489 - 61.32% - 380.00 19.00 390.00 18.00 - 83-IOU )011-neak) 915.390 - 687.37% 278 - 380.00 12.70 380.00 12.20 - 1
Terrroorary Industrial 0.394 - 0.30%, 23 - 14.50 14.50 Total Industrial 2,387 - 1826.14% 73,684 58,870 I I - - Bulk - - 0.00% -
C1(a) SupPly at400l23oVotto lesS 0.16 - 0.12% 29 - 15.00 15,00 - - ClIb) Supplo 01400030 Volls -0th 0.12 - 0.09% 5 11 400.00 14.50 400.00 14.80 -
CilolTirne <fUse )TOU) - Peak 1.75 - 1.33% - 400.00 19.00 400.00 18.00 - 1 Time of Use ITOUl- Off-Peak 7.59 - 6.01% 73 312 400.00 13.00 400.00 12.50 - 1
l2lal Supply at 11 kV - - 0.00% - 380.00 14.30 380.00 14.30 - C2'b) 'here of Use ITOU) -Peak 27.65 - 21.07% - 380.00 19.00 380.00 18.00 - 1
Tone of Use ITOUl - Off-Peck 119.24 - 90.84% 38 - 300.00 f2.80 380.00 12.30 - Temp Bulk - - 0.00% . . - - Total Sieqie Point Supply 157 - 119.47% 145 323 - -
Agricultural Tube-welts - Tariff 0 - - 0.00% - Scare .eso Than 5 KW)0-llal) 0.06 - 0.06% 458 - 14.50 12.00 - 3 Agncujtural Tube-veIls 0.2) Normal) 0.05 - 0.04% 4,988 8 200.00 14.00 200.00 10.35 - 4 ,hgncultural Tube-cells 1D-2/lSubcithZ 71.50 - 11.107 - 200.00 19.00 200.00 10.35 SCARP 5 Inc 0 Aboue Peak 0.11 - - 200.00 12.70 200.00 10.35 SCARFS kw& A'coue Off Peak 1.18 - 0.90% 13 - 200.00 19.00 - 10.35 200 9 Aqhcultural <=5 Ion lNorrrrcll Peak 0.22
1 -
Aqr/cultural =00 low INorreall Off Pea 2.12 372 Aqncultural 5 low )Suboidizedl 0-1 53.70 Agrioultumal =n5ino)sucridrzedl 0-1 345.73 - 263.39% 33,157 200.00 12.70 5.35 200 7 ITotat Agricultural I 475 I - I 361.B1%j 50.135 I 9 I I I - - Public L/ght/eg - - 0.00%
Tar/ItO 7.39 - 5.63% 590 14.00 1400 Total Tariff G 7.39 - 5.63°/, 590 I I I ResIdentIal Colon/es H - - 0.00%
Hoosing Colonies Attached to mdc 1.04 0 0.80% 15 I 14.00 I 14.00 'Total Tariff H I - 0.80% 15 I I I AJK - 0 0.00% Spec/al Contracts-Tantflk (AJK) - - 0.00% 14 360.00 14.00 300.00 12.22 - 2
Time of USe )T0Ul- Peak 122.18 - 93.00% 360.00 19.00 360.00 18.00 - Time 01 Use (TOW-Oft-Peak 117.19 - 09.28% 360.00 12.70 360.00 12.20 -
Total AJK 239 - 182.36% 14 - I - - I General Seroices A-3 131 20,895 - I I Grand Total 9,946 - 7576.89% 3,717,843 02,970 I I I - - I
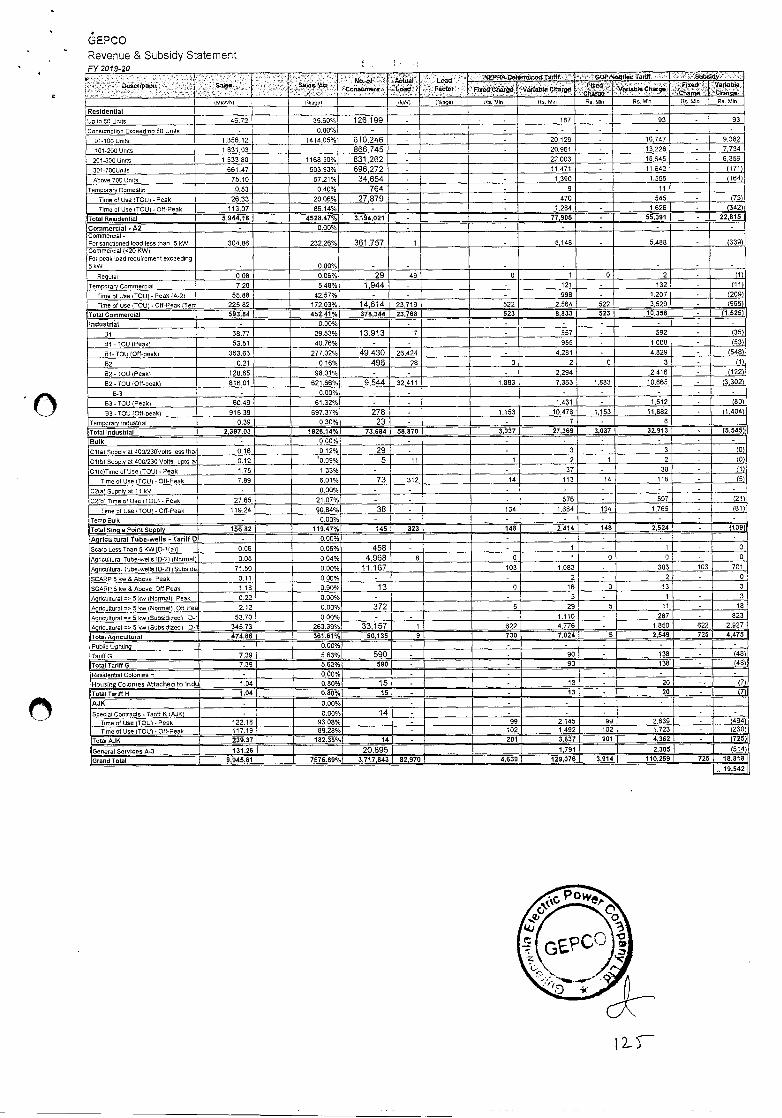
GEPCO Revenue & Subsidy Statement
• . . ..
0 r Pu . .
S. eS
. "' '' . . .
Sales 'to 't "v 5 en
Aoeei ...' Load
L•' ...'NEPRA '' Tariff..' ". '. GOP.Bek6edTarlff .' '.' Sab'dy
F eeoC Fx d Olsuege r.arenbt 050r50 Va tac ech
(ORPOr) likager IrW) l%age) 95. Sin Ru. Sin Re. Sin Re Site Os. oln Re. Sin
Residential (iOta 50 jorts 46.72 35.60% 126,199 - . - 187 - 93 - 93
Corrsurrrctioe Exceedirin 00 beds - 0.00% - - . - - - - -
ol-lopurirts 1,856,12 1414.05%) 510.246 - . , - 20.129 - 10,747 - 9.382
101-200lJrrrts 1,631,03 566.745 . 20,961 - 13,228 - 7,734
201-330Untte 1.533,80 1168.50% 831,262 - - 22.003 - 15,645 . 6.359
301-700Unrts 661.47 503.93% 696,272 - - 11,471 - 11,642 - (171)
Above 700 Units 75,10 57.21% 34.654 - - 1,390 - 1,555 - (164)
Temporary DomestIc 0,53 0.40% 764 - - 9 - 11
Time of Use ITCU) - Peak 26,33 20.06% 27 879 - - 470 - 545 - (75)
then of Use (TOUI .00-Peak 113.07 86,14% - - - 1,284 - 1,626 - (342)
Total Residential 5,944.18 4528,47% 3,194,021 - - 77,905 - 55,091 - 22,815
Commercial - A2 - 0.00% - - - - - Commercial - For sanctioned load less than 5kW 304,86 232.26% 361,757 1 - 5,148 - 5,408 - (339) Commercial (025KW) For peak toad requirement eoceedlng 56W - 0.00% - - - - - - - -
Regular 0,08 0.06% 29 49 0 1 0 2 - (1)
Teerovrary Coermnercral 7.20 5.48% 1,944 - - 121 - 132 - (11)
Tirrre ot Use (TOUt - Peak 15-21 55.88 42.57% - - - 998 - 1,207 - (209)
Time of Use ITCU) .ott-Pnak (Tern 225.82 172,03% 14,614 23,719 522 2.564 522 3.529 - (965)
Total Commercial 593,84 452,41% 370,344 23,768 523 8,833 523 10.358 - 11,525)1
Industrial - 0,00% - . - - - - -
61 38.77 29.53% 13,913 7 - 557 - 592 - (35)
81 - TOU (Peak) 53,51 40.76% - - - 955 - 1,005 - (53)
Bi.TOU (Oft-peak) 363.63 277,02% 49430 26.424 - 4.281 - 4,829 (540)
02 0.21 0,16% 496 28 0 2 0 3 - (1)
82-TOU Peak) 128.65 98.01% - - - 2.294 - 2,416 - (122)
02-'TOU (Off-peak) 016.01 621.66% 9,544 32.411 1,883 7.363 1,883 10,665 - (3,302)
0-3 - 0.50% - - - - - - - -
93 -TOU (Peaki 80.49 61.32% - - - 1,431 - 1,512 - (80)
33-TOUIOII-ceak) 915.39 697.37% 278 - 1.153 10.470 1.153 11,882 - (1.404)
Terrrporary lodrrstoal 0,39 0,30% 23 - - 7 - 6
Total Industrial 2.397,03 1826.14% 73,684 58,870 3,037 27,369 3,037 338'iT'] ' (5,545(1
Bulk - 0,00% - - - - - - -
CI(a) Sirocly at 400l230Volts lesslhar 0.16 0,12% 29 - - 3 - 3 . (0)
C1(b) SO0L( 01400)230 Volts -upto or 0.12 0.05% 5 ii 1 2 1 2 - (0)
Cllc)Trmne of Use (TOUt- Peak 1.75 1.33% - - - 37 - 38 - (1)
Timeot Use )TClJ( - 011-Peak 789 6.01% 73 312 14 113 14 118 - (5)
C2la( Simply alit kV - 0.00% - - - - - - - -
C2(bl Time of Use ITCUl. Peak 27.65 21.07% - - - 576 - 597 - (21)
TimneotUselTOUi-CII-Peak 11624 90.84% 38 - 134 1,684 134 1.765 - 181)
Teroo 8r95 - 0.00% - - - - - - - -
IlTotat Single Point Supply I 156,82 119.47% 145 323 148 2,414 148 2,524 - I (109)]
Agricultural Tube-wells - Tariff 0 - 0.00% - - - - - - -
Scalp Loss Than 5KW (0-1(a)] ' 0.06 0.05% 458 - - 1 - 1 - 0
Aqricullural Tube-weLls ID-21 (Ncrrrial) 0.05 0.04% 4,968 0 0 1 0 0 - 0
Aqrrcultural Tube-wel)s)D-21 )Subsidrz 71.50 0.00% 11,167 103 1,083 - 383 103 701
SCARP 5 & Above Peak 0.11 5.00% - - 2 - 2 - 0
SCARPbkm&Above Ott Peak 118 0.90% 13 0 16 0 13 - 3
Ayrrcultr.rul 0 5kw Normal) Peak 0,22 0.00% - - S - 1 - 3
.kqocultural=c5 cm (Normal) 00 Pea 2.12 0.00% 372 5 29 5 11 - 18
Agricultural S kwlSubsidizedl 0-1 53,70 0.00% - - - 1,110 - 257 - 823
Agricultural 0 5kw (Subsldrzedl 0-i 345,73 263.39% 33,157 1 622 4.776 - 1.850 622 2.927
Total Agmioultumal 474.66 361,61% 50,135 9 730 7.024 5 2,549 725 4,475j
Public Lr3htir)5 . 0.00% - - - - - -
100110 7.35 5.63% 590 - - 90 - 138 - (48)
Total TariffS 7.39 5.63% 590 - - 90 - 138 - I )48(
Residential Colorves H j - 0.00% - - - . - - -
Housing Colonies Attacked to fodu4 1.04 0,08% 15 - - 13 - 20 -..
Total Tariff H 1 1.04 1 0-80%I 151 - I - 13 I - 20 I - l7)
AJK - 0.00% - - - -
Scecial Contracts - TaoS K rAiKI - 0,00% 14 - - . - - - - Time of Use (TOU1 -Peak 122,18 93.08% - 99 2,145 99 2,639 - (494)
Time of (Jsn ITCh) - Ott-Poalc 117.19 89.28% - 102 1.492 102 1.723 (230)
ITotal AiR I 239.37 I 182.35%) 141 - I 201 1 3,637 I 201 I 4,362 I - I (725)1
Genoral Sorvioes 5-3 131.26 20.895 1,791 2.305 1 (514)
IGman4Total 9945.51 7576,89% 3,717.843 82,970 4,639 129,076 3,914 110,259 7251 18,8131
19,542
i2-
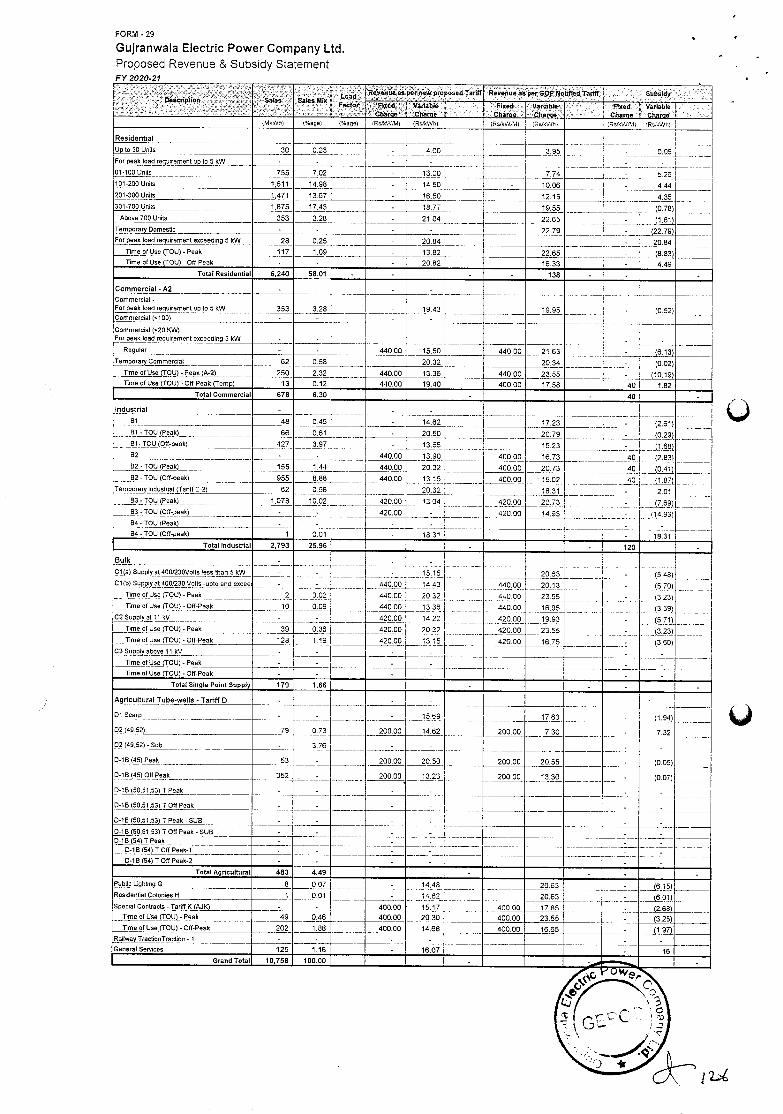
FORM -29
Gujranwala Electric Power Company Ltd.
Proposed Revenue & Subsidy Statement FY 2020-21
0eacnptton
. .' ...
Sales
. ..............
Sales M it Pa tar
Re,erryte as per e w proposed Tariff Revenue as per GOP dot fled Tariff Suborifj
F ped Charge
Van bin Charon
I F ned Charae
Van bIt Charge
Fixed Charge
Ianable Ce
MkWh( aSH %agei RsilsWitaj iR5l iRikWTiul 5o5Whi RsIUSVIM) gsiiWhl
Residential
-
- 9--L--- -- LIp to 50 Units 30 0.25 - 4.00 - 3.95
For peak load requirement up to 5 kW - - - - -
01-100 Units 755 702 - 13.00 7,74 - 5.26
4.44
4.35
101-200 Units 1611 1495 - 14.50 - 10.06
12.15
- 201-300 Units 1471 13.67 - 16.50
301-700 Units 1875 17,43 - 18.77 19.55 - (0.78)
Aboue 700 Units 353 325 - 21.04 22.65 - Temporam0omestic - - - - 22.79 - ,_)22.79) For peak load requirement exceeding 5 kW 28 0.26 - 20.84 - 20.84
Time otUse )TOU)-Peak 117 1.09 - 13.82 22.65 - Time 01 Use (TOU) -06-Peak - - - 20.82 16.33 - 4,49
Total Residential 6,240 58.01 - - - - 138 - -
Commercial - A2 - - -
- (0.52)
Commercial - For peak load requirement up toO kW 353 3.28 - 19.43 19.95 Commercial (0100) - - - -
Commercial 10201014 For peak lead requirement exceeding 5 kW - - - . - -
Regular - - 440.00 15.50 440.00 21,63 - (6.13) Tempyy Commercial 62 0.58 20.32 20.34 - -- _,)O.02)
(10.19) -
Time of Use (IOU) - Peak (A-2) 250 2.32 440.00 13.36 440.00 23.55 - TimeofUsecroU)-off-Peak)Temp) 13 0.12 440.00 19.40 400.00 17.58 40 1.82
Total Commercial 678 6.30 - - 40
Industrial - - -
B1 48 0.45 - 14.62 17.23 - ,,J2.61) 81 -IOU (Peak) 66 0,61 - 20.60 20.79 - ,j0.29) 81- TOU (06-peak) 427 3.97
- -. , -
440.00
13,55
13.50
15.23 82 - 400,00 16.73
- 40 (2.83)
82- IOU (Peak) 155 1.44 440.00 20.32 400,00 20.73 40 (041)1
92-IOU (05-peak) 955 8.88 440.00 13.15 400.00 15.02 40 11.87), Temporary lndustnal llaritfE-21 62 0.58 20.32
420.00
18.31 -
i,,, -
-
2.01 B3- IOU (Peak) 1,078 1002 420.00 1304 20.73 17.69)
(14,93) -
B? - IOU (06-peak) - - 420,00 - 420,00 14.93 84- TOU IPeak) - - - - -
B4 - IOU (05-peak) 1 0.01 - 18.31 - 18.31 Total Industrial 2,793 25,96 - - 120
Bulk -
, , 20.63 - (5,48(
(5.70)
(3.23)
(5.71)
(3.23)
),3.60)
-
-
--(a59)
Cl(a( 5uppiy at 450/230Vnits less than 5kW -
0.02
0.09
440,00
440.00
--- 15
14.43
2032
1336
C1(b(Supplyat400l230Volts-upto and eaceer
TirnnotUse)TC'U)-Penk
'flmeotUse(IOU)-06-Peuk
-
2
10
440.00
440.00
440.00
420.00
420.00
20.13
23.55
, 16.95
19.93
23.55
-
-
-
-
-
440,00
C2Supplyatll kV - 420,00 1422
Time of Use (IOU) - Peak 39 0,36 420.00 20.32
Time 01 Use ITOU)-Ot)-Peak 128 1.19 420.00 13.15 420.00 16.75 C3Suppl,yabnvell kV - - -
Time of Use (IOU) - Peak - - -
Time 01 Use (IOU) - 06-Peak - - - -
Total Single Point Suppty 179 166 - - -
Agricultural Tube-welts - Tariff 0 - - - -
DlScarp - - - 15.59
14,62 200.00
17.63 -...........11.94,)
- 7.32 02 149,52) 79 0.73 200,00 7.30
02 (49,52) - Sub - 3.76 - - -
200.00
- -
0-18 (45) Peak 53 - 200.00 20.50 20.56 - (0.05)
0-18 (45) Off Peak 352 . - 200.00 13.23 200.00 13.30 - -
-
(0.07),
0-lB (50,51,53)1 Peak - - - -
0-lB (50,51,5311 0ff Peak - - - - - - -
0-f B (50,51,53)1 Peak - SUB - - - - - -
0-18(50,51,53) 106 Peak - SUB - - - - - - 0-1B)54)TPeak - - - - - -
D-1B(td)TollPeak-t - - - - - -
0-1 B (54) TOO Peak-? - - - - - -
Total Agricultural 483 4.49 - - -
Public Lighbn9 0 8 007 - 14.48 20.63 - Residenitul Colonies H 1 0.01 - 14,62 20.63 - (6.01) Special Contracts-Tariff l(JAJK( - -
0,46
400.00 ' 15,17 400,00 17.85 - (2.68) Time 01 Use )TOU) - Peak 49 400.00 20.30 400.00 23.55 - (3.26) 'flereofUse(IOU)-Off-Peak 202 1.98 400.00 14.68 400.00 16.65 -
Railway Tracrionlraction - I - - - - - -
Oeneralgervices 125 1.16 - 16.07 - 16 Grand Total 10758 100.00 -
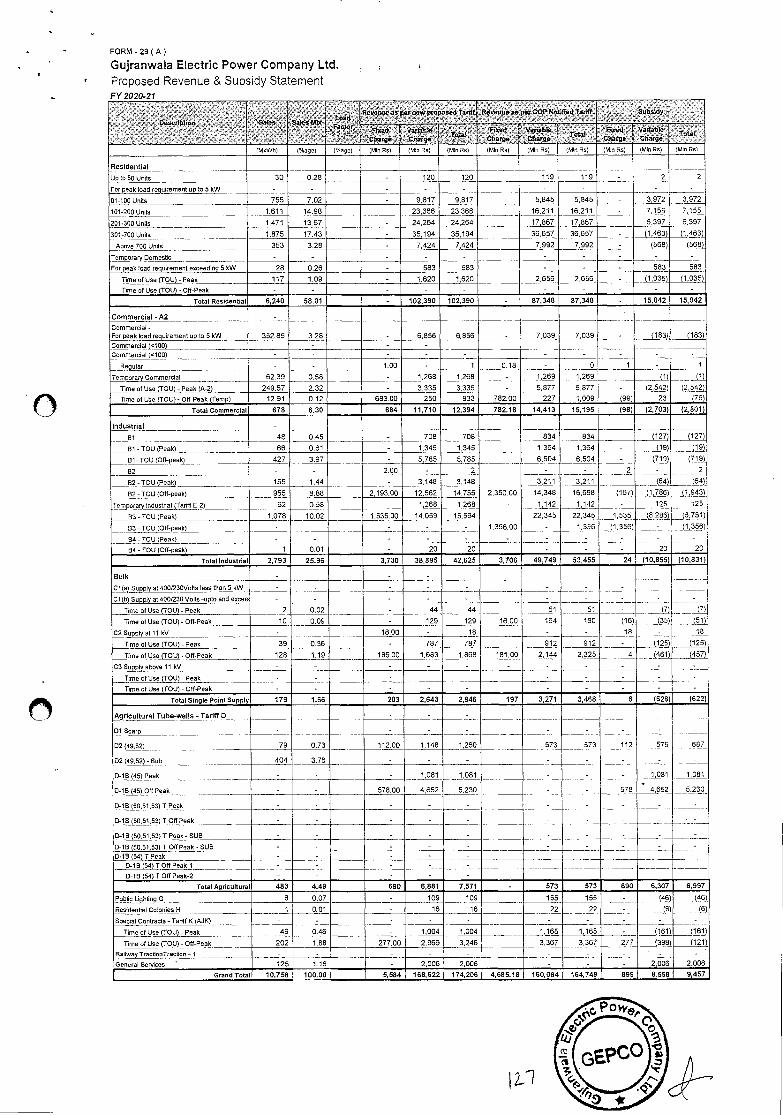
FORM -29) A)
Gujranwala Electric Power Company Ltd.
Proposed Revenue & Subsidy Statement
C p1
• ...
9 von
<,.:. say Mc'
-
L vo as per stew proposed Tacit Revenue as pet GOP Not-bed Tariff Subsidy
L -'Plead'', Charge.
'vianfitble Cfiäre
Total .. Fixed I Cha.
Variable Charge.........:. To FiCesi
Chak Viable Charge
Total
)MkWh) )%age) )%age) Mm Os) (trio Os) (Mm Os) (Mm Os) (Mm Os) (MIn Rn) (Mm Os) 1Mm Os) (Mm Os)
Residential 2 Upto50Unmts 30 0.28 - 120 120 119 119 - 2
For peak toad nequirernenl U 05 kW - - - - - - - - - -
01-100 Units 755 7.02 - 9,817 9,817 5,845 5.845 - 3,972 3,972
101-200Units 1,611 14.98 - 23,366 23,366 16.211 16,211 - 7,155 7,155
201-300Units 1,471 13.67 - 24,264 24,264 17,867 17,867 6,397 6,397
301-700 Units 1,875 17.43 - 35,194 35,194 36,657 36,657 - (1,463) ),4631
Above 700 Units 353 3.28 - 7,424 7,424 7,992 7,992 - (568) (568)
Temporary Domesbc - - - - - - - - - - For peak load requirement eoceeding 5kW 28 0.26 - 583 583 - - - 583 583
TimeotUse(TOU)-Peak 117 1.09 - 1.620 1,620 2,656 2.656 - (1,035) (1,035)
'Once of Use (TOU) - 06-Peak - - - - - - - - - -
Tatal Residential 6,240 58.01 - 102,390 102,390 - 87,348 87,348 - 15,042 15,042
Commercial - A2 -
Commercial - For peak )oad requirement up to 5k59 352.85 3.28 - 6,856 6,856 - 7,039 7,039 - (183) (183) Commercia) (<100) - - - - Commercia) )o100) - - - - - - - - - -
Regu)ar - - 1.00 - 1 0.18 - 0 1 - 1
TemporaryCommerciat 62.39 0.58 - 1.268 1,268 - 1,269 1,269 - ( (1)
Time of Use (TOU) - Peak )A-2) 249.57 2.32 - 3,335 3,335 -
782.00
5,877 5.877 - (2,542) (,542)
(76) Time of Use )TOU)- 00-Peak (Temp) 12.91 0.12 683.00 250 933 227 1,009 (99) 23
Total Cammeruial 678 6.30 684 11,710 12,394 782,18 14,413 15,195 (98) (2,703) (2,801)
Industrial -
BI 48 0.45 - 708 708 834 834 - (127) (127)
81- TOU )Peak) 66 0.61 - 1,345 1,345 1,364 1,364 - J19( (1!) 81-TOU )off-peak) - 427 3.97 - 5,785 5,785 6,604 6,504 - 719) (719)
2
)64) 82 - - . - 2.00 - 2
3,148
2,360.00
-
1,356.00
-
- 2
. -
-
(4) 82-TOU)Peak) 155 1.44 - 3.148 3,211 3,211
B2-TOU)00-peafi) 955 8.88 2,193.00 12,502 14,755 14,348 16,698 )157j _,(,786) (1,943)
Temporary Industrial )Taniff P.2) 62 0.58 - 1,268 1,268 1,142 1,142 - 125
(8,286)
-
- 20
125
(6,7 11 (1,356)
- 20
B3-TOU )Peak) 1,078 10.02 1,535.00 14,059
-
22,345
1,356
1,535
(1,356)
- -
B3-TOU)Off-peak) - - - -
84- TOU )Peak) - - - - - - -
- - 84- TOU 10ff-peek) 1 0.01 - 20 20
Totaltedostrial 2,793 25.96 3,730 38,895 42,625 3,706 49,749 53,455 24 (10,855) (10,831)
Bulk - - -
- - C,)5) Supply at 400)230 Volts coo than 5 kW - - - - - - . -
Ct )b) Supply at 400/230 Volts -opto and eoceen - - - - - - - . - (7)
. (.i(
Time olUse (TOU) - Peak 2 0.02 - 44 44 51 51 - (7)
Time elUse )TOU) - 0ff-Peak 10 0.00 - 129 129 16.00 104 180 (16) (35)
C2Suppiyatl1 kV - - 18.00 - 18 - - 18 - 18
Time olUne )TOU( - Peak 39 0.36 - 787 797 912 912 - )12) (125)
limeofUoe(T0tM.off-Peak 128 1.19 185.00 1,683 1,868 181.00 2,144 2,325 4 k461) L4.511
C3 Supply above 11 kV - - - - - - - - - - -
- Time of Use (TOU) - Peak - - - - - . - - -
lime of Use (TOLl) - Off-Peak - - - - - - - - - -
Tetal Single Paint Supply 179 1.66 203 2,643 2,846 197 3,271 3,468 6 (628) (622)
gricultural Tube-wells - Tariff 0 - - - -
- - -
• 75
-
687
OlScarp - - - - - -
02)49,52) 79 0.73 112.00 1,148 1,260 573 573 112
02)49,52) - Sub 404 3.76 - - - - - - - -
D-IB)45( Peak . - - - 1,081 1,081 - - - 1,081
4,652
1,081
5,230 0-lB )45) Off Peak - - 578.00 4,652 5,230 - - 578
0-19 )50,51 53) T Peak - - - - - - - - - -
0-lB (50,51,53)708 Peak - - - - - - - - - . -
- D-16 (50,91,53) T Peak - SUB - - - - - - - - -
D-IB)50,sf,53)T Off Peak-SUB - - - - - - - - - - 0-1B(54)TPeak - - - - -
0-18)54)700 Peak-i - - - - -
D-1 B (54) TOO Peak-2 - - - - -
TatatAgricaBorat 483 449 690 6,881 7,571 - 573 573 690 6,307 6,997
PobFc,(yhiog 0 8 0,07 - 109 109 155 155 - J) (46,(
Residen5a) Colonies H 1 0,01 - 16 16 22 22 - ) (6)
Special Contracts - Tariff K )AJK) - - - - - - - - - - (181) lime otUse (TOU) - Peak 49 0.46 - 1,004 1,004 1,165 1,165 - (161)
TirjreolUoe)TOU)-00-Pnak 202 1.88 277,00 2,969 3,246 3,367 3.367 277 (396) (121)
Railmay Trao500Trac0on -1 - - - - - - - - . - -
General Services - 125 1.16 - 2,006 2,006 - - - 2,006 2,006
GrandTotat 10,758 100,00 5,584 168,822 174,206 4,688,18 160,064 164,749 898 8,508 9,487
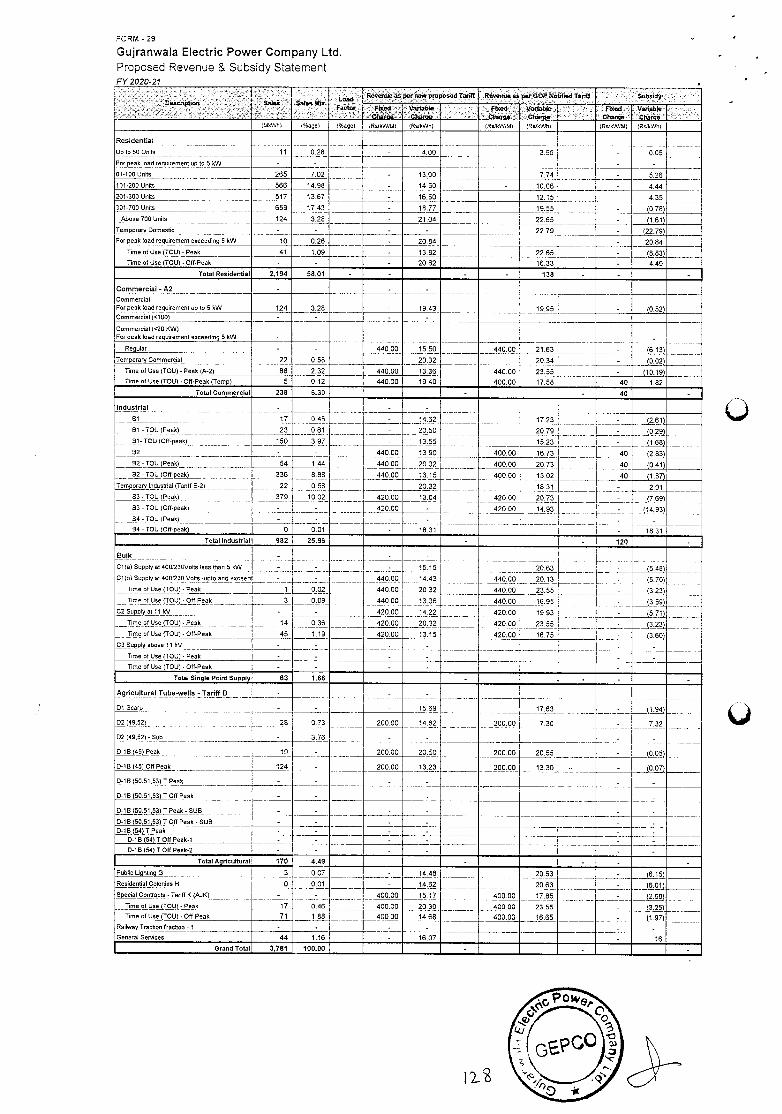
FORM -29
Gujranwala Electric Power Company Ltd.
Proposed Revenue & Subsidy Statement FY 2020-21
0 pUon
- .
Salau S to Uric
- -
I. B ammo per ow prupovod Tmdf Reeenrm pa GOP Notrfl d boB S 8 r8y
- '' Freed
Cboroo' Vanaoao Cbaee
Fr*od chorine
V nable Chime '
Freed Chnto
V nte Cborrte
lMkWhl Iffagel l%agel igsjirWig( lgsilrWh) 1051kW/MI lRsiIrWhl (5r/kW/ Ml lRs,kWb/
Residential
11 0.25 Up to 50 Units - 4.00 3.95 - 0.05
For peak load requirement up to 5 kW - - - - - -
01-too Units 265 7.02 - 13.00 7.74 - 5.26
101-200 Units 566 14.98 - 14.50 - 10.06 - 4.44
201-300 Units 517 13.67 - 16.50 12.15 4.35 301-700 Ueits 659 17.43 - 18.77 19.55 - (0.78)
Above 700 Units 124 3.28 - 21.04 22.65 - (1.61) Temporary Domestic - - - - 22.79 - (22.79) For peak load requirement eooeeding 5 kW 10 0.26 - 20.84 - 20.84
Trme of Use (TCU) - Peak 41 1.09 - 13.82 22.65 - (p83J Time of Use )TOU) - Off-Peak - - - 20.82 16.33 - 4.49
Total Residential 2,194 58.01 - - - - 138 - -
Commercial - A2 - - -
Commercial - For peak load requirnment up to 5kW 124 3.28 - 19.43 19.95 - (0.52) Commeroiol (0105) - - - -
Commeccial (<351(W) For poak load requirement naoeedrng 5 kW - - - -
Regular - - 440.00 15.50 440.00 21 63 - (6.13)
Temporary Commercial 22 0.58 20.32 20.34 - (0.02) limeotUse(TOU)-Poak(A-2) 88 2.32 440.00 13.36 440.00 23.55 - (10.19) Time otUne )TOU) -Oft-Peak )Temp) 5 0.12 440,00 1940 400.00 17,58 40 1.82
Total Commercial 238 6.30 - - 40
Industrial -
0.45
- -
St 17 - 14.62 17.23 -
-
-
)2.61L
(p.29)
11.68)
81 - TOU (Peak) 23 0.61 - 20.50 20 79 - SI- TOU 108-peak) 150 3.97 - 13.55 15,23
82 , - - 440.00 13.90 400,00 16.73 40 J7) 80-IOU (Peak) 54 1.44 440.00 20.32 400.00 20.73 40 (0.41)
- 82- IOU (0ff-peak) 336 8.86 440.00 13.15 400.00 15.02 40 (1.87) ,ypypurary lndr,snlal (Tariff E-2)
83 -TOU (Peak)
22 0.53 2032 18.31 - 2.01 379 1002 420.00 13.04 420.00 20.73 - (7.69)
33-IOU 1ff-peak) - - 420.00 - 420.00 14.93 ' - -
_J14.93) - 04 - IOU (Peak) - - - -
84- IOU (Ott-peak) 0 001 - 18.31 - 18.31 Total lndastr'ial 982 25.96 - - 120
Balk
Ct(a) Supply at 400I230Volto less than 5kW
-
- -
- -
2063 - 15.48) - 15.15
Ct)b) Supply at 400:230 Volts -upto and neceen - -
0.02
440.00
440.00
14.43
20.32
440.00
440,00
20.13 -
- (3.23) ToneofUse)IOU)-Peak 1 23.55
'flme of Use çl'OU)-Off-Peak 3 0.09 440.00 13.36,
14 22
20.32
440,00 16.95 -
-
(p59), C2 Suppip art I kV - - 420.00
420.00
420.00 19 93 Timo of Use (TOp) - Peak 14 0.36 420.00 23 55 - 'flme of Use )TOU) - 0ff-Peak 45 1,19 420.00 13.15 420.00 16.75 - )3.6(p
C3 Supply above 11 by - - - - - -
lime of Use ITOU) - Peak - - - - - -
lime of Use (TOO) - 09-Peak - - - - - -
Total Single Point Supply 63 1.66 - - -
Agricultural Tuba-welts - Tariff 0 - -
-
-
1569 17.63 - (),) Dl Scary - -
D2 (49.52) ,
02 (49.62)- Sub
28
-
0.73
3.76
200.00 14.62 200.00 7.30 -
-
7.32
- - -
D-1B (45) Peak 19
124
-
-
200.00 20.50 200.00 20.55 - )05)
D-1B(45)O9Peak 200.00 13.23 200.00 13.30 .. - (0.07)
D-1B (50,5r,53( I Pnak - - - - - -
0-16)50.51,53) T 09 Peak - - - - - -
0-IS (50,51,53)1 Peak - SUB - - - - - -
0-tB )55.51,53) TOP Peak - SUB - - - - - - D-tB(54)TPnak - - - - - -
D-IB)54)TOttPeak-t - - - - - -
D-1B)54)TO6Peak-2 - - - - - -
Total Agrrouttura! 170 4.49 - - -
Public UghFn,(p 3 0.07 - 14 48 20.53 - (6.l Residenbel Colonies H 0 0.01 - 14.62 20.63 - (6.01) Special Contracts -Tariff lit )AJK) -
17
-
0.46
-- 400.00
400.00
15 17
20.30
400.00
400.00
17.85
23.55
- (2.68) 'Time olUsa(l'OU)-Peak - - 1imeotUsçTOU)-O9.Peak 71 1.88 400.00 1468 400.00 16.65 -
Raiknay Truo6oaTrac5on - f - - - - - -
General Serorces 44 1.16 - 16.07 - 16 Grand Total 3,781 100,00 - -
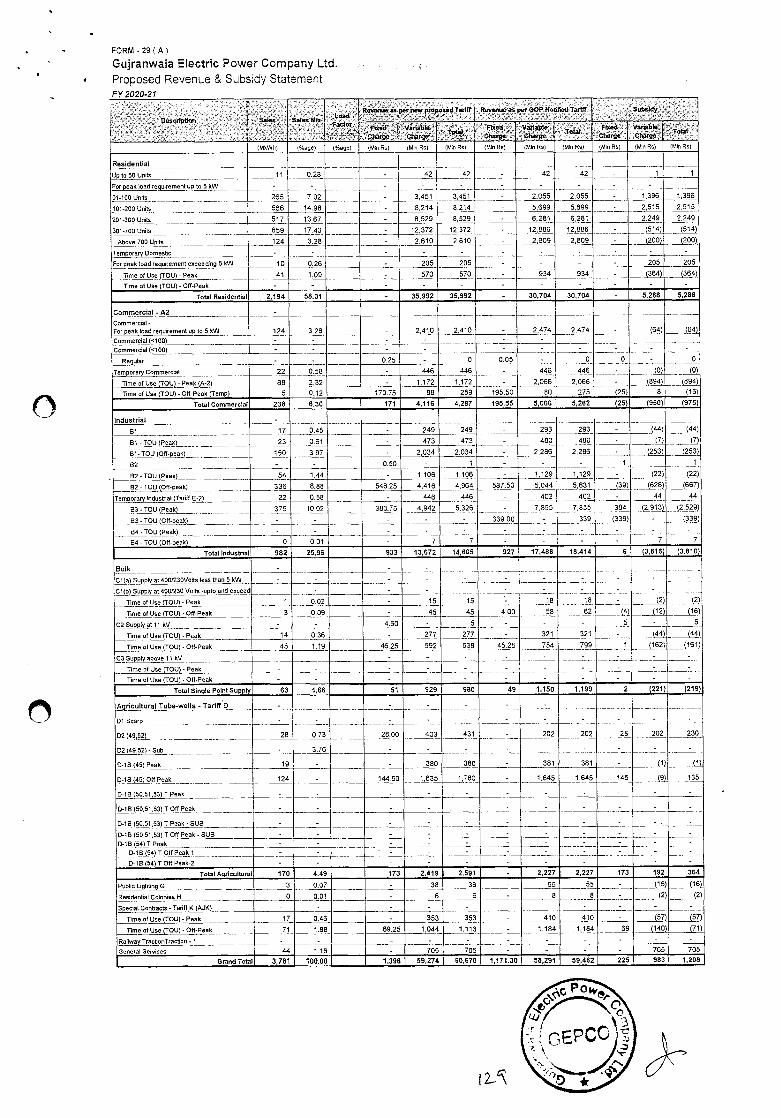
FORM - 29 1 A)
Gujranwala Electric Power Company Ltd.
Proposed Revenue & Subsidy Statement
- - - H
Lea Revenue as per new po pot di eaR Rer..000 at per GOP Notabed TardO Sub dy
Factor , Fiend iTharge
- Variable ctrare
- ,, Fined otsarge
Veelable Claargrr
Fixed' ciserge
Vorioble. cloarge
- Total
)MkWh) %oge) (Rage) (Mitt Ru) (Mitt Ru) (Mi, Rs) (MO Ru) (Mm Ru) (MM Ru) (Mm Ru) (Mm Ru) )M)n Rs)
Residential
42 Up r050 UnOs - 11 - 0.28 - 42 - 42 42 - 1 1
For peek load requirement up to 5 kW - - - - - - - - - - -
91-I00iJn0s 265 7.02 - 3451 3,451 - 2055 2,055
5,699
-
-
1,396
2,5)5
1.396
2,515 101-200 Units - 566 14,98 - 8,214 5,214 - 5,699
201-300 Unto 517 13.67 - 8,529 8,529 - 6,281 6.281 2,249 2,249
301-700 Units 959 17,43
3.28
- 12,372 12,372 - 12,886 12,896 - (514) (514)
Aboue 700 Undo 124 - 2,610 2,610 - 2,509 2,509 - (200) (20
Temporary Domes5c - - - - - - - - - - -
For peek toad requirenrent exceeding 5kW 10 0.26 - 205 205 - - - - 205 205
Time of Use (TOLl) - Peak 41 1.09 - 570 570 - 934 934 - (364) (264)
- 'note of Use (TOU) - Ott-Peek - - - - - - - - - -
Total Reoiderrtial 2194 58,01 - 35,992 35,992 - 30,704 30,704 - 5,288 5,288
Commercial - A2 -
(64) Commercial - For peak load requirement up to 5kW 124 3.28 - 2,410 2,410 - 2,474 2,474 - (6
Commercial (nloo( - - - - - - Commercial (<100) - - - - - - - - - - -
Regdiar - - 0.25 - 0 0.05 - 0
2.066
275
446446
0
-
-
-
(0)
0
(2) Tomporary Commercial 22 0.58 - 446 446 -
- 2,066 Time of Use (TOLl) - Peak(A-2( - 08 2.32 - 1,172 1,172 (894) (094)
Time xl Use (IOU) - Off-Peak (Temp) 5 0,12 170.75 08 250 195.50 80 (25) 5 (16)
Tatal Commercial 238 6,30 171 4,116 4,287 195.55 5,068 5,262 (25) (950) (975)
ledustrial -
0,45 249 - 293 BI 17 - 249 293 - J44) )
01 - IOU (Peak) - 23 0.61 - 473 473 - 450 480 - (7) (7) 01-TOU)Off-peak) 150 3.97 - 2,034 2.034 - 2,206 2,286 - )2) (253)
82 - - 0.50 - 1 - - - 1,129 - (22) (22) 62-TOU(Peak) 54 1.44 - 1,106 1.106 - 1,129
62 -TOU (Ott-peak) 336 8.88 548.25 4,416 4,964 587.50 5,044 5,631(39)
- Temporary)ndosmal(TariltE-2) 22 0.55 - 446 446 - 402 402 44 44
93-TOU (Peak) 379 10.02 383.75 4,942 5326
- 339.00 - 339
-
__..
...._@.?.)
- .... -
- (339)
7
53-IOU (Off-peak( - - - -
04-TOU(PeekL.,,, - . - - - '. . ' -- - 7 B4 - IOU (OR-peek) 0 0,01 - 7 7 - - -
Total Industrial 982 25,96 933 13,672 14,605 927 17,488 18,414 6 (3,616) (3,810)
Bulk - - -
- - - , -
- -
-
-
-
-
- (2J
C1)a) Supply at 400l230VOlts lesu then 5 ktfd - - - -
01(b) Supply at 400)230 Vo0u,j)pto end exceed -
1
- - - -.. 15
- -
15 .---. .. -
-- 82
Time of Use (TOU) - Pnak 0.02 - 15 - 22(
Time cl Use lTOU) - OR-Peak 3 0.09 - 45 45 4,00 58 (4)
S
(12) 116)
02 Supply at It kV - - 4.50 - 5
277
- - - - 5 . . -.
Time of Use (TOU( - Peak .
14 0.36 - 277 - 321 321 - (44) (44)
IimeotUse(TOU)-Off-Peak 45 1.19 46.25 592 638 45.25 754 799 1 j162)
-
)(2.)) - C3 Supply above 11 tV - - - - - - - - -
Time ol Use (IOU) - Peak - ' - - -
-
-
-
-
-
-
-
-
-
-
-
-
- Time of Use (IOU) - OR-Peak - - - -
Total Single PeintSupplp 63 1.66 51 929 980 49 1,150 1,199 2 (221) (219)
Ag1iculturaITube-wells-TarifffD -
-
0.73
.._._.__:__
- , .
431
.... .,_
- -
_. ..-
-
._,. -------
-
28
-
202
-
230
OtScarp -
D2 (49,521 28 25,00 403 - 202 202
02)49,52) - Sub . - 3.76 - - - - - - -
-
-
(1)
-
0-lB (45) Peak 19 - - 350 380 - 381 381 )7,)
lD-18(45(Of)Peak 124 - 144,50 1,635 1,750 - 1,645 1,645
-
145 - (9J 135
- 0-tB (50.51,53)1 Pnak - - . - - ' - - - -
0-tB (50,51,53) TOP Peak - - - - . - - - - - - -
0-to (55.51.53)1 Peak - SUB - - - - - - - - - -
- D-tB (50.5153) I Ott Peak - SUB - - - - - - - - -
- 0-tB(24(TPeak - . - - - -
- - - - - -
0-f B (54) T Off Peak-I - - . - - - - - -
-
- -
D-tB(54(TOffPeak-2 - - - - - - , - - -
TotalAgxicultural 170 4,49 173 2,419 2,591 - 2,227 2,227 173 192 364
Pubic Ug)y)(59G 3 0.07 - 38 38 - 55 55 - (16) 11) - --
Residenbal Colanres H 0 5,01 - 6 6 - 8 8 -
-
(2)
-
(2)
- Special Conoacts - TariR K (AJK) - - - - - - - -
Time of Use (TOl.l( Peak 17 0.46 - 353 353 - 415 410 - (57) (57)
Time of Use (TOU(-Off-Peak 71 1.55 69.25 1,044 1,113 - 1,184 1,184 69 (140) (71)
Ralway Trecbonlracrian - I - - - - - - - - - -
Genaral Sernicas 44 1.16 - 705 705 - - - - 705 705
Grandiofal 3,781 100.00 1,396 59,274 60,670 1,171.30 58,291 59,462 225 983 1,208
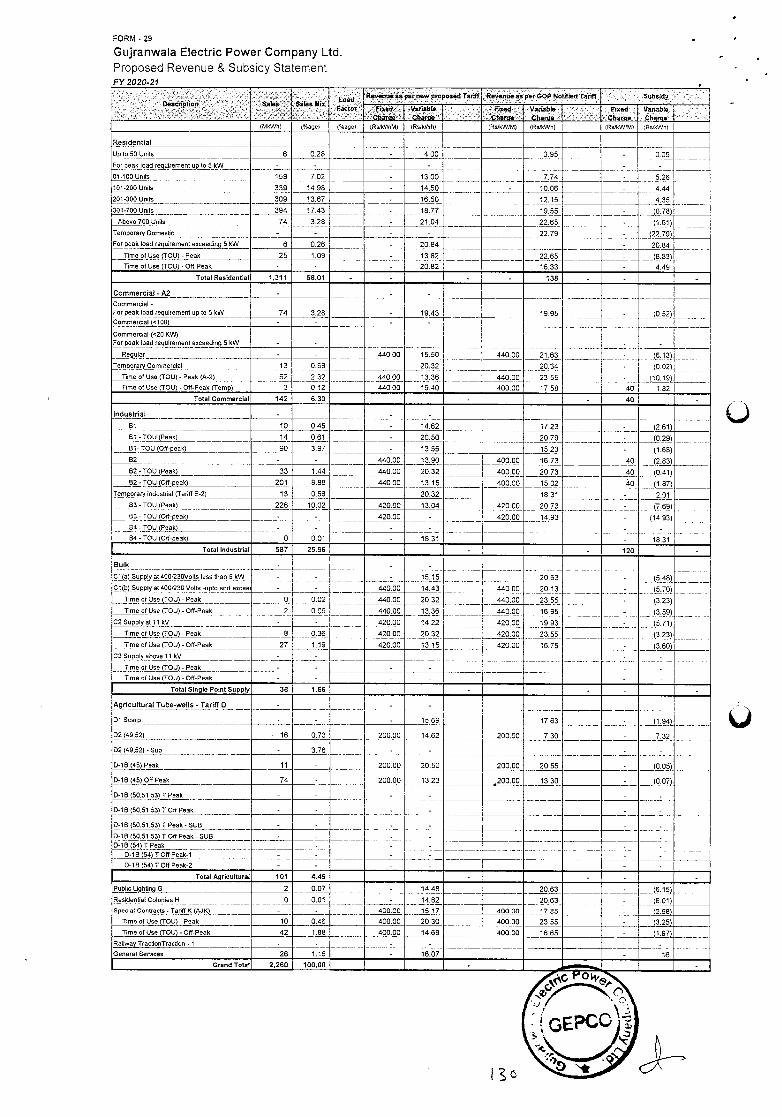
FORM -29
Gujranwala Electric Power Company Ltd.
Proposed Revenue & Subsidy Statement FY 2020-21
Description
'.:
Sates S es Mx Load r
Revenue as per new proposed Tariff Rev nec a p r GOP Notified T rift Subsid-
Fixed V rable oharue" ............
Fixed Variable Charue
Fx d 'Charge'
Variable cirariro
Mews) (%age) (%agn) RsIkWA1) )Rs/WIh) )tts4WIM) (Rn/kWh) (RsfliW/1A) ffvkWh)
Residential
Up to 50 Units 6 0.28 - 4.00 3.95 - 0.05
-
5.26
For peak load requiternent up to 5 kW
01-100 Urrits
- - - - - -
159 702 - 13.00 7.74 - I0t-200 Units 339 14.98 - 14.50 10.06 - 4.44 201-300 Units 309 13.67 - 16.50 12.15 4.35 301-100 Unrts 394 1743 - 18.77 19,55
22.65 - - (0,
Above700Units 74 3.28 - 21.04 - ((.61)
)22.79) Temporary Dornevdc - .. - - - 22.79 - For peak load requirement exceeding 5kW 6 0.26 - 20.84 -- - ------ --------- -
22.65
- 20.84 Time 01 Use (lOU) - Peak 25 1.09 - 13.82 - (8.83) Time of Use )TOU) -00-Peak - - - 20.82 16.33 - 4.48
Total Residential 1,311 58.01 - - - - 138 - -
Commercial - A2 - - - Commercial - For peak toad requirement upto S kW 74 3.28 - - 19.43 19.95 - (0.52) Commercial (nioff) - - - -
- Commeroa) (<20 KV7 For peak load requirement eeceeding 5 kW - -
Re9u)Or . - - 440.00 15.50 440.00 21.63 (6.13)
(10.19) - ------(t.02( TemporaryCommercia) 13 0.58 20.32 ?O.34 .
440.00 23.55 40
Time ntUse (TOU) - Peak )A-2) 52 2.32 440.00 13.36 Time of Use )ToU) -Ott-Peak )Temp( 3 0.12 440.00 19.40 400.00 1758 1.92
Total Commercial 142 6.30 - - 40
Industrial - - -
BI 10 0.45 - 14.62 17.23 - (261) St - lOU )Py9k) 14 0.61 - 20.50 20.79 - (.29( 81- TOU (00-peak) 90 3.97 - 13.55 15.23 - B2 - - 440.00 13.90 400.00 16.73 40 (2) B2 - TOU )Peak( 33 1.44 440.00 20.32 400.00 20.73 40 82-TOU)Off-peak) 201 8.88 440.00 13.15 400.00 15.02 40 (1.87)
Temporary Industrial (Tariff E-2) 13 0.58 20.32 18.31 - 2.01 83 -TOU (Peak) 226 10.02 420.00 13.04 420.00 20.73 - . - (7.69)
i4.93) -
18.31
- - 83 -TOU (00-peak) - - 420.00 - 420.00 14.93 - 84 - TOU (Peak) -
0
- - - -
- 84 -TOU 100-peak) 001 - 18.31
Total Industrial 587 25.96 - - 120
Bulk - - -
20.63
20.13 - -
-
(5.48)
'. (70)
)3.23)
(3.59 -(5.71)
- -
-
ci.$)ssp!yal 4o0o30vnitslesuthan 5 kW - - - 440.00
8.15
14.43 -
440.00 01(b) Supplyaldooc23o Volts -upto end eecee - -
Time ul UseJLCU( - Peak 0 0.02 440.00 20.32 440.00 23.55 Time of Use )TOU)-off-Peak 2 0.09 440.00 13.36 440.00 16.95 - .......-
- C2Supp)yallt kV - - 420.00 14.22 420.00
420.00
19.83
23.55 Time of Use (TOU( - Peak 8 0.36 420.00 20.32 -- - -
(323j
J3.60( Time of Use (TOU)-otf-Peak 27 1.19 420.00 13.15 420.00 16.75 C3 Supply above t t kV - -
-
- - -
- - -
- Time of Usp,(TOU( - Peak - - -
Time of Use (TOU( - 00-Peak - - - - - -
Total Single Point Supply 38 1.66 - - -
AQriculturat Tube-wafts - Tariff 0 - - -
Dl Scarp - - - 15.69 17.63 - - jl.94)
7.32 22)49,52) 16 0.73 200.00 14.62 200.00 7.30 -
02)49,52)-Sub - 3.76 - -
-
-------------
(0.05) D-1B (45) Peak 11 - 200.00 20.50 200.00 20.55
0-lB (45) 0ff Peak 74 - 200.00 13.23 ,200.00 13.30 - J0.07)
D-tB (50,51,53) T Peak - - - - - -
0-lB )50,51,53(TotlPeak - - - - - -
0-lB (50,51,53) T Peak - SUB - - - - - -
0-tB (50.51 .53(T00 Peak-SUB - - - - - - 0-1B(54)TPeak -
- - -
- - - -
- - D-1 B (54) TOO Peak-I - -
0-I B (54) TOO Peak-2 - - - - - -
Tatal Agricu5urat 101 4.49 - - -
Public L9hung 0 2 0.07 - 14.48 20.63 - 6.15) Resideebal Colonies H , 0 0.01 - 14.62 20.63 - (601) Speoiat Corirants - Tariff K (AJK) - - 400.00 15.17 400.00 17.65 - (2.68)
Time el Use (TOU) - Peak 10 0.46 400.00 20.30 400.00 23.55 - (3.25) Time of Use (TOU) -0ff-Peak 42 1.88 400.00 14.68 400.00 18.65 -
Railway Trac5onTracdon - 1 - - - - - - General Services 26 1.16 - 16.07 - 16
Grand Total 2,260 100.00 - _-
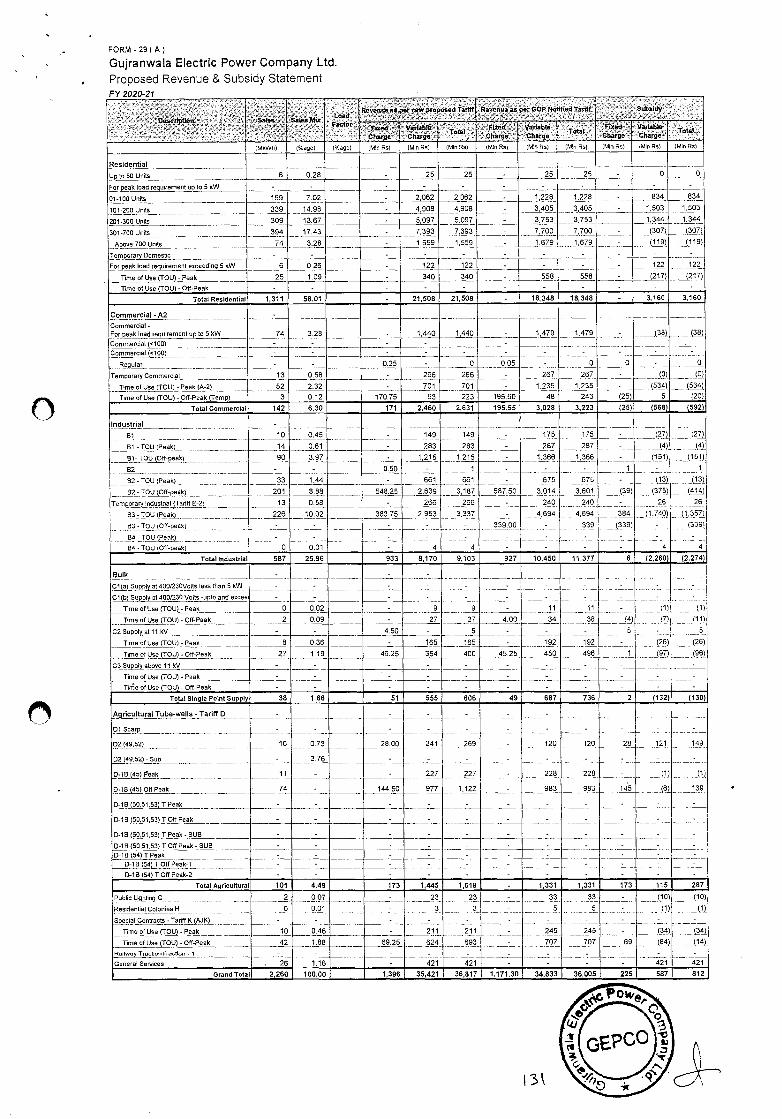
FORM - 29 A)
Gujranwala Electric Power Company Ltd. Proposed Revenue & Subsidy Statement
Descripti n • •. - -
sate - -
s lea Sun ''
Load Reverweas per new pr posed TarOt Rae a a aa p GOP Notrired Tanif Subsidy
-Plead Chazga -
Vable Charge
° Fleed
Cls(srge Vadable Charge
Fleed Chai'ge
Vadable Charge-'
T tat °
(MkWh) )%agel (%uge) IMP Os) 1Mm Os) (Mm Os) (MIn Rs) Mm Os) )Mle Rs) Mm Os) kiln Rs) Mm Os)
Residential - Up to 50 Units 6 028 - 25 25 - 25
-
25 - 0 0
- For peak load reqairerrient op to 5 kVV - - - - - - - - -
S1-loltUnils 159 7.02 - 2052 2062 - 1228 1,228 - 834 834
101-200 Units 339 14.98 - 4908 4,908 - 3,405 3,405 - 1,503 1,503
201-300 Units 309 13.67 - 5,097 5,097 - 3,753 3,753 1,344 - 1,344
(307(
- 122
(21,7k
-
(119)1,119) 301-700 Units 394 17.43 - 7,393 7,393 - 7,700 7.700 - (07)
-
Above 700 Units 74 3.28 - 1,559 1,559 - 1,679
-
1.679
-
-
Temporary Domestc - - - - - -
For peak load requiremenleoceeding 5kW 6 0.26 - 122 122 - - - - 122
TimeofUse)TOU)9 25
-
1.09
-
-
-
340 340 - 558 558 - (217)
llmeotUse(TOU)-Olt-Peak - - - - - - -
Total Residential 1,311 58.01 - 21,508 21,508 - 18,348 18,348 - 3,160 3,160
Commercial - A2 -
1,440 (38) (38) Commercial - For peak load requirement up to 5 kW 74 3.29 - 1,440 - 1,479 1,479 -
commercia (0100) - - - - - - --.•- __ -__ :._
-........ 0 0
.
0
)54)
Commerci(v10S)
Regular -
- - - - - - - - - 0.25 - 0 0.05 -
TemporaryCommercial 13 0.58 - 266 266 - 267 267 - (534) Time 01 Use )TOU) - Peak (A-2) 52 2.32 - 701 701 - 1,235 1,235 -
Time nit Use (TOU) - Op-Peak (Temp) 3 0.12 170.75 53 223 195.50 48 243 (25) 5 120)
Total Commercial 142 6.30 171 2,460 2,631 195.55 3,028 3,223 (25) (568) (592)
Industrial - 149 149 175
287
175
287
-
-675
3,601
81 10 0.45 - -
-
- (27J (27k
(4)
(151)
1
14) .......
BI-TOU (Peak) 14 0.61 - 283 283 -
1
(4)
__...(1iJ -
(37))
. __.(i
61-TOU (Off-peak) 90 3.97 - 1.215 1,215 - __ieQ -
3,014
-675 B2 - - - 0.50 - 1
661
3,187
-
5870
-
62-TOU lPeak( 33 1.44 - 661
(39) 62- TOU (OP-peak) 201 8.68 548.25 2.639
Temporary Industrial )Tariff 6-2) 13 0.58 - 266 266 240
4,694 -
240 494
- -
-
384
26
(1,740)
26
(1,357)
4
83-TOU (Peak) 226 1002 383.75 2,953 3,337
- -
4
-
z70U(0P-peek)
84- TOU (Peak) - - - -
-
339.00 - -
- -
k?) - -
- ......... -
4 - -
- 84 - TOU (Op-peak) 0 0.01 - 4
Totallndaslrial 587 25.96 933 8,170 9,103 927 10,450 11,377 6 (2,280) (2,274)
Bulk - - - -
-
-
11
-
-
-
-
-
(1)
(7)
- , ........ (26)
(97)
-
-
11
(11)
(7) - (96)
-
C1)u) Sappiy at 400l230Volls less than 5 kW - - - - - . -
-
11
C1(b) Supply at 400,235 Volts -uprn and eecee, - - - - -
Time 01 Use )TOU) - Peak 0 0.02 - 9 9 -
Time of Use )TOU) - OP-Peak 2 0.09 - 27 27 4,00 34 38
-
192
(( 6
- C2 Supply at 11 kV - - 4.50 - 5 - -
192 Time of Use )TOU( - Peak 8 0.36 - 165 165 -
Time nt Use )TOU) - OP-Peak 27 1.19 46.25 354 400 425 450 456
.
-
- 1
- C3Supplyabovel1kV - - - . - - -
Time of Use )TOU) - Peak - - - , - - - - - - -
- Tie(e of Use )TOU) - Op-Peak - - - - . . - - - .
Total Single Point Supply 38 1.66 51 555 606 49 687 736 2 (132) - (130)
Agricultural Tube-wells - Tar(ff 0 - - -
-
-
- - 28
-
121
-
- 149
139
-
-
(1)('
olScarp I - D2 )49,52) 16 0.73
376
28.00 241
-
269
-
-- -
-
120
-
120
- -
228 -
02(49.52)-Sub - -
D-)B)45)eak 11 227 227
1,122
- 226
145 (6), 0-tB (45) OPPeak 74 - 144.50 977 - 983 983
0-I B (50,51.93) T Peak - - - - - - . - - -
0-tB )55.51,53) TOP Peak - - - - -
-
- - - - -
0-18 (50,51.53) T Peak - SUB - - - - - - - - -
- -
0-18 (50.51,53) TOP Peak - SUB - - - - - - -- - - - - -
- - D-1B(54)TPeak - - - - - - - - -
0-lB 154) T Off Peak-I - - - -
- .
- - -
- - 0-lB 154) TOP Peak-2 - - - - -
Total Agricultural 101 4.49 173 1,445 1,618 - 1,331 1,331 173 115 287
Pub)icLighitngG
0 -
0.07 23
-
...._. --
- 245
- -- -- --- ----1,1)
245 - - O)
- (4)
(14)
- - - 421
Residenita)Co)oniesh 3
Special Contracts - TariP K )AJK)
Time of Use (TOU) - Peak - 10 046 211 211 - - -- llmeolUselTOU)-OP-Peak 42 1.88 69.25 624 693 - - --
-
707
-
707 69 (84)
- - 421
RairwayTraenoetn0000n-1 - - - ------ 421
- - - Generol Seces - 26 1.16 - 421 - - - -
GrandTolal 2,260 100.00 1,396 35,421 36,817 1,171.30 34,833 36,005 225 587 812
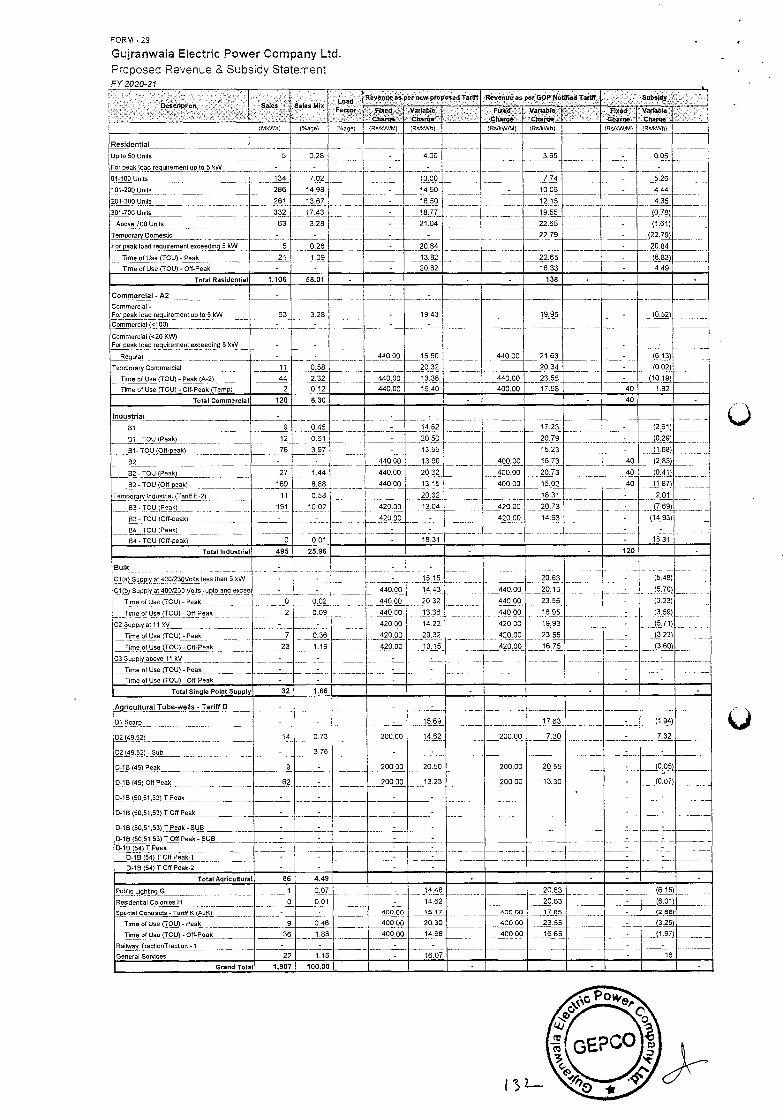
FORM .29
Gulranwala Electric Power Company Ltd.
Proposed Revenue & Subsidy Statement FY 2020-21
Onset pliun Sates Sales M ii
Revenue as per w omaosed'Tae Renue as r GOP Notwd Tar .. . . Subs
..........Chae' Fraud Variable
Chge ....... F aed
C5arae . Variable
•. •• •, Fixed
Chacqe' Variable
(MkWlr) IRate) I (%agel )RSSWIW) RsAWhl )esrlrWlr.1( (Rs/trWtr) )RtrW/M) lRvtrWh)
Residential
Up 1050 Units 5 0.28 - 4.00 3.95 - 0.05
For peak toad requirement imp to 5 5W - - - -
01-lOS Units 134 7,02 -
-
13.00 7.74 - 5.26
l0t-200Unds 286 14.98 14.50 - 10.06 - 4.44
201-300 Unto 261 13,87 -
-
16.53
18.77
12.15
19.55 -
4.35
301-lo0Urmits 332 17.43 (0.78)
)1,611 Above 700 Units 63 3.28 - 21.04 22.65 -
Tenrporaryoemnesbc . - - - 22.79 - (22.79)
For peak load requirement exceeding 5 kVV 5 0.26 - 20,84
22.55
- 20.84
Time of Use (TCU) - Peak 21 1.09 - 13.82 - (p.83)
lime of Use (IOU) -05-Peak - - 20.82 16.33 - 4,49
Total Residential 1,106 58.01 - - - 138 - -
Commercial - A2 - - -
Commercial - For peak load requirement up 105 kW 63 3,28 - 1943 19.95 - (0.52) -- Commercial (0100) - - - -
Commercial ry2O KVd) For peak load meqoimemeot exceeding 5 SW -
-
-
-
-
-.
-
(6.),
(0.02)
Regolar 440,00 1550
20.32
440.00 21.63
TnmporaryCcmrrrercial 11 0.58 20.34 -
Time of Use (TOU) - Peak (A-2) 44 2.32 440.00 13,36 440.00 23.55 - ,)10.19)
Time of Use (TOUt - Off-Peak (Tempt 2 0,12 440,00 19,40 400.00 17.58 40 1.82
Total Commercial 120 6.30 - - 40
Industrial - - -
14.62
20.50
81 9 0.45 -
-
17.23
20.79
- (2.61)
81- TOU (Peak) 12 0.61 -
-
,(0.29J
(1.68) 81-IOU (Ott-peek) 76 3.97 - 13.55 1523
02 - - 440.00 13.90 400.00
400.00
400,00
16.73 40 (2.83)
02- IOU (Peak) 27
169 8.88
1.44 , 440.00 20 32 20.73 -- - 40 (0.41)
82- TOU (Off-peak) 440.00 13.15 15.02 40 J1.L1 Temporary Industrial (Tariff 0-2) 11 0.58 20.32 18.31
20.73
-
-
-
2.01
83 -TOU (Peak) 191 10,02 420,00 13.04 , 420,00 (769j_
(14.93)
-
1831
83- IOU (Off-peak) - - 420.00
-
-
-
420.00 14.93
Bd - TOU (Peak) - . - -
64- TOU (Off-peak) 0 0,01 - 18.31 -
Total todustrial 495 25.96 - - 120
Bulk -
- -
- -
0
2
-
-
0.02
0.09 440.00
,
-
-
-
15.15
14.43
20.32
13.36
14.22
20.63 -
-
- -
-
- 19.93 - (5.71)
.(5.70)
.(3.59) -
(5.48)
(3.23)
(323)
p.60)
ct(o)sspply at400i230Volls less fran SkIN
CIL (SupRy at 400,231 VoltS spio sod exFeem
lime of Use (IOU) - Peak
linmeotUse)TOU)-0ff-Peak
44000 - 440.00 - 20.13
23.55
23.55
..40.00165
440.00
420.00
440 00
420.00 C2 Supply at tlkV . - -
Time of Use (IOU)-Peak 7 0.36 420.00 20.32 , 420li0
420.00 Time of Use (TOU) -Off-Peak 23 1.10 420.00 13.15 16.75
-. -, . C3 Supp)y above 11 ff1 -
-
-
-
- - -
-
-
Timneof Use (IOU) - Peak - - . -
lime of Use (IOU) - Ott-Peak - - - - - -
Total Siegte Polot Supply 32 1.66 . - -
Agricultural Tube-welts - Tariff 0 - - - .
7.32
94,,,,,,,
-
Of Scary - - -
200.00
15.69 17.63 - ,,
-
-
-
D2(49.52) 14 0.73 14.52 200.00 . 7.30
02 t49,52( - Sub -
9
3.76 - - . -
0-tB (45) Peak - 200.00 20.50 200.00 20.55 (005)
0-lB (45)08 Peak
D-18 (50.51,53)1 Peak
62
-
-
-
200,00 13.23 200.00 13.30 -
-
(0.07)
- - - -
D-1B(,t,53)TOlf Peak - - - - . - -
D-tB (50,51.93)1 Peak-SUB - - - - - -
0-18 (50.51.53)105 Peak - SUB - - - - - - O-tB(54)TPoak - - - -
-
--
- 0-IB)54)TOtfPeak-1 - - - -
D-t8 (54) TOO Peak-2 - - - - - -
Total Agricultural 86 4,49 - -
PublicLighbng0 I
0
.0.07
0.01 -
400,00
, -14A8
14.62,
15.17
20.63 - (6.15)
ResidenSol Colonies H 20.63 - (6.01)
SpeoiolCcniruots-TariOK)A.JK) - - 400.00 17.85 - (2.68)
TiemeolUse)TOU)-Peak 9 0.46 400,00 20,30 400,00 23.55 - )3.25)
lime of Uso (IOU) -Off-Peak 36 1.88 400,00 14.68 400,00 16.65 - ,j1)7)
Railway lracfenlrac000 -1 - - - - - -
General Sereces 22 1.16 - 16.07 - 16
Grand Tatal 1,907 100,00 - -
VL-
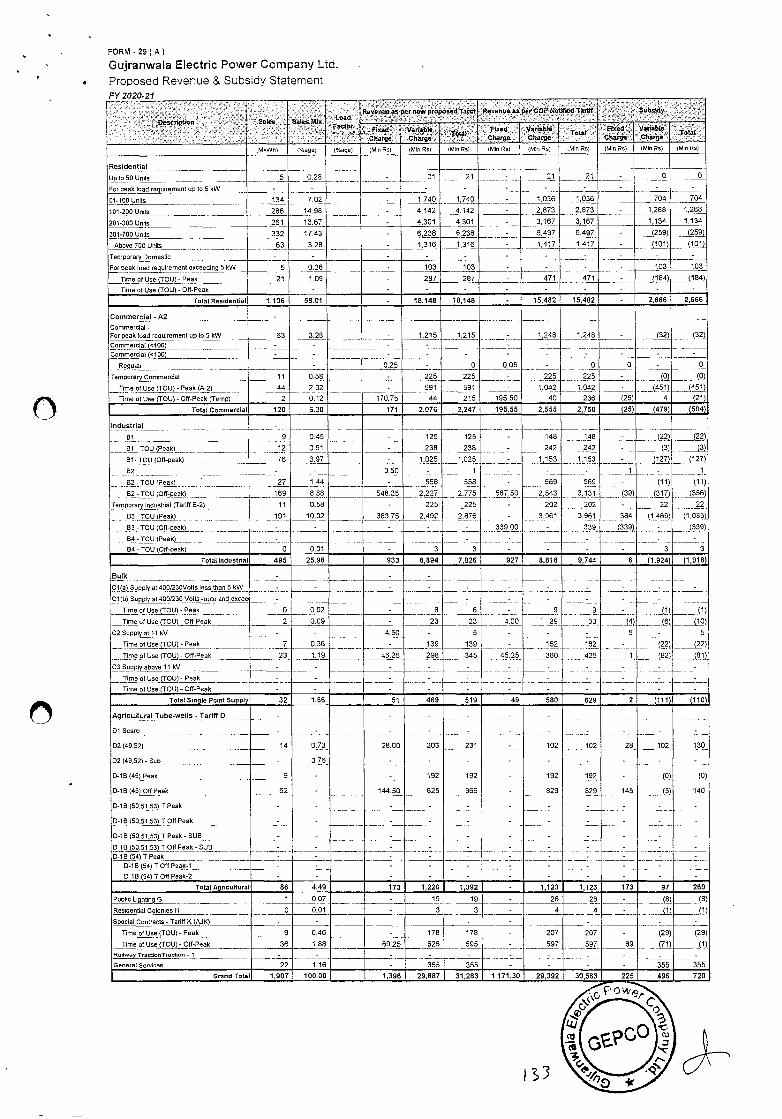
FORM -29 A)
Gujranwala Electric Power Company Ltd. Proposed Revenue & Subsdy Statement
0 SCP4).tQfl .' ' ':
s :
L ad Reverse as per new pr posedT nif Re a e as per SOP Netrirmi Tariff Suberdy
...... Fixd Charge
. Varb ...., . Chare
Fixed . Cbae
VaHa Chge
Fked .. Chae
Vanab charge
(MkWh) )%age) )%xgn) (Mm Rn) (Mm Re) Mm Re) Mm Re) Mlii Re) Mm Re) Mm Re) Mm Re) (Mmii Re)
Residential 21 U_p to 50 Unite 5 0.28 -
-
21
-
21 - 21 - 0 0
For peale load requirement up toO kW - - - - - - - - -
01-too Units 134 7.02 - 1,740 1,740 - 1,036 1,036 - 704 704
101-200 Units 286 14.98 - 4,142 4,142 - 2,873 2,873 - 1,268 1,268
201-300Unite 261 13.67 - 4,301 4,301 - 3,167 3,167 1.134 1,134
301-700 Units 332 17.43 - 6,238 6,238 - 6,457 6,497 - (259) (2
Above 700 Units 63 3.28 - 1,316 1,316 - 1,417 1,417 - 101) (101)
Temporary Domesdo - - - - - - - - - - -
For peak load requiremeRt exceeding 5kW 5 0.26 - 103 103 - - - - 103 103
Timers xl Uee (7014- Peak 21 1.09 - 287 287 - 471 471 - (184) (194)
Time of Use (TOU) - 08-Peak - - - - - - - - - - -
Total Residential 1,106 58.01 - 18,148 18,148 - 15,482 15,482 - 2,666 2,666
Commercial - A2 -
)3 Commercial - For peak load requirement up 105 kW 63 3.28 - 1,215 1,215 - 1,248 1,248 - (32) Commercial (<100) - - - - - -
- - -
- Commercial (<100) - - - - -
0,05
- -
Regular - - 0.25 - 0 - 0 0 0
TemporaryCommercial 11 0.58 . - 225 225 .225 225
1,042
- (0J (0)
Time of Use (TOU) - Peak (A-2) 44 2.32 - 591 591 - 1,042 - 4511 451)
Time otUee (IOU) - 08-Peak )Temp) 2 0.12 170.75 44 215 195.50 40 236 (25) 4 (21)
Total Commercial 120 6.30 171 2,076 2,247 195.55 2,555 2,750 (25) (479) (504)
Industrial -
51 9 0.45 - 125 125 - 148
242
'148
242
-
- )
(22)
51 -TOU (Peak) 12 . 0.61 - 238 238 - (3)
-. BI-TOU(011-peak)
82
76 3.97 - 1,025 1,025 - 1,153 1,153
- 1
-_)127)
()@,i)
-
(1.1i
22
---,469(
- 3
(339)-
(127)
- - 0.50 - 1 -
-
- 1
(ii). (356)
02-TOU (Peak) ' 27 1.44 - 558 558 569
202
- - -
.3,5613,961
24433,131 5,t
202
.......339
- -
!.JPU (08-pealo) 169 8.88 548.25 2,227 2,775 587.50
Temporary )ndoetnal (Tariff 0.2) 11 0.58 - 225 225 -
339.00
22
(jp85(
(339)
-
B3-TOU (Peak) 191 10.02 383.75 2,492 2476
-
84
- -
83-TOU (Oft-peak) - - - -
84- TOU (Peak) - - - - - - 3
- - 94-TO (08-peek) 0 0.01 - 3 3
Totalledaetrial 495 25.96 933 6,894 7,826 927 8,818 9,744 6 (1,924) (1,918)
Bulk - - - - -- - -
........... -
-
- ------- -
-
9
-
- -
-
-
- Cl)a) Supply xl 400)230VoltS less Ihan S kW - - - -
01(b) Supply at 400030 Volts -apto and exceem - - - - - - -
'Pine of Use )TOU) -Peak 0 0.02 - 9 8 - 9 () (1)
Time of Use )TOU)-08-Peak 2 0.C9 - 23 23 4.00 29 33
.
(4)
5 () (10)
C2 Supply at 11kV - - 4.50 - 5 - - - 5
Time of Use )TOU)-Peak 7 0.36 - 139 139 -
45.25
162162
380425 1
.,,,,,,- - -
-
-
(22) (22)
'flmeolUee)TOU)-olf-Peak 23 1,19 46.25 298 345 (.82)
-
(81)
- c_3...8opp!y above 11kV - - - - - - -
11mev) Use )TOU) - Peak - - - - -
-
- - - -
- Time of Uee )TOU) - 0ff-Peak - - - - - - - - -
TeralSingle Point Supply 32 1.66 51 469 519 49 580 629 2 (111) (110)
Agricultural Tube-wells - Tariff 0 -
-
073
-
-
-
-
- -
.
-
-
102 102
- -
102
DlSoarp - -
130 02(49.52) 14 28.00 203 231 28
02 49,52) - Sub - 3.76 - - - - - - -
D-lBi5)Pek - . 9 - - 192
969 -
__192_:...__.,i,.82-----------
829 529 145 j) 140 0-lB (45) Off Peak 62 - 144.50 825
0-19 (50,51,53) T Peak - - - - - - - -
-
-
- - - -
-
-
- -
-
- -
-
0-tB (50,51,53) TOP Peak - - - - - - -
0-lB (50,51,53) T Peale-SUB - - - - - - -
0-lB )50,51,53)T Off Peak - SUB - - - - - -
- - - - -
0-18)54)TPeak - - - - - - - -
0-lB )54) TOff Peak-I - - - - - -
- -
- - 0-I B )54) T 08 Peak-2 - - - - -
TotaIAgricu9oral 86 4,49 173 1,220 1,392 - 1,123 1,123 173 97 269
Public Lighitng 0 1 0.07 - 19 19 - 28 28 - ((. (8)
Residnn0a) Colonies H 0 0.01 - 3 3 - 4 4 - 11),
Special ConttOcls - Tariff K (AJK) - - - - - - - - -
Time of Uee)TOU)-Peak 9 0.46 - 179 178 -
597
207207
597 69
-(28)(29)
(71) (1) lime of Use (IOU) - Off-Peak 36 1,88 69.25 526 595 - Ratseay Traceontrac000 - C - - - - - - - -
-
- -
355
-
355 GeneralSemeioee 22 1.16 - 355 355 - - Grand Total 1,907 100.00 1,396 29,887_ 31,283 1,171,30 29,392 30,563 225 496 720
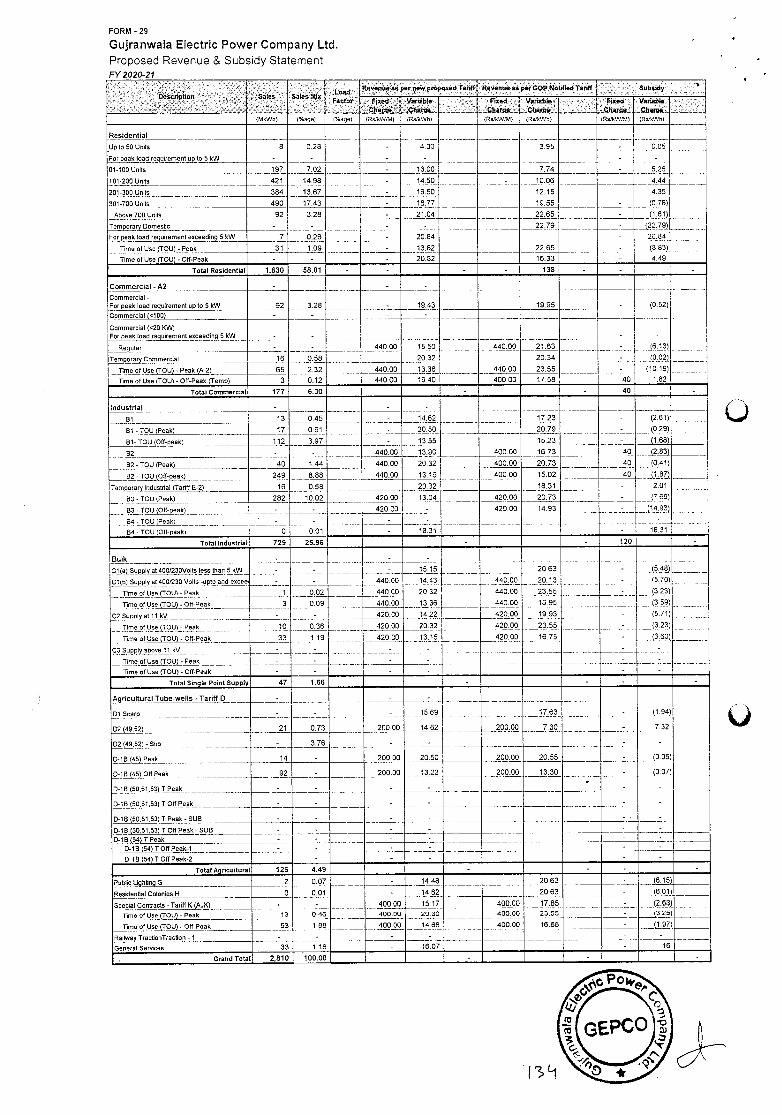
FORM -29
Gujranwala Electric Power Company Ltd. Proposed Revenue & Subsidy Statement FY 2020-21
escriptien Sates Sates Mix Load Re ens asp ix wpropo edTardf Renenxeasp rGOPNotdl.dlartff Sxbsdy
Fast r I
°oed •. Chamd"
V riabte Came . '
Fixed . Cme'
Variable 'Chame .
Fixed . Charee
Vanable Okarse
iMkWhI i%ael thage) (Ru/hTMl (RiWhl (Re/h/OTt) (Ru/iWO) (RO/It) 00/i/Nh)
Residential
-
Up toSS Units 8 0.28 ,, -4.30
- - 3.95 - 0.05
For peak load requirenrentyp_to 5 kW - - . - . -
-
-
O1-iO0Un0s 197 7.02 - 13.00 7.74 5.26
101-200 Units 421 14.98 - 14,50 - 10.06 - 4.44
251-300 Units 384 13.67 - 10.50 12.15
-.
4.35
)0.78)
(1.61)
301-700 Units 490 1743 - 18.77 19.55
Above700Un0s 92 3.28 - 21.04 22.65
22.79
-
Tempora0 Do,rres0c - - - - - 1,22.79)
20.84
(83J
For peak load requirement eaceeding 5 kW 7 0.26 - 20.84
22.65
-
- TimeofUse)TOU)-Penk 31 1.09 - 13.82
Time of Use )TOU) - Ott-Peak - - - 20.82 16.33 - 4,49
Tetal Residential 1630 58.01 - - - 138 - -
Commercial - A2 - - -
(0.52) Commercial - For peak load requirement up to 5 kW 92 3.28 - 19.43 19.95 -
Commercial (01001 - - - -
Commercial (<20 KV For peak load requirement exceeding 5 itT -
-
-
15.50 440.00 .
21.63
- -
Regular - 440.00 -
-
-
_)6.13)
(042)
(10.18)
1.82
TemporyCommercial 16 0.58 , 20.32 20,34
23.55 Time 01 Use (lOU) - Peak )A-2) 65 2.32 440.00 13.36 440.00
Time of Use (IOU) - Ott-Peak (Temp) 3 0.12 440.00 1940 400.00 17.58 40
Total Commeroixl 177 6.30 - - 40
Industrial - - -
91 13 0.45 -
-
14.62
20.50
1723 (2.81)
81- IOU (Peak) 17 0.61 20.79 (0.29)
Bl-TOU(Olf-peak) 112 3.97 - 13.55 15.23 (1.68)
82 - - 440.00 12.90 400.00 16.73 40 J2.83)
B2-TOU)Peek) 40 1.44 440.00 20.32 400.00 20.73 40 ,J0.41)
62- TOU (08-peak) 249 8.88 440.00 13.15 400.00 15.02 40 (1.87J
Temporary Industrial (lariltE-2) 16 0.58 20.32 18.31 2.01
83- IOU (Peak) 282 10.02 420.00 13.04 420.00 20.73 (7.69)
83-TOU)Olt-peak) - - 420.00 - 420.0014,93
-
(14.93)
18.31 54- TOU IPeak) . - - - -
84- IOU (Ott-peak) 0 0.01 - 18.31
Total Industrial 729 25.96 - - 120
Bulk - -
-
-
15 15 20.63 -
-
(5.48)
(5.70)
)23)
(358)
5.71)
....1,360)
-
-
- ......(3.23)
............
Cl (a) Supply at 400030Vol1s less than 0 kW -
-
-
Cl(S) Supply at 400030 Volts -upto and eaceer - 440.00 14.43 440.00
440.00
20.13
23.88
-
Time 51 Use (TOU)-Feak 1 0.02 440.00 2032
Time of Use )TOU)-Olf-Peok 3 0.09 440.CO 13.36 440.00 15.95
23.55
16.75
19.93 -
-
- --
-
-
'-------.------
C2oupplyatllkV - - 420.00 14.22 420.00
flmoolUseçtOU)-Peak 10 0.36 420.00 20.32 420.00
420.05 limeolUse(TOU)-Oft.Peak 33 1.19 420.00 13.15
C3 Supplyabnvel1 kV - ,,
lime of Use (Toil) - Peak - -
...........................
- -
-. - ................
Time of Use (TOU) - 0ff-Peak - - - - -
Total Single Paint Supply 47 1.66 - - -
Agricultural Tube-wells - Tariff 0 - - -
200.00
-
17.63
7.30
().94)
7 32
-. olScarp -
21
- - 1569 -
02 (49.52) 0.73 200.00 14.62 -
D2 (49.52) - Sub - 3.76 - - -
-
-
(0.) 0-18 )45IPeak 14 - 200.00 20.50 200.00 20.55
O-10)45)OlfPeak 92 - . 200.00 13.23 200.00 13.30 - (0.07)
- 0-IS (50,51.53)1 Peak - - - - -
0-15 150,51.53) T Off Peak - - - - -
. .
-
- 0-18(50,51.53)1 Peak - SUB - - - -
0-I B (50.51,5311 Off Peak - SUB - - - - - - D-1B4)TPeak - - - - - -
0-18 (54)100 Peak-i - - - - - -
D-IB (54)1011 Peak-2 - - - - - -
TotalAgncuultamal 126 4.49 - - -
PublicUghhngG 2 0.07 - 14.48 20.63 - (6.15)
Rosidenhal Colonies H 0 0.01 - 14.82 20.63 - (691)
Special Conttacts-Tapff K )AJK) - 13
- 400.00 15.17 400.00
450.00
17.85
23,55 - .)24,)
Time of Use (TOU) - Peak 0,46 400,00 20.30
Time of Use IJOU) - Ott-Peak - 53 1.68 400.00 14,68 400.00 16.65 -
Railway,1yysonTrac5on - I - - - - - -
General Sernices 33 1.16 - 16.07 - 16
- Grand Tetat 2810 100.00 - -
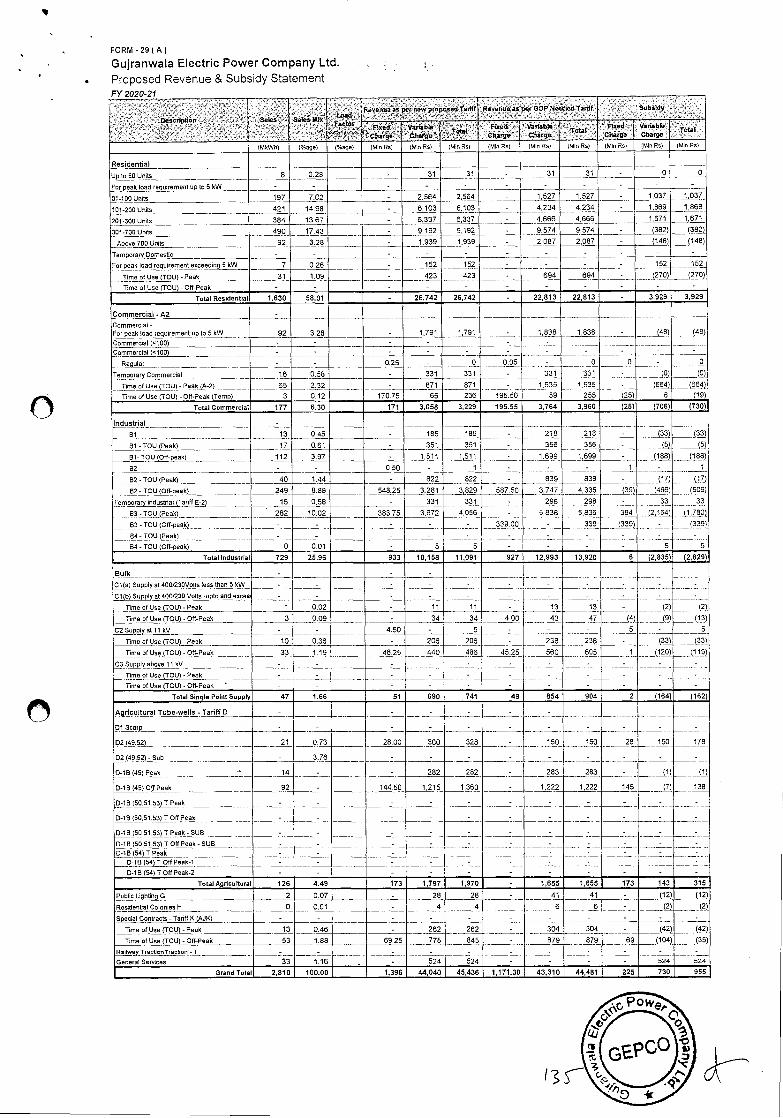
FORM -29(A)
Gujranwala Electric Power Company Ltd.
Proposed Revenue & Subsidy Statement
Ge cnptaon -' . '-
"• •-:•. -:
Sates
.. ••. .
SateaMfo '''..
... '-:.
Load Racenucas per cow pr posed 1' riB Rasenu ac per GOP 'dotif ted Tariff SubsIdy
"i-"?: 5r ,.,Fl*ed -
Chte-Be..'.Chdrqj.....
Varbte' ' '. 1.' -:•.•
- Fteed'- Charge:
Vadabte cftargé'. .
.Ot.''cha
Fteed - Vabte Charge'
T
(MkWh) )%age) )%age) Mm Re) (Mm Re) ('din Re) Mm Re) (Mlii Ru) Mm Re) )MIn Rum Mm Re) Mm Re)
Residential
to 50 Units 8 0.28 - 31 31 - 31 31 - 0 0
For peak toad requirement up to 5 kW - - - - - - - - - - -
01-tOSUnits 197 7.02 - 2564 2564 - 1527 1527 - 1037 1,037
tol-200Unrts 421 14.98 - 6103 6,103 - 4,234 4,234 - 1,869 1,869
201-300 Units 384 13.67 - 6,337 6,337 - 4,666 4,666 1,671 1,671
301-700Un0s 490 17.43 - 9,192 9,192 - 9,574 9,574 - J382) (382)
Above705Unmts 92 3.28 - 1,939 1,939 - 2,097 2,087 - (148) (148)
Temporary Domestic - - - - - - - - - - -
For peak )oad requirerneRt eoceeding 5kW 7 0.26 - 152
423
-
152
423
- - - - 152 152
'lime of Use )TOU) - Peak 31 1.09 -
-
- 694 694 - (29)
-
(270J
- Time of Use (FOU) - OR-Peak - - - - - - -
Total Reeideetial 1630 58.01 - 26,742 26,742 - 22,813 22,813 - 3,929 3,929
Commercial - A2 -
J8(
. - -
Commercial - For peak toad requirement up to 5kW 92 3.28 - 1,791 1,791 - 1,838 1,838 -
Commercia) (<100) - - - - - - ............ -
0
Commercia) (dUO) - - - - - - - -
Repatar - - 0.25 - 0 0.05
-
- 0 - 0
TemporaCammercial 16 0.58 - 331 331 331 331 - (U)
(664)
9) (964) lime of Use )TOU) - Peakj-2) 65 2.32 - 871 871 - 1,535 1,535 -
Time of Use (TOU) -Off-Peak (Temp) 3 0,12 170.75 65 236 195.50 59 255 (25) 8 (19)
Total Commeroiat 177 6.30 171 3,058 3,229 195.55 3,764 3,960 (25) (706) (730)
Industrial -
,9)9) (5)
9)3) Br 13 0.45 - ,_ 185 185 - 218 219 -
St -TOU (Peak) 17 0.61 - 351 351 - 356 356 - (5)
Bt-TOU (OR-peak) 112 3.97 - 1,511 1,511 - 1.699
-
839
1,699 -
1
(1,)
-
(188)
1 82 - - 0.50 - I -
92- TOU (Peak) 40 1.44 - 822 822 - 839 tj7} j17(
B2- TOU (Off:peak) 249 8.88 548.25 3,281 3,829 587.50 3,747 4,335 (39) (466) (506)
Tempprory,)ydustrial (Tariff 0-2) 16 0.59 - 331 331 - 298
5,836
-
-
-
298
339
5,836 394
(339)
--- -----------,.._ (2,16J,
-
-
5
......3. )j,780) 63 -TOU (Peak) 282 10,02 383.75 3,672 4,056 -
83 - TOU (Off-peak) - - - - - 339.00
-
-
(339)
-
5
04- TOU (Peak) - . - - - - -
94- TOU (Off-peak) 0 0.01 - 5 5
Totalledustrial 729 25.96 933 10,158 11,091 527 12,993 13,920 6 (2,835) (2,529)
- - - -
- -
-
-
(2)
-
-
L2.(
Ct (a) Supply at 400,230Valts tess than 5 kW - - ' - - -
Cub) Supply at 400)230 Volts -upto and eacee - . - - - - - -
Time of Use )TOU) - Peak 1 0,02 - 11 11 - 13 13 -
Time of Use )TOU)-Off-Peak 3 0,09 - 34 34 4.00 43
- - 5
47_)4) (9)
-
1,13)
C2 Supply at Ii kV - - 4.50 - 5 -
Time of Use (TOU) - Peak 10 0.36 - 206 206 - 238 238 - (33) )33(
Time at Use )TOU)-Off-Peak 33 1.19 4625 440 496 45.25 560 605 1 (120) (119)
C3 Supply above 11 kV - - - - -
--
- -
- -
-
- -
-
- -
-
Time at Use (TOU) - Peak - -
- H - - - - . - -
Time of Use )TOU) - Off-Peak - - - - - - - -
Total Siegte Poiet Supply 47 1.66 51 690 741 49 854 904 2 (164) (162)
Agi-icuttural Tube-wells - Tariff 0 - - - - - -
- -
150
-
29
-
150
-
178
DlScorp - - - - - -
02 (49.52) - 21 0.73 28.00 300 328 - 150
02(49.52) - Sub - 3.76 - - - - , - - - - -
0-18)49) Peak 14 - - 202 282 - 283 283 - (1) )j,)
D-tB(45)O9Peak 92 - 144,50 1,215 1,360 - 1,222 1,222 145 (7( 138
0-lB (50,51,53) T Peak - - - - - - - - - -
-
-
- O-ts)55.51,53)T Off Peak - - - - - - - -
-
-
D-IB (50.51,53) T Peak - SUB - - - - - - - - - -
0-18 (55,51.53) T OR Peak - SUB - - - - - .
- - - - - - -
- -
-
O-tB(54)Tpeak - - - - -
-
-
. - "
- -
- - -
-
-
0-f B (54) T Off Peak-i - - . - -
-
-
-
-
- 0-tB (54) T 06 Peak-2 - - - - -
TotalABricaRural 126 4.49 173 1,797 1,970 - 1,655 1,655 173 143 315
Public Lightng 0 2 0.07 - 28 28 - 41 41 - j),) 11)
Residen8ulColaniesH 0 0,01 - 4 4
-
-6
- .
- - 6
-
-
-
9)) (2)
Special Con5acts - Tariff K )AJK) - - - - - - -
'flemeofUse(TOU)-Peak 13 0,46 - 262 262 - 304 304 - (42) (42)
Time of Use ('t'OU)-Off-Peak 53 1.89 69.25 775 845 - 879 879 69 (104) J35)
- Railway TrasnoeTruurion - - - - - - -
-
- - - -
Oenerat 0eMces 33 1.16 - - 524 524 - - - 524 524
GraedTotul 2,810 100.00 , 1,396 44,040 45,436 1,171.30 43,310 44,481 225 730 955
MEPCO Bonds
Particulars Interest
Rate
FY Opening Balance
Redemption Closing
Balance Interest Char.es
NIL
35
Form # - PPP I to Form # - PPP 10
Under NEPRA Guide Lines for Determination of Consumer End Tariff (Methodology and
Process), 2015
Pertains to CPPAG
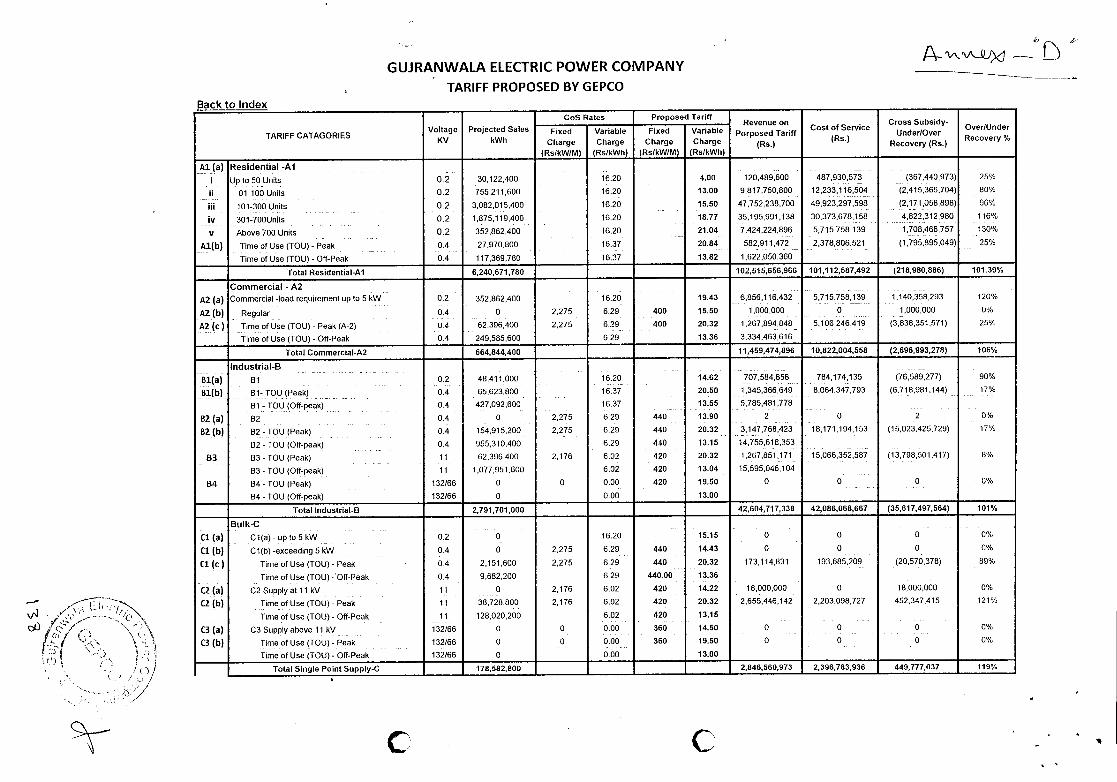
GUJRANWALA ELECTRIC POWER COMPANY TARIFF PROPOSED BY GEPCO
o Index
TARIFF CATAGORIES Voltage
KV Projected Sates
kwh
CoS Rates Proposed Tariff Revenue on
Porposed Tariff (Ra)
Cost of Service (Ra.)
Cross Subsidy- UnderlOver
Recovery )Rs.)
Over/Under Recovery %
Fixed Charge
(Rs/kW/M)
Variable Charge
(Rs/kWh)
Fixed Charge
(Rs/kW/M)
Variable Charge
(Rs/kWh)
Al (a) Residential -Al
i Up 1050 Units 0.2 30122,400 16.20 4.00 - 120,489,600 487,930,573 (367,440,973) 25%
ii 01 100Units 02 755211 600 1620 1300 9817750800 12233116504 (2415365704) 80/
iii - 101-300 Units 0.2 3,082,015,400 16.20 - 15.50 47,752,238,700 49,923,297,598 (2,171,058,898) 96%
iv 301-700Units 0.2 1,875,119,400 16.20 18.77 35,195,991,138 - 30,373.678,158 4,822,312,980 116%
v Above 700 Units 02 352 862 400 1620 21 04 7424224896 5715758 139 1 708 466 757 130/
Al(b) Time of Use (TOU) Peak 0 4 27 970 800 16 37 20 84 582 911 472 2 378 806 521 (1 795 895 049) 25 /
Time of Use (TOU) - Off-Peak 0.4 117,369,760 16.37 13.82 1,622,050,360
Total Residential-Al 6,240,671,780 102,515,656,966 101,112,587,492 (218.980.886) 101.39%
Commercial - A2
A2(a) Commercial-load requirement upto 5kW 0.2 352,862,400 16.20 19.43 6,856,116,432 5,715,758.139 1,140,358,293 120%
A2(b) Regular . 0.4 - 0 2,275 6.29 400 15.50 1,000,000 - 0 1,000,000 0%
AZ (c) Time of Use (TOU) Peak (A 2) 04 62396400 2276 699 400 2032 I 267 894 848 5 106 246 419 (3836351 671) 26 /
Time of Use (TOU) - Off-Peak 0.4 249,585,600 6.29 13.36 3,334,463,616
Total Commercial-A2 664,844,400 11,459,474,896 10,822,004,558 (2,696,993,278) 106%
Industrial-B
81(a) 81 - 0.2 48,411,000 16.20 14,62 707,584,858 784,174,135 (76,589,277) 90%
Bl(b) Bi TOU (Peak) 04 65623800 16 37 20 50 1 34,) 3661)49 8064347793 (6718981144) 17 /
B1-TOU (Off-peak) 0.4 427,092,600 1637 13.55 5,785,481,778
82(a) - 62 - - 0.4 0 2.275 6.29 440 13.90 - 2 - 0 2 0%
82(b) B2 IOU (Peak) 04 154915200 2275 629 440 2032 3147768423 18171 194153 (1502342729) 17/
- - 02-TOU (Off-peak)--
0.4 955,310,400 6.29 440 - 13.15 14,755,618.353
- B3 03- IOU (Peak) - 11 62,396,400 2,176 6.02 420 20.32 ¶267,851,171 -15,066,352,587 (13,798,501,417) 8%
- B3 - TOU (Off-peak) II - 1,077,951,600 6.02 420 13.04 15,595,046.104 - -- -
B4 ff4-IOU (Peak) 132/66 0 0 0.00 420 19.50 0 0 0 0% -
04- TOU (Off-peak) 132/66 0 0.00 13.00 - -
Total Industrial-B 2,791,701,000 42,604,717,338 42,086,068,667 (35,617,497,564) 101%
Bulk-C
Cl (a) C1(a) - U 1o5kW - -- 0.2 0 16.20 15.15 0 - 0 0 0%
Cl (b) C1(b) -exceeding 5kW 0.4 0 2,275 6.29 440 -- 14,43 0 0 0 0%
Cl (c) Time of Use (TOU) - Peak 0.4 2,151,600 2,275 6.29 440 - - 20.32 173,114,831 193,685,209 (20,570,378) 89%
Time of Use (TOU) -Off-Peak 0.4 9,682,200 6.29 440.00 13.36
CZ(a) C2 Supply at 11 kV - 11 0 - 2,176 6.02 420 14.22 18,000,000 0 - - 18,000,000 0%
CZ (b) Time of Use (TOU) - Peak-- - 11 38,728,800 2,176 6.02 420 20.32 2,655,446,142 2,203,098,727 452,347,415 121%
- - - Time of Use (TOU)- Off-Peak - 11 128,020,200 6.02 420 13.15 - -
C3(a) C3 Supply above 11kV - 132/66 0 0 0.00 360 14.50 0 - 0 0 0%
C3 (b) lime of Use (IOU) - Peak - 132/66 0 0 0.00 360 19.50 - 0 0 0 0%
lime of Use (TOU) - Off-Peak 132/66 0 0.00 13.00
Total Single Point Supply-C 178,582,800 - 2,846,560,973 2,396,783,936 449,777,037 119%
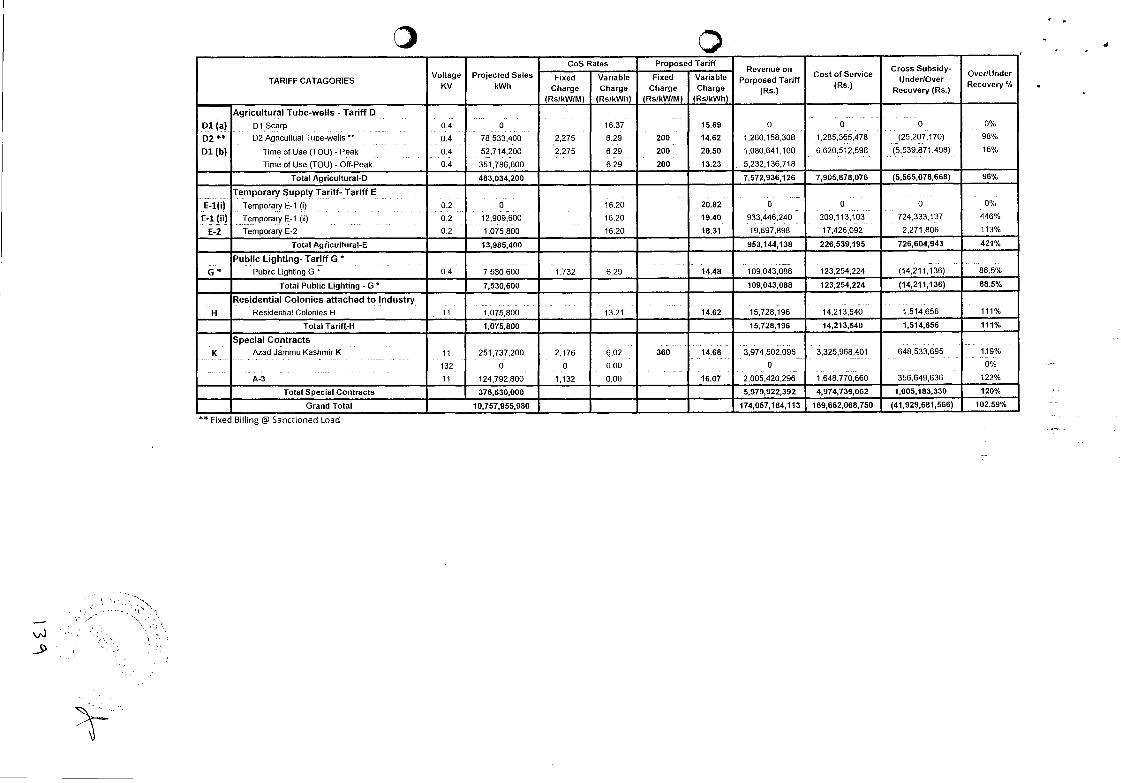
TARIFF CATAGORIES Voltage
Ky Projected Sales
kWh
CoS Rates Proposed Tariff Revenue on
Porposed Tariff (Rs.)
Cost of Service Cross Subsidy-
Under/Over Recovery (Rs.)
Over/Under Recovery /
Fixed Charge
(Rs/kW/M)
Variable Charge
(Rs/kWh)
Fixed Charge
(Rs/kW/M)
Variable Charge
(Rs/kWh)
Agricultural Tube-wells - Tariff D
D1(a) Dl Scarp 0.4 0 1637 15.69 0 0 0 0%
02 ** D2 Agricultual Tube-wells - 0.4 78,533,400 2,275 6.29 200 14.62 1,260,158,308 1,285,365,478 (25,207170) 98%
Dl (b} Time of Use (TOU) - Peak 0.4 52,714.200 2,275 6.29 200 - 20.50 1080,641.100 6,620,512,598 (5,539,871.498) 16%
Time of Use (TOU) - Off-Peak 0.4 351,786,600 6.29 200 13.23 5,232,136,718
Total Agricultural-D 483034,200 7,572,936,126 7,905,878,076 (5,565,078,668) 96%
Temporary Supply Tariff- Tariff E - E-1(i) Temporary E-1 (i) 0,2 0 16.20 20.82 0 - 0 - 0 0%
6-1 (ii) Temporary E-1 (ii) 0.2 12,909,600 16.20 19.40 933,446,240 209,113,103 724,333,137 446%
E-2 Temporary E-2 0.2 1,075,800 16.20 18.31 19,697,898 17,426,092 2,271,806 113%
Total Agricultural-E 13,985,400 -
953,144,138 226,539,195 726,604,943 421%
Public Lighting- Tariff G * G Pub/ic Lighting 0 * 0.4 7,530,600 1,732 6.29 14.48 109,043,088 123,254,224 (14,211,136) 88.5'iii
Total Public Lighting - G * 7,530,600 .
109,043,088 123,254,224 -
(14,211,136) 88.5%
Residential Colonies attached to Industry - - H Residential Colonies H , II 1,075,800 13.21 14.62 15,728,196 14,213,540 1,514,656 111%
Total Tariff-H 1,075,800 15,728,196 14,213,540 1,514,656 111%
Special Contracts
K Azad Jammu Kashmir K - II 251,737,200 2,176 6.02 360 14.68 3,974,502,096 3,325,968,401 648,533,695 1.19%
- 132 0 0 0.00 0 - 0%
A-3 11 ,
124,792,800 1.132 0.00 16.07 2,005,420.296 1,648,770,660 356,649,636 122%
Total Special Contracts 376,530,000 - 5,979,922,392 4.974,739,062 1,005,183,330 120%
Grand Total 10,757,955,980 174,057,184,113 169,662,068,750 (41,929,681,566) 102.59%
** Fixed Billing @ Sanctioned Load
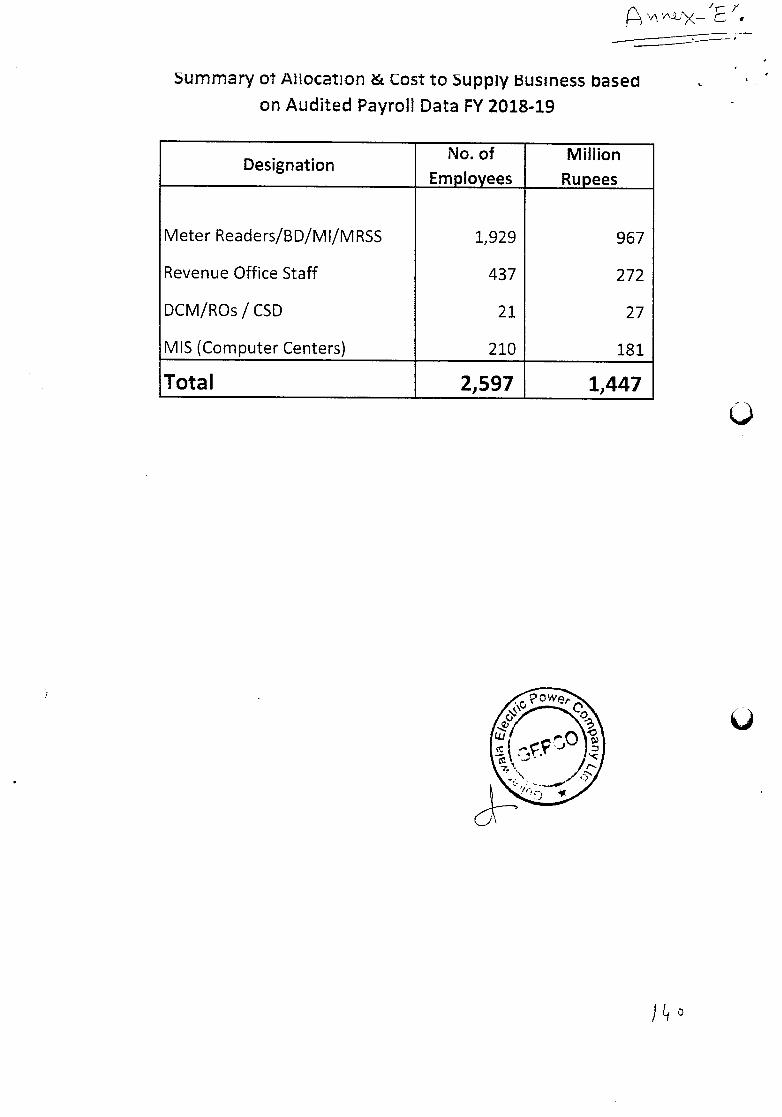
\i\ "-- X—
Summary 01 Aflocation & Cost to Supply Business based on Audited Payroll Data FY 2018-19
Designation No. of
Employees Million
Rupees
Meter Readers/BD/MI/MRSS 1,929 967
Revenue Office Staff 437 272
DCM/ROs / CSD 21 27
MIS (Computer Centers) 210 181
Total 2,597 1,447
a
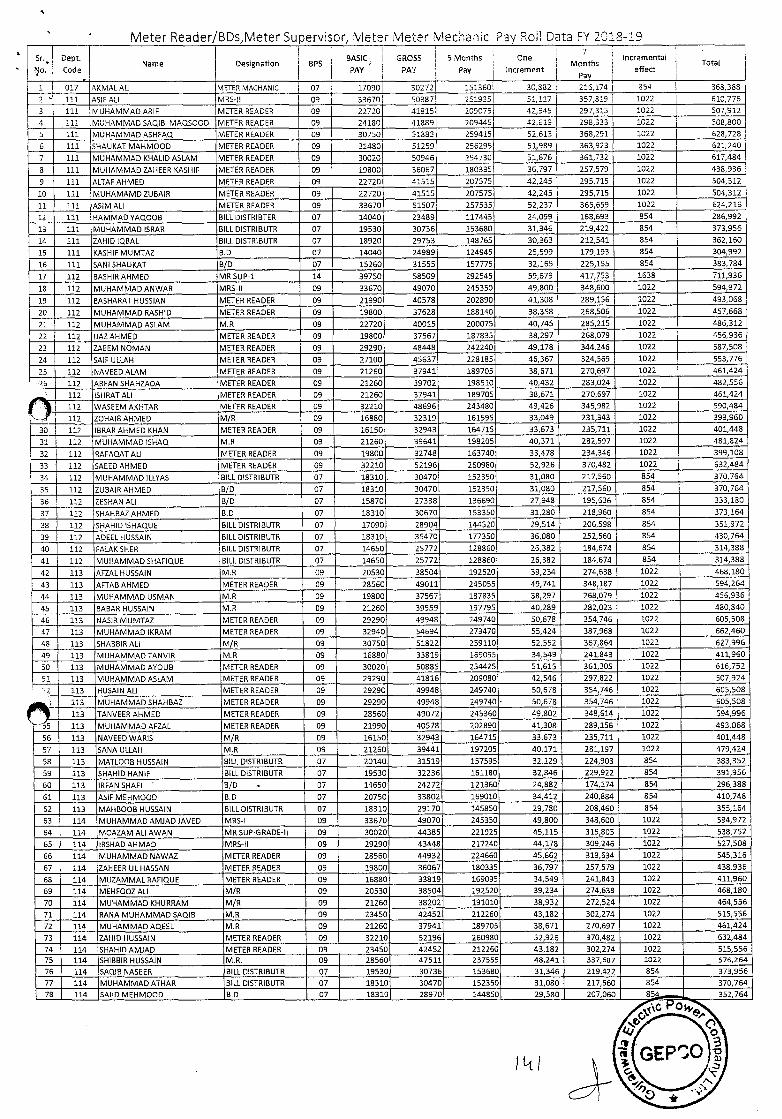
- vieter rceaaer/bus IvleTer upervsor, iveir ivieler v ecnanic r-'ey ioii Udid 1
Sr.
No.
Dept.
Code Name
. . Designation BPS
BASIC
PAY
GROSS
PAY
S Months
Pay
One Months
Increment Pay
Incremental
effect Total
1 017 AKMAL ALl METER MACHANIC 07 17090 30272 151360 30382 216174 854 368,388
2 111 ASIF ALl MRS-lI 09 33670 50387 251935 51117 357,819 1022 610,776
3 111 MUHAMMAD ARIF METER READER 09 22720 41815 209075 42,345 297,815 1022 507,912
4 111 MUHAMMAD SAQIB MAQSOOD METER READER 09 24180 41389 209445 42,619 298,333 1022 508,800
5 111 MUHAMMAD ASHFAQ METER READER 09 30750 51883 259415 52,613 368,291 1022 628,728
6 111 SHAUKAT MAHM000 METER READER 09 31480 51259 256295i 51,989 363,923 1022 621,240
7 111 MUHAMMAD KHALIDASLAM METER READER 09 30020 50946 254730 51,576 361,732 1022 617,434
8 111 MUHAMMAD ZAHEER KASHIF METER READER 09 19800 36067 1B0335 36,797 257,579 1D22 436,936
9 111 ALTAF AHMED METER READER 09 22720 41515 207575 42,245 295,715 1022 504,312
10 111 MUHAMAMD ZUBAIR METER READER 09 22720 41515 207575 42,245 29S,715 1022 504,312
11 111 ASIM ALl METER READER 09 33670 51507 257535 52,237 365,659 1022 624,216
12 111 HAMMAD YAQOOB BILL DISTRIBTER 07 14040 23489 117445 24,099 168,693 854 286,992
13 111 MUHAMMAD ISRAR BILL DISTRIBUTE 07 19530 30736 153680 31,346 219,422 854 373,956
14 111 ZAHID IQBAL BILL DISTRIBUTR 07 18920 29753 148765 30,363 212,541 854 362,160
15 111 KASHIF MUMTAZ B.D 07 14040 24989 124945 25,S99 179,193 854 304,992
16 111 SANI SHAUKAT BID 07 15260 3155S 157775 32,165 225,155 854 383,784
17 112 BASHIR AHMED MR SUP-i 14 39750 58509 292545 59,679 417,753 1638 711,936
18 112 MUHAMMAD AN WAR MRS-Il 09 33670 49070 245350 49,800 348,600 1022 594,972
19 112 BASHARAT HUSSIAN METER READER 09 21990 40578 202890 41,308 289,156 1022 493,068
20 112 MUHAMMAD RASHID METER READER 09 19800 37628 188140 38,358 268,506 1022 457,668
21 112 MUHAMMAD ASLAM M.R 09 22720 40015 200075 40,745 285,215 1022 486,312
22 112 IJAZAHMED METER READER 09 19800 37567 187835 38,297 268,079 1022 456,936
23 112 ZAEEM NOMAN METER READER 09 29290 48448 242240 49,178 344,246 1022 587,5D8
24 112 SAIF ULLAH METER READER 09 27100 45637 228185 46,367 324,569 1022 553,776
25 112 NAVEED ALAM METER READER 09 21260 37941 189705 38,571 270,697 1022 461,424
)5 112 ARFAN SHAHZADA METER READER 09 21260 39702 198510 40,432 283,024 1022 482,556
ISHRAT ALl METER READER 09 21260 37941 189705 38,671 270,697 1022 451,424
O112
- 112 WASEEM AKHTAR METER READER 09 32210 48696 243480 49,426 345,982 1022 590,484
112 ZOHAIBAHMED M/R 09 16880 32319 16159S 33,049 231,343 1022 393,960
30 112 IBRAR AHMED (HAN METER READER 09 151S0 32943 164715 33,573 235,711 1022 401,448
31 112 MUHAMMAD ISHAQ M.R 09 21260 39641 198205 40,371 282,S97 1022 481,824
32 I 112 RAFAQAT ALl METER READER 09 19800 32748 163740 33,478 234,346 1022 399,108
33 112 SAEED AHMED METER READER 09 32210 52196 250980 52,926 370,452 1022 632,484
34 112 MUHAMMAD ILLYAS BILL DISTRIBUTE 07 18310 . 30470 152350 31,080 217,560 854 370,764
35 112 ZUBAIR AHMED B/D 07 18310 30470 152350 31,080 217,560 854 370,764
35 112 ZESHAN ALl B/D 07 15870 27338 136690 27,948 195,636 854 333,180
37 112 SHAHBAZAHMED B.D 07 18310 30670 153350 31,280 218,960 854 373,164
38 112 SHAHID ISHAQUE BILL DISTRIBUTE 07 17090 28904 144520 29,514 206,598 354 351,972
39 112 ADEEL HUSSAIN BILL DISTRIBUTE 07 18310 35470 177350 36,080 252,560 854 430,764
40 112 FALAKSHER BILLDISTRIBUTR 07 14650 25772 128860 26,382 184,674 854 314,388
41 112 MUHAMMAD SHAFIQUE BILL DISTRIBUTE 07 14650 2S772 128860 26,382 184,674 854 314,388
42 113 AFZAL HUSSAIN M.R 09 20530 38504 192520 39,234 274,638 1022 468,180
43 113 AFTAB AHMED METER READER 09 28560 49011 245055 49,741 348,187 1022 594,264
44 113 MUHAMMAD USMAN M.R 09 19800 37567 187835 38,297 268,079 1022 456,936
45 113 BABAR HUSSAIN M.R 09 21260 39559 197795 40,289 282,023 1022 480,840
46 11.3 NASIR MUMTAZ METER READER 09 29290 49948 249740 50,678 354,746 1022 60S,508
47 113 MUHAMMAD IKRAM METER READER 09 32940 54694 273470 55,424 387,968 1022 662,460
48 113 SHABBIR ALl M/R 09 30750 51822 259110 52,552 367,864 1022 627,996
49 113 MUHAMMAD TAN VIR M.R 09 16880 33819 169095 34,549 241,843 1022 411,960
50 113 MUHAMMAD AYOUB METER READER 09 30020 50885 254425 51,615 361,305 1022 616,752
51 113 MUHAMMAD ASLAM METER READER 09 29290 41816 209080 42,546 297,822 1022 507,924
2 113 HUSAIN ALl METER READER 09 29290 49948 249740 SO,678 3S4,746 1022 605,508
113 MUHAMMAD SHAHBAZ METER READER 09 29290 49948 249740 - 50,678 354,746 1022 605,S08
113 TAN VEER AHMED METER READER 09 28560 49072 245360 49,802 348,514 1022 594,996
25 113 MUHAMMAD AFZAL METER READER 09 21990 40578 202890 41,308 289,156 1022 493,068
56 113 NAVEED WARIS M/R 09 16150 32943 164715 33,673 235,711 1022 401,448
57 113 SANA ULLAH M.R 09 21260 39441 197205 40,171 281,197 1022 479,424
58 113 MATLOOB HUSSAIN BILL DISTRIBUTE 07 20140 31519 157595 32,129 224,903 854 383,352
59 113 SHAHID HANIF BILL DISTRIBUTE 07 19530 32236 161180 32,846 229,922 854 391,956
60 113 IRFAN SHAFI - B/D 07 14650 24272 121360 24,882 174,174 854 295,388
61 113 ASiF MEHMOOD B.D 07 20750 33802 169010 34,412 240,384 854 410,748
62 113 MAHBOOB HUSSAIN BILL DISTRIBUTE 07 18310 29170 145850 29,780 208,460 8S4 355,164
63 114 MUHAMMAD AMJAD JAVED MRS-I 09 33670 49070 24S3S0 49,800 348,600 1022 594,972
64 114 MOAZAM ALl AWAN MR SUP-GRADE-Il 09 30020 44385 221925 45,115 315,805 1022 538,752
65 114 IRSHADAHMAD MRS-Il 09 29290 43448 217240 44,178 309,246 1022 527,508
66 114 MUHAMMAD NAWAZ METER READER 09 28580 44932 224660 45,662 319,634 1022 545,316
67 114 ZAHEER UL HASSAN METER READER 09 19800 35067 180335 36,797 257,579 1022 438,936
68 114 MUZAMMAL RAFIQUE METER READER 09 16880 33819 169095 34,549 241,843 1022 411,960
69 114 MEHFOOZ ALl M/R 09 20530 38504 192520 39,234 274,638 1022 468,180
70 114 MUHAMMAD KHURRAM M/R 09 21260 38202 191010 38,932 272,524 1022 464,556
71 114 RANA MUHAMMAD SAQIB M.R 09 23450 42452 212260 43,182 302,274 1022 515,556
72 114 MUHAMMAD AQEEL M.R 09 21250 37941 189705 38,671 270,697 1022 461,424
73 114 ZAHID HUSSAIN METER READER 09 32210 52196 260980 52,926 370,482 1022 632,484
74 114 SHAHID AMJAD METER READER 09 23450 42452 212260 43,1B2 302,274 1022 515,556
75 114 SHIBBIR HUSSAIN M.R. 09 28560 47511 237555 48,241 337,687 1022 576,264
76 114 SAQIB NASEER BILL DISTRIBUTR 07 19530 30736 1536B0 31,346 219,422 854 373,956
77 114 MUHAMMAD ATHAR BILL DISTRIBUTR 07 18310 30470 152350 31,080 217,560 854 370,764
78 114 SAJID MEHM000 9.0 07 18310 28970 144850 29,580 207,060 854,,,..,.,.._,,, 3S2,764
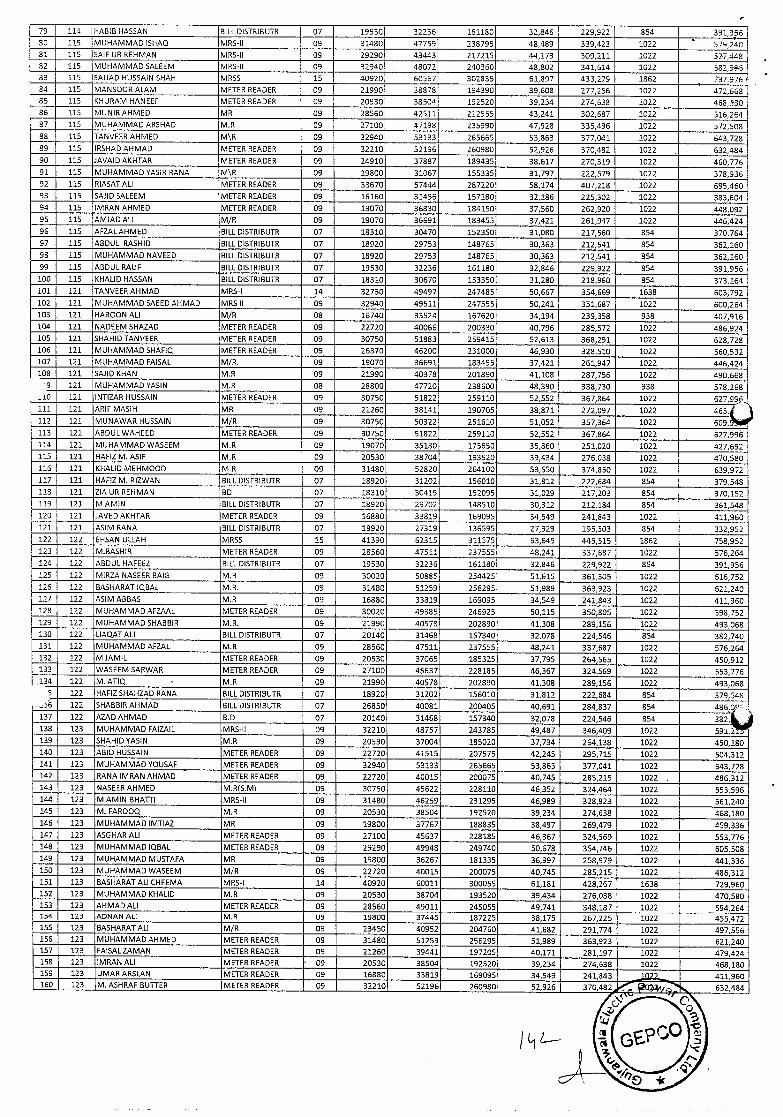
79 114 HABIB HASSAN BILL DISTRIBUTE 07 19530 32236 161180 32,846 229,922 B54 391,956 80 115 MUHAMMAD ISHAQ MRS-Il 09 31480 47759 238795 48,489 339,423 1022 579,240 81 115 SAlE UR REHMAN MRS-Il 09 29290 43443 217215 44,173 309,211 1022 527,448 82 115 MUHAMMAD SALEEM MRS-Il 09 32940 48072 240360 48,802 341,614 1022 582,98'S 83 115 SAJJAD HUSSAIN SHAH MRSS iS 40920 60567 302835 61,897 433,279 1852 737,975k' 84 115 MANSOOR ALAM METER READER 09 21990 38878 194390 39,608 277,256 1022 472,668 85 113 KHURAM HANEEF METER READER 09 20530 38504 192520 39,234 274,638 1022 468,R30 86 115 MUNIR AHMED MR 09 28560 42511 212555 43,241 302,687 1022 516,264 87 115 MUHAMMAD ARSHAD M.R 09 27100 47198 235990 47,928 335,495 1022 572,508 88 115 TANVEER AHMED M\R 09 32940 53133 265655 53,863 377,041 1022 643,728 89 115 IRSHAD AHMAD METER READER 09 32210 52196 260980 52,926 370,482 1022 632,484 90 115 JAVAID AKHTAR METER READER 09 24910 37887 189435 38,617 270,319 1022 450,775 91 115 MUHAMMAD YASIR R,ANA M\R 09 19800 31067 155335 31,797 222,579 1022 378,936 92 115 RIASATALI METER READER 09 33570 57444 287220 58,174 407,218 1022 595,460 93 115 SAuD SALEEM METER READER 09 15160 31456 157280 32,186 225,302 1022 383,504 94 115 IMRAN AHMED METER READER 09 19070 36830 184150 37,560 262,920 1022 448,092 95 115 AMJAD ALl M/R 09 19070 36591 183455 37,421 251,947 1022 446,424 96 115 AFZALAHMED BILL DISTRIBUTR 07 18310 30470 152350 31,080 217,560 854 370,764 97 115 ABDUL RASHID BILL DISTRIBUTR 07 18920 29753 148765 30,353 212,541 854 362,160 98 115 MUHAMMAD NAVEED BILL DISTRIBUTR 07 18920 29753 148765 30,363 212,541 854 362,160 99 115 ABDUL R,AUF BILL DISTRIBUTR 07 19530 32236 161180 32,846 229,922 854 391,956
100 115 KHALID HASSAN BILL DISTRIBUTR 07 18310 30670 153350 31,280 218,960 854 373,164 101 121 TANVEER AHMAD MRS-I 14 32730 49497 247485 50,667 354,669 1638 603,792 102 121 MUHAMMAD SAEED AHMAD MRS II 09 32940 49511 247S55 50,241 351,687 1022 500,264 103 121 HAROON ALl M/R 08 16740 33524 157620 34,194 239,358 938 407,916 104 121 NADEEM SHAZAD METER READER 09 22720 40066 200330 40,796 285,572 1022 486,924 105 121 SHAHID TAN VEER METER READER 09 30750 51883 259413 52,613 368,291 1022 628,728 106 121 MUHAMMAD SHAFlQ METER READER 09 25370 46200 231000 46,930 328,510 1022 560,532 107 121 MUHAMMAD FAISAL M/R. 09 19070 35691 183455 37,421 261,947 1022 446,424 108 121 SAJID KHAN M.R 09 21990 40378 201890 41,108 287,756 1022 490,668
9 121 MUHAMMAD YASIN M.R 08 28800 47720 238600 48,390 338,730 938 578,268 i0 121 INTIZAR HUSSAIN METER READER 09 30750 S1822 259110 52,552 367,864 1022 627,966
111 121 ARIF MASIH MR 09 21260 38141 190705 38,871 272,097 1022 463, 112 121 MUNAWAR HUSSAIN M/R 09 30750 50322 251510 51,052 357,364 1022 609, 113 121 ABDULWAHEED METER READER 09 30750 51822 259110 52,552 367,864 1022 627,996 114 121 MUHAMMAD WASEEM M.R 09 19070 35130 175550 35,860 251,020 1022 427,692 115 121 HAFIZ M. ASIF M.R 09 20530 38704 193520 39,434 276,038 1022 470,580 116 121 KHALID MEHM000 M.R 09 31480 52820 264100 53,550 374,850 1022 639,972 117 121 HAFIZ M. RIZWAN BILL DISTRIBUTR 07 18920 31202 156010 31,812 222,684 854 379,548 118 121 ZIA UR REHMAN BD 07 18310 30419 152095 31,029 217,203 854 370,152 119 121 M.AMIN BILL DISTRIBUTE 07 18920 29702 148510 30,312 212,184 854 361,548 120 121 JAVED AKHTAR METER READER 09 16880 33819 169095 34,549 241,843 1022 411,960 121 121 ASIM RANA BILL DISTRIBUTR 07 18920 27319 135S95 27,929 195,503 854 332,952 122 122 EHSAN ULLAH MRSS 15 41390 52315 311575 63,645 445,515 1862 758,952 123 122 M.BASHIR METER READER 09 28550 47511 237555 48,241 337,687 1022 576,264 124 122 ABDUL HAFEEZ BILL DISTRIBUTR 07 19530 32236 161180 32,845 229,922 854 391,956 125 122 MlRZ,A NASEER BAlD M.R 05 30020 50885 254425 51,515 361,305 1022 615,752 125 122 BASHARAT IQBAL M.R. 09 31480 51259 255295 51,989 363,923 1022 621,240 127 122 ASIM ABBAS M.R 09 16880 33319 169095 34,545 241,843 1022 411,960 128 122 MUHAMMAD AFZAAL METER READER 09 30020 49385 245925 50,115 350,805 1022 598,752 129 122 MUHAMMAD SHABBIR MR. 09 21990 40578 202890 41,308 289,156 1022 493,068 130 122 LIAQ.AT ALl BILL DISTRIBUTR 07 20140 31468 157340 32,078 224,545 854 382,740 131 122 MUHAMMAD AFZAL M.R 09 28550 47511 237S55 48,241 337,687 1022 575,264 132 122 M JAMIL METER READER 09 20530 37065 185325 37,795 264,565 1022 450,912 133 122 WASEEM SARWAR METER READER 09 27100 45537 228185 46,367 324,569 1022 553,775 134 122 M. ATIQ - M.R 09 21990 40578 202890 41,308 289,156 1022 493,068
5 122 HAFIZSHAHZAD RANA BILL DISTRIBUTE 07 18920 31202 156010 31,812 222,684 854 379,548 122 SHABBIR AHMAD BILL DISTRIBUTR 07 26850 40081 200405 40,691 284,837 854 486,0i'
137 122 AZAD AHMAD B.D 07 20140 31468 157340 32,078 224,546 854 332, 138 123 MUHAMMAD FAIZAIL MRS-Il 09 32210 48757 243785 49,487 346,409 1022 591.2 139 123 SHAHIDYASIN M.R 09 20530 37004 185020 37,734 264,138 1022 450,180 140 123 ARID HUSSAIN METER READER 05 22720 41515 207575 42,245 265,715 1022 504,312 141 123 MUHAMMAD YOUSAF METER READER 09 32940 53133 255665 53,853 377,041 1022 643,728 142 123 RANA IMRAN AHMAD METER READER 09 22720 40015 200075 40,745 285,215 1022 - 486,312 143 123 NASEER AHMED M.R(S.M) 09 30750 45622 228110 46,352 324,464 1022 553,595 144 123 M.AMIN BHATTI MRS-Il 09 31480 45259 231295 45,989 328,923 1022 561,240 145 123 M. FAROOQ M.R 09 20530 38504 192520 39,234 274,638 1022 468,180 146 123 MUHAMMAD IMTIAZ MR 09 19800 37767 185835 38,497 269,479 1022 459,336 147 123 ASOHAR ALl METER READER 09 27100 45637 228185 46,367 324,569 1022 553,776 148 123 MUHAMMAD IQBAL METER READER 09 29290 49948 249740 50,678 354,746 1022 605,508 149 123 MUHAMMAD MUSTAFA MR 09 19800 36267 181335 36,997 258,979 1022 441,336 150 123 MUHAMMAD WASEEM M/R 09 22720 40015 200075 40,745 285,215 1022 486,312 151 123 BASHARAT ALl CHEEMA MRS-I 14 40920 60011 300055 61,181 428,267 1638 729,960 152 123 MUHAMMAD KHALID M.R 09 20530 38704 193520 39,434 276,038 1022 470,580 153 123 AHMAD ALl METER READER 09 28560 49011 245055 49,741 348,187 1022 594,264 154 123 ADNAN ALl M.R 05 19800 37445 187225 38,175 267,225 1022 455,472 155 123 BASHARAT ALl M/R 09 23450 40952 204760 41,682 291,774 1022 497,556 155 123 MUHAMMAD AHMED METER READER 09 31480 51259 256295 51,989 353,923 1022 521,240 157 123 FAISALZAMAN METER READER 09 21260 39441 197205 40,171 281,197 1022 479,424 158 123 IMRAN ALl METER READER - 09 20530 38504 192520 39,234 274,638 1022 468,180 159 123 UMAR ARSLAN METER READER 09 16880 33819 159095 34,549 241,843 411,960 160 123 M. ASHRAF BUTTER METER READER 09 32210 52196 250980 52,926 370,482 - , 632,484
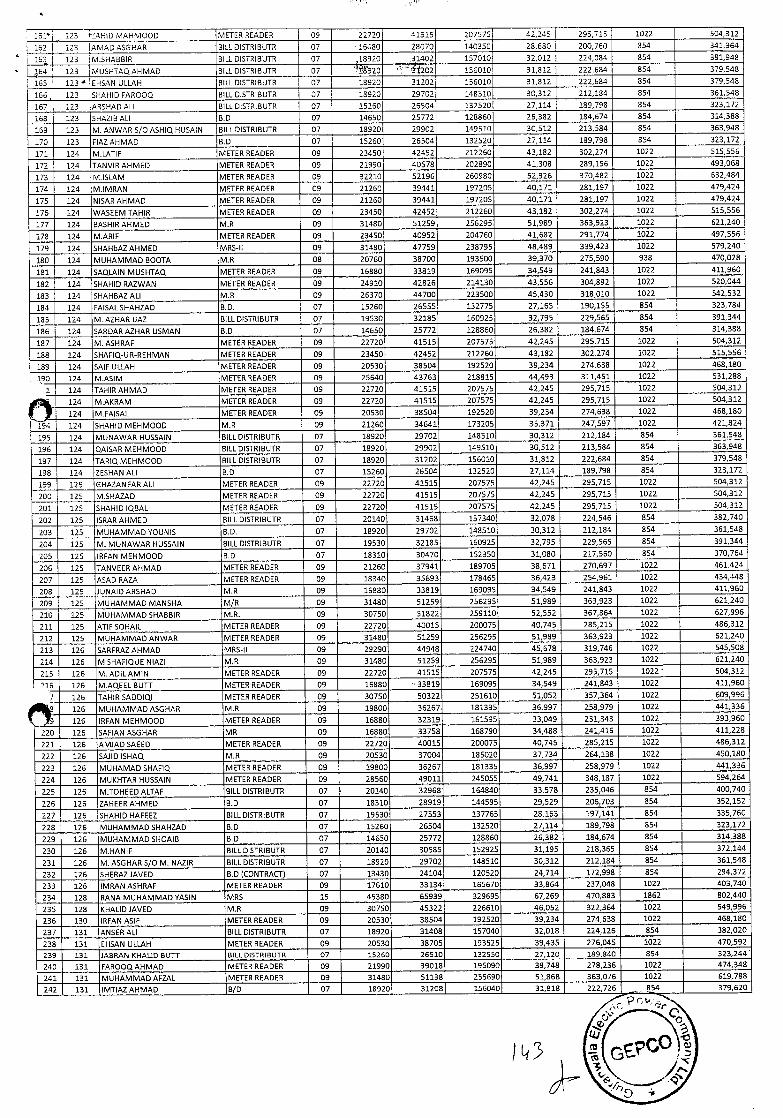
161-b 123 AHID MAHM000 METER READER 09 22720 41515 207575 42,245 295,715 1022 504312
162 123 AMAD ASGHAR BILL DISTRIBUTR 07 16480 28070 140350 28,630 200,760 354 341.964
163 123 M.SHABBIR BILL DISTRIBUTR 07 58920 31402 157010 32,012 224,084 854 381,948
64 123 MUSHTAQAHMAD BILL DISTRIBUTR 07 '1920 6l202 156010 31,812 222,684 854 379,548
165 123 EHSAN ULLAH BILL DISTRIBUTR 07 18920 31202 156010 31,812 222,5B4 B54 379,548
166 • 123 Sl-IAl-IID FAR000 BILL OISTRIBUTR 07 18920 29702 148510 30,312 212,184 854 361,548
167 123 ARSHAD ALl BILL DISTRIBUTR 07 15260 26504 132520 27,114 189,798 854 323,172
168 123 SHAZIB ALl B.D 07 14B50 25772 128860 26,382 184,674 854 314,388
169 123 M. AN WAR 5/0 ASHIQ HUSAIN BILL DISTRIBUTR 07 18920 29902 149510 30,512 213,584 854 363,948
170 123 FIAZAHMAD B.D 07 15260 26504 132520 27,114 189,798 854 323,172
171 124 M.LATIF METER READER 09 23450 42452 212260 43,182 302,274 1022 515,556
172 124 TANVIR AHMED METER READER 09 21990 40578 202890 41,308 289,156 1022 493,068
173 124 M.ISLAM METER READER 09 32210 52196 260980 52,926 370,482 1022 632,484
174 124 M.IMRAN METER READER 09 21260 39441 197205 40,171 281,197 1022 479,424
175 124 NISAR AHMAD METER READER 09 21260 39441 197205 40,171 281,197 1022 479,424
176 124 WASEEM TAHIR METER READER 09 23450 42452 212260 43,182 302,274 1022 515,556
177 124 BASHIRAHMED M.R 09 31480 51259 256295 51.989 363,923 1022 621,240
178 124 M.ARIF METER READER 09 23450 40952 204760 41,682 291,774 1022 497.556
179 124 SHAHbAZAHMED MRS-Il 09 31480 47759 238795 48,489 339,423 1022 579,240
180 124 MUHAMMAD BOOTA M.R 08 20760 38700 193500 39,370 275,590 938 470,028
181 124 5A0141N MUSHTAQ METER READER 09 16880 33819 169095 34,549 241,843 1022 411,960
182 124 SHAHID RAZWAN METER READER 09 24910 42826 214130 43,556 304,892 1022 520,044
183 124 SF-IAHBAZ ALl M.R 09 26370 44700 223500 45,430 318,010 1022 542,532
184 124 FAISAL SHAHZAD B.0. 07 15260 26555 132775 27,165 190,155 854 323,784
185 124 M. AZHAR IJAZ BILL DISTRIBUTR 07 19530 32185 160925 32,795 229,565 854 391,344
186 124 SARDAR AZHAR USMAN B.D 07 14650 25772 128860 26,382 184,674 854 314,388
187 124 M. ASHRAF METER READER 09 22720 41515 207575 42,245 295,715 1022 504,312
188 124 SHAFIQ-UR-REHMAN METER READER 09 23450 42452 212260 43,182 302,274 1022 515,556
189 124 SAIF ULLAH METER READER 09 20530 38504 192520 39,234 274,638 1022 468,180
190 124 M.ASIM METER READER 09 25640 43763 218815 44,493 311,451 1022 531,288
1 124 TAHIR AHMAD METER READER 09 22720 41515 207575 42,245 295,715 1022 504,312
124 M.AKRAM METER READER 09 22720 41515 207575 42,245 295,715 1022 504,312
124 M.FAISAL METER READER 09 20530 38504 192520 39,234 274,638 1022 468,180
194 124 SHAHID MEHMOOD M.R 09 21260 34641 173205 35,371 247,597 1022 421,824
195 124 MIJNAWAR HUSSAIN BILL DISTRIBUTR 07 18920 29702 148510 30,312 212,184 854 361,548
196 124 Q.AISAR MEHM000 BILL DISTRIBUTR 07 18920 29902 149510 30,512 213,584 854 363,948
197 124 TARIQ MEHMOOD BILL DISTRIBUTR 07 18920 31202 156010 31,812 222,684 854 379,548
198 124 ZESHAN ALl 8.0 07 15260 26504 132520 27,114 189,798 854 323,172
199 125 C-HAZANFAR ALl METER READER 09 22720 41515 207575 42,245 295,715 1022 504,312
200 125 M.SHAZAD METER READER 09 22720 41515 207575 42,245 295,715 1022 504,312
201 125 SHAHID IQBAL METER READER 09 22720 41515 207575 42,245 295,715 1022 504,312
202 125 ISRAR AHMED BILL DISTRIBUIR 07 20140 31468 157340 32,078 224,546 854 382,740
203 125 MUHAMMAD YOUNIS 8.0. 07 18920 29702 148510 30,312 212,184 854 361,548
204 125 M. MUNAWAR HUSSAIN BILL DISTRIBUTR 07 19530 32185 160925 32,795 229,565 854 391,344
205 125 IRFAN MEHMOOD 8.0 07 18310 30470 152350 31,080 217,560 854 370,764
206 125 TANVEER AHMAD METER READER 09 21260 37941 189705 38,671 270,697 1022 461.424
207 125 ASAD RAZA METER READER 09 18340 35693 178465 36,423 254,961 1022 434,448
208 125 JUNAIDARSHAD M.R 09 16880 33819 169095 34.549 241,843 1022 411.960
209 125 MUHAMMAD MANSHA M/R 09 31480 51259 256295 51,989 363,923 1022 621,240
210 125 MUHAMMAD SHABBIR M.R. 09 30750 51822 259110 52,552 367,364 1022 627.996
211 125 ATIF SOHAIL METER READER 09 22720 40015 200075 40,745 285,215 1022 486,312
212 125 MUHAMMAD ANWAR METER READER 09 31480 51259 256295 51,989 363,923 1022 621,240
213 126 SARFRAZAHMAD MRS-Il 09 29290 44948 224740 45,678 319,746 1022 545,508
214 126 M SHAFIQUE NIAZI M.R 09 31480 51259 256295 51,989 363,923 1022 621,240
215 126 M. ADILAMIN METER READER 09 22720 41515 207575 42,245 295,715 1022 504.312
16 126 M.AQEEL BUTT METER READER 09 16880 33819 169095 34,549 241,843 1022 411,960
126 TAHIR SADDIQI METER READER 09 30750 50322 251610 51,052 357,364 1022 609,996
126 MUHAMMAD ASGHAR M.R 09 19800 36267 181335 36,997 258,979 1022 441,336
126 IRFAN MEHMOOD METER READER 09 16880 32319 151595 33,049 231,343 1022 393,960
220 126 SARAN ASGHAR MR 09 16880 33758 168790 34,488 241,416 1022 411,228
221 126 AMJAD SAEED METER READER 09 22720 40015 200075 40,745 285,215 1022 486,312
222 126 SAJID ISHAQ M.R 09 20530 37004 185020 37,734 264,138 1022 450,180
223 126 MUHAMAD SHAFIQ METER READER 09 19800 36267 181335 36,997 258,979 1022 441,336
224 126 MUKHTAR HUSSAIN METER READER 09 28560 49011 245055 49,741 348,187 1022 594,264
225 126 M.TOHEED ALTAF BILL DISTRIBUTR 07 20140 32968 164840 33,578 235,046 854 400,740
226 126 ZAHEERAHMED B.D 07 18310 28919 144595 29,529 206,703 854 352,152
227 126 SHAHID HAFEEZ BILL DISTRIBUTR 07 19530 27553 137765 28,163 197,141 854 335,760
228 126 MUHAMMAD SHAHZAD 8.0 07 15260 26504 132520 27,114 189,798 854 323,172
229 126 MUHAMMAD SHOAIB B.D 07 14650 25772 128860 26,382 184,674 854 314,388
230 126 M.HANIF BILL DISTRIBUTR 07 20140 30585 152925 31,195 218,365 854 372,144
231 126 M. ASGHAR 5/0 M. NAZIR BILL DISTRIBUTR 07 18920 29702 148510 30,312 212,184 854 361,548
232 126 SI-IERAZJAVED B.D (CONTRACT) 07 13430 24104 120520 24,714 172,998 854 294,372
233 126 IMRAN ASHRAF METER READER 09 17610 33134 165670 33,864 237,048 1022 403,740
234 128 RANA MUHAMMAD YASIN MRS 15 45380 65939 329695 67,269 470,883 1862 802,440
235 128 KHALIDJAVED M.R 09 30750 45322 226610 46,052 322,364 1022 549,996
236 130 IRFAN ASIF METER READER 09 20530 38504 192520 39,234 274,638 1022 468,180
237 131 ANSER ALl BILL DISTRIBUTR 07 18920 31408 157040 32,018 224,126 854 382,020
238 131 EI-ISAN ULLAH METER READER 09 20530 38705 193525 39,435 276,045 1022 470,592
239 131 JABRAN KHALID BUTT BILL DISTRIBUTR 07 15260 26510 132550 27,120 139.840 854 323,244
240 131 FAROOQAHMAO METER READER 09 21990 39018 195090 39,748 278,236 1022 474,348
241 131 MUHAMMAD AFZAL METER READER 09 31480 51138 255690 51,868 363,076 1022 619,788
242 131 IMTIAZAHMAD BID 07 18920 31208 156040 31,818 222,726 .. 54 379,620
/L13
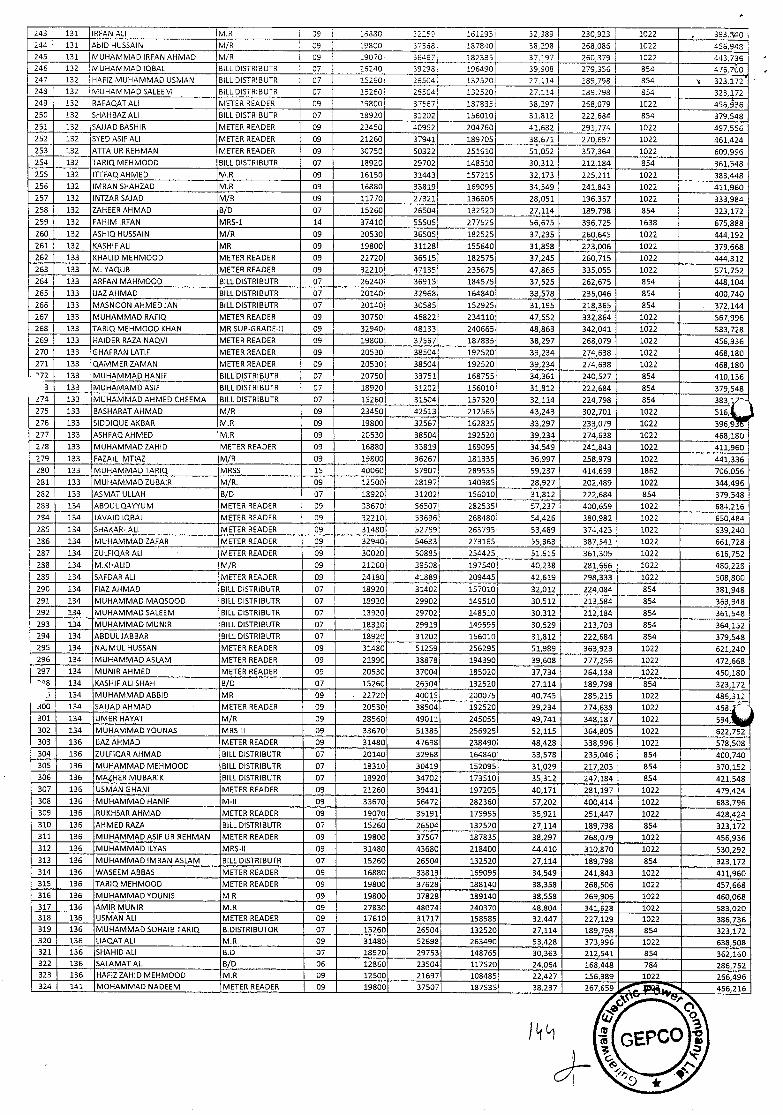
243 131 IRFAN ALl M.R 09 26230 33250 1612951 32389 230,923 1022 393, 10 244 131 AbID HUSSAIN MIS 09 19800 37568 137840 38,298 268,085 1022 456,948 245 131 MUHAMMAD IRFAN AHMAD M/R 09 19070 3667t 182335 37,197 260,379 1022 443,736 246 132 MUHAMMAD IQBAL BILL DISTRIBUTR 07 29240 39298, 196490 39,908 279,356 854 476,700 247 132 HAFIZ MUHAMMAD USMAN BILL D!STRIBUTR 07 13250 25504, 132520 27,114 189,798 854 323,172 248 132 MUHAMMAD SALEEM BILL DISTRIBUTR 07 35260 251C4 132520 27.114 189,798 854 323,172
132 RAFAO.AT ALl METER READER 09 19200 37567 187535 38,297 268,079 1022 456,936 132 SHAHBAZ ALl BILL DISTRIBUTS 07 13920 31202 156010 31,812 222,684 854 379,548 132 SAJJAD BASHIR METER READER 09 23450 40952 204760 41,682 291,774 1022 497,556
132 SYED ASIF ALl METER READER 09 21260 37941 189705 38. 671 270. 697 1022 461,424 253 132 ATTA UR REHMAN METER READER 09 30750 50322 251610 51,052 357,364 1022 609,996 254 132 TARIQ MEHM000 BILL DISTRIBUTR 07 18920 29702 148510 30,312 212,184 854 361,548 255 132 IITFAQAHMED M.R 09 16150 31443 157215 32,173 225.211 1022 383,448 256 132 IMRAN SHAHZ.AD M.R 09 16880 33819 169095 34,549 241,843 1022 411,960
257 132 INTZ.AR SAJAD M/R 09 11770 27321 136605 28,051 196,357 1022 333,984 258 132 ZAHEER AHMAD B/D 07 15260 26504 132520 27,114 189,798 854 323,172
259 132 FAHIM IRFAN MRS-i 14 37410 55505 277525 56,675 396,725 1638 675,888 260 132 ASHIQ HUSSAIN M/R 09 20530 36505 182525 37,235 260,645 1022 444,192
261 132 K.ASHIF ALl MR 09 19800 31128 155640 31,858 223,006 1022 379,668 262 133 KHALID MEHM000 METER READER 09 22720 36515 182575 37,245 260,715 1022 444,312
263 133 M. YAQUB METER READER 09 32210 47135 235675 47,865 335,055 1022 571,752
264 133 ARFAN MAHM000 BILL DISTRIBUTR 07 26240 36915 184575 37,525 262,675 854 448,104
265 133 IJAZ AHMAD BILL DISTRIBUTR 07 20140 32968 164840 33,578 235,046 854 400,740
266 133 MASNOON AHMED JAN BILL DISTRIBUTR 07 20140 30585 152925 31,195 218,365 854 372,144
267 133 MUHAMMAD RAFIQ METER READER 09 30750 46822 234110 47,552 332,864 1022 567,996
268 133 TARIQ MEHM000 KHAN MR SUP-GRADE-Il 09 32940 42133 240665 48,863 342,041 1022 583,728
269 133 HAIDER RAZA NAO.VI METER READER 09 19800 37567 187835 38,297 268,079 1022 456,936 270 133 GHAFRAN LATIF METER READER 09 20530 38504 192520 39, 234 274,638 1022 468,180
271 133 QAMMER ZAMAN METER READER 09 20530 38504 192520 39,234 274,638 1022 468,180 72 133 MUHAMMAD HANIF BILL DISTRIBUTR 07 20750 33751 168755 34,361 240,527 854 410,136
133 MUHAMAMD ASIF BILL DISTRIBUTR 07 18920 31202 156010 31,812 222,684 854 379,548
274 133 MUHAMMAD AHMED CHEEMA BILL DISTRIBUTR 07 11260 31504 157520 32,114 224,798 854
275 133 BASHARAT AHMAD M/R 09 23450 42513 212565 43,243 302,701 1022 518,
276 133 SIDDIQUE AKBAR M.R 09 19800 32567 162835 33,297 233,079 1022 396,9 o 277 133 ASH FAQ AHMED M.R 09 20530 38504 192520 39,234 274,638 1022 468,180
278 133 MUHAMMAD ZAHID METER READER 09 16880 33819 34,549 241,843 1022 411,960
279 133 FAZAIL IMTIAZ MIS 09 16800 36267 36,997 258,979 1022 441,336
280 133 MUHAMMAD TARIQ MRSS 15 40080 57907 289535 59,237 414,659 1862 706,056
281 133 MUHAMMAD ZUBAIR M/R. 09 12500 28197 140985 202,489 1022 344,496
282 133 ASMAT ULLAH B/D 07 23920 31202 156010 222,684 854 379.548
283 134 ABDUL QAYVUM METER READER 09 39670 56507 282535 57,237 400,659 1022
234 134 JAVAID IQBAL METER READER 09 32210 53696 268480 54,426 380,982 1022
285 134 SHAKAR- ALl METER READER 09 31480 52759 263795 53,489 374,423 1022
286 134 MUHAMMAD Z.AFAR METER READER 09 32940 54633 273165 55,363 387,541 1022
287 134 ZULFIQ.AR ALl METER READER 09 30020 50885 254425 51,615 361,305 1022
288 134 M. K HA LID MIR 09 21260 39508 197540 40,238 28 1. 866 1022 480,228
259 134 SAFDAR ALl METER READER 09 24180 41889 209445 42,619 298,333 1022 508,800
290 134 FIAZAHMAD BILL DISTRIBUTR 07 18920 31402 157010 32,012 224,084 854 381,948
291 134 MUHAMMAD MAQS000 BILL DISTRIBUTR 07 15920 29902 149510 30,512 213,584 854 363,948
292 134 MUHAMMAD SALEEM BILL DISTRIBUTR 07 13920 29702 148510 30,312 212,184 854 361,548
293 134 MUHAMMAD MUNIR BILL DISTRIBUTR 07 18310 29919 149595 30,529 213,703 854 364,152 294 134 ABDUL JABBAR BILL DISTRIBUTR 07 18920 31202 156010 31,812 222,684 854 379,548 296 134 NAJMUL HUSSAN METER READER 09 31480 51259 256295 5 1.989 363,923 1022 621,240 296 134 MUHAMMAD ASLAM METER READER 09 21990 38878 194390 39.608 277,256 1022 472,668 297 134 MUNIR AHMED METER READER 09 20530 37004 185020 37,734 264,138 1022 450,180 "08 134 KASHIF ALl SHAH BID 07 15260 26304 132520 27,114 189,798 854 323. 172
134 MUHAMMAD ABBID MR 09 22720 40015 200075 40,745 285,215 1022 486,312 200 134 SAIJAD AHMAD METER READER 09 20530 38504 192520 39, 234 274,638 1022 468,1-" 301 134 UMER HAYAT M/R 09 28560 49011 245055 49,741 348,187 1022 594, 302 134 MUHAMMAD VOUNAS MRS-lI 09 33670 51385 256925 52,115 364,805 1022 622.752 303 136 IJAZ AHMAD METER READER 09 31480 47698 238490 48,428 338,996 1022 578,508 304 136 ZULFIQARAHMAD BILLDISTRIBUTR 07 20140 32968 164840 33,578 235,046 854 400,740 305 136 MUHAMMAD MEHM000 BILL DISTRIBUTR 07 18310 30419 152095 31,029 217,203 854 370,152 306 136 MAHER MUBARIK BILL DISTRIBUTR 07 18920 34702 173510 35,312 247.184 854 421,548 307 136 USMAN GHANI METER READER 09 21260 39441 197205 40,171 281,197 1022 479,424 308 136 MUHAMMAD HANIF M-II 09 33670 56472 282360 57,202 400,414 1022 683,796 309 136 RUKHSAR AHMAD METER READER 09 19070 35191 175955 35,921 251,447 1022 428,424 310 136 AHMED RAZA BILL DISTRIBUTR 07 15260 26504 132520 27.114 189,798 854 323,172 311 136 MUHAMMAD ASIF UR REHMAN METER READER 09 19800 37567 187835 38.297 268,079 1022 456,936
312 136 MUHAMMAD ILYAS MRS-Il 09 31480 43680 218400 44,410 310,870 1022 530,292
313 136 MUHAMMAD IMRAN ASLAM BILL DISTRIBUTR 07 15260 26504 132520 27,114 189.798 854 323,172 314 136 WASEEM ABBAS METER READER 09 16880 33819 169095 34,549 241,843 1022 411,960 315 136 TARIQ MEHMOOD METER READER 09 19800 37628 188140 38,358 268,506 1022 457,668 316 136 MUHAMMAD YOUNIS M R 09 19800 37828 189140 38.558 269,906 1022 460,068 317 136 AMIR MUNIR M.R 09 27830 48074 240370 48.804 341.628 1022 583,020 318 136 USMAN ALl METER READER 09 17610 31717 158585 32,447 227,129 1022 386,736 319 136 MUHAMMAD SOHAIB TARIQ B.DISTRIBUTOR 07 15260 26504 132520 27,114 189,798 854 323.172 320 136 LIAQAT ALl M.R 09 31480 52698 263490 53,428 373,996 1022 638,508 321 136 SHAHID ALl 8.0 07 18920 29753 148765 30,363 212,541 854 362,160 322 136 SALAMAT ALl BID 05 12860 23504 117520 24.064 168.448 784 286,752 323 136 HAFIZZAHID MEHM000 M.R 09 12500 21697 108485 22,427 156,989 1022 266,496 324 141 MOHAMMAD NADEEM METER READER 09 19800 37507 187535 38,237 267,559 456,216
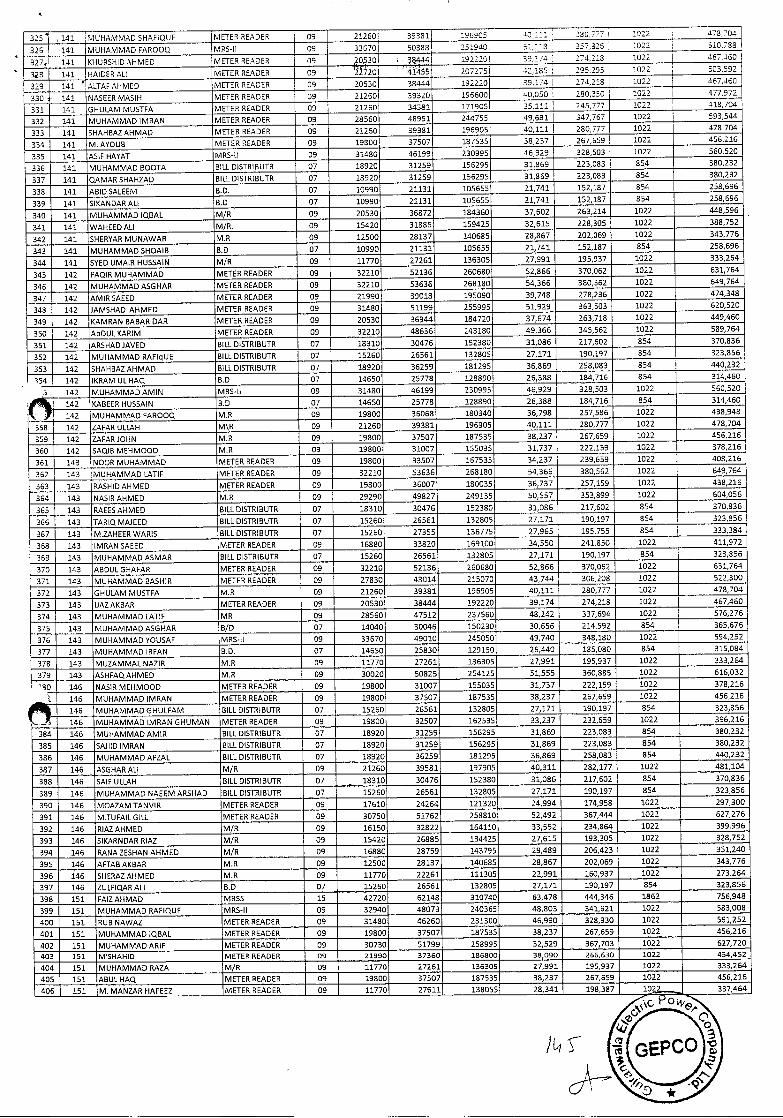
325 141 MUHAMMAD SHAFIQUE METER READER 09 21260 39381 196?CS 30,777 1022 I 178704
325 141 MUHAMMAD FAR000 MRS-Il 09 33670 50382 2519401 51,1:8 357325 1022 510,783
327 141 KHURSHID AHMED METER READER 09 QS3O 38444 192220 39,17 274218 1022 467,460
38 141 RAIDER AU METER READER 09 720i '4i455 207275 12185 295,295 1022 503592
329 141 ALTAF AHMED METER READER 09 20530 38444 192220 39,174 274,218 1022 467,460
330 141 NASEER MASIH METER READER 09 21260 39320 196600 40,050 280,350 1022 477,972
331 141 GHULAM MUSTFA METER READER 09 21260 34381 171905 35,111 245,777 1022 118,704
332 141 MUHAMMAD IMRAN METER READER 09 28560 48951 244755 49,681 347,767 1022 593,544
333 141 SHAHBAZAHMAD METER READER 09 21250 39381 196905 40,111 280,777 1022 478,704
334 141 M. AYDUB METER READER 09 19300 37507 187535 38,237 267,659 1022 456,216
335 141 ASIF HAYAT MRS-Il 09 31480 46199 230995 46,929 328,503 1022 560,520
336 141 MUHAMMAD BOOTA BILL DISTRIBUTE 07 18920 31259 156295 31,869 223,083 854 380,232
337 141 OAMAR SHAHZAD BILL DISTRIBUTR 07 18920 31259 156295 31,869 223,083 854 380,232
338 141 ABID SALEEM B.D. 07 10990 21131 105655 21,741 152,187 854 258,696
339 141 SIKANDAR ALl B.D 07 10990 21131 105655 21,741 152,187 854 258,696
340 141 MUHAMMAD QBAL M/R 09 20530 36872 184360 37,602 263,214 1022 448,596
341 141 WAHEED ALl M/R. 09 15420 31885 159425 32,615 228,305 1022 388,752
342 141 SHERYAR MUNAWAR M.R 09 12500 28137 140685 28867 202,069 1022 343,776
343 141 MUHAMMAD SHOAIB B.D 07 10990 21131 105655 21,741 152,187 854 258,696
344 141 SYED UMAIR HUSSAIN M/R 09 11770 27261 136305 27,991 195,937 1022 333,264
345 142 FAQJR MUHAMMAD METER READER 09 32210 52136 260680 52,866 370,062 1022 631,764
346 142 MUHAMMAD ASGHAR METER READER 09 32210 53636 268180 54,366 380,562 1022 649,764
347 342 AMIR SAEED METER READER 09 21990 39018 195090 39,748 278,236 1022 474,348
348 142 JAMSHAD AHMED METER READER 09 31480 51199 255995 51,929 363,503 1022 620,520
349 142 KAMRAN BABAR DAR METER READER 09 20530 36944 184720 37,674 263,718 1022 449,460
350 142 AbDUL KARIM METER READER 09 32210 48636 243180 49,366 345,562 1022 589,764
351 142 ARSHADJAVED BILL DISTRIBUTE 07 18310 30476 152380 31,086 217,602 854 370,836
352 142 MUHAMMAD RAFIqUE BILL DISTRIBUTR 07 15260 26561 132805 27,171 190,197 854 323,856
353 142 SHAHBAZ AHMAD BILL DISTRIBUTR 07 18920 36259 181295 36,869 258,083 854 440,232
54 142 IKRAM UL HAQ 9.D 07 14650 25778 128890 26,388 184,716 854 314,460
3 142 MUHAMMADAMIN MRS-Il 09 31480 46199 230995 46,929 328,503 1022 560,520
142 KABEER FIUSSAIN B.D 07 14650 2577B 128890 26,388 184,716 854 314,460
142 MUHAMMAD FAROOQ M.R 09 19800 36068 180340 36,798 257,586 1022 438,948
358 142 ZAFAR ULLAH M\R 09 21260 39381 196905 40,111 280,777 1022 478,704
359 142 ZAFAR JOHN M.R 09 19800 37507 187535 38,237 267,659 1022 456,216
360 142 SAQIB MEHMOOD M.R 09 19800 31007 155035 31,737 222,159 1022 378,216
361 143 MOOR MUHAMMAD METER READER 09 19800 33507 167535 34,237 239,659 1022 408,216
362 143 MUHAMMAD LATIF METER READER 09 32210 53636 268180 54,366 380,562 1022 649,764
363 143 RASHID AHMED METER READER 09 19800 36007 180035 36,737 257,159 1022 438,216
364 143 NASIR ARMED M.R 09 29290 49827 249135 50,557 353,899 1022 604,056
365 143 RAEES AHMED BILL DISTRIBUTR 07 18310 30476 152380 31,086 217,602 854 370,836
366 143 TARIQ MAJEED BILL DISTRIBUTR 07 15260 26561 132805 27,171 190,197 854 323,856
367 143 M.ZAHEER WARIS BILL DISTRIBUTR 07 15260 27355 136775 27,965 195,755 854 333,384
368 143 IMR,AN SAEED METER READER 09 16880 33820 169100 34,550 241,850 1022 411,972
369 143 MUHAMMAD ASMAR BILL DISTRIBUTE 07 15260 26561 132805 27,171 190,197 854 323,856
370 143 ABDLIL GHAFAR METER READER 09 32210 52136 260680 52,866 370,062 1022 631,764
371 143 MUHAMMAD BASHIR METER READER 09 27830 43014 215070 43,744 306,208 1022 522,300
372 143 ISHUlAM MUSTFA M.R 09 21260 39381 196905 40,111 280,777 1022 478,704
373 143 IJAZAKBAR METER READER 09 20530 38444 192220 39,174 274,218 1022 467,460
374 143 MUHAMMAD LATIF MR 09 28560 47512 237560 48,242 337,694 1022 576,276
375 143 MUHAMMAD ASGHAR 8/0 07 14040 30046 150230 30,656 214,592 854 365,676
376 143 MUHAMMAD YOUSAF MRS-Il 09 33670 49010 245050 49,740 348,180 1022 594,252
377 143 MUHAMMAD IRFAN B.D. 07 14650 25830 129150 26,440 185,080 854 315,084
378 143 MUZAMMAL NAZIR M.R 09 11770 27261 13630S 27,991 195,937 1022 333,264
379 143 ASHFAQAHMED M.R 09 30020 50825 254125 51,555 360,885 1022 616,032
'90 146 NASIR MEHM000 METER READER 09 19800 31007 155035 31,737 222,159 1022 378,216
5 146 MUHAMMAD IMRAN METER READER 09 19800 37507 187535 38,237 267,659 1022 456,216
ØáI146
146
MUHAMMAD GHULFAM BILL DISTRIBUTE 07 15260 26561 132805 27,171 190,197 854 323,856
MUHAMMAD IMRAN GRUMAN METER READER 09 19800 32507 162535 33,237 232,659 1022 396,216
384 146 MUHAMMAD AMIR BILL DISTRIBUTR 07 18920 31259 156295 31,869 223,083 854 380,232
385 146 SAJIID IMRAN BILL DISTRIBUTE 07 18920 31259 156295 31,869 223,083 854 380,232
386 146 MUHAMMAD AFZAL BILL DISTRIBUTE 07 18920 36259 181295 36,869 258,083 854 440,232
387 146 ASC'HAR ALl M/R 09 21260 39581 197905 40,311 282,177 1022 481,104
388 146 SAIF ULLAH BILL DISTRIBUTR 07 18310 30476 152380 31,086 217,602 854 370,836
389 146 MUHAMMAD NAEEM ARSHAD BILL DISTRIBUTE 07 15260 26561 132805 27,171 190,197 854 323,856
390 146 MOAZAM TANVIR METER READER 09 17610 24264 121320 24,994 174,958 1022 297,300
391 146 M.TUFAILGILL METER READER 09 307S0 51762 258810 52,492 367,444 1022 627,276
392 146 RIAZAHMED M/R 09 16150 32822 164110 33552 234,854 1022 399,996
393 146 SIKARNDAR RIAZ M/R 09 15420 26885 134425 27,615 193,305 1022 328,752
394 146 RANA ZESHAN ARMED M/R 09 16880 28759 143795 29,489 206,423 1022 351,240
395 146 AFTABAKBAR M.R 09 12500 28137 140685 28,867 202,069 1022 343,776
396 146 SHERAZAHMED M.R 09 11770 22261 11130S 22,991 160,937 1022 273,264
397 146 ZULFIQAR ALl B.D 07 15260 26561 132805 27,171 190,197 854 323,856
398 151 FAIZAHMAD MESS iS 42720 62148 310740 63,478 444,346 1862 756,948
399 151 MUHAMMAD RAFIQUE MRS-Il 09 32940 48073 240365 48,803 341,621 1022 583,0DB
400 151 RUB NAWAZ METER READER 09 31480 46260 231300 46,990 328,930 1022 561,252
401 151 MUHAMMAD IQBAL METER READER 09 19800 37507 187535 38,237 267,659 1022 456,216
402 151 MUHAMMAD ARIF METER READER 09 30730 51799 258995 52,529 367,703 1022 627,720
403 M'SHAHID METER READER .6 U*I.I 38,090 18.*1!I 1022 454,452
404 151 MUHAMMAD RAZA M/R 09 11770 27261 136305 27,991 195,937 1022 333,264
405 151 ABUL HAQ METER READER 09 19800 37507 187S3S 38,237 267,6S9 1022 456,216
406 151 M. MANZAR HAFEEZ METER READER 09 11770 27611 138055 28,341 198,387 102 337,464
(GEPCO
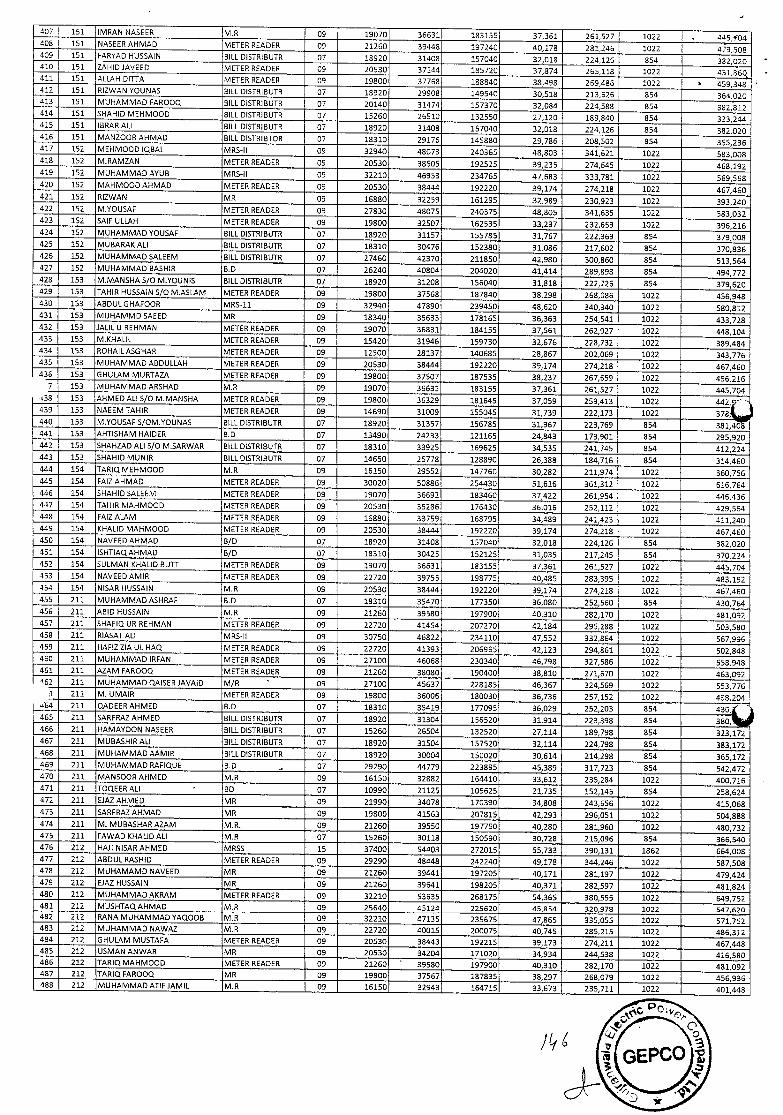
407 151 IMRAN NASEER rvl.R 09 19070 36631 183155 37,361 261,527 1022 4t5,9Q4 408 151 NASEER AHMAD METER READER 09 21260 39443 197240 40,178 281,246 1022 479,508 409 151 FARYAD HUSSAIN BILL DISTRIBUTR 07 18920 31408 157040 32,018 224,126 854 382,020 410 151 ZAHID JAVEED METER READER 09 20530 37144 185720 37,874 265,118 1022 451,560 411 151 ALLAH DITTA METER READER 09 19800 37768 188840 38,198 269,486 1022 459,348 412 151 RIZWAN YOUNAS BILL DISTRIBUTE 07 18920 29908 149540 30,518 213,626 854 364,020 413 151 MUHAMMAD FAR000 BILL DISTRIBUTE 07 20140 31474 157370 32,084 224,588 854 382,812 414 151 SHAHID MEHM000 BILL DISTRIBUTR 07 15260 26510 132550 27,120 189,840 854 323,244 415 151 IBRAR ALl BILL DISTRIBUTR 07 18920 31408 157040 32,018 224,126 854 382,020 416 151 MANZOOR AHMAD BILL DISTRIBTOR 07 18310 29176 145880 29,786 208,502 854 355,236 417 152 MEHMOOD IQ8AL MRS-Il 09 32940 48073 240365 48,803 341,621 1022 583,008 418 152 M.RAMZAN METER READER 09 20530 38505 192525 39,235 274,545 1022 468,192 419 152 MUHAMMAD AYUB MRS-Il 09 32210 46953 234765 47,6B3 333,781 1022 569,568 420 152 MAHMOODAHMAD METER READER 09 20530 38444 192220 39,174 274,218 1022 467,460 421 152 RIZWAN MR 09 16880 32259 151295 32,989 230,923 1022 393,240 422 152 M.YOUSAF METER READER 09 27830 48075 240375 48,805 341,635 1022 583,032 423 152 SAIl ULLAH METER READER 09 19800 32507 162535 33,237 232,659 1022 396,216 424 152 MUHAMMAD YOUSAF BILL DISTRIBIJTR 07 18920 31157 155785 31,767 222,369 854 379,008 425 152 MUBARAI< ALl BILL DISTRIBUTE 07 18310 30476 152380 31,086 217,602 854 370,836 426 152 MUHAMMAD SALEEM BILL DISTRIBUTE 07 27460 42370 211850 42,980 300,860 854 513,564 427 152 MUHAMMAD BASHIR B.D 07 25240 40804 204020 41,414 289,898 854 494,772 428 153 M.MANSHA 5/0 M.YOUNIS BILL DISTRIBUTE 07 1B920 31208 156040 31,818 222,726 854 379,620 429 153 TAHIR HUSSAIN 5/0 M.ASLAM METER READER 09 19800 37568 187840 38,298 268,086 1022 456,948 430 153 ABDULGHAFOOR MRS-il 09 32940 47890 239450 48,620 340,340 1022 580,812 431 153 MUHAMMD SAEED MR 09 18340 35633 178165 35,363 254,541 1022 433,728 432 153 JALIL U REHMAN METER READER 09 19070 36831 184155 37,561 262,927 1022 448,104 433 153 M.KHALIL METER READER 09 15420 31946 159730 32,676 228,732 1022 389,484 434 153 ROHAILASGHAR METER READER 09 12500 28137 140585 28,867 202,069 1022 343,776 435 153 MUHAMMAD ABDULLAH METER READER 09 20530 38444 192220 39,174 274,218 1022 457,460 436 153 GHULAM MURTAZA METER READER 09 19800 37507 187535 38,237 267,559 1022 455,216
7 153 MUHAMMAD ARSHAD M.R 09 19070 36631 183155 37,361 261,527 1022 445,704 438 153 AHMED ALl Sb M.MANSHA METER READER 09 19800 36329 181645 37,059 259,413 1022 439 153 NAEEM TAHIR METER READER 09 14690 31009 155045 31,739 222,173 1022 378, 440 153 M.YOUSAF S/OM.YOUNAS BILL DISTRIBUTE 07 18920 31357 155785 31,967 223,769 854 381,408 441 153 AHTISHAM HAIDER 8.0 07 13490 24233 121165 24,843 173,901 854 295,920 442 153 SHAHZAD ALl 5/0 M.SARWAR BILL DISTRIBUTE 07 18310 33925 169525 34,535 241,745 854 412,224 443 153 SHAHID MUNIR BILL OISTRIBUTR 07 14650 25778 128890 25,388 184,716 854 314,460 444 154 TARIQ MEHM000 M.R 09 15150 29552 147750 30,282 211,974 1022 350,755 445 154 FAIZAHMAD METER READER 09 30020 50886 254430 51,515 361,312 1022 516,764 446 154 SHAHID SALEEM METER READER 09 19070 36592 183460 37,422 261,954 1022 445,436 447 154 TAHIR MAHMOOD METER READER 09 20530 35286 176430 36,016 252,112 1022 429,564 448 154 FAIZ ALAM METER READER 09 16880 33759 168795 34,489 241,423 1022 411,240 449 154 KHALID MAHMOOD METER READER 09 20530 38444 192220 39,174 274,218 1022 467,460 450 154 NAVEED AHMAD B/D 07 18920 31408 157040 32,018 224,125 854 382,020 451 154 ISHTIAQAHMAD B/D 07 18310 30425 152125 31,035 217,245 854 370,224 452 154 SULMAN KHALID BUTT METER READER 09 19070 36631 183155 37,351 251,527 1022 445,704 453 154 NAVEED AMIR METER READER 09 22720 39755 198775 40,485 283,395 1022 483,192 454 154 NISAR HUSSAIN M.R 09 20530 38444 192220 39,174 274,218 1022 467,460 455 211 MUHAMMAD ASHRAF 8.0 07 18310 35470 177350 35,080 252,550 854 430,754 456 211 ABID HUSSAIN M.R 09 21260 39580 197900 40,310 282,170 1022 481,092 457 211 SHAFIQ UR REHMAN METER READER 09 22720 41454 207270 42,184 295,288 1022 503,580 458 211 RIASAT ALl MRS-Il 09 30750 46822 234110 47,552 332,854 1022 567,995 459 211 HAFIZZIA UL HAQ METER READER 09 22720 41393 206955 42,123 294,861 1022 502,848 450 211 MUHAMMAD IRFAN METER READER 09 27100 46068 230340 45,798 327,585 1022 558,948 461 211 AZAM FAROOQ METER READER 09 21250 38080 190400 38,810 271,670 1022 463,092
62 211 MUHAMMADQAISERJAVAID M/R ' 09 27100 45537 228185 45,357 324,569 1022 553,775 3 211 M. UMAIR METER READER 09 19800 36005 180030 36,736 257,152 1022 438,204
-+54 211 QADEER AHMED B.D 07 18310 35419 177095 36,029 252,203 854 430. 465 211 SARFRAZ AHMED BILL DISTRIBUTR 07 18920 31304 156520 31,914 223,398 854 380, 456 211 HAMAYOON NASEER BILL DISTRIBUTR 07 15250 26504 132520 27,114 189,798 854 323,172 457 211 MUBASHIR ALl BILL DISTRIBUTR 07 18920 31504 157520 32,114 224,798 854 383,172 458 211 MUHAMMAD AAMIR BILL DISTRIBUTR 07 18920 30004 150020 30,614 214,298 354 365,172 469 211 MUHAMMAD RAFIQUE B.D .. 07 29290 44779 223895 45,389 317,723 854 542,472 470 211 MANSOOR AHMED M.R 09 16150 32882 164410 33,512 235,284 1022 400,715 471 211 TOQEER ALl ED 07 10990 21125 105625 21,735 152,145 854 258,624 472 211 EJAZAHMED MR 09 21990 34078 170390 34,808 243,655 1022 415,068 473 211 SARFRAZAHMAD MR 09 19800 41563 207815 42,293 296,051 1022 504,888 474 211 M. MUBASHAR AZAM M.R. 09 21260 39550 197750 40,280 281,960 1022 480,732 475 211 FAWAD KHALID ALl M.R 07 15260 30118 150590 30,728 215,095 854 365,540 476 212 HAil NISAR AHMED MRSS 15 37400 S4403 272015 55,733 390,131 1862 664,008 477 212 ABDUL RASHID METER READER 09 29290 48448 242240 49,178 344,245 1022 587,508 478 212 MUHAMAMD NAVEED MR 09 21250 39441 197205 40,171 281,197 1022 479,424 479 212 EJAZ HUSSAIN MR 09 21250 39641 198205 40,371 282,597 1022 481,824 480 212 MUHAMMAD AKRAM METER READER 09 32210 53635 25B175 54,355 380,555 1022 649,752 481 212 MUSHTAQAHMAD M.R 09 25640 45124 225620 45,854 320,978 1022 547,620 482 212 RANAMUHAMMADYAQOOB M.R 09 32210 47135 235675 47,865 335,055 1022 571,752 483 212 MUHAMMAD NAWAZ M.R 09 22720 40015 200075 40,745 285,215 1022 485,312 484 212 GHULAM MUSTAFA METER READER 09 20530 38443 192215 39,173 274,211 1022 457,448 485 212 USMAN AN WAR MR 09 20530 34204 171020 34,934 244,538 1022 416,580 486 212 TARIQ MAHMOOD METER READER 09 21260 - 39530 197900 40,310 282,170 1022 481,092 487 212 TARIQFAROOQ MR 09 19800 37567 187835 38,297 268,079 1022 455,936 488 212 MUHAMMADATIFJAMIL M.R 09 15150 32943 164715 33,673 235,711 1022 401,448
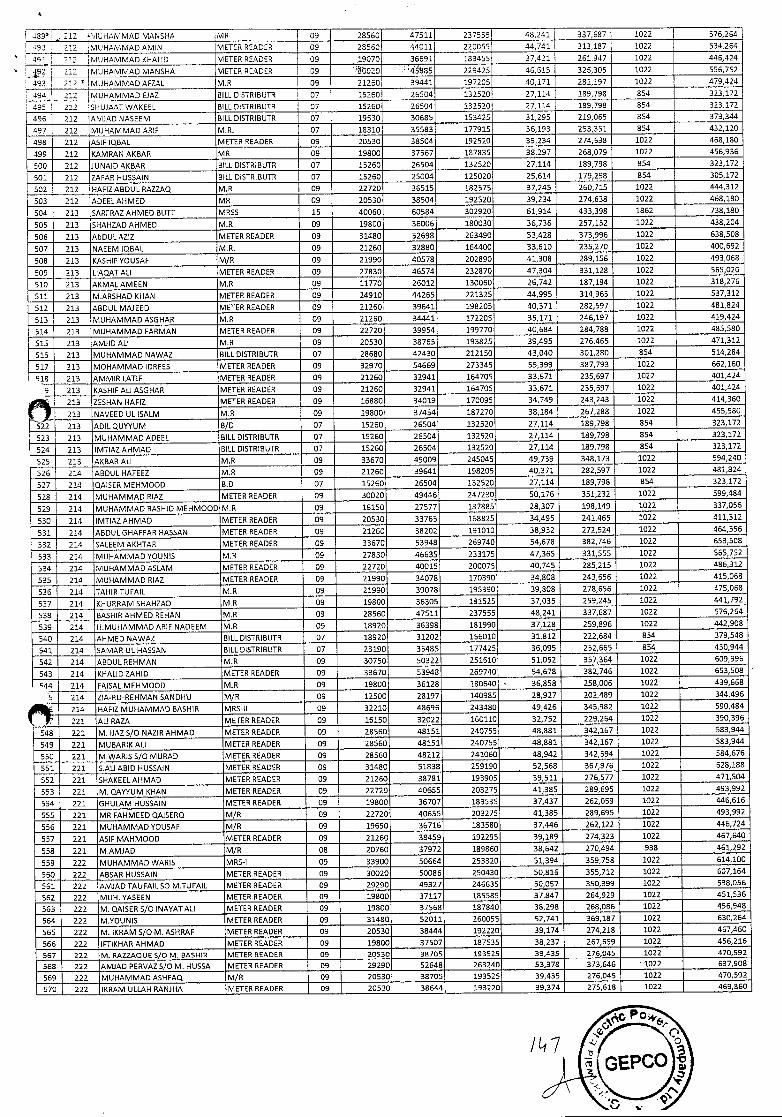
489k - 212 •",IUHAMMAD MANSHA MR 09 28560 47511 237555 48241 337687 1022 576264
444 212 MUHAMMAD AMIN METER READER 09 2E560 44011 220055 44741 313187 1022 534264
491 212 MUHAMMAD 6HALID METER READER 09 19070 36691 183455 37421 261,947 1022 446,424
'92 212 MUHAMMAD MANSHA METER READER 09 020 '4835 229425 46,615 326,305 1022 556,752
493 212 MUHAMMAD AFZAL MR 09 21260 39441 197205 40,171 281,197 1022 479,424
464 212 MUHAMMAD EJAZ BILL DISTRIBUTR 07 15260 26504 132520 27,114 189,798 854 323,172
496 212 SHUJAAT 'NAKEEL BILL DISTRIBUTR 07 15260 26504 132520 27,114 189,798 B54 323,172
396 212 AMJAD NASEEM BILL DISTRIBUTR 07 19530 30685 153425 31,295 219,065 854 373,344
497 212 MUHAMMAD ARIF MR. 07 18310 35583 177915 36,193 253,351 854 432,120
498 212 ASIF IQBAL METER READER 09 20530 38504 192520 39,234 274,638 1022 468,180
499 212 KAMRAN AKBAR MR 09 19800 37567 187835 38,297 268,079 1022 456,936
500 212 JUNAID AKBAR BILL DISTRIBUTR 07 15260 26504 132520 27,114 189,798 854 323,172
501 212 Z.AFAR HUSSAIN BILL DISTRIBUTR 07 15260 25004 125020 25,614 179,298 854 305,172
502 212 HAFIZABDUL RAZZAQ M.R 09 22720 36515 182575 37,245 260,715 1022 444,312
503 212 ADEELAHMED MR 09 20530 38504 192520 39,234 274,638 1022 468180
504 213 SARFRAZ AHMED BUTT MRSS 15 40060 60584 302920 61,914 433,398 1862 738180
505 213 SHAHZAD AHMED M.R 09 19800 36006 180030 36,736 257,152 1022 438,204
506 213 AbDUL AZIZ METER READER 09 31480 52698 263490 53,428 373,996 1022 638,508
507 213 NAEEM IQBAL MR. 09 21260 32880 154400 33,610 235,270 1022 400,692
508 213 KASHIF YOUSAF M/R 09 21990 40578 202890 41,308 289,156 1022 493,068
509 213 LIAQ.AT ALl METER READER 09 27830 46574 232870 47,304 331,128 1022 565,020
510 213 AKMALAMEEN M.R 09 11770 26012 130060 26,742 187,194 1022 318,276
511 213 M.ARSHAD KHAN METER READER 09 24910 44265 221325 44,995 314,965 1022 537,312
512 213 ABDUL MAJEED METER READER 09 21260 39641 198205 40,371 282,597 1022 481,824
513 213 MUHAMMAD ASGHAR M.R 09 21260 34441 172205 35,171 246,197 1022 419,424
514 213 MUHAMMAD FARMAN METER READER 09 22720 39954 199770 40,684 284,788 1022 485,580
515 213 AMJID ALl M.R 09 20530 38765 193825 39,495 275,465 1022 471,312
516 213 MUHAMMAD NAWAZ BILL DISTRIBUTR 07 28680 42430 212150 43,040 301,280 854 514,284
517 213 MOHAMMAD IDREES METER READER 09 32970 54669 273345 55,399 387,793 1022 662,160
.918 213 AMMIR LATIF METER READER 09 21250 32941 164705 33,671 235,697 1022 401,424
9 213 KASHIF ALl ASGHAR METER READER 09 21260 32941 164705 33,671 235,697 1022 401,424
P. 213
213
ZESHAN HAFIZ METER READER 09 16880 34019 170095 34,749 243,243 1022 414,360
NAVEED UL ISALM M.R 09 19800 37454 187270 38,184 267,288 1022 455,580
522 213 ADILQUYYUM B/D 07 15260 26504 132520 27,114 189,798 854 323,172
523 213 MUHAMMAD ADEEL BILL DISTRIBUTR 07 15260 26504 132520 27,114 189,798 854 323,172
524 213 IMTIAZAHMAD BILLDISTRIBUTR 07 15260 26504 132520 27,114 189,798 854 323,172
525 213 AKBAR ALl M.R 09 33670 49009 245045 49,739 348,173 1022 594,240
526 214 ABDUL HAFEEZ M.R 09 21260 39641 198205 40,371 282,597 1022 481,824
527 214 QAISER MEHMOOD 6.0 07 15260 26504 132520 27,114 189,798 854 323,172
528 214 MUHAMMAD RIAZ METER READER 09 30020 49446 247230 50,175 351,232 1022 599,484
529 214 MUHAMMAD RASHID MEHMOOD M.R 09 16150 27577 137885 28,307 198,149 1022 337,055
530 214 IMTIAZAHMAD METER READER 09 20530 33765 168825 34,495 241,465 1022 411,312
531 214 ABDULGHAFFAR HASSAN METER READER 09 21250 38202 191010 38,932 272,524 1022 464,556
532 214 SALEEM AKHTAR METER READER 09 33670 53948 269740 54,678 382,746 1022 653,508
533 214 MUHAMMAD YOUNIS M.R 09 27830 46635 233175 47,365 331,555 1022 565,752
534 214 MUHAMMAD ASLAM METER READER 09 22720 40015 200075 40,745 285,215 1022 486,312
535 214 MUHAMMAD RIAZ METER READER 09 21990 34078 170390 34,808 243,656 1022 415,068
536 214 TAHIR TUFAIL M.R 09 21990 39078 195390 39,808 278,656 1022 475,063
537 214 KHURRAM SHAHZAD M.R 09 19800 36305 181525 37,035 259,245 1022 441,792
538 214 BASI-IIR AHMED REHAN M.R 09 28560 47511 237555 48,241 337,687 1022 576,264
539 214 H.MUHAMMAD ARIF NADEEM M.R 09 18920 36398 181990 37,128 259,896 1022 442,908
540 214 AHMED NAWAZ BILL DISTRIBUTR 07 18920 31202 155010 31,812 222,684 854 379,548
541 214 SAMAR UL HASSAN BILL DISTRIBUTR 07 23190 35485 177425 35,095 252,555 854 430,944
542 214 ABDUL REHMAN M.R 09 30750 50322 251610 51,052 357,364 1022 609,995
543 214 KHALID ZAHID METER READER 09 33670 53948 269740 54,678 382,746 1022 653,508
644 214 FAISAL MEHMOOD M.R 09 19800 36128 180640 -' 36,858 258,006 1022 439,668
5 214 ZIA-RU-REHMAN SANOHU M/R 09 12500 28197 140985 28,927 202,489 1022 344,496
214 HAFIZ MUHAMMAD BASHIR MRS-Il 09 32210 48596 243480 49,426 343,982 1022 590,484
221 ALl RAZA METER READER 09 16150 32022 160110 32,752 229,254 1022 390,395
548 221 M. JAZ S/0 NAZIR AHMAD METER READER 09 28560 48151 240755 48,881 342,167 1022 583,944
549 221 MUBARIK ALl METER READER 09 28560 48151 240755 48,881 342,167 1022 583,944
550 221 M.WARIS S/a MURAD METER READER 09 28560 48212 241060 48,942 342,594 1022 584,676
551 221 SALI ABID HUSSAIN METER READER 09 31480 51838 259190 52,568 367,976 1022 528,188
552 221 SHAKEEL AHMAD METER READER 09 21260 38781 193905 39,511 275,577 1022 471,504
553 221 M. O,A'(YUM KHAN METER READER 09 22720 40655 203275 41,385 289,695 1022 493,992
554 221 GHULAM HUSSAIN METER READER 09 19800 36707 183535 37,437 262,059 1022 446,616
555 221 MR FAHMEED QAISERQ M/R 09 22720 40655 203275 41,385 289,695 1022 493,992
556 221 MUHAMMADYDUSAF M/R 09 19650 36716 183580 37,445 262,122 1022 446,724
557 221 ASIF MAHM000 METER READER 09 21260 38459 192295 39,189 274,323 1022 467,640
558 221 M.AMJAD M/R 08 20780 37972 189850 38,642 270,494 938 461,292
559 222 MUHAMMAD WARIS MRS-I 09 33900 50664 253320 51,394 359,758 1022 614,100
560 222 ABSAR HUSSAIN METER READER 09 30020 50086 250430 50,816 355,712 1022 607,164
561 222 AMJADTAUFAILSO M.TUFAIL METER READER 09 29290 49327 246635 50,057 350,399 1022 598,056
562 222 MUH. YASEEN METER READER 09 19800 37117 185585 37,847 264,929 1022 451,536
363 222 M. QAISER S/a INAVAT ALl METER READER 09 19800 37568 187840 38,298 268,086 1022 456,948
564 222 M.YOUNIS METER READER 09 31480 52011 260055 52,741 359,187 1022 630,264
565 222 M. IKRAM 5/0 M. ASHRAF METER READER 09 20530 38444 192220 39,174 274,218 1022 467,450
566 222 IFTIKHAR AHMAD METER READER 09 19800 37507 187535 38,237 267,639 1022 436,216
567 222 M. RAZZAQUE 5/0 M. BASHIR METER READER 09 20530 38705 193525 39,435 276,045 1022 470,592
568 222 AMJAD PERVAZS/0 M. HUSSA METER READER 09 29290 52648 263240 53,378 373,646 '1022 637,908
559 222 MUHAMMAD ASHFAQ M/R 09 20530 38705 193525 39,435 276,043 1022 470,592
570 222 IKRAM IJLLAH RANJHA METER READER 09 20530 38644 193220 39,374 275,618 1022 469,860
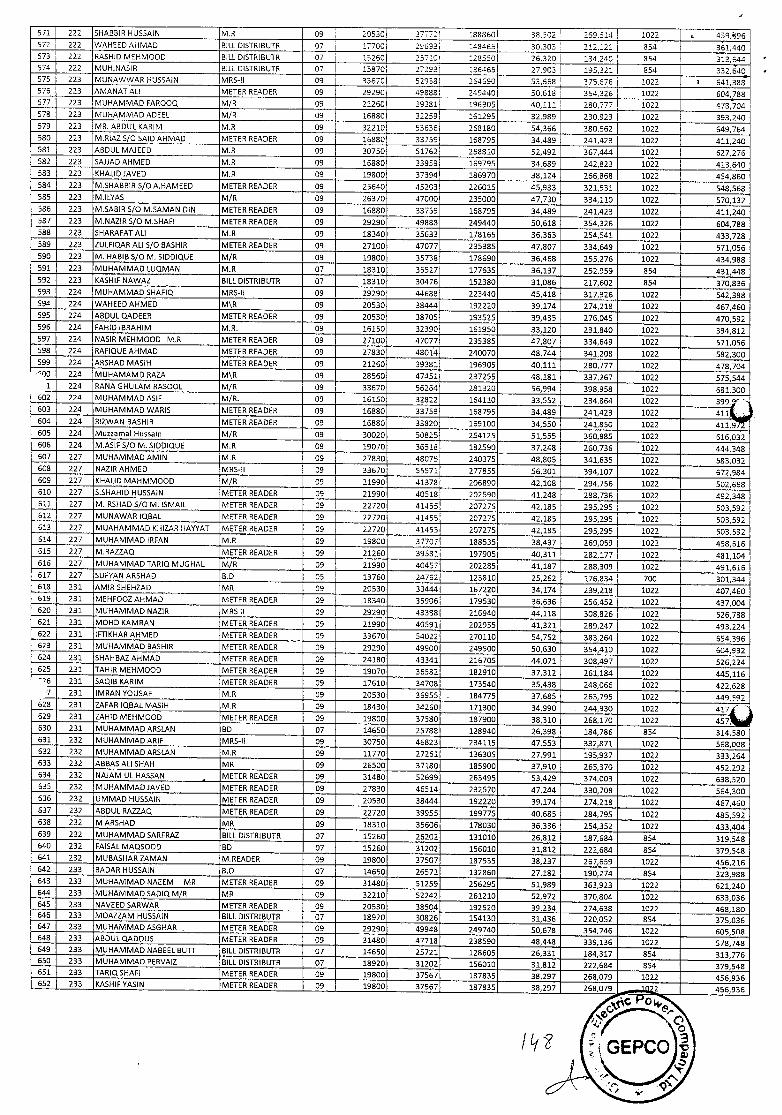
571 222 SHABBIR HUSSAIN M.R 09 20530 377711 1888601 38,502 269,514 1022 459,96 572 222 WAHEED AHMAD BILL DISTRIBUTR 07 i 17700 29693 1484631 30303 212,121 854 361,440 573 222 RASHID MEHM000 BILL DISTRIBUTR 07 15260 257101 128550 26,320 184,240 854 313,644 574 222 MUH.NASIR BILL DISTRIBUTR 07 13870 272931 1364651 27,903 195,321 I 854 332,640 575 223 MUNAWWAR HUSSAIN MRS-Il 09 33G70 529331 264680 53,568 375,576 1022 641,388 576 223 AMANAT ALl METER READER 09 29290 498881 2494401 50,618 354,326 1022 604,788 577 223 MUHAMMAD FAROOQ MIS 09 21260 39381 196905 40,111 280,777 1022 478,704 578 223 MUHAMMAD ADEEL M/R 09 16880 32259 161295 32,989 230,923 1022 393,240 579 223 MR. ABDUL KARIM M.R 09 32210 53636 268180 54,366 380,562 1022 649,764 580 223 M.RIAZ 5/0 SAID AHMAD METER READER 09 19880 33759 168795 34,489 241,423 1022 411,240 581 223 ABDUL MAJEED M.R 09 30750 51762 258810 52,492 367,444 1022 627,276 582 223 SAJJAD ARMED M.R 09 15880 33959 169795 34,689 242,823 1022 413,640 583 223 KHALIDJAVED M.R 09 19800 37394 186970 38,124 266,868 1022 454,860 584 223 M.SHABBIR Sf0 AHAMEED METER READER 09 25640 45203 226015 45,933 321,531 1022 548,568 585 223 M.ILYAS M/R 09 26370 47000 235000 47,730 334110 1022 570,132 586 223 M.SABIRS/O M.SAMAN DIN METER READER 09 16880 33759 168795 34,489 241,423 1022 411,240 987 223 M.NAZIR 5/0 M.SHAFI METER READER 09 29290 49883 249440 50,618 354,326 1022 604,788 588 223 SHARAFAT ALl M.R 09 18340 35633 178165 36,363 254,541 1022 433,728 589 223 ZULFIO,AR ALl 5/0 BASHIR METER READER 09 27100 47077 235385 47,807 334,649 1022 571,056 590 223 M. HABIB 5/0 M. SIDOIQUE M/S 09 19800 35738 178690 36,468 255,276 1022 434,988 591 223 MUHAMMAD LUQMAN M.R 07 18310 35527 177635 36,137 252,959 854 431,448 592 223 KASHIF NAWAZ BILL DISTRIBUTR 07 18310 30476 152380 31,086 217,602 854 370,836 593 224 MUHAMMAD SHAFIQ MRS-Il 09 29290 44688 223440 45,418 317,926 1022 542,388 594 224 WAHEED ARMED M\R 09 20530 38444 192220 39,174 274,218 1022 467.460 595 224 ABDULOADEER METER READER 09 20530 38705 193525 39,435 276,045 1022 470,592 596 224 FAHID IBRAHIM MR. 09 16150 32390 161950 33,120 231,840 1022 394,812 597 224 NASIR MEHMOOD M.R METER READER 09 27100 47077 235385 47,807 334,649 1022 571,056 598 224 RAFIQUEAHMAD METER READER 09 27830 48014 240070 48,744 341,208 1022 582,300 599 224 ARSHAD MASIH METER READER 09 21260 39381 196905 40,111 280,777 1022 478,704
-"00 224 MUHAMAMD RAZA M\R 09 28560 47451 237255 48,181 337,267 1022 575,544 1 224 RANA GHULAM RASOOL M/R 09 33670 56264 281320 55,994 398,958 1022 681,300
602 224 MUHAMMAD ASIF MIR. 09 16150 32822 164110 33,552 234,864 1022 399 0 l
411 603 224 MUHAMMAD WARIS METER READER 09 16880 33759 168795 34,489 241,423 1022 604 224 RIZWAN BASHIR METER READER 09 16880 33820 169100 34,550 241,850 1022 411,9, 605 224 Muzzamal Hussain MIS 09 30020 50825 254125 51,555 360,885 1022 616,032 606 224 M.ASIF Sb M. SIDDIQUE M.R 09 19070 36518 182590 37,248 260,736 1022 444,348 607 227 MUHAMMAD AMIN M.R 09 27830 48075 240375 48,805 341,635 1022 583,032 608 227 NAZIS AHMED MRS-lI 09 33670 55571 277855 56,301 394,107 1022 672,984 609 227 KHALID MAHMMOOD M/R 09 21990 413781 206890 42,108 294,756 1022 502,668 610 227 S.SHAHID HUSSAIN METER READER 09 21990 40518 202590 41,248 288,736 1022 492,348 611 227 M.IRSHAD Sf0 M. SMAlL METER READER 09 22720 414S5 207275 42,185 295,295 1022 503,592 612 227 MUNAWAR IQBAL METER READER 09 22720 41455 207275 42,185 295,295 1022 503,592 633 227 MUAHAMMAD KHIZAR HA'l"?AT METER READER 09 22720 41455 207275 42,185 295,295 1022 S03,592 514 227 MUHAMMAD IRFAN M.R 09 198110 37707 188535 38,437 269,059 1022 458,616 615 227 M.RAZZAQ METER READER 09 21260 39581 197905 40,311 282,177 1022 481,104 616 227 MUHAMMADTARIQMUGHAL M/S 09 21990 40457 202285 41,187 288,309 1022 491,616 617 227 SUFYAN ARSHAD B.D 05 13760 24762 123810 25,262 176,834 700 301,344 613 231 AMIR SHEHZAD MR 09 20530 33444 167220 34,174 239,218 1022 407,460 619 231 MEHFOOZ AHMAD METER READER 09 18340 35906 179530 36,636 2S6,452 1022 437,004 620 231 MUHAMMAD NAZIR MRS II 09 29290 43388 216940 44,118 308,826 1022 526,788 621 231 MOHD KAMRAN METER READER 09 21990 40591 202955 41,321 289,247 1022 493,224 622 231 IFTIKHAR AHMED METER READER 09 33670 54022 270110 54,752 383,264 1022 654,396 623 231 MUHAMMAD BASHIR METER READER 09 29290 49900 249500 50,630 354,410 1022 604,932 624 231 SHAHBAZ AHMAD METER READER 09 24180 43341 216705 44,071 308,497 1022 526,224 625 231 TAHIR MEHM000 METER READER 09 19070 36582 182910 37,312 261,184 1022 445,116 "6 231 SAQIB KARIM METER READER 09 17610 34708 173540 35,438 248,066 1022 422,628
7 231 IMRAN YOUSAF M.R 09 20530 36955 - 184775 37,685 263,795 1022 449,592 - 528 231 ZAFAR IQBAL MASiH M.R 09 18430 34260 171300 34,990 244,930 1022 417 529 231 ZAHID MEHMOOD METER READER 09 19800 37580 187900 38,310 268,170 1022 457. 630 231 MUHAMMAD ARSLAN BD 07 14650 25788 128940 26,398 184,786 854 314,580 631 232 MUHAMMAD ARIF MRS-Il 09 30750 46823 234115 47,553 332,871 1022 568,008 632 232 MUHAMMAD ARSLAN M.R 09 11770 27261 136305 27,991 195,937 1022 333,264 633 232 ABBAS ALl SHAH MR 09 26500 37180 185900 37,910 26S,370 1022 452,292 634 232 NAJAM UL HASSAN METER READER 09 31480 52699 263495 53,429 374,003 1022 638,520 635 232 MUHAMMAD JAVED METER READER 09 27830 46514 232570 47,244 330,708 1022 564,300 636 232 UMMAD HUSSAIN METER READER 09 20530 38444 192220 39,174 274,218 1022 467,460 637 232 ABDUL RAZZAQ METER READER 09 22720 39955 199775 40,685 284,795 1022 485,592 638 232 M ARSHAD MR 09 18310 35606 178030 36,336 254,352 1022 433,404 639 232 MUHAMMAD SARFRAZ BILL DISTRIBUTR 07 15260 26202 131010 26,812 187,684 854 319,548 640 232 FAISAL MAQSOOD BD 07 15260 31202 156010 31,812 222,684 854 379,548 641 232 MUBASHAR ZAMAN M.READER 09 19800 37507 187535 38,237 267,659 1022 456,216 642 233 BADAR HUSSAIN 8.0 07 14650 26572 132860 27,182 190,274 854 323,988 643 233 MUHAMMAD NAEEM MR METER READER 09 31480 51259 256295 51,989 363,923 1022 621,240 644 233 MUHAMMADSADIQM/R MR 09 32210 52242 261210 52,972 370,804 1022 633,036 645 233 NAVEED SARWAR METER READER 09 20530 38504 192520 39.234 274.638 1022 468,180 646 233 MOAZZAM HUSSAIN BILL DISTRIBUTR 07 18920 30826 154130 31,436 220,052 854 375,036 647 233 MUHAMMAD ASGHAR . METER READER 09 29290 49948 249740 50,678 364,746 1022 505,508 648 233 ABDUL QADDUS METER READER 09 31480 47718 238590 48,448 339,136 1022 578,748 649 233 MUHAMMAD NABEEL BUTT BILL DISTRIBUTR 07 14650 25721 128605 26,331 184,317 854 313,776 650 233 MUHAMMAD PERVAIZ BILL DISTRIBUTR 07 18920 31202 156010 31,812 222,684 854 379,548 6S1 233 TARIQ SHARI METER READER 09 19800 37567 187835 38,297 268,079 1022 456,936 6S2 233 KASHIF YASIN METER READER 09 19800 37567 187835 38,297 268,079
, 456,936
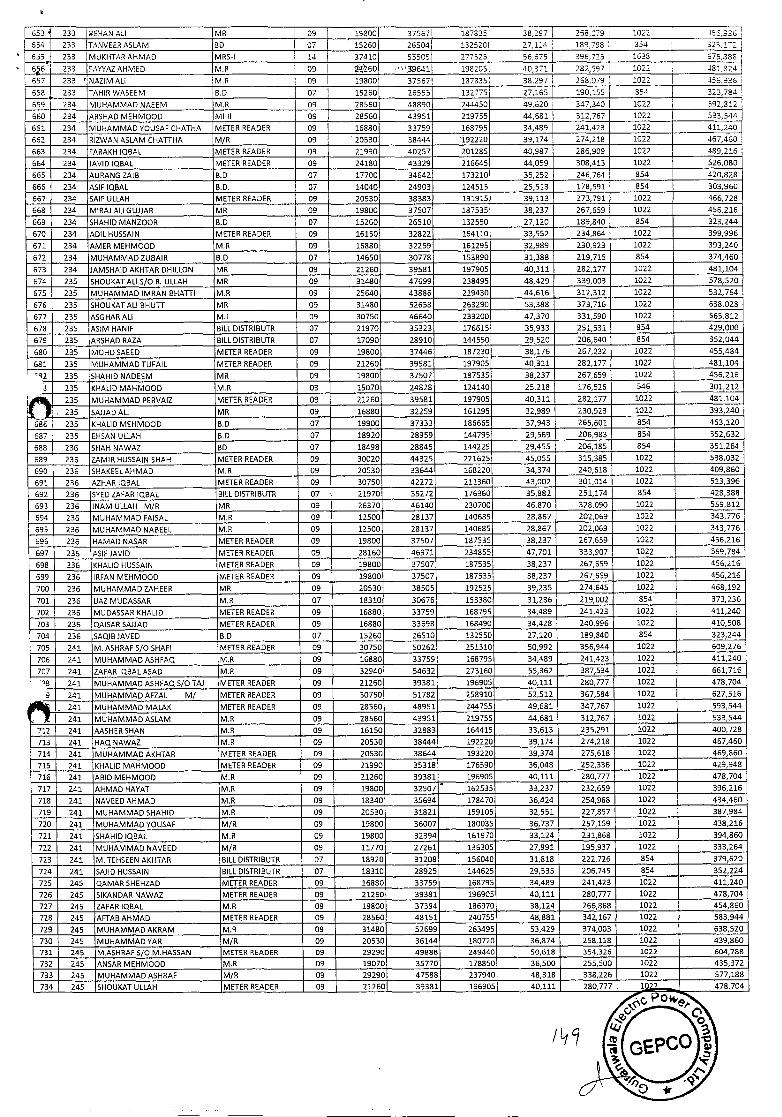
553 1 233 REHAN ALl MR 09 198001 37567 187835 38297 258,179 1021 -115,956
854 233 TANVEER ASLAM ED 07 15260 265041 132520 27114 189798 354 323,172
6.55 233 MU6HTAR AHMAD MRS-I 14 37410 SSSOS 277525 55675 396,725 1538 671838
66 233 FASYAZAHMED M.R 09 60 :.354j 198205 40,371 282,597 I 1022 481,324
657 233 NAZIM AU M.R 09 198001 37567 187835 38,297 268,079 1022 456.936
658 233 TAHIR WASEEM B.D 07 15260 26555 132775 27,165 190,155 854 323,784
659 234 MUHAMMAD NAEEM M.R 09 28560 48890 244450 49,620 347,340 1022 592.812
680 234 ARSHAD MEHMOOD MI-Il 09 28560 43951 219755 44,681 312,767 1022 533,544
661 234 MUHAMMAD YOUSAF CHATHA METER READER 09 16880 33759 168795 34,489 241,423 1022 411,240
662 234 RIZWAN ASLAM CHATTHA M/R 09 20530 38444 '192220 39,174 274,218 1022 467,460
663 234 FARAKH IQBAL METER READER 09 21990 40257 201285 40,987 286,909 1022 459,216
664 234 JAVID IQBAL METER READER 09 24180 43329 216645 44,059 308,413 1022 525,080
665 234 AUR.ANG ZAIB B.D 07 17700 34642 173210 35,252 246,764 854 420,828
666 234 ASIF IQBAL 8.0. 07 14040 24903 124515 25,513 178,591 854 303,960
667 234 SAIF ULLAH METER READER 09 20530 38383 191915 39,113 273,791 1022 466,728
668 234 MIRAJ ALl GUJJAR MR 09 19800 37507 187535 38,237 267,659 1022 456,216
669 234 SHAHID MANZOOR 8.0 07 15260 26510 132550 27,120 189,840 854 323,244
670 234 ADIL HUSSAIN METER READER 09 16150 32822 164110 33,552 234,864 1022 399,996
671 234 AMER MEHMOOD M.R 09 16880 32259 161295 32,989 230,923 1022 393,240
672 234 MUHAMMAD ZUBAIR B.D 07 14650 30778 153890 31,388 219,716 854 374,460
673 234 JAMSHAID AKHTAR OHILLON MR 09 21260 39581 197905 40,311 282,177 1022 481,104
674 235 SHOUKAT ALl S/OR. ULLAH MR 09 31430 47699 238495 48,429 339,003 1022 578,520
575 235 MUHAMMAD IMRAN BHATTI M.R 09 25640 43886 219430 44,616 312,312 1022 532,764
676 235 SHOUKAT ALl BHUTT MR 09 31480 52658 263290 53,388 373,716 1022 538,028
677 235 ASGHAR ALl Mi 09 30750 45640 233200 47,370 331,590 1022 565,812
678 235 ASIM HANIF BILL DISTRIBUTE 07 21970 35323 176615 35,933 251,531 854 429,000
679 235 ARSHAD RAZA BILL DISTRIBUTE 07 17090 28910 144550 29,520 206,640 854 352,044
680 235 MOHDSAEED METER READER 09 19800 37446 187230 38,175 267,232 1022 455,484
681 235 MUHAMMAD TUFAIL METER READER 09 21260 39581 197905 40,311 282,177 1022 481,104
82 235 SHAHID NADEEM MR 09 19800 37507 187535 38.237 267,659 1022 4S6,216
3 235 KHALID MAHM000 M.R 03 15070 24828 124140 25,218 176,526 546 301,212
- 235 MUHAMMAD PERVAIZ METER READER 09 21260 39581 197905 40,311 282,177 1022 481,104
235 SAJJAD ALl MR 09 16880 32259 161295 32,989 230,923 1022 393,240
586 235 KHALID MEHM000 8.0 07 19900 37333 186665 37,943 265,601 854 453,120
687 235 EHSAN ULLAH B.D 07 18920 28959 144795 29,569 206,983 854 352,632
688 236 SHAH NAWAZ BD 07 18498 28845 144225 29,455 206,185 854 351,254
689 236 ZAMIR HUSSAIN SHAH METER READER 09 30020 44325 221625 45,055 315,385 1022 538,032
690 236 SHAKEELAHMAD M.R 09 20530 33544 165220 34,374 240,618 1022 409,860
691 236 AZI-IAR IQBAL METER READER 09 30750 42272 211350 43,002 301,014 1022 513,396
692 236 SYED Z.AFAR IQBAL BILL DISTRIBUTR 07 21970 35272 176360 35,882 251,174 854 428,388
693 236 INAM ULLAH M/R MR 09 26370 46140 230700 46,870 325,090 1022 559,812
694 236 MUHAMMAD FAISAL M.R 09 12500 28137 140685 28,867 202,069 1022 343,776
595 236 MUHAMMAD NABEEL M.R 09 12500 28137 140685 28,867 202,069 1022 343,775
696 236 HAMAD NASAR METER READER 09 19800 37507 187535 38,237 267,653 1022 456,216
697 236 ASIF JAVID METER READER 09 28160 46971 234855 47,701 333,907 1022 569,784
698 236 KHALID HUSSAIN METER READER 09 19500 37507 187535 38,237 267,659 1022 456,216
699 236 IRFAN MENM000 METER READER 09 19800 37507 187535 35,237 257,659 1022 455,216
700 236 MUHAMMAD ZAHEER MR 09 20530 38505 192525 39,235 274,645 1022 465,192
701 236 IJAZ MUDASSAR M.R 07 18310 30675 153380 31,286 219,002 854 373,236
702 236 MUDASSAR KHALID METER READER 09 16880 33755 168795 34,489 241,423 1022 411,240
703 236 O.AISAR SAJJAD METER READER 09 16880 33698 168490 34,428 240,996 1022 410,508
704 235 SAQIB JAVED 8.0 07 15250 25510 132550 27,120 189,840 854 323,244
705 241 M. ASHRAF S/O SHAFI METER READER 09 30750 50262 251310 50,992 356,944 1022 609,276
706 241 MUHAMMAD ASHFAQ MR 09 16880 33759 168795 34,489 241,423 1022 411,240
707 241 - ZAFAR IQBALASAD M.R 09 32940 54632 273160 55,362 387,534 1022 661,716
"8 241 MUHAMMADASHFAQS/OTAJ METERREADER 09 21260 39351 196905 40,111 280,777 1022 478,704
9 241 MUHAMMAD AFZAL M/ METER READER 09 30750 51782 258910 52.512 367,584 1022 627,516
r,
241 MUHAMMAD MALAK METER READER 09 28550 48951 244755 49,681 347,767 1022 593,344
241 MUHAMMAD ASI..AM M.R 09 28560 43951 219755 44,681 312,767 1022 533,544
712 241 AASHERSHAN M.R 09 16150 32883 164415 33,613 235,291 1022 400,728
713 241 HAQNAWAZ M.R 09 20530 38444 192220 39,174 274,218 1022 467,460
714 241 MUHAMMAD AKHTAR METER READER 09 20530 38644 193220 39,374 275,618 1022 469,860
715 241 KHALID MAFIMOOD METER READER 09 21990 35318 176590 36,048 252,336 1022 429,948
716 241 ARID MEHM000 M.R 09 . 21250 39381 196905 40,111 280,777 1022 478,704
717 241 AHMAD HAVAT M.R 09 19800 32507 • 162535 33,237 232,659 1022 396,216
718 241 NAVEED AHMAD M.R 09 18340 35694 178470 36,424 254,968 1022 434,460
719 241 MUHAMMAD SHAHID MR 09 20530 31821 159105 32,551 227,857 1022 387,984
720 241 MUHAMMAD YOUSAF M/R 09 19800 36007 180035 36.737 257,159 1022 438,216
721 241 SHAHID IQBAL M.R 09 19800 32394 161970 33,124 231,868 1022 394,860
722 241 MUHAMMAD NAVEED M/R 09 11770 27261 136305 27,991 195,937 1022 333,264
723 241 M. TEHSEEN AKHTAR BILL DISTRIBUTE 07 18920 31208 156040 31,818 222,726 854 379,620
724 241 SAJID HUSSAIN BILL DISTRIBUTE 07 18310 28925 144625 29,535 206,745 854 3S2,224
725 245 QAMAR SHEHZAD METER READER 09 16880 33759 168795 34,489 241,423 1022 411,240
726 245 SIKANDAR NAWAZ METER READER 09 21250 39381 196905 40.111 280,777 1022 478,704
727 24S ZAFAR IQBAL M.R 09 19800 37394 186970 38,124 266,868 1022 454,860
728 245 AFTABAHMAD METER READER 09 28560 48151 240755 48,881 342,157 1022 583,944
729 245 MUHAMMAD AKRAM M.R 09 31480 52699 263495 53.429 374,003 1022 638,520
730 245 MUHAMMAD VAR M/lE 09 20530 36144 180720 36,874 258,118 1022 439,860
731 245 M.ASHRAF 5/0 M.HASSAN METER READER 09 29290 49885 249440 50,818 354,326 1022 604,788
732 245 ANSAR MEHM000 M.R 09 19070 35770 178850 36,500 255,500 1022 435,372
733 245 MUHAMMAD ASHRAF M/R 09 29290 47588 237940 48,318 338,226 1022 577,188
734 245 SHOUKAT ULLAH METER READER 09 21260 39381 196905 40,111 280,777 ,2....,,. 478,704
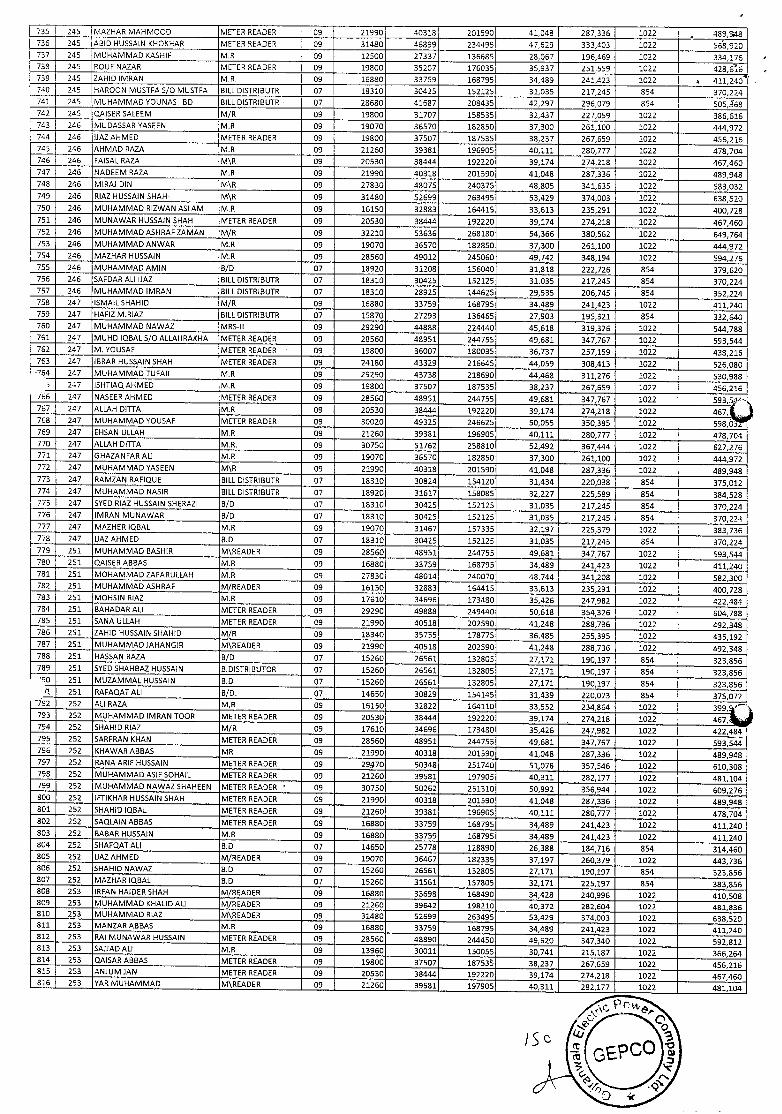
735 245 MAZHAR MAHrv1000 METER READER 09 21990 40319 201590 41048 287335 1022 489,8 736 245 ABID HUSSAIN KHOKHAR METER READER 09 31480 46899 234495 47629 333403 1022 568,920 737 245 MUHAMMAD KASHIF M.R 09 12500 27337 136685 28067 196469 1022 334,176 738 245 ROLJF NAZAR METER READER 09 19800 35207 176035 35,937 251,559 1022 428,64 739 245 ZAHIO IMRAN MR. 09 16880 33759 168795 34,489 241423 1022 411,240 740 245 HAROON MUSTFA Sf0 MUSTFA BILL DISTRIBUTE 07 18310 30425 152125 31,035 217,245 854 370,224 741 245 MUHAMMAD YDUNAS BD BILL DISTRIBUTR 07 28680 41687 208435 42,297 296,079 854 505,6B 742 245 QAISER SALEEM M/R 09 19800 31707 158535 32,437 227,059 1022 386,616 743 246 MUDASSAR YASEEN M.R 09 19070 36570 182850 37,300 261,100 1022 444,972 744 246 IJAZAHMED METER READER 09 19800 37507 187535 38,237 267,659 1022 456,216 745 246 AHMAD RAZA M.R 09 21260 39381 196905 40,111 280,777 1022 478,704 746 246 FAISAL RAZA M\R 09 20530 38444 192220 39,174 274,218 1022 467,460 747 246 NADEEM RAZA M.R 09 21990 40318 201590 41,048 287,336 1022 489,948 748 246 MIRAJ DIN M\R 09 27830 48075 240375 48,805 341,635 1022 583,032 749 246 RIAZ HUSSAIN SHAH- M\R 09 31480 52699 263495 53,429 374,003 1022 638,520 750 246 MUHAMMAD RIZWAN ASLAM M.R 09 16150 32883 164415 33,613 235,291 1022 400,728 751 246 MUNAWAR HUSSAIN SHAH METER READER 09 20530 38444 192220 39,174 274,218 1022 467,460 752 246 MUHAMMAD ASHRAF ZAMAN M/R 09 32210 53636 268180 54,366 380,562 1022 649,764 753 246 MUHAMMAD AN WAR M.R 09 19070 36570 182850 37,300 261,100 1022 444,972 754 246 MAZHAR F1USSAIN M.R 09 28560 49012 245060 49,742 348,194 1022 594,276 755 246 MUHAMMAD AMIN B/D 07 18920 31208 156040 31,818 222,726 854 379,620 756 246 SAFDAR ALl LIAZ BILL DISTRIBUTR 07 18310 30425 152125 31,035 217,245 854 370,224 757 246 MUHAMMAD IMRAN BILL DISTRIBUTE 07 18310 28925 144625 29,535 206,745 854 352,224 758 247 ISMAILSHAHID M/R 09 16880 33759 168795 34,489 241,423 1022 411,240 759 247 HAFIZ M.RIAZ BILL DISTRIBUTR 07 15870 27293 136465 27,903 195,321 854 332,640 760 247 MUHAMMAD NAWAZ MRS-Il 09 29290 44888 224.440 45,618 319,326 1022 544,788 761 247 MUHD IQBAL Sf0 ALLAHRAKHA METER READER 09 28560 48951 244755 49,681 347,767 1022 593,544 762 247 M. VOUSAF METER READER 09 19800 36007 180035 36,737 257,159 1022 438,216 763 247 IBRAR HUSSAIN SHAH METER READER 09 24180 43329 216645 44,059 308,413 1022 526,080 '64 247 MUHAMMAD TUFAIL M.R 09 29290 43738 218690 44,468 311,276 1022 530,988
247 ISHTIAQAHMED M.R 09 19800 37507 187535 38,237 267,659 1022 456,216 /66 247 NASEER AHMED METER READER 09 28560 48951 244755 49,681 347,767 1022 593,5L'- 767 247 ALLAH DITTA M.R 09 20530 384-44 192220 39,174 274,218 1022 467, 768 247 MUHAMMAD YOUSAF METER READER 09 30020 49325 246625 50,065 350,385 1022 598,Oz 769 247 EHSAN ULLAH M.R 09 21260 39381 196905 40,111 280,777 1022 478,704 770 247 ALLAH DITTA M.R. 09 30750 51762 258810 52,492 367,444 1022 627,276 771 247 GHAZANFAR ALl M.R 09 19070 36570 182850 37,300 261,100 1022 444,972 772 247 MUHAMMAD YASEEN M\R 09 21990 40318 201590 41,048 287,336 1022 489,948 773 247 RAMZAN RAFIQUE BILL DISTRIBUTE 07 18310 30824 154120 31,434 220,038 854 375,012 774 247 MUHAMMAD NASIR BILL DISTRTBUTR 07 18920 31617 158085 32,227 225,589 854 384,528 775 247 SYED RIAZ HUSSAIN SHERAZI B/D 07 18310 30425 152125 31,035 217,245 854 370,224 776 247 IMRAN MUNAWAR 8/0 07 18310 30425 152125 31,035 217,245 854 370,224 777 247 MAZHER IQBAL M.R 09 19070 31467 1S7335 32,197 225,379 1022 383,736 778 247 IJAZ AHMED 8.0 07 18310 30425 152125 31,035 217,245 854 370,224 779 251 MUHAMMAD BASHIR M\READER 09 28560 48951 244755 49,681 347,767 1022 593,544 780 251 QAISER ABBAS M.R 09 16880 33759 168795 34,489 241,423 1022 411,240 781 251 MOHAMMAD ZAFARULLAH M.R 09 27830 48014 240070 48,744 341,208 1022 582,300 782 251 MUHAMMAD ASHRAF M/READER 09 16150 32883 164415 33,613 235,291 1022 400,728 783 251 MOHSIN RIAZ M.R 09 17610 34696 173480 35,426 247,982 1022 422,484 784 251 BAHADAR ALl METER READER 09 29290 49888 249440 50,618 354,326 1022 604,788 785 251 SANA ULLAH METER READER 09 21990 40518 202590 41,248 288,736 1022 492,348 786 251 ZAHID HUSSAIN SHAHID M/R 09 18340 35755 178775 36,485 255,395 1022 435,192 787 251 MUHAMMAD JAHANGIR M\READER 09 21990 40518 202590 41,248 288,736 1022 492,348 788 251 HASSAN RAZA B/D 07 15260 26561 132805 27,171 190,197 854 323,856 789 251 SYED SHAHBAZ HUSSAIN B.DISTRIBUTOR 07 15260 26561 132805 27,171 190,197 854 323,856 '90 251 MUZAMMAL HUSSAIN B.D 07 15260 26561 132805 27,171 190,197 854 323,856
/1 251 RAFAQ.AT ALl BID. 07 14650 30829 154145 31,439 220,073 854 375,072 i92 252 ALl RAZA M.R 09 16150 32822 164110 33,552 234,864 1022 399. '' 793 252 MUHAMMAD IMRAN TOOR METER READER 09 20530 38444 192220 39,174 274,218 1022 467, 794 252 SHAHID RIAZ M/R 09 17610 34696 173480 35,426 247,982 1022 422,484 795 252 SARFRAN (HAN METER READER 09 28560 48951 244755 49,681 347,767 1022 593,544 796 252 KHAWARABBAS MR 09 21990 40318 201590 41,048 287,336 1022 489,948 797 252 RANAARIF HUSSAIN METER READER 09 29470 50348 251740 51,078 357,546 1022 610,308 798 252 MUHAMMAD ASIF SOHAIL METER READER 09 21260 39581 197905 40,311 282,177 1022 481,104 799 252 MUHAMMAD NAWAZ SI-IAHEEN METER READER ' 09 30750 50262 251310 50,992 356,944 1022 609,276 800 252 IFTIKHAR HUSSAIN SHAH METER READER 09 21990 40318 201590 41,048 287,336 1022 489,948 801 252 SHAHID IQBAL METER READER 09 21260 39381 196905 40,111 280,777 1022 478,704 802 252 SAQLAIN ABBAS METER READER 09 16880 33759 168795 34,489 241,423 1022 411,240 803 252 BABAR HUSSAIN M.R 09 16880 33759 168795 34,489 241,423 1022 411,240 804 252 SHAFQAT ALl B.D 07 14650 25778 128890 26,388 184,716 854 314,460 805 252 IJAZAHMED M/READER 09 19070 36467 182335 37,197 260,379 1022 443,736 806 252 SHAHID NAWAZ B.D 07 15260 26561. 132805 27,171 190,197 854 323,856 807 252 MAZHAR IQBAL B.D 07 15260 31561 157805 32,171 225,197 854 383,856 808 253 IRFAN HAIDER SHAH M/READER 09 16880 33698 168490 34,428 240,996 1022 410,508 809 263 MUHAMMAD KHALID ALl M/READER 09 21260 39642 198210 40,372 282,604 1022 481,836 810 253 MUHAMMAD RIAZ M\READER 09 31480 52699 263495 53,429 374,003 1022 638,520 811 253 MANZAR ABBAS M.R 09 16880 33759 168795 34,489 241,423 1022 411,240 812 253 8.41 MUNAWAR HUSSAIN METER READER 09 28560 48890 244450 49,620 347,340 1022 592,812 813 253 5AJJAD ALl M.R 09 13960 30011 150055 30,741 215,187 1022 366,264 814 253 QAISAR ABBAS METER READER 09 19800 37507 187S3 38,237 267,659 1022 456,216 815 253 ANJUM JAN METER READER 09 20530 38444 192220 39,174 274,218 1022 467,460 816 253 VAR MUHAMMAD M\READER 09 21260 39581 197905 40,311 282,177 1022 481,104
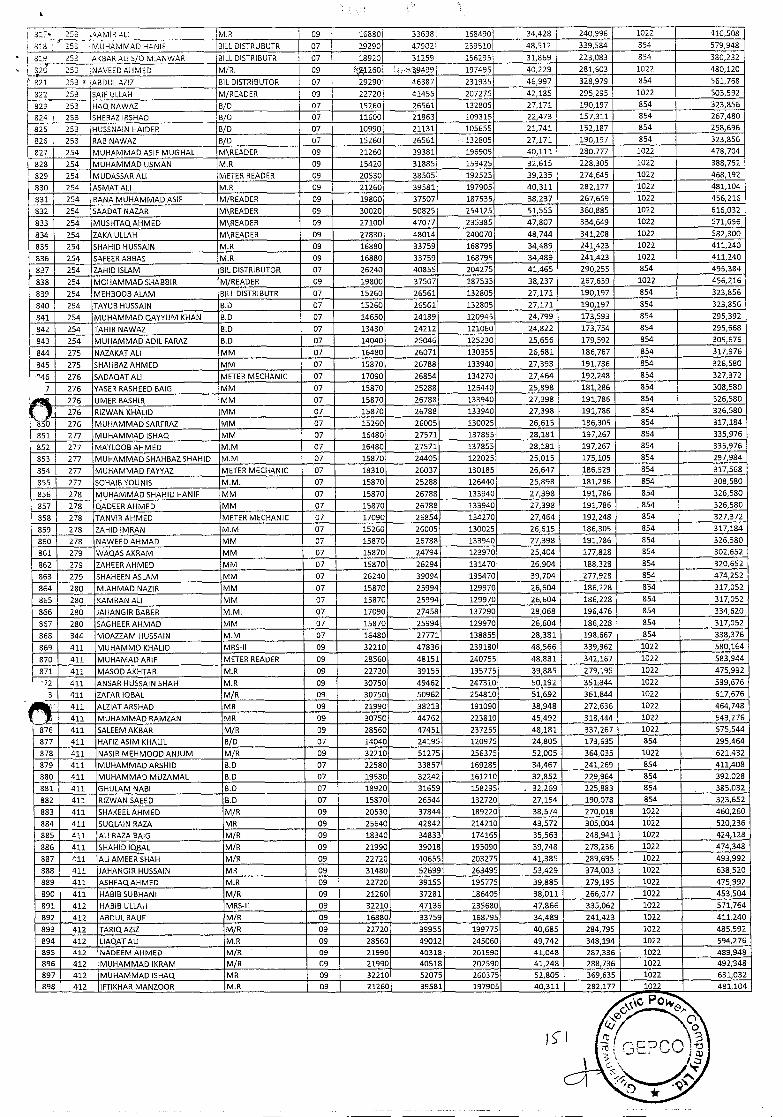
327 251 3AMIR AU M.R 09 16830 33698 158490 34,428 240,996 1022 410,508
318 253 MUHAMMAD HANIF BILL DISTRUBUTR 07 29290 47902 239510 48,512 339,584 854 579,948
819 253 AKSAR ALl S/C MAN WAR SILL DISTRIBUTR 07 18920 31259 156295 31,869 223,083 854 380,232
82 253 NAVEEDAHMED M/R. OS 128O :,,N9499 197495 40,229 281,603 1022 480,120
821 253 ABDULAZIZ BIL DISTRIBUTOR 07 29290 46387 231935 46997 328,979 854 561,768
822 253 SAIF ULLAH M/READER 09 22720 41455 207275 42,185 295,295 1022 503,592
823 253 HAQ NAWAZ BID. 07 15260 26561 132805 27,171 190,197 854 323,858
824 253 SHERAZ IRSHAD B/D 07 11600 21863 109315 22,473 157,311 854 267,480
825 253 HUSSNAIN HAIDER BID 07 10990 21131 105655 21,741 152,187 854 258,696
826 253 RAB NAWAZ BID 07 15260 26551 132805 27,171 190,197 854 323,858
827 254 MUHAMMAD ASIF MUGHAL M\READER 09 21260 39381 196805 40,111 280,777 1022 478,704
828 254 MUHAMMAD USMAN M.R 09 15420 31885 158425 32,615 228,305 1022 388,752
829 254 MUDASSAR ALl METER READER 09 20530 38505 192525 39,235 274,845 1022 488,192
830 254 ASMAT ALl M.R 09 21260 39581 197905 40,311 282,177 1022 481,104
831 254 RANA MUHAMMAD ASIF M/READER 09 19800 37507 187535 38,237 267,658 1022 456,216
832 254 SAADAT NAZAR M\READER 08 30020 50825 254125 51,555 360,885 1022 616,032
833 254 MUSHTAQAHMED M\READER 08 27100 47077 235385 47,807 334,649 1022 571,056
834 254 ZAKA ULLAH M\READER 09 27830 48014 240070 48,744 341,208 1022 582,300
835 254 SHAHID HUSSAIN M.R 09 16880 33759 168795 34,489 241,423 1022 411,240
836 254 SAFEER ABBAS M.R 09 16880 33759 158795 34,489 241,423 1022 411,240
837 254 ZAHID ISLAM BIL DISTRIBUTOR 07 26240 40855 204275 41,463 290,255 854 495,384
838 254 MOHAMMADSHABBIR M/READER 09 19800 37507 187535 38,237 267,658 1022 456,216
839 254 MEHBOOBALAM BILLDISTRIBUTR 07 15260 26561 132805 27,171 190,197 854 323,855
840 254 TAYUB HUSSAIN S.D 07 15260 26561 132805 27,171 190,197 854 323,856
841 254 MUHAMMAD OJVIYUM KHAN B.D 07 14650 24189 120945 24,799 173,593 854 295,392
842 254 TAHIR NAWAZ S.D 07 13430 24212 121060 24,822 173,754 854 295,668
843 254 MUHAMMAD ADIL FARAZ S.D 07 14040 25046 125230 25,656 179,582 854 305,675
844 275 NAZ.AK.AT ALl MM 07 16480 26071 130355 26,681 186,767 854 317,976
845 275 SHAHBAZAHMED MM 07 15870 26788 133940 27,398 191,786 854 326,580
'46 275 SADAQAT ALl METER MECHANIC 07 17090 26854 134270 27,464 192,248 854 327,372
7 276 YASER RASHEED BAIG MM 07 15870 25288 126440 25,898 181,286 854 308,580
276 UMER BASHIR MM 07 15870 26788 133940 27,398 191,786 854 326,580
276 RIZWAN KHALID MM 07 15870 26788 133940 27,398 191,786 854 326,580
850 276 MUHAMMAD SARFRAZ MM 07 15260 26005 130025 26,615 186,305 854 317,184
851 277 MUHAMMAD ISHAQ MM 07 16480 27571 137855 28,181 197,267 854 335,976
852 277 MATLOOB AHMED M.M 07 16480 27571 137855 28,181 197,267 854 335,976
853 277 MUHAMMAD SHAHSAZ SHAHID M.M 07 15870 24405 122025 25,015 175,105 854 297,984
854 277 MUHAMMAD FAYYAZ METER MECHANIC 07 18310 26037 130185 26,647 186,529 854 317,568
855 277 SOHAiB YOUNIS MM. 07 15870 25288 126440 25,898 181,286 854 308,580
856 278 MUHAMMAD SHAHID HANIF MM 07 15870 26788 133940 27,398 191,786 854 326,580
857 278 QADEERAHMED MM 07 15870 26783 133940 27,398 191,786 .854 326,580
858 278 TAN VIR AHMED METER MECHANIC 07 17090 26854 134270 27,464 192,248 854 327,372
859 278 ZAHID IMRAN M.M 07 15260 26005 130025 26,615 186,305 854 317,184
880 278 NAWEED AHMAD MM 07 15870 26788 133940 27,398 191,786 854 326,580
861 279 WAQ,ASAKRAM MM 07 15870 24794 123970 25,404 177,828 854 302,652
862 279 Z.AHEERAHMED MM 07 15870 26294 131470 26,904 188,323 854 320,652
863 279 SHAHEEN ASLAM MM 07 28240 39094 185470 39,704 277,928 854 474,252
864 280 M.AHMAD NAZIR MM 07 15870 25994 129970 26,604 186,228 854 317,052
865 290 KAMRAN ALl MM 07 15870 25994 129970 26,604 186,228 854 317,052
866 280 JAHANGIR SABER M.M. 07 17090 27458 137290 28,068 196,476 854 334,620
867 280 SAGHEER AHMAD MM 07 15870 25994 129970 26,504 186,228 854 317,052
868 344 MOAZZAM HUSSAIN M.M 07 16480 27771 138855 28,331 198.667 854 338,376
868 411 MUHAMMD KHALID MRS-Il 09 32210 47836 239180 43,566 339,952 1022 580,164
870 411 MUHAMAD ARIF METER READER 09 28560 48151 240755 48,831 342,167 1022 583,944
871 411 MASODAKHTAR M.R 09 22720 39155 195775 39,835 279,195 1022 475,982
'72 411 ANSAR HUSSAIN SHAH M.R 09 30750 49462 247310 50,192 351344 1022 599676
3 411 ZAFAR IQBAL M/R 09 30750 50962 254810 51,692 361,844 1022 617,676
411 ALZIATARSHAD MR 09 21990 38218 181090 38,948 272,636 1022 464,748
411 MUHAMMAD RAMZ.AN MR 09 30750 44762 223810 45,492 318,444 1022 543,276
876 411 SALEEM AKBAR M/R 09 28560 47451 237255 48,181 337,267 1022 575,544
877 411 HAFIZASIM KHAL!L BID 07 14040 24195 120975 24,805 173,635 854 295,464
878 411 NASIR MEHM000 ANJUM M/R 09 32210 51275 256375 52,005 364,035 1022 621,432
879 411 MUHAMMAD ARSHID S.D 07 22580 33857 169285 34,467 241,269 854 411,408
880 411 MUHAMMAD MUZAMAL S.D 07 19530 32242 161210 32,852 229,964 854 392,028
881 411 GHULAM NABI S.D 07 18920 31659 158295 32,269 225,883 554 385,032
882 411 RIZWAN SAEED S.D 07 15870 26544 132720 27,154 190,078 854 323,652
883 411 SHAKEELAHMED MIR 09 20530 37844 189220 38,574 270,018 1022 450,260
884 411 SUQLAIN RAZA MR 09 25640 42842 214210 43,572 305,004 1022 520,236
885 411 ALl RAZA BAIG M/R 09 18340 34833 174165 35,563 248,941 1022 424,128
886 411 SHAHID IQBAL M/R 09 21990 39018 195080 39,748 278,236 1022 474,348
887 411 ALl AMEER SHAH M/R 09 22720 40655 203275 41,385 289,695 1022 493,992
888 411 JAHANGIR HUSSAIN MR 09 31480 52599 263495 53,429 374,003 1022 638,520
889 411 ASHFAQAHMED M.R 09 22720 39155 195775 39,885 279,195 1022 475,992
890 411 HABIB SUBHANI M/R 09 21260 37281 186405 38,011 266,077 1022 453,504
891 412 HABIB ULLAH MRS-Il 09 32210 47136 235680 47,865 335,052 1022 571,764
892 412 ABDUL RAUF M/R 09 16880 33759 168795 34,489 241,423 1022 411,240
893 412 TARIQAZIZ M/R 09 22720 39955 199775 40,685 284,795 1022 485,592
894 412 LIAQAT ALl M.R 09 28560 49012 245060 49,742 348,194 1022 594,276
895 412 NADEEM AHMED M/R 09 21990 40318 201590 41,048 287,336 1022 489,948
896 412 MUHAMMAD IKRAM M/R 09 21990 40518 202590 41,248 288,736 1022 492/348
897 412 MUHAMMAD ISHAQ MR 09 32210 52075 260375 52,805 359,635 1022 631,032
898 412 IFTIKHAR MANZOOR M.R 09 21260 39581 197905 40,311 282,177 1022 481,104
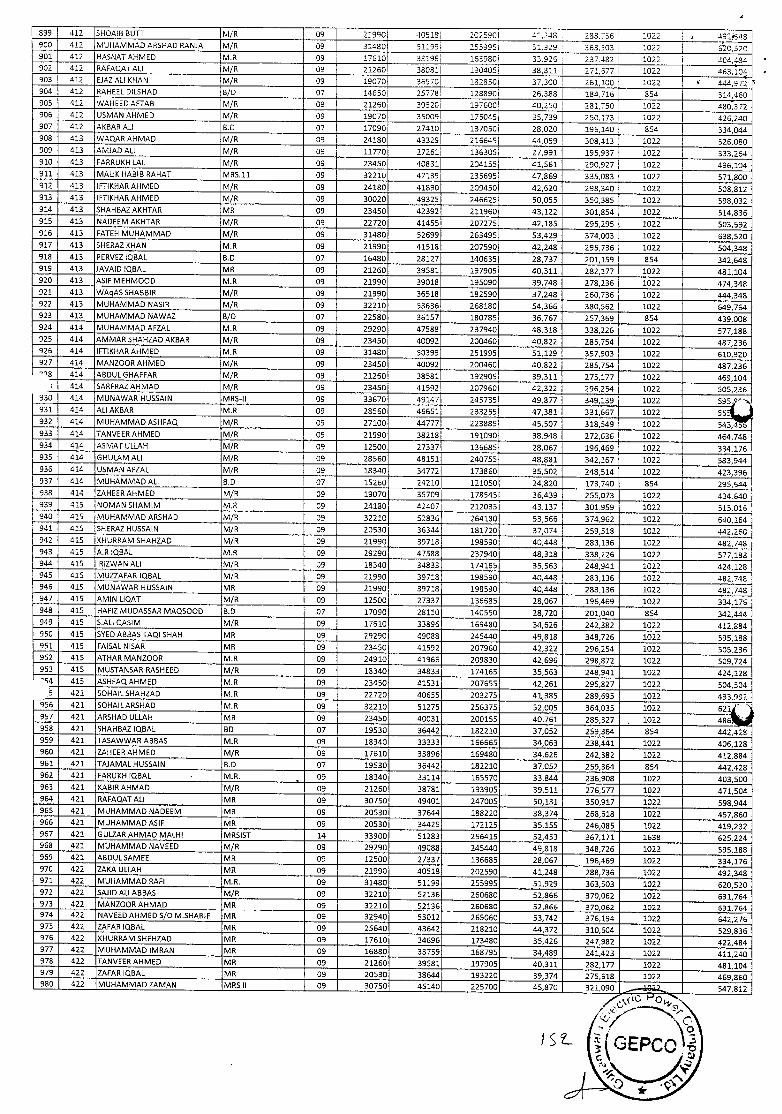
899 412 SHOAIB BUTT M/R 09 21990 40515k 2025901 -11,243 288136 :022 492r348 900 412 MUHAMMAD ARSHAD RANJA M/R 09 31480 51299 255995 51929 363903 :022 5O,520 901 412 HASNATAHMED M.R 09 17610 33198 163980 33,926 237482 I 1022 .104,484 902 412 RAFAOATALI M/R 09 21260 38081 190405 38,311 271,577 1022 463,104 903 412 EJAZ ALl KHAN MIS 09 19070 36570 182850 37,300 261100 1022 444,972 904 412 RAHEEL DILSHAD BID 07 14650 25778, 128890 26,388 184,715 854 314,460 905 412 WAHEED AFTAB M/R 09 21260 39520 197600 40,250 281,750 1022 380,372 906 412 USMAN AHMED M/R 09 19070 35009 175045 35,739 I 250,173 I 1022 426,240 907 412 AKBAR ALl 8.0 07 17090 27410 137050 28,020 196,140 854 334,044 908 413 WAQARAHMAD M/R 08 24180 43329 216645 44059 308,413 1022 526,080 909 413 AMJAD ALl M/R 09 11770 27261 136305 27,991 195,937 1022 333,264 910 413 FARRUKH LAL M/R 09 23450 40831 204155 41,561 290,927 1022 496,104 911 413 MALIK HABIB RAHAT MRS.11 09 32210 47139 235695 47,869 335,083 1022 571,800 912 413 IFTIKHARAHMED M/R 09 24180 41890 209450 42,620 298,340 1022 508,812 913 413 IFTIEHAR AHMED M/R 09 30020 49325 246625 50,055 350,385 1022 598,032 914 413 SHAHBAZAKHTAR MR 09 23450 42392 211960 43,122 301,854 1022 514,836 915 413 NADEEM AKHTAR M/R 09 22720 41455 207275 42,185 295,295 1022 503,592 916 413 FATEH MUHAMMAD M/R 09 31480 52699 263495 53,429 374,003 1022 638,520 917 413 SHERAZ KHAN M.R 09 21990 41518 207590 42,248 295,736 1022 504,348 918 413 PERVEZ IQBAL B.D 07 16480 28127 140635 28,737 201,159 854 342,648 919 413 JAVAID IQBAL MR 09 21260 39581 197905 40,311 282,177 1022 481,104 920 413 ASIF MEHM000 M.R 09 21990 39018 195090 39,748 278,236 1022 474,348 921 413 WAqASSHABBIR M/R 09 21990 36518 182590 37,248 260,736 1022 444,348 922 413 MUHAMMAD NASIR MIS 09 32210 53636 268180 54,366 380,562 1022 649,764 923 413 MUHAMMAD NAWAZ 8/0 07 22580 36157 180785 36,767 257,369 854 439,008 924 414 MUHAMMAD AFZAL M.R 09 29290 47588 237940 48,318 338,226 1022 577,188 925 414 AMMAR SHAHZAD AKBAR M/R 09 23450 40092 200460 40,822 285,754 1022 487.236 926 414 IFTIKHARAHMED M.R 09 31480 50399 251995 51,129 357,903 1022 610,920 927 414 MANZOORAHMED M/R 09 23450 40092 200460 40,822 285,754 1022 487,236 "8 414 ABDULGHAFFAR M/R 09 21260 38581 192905 39,311 275,177 1022 469,104
414 SARFRAZAHMAD M/R 09 23450 41592 207960 42,322 296,254 1022 505,236 930 414 MUNAWAR HUSSAIN MRS-Il 09 33670 49147 245735 49,877 349,139 1022 931 414 ALl AKBAR M.R 09 28560 46651 233255 47,381 331,667 1022 56: 932 414 MUHAMMAD ASHFAQ M/R 09 27100 44777 223885 45,507 318,549 1022 543,4 933 414 TANVEER AHMED MIS 09 21990 38218 191090 38,948 272,636 1022 464,748 934 414 ASMAT ULLAH M/R 09 12500 27337 136685 28,067 196,469 1022 334,176 935 414 GHULAM ALl M/R 09 28560 48151 240755 48,881 342,167 1022 533,944 936 414 USMAN AFZAL M/R 09 18340 34772 173860 35,502 248,514 1022 423,396 937 414 MUHAMMAD ALl 8.0 07 15260 24210 121050 24,820 173,740 854 295,644 938 414 ZAHEERAHMED M/R 09 19070 35709 178545 36,439 255,073 1022 434,640 939 413 NDMAN SHAMIM M.R I 09 24180 42307 212035 43.137 301.959 1022 513,016 940 415 MUHAMMAD ARSHAD M/R 09 32210 52836 264180 53,566 374,962 1022 640,164 941 415 SNERAZ HUSSAIN M/R 09 20530 36344 181720 37,074 259,518 1022 442,29C 942 415 KHURRAM SHAHZAD MIS 09 21990 39718 198590 40,448 283,136 1022 482,748 943 415 A.R QBAL M.R 09 I 29290 47588 237940 48,318 338,226 1022 577,188 944 415 RiZWAN ALl MIS 09 18340 34833 174165 39,563 248,941 1022 424,128 945 413 MUZZAFAR IQBAL MIS 09 21990 39718 198190 40,443 283,136 1022 482,748
482,7J
334,175
946 413 MUNAWAR HUSSAIN MR 09 21990 39718 198590 40,448 283,136 1022 947 415 AMlN LIQAT M/R 09 12500 27337 136685 28,067 196,469 1022 948 415 HAFIZ MUDASSAR MAQSOOD B.D 07 17090 28110 140550 28,720 201,040 854 342,444 949 415 S.ALI QASIM M/R 09 17610 33896 169480 34,626 242,382 1022 412,884 950 415 SYED ABBAS TAQI SHAH MR 09 29290 49088 245440 49,818 348,726 1022 595,188 951 415 FAISAL NISAR MR 09 23450 41592 207960 42,322 296,254 1022 305,236 952 415 ATHAR MANZDOR M.R 09 24910 41966 209830 42,696 298,872 1022 509,724 953 415 MUSTANSAR RASHEED M/R 09 18340 34833 174165 35,563 248,941 1022 424,128
54 413 ASHFAQAHMED M.R 09 23450 41531 207655 42,261 295,827 1022 504,504 5 421 SOHAILSHAHZAD M.R 09 22720 40655 203275 41,385 289,695 1022
956 421 SOHAILARSHAD M.R 09 32210 51275 256375 52,005 364,035 1022 621 957 421 ARSHAD ULLAH MR 09 23450 40031 200155 40,761 285,327 1022 486, 958 421 SHAHBAZ IQBAL 80 07 19530 36442 182210 37,052 259,364 854 442,429 959 421 TASAWWAR ABBAS M.R 09 18340 33333 166665 34,063 238,441 1022 406,128 960 421 ZAHBERAHMED MIS 09 17610 33896 169480 34,626 242,382 1022 412,884 961 421 TAJAMAL HUSSAIN B.D 07 19530 36442 182210 37,052 259,364 854 442,428 962 421 FARUKH IQBAL MR. 09 18340 33114 165570 33,844 236,908 1022 403,500 963 421 K,ABIRAHMAD M/R 09 21260 38781 193905 39,511 276,577 1022 471,504 964 421 RAFAQAT ALl MR 09 30750 49401 247005 50,131 350,917 1022 598,944 965 421 MUHAMMAD NADEEM MR 09 20530 37644 188220 38,374 268,618 1022 457,660 966 421 MUHAMMAD ASIF MR 09 20530 34425 172125 35,155 246,085 1022 419,232 967 421 GULZARAHMAD MALHI MRSIST 14 33900 51283 256415 52,453 367,171 1638 625,224 968 421 MUHAMMAD NAVEED MIR 09 29290 49088 245440 49,818 348,726 1022 595,188 969 421 ABDULSAMEE MR 09 12500 27337 136685 28,067 196,469 1022 334,176 970 422 ZAKA ULLAH MR 09 21990 40518 202590 41248 288,736 1022 492,348 971 422 MUHAMMAD RAFI M.R. 09 31480 51199 255995 51,929 363,303 1022 620,520 972 422 SAJID ALl ABBAS M/R 09 32210 52136 260680 52,866 370,062 1022 631,764 973 422 MANZOOR AHMAD MR 09 32210 52136 260680 52,866 370.062 1022 631,764 974 422 NAVEED AHMED Sb M.SHARIF MR 09 32940 53012 265060 53,742 376,194 1022 642,276 975 422 ZAFAR IQBAL MR 09 25640 43642 218210 44,372 310,604 1022 529,836 976 422 KHURRAM SHEHZAD MR 09 17610 34696 173480 3S,426 247,982 1022 422,484 977 422 MUHAMMAD IMRAN MR 09 16880 33759 168795 34,489 241,423 1022 411,240 978 422 TAN VEER AHMED MR 09 21260 39581 197905 40,311 282,177 1022 481,104 979 422 ZAFAR IQBAL MR 09 20530 38644 193220 39,374 275,618 1022 469,860 980 422 MUHAMMAD ZAMAN MRS II 09 30750 45140 225700 45,870 321,090 547,812
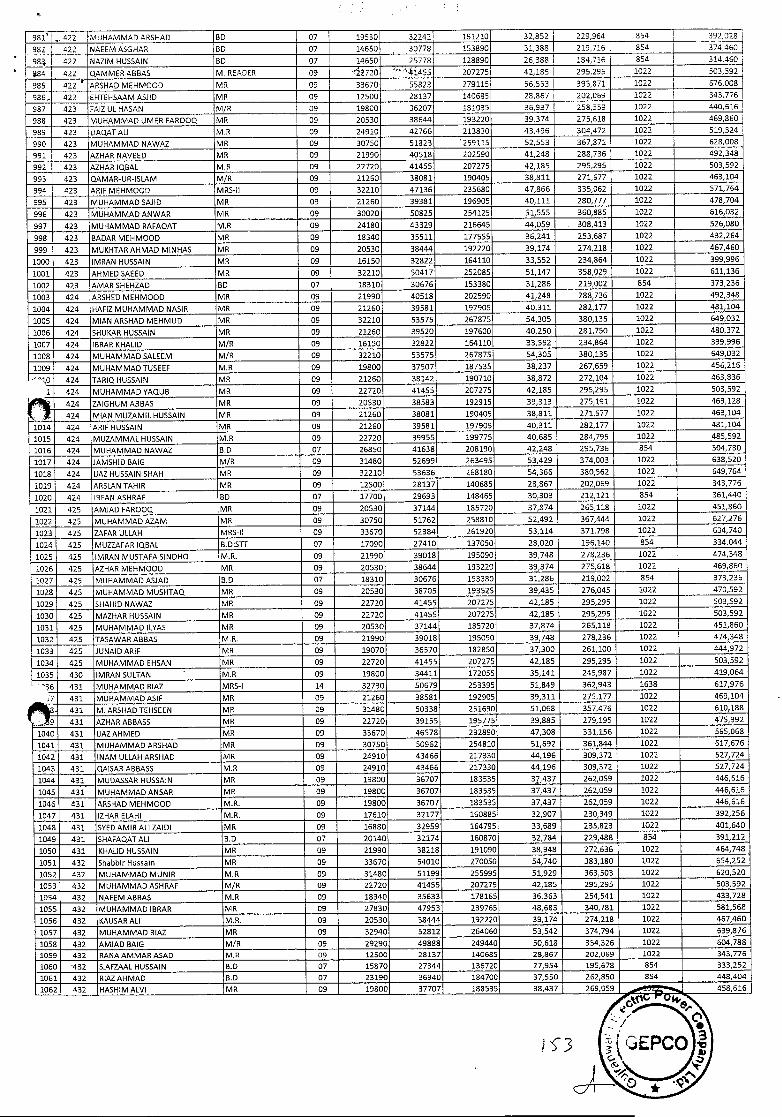
981' 422 MUHAMMAD ARSHAD BD 07 19530 32242 151210 32,852 229,964 854 392,028
982 422 NAEEM ASGHAR BD 07 I 14550 30778 153890 31,388 219,716 854 374,460
98. 422 NAZIM HUSSAIN SD 07 { 14650 25778 128890 25,388 184,716 854 314,450
844 422 Q,AMMERABBAS M. READER 09 th720 '41455 207275 42,185 295,295 1022 503,592
985 422 ARSHAD MEHM000 MR 09 33670 55823 279115 56,553 395,871 1022 676,008
986.. 422 EHTEHSA,AM ASJID MR 09 12500 28137 140585 28,867 202,069 1022 343,776
987 423 FAIZ UL HASAN M/R 09 19800 36207 181035 36,937 258,559 1022 440,816
988 423 MUHAMMAD UMER FAR000 MR 09 20530 38544 193220 39,374 275,618 1022 459,860
989 423 LIAQAT ALl M.R 09 24910 42766 213830 43,496 304,472 1022 519,324
990 423 MUHAMMAD NAWAZ MR 09 30750 51823 259115 52,553 367,871 1022 628,008
991 423 AZHAR NAVEED MR 09 21990 40518 202590 41,248 288,736 1022 492,348
992 423 AZHAR IQBAL M.R 09 22720 41455 207275 42,185 295,295 1022 503,592
993 423 Q,AMAR-UR-ISLAM M/R 09 21260 38081 190405 38,811 271,677 1022 453,104
994 423 ARIF MEHMOOD MRS-Il 09 32210 47136 235680 47,866 335,062 1022 571,764
995 423 MUHAMMAD SAuD MR 09 21260 39381 196905 40,111 280,777 1022 478,704
996 423 MUHAMMAD AN WAR MR 09 30020 50825 254125 51,555 360,885 1022 616,032
997 423 MUHAMMAD RAFAQ,AT M.R 09 24180 43329 216645 44,059 308,413 1022 526,080
998 423 BADAR MEHMOOD MR 09 18340 35511 177555 36,241 253,687 1022 432,264
999 423 MUKHTARAHMAD MINHAS MR 09 20530 38444 192220 39,174 274,218 1022 467,460
1000 423 IMRAN HUSSAIN MR 09 16150 32822 164110 33,552 234,864 1022 399,996
1001 423 AHMED SAEED MR 09 32210 50417 252085 51,147 358,029 1022 611,136
1002 423 AMAR SHEHZAD SD 07 18310 30676 153380 31,286 219,002 854 373,236
1003 424 ARSHED MEHMOOD MR 09 21990 40518 202590 41,248 288,736 1022 492,348
1004 424 HAFIZ MUHAMMAD NASIR MR 09 21260 39581 197905 40,311 282,177 1022 481,104
1005 424 MIAN ARSHAD MEHMUD MR 09 32210 53575 267875 54,305 380,135 1022 649,032
1006 424 SHUKAR HUSSAIN MR 09 21260 39520 197600 40,250 281,750 1022 480,372
1007 424 IBRAR KHALID M/R 09 16150 32822 164110 33,552 234,864 1022 399,996
1008 424 MUHAMMAD SALEEM MIS 09 32210 53575 267875 54,305 380,135 1022 649,032
1009 424 MUHAMMAD TUSEEF M.R 09 19800 37507 187535 38,237 267,659 1022 456,216
"10 424 TARIQ HUSSAIN MR 09 21260 38142 190710 38,872 272,104 1022 463,836
1 424 MUHAMMAD YAQUB MR 09 22720 41455 207275 42,185 295,295 1022 503,592
ZAIGHUM ABBAS MR 09 20530 38583 192915 39,313 275,191 1022 459,128 rI 424
424 MIAN MUZAMIL HUSSAIN MR 09 21260 38081 190405 38,811 271,677 1022 463,104
1014 424 ARIF HUSSAIN MR 09 21250 39581 197905 40,311 282,177 1022 481,104
1015 424 MUZAMMAL HUSSAIN M.R 09 22720 39955 199775 40,685 284,795 1022 485,592
1016 424 MUHAMMAD NAWAZ 8.0 07 26850 41638 208190 42,248 295,736 854 504,780
1017 424 JAMSHID BAIG M/R 09 31480 52699 263495 53,429 374,003 1022 638,520
1018 424 IJAZ HUSSAIN SHAH MR 09 32210 53636 268180 54,365 380562 1022 649,764
1019 424 ARSLAN TAHIR MR 09 12500 28137 140685 28,867 202069 1022 343,776
1020 424 IRFAN ASHRAF 80 07 17700 29693 148465 30,303 212,121 854 361,440
1021 425 AMJAD FAR000 MR 09 20530 37144 185720 37,874 265,118 1022 451,860
1022 425 MUHAMMAD AZAM MR 09 30750 51762 258810 52,492 367,444 1022 627,276
1023 425 ZAFAR ULLAH MRS-il 09 33670 52384 261920 53,114 371,798 1022 634,740
1024 425 MUZZAFAR IQBAL B.DISTT 07 17090 27410 137050 28,020 196,140 854 334,044
1025 425 IMRAN MUSTAFASINDHO M.R. 09 21990 39018 195090 39,748 278,236 1022 474,348
1026 425 AZHAR MEHMOOD MR 09 20530 38644 193220 39,374 275,618 1022 469,860
1027 425 MUHAMMAD ASJAD 8.0 07 18310 30676 153380 31,286 219,002 854 373,236
1028 42S MUHAMMAD MUSHTAQ MR 09 20530 38705 193525 39,435 276,045 1022 470,592
1029 425 SHAHID NAWAZ MR 09 22720 41455 207275 42,185 295,295 1022 503,592
1030 425 MAZHAR HUSSAIN MR 09 22720 41455 207275 42,185 295,295 1022 503,592
1031 425 MUHAMMAD ILYAS MR 09 20530 37144 185720 37,874 265,118 1022 451,860
1032 425 TASAWAR ABBAS MR. 09 21990 39018 195090 39,748 278,236 1022 474,348
1033 425 JUNAIDARIF MR 09 19070 36570 182850 37,300 261,100 1022 444,972
1034 425 MUHAMMAD EHSAN MR 09 22720 41455 207275 42,185 295,295 1022 503,592
1035 430 IMRAN SULTAN - M.R 09 19800 34411 172055 35,141 245,987 1022 419,064
36 431 MUHAMMAD RIAZ MRS-I 14 32730 50679 253395 51,849 362,943 1638 617,976
J7 431 MUHAMMAD ASIF MR 09 21260 38581 192905 39,311 275,177 1022 469,104
- 431 M. ARSHAD TEHSEEN MR 09 31480 50338 251690 51,068 357,476 1022 610,188
9 431 AZHAR ABBASS MR 09 22720 39155 195775 39,885 279,195 1022 475,992
1040 431 JAZAHMED MR 09 33670 46578 232890 47,308 331,156 1022 565,068
1041 431 MUHAMMAD ARSHAD MR 09 30750 50962 254810 51,692 361,844 1022 617,676
1042 431 INAM ULLAH ARSHAD MR 09 24910 43466 217330 44,196 309,372 1022 527,724
1043 431 cLAISAR ABBASS M.R 09 24910 43466 217330 44,196 309,372 1022 527,724
1044 431 MUDASSAR HUSSAIN MR 09 19800 36707 183535 37,437 262,059 1022 446,516
1045 431 MUHAMMAD ANSAR MR 09 19800 36707 183535 37,437 262,059 1022 446,618
1046 431 ARSHAD MEHM000 MR. 09 19800 36707 183515 37,437 262,059 1022 446,616
1047 431 IZHAR ELAHI M.R. 09 17610 32177 160885 32,907 230,349 1022 392,256
1048 431 SYED AMIR ALl ZAIDI MR 09 16880 32959 164795 33,689 235,823 1022 401,640
1049 431 SHAFAQAT ALl B.D 07 20140 32174 160870 32,784 229,488 854 391,212
1050 431 KHALID HUSSAIN MR 09 21990 38218 191090 38,948 272,536 1022 464,748
1051 432 Shabbir Hussain MR 09 33670 54010 270050 54,740 383,180 1022 654,252
1052 432 MUHAMMAD MUNIR M.R 09 31480 51199 255995 51,929 363,503 1022 520,520
1053 432 MUHAMMAD ASHRAF M/S 09 22720 41455 207275 42,185 295,295 1022 503,592
1054 432 NAEEM ABBAS M.R 09 18340 35633 178165 36,363 254,541 1022 433,728
1055 432 MUHAMMAD IBRAR MR 09 27830 47953 239765 48,683 340,781 1022 581,568
1056 432 KAUSAR ALl M.R. 09 20530 38444 192220 39,174 274,218 1022 467,460
3057 432 MUHAMMAD RIAZ MR 09 32940 52812 264060 53,542 374,794 1022 639,876
1058 432 AMJAD BAIG MIS 09 29290 49888 249440 50,618 354,326 1022 604,788
1059 432 RANAAMMARASAD M.R 09 12500 28137 140685 28,867 202,069 1022 343,776
1060 '432 S.AFZAAL HUSSAIN B.D 07 15870 27344 136720 27,954 195,678 854 333,252
1061 432 RIAZAHMAD 8.0 07 23190 36940 184700 37,550 262,850 854 448,404
1062 432 HASHIM ALVI MR 09 19800 37707 188535 38,437 269,059 458,616
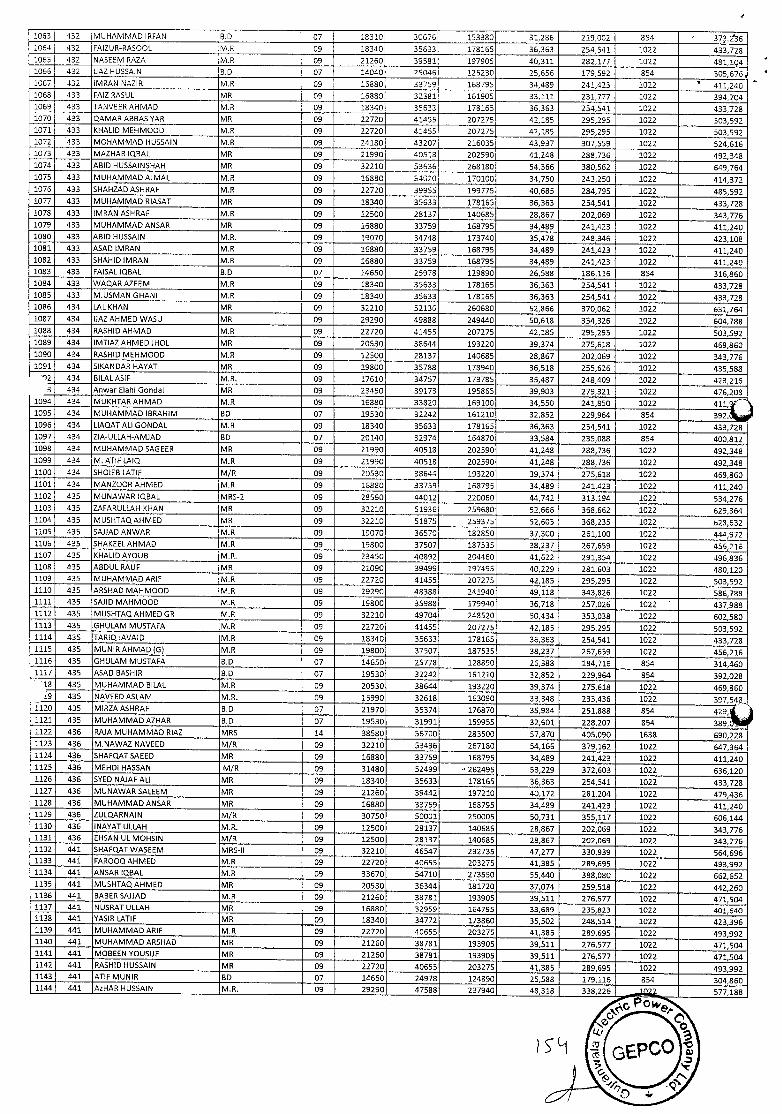
1063 432 MUHAMMAD IRFAN S.D 07 18310 30676 153380 31286 219,002 854 37,t36 1064 432 FAIZUR-RASOOL M.R 09 18340 35633 178165 36,363 254,541 1022 433,728 1065 432 NASEEM RAZA M.R 09 21260 39581 197905 40,311 282,177 1022 481,1ç4
305,876 1066 432 JAZ HUSSAIN 9.0 07 14440 25046 125230 25,656 179592 854 1067 432 MRAN NAZIS M.R 09 15880 33759 168795 34,489 241,423 1022 411,240 1068 433 FAIZ RASUL MR 09 25880 32381 161905 33,111 231,777 1022 394,704 1069 433 TANVEERAHMAD M.R 09 18340 35633 178165 36,363 254,541 1022 433,728 1070 433 QAMARABBASYAR MR 09 22720 41455 207275 42,185 295,295 1022 503,592 1071 433 KHALID MEHM000 M.R 09 22720 41455 207275 42,185 295,295 1022 503,592 1072 433 MOHAMMAD HUSSAIN M.R 09 24180 43207 216035 43,937 307,559 1022 524,615 1073 433 MAZHAR IQBAL MR 09 21990 40518 202590 41,248 288,736 1022 492,348 1074 433 ABID HUSSAINSHAH MR 09 32210 53636 268180 54,356 380,562 1022 649,764 1075 433 MUHAMMAD AJMAL M.8 09 15880 5020 170100 34,750 243,250 1022 414,372 1076 433 SHAHZAD ASHRAF M.R 09 22720 39955 199775 40,685 284,795 1022 485,592 1077 433 MUHAMMAD RIASAT MR 09 18340 35633 178165 36,363 254,541 1022 433,728 1078 433 IMRAN ASHRAF M.R 09 12500 28137 140685 28,867 202,069 1022 343,776 1079 433 MUHAMMAD ANSAR MR 09 15880 33759 168795 34,489 241,423 1022 411,240 1080 433 ABID HUSSAIN MR. 09 19070 34748 173740 35,478 248,346 1022 423,108 1081 433 ASAD MRAN
V 15880 33759 168795 34,489 241,423 1022 411,240
1082 433 SHAHID IMRAN 16880 33759 168795 34,489 241,423 1022 411,240 1083 433 FAISAL IQBAL 07 14650 25978 129890 26,588 186,116 854 316,860 1084 433 WAQ.AR AZEEM 09 18340 35633 178165 36,363 254,541 1022 433,728 1085 433 MUSMAN GHANI 09 18340 35633 178165 36,363 254,541 1022 433,728 1086 434 LAL KHAN 09 32210 52136 260680 52,866 370,062 1022 631,764 1087 454 IJAZAHMEDWA5U 09 29290 49888 249440 50,618 354,326 1022 604,788 1088 434 RASHID AHMAD 09 22720 41455 207275 42,185 295,295 1022 503,592 1089 434 IMTIAZAHMEDJHOL 09 20530 38644 193220 39,374 275,618 1022 469,850 1090 434 RASHID MEHMOOD 09 12500 28137 140685 28,867 202,059 1022 343,776 1091 434 SIKANDAR HAYAT 09 19800 35788 178940 36,518 255,625 1022 435,588
12 434 BILALASIF 1 09 17610 34757 173785 35,487 248,409 1022 423,216 3 434 Ariwar Elahi Gondal 09 23450 39173 195865 39,903 279,321 1022 476,208
1094 434 MUKHTAR AHMAD M.R 09 16880 33820 169100 34,550 241,850 1022 411, 1095 434 MUHAMMAD IBRAHIM BD 07 19530 32242 161210 32,852 229,964 854 392. - 1096 434 LIAQAT ALl GONDAL MR 09 18340 35633 178165 36,363 254,541 1022 433,728 1097 434 ZIA-ULLAH-AMJAD BD 07 20140 32974 164870 33,584 235,088 854 400,812 1098 434 MUHAMMAD SAGEER MR 09 21990 40518 202590 41,248 288,736 1022 492,348 1099 434 M. ATIF LAFO M.R 09 21990 40518 202590 41,248 268,736 1022 492,348 1100 434 SHOIEB LATIF MIS 09 20550 38644 193220 39,374 275,618 1022 469,860 1101 434 MANZOCR AHMED M.R 09 i6880 33759 168795 34,489 241,423 1022 411,240 1102 435 MUNAWAR QBAL MRS-2 09 28580 44012 220060 44,742 313,194 1022 534,278 1103 435 ZAFARULLAH KHAN MR 09 32210 51936 259680 52,666 368,662 1022 629,364 1104 435 MUSHTAQAHMED MR 09 32210 51875 259375 52,605 368,235 1022 623,532 1105 435 SAJJAD AN WAR M.R 09 19070 35570 182850 37,300 261,100 1022 444,972 1105 435 SHAKEELAHMAD M.R 09 19800 37507 187535 38,237 267,659 1022 455,216 1107 435 KHALID AYOUB MR. 09 23450 40892 204460 41,622 291,354 1022 496,836 1108 435 ABDUL RAUF MR 09 21090 39499 197495 40,229 281,603 1022 480,120 1109 435 MUHAMMAD ARIF M.R 09 22720 41455 207275 42,185 295,295 1022 503,592 1110 435 ARSHAD MAHM000 M.R 09 29290 48388 241940 49118 343,826 1022 586,788 1111 435 SAuD MAHMOOD M.R 09 19800 35988 179940 36,718 257,026 1022 437,988 1112 435 MUSHTAQAHMEDGR M.R 09 32210 49704 248520 50,434 353,038 1022 602,580 1113 435 GHULAM MUSTAFA M.R 09 22720 41455 207275 42,185 295,295 1022 503,592 1114 435 TARIQJAVAID M.R 09 18340 35633 178165 36,363 254,541 1022 433,728 1115 435 MUNIRAHMAD(G) 09 19800 37507 187535 38,237 267,659 1022 456,216 1116 435 GHULAM MUSTAFA I I 14650 25778 128890 26,388 184,716 854 314,460 1117 435 ASAD BASHIR : I 19630 32242 161210 32,852 229,964 854 392,028
38 435 MUHAMMAD BILAL 20530 38644 193220 39,374 275,618 1022 469,850 19 435 NAVEEDASLAM • 15990 32618 163090 33,348 233,436 1022 397,543
1120 435 MIRZA ASHRAF I 21970 35374 176870 35,984 291,888 854 429, 1121 435 MUHAMMAD AZHAR B.D 07 19530 31991 159955 32,501 228,207 854 389,. 1122 436 RAJA MUHAMMAD RIAZ MRS 14 38580 56700 283500 57,870 405,090 1638 690,228 1123 436 M.NAWAZ NAVEED MIS 09 32210 53436 267180 54,166 379,162 1022 547,364 1124 436 SHAFQ,ATSAEED MR 09 16880 33759 168795 34,489 241,423 1022 411,240 1125 436 MEHDI HASSAN M/R 09 31480 52499 ' 262495 55.229 372,603 1022 636,120 1126 436 SYED NAJAF ALl MR 09 18340 35633 178165 36,363 254,541 1022 433,728 1127 435 MUNAWAR SALEEM MR 09 21260 39442 197210 40,172 281.204 1022 479,436 1128 436 MUHAMMAD ANSAR MR 09 16880 33759 168795 34,489 241,423 1022 411,240 1129 436 ZULQARNAIN M/R 09 30750 50001 250005 50,731 355,117 1022 606,144 1130 436 INAYAT ULLAH MR. 09 12500 28137 140685 28,867 202,069 1022 343,776 1131 436 EHSAN UL MOHSIN M/R 09 12500 28137 140685 28,867 202,069 1022 343,776 1132 441 SHAFQATWASEEM MRS-Il 09 32210 46547 232735 47,277 330.939 1022 564,696 1133 441 FAR000AHMED M.R 09 22720 40655 203275 41,385 289,695 1022 493,992 1134 441 ANSAR IQBAL M.R 09 33670 54710 273550 55,440 388,080 1022 662,652 1135 441 MUSHTAQAHMED MR 09 20530 36344 181720 37,074 259,518 1022 442,260 1136 441 BABES SAJJAD M.R 09 21260 38781 193905 39,511 276,577 1022 471,504 1137 441 NUSRAT ULLAH MR 09 16880 32959 164795 33,689 235,823 1022 401,640 1138 441 YASIR LATIF MR 09 18340 34772 173860 35,502 248,514 1022 423,396 1139 441 MUHAMMAD ARIF M.R 09 22720 40655 203275 41,385 289,695 1022 493,992 1140 441 MUHAMMAD ARSHAD MR 09 21260 38781 193905 39,511 276,577 1022 471,504 1141 441 MOBEEN YOUSUF MR 09 21260 38781 193905 39,511 276,577 1022 471,504 1142 441 RASHID HUSSAIN MR 09 22720 40655 203275 41,385 289,695 1022 493,992 1143 441 ATIF MUNIR BD 07 14650 24978 124890 25.588 179,116 854 304,860 1144 441 AzHAR HUSSAIN MR. 09 29290 47588 237940 48,318 338,225 577,188
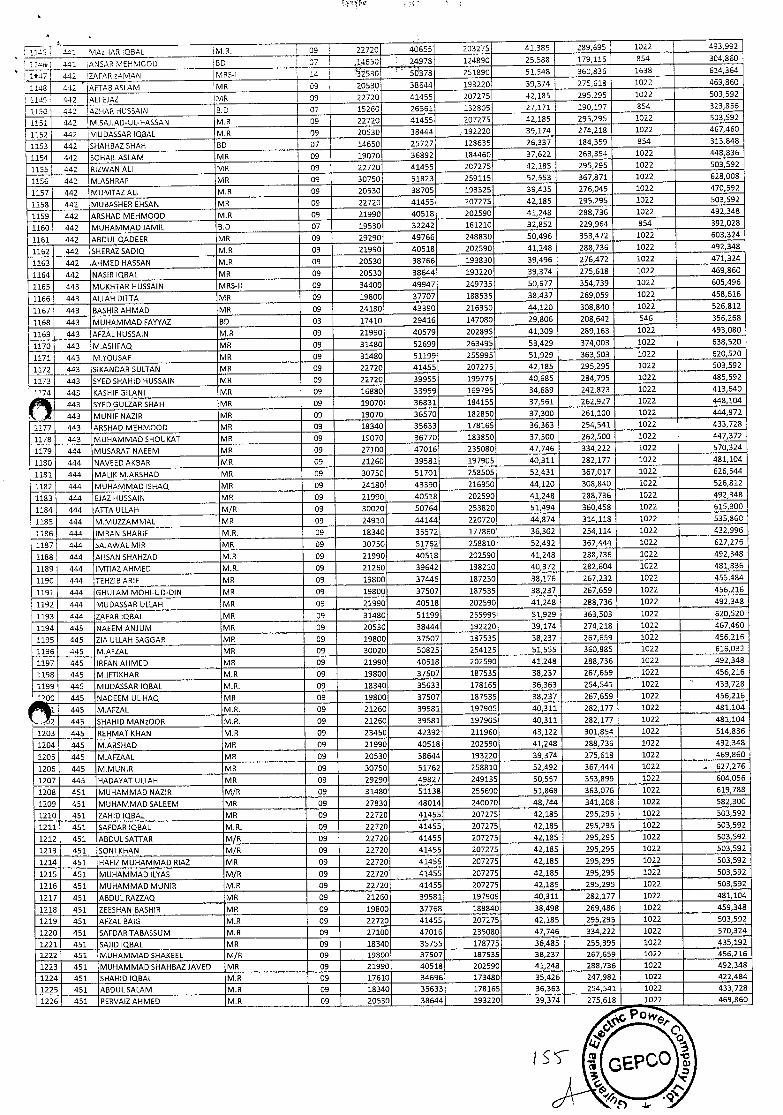
1111 J4 MAzHAR C,BAL .M.9. 09 22720 40655 203275 41385 289,695 1022 493,992
1244-i 441 A4SAR vIEHM000 BC 07 ,14550 24978 124890 25,588 179116 854 304,860
1*47 42 ZAF8Rz.AMAN MRS-i 14 353O b378 251890 51,548 360,836 1638 614,364
1148 442 • AFTABASLAM MR 09 20530 38644 193220 39,374 275,618 1022 469,860
114" 442 AU SJAZ MR 09 22720 41455 207275 42,185 295,295 1022 503,592
1150 442 AZHAR HUSSAIN B.2 07 15260 26561 132805 27,171 190,197 854 323,856
1151 442 M.SAJJAD-UL-HASSAN M.R 09 22720 41455 207275 42,185 295,295 1022 503,592
1152 442 MUDASSAR OBAL M.R 09 20530 38444 192220 39174 274,218 1022 467,460
1153 442 SHAHBAZ SHAH BC 07 14650 25727 128635 26,337 184,359 854 313,848
1154 442 SOHAILASLAM MR 09 19070 36892 184460 37,622 263,354 1022 448,836
1155 442 RIZWAN ALl MR 09 22720 41455 207275 42,185 295,295 1022 503,592
1156 442 M.ASHRAF MR 09 30750 51823 259115 52,553 367,871 1022 628,008
1157 442 MUMTAZ ALl M.R 09 20530 38705 193525 39,435 276,045 1022 470,592
1158 442 MUBASHER EHSAN MR 09 22720 41455 207275 42,185 295,295 1022 503,592
1159 442 ARSHAD MEHMOOD M.R 09 21990 40518 202590 41,248 288,736 1022 492,348
1160 442 MUHAMMAD JAMIL B.0 07 19530 32242 161210 32,852 229,964 854 392,028
1161 442 ABDULQADEER MR 09 29290 49766 248830 50,496 353,472 1022 603,324
1162 442 SHERAZSADIQ M.R 09 21990 40518 202590 41,248 288,736 1022 492,348
1163 442 AHMED HASSAN M.R 09 20530 38766 193830 39,496 276,472 1022 471,324
1164 442 NASIR IQBAL MR 09 20530 38644 193220 39,374 275,618 1022 469,860
1165 443 MUKHTAR HUSSAIN MRS-Il 09 34400 49947 249735 50,677 354,739 1022 605,496
1166 443 ALLAH DITTA MR 09 19800 37707 186535 38,437 269,059 1022 458,616
1167 443 BASHIR AHMAD MR 09 24180 43390 216950 44,120 308,840 1022 526,812
1168 443 MUHAMMAD FAYYAZ BC 03 17410 29416 147080 29,806 208,642 546 356,268
1169 443 AFZAL HUSSAIN M.R 09 21990 40579 202895 41,309 289,163 1022 493,080
1170 443 MASHFAQ MR 09 31480 52699 263495 53,429 374,003 1022 638,520
1171 443 M.YOUSAF MR 09 31480 51199 255995 51,929 363,503 1022 620,520
1172 443 SIK,ANDAR SULTAN MR 09 22720 41455 207275 42,185 295,295 1022 503,592
1173 443 SYED SHAHID HUSSAIN MR 09 22720 39955 199775 40,685 284,795 1022 485,592
• 74 443 KASHIF GILANI MR 09 16880 33959 169795 34,689 242,823 1022 413,540
443 SlED GULZAR SHAH MR 09 19070 36831 184155 37,561 262,927 1022 448,104 (,j 443 MUNIF NAZIR MR 09 19070 36570 182850 37,300 261,100 1022 444,972
1177 443 ARSHAD MEHMOOD MR 09 18340 35633 178165 36,363 254,541 1022 433,728
1178 443 MUHAMMAD SHOUKAT MR 09 19070 36770 183850 37,500 262,500 1022 447,372
1179 444 MUSARAT NAEEM MR 09 27100 47016 235080 47,746 334,222 1022 570,324
1180 444 NAVEED AKBAR MR 09 21260 39581 197905 40,311 282,177 1022 481,104
1181 444 MALII( MARSHAD MR 09 30750 51701 258505 52,431 367,017 1022 626,544
1182 444 MUHAMMAD ISHAQ MR 09 24180 43390 216950 44,120 308,840 1022 526,812
1183 444 EJAZ HUSSAIN MR 09 21990 40518 202590 41,248 288,736 1022 492,348
1134 444 ATTA ULLAH M/R 09 30020 50754 253820 51,494 360,458 1022 615,300
1185 444 M.MUZZAMMAL MR 09 24910 44144 220720 44,874 314,118 1022 535,860
1186 444 MRAN SHARIF M.R. 09 18340 35572 177860 36,302 254,114 1022 432,996
1187 444 SAJAWAL MIR MR 09 30750 51762 258810 52,492 357,444 1022 627,276
1188 444 AHSAN SHAHZAD M.R 09 21990 40518 202590 41,248 288,736 1022 492,348
1189 444 IMTIAZAHMED MR. 09 21260 39642 198210 40,372 282,604 1022 481,836
1190 444 TEHZIB ARIF MR 09 19800 37446 187230 38,176 257,232 1022 455,484
1191 444 GRULAM MOHI-UD-DIN MR 09 19800 37507 187535 38,237 267,559 1022 456,216
1192 444 MUDASSAR ULLAH MR 09 21990 40518 202590 41,248 288,736 1022 492,348
1193 444 ZAFAR OBAL MR 09 31480 51199 255995 51,929 363,503 1022 620,520
1194 445 NAEEM ANJUM MR 09 20530 38444 192220 39,174 274,218 1022 467,460
1195 445 ZIA ULLAH SAGGAR MR 09 19800 37507 187535 38,237 267,659 1022 456,216
1196 445 M.AFZAL MR 09 30020 50825 254125 51,555 360,885 1022 615,032
1197 445 IRFAN AHMED MR 09 21990 40518 202590 41,248 288,736 1022 492,348
1198 445 M.IFTIKHAR M.R 09 19800 37507 187535 38,237 267,659 1022 456,215
1199 445 MUDASSAR IQBAL MR. 09 18340 35633 178165 36,363 254,541 1022 433,728
'OC 445 NADEEM UI HAQ MR 09 19800 37507 187535 38,237 267,659 1022 456,216
445 M.AFZAL MR. 09 21260 39581 197905 40,311 282,177 1022 481,104
2 445 SHAHID MANz0OR M.R. 09 21260 39581 197905 4D,311 282,177 1022 481,104
1203 445 REHMAT KHAN M.R 09 23450 42392 211960 43,122 301,854 1022 514,836
1204 445 M.ARSHAD MR 09 21990 40518 202590 41,248 288,736 1022 492,348
1205 445 M.AFZAAL MR 09 20530 38644 193220 39,374 275,618 1022 459,860
1206 445 MMUNIR MR 09 30750 51762 258810 52,492 367,444 1022 527,276
1207 445 HADAYAT ULLAH MR 09 29290 49827 249135 50,557 353,899 1022 604,056
1208 451 MUHAMMAD NAZIR M/R 09 31480 51138 255690 51,868 363,075 1022 619,788
1209 451 MUHAMMAD SALEEM MR 09 27830 48014 240070 48,744 341,208 1022 582,300
1210 451 ZAHID IQBAL MR 09 22720 41455 207275 42,185 295,295 1022 503,592
1211 451 SAFDAR IQBAL MR. 09 22720 41455 207275 42,185 295,295 1022 503,592
1212 451 ABDULSATTAR M/R 09 22720 41455 207275 42,185 295,295 1022 503,592
1213 451 SONI KHAN M/R 09 22720 41455 207275 42,185 295,295 1022 503,592
1214 451 HAFIZ MUHAMMAD RIAZ MR 09 22720 41455 207275 42,185 295,295 1022 503,592
1215 451 MUHAMMAD ILYAS M/R 09 22720 41455 207275 42,185 295,295 1022 503,592
1216 451 MUHAMMAD MUNIR M.R 09 22720 41455 207275 42,185 295,295 1022 503,592
1217 451 ABDUL RAZZAQ MR 09 21260 39581 197905 40,311 282,177 1022 481,104
1218 451 ZEESHAN BASHIR MR 09 19800 37768 188840 38,498 269,486 1022 459,348
1219 451 AFZAL BAIG M.R 09 22720 4145S 207275 42,185 295,295 1022 503,592
1220 451 SAFDARTABASSUM M.R 09 27100 47016 235080 47,746 334,222 1022 570,324
1221 451 SAuD IQBAL MR 09 18340 35755 178775 36,485 255,395 1022 435,192
1222 451 MUHAMMAD SHAKEEL M/R 09 19800 37507 187535 38,237 267,659 1022 456,216
1223 451 MUHAMMAD SHAHBAZJAVED MR 09 21990 40518 202590 41,248 288,736 1022 492,348
1224 451 SHAHID IQBAL M.R 09 17610 34696 173480 35,426 247,982 1022 422,484
1225 451 ABOULSALAM MR 09 18340 35633 178165 36,363 254,541 1022 433,728
1226 451 PERVAIZAHMED MR 09 20530 38644 193220 39,374 275,518 1022 469,860
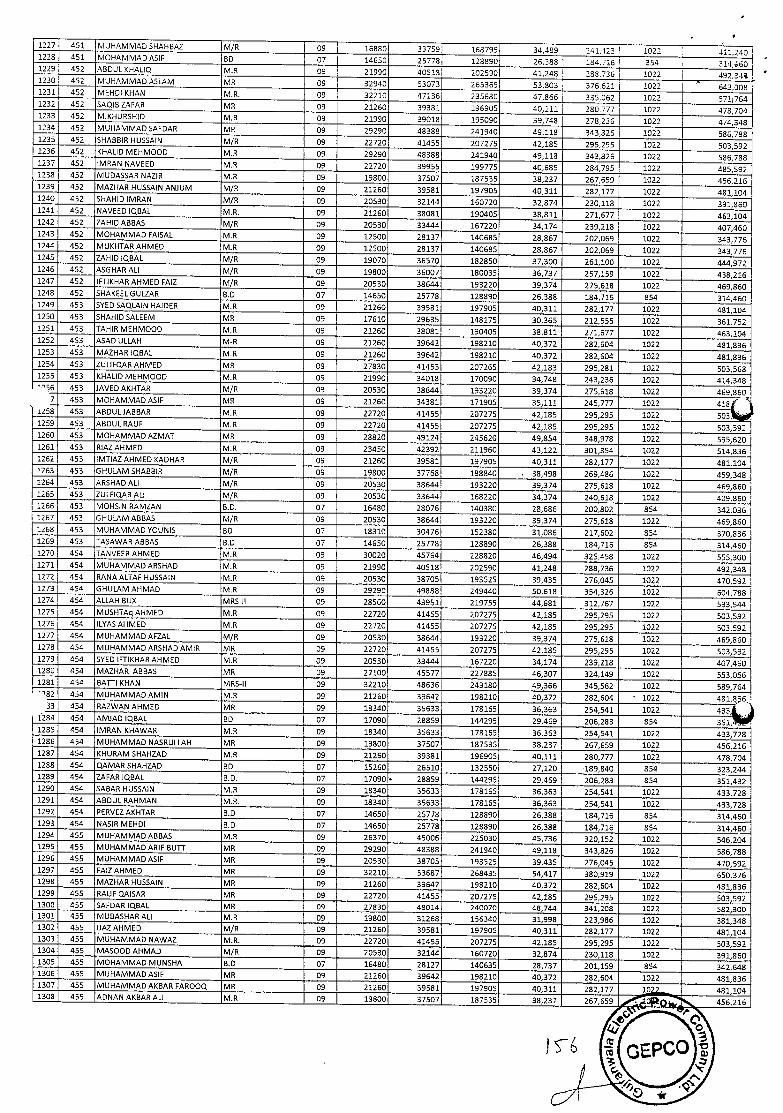
1227 451 MUHAMMAD SHAHBAZ M/R 09 19880 33759 168795 34,489 241,323 1022 411,240 1228 451 MOHAMMAD ASIF BD 07 14650 25778 128890 26388 184,716 354 314,440 1229 452 ABDUL KHAUQ M.R 09 21990 40518 202590 41,248 288,736 1022 492,34 1230 452 MUHAMMAD ASLAM MR 09 32940 53073 265365 13,803 375,521 1022 " 643,008 1231 452 MEHDI KHAN M.R. 09 32210 47136 235680 47,866 335,062 1022 571t754 1232 452 SAQIB Z.AFAR MR 09 21260 39381 196905 40,111 280,777 1022 478,704 1233 452 M.KHURSHID M.R 09 21990 39018 195090 39,748 278,236 1022 474,348 1234 452 MUHAMMAD SAFDAR MR 09 29290 48388 241940 49,118 343,826 1022 586,788 1235 452 SHABBIR HUSSAIN M/R 09 22720 41455 207275 42,185 295,295 1022 503,592 1236 452 KHALID MEHM000 M.R 09 29290 48388 241940 49,118 343,826 1022 586,788 1237 452 IMRAN NAVEED M.R 09 22720 39955 199775 40,685 284,795 1022 485,592 1238 452 MUDASSAR NAZIR M.R 09 19800 37507 187535 38,237 267,659 1022 456,215 1239 452 MAZHAR HUSSAIN ANJUM M/R 09 21260 39581 197905 40,311 282,177 1022 421,104 1240 452 SHAHID IMRAN MIR 08 20530 32144 160720 32,874 230,118 1022 391,860 1241 452 NAVEED IQBAL M.R. 09 21260 38081 190405 38,811 271,877 1022 463,104 1242 452 ZAHID ABBAS M/R 09 20530 33444 167220 34,174 239,218 1022 407,450 1243 452 MOHAMMAD FAISAL M.R 09 12500 28137 140685 28,867 202,059 1022 343,776 1244 452 MUKHTAR AHMED M.R 09 12500 28137 140685 28,867 202,069 1022 343,776 1245 452 ZAHID IQBAL M/R 09 19070 36570 182850 37,300 261,100 1022 444,972 1246 452 ASGHAR ALl M/R 09 19800 36007 180035 36,737 257,159 1022 438,216 1247 452 IFTIKHAR AHMED FAIZ M/R 09 20530 38644 193220 39,374 275,618 1022 469,860 1248 452 SHAKEELGULZAR 8.0 07 14650 25778 128890 26,388 184,716 854 314,460 1249 453 SYED SAQLAIN HAIDER M.R 09 21260 39581 197905 40,311 282,177 1022 481,104 1250 453 SHAHID SALEEM MR 09 17610 29635 148175 30,365 212,555 1022 361,752 1251 453 TAHIRMEHM000 M.R 09 21260 38081 - 190405 38,811 271,677 1022 463,104 1252 453 ASAD ULLAH M-R 09 21260 39642 198210 40,372 282,604 1022 481,836 1253 453 MAZHAR IQBAL M.R 09 21260 39642 198210 40,372 282,604 1022 481,836 1254 453 ZULIFQ,AR AHMED MR 09 27830 41453 207265 42,183 295,281 1022 503,568 1255 453 KHALID MEHMOOD M.R 09 21990 34018 170090 34,748 243,236 1022 414,348 '"56 453 JAVEDAKHTAR M/R 09 20530 38644 193220 39,374 275,618 1022 469,860
7 453 MOHAMMAD ASIF MR 09 21260 34381 171905 35,111 245,777 1022 418 1258 453 ABDULJABBAR M.R 09 22720 41455 207275 42,185 295,295 1022 503. 1259 453 ABDUL RAUF M.R 09 22720 41455 207275 42,185 295,295 1022 503,592 1260 453 MOHAMMADAZMAT MR 09 28820 49124 245620 49,854 348,978 1022 595,520 1261 453 RIAZAHMED M.R 09 23450 42392 211960 43,122 301,854 1022 514,836 1262 453 IMTIAZAHMED KADHAR M/R 09 21260 39581 197905 40,311 282,177 1022 481,104 1263 453 GRULAM SHABBIR M/R 09 19800 37768 188840 . 38,498 269,486 1022 459,348 1264 453 ARSHAD ALl M/R 09 20530 38644 193220 39,374 275,618 1022 469,860 1265 453 ZULFIO.AR AU M/R 09 20530 33644 168220 34,374 240,618 1022 409,860 1266 453 MORSIN RAMZAN B.D. 07 16480 28076 140380 28,585 200,802 854 342.035 1267 453 GHULAM ABBAS M/R 09 20530 38644 193220 39,374 275,618 1022 469,860 1268 453 MUHAMMAD YOUNIS 3D 07 18310 30476 152380 31,086 217,502 854 370,835 1259 453 TASAWAR ABBAS B.D 07 14650 25778 128890 26,388 184,716 854 314.450 1270 454 TANVEER AHMED M.R 09 30020 45764 228820 46,494 325,458 1022 555,300 1271 454 MUHAMMAD ARSHAD M.R 09 21950 40518 202590 41,248 288,736 1022 492,348 1272 454 RANA ALTAF HUSSAIN M.R 09 20530 38705 193525 39,435 276,045 1022 470,592 1273 454 GHULAM AHMAD M.R 09 29290 49888 249440 50,618 354,326 1022 604,788 1274 454 ALLAH BUX MRS-lI 09 28560 43951 219755 44,681 312,767 1022 533,544 1275 454 MU5HTAq AHMED M.R 09 22720 41455 207275 42,185 295,295 1022 503,592 1276 454 ILYASAHMED M.R 09 22720 41455 207275 42,185 295,295 1022 503,592 1277 454 MUHAMMAD AFZAL M/R 09 20530 38644 193220 39,374 275,618 1022 469,860 1278 454 MUHAMMADARSHADAMIR MR 09 22720 41455 207275 42,185 295,295 1022 503,592 1279 454 SYED IFTIKHAR AHMED M.R 09 20530 33444 167220 34,174 239,218 1022 407,460 1280 454 MAZHAR ABBAS MR 09 27100 45577 227885 46,307 324,149 1022 553,056 1281 454 BATTI KHAN MRS-Il 09 32210 48536 243180 49,366 345,562 1022 589,764 ''82 454 MUHAMMAD AMIN M.R 09 21260 39642 198210 40,372 282,604 ' 1022 481,836
33 454 RAZWAN AHMED MR 09 18340 35633 178165 36,363 254,541 1022 433 1284 454 AMJAD IQBAL BD 07 17090 28859 144295 29,469 205,283 854 351, 1285 454 IMRAN KHAWAR M.R 09 18340 35633 178165 36,363 254,541 1022 433,728 1286 454 MUHAMMAD NASRULLAH MR 09 19800 37507 187535 38,237 257,659 1022 456,216 1287 454 KHURAM SHAHZAD M.R 09 21260 39381 196905 40,111 280,777 1022 478,704 1288 454 Q,AMAR SHAHZAD BD 07 15260 25510 132550 27,120 189,840 854 323,244 1289 454 ZAFAR IQBAL B.D. - 07 17090 • 28859 144295 29,469 206,283 854 351,432 1290 454 SABAR HUSSAIN M.R 09 18340 35633 178165 36,353 254,541 1022 433,728 1291 454 ABDUL RAHMAN M.R. 09 18340 35633 178165 36,363 254,541 1022 433,728 1292 454 PERVEZAKHTAR B.D 07 14650 25778 128890 26,388 184,715 854 314,460 1293 454 NASIR MEHOl B.D 07 14650 25778 128890 26,388 184,715 854 314,460 1294 455 MUHAMMAD ABBAS M.R 09 26370 45006 225030 45,736 320,152 1022 546,204 1295 455 MUHAMMAD ARIF BUTT MR 09 29290 48388 241940 49,118 343,826 1022 586,788 1296 455 MUHAMMAD ASIF MR 09 20530 38705 193525 39,435 276,045 1022 470,592 1297 455 FAIZAHMED MR 09 32210 53587 268435 54,417 380,919 1022 650,376 1298 455 MAZHAR HUSSAIN MR 09 21260 39642 198210 40,372 282,604 1022 481,836 1299 455 RAUF QAISAR MR 09 22720 41455 207275 42,185 295,295 1022 503,592 1300 455 SAFDAR IQBAL MR 09 27830 48014 240070 48,744 341,208 1022 582,300 1301 455 MUBASHAR ALl M.R 09 19800 31268 156340 31,998 223,986 1022 381,348 1302 455 IJAZAHMED M/R 09 21260 39581 197905 40,311 282,177 1022 481,104 1303 455 MUHAMMAD NAWAZ M.R. 09 22720 41455 207275 42,185 295,295 1022 503,592 1304 455 MASOOD AHMAD M/R 09 20530 32144 160720 32,874 230,118 1022 391,860 1305 455 MOHAMMAD MUNSHA B.D 07 16480 28127 140635 28,737 201,159 854 342,648 1306 455 MUHAMMAD ASIF MR 09 21260 39642 198210 40,372 282,604 1022 481,836 1307 455 MUHAMMAD AKBAR FAROOQ MR 09 21250 39581 197905 40,311 282,177 10 481,104 1308 455 ADNAN AKBAR ALl M.R 09 19800 37507 187535 38,237 267,659 456,216
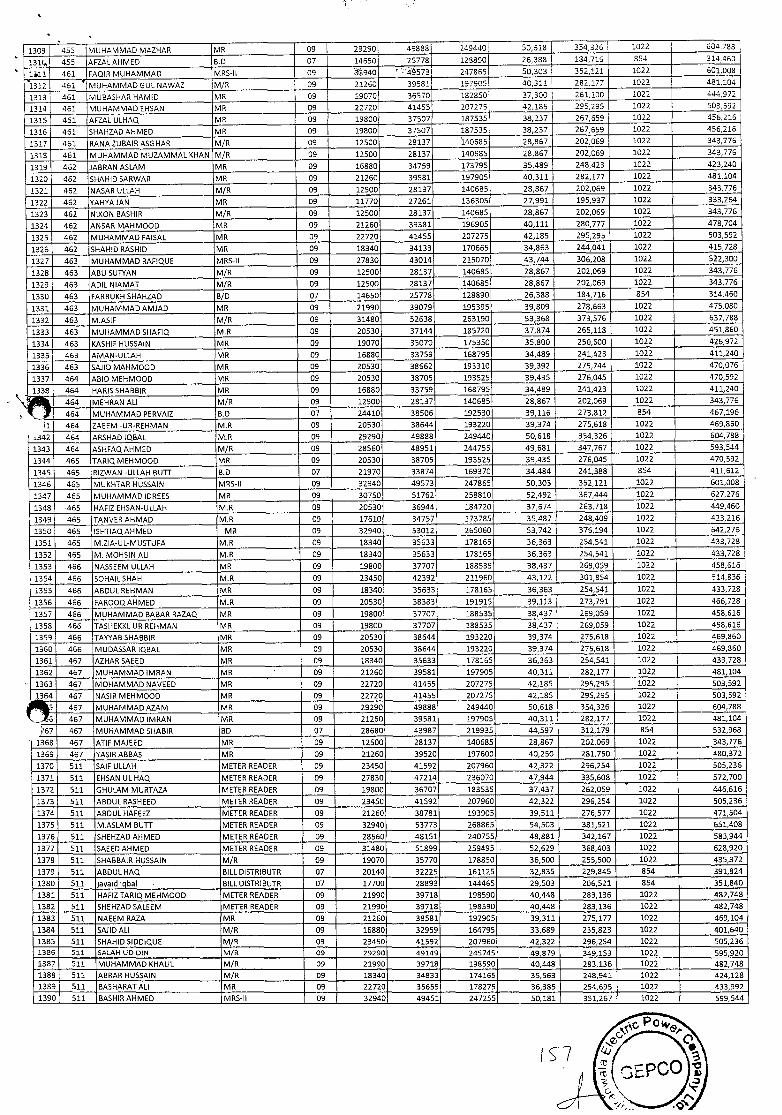
(7
1309 455 MUHAMMAD MAZHAR MR 09 29290 49888 24944W 50818 354326 1022 60,788
131fiI 455 AFZALAHMED B.D 07 14650 25778 128890 26,388 184,716 854 314460
111 461 FAQIR MUHAMMAD MRS-Il 09 940 4573 247865 50,303 352,121 1022 601,008
1312 461 MUHAMMADGUL NAWAZ M/R 09 21260 39581 197905 40,311 282,177 1022 481,104
1313 461 MUBASHAR HAMID MR 09 19070 36570 182850 37,300 261,100 1022 444,372
1314 481 MUHAMMAD EHSAN MR 09 22720 41455 207275 42.185 295,295 1022 503,592
1315 461 AEZAL ULHAQ MR 09 19800 37507 187535 38,237 267,659 1022 456216
1316 461 SHAHZ.AD AHMED MR 09 19800 37507 187535 38,237 267,659 1022 455,216
1317 461 RANA ZUBAIR ASGHAR M/R 09 12500 28137 140685 28,867 202,069 1022 343,776
1318 461 MUHAMMAD MUZAMMAL (HAN M/R 09 12500 28137 140685 28,867 202,069 1022 343,776
1319 462 JABRAN ASLAM MR 09 16880 34759 173795 35,489 248,423 1022 423,240
1320 462 SHAHID SARWAR MR 09 21260 39581 197905 40,311 282,177 1022 481,104
1321 462 NASAR ULLAH M/R 09 12500 28137 140685 28,867 202,069 1022 343,776
1322 462 YAHYA JAN MR 09 11770 27261 136305 27,991 195,937 1022 333,254
1323 462 NIXON BASHIR M/R 09 12500 28137 140685 28,867 202,069 1022 343,776
1324 462 ANSAR MAHMOOD MR 09 21250 39381 196905 40,111 280,777 1022 478,704
132S 462 MUHAMMAD FAISAL MR 09 22720 41455 207275 42,185 295,295 1022 503,592
1326 462 SHAHID RASHID MR 09 18340 34133 170655 34,863 244,041 1022 415,728
1327 463 MUHAMMAD RAFIQUE MRS-Il 09 27830 43014 215070 43,744 306,208 1022 522,300
1328 463 ABU SUFYAN M/R 09 12500 28137 140685 28,867 202,059 1022 343,776
1329 463 ADIL NIAMAT M/R 09 12500 28137 140685 28,867 202,069 1022 343,776
1330 463 FARRUKH SHAHZAD BID 07 14650 25778 128890 26,388 184,716 854 314,460
1331 453 MUHAMMAD AMJAD MR 09 21990 39079 195395 39,809 278,653 1022 475,080
1332 463 M.ASIF M/R 09 31480 52638 263190 53,368 373,576 1022 637,788
1333 463 MUHAMMAD SHAFIQ M.R 09 20530 37144 185720 37,874 255,118 1022 451,860
1334 463 KASHIF HUSSAIN MR 09 19070 35070 175350 35,800 250,600 1022 426,972
1335 463 AMAN-ULLAH MR 09 16880 33759 158795 34,489 241,423 1022 411,240
1336 463 SAuD MAHMOOD MR 09 20530 38562 193310 39,392 275,744 1022 470,076
1337 464 ABID MEHM000 MR 09 20530 38705 183525 39,435 276,045 1022 470,592
1338 464 HARIS SHABBIR MR 09 15880 33759 168795 34,489 241,423 1022 411,240
464 MEHRAN ALl M/R 09 12500 28137 140685 28,867 202,069 1022 343,776
464 MUHAMMAD PERVAIZ 8.0 07 24410 38506 192530 39,116 273,812 854 457,196
1 464 ZAEEM -UR-REHMAN M.R 09 20530 38544 193220 39,374 275,518 1022 459,860
342 464 ARSHAD IQBAL M.R 09 29290 49888 249440 50,618 354,326 1022 604,788
1343 464 ASHFAQAHMED MIR 09 28550 48951 244755 49,681 347,757 1022 593,544
1344 465 TARIQMEHM000 MR 09 20530 38705 193525 39,435 276,045 1022 470,592
134S 465 RIZWAN -ULLAH BUTT 8.0 07 21970 33874 169370 34,484 241,388 854 411,512
1345 465 MUKI-ITAR HUSSAIN MRS-Il 09 32940 49573 247865 50,303 352,121 1022 601,008
1347 455 MUHAMMAD IDREES MR 09 30750 51762 258810 52,492 357,444 1022 627,276
1348 -465 HAFIZ EHSAN-ULLAH M.R 09 20530 36944 184720 37,674 263,718 1022 449,460
1349 465 TAN VER AHMAD MR 09 17610 34757 173785 35,487 248,409 1022 423,216
1310 455 ISHTIAQAHMED MR 09 32940 53012 265060 53,742 376,194 1022 642,276
1351 465 M.ZlA-UL-MUSTUFA M.R 09 18340 35633 178165 36,363 254,541 1022 433,728
1352 465 M. MOHSIN ALl M.R 09 18340 35633 178165 36,363 254,541 1022 433,728
1353 466 NASSEEM UU.AH MR 09 19800 37707 188535 38,437 269,059 1022 458,616
1354 466 SOHAILSHAH M.R 09 23450 42392 211960 43,122 301,854 1022 514,836
1355 466 ABDUL REHMAN MR 09 18340 35633 178165 36,363 254,541 1022 433,728
1356 466 FAROOQAHMED M.R 09 20530 38333 191915 39,113 273,791 1022 466,728
1357 466 MUHAMMAD BABAR RAZAQ MR 09 19800 37707 188535 38,437 269,059 1022 458,616
1358 466 TASHEKKL UR REHMAN MR 09 19800 37707 188535 38,437 269,059 1022 458,616
1359 466 TAYYAB SHABBIR MR 09 20530 38644 193220 39,374 275,618 1022 469,860
1360 466 MUDASSAR IQBAL MR 09 20530 38644 193220 39,374 275,618 1022 469,860
1361 467 AZHARSAEED MR 09 18340 35833 178165 35,363 254,541 1022 433,728
1362 467 MUHAMMAD IMRAN MR - 09 21260 39581 197905 40,311 282,177 1022 481,104
1363 467 MOHAMMAD NAVEED MR 09 22720 41455 207275 42,185 295,295 1022 503,592
467 NASIR MEHM000 MR 09 22720 41455 207275 42,185 295,295 1022 503,592
467 MUHAMMAD AZAM MR 09 29290 49888 249440 50,618 354,326 1022 604,788
.6 467 MUHAMMAD IMRAN MR 09 21260 39581 197905 40,311 282,177 1022 381,104
167 467 MUHAMMAD SHABIR BD 07 28680 43887 219935 44,597 312,179 854 532,968
- 1368 467 ATIF MAJEED MR 09 12500 28137 140685 28,867 202,069 1022 343,776
1369 467 YASIR ABBAS MR 09 21260 39520 197600 40,250 281,750 1022 480,372
1370 511 SAIF ULI.AH METER READER 09 23450 41592 207960 42,322 296,254 1022 505,236
1371 511 EHSAN UL HAlt METER READER 09 27830 47214 236070 - 47,944 335,608 1022 572,700
1372 511 GHULAM MURTAZA METER READER 09 19800 36707 183535 37,437 262,059 1022 446,616
1373 511 ABDUL RASHEED METER READER 09 23450 41592 207960 42.322 296,254 1022 505,236
1374 511 ABDUL HAFEEZ METER READER 09 21260 38781 193905 39,511 276,577 1022 471,504
1375 511 M.ASLAM BUTT METER READER 09 32940 53773 268865 54,503 381,521 1022 651,408
1376 511 SHEHZADAHMED METER READER 09 28560 48151 240755 48,881 342,167 1022 S83,944
1377 511 SAEED AHMED METER READER 09 31480 51899 259495 52,629 368,403 1022 628,920
1378 511 SHABBAIR HUSSAIN M/R 09 19070 35770 178850 36,500 255,500 1022 435,372
1379 511 ABDUL HAO. BILL DISTRIBUTR 07 20140 32225 161125 32,835 229,845 854 391,824
1380 511 javaid iqbal BILL OISTRIBUTR 07 17700 28893 144465 29.503 206,521 854 351,840
1381 511 HAFIZTARIQ MEHM000 METER READER 09 21990 39718 198590 40,448 283,136 1022 482,748
1382 511 SHEHZAD SALEEM METER READER 09 21990 39718 198590 40,448 2B3,136 1022 482,748
1383 511 NAEEM RAZA MR 09 21260 3B581 192905 39,311 275,177 1022 469,104
13B4 511 SAuD ALl M/R 09 168B0 32959 164795 33,689 235,823 1022 401,640
1385 511 SHAI-IID SIDDIQUE MJR 09 23450 41592 207960 42,322 296,254 1022 505,236
•.. 511 SALAH UD DIN M/R 44I.I III LPL.1 49,879 349,153 1022 595,920 1387 511 MUHAMMAD KHALIL M/R 09 21990 39718 198590 40,448 283,136 1022 482,748
1388 511 ABRAR HUSSAIN M/R 09 18340 34833 174165 35,563 248,941 1022 424,128
1389 511 BASHARAT ALl MR 09 22720 35655 178279 36,385 254,695 1022 433,992
1390 511 BASHIRAHMED MRS-lI 09 32940 49451 2472S5 50,181 351,267 1022 599,544
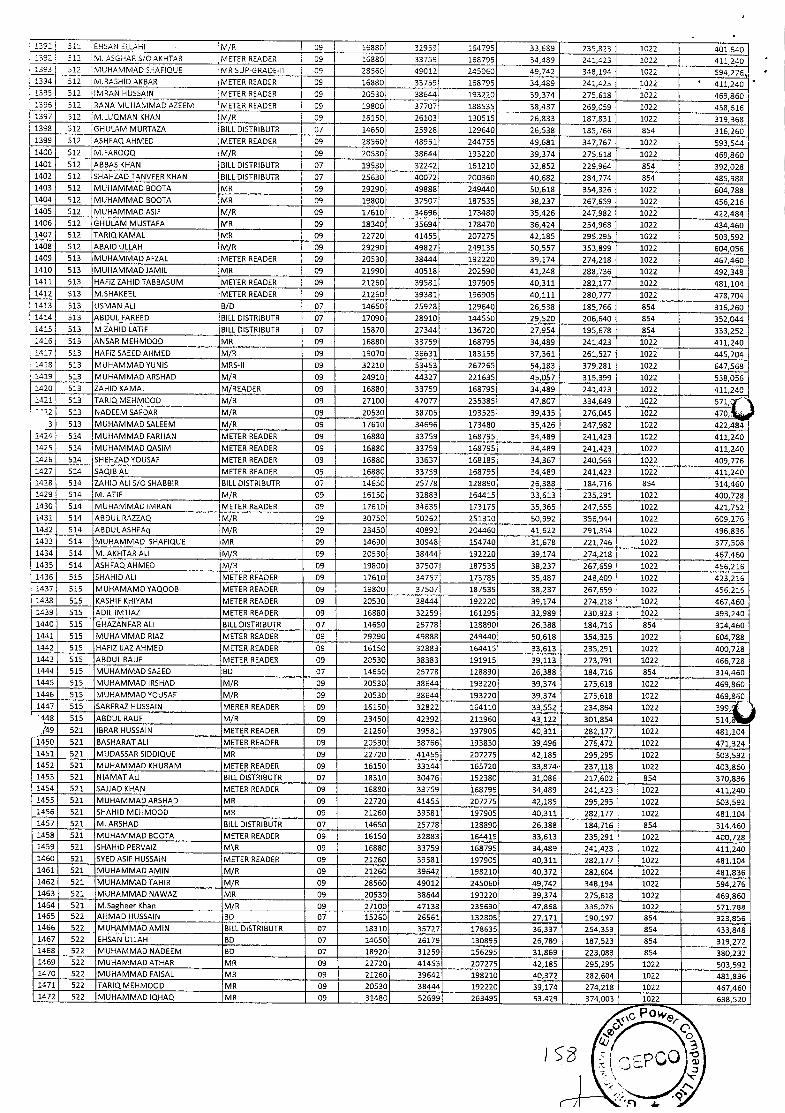
1591 511 EHSAN ELLAHI M/R 09 16880 32959 164795 33,689 235,823 1022 401.640 1392 512 M. AIGHAR S/C .IKHTAR METER READER 09 16880 33759 168795 34,489 241,423 1022 411,240 1393 512 MUHAMMAD SHAFIQUE MR SUP-GRADE-U 09 28360 49012 245060 49,742 348,194 1022 594,278 1394 512 M.RASHID AUBAR METER READER 09 16880 33759 168795 34,489 241,423 1022 411,240 1395 512 IMRAN HUSSAIN METER READER 09 I 20530 38644 193220 39,374 275,618 1022 469,860 1395 512 RANA .'vIUHAMMAD AZEEM METER READER 09 19800 37707 188535 38,437 269,059 1022 458,616 1397 512 M.LUQMAN KHAN M/R 09 16150 26103 130515 26,833 187,831 1022 319,358 1398 512 GHULAM MURTAZA BILL DISTRIBUTR 07 14550 25928! 129640 25,538 185,766 854 316,260 1399 512 AS}-IFAQ ARMED METER READER 09 28560 48951 244755 49,681 347,767 1022 593,544 1400 512 M.FAROOQ M/R 09 20530 38644 193220 39,374 275,618 1022 469,860 1401 512 ABBAS KHAN BILL DISTRIBUTR 07 19530 32242 161210 32,852 229,964 854 392,028 1402 512 SHAHZAD TAN VEER (HAN BILL DISTRIBUTR 07 23630 40072 200360 40,682 284,774 854 485,988 1403 512 MUHAMMAD BOOTA MR 09 29290 49888 249440 50,618 354,326 1022 604,788 1404 512 MUHAMMAD BOOTA MR 09 19800 37507 187535 38,237 267,659 1022 456,216 1405 512 MUHAMMAD ASIF M/R 09 17610 34696 173480 35,426 247,982 1022 422,484 1406 512 GHULAM MUSTAFA MR 09 18340 35694 178470 36,424 254,968 1022 434,460 1407 512 TARIQKAMAL MR 09 22720 41455 207275 42,185 295,295 1022 503,592 1408 512 ABAID ULLAH M/R 09 29290 49827 249135 50,557 353,899 1022 604,056 1409 513 MUHAMMAD AEZAL METER READER 09 20530 38444 192220 39,174 274,218 1022 457,460 1410 513 MUHAMMAD JAMIL MR 09 21990 40518 202590 41,248 288,736 1022 492,348 1411 513 HAFIZZAHIDTABBASUM METER READER 09 21260 39581 197905 40,311 282,177 1022 481,104 1412 513 M.SHAKEEL METER READER 09 21260 39381 196905 40,111 280,777 1022 478,704 1413 513 USMAN ALl B/D 07 14650 25923 129540 26,538 185,766 854 316,260 1414 513 ABDUL FAREED BILL DISTRIBUTR 07 17090 28910 144550 29,520 206,640 854 352,044 1415 513 M ZAHID LATIF BILL DISTRIBUTR 07 15870 27344 136720 27,954 195,678 854 333,252 1416 513 ANSAR MEHM000 MR 09 16880 33759 168795 34,489 241,423 1022 411,240 1417 513 HAFIZ SAEED ARMED M/R 09 19070 36531 183155 37,361 261,527 1022 445,704 1418 513 MUHAMMADYUNIS MRS-Il 09 32210 53453 267265 54,183 379,281 1022 647,568 1419 513 MUHAMMAD ARSHAD M/R 09 24910 44327 221635 45,057 315,399 1022 538,055 1420 513 ZAHID KAMAL M/READER 09 15880 33759 168795 34,489 241,423 1022 411,240 1421 513 TARIOMEHMOOD M/R 09 27100 47077 235385 47,807 334,649 1022 571, - '2 513 NADEEM SAIDAR M/R 09 20530 38705 193525 39,435 276,045 1022 470,.
3 513 MUHAMMAD SALEEM M/R 09 17610 34696 173480 35,426 247,982 1022 422,484 1424 514 MUHAMMAD FARHAN METER READER 09 16880 33759 158795 34,489 241,423 1022 411,240
1425 514 MUHAMMAD OASIM METER READER 09 16880 33759 168795 34,489 241,423 1022 411,240 1426 514 SHEHZAD YOUSAF METER READER 09 16880 33537 158185 34,367 240,569 1022 409,775
1427 514 SAQIB ALl METER READER 09 16880 33759 168795 34,489 241,423 1022 411,240 1428 514 ZAHID ALl 5/0 SHABBIR BILL DISTRIBUTR 07 14650 25778 128890 26,388 184,716 854 314,460 1429 514 M. ATIF M/R 09 16150 32883 164415 33,613 235,291 1022 400,728 1430 514 MUHAMMAD IMRAN METER READER 09 17610 34635 173175 35,365 247,555 1022 421,752 1431 514 ABDULRAZZAQ M/R 09 30750 50262 251310 50,992 356,944 1022 609,276 1432 514 ABDULASHFAq M/R 09 23450 40892 204450 41,622 291,354 1022 496,836
1433 514 MUHAMMAD SHAFIQUE MR 09 14590 30948 154740 31,678 221,745 1022 377,508 1434 514 M. AKHTAR ALl M/R 09 20530 38444 192220 39,174 274,218 1022 457,460 1435 514 ASHEAQARMED M/R 09 19800 37507 187535 38,237 267,659 1022 456,216 1435 515 SHAHID ALl METER READER 09 17610 34757 173785 35,487 248,409 1022 423,216 1437 515 MUHAMAMD YAQOOB METER READER 09 19800 37507 187535 38,237 267,659 1022 456,215
1438 515 KASHIF KHIYAM METER READER 09 20530 38444 192220 39,174 274.218 1022 467,460 1439 515 ADIL IMTIAZ METER READER 09 16880 32259 161295 32,989 230,923 1022 393,240 1440 515 GHAZANFAR ALl BILL DISTRIBUTR 07 14650 25778 128890 26,388 184,716 854 314,460 1441 515 MUHAMMAD RIAZ METER READER 09 29290 49883 249440 50,618 354,326 1022 604,788 1442 515 HAFIZ IJAZ ARMED METER READER 09 16150 32883 164415 33,613 235,291 1022 400,728 1443 515 ABDUL RAUF METER READER 09 20530 38383 191915 39,113 273,791 1022 466,728 1444 515 MUHAMMAD SAEED BD 07 14650 25778 128890 26,388 184,716 854 314,460 1445 315 MUHAMMAD IRSHAD M/R 09 20530 38644 193220 39,374 275,618 1022 469,860 1446 515 MUHAMMAD YOUSAF M/R 09 20530 38544 193220 39,374 275,618 1022 469,850 . 1447 515 SARFRAZ HUSSAIN MERER READER 09 16130 32822 164110 33,552 234,864 1022 399, '448 515 ABDUL RAUF M/R 09 23450 42392 211960 43,122 301,854 1022 514,
49 521 IBRAR HUSSAIN METER READER 09 21260 39581 197905 40,311 282,177 1022 481,104 1450 521 BASHARAT ALl METER READER 09 20530 38765 193830 39,496 276,472 1022 471,324 1451 521 MUDASSAR SIDDIQUE MR 09 22720 41455 207275 42.185 295,295 1022 503,592 1452 521 MUHAMMAD KHURAM METER READER 09 16150 33144 165720 33,874" 237,118 1022 403,860 1453 521 NIAMAT ALl BILL DISTRIBIJTR 07 18310 30476 152380 31,086 217,602 854 370,836 1454 521 SAJJAD (HAN METER READER 09 15880 33759 168795 34,489 241,423 1022 411,240 1455 521 MUHAMMAD ARSHAD MR 09 22720 41455 207275 42,185 295,295 1022 503,592 1456 521 SHAHID MEHM000 MR 09 21260 39581 197905 40,311 282,177 1022 481,104 1457 521 M, ARSHAD BILL DISTRIBUTR 07 14650 25778 128890 26,388 184,716 854 314,460 1458 521 MUHAMMAD BOOTA METER READER 09 16150 32883 164415 33,613 235,291 1022 400,728 1459 521 SHAHID PERVAIZ M\R 09 16880 33759 168795 34,489 241,423 1022 411,240 1460 521 SYED ASIF HUSSAIN METER READER 09 21260 39581 197905 40,311 282,177 1022 481,104 1461 521 MUHAMMAD AMIN M/R 09 21260 39642 198210 40,372 282,604 1022 481,836 1462 521 MUHAMMAD TAHIR M/R 09 28560 49012 245060 49,742 348,194 1022 594,276 1463 521 MUHAMMAD NAWAZ MR 09 20530 38644 193220 39,374 275,618 1022 469,860 1454 521 M.Sagheer Khan M/R 09 27100 47138 235690 47,868 335,076 1022 571,788 1465 522 AHMAD HUSSAIN SD 07 15260 25551 132805 27,171 190,197 854 323,856 1466 522 MUHAMMADAMIN BILLDISTRIBUTR 07 18310 35727 178635 36,337 354,339 854 433,848 1467 522 EHSAN ULLAH 80 07 14650 25179 130895 26,789 187,523 854 319,272 1468 522 MUHAMMAD NADEEM BD 07 18920 31259 156295 31,869 223,083 854 380,232 1469 522 MUHAMMAD ATHAR MR 09 22720 41455 207275 42,185 295,295 1022 503,592 1470 522 MUHAMMAD FAISAL MR 09 21260 39642 198210 40,372 282,604 1022 481,836 1471 522 TARIQ MEHMOOD MR 09 20530 38444 192220 39,174 274,218 1022 467,460 1472 522 MUHAMMAD IQHAQ MR 09 31480 52699 263495 53,429 374,003 1022 638,520
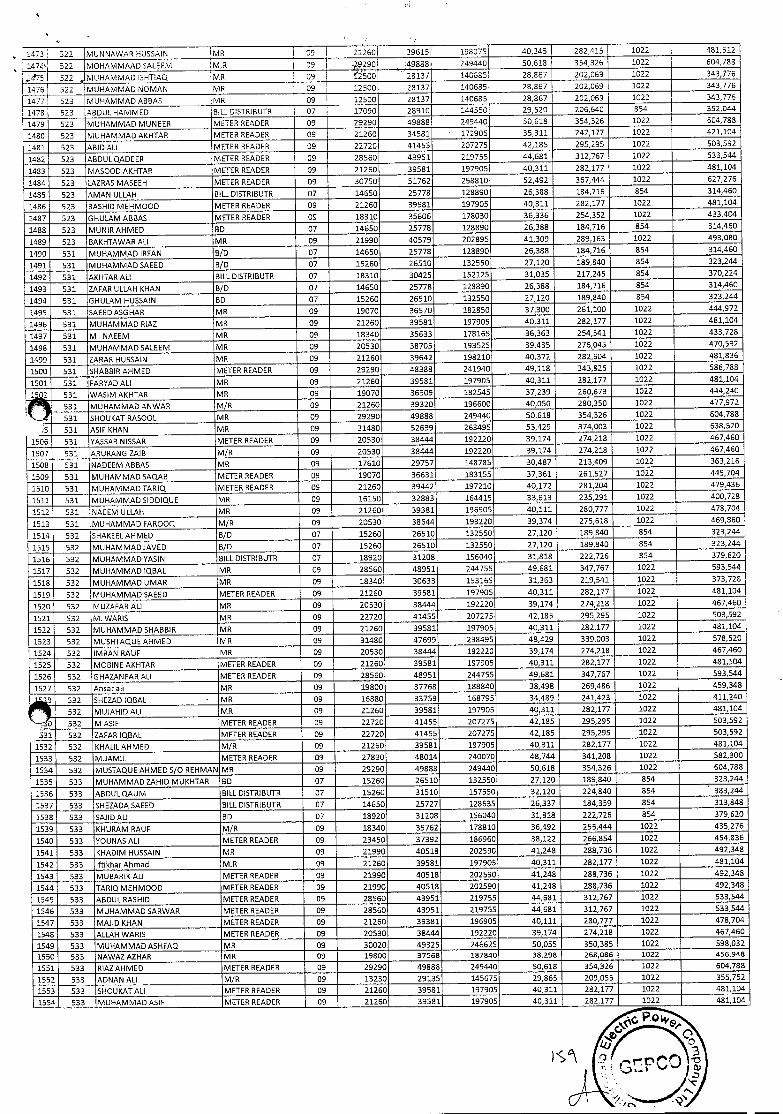
i473 322 MUNNAWAR 4.USSAIN MR 09 21260 59615 198075 40,345 282,415 1022 481,512
147' 522 MOHAMMAAD SALEEM M,R 09 .9290 = 49888 249440 50,618 354,326 1022 604,788
475 522 MUHAMMAD ISHTIAQ MR 09 2500 • 28137 140685 28,867 202,069 1022 343,776
1476 522 MUHAMMAD NOMAN MR 09 12500 28137 140685 28,867 202,069 1022 343,776
1477 523 MUHAMMAD ABBAS MR 09 12500 28137 140685 28,867 202,069 1022 343,776
1478 523 ABDULI-IAMMED BILLDISTRIBUTR 07 17090 28910 144550 29,520 206,640 854 352,044
1479 523 MUHAMMAD MUNEER METER READER 09 29290 49888 249440 50,618 354,326 1022 604,788
1480 523 MUHAMMAD AKHTAR METER READER 09 21260 34581 172905 35,311 247,177 1022 421,104
1481 523 ABID ALl METER READER 09 22720 41455 207275 42,185 295,295 1022 503,592
1482 523 ABDULQADEER METER READER 09 28560 43951 219755 44,681 312,767 1022 533,544
1483 523 MASOOD AKHTAR METER READER 09 21260 39581 197905 40,311 282,177 1022 481,104
1484 523 LAZRAS MASEEH METER READER 09 30750 51762 258810 52,492 367,444 1022 627,276
1485 523 AMAN ULLAH BILL DISTRIBUTR 07 14650 25778 128890 26,388 184,716 854 314,460
1486 523 RASHID MEHM000 METER READER 09 21260 39581 197905 40,311 282,177 1022 481,104
1487 523 GHULAM ABBAS METER READER 09 18310 35606 178030 36,336 254,352 1022 433,404
1488 523 MUNIRAHMED BD 07 14650 25778 128890 26,388 184,716 854 314,460
1489 523 BAKHTAWAR ALl MR 09 21990 40579 202895 41,309 289,163 1022 493,080
1490 531 MUHAMMAD IRFAN BID 07 14650 25778 128890 26,388 184,716 854 314,460
1491 531 MUHAMMAD SAEED B/D 07 15260 26510 132550 27,120 189,840 854 323,244
1492 531 AKHTAR AU BILL DISTRIBUTR 07 18310 30425 152125 31,035 217,245 854 370,224
1493 531 ZAFAR ULLAH KHAN B/D 07 14650 25778 128890 26,388 184,716 854 314,460
1494 531 GHULAM HUSSAIN 80 07 15260 26510 132550 27,120 189,840 854 323,244
1495 531 SAEEDASGHAR MR 09 19070 36570 182850 37,300 261,100 1022 444,972
1496 531 MUHAMMAD RIAZ MR 09 21260 39581 197905 40,311 282,177 1022 481,104
1497 531 M NAEEM MR 09 18340 35633 178165 36,363 254,541 1022 433,728
1498 531 MUHAMMAD SALEEM MR 09 20530 38705 193525 39,435 276,045 1022 470,592
1499 531 ZARAR HUSSAIN MR 09 21260 39642 198210 40,372 282,604 1022 481,836
1500 531 SI-IABBiR AHMED METER READER 09 29290 48388 241940 49,118 343,826 1022 586,788
1501 531 FARYAD AU MR 09 21260 39581 197905 40,311 282,177 1022 481,104
531 WASIM AKHTAR MR 09 19070 36509 182545 37,239 260,673 1022 444,240
531 MUHAMMAD AN WAR M/R 09 21260 39320 196600 40,050 280,350 1022 477,972
531 SHOUKAT RASOOL MR 09 29290 49888 249440 50,618 354,326 1022 604,788
5 531 ASIF <HAN MR 09 31480 52699 263495 53,429 374,003 1022 638,520
1506 531 YASSAR NISSAR METER READER 09 20530 38444 192220 39,174 274,218 1022 467,460
1507 531 ARURANG ZAIB M/R 09 20530 38444 192220 39,174 274,218 1022 467,460
1508 531 NADEEM ABBAS MR 09 17610 29757 148785 30,487 213,409 1022 363,216
1509 531 MUHAMMAD SAQAB METER READER 09 19070 36631 183155 37,361 261,527 1022 445,704
1510 531 MUHAMMAD TARIQ METER READER 09 21260 39442 197210 40,172 281,204 1022 479,436
1511 531 MUHAMMAD SIDDIQUE MR 09 16150 32883 164415 33,613 235,291 1022 400,728
1512 531 NAEEM ULLAH MR 09 21260 39381 196905 40,111 280,777 1022 478,704
1513 531 MUHAMMAD FAROOQ M/R 09 20530 38644 193220 39,374 275,618 1022 469,360
1514 532 SHAKEELAHMED BID 07 15260 26510 132550 27,120 189,840 854 323,244
1515 532 MUHAMMAD JAVED B/D 07 15260 26510 132550 27,120 189,840 854 323,244
1516 532 MUHAMMAD YASIN BILL DISTRIBUTR 07 18920 31208 156040 31,818 222,726 854 379,620
1517 532 MUHAMMAD IQBAL MR 09 28560 48951 244755 49,681 347,767 1022 593,544
1518 532 MUHAMMAD UMAR MR 09 18340 30633 153165 31,363 219,541 1022 373,728
1519 532 MUHAMMAD SAEED METER READER 09 21260 39581 197905 40,311 282,177 1022 481,104
1520 532 MUZAFAR ALl MR 09 20530 38444 192220 39,174 274,218 1022 467,460
1521 532 M. WARIS MR 09 22720 41455 207275 42,185 295,295 1022 503,592
1522 532 MUHAMMAD SHABBIR MR 09 21260 39581 197905 40,311 282,177 1022 481,104
1523 532 MUSHTAQUEAHMED MR 09 31480 47699 238495 48,429 339,003 1022 578,520
1524 532 IMRAN RAUF MR 09 20530 38444 192220 39,174 274,218 1022 467,460
1525 532 MOBINE AKHTAR METER READER 09 21260 39581 197905 40,311 282,177 1022 481,104
1526 532 GHAZANFAR ALl METER READER 09 28560 48951 244755 49,681 347,767 1022 593,544
1527 532 Ansar all MR 09 19800 37768 188840 38,498 269,486 1022 459,348
532 SHEZAD IQBAL - MR 09 16880 33759 168795 34,489 241,423 1022 411,240
532 MUJAHID ALl MR 09 21260 39581 197905 40,311 282,177 1022 481,104
,0 532 M ASIF METER READER 09 22720 41455 207275 42,185 295,295 1022 503,592
231 532 ZAFAR OBAL METER READER 09 22720 41455 207275 42,185 295,295 1022 503,592
1532 532 KHALILAHMED M/R 09 21260 39581 197905 40,311 282,177 1022 481,104
1533 532 MJAMIL METER READER 09 27830 48014 240070 48,744 341,208 1022 582,300
1534 532 MUSTAQUE ARMED 5/0 REHMAN MR 09 29290 49888 249440 50,618 354,326 1022 604,788
1535 533 MUHAMMAD ZAHID MUKHTAR RD 07 15260 26510 132550 27,120 189,840 854 323,244
1536 533 ABDULQAUM BILLDISTRIBUTR 07 15260 31510 157550 32,120 224,840 854 383,244
1537 533 SHEZADA SAEED BILL DISTRIBUTR 07 14650 25727 128635 26,337 184,359 854 313,848
1538 533 SAJID ALl BD 07 18920 31208 156040 31,818 222,726 854 379,620
1539 533 KHURAM RAUF M/R 09 18340 35762 178810 36,492 255,444 1022 435,276
1540 533 YOUNAS ALl METER READER 09 23450 37392 186960 38,122 266,854 1022 454,836
1541 533 KHADIM HUSSAIN MR 09 21990 40518 202590 41,248 288,736 1022 492,348
1542 533 IftikharAhmad M.R 09 21260 39581 197905 40,311 282,177 1022 481,104
1543 533 MUBARIK ALl METER READER 09 21990 40518 202590 41,248 288,736 1022 492,348
1544 533 TARIQ MEHM000 METER READER 09 21990 40518 202590 41,248 288,736 1022 492,348
1545 533 ABDUL RASHID METER READER 09 28560 43951 219755 44,581 312,767 1022 533,544
1546 533 MUHAMMAD SARWAR METER READER 09 28560 43951 219755 44,681 312,767 1022 533,544
1547 533 MAJID KHAN METER READER 09 21260 39381 196905 40,111 280,777 1022 478,704
1548 533 ALLAH WARIS METER READER 09 20530 38444 192220 39,174 274,218 1022 467,460
1549 533 MUHAMMAD ASHFAQ MR 09 30020 49325 246625 50,055 350,385 1022 598,032
1550 533 NAWAZAZHAR MR 09 19800 37568 187840 38,298 268,086 1022 456,948
1551 533 RIAZAHMED METER READER 09 29290 49888 249440 50,618 354,326 1022 604,788
1552 533 ADNAN ALl M/R 09 13230 29135 145675 29,865 209,055 1022 355,752
1553 533 SHOUKAT ALl METER READER 09 21260 39581 197905 40,311 282,177 1022 481,104
1554 533 MUHAMMADASIF METERREADER 09 21260 39581 197905 40,311 282,177 1022 481,104
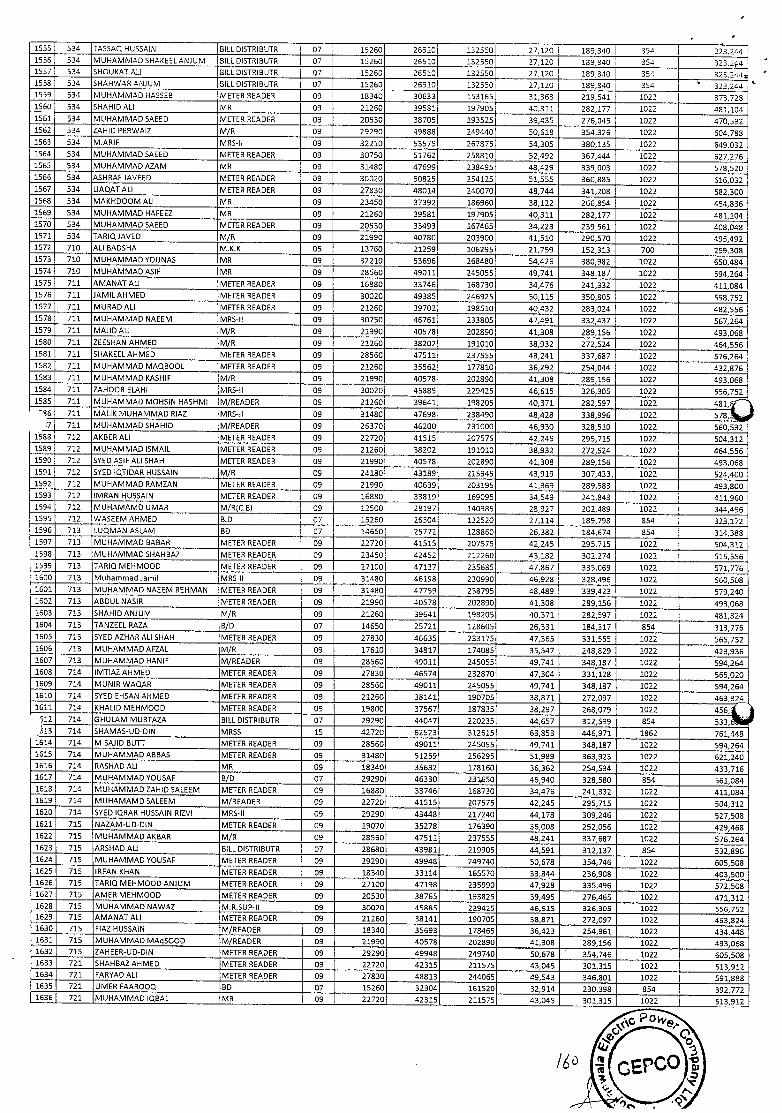
1555 534 TASSAQ F-!USSA!N BILL DISTRIBUTR 07 15260 26510 132550 27120 189340 354 123,2& 1556 534 MUHAMMAD SHAKEELANJUM BILL DISTR!BUTR 07 15260 26510 132550 27120 189,340 354 323,24 1557 534 SHOUKATAL! BILLD!STR!BUTR 07 15260 26510 132550 27,120 189,340 354 323,244 1558 534 SHAH WAR ANJUM BILL DISTRIBUTR 07 15260 26510 1325501 27,120 189,340 354 323,204 1539 534 MUHAMMAD HASSEB METER READER 09 18340 30633 153155 31,363 219,541 1022 373,728 1550 534 SHAH!D AL! MR 09 21260 39581 197905 40,311 282,177 1022 481,104 1561 534 MUHAMMAD SAEED METER READER 09 20530 38705 193525 39,435 276,045 1022 470,592 1562 534 ZAHID PERWAIZ M/R 09 29290 49888 249440 50,618 354,326 1022 504,788 1563 534 MARIE MRS-Il 09 32210 53575 267875 54,305 380,135 1022 649,032 1554 534 MUHAMMAD SAEED METER READER 09 30750 51762 258810 52,492 367,444 1022 527,276 1555 534 MUHAMMAD AZAM MR 09 31480 47599 238495 48,429 339,003 1022 578,520 1556 534 ASHRAF JAVEED METER READER 09 30020 50825 254125 51,555 360,885 1022 616,032 1567 534 LIAQAT ALl METER READER 09 27830 48014 240070 48,744 341,208 1022 582,300 1558 534 MAKHDOOM ALl MR 09 23450 37392 186960 38,122 265,854 1022 454,836 1569 534 MUHAMMAD HAFEEZ MR 09 21260 39581 197905 40,311 282,177 1022 481,104 1570 534 MUHAMMAD SAEED METER READER 09 20530 33493 157465 34,223 239,561 1022 408,048 1571 534 TARIQJAVED M/R 09 21990 40780 203900 41,510 290,570 1022 495,492 1572 710 ALl BADSHA M.K.K 05 13760 21259 106295 21,759 152,313 700 259,308 1573 710 MUHAMMAD YOUNAS MR 09 32210 53696 268480 54,426 380,982 1022 550,484 1574 710 MUHAMMAD ASIF MR 09 28550 49011 245055 49,741 348,187 1022 594,264 1575 711 AMANAT ALl METER READER 09 15880 33746 168730 34,476 241,332 1022 411,084 1576 711 JAMILAHMED METER READER 09 30020 49385 245925 50,115 350,805 1022 598,752 1577 711 MURAD ALl METER READER 09 21250 39702 198510 40,432 283,024 1022 482,556 1578 711 MUHAMMAD NAEEM MRS-Il 09 30750 46761 233805 47,491 332,437 1022 557,264 1579 711 MAJID AL! M/R 09 21990 40578 202890 41,308 289,155 1022 493,068 1580 711 ZEESHAN AHMED M/R 09 I 21260 38202 191010 38,932 272,524 1022 464,556 1581 711 SHAKEELAHMED METER READER 09 28560 47511 237555 48,241 337,687 1022 576,264 1582 711 MUHAMMAD MAQBOOL METER READER 09 21260 35562 177810 36,292 254,044 1022 432,876 1583 711 MUHAMMAD K.ASHIF M/R 09 21990 40578 202890 41,308 289,156 1022 493,068 1584 711 ZAHOOR ELAHI MRS-Il 09 30020 45883 229425 46,615 326,305 1022 556,712 1585 711 MUHAMMAD MOHSIN HASHMI M/READER 09 21260 39641 198205 40,371 282,597 1022 481, "'
56 711 MALIK MUHAMMAD RIAZ MRS-lI 09 31480 47698 238490 48,428 338,996 1022 578. .7 711 MUHAMMAD SHAHID M/READER 09 26370 45200 231000 46,930 328,510 1022 560,332
1588 712 AKBER AL! METER READER 09 22720 41515 207575 42,245 295,715 1022 504,312 1589 712 MUHAMMAD lSMAIL METER READER 09 21260 38202 191010 38,932 272,324 1022 464,555 1590 712 SYED ASIF ALl SHAH METER READER 09 21990 40578 202890 41,308 289,156 1022 493,068 1591 712 SYED IQT!DAR HUSSAIN M/R 09 24180 43189 215945 43,919 307,433 1022 524,400 1592 712 MUHAMMAD RAMZAN METER READER 09 21990 40639 203195 41,359 289,583 1022 493,800 1593 712 IMRAN HUSSAIN METER READER 09 15880 33819 159095 34,549 241,843 1022 411,960 1594 712 MIJHAMAMD UMAR M/R{C.B) 09 12500 28197 140985 28,927 202,489 1022 344,495 1595 712 WASEEM AHMED 8.0 07 15250 26504 132520 27,114 189,798 854 323,172 1596 713 LUOMAN ASLAM BD 07 14650 25772 128850 25,382 184,674 854 314,388 1597 713 MUHAMMAD BABAR METER READER 09 22720 41515 207575 42,245 295,715 1022 504,312 1598 713 MUHAMMAD SHAHBAZ METER READER 09 23450 42452 212260 43,182 302,274 1022 515,555 1599 713 TARIQ MEHMDOD METER READER 09 27100 47137 235685 47,867 335,069 1022 571,775 1500 713 Muhammad Jamil MRS-Il 09 31480 46198 230990 46,928 328,496 1022 360,508 1601 713 MUHAMMAD NAEEM REHMAN METER READER 09 31480 47759 238795 48,489 339,423 1022 579,240 1602 713 ABDUL NASIR METER READER 09 21990 40578 202890 41,308 289,156 1022 493,068 1503 713 SHAHID ANJUM M/R 09 21250 39641 198205 40,371 282,597 1022 481,824 1604 713 TANZEEL RAZA B/D 07 14550 25721 128605 26,331 184,317 854 313,775 1505 713 SYED AZHAR AL! SHAH METER READER 09 27830 46533 233175 47,365 331,555 1022 565,752 1605 713 MUHAMMAD AFZAL M/R 09 17610 34817 174085 35,547 248,829 1022 423,936 1607 713 MUHAMMAD HANIF M/READER 09 28560 49011 245055 49,741 348,187 1022 594,264 1608 714 IMT!AZAHMED METER READER 09 27830 46574 232870 47,304 331,128 1022 565,020 1609 714 MUNIR WAQ,AR METER READER 09 28560 49011 245055 49,741 348,187 1022 594,264 1610 714 SYED EHSAN AHMED METER READER 09 21260 38141 190705 38,871 272,097 1022 463,824 1611 714 KHAL!D MEHMOOD METER READER 09 19800 37567 187835 38,297 268,079 1022 456,
512 714 GHULAM MURTAZA BILL DISTRIBUTR 07 29290 44047 220235 44,657 312,599 854 533, 13 714 SHAMAS-UD-DIN MRSS 15 42720 62523 312615 63,853 446,971 1862 761,448
1614 714 M.SAJID BUTT METER READER 09 28560 49011 245055 49,741 348,187 1022 594,264 1613 714 MUHAMMAD ABBAS METER READER 09 31480 51259 256295 51,989 363,323 1022 621,240 1616 714 RASHAD ALl MR 09 18340 35632 178160 36,362 254,534 1022 433,716 1617 714 MUHAMMAD YOUSAF BID 07 29290 46330 231550 46,940 328,580 854 161,084 1618 714 MUHAMMAD ZAHID SALEEM METER READER 09 16880 33746 168730 34,475 241,332 1022 411,084 1619 714 MUHAMAMD SALEEM M/READER 09 22720 41515 207575 42,245 295,715 1022 504,312 1520 714 SYED IQRAR HUSSAIN RIZVI MRS-lI 09 29290 43448 217240 44,178 309,246 1022 527,508 1621 715 NAZ.AM-UD-DlN METER READER 09 19070 35278 176390 36,008 252,056 1022 429,468 1622 715 MUHAMMADAKBAR M/R 09 28560 47511 237555 48,241 337,687 1022 576,264 1623 715 ARSHAD ALl BILL DISTRIBUTR 07 28680 43981 219905 44,591 312,137 854 532,896 1624 715 MUHAMMAD YOUSAF METER READER 09 29290 49948 249740 50,678 354,746 1022 605,508 1625 715 IRFAN KHAN METER READER 09 18340 33114 165570 33,844 236,908 1022 403,500 1626 715 TARIQ MEHMOOD ANJUM METER READER 09 27100 47198 235990 47,928 335,496 1022 572,508 1627 715 AMER MEHMOOD METER READER 09 20530 38765 193825 39,495 276,465 1022 471,312 1628 715 MUHAMMAD NAWAZ M.R.SUP-II 09 30020 45885 229425 45.615 326,305 1022 555,752 1629 715 AMANAT AL! METER READER 09 21250 38141 190705 38,871 272,097 1022 453,824 1630 715 FIAZ HUSSAIN M/READER 09 18340 35693 178465 35,423 254,961 1022 434,448 1631 715 MUHAMMAD MAqS000 M/READER 09 21990 40578 202890 41,308 289,156 1022 493,068 1632 715 ZAHEER-UD-DIN METER READER 09 29290 49948 249740 50,678 354,746 1022 605,SOB 1633 721 SHAHBAZ ARMED METER READER 09 22720 42315 211575 43,045 301,315 1022 513,912 1634 721 FARYAD ALl METER READER 09 27830 48813 244065 49,543 345,801 1022 591,888 1535 721 UMER FAAR000 BD 07 15260 32304 161520 32,914 230,398 854 392,772 1636 721 MUHAMMAD !QBAL MR 09 22720 42315 211575 43,045 301,315 1022 513,912
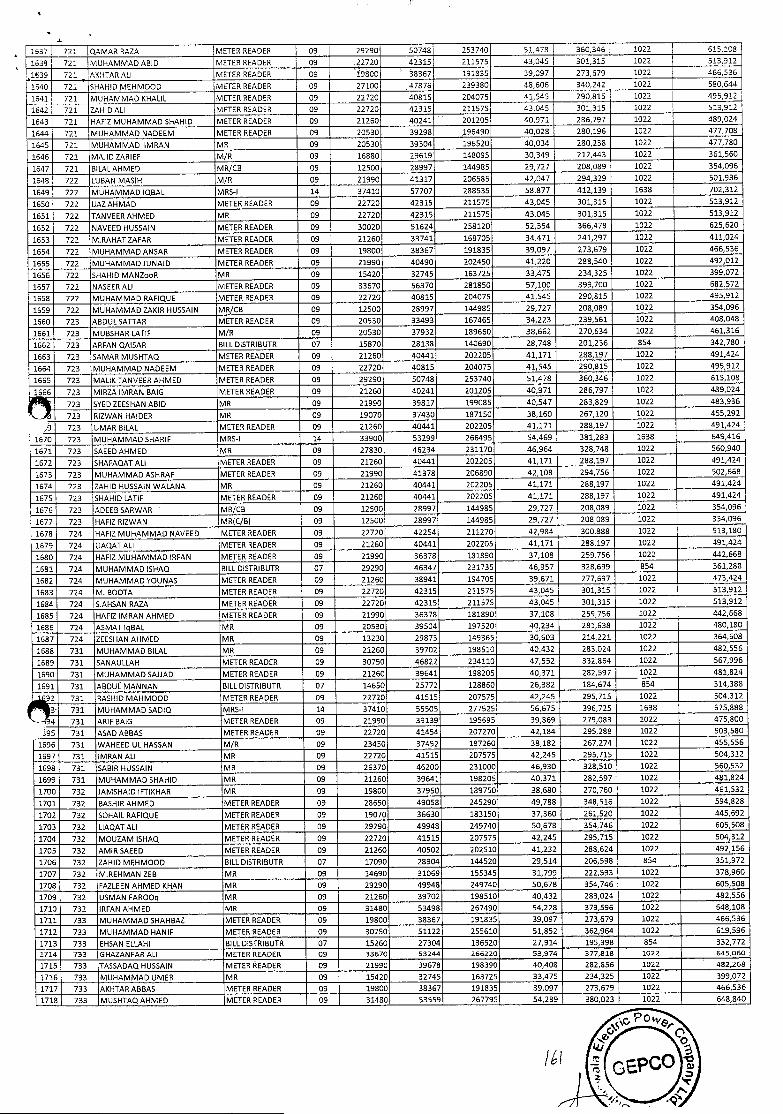
'l
1637 721 OAMAR RAZA METER READER 09 29290 50748 253740 51,478 360,346 1022 615,108
1538 721 MUHAMMAD ABID METER READER 09 22720 42315 211575 43,045 301,315 1022 513,912
1839 721 AKHTAR ALl METER READER 09 i9800 38367 191835 39,097 273,679 1022 466,536
1640 721 SHAHID MEHMQQD METER READER 09 27100 47876 239380 48,606 340,242 1022 580,644
1641 721 MUHAMMAD KHALIL METER READER 09 22720 4D815 204075 41,545 290,815 1022 495,912
1542 721 ZAHID ALl METER READER 09 22720 42315 211575 43,045 301,315 1022 513,912
1643 721 HAFIZ MUHAMMAD SHAHID METER READER 09 21260 40241 - 201205 40,971 286,797 1022 489,024
1644 721 MUHAMMAD NADEEM METER READER 09 20530 39298 196490 40,028 280,196 1022 477,708
1645 721 MUHAMMAD IMR.AN MR 09 20530 39304 196520 40,034 280,238 1022 477,780
1646 721 MAJID ZARIEF M/R 09 16880 29619 148095 30,349 212,443 1022 361,560
1647 721 BILALAHMED MR/CS 09 12500 28997 144985 29,727 208,089 1022 354,096
1648 722 LUBAN MASIH M/R 09 21990 41317 206585 42,047 294,329 1022 501,936
1649 722 MUHAMMAD IQBAL MRS-I 14 37410 57707 288535 58,877 412,139 1638 702,312
1550 722 IJAZAHMAD METER READER 09 22720 42315 211S75 43,045 301,315 1022 513,912
1651 722 TAN VEER AHMED MR 09 22720 42315 211575 43,045 301,315 1022 513,912
1652 722 NAVEED HUSSAIN METER READER 09 30020 51624 258120 52,354 366,478 1022 625,620
1653 722 M.RAHATZAFAR METER READER 09 21260 33741 168705 34,471 241,297 1022 411,024
1654 722 MUHAMMAD ANSAR METER READER 09 19800 38367 191835 39,097 273,679 1022 466,536
1655 722 MUHAMMAD JUNAID METER READER 09 21990 40490 202450 41,220 288,540 1022 492,012
1656 722 SHAHID MANZooR MR 09 15420 32745 163725 33,475 234,325 1022 399,072
1657 722 NASEER ALl METER READER 09 33570 56370 281850 57,100 399,700 1022 582,572
1558 722 MUHAMMAD RAFIQUE METER READER 09 22720 40815 204076 41,545 290,815 1022 495,912
1659 722 MUHAMMAD ZAKIR HUSSAIN MR/CR 09 12500 28997 144985 29,727 208,089 1022 354,096
1660 723 ABDULSATTAR METER READER 09 20530 33493 167465 34,223 239,561 1022 408,048
1661 723 MUBSHAR LATIF M/R 09 20530 37932 189660 38,662 270,634 1022 451,316
1662 723 ARFAN QAISAR BILL DISTRIBUTR 07 15870 28138 140690 28,748 201,236 854 342,780
1663 723 SAMAR MUSHTAQ METER READER 09 21260 40441 202205 41,171 288,197 1022 491,424
1664 723 MUHAMMAD NADEEM METER READER 09 22720 40815 204075 41,545 290,815 1022 495,912
1665 723 MALIK TAN VEER ARMED METER READER 09 29290 50748 253740 51,478 360,346 1022 615,108
1656 723 MIRZA IMRAN RAID METER READER 09 21260 40241 201205 40,971 286,797 1022 489,024
723 SYED ZEESHAN ABID MR 09 21990 39817 199085 40,547 283,829 1022 483,936
723 RIZWAN HAIDER MR 09 19070 37430 187150 38160 267,120 1022 455,292
9 723 UMAR BILAL METER READER 09 21260 40441 202205 41,171 288,197 1022 491,424
1670 723 MUHAMMAD SHARIF MRS-I 14 33900 53299 266495 54,469 381,283 1638 649,416
1671 723 SAEED AHMED MR 09 27830 46234 231170 46,964 328,748 1022 560,940
1672 723 SHAFAQ,AT ALl METER READER 09 21260 40441 202205 41,171 288,197 1022 491,424
1673 723 MUHAMMAD ASHRAF METER READER 09 21990 41378 206890 42,108 294,756 1022 502,668
1674 723 ZAHID HUSSAIN WALANA MR 09 21260 40441 202205 41,171 288,197 1022 491,424
1675 723 SHAHID LATIF METER READER 09 21260 40441 202205 41,171 288,197 1022 491,424
1576 723 ADEEB SARWAR MR/Ca 09 12500 28997 144985 29,727 208,089 1022 354,096
1677 723 HAFIZ RIZWAN MR(C/B) 09 12500 28997 144985 29,727 208,089 1022 334,096
1678 724 HAFIZ MUHAMMAD NAVEED METER READER 09 22720 42254 211270 42,984 300,888 1022 513,180
1579 724 LIAQ,AT ALl METER READER 09 21260 40441 202205 41,171 288,197 1022 491,424
1680 724 HAFIZ MUHAMMAD IRFAN METER READER 09 21990 35378 181890 37,108 259,756 1022 442,568
1681 724 MUHAMMAD ISHAQ BILL DISTRIBUTR 07 29290 46347 231735 46,957 328,699 854 561,288
1682 724 MUHAMMAD YOUNAS METER READER 09 21260 38941 194705 39,671 277,597 1022 473,424
1683 724 M. BOOTA METER READER 09 22720 42315 211575 43,045 301,315 1022 513,912
1684 724 SAHSAN RAZA METER READER 09 22720 42315 211575 43,045 301,315 1022 513,912
1685 724 HAFIZ IMRAN AHMED METER READER 09 21990 36378 181890 37,108 259,756 1022 442,668
1685 724 ASMAT IqBAL MR 09 20530 39504 197520 40,234 281,638 1022 480,180
1587 724 ZEESHAN AHMED MR 09 13230 29873 149365 30,603 214,221 1022 364,608
1688 731 MUHAMMAD BILAL MR 09 21260 39702 198510 40.432 283,024 1022 482,556
1689 731 SANAULLAH METER READER 09 30750 46822 234110 47,552 332,864 1022 567,996
1690 731 MUHAMMAD SAJJAD METER READER 09 21260 39641 198205 40,371 282,597 1022 481,824
1691 731 ABDUI MANNAN BILL DISTRIBUTR 07 14650 25772 128860 26,382 184,674 854 314,388
92 731 RASHID MAHM000 METER READER 09 22720 41515 207575 42,245 295,715 1022 504,312
3- 731 MUHAMMAD SADIQ MRS-I 14 37410 55508 277525 56,675 396,725 1638 675,888
4 731 ARIF BAlD METER READER 09 21990 39139 195695 39,869 279,083 1022 475,800
95 731 ASAD ABBAS METER READER 09 22720 41454 207270 42,184 295,288 1022 503,580
1696 731 WAHEED UL HASSAN M/R 09 23450 37452 187260 38,182 267,274 1022 455,556
1697 731 IMRAN ALl MR 09 22720 41515 207575 42,245 295,715 1022 504,312
1698 731 SABIR HUSSAIN MR 09 26370 46200 231000 46,930 328,510 1022 560,532
1699 731 MUHAMMAD SHAHID MR 09 21260 39641 198205 40,371 282,597 1022 451,824
1700 732 JAMSHAID IFTIKHAR MR 09 19800 37950 189750 38,680 270,760 1022 461,532
1701 732 BASHIR AHMED METER READER 09 28650 49058 245290 49,788 348,516 1022 594,828
1702 732 SOHAIL RAFIQUE METER READER 09 19070 36630 183150 37,360 261,520 1022 445,692
1703 732 LIAQATALI METER READER 09 29290 49948 249740 50,678 354,746 1022 605,508
1704 732 MOUZAM ISHAQ METER READER 09 22720 41515 207575 42,245 295,715 1022 504,312
1705 732 AMIRSAEED METER READER 09 21260 40502 202510 41,232 288,624 1022 492,156
1706 732 ZAHID MEHMOOD BILL DISTRIBUTR 07 17090 28904 144520 29,514 206,598 854 351,972
1707 732 MREHMAN ZEB MR 09 14690 31069 155345 31,799 222,593 1022 378,960
1708 732 FAZLEEN AHMED KHAN MR 09 29290 49948 249740 50,678 354,746 1022 605,508
1709 732 USMAN FAROOq MR 09 21260 39702 198510 40,432 283,024 1022 482,556
1710 732 IRFAN AHMED MR 09 31480 53498 267490 54,228 379,596 1022 648,108
1711 733 MUHAMMAD SHAHBAZ METER READER 09 19800 38367 191835 39,097 273,679 1022 466,536
1712 733 MUHAMMAD HANIF METER READER 09 30750 51122 255610 51,852 362,964 1022 619,596
1713 733 EHSAN ELLAI-Il BILL DISTRIBUTR 07 15260 27304 136520 27.914 195,398 854 332,772
1714 733 'IHAZ.ANFAR ALl METER READER 09 33670 53244 266220 53,974 377,818 1022 645,060
1715 733 TASSADAQ HUSSAIN METER READER 09 21990 39678 198390 40,408 282,856 1022 482,268
1716 733 MUHAMMAD UMER MR 09 15420 32745 163725 33,475 234,325 1022 399,072
1717 733 AKHTARABBAS METER READER 09 19800 38367 191835 39,097 273,679 1022 466,536
1718 733 MUSHTAQAHMED METER READER 09 31480 53559 267795 54,289 380,023 1022 648,840
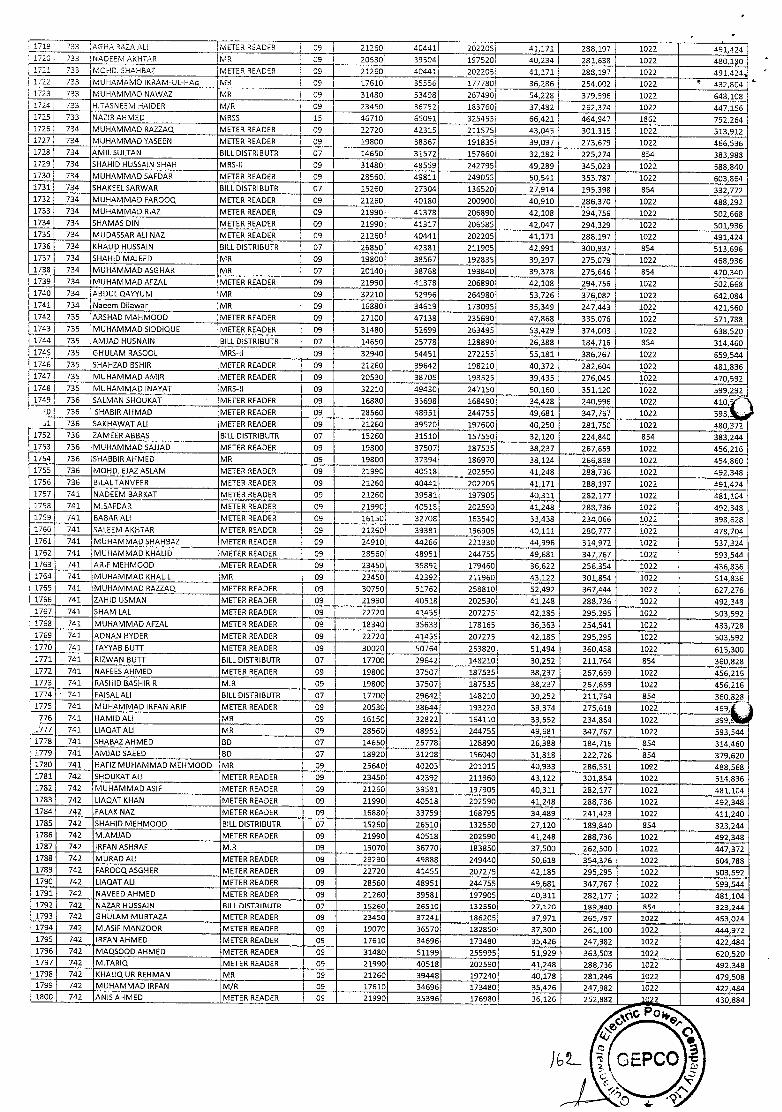
1719 733 'AGHA 4424 4U METER READER 09 21260 40441 202205 41,171 288,197 1022 491,424 1720 733 NADEEM AKHTAR MR 09 20530 39504 197520 40,234 281,638 1022 480,1 2721 733 .MOHD. SHAHBAZ METER READER 09 21250 40441 202205 41,171 298,197 1022 491,424k 1722 733 MUHAMAMD KRAM-UL-HA MR 09 I 17510 35556 177780 35,285 254,002 1022 432,804 1723 733 MUHAMMAD NAWAZ MR 09 31480 53498 257490 54228 379,596 1022 648,108 2724 733 H.TASNEEM HADER M/R 09 23450 36752 183760 37,482 262,374 1022 447,156 1725 733 NAZIRAHMED MRSS 15 45710 65091 32545S 66,421 464,947 1862 792,264 1726 734 MUHAMMAD RAZZAO METER READER 09 22720 42315 211575 43,049 301,315 1022 513,912 1727 734 MUHAMMAD YASEEN METER READER 09 19800 38367 191835 39,097 273,679 1022 465,535 1728 734 AMIL SULTAN BILL DISTRIBUTR 07 14650 31572 157850 32,182 225,274 854 383,988 1729 734 SHAHID HUSSAIN SHAH MRS-Il 09 I 31480 48559 242795 49,289 345,023 1022 588,840 1730 734 MUHAMMAD SAFDAR METER READER 09 28560 49811 249055 50,541 353,787 1022 603,864 1731 734 SHAI(EELSARWAR BILLDISTRIBUTR 07 15250 27304 136520 27,914 195,398 854 332,772 1732 734 MUHAMMAD FAROOQ METER READER 09 21260 40180 200900 40,910 286,370 1022 488,292 1733 734 MUHAMMAD RIAZ METER READER 09 21990 41378 206890 42,108 294,756 1022 502,668 1734 734 SHAMAS DIN METER READER 09 21990 41317 206585 42,047 294,329 1022 501,936 1735 734 MUDASSAR AL NAZ METER READER 09 21260 40441 202205 41,171 288,197 1022 491,424 1736 734 KHALID HUSSAIN BILL DISTRIBUTR 07 26850 42381 211905 42,991 300,937 854 513,696 1737 734 SHAHID MAJEED MR 09 19800 38557 192835 39,297 275,079 1022 458,936 1738 734 MUHAMMAD ASGHAR MR 07 20140 38768 193840 39,378 275,646 854 470,340 1739 734 MUHAMMAD AFZAL METER READER 09 21990 41378 206890 42,108 294,758 1022 502,668 1740 734 ABDULQAYYUM MR 09 32210 52996 264980 53,726 376,082 1022 642,084 1741 734 Naeem Dilawar MR 09 16880 34619 173095 35,349 247,443 1022 421,560 1742 735 ARSHAD MAHMOOD METER READER 09 27100 47138 235690 47,868 335,076 1022 571,788 1743 735 MUHAMMAD SIDDIQUE METER READER 09 31480 52699 253495 53,429 374,003 1022 638,520 1744 735 AMJAD HUSNAIN BILL DISTRIBUTR 07 14550 25778 128890 26,388 184,716 854 314,450 1745 735 GHULAM RASOOL MRS-Il 09 32940 54451 272255 55,181 386,267 1022 659,544 1746 735 SHAHZAD BSHIR METER READER 09 21250 39642 198210 40,372 282,604 1022 481,836 1747 735 MUHAMMAD AMIR METER READER 09 20530 38705 193525 39,435 276,045 1022 470,592 1748 735 MUHAMMAD INAYAT MRS-lI 09 32210 49430 247150 50,160 351,120 1022 599,292 1749 736 SALMAN SHDUKAT METER READER 09 16880 33698 168490 34,428 240,996 1022 410,'
0 736 SHABIRAHMAD METER READER 09 28560 48951 244755 49,681 347,757 1022 593, ,1 736 SAKHAWAT ALl METER READER 09 21260 39520 197600 40,250 281,750 1022 480,372
1752 735 ZAMEER ABBAS BILL DISTRIBUTR 07 15260 31510 157550 32,120 224,840 854 383,244 1753 736 MUHAMMAD SAJJAD METER READER 09 19800 37507 187535 38,237 267,659 1022 455,216 1754 736 SHABBIR AHMED MR 09 19800 37394 186970 38,124 265,868 1022 454,860 1755 735 MOHD. EJAZASLAM METER READER 09 21990 40518 202590 41,248 288,735 1022 492,348 3756 736 BILALTAN VEER METER READER 09 21250 40441 202205 41,171 288,197 1022 491,424 17S7 741 NADEEM BARKAT METER READER 09 21260 39581 197905 40,311 282.177 1022 481,104 1758 741 MSAFDAR METER READER 09 21990 40518 202590 41,248 288,736 1022 492.348 1759 741 BABAR ALl METER READER 09 16150 32708 163540 33,438 234,066 1022 398,628 2780 741 SALEEM AKHTAR METER READER 09 21260 39381 196905 40,111 280,777 1022 478,704 1761 741 MUHAMMAD SHAHBAZ METER READER 09 24910 44266 221330 44,996 314,972 1022 537,324 1762 741 MUHAMMAD KHALID METER READER 09 28560 48951 244755 49,881 347,767 1022 593,544 1763 741 ARIF MEHMOOD METER READER 09 23450 35892 179460 36,622 256,354 1022 436,836 1764 741 MUHAMMAD KHALIL MR 09 23450 42392 211960 43,122 301,854 1022 514,836 1765 741 MUHAMMAD RAZZAQ METER READER 09 30750 51762 258810 52,492 367,444 1022 827,276 1766 741 ZAHID USMAN METER READER 09 21990 40518 202530 41248 288,736 1022 492,348 1767 741 SHAM LAL METER READER 09 1 22720 41455 207275 42,185 295,295 1022 503,592 176B 741 MUHAMMAD AFZAL METER READER 09 18340 35633 178165 36,363 254,541 1022 433,728 1769 741 ADNAN HYDER METER READER 09 22720 41455 207275 42,185 295,295 1022 503,592 1770 741 TAYYAB BUTT METER READER 09 30020 50764 253820 51,494 360,458 1022 615,300 1771 741 RIZWAN BUTT BILL DISTRIBUTR 07 17700 29642 148210 30,252 211,764 854 360,828 1772 741 NAFEESAHMED METER READER 09 19800 37507 187535 38,237 267,659 1022 456,215 1773 741 RASHID BASHIR R M.R 09 19800 37507 187535 38,237 267,659 1022 456,216 1774 741 FAISALALI BILL DISTRIBUTR 07 17700 29642 148210 30,252 211,764 854 360,328 1775 741 MUHAMMAD IRFAN ARIF METER READER 09 20530 38644 193220 39,374 275,618 1022 489, 778 741 HAMID ALl MR 09 16150 32822 164110 33,552 234,864 1022 399,..
...777 741 LIAQAT ALl MR 09 28560 48951 244755 49,681 347,767 1022 593,544 1778 741 SHABAZAHMED BD 07 14650 25778 128890 26,388 184,716 854 314,460 1779 741 AMJAD SAEED BD 07 18920 31208 156040 31,818 222,726 854 379,620 1780 741 HAFIZ MUHAMMAD MEHMOOD MR 09 25640 40203 201015 40,933 286,531 1022 488,568 1781 742 SHOUKAT AU METER READER 09 23450 42392 211960 43,122 301,854 1022 514,836 1782 742 MUHAMMAD ASIF METER READER 09 21260 39531 197905 40,311 282,177 1022 481,104 1783 742 LIAQAT KHAN METER READER 09 21990 40518 202590 41,248 288,736 1022 492,348 1784 742 FALAK NAZ METER READER 09 16880 33759 168795 34,489 241,423 1022 411,240 1785 742 SHAHID MEHMOOD BILL DISTRIBUTR 07 15260 26510 132550 27,120 189,840 854 323,244 1786 742 M.AMJAD METER READER 09 21990 40518 202590 41,248 288,736 1022 492,348 1787 742 IRFAN ASHRAF M.R 09 19070 36770 183850 37,500 262,500 1022 447,372 1788 742 MURAD ALl METER READER 09 29290 49888 249440 50,618 354,326 1022 604,788 1789 742 FAROOQ ASGHER METER READER 09 22720 41455 207275 42,185 295,295 1022 503,592 1790 742 LIAQAT ALl METER READER 09 28560 48951 244755 49,681 347,767 1022 593,544 1791 742 NAVEED AHMED METER READER 09 21260 39581 197905 40,311 282,177 1022 481,104 1792 742 NAZAR HUSSAIN BILL DISTRIBUTR 07 15260 26510 132550 27,120 189,840 854 323,244 1793 742 GHULAM MURTAZA METER READER 09 23450 37241 186205 37,971 265,797 1022 453,024 1794 742 M.ASIF MANZOOR METER READER 09 19070 36570 182850 37,300 261,100 1022 444,972 1795 742 IRFAN AHMED METER READER 09 17610 34696 173480 35,426 247,982 1022 422,484 1796 742 MAQSOOD AHMED METER READER 09 31480 51199 255995 51,929 363,503 1022 620,520 1797 742 M.TARIQ METER READER 09 21990 40518 202590 41,248 288,736 1022 492,348 1798 742 KlIALIQ UR REHMAN MR 09 21260 39448 197240 40,178 281,246 1022 479,508 1799 742 MUHAMMAD IRFAN M/R 09 17610 34696 173480 35,426 247,982 1022 422,484 1800 742 ANIS AHMED METER READER 09 21990 35396 176980 36,125 252,882 1022 430,884
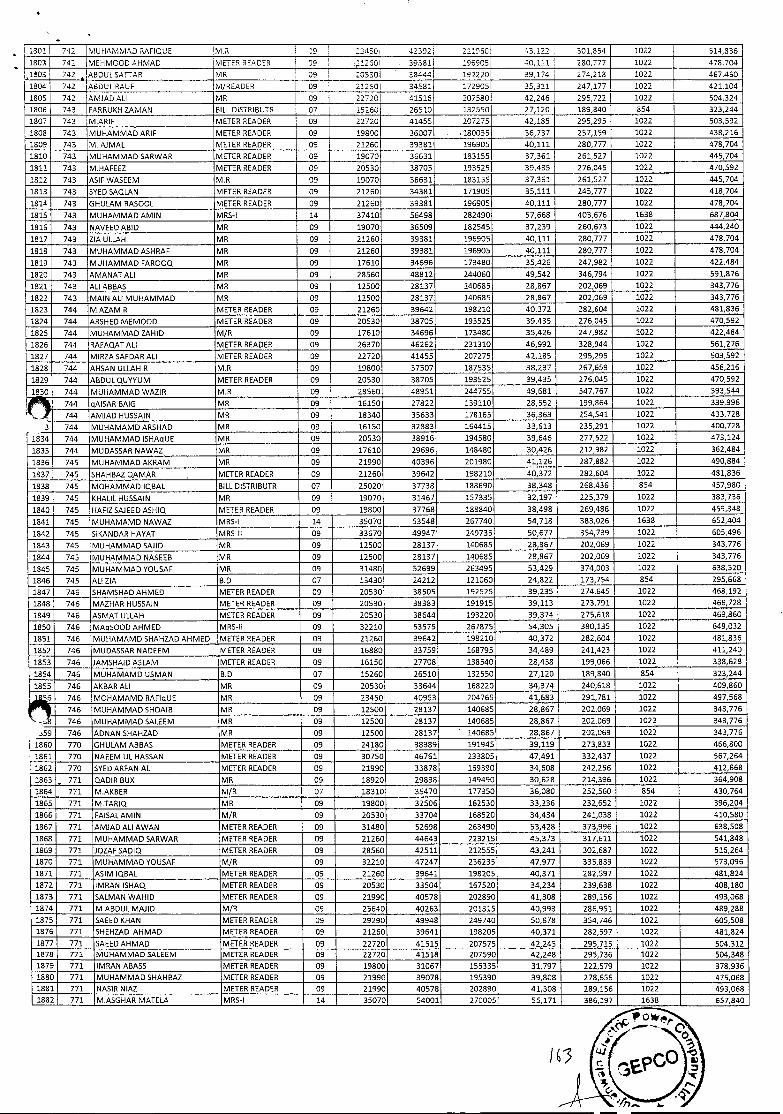
1301 742 MUHAMMAD RAFIQUE M.R 09 23450 42392 011960 43122 301,854 1022 514,836
1803 742 MEHMCCD AHMAD METER READER '39 125O 393811 196905 40,111 280,777 1022 478,704
1803 742 - ABDULSATTAR MR 09 20530 38444 192220 39,174 274,218 1022 467,460
1804 742 ABDUL RAUF M/READER 09 212301 34581 172905 35,311 247,177 1022 421,104
1805 742 AMJAD AL! MR 09 22720 41516 207580 42,246 295,722 1022 504,324
1806 743 FARRUKH ZAMAN BILL DISTRIBUTR 07 15260 26510 132550 27,120 189,840 854 323,244
1807 743 M.ARIF METER READER 09 22720 41455 207275 42,185 295,295 1022 503,592
1808 743 MUHAMMAD ARIF METER READER 09 19800 36007 180035 36,737 257,159 1022 438,216
1809 743 M. AJMAL METER READER 09 21260 39381 196905 40,111 280,777 1022 478,704
1810 743 MUHAMMAD SARWAR METER READER 09 19070 36631 183155 37,361 261,527 1022 445,704
1811 743 M.HAFEEZ METER READER 09 20530 38705 193525 39,435 276,045 1022 470,592
1812 743 ASIF WASEEM M.R 09 19070 36631 183155 37,361 261,527 1022 445,704
1813 743 SYED SAQLAN METER READER 09 21260 34381 171905 35,111 245,777 1022 418,704
1814 743 GHULAM RASOOL METER READER 09 21260 39381 196905 40,111 280,777 1022 478,704
1815 743 MUHAMMAD AMIN MRS-I 14 37410 56498 282490 57,668 403,676 1638 687,804
1816 743 NAVEED ABID MR 09 19070 36509 182545 37,239 260,673 1022 444,240
1817 743 ZIA IJLLAH MR 09 21260 39381 196905 40,111 280,777 1022 478,704
1818 743 MUHAMMAD ASHRAF MR 09 21260 39381 196905 40,111 280,777 1022 478,704
1819 743 MUHAMMAD FAROOQ MR 09 17610 34696 173480 35,426 247,982 1022 422,484
1820 743 AMANATALI MR 09 28560 48812 244060 49,542 346,794 1022 591,876
1821 743 ALl ABBAS MR 09 12500 28137 140685 28,867 202,069 1022 343,776
1822 743 MAIN ALl MUHAMMAD MR 09 12500 28137 140685 28,867 202,069 1022 343,776
1823 744 M AZAM R METER READER 09 21260 39642 198210 40,372 282,604 1022 481,836
1824 744 ARSHED MEM000 METER READER 09 20530 38705 193525 39,435 276,045 1022 470,592
1825 744 MUHAMMAD ZAHID M/R 09 17610 34696 173480 35,426 247,982 1022 422,484
1826 744 RAFAQ,AT ALl METER READER 09 26370 46262 231310 46,992 328,944 1022 561,276
1827 744 MIRZA SAFDAR ALl METER READER 09 22720 41455 207275 42,185 295,295 1022 503,592
1828 744 AHSAN ULLAH 9 M.R 09 19800 37507 187535 38,237 267,659 1022 456,216
1829 744 ABDUL QUYYUM METER READER 09 20530 38705 193525 39,435 276,045 1022 470,592
1830 744 MUHAMMAD WAZIR M.R 09 28560 48951 244755 49,681 347,767 1022 593,544
744 qAISAR BAlD MR 09 16150 27822 139110 28,552 199,864 1022 339,996
744 AMJAD HUSSAIN MR 09 18340 35633 178165 36,363 254,541 1022 433,728
3 744 MUHAMAMD ARSHAD MR 09 16150 32883 164415 33,613 235,291 1022 400,728
1834 744 MUHAMMAD ISHAqUE MR 09 20530 38916 194580 39,646 277,522 1022 473,124
1835 744 MUDASSAR NAWAZ MR 09 17610 29696 148480 30,426 212,982 1022 362,484
1836 745 MUHAMMAD AKRAM MR 09 21990 40396 201980 41,126 287,882 1022 490,884
1837 745 SHAHBAZQ.AMAR METER READER 09 21260 39642 198210 40,372 282,604 1022 481,836
1838 745 MOHAMMAD IQBAL BILL DISTRIBUTR 07 25020 37738 188690 38,348 268,436 854 457,980
1839 74S KHALIL HUSSAIN MR 09 19070 31467 157335 32,197 225,379 1022 383,736
1840 745 HAFIZSAJEEDASHIQ METER READER 09 19800 37768 188840 38,498 269,486 1022 459,348
1841 745 MUHAMAMD NAWAZ MRS-I 14 35070 53548 267740 54,718 383,026 1638 652,404
1842 745 SIKANDAR HAVAT MRS-Il 09 33670 49947 2497351 50,677 354,739 1022 605,496
1843 745 MUHAMMAD SAuD MR 09 12500 28137 140685 28,867 202,069 1022 343,776
1844 745 MUHAMMAD NASEEB MR 09 12500 28137 140685 28,867 202,069 1022 343,776
1845 745 MUHAMMAD YOUSAF MR 09 31480 52699 263495 53,429 374,003 1022 638,520
1846 745 ALl ZIA B.D 07 13430 24212 121060 24,822 173,754 854 295,668
1847 746 SHAMSHAD AHMED METER READER 09 20530 38505 192525 39,235 274,645 1022 468,192
1848 746 MAZHAR HUSSAIN METER READER 09 20530 38383 191915 39,113 273,791 1022 466,728
1849 746 ASMAT ULLAH METER READER 09 20530 38644 193220 39,374 275,618 1022 469,860
1850 746 MAq5000 AHMED MRS-lI 09 32210 53575 267875 54,305 380,135 1022 649,032
1851 746 MUHAMAMD SHAHZAD AHMED METER READER 09 21260 39642 198210 40,372 282,604 1022 481,836
1852 746 MUDASSAR NADEEM METER READER 09 16880 33759 168795 34,489 241,423 1022 411,240
1853 746 JAMSHAlD ASLAM METER READER 09 16150 27708 138540 28,438 199,066 1022 338,628
1854 746 MUHAMAMD USMAN 8.0 07 15260 26510 132550 27,120 189,840 854 323,244
1855 746 AKBAR ALl MR 09 20530 33644 168220 34,374 240,618 1022 409,860
5 746 MOHAMAMD RAFIqUE MR 09 23450 40953 204765 41,683 291,781 1022 497,568
746 MUHAMMAD SHOAIB MR 09 12500 28137 140685 28,867 202,069 1022 343,776
-4 746 MUHAMMAD SALEEM MR 09 12500 28137 140685 28,867 202,069 1022 343,776
u59 746 ADNAN SHAHZAD MR 09 12500 28137 140685 28,867 202,069 1022 343,776
1860 770 GHULAM ABBAS METER READER 09 24180 38389 191945 39,119 273,833 1022 466,800
1861 770 NAEEM UL HASSAN METER READER 09 30750 46761 233805 47,491 332,437 1022 567,264
1862 770 SYEDARFAN ALl METER READER 09 21990 33878 169390 34,608 242,256 1022 412,668
1863 771 QADIR BUX MR 09 18920 29898 149490 30,628 214,396 1022 364,908
1864 771 M.AKBER M/R 07 18310 35470 177350 36,080 252,560 854 430,764
1865 771 M.TARIQ MR 09 19800 32506 162530 33,236 232,652 1022 396,204
1866 771 FAISALAMIN M/R 09 20530 33704 168520 34,434 241,038 1022 410,580
1867 771 AMJAD ALl AWAN METER READER 09 31480 52698 263490 53,428 373,996 1022 638,508
1858 771 MUHAMMAD SARWAR METER READER 09 21260 44643 223215 45,373 317,611 1022 541,848
1869 771 JOZAF SADIQ METER READER 09 28560 42511 212555 43,241 302,687 1022 516,264
1870 771 MUHAMMAD VOUSAF M/R 09 32210 47247 236235 47,977 335,839 1022 573,096
1871 771 ASIM IQBAL METER READER 09 21260 39641 198205 40,371 282,597 1022 481,824
1872 771 IMRAN ISHAQ METER READER 09 20530 33504 167520 34,234 239,638 1022 408,180
1873 771 SALMAN WAHID METER READER 09 21990 40578 202890 41,308 289,156 1022 493,068
1874 771 M.ABDUL MAJID M/R 09 25640 40263 201315 40,993 286,951 1022 489,288
1875 771 SAEED KHAN METER READER 09 29290 49948 249740 50,678 354,746 1022 605,508
1876 771 SHEHZAD AHMAD METER READER 09 21260 39541 198205 40,371 282,597 1022 481,824
1877 771 SAEED AHMAD METER READER 09 22720 41515 207575 42,245 295,715 1022 504,312 1,878 771 MUHAMMAD SALEEM METER READER 09 22720 41518 207590 42,248 295,736 1022 504,348
1879 771 IMRAN ABASS METER READER 09 19800 31067 155335 31,797 222,579 1022 378,936
1880 771 MUHAMMAD SHAHBAZ METER READER 09 21990 39078 195390 39,808 278,656 1022 475,068
1881 771 NASIR NlAZ METER READER 09 21990 40578 202890 41,308 289,156 1022 493,068
1882 771 M.ASGHAR MATELA MRS-I 14 35070 54001 270005 5S,171 385,197 1638 657,840
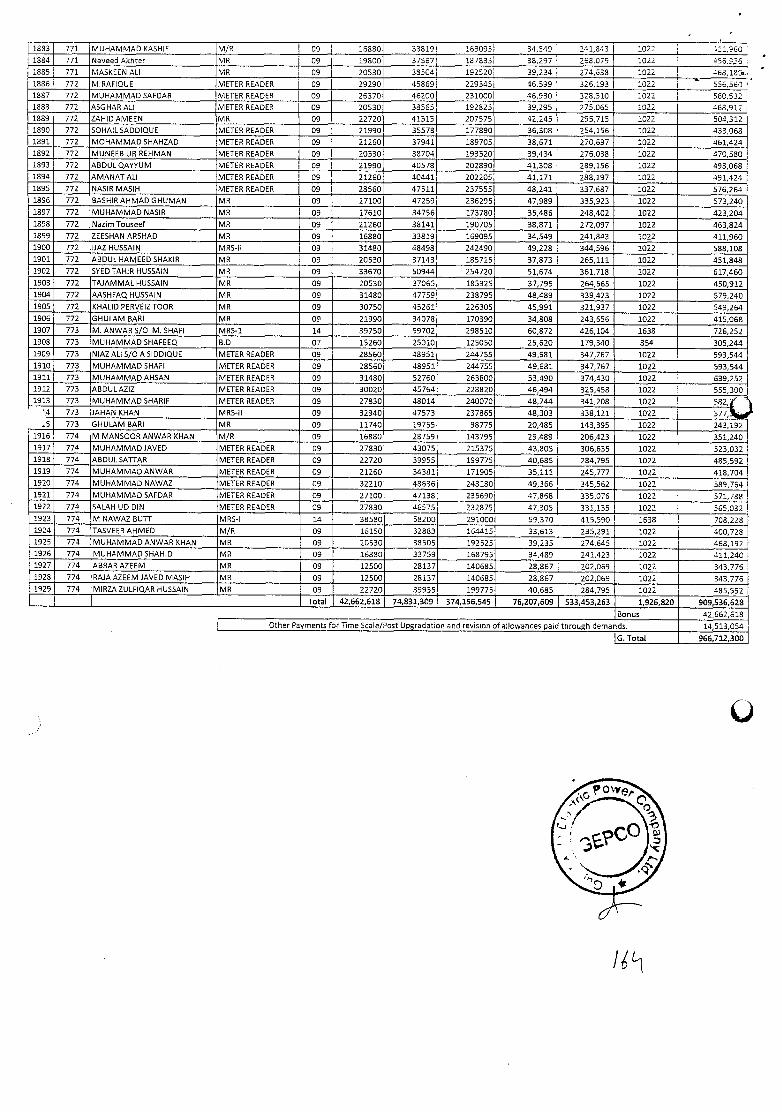
1883 771 MUHAMMAD KASHIF M/R 09 16880 33819 169095 34,549 241,843 1022 -12,960
1884 771 Naveed Akhter MR 09 19800 37567 187835 38,297 258,079 1022
1885 771 MASKEEN ALl MR 09 20530 3S5C4 192520 39,234 274,833 1022 68,182,
1886 772 M.RAFIQUE METER READER 09 29290 45869 229345 46,599 326,193 1022 556,560
1887 772 MUHAMMAD SAFDAR METER READER 09 26370 46200 231000 46,930 328,510 1022 560,532
1888 772 ASGHAR AU METER READER 09 20530 38565 192825 39,295 275,065 1022 468,912
1889 772 ZAHIDAMEEN MR 09 22720 41515 207575 42,245 295,715 1022 504,312
1890 772 SOHAILSADDIQUE METER READER 09 21990 35578 177890 36,308 254,156 1022 433,068
1891 772 MOHAMMAD SHAHZAD METER READER 09 21260 37941 189705 38,671 270,697 1022 461,424
1892 772 MUNEEB UR REHMAN METER READER 09 20530 38704 193520 39,434 276,038 1022 470,580 1893 772 ABDUL OAYYUM METER READER 09 21990 40573 202890 41,308 289,156 1022 493,068
1894 772 AMANAT ALl METER READER 09 21260 40441 202205 41,171 288,197 1022 491,424
1895 772 NASIR MASIH METER READER 09 28560 47511 237555 48,241 337,687 1022 576,264 1896 772 BASHIR AHMAD GHUMAN MR 09 27100 47259 236295 47,989 335,923 1022 573,240
1897 772 MUHAMMAD NASIR MR 09 17610 34756 173780 35,486 248,402 1022 423,204 1898 772 NazimTouseef MR 09 21260 38141 190705 38,871 272,097 1022 463,824 1899 772 ZEESHAN ARSHAD MR 09 16880 33819 169095 34,549 241,843 1022 411,960
1900 772 IJAZ HUSSAIN MRS-U 09 31480 48498 242490 49,228 344,596 1022 588,108 1901 772 ABDUL HAMEED SHAKIR MR 09 20530 37143 185715 37,873 265,111 1022 451,848
1902 772 SYEDTAHIR HUSSAIN MR 09 33670 50944 254720 51,674 361,718 1022 617,460
1903 772 TAJAMMAL HUSSAIN MR 09 20530 37065 185325 37,795 264,565 1022 450,912
1904 772 AASHFAQ HUSSAIN MR 09 31480 47759 238795 48,489 339,423 1022 579,240
1905 772 KHALID PERVEIZTOOR MR 09 30750 45261 226305 45,991 321,937 1022 549,264
1906 772 GHULAM BARI MR 09 21990 34078 170390 34,808 243,656 1022 415,068
1907 773 M. AN WAR 5/0 M. SHAFI MRS-i 14 39750 59702 298510 60,872 426,104 1638 726,252
1908 773 MUHAMMAD SHAFEEQ B.D 07 15260 25010 125050 25,620 179,340 854 305,244 1909 773 NIAZ AU Sb A SIDDIQUE METER READER 09 28560 48951 244755 49,681 347,767 1022 593,544
1910 773 MUHAMMAD SHAFI METER READER 09 28560 48951 244755 49,681 347,767 1022 593,544 1911 773 MUHAMMAD AHSAN METER READER 09 31480 52760 263800 53,490 374,430 1022 639,252 1912 773 ABDULAZIZ METER READER 09 30020 45764 228820 46,494 325,458 1022 555,300
1913 773 MUHAMMAD SHARIF METER READER 09 27830 48014 240070 48,744 341,208 1022 582, ' '4 773 JAHAN KHAN MRS-li 09 32940 47573 237865 48,303 338,121 1022 577, 5 773 GHULAM BARI MR 09 11740 19755 98775 20,485 143,395 1022 243,192
1916 774 M MANSOOR AN WAR KHAN M/R 09 16880 2B759 143795 29,489 206,423 1022 351,240 1917 774 MUHAMMAD JAVED METER READER 09 27830 43075 215375 43,805 306,635 1022 523,032 1918 774 ABDULSATTAR METER READER 09 22720 39955 199775 40,685 284,795 1022 485,592 1919 774 MUHAMMAD AN WAR METER READER 09 21260 343131 171905 35,111 245,777 1022 418,704 1920 774 MUHAMMAD NAWAZ METER READER 09 32210 43636 243180 49,366 345,562 1022 589.754 1921 774 MUHAMMAD SAFDAR METER READER 09 I 27100 47138 235690 47,868 335.076 1022 571,758 1922 774 SALAN U0 DIN METER READER 09 27830 46575 232875 47,305 331,135 1022 565,032 1923 774 M NAWAZ BUTT MRS-I 14 38580 58200 291000 55,370 415,590 1638 708,228 1924 774 TASVEER AHMED M/R CU 10150 32883 164415 33,613 235,291 1022 400,728 1925 774 MUHAMMAD AN WAR <HAN MR 09 20530 38505 192525 39,235 274,645 1022 488,192 1926 774 MUHAMMAD SHAHID MR 09 15880 33759 168795 34,489 241,423 1022 411,240 1927 774 ABRAR AZEEM MR 09 12500 23137 140685 28,867 202,069 1022 343,776 1928 774 RAJA AZEEM JAVED MASIH MR 09 12500 28137 140685 28,867 202,069 1022 343,775 1929 774 MIRZA ZULFIQAR HUSSAIN MR 09 22720 39955 199775 40,685 284,795 1022 485,592
Total 42,662,618 74,831,309 374,156,545 76,207,609 833,453,263 1,926,920 909,536,628
Bonus 42,662,618
Other Payments for Time Scale/Post Upgradation and revision of allowances paid through demands. 14,513,054
G. Total 966,712,300
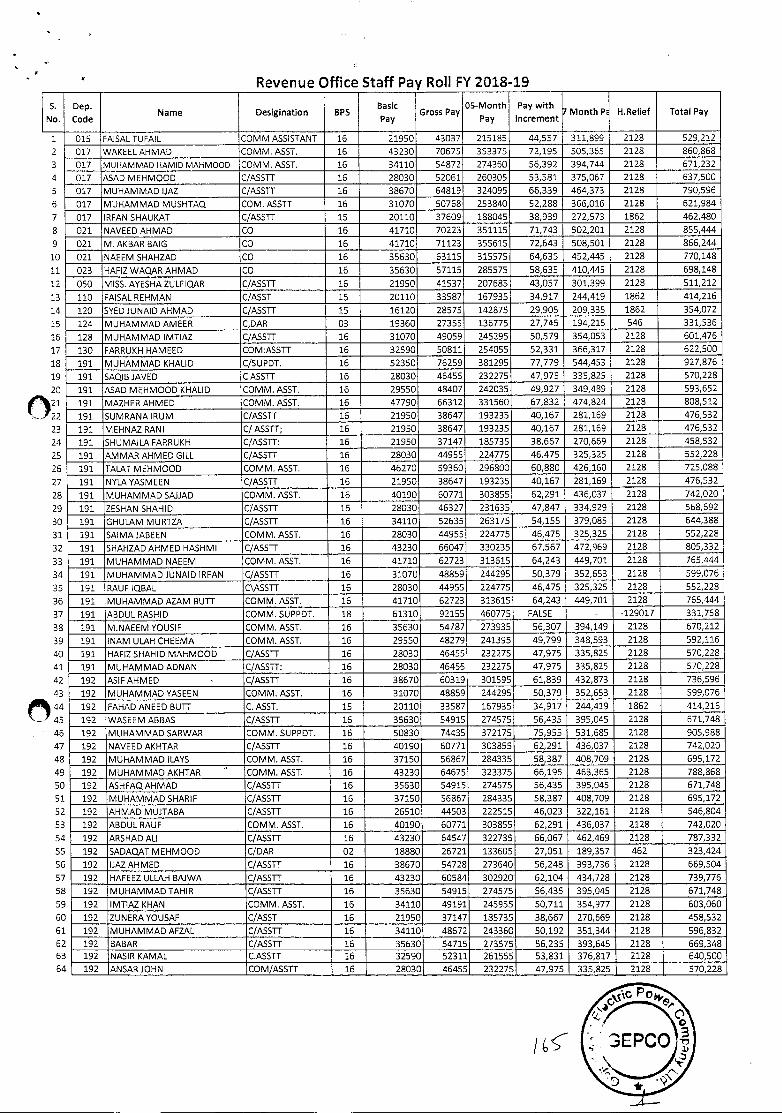
S.
No.
2
3
4
5
6
7
8
9
10
11
12
13
14
15
16
17
18
19
20
O21 22
23
24
25
26
27
28
29
30
31
32
33
34
35
36
37
38
39
40
41
42
43
44 45
46
47
42
4
5C
5]
5
5
5
5
5
5
5
6
6
6 6
6
Revenue Office Staff Pay Roll P1 2018-19
Dep.
Code Name
. . Desigination BPS
Basic
Pay Gross Pay
OS-Month
Pay
Pay with 7
Increment Month Ps H.Relief Total Pay
015 FAISALTUFAIL COMM ASSISTANT 16 21950 43031 215185 44,557 311,899 2128 529,212
017 WAKEEL AHMAD COMM. ASST. 16 43230 70675 353375 72,195 505,365 2128 860,868
017 MUHAMMAD HAMID MAHMOOD COMM. ASST. 16 34110 54872 274360 56,392 394,744 2128 671,232
017 ASAD MEHMOOD C/ASSTT 16 28030 52061 260305 53,581 375,067 2128 637,500
017 MUHAMMAD IJAZ C/ASSTT 16 38670 64819 324095 66,339 464,373 2128 790,596
017 MUHAMMAD MUSHTAQ COM.ASSTT 16 31070 50768 253840 52,288 366,016 2128 621,984
017 IRFAN SHAUKAT C/ASSTT 15 20110 37609 188045 38,939 272,573 1862 462,480
021 NAVEED AHMAD CO 16 41710 70223 351115 71,743 502,201 2128 855,444
021 M. AKBAR BAIG CO 16 41710 71123 355615 72,643 508,501 2128 866,244
021 NAEEM SHAHZAD CO 16 35630 63115 315575 64,635 452,445 2128 770,148
023 HAFIZWAO,ARAHMAD CO 16 35630 57115 285575 58,635 410,445 2128 698,148
050 MISS. AYESHA ZULFIQAR C/ASSTF 16 21950 41537 207685 43,057 301,399 2128 511,212
110 FAISAL REHMAN C/ASST 15 20110 33587 167935 34,917 244,419 1862 414,216
120 SYEDJUNAIDAHMAD C/ASSTT 15 16120 28575 142875 29,905 209,335 1862 354,072
124 MUHAMMAD AMEER C,DAR 03 19360 27355 136775 27,745 194,215 546 331,536
128 MUHAMMAD IMTIAZ C/ASSTT 16 31070 49059 245295 50,579 354,053 2128 601,476
130 FARRUKH HAMEED COM:ASSTT 16 32590 50811 254055 52,331 366,317 2128 622,500
191 MUHAMMAD KHALID C/SUPDT. 16 52350 76259 381295 77,779 544,453 2128 927,876
191 SAQIB JAVED C ASSTT 16 28030 46455 232275 47,975 335,825 2128 570,228
191 ASAD MEHMOOD KHALID COMM. ASST. 16 29550 48407 242035 49,927 349,489 2128 593,652
191 MASHER AHMED COMM. ASST. 16 47790 66312 331560 67,832 474,824 2128 808,512
191 SUMRANA IRUM C/ASSTT 16 21950 38647 193235 40,167 281,169 2128 476,532
191 MEHNAZ RANI C/ASSTT; 16 21950 38647 193235 40,167 281,169 2128 476,532
191 SHUMAILA FARRUKH C/ASSTT: 16 21950 37147 185735 38,667 270,669 2128 458,532
191 AMMAR AHMED GILL C/ASSTT 16 28030 44955 224775 46,475 325,325 2128 552,228
191 TALAT MEHMOOD COMM. ASST. 16 46270 59360 296800 60,880 426,160 2128 725,088
191 NYLAYASMEEN C/ASSTT 16 21950 38647 193235 40,167 281,169 2128 476,532
191 MUHAMMAD SAIJAD COMM. ASST. 16 40190 60771 303855 62,291 436,037 2128 742,020
191 ZESHAN SHAHID C/ASSTT 16 28030 46327 231635 47,847 334,929 2128 568,692
191 GHULAM MURTZA C/ASSTT 16 34110 52635 263175 54,155 379,085 2128 644,388
191 SAIMAJABEEN COMM. ASST. 16 28030 44955 224775 46,475 325,325 2128 552,228
191 SHAHZADAHMED HASHMI C/ASSTT 16 43230 66047 330235 67,567 472,969 2128 805,332
191 MUHAMMAD NAEEM COMM. ASST. 16 41710 62723 313615 64,243 449,701 2128 765,444
191 MUHAMMAD JUNAID IRFAN C/ASSTT 16 31070 48859 244295 50,379 352,653 2128 599,076
191 RAUF IQBAL C\ASSTT 16 28030 44955 224775 46,475 325,325 2128 552,228
191 MUHAMMAD AZAM BUTT COMM. ASST. 16 41710 62723 313615 64,243 449,701 2128 765,444
191 ABDUL RASHID COMM. SUPPDT. 18 61310 92155 460775 FALSE - -129017 331,758
191 M.NAEEM YOUSIF COMM. ASST. 16 35630 54787 273935 56,307 394,149 2128 670,212
191 INAM ULAI-1 CHEEMA COMM. ASST. 16 29550 48279 241395 49,799 348,593 2128 592,116
191 HAFIZ SHAHID MAHMOOD C/ASSTT 16 28030 46455 232275 47,975 335,825 2128 570,228
191 MUHAMMAD ADNAN C/ASSTT: 16 28030 46455 232275 47,975 335,825 2128 570,228
192 ASIFAHMED - C/ASSTT 16 38670 60319 301595 61,839 432,873 2128 736,596
192 MUHAMMAD YASEEN COMM. ASST. 16 31070 48859 244295 50,379 352,653 2128 599,076
192 FAHAD ANEED BUTT C. ASST. 15 20110 33587 167935 34,917 244,419 1862 414,216
192 WASEEM ABBAS C/ASSTT 16 35630 54915 274575 56,435 395,045 2128 671,748
192 MUHAMMAD SARWAR COMM. SUPPDT. 16 50830 74435 372175 75,955 531,685 2128 905,988
192 NAVEED AKHTAR C/ASSTT 16 40190 60771 303855 62,291 436,037 2128 742,020
192 MUHAMMAD LAYS COMM. ASST. 16 37150 56867 284335 58,387 408,709 2128 695,172
192 MUHAMMAD AKHTAR COMM. ASST. 16 43230 64675 323375 66,195 463,365 2128 788,868
192 ASHFAQAHMAD C/ASSTT 16 35630 54915 274575 56,435 395,045 2128 671,748
192 MUHAMMAD SHARIF C/ASSTT 16 37150 56867 284335 58,387 408,709 2128 695,172
192 AHMAD MUJTABA C/ASSTT 16 26510 44503 222515 46,023 322,161 2128 546,804
192 ABDUL RAUF COMM. ASST. 16 40190 60771 303855 62,291 436,037 2128 742,020
192 ARSHAD ALl C/ASSTT 16 43230 64547 322735 66,067 462,469 2128 787,332
192 SADAQ.AT MEHMOOD C/OAR 02 18880 26721 133605 27,051 189,357 462 323,424
192 IJAZAHMED C/ASSTT 16 38670 54728 273640 56,248 393,736 2128 669,504
7 192 HAFEEZ ULLAH BAJWA C/ASSTT 16 43230 60584 302920 62,104 434,728 2128 739,776
192 MUHAMMAD TAHIR C/ASSTT 16 35630 54915 274575 56,435 395,045 2128 671,748
) 192 IMTIAZ KHAN COMM. ASST. 16 34110 49191 245955 50,711 354,977 2128 603,060
) 192 ZUNERA YOUSAF C/ASST 16 21950 37147 185735 38,667 270,669 2128 458,532
192 MUHAMMAD AFZAL C/ASSTT 16 34110 48672 243360 50,192 351,344 2128 596,832
a 192 BABAR C/ASSTT 16 35630 54715 273575 56,235 393,645 2128 669,348 3 192 NASIR KAMAL C.ASSTT 16 32590 52311 261555 53,831 376,817 2128 640,500
5 192 ANSAR JOHN COM/ASSTT 16 28030 46455 232275 47,975 335,825 2128 570,228
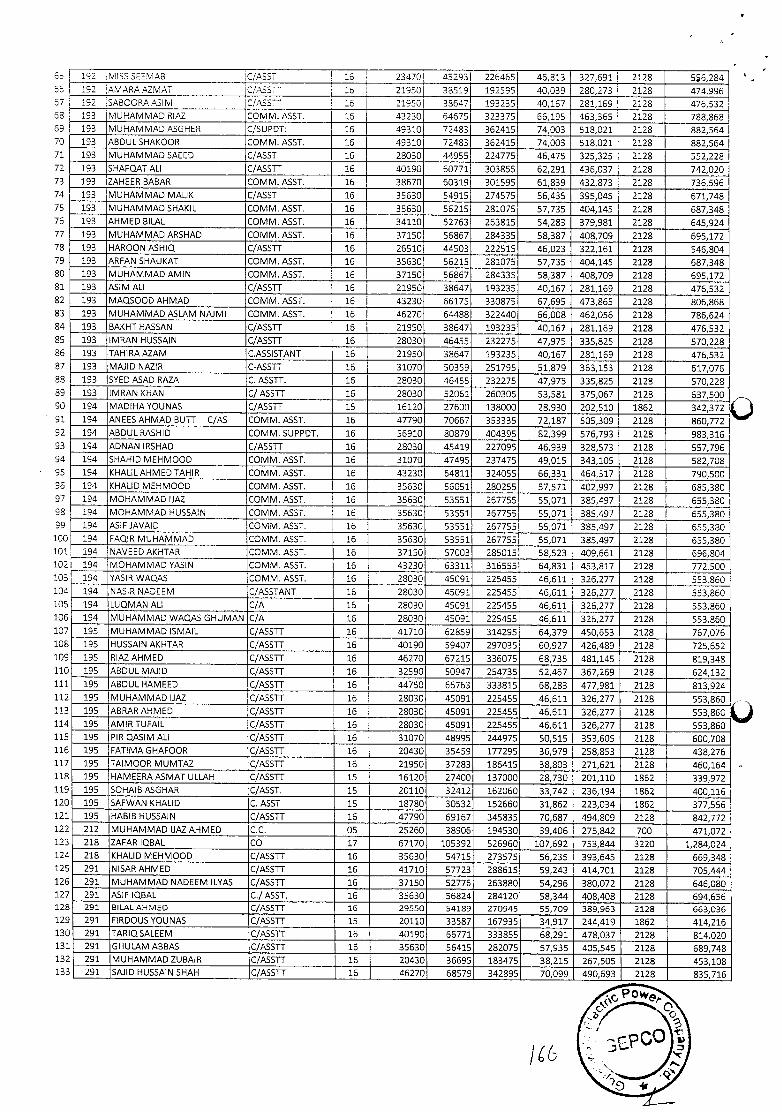
192 MISS SEEMAB C/ASST 16 23470 45293 226465 46,813 327,691 2128 56,284 192 AMARAAZMAT C/ASSTT 15 21950 33519 192595 40,039 280,273 2128 474,996 192 SABCCRAASIM C/ASSTT 16 21950 38647 193235 40,167 281,169 2128 476,532 193 MUHAMMAD RIAZ COMM. ASST. 16 43230 64575 323375 66,195 463,365 2128 788,868 193 MUHAMMAD ASGHER C/SUPDT: 16 49310 72483 362415 74,003 518,021 2128 882,564 193 ABDULSHAKOOR COMM. ASST. 16 49310 72483 362415 74,003 518,021 2128 882,564 193 MUHAMMAD SAEED C/ASST 16 28030 44955 224775 46,475 325,325 2128 552,228 193 SHAFOAT ALl C/ASSTT 16 40190 60771 303855 62,291 436,037 2128 742,020 193 ZAHEER BABAR COMM. ASST. 16 38670 60319 301595 61,839 432,873 2128 736,596 193 MUHAMMAD MAUK C/ASST 16 35630 54915 274575 56,435 395,045 2128 671,748 193 MUHAMMAD SHAKIL COMM. ASST. 16 35630 56215 281075 57,735 404,145 2128 687,348 193 AHMED BILAL COMM. ASST. 16 34110 52763 263815 54,283 379,981 2128 645,924 193 MUHAMMAD ARSHAD COMM. ASST. 16 37150 56867 284335 58,387 408,709 2128 695,172 193 HAROON ASHIQ C/ASSTT 16 26510 44503 222515 46,023 322,161 2128 546,804 193 ARFAN SHAUKAT COMM. ASST. 16 35630 56215 281075 57,735 404,145 2128 687,348 193 MUHAMMAD AMIN COMM. ASST. 16 37150 56867 284335 58,387 408,709 2128 695,172 193 ASIM ALl C/ASSTT 16 21950 38647 193235 40,167 281,169 2128 476,532 193 MAQSOOD AHMAD COMM. ASST. 16 43230 66175 330875 67,695 473,865 2128 806,868 193 MUHAMMAD ASLAM NAJMI COMM. ASST. 16 46270 64488 322440 66,008 462,056 2128 786,624 193 BAKHT HASSAN C/ASSTT 16 21950 38647 193235 40,167 281,169 2128 476,532 193 IMRAN HUSSAIN C/ASSTT 16 28030 46455 232275 47,975 335,825 2128 570,228 193 TAHIRAAZAM C.ASSISTANT 16 21950 38647 193235 40,167 281,169 2128 476,532 193 MAJID NAZIR C-ASSTT 16 31070 50359 251795 51,879 363,153 2128 617,076 193 SYED ASAD RAZ.A C. ASSTT. 16 28030 45455 232275 47,975 335,825 2128 570,228 193 IMRAN KHAN C/ASSTT 16 28030 52061 260305 53,581 375,067 2128 637,500
I 194 MADIHA YOUNAS C/ASSTT 15 16120 27600 138000 28,930 202,510 1862 342,372 194 ANEES AHMAD BUTT C/AS COMM. ASST. 16 47790 70667 353335 72,187 505,309 2128 860,772 194 ABDUL RASHID COMM. SUPPDT. 16 56910 80879 404395 82,399 576,793 2128 983,316 194 ADNAN IRSHAD C/ASSTT 16 28030 45419 227095 46,939 328,573 2128 557,796 194 SHAHID MEHMOOD COMM. ASST. 16 31070 47495 237475 49,015 343,105 2128 582,708 194 KHALILAHMEDTAHIR COMM.ASST. 16 43230 64811 324055 66,331 464,317 2128 790,500 194 KHALID MEHMOOD COMM. ASST. 16 35630 55051 280255 57,571 402,997 2128 685,380 194 MOHAMMAD IJAZ COMM. ASST. 16 35630 53551 267755 55,071 385,497 2128 655,380 194 MOHAMMAD HUSSAIN COMM. ASST. 16 35630 53551 267755 55,071 385,497 2128 655,380 194 ASIFJAVAID COMM. ASST. 16 35630 53551 267755 55,071 385,497 2128 655,380 194 FAQJR MUHAMMAD COMM. ASST. 16 35630 53551 267755 5S,071 385,497 2128 655,380 194 NAVEED AKHTAR COMM. ASST. 16 37150 57003 285015 58,523 409,661 2128 696,804 194 MOHAM MAD YASIN COMM. ASST. 16 43230 63311 316555 64,831 453,817 2128 772,500 194 YASIR WAO.AS COMM. ASST. 16 28030 45091 225455 46,611 326,277 2128 553,860 194 NASIR NADEEM C/ASSTANT 16 28030 45091 225455 46,611 326,277 2128 553,860 194 LUQMAN ALl C/A 16 28030 45091 225455 46,611 326,277 2128 553,860 194 MUHAMMAD WAQAS GHUMAN C/A 16 28030 45091 225455 46,611 326,277 2128 553,860 195 MUHAMMAD ISMAIL C/ASSTT 16 41710 62859 314295 64,379 450,653 2128 767,076 195 HUSSAIN AKHTAR C/ASSTT 16 40190 59407 297035 60,927 426,489 2128 725,652 195 RIAZ AHMED C/ASSTT 16 46270 67215 336075 68,735 481,145 2128 819,348 195 ABDUL MAIID C/ASSTT 16 32590 50947 254735 52,467 367,269 2128 624,132 195 ABDUL HAMEED C/ASSTT 16 44750 66763 333815 68,283 477,981 2128 813,924 195 MUHAMMAD IJAZ C/ASSTT 16 28030 45091 225455 46,611 326,277 2128 553,860 195 ABRAR AHMED C/ASSTT 16 28030 45091 225455 46,611 326,277 2128 553,860 195 AMIR TUFAIL C/ASSTT 16 28030 45091 225455 46,611 326,277 2128 553,860 195 PIR O.P.SIM ALl C/ASSTT 16 31070 48995 244975 50,515 353,605 2128 600,708 195 FATIMA GHAFOOR C/ASSTT 16 20430 35459 177295 36,979 258,853 2128 438,276 195 TAIMOOR MUMTAZ C/ASSTT 16 21950 37283 186415 38,803 271,621 2128 460,164 195 HAMEERAASMATULLAH C/ASSTT 15 16120 27400 137000 28,730 201,110 1862 339,972 195 SOHAIB ASGHAR C/ASST. 15 20110 32412 162060 33,742 236,194 1862 400,116 195 SAFWAN KHALID C. ASST 15 18780 30532 152660 31,862 223,034 1862 377,556 195 HABIB HUSSAIN C/ASSTT 16 47790 69167 345835 70,687 494,809 2128 842,772 212 MUHAMMAD IJAZAHMED C.C. 05 25260 38906 194530 39,406 275,842 700 471,072 218 ZAFAR IQBAL CO 17 67170 105392 526960 107,692 753,844 3220 1,284,024 218 KHALID MEHMOOD C/ASSTT 16 35630 54715 273575 56,235 393,645 2128 669,348 291 NISAR AHMED C/ASSTT 16 41710 57723 288615 59,243 414,701 2128 705,444 291 MUHAMMAD NADEEM ILYAS C/ASSTT 16 37150 52776 263880 54,296 380,072 2128 646,080 291 ASIF IQBAL C./ASST. 16 35630 56824 284120 58,344 408,408 2128 694,656 291 BILALAHMED C/ASSTT 16 29550 54189 270945 55,709 389,963 2128 663,036 291 FIRDOUS YOUNAS C/ASSTT 15 20110 33587 167935 34,917 244,419 1862 414,216 291 TARIOSALEEM C/ASSTT 16 40190 66771 333855 68,291 478,037 2128 814,020 291 GHULAM ABBAS C/ASSTT 16 35630 56415 282075 57,935 405,545 2128 689,748 291 MUHAMMAD ZUBAIR C/ASSTT 16 20430 36695 183475 38,215 267,505 2128 453,108 291 SAJID HUSSAIN SHAH C/ASSTT 16 46270 68579 342895 70,099 490,693 2128 835,716
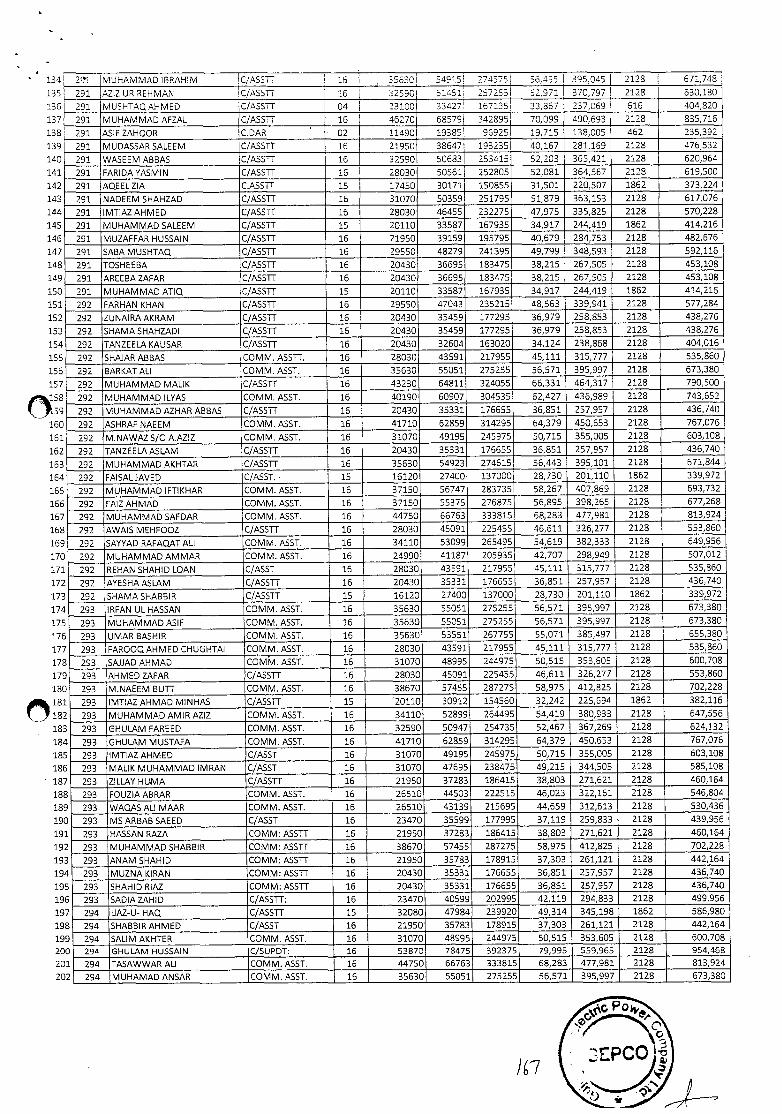
134
135
136
137
138
139
140
141
142
143
144
145
146
147
148
149
150
151
152
153
154
155
156
157
16C
161
162
163
16
165
16
16
165
165
17(
17:
17:
17:
17'
17
17
17
17
17
18
18 18
18
18
18
18
18
18
18
19
19
19
15
15
15
15
15
15
15
25
25
251 MUHAMMAD IBRAHIM C,/ASSIT 16 35530 549i5 274575 56,435 395045 2123 671,748
291 AZZ UR REHMAN C/ASSTT 16 32590 514511 2S7255 52971 370,797 2128 630,180
291 MUSHTAQAHMED C/ASSTT 04 I 23100 33427 167135 33,867 237,069 616 404,820
291 MUHAMMAD AFZAL C/ASSIT 15 46270 68579 342895 70,099 490,693 2128 835,716
291 ASIF ZAHOOR C.DAR 02 11490 19385 96925 19,715 133,005 462 235,392
291 MUDASSAR SALEEM C/ASSTT 16 21950 38647 193235 40,167 281,169 2128 476,532
291 WASEEM ABBAS C/ASSTT 16 32590 50683 253415 52,203 365,421 2128 620,964
291 FARDAYASMIN C/ASSTT 16 28030 50561 252805 52,081 364,567 2128 619,500
291 AQEELZIA C.ASSTT 15 17450 30171 150855 31,501 220,507 1862 373,224
291 NADEEM SHAHZ.AD C/ASSTT 16 31070 50359 251795 51,879 363,153 2128 617,076
291 IMTIAZAHMED C/ASSTT 16 28030 46455 232275 47,975 335,825 2128 570,228
291 MUHAMMAD SALEEM C/ASSTT 15 20110 33587 167935 34,917 244,419 1862 414,216
291 MUZAFFAR HUSSAIN C/ASSTT 16 21950 39159 195795 40,679 284,753 2128 482,676
291 SABA MUSHTAQ C/ASSTT 16 29550 48279 241395 49,799 348,593 2128 592,116
291 TOSHEEBA C/ASSTT 16 20430 36695 183475 38,215 267,505 2128 453,108
291 AREEBAZAFAR C/ASSTT 16 20430 36695 183475 38,215 267,505 2128 453,108
291 MUHAMMAD ATIO C/ASSTT 15 20110 33587 167935 34,917 244,419 1862 414,216
292 FARHAN KHAN C/ASSTT 16 29550 47043 235215 48,563 339,941 2128 577,284
292 ZUNAIRAAKRAM C/ASSTT 16 20430 35459 177295 36,979 258,853 2128 438,276
292 SHAMA SHAHZADI C/ASSTT 16 20430 35459 177295 36,979 258,853 2128 438,276
292 TANZEELA KAUSAR C/ASSTT 16 20430 32604 163020 34,124 238,868 2128 404,016
292 SHAJAR ABBAS COMM. ASSTT. 16 28030 43591 217955 45,111 315,777 2128 535,860
292 BARKAT AL! COMM. ASST. 16 35630 55051 275255 56,571 395,997 2128 673,380
292 MUHAMMAD MAUK C/ASSTT 16 43230 64811 324055 66,331 464,317 2128 790,500
292 MUHAMMAD LYAS COMM. ASST. 16 40190 60907 304535 62,427 436,989 2128 743,652
292 MUHAMMAD AZHAR ABBAS C/ASSTT 16 20430 35331 176655 36,851 257,957 2128 436,740
292 ASHRAF NAEEM COMM. ASST. 16 41710 62859 314295 64,379 450,653 2128 767,076
292 M.NAWAZ Sb A.AZ!Z COMM. ASST. 16 31070 49195 245975 50,715 355,005 2128 603,108
292 TANZEELAASLAM C/ASSTT 16 20430 35331 176655 36,851 257,957 2128 436,740
292 MUHAMMAD AKHTAR C/ASSTT 16 35630 54923 274615 56,443 395,101 2128 671,844
292 FAISALJAVED C/ASST. 15 16120 27400 137000 28,730 201,110 1862 339,972
292 'MUHAMMAD IFTIKHAR COMM. ASST. 16 37150 56747 283735 58,267 407,869 2128 693,732
292 FAIZ AHMAD COMM. ASST. 16 37150 55375 276875 56,895 398,265 2128 677,268
292 MUHAMMAD SAFDAR COMM. ASST. 16 44750 66763 333815 68,283 477,981 2128 813,924
292 AWAIS MEHFOOZ C/ASSTT 16 28030 45091 225455 46,511 326,277 2128 553,860
292 SAYYAD RAFAOAT AL! COMM. ASST. 16 34110 53099 265495 54,619 382,333 2128 649,956
292 MUHAMMAD AMMAR COMM. ASST. 16 24990 41187 205935 42,707 298,949 2128 507,012
292 REHAN SHAHID LOAN C/ASST 16 28030 43591 217955 45,111 315,777 2128 535,860
a 292 AYESHA ASLAM C/ASSTT 16 20430 35331 176655 36,851 257,957 2128 436,740
3 292 SHAMASHABBIR C/ASSTT 15 16120 27400 137000 28,730 201,110 1862 339,972
6 293 IRFAN UL HASSAN COMM. ASST. 16 35630 55051 275255 56,571 395,997 2128 673,380
5 293 MUHAMMAD ASIF COMM. ASST. 16 35630 55051 275255 56,571 395,997 2128 673,380
5 293 UMAR BASHIR COMM. ASST. 16 35630 53551 267755 55,071 385,497 2128 655,380
7 293 FAR000AHMED CHUGHTA! COMM. ASST. 16 28030 43591 217955 45,111 315,777 2128 535,860
8 293 SAJJAD AHMAD COMM. ASST. 16 31070 48995 244975 50,515 353,605 2128 600,708
9 293 AHMED ZAFAR C/ASSTT 16 28030 45091 225455 46,611 326,277 2128 553,860
0 293 M.NAEEM BUTT COMM. ASST. 16 38670 57455 287275 58,975 412,825 2128 702,228
1 293 IM11AZ AHMAD MINHAS C/ASSTT 15 20110 30912 154560 32,242 225,594 1862 382,116
2 293 MUHAMMAD AMIR AZIZ COMM. ASST. 16 34110 52899 264495 54,419 380,933 2128 647,556
3 293 OHULAM FAREED COMM. ASST. 16 32590 50947 254735 52,467 367,269 2128 624,132
4 293 GHULAM MUSTAFA COMM. ASST. 16 41710 62859 314295 64,379 450,653 2128 767,076
5 293 IMTIAZ AHMED C/ASST 16 31070 49195 245975 50,715 355,005 2128 603,108
6 293 MALIK MUHAMMAD IMRAN C/ASST 16 31070 47695 238475 49,215 344,505 2128 585,108
7 293 ZILLAY HUMA C/ASSTT 16 21950 37283 186415 38,803 271,621 2128 460,164
8 293 FOUZIA ABRAR COMM. ASST. 16 26510 44503 222515 46,023 322,161 2128 546,804
9 293 WAQ,AS ALl MAAR COMM. ASST. 16 26510 43139 215695 44,659 312,613 2128 530,436
0 293 MS ARBAB SAEED C/ASST 16 23470 35599 177995 37,119 259,833 2128 439,956
1 293 HASSAN RAZA COMM: ASSTT 16 21950 37283 186415 38,803 271,621 2128 460,164
2 293 MUHAMMAD SHABBIR COMM: ASSTT 16 38670 57455 287275 58,975 412,825 2128 702,228
3 293 ANAM SHAHID COMM: ASSTT 16 21950 35783 178915 37,303 261,121 2128 442,164
4 293 MUZNA KIRAN COMM: ASSTT 16 20430 35331 176655 36,851 257,957 2128 436,740
5 293 SHAHID RIAZ COMM: ASSTT 16 20430 35331 176655 36,851 257,957 2128 436,740
56 293 SADIAZAHID C/ASSTT: 16 23470 40599 202995 42,119 294,833 2128 499,956
57 294 IJAZ-U- HAQ C/ASSTT 15 32080 47984 239920 49,314 345,198 1862 586,980
58 294 SHABBIR AHMED C/ASST 16 21950 35783 178915 37,303 261,121 2128 442,164
59 294 SALIM AKHTER COMM. ASST. 16 31070 48995 244975 50,515 353,605 2128 600,708
10 294 GHULAM HUSSAIN C/SUPDT: 16 53870 78475 392375 79,995 559,965 2128 954,468
21 294 TASAWWAR AL! COMM. ASST. 16 44750 66763 333815 68,283 477,981 2128 813,924
22 294 MUHAMAD ANSAR COMM. ASST. 16 35630 55051 275255 56,571 395,997 2128 673,380
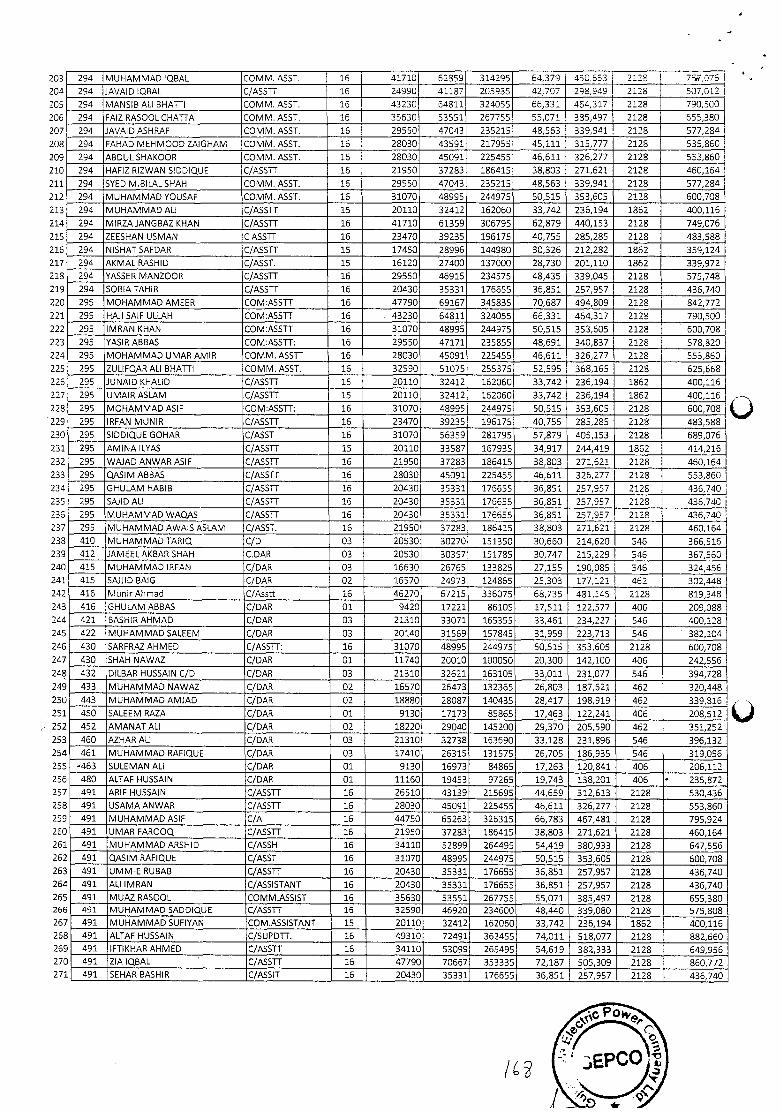
203
204
205
206
207
208
209
210
211.
212
213
214
215
216
217
218
219
220
221
222
223
224
225
226
227
228
229
230
231
232
233
234
235
236
237
238
239
240
241
242
243
244
245
246
247
248
249
25C
251
252
253
254
255
25€
257
258
259
26C
261
261
261
26
265 26
26
26
26c
27(
271
294 MUHAMMAD IQBAL COMM. ASST. 16 41710 62859 314295 64.379 450.653 2128 7,076
294 JA\JAID IQBAL C/ASSrr 16 24990 41187 205935 42707 298949 2128 507,012
294 MANSIB ALl BHATTI COMM. ASSI. 16 I 43230 64811 324055 66,331 464,317 2128 790,500
294 FAlL RASOOL CHATTA COMM. ASST. 16 35630 53551 267755 55,071 385,497 2128 655,380
294 JAVAID ASHRAF COMM. ASST. 16 29550 47043 235215 48,563 339,941 2128 577,284
294 FAHAD MEHM000 ZAIGHAM COMM. ASST. 16 28030 43591 217955 45,111 315,777 2128 535,860
294 ABDUL SHAKOOR COMM. ASSI. 16 28030 45091 225455 46,611 326,277 2128 553,860
294 HAFIZ RIZWAN SIDDIQUE C/ASSTT 16 21950 37283 186415 38,803 271,621 2128 460,164
294 SYED M.BILAL SHAH COMM. ASST. 16 29550 47043 235215 48,563 339,941 2128 577,284
294 MUHAMMADYOUSAF CDMM.ASST. 16 31070 48995 244975 50,515 353,605 2128 600,708
294 MUHAMMAD ALl C/ASS1T 15 20110 32412 162060 33,742 236,194 1862 400,116
294 MIRZA JANGBAZ KHAN C/ASSTT 16 41710 61359 306795 62,879 440,153 2128 749,076
294 ZEESHAN USMAN CASSTT 16 23470 39235 196175 40,755 285,285 2128 483,588
294 NISHAT SAFOAR C/ASSTT 15 17450 28996 144980 30,326 212,282 1862 359,124
294 AKMAL RASHID C/ASST. 15 16120 27400 137000 28,730 201,110 1862 339,972
294 YASSER MANZOOR C/ASSTT 16 29550 46915 234575 48,435 339,045 2128 575,748
294 SOBIA TAHIR C/ASSTT 16 20430 35331 176655 36,851 257,957 2128 436,740
295 MOHAMMADAMEER COM:ASSTT 16 47790 69167 345835 70,687 494,809 2128 842,772
295 HAil SAIF ULLAH COM:ASSTT 16 43230 64811 324055 66,331 464,317 2128 790,500 295 IMRAN KHAN COM:ASSTT 16 31070 48995 244975 50,515 353,605 2128 600,708
295 YASIR ABBAS COM:ASSTT: 16 29550 47171 235855 48,691 340,837 2128 578,820 295 MOHAMMAD UMAR AMIR COMM. ASSTT 16 28030 45091 225455 46,611 326,277 2128 553,860
295 ZULIFOAR ALl BHATTI COMM. ASST. 16 32590 51075 255375 52,595 368,165 2128 625,668
295 JUNAID KHALID C/ASSTT 15 20110 32412 162060 33,742 236,194 1862 400,116
295 UMAIR ASLAM C/ASSTT 15 20110 32412 162060 33,742 236,194 1862 400,116
295 MOHAM MAD ASIF COM:ASSTT: 16 31070 48995 244975 50,515 353,605 2128 600,708
295 RFAN MUNIR C/ASSTT 16 23470 39235 196175 40,755 285,285 2128 483,588
295 SIDDIQUE GOHAR C/ASST 16 31070 56359 281795 57,879 405,153 2128 689,076
295 AMINA ILYAS C/ASSTT 15 20110 33587 167935 34,917 244,419 1862 414,216
295 WAJAD AN WAR ASIF C/ASSTT 16 21950 37283 186415 38,803 271,621 2128 460,164
295 O.ASIM ABBAS C/ASSTT 16 28030 45091 225455 46,611 326,277 2128 553,860
295 GHULAM HABIB C/ASSTT 16 20430 35331 176655 36,851 257,957 2128 436,740
295 SAuD ALl C/ASSTT 16 20430 35331 176655 36,851 257,957 2128 436,740
295 MUHAMMAD WAQAS C/ASSTT 16 20430 35331 176655 36,851 257,957 2128 436,740 295 MUHAMMAD AWAIS ASLAM C/ASST. 16 21950 37283 186415 38,803 271,621 2128 460,164
410 MUHAMMAD TARIQ C/D 03 20530 30270 151350 30,660 214,620 546 366,516 412 JAMEEL AKBAR SHAH C.DAR 03 20530 30357 151785 30,747 215,229 546 367,560 415 MUHAMMAD IRFAN C/OAR 03 16630 26765 133825 27,155 190,085 546 324,456 415 SAJJID BAIG C/OAR 02 16570 24973 124865 25,303 177,121 462 302,448 416 MunirAhmad C/Asstt 16 46270 67215 336075 68,735 481,145 2128 819,348 416 GHULAM ABBAS C/OAR 01 9420 17221 86105 17,511 122,577 406 209,088 421 BASHIR AHMAD C/OAR 03 21310 33071 165355 33,461 234,227 546 400,128 422 MUHAMMAD SALEEM C/DAR 03 20140 31569 157845 31,959 223,713 546 382,104 430 SARFR.AZ AHMED C/ASSTT: 16 31070 48995 244975 50,515 353,605 2128 600,708 430 SHAH NAWAZ C/OAR 01 11740 20010 100050 20,300 142,100 406 242,556
432 DILBAR HUSSAIN C/D C/OAR 03 21310 32621 163105 33,011 231,077 546 394,728 433 MUHAMMAD NAWAZ C/OAR 02 16570 26473 132365 26,803 187,621 462 320,448 443 MUHAMMAD AMJAD C/OAR 02 18880 28087 140435 28,417 198,919 462 339,816 450 SALEEM RAZA C/OAR 01 9130 17173 85865 17,463 122,241 406 208,512 452 AMANAT ALl C/OAR 02 18220 29040 145200 29,370 205,590 462 351,252 460 AZHAR ALl C/OAR 03 21310 32738 163690 33,128 231,896 546 396,132
461 MUHAMMAD RAFIQUE C/OAR 03 17410 26315 131575 26,705 186,935 546 319,056 -.463 SULEMAN ALl C/DAR 01 9130 16973 84865 17,263 120,841 406 206,112 480 ALTAF HUSSAIN C/DAR 01 11160 19453 97265 19,743 138,201 406 235,872 491 ARIF HUSSAIN C/ASSTT 16 26510 43139 215695 44,659 312,613 2128 530,436 491 USAMAANWAR C/ASSTT 16 28030 45091 225455 46,611 326,277 2128 553,860 491 MUHAMMAD ASIF C/A 16 44750 65263 326315 66,783 467,481 2128 795,924 491 UMAR FAR000. C/ASSTT 16 21950 37283 186415 38,803 271,621 2128 460,164 491 MUHAMMAD ARSHIO C/ASSH 16 34110 52899 264495 54,419 380,933 2128 647,556 491 QASIM RAFIQUE C/ASST 16 31070 48995 244975 50,515 353,605 2128 600,708 491 UMM-E RUBAB C/ASSTT 16 20430 35331 176655 36,851 257,957 2128 436,740 491 ALl IMRAN C/ASSISTANT 16 20430 35331 176655 36,851 257,957 2128 436,740 491 MUAZ RASOOL COMM.ASSIST 16 35630 53551 267755 55,071 385,497 2128 655,380 491 MUHAMMAD SADDIQUE C/ASSTT 16 32590 46920 234600 48,440 339,080 2128 575,808
7 491 MUHAMMAD SUFIYAN COM.ASSISTANT 15 20110 32412 162050 33,742 236,194 1862 400,116 491 ALTAF HUSSAIN C/SUPDTT. 16 49310 72491 362455 74,011 518,077 2128 882,660 491 IFTIKHAR AHMED C/ASSTT 16 34110 53099 265495 54,619 382,333 2128 649,956 491 ZIA IQBAL C/ASSTT 16 47790 70667 353335 72,187 505,309 2128 860,772 491 SEHAR BASHIR C/ASSIT 16 20430 35331 176655 36,851 257,957 2128 436,740
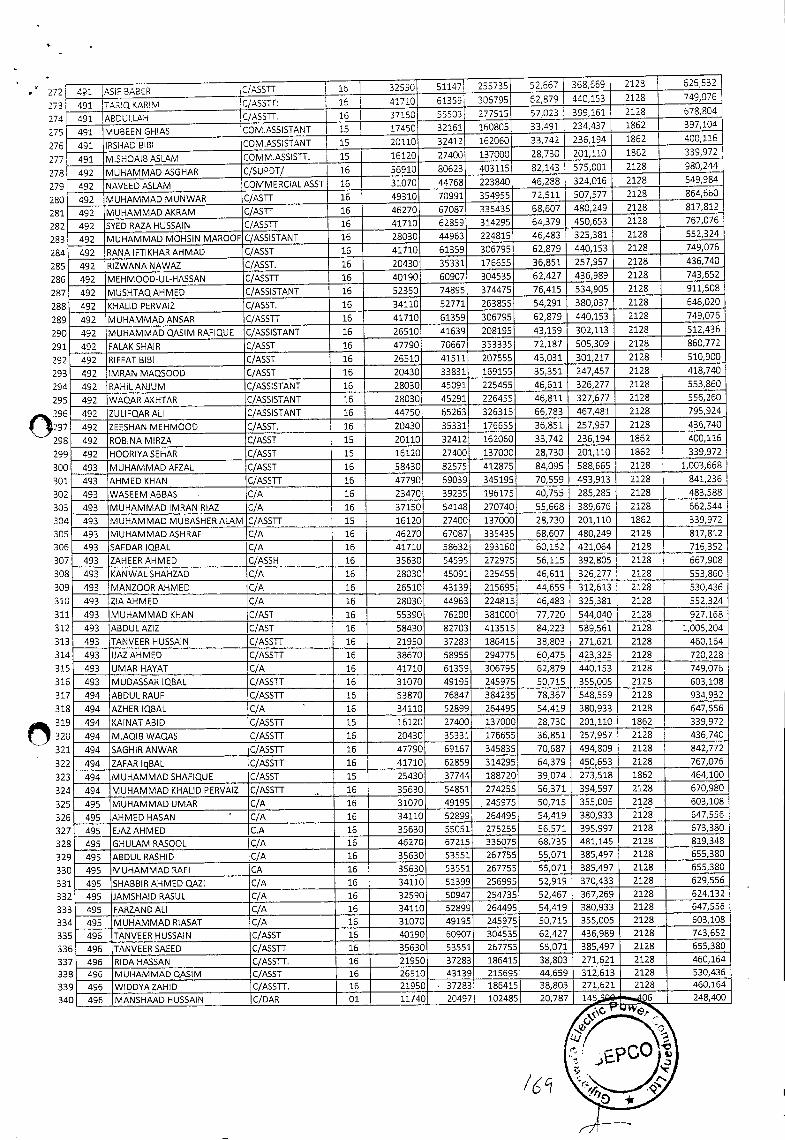
. 272 :73 274 275 276 277 278 279 280 281 282 283 284 285 286 287 288 289 29C 291 292 291 29
29I 30( 30: 30: 30: 30' 3O 301 30 30: 30: 31 31 31 31 31 31 31 31 31
41 ASIF BABER CIASSTT 16 I 325901 51147 255735 52,567 368,669 2128 626,532 491 TA9QKARIM IC/ASSTT: 15 41710 61359 306795 62,879 440,153 2128 749,076
1 491 ABDULLH C/ASSTT. 16 37150 55503 277515 57,023 399,161 2128 678,804 491 MUBEEN GHIAS COMASSISTANT 15 17450 32161 160805 33491 234,437 1862 397,104 491 IRSHAD BIBI COM.ASSISTANT 15 20110 32412 162060 33,742 236,194 1862 400,116 491 M.SHOAIB ASLAM COMM.ASSISTT. 15 16120 27400 137000 28,730 201,110 1862 339,972 492 MUHAMMAD ASGHAR C/SUPDT/ 16 56910 80623 403115 82,143 575,001 2128 980,244 492 NAVEEDASLAM COMMERCIALASST 16 31070 44768 223840 46238 324,016 2128 549,984 492 MUHAMMAD MUNWAR C/ASTT 16 49310 70991 354955 72,511 507,577 2128 864,550 492 MUHAMMAD AKRAM C/ASTT 16 46270 67087 335435 68,607 480,249 2128 817,812 492 SYED RAZA HUSSAIN C/ASSTF 16 41710 62859 314295 64,379 450,653 2128 767076 492 MUHAMMAD MOHSIN MAROOF C/ASSISTANT 16 28030 44963 224815 46,483 325,381 2128 552,324 492 RANA IFTIKHAR AHMAD C/ASST 16 41710 61359 306795 62,879 440,153 2128 749,076 492 RIZWANA NAWAZ C /ASST. 16 20430 35331 176655 36,851 257,957 2128 436,740 492 MEHMOOD-UL-HASSAN C/ASSTT 16 40190 60907 304535 62,427 436,989 2128 743,652 492 MUSHTAQAHMED C/ASSISTANT 16 52350 74895 374475 76,415 534,905 2128 911,508 492 KI-3ALID PERVAIZ C/ASST. 16 34110 52771 263855 54,291 380,037 2128 646,020 492 MUHAMMAD ANSAR C /ASSTT 16 41710 61359 306795 62,879 440,153 2128 749,076
I 492 MUHAMMAD O,ASIM RAFIQUE C/ASSISTANT 16 26510 41639 208195 43,159 302,113 2128 512,436 492 FALAK SHAIR C/ASST 16 47790 70667 353335 72,187 505,309 2128 860,772 492 RIFFAT BIBI C /ASST 16 26510 41511 207555 43,031 301,217 2128 510,900
I 492 IMRAN MAQS000 C/ASST 16 20430 33831 169155 35,351 247,457 2128 418,740 3 492 RAHILANJUM C /ASSISTANT 16 28030 45091 225455 46,611 326,277 2128 553,860 1 492 WAOAR AKHTAR C/ASSISTANT 16 28030 45291 226455 46,811 327,677 2128 556,260
492 ZULIFQAR ALl C/ASSISTANT 16 44750 65263 326315 66,783 467,481 2128 795,924 492 ZEESHAN MEHM000 C/ASST. 16 20430 35331 176655 36,851 257,957 2128 436,740
3 492 ROBINA MIRZA C/ASST 15 20110 32412 162060 33,742 236,194 1862 400,116 492 HOORIYASEHAR C/ASST 15 16120 27400 137000 28,730 201,110 1862 339,972 493 MUHAMMAD AFZAL C/ASST 16 58430 82575 412875 84,095 588,665 2128 1,003,668 493 AHMED KHAN C/ASSTT 16 47790 69039 345195 70,559 493,913 2128 841,236
a 493 WASEEM ABBAS - C/A 16 23470 39235 195175 40,755 285,285 2128 483,588 3 493 MUHAMMAD IMRAN RIAZ C/A 16 37150 54148 270740 55,668 389,676 2128 662,544 3 493 MUHAMMAD MUBASHERALAM C/ASSTT 15 16120 27400 137000 28,730 201,110 1862 339,972 5 493 MUHAMMAD ASHRAF C/A 16 46270 67087 335435 68,607 480,249 2128 817,812 5 493 SAFDAR IQBAL C/A 16 41710 58632 293160 60,152 421,064 2128 716,352 7 493 ZAHEER AHMED C/ASSH 16 35630 54595 272975 56,115 392,805 2128 667,908 3 493 KANWALSHAHZAD C/A 16 28030 45091 225455 46,611 326,277 2128 553,860 1 493 MANZOOR AHMED C/A 16 26510 43139 215695 44,659 312,613 2128 530,436 3 493 ZIAAHMED C/A 16 28030 44963 224815 46,483 325,381 2128 552,324 1 493 MUHAMMAD KHAN CJAST 16 55390 76200 381000 77,720 544,040 2128 927,158 2 493 ABDULAZIZ C/AST 16 58430 82703 413515 84,223 589,561 2128 1,005,204 3 493 TAN VEER HUSSAIN C/ASSTT 16 21950 37283 186415 38,803 271,621 2128 460,164 4 493 IJAZAHMED C/ASSTT 16 38670 58955 294775 60,475 423,325 2128 720,228 5 493 UMARHAYAT C/A 16 41710 61359 306795 62,879 440,153 2128 749,076 6 493 MUDASSAR IQBAL C/ASSTT 16 31070 49195 245975 50,715 355,005 2128 603,108 7 494 ABDUL RAUF C/ASSTT 16 53870 76847 384235 78,367 548,569 2128 934,932 8 494 AZHER IQBAL C/A 16 34110 52899 264495 54,419 380,933 2128 647,556 9 494 KAINAT ABID C/ASSTT 15 16120 27400 137000 28,730 201,110 1862 339,972 0 494 M.AQIB WAOAS C/ASSTT 16 20430 35331 176655 36,851 257,957 2128 436,740 1 494 SAGHIR ANWAR C/ASSTT 16 47790 69167 345835 70,687 494,809 2128 842,772 2 494 ZAFAR Iq BAL C/ASSTT 16 41710 62859 314295 64,379 450,653 2128 767,076 3 494 MUHAMMAD SHAFIQUE C/ASST 15 25430 37744 188720 39,074 273,518 1862 464,100 4 494 MUHAMMAD KHALID PERVAIZ C/ASSTT 16 35630 54851 274255 56,371 394,597 2128 670,980 5 495 MUHAMMAD UMAR C/A 16 31070 49195 245975 50,715 355,005 2128 603,108 6 495 AHMED HASAN C/A 16 34110 52899 264495 54,419 380,933 2128 647,556 7 495 EJAZAHMED C.A 16 35630 55051 275255 56,571 395,997 2128 673,380 8 495 GHULAM RASOOL C/A 16 46270 67215 336075 68,735 481,145 2128 819,348 ,9 495 ABDUL RASHID C/A 16 35630 S3551 267755 55,071 385,497 2128 655,380 0 495 MUHAMMAD RAFI CA 16 35630 53551 267755 55,071 385,497 2128 655,380 1 495 SHABBIR AHMED QAZI C/A 16 34110 51399 256995 52,919 370,433 2128 629,556
12 495 JAMSHAID RASUL C/A 16 - 32590 50947 254735 52,467 367,269 2128 624,132 3 495 FARZ.AND ALl C/A 16 34110 52899 264495 54,419 380,933 2128 647,556
14 495 MUHAMMAD RIASAT C/A 16 31070 49195 245975 50,715 355,005 2128 603,108 15 496 TAN VEER HUSSAIN C /ASST 16 40190 60907 304535 62,427 436,989 2128 743,652 16 496 TANVEER SAEED C/ASSTT 16 35630 535S1 267755 55,071 385,497 2128 655,380 17 496 RIDA HASSAN C/ASSTT. 16 21950 37283 186415 38,803 271,621 2128 460,164 38 496 MUHAMMAD QASIM C/ASST 16 26510 43139 215695 44,659 312,613 2128 530,436 39 496 WIDDYA ZAHID C/ASSTT. 16 21950 37283 186415 38,803 271,621 2128 460,164 10 496 MANSHAAD HUSSAIN C/DAR 01 11740 20497 102485 20,787 145 06 248,400
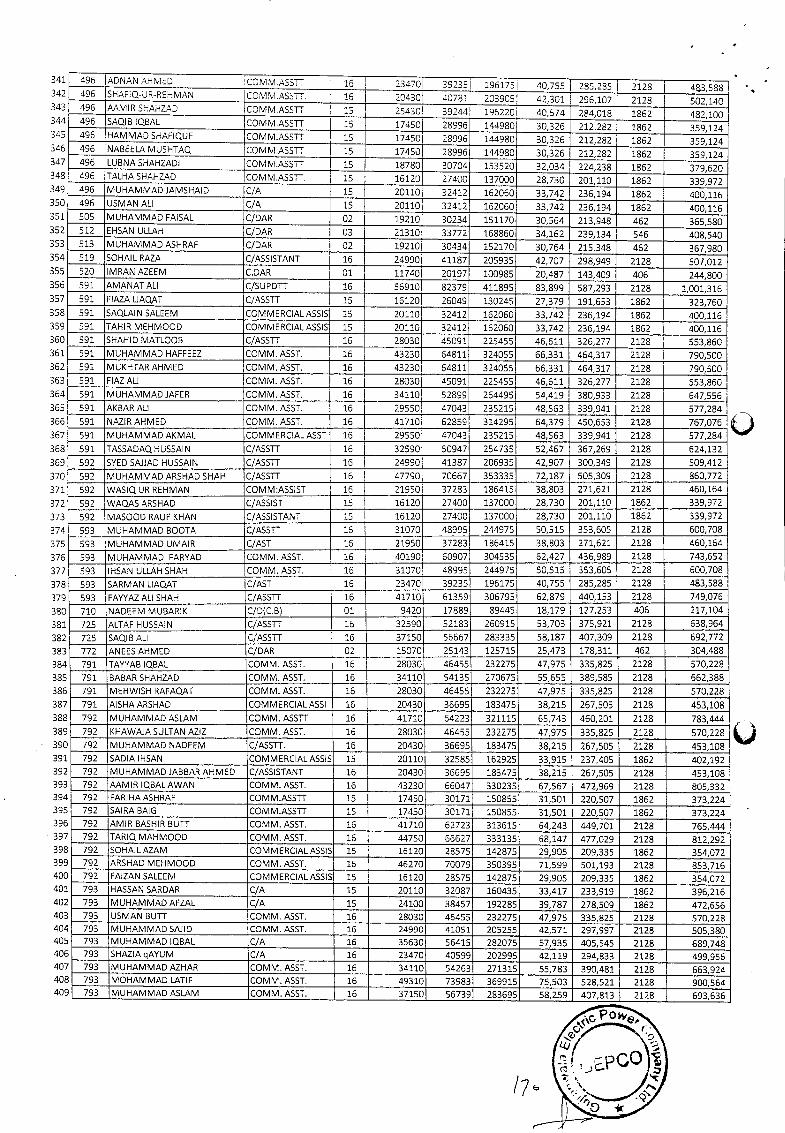
496 ADNAN AHMED COMM.ASSTT 16 23470 392351 1961751 40,755 285,285 2128 483,588 496 SHAF!Q-UR.REHMAN C0MMASS. 15 20430 4Q73i 203905 42,301 296,107 2123 502,140 496 AAMIR SHAHZAD COMM.ASSTT 15 25430, 392d4 196220 40,574 284,018 1862 482,100 496 SAQIB QBAL COMM.ASSTT 15 17450 28996 1449801 30,326 212,282 1862 359,124 496 HAMMAD SHAFIQUE COMM.ASSTT 15 174501 28996 144980 30,326 212,282 1862 359,124 496 NABEELA MUSHTAO. COMM.ASSTT 15 174501 28996 144980 30,326 212,282 1862 359,124 496 LUBNASHAHZADI COMM.ASSTT 15 18780 30704 153520 32,034 224,238 1862 379,620 496 TALHASHAHZAO COMM.ASSTT. 15 16120 27400 137000 28,730 201,110 1862 339,972 496 MUHAMMAD JAMSHAID C/A 15 20110 32412 162060 33,742 236,194 1862 400,116 496 USMAN ALl C/A 15 20110 32412 162060 33,742 236,194 1862 400,116 505 MUHAMMAD FAISAL C/OAR 02 19210 30234 151170 30,564 213,948 462 365,580 512 EHSAN ULLAH C/DAR 03 21310 33772 168860 34,162 239,134 546 408,540 513 MUHAMMAD ASHRAF C/DAR 02 19210 30434 152170 30,764 215,348 462 367,980 519 SOHAIL RAZA C/ASSISTANT 16 24990 41187 205935 42,707 298,949 2128 507,012 520 IMRAN AZEEM C.DAR 01 11740 20197 100985 20,487 143,409 406 244,800 591 AMANAT AL! C/SUPDTT 16 56910 82379 411895 83,899 587,293 2128 1,001,316 591 FIAZ.A LIAQAT C/ASSTT 15 16120 26049 130245 27,379 191,653 1862 323,760 591 SAQLAIN SALEEM COMMERCIALASSIS 15 20110 32412 162060 33,742 236,194 1862 400,116 591 TAHIR MEHMOOD COMMERCIAL ASSIS 15 20110 32412 162060 33,742 236,194 1862 400,116 591 SHAHID MATLOOB C/ASSTT 16 28030' 45091 225455 46,611 326,277 2128 553,860 591 MUHAMMAD HAFFEEZ COMM. ASST. 16 43230 64811 324055 66,331 464,317 2128 790,500 591 MUKHTARAHMED COMM. ASST. 16 43230 64811 324055 66,331 464,317 2128 790,500 591 FIAZ ALl COMM. ASST. 16 28030 45091 225455 46,611 326,277 2128 553,860 591 MUHAMMAD JAFER COMM. ASST. 16 34110 52899 264495 54,419 380,933 2128 647,556
591 AKBAR AL! COMM. ASST. 16 29550 47043 235215 48,563 339,941 2128 577,284
591 NAZIR AHMED COMM. ASST. 16 41710 62859 314295 64,379 450,653 2128 767,076 1 591 MUHAMMAD AKMAL COMMERCIAL ASST 16 29550 47043 235215 48,563 339,941 2128 577,284
591 TASSADAQHUSSAIN C/ASSTT 16 32590 50947 254735 52,467 367,269 2128 624,132
592 SYED SAJJAD HUSSAIN C/ASSTT 16 24990 41387 206935 42,907 300,349 2128 509,412
592 MUHAMMAD ARSHAD SHAH C/ASSTT 16 47790 70667 353335 72,187 505,309 2128 860,772
592 WASIQ UR REHMAN COMM:ASSIST 16 21950 37283 186415 38,803 271,621 2128 460,164
592 WAO,AS ARSHAD IC/ASSIST 15 16120 27400 137000 28,730 201,110 1862 339,972
592 MAS000 RAUF KHAN C/ASSISTANT 15 I 16120 27400 137000 28,730 201,110 1862 339,972
593 MUHAMMAD BOOTA C/ASSTT 16 31070 489951 244975 50,515 353,605 2128 600,708
593 MUHAMMAD UMAIR C/AST 16 21950 37283 186413 38,803 271,621 2128 460,164
593 MUHAMMAD FARYAD COMM. ASST. 16 40190 60907 304535 62,427 436,989 2128 743,652
593 IHSAN ULLAH SHAH COMM. ASST. 16 31070 48995 244975 50,515 353,605 2128 600,708
593 SARMAN LIAQ,AT C/AST 16 23470 39235 196175 40,755 285,285 2128 483,588
593 FAYYAZ AL! SHAH C/ASSTT 16 41710 61359 306795 62,879 440,153 2128 749,076
710 NADEEM MUBARIK C/D(C.B) 01 9420' 17889 89445 18,179 127,253 406 217,104
725 ALTAF HUSSAIN C/ASSTT 16 32590 52183 260915 53,703 375,921 2128 638,964
725 SAQIB ALl C/ASSTT 16 37150 56667 283335 58,187 407,309 2128 692,772
772 ANEES AHMED C/DAR 02 15070 25143 125715 25,473 178,311 462 304,488
791 TAYYAB IQBAL COMM. ASST. 16 28030 46455 232275 47,975 335,825 2128 570,228
791 BABAR SHAHZ.AO COMM. ASST. 16 34110 54135 270675 55,655 389,585 2128 662,388
791 MEHWISH RAFAQAT COMM. ASST. 16 28030 46455 232275 47,975 335,825 2128 570,228
791 AISHAARSHAD COMMERCIALASSI 16 20430 36695 183475 38,215 267,505 2128 453,108
792 MUHAMMAD ASLAM COMM. ASSTT 16 41710 64223 321115 65,743 460,201 2128 783,444
792 KHAWAJA SULTAN AZIZ COMM. ASST. 16 28030 46455 232275 47,975 335,825 2128 570,228 792 MUHAMMAD NADEEM C/ASSTT. 16 20430 36695 183475 38,215 267,505 2128 453,108 792 SADIA IHSAN COMMERCIAL ASSIS 15 20110 32585 162925 33,915 237,405 1862 402,192 792 MUHAMMAD JABBAR AHMED C/ASSISTANT 16 20430 36695 183475 38,215 267,505 2128 453,108 792 AAMIR IQBALAWAN COMM. ASST. 16 43230 66047 330235 67,567 472,969 2128 805,332 792 FARIHAASHRAF COMM.ASSTT 15 17450 30171 150855 31,501 220,507 1862 373,224 792 SAIRA BAIG COMM.ASSTT 15 17450 30171 150855 31,501 220,507 1862 373,224 792 AMIR BASHIR BUTT COMM. ASST. 16 41710 62723 313615 64,243 449,701 2128 765,444 792 TARIQ MAHM000 COMM. ASST. 16 44750 66627 333135 68,147 477,029 2128 812,292 792 SOHAILAZAM COMMERCIALASSIS 15 16120 28575 142875 29,905 209,335 1862 354,072 792 ARSHAD MEHMOOD COMM. ASST. 16 46270 70079 350395 71,599 501,193 2128 853,716 792 FAIZAN SALEEM COMMERCIALASSIS 15 16120 28575 142875 29,905 209,335 1862 354,072 793 HASSAN SARDAR C/A 15 20110 32087 160435 33,417 233,919 1862 396,216 793 MUHAMMAD AFZAL C/A 15 24100 38457 192285 39,787 278,509 1862 472,656 793 USMAN BUTT COMM. ASST. 16 28030 46455 232275 47,975 335,825 2128 570,228 793 MUHAMMAD SAuD COMM. ASST. 15 24990 41051 205255 42,571 297,997 2128 505,380 793 MUHAMMAD IQBAL C/A 16 35630 56415 282075 57,935 405,545 2128 689,748 793 SHAZIA qAYUM C/A 16 23470 40599 202995 42,119 294,833 2128 499,956 793 MUHAMMAD AZHAR COMM. ASST. 16 34110 54263 271315 55,783 390,481 2128 663,924 793 MOHAMMAO LATIF COMM. ASST. 16 49310 73983 369915 75,503 528,521 2128 900,564 793 MUHAMMAD ASLAM COMM. ASST. 16 37150 56739 283695 58,259 407,813 2128 693,636
/7
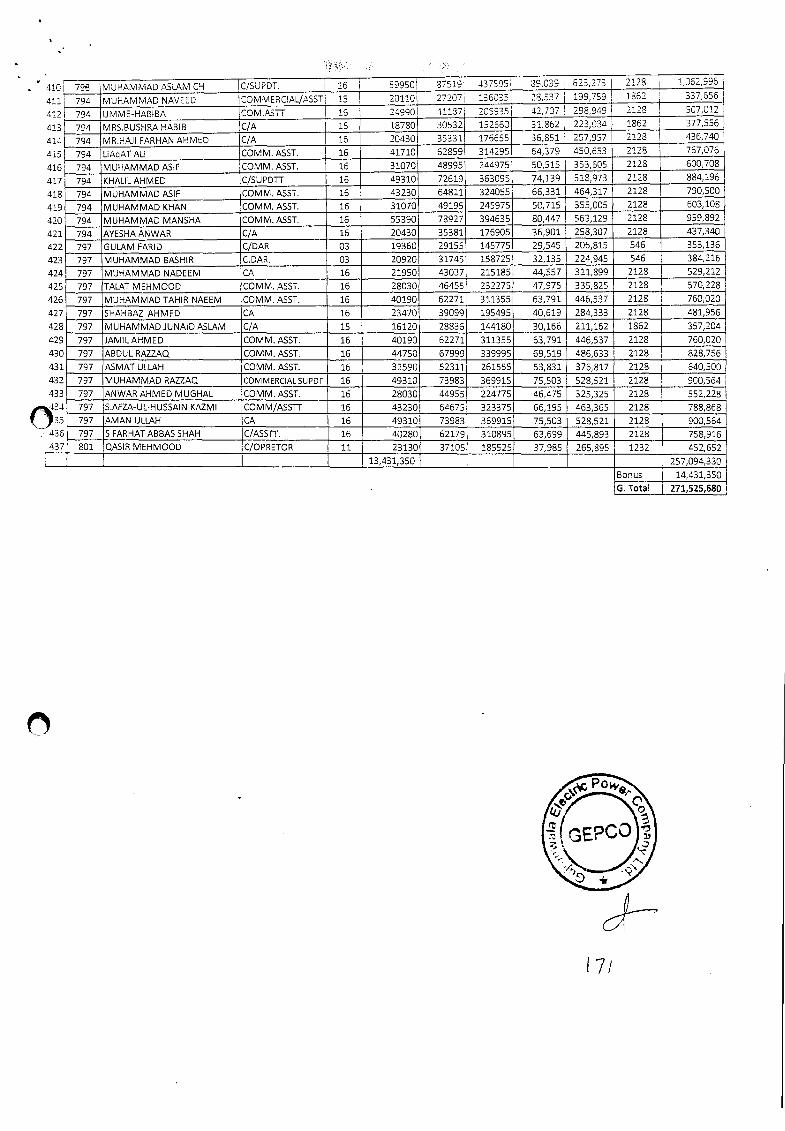
410
411
412
413
414
'115
416
417
418
419
420
421
422
423
424
425
426
427
428
429
430
431
432
433
434
33
436
437
79 MUHAMMAD ASLAM CH C/SUPDT. 16 59950 87519 437595i 39,039 623,273 I 2128 1,062,9961
794 MUHAMMAD NAVEED COMMERCIAL/ASST 15 20110 27207 236035 28,537 199,759 1862 337,o56
794 UMME-HABIBA COM.ASTT 16 24990 41137 205935 42,707 298,949 2128 507,012
794 MRS.BUSHRA HABIB C/A 15 18780 30532 152660 31,862 223,034 1862 377,556
794 MR.HAJI FARHAN AHMED C/A 16 20430 353311 176655 36,851 257,957 2128 436,740
794 UAqAT AU COMM. ASST. 16 41710 62859 314295 64,379 I 450,653 2128 767,075
794 MUHAMMAD ASIF COMM. ASST. 16 31070 48995 244975 50,515 353,605 2128 600,708
794 KHALILAHMED C/SUPDU 16 49310 72619 363095 74,139 518,973 2128 I 884,196
794 MUHAMMAD ASIF COMM. ASST. 16 43230 64811 324055 66,331 464,317 2128 790,500
794 MUHAMMAD KHAN COMM. ASST. 16 31070 49195 245975 50,715 355,005 2128 603,108
794 MUHAMMAD MANSHA COMM. ASST. 16 55390 78927 394635 80,447 563,129 2128 959,892
794 AYESHA AN WAR C/A 16 20430 35381 176905 36,901 258,307 2128 437,340
797 GULAM FARID C/OAR 03 19360 29155 145775 29,545 206,815 546 353,136
797 MUHAMMAD BASHIR C.DAR. 03 20920 31745 158725 32,135 224,945 546 384,216
797 MUHAMMAD NADEEM CA 16 21950 43037 215185 44,557 311,899 2128 529,212
797 TALAT MEHM000 COMM. ASST. 16 28030 46455 232275 47,975 335,825 2128 570228
797 MUHAMMAD TAHIR NAEEM COMM. ASST. 16 40190 62271 311355 63,791 446,537 2128 760,020
797 SHAHBAZ AHMEO CA 16 23470 39099 195495 40,619 284,333 2128 481,956
797 MUHAMMAD JUNAID ASLAM C/A 15 16120 28836 144180 30,166 211,162 1862 357,204
797 JAMILAHMED COMM.ASST. 16 40190 62271 311355 63,791 446,537 2128 760,020
797 ABDUL RAZZAQ COMM. ASST. 16 44750 67999 339995 69,519 486,633 2128 828,756
797 ASMAT ULLAH COMM. ASST. 16 32590 52311 261555 53,831 376,817 2128 640,500
797 MUHAMMAD RAZZ.AQ COMMERCIALSUPDT 16 49310 73983 369915 75,503 528,521 2128 900,564
797 AN WAR AHMED MUGHAL COMM. ASST. 16 28030 44955 224775 46,475 325,325 2128 552,228
797 S.AFZ.A-UL-HUSSAIN KAZMI COMM/ASSTT 16 43230 64675 323375 66,195 463,365 2128 788,868
797 AMAN ULLAH CA 16 49310 73983 369915 75,503 528,521 2128 900,564
797 S FARHAT ABBAS SHAH C/ASSTT. 16 40280 62179 310895 63,699 445,893 2128 758,916
801 OASIR MEHMOOD C/OPRETOR 11 23130 37105 185525 37,985 265,895 1232 452,652
13,431,350 257,094,330
Bonus 14,431,350
G. Total 271,525,680
17i
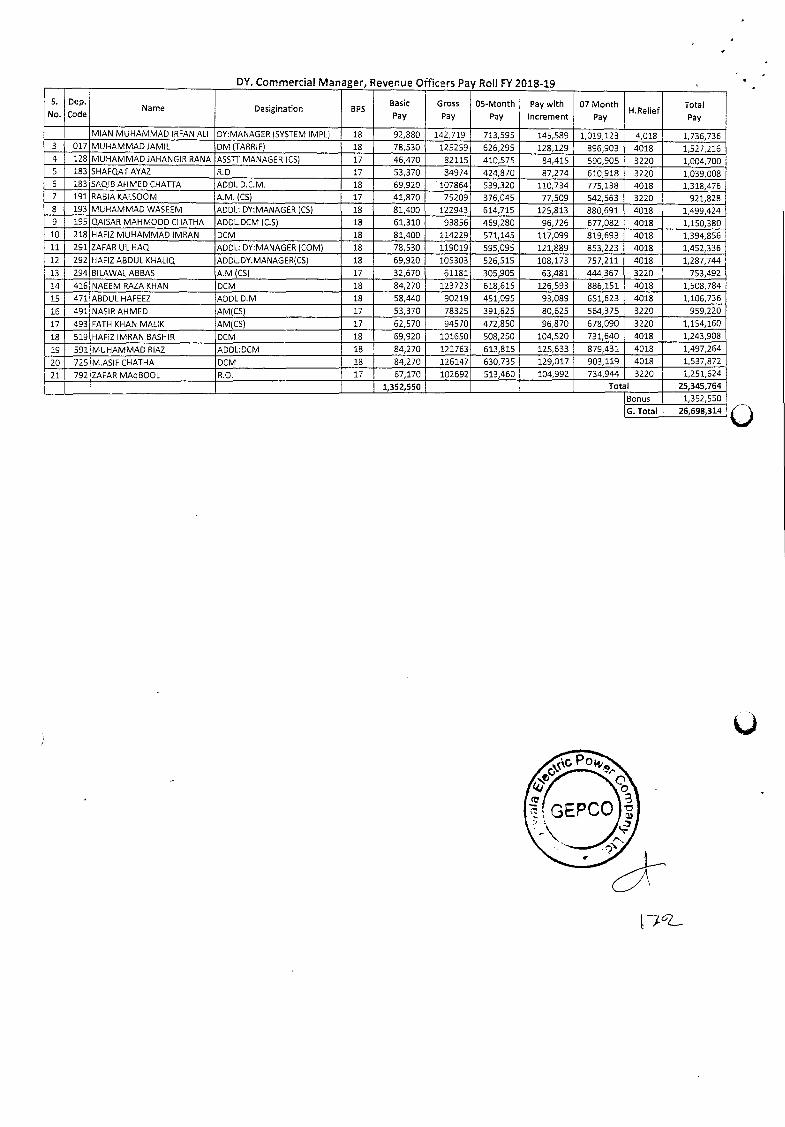
DY. Commercial Manager, Revenue Officers Pay Roll FY 2018-
S.
No.
Dep.
Code Name Desigination BPS
Basic
Pay
Gross
Pay
05-Month
Pay
Pay with
Increment
07 Month
Pay H.Relief
Total
Pay
MIAN MUHAMMAD IRFAN ALl DY:MANAGER (SYSTEM IMPL) 18 92,880 142,719 713,595 145,589 1,019,123 4,018 1,736,736 3 017 MUHAMMAD JAMIL DM (TARRIF) 18 78,530 125259 626,295 128,129 896,903 4018 1,527,216 4 128 MUHAMMAD JAHANGIR RANA ASSTT MANAGER (CS) 17 46,470 82115 410,575 84,415 590,905 3220 1,004,700 5 183 SHAFQATAYAZ 8.0 17 53,370 84974 424,870 87,274 610,918 3220 1,039,008 6 183 SAQIB AHMED CHATTA ADDL D.C.M. 18 69,920 107864 539,320 110,734 775,138 4018 1,318,476 7 191 RABIA KALSOOM A.M. (CS) 17 41,870 75209 376,045 77,509 542,563 3220 921,828 8 193 MUHAMMAD WASEEM ADDL: DY:MANAGER (CS) 18 81,400 122943 614,715 125,813 880,691 4018 1,499,424 9 195 0.AISAR MAHM000 CHATHA ADDL.DCM (CS) 18 61,310 93856 469,280 96,726 677,082 4018 1,150,380
10 218 HAFIZ MUHAMMAD JMRAN DCM 18 81,400 114229 571,145 117,099 819,693 4018 1,394,856
11 291 ZAFAR UL HAQ ADDL: DY:MANAGER (CaM) 18 78,530 119019 595,095 121,889 853,223 4018 1,452,336
12 292 HAFJZ ABDUL KHALIQ ADDL.DY.MANAGER(CS) 18 69,920 105303 526,515 108,173 757,211 4018 1,287,744
13 294 BILAWAL ABBAS A.M (CS) 17 32,670 61181 305,905 63,481 444,367 3220 753,492
14 416 NAEEM RAZA KHAN 0CM 18 84,270 123723 618,615 126,593 886,151 4018 1,508,784
15 471 ABDUL HAFEEZ ADDL D.M 18 58,440 90219 451,095 93,089 651,623 4018 1,106,736
16 491 NASIRAHMED AM(CS) 17 53,370 78325 391,625 80,625 564,375 3220 959,220
17 493 FATH KHAN MALIK AM)CS) 17 62,570 94570 472,850 96,870 678,090 3220 1,154,160
18 519 HAFIZ IMRAN BASHIR 0CM 18 69,920 101650 508,250 104,520 731,640 4018 1,243,908
19 591 MUHAMMAD RIAZ ADDL:DCM 18 84,270 122763 613,815 125,633 879,431 4018 1,497,264
20 725 M.ASIF CHATHA DCM 18 84,270 126147 630,735 129,017 903,119 4018 1,537,872
21 792 ZAFAR MAqBOOL R.O. 17 67,170 102692 513,460 104,992 734,944 3220 1,251,624
1,352,SSO Total 25,345,764
Bonus 1,352,550
G. Total 26,698,314
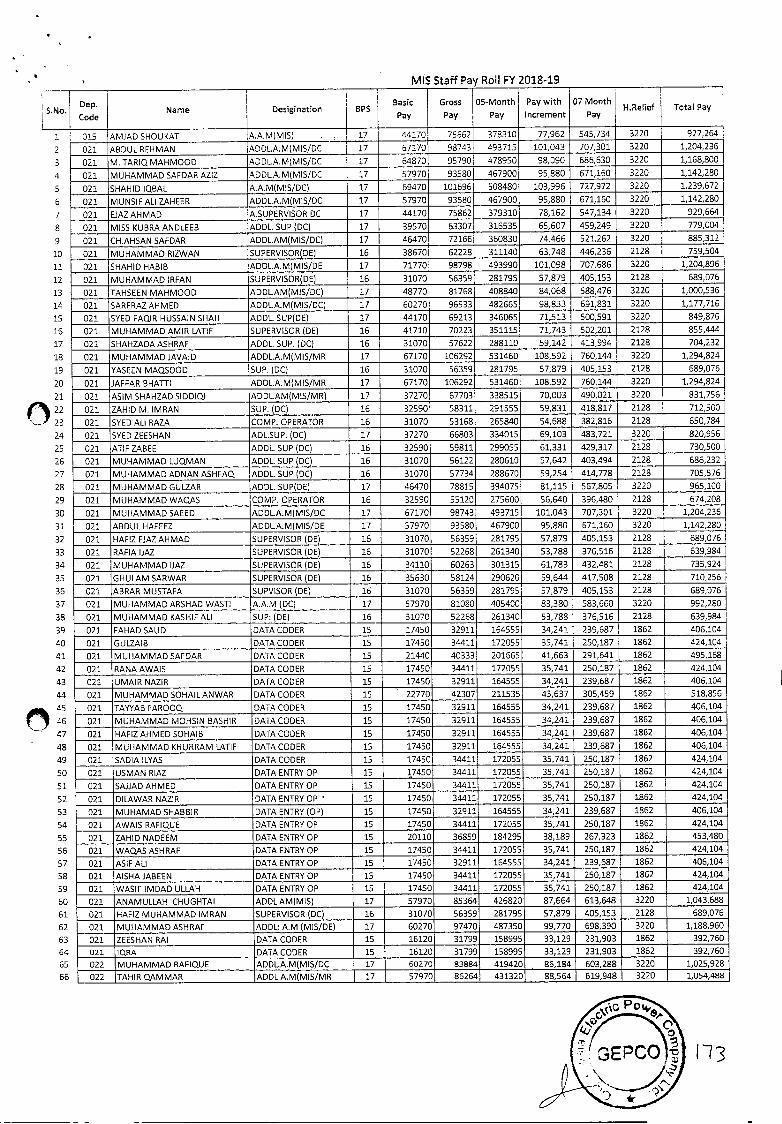
S.No.
2
4
6
7
8
9 10 11
12
13 14 15 16 17
18
19
20
21
O22 23 24
25 26 27
28
29
30
31 32
33 34
35
36 37
38 39
40 41
42 43
MS Staff Pay Rol! F? 2018-19
Dep.
Code Name Desgination BPS
Basic Pay
Gross Pay
05-Month Pay
Pay with Increment
07 Month
Pay HRelief Total Pay
015 AMJAD SHOUKAT A.A.M(MIS) 17 44170 75662 378310 77,962 545,734 3220 927,264
021 ABDUL REHMAN ADDLA.M(MIS/DC 17 67170 94743 493715 101,043 707,301 3220 1,204,236
021 M. TARIQ MAHM000 ADDL.A.M)MIS/DC 17 64870 95790 478950 98,090 686,630 3220 1,168,800
021 MUHAMMAD SAFDAR AZIZ ADDLA.M)MIS/DC 17 57970 93580 467900 95,880 671,160 3220 1,142,280
021 SHAHID IQBAL A.A.M)MIS/DC) 17 69470 1016961 508480 103,996 727,972 3220 1,239,672
021 MUNSIF ALl ZAHEER ADDL.A.M)MIS/DC 17 57970 93580 467900 95,880 671,160 3220 1,142,280
021 EJAZAHMAD A.SUPERVISOR DC 17 44170 75862 379310 78,162 547,134 3220 929,664
021 MISS KUBRA ANDLEEB ADOL. SUP (DC) 17 39570 63307 316535 65,607 459,249 3220 779,004
021 CH.AHSAN SAFDAR ADDL.AM)MIS/DC) 17 46470 72166 360830 74,466 521,262 3220 885,312
021 MUHAMMAD RIZWAN SUPERVISOR(DE) 16 38670 62228 311140 63,748 446,236 2128 759,504
021 SHAHID HABIB ADDL.A.M)MIS/DE 17 71770 98798 493990 101,098 707,686 3220 1,204,896
021 MUHAMMAD IRFAN SUPERVISOR(DE) 16 31070 56359 281795 57,879 405,153 2128 689,076
021 TAHSEtN MAHMOOD ADDLAM)MIS/DC) 17 48770 81768 408840 84,068 588,476 3220 1,000,536
021 SARFRAZAHMED ADDLA.M(MIS/DC) 17 60270 96533 482665 98,833 691,831 3220 1,177,716
021 SYED FAOJR HUSSAIN SHAH ADOL. SUP(DE) 17 44170 69213 346065 71,513 500,591 3220 849,876
021 MUHAMMAD AMIR LATIF SUPERVISOR (DE) 16 41710 70223 351115 71,743 502,201 2128 855,444
021 SHAHZADA ASHRAF ADDL. SUP. (DC) 16 31070 57622 288110 59,142 413,994 2128 704,232
021 MUHAMMAD JAVAID ADDLA.M)MIS/MR 17 67170 106292 531460 108,592 760,144 3220 1,294,824
021 YASEEN MAQSOOD SUP. (DC) 16 31070 56359 281795 57,879 405,153 2128 689,076
021 JAFFAR BHATTI ADDLA.M)MIS/MR 17 67170 106292 531460 108,592 760,144 3220 1,294,824
021 ASIM SHAHZAD SIDDIOJ ADDLAM)MIS/MR) 17 37270 67703 338515 70,003 490,021 3220 831,756
021 ZAHID M. IMRAN SUP. (DC) 16 32590 58311 291555 59,831 418,817 2128 712,500
021 SYED ALl RAZ.A COMP. OPERATOR 16 31070 53168 265840 54,688 382,816 2128 650,784
021 SYED ZEESHAN ADL.SUP. (DC) 17 37270 66803 334015 69,103 483,721 3220 820,956
021 ATIF ZABEE ADDL SUP (DC) 16 32590 59811 299055 61,331 429,317 2128 730,500
021 MUHAMMAD LUQMAN ADDL. SUP (DC) 16 31070 56122 280610 57,642 403,494 2128 686,232
021 MUHAMMAD ADNAN ASHFAO. ADDL. SUP (DC) 16 31070 57734 288670 59,254 414,778 2128 705,576
021 MUHAMMAD GULZ.AR ADDL. SUP(Dt) 17 46470 78815 394075 81,115 567,805 3220 965,100
021 MUHAMMAD WAO,AS COMP. OPERATOR 16 32590 55120 275600 56,640 396,480 2128 674,208
021 MUHAMMAD SAEED ADDL.A.M)MIS/DC 17 67170 98743 493715 101,043 707,301 3220 1,204,236
021 ABDUL HAFEEZ ADDLA.M)MIS/DE 17 57970 93580 467900 95,880 671,160 3220 1,142,280
021 HAFIZ EJAZ AHMAD SUPERVISOR )DE) 16 31070 56359 281795 57,879 405,153 2128 689,076
021 RAFIA IJAZ SUPERVISOR (DE) 16 31070 52268 261340 53,788 376,516 2128 639,984
021 MUHAMMAD IJAZ SUPERVISOR (DE) 16 34110 60263 301315 61,783 432,481 2128 735,924
021 GHULAM SARWAR SUPERVISOR )DE) 16 35630 58124 290620 59,644 417,508 2128 710,256
021 ABRAR MUSTAFA SUPVISOR )DE) 16 31070 56359 281795 57,879 405,153 2128 689,076
021 MUHAMMAD ARSHAD WASTI A.A.M (DC) 17 57970 81080 405400 83,380 583,660 3220 992,280
021 MUHAMMAD KASHIF ALl SUP: (DE) 16 31070 52268 261340 53,788 376,516 2128 639,984
021 FAHAD SAUD DATA CODER 15 7450 32911 164555 34,241 239,687 1862 406,104
021 GULZAIB DATA CODER 15 17450 34411 172055 35,741 250,187 1862 424,104
021 MUHAMMAD SAFDAR DATA CODER 15 21440 40333 201665 41,663 291,641 1862 495,168
021 RANA AWAIS DATA CODER 15 17450 34411 172055 35,741 250,187 1862 424,104
021 UMAIR NAZIR DATA CODER 15 17450 32911 164555 34,241 239,687 1862 406,104
021 MUHAMMAD SOHAILANWAR DATA CODER 15 22770 42307 211535 43,637 305,459 1862 518,856
021 TAYYAB FAR000 DATA CODER 15 17450 32911 164555 34,241 239,687 1862 406,104
021 MUHAMMAD MOHSIN BASHIR DATA CODER 15 17450 32911 164555 34,241 239,687 1862 406,104
021 HAFIZ AHMED SOHAIB DATA CODER 15 17450 32911 164555 34,241 239,687 1862 406,104
021 MUHAMMAD KHURRAM LATIF DATA CODER 15 17450 32911 164555 34,241 239,687 1862 406,104
021 SADIA ILYAS DATA CODER 15 17450 34411 172055 35,741 250,187 1862 424,104
021 USMAN RIAZ DATA ENTRY OP 15 17450 34411 172055 35,741 250,187 1862 424,104
021 SAJJAD AHMED DATA ENTRY OP 15 17450 34411 172055 35,741 250,187 1862 424,104
021 DILAWAR NAZIR DATA ENTRY OP 15 17450 34411 172055 35,741 250,187 1862 424,104
021 MUHAMAD SHABBIR DATA ENTRY (OP) 15 17450 32911 164555 34,241 239,687 1862 406,104
021 AWAIS RAFIQUE DATA ENTRY OP 15 17450 34411 172055 35,741 250,187 1862 424,104
021 ZAHID NADEEM DATA ENTRY OP 15 20110 36859 184295 38,189 267,323 1862 453,480
021 WAQAS ASHRAF DATA ENTRY OP 15 17450 34411 172055 35,741 250,187 1862 424,104
021 ASIF ALl DATA ENTRY OP 15 17450 32911 164SSS 34,241 239,687 1862 406,104
021 AISHA JABEEN DATA ENTRY OP 15 17450 34411 172055 35,741 250,187 1862 424,104
021 WASIF IMDAD ULLAH DATA ENTRY OP 15 17450 34411 172055 35,741 250,187 1862 424,104
021 ANAMULLAH CHUGHTAI ADDLAM(MIS) 17 S7970 85364 426820 87,664 613,648 3220 1,043,688
021 HAFIZ MUHAMMAD IMRAN SUPERVISOR (DC) 16 31070 56359 281795 57,879 405,153 2128 689,076
021 MUHAMMAD ASHRAF ADOL: A.M (MIS/DE) 17 60270 97470 487350 99,770 698,390 3220 1,188,960
021 ZEESHAN RAI DATA CODER 15 16120 31799 158995 33,129 231,903 1862 392,760
021 IQRA DATA CODER 15 16120 31799 158995 33,129 231,903 1862 392,760
022 MUHAMMAD RAFIQUE ADDL.A.M(MIS/DC 17 60270 83884 419420 86,184 603,288 3220 1,025,928
022 TAHIR QAMMAR ADDL.A.M(MIS/MR 17 57970 86264 431320 88,564 619,948 3220 1,054,488
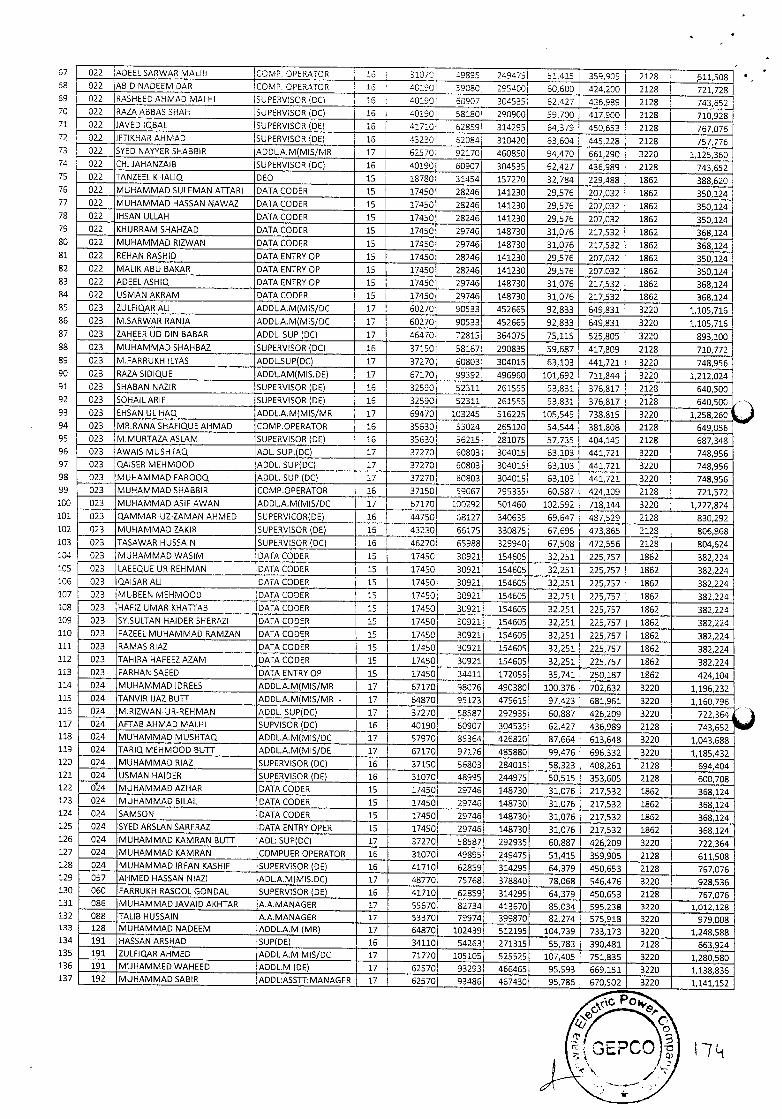
022 ADEELSARWAR MALHI CCMP. OPERATOR 16 31070) 498951 249475 51,415 359,905 2128 .11,508 022 ABID NADEEM DAR COMP, OPERATOR 16 C190I 59080 295400 60,600 424,200 2128 721,728 022 RASHEEDAHMAD MALHI SUPERVISOR CC) 16 0190) 50907 3045351 52427 436,989 2128 743,652 022 RAZAABBASSHAH SUPERVISOR (DC) 16 40190) 58180 290900 59,700 417,900 2128 710,928 022 JAVED IQBAL SUPERVISOR (DE) 16 41710) 62859 314295 64,379 450,653 2128 767,076 022 IFTIKHAR AHMAD SUPERVISOR (DEl 16 432301 52084 310420 63,604 445,228 2128 757,776 022 SYED NAYYER SI-IABBIR ADDLA.M(MIS/MR 17 62570) 92170 460850 94,470 661,290 3220 1,125,360 022 CH. JAHANZAIB SUPERVISOR (DC) 16 40190 60907 304535 62,427 436,989 2128 743,652 022 TANZEEL KHALIQ DEC 15 18780, 31454 157270 32,784 229,488 1862 388,620 022 MUHAMMAD SULEMAN ATTARI DATA CODER 15 17450) 28246 141230 29,576 207,032 1862 350,124 022 MUHAMMAD HASSAN NAWAZ DATA CODER 15 17450 28246 141230 29,576 207,032 1862 350,124 022 IHSAN ULLAH DATA CODER 15 17450 28246 141230 29,576 207,032 1862 350,124 022 KHURRAM SHAHZAD DATA CODER iS 17450 29746 148730 31,076 217,532 1862 368,124 022 MUHAMMAD RIZWAN DATA CODER 15 17450 29746 148730 31,076 217,532 1862 368,124 022 REHAN RASHID DATA ENTRY OP 15 17450 28246 141230 29,576 207,032 1862 350,124 022 MALIK ABU BAKAR DATA ENTRY OP 15 17450 28246 141230 29,576 207,032 1862 350,124 022 ADEEL ASHIQ DATA ENTRY OP 15 17450 29746 148730 31,076 217,532 1862 368,124 022 USMAN AKRAM DATA CODER I 15 17450 29746 148730 31,076 217,532 1862 368,124 023 ZULFIOAR ALl ADDLA.M(MIS/DC 17 60270 90533 452665 92,833 649,831 3220 1,105,716 023 M.SARWAR RANJA ADDLA.M(MIS/DC 17 6027D 90533 452665 92,833 649,831 3220 1,105,716 023 ZAHEER UD DIN BABAR ADDL. SUP (DC) 17 46470 72815 364075 75,115 525,805 3220 893,100 023 MUHAMMAD SHAHBAZ SUPERVISOR (DC) 16 37150 58167 290835 59,687 417,8D9 2128 710,772 023 M.FARRUKH ILYAS ADDLSUP(DC) 17 37270 60803 304015 63,103 441,721 3220 748,956 023 RAZA SIDIQUE ADDLAM(MIS.DE) 17 67170 99392 496960 101,692 711,844 3220 1,212,024 023 SHABAN NAZIR SUPERVISOR )DE) 16 32590 52311 261555 53,831 376,817 2128 640,500 023 SOHAILARIF SUPERVISOR )DE) 16 32590) 52311 261555 53,831 376,817 2128 640,500 023 EHSAN UL HAQ ADDL.A.M(MIS/MR 17 69470 103245 516225 105,545 738,815 3220 1,258,260 023 MR.RANA SHAFIQUE AHMAD COMP.OPERATOR 16 35630 53024 265120 54,544 381,808 2128 649,056 023 M.MURTAZAASLAM SUPERVISOR )DE) 16 35630 56215 281075 57,735 404,145 2128 687,348 023 AWAIS MUSHTAQ ADL SUP.(DC) 17 37270 60803 304015 63,103 441,721 3220 748,956 023 QAISER MEHMOOD ADDL. SUP(DC) 17 37270) 60803 304015 63,103 441,721 3220 748,956 023 MUHAMMAD FAROOQ ADDL. SUP (DC) 17 37270) 60803 304015 63,103 441,721 3220 748,956 023 MUHAMMAD SHABBIR COMP.OPERATOR 16 37150 59067 295335 60,587 424,109 2128 721,572 023 MUHAMMAD ASIF AWAN ADDL.A.M(MIS/DC 17 67170 100292 501460 102,592 718,144 3220 1,222,824 023 OAMMAR-UZ-ZAMAN AHMED SUPERVICOR(DE) 16 44750 58127 340635 69,647 487,529 2128 830,292 023 MUHAMMAD ZAKIR SUPERVISOR (DE) 16 43230 65175 330875 67,595 473,865 2128 806,868 023 TASAWAR HUSSAIN SUPERVISOR (DC) 16 46270 65988 329940 67,508 472,556 2128 804,624 023 MUHAMMAD WASIM DATA CODER 15 17450 30921 154605 32,251 225,757 1862 382,224 023 LAEEQUE UR REHMAN DATA CODER 15 17450 30921 154605 32,251 225,757 1862 382,224 023 O,AISAR ALl DATA CODER 15 17450 30921 154605 32,251 225,757 1862 382,224 023 MUBEEN MEHM000 DATA CODER 15 17450 30921 154605 32,251 225,757 1862 382,224 023 HAFIZ UMAR KHATTAB DATA CODER 15 17450 30921 154605 32,251 225,757 1862 382,224 023 SY.SULTAN HAIDER SHERAZI DATA CODER 15 17450 30921 154605 32,251 225,757 1862 382,224 023 FAZEEL MUHAMMAD RAMZAN DATA CODER 15 17450 30921 154605 32,251 225,757 1862 382,224 023 RAMAS RIAZ DATA CODER 15 17450 30921 154605 32,251 225,757 1862 382,224 023 TAI-iIRA HAFEEZ AZAM DATA CODER 15 17450 30921 154605 32,251 225,757 1862 382,224 023 FARHAN SAEED DATA ENTRY OP 15 17450 34411 172055 35,741 250,187 1862 424,104 024 MUHAMMAD IDREES ADDL.A.M(MIS/MR 17 67170 98076 490380 100,376 702,632 3220 1,196,232 024 TANVIR IJAZ BUTT ADDL.A.M(MIS/MR - 17 64870 95123 475615 97,423 681,961 3220 1,160,796 024 M.RIZWAN-UR-REHMAN ADDL. SUP(OC) 17 37270 58587 292935 50,887 426,209 3220 722,364 024 AFTAB AHMAD MALHI SUPVISOR (DC) 16 40190 50907 304535 62,427 436,989 2128 743,652 024 MUHAMMAD MUSHTAQ ADDL.A.M(MIS/DC 17 57970 85364 426820 87,664 613,648 3220 1,043,688 024 TARIQ MEHM000 BUTT ADDL.A.M(MIS/DE 17 67170 97176 485880 99,476 696,332 3220 1,185,432 024 MUHAMMAD RIAZ SUPERVISOR (DC) 16 3715C 55303 284015 58,323 408,261 2128 694,404 024 USMAN HAIDER SUPERVISOR (DE) 16 31070 48995 244975 50,515 353,605 2128 600,708 04 MUHAMMAD AZHAR DATA CODER 15 17450 29746 148730 31,076 217,532 1862 368,124 024 MUHAMMAD BILAL DATA CODER 15 17450 29746 148730 31,075 217,532 1862 368,124 024 SAMSON DATA CODER 15 17450 29746 148730 31,076 217,532 1862 368,124 024 SYED ARSLAN SARFRAZ DATA ENTRY OPER 15 17450 29746 148730 31,076 217,532 1862 368,124 024 MUHAMMAD KAMRAN BUTT AOL: SUP(DC) 17 37270 58587 292935 60,887 426,209 3220 722,364 024 MUHAMMAD KAMRAN COMPUER OPERATOR 16 31070 49895 249475 51,415 359,905 2128 611,508 024 MUHAMMAD IRFAN KASHIF SUPERVISOR (DE) 16 41710 62859 314295 64,379 450,653 2128 767,076 057 AHMED HASSAN NIAZI ADLA.M(MIS.DC) 17 48770 75768 378840 78,068 546,476 3220 928,536 060 FARRUKH RASOOL GONDAL SUPERVISOR )DE) 16 41710 62859 314295 64,379 450,653 2128 767,076 086 MUHAMMAD JAVAID AKHTAR A.A.MANAGER 17 55670 82734 413670 85,034 595,238 3220 1,012,126 088 TALIB HUSSAIN A.A.MANAGER 17 53370 79974 399870 82,274 575,918 3220 979,008 128 MUHAMMAD NADEEM AIDDLA.M (MR) 17 64870 102439 512195 104,739 733,173 3220 1,248,588 191 HASSAN ARSHAD SUP)DE) 16 34110 54263 271315 55,783 390,481 2128 663,924 191 ZULFIARAHMED ADDLA.M MIS/DC 17 71770 105105 525525 107,405 751,835 3220 1,280,580 191 MUHAMMED WAHEED ADDL.M (DE( 17 62570 93293 466465 95,593 669,151 3220 1,138,836 192 MUHAMMAD SABIR ADDL:ASSU:MANAGER 17 62570 93486 467430 95,786 670,502 3220 1,141,152
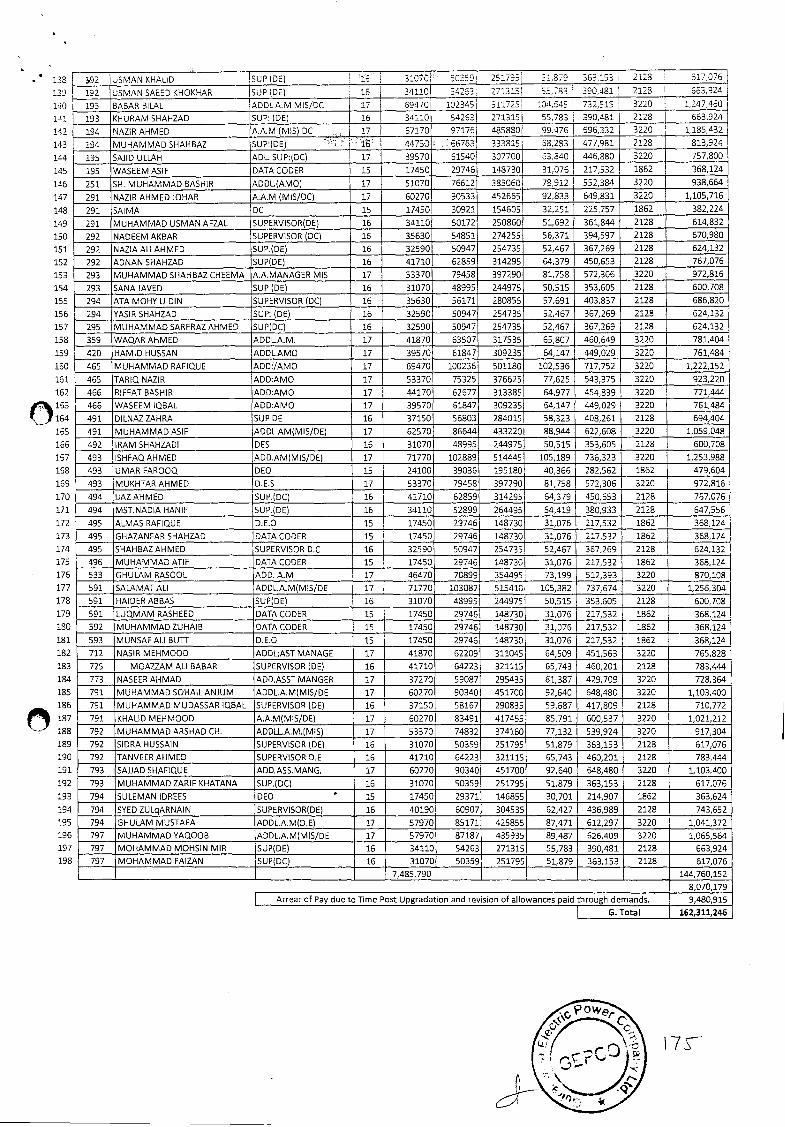
• 138 1
140
141
142
143
144
145
146
147
148
149
150
151
152
153
154
155
156
157
158
159
160
161
162
O 153
154
165
166
167
168
169
170
171
172
173
174
175
176
177
178
179
180
181
182
183
184
185
189
190
191
192
193
194
195
196
197
198
.92 USMAN KHALID SUP (DE) 15 3:0 30359 25179E 51,379 353.153 2128 617076
192 USMAN SAEED KHOKHAR SUP (DE) 15 I 34110 54253 271315 53,783 390481 2128 663,924
193 BABAR BILAL ADDLA.M MIS/DC 17 69470 102345 311725 10t,545 732,515 3220 1,247,450
193 KHURAM SHAHZ.AD SUP: (DE) 15 34110 542631 271315 55,783 390,481 2128 653,924
194 NAZIR AHMED A.A.M (MIS) DC 27 57170! 97175 485880 99,475 695,332 3220 1,185,432
194 MUHAMMAD SHAHBAZ SUP:)DE) 55 44752 66763 333815 68,283 477,981 2128 813,924
195 SAJID ULLAH ADL SUP:(DC) 17 39570 61540 307700 53340 446,880 3220 757,800
195 WASEEM ASIF DATA CODER 15 17450 29746 148730 31,076 217,532 1862 368,124
251 SH. MUHAMMAD BASHIR ADDL(AMO) 17 51070 76612 3830501 78,912 552,384 3220 938,564
291 NAZIR AHMED JOHAR A.A.M (MIS/DC) 17 50270 90533 452665 92,833 649,831 3220 1,105,716
291 SAIMA DC 15 17450 30921 154605 32,251 225,757 1852 382,224
291 MUHAMMAD USMAN AFZAL SUPERVISOR(DE) 16 34110 50172 250860 51,692 361,844 2128 614,832
292 NADEEM AKBAR SUPERVISOR (DC) 16 35630 54851 274255 56,371 394,597 2128 570,980
292 NAZIA ALl AHMED SUP.)DE( 16 32590 50947 254735 52,467 367,269 2128 524,132
292 ADNAN SHAHZAD SUP)DE) 16 41710 62859 314295 64,379 450,653 2128 767,075
293 MUHAMMAD SHAHBAZ CI-IEEMA A.A.MANAGER MIS 17 53370 79458 397290 81,758 572,306 3220 972,816
293 SANA JAVED SUP (DE) 16 31070 48995 244975 50,515 353,605 2128 500,708
294 ATA MOHY U DIN SUPERVISOR (DC) 15 35530 56171 280855 57,691 403,837 2128 685,820
294 YASIR SHAHZAD SUP: )DE) 16 32590 50947 254735 52,467 367,269 2128 524,132
295 MUHAMMAD SARFRAZ AHMED SUP(DC) 15 32590 50947 254735 52,467 367,269 2128 624,132
359 WAQAR AHMED ADDLA.M. 17 41870 63507 317535 65,807 460,649 3220 781,404
420 HAMID HUSSAN ADDLAMO 17 39570 61847 309235 64,147 449,029 3220 761,484
465 MUHAMMAD RAFIQUE ADD:JAMO 17 69470 100235 501180 102,536 717,752 3220 1,222,152
465 TARIQNAZIR ADD:AMO 17 53370 75325 376625 77,625 543,375 3220 923,220
466 RIFFAT BASHIR ADD:AMO 17 44170 52577 313385 64,977 454,839 3220 771,444
466 WASEEM IQBAL ADD:AMO 17 39570 51847 309235 64,147 449,029 3220 761,484
491 DILNAZ ZAHRA SUP DE 16 37150 S6803 284015 58,323 408,261 2128 694,404
491 MUHAMMAD ASIF ADDLAM(MIS/DE) 17 62570 86644 433220 88,944 622,608 3220 1,059,048
492 IRAM SHAHZADI DES 16 31070 48995 244975 50,515 353,605 2128 600,708
493 ISHFAQAHMED ADD.AM(MIS/DE) 17 71770 102889 514445 105,189 736,323 3220 1,253,988
493 UMAR FAROOQ DEO 15 24100 39036 195180 40,366 282,562 1862 479,604
493 MUKHTAR AHMED D.E.S 17 53370 79458 397290 81,758 572,306 3220 972,815
494 IJAZAHMED SUP.(DC) 16 41710 62859 314295 54,379 450,553 2128 767,076
494 MST.NADIA HANIF SUP.(DE) 16 34110 52899 264495 54,419 380,933 2128 547,556
495 ALMAS RAFIQUE D.E.0 15 17450 29745 148730 31,076 217,532 1862 368,124
495 GHAZANFAR SHAHZAD DATA CODER 15 17450 29746 148730 31,076 217,532 1862 368,124
495 SHAHBAZAHMED SUPERVISOR D.0 16 32590 50947 254735 52,467 367,269 2128 624,132
496 MUHAMMAD ATIF DATA CODER 15 17450 29746 148730 31,076 217,532 1862 368,124
533 GHULAM RASOOL ADD. A.M 17 46470 7C899 354495 73,199 512,393 3220 870,108
591 SALAMAT ALl ADDLA.M(MIS/DE 17 71770 103082 515410 105,382 737,674 3220 1,256,304
591 HAIDERABBAS SUP(DE) 15 31070 48995 244975) 50,515 353,605 2128 600,708
591 LUQMAM RASHEED DATA CODER 15 17450 29746 148730 31,076 217,532 1862 358,124
592 MUHAMMAD ZUHAIB DATA CODER 15 17450 29746 148730 31,076 217,532 1862 368,124
593 MUNSAF ALl BUTT D.E.O 15 17450 29746 148730 31,076 217,532 1862 368,124
712 NASIR MEHM000 ADDL;AST MANAGE 17 41870 62209 311045 64,509 451,563 3220 765,828
725 MOAZZAM ALl BABAR SUPERVISOR (DE) 16 41710 64223 321115 65,743 460,201 2128 783,444
773 NASEER AHMAD ADD.ASST MANGER 17 37270 59087 295435 61,387 429,709 3220 728,364
791 MUHAMMAD SOHAILANJUM ADDLA.M(MIS/DE 17 60270 90340 451700 92,640 648,480 3220 1,103,400
791 MUHAMMAD MUDASSAR IQBAL SUPERVISOR (DE) 16 37150 58167 290835 59,587 , 417,809 2128 710,772
791 KHALID MEHMOOD A.A.M(MIS/DE) 17 60270 83491 417455 85,791 600,537 3220 1,021,212
792 MUHAMMAD ARSHAD CH. ADDLL.A.M.(MIS) 17 53370 74832 374160 77,132 539,924 3220 917,304
792 SIDRA HUSSAIN SUPERVISOR )DE) 16 31070 50359 251795 51,879 363,153 2128 617,076
792 TAN VEER AHMED SUPERVISOR D.E 16 41710 64223 321115 65,743 460,201 2128 783,444
793 SAJJAD SHAFIQUE ADD.ASS.MANG. 17 60270 90340 451700 92,640 648,480 3220 1,103,400
793 MUHAMMAD ZARIF KHATANA SUP.)DC) 16 31070 50359 251795 51,879 363,153 2128 617,076
794 SULEMAN IDREES DEO 15 17450 29371 146855 30,701 214,907 1862 363,624
794 SYED ZULqARNAIN SUPERVISOR(DE) 15 40190 60907 304535 62,427 436,989 2128 743,652
794 GHULAM MUSTAFA ADDL.A.MID.E) 17 57970 85171 425855 87,471 612,297 3220 1,041,372
797 MUHAMMAD YA000B ADDL.A.M(MIS/DE 17 57970 87187 435935 89,487 626,409 3220 1,065,564
797 MOHAMMAD MOHSIN MIR SUP(DE) 16 34110 54263 271315 55,783 390,481 2128 663,924
797 MOHAMMAD FAIZAN SUP)DC) 16 31070 50359 251795 51,879 363,153 2128 617,076
7,485,790 144,760,152
8,070,179
Arrear of Pay due to Time Post Upgradation and revision of allowances paid through demands. 9,480,915
G. Total 162,311,246
17
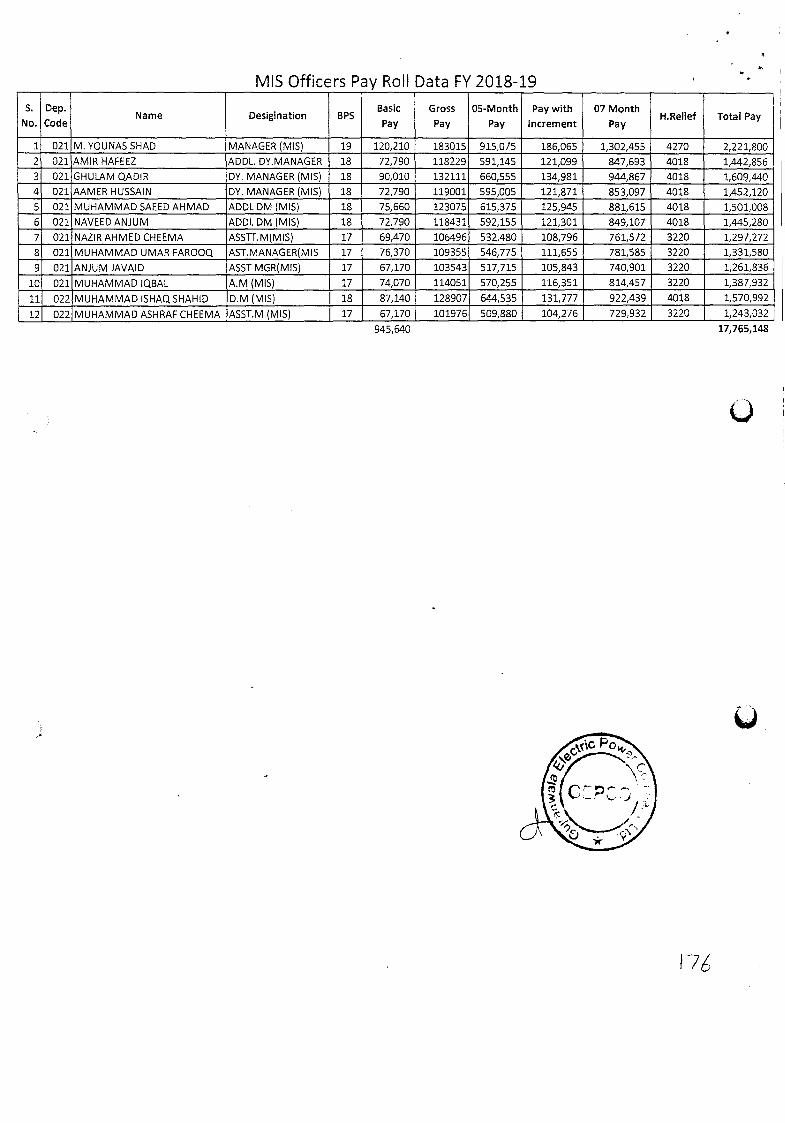
MIS Officers Pay Roll Data FY 2018-19
S.
No.
Dep.
Code Name
. . Desigination BPS
Basic
Pay
Gross
Pay
05-Month
Pay
Pay with
Increment
07 Month
Pay H.Relief Total Pay
1 021 M. YOUNAS SHAD MANAGER (MIS) 19 120,210 183015 915,075 186,065 1,302,455 4270 2,221,800
2 021 AMIR HAFEEZ ADDL. DY.MANAGER 18 72,790 118229 591,145 121,099 847,693 4018 1,442,856
3 021 GHULAM QADIR DY. MANAGER (MIS) 18 90,010 132111 660,555 134,981 944,867 4018 1,609,440
4 021 AAMER HUSSAIN DY. MANAGER (MIS) 18 72,790 119001 595,005 121,871 853,097 4018 1,452,120
5 021 MUHAMMAD SAEED AHMAD ADDL DM (MIS) 18 75,660 123075 615,375 125,945 881,615 4018 1,501,008
6 021 NAVEED ANJUM ADDL DM (MIS) 18 72,790 118431 592,155 121,301 849,107 4018 1,445,280
7 021 NAZIR AHMED CHEEMA ASSU.M(MIS) 17 69,470 106496 532,480 108,796 761,572 3220 1,297,272
8 021 MUHAMMAD UMAR FAR000 AST.MANAGER(MIS 17 76,370 109355 546,775 111,655 781,585 3220 1,331,580
9 021 ANJUM JAVAID ASST MGR(MIS) 17 67,170 103543 517,715 105,843 740,901 3220 1,261,836
10 021 MUHAMMAD IQBAL A.M (MIS) 17 74,070 114051 570,255 116,351 814,457 3220 1,387,932
11 022 MUHAMMAD ISHAQSHAHID D.M (MIS) 18 87,140 128907 644,535 131,777 922,439 4018 1,570,992
12 022 MUHAMMAD ASHRAF CHEEMA ASST.M (MIS) 17 67,170 101976 509,880 104,276 729,932 3220 1,243,032
945,640 17,765,143

OIJJR&NWMAA ELECTIC POWER COMPANY
Financial Statements
For
Financial Year
2019-20
m
S
#__s - .. - ._ RJI LUfl
Grant Thornton Anjum Rahrnan 1-inter floor, Eden Centre, 43•JaH Road, Lahore 54000, Pakistan.
T +924237423 62123, 37422 987
F +92 42 37425 485 www.gtpak.com
An instinct for growth
I7 Chartered Accountants Menrior of Grant Thornton trietnational Ltd
Offices in Karach & tsInnbau
INDEPENDENT AUDITOR'S REPORT
To the members of Gujranwala Electric Power Company Limitcd
Report on the Audit of the Financial Statements
Opinion
\"l'e have iudiied the imexed financial statements of G njran\vala Electric Power Company Limited ("the
Company") which comprise the statement of financial position as at june 30, 2020, and thc statcment of profit
or loss and other comprehensive income, the statement of changes in equity, the statement of cash flows for
the year then ended, and notes to the financial statements, including a summary of significant accounting
policies and other explanatory information, and we state that we have obtained all the information and
explanations \vhich, to the best of our knowledge and belief, were necessary for the purposes of the audit.
In our opinion and to the best of our information arid according to the explanations given to us, the statement
of financial position, statement of profit or loss and other comprehensive income, the statement of changes in
equity and the statement of cash flows together \vith the notes forming part thereof conform with the
accounting and reporting standards as applicable in Pakistan and give the information required by the
Companies Act, 2017 (XIX of 2017), in the manner so required and respectively give a true and fair view of the
state of the Company's affairs as at june 30, 2020 and of the loss and other comprehensive loss, the changes in
equity and its cash flows for the year then ended.
Basis for Opinion
We conducted our audit in accordance with International Standards on Auditing (ISAs) as applicable in
Pakistan. Our responsibilities under those standards are further described in the Auditor's Responsibilities for the
lied/i oj the Financial S/elements section of our report. \\'e are independent of the Company in accordance with
the International lithics Standards Board for Accountants' C'ode if EihicsforProJissiona/..Accounianis as adopted b
the Institute of Chartered Accountants of Pakistan (the Code) and we have fulfilled our other ethical
responsibilities in accordance with the Code. \Ve believe that the audit evidence we have obtained is sufficient
and appropriate to provide a basis for our opinion.
Emphasis of Matter
\\e draw attention to following notes of the annexed financial statements:
a. Note 21 .2 of the annexed financial statements which describes the contingencies which are pending for resolution thereof and the management is cxpccung faeorablc outcome and hence, no provision for the .tiiie li.is been iiitde in the fiiiinct. I silt c:iieiiis.
Grant Tncrrtcn A0 os: loLl (it JtO.Vt (I
Note I Ii annexed Ln:incial statements
(,ov.a,: ,: Pakistan COP chtdiiitt
amountng :ci Rs. 3.394 milli'>a and Rs. 405.S
which : dic:ite that v r:' subsidtes recetv:ihle f:u in the
fuel n:iec adtustir.cnt sulistuv, and agricul a nil ubsidv
million respectively, arc long outstanuing ; and
C. Note 7.2.1 of the annexed financial statements which is disclosing ongoing dispute \Vlth the
Government of .-\zad Jammu and Kashmir (.\ K) on account of sale rate being charged to :\ K and its
recoverability through GOP.
Our opinion is not modified in respect of these matters.
Information Other than the Financial Statements and Auditor's Report Thereon
Management is tesponsibic for the other information. The other information comprises the Directors' Report,
but does not include the financial statements and our auditor's report thereon.
Our opinion on the financial statements does not cover the other information and we do not express any form
of assurance conclusion thereon.
In connection with our audit of the financial statements, our responsibility is to read the other information and,
in doing so, consider whether the other information is materially inconsistent with the financial statements or
our knowledge obtained in the audit or othenvise appears to be materIally misstated. if, based on the \vork
have performed, \VC conclude that there is a material inissiateinerii of this other ioform;iuon, we are reL1uired to
report that fact. \Ve have nothing to report in this regard.
Responsibilities of Management and Board of Directors for the Financial Statements
Management is responsible for the preparation and fair presentation of the financial statements in accordance
with the accounting and reporting standards as applicable in Pakistan and the requirements of Companies ;\ct,
2017(XlX of 2017) and for such internal control as management determines is necessary to enable the
preparation of financial statements that are free from material misstatement, whether due to fraud or error.
In preparing the financial statements, management is responsible for assessing the Company's ability to
continue as a going concern, disclosing, as applicable, matters related to going concern and using the going
concern basis of aceounung unless management either intends to liquidate the Company or to cease operatnns,
or has no realistic alternative but to do so.
Board of directors are responsible for overseeing the Compan)"s financial reporting process.
Auditor's Responsibilities for the Audit of the Finaicial Statements
Our objectives are to obtain reasonable assurance about whether the financial statements as a whole are free
from material misstatement, whether due to fraud or error, and to issue an auditor's report that includes our
opinion. Reasonable assurance is a high level of assurance, but is not a guarantee that an audit conducted in
accordance with ISAs as applicable in Pakistan will always detect a material misstatement when it exists.
Misstatements can arise from fraud or error and are considered material if, individually or in the aggregate, they
could reasonably be expected to influence the economic decisions of users taken on the basis of these financial
statements.
OrantThornton An in5tnct for growi
• .:. part of ui .u..h: ::ccJ;uice'.v'.th IS.'.s as appli able in Pakistan, we exercise prolesstonal judgment nid :u.iintaiii pr ssuai skepticism throughout the audit. \\' also:
Identify and assess the risks of material misstatement of the financial statements, whether due to fraud
or error, design and perform audit procedures responsive to those risks, and obtain audit evidence that
is sufficient and appropriate to provide a basis for our opinion. The risk of not detecting a material
misstatement resulting from fraud is higher than for one resulting from error, as fraud may involve
collusion, forgery, intentional omissions, misrepresentations, or the override of internal control.
• Obtain an understanding of internal control relevant to the audit in order to design audit procedures
that arc appropriate in the circumstances, but not for the purpose of expressing an opinion on the
effectiveness of the Company's internal control.
• Evaluate the appropriateness of accounting policies used and the reaionablencss of accounting estimates
and related disclosures made by management.
• Conclude on the appropriateness of management's use of the going concern basis of accounting and,
based on the audit evidence obtained, whether a material uncertainty exists related o events or
conditions that may cast significant doubt on die Company's ability tp continue as a going concern. If
we conclude that a material uncertainty exists, we are required to draw attention in our auditor's report
to the related disclosures in the financial statements or, if such disclosures arc inadequate, to modify our
opinion. Our conclusions arc based on the audit evidence obtained up to the date of our auditor's
report. 1-lowever, future events or conditions may cause the Company to cease to continue as a going
concern.
• Evaluate the overall presentation, structure and content of the financial statements, including the
disclosures, and whether the financial statements represent the underlying transactions and events in a
manner that achieves fair presentation.
We communicate with the board of directors regarding, among other matters, the planned scope and timing of
the audit and significant audit findings, including any significant deficiencies in internal control that we identify
during our audit.
Report on Other Legal and Regulatory Requirements
ilased on our audit, we further report that in our opinion:
a) proper books of account have been kept by the Company as required by the Companies Act, 2017
(XIX of 2017);
b) the statement of Financial posluon, the statement of profit or loss and other comprehensive ulcoine,
the statement of changes in equity and the statement of cash flows together with the notes thereon
have been drawn up in conformity with the Companies Act, 2017 (XIX of 2017) and are in agreement
with t lie books of account and returns;
c) Investments made, expenditure incurred and guarantees extended during the year were for the purpose
of the Company's business; and
d1 no 7.:ikat was cleLlilcimble at source tinder the /.:ik:it :ind Ushmz Ordinance, I9tTh (X\'ll I P)M())
GrantThornton Ar, instinct or iJrowtlr
Other Mattcr
\'ce also draw attention to the fact that inancjal sta:emcnts for the year ended 30 June 2020 were audited by
another firm of auditors, whose report dated 21 February, 2020 expressed an unmodified opinion thereon
respectively.
The engagement partner on the audit resulting in this independent auditors report is Imran Afzal.
I-IARTERED ACCOU Chartered Accountants
Lahore
Dated: 7 May 2021
LU
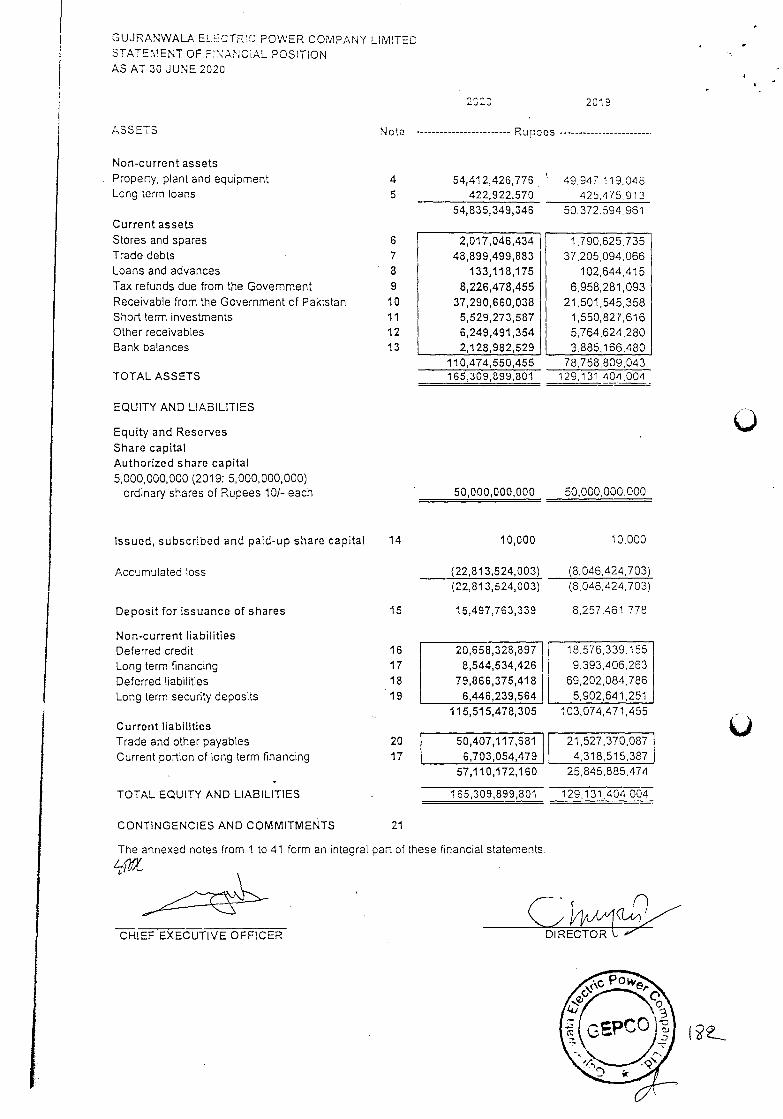
18,576,339.155 9, 393 .4 06 .263
69,202,084.786 5,902,641,251
103,074,471,455
21,527,370,087 4,318,515,387
GUJRANWALA ELECTRIC POWER COMPANY LIMITED STATEMENT OF FANCiAL POSITION AS AT 30 JUNE 2020
2019
ASSETS Note
Ru o es
Non-current assets
Property, plant and equipment Long term loans 5
54,41 2,426,776 422,922,570
49.947 119.045 425475913
54,835,349,346 50,372.594,961 Current assets
Stores and spares Trade debts Loans and advances
Tax refunds due from the Government
Receivable from the Government of Pakistan Short term investments Other receivables Bank balances
6 2,017,046,434 7 48,899,499,883 8 133,118,175 9 8,226,478,455
10 37,290,660,038 11 5,529,273,587 12 6,249,491,354 13 2,1 28,982,529
1,790.625,735 37,205,094,066
102,644,415
6,958,281,093 21,501,545,358
1,550,827,616 5,764,624,280 3.885.166,480
110,474,550,455
78,758,809,043 TOTAL ASSETS 165,309,899,801
129,131 404,004
EQUITY AND LIABILITIES
Equity and Reserves
Share capital Authorized share capital
5000,000,000 (2019: 5,000,000,000) ordinary shares of Rupees 10/- each 50,000,000,000 50,000,000,000
Issued, subscribed and paid-up share capital
Accumulated loss
14 10,000
(22,81 3,524,003) (22,81 3,524,003)
Deposit for issuance of shares 15 15,497,763,339
Non-current liabilities Deferred credit 16 20,658,328,897
Long term financing 17 8,544,534,426
Deferred liabilities 18 79,866,375,418
Long term security deposits 19 6,446,239,564 115,515,478,305
Current liabilities Trade and other payables 20 50,407,117,681
Current portion of long term financing 17 6,703,054,479 57,110,172,160
TOTAL EQUITY AND LIABILITIES 165,309,899,801
CONTINGENCIES AND COMMITMENTS 21
The annexed notes from 1 to 41 form an integral part of these financial statements.
tz L
10,000
(8,046,424,703) (8,046,424,703)
8,257.461,778
25,845,885.474
129,131.404 004
C
CNIEF EXECUTIVE OFFICER DIRECTOR
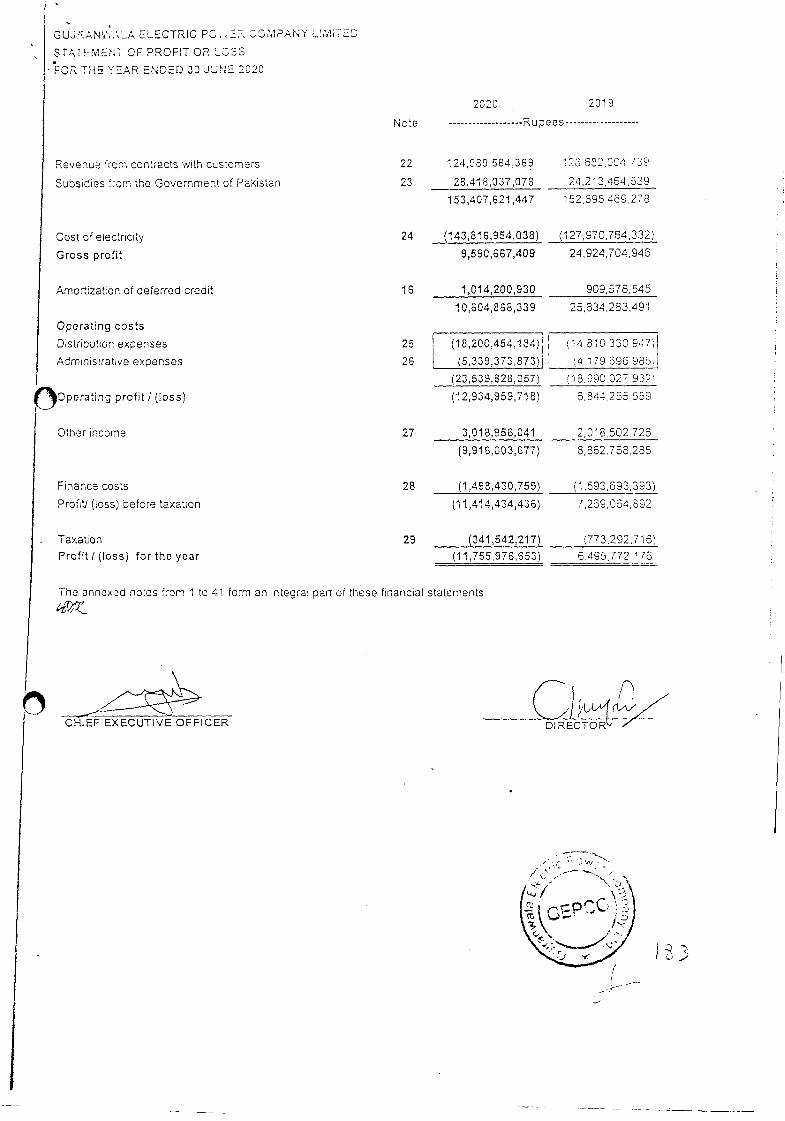
-
GUJAANVAA ELECTRIC PC T COMPANY LIMTEC
STATEMENT OF PROFIT OR LOSS
FOA THS 'r'AR ENDED 30 JUNE 2020
Revenue from contracts with customers
No to
22
2020 2019
Rupees
124,989,584,369 123.682.004 '39
Subsidies from the Government of Pakistan 23 28,418,037,078 24213,454,539
153,407,621,447 152,895469,278
Cost of electricity 24 (143,81 6,954,038) (127,970,764,332)
Gross profit 9,590,667,409 24,924,704,946
Amortization of deferred credit 16 1,014,200,930 909,578,545
10,604,868,339 25,834,283,491
Operating costs
Distribution expenses 25 (18,200,454,134) (14 810 330 947)
Administrative expenses 26 (5,339,373,873) (4 179696 983,
(23,539,828,057) (18.990.027 933l
operating profit! (loss) (12,934,959,718) 6,84.255 559
Other income 27 3,01 8,956,041 2,01 8,502,726
(9,91 6,003,677) 8,862,758,285
Finance costs 28 (1,498,430,759) (1,593,693,393)
Profit! (loss) before taxation (11,414,434,436) 7,269,064,892
Taxation 29 (341,542,217) (773,292,716)
Profit I (loss) for the year (11,755,976,653) 6.495.772 176
The annexed notes from 1 to 41 form an integral part of these financial statements.
CHIEF EXECUTIVE OFFICER DIRECTOR
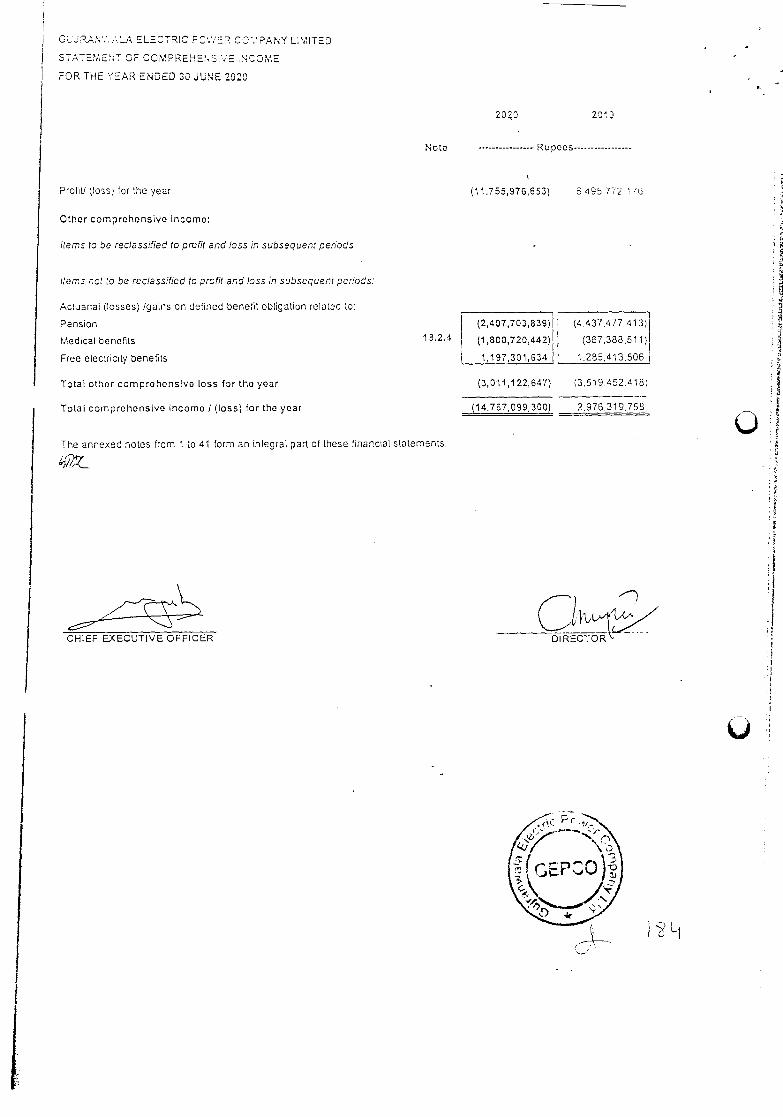
GL'JRA5.'...L ELECTPJC PC.'Ei COMPANY LIM1TED
STATEME1T OF COMPREHEtS:;E INCOME
FOR THE YEAR ENDED 30 JUNE 2020
20'3 2019
Note
Frofitl (toed for the year
Other comprehensive incomo:
Items to be reclassified to profit and loss in subsequent periods
Items not to be reclassified to profit and loss in subsequent periods:
Actuarial (tosses) /gains on defined benefit obligation related to:
Pension
Medical benefits 18.2.4
Free electricity benefits
Total other comprehensive loss for tho year
Total comprohensivo incomo / (loss) for the year
The annexed notes from 1 to 41 form an integral part of these financial slatements.
CHIEF EXECUTIVE OFFICER
Rupees
(11,755,976,653) 6 495 772 1 'i,i
(2,407,703,839) (4.437.477,413)
(1800,720,442) (367,388,511)
1,197,301,634 1.285,413,506
(3,011,122,647) (3.519.452.4181
(14,767,099,300) 2,976.31 9,758
)L1
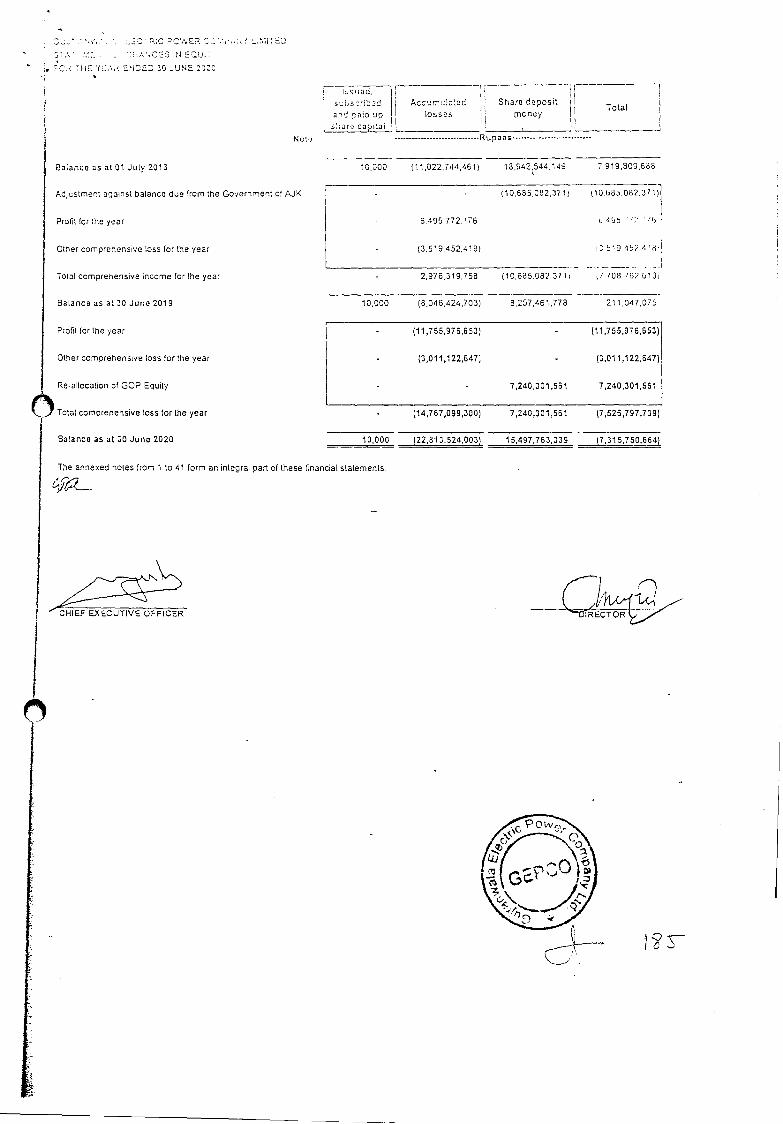
• •.: 0 7JC ?'tJE11 c::,'.:,;, LMITEU
AGE3 tl
HE '/J1 ONCED 30 JUNE 2320
Nuts
suLsrib2d an( naid 'ip shrs capital
Accurrlcted losses
Share deposit
money Totat
Rupso;
Balance as atOl July 2013 10,300 (11.022.744.461) 13,942,544.149 7,919,809,6138
Adjustment against balance due from the Government ot AJK 110,685,082.37 t( (10.585.082.3 71)
Prolit tar the year 5,495 772.176 5455
Other comprehensive loss tar the yesr (3.519,452,4181 '9 'v
Total comprehensive income for the 'fear 2.976.319.7513 llo.635.08?.371 jI /08 76? 513
Balance as at 30 June 2019 10.000 (8.046,424,703) 8,257,461,778 211.047.075
Ptot(t for the year (11,755,976,653) (11,755,976,653)
Other comprehensive lOSS for the year (3,011,122,647; (3,01 1,122,647)
Re-allocation of GOP Equity 7,240,301,561 7,240,301,561
Total comprehensive loss for the year (14,767,099,300) 7,240,301,561 (7,525,797,739)
Balance as at 30 June 2020 10,000 (22,81 3,524,003) 15,497,763,339 (7,31 5,750,664)
The annexed notes Item 1 to 41 form an integral part of these fnanc(al statements.
RECTOR
CHIEF EXECUTIVE OFFICER
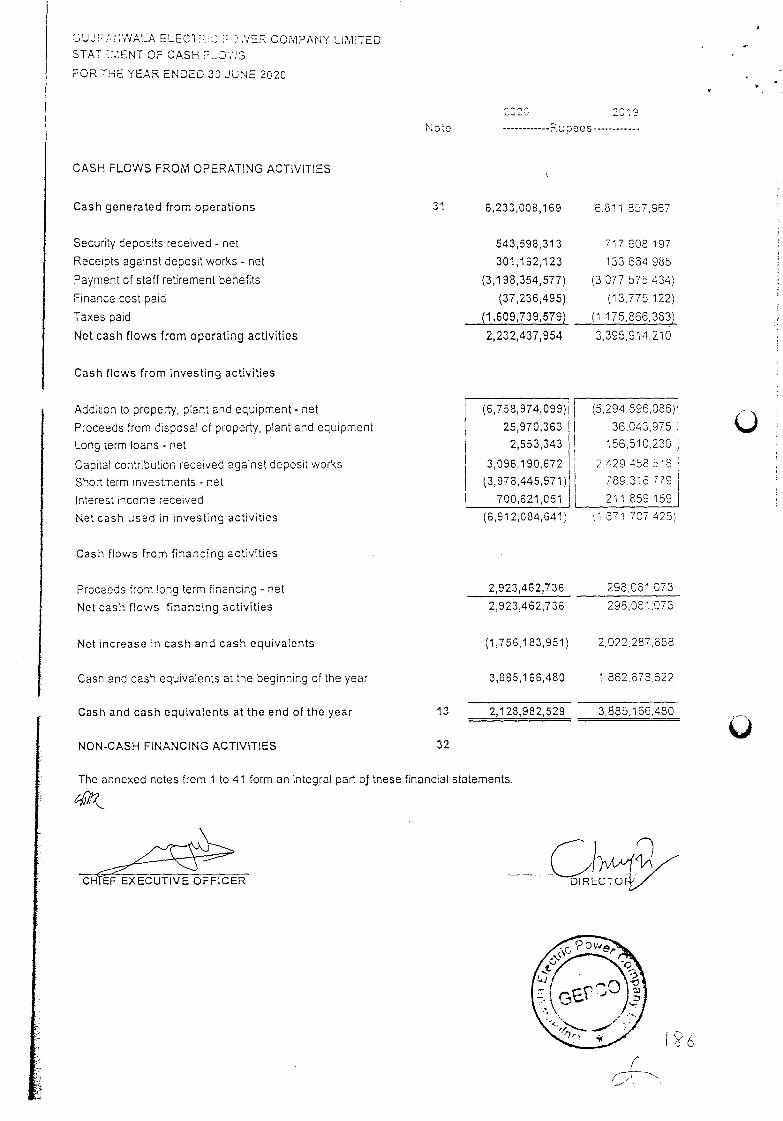
(6,758,974,099)
25,970,363
2,553,343
3,096,1 90,672
(3,978,445,971)
700,621,051
(5. 294, 896,086)
36.C43,975
156,510,230
2 429 458 5 "5
789 316 779
211 859 159
CUJ2J'71ALA ELECT7.: S D'.VER COMPANY LNUTED
STATS77ENT OF CASH 25073
FOR TNE YEAR ENDED 30 JUNE 2020
C
No ;o
F.upeos
CASH FLOWS FROM OPERATING ACTIVITIES
Cash generated from operations 31 6,233,008,169 6,81 1,857,967
Security deposits received - net
Receipts against deposit works - net
Payment of staff retirement benefits
Finance cost paid
Taxes paid
Not cash flows from operating activities
Cash flows from investing activities
Addition to property, plant and equipment - net
Proceeds from disposal of property, plant and equipment
Long term loans - net
Capital contribution received against deposit works
Short term investments - net
Interest income received
Net cash used in investing activities
Cash flows from financing activities
Proceeds from long term financing - net
Net cash flows financing activities
Net increase in cash and cash equivalents
Cash and cash equivalents at the beginning of the year
Cash and cash equivalents at the end of the year
NON-CASH FINANCING ACTIVITIES
13 2,128,982,529
543,598,313
301,162,123
(3,1 98,354,577)
(37,236,495)
(1,609,739,579)
(6,912,084,641)
2,923,462,736
(1,756,183,951)
3,885,1 66,480
2,232,437,954
2,923,462,736
717 608 197
133 664 985
(3 077 575,434)
(13.775.122)
(1,175,866,383)
3,395,914,210
298,081,073
298,081,073
2,022,287,858
1.862,878,622
3.885.166.480
1 571 707 425)
32
The annexed notes from 1 to 41 form an integral part 0! these financial statements.
CH7EF EXECUTIVE OFFICER
GUJ.'A'iLA ELLiCTRi. C ;;OR COM/ANY LHTED
NOTi:. :0 FCtA_ S 0'TEMENTS
FOP. THE YEAR ENDED 30 JUNE 2020
THE COMPANY AND ITS OPERATIONS
1.1 0-...' a53 Ecrc o'.'.or Company Limod (:ro Company) is a pubc irndod Company inoorporatoc in Pak:stan
o r.i:oc C. npzinios Ordinance, 19d; 'now the Companies Act. 2017). The Cbmpany was established to or ro, rocorioo, rhts, assets, oba:. is aid liubiIitcs ot Conwain Area Electrcty Board owned cy
and Poor Ceielopment Authority (WADA), and such other assets and Uabihties as ayroed toe Comuany
was incorporated on April 02, 1998 and commenced commercial operations on July 01, 1998 The principal activity
of the Company is the distribution of eiectricitt' within defined geographical territory of Gujranwala. Salkol. Narowal
Gujrat, Mandi Bahauddin and Hafiz Abad. The cegstered office of the Company is s:tuated at 565-A Model Town
CT Road, Gujranwala.
1.2 The Company took over certain properties, assets, rights, obligations and liabilities relating to distribution of
electricity from Pakistan Water and Power Development Authority (WAPDA) under Business Transfer Agreement
(BTA) dated June 29, 1998. The details of assets, liabilities and related matters as provided under clause 1.1 of the BTA were finalized with WAPDA through a Supplementary Business Transfer Agreement (SBTA).
1.3 The Council of Common Interest (CCI) in its meeting held on September 12, 1993 approved the privatization of
thermal power generation units (GENCOs) and power distribution companies (DISCOs) in a phased program, The Cabinet Committee on Privatization (CCOP) in its meeting held on February 17, 2009 approved privatization of
certain GENCOs and DISCOs, and this decision was ratified by Federal Cabinet in its meeting, held on January 06, 2010. President and Prime Minister of Pakistan also approved privatization of GENCOs and DISCOs including the
Company during a presentation given to them by Ministry of Privatization on November 22, 2010. Decision of President and Prime Minister has also been subsequently ratified by the Council of Common Interest (CCI) during
its meeting held on April 28, 201 1.Based on the approval of Council of Common InteresI ICCIl and Cabinet
Committee on Privatization (COOP) the privatization of the Company is in process.
2. BASIS OF PREPARATION
2.1 Statement of compliance
These financial statements have been prepared in accordance with the accounting and reporting standards as
applicable in Pakistan. The accounting and reporting standards as applicable in Pakistan comprise of:
- International Financial Reporting Standards (IFRS Standards) issued by the International Accounting
Standards Board (lASB) as notified under the Companies Act, 2017: and
- Provisions of and directives issued under (the Act).
Where provisions of and directives issued under the Act, differ from the IFRS Standards, the provisions of and
directives issued under the Act, have been followed.
2.2 Basis of measurement
These financial statements have been prepared under historical cost convention except for certain f:nancial
instruments and retirement employee benefits which are carried at fair value.
2.3 Functional and presentation currency
The financial statements are prepared in Pak Rupees which is the functional and presentation currency of the
Company.
2.4 Significant accounting judgments and critical accounting estimates / assumptions
The preparation of financial statements in conformity with the approved accounting standards requires use of
certain critical accounting estimates. It also requires the management to exercise its judgment in the process of
applying the Company's accounting policies. Estimates and judgments are continually evaluated and are based on
historical experience, including expectation of future events that are believed to be reasonable under the
circumstances. The areas where various assumptions and estimates are significant to the Companys financial
statements or where judgments were exercised in application of accounting policies are as follows
2.4.1 Useful lives, residual values and depreciation of operating fixed assets
The Company reviews the appropriateness of the rates of depreciation, useful lives and residual values used in Ilse
calculation of depreciation on items of property, plant and equipment on a regular basis. Further, where applicable,
an estimate of the recoverable amount of assets is made for possible impairment on an annual basis. In making these estimates, the Company uses the technical resources available inside/outside the Company, as appropriate. Any change in these estimates in the future might affect the carrying amount of items of property, plant and
equipment with a corresponding effect on the depreciation charge, impairment and amortization of deferred credit.
'97
GUJRANWALA ELECTRIC POWER COMPANY LIMITED
2.4.? Lpecind credit loss
revienu .:s ::ae debts a: each rl: eate to denley the e:rslnce at any dobtfui debts and to a a e,n:her a p vcn should be record:t in he statement of profit or loss In particular, judgment by
is req :ad n the estimadon of thu Inn ant and tinny n the future cash hows. when determininq the a qrc con rcc'nlori. Such estimates are :n'.cd on assumptions about a number of factors and actual results
may differ, resulting in future changes to the provisons.
2.4.3 Taxation
The Company takes into account the current income tax law and decisions taken by the taxation authorities.
Instances where the Company's views differ from the views taken by the income tax department at the assessment
stage and where the Company considers that its view on items of material nature is in accordance with law, the amounts are shown as contingent liabilities.
Deferred tax assets are recognized for all unused tax losses and credits to the extent that it is probable that tuture
taxable profit will be available against which such losses and credits can be utilized. Significant management
judgment is required to determine the amount of deferred tax assets that can be recognized, based upon the likely
liming and the level of future taxable profits, together with future tax piar.ning strategies.
2.4.4 Provisions
The assessment of provisions inherently involves the exercise of significant judgment as the outcome of the future
events cannot be predicted with certainty. The Company, based on the availability of the latest information
estimates the values of contingent assets and liabilities which may differ on the occurrence / non-occurrence of
uncertain future events. Based on the expected outcomes and lawyers' judgments, appropriate disclosure or
provision is made in the financial statements.
2.4.5 Impairment
The carrying amounts of the Company's assets are reviewed at each reporting date to determine whether there is
any indication of impairment. If any such indication exists, the assets' recoverable amount is estimated and
impairment losses are recognized in the statement of profit or loss. A previously recognized impairment loss is
reversed only if there has been a change in the estimates used to determine the asset's recoverable amount since
the last impairment toss was recognized. If that is the case, the carrying amount of the asset is increased to its
recoverable amount. The increase cannot exceed the carrying amount that would have been determined, net of
depreciation, had no impairment loss been recognized for the asset in prior years. Such reversal is recognized in
statement of profit or loss.
2.4.6 Deferred credit
Amounts received from consumers and the Government as contributions towards the cost of extension of
distribution network and of providing service connections are deferred for amortization over the estimated useful
lives of related assets except for separately identifiable services in which case revenue is recognized upfronl upon
establishing a connection network.
2.4.7 Employee retirement benefits
The main features of the schemes operated by the Company for its employees are as follows:
Defined benefit ptans
The Company operates unfunded pension, post retirement free electricity and medical benefits schemes for all its
permanent employees. Provisions are made in accordance with the actuarial recommendations The latest valuation was carried out as at 30 June 2020. The future contribution rates of these plans include allowances for
deficit and surplus. Projected Unit Credit Method with the following significant assumptions is useci for valuation i
these schemes:
Pension Free Free and leave
electricity medical encashment 2020: benefits benefits benetits
Expected rate for discounting liabilities . 9.25% 9.25% 9.25%
Expected rate for increase in electricity cost 8.25%
Expected rate for increase in medical cost - 9.25%
Expected increase in pensionable pay 8.25%
Pension index rate 3.00%
GUJRANWALA ELECTRIC POWER COMPANY LIMITED
14,50% 14 2
14.50%
13.50%
S.25%
:c a:e for :.ccur iabties
for roroaso rr eiectricty cost
Eioo rate for :r;reaso fl rnedcai cost
Ex:oc:c increase in pensionable pay
Pension index rate
14.50%
13.25%
Accumulating compensated absences
The employees of the Company are entitled to accumulating compensated absences, which are encashable at the time of retirement up to a maximum limit of 365 days. Provisions are made in accordance with the actuarial
recommendations. The latest valuation was carried out as at June 30, 2020.
Other benefits For General Provident Fund and WAPDA Welfare Fund, the Company makes deduction from salanes of the
employees and remits these amounts to the funds established by WAPDA.
3 SUMMARY OF SIGNIFICANT ACCOUNTING POLICIES
The significant accounting policies which have been adopted in the preparation of financial slalemenls of lhe Company are consistent with previous year except as discussed in Note 3.1 to Ihese financial slatemerrls dS
follows:
3.1 Standards, interpretations and amendments to published approved accounting standards effective during
the year
The accounting policies adopted in the preparation of these financial statements are consistent with those of the previous financial year except as described below:
(FRS-16 Leases
IFRS-3 Business Combination (Amendments)
IFRS-4 Insurance Contracts (Amendments)
IFRS-1 1 Joint Arrangements (Amendments)
lAS-12 Income taxes (Amendments)
lAS-19 Employee Benefits (Amendments)
lAS-28 Investments in associate and joint venture (Amendments)
IFRlC-23 Uncertainty over Income Tax Treatments
The adoption of the above amendments, improvements to accounting standards and interpretations did not have any material impact on the financial statements.
3.2 Changes in accounting policies and disclosures
New and amended standards and interpretations
During the year, the Company has adopted lFRS 16 "Leases" from 1 July, 2019.Due to the transaction methods chosen by the Company in applying these standards, comparative information throughout these financrals statements has not been restated to reflect the requirements of the new standards. The details of new significance accounting policies adopted and the nature and effect of the changes to previous accounting policies are set out below
IFRS 16-Leases
IFRS 16 'Leases' - It will result in almost all leases being recognised on the statement of financat poston as the distinction between operating and finance leases is removed. Under the new standard, an asset (the right to use lire leased item) and a financial liability to pay rentals are recognised. The only exceptions are short-term and low-vrdue leases. There is no impact of adoption of these standards on these financial statements.
4L
GUJRAN'vVAL.A ELECTRiC POWER CCiFAN' L.t1iTE
3.3 Property plant and equipment
a) Initial measurement
Al items of ooerstr fixed assets are n:tiaity 1:OrC2o at cost.
Coo: no_des eip :lure Ida: is brood,' .abe to Ire acquisition of the asset Tne 005l of sail- con'u::u:ed scouts :udos the cost of :' .,I'oo:i!s, direct labor and any other costs directly attributable to brinir.c toe assets to 3 working 0000il:o for l,reir :oteoded use. Major renewals and :mprcvemenfs are capitalized. Minor replacement, repairs and maintenance are charged to statement of profit or loss.
b) Subsequent measurement
Items of operating fixed assets other than land, buildings and distribution equipment are staled at cost less accumulated depreciation and accumulated impairment, (ii any).
Land, buildings and distribution equipment are measured at the revalued amount less accumulated depreciation and impairment (if any).
c) Depreciation
Depreciation is charged to statement of profit or tOSS on the straight-line method so as to write off the cost of an asset over its estimated useful life at the robs given in Note 4.1. Depreciation on assets is charged from the month in which an asset is acquired while no depreciation is charged for the month in which the asset is disposed off. -
Depreciation provided on construction equipment and vehicles during the period of construction of fixed assets is capitalized as part of the cost ot fixed assets.
d) Disposal
An item of property, plant and equipment is derecognized upon disposal or when rio future economic benefits are expected from its use or disposal. Any gain or lcss arising on derecognition of Ihe asset (calculated as the difference between the net disposal proceeds and carrying amount of the asset) is included in the statement of profit or loss account in the year the asset is derecognized
e) Impairment of assets
The carrying amounts of the Company's assets are reviewed at each reporting date to determine whether
there is any indication of impairment. f such indication exists, the recoverable amount of such asset is estimated. An impairment loss is recognized wherever the carrying amount of the asset exceeds its
recoverable amount, Impairment losses are recognized in statement of profit or toss. A previously recognized impairment toss is reversed only if there has been a change in the estimates used to
determine the asset's recoverable amount since the last impairment 055 was recognized.
1) Capital work in progress
Capital work-in-progress is stated at cost on applicable overheads less impairment (if any).
3.4 Stores and spares
These are valued at the lower of cost and net realizable value. Cost is determined on a weighted average
basis, comprising invoice values and the related charges that have been incurred in bringing the inventories to
their present location and condition.
Net realizable value represents the estimated selling price in the ordinary course of the business less alt
estimated costs of completion and estimated costs necessary to be incurred in order to make the sale.
Impairment
At each reporting date, stores and spares and loose tools are assessed for impairment. If stores and spares
and loose tools is impaired, the carrying amount is reduced to its selling price less costs to complete and sell.
The impairment loss is recognized immediately in the distribution costs in the statement of profit or loss.
3.5 Trade debts
Trade debts are initially measured at their transaction price- under IFRS 15 and subsequently measurea at
amortized cost less any allowance for expected credit losses (ECL).
0
GUJRANWALA ELECTRIC POWER COMPANY LIMITED
AIlc.';ance expc:tad credit ceaas are hui;e'J on the dilference between the contractual cash tlo':s
due ri accordance .'.lri the contract and a; uursh lows that the Company expects to receive The shontati s then c:sccun:ed at cii approximation ti. the assets original effective interest çate. For trade and other recevcdes. tao Company has applied the standards simplified approach and has calculated ECLs based on lifetime expected credit losses. The Company has established a provision matrix that is based on the
Company's historical credit toss experience, adjusted for forward-looking factors specific to the debtors and the econcrnic environment. However, in certain cases, the Company may also consider a financial asset to be in default when internal or external information indicates that the Company is unlikely to ?eceive the outstanding contractual amounts in full'before taking into account any credit enhancements held by the Company.
IFRS 9 "Financials Instruments" from 1 July, 2018 except that, Securities and Exchange Commission of Pakistan in its S.R.O 985(1)/2019 dated 2 September, 2019 notified that the requirements contained in IFRS 9 with respect to application of Expected Credit Losses method shall not be applicable to companies holding financial assets due from the Government of Pakistan till 30 June, 2021.
3.6 Cash and cash equivalents
Cash and cash equivalents are carried at cost. For the purpose of cash flow statement, cash and cash equivalents comprise cash in hand, balances with banks in current and deposit accounts, and short-term highly liquid investments with original maturities of three months or less, and that are readily convertible to known amounts of cash, and subject to an insignificant risk of changes in value.
3.7 Staff retirement benefits
The Company provides funded pension, post-retirement medical, free electricity benefits and compensated absences to all its regular employees. Obligations for these benefits are determined on the basis of an actuarial valuation carried out by using the Projected Unit Credit Method as required by lAS-19."Employee benefits".
Actuarial gains and losses are recognized in the other comprehensive income in the period in which they occur Past-service costs are recognized immediately in the statement of profit or loss. The latest actuarial valuation of the plan was carried out as at 30 June 2020 by Anwar Associate.
The Company also maintains a General Provident Fund and WAPDA Welfare Fund for all its regular employees. The Company makes deductions from salaries of its employees and remits these amounts to the respective funds established by WAPDA.
Other long term benefits
The Company's employees are also entitled for accumulated compensated absences, which are encashed at the time of retirement up to a maximum limit of 365 days. Provisions are made annually to cover the obligation and are charged to statement of profit or loss currently. Actuarial gains and losses regarding compensated absences are recognized in the year of occurrente.
3.8 Income tax
Income tax expense is recognized in the statement of profit or loss except to the extent that it relates to items recognized in other comprehensive income or directly in equity (if any), in which case the tax amounts are recognized directly in other comprehensive income or equity.
Income tax comprises of current tax and dOferred tax.
Current tax
Current tax is the expected tax payable on the taxable income for the year; calculated using rates enacted or substantively enacted by the end of the reporting period. The calculation of current tax takes into account tax credit and tax rebates, if any, and is inclusive of any adjustment to income tax payable or recoverable in respect of previous years.
Deferred tax A deferred tax liability is recognized for all temporary differences that are expected to increase taxable profit in the future. Deferred tax assets are recognized for all temporary differences that are expected to reduce taxable profit in the future, and the carry forward of unused tax losses.
The amount of deferred tax provided is based on the expected manner of realization or settlement 'of the carrying amount of assets and liabilities using the tax rates enacted at the reporting date.
GUJRANWALA ELECTRIC POWER COMPANY LIMITED
Judament and estimates
Signfioor.: ,rmer: -::rec .. r:'r,.: Hoon- :x e.'oeses and ocr spendIng provis:cn for tax. There oo rru' :r. ;rs and calcua:ions for which tne uitima:e tax determination is uncertain during the ordinary course of ous.ness.
Furirrer, c:rr',rn.o amount of deferred tax assets is reviewed a each reporting date and is adjusted to reflect the current assessment of future taxoole proi;ts. If ruquired, carrying amount of deterred tax asset is reduced to
the extent that it is no longer probable that sufficient taxable profits to aflow the benefit of pad or all of that
recognized deferred tax asset to be utilized. Any such reduction shall be reversed to the extent that it becomes probable that sufficient taxable profit will be available.
3.9 Deferred credit
Amounts received from consumers and the Government as contributions towards the cost of extension of the
electricity distribution network, and for providing service connections, is deferred and amortized over the
estimated useful lives of related assets. Amortization of deferred credit commences upon completion of related
work which is taken to the statement of profit or loss each year corresponding to the depreciation charge of relevant asset for the year.
3.10 Trade and other payables
Trade payables are obligations under normal short-term credit terms. These are measured at the undiscounted
amount of cash to be paid.
3.11 Provisions
Provisions are recognized when the Company has a present obligation (legal or constructive) as a result of a
past event, it is probable that the Company will be required to settle the obligation, and a reliable estimate can
be made of the amount of the obligation.
The amount recognized as a provision is the best estimate of the consideration required to settle the present
obligation at the end of the reporting period, takng- into accour,t the risks and uncertainties surrounding the
obligation.
Where the effect of the time value of money is material, the amount expected to be required to settle the
obligation is recognized at present value using a pre-tax discount rate. The unwinding of the discount is
recognized as finance cost in the statement of profit or loss.
Wnen some or alt of the economic benefits required to settle a provision are expected to be recovered from a
third party, the receivable is recognized as an asset if it is virtually certain that reimbursement will be received
and the amount of the receivable can be measured reliably.
As the actual outflows can differ from estimates made for provtsions due to changes in laws, regulations, public
expectations, technology, prices and conditions, and can take place many years in the future, the carrying
amounts of provisions are reviewed at each reporting date and adjusted to take account of such changes. Any
adjustments to the amount of previously recognized prevision is recognized in the statement of profit or loss
unless the provision was originally recognized as part of cost of an asset.
3.12 Contingent liabilities
A contingent liability is disclosed when the Company has a possible obligation as a result of past events,
whose existence will be confirmed only by the occurrence or non-occurrence, of one or more uncertain future events not wholly within the control of the Company; or the Company has a present legal or constructive obligation that arises from past events, but it is not probable that an outflow of resources embodying economic
benefits will be required to settle the obligation, or the amount of the obligation cannot be measured with
sufficient reliability.
3.13 Borrowings & borrowing costs
Loans are measured at amortized cost using the effective interest method.
Interest expense is recognized on the basis of the effective interest method and is included in finance costs The borrowing cost on qualifying assets is included in the cost of the related assets.
3.14 Foreign currencies
The financial statements are presented in Pak Rupees, which is the Company's functional currency
Transactions in foreign currency during the year are initially recorded in the functional currency at the rate prevailing at the date of transaction.
1'3
c:co
is .
CUR.-\i.LA ELECTRlC POWER COMPANY LlMlTED
tr3r'.SaC LS are r ordod using tao exanano rates moving on the date ot Ira n520hOnS. All
onota., ris:e:s and au tue a fcga curroncros are trarrihatod at exchange rates prevarl;ng at the reportrng
mile error: i. case of morcn currency oan.s covered dv the Clate Bank at P:krstans Excnange Risk
Cmeragr c:re.me. ,vhicr: nrc raflatatee at Ire rates provrhrod unCen he scheme. A non-monetary items are
hnntt: ru rupees at xoaange rules nrevumrrg air he due ci transaction m on the date when lair values
are determined
Exchange differences for the period up to the date of commissionrng of assets financed ut at foreign currency
loans and to the extent that total cost of capitalization do not exceed the equivalent borrowing rate contracted in functional currency are capitatized. Alt other exchange differences are charged to statement of profit Or toss
3.15 IFRS 15 Revenue from Contracts with Customers
The Company recognizes revenue from contracts with customers based on a five step model as set Out in
IFRS 15:
Step-i
Identify contract(s) with a customer: A contract is defined as an agreement between two or more parties that
creates enforceable rights and obligations and sets out the criteria for every contract that must be met.
Step-2
Identify performance obligations in the contract: A performance obligation is a promise in a contract with a
customer to transfer a good or service to the customer.
S to p.3
Determine the transaction price: The transaction price is the amount of consideration to which the Company
expects to be entitled in exchange for transferring promised goods or services to a customer, excluding
amounts collected on behalf of third parties.
Step-4
Allocate the transaction price to the performance obligations in the contract: For a contract that has more than
one performance obligation, the Company allocates the transaction price to each performance obligation in an
amount that depicts the amount of consideration to which the Company expects to be entitled in exchange for satisfying each performance obligation.
Step-5
Recognize revenue when (or as) the Company satisfies a performance obligation.
Mentioned below are different revenue streams of the Company and their terms of recognition of revenue after
satistying all the five steps of revenue recognition in accordance with IFRS 15.
a) Electricity sale / Tariff differential subsidy I Rental and service income / Fuel price adjustment! Service
charges on collection of PTV fee and electricity duty
Revenue from electricity sales I Tariff differential subsidy I Rental and service income I Fuel price adjustment / Service charges on collection of PT\J fee and electricity duty are recognized on the basis of periodic meter
readings of electricity supplied to consumers at the rates determined by National Electric Power Regulatory
Authority (NEPRA) and subsequently notified by GOP, substantiating the revenue recognition over the time.
b) Sale of scrap
Revenue from sale at scrap is recognized on dispatch of goods at a point in time.
C) Amortization of deferred credit
Deterred credit against consumers contributions is released to statement of profit or toss over the expected useful life of the asset underlying the contribution except for separately indefinable services in which case
revenue is recognized upfront upon establishing a connection network.
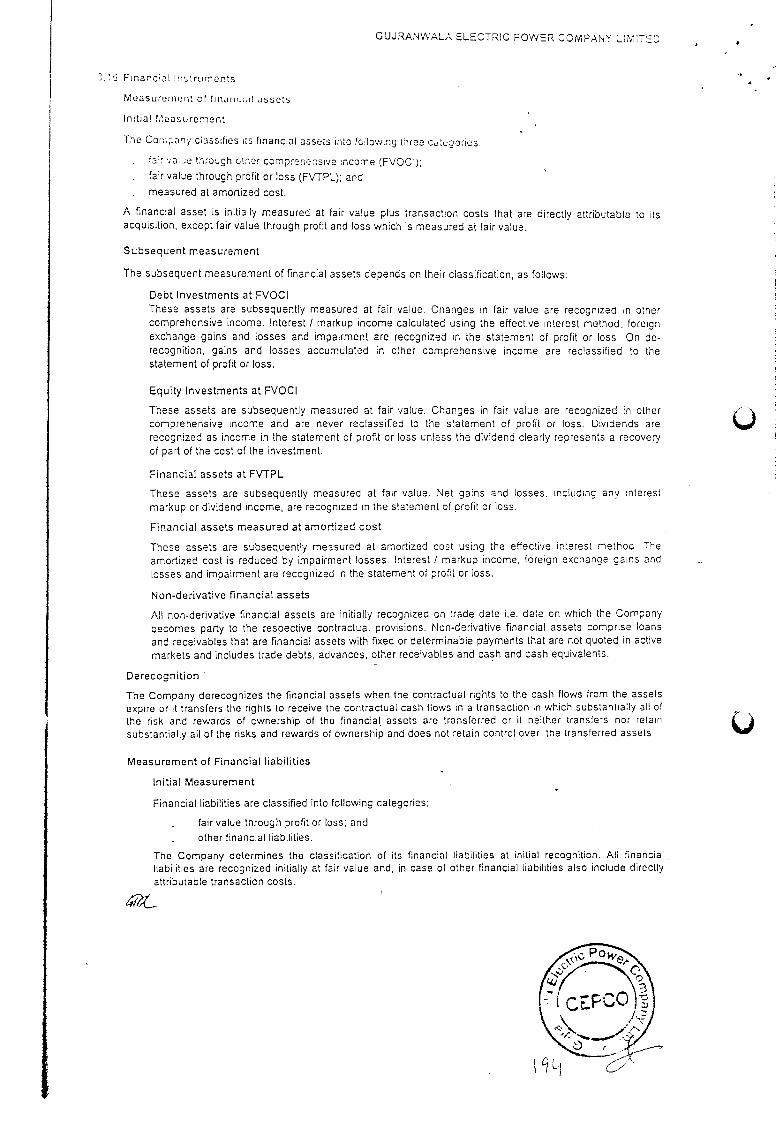
G'JJRANWALA ELECTRIC POWER COMPANY LIMITED
3. 3 Financial !irruments
Mcasuremirii ot tInir ,.i,ii assets
Initial Measurement
The Coii;any classifies Is financial assets into following three culeoouies.
far va,je through cinor comprehensive income (FVOCI);
fair value through profit or loss (FVTPL); and
measured at amortized cost.
A financial asset is in:tially measured at fair value plus transaction costs that are directly attributable to its
acquisition, except fair value through profit and loss which is measured at fair value.
Subsequent measurement
The subsequent measurement of financial assets depends on their classification, as follows.
Debt Investments at FVOCt
These assets are subsequently measured at fair value. Changes in fair value are recognized in other
comprehensive income. Interest / markup income calculated using the effective interest method, foreign
exchange gains and losses and impairment are recognized in the statement of profit or loss. On do-
recognition gains and losses accumulated in other comprehensive income are reclassified to the
statement of profit or loss.
Equity Investments at FVOCI
These assets are subsequently measured at fair value. Changes in fair value are recognized in other
comprehensive income and are never reclassified to the statement of profit or loss. Dividends are
recognized as income in the statement of profit or loss unless the dividend clearly represents a recovery
of part of the cost of the investment.
Financial assets at FVTPL
These assets are subsequently measured at fair value. Net gains and losses, including any interest
markup or dividend income, are recognized in the statement of profit or loss.
Financial assets measured at amortized cost
These assets are subsequently measured at amortized cost using the effective interest method. The
amortized cost is reduced by impairment losses. Interest I markup income, foreign exchange gains and
losses and impairment are recognized in the statement of profit or loss.
Non-derivative financial assets
All non-derivative financial assets are initially recognized on trade date i.e. date on which the Company
becomes party to the respective contractual provisions. Non-derivative financial assets comprise loans
and receivables that are financial assets with fixed or determinable payments that are not quoted in active
markets and includes trade debts, advances, other receivables and cash and cash equivalents.
Derecognition -
The Company derecognizes the financial assets when the contractual rights to the cash flows from the assets
expire or it transfers the rights to receive the contractual cash flows in a transaction in which substantially all of the risk and rewards of ownership of the financial assets are transferred or it neither transfers nor retain
substantially all of the risks and rewards of ownership and does not retain control over the transferred assets
Measurement of Financial liabilities
Initial Measurement
Financial liabilities are classified into following categories:
fair value through profit or loss; and
other financial liabilities.
The Company determines the classification of its financial liabilities at initial recognition. All financial liabilities are recognized initially at fair value and, in case of other financial liabilities also include directly
attributable transaction costs.
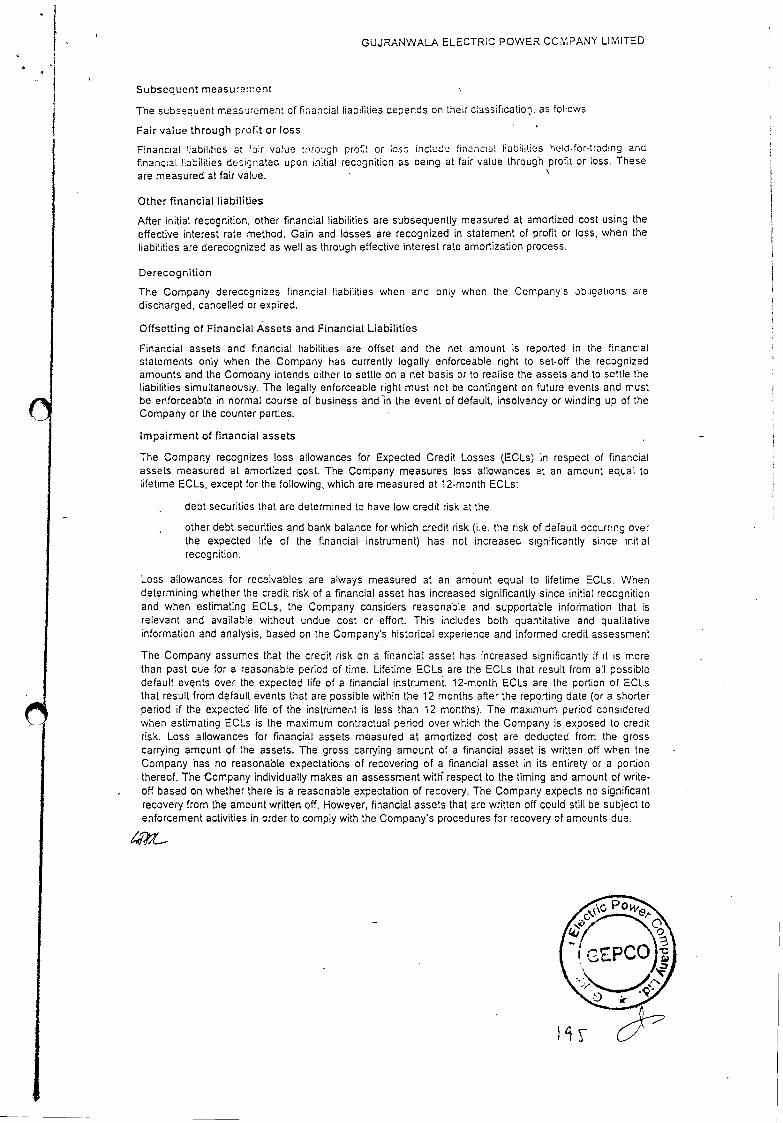
GUJRANWALA ELECTRIC POWER COMPANY LIMITED
Subsequent measure:ent
The subsequent measurement of financial liabilities depends on their classificatio, as foliows.
Fair value through profit or loss
Financial liabilities at fair value through profit or loss include financial liabtes held-for-trading and financial liabilities des;nated upon initial recognition as being at lair value through profit or loss. These are measured at fair value.
Other financial liabilities
After initial recognition, other financial liabilities are subsequently measured at amortized cost using the effective interest rate method. Gain and losses are recognized in statement of profit or loss, when the liabilities are derecognized as well as through effective interest rate amortization process.
Derecognition
The Company derecognizes financial liabilities when and only when the Companys obligations are discharged, cancelled or expired.
Offsetting of Financial Assets and Financial Liabilities
Financial assets and financial liabilities are offset and the net amount is reported in the financial statements only when the Company has currently legally enforceable right to set-off the recognized amounts and the Company intends either to settle on a net basis or to realise the assets and to settle the liabilities simultaneously. The legally enforceable right must not be contingent on future events and must be enforceable in normal course of business and in the event of default, insolvency or winding up of the Company or the counter parties.
Impairment of financial assets
The Company recognizes loss allowances for Expected Credit Losses (ECLs) in respect of financial assets measured at amortized cost. The Company measures loss allowances at an amount equal to lifetime ECLs, except for the following, which are measured at 12-month ECLs:
debt securities that are determined to have low credit risk at the
other debt securities and bank balance for which credit risk (i.e. the risk of default occurring over the expected life of the financial instrument) has not increased significantly since initial recognition.
Loss allowances for receivables are always measured at an amount equal to lifetime ECLs. When determining whether the credit risk of a financial asset has increased significantly since initial recognition and when estimating ECLs, the Company considers reasonable and supportable information that is relevant and available without undue cost or effort. This includes both quantitative and qualitative information and analysis, based on the Company's historical experience and informed credit assessment
The Company assumes that the credit risk on a financial asset has increased significantly if it is more than past due for a reasonable period of time. Lifetime ECLs are the ECLs that result from all possible default ev?nts over the expected life of a financial instrument. 12-month ECLs are the portion of ECLs that result from default events that are possible within the 12 months after the reporting date (or a shorter period if the expected life of the instrument is less than 12 months). The maximum period considered when estimating ECLs is the maximum contractual period over which the Company is exposed to credit risk. Loss allowances for financial assets measured at amortized cost are deducted from the gross carrying amount of the assets. The gross carrying amount of a financial asset is written off when the Company has no reasonable expectations of recovering of a financial asset in its entirety or a portion thereof. The Company individually makes an assessment with respect to the timing and amount of write-
off based on whether there is a reasonable expectation of recovery. The Company expects no significant recovery from the amount written off. However, financial assets that are written off could still be subject to enforcement activities in order to comply with the Company's procedures for recovery of amounts due.
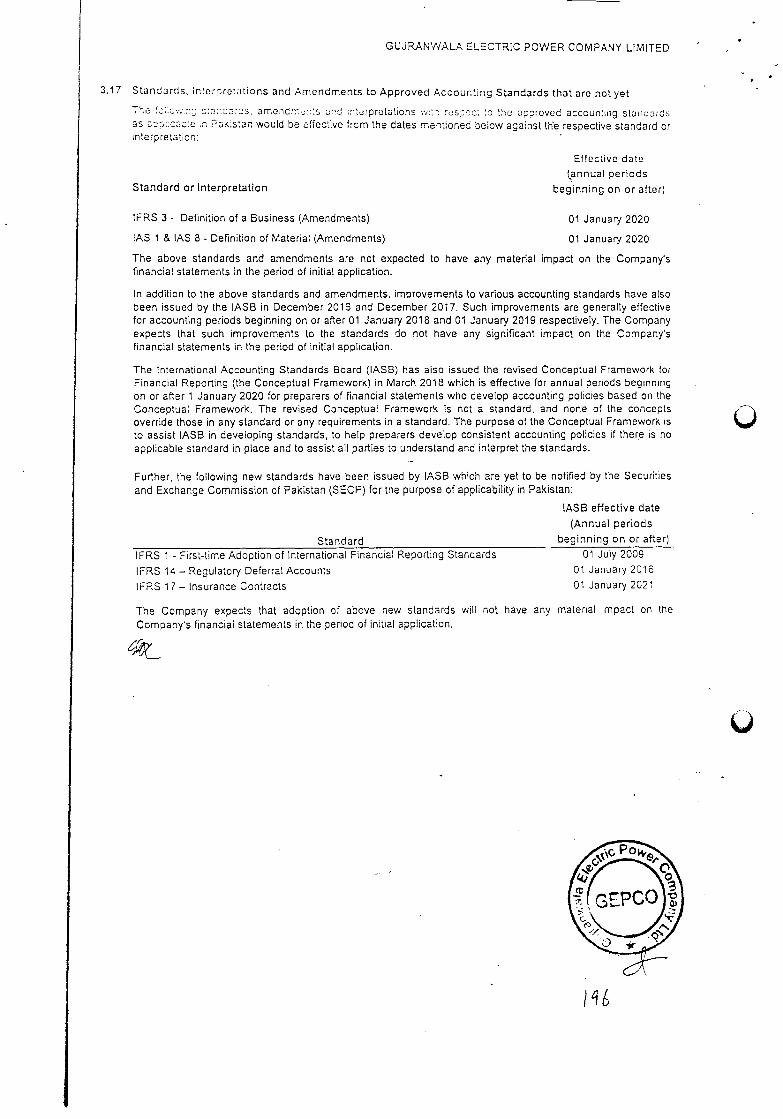
GUJRANWALA ELECTRIC POWER COMPANY LIMITED
3.17 Standards, in rnretatrons and Amendments to Approved Accounting Standards that are not yet
The :.ow.n ::.? c:s, amend ....:s and nterpreiations w:n s:oc: o the epproved accounting standards as e:c:e •rr Pk;stan would be effective from the dates mentioned below against th'e respective standard or interpretation:
Standard or Interpretation
IFRS 3 - Definition of a Business (Amendments)
lAS I & lAS 8 - Definition of Material (Amendments)
Effective date
annual periods
beginning on or after)
01 January 2020
01 January 2020
The above standards and amendments are not expected to have any material impact on the Company's financial statements in the period of initial application.
In addition to the above standards and amendments, improvements to various accounting standards have also been issued by the lASS in December 2016 and December 2017. Such improvements are generally effective for accounting periods beginning on or after 01 January 2018 and 01 January 2019 respectively. The Company expects that such improvements to the standards do not have any significant impact err the Company's financial statements in the period of initial application.
The International Accounting Standards Board (lASS) has also issued the revised Conceptual Framework for Financial Reporting (the Conceptual Framework) in March 2018 which is effective for annual periods beginning on or after 1 January 2020 for preparers of financial statements who develop accounting policies based on the Conceptual Framework. The revised Conceptual Framework is not a standard, and none of the concepts override those in any standard or any requirements in a standard. The purpose of the Conceptual Framework is to assist lASS in developing standards, to help preparers develop consistent accounting policies if there is no applicable standard in place and to assist all parties to understand and interpret the standards.
Further, the following new standards have been issued by ASS which are yet to be notified by the Securities and Exchange Commission of Pakistan (SECP) for the purpose of applicability in Pakistan:
IASB effective date
(Annual periods
beginning on or after)
IFRS 1 - First-time Adoption of International Financial Reporting Standards 01 July 2009
IFRS 14— Regulatory Deferral Accounts 01 January 2016
IFRS 17— Insurance Contracts 01 January 2021
The Company expects that adoption of above new standards will not have any material impact on the
Company's financial statements in the period of initial application.
Standard
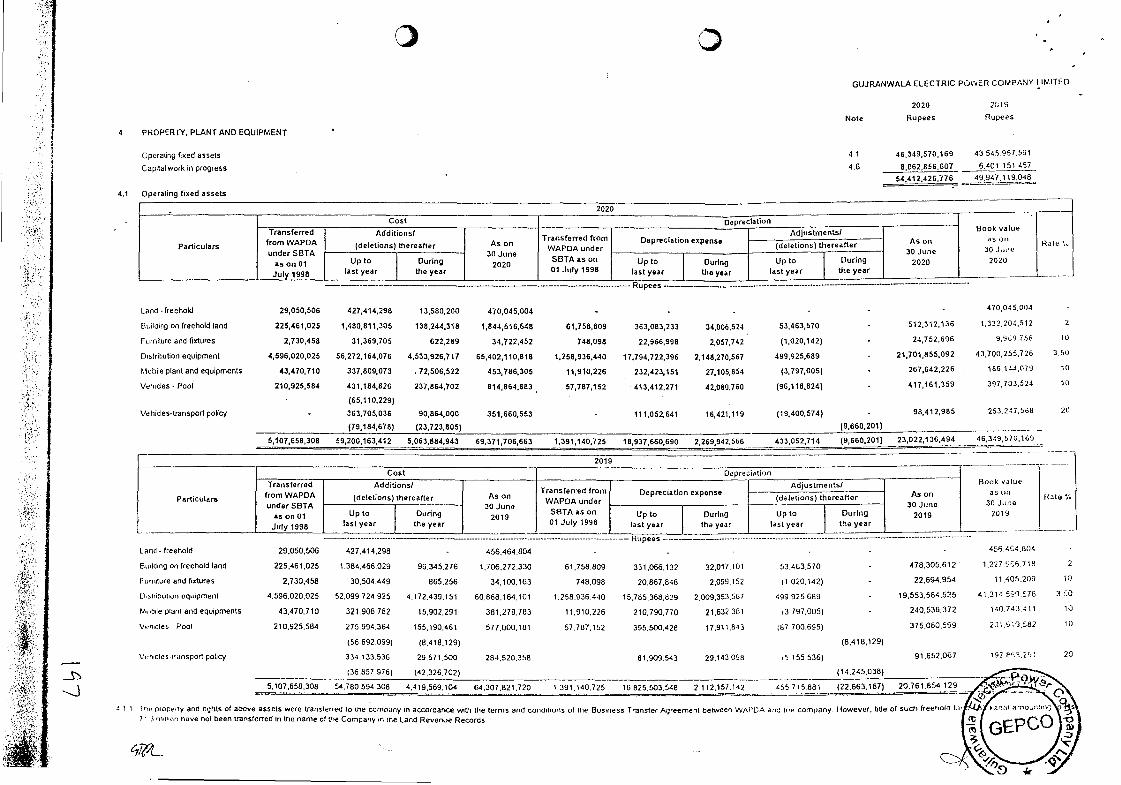
GUJRANWALA ELECTRIC POWER COMPANY lIMITED
4 PROPERTY, PLANT AND EQUIPMENT
Note
2020
Rupees
2019
Rupees
Gperating fixed assets 4 1 46,349,570,169 43545 961.591
Capital work in progress 4.6 8,062,856,607 6.401 151.457
54412,426,776 49947.119.048
4.1 Operating fixed assets
2020
Particulars
Cost DepreCIatIon - Book value
as on ° Jiiiiii
2020
Rate
Transferred from WAPDA
under SBTA oi
July 1998
Additions!
(deletions) thereafter As on 30 june
2020
Transferred from WAPDA under
SBTA as on 01 July 1998
DeprecIatIon expense Adjustments!
As on
30 June 2020
(deletions) thereafter
Up to last year
During the year
Up to last year
During
the year
Up to last year
DurIng the year
u peas
Land- freehold 29,050,506 427,414,298 13,580,200 470,045,004 470,045,004
Building on lreehold land 225,461,025 1480,811,305 138,24.4,318 1,844,516,648 61,758,809 363,083,233 34,006,524 53,463,570 512,312,136 1,332,204.512 2
Furniture and fixtures 2,730,458 31,369,705 622,289 34,722,452 748,098 22,966,998 2,057,742 (1,020,142) 24,752,686 9,969,756 It)
Distribution equipment 4,596,020,025 56,272,164,076 4,533,926,717 65,402,110,818 1,258936,4.40 17,794,722,396 2,148,270,567 499,925,689 21,701,855,092 43,700,255,126 3.50
Mobile plant and equipments 43,470,710 337,809,073 - 72,506,522 453,786,305 11,910,226 232,423,151 27,1 05,854 (3, 797,00 5) 267,642,226 186,14-4,079 it)
Vehicles. Pool 210,925,584 431,184,826 237,864,702 814,864,883 57,787,152 413,412,271 42,080,160 (96,118,824) 417,161,359 397,703,524 10
(65.1 10,229)
Vehicles-Iransporl policy 363,705,036 90,86.4,000 351,660.553 111,052641 16,421.119 (15,400,574) 98,41 2,985 253,247,568 20
(79,184,678) (23,723,805) (9,660,201)
5,107,658,308 59,200,163,412 5,063,884,943 69,371,706,663 1.391,140,725 18,937,6.6.0,690 2,269,942,566 433,052,714 (9,660.201) 23,022,1 36,494 46349,570,169
2019
Particulars
Cost Depreciation — Book value
as oii
30 JunO
2019
Transferred
from WAPDA
under SBTA on 01
July 1998
Additions!
(deletions) thereafter As on 30 June
2019
Transferred from
WAPDA under
SBTA axon 01 July 1998
Depreciation expense Adjustments!
As on 30 Junta
2019
(deletions) thereafter
Up to last year
During the year
Up to last year
DurIng the year
Up to last year
DurIng the year
Rupees
Land- freehold 29,050,506 427 .4 14 .298 456,464,804
Building on freehold land 225,461.025 t.384,466.029 96.345.276 1,706,272,330 61,758,809 331,066,132 32.017. 101 5 3,4 63.570 478 .305 ,6 12
Furniture and fixtures 2 .730.458 30.504.449 865.256 34,100.163 748,098 20,867,846 2 ,099, 152 (1 020,142) 22,694,954
(.7stribut,on equuiprnent 4 .596 .020 .025 52.099 724 925 4.172.439.151 60.868.184.10 1 1,258,936.440 15,785,368,829 2 .009,353. 567 499 925.689 19,553,584.525
Mobile plant and equipments 43 .470, 7 10 32 1.906 782 15,902.291 381,279.703 11.910,226 210,790,770 21.632,381 3 797.005) 240, 536.37 2
Venocles Pool 210.925,58.4 275 994 364 155,190.461 577,000,181 57.7 07.152 395,500,428 17.911.843 187 700.695) 37 5,080.599
(56 692 0991 18.418.129) (8,4 16,129)
Vnrnucles.I'anspxrt policy 334,133,536 29.571,500 284,520.3 58 81.909,543 29.143,098 5 155,536) 91,652 .00 7
136.857 976) (42,326.702) (14.24 5.038)
5,107 .658 .308 54.780 594 308 4,419,569.104 6-4,307,821,720 1 391,140,725 16825503548 2 112.157.142 .ttub 715,881 (22,663,167) 20.761.854,120
1 1 ne properly and nghts of above assets were txansterreui to trw company in accordance with the terms and conditions of the Business Transfer Aujreernent between WAPDA aiuc ire company However, title of such freehold .4' 7' .1 nnnuieorr have not been transferred in the name of Sue Company in the Land Revenue Records
456.404,804
1.237.905.718 2
11.405.200 10
41,311090.576 3r0
140.743 411 ii)
207.070.582 10
192 8,4.257 20
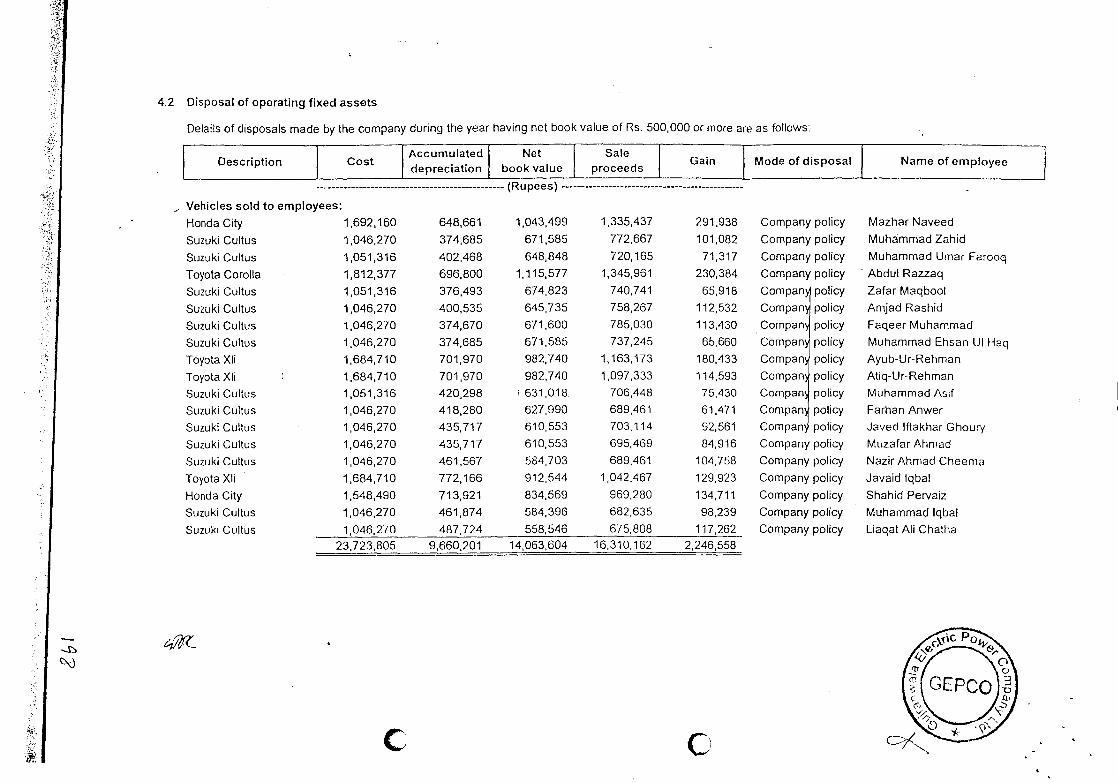
4.2 Disposal of operating fixed assets
Details of disposals made by the company during the year having net book value of Rs. 500,000 or more are as follows:
Net Sale Description Cost
Accumulatedj depreciation book value proceeds
Gain -
Mode of dis posal f
Name of employee
Vehicles sold to employees:
(Rupees)
Honda City 1,692,160 648,661 1,043,499 1,335,437 291,938 Company policy Mazhar Naveed
Suzuki Cultus 1,046,270 374,685 671,585 772667 101,082 Company policy Muhammad Zahid
Suzuki Cultus 1,051,316 402,468 648,848 720,165 71,317 Company policy Muhammad Umar Farooq
Toyota Corolla 1,812,377 696,800 1,115,577 1,345,961 230.384 Company policy Abdul Razzaq
Suzuki Cultus 1,051,316 376,493 674823 740741 65,918 Company policy Zafar Maqbool
Suzuki Cultus 1,046,270 400,535 645,735 758,267 112,532 Company policy Arnjad Rashid
Suzuki Cultus 1,046,270 374.670 671,600 785,030 113,430 Company policy Faqeer Muhammad
Suzuki Cultus 1,046,270 374,685 671,585 737245 65,660 Company policy Muhammad Ehsan UI Haq
Toyota Xli 1,684,710 701970 982,740 1,163,173 180,433 Company policy Ayub-Ur-Rehman
Toyota Xli 1,684,710 701,970 982,740 1,097333 114,593 Company policy Atiq-Ur-Rehman
Suzuki Cultus 1,051,316 420298 631,018, 706448 75,430 Cornpan policy Muhammad Asif
Suzuki Cultus 1,046,270 418,280 627990 689461 61.471 Company policy Farhan Anwer
Suzuki Cultus 1,046,270 435,717 610,553 703,114 92,561 Compan policy Javed lftakhar Choury
Suzuki Cultus 1,046,270 435,717 610,553 695469 84,916 Company policy Muzafar Ahmad
Suzuki Cultus 1,046,270 461,567 584703 689,461 104,758 Company policy Nazir Ahmad Cheema
Toyota Xli 1,684,710 772,166 912544 1042,467 129.923 Company policy Javaid lqbal
Honda City 1548,490 713,921 834,569 969,280 134,711 Company policy Shahid Pervaiz
Suzuki Cultus 1,046,270 461,874 584,396 682,635 98,239 Company policy Muhammad lqbal
Suzuki Cultus 1,046.270 487,724 558546 675,808 117,262 Company policy Liaqat All Chatha 23,723,805 9,660,201 14,063604 16,310,162 2,246,558
C
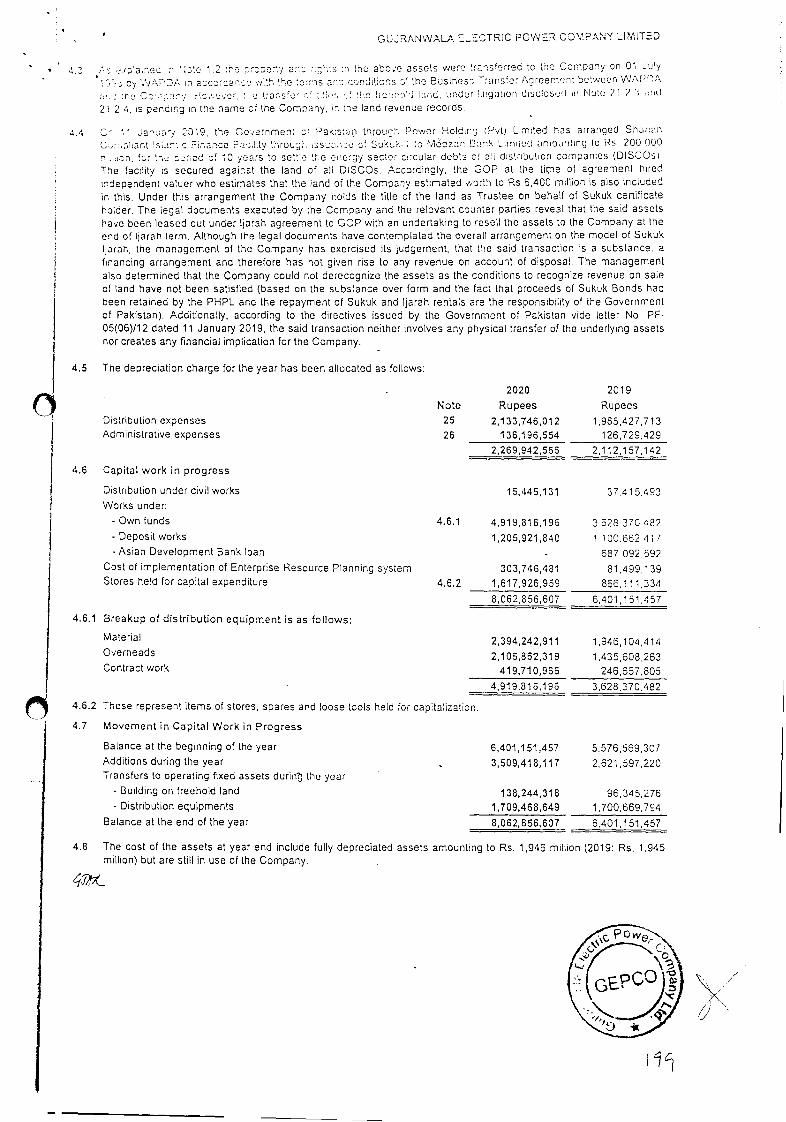
GUJRAN'YVALA ELECTRIC POWER COMPANY LIMITED
-tO •xpiane.: ,n 'icie 1 2 (ho :operi'j on. c3f15 :n toe abo..'e assets were (rcos'arred to toe Company on 01 .H'y cy 'HAPEA n a000rOance with (he to cs r'h conditions ;' the Busnes: T iinsfer Ameemont oelwuc'fl WA)'tA
.:ifle C: -:nn; Ho:.u'.o ' t:anstur tin Ho ticuf" lund, undur litigation disuloau:I in Notu 7 i'?'lund
2 2 4, is pending in the name of the Company. r. the land revenue records.
4.4 C 11 Januuj 2319, the Goiernmenl Ci Pakstun thouch Power HoIdin )Pvt) Limited has arranged Snauin
C:; phant si.m..c Finance Pu :.hty hrougr. ss ;cc Sukc.. to MOOztt1'i 0:i'ik Liriilud riniou'iling to Ps 200 (100
:n, for fn, ceriod of 10 voars to se(te (he cirorny sector circular debts of all distribution companies (DISCOS) The fac:lity is secured against the land of all DISCOs. Accordingly, the GOP at the (icne of agreement hired
independent valuer who estimates that the land of the Company estimated worth to Rs 6,400 million is also included
in this. Under this arrangement the Company holds the title of the land as Trustee on behalf of Sukuk certificate holder. The legal documents executed by the Company and the relevant counter parties reveal that the said assets have been teased out under ljarah agreement to GOP with an undertaking to resell the assets to the Company at the end of Ijarah term. Although the legal documents have contemplated the overall arrangement on the model of Sukuk llarah, the management of the Company has exercised its judgement, that the said transaction is a substance, a financing arrangement and therefore has not given rise to any revenue on account of disposal. The management also determined that the Company could not derecognize the assets as the conditions to recognize revenue on sale of land have not been satisfied (based on the substance over form and the fact that proceeds of Sukuk Bonds had been retained by the PHPL and the repayment of Sukuk and ljarah rentals are the responsibtlity of the Government of Pakistan). Additionally, according to the directives issued by the Government of Pakistan vide letter No PF-05(06)112 dated 11 January 2019, the said transaction neither involves any physical transfer of the underlying assets nor creates any financial implication for the Company.
4.5 The depreciation charge for the year has been allocated as follows:
Note
2020
Rupees
2019
Rupees
Distribution expenses 25 2,133,746,012 1,985,427,713 Administrative expenses 26 136,196,554 126,729,429
2,269,942,566 2,112,157,142
4.6 Capital work in progress
Distribution under civil works 15,445,131 37.4 15 493
Works under:
- Own funds 4.6.1 4,919,816,196 3 628 370482
- Deposit works 1,205,921,840 1 100.662 417
- Asian Development Bank loan 687 092 592
Cost of implementation of Enterprise Resource Planning system 303,746,481 81,499,139 Stores held for capital expenditure 4.6.2 1,617,926,959 866,111,334
8,062,856,607 6,401,151,457
4.6.1 Breakup of distribution equipment is as follows:
Material 2,394,242,911 1,946,104,414 Overheads 2,105,862,319 1,435,608,263 Contract work 419,710,965 246,657,805
4,919,816,196 3,628,370,482
4.6.2 These represent items of stores, spares and loose tools held for capitalization.
4.7 Movement in Capital Work in Progress
Balance at the beginning of the year 6,401,151,457 5,576,569,307 Additions during the year 3,509,418,117 2,621,597.220 Transfers to oPerating fixed assets durin' the year
- Building on freehold land 138,244,318 96. 34 5, 276 - Distribution equipments 1,709,468,649 1,700,669,794
Balance at the end of the year 8,062,856,607 6,401,151,457
4.8 The cost of the assets at year end include fully depreciated assets amounting to Rs. 1,946 million (2019: Rs. 1,945 million) but are still in use of the Company.
0
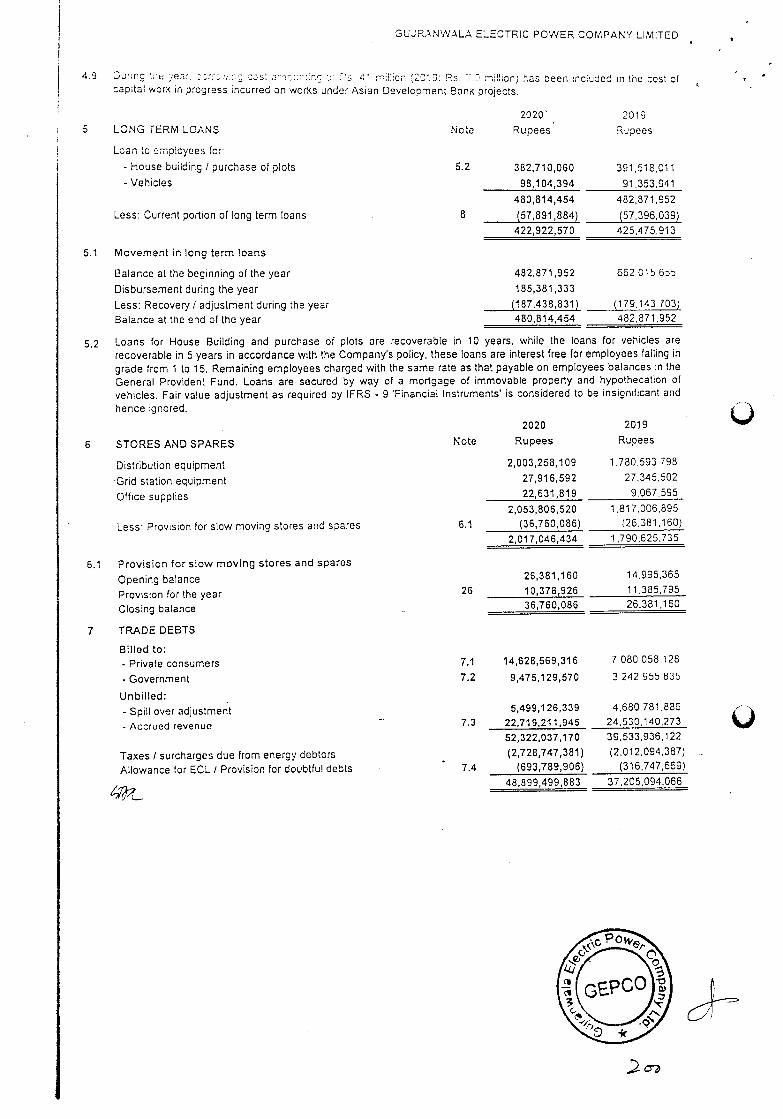
4.9
5
5.1
GU,JRANWALA ELECTRIC POWER COMPANY LIMITED
Cur:ng :.e jea: .:. cs' e:..:rc 41 rr:ion (2013; P.s. .3 million) has been ncluded in the cost of capital work in progress incurred on works under Asian Development 8anc projects.
2020' 2019 LONG TERM LOANS Note Rupees Rupees
Loan to employees fcr:
- House building I purchase of plots 5.2 382,710,060 391,518,011
- Vehicles 98,104,394 91,353,941
480,814,454 482,871,952
Less: Current portion of long term loans 8 (57,891,884) (57,396,039)
422,922,570 425,475,913
Movement in long term loans
Balance at the beginning of the year 482,871,952 662 0t5 6b5
Disbursement during the year 185,381,333
Less: Recovery I adjustment during the year (187,438,831) (179.143 703)
Balance at the end of the year 480,814,454 482.871,952
5.2 Loans for House Building and purchase of plots are recoverable in 10 years, while the loans for vehicles are recoverable in 5 years in accordance with the Company's policy, these loans are interest free for employees falling in grade from 1 to 15. Remaining employees charged with the same rate as that payable on employees balances in the General Provident Fund. Loans are secured by way of a mortgage of immovable property and hypothecation of vehicles. Fair value adjustment as required by IFRS - 9 'Financial Instruments' is considered to be insignificant and hence ignored.
6 STORESANDSPARES Note
2020
Rupees
2019
Rupees
Distribution equipment 2,003,258,109 1.780.593 798
Grid station equipment 27,91 6,592 27.345.502
Office supplies 22,631,819 9,067.595
2,053,806,520 1.817.006.895
Less: Provision for stow moving stores and spares 6.1 (36,760,086) (26,381,160)
2,017,046,434 1,790,625,735
6.1 Provision for slow moving stores and spares
Opening balance 26,381,160 14,995,365
Provision for the year 26 10,378,926 11,385,795
Closing balance 36,760,086 26,381,160
7 TRADE DEBTS
Billed to: - Private consumers 7.1 14,628,569,316 7.080 058 128
- Government 7.2 9,475,129,570 3 242 9b5 835
Unbilled:
- Spill over adjustment 5,499,1 26,339 4,680.781,886
- Accrued revenue 7.3 22,719,211,945 24.530,1 40,273
52,322,037,170 39,533,936,122
Taxes I surcharges due from energy debtors (2,728,747,381) (2,01 2,094,387)
Allowance for ECL / Provision for doubtful debts 7.4 (693,789,906) (316,747,669)
48,899,499,883 37 205,094.066
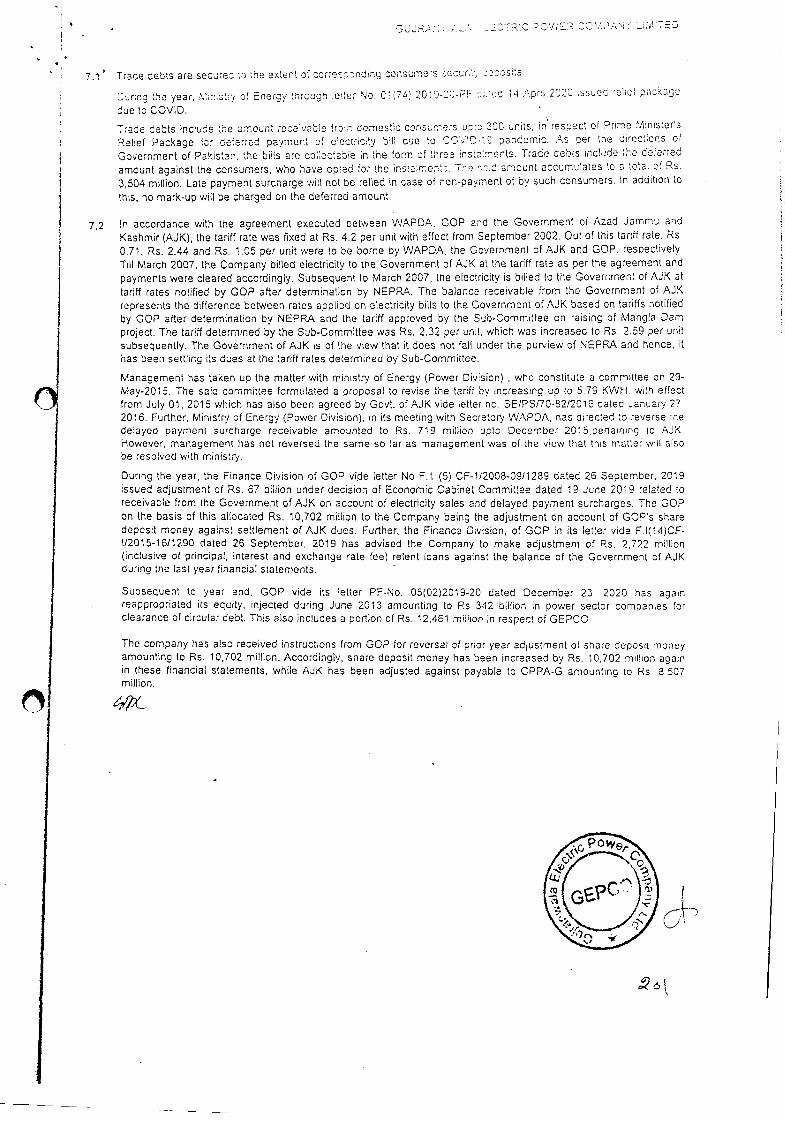
'TiC O'iT :o,."'_llTE•
7,1 Trace beets are securec :•o he extent of corre oondir.g consumers ocur. ocsS.
uring :hc year, zrf of En orgy thrcugrr ieter No. 01(74 2O9--PF :ud 14 Apnl 202 suuic rcht packau
due to COVID.
Trade debts include he e.rnount receivable fror. domestic consumers unto 300 units, in resnect of Prime Ministers Relief Package for deferred payment of electricity bill due to OOVfD-i'3 pordemic. As per the drccticns of Government of Pakistan, the bills are coltectable in the form of three instments. Trade oebts include the deferred amount against the consumers, who have opted for the instalments. The solo amount accumulates to a total of Re. 3,504 million. Late payment surorrarge will not be relied in case of non-payment of by such consumers. In addition to
this, no mark-up wilt be charged on the deferred amount.
7.2 In accordance with the agreement executed between WAPDA, GOP and the Government of Azad Jammu and Kashmir (AJK), the tariff rate was fixed at Rs. 4.2 per unit with effect from September 2002. Out of this tariff rate. Re. 0.71, Rs. 2.44 and Rs. 1.05 per unit were to be borne by WAPDA, the Government of AJK and GOP. respectively Tilt March 2007, the Company billed electricity to the Government of AJK at the tariff rate as per the agreement and payments were cleared accordingly. Subsequent to March 2007, the electricity is billed to the Government of AJK at tariff rates notified by GOP after determination by NEPRA. The balance receivable from the Government of AJK represents the difference between rates applied on electricity bills to the Government of AJK based on tariffs notified by GOP after determination by NEPRA and the tariff approved by the Sub-Committee on raising of Mangla Darn project. The tariff determined by the Sub-Committee was Re. 2.32 per unit, which was increased to Re. 2.59 per unit subsequently. The Government of AJK is of the view that it does not fall under the purview of NEPRA and hence, it has been settling its dues at the tariff rates determined by Sub-Committee.
Management has taken up the matter with ministry of Energy (Power Division) , who constitute a committee on 29-May-2015. The said committee formulated a proposal to revise the tariff by increasing up to 5.79 KWH, with effect from July 01, 2015 which has also been agreed by Govt. of AJK vide letter no. SE/PSI7O-82/2016 dated January 27 2016. Further, Ministry of Energy (Power Division), in its meeting with Secretory WAPDA, has directed to reverse the delayed payment surcharge receivable amounted to Re. 719 million upto December 2015.pertaining to AJK However, management has not reversed the same so far as management was of the view that this matter will also be resolved with ministry.
During the year, the Finance Division of GOP vide letter No F.1 (5) CF-112008-0911289 dated 26 September, 2019 issued adjustment of Rs. 67 billion under decision of Economic Cabinet Committee dated 19 June 2019 related to receivable from the Government of AJK on account of electricity sales and delayed payment suroharges. The GOP on the basis of this allocated Rs. 10,702 million to the Company being the adjustment on account of GOP's share deposit money against settlement of AJK dues. Further, the Finance Division, of GOP in its letter vide F.l(14)CF-/2015-16/1290 dated 26 September, 2019 has advised the Company to make adjustment of P.s. 2.722 million
(inclusive of principal, interest and exchange rate fee) relent loans against the balance of the Government of AJK during the last year financial statements. -
Subsequent to year end, GOP vide its letter PP-No. 05(02)2019-20 dated December 23. 2020 has again reappropriated its equity, injected during June 2013 amounting to Re 342 billion in power sector companies for clearance of circular debt. This also includes a portion of Re. 12,461 million in respect of GEPCO
The company has also received instructions from GOP for reversal of prior year adiuslment of share deposit money amounting to Rs. 10,702 million. Accordingly, share deposit money has been increased by Re. 10,702 million again in these financial statements, while AJK has been adjusted against payable to CPPA-G amounting to Re 8.507 million.
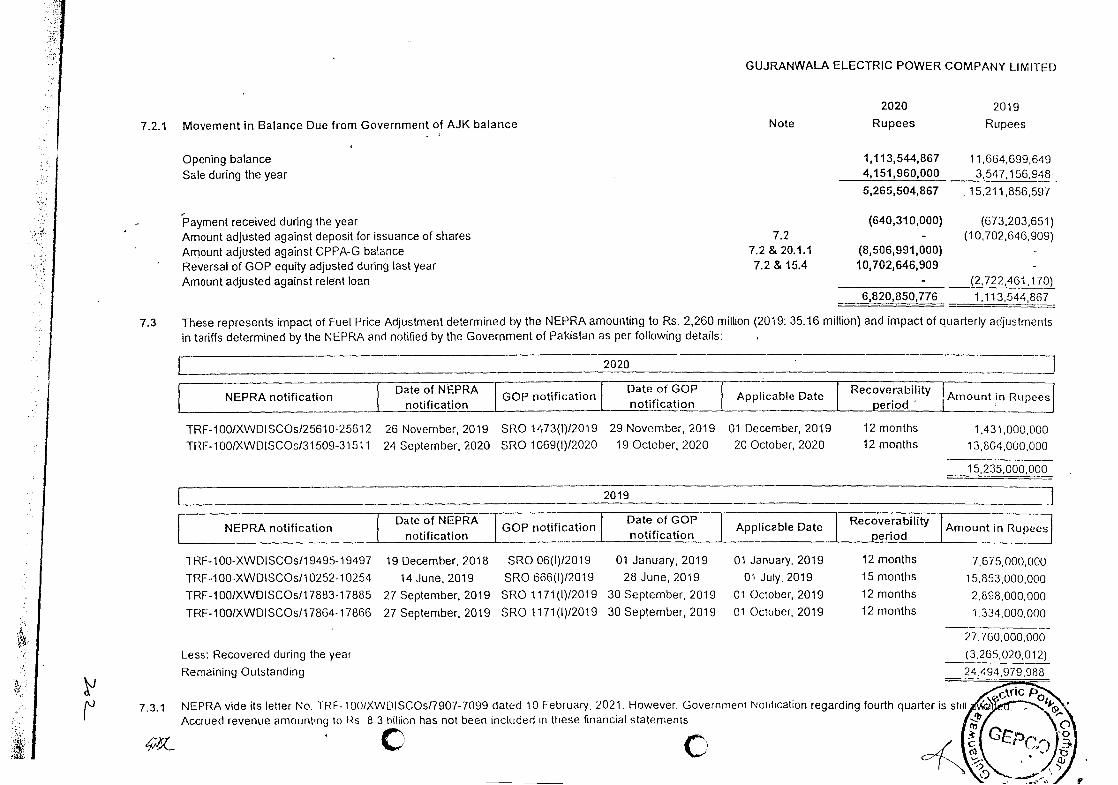
(3,265,020,012)
24494,979,083
Less: Recovered during the year
Remaining Outstanding
C
7.3.1 NEPRA vide its letter No. TRF 100/XWDlSCOs/7907-7099 dated 10 February. 2021. However. Government Notification regarding fourth quarter is still Accrued revenue amounting to Rs 8 3 hllion has not been included in these financial statements
C
GUJRANWALA ELECTRIC POWER COMPANY LIMITED
2020 2019
Movement in Balance Due from Government of AJK balance Note Rupees Rupees
Opening balance 1,113,544,867 11,664,699,649 Sale during the year 4,151,960,000 3.547,156,948
5,265,504,867 .15,211,856,597
Payment received during the year (640,310,000) (673,203,651) Amount adjusted against deposit for issuance of shares 7.2 (10,702,646,909) Amount adjusted against CPPA-G balance 7.2 & 20.1.1 (8,506,991,000) Reversal of GOP equity adjusted during last year 7.2 & 15.4 10,702,646,909 Amount adjusted against relent loan (2,722,461,170)
6,820,850,776 1,113,544,867
7.3 These represents impact of Fuel Price Adjustment determined by the NEPRA amounting to Rs. 2260 million (2019: 35.16 million) and impact of quarterly adjustments in tariffs determined by the NEPRA and notified by the Government of Pakistan as per following details:
2019
2020
NEPRA notification Date of NEPRA
notification GOP notification
Date of GOP notification
Applicable Date Recoverability period
TRF-100/XWDlSCOs/25610-25612 TRF-100/XWDlSCOs/31509-31511
26 November, 2019 SRO 1473(1)/2019
24 September, 2020 SRO 1069(1)/2020
29 November, 2019 01 December, 2019
19 October, 2020 20 October, 2020
12 months 12 months
1 5,235,000,000
-J
1,431,000,000
13,804,000,000
Amount in Rupees
NEPRA notification Date of NEPRA
notification GOP notification
Date of GOP notification
Applicable Date Recoverability period
Amount in Rupee
TRF-1 00-XWDlSCOs/1 9495-19497 19 December, 2018 SRO 06(1)/20 19 01 January, 2019 01 January, 2019 12 months 7,675,000,000
TRF-1 00-XWDlSCOs/1 0252-10254 14 June, 2019 SRO 666(I)/2019 28 June, 2019 01 July, 2019 15 months 15.853,000,000
TRF-1 00/XWDlSCOs/17883-17885 27 September, 2019 SRO 1171(1)/2019 30 September, 2019 01 October, 2019 12 months 2,898,000,000
TRF-100/XWDlSCOs/1 7864-17866 27 September, 2019 SRO 1171(1)/2019 30 September, 2019 01 October, 2019 12 months 1 334,000,000
2 7. 760,000,000
I
7.2.1
f'J
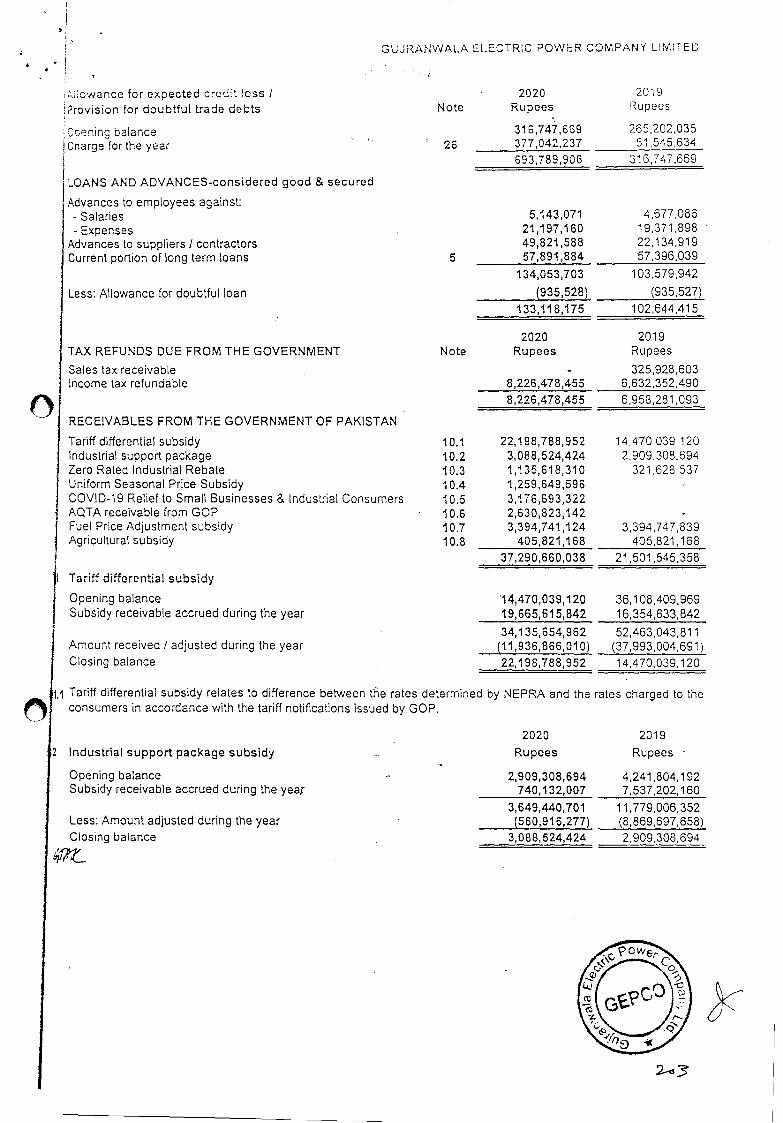
0
GUJRANWALA ELECTRIC POWER COMPANY LIMITED
;::owance for expected credit loss / 2020 2019
9rovision for doubtful trade debts Note Rupees Rupees
ODening balance 315,747,669 265,202,035
Charge [or the year 26 377,042,237 51,545,634
693,789,906 316,747,669
LOANS AND ADVANCES-considered good & secured
Advances to employees against: - Salaries 5,143071 4,677,086
- Expenses 21,197,160 19,371,898 Advances to suppliers I contractors 49,821,588 22,134,919 Current portion of long term loans 5 57,891,884 57,396,039
134,053,703 103,579,942
Less: Allowance for doubtful loan (935,528) (935,527)
133,118,175 102,644,415
2020 2019 TAX REFUNDS DUE FROM THE GOVERNMENT N ote Rupees Rupees
Sales tax receivable 325928,603 Income tax refundable 8,226,478,455 6,632,352,490
8,226,478,455 6,958,281,093
RECEIVABLES FROM THE GOVERNMENT OF PAKISTAN
Tariff differential subsidy 10.1 22,198,788,952 14.470 039 120 Industrial sup port package 10.2 3,088,524,424 2,909,308.694 Zero Rated Industrial Rebate 10.3 1,135,618,310 321,628 537 Uniform Seasonal Price Subsidy 10.4 1,259,649,596 COVID-19 Relief to Small Businesses & Industrial Consumers 10.5 3,176,693322 AQTA receivable from GOP 10.6 2,630,823,142 Fuel Price Adjustment subsidy 10.7 3,394,741,124 3,394,747,839 Agricultural subsidy 10.8 405,821,168 405,821,168
37,290,660,038 21,501,545,358
I Tariff differential subsidy
Opening balance 14,470,039,1 20 36,108,409,969 Subsidy receivable accrued during the year 19,665,615,842 16,354,633,842
34,135,654,962 52,463,043,811 Amount received / adjusted during the year (11,936,866,010) (37,993,004,691) Closing balance 22,1 98,788,952 14,470,039,120
ii Tariff differential subsidy relates to difference between tle rates determined by NEPRA and the rates charged to the consumers in accordance with the tariff notifications issued by GOP.
2 Industrial support package subsidy
2020
Rupees
2019
Rupees
Opening balance 2,909,308,694 4,241,804,192 Subsidy receivable accrued during the yea.r 740,132,007 7,537,202,160
3,649,440,701 11,779,006,352 Less: Amount adjusted during the year (560,91 6,277) (8,869,697,658) Closing balance 3,088,524,424 2,909,308,694
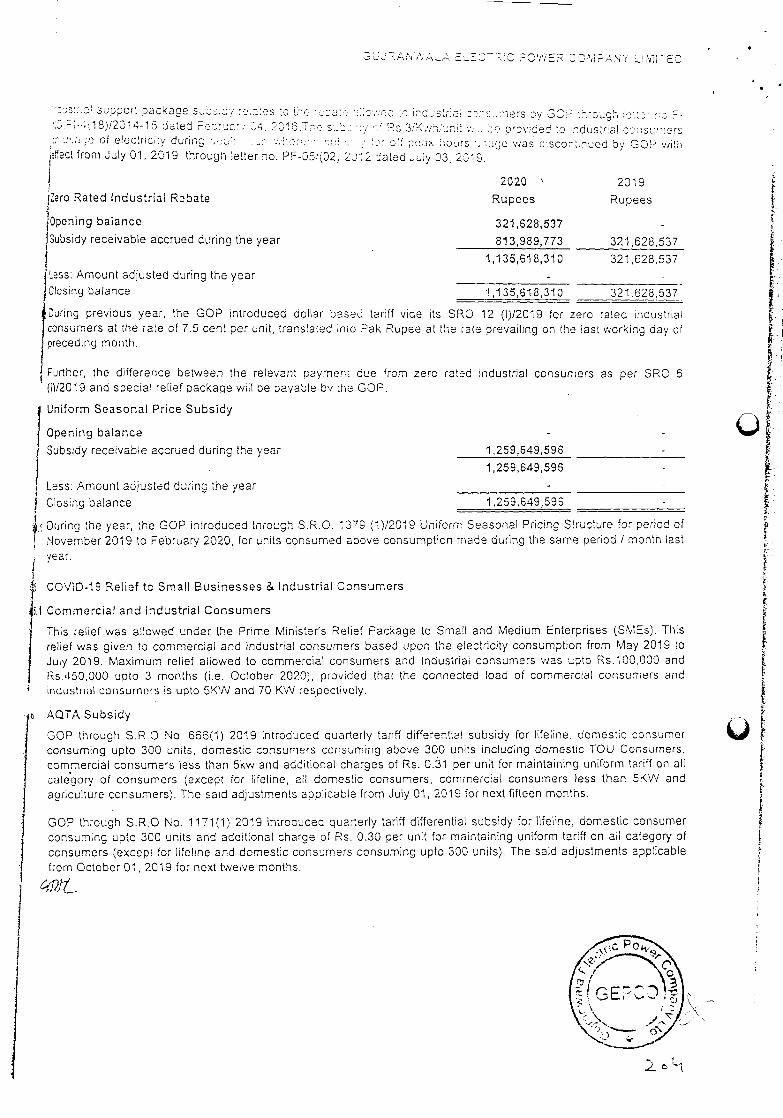
2
?0-i'iER 32 PAN" L$OTEO
os':.o suopod package S.O( o.::es o ho u O.P-.;,18)/2014-15 dated Focjpr, 4, 216.Th s.: .'o'
o of electricity during ';u': ...: ;.t'or'.. ect from July 01, 2019 through letter no. PF-05JD2 )
:I.c..oc :: ndustr.:: C: -:r.ers o' 0-OP hrcugh :: ls 3JK.';h. -:: ',. provided to nduslrial o:su.'ors
;. oh hours u;ue was disconhnued by 0-OP '.'iith 12 dated July 03. 2319.
2020 2019
lero Rated Industrial Rebate Rupees Rupees
iOpening balance 321,628537 -
Subsidy receivable accrued during the year 813,989,773 321628537
1,135,618,310 321,628,537
Amount adjusted during the year
Closing balance 1,135,618,310 321,628.537
During previous year, the GOP introduced aollar based tariff vide its SPO 12 (1)/2019 for zero rated industrial consumers at the rate of 7.5 cent per unit, translated into Pak Rupee at the rate prevailing on the last working day of preceding month.
Further, the difference between the relevant payment duo from zero rated industrial consumers as per SRO 6 (11/2019 and special relief ackaqe will be oayable by the GOP.
Uniform Seasonal Price Subsidy
Opening balance
Subsidy receivable accrued during the year 1259,649,596
1,259,649,596
Less: Amount adjusted during the year
Closing balance 1,259,649,596
During the year, the GOP introduced through S.R.O. 1379 (1)12019 Uniform Seasonal Pricing Structure for period of November 2019 to February 2020, for units consumed above consumption made during the same period / month last
year.
COVID-19 Relief to Small Businesses & Industrial Consumers
5,1 Commercial and Industrial Consumers
This relief was allowed under the Prime Minister's Relief Package to Small and Medium Enterprises (SMEs). This relief was given to commercial and industrial consumers based upon the electricity consumption from May 2019 to July 2019. Maximum relief allowed to commercial consumers and Industrial consumers was upto Rs.100,000 and Rs 450,000 upto 3 months (i.e. October 2020), provided that the connected load of commercial consumers and
• industrial consumers is upto 5KW and 70 KW respoctively.
AQTA Subsidy
0-OP through S.R.O No. 666(1) 2019 introduced quarterly tariff differential subsidy for lifeline, domestic consumer • consuming upto 300 units, domestic consumers consuming above 300 units including domestic TOU Consumers.
commercial consumers less than 5kw and additional charges of Rs. 0.31 per unit for maintaining uniform tariff on all category of consumers (except for lifeline, all domestic consumers, commercial consumers less than 5KW and agriculture consumers). The said adjustments applicable from July 01, 2019 for next fifteen months.
GOP through S.R.O No. 1171(1) 2019 introduced quarterly tariff differential subsidy for lifeline, domestic consumer consuming upto 300 units and additional charge of Rs. 0,30 per unit for maintaining uniform tariff on all category of consumers (except for lifeline and domestic consumers consuming upto 300 units). The said adjustments applicable
from October 01. 2019 for next twelve months.
Hit
I
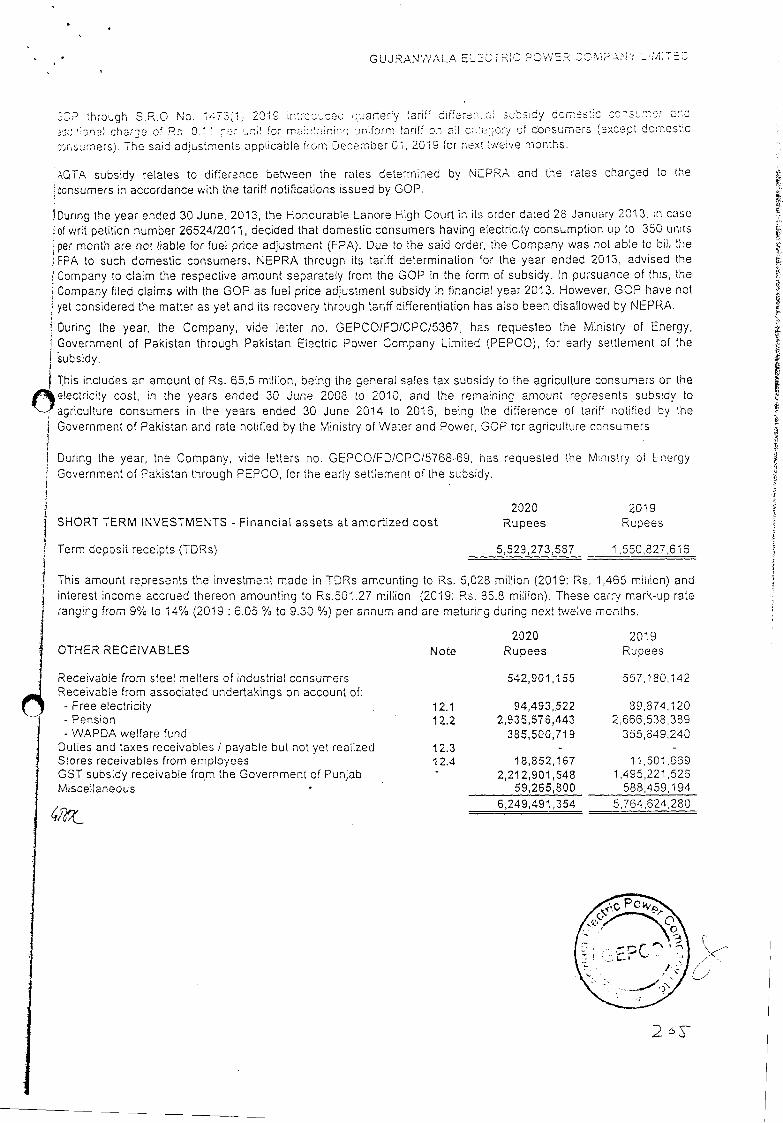
GIJJRANWALA E3TP.iC POViER1 C:-'''
3CR through S.R.O No. :731 2019 intr:Jucec uaarterly tariff differec:.rb subsidy domssc o smor OflO
ic :onal choro o' Rc. 0. or unit for m 'uninu uniform tariff on aJ cn:cor/ of consumers except domestic
:rsumers). The said adjustments applicable from December 01 2019 for next twelve months.
AQTA subsidy relates to difference between the rates determined by NEPRA and the rates charged to the
consumers in accordance with the tariff notifications issued by GOP.
During the year ended 30 June, 2013, the Honourable Lahore High Cour1 in its order dated 28 January 2013, n case
of writ petition number 26524/2011 decided that domestic consumers having electricity consumption up to 350 units
per month are not liable for fuel price adjustment (FPA). Due to the said order, the Company was not able to bill the
FPA to such domestic consumers. NEPRA through its tariff determination for the year ended 2013, advised the
I Company to claim the respective amount separately from the GOP in the form of subsidy. In pursuance of this, the
Company filed claims with the GOP as fuel price adjustment subsidy in financial year 2013. However, GOP have not
yet considered the matter as yet and its recovery through tariff differentiation has also been disallowed by NEPRA.
During the year, the Company, vide letter no. GEPCOIFDJCPC/5367, has requested the Ministry of Energy,
I Government of Pakistan through Pakistan Electric Power Company Limited (PEPCO), for early settlement of the
I subsidy.
4 This includes an amount of Ps. 65.5 million, being the general sales tax subsidy to the agriculture consumers on the
Oeiectricity cost, in the years ended 30 June 2008 to 2010, and the remaining amount represents subsidy to
agriculture consumers in the years ended 30 June 2014 to 2016, being the difference of tariff notified by the
Government of Pakistan and rate notified by the Ministry of Water and Power, GOP for agriculture consumers
During the year, the Company, vide letters no. GEPCO/FD/CPC/5768-89, has requested the Mnistry of S nergy
Government of Pakistan through PEPCO, for the early settlement of the subsidy.
SHORT TERM INVESTMENTS - Financial assets at amortized cost
Term deposit receipts (TDRs)
2020 2019 Rupees Rupees
5,529,273,587 1,550,827,616
This amount represents the investment made in TDRs amounting to Rs. 5,028 million (2019: Rs. 1,465 million) and
interest income accrued thereon amounting to Rs.501.27 million (2019: Ps. 85.8 miilion). These carry mark-up rate
ranging from 9% to 14% (2019 : 6.05 % to 9.30 ~) per annum and are maturing during next twelve months.
2020 2019 OTHER RECEIVABLES Note Rupees Rupees
Receivable from steel melters of industrial consumers 542,901,155 557.180,142 Receivable from associated undertakings on account of: - Free electricity . 12.1 94,493,522 89,874.120 - Pension 12.2 2,935,575,443 2,666,538,389 - WAPDA welfare fund 385,500,719 355,849,240
Duties and taxes receivables / payable but not yet realized 12.3 -
Stores receivables from employees 12.4 18,852,157 11,501,669 GST subsidy receivable from the Government of Punjab 2,212,901,548 1,495,221,526 Miscellaneous 59,265,800 588,459,194
6,249,491,354 5,764,624,280
2
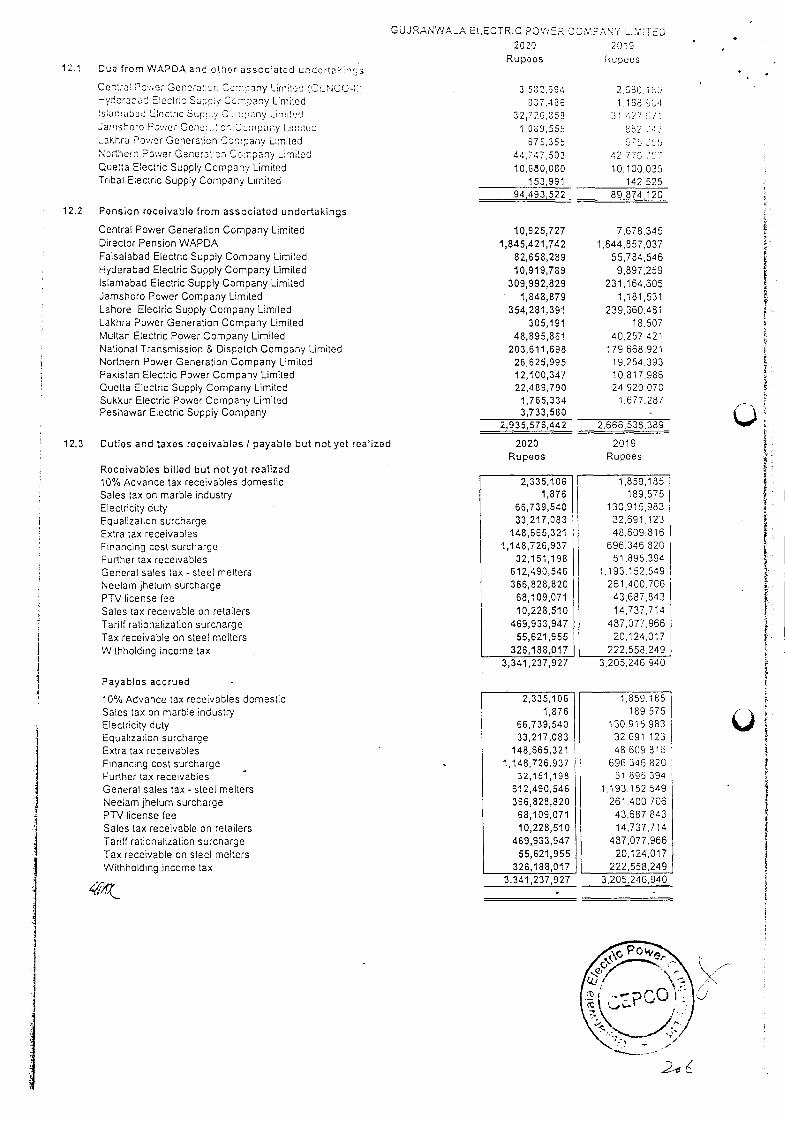
GUJR,ANWALA ELECTRlC POWER CCtiPAN'( LEPITEL 2020 2019
Rupees Eupees 12.1 Duo from WAPDA and other associated un.dortoins
Control Power Genoratior, Company L:miioij 'CENCC -v 3,532,594 2,530.1 Hyderaa,d Electric Supc.' Company Limited 337,486 1.188 504 lsiurriiihud Electric Suptv C'mnv Liiiiitea 3 27 20,353 /
Jatnshcro P'.'.'er Oen:cr. mpnny Liin:le 1,039,555 882 :4 LaKhro Power Generation Company Limited 675,355 Northern Power Generat on Company Lmitod 44,717,503 42 775 Duetta Electric Supply Company Limited 10,630,080 10.100,035 Tribal Electric Supply Company Limited 153,991 142 525
94,493,522 89,874 120
12.2 Pension receivable from associated undertakings
Central Power Generation Company Limited 10,925,727 7,678.345 Director Pension WAPDA 1,845,421,742 1,844,857,037 Faisalabad Electric Supply Company Limited 82,658,289 55,784.546 Hyderabad Electric Supply Company Limited 10,919,789 9,897,259 Islamabad Electric Supply Company Limited 309,992,829 231,164,605 .Jamshoro Power Company Limited 1,848,879 1,181,531 Lahore Electric Supply Company Limited 354,281,391 239,360.481 Lakhra Power Generation Company Limited 305,191 18507 Multan Electric Power Company Limited 48,895,861 40.257 421 National Transmission & Dispatch Company Limited 203,611,698 179,668.921 Northern Power Generation Company Limited 26,625,995 19,254393 Pakistan Electric Power Company Limited 12,100,347 10,817,986 Quetta Electric Supply Company Limited 22,489,790 24920.070 Sukkur Electric Power Company Limited 1,765,334 1.677.287 Peshawar Electric Supply Company 3,733,580 -
2,935,576,442 2.666.538,389
12,3 Duties and taxes recoivablos I payable but not yet realized 2020 2019 Rupees Rupees
Rocoivables bitted but not yet realized 10% Advance tax receivables domestic 2,335,106 1,859,185 Sales tax on marble industry 1,876 189,575 Electricity duty 66,739,540 130,915,983 Equalization surcharge 33,217,083 32 .69 1. 123 Extra tax receivables 148,665,321 48,609.8 16 Financing cost surcharge 1,148,726,937 696.346 820 Further tax receivables 32,151,198 51.895.394
General sales tax - steel melters 612,490,546 1,193.152, 549 Neelam jhelum surcharge 366,828,820 261,400.706
PTV license fee 68,1 09,071 43,687,843 Sales tax receivable on retailers 10,228,510 14,737,714 Tariff rationalization surcharge 469,933,947 487,077,966 Tax receivable on steel melters 55,621,955 20,124,017 Withholding income tax 326,188,017 222,558,249
3,341,237,927 3,205,246,840
Payablos accrued
10% Advance tax receivables domestic 2,335,106 1,859,185 Sales tax on marble industry 1,876 189,575 Electricity duty 66,739,540 130.915 983 Equalization surcharge 33,217,083 32691 123 Extra tax receivables 148,665,321 4860931 3 Financing cost surcharge 1,148,726,937 696 346 820 Further tax receivables 32,151,198 51 895 394 General sales tax - steel melters 612,490,546 1.193.152.549 Neelam jhelurn surcharge 366,828,820 261.400 706 PTV license fee 68,109,071 43,687.84 3 Sales tax receivable on retailers 10,228,510 14,737,714 Tariff rationalization surcharge 469,933,947 4 87.077.966 Tax receivable on steel melters 55,621,955 20,124 .0 17 Withholding income tax 326,188,017 222,558.249
3,341,237,927 3, 205 .246, 940
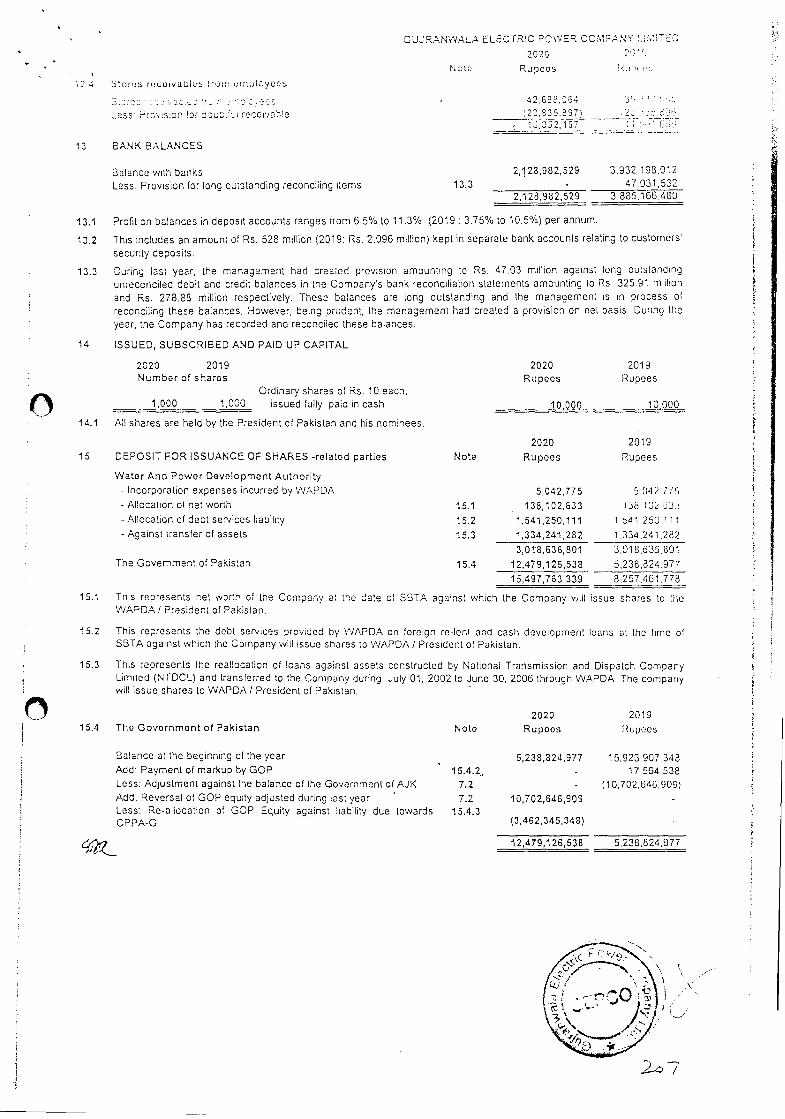
Stores r .u,vabios rOi; empicyces
Less. P es:Cn or ooui'' recc'ivoble
2.4
4 2, 68 2, 0 64 (23, 83 5.8 97 10,052,157
13 BANK BALANCES
2,128,982,529 3.932.195.012 47.031,532
2,128,982,529 3.885,166,480
8alance with banks Less. Piovision for long outstanding reconciling [c-ms 13.3
0 10000 10000
Ordinary shares of Rs. 10 each, 1,000 1,000 issued fully paid in cash
CUJRANW,ALA ELECTRIC POWER COMPANY LIMITED
2020 22'.
Note Rupees
13.1 Profit on balances in deposit accounts ranges from 6.5% to 11.3% (2019 : 3.75% to 10.5%) per annum.
13.2 This includes an amount of Rs. 528 million (2019: Rs. 2.096 million) kept in separate bank accounts relating to customers'
security deposits.
13.3 During last year, the management had created provision amounting to Rs 47.03 million against long outstanding unreconcited debit and credit balances in the Company's bank reconciliation statements amounting to Rs 325.91 million and Rs. 278.88 million respectively. These batances are long outstanding and the management is in process of reconciling these balances. However, being prudent, the management had created a provision on net basis [During the
year, the Company has recorded and reconciled these balances.
14 ISSUED, SUBSCRIBED AND PAID UP CAPITAL
2020 2019 2020 2019 Number of shares Rupees Rupees
14.1 AS shares are held by the President of Pakistan and his nominees.
2020 2019
15 DEPOSIT FOR ISSUANCE OF SHARES -related parties Note Rupees Rupees
Water And Power Development Authority
- lncorporatmon expenses incurred by WAPDA 5,042,775 5042 77',
- Allocation of net worth 15.1 138,102,633 138 tOO OJ.i
- Allocation of debt services liability 15.2 1,541,250,111 1 541 250 lii
- Against transfer of assets 15.3 1,334,241,282 1,334,241.282
3,018,636,801 3,018,636.801 The Government of Pakistan 15.4 12,479,126,538 5,238,824.977
15,497,763,339 8,257,451.778
15.1 This represents net worih of the Company at the date of SSTA against which the Company v/ill issue shares to the WAPDA / President of Pakistan.
15.2 This represents the debt services provided by WAPDA on foreign re-lent and cash development loans at the lime of SBTA against which the Company will issue shares to WAPDA I President of Pakistan.
15.3 This represents the reallocation of loans against assets constructed by National Transmission and Dispatch Company Limited (NTDCL) and transferred to the Company during July 01, 2002 to June 30. 2006 through WAPDA The company will issue shares to WAPDA I President of Pakistan.
2020 2019 Tho Governmormt of Pakistan Note Rupees Rupees
Balance at the beginning of the year - 5,238,824,977 15,923,907,343
Add: Payment of markup by GOP 15.4.2 - 17.564,538 Less: Adjustment against the balance of the Governmenl 01 AJK 7.2 - (10,702,t146.9091 Add: Reversal of GOP equity adjusted during last year 7.2 10,702,646,909 Less: Re-allocation of GOP Equity against liability due towards 15.4.3 CPPA-G f3,462,345,348)
12,479,126,538 5,238,824,977
15.4
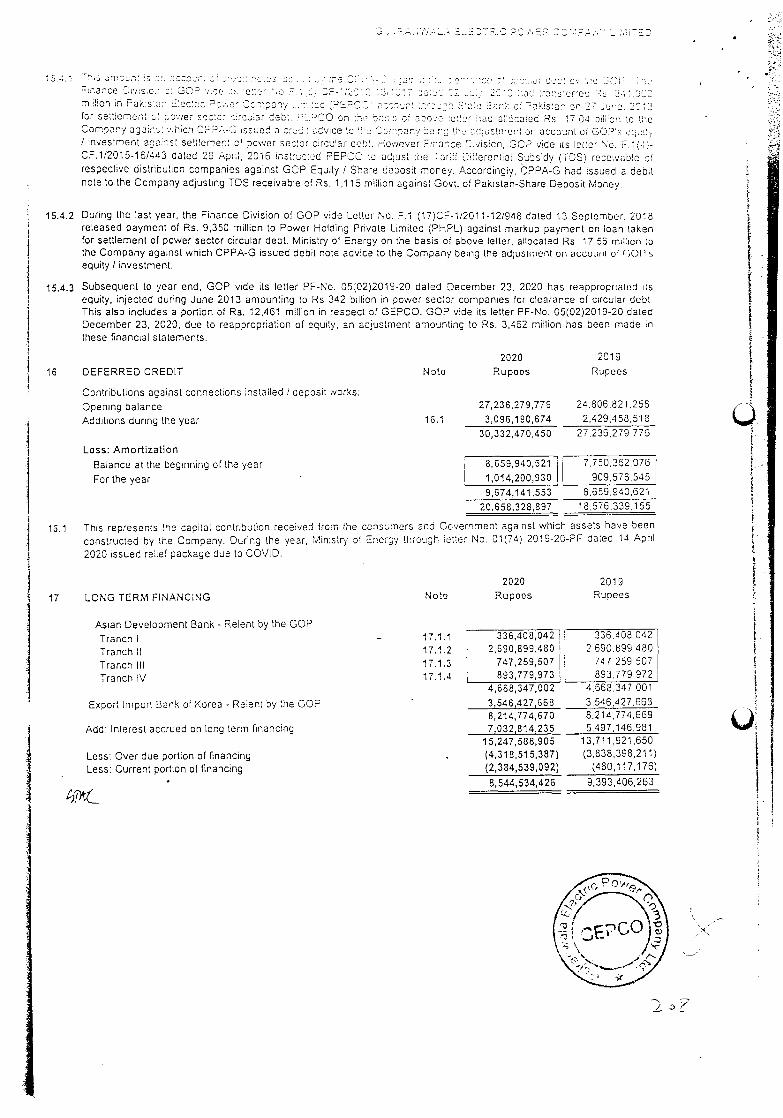
1541 "h.aamc.i- l.s ...:O,r;'':r,,o4 -aP .•'- .'."'.;'o'''."'.'i ;''. c.'o.''u 1G1 Fr,ance Divis.o.'. GC .00 .:s char ',o T P-COC 0 7 ::'. 00 0 '.aJ ira' or'oo 'Os '000 million in Pak:si:". B:echr:c Fo.'.r Ocnrq:ny 0.n'.:sd PEPC ,acaar' :b:'a - Sa:a 3a0: o' 'ok:siar or 2' 0re 2':i for settlement of sa'.'ier sofo' o:rcuiar aot .H. 'CG on in o: abo.'a cifar nad a10caied Ps. 17.04 o0cn ho hOc Company agains .'nch CF?'.- 0 cooed a orsa odv:ce fo ' nvaj'r'n r'ustn'o"i on account of GOP'5 or;oihs I nveslment aoa.'rs settlement of power secor circular dcc:. However Frnnce 1Gviscn, GOP ide its letter No. 7.1 (4)-CF.112015-161443 dated 23 .PprJ, 2016 instrocied FEPCO :o adpist hOe Tarlif Ltfferental Soosdy (TDS) receivuolo of respective distribution companies against GOP Equity / Share deposit money. AccordIngly, CPPA-G had issued a debt note to the Company adjusting TDS receivable of Rs. 1115 million against Govt. of Pakistan-Share Deposit Money.
15.4.2 During the last year, the Finance Division of GOP vide Letter No. F.i (17)CF-112011-12/948 dated 13 September. 2018 released payment of Rs. 9350 million to Power Holding Private Limited (PHPL) against markup payment on loan taken for settlement of power sector circular debt. Ministry of Energy on the basis of above tetter, allocated Rs 17 56 millcn to the Company against which CPPA-G issued debit note advice to the Company being the adjustment on account of (101's equity / investment.
15.4.3 Subsequent to year end, GOP vide its letter PF-No. 05(02)2019-20 dated December 23, 2020 has reappropriatud its equity, injected during June 2013 amounting to Rs 342 billion in power sector companies for clearance of circular debt This also includes a portion of Rs. 12,461 million in respect of GEPCO. GOP 'iide its letter PF-No. 05(02)2019-20 dated December 23, 2020, due to reappropriation of equity, an adjustment amounting to Rs. 3,462 million has been made in these financial statements.
16 DEFERRED CREDIT
Contributions against connections installed / deposit works.
Nato
2020
Rupoos
2019
Rupees
Opening balance 27,236,279,776 24,806,821.258
Additions during the year 16.1 3,096,1 90,674 2,429,458,518
30,332,470,450 27,236,279.776
Loss: Amortization
Balance at the beginning of the year 8,659,940,621 7,750,362.075
For the year 1,014,200,930 909.578,54 5
9,674,141,553 8,659,940.62 1
20,658,328,897 18,576,339.155
15.1 This represents the capital contribution received from the consumers and Government against which assets have been
constructed by the Company. During the year, Min:strj of Energy through eifer No. 01(74) 2019-20-PP dated 14 April
2020 issued relief package due to COVID.
2020 2019
17 LONG TERM FINANCING Noto Rupees Rupees
Asian Development Bank - Relent by the GOP
Trench I 17.1.1 336,408,042 336 438 042
Tranch It 17.1.2 2,6 90,8 9 9.4 8 0 2 690.899 480
Tranch Ill 17.1.3 747,259,507 747 259 507
Tranch IV 17.1.4 893,779,973 893. 779. 972
4,668,347,002 4,668.347 001
Export Import Bank of Korea - Relent by the GOP 3,546,427,668 3,546.42 7,668
8,214,774,670 8,214,774,669
Add: Interest accrued on long term financing 7,032,814,235 5,497,146,981
15,247,588,905 13,711,921,650
Less: Over due portion of financing (4,31 8,51 5,387) (3,838,398,211)
Less: Current portion of financing (2,384,539,092) (480,117,176)
8,544,534,426 9,393,406,263
I ' '1'
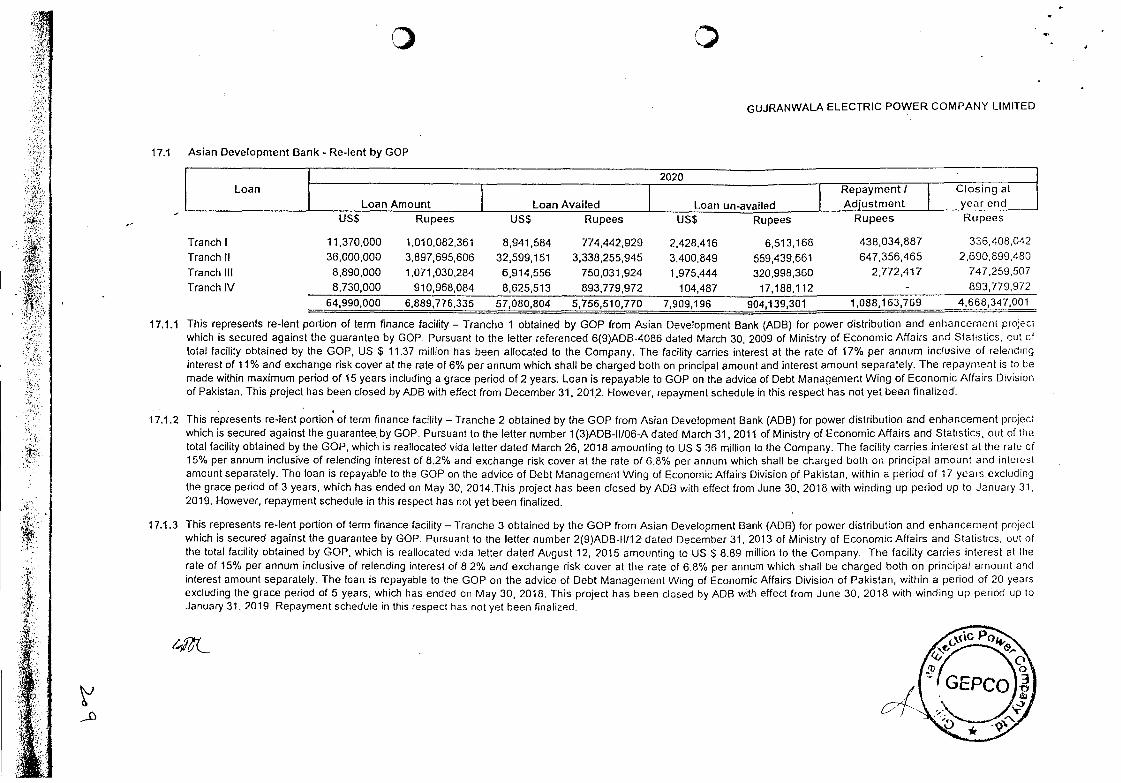
GUJRANWALA ELECTRIC POWER COMPANY LIMITED
17.1 Asian Development Bank - Re-lent by GOP
Loan 2020
Loan Amount Loan Availed Loan un-availed J Repayment! Adjustment
Closing at
year end
uss Rupees Uss Rupees uss Rupees Rupees Rupees
Tranch I 11,370,000 1,010,082,361 8.941.584 774,442,929 2.428,416 6,513,168 438,034,887 336,408,042
Tranch II 36,000,000 3,897,695,606 32,599,151 3,338,255,945 3,400,849 559,439,661 647,356,465 2,690.699,480
Tranch Ill 8,890,000 1,071,030,284 6,914,556 750,031,924 1.975,444 320,998.360 2,772,417 747,259,507
Tranch IV 8,730,000 910,968,084 8,625,513 893,779,972 104,487 17,188,112 893,779,972
64,990,000 6,889,776,335 57,080,804 5,756,51 0,770 7,909,196 904,139,301 1,088,163,769 4,668,347,001
17.'Ll This represents re-lent portion of term finance facility — Tranche 1 obtained by GOP from Asian Development Bank (ADB) for power distribution and enhancement pioeci which is secured against the guarantee by GOP. Pursuant to the letter referenced 6(9)ADB-4086 dated March 30, 2009 of Ministry of Economic Affairs and Stattsbcs. cut cf total facility obtained by the GOP, US $ 11.37 million has been allocated to the Company. The facility carries interest at the rate of 17% per annum inclusive of releriding interest of 11% and exchange risk cover at the rate of 6% per annum which shall be charged both on principal amount and interest amount separately. The repayment is to be made within maximum period of 15 years including a grace period of 2 years. Loan is repayable to GOP on the advice of Debt Management Wing of Economic Affairs Division of Pakistan. This project has been closed by ADB with effect from December 31, 201,2. However, repayment schedule in this respect has not yet been finalized.
17.1.2 This represents re-lent portion of term finance facility — Tranche 2 obtained by the GOP from Asian Development Bank (ADB) for power distribution and enhancement project which is secured against the guarantee by GOP. Pursuant to the letter number 1(3)ADB-ll/06-A dated March 31, 2011 of Ministry of Economic Affairs and Statistics, out of the total facility obtained by the GOP, which is reallocated vida letter dated March 26, 2018 amounting to US S 36 million to the Company. The facility carries interest at the rate cf 15% per annum inclusive of relending interest of 8.2% and exchange risk cover at the rate of 6.8% per annum which shall be charged both on principal amount and interest amount separately. The loan is repayable to the GOP on the advice of Debt Management Wing of Economic Affairs Division pf Pakistan, within a period of 17 years excluding the grace period of 3 years, which has ended on May 30, 2014.This project has been closed byADB with effect from June 30, 2018 with winding up period up to January 31. 2019. However, repayment schedule in this respect has not yet been finalized.
17.1.3 This represents re-lent portion of term finance facility— Tranche 3 obtained by the GOP from Asian Development Bank (ADB) for power distribution and enhancement project which is secured against the guarantee by GOP. Pursuant to the letter number 2(9)ADB-ll/12 dated December 31, 2013 of Ministry of Economic Affairs and Statistics, out of the total facility obtained by GOP, which is reallocated vida letter dated August 12, 2015 amounting to US S 8.89 million to the Company. The facility carries interest at the rate of 15% per annum inclusive of relending interest of 8 2% and exchange risk cover at the rate of 6.8% per annum which shall be charged both on principal amount and interest amount separately. The loan is repayable to the GOP on the advice of Debt Management Wing of Economic Affairs Division of Pakistan, within a period of 20 years excluding the grace period of 5 years, which has ended on May 30, 2018. This project has been closed by ADB with effect from June 30, 2018 with winding up period up to January 31, 2019. Repayment schedule in this respect has not yet been finalized.
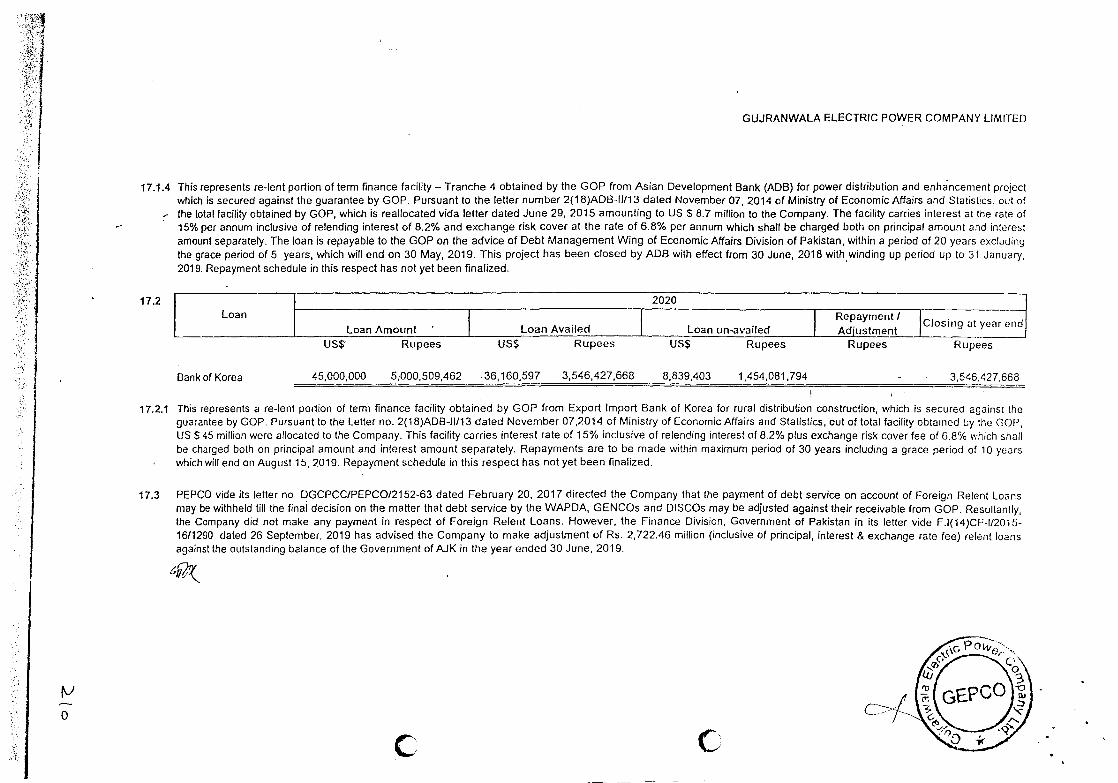
USS uss uss, Rupees Rupees Rupees Rupees Rupees
Bank of Korea 3,546,427668 45,000000 5,000,509,462 36,160597 3,546,427,668 8,839,403 1,454,081,794
GUJRANWALA ELECTRIC POWER COMPANY LIMITED
17.1.4 This represents re-lent portion of term finance facility - Tranche 4 obtained by the GOP from Asian Development Bank (ADB) for power distribution and enhancement project which is secured against the guarantee by GOP. Pursuant to the letter number 2(18)ADB-ll/13 dated November 07. 2014 of Ministry of Economic Affairs and Statistics, out of
- the total facility obtained by GOP, which is reallocated vida letter dated June 29, 2015 amounting to US S 8.7 million to the Company. The facility carries interest at the rate of 15% per annum inclusive of relending interest of 8.2% and exchange risk cover at the rate of 6.8% per annum which shall be charged both on principal amount and interest amount separately. The loan is repayable to the GOP on the advice of Debt Management Wing of Economic Affairs Division of Pakistan, within a period of 20 years excluding the grace period of 5 years, which will end on 30 May, 2019. This project has been closed by ADS with effect from 30 June, 2018 with winding up period up to 31 January, 2019. Repayment schedule in this respect has not yet been finalized.
Loan 2020
Loan Amount Loan Availed Loan un-availed Repayment / Adjustment
Closing at year end
17.2.1 This represents a re-lent portion of term finance facility obtained by GOP from Export Import Bank of Korea for rural distribution construction, which is secured against the guarantee by GOP. Pursuant to the Letter no. 2(18)ADB-ll/13 dated November 07,2014 of Ministry of Economic Affairs and Statistics, out of total facility obtained by the GOP, US S 45 million were allocated to the Company. This facility carries interest rate of 15% inclusive of relending interest of 8.2% plus exchange risk cover fee of 6.8% '.'hich shall be charged both on principal amount and interest amount separately. Repayments are to be made within maximum period of 30 years including a grace period of 10 years which will end on August 15, 2019. Repayment schedule in this respect has not yet been finalized.
17.3 PEPCO vide its letter no. DGCPCC/PEPCO/2152-63 dated February 20, 2017 directed the Company that the payment of debt service on account of Foreign Relent Loans may be withheld till the final decision on the matter that debt service by the WAPDA, GENCOs and DISCOs may be adjusted against their receivable from GOP. Resultantly, the Company did not make any payment in respect of Foreign Relent Loans. However, the Finance Division, Government of Pakistan in its letter vide F.l(14)CF-l/2015-16/1290 dated 26 September, 2019 has advised the Company to make adjustment of Rs. 2,722.46 million (inclusive of principal, interest & exchange rate fee) relent loans against the outstanding balance of the Government of AJK in the year ended 30 June, 2019.
17.2
t)
0
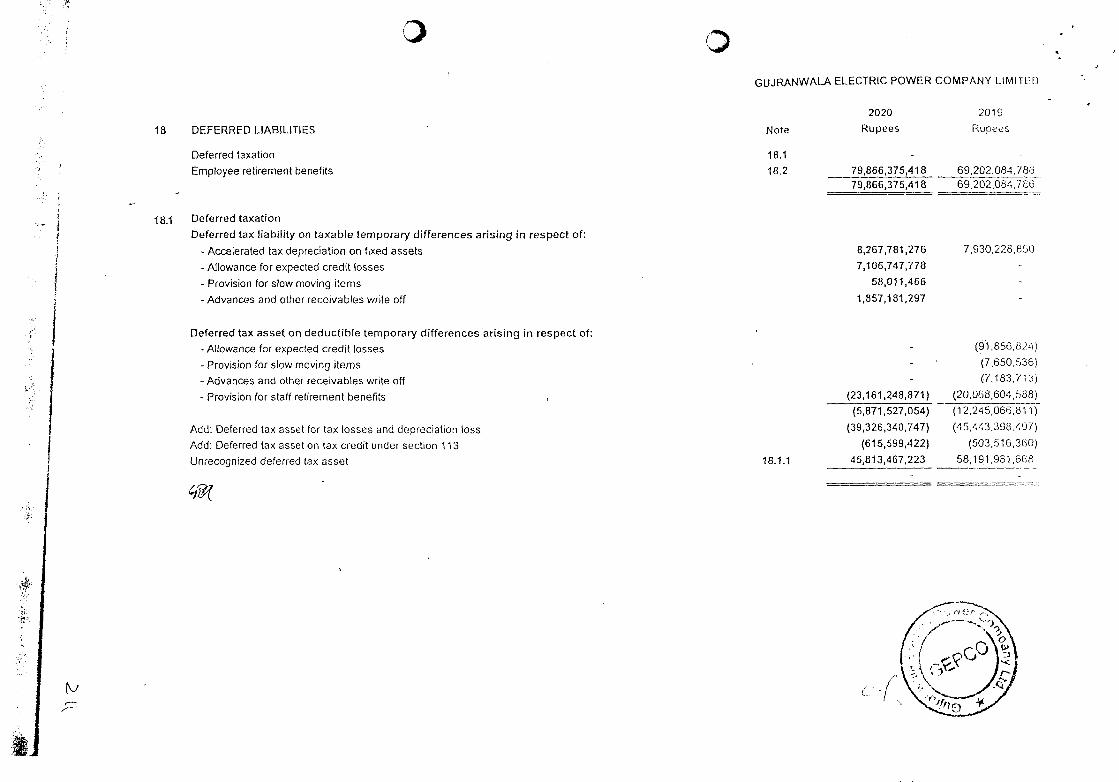
GUJRANWALA ELECTRIC POWER COMPANY LIMITSD
2020 2019
18 DEFERRED LIABILITIES Note Rupees Rupees
Deferred taxation 18.1
Employee retirement benefits 18.2 79,866,375,418 69,202,084,786
79,866,375,418 69,202,084,766
18.1 Deferred taxation
Deferred tax liability on taxable temporary differences arising in respect of:
- Accelerated tax depreciation on fixed assets 8,267,781,276 7,930,228,850
- Allowance for expected credit losses 7,1 06,747,778
- Provision for slow moving items 58,011,466
- Advances and other receivables write off 1,857,181,297
Deferred tax asset on deductible temporary differences arising in respect of:
- Allowance for expected credit losses (91,856,824)
- Provision for slow moving items (7,650,536)
- Advances and other receivables write off (7,183,713)
- Provision for staff retirement benefits (23,161,248,871) (20,068,604,588)
(5,871,527,054) (12,245,066,811)
Add: Deferred tax asset for tax losses and depreciation loss (39,326,340,747) (45,443,398.497)
Add: Deferred tax asset on tax credit under section 113 (61 5,599,422) (503,516,360)
Unrecognized deferred tax asset 18.1.1 45,813,467,223 58,191,981,668
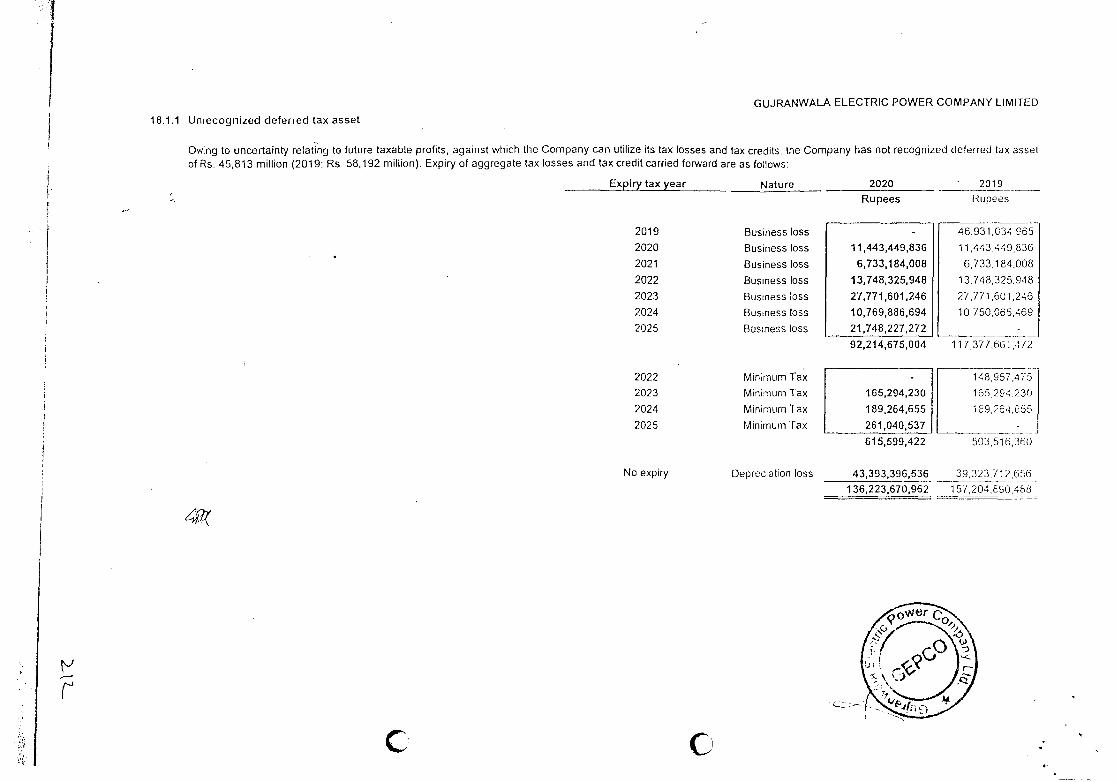
11,443,449,836
6,733,184,008
13,748,325,948
27,771,601,246
10,769,886,694
21,748,227,272
92,214,675,004
46.931,034 965
11,443.449,836
6,733,1 84,008
13,748,325,948
27,771601,246
10,750,065,469
11 7,377,661,472
165,294,230
189,264,655
261,040,537
615,599,422
148,957,475
165294.230
1 89,264,655
503,516,360
GUJRANWALA ELECTRIC POWER COMPANY LIMITED
18.1.1 Unrecognized deferred tax asset
Owing to uncertainty relating to future taxable profits, against which the Company can utilize its tax losses and tax credits, the Company has not recognized deterred tax asset of Rs. 45,813 million (2019: Rs 58,192 million). Expiry of aggregate tax losses and tax credit carried forward are as follows:
Expiry tax year Nature 2020 2019
Rupees Rupees
2022
2023
2024
2025
2019
2020
2021
2022
2023
2024
2025
No expiry
Business loss
Business loss
Business loss
Business loss
Business loss
Business loss
Business loss
Minimum Tax
Minimum Tax
Minimum Tax
Minimum Tax
Depreciation loss 43,393,396,536
136,223,670,962
39,323.712,656
157,204,890,486
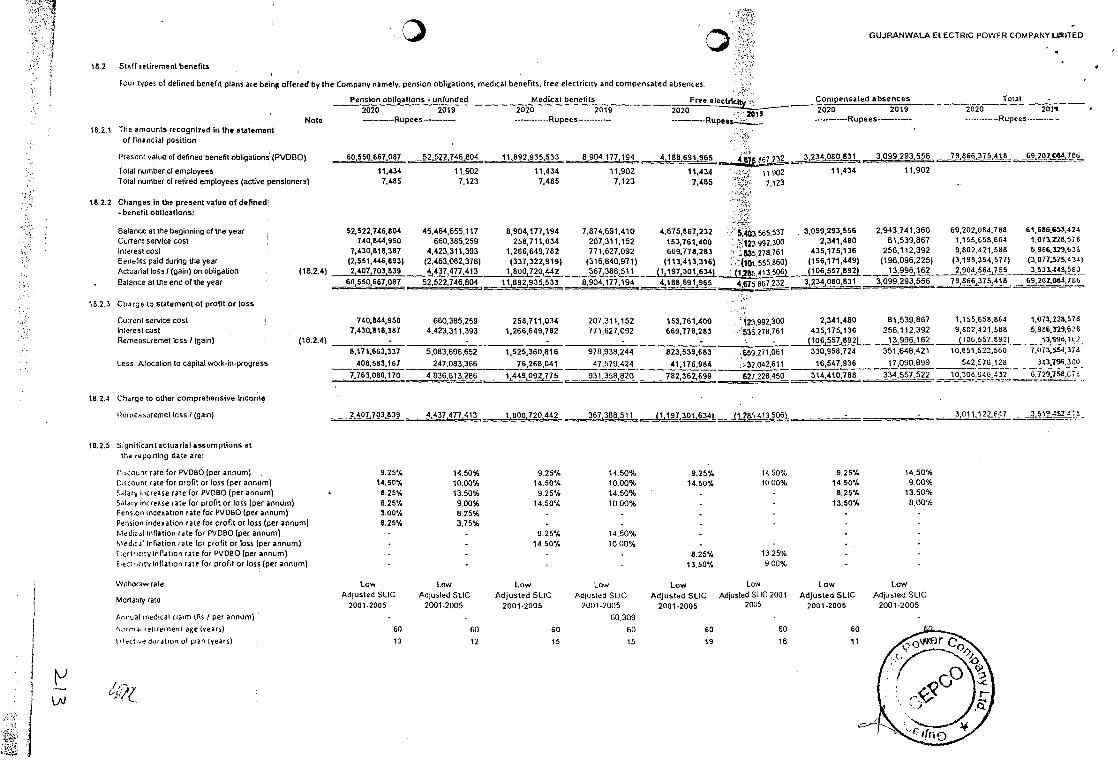
0 18.2 Staff retirement benefits
Four types of defined benefit plans are being offered by the Company namely, pension obligations, medical benefits, free electricity and compensated absences.
GUJRANWALA ELBCTRIC POWER COMPANY 11iTEO
18,2.1
18.2.2
18.2.3
18.2.4
18.2.5
Note The amounts recognized in tha statement of financial position
Pension obligations - unfunded Medical benefits Free eiectrlc.:. Compensated absences Total
2020 2019 -----Rupees-----------
2020 2019 Rupees
2020 C19
2020 2019 2020 2019 Rupees -
Present value of defined benefit obligations (PVDBO) 60,550,667,087 52,522,746,804 Ii 892,935,533 8 904,177.194 4 188 691 965 _f67?32 3234080831 3,099,293,556 79,866,375,418 69,202.4,769
Total number of employees 11,4.34 11,902 11,434 11902 11,434 . 11.902 11,434 11.902
Total number of retired employees (active pensioners) 7.485 7,123 7,485 7.123 7.485 "''. 7.t23
Changes in the present value of defined
-benefit obtloattons:
Balance at the beginning of the year 52,522,746,804 45.464655,117 8,904,177,194 7,874,691,410 4,675,867,232 54Q3 565.531 3,099,293,556 2,943,741,360 69,202,084,788 61,666..53,424
Current service cost 740,044,950 660,385,259 258,711,034 207.311,152 153,761.400 .', i.'3 992.300 2,341,480 81,539.867 1,155,658.864 1,013.298,576
InleresIcost 7.430,818,387 4,423,311,393 1266,649,782 771,627,092 669,778,283 ..3s2i8.76I 435,175,136 256.112,392 9,802,421,598 5,966.329,634
Berrefits paid during the year (2,551,446,893) (2.463,082,378) (337,322,919) (316,840.971) (113,413,316) .' jjO 555 860) (196,171,4.49) (196.096.225) (3,198,354,577) (3,077.515.4341
Actuarial loss! (gain) on obligation (18.2.4) 2,407,703,839 4.437.477,413 1,800,72q,4.42 367,388.511 (1,197,301,634) (1,285413:506) (l06,557,92) 13,996,162 2,904.564,755 3,533 i . 63
Balance at the end of the year 60.550,667,087 52.522,746.804 11,892,935,533 8,904,177,194 4,188,691,965 467.1867232 3,234080,831 fi,099.293,556 79,866,375,418 60204.166
Charge to statement of profit or loss
Current service cost 740,84.4,950 660,385.259 258,711,034 207,311,152 153,761,400 .. s,gg2,300 2,341,480 81,539,867 1,155,658,864 1,013,238,518
IrIleresI cost 7,430,818,387 4.423.311.393 1,266,649,782 771,627,092 669,778,283 .. 5.278.76l 435,175,136 256,112,392 9,602,421,588 5,986,329,628
Remeasuremet loss / (gain) (18.2.4) - - - - - - (106,557,892( 13.996.162 (106,557.892) 13.945.182
8,171,663,337 5,083,696,652 1,525,360,816 978,938,244 823,539,683 .659,271.061 330,958,724 351,648,421 10,851,522,560 7,013.9.94,318
Less. AJlocalion to capital worts-in-progress 408,583,167 247,083,366 76,268,041 47,579,424 41,176,984 32,042.611 16,547,936 17,090.899 542,576,128 343,196.300
7,763.080,170 4,836,613,286 1,449,092,775 931,358,820 782 362 699 627 228.450 314,410,788 334,557.522 10,308,546,432 6,7218,758,CE
Charge to other comprehensive Income
Hen:easuremet toss! (gain) 2,407,703.839 4,437477,413 1,800,720,442 367 388 511 (1,197 301,634) 1 285413 50j. 3,O11,22.fl27 3,51,a.92
Significant actuarial assumptions at
the reportiSy date are:
L'ircounr rate for PVDBO (per annum) 9.25'l. 14.50% 9.25'!. 14.50% 9.25% 14. 50% 925% 14. 50%
D.scoust rate for profit or loss (per annum) 14.5O'/. 10.00% 14.50% 10. 00% 14. 50% 10 00% 14.50% 9.00% Sjlar increase rate for PVOBO (per annum) 8.25% 13.50% 9.25'!. 14 .50% 8.25% 13. 60%
Salary increase rate for profit or loss (per annum) 8.25% 9.00% 14.50% 10. 00% 13.50% 8.00%
Pession indeaation rate for PVDBO (per annum) 3.00% 8.25% Pension indexation rate for profit or loss (per annum) 8.25% 3.7 5% Medical Inflation rate for PVOBO (per annum) 9.25'!. 14.50% f,ldi4i Inflation rate for profit or toss (per annum) 14.50% 1000% Electricity Inflation rate for PVOBO (per annum) 8.25% 13.2 5%
tlecrrcity Inflation rate for profit or lost (per annum) 13.50% 9 00%
Withdraw rate Low Low Low Low Low Low Low Low
M I I 0 arty ra Adjusted SLIC
2001.2005
Adjusled SLIC
2001-2005
Adjusted SLIC
2001-2005 Adlusted SLIC
2001.2005 Adjusted SLtC
2001-2005
Adjusted SLIC 2001 2005
Adjusted SLIC
2001.2009
Adjusted SLIC
2001-2005
Anirual medical claim (Es I per annum) - 60.309
h,,,ma retirement age lyears) 60 60 60 60 60 60 60
llincti',e duration or plan years) 13 12 15 15 19 18 11
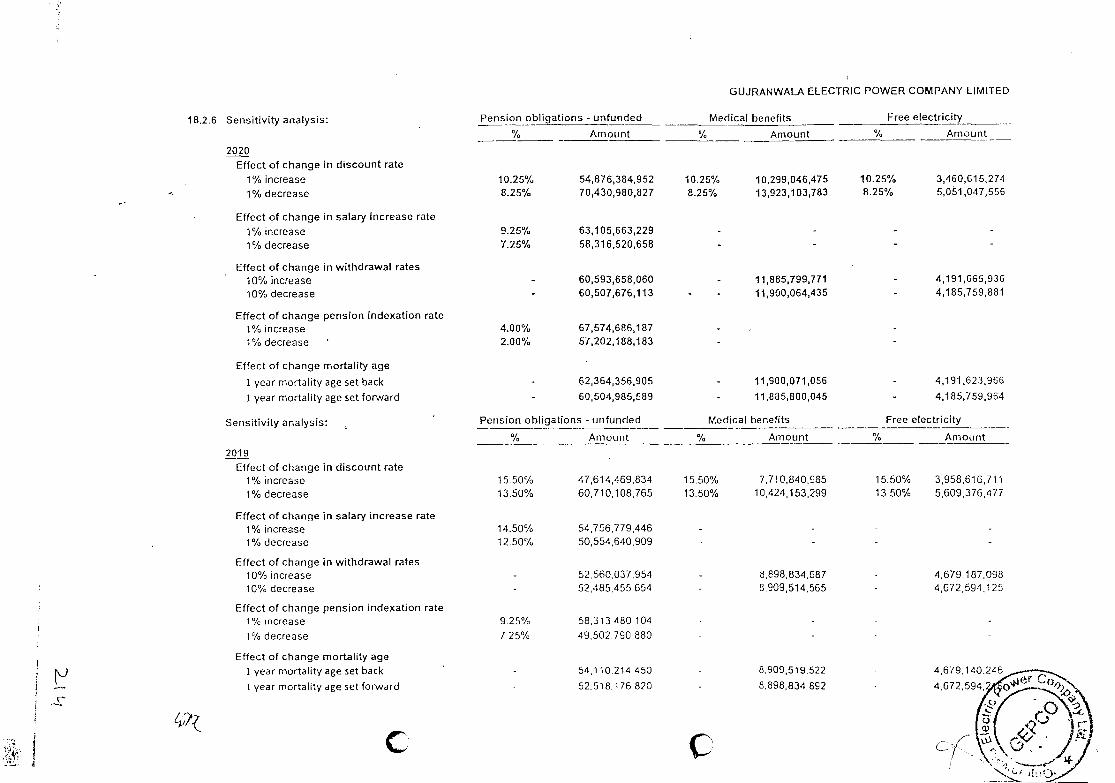
18.2.6 Sensitivity analysis:
2020
Pension obligations - unfunded
GUJRANWALA ELECTRIC POWER COMPANY LIMITED
Medical benefits Free electricity 0/ Amount 0/ Amount % Amount
Effect of change in discount rate
1% increase 10.25% 54,876,384,952 10.2 5% 10,299,046,475 10. 25% 3,460,615,274
1% decrease 8.25% 70,430,980,827 8.25% 13,923,103,783 8.2 5% 5,051,047,556
Effect of change in salary increase rate
1% increase 9.25% 63,105,663,229
1% decrease 7.25% 58,316,520,658
Effect of change in withdrawal rates 10% increase 60,593,658,060 11,885,799,771 4,191,665,936
10% decrease 60,507,676,113 11,900,064,435 4,185,759,881
Effect of change pension indexation rate 1% increase 4.00% 67574,686,187 1% decrease 2.00% 57,202,188,183
Effect of change mortality age
1 year mortality age set back 62,364,356,905 11,900,071,056 4,191,623,966
1 year mortality age set forward 60,504,985,589 11,885,800,045 4,185,759,964
Sensitivity analysis: Pension obligations - unfunded Medical benefits Free electricity 0/ Amount 0/ Amount 0/ Amount
2019 Effect of change in discount rate
1% increase 15. 50% 47,614,469,834 15. 50% 7,710,840,985 15. 50% 3,958,616,711
1% decrease 13. 50% 60,710,108,765 13. 50% 10,424,153,299 13.50% 5,609,376,477
Effect of change in salary increase rate 1% increase 14. 50% 54,756,779,446 1% decrease 12. 50% 50,554,640,909
Effect of change in withdrawal rates 10% increase 52, 560, 037 .954 8,898,834,687 4,679,1 87,098 10% decrease 52,485,455 654 8,909,514,565 4,672,594,125
Effect of change pension indexation rate 1% ncrease 9.25% 58,313 480 104
1% decrease 7 25% 49,502.790 880
Effect of change mortality age 1 year mortality age set back 54,110,214 450 8,909,519,522 4,679,1 40.2L6
1 year mortality age set forward 52,518,176 820 8.898,834,892 4,672,594
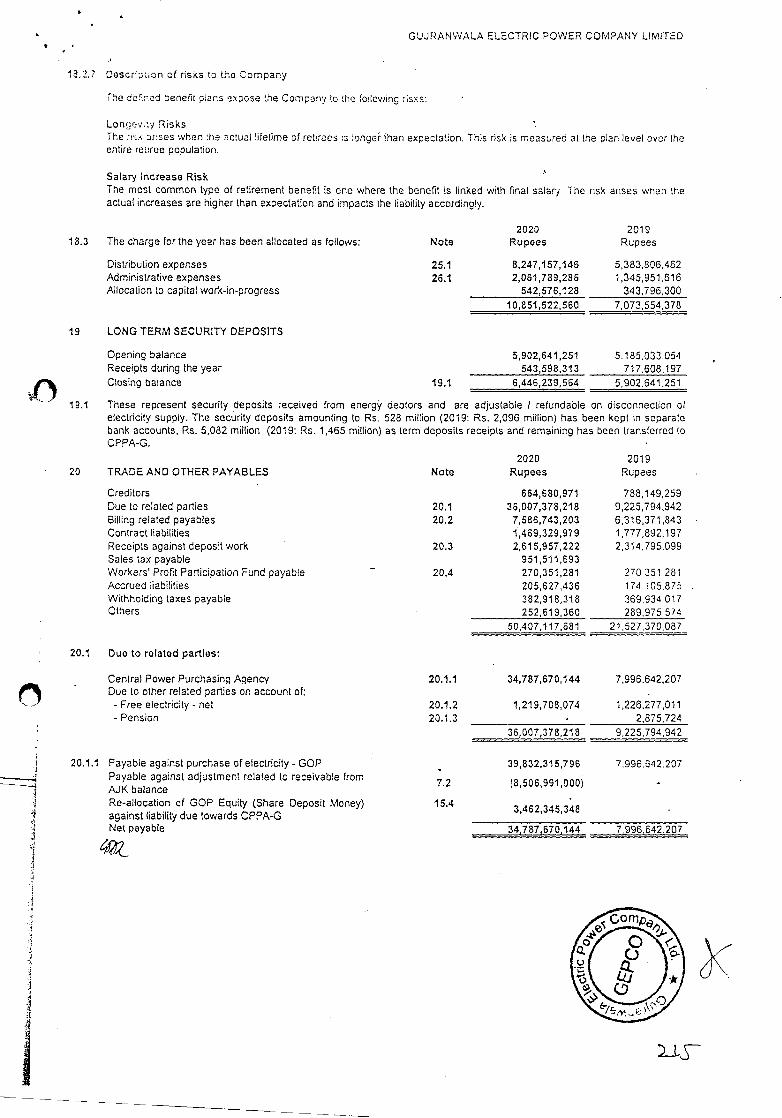
GUJRANWALA ELECTRIC POWER COMPANY LIMITED
18.2.7 Doscripuon of risks to the Company
The dofired denefit plans expose the Company to the following risks:
Longev..y Risks The ar:ses when the actual lifetime of retirees is longer than expectation. This risk is measured at the plan level over the entire ret:ree population.
Salary Increase Risk The most common type of retirement benefit is cne where the benefit is linked with final salarj The actual increases are higher than expectation and impacts the liability accordingly.
risk arises wnen the
2020 2019 The charge for the year has been allocated as follows: Note Rupees Rupees
Distribution expenses 25.1 8,247,157,146 5,383,806462 Administrative expenses 26.1 2,061,789,286 1,345, 95 1.6 16 Allocation to capital work-in-progress 542,576,128 343,796,300
10,851,522560 7,073, 554,378
LONG TERM SECURITY DEPOSITS
Opening balance 5,902,641,251 5,185,033.054 Receipts during the year 543,598,313 717,608,197 Closing balance 19.1 6,446,239,564 5,902.64 1.251
19.1 These represent security deposits received from energy debtors and are adjustable / refundable on disconnection ol electricity supply. The security deposits amounting to Rs. 528 million (2019: Rs. 2096 million) has been kept in soparate bank accounts, Rs. 5,082 million (2019: Rs. 1,465 million) as term deposits receipts and remaining has been transferred to CPPA-G.
2020 2019 TRADE AND OTHER PAYABLES Note Rupees Rupees
Creditors 664,680,971 788,149,259 Due to related parties 20.1 36,007,378,218 9,225,794,942 Billing related payables 20.2 7,586,743,203 6,316,371,843 Contract liabilities 1,469,329,979 1,777,892,197 Receipts against deposit work 20.3 2,61 5,957,222 2,314,795.099 Sales tax payable 951,511,693 Workers' Profit Participation Fund payable 20.4 270,351,281 270.351 281 Accrued liabilities 205,627,436 174 i05.87i Withholding taxes payable 382,918,318 369 934 017 Others 252,619,360 289,975.5 74
50,407,117,681 21,527,370.087
Duo to related parties:
Central Power Purchasinq Aqency 20.1.1 34,787,670144 7,996,642.207 Due to other related parties on account of: - Free electricity - net 20.1.2 1,219,708,074 1,226,277,011 - Pension 20.1.3 2,875,724
36,007,378,218 9,225,794,942
Payable against purchase of electricity - GOP 39,832,315,796 7.996.642.207 Payable against adjustment related to receivable from AJK balance
7.2 (8,506,991,000)
Re-allocation of GOP Equity (Share Deposit Money) against liability due towards CPPA-G
15.4 3,462,345,348
Net payable 34,787,670,144 7,996,642.207
1J-s--
18.3
19
20
20.1
20.1.1
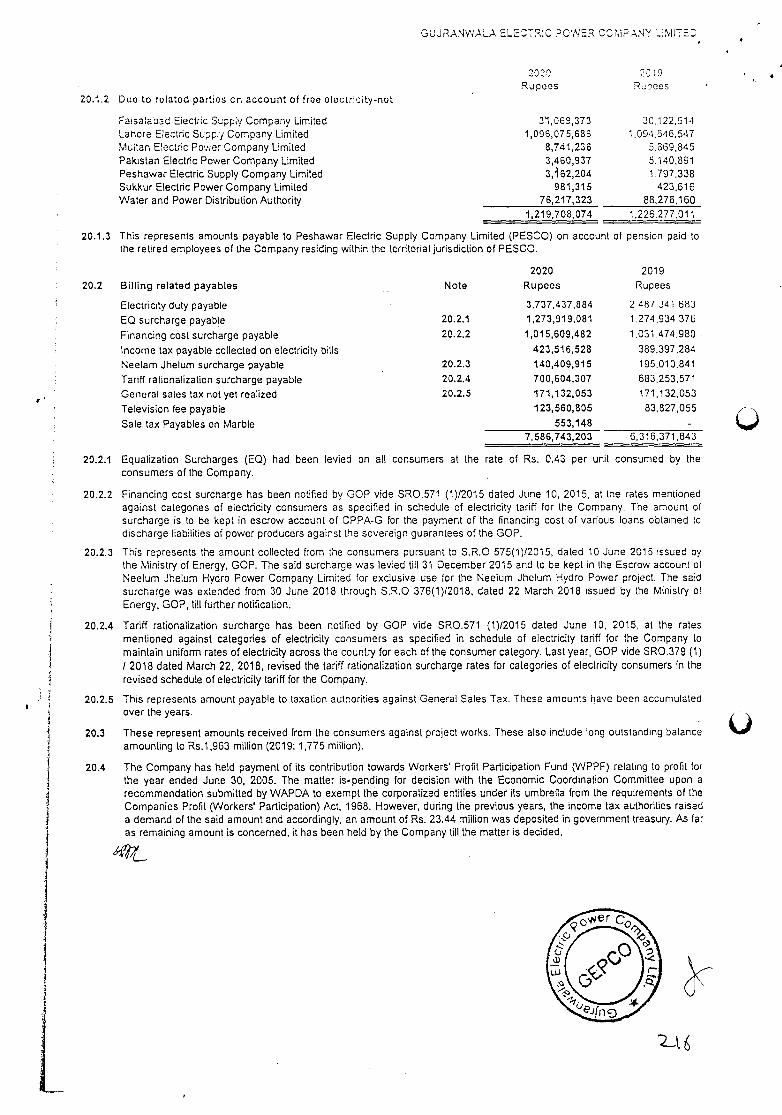
20.1.2
GUJRANWALA ELECTRIC POWER CCMPN'( _.MITE
2020 20 9 Rupees Rupos
Duo to rolatod parties on account of free electricity-not
Faisalabad Electric Supply Company Limited 31,069,373 30.122,614 Lahore Electric Suppy Company Limited 1,096,075,686 1.094646,547 Muitan Electric Power Company Limited 8,741,236 5.369,845 Pakistan Electric Power Company Limited 3460,937 5,140,891 Peshawar Electric Supply Company Limited 3,62,204 1,797.338 Sukkur Electric Power Company Limited 981,315 423,616 Waler and Power Distribution Authority 76,217,323 88,276,160
1,219,708,074 1,226,277,011
20.1.3 This represents amounts payable to Peshawar Electric Supply Company Limited (PESCO) on account of pension paid to Ihe retired employees of the Company residing within the territorial jurisdiction of PESCO.
2020 2019
20.2 Billing related payables Note Rupees Rupees
Electricity duty payable 3,737,437,884 2 487 .341 683
EQ surcharge payable 20.2.1 1,273,919,081 1,274,934.376
Financing cost surcharge payable 20.2.2 1,015,609,482 1,031,474.980
Income tax payable collected on electricity bills 423,516,528 389,397.284
Neetam Jhelum surcharge payable 20.2.3 140,409,915 195,010,841
Tariff rationalization surcharge payable 20.2.4 700,604,307 683.253.571
General sales tax not yet realized 20.2.5 171,132,053 171,132,053
Television fee payable 123,560,805 83,827,055
Sate tax Payables on Marble 553,148 - 7,586,743,203 6,316,371,843
20.2.1 Equalization Surcharges (EQ) had been levied on all consumers at the rate of Rs. 0.43 per unit consumed by the consumers of the Company.
20.2.2 Financing cost surcharge has been notified by GOP vide SRO.571 (1)/2015 dated June 10, 2015, at the rates mentioned against categories of electricity consumers as specified in schedule of electricity tariff for the Company. The amount of surcharge is to be kept in escrow account of CPPA-G for the payment of the financing cost of various loans obtained to discharge liabilities of power producers against the sovereign guarantees of the GOP.
20.2.3 This represents the amount collected from the consumers pursuant to S.R.O 575(1)/2015, dated 10 June 2015 issued by the Ministry of Energy, GOP. The said surcharge was levied till 31 December 2015 and to be kept in the Escrow account of Neelum Jhelum Hydro Power Company Limited for exclusive use for the Neelum Jhelum Hydro Power project. The said surcharge was extended from 30 June 2018 through S.R.O 376(1)/2018, dated 22 March 2018 issued by the Ministry of Energy, GOP, till further notification.
20.2.4 Tariff rationalization surcharge has been notified by GOP vide SRO.571 (1)/2015 dated June 10, 2015, at the rates mentioned against categories of electricity consumers as specified in schedule of electricity tariff for the Company to maintain uniform rates of electricity across the country for each of the consumer category. Last year, GOP vide SRO.379 (1) I 2018 dated March 22. 2018, revised the tariff rationalization surcharge rates for categories of electricity consumers in the revised schedule of electricity tariff for the Company.
20.2.5 This represents amount payable to taxation authorities against General Sales Tax. These amounts have been accumulated over lhe years.
20.3 These represent amounts received from the consumers against project works. These also include long oulslandiny balance amounting to Rs.1,963 million (2019: 1,775 million).
20.4 The Company has held payment of its contribution towards Workers' Profit Participation Fund (WPPF) relating to profit for the year ended June 30, 2005. The matter is pending for decision with the Ecohomic Coordination Committee upon a recommendation submitted by WAPDA to exempt the corporatized entities under its umbrella from the requirements of the Companies Profit (Workers' Participation) Act, 1968. However, during the previous years, the income tax authorities raised a demand of the said amount and accordingly, an amount of Rs. 23.44 million was deposited in government treasury. As far as remaining amount is concerned, it has been held by the Company till the matter is decided.
U
L
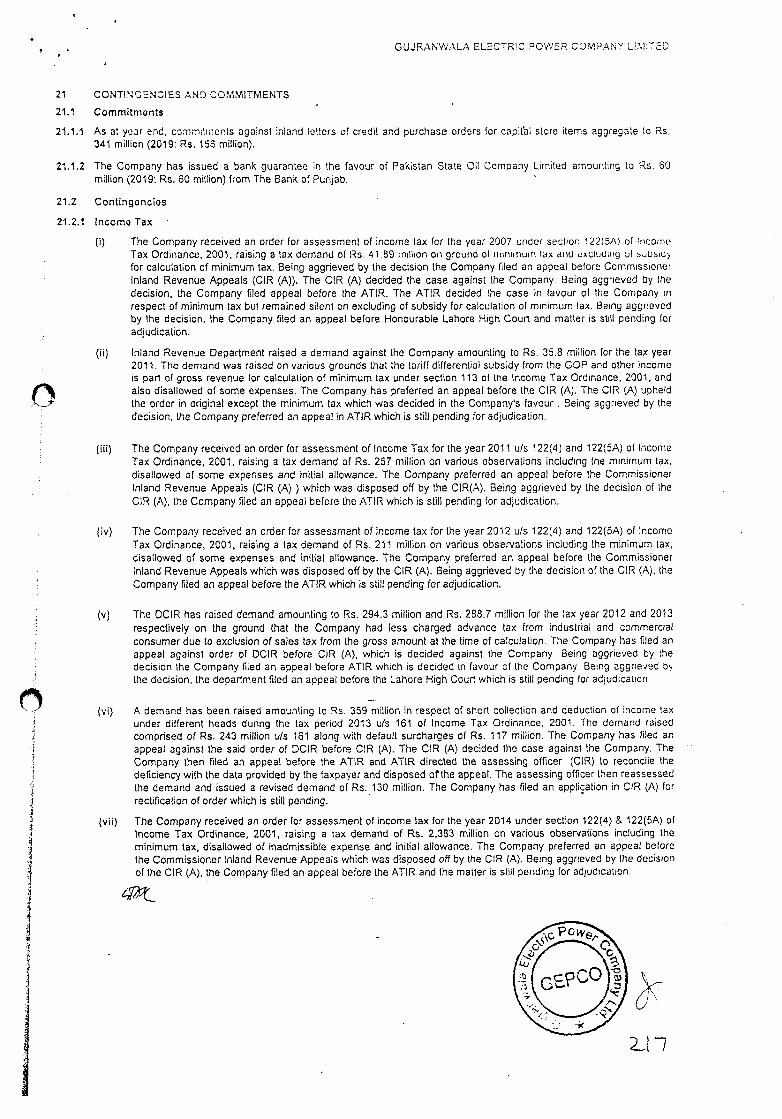
2J7
GUJRANWALA ELECTC POWER COMPANY LiMITED
21 CONTINGENCIES AND COMMITMENTS
21.1 Commitments
21.1.1 As at year end, commitments against inland etters of credit and purchase orders for capitbt store items aggregate to Rs, 341 million (2019: Rs. 158 million).
21.1.2 The Company has issued a bank guarantee in the favour of Pakistan State Oil Company Limited amounting to Rs. 60 million (2019: Rs. 60 million) from The Bank of Punjab.
21.2 Contingencies
21.2.1 Income Tax
(i) The Company received an order for assessment of income tax for the year 2007 under section 12215A) ol Income Tax Ordinance, 2001, raising a tax demand 01 Rs. 41.89 million on ground 01 ririnrinuiri lax arid excluding ul aebsidy
for calculation of minimum tax. Being aggrieved by the decision the Company filed an appeal before Commissioner Inland Revenue Appeals (CIR (A)). The CIR (A) decided the case against the Company. Being aggrieved by the decision, the Company filed appeal before the ATIR. The ATIR decided the case in favour of the Company in respect of minimum tax but remained silent on excluding of subsidy for calculation of minimum lax. Being aggrieved by the decision, the Company filed an appeal before Honourable Lahore High Court and matter is still pending for adjudication.
(ii) Inland Revenue Department raised a demand against the Company amounting to Rs. 35.8 million for the tax year 2011 The demand was raised on various grounds that the tariff differential subsidy from the GOP and other income is part of gross revenue for calculation of minimum tax under section 113 of the Income Tax Ordinance, 2001. and also disallowed of some expenses. The Company has preferred an appeal before the CIR (A). The CIR (A) upheld the order in original except the minimum tax which was decided in the Company's favour . Being aggrieved by the decision, the Company preferred an appeal in ATIR which is still pending for adjudication.
(iii) The Company received an order for assessment of Income Tax for the year 2011 u/s 122(4) and 122(5A) of lhcome Tax Ordinance, 2001, raising a tax demand of Rs. 257 million on various observations including the minimum lax. disallowed of some expenses and initial allowance. The Company preferred an appeal before the Commissioner Inland Revenue Appeals (ClR (A) ) which was disposed off by the CIR(A). Being aggrieved by the decision of Ihe dR (A), the Company filed an appeal before the ATIR which is still pending for adjudication.
(iv) The Company received an order for assessment of income tax for the year 2012 u/s 122(4) and 122(5A) of Income Tax Ordinance, 2001, raising a tax demand of Rs. 211 million on various observations including the minimum tax, disallowed of some expenses and initial allowance. The Company preferred an appeal before the Commissioner Inland Revenue Appeals which was disposed off by the CIR (A). Being aggrieved by the decision of the CR (A), the Company filed an appeal before the ATIR which is still pending for adjudication.
(v) The DCIR has raised demand amounting to Rs. 294.3 million and Rs. 288.7 million for the tax year 2012 and 2013 respectively on the ground that the Company had less charged advance tax from industrial and commercial consumer due to exclusion of sales tax from the gross amount at the time of calculation. The Company has filed an appeal against order of DCIR before CIR (A), which is decided against lhe Company Being aggrieved by the decision the Company filed an appeal before ATIR which is decided in favour of the Company Being aggrieved b the decision, the department filed an appeal before the Lahore High Court which is still pending for adjudication
(vi) A demand has been raised amounting to Rs. 359 million in respect of short collection and deduction of income lax under different heads during the tax period 2013 u/s 161 of Income Tax Ordinance, 2001. The demand raised comprised of Rs. 243 million u/s 161 along with default surcharges of Rs. 117 million. The Company has filed an appeal against the said order of DCIR before CIR (A). The CIR (A) decided the case against the Company. The Company then filed an appeal before the ATIR and ATIR directed the assessing officer (dIR) to reconcile the deficiency with the data provided by the taxpayer and disposed orthe appeal. The assessing officer then reassessed the demand and issued a revised demand of Rs. 130 million. The Company has filed an application in CIR (A) for rectification of order which is still pending.
(vii) The Company received an order for assessment of income tax for the year 2014 under section 122(4) & 122(5A) of Income Tax Ordinance, 2001, raising a tax demand of Rs. 2,393 million on various observations including the minimum tax, disallowed of inadmissible expense and initial allowance. The Company preferred an appeal before the Commissioner lnland Revenue Appeals which was disposed off by the CIR (A). Being aggrieved by the decision of the CIR (A), the Company filed an appeal before the ATIR and the matter is still pending for adjudication.
GUJRANWALA ELECTRIC POWER COMPANY LIMITED
(viii) Inland Revenue Department has raised a demand against the Compony amounting to Rs. 937 million and Rs. 983 million for he tax year 2014 and 2015 respectively. The demand was raised on the ground that tariff differential subsidy from Ihe GOP and other income falls under the definition of turnover for calculation of minimum tax under section 113 of the ITO, 2001. However, the Company contended the matter on the ground that minimum tax is not applicable due to declared gross losses and also the subsidy is exempt from tax. The Company has preferred an appeal before CIR (A) who upheld the order-in-original. Being aggrieved by the decision of CIR (A), the Company then preferred an appeal before ATIR. The ATIR decided the case against the Coinpany except recognition of deferred credit which is decided in Company's favour. Being aggrieved by the decision the Company has taken up the matter before the Honourable Lahore High Court. The appeal is still pending for adjudication.
(ix) DCIR had issued an order for assessment of income tax for the year 2016 under section 122(5A) of Income Tax Ordinance, 2001, raising a tax demand of Rs. 1,012 million on various observations including the minimum tax, disallowed of inadmissible expense and subsidy income . The Company preferred an appeal before CIR (A) who annulled the previous order and gave direction to the income tax department to verify the data before issuance of revised order. The matter is still pending for adjudication.
(x) DCIR raised amounting to Rs. 176 million on the grounds that the Company did not withhold the Income Tax @ 8% on Use of system charges on NTDC invoices, whereas NTDC has submitted their liability along with their annual Income Tax return, therefore default surcharge amounting to Rs. 176 million is recoverable for non withholding. The Company has filed an appeal against order of OCIR before CIR (A), that withholding on power purchase is not applicable as per SRO 586ç)/91. The ClR(A) upheld the order in original. Being aggrieved by the decision the Comanv filed an aøeal before ATIR which still pendinq for adiudication.
The Company received an order for assessment of income tax for the tax year 2013 under section 122(5A) of Income Tax Ordinance, 2001, raising a tax demand of Rs. 11,288 million vide Order dated 26-06-2019 on ground of minimum tax, unexplained income or assets and disallowance of expenses. Company filed an appeal before Commissioner Inland Revenue Appeals who upheld the Order in Original. Being aggrieved by the decision of CIR (A) Company preferred an appeal before Appellate Tribunal Inland Revenue and matter is still pending for adiudication.
The Company received an order for assessment of income tax for the tax year 2017 under section 122(5A) of Income Tax Ordinance, 2001, raising a tax demand of Rs. 571 million vide Order dated 29-10-2020 on ground of minimum tax, disallowance of expenses and excluding of subsidy for calculation of minimum tax. Company filed an appeal before Commissioner Inland Revenue Appeals CIR (A) and matter is still pending for adjudication.
(xiii) The Company received an order for assessment of income tax for the tax year 2018 under section 122(5A) of Income Tax Ordinance, 2001, raising a tax demand of Rs. 809 million vide Order dated 30-09-2020 on ground of minimum tax under Section 113 of Income Tax Ordinance, 2001. Being aggrieved by the decision the Company filed an appeal before Commissioner Inland Revenue Appeals CIR (A) and matter is still pending for adjudication.
(xiv) A demand has been raised amounting to Rs. 548 million in respect of short collection and deduction of income tax under different heads during the tax period 2015 uls 161 of Income Tax Ordinance, 2001. The demand raised comprised of Rs. 396.5 million u/s 161 along with default surcharges of Rs. 151.9 million u/s 205. The Company has filed an appeal against the said order before CIR (A). The ClR (A) decided the case against the Company. The Company then filed an appeal before the ATIR which is still pending.
(xv) The Company has recorded minimum tax at the rate of 0.25% of total tumover considering electricity as fast moving consumer goods (FMCG) as per section 113 of Income Tax Ordinance, 2001. However, an additional provision of Rs. 5,446 million for the year ended 2016 to 2020 can arise in future f the tax department does not treat electricity as FMCG and the matter is decided against the Company. However, the management is confident that the said treatment shall be accepted and therefore the provision for taxation has been made by treating the electricity as FMCG.
(xvi) The Company received an order for assessment of income tax for the tax year 2019 under section 122(5A) of the Income Tax Ordinance, 2001, raising a tax demand of Ra. 966 million vide Order dated 09-Feb-21 on ground of minimum tax under Section 113 of Income Tax Ordinance, 2001. Being aggrieved by the decision the Company filed an appeal before Commissioner Inland Revenue Appeals CIR (A) and matter is still pending for adjudication.
For all the above referred cases, the Company's counsel is of the view that the matters will be decided in favour of the Company, accordingly, no provision has been made in these financial statements.
0
0
GUJRANWALA ELECTRIC POWER COMPANY LIMITED
21.2.2 Salos tax
Inland Revenue Department raised a demand against the Company on following issues:
)i) Inland Revenue Department has raised a demand amounting to Ra. 1,235.8 millio,n and Rs 717 iiilIior el the ta
periods Apri 2011 to August 2011 and October 2011 and for tax periods trcn\ July 2008 to Decembei 2010. respectively on ground of alleged nonooyment of sale tax collected from the steel melters and alleged illegal adjustment of such output tax against its input tax. Company challenged the Show Cause Notices in Honourable Lahore High Court, Lahore. Learned Counsel for the petitioners stated that the reason for considering considering the Sales Tax of Steel Melters as Output tax is result of defective Sales Tax payment Challan Form under SRO 716(1)12009 dated 10.08.2009. The Honourable Lahore High Court, Lahore stated that this is not a question of law before us, therefore, we do not require to examine the same. The Company being aggrieved by the decision of Honourable Lahore High Court, Lahore tiled a CPLA before the Honourable Supreme Court of Pakistan. The proceedings of the case are stilt pending.
(ii) RTO Gujranwala has raised a demand of Rs 4,861 million for the year ended June 2012 in respect of general sales tax on tariff differential subsidy, sale to the Government of AJK, amortization of deferred credit, zero rated, free electricity and steel melters. Against the order the Company filed an appeal before the CIR (A). On few matters the ClR(A) decided the case in favour of the Company and remaining was remanded back to the ACIR except for sale tax on free electricity amounting to Rs. 5.9 million which is decided against the Company. The Company filed an appeal in the ATlR for free elect.ricity matter which is still pending for adjudication..
(iii) The DCIR in his order dated February 3,2015 raised a demand of Rs. 47.86 million under section 11(2) and 33(5)01 Sales Tax Act, 1990. The learned DCIR alleged that taxpayer charged sates tax at the rate of 16% instead of 17% on taxable supplies. The Company filed appeal before CIRCA) against the above mentioned order. However, ClR (A) upheld the order-in-original and being aggrieved by the order of the CIR (A), the Company preferred an appeal before the ATIR which is still pending for adjudication.
(iv) The DCIR has issued order on the ground that the Company has granted fuel price adjustment to consumers from January 2015 to October 2015 under different heads which is out of sales tax previously charged, collected and deposited in Government treasury and credit has already been claimed by the consumers through their monthly sales tax returns. Hence the adjustment of Rs. 1,385 million as fuel price adjustment against current liability is inadmissible. Being aggrieved by the order, the Company tiled an appeal in ClR (A). The CIR (A) upheid the decision of the DCIR. Being aggrieved by the decision of the CIR (A), the Company filed an appeal in the ATIR. The ATIR also upheld the Order in Original. Being aggrieved by the decision of ATlR, Company preferred an appeal before Lahore High Court. However, the matter is still pending for adjudication.
(v) A demand amounting Rs. 1.83 million has been raised by the learned officer by passing order No.18ISTJGRW/2016 dated May 11, 2016 alleging that the Company has claimed input tax on inadmissible goods during the period from July 2014 to June 2015. Being aggrieved by the order the Company filed an appeal in CIR (A). However, the CIR (A) upheld the decision of teamed officer and being aggrieved by the decision the Company preferred an appeal before ATIR and the matter is still pending for adjudication before ATIR.
(vi) A demand has been raised amounting to Rs. 3.2 million, Rs. 25.5 million, Rs. 7.5 million and Rs. 33.3 million in respect of default surcharges under section 34(1)(a) and 33(5) for late payment of extra tax and further tax. Being aggrieved with the order of the DCIR, the Company has filed appeal against the order of the learned DCIR challenging the alleged default surcharges and penalty and contending therein that taxpayer is mere a collector of extra lax and further tax through electricity bills and paid to the Government on collection basis. The CIR (A) upheld the order in original. Being aggrieved by the appellate order, the Company preferred an appeal before ATlR and the same is pending for adjudication.
(vii) The learned officer has passed an order creating demand amounting to Rs. 657.3 million and Rs 100 2 million In respect of zero rated supplies includes sales to the Government of AJK and inadmissibility of input tax clairiieu respectively along with default surcharge and penalty u/s 33(11) and 33(5) of Sales Tax Act 1990 or the year ended June 2013. Being aggrieved by the order Company filed an appeal in CIR (A). CIR (A) deleted the demand amounting to Rs. 100.2 million of inadmissible input tax and penalty except of Rs. 1.8 million and data for zero rated supplies was submitted to department for verification, whereas the demand of tax on sale to the Government of AJK is upheld. The Company being aggrieved, preferred an appeal before ATiR regarding the matter which was decided against the Company. The ATIR decided the case against the Company. Being aggrieved by the decision, the Company filed and appeal before the Lahore High Court which is still pending for adjudication.
GUJRANWALA ELECTRIC PCV'IER COMPANY LIMITED
(viii) The DCIP: through its order no. 75 dtud Februant 10, 2015 uoced a penalty of Rs 1 313 ia/iU, .3ib j 0i
Tax Act, 1350 due to non-withholdinc of soles tax for Ure penod ol November 2013, December 2013 dnd - 0610017
2014. The Company Ofed an appeal before CIR (A) against the above mentioned order. The learned CIP (A) uphei the pena3y of Rs. 1.26 miflion in his order doted April 1, 2015. The Company 'being aggrieved with he ueosron of learned CIR (A) filed an appeal u/s 46 of Sales Tax Act, 1990 before the ATIR. The nI)er is p011131119 ui adjudication. -
(ix) The DCIR has issued order against the Company demanding Rs. 2,664 miliioh.under section 11(2) and penalty amounting Rs. 133 million under section 33(5) of the Sales Tax Act 1990 on the ground that the Company has made short payment of tax under different heads for the period of January 2015 to October 2015 as the Company has allowed other adjustments to the consumers and sales tax thereon was neither charged nor collected/paid by it. Being aggrieved by the decision the Company preferred an appeal before ClR(A), who remanded back the case towards the assessing authority for verification, verification was conducted by the DCIR but no discrepancy was found.
(x) The learned officer passed an order against the Company demanding Rs. 794.20 million along with default surcharge and penalty alleging that the Company has illegally adjusted output tax collected from sleet melters at fixed rate as per rule 58(H) of Special Procedure Rules 2007 against input tax for the period of July 2013 to June 2014. The Company preferred an appeal before CIR (A) which was decided in favour of the company. Being aggrieved by the decision, FBR filed an appeal before the ATIR, which is still pending for adjudication.
(xi) The DCIR has issued an order against the Company demanding Rs 370 million as sales tax along with default surcharge of Rs. 146 million and Rs. 18 million as penalty on the ground that sales tax was not paid on account of supplies to consumers of AJK from July 2013 to June 2014. The Company preferred an appeal before CIR (A), ClR(A) upheld the decision. Being aggrieved by the decision of the ClR (A), the Company filed an appeal before the ATIR. The ATlR decided the case against the Company and company filed reference before Honourable Lahore Hiah Court. Lahore.
(XII) The ACIR has issued order against the Company demanding Rs. 5,693.6 million along with default surcharge 01 Rs 284.7 million on the ground that there is difference between sales declared in sales tax returns and financials statement for the year ended June 2010 and 2011 thus made short payment of sales tax of differential amount The Company is of the view that subsidy received from the Government is not part of sales as per the section 3 read with rule 13 of the special procedures rule. Against the order the Company preferred an appeal butore CIII fAi which
is decided against the Company. Being aggrieved by the decision of the dR (A), the Company fried an appeal before the ATIR which is decided in the favour of the Company. Being aggrieved by the decision the departmenT filed an appeal before the Lahore High Court which is still pending for adjudication.
(xiii) The DCtR has issued order against the Company demanding Rs. 2,651.7 million along with default surcharge and penalty 015% on various grounds that there is not charging of sales tax err AJK sales, demand notices, non financial assets, connection fees and difference between sate declared in sales tax return and audited account for the year ended June 2009. Against the order the Company preferred an appeal before CIR (A) which is partially decided in favour of the Company. Being aggrieved by the decision of the ClR (A), the Company filed an appeal before the ATIR which is decided in the favour of Ihe Company. Being aggrieved by the decision the department fifed an appeal before the Lahore High Court which is still pending for adjudication.
(xiv) The DCIR has issued an order dated 26-06-2020 against the Company demanding Rs. 5,396.6 million as sales tax along with default surcharge and penalty on the ground that sales tax was not charged on subsidy and supply of electricity to consumers ofAJK from July 2014 to June 2015. The Company preferred an appeal before CIR (A) The matter is stilt pending for adjudication.
(xv) The OCIR has passed an order dated 08-06-2020 against the Company demanding Rs. 4,331 million as sales tax along with default surcharge and penalty on the ground that sales tax was not charged on subsidy for the tax year 2018. The Company preferred an appeal before CIR (A). The matter is still pending for adjudication.
L.
CUJRANWALA ELECTRIC POWER COMPANY LIMITED
(xvi) The DCIR has ssueo an ocer aga:ns Inc Company dernandwg Rs. 4,474 miSer on the ground that sales ax was rot charged on subsidy for the tax year 2017. The Company pefarred an appeal before ClR (A). The CIR (A) annulled the Order n crigina vido Order daub 23-11-2019. Being aggrieved by the decision of CIR(A), department preferred an appeal by ATIR. The matter is still pending for adjudication.
(xvii) The DCIR has issued an order against the Company demandir.g Re. 3,931 million on the ground that sales tax was not charged on subsidy for the tax year 2016. The Company preferred en appeal before CIR (A). The CIR (A) annulled the Order in original vide Order dated 28-11-2019. Being aggrieved by the decision of CIR(A). department preferred an appeal by ATIR, The matter is still pending for adjudication.
For all the above referred cases, the Company's counsel is of the view that the matters wilt be decided in favour 01 InC
Company, accordingly, no provision has been made in these financial statements.
21.2.3 In 1990, a land measuring 74 Kanals and 5 Marlas acquired by WAPDA for construction of 132 KV grid station situated at Lahore Road (WAPDA Town) Gujranwata for Rs. 8.19 million. Three out of ten land owners representing 27 Kanals and 11 Marlas challenged acquisition process before Senior Civil Judge, Gujranwala. The Civil Judge declared the entire acquisition process null and void.
The Company filed appeals before District & Session Judge, Gujranwala and Honourable Lahore High Court which were dismissed by alt the courts. The Company filed an appeal before Supreme Court of Pakistan which was also dismissed. Thereafter, the Company filed Civil Review Petition before Supreme Court of Pakistan against Supreme Court's judgment dated July 14, 2009 which were converted into Civil Appeals. These appeals have been dismissed by Supreme Court of Pakistan vide judgment dated January 24, 2013. The Company has filed Civil Review Petitions before Supreme Court against said judgment. After hearing the arguments from both sides Supreme Court allowed the Civil Review Petitions which were afterwards dismissed by the Supreme Court of Pakistan (SCP) vide its order dated November 15, 2016 In pursuance of the said judgement of SCP, management of the Company has decided to re-acquire the land from the owners and the Company has approached the Punjab Revenue Department for reinitiation of the acquisition process. Later on. one out of ten land owners submitted an application to the civil court requiring to return his portion of the Land of 6 kanal and 1 Maria, for which the hearing is still pending. The valuation process by Revenue Department is pending, hence, no provision has been recorded in the financial statements.
21.2.4 In 1973, a plot of land measuring 11 kanals and 9 marlas situated at 565 A, Model Town, Gujranwala was transferred to WAPDA by GDA (forrnerty Gujranwata Improvement Trust). In 2004, while transferrtng the plot from WAPDA to the Company under the Supplementary Business Transfer Agreement (SBTA), transfer deed of the plot was missing in WAPDA record. WAPDA requested GDA to provide the same. However, GDA found that 4 Kanals and 1 marIa of land was not allotted to WAPDA and raised a demand of Rs 81.74 million for this disputed piece of land.
In 2009, the Company, in order to resolve the issue, agreed to put the matter before District Price Assessment Committee (DPAC). DPAC, having considered the matter from both parties, decided to increase the demand to Rs.163.30 million on just and equitable basis. On May 16, 2011, the Company received a notice from GDA for taking enforced possession of disputed land on account of failure to pay the demanded dues. The Company filed a declaratory suit against GDA before Civil Judge. After hearing the arguments from both sides, it has been held that GDA have no entitlement documents in lheir favour regarding the land so by no stretch of imagination it can be said that the Company is encroacher FuriCer the claim in respect of decreeing the suit for area, learned judge has held that suit is dismissed to the extent of this area
In pursuance of the said judgemeni of civil court, GDA filed appeal in District Session Court in March. 2019 which is still pending. The Company's legal counsel believes that the matter will be decided in the Company's favour, hence, no provision has been made in these financial statements.
4 I
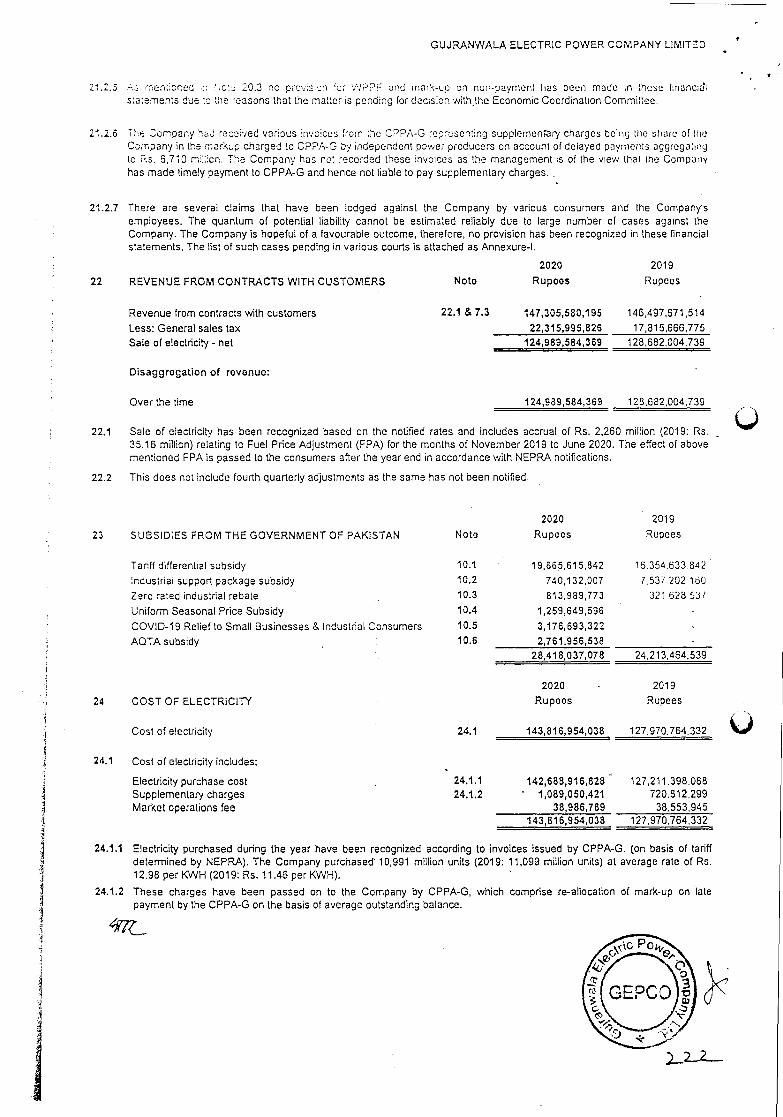
GUJRANWALA ELECTRIC POWER COMPANY LIMITOD
21.2.5 mentioned c:c 20.3 no prcvscn for 'i'JPPF and mark-up on non-payment has been made in these tinanc:ai't statements due to the reasons that the matter is pending for decision with the Economic Coordination Committee.
21.2.6 Tn' Company had reoeried various invoices from the CPPA-G rooresenling suppIemenaiy charges beirg the share of the Company in the markup charged to CPPA-G by independent power producers on account of delayed payments aggregating to Rs. 6,710 m:2cn. The Company has not recorded these invoices as the management is of the view that the Company has made timety payment to CPPA-G and hence not liable to pay supplementary charges.
21.2.7 There are several claims that have been lodged against the Company by various consumers and the Companys employees. The quantum of potential liability cannot be estimated reliably due to large number ol cases against the Company. The Company is hopeful of a favourable outcome, therefore, no provision has been recognized in these financial statements. The list of such cases pendinq in various courts is attached as Annexure-l.
2020 2019
22 REVENUE FROM CONTRACTS WITH CUSTOMERS Note Rupees Rupees
Revenue from contracts with customers 22.1 & 7.3 147,305,580,195 146497,671,514
Less: General sales tax 22,315,995,826 17,8 1 5,666,775
Sate of electricity - net 124,989,584,369 128,682,004,739
Disaggregation of revenue:
Over the time 124,989,584,369 128,682,004739
22.1 Sate of electricity has been recognized based on the notified rates and includes accrual of Rs. 2,260 million (2019: Rs. 35.16 million) relating to Fuel Price Adjustment (FPA) for the months of November 2019 to June 2020. The effect of above mentioned FPA is passed to the consumers after the year end in accordance with NEPRA notifications.
22.2 This does not include fourth quarterly adjustmerfls as the same has not been notified.
2020 2019
SUBSIDIES FROM THE GOVERNMENT OF PAKISTAN Note Rupees Rupees
Tariff differential subsidy 10.1 19,665,615,842 16354 633 842
Industrial support package subsidy 10.2 740,1 32,007 7537 202 160
Zero rated industrial rebate 10.3 813,969,773 321 628 03/
Uniform Seasonal Price Subsidy 10.4 1,259,649,596
COVID-19 Relief to Small Businesses & Industrial Consumers 10.5 3,176,693,322
AQTA subsidy 10.6 2,761,956,538 28,418,037,078 24,213,464,539
2020 2019
COST OF ELECTRICITY Rupees Rupees
Cost of electricity 24.1 143,81 6,954,038 127,970,764.332
Cost of electricity includes:
Electricity purchase cost 24.1.1 142,688,916,828 127,211,398.088 Supplementary charges 24.1.2 1,089,050,421 720.612.299 Market operations fee 38,986,789 38.553,945
143,816,954,038 127,970.764,332
24.1.1 Electricity purchased during the year have been recognized according to invoices issued by CPPA-G. (on basis of tariff determined by NEPRA). The Company purchased 10,991 million units (2019: 11,099 million units) at average rate of Rs. 12.98 per K'VH (2019: Rs. 11.46 per KWH).
24.1.2 These charges have been passed on to the Company by CPPA-G, which comprise re-allocation of mark-up on late payment by the CPPA-G on the basis of average outstanding balance.
23
24
24.1
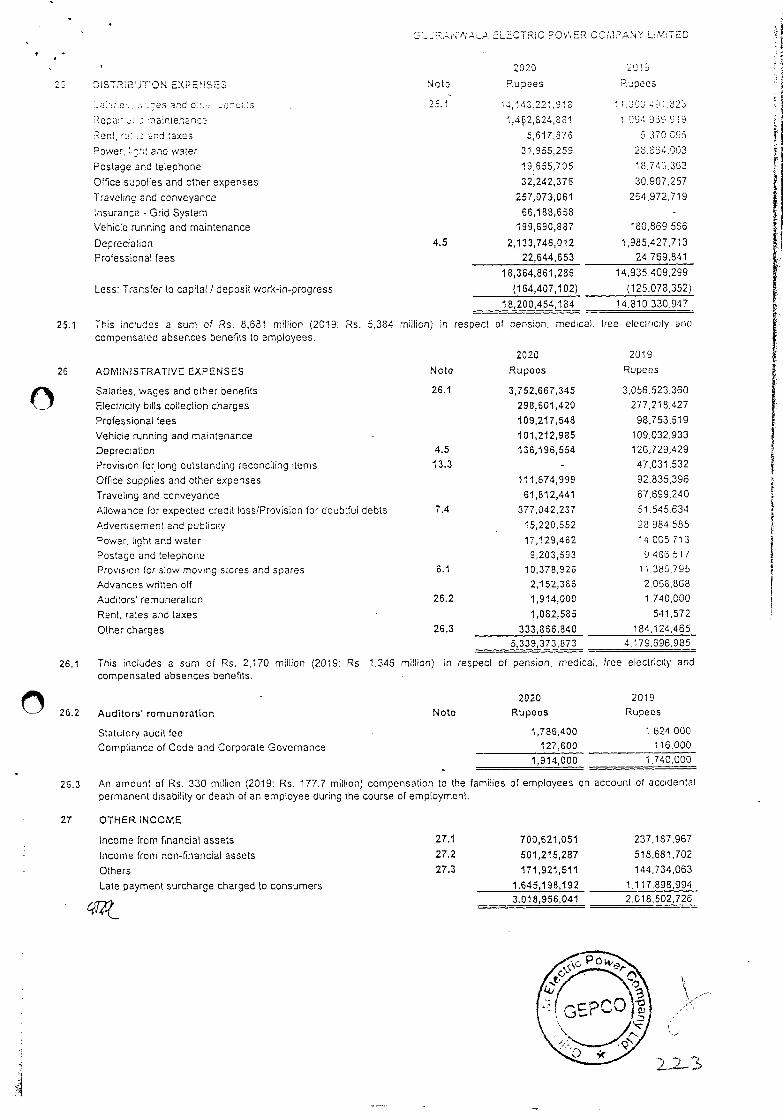
0
20 01STR12JTION EXPENSES Note
r'/40A ELCTRiC P01/ER COiIPANY LITED
2020 2019
Rupees Rupees
.'.es and c:.".' e.ne::s 25.1 14,143.221913 006 191 223
Repair naintenanco 1.42,824,831 004 030 9 9
Rent, ru:.: end taxes 5617876 5 370 095
Power, :nt and water 31,955,259 23.364.003
Postage and telephone 19,655705 16,746.333
Office supplies and other expenses 32,242,376 30,907.257
Traveling and conveyance 257,073,061 264,972,719
Insurance - Grid System 66,188,658
Vehicle running and maintenance 199,690,887 180.869,566
Depreciation 4.5 2,133,746,012 1,985,427.713
Professional fees 22,644,653 24,769.841
18,364,861,286 14,935,409.299
Less: Transfer to capital! deposit work-in-progress (164,407,102) (125.078,352)
18,200,454,184 14,810,330.947
25.1 This includes a sum of Rs. 8,681 million (2019: Rs. 5,384 million) in respect of pension. medical, free electricity eric
compensated absences benefits to employees.
2020 2019
26 ADM1N1STRATIVE EXPENSES Note Rupees Rupees
Salaries, wages and other benefits 26.1 3,752,667,345 3,056,523.360
Electricity bills collection charges 298,601,420 277,218.427
Professional fees 109,217,548 98,753,519
Vehicle running and maintenance 101,212,985 109.032.933
Depreciation 4.5 136,196,554 120.729,429
Provision for long outstanding reconciling items 13.3 47,031,532
Office supplies and other expenses 111,674,999 92.835,396
Traveling and conveyance 61,812,441 87,699,240
Allowance for expected credit loss/Provision for doubtful debts 7.4 377,042,237 51.545 634
Advertisement and publicity - 15,220,552 28 984 585
Power, light and water 17,129,462 14 005 713
Postage and telephone 9,203,593 9 486,5 /
Provision for slow moving stores and spares 6.1 10,378,926 11 385,795
Advances written off 2,152,386 2.058.868
Auditors' remuneration 26.2 1,914,000 1,740.000
Rent, rates and taxes 1,082,585 541,572
Other charges 26.3 333,866,840 184,124,465
5,339,373,873 4,179,696,985
26.1 This includes a sum of Rs. 2,170 million (2019: Rs. 1,346 million) in respect of pension, medical, free electricity and compensated absences benefits.
26.2 Auditors' remuneration,
Statutory audit fee
Compliance of Code and Corporate Governance
2020 2019
Note Rupees Rupees
1,786,400 1 824 000
127,600 116,000
1,914,000 1,740,000
26.3 An amount of Rs. 330 million (2019: Rs. 177.7 million) compensation to the families of employees on account of accidental permanent disability or death of an employee during the course of employment.
27 OTHER INCOME
Income from financial assets 27.1 700,621,051 237.187,967
Income from non-financial assets 27.2 501,215,287 513,681,702
Others 27.3 171,921,511 144,734,063
Late payment surcharge charged to consumers 1,645,198,192 1.117.898.994
3,018,956,041 2.018.502,726
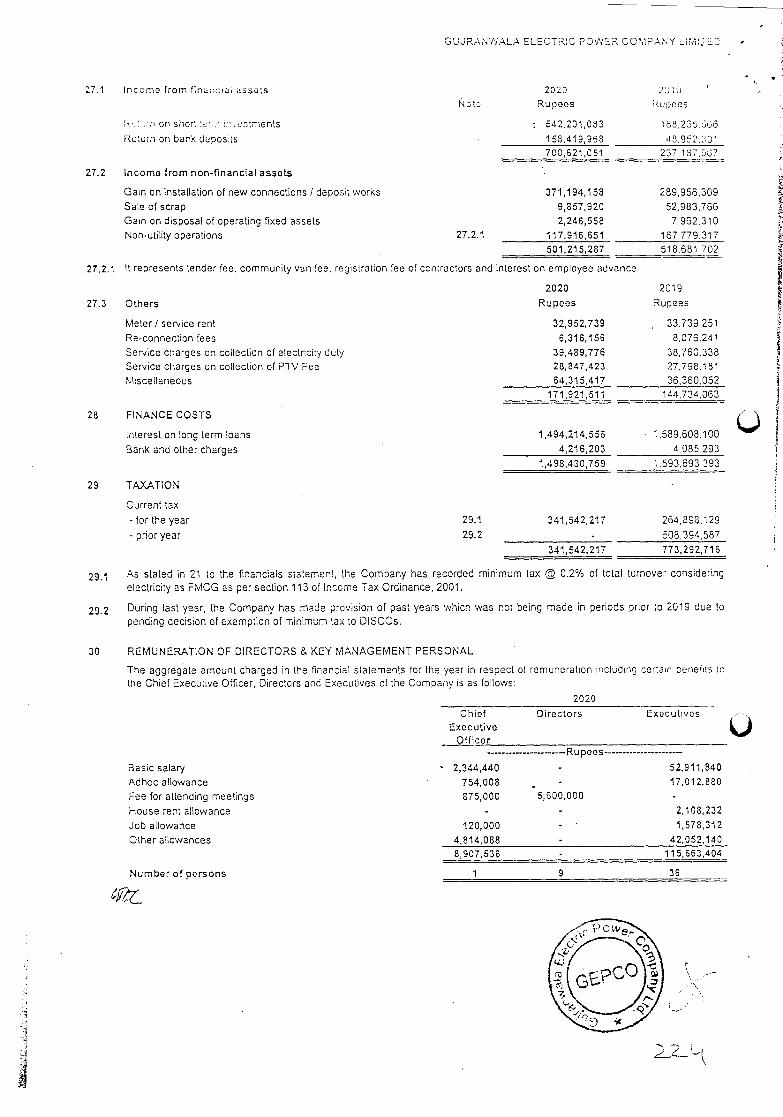
GLJRANWALA ELECTRlC POWER COMPANY LIMO
Incomo from fin ucla: assets
on shori eu eu:'. .uctments
Return on bank deposuts
Note
2020
Rupees
542,201,083
158,419,958
Rupees
188.235.036
43,952,301
700,621,051 237,187.ti37
Income from non-financial assets
Gain on installation of new connections I deposit works 371,194,158 289,956.309
Sale of scrap 9,857,920 52,983.766
Gain on disposal of operating fixed assets 2,246,558 7,962.310
Non-utility operations 27.2.1 117,916,651 167.779.317
501,215,287 518.681 702
27.2.1 It represents tender fee, community van fee, registration fee of contractors and interest on employee advance
2020 2019
Others Rupees Rupees
Meter I service rent 32,952,739 , 33,739,251
Re-connection fees 6,316,156 8.076.241
Service charges on collection of electricity duty 39,489,776 38,760.338
Service charges on collection of PTV Fee 28,847,423 27,798.181
Miscellaneous 64,315,417 36,360,052
171,921,511 144,734.063
FtNANCE COSTS
Interest on tong term loans 1,494,214,556 • 1,589,608,100
Bank and other charges 4,21 6,203 4.085293
1,498,430,759 1.593,693,393
TAXATION
Current tax
- for the year 29.1 341,542,217 264,898,129
- prior year 29.2 - 508,394,587
341,542,217 773,292,716
29.1 As stated in 21 to the financials statement, the Company has recorded minimum tax @ 0.2% of total turnover considering
electricity as FMCG as per section 113 of Income Tax Ordinance, 2001.
29.2 During last year, the Company has made provision of past years which was not being made in periods prior to 2019 due to
pending decision of exemption of minimum tax to DISCOs.
30 REMUNEPTION OF DIRECTORS & KEY MANAGEMENT PERSONAL
The aggregate amount charged in the financial statements for the year in respect of remuneration including certain oenefitsc the Chief Executive Officer, Directors and Executives of the Company is as follows:
Basic salary
Adhoc allowance
2020
Chiof Executive
Officer
Directors Executives
- 2,344,440
' 754,008
Ru poos
52,911,840
17,012,880
Fee for attending meetings 875,000 5,600,000
House rent allowance - 2,108,232
Job allowance 120,000 1,578,312
Other allowances 4,814,088 42,052,140
8,907,536 115,663,404
Number of persons 1 9 36
27.1
27.2
27.3
28
29
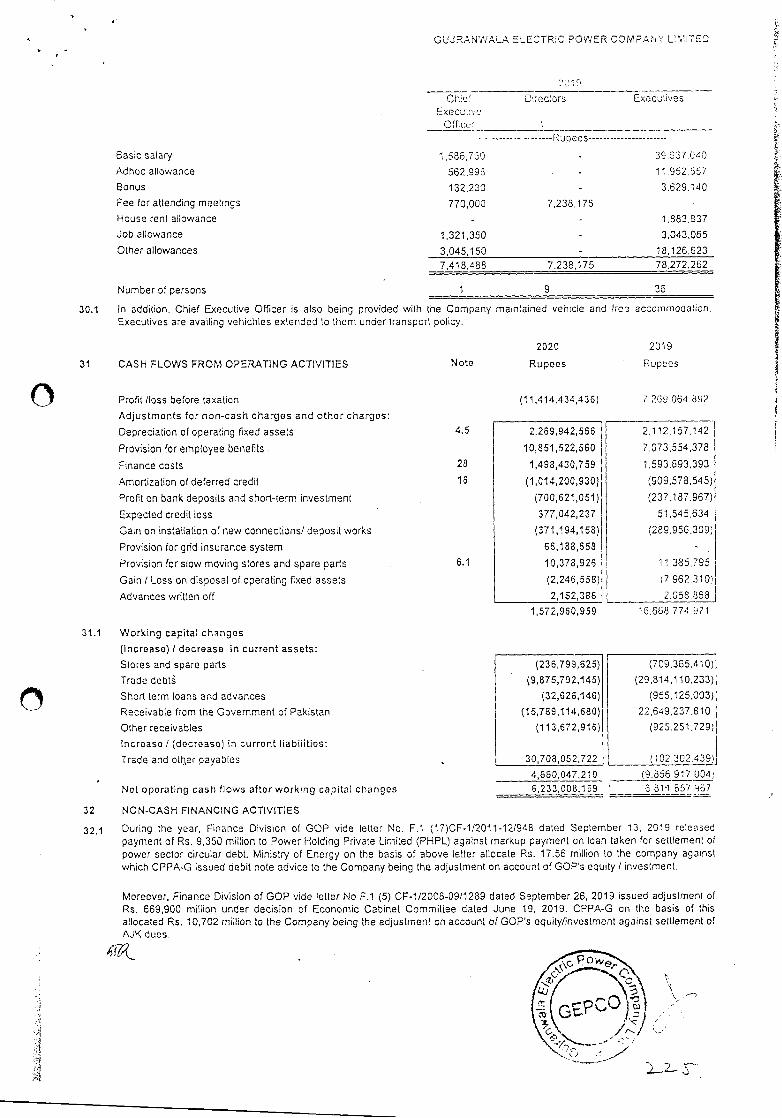
23 6, 79 9, 625)
(9,875,792,145)
(32,626,146)
(15,789,114,680)
(113,672,916)
(709,365.410)
(29.514,110,233)
(955,1 25.003)
22 .649,237 .8 10
(925.251.729)
30,708,052,722
(102.302.439)
4,660,047,210
(9.856 917 0041
6,233,008,169 0 81'i 857 1157
GUJRANWALA ELECTRIC POWER COMPANY LIMITED
Cho I ExeculvC
O tOG
Diraclors Ex C CU Iiv 5
Ouoecs
Basic salary 1.586,730 39 637 040
Adhoc allowance 562,993 11,952,557
Bonus 132,230 3.629,140
Fee for attending meetings 770,000 7,238,175
House rent allowance 1.883.837
Job allowance 1,321,350 3,043,065
Other allowances 3,045,150 18,126,623
7,418,458 7,238,175 78,272.262
Number of persons 1 9 36
30.1 ln addition. Chief Executive Officer is also being provided with the Company maintained vehicle and tree accommodation. Executives are availing vehichies extended to them under transport policy.
2020 2019
31 CASH FLOWS FROM OPERATING ACTIVITtES Note Rupees Rupees
Profit /ioss before taxation
Adjustments for non-cash charges and othor chargos:
Depreciation of operating fixed assets
Provision for employee benefits
Finance costs
Amortization of deferred credit
Profit on bank deposits and short-term investment
Expected credit loss
Gain on installation of new connections! deposit works
Provision for grid insurance system
Provision for slow moving stores and spare parts
Gain I Loss on disposal of operating fixed assets
Advances written off
4.5
28
16
6.1
(11,414,434,436) 7 269 064 8112
2,269,942,566 2,1 12,157.142
10,851,522,560 7,073.554,378
1,498430,759 1,593,693,393
(1,014,200,930) (909.578.545)
(700,621,051) (237.187.967)
377,042,237 51,545.634
(371,194,158) (289.956.309)
66,1 88,658
10,378,926 11.385.795
(2,246,558) 17 962.310)
2,152,386 2.058.868
1,572,960,959 16.608.774.971
31.1 Working capital changes
(Increase)! decrease in current assets:
Stores and spare parts
Trade debt
Short term loans and advances
Receivable from the Government of Pakistan
Other receivables
Increase I (decrease) in current liabilities:
Trade and olrler payables
Net oporating cash flows after working capital changes
32 NON-CASH FINANCING ACTIVITIES
32.1 During the year, Finance Division of GOP vide letter No. F.1 (17)CF.1/2011-12/948 dated September 13. 2019 released payment of Rs. 9,350 million to Power Holding Private Limited (PHPL) against markup payment on loan taken for settlemenl 01 power sector circular debt. Ministry of Energy on the basis of above letter allocate Rs. 17.56 million to the company against which CPPA-G issued debit note advice to the Company being the adjustment on account of GOP's equity / investment.
Moreover, Finance Division of GOP vide letter No F.1 (5) CF-1/2008-09/1289 dated September 26, 2019 issued adjustment of Rs. 669,900 million under decision of Economic Cabinet Committee dated June 19, 2019. CPPA-G on the basis of this allocated Rs. 10,702 million to the Company being the adjustment on account of GOP's equity/investment against settlement Of
AJK dues.
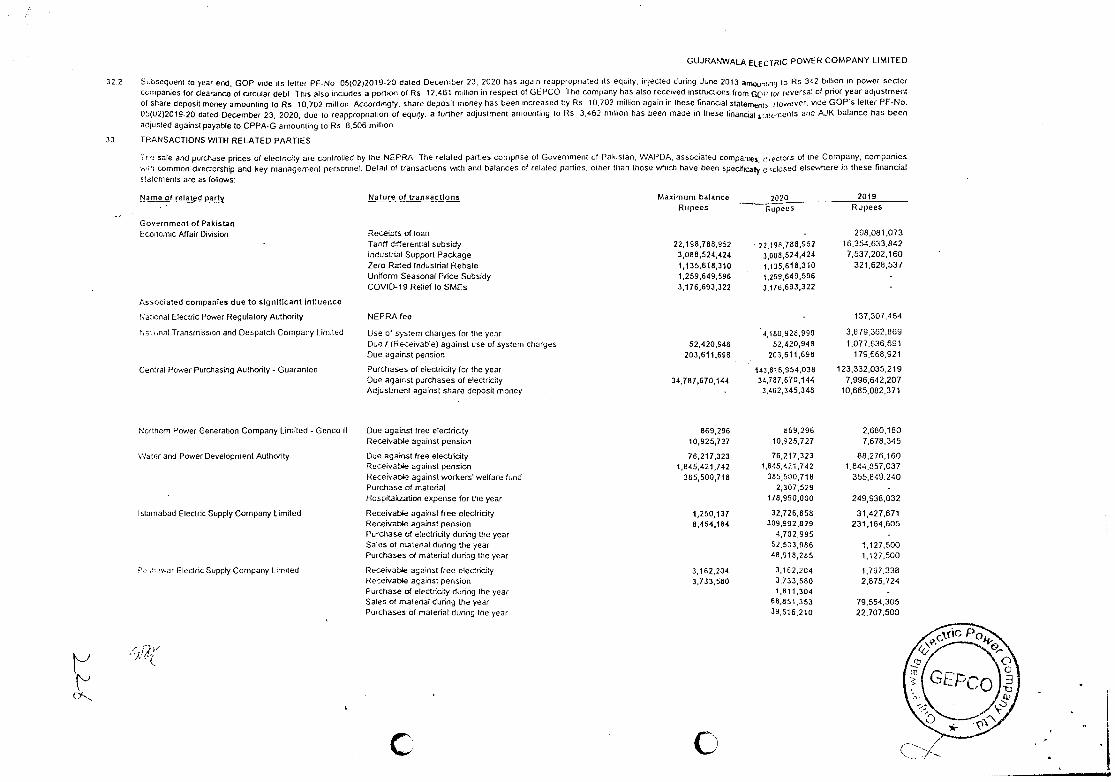
GUJRANWAL ELECTRIC POWER COMPANY LIMITED
32 2 Subsequent lo year end. GOP wide its loller PF-No 05(02)2019-20 dated December 23, 2020 haS again reappropnated its equity, injected during June 2013 artsoj'uni5 0 Fis 342 billiOn in power sector
Coilipanies for dearar-ice of circular debt TIns also includes a portion of Rs 12,461 million in respect ot GEPCO The coi-npany has also received instructions from Ccl' tsr ruversat at poor year adjustment
of share deposit money amounting to Fis 10702 million Accordingly, share deposit money has been increased by ITs 10,702 million again in these financial statemenis flow-ever, vise GOP's letter PF-No. 05(02)20t9-20 dated December 23, 2020, due 10 reappropnation of OqUity. a further adjustment amounting 10 Fts 3.462 million has been made in these financial &:a,crnelts and AJK balance has been
ad;usled against payable to CPPA-G amounling to ITs, 8,506 million
33 TRANSACTIONS WITH RELATED PARTIES
sale and purchase prices of electricity are controlled by the NEPRA The relaled parties compose of Government of Pakistan, WAPOA, associated companies rtuectols of tire Company, companies .'tti common doectorship and key management personnel. Detail of transactions with and balances of relaled parties, olher than those wf'iicti have been specifically csscjosed elsewhere in these financial
statements are as follows:
Name of related party Nature of transactions Maximum balance 2020 2019 Rupees 11upee5 Rupees
Government of Pakistan Ecoitomic Affair Division fTeceiptu of loan 298.081,073
Tariff drflerential subsidy 22,1 98.788,952 32,198,788,952 16,354,633,842 Industrial Support Package 3,088,524,424 3,098,524,424 7.537,202,160 Zero Rated Industrial Rebate 1,135.618,310 1,135,618,310 321,628.537 Uniform Seasonal Price Subsidy 1,259,649,596 1.259,649,596 COVID-19 Relief to SMEs 3,176,693,322 3,176,693.322
Associated companies due to significant influence
National Etectric Power Regulatory Authority NEPR,A fee 137,307,464
r;:-rital Transmission and Despatch Contpany Limited Use of system charges for the year 4,180,928,990 3,879,362,869
Due / (Receivable) against use of system charges 52,420,948 52,420,948 1,077,636,691 Due against pension 203,61 1,698 203,611,698 179,668.921
Central Power Purchasing Authority - Guaranlee Purchases of electricity for the year I43,816,9S4,038 123,332,035,219 Due against purchases of electricity 34,787,670,14-4 34,787,670,144 7,996,642,207 Adjustment against share deposit money 3,462,345,348 10,685,082,371
Northern Power Generation Company Limited - Genco II Due against free electricity 869,296 869,296 2,680,180 Receivable against pension 10,925,727 10,925,727 7,678,345
Vfatnr and Power Development Authority Due agaksst free etectricity 76,217,323 76,217,323 88,276,160 Receivable against pension 1,845,421,742 1,845,421,742 1,844,857.037 Receivable against workers' welfare fund 385,500,718 385,500,718 355,849,240 Purchase of material 2,307,529 Hospitalization expense for the year 178,990,000 249,938,032
lslarnabad Electric Supply Company Limited Receivable against free electricity 1,250,137 32,726,858 31,427,671 Receivable against pension 8,454,184 309,992,829 231,164,605 Purchase of electricity during the year 4,702,995 Sales of material during the year 52,533,996 1,127.500 Purchases of material during the year 48,9t8,285 1,127,500
'rwar Electric Siippty Company Limiled Receivable against tree electricity 3,162,204 3,162,204 1,797.338 Receivable against pension 3,733,580 3,733,580 2,875.724 Purchase of electricity during the year 1.811,304 - Sales of material during the year 69,85t,353 79,55-4,305 Purchases of material during he year 39,516,210 22,707.500
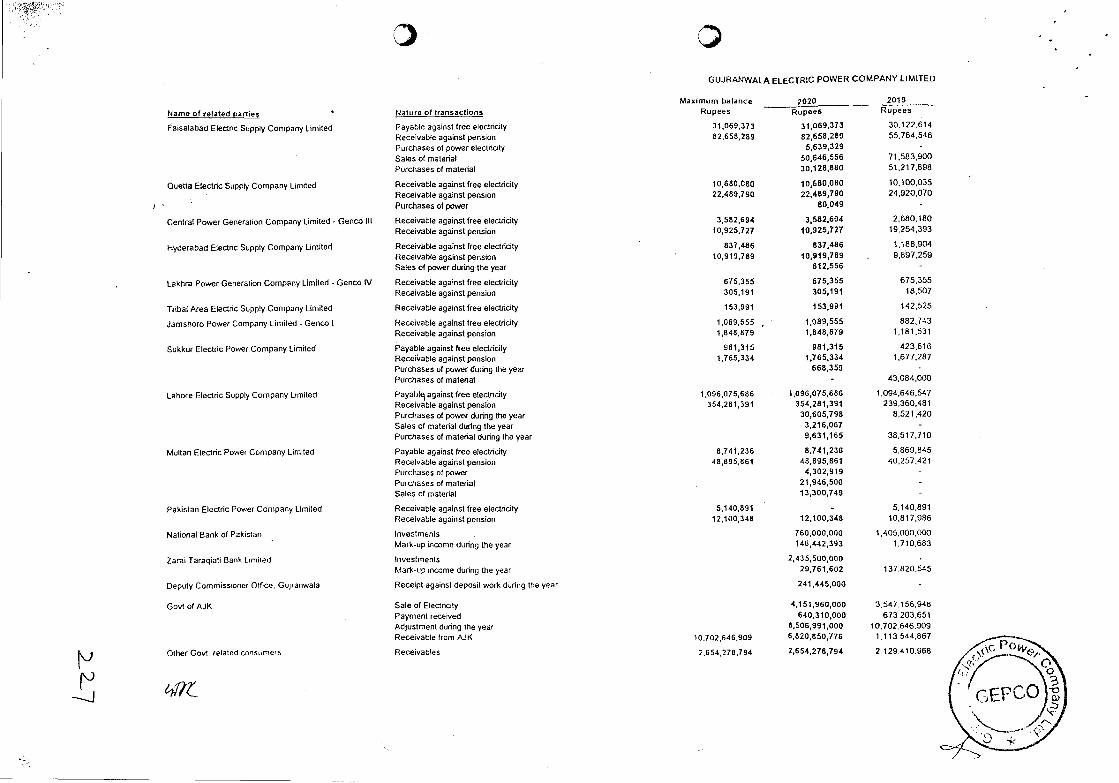
Name of related parties Nature of transactions
GUJRANWALA ELECTRIC POWER COMPANY LIMITED
Maximum balance 2020 2019 Rupees Rupees Rupees
Faisatabad Electnc Supply Company Limited Payable against free electricity 31,069,373 31,069,373 30,122.614
Receivable against pension 82,658,289 82,658,289 55.784.546
Purchases of power electncrty 5,639,329
Sales of material 50,646,566 71,563,900
Purchases of material 30,128,880 51,217,898
Quetta Etectnc Supply Company Limited Receivable against tree electricity 10,680,080 10,680,080 10,100,035
Receivable against pension 22,489,790 22,489,790 24,920,070
Purchases of power 80,049 -
Central Power Generation Company Limited Genco III Receivable against free electricity 3,582,694 3,582,694 2,680.180
Receivable against pension 10,925,727 10,925,727 lg.254,393
Hyderabad Etectnc Supply Company Limited Receivable against free electricity 837,4.86 837,486 1,188,904
Receivable against pension 10,919,789 10,919,789 , 9,897,259
Sales of power during the year 612,556 -
Lakhra Power Generation Company Limited - Genco IV Receivable against free electricity 675,355 675,355 675,355
Receivable against pension 305,191 305,191 18,507
Tribal Nea Electric Supply Company Limited Receivable against free electricity 153,991 153,991 142.525
Jamshoro Power Company Limited - Genco I Receivable againsf free electricity 1,089,555 1,089,555 882,743
Receivable against pension 1,848,879 1,848,879 1,181,531
Sukkur Electric Power Company Limited Payable against free electricity 981,315 981,315 423,616
Receirable against pension 1,765,334 1,765,334 1,677,267
Purchases of power during the year 668,359 -
Purchasea of material - 43,084.000
Lahoce Electric Supply Company Limited Payahl against free electricity 1,096,075,686 1,096,075,686 1,094,646.547
Receivable against pension 354,281,391 354,281,391 239,360,461
Purchases of power during the year 30,605,798 8,521,420
Sales of material during the year 3,216,067
Purchases of material during the year 9,631,165 36,517,710
Multan Electric Power Company Limited Payable against free electricity 8,741,236 8,741,236 5,869,845
Receivable against pension 48,895,861 48,895,861 40,257,421
Purchases of power 4,302,919 -
Purchases of material 21,946,500 Sales of material 13,300,749 -
Pakistan Electric Power Company Limited Receivable against free electricity 5,140,891 - 5,140,891
Receivable against pension 12,100,348 12,100,348 10,817,986
National Bank of Pakistan Investments 760,000,000 1,405,000,000
Mark-up income during the year 146,4-42,393 1.710,663
Zarai Taraqiati Bank Limited Investments 2,435,500,000
Mark-up income during the year 29,761,602 137,620.5-45
Deputy Commissioner Office. Gujianwala Receipt against deposit woric during the year 241,445,000
Govt of AJK Sale of Electncify 4,151,960,000 3,547,156,946
Payment received 640,310,000 673 203.651
Adjustment during the year 6,506,991,000 10,702,646,909 Receivable from AJK 10,702,646,909 6,820,850,776 1.113.544.867
Other Govt related ConsumerS Receivables 2,654,278,794 2,65-4,278,794 2.129.410.966
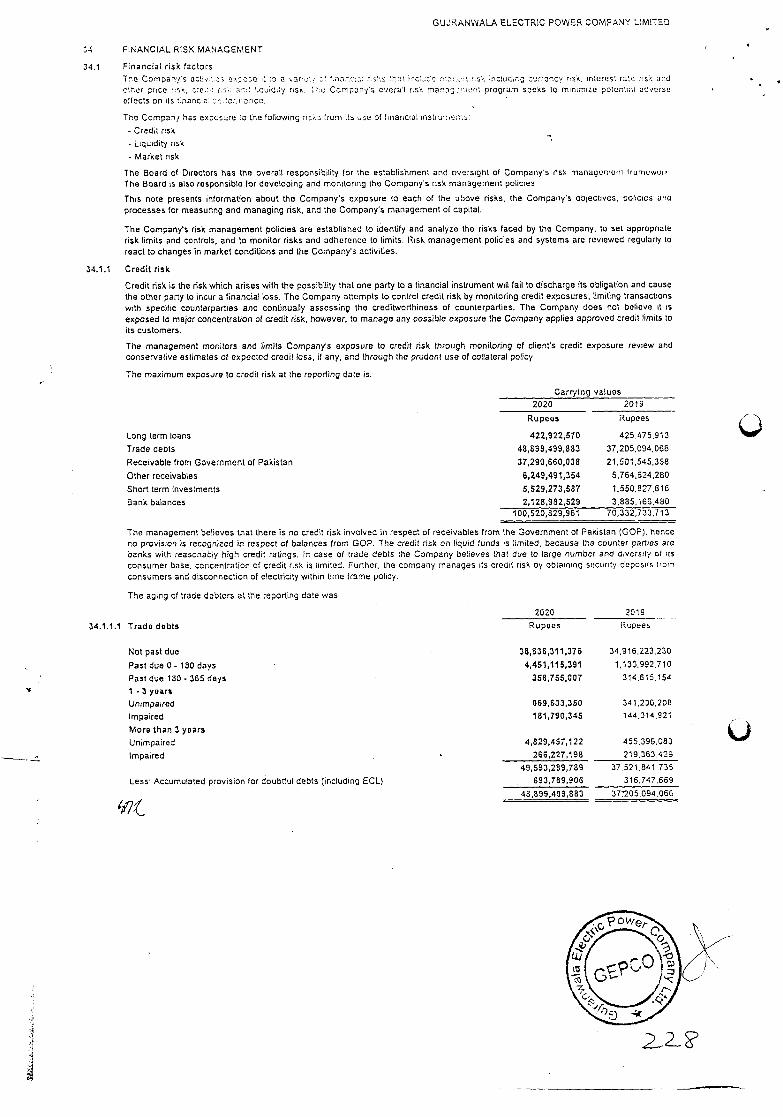
GURANWALA ELECTRIC POWER COMPANY LIMITED
Z4 FINANCIAL RISK MANAGEMENT
34.1 Financial risk factors
The Companys achy.: eose 1 ho a ysry: c. .ssr::. ks :c!rIe r::: ,': incisOrs currency nsk. ntc'res re.r nk md crn.sr price u, crc,:: srI .quidity risc. ire Company's oversi 1:5k mms rnrenl program seeks 10 minimiCe pclenhial adverse etfechs on 15 t.nanC. or;isriCe.
The Ccmpanj has exposure 10 the tollowing riuc from its sue of tinancial instrurrre:r:3:
- Credil oak
- Liquidity risk
- Market risk
The Board of Directors has the overall responsibility for the establishment and oversight of Compairys ilsk managerirc'nl iririrewur, The Board is also responsible for developing and moniloriog the Cornperiys risk rrianagemeoi policies
This note presents information about the Company's exposure to each of the above risks, the Companys oblectives, policies and processes for measuring and managing risk, and the Company's management ol capital.
The Company's risk management policies are established to identify and analyze the risks faced by the Company, to set appropriate risk limits and controls, end to monitor risks and adherence to limits. Risk management policies and systems are reviewed regularly to react to changes in market conditions and the Company's activities.
341.l Credit risk
Credit risk is the risk which arises with the possibility that one party to a financial instrument will fail to discharge its obligation and cause
the other party to incur a financial loss, The Company attempts to control credit risk by monitoring credit exposures, limiting transactions
with specific countenpanties and continually assessing the creditworthiness of counterparties. The Company does not believe it is
exposed to major concentration of credit risk, however, to manage any possible exposure the Company applies approved credit Fmils 10 its customers.
The management monitors and limits Company's exposure to credit risk through monitoring of client's credit exposure review and
conservative estimates of expecled credit loss, if any, and lhrough the prudent use of collateral policy
The maximum exposure to credit risk at the reporting date is:
Carrying values
2020 2019
Rupees Rupees
Long term loans 422,922,570 425.475.913
Trade debts 48,899,499,883 37,205.094,066
Receivable from Government of Pakistan 37,290,660,038 21.501,545,358
Other receivables 6,249,491,354 5,764,624.280
Short term investments 5,529,273,587 1,550,827,816
Bank balances 2,128,982,529 3,885,166,480
100,520,829,961 70,332,733,713
The management believes that there is no credit risk involved in respect of receivables from the Government of Pakislari (GOP). hence no povisioo is recognized in respect of balances from GOP. The credit risk on liquid funds is limited, because the counter parties are banks with reasonably high credit ratings. In case 01 trade debts Ihe Company believes that due 10 large number and diversily of Is consumer base, concentration of credit risk is limiled. Further, the company manages its credit risk by obtaining security deposits mm consumers and disconr,ection of electricity within lime lrame policy.
The aging of trade deblora at the reporting date was:
34.1,1.1 Trade debts
2020 2019
Rupees Rupees
Not pest due 38,836,311,376 34,916,223.230
Past due 0- 180 days 4,451,115,391 1,130,992,710
Past due 180-365 days 358,755,007 314.615.154
- 3 years
Unimpaired 669633,350 341.236,208
Impaired 181,790,345 144,014,921
More than 3 years
Unimpaired 4829,457,122 455,396.083
Impaired 266,227,198 219.363.429
49,593,289,789 37.521.841.735
Less: Accumulated provision for doubtful debts (including ECL) 693,789,906 316,747.669
48,899,499883 37205.094.066
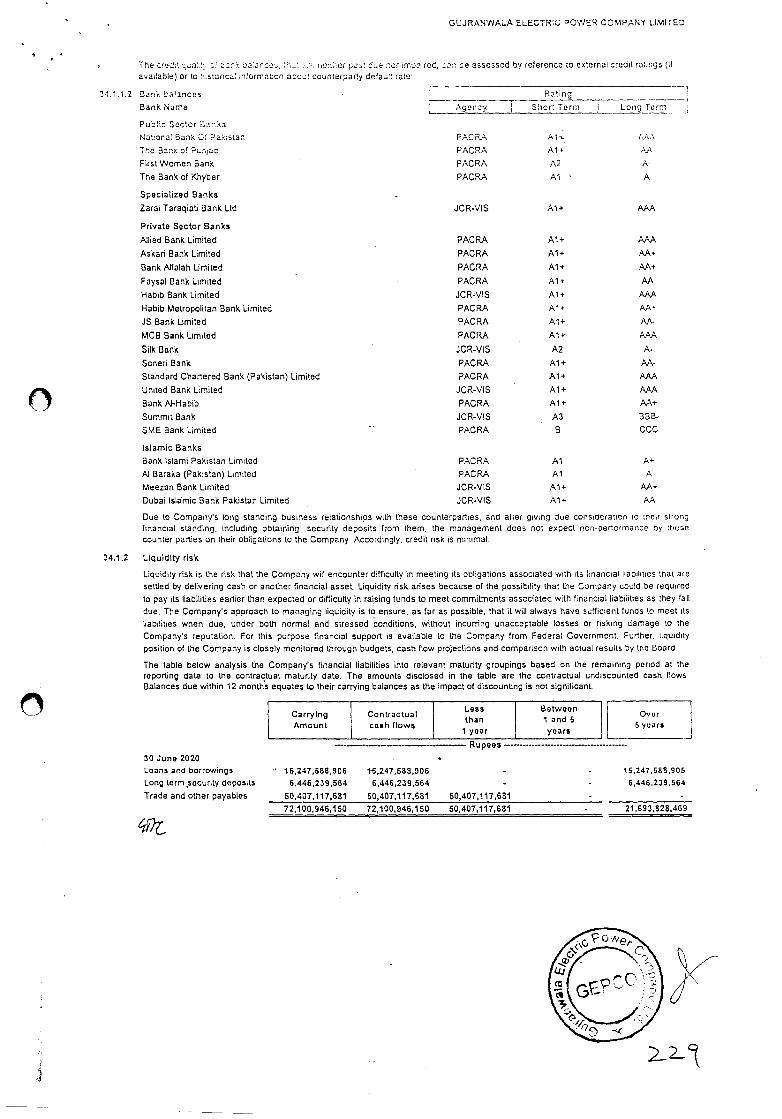
GUJRANWALA ELECTRK POWER COMPANY LIMITED
The cruCl un ..l c''. bcrcs, Ih: r:thr punt bue ncr mprred, cu' Se assessed by reference to external credit ratings III available) or to h.s:0r103 nformation acout counterparfy defautt rate:
34.1.1.2 Bank balances
Bank Name
Public Sector gacks
Rating
Age r. cy Short Term Long Term
NaConat Bank Cl Pakstan PACRA Al. ,V,A
The Ba;ix of Punno PACRA Al.
First Women Bank PACRA A2 A-
The Bank of Khyber PACRA Al ' A
Specialized Banks -
Zarai Taraqiali Bank Ltd JCR-VIS Al+ AAA
Private Sector Banks
Allied Bank Limited PACRA Al+ AAA
Askari Bank Limited PACRA Al+
Bank Alfalah Limited PACRA Al+
Faysal Bank Limited PACRA Al. A.A
Habib Bank Limited JCR-VlS Al+
Habib Metropolitan Bank Limited PACRA Air
JS Bank Limited PACRA Al+
MCB Bank Limited PACRA A1+ M,A
Silk Bank JCR-VIS A2 A.
Soneri Bank PACRA A1+
Standard Chartered Bank (Pakistan) Limited PACRA Al+
United Bank Limited . JCR-VlS Al+ MA
Bank Al-Habib PACRA A1+
Summit Bank JCR-VIS A3 BBB-
SME Bank Limited PACRA B CCC
Islamic Banks
Bank Islami Pakistan Limited PACRA Al
Al Baraka (Pakistan) Limited PACRA Al A
Meezan Bank Limited JCR-VIS A1+
Dubai Islamic Bank Pakistan Limited JCR-VlS Al.
Due to Company's long standing business relationships with these counterparties, arid after giving due consideration to neil sirorig financial standing, including obtaining security deposits from them, the management does not expect non-performance Op ti,e5e counter parties on their obligations to the Company. Accordingly, credit risk is minimal.
34.1.2 Liquidity risk
Liquidity risk is the risk that the Company will encounter difficulty in meeting its obligations associated with its financial liabilities trial are
setlied by delivering cash or another financial asset. Liquidity risk arises because of the possibility that the Company could be required to pay its liabilities earlier than expected or difficulty in raising funds to meet commitments associated with financial liabilities as they fall due. The Company's approach to managing liquidity is to ensure, as far as possible, that it will always have sufficient funds to meet ifs liabilities when due, under both normal and stressed conditions, without incurring unacceptable losses or risking damage to the Company's reputation. For this purpose financial support is available to the Company from Federal Government. Further, liquidity position of the Company is closely monitored through budgets, cash flow projections and comparison with actual results by the Board
The table below analysis the Company's financial liabilities into relevant maturity groupings based on the remaining period at the reporting date to tIre contractual maturity date. The amounts disclosed in the table are the contractual undiscounted Cash flows Balances due within 12 months equates to their carrying balances as the impact of discounting is not significant.
Carry trig Amount
Contractual cash ttows
Less than
I yoar
Betwoen 1 and 5 years
Over 5 years
30 June 2020
Rupees
Loons and borrowings ' 15,247,588,905 15,247,588,906 15,247,588,905
Long term ,securlty deposits 6,446,239,564 6,446,239,564 - 6,446,239,554
Trade arid other payables 50,407,117,681 50,407,117,681 50407,117,681
72,100,946,150 72,100,946,150 50,407,117,681 21,593,828,469
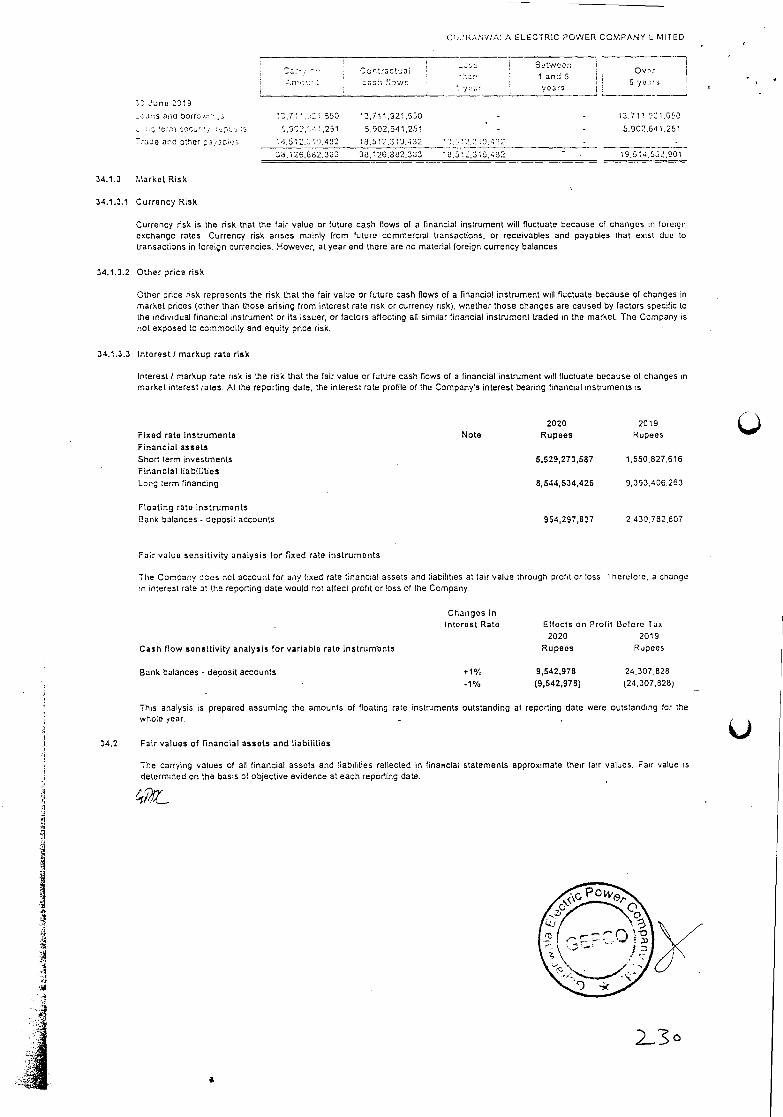
CU'RANWALA ELECTRIC POWER COMPANY LIMITED
2:' Suns 2218
Oo'mtractua Eetwen
Over I and 5
flynn.:'; years
L..ins ann corn..... '.2.711.2 1,650 10,711,921,550 13,711,221.653
mr cecm.m1 .251 5,902,641,251 5902.641.251
Tranie an'md other 7facnn. I J.432 13.512,31'J.142 .7.
j25,8i32.353 33,126,862,303 - 19,614,552,901
34.1.3 Market Risk
34.1.3.1 Currency Risk
Currency risk is the risk that the fair value or future cash flows of a financial instrument will flucfuale because of changes in foreign exchange rates. Currency risk arises mainly from future commercial transactions, or receivables and payables lhaf exist due 10 transactions in foreign currencies. However, at year end there are no malenal foreign currency balances
34.1.3.2 Other price risk
Other price risk represents the risk that the fair value or future cash flows of a financial instrument will fluctuate because of changes in market prices (other than those arising from interest rate risk or currency risk), whether those changes are caused by factors specific to the individual financial instrument or its issuer, or faclors affecting all similar financial instrument traded in tIre market. The Company is not exposed to commodity and equity price risk.
34.1.3.3 Interest I markup rate risk
Interest I markup rate risk is the risk that the fair value or future cash flows of a financial instrument will fluctuate because of changes in market interest rates. AL the reporting date, the interest rate profile of the Company's interest bearing financial instruments is
Fixed rate Instruments
Financial assets
Short term investments
FInancial liabilities
Long term financing
Floating rate instruments
Bank balances - deposit accounts
2020 2019 Note Rupees Rupees
5,529,273,587 1,550,527,616
8,544,534,426 9,393,406.263
954,297,837 2,430,782.807
Fair value sensitivity analysis for flxed rate instruments
The Company dccx not account for any fixed rate tinancial assets and liabilities at fair value through proht or loss Therefore, a change rn I leresl rate at lIre reporting data would not affect profit or loss of the Company.
Changes In Interest Rate Effects on Profit Before Tax
2020 2019
Cash flow sensitivity analysis for variable rate instrum'onts Rupees Rupees
Bank balances - deposit accounts 9,542,978 24.307,528
(9,542,975) (24,307,8281
This analysis is prepared assuming the amounts of floating rate instruments outstanding at reporting date were outstanding for the whole year. -
34.2 Fair values of financIal assets and liabilities
The carrying values of all financial assets and liabilities reflected in fine,ciaI statements approximate their fair values. Fair value is delermined on the basis of objective evidence at each reporting date.
23°
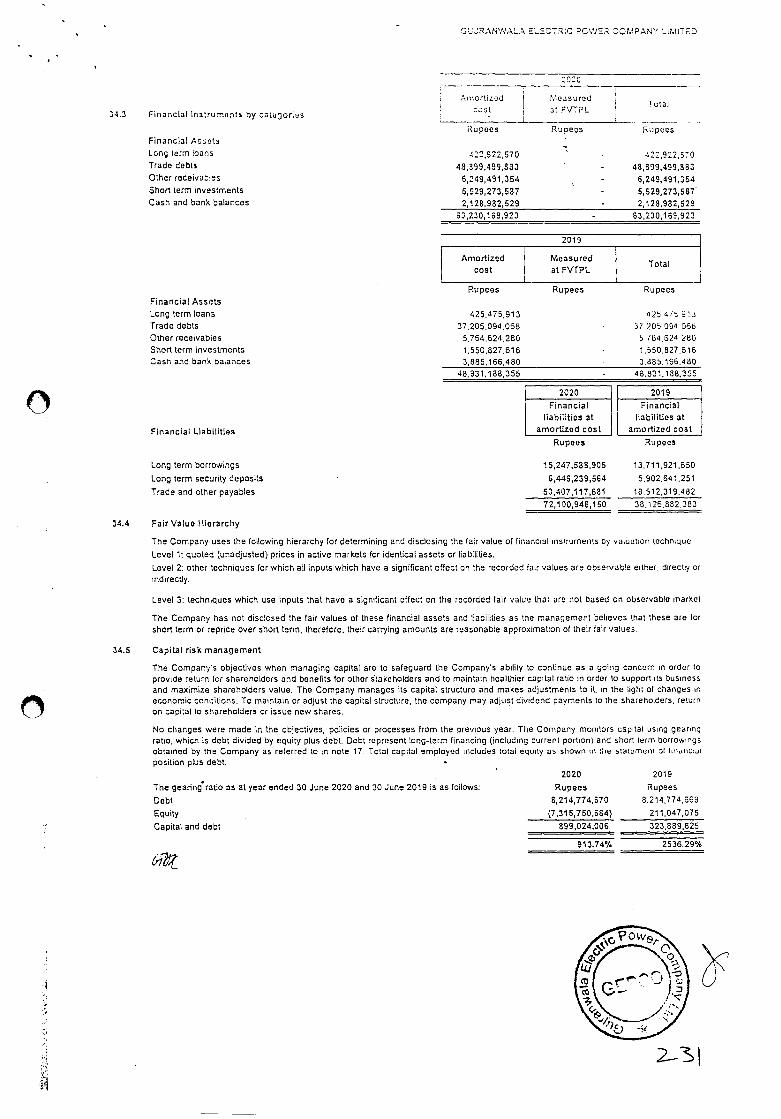
Financial Assets
Long term loans
Trade debts
Other receivables
Short term investments Cash and bank balances
425.475,913 4254 , 5 0:j
37.205.094.066 37 705 004 060
5,754,624,280 5 104.624 '280
1,550,827,616 1,550,827.616
3,885,166,4 80 3,885,166.4 80
48,831,188,355 48,831,188,355
Financial Liabilities
2020 2019
Financial Financial
liabilities at liabilities at
amortized cost amortized cost
GRANVV.&L. ELECTRC PCVIER COMPANY LMlTED
2020
34.3 FinancIal In rumorita by catugorlus
Financial As ists
;nortizod Measursd Total
at FVTPL
Ru pee a Ru peas Rupees
Long term laCtiC 422,922570 4 22.922, 57 0 Trado debts 48,899,499,833 48,899,499,883 Other receivacles 5,249,491,354 6,249,491,354 Short term nvestmenls 5,529,273,537 5,529,273,587 Cash and bank balances 2,128,982,529 2,128,982,529
53,230,1 59,923 63,230,169,923
2019
Amortized
cost
Measured at FVTPL
Total
Rupees Rupees Rupees
Rupoos Ru po as
Long term borrowings 15,247,588,905 13 .7 11, 921 .6 50
Long term securtty deposits 6,446,239,554 5,902,641.251
Trade and other payables 50,407,117,681 18,512,319,482
72,100,946,150 38,126,882,383
34.4 Fair Value t'lierarchy
The Company uses the following hierarchy for determining and disclosing the lair value Of financial instruments by valuation technique
Level 1: quoted (unadjusted) prices in active markets for identical assets or liabilities.
Level 2: other techniques for which all inputs which have a significant effect on the recorded fair values are observable either, directly or indirectly.
Level 3: techniques which use inputs that have a significant effect on the recorded lair value that are not based on observable market
The Company has not disclosed the fair values of these financial assets and Sabilifies as the management believes that these are for short term or repnce over short term, therefore, their carrying amounts are reasonabie approximation of their fair values.
34.5 Capital risk management
The Company's objectives when managing capital are to safeguard the Company's ability to continue as a going concern in order to provide return tot shareholders and benefits for other stakeholders and to maintain healthier capital ratio in order to support its business and maximize shareholders value. The Company manages its capitat structure and makes adjustments to it. in the tight at changes in
economic conoitions. To maintain or adjust the capital structure, the company may adjust dividend payments to the shareholders, return on capital to shareholders or issue new shares.
No changes were made in the objectives, policies or processes from the previous year. The Company monitors capital using gearng ratio, which is debt divided by equity plus debt. Debt represent long-term financing (including current portion) and short term borrowings obtained by the Company as relerred to ri note 17. Total capital employed includes total equity as shown in the statumeiri of tiiiuiiciui position plus debt.
2020 2019
The gearin ratio as at year ended 30 June 2020 and 30 June 2019 is as follows: Rupees Rupees
Debt 8,214,774,670 8.214,774,669
Equity , (7,315,750,664) 211,047,075
Capital and debt 899,024,006 323,889,825
913.74% 2536. 29%
2-31
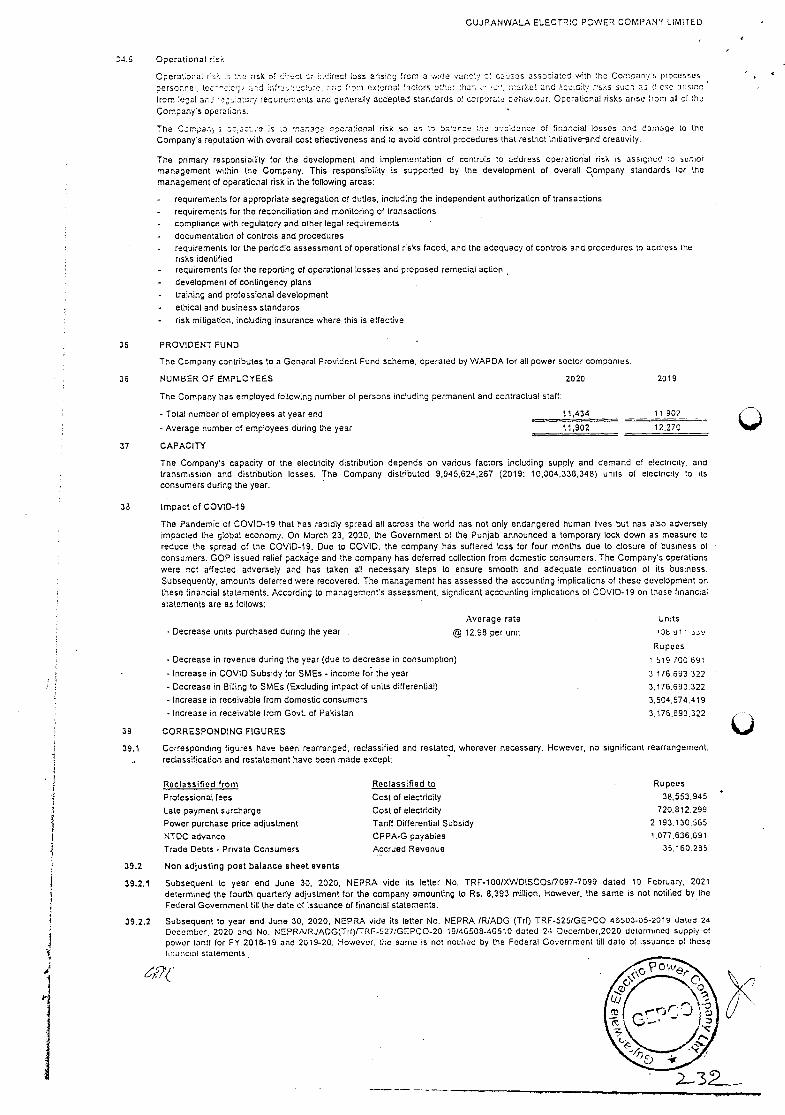
NUMBER OF EMPLOYEES
The Company has employed following number of persons including permanent and contractual staff:
2020 2019
- Total number of employees at year end 11,434 11 502
- Average number of employees during the year 11,902 12,270
CAPACITY
35 PROVIDENT FUND
The Company contributes to a General Provident Fund scheme, operated by WAPDA for all powor sector companies
36
37
GUJRANWALA ELECTRIC PO'NER COMPANY LIMITED
34.5 Operational risk
Operational r-s's risk ot c:s:t indirect loss arising from a wide variety 01 ca:Jses associated with the Correarry S processes
personnel, teen-nc';. :,r,d ;s ccte:e, end horn seternel factors ser:ha •. s:arkct urd ltquidhly c:aks ousas 1 sIc acs:ns
from legal ar.y "rns:a:rn, requirements and generally accepted star,tiards of C porale oetisv:our. Operational riska arise from all at this
Company's operstior.s.
The Company; urn'S is to rane operational risk so as to tistire he e;alisance of financial tosses and damage to the Companys reputation with overall cost effectiveness arid to avoid control procedures that restrict inilialive-Bnd creativity.
The primary responsibility for the development and implementation ci controls to address operational risk is assigrrirni to sisflioi management within (he Company. This responsibility is supported by the development of overall Company standards br the
management of operational risk in the following areas:
- requirements for appropriate segregation of duties, including the independent authorization of transactions
- requirements for the reconciliation and monitoring of transactions
- compliance with regulatory and oIlier legal requirements
- documentation of controls and procedures
- requirements for the periodic assessment of Operational risks faced, and the adequacy of controls and procedures to address the risks identified
- requirements for the reporting of operational lOSSes and proposed remedial action
- development of contingency plans
- training and professional development
- ethical and business standards
- risk mitigation, including insurance where this is effective
The Company's capacity of the electricity distribution depends on various factors including supply and demand of electricity, and transmission and distribution losses. The Company distributed 9,945.624,267 (2019: 10,004,338,348) units of electricity to Is consumers during the year.
33 Impact of COVID-19
The Pandemic of COVID-19 that has rapidly spread all across the world has not only endangered human lives but has also adversely impacted the global economy. On March 23, 2020, the Government of the Punjab announced a temporary lock down as measure to reduce the spread of the COVID-19. Due to COVID, the company has suffered loss for four months due to closure of business of consumers. GOP issued relief package and the company has deterred collection from domestic consumers. The Company's operations were not affected adversely and has taken all necessary steps to ensure smooth and adequate continuation of its business. Subsequenty, amounts deterred were recovered. The management has assessed the accounting implications of these development on these financial statements. According to management's assessment, significant accounting implications of COVID-19 on these linancial
statements are as follows:
Average rate Units
- Decrease units purchased during the year i 1298 pet unit 'it isi sue
Rupees
- Decrease in revenue during the year (due to decrease in consumption) rg 100 syr
- Increase in COVID Subsidy for SMEs - income for the year 3 176 693 322
- Decrease in Billing to SMEs (Excluding impact of units differential) 3.176.693.322
Increase in receivable from domestic consumers 3,504,574.419
- Increase in receivable from Govt. of Pakistan 3.176.693.322
39 CORRESPONDING FIGURES
39.1 Corresponding figures have been rearranged, reclassified and restated, wherever necessary. However, no significant rearrangement.
reclassification and restatement have been made except:
39.2
39.2.1 determined the fourth quarterly adjustment for the company amounting to Rs. 8,393 million. However, the same is not notified by the Federal Government till the date of issuance of financial statements.
39.2.2 Subsequent to year end June 30, 2020, NEPRA vide its letter No. NEPRA /R/ADG (Trf) TRF-525/GEPCO 46503-05-2019 dated 24 December, 2020 and No. NEPR,VRJADG(Tril1TRF-527/GEPCO-20 19/66505.40510 dated 24 December2020 dolermined supply of power larrtl for FY 2018-19 and 2019-20. However. Ire same is not naIled by the Federal Government till date of issuance of those liruricial statemonls.
0
Reclassified from Reclassified to . Rupees
Professional fees Cost of electricity 38,553,945
Late payment surcharge Cost of electricity 720.812.299
Power purchase price adjustment Tariff Differential Subsidy 2 193.130.565
NTDC advance CPPA-G payables 1.077.636.69
Trade Debts - Private Consumers Accrued Revenue 35.160 285
Non adjusting post balance sheet events
Subsequent to year end June 30, 2020, NEPRA vide its letter No. TRF-100/XWDlSCOs17O97-7099 dated 10 February. 2021
0
'uHdnq a betthr workhig word
GUJRANWALA ELECTRIC POWER COMPANY LIMITED
FINANCIAL STATEMENTS FOR THE YEAR ENDED 30 JUNE 2019
E'( firc 1ds
goE-, 4t flr, ?c,? M. .4cn
.O. 5c L04,
let: +942 37' SIC:11 3734tJ13
c.hr'jI.e. Orr: )33
t
i!drq , be:zr
INDEPEN DENT AUDITOR'S REPORT
To the members of Gujranwala Electric Power Company United
Report on the audit of the financial statements
Opinion
We have audited the annexed financial statements of Gujranwaa Electric Power Company Limited ("the Company") which comprise the statement of financial position as at 30 June 2019 and the statement of profit or loss, the statement of comprehensive income, the statement of changes in equity, the statement of cash flows for the year then ended, and notes to the financial statements, including a summary of significant accounting policies and other explanatory information, and we state that we have obtained all tne information and explanations which, to the best of our knowledge and belief, were necessary for the purposes of the audit.
In our opinion and to the best of our information and according to the explanations given to us, the statement of financial position, the statement of proft or loss, the statement of comprehensive income, the statement of changes in equity and the statement of cash flows together with the notes forming part thereof conform with the accounting and reporting stanaards as applicable in Pakistan and give the information required by the Companies Act, 2017 (XIX of 2017), in the manner so required and respectively give a true and fair view of the state of the Companys affairs as at 30 June 2019 and, its profit, total comprehensive income, the changes in equity ana cash flows for the year then ended.
Basis for Opinion
W conducted our audit in accordance with International Standards on Auditing (ISAs) as applicable in Pakistan. Our responsibilities under those standards are further described in the Auditors' Responsibilities for the Audit of the Financial Statements section of our report. We are independent of the Company in accordance with the International Ethics Standards Board for Accountants' Code of Ethics for Professional Accountants as adopted by the Institute of Chartered Accountants of Pakistan (the Code) and we have fulfilled our other ethical responsibilities in accordance with the Code. We believe that the audit evidence we have obtained is sufficient and appropriate to provide a basis for our opinion.
Emphasis of matter
We draw attention to the contents of the following notes to the financial statements:
a. Note 21.2 of the financial statements which describes the contingencies which are pending for resolution thereof and the management is expecting favorable outcome and hence, no provision for the same has been made in the financial statements;
b. Note 10 of the financial statements which indicates that various subsidies receivable from the Government of Pakistan including Fuel Price Adjustment Subsidy, Power Purchase Price Adjustment Subsidy and Agricultural Subsidy amounting to Ps. 3,394 million, Ps. 2,193 million and Rs. 405.8 million respectively, are long outstanding.
Our opinion is not modified in respect of the above matters.
Information Other than the Financial Statements and Auditors' Report Thereon
Management is responsible for the other information. The other information comprises the information included in the Director's Report, but does not include the financial statements and our auditors' report thereon.
Our opinion on the financial statements does not cover the other information and we do not express an form of assurance or conclusion thereon.
Contd...
3L
0
GEPC'
-: 2 :-
In connection with our audit of the financial statements, our responsibWty is to read the otner information identified above when it becomes available and, in doing so, consider whether the otner information is materially inconsistent with the financial statements or our knowledge obtained in tne audit, or otherwise appears to be materially misstated. If, based on the work we have performed, we conclude that there is a material misstatement of this other information, we are required to report that fact. We have nothing to report in this regard.
Responsibilities of Management and Board of Directors for the Financial Statements
Management is responsible for the preparation and fair presentation of the financial statements in accordance with the accounting and reporting standards as applicable in Pakistan and the requirements of Companies Act, 2017 (XIX of 2017) and for such internal control as management determines is necessary to enable the preparation of financial statements that are free from material misstatement. whether due to fraud or error.
In preparing the financial statements, management is responsible for assessing the Company's ability to continue as a going concern, disclosing, as applicable, matters related to going concern and using the going concern basis of accounting unless management either intends to liquidate the Company or to cease operations, or has no realistic alternative but to do so.
Board of Directors are responsible for overseeing the Company's financial reporting process.
Auditor's Responsibilities for the Audit of the Financial Statements
Our objectives are to obtain reasonable assurance about whether the financial statements as a vfloe are free from material misstatement, whether due to fraud or error, and to issue an auditor's report that includes our opinion. Reasonable assurance is a high level of assurance, but is not a guarantee that an audit conducted in accordance with ISAs as applicable in Pakistan will always detect a material misstatement when it exists.
Misstatements can arise from fraud or error and are considered material if, individually or in the aggregate, they could reasonably be expected to influence the economic decisions of users taken on the basis of these financial statements.
As part of an audit in accordance with lSAs as applicable in Pakistan, we exercise professional judgment and maintain professional skepticism throughout the audit. We also: • Identify and assess the risks of material misstatement of the financial statements, whether due to
fraud or error, design and perform audit procedures responsive to those risks, and obtain audit evidence that is sufficient and appropriate to provide a basis for our opinion. The risk of not detecting a material misstatement resulting from fraud is higher than for one resulting from error, as fraud may involve collUsion, forgery, intentional omissions, misrepresentations, or the osrride of internai control.
• Obtain an understanding of internal control relevant to the audit in order to design audit procedures that are appropriate in the circumstances, but not for the purpose of expressing an opinion on the effectiveness of the Company's internal control.
• Evaluate the appropriateness of accounting policies used and the reasonableness of accounting estimates and related disclosures made by management.
• Conclude on the appropriateness of management's use of the going concern basis of accounting and, based on the audit evidence obtained, whether a material uncertainty exists related to events or conditions that may cast significant doubt on the Company's aoility to continue as a going concern. If we conclude that a material uncertainty exists, we are required to draw attention in our auditor's report to the related disclosures in the financial statements or, if such disclosures are inadequate, to modify our opinion. Our conclusions are based on the audit evidence obtained up to the date of our auditor's report. However, future events or condition •- cause the Company to cease to continue as a going concern.
Contd...P/3
Evaluate the overafl presentation, structure arid content of the financial statements. ncHc:n;
disclosures, and whether the financial statements represent the underlying transactions arc e;0nt5
in a manner that achieves fair presentation.
We communicate with the Board of Directors regarding, among other matters, the planned scope arc timina of the audit and significant audit findings, including any significant deficiencies in internal contr that we identify during our eucit.
Report on Other Legal and Regulatory Requirements
Based on our audit, we further report that in our opinion:
a) proper books of account have been kept y the Company as required c,' rhe Ccm::nr as 2017(XlXof 2017);
the statement of financial position, the statement of profit or loss, toe s:ntement comprehensive income, the statement of changes in equity ann me statement of casc fc,s together with the notes thereon have been drawn up in conformity with the Companies Act,
2017 (XIX of 2017) and are in agreement with the books of account ann returns:
C) investments made, expenditure incurred and guarantees extended during toe year ere for tne
purpose of the Company's business; and
No Zakat was deductible at source under the Zakat ann Ushr Orainance, 198C çXvi, f 198C.
Other Matter
The financial statements of the Company for the year ended 30 June 2018 were auditec by anotnor firm c chartered accountants who expressed a qualified opron on those sttemerns or 0 :.c
2318, with respect to balance receivable from the Government 01 Azad Janmu a:- c
amounting to Rs, 1i,65 million as they were unable to obtain sufficient apc:rop'riate anct tne recovery of tnis receivacle and its expected timeframe and wnetner anj an,usLment
was necessary.
During the current year, the receivables from the Government nfAJK have oeen tne sertlec odd advice of the Government of Pakistan as fully explained in Note 7.2. Hence, we have not qualified our
uOit opinion in the current year.
The engagement partner on the audit resulting in this independent auditors' report is Sa;ad Hussein CL.
E)n
Chartered Accountants Lahore: 21 February 2020
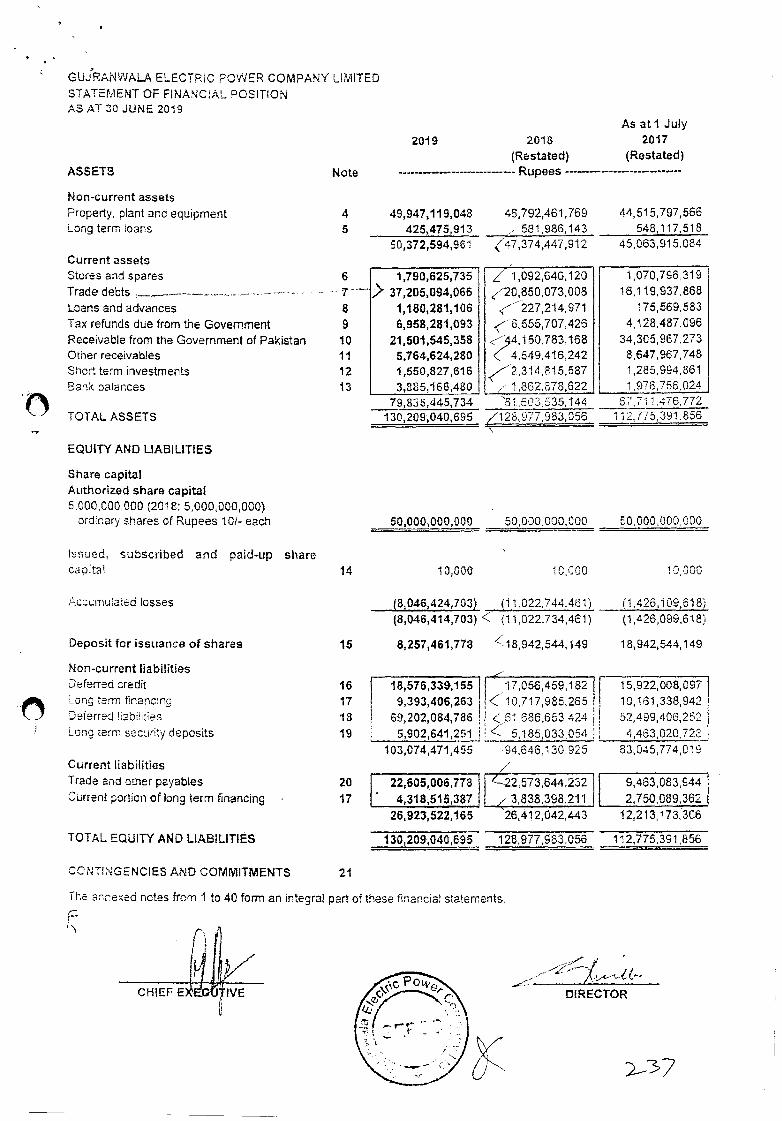
GUJRANWALA ELECTRC POWER COMPANY LIMITED STATEMENT OF FINANCIAL POSITION AS AT 30 JUNE 2019
As atl July 2019 2018 2017
(Restated) (Restated) ASSETS Note Rupees --------
Non-current assets Property, plant and eqthpment 4 49,947,119,048 46,792,461,769 44,515,797,566 Long term oars 5 425,475,913 581,986,143 548117,518
50,372,594,961 (47,374,447,912 45,063,91 5.084 Current assets Stores and spares 6 1,790,625,735 / 1,092,646120 1,070,796,319 Trade debts > 37,205,094,066 < - 20,850,073,008 16,1 19,937,868 Loans and advances 8 1,180,281,106 <227,214971 175, 569583
Tax refunds due from the Government 9 6,958,281,093 < 6,555,707426 4,128,487.096 Receivable from the Government of Pakstan 10 21,501,545,358 <-4, 150.783168 34,305,967,273 Other receivables 11 5,764,624,280 <' 4,549416,242 8,647,967,748 Short term investments 12 1,550,827,616 5,587 <23i4.8l 1,285,994,861 Banx balances 13 3,885,165,480 1862,878,622 1976,756,024
79,8:3 5,445,734 '81.503,535,144 67,711.476,772 TOTAL ASSETS 130,209,040,695 128,977,983,056 112,775,391.856
EQUITY AND UABIL1TIE5
Share capital Authorized share capital 5,000,000,000 (2018: 5,000,000,000)
ordinary shares of Rupees '10/- each 50,000,000,000 50,000,000,000 5U.000,000,000
Issued, subscribed and paid-up share Capital 14 10,306 10,000 10,000
Accumuiated losses (8,046,424,703) (il,Q22,744.46i (1,426,109,618) (8,046,414,703) < (11.022,734,461) (1,426,099,618)
Deposit for issuance ol shares 15 8,257,461,778 <18,942,544,149 18,942,544,149
Non-current liabilities Deferred credit 16 18,576,339155 H7,056,459,182 15,922,008,097 Lang term financng 17 9,393,406,263 K' 10,717,985,265 10,161,338,942 Deferred hbiities 18 69,202,084,786 <61686,653,424 52,499,406,252 Long term security deposits 19 5,902,641 ,251 < 5,185,033,054 4,463,020,728
103,074,471,465 94,646.130,925 83,045774016 Current liabilities /
Trade and other payables 20 22,605006,778 -22 573,644,232 9,463,083.944 Current portion of long term financing 17 4,318,515,387 /3,838,398.211 2,750,089,362
26,923,522,165 26412,042,443 12,213,173.306
TOTAL EQUITY AND LIABILITIES 130,209,040,695 128,977,963,056 112,775,391,856
COTiNGENCIE5 AND COMMITMENTS 21
The annexed rctes from I to 40 form an integral part of these financial statements.
CHIEFE j7 IVE DIRECTOR
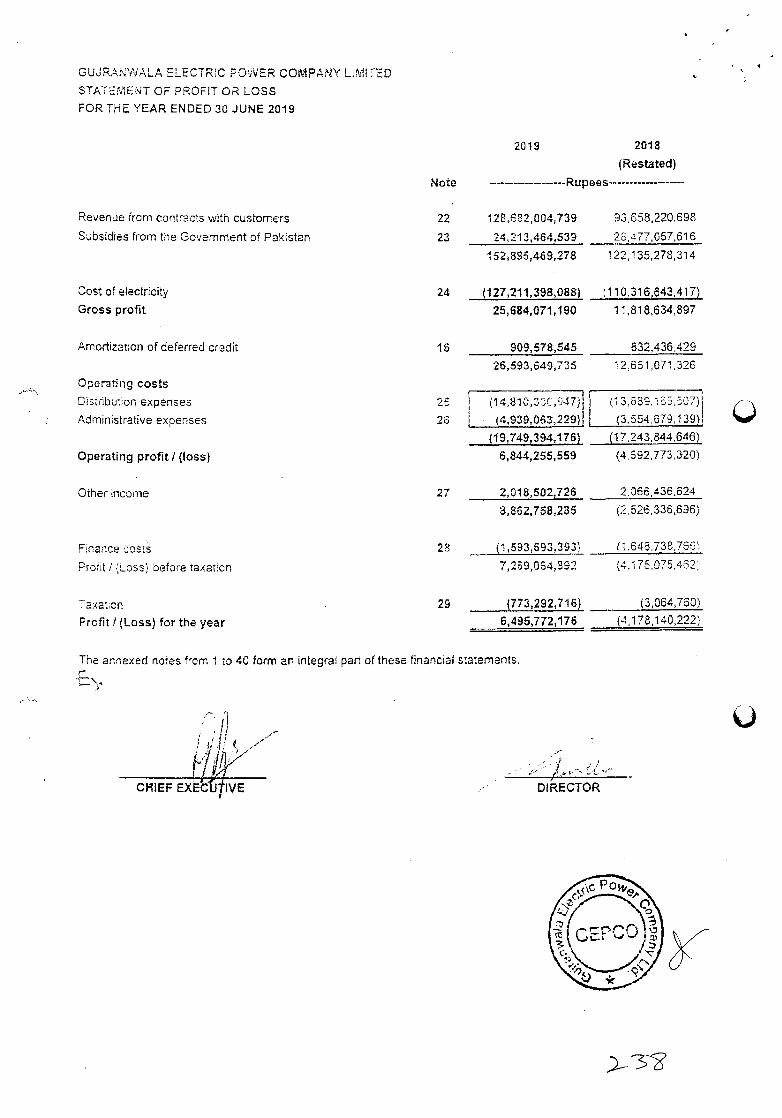
GUJ RAN WALA ELECTRIC POWER COMP,NY LIMITED
STATEMENT OF PROFIT OR LOSS
FOR THE YEAR ENDED 30 JUNE 2019
Note
2019 2018
(Restated)
Rupees..--------
Revenue from contracts with customers 22 121,682,004,739 93,658,220,698
Subsidies from the Government of Pakistan 23 24,213,464,539 26,477,057,618
1523295,469,278 122,135,278314
Cost of electricity 24 (127,211,398,088) (110,316,643,417)
Gross profit 25,684,071,190 11,818,634,897
Amortizaoon of deferred credit 16 909,578,545 332,436,429
26,593,649,735 12651,071,326
Operating costs
Distibuton expenses 1 3,639.1 65, 507
Administrative expenses 26 (4,939,063,229) (3,554,579139),
(19,749,394,176) (17,243,844,646)
Operating profit / (loss) 6,844,255,559 (4.592,773,320)
Other income 27 2,018,502,726 2,066,436.624
3,852,758,285 (2,526,336,696)
Finance costs 23 (1,593,693,393) (1.645.738,765)
Profit 1 Loss) aefore taxation 7,259,064,892 (4.175,075,462:
Taxatcn 29 (773,292,716) (3,064,760)
Profit / (Loss) for the year 6,495,772,176 (4,178,140,222)
The annexed notes from 1 to 40 form an integral part of these financial statements.
DIRECTOR
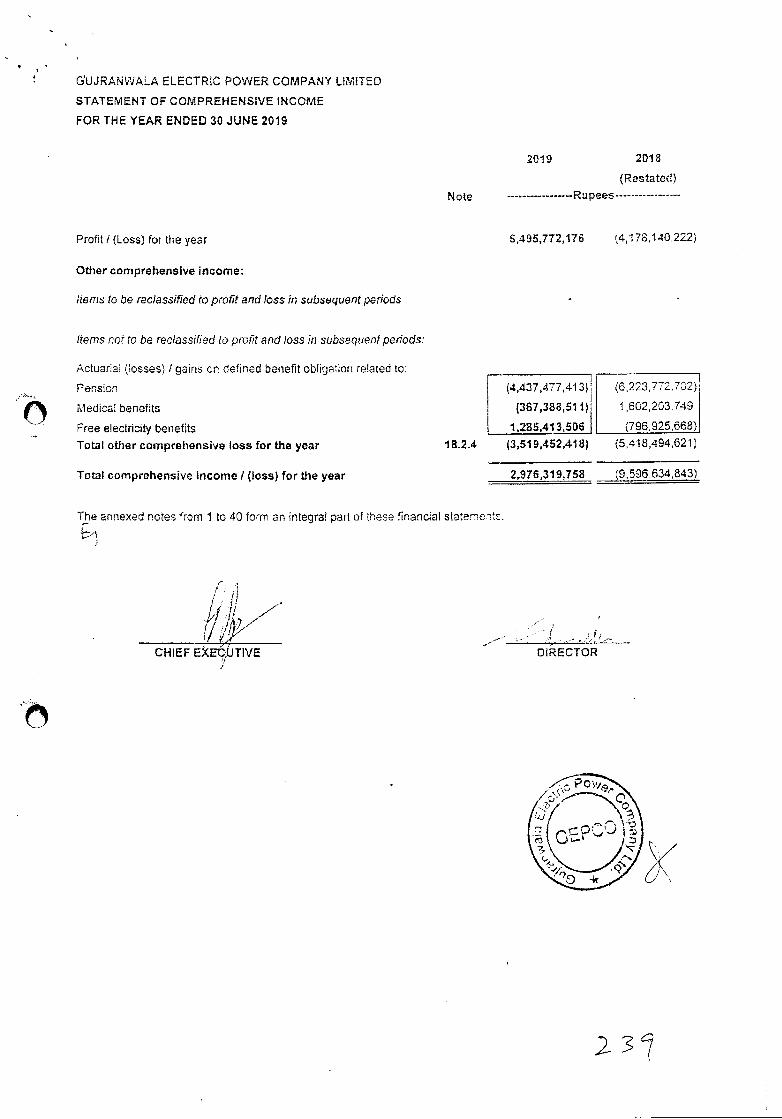
0
G'UJRANWALA ELECTRIC POWER COMPANY LIMITED
STATEMENT OF COMPREHENSIVE iNCOME
FOR THE YEAR ENDED 30 JUNE 2019
2018
(Restated)
Rupees--------
Profit / (Loss) for the year 6,495,772,176 (4,178,'140222)
Other comprehensive income:
ltefns ía be reclassified to profit and loss in subsequent periods
items not to be reclassified to pro flt and loss in subsequent periods:
Actuari (losses) / gains on defined benefit obligation related to:
Pension 4,437,477,413) (6,223,772.702)
Medical benefits (367,383,511) 1 602,203.749
Free electricity benefits '1,285,413,506 (796,925,668)
Total other comprehensive loss for the year 18.2.4 (3,519,452,418) (5,418,494,621)
Total comprehensive income I (loss) for the year 2,976,319,758 (9596,634,843)
The annexed notes from I to 40 form an integral part of these financial statements.
V CHIEF EXEC,UTIVE
DIRECTOR
2019
Note
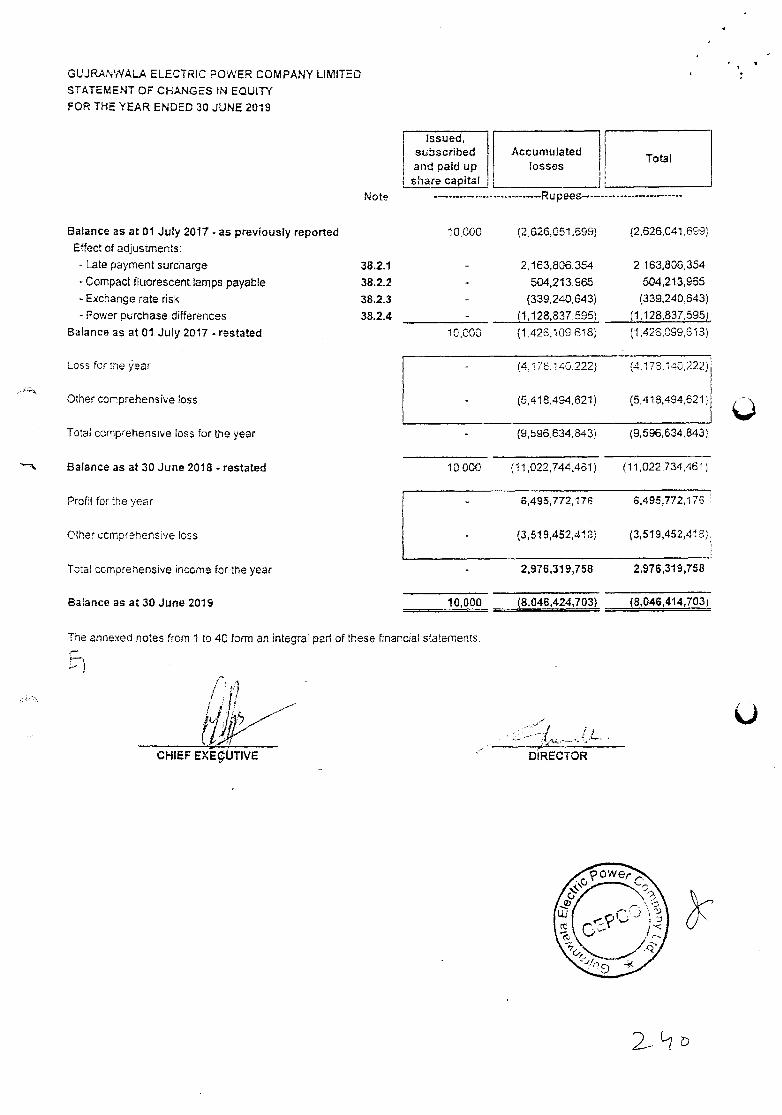
Issued, subscribed and paid up share capital
Accumulated losses
Total
"
GUJRANWALA ELECTRIC POWER COMPANY LIMITED STATEMENT OF CHANGES IN EQUITY
FOR THE YEAR ENDED 30 JUNE 2019
Note -- Rupees----------
Balance as at 01 July 2017 - as previously reported 10000 (2,626,051,599) (2,626,041,699)
Effect of adjustments:
- Late payment surcharge 38.2.1 2,163,806,354 2163,806,354
- Compact fluorescent lamps payable 38.2.2 504,213,965 504,213,965
- Exchange rate risk 38.2.3 (339,240643) (339,240,643)
- Power purchase differences 38.2.4 (1 128,837,695) (1,128,837,595)
Balance as at 01 July 2017 - restated 10,000 (1,426,109618) (1,426,099,613)
uoss for the ear (4.176.140.222) (4.i78.i4C222)
Other comprehensive loss (5,418.494,621) (5,418.494,621)
Total comprehensive toss for the year (9,596,634,843) (9,596,634,843)
Balance as at 30 June 2018 - restated 10.000 (11,022,744,481) (11,022,734,461)
Profit for the year 6,495,772,176 6,498,772,175
Other ccmprebens'ie toss (3,519,452,418) (3,519,452,416)
Total comprenensive inccme for the year 2,976,319,758 2,976,319,758
Balance as at 30 June 2019 10,000 (8,046,424,703) (8,046,414,7031
The annexed notes from 'Ito 40 form an integral part of these financial statements.
1,
CHIEF EXEcUTIVE
DIRECTOR
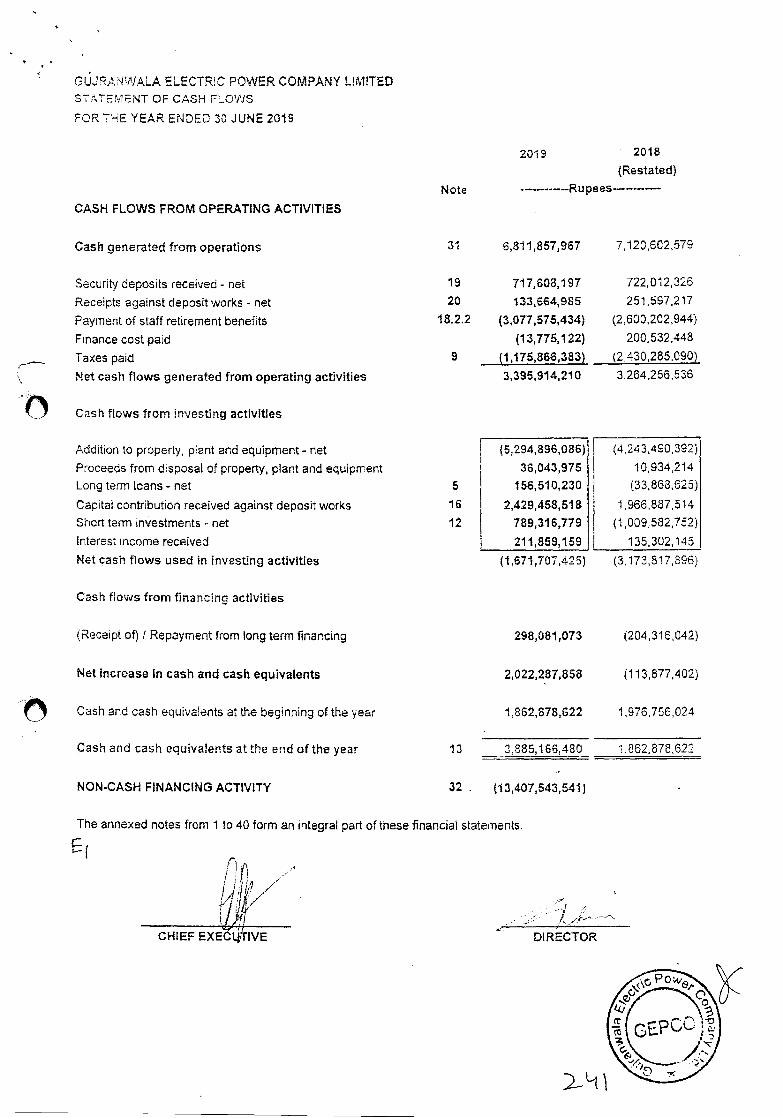
31 8,811,857,967
19 717,608,197
20 133,664,985
18.2.2 (3,077,575,434)
(13,775,122)
9 (1,175,868,383)
3,395,914,210
7 120,602,579
722,012,326
251,597,217
(2.600,202,944)
200,532,448
(2.430,285,090)
3.264,256,536
(5,294,896,086)
36,043,975
156,510,230
2,429,458,518.
789,31 6,779
211,859,159
(4: 243,490,392)
10,934,214
(33,868,625)
1,966,887,514
(1,009,582,752)
135.302,145
5
16
12
(1,671,707,425) (3,173,817,896)
298,081,073 (204,316,042)
2,022,287,858 (113,877,402)
1,862,878,622 1,976,756,024
13 3.885,166,480 1.862,878,622
32 . (13,407,543,541)
GUJR.ANWALA ELECTRlC POWER COMPANY LIMITED
STATEMENT OF CASH FLOWS
FOR THE YEAR ENDED 30 JUNE 2019
2019 2018
(Restated)
Note
CASH FLOWS FROM OPERATING ACTIVITIES
Cash generated from operations
Security deposits received - net
Receipts against deposit works - net
Payment of staff retirement benefits
Finance cost paid
Taxes paid
Net cash flows generated from operating activities
0 Cash flows from investing activities
Addition to property, plant and equipment - net
Proceeds from disposal of property, plant and equipment Long term loans - net
Capital contribution received against deposit works Short term investments .- net
Interest income received
Net cash flows used in investing activities
Cash flows from financing activities
Recept of) I Repayment from long term financing
Net Increase in cash and cash equivalents
Cash and cash equivalents at the beginning of the year
Cash and cash equivalents at the end of the year
NON-CASH FINANCING ACTIVITY
The annexed notes from 1 to 40 form art integral part of these financial statements.
/1•1•\
/, //
CHIEF EXE/rIVE
DIRECTOR
GUJRANWALA ELECTRIC POWER COMPANY LIMITED NOTES TO THE FINANCIAL STATEMENTS
FOR THE YEAR ENDED 30 JUNE 2019
1. THE COMPANY AND ITS OPERATIONS
1.1 Gujranwala Electric Power Company Limited (the Company) is a public limited Company incorporated in Pakistan under the repealed Companies Ordinance, 1984 (now the Companies Act, 2017). The Company was established to take over all properties, rights, assets, obligations and liabilities of Gujranwala Area Electricity Board owned by Water and Power Development Authority (WAPDA), and such other assets and liabilities as agreed. The Company was incorporated on 02 April, 1998 and commenced commercial ooeraocns on 0 Juy, 1998. The pnncipal activity of the Company is the distribution of electricity within defined geographical territory of Gujranwsla. Sialkot, Narowal, Gulrat, Mandi Bahauddin and Haflz Abad. The registered office of The Tonpany is situated a;: 565-A Mcce Tcwn GT Road, Gujranwala.
1.2 The Company took over certain properties, assets, rights, obligations and liabilities relating to distribution of electncity from Pakistan Water and Power Development Authority IWAPDA) under Busness Transfer Agreement (BTA) dated June 29, 1998. The details of assets, liabilities and related matters as provided under clause 1.1 of the BTA were finalized with WAPDA through a Supplementary Business Transfer Agreement (SBTA).
1.3 The Council of Common Interest (CCI) in its meeting held on 12 Septernoer, 1993 approved toe privatization of thermal power generation units (GENCOs) and power distribution companies (DISCOS) in a phaseo program. The Cabinet Committee on Privatization (CCOP) in its meeting held on 1" Fsbruarj, 2009 approved privatization of certain GENCOs and DISCOs, and this decision was ratified by Federal Cabinet in its meeting, heic on 06 January, 2010. President and Prime Minister of Pakistan also approved privatization cf GENCOs and DISCOs includir,g the Company during a presentation given to them by Ministry of Privatizaiicn 22 November, 2010. Decsion of Presdent and Prime Minister has also been subsecuentiy ratified oy The Ocu'ct of Common lr.teres: 1OCi during its meeting held on 28 April, 2011.Based on the approval of Counci: of Common Interest (CCii ann Cabinet Committee on Privatization (CCOP) the privatization of the Company is n process.
2. BASIS OF PREPARATION
2.1 Statement of compliance
These financial statements have been prepared in accordance with the accounting and reporting standards as applicable in Pakistan. The accounting and reporting standards as applicable in Pakistan comprise of:
International Financial Reporting Standards (IFRS Standardst issued by the ntemational Accounting Standards Board (lASB) as notified under the Companies ct. 2Co7: and
Provisions of and directives issued under (the Act).
Where provisions of and directives issued under the Act, aiffer frorr the F.RS Stardarcs, toe provisons of and directives issued under the Act, have been followed.
2.2 Basis of measurement
These financial statements have been prepared under historical cost convention except for certain financial instruments and retirement employee benefits which are carried at present value.
2.3 Functional and presentation currency
The financial statements are prepared in Pak Rupees which is the functional and presentation currencj of tne Company.
2.4 Significant accounting judgments and critical accounting estimates J assumptions
The preparation of financial statements in conformity with the approved accounting standaros requires use of certain critical accounting estimates, It also requires the management to exercise its judgment in the process of applying the Companys accounting policies. Estimates and judgments are continually evaluated and are based on histoncal experience, including expectation of future events that are beeved to be reasonable under the circumstances. The areas where various assumptions and estimates are significant to the Ccmpany's fir:ancial statements or where judgments were exercised in application of accounting olicies are as follcws:
GUJRANWALA ELECTRIC POWER COMPA'( LiMrfEO
2.4.1 Useful lives, residual values and depreciation method of operating fixed assets.
The Company reviews the appropriateness of the rates of depreciation, useful lives and residual values used in the calculation of depreciation on items of property, plant and equipment on a recular basis. Further, where applicable, an estimate of the recoverable amount of assets is made for possible impairment or an annual basis. In making these estimates, the Company uses the technical resources available inside/outside the Company, as appropriate. Any change in these estimates in the future might affect the carryir.g amount of items of property. plant and equipment with a corresponding effect on the depreciation charge, impairment and amortization of deferred credit.
2.4.2 Taxation
The Company takes into account the current income tax law and decisions taker b'j the taxation authorities. Instances where the Company's views differ from the views taken by the income tax dapartment ci the assessrnelt stage and where the Company considers that its view on items of material nature is in accc'rOance witn law, the amounts are shown as contingent liabilities.
Deferred tax assets are recognized for all unused tax losses and credits to the extent that it is prcbable that future taxable profit will be available against which such losses and credits can be utilizecL Significant management judgment is required to determine the amount of deferred tax assets that can be recognized, based upon the likely timing and the level of future taxable profits, together with future tax p1annng strategies.
2.4.3 Provisions
The assessment of provisions inherently involves the exercise of signiftcsr.t udcment as the outcome of me future events cannot be predicted with certainty. The Company, based cn rhe ojauaoilir.j of the crest nformation, estimates the values of contingent assets and liabilities which may differ an the occurrence / non-dc.:urrence cf uncertain future events. Based on the expected outcomes and lawyers' udgrnents, appropriate disciosure or provision is made in the financial statements.
2.4.4 Impairment
The carrying amounts of the Company's nonfinancial assets are reviewed at each reporting date to determine whether there is any indication of impairment. If any such indication exists, me assets recoverable amount is estimated and impairment losses are recognized in the statement of profit or loss. A previously recognized impairment loss is reversed only if there has been a change in the estimates used to aetermine the assets recoverable amount since the last impairment loss was recognized. lf that is the case, the carrying amcuct of the asset is increased to its recoverable amount. The increase cannot exceed me caro/ing amount that wou.d nave been determined, net of depreciation, had no impairment loss been recognized tar the asset in prior years. Such reversal is recognized in statement of profit or loss.
2.4.5 Employee retirement benefits
The main features of the schemes operated by the Company for its employees are as follows:
Defined benefit plans
The Company operates unfunded pension, post retirement free electricits ard medical benefits schemes for all its permanent employees. Provisions are made in accordance witrr the sc:uaflai recommerrdaticr:s. The latest valuation was carried out as at 30 June 2019. The future contributicri reics of these jians rolude allowances (or deficit and surplus. Projected Unit Credit Method with the following signihcarn assumptions is osed for vauCtion of these schemes:
Psnsion Free Free and leave
e1ectr1cty medical encashmerit 2019: benefits benefits benefits Expected rate for discounting liabilities 14.50% 14.50% 14.25%
Expected rate for increase in electricity cost 13.25% Expected rate for increase in medical cost 14.50% Expected increase in pensionable pay 13.50% Pension index rate 8.25%
2018:
GUJRANWALA ELECTRIC POWER COMPANY LIMITED
Expected rate for discounting liabilities 10.00% 1000% 10.00%
Expected rate for increase in electricity cost 9.00%
Expected rate for increase in medical cost 9.00%
Expected increase in pensionable pay 9.00%
Pension index rate 3.75%
Exposure inflation rate 10.00%
Accumulatinq compensated absences
The employees of the Company are entitled to accumulating compensated absences, which are encashable at the time of retirement up to a maximum limit of 365 days. Provisions are made n accordance with The actuarial recommendations. The latest valuation was carried out as at 30 June, 2019.
Other benefits
For General Provident Fund and WAPDA Welfare Fund, the Company makes deduction from salaries of the
employees and remits these amounts to the funds established by WARDA.
3 SUMMARY OF SIGNIFICANT ACCOUNTING POLICIES
The significant accounting policies which have been adopted in the preparation of financial statements of the Company are consistent with previous year except as discussed in Note 3.1 to these financial statements as follows:
3.1 Standards, interpretations and amendments to published approved accounting standards effective during the year
The accounting policies adopted in the preparation of these financial statements are consister.t with those of the previous financial year except as described below:
FRS 15 - Revenue from Contracts with Customers
lFRS 9 - Financial Instruments
lFRlC 22 - Foreign Currency Transactions and Advance Conside-ation
lAS 40 - Transfers of Investment Property (Amendments) IFRS 2 - Classification and Measurement of Share Based Payment Transactions
The adoption of the above amendments, improvements to accounting smnderds and interpretations did not hae any material impact on the financial statements.
3.2 Changes in accounting policies and disclosures
New and amended standards and interpretations
During the year the Company has adopted IFRS 15 "Revenue from Contract with Customers" and IFP.S 9 "Financials Instruments" from 1 July, 2016 except that, Securities and Exchange Commission of Pakistanin its S.R.O 985(1)12019 dated 2 September, 2019 notified that the requirements contained in FRS 9 who respect to application of Expected Credit Losses method shall not be applicable to companies holding finsncia assets due from the Government of Pakistan till 30 June, 2021. Due to the transaction methods chosen by th Company in applying these standards, comparative information throughout these finarcials statements has no been restated to reflect the requirements of the new standards. The details of new significance accounting polices adopted and the nature and effect of the changes to previous accounting policies are sat out below:
3.2.1 IFRS 15 Revenue from Contracts with Customers
IFRS 15 supersedes AS 11 Construction Contracts, lAS 18 Re'ienue and related interoretations and it pIias, with limited exceptions, to all revenue arising from contracts with its customers. FRS 15 estaclishes a five-step model to account for revenue arising from contracts with customers and requires that revenue be ecognizad at an amount that reflects the consideration to which an entity expects to be entitled ir, exchange for transferring goods or services to a customer.
IFRS 15 requires entities to exercise judgement, taking into consideration Ci of the relevant facts and circumstances when applying each step of the model to contracts with their customers. The standard also specifies the accounting for the incremental costs of obtaining a contract and the costs directly related to fulfilling a contract. In addition, the standard requires relevant disclosures.
f)
-o
GUJRANWALA ELECTRtC POWER COMPANY LIMITED
Changes in accounting policies resulting from application of lFRS 15
Revenue Recognition
The Company recognizes revenue from contracts with customers based or: a five step mc.dei as set o.t in IFRS 15:
Step-I Identify contract(s) with a customer: A contract is defined as art agreement between two or more parties that creates enforceable rights and obligations and sets out the criteria for every contract the: must oe met.
Step-2 Identify performance obligations in the contract: A performance obligation is a promise n a contract wth a customer to transfer a good or service to the customer.
Step-3 Determine the transaction price: The transaction price is the amount of consideration to which the Company expects to be entitled in exchange for transferring promised goods or services to a customer, excluding amounts collected on behalf of third parties.
Step Allocate the transaction price to the performance obligations in the contract: For a contract that has more than one performance obligation, the Company allocates the transaction price to each performance obligation in an amount that depicts the amount of consideration to which the Company expects to be entitled in exchange for satisfying each performance obligation.
Step-5 Recognize revenue when (or as) the Company satisfies a performance obligation.
Mentioned below are different revenue streams of the Company and their terms of recognition of revenue after satisfying all the five steps of revenue recognition in accordance with FRS 15.
a) Electricity sale I Tariff differential subsidyl Rental and service income I Fuel price adjustrrien: I Service
Revenue from electricity sales / Tariff differential subsidy I Rental and service income I Fuel price adjustment I Service charges on collection of PTV fee and electricity duty are recognized on the basis of periodic meter readings of electricity supplied to consumers at the rates determined by National Electric Power Regulatory Authority (NEPRA) and subsequently notified by GOP, substantiating the revenue recognition over tne time.
b) Sale of scrap
Revenue from sale of scrap is recognized on dispatch of goods a: a point in time.
C) Amortization of deferred credit
Deferred credit against consumers' contributions is released to statement o nrofit 0r loss over the expectec useful life of the asset underlying the contribution except for separately roeflneote services : which case revenue is recognized upfront upon establishing a connection network.
d) Gain on installation of new connections
Gain or loss on installation of new connections I deposit works is recognized up to 10% variation between receipts against deposit works and actual expenditures incurred on the project.
e) Interest income
Interest income is recognized using effective interest rate method.
Impact of adoption of IFRS 15 on the financial statements
The Company has applied IFRS 15 using the modifled retrospective approach for transition. This approach requires entities to recognize the cumulative effect of initially applying IFRS 15 ax an adjustment to the opening balance of unappropriated profit in the period of initial application. Comparative prior year periods would riot be adjusted...The application of IFRS 15 does not have any significant impact on the revenue recognition of the Company because there is mostly one performance obligation and revenue is recognized at a point in time excpt for the terminologies that are to be used in accordance with lFRS 15 in each contract as mentioned in respective nate to the financial statements and therefore, the cumulative effect of initially applying this standard as an adjustment to the opening balance of accumulated loss in the period of initial application is insignificant.
3.2.2 IFRS 9 Financial Instruments
Changes in accounting policies resulting from application of IFRS 9
Financial instruments: assets
The Company applied IFRS 9 effective from 01 July 2018. All comparative numbers for financial year 2018 were prepared under lAS 39. This is the first year of IFRS 9 adoption and comparatives have not been restated.
GUJRANWALA ELECTJC SOWER COMPANY LIMITED
i) Classification and measurement of financial instruments
!FRS 9 Financial Instruments: Recognition and Measurement outlines the reauirements fcc he recogr:'tion and measurement of financial assets and liabilities and replaces AS 39.
Financial instruments are initially recognized when an entity becomes a party to the contractual rovisicns of the instrument, and are classified into various categories depending upon the tyoe of instrument, which then determines the subsequent measurement of the instrument.
IFRS 9 classification is based on two aspects; the business model within which the asset is held (the business model test) and the contractual cash flows of the asset which meet the solely payments of principal and interest (SPPl') test.
lFRS 9 includes three principal classification categories for financial assets: measured at amortizeo cost, fair value through other comprehensive income (FVTOCi) and fair value through prcfit or loss (FVTL). The Company determines the classification at initial recognition.
Financial assets at amortized cost
A financial asset is measured at amortized cost if it meets both of the following conditions and is not designated as at FVTPL:
- The asset is held within a business model whose objective is to hold assets to collect contractual cash flows; and
The contractual terms of the financial asset give rise on specified dates to casn flows that are solely payments of principal and interest on the principal amount outstanding.
Financial assets at FVTOCI
A debt instrument is measured at F'iTOCI only ft meets bcth of the foi!CA'nO cor.cii,cns and v riot oesiqr;ated as at FVTPL:
The asset is held within a business model whose objective is CcnieveO by both collecting ccrnractua casn flows and selling financial assets; and
- The contractual terms of the financial asset give rise on specified da:es to casn lcws tnat are solely payments of principal and interest on the principal amount outstanding.
On initial recognition of an equity investment that is not held for trading, me Company may irrevocably elect to present subsequent changes in fair value in other comprehensive income. This election a made on an investment by investment basis.
In addition, on initial recognition, the Company may irrevocably desigreta a financiat asset that ctheise meets the requirements to be measured at amortized ccst or at F'TOCl as at P!TL if ocing so etrr:r.aree or significantly reduces an accounting mismatch that wcuid other,ise arise.
The Company does not have any financial asset designate fair value thrcugt, ctner comprehensive inccme.
Financial assets at fair value through profit or loss
A financial asset is mandatorily classified in this category if it is acquired pdncipally mr :e pLroose of seling in the short term, or if it fails the SPPI test. Derivatives are classified as F'tTPL as they do:not meet he SPFI criteria.
A financial asset can be classified in this category by choice if so designated by management at ncepdon. Tnis designation is because the relevant assets and liabilities (inctuoing derivatives) are managed together and internal reporting is evaluated on a fair value basis.
The Company defines fair value asthe price, as at the measurement date, that would be received to sell an asset or paid to transfer a liability in an orderly transaction between market participants.
The Company does not have any financial asset designate fair vaive tnrcugh prot or loss.
ii) Initial recognition
At initial recognitton, an entity shall measure a financial asset at its fair value Pius. :n the case of a financial asset not at fair value through profit or loss, transaction costs that are directly attributable to tne acquisitcn of the financial asset.
iii) Subsequent measurement
Gains and losses arising from changes in the fair value of assets classified as fair value through profit or loss are included in the statement of profit or loss in the period in which they arise.
GUJRANWALA ELECTR!C POWER COMPANY LlM1TED
Gains and losses arising from changes in the fair VCiUC of debt instruments cissiied as fair value through other comprehensive income are recognized as other comprehensive income until the flnancial asset is derecognized or impaired, at which time the cumulative gain or loss previously recognized as other comprehensive income is recognized in the statement of profit or loss. Any premium or discount paid on the purchase of securities held at amortized cost is amortized through the statement of profit or loss using the effective interest rate method.
The fair values of quoted investments in active markets are based on current bid prices. ri other cases, the Company establishes fair value by using appropriate valuation techniques.
Financial assets are derecognized when the rights to receive cash flows from the flnanciai assets have expired or where the Company has either transferred substantially all of :ne risks and rewards of cwnershro or the Company deems that it no longer retains control of the risks and rewards of ownersht.
The Company has no modified financial instruments.
iv) Impairment of financial assets
IFRS 9 replaces the 'incurred loss' model in lAS 39 with an 'expected credit toss model. IFRS 9 requires impairment assessment on all of the following financial instruments that are oct measured a FVTL:
- financial assets that are debt instruments measured at amortized cost 01 F'VTOCl
- lease receivables; and - loan commitments and financial guarantee contracts issued.
Under FRS 9, no impairment loss is recognized on equity investrrents. lERS 9 requrres a toss allowance tc be recognized atan amount equal to either 12-month Expected Credit Loss .'ECL) or lifetime ECLs. L:fetime ECLs are the ECLs that result from all possible default events over the ex3ectred ife of a flrancia; netrirnent, whereas 12-month ECLs are the portion of ECLs that result from defailt avnts that are possible within toe 12 months after the reporting date.
The term 'expected credit loss' does not imply that losses ale anticipated, rather that there is recognition of the potential risk of toss.
The Company has applied the simplified approach to measuring expected credit losses, which uses a lifetime expected loss allowance. To measure the expected credit losses, trade debts have been grouped based or days overdue.
Financial instruments: liabilities
I) Initial recognition and measurement
Financial liabilities are classified, at initial recognition, as financiel tiabilites at fair 'aeii,,e through profit or less, loans and borrowings, payables, or as derivatives designated as hedng irstrLrr.ans art effective heogs, as appropriate.
All financial liabilities are recognized initially at fair value and, in the case of loans and oorrowings and payables,'net of directly attributable transaction costs.
The Company's financial liabilities include trade and other payables, loans and borrowings.
ii) Subsequent measurement
Financial liabilities are subsequently measured at amortized cost.
iii) Derecognition
A financial liability is derecognized when the obligation under the iiadI[tt a oischarged CI cat catac or expires. When an existing financial liability is replaced by another from th& same eider on sibstaçtiaii Jfferentteriiis, or the terms of an existing liability are substantially modified, such an exchange or modification s treated as the derecognition of the original liability and the recognition of a new liability. The difference in the respective carrying amounts is recognized in the statement of profit or loss.
Impacts of adoption of IFRS 9 on the financial statements as on 31 July 2018
On 01 July 2018, the Company's management has assessed which business models apply to the financial assets held by the Company at the date of initial application of IFRS 9. The management has reviewed and assessed the Company's existing financial assets for impairment in accordance with the guidance included in IFRS 9, to determine the credit risk associated with the respective financial assets and has incorporated the same in the financial statements of the Company. Toe management has also concluded that the impact of impairment of these financial assets under IFRS 9 is insignificant for the Company's financial statements of prior year and accordingly no adjustment has been made to the flgures repor.ed in previous year. ir; addItion to this, in the current year, management has assessed and conduced that Impact of ECL is not material for the Company's financial statements. Therefore, the cumulative effect of initially applying this standard as an adjustment to the opening balance of accumulated loss in the pahoo of irdtial apiicati.on is insignificant.
GUJRANWALA ELECTRIC POWER COMPANY LIMITEC
3.3 Property, plant and equipment
a) Initial measurement
All items of operating fixed assets are initially recorded at cost.
Cost includes expenditure that is directly attributable to the acquisition of the asset. The cost of seif-constructed assets includes the cost of materials, direct labor and any other costs directly attributable to bringing the assets to a working condition for their intended use. Mor renewals and improvements are capitalized. Minor replacement, repairs and maintenance are charged to statement of profit or loss.
b) Subsequent measurement
Items of operating fixed assets other than land, buildings and distribution equipment are stated at cost less accumulated depreciation and accumulated impairment losses, (if any).
Land, buildings and distribution equipment are measured at the revalued amount less accumulated depreciation and impairment loss (if any).
C) Depreciation
Depreciation is charged to statement of profit or loss on the straight-line method so as to write off the cost of an asset over its estimated useful life at the rates given in Note 4.1. Depreciation on assets is charged from the month in which an asset is acquired while no depreciation is charged for the month in which the asset is disposed off.
Depreciation provided on construction equipment and vehicles during the period of construction of fixed assets is capitalized as part of the cost of fixed assets.
d) Disposal
An item of property, plant and equipment is derecognized upon disposal cc when no future economic benefits are expected from its use or disposal. Any gain or toss arising on derecagnition of the asset (calculated as the difference between the net disposal proceeds and carrying amo.nr of the asset) is included in the statement of profit or loss account in the year the asset is derecogr.zec.
e) Impairment of assets
The carrying amounts of the Company's assets are reviewed at each reporting date to determine whether there is any indication of impairment. If such indication exists, the recoverable amount of such asset is estimated. An impairment loss is recognized wherever the carrying amount of the asset exceeds its recoverable amount. Impairment losses are recognized in statement of profit or loss. A previously recognized impairment loss is reversed only if there has been a change in tne estimates used to determine the assets recoverable amount since the last impairment loss was recognized.
f) Capital work in progress
Capital work-in-procress is stated at cost on applicable overheads less impairment (if any).
3.4 Stores and spares
Measurement
These are valued at the lower of cost and net realizable value. Cost is determined on a weighted average basis, comprising invoice values and the related charges that have been incurred in bringing the inventories to their present location and cond Won.
Net realizable value represents the estimated selling price in the ordinary course of the business less all estimated costs of completion and estimated costs necessary to be incurred in order to make the sale.
GUJRANWALA ,ELECTR1C POWER COMPAN'( LIMITED
Impairment At each reporting date, stores and spares and loose tools are assessed for mparment. If stores and scares and loose tCOi5 is impaired, the carrying amount is reduced to its selling price ens coats io cCmpiete ann set. The impairment loss is recognized immediately in the distribution costs n the statement of profit or ass.
3.5 Trade debts
Measurement Trade debts are initially measured at their transaction price under IFRS 15 ar.d subsequently measured at
amortized cost less any allowance for expected credit losses (ECL).
3.5.1 AHowance for expected credit losses (ECL)
Allowance for expected credit losses (ECLs) are based on the difference between tne contractual cash flows due in accordance with the contract and all the cash flows that the Company exoects to receive. The shortfall is then discounted at an approximation to the asset's original effective interest rate. For trade and other receivables, the Company has applied the standard's simplified approach and has calculated ECLs based on lifetime expected credit losses. The Company has established a provision matrix that is based on the Company's historical credit loss experience, adjusted for forward-looking factors specific to the debtors and the economic environment. However, in certain cases, the Company may also consider a financial asset to be in default when internal or external information indicates that the Company is unlikely to receive the outstanding contractual amounts in full before taking into account any credit enhancements held by the
3.6 Cash and cash equivalents
Cash and cash equivalents are carried at cost. For the purpose of statemert of nasa flow, nasa and cash equivalents comprise cash in hand, balances with banks in current saG deposit accounts, and short-term highly liquid investments with original maturities of three months or less, and that are reaoily convertbie to known amounts of cash, and subject to an insignificant risk of changes in value.
3.7 Staff retirement benefits
The Company provides unfunded pension, post-retirement medica:, free electricity benefits and compensated absences to all its regular employees. Obligations for these benefits are determined on the basis of an actuarial valuation carried out by using the Projected Unit Credit Memod as requ;rec by AS19,"Empioyee benefits".
Actuarial gains and losses are recognized in the other comprehensive income a the period n wr,ich they occur. Past-service costs are recognized immediately in the statement of profit or ass. The latest actuarial valuation of the plan was carried out as at 30 June, 2019 by Anwar Associate.
The Company also maintains a General Provident Fund and WAPDA Welfare Fund for all ts regular employees. The Company makes deductions from salaries of its employees and remits tnese amounts to the respective funds established by WAPDA.
Other long term benefits The Company's employees are also entitled for accumulated compensated absences, wncn are encashed at the time of retirement up to a maximum limit of 365 days. Provisions are made antuaiiy to cover the oblgaton and are charged to statement of profit or loss currently. Actuarial gains and losses regarding compensated absences are recognized in the year of occurrence.
GUJRANWALA ELECTRIC POWER COMPANY LIMITED
3.8 income tax
Income tax comprises of current tax and deferred tax.
Income tax expense is recognized in the statement of profit or loss exceci to the extent that It relates to items recognized in other comprehensive income or directly in equity (if any. in wticn case the tax amounts are recognized directly in other comprehensive income or equity.
Current tax Current tax is the expected tax payable on the taxable income for the year; calculated Using rates enacted or substantively enacted by the end of the reporting period. The calculation of current tax takes into account tax credit and tax rebates, if any, and is inclusive of any adjustment to income tax payable or recoverable in respect of previous years.
Deferred tax A deferred tax liability is recognized for all temporary differences that are expected to increase taxable profit n the future. Deferred tax assets are recognized for all temporary differences mat ace expecteo to reduce taxable profit in the future, and the canyforward of unusec tax losses.
The amount of deferred tax provided is based on the expected manner of realization or sertlement ci die carrying amount of assets and liabilities using the tax rates enacted at the reporting date.
Judgment and estimates Significant judgment is required in determining the income tax expenses and corresponding provision fcr tax. There are many transactions and calculations for which the ultimate tax determination is uncertain during the ordinary course of business.
Further, the carrying amount of deferred tax assets is reviewed at each reporting cate and is adjusted to reflect the current assessment of future taxable profits. If required carrjing amount of deferred tax asset is reduced to the extent that it is no longer probable that sufficient taxable profits to allow the benefit of part or all of that recognized deferred tax asset to be utilized. Any such reduction shail be reversed to the extent that it becomes probable that sufficient taxable profit will be available.
3.9 Deferred credit
Amounts received from consumers and the Government as contributions towards the cast of extension of the electricity distribution network, and for providing service connections, is deferred ana amortized over the estimated useful lives of related assets. Amortization of deferred credit commences upon completion of related work which is taken to the statement of profit or loss each year cormeoperding to the depreciat:or. crarge of relevant asset for the year.
3.10 Trade and other payabies
Trade payables are obligations under normal short-term credit terms. These are measured at me undiscounted amount of cash to be paid.
3.11 Provisions
Provisions are recognized when the Company has a present obligaticn (legal or constructive) as a result of a past event, it is probable that the Company will be required to settie the cbiigation, en a reliable estirrata oar be made of the amount of the obligation.
The amount recognized as a provision is the best estimate of the consideration required to settle the present obligation at the end of the reporting period, taking into account the rsks and uncertainties surrounding tne obligation.
GUJRANWALA ELECTRIC POWER COMPANY LIMITED
Where the effect of the time value of money is material, the amount exeotea to be required to settle the obligation is recognized at present value using a pre-tax disccuot ste. The unwcing o the disccunt is recognized as finance cost in the statement of profit or loss.
When some or all of the economic benefits required to settle a provision are expected to be recovered from a third party, the receivable is recognized as an asset if it is virtually certain that reimbursement will be received and the amount of the receivable can be measured reliably.
As the actual outflows can differ from estimates made for provisions due to changes in laws, regulatlons, public expectations, technology, prices and conditions, and can take place many years ri the future, the carrying amounts of provisions are reviewed at each reporting date cod adjusted to take account of suon changes. Any adjustments to the amount of previousiy recognizec pooviscn is recognizec 0005 statement of profit or loss unless the provision was originally recognized as par o ccstcf an asset.
3.12 Contingent liabilities
A contingent liability is disclosed when the Company has a possible obligation as a result of past events, whose existence will be confimied only by the occurrence or non-occurrence, of one or more uncertain future events not wholly within the control of the Company; or the Company has a present legal or constructive obligation that arises from past events, but it is not probable that an outflow of resources embodying economic benefits will be required to settle the obligation, or the amount of the obligation cannot be meesurec with
3.13 Borrowing costs
Measurement Loans are measured at amortized cost using the effective interest me:ncd.
Interest Interest expense is recognized on the basis of the effective interest metiod and is included in finance costs. The borrowing cost on qualifying assets is included in the cost of the related assets.
3.14 Foreign currencies
The financial statements are presented in Pak Rupees, which s th..3omp2v's functional currency. Transactions in foreign currency during the year are initially recorded to the functicra: currency at the rete prevailing at the date of transaction.
3.15 Standards, Interpretations and Amendments to Approved Accounting Standards that are not yet
The following standards, amendments and interpretations with respect to the approved accounting stanoaros as applicable in Pakistan would be effective from the dates mentioned below against the respective standard or interpretation:
Standard or Interpretation
IFRS 3 - Definition of a Business (Amendments)
IFRS 3 - Business Combinations: Previously held interests in a joint coeretion
IFRS 4 - Insurance Contracts: Applying IFRS 9 Financial Instruments witn IFRS 4 Insurance Contracts (Amendments)
Effective date annuat periods
beginoirg on or after)
Ci January 2020
0 january2019
01 July 2019
GUJRANWAL& ELECTRIC OWER COMPANY LIMITED
Effective date (annual periods
Standard or Interpretation beginning on or after)
IFRS 9 - Prepayment Features with Negative Compensation (Amendments) 31 July 2019
IFRS 10- Consolidated Financial Statements and AS 28 Investment In Associates and Joint Ventures - Sale or Contribution of Assets between a rvestor end its Associate or Joint Venture (Amendment)
IFRS 11 - Joint Arrangements: Previously held interests in a joint operation
IFRS 16- Leases
AS 1 & lAS 8 - Definition of Material (Amendments)
lAS 12 - Income Taxes: Income tax consequences of payments on financiai instruments classified as equity
lAS 19 - Plan Amendment, Curtailment or Settlement (Amendments
lAS 23 - Borrowing Costs - Borrowing costs eligible for capitalization
lAS 28 - Long-term Interests in Associates and Joint Ventures (Arnerdrnents)
IFRIC 23 - Uncertainty over Income Tax Treatments
Not et finalized
31 January 2319
31 January2019
01 Janary 2020
01 ianJary 2019
31 January2019
01 January2019
.01 January 2019
Cl January 2319
The above standards and amendments are not expected to have any materici impact on the Company's financial statements in the period of initial application.
in addition to the above standards and amendments, improvements to various accounting stancards have also been issued by the IASB in December 2016 and December 2017. Such improvements are generally effective for accounting periods beginning on or after 01 January 2018 and 01 January 2019 respectively. The Company expects that such improvements to the standards do not have any significant impact on the Company's financial statements in the period of initial application.
The International Accounting Standards Board (IASE has aiso issued the revised Concepuai Framewcrk for Financial Reporting (the Conceptual Framework) in March 2313 vhich is effective or annual periods beginning on or after 1 January 2020 for preparers of financial sts:ements who develop accounting oo!iCie3 based on the Conceptual Framework. The revised Conceptual Framework is not a standard, and none of the concepts override those in any standard or any requirements in a standard. The purpose of the Conceptua Framework is to assist IASB in developing standards, to help preparers develop consistent accounting policies if there is no applicable standard in place and to assist all parties to understand and interpret the standards.
Further, the following new standards have been issued by lASB which are yet to be r.ctified by the Securities and Exchange Commission of Pakistan (SECP) forthe purpose of aapiicability in PaKistan:
IASB effective date (Annual periods
Standard bagnning on or after) IFRS 1 - First-time Adoption of International Financial Reporting Stadarc C J.fly 2009 lFRS 14— Regulatory Deferral Accounts 31 january 2016
IFRS 17— Insurance Contracts 01 jer,uary 2021
The Company expects that adoption of above new standards wilt not have any material irnpacm on the Company's financial statements in the period of initial application.
IFRS-16
The Company expects that IFRS-16 will not have any significant impact on the Company's financial statements in the period of initial application.
GUJRANWALA ELECTRtC POWER COMPANY LIMITED
4.3 As explained in Note 1.2 the property and rights in the above assets were transferred to the Company on 01 july 1998 by WAPDA in accordance with the terms and conditions of the Business Transfer Agreement between WAPDA and the Company. However, the transfer of titles of the freehold land, under litigation cieclosed in Note 21.2.3 and 21.2.4, is pending in the name of the Company, in the land revenue records.
4.4 On Ii January 2019, the Govemment of Pakistan through Power Holding (Pvt Limited has arranged Shariah Compliant Islamic Finance Facility through issuance of Sukuk-1 to Meezar; BanK Limited amounting to s. 200000 million, for the period of 10 years to settle the energy sector circular debzs of al distribution companies 3iSCOs). The facility is secured against the land of all DISCOs. Accordingly, the GOP at the dma of agreement hired independent valuer who estimates that the land of the Company estimated worth to Ps 6403 million is aisO included in this. Under this arrangement the Company holds the title of the land as trustee on beneif of Sukk certiflcate holder. The legal documents executed by the Company and the relevant counter parties reveal that the said assets have oeen eased out under ljarah agreement to GOP with an undertaking to resell the assets to the Company at the end of ljarah term. Although the legal documents have contemplated the overall arrangement on the modei of SuKuk ljarah, the management of the Company has exercised its judgement, that the said transaction is a substance, a financing arrangement and therefore has not given rise to any revenue on account of disposal. The management also determined that the Company could not derecognized the assets as the cOnditions to reccgnize revenue on sale of land have not been satisfied. Based on the substance over form and the fact that proceeds of SukuK Bonds had been retained by the PHPL and the repayment of Sukuk and ljarah rentals are the responsibility of the Government Pakistan. Additionally, according to the directives issued by the Government of ?aistan vi6 letter No. PF-05(06)112 dated lii January 2019, the said transaction neither involves any physical :canstar of the nderlying assets nor creams any financial implication for the Company.
4.5 The depreciation charge for the year has been allocated as follows:
2019 2018
Note Rupees Rupees
Distribution expenses 25 i,985,427,713 1,838806,134 Administrative expenses 26 126,729,429 117373634
2,112,157,142 1,956,176,738
4.6 Capital work in progress
Distribution under civil works 37415,493 32,313,418
Works under: - Own funds 4.6.1 3,628,370,462 3,222,448,214 - Deposit works 1,00,682,417 895,541,530
- Asian Development Bank loan 887,092,692 577,243,596
Cost of implementation of Enterprise Resource Planning system 81,499,139 Stores held for capital expenditure 4.6.2 866,111,334 848,522,559
6,401,151,457 5,576,569,307
4.6.1 Breakup of distribution equipment is as follows:
Material 1,946,104,414 1,582,371,281 Overheads 1.435,608,263 1,247,867,898 Contract work 246,557,805 292,209,0:35
3,628,370,482 3.222,448,214
4.6.2 These represent items of stores, spares and loose tools held for capitalization.
4.7 Movement in Capital Work in Progress Balance at the beginning of the year 5,576,869,307 7,573,877,134 Additions during the year 2,621,397,220 2,624,670,512 Transfers to operating fixed assets during the year:
- Building on freehold land 96,346,276 97,583,623 - Distribution equipments 1,703,859,794 .,372,389,914
Less: Expensed out - 157,OC'a, 832 Balance at the end of the year 5,431,151,457 5,576,569,337
4.8 The cost of the assets at year end include fully depreciated assets amountin to Rs. 1,945 million) but are still in use of the Company.
million 2018: P.s. 1,100
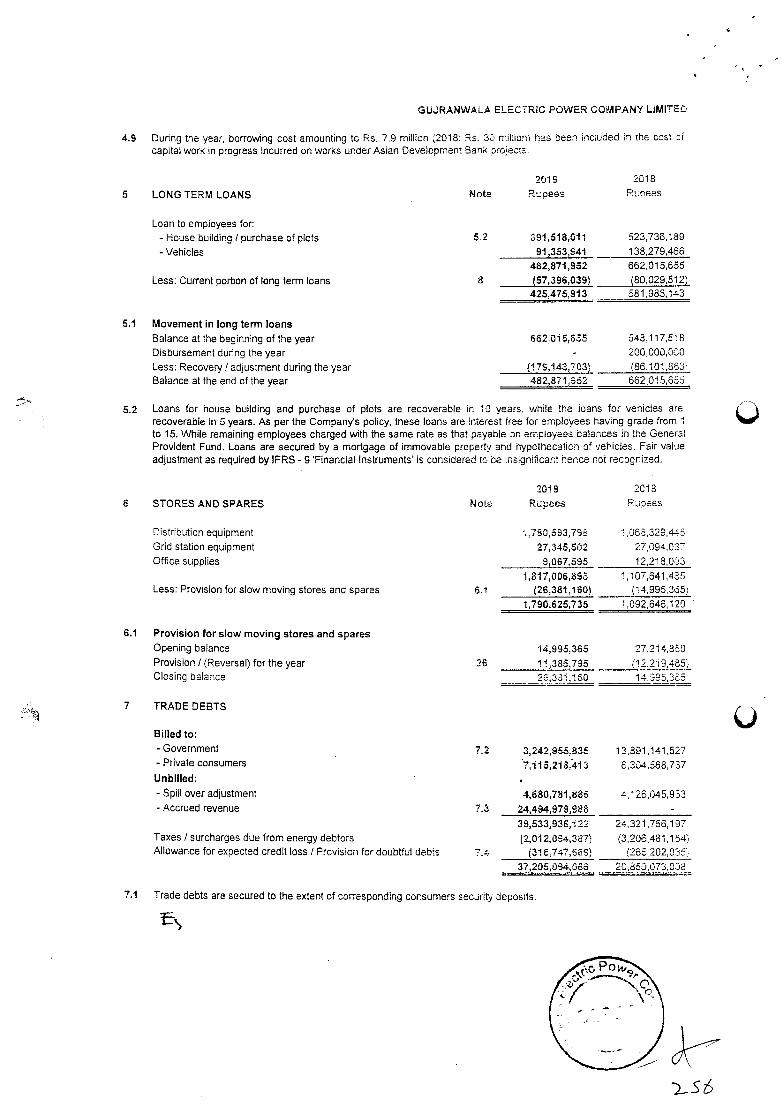
GUJRANWALA ELECTRIC POWER COiIPANY LIMITEC
4.9 During the year, borrowing cost amounting to Rs. 7.9 miHion 2018: Re. 30 mibion) has been inc'uded in the cost oi capital work in progress incurred on works under Asian Develcprnent BanK poects
LONG TERM LOANS
Loan to employees for:
Note 2019
Rupees
2018 Rucees
- House building / purchase of plots 5.2 391,518,011 523,736,189
- Vehicles 91,353,941 138,279,466
482,871,952 662,015,655
Less: Current portion of long term loans 8 (57,396,039) (80,029,512) 425,475,913 581985,143
Movement in long term loans
Balance at the beginning of the year 662,01.5,655 548,117,5' 8
Disbursement during the year 200,000,000
Less: Recovery I adjustment during the year (179,143,703) (86,101863 Balance at the end of the year 482,871962 662,015,655
5.2 Loans for house building and purchase of plots are recoverable in 13 years, while the loans for venicles are recoverable in 5 years. As per the Company's policy, these loans are interest free for employees having grade from 1 to 15. While remaining employees charged with the same rate as that payable on employees balances in the General Provident Fund. Loans are secured by a mortgage of immovable propert'j and hypothecatien of vehicles. Fair value adjustment as required by IFRS - 9 'Financial Instruments' is considered to. be nsignificant hence not recognized.
2019 2018
STORES AND SPARES Note Rutees Rupees
Distribution equipment .780,593,798 366,329,445
Grid station equipment 27,345,502 27,094,037 Office supplies 9,067,585 12,218,033
1,817,006,895 1,107.641,435 Lees: Provision for slow moving stores and spares 6.1 (26,381,160) 14,995,3d5)
1,790,625,735 1,092,646,120
Provision for slow moving stores and spares Opening balance 14,995365 27,214,850 Provision / (Reversal) for the year 26 11,385,795 (12,2i9,485 Closing balance 26,381,160 14,995,355
TRADE DEBTS
Billed to:
- Government 72 3,242,955,835 13,891,141,527 - Private consumers 7,115,218,413 6,304,568,737 Unbilled: - Spill over adjustment 4,680,781,866 4,126,045,933 - Accrued revenue 7.3 24,494,979,988
39,533,936,122 24,321,756,197 Taxes I surcharges due from energy debtors f2,012,094,367) (3,206,481,154' Allowance for expected credit loss I Provision for doubtful debts (316,747,669) (265,202,035;
37,205,094,066 20,853,073,038
7.1 Trade debts are secured to the extent of corresponding consumers security deposits.
5
5.1
6
6.1
7
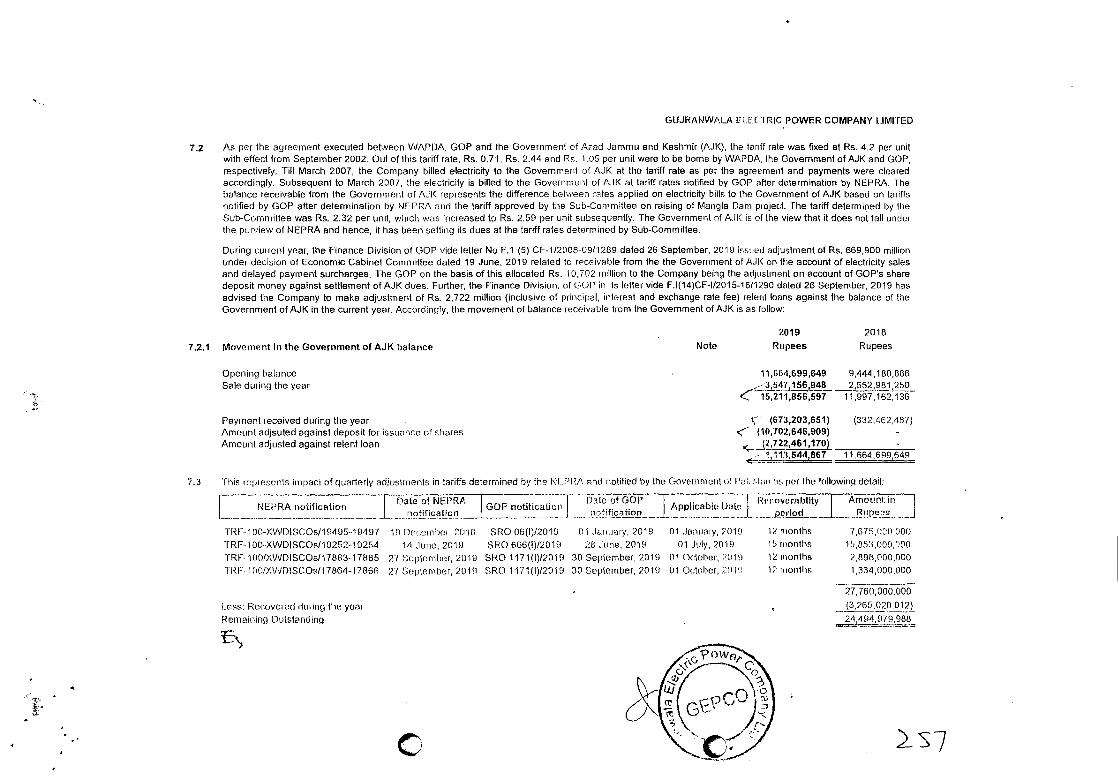
GUJRAf'JWALA ELECTRIC POWER COMPANY IJMITED
7.2 As per the agreement executed between WAPDA, GOP and the Government of Aced Jammu and Kashmir (AJK), the tariff rate was fixed at Re. 4.2 per unit with effect from September 2002. Out of this tariff rate, Rs. 0.71 Rs. 2.44 and Rs. 1.05 per unit were to be borne by WAPDA, the Government of AJl< and GOP, respectively. Till March 2007, the Company biDed electricity to the Government of A,IK at the tariff rate as per the agreement and payments were cleared accordingly. Subsequent to March 2007, the electricity is billed to the Governnienl of AJK at tariff rates notified by GOP after determination by NEPRA. The balance receivable from the Government of AJK represents the difference between rates applied on electricity bills to the Government of AJI< based on tariffs notified by GOP after determination by NEPRA and the tariff approved by the Sub-Committee on raising of Mangla Dam project. The tariff determined by the Sub-Committee was Rs. 2.32 per unit, which was increased to Rs. 2.59 per unit subsequently. The Government nf A.JK is of the view that it does not fall under the pureiew of NEPRA and hence, it has been setting its dues at the tariff rates determined by Sub-Committee.
During current year, the Finance Division of GOP vide letter No F.1 (5) CF-112008-0911239 dated 26 September, 2019 issued adjustment of Rs, 669,900 million under decision of Economic Cabinet Committee dated 19 June, 2019 related to receivable from the the Government of AJK on the account of electricity sales and delayed payment surcharges. The GOP on the basis of this allocated Rs. 10,702 million to the Company being the adjustment on account of GOP's share deposit money against settlement of AJK dues. Further, the Finance Division, of GOP in its letter vide F.l(14)CF-112015-16/1290 dated 26 September, 2019 has advised the Company to make adjustment ot Rs. 2,722 million (inclusive of principal, interest and exchange rate fee) relent loans against the balance of the Government of AJK in the current year. Accordingly, the movement of balance receivable from the Government of AJK is as follow:
7.2.1 Movement in the Government of AJK balance Note 2019
Rupees 2018
Rupees
Opening balance 11,664,699,649 9,444,180,886 Sale during the year -3,547,156,948 2,552,981,250
15,211,856,597 11,997,162,136
Payment received during the year ç (673,203,651) (332,462,487) Amount adjauted against deposit for issuance of shares '( t10J02,646,909) Amount adjusted against relent loan ç (2,722,461,170)
1,11.3,544,867 ,. 11,664,699,649
7.3 This rrpiesonts impact of quarterly adjustments in tariffs determined h' the N[PPJ\ end notified by the Gov&rnment nt PaI,i',lurr as for lh following detail:
-. E1EPRA noefication
r j_
F l:ate of NEPRP. , , .
notrfrcatrori ...
GOP notiticahon L
Date of GOP . . .
riotrfication_, . . 1 Applicable Date
_._. ......... J?erlod
Rro:nverabllty I jRupeee
Amount in
TRr.loo-xv\ID1sCOs/19495..1 94 97 ill Dr'cember , 20111 SRO 06(1)12019 01 January, 2019 01 ,ICOU'rMY, 2(110 1') nronths 7675,1101) 000
TRF1 00XWDISCOs/10252-10254 14 ,luire, 2019 SRO 666(1)12019 28 June, 2019 01 July, 2019 1 6 months 16,853,000,000
TRE 1001XVrJDISCOsI1788317885 27 September, 2019 SF40 1171(1)/2019 30 September, 2011) 01 October, 2013) 12 months 2,8913,000,000
TRF. 100/X\/VDlSCOe/17864-17866 27 September, 2019 SRO 1171(1)/2019 30 September, 2019 01 October, 20 i 12 rrronllrs 1334,000,000
27,760,000,000
1_ess: Recuveruci during the year (3,265,020,012)
Remaining Outstanding 24.'194.979. 98B
C
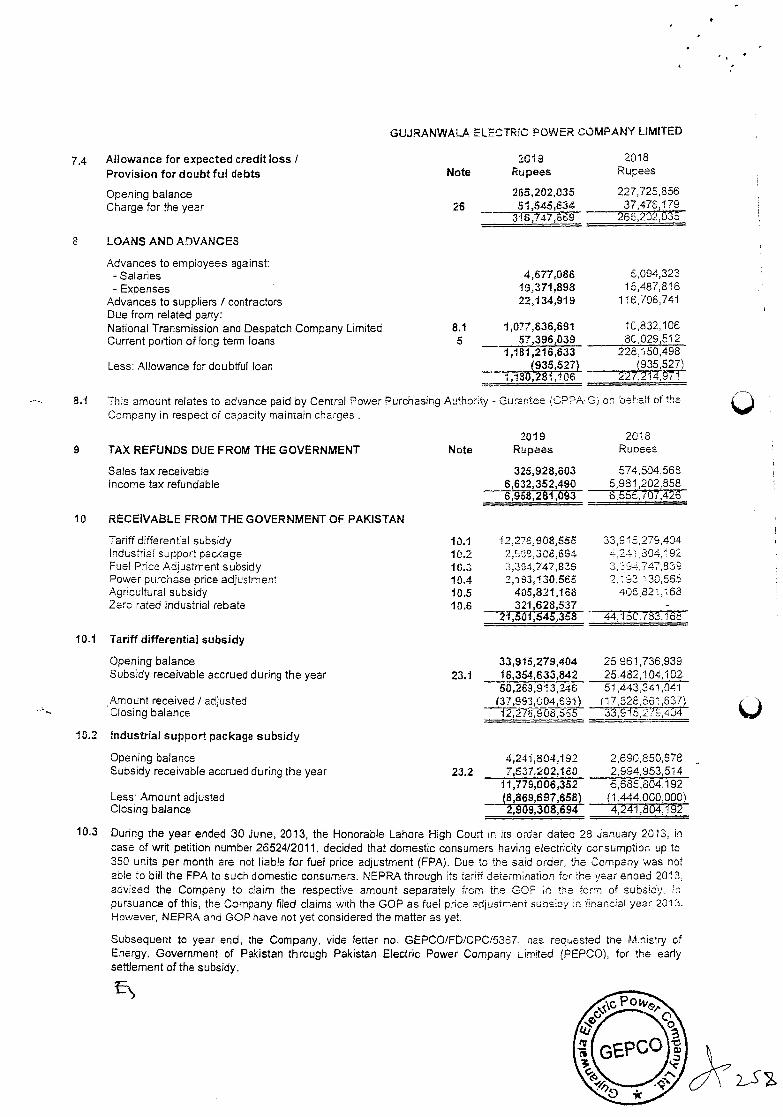
Allowance for expected credit loss / Provision for doubt ful debts
GUJRANWALA ELECTRIC POWER COMPANY LIMITED
2019 2018 Note Rupees Rupees
Opening balance 265,202,035 227725856
Charge for the year 26 51,545,634 37,476, 179 316,747,669 265,202,035
LOANS AND ADVANCES
Advances to employees against: - Salaries 4,677,086 5,094,323 - Expenses 19,371,898 15,487,815
Advances to suppliers I contractors 22,134,919 116,706,741 Due from related party: National Transmission and Despatch Company Limited 8.1 1,077,636,691 10832,106 Current portion of long term loans 5 57,396,039 80029512
1,181,216,633 228150,498 Less: Allowance for doubtful loan (935,527) (935,527)
1,180,281,106 227,2 f4, 97
This amount relates to advance paid by Central Power Purchasing Author Company in respect of capacity maintain charges
- Gurantee (C?2A-G
2019
on behalf of the
2018 TAX REFUNDS DUE FROM THE GOVERNMENT Note Rupees Rupees
Sales tax receivable 325,928,603 574,504568 Income tax refundable 6,632,352,490 5,981202,858
6,958,281,093 8,556,707,426
RECEIVABLE FROM THE GOVERNMENT OF PAKISTAN
Tariff differential subsidy 10.1 2,276,908,555 33.916279,404 industrial support package 10.2 2,936,3C8,694 24:,804192 Fuel Price Adjustment subsidy 10.3 3,354,747,839 3,354747,83E Power purchase phce adjustment 10.4 2,93,130,5€6 2. : 93 130, 565 Acricultural subsidy 10.5 405,821,158 406821,168 Zero rated industrial rebate 10.6 321,626,537
21,501,545,358 44,150,783,165
Tariff differential subsidy
Opening balance 33,915,279,404 25961,736,939 Subsidy receivable accrued during the year 23.1 16,354,633,842 25,482,104,102
50,269,913,246 51443,341,041 Amount received / adjusted L37,993,UO4,63) (17528,581,637 Closing balance 33,615,276,404
Industrial support package subsidy
Opening balance 4,241 804,192 2,690,850,578 Subsidy receivable accrued during the year 23.2 7,637,202,160 2,994,953,514
11,779,006,352 5,685,804,192 Less: Amount adjusted (8,869,697,658) (1444,000,000) Closing balance 2,909,308,694 4,241 ,804,192
10.3 During the year ended 30 June, 2013, the Honorable Lahore High Court in its order dated 23 ,.ianuary 2013, in case of writ petition number 26524/2011, decided that domestic consumers having electricity consumption up to 350 units per month are not liable for fuel price adjustment (FPA). Due to the said order, the Company was not able to bill the FPA to such domestic consumers. NEPRA through its tariff deterrnnation for the year enoed 2013. advised the Company to claim the respective amount separately from the GOP ;n te form of subsid', in pursuance of this, the Company filed claims with the GOP as fuel price adjustment subsidy in financial year 2013. However, NEPRA and GOP have not yet considered the matter as yet.
Subsequent to year end, the Company, vide letter no. GEPCO/FD/CPC/5367, nas requested tne Mnis1y of Energy, Government of Pakistan through Pakistan Electric Power Company Limited (PEPCO), for the early settlement of the subsidy.
74
8
8.1
9
10
10.1
10.2
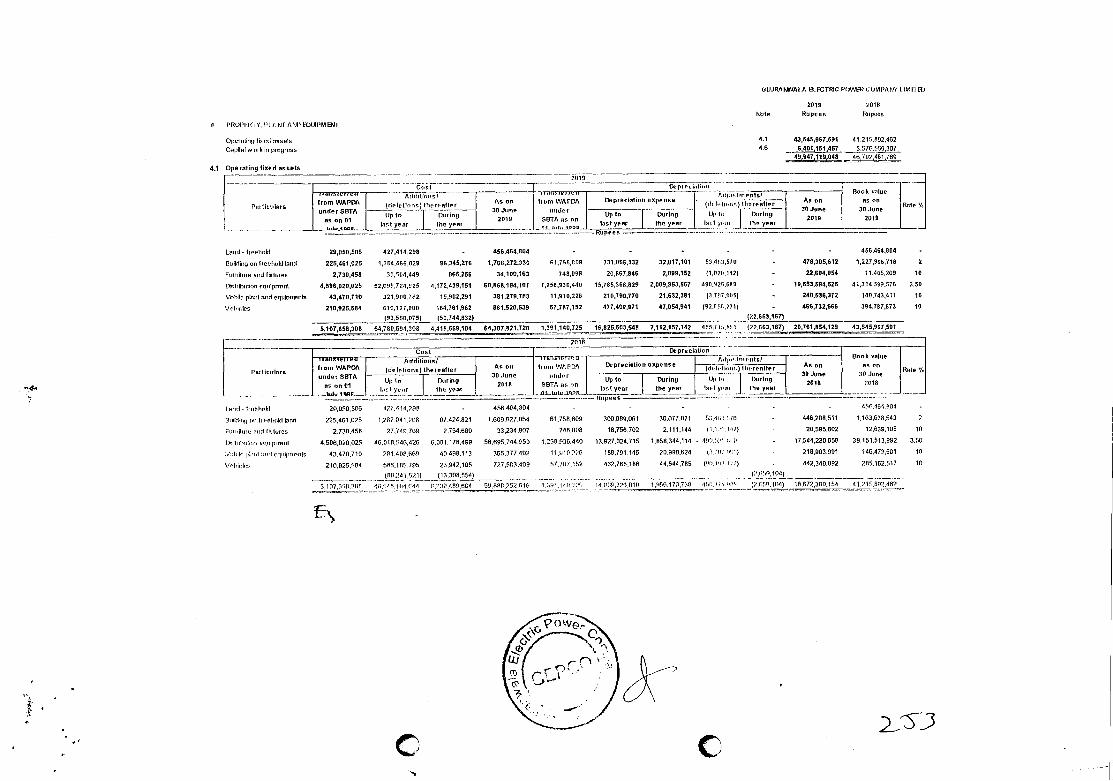
Pal Iiou(nrs from WAPE3A
enderSSTA >> I
.Jte 4500
2018
Puil colors
Cod
from WAPDA
Under SBTA 05 on 01
A Id it ionsi
(deletions) theteatter As en
30 tone
2018
'llaflslrlttlfl'
from 567.705
under
SBTA as an 0iloIoi.655
Up lo During (3,1> 5001 the year
WUJRAPIVALA 1OCT68 C 0(091184 C(IM I'511'1 [(6111 ElI)
II I'RUI'1311l '1, P1/WI AN!> LPM4E
dote
2019
Rupees
2019
TMupees
Operating loon usuoIs 4.1 63,545967,591 41.210.002,462
cai,/aI work in progress 4.6 6401,161,457 5.575,559 307 49,9419,045 453909
4.1 Operatirrg fixed as6e96
2019
Cost Dx precintion Book oulue
30 JUne
2019
Rate '/,
#nl>IitrOr>s I
(detotlonis) ll>er>'aller °>
30June
2019
n'rourreTre.nrj
from WAPDA I u>rdee
OBTA as on
Depredation expense 7 riju.s rn mIst
As on 39 ieee
2015
)rin'l.'I uric) thereafter .1 .
Up to Drnr>ng
(act year,
the year
lip to Dnrlug llj' 1 During
Rupees
Loud - lroelroid 29,555,996 427,414,290 - 456,464,004
tlrrrklirrg orr (,eolrohl land 225,461,025 1,304,466,029 96,345,276 1,706,272,330 61,760,7.59
Frrrrritrne nod t'nlsres 2,130,458 30,004,449 860,206 34,100,163 740,095
Ostrihrrtion eqrripnrnnt 4,596,020,025 52,051r,724,!25 4,172,439,151 8t1,868,184,lO1 1,208,936,440
849,hiin plrnnrl nod e4rnlpn'oois 43,470,710 321,8416,762 10,952,291 301,279,703 11,910,226
VeI,ir1es 215,925,584 610,121,500 184,761,962 861,520,538 57,707,152
(93,500,975) (50,744,8 32)
5,157,858,308 94,780,554,300 4,419,569,104 04,307,921,720 1,391,140,725
456,464,804
331,065,132 30,017,101 63,41,3,070 478,355,512 1,227,966,718
20,567,546 2,099,152 (1,520,142) - 22,694,964 11,455,209 10
19,785,300,829 2,099,353,567 495,926,650 19,003,584,525 41314,509,676 3.50
215,790,770 21,632,381 )3.1117.0116) 240,536,372 140,743,411 15
477,405,871 47,054,941 (92,841,731) 466,132,006 394,757,513 10
(22,663,167)
16,525,503,648 2,112,157,142 455,7 13,.lrnt (22,663,167) 20,761,884,129 43,645,967,591
Lorrni - tronhoki 29,050,556 421.414,279 409.474.504 -
I3rnilrlirrrjrrr Irrelrokl toad 226,481,026 1 .777 .04 1.70 5 77,424.821 1,609,527.064 61.708.508
Fiirrrilrnrri urn 1'o:turos 2 .730,4 58 2_7,745.775 2,754.650 33,234,507 748,095
I)nlrlli,rlii,3,111111i1r1 ,nrrrl 4. 556, 020, 020 46,01 9,546,420 7,051,175,489 56,695,744,750 1,255,730,440
l,/rrinlu i'iriil inn lrlrrilrfl0'flls 43 .4 7 0 .7 00 351,405,669 40,490,113 307,377,49? 11,1r10,77P
\'nIrir Irno 21 0 .920,6 84 596,195 .700 23,912,100 727,653,409 S7Jlr'f,162
(>31(341,521) (13,305,554)
5,107 .63 Ii .3115 41.13)7.1114.144 6.232.459651 57,055,257.016 1.:r51.//u.21'1.
L lad year
lipto
Depeeciotinn nopenne
Do, inn the year
Dx p re e lotion
(It' In, During lout p101 lIne year
(iii' (nI inrnc) tin>' recIter 0r11r,'Jn>,' 0(5>
As en 39 June
2518
Rank oa(ue
30 June 7018
Rate 1'.
Rupees
307,989,041 30.077.071 121 '31.1.16
18,756,702 2,111,144 (1,13 '3' II?)
13,927.024710 1,850,344,114 , 41r13.3[". .311
185.791.146 20,959,524 (3.'lr.
432.769.106 44,644,755 5rr r/
14,11171,)26,910 l,966.177...71n11 .13,1/ 13,1111'
(?,Ii1nIn,104(
(71.59)114) 19,572,390,104 41.2113592,46?
4 61, 4 13.4 , 1/04
446,298,011 1,163.639,543
20,595.502 12.639.105 10
17,544,230,959 39,151,513.992 3.50
218,903.591 345.173.701 17
442,340,892 255,162.517 17
- 2'
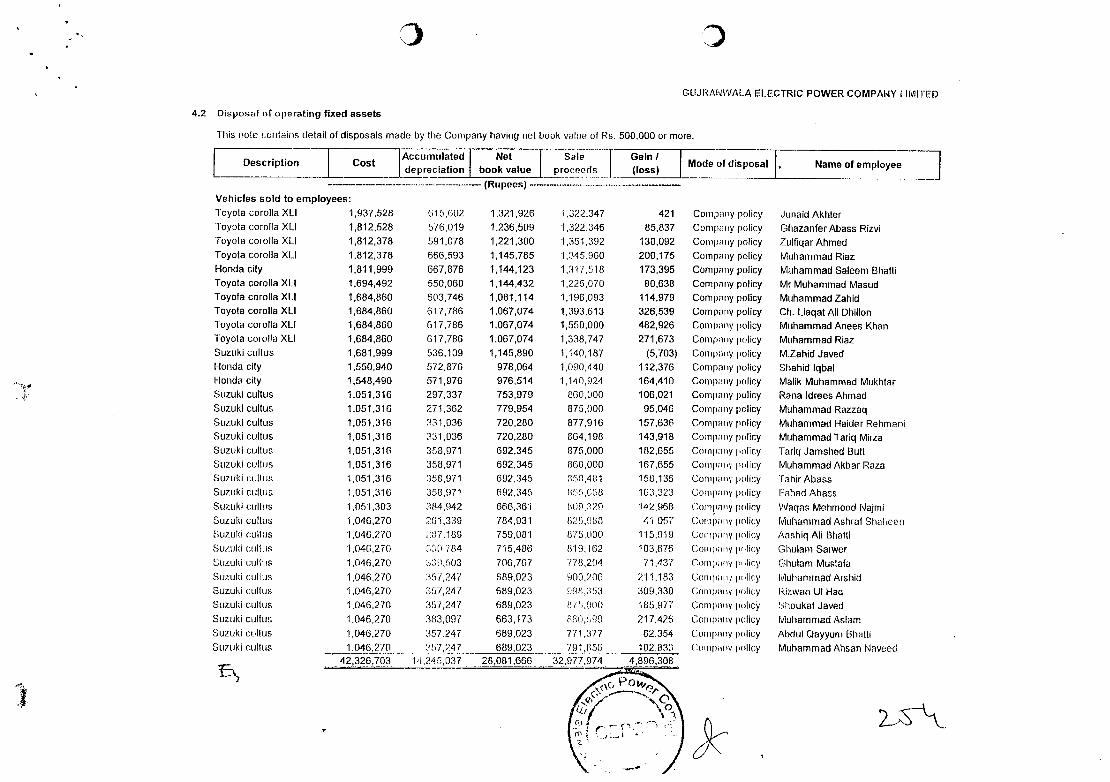
3 , D
GUJRANWAL ELECTRIC POWER COMPAWY LIMITED
4.2 Disposal of operating fixed assets
This note r.orilai,is detail of disposals made by the Company having net book value ol Rs. 500000 or more.
Description Accumulated
Cost Jdepreciation
Net book value
Sale proceeds
Gain / (loss)
Mode of disposal Name of employee
Vehicles sold to employees:
------------------ -(Rupees) -.
Toyota corolla XLI 1,937,528 615,602 1,321,926 1,322,347 421 Company policy Junaid Akhter Toyota corolla XLI 1,812,528 576,019 1,236,509 1,322,346 85,837 Company policy GliazanferAbass Rizvi Toyota corolla XLI 1,812,378 591,078 1,221,300 1,351,392 130,092 Company policy Zulfiqar Ahmed Toyota corolla XLI 1,812,378 666,593 1,145,785 1,34 5, 960 200,175 Company policy Muhammad Riaz Honda city 1,811,999 667,876 1,144,123 1,317,518 173,395 Company policy , Muhammad Saleem Bhalli Toyota corolla XLI 1,694,492 550,060 1,144,432 1,225,070 80,638 Company policy Mr Muhammad Masud Toyota corolla XLI 1,684,860 603,746 1,081,114 1,196,093 114,979 Company policy Muhammad Zahid Toyota corolla XLI 1,684,860 617,786 1,067,074 1,393,613 326,539 Company policy Ch. Liaqat Alt Dhillon Toyota corolla XLI 1,684,860 617,786 1,067,074 1,550,000 482,926 Company policy Muhammad Anees Khan Toyota corolla XLI 1,684,860 617,786 1,067,074 1,338,747 271,673 Company pcicy Muhammad Riaz Suzuki coItus 1,681,999 536,109 1,145,890 1,140,187 (5,703) Company policy M.Zahid Javed Honda city 1,550,940 572,876 978,064 1,090,440 112,376 Company policy Shahid lqbal Honda city 1,548,490 571,976 976,514 1,140,924 164,410 Company pnlcy Malik Muhammad Mukhtar Suzuki cultus 1,051,316 297,337 753,979 060,000 106,021 Company policy Rarra ldrees Ahmad Suzuki cultus 1,051,316 271,362 779,954 075,1)00 95,046 Company policy Muhammad Razzaq Suzuki cultus 1,051,316 331,036 720,280 877,916 157,636 Conipar ry policy Muhammad Hairier Rehmaoi Suzuki cultus 1,051,316 331,036 720,280 864,198 143,918 Company policy Muhammad Tariq Mirza Suzuki coItus 1,051,316 358,971 692,345 875,000 182,655 Company policy Tariq Jamshed Butt Suzuki cullus 1,051,316 358,971 692,345 860,000 167,655 Conrpniy inlicy Muhammad Akbar Raza Suzuki cullus 1,051,316 358,971 692,345 $50,481 158,136 Compay policy 'lahirAbass Suzuki cullus 1,051,316 358,971 692,345 S S 163,323 Comprny policy Fahad Ahass Suzuki cultus 1,051,303 384942 666,361 099,320 142,968 Compauy policy \'Vaqas Mehmood Najmi Suzuki cultus 1,046,270 2.61,339 784,931 825,980 '11,057 Company policy Muhammad Ashraf Shal eon Suzuki cullus 1,046,270 ;$17,189 759,081 875,900 '115,019 Canipa V plIry Aashiq Ati Bhatli Suzuki culhrs 1,046,270 230,184 715,486 (119,162 103,676 Coriiny tiny Chulam Sarwer Suzuki coOns 1,046,270 339,503 706,767 770,204 71,437 Comtnuy p 'licy Ghutam Mustafa Suzuki coItus 1,046,270 357,247 689,023 900,206 211,183 Cur ii i ' I) Icy Muhammad /krshid Suzuki cultus 1,046,270 357,247 689,023 $98,353 309,330 Compary policy kizwan Ut Haq Suzuki coItus 1,046,270 357,247 689,023 1915 ((9) 185,977 Company policy Shoukat Javed Suzuki cultim 1,046,270 383,007 663,173 $80,099 217,426 CorrIprIrry policy Muhammad Aslam Suzuki coItus 1,046,270 357.247 659,023 771,377 62,354 Conpiry policy Abdut Qayyum Bhalti Suzuki coItus 1,046,270 :.ft7,247 689,023 791,856 102,833 Company policy Muhammad Ahsan Naveed
42,326,703 1'-i .24 5,037 26,081,666 32,977,974 4,896,308
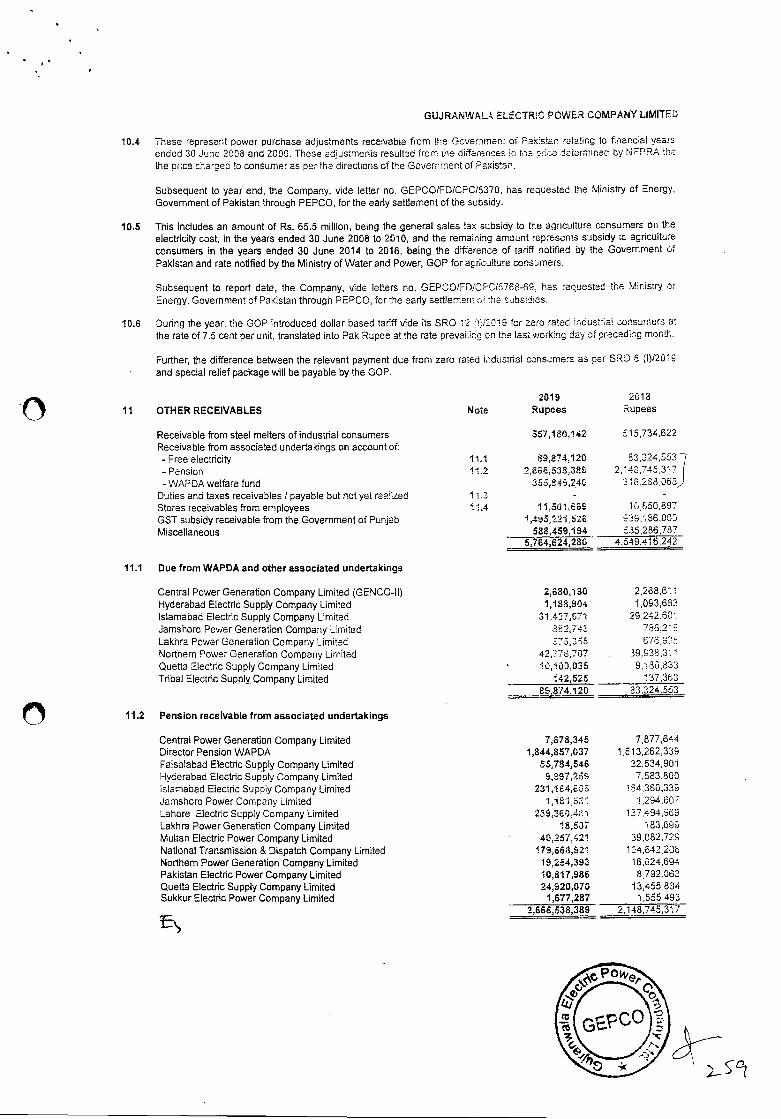
GUJRANWAL& ELECTRtC POWER COMPANY LIMITED
10.4 These represent power purchase adjustments receivable from the Govsmmen: of Pakistan relarg to financial years ended 30 June 2008 and 2009. These adjustments resulted from the differences in me nhce determined by NIEPRA the the price charced to consumer as per the directions of the Government of PaKistan.
Subsequent to year end, the Company, vide letter no. GEPCO/FD/CPC/5370, has requested the Ministry of Energy, Government of Pakistan through PEPCO, for the early settlement of the subsidy.
10.5 This includes an amount of Rs. 65.5 million, being the general sales tax subsidy to the agriculture consumers on the electricity cost, in the years ended 30 June 2008 to 2010, and the remaining amount represents subsidy IC agncultute consumers in the years ended 30 June 2014 to 2016, being the dtfference of tariff notified by the Government of Pakistan and rate notified by the Ministry of Water and Power, GOP for agrcjiture cortsmers.
Subsequent to report date, the Company, vide letters no. GEPCOIFDICF'C15768-69. has recuesmed the Mir.istry of Energy, Government of Pakistan through PEPCD, for the early sett!emerri f the subsidies.
10.6 During the year the GOP introduced dollar based tariff vide its SRO 12 2319 for zero rated ndus:nat consumers at the rate of 7.5 cent per unit, translated into Pak Rupee at the rate prevailing on the last working day of preceding month.
Further, the difference between the relevant payment due from zero rated industrial consumers as per SRO 8 (1)12019 and special relief package will be payable by the GOP.
2019 2018 OTHER RECEIVABLES Note Rupees Rupees
Receivable from steel melters of industrial consumers 567,180,142 815,734,622 Receivable from associated undertakings on account of: - Free electricity 11.1 89,274;120 83,324,5531 - Pension 11.2 2,896,533,329 2,148,745,37 - WAPDA welfare fund 355,849,240 3 I8,238
Duties and taxes receivables / payable but not yet realized 11.3 Stores receivables from employees 11.4 11,301,669 10,850,897 GST subsidy receivable from the Government of Punjab 1,4s3221,526 939,'36,003 Miscellaneous 528,459,194 535,286787
5,764,624,280 4,549416,242
Due from WAPDA and other associated undertakings
Central Power Generation Company Limited (GENCO-ll) 2,680,180 2,288,611 Hyderabad Electric Supply Company Limited 1,188,904 1,093,683 Islamabad Electric Supply Company Limited 31,427,671 29.242,601 Jamshoro Power Generation Company Limited 582,748 786.213 Lakhra Power Generation Company Limited 775,365 676,9.17 Northern Power Generation Company Limited 42,778,707 39.938,3'. Quetta Electric Supply Company Limited 10,100,035 9,t 80,333
Tribal Electric Supply Company Limited 142,526 t37,363 89,374,120 83.324.553
Pension receivable from associated undertakings
Central Power Generation Company Limited 7,678,345 7.877,644 Director Pension WAPDA 1,844,857,037 1,813,262,339 Faisalabad Electric Supply Company Limited 55,784,546 32.534,901 Hyderabad Electric Supply Company Limited 9,297,2139 7583,800 slamabad Electric Supply Company Limited 231,154,635 154,330,339 Jamshoro Power Company Limited 1,181,837 1.294,607 Lahore Electric Supply Company Limited 239,36C 431 137,494,969 Lakhra Power Generation Company Limited 18,507 83,685 Multan Electric Power Company Limited 40,257,421 39,082,729 National Transmission & Dispatch Company Limited 173,863,921 134,642,208 Northern Power Generation Company Limited 19,254,393 16,624,694 Pakistan Electric Power Company Limited 10,817,986 8792,363 Quetta Electric Supply Company Limited 24,920,070 13,455,834 Sukkur Electric Power Company Limited 1,677,287 1,555,493
2,666,538,389 2,148,745,317
11
11.2
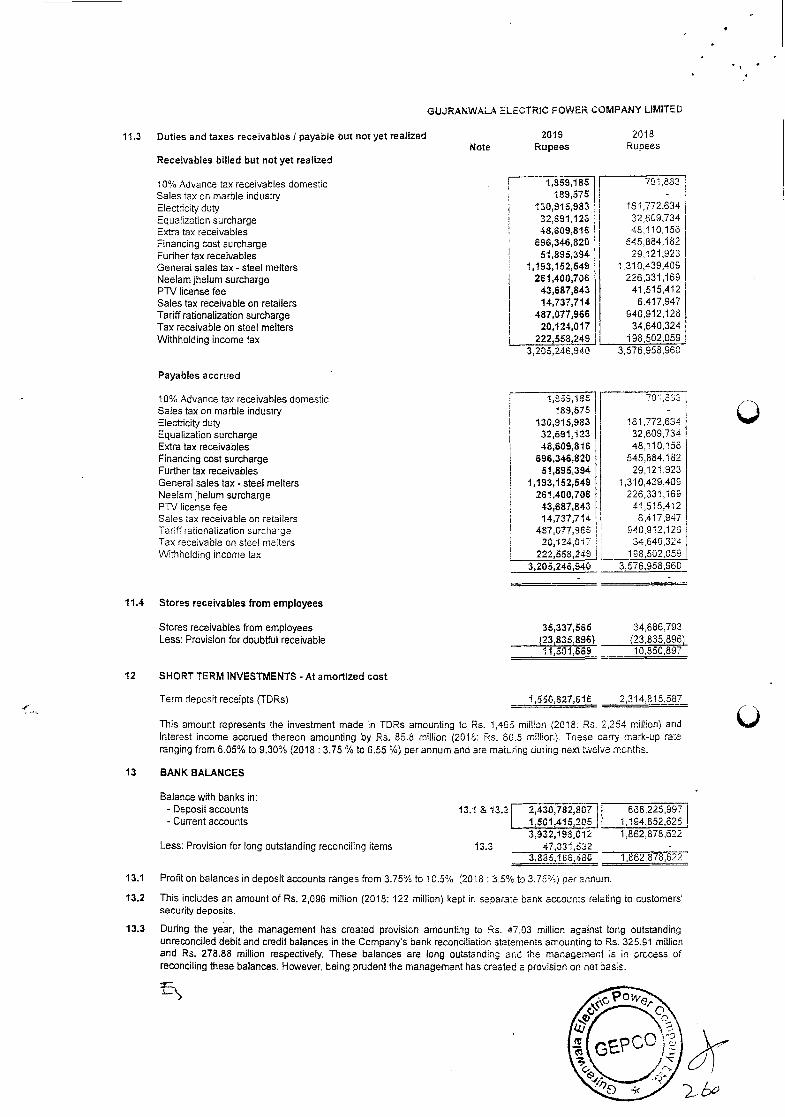
GUJRANWALA ELECTRIC
Duties and taxes receivables) payable but not yet realized Note
Receivables billed but not yet realized
10% Advance tax receivables domestic Sales tax on marble industry Electricity duty Equalization surcharge Extra tax receivables Financing cost surcharge Further tax receivables
POWER COMPANY LIMiTED
2019 2018 Rupees Rupees
1,859,185 189,575
130,915,983 32,691,123 48,609,816
696,346,820 51,895,394
731,883 -
181772,634 32,609,734 48,110,156
545,884,162 29,121,923
General sales tax - steel melters 1,193,152,549 1 310,439,409 Neelam jhelum surcharge 281,400,706 226,331,169 PTV license fee 43,687,843 41,515,412 Sales tax receivable on retailers 14,737,714 6.417,947 Tariff rationalization surcharge 487,077,966 940,912,128 Tax receivable on steel melters 20,124,017 34,640,324 Withholding income tax 222,553,249 198,502,059
3,205,246,940 3,576,958,960
Payables accrued
10% Advance tax receivables domestic 1,355,185 '3l .8i3 Sales tax on marble industry 189,575 Electricity duty 130,915,983 161,772,634 Equalization surcharge 32,691,123 32,609,734 Extra tax receivables 48,609,815 48,'.10,156 Financing cost surcharge 596,346,820 545,884,182 Further tax receivables 51,895,394 29,121,923 General sales tax - steel melters 1,193,152,549 1,310,439409 Neelam jhelum surcharge 261,400,706 226,331,169 PTV license fee 43,687,843 41,516,412 Sales tax receivable on retailers 14,737,714 6,417,947 Tariff rationalization surcharge 487,077,966 940912,123 Tax receivable on steel mailers 20,124,017 34,640,324 Withholding income tax 222,558,249 138,502,059
3,205,246,940 3,576,958,960
Stores receivables from employees
Stores receivables from employees 35,337,565 34.686,793 Less: Provision for doubtful receivable (23,835,896) (23,835,896)
11,501,669 10,850,897
SHORT TERM INVESTMENTS - At amortized cost
Term deposit receipts (TDRs) 1,550,827,616 2,314,615,587
This amount represents the investment made in TDRs amounting to Ps. 1,465 million (2018: Rs. 2,254 million) arid interest income accrued thereon amounting by Rs. 85.8 million (2013: Ps. 60.5 mi!lior). These carry mark-up ra:e ranging from 6.05% to 9.30% (2018 : 3.75 % to 6.55 %) per annum and are matLhng during next lelve months.
13 BANK BALANCES
Balance with banks in: - Deposit accounts 13.1 & 13.31 2,430,782,807 668,225,997 - Current accounts 1,501,415,205 I 1,194,652,625
3,932,198,012 1,862,878,622 Less: Provision for long outstanding reconciling items 13.3 47,031,532 -
3,335,166,480 1,862:878,622
13.1 Profit on balances in deposit accounts ranges from 3.75% to 10.5% (2018 : 3.5/c to 3.75%) per annum.
13.2 This includes an amount of Rs. 2,096 million (2018: 122 million) kept ir. separate bank accounts relating tc customers' security deposits.
13.3 During the year, the management has created provision amounting to Ps. 47.03 million against long outstanding unreconciled debit and credit balances in the Company's bank reconciliation statements amounting to Rs. 325.91 million and Ps. 278.88 million respectively. These balances are long outstanding ar.d the management is in process of reconciling these balances. However, being prudent the management has created a provision on net oasiS.
11.3
11.4
12
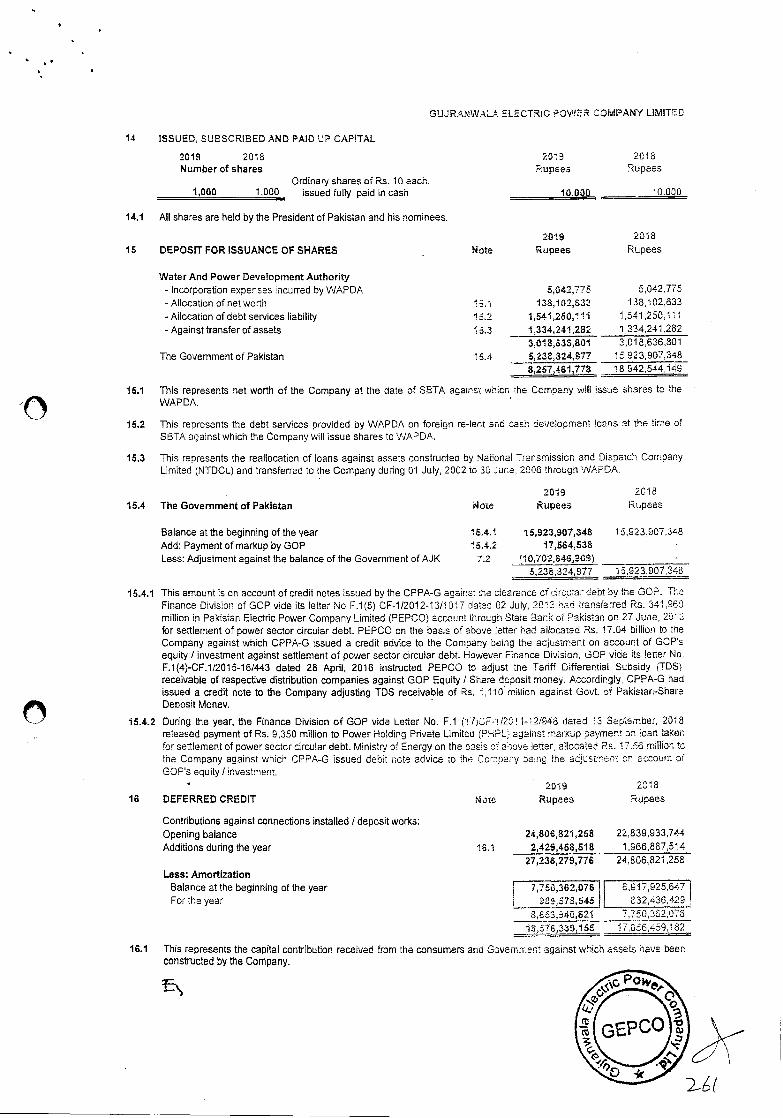
GUJ RAN WALk ELECTRIC CWER COMPANY LIMITED
14 ISSUED, SUBSCRIBED AND PAID UP CAPITAL
2019 2018 201 2018 Number of shares Rupees Rupees
Ordinary shares of Rs. 10 each, 1,000 1,000 issued fully paid in cash 10000 10.000
14.1 All shares are held by the President of Pakistan and his nominees.
2019 2018 15 DEPOSIT FOR ISSUANCE OF SHARES Note Rupees Rupees
Water And Power Development Authority - Incorporation expenses incurred by WAPDA 5,042,778 5,042,775 -Allocation of net worth 15.1 138,102,632 138,102,633
- Allocation of debt seMces liability 15.2 1,541,250,111 1,541,250,111
- Against transfer of assets I 5.3 1.334,241,282 1334,241,282 3,018,633,801 3,01 8.636,801
The Government of Pakistan '15.4 5,238,324,977 15,923,907,348 8,257,461,778 18,942,544,149
15.1 This represents net worth of the Company at the date of SETA aganstwh cn the Company will issve shares to the WAPDA.
15.2 This represents the debt seiices provided by WAPDA on foreign re-lent and cash development loans at the time of SBTA against which the Company will issue shares to WAPDA.
15.3 This represents the reallocation of loans against assets constwctec by National Transrnissicn and Dispatch Company Limited (NTDCL) and transferred to the Company during 01 July, 2002 to 30 June, 2306 through WAPDA
2019 2018
The Government of Pakistan i'IOLC Rupees Rupees
Balance at the beginning of the year 15.4.1 15,923,907,343 15,523.907,348 Add: Payment of markup by GOP 15,4.2 17,564,538 Less: Adjustment against the balance of the Government of AJK 7.2 fio,702,646,909)
5,238,324,977 15,923,907,348
15.4.1 This amount is on account of credit notes issued by the CPPA-G against the clearance cf circular debt by the GOP. The Finance Division of GOP vide its letter No F.1(5) CF-l/2012-13/1017 dated 02 July, 2019 cod transferred Rs. 341,960 million in Pakistan Electric Power Company Limited (PEFCO) account through State Bank of Pakistan on 27 June, 2Q10 for settlement of power sector circular debt. PEPCO on the basis of above etter had allocated Rs. 17.04 billion to the Company against which CPPA-G issued a credit advice to the Company being the aojustment on account of GOP's equity I investment against settlement of power sector circular debt. However Finance Division, GOP vioe its letter No. F.1(4)-CF.112015-161443 dated 28 April, 2016 instructed PEPCO to adjust the Tariff Differential Subsidy (TDS) receivable of respective distribution companies against GOP Equity I Share deposit money. Accordingly, CPPA-G had issued a credit note to the Company adjusting TDS receivable of Ra. 1,110 million against Govt. of Pakistan-Share Deposit Money. -
15.4.2 During the year, the Finance Division of GOP vide Letter No. F.l 7)CF-11201 1-12/948 dated 13 September, 2018 released payment of Rs. 9,350 million to Power Holding Private Limitec (PPL. against markup ayment on loan taken for settlement of power sector circular debt. Ministry of Energy on the oasis of anove letter, allocated Re. 17.56 rnIlion to the Company against which CPPA-G issued debit r,cte advice to the Company ococ the adjustment on account of GOP's equity I investment.
16
16.1 This represents the capital contribution received from the consumers and Government against which assets have been constructed by the Company.
15.4
2019 2318 DEFERRED CREDIT Nose Rupees Rupees
Contributions against connections installed I deposit works: Opening balance 24,806,821,258 22,839,933,744
Additions during the year 16.1 2,429,458,518 1,966,887,514 27,236,279,776 24,806,821,258
Less: Amortization Balance at the beginning of the year 7,750,362,076 6,517,925,647 For the year 909,573,545 232,436,429
8,255,940,621 7,750,362,073 18,576,339,155 17,056.459,182
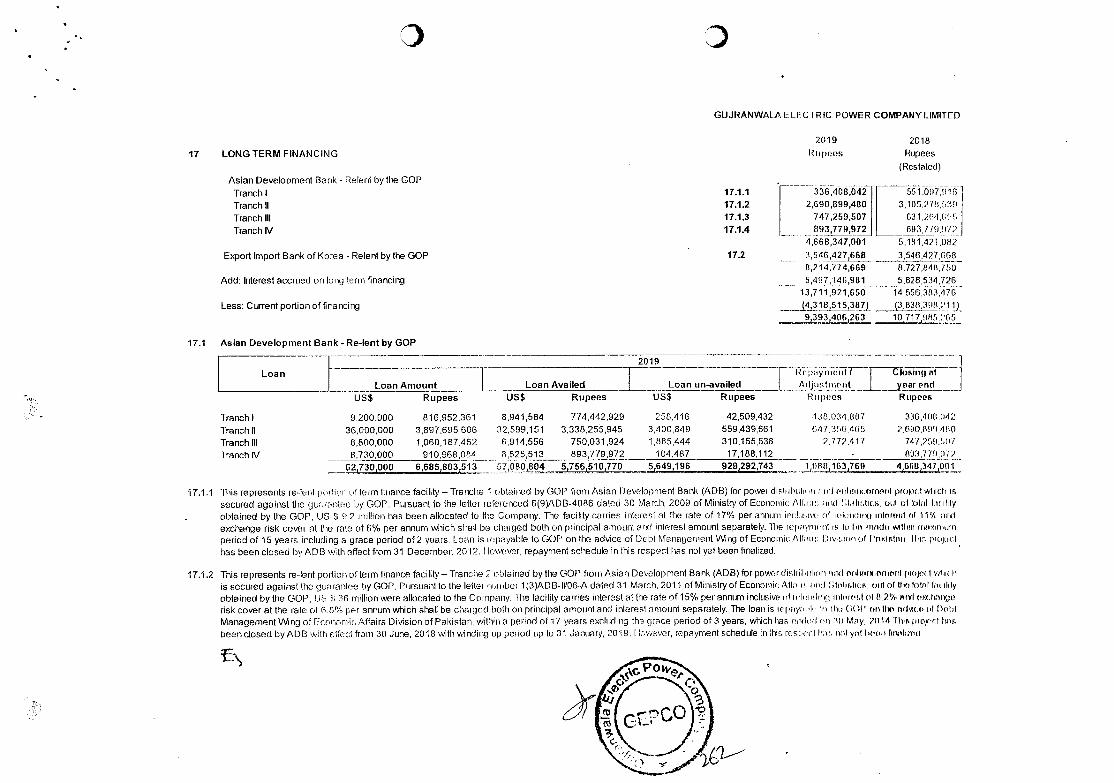
17 LONG TERM FINANCING
Asian Development Bank - Relent by the GOP
GUJRANWAIA ELECTRIC POWER COMPANY LIMITED
2019 2018 Rupees Rupees
(Restated)
Tranch I 17.1.1 336,408,042 551,097,916
Tranch II 17.1.2 2,690,699,480 3,105,278 ,s:o
Tranch III 17.1.3 747,259,507 63 1,2 154 .1, 1,3
Tranch FV 17.1.4 893,779,972 893,779,1372
4,668,347,001 5,181,421082
Export Import Bank of Korea - Relent by the GOP 17.2 3,546,42 3,546,427,668 6,214.774,669 8,727,841)750
Add: Interest accrued on long term financing 5,497,146,961 5,828,534,726 13,711,921,650 14,556,383,476
Less: Current portion of financing (4,318 ,515,387)_ (3.838,398,21 a
2. 93,406,263 10,717,985.265
17.1 Asian Development Bank - Re-lent by GOP
Loan 2019
C1Tat year end Loan Amount Loan Availed Loan un-availed
Pr ey atoll
Adjtistttit'rit
US$ Rupees US$ Rupees US$ Rupees Rupees Rupees
Tranchf 9,200,DOO 816,952,361 8,941,584 774,442,929 258,416 42,509,432 433,0341187 336,41)1)042
Tranch II 36,000,000 3,897.695,606 32,599,151 3,338,255,945 3,400,849 559,439,661 547,356,465 2690,1)91)481)
Tranch lit 8,800,000 1,060,187,462 6,914,556 750,031,924 1,885,444 310,155,538 2.772,41 74 .1,2511.51)1
Tranch W 8,730,000 910,968,08'l 8,625,513 893,779,972 104,487 17,188,112 893,779,1)72
6230 000 6 685 80313 5780,804 5,75,510770 ,L649'196 92992,743 1,t)l18163769 416661347,001
'17.1.1 Ihis represents re-lent pl'l'liu'l'i ri lei mn lii ance facility — Tranche 1 obtained by GOP from Asian Development Bank (ADB) for power dlviii '1)9,0 taut ('iltcIrcornIt protect wiucli is secured against the guu.mi'11013 by GOP. Pursuant to the loller releenced 6(9)ADB-4086 dated 3D March, 2009 01 Ministry of Economic Alitu:, tial Otiliutiert, oul ot lolt/ lit lily obtained by the GOP, U53 ; 9.2 mIlton has boon allocated to the Company. The facility carries intermit at Ihe ate of 17% per annum inulijuiw of iokiittç ntrwost ol 11'S rid exchange risk cover at the role o16% per annum which shall be charged both on principal amount l'i1 inbred amount separately. The letiiyml')ll iS Ic' lie 1011 Vll,iil ruluirliumn period of 15 years including a grace period of 2 years. l_oan is iepayable to GOP on the advice ci Duhi Muunaei'irent V\4ng of Economic Alb;,iic Divicmo of l'rrkuttno tin. has been closed by ADB with crftect from 31 December, 2012. I'lovvnver, repayment schedule in this rovpCct has not yet been finalized.
17.1.2 This represents re-lent portion of temi finance facility— Tranolse 2 nblairwd bythe GOP from Asian Development Bank (ADB) forpowerdir;lril'ubion iril Or4UIIS;Cfl)CI)t Put') I vita 9 is secured against Ihe guaranlee by GOP. Pursuant to the letlei ourriber 1(3)ADB-11106-A dated 31 Mmcli, 2011 of Ministry of Economir. Atiniiu nod titlatus, oul ol 11w total I,',, Sly obtained by the GOP, JO Ii; 36 million were allocated to lhe Company. The facility carries interest at the rate of 15% per annum inclusive of r,'li'c'lioct eili'rr'r.t of ft 2/ arI oxr.tsruge risk cover at the rate 01 6.835 pie annum which shall be chalged both on principal amount and inlerest omount separately. The loan is °l'°Y'1'1' Iii fur 1)01' ii 11W' II(1'MII of l)otd Management Wing of Economic Atfairs Division of Pakistan, wIthin a period of 1'! years excluding the grace period of 3 years, wfrich has nooi'd ri tim May. 2014 ituspiojort fart been closed byADB with effect from 30 June, 2018 with winding up poniod up to 1 January, 2019. I however, repayment schedule in Ihie resp'cl ru. ccl ynt loon frsl,md
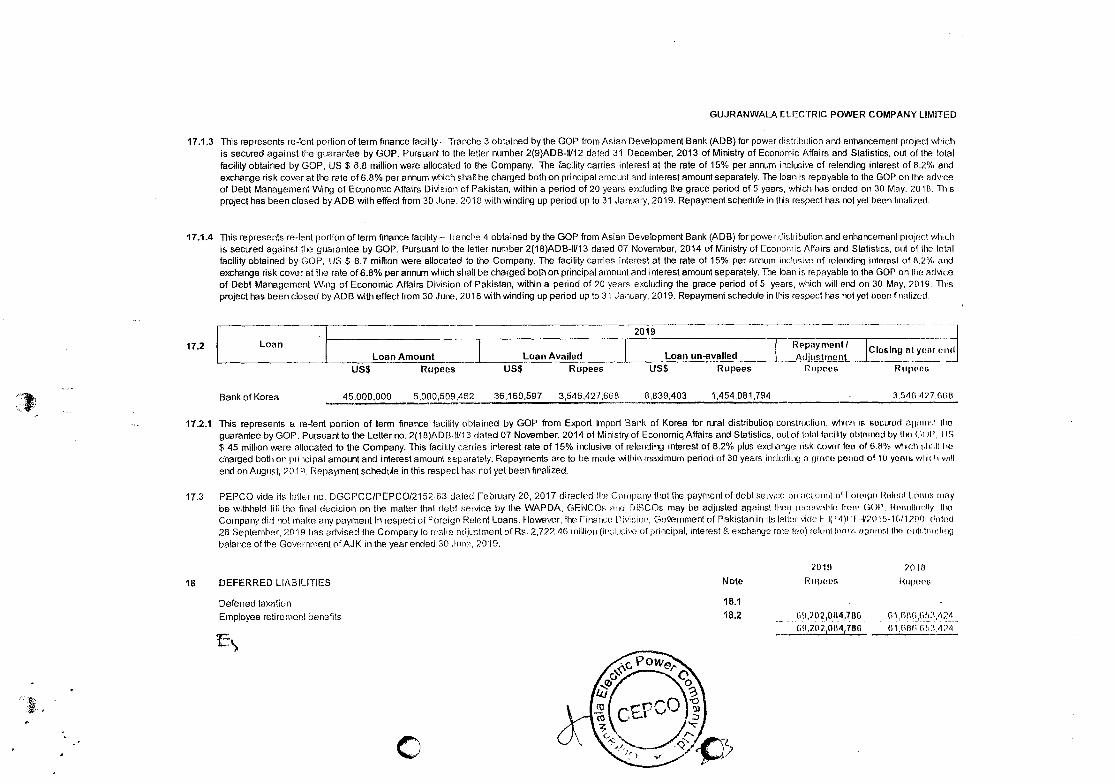
GUJRANWALA ELECTRIC POWER COMPANY LIMITED
17.1.3 This represents re-lent portion of term finance facility — Tranche 3 obtained by the GOP from Asian Development Bank (ADB) for power distribution and enhancement project which is secured against the guarantee by GOP. Pursuant to the letter number 2(9)ADB-lV12 dated 31 December, 2013 of Ministry of Economic Affairs and Statistics, out of the total
facility obtained by GOP, US $ 8.8 million were allocated to the Company. The facility carries interest at the rate of 15% per annum inclusive of relonding interest of 8.2% and exchange risk cover at the rate of 6.8% per annum which shall be charged both on principal amount and interest amount separately. The loan is repayable to the GOP on the advice of Debt Management r.Wing of Economic Affairs Division of Pakistan, within a period of 20 years excluding the grace period of 5 years, which has ended on 30 Mriy, 20113. uris project has been closed by ADD with effect from 30 June. 2018 with winding up period up to 31 January, 2019. Repayment schedule in this respect has not yet been finulized.
17.1.4 This represents re-tent portion of term finance facility — Tranche 4 obtained by the GOP from Asian Development Bank (ADB) for Dowel Jictribulion and enhancement project which is secured against the guarantee by GOP. Pursuant to the letter number 2(18)ADB-IV13 dated 07 November, 2014 of Ministry of Economic Affairs and Statistics, out of lhcr total facility obtained by GOP, US $ 8.7 million were allocated to the Company. The facility carries interest at the rate of 15% per annum inclusive of relending interest of 8.2% and exchange risk cover at the rate of 6.8% per annum which shall be charged both on principal amount and interest amount separately. The loan is repayable to the GOP on the advice of Debt Management \Wing of Economic Affairs Division of Pakistan, within a period of 20 yeers excluding the grace period of 5 years, which will end on 30 May, 2019. This project has been closed by ADB with effect from 30 June, 2018 with winding up period up to 31 January, 2019. Repayment schedule in tIns respect has not yet been firnnnlizud.
2019 Loan
Loan Amount Repayment!
Loan un-availed ] Adjustment Closing at year eiiil
1 Loan Availed 17.2
US$ Rupees US$ Rupees US$ Rupees t'iripees Rupees
Bank of Korea 45,000,000 5,000,509,462 36,160,597 3,546,427,668 8,839,403 1,454,081,794 3,540,477,608
17.2.1 This represents a ic-tent portion of term finance facility obtained by GOP from Export Import Bank of Korea for rural distributing cornslruction. which is secured nhirnirnnl Iho guarantee by GOP. Pursuant to the Letter no. 2(18)AD B-tI/i 3 dated 07 November, 2014 of Ministry of Economic Affairs and Statistics, out of total facility obtanred by l (ut', IS $ 45 million were allocated to the Company. This facility carries interest rate of 15% inclusive of relending interest of 8.2% pIus exchange risk cover fee of 6.8/, wiie;h r.lrnll 'u charged both on piincipal amount and interest amount separately. Repayments are to be made within maximum period of 30 years including a giacu period of 10 years which vail end on August, 201 P.. Repayment schedule in this respect has not yet been finalized.
17.3 PEPCO vide its lellcr no. DGCPCCr'PEPC012152-63 dated rebruary 20, 2017 direcled urn Craipriiry that the payment of debt service on riccniunl oIl oiurpri Rehinni Lnnrirra nary be withheld liii the final deciejoir on the matter thai debt service by the WAPDA, GENCOs and 1) ISCOs may be adjusled agairrsl boil I rr:onv;rhlr lrorrr 001', Hriillarnhhy. ho Comparrydiri not make any payment in respect of Foreign Relent Loans. However, The Finance Piviinrr Go0ernment üf Pakistan in its letter veto I 1114)11 V2() 15-1G/12l)h) rIoted 26 September, 2019 tis advised the Company In rnrake nn{juelment of Re. 2,722.46 million (iilclLmei\'o of principal, interest & exchange rote Tao) rotinl iron'. i,rCin'moet tier numb I/n nçj
balance of the Government ofAJK in the year ended 30 ,Im mnm, 2019.
20 19 20113
18 DEFERRED LIABILITIES Note Ruj,oe ltiipoins
Deferred taxation 18.1
Employee retirement benefits 18.2 fiti,202,084,786 63 ,Gtlfi.tif,3,424 th fyi) 20f14,786 111 .mitto i sm. 424
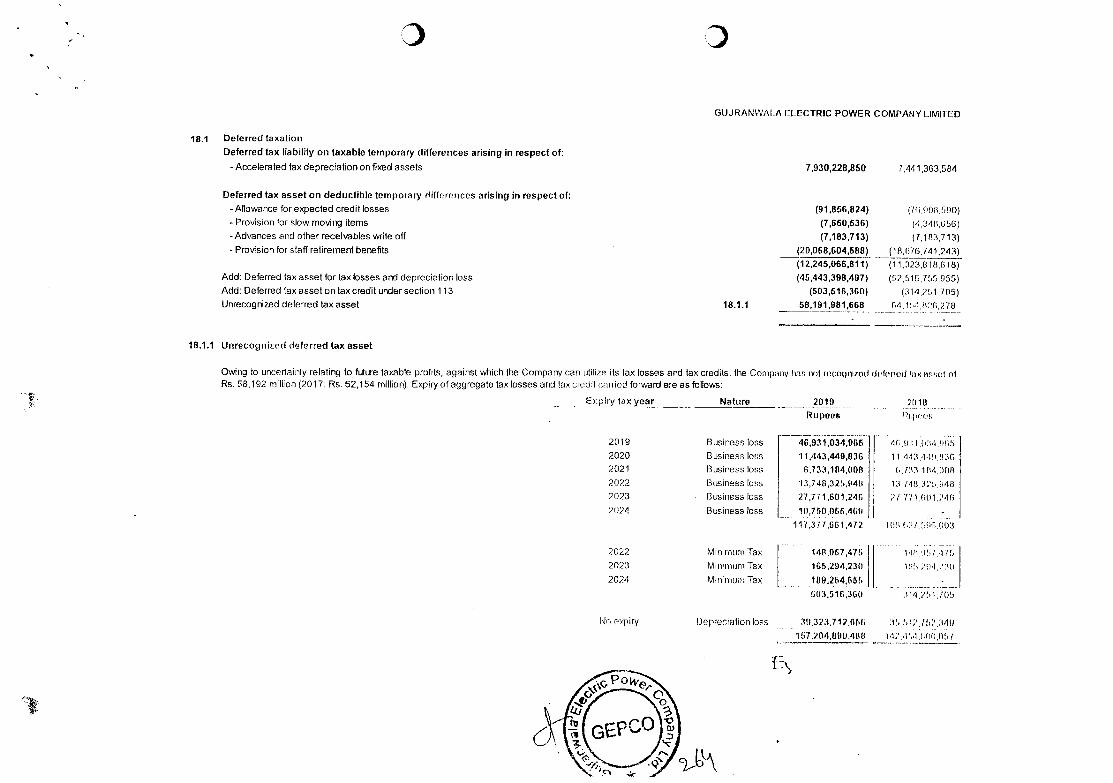
18.1 Deferred taxation
Deferred tax liability on taxable temporary differences arising in respect of:
(UJRANWALA ELECTRIC POWER COMPANY LIMITED
- Accelerated tax depreciation on fixed assets 7,930,228,850 7.441,363,584
Deferred tax asset on deductible temporary differences arising in respect of:
-Allowance for expected credit losses (91,856,824) 1/1 690) - Provision for slow moving items (7,650,536) ('1 34 0 0 56) -Advances nd other receisbles write off (7,183,713) 17.1 63,713) - Provision for staff retirement benefits (20,068,604,588) (16,676,741,243)
(12,245,066,811) (11.323,818,618) Add: Deferred tax asset for tax losses and depreciation loss (45,443,398,497) (57,516,755,955) Add: Deferred lax asset on tax credit under section 113 (503,516,360) (361.261,705) Unrecognized deferred tax asset 18.1.1 58,191,981,668 C.4.16.1,1126,278
18.1.1 Unrecognixed deferred tax asset
Owing to uncertainly relating to future taxable profits, against which the Company can utilize its tax losses and tax credits, the Company has not recognized ch'toriod l:ixor.sot of Rs. 58,192 million (2017: Rs. 62,154 million). Expiry of aggregate tax losses and tax credit carried forward are as follows:
- Erpiry tax year Nature 2019 21)111 Rupees
2019 Business Ions 46,931,034,965 46,1)31 ,104,ous 2020 Business lo:;s 11,443,449,836 11,443 '1 iti, 1136 2021 Business Ions 6,733,184,0011 I;, 133 1114,0011 2022 Business loss 'I 3,748,325,1348 13, 2023 Business loss 27 77 1,601,24 6 202/i Business loss 10,75006546(1
117,377,661,472 196 (7/ '91,1(03
2022 Minimum Tax 148,957,475 l'I0 .057.175 2023 Minimum Tax 165294,230 1)1 ,' 91 ;' :io 2024 Minimum Tx 189,2t4,6bt.
503,511)360 31.1/61,1(11,
No a:.'piry Depreciation loss 39,323,71 2,OM)
57,204 .890 48 II 31. 61k' ff7 341)
142 '11 (.1)0961
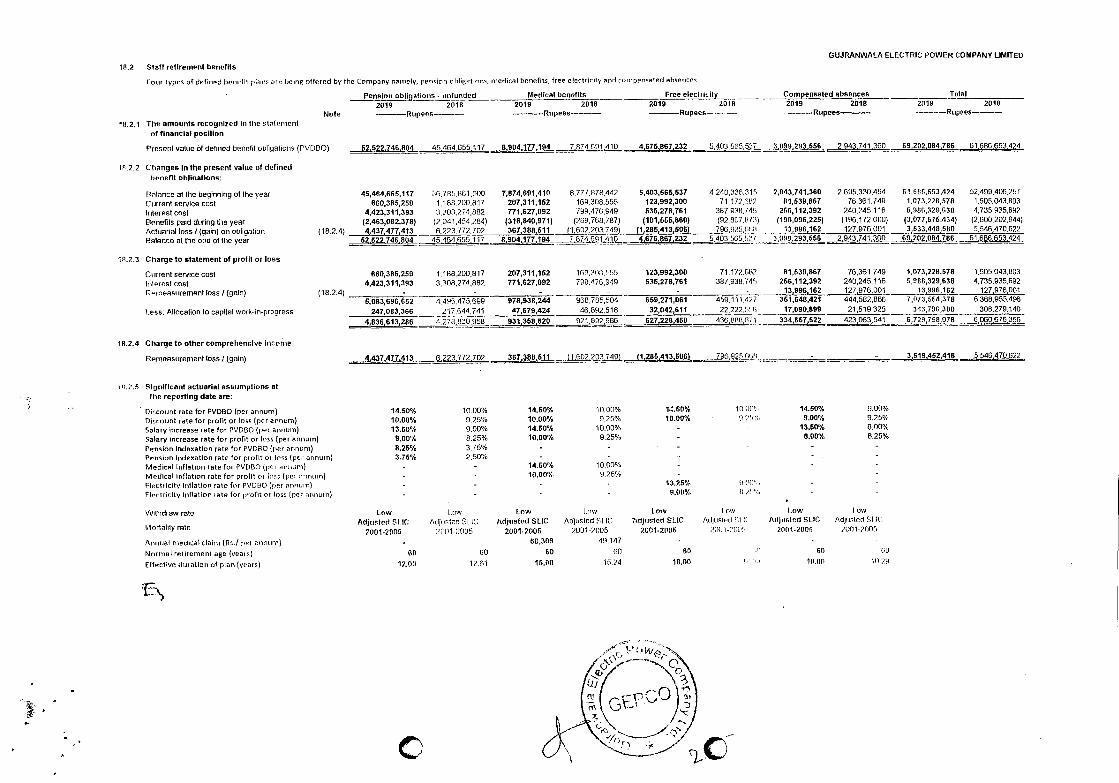
GUJRANWALA ELECTRIC POWER COMPANY LIMITED
18.2 Staff retirement benefits
Four types of defined benefit piarosa re being offered by the Company namely, pension obligotions, medical benefits, free electricity and compensated absences.
Pension obligations- unfunded Medical benefits Free eloctrklly,,_, Compensated absences Total
2019 2(118 2019 2018 2019 2018 2019 2018 2019 2018
Note —Rupees.---- —Rupees----- -Rupees-------- _.___Rupees --------Rupees —
18.2.1 The amounts recognized In fire trirrfernent oltinancial posItIon
Preseni value of defined benefit obligations (PVDBO) 62,522,746,804 45464,055 117 5,904,177,194
Changes In the present value of defined benefit oblinatlons:
Distance af fhe beginning of fhe year 46,464,666,117 35,785,861,000 7,874,691,410 Crjrrenf service cost 660,385,289 1,180,200,817 297,311,162 fitferest cost 4,423,311,393 3,300,274,882 771,627,092
Benef(fS paid during fIre year (2,463,082,378) (2,041,454,284) (316,840,971)
Acfuariaf fops (gain) on obligelion (18.2.4) 4,437,477,413 6,223,772,702 611 Balance 81 the end of flie year 52,522,746,804 45,464.655 117
Charge to statement of profit or loss
Current service cost 660,306,259 1,198,200,817 207,311,152 lrrtvresf cost 4,423,311,393 3,308,274,892 771,627,092 Fr"meastiremenf ions / (gain) (18.2.4) - - -
5,083,698,652 4,4911,475,699 978,938,244
less. Aifocaiion to capital workin.progress 247,083,366 217,644,741 47,679,424
4,636,613,286 4,276.1130,958 931,358,820
Charge to other compreftensive Income
ffemeasuremenf loss I (gsin) 4437477,413 6223.772.702 367,388,611
SignIfIcant actuarIal assumptions at the reportIng date are:
Discount rate for PVDBO (per annum) 14.50% 10, 00% 14.60%
Discount rate for profit or loss (per annum) 10.00% 0.25% 10.00%
Salary Increase raie for PV080 (per annum) 13.50% 0.00% 14.60'!,
Salary Increase rate for profit or less (per annum) 9.00% 8.25% 10.00%
Pension Indexation rate for PV600 (per annum) 8.25% 3,75% Pension indeeation rate for profit or loss (per annum) 3.75% 2.50% Medical Inflation rate for PVDBO (p0, annum) 14.60%
Medical Inflation rate for pi'ollt or its (ye,' 15,100) 10,00'/r
f'.lectt icit.y Inflation rate for PV000 (per bourn) -
Ftertr(clty Inflation tate for profit or loss (per ,u,itrnn)
Vrt,llrdraw rain Lew I.rrw Low
or a y rae hI I if f Adjusted 5116 Ad(usle.d SI IC
:°It1-2C25 /tdjunted SLIC
2001.2005
Annual medical claim (9s./ per zinnuni) . 60,309
Normal retirement age (yeats) 90 (50 60
Effective dutatiolo of plan (('ears) 12.05 1/,1.1 15.00
C
10.2.2
18.2.3
18.2.4
5,403,505,527 3,099,293,556 2,943,741,300 69,202,084,786 , 01 f86 53424
4,240,335,315 2,843,741.360 2,6l15,330.4'34 61,6115.853,424 ti2,499,406,2'fil 71,172,682 81,1,39,867 75,361,749 1,673,228,578 1,505,043,803
387,9211.145 286,112,392 240,245,116 5,988,329,638 4735,935697 (92,007.lil/) (196,096,225) (196,172,0(10) (3,077,576,434) (2,600,202,944) 796,925/Ill 1 ,,996,16Z 127,976,001 3,533,440,550 5,546,470.622
5403565i37 3,699,293,656 2943741 360 69,202 004 786 61 606,653,424
71,172,18? 81,639,867 76,361.749 1,073,228,578 1,505,043.803 387,938,74'i 256,112,392 240,245,116 6,906,329,636 4,735,935,692
- 13,096,162 127,976,001 — 13996,162 127,976,001 459,111,427 361,648,421 444,582,866 7,073,554,378 6,368,955,496 22,222.1Cr 17,090,899 21,519,325 343,795,300 308.279.140
436,009,511 334667622 423,063,541 6,729,758,078 6,060676,356
796,925 1 11.)1 _. - 3,619,452.418 5,546.470,622
101111':', 14.50% 9.00% 5 ":1. 9.00% 9.25%
13.50% 6.00% 8.00% 8.25%
11101'',.
isv,' Low low low IrrW
Adjusted SI IC 7tdjusterl St.IC Adjitslrol CIII !rrljrtr.ted SLIC Adyrslnri SI IC'
2001-2005 20111-28011 2ltlil.:'liL'f. 21101-2000 20(11-2005
49,147 60 611 '"I 65 1,0
16.24 16.110 '" ''.1 lll.ltfl 1(129
,,,,_L874 1111 410 4,675,867,232
8,777,8711,442 5,403,565,537 159,308,555 123,992,300 799,476,949 630,278,761
(269.768,787) (101,555,860) )1,G02.203,7,) (1,285,413,506)
4,675,867,232
ltip.311?,y,55 123,992,300 798.470,549 635,278,161
- - 1168,765,504 659,271,061
46.892,518 32,042,611
921,802 056 627,228,450
(1,602 203,749) (1,286,413.506)
10. 09% 14.50% 9.25% 10.00%
10.00% - 9.25%
10.00% 9 75% -
- 13,26% - 9.05%
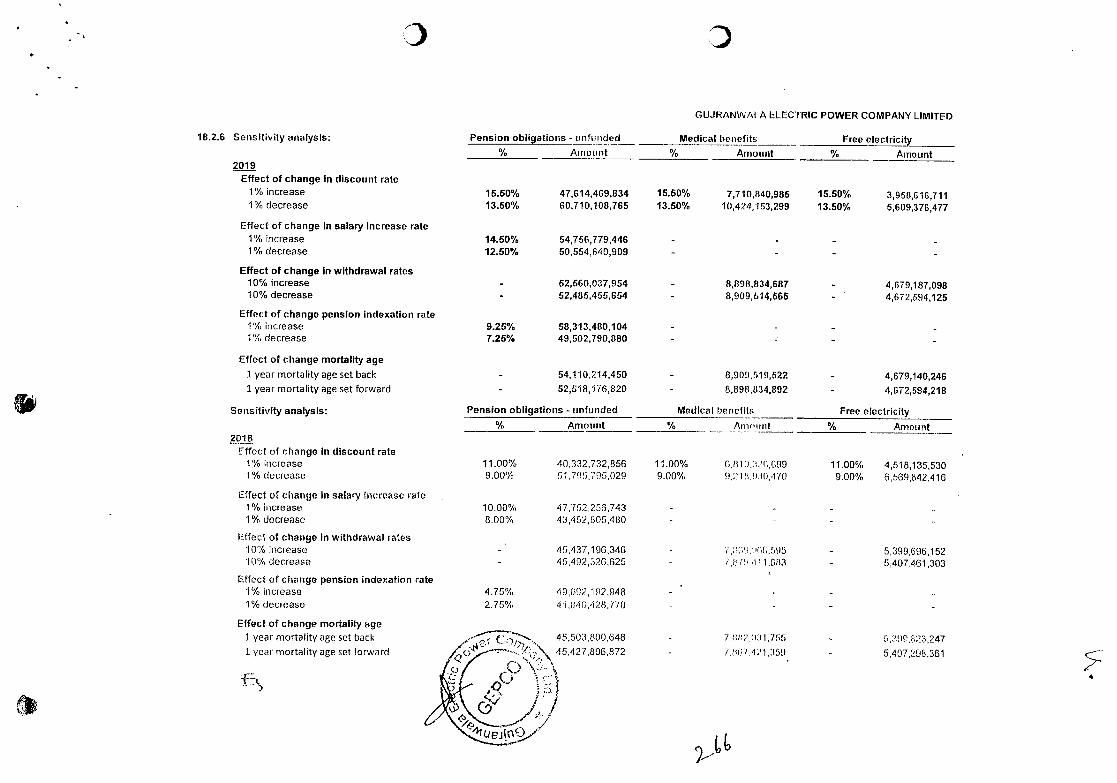
Pension obligations - unlnucled
GUJRANWAIA ELECTRIC POWER COMPANY LIMITED
Medical benefits Free electricity
% Amount % Amount % Amount
15.50% 47,614,469,834 15.50% 7,710,840,985 15.50% 3,958,616,711 13.50% 60,710,108,765 13.50% 10,424,153,299 13.50% 5,609,376,477
14.50% 54,756,779,446 - - 12.50% 50,554,640,909 -
52,560,037,954 8,898,834,687 4,679,187,098 52,485,455,654 8,909,514,565 - 4,672,594,125
9.25% 58,313,480,104 - 7.25% 49,502,790,880 - - -
54,110,214,450 8,909,519,522 - 4,679,140,246 52,518,176,820 8,898,834,892 4,672,594,218
18.2.6 Sensitivity analysis:
2019 Effect of change In discount rate
1% increase 1% decrease
Effect of change In salary increase rate 1% increase 1% decrease
Effect of change in withdrawal rates 10% increase 10% decrease
Effect of change pension indexation rate 1% increase 1"/ decrease
Effect of change mortality age
1 year mortality age set back
1 year mortality age set forward
Sensitivity analysis: Pension obligations - unfunded Medical bnetlt Free electricity
Effect of change mortality ge 1 year mortality age set back
1 year mortality age set forward
% Amount % Aninilni % Amount
11.00% 40,332,732,856 11.00% S , 111(1, 3, 'I .6 99 11.00% 4,51 8,135,530 9.00% 51795,795,029 9.00% 1) .2 lii. 1 (30 , '170 9.00% 6,569,812,416
10.00% 47,752,256,743 8.00% 43,152,805,460
45,437,196,346 5,399,696,152 - 45492,326,625 7,5(9 .111.6113 5,407,461,303
4.75% 49,592,192,948 2.75% 41,546,428,770
45,503,800,648 70(6' (131,755 9,3119,823,247
':•(\ 45,427,806,872 ((11(7 121.351) 5,407,298,361
_O v.. \
2018 Effect of change in discount rate
1% increase 1% decreace
Effect of change in salary Increase ale 1% increase 1% decrease
Effect of change in withdrawal rates 10% increase 10% decrease
Effect of change pension indexation rate 1% increase 1% decrease
' /! .7
41tjejc,/
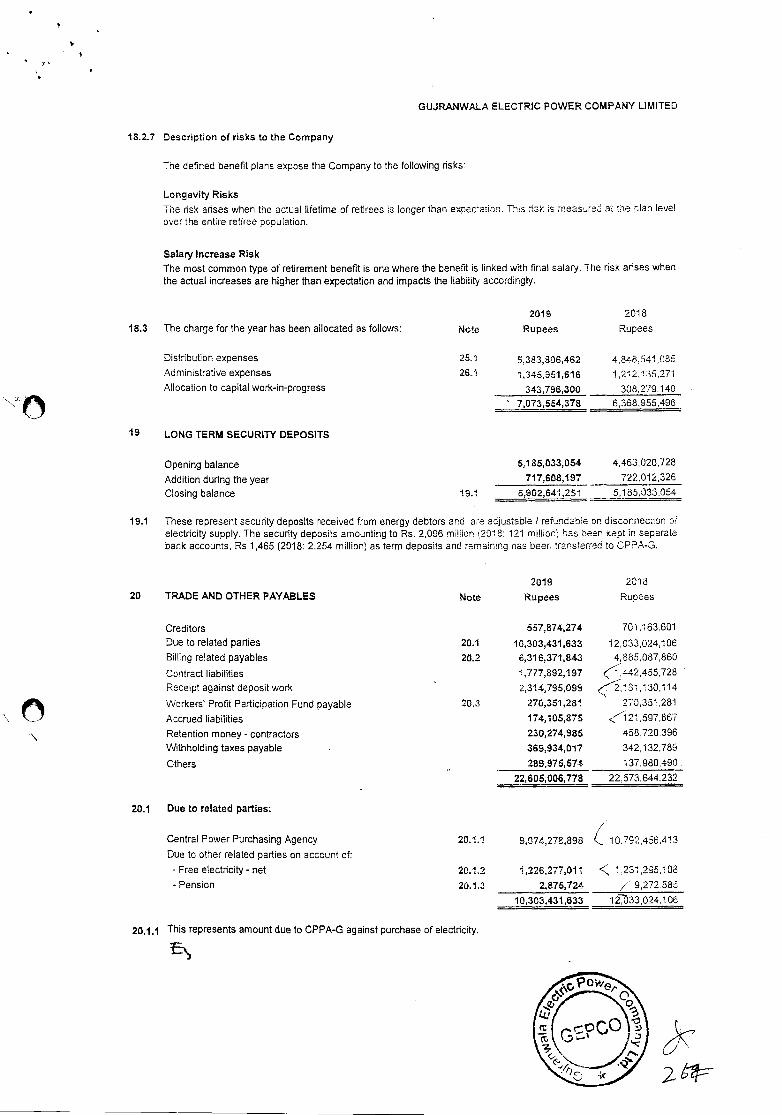
GUJRANWALA ELECTRIC POWER COMPANY LIMITED
18.2.7 Description of risks to the Company
The defined benefit plans expose the Company to the following risks:
Longevity Risks
The risk arises when the actual lifetime of retirees is longer than expec:aticn. This hsk is rneasure a fie 7..Ian level over the entire retiree population.
Salary Increase Risk The most common type of retirement benefit is one where the benefit is linked with final salary. The risk arises when the actual increases are higher than expectation and impacts the liability accordingly.
18.3 The charge for the year has been allocated as follows:
Distribution expenses
Administrative expenses
Allocation to capital work-in-progress
19 LONG TERM SECURITY DEPOSITS
2019 2018
Note Rupees Rupees
2&1 5,323,306,482 4,848,541.035 26.i i,345,961,616 1212,135,271
343,796,300 308,279.140 7,073,554,378 6,368,955,496
Opening balance 5,185,033,054 4,463,020,728
Addition during the year 717,608,197 722,012,326
Closing balance 19.1 5,902,641,251 5,185,033.054
19.1 These represent security deposits received from energy debtors and are adjustable I refundable on disconnection of electricity supply. The security deposits amounting to Rs. 2,096 million (2018: 121 million) has been kept in separate bank accounts, Rs 1,465 (2018: 2.254 million) as term deposits and remaining has beer transferrec to CPPA-3.
2019 2018 20 TRADE AND OTHER PAYABLES Note Rupees Rupees
Creditors 557,874,274 701.163.601
Due to related parties 20.1 10,303,431,633 12,033,024,106 Billing related payables 20.2 6,316,371,843 4,885,087,860
Contract liabilities 1,777,892,197 (,442,455,728 -
Receipt against deposit work 2,314,795,099 ("18i,130.114
Workers Profit Participation Fund payable 20.3 270,351,281 273,351,281
Accrued liabilities 174,105,875 <121,597,867
Retention money - contractors 230,274,985 458.720,396
Withholding taxes payable . 369,934,017 342,132,789
Others 289,975,574 137,980,490
22,605,006,778 22.573,644,232
20.1 Due to related parties:
Central Power Purchasing Agency
Due to other related parties on account of:
- Free electricity - net
- Pension
20,1.1 9,074,278,893 10.792,456,413
20.1.2 1,226,277,011 <, 1,231 295,108
20.1.3 2,875,724 7 9,272.585
10,303,431,633 133,024,106
20.1.1 This represents amount due to CPPA-G against purchase of electricity.
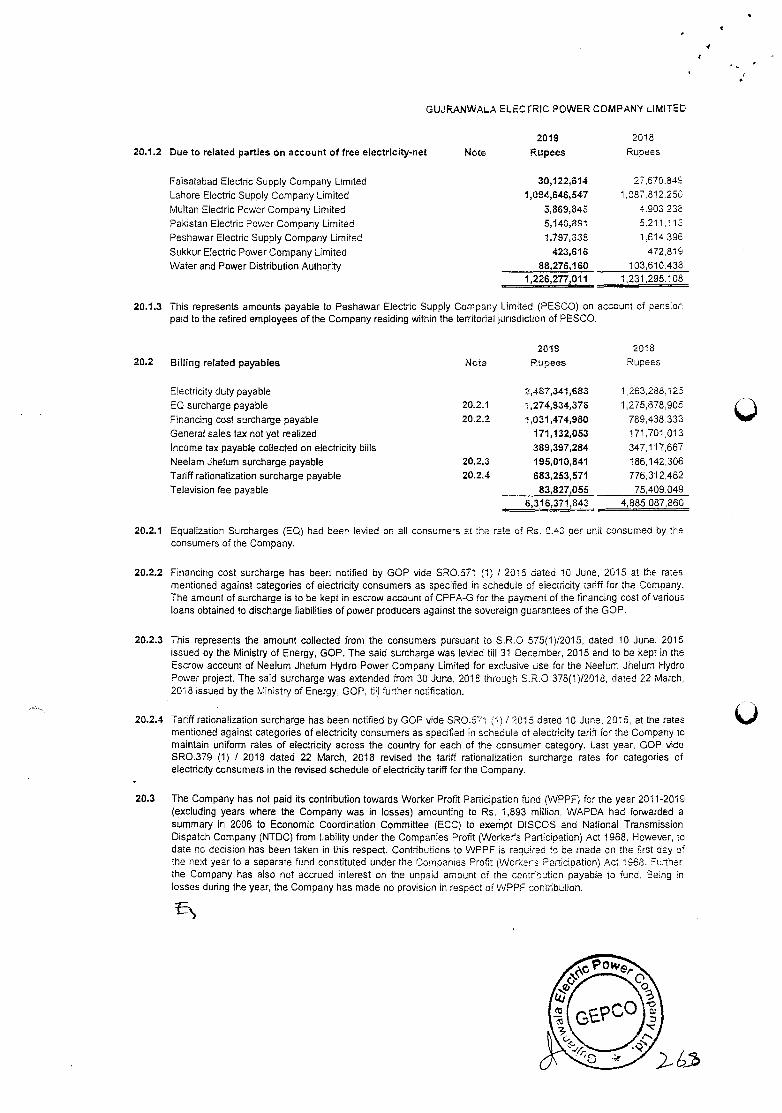
GUJRANWALA ELECTRIC POWER COMPAN'f LIMITED
2019 2018 20.1.2 Due to related parties on account of free electricity-net Note Rupees Rupees
Faisalabad Electric Supply Company Limited 30,122,614 27,670.849
Lahore Electric Supply Company Limited 1,094,646,547 1087812.250
Multan Electric Power Company Limited 5,869,845 4.903,235
Pakistan Electric Power Company Limited 5,140,891 5,211,118
Peshawar Electric Supply Company Limited 1,797,338 1,614.396
Sukkur Electric Power Company Limited 423,616 472,819
Water and Power Distribution Authority 88,276,180 103,610.438 1,226,277,011 1,231,295.108
20.1.3 This represents amounts payable to Peshawar Electric Supply Company Limited (PESCO) on account of pension paid to the retired employees of the Company residing within the territorial jurisdiction of PESCO.
2019 2018 20.2 Billing related payables 'Jote Rupees Rupees
Electricity duty payable 2,487,341,683 1,263,288,125
EQ surcharge payable 20.2.1 1,274,934,376 1.275,678,905
Financing cost surcharge payable 20.2.2 1,031,474,980 789,38.333 General sales tax not yet realized 171,132,053 171,701,013
Income tax payable collected on electricity bills 389,397,284 347,117,667
Neelam Jhelum surcharge payable 20.2.3 195,010,841 186,142,306 Tariff rationalization surcharge payable 20.2.4 683,253,571 776,312,462 Television fee payable 83,827,055 75,409,049
6,316,371,843 4,885,087,860
20.2.1 Equalization Surcharges (EQ) had been levied on all consumers at the rate of Rs. 0.43 per unit consumed by the consumers of the Company.
20.2.2 Financing cost surcharge has been notified by GOP vide SRO.571 (1) I 2015 dated 10 June, 2015 at the rates mentioned against categories of electricity consumers as specified in schedule of electricity tariff for the Company. The amounl of surcharge is to be kept in escrow account of CPPA-G for the payment of the financing cost of various loans obtained to discharge liabilities of power producers against the sovereign guarantees of the GOP.
20.2.3 This represents the amount collected from the consumers pursuant to S.R.O 575(1)12015, dated 10 June, 2015 issued by the Ministry of Energy, GOP. The said surcharge was levied till 31 December, 2015 and to be kept in the Escrow account of Neelum Jhelum Hydro Power Company Limited for exclusive use for the Neelurr Jhe!um Hydro Power project. The said surcharge was extended from 30 June, 2018 through S.R.O 376(1)/2013, dated 22 March, 2018 issued by the Ministry of Energy, GOP, fit further notification.
20.2.4 Tariff rationalization surcharge has been notified by GOP vide SRO.571 (1: /2015 dated 10 June, 2015, at the rates mentioned against categories of electricity consumers as specified in schedule of electricity tariff for the Company to maintain uniform rates of electricity across the country for each of the consumer category. Last year, GOP vide SRO.379 (1) / 2018 dated 22 March, 2018 revised the tariff rationalization surcharge rates for categories of electricity consumers in the revised schedule of electricity tariff for the Company.
20.3 The Company has not paid its contribution towards Worker Profit Participation fund (WPPF) for the year 2011-2019 (excluding years where the Company was in losses) amounting to Rs. 1,893 million. WAPDA had forwarded a summary in 2006 to Economic Coordination Committee (ECC) to exertpt DISCOS and Nationat Transmission Dispatch Company (NTDC) from liability under the Companies Profit (Worker's Participation) Act 1968. However, to date no decision has been taken in this respect. Contributions to WPPF is required to be made on the first day of the next year to a separate fund constituted under the Companies Profit OiVori<ars Panicipation) Act 1968. Further. the Company has also not accrued interest on the unpaid amount of the ccrtriOution payable to funo. Seing in losses during the year, the Company has made no provision in respect of WPPF contribution.
•4)
4
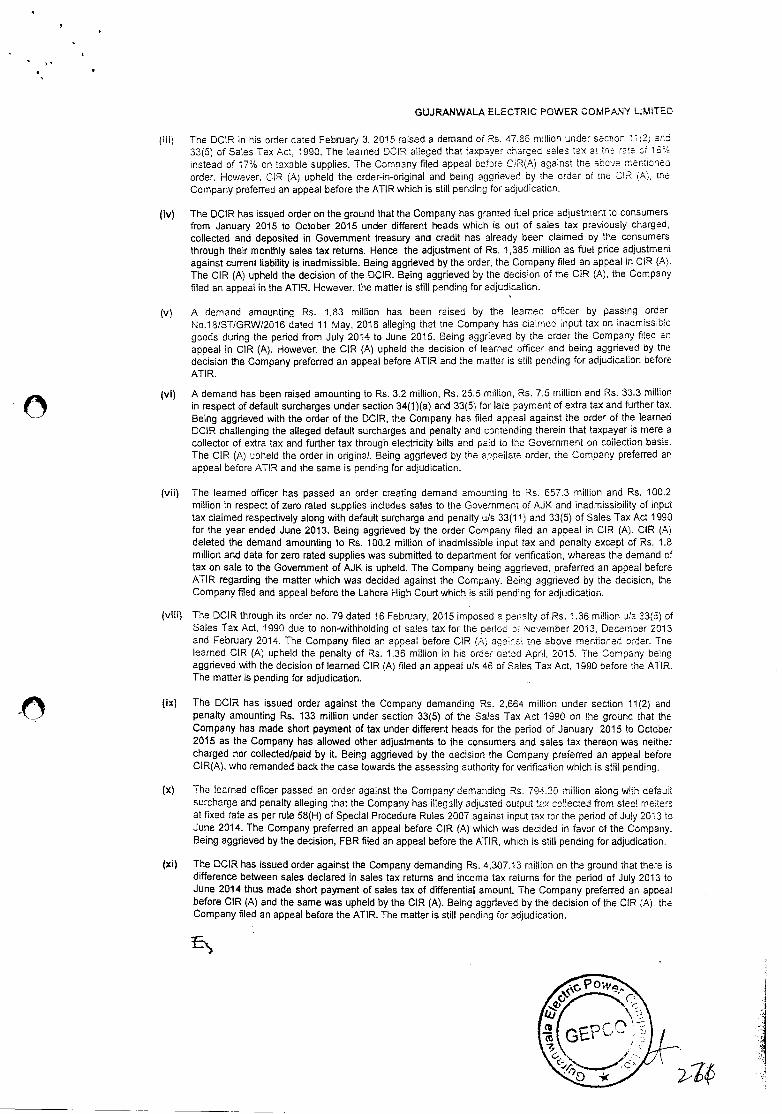
GUJRANWALA ELECTRIC POWER COMPANY LIMITED
(iii) The OCIR in his order dated February 3, 2015 raised a demand of Rs. 4786 million under section 1 1i2 an 33(5) of Sales Tax Act. 1990. The learned DClR alleged that taxpayer charged sales tax at the rate of 16% instead of 17% en taxable supplies. The Company flied appeal before CR(A) against the above mertioneC order. However, CIR jA) upheld the order-in-original and being aggrieved by the order of tne CIR tA), me Company preferred an appeal before the ATIR which is still pending for adjudication.
(iv) The DCIR has issued order on the ground that the Company has granted fuel price adjustment to consumers from January 2015 to October 2015 under different heads which is out of sales tax pret.tously charged, collected and deposited in Government treasury and credit has already been claimed by the consumers through their monthly sales tax returns. Hence the adjustment of Rs. 1,385 million as fuel price adjustment against current liability is inadmissible. Being aggrieved by the order, the Company filed an appeal in CIR (A). The CIR (A) upheld the decision of the DCIR. Being aggrieved by the decision of the CIR (A), the Company filed an appeal in the ATIR. However, the matter is still pending for adjudication.
(v) A demand amounting Rs. 1.83 million has been raised by the learned officer by passing order No.18/STJGRW/2016 dated ii May, 2016 alleging that me Company has claimed nput tax on inacmissbie goods during the period from July 2014 to June 2015. Being aggrieved by the amer the Company filed an appeal in CIR (A). However, the ClR (A) upheld the decision of learned officer and being aggrieved by the decision the Company preferred an appeal before ATIR and the matter is still pending for adjudication before ATIR.
(vi) A demand has been raised amounting to Rs. 3.2 million, Rs. 25.5 million, Rs. 7.5 million and Rs. 33.3 million in respect of default surcharges under section 34(1)(a) and 33(5) for late payment of extra tax and further tax. Being aggrieved with the order of the OCIR, the Company has flied appeal against the order of the learnea DCIR challenging the alleged default surcharges and penalty and contending therein that taxpayer is mere a collector of extra tax and further tax through electricity bills and paid to the Government on collection basis. The CIR (A) upheld the order in original. Being aggrieved by the appeilate order, the Company preferred ar appeal before ATIR and the same is pending for adjudication.
(vii) The learned officer has passed an order creating demand amounting to Rs. 657.3 million and Rs. 100.2 million in respect of zero rated supplies includes sales to the Government of AJK and inadmissibility of input tax claimed respectively along with default surcharge and penalty u/s 33(11) and 33(5) of Sales Tax Act 1990 for the year ended June 2013. Being aggrieved by the order Company filed an appeal in CIR (A). ClR (A) deleted the demand amounting to Rs. 100.2 million of inadmissible input tax and penalty except of Rs. 1.8 million and data for zero rated supplies was submitted to department for verification, whereas the demand of tax on sale to the Government of AJK is upheld. The Company being aggrieved, preferred an appeal before ATIR regarding the matter which was decided against the Company. Being aggrieved by the decision, the Company filed and appeal before the Lahore High Court which is still pending for adjudication.
(viii) The DCIR through its order no. 79 dated 16 February, 2015 imposed a penalty of Rs. 1.36 million u's 33(5) of Sales Tax Act, 1990 due to non-withholding of sales tax for the period of November 2013, December 2013 and February 2014. The Company filed an appeal before CIR (A) agar.s me above mentioned order. Th learned ClR (A) upheld the penalty of Rs. 1.36 million in his order Dated April, 2015. The Company being aggrieved with the decision of learned CIR (A) filed an appeal u/s 46 of Sales Tax Act, 1990 before the ATIR. The matter is pending for adjudication.
(ix) The DCIR has issued order against the Company demanding Rs. 2,664 million under section 11(2) and penalty amounting Rs. 133 million under section 33(5) of the Sales Tax Act 1990 on the ground that the Company has made short payment of tax under different heads for the period of January 2015 to October 2015 as the Company has allowed other adjustments to the consumers and sales tax thereon was neither charged nor collected/paid by it. Being aggrieved by the decision the Company preferred an appeal before ClR(A), who remanded back the case towards the assessing authority for verification which is still pending.
(x) The learned officer passed an order against the Companr demanding Ra. 794.20 million along with default surcharge and penalty alleging that the Company has illegally adjusted output tax collected from steel melters at fixed rate as per rule 58(H) of Special Procedure Rules 2007 against input tax for the period of July 2013 to June 2014. The Company preferred an appeal before CIR (A) which was decided in favor of the Company. Being aggrieved by the decision, FBR filed an appeal before the ATIR, which is still pending for adjudication.
(xi) The DCIR has issued order against the Company demanding Rs. 4,307.13 million on the ground that there is difference between sales declared in sales tax retums and income tax returns for the period of July 2013 to June 2014 thus made short payment of sales tax of differential amount. The Company preferred an appeal before CIR (A) and the same was upheld by the ClR (A). Being aggrieved by the decision of the ClP. (A). the Company filed an appeal before the ATIR. The matter is still pending for adjudication.
E.)
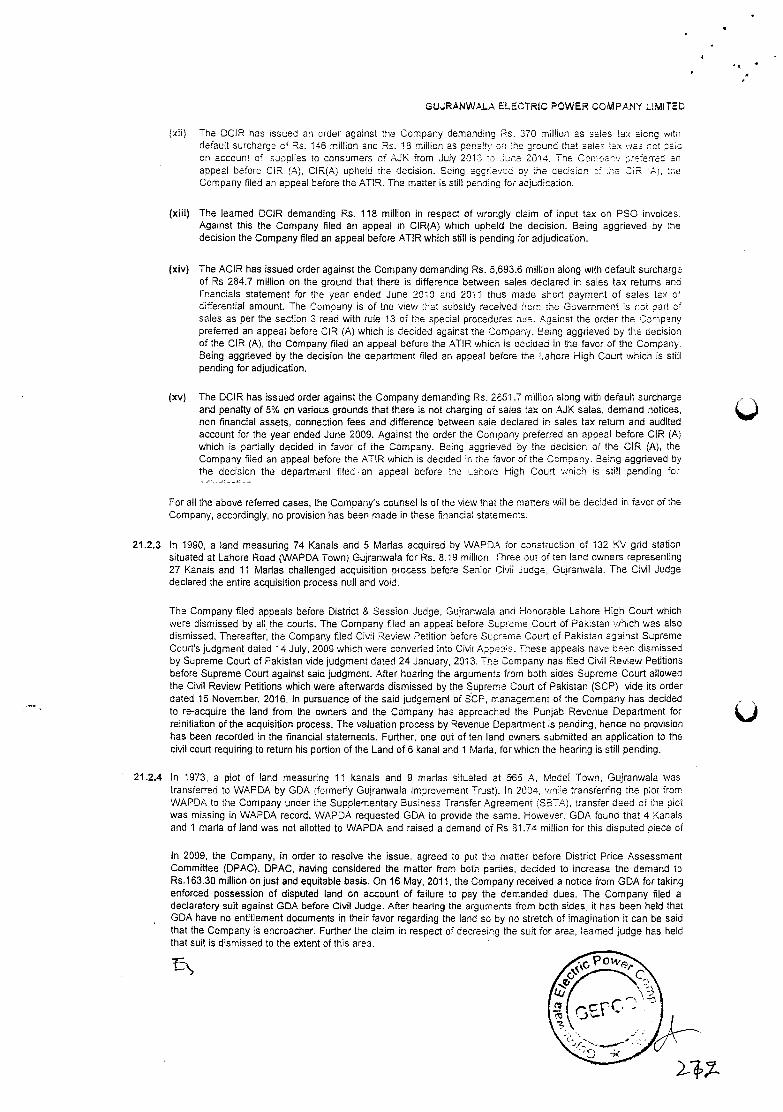
GUJRANWALA ELECTRIC POWER COMPANY LIMITED
(xii) The DCIR has issued an order against the Company demanding Re. 370 million as sales tax sicng witn default surcharge of Rs. 146 million and Re. 13 million as penalt. on me ground that sales iex vies not paic on account of supplies to consumers of AJK from July 201.3 no June 2314. The Ccrnony preferred an appeal before CIR (A), CIR(A) upheld the decision. Being aggrieved by the decision :he OR A, me Company filed an appeal before the ATtR. The matter is still pending for adjudication.
(xiii) The learned DCIR demanding Rs. 118 million in respect of wrongly claim of input tax on PSO invoices. Against this the Company filed an appeal in CIR(A) which upheld the decision. Being aggrieved by the decision the Company filed an appeal before ATlR which still is pending for adjudication.
(xiv) The ACIR has issued order against the Company demanding Rs. 5,693.6 million along with default surcharge of Rs 284.7 million on the ground that there is difference between sales declared in sales tax returns and financials statement for the year ended June 2010 and 2011 thus made short payment of sales tax ot differential amount. The Company is of the view that subsidy received from the Govetnrnent is not part of sales as per the section 3 read with rule 13 of toe special procedures rum. Against the order the Company preferred an appeal before CIR (A) which is decided against the Company. Being aggrieved by tine decision of the CIR (A), the Company filed an appeal before the ATIR which is oecided in the favor of the Company. Being aggrieved by the decision the department filed an appeal before the Lahore High Court which is still pending for adjudication.
The DCIR has issued order against the Company demanding Rs. 2651.7 million along with default surcharge and penatty of 5% on various grounds that there is not charging of sales tax on AJK sales, demand notices, non financial assets, connection fees and difference between sale declared in sales tax return and audited account for the year ended June 2009. Against the order the Company preferred an appeal before dR (A) which is partially decided in favor of the Company. Being aggrieved by the decision of the CIR (A), the Company filed an appeal before the ATlR which is decided in the favor of the Ccmany. Being aggrieved by the decision the department filed an appeal before ihe Lehore High Court which is still pending for
For all the above referred cases, the Company's counsel is of the view that the matters will be decided in favor of Ihe Company, accordingly, no provision has been made in these financia) statements.
21.2.3 In 1990, a land measuring 74 Kanals and 5 Marlas acquired by WAPDA for construction of 132 Ky grid station situated at Lahore Road APDA Town) Gujranwala for Rs. 8. t9 million. Three out of ten land owners representing 27 Kanals and 11 Martas challenged acquisition process before Senior Civil Judge, Guiranwala. The Civil Judge declared the entire acquisition process null and void.
The Company filed appeals before District & Session Judge, Gujranwala and Honorable Lahore High Court which were dismissed by all the courts. The Company filed an appeal before Supreme Court of Pakistan which was also dismissed. Thereafter, the Company filed Civil Review Petition before Supreme Court of Pakistan against Supreme Court's judgment dated 14 July, 2009 which were converted into Civit AposaiS. These appeals have been dismissed by Supreme Court of Pakistan vide judgment dated 24 January, 2013. The Company has flied Civil Review Petitions before Supreme Court against said judgment. After hearing the arguments from both sides Supreme Court allowed the Civil Review Petitions which were afterwards dismissed by the Supreme Court of Pakistan (SCP) vide its order dated 15 November, 2016. In pursuance of the said judgement of SCF, management of the Company has decided to re-acquire the land from the owners and the Company has approached the Punjab Revenue Department for reinitiation of the acquisition process. The valuation process by Revenue Department is pending, hence no provision has been recorded in the financial statements. Further, one out often land owners submitted an application to the civil court requiring to return his portion of the Land of 6 kanal and 1 Maria, for which the hearing is still pending.
21.2.4 In 1973, a lot of land measuring 11 kanals and 9 martas situated at 565 A, Model Town, Gujranwala was transferred to WAPDA by GDA (formerty Gujranwala Improvement Trust). In 2034, wn:ie transferring the piot from WAPDA to the Company under the Supplementary Business Transfer Agreement (SBTA), transfer deed of the Dim
was missing in WAPDA record. WAPDA requested GDA to provide the same. However. ODA found that 4 Kanals and 1 maria of land was not allotted to WAPDA and raised a demand of Rs 31.74 million for this disputed piece of
In 2009, the Company, in order to resolve the issue, agreed to put the matter before District Price Assessment Committee (DPAC). DPAC, having considered the matter from both parties, decided to increase the demand to Rs.163.30 million on just and equitable basis. On 16 May, 2011, the Company received a notice from GDA for taking enforced possession of disputed land on account of failure to pay the demanded dues. The Company filed a declaratory suit against GDA before Civil Judge. After hearing the arguments from both sides, it has been held that GDA have no entitlement documents in their favor regarding the land so by no stretch of imagination it can be said that the Company is encroacher. Further the claim in respect of decreeing the suit for area, learned judge has held that suit is dismissed to the extent of this area.
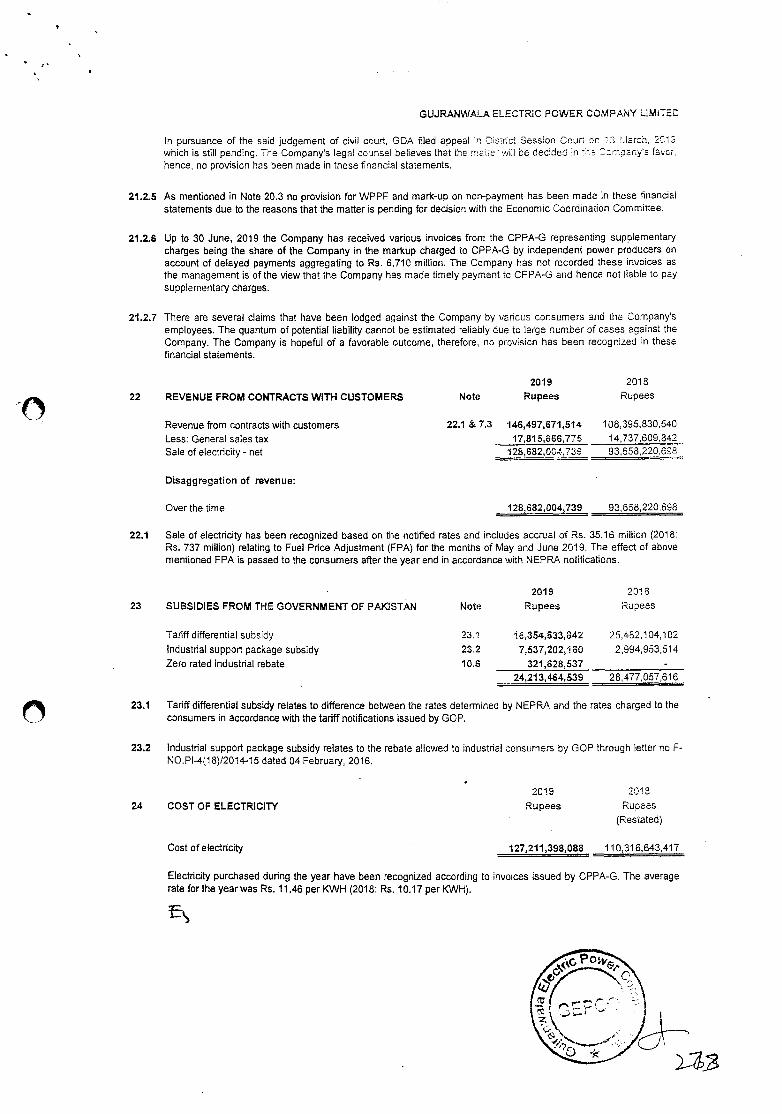
GUJRANWAL4 ELECTRIC POWER COMPANY UMITED
In pursuance of the said judgement of civil court, GDA flied appeal in Disirtct Session Court cr 3 .larcn, 2015 which is still pending. The Company's legal counsel believes that the n-.her will be decided in hs C:mpny's facr, hence, no provision has been made in these financial statements.
21.2.5 As mentioned in Note 20.3 no provision for WPPF and mark-up on non-payment has been made in these financial statements due to the reasons that the matter is pending for decision with the Economic Coordination Committee.
21.2.6 Up to 30 June, 2019 the Company has received various invoices from the CPPA-G representing supolementary charges being the share of the Company in the markup charged to CPFA-t by independent power producers on account of delayed payments aggregating to Rs. 6,710 million. The Company has not recorded these invoices as the management is of the view that the Company has made timely payment tc CPPA-G and hence not liable to pay supplementary charges.
21.2.7 There are several claims that have been lodged against the Company by vsricus consumers and the Company's employees. The quantum of potential liability cannot be estimated reliably due to large number of cases against the Company. The Company is hopeful of a favorable outcome, therefore, no provisicn has been recognizec in these financial statements.
2019 2018
22 REVENUE FROM CONTRACTS WITH CUSTOMERS Note Rupees Rupees
23
Revenue from contracts with customers Less: General sales tax Sale of electricity - net
22.1 & 7.3 146,497,671,514 17,815,866,775
128,682,0C4,739
108,395,830,540 14,737,609,342 93,658,220,698
bisaggregation of revenue:
Over the time
128,682,004,739 93,658,220,698
22.1 Sale of electricity has been recognized based on the notified rates and includes accrual of Rs. 35.16 million (2018: Rs. 737 million) relating to Fuel Price Adjustment (FPA) for the months of May and June 2019. The effect of above mentioned FPA is passed to the consumers after the year end in accordance with NEPRA notifications.
2019 2018
SUBSIDIES FROM THE GOVERNMENT OF PAKISTAN Note Rupees Rupees
Tariff differential subsidy 23.1 18,354,633,842 25,482,1 04,102
Industrial support package subsidy 2&2 7,637,202,160 2,994,953,514 Zero rated industrial rebate 10.6 321,828,537 -
24,213,464,539 28,477,057,616
23.1 Tariff differential subsidy relates to difference between the rates determined by NEPRA and the rates charged to the consumers in accordance with the tariff notifications issued by GOP.
23.2 Industrial support package subsidy relates to the rebate allowed to industrial consumers by GOP through letter no F-NO.Pl-4(18)/2014-15 dated 04 February, 2016.
2019 2018
24 COST OF ELECTRICITY Rupees Rupees (Restated)
Cost of electricity 127,211,398,088 110,316,643,417
Electricity purchased during the year have been recognized according to invoices issued by CPPA-G. The average rate forthe yearwas Rs. 11.46 per KWH (2018: Re. 10.17 per K\NH).
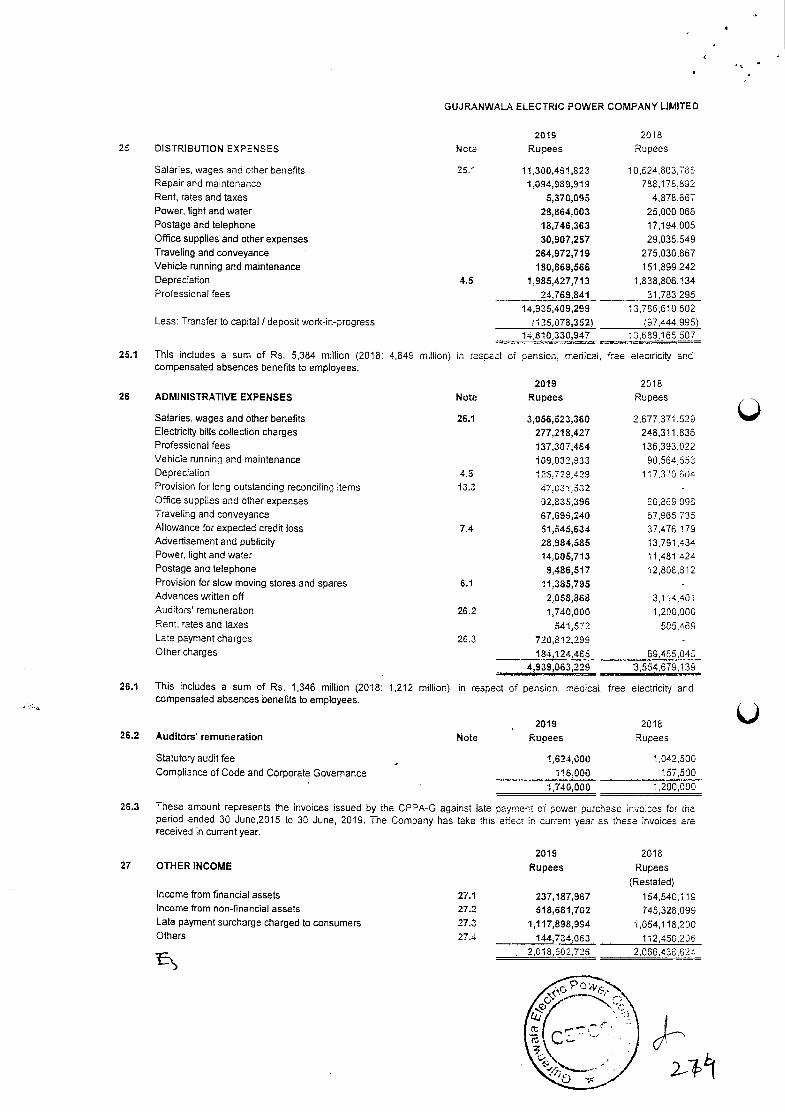
25 DISTRIBUTION EXPENSES
GUJRANWALA ELECTRIC POWER COMPANY LIMITED
2019 2018 Note Rupees Rupees
Salaries, wages and other benefits 25. 11,300,491,823 10,624,803,785 Repair and maintenance 1,094,989,919 788,178.892 Rent, rates and taxes 5,370,095 4,878867 Power, light and water 28,864,003 25,000,066 Postage and telephone 13,746,363 17,194,005 Office supplies and other expenses 30,907,257 29,035,549 Traveling and conveyance 264,972,719 275,030,867 Vehicle running and maintenance 180,869,566 151,899,242 Depreciation 4.5 1,985,427,713 1,838,806,134 Professional fees 24,769,841 31,783,295
14,935,409,299 13,786,610,502 Less: Transfer to capital / deposit work-in-progress 125,078,352) 97,444,995)
14,810,330,947 13,689,165,507
25.1 This includes a sum of Rs. 5,384 million (2018: 4,849 million) in respect of pensioo, medical, free electricity and compensated absences benefits to employees.
2019 2018 26 ADMINISTRATIVE EXPENSES Note Rupees Rupees
Salaries, wages and other benefits 26.1 3,056,523,360 2,677,371,529 Electricity bills collection charges 277,218,427 248,311,836 Professional fees 137,307,484 136,393,022 Vehicle running and maintenance 109,032,933 90,564,553 Depreciation 4.5 125.729,429 117,370,60 Provision for long outstanding reconciling items 13.3 47,031.532 Office supplies and other expenses 92,835,396 56,869,096 Traveling and conveyance 67,699,240 67,965735 Allowance for expected credit loss 7.4 51,546,834 37,476,179 Advertisement and publicity 28,984,685 13,791,434 Power, light and water 14,005,713 11,481,424 Postage and telephone 9,486,517 12,808,812 Provision for slow moving stores and spares 6.1 11,385,795 Advances written off 2,058,368 3,114,401 Auditors' remuneration 26.2 1,740,000 1,200,000 Rent, rates and taxes 541,572 505,469 Late payment charges 26.3 720,812,299 - Other charges 184,124,466 69,455,045
4,939,063,229 ,554,679,139
26.1 This includes a sum of Rs. 1,346 million (2018: 1,212 million) in respect of pension, rneuical, free electricity and compensated absences benefits to employees.
2019 2018 26.2 Auditors remuneration Note Rupees Rupees
Statutory audit fee 1,62.4,000 1,042,500 Compliance of Code and Corporate Governance 116,000 157,500
1,740,000 1,200,000
26.3 These amount represents the invoices issued by the CPPA-G against late payment of power purchase invoices for the period ended 30 June2015 to 30 June, 2019. The Company has take this effect in current year as these invoices are received in current year.
2019 2018 27 OTHER INCOME Rupees Rupees
(Restated) Income from financial assets 27.1 237,187,967 154,540,119 Income from non-financial assets 27.2 518,681,702 745,328,099 Late payment surcharge charged to consumers 27.3 1,117,898,994 1,054,118,200 Others 27.4 144,734.063 112,450,206
2,018,502725 2,066,436,624
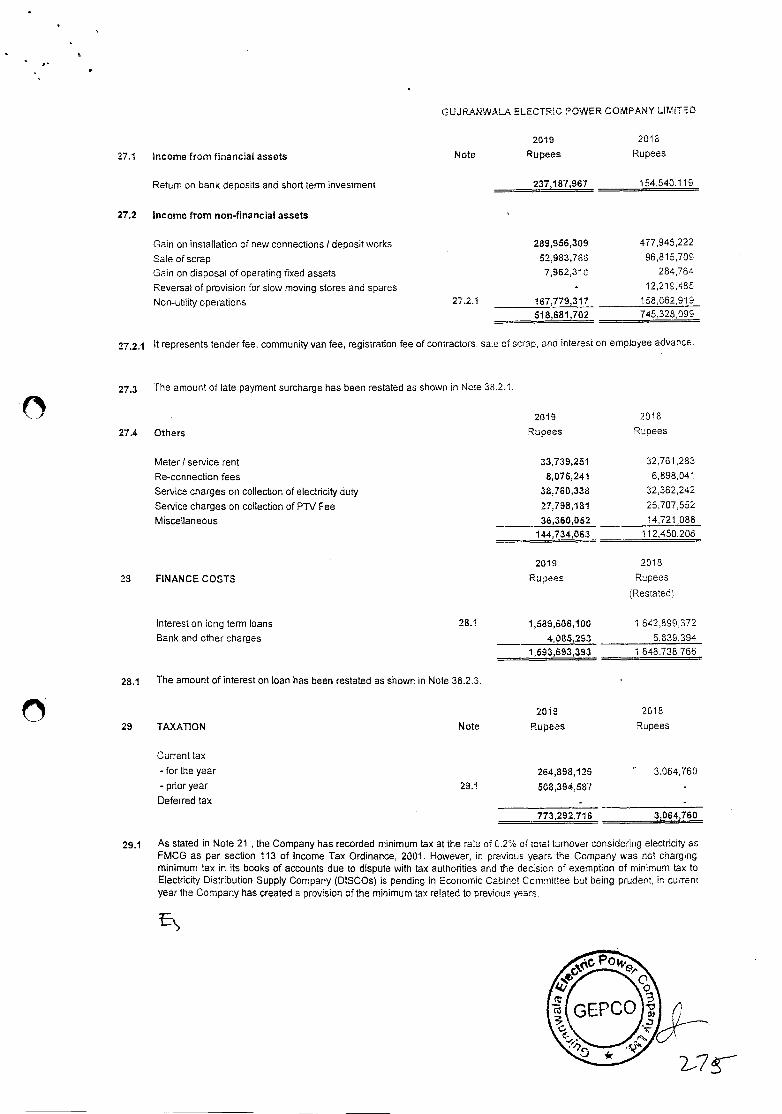
27
Income from financial assets
Return on bank deposits and short term investment
GUJRANWALA ELECTR!C POWER COMPANY LIMITED
2019 2018
Note Rupees Rupees
237,187,967 154,540,119
Income from non-financial assets
Gain on installation of new connections I deposit works 289,966,309 477,945,222
Sale of scrap 52,983,769 96,815,709
Gain on disposal of operating fixed assets 7,962,310 284,764
Reversal of provision for slow moving stores and spares 12,219,465
Non-utility operations 27.2.1 167,779,317 158,062,919
518,681,702 745,328,099
27.2.1 It represents tender fee, community van fee, registration fee of contractors. see of scrap, and interest on employee advance.
27.3 The amount of late payment surcharge has been restated as shown in Note 38.2.1.
2019 2018
Others Rupees Rupees
Meter / service rent 33,739,251 32,761283
Re-connection fees 8,076,241 6,898,041
Service charges on collection of electricity duty 38,760,338 32,362,242
Service charges on collection of PTV Fee 27,798,181 25,707,552
Miscellaneous 36,360,052 14,721,088
144,734,063 112,450,206
2019 2018
FINANCE COSTS Rupees Rupees
(Restated)
Interest on long term loans 28.1 1,689,608,100 1,642,899,372
Bank and other charges 4,085,293 5,839,394
1,593,693,393 1,646,738,766
28.1 The amount of interest on loan has been restated as shown in Note 38.2.3.
27.1
27.2
27.4
23
29 TAXATION
Current tax
- for the year
- prior year
Deferred tax
2013 2018
Note Rupees Rupees
264,898,129 3,064,760
29.1 508,394,587
773,292,716 3,064,760
29.1 As stated in Note 21 , the Company has recorded minimum tax at the rate of 0.2% of total turnover considering electricity as FMCG as per section 113 of Income Tax Ordinance, 2001. However, ii-. previous years the Company was not charging minimum tax in its books of accounts due to dispute with tax authorities and the decision of exemption of minimum tax to Electricity Distribution Supply Company (DISCOS) 5 pending in Economic Cabinet Committee but being prudent, in current year the Company has created a provision of the minimum tax related to previous years.
Es
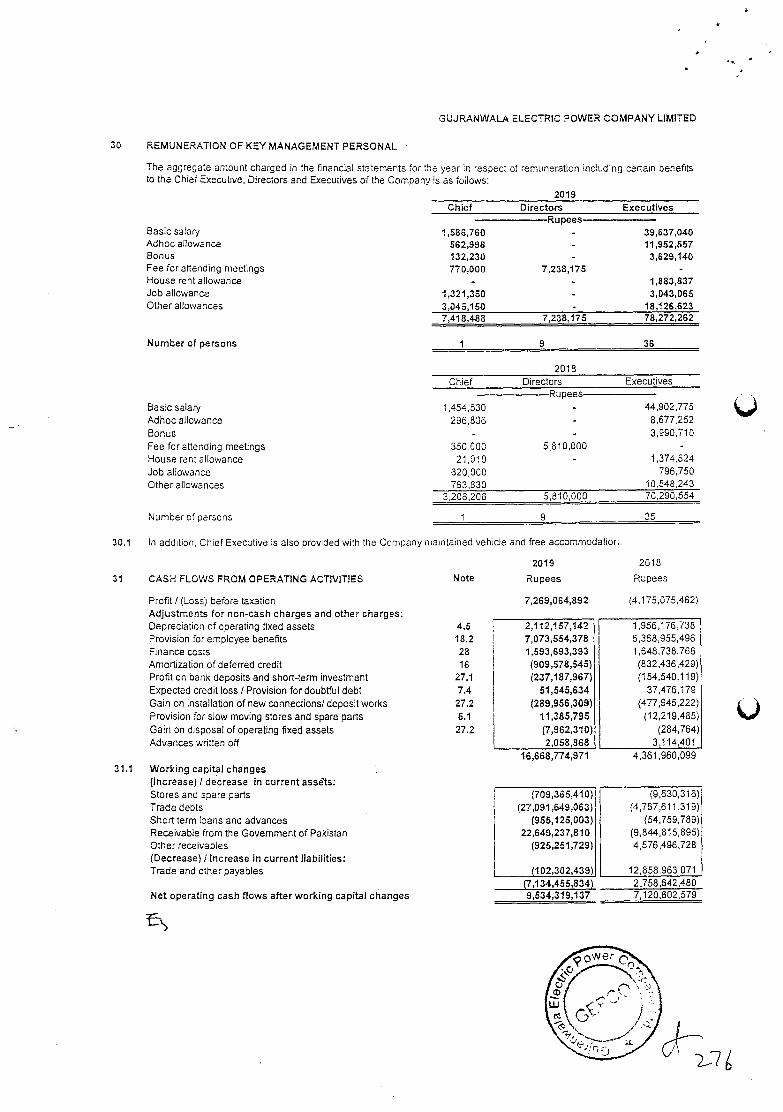
2,112,157,142 7,073,554,378 1,593,693,393 (909,578,545) (237,187,967)
51,545,634 (289,956,309)
11,385,795 (7,962,310) 2,058,868
1,956,176,738 6,368,955,496 1,648,738,766 (832,436,429) (154,540,119)
37,476,179 (477,945,222)
(12,219,485) (284,764)
3,114,401
GUJ RAN WALA ELECTRIC POWER COMPANY LIMITED
30 REMUNERATION OF KEY MANAGEMENT PERSONAL
The aggregate amount charged in the financial statements for the year in respect of remuneration including certain benefits to the Chief Executive, Directors and Executives of the Company is as follows:
Basic salary Adhoc allowance Bonus
2019 Chief Directors Executives
1586,760 562,998 132,230
Rupees 39,637,040 11,952,557
3,629,140 Fee for attending meetings 770,000 7.238,175 House rent allowance - 1,883,837 Job allowance 1,321,350 3,043,065 Other allowances 3,045,150 - 18,126,623
7,418,488 7,238,175 78,272,262
Numberof persons 1 9 36
2018 Chief Directors Executives
Basic salary Adhoc allowance Bonus
1,454,530 296,836
Rupees
Fee for attending meetings 350,000 5.810,000 House rent allowance 21,010 Job allowance 320,000 Other allowances 763,830
3,206,206 5,810,000
Number of persons 1 9
30.1 In addition, Chief Executive is also provided with the Company maintained vehicle and free accommodation.
2019 2018
31 CASH FLOWS FROM OPERATING ACTMTIES Note Rupees Rupees
44,902,775 8,677,252 3,990,710
1,374,824 796,750
10,548,243 70,290,554
35
Profit! (Loss) before taxation Adjustments for non-cash charges and other charges: Depreciation of operating fixed assets 4.5 Provision for employee benefits 18.2 Finance costs 28 Amortization of deferred credit 16 Profit on bank deposits and short-term investment 27.1 Expected credit loss / Provision for doubtful debt 7.4 Gain on installation of new connections/ deposit works 27.2 Provision for slow moving stores and spare parts 6.1 Gain on disposal of operating fixed assets 27.2 Advances written off
31.1 Working capital changes (Increase) I decrease in current assets: Stores and spare parts Trade debts Short term loans and advances Receivable from the Govemment of Pakistan Other receivables (Decrease) / Increase in current liabilities: Trade and other payables
7,269,064,892 (4,175,075,462)
16,668,774,971 4,361,960,099
(709,365,410) (27,091,649,063)
(955,125,003) 22,649,237,810
(925,251,729)
(102,302,439)
(9,630,316) (4,767,611,319)
(54,759,789) (9,844,815,895) 4,576,496,728
12,858,963,071 (7,134,455,834) 2,758,642,480
Net operating cash flows after working capital changes 9,534,319,137 7,120,602,579
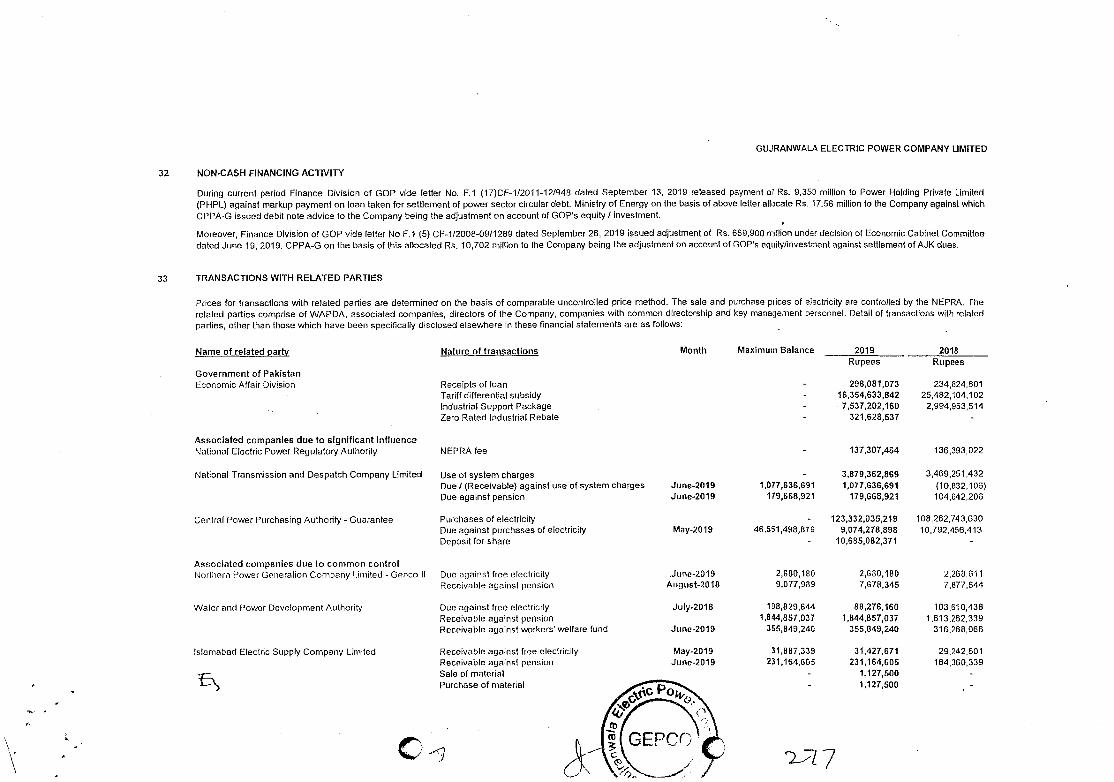
GtJJRANWALA ELECTRIC POWER COMPANY LIMITED
32 NON-CASH FINANCING ACTIVITY
During current period Finance Division of GOP vide letter No. F.1 (17)CF-1/2011-12/948 dated September 13, 2019 released payment 0? Rs. 9,35'3 million to Power Holding Private Limited (PHPL) against markup payment on loan taken for settlement of power sector circular debt. Ministry of Energy on the basis of above letter allocate Ru. 17.56 million to the Company against which CPPA-G issued debit note advice to the Company being the adjustment on account of GOP's equity I investment.
Moreover, Finance Division of GOP vide letter No F.1 (5) CF-1/2008-09/1289 dated September 26, 2019 issued adjustment of Ps. 669,900 million under decision of Economic Cabinet Committee dated June 19, 2019. CPPA-G on the basis of this allocated Rs. 10,702 million to the Company being the adjustment on account of GOP's equity/investment against settlement of AJK dues.
33 TRANSACTIONS WITH RELATED PARTIES
Prices for transactions wilh related parties are determined on the basis of comparable uncontrolled price method. The sale and purchase prices of electricity are controlled by the NEPRA. The related parties comprise of WAPDA, associated companies, directors of the Company, companies with common directorship and key management personnel. Detail of transactions with related parties, other than those which have been specifically disclosed elsewhere in these financial statements are as follows:
Name of related party Nature of transactions Month MaxImum Balance 2019 2018 Rupees Rupees
Government of Pakistan Economic Affair Division Receipts of loan 298,081,073 234,824,601
Tariff differential subsidy 16,354,633,842 25,482,104,102 Industrial Support Package 7,537,202,160 2,994,953,514 Zero Rated Industrial Rebate 321,628,537 -
Associated companies due to significant influence National Electric Power Regulatory Authority NEPRA fee 137,307,464 136,393,022
National Transmission and Despatch Company Limited Use of system charges 3,879,362,869 3,469,251,432 Due/ (Receivable) against use of system charges June-2019 1,077,636,691 1,077,636,691 (10,832,106) Due against pension June-2019 179,668,921 179,668,921 104,642,206
Central Power Purchasing Authority - Guarantee Purchases of electricity - 123,332,035,219 108,282,743,630 Due against purchases of electricity May-2019 46,551,498,976 9,074,278,898 10,792,456,413 Deposit for share 10,685,082,371 -
Associated companies due Ia common control Northern Power Generation Company limited - Genco II Due against free electricity .June-2019 2,680,180 2,680,180 2,268,611
Receivable against pension Aug ust-20 18 9,077,989 7,678,345 7,877,644
Water and Power Development Authority Due against tree electricity July.2018 198,829,644 88,276,160 103,610,438 Receivable against pension 1,844,857,037 1,844,857,037 1,613,262,339 Receivable against workers' welfare fund June-2019 355,849,240 356,849,240 316,288,066
lslamabad Electric Supply Company Limited Receivable against free electricity May-2019 31,887,339 31,427,671 29,242,601 Receivable against pension June-2019 231,164,695 231,164,605 164,360,339 Sale of material 1,127,500 - Purchase of material 1,127,500
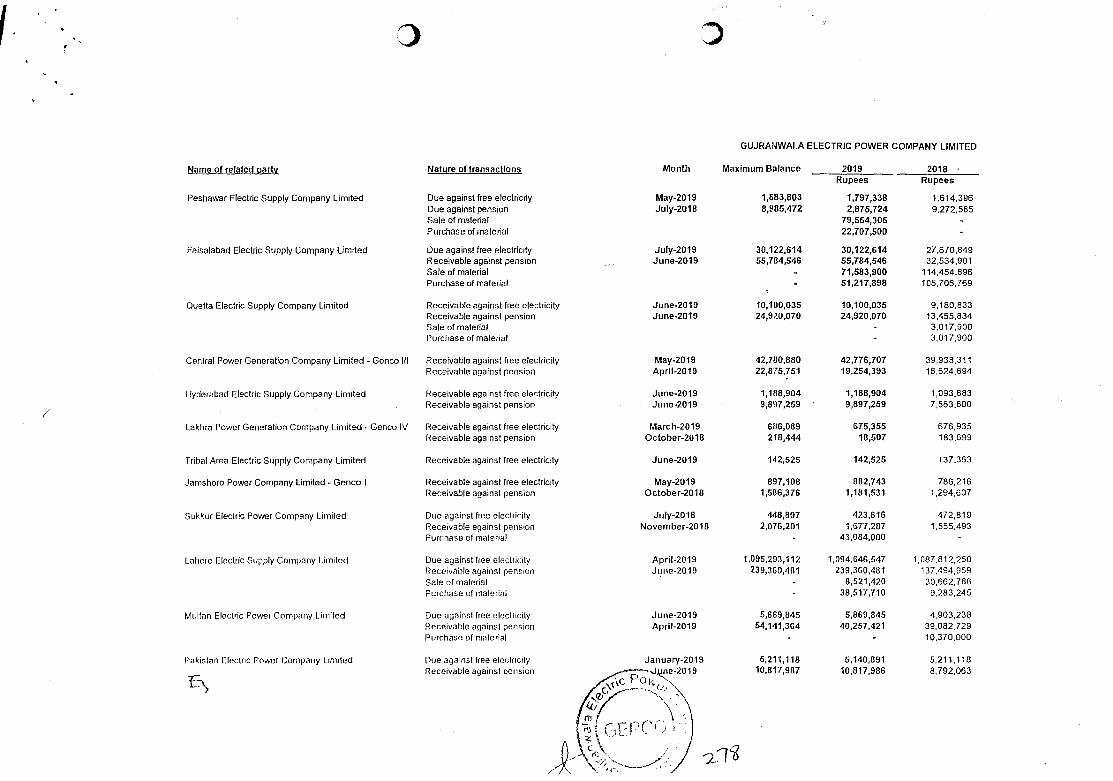
Due againsl free electricity Receivable against pension Purchase of material
Due against tree electricity Receivable against pension
January-20 19 :-'--'•-Jj,ine-2019
0
-
June-2019 5,869,845 April-2019 54,141,364
5,211,118 10,817,987
GUJRAiWALA ELECTRIC POWER COMPANY LIMITED
Name of related party
Peshawar Electric Supply Company Limited
Faisalabad Electric Supply Company Limited
Quetta Electric Supply Company Limited
Central Powor Generation Company Limited Gonco Ill
Hyderabad Electric Supply Company Limited
Lakhra Power Generation Company Limited - Gonco IV
Tribal Area Electric Supply Company Limited
Jamshoro Power Company Limited.- Genco I
Sukkur Electric Power Company Limited
[chore Electric Supply Company Limited
Mijitan Electric Power Company Limited
Pakistan Electric Power Company Limited
Nature of transactions
Due against free electricity Due against pension Sale of material Purchase of material
Due against free electricity Receivable against pension Sale of material Purchase of material
Receivable against free electricity Receivable against pension Sale of material Purchase of material
Receivable against free electricity Receivable against pension
Receivable against free electricity Receivable against pension
Receivable against free electricity Receivable against pension
Receivable against free electricity
Receivable against tree electricity Receivable against pension
Due against free electricity Receivable against pension Purchase of malarial
Due against tree electricity Receivable against pension Sale of material Purchase of material
Month Maximum Balance
May-2019 1,683,803 July-2018 8,985,472
July-2019 30,122,614 June-2019 55,784,546
June-2019 10,100,035 June-2019 24,900,070
May-2019 42,7110,880 April-2019 22,875,751
June-2019 1,1118,904 June-2019 9,897,259
March-2019 686,089 October-2018 218,444
June-2019 142,525
May-2019 897,108 October-2018 1,586,376
July-2018 448,897 Novernber-2018 2,076,201
April-2019 1,095,293,112 Juiie-2019 239,360,4131
2019 Rupees
1,797,338 2,875,724
79,554,305 22,707,500
30,122,614 55,784,546 71,583,900 51,217,898
10,100,035 24,920,070
42,776,707 19,254,393
1,188,904 9,897,259
675,355 18,507
142,525
882,743 1,181,531
423,616 1,677,287
43,084,000
1,094,646,547 239,360,481
8,521,420 313,517,710
5,869,845 40,257,421
5.140,89 1 10,817,986
2018 - Rupees
1,614,396 9,272,585
27,670,849 32,534,901
114,454,896 105,705,769
9,180,833 13,455,834 3,017,900 3,017,900
39,938,311 16,624,694
1,093,683 7,583,800
676,935 183,699
137,363
786,216 1,294,607
472,819 1,555,493
1, 087.8 12,250 137,494,969 30662,786 9283,245
4903,238 39,082,729 10,370.000
5,211,118 8,792,063
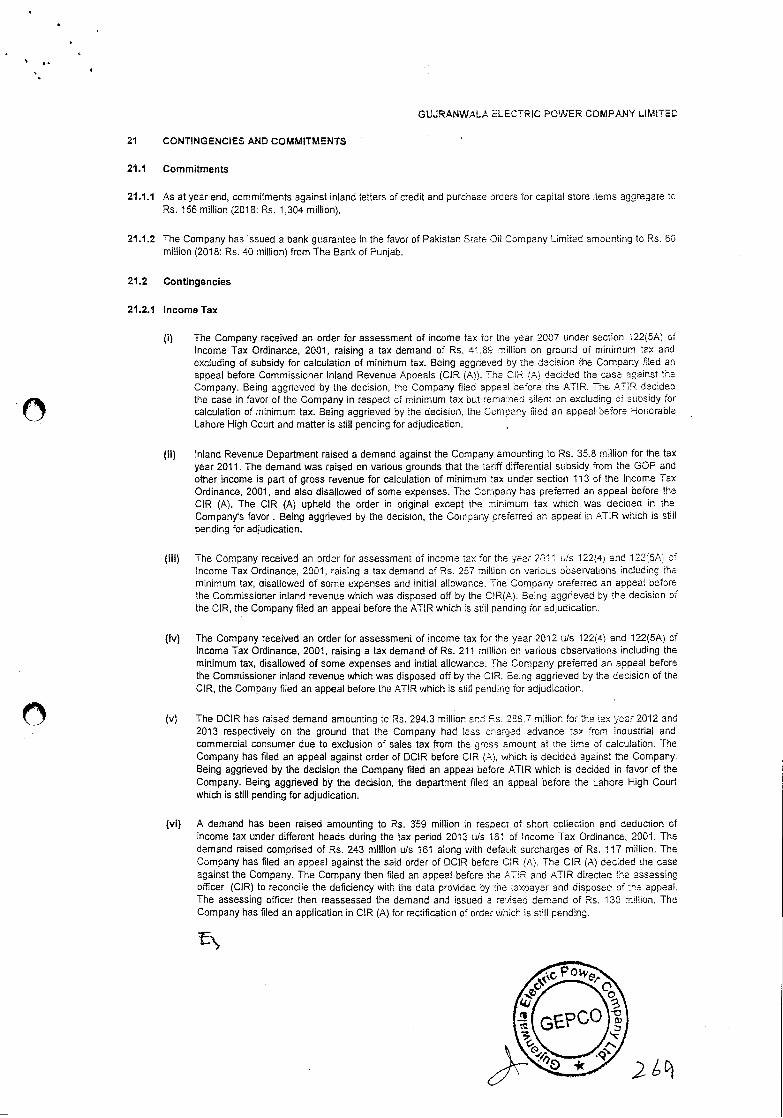
GUJRANWALA BLECTRIC POWER COMPANY LIMiTED
21 CONTINGENCIES AND COMMITMENTS
21.1 Commitments
21.1.1 As at year end, commitments against inland letters of credit and purchase orders for capital store items aggregate to Rs. 156 million (2018: Rs. 1304 million).
21.1.2 The Company has issued a bank guarantee in the favor of Pakistan State Oil Company Limited amounting to Rs. 63 million (2018: Re. 40 million) from The Bank of Funjab.
21.2 Contingencies
21.2.1 Income Tax
(i) The Company received an order for assessment of income tax for the year 2007 under section 122(5A) of Income Tax Ordinance, 2001, raising a tax demand of P.s. 41.89 million on ground of minimum tax and excluding of subsidy for calculation of minimum tax. Being aggrieved by the decision the Company fled an appeal before Commissioner Inland Revenue Appeals (CIR (A)). The dR (A decided the case against tne Company. Being aggrieved by the decision, the Company flied appeal before the ATIR. The ATiR decidea the case in favor of the Company in respect of minimum tax but ernained silent on excluding of subsidy for calculation of minimum tax. Being aggrieved by the decision, the Comoany filed an appeal before Honorable Lahore High Court and matter is still pending for adjudication.
(H) Inland Revenue Department raised a demand against the Company amounting to Rs. 35.8 million for the tax year 2011. The demand was raised on various grounds that the tariff differential subsidy from the GOP and other income is part of gross revenue for calculation of minimum tax under section 113 of the Income Tax Ordinance, 2001, and also disallowed of some expenses. The Company has preferred an appeal before the CIR (A). The CIR (A) upheld the order in original except the minimum tax which was decioed in the Company's favor . Being aggrieved by the decision, the Company preferred an appeal in ATIR which is still pending for adjudication.
(iii) The Company received an order for assessment of income tax for the year 2011 u/s 122(4) and 122(5A) of Income Tax Ordinance, 2001, raising a tax demand of Rs. 257 million cit various observations including ins minimum tax, disallowed of some expenses and initial allowance. The Company preferred an appeal before the Commissioner inland revenue which was disposed off by the CtR(A). Being aggrieved by the decision of the CIR, the Company filed an appeal before the ATIR which is sthl pending for adjudication.
(iv) The Company received an order for assessment of income tax for the year 2012 u/s 122(4) and 122(5A) ef Income Tax Ordinance, 2001, raising a tax demand of Rs. 211 million on various observations including the minimum tax, disallowed of some expenses and initial allowance. The Company preferred an appeal before the Commissioner inland revenue which was disposed off by the dR. Being aggrieved by the decision of the CIR, the Company filed an appeal before the AT!R which is still pending for adjudication.
(v) The DCIR has raised demand amounting to Re. 294.3 million and Fs. 288.7 million for the tax year 2012 and 2013 respectively on the ground that Ihe Company had less onarged advance tax from industrial and commercial consumer due to exclusion of sales tax from the gross amount at the time of calculation. The Company has filed art appeal against order of DClR before CIR (A), which is decided against the Company. Being aggrieved by the decision the Company filed an appeal before ATIR which is decided in favor of the Company. Being aggrieved by the decision, the department filed art appeal before the Lahore High Court which is still pending for adjudication.
(vi) A demand has been raised amounting to Rs. 359 million in respect of short collection and deduction of income tax under different heads during the tax period 2013 uis 181 of Income Tax Ordinance, 2001. The demand raised comprised of P.s. 243 million u/s 161 along with default surcharges of Rs. 117 million. The Company has filed an appeal against the said order of DCIR befcre CIR (A). The CIR (A) decided the case against the Company. The Company then filed an appeal before the ATIR and ATIR directed the assessing officer (CIR) to reconcile the deficiency with the data provided by the taxpayer and disposec of :he appeal. The assessing officer then reassessed the demand and issued a revisea demand of P.s. 130 million. The Company has filed an application in CIR (A) for rectification of order which is still pending.
G:cO!
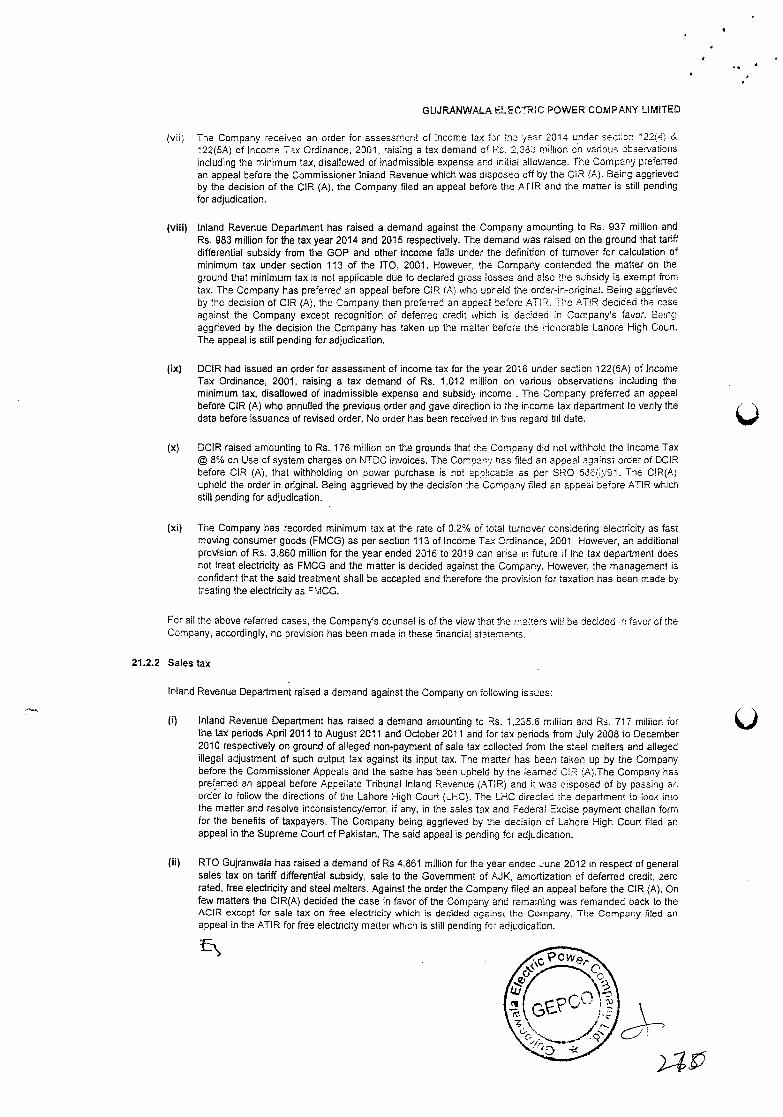
GUJRANWAL& ELECTRIC POWER COMPANY LLM1TED
(vii) The Company received an order for assessment of income tax fnr trw 'year 2314 under se,::;cn 22(4; & 122(5A) of Income Tax Ordinance, 2361, raising a tax demand of Ra. 2,383 million ort various obsert'ations including the minimum tax, disallowed of inadmissible expense and initial allowance. The Company preferred an appeal before the Commissioner Inland Revenue which was disposed off by the CiR lA). Being aggrieved by the decision of the CIR (A), the Company filed an appeal before the ATIR and the matter is still pending for adjudication.
(viii) Inland Revenue Department has raised a demand against the Company amounting to Rs. 937 million and Rs. 983 million for the tax year 2014 and 2015 respectively. The demand was raised on the ground that tariff differential subsidy from the GOP and other income falls under the definition of turnover for calculation of minimum tax under section 113 of the ITO, 2001. However, the Company contended the matter on the ground that minimum tax is not applicable due to declared gross losses and also the subsidy is exempt from tax. The Company has preferred an appeal before CIR (A) who upheld the order-in-original. Being aggrieved by the decision of CIR (A), the Company then preferred an appeal before ATlR. The ATIR decided the case against the Company except recognition of deferrec credit whicri is decided in Company's favor. Be:ng aggrieved by the decision the Company has taken up the matter before the Hcncrable Lariore High Court. The appeal is still pending for adjudication.
(ix) DCIR had issued an order for assessment of income tax for the year 2016 under section 122(5A) of Income Tax Ordinance, 2001, raising a tax demand of Rs. 1,012 million on various observations including the minimum tax, disallowed of inadmissible expense and subsidy income . The Company preferred an appeal before CIR (A) who annulled the previous order and gave direction to the income tax department to verify the data before issuance of revised order. No order has been received in this regard titi date.
(x) DCIR raised amounting to Rs. 176 million on the grounds that the Company did not withhold the Income Tax @ 8% on Use of system charges on NTDC invoices. The Comoanv has filed an appeal against order of DCIR before CIR (A), that withholding on power purchase is not Cpol:cabie as per SRO 586'i.'9l. The CIR(A) upheld the order in original. Being aggrieved by the decision the Company filed an appeal before ATIR which still pending for ad(udication.
(xi) The Company has recorded minimum tax at the rate of 0.2% of total turnover considering electricity as fast moving consumer goods (FMCG) as per section 113 of Income Tax Ordinance, 200t However, an additional provision of Rs. 3,860 million for the year ended 2016 to 2019 can arise in future if the tax department does not treat electricity as FMCG and the matter is decided against the Company. However, the management is confident that the said treatment shall be accepted and therefore the provision for taxation has been made by treating the electricity as FMCG.
For all the above referred cases, the Company's counsel is of the view that the matters will be decided n favor of the Company, accordingly, no provision has been made in these financial statements.
21.2.2 Sales tax
Inland Revenue Department raised a demand against the Company on following issues:
(I) Inland Revenue Department has raised a demana amounting to Rs. 1235.8 million and Re. 717 million for the tax periods April 2011 to August 2011 and October 2011 and for tax periods from July 2008 to December 2010 respectively on ground of alleged non-payment of sale tax ccllected from the steel melters and alleged illegal adjustment of such output tax against its input tax. The matter has been taken up by the Company before the Commissioner Appeals and the same has been upheld by the learned CIR A).The Company has preferred an appeal before Appeilate Tribunal Inland Revenue (ATlR) and it was disposed of by passing Cr'. order to follow the directions of the Lahore High Court (LHC). The LHC directed the department to look nrc the matter and resolve inconsistency/error, if any, in the sales tax and Federal Excise payment challan form for the benefits of taxpayers. The Company being aggrieved by the decision of Lahore High Court filed an'. appeal in the Supreme Court of Pakistan. The said appeal is pending for adjudication.
(ii) RTO Gujranwala has raised a demand of Rs 4,861 million for the year ended June 2012 in respect of general sales tax on tariff differential subsidy, sale to the Government of AJK, amortization of deferred credit, zero rated, free electricity and steel melters. Against the order the Company filed an appeal before the CIR (A). On few matters the ClR(A) decided the case in favor of the Company and remaining was remanded back to the ACIR except for sale tax on free electricity which is decided against the Company. The Company filed an appeal in the ATIR for free electricity matter which is still pending for adjudication.
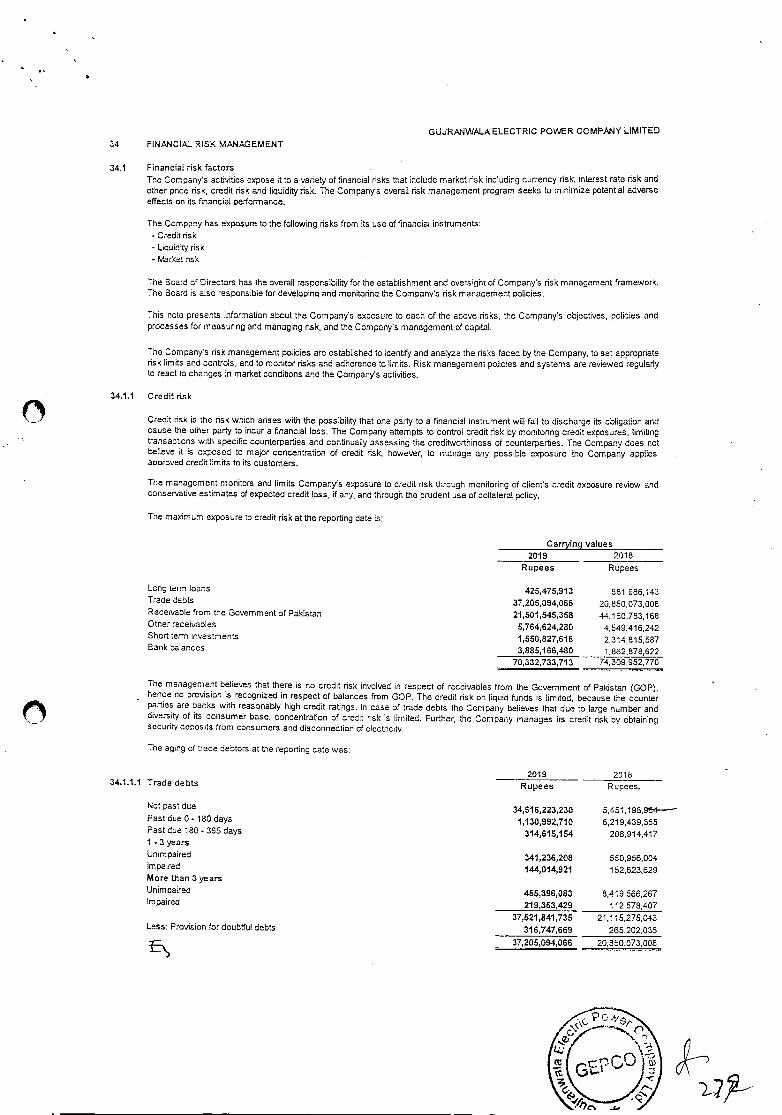
GU.JRANWALA ELECTRIC POWER COMPANY LIMITED
34 FINANCIAL RISK MANAGEMENT
34.1 Financial risk factors The Company's activities expose it to a variety of financial risks that include market risk including currency risk, interest rate risk and other price risk, credit risk and liquidity risk. The Company's overall risk management program seeks to minimize potential adverse effects on its financial performance.
The Company has exposure to the following risks from its use of financial instruments: - Credit risk - Liquidity risk - Market risk
The Board of Directors has the overall responsibility for the establishment and oversighi of Company's risk management framework. The Board is also responsible for developinq and monitoring the Company's risk management policies.
This note presents information about the Company's exposure to each of the above risks, the Company's objectives, policies and processes for measuring and managing risk, and the Company's management of capital.
The Company's risk management policies are established to identify and analyze the risks faced by the Company, to Set appropriate risk limits and controls, and to monitor risks and adherence to limits. Risk management policies arid systems are reviewed regularly to react to changes in market conditions and the Company's activities.
34.1.1 Credit risk
Credit risk is the nsk which arises with the possibility that one party to a financial instrument will fail to discharge its obligation and cause the other party to incur a financial loss. The Company attempts to control credit risk by monitoring credit exposures, limiting transactrcns with specific counterparties and continually assessing the credibeorthiness of counterparties. The Company does not believe S is exposed to mator concentration of credit risk, however, to manage any possible exposure the Company applies approved credit limits to its customers.
The management monitors and limits Company's exposure to credit risk through monitoring of clienfs credit exposure review and conservative estimates of expected credit loss, if an'], and through the prudent use of collateral pclicy.
The maximum exposure to credit risk at the reporting date is:
Carrying values 2019 2018
Rupees Rupees
Long term loans 425,475,913 581,986,143 Trade debts 37,205,094,066 20,850,073,008 Receivable from the Govemrnent of Pakistan 21,501,545,368 44,150,783,168 Other receivables 5,764,624,280 4,549,416,242 Short term Investments 1,550,827,616 2,314,815,587 Bank balances 3,886,166,480 1,862,878,622
70,332,733,713 74,309,952,770
The management believes that there is no credit risk involved in respect of receivables from the Government of Pakistan (GOP), hence no provision is recognized in respect of balances from GOP. The credit risk on liquid funds is limited, because the counter parties are banks with reasonably high credit ratings. In case of trade debts the Company believes that due to large number and diversity of its consumer base, concentration of credit risk is limited. Further, the Company manages its credit risk by obtaining security deposits from consumers and disconnection of electricity.
The aging of trade debtors at the reporting date was:
34.1.1.1 Trade debts
Not past due
2019 2015 Rupees
34,916,223,230
Rupees.
5,451 ,196,9 PastdueO-leodays 1,130,992,710 6,219,439,355 Past due 180-365 days 314,616,154 208,914,417 1 -3 years Unimpaired 341,236,208 550,956,004 Impaired 144,014,921 152,623,629 More than 3 years Unimpaired 455,396,083 8,419,566,267 Impaired 219,363,429 112,578,407
37,521,841,735 21,115,275,043 Less: Provision for doubtful debts 316,747,669 265,202,035
37,206,094,066 20,850,073,008
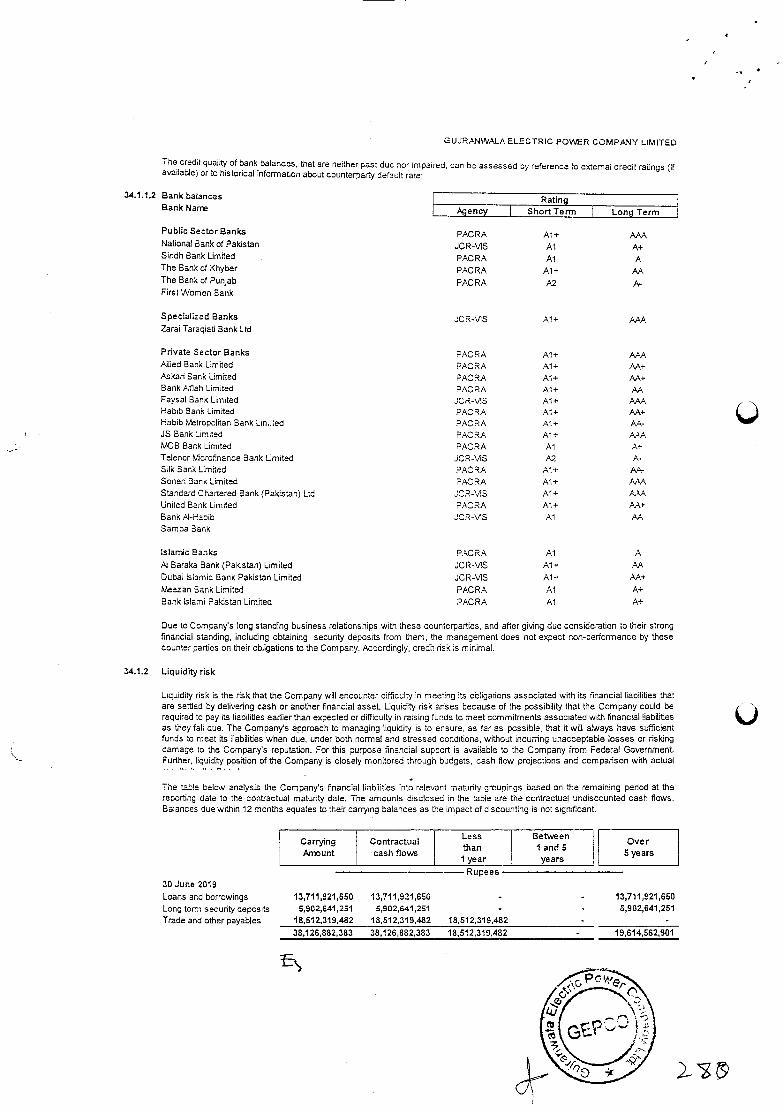
GUJRAN WALA ELECTRIC POWER COMPANY LIMITED
The credit quality of bank balances, that are neither past due nor impaired, can be assessed by reference to external credit ratings (f availatse) or to historical information about counternarty default rate:
34,1.1.2 Bank balances Bank Nan
Rating Agency ShortTerm Long Term
Public Sector Banks PACRA Al + National Bank of Pakistan JCR-V1S Al A+ Sindh Bank Umited PACRA Al A The Bank of Khyber PACRA Al + M The BankofPunjab PACRA First Women Bank
Specialized Banks JCR-AS Al+ AM. Zarai Taraqiati Bank Ltd
Private Sector Banks PACRA Al+ AAA Allied Bank Limited PACRA Al+ Askari Bank Umited PACRA Al+ AA+ Bank /'ilflah Limited PACRA Al+ Faysal Bank Limited JCRV1S Ai+ AAA Habib Bank Limited PACRA Al+ Habib Metropolitan Bank Lin..led PACRA A1+ A- IS Bank Limited PACRA Al+ AA MCB Bank Limited PACRA Al Telerror Microfinance Bank Limited JCR-U1S A2 Silk Bank Limited PACRA A+ A. Soneri Bank Limited PACRA Ai+ Standard Chartered Bank (Pakistan) Ltd JCR-'elS Al+ United Bank Limited PACRA Al+ Bank Al-Habib JCR-ilS Al AA Samba Bank
lslanic Banks PACRA Al A Al Baraka Bank (Pakistan) Limited JCR-U1S Al+ AA Dubai toamic Bank Pakistan Limited JCR-V15 Al+ Meezan Bank Limited PACRA Al A+ Bank Islami Pakistan Limited PACRA Al
Due to Company's long standing business relationships with these counterparties, and after giving due consideration tO their strong financial standing, including obtaining security deposits from them, the management does not expect non-performance by these counter parties on their obligations to the Company. Accordingly, credit risks minimal.
34.1.2 Liquidity risk
Liquidity risk is the risk that the Company will encounter difficulty in meeting its obligations associated with its itnancial liabilities that are setited by delivering cash or another financial asset. Liquidity risk arises because of the possibility that the Company could be required to pay its liabilities earlier than expected or difficulty in raising fur.os to meat commitments associated with financial liabilities as they fall due. The Company's approach to managing liquidity is to ensure, as far as possible, that it will always have sufficient funds to meet its liabilities when due, under both normal and stressed conditions, without incurring unacceptable losses or risking damage to the Company's reputation. For this purpose financial support is available to the Company from Federal Government. Further, liquidity position of the Company is closely monitored through budgets, cash flow projections and comparison with actual
The table below analysis the Company's financial liabilities into relevant maturity groupings based on the remaining period at the reporting date to the contractual maturity date. The amounts disclosed in the table are the contractual undiscounted cash flows. Balances due within 12 months equates to their carrjirtg balances as the impact of discounting is not significant.
Carrying Contractual Less Between
Over ,4nunt cash ftowe
than 1 year
1 and 5 years
5 years
30 June 2019 Rupees
Loans and borrowings 13,711,921,650 13,711,921,650 13,711,921,650 Long term security deposits 5,902,641,281 5,902,841,251 5,902,641,251 Trade and other payabjes 18,512,319,482 18,512,319,482 18,512,319,482
38,126,882,383 38,126,882,383 18,512,319,482 19,614,562,901
0
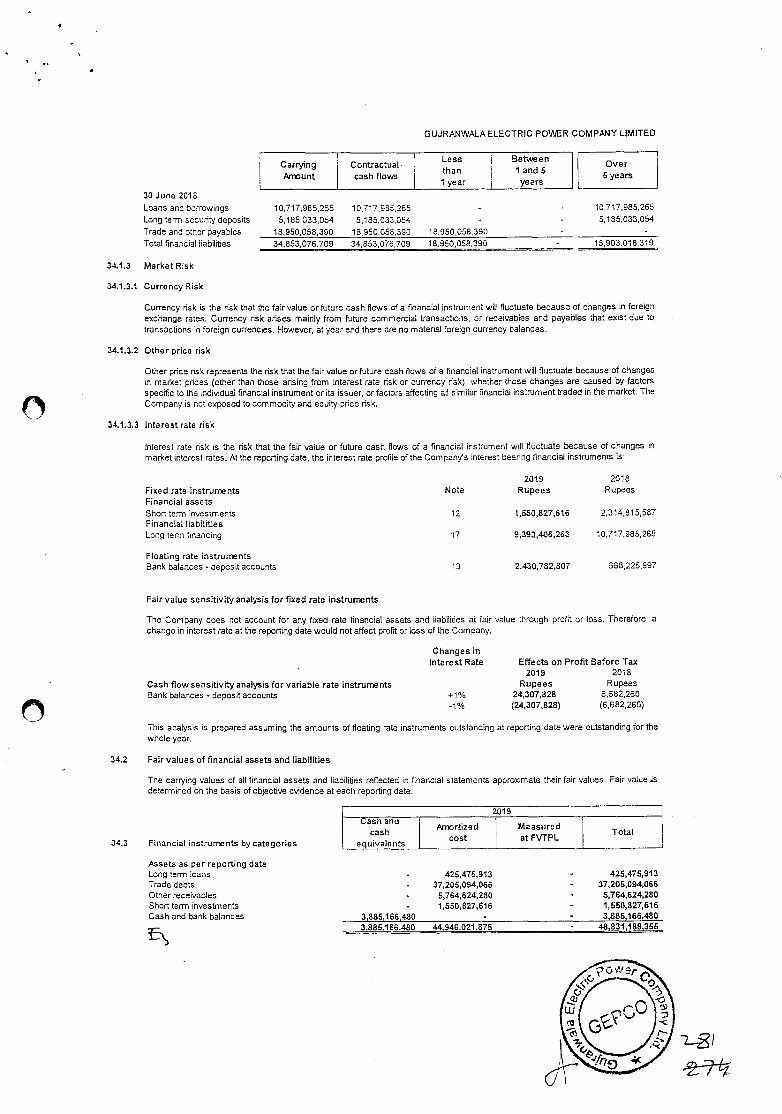
GUJRAN WALA ELECTRIC POWER COMPANY LIMITED
Carrying Amount
Contractual- cash flows
Less than 1 year
Between I and S years
Over 5 years
10,717,985,265 10,717,985,265 10,717,985,265
5,185,033054 5,185,033,054 5,185,033,054
18950058,390 18,950,058,390 18950,058390 34853,076,709 34,853,076,709 18,950,058,390 15,903.018,319
30 June 2018 Loans and borrowings Long tern, security deposits Trade and other payable.s Total financial Iiabiities
341.3 Market Risk
34.1.3.1 Currency Risk
Currency risk is the risk that the fair value or future cash tows of a financial instrument will fluctuate because of changes in foreign exchange rates. Currency risk arises mainly from future commercial transactions, or receivables and paysbies that exist due 10 transactions in foreign currencies. However, at year end there are no material foreign currency balances.
34.1.3.2 Other price risk
Other price risk represents the nsk that the fair value or future cash flows of a financial instrument will fluctuate because of changes in mariset prices (other than those arising from interest rate risk or currency risk), whether those changes are caused by factors specific to the individual financial instrument or its issuer, or factors affecting all similar financial instrument traded in the market The Company is nct exposed to commodity and equity price risk,
34.1.3.3 Interest rate risk
Interest rate risk is the risk that the fair value or future cash flows of a financial irstrument will fluctuate because of changes in market inferest rates. At the reporting date, the interest rate profile of the Company's interest bearing financial instruments is:
2019 2018 Fixed rate instruments Financial assets
Note Rupees Rupees
Short term investments Financial liabilities
12 1,550,827,616 2,314,815,587
Long tern, financing -
Floating rate instruments
17 9,393,406,263 10,717,985,265
Bank balances - deposit accounts
Fair value sensitivity analysis for fixed rate instruments
13 2,430,782,307 368,225,997
The Company does not account for any fixed rate financial assets and liabilities at fair value through profit or loss. Therefore, a change in interest rate at the reporting date would not affect profit or loss of the Company.
Changes in Interest Rate Effects on Profit Before Tax
2019 2018
Cash flow sensitivity analysis for variable rate instruments Rupees Rupees Bank balances - deposit accounts +1% 24,307,828 6,682,260
-1% (24,307,828) (6,682,260)
This analysis is prepared assuming the amounts of floating rate instruments outstanding at reporting date were outstanding for the whole year.
34.2 Fair values of financial assets and liabilities
The carrying values of alt financial assets and liabilities reflected in flnancial statements approximate their fair values. Fair value is determined on the basis of objective evidence at each reporting date.
34.3 Financiat instruments by categories
2019 Cash and
cash equivalents
Amortized cost
Measured at FVTPL
Total
Assets as per reporting date Long term loans 425,475,913 Trade debts 37,205,094,066 Other receivables 5,764,624,280 Short term investments - 1,550,827,616 Cash and bank balances 3,885,166,4.80
3,885.166,480 48:946.021,875
425,475,913 37,205,094,066 5,764,624,280 1,550,827,616 3,885,166,480
48,831188,355
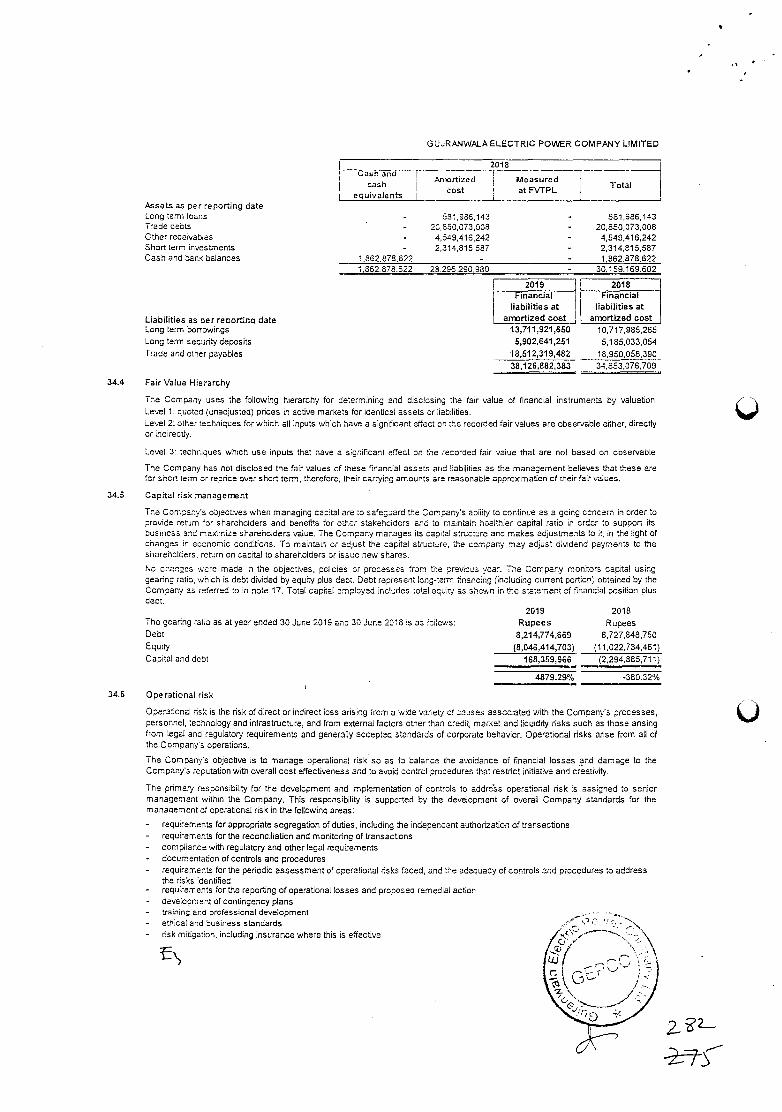
Cash2018
cash [ Anroi'tized Measured
equivalents cost at F\,TPL Total
GUJRANWALA ELECTRIC POWER COMPANY LIMITED
S
Assets as per reporting date Long term loans 581986,143 Trade debts 20850073008 Other receivables 4,549416,242 Short term investments - 2,314,815,587 Cash and bank balances 1,862,878,622
1.862878.622 28 296.290.980
581.986,143 20,850,073,008
4,549,416,242 2,314,815,587 1,862.878,622
30, 159.169. 602
Liabilities as oer reoortin date Long term borrowings Long term security deposits Trade ar,d other payables
2019 2018 Financial Financial
liabilities at liabilities at anrtized cost an'rtized cost
13,711,921,650 10,717,985,265 5,902,641,251 5,185,033,054
18,512,319,4.82 18,950,058,390 38,126,882,383 34,853,076,709
34.4 Fair Value Hierarchy
The Company uses the following hierarchy for determining and disclosing the fair value of financial instruments by valuation Level 1: quoted (unadjusted) prices in active markets for identical assets or liabilities. Level 2: other techniques for which all inputs which have a significant effect on the recorded fair values are observable eilher, directly or indirectly.
Level 3: techniques which use inputs that have a ivgnitcant effect on the recorded fair value that are not based on observable
The Company has not disclosed the fair values of these financial assets and liabilities as the management believes that these are for short term or repilce over short term, therefore, their carrying amounts are reasonable approximation of their fair values.
34.5 Capital risk management
Tne Company's objectives when managing capital are to safeguard the Company's ability to continue as a going concern in order to provide return for shareholders and benefits for other stakeholdera and to maintain healthier capital ratio in order to supPort its business and maivrnizs shareholders value. The Company manages its oapitel structure and makes adjustments to it, in the light of changes n economic conditions. To maintain cr adjust the capital structure, the company may adjust dvidend payments to the shareholders, return on capital to shareholders or issue new shares.
No cnsr.ges were made in the objectives, policies or procssses from the previous "ear. The Company monitors capital using gearing ratio, which is debt divided by equity plus debt. Debt represent tang-term financing (including current porticr obtained by the Company as referred to in note 17. Total capital employed includes total equity as shown in the statement of financial position plus deot.
The geanng ratio as at year ended 30 June 2019 aria 30 June 2018 is as foilows: 2019
Rupees 2018
Rupees Debt 8,214,774669 8,727,848,750 Equity (8,046,414,703) (11,022,73.4,461) Capital and debt 168,359,966 (2,294,885,711)
4879.29% -380.32%
34,6 Operational risk
Opersoonal risk is the risk of direct or indirect loss arising from a wide variet'j of osuses associated with the Company's processes, personnel, technology and infrastructure, and from external factors other than credit, market and liquidity risks such as those arising from legal and regulatory requirements and generally accepted standards of corporate behavior. Operational risks arise from all of the Company's operations,
The Company's Objective is to manage operational risk so as to balancs the avoidance of financial losses and dsmage to the Company's reputation with overall cost effectiveness and to avoid control procedures that restrict initiative and creativity.
The prinlsnj responsibility for the development and implementation of controls to addre'ss operational risk is assigned to senior management within the Company. This responsibility is supported by the development of overall Company standards for the rnanaoement of operational risk in the following areas:
- requirements for appropriate segregation of duties, including the independent authorization of transactions - requirements for the reconciliation and monitoring of transactions - compliance with regulatory and other legal requirements - documentation of controls and procedures - requirements for the periodic assessment of operational risks faced, and the adequacy of controls and procedures to address
the risks identified - requirements for the reporting of operational tosses and proposed remedial action - development of contingency plans - training and professional development - ethical and business standards - risk mitigation, including insurance where this is effective
22_
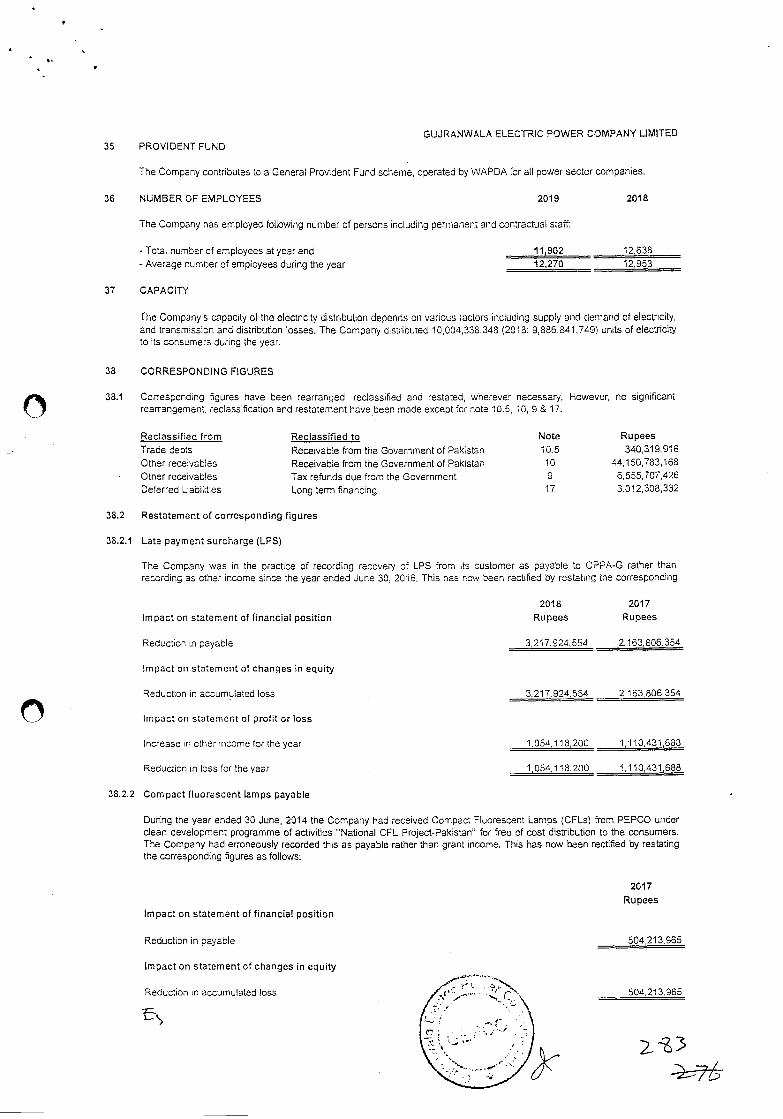
GUJRANWALA ELECTRIC POWER COMPANY LIMITED 35 PROVIDENT FUND
The Company contributes to a General Provident Fund scheme, operated by WAPDA for all power sector companies.
36 NUMBER OF EMPLOYEES 2019 2018
The Company has employed following number of persons including permanent and contractual staff:
- Total number of employees at year end
- Average number of employees during the year
11,902 12.638
12,270 12,953
37 CAPACITY
The Company's copaaty of the electricity distribution depends on various (actors including supply and demond of electricity, and transmission and distribution losses. The Company distributed 10,004,338,348 (2018: 9,886,841,749) units of electncity to its consumers during the year.
38 CORRESPONDING FIGURES
38.1 Correspcnding figures have been rearranged, reclassified and restated, wherever necessary. However, no significant rearrangement, reclassification and restatement have been made except for note 10.5, 10, 9 & 17.
Reclassified from Reclassified to Note Rupees
Trade debts Receivable from the Government of Pakistan 10.5 340,319,916
Other receivables Receivable from the Government of Pakistan 10 44,150,783,168
Other receivables Tax refunds due from the Government 9 6,555,707,426
Deferred Liabilities Long term financing 17 3012,308,332
38.2 Restatement of corresponding figures
38.2.1 Late payment surcharge (LPS)
The Company was in the practice of recording recovery of LPS from its customer as payable to CPPA-G rather than recording as cther income since the year ended June 30, 2016. This has nc
Impact on statement of financial position
been rectified by restating the corresponding
2018 2017
Rupees Rupees
Reduction in payable 3.217,924,554 2.163.806.354
Impact on statement of changes in equity
Reduction in accumulated loss 3.217,924,554 2,163,806,354
Impact on statement of profit or loss
Increase in other income for the year 1.054,118,200 1,110,431,688
Reduction in loss for the year 1,054,115,200 1,110,431,688
Compact fluorescent lamps payable
During the year ended 30 June, 2014 the Company had received Compact Fluorescent Lamps (CFLs) from PEPCO under dean development programme of activities "National CFL Project-Pakistan" for free of cost distribution to the consumers. The Company had erroneously recorded this as payable rather than grant income. This has now been rectified by restating the corresponding figures as follows:
2017
Rupees
Impact on statement of financial position
Reduction ri payable
Impact on statement of changes in equity
Reduction in accumulated loss
504,213,965
504,213.965
38.2.2
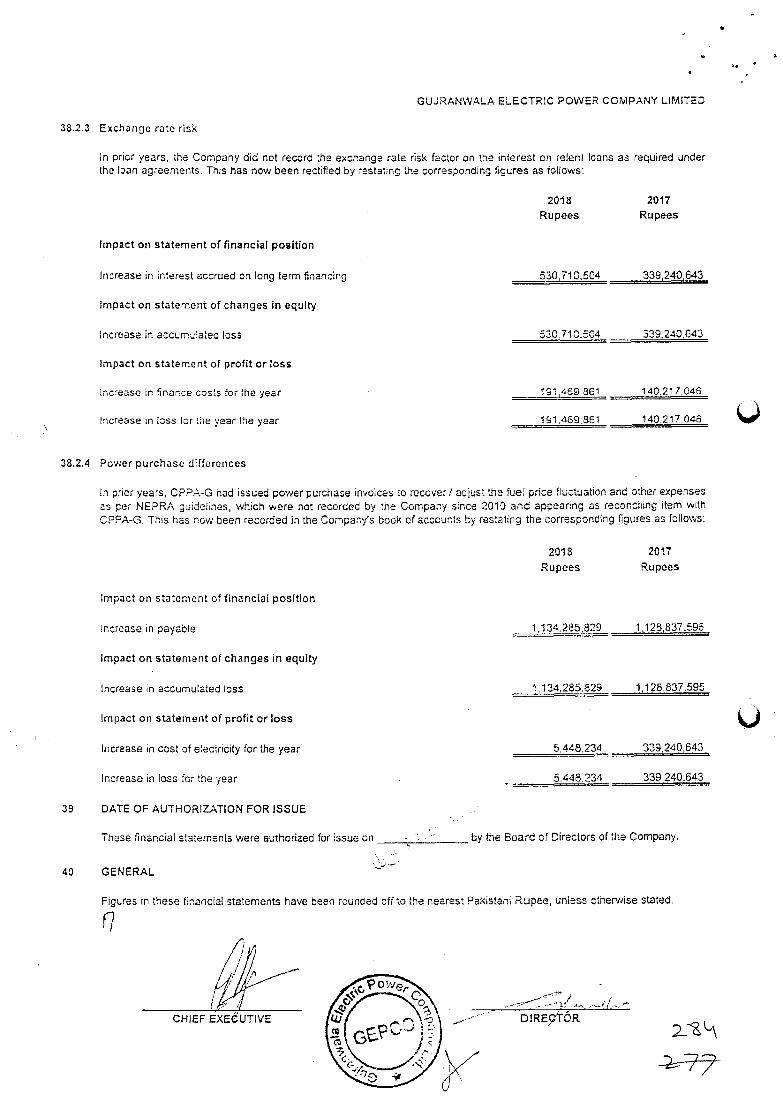
CHIEF EXEUTIVE
GUJRANWALA ELECTRIC POWER COMPANY LIMITED
38.2.3 Exchange rate risk
In prier years, the Company did not record the exchange rate risk factor on the interest on relent loans as required under the loan agreements. This has now been rectified by restating the corresponding figures as follows:
Impact on statement of financial position
2018 Rupees
2017 Rupees
Increase in interest accrued on tong term financing 53Q71O,504 339,240643
Impact on statement of changes in equity
Increase in accumulated loss 530,710,504 339,240,643
Impact on statement of profit or loss
Increase in finance costs for the year 191469 361 140,217.046
Increase in loss for the year the year 191.469,361 140.217.046
33.2.4 Power purchase differences
In prier years, CPPA-G had issued power purchase invoices to recover / adlust the fuel price fiuctution and other expenses as per NEPRA guidelines which were not recorded by the Company since 2013 and appearing as reconciling item with CFPA-G. This has now been recorded in the Company's bock of accounts by restating the corresponding figures as follows:
Impact on statement of financial position
Increase in payable
Impact on statement of changes in equity
Increase n accumulated toss
Impact on statement of profit or loss
Increase in cost of electricity for the year
Increase in loss for the year
39 DATE OF AUTHORIZATION FOR ISSUE
These flnancial statements were authorized for issue on
40 GENERAL
2013 2017
Rupees Rupees
1,134.285,629 1,126,837.595
1,134,285,829 1,125837,595
5,448.234 339,240.643
5.448.23 339.240.643
by the Board of Directors of the Company.
Figures in these financial statements have been rounded off to the nearest Pakistani Rupee, unless otherwise stated.
Gujranw ala Electric Power Company
(GEPCO)
Guj ranwa a
Employees' Defined Benefit 1'lans
Actuarial Valuation Report as at 30.06.2 020
LAS 19(ftev 2011)
C-5 Otticers Colony [Old), Zarar Shaheed Road, Lahore Cantoment-54810, Pakistan Tel: +92 [42) 36624520, Cell: +92 313 9753755
Email: [email protected]
(,..:(( PeP: .vHt
.\ctuarial Valuation Rcp . \-P) l\.2t)I
iabie u;
I cr IC 2
2 Complia nec with I'rofessional Guidance 2
3 Scope ui \VorI. 2
4 Data and In formation 3
5 \aluation Assumptions 4
6.1 Discount Rate 4
6.2 Expected Salary Increase 4
6.7 Pens ion I ndcxat ion Rate 5
6.4 J\' erate Medical Cost S
6.5 EIcctticit Indcxation Rate 5
66 \IuIi.aljt\ Rates
6.7 \\ ithdraval Rates 5
6 Actuarial Calculation letliod 5
7 Sum ma ry of the Actuarial Results 6
Annexure A 7
Annexure 13 15
:\nflexure C 19
Annexure D 21)
A\V ASSC .\car
• :iles r)etinctI u&': :d Oaus
'v UiI -,
ihis ;\cluLlriLli \ OL Oh ih)OL hiicU O U !.ort) has been preparci i the
request el fjurane. aia i.lieetric '.er Foin:anv GtiPCC ) cscnt foe Acuarial Ii dbies lr
G1iPCO's. kmpi'ees Defined Benefit Plans, as at June 30, 2020. to be incorporated in its Financial Statements. as required under international Accounting Standards.
\\'e have conducted Actuarial Valuation ol'the following Benefit Plans ofièred by GEPCO to its
cm plo\ees:
1) Pension Scheme 2) Free Elect ricitv Scheme
3) Post-Retirement Medical l3enciits
4) Leave Encashment Scheme
GFPCO pro ides Benefits to the employees as per the Benefit Rules, shown in Plan Provision
Section.
All our Actuarial calculations are based on the data provided by GEPCO's management in the written farm and through oral communication.
Ihis Report is solely or the use of the Management and the Auditors of GEICO. it may not he modi fled. incorporated into or used in other material, sold or otheivise provided, in whole or in part. to any other person or entit\. without our permission.
It is requested that GEPCO Management may kindly notify us promptly after receipt of this Report. i lit is a arc ui any additional in formation that may affect the results of this Report.
2 Compliance with Professional Guidance
11 is Report complies v ith the applicable Actuarial Standards issued by Pakistan Society of Actuaries (PSoA) as lallo\\ s:
• PSoi\ ( iuidancc Note 6 ((3 NO): General Actuarial Practice • PSo;\ (ilhiLlance Note 3 (GN3 ) and Guidance Note 4 (GN4): Assumptions
3 Scope of Work
Brief description ot the Scope of Work is as follow:
Determination of F&L Cl1Lirue under each Defined Benefit Plan based on future Demographic and l.conomic assumptions as at 30.06.2020
• Determination of the amounts to be incorporated in the Balance Sheet, income Statement and Other Comprehensive Income (OCI).
• Determination of actuarial gain/loss during the year in accordance with revised LAS 19 • l'reparation of Statement showing the Movement in PresentValue of Defined Benefit
Obligation under each Scheme • Determination of estimated P&L charge under each scheme for FY ending June 30, 2021
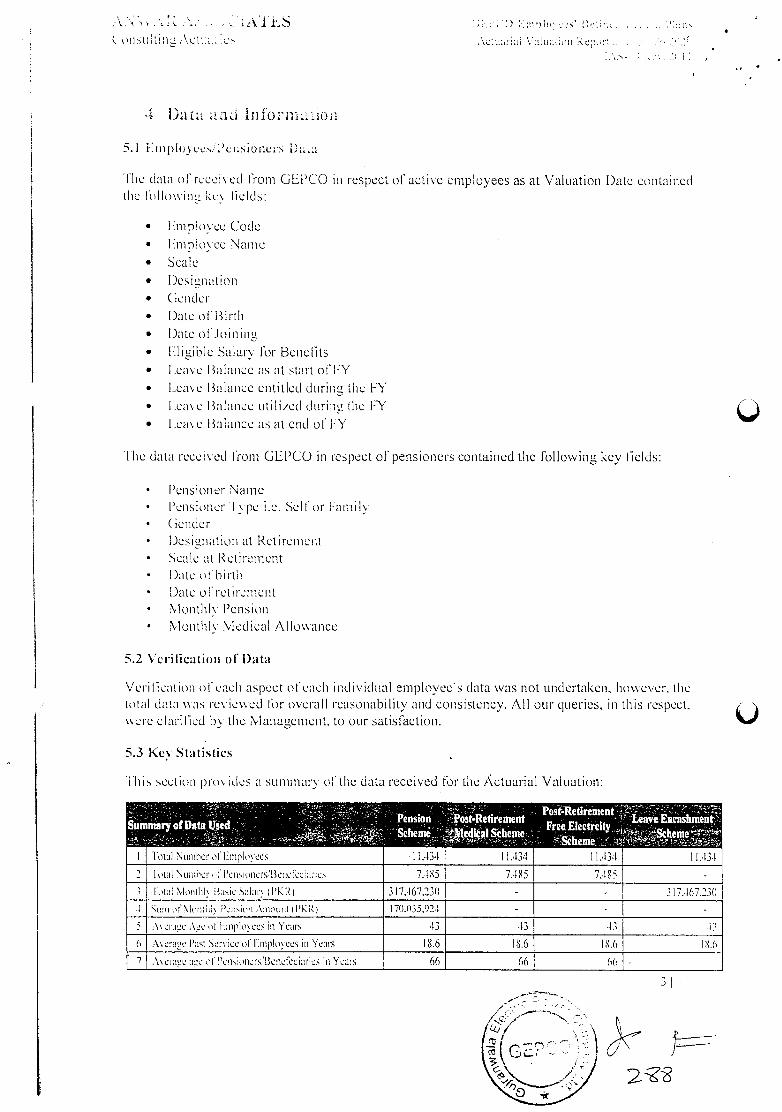
Al ES ) iu: :
CUuia \du ier 4
i)at. L1U 1r1iomni.:1on
:.1 tiIipio\ec.'Ii'cnsioflcrs i3ai
the data of received from GE1CO in respect of active employees as at Valuation Date contained the ollo\\ ing key fields:
• l.mplo\ee Code
• kniplovee Name
• Scale
• DesiLtllat!On • (icider • Date of Birth • Date olioiniiic,
• kligihle Salary for Benefits • I cave I alance as at start of FY
• Lea\ e Balance entitled during the FY
• I ea e 1 alance uti li/ed during the FY
• l.,ea e Balance as at end of FY
1 he data received from GEPCO in respect of pensioners contained the following key fields:
• Pensioner Name • Pensioner I pe i.e. Sell or I-amity • Gender • Designation at Retirement • Scale at Retirement • Bate of birth • Date o I ret rement • Monthly Pension • Monthly Med cal Allowance
5.2 \cn licatiun of 1)ata
Veri ttcation of each aspect of each individual employee's data was not undertaken. hoever. the totiil data as reviewed tr overall reasonability and consistency. All our queries, in this respect.
crc clarified by the Management. to our satisfaction.
5.3 Key Statistics
I Ii is section pro ides a summary of the data received for the Actuarial Valuatioi:
SummaryofData
- -.. -- . '
Used -
Intal Number nf Empin ecu
. Pension Shen
II .13.1
- :. . Post-Retirement
tdICaIScheme
11434
Post-Retirement-- .
FrceElect:ci(y
II .434
-Leave Encashment
11.43
2 1 ni.il Number' 'cincis,'1yic,e 7.185 7.185 7(85 -
3 Lial \hsiihI tune Saku- il'KR) 317,467.23(1 - - 317.167.230
.1 Sum n \ini0\ PenOun Amunt ( PKR I 70.035,92-I - - -
5 A crane .\sc Ii n Iees in Years (3 (3 47 •13
6 .-\s crane P:ist Scm cc ni LinpIo ecs in Yeats 18.6 I 8.6 18.6 -1.6
7 Averane inc 1 ctsinners!l3enei ciar:cs in Yea-s 66 66 66 -
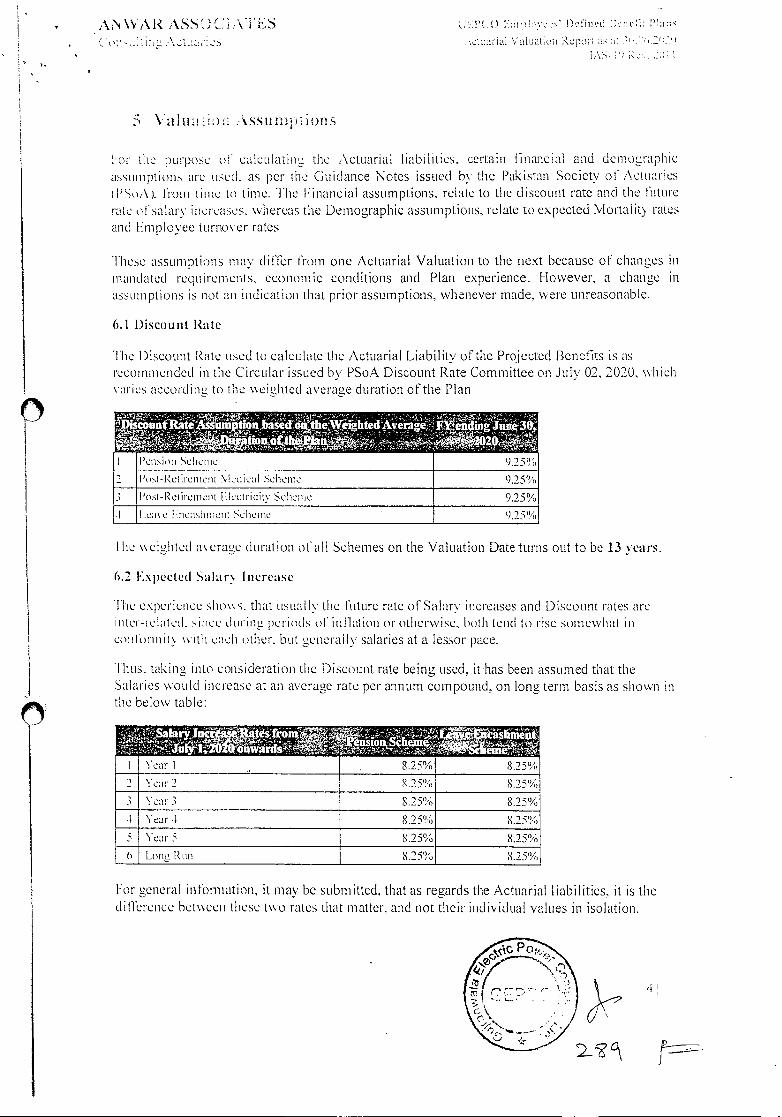
4
AVvAR AS iES ( •_t( C) :.: e. t)iii'e :1:T,
Va1iLIa(i1n Rcpo AS-
- \ilutiit .SStittittit)flS
lor tile U10SC (0 calculatuic the Actuarial liabilities, certain linanc al and demographic asslunptioflS are used, as per the Guidance Notes issued by the Pakistan Society of' Actuaries PSoi\ ). from time to time. Ihe Financial assumptions, relate to the discount rate and the luture
rate of salary increases. hereas the Demographic assumptions, relate to expected Mortality rates and kmplovee turnover rates
These assumptions may difThr from one Actuarial Valuation to the next because of' changes in mandated requirements. econoni ic conditions and Plan experience. However, a change in assumptions is not an indication that prior assumptions, whenever made, were unreasonable.
6.1 1)iscount Rate
'l'he Discount Rate used to calculate the Actuarial Liability of the Projected Benefits is as recommended in the Circular issued he PSoA Discount Rate Committee on July 02, 2020. \\hich varies according to the eighted average duration of the Plan
I't-lCciiiciini \tcdia! Sehemu 25%
l'ost-t?.elireineilt t1cctricitv Seheiuic 9.25?/
Cd\ ( t ncihucn SCI1t.N1(C
I he cighted average duration ol'all Schemes on the Valuation Date turns out to be 13 ears.
6.2 F.xpccted Salary Increase
lie e\perience sho\\ s. that usual lv the future rate of Salary increases and Discount rates are inter-related. since (luring periods ol inflation or otherwise. 1)0th tend to rise somewhat ill coin form nt\ \vntll each other. but gcnerai lv salaries at a lessor pace.
lhus. taking into consideration the Discount rate being used, it has been assumed that the Salaries would increase at an average rate per annum compound, on long term basis as shown in the belov table:
I Ycir I 8.25% 8.25%
2 Year 2 8.25% 8.25%
3 \ear 3 825% 8.25%
4 Year 1 8.25% 8.25%
5 Year 5 8.25% 8.25%
( Long Run 8.25% 8.25%
For general inlomiation, it may be submitted, that as regards the Actuarial liabilities, it is the ditlerence between these to rates that matter, and not their individual valLies in isolation.
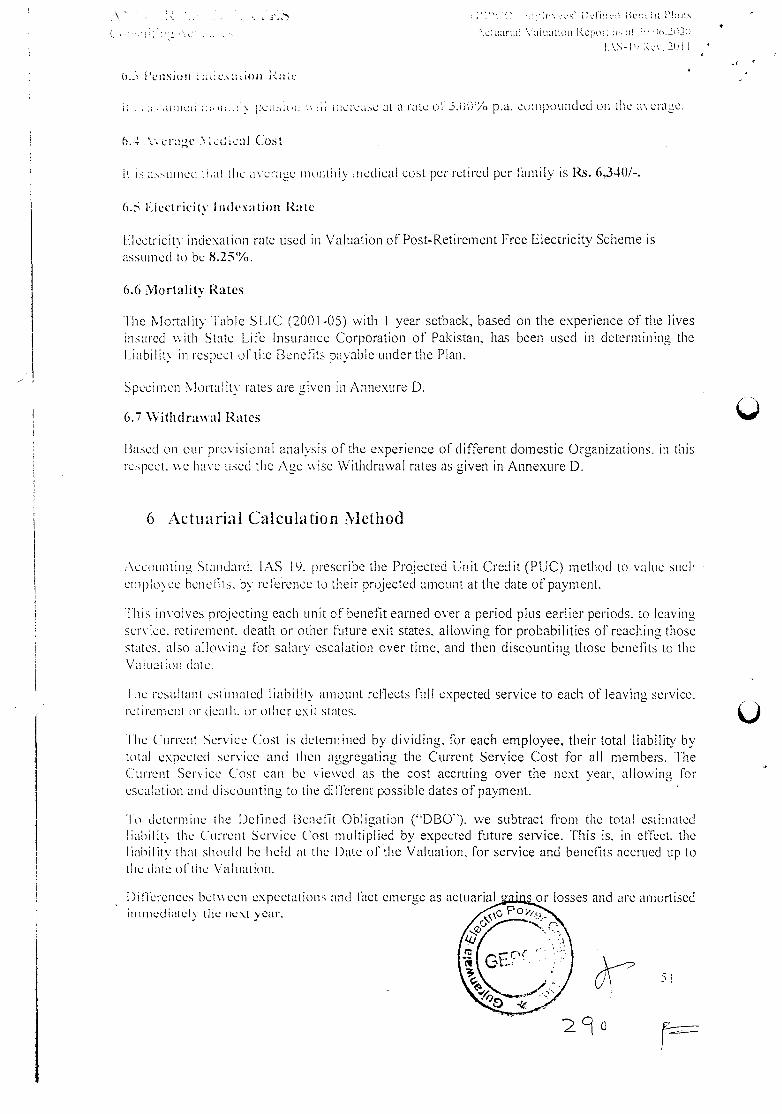
\:;irH \ !uuioa kpo .. :.:
I.'5I \. 2H I
n i 1O)II ' i(> I I
'.: peio;a .. iac at a rate o .tlYjVo pa. cumpouiidcci on the a crage.
6.4 .\. c rage Tal Cost
I uined alt [he averauc nunth iv medical cost per retired per family is R. 6,3-)I-.
6.5 Liectricitv I 11(lCXa Lion Rate
Nlectricitv indexation rate used in Valuation of Post-Retirement Free Electricity Scheme is assumed to be 8.25%.
6.6 Mortality Rates
The Mortality Table SLIC (2001 -05) with 1 year setback, based on the experience of the lives insured ith State Life Insurance Corporation of Pakistan, has been used in determining the Liabi tv in respect of the Benefits payable under the Plan.
Specimen Mortality rates are given in Annexure D.
6.7 \Vithdrawal Iites
Based on our provisional analysis of the experience of different domestic Organizations. in this respect. we have used the Age wise Withdrawal rates as given in Annexure D.
6 Actuarial Calculation Method
Accountinu Standard. LAS 19. prescribe the Projected Unit Credit (PUC) method to valLie such ernplo\ Ce henedts. by reference to their projected amount at the date of payment.
1 his involves projecting each unit of benefit earned over a period plus earlier periods, to leaving ser ice, retirement. death or other future exit states, allowing for probabilities of reaching those states, also allowing for salary escalation over time, and then discounting those benefits to the Valuation date.
I he resultant estimated liability aiiount reflects full expected service to each of leaving service. ret renient or death, or other exit states.
The Current Service Cost is detennined by dividing, for each employee, their total liability by total expected service and then aggregating the Current Service Cost for all members. The (:uri'et Ser ice Cost can he viewed as the cost accruing over the next year, allowing for escalation and discounting to the di Terent possible dates of payment.
'Jo determine the Defined 13eneflt Obligation ('DBO"). we subtract from the total estimated I ability the Current Service Cost multiplied by expected future service. This is, in etThct. the I iabil itv that should be held at the Date of the Valuation, for service and benefits accrued up to tl ie date of the Valuation.
Difi rences between expectations and Ilict emerge as actuarial o' ' s or losses and are amortised ill med atetv the next year.
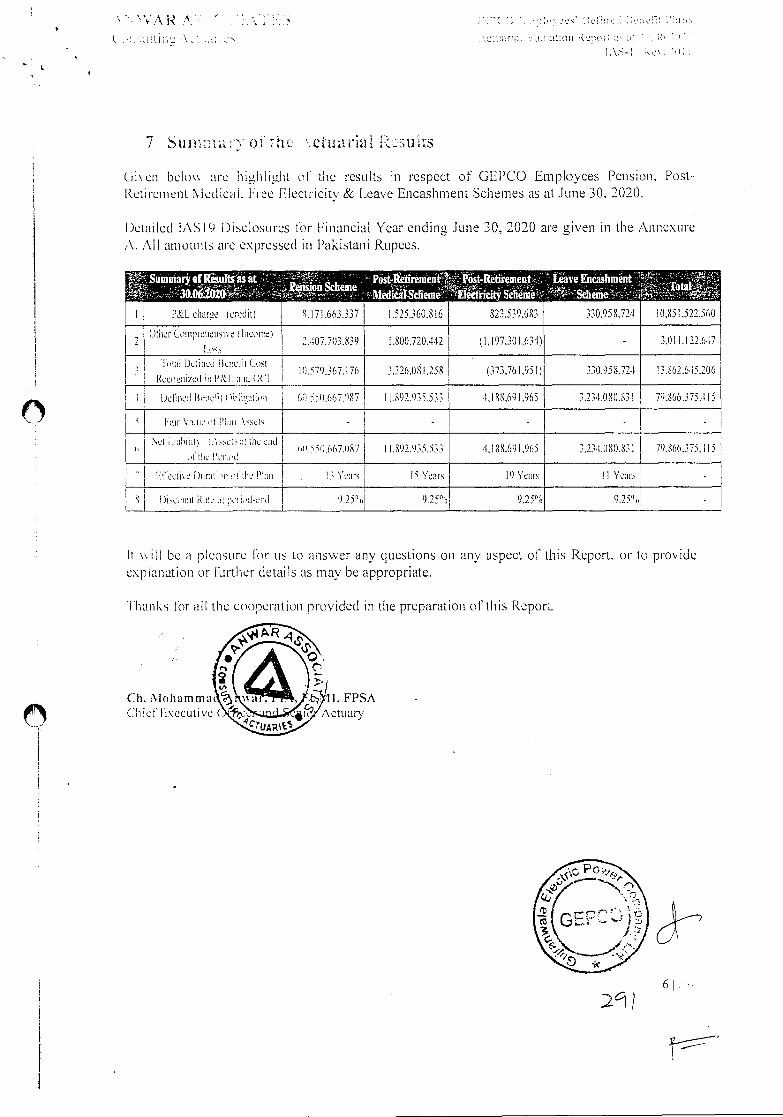
''11. FPSA
Actuary Cli. \loham ma CF jet' Executive
AR
d,UL.Ofl
7 Siinn.:' Oi 7fl0' _ctuaviai 3U!tS
Civen belo\\ are highliuiit ul' the results in respect of GEPCO Employees Pension. Post-Retirement Medical. Free Electricity & Leave Encashment Schemes as at June 30. 2020.
Detailed lAS 19 Disclosures fr Financial Year ending June 30, 2020 are given in the Annexure A. All amounts arc expressed in Pakistani Rupees.
SummaryofRisuf&asat " 3OOtO2O
'•' , Post-RètirimeiilFost-Retirement; MethScheme Fincity S'cheme
823,539.683
Leave Encashment &heme
330.958,72!
.
C Jota
lO.$S .522.360 P&L ciiaree credit) 9.171663.337 1.525.360.816
2 Other Csn r '6ensis I 'lerare
.407.703.839 .800,720,442 (1,197,301,634) - 3.0 I. 22.617
Foal Iktzud HL.Uit Co
Reet'si'ied 'a l'&l dad 00! lf.379J67.I7o 3.326.08.258 (373,76 1.951) 330,958.724 13.862.615.206
I DeOned 13 c fl's tO.550.667087 11,892.935,533 4,188,691,965 3.231.080.83! 79.866.375,115
5 Faa- Value I 'ian - - - -
et l!dhLdt\ .. the end
UIL V'IS 'Li '0.55.667.087 11,892.935,533 4.188.691.965 3,234.080.83! 79.866.375.4 IS
!;ndCl\L Dur:id'n he Ilan 3 Years IS Years 9 Years I I Years -
Dic Hilt It cc it p d-end 9.25' 9.25°' 9.25° 9.23° n -
It ill be a pleasure For us to answer any qLlestions on any aspect of this Report. or to provide explanation or Further details as may be appropriate.
1 hauLs hr all the cooperation provided in the preparation of this Report
61
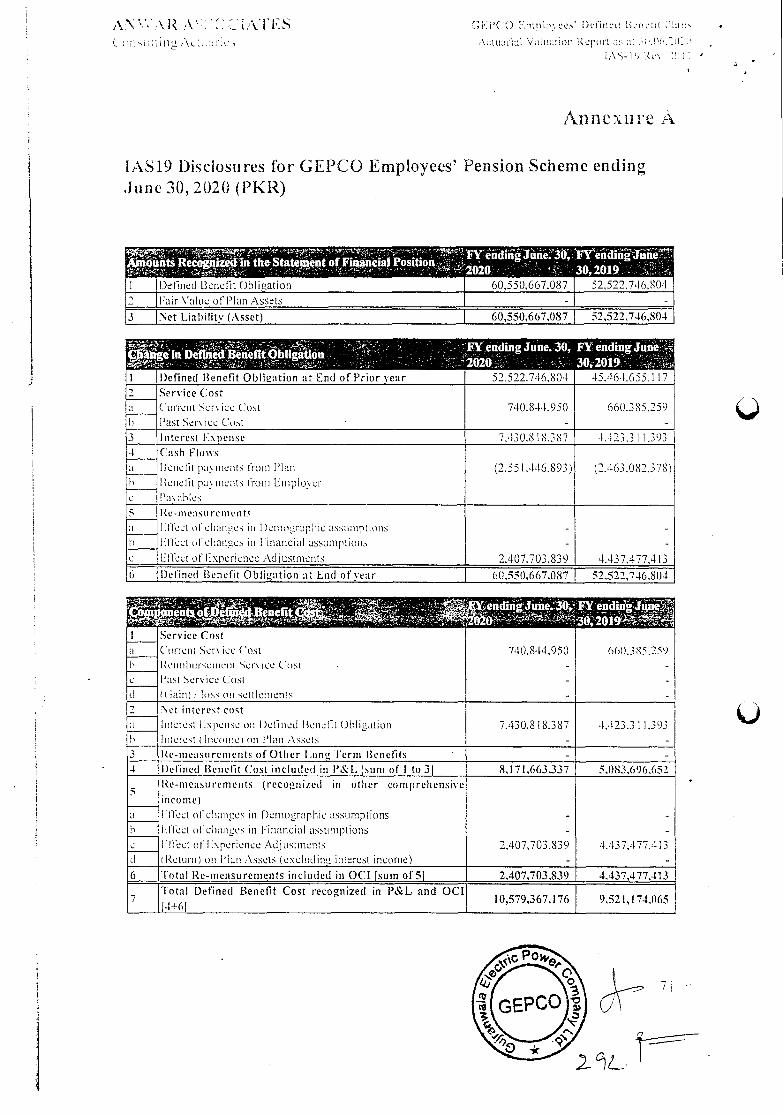
52,522,746.804 60,550,667.087 Detined Benefit Oblication
52,522,746,804 60,550,667,087 '.et Lia hilit (Asset)
140r Value of Plan Assets
eliding June. 30, F1' ending June' 30,2019 in the Statement of Financia' Position
A\ :\R . Aii (Pi'('() .mui ces )hiea
( iit \L:;:c ,\uaiiai Valuation Rortoa:i' .11 ;\-I) 4c'.
Annexine A
LAS 19 Disciosures for GEPCO Employees' Pension Scheme ending June 30, 2020 (PKR)
1
.3 ''' - - 'FYendingJune.30, in Dc ned Benefit 0i3tlgatboul
' ..-.
FYóndingJuñe'st 30,2019
Defined Benefit ObIitition at End of Prior year 52,522.7 (6.804 45. (61.655 117
2 Service Cost Current 5cr'. ice Cast
Past 5cr'. cc (.'ost .
740.844.950
-
660.385,259
-
a
O
3 Interest L\peosc 7,430,818.387 -1.423.3 11.393
4 Cash Flows Nenelit pa meats Iruni 1'lan
I e tie lit pt.i ate n N fro in Liii pio\ er Pa'. ihle
(2.551.146.893) (2.463.082.378) a h
c
5 Re-meosureinerit Illeet old nt_ic iii l)eiitiiorttplitc assumptions
I. let_it a I cltani_ies ii Ni nancial assumption_i
Filet_it of Experience Adjustments
-
-
2.407.703.839
-
4,437,477.413
i N
c
6 Defined Benefit Obligation at End of year 60,551),667,087 52,522,746,804
I '' 2bD 30 201
Service Cost
Current 5cr', ice Cost Niciiiihurseiiiciit Service (ust Fast 5cr', ice Cost
( am) loss on settlements
740.844,950 - -
66O.3$5.25) - -
-
a I'
'..
4
2 'et interest cost hth_irest .spciise ott l)clined IlericliL Dhlitoition Interest laconic) on Plan ,\ssels
7.430,8 18.387 -
1,123.3 1.393 -
1
O
3 Re-measurements of Other I .on lerm Benefits - - 4 Defined Benefit Cost included in P&1. sum of I to 3j 8,171,663,337 5,083,696,652 - Re-measurements (recognized in other comprehensive
Inc U me)
liiet of changes in l)emographie assumptions
fleet ol ehanoc in Financial assumptions Ftleet of Experience Adjustments
Return) on 'ion Assets (exeludini_i interest income)
-
-
2,407,703,S39 -
-
-
4.43 7.-177,413 -
ii
O
e I
6 Total Re-measurements included in OCI Isum of5l 2,407,703,839 4,437,477.413
Total Defined Benefit Cost recognized in P&L and OCI
4±61 10,579,367,176 9,521,174.065
0
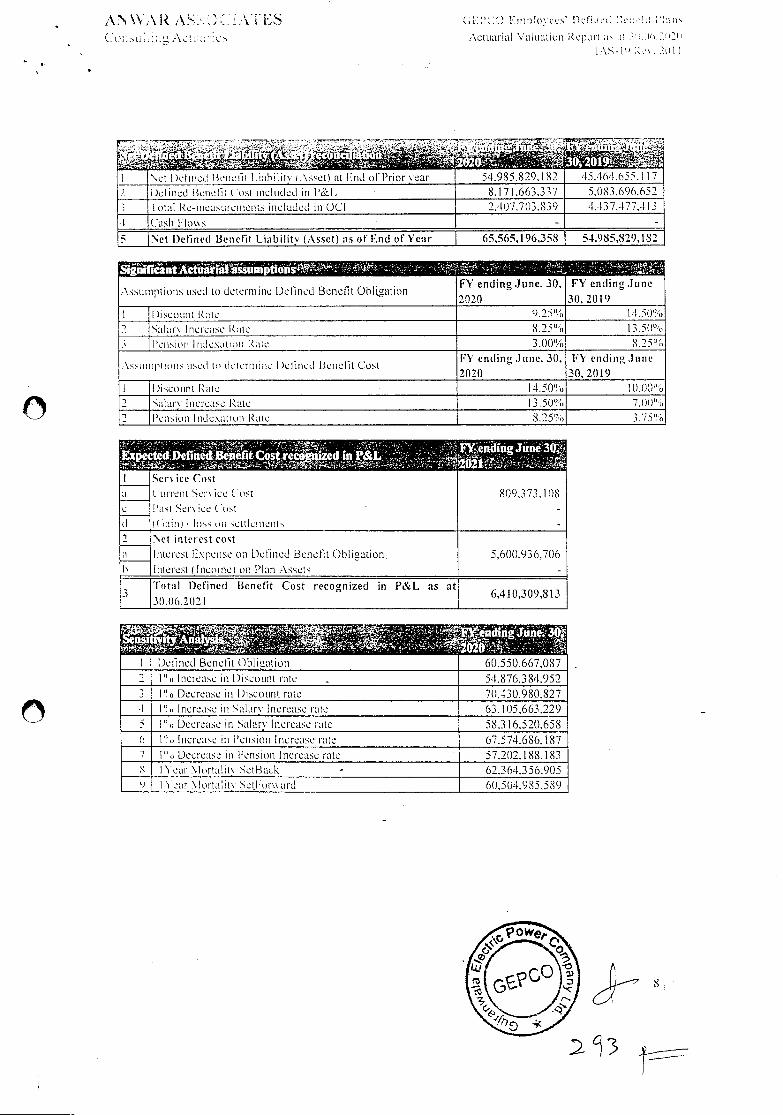
•EPd:DeflnedBejiéfitCóstréé r*iied .inP&L, ending June3O
Service Cost (unent Ser\ ice cost
Past Ser ice Cost I (aol) loss n setilement
Net interest cost
Interest Ls.pense on Defined Benefit Obligation
I merest (I nenine I on Plan Assets
Total Defined Benefit Cost recognized in P&L as at
31)06.2021
809.373.108
5,6011936.706
6,410,309,813
r\cL:. :e
(i.() :res' 1)c6ne 1.: It
r\ctuariai 'valuation kClO!t 1 ) 1
!.\'v- , \. 2uI
\ei l)eiiiied teitefit liahiI4 .\sset) at End ol'Prior year 54.985.829.182 45.161.655. 17
2 I )clined ltenetit ( OSt included in l'&L 8.171.663,337 5.083.696.652
3 I out! Reoticasurenienis included in DCI 2.407,703,839 4.437.477.4 3
1 Cash FIns - - 5 Net Defined Benefit Liability (Asset) as of End of Year 65,565,196,35S 54,985,829,1S2
sijt isurnfi6:2 . --
FY endino June. 30,
2020
3
FY endina June
30, 2019 - . .
ASSui iptions used to determine Dehned Benefit Ohll2ation
I )iscouni R:iie 9.25% 11.50%
I Sillar\ Increase Rate 8.250 o I 3.SOo
3 !'ensioii lnde\aiioii Rate 3.00% 8.25%
• - . .\ssw phony used In delernone I )e) ned ltcnelit Lost
Fl endinc' June. 30,
2020
F' ending June
30, 2019
I I)iscoLint Rate 14.50% 0.00%
2 'valary Increase Rate 13.50% 7.1)00
2 Pension I iidc.\ation Rate 8.25% 3.75%
I °
Defined Benefit Obligation &z 0" .
60.550.667,087
2 l° Increase in Discount rate . 54.876.384.952 3 I0o Decrease in Discount rate 70.430.980,827 1 Io Increase in 4ilar Increase rate 63.11)5,663.229
5 I "o Decrease in Salary Increase rate 58.316.520.658 6 I0o literetise iii Pension Increase rate (,7.574.686, 187
Decrease ni l'ension Increase rate - 57,202,188.183 S I Year \InrIaliI\ SetBacL 62.364.356,905 0 I Year \lortaitir Set,l-orsvard 60,504.985,589
si
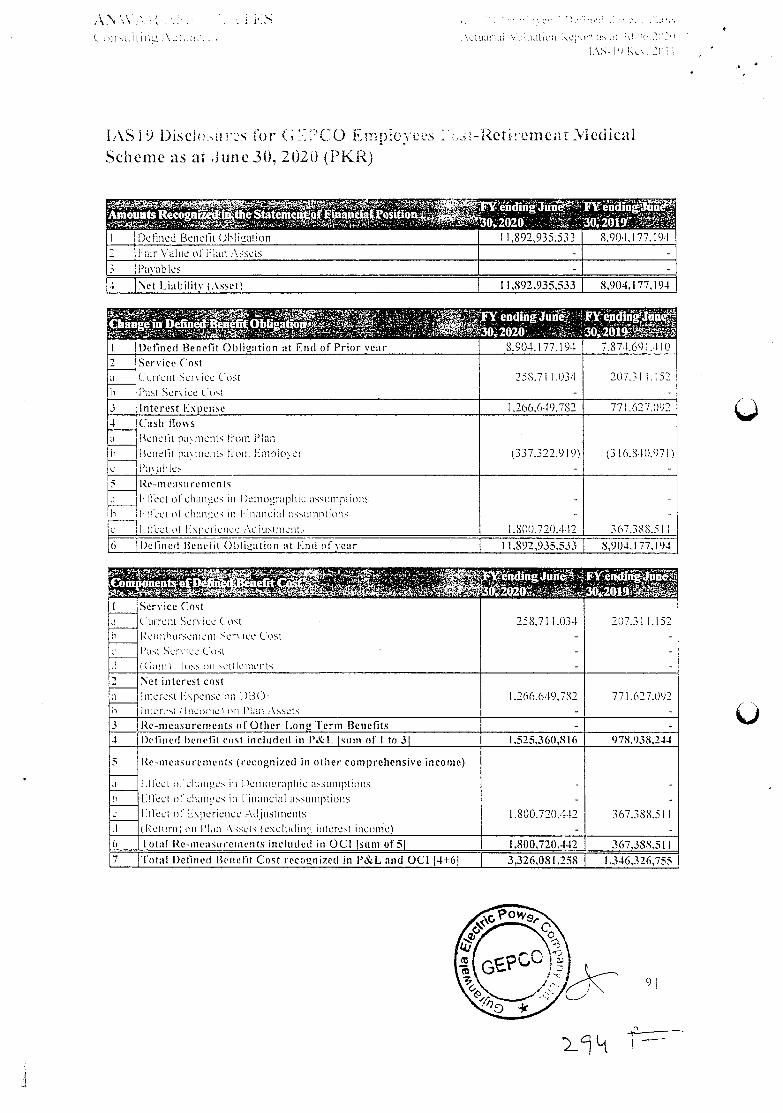
( UIHUI \cirnirH ',': IlfitROl o 'u)
i.\-H Rc\
1.\.S 1 9 Discliii r28 ior G 1. .CO Enpuvces j-eti:rnCnt Medical
Scheme as at ,June 30, 2U20 (PKR)
O2O2O. -J
amounts
I
" :-' '... -
Defined Benefit 000eation 11,892,935.533 8.904.177,191 2 I-air Value 01 lOan .\sets - -
3 Pavables - -
4 Net Liability (sset) 11,892,935,533 8,904,177,194
T+ Define
ending Jul 39,2O2O
FYdihiné 3O,2Ot9
I Defined Benefit ObIiation at End of Prior year 8.904.177.191 7.87.1 691. 110
2 Service Cost . urreni 8cr'. icc rust Rist 8cr'. cc Cut
258.711.034 -
207.311.152 -
a h
3 Interest Expense 1.266.649.782 771.627.002 4 Cash flows
BeneOt pa ments ruin Plan I tcnel4 pa\ n cuts ftoiii Emplor er ';i'.ables
(337.322.919) -
(3 16.810.971) a O C
r Re-measurements lOect of cliriiucs ii I )cmuurapliic assumptions 0 DCI of Ifl1m5 lii I itiincial a'. mpliii 15
LtIccl H I pericllcc .\dliistiiicni
- -
.800.720.412
- -
367.388.511
a O c
6 I)eflned Benefit Obfigatiun at Lnd of year 11.892,935,533 8,903,177,194
I Service Cost Current 8cr'. ice Coct Rci OL cnicnt 8cr'. ice Loct I'ust 8cr'. cc Oust -
los'. oii itliieiit'.
258.711.034 - -
-
207.311.152 - -
-
a H c
2 Net interest cost Interest l;\pensc on DBC)- liilcie'.L Incunc ) ii I'lai Assets
1.266.649.782 -
771.627.092 -
1
O
3 Re-measurements of Other Long Term Benefits - - 3 I)eflned lieneht cost included in P&I, Isuni of I to 31 1,525,360,816 978,938,234
5 Re-measurements (recognized in other comprehensive income)
-.IDci Icluuiliics hi I )cin rrap!iic IssullIptiuns Lftcct of chanocs in Financial assumptions Irtiect oO E.\permcnce Adjustments (ken in) ui Inn A'.sets (exclidimi, merest inCimmile)
- -
1,800,720.442 -
- -
367.388.511 -
a O
c 1 6 I otal Re-omeasureinents included in OCI sum of51 1,800,720,442 367.388.511 7 l'otal 1)eflned Benefit Cost recognized in E'&L and OCt 4+61 3,326,081,258 1,346,326,755
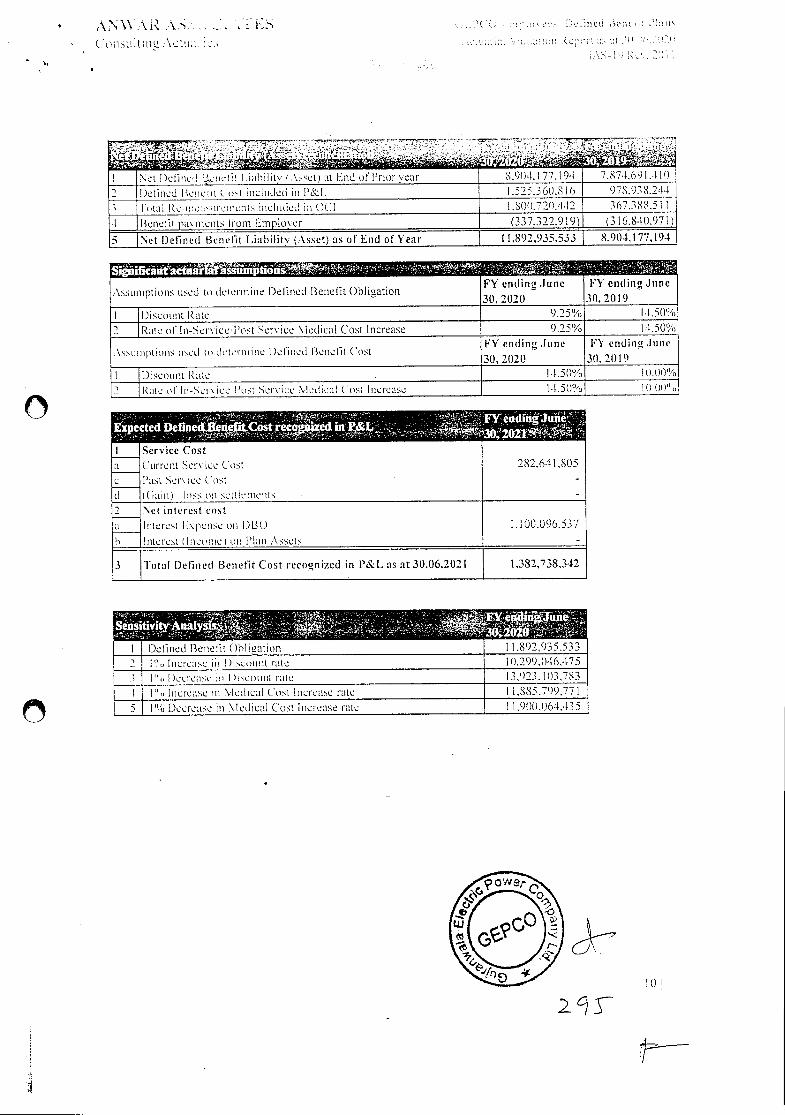
Expected Define Be4itcost Cq
Service Cost
Current 8er ice Cost
Past 8er\ ice Cost
( tim loss nt settlemetits
Net interest cost
Interest Expense on DOD
Interest litcinnel ott Plan Assets
iota! Defined Benefit Cost recognized in P&L as at 30.06.2021
282.64 I.S05
d in•P
I. 100,096.537
1,382.738,342
r ending.June
Lusuitil ;\U.
3O 2 1
Net I)eftied LLnet0 liability (.\1set) at End of Prior year 8.904.177.194 7.87t.6)I .. l()
2 I )eliued lteiicfl it included in P&L I .525.3 60.8 lb 978938,214
I.tnl l-:'lrcincnts included in DCI I.80i122('.112 367.388,51 I
I Nenelit pu lien's from Emplo\er (337.322.9191 (316.840.97!
5 Net Defined Benefit Liability (ssct) as of End of Year 11,892,935,533 8,904,177,194
àntictii'r 'asiiñi' OE
Assumptions used to determine Defined Benefit Oblication FY ending June
30, 2020
FY ending June
30,2019
I Di scoutit Rate 9.25% 1.1.50%
2 Rate of ln-8erice.'I'ost 8ervice DedieaI Cost Increase 9.25% 11.500,
.\su!iiptioils used ii, deteriiiine I)eliiied Benefit Cost FY ending June
30, 2020
FY ending June
30, 2019
I l.)iseount Rate . 11.50% II) 00%
2 kate ,,t Iri-Nerice Post ervlce )!edieal Cost Increase l4.50'o IU. l)(10 o
'- . ...... SensdwyAnaIyj, , 7
unea.. o
I Defined Benefit Obligation 11.892.935.533
2 0 Increase ii i )icouitt rate 10.299.l)16.-175
3 I" Decrease a, I t,'ou,tt rate 3,023.03.783
.1 I" Increase ii \IcdicaI Cost Increase rate 11.885.799.771
5 I ° Decrease in \Iedical Cost Increase rate 11900064 ,135
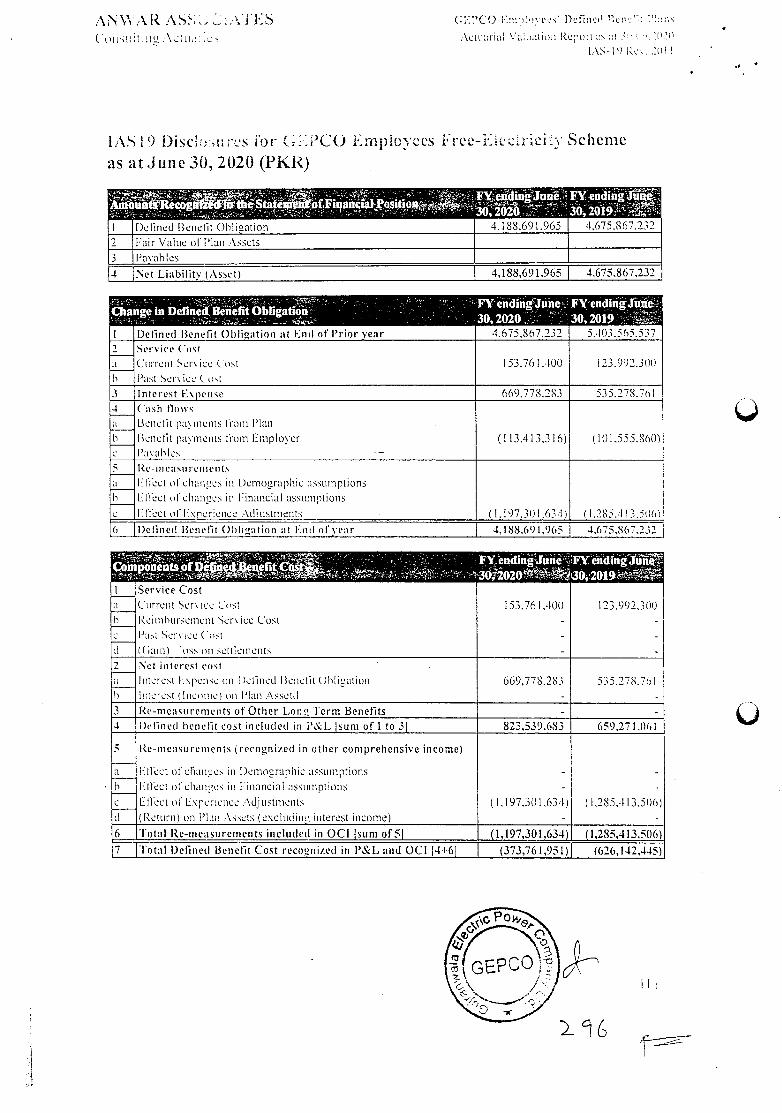
Ai' \\ \. I( \S' ..i FS C F'C() E ::vee ' Dc tine!
('iIlI \c;: Actuarial ilL tRi Re'oii as it
1.15- 0 Re
IA () DIsci:; rs for (C() Lmpiovecs Free-i ccrici Scheme as at June 30, 2020 (P1(R)
4.ISS'.691.965 4,675.867,232 Detined Benefit OhIiation
2 Fair 'value ut Plan •\ssets
3 Pa' ables
4 Net Liabilits (Asset) 4,188,691,965 4,675,867,232
9• :7.,. Change in Defined Benefit Obligation 30,2020
4.675.867.232
30,2019 5.103.565.537 I I)efined Benefit Obligation at End of Prior year
2 Service Cost
Current Ser ice Cost
Past Ser ice F ost
153.76 1.400 I 23.992.3(11)
6
3 Interest Expense 669.778.283 535.278.761
4 (ash tlosys
Betie lit pzo nients rum Plan
Benefit payments from Employer
l'aahles —
(113.413.3 16) (I 01.555.8601
a
6
e
5 Re-nictisu reitients
F) feet of changes iii Demographic assumptions
F fleet o I chances mi Financial assum ptions
Effect of' Fxperienee Adustrnents (1.197.301.634) (.285.4 I 3.50(1
6
e
6 Defined Benefit Obligation at End of year 4,188,691,965 4,675,867,232
I
' 3D O2030, 2019 Service Cost
Curretit Ser ice Cost
Ret nihurseinent Service Cost
Past Ser ice (iist
( an) loss ito settlements
153.76 1,400
-
-
-
123.992,300
-
-
-
a
0
c
I
2 Net interest cost
Interest I\pemise on I )clined Benefit ( )hliuiitton
Interest I Income) iii 'lan Assetd
669,778.283
-
535,278.761
- O
3 Re-measurements of Other Lone Term Benefits - -
4 Defined benefit cost included in i'&L Isum of ito 31 823,539,683 659,271,1)61
5 Re-measurements (recognized in other comprehensive income)
Effect of cliaimges m Demographic assutliptions
ERect of chances in Financial assumptions
ERect of [xperence Adjustmeitts
(Return) on Platt .\ssets (e\cluulutg interest income)
-
-
(1.197.301.634)
-
-
-
(1.285.113.506)
-
a
h
c
if
6 'Fotal Re-measurements included in OCI Isurn of51 — (1,197,301,634) (1.285,413,51)6)
7 Total l)eflned Benefit Cost recognized in P&L and OCI 4+61 (373,761,951) (626,142,445)
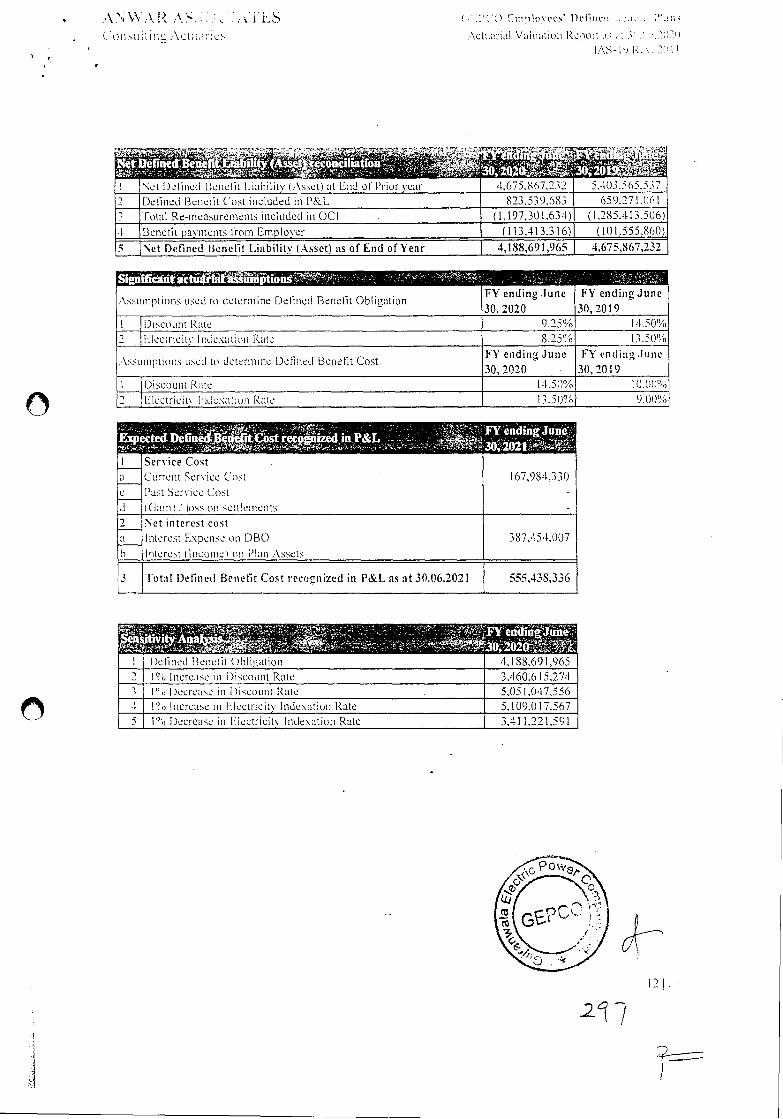
FY ending June, 30,2021
-
ected DerIneiefitçostrecgjflzedmP&L
Service Cost
Current Service Cost
l'ast Ser ic Cost
I (iain loss on settlements
a 167,984,330
c
ii
Net interest cost
Interest Expense on DBO
Interest I Incutne I ott Plan Assets
a 3 87,45 4.007
h
3 Total 1)eflnetl Benefit Cost reeonized in P&L as at 30.06.2021 555,43S,336
\'sVs ..\R . ES ) t)0)\ 1c1ie .... .
OItstttHO .\ct.t. cs r\cliiLtriai VoEation Repo
118- Rc\.
Net l)elincd Itenelit Liability (As.ci) at End of Prior year 4,675.867,232 5,103,565.537
2 Defined Benclit fast included in P&L 823,539.683 659.271.1)0 I
3 Total Re-measurements included in OCI (1,197,301.634) (1,285,413.506)
.1 Benefit payments from Employer (113.413.3 16) (101.555.860)
5 Net Defined Benefit Liability (Asset) as of End of Year 4,188,691,965 3,675,867,232
Sign fictacti*rt*i , V .
FY endina June
30, 2020
FY endino June
30,2019 Assumptions used to determ ne Deitned Benefit Obltatton
I Discount Rate 9.25% 14.50%
2 Llectricity Indexution Rate 8.25% 13.50%
- , Ass mpttons used to determ ne Dehned Benefit Cost
FY endino June
30,2020
FY endino JUne
30,2019
l )i scount Rate 14.50% 10.00%
2 Llectricit\ lnde.\a:io!t kate 3.50% 9.00%
I Defined Benefit ()hlioation 4,188,691.965
2 I i o Increase at I )iscount Rate 3,460,615,274
3 I I )ccrease in I )Kcount Rate . 5.05 1.017,556
-I 1% Increase ii l.lectrtcttv lnde.\atton Rate 5,109,017.567
5 I Decrease l•:!cctricity Itidexatiuti Rate 3,411,221,591
2.
27
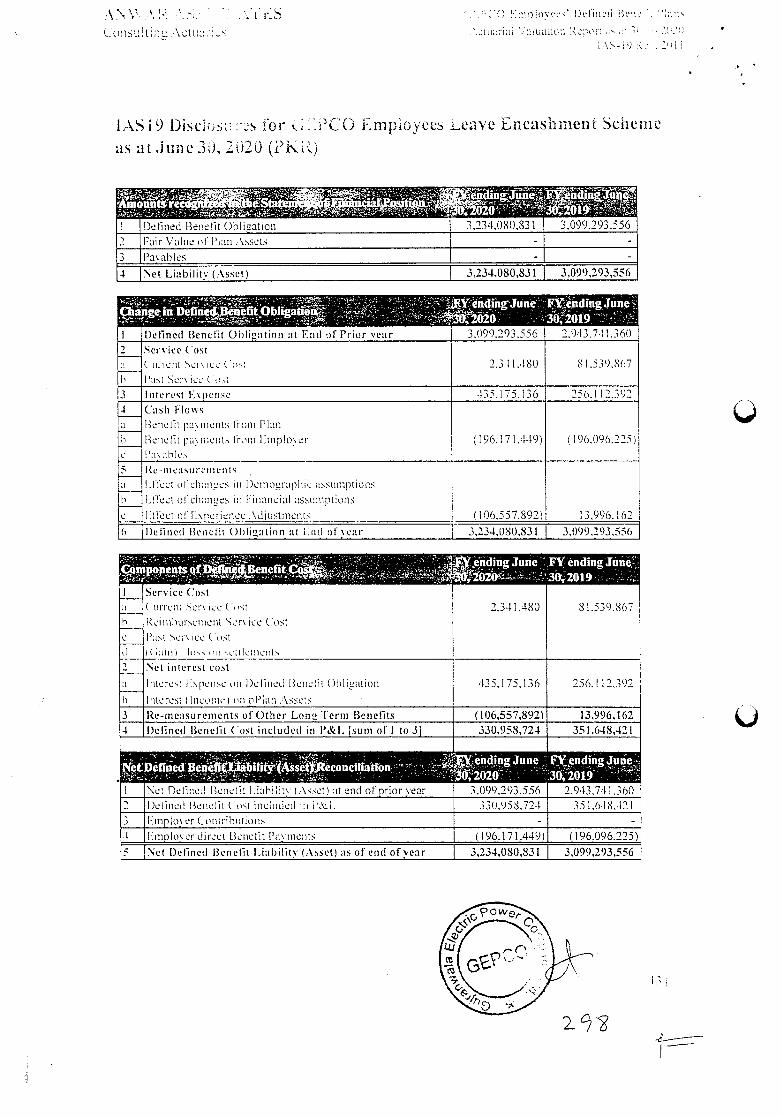
S :0 I ove' D!'iiieii n
SIUH :\ctu:_ .'.ia:'iu auaLun enoii l;\-i') 4:
IASi9 Disciu. s for iCO Ernpioyees LCàVC Encashnient Scheme 1' , JS at j1jiU. _)si, ii_J) ,!
-
I Defined Benefit Oh ligation 3,234,080.831 3.099.293.556
2 Fair Value u! lan .\ssels - -
3 Pavahles - -
4 t Liability (Asset) 3,234,080,831 3,099,293,556
I
9angern Define4Beuefit Obhgauei
Defined Benefit Obligation at End of Prior year
Service Cost -
.-"Yenthng7June FYfendingJune 3O,2O19
3,099.29',556 2.9t3.7l 1.361)
2 C in ciii Ci\ ICC C o'i
llo.i Ci \ ICC C •ot
2.341,180 81.539.867 :i
h
3 Interest Espen',e 135.175.136 256.1 2,392
4 ('ash Flows Benefit p' nents ftnni P Ian
BeT1eht pa\ nents li'om [mplo\ er I'a\ iblcs
(196.171.449) (196.096.223)
:i
N e
S Re-ineasu rements [licct ichnges in oem nrupiiicissunlptions - I: fleet 0) changes in ('inane ml assumptions
Eftcct of E.\neriencC .-\djustments (106.557892) 13,996.162
N
e
(, Be fined Benefit ()hli2alion at i.ud of year 3,234,080,831 3,099,293.556
I
endmg une
2.341.480
Yending une
81.539.867
Service Cost (nrrcni 'sers ice (''a
Eci mihursemnent 'sers cc Cost
l'it scr\ ICC C i-a t ii lio ii
h
e
2 Net interest cost
Interest N\pense on Defined Benefit Obligation
Interest (Income) tin il-lan .\sscts
435,175,136 256,! 2,392 a
b
3 Re-measurements of Other Lone Term Benefits (106,557,892) 13,996,162
4 Defined Benefit C 'ost included in P&L Esum of I to 1 330,958,724 351.648,421
I
ilitseconcitiafion .
\et Defined Benefit I.iahliit\ l\et) at end of prior year
Ju tie
3.099.293.556
nng'
2.943.711.360
2 Delined Dccli t. tist included ii i&L 330.958,72 35 1,618.121
3 l-mplo\ er Cont iN nuns - -
-I Emplo'. er direct Benefit Pa'. mnents 1196.171.449) (196.096.225)
5 Net Defined Benelmi Liability (Asset) as of end of year 3,234,080,831 3,099,293,556
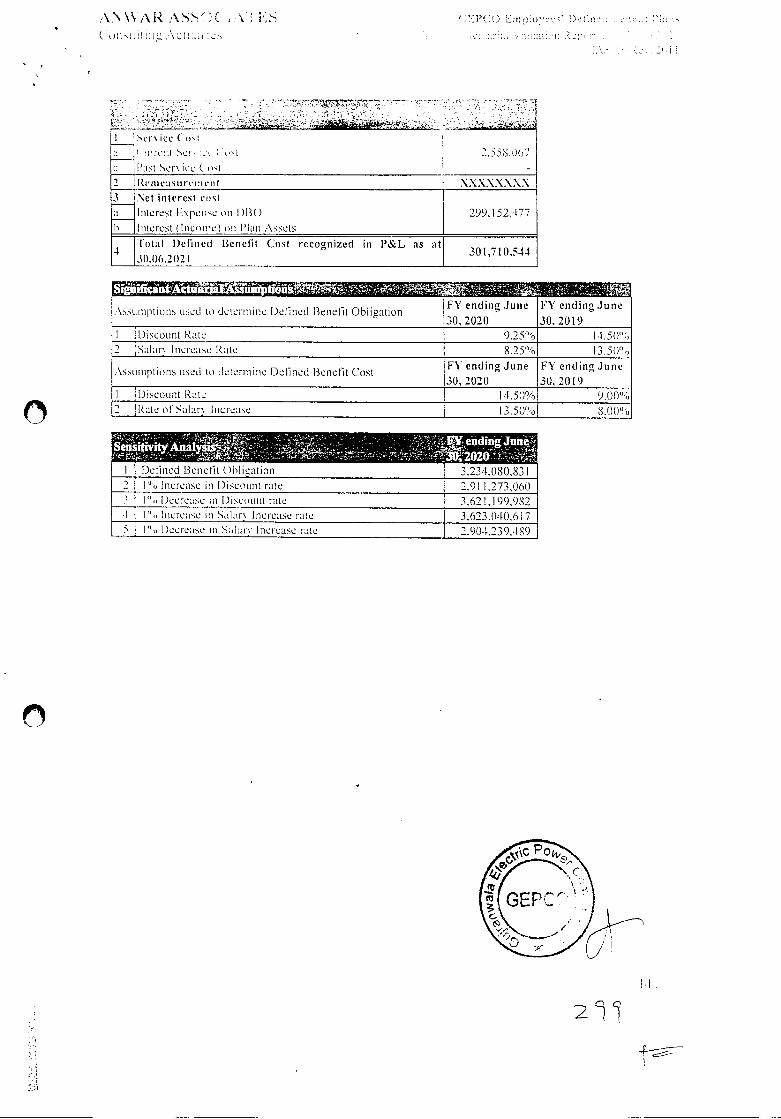
A1'\ARA-:( ;..\is
( utO ;\cL
(.1'(.)r.u'.. in
'ervicc ( u. I cut
l'it er ice (.'it I Re 01 en S U re i cut
3 Net interest cost
Interest Exrcnse on )B()
Interest I lncoiiie) 'n 'kin Assets
:1
b
-I Iota! Defined Ieneflt Cost recognized in P&L as at
FY ending June
30,2020
F\' ending June
30,2019 .\suInptiuits used to detertuine Dekned 13ene01 Obligation
I Discount Rate 9.25°'o I
2 4iI:iry Increase Rate 8.25% I3.50'k
Assumptions used to determine Deflned Benetit Cost FY ending June
30, 2020
FY ending June
30, 2019
I Discount Rate 14.50% 9.0006
2 Rate otSalar\ Increase 13.50% 8.00%
- .. Se4wna1y&-
I Detined Benefit Obligation
FYendingJune *2020 o..
3.234 080,831
2 } % Increase in Discount rate 2.911.273,060 0 )eerease in Discouttt rate 3.621.199.982
0, I tcrease it ,ilnr Increase rate 3.623.040.617 S 1% Decrease in aiury Increase rule 2,904,239.489
2
2.55 S.d& 7
xxxxxxxx
299,152,477
30.06.2021 301,710,544
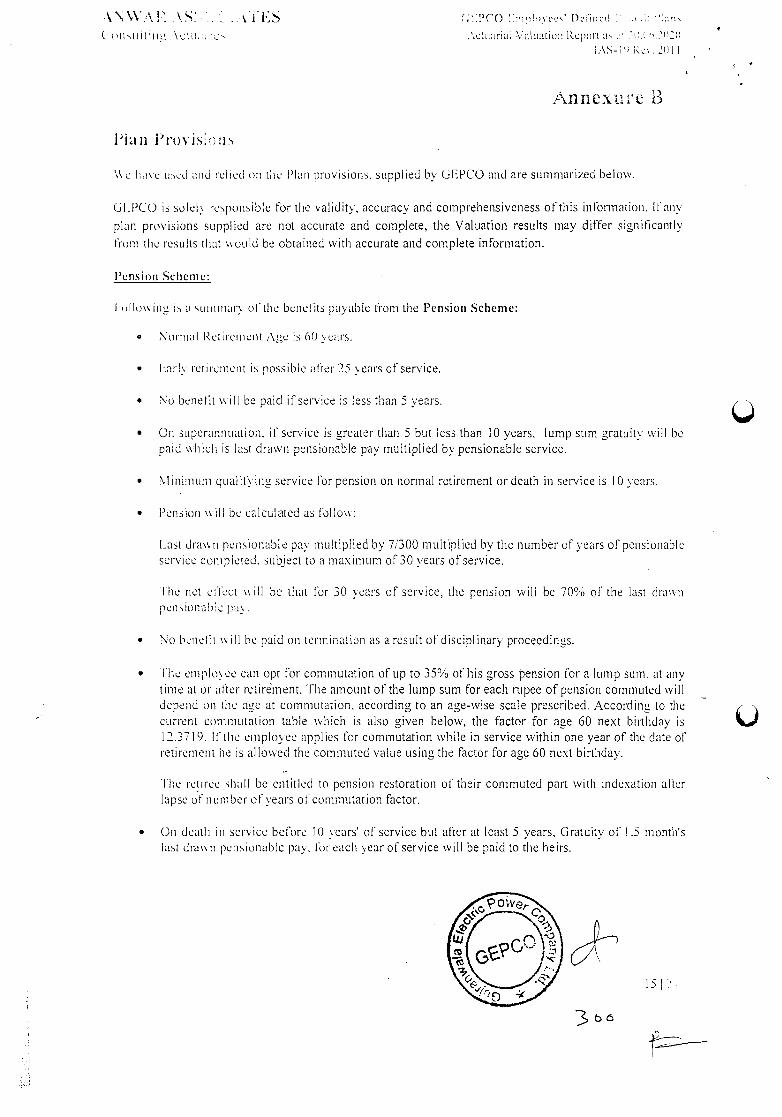
\VM I .. (,'.t1() 1)\i't\ 1)rF!n'd.:.
( Iiiitji1 ;\t .\CtLSIiU I<c)nr1 I'
l;\t',-0 .0)11
f\flnCXUYt B
l'ian iI')ViS)t1
e iia e ucd and rd ed on the Plan provisions. supplied by GEPCO and are summarized below.
GOIPCO is solel responsible for the validity, accuracy and comprehensiveness of this information. lfanv
plan provisions supplied are not accurate and complete, the Valuation results may differ significantly
from the results that would be obtained with accurate and complete information.
PenNion Selienie:
lollo ito is a suniniary of the benefits payable from the Pension Scheme:
o Normal Retirement j\e is 60 years.
• karlv retiretnent is possible after 25 years of service.
• No benefit will be paid if service is less than 5 years.
• On superannuation, if service is greater than S but less than 10 years, lump sum gratuity will be paid which is last drawn pensionable pay multiplied by pensionable service.
'vlinimum qual l'ving service for pension on normal retirement or death in service is 10 years.
Pension will be calculated as follow:
Last drawn pensionable pay multiplied by 71300 multiplied by the number of years of pensionable service completed. subject to a maximum of30 years of service.
1 he net effect ill be that for 30 years of service, the pension will be 70% of the last drawn pensionabie P
No benefit will be paid on termination as a result of disciplinary proceedings.
• I he enlplo\ cc can opt for commutation of up to 35% of his gross pension for a lump sum, at any time at or after retire'ment. ihe amount of the lump sum for each rupee of pension commuted will depend on the age at commutation, according to an age-wise scale prescribed. Accordine to the current coniniutation table which is also given below, the factor for age 60 next birthday is 12.37 19. If the employee applies for commutation while in service within one year of the date of' retirement he is allowed the commuted value using the factor for age 60 next birthday.
Ihe retiree shall be entitled to pension restoration of their commuted part with indexation after lapse of' number of years of commutation factor.
On death in service before It) years of service but after at least 5 years. Gratuity of .5 months last dra 11 pensionable pay, for each year of service will be paid to the heirs.
IS
3a
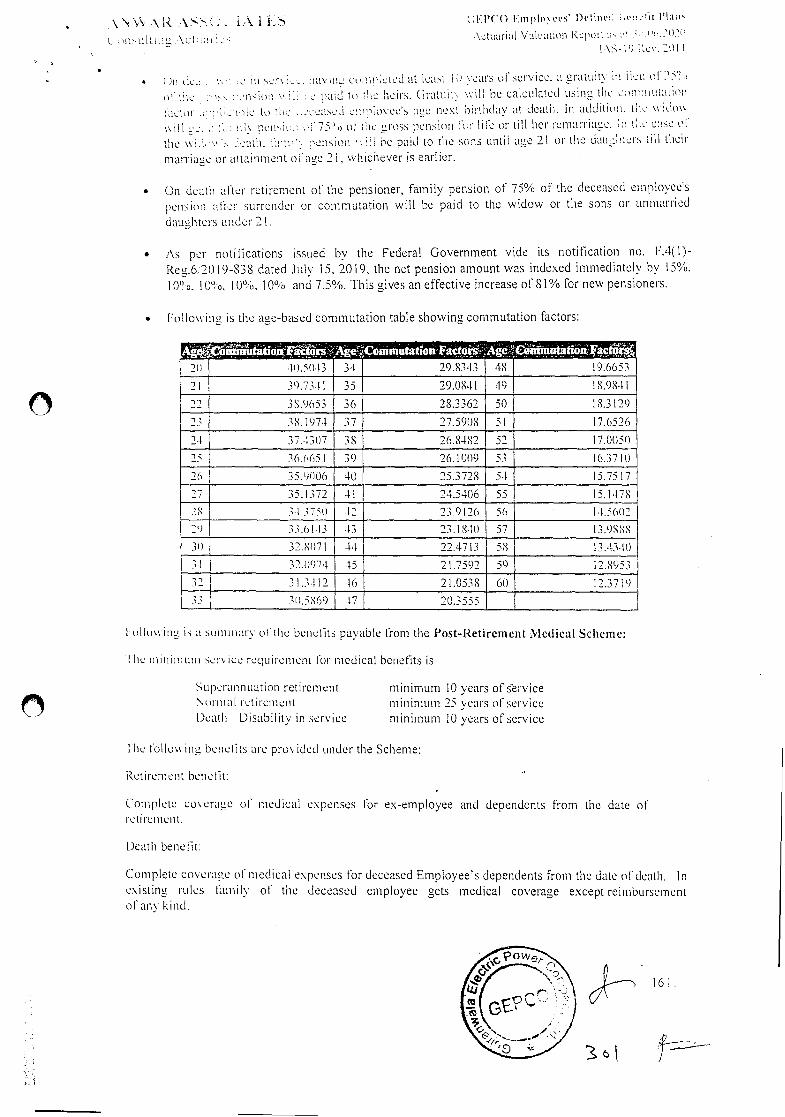
161.
.I'1l'C() !ntpl ris' 1)ctin . Lj61 I't:ni
L 000 ;\Ci :u \utuarial Valuation I ron :o. :0 0 0ev. lOt
• in dv.: o:.. ii svi\ o. toy air: ct:mfeted at ie:i.t I) \ears ot service. a gratuity a iv:: oI:
of the : :vnioo if c paid to he heirs. Gra1ui will be calculated using the c(mi:ut:ition
actor ::fcnhe to ti:c occeascri catfovees ace next o:rthdav at death. In addition. iNc widow
no. a O:011\ pen:ava of 75h itt the cross tension or tile or till her remarriage. Itt t::ce:e @1
the if.O heath. thai CitS10i1 'a Ii he paid to the suns until ace 2) or the daucloers till their
maiTiace or atrainnient of ace 21, whichever is earl icr.
• On death alter retirement of the pensioner, family pension of 75°A of the deceased employees
pension aRer surrender or commutation will be paid to the widow or the sons or unmarried
daughters under 2 I
As per notifications issued by the Federal Government vide its notification no. F.4(I)-
Reu.6;2019-838 dated July 15, 2019, the net pension amount was indexed immediately by 15%. 100 0. I 0%. 10%. 10% and 7.5%. This gives an effective increase of 81% for new pensioners.
Following is the age-based commutation table showing commutation factors:
19.6653 20 4(05043 34 29.8343 48
21 39.7341 35 29.0841 49 18.9841
22 38.0653 36 28.3362 50 18.3129
23 38.1971 37 27.5908 51 17.6526
23 37.4307 38 26.8482 52 17.0050
25 36.6051 39 26.1009 53 16.3710
26 35.9006 40 25.3728 54 15.7517
35.1372 4! 24.5406 55 15.1478
2t 31.375(1 (2 23.9126 56 (.5(012
33.61 3 (3 23.1841) 57 13.9888
31) 32.8071 44 22.47(3 58 13.13.0)
3] 32.0974 45 21.7592 59 12.8953
32 31.3.112 (6 2 1.0538 60 12.3719
33 39.5869 (7 20.3555
allowing is a suiiiiiiary of the beoelits payable from the Post-Retirement Medical Scheme:
lie nuniniuin ser ice requirement for medical benefits is
Superannuation retirement Nonital retirement Death Disability in service
minimum 10 years ofervice minimum 25 years o service minimum 10 years of service
I he lollo ing benefits are pro ided under the Scheme:
Retirement benefit:
Complete coerace of medical expenses for ex-employee and dependents from the date of ret i ic tile 01.
Death hene fit:
Complete coverage of medical expenses for deceased Employee's dependents from the date of death. In
existing rules himily of the deceased employee gets medical coverage except reimbursement otanv Lind.
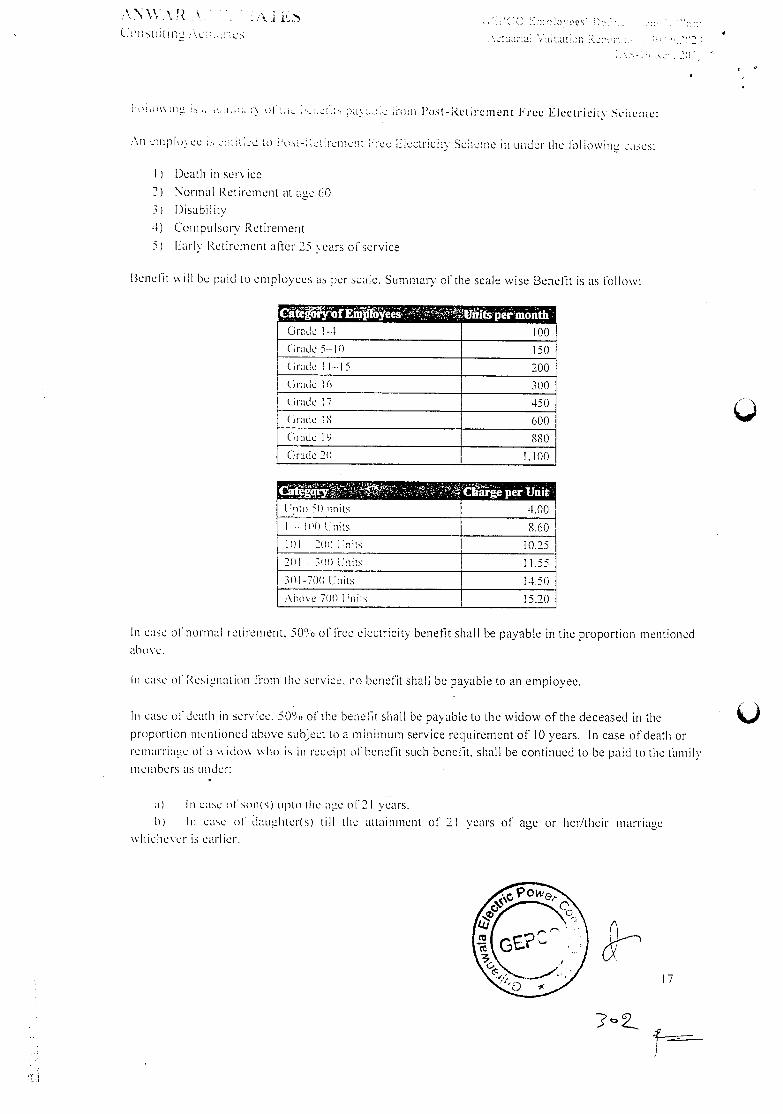
17
cotsuiti ;\CL,..
.o.. t.... cii p1\:...e iom i'nst-Retrement Free Electricity ce:nc:
.-\ti einplo CC tO l cpi Eieefticio Scitciic in under the IbIlovin ciscs:
I) Death iii ser ice
2) Normal Retirement at ace 60
3) Disability
4) Conipulsory Retirement
5,1 Early Retirement ater 25 \ears of service
ltenel)t will be paid to employees as per scale. Summary of the scale wise Benefit is as follow:
Grade -1 lOU
(iride 5--- 0 150
(irLide -15 200
Grade 300
Grade 17 450
Grade IS 600
(irde tO 880
(rade 2)) 1,100
t.pt() 5)) units
CtgeperUnit 4.00
0 8.60
I))) 2(11) Lnits 10.25
2))! --- 30)) Ends 11.55
31)1-70)) Enits 1451)
e 70)) Ends 15.20
In ease of' normal retirement. 50 o of' free electricity benefit shall be payable in the proportion mentioned
ahos e.
Iii case nl Resioiiat inn lionu the service, no benefit shall be payable to an employee.
In ease of death in service. 5Ot0 of the benefit shall be payable to the widow of the deceased in the
proportion mentioned above subject to a minimum service requirement of 10 years. In case of death or
reillarriace of in rto\ v Ito is in receipt of benefit such benefit, shall be continued to be paid to the Ibm i ly
members as under:
In case of snns) tipto the age of2 I years.
h) In ease of daucliler(s) till the attainment of 21 years of age or her/their marriage
vh iehever is earl er.
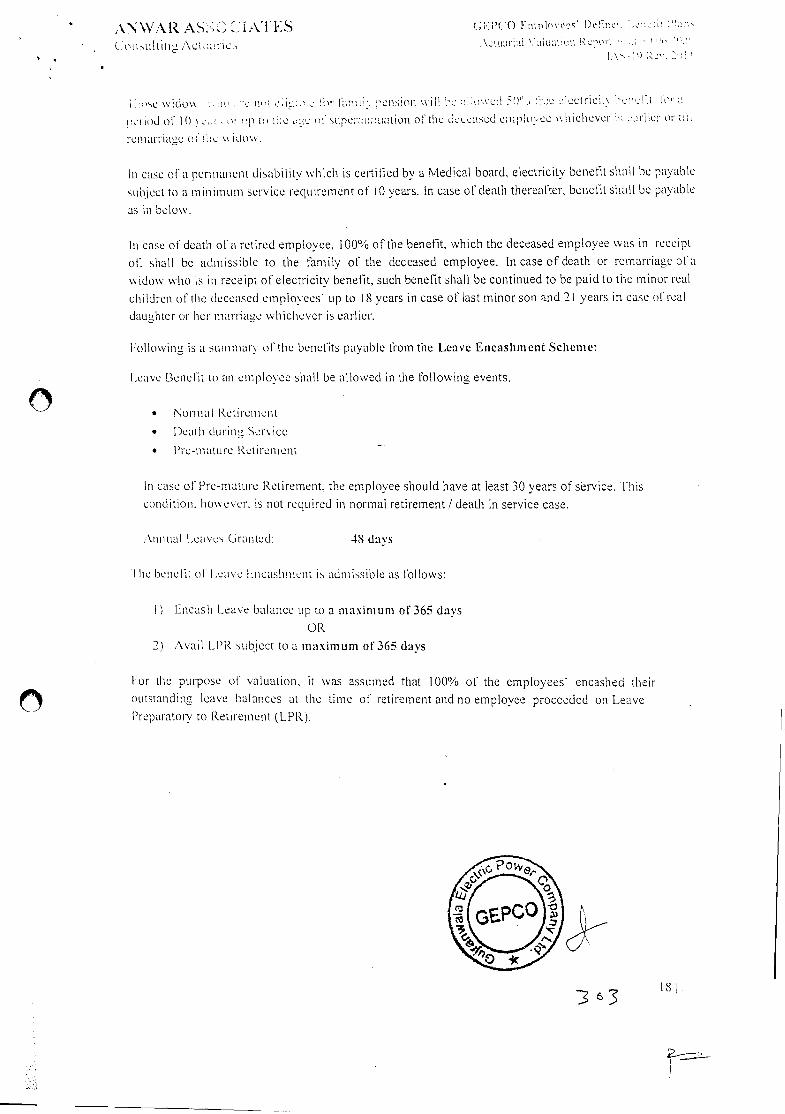
I\.NWAR (;•;Pi:'() Fiin1r.'c I)e01;
iultii Acloin ie \ciuihii \ivahen -
1.\- h':.
:kse wido h no civ',: lr Ianoo nensloil \ViiHe o.uwcd ? ectr:Cit\ .c:Kt K 0
p-riod ol 1(1 p :o :e :0: h up ;:::ualion ofthc coased Hu\ee Kinchever K :irher or
remarriage (I lii: how.
In case of a permanent disability which is certified by a Medical board. electricity benefit shall be payable
suhect to a in inimum service requirement of 10 years. in case of death thereafter, bcnefit shall be payable
as in below.
in case of death of a retired employee, 100% of the benefit, which the deceased employee was in receipt
oil shall be admissible to the family of the deceased employee. In case of death or remarriage of a
widow who is in receipt of electricity benefit, such benefit shall be continued to be paid to the minor real
children of the deceased employees' up to 18 years in case of last minor son and 21 years in case of real
daughter or her marriage whichever is earlier.
lollowing is a summary of the benefits payable from the Leave Encashnient Scheme:
l.cive Benefit to an employee shall be allowed in the following events.
• Nionna I Retireinen t
• Deat Ii during Ser\ ice
• Pre-niature Retirement
In case of Pre-mature Retirement, the employee should have at least 30 years of sbrvice. [his
condition, however, is not required in normal retirement! death in service case.
\tinual l.eav es (iranted: 48 days
I lie heiietit ol I .ea e Nncashiitent is admissible as follows:
I) Encash Leave balance v.p to a maximum of 365 days
OR
2) Avail LPR sublect to a maximum of 365 days
I-or the purpose of valuation, it was assumed that i00% of the employees' encashed their
outstanding leave balances at the time of retirement and no employee proceeded on Leave
Preparatory to Retirement (LPR).
181
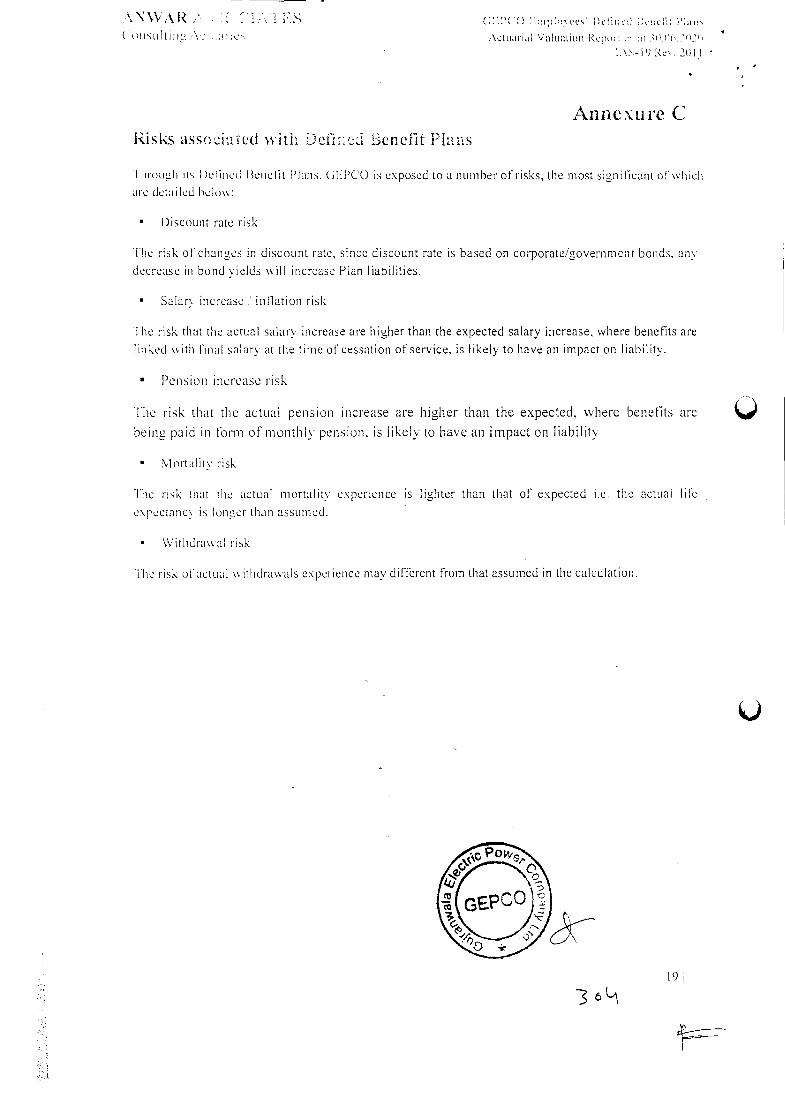
i t)lti! COt in
( oiisiiltiiin \iurial \'aluaiioii
I.\-l9 ke\. 2W!
A.nnexure C
Risks assoia ted ith Deiin Benefit Plans
I IiroiieIi its I )eflncd ltcnclh 'Ions. (ULl'CO is exposed to a number of risks, the most signi icant of which
are detailed he low:
Discount rate risk
[he risk of changes in discount rate, since discount rate is based on corporate/government bonds, any
decrease in bo ad yields wil in crease P ian liabilities.
Salary increase inflation risk
[he risk that the actual salary increase are higher than the expected salary increase, where benefits are
linked with final salar at the time of cessation of service, is likely to have an impact on liability.
Pension increase risk
llie risk that the actual pension increase are higher than the expected, where benefits arc
being paid in lonTi of monthly pension. is likely to have an impact on liability
l ortal dv risk
1lmc risk that the actual mortal dv experience is lighter than that of expected i.e. the actual I ftc
e\pectanc\ is longer than assumed.
\\'itldrawai risk
Ihe risk of actual withdrawals experience may different from that assumed in the calculation.
19
36
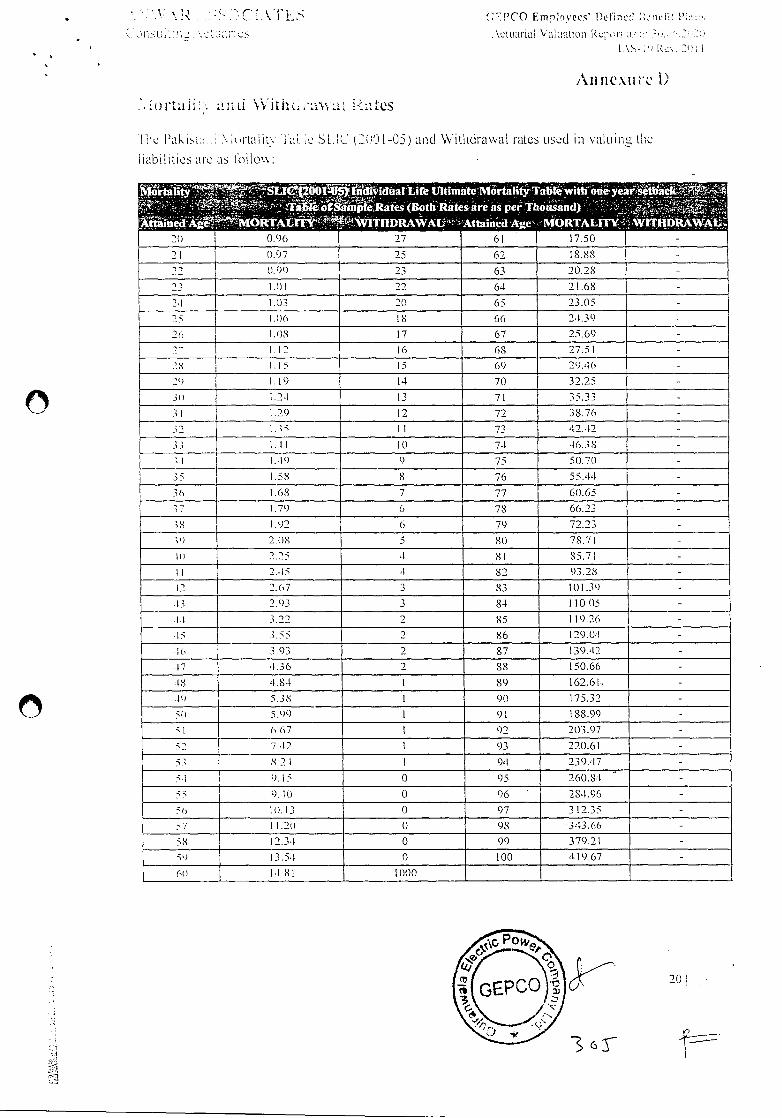
(TPCO Emn!nvee.s' 1)tin.ui ni'tO P:
UiOu :,OlLC .\etuariai Valuation kjuri a a' R.
AI111eXt1r I)
I \Vjth i-.ts
the Pak ntu. rtaiit 1 ai:e S LIC 1i)O l-O) and Withdrawal rates used iii valuina the
liabilities are as follow:
2001 ø5 Individu d Life Ultimate Mortality Table with one yeaI sthack TakoCSamptc R its (oth Rates ire as pr Thousand)
: i. ta.:' .
Mta1it
20 1 0.96 27 61 17.50 -
21 0.97 25 62 18.88 -
22 0.99 23 63 20.28 -
23 1.01 22 64 21.68 -
2) 1.03 20 65 23.05 -
25 1)6 IS 66 24.39 -
26 1.0$ 17 67 25.69 -
27 1.12 6 68 27.5) -
I. I 5 15 69 29.-IC) -
29 1.19 14 70 32.25 -
30 1.2-I 13 71 35.33 -
3) .29 12 72 38.76 -
.12 .35 11 73 42.42 -
$3 III 0 74 46.38 -
1.19 9 75 50.70 -
35 1.5$ 8 76 55.44 -
36 1.68 7 77 60.65 -
'17 .79 6 73 66.23 -
.0-1 1.92 6 79 72.23 -
1') 2.118 5 80 78.71 -
10 2.25 4 SI 85.71 -
II 2.-IS 4 82 93.28 -
2 2.07 3 83 101.39 -
1$ 2.93 3 84 10.05 -
.1 3.22 2 85 119.26 -
IS .3.55 2 86 129.0-I -
.10 3.93 2 87 139.42 -
.17 4.36 2 88 150.66 -
IS 4.84 1 89 162.61.. -
.19 5.38 1 90 175.32 -
51) 5,9t) I 91 188.99 -
SI 6.67 I 92 203.97
52 7.12 1 93 220.61 -
53 8.2.1 I 94 239.17 -
9.15 0 95 260.81
55 9.10 0 96 - 284.96 -
56 111.13 0 97 312.35 -
57 11.21) 0 98 343.66 -
58 2.3) 0 99 379.21 -
59 13.5.1 0 100 419.67 -
1.1.81 1000 -
20
Loi' sit i; g ACtuayj
.
Gujranwala Electric Power Company (GEPCO) Gujranwaia
Employees' Pension, Post-Retirement Medical,
Post-Retirement Free Electricity & Leave Encashment Plans
Actuarial Valuation Report as at 30.06.2019
lAS 19 (Rev 2011)
Wednesday, January 1, 2020
C-5 Officers Colony (Old), Zarar Shaheed Road, Lahore Cantoment-54810, Pakistan Tcl: +92 [42) 36624520, Ccli: +92 313 9753755
Email: [email protected]
GEPCO E:nplovees' Pension, Post-Rehrenent edci1, CCATE5 Poct-Fetirement Free Eiectrici iv & Leave Lena nent Pines
Actuaniri V catIon hOo t 3O.O2ci5
Table of Contents
Overview 2
1 Scope of Work 2
2 Compliance with Professional Guidance 2
3 Methodology 3
3.1 Process Flowchart 3
3.2 Data and Information 3
3.2.1 Employee Data 3
3.2.2 Verification of Data 4
3.2.3 Key Statistics 4
3.3 Valuation Assumptions 5
3.3.1 Discount Rate 5
3.3.2 Expected Salary Increase 5
3,3.3 Pension Indexation Rate 5
3,3.4 Average Medical Cost 5
3.3.5 Electricity Indexation Rate 6
3.3.6 Demographic assumptions 6
3.4 Actuarial Method 7
4 Actuarial Results 7
4.1 Results Summary 7
AnnexureA 8
AnnexureB 16
AnnexureC 20
37
2
GEPCO Empiovees Pension, Fost-Retirern S nt iciicn1, Post-Retirement Free Electrici ; 0 ee':c Fr :oont FOrs tcner\o:ortion
ASFOLjAFs
Ove rvi e\v
This Actuarial Valuation Report Ehercin reièrred to as a 'Report'j has been prepared at the request of Gujranwala Electric Power Cnmanv Limited (CEPCIfl to J)reSent tctujrni Eetimates of us Defined Benefit Plans Liabilities as at june 30, 2019 to incoroorate, as the Organization looms appropriate, in its Financial Statements under international Financial Reporting Standards. GEPCO provides Benefits as per its Benefit Rules. A summary of these Rules is shown in Plan Provision section.
We have relied upon data provided by the GEPCO's management in the written form and through oral communication. The reasonability checks performed on the data are presented in the data section of the Report.
p.
This Report is solely for the use of the Management and the Auditors of GEPCO. It may not be modified, incorporated into or used in other material, sold or otherwise provided, in whole or in part, to any other person or entity, without our permission.
GEPCO should notify us promptly after receipt of this Report, if it is aware of any information that would affect the results of this Report and which has not been communicated to us or is not incorporated herein.
1 Scope ofWork
Brief description of the Scope of\'Vork is as follow:
• Determination of Employees' Pension, Post-Retirement Medical, Post-Retirement Free
Electricity & Leave Encashment cost for the year ending 30.06.2019 based on future
Demographic and Economic assumptions
• Determination of the amounts to be incorporated in the Balance Sheet, Income Statement
and Other Comprehensive Income (OCI),
Determination of actuarial gain/loss during the year in accordance with IAS19 Rev. 2011.
Preparation of Statement showing the movement in Present value of Defined Employees'
Pension, Post-Retirement Medical, Post-Retirement Free Electricity & Leave Encashment
Obligation (Actuarial Liability) for the FY 2018-19 Determination of estimated P&L charge under each Scheme for the year ending June 30,
2020.
2 Compliance with Professional Guidance
This Report complies with the applicable Actuarial Standards issued by Pakistan Society of
Actuaries (PSoA) as follows:
• PSoA Guidance Note 6 (GN6): General Actuarial Practice
• PSoA Guidance Note 3 (GN3) and Guidance Note 4 (GN4): Assumptions
We are not aware of any material changes or events that occurred subsequent to the Valuation date of the data provided by GEPCO for this analysis that may have a material impact on the results of
the Actuarial Valuations.
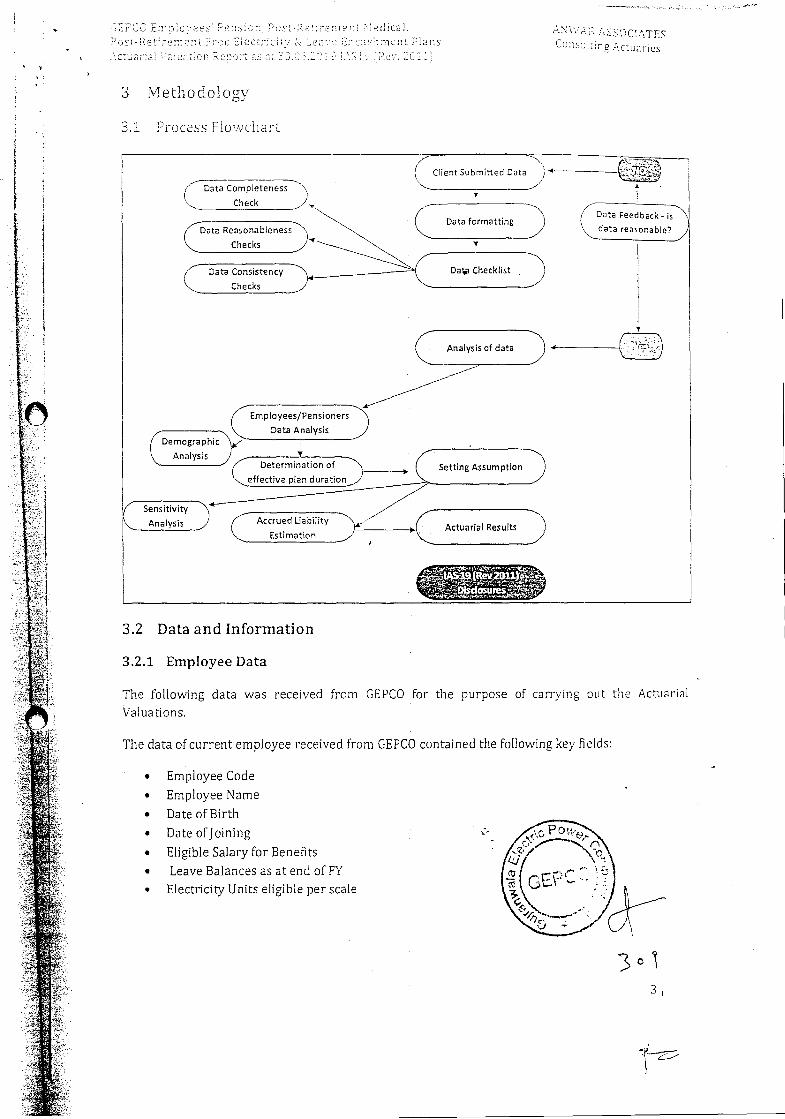
Accrued Liability I Sensitivity \\ Analysis
Estimation
Employees/Pensioners
Data Analysis
Determination of
effective plan duration_) Setting Assumption
Data formatting
Da Checklist
Analysis of data
(Demographic
Analysis
JEPOC E:n a'es PensP iecO
ctara a:ancr. a: JO
i-s11e
E:.P:ment Plans
ANAE
CcaSapig AC:U:IIieS
3 Methodoiogy
3.1 Process Flowchart
3.2 Data and Information
3.2.1 Employee Data
The following data was received from GEPCO for the purpose of carrying out the Actuarial
Valuations.
The data of current employee received from GEPCO contained the following key fields:
• Employee Code
• Employee Name
• Date of Birth
• Date ofjoining
• Eligible Salary for Benefits
• Leave Balances as at end of FY
• Electricity Units eligible per scale
3o1 3
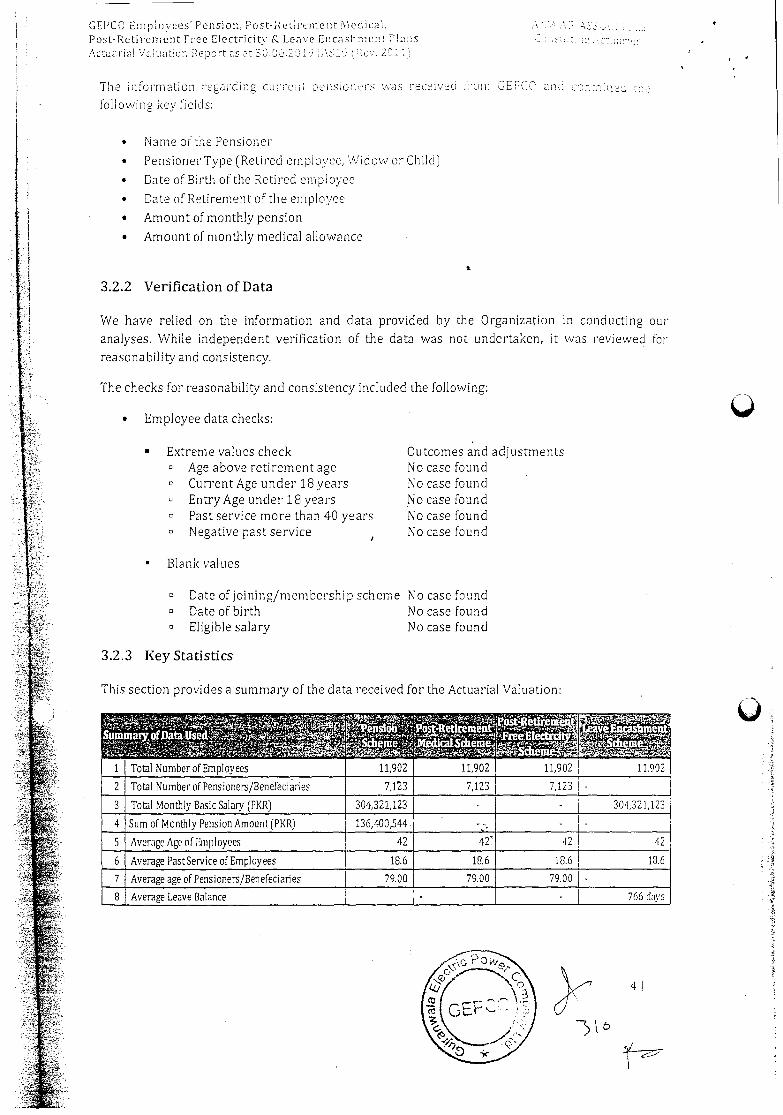
GEICO Employees' Pension. Post-RCLIi'emellt ieLC2,
Post-Retirement Free Electricity Leave EncasL mcO Clans Actuarial vauat:cr, Fe:ort as a 30.O6.2Ui '15ay.
The information regarchng cu;rci,i aensionris seas reccived om ub.iLC and c:nliisd
folloseing key fields:
• Name of the Pensioner
• Pensioner Type (Retired employee, \'Vidow or Childj
• Date of Birth of the Retired employee
• Date of Retirement of the employee
• Amount of monthly pension
Amount of monthly medical allowance
3.2.2 Verification of Data
We have relied on the information and data provided by the Organization in conducting our
analyses. While independent verification of the data was not undertaken, it was reviewed for
reasonability and consistency.
The checks for reasonability and consistency included the following:
Employee data checks:
• Extreme values check Age above retirement age Current Age under 18 years Entry Age under 18 years Past service more than 40 years Negative past service
Blank val ties
Outcomes and adjustments No case found No case found No case found No case found No case found
Date ofjoining/membei-ship scheme No case found Date of birth No case found Eligible salary No case found
3.2.3 Key Statistics
This section provides a summary of the data received for the Actuarial Valuation:
1
LSch ' them ,
Total Number of Employees 11,902 11,902 11,902 11,902
2 Total Number of Pensioners/Benefeciaries 7123 7,123 7,123 -
3 Total Monthly Basic Salary (PKRJ 304,321,123 - - 304,321,123
4 Sum of Monthly Pension Amount (PKR) 136,400,544 - - -
5 Average Age of Employees 42 42 '12 '12
6 Average PastService of Employees 18.6 18.6 18.6 18.6
7 Average age of Pensioners/Benefeciaries 79.00 79.00 79.00 -
8 Average Leave Balance - . 766 days
4J
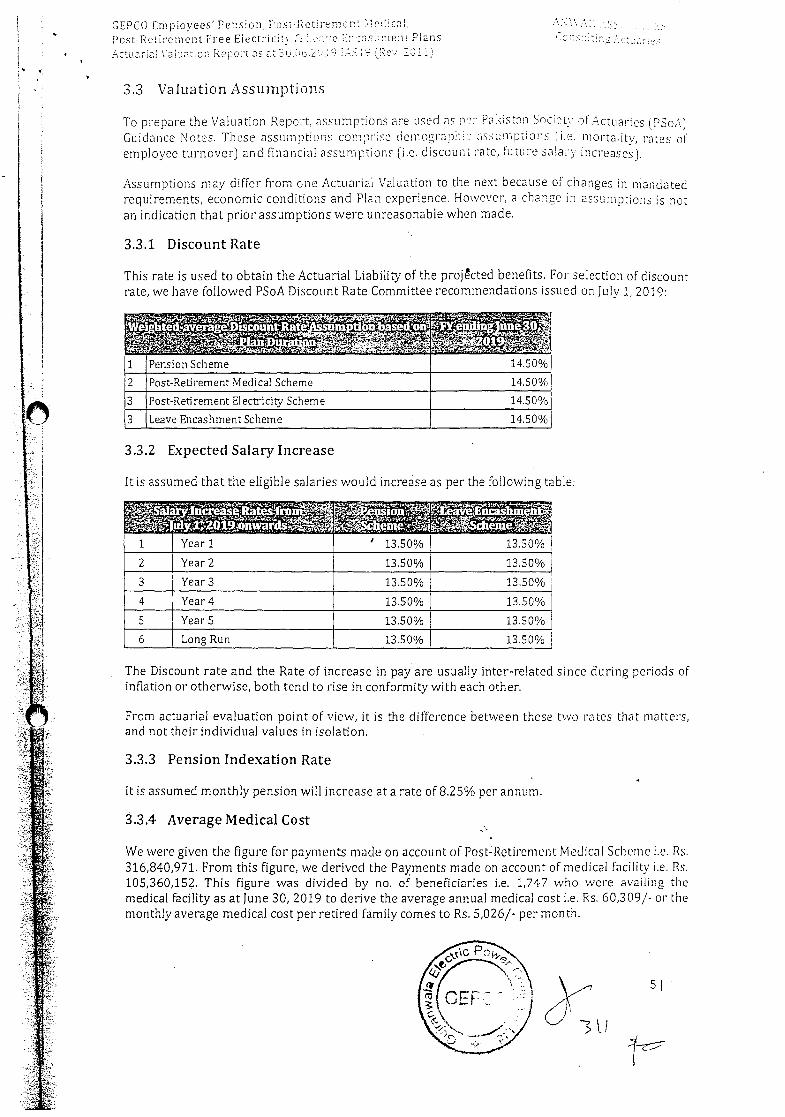
GEPCO Employees' Pension, Post-Retirement Hcnl.
Post-Retirement Free Eiectricitv A •.. e;:c 7,ncas.o:ient Plans Actuarial Valuation Repeat as at 3U.e2tI IS :10c.'. O11J
3.3 Valuation Assumptions
To prepare the Valuation Report, assumptions are used as Pr Paidstrn Society of Actuaries (PSOA) Guidance Notes. These assumptions comlinec oetnograph :issumittiOiIs (i.e. mortajita' rates of employee turnover) and financial assumptions (i.e. discount rate, future sainry increases).
Assumptions nitty differ from one Actuarial Valuation to the next because of changes in mandated requirements, economic conditions and Plan experience. However, a change in assumptions is not an indication that prior assumptions were unreasonable when made.
3.3.1 Discount Rate
This rate is used to obtain the Actuarial Liability of the proj&ted benefits, Fat' selection of discount rate, we have followed PSoA Discount Rate Committee recommendations issued on July 1, 2019:
1 Pension Scheme 14.50%
2 Post-Retirement Medical Scheme 14.50%
3 Post-Retirement Electricity Scheme 14.5 0°/s
3 Leave Encashment Scheme 14.50%
3.3.2 Expected Salary Increase
It is assumed that the eligible salaries would increase as per the following table:
2 Year 2 13.50% 13.50%
3 Year 3 13.50% 13.50%
4 Year 4 13.50% 13.50%
5 YearS 13.50% lS.SO%
6 Long Run 13.50% 13.50%
The Discount rate and the Rate of increase in pay are usually inter-related since during periods of inflation or otherwise, both tend to rise in conformity with each other.
From actuarial evaluation point of view, it is the difference between these two rates that matters, and not their individual values in isolation.
3.3.3 Pension Indexation Rate
It is assumed monthly pension will increase at a rate of 8.25% per annum.
3.3.4 Average Medical Cost
We were given the figure for payments made on account of Post-Retirement Medical Scheme i.e. Rs. 316,840,971. From this figure, we derived the Payments made on account of medical facility i.e. Rs. 105,360,152. This figure was divided by no. of beneficiaries i.e. 1,747 who were availing the medical facility as at June 30, 2019 to derive the average annual medical cost i.e. Rs. 60,309/- or the monthly average medical cost per retired family comes to Rs. 5,026/- per month.
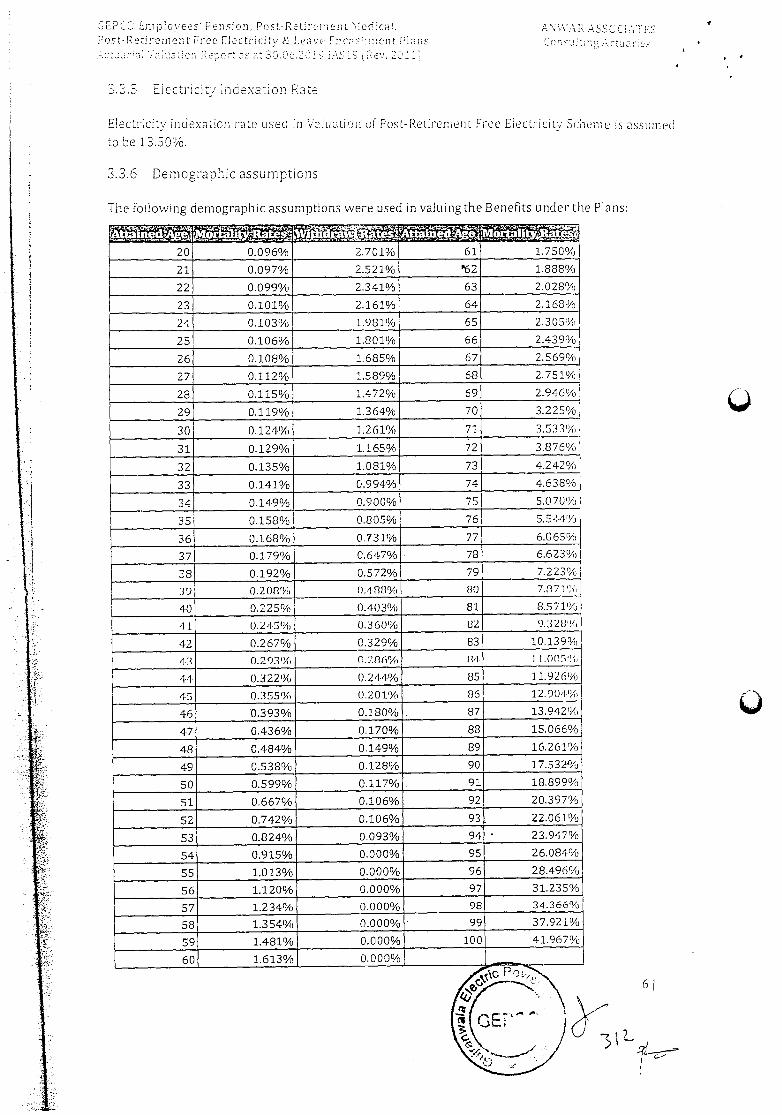
IEP:IC Employees Fens:on, Post-i emeni 'ecifcai, Post-Retirement Free Electricity & Leave Fr craP rent Plans
as a: 30.C6.2CF PEEP Fey. 111 1
ctPAR .ASStjCiAF Conaaiir. p
3.3.5 Eiectricity indexation Rate
Electricity indexation rate used in Valuation of Post-Retirement Free Electricity Scheme is assumed
to be 13.50%.
3.3.6 Demographic assumptions
The following demographic assumptions were used in valuingthe Benefits under tie Plans:
20 0.096% 2.701% 61 1.750%
21 0.097% 2.521% 62 1.888%
22 O.099% 2.341% 63 2.028%
23 0.101% 2.161% 64 2.168%
24 0.103% 1.981% 65 2.30574
25 O.106% 1.801% 66 2.439%
26 0.108% 1.685% 67 2.569%
27 0.112% 1.589% 68 2.751%
28 0.115% 1.472% 69 2.946%
29 0.119% l.364% 70 3.225%
30 0.124% 1.261% 71 3.533%
31 0.129% 1.165% 72 3.876%
32 0.135% 1.081% 73 4.242%
33 O.141% 0.994% 74 4.638%
34 0.149% 0.900% 75 5.070%
35 0.158% 0.805% 76 5.544% I
36 0.168% 0.731% 77 6.065%
37 0.179% 0.647% 78 6.623%
38 0.192% 0.572% 79 7.223%
39 0.208% ft'188% 00 7.8715
40 0.225% 0.403% 81 8.571%
41 0.245% 0.360% 02 9.320%
42 0.267% 0.329% 83 10.139%
13 0.293% 0.286% 81 1 1.0055
44 0.322% 0.244% 05 11.926%
45 0.355% 0.201% 86 12.901%
46 0.393% 0.180% 87 13.942%
47 0.436% 0.170% 88 15.066%
48 0.484% 0.149% 89 1G.261%
49 0.538% 0.128% 90 17.532%
50 0.599% 0.117% 91. 18.899%
51 O.667% 0.106% 92 20.397%
52 0.742% 0.106% 93 22.061%
53 0.824% 0.093% 94 23.947%
54 0.915% 0.000% 95 26.084%
55 1.0 13% 0.000% 96 28.496%
56 1.120% 0.000% 97 31.235%
57 1.234% 0.000% 98 34.366%
58 1.354% 0.000% 99 37.921%
59 1.481% 0.000% 100 41.967%
60 1.613% 0.000%
0
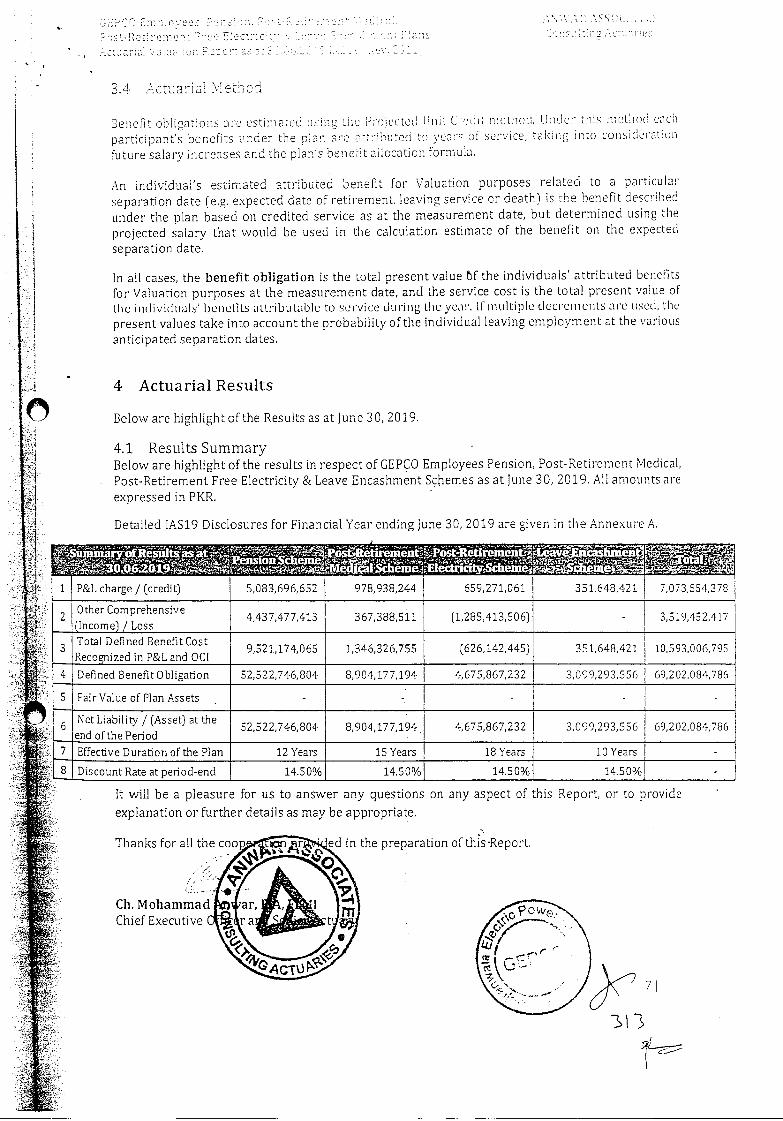
11L
Thanks for all the coo ed in the preparation of this-Report.
Ch. Mohammad Chief Executive
S 50
.5 LUSHUS
3.4 Actuatial lolethod
Benefit obligations are estimated osin -rojected lini Ccd method. Under ohs method each
participants benefits under the rise are s:Thued to ems of service, takiog into consideration future salary increases and the plan's benefit ailccaticn fbrmuia.
An individual's estimated attributed benefit for Valuation purposes related to a particular separation date (e.g. expected date of retirement, leaving serce or death) is the benefit described under the plan based on credited service as at the measurement date, but determined using the projected salary that would be used in the calculation estimate of the benefit on the expected
separatiOn date.
In all cases, the benefit obligation is the total present value f the individuals' attributed benefits for Valuation purposes at the measurement date, and the service cost is the total present value of the individuals' beneliLs attributable to service during the year. If multiple decrements are used, the present values take into account the probability of the individual leaving employment at the various anticipated separation dates.
4 Actuarial Results
Below are highlight of the Results as at June 30, 2019.
4.1 Results Summary Below are highlight of the results in respect of GEPCO Employees Pension, Post-Retirement Medical, Post-Retirement Free Electricity & Leave Encashment Schemes as at June 30, 2019. All amounts are
expressed in PKR.
Detailed IAS19 Disclosures for Financial Year ending June 30, 2019 are given in the Annexure A.
-
I I . I ' . .
. • • . -
, -.'-- , . . t . I I ' I ' ' I
I _•II
;.. -_._- , . ,
:- . .
,-.- ..'- -.
-, .,
'-1:.
5,083,696,652
. I'
1 P&L charge / (credit) 978,938,244 659,271,061 351,648,421 7,073,554,378
2 OtherComprehensive (Income) / Loss
4,437,477,413 367,388,511 (1,285,413,506) - 3,519,452,417
Total Defined Benefit Cost Recognized in P&L and OCI
9,521,174,065 1,346,326,755 (626,142,445) 351,648,421 10,593,006,795
4 Defined Benefit Obligation 52,522,746,804 8,904,177,194 4,675,867,232 3,099,293,556 69,202,084,786
5 Fair Value of Plan Assets - - -
6 Net Liability / (Asset) at the end of the Period
52,522,746,804 8,904,177,194 4,675,867,232 3,099,293,556 69,202,084,786
7 Effective Duration of the Plan 12 Years 15 Years 18 Years 10 Years -
Discount Rate at period-end 14.SO% 14.50% 14.50% 14.50% -
It will be a pleasure for us to answer any questions on any aspect of this Report, or to provide
explanation or further details as may be appropriate.
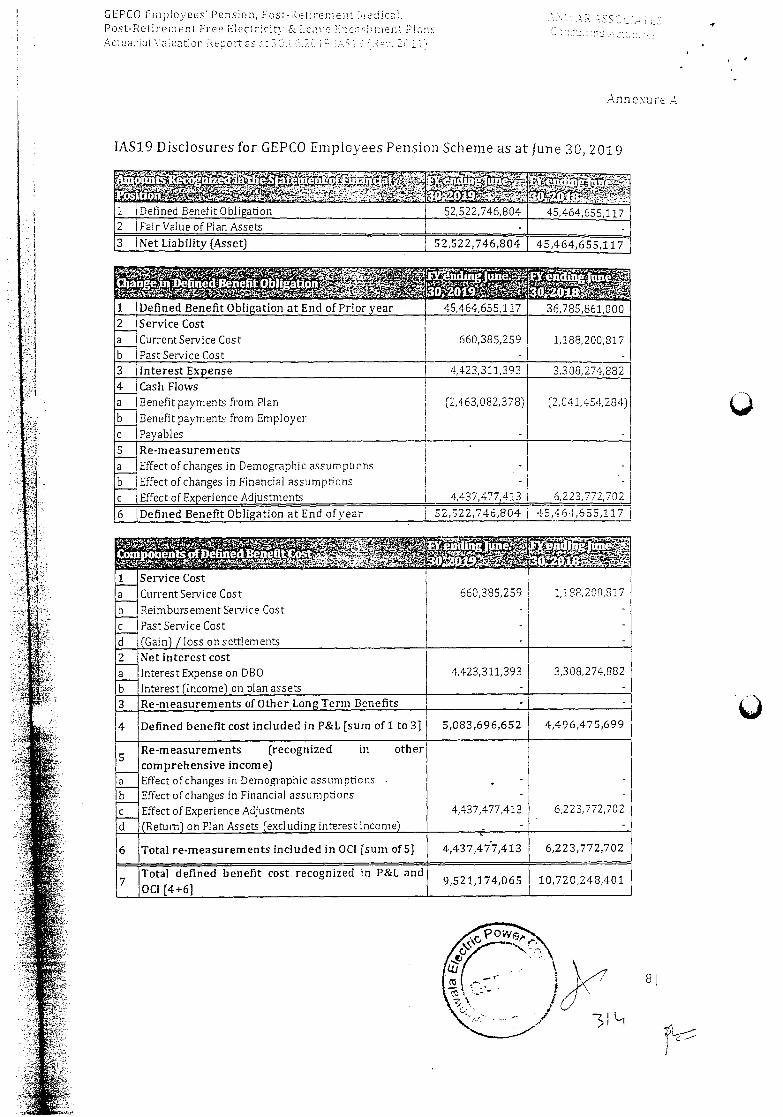
3H
GEPCO Employees Pension, Fos-iet:remen Pdico, Post-Retirement F;ee E]cctr:cit'; & Lc,'e P:c; oen P1 Actua:ial Pa a1on Reaort as at 30.PG P LPI P Ps..
Annexure A
IAS19 Disclosures for GEPCO Employees Pension Scheme as at June 30, 2019
1 DefIned Benefit Obligation 52522,746,804 45,464,655,117 2 Fair Value of Plan Assets - - - - 3 Net Liability (Asset) 52,522,746,804 - 45,464,655,117
1
CbangeJnDefined Benefit ObIaUon '-
36,785,861,000 Defined Benefit Obligation at End of Prior year 45,464,655,117 2 Service Cost
Current Service Cost Past Service Cost
660,385,259 -
1,188,200,817 -
a b 3 Interest Expense 4,423,311,393 3,308,274,882 4 Cash Flows
Benefit payments from Plan Benefit payments from Employer Payables
C2,463,082,378)
-
(2,041,454,284)
-
a b c 5 Re-measurements
Effect of changes in Demographic assumptions Effect of changes in Financial assumptions Effect of Experience Adjustments
- -
4,437,477,413
-
6,223,772,702
a b c 6 Defined Benefit Obligation at End ofyear 52,322,746,804 45,464,655,117
c:p CoDnj
1 Service Cost Current Service Cost Reimbursement Service Cost PastServiceCost (Gain) / loss on settlements
660,385,259
- - -
1,18e,200,817
- - -
a b c d 2 Net interest cost
Interest Expense on DBO Interest (Income) on plan assets
4,423,311,393 -
3,308,274,882 -
a b 3 Re-measurements of Other Long Term Benefits - -
4 Defined benefit cost included in P&L [sum of 1 to 3] 3,083,696,652 4,496,475,699
5 Re-measurements (recognized in other comprehensive income) Effect of changes in Demographic assumptions Effect of changes in Financial assumptions Effect of Experience Adjustments (Return)onPlanAssets (exciudinginterestinconie)
- -
4,437,477,413 -
- -
6,223,772,702
-
a b c d
6 Total re-measurements included in OCI [sum of 3] 4,437,477,413 6,223,772,702
Total defined benefit cost recognized in P&L and OCI [4+6]
9,521,174,065 10,720,248,401
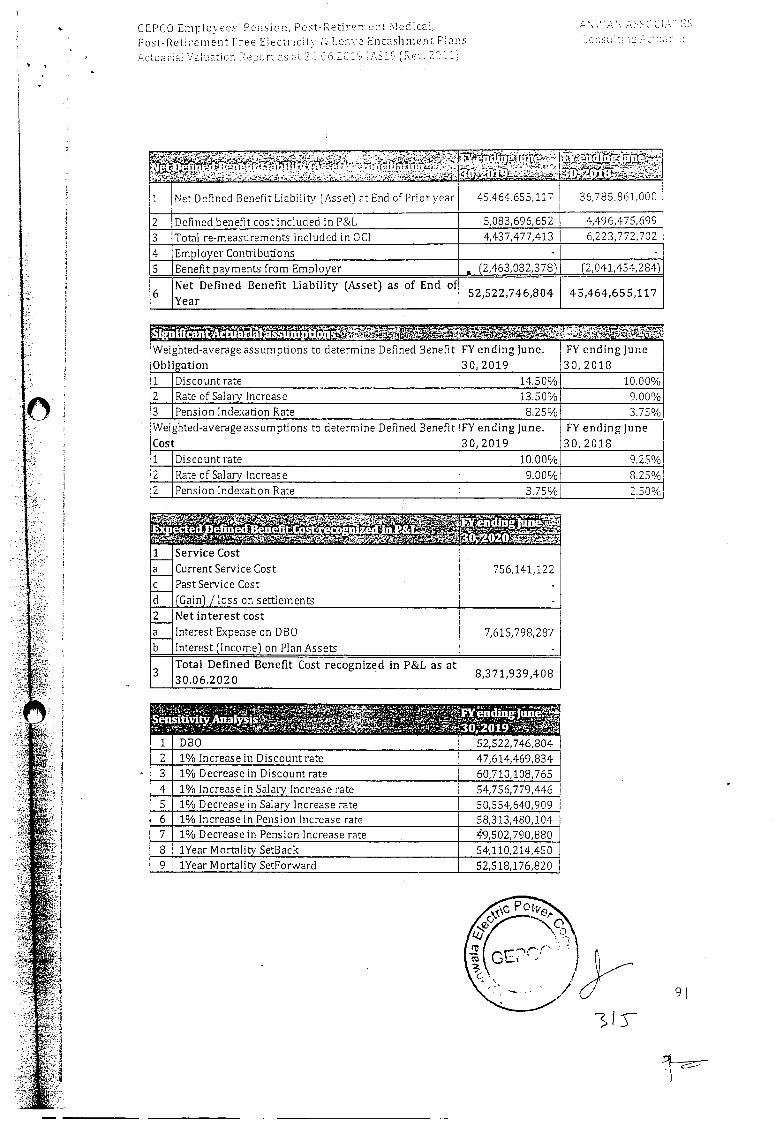
GEPCO Eniplovees Pension, Post-RetirenjeaL iedcaI, Post-Retirement Free Electiicitv La EncashmenL P.ans Actuariei Vaivator. Renort as 5.1.56.2319 1519 [Re:. 2311[
1 Net Defined Benefit Liability [Asset] at End of Prioryear 45464,655,117 36,785,861,000
2 Defined benefit cost included in P&L 5,083,696,652 4,496,475,699 3 Total re-measurements included in OCI 4,437,477,413 6,223,772,702 4 Employer Contribuons - - 5 Benefit payments from Employer (2,463,082,378) 12,041,454,284)
6 Net Defined Benefit Liability (Asset) as of End of Year
52,522,746,804 45,464 655,117
Weighted-average assumptions to determine Defined Benefit ObYgation
FY ending June. 30, 2019
FY ending June 30,2018
1 Discount rate 14.50% 10.00% 2 Rate of Salary Increase 13.50% 9.00% 3 Pension Indexation Rate 8.25% 3.75% Weighted-average assumptions to determine Defined Benefit Cost
FY ending June. 30,2019
FY ending June 30,2018
1 Discount rate lO.00% 9.25% 2 Rate of Salary Increase 9.00% B.25% 2 Pension Indexation Rate 3.75% 2.50%
1 Service Cost Current Service Cost PastService Cost [Gain) /loss on settlements
756,141,122 - -
a c d 2 Net interest cost
Interest Expense on DBO Interest (Income) on Plan Assets
7,615,798,287 -
a b
Total Defined Benefit Cost recognized in P&L as at 30.06.2020 8 371 939 408
1
1
Sensitivity AnaIysis
DBO 2Oi9 52,522,746,804
2 1% Increase in Discountrate 47,614,469,834 3 1% Decrease in Discount rate 60,710,108,765 4 1% Increase in Salary increase rate 54,756,779,446 5 1% Decrease in Salary Increase rate 50,554,640,909 6 1% Increase in Pension Increase rate 58,313,480,104 7 1% Decrease in Pension Increase rate f9,502,790,880 8 lYear Mortality SetBack 54,110,214,450 9 lYear Mortality SetForward 52,518,176,820
9
3J

Jc -.erenen ewca! & Lee cnsL:eiins
\'7' --
GflS'il; ;\L
JAS1Y Disclosures for GEPCO Employees Post-Retirement Medical Scheme as at June 30, 2019
1 Defined Benefit Obligation 8,904,177,194 7,874,691,410 2 Fair Value of Plan Assets - - 3 Payables - - 4 Net Liability (Asset) - 8,904,177,194 7,874,691,410
i1Ttti :ci 04J 1) IrO1
1 Defined Benefit Obligation at End ofPrioryear 7,874,691,410 8,777,878,442 2 Service Cost
CurrentService Cost PastSei-viceCost
207,311,152 -
169,308,555 -
a b 3 Interest Expense 771,627,092 799,476,949 4 Cash flows
Benefit payments from Plan BenefItpayments from Employer Payables
(316,840,971) -
(269,768,787) -
a b c 5 Re-measurements
Effect of changes in Demographic assumptions Effect of changes in Financial assumptions Effect of Experience Adjustments
- -
367,388,511
- -
11,602,203749)
a b c 6 Defined Benefit Obligation at End of year 8,904,177,194 7,874,691,410
1 Service Cost Current Service Cost Reimbursement Service Cost PastService Cost (Gain)/lossonsettlements
207,311,152 - - -
169,308,555 - - -
a b c d 2 Net interest cost
Interest Expense on DBO Interest (Income) on plan assets
771,627,092 -
799,476,949 -
a b 3 Re-measurements of Other Long Term Benefits - - 4 Defined benefit cost included in P&L [sum of 1 to 3] 978,938,244 968,785,504
5 Re-measurements (recognized in other comprehensive income) Effect of changes in Demographic assumptions
in Financial assumptions Effect of Experience Adjustments (Return) on Plan Assets (excluding interest income)
_Effectofchanges - -
367,388,511 ,- -
- -
(1,602,203,749)
a b c d 6 Total re-measurements included in OCI [sum of5J 367,388,511 (1,602,203,749)
Total defined benefit cost recognized in P&L and OCI [4+6]
1,346,326,755 (633,418,245)
10 I
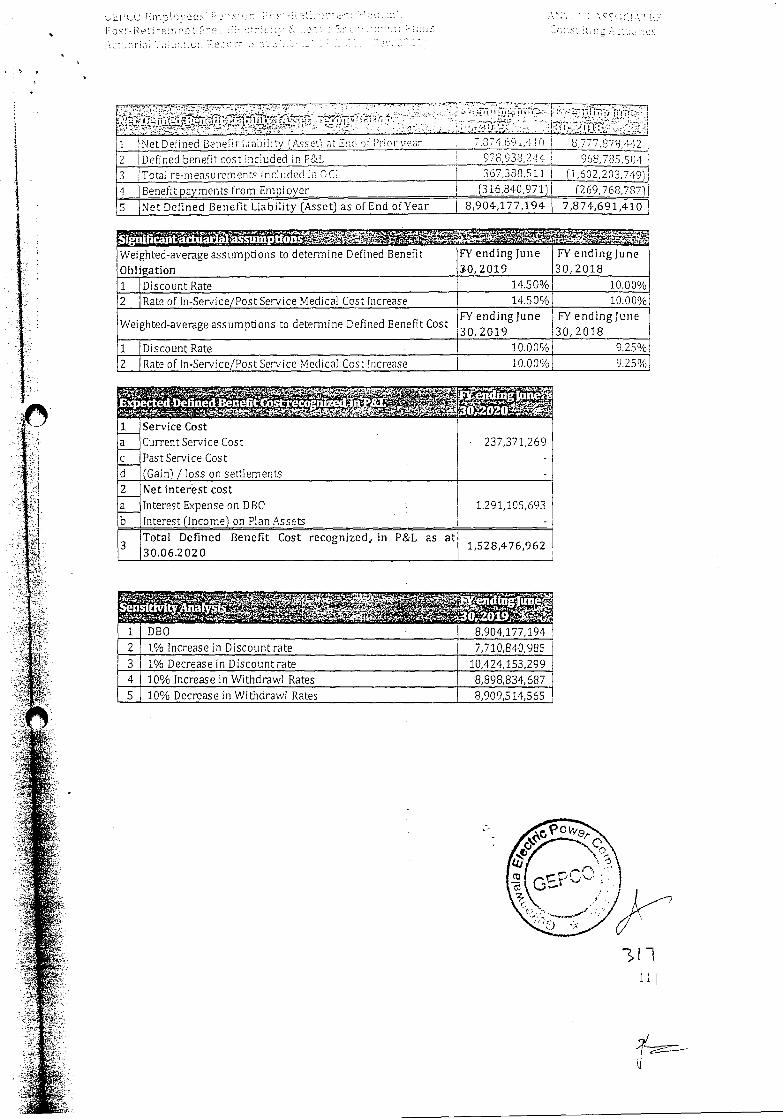
LU 7
r r Lr
1 Net Defined Benefit Liability (\ssei at End 'n Pnor year 7,$7'Lb9i,1111 D,777,88,442 2 Defined benefit cost included in P&'L 978,938,244 968,705,504 3 Total re-measurements included in CCI 367388,511 (1,602,203,749)
4 Benefit payments from Employer (316,840971) (269,768,787)
5 Net Defined Benefit Liability (Asset) as of End of Year 8,904,177,194 7,874,691,410
Weighted-average assumptions to determine Defined Benefit oblgation
FY ending June 0,2019
FY ending June 30,2018
1 Discount Rate 14.50% 10.00% 2 Rate of ln-Service/PostService Medical Cost Increase 14.50% 10.00%
Weighted-average assumptions to determine Defined Benefit Cost FY ending June 30 2019
FY ending June 30 2018
1 Discount Rate 10.00% 9.25% 2 Rate of In-Service/Post Service Medical Cost Increase lO.0O% 9.25%
1 Service Cost Current Service Cost PastService Cost (Gain) / loss on settlements
. 237,371,269 - -
a c d 2 Netinterèstcost
Interest Expense on DBO Interest (Income) on Plan Assets
1,291,105,693 -
a b
Total Defined Benefit Cost recognized in P&L as at 30.06.2020
1,528,476,962
1 DBO . 8,904,177,194 2 1% Increase in Discount rate 7,710,840,985 3 1% Decrease in Discount rate 10,424,153,299 4 lo% Increase in Withdrawl Rates 8,898,834,687 5 10% Decrease in Withdrawl Rates 8,909,514,565
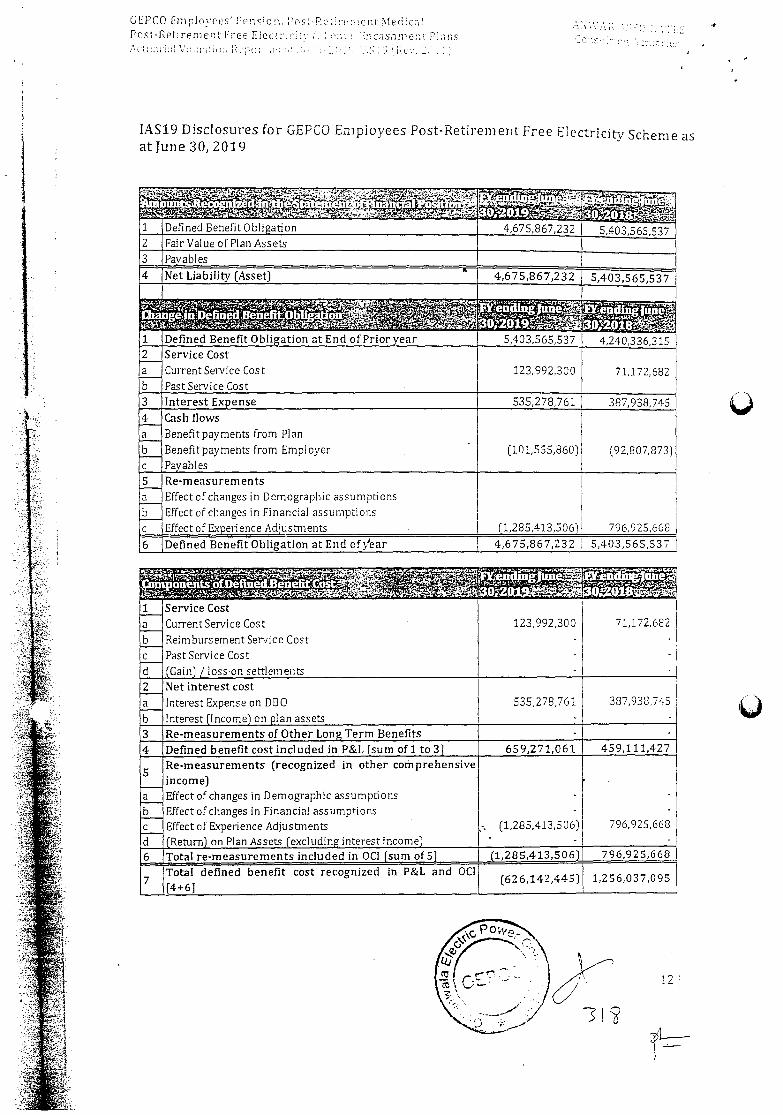
12 I
GEPCO Employees Pecicn, cs-[-crent iedicri
Post-Retiremen Free Eiect:c - P:rrshme: P irs Pl,1V.:;j:
IAS19 Disclosures for GEPCO Employees Post-Retirement Free Electricity Scheme as at June 30, 2019
'--:
1 Defined Benefit Obligation 4,675,867,232 5,403,565537 2 Fair Value of Plan Assets 3 Pa ables 4 Net Liability (Asset) 4,675,867,232 5,403,565,537
ndingJte
1 Defined Benefit Obligation at End of Priorjear 5,403,565,537 4,240,336,315 2 Service Cost
Current Service Cost PastService Cost
123,992,300 71,172,682 a b 3 Interest Expense 535,278,761 387,938,745 4 Cash flows
Benefit payments from Plan Benefit payments from Employer Payables
(101,555,860) (92,807,873) a b c 5 Re-measurements
Effect of changes in Demographic assumptions Effect of changes in Financial assumptions Effect of Experience Adjustments 11,285,413,506 796,925,668
a b c 6 Defined Benefit Obligation at End of3/ear 4,675,867,232 5,403,565,537
1 Service Cost CurrentService Cost Reimbursement Service Cost PastService Cost (Gain)] losson settlements
123,992,300
- -
71,172,682
- -
a b c d 2 Net interest cost
Interest Expense on DBO Interest (Income) on plan assets
535,278,761 -
387,9313,745
- a b 3 Re-measurements of Other Long Term Benefits - - 4 Defined benefit cost included in P&L [sum ofl to 3) 659,271,061 459,111,427
5 Re-measurements (recognized in other comprehensive income) Effect of changes in Demographic assumptions Effect of changes in Financial assumptions Effect of Experience Adjustments (Return) on Plan Assets (excluding interest income)
- -
,-. (1,285,413,506) -
- -
796,925,668 -
a b c d 6 Total re-measurements included in OCI [sum of 5) (1,285,413,506) 796,925,668
Total defined benefit cost recognized in P&L and OCI (626142445) 1,256,037,095
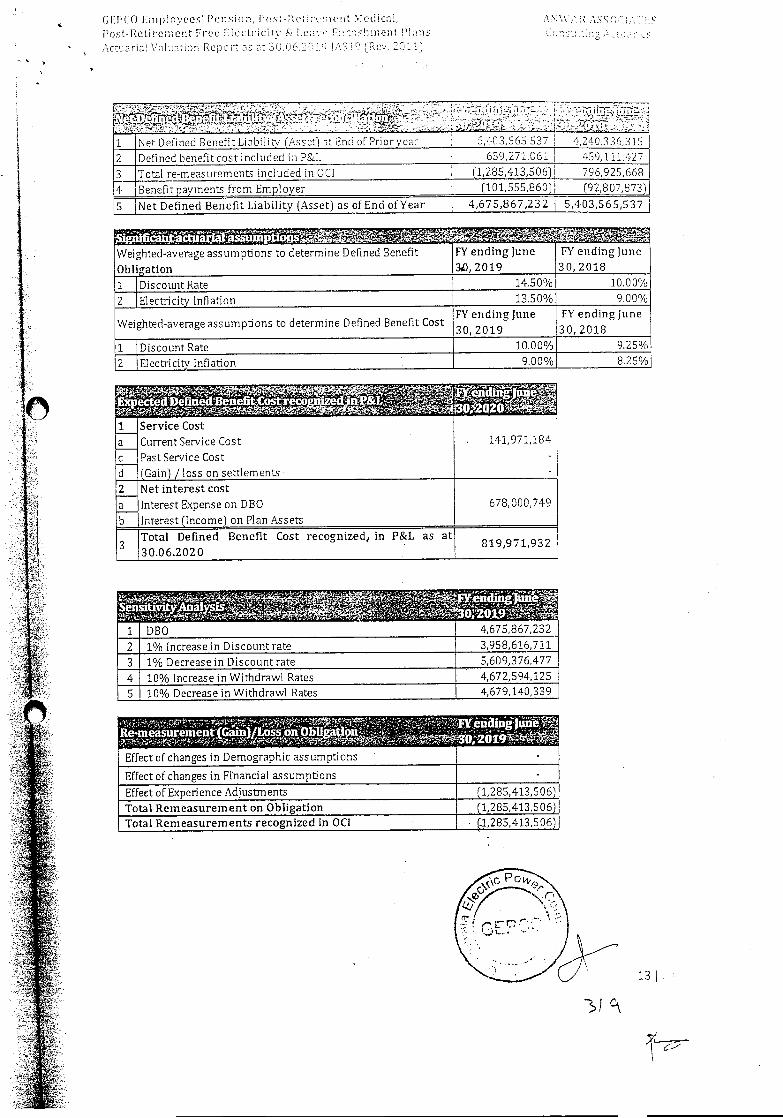
(1,285,413.5 06) (1,285,413,506)
85, 4 13, 5 06)
Effest of Experience Adjustments Total Remeasurement on Obligation Total Remeasurements recognized in OCI
13
FjuIi '3OO19 Réméasremept'(Gain)/LossonOb1I
Effect of changes in Demographic assumptions
Effect of changes in Ffnancial assumptions
GFPCO Employees' Pension, P cm-Ee 'uncut edicoi, It ASE .1.0! i.Y Post-Retirencot Puce L]CL'tlicitv i.en'." Pm. n'hmnemmi El 4cuarial Volumcn Repout ot 30. P\S19 Rcv. 2C11)
I -
1 Net Defined Benefit Liability (Asset) at End of Prioryeem 5,401,565537 4,240,336,315
2 Defined benefit cost included iii P&L 659,271061 459,111427
3 Total re-measurements included in OCT (1,285,413,506) 796,925,668
4 Benefit payments from Employer (101,555,8601 (92,807,873)
5 Net Defined Benefit Liability (Asset) as of End ofYear 4,675,867,232 5,403,565,537
Weighted-average assumptions to determine Defined Benefit
Obligation
FY ending June
3, 2019
FY ending June 30,2018
1 Discount Rate 14.50% 10.0 0%
2 Electricity Inflation 13.50% 9.00%
Weighted-average assumptions to determine Defined Benefit Cost FYendingJune
30, 2019
FYendingJune
30, 2018
1 Discount Rate 10.00% 9.25%
2 Electricity Inflation 9.00% 8.25%
. 141,971,184
- -
1 Service Cost CurrentService Cost PastService Cost (Gain) /loss on settlements
a
c d 2 Net interest cost
Interest Expense on DBO .
Interest (Income) on Plan Assets
678,000,749 a b
Total Defined Benefit Cost recognized1 in P&L as at
30.06.2020 819 971 932
4,675,867,232 1 DBO
2 1% Increase in Discount rate 3,958,616,711
3 1% Decrease in Discount rate 5,609,376,477
4 10% Increase in Withdrawl Rates 4,672,594,125
5 lO% Decrease in Withdraw] Rates 4,679,140,339
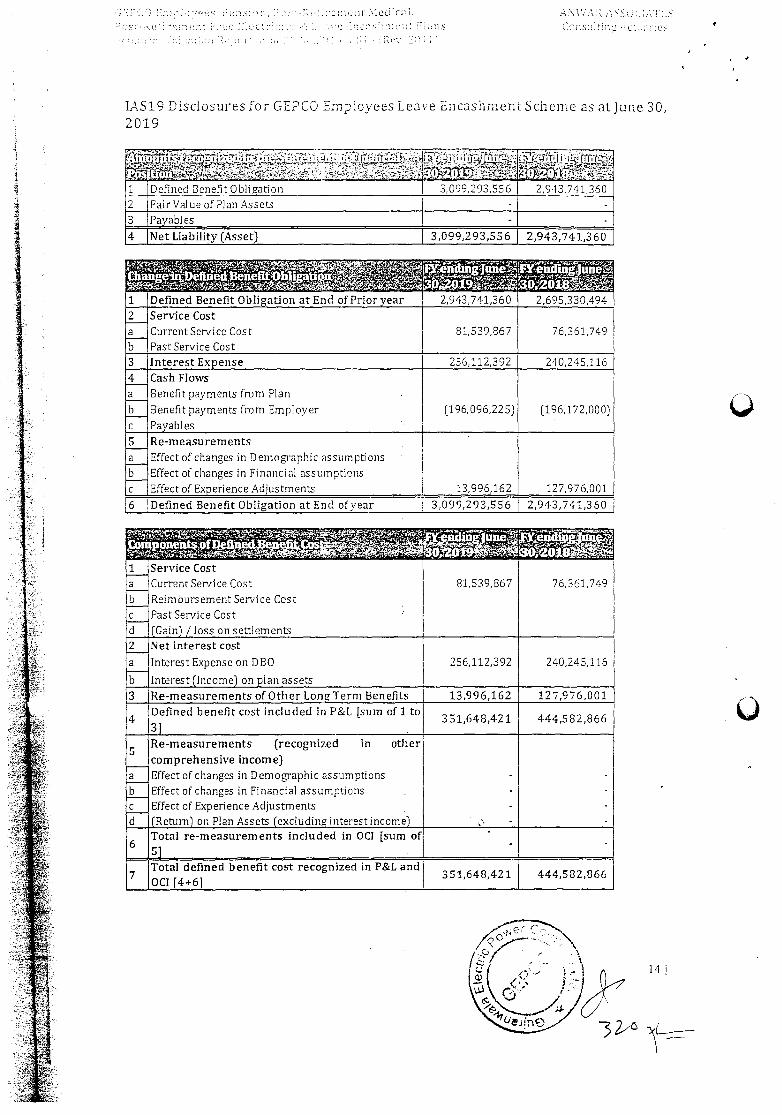
32-'
IAS19 Disclosures for GEPCO Empovees Leave Encashment Scheme as at June 30, 2019
iutg
1 Defined Benefit Obligation I 3099,293556 2,943,741,360 2 Fair Value of Plan Assets - - 3 Payables - - 4 Net Liability (Asset) 3,099,293,556 2,943,741,360
1
aTii
Defined Benefit Obligation at End ofPrioryear 2,943,741,360 2,695,330,494 2 Service Cost
Current Service Cost PastServiceCost
81,539,867 76,361,749 a b 3 Interest Expense 256,112,392 240,245116 4 Cash Flows
Benefit payments from Plan Benefit payments from Employer Payables
[196,096,225) (196,172,000) a b c 5 Re-measurements
Effect of changes in Demographic assumptions Effect of changes in Financial assumptions Effect of Experience Adjustments 13,996,162 127,976,001
a b c 6 Defined Benefit Obligation at End ofyear 3,099,293,556 2,943,741,360
81,539,867 76,361,749 1 Service Cost
Current Service Cost Reimbursement Service Cost Past Service Cost (Gain) / loss on settlements
a b c d 2 Netinterestcost
Interest Expense on DBO Interest (Income) on plan assets
256,112,392 240,245,116 a
b 3 Re-measurements of Other Long Term Benefits 13,996,162 127,976,001
Defined benefit cost included in P&L [sum of 1 to 351,648,421 444,582,866
Re-measurements (recognized in other comprehensive income) Effect of changes in Demographic assumptions Effect of changes in Financial assumptions Effect of Experience Adjustments (Return) on Plan Assets (excluding interest income)
- - -
,- -
- - -
a b c d
6 Total re-measurements included in OCI [sum of 5]
- -
Total defined benefit cost recognized in P&L and OCI [4+6]
351,648,421 444,582,866
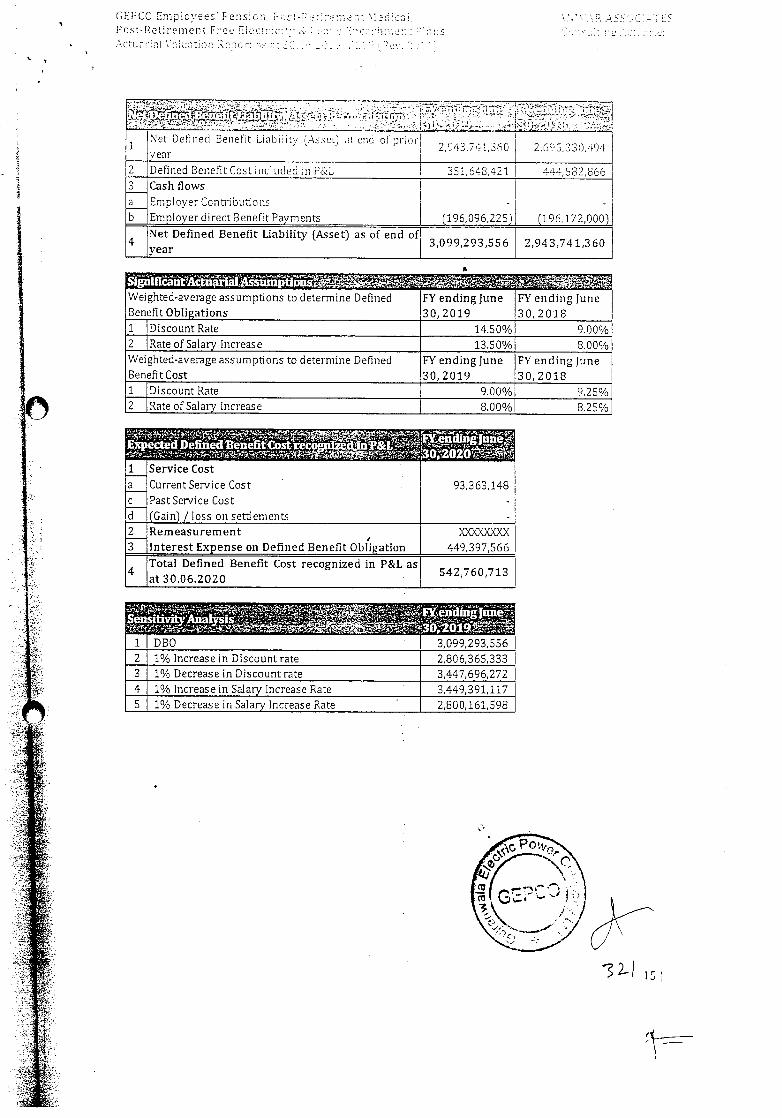
GEPCO Employees' Fensbm P Post-Retirement Frco Eiec'o:c .•'\Ctun:PiJ \ ccntioo 'no
1 Net Defined Benefit Liabiliu,' (Assec ot cod of prior year
, ,J43,í4,0 L,6YJ,O,9',
2 Defined Benefit Cost included in P&L 351,648,421 444, 582,866 3 Cash flows
Employer Contributions Employer direct Benefit Payments
- (196,096,225)
- (196,172,000)
a b
Net Defined Benefit Liability (Asset) as of end of year 3,099,293,556 2,943,741,360
Weighted-average assumptions to determine Defined Benefit Obligations
FY ending June 30,2019
FY ending June 30,2018
1 Discount Rate 14.SO% 900% 2 Rate of Salary Increase 13.50% 8.00% Weighted-average assumptions to determine Defined BenefitCost
FY ending June 30,2019
FY ending June 30,2018
1 Discount Rate 9.00% 9.25% 2 Rate of Salary Increase 8.00% 8.25%
>r'4- c$ ,. 3 .- /9Z3OZO2O 1 Service Cost a Current Service Cost 93,363,148 C PastService Cost - d (Gain)/lossonsettlements - 2 Remeasurement XXXXX)OKX 3 Interest Expense on Defined Benefit Obligation 449,397,566
Total Defined Benefit Cost recognized in P&L as at 30.06.2020 542 760 713
OO19t 3,099,293,556 1 DBO
2 1% Increase in Discount rate 2,806,365,333 3 1% Decrease in Discount rate 3,447,696,272 4 1% Increase in Salary Increase Rate 3,449,391,117
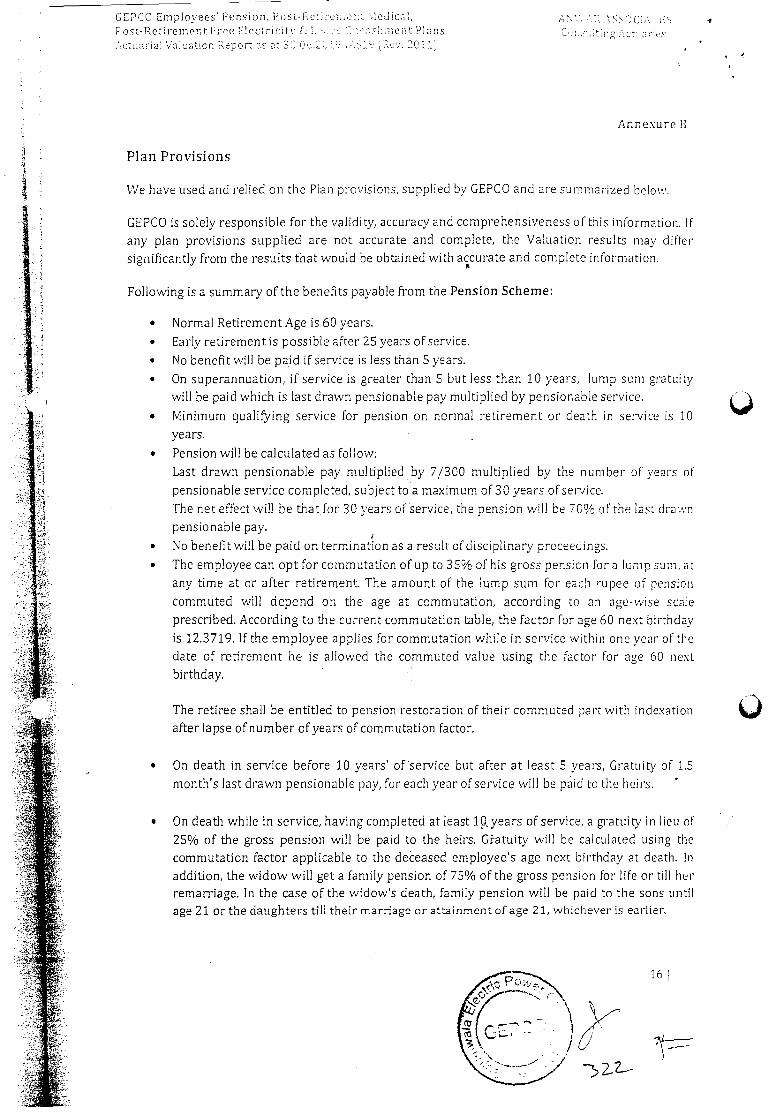
16
GEPCO Employees Pension, i'ost-Pcü ena rt led c .rccci:, 4
Post-Re reniontirre E!octririt': P'. ':y si:iwat Plans ifl
ctuasia Viuticr Peport as a 3C 1.'S 'HRv. 2C
Annexure B
Plan Provisions
We have used and relied on the Plan provisions, supplied by GEPCO and are summarized below.
GEPCO is solely responsible for the validity, accuracy and comprehensiveness of this information. If
any plan provisions supplied are not accurate and complete, the Valuation results may differ
significantly from the results that would be obtained with accurate and complete information.
Following is a summary of the benefits payable from the Pension Scheme:
• Normal Retirement Age is 60 years.
• Early retirement is possible after 25 years of service.
• No benefit will be paid if service is less than 5 years.
• On superannuation, if service is greater than 5 but less than 10 years, lump sum gratuity
will be paid which is last drawn pensionable pay multiplied by pensionable service.
• Minimum qualifying service for pension on normal retirement or death in service is 10
years.
• Pension will be calculated as follow:
Last drawn pensionable pay multiplied, by 7/300 multiplied by the number of years of
pensionable service completed, subject to a maximum of 30 years of service.
The net effect will be that for 30 years of service, the pension will be 70% of the last drawn
pensionable pay.
• No benefit will be paid on termination as a result of disciplinary proceedings.
• The employee can opt for commutation of up to 35% of his gross pensicn for a lump sum, at
any time at or after retirement. The amount of the lump sum for each rupee of pension
commuted will depend on the age at. commutation, according to an age-wise scale
prescribed. According to the current commutation table, the factor for age 60 next birthday
is 12.3719. If the employee applies for commutation while in service within one year of the
date of retirement he is allowed the commuted value using the factor for age 60 next
birthday.
The retiree shall be entitled to pension restoration of their commuted part with indexation
after lapse of number of years of commutation factor.
• On death in service before 10 years' of'service but after at least 5 years, Gratuity of 1.5
month's last drawn pensionable pay, for each year of service will be paid to the heirs.
• On death while in service, having completed at least 1years of service, a gratuity in lieu of
25% of the gross pension will be paid to the heirs, Gi-atuity will be calculated using the
commutation factor applicable to the deceased employee's age next birthday at death. In
addition, the widow will get a family pension of 75% of the gross pension for life or till her remarriage. In the case of the widow's death, family pension will be paid to the sons until age 21 or the daughters till their marriage-or attainment of age 21, whichever is earlier.
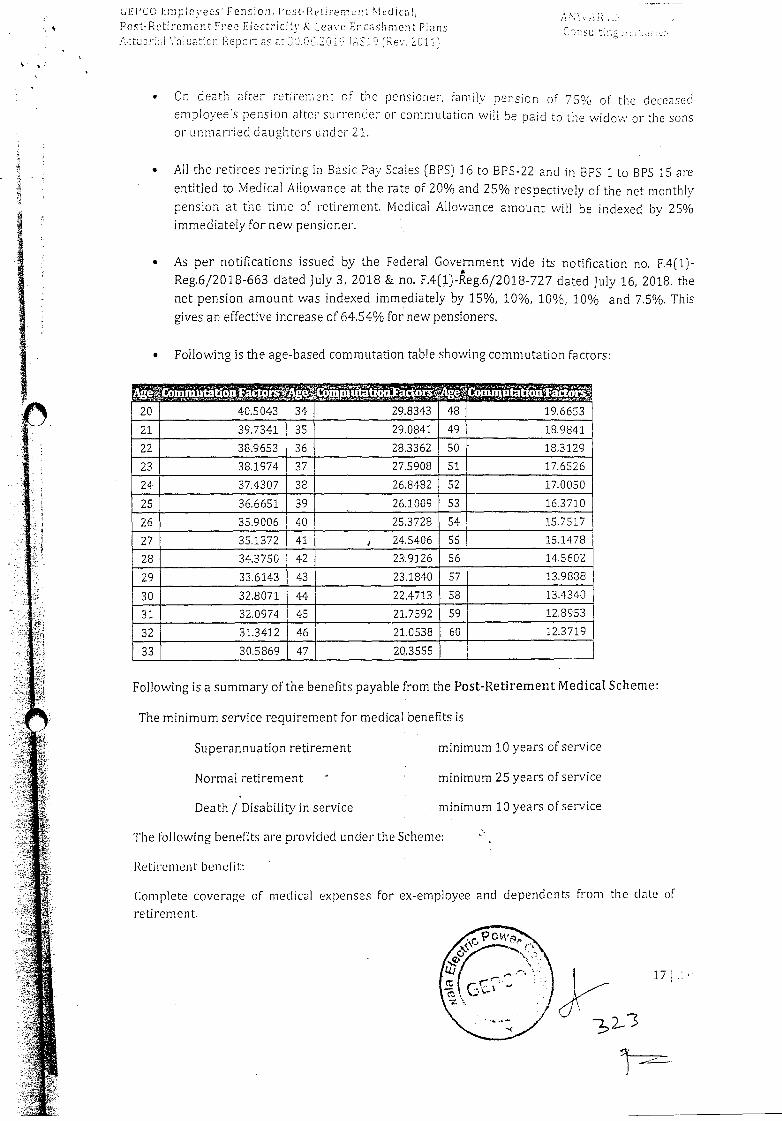
17
(iEFCO Lmpioyees Fensicn, )o .1 remei:J 0icai, Post-Retirement Free Fiectricitu & Leaue Enca.chment Plans 1ctuarlol 7eiuoon Report as at 300(01010 A31? Rev. 201
Cur so g
On death after retirement of the pensioner, family pension of 75% of the deceased
employees pension after surrender or commutation will be paid to the widow or the sons or unmarried daughters under 21.
• All the retirees retiring in Basic Pay Scales (BPS) 16 to BPS-22 and in BPS ito BPS 15 are
entitled to Medical Allowance at the rate of 20% and 25% respectively of the net monthly
pension at the time of retirement. Medical Allowance amount will be indexed by 25%
immediately for new pensioner.
• As per notifications issued by the Federal Government vide its notification no. F.4(i)-
Reg,6/2018-663 dated July 3, 2018 & no. F.4(1)-Reg.6/2018-727 dated July 16, 2018. the
net pension amount was indexed immediately by 15%, 10%, 10%, 10% and 7.5%. This
gives an effective increase of 64.54% for new pensioners.
Following is the age-based commutation table showing commutation factors:
20 40.5043 34 29.8343 48 19.6653
21 39.7341 35 29.0841 49 18.9841
22 38.9653 36 28.3362 50 18.3129
23 38.1974 37 27.5908 51 17.6526
24 37.4307 38 26.8482 52 17.0050
25 36.6651 39 26.1009 53 16.3710
26 35.9006 40 25.3728 54 15.7517
27 35.1372 41 24.5406 55 15.1478
28 34.3750 42 23.9126 56 14.5602
29 33.6143 43 23.1840 57 13.9888
30 32.8071 44 22.4713 58 13.4340
31 32.0974 45 21.7592 59 12.8953
32 31.3412 46 21.0538 60 12.3719
33 30.5869 47 20.3555
Following is a summary of the benefits payable from the Post-Retirement Medical Scheme:
The minimum service requirement for medical benefits is
Superannuation retirement minimum 10 years of service
Normal retirement minimum 25 years of service
Death / Disability in service minimum 10 years of service
'l'he following benefits are provided under the Scheme:
Retirement benefit:
Complete coverage of medical expenses for ex-employee and dependents from the date of
retirement.
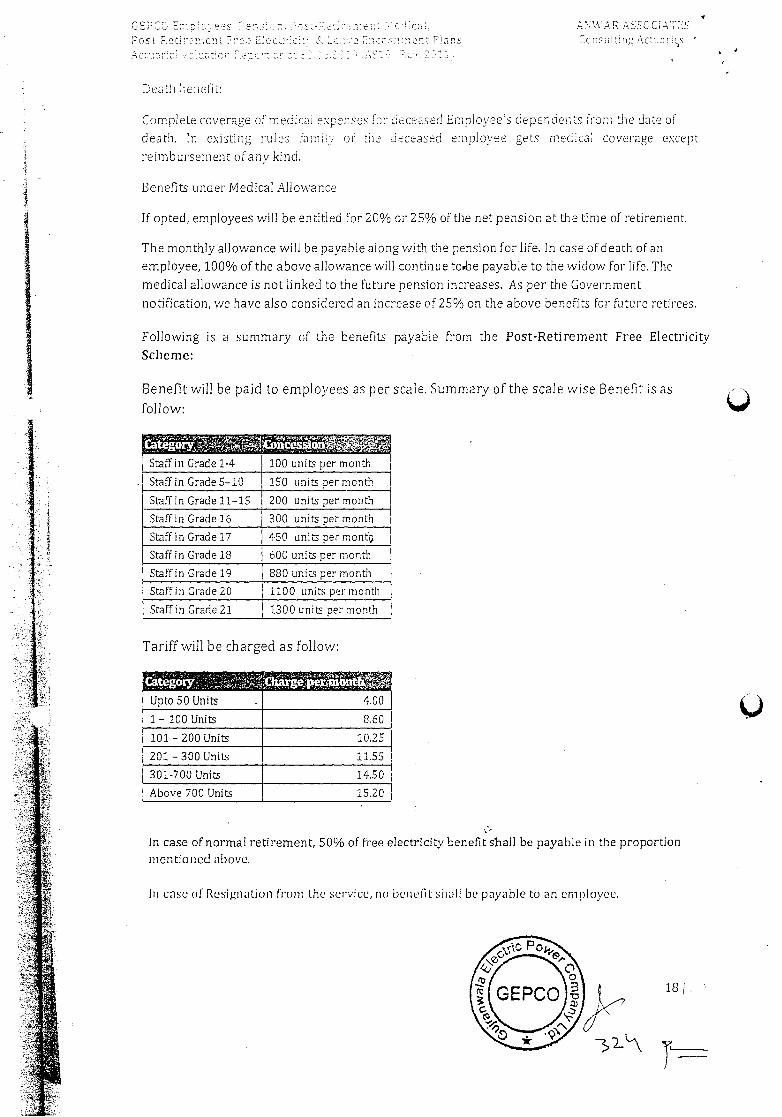
Upto 50 Units
1 - 100 Units
101 - 200 Units
201 -300 Units
301-700 Units
Above 700 Units
10.25
11.55
14.50
15.20
18!.
seVAR socc'ms
Post-Re rnen: tme S. L.:. a Poco.-an:ot Ptans Ccnsi - , St
Death benef
Complete coverage of medical expenses for deceased Employees dependents from the date of
death. In existing rules fami.r of the deceased employee gets medical coverage except
reimbursement of any kind.
Benefits under Medical Allowance
If opted, employees will be entitled for 20% OF 25% of the net pension at the time of retirement.
The monthly allowance will be payable along with the pension for life. In case ofdeath of an
employee, 100% of the above allowance will continue toe payable to the widow for life. The
medical allowance is not linked to the future pension increases. As per the Government
notification, we have also considered an increase of 25% on the above benefits for future retirees.
Following is a summary of the benefits payable from the Post-Retirement Free Electricity
Sche me:
Benefit will be paid to employees as per scale. Summary of the scale wise Benefit is as
follow:
; -'1a-
Staff in Grade 1-4 100 units per month
Staff in Grade 5-10 150 units per month
Staff in Grade 11-15 200 units per month
Staff in Grade 16 300 units per month
Staff in Grade 17 450 units per monti
Staff in Grade 18 600 units per month
Staff in Grade 19 880 units per month
Staftin Grade 20 1100 units per month
Staff in Grade 21 1300 units per month
Tariff will be charged as follow:
In case of normal retirement, 50% of free electricity benefIt shall be payable in the proportion mentioned above.
In case of Resignation ftoin the service, no benefit shall be payable to an employee.
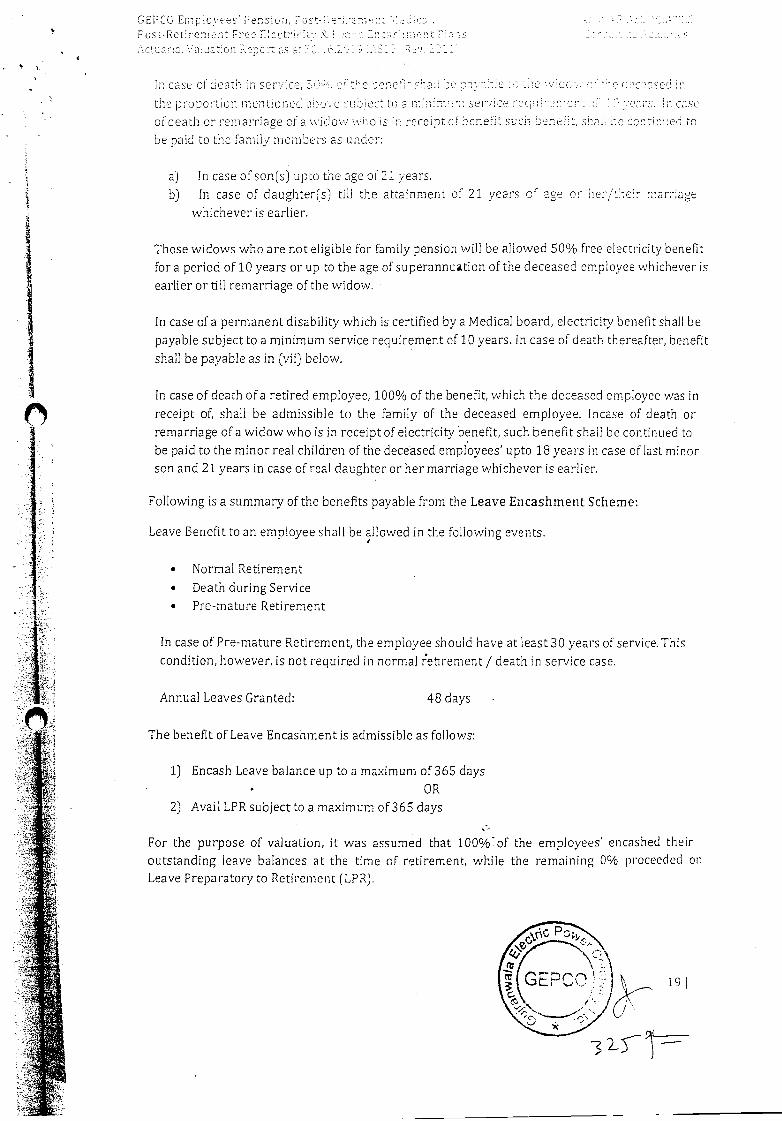
GEFCO En:poves tensiu:., Pcst-Reti:enc:i' Fr Fcrrc-
\aer. F.sa: c
in case o ceato in ser:ice. r eeb ha cc. rio cc 2orsec: loPoo: men boned cre;e ec to a mm n:sevCern1 c we:-: :;ow.n case
of death orrencarriage cia wdov; who s in receip:cfbcneiit such boneht ohm: cc ronicued to be paid to the family members as under:
a) In case ofson(s) upto the age of 21 years. b) In case of daughter(s) till the attainment of 21 years of age or her/thci:- marriage
whichever is earlier.
Those widows who are not eligible for family pension will be allowed 50% free electricity benefit for a period of 10 years or up to the age ofsuperannution of the deceased employee whichever is earlier or till remarriage of the widow.
In case of a permanent disability which is certified by a Medical board, electricity benefit shall be payable subject to a minimum service requirement of 10 years. In case of death thereafter, benefit shall be payable as in (vii) below.
In case of death ofa retired employee, 100% of the benefit, which the deceased employee was in receipt of, shall be admissible to the family of the deceased employee. Incase of death or remarriage ofa widow who is in receipt of electricity benefit, such benefit shall be continued to be paid to the minor real children of the deceased employees' upto 18 years in case of last minor son and 21 years in case of real daughter or her marriage whichever is earlier.
Following is a summary of the benefits payable from the Leave Encashment Scheme:
Leave Benefit to an employee shall be allowed in the following events.
• Normal Retirement • Death during Service • Pre-mature Retirement
In case of Pre-mature Retirement, the employee should have at least 30 years of service. This condition, however, is not required in normal retirement / death in service case.
Annual Leaves Granted: 48 days
The benefit of Leave Encashment is admissible as follows:
1) Encash Leave balance up to a maximum of 365 days OR
2) Avail LPR subject to a maximum of 365 days
For the purpose of valuation, it was assumed that 100%of the employees' encashed their outstanding leave balances at the time of retirement, while the remaining 0% proceeded on Leave Preparatory to Retirement (LPR).
\c pot-".
(f (GEPCO,: 19
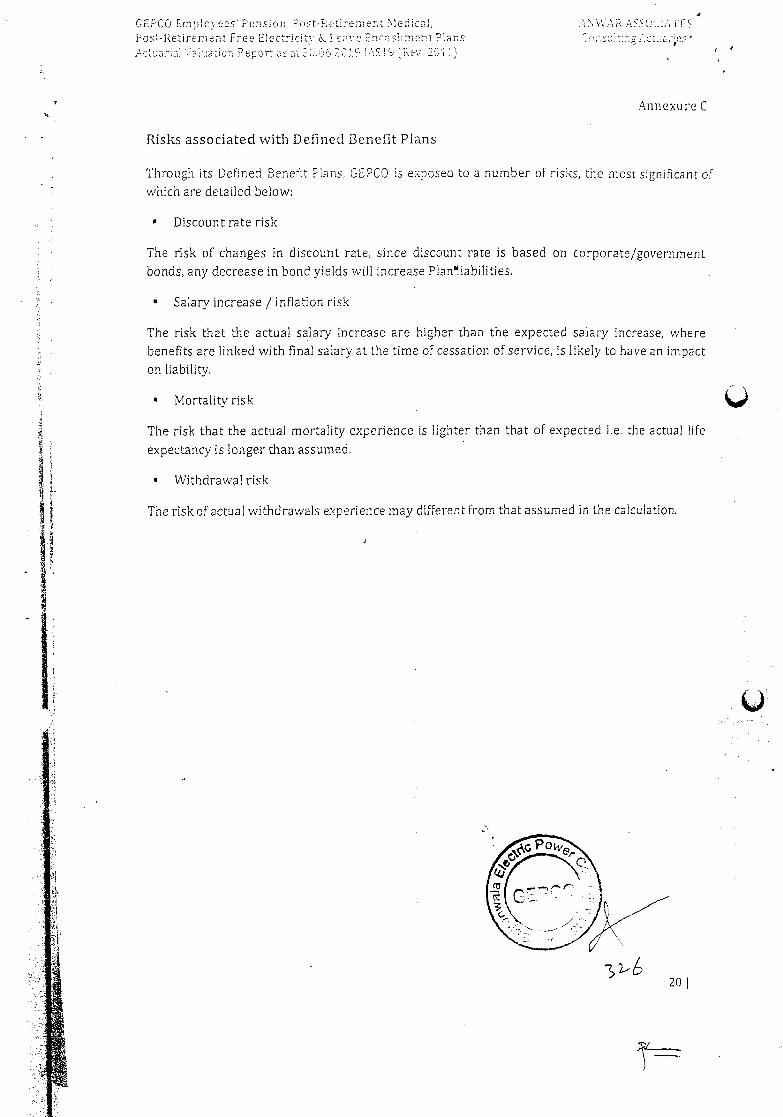
4
CEPCO Emp!cvees Pension, st-Retirement '.ledicni, tt-1 TOcL iF Post-Retirement Free Electricity 5 Ler•e Encnsment Plans tctcarini \'a aticn Reporc cc ct •C9 A519 Rsv, 2Gi)
Annexure C
Risks associated with Defined Benefit Plans
Through its Defined Benefit Pian, GEPCO is exposed to a number of risks, the most significant of which are detailed below:
' Discount rate risk
The risk of changes in discount rate, since discount rate is based on corporate/government bonds, any decrease in bond yields will increase Planiabilities.
Salary increase / inflation risk
The risk that the actual salary increase are higher than the expected salary increase, where benefits are linked with final salary at the time of cessation of service, is likely to have an impact on liability.
Mortality risk
The risk that the actual mortality experience is lighter than that of expected i.e. the actual life expectancy is longer than assumed.
Withdrawal risk
The risk of actual withdrawals experience may different from that assumed in the calculation.
20(
GOVERNMENT OF PAKISTAN FiNANCE DIVISION (Regulations Wing)
F.No.14(1)R-3/2021- 90 Islamabad, the 3 March, 2021
OFFICE MEMORANDUM
Subject:- GRANT OF DISPARITY REDUCTION ALLOWANCE
The undersigned is directed to convey the approval of the Federal
Government for grant of Disparity Reduction Allowance © 25% of the basic pay of
Basic Pay Scales 2017 w.e.f. 1 March 2021. This allowance shall be admissible to
civil employees in BPS 1-19 of the Federal Government, (including employees of the
Federal Secretariat and attached departments), who have never been allowed
additional allowance/allowances equal to or more than 100% of the basic pay
(whether frozen or not) or performance allowance subject to the following conditions:
a) This Allowance will not be admissible to the employees of the organizations as mentioned in Annexure-1 and those employees who are drawing additional allowance/allowances equal to or more than 100% of the basic pay(whether frozen or otheiwise);
b) This allowance will be frozen at the level drawn on l March 2021 c) This Allowance will be subject to Income Tax; d) This Allowance will be admissible during leave and entire period of LP.R.
except during extra ordinary leave; e) This Allowance will not be treated as part of emoluments for the purpose of
calculation of Pension/Gratuity and recovery of House Rent: f) This Allowance will not be admissible to the employees during the tenure of
their posting/deputation abroad; g) This Allowance will be admissible to the employees on their repatriation from
posting/deputation abroad at the rate and amount which would have been admissible to them, had they not been posted abroad;
h) This Allowance will be admissible during the period of suspension; i) The term "Basic Pay" will also include the amount of Personal Pay granted on
account of annual increment (s) beyond the maximum of the existing pay scales.
2. All the Principal Accounting Officers and Heads of the departments
are requested to ensure the compliance of this O.M in letter and spirit.
3. Any issues arising out of the implementation of Disparity Reduction
Allowance will be resolved by a committee notified vide Finance Division
O.M.No.F.14(1)R-312021- 91 dated 3 March 2021,
(Muhammad Shahid Ahmed Cli.) Deputy Secretary (R-l)
ALL MINISTRIESIDIVISIONSIDEPARTMENTS
Web Administrator, Finance DMsioa, lslarnabad (P.T.0)
-
Copy to:
1. Presidenrs Secretariat (Public), Islamabad. 2. Presidenfs Secretariat (Personal), Islamabad. 3. Prime Ministers Office (Public), Islamabad. 4. Prime Ministers Office (Internal), Islamabad. 5. National Assembly Secretariat, Islamabad. 6. Senate Secretariat. Islamabad. 7. Election Commission of Pakistan, Islamabad. 8. Supreme Court of Pakistan, Islamabad. 9. Federal Shariat Court, lslamabad. 10. Auditor General of Pakistan, Islarnabad. 11. Controller General of Accounts, islamabad. 12. AGPR, lslamabad/Lahore/Peshawar/Karachi/Quetta. 13, Military Accountant General, Rawalpindi. 14. All JS(expenditure / DS Expenditure) attached to Ministries!
Divisions etc and all officers of Finance Division. 15. Chief Accounts Officer, Mb Foreign Affairs, lslamabad. 16. All Chief Secretaries/Finance Secretaries of the Government of
Punjab/Sindh/Khyber Pakhtunkhwa/Balochistan/Azad State of Jammu & Kashmir and Gilgit Baltistan with the recommendation to consider adopting the proposed disparity allowance for their employees to be funded from provinces own resources.
17. Federal Public Service Commission, F-5/1, Agha Khan Road, Islamabad.
18. Secretary, Wafaqi Mohtasib (Ombudsman)'s Secretariat, Islamabad.
19. Central Directorate of National Savings, Islamabad. 20. National Accountability Bureau, Islamabad. 21. Intelligence Bureau, Islamabad. 22. Pakistan Mint, Lahore. 23. Dte.Gen, Pakistan Post, lslamabad. 24. Secretariat Training Institute, Islamabad. 25. Directorate General of Inspection & Training, Customs & Central
Excise, 8th Floor, New Customs House, Karachi. 26. Federal Tax Ombudsman's Secretariat, Islama
(Muhammad StidAhmed Ch.) Deputy Secretary (R-I)
-q
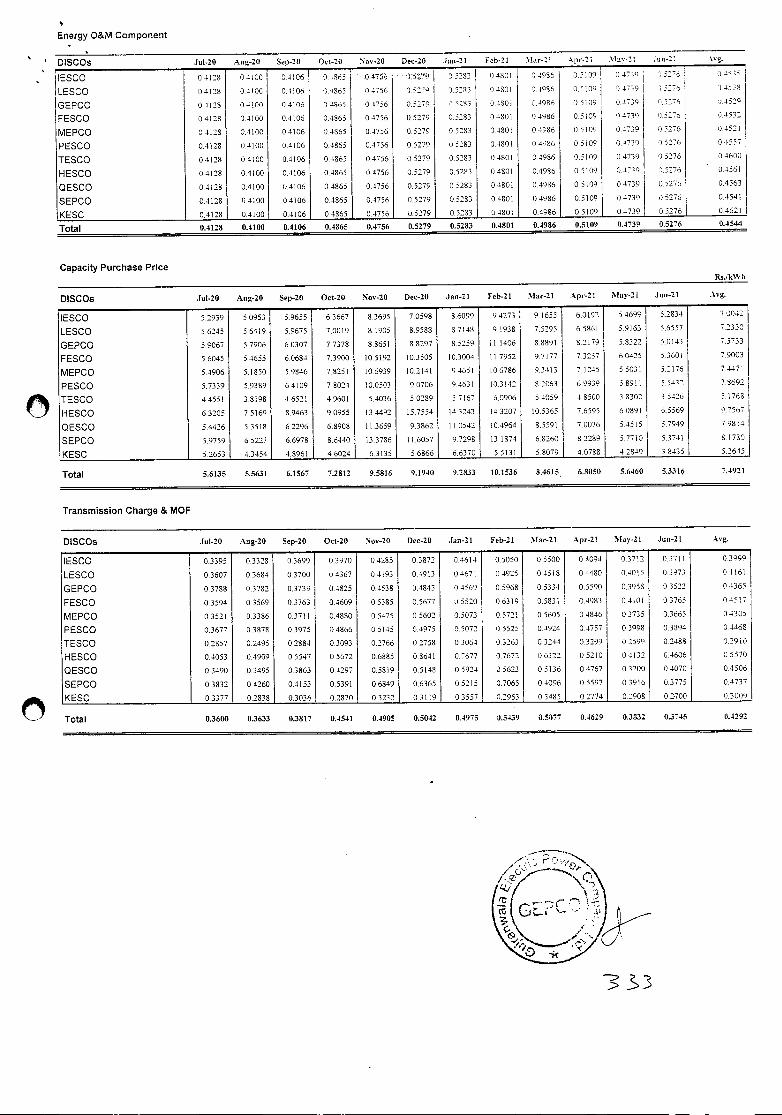
Energy O&M Component
¼2-20 Seo-20 -20 Nov-20 Dec-20 Jan-21 Feb-23 \Iar-2 Apr-!! May-21 Jun-21 'vo.
ESCO 04128 04100 04106 348e5 04750 55739 os:o: 04801 04936 35100 54739 52
LESCO 04128 04!00 0410v U-18o5 04756 052" 15443 3430! 44486 0510° 4'° 15440 04535
GEPCO 04128 04100 0410o 04465 3.1756 05:70 15:03 3.400! 0-!964 0510° 01440 5446 0.1520
FESCO 04128 04100 04106 04865 0475o 0.5279 0.5443 04801 04986 05109 34739 1.5276 34532
MEPCO 04128 0.4100 04106 0.4865 04756 05279 05293 34801 04°86 0510° 04739 05276 04521
PESCO 0.4128 0.4100 0.4106 3.4065 0.4756 05279 0 5283 0480! 04986 35109 04739 5276 04557
TESCO 04128 04100 04106 0.4865 04756 05279 05283 04801 04006 05109 04739 05276 04600
HESCO 04128 04100 01106 04865 04756 05279 05203 0430! 04986 05109 31759 5276 0456!
QESCO 04128 0.4100 04106 04865 0.4756 05279 05283 0480! 04986 05109 04739 0.5276 04563
SEPCO 04128 04100 04106 0.4365 0.4756 05279 05283 04801 04986 05109 34730 05276 0454!
KESC 0.4128 04100 04109 04865 04756 0.5279 0.5283 0480! 04986 05109 04739 05276 0.4621
Total 0.4 128 0.4 100 0.4 106 0.4865 0.4756 0.5279 0.5283 0.4801 0.4986 0.5 109 0.4739 .40
Capacity Purchase Price RsJk'A h
DISCOs Jul-20 Aug-20 Sep-20 Oct-20 Nov-20 Dec-20 Jan-21 Feb-21 Mar-21 Apr-21 May-21 Jun-21 Avg.
IESCO 5.2939 5.0953 59655 63667 8.3695 70598 86099 04273 9 655 60192 54990 52334 70042
LESCO 5.6245 56419 59675 7.0019 3 905 8.9518 87143 9 1938 75295 6586! 59163 5.6557 7.2330
GEPCO 59067 57906 6.0307 77378 8865! 88297 85259 111406 8389! 82179 5.8322 50143 75733
FESCO 56045 54655 60681 73900 10.5192 0.3505 10.3004 117952 9.7177 73257 60425 5360! 79003
MEPCO 54906 51850 59846 7825! 06939 10214! 0465! 06786 9.3413 71245 5503! 54476 7.4471
PESCO 5.7339 59389 64109 78024 10.0503 90706 9.463! 10.3142 82063 6.9°39 589!! 55432 75692
TESCO 4455! 38198 4652! 4.960! 54036 50239 57!7 60906 54059 48500 33302 3.5421, 5.1763
HESCO 63205 75169 89463 9.0955 I344Q2 157554 143243 143207 105365 7.6595 o089! 6.5569 97567
QESCO 5.4426 53513 6.2296 6.8908 113659 93862 II 0542 0.4964 8.559! 70076 54515 57949 79814
SEPCO 59759 65227 6.6978 8.6440 13.3786 11.6057 07298 13 1374 60260 82289 57710 5374! 8 1700
KESC 5.2653 4.3454 4.896! 46024 53135 56866 o370 5513! 5.8079 40788 42829 33435 52645
Total 5.6135 5.5631 6.1567 7.2812 9.5816 9.1940 9.2833 10.1536 8.4615 68050 5.6460 5.3316 7.4921
Transmission Charge & MOF
DISCOs Jul-20 Aug-20 Sep-20 Oct-20 Nov-20 Dec-20 Jan-21 Feb-21 Mar-21 Apr-21 May-25 Jun-21
ESCO 0.3395 0.3328 03699 03970 04285 03872 04614 05050 05500 04094 03712 037!! 0390°
LESCO 0.3607 0.3684 03700 04367 04193 0.4913 0.467! 04925 04518 04430 04015 0.3973 OlIn!
GEPCO 03781 0.3782 03739 0.4025 04538 04843 04569 0.5968 05334 05590 03958 03522 04365
FESCO 03594 03569 0.3763 04609 0.5385 0.5677 4.5520 06319 0583! 04983 04101 03765 04517
MEPCO 0.352! 03386 0.371! 0.4080 05475 0.5602 0.5073 05721 05605 0.4846 03735 03665 04305
PESCO 0.367 03878 0.3975 04166 05145 04975 05072 0.5525 0.4924 04757 03098 03894 0.4463
TESCO 0.2857 0.2495 02884 03093 0.2766 02758 03064 03263 03244 03299 02590 02488 02913
HESCO 0.4053 04909 0.5547 05672 0.6085 0 8n4! 07677 07672 06322 0.1210 34132 64306 C 5570
QESCO 03490 0.3495 03863 04297 0.5819 0.5148 05924 05623 0.5136 04767 03700 0.4070 04500
SEPCO 0.3832 04260 0.4153 0.539! 06849 06365 0.5215 11.7065 04096 05597 03916 0.3775 04737
KESC 03377 02838 03036 0.2870 03232 03119 03557 0.2953 03485 0.2774 04409 02-700 03000
Total 0.3600 0.3633 0.3817 0.3541 0.4905 0.5042 0.4975 0.5439 0.5077 0.3629 0.3832 0.3745 0.4292
3-33
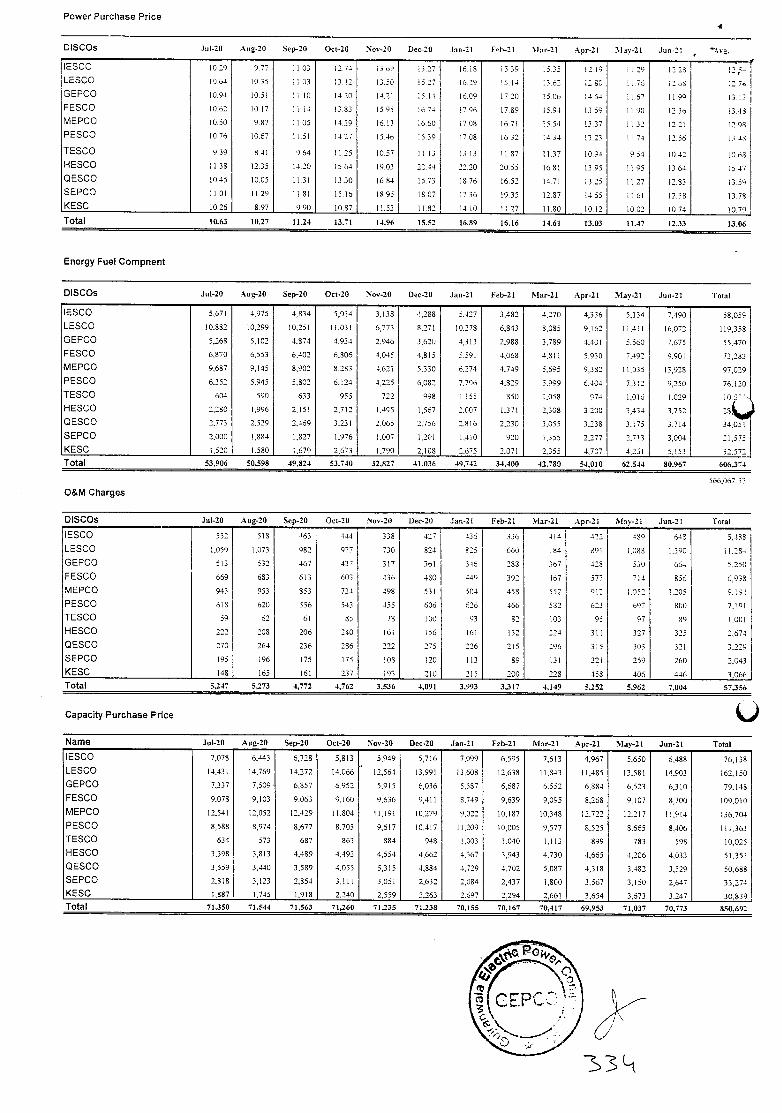
Power Purchase Price
DISCOs Jul-20 Aug-20 Sep-20 Oct-20 Nov-20 Dec-20 jan-21 Feb-21 Mar-21 Apr-21 May-21 Jun-21
IESC0 1029 977 1103 12.74 1369 3.27 16.18 539 535 1219 129 1220 I24
LESCO 1064 0.35 1 03 13.42 1350 15.27 6.29 5 14 1362 1285 11.76 265 274
GEPCO 10.94 10.51 11.10 4.20 14.21 5.14 609 1720 15.06 11.54 ll.6 1190 3 3
FESCO 10,62 1017 ill 1335 595 16.74 1796 17.89 594 1359 1190 236 340
MEPCO 10.50 9.37 II 05 14.29 6.13 1660 17.00 16.7] 15.54 13.37 II 32 1221 1298
PESCO 1076 1067 115! 4.27 1546 1539 1708 16.32 14.34 13.75 H 74 12.56 3 45
TESCO 9.39 841 964 125 057 11.13 13.13 11.87 11.37 10.94 9.54 1042 1065
HESCO 11.38 2.35 1420 5.64 19.03 22.44 22.20 20.55 1681 13.95 11 45 1364 1547
QESCO 10.45 1005 11.31 13.30 16.84 1573 1876 1652 1471 1325 1127 12.83 3,50
SEP00 1.01 11.29 II 81 15.16 1895 18.07 1736 1935 12.37 14.55 I! 6! 12.38 13.718
KESC 10.26 897 990 10.87 11.53 11,02 1410 1.27 1100 10.12 1002 074 10.79
Total 10.63 10.27 11.24 13.71 14.96 15.52 16.89 16.16 14.61 13.03 11.47 12.33 13.06
Energy Fuel Compnent
DISCOs Jul-20 Aug-20 Sep-20 Oct-20 Nov.20 Dec-20 Jan-21 Feb-21 Mar-21 Apr-21 May-21 Jun-21 Total
IESC0 5,67! 4,975 4,834 5,014 3.138 -1.280 5.427 3.482 4,270 4,336 5,134 7,490 58,059
LESCO 10,882 10,299 10,251 11,031 6,773 8,271 0.273 6,843 8,085 9.162 11.411 6.072 119,350
GEPCO 5,260 5.102 4.374 4,934 2.946 3.620 4,313 2,988 3,709 4,40! 5.560 7,675 55,470
FESCO 6.870 6,553 6,402 6,806 4.045 4,815 5.591 4.068 4,0!] 5.930 7.492 9,901 73,283
MEPCO 9,607 9,145 0,902 3,283 4.621 5.330 6.274 4,749 5,695 9302 11,035 13,928 97,029
PESCO 6.352 5.945 5,802 6,124 4.225 6,082 7,796 4,829 5.999 6.404 7.312 9,250 76.120
TESCO 604 590 633 955 722 998 1.155 350 .058 974 1,016 1.029 .103""-
HESCO 2,280 1,996 2,151 2,712 1,495 1,567 2.007 1,371 2,308 3,200 3.434 3.752 23
QESCO 2.773 2,529 2,469 3.23! 2,065 2.756 2,016 2,230 3,055 3.238 3.175 3,714 34,051
SEP00 2,000 1,384 1,027 1,976 1,007 1,201 1.410 920 1,355 2,277 7,713 3.004 21,575
KESC 1,520 1.580 1,679 2,673 1,790 2,108 2.675 2.071 2.355 4.707 4.26! 5,153 32.572
Total 53,906 50,598 49,824 53.740 32.82' 4 1.036 49,742 34,400 42,780 54,010 62,544 80.967 606,374
566,762.33
0&M Charges
DISCOs Jul-20 Aug-20 Sep.20 Oct-20 Nov-20 Dec-20 Jan-21 Feb-21 18'lar-21 .-'pr-21 May-21 Jun-21 Total
IESC0 552 518 163 444 330 427 436 336 III 144 459 645 5.158
LESCO 1,059 1,073 982 977 730 824 825 660 84 59] 1,1100 1.300 11.284
GEPCO 513 532 467 437 317 361 346 263 3b7 428 530 66-1 5,250
FESCO 669 633 613 603 436 480 440 392 467 577 714 856 6,938
MEPCO 943 953 353 734 490 531 554 453 552 912 .352 1 205
PESCO 618 620 556 543 455 606 626 466 5.32 623 697 800 7.19!
TESCO 59 62 61 85 78 00 93 02 103 95 97 39 .00!
HESCO 222 208 206 240 161 156 161 132 224 3!! 327 325 2.674
QESCO 270 261 236 286 222 275 226 215 296 315 303 32! 3.229
SEPCO 95 196 175 175 08 120 113 89 13! 22! 259 260 2.043
KESC 140 165 6! 237 193 210 215 250 223 455 406 446 3.066
Total 5,247 5.273 4,772 4,762 3,536 4,091 3,993 3,317 4,149 5.252 5,962 7,004 57,356
Capacity Purchase Price
Name Jul-20 Aug-20 Sep-20 Oct-20 Nov-20 Dec-20 Jan-21 Feb-21 Mar-21 Apr-21 May-21 Jun-21 Total
IESC0 7.078 6,443 6,728 5,813 5,949 5,716 7,099 6.595 7,613 4,967 5,650 6,488 76,138
LESCO 14,43! 14.769 14.272 14,066 12,564 13,99] 3,608 12,638 11.813 11,485 3.58! 14,903 162.150
GEPCO 7,337 7,509' 6,S57 6.952 5,915 6,036 5,537 6,607 6.552 6,384 6,523 6,310 79j48
FESCO 9,078 9,103 9.063 9,160 9,636 9,4!! 8,749 9,639 9,095 8,268 9.107 8.700 109.010
MEPCO 12.54! 2,052 12,429 11.804 11,191 0,279 9.022 10,187 10,348 2.722 12.217 11,914 136,704
PESCO 8,588 8,974 8,677 8.703 9,617 10.417 11,209 10,005 9,577 8.525 8.665 8.406 111,363
TESCO 634 573 687 363 304 943 1,003 1.040 1.113 099 783 598 10.025
HESCO 3,398 3,813 4,439 4,493 4,554 4.662 4,367 3.943 4.730 4,665 4,206 4,033 51.353
QESCO 3,559 3,440 3,589 4,055 5,315 4,834 4,729 4,702 5,087 4,313 3.482 3,529 50,688
SEPCO 2,818 3,t23 2,854 3,11! 3,051 2,632 2,084 2,437 1,800 3.567 3,150 2,647 33,274
KESC 1,887 1,745 1,918 2.240 2,559 2,263 2.697 2,294 2,661 3,654 3,673 3.247 30,839
Total 71,350 71,544 71,563 71,260 71.235 71,238 70,155 70,167 70.4 17 69,953 71,037 70,773 850,692
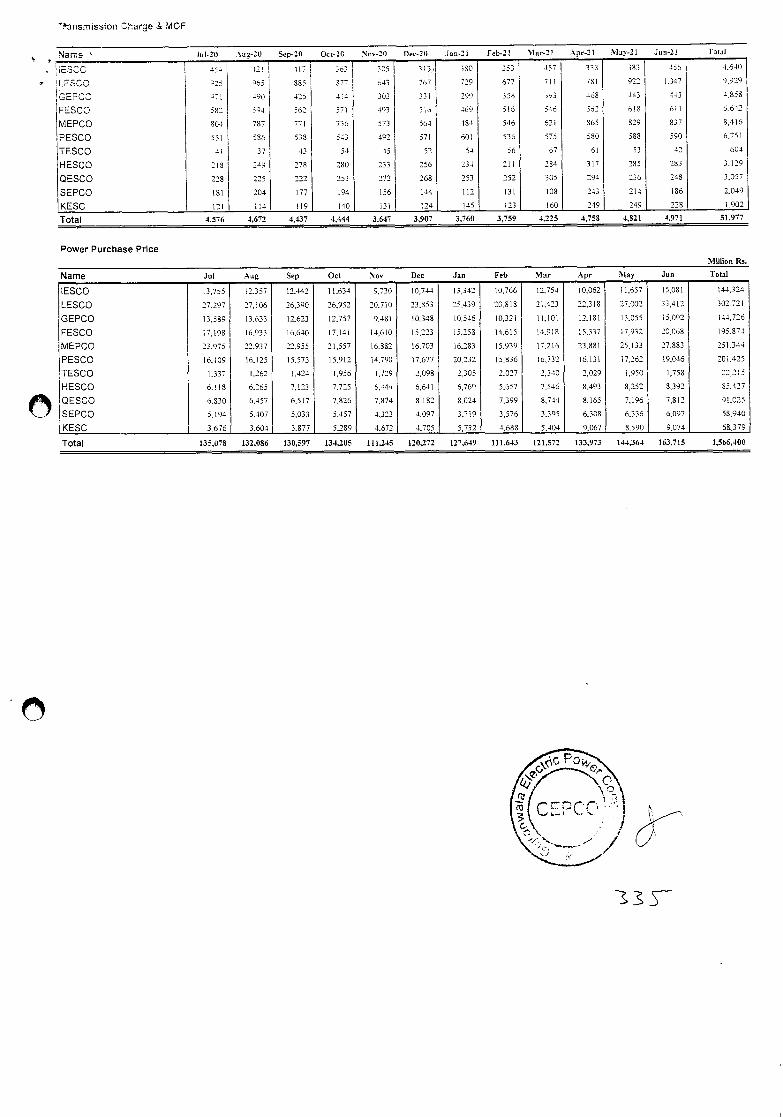
rismission Charge & MOP
Sep-28 Oct-20 '!ov-20 Dec-lU jao-2 Feb-21 Mar-21 Apr-21 'clay-21 Jun-21 Total
,S0C 454 42! 417 3.53 375 313 300 353 457 338 383 456 4.640
LESCO 425 155 585 57 643 7.57 729 677 71! 78! 922 .047 9,929
GEPCO 471 195 425 474 303 331 299 358 393 468 443 -3 t.858
FESCO 58: 594 562 571 493 516 469 516 546 562 618 6!! 6.642
MEPCO 304 787 77! 736 573 564 484 546 60! 865 829 837 8.416
PESCO 551 586 538 513 492 571 501 536 575 5S0 583 590 6,751
TESCO 4! 37 43 54 45 52 54 56 67 6! 53 42 604
HESCO 218 249 278 280 233 256 234 21! 284 317 285 283 3.129
QESCO 228 225 222 253 272 268 253 252 305 294 235 248 3,057
SEP00 151 204 177 194 156 144 112 13! 108 243 214 186 2049
KESC 21 114 119 140 3! 24 145 123 160 249 249 228 1,902
Total 4,576 4,672 4,437 4,444 3,647 3,907 3,760 3,759 4,225 4,758 4,021 4.971 51,977
Power Purchase Price Million Rs.
Name Jul Aug Sep Oct Nov Dec Jan Feb 'elar Apr May Jun lotal
IESC0 13,755 2.357 12,442 11,634 9,730 10,744 13,342 10,766 12,754 10,062 11,657 15,081 14'L324
LESCO 27,297 27,106 26,390 26,952 20,710 23,85325,43920.81821.423 22,318 27.002 33,412 302,72!
GEPCO 13,589 13,633 12,623 12,757 9,48! 10,348 10,546 10,32! 11.10! 12,18! 13.055 5,092 44.726
FESCO 17,198 16,933 6,610 17,141 14.610 15,223 15,253 14.615 4,913 15.337 7.932 0,068 95,874
MEPCO 23,975 22,937 22.955 21,557 16.882 16,703 6.283 15.939 17.216 23.881 25.133 27.883 251.344
PESCO 16.109 I6j25 15.573 15.912 14.790 7,677 20.232 15,836 16,732 16,13! 17,262 19,046 20i.425
TESCO 1,337 1,262 .424 1,956 729 2,098 2,305 2027 2,340 2,029 1,950 1.758 22.215
HESCO 6.118 6.265 7,123 7.725 6.444 6,64! 6,76° 5,657 7.546 8.493 8.252 8.392 85.427
QESCO 6,830 6,457 6,517 7,826 7,874 8,182 8,024 7,399 8,744 8,165 7,196 7,812 91.025
SEP00 5,194 5,407 5,033 5,457 4,323 4,097 3,719 3,576 3.395 6,308 6,336 6,097 58.940
KESC 3.676 3,604 3.877 5.289 4.672 4,705 5,732 4,688 5,404 9,067 8.590 9,074 68,379
Total 135,078 132.086 130,597 134,205 111,245 120,272 127,649 111.643 121,572 133,973 144,364 163,715 1,566,400
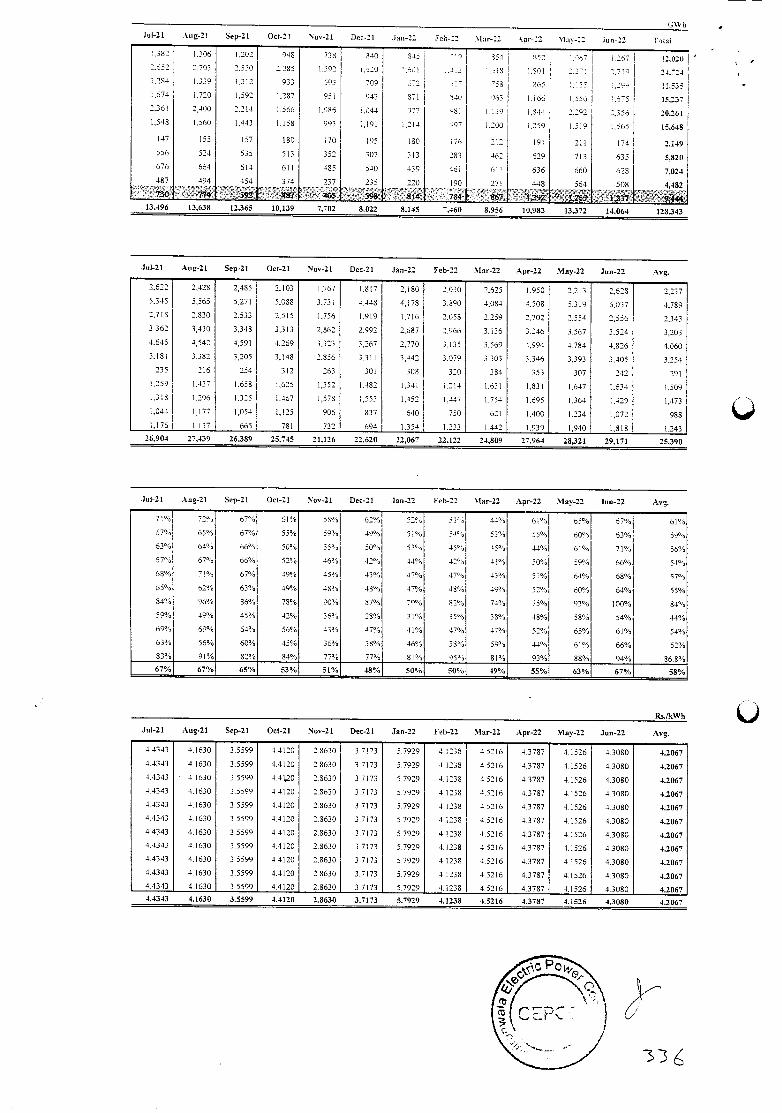
3T3
GW h Jul-21 Aug-21 Sep-21 Oct-21 Nov-21 Dec-21 jan-22 Feij-2 .°.1ar-2 Ator-2 \1av-22 Jun-22 'Total
.382 .306 1.202 941 730 040 345 19 554 052 .267 267 12.021) 2.652 2,753 2.550 2.555 1.592 i.'aO 1,62! .-1 ',ols :.so! 2.271 2219 24224 1,284 .339 1.212 933 443 709 :2 51" "SO 365 :55 :9v 11.835 1.674 1.720 1,592 .287 95i 943 071 34.3 963 1.166 .556 1.o75 15.237 2.361 2.100 2.214 .566 .086 .044 977 S: .139 1.644 2.292 2,356 20,261 1,548 1.560 1.443 1.158 993 1,191 .2)4 497 .200 .259 1.519 .565 15.648
147 155 157 180 70 95 .30 176 212 191 21! 174 2,149 556 524 535 513 352 307 313 283 462 629 713 635 5.820 676 664 614 61! 485 540 439 46! 611 636 660 628 7,024 487 494 454 374 237 235 220 190 271 448 , 564 508 4.482
..................2' ''-'v'' lz:" t' 237'
.4 13,638 12,365 10, 139 7,702 8.022 8,145 7.460 8.986 10.983 13.372 14.064 128.343
jul-21 Aug-21 Sep-21 Oct-21 Nov-21 Dec-21 Jan-22 Feb-22 Mar-22 Apr-22 May-22 Jun-22 Avg.
2.622 2.428 2,485 2.103 L767 1.817 2,180 2.030 2.625 .950 2.213 2,628 2,237 5.345 5.565 5.271 5,088 3.231 4.445 4,178 3.090 4.084 4.508 5.319 6.037 4789 2,718 2,830 2.533 2.515 1.756 1.919 1,716 2.058 2.259 2,702 2.554 2,556 2.343 3.362 3.430 3.348 3.3 13 2.662 2.992 2,687 2.966 3.136 3.246 3.567 3.524 3,203 4.645 4.542 4,591 4.269 3.323 3,257 2.770 3.135 3.569 4.994 4.784 4,826 4.060 3.181 3.312 3,205 3)48 2.156 3.311 3,442 3.079 3.303 3.346 3.393 3.405 3,254
235 216 254 312 263 30! 308 320 384 353 307 242 291 .259 1,437 1.658 1.625 1.352 1.482 1.34! 1.214 1.63! 1,831 1.647 .634 1,509
1.318 1.296 1.326 1,467 1.578 1,553 .452 1.147 1.754 1.695 1.364 .429 1,473 1,044 1.177 1,054 1,125 906 137 640 750 62! 1.400 1,234 1,072 988 1.176 1.137 665 78! 732 694 1.354 1.233 1,442 L939 1,940 ISIS 1.243
26,904 27.439 26389 25.745 2 1.126 22,620 22,067 22,122 24,809 27,964 28,321 29.17 1 25390
.lul-21 Aug-21 Sep-21 Oct-21 Nov-21 Dec-21 Jan-22 Feb-22 Mar-22 Apr-22 May-22 Jun-22 Avg.
71°0 729'o 67°', 61% 5596 6290 5256 53% 44% 6100 55% '57% 61%,
67% 65% 67% 55% 59% 493'o 5% 54% 53% 55% 60% 63°/. 59%, 63% 64% 66% 50% 55°', 50% 53°, 45% .15% 44% 61% 7106 56% 67% 67% 66% 52% 46% 42% 149', 4296 4106 50% 59% 66% 51°',
68% 710/, 67% 49°', 45% 43% 47% 47% 43% 51% 64% 68% 57%
65°' 6% 63% 49% 48°', 48% 47% 48% 49% 52% ',O% 64% 55% 84% 96% 86% 78% 90% 87% 70% 82°/o 71% 75% 93°6 00% 84%
59% 499'S 45% 42% 36% 28% lj% 35% 38% 48% 58% 54% 44%
69% 69°", 64% 56% 43°', 17% 4196 17°' 4796 52% 65% 9j0/, 54%
63°/, 56% 60% 45% 36% 38% 469', 30% 59°', 44% 61% 66°/o 52%
83% 91% 82% 84% 77% 77°/a 81% 95% 810/, 93% 88% 94% 868% 67% 67% 65% 53% 51% 48% 50% 50% 49% 55% 63% 67% 58%
RsJkWh
Jul-21 Aug-21 Sep-21 Oct-21 Nov-21 Dec-21 Jan-22 Feb-22 Mar-22 Apr-22 May-22 Jun-22 Avg.
4.4343 4.1630 35599 4.4120 2.1630 31173 5.7929 4.1235 4.5216 4.3787 4.1526 4.3080 4.2067
44343 41630 3,5599 44120 21630 3.7173 5.7929 4.1238 4.5216 4.3787 4.1526 4.3080 4.2067 4.4343 ' 4.1630 35599 4.4l0 2.8630 3 7173 5.7929 4.1:30 45216 4.3787 4.1526 43080 4.2067 44343 4.1630 35599 4.4120 2.8630 3 7173 5.7929 4.1230 45216 4.3787 4 1526 1.3080 42067 4.4343 4.1630 35599 44120 2.1630 3 7173 5.7929 4 1230 4,5216 4.3787 4.1526 4.3080 4.2067
44343 4.1630 35599 44120 2.8630 37173 5.7929 41238 4.5216 43787 4.1526 43080 4.2067 4.4343 41630 35599 4.4120 2.8630 3.7173 5,7929 4.1230 4.5216 4.3787 4.1526 43080 4.2067 4.1343 4,1630 35599 4.4120 2.1630 3.7173 5.7929 4.1238 45216 4.3787 4,1526 4.3080 4.2067 14343 4,1630 35599 44120 2,8630 37173 5,7929 4.1238 4.5216 43787 4.1526 4.3080 4.2067 4.4343 4,1630 3,5599 4.4120 2.8630 3.7173 5,7929 4.1238 4,5216 4.3787 41526 4.3080 4.2067 4.4343 4.1630 3.5599 4.4120 2.8630 3.7173 5.7929 4,1238 45216 4,3787 4.1526 4,3080 4.2067 4.4343 4.1630 3,5599 4.4120 2.8630 3.7 173 5.7929 4. 1238 4.52 16 4.3787 4. 1826 4.3080 4,2067
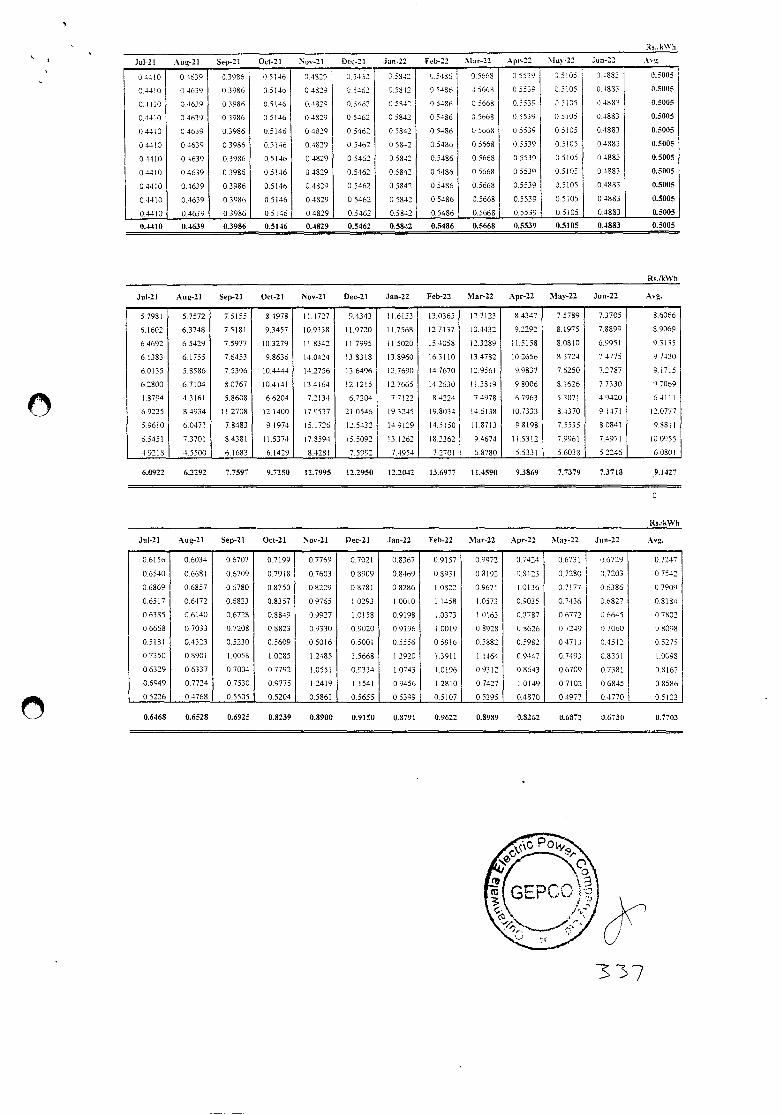
Rs kWh
Jul-21 Au-2l Sep-21 Oct-21 Nov-21 Dec-21 Jan- 22 Feb-22 Mar-22 Apr-22 May-22 Jan-22 A-. g.
04410 0 4533 0 3956 05146 04529 7.5462 0.5842 95-136 0.5568 05539 05105 0.4852 8.5005
04410 04639 0.3986 0.5146 04829 9.5462 05842 0548y 05668 05539 05105 04853 0.5005
05410 04639 03986 0.5146 0.4029 05462 55842 0.5436 05668 0.5533 35105 4.4833 0.5005
0 4410 0.4639 0.3986 05146 0.4829 0.5462 0 5842 0.5486 0.5668 05539 05105 0 4883 0.5005
04410 04639 03986 0.5146 04829 05462 05842 05486 0.5668 05539 05105 04883 0.5005
0 4410 04639 03986 0.5146 0.4829 05462 0.5842 0.5486 0.5668 0.5539 0.5105 0.4883 0.5005
0.4410 04639 03986 0.5146 0.4829 05462 35842 05486 0.5668 05539 35105 04883 0.5005
0.4410 0.4639 03986 0.5146 04829 0.5462 0.5842 0.5486 05668 05539 0 5103 04883 0.5005
0.4410 0.1639 0.3986 0.5146 04529 05462 35842 0.5486 0.5668 05539 0.5105 0.4883 0.5005
0.4410 04639 0,3986 05146 04829 05462 0.5812 05486 0.5668 0.5539 05105 04883 0.5005
0.4410 04639 03986 05146 0,4829 0,5442 0.5842 0.5486 0.5668 0,5539 05105 0.4803 0.5005
0.44 10 0.4639 03986 0.5 146 04829 0.5462 0.5842 0.5486 0.5668 0.5539 0.5105 0.4883 0.5005
RsjkWh
Jul-21 Aug-21 Sep-21 Oct-21 Nov-21 Dec-21 Jan-22 Feb-22 Mar-22 Apr-22 May-22 Jun-22 Avg.
5798! 5,7572 75155 8,4978 11,1727 9,4343 116153 13,0365 12.7123 8,4347 75789 7,3705 86066
6.1602 6.3748 75181 9,3457 10,9338 11,9720 117568 127137 10.4432 92292 81975 7.8899 8,9069
64692 65429 7,5977 103279 11,8342 11.7995 115020 15.4058 12.3289 115158 8,0810 6,9951 93135
61383 6,1755 76453 98636 14.0424 13.83 18 13.8960 163110 134782 102656 8,3724 74775 97430
6.0135 58586 7,5396 10,44-14 14,2756 13.6496 127690 14.7670 12,956! 99837 7,6250 7,2787 91715
62800 67104 80767 104141 134164 121215 127665 142630 11.3819 98006 81626 77330 97069
4.8794 1,316! 5,8608 66204 7.2134 5,7204 77122 8.4221 7.4978 6.7963 53071 49420 6,41 I
69225 8,4934 11,2708 12.1400 17,9537 21,0546 193245 198034 14.6138 10.7333 84370 9147! 120777
5,9610 6.0471 70483 9,1974 5,1726 12,5432 119129 14.5150 11.8713 98198 75535 8.0841 9.88!!
6545! 7.370! 84381 11,5374 178594 15.5092 13.1262 182362 94674 11.5312 7996! 74971 100955
49215 4.5500 6.1683 6 1429 8.428! 7,5992 7.4954 7270! 6.8780 5533! 56038 52246 6.OSOI
&0922 6.2292 7.7597 9.7250 12.7995 12.2950 12.2042 13.6977 11.4590 9.3869 7.7379 7.3713 9.1427
0
Rs.JkWh
Jul-21 Aug-21 Sep-21 Oct-21 Nov-21 Dec-21 Jan-22 Feb-22 Mar-22 Apr-22 May-22 Jun-22 Avg.
06156 0.6034 06707 07199 07769 0702! 08367 09157 0.9972 07421 0.673! 0,6729 07247
0,6540 0.6681 0,6709 07918 07603 0.8909 0.8469 0,893! 0.3192 08123 0,7280 0,7203 0.7542
0.6869 0.6857 06780 08750 0.8229 0.878! 0.8286 1,0822 0.9671 1.0136 07177 06306 07909
0.6517 06472 0,6823 0,8357 0,9765 1,0293 I 0010 1,1458 1 0573 0.9035 07436 06827 0.8184
0.6385 06140 06728 08849 0.9927 1.0158 0.9198 I 0373 1.0163 03787 0.6772 0.6645 07802
06668 0.7033 07208 0,8823 09330 0.9020 09196 1.0019 08928 00626 07249 57060 08098
0518,! 0,4523 05230 05609 0,5016 05001 0,5556 05916 0.5882 0.5982 01713 04512 0.5275
07350 0.8901 I 0050 1.0285 1 2485 1.5668 13920 13911 I 1464 09447 0.7493 0.8351 1.0098
0,6329 0,6337 0,7004 07792 1.0551 09334 1.0743 10196 0.9312 0.8643 0,6709 07381 0.8167
0.6949 0,7724 0.7530 0.9775 12419 1.1541 0,9456 1,2810 07427 1.0149 0,7102 0.6845 05586
05226 0.4768 0.5505 05204 0.5861 0.5655 05399 0,5107 0.5395 0.4870 04977 04770 0.5123
0.6468 06528 0.6925 0.8239 0.8900 09150 0.8791 0.9622 0.3989 0.3262 06872 0.6730 0.7703
337
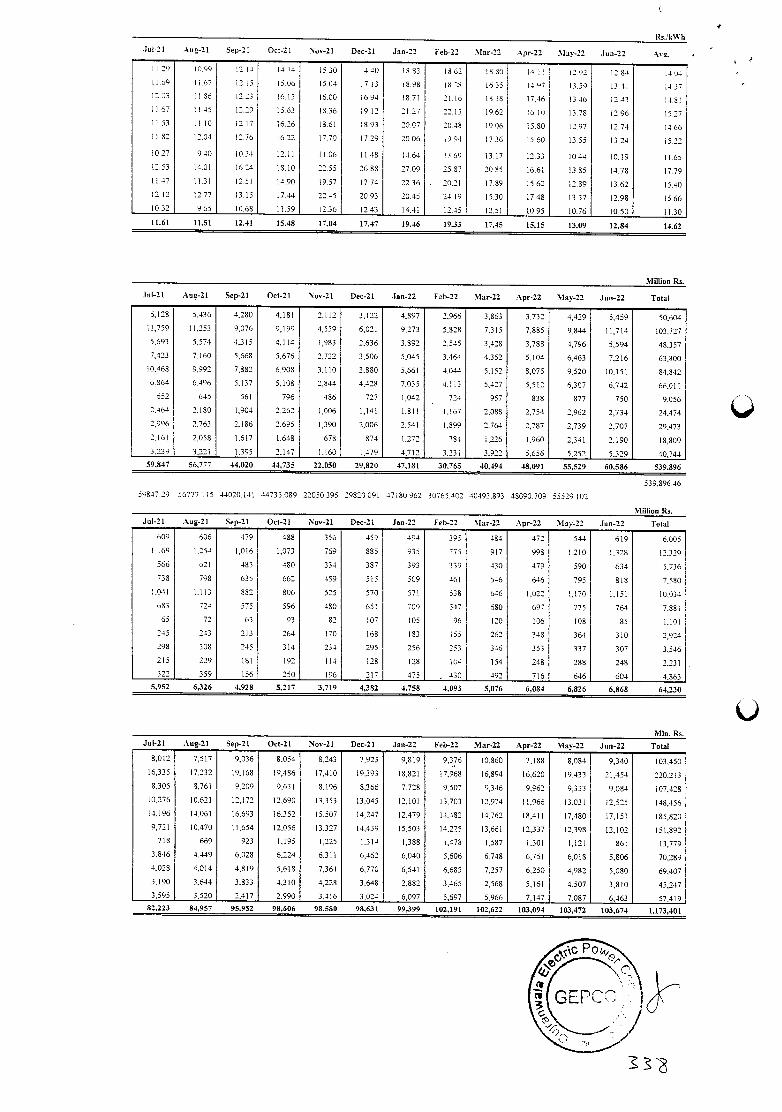
Rs.IkWh
Jul-21 Aug-21 Sep-21 Oct-21 Nov-21 Dec-21 Jau-22 Feb-22 Mar-22 Apr-22 May-22 Jun-22 Avn.
H 29 1099 1214 1314 530 1440 853 562 050 1411 292 284 404 I a8 I 67 i2 5 15.06 15.04 17 13 898 026 1635 1497 1359 13.41 437
12.03 1156 12.23 1613 1600 6.94 371 21 16 1838 1716 13.46 12 33 481 I] 67 .45 12.29 15.63 836 19 2 2! 27 22 13 19.62 16.10 1378 12.96 15.27 1153 I! 10 12.17 1626 1661 16.93 2007 2048 1906 15.80 12.97 12.74 14.66 1182 204 1276 6.22 1770 729 20.06 394 17.36 15.60 1355 3.24
027 940 10.34 12.11 1106 1148 4.64 3.69 1317 12.33 1044 10.19 II ó5 12.53 1401 6.23 Is 10 2255 2688 2709 25.87 20.85 16.61 1385 4.78 1779 11.47 11.31 1251 4.90 19.57 1774 22.36 20.2! 1789 1562 12.89 13.62 1540 12 12 12.77 13.15 17.44 22.45 2093 20.45 2419 1538 17.48 1337 12.98 1566
1032 965 10.68 11.59 2.36 1243 14.4! 1245 12.5! 10.95 10.76 10.50 11.30
11.61 11.51 12.41 15.48 17.04 17.4' 19.46 1933 17.45 15.15 13.09 12.84 14.62
Milliou Rn.
Jul-21 Aug.21 Sep-21 Oct-21 Nov-21 Dec-21 Jan-22 Feb-22 Mar-22 Apr-22 May-22 Jun-22 Total
5,128 5.436 4,280 4.181 2.112 3,122 4.897 2.966 3,863 3,732 4,429 5,459 50,ó04
11,759 11,253 9,076 9.199 4,559 6,02! 9,273 5,128 7,315 7,885 9,844 11,714 l03.727
5.693 5.574 4.315 4,114 983 2.636 3,892 2,545 3,428 3,788 4,796 5,594 48.357
7,423 7,160 5,668 5,676 2,722 3,506 5,045 3.464 4.352 5,104 6,463 7,216 63.800
0,468 9.992 7,882 6,908 3,110 3,380 5.66! 4.044 5,152 8,075 9,520 10,151 84,842
6.864 6,496 5,137 5,108 2,844 4.428 7.035 4.113 5.427 5,512 6,307 6.742 66,0!!
652 645 56! 796 486 727 1,042 724 957 838 877 750 9,056
2.464 2.180 1,904 2.262 1,006 1,14! 1.81! 1,167 2,088 2.754 2.962 2,734 24.474
2,996 2.763 2.186 2.695 1,390 2,006 2.541 1,899 2.764 2,787 2,739 2.707 29.473
2,161 2,058 1.617 1.648 678 874 1.272 784 1,226 1,960 2.34! 2.190 18,809
3.239 3.22! 1.395 2.147 1.160 1,379 4,712 3.23! 3.922 5.656 5.252 5.329 40,744
59,847 56,777 44,020 44.735 22.050 29,820 47,181 30.765 40.494 48,091 55,529 60,586 539,896
59847.29 06777 115 44020141 34735.089 22050.395 2982009! 47180.962 30765 402 40493.893 48090,709 55529 102
539,896.46
Million Rn.
Jul-21 Aug-21 Sep-21 Oct-21 Nov-21 Dec-21 Jan -2 2 Feb-22 Mar-22 Apr-22 7elav-22 Jun-22 Total
609 606 479 488 356 459 494 395 484 472 544 619 5.005
1.169 I.25J 1,016 1,073 769 885 935 775 917 998 1.210 1.328 12,329
566 621 483 480 334 387 393 339 430 479 590 634 5,736
738 798 635 662 459 515 509 461 546 646 795 813 7,580
.04! 1,113 862 806 525 570 571 538 646 1,022 1,170 1,151 10,034
683 724 575 596 480 651 704 547 560 597 775 764 7.681
65 72 63 93 82 107 lOS 96 120 106 108 85 1.10!
245 243 213 264 170 168 183 155 262 348 364 310 2,924
298 308 245 314 234 295 256 253 346 353 337 307 3,546
215 229 18! 192 14 128 128 104 154 248 288 246 2,231
322 359 156 250 196 217 475 - 332' 492 716 646 604 4,863
5,952 6,326 4.928 5,217 3,719 4,382 4,758 4,093 5,076 6,084 6,826 6,868 64,230
Mlii. Rn.
Jul-21 Aug-21 Sep-21 Oct-21 Nov-21 Dec-21 Jan-22 Feb-22 Mar-22 Apr-22 May-22 Jun-22
8,012 7,517 9,036 8.054 8.243 7,923 9,819 9,376 10,860 7,188 8,084 9,340 103,450
16,335 17,232 19,161 9,486 17.410 19,393 18,821 17,968 15,894 16,620 19.433 21,454 220,213
8.305 8.761 9.209 9,53! 8,196 8366 7,728 9.507 9,346 9,962 9,333 9.084 107,428
10,276 10.621 12,172 12.690 13,353 13,045 12,10! 13,703 12,974 11,966 13,03! 12,525 138,456
14,196 14,061 15,693 16,352 15,507 14,247 12,479 4,482 14,762 18,41! 17,480 17,15! 185,820
9,721 10,470 11.654 12,056 13,327 14,439 15,503 14,225 13,651 12,337 12.398 12,102 151,892
718 659 923 1.195 1,225 1,314 1,388 1,478 1,587 1.301 1,12! 36! 13,779
3,846 4.449 6,028 6,224 6.31! 6,462 6.040 5,606 6.748 6.75! 6,018 5,806 70,289
4,028 4,014 4,819 5,618 7,364 6.770 6,541 6,635 7,257 5,250 4,982 5,080 69,407
3,190 3,544 3,833 4,310 4,228 3.648 2,882 3,465 2,568 5,15! 4,507 3,810 45,247
3,595 3,520 2.417 2.990 3,415 3,024 6,097 5,597 5,966 7,147 7.087 6,463 57,419
82,223 84,957 95.952 98,606 98,580 98.631 99399 102.191 102,622 103,094 103,472 103,674 1,173,401
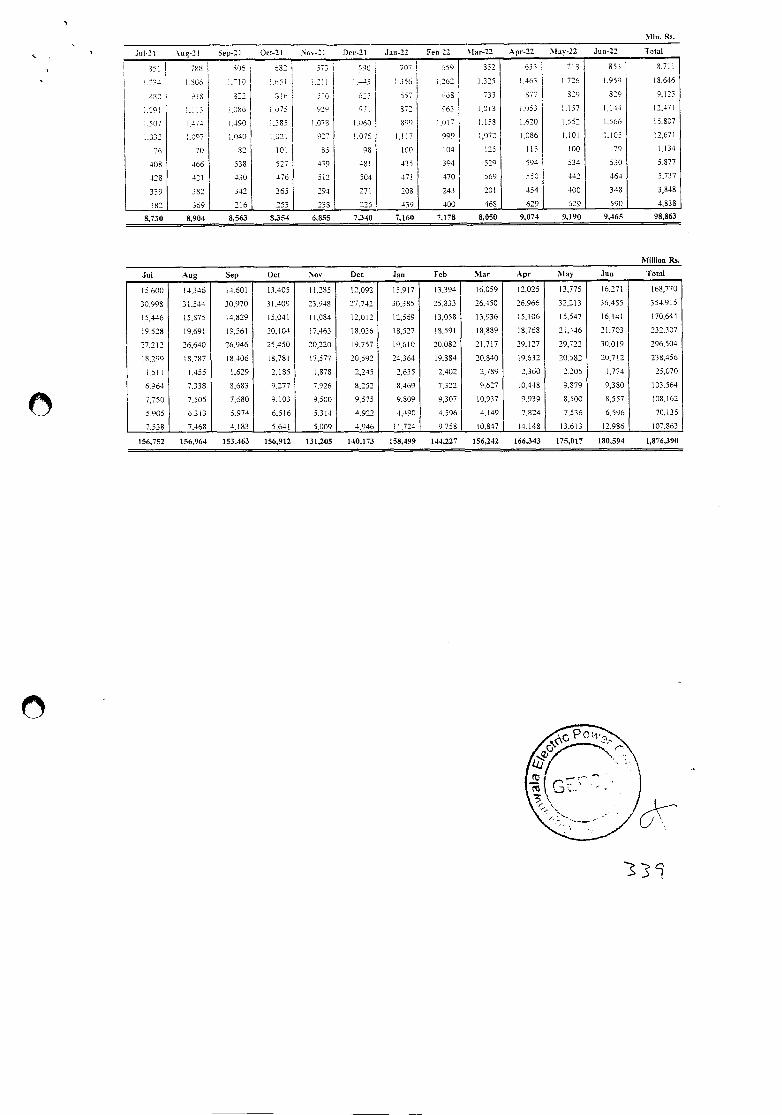
Oct-2 No-21 Dec'21 Jul-21 -ao-2l Jan-22 Feb-22 Mar-22 Apr-22 May-22 Juu-22 Total
8,730 8,904 8,56.3 8,354 6,855 7,340 7,160 7,178 8,050 9,074 9.190 9,465 98,063
Jul Au Se Oct Nov Dec Jan Feb Mar Apr May Jun Total
1,876,390 156,752 156,964 153,463 156,912 131,205 140,173 158,499 144,227 156,242 166.343 175,017 180,594
7,lln. s.
451 758 326 o52 577 790 70' . 659 352 633 18 853 8.711
15136 .71'J ,5i .21 1.444 1.356 .262 1.325 1463 (.726 (.959 18.646
437 913 5 316 5713 672 557 663 733 S77 328 829 9.123
1,30! 1.113 .086 1.475 929 '1 872 963 1.013 053 .157 1,144 12.471
1.507 (.474 1.490 1.385 l,08 (.060 899 1.01 1,158 1.620 .552 1.566 15.107
1.072 .097 1.740 (.021 927 .075 1.17 989 (.077 1.016 1,10! 1.105 12,67!
76 70 32 10! 85 98 100 104 125 115 100 79 .134
408 466 538 527 439 48! 435 394 529 594 534 530 5,877
428 42! 430 476 512 504 471 470 569 550 442 464 5,737
339 382 342 365 294 271 206 243 20! 454 400 348 3,848
382 369 216 253 238 223 439 400 468 629 629 590 4.838
Million Rs,
15.600 14.346 14.60! 13,405 11.213 12,092 15.917 13,394 16,059 12,025 13,775 16,271 168,770
30,993 31.544 30,970 31.409 23,048 27.742 30.385 25.833 26,450 26.966 32,213 36.455 354,915
(5.446 15.875 14,829 15.041 11.084 12,012 12,569 13,058 13,936 15,106 15.547 16,14! 170,644
19.528 19,691 19,561 20,104 (7,463 18.036 18,527 18,591 18,889 11,768 21,446 21,703 232,307
27.212 26,640 26,946 25,450 20,220 19,757 19,610 20,082 21,717 29.127 29.722 30,019 296,504
18,299 18,787 18,406 18.78! 17.577 20.592 24,364 19.884 20,840 9.632 20.582 20,712 238,456
1.5!! 1,455 1,629 2,185 (.878 2,245 2.635 2,402 2.789 2,360 2.205 1,774 25,070
6.964 7,338 8,683 9,277 7.926 8.252 8.469 7.322 9,627 10.448 9,879 9,380 103,564
7,750 7.505 7,680 9,103 9.500 9.575 9.809 9,307 10,937 9,939 8,500 8,557 08,162
5.905 6.313 5.974 6,516 5.314 4.922 4,490 4,596 4,149 7.824 7,536 6,596 70,135
7,538 7,468 4,183 5,64! 5.009 4.946 11.724 9.758 10.847 14.148 13,613 12.986 107.863
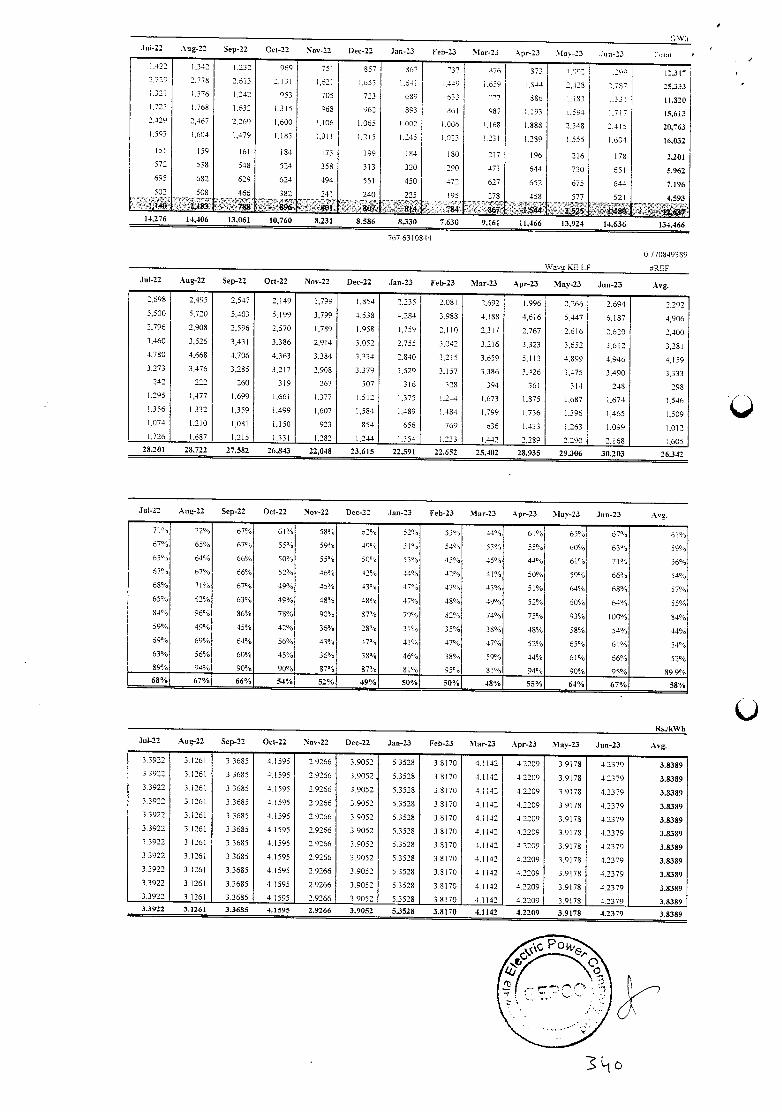
GW!I Jul-22 Aug-22 Sep-22 Oct-22 Nov-22 Dec-22 Jan-23 Feb-23 Mar-23 pr-23 \lav-23 Jun-23
422 1342 232 969 75! 657 867 37 376 873 1.19: :9° 12.3r 2,7:9 :778 2,613 2,131 1,52! 1.653 i4; .449 1.659 844 2.4:8 2.787 25,333 1.32! .316 1.242 953 703 723 689 533 77 4% .133 .331 11.320 .723 1.768 1.632 1,315 955 962 893 861 987 .193 .594 1,717 15,613
2.429 2.467 2.269 1,600 .106 1,065 1.002 .066 .168 1.888 2.348 2.015 20,763 .593 1,604 1,479 1,183 1,0! 1,215 1.245 1.323 .231 1.289 1.555 1.604 16,032 15! 159 161 84 73 199 84 80 217 196 216 78 2,201 572 538 548 524 358 313 320 290 473 644 730 65! 5.962 695 682 629 624 494 551 450 172 627 652 675 644 7.196 502 508 466 382 24! 20 225 195 278 458 577 521 4,593
1,1448.' '[,$31 .:7€8'°'896 8&. 4 - '-6i- 1j,544• 1,5.- 489..' . , 437 .231 8.586 8330 7.630 9,161 11.466 13.924 14.636 134.466
767 6310844
0. 7701493 89
Way,, KE LF
Jul-22 Aug-22 Sep-22 Oct-22 Nov-22 Dec-22 Jan-23 Feb-23 Mar-23 Apr-23 May-23 Jun-23 Avn.
2.698 2,495 2,547 2,149 1,799 1,854 2,235 2.08! 2.692 1.996 2,266 2.694 2.292 5.500 5.720 5,403 5.199 3,799 4.538 4.284 3.988 4.188 4,616 5,447 5.187 4,906 2,796 2,908 2.596 2,570 1,780 1,958 1,759 2.110 2,317 2.767 2.616 2.620 2,400 3,460 3,526 3,43! 3.386 2,914 3,052 2.755 3.042 3.216 3.323 3,652 3.612 3,281 4.780 4,668 4,706 4,363 3.384 3.334 2.840 3.215 3,659 5.113 4.899 4.946 4,159 3,273 3,476 3,285 3,217 2.908 3.379 3.529 3.157 3.386 3.426 3,475 3.490 3,333
242 222 260 319 267 307 316 328 394 361 314 248 298 1.295 1,477 1,699 1.661 .377 1.512 1,375 .244 1,673 .875 1,687 1,674 1,546 .356 1,332 1.359 1,499 1,607 1,584 1.489 .484 799 1,736 1.396 1.465 .509
1,074 1.210 1,081 1.150 923 854 656 769 636 1.433 .263 1.099 .012 1.726 1.687 1,215 1,331 1,282 .244 1.354 1.233 1.442 2,289 2,290 2.168 1,605
27,582 26,843 22,048 23.615 22391 22.652 25,402 28.935 29,306 30.2 03 26342
Jul-22 Aug-22 Sep-22 Oct-22 Nov-22 Dec-22 Jan-23 Feb-23 Mar-23 Apr-23 May-23 Jun-23 Avg.
7!", 72% 67% 61% 58% 5% 520,, 53% 4-1°', 610 o 65% 67% 61% 67°' 65% 67°', 55°', 59!', 49°', 5% 54° 1 53% 55% 60% 63", 63°', 64% 66% 509', 55°', 50°', 5306 45°', 45% 44°', 6!'', 71% 56°", 67!', 67% 66% 52% 16% 42% 44% 44!', 410,", 509', 59°4 66!', 54°', 68% '7j% 67% 4906 45% 430, 470, 47°', 43% 51% 64% 68% 57% 65!', 62% 63°", 49% 48% 48% 47% 48% 49°', 52% 60% 64% 55% 84°'o 96% 86% 78% 90% 87% 7991, 32!", 74% 75% 93% 100°", 84% 59% 49% 45% 42% 36°/, 23% 3!!', 35% 38% 48% 58% 54°', .14% 69°', 69% 64% 56°', 43% 47°', 41% 47% 47% 52% 65% 6106 54% 63% 56% 60% 45% 36% 38% 46% 38°', 59% 44% 61% 66% 52% 89% 94% 90% 90% 87°', 87% 81% 95!', 81% 94% 90°/, 95% 89.9!', 68°!, 67% 66% 54% 52% 49% 50% 50% 48% 55°,6 64% 67% 58%
Rs.,kWh
Jul-22 Aug-22 Sep-22 Oct-22 Nov-22 Dec-22 Jan-23 Feb-23 Mar-23 Apr-23 May-23 Jun-23 Ave.
3.3922 3.1261 3.3685 4.1595 29266 39052 53528 3.8170 4.1142 4.2209 39178 4.2379 3.8389 33922 3.1261 33685 4.1595 2.9266 39052, 5.3528 3.8170 4.1142 42209 3.9178 4.2379 3,8389 33922 3.1261 3.3685 4 1595 29266 39052 5.3528 35170 4.1142 42209 3.9178 4.2379 3,8389 33922 3.125! 3.3685 41595 29266 3.9052 5.3528 3.8170 4.1112 4.2209 3.9178 4.2379 3.8389 3.3922 3.1261 3.3685 4.1595 2.9266 39052 5.3528 3.8170 4.1142 4.2209 3 9178 42379 3.8389 3.3922 3.1261 3.3685 4.1595 2.9266 3.9052 53528 3 8170 4.1142 4.2209 39178 42379 3.8309 3.3922 3 261 33685 4.1595 2,9256 3 9052 5.3528 3 8170 4.1142 4.2209 39178 4.2379 3.8389 33922 3126! 33685 4.1595 2.9265 3.9052 5.3528 38170 4.1142 42209 3.9178 4.2379 3,8389 3.3922 3.1251 33685 4.1595 2.9266 3.9052 53528 38170 41142 4.2209 39178 4.2379 3.8309 33922 3.1261 33685 4.1595 29266 3.9052 5.3528 38170 4.1142 42209 39178 4.2379 3.8389 3.3922 3.126! 3,3685 4 1595 2.9266 39052 5.3528 3.8170 41142 42209 3.9178 42379 3.8389
3.3685 4, 1595 2.9266 3.9052 5.3528 3.8170 4.1142 4.2209 39178 4.2379 3.8389
TL1c
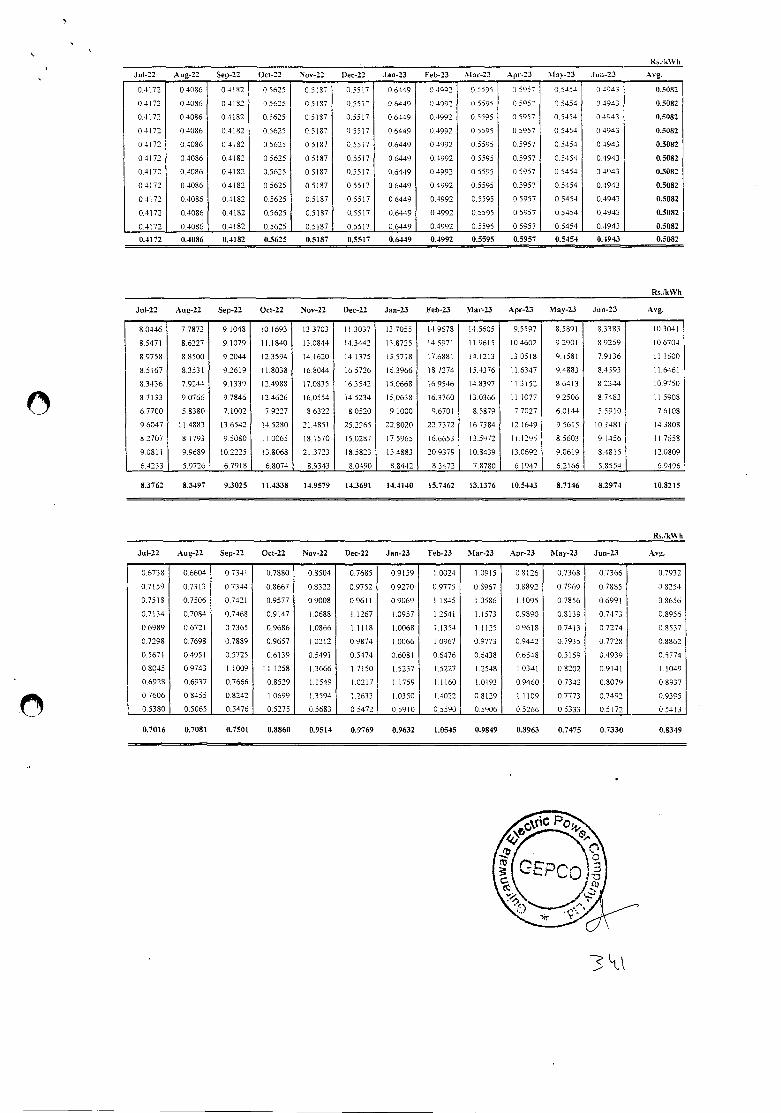
Rs.ikWh
Jul-22 Aug-22 Sep-22 Oct-22 Nov-22 Dec-22 Jan-23 Feb-23 Mar-23 Apr-23 Ma-23 Jun-23 Avg.
04172 04086 04182 05625 05187 05517 06449 04992 05595 05957 05454 04943 0.8082
04172 04086 04182 0.5625 0.5187 0.5517 06449 0.4992 05595 05957 0.5454 0.4943 0.5082
01172 04086 04182 0.5625 05187 0.5517 0.6449 04992 05595 0.5957 05454 0.4943 0.5082
0.4172 0.4086 0.4182 0.5625 0.5187 05517 06449 0.4992 05595 05957 05454 04943 0.5082
04172 04086 0.4182 05625 05187 05517 0.6449 04992 0.5595 05957 05451 04943 0.5082
04172 04086 0.4182 05625 0.5187 05517 0.6449 04992 05595 0.5957 05454 04943 0.5082
0.4172 0.4086 04182 0.5625 05187 05517 0.6449 0.4992 0.5595 0.5957 0.5454 3.4943 0.5082
0.4172 04086 0.4182 0.5625 0.5187 05517 0.6449 04992 0.5595 0.5957 0.5454 0.4943 0.5082
04172 0.4086 0.4182 05625 05187 0.55 17 0.6449 0.4992 0.5595 0.5957 05454 0.4943 0.5082
0.4172 04086 0,4182 05625 0.5187 0.5517 0.6449 0,4992 0.5595 05957 0.5454 0.4943 0.5082
0,4172 0.4086 0.4182 0.5625 0.5187 0.5517 0.6449 0.4992 0.5595 0,5957 05454 0,4943 0.5082
0.4 172 0.4086 0.4182 0.5625 0.5 187 0.55 17 0.6449 0.4992 0.5595 0.5957 0.5454 0.4943 0.5082
Ru/kWh
Jul-22 Aug.22 Sep-22 Oct-22 Nov-22 Dec-22 Jan-23 Feb-23 Mar-23 Apr-23 May-23 Jun-23 Avg.
8.0446 7.7873 9.1048 10.1693 133703 11.3037 13.7055 14.9678 14.5605 95597 55891 8.3383 10304!
8.5471 8,6227 9 1079 111840 13,0811 14.3442 138725 14.5971 119615 104602 92901 89259 10.6704
89758 88500 9.2044 12.3594 4.1620 14.1375 135718 17.6881 14.1213 130518 9.1581 7.9136 11.1600
8.5167 8.353 1 9.2619 118038 16.8044 16,5726 163966 18.7274 15,4376 II 6347 9.4883 8.4593 11.6461
8.3436 7.9244 9.1339 12.4988 17.0835 16.3542 150668 16.9546 148397 11.3152 8.6413 82344 10.9750
87133 90766 9.7846 12.4626 16.0554 145234 15,0638 163760 30366 11.1077 92506 8.7483 15908
67700 5.8380 7.1002 7.9227 86322 80520 9 1000 9.6701 8.5879 7.7027 60144 5.5910 7.6108
96047 114883 13.6542 14.5280 214851 25.2265 228020 227372 16.7384 12.1649 95615 10,3481 14.3808
8.2707 8.1793 95080 11.0065 18.1570 150287 17.5965 16.6653 13.5972 11.1295 85603 9.1456 117658
9.0811 99689 10.2225 138068 21.3723 185823 15.4883 259379 10.8439 130692 9.0619 8,4815 2.0809
6.4233 5.9726 6.7918 6.8074 8.9343 8.0490 88442 8.3472 78780 6.1947 62166 5.8554 58496
8.3762 8.3497 9.3025 11.4338 14.9579 14.3691 14.4140 15.7462 13.1376 10.5443 8.7146 8.2974 10.82 15
Rs.kWh
Jul-22 Aug-22 Sep-22 Oct-22 Nov-22 Dec-22 Jan-23 Feb-23 Mar-23 Apr-23 May-23 Jun-23 Avg.
06738 0.6604 0734! 0.7880 08504 07685 09159 .0024 1.0915 08126 0.7368 0.7366 0.7932
0.7159 0.7313 0.7344 08667 0.8322 09752 09270 09775 08967 0.8892 07969 0.7885 0.8254
0.7518 0.7506 0.742! 09577 0.9008 09611 0.9069 .1845 1 0586 11095 0.7856 06991 3.8656
0.7134 07084 0.7468 0.9147 10688 1.1267 1.0957 .2541 1 573 0.9890 08139 0.7473 0.8956
0.6989 06721 0,7365 0,9686 10866 1,1118 1.0068 1.1354 1.1125 09618 0.7413 07274 0.8537
0.7298 0.7698 07889 0.9657 I 0212 09874 I 0066 1.0967 09773 09442 0.7935 0.7728 08862
0.567! 04951 0.5725 0,6139 05491 0,5474 0,608! 0.6476 0.6438 0.6548 0.5159 0.4939 0.5774
08945 09743 11009 - 1.1258 13666 1.7150 1.5237 1,5227 12548 10341 08202 0.9141 11049
0.6928 0.6937 0.7666 0,8529 1.1549 1.0217 1,1759 11160 1 0193 0,9460 0.7343 0.8079 0.8937
07606 0.8455 0.8242 1.0699 1,3594 1.2633 I 0350 1 4022 08129 1.1109 0.7773 0.7492 09395
05380 0.5065 0.5476 0.5275 0.5603 0.5472 0.5910 0.5590 0.5906 0.5266 05333 05172 0.5413
0.7016 0.7081 0.7501 0.8860 0.9514 0.9769 0.9632 1.0545 0.9849 0.8963 0.7475 0.7330 0.8349
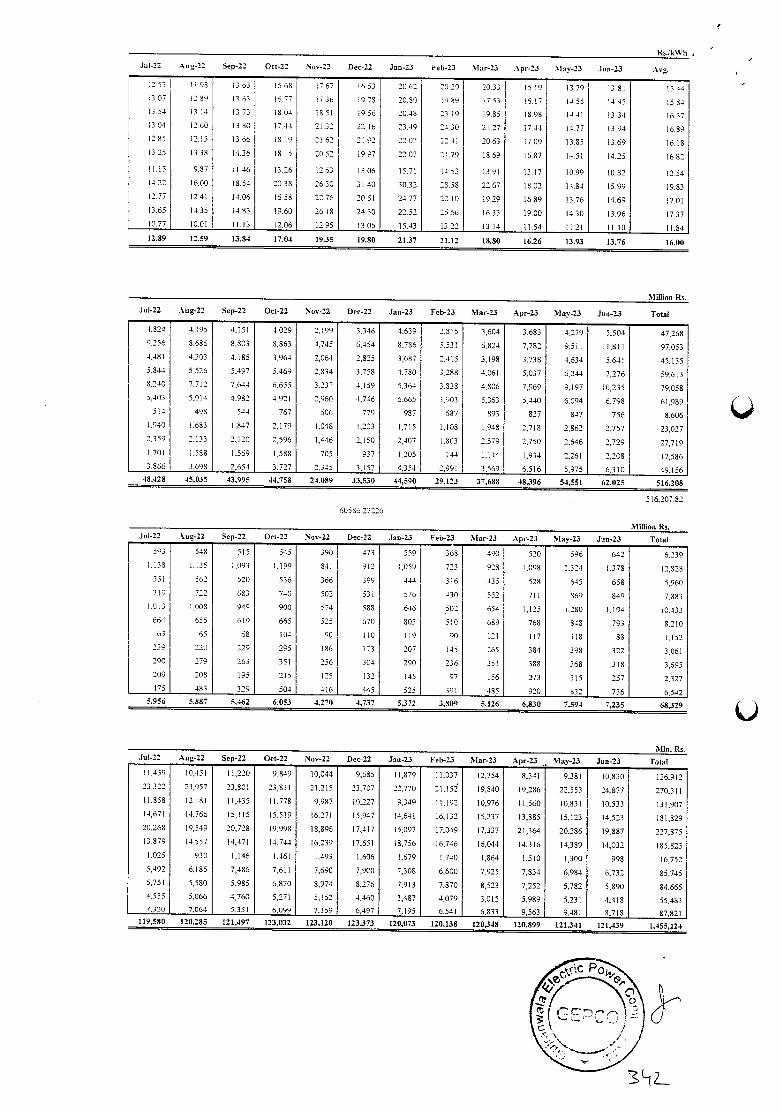
,1
Jul-22 .-thg-22 Sep-22 Oct-22 Nov-22 Dec-22 Jan-23 Feb-23 Mar-23 Apr-23 May-23 Jun-23 Avg.
RsjkWh
253 1 98 1363 568 767 9.53 2062 :029 20.33 15.19 1376 13.81 1541 307 12.89 1363 6 77 736 978 20.80 9.89 17.53 16.17 1455 1445 564 351 13 14 3 73 804 1851 9.56 2018 23 9 19.85 1898 14.41 334 1637
1304 2.60 13.80 1744 21.32 22.16 2349 2130 2127 1714 1477 3.91 6.89 12.85 12 3 13.ó6 IS 19 2! 62 21.92 22.07 24l 20.63 17.09 1385 3.69 16.18 13.25 13.38 14.36 IS. 15 2052 1907 2207 2! 79 18.69 16,87 1451 1425 1682
11.15 9.87 11.46 13.26 12.63 1306 1571 1493 13.9! 13.17 1099 10.82 254 1422 16,00 18,54 20.38 26.30 3140 3032 28,58 22.67 18.02 14.84 15.99 19.83 12.77 12.41 14.06 16.58 22.76 2051 24.77 22.10 19.29 16.89 13,76 14,69 17,01 13.65 1435 14.83 1960 26.18 2430 2252 556 1633 19,00 14,30 13.96 17,37 10.77 10.01 1143 12,06 1295 13,05 15,43 13.22 1314 11.54 1121 11.10 11,84 12.89 12.59 13.84 17.04 19.35 198O 21.37 21.12 18.80 16.26 13.93 13.76 16.00
Million Ru.
Jul-22 Aug-22 Sep-22 Oct-22 Nov-22 Dec-22 Jan-23 Feb-23 Mar-23 Apr-23 May-23 Jun-23 Total
4824 4,195 4.15! 4.029 2,199 3.346 4.639 2.315 3,604 3,683 4,279 5.504 47,268 9.256 8,686 8,303 8.863 4,745 6,454 8,786 5,53! 6,824 7,782 9,51! 11.811 97,053 4,481 4,303 4.185 3,964 2,064 2,825 3,687 2.115 3,198 3.738 4,634 5,64! 45,135 5.844 5.526 5.497 5.469 2.834 3.758 4.780 3.288 4.061 5,037 6,244 7,276 59,613 8.240 7.712 7.644 6.655 3.237 4.159 5.364 3.838 4,806 7,969 9.197 10,235 79,058 5,403 5.014 4.982 4.921 2,960 4,746 6.665 3,903 5,063 5,440 6.094 6.798 61,989
514 498 544 767 506 779 987 587 893 827 847 756 8,606 1.940 1.683 1.847 2.179 1.048 1.223 1,715 .108 1,948 2,718 2,862 2.757 23,027 2.359 2.133 2,120 2,596 1,446 2.150 2.407 .803 2.579 2.750 2.646 2,729 27,719 1701 1,588 1.569 1,588 705 937 1,205 144 1,144 1.934 2.26! 2.208 17,586 3.866 3,698 2.654 3,727 2.345 3,152 4,354 2.99! 3.569 6.516 5,975 6.310 49,156
48.428 45,035 43.995 44,758 24.089 33.530 44,590 29. 123 37,688 48.396 5-1,551 62,025 516,208
516,20782
60586 27226
Million Rs. Jo 1-22 Aug-22 Sep-22 Oct-22 Nov-22 Dec-22 Jan-23 Feb-23 Mar-23 Apr-23 May-23 Jun-2
53 548 515 545 390 473 559 368 490 520 596 642 6.239 1.138 1.135 .093 1.199 841 912 1.059 723 921 !,09S 1.324 1,378 2,528
551 562 520 536 366 399 444 3ó 435 528 645 658 5.960 719 722 683 740 502 531 576 43Q 552 7!! 869 849 7,883
1.013 1.008 94° 900 574 588 646 502 654 .125 1.280 1.194 10.433 664 655 619 665 55 570 803 510 589 768 848 793 8.210
63 95 68 l0 90 110 119 90 121 17 18 88 1.152 239 220 229 295 186 173 207 45 265 384 398 322 3,061 290 279 263 351 256 304 290 236 351 388 368 318 3,695 209 208 195 215 125 132 145 97 156 203 315 257 2,327 475 483 329 504 416 445 525 39! 485 920 832 736 6,542
.956 5,887 5,462 6,053 4.2"O 4,737 5,372 3.809 5,126 6,830 7.594 7,235 68,329
MIn. Rs. Jul-22 Aug-22 Sep-22 Oct-22 Nov.22 Dec-22 Jan-23 Feb-23 . Mar-23 Anr-23 May-23 tun-
11.439 10.451 11.220 9,849 10,044 9.685 11,879 11.037 12.754 1,341 9,38! 10.830 126.912 23.322 23,957 23.801 23,83! 21.215 23.707 22.770 21.152 19.540 19,286 22.553 24.877 270.311 11.858 12.181 11,435 11,778 9,987 10.227 9,349 11,192 10,976 1.560 10.831 10.533 131,907 14,67! 14,766 15,115 15.519 16.271 15,947 14,64! 16.132 15.237 13,885 15,123 14.523 181,829 20.268 19,549 20.728 19.998 8,896 17,417 15,097 17,349 17,337 21,364 20.286 19,887 227,875 13.179 14.557 14.471 14,744 16,239 17,651 18,756 16,746 16,044 14,316 14,319 14.032 85.523 1.025 930 1,146 1.46! 493 1.606 1.679 1,740 1.864 1,510 1,300 998 16,752 5,492 6,185 7,416 7.6!! 7.690 7,900 7,308 6,600 7,925 7,834 6,984 6,732 85,745 5,751 5,580 5.985 6.870 8.974 8,276 7,913 7.870 8,523 7,252 5,782 5,890 84,665 4.555 5,066 4.760 5,271 5.152 4,460 3,417 4.079 3.015 5,989 5,231 4.411 55.413 7.320 7.064 5,351 6.099 7,159 6,497 7,195 6,54! 6.133 9.563 9,481 8718 87,821
580 120,285 121.497 123,032 123.120 123.373 120,073 120.138 120,348 120,899 121,341 121,439 1,455,124
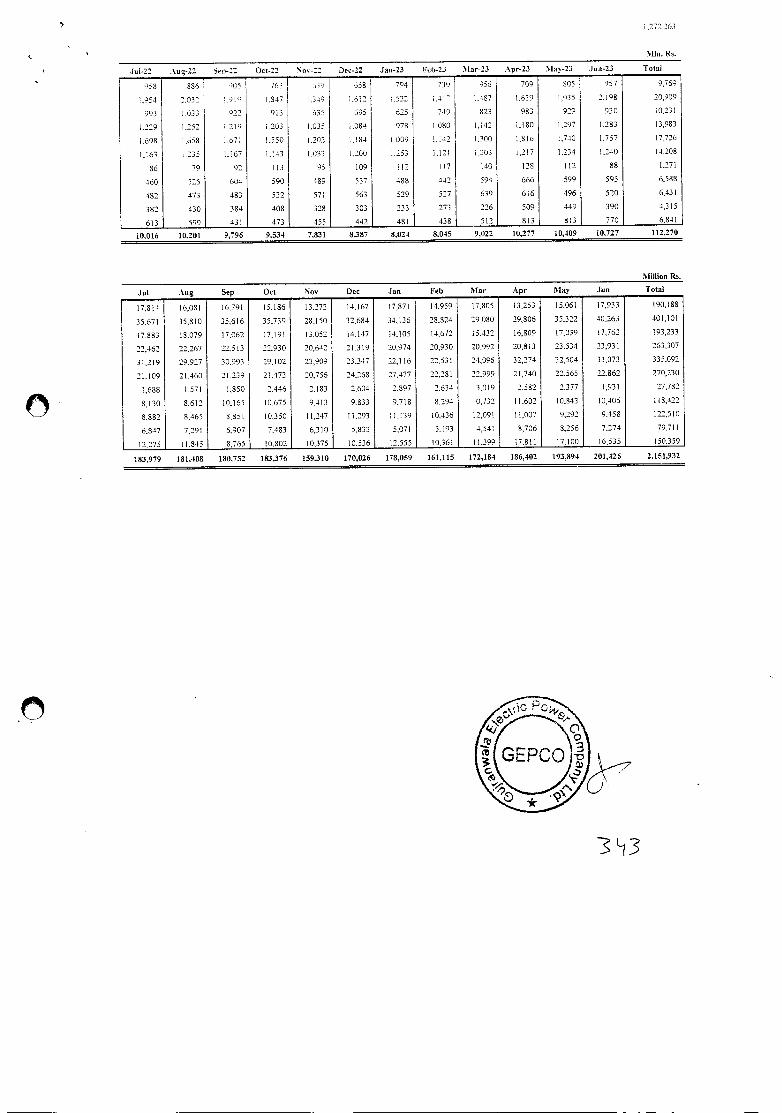
1.272.263
Mlii. Ri.
Jul-22 Aug-22 Sen- 22 Oct-22 Nov-22 Dec-22 Jan-23 Feb-23 Mar-23 Apr-23 May-23 Jua-23 Total
753 336 05 763 639 358 794 739 956 709 505 957 4,764
.954 2.032 .9l 547 349 .ó12 1,522 417 .487 1,639 .935 2.198 20,909
993 1,033 422 913 635 695 625 749 823 983 929 930 10,231
1.229 1.252 I 219 .203 1.035 1,084 978 1.080 1,142 ISO 1.297 .283 13.983
.698 .658 .671 .550 1,202 i,!14 1.009 1.142 1.300 1.816 1,740 1.757 7.726
1.163 .235 1.167 .143 1.033 1.200 1.253 1.121 1.203 1.217 1.234 .240 14,208
36 79 92 113 95 109 112 117 140 128 112 88 1.271
460 525 601 590 459 537 4S8 442 594 666 599 595 6,588
482 473 483 532 571 563 529 527 639 616 496 520 6,431
382 430 384 408 328 303 233 273 226 509 449 390 4,315
613 599 431 473 455 442 48! 438 512 813 813 770 6.841
10,016 10.201 9,796 9.534 7,831 8,387 8.024 8.045 9,022 10,277 10,409 10,727 112,270
Million Rs.
Oct Nov Dec Jan Feb Mar Apr May Jun Total
17814
35.67!
17,883
22,462
16,051
35,810
13,079
22.267
16,791
35616
17,062
22,313
15.186
35,739
7,19!
22.930
13,272
28.150
13.052
20.642
4.162
32.684
14,147
17,371
34,136
14j05
21,31920,97420.93020.992
4,959
25.324
14,672
17.805
29,080
15.432
13.253
29,806
6,809
20,813
15,06!
35.322
17,039
23.534
17,933
40,263
17,762
23,93!
190,188
401,10!
193,233
263,307
31,319 29,927 30,993 29,102 73,909 23.347 22,116 22,53! 24,096 32,274 32,504 33,073 335,092
21.109 21,460 21,23921.47320,75624,268 27,477 22,28! 22,999 21,740 22,565 22,362 27Q230
1,688 1,571 1.850 2.446 2,183 2,604 2,597 2.634 3.019 2,582 2.377 1,931 27,732
8,130 8,612 10i65 10.675 9,413 9.833 9,718 8,294 10,732 11,602 10,843 0,405 118,422
8,S82 8,465 8.351 10,350 1,247 11,293 11,139 10,436 12,09! 11,007 9,292 9.458 122,510
6,847 7,29! 6,907 7,483 6,310 5.833 5.071 5.193 4,541 8,706 5,256 7,274 79,7!!
12.275 11.815 8,765 10.802 10,375 0.536 12,555 10,361 11,399 17.81! 17.100 6,535 150.359
183,979 181.408 180,752 183,376 159.310 170,026 178,059 161,115 172.184 186,402 193,894 201,426 2,151.932
3ti3
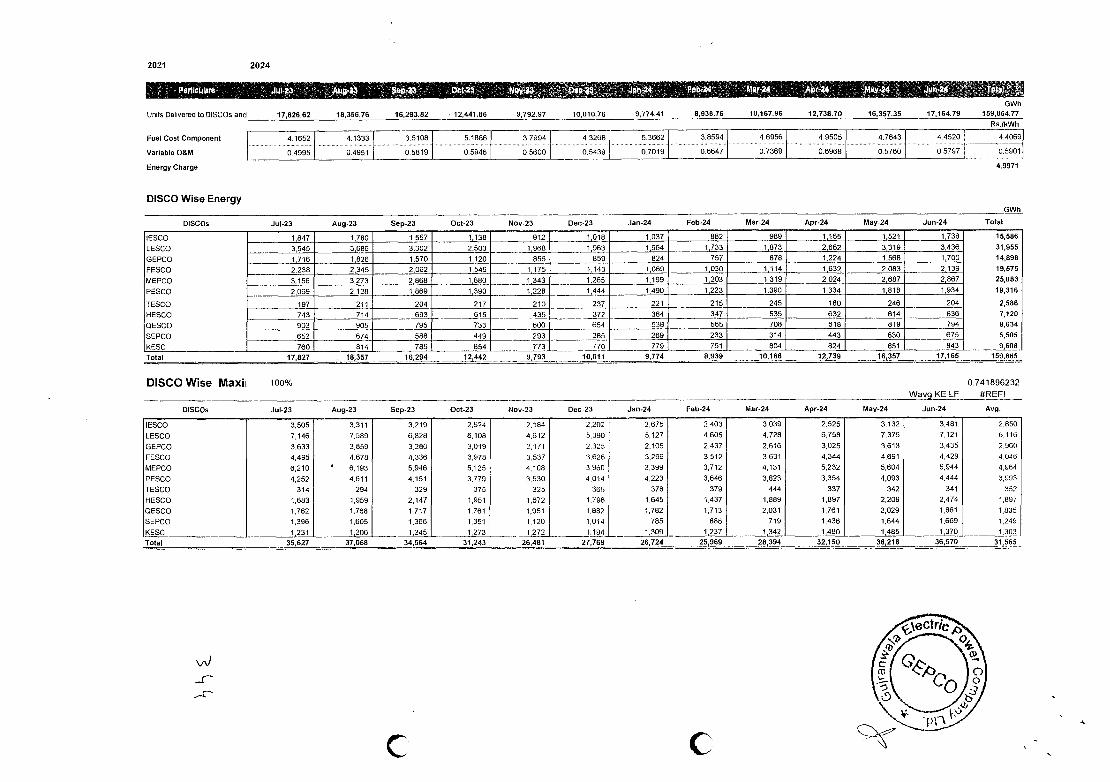
2021 2024
GWh
Units Delinered to DISCOs and 17,826.62 18,356.76 16,293.82 12,441.86 9,792.97 10,010.76 9,774.41 8,938.76 10,167.96 12,738.70 16,357.35 17,164.79 159,864.77 Rs.lkWh
Fuel Cost Component 4. 1652 4.1333 3,5108 5.1886 3 7994 4 3268 5.3662 3. 8594 4 .6956 4 9505 4 7643 4 4520 4 4069
Variable O&M 0 4995 0.495 1 0. 58 19 0,5946 0 5600 05439! 0.7019 0 6647 0 7369 0 6968 0 5760 0 5787 0. 5901
Energy Charge 4,9971
DISCO Wise Energy 6681
DISCOs Jul-23 Aug-23 Sep-23 Oct-23 Nov-23 Dec.23 Jan-24 Feb-24 Mar-24 Apr-24 May-24 Jun-24 Total
ESCO LESCO
GEPCO
FESCO
MEPCO
PESCO
TESCO 1-IESCO
QESCO
SEPCO
KESC
1,847 1,780 1,557 1,138 912 1,018 1,037 882 989 1165 1,521 1,738 15,586
31,955
14,898
19,575 25,083
19,316
2,586
7,120
8,634 5,505
9,608
3,545 3,689 3,302 2,503 1 968 1 963 1964 1,733 1.873 2,662 3,319 3,436
1,716 l,26 1,570 1,120 856 859 824 757 878 1,224 1,568 1,700
2,238 2,345 2,062 1,545 1175 1,143 1,069 1,030 1,114 1,632 2083 2,139
3,156 3,273 2,868 1,880 1 343 1,265 1,199 1,203 1,319 2,024 2,687 2,867
2,069 2128 1,869 1,390 1228 1,444 1,490 1,223 1,390 1,334 1,818 1,934
197 211 204 217 210 237 221 215 245 180 246 204
743 714 693 615 435 372 384 347 535 632 614 836
903 905 795 733 600 654 538 565 708 618 819 794
652 674 588 449 293 285 269 233 314 443 630 675
760 814 785 854 773 770 779 751 804 824 851 843
Total 17,827 18.357 16.294 12,442 9,793 10,011 9,774 6,939 10,168 12,739 16,357 17,165 159865
DISCO Wise Maxii 100% 0.74 1896232
Wavg KE LF #REF!
DISCOs Jul-23 Aug-23 Sep.23 Oct-23 Nov-23 Dec-23 Jan-24 Feb-24 Mar-24 Apr-24 May-24 Jun-24 Avg.
IESCO
LESCO
GEPCO FESCO
3.505
7,146
3,633 4,495
3,311
7,589
3.859
4,678
3,210
6,828
3,280
4,336
2,524
6.108
3,019
3,978
2,184
4,612 2,171
3,537
2,202 5,390
2,325
3,626
2,675
5,127
2,105
3,296
2.403
4,605
2,437
3,512
3,039
4,728
2.616
3,631
2.525
6,758
3,025
4,344
3,132
7,375
3,613
4,691
3,481
7,121
3,435
4,429
2.850
0,118
2,9011
4,046
MEPCO 6,210 • 6,193 5,946 5,125 4,108 3,960 3,399 3,712 4,131 5,232 5,604 5,944 4,564
PESCO 4,252 4,611 4.151 3,775 3,530 4,014 4,223 3,646 3,823 3,354 4,093 4,444 3,9133
TESCO 314 294 329 375 325 365 378 379 444 337 342 341 352
HESCO 1,683 1,959 2.147 1,951 1,672 1,796 1.645 1,437 1,889 1,897 2,209 2,474 1,897
QESCO 1,762 1,768 1,717 1,761 1.951 1,882 1,782 1,713 2,031 1,761 2.029 1,861 1,835
SEPCO 1,396 1,605 1,366 1,351 1.120 1,014 785 888 719 1,436 1.644 1,669 1.249
KESC 1,231 1,200 1,245 1,273 1,272 1,194 1,309 1,237 1 342 1,450 1,485 1,370 1,303
Total 35,627 37,068 34,564 31,243 26,481 27,769 26,724 25,969 28,394 32,150 36,218 36,570 31,565
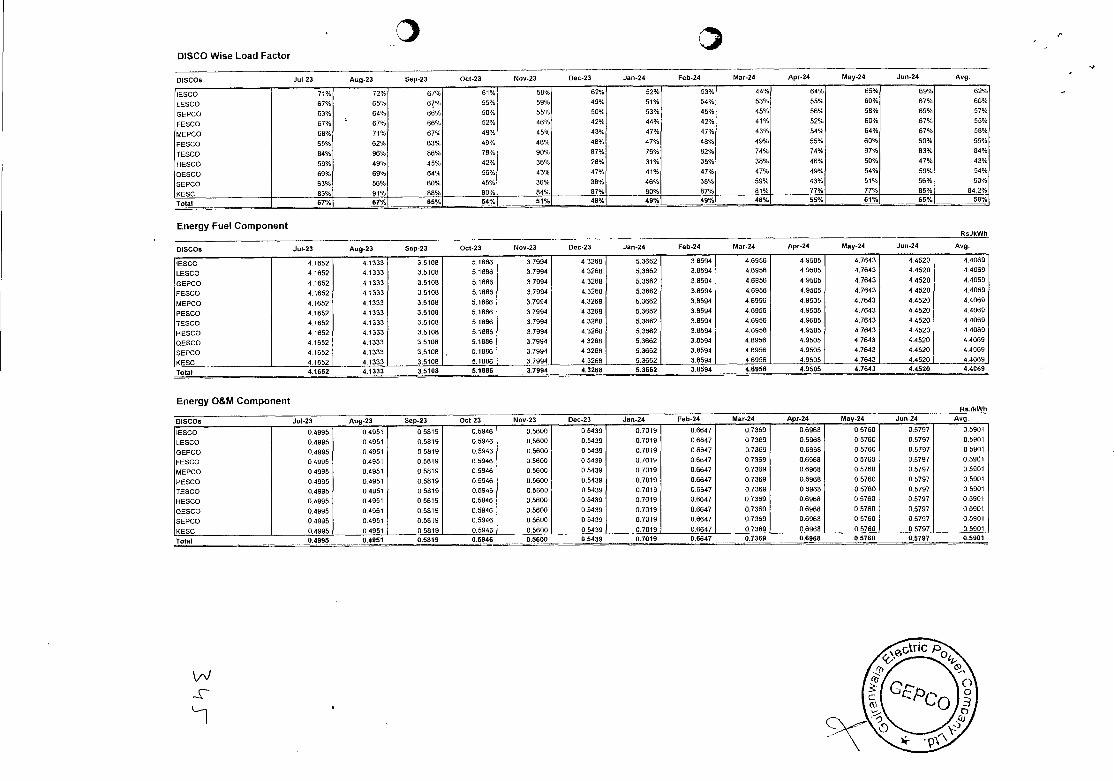
DISCO Wise Load Factor
DISCOS Jul-23 Aug-23 Sep-23 Oct-23 Nov-23 Dec-23 Jan -24 Feb-24 Mar-24 Apr-24 May-24 Jun -24 Avg.
IESCO 71% 72% 67% 61% 58% 62% 52% 53% 44% 64% 65% 69% 62%
LESCO 67% 65% 6% 55% 59% 49% 51% 54% 53% 55% 60% 67% 60%
GEPCO 63% 64% 66% 50% 55% 50% 53% 45% 45% 56% 58% 69% 57%
FESCO 67% 67% 66°/U 52% 46% 42% 44% 42% 41% 52% 60% 97% 55%
MEPCO 66% 71% 67% 49% 45% 43% 47% 47% 43% 54% 64% 67% 58%
PESCO 65% 62% 63% 49% 48% 40% 47% 46% 49% 55% 60% 60% 55%
TESCO 84% 96% 86% 78% 90% 87% 19% 82% 74% 74% 97% 83% 84%
HESCO 59% 49% 45% 42% 36% 28% 31% 35% 38% 46% 50% 47% 43%
QESCO 69% 69% 64% 56% 43% 47% 41% 47% 47% 49% 54% 59% 54%
SEPCO 63% 56% 60% 45% 36% 36% 46% 38% 59% 43% 51% 56% 50%
KESC 83% 91% 88% 90% 84% 87% 80% 87% 81% 77% 77% 85% 842%
Total -- - - 67% 67% 65% 54% - 51% 48% 49% 49% 49% 55% 61% 65% 58%
Energy Fuel ComponentRs.lkWh
DISCOS Jul-23 Aug-23 Sep-23 Oct-23 Nov-23 Dec-23 Jan-24 Feb-24 Mar-24 Apr-24 May-24 Jun-24 Avg.
IESCO 4.1652 4.1333 3.5108 51886 37994 43268 5.3662 3.8594 4.6956 4.9505 4.7643 4.4520 4,4069
LESCO 41652 41333 35108 5,1886 3.7994 4.3268 5.3662 3.8594 4,6956 49505 4.7643 4,4520 4.4069
GEPCO 4,1652 4.1333 3.5108 5.1886 37994 43268 5.3662 3,8594 46956 4.9505 4.7643 44520 4,4069
FESCO 4.1652 41333 3,5108 5.1886 3,7994 4.3268 5.3662 3,8594 4.6956 4.9505 4.7643 4.4520 4.4069
MEPCO 4.1652 4.1333 3.5108 5,1886 3.7994 4.3268 53662 3.8594 4,6956 4.9505 4.7643 4.4520 4.4069
PESCO 4.1652 4.1333 3.5108 5,1886 37994 4.3268 5,3662 3.8594 40956 4.9505 4.7643 44520 4.4069
TESCO 4.1652 4,1333 3.5108 51886 3,7994 43268 5.3662 3.8594 4.6956 4.9505 4.7643 4.4520 44069
HESCO 41652 4,1333 3.5108 5,1886 3,7994 4,3268 5.3662 3,859.4 4,6956 4,9505 4,7643 4,4520 44069
OESCO 4,1652 4,1333 3.5108 5,1886 3,7994 4.3268 5.3662 38594 4,6956 4,9505 4,7643 44520 4.4669
SEPCO 4.1652 4.1333 3.5108 51885 37994 4,3268 5,3662 3,8594 4.6956 4.9505 4.7643 4,4520 4,4059
KESC 4,1652 4,1333 3.5108 5.1886 37994 4,3268 53662 3,8594 46956 49505 4,7643 44520 4,4065
Total 41652 4.1333 3.8108 5. 1886 3.7994 4. 3 268 5.36
Energy O&M ComponentR8JkWh
1-23 Nov-23 Dec-23 Jan-24 Feb-24 Mar-24 Apr-24 May-24 Jun -24 Avg.
IESCO 0,4995 0,4951 0,5819 0,5946 0,5600 0,5439 0.7019 0,6647 0,7369 06968 05760 0,5797 0,5901
LESCO 0,4995 0,4951 0.5819 0,5946 0,5600 0,5439 0.7019 0,6647 0,7369 06969 0,5760 0.5797 0.5901
GEPCO 0,4995 0,4951 0,5819 0,5946 0.5601) 0 5-439 0.7019 0,6647 0,7369 0,6968 0,5760 0.5797 0 5901
FESCO 04995 0,495) 05819 05846 0,5600 05439 0,7019 06647 07369 0,6968 0,5760 0,5797 05861
MEPCO 04995 0,4951 05819 05946 05600 05439 07019 0.6647 0,7369 06969 0,5760 0,5797 0,5901
PESCO 0,4995 0.4951 0,5819 0,5946 0.5600 0.5439 0,7019 0,6647 07369 06968 0,5760 0.5797 0,5901
TESCO 04995 04951 05819 05946 05600 05439 07019 0.6647 07369 06969 0.5760 05797 05901
HESCO 0.4995 0,4951 05819 0.5946 0.5600 0,5439 0,7019 0.6647 0,7369 0,6968 0.5760 0.5797 05901
QESCO 0,4995 0,4951 0,5819 0.5946 05600 0.5439 0.7019 0.6647 0,7369 0,6968 0,5760 0,5797 08501
SEPCO 0.4995 0,4951 0.5819 0,5946 05550 05435 0,7019 0,6647 0,7369 0.6968 05760 0,5797 0,5901
EEOC 04995 0 495) 0,5819 0 5946 0 5600 0 5439 0 7019 06647 0,7369 0,6968 0,9760 0 5797 0 5901
Total 0.4995 0.4951 0.5919 0.5946 0.5600 9.54 39 0.7019 .66
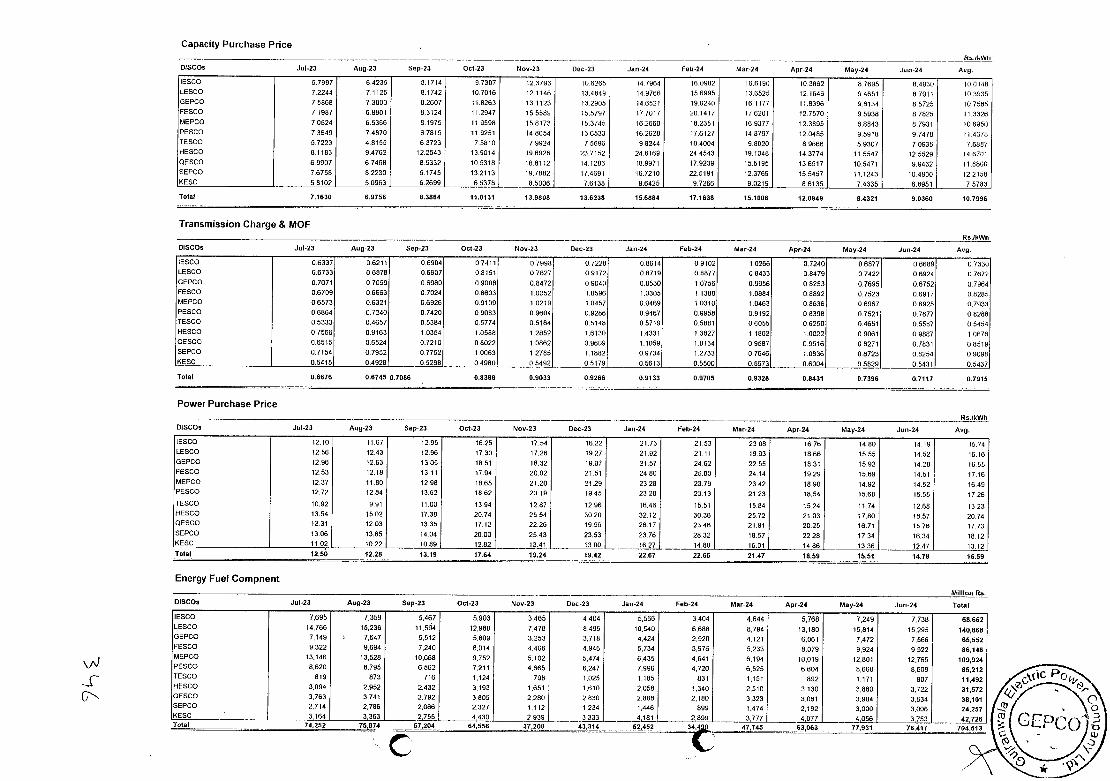
Capacity Purchase Price
Ru.lkWh
Avg. DISCOS Jul-23 Aug-23 Sep-23 Oct-23 Nov-23 Doc-23 Jan-24 Feb-24 Mar-24 Apr-24 May-24 Jun-24
IESCO 67997 6.4235 8.1714 9.7307 123793 06265 147964 16,0982 16.6150 0.3862 87695 8,4930 0.040 LESCO 7.2244 7.1125 8.1742 107016 12.1146 13.4649 149766 156995 13.6525 121646 9.4651 87811 0.3935 GEPCO 75868 73000 82607 11,8263 13,1123 132905 146521 19.0240 161177 11.8396 9,8134 85725 10.7585 FESCO 71987 6,8901 8.3124 11 2947 155589 155797 7.7017 20 1417 17.6201 127570 95938 87825 11.3326 MEPCO 7.0524 6.5366 8.1975 11 9598 15,8173 153745 16,2660 18.2351 16,9377 12,3895 8.8843 87931 0.6950 PESCO 7,3649 74870 87815 119251 14.8654 136533 16,2628 17.6127 14,8797 12.0485 9,5918 9.7478 11.4378 TESCO 57223 48155 6.3723 7.5810 79924 75696 98244 104004 98020 89666 59307 70935 76887 HESCO 81183 9,4762 12,2543 139014 '198926 237152 24,6169 24.4543 191048 14.3774 11.5547 12.5529 14.6701 QESCO 69907 67408 8.5332 10.5318 168112 14 1283 18.9971 17.9239 155195 13.6517 105471 9.9432 11.8605 SEPCO 7.6758 8.2230 9.1745 132113 19.7882 17.4691 16.7210 22.5191 12.3769 15,5457 11.1243 104800 122158 KESC 58102 5.0963 6.2699 6.5378 8.5506 76136 9,6425 9.7266 9.0219 86135 74335 6.8951 7.5783
Total 7.1630 6 .875 6 8.3864 11,0131 13. 96 08 13.6239 15.6884 17.1638 15.1006 12.0949 9.4321 9.0360 10,7996
Transmission Charge & MOF RS.IkWh
DISCOS Jul-23 Aug-23 Sep-23 Oct-23 Nov-23 Dec-23 Jan -24 Feb-24 Mar-24 Apr-24 May-24 Jun -24 Avg.
IESCO 0.6337 5,6211 0,6904 0 7411 0 7998 0,7228 0,8614 0 9102 1,0266 0,7240 0,6877 0.6609 0 7330 LESCO 06733 06979 0,6907 0,8151 07827 09172 05719 0,8877 08433 08479 0,7422 06924 07672 GEPCO 0,7071 0,7059 0,6980 0,9008 0,8472 0 9040 0.0530 1.0756 5,9956 0 8253 0.7695 06752 0 7964 FESCO 0,6709 0,6663 0,7024 0,0603 1,0052 1,0596 1,0305 1,1388 10984 0,8892 0,7523 0,6917 08265 MEPCO 0,6573 0,6321 0,6926 0,9109 1,0219 10457 0,9469 10310 10463 0,8636 0,6967 06925 0,7933 PESCO 06864 0 7240 0 7420 09083 0 9604 0,9286 09467 0 9958 0 9192 0 8398 0,7521 0 7677 0 8288 TOSCO 0,5333 0,4657 05384 0,5774 0,5164 05148 05719 0,5801 06055 06250 04651 05567 05454 HESCO 07566 0,9163 1,0354 1,0580 1,2852 1,6130 1,4331 13827 1.1802 1,0022 0,9061 0.9807 1,0675 QESCO 06515 0,6524 0,7210 08022 1 0862 096119 1.1059 1 0134 0,9587 09516 08271 07831 08519 SEPCO 0,7154 07952 0,7752 1,0063 1,2785 1,1882 09734 1.2733 0,7646 1,0836 08723 0,5254 05098 KESC 0.5415 0,4929 0,5298 0,4980 05492 0.5179 0,5613 0,5500 05573 0.6004 0,5829 0,5431 0,5437
Total 0.6676 0.6745 8.7086 - 0.8388 9.9033 0.9266 0.9133 0.9705 0.9328 0.8431 0.7396 0. 7117 0.7915
Power Purchase Price RS.lkWh
DISCOs Jul-23 Aug-23 Sep-23 Oct-23 Nov-23 Dec-23 Jan-24 Feb-24 Mar-24 Apr-24 May-24 Jun-24 Avg.
IESCO 12,10 11,67 1295 16,25 17,54 16,22 21,73 21,53 2308 1676 14,80 14 19 15 74 LESCO 1266 12,43 12.96 1730 17.26 19,27 21.92 2111 1993 1066 15.55 14,52 16,16 GEPCO 12,96 12,63 1305 1051 18,32 19,07 2157 2462 2255 1831 15,92 14,28 1655 FESCO 12,53 12,18 13,11 17,94 20,92 21,51 2480 25,80 24,14 1929 1569 14,51 17,16 MEPCO 12,37 11.90 12,98 18,65 21.20 2129 23,20 23,79 2342 1890 1492 14,52 16,49 PESCO 12,72 12,84 13.92 18,62 20.19 1945 23.28 23,13 2123 10,54 1568 15,65 1726
TESCO 10,92 9.91 11,00 1394 12,87 12,96 16,46 15,51 15,84 1524 11,74 1268 1323 HESCO 13.54 15.02 17.38 20,74 2554 3020 32,12 30,36 2572 21,03 17.80 18,57 20,74 QESCO 12,31 12,03 13,35 17,12 22,26 19.96 26,17 23,46 21,91 20,25 16.71 15,76 17,73 SEPCO 13,06 13.65 14.04 2500 2543 23,53 23,76 28,32 1897 22.28 17.34 16.34 18 12 KESC 11,02 10,22 10,89 1282 13,41 13,00 16,27 1480 15,01 14,86 13,36 12,47 13.12 Total 12.50 12.28 13.19 17,64 19.24 19.42 22.67 22.66 21.47 18.59 15.51 14.78 46.59
Energy Fuel Compnent
Million Ru.
DISCOs Jul-23 Aug-23 Sep-23 Oct-23 Nov-23 Dec-23 Jan-24 Feb-24 Mar-24 Apr-24 May-24 Jun-24 Total
IESCO 7.695 7,359 5,467 5,903 3,465 4,404 5,566 3.404 4,644 5,768 7,249 7.738 69,662 LESCO 14,766 15.236 11,594 42,988 7,478 8,495 10,540 6.688 8,794 13.180 15,814 15.295 140,868 GEPCO 7,145 7,547 5,512 5,805 3.253 3,718 4,424 2,920 4,121 6.061 7,472 7,566 65,552 FESCO 9,322 9,694 7.240 0.014 4.466 4.946 6.734 3.976 5.233 8.079 9.924 9.522 86,148 MEPCO 13,146 13.528 10.068 9,752 5,102 5.474 6,435 4,641 6.194 10.019 12,801 12.765 109,924 PESCO 8.620 8.795 6.562 7.211 4.665 6.247 7.996 4.720 6,525 6.604 8.660 8,609 98,212 TESCO 819 873 716 1,124 798 1,025 1,195 831 1.151 892 1,171 907 11,492 HESCO 3,094 2,952 2,432 3,193 1,651 1,610 2.058 1.340 2,510 3,130 3,880 3,722 31,572 QESCO 3,763 3,744 2,792 3,805 2,2811 2.830 2,808 2.180 3.323 3.091 3.904 3,534 38,101 SEPCO 2.714 2.786 2,066 2,327 1.112 1.234 1.446 899 1.474 2.192 3.000 3,006 24,257 KESC 3,164 3363 2755 4,430 2,938 3333 4,181 2899 3,777 4.077 4056 3,753 42726
556 37,208 43,314
C,
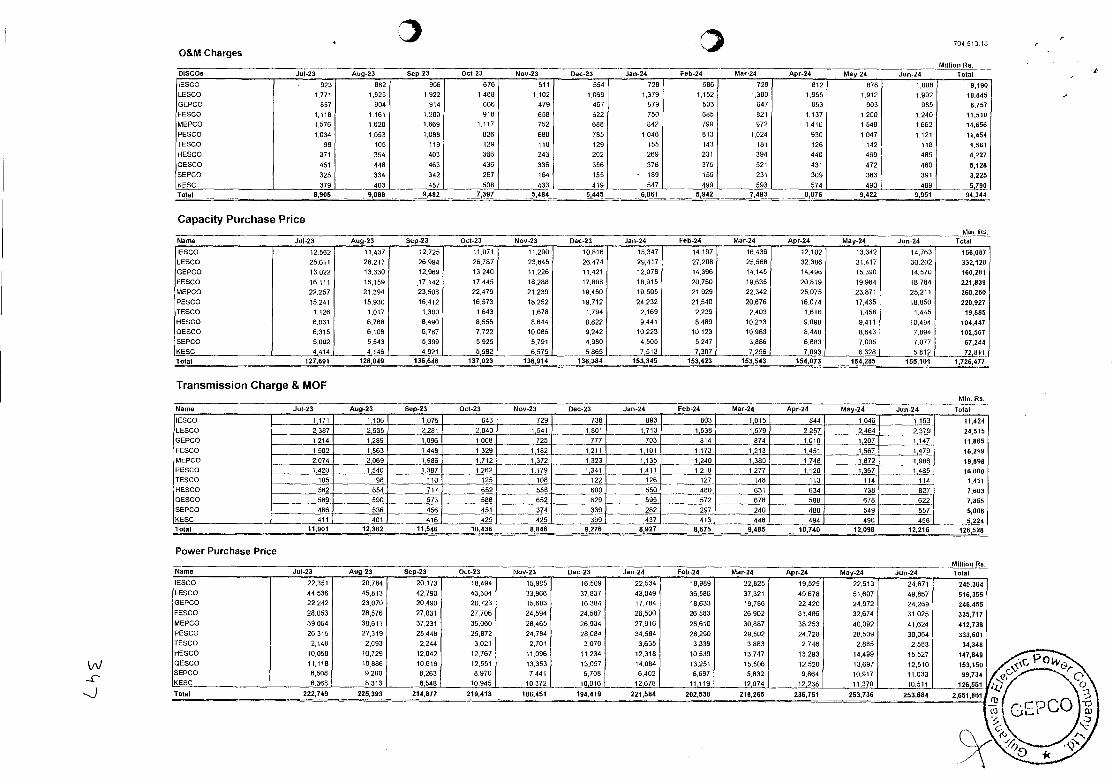
704.51310
O&M Charges M8ion lb.
DISCOs Jul-23 Aug-23 Sep-23 Oct-23 Nov-23 Dec-23 Jan-24 Feb-24 Mar-24 Apr-24 May-24 Jun-24 Total
ESCO . 923 882 906 676 511 554 726 586 729 812 876 1,008 9,100 LESCO 1,771 1.025 1,922 1,408 1.102 1.058 1,379 1,152 1,380 1,855 1,912 1,992 18,848 GEPCO 857 904 914 660 479 467 579 503 647 853 903 985 8,787 FESCO 1,110 1,161 1,200 910 658 622 750 685 821 1,137 1,200 1.240 11,510 MEPCO 1,576 1,620 1,669 1,117 752 688 042 785 572 1.410 1,548 1,652 14,656 PESCO 1,034 1.053 1,599 826 690 785 1,046 813 1,024 930 1,047 1.121 11,454 TESCO 99 105 119 129 118 129 155 143 181 126 142 115 1,561 HESCO 371 354 403 366 243 202 265 231 394 440 460 405 4,227 QESCO 451 448 463 436 336 356 378 375 521 431 472 460 5,128 SEPCO 325 334 342 267 164 155 - 189 155 231 309 363 391 3,225 KESC 379 403 457 508 433 419 547 499 593 574 490 489 5700 Total 8,905 9,088 9,482 7,397 5,484 5,445 6,861 5,942 7,493 8,876 9,422 8,551 84,344
Capacity Purchase Price Mm. Ru.
Name Jul-23 Aug-23 So Oct-23 Nov-23 Dec-23 Jan-24 Feb-24 Mar-24 Apr-24 May-24 Jon -24 Total
IESCO 12,562 11,437 12,725 11,071 11,290 10,816 15,347 14,197 16,436 12,102 13.342 14,763 156,087 LESCO 25,611 26,217 26,994 26,757 23,845 26,474 25,417 27,208 25,566 32,386 31,417 30,202 332,128
GEPCO 13,022 13,335 12.969 13,240 11,226 11,421 12,070 14,396 14.145 14,496 15,390 14,570 10,251
FESCO 16,111 16,159 17,142 17,445 18,280 17,000 18,915 20,750 19,635 20,819 19,984 18,784 221,839 MEPCO 22,257 21,394 23,508 22,479 21,239 19,450 19,505 21,929 22,342 25.075 23,871 25,211 268,260
PESCO 15,241 15,930 16,412 16,573 18,252 19,712 24.232 21,540 20,676 16,074 17,435 18,850 220,927 TESCO 1,126 1.017 1,300 1,643 1.678 1,794 2,169 2,239 2,403 1.616 1.458 1,445 19,885 HESCO 6,031 6,768 8,490 9,556 8.644 8,822 9,441 8,489 10,213 9,090 9,411 10,494 104,447 QESCO 6,315 6,106 6,787 7,722 10,086 9,242 10,223 10,123 10,983 8,440 8,643 7,894 102,567 SEPCO 5,002 5543 5,399 5,925 5,791 4.980 4,505 5,247 3.886 6.883 7,005 7.077 67,244 EEOC 4414 4 146 4,921 5,582 6,575 5865 7,513 7,307 7256 7.093 6,328 5,812 72 811 Total 127,691 128,049 136,646 137,023 136,914 136,384 153,345 153,423 153,543 154,073 154,285 155.101 726,477
Transmission Charge & MOF
Mb. Rn.
Total Name Jul-23 Aug-23 Sep-23 Oct-23 Nov-23 Dec-23 Jan-24 Feb-24 Mar-24 Apr-24 May-24 Jun -2 4
lESCO
LESCO
GEPCO
FESCO
MEPCO
PESCO
TESCO
HESCO
QESCO
SEPCO
KESC
1171 1,106 1,075 043 729 736 893 803 1015 844 1,046 1163 11,424
24,515
11,865
16,219
19,898 16,090
1,411
7.603
7,355
5,008
5224
2387 2,535 2,281 2040 1,541 1,801 1,713 1,538 1,579 2,257 2464 2379
1214 1,289 1,006 1,008 725 777 703 814 874 1.010 1207 1147 1502 1.563 1,449 1,329 1j2 1,211 1,101 1,173 1.213 1.451 1,567 1479 2074 2069 1,986 1.712 1.372 1323 1,135 1,240 1,380 1.740 1,072 1986 1420 1540 1.387 1262 1179 1341 1411 1218 1277 1120 1,367 1,485
105 90 110 125 108 122 126 127 146 113 114 114 562 654 717 652 558 - 650 550 480 631 634 738 827 589 590 573 588 652 629 - 595 572 670 588 678 622 466 536 456 451 374 339 262 297 240 480 549 557 411 401 416 425 425 399 437 413 448 494 496 456
Total 11,501 12,382 11,546 10,436 8,046 9.276 8,927 8,675 9,485 10,740 12,098 12,216 126,528
Power Purchase Price Million Ru.
Name Jul-23 Aug-23 Sep-23 Oct-23 Nov-23 Dec-23 Jan-24 Feb-24 Mar-24 Apr-24 May-24 Jun-24 Total lESCO 22,351 20,784 20,173 18,494 15,905 16,509 22,534 18,989 22,825 19,525 22,513 24,671 245,364 LESCO 44,536 45,013 42,790 43,304 33,566 37,837 43,049 36.505 37,321 49.678 51,607 49,867 516,355 GEPCO 22.242 23,070 20.490 20.723 15.683 16,384 17,704 18,633 19,786 22,420 24,972 24,269 246,455 FESCO 28,053 28,576 27,031 27,706 24,594 24,587 26,500 26,503 26,902 31,486 32,674 31,025 335,717 MEPCO 39.054 38,611 37,231 35,060 28.465 26,934 27.916 20,610 30,887 38,253 40,092 41.624 412,738 PESCO 26.315 27,319 25,448 25.872 24,784 28,084 34,604 28,290 29,502 24.728 28.509 30,064 333.601 TESCO 2,140 2,093 2,244 3,021 2,701 3,070 3,635 3,339 3,083 2,746 2,855 2,503 34.348 HESCO 10.058 10.729 12,042 12,767 11,096 11,234 12,318 10,539 13,747 13,293 14,489 15,527 147,849 QESCO 11.110 10,886 15,616 12,551 13,353 13.057 14,054 13,251 15,006 12,520 13,697 12,510 153,150 SEPCO 8,508 9,200 0,263 8,970 7.441 6,708 6.402 6,597 5,032 9,864 10,917 11,033 90,734 KESC 8,358 8,313 8,548 10,945 10372 10016 12.678 11,119 12,074 12,238 11,370 10,511 126 551 Total 222,749 225,393 214,877
-219,413 188,451 194,419 221,584 202,538 218,265 236,751 253,736 253,684 2,651,861
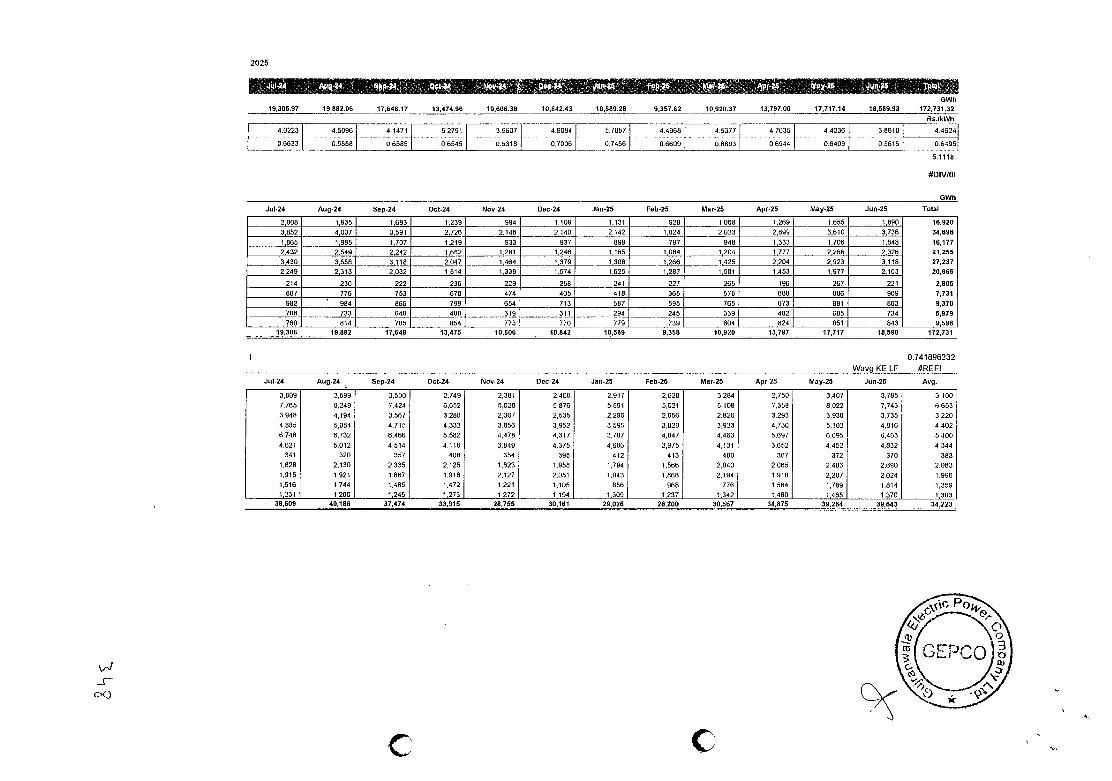
Jul-24 Aug-24 Sep-24 Oct-24 Nov-24 Dec-24 Jan-25 Feb-25 Mar-25 Apr-25 May-25 Jun-25 Total
2025
GWS 19,305.97 19882.56 17,648.17 13,474.96 10,606.38 10,842.43 10,589.28 9,357.62 10,920.37 13,797.00 17,717.14 18,589.93 172,731.32
Rs.lkWh
40223 4,5096 - -
4 1471 52791 36607 4,9054 [ 5,7057 4.4968 4.5377 4.7035 4,4236 3.0610 4.4624
06633 0.5855 --6555 06545 0.6315 07006] 0.7466 0 6609 - 0,6093 0.6944 0 6409 0 5616 06495
5.1118
#DI V/ol
OWS
2,008 1,935 1693 1,239 994 1,109 1,131 928 1,068 1.269 1,655 1,890 16,920
34,696
16,177 21,255
27,237 20,965
2,805
7,731
9,370
5,979 9,596
3,862 4,007 3,591 2,726 2,146 2,140 2,142 1,824 2,023 2,099 3,610 3.736
1,865 1,985 1,707 1219 933 937 899 797 948 1,333 1,706 1,040 2,432 2.549 2242 1 602 1,281 1,246 1,165 1,084 1204 1,777 2,266 2,326
3,430 3,558 3,118 2.047 1,464 1,379 1,308 1,266 1,425 2,204 2,923 3,118 2,249 2,313 2032 1514 1339 1,574 1,625 1,287 1501 1,453 1,977 2,103
214 230 222 236 229 258 241 227 265 199 267 221
807 776 753 670 474 405 418 365 578 688 886 809
982 984 865 799 654 713 587 595 765 673 891 863 708 733 640 488 319 311 294 245 339 482 685 734
760 814 785 854 773 770 779 739 804 .824 851 843 19,306 19,882 17,648 13,475 10,606 10,842 15,589 9,358 10,920 13,797 17,717 18,590 112,731
Jul-24 Aug-24 Sep-24 Oct-24 Nov-24 Dec-24 Jan-25 Feb-25 Mar-25 Apr-25 May-25 Jun-25 Avg.
38,609 40,186 37,474 33,915 28,755 30,161 29,026 28,200 30,567 34,875 39,264 39,643 34,223
0.741896232
Wavg KE LF #REF!
3,809 3,599 3,500 2.749 2.391 2,400 2,517 2,620 3,284 2,750 3.407 3.785 3,100 7.765 8.249 7.424 6.652 5.028 5.876 5.591 5,021 5,108 7.358 8.022 7,743 6.653 3,948 4.194 3,567 3,280 2,367 2,535 2,256 2,656 2,626 3.293 3,930 3 735 3,220
4,885 5,084 4,715 4.332 3,856 3.952 3,595 3.829 3,923 4,730 5.102 4,816 4.402 6.748 6.732 6.466 5.582 4.478 4.317 3,707 4.047 4.463 5.697 6.095 6.463 5.400
4.621 5.012 4,514 4.116 3,849 4.375 4,605 3,975 4,131 3,852 4,452 4,832 4,344 341 320 357 408 354 358 412 413 480 367 372 370 383
1.828 2.130 2.335 2,125 1,923 1.958 1,794 1.566 2.040 2.065 2,403 2.690 2.063 1.915 1.921 1.867 1.918 2.127 2.051 1,843 1.868 2,194 1,918 2,207 2.024 1.996 1,516 1,744 1,485 1.472 1,221 1,105 856 968 776 1.564 1,789 1.814 1,359 1,231 1,200 1 245 1,273 1,272 1,194 1,309 1,237 1,342 1,480 1,485 1,370 1,303
0
( GEPCO
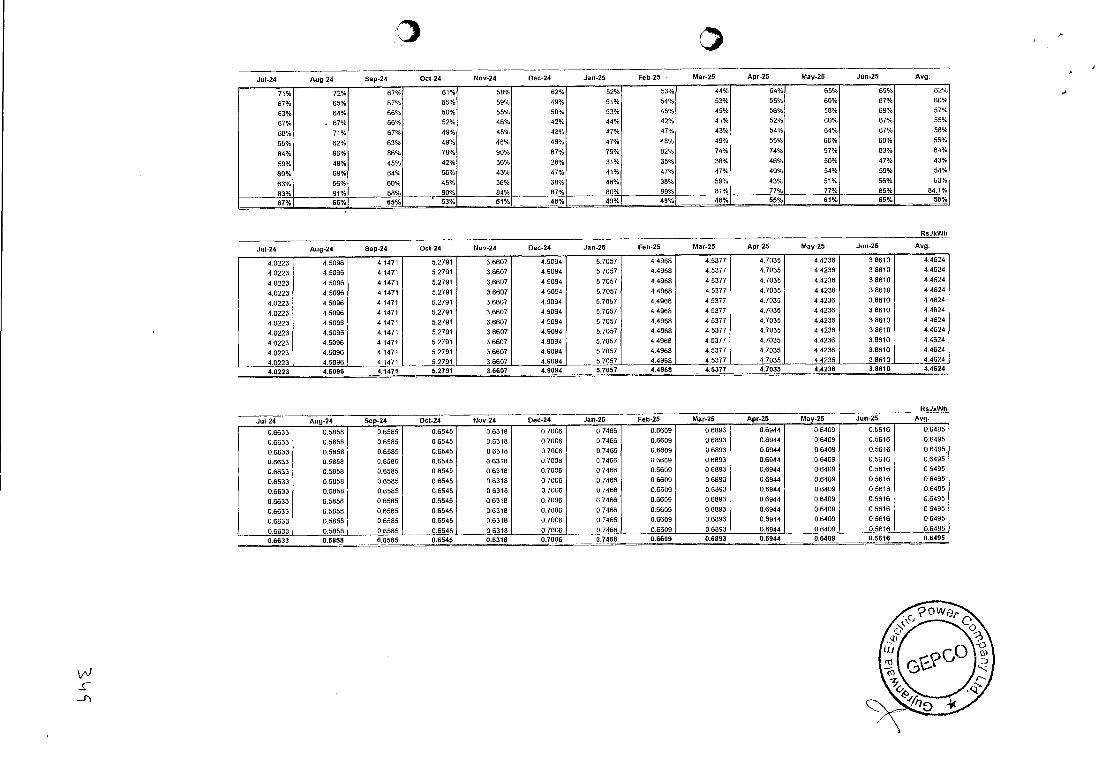
"I
Jul-24 Aug-24 Sep-24 Oct-24 Nov-24 Dec-24 Jan-25 Feb-25 Mar-25 Apr-25 May-25 Jun -25 Avg.
71% 72% 67% 61% 56% 62% 52% 53% 44% 64% 65% 69% 62%
67% 65% 67% 55% 59% 49% 51% 54% 53% 55% 60% 67% 60%
63% 64% 66% 50% 55% 50% 53% 45% 45% 56% 58% 69% 57%
67% . 67% 66% 52% 46% 42% 44% 42°/a 41% 52% 60% 67% 55%
68% 71% 67% 49% 45% 43% 47% 47% 43% 54% 64% 67% 58%
65% 62% 63% 49% 48% 48% 47% 48% 49% 55% 60% 60% 55%
84% 96% 86% 78% 90°,5 87% 79% 82% 74% 74% 97% 630,5 84%
59% 49% 45% 42% 36% 28% 31% 35% 38% 46% 50% 47% 43%
69% 69% 64% 56% 43% 47% 41% 47% 47% 49% 54% 59% 54%
56% 60% 45% 36% 38% 46% 38% 59% 43% 51% 56% 50%
83% 91% 88% 90% 84% 87% 90% 89% 81% 77% 77% 89% 84.1%
67% 66% 65% 53% 51% 48% 49% 49% 48% 55% 61% 65% 58%
Rn/kWh
Jul-24 Aug-24 Sep-24 Oct-24 Nov-24 Dec-24 jan-25 Feb-25 Mar-25 Apr-25 May-25 Jun-25 Avg.
4.0223 4.5096 4.1471 5.2791 3.6607 4.9094 5.7057 4.4968 4.5377 4.7035 4.4236 3.8610 44624
40223 4.5096 4.1471 5.2791 3.6607 4.9094 5.7057 4,4968 4.5377 4.7035 4,4236 38610 4.4624
4,0223 4,5096 4,1471 5.2791 3.6607 49094 57097 4.4968 45377 4.7035 4.4236 3.8610 4.4624
4.0223 4.5096 4.1471 5.2791 3.6607 4.9094 5.7057 4.4968 4.5377 4.7035 4,4236 3.8610 4.4624
4.0223 4.5096 4.1471 5.2791 3,6607 4.9094 5.7057 4.4968 4.5377 4.7035 4.4236 3.8610 4 4624
4.0223 4.5096 4,1471 5.2791 3.6607 4.9094 5.7057 4.4968 4.5377 4.7035 4.4236 3,8610 4,4624
4.0223 4.5096 4,1471 5.2791 3.6607 4,9094 5.7057 4,4968 4.5377 4.7035 4.4236 38610 4.4624
4,0223 4.5096 4.1471 5.2791 3.6607 4.9094 5.7057 4.4968 4.5377 4.7035 44236 3.8610 4,4524
4.0223 4,5096 4 1471 52791 3 6607 4.9094 5.7057 4.4968 4.5377 4,7035 4,4236 3.8610 4.4624
4.0223 4.5096 4,1471 5.2791 3.6607 49094 57057 44968 45377 4,7035 44236 3.8610 44624
40223 4.5096 4.1471 5.2791 3.6607 4,9094 5.7057 44968 45377 4.7035 4,4236 3.8610 44624
4.0223 4. 8896 4.1471 5.2791 3. 66 07 4.9094 5.7057 .496
Rn/kWh
Nov-24 Dec-24 Jan-25 Feb-25 Mar-25 Apr-25 May-25 Jun-25 Avg.
0.6633
0.6633
0.6633
0.5858
05858
0.5058
0.6585
06585
06565
0.6545
06545
0 65.45
0.6310
06318
06318
0,7006
0,7006
0.7006
0.7466
07466
07466
06609
06609
06609
0,6893
06093
0.6093
0.6944
0,6944
0,6944
06409
06409
0.6409
0.5616
05616
0.5616
06455
06495
0.6455,
06633 0 5059 0.6585 0.6545 06318 0 7006 0 7466 0 6609 0 6093 0,6944 0,6409 0 5616 05495
06633 0 5858 0,6585 06545 06318 0,7006 0 7466 06609 0 6893 0.6944 0.6409 0.5616 06495
0.6633 0.5058 06585 0,6545 05318 07006 07466 06609 06093 06944 0.6409 05616 06495
0.6633 0.5058 0.6565 0.6545 0 6318 0 7006 0 7466 0.6609 0 6093 0.6944 0.6409 0,5616 06495
0.6633 0.5858 0,6565 06545 06310 0.7006 0 7466 0,6909 0.6093 0.6944 0.6409 0.5616 0.6495
0.6633 0 5858 0.6585 06545 0,6310 0,7006 0 7466 0.6609 0 6893 06944 06409 0 5616 0 9495
06633 05658 0,6585 06545 06318 0,7006 07456 06609 06893 0,5044 0,6409 05616 06495
06633 0.5850 0.6585 0.0545 06318 0,7006 0.7466 0,6609 0.6893 0.6944 0,6409 0.5616 0.6495
0.6633 0.5858 0.6585 0.6545 0. 63 18 0.7006 0.7466 0.6609 0.68 9
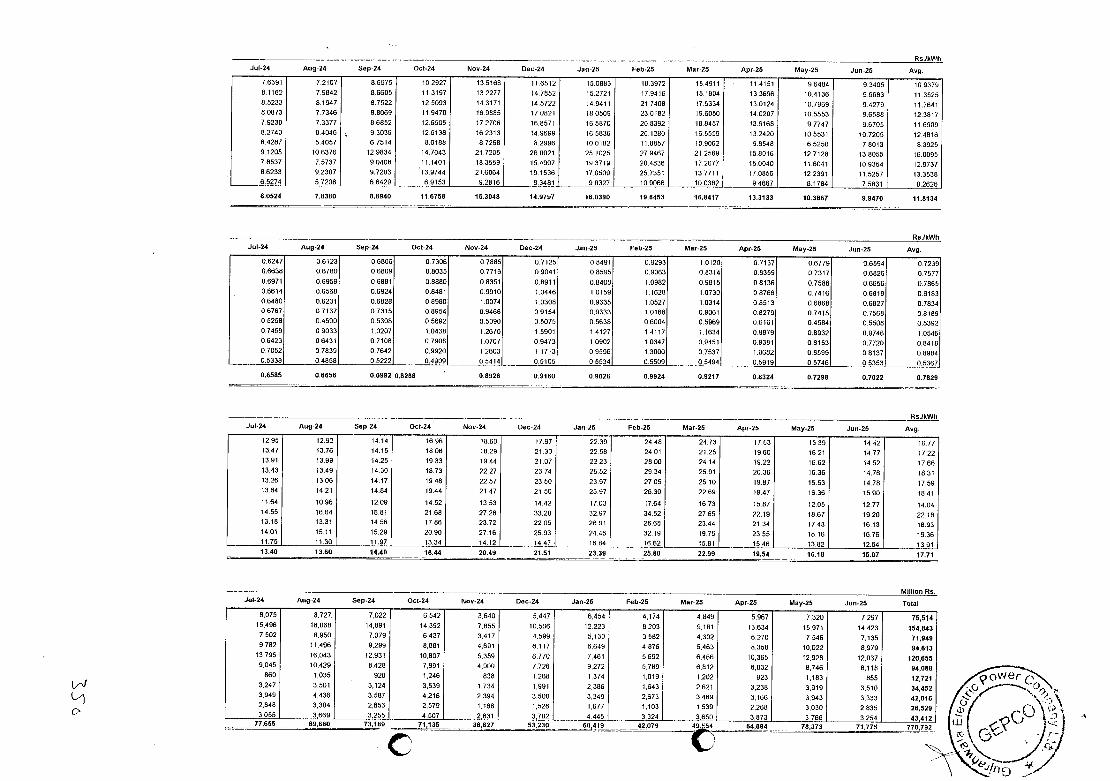
Rs,/kWb Jul-24 Aug-24 Sep-24 Oct-24 Nov-24 Dec-24 Ja,t-20 Feb-25 Mar-25 Apr-29 May-25 Jun -25 Avg.
12.95 12.92 1414 1696 1560 17.97 22.39 2448 24.73 17.53 1539 1442 16/7 13.47 13.76 14.15 1806 18.29 21.30 2255 2401 21.25 19.60 1621 14.77 1722 13.91 13.09 14.25 19.33 1944 21.07 2223 2000 24.14 1022 16.62 14.52 1766 13,43 13,49 14.30 18,73 22,27 2374 25.52 29.34 25.91 20,30 1636 14.76 18.31 13.26 1306 14.17 19.48 2257 23.50 23.97 27.05 25,10 1907 15.53 1478 17,59 13.64 14.21 14,84 19.44 21.47 21.50 23,67 2630 22.69 1947 16.36 15.90 1041 11.64 10.96 12.08 1452 13.53 14,42 17.03 17.64 1673 1507 12.05 12.77 14.04 14,55 16.64 1881 21.68 27.28 33.20 3207 34.52 2765 22.19 18.67 1820 2218 13.18 13.31 14.56 1786 2372 2205 2691 26,60 23,44 21 34 17,40 16.13 10.93 14.01 15.11 15.29 2050 2716 2593 24.46 32.19 1975 23.55 1016 16.76 19.36 11,75 1130 11.97 13.34 14.12 14.47 1664 1662 1581 1546 13.02 12,54 13.91
13.60 14.48 18.44 20.49 21.51 23.39 25.80 22.99 19.54 16.18 15.07 17.71
MIllion Rn. Jut-24 Aug-24 Sep-24 Oct-24 Nov-24 Dec-24 Jan-25 Feb-25 Mar-25 Apr-25 May-25 Jun -25 Total
6,075 8.727. 7,022 6,542 3,640 5,447 6,454 4,174 4,849 5,967 7.320 7,297 75,514 15,496 16.060 14,891 14.392 7.055 10.506 12,223 9.203 9,181 13,634 15,971 14,423 104,043 7,502 8,950 7,079 6,437 3,417 4,599 5.130 3,582 4,302 6270 7.546 7.135 71,949 9,782 11.496 9.299 8,801 4,691 6.117 6,649 4,876 5,463 8,358 10.022 8.079 94,613
13,795 16,043 12.931 10,807 5,359 6,770 7,461 5.692 6,466 10,365 12.928 12.037 120,655 9,045 10,429 8,428 7,991 4,000 /726 9.272 5,789 6.812 6,032 0,746 0,118 94,088
860 1,035 920 1.246 838 1,268 1,374 1.019 1,202 923 1,183 855 12,721 3,247 3,501 3,124 3,539 1,734 1,991 2,306 1,643 2,621 3.238 3,919 3,510 34,452 3,949 4,436 3,587 4,216 2,394 3,500 3,349 2,673 3,469 3,166 3,943 3,333 42,016 2,648 3,304 2,653 2,579 1,168 1,526 1,677 1,103 1,539 2,268 3,030 2,835 26,529 3,055 3,669 3,255 4,507 2,831 3j 4,445 3,324 3,650 3,873 3,766 3,254 43,412
Rs.lbWh Jul-24 Aog-24 Sep-24 Oct-24 Nov-24 Dec-24 Jan-25 Feb-25 Mar-25 Apr-25 May-25 Jun-25 Avg.
76391 7,2107 8,6575 102927 135165 116512 15.0583 183972 18,4911 - 11.4151 96454 9.3405 10.9379 8.1162 7.9842 9.6605 11,3197 13.2277 14.7552 15,2721 179416 15.1904 133696 10.4136 96693 113525 8,5233 8.1947 8,7522 125053 143171 4.5722 145411 21 7408 179334 13.0124 10,7969 9.4279 11.7641 80873 77346 8.5069 119470 16.9885 175821 180505 23.0182 19.6050 140207 10.5553 9,6558 12.3817 79230 7.3377 86852 12.8505 172706 16.8571 16,5870 208392 188457 136168 97747 96705 11.6906 8.2740 84046 9,3035 126138 162313 14.5999 16.5836 201280 16.5559 13.2420 105531 107205 12.4816 6.4287 54057 67514 80108 57268 82990 100182 115557 10.9062 98548 6.5250 78013 8.3925 9.1205 10,6376 129834 14.7043 21,7205 266021 25.025 27.9467 21,2565 155016 12.7128 13.8055 16.0095 78537 7.5737 90408 11.1401 183559 '15.4907 19.3719 264836 17.2677 150040 116041 10.9354 12.9737 86233 9.2307 9,7203 13.9744 21.6064 191536 170508 25.7351 137711 17.0856 122391 11,5257 133538 65274 57208 66429 6.9153 92816 83481 98327 109066 100382 94667 81784 7.5831 82626
8.0524 7.8388 8.8940 11.6758 15. 304 8 14.9757 16.0390 19. 64 5 3 16.8417 13.3133 10.3667 9.9470 11.8134
RsibWh Jul-24 Aug-24 Sep-24 Oct-24 Nov-24 Dec-24 Jan-25 Feb-25 Mar-25 Apr-25 May-25 Jun -25 Avg.
0.6247 06123 06806 0.7306 0.7085 0.7125 08491 0.9293 1.0120 0.7137 0.6779 0.6594 0.7239 0,6630 06780 0.6809 0.8035 0.7716 09041 08595 0,9063 0,8314 08359 0.7317 0.6828 0.7577 0.6971 06959 06881 08000 08351 08911 08400 1.0982 09815 08136 07586 06656 0.7065 0.6614 0.6568 0.6924 0.8481 0,9910 1.0446 1 0158 1.1620 1.0730 08766 0.7416 0,6819 0.8183 06400 06231 06820 08980 10074 10308 0,9335 10527 10314 08513 06868 0,6827 07834 06767 07137 07315 08854 09468 09154 0,9333 10168 09061 08279 07415 07569 00189 0.5258 0,4590 0.5308 0.5692 0,5090 0,5075 0.5630 0.5004 0.5969 0.6161 04584 0.5508 0.5392 0.7459 05033 1,0207 1,0438 1.2670 1.5901 1.4127 1 4117 1,1634 0.9879 0,8832 0,5746 1.0546 06423 0.6431 0.7108 0.7908 1.0707 0.9473 10902 1.0347 0,9451 00381 09153 0.7720 0.0418 07052 0,7839 0.7642 0.9920 12603 11713 0.9596 1,3000 07537 1.0682 0.8599 0.8137 0.5984 0.5338 0.4858 0.5222 0.4909 0.5414 05105 08534 0.5509 0,5494 0.5919 0,5746 05353 0,5367
0.6585 0.6656 0.6992 0.8288 8.8928 0.9160 0.9026 0.9924 0.9217 0.8324 0.7298 0.7022 0.7828
64,884 78,373 71,778 770,792
.230 60,418 42,078
c'
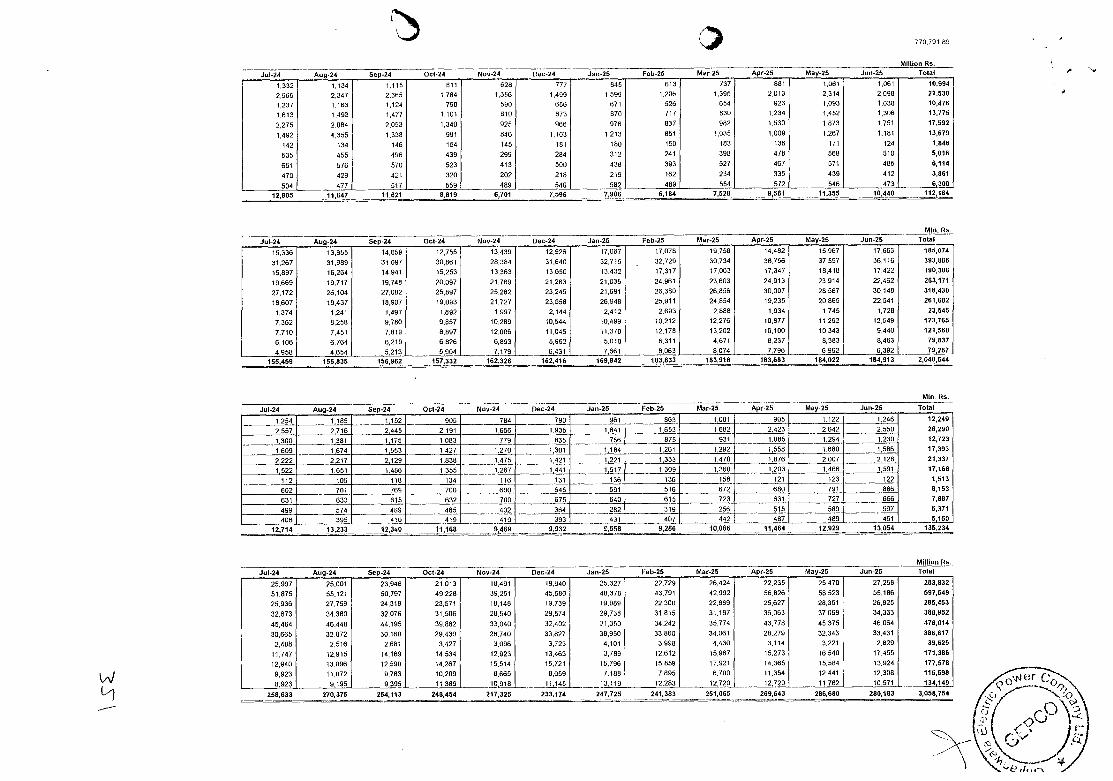
770,791.89
Million Rn. Total Apr-25 May-25 Jun -25 Mar-25 Feb-25 Nov-24 Jan-25 Oct-24 Dec-24 Se 0-24 Jol-24 Ann -24
6,184 '5 7,906 7,596 6,701 8,819 11,621 12,805 11,647
Un- Se 0-2 Oct-24 Nov-24 Dec-24 Jan -25 Feb-28 Mar-25 Apr-25 May-25 Jun-25 Total
184,913 2,040, 183,918 183,683 104,022 183,833 169,842 162,328 162,416 (56,962 157,332 155,835 155.459
Mm. Rn.
Total Jun-25 Mar-25 Apr-25 May-25 Feb-25 Jan -25 Nov-24 Dec-24 Oct-24 Jul- Auq-24 Sep-24
135,234 10,066 11,484 12,929 13,554 9,286 9,932 0,558 12,714 13,233 12,340 11,165 9,469
Million Rn. Total Mar-25 Apr-25 May-25 Jun -25 Jan-25 Feb-25 Dec-24 Oct-24 Nov-24 Ju (-24 Ao0-24 Sep-24
1,332 1.134 1,115 811 628 777 845 613 737 851 1,061 1,061 (0,594
2,555 2.347 2,355 1,764 1,356 1,499 1.599 1,206 1,395 2.013 2,314 2,098 22,530
1,237 1,163 l,124 798 590 656 (971 526 654 926 (.093 1,030 10,476
1,613 1,493 1,477 1,101 510 673 070 717 830 (.234 1,452 1,306 13,775
2,275 2.004 2,053 1,340 925 964 979 637 992 1,530 1,673 1,751 17,592
1,492 1,355 1,335 991 546 1,103 1.213 851 1,035 1,009 1,267 1,101 13,679
142 134 146 154 145 101 185 150 03 136 171 124 1,846
535 455 496 439 299 284 312 241 390 479 568 510 5,016
651 576 570 523 413 509 438 393 527 467 571 485 6,114
470 429 421 320 202 218 219 162 234 335 439 412 3,561
504 477 517 559 489 540 502 469 554 572 546 473 6,305
MIS. Rn.
15,336 13,955 14,659 12,755 13,439 12,926 17,067 17,078 (9,758 14,482 15,967 17,653 185,574
31,267 31,989 31,097 30,86l 28,394 31,640 32,715 - 32,729 30,734 36,756 37,597 36,1(6 353,586
15,897 16.264 14,941 15,253 13,363 3,650 13,432 l7,317 17.003 (7,347 18,4l8 17,422 195,306
19,669 (9,717 19.740 20,097 21.769 21.283 21.035 24.961 23.603 24.913 23.914 22,462 263,171
27,172 26,104 27.082 25,897 25.282 23.245 21,691 26,380 26,556 30.007 20,567 30,148 318,430
15,607 19,437 19,907 19,093 2(727 23,555 26,848 25,911 24,854 (9,235 20,865 22,541 261,682
1,374 l,241 1,497 (.592 1997 2,144 2,412 2,693 2,588 1,934 1.745 1,728 23,545
7,362 5,258 9,780 9,857 10,289 10,544 10,489 10,212 l2,216 10,877 (1,262 12,549 123,765
7,710 7.451 7.818 8,597 12.006 11.045 ((.370 12.178 13,202 0,100 10,343 9,440 121,565
6,106 6,764 6,219 6,826 6.893 5,952 5,0(0 6,311 4,671 8.237 8,383 8,463 79,837
4,955 4654 5,213 5,904 7,179 6,431 7661 8.063 8,074 7.796 6,962 6,392 79,257
1,254 1,185 1,152 905 784 790 961 863 1,081 905 1.122 1,246 12,249
26,200
12,723
17,393
21,337
17,165
1,513
5,153
7,887
5,371
2,557 2,718 2,445 2,191 1656 1,935 1,841 1.653 1.682 2,423 2.642 2,550
1,300 I 381 (.175 1.053 779 535 756 875 931 1.085 1 294 (.230
1,609 1,674 I 553 1 42/ 1,270 1,301 1,154 1.261 1,292 1 558 1,680 1,556
2,222 2,217 2(29 1,838 1,475 1,421 1.221 1.333 1.470 1,8/6 2,007 2.128
1,522 (.651 1,486 1355 1.267 1,441 1.517 1.309 1.360 (203 1.466 (.591
112 105 118 134 116 131 136 136 108 121 123 122
602 701 769 700 600 645 591 516 672 680 791 586
631 633 615 632 700 675 640 615 723 631 727 666
499 574 469 455 402 364 393
282 3(9 255 515 589 597
406 395 410 4(9 419 4J1 407 442 487 489 451
3,0S8,754 269,643 286,688 288,183 241,383 251,965 258,633 270,375 254,113 248,454 217,325 233,174 247,725
25,997 25,001 23.948 21,013 (5,491 19.940 25.327 22,729 26,424 22,235 25,470 27.258 283,532
51,875 55,121 50,797 49,228 39,251 45,580 48,375 43,791 42,992 56,826 58,523 55,186 597,549
25.936 27.759 24,318 23,571 18,148 (9.739 19,989 22,300 22,889 25.627 28.351 26.825 285,453
32,673 34.380 32,076 31,506 28,540 29,574 29,735 31,815 31.187 36,063 37,069 34,333 385,9S2
45,464 46,448 44,195 39,882 33,040 32.402 31,350 34,242 35,774 43,778 45,375 46,064 478,014
30,665 32,872 30,160 29,430 28,740 33.827 38,950 33.860 34.061 28.278 32,343 33,431 386,617
2,458 2.516 2,6111 3,427 3,096 3.723 4,101 3.998 4,430 3,114 3,221 2.829 39,625
11.747 12,915 14,169 14,534 (2.923 13.463 13,759 12,612 15,967 15,273 (6.540 13,455 171,356
12,940 13,096 12,590 14,267 15,514 15,721 (5,796 (5,859 17,921 14,365 15,584 13,924 (77.578
9,923 (1,072 9,783 10,209 8,665 8,059 7.188 7,895 6,700 (1,354 12.441 12,308 115,598
5,923 9,195 9,395 11,389 10,918 ttj40 13,1(9 12,253 12,720 12.729 11,762 10,571 134,149
LI
I