geophysical and hydrogeological experiments from a shallow hydrothermal system at solfatara volcano,...
TRANSCRIPT

Geophysical and hydrogeological experiments from a shallow
hydrothermal system at Solfatara Volcano, Campi Flegrei, Italy:
Response to caldera unrest
Pier Paolo G. Bruno,1 Giovanni P. Ricciardi,1 Zaccaria Petrillo,1 Vincenzo Di Fiore,2
Antonio Troiano,1 and Giovanni Chiodini1
Received 8 March 2006; revised 10 December 2006; accepted 26 February 2007; published 5 June 2007.
[1] Integration of high-resolution geophysical and hydrogeological investigations atSolfatara Volcano, Campi Flegrei, Italy, allowed us to (1) image the shallow andintermediate subsurface to the crater, (2) elucidate patterns in the shallow subsurfacedegassing, and (3) refine and upgrade volcano-monitoring strategies for this dynamic area.Our results show that the subsurface to the crater can be divided roughly into two zones: adry, outcropping layer overlying a horizon saturated by hydrothermal fluids. Withinthis saturated zone, intersections of dominant NW- and ENE-striking structural lineamentsact as preferential escape conduits for the fluids which generate high microseismicnoise amplitudes in the southeastern part of the crater. Hydrogeological data suggest anuprising of the isotherms below Solfatara crater, and a marked increment of fluiddegassing, over the last 40 years. Sudden variations of both seismic noise level and noisecycling are positively correlated with early stages of ground inflation during the AD 2000uplift. We believe therefore that monitoring of seismic noise can be used for upgradingearly warning strategies in this sector of the Campi Flegrei volcanic system.
Citation: Bruno, P. P. G., G. P. Ricciardi, Z. Petrillo, V. Di Fiore, A. Troiano, and G. Chiodini (2007), Geophysical and
hydrogeological experiments from a shallow hydrothermal system at Solfatara Volcano, Campi Flegrei, Italy: Response to caldera
unrest, J. Geophys. Res., 112, B06201, doi:10.1029/2006JB004383.
1. Introduction
[2] Volcanoes can dissipate large amounts of heat viafumaroles and diffuse degassing of hydrothermal-volcanicfluids through soils. This process has been recently inves-tigated in detail at Solfatara, a volcano located within theactive Campi Flegrei caldera of southern Italy (Figure 1a).Solfatara releases about 1500 t/day of volcanic-hydrothermalCO2 as a result of diffuse degassing through soil (Figures 1band 1c). During this process, about 3350 t/day of steamcondenses, generating hydrothermal fluid circulation[Chiodini et al., 2001]. The heat released by condensation(7.5 � 1012 J/day) represents the largest part of the totalheat dissipated by the hydrothermal degassing at Solfatara(1.19 � 1013 J/day [Chiodini et al., 2001]). This value,which is only a fraction of the total convective hydro-thermal flux at the whole Campi Flegrei caldera, is stillmuch higher than other known energy released within thecaldera during the current period of quiescence of CampiFlegrei, as a result of thermal conduction, earthquakes,
and ground deformation. Hydrothermal fluids at Solfataraare believed to induce and/or enhance rock deformation[Oliveri del Castillo and Montagna, 1984; Bonafede,1991; De Natale et al., 1991; Gaeta et al., 1998] byincreasing the pore pressure (and hence modifying theeffective stress) and rock temperature (inducing thermalexpansion). Chiodini et al. [2003] suggested that atCampi Flegrei (as well as at other similar calderas, suchas Long Valley, Yellowstone, and Rabaul), periods ofintense magmatic degassing affect both chemical changesof fumaroles and ground deformation during unrest crises.That is, when degassing exceeds the physical capabilities ofthe host rock and the ability of the hydrothermal system toremove the fluids, the resulting overpressure can produceground deformation [Oliveri del Castillo and Montagna,1984]. Therefore it is important to delineate the physicalproperties of the shallow hydrothermal system. We willshow that the fluid and heat transport associated withhydrothermal circulation at Solfatara generate clear geo-physical anomalies and high levels of seismic noise. We willalso show how periods of intense magmatic degassing,which can potentially trigger unrest phases, affect levelsand patterns of microseismic noise. These changes can beused to improve monitoring techniques and hazard assess-ment at Campi Flegrei.[3] Our surveys therefore aim to (1) image the shallow
and intermediate subsurface (<500 m) of the crater, identi-fying discontinuities, such as fractures and faults, that may
JOURNAL OF GEOPHYSICAL RESEARCH, VOL. 112, B06201, doi:10.1029/2006JB004383, 2007
1Istituto Nazionale di Geofisica e Vulcanologia, Osservatorio Vesuviano,Naples, Italy.
2Consiglio Nazionale delle Ricerche, Istituto Per l’Ambiente Marino eCostiero, Naples, Italy.
Copyright 2007 by the American Geophysical Union.0148-0227/07/2006JB004383$09.00
B06201 1 of 17
act as pathways for gases; (2) estimate depth, morphology,and the physical parameters of the water-saturated subsur-face zone; and (3) evaluate any relationship betweenhydrothermal fluids and the groundwater system in this partof Campi Flegrei. To our knowledge, this is the first attemptat detailed imaging of the subsurface (beneath the crater)features of a shallow degassing system within an active
volcanic area by integration of geophysical, geochemical,and hydrogeological surveys.
2. Geology and Hydrothermal Features
[4] Solfatara volcano is a 0.6-km-wide tuff cone, situated180 m above sea level to the NE of Pozzuoli, within thedensely populated Campi Flegrei Caldera (Figure 1a). The
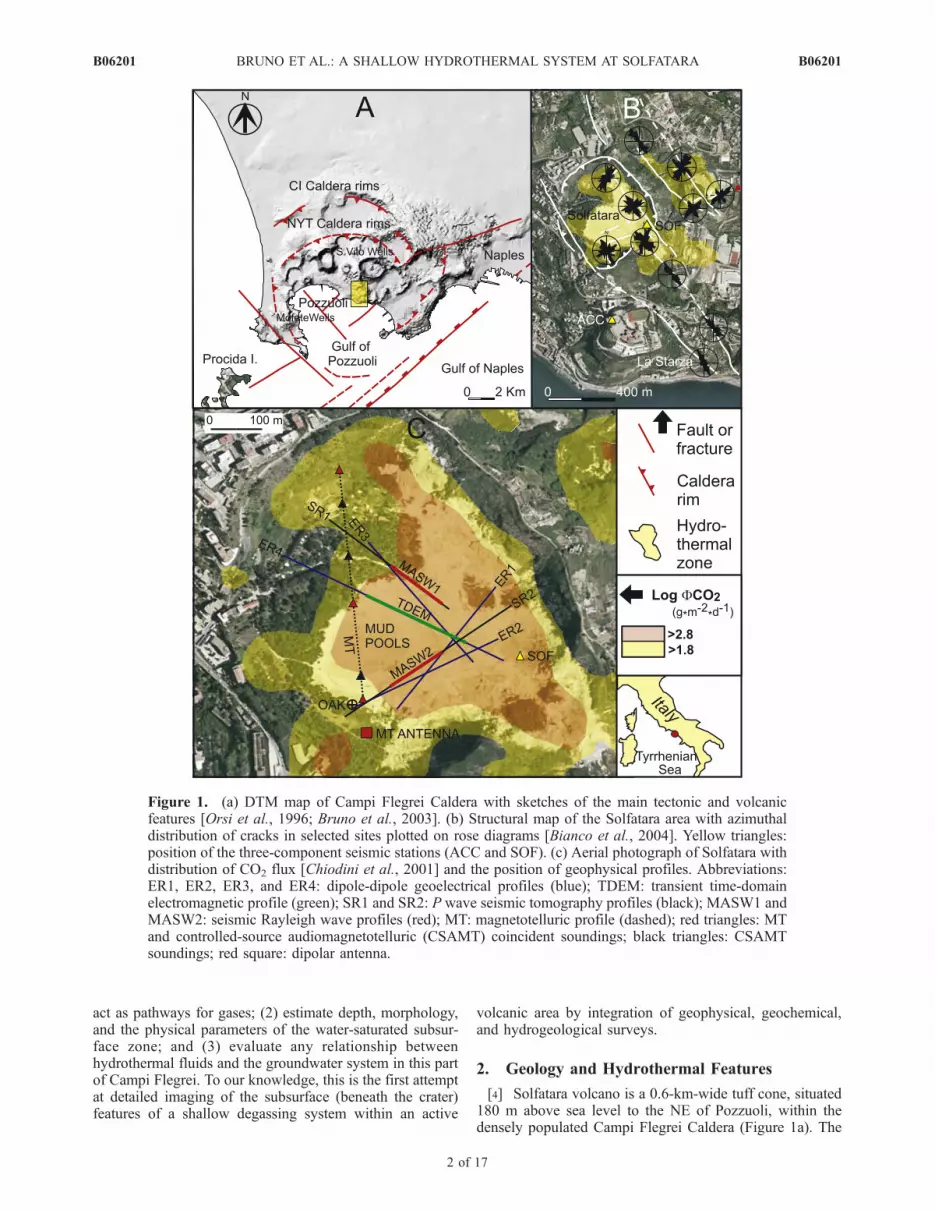
Figure 1. (a) DTM map of Campi Flegrei Caldera with sketches of the main tectonic and volcanicfeatures [Orsi et al., 1996; Bruno et al., 2003]. (b) Structural map of the Solfatara area with azimuthaldistribution of cracks in selected sites plotted on rose diagrams [Bianco et al., 2004]. Yellow triangles:position of the three-component seismic stations (ACC and SOF). (c) Aerial photograph of Solfatara withdistribution of CO2 flux [Chiodini et al., 2001] and the position of geophysical profiles. Abbreviations:ER1, ER2, ER3, and ER4: dipole-dipole geoelectrical profiles (blue); TDEM: transient time-domainelectromagnetic profile (green); SR1 and SR2: P wave seismic tomography profiles (black); MASW1 andMASW2: seismic Rayleigh wave profiles (red); MT: magnetotelluric profile (dashed); red triangles: MTand controlled-source audiomagnetotelluric (CSAMT) coincident soundings; black triangles: CSAMTsoundings; red square: dipolar antenna.
B06201 BRUNO ET AL.: A SHALLOW HYDROTHERMAL SYSTEM AT SOLFATARA
2 of 17
B06201

area has been blanketed by two large eruptions: the Cam-panian Ignimbrite (39 ka [De Vivo et al., 2001]) and theNeapolitan Yellow Tuff (14 ka [Deino et al., 2004, andreferences therein]). Over the last 14 ka, volcanic activityhas occurred mainly within the caldera, commonly focusedalong its rim and regional faults [De Astis et al., 2004;Bruno, 2004; Bruno et al., 2003; D’Antonio et al., 1999].The erupted products, which range in composition from K-basalts to trachyte and phonolite, were mainly generatedduring explosive eruptions [De Vivo et al., 2001].[5] Uplift of the Campi Flegrei caldera floor, followed by
renewed volcanic activity, occurred between 10 and 5 ka b.p.[Cinque et al., 1985]. Sea level measurements, made on theruins of a Roman market built near the seashore town ofPozzuoli, indicate a slow subsidence of the area sinceRoman times. This subsidence was first interrupted by a7-m uplift, which took place west of Pozzuoli between 1530and 1538 AD, ending with the Monte Nuovo eruption in1538 AD [Di Vito et al., 1987]. After the 1538 eruption, thesubsidence continued until 1968. Then, rapid uplift startedagain, totaling about 170 cm during 1969–1972 and 182 cmduring 1982–1984 [Berrino et al., 1984].[6] In contrast to the sinking phases, uplift episodes are
accompanied by seismic activity. Earthquakes occur mostlyalong the coast around Pozzuoli, at Solfatara, and within thebay. Seismic activity does not extend outside the margin ofthe caldera and abruptly terminates at 3.5- to 4-km depth,suggesting a sharp transition from brittle to ductile behavior.The maximum recorded magnitude (4.0) was measured in1984 [Orsi et al., 1999]. Earthquakes are likely associatedwith the upward migration of a pressure front triggered byan excess of fluid pressure from a magmatic intrusion, andwith the brittle readjustment of the inflated system occurringalong some lubricated structures [Bianco et al., 2004].[7] Geothermal wells drilled during the 1980s enabled
detailed investigation of the distribution of the hydrothermalalteration minerals at Campi Flegrei [Chelini and Sbrana,1987]. The shallower (<300 m) hydrothermal alterationzones, composed of argillitic and illite-chlorite mineralassemblages, form at temperatures <250�C. These assemb-lages induce a reduction in the rock permeability and repre-sent the caprock for the hydrothermal reservoir. At greaterdepths (�300–600 m), a Ca-Al silicate alteration zone,composed of abundant neogenic hydrothermal minerals,increases instead rock permeability. At the deepest level, athermometamorphic alteration zone (�1500–2000 m) likelyrepresents a deeper portion of the hydrothermal reservoir.[8] Stratigraphic and geochronological data show that
Solfatara formed between 3.8 and 4.1 ka [Di Vito et al.,1999]. Phreatic eruptions also occurred during the 12thcentury [Rosi and Santacroce, 1984]. The volcanic productsconsist of breccia covered by accretionary lapilli-rich, dune-bedded ash, and lapilli beds [Rosi and Sbrana, 1987]. Thesedeposits cover about 0.8 km2 and are extremely altered byhydrothermal activity. Solfatara volcano is also affected byintense, diffuse degassing (Figure 1). The distribution ofthe hydrothermal alteration in the subsoil of Solfatara isunknown because of a lack of deep wells. However, wehypothesize that hydrothermal zones indicative of highertemperatures are present at relatively shallow depths becauseof the presence of a marked thermal anomaly caused by theexpulsion of hot gases. Mud and soil samples show that
interaction between low (1.3–2.5) pH, high-temperaturewaters, and the altered trachitic rocks of Solfatara formsalunite and opal-bearing assemblages, while an associationof alunite-opal-10 A halloysite-pyrite forms from waterswith pH � 4.5.[9] The subrectilinear NE and SW rims of Solfatara are
cut by two normal faults that strike NW-SE (Figure 1b[Bianco et al., 2004]). Outside the crater, two NW-SEstriking faults cut the eastern part of the tuff cone. Thesefaults move in response to a normal stress field, character-ized by a subvertical s1 and a NE-SW striking subhori-zontal s3. Two main crack systems striking NW-SE andNNE-SSW/NE-SW are also present at Solfatara (Figure 1b[Bianco et al., 2004]). Most of these fractures are subvert-ical with dips > 60� and are filled by hydrothermal minerals.The NW-SE crack system is related to the main faultsegments affecting the tuff cone. Carbon dioxide degassingpaths are also oriented along the same direction (Figures 1band 1c [Chiodini et al., 2001]). New NE-SW cracks alsoformed on Solfatara crater during the inflation episode of1982–1984 [Rosi and Sbrana, 1987; Acocella et al., 1999].
3. Data Acquisition and Processing
3.1. Electromagnetic and Electrical Data
[10] Resistivity is very sensitive to fluid saturation andtemperature as well as fracture properties of the rock matrixand chemical reactions between the pore electrolytes and theminerals [Llera et al., 1990]. Since these parameters aremodified by processes generated by volcanism, geoelec-trical methods are the main exploration tools used involcanic and hydrothermal areas. We used different techni-ques with different resolution to explore to varying depths.To investigate the subsurface structure down to severalhundreds of meters in depth, we performed three widebandmagnetotelluric (MT) soundings (acquired in two frequencybands of 2048 and 64 Hz) and six controlled-source audio-magnetotelluric soundings in the frequency band 100 000–10 Hz along a 500-m N-S profile inside the Solfatara crater(Figure 1). We also examined in higher resolution thesubsurface of the crater down to 80 m by using bothdipole-dipole DC electric profiling and transient electro-magnetic techniques.[11] The MT soundings were acquired with two complete
synchronous Metronix stations (each one equipped withthree magnetic and two electric channels) to allow formultivariate data analysis. The use of the Robust Multivar-iate Error-in-Variables method (RMEV [Egbert, 1997]) toestimate the tensor impedance allows for a more detailedanalysis of coherent electromagnetic noise, mainly originat-ing from railroads and power lines in this part of CampiFlegrei. Examination of MT data between 0.1 and �10 sshowed a good signal-to-noise ratio, whereas severe near-field effects were present at higher periods. We thereforelimited our MT data inversion to 10 s.[12] Controlled-source audiomagnetotelluric (CSAMT)
soundings were acquired to improve our understanding onthe shallower structure and to evaluate possible static shiftproblems of the resistivity curves estimated by MT.CSAMT data were acquired using a STRATAGEM EH-4system source, which uses a 50-Hz notch filter to limit near-field effects due to electrical networks, and two orthogonal
B06201 BRUNO ET AL.: A SHALLOW HYDROTHERMAL SYSTEM AT SOLFATARA
3 of 17
B06201

dipolar antennas energizing in the frequency band 100 000–1000 Hz. Near-field effects are present in the first twoCSAMT sites in the vicinity of the source (Figure 1c); heredata were acquired using only the natural magnetotelluricsource. The other four soundings recorded electromagneticdata in the plane wave approximation [Goldstein andStrangway, 1975], allowing us to estimate the resistivityMT impedance tensor. Resistivity and phase curves, estimat-ed for the six CSAMT soundings in the complete acquisitionband (100 000–10 Hz), showed a good signal-to-noise ratioand a smooth pattern. Resistivity curves suggest the CSAMTare consistent with the DC electric and transient electromag-netic data. The lower band (64 Hz) relative to the three MTstations (sites 1, 3, and 6 MT, coincident with CSAMT sites;Figure 1c) shows good resistivity and phase down to 0.1 Hz.As the frequency decreases (band 0.1–0.001 Hz), resistivityand phase patterns are consistent with near-field effectsrendering the MT tensor not definable [Quian and Pedersen,1991]. We substituted the noise-contaminated band of MTdata with the noise-free band estimated by the CSAMT. TheCSAMTandmagnetotelluric data were then processed with atwo-dimensional inverse code [Rodi and Mackie, 2001] ontransverse electric (TE) and transverse magnetic (TM) modesseparately. As discussed by Siripunvaraporn et al. [2005],three-dimensional structures are better constrained on two-dimensional sections by the inversion of the TM mode only.However, inversion of TM and TE modes achieved verysimilar results. A joint inversion of both TE and TM modesallowed us to reconstruct the electric image along the north-south profile. The final RMS value was about 6. This erroralso takes into account the approximation of a three-dimensional structure with a two-dimensional model.[13] Four electric profiles were acquired using the dipole-
dipole configuration and an array of 64 electrodes. As asource, we used the IRIS Syscal R2 system, with a maximumvoltage of 800 V and a maximum output current of 2 A forthe DC electrical measurements. The electrode spacing was7 m for profile ER4 and 4 m for the other three profiles.Digital stacking of repeated waveforms in the field providedan increase of signal-to-noise ratio. The raw data wereprocessed using an Occam’s nonlinear inversion algorithmthat yields a minimum roughness solution consistent with thedata type and accuracy. This algorithm, based on a finiteelement forward solver, is described by LaBrecque et al.[1999]. This method searches the smoothest resistivityprofile related to experimental measurements. Taking intoaccount the rough volcanic environment in which the datawere acquired, together with the approximation of a three-dimensional structure along a two-dimensional profile, theaverage RMS-associated uncertainty on inversion of theDC electric profiles of �9 was considered satisfactory.[14] The procedure utilized for subsoil exploration using
transient electromagnetic techniques (time domain electro-magnetic method or TDEM) is based on the propagation ofan induced electromagnetic field; a steady current is forcedto flow in a loop for several milliseconds to allow the turn-ontransient in the ground to dissipate. An ultrafast TDEMsystem was employed to evaluate the transient decay of thesecondary magnetic field in a coincident loop configurationwith a radius of 25 m. The time window ranged from 4 to239 ms with 24 channels of signal integration. Time domainelectromagnetic data lack spatial resolution at near surface.
However, we recovered it using data from electrical profileER4 which is coincident to TDEM (Figure 1). TDEMapparent resistivity data were transformed to an effectivesubsurface resistivity by means of one-dimensional inver-sion analysis using conventional least squares approxima-tion [e.g., Meju, 1998]. A two-dimensional section wasobtained by spatial interpolation of 10 TDEM soundings.
3.2. Active Seismic Data
[15] Two P wave seismic refraction surveys and twoRayleigh wave measurements, made using the multichannelanalysis of surface waves or MASW method [Park et al.,1999], were conducted along two NE and NW headingprofiles with the aim of locating P wave velocity (Vp)anomalies related to degassing structures and estimating thedistribution of S wave velocity (Vs) in the shallow subsur-face of the crater (Figure 1). Another goal was to provide anestimate of Vp/Vs variation with depth. All seismic datawere recorded using a 48-channel �21 bit engineeringseismograph and 40-Hz (P wave) and 4.5-Hz (Rayleyghwave) vertical geophones.[16] Two seismic refraction profiles were acquired using
200- to 300-g blasting explosive charges inside 1-m-deepshot holes. Geophone spacing was 5 m for profile SR1 and8 m for profile SR2. The source move out was twice thegeophone spacing. First arrival traveltimes were handpicked,checked for consistency (using reverse, split, and offsetprofile configurations [Ackermann et al., 1986]), and inter-preted using the generalized reciprocal method [Palmer,1980]. This method allows for detection of vertical andlateral seismic velocity changes and for resolution ofirregularities of the refracting surfaces. The generalizedreciprocal method is also suitable for identifying thinlayers where velocity inversion occurs. The optimum shot-geophone distance, defined on the basis of velocity analysisfunction and time-depth function, allows the interpreter togenerate the migrated subsurface seismic section. Refractiondata results were refined using a high-efficiency tomographiciterative reconstruction technique that updates the velocityof a single cell by using all the rays passing through that cell(simultaneous iterative reconstruction technique, SIRT[Menke, 1989]). The SIRT method is a ‘‘local optimizationmethod.’’ That is, it requires a good a priori model (forexample, a model interpreted using the generalized recip-rocal method), since the solution usually is near this model.In other words, this approach gives a ‘‘weighted spatialaverages’’ [Menke, 1989] of the ‘‘true’’ model to achieve areliable model of the subsoil. The calculation of theoreticalraypaths and associated traveltimes is solved by the finitedifference solutions of the eikonal equations of Vidale[1988]. This method solves the stability problems in thepresence of significant velocity heterogeneity due to dis-continuous gradient of the wavefront. The final RMS errorwas 1.8 ms for seismic profile SR1 and 2.2 ms for SR2.[17] Multichannel analysis of Rayleigh wave dispersion
(MASW; Figure 1) was carried out using explosives, asledgehammer, and noise (stacks of 10 windows of 32 seach). The dispersion curve was picked in the ‘‘frequency-slowness’’ domain with the aim of overcoming (1) the‘‘frequency-wave number’’ domain requirement of a largenumber of traces and (2) the undesirable effect of spatialpadding and spectral leakage in the power spectrum. The
B06201 BRUNO ET AL.: A SHALLOW HYDROTHERMAL SYSTEM AT SOLFATARA
4 of 17
B06201

analysis chosen adds a spectral power-ratio calculation toMcMechan and Yedlin’s [1981] technique; in this way, itwas possible to obtain a spectral normalization of therecords. Furthermore, to enhance the spectra, a stack in‘‘frequency-slowness’’ domain gathered several traces in aunique ‘‘frequency-slowness’’ group, following the rules ofnear and far offset, as explained in the study by Park et al.[1999]. To carry out the solution of the eigenvalue problemand to perform the inversion procedure, we utilized the codedescribed by Lai and Rix [1998], based on the ‘‘Occam’sinversion’’ algorithm [Constable et al., 1987]. The startingmodel was obtained (autonomously from seismic refractiondata) using shear-wave velocities, density, and Poisson ratiovalues measured on different rock samples from Solfatara[Nunziata et al., 1999]. In addition, several values of shear-wave velocities were tested, choosing the one having thesmallest initial RMS deviation between the picked and thecalculated dispersion curve.
3.3. Microseismic Noise
[18] It is well known that in many geothermal systems,fluids at depth create a background of seismic noise [Kieffer,1984]. The analysis of seismic noise at Solfatara involvesthe separation of hydrothermal noise from that of a differentorigin (for example, meteorological, cultural, etc.). A three-component recording station (labeled as SOF: Figure 1c)was deployed for more than a year in the SE corner ofSolfatara, near the most active fumaroles. Study of SOFdata shows that noise amplitude varies in a 24-hour period;it is characterized by high levels during the day and lowlevels between 2:00 AM and 5:30 AM. To limit the effect ofcultural noise, spatial measurements of seismic noise atSolfatara were conducted during the night. The deviceconsisted of an array of four vertical 1-Hz geophones setup with a cross geometry. To separate hydrothermal fromrandom noise, we applied the technique described by White[1973] to the signals recorded by the array, progressivelyincreasing the spacing between geophones from 1 to 10 m.In this way, it was possible to obtain the maximumcoherence on signals with wavelengths greater than thereciprocal distance between the sensors. The processingshowed that the maximum coherence of nonrandom (hydro-thermal) noise is located in the 10- to 15-Hz frequency band,which was used for spatial seismic noise comparison withinSolfatara crater. A 10-m array spacing was used to samplethe spatial distribution of noise. The four signals of thearray were sampled and continuously stacked for 450 s.
3.4. Gravity Data
[19] Oliveri del Castillo et al. [1968] acquired high-resolution data in the crater before the uplift episodes of1969–1972 and of 1982–1984. We used these data tocompare with newly acquired data to ascertain whether ornot the shallow structure of the volcano has remainedmostly unchanged over the last 40 years, or indeed, to seeif the two more recent uplift episodes have influenced bothshallow degassing and groundwater pathways. The grid ofstations consisted of 50 observation points spaced �50 mfrom each other. Measurements were made using a Wordengravimeter with a sensitivity of 0.108 mGal. The observedgravity values were corrected by Oliveri del Castillo et al.[1968] to a local datum of 97 m above sea level, using a
density value of 1.40 g/cm3 for surrounding masses. Weapplied a simple boundary analysis technique which consistsof the study of the horizontal derivative of the gravity[Cordell, 1979; Cordell and Grauch, 1985], with the aimof enhancing the boundaries of anomalous mass sources.
3.5. Hydrogeological Data
[20] The release of large amounts of hydrothermal volca-nic fluids at Solfatara does affect the pattern of undergroundwater circulation and temperature. To quantify thesechanges, we measured the water table level and temperaturein about 30 boreholes at Solfatara and nearby. The watertable was determined using an open electric circuit thatcloses when the water level is reached. Temperatures weremeasured using a digital thermometer with an accuracy of±0.1�C. The data were acquired over a period of 3 daysduring the month of July 2003. Daily variations of bothtemperature and water level were averaged making fivemeasurements every 5 hours. Continuous monitoring of twoboreholes outside Solfatara showed that water table oscil-lations did not exceed 2 m and groundwater temperaturesremained almost constant (±2�C) during the 3-day timespan. At Solfatara, two measurements of the water level andtemperature were done at the OAK well and at the mudpools, where the saturated zone outcrops at the surface(Figure 1c).
4. Results
4.1. Electromagnetic and Electrical Data
[21] The sensitivity of electrical resistivity to a wide rangeof variables (of both host rock and pore fluids) makes itdifficult to predict quantitatively the electrical response of ahydrothermal area. However, experimental data and model-ing [Detwiler and Robefls, 2003] show that electricalresistivity is an indicator of saturation in geothermal sys-tems. Integrated analysis of the electromagnetic and DCelectrical data illustrates that the subsurface of the shallowcrater can be approximately divided in two electrical zones:an outcropping, resistive layer ‘‘A’’ that sits above aconductive (1–15 W m) body ‘‘B’’ (Figures 2–4). Layer‘‘A’’ is about 20–50 m thick in the northwestern side of thecrater, progressively becoming thinner toward the centralpart of the crater until it disappears below the mud poolsarea (Figure 3). We compared the results of our resistivityprofiles with the CO2 flux and temperature patterns at thesurface [Chiodini et al., 2001, 2005]. It can be seen that, ingeneral, soil CO2 degassing and temperatures are higherwhere layer A is thinner, or absent. Electrical resistivity inzone ‘‘A’’ is compatible with a nonsaturated argilliticalteration zone affected by CO2 degassing. The low-resistivity zone ‘‘B’’ corresponds to the hydrothermal aqui-fer recharged by natural condensates. Magnetotelluric datashow that this saturated area extends down to a depth of300–400 m below the crater floor (see Figure 2). Below400 m, the resistivity increases. We interpret this fact asindicative of either a change in geology or, more likely(considering the increasing temperature gradient), anincrease in the gas and steam fraction with respect to water.Roberts et al. [2002] found that in fractured samples, thepartial replacement of conducting brine with insulatingwater vapor is followed by a gradual increase in resistivity.
B06201 BRUNO ET AL.: A SHALLOW HYDROTHERMAL SYSTEM AT SOLFATARA
5 of 17
B06201

In particular, in fractured tuff samples, vaporization/condensation can result in resistivity changes that are morethan an order-of-magnitude greater than those measured inintact samples.[22] Within conductive zone ‘‘B,’’ we found three anom-
alous higher resistivity areas, including (1) a subcircularbody ‘‘C,’’ imaged at the southeastern end of electricalprofile ER4 (Figure 3), and at the northwestern end ofprofile ER2, beneath the main fumaroles (Figure 4); (2) anelongated body ‘‘D’’ discovered along profiles ER4 andTDEM (Figure 3); and finally (3) an elongated body ‘‘E’’which splits hydrothermal aquifer ‘‘B’’ in two parts on themagnetotelluric profile (Figure 2). Body ‘‘E‘‘ is also visibleas a subcircular, resistive area (E) along electrical profilesER1 and ER2 (Figure 4) and most probably represents theelectrical image of a NW-SE striking fault cutting Solfataracrater. Most of these resistivity anomalies can be related tofaults and/or fractures affected by the expulsion of gas-richhydrothermal fluid. Gas and steam pressure drives the liquidphases outside of the fractures, ensuring a relative increasein resistivity for the fractures with respect to the neighboringsaturated zones of rock. Old or inactive degassing pathwaysare also imaged as higher resistivity and higher-densityzones if the fractures are filled by resistive alterationminerals such as alunite and opal instead of water. Thedistinction between active and inactive degassing pathwaysis discussed in section 5.
4.2. Active Seismic Data
[23] Because of the geological conditions at the site andlogistics that limited the maximum source-receiver offset aswell as data quality at far offsets, the seismic surveysachieved a limited depth penetration. Thus only the veryshallow parts of the crater (i.e., the top 30 m) were imaged.Interpretation of seismic refraction profiles (SR: Figure 5)reveals a first layer with a P wave velocity of 300–800 m/s,sited above a substratum with higher P wave velocity(1000–2600 m/s). The width of the first layer varies from8 to 20 m, comparable in thickness to layer ‘‘A’’ determinedby the resistivity survey. Underneath layer ‘‘A,’’ the P wavevelocity increases considerably (more gradually on seismicprofile SR1), and its lateral distribution appears heteroge-neous. A high-velocity anomaly of 2600 m/s is recognizedon SR1 (Figure 5a: location 250–350 m). Two other high-velocity zones are also present on seismic profile SR2(about 2400 m/s; Figure 5b). The anomaly to the south-western end of profile SR2, located at the margin of themodel, might not represent a real geological feature becauseof uncertainty associated with low seismic ray coverage.The second high-velocity anomaly on profile SR2 (‘‘E’’ inFigure 5b) matches with the top of the high-resistivity body’’E,’’ found along electrical profiles ER1 and ER2. CO2 fluxand soil temperature are higher along P wave anomaly ‘‘E’’(Figure 5b).[24] Inversion of the Rayleigh wave dispersion curves
(Figure 6) allowed us to estimate, about in the middle ofP wave profiles, the variation of shear wave velocity to adepth of 32 m. Using the P wave velocities of Figure 6,horizontally averaged along the overlap area common toboth Rayleigh wave and P wave profiles (Figure 1), wewere able to estimate the Vp/Vs value. The calculatedVp/Vs values are equal to about 2 between 0- and 16-mdepth (corresponding to layer ‘‘A’’); thereafter, the ratioincreases within layer ‘‘B,’’ reaching a maximum value of4.5 at 28-m depth. Average Vp/Vs values for layer ‘‘A’’ arecompatible with dry unconsolidated soils/rocks and alsowith the presence of gas. Small amounts of gas significantlyreduce the compressional velocities, while Poisson’s ratiosfor gas-saturated rocks are lower than those for fluid-saturated rocks. Recent experiments [Zimmer et al., 2002]show that Vp/Vs values around 4, similar to those foundbelow 16- to 20-m depth, are instead caused by a very highdegree of water saturation in the soils/rocks.
4.3. Microseismic Noise
[25] The seismic signal at Solfatara is dominated bycontinuous noise rather than discrete events. The temporalvariation of seismic noise amplitude, recorded at seismicstation SOF, follows a quasi 24-hour period (Figure 7). Thehigh noise amplitude recorded during the day cannot be dueto human activity, since the spectral pattern of seismicstation ACC (Figure 1b), which is closer than station SOFto the main sources of cultural noise, is characterized by alower amplitude, and it does not show any daily periodicity(Figure 7a). Furthermore, it is worth noting that the varia-tion of H2O/CO2 is consistent with noise cycling(Figure 7b). We therefore conclude that at Solfatara, themain source of the seismic noise is not cultural, buthydrothermal.
Figure 2. Resistivity section obtained by the two-dimensional inversion of CSAMT-MT data. Red square,CSAMT antennas; red triangle, CSAMT-MT station; blacktriangle, CSAMT station (see location in Figure 1). Colorscale is log(resistivity) in W m. Labels ‘‘A,’’ ‘‘B,’’ and ‘‘E’’refer to anomalous features discussed in the text. CO2 flux[Chiodini et al., 2001] and temperature [Chiodini et al.,2005] patterns are plotted for comparison along the profilestrike.
B06201 BRUNO ET AL.: A SHALLOW HYDROTHERMAL SYSTEM AT SOLFATARA
6 of 17
B06201

Figure 3. NW-SE striking electrical (ER3 and ER4) and TDEM profiles with CO2 flux [Chiodini et al.,2001] and temperature [Chiodini et al., 2005] patterns plotted along the profile strike. Electrical anomaly‘‘D’’ dipping to the NW, with r of 12–20 W m is consistently found along profiles ER4 and TDEM.
Figure 4. NE-SW oriented electrical profiles ER1 and ER2, with CO2 flux [Chiodini et al., 2001] andtemperature [Chiodini et al., 2005] patterns plotted along the profile strike. Both profiles show in theircentral part a subcircular, �100-m-wide � 40-m-high anomalous body ‘‘E,’’ located at 30-m depth withinthe conductive substratum ‘‘B.’’ Body ‘‘E’’ is characterized by a resistivity anomaly (20–70 W m). Therapid change of resistivity along body ‘‘E’’ on ER1 and ER2 implies that chemical and physicalproperties are changing quite rapidly in the direction perpendicular to the two lines.
B06201 BRUNO ET AL.: A SHALLOW HYDROTHERMAL SYSTEM AT SOLFATARA
7 of 17
B06201

Figure 5. Seismic tomograms SR1 and SR2 with CO2 flux [Chiodini et al., 2001] and temperature[Chiodini et al., 2005] patterns plotted along the profile strike. Continuous lines show depth andmorphology of the refracting interface evaluated with the generalized reciprocal method [Palmer, 1980].Peripheral and deeper parts of the tomographic models, with low ray density, are not shown. High-velocity body ‘‘E’’ matches with the top of body ‘‘E’’ shown on MT, ER1, and ER2.
Figure 6. Vs depth profile (1) and Vp/Vs value (2) relative to multichannel analysis of Rayleigh wavedispersion along MASW1 and MASW2 soundings (see Figure 1 for position). Average depth of seismicinterface A-B (16 m) is drawn for both graphs for comparison. On line MASW1, the estimated Vs curveshows a rapid increase (100–400 m/s) in the first 16–20 m; thereafter, Vs remains almost constant downto 32 m. On line MASW2, a similar trend is seen, although Vs continues to increase to a depth of 24 m,reaching a maximum value of about 540 m/s at 32 m.
B06201 BRUNO ET AL.: A SHALLOW HYDROTHERMAL SYSTEM AT SOLFATARA
8 of 17
B06201

[26] Daily fluctuations of seismic noise at Solfatara arelikely witness of the intrinsic instability of the hydrothermalsystem. Noise cyclical variation is also common in otherhydrothermal systems. For example, Vandemeulebrouck etal. [2005] compared analogue experiments to two volcaniclake areas in New Zealand and found that there is anagreement between seismic noise, thermal activity, andwater level cycling, which is due to gravitational ratherthan the purely convective instability nature of these hydro-thermal systems, without any change in the underlyingmagmatic system. During volcano monitoring at CampiFlegrei, as well as in other similar calderas, it is crucial tobe able to discriminate intrinsic hydrothermal instabilitiesfrom ones of magmatic origin. For example, the level of
seismic noise at SOF abruptly increased on 22 March 2000(Figure 7a) at the beginning of a minor uplift episode atCampi Flegrei [Civetta, 2001]. Moreover, the noise cyclingchanged, with superimposition of other cycles on the typicalpreuplift 24-hour sequence (Figure 7a). This AD 2000 upliftcaused an increase in the flux of emissions at fumarolescorresponding to an increase of seismic noise amplitude ofmagmatic rather than intrinsic hydrothermal origin.[27] The spatial distribution of noise (Figure 8) has its
maxima along the SE and NE borders of the volcano,especially where the most active fumaroles are located.Spatial noise distribution in the crater is correlated withCO2 degassing (Figure 1). Seismic noise decreases in themud pools area, where degassing is less energetic and it is
Figure 7. (a) Amplitude of the seismic noise recorded by the three-component 1-Hz seismic stations‘‘SOF’’ and ‘‘ACC’’ (see Figure 1 for location) during the period 19–24 March 2000. Gain parametersare equal for both stations. Each point is the average of the amplitude of the 10- to 15-Hz frequencywindow, of the vertical component signal on a 5-min window time. (b) Comparison between seismicnoise amplitude pattern recorded on 21 March 2000 and H2O/CO2 variation (same day) between 8:00 and19:00. Both signals were transformed in the nondimensional z-score space [DeLaughter et al., 2005].
B06201 BRUNO ET AL.: A SHALLOW HYDROTHERMAL SYSTEM AT SOLFATARA
9 of 17
B06201

close to background levels in the NW sector of Solfatara.There is also a correlation between high noise amplitudeand the anomalous areas imaged by the two-dimensionalgeophysical profiles (Figure 8).
4.4. Gravity Data
[28] The Bouguer anomaly data (Figure 9a) acquired byOliveri del Castillo et al. [1968] display a gravity minimumsited just south of the boiling mud pools (point ‘‘2’’ inFigure 9a) and other two minima on the western and easternedges of the crater rim (points ‘‘1’’ and ‘‘3,’’ respectively).By contrast, a positive Bouguer anomaly occurs on thenorthern rim of the crater (point ‘‘4’’ in Figure 9a). Bougueranomalies ‘‘2,’’ ‘‘3,’’ and ‘‘4’’ of these data correlate withthe maxima of the present seismic noise distribution in thecrater. Bouguer anomaly ‘‘1,’’ however, does not correlatewith either CO2 discharge or with anomalous seismic noisezones. A possible interpretation is that the uplifts of 1969–1972 and 1980–1984 have modified, in part, the shallowdegassing system, deactivating some of the pre-1969 paths,such as the area of Bouguer anomaly ‘‘1’’.[29] The horizontal derivative map of Bouguer anomalies
(Figure 9b) presents its maxima clearly aligned along NWand ENE directions, coincident with the strike of regionaltectonic lineaments bounding and intersecting Solfataracrater. These faults, probably filled by hydrothermalalteration minerals and/or by gas and liquid phases, forma measurable gravity anomaly. There is no correlationbetween the hypothesized NW-SE striking fault (imaged by
two-dimensional methods and labeled as ‘‘E’’ on Figure 9b)and the gravity data.
4.5. Hydrogeological Data
[30] Water table levels exhibit a difference of 80–90 mbetween Solfatara and the surrounding areas (Figure 10). Inthe crater, the water table outcrops at the boiling mud pools(97 m above sea level), and it is found at 90 m above sealevel in the OAK well (Figure 1). Water level drops at�40–50 m above sea level just outside the western bound-ary of the caldera and at 10–20 m above sea level less than300 m away from the caldera rims. Precipitation affectingSolfatara produces an average amount of �730 t/day ofwater [Ricciardi and Siniscalchi, 2006] which is largelyinsufficient to explain the upwelling of the saturated zone.[31] The upwelling water table below Solfatara correlates
with a peak of about 98�C in groundwater temperature(Figures 10b and 10c). Water temperatures inside andoutside Solfatara differ by about 60�C. Two other temper-ature peaks of 65�C and 85�C, also accompanied by risingwater tables, are found to the south and northwest ofSolfatara (Gerolomini and Agnano: Figure 10c) wherefumaroles and high CO2 degassing have been described[i.e.,Chiodini et al., 2001]. Temperature measurements madeat OAK well during the period 1871–1877 [De Luca, 1880]and today show that (1) the water temperature has increasedfrom 57�C to 98�C, implying an uprising of the isothermsbelow Solfatara crater; and (2) the saturated zone has risen,on average, from 12 m to the present-day 7 m below ground
Figure 8. Spatial distribution of the amplitude of seismic noise (*10�4 cm/s; 10- to 15-Hz frequencywindow) at Solfatara crater. Symbols: (1), mesh of measuring positions; (2) caldera borders; (3) regionalfaults; (4), proposed ‘‘E-E’’ fault; (5), location of the anomalies discovered by the geophysical surveys.Notice that Bouguer anomaly ‘‘3’’ coincides with resistivity anomaly ‘‘C.’’ Label ‘‘3’’ was omitted.
B06201 BRUNO ET AL.: A SHALLOW HYDROTHERMAL SYSTEM AT SOLFATARA
10 of 17
B06201

surface, suggesting an increment of hydrothermal fluidcondensation and therefore a marked increment of fluiddegassing.
5. Discussion
5.1. Combined Interpretation of Geophysical Data
[32] At Solfatara, geophysical data reveal that the veryshallow subsoil beneath the crater is made up of two zones:a discontinuous and more resistive layer (A) with a Vp/Vsvalue of 2 and thicknesses between 0 and 70 m, overlying avery low-resistivity layer (B) that in its shallow part has aVp/Vs value >4. Zone ‘‘A’’ corresponds to a ‘‘dry’’ argilliticalteration zone affected by CO2 degassing. The low-resistivity zone ‘‘B’’ corresponds to the hydrothermalaquifer recharged by natural condensates [Todesco etal., 2003]. The magnetotelluric data (given in Figure 2)
show that zone ‘‘B extends down to at least 300–400 mbelow ground surface. Resistivity and seismic velocities(Figures 2–6) are also consistent with zones ‘‘A’’ and‘‘B’’ having been affected by lateral heterogeneities thatcan be explained in terms of the interaction betweenstructural patterns and degassing dynamics within shallowhydrothermal circulation cells. Faults and fractures in thecrater most likely act as preferential degassing pathways,as shown by the NW elongated shape of the CO2
degassing structure in Figure 1. The pattern of CO2 flux,soil temperature, and seismic noise can help to discrim-inate between active and inactive paths. Active degassingareas are characterized by high seismic noise, high CO2
fluxes, and high soil temperatures. However, comparisonbetween the different maps is difficult to assess bysimple visual evaluation. Therefore in order to explore
Figure 9. (a) High-resolution Bouguer anomaly map of Solfatara crater, acquired by Oliveri del Castilloet al. [1968], draped over the local topography. (b) Horizontal derivative of the Bouguer anomaly data.Symbols: see Figure 8.
B06201 BRUNO ET AL.: A SHALLOW HYDROTHERMAL SYSTEM AT SOLFATARA
11 of 17
B06201

any correlation between the different parameters, we havestacked them in the nondimensional space of the z-score[DeLaughter et al., 2005]. The z-score associated withthe ith observation of a random variable xi is given by:
zi ¼ xi � mð Þ=s
where m is the mean and s is the standard deviation of allobservations x1. . . xn. A stack of noncorrelating parts of themaps would produce a diminishing value of the modulus.By contrast, stacked correlated zones would produce anincrease of the modulus. It is assumed that there is an‘‘in-phase’’ correlation among the parameters; that is, highvalues of CO2 flux correspond to high value of Bougueranomalies etc.[33] In order to be able to compare with previous maps,
we used the distribution of CO2 flux and temperatures
measured at surface of Solfatara during AD 2000 [Chiodiniet al., 2001, 2005]. The maps scaled in the z-score space(Figure 11) illustrate, as might be expected, that temperatureand CO2 flux patterns are very similar, with a correlationcoefficient of 0.84. The stacking of selected maps (Figure 12)enables us to see that high noise levels are positivelycorrelated with CO2 degassing and soil temperature alongthe NE and SE rims, where the most vigorous fumaroles arelocated. These areas are also characterized by anomalousgravity values on the AD 1968 Bouguer anomaly map,confirming that some of these zones (i.e., anomalies ‘‘3’’and ‘‘4’’) were already active before the inflation episodesof 1969–1972 and 1982–1984. In Figure 13, the faultpatterns affecting Solfatara have been superimposed onthe stack of three maps: seismic noise, Bouguer anomaly,and CO2 flux. From this figure, we can see that degassing isconcentrated mostly at the intersection of faults and frac-
Figure 10. (a) Three-dimensional topographic map of Solfatara area. (b) Three-dimensional map of thewater table level. (c) Color map of the water table temperature (in �C). Dots show the measuring points.Two direct measurements of the water table level and temperature were made within Solfatara crater inthe OAK well (Figure 1c) and at the boiling mud pools, where the saturated zone outcrops at surface. Thetrend of the water table below the crater was reconstructed using resistivity information.
B06201 BRUNO ET AL.: A SHALLOW HYDROTHERMAL SYSTEM AT SOLFATARA
12 of 17
B06201

Figure 11. CO2 flux, Bouguer anomaly, soil temperature, seismic noise, and horizontal derivative ofBouguer anomaly, all rescaled using the z-score technique [DeLaughter et al., 2005]. Labels ‘‘1’’ to ‘‘4’’and ‘‘C,’’ ‘‘D,’’ ‘‘E,’’ and ‘‘F’’ show the position of the anomalies discovered by the geophysical surveys.Notice that Bouguer anomaly ‘‘3’’ coincides with resistivity anomaly ‘‘C.’’ Label ‘‘3’’ was omitted.
B06201 BRUNO ET AL.: A SHALLOW HYDROTHERMAL SYSTEM AT SOLFATARA
13 of 17
B06201

tures, and that Solfatara crater can be divided into aninactive sector, located in the NW, and a SE sector that ishost to degassing activity. It is worth noting that seismicevents accompanying the recent inflation episodes (between1969 and 2000) show a concentration of seismic activity inboth number of events and maximum magnitude in the SWsector of Solfatara [e.g., Orsi et al., 1999, among others]. InFigure 13, the areas of maximum correlation betweenseismic noise, gravity, and CO2 are oriented NW and ENEand match with the anomalous zones imaged by oursurveys. The highest z-score values are found above zones‘‘C,’’ ‘‘D,’’ and ‘‘E,’’ and Bouguer anomalies ‘‘3’’ and ‘‘4’’.In particular, the fault E-E (inferred on the basis of magneto-telluric and DC electrical surveys) seems partially inacti-vated, considering it is affected by hydrothermal circulationonly in its SW end where it intersects ENE striking faults.
5.2. Qualitative Modeling of Geothermal Processes
[34] Hydrothermal fluids of magmatic origin, as impliedby their temperature and the isotopic composition of H2O,CO2, and He [Tedesco et al., 1990; Allard et al., 1991;Panichi and Volpi, 1999], are continuously being dis-charged at Solfatara crater. A cartoon of the shallow
hydrothermal circulation hypothesized for Solfatara volcanois presented in Figure 14. Geothermal fluids, present belowthe crater floor predominantly in the gas phase, ascendalong preexisting structural pathways. Part of the gas phase,including a fraction of steam, feeds the vigorous fumaroles(SOF), located at the intersection of the main faults with thelocal topography. Other parts of the gas phase are dispersedto air along rock microfractures as diffuse soil degassing.Above the 200�C isotherm, which can be roughly placed ataround 300- to 400-m depth on the basis of the magneto-telluric data, the ascending gas is accompanied by largevolumes of condensation which contribute to saturate thehost rock. Chiodini et al. [2001] evaluated this water supplyto be at least 3350 t/day. Condensation of hydrothermalfluids feeds the aquifer below Solfatara crater and likelygenerates a high hydraulic gradient at surface, causing waterto flow from Solfatara toward neighboring areas dependingon the permeability properties of the host rock. Consideringthat there is a 40-m-high water section of exchangebetween Solfatara and the surrounding shallow aquifer(see Figure 14), which has a cylindrical symmetry, aminimum permeability of 0.05 mD is required to allow3350 tons of water to flow outside the crater each day.
Figure 12. Stacked maps obtained using two different sets of data (see labels). For map location, see theupper left chart of Figure 11.
B06201 BRUNO ET AL.: A SHALLOW HYDROTHERMAL SYSTEM AT SOLFATARA
14 of 17
B06201

Measured permeability of Campi Flegrei rocks is, onaverage, higher than this value [Vanorio et al., 2002].Therefore we believe that the outcropping of the water tablebelow the crater and the resulting high hydraulic table
gradient at the edges of Solfatara volcano is due to areduction of permeability caused by bounding faults filledby hydrothermal alteration minerals. An alternative expla-nation is that the amount of condensation water feeding the
Figure 13. Map obtained by stacking the CO2 flux, seismic noise, and Bouguer anomaly maps ofFigure 11, then draped on top of the local topography and tectonic structures at Solfatara. Symbols: seeFigure 8.
Figure 14. Hydrothermal model of Solfatara caldera along a NW-striking cross section. The top ofsaturated zone, including its shape, the extent of the gas-saturated zone, and the position of isotherms arehypothetical and have been located according to the findings of our surveys. Isotherms and liquidsurfaces are about 200 m deeper than those reported by Chiodini et al. [2003]. The faults shown are alsohypothetical and are drawn only for discussion purposes.
B06201 BRUNO ET AL.: A SHALLOW HYDROTHERMAL SYSTEM AT SOLFATARA
15 of 17
B06201

basal aquifer is larger than the value of 3350 t/day estimatedby Chiodini et al. [2003].
6. Conclusions
[35] Integration of geophysical and hydrogeological dataprovides an opportunity to better understand the maingeological features and the shallow hydrothermal activitythat occur in the subsurface (0–400 m) of Solfatara. Thisknowledge is important because hydrothermal fluids caninduce or enhance inflation episodes [Oliveri del Castilloand Montagna, 1984; Bonafede, 1991; De Natale et al.,1991; Gaeta et al., 1998]. Geophysical surveys show thepresence of several anomalous zones that correlate with theintersection of the main structural lineaments and which actas preferential shallow degassing pathways. High seismicnoise levels match with these paths. Furthermore, conden-sation of hydrothermal fluids causes an upwelling of thesaturated zone by about 80 m below Solfatara, whencompared to neighboring areas. This upwelling has furtherincreased after 1969. Our field observations demonstratethat today, water levels and temperatures have not yetreturned to pre-1968 conditions. Comparison between grav-ity data, recorded before 1969, and our geophysical surveyssuggests that the recent inflation episodes at Campi Flegreihave likely modified the shallow hydrothermal system.Future changes in the heat flux from a magma body locatedunderneath Solfatara and/or processes resulting in the for-mation of argillitic mineral assemblages at relatively shal-low depths may influence pressurization events in thehydrothermal system. These will affect measurable physicaland chemical changes in the shallow hydrothermal system,together with ground deformation and seismic swarms.Thus time series studies of geophysical and hydrogeologicalsurveys at Solfatara, focused on monitoring changes in theshallow hydrothermal circulation, can be useful aids inevaluating and assessing volcanic hazard at Campi Flegrei.In particular, our data indicate that the seismic noiseamplitude, calculated in the 10- to 15-Hz band, positivelycorrelates with fluid degassing activity and is also sensitiveto flow variation of the main fumaroles due to overpressu-rization events. This is highlighted by seismic noise at SOFshowing an increase of activity and variation of cycling atthe very beginning of ground deformation during the upliftof 2000. We therefore suggest integrating the alreadymonitored parameters with real-time monitoring of seismicnoise at SOF to improve the early detection of volcanic-hydrothermal events at Campi Flegrei.
[36] Acknowledgments. The authors gratefully thank Cornel deRonde for carefully revising this manuscript, Alberto Godio and ClaudioStrobbia for acquisition and processing of DC electrical data, FrancescoCosti for seismic data interpretation by means of generalized reciprocalmethod, Giovanni Bais for Rayleigh data processing, and Roberto Morettiand Monica Piochi for fruitful discussions.
ReferencesAckermann, H. D., L. W. Pankratz, and D. Dansereau (1986), Resolution ofambiguities of seismic refraction traveltime curves, Geophysics, 51(2),223–235.
Acocella, V., F. Salvini, R. Funiciello, and C. Faccenna (1999), The role oftransfer structures on volcanic activity at Campi Flegrei (Southern Italy),J. Volcanol. Geotherm. Res., 91, 123–139.
Allard, P., A. Maiorani, D. Tedesco, G. Cortecci, and B. Turi (1991), Iso-topic study of the origin of sulfur and carbon in Solfatara fumaroles,Campi Flegrei caldera, J. Volcanol. Geotherm. Res., 48, 139–159.
Berrino, G., G. Corrado, G. Luongo, and B. Toro (1984), Ground deforma-tion and gravity changes accompanying the 1982 Pozzuoli uplift, Bull.Volcanol., 47(2), 187–200.
Bianco, F., E. Del Pezzo, G. Saccorotti, and G. Ventura (2004), The role ofhydrothermal fluids in triggering the July-August 2000 seismic swarm atCampi Flegrei, Italy: evidence from seismological and mesostructuraldata, J. Volcanol. Geotherm. Res., 133, 229–246.
Bonafede, M. (1991), Hot fluid migration: An efficient source of grounddeformation. Application to the 1982–85 crisis at Campi Flegrei-Italy,J. Volcanol. Geotherm. Res., 48, 187–198.
Bruno, P. P. G. (2004), Structure and evolution of the Bay of Pozzuoli(Italy) using marine seismic reflection data: implications for collapse ofthe Campi Flegrei caldera, Bull. Volcanol., 66(4), 342–355.
Bruno, P. P. G., A. Rapolla, and V. Di Fiore (2003), Structural settings ofthe Bay of Naples (Italy) by seismic reflection data: Implications for theCampanian volcanism, Tectonophysics, 372, 192–213.
Chelini, W., and A. Sbrana (1987), Subsurface geology, in PhlegreanFields, edited by M. Rosi and A. Sbrana, CNR Quaderni de ‘‘La RicercaScientifica’’, vol. 114, pp. 94–103.
Chiodini, G., F. Frondini, C. Cardellini, D. Granieri, L. Marini, andG. Ventura (2001), CO2 degassing and energy release at Solfatara volca-no, Campi Flegrei, Italy, J. Geophys. Res., 106, 16213–16221.
Chiodini, G., M. Todesco, S. Caliro, C. Del Gaudio, G. Macedonio, andM. Russo (2003), Magma degassing as a trigger of bradyseismic events:The case of Phlegrean Fields (Italy), Geophys. Res. Lett., 30(8), 1434,doi:10.1029/2002GL016790.
Chiodini, G., D. Granieri, R. Avino, S. Caliro, A. Costa, and C. Werner(2005), Carbon dioxide diffuse degassing and estimation of heat releasefrom volcanic and hydrothermal systems, J. Geophys. Res., 110, B08204,doi:10.1029/2004JB003542.
Cinque, A., G. Rolandi, and V. Zamparelli (1985), L’Estensione dei DepositiMarini Olocenici nei Campi Flegrei in Relazione alla Vulcano-Tettonica,Boll. Soc. Geol. Ital., 104, 327–348.
Civetta, L. (2001), Rendiconto sull’attivita di sorveglianza, II semestre(Luglio-Dicembre 2000), Open file report, 77 pp., INGV-Nat. Instituteof Geophys. and Volcanol., Italy.
Constable, S., R. Parker, and C. Constable (1987), Occam’s inversion: Apractical algorithm for generating smooth models from electromagneticsounding data, Geophysics, 52, 289–300.
Cordell, L. (1979), Gravimetric expression of the graben faulting in SantaFe Country and the Espanola Basin, New Mexico. New Mexico Geol.Soc. Guidebook, 30th Field Conf., pp. 59–64.
Cordell, L., and V. J. S. Grauch (1985), Mapping basement magnetizationzones from aeromagnetic data in the San Juan Basin, New Mexico, in TheUtility of Regional Gravity and Magnetic Anomaly Maps: Society ofExploration Geophysicists, Tulsa, Oklahoma, edited by W. J. Hinze,pp. 181–197.
D’Antonio, M., L. Civetta, and V. Di Girolamo (1999), Mantle sourceheterogeneity in the Campanian Region (South Italy) as inferred fromgeochemical and isotopic features of mafic volcanic rocks with shosho-nitic affinity, Mineral. Petrol., 67, 163–192.
De Astis, G., L. Pappalardo, and M. Piochi (2004), Procida Volcanic His-tory: New insights in the evolution of the Phlegraean Volcanic District(Campania region, Italy), Bull. Volcanol., 66, 622–641, doi:10.1007/s00445-004-0345.
De Gennaro, M., E. Franco, and D. Stanzione (1980), Le alterazioni adopera di fluidi termali alla Solfatara di Pozzuoli (Napoli): mineralogia egeochimica, Period. Mineral., 49, 5–22.
De Luca, S. (1880), Studio di un pozzo all’Interno della Solfatara diPozzuoli, Atti R. Accad. Sci. Fis. Mat., 9(3), 25–40.
De Natale, G., F. Pingue, P. Allarde, and A. Zollo (1991), Geophysical andgeochemical modelling of the 1982–1984 unrest phenomena at CampiFlegrei caldera (Southern Italy), J. Volcanol. Geotherm. Res., 48(1/2),199–222.
De Vivo, B., G. Rolandi, P. B. Gans, A. Calvert, W. A. Bohrson, F. J. Spera,and H. E. Belkin (2001), New constraints on the pyroclastic eruptivehistory of the Campanian volcanic Plain (Italy), Mineral. Petrol., 73,47–65.
Deino, A. L., G. Orsi, S. de Vita, and M. Piochi (2004), The age ofthe Neapolitan Yellow Tuff caldera-forming eruption (Campi Flegreicaldera—Italy) assessed by 40Ar/39Ar dating method, J. Volcanol.Geotherm. Res., 133, 157–170.
Detwiler, R. L., and J. J. Robefls (2003), Electrical resistivity as an indi-cator of saturation in fractured geothermal reservoir rocks: experimentaldata and modeling, Geothermal Resources Council 2003 Annual Meet-ing, Morelia, Mexico, October 12–15, 2003, 12 pp.
B06201 BRUNO ET AL.: A SHALLOW HYDROTHERMAL SYSTEM AT SOLFATARA
16 of 17
B06201

Di Vito, M., L. Lirer, G. Mastrolorenzo, and V. Rolandi (1987), The 1538Monte Nuovo eruption (Campi Flegrei, Italy), Bull. Volcanol., 49, 608–615.
Di Vito, M. A., R. Isaia, G. Orsi, J. Southon, S. de Vita, M. D’Antonio,L. Pappalardo, and M. Piochi (1999), Volcanism and deformation since12,000 years at the Campi Flegrei caldera (Italy), J. Volcanol. Geotherm.Res., 91(2–4), 221–246.
Egbert, G. D. (1997), Robust multiple station magnetotelluric data proces-sing, Geophys. J. Int., 130, 4751997.
Gaeta, F. S., G. De Natale, F. Peluso, G. Mastrolorenzo, D. Castagnolo,C. Troise, F. Pingue, D. G. Mita, and S. Rossano (1998), Genesis andevolution of unrest episodes at Campi Flegrei caldera: The role of thermalfluid-dynamical processes in the geothermal system, J. Geophys. Res.,103(B9), 20921–20933.
Goldstein, M. A., and D. W. Strangway (1975), Audio-frequency magne-totellurics with a grounded electric dipole source, Geophysics, 40(4),669–683.
Kieffer, S. W. (1984), Seismicity of Old Faithful geyser: An isolated sourceof geothermal noise and possible analogue of volcanic seismicity,J. Volcanol. Geotherm. Res., 22, 59–95.
LaBrecque, D. J., G. Morelli, W. Daily, A. Ramirez, and P. Lundegard(1999), Occam’s inversion of 3-D electrical resistivity tomography, inThree-Dimensional Electromagnetics, edited by M. Oristaglio andB. Spies, Soc. of Expl. Geophys., pp. 575–590.
Lai, C. G., and G. J. Rix (1998), Simultaneous Inversion of Rayleigh PhaseVelocity and attenuation for Near-Surface Site Characterization, ReportNo. GIT-CEE/GEO-98-2, 258 pp., Georgia Institute of Technology,School of Civil and Environmental Engineering.
Llera, F. J., M. Sato, K. Nakatsuka, and H. H. Yokoyama (1990), Tempera-ture dependence of the electrical resistivity of water-saturated rocks,Geophysics, 55, 576–585.
McMechan, G. A., and M. J. Yedlin (1981), Analysis of dispersive wavesby wave field transformation, Geophysics, 46, 869–874.
Meju, M. A. (1998), A simple method of transient electromagnetic dataanalysis, Geophysics, 63, 405–410.
Menke, W. (1989), Geophysical Data Analysis: Discrete Inverse Theory,289 pp., International Geophysics Series, vol. 45, Elsevier, New York.
Nunziata, C., R. Mele, and M. Natale (1999), Shear wave velocities andprimary influencing factors of Campi Flegrei-Neapolitan deposits, Eng.Geol., 54, 299–312.
Oliveri del Castillo, A., and S. Montagna (1984), Nuovi elementi sullaconnessione tra termofluidodinamica e geodinamica ai Campi Flegrei(Napoli): bradisismo 1982–1984, Boll. Soc. Geol. Ital.
Oliveri del Castillo, A., A. Palumbo, and E. Percolo (1968), Contributo allostudio della Solfatara di Pozzuoli (Campi Flegrei) mediante osservazionegravimetriche, Ann. Oss. Vesuv., 22(9), 217–225.
Orsi, G., M. Di Vito, and S. De Vita (1996), The restless, resurgent CampiFlegrei nested caldera, Italy: Constraints on its evolution and configura-tion, J. Volcanol. Geotherm. Res., 74, 179–214.
Orsi, G., L. Civetta, C. Del Gaudio, S. De Vita, M. A. Di Vito, R. Isaia,S. M. Petrazzuoli, G. P. Ricciardi, and C. Ricco (1999), Short-termground deformations and seismicity in the resurgent Campi Flegrei Cal-dera (Italy): An example of active block-resurgence in a densely popu-lated area, J. Volcanol. Geotherm. Res., 91, 415–451.
Palmer, D. (1980), The Generalized Reciprocal Method of Seismic Refrac-tion Interpretation, 104 pp., Soc. Explor. Geophys., Tulsa, OK, USA.
Panichi, C., and G. Volpi (1999), Hydrogen, oxygen and carbon isotoperatios of Solfatara fumaroles (Phlegraean Fields, Italy): Further insightinto source processes, J. Volcanol. Geotherm. Res., 91, 321–328.
Park, C. B., R. D. Miller, and J. Xia (1999), Multichannel analysis ofsurface waves, Geophysics, 64, 800–808.
Quian, W., and L. B. Pedersen (1991), Industrial interferences magnetotel-lurics: An example from the Tangshan area, China, Geophysics, 56, 265–273.
Ricciardi, G. P., and V. Siniscalchi (2006), Meteorologia Vesuviana, Openfile report, CD-ROM, INGV—Nat. Institute of Geophys. and Volcanol.,Italy.
Roberts, J. J., R. L. Defwiler, W. Ralph, and B. P. Bonner (2002), Fracturesurface area effects on fluid extraction and the electrical resistivity ofgeothermal reservoir rocks, Geothermal Resources Council’s 2002Annual Meeting: Reno, Nevada, September 22–25, 2002.
Rodi, W., and R. L. Mackie (2001), Nonlinear conjugate gradients algo-rithm for 2-D magnetotelluric inversion, Geophysics, 66(1), 174–187.
Rosi, M., and R. Santacroce (1984), Volcanic hazard assessment in thePhlegrean Fields: A contribution based on stratigraphic and hystericaldata, Bull. Volcanol., 47(2), 359–370.
Rosi, M., and A. Sbrana (1987), Phlegrean Fields, National Council ofResearch (Italy), Quad. Ric. Sci., 114, 1–175.
Siripunvaraporn, W., G. Egbert, and M. Uyeshima (2005), Interpretation oftwo-dimensional magnetotelluric profile data with three-dimensional in-version: Synthetic examples, Geophys. J. Int., 160, 804–814.
Tedesco, D., P. Allard, Y. Sano, H. Wakita, and R. Pece (1990), Helium-3in subaerial and submarine fumaroles of Campi Flegrei caldera, Italy,Geochim. Cosmochim. Acta, 54, 1105–1116.
Todesco, M., G. Chiodini, and G. Macedonio (2003), Monitoring and mod-elling hydrothermal fluid emission at La Solfatara (Phlegrean Fields,Italy). An interdisciplinary approach to the study of diffuse degassing,J. Volcanol. Geotherm. Res., 125, 57–79.
Vandemeulebrouck, J., D. Stemmelen, T. Hurst, and J. Grangeon (2005),Analogue modeling of instabilities in crater lake hydrothermal systems,J. Geophys. Res., 110, B02212, doi:10.1029/2003JB002794.
Vanorio, T., M. Prasad, D. Patella, and A. Nur (2002), Ultrasonic velocitymeasurements in volcanic rocks: Correlation with microtexture, Geophys.J. Int., 149, 22–35.
Vidale, J. (1988), Finite difference calculation of traveltimes, Bull. Seismol.Soc. Am., 78, 2062–2076.
White, R. E. (1973), The estimation of signal spectra and related quantitiesby means of the multiple coherence function, Geophys. Prospect., 21,660–703.
Zimmer, M., M. Prasad, and G. Mavko (2002), Pressure and porosityinfluences on VP-VS ratio in unconsolidated sands, Lead. Edge, 21,178–183.
�����������������������P. P. G. Bruno, G. Chiodini, Z. Petrillo, G. P. Ricciardi, and A. Troiano,
Instituto Nazionale di Geofisica e Vulcanologia, Osservatorio Vesuviano,Naples, Italy. ([email protected])V. Di Fiore, Consiglio Nazionale delle Ricerche, Istituto Per l’Ambiente
Marino e Costiero, Naples, Italy.
B06201 BRUNO ET AL.: A SHALLOW HYDROTHERMAL SYSTEM AT SOLFATARA
17 of 17
B06201