geophysical abstracts, 180-183 january-december 1960
TRANSCRIPT
•
Geophysical Abstracts, 180-183 January-December 1960
GEOLOGICAL SURVEY BULLETIN 1116
Abstracts of current literature pertaining to the physics of the solid earth and to f!eophysical exploration
UNITED STATES GOVERNMENT PRINTING OFFICE, WASHINGTON : 1961
UNITED STATES DEPARTMENT OF THE INTERIOR
STEWART L. UDALL, Secretary
GEOLOGICAL SURVEY
Thomas B. Nolan, Director
1
CONTENTS
[The letters in parentheses are those used to designate the chapters for separate publication]
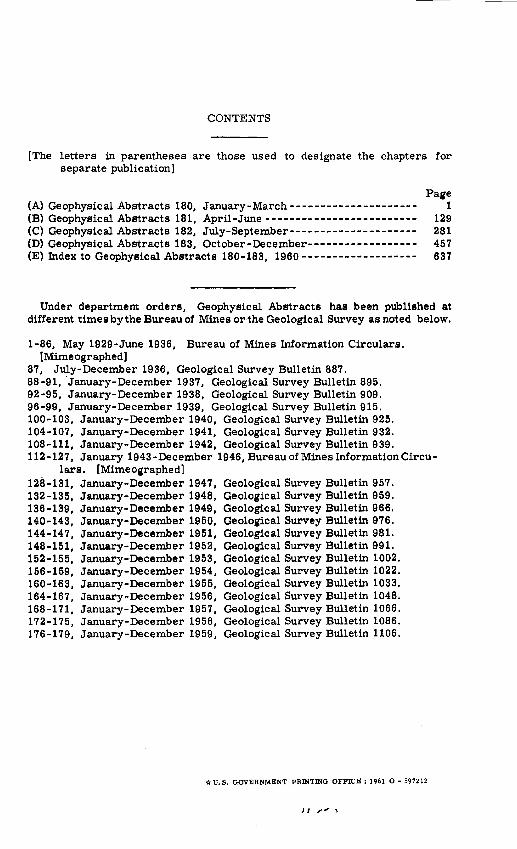
Page (A) Geophysical Abstracts 180, January-March--------------------- 1 (B) Geophysical Abstracts 181, April-June------------------------- 129 (C) Geophysical Abstracts 182, July-September--------------------- 281 (D) Geophysical Abstracts 183, October-December------------------ 457 (E) Index to Geophysical Abstracts 180-183, 1960 ------------------- 637
Under department orders, Geophysical Abstracts has been published at different times by the Bureau of Mines orthe Geological Survey as noted below.
1-86, May 1929-June 1936, Bureau of Mines Information Circulars. [Mimeographed]
87, July-December 1936, Geological Survey Bulletin 887. 88-91, 'January-December 1937, Geological Survey Bulletin 895. 92-95, January-December 1938, Geological Survey Bulletin 909. 96-99, January-December 1939, Geological Survey Bulletin 915. 100-103, January-December 1940, Geological Survey Bulletin 925. 104-107, January-December 1941, Geological Survey Bulletin 932. 108-111, January-December 1942, Geological Survey Bulletin 939. 112-127, January 1943-December 1946, Bureau of Mines Information Circu-
lars. [Mimeographed] 128-131, January-December 1947, Geological Survey Bulletin 957. 132-135, January-December 1948, Geological Survey Bulletin 959. 136-139, January-December 1949, Geological Survey Bulletin 966. 140-143, January-December 1950, Geological Survey Bulletin 976. 144-147, January-December 1951, Geological Survey Bulletin 981. 148-151, January-December 1952, Geological Survey Bulletin 991. 152-155, January-December 1953 1 Geological Survey Bulletin 1002. 156-159, January-December 1954 1 Geological Survey Bulletin 1022. 160;.163, January-December 1955, Geological Survey Bulletin 1033. 164-167 1 January-December 1956 1 Geological Survey Bulletin 1048. 168-171, January-December 1957 1 Geological Survey Bulletin 1066. 172-175 1 January-December 1958, Geological Survey Bulletin 1086. 176-179, January-December 1959 1 Geological Survey Bulletin 1106.
-trU.S, GOVERNMENT PRINTING OFFICE: 1961 0- 597Z1Z
II ,..,. ~

Geophysical Abstracts 180 January-March 1960
By JAMES W. CLARKE, DOROTHY B. VITALIANO, VIRGINIA S. NEUSCHEL, and others
GEOLOGICAL SURVEY BULLETIN 1116-A
Abstracts of current literature pertaining to the physics of the solid earth and to geophysical exploration
UNITED STATES GOVERNMENT PRINTING OFFICE, WASHINGTON : 1960
UNITED STATES DEPARTMENT OF THE INTERIOR
FRED A. SEATON, Secretary
GEOLOGICAL SURVEY
Thomas B. Nolan, Director
For sale by the Superintendent of Documents, U.S. Government Printin!l Office, Washin!lton 25, D.C. Price 40 cents (sin!lle copy). Subscription price: $1.75; 50 cents additional for forei!ln maUin!l. Use of funds for printin~ this publication has been approved by the Director of the Bureau of the Bud!let (June 23, 1960).
CONTENTS
Introduction---------------------------------------------------Extent of coverage------------------------------------------List of journals--------------------------------------------Form of citation--------------------------------------------Abstracters-------------------------------------------------
Age determinations --------------------------------------------Cosmogony ----------------------------------------------------Earthquakes and earthquake waves--------------------------------Earth tides and related phenomena--------------------------------Elasticity------------------------------------------------------Electrical exploration-------------------------------------------
Electrical logging ----------------------------------------------Exploration summaries and statistics-----------------------------
General ------------------------------------------------------Geodesy ------------------------------------------------------Geotectonics --------------------------------------------------Glaciers-------------------------------------------------------Gravuy-------------------------------------------------------Heat and heat flow ----------------------------------------------Internal constitution of the earth ---------------------------------Isotope geology-------------------------------------------------Magnetic field of the earth--------------------------------------Magnetic properties and paleomagnetism --------------------------Magnetic surveys-----------------------------------------------Microseisms -------------------.-------------------------------Radioactivity---------------------------------------------------Radioactivity surveying and logging-------------------------------Seismic exploration---------------------------------------------Strength and plasticity ------------------------------------------Submarine geology---------------------------------------------Volcanology---------------------------------------------------Index----------------------------------------------------------
III
Page
1 1 1 2 3 3
10 13 23 26 33 42 45 51 52 58 61 64 69 71 73 75 79 86 94 95 98
104 115 116 117 123

GEOPHYSICAL ABSTRACTS 180, JANUARY- MARCH 1960
By James W. Clarke, Dorothy B. Vitaliano, Virginia S. Neuschel, and others
INTRODUCTION
Extent of Coverage
Geophysical Abstracts includes abstracts of technical papers and books on the physics of the solid earth, the application of physical methods and techniques to geologic problems, and geophysical exploration. The table of contents, which is alphabetically arra,nged, shows the material covered.
Abstracts are prepared only of material that is believed to be generally available. Ordinarily abstracts are not published of material with limited circulations (such as dissertations, open-file reports, or memoranda) or of other papers presented orally at meetings. Abstracts of papers in Japanese and Chinese are based on abstracts or summaries in a western language accompanying the paper.
List of Journals
Lists of journals published in Geophysical Abstracts 160 (January-March 1955, Bulletin 1033-A) and subsequent issues through 175 {October-December 1958, Bulletin 1086...,D) have been compiled into a single list, which may be obtained by writing to the U.S. Geological Survey, Washington 25, D. C.
Supplements to this master list have been published in each issue since Geophysical Abstracts 175. The following is an additional supplement that lists references cited in Geophysical Abstracts 180 that have not been listed previously.
Acad. Columbiana Cienc. Exactas, F:ls. y Nat. Rev.- Revista de la Academia Columbiana de Ciencias Exactas, Ffsicas y Naturales. Bogota, Columbia.
Acad. Roumaine, Rev. Geol.-Geog.- Academie de la Republique Populaire Roumaine, Revue de Geologie et de Geographie [Academy of the Rumanian People's Republic, Revue of Geology and Geography]. Bucure~ti (Bucharest), Rumania.
Acta Geol. Sinica-Acta Geologica Sinica. Academia Sinica. [Chinese Geological Proceedings. Chinese Academy]. Peiping, China.
Akad. Nauk Beloruss. SSR, Inst. Geol. Nauk Trudy-Akademiya Nauk Belorusskoy SSR, Trudy Instituta Geologicheskikh Nauk [Academy of Science of Belorussian SSR, Papers of the Institute of Geological Sciences, Minsk, B.S.S.R.
Akad. Nauk SSSR Inst. Okeanologii Trudy-Akademiya Nauk SSSR, Institut Okeanologii, Trudy [Academy of Sciences of the U. S. S. R. , Institute of Oceanology, Papers]. Moskva (Moscow), U.S.S.R.
Akaq. Nauk SSSR Meteoritika-Akademiya Nauk SSSR, Komitet po Meteoritam, Meteoritika [Academy of Sciences of the U.S.S.R., Committee on Meteoritics]. Moskva (Moscow), U.S.S.R.
Akad. Nauk Turkmen. SSR, Inst. Fiziki iGeofiziki. Trudy-AkademiyaNauk Turkmenskoy SSR. Institut fiziki i geofiziki Trudy [Academy of Sciences of the Turkmen S. S. R. Institute of Physics and Geophysics Papers]. Ashkhabad, Turkmen SSR.
2 GEOPHYSICAL ABSTRACTS 180, JANUARY -MARCH 1960
Edinburgh Geol. Soc. Trans. -Transactions of the Edinburgh Geological Society. Edinburgh, Scotland.
Folia Sci. Africae Centralis-Folia Scientifica Africae Centralis. L'institut pour la recherche scientifique en Afrique centrale. Bukavu, Belgian Congo.
Geodezia es Kartografia-Geodezia es Kartografia. Allami Foldmeresi es Terkepeszeti Hivatal Lapja. [Geodesy and Cartography. State Surveying and Cartographic Office Journal]. Budapest, Hungary.
Indiana Acad. Sci. Proc. -Proceedings of Indiana Academy of Science. Indianapolis, Indiana.
Kali u. Steinsalz-Kali und Steinsalz. Kaliverein. [Potash and Rock salt. Potash Union]. Hanover, Germany.
Low Temperature Sci. -Low Temperature Science. Institute of Low Temperature Science. Hokkaido University. Hokkaido, Japan.
Natural History. -Natural History. The American Museum of Natural History. New York, New York.
[Norway] Geof. Komm. -Den Geofysiske Kommisjon [The Geophysical Commission (Norway)]. Bergen, Norway.
Pennsylvania Geol. Survey Inf. Circ. -Pennsylvania Geological Survey Information Circular. Pennsylvania Topographic and Geological Survey. Harrisburg, Pennsylvania.
Philippine Jour. Sci. -The Philippine Journal of Science. The Institute of Science and Technology. Manila, Philippines.
Phys. Soc. Japan Jour. -Journal of the Physical Society of Japan. Department of Physics, Faculty of Science, University of Tokyo. Tokyo, Japan.
Sea Frontiers-Sea Frontiers. Bulletin of the International Oceanographic Foundation, Marine Laboratory, University of Miami. Coral Gables, Florida.
Tokyo Univ. Geophys. Inst. Geophys. Notes-Tokyo University Geophysical Institute, Faculty of Science Geophysical Notes. Tokyo, Japan.
U.S. Air Force Cambridge Research Center, Geophysics Research Directorate Research Notes. U.S. Air Force Cambridge Research Center, Geophysics Research Directorate Research Notes. Bedford, Massachusetts.
U.S. Army Corps Engineers, Greenland Ice Cap Research Program Studies (1955-56). Washington, D. C.
Universum-Universum. Gesellschaft fur Natur und Technik [Society for Nature and Technology]. Vienna, Austria.
Uzbek. Geol. Zhur. - Uzbekskiy Geologicheskiy Zhurnal. Akademiya Nauk Uzbekskoy SSR [Uzbek Geological Journal. Academy of Science, Uzbek SSR]. Tashkent, Uzbek SSR.
Volcano!. Soc. Japan Bull. -Bulletin of the Volcanological Society of Japan. The Volcanological Society of Japan. Tokyo, Japan.
Vyssh. Ucheb. Zavedeniy Izv., Neft' i Gaz-Ministerstvo Vysshego Obrazovaniya SSSR, Izvestiya Vysshich Uchebnykh Zavedeniy Neft' i Gaz [Ministry of higher education of the U.S.S.R., Bulletin of the institutions of higher learning, Oil and Gas]. Moskva [Moscow], U.S.S.R.
Form of Citation
The abbreviations of journal titles used are those used in the U. S. Geological Survey publications and in many geological journals. For papers in most languages other than English, the title is given in the original language as well as in translation. Slavic names and titles have been transliterated by the system used by the United States Board of Geographic Names. This system of transliteration for Russian is given in Geophysical Abstracts 148 (January-March 1952, Bulletin 991-A) andin the new "List of Journals" announced above. Titles of papers in Japanese and Chinese are given in translation only.
AGE DETERMINATIONS 3
Abstracters
Abstracts in this issue have been prepared by Wanda L. Grimes, I. Roman, A. J. Shneiderov, and S. T. Vesselowsky, as well as by the principal authors. Authors' abstracts are used in many instances. The initials of an abstracter following the notation "Author's abstract" indicates a translation from the original language.
AGE DETERMINATIONS
180-1. Holmes, Arthur. A revised geological time-scale: Edinburgh Geol. Soc. Trans., v. 17, pt. 3, p. 183-216, 1960.
The time-scale constructed in 1947 was based on certain assumptions that have recently been shown to be wrong. Appalachian pegmatites dated at 350 million years and thought to be Taconic (Ordovician) are'now fourid tobeAcadian (Late Devonian), while others, dated at 255 million years and thought to be Acadian can now be referred to the Permian. Other recent evidence consistently leads to an extension of the 1947 scale that carries the beginning of the Cambrian back to about 600 million years ago. The scale now constructed from the data available up to October 1959 is as follows (in m. y. ):
Tertiary 70 Carboniferous 80 70 ± 2 ................... ·. 350 ± 10
Cretaceous 65 Devonian 50 135 ± 5 400 ± 10
Jurassic 45 Silurian 40 180 ± 5 440 ± 10
Triassic 45 Ordovician 60 225 ± 5 500 ± 15
Permian 45 Cambrian 100 270 ± 5 600 ±20
One of the more significant consequences of this revision is that many dated rocks from Africa and the other "Gondwanaland" continents which were formerly ascribed to the Late Precambrian now become Cambrian. Important orogenic and plutonic phases of a major geological cycle, implying by analogy an extensive system of geosynclines, occurred at about the close of the Prec~brian and early in the Ordovician. -Author's abstract
180-2. Davidson, C. F. The geological time-scale: Nature, v. 184, no. 4695, supp. no. 17, p. 1310, 1959; ibid., v. 184, no. 4697, supp. no. 19, p. 1473, 1959.
Davidson does not agree with Kulp and his colleagues (see Geophys. Abs. 179-2) that the time scale proposed by Mayne, Lambert, ~d York (see Geophys. Abs. 176-1} "is not supported by measurements other than their own," but rejects the time scale on other grounds. He finds 91 acceptable values in the literature (66 from the Russian), all related to samples that are well defined stratigraphically. The evidence strongly suggests that the argon loss from feldspar is exceptionally high in unweathered and unmetamorphosed rocks; Sardarov (see Geophys. Abs. 180-14) showed that this loss is directly proportional to the degree of perthitization, which might explail'l: why ages based only on pegmatitic feldspal' tend to be low whereas whole -rock ages based on granodiorite, plagiogranite, and unmetamorphosed rocks devoid of perthitic structures agree well with biotite ages for the same rocks.
Davidson acknowledges that data brought to his attention since the previous
4 GEOPHYSICAL ABSTRACTS 180, JANUARY -MARCH 1960
study (mainly unpublished) require an extension of the Holmes B time scale; however, there is still no support for the conclusion that the Lower Cambrian is older than 600 X 106 yr. -D. B. V.
180-3. Gastil, Gordon. The distribution of mineral dates in time and space: Am. Jour. Sci., v. 258, no. 1, p. 1-35, 1960.
Most igneous and metamorphic mineral dates indicate times of rock cooling and the terminal event of crustal adjustment. Accordingly, the distribution of mineral dates in time indicates the periodicity of such events, and the distribution in space indicates the geometry of their occurrence.
A plot of mineral date abundance against age shows that crustal adjustments are periodic and roughly cyclic. Intervals for which abundant mineral dates have been preserved are about 175-250 million years in length, with cycles of about 350-500 million years. Intervals of date abundance fall in the ranges 2, 710-2, 490, 2, 220 -2, 060, 1, 860-1, 650, 1, 480 -1, 300, 1, 100-930, 620 -280, and 120 million years to present.
Mineralogenic events of very different ages are commonly recorded in the same area, not infrequently in the same rock. Large areas, however, can be characterized by the mineral-dates of the last interval of mineralogenic activity by which they were seriously affected. The spatial distribution of mineral dates in North America defines a sequence of age provinces, which are younger nearer the continental margin, but does not support the hypothesis of continental accretion. An hypothesis envision~ng the gradual outward solidification of an originally mobile continent is more satisfactory but is not supported by the spatial distribution of mineral dates on other continents and does not explain repeated widespread rejuvenation of stable areas.
A table of mineral dates, included as an appendix, gives every locality for which a mineral date, attributed to fundamental crustal adjustment, has been determined by methods and materials currently regarded as reliable. -V.S.N.
180-4. Studenikova, Z. V., and Knorre, K. G. 0 vozraste granitov Severnogo Kavkaze [On the age of the granites of the North Caucasus]: Geokhimiya, no. 7, p. 573-579, 1957.
Four different granite complexes are distinguished in the North Caucasus on the basis of argon age determinations: the Main Range (270-450 X 106 yr), the "Northern" (210-230 X 106 yr), the Mesozoic (87-140 X 106 yr), and the Cenozoic (15-50 X 106 yr). -D. B. V.
180-5. Komlev, L. V., Danilevich, S. I., Ivanova, K. S., Zykov, S. 1., Kuchina, G. N., Mikhalevskaya, A. D., and Filippov, M. S. 0 vozraste nekotorykh redkometal'nykh granitnykh intruziy Tsentral 'nogo Kazakhstana [On the age of some rare-metal granite intrusions of Central Kazakhstan]: Geokhimiya, no. 8, p. 64 7-656, 1957.
On the basis of lead, helium, and argon age determinations on a number of monazites and brannerites, the age of the Akchatau rare-metal granite intrusions is established as 300 ± 10 X 106 yr. The age is thus late Caledonian, rather than late Hercynian as previously deduced from the geologic evidence. -D.B.V.
180-6.
AGE DETERMINATIONS 5
Komlev, L. V., Danilevich, S. I., Ivanova, K. S., Mikhalevskaya, A. D., Savonenkov, V. G., and Filippov, M. S. 0 vozraste geologicheskikh formatsii yugo-zapadnoy chasti ukrainskogo dokembriya [On the age of the geologic formations of the southwestern part of the Ukrainian Precambrian]: Geokhimiya, no. 7, p. 566-572, 1957.
Average ages determined on monazites from southwestern UkrainianS. S. R. show that both the Chudnovo-Berdichev granite and the sobites are 2,100 ± 50 X 106 yr old and the charnockites 1, 950 ± 50 X 106 yr. Inasmuch as one sample of charnockite gave an age of 2, 100 X 106 yr and one sample of sobite gave a younger age, no definite conclusion is drawn as to whether these results indicate 1 or 2 magmatic cycles. (See also Geophys. Abs. 179-7. )D.B. V.
180-7. Vinogradov, A. P. , Tugarinov, A. I., Fedorova, V. A., and Zykov, S. I. Vozrast dokembriyskikh porod Ukrainy. Soobshcheniye 3 [The age of the Precambrian rocks of the Ukraine. Communication 3]: Geokhimiya, no. 7, p. 559-565, 1957.
In view of the discrepancies found between lead~uranium or lead-thorium ages of monazite and allanite on the one hand and argon ages of biotite on the other, lead-uranium measurements were made on allanite and zircon from the same samples to check the results. The Pb207;u235 ratios were found to be the most reliable. -D. B. V.
180-8. Stern, T[homas] W., and Stieff, L[orin] R. Radium-uranium equilibrium and radium-uranium ages of some secondary minerals: U.S. Geol. Survey Prof. Paper 320, pt. 13, p. 151-156, 1959.
Ten samples of carnotite and metatyuyamunite ore that contain more than 0. 1 percent lead have been analyzed for uranium, radium-226, and lead. Seven contain less than the equilibrium amount of radium-226 for the uranium present, and three are in radioactive equilibrium within the limits of experimental error. Radioactive equilibrium between uranium-238 and thorium-230 is effectively established in 500, 000 years; therefore, the seven radium-deficient minerals have been altered within that time span. The remaining three samples have not lost thorium-230 by alteration within the last 500, 000 years or radium-226 within the last 15, 000 years. An approximate lead-uranium age can be determined from these lead-bearing minerals if they have not been significantly leached of lead or uranium.
Carnotite and metatyuyamunite that have formed on joints and fractures are low in lead (less than 0. 01 percent) and appear from field relations to be of recent origin. These coatings are local concentrations formed after the water table was lowered and the deposits were oxidized. If these minerals are not now in radium-uranium equilibrium, did not contain thorium-230 and radium-226 at the time of their deposition, and have not been further altered by selective leaching or enrichment of radium, thorium-230, or uranium, their time of formation can be established. Radium-uranium ages determined on five Colorado Plateau secondary minerals range from approximately 10, 000 to 120, 000 years.
Radiocolloids, local concentrations of radium and its daughter products that persist for only about 15, 000 years, are present in some oxidized ores. -Authors' abstract
6
180-9.
GEOPHYSICAL ABSTRACTS 180, JANUARY -MARCH 1960
Ledent, D. Determination de ages absolus des mineraux uraniferes et thoriferes [Determination of the absolute ages of uranium- and thorium -bearing minerals]: InternaL Electronic and Nuclear Cong., Rome 1958, Proc., v. l, p. 321-325, 1958.
The method of determining absolute age by means of the radioisotopes radium-D (lead-210, half life T = 22 yr) or thorium-B (lead-212, T = 10. 6 hr) developed in 1951 by Houtermans is used less often than the regular lead method. Like the chemical method the radioisotope methods alone give only one ratio, but combined withisotopicanalysis theygivetwo orthree(Pb207/Pb2°6, Pb206ju238, and (or) Pb208/Th232). The theoretical basis of the method is the fact that if radioactive equilibrium is established between uranium or thorium and their daughter products, the measurement of the activity of any of the daughter products yields that of the parent; and measurement of the specific activity of one daughter product (number of disintegrations per sec per mg lead) gives the lead-uranium or lead-thorium ratio. Lead-210 emits betaradiation and can be measured by the beta-radiation of its immediate. descendent radium-E (bismuth-210, T = 5 days), which reaches equilibrium with it after 50 days; similarly lead-212 can be measured by means of the beta-radiation of its descendent thorium-C (bismuth-212, T = about 60 min).
The experimental procedure involves measuring the number of disintegrations per sec of ~ solution containing radiochemically pure lead and determining the lead concentration of the solution. Theoretically the lead-210 and lead-212 methods present the same advantages--they are very sensitive and are not affected by loss of normal lead or recent loss of uranium. The former is experimentally simpler, because the relatively short half life of the latter makes it difficult to maintain a stable solution. In the nuclear physics laboratory of the University of Brussels, several micrograms of thorium and some dozens of micrograms of lead can be analyzed with an accuracy of 2 or 3 percent by these methods regardless of the nature of the mineral studied. -D.B.V.
180-10. Gerling, E. K., and Shukolyukov, Yu. A. K voprosu ob 817redelenii absolyutnogo vozrasta po sootnocheniya izotopov Sr /Sr86 v osadochnykh porodakh [On the problem of determination of the absolute age according to the sr87;sr86 isotope ratio in sedimentary rocks]: Geokhimiya, no. 3, p. 187-190, 1957.
Variations in the Sr87 /Sr86 and Sr87Jsr88 ratios in two dated Precambrian marbles and a Permian celestite based on mass spectometric study are considerably less than Wickman has suggested (see Geophys. Abs. 132-9859). Due to isotope fractionation the strontium content cannot be determined with an accuracy better than l. 5-2 percent under the conditions described in this · paper. It is not yet possible to use the Sr87 /Sr86 ratio as an absolute-age criterion. -D. B. V.
Compston, W., and Jeffery, P. M. Anomalous "common strontium" in granite. See Geophys. Abs. 180-250.
180-ll. Giletti; Bruno J. Rubidium-strontium ages of Lewisian rocks from north-west Scotland: Nature, v. 184, no. 4701, supp. no. 23, p. 1793-1794, 1959.
The ages of 2 biotites and 2 feldspars from Lewisian (Scourian and Laxfordian) rocks in northwest Scotland were measured by the rubidium-strontium method. An isotope dilution technique, to be described elsewhere, was used for determining the rubidium and strontium concentrations and the strontium isotopic composition in the purified mineral. The rubidium-87 half life
AGE DETERMINATIONS 7
was taken as 5. 0 X 1010 yr. Results are tabulated. Feldspar from a Scourian pegmatite gives an age of 2, 730 ± 30 X 106 yr; the biotites and the other feldspar from two Laxfordian localities have an average age 1, 440 ± 30 X 106 yr. The fact that the primary basement at the western margin of the European continent is at least 2, 700 X 106 yr old is of very broad interest. -D. B. V.
180-12. Wasserburg, G. J., Wetherill, G. W., and Wright, Lauren A. Ages in the Precambrian terrane of Death Valley, California: Jour. Geology, v. 67, no. 6, p. 702-708, 1959.
87 87 40 40 . . The Sr /Rb and A /K ages of mmerals present m three pre-Pahrump
igneous and metamorphic rocks from the southern Death Valley region, California, indicate an event 1. 7 X 10⁹ yr ago. It is concluded that the present western continental margin in this area has been a part of the continental structure for well over 1. 7 billion years. Because of the expanded time scale, it is possible that continental growth has operated here in epochs earlier than 1. 7 billion years.
Concordant ages obtained on two rocks gave results in disagreement with the observed field relationships; this illustrated the apparent inability of the dating methods to resolve finer time events in complicated geologic terranes. -V.S.N.
180-13. Jager, Emilie, and Faul, Henry. Age measurements on some granites and gneisses from the Alps: Geol. Soc. America Bull., v. 70, no. 12, pt. 1, p. 1553-1558, 1959.
The results of potassium-argon and rubidium-strontium age determinations on granites and gneisses from the Aare massif and the Baveno and Ticino areas in the Alps are reported. The Mont Orfano granite is the oldest (290 X 106 yr by the rubidi~m-strontium method and 270 Xl06 yr by the argon method). The Baveno granite is also 270 X 106 yr old by the argon method; the exact agreement of the argon ages of these two samples taken several kilometers apart may imply that all radiogenic argon was lost from the micas 270 million years ago as a result of gentle regional metamorphism that did not affect the rubidium-strontium ratio.
The age of the brown mica in the Mittagfluh granite by both methods is 77 X 106 yr, and the green mica of the central Aare granite is 23 X 106 yr by the argon method. This may indicate that the former is older than its measured age, and that some of the mica recrystallized during the Alpine orogeny. The results from Val Verzasca leave little doubt that the Penninic nappes were thrust and the micas completely recrystallized 18 million years ago. -D. B. V.
180-14. Sardarov, S. S. Sokhrannost' radiogennogo argona v mikroklinakh [Retention of radiogenic argon in microcline]: Geokhimiya, no. 3, p. 193-197' 1957.
Comparison of the argon ages of microcline and mica from fine-grained granites, as determined by different investigators, shows that the microcline ages are 10-85 percent lower than the mica ages. The argon loss is proportional to the degree of perthitization of the microcline. -D. B. V.
180-15. Voshage, H., and Hintenberger, H. Calculationof cosmic-ray ages intheironmeteorites "Carbo" and "Treysa": Nature, v. 185, no. 4706, p. 88-89, 1960.
8 GEOPHYSICAL ABSTRACTS 180, JANUARY -MARCH 1960
Using the same formula and practically the same numerical constants, except for defining R as the K39 /K41 ratio in ordinary potassium instead of as K39 /K40 as in Marshall's paper (see Geophys. Abs. 178-24), a cosmic ray age of 1. 36 X109 yr is obtained for the Carbo meteorite instead of 0. 69 X 109 yr as obtained by Marshall. The discrepancy is too large to be explained by the use of the different ratio alone.
As isotopic abundance measurements on the extremely small potassium samples available for measurement still show rather large statistical fluctuations, the uncertainties in cosmic ray ages are relatively large. The limits for the radiation ages in Carbo and Treysa are calculated as Tc = 1. 05 -1. 40 X 109 yr and TT=O. 50-0. 67 X 109 yr, respectively. Eliminating the production crosssections from the formula, the difference between the ages of the two meteorites is found to range from 0. 35 X 109 to 1. 25 X 109 yr. This estimate is consistent with the calculated ages but has a higher degree of certainty, as the statement is completely independent of the cr41 I cr40 ratio of the production cross section. The existence of such a difference in age is in itself remarkable. (See also Geophys. Abs. 179-282). -D. B. V.
180-16. Gottfried, David, Jaffe, Howard W., and Senftle, Frank E. Evaluation of the lead-alpha (Larsen) method for determining ages of igneous rocks: U.S. Geol. Survey Bull. 1097-A, p. 1-63, 1959.
An evaluation is made of the limitations of the lead-alpha age method and its applicability to geologic problems. The largest source of analytical error is in lead analysis, particularly for minerals with less than 10 ppm of lead. For zircon and other accessory minerals with more than 10 ppm of lead, analytical precision is 4-10 percent of the mean of duplicate measurements. Agreement between the alpha emission measured by thick source alpha counting and that calculated from the uranium and thorium content of zircon and monazite indicates that the alpha activity measurements have an accuracy of about ± 5 percent.
Application of the method to large numbers of samples of igneous rocks younger than Precambrian produces a scatter pattern of age data similar to that expected from experimental error. Standard deviation from the mean age is about 10 percent or less for minerals of rocks older than Cretaceous; for younger rocks containing zircon with very low lead content, it is considerably greater than 10 percent but less than 10 million years. It is shown that the presence of common lead or the loss or gain of parent or daughter products do not contribute significantly to errors in age measurements of most of the rocks tested that were younger than Precambrian. With few exceptions these ages agree with the geologic sequence of events and with the Holmes B geologic time scale.
Lead-alpha ages are in good agreement with many ages determined by the lead isotope, Ar~OjK40, and sr8T/Rb87 methods on unmetamorphosed igneous rock minerals younger than Precambrian. Agreement with other methods is poor for zircon from Precambrian rocks, and it seems likely that lead has been lost by partial or complete recrystallization in response to metamorphic processes. Lead-alpha ages from metamorphosed igneous rocks do not yield the true age of igneous activity but may approach the age. of metamorphism. -V.S.N.
180-17. Jaffe, Howard W., Gottfried, David, Waring, Claude L., and Worthing, Helen W. Lead -alpha age determinations of accessory minerals of igneous rocks (1953-1957): U.S. Geol. Survey Bull. 1097-B, p. 65-148, 1959.
AGE DETERMINATIONS 9
Lead -alpha age determinations of accessory minerals from about 400 rocks completed by the U.S. Geological Survey between July 1953 and January 1957 are reported. The samples dated are predominately silicic to intermediate igneous rocks, which represent most ofthe major intrusive bodies in the United States; a limited number of specimens from Mexico, Canada, Norway, Finland, France, Ceylon, Nyasaland, Formosa, Greenland, British Territories in Borneo, and Saudi Arabia are included. All the ages and the experimental data, equations, and constants from which they were calculated are given in tabular form. The most probable geologic age of each rock is cited for comparison with the measured age. A geographic index of sample localities follows the tabulation. - V. S. N.
180-18. Kapitanov, Yu. T., and Serdyukova, A. S. Opyt ispol'zovaniya metodov s primeneniyem a-scheta dlya opredeleniya absolyutnogo geologicheskogo vozrasta gornykh porod [Experience with the use of alpha-counting methods for determination of the absolute geologic age of rocks]: Geokhimiya, no. 7, p. 615-620, 1957.
The absolute ages of nine zircons have been determined by studying radiation changes in their crystal lattices and using the absolute alpha-particle count in thin layers. The formula used in the calculations is given, together with a simplified form used for zircons less than. l X 109 yr old. The ages were also determined by the potassium-argon and lead-isotope ratio methods, and on three pure zircons by the lead-alpha method. Values calculated by the method of radiation change and by the lead-alpha method are in good agreement with values obtained by the other methods .. -D. B. V.
180-19. Broecker, Wallace S., Olson, Edwin A., and Orr, Phil C. Radiocarbon measurements and annual rings in cave formations: Nature, v. 185, no. 4706, p. 93-94, 1960.
The carbon-14 method has been used to test the hypothesis that the prominent rings found in certain calcite deposits of Moaning Cave in California represent annual growth variations. Measurements were made on a presumably active section of travertine covering a human femur. When dis.covered in 1951, the specimen had 1, 206 identifiable rings and about 200 obscured rings; thus, if the rings formed annually without interruption, the bone became the nucleus of the cave formation about 1, 400 years ago. The radiocarbon age of a sample with a mean depth of 1. 3 em in the specimen is 200 ± 100 yr, for one 7. 5 em in mean depth, 1, 200 ± 200 yr. It is concluded that the rings observed are annual, probably reflecting seasonal changes in mode of deposition, and that the carbon-14 method can be applied to such problems.- D. B. V.
180-20. Pelletier, Henri, Delibrias, Georgette, Labeyrie, Jacques, Perquis, Marie-Therese, and Rudel, Aime. Mesure de l'age de l'une des coulees volcaniques issues du Puy-de-la-Vache (Puyde-Dome) par lamethode du carbone-14 [Measurement of the age of one of the volcanic flows from the Puy-de -la-Vache ( Puy-deDome) by the carbon-14 method]: Acad. Sci. [Paris] Comptes Rendus, v. 249, no. 21, p. 2221-2222, 1959.
A carbonized oak branch found in the soil underlying one of the lava flows from the Puy-de-la-Vache in the Auvergne, France, has been dated by the carbon-14 method as 7, 650 ± 350 yr. -D. B. V.
10 GEOPHYSICAL ABSTRACTS 180, JANUARY -MARCH 1960
180-21. Mavritskiy, B. F. Ob istorii razvitiya Zapadno-Sibirskogo artezianskogo basseyna i perspektivy yego neftegazonosnosti [History of development of the West Siberian artesian basin and its oilgas prospects]: Geologiya Nefti, no. 4, p. 38-44, 1958.
Determination of the ground-water regimen in the West Siberian Lowland is best accomplished on a basis of age determination of the water. The formula T = He/A · 77.1 X 10⁶ yr is used. The ages thus obtained yield a consistent picture for the movement of younger waters through aquifers and their displacement of older waters.- J. W. C.
180-22. Kortsenshteyn, V. N. 0 zone geliyenosnykh zastoynykh podzemnykh vod yurskikh otlozheniy monoklinali tsentral 'nogo Predkavkaz' ya [Zone of helium-bearing stagnant ground water of the Jurassic sediments of the monocline of the central Cis-Caucasus]: Akad. Nauk SSSR Doklady, v. 125, no. 1, p. 173-176, 1959.
The age of ground water in Jurassic rocks of the Cis-Caucasus is determined using the formula of Kozlov (1950) and Savchenko (1953), which is T = He/ A · 115 X 106 yr. Ages ranging from 627 to 1, 234 million years are obtained. It is assumed that helium from the underlying rocks has migrated into the aquifer, thereby upsetting the He/ A ratio and precluding the use of this method for this particular water. - J. W.· C.
COSMOGONY
180-23. Hoffman, John H., and Nier, Alfred 0. Production of helium in iron meteorites by the action of cosmic rays: Phys. Rev., v. 112, no. 6, p. 2112-2117, 1958.
The helium distribution in a slice from the iron meteorite, Grant, has been measured and plotted in the form of contour maps. The contours of constant helium show a minimum helium content and isotopic ratio, He3/He4, near the center of the slice, the isotopic ratio varying from 0. 26 near the center to 0. 30 at the surface. A cosmogenic helium production rate equation was fitted to the data giving a He3 /He~ production ratio by primary cosmic rays of 0. 50 and "by secondary particles of 0.14. Primary and secondary particle interaction cross sections were found to be 540 mb and 720 mb, respectively. The ratio of the average postatmospheric radius to the preatmospheric radius of Grant was calculated to be 0. 65.- Authors' abstract
180-24. Murin, A. N., and Yutlandov, I. A.· K voprosu ob opredelenii kosmicheskogo vozrasta meteoritov [On the problem of determination of the cosmic age of meteorites]: Geokhimiya, no. 1, p. 33-35, 1957.
It is calculated that 1. 7 X 10l8 argon atoms, or 0. 06 cm3 of argon, are formed in 109 yr-in meteorites as a result of cosmic-ray action. The amount of neon is calculated to be 0. 01 cm3 in 109 yr. This is more than enoughfor mass-spectrometric determinations, from which the age of meteorites canbe calculated.- D. B. V.
180-25. Kvasha, L. G .. Akhondrity; vektornaya diagramma khimicheskikh sostavov [Achondrites; a vector diagram of their chemical compositions]: Akad. Nauk SSSR Meteoritika, no. 17, p. 23-46, 1959.
COSMOGONY 11
Achondrites lacking, or almost lacking in feldspar (chassignites, amphoterites, nakhlites, khladnites, urelites, and their variations) and those that consist almost entirely of feldspar were chemically analysed. A vector diagram was constructed from a table of 51 varieties of achondrites and 12 vavieties of ultrabasic and basic rocks from the earth. A comparison of chemical compositions of achondrites and the rocks of the earth's crust shown in the diagram indicates that the diversity and range of chemical composition of achondrites are the same as those of the ultrabasic and basic rocks.-A.J.S.
Voshage, H., and Hintenberger, H. Calculation of cosmic-ray ages in the iron meteorites "Carbo" and "Treysa. " See Geophys. Abs. 180-15.
180-26. Windsor, Maurice W. Volcanoes on the moon: Nature, v. 184, no. 4698, supp. no. 20, p. 1556-1557, 1959.
It is suggested that the emission of gases observed by Kozyrev on the moon (seeGeophys. Abs. 177-368)may be ascribed to an explosivelyexothermic recombination of radiation-damaged material, possibly triggered by an abnormally high level of incident radiation such as might occur during or after periods of intense solar activity. This hypothesis is based on two assumptions: that the upper layer of the moon's surface can store energy chemically in the form of free radicals and reactive chemical species, and that the temperature is low enough even during the lunar day that no chemical reaction takes place in the absence of disturbances of the kind postulated. Several implications and predictions regarding the proposed model are discussed. In this view, Kozyrev's observation is not incompatible with a meteor-impact origin for the moon's craters.- D. B. V.
180-27. Ur!iy, Harold C. Criticism of the melted moon theory: Jour. Geophys. Research, v. 65, no. 1, p. 358-359, 1960.
Difficulties in Kuiper's hypothesis that an original "accreted crust" floats on a completely molten subcrust in the moon are pointed out. As both crust and molten material are assumed to be of average primitive composition, the denser solid crust should disintegrate and sink into the liquid. Further, the age required to produce the melting is greater than present estimates of 5. 5 X 10⁹ yr; the moon's irregular shape implies substantial mechanical strength; and the assumed melting process (by radiogenic heat) is unrealistic in the light of corresponding terrestrial processes. -D. B. V.
180-28. Beard, David B. Absence of craters on the far side of the moon: Nature, v. 184, no. 4699, supp. no. 21, p. 1631, 1959.
If the reported lower incidence of craters on the moon's far side is correct, it may be readily explained by the effect of the earth's gravitational field on meteoric material orbiting around the sun. The directions of such particles relative to the plane of the ecliptic (plane of the earth's orbit) are uniquely related to their perpendicular distance to the ecliptic plane at the earth's orbit. Therefore, scattering components in the ecliptic plane, where particle velocities are isotropic, have no effect on particle flux on the moon's surface; scattering components perpendicular to the ecliptic plane, however, double the incidence of particles hitting the moon by directing particles above and below the earth towards the moon. In terms of particle energy K, the ratio of the number of craters on the earth side of the moon to the number on the far side is given by 2 or (1-2. 6/K), whichever is less; present observations and interpretations suggest that K is of the order of unity. -D. B. V.
12 GEOPHYSICAL ABSTRACTS 180, JANUARY -MARCH 1960
180-29. Bryunelly, B. [Bryunelli, B. Ye.], and Janovsky [Yanovskiy], B. [U.] Untersuchung der elektromagnetischen Variationen des Erdfeldes [Investigation of the electromagnetic variations of the earth 1 s field]: Freiberger Forschungshefte C60 Geophysik, p. 13 -16; 1959.
At the VNIIGeofizika research institute in the U.S.S.R. a simple relationship was established, based on the formulas of Tikhonov and Lepskaya (Geophys. Abs. 152-14249}, between the electric and magnetic fields of the earth for the case where these fields vary slowly with time and the conducting layers overlie nonconducting layers of greater thickness. In this case the field intensity vectors are horizontal and perpendicular to one another, and should be proportional to one another to the extent that the mean conductivity of the upper layer (that is, the quotient of the intensity in that layer and the mean specific resistance} is valid as a prqportionality factor. If the equation derived could be justified, the variation method would be applicable to prospecting; it should be simpler than the Tikhonov-Cagniard magnetotelluric method.
The proposal was tested in the laboratory using newly developed magnetographs with photoelectric amplification that are 100 times more sensitive than observatory instruments; they record both electric and magnetic components simultaneously. Field tests were made during an expedition in the Tumen area. The results show that the electrical conductivity of the earth 1 s crust as calculated from the proportionality factor between electrical (E) and magnetic (H) components is systematically 10 percent higher than that obtained by earlier methods. This discrepancy, as well as the fact that electric and magnetic variations are not perfectly simultaneous, can be explained as the effect of electric currents flowing in the crystalline basement; the latter, therefore, cannot be nonconducting as originally assumed.
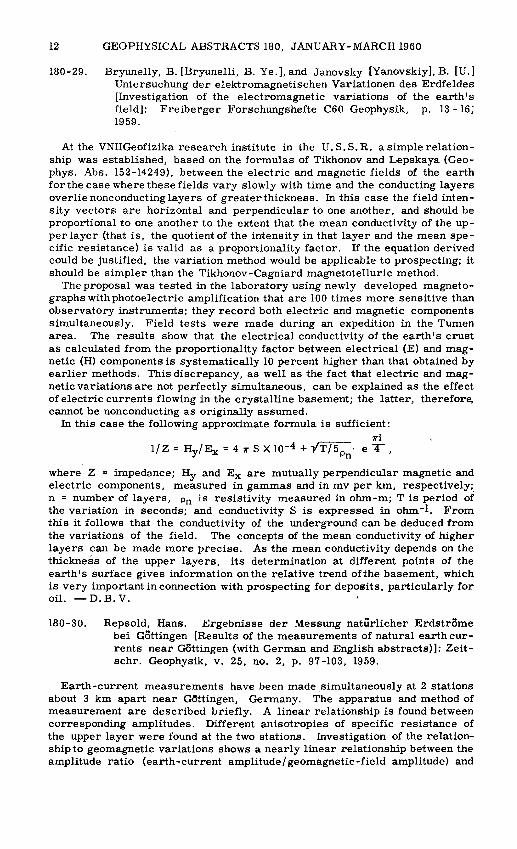
In this case the following approximate formula is sufficient: 11'i
1/Z = Hy/Ex = 4 1r S X 10-4 + VT/5Pn. e 4,
where Z = impedance; Hy and Ex are mutually perpendicular magnetic and electric components, measured in gammas and in mv per km, respectively; n = number of layers, Pn is resistivity measured in ohm-m; Tis period of the variation in seconds; and conductivity S is expressed in ohm -1. From this it follows that the conductivity of the underground can be deduc·ed from the variations of the field. The concepts of the mean conductivity of higher layers can be made more precise. As the mean conductivity depends on the thickness of the upper layers, its determination at different points of the earth 1 s surface gives information on the relative trend of the basement, which is very important in connection with prospecting for deposits, particularly for oil. -D.B.V.
180-30. Repsold, Hans. Ergebnisse der Messung natiirlicher Erdstrome bei Gottingen [Results of the measurements of natural earth currents near GOttingen (with German and English abstracts}]: Zeitschr. Geophysik, v. 25, no. 2, p. 97-103, 1959.
Earth-current measurements have been made simultaneously at 2 stations about 3 km apart near Gl5ttingen, Germany. The apparatus and method of measurement are described briefly. A linear relationship is found between corresponding amplitudes. Different anisotropies of specific resistance of the upper layer were found at the two stations. Investigation of the relationshipto geomagnetic variations shows a nearly linear relationship between the amplitude ratio (earth-current amplitude/ geomagnetic-field amplitude} and
EARTHQUAKES AND EARTHQUAKE WAVES 13
the square root of the frequency. The phase difference between earth currents and the magnetic field increases from 90° for low frequencies to nearly 180° for higher frequencies. -D. B. V.
180-31. Dupuy, Mlle. Dispositif electromecanique eliminant les variations lentes des courants telluriques [Electromechanical apparatus eliminating the slow variations of telluric currents]: Annales Geophysique, v. 14, no. 3, p. 392-393, 1958.
An electromechanical device is described that filters telluric currents over a wide range of frequencies. The beam of a balance supports a coil at each end; rotations of the balance correspond to displacements of the coils in the airgap of two fixed magnets. Each coil bears 2 independent windings, 1 anq 2 on the first, 1' and 2' on the second; these are connected to form 2 circuits, the first (1 and I') connected to the telluric line, the second (2 and 2') to a shunted galvanometer. The device is analogous to an electromagnetic seismograph. -D. B. V.
180-32.
EARTHQUAKES AND EARTHQUAKE WAVES
Smith, W. E. T. Bibliography of seismology - January -June, 1958: Dominion Observatory Ottawa Pubs., v. 22, p. 61-83,1959.
This is an addition to the author index of the "Bibliography of Seismology," a continuing series published at 6-month intervals (see also Geophys. Abs. 177-33,-34). -v. s. N.
180-33. Brazee, Rutlage J., and Cloud, William K. United States earthquakes 1957: U.S. Coast and Geod. Survey, 108 p., 1959.
This is a summary of earthquake activity for the calendar year 1957 in the United States and regions under its jurisdiction. Noninstrumental results are listed for all recorded earthquakes, and a summary is given in tabular form of seismological observatory and strong-motion seismograph results. V.S.N.
180-34. O'Reilly, John. Yellowstone quake: Natural History, v. 69, no. 1, p. 25-31, 1960.
The earthquakeofAugust 17,1959, in southwestern Montana (Hebgen earthquake), the fourth most severe ever recorded in the United States, produced a notable renewal of hot spring and geyser activity in nearby Yellowstone Park. New geysers, mud volcanoes, and fumaroles have appeared and a few, such as Grand Geyser, have ceased activity. One of the more spectacular changes is that of Sapphire Pool; formerly a clear pool that boiled over periodically, it now erupts boiling water 175 feet into the air at intervals from 30 minutes to It hours. No change has been noted in Old Faithful geyser. - V. S. N.
180-35. Eaton, J[erry] P., and Krivoy, Harold L. Hawaiian Volcano Observatorysummaryl2, October-December 1958: U.S. Geol. Survey Hawaiian Volcano Observatory Summ., no. 12, 8 p., 1959.
Seismographs at Uwekahuna recorded 338, 138, and 216 local earthquakes forthe months of October, November, and December, respectively. For the most part the earthquakes were mild and occurred near Kilauea caldera. Tilting at Whitney station was normal for all 3 months.
Local earthquakes of magnitude 2. 5 or greater and all distant earthquakes recorded on the islands of Hawaii and Maui are listed. - V. S. N.
557043 0 - 60 - z
14 GEOPHYSICAL ABSTRACTS 180, JANUARY -MARCH 1960
180-36. Trapp, Erich. Zehn Jahre Erdbebentatigkeit in Csterreich [Ten years earthquake activity in Austria]: Universum, v. 14, no. 19, p. 574-577, 1959.
The earthquake activity in 1949-58 in Austria is reviewed from the standpoint of frequency, intensity, and extent. Five earthquakes with an intensity between 6 and 6t occurred during this period; three of these were in Tyrol. The distribution of epicenters is shown on a map. These points are clustered and occur in zones that conform to the same . pattern as that of the last few decades. -J. W.C.
180-37. Sultanov, F. S., and Islamov, S. Sh. 0 nablyudeniyakh seysmicheskoy stantsii Budzhakh [Observations of the Budzhag seismic station (in Azerbaijan, with Russian summary}]: Akad. Nauk Azerbaydzhan. SSR Izv., no. 1, p. 95-102, 1959.
Four temporary seismic stations were established for study of the seismicityof the Nukha-Zakatal' massif in the Azerbaijan S. S. R. in the period 1954-56. Data of the Budzhag station located at the epicenter of the September 2-5, 1953, earthquake are analyzed. There is an anomaly for the azimuth and angle of arrival of the seismic waves for this station; this is apparently due to the presence of a dipping discontinuity near the station. The focus of tlie main Lagich earthquake of March 21, 1956, did not coincide with all focuses of the preliminary and aftershocks. These focuses constitute agroup disposed over an area. (See also Geophys. Abs. 171-76, 172-237, 174-29.} -J.W.C.
180-38. Gayskiy, V. N., and Katok, A. P. 0 seysmichnosti Tadzhikistana v 1956 [Seismicity of Tadzhikistan in 1956]: Akad. Nauk Tadzhik. SSR Inst. Seysmologii Trudy, v. 94, p. 3-13, 1958.
Analysis of the seismic data for 1956 confirms the basic conclusion made earlier on the presence in the area of two main seismic zones: the south TienShan and the Pamir Hindu Kush. These are separated by a belt of weak activity. The distribution of epicenters and intensity of shocks for each quarter of the year are shown on maps. The areal density of epicenters is also contoured on a map. A correlation between the course of change of the number of deep shocks and of shocks with a normal depth of focus indicates the presence of an interrelationship. - J. W. C.
180-39. Kukhtikova, T. I. K voprosu o sopostavlenii seysmicheskikh i geologicheskikh dannykh [On the problem of comparison of seismic and geologic data]: Akad. Nauk Tadzhik. SSR Inst. Seysmologii Trudy, v. 71, p. 21-28, 1957.
The relationship of the dynamic parameters of earthquake focuses to the structural elements of the Garro district in the Tadzhik S. S. R. is the basis for a discussion of the most logical means for comparison of seismic and geological data. It is noted that some recent tectonic movements are fully or partially influenced by the geologic structure; others are independent of it. -J.W.C.
180-40. Semenov, A-. A. Perechen' zemletryaseniy v sredney Azii i sopredel'nykh s neyu stranakh s drevnikh vremen do 1830 goda [List of earthquakes in central Asia and adjacent countries from ancient times to 1830]: Akad. Nauk Tadzhik. SSR Inst. Seysmologii Trudy, v. 94, p. 37-52, 1958.
EARTHQUAKES AND EARTHQUAKE WAVES 15
A list of earthquakes over a 1, 600-year period is presented. A bibliography of sources contains 14 references; these are largely by ancient eastern authors. A total of 130 earthquakes are described. The year alone is given for the early earthquakes; those of successively later date are known as to month, then day, and finally hour and minute. The shocks described are designated largely as strong. - J. W. C.
180-41. Gubin, I. Ye., and Kinyapina, T. A. Gazorchashminskoye zemletryaseniye 1956 g [Gazorchashmin earthquake of 1956]: Akad. Nauk. Tadzhik. SSR lnst. Seysmologii Trudy, v. 94, p. 15-28, 1958.
The Gazorchashmin earthquake of intensity between 7 and 8 occurred on February 22, 1956, at 14ho3m in the Garm region. This earthquake was a surface type; the focus was at a depth of 5 km or less. The focus occurred on the geologically defined Vakhsh structural step, a zone in which movement apparently occurs in connection with irregular uplift of the forward zone of the south Tien-Shan and the interior zone of Pamir. Strong and weak earthquakes at focal depths generally to 5 km have been registered previously in this zone. - J. W. C.
180-42. Kon 1kov, A. A. Nurekskoy zemletryaseniye 22 Sentyabrya 1956 g [Nurek earthquake of 22 September 1956]: Akad. Nauk Tadzhik. SSR lnst. Seysmologii Trudy, v. 94, p: 29-36, 1958.
The seismic net of the Tadzhik S. S. R. registered a strong earthquake on September 22, 1956, at 21h56m, 45 km southeast of Stalinabad. Other strong earthquakes have b.een recorded in this region in 1930, 1943, 1945, and 1954. Damage to structures and a number of small faults in loess are described. The intensity' of the earthquake is shown on a map; the epicentral zone lies within the intensity-a contour. The depth of the focus was 6.3 km. - J. W. C.
180-43. Leonov, N. N. Ulugchatskoye zemletryaseniye 1955 g [The Ulugchat earthquake of the year 1955]: Akad. Nauk SSSR Izv. Ser. Geofiz., no. ll, p. 1708-1713, 1959.
OnAprill5, 1955, a strong earthquake occurred in Sm 11tszyan, just north of the city of Ulugchat. Three shocks occurred at 3h4o 1, 4h12 1, and 4h14 1 Greenwich time. The geographic coordinates of the epicenter were determined as 4> = 39°9 1 N.; :\ = 74°6 1 E. This earthquake reached an intensity of 7 (Russian scale) near the village of AlaykE:H. Some manifestations of this earthquake were described by Rozova (see Geophys. Abs. 169-49). Damage to buildings caused by this earthquake was very extensive, especially to dwellings of poor construction built of adobe bricks. It is interesting to note that 60-90 minutes after the Ulugchat earthquake a new local very shallow shock occurred in the region of Katta-Kurgan some 75-100 km northeast. Leonov does not consider this as an ordinary aftershock but rather as a separate earthquake triggered by the Ulugchat earthquake. Such 11induced 11 earthquakes are known to have occurred in the Caucasus, northern Tien-Shan, and other regions. The depth of the Ulugchat focus was determined by different investigators as ranging from 80-120 km.- S. T.V.
180-44. Pasechnik, I. P. Vozdushnyye volny voznikshiye pri Gobi-Altay-skom zemletryasenii 4. 12. 1951 g [The air waves produced by the Gobi-Altay earthquake of December 4, 1957]: Akad. Nauk SSSR Izv. Ser. Geofiz., no. 11, p. 1687-1689, 1959.
16 GEOPHYSICAL ABSTRACTS 180, JANUARY -MARCH 1960
A description is given of the Gobi-Altay earthquake of December 4, 1957. The absence of seismic stations in this area made precise determination of the depth of the focus impossible. The intensity (M} of this earthquake was determined by many seismic stations from the intensity of surface waves as ranging from 7. 8 to 8. 6. The air pressure waves produced by this earthquake were measured by microbarographs installed at a provisional station located 2, 440 km from the epicenter. The variation of the aerial wave pressure was about 5-6 bars. Velocity of the propagation of the air wave is 320 m per sec. The geographic coordinates of the epicenter were determined as ~ = 45. 5° N., .:\. = 100. oo E. The focus was exceedingly shallow; it produced high intensity surface waves and only weak body waves.- S. T.V.
180-45. Jones, O[wen] S. Queensland earthquakes and their relation to structural features: Royal Soc. New South Wales Jour. and Proc., v. 92, pt. 4, p. 176-181, 1958(1959}.
The epicenters of all recorded Queensland earthquakes with two exceptions are in the region between the Main Divide and the coast; this is an area of highly folded and faulted rocks. The majority of shocks have occurred in the area to the west of the Maryborough Basin, and many of them are probably related to structures parallel to and associated with the basin. Most of the other epicenters can be associated with probable structural features, but basically this study clearly illustrates how little is known of the detailed structure of Queensland. The details of recorded Queensland earthquakes are given in two tables. - V. S. N.
Berg, E. Tectonics and seismicity of the Western Rift Valley. See Geophys. Abs. 180-203.
180-46. Petrushevskiy, B. A. Uralo-Sibirskaya epigertsinskaya platforma i Tyan'-Shan' [Ural-Siberian epi-Hercynianplatform andthe Tien Shan]: Moscow, Akad. Nauk SSSR, Geofiz. Inst., 552 p., 1955.
The structure of a vast area from the Ural Mountains on the west to the Yenisei River on the east and from the Amu Dar'ya River on the south to the Arctic Sea on the north is analysed in this book. Chapter 3 deals with the relationship of geologic and seismic phenomena. The determination of a connection between seismic phenomena and intensity of recent movements having a geomorphologic expression cannot be made; for example, there is no definite relation between the rate and magnitude of movement and the frequency and strength of earthquakes. The distribution of epicenters does not, in general, bear out a relation of earthquakes to faults or folds visible on the surface.
The present status of seismology apparently does not permit detailed determination of the depth of focuses; the maximum depth in the U.S.S.R., however, is about 300 km. - J. W. C.
180-47. Balakina, L. M. 0 raspredelenii napryazheniy, deystvuyushchikh v ochagakh zemletryaseniy severozapadnoy chasti Tikhogo Okeana [The distribution of stresses acting at the focuses of earthquakes in the northwestern portion of the Pacific Ocean]: Akad. Nauk SSSR Izv. Ser. Geofiz., no. ll, p. 1599-1604, 1959.
It is reasonable to assume that the genesis of an earthquake is not the result of local stresses at the focus but is the manifestation of the entire system of stresses acting in a seismic zone. Balakina presents the results of the study of 24 earthquakes occurring in the northwestern part of the Pacific Ocean, including the Japanese Islands, the Kurile Islands, and the Kamcha-
EARTHQUAKES AND EARTHQUAKE WAVES 17
tka Peninsula. The distribution of stresses in the mantle in this area is determined; two maps are presented. This distribution is in agreement with Benioff (see Geophys. Abs. 157-173}, who believes that the main factor in the formation of arcs or elongate ridges is horizontal compression directed at 90° to the axis of the ridge. This type of stress can be explained by subsidence of the bottom of the Pacific Ocean, which in turn produces pressure along the coast directed toward the continent.- S. T.V.
180-48. Savarenskiy, Ye. F. Izucheniye tsunami [Study of tsunami]: Akad. Nauk SSSR Vestnik, no. 9, p. 11-15, 1958.
Tsunami are considered to be a result of faulting in the ocean floor. It is suggested that the catastrophic tsunami of November 4-5, 1952, in the Kuriles and Kamchatka was caused by an elastic failure of the earth's crust and subcrust along the Kurile-Kamchatka arc. The ocean floor is subsiding on the east of the Kurile Trench and rising on the west. The resulting compression and tension strains in the boundary zone between these opposing movements sporadically give rise to faults hundreds or even thousands of kilometers long; these produce underwater earthquakes which cause tsunami. Since seismicand acoustic-wave velocities are greater than the tsunami velocity (about 0. 2 m per sec}, Savarenskiy suggests a determination of ocean-floor epicenters by data from special high-speed seismographs (developed at the Institute of the Physics of the Earth} combined with hydroacoustic observations of the pressure-wave front of a tsunami. -A. J. S.
180-49. Popov, G. I. 0 polozhenii epitsentrov tsunamigennykh zemletryaseniy Dal'nego Vostoka [The location of epicenters of tsunami-producing earthquakes of the Far Eastern Region]: Akad. Nauk SSSR Izv. Ser. Geofiz., no. 8, p. 1199-1201, 1959.
Submarine landslides due to earthquakes in the Kamchatka-Kurile area extend over broad areas and involve an enormous volume of water; great tsunami can thus be produced. This feature of earthquakes is to be taken into consideration in evaluating the tsunami danger.- S. T.V.
180-50. Solov'yev, S. L., and Shebalin, N. V. Zunami i intensivnost' Kurilo-Kamchatskikh zemletryaseniy [Tsunami and magnitude of Ku-rile-Kamchatka earthquakes]:Akad. NaukSSSR Izv. Ser. Geofiz., no. 8, p. 1195-1198, 1959.
The U.S.S.R. is now organizing a service in the Far Eastern Region to alert the population to the danger of impending tsunami. Special seismic stations will be installed for the rapid determination of the coordinates of earthquake focuses. Criteria must be established for recognizing an earthquake that will cause a tsunami. It has been established empirically that tsunami are produced only by an earthquake of magnitude ~ 7 ~ . A nomogram covering the Far Eastern Region is reproduced; it gives the degree of danger from an incoming tsunami for any epicentral distance.- S. T.V.
180-51. Dubrovskiy, V. G. Opyt primeneniya differentsial'nogo metoda izucheniya seysmoelektricheskikh yavleniy [Experiment in the use of the differential method of study of seismoelectric phenomena]: Akad. Nauk Turkmen. SSR, Inst. Fiziki i Geofiziki Trudy, v. 4, p. 9-12, 1958.
The differential method of study of seismoelectrical phenomena as forerunners of an oncoming earthquake proposed by Ivanov (see Geophys. Abs.
18 GEOPHYSICAL ABSTRACTS 180, JANUARY -MARCH 1960
144-12539) is discussed with regard to techniques, organization, and application of the method. The purpose of the study is to find a way of reducing the background geoelectric, geomagnetic, and ionospheric disturbances in order to separate and record the parts of the disturbances that are due to tectonic processes at the focus of the developing earthquake. The experimental field tests carried out by the Turkmen Academy of Science in 1954 are described. -A.J.S.
180-52. Stovas, M. V. Peremennost' vrashcheniya Zemli i geotektonika [Variability of the earth's rotation and geotectonics]: L'vov. Geol. Obshch. Geol. Sbornik, no. 5-6, p. 447-461, 1958.
This investigation is based on the assumption that the earth's angular velocity decreases gradually during an historical period of time; this decrease takes place unevenly, that is, at certain particular moments the angular velocity increases and then slows down. Stovas presents evidence ~f a close correlation (0. 886) between the energy of deep-focus earthquakes and the energy of year-to-year variations in the rotation of the earth (1906-44). On the basis of earlier investigations (see Geophys. Abs. 172-92, 178-52) Stovas believes that large fluctuations are superimposed on the rate of decrease of the earth's angular velocity due to tidal friction, and such fluctuations are probably the result of internal and external (cosmic) causes.- A. J. s.
180-53. Droste, Sophia [Zofia]. and Teisseyre, Roman. The m.echanism of earthquakes according to dislocation theory: Tohoku Univ. Sci. Repts., ser. 5, v. ll, no. 1, p. 55-71, 1959.
Droste, S[ophia (Zofia)], and Teisseyre, R[oman]. The mechanism of earthquakes in terms of the dislocation theory: Annali Geofisica, v. 12, no. 2, p. 179-188, 1959.
These papers are essentially the same. A new theory of earthquake mechanism is presented, based on the assumption that there is a nonhydrostatic part of stress in the medium as well as a field of inhomogeneities in the broadest sense. Even very small inhomogeneities may serve as points of attachment; they constitute the nuclei of discharge of strain energy in the medium, and together with stresses they determine the area of the earthquakes. These assumptions are considered in the light of the physical theory of dislocation, which may be interpreted as the theory of inhomogeneities in a field of forces.
E!ilrthquake mechanism is presented as a violent movement of the dislocation line or a violent deformation of the dislocation area; release of energy accumulated along the dislocation line occurs at the moment when two dislocation areas join or when the dislocation reaches the earth's surface. Com.:.. parison of theoretical with observed energy release shows good agreement in the case of four earthquakes.- D. B. V.
180-54. Mikumo, Takeshi. A consideration on generation mechanism of local earthquakes: Kyoto Univ. Coll. Sci. Mem., ser. A, v. 29, no. 2, p. 221-240, 1959.
For clarifying the mechanism of occurrence in microearthquakes, the pushpull pattern of initial motions and the amplitude distribution of the P and S waves were studied for numerous local shocks generated in the Wakayama district, Japan. Distribution of theoretical amplitudes of the P and S waves for both quadrant and conical type mechanism were calculated and compared with observed values at each station. The agreement was good in the conical type, and this was assumed as the mechanism for local earthquakes.
EARTHQUAKES AND EARTHQUAKE WAVES 19
For more than half the shocks, the half angle of the angle of vertex of the nodal cone was found to range from 60° to 70° with a frequency distribution similar to that of the Gaussian. The inclination angle of the conical axes was distributed between 0° and 40°. Neither seemed related to the focal depth and no systematic pattern was found in the geographical distribution of the orientations of the conical axes. A certain relationship, however, seems to exist between the vertical angle of the nodal cone andthe period ofthe initial waves and, thus, it is presumed that the focal region may have an azimuthal difference in its shape. - V.S. N.
180-55. Aki, Keiiti. The use of Love waves for the study of earthquake mechanism: Jour. Geophys. Research, v. 65, no. 1, p. 323-331, 1960.
Long-period Love waves of continental path were successfully used for the study of earthquake mechanism. Wave forms were compared for earthquakes of similar size that occurred within a limited area and were recorded by the same instrument at a given station. For the aftershocks of the Kern County earthquake of 1952 and for the Nevada earthquakes of 1954, the direction of lateral fault motion derived from Love wave data agreed perfectly with that derived from body-wave data. The Love wave evidence also strongly supports Honda's hypothesis that the source is a pair of couples (see Geophys. Abs. 170-48, 178-69).- D. B. V.
180-56. Gutenberg, B[eno]. Wave velocities below the Mohorovicic discontinuity: Royal Astron. Soc. Geophys. Jour., v. 2, no. 4, p. 348-352, 1959.
Longitudinal-wave velocities immediately below the crust, found by various investigators. for continental regions, decrease on the average from about 8. 2 kmps, if the M-discontinuity is 30 km deep, to about 8. 0 kmps, if it is 50 km deep. The rate of decrease in velocity (0. 011 ± 0. 0016 kmps per km) is statistically significant and exceeds appreciably the critical rate of 0. 0013 kmps per km required for a low-velocity channel. The corresponding average decrease in transverse-wave velocity from 4. 64 kmps if the M-discontinuity is at 30 km to 4. 56 kmps if it is at 50 km(a rate of 0. 004±0. 0056kmps per km) can be expected to represent average conditions only if this decrease in velocity is considered in connection with that for longitudinal waves. For a depth of 60 km both calculated velocity-depth curves connect smoothly with those found by Gutenberg from earthquake traveltimes. The new results confirm the hypothesis that under continents, the asthenosphere low-velocity channel starts at the M-discontinuity.- D. B. V.
180-57. Lehmann, I [nge]. Velocities of longitudinal waves in the upper part of the earth's mantle: Dominion Observatory Ottawa Pubs., v. 19, no. 10, p. 381-406, 1959, reprinted from Annales Geophysique, v. 15, no. 1, p. 93-118, 1959.
This investigation deals with the upper part of the earth's mantle in Europe. The P-traveltime curve is taken to be nearly a straight line up to about 15° epicentral distance; therefore, the velocity at depth can be derived only by trial and error and not by the direct method. The velocity gradient is taken to be quite small or zero in an upper layer, which extends to a depth of 220 km where an abrupt increase of velocity and velocity gradient occurs. From about 15° onwards the P curve becomes associated with waves refracted in the deeper layer. Velocities derived are given in a table and compared with those of Jeffreys. Up to 22° the corresponding P curve is in good agreement with Jeffreys' revised 1954 curve.
20 GEOPHYSICAL ABSTRACTS 180, JANUARY -MARCH 1960
Properties of P and pP curves of shocks having focuses at some depth in the upper layer are considered. The P times of some deep Rumanian earthquakes all from the same focus and of a deep Tyrrhenian Sea earthquake are compared with those calculated.
It is concluded that the solution for a velocity function here adopted is a possible one but is not unique. More observations are required; more precise determinations of amplitude variation would be particularly useful.-- V.S.N.
180-58. Gayskiy, V. N., and Abdurashitova, Z. Ugly vykhoda prodol'nykh voln pri glubokikh Afganskikh zemletryaseniyakh [Angles of emergence of longitudinal waves in connection with deep Afghan earthquakes]: Akad. Nauk Tadzhik. SSR Inst. Seysmologii, Trudy, v. 94, p. 83-90, 1958.
Values of the angles of emerg~nce of longitudinal waves from deep earthquakes in Afghanistan were obtained at 74 seismographs. The average quadratic error was determined for each earthquake; it was a minimum of3-7° for each determination and 2-5° for the average value of the angle for a particular depth of focus. For the seismic stations of the Stalinabad regionit has proved not possible in practice to determine depth of focus by means of the angle of emergence, at the present level of accuracy and with present knowledge of the structure of the crust under the stations. The angle of emergence, however, may be useful in elucidating crustal structure in these areas.J.W.C.
180-59. Kamitsuki, Akira. On local character of Poisson's ratio in the earth's crust: Kyoto Univ. Coll. Sci. Mem., ser. A, v. 29, no. 2, p. 163-185, 1959.
The P-S diagram is effectively used to detect any areas of anomalous value of Poisson's ratio in the earth's crust. Numerous results previously obtained indicate that the earth's crust may have distinct local characteristics. In this paper a study of the crust of the Kyushu district, Japan, is discussed in detail. The value of the ratio Vp /V sis correlated with the focal depth of each of 12 earthquakes that occurred in or near Kyushu. An anomalously large value of about 1. 80 to 1. 85 for the ratio Vp/V s was found to occur at depths ranging from about 20 to 40 km in the earth's crust. This anomaly suggests the possible existence of a local magmatic reservoir.
Secular variation of seismic wave velocities has been reported by other investigators, and it is possible that the value of the ratio of Vp/V s may vary with time. Further research on the value of the ratio is recommended as an important means of increasing knowledge of the earth's crust.- V. S. N.
180-60. Kamitsuki, Akira. On azimuthal distribution of the crustal Poisson's ratio in case of earthquake occurrences (preliminaries): Kyoto Univ. Coll. Sci. Mem., ser. A, v. 29, no. 2, p. 213-220, 1959.
In orderto clarify the cause and mechanism of earthquakes, a P-S diagram analysis is applied to some shallow earthquakes in Japan. With this method, the value of Poisson's ratio depends only on the elastic properties of the earth's crust. Examination of sh~low earthquakes having a quadrant-type distribution of initial motion showed the value of Poisson's ratio to be considerably different in the push and pull zones. This may be related to the partition of stress energy causing the P and S waves.
In the case of the Yoshino earthquake where the focus was below the Mohorovicic discontinuity, no conspicuous effect could be found. This possibly may be due to its greater depth or to a mechanism of another type.- V. S. N.
180-61.
EARTHQUAKES AND EARTHQUAKE WAVES 21
Benioff, H[ugo]. Long waves observed in the Kamchatka earthquake of November 4, 1952: Jour. Geophys. Research, v. 63, no. 3, p. 589-593, 1958.
The electromagnetic strain seismograph developed to record waves in the 5-20 sec period range has a recording galvanometer of 3-min period and equivalent pendulum magnification factor for surface waves of 20. The first great earthquake recorded by this seismograph combination was the Kamchatka shock of 1952. Portions of the strain seismogram are reproduced. The most prominent event in the first part is the G1 wavelet, a horizontally polarized surface wave with no vertical component. G-wave traveltime around the earth measured by comparing arrival time intervals for G4 -G2 and G3 -G1, was 152. 3 min, corresponding to a surface velocity of 4. 38 kmps.
A wave not previously observed had a period of 2. 8 min in its initial portion and 2. 25 min in the ensuing portion; its traveltime is that of (PS PS PS)2. A wave of 57-min period may represent a free vibration of the earth excited by the earthquake. A strain pulse of approximately 12-hr duration is prominent in a plot of measured points on a 24-hr time scale; this pulse may represent a worldwide strain readjustment in response to strain release at the earthquake source.- D. B. V.
180-62. Bath, Markus. Channel waves [with discussion]: Jour. Geophys. Research, v. 63, no. 3, p. 583-587, 1958.
Four models that attempt to explain channel waves in the earth are presented. Of these Bath prefers the ''revised model", a combination of his original model and Gutenberg's (see Geophys . .Abs. 163-99, 161-99); it differs from Gutenberg's model by introducing Li, propagated in the intermediate layer, and by restricting Lgl to the uppermost layer of the crust. The "classical" model is shown to be improbable. Low-velocity layers appear to be necessary.- D. B. V.
180-63. Sato, Y[asuo]. Classification of surface waves and related topics [with discussion]: Jour. Geophys. Research, v. 63, no. 3, p. 635-636, 1958.
The symbols [E] and [S], respectively, are used to designate surface waves whose amplitude varies exponentially and sinusoidally with distance in the direction normal to the boundary; single or double bars over these symbols denote free or fixed surfaces, and [EE] or [SS] indicates that two body wave types are involved in the motion. Love waves are represented by [S/E] and Stoneley waves by [EE/ EE]; two media with different properties are required for their existence. Rayleigh waves, requiring only one medium, are represented by [EE]. Surface waves expressed by n letters are called n-phase type; thus, Rayleigh and Love waves are 2-phase-type waves and Stoneley waves are 4-phase-type waves. -D. B. V.
180-64. Kovach, Robert L. Surface wave dispersion for an Asio-Mrican and a Eurasian path: Jour. Geophys. Research, v. 64, no. 7, p. 805-813, 1959.
Love and Rayleigh waves in the period range of 20 to 83 seconds were well recorded at Lwiro, Belgian Congo, from an Aleutian shock on March 20, 1958. The epicentral distance is 14, 240 km (128°), and the direct path is almost entirely continental. The path through the antipodes is almost entirely oceanic, and the corresponding Rayleigh waves were recorded at Lwiro and at Pieter-
22 GEOPHYSICAL ABSTRACTS 180, JANUARY -MARCH 1960
maritzburg, South Africa. Dispersion data indicate an average crustal thickness of slightly less than 40 km for the continental path and a mean sediment thickness of 0. 8 km for the oceanic path.
Uppsala seismograms of the Sinkiang shock of June 24, 1958, exhibited fundamental and higher mode Love waves, Rayleigh waves affected by near-surface sediments, and higher mode Rayleigh or M2 waves. An average crustal thickness of about 45 km is indicated for the path which was studied. This result agrees well with available Russian refraction measurements.-Author 1s abstract
180-65. Arkhangel 1skiy, V. T. 0 chuvstvitel 1nosti electrodinamicheskogo seysmonaklonomera s gal 1vanometricheskoy registratsiey [Sensitivity of an electrodynamic seismic tiltmeter with galvanometric recording]: Akad. Nauk Turkmen. SSR lnst. Fiziki i Geofiziki Trudy, v. 4, p. 3-8, 1958.
In a search for indicators for forecasting local earthquakes, Arkhangel 1 -
skiy studies tilt motions of the earth 1 s surface from the records of seismic tiltmeters. Since this instrument records the derivative of a tilt in time, the magnitude of th~ tilt for a given period of time can be determined. The effect of a tilt on the pendulum and galvanometer motions of the apparatus are discussed, and the fundamental equations determining the sensitivity ofthe seismic t~tmeter are derived. -A. J. S.
180-66. Pachadzhanova, G. N. K voprosu o primenyayemosti razlichnykh godografov dlya obrabotki blizkikh melkikh zemletryaseniy sredney Azii [Problem of the use of various hodographs for treatment of near small earthquakes of central Asia]: Akad. Nauk Tadzhik. SSR lnst. Seysmologii Trudy, v. 94, p. 53-62, 1958.
Data of observations of the wide net of seismic stations of central Asia are at present worked up according to the traveltime curves of Rozova. Use of the Jeffreys traveltime curve, however, has been recommended. The accuracy of the two methods is compared. Treatment of 10 earthquakes of different regions of the Tadzhik S.S.R. demonstrates that the positions of the epicenters as determ.ined by the two methods do not differ significantly.-- J. W. C.
180 ... 67. Kozlov, A. B. 0 nekotorykh trudnostya.kh pri postroyenii prostranstvennykh dinamicheskikh godografov [Some difficulties in construction of spatial dynamic hodographs]: Akad. Nauk Tadzhik. SSR Inst. Seysmologii Trudy, v. 94, p. 63-81, 1958.
The problem of the calibration and stability of apparatus is examined. Instruments at the same station and at several stations may differ in their calibration by 20 percent or more. The stability of a channel at different times may differ by i5-20 percent. The attempt is also made to calculate the local conditions at the different stations of the Stalinabad network. -- J. W. C.
180-68. Ambraseys, Nicholas N. A note of the effect of surface loading on the shear response of overburden: Jour. Geophys. Research, v. 65, no. 1, p. 363-366, 1960.
The solution to a problem that often arises in earthquake engineering is given briefly. The problem is to find the shear response characteristics of an elastic homogeneous overburden subject to a seismic base disturbance when its surface is uniformly loaded. An example is given at the base and top, and the periods of the first two modes offree undamped oscillation are determined for an alluvial deposit 16 feet thick.- D. B. V.
180-69.
EARTH TIDES AND RELATED PHENOMENA 23
Medvedev, S. V. Eksperimental'nyye issledovaniya kolebaniy zhestkikh sooruzheniy pri seysmicheskikh vozdeystviyakh [Experimental investigations of the vibrations of rigid structures under seismic influences]: Akad. Nauk SSSR Inst. Fiziki Zemli Trudy, no. 1 (168) (Voprosy inzhenernoy seysmologii no. 1), p. 65-129, 1958.
In most cases it is impossible to discuss the problem of the vibrations of a structure independently of the vibrations of the ground; it is necessary to arl;
alyze the vibrations of the entire system. This is especially true in the case ofvibrations produced by earthquakes. In selecting a hypothesis on the modes of vibrations, it is advantageous to start with assumptions corresponding at least approximately to reality. Thus, before starting the mathematical analysis it is important to determine the mode and the amplitudes of several probable vibrations. One part of this article deals with the measurement of vibrations of different floors and wings of a structure and of the ground. A special apparatus consisting of a vibrograph, oscillograph, and galvanometers was designed and built for this purpose; with 6-12 channels, it could measure and record simultaneously vibrations at as many as 12 points. Deformation of the ground or its vibration produced by any factor must be established by a geophysicist and given tothe engineer designing the structure and the foundation, together with a brief outline of the geology of the adjoining area. The results of the measurements of vibrations made on several structures are presented, and several oscillograms and numerical data are given. The structures were a nearly rectangular three-story brick building and a brick church tower. The computations can serve as an example of the procedure to be followed in analyzing the vibrations of similar structures .. The study clearly indicates the division of the work of the engineer and of the geophysicist. -S.T.V.
180-70.
EARTH TIDES AND RELATED PHENOMENA
Pertsev, B. P., Pariyskiy, N. N., and Kramer, M. V. Sravneniye razlichnykh metodov garmonicheskogo analiza prilivnykh deformatsiy zemli [A comparison of various methods of harmonic analysis of the tidal deformations of the earth]: Akad. Nauk SSSR Izv. Ser. Geofiz., no. 2, p. 242-243, 1959.
Four methods of harmonic analysis of earth tides have been compared . The Pertsev method compared to those of Doodson, Lennon, and Lecolazet does not differ as to the amount of labor involved; Pertsev' s method, however , is slightly more precise. A study by Lecolazet (see Geophys. Abs. 177-79), not included in the comparison, takes into account higher harmonics, which probably increase the precision of his method.- S. T.V.
180-71. Longman, I. M. Formulas for computing the tidal accelerations due to the sun and moon: Jour. Geophys. Research, v. 64, no. 12, p. 2351-2355, 1959.
A summary of formulas by means of which tidal accelerations due to the moon and sun can be computed at any given time for any point on the earth's surface, without reference to tables, is presented. The form~las are convenient for computer use. The equations were checked by computing anumber of cases on an IBM 709 computer and comparing the results with computations based on Pettit's paper (see Geophys. Abs. 157-11) and also with unpublished computations by Pettit on the S. W. A. C. machine. In every case agreement to within a fraction of a microgal was obtained. -D. B. V.
24 GEOPHYSICAL ABSTRACTS 180, JANUARY -MARCH 1960
180-72. Service Hydrographique de la Marine and Companie Generale de Geophysique. Tidal gravity corrections for 1960: Geophys. Prosp., v. 7, supp. no. 1, 53 p., 1959.
Three tables give the corrections for hourly intervals throughout 1960, that must be added to observed gravity values in order to eliminate the disturbing effect of the sun and moon. The factor l. 2 introduced by the earth's elasticity has been incorporated in the values given. The corrections are given in units of a hundredth of a mgal to the nearest half unit. Table 1 can be used for all longitudes; table 2 is for longitudes ranging from 45° W. to 75° E. (Europe, Africa, and the Near East) and from 135° E. to 105° W.; and table 3 is for longitudes ranging from 15° W. to 135° W. (the American continents) and from 45° E. to 165° E. (the Far East). -D. B. V.
180-73. Haubrich, Richard, Jr., and Munk, Walter [H]. The pole tide~ Jour. Geophys. Research., v. 64, no. 12, p. 2373-2388, 1959.
About 11, 000 mean monthly values of sea level from 11 tide stations have been analyzed by the method of Tukey to obtain the power spectrums in the frequency range of 0. 0125 to 6 cycles per year. The results show a sharp rise at the low-frequency tail, presumably associated with sea-level variations arising from continental unrest; the line spectrum associated with the annual variation and its harmonics; and a weak peak of 0. 84 cycles per year, barely above noise level, which is identified with the 14 -month "pole tide" corresponding to the earth's free nutation (Chandler wobble). The average pole tide for all stations gives an amplitude twice that predicted by the equilibrium theory.
The tidal-effective Love number k of the planet earth (derived from the period of free nutation) is usually set equal to the corresponding number ke for the solid earth (derived from seismic observations), but there should be a difference because of the effects of the ocean and the fluid core. If the pole tide follows the equilibrium law the two effects happen to cancel; if it does not follow this law, there is no way at present to compare k and ke. - D.B. V.
180-74. Melchior, P[aul] [J]. Zavisimost' mezhdy dvizheniyem polyusa i izmeneniyami skorosti vrashcheniya zemli [Relationship between the movements of the poles and variations in the rate of the earth's rotation]: Astron. Zhur., v. 36, no. 5, p. 920-933, 1959.
An attempt is made broadly to reconcile the results of astronomical observations of the pole movement and the variation of the earth's rotation with purely geophysical observations, such as earth tides, general atmospheric circulation, and continued regression of glaciers. The following 3 problems are discussed: (a) the correlation between the free component in the pole movements and the semimonthly, monthly, and the semiannual variation in the rate of the earth's rotation, earth tides, seismic activity, and isostatic uplift and subsidence; (b) the correlation between the forced annual component of the pole's motions and the annual variation in the rate of the earth's rotation, meteorological phenomena, and oceanographic phenomena; (c) the correlation between the secular pole displacement, the secular variations in the rotation rate of the earth, and glaCial phenomena. Melchior suggests a new term "geophysical astronomy" for the kind of studies he proposes in this paper. -A.J.S.
180-75. Brower, D. Flyuktuatsii i vekovyye izmeneniya skorosti virashcheniya Zemli [Fluctuations and secular variations of the earth's rotation rate]: Astron. Zhur., v. 36, no. 5, p. 933-935, 1959.
EARTH TIDES AND RELATED PHENOMENA 25
Turbulent movements in the earth's core may be the cause of the unsystema tic variations in the rate of the earth's rotation. Movements of this type result in variations of the earth's moment of inertia and produce values in the westward drift ofthe earth's magnetic field in good agreement with the observed variation of the length of the day. Observations of the character of the fluctuation curve show its intermediate position between two interpretations, one containing a term correlated with the friction between the core and the mantle and another without this term. These observations indicate that the earth's rate of rotation is affected by two distinct causes.- A. J. S.
180-76. Jeffreys, Harold. Nutation; comparison of theory and observations: Royal Astron. Soc. Monthly Notices, v. ll9, no. 2, p. 75-80, 1959.
Theoretical values are given for the principal, semiannual, and fortnightly nutations, based on the central particle and Roche earth models. These are compared with Fedorov's observed values. Agreement is better than in any previous comparison. The fortnightly terms are almost the same for both models and agree with observation. Both components of the semiannual motion agree best with the central particle model. The observed 19-yearly motion in obliquity agrees best with the central particle model, that in longitude best with the Roche model, and some discrepancy ·would remain for any model. -Author's summary
180-77. Jeffreys, H[arold]. Nutatsiya i kolebaniye shiroty [Nutation and latitude variation]: Astron. Zhur., v. 36, no. 5, p. 918-920, 1959.
On the basis of two extreme models of the earth's core selected in such a way as to preserve correct values of the earth's mass and moment of inertia (see Geophys. Abs. 175-74, -75), a geophysical evaluation of the mechanical characteristics of the earth's crust is given. The latitude-variation period was foundto be 392 days; this becomes 430 days when the ocean effect is considered. The 18. 6-year nutation value is found to be in better agreement with observational data than values given by other theoretical determinations; however, it is not yet completely satisfactory. -A. J. S.
180-78. Fedorov, Ye. P. Nutatsiya po dannym shirotnykh nablyudeniy [Nutation according to the data of latitude observations]: Astron. Zhur., v. 36, no. 5, p. 914-918, 1959.
From the new values of coefficients of certain members of the nutation equation, determined from numerous latitude observations, the nutation's constant value is found to be considerably smaller, and the values of the semiannual and semimonthly members are larger than the respective theoretical values determined on the assumption that the earth is a totally elastic body. The theoretical values of the ratio of the nutation ellipse axes need no correction. From comparison of observational and theoretical data, it is concluded that the results obtained agree qualitatively with what could be expected from the theory of dynamic effects of the fluid core of the earth. -A.J.S.
180-79. Fedorov, Ye. P. Nutatsiya i vynuzhdennoye dvizhenniye polyusov Zemli po dannym shirotnykh nablyudeniy [Nutation and forced motion of the earth's poles from data of latitude observations]: Kiev. Akad. Nauk Ukrain. SSR, ll4 p., 1958.
Using data from the theory of precession and nutation of an absolutely rigid earth, differential equations of motion of the kinetic angular momentum of
26 GEOPHYSICAL ABSTRACTS 180, JANUARY -MARCH 1960
the earth are derived and solved for a perfectly elastic earth. The motion of the poles during elastic deformation of the earth is analyzed; Fedorov concludes that all terms in Oppolzer's formula for nutation should be reduced by a common multiplier (1- Ka>. where Ko is the difference between angular momentum at the equator and the poles, corrected for the effect ofocean tides.
The principal terms of the earth's nutation are evaluated on the basis of data on latitude variation, and the forced motion of the poles is determined. The value of the nutation constant N is found to be 9.1980" ± 0. 0018". The observed values of nutation and latitude variation are compared with the theoretic results. Considerable divergence is found; this may necessitate an adjustment in the value of K
0 in the theoretical formula and lead to a different con
cept concerning the earth's mechanical properties. Interaction between core and mantle is discussed finally. The theory developed in the first part does not take into account the viscosity of the core, elastic deformation in the mantle, or effect of magnetic forces. ---A.J.S.
180-80. Fedorov, E. [Ye.] P. On the computation of the pole coordinates: Bull. Geod., no. 54, p. 29-34, 1959.
It is urged that in processing International Geophysical Year data the polar coordinates should be calculated on the basis of data from all available obs~rvatories for the following reasons: (a) the stations of the International Latitude Service now provide only a third of the total latitude observations, (b) no longer can it be assumed that nonpolar variations are identical for all these stations and, (c) no longer can it be assumed that irregular changes of mean latitude are exceptional. - D. B. V.
ELASTICITY
180-81. Richter, C[harles] F. Body waves in inhomogeneous media: Jour. Geophys. Research, v. 63, no. 3, p. 607-608, 1958.
It is demonstrated for 2 special cases that 3 differential equations of motion with 3 different sets of constant parameters exist for wave propagation in inhomogeneous isotropic mediums. These particular cases have no seismological inter.est; but if three wave types exist for these, they must also be considered in more general cases. -D. B. V. ·
180-82. Borodachev, N. M. 0 postroyenii obshchego resheniyadinamicheskoy zadachi teorii uprugosti dlya poluprostranstva [The development of a general solution ofthe dynamic problem of the theory of elasticity for semispace]: Akad.' Nauk SSSR Izv. Ser. Geofiz., no. 11, p. 1684-1686, 1959.
The problems related to unsteadyvibrations in an elastic semispace at present are mostly solved either by the method of functional invariants (the method of Smirnov and Sobolev) or by the method of contour integrals. Borodachev suggests a new method called the method of integral transformations and presents a mathematical derivation for an isotropic elastic medium, a system of equations in vectorial form representing the components of the displacements n, v, w, in Descartian coordinates. Applying Laplace transformation to this system and also the two - dimensional Fourier transformation, Borodachev after rather long analjtical transformations obtains final formulas for the determination on the basis of given boundary conditions. The treatment is purely theoretical. - S. T. V.
180-83.
ELASTICITY 27
Davies, R. M. Approximate theories of the propagation of elastic waves in bounded solids [with discussion]: Jour. Geophys. Research, v. 63, no. 3, p. 609-612, 1958.
An approximate theory of wave propagation can be tested by applying it to a case where the exact solution is known, such as an infinitely long right circular cylinder of radius a. The simplest comparison that can be made is comparison of dispersion curves; another is to compare the curves which illustrate how the components of the field vectors depend on radial distance for various values of a/>.. (>.. = wavelength). -D. B. V.
180-84. Menzel, H[einz ]. Propagation of seismic waves through a layer with velocity increasing linearly with depth: Jour. Geophys. Research, v. 63, no. 3, p. 605-606, 1958.
The results of mathematical study of the propagation of a plane compressional wave in an isotropic elastic half space in which the density is constant and the elastic parameters vary linearly with depth are presented briefly.D. B. V.
180-85. Khaykovich, I. M., and Khalfin, L. A. Ob effektivnykh dinamiche~ skikh parametrakh- neodnorodnykh uprugikh sred pri rasprostranenii ploskikh prodol'noy volny [The effective dynamic parameters of heterogeneous elastic media through which a plane longitudinal wave is propagating]: Akad. Nauk SSSR Izv. Ser. Geofiz., no. 4, p. 505-515, 1959.
The problem of finding effective dynamic parameters of a heterogeneous two-component elastic medium, through which a plane-monochromatic longitudinal wave propagates, is solved on the following assumptions: the main medium is homogeneous and perfectly elastic; heterogeneities in the form of small spheres are evenly disseminated through the first medium so that the two mediums constitute an ordered array. The wavelength is assumed to be much greater than the dimensions of the disseminated spheres; every sphere is assumed to be a seismic dipole oscillating in the direction of the Z-axis. This makes it possible to define the potentials of displacement on just one coordinate. Khaykovich and Khalfin derive the integral equation for the longitudinal potential of the total-displacement field. The solution of the problem can be presented as a system of two equations from which the two dynamic parameters can be found, namely, the effective velocity of longitudinal waveR and the effective density of an heterogeneous two-component medium. It is interesting to note- that the determined parameters show the presence of dispersion and absorption in the two-component medium, whereas neither of the component mediums individually possesses these properties.- S. T.V.
180-86. Dix, S. H[ewitt]. Small changes in Cagniard's method [with discussion]: Jour. Geophys. Research, v. 63, no. 3, p. 613-617, 1958.
The mathematical technique developed by Cagniard to solve problems of seismic wave propagation is not altogether deductive; consequently it is necessary to verify whether the solution obtained actually satisfies all the conditions of the problem. A simple case is examined: determination of the displacement variation resulting from application of a unit step in the scaler potential in the case of a point source embedded at depth H below the free surface of an elastic half space. It is shown that an invalid result is obtained by projecting the asymptotic solution back to short distances.
28 GEOPHYSICAL ABSTRACTS 180, JANUARY -MARCH 1960
Formulations of the surface line source problem are developments of real advantage in that they show in a general way the consequences of carrying out an integration near a pole. -D. B. V.
180-87. Knopoff, L[eon]. Love waves from a line SH source: Jour. Geo-phys. Research, v. 63, no. 3, p. 619-630, 1958.
The development of Love (SH) waves is investigated by means of a ray construction at a number of points in the surface of a system consisting of an elastic, homogeneous, isotropic semiinfinite half space, overlain by a homogeneous elastic layer of finite thickness and lowerS-wave velocity, in which a line source vibrates impulsively parallel to its own length. The fine structure of the dispersive Love wave train is shown to correspond to the superposition of a number of multiple reflections within the surface layer. -D.B.V.
180-88. Strick, E. The transient response in a liquid overlying a solid [with discussion]: Jour. Geophys. Research, v. 63, no. 3, p. 645-649, 1958.
The simple case of a source in a semiinfinite fluid overlying an elastic half space has been investigated experimentally and theoretically. The measured pressure variation was compared with the theoretical pressure variation calculated for the case of a line source. The models discussed consist of water over pitch, water over plaster of paris, and water over iron; a spark source was used. The results are presented graphically. A "pseudo-Rayleigh wave" having many of the properties of a refracted wave was observed. It radiates into the fluid as it progresses parallel to the interface and, therefore, is an arrival that would be difficult to locate in Sato's classification of surface waves (see Geophys. Abs. 180-63).- D. B. V.
Knopoff, Leon. Velocity of sound in two-component systems. See Geophys. Abs. 180-241.
180-89. Lisowski, A. Failure of rock cubic specimens in the light of the theory of elasticity: Acad. Polonaise Sci. Bull. , Ser. Sci. Tech. , v. 7, no. 5, p. 341-351, 1959.
Finding the displacements on the basis of known relations of the theory of elasticity, the values of stresses are calculated theoretically for each point in the cross section of rectangular rock samples. These quantities are used for determining and explaining the type of fracture of compressed specimens of brittle materials. The conclusions are of interest in studies of rock deformation in mines.- D. B. V.
180-90. Vinogradov, S. D. Uprugiye impulsy, voznikayushchiye v massive pod davleniyem [Elastic impulses produced in a mass under pressure]: Akad. Nauk SSSR Izv. Ser. Geofiz., no. 2, p. 296-300, 1959.
The results of the experiments made by Vinogradov in a potash mine near the city of K.alush in the western Ukrainian S. S. R. and in the K.alinin mine in the Kizelovo coal field are described. The pressure on the mass was produced by a hydraulic cushion made of copper filled with water or oil. The cushion was placed in a narrow slot drilled in the rock. The slot was filled with expandable cement sothat the pressure inside the cushion was transmitted to the body of salt or coal, producing vibrations or, if sufficiently strong,
ELASTICITY 29
cracks in it. The intensity of impulses produced by a pump connected with the cushion was measured with a piezoelectric receiverprovided with an amplifier. The pressure inthe cushion was increased by steps of20 kg per cm2. The distribution of stresses over the mass was determined from a model made of photoelastic material. Vinogradov found that the intensity (W) of the impulses varied with time (t), following the relation W = cCk(c and k are constants, k being about unity). The creep of rocks varies with time according to the sa.me law. It is possible to obtain a good picture of the pressure distribution and its intensity in the mass by seismoacoustic observations, following the experiments of Riznichenko. These observations give a warning of an approaching rockburst.- S. T.V.
180-91. Konstantinova, A. G. 0 forme uprugikh impulsov, soprovozhdayushchikh rasrusheniye gornykh porod [The shape of elastic impulses accompanying the disintegration of rocks]: Akad. Nauk SSSR Izv. Ser. Geofiz., no. 4, p. 604-610, 1959.
It is known that the appearance of cracks and fissures in solid bodies is accompanied by noise and elastic vibrations that can be readily observed and recorded. They often serve as an indicator of dangerously high stresses in the walls of mine galleries. This forms the physical basis for the seismoacoustic: method of study of complicated and violent processes of disintegration of 1;olid bodies such as rockbursts. The results are given of a laboratory study of numerous specimens that were destroyed in a press of a capacity ranging from 4 to 100 tons. Specimens of collophane, paraffin, a mixture of gypsum with sand, talco-chlorite, coal, and marble were tested. Elastic impulses and the resulting vibrations were measured and recorded by piezoelectric receivers containing crystals of Seignette's salt. Numerous oscillograms are reproduced. The shape of the vibrations depends on the force applied and on the form of the moment. Many of the ruptures produced belong to a typ,e of cleavage combined with rupture, and their oscillograms are similar to the records obtained in coal mines. The shape of the vibrations was found to be very similar to a one-cycle vibration. - S. T.V.
180-92. Shamina, 0. G. Pogloshcheniye prodol 'nykh i poperechnykh voln v obraztsakh razlichnoy formy [The absorption of longitudinal and transverse waves in specimens of different shape]: Akad. Nauk SSSR Izv. Ser. Geofiz. no. ll, p. 1619-1624, 1959.
The dependence of the absorption of elastic waves on the shape of the specimens through which they propagate has been investigated experimentally by Shamin:a who uses the method of ultrasonic sounding on 2- and 3- dimensional models. It was found that for the same dominant frequency the coefficient of absorption oflongitudinal waves propagating in a rod, in a plate, or in a massive block, all prepared from the same material, has different values. The materials used were plexiglas, duraluminum, and vinyl. These ratios of absorption coefficients differ from the theoretically computed values (using the Gurevieh formulas) by not more than 10 percent. For equal predominant frequenciE!S of vibrations, the coefficients of absorption of longitudinal and transverse waves have the same values. The ratio of the absorption coefficients of trani3Verse and of longitudinal waves in massive blocks is equal to the inverse ratio of their velocities. This corresponds to the equality of the .decrements of the absorption coefficients of these waves; The only disagreement between the results obtained by Shamina and the data of several theoretical investigations pertaining to this question was the following: according to Shamina the transverse waves propagating in an infinite medium must be absorbed about twice as strongly as the longitudinal ones, whereas the studies
557043 0 - 60 - 3
30 GEOPHYSICAL ABSTRACTS 180, JANUARY-MARCH 1960
of Gurevich (1955) and Deryagin (1931) give a value ranging from 4 to 5 for this ratio. This discrepancy probably indicates more complicated physical conditions than those assumed in the experiments of Shamina. - S. T.V.
180-93. Ishida, Tamotsu. Velocity of elastic waves in sea ice (in Japanese, with English summary): Low Temperature Sci., ser. A, no. 17, p. 99-108, 1958.
Shock waves were produced in sea ice by beating a stone, placed on the ice, with a hammer. The velocity of the longitudinal waves in level ice of 16 em thick was found to be 2, 800 m per sec at -l°C. Young's modulus of the sea ice calculated from this velocity was 5. 2 X 10¹⁰ d per cm2, which agrees with the value measured by the vibration method for rectangular bars of the same sea ice.
A formula was derived to determine the absorption of the shock wave by the sea ice. - V.S.N.
180-94. Ishida, Tamotsu. Propagation of elastic waves in sea ice: Low Temperature Sci., ser. A, no. 18, p. 157-169, 1959.
Elastic-wave' propagation was studied in the fast ice, 14-26 em thick, with the depth of water at about 3m, on the Okhotsk Sea coast of Hokkaido. The measured velocities of the elastic waves and values of the elastic constants at the· mean temperature of -1. 5°C were as follows: longitudinal velocity in the thin plate, 2, 000 miles per sec; shear velocity in the thin plate! 1, 090 miles per sec; Poisson's ratio, 0. 38; and Young's modulus, 2. 9 X 10 0 dper cm2. The slow longitudinal velocity was attributed to the condition of the ice.
Dispersive flexural waves which appeared on the seismograms were used to study the propagation of the elastic waves in the sea ice. Formulas are given to represent the group velocity of these waves and for the energy dissipation of the shock waves generated from the line source. The frequency of the attenuation constants was found to be characteristic of the sea-ice structure. -V.S.N.
180-95. Carder, D[ean] S., and Cloud, W[illiam] K. Surface motion from large underground explosions: Jour. Geophys. Research, v. 64, no. 10, p. 1471-1487, 1959.
Seismic effects of several underground nuclear explosions were measured in terms of ground surface motion by suitable seismographs from 1, 200 feet to nearly 10 miles from the source and with teleseismic instruments at great distances. Empirical formulas developed ·prior to the explosions predicted the ground effects from the Rainier shot (1. 7 kilotons 900 ft underground) and several larger shots with fair accuracy but with certain limitations: at distances greater than a few thousand feet, observed displacements were somewhat larger than the formula predicted; frequencies of ground waves did not exceed 20 cycles per sec; and source conditions and material were in fair duplication. Gro'Wld amplitudes on deep alluvium were, as expected, more than twice the amplitudes at nearly the same distance on rock. Velocity-response spectrums of one of the shots have been made and reproduced. The magnitude of the Rainier shot was about 4. 0, based on the assumption that the source was contained in a volume of rock comparable to that of an earthquake having the same magnitude. Local traveltime data indicate that the rock associated with a speed of about 6. 2 kmps is about 3, 600 feet beneath the shot point area. -D. B. V.
ELASTICITY 31
180-96. Romney, Carl. Amplitudes of seismic body waves from underground nuclear explosions: Jour. Geophys. Research, v. 64, no. 10, p. 1489-1498, 1959.
Seismic waves from underground nuclear explosions in Nevada were observed at a number of temporary stations along a line extending eastward to Maine. A study of the seismograms from these stations and from a large number of permanent stations has shown that the amplitude of Pn varies inversely as the cube of the distance between 200 and 1, 100 km. Pn then disappears and a late-arriving highervelocity wave appears with relatively large amplitude. This later P wave has a slight amplitude maximum at about 2, 000 km, after which it decreases irregularly with distance.
Between 200 and 2, 000 km the amplitude of S (or Lg) varies inversely as the cube of the distance. The vertical, radial, and transverse components are of approximately equal size and are about three times the amplitude of Pn between 200 and 1, 000 km.
At distances of 100 km or more the amplitudes of the body waves are proportional to the first power of the explosive yield. The explosions produced seismic waves equivalent in size to those from natural earthquakes of magnitude: M = 3. 65 +logY, where Y is the energy of the explosion expressed in kilotons of TNT equivalent. -Author's abstract
180-97. Berg, Joseph W., Jr., and Cook, Kenneth L. Ground- motion measurements near quarry blasts at Promontory Point, Utah: Seismol. Soc. America Bull., v. 49, no. 4, p. 391-397, 1959.
Ground amplitudes and accelerations are presented for distances of 8, 000, 22, 000, 43, 700, and 72, 200 feet from 3 quarry blasts of more than 1, 000, 000 lb of explosives each that were detonated at Promontory Point, Utah. The equation log Dm = 1. 52 log x + 4. 51 (Dm =maximum total displacement ampli· tude in inches,. x = distance from source in feet) fits the data of maximum total displacement versus distance for those distances. Maximum vertical acceleration versus distance forthe same distances is given by the equation log Am = -2. 55 log x + 10. 68 <Am =maximum vertical acceleration in feet per sec2, x = distance from source in feet). - D. B. V.
180-98. Vanek, JiH, and Klima, Karel. Untersuchung des seismischen Effekts bei Sprengungen mit Millisekundenzundung in Gruben [Investigation of the seismic effect in blasts with millisecond firing in mines]: Freiberger Forschungshefte, C60 Geophysik, p. 68-75, 1959.
The results of measurements ofthe seismic effect in mine blasts with millisecond firing, together with macroscopic estimation of the effect of the blasts, show that the mechanism of such explosions in mines is very probably different from that in quarries. The increase of demolition energy (Ez) in the case of mines is accomplished at the expense of displacement energy (E A), whereas in quarries the increase in E z is at the expense of seismic energy (Es>· A series of controlled experiments in mines and quarries would be necessary to support this opinion. -D. B. V.
180-99. Research Group for Explosion Seismology [Japan]. Observations of seismic waves from four explosions near the Kamaisi mine: Tokyo Univ. Earthquake Research Inst. Bull., v. 37, pt. 1, p. 89-121, 1959.
In order to determine more precisely the position and form of the dipping
32 GEOPHYSICAL ABSTRACTS 180, JANUARY -MARCH 1960
boundary between the layers having P-wave velocities of 5. 75-5. 85 and 6.10-6. 20 kmps, respectively (see Geophys. Abs. 173-256, 174-240), four explosions were set off in the vicinity of the Kamaisi mine in Japan. Complete data are tabulated and numerous seismograms are reproduced. The earlier assumption that this P2 - P 3 boundary rises eastward and almost reaches the surface near the Kamaisi mine is confirmed.- D. B. V.
180-100. Asano, Shuzo; Den, Nozomu; Mikumo, Takeshi; Shima, Etsuzo; and Usami, Tatsuo. On the travel-times of S-waves, derived from the explosion seismic observations: Tokyo Univ. Earthquake Research Inst. Bull., v. 37, pt. 2, p. 279-306, 1959.
Shocks from ll large blasts, set off for engineering purposes in the Tohoku and Kwanto areas in Japan, and from 2 other explosions for research purposes have been observed. The arrival times of the late phases, particularly the S phases, are considered in this paper. Data are tabulated, giving names of explosions, names of stations at which recorded, epicentral distances, S-wave arrival times, degree of accuracy of readings, and S-wave traveltimes. Velocities of 3. 04 and 3. 36 kmps were derived near the Kamaisi Mine, 3. 06 and3. 57 kmps intheTohoku area, and3. 63 kmps in the Kwanto area; these are taken to be S-waves. The depths of the discontinuties calculated from these velocities are fairly consistent with those calculated from P waves, although the S-wave velocities used in the calculations were mean values. Information about Sn is insufficient because of the scarcity of data from distant observations. Various Vp/V s values are also calculated and compared in a table with results for western Transvaal, the Canadian Shield, and western Australia.- D. B. V.
180-101. Asano, Shuzo. On the accuracy of hypocenter determination III [in Japanese with English abstract]: Tokyo Univ. Earthquake Research Inst. Bull., v. 37, pt. 2, p. 337-345, 1959.
Seismic waves generated by detonation of 156 tons of explosives, in connection with construction of the Mihoro dam in central Japan, were recorded at about 10 Japanese observatories. Although the recorded amplitude was small and the onset of initial motion not clear except at Matsushiro, an attempt was made to determine focal quantities by the least -squares method. The results are tabulated. The position of the epicenter was determined within 0.1°; the determination of velocity was fairly good, but that of origin time was not very accurate. Giving weight to the Matsushiro observation improved the accuracy of the results, especially with respect to origin time. S-wave velocity was determined as 3. 34 kmps.- D. B. V.
180-102. Doyle, H. A., Everingham, I. B., and Hogan, T. K. Seismic recordings of large explosions in south-eastern Australia: Australian Jour. Physics, v. 12, no. 3, p. 222-230, 1959.
Three very large quarry explosions of 50-100 tons of high explosives in the Snowy Mountains area, New South Wales, were recorded at distances up to 375 km. The P- and S-wave velocities in the crust for this part of Australia were determined as 6. 04 ± 0. 04 and 3. 62 ± 0. 03 kmps, respectively. The Pn velocity was found to be 8. 03 kmps (± 0. 2 kmps). Assuming the layer above the Mohorovicic discontinuity to be uniform, crustal thickness is calculated to be 37 km. -D. B. V.
ELECTRICAL EXPLORATION 33
Davidson, R. J., Williams, L. W., Loh, R. P., Horvath, J[osef], and Keunecke, 0. Geophysical survey of the Renison Bell tin field, Tasmania. See Geophys. Abs. 180-319.
180-103. Belluigi, A[rnaldo]. Das skalare, durch einen rechteckigen Impuls in einem homogenenen Medium erzeugte Potential (Erste Naherungsrechnung) [The scalar potential generated by a rectangular impulse in a homogeneous medium (First approximation)]: Annali Geofisica, v. 12, no. 2, p. 149-153, 1959.
This paper calculates theoretically an approximation of the "electric scaler potential" generated in an homogeneous medium of low conductivityby an electrode that supplies a "unit current pulse" with velocity of propagation v. The cas~ of a rectangular pulse of duration T is examined. This case integrates the effects of each individual pulse. Therefore, the "direct scalar potential" and the "gap potential" are evaluated.- D. B. V.
180-104. Utzmann, Rene. Die Anwendung von Modellen in der elektrischen Prospektion [The application of models in electrical prospecting]: Freiberger Forschungshefte C60 Geophysik, p. 86-101, 1959.
The theory of model experiments in electrical exploration and the apparatus and measurement methods are discussed briefly (with photographs and schematic diagrams of the models). Then some examples of application of different electrical methods--telluric, d. c. depth sounding, induced polarization, and composite effects are given.- D. B. V.
180-105. Kelly, Sherwin F. Spontaneous polarization, or self-potential method, in Methods and case histories in mining geophysics: [Canada] Commonwealth Mining and Metall. Cong. (6th), p. 53-59, 1957.
The electrical currents spontaneously generated by the electrochemical reactions between metallically conductive minerals and electrolytes in the surrounding rocks and soils are discussed, and the factors that influence the strength ofthe potentials observable atthe surface are pointed out. The electrical field emanating from a mineral deposit is mapped at the surface by observing the potentials naturally present in the ground with a potentiometervoltmeter sensitive to 1 mv on a systematic grid of observation points. Factors that influence the results are discussed, and the important problems to be met in any survey are listed.- V. S. N.
180-106. Zagarmistr, A. M. Ob ispol'zovanii povyshennoy razreshayushchey sposobnosti dipol'noosevogo zondirovaniya pri issledovaniyakh razreza tipa H [On the utilization of the greater resolving power of dipole-axial sounding in exploration of H-type profiles]: Prikladnaya Geofizika, no. 16, p. 130-144, 1957.
Dipole -axial sounding (DOZ) is analyzed and the curves P min/ P1 versus (h2/h1) are discussed for the case of H-type profiles, which consist ofthree layers in which the h2 ::>- 3hl; Pmin is mean minimum value of the specific resistances of the profile; P1 is mean longitudinal resistivity of the two upper layers; and hi and h2 are thickness of first and second layers respectively. The resistivity of the third layer is assumed to be infinite. A method of converting the data of vertical electric sounding (VEZ) into DOZ is given for profiles different from the H-type. A comparison of DOZ data with borehole data along the profile shows a good correspondence and indicates that better resolution of the dip can be obtained by the DOZ method than by dipole-equatorial sounding (DEZ).- A. J. S.
34 GEOPHYSICAL ABSTRACTS 180, JANUARY-MARCH 1960
180-107. Rokityanskiy, I. I. 0 prirode vyzvannoy polyarizatsii ionoprovodyashchikh porod [On the nature of induced polarization of ionoconducting rocks]: Akad. Nauk SSSR Izv. Ser. Geofiz., no. 7, p. 1055-1060, 1959.
This is a continuation of Rokityanskiy' s study of the phenomenon of induced polarization (see Geophys. Abs. 169-125). Theories explaining this phenomenon are discussed, and a tentative hypothesis is suggested. Accordingto one of the latest theories the potential of induced polarization is the result of electro-osmosis: the flow of electric current through a porous specimen produces a difference of osmotic pressure at the ends, and after interruption of the current there is a reverse flow of the fluid. This generates an electric potenti•l due to the electrocapillary effect. Another hypothesis attempts to explain induced polarization effect in ionic conducting rocks by a deformation of the double electric layer enveloping each particle, making it act as a dipole oriented along the primary field. Both hypotheses proved ina9equate to explain the experimental data. A new hypothesis that takes into account the forces that act on the diffuse part of the double electric layer is proposed.S.T.V., A.J.S.
180-108. Van'yan, L. L. K teorii dipol'nykh elektromagnitnykh zondirovaniy [On· the theory of dipole electromagnetic sounding]: Prikladnaya Geofizika, no. 16, p. 145-160, 1957.
A mathematical apparatus for a simplified construction of dipole electromagnetic sounding curves is developed for the case where the dipole separation is large in comparison with the length ofthe induced electromagnetic wave propagating vertically in the ground (for example, P = 10 ohms, dipole separation = 12 km, frequency 1 cycle per sec). Van'yan derives the following formulas for the horizontal components Ex and Ey of the electric field, and the vertical com~onent Bz of the magnetic field: Ex = (I/21Tr3)(2- 3 cos2</>) z 2; Ey = -(3Ixy/21Tr )Z2; Bz = (3I sin </>/1r iwr4)z2, where x, y, r, and <bare coordinates of the observation point, w is circular frequency of the dipole sinusoidal wave, I is the dipole moment, and i = A. Curves of dipole electromagnetic sounding in a two-layer medium are given.- A. J. S.
180-109. Dzhafarov, Kh. D. K interpretatsii krivykh vertical'nogo elektri- cheskogo zondirovaniya (VEZ) tipa KN [On interpretation of curves
of vertical electric sounding(VEZ) ofKNtype]: Ucheb. Zavedeniy, Izv. Vyssh., Neft' i Gaz, no. 3, p. ll-16, 1959.
The problem of interpretation of vertical electrical sounding (VEZ) curves of the type KN ( pt < P2 > P3 < P4) are discussed, and a method is proposed for interpretating the VEZ curves for a th~ee-layer medium resting on a basement of infinite resistance with P3 /PI =constant. The method is based on using the extreme of the VEZ curves and theoretical nomograms for the four-layer case. The method suggested was found to have an error of less than 10 percent in the determination of basement depth.- A. J. S.
180-llO. Tikhonov, A. N., Shakhsuvarov, D. N., and Rybakova, Ye. V. Ob osobennostyakh elekromagnitnogo polya dipolya, vozbuzhdayemogo v sloye, lezhashchem na izolyatore [Peculiarities of the electromagnetic field of a dipole produced in a layer overlying an insulator]: Akad: Nauk SSSR Izv. Ser. Geofiz., no. ll, p. 1670-1672, 1959.
ELECTRICAL EXPLORATION 35
If an electromagnetic dipole induces afield in a homogeneous layer of thickness h overlying a perfect insulator, the field can be determined in the equatorial plane of the dipole, that is, the plane perpendicularly bisecting the elements of the dipole. If r is the distance of the testpoint from the dipole, L the wave length of the dipole field, h the thickness of the overlying layer, and B the vertical field amplitude at the testpoint, curves of (r/L)2B can be plotted against (L/h), one for eachvalue of (r/h). These curveshave extremal points and asymptotic directions as L increases; the family of curves has a limiting curve as r increases. The value ofthe extrema and the asymptotic directions depend on r/h leading to a determination of the value of h. The conductivity of the upper layer can also be determined by a suitable replotting of the data.
The families of curves of phase and of horizontal intensity furnish additional information. If the field curves do not have distinct extrema, the method fails, but if they do, they can be matched against theoretical reference curves. -I.R.
180-111. D'yakonov, B. P. Difraktsiya elektromagnitnykh voln na sfere, raspolozhennom v poluprostranstve The diffraction of electromagnetic waves on _a sphere, located in a semispace]: Akad. Nauk SSSR Izv. Ser. Geofiz., no. 11, p. 1579-1590, 1959.
The problem of diffraction of electromagnetic waves on a sphere located in homogeneous semispace is treated. The solution of the problem is obtained in the form of an infinite system of algebraic equations having a normal determinant. Such solution is well adapted to computations in low frequency procedures of electric exploration. The solution is obtained by the method of iterations; it takes into account not only the affect of the homogeneous medium on the original field, but also the interaction between the sphere and the boundary plane on the pattern of the field in the sphere and the adjoining regions. - S. T~ V.
180-112. Molotschnow [Molochnov], G. [V. ], and Janovsky, [Yanovskiy], B. [U.] Mode11versuche mit niederfrequentem elektromagnetischem Feld [Model experiments with low- frequency electromagnetic field]: Freiberger Forschungshefte C60 Geophysik, p. 17-29, 1959.
The theoretical basis of electromagnetic frequency sounding is outlined briefly and a tank model that was used to imitate 2- and 3-layered structure is described. The results of the model investigations show that the method using a vertical dipole for exciting and receiving the magnetic field could distinguish not only the structures in question but also certain analogous structures that differ only with respect to the resistivity of the first layer. Sharp differentiation of structures was possible at distances of more than six times the thickness of the conducting layer. It is concluded that for the recognition of structures only one component (either the radial or the vertical) ofthe electromagnetic field need be measured. The radial component can be measured with lower frequencies than the vertical. -D. B. V.
180-113. Hedstrom, E. H., and Parasnis, D. S. Some model experiments relating to electromagnetic prospecting with special reference to airborne work: Geophys. Prosp., v. 6, no. 4, p. 322-341, 1958.
After a discussion of the underlying principles, some electromagnetic model experiments made primarily in connection with the development of the ABEM airborne method are described. The experiments were made on thin vertical and horizontal conductors of "infinite" ext·ent with coil arrangements
36 GEOPHYSICAL ABSTRACTS 180, JANUARY -MARCH 1960
involving one transmitter and one receiver unit. The in-phase and out-ofphase components of the field picked up by the receiver were measured in percent of the amplitude of the normal field at the receiver. In this case 19
phase-shift corresponds to 1. 75 percent of the normal field amplitude. The experiments were made on a scale 600-2, 000 times smaller than the natural scale. The ores and overburdens normally encountered in the field were simulated by sheets of Cu, Al, Zn, and Pb of varying thicknesses. The frequencies used were 500, 880 and 1, 500 cycles per sec. The variation of the secondary fields with the thickness, resistivity and depths of the conductors causing them is discussed in some detail. The bearing of the laboratory work on ground and especially airborne electromagnetic methods is indicated. A few miscellaneous experiments are also described. The results of an airborne survey over a known ore body and those of the corresponding model experiments are given. The ABEM airborne electromagnetic method and the so-called 11Canadian" method are·briefly compared in the light of the model experiments described. - Authors 1 abstract
180-ll4. Sato, Motoaki, and Mooney, Harold M. The electrochemical mechanism of sulfide self-potentials: Geophysics, v. 25, no., 1, p. 226-249, 1960.
Self-potentials associated with a sulfide ore body result from the ohmic potential drop within the country rocks. The electric current is produced by separate but simultaneous reduction of oxidizing agents near the surface and oxidation of reducing agents at depth; the ore does not participate directly in either reaction but serves as a conductor to transfer the electrons from the reducing to the oxidizing agents. The possibility that these reactions will take place depends on differences in oxidation potential of ground waters at different depths. In the zone of weathering the oxidation potential, controlled by the reduction mechanism of oxygen, ranges from 0. 2 to 0. 7 v (on the hydrogen scale). If the ore tends to oxidize at some lower potential, then the latter is the available one. Below the water table the potential is probably controlled by the oxidation- reduction equilibria of iron-rich minerals and ranges from 0 to -0. 3v; the maximum potential is independent of ore type.
The maximum potential difference available to produce natural currents is estimated at: graphite 0. 8, pyrite 0. 7, covellite 0. 6, chalcocite 0. 5, and galena 0. 3 v. Self-potentials will be large if the ore body is composed of minerals difficult to oxidize, has low electrical resistance, and is close to the surface. -D. B. V.
180-ll5. Ward, S[tanley] H., and Gledhill, T. R. Ele9tromagnetic surveying--ground methods, in Methods and case histories in mining geophysics: [Canada] Commonwealth Mining and Metall. Cong. (6th), p. 63-70, 1957.
The principles and operation of two of the most common forms of inductive electromagnetic- survey techniques are outlined; these are the vertical and the horizontal-transmitting coil systems. Field techniques are described and the two systems compared in detail with a listing of the advantages and limitations of each system. On the basis of work in New Brunswick, a grading of conductors is proposed to help in sorting out those conductors caused by sulfide mineralization (see also Geophys. Abs. 174-145). - V.S.N.
180-ll6. Rodionov, P. F. Opyt opredeleniya azimuta i ugla padeniya slantsevatosti vmeshchayushchikh porod i rudnykh tel na ural 1 skikh kolchedannykh mestorozhdeniyakh po dannym metoda zar;rada
ELECTRICAL EXPLORATION 37
[Experience with determination of the azimuth and the dip of the schistosity of country rock and ore bodies at the Ural pyrite deposits by electric- charge method]: Akad. Nauk SSSR Sibirskoye Otdeleniye Izv., no. 1, p. 33-43, 1958.
A method of determining the strike and dip of an ore body from the direction and magnitude of displacement of the maximum potential with respect to the point of an electric charge is described. The charge is impressed at a depth of at least twice the depth of the bottom of ore body. Therefore, the maximum potential is displaced with respect to the charge point in a direction opposite to that of the dip; the direction of the dip is thereby determined. The approximate angle of dip is determined from the maximum potential displacement (or zero point of the potential gradient) with respect to the charge point. The strike is then normal to the direction of dip. -A. J. S.
180-117. Novozhilova, M. Ye. Otsenka razlichnykh sposobov raboty metodom yestestvennogo polya po skheme gradiyenta [Evaluation of various approaches to the utilization of natural field method according to gradient scheme], in Geofizicheskiye Metody Razvedki: Moscow, Gosgeoltechizdat, p. 39-45, 1955.
Three methods of exploration using the earth 1 s natural electric field are discussed: the electrode- exchange method where the position of the electrodes is reversed in place; the parallel-replacement method where both electrodes are moved forward by one interval; and the transposition -of - electrades -over method where each of the two electrodes becomes alternately a forward or a backward one. The first two methods are considered inadequate to give correct gradients, whereas the third was found to be useful where the potential scheme carmot be applied because of stray industrial currents. -A.J.S.
180-118. Shibata, Kihei. Studies of the spontaneous- polarization method at the Hosokura mine, Miyagi Prefecture [in Japanese with English summary]: Japan Geol. Survey Bull., v. 10, no. 4, p. 47-56, 1959.
A study of the spontaneous polarization method of electrical surveying was made at the Hosokura zinc-galena-copper deposit, Miyagi Prefecture, Japan. SP logs were made in 5 vertical holes, 10 meters deep, drilled on a surface anomaly. From the log data the vertical potential distribution on the near surface was determined. In the drifts no distinct relation could be determined between the SP potential and wall rock alteration. The contact potential between electrode and minerals or rocks on the walls of the drifts showed a potential surrounding the ore body but not in the ore body itself. - V. S. N.
180-119. Seigel, H[arold] 0. The resistivity method, in Methods and case histories in mining geophysics: [Canada] Commonwealth Mining and Metall. Cong. (6th), p. 59-62, 1957.
The principles underlying the measurement of resistivity of a substance to the flow of an electric current and the resistivities characteristic of the major rock types in nature are discussed. General field procedures for measuring resistivity are given, and the system employed in Canada is discussed. A discussion of interpretation of results is included.- V. S. N.
38 GEOPHYSICAL ABSTRACTS 180, JANUARY -MARCH 1960
180-120. Semenov, A. S., and Novozhilova, M. Ye. Vliyaniye kontsentratsii i temperatury rastvora napolyarizatsiyu mednykh nepolyarizuyushchikhsya elektrodakh [Effect of concentration and temperature of the solution on polarization of copper nonpolarizing electrodes], in Geofizicheskiye Metody Razvedki: Moscow, Gosgeoltekhizdat, p. 46-53, 1955.
The effect of a difference in the concentration of copper sulfate on a pair of copper nonpolarizing electrodes and the difference in their temperatures on the measured potential in electric exploration by the self -potential method is discussed. It was found that polarization owing to the difference in concentrations of the copper sulfate solution in the electrodes never exceeds 1 mv even for saturated solutions, whereas polarization owing to a temperature difference of only 1°C between the electrodes is 0. 7-1 mv.- A. J. S.
180-121. Ward, S[tanley] H. Airborne electromagnetic surveying, in Methods and case histories in mining geophysics: [Canada] Commonwealth Mining and Metal!. Cong. (6th), p. 71-78, 1957.
Airborne electromagnetic prospecting is one of the newest geophysical techniques to be made available to the mining industry and is intended to be a rapid. reconnaissance-survey technique that will locate most economic deposits of massive sulfide mineralization within 100 to 200 feet of the surface. Most of the AEM systems in operation today are based on the measurement of the mutual impedancebetweentwo coils asthis impedance is affected bythe presence of nearby naturally occurring conductive bodies. The intelligent application of the system presupposes a sound knowledge, on the part of the exploration geophysicists, of the general geology of the area to be surveyed. Unlike airborne magnetic systems, AEM systems may be designed to provide optimum performance under a given set of geological conditions.
In designing an AEM system, the geophysicist must choose the optimum combination of variables that are also common to the airborne magnetometer plus the optimum combination of such factors as frequency of operation, coil configuration, and limiting air turbulence. The data obtained are only as reliable as the ability of the interpreter to recognize a true anomaly, and here correlation of the AEM data with geology, photogeology, and aeromagnetic data is of great importance. In the application of AEM to the exploration of any specific tract of land, line spacing and the sharp decrease in anomaly amplitude with altitude must be borne in mind.- V. S. N.
180-122. Keller, George V. Directional resistivity measurements in exploration for uranium deposits on the Colorado Plateau: U.S. Geol. Survey Bull. 1083-B, p. 37,..72, 1959.
A study of the electrical properties of the Morrison formation in the Uravan mineral belt of the Colorado Plateau province indicates that there is a significant correlation between electrical resistivity and the relative favorability for occurrence of ore. Measurement of resistivity trends by placing one electrode in a drill hole and spreading the others out radially on the surface seems to offer a means of exploiting the resistivity-favorability correlation.
Field tests of such directional-resistivity measurements were made in the Spud Patch area in San Miguel County, Colorado, and the White Canyon district in San Juan County, Utah. Results indicated that the method could predict location of favorable areas in the Spud Patch area at distances of 600-1, 000 feet with a high degree of success. Directional resistivity measurements were successful in the White Canyon district in tracing channel conglomerate where surface conditions were favorable.- V. S. N.
ELECTRICAL EXPLORATION 39
180-123. Keller, George V. Electrical properties of sandstones of the Morrison formation: U.S. Geol. SurveyBull. 1052-J, p.307-344, 1959.
The electrical properties of the Morrison formation in the Uravan mineral belt of the Colorado Plateau have been studied to determine whether there are anomalous variations in these properties in and near zones of uranium-vanadium minerals which might serve as a target for geophysical prospecting . Measurements of electrical properties of the Morrison formation in place were obtained by the electric logging of 147 drill holes, and measurements were made of the resistivity and porosity of 440 drill cores in the laboratory to aid in the interpretation of the electric logs. The resistivity of the sandstone members of the Morrison formation is highest in areas that are the most favorable for the occurrence of ore. This increase in resistivity is probably due to a lower water saturation or a lower salinity of the water in the favorable areas.- Author's abstract
180-124. Lundberg, Hans. The discovery of large lead-zinc deposits at Buchans, Newfoundland, in Methods and case histories in mining geophysics: [Canada] Commonwealth Mining and Metall. Cong. (6th)' p. 141-154, 1957.
This paper describes an equipotential survey made in 1926 at the Buchans River mine, Newfoundland, which at that time was a small lead-zinc deposit with about 100, 000 tons reserve. The survey outlined a very large body of ore from which 10, 000, 000 tons had been shipped to early 1956. Most recent surveys have added to the known ore bodies, but the major outlines were obtained from the 1926 survey. - V. S. N.
180-125. Bergey, w. R., Clark, A. R., Frantz, J. C., Keevil, N. B., and Smith, F. Gordon. Discovery of copper-nickel ore bodies at the T~magami mine, Ontario, in Methods and case histories in mining geophysics: [Canada] Commonwealth Mining and Metall. Cong. (6th), p. 168-175, 1959.
The large copper-nickel ore bodies at the Temagami mine, Ontario, Canada, were found by combining the results of geological study with those of aeromagnetic and detailed ground geophysical surveys. Selection of the particular area for prospecting was based on the hypothesis that the narrow belt north and west of the Huron-Mistassini line is much more favorable for basemetal occurrence than is the region as a whole.
Aeromagnetic surveys outlined major formational features. Self-potential surveys indicated the intensity of sulfide mineralization and pinpointed the suboutcrop. A resistivity survey indicated deposits generally, and combined self-potential and resistivity indicated the dip and plunge of the deposits. Electromagnetic surveys outlined the margins of the massive parts of the deposits and were used to check self-potential and resistivity anomalies. -V.S.N.
180-126. Kelly, Sherwin F. Spontaneous polarization survey on Noranda mines, Quebec, 1924, in Methods and case histories in mining geophysics: [Canada] Commonwealth Mining and Metall. Cong. (6th), p. 290-293, 1957.
The first systematic survey using the spontaneous polarization method in the Western Hemisphere was made in 1924 at the Horne mine of Noranda Ltd. , western Quebec. Numerous centers of electrical activity were mapped, and
40 GEOPHYSICAL ABSTRACTS 180, JANUARY -MARCH 1960
their relation to the subsequently discovered sulfide bodies is shown on the accompanying illustrations. The advantage is demonstrated of basing the interpretation on equipotential contours rather than solely on peaks on the profiles, as was done originally. The original maps are reproduced for compari..: son with modern type of representation. - V. S. N.
180-127. Vincenz, S. A., and Versey, H. R. The application of the resistivity method to hydrogeological problems in Jamaica, in Methods and case histories in mining geophysics: [Canada] Commonwealth Mining and Metall. Cong. (6th), p. 323-340, 1957.
Two examples of the use of resistivity measurements in locating water for irrigation purposes are described. In the first example, a resistivity survey of a water-logged area shows the results of 30- and 60-foot separation surveys on equiresistivity maps; the. interpretation of these maps is facilitated by a corresponding map of isoratios of the resistivities obtained with a twoelectrode separation. This procedure removes much of the disturbing influence of variable surface resistivity. A site is suggested for another well. In the second example, the thickness of an unconsolidated overburden on a limestone aquifer is determined. Wenner and Cooper depth probes were made near the existing well and at the site where information was required. The curves obtained with Cooper's arrangement gave more satisfactory results than those obtained with Wenner's; in both examples depths to bedrock of the same order of magnitude were obtained. - V. S. N.
180-128. Frischknecht, Frank C. Scandinavian electromagnetic prospecting: Mining Eng., v. 11, no. 9, p. 932-937, 1959; also in Am. lnst. Mining Metall. Petroleum Engineers Trans., v. 214, 1959.
Electromagnetic prospecting methods, as used continuously and successfully in Scandinavia since the 1920's, are described with emphasis on fixedand moving-source methods. Fixed-source methods (including the turam and radio reference signal, compensator, cross- ring, and borehole methods) measure electromagnetic fields about the source. The mutual coupling between the source and the earth is constant, but the mutual coupling between the receiver and the earth (unless the earth is homogeneous) and between the source and the receiver changes at each station. The results are usually normalized by relating the field data to the calculated free space or primary field. Moving-source methods (the Slingrarn, cross-ring, rotating-field, and borehole methods) measure changes in the mutual coupling between source and receiver. The .coupling between both the source and receiver and the earth (unless the earth is homogeneous) changes at each station, butthe freespace coupling between source and receiver remains constant. Results are normalized in the instrument by relating the readings to the free-space coupling. Areas of application for each type of method are discussed and a comparison of merits of the two systems given.
The paper concludes with a description of the equipment needed for ground electromagnetic work. - V. S. N.
King, Anthony J. A geophysical investigation of auriferous reefs in southern Tanganyika. See Geophys. Abs. 180-308.
180-129. Rao, M. B. Rarnachandra, and Rao, M. N. Suryanarayana. Electrical surveys for exploration for sulphide ores in India, in Methods and case histories in mining geophysics: [Canada] Commonwealth Mining and Metall. Cong. (6th), p. 312-322, 1957.
ELECTRICAL EXPLORATION 41
Results of systematic geophysical surveys by the Government of Mysore and the Government of India of the old workings of the Chitaldrug belt at Ingaldhal and G. R. Hali areas, Mysore State, India, are given.
Spontaneous polarization surveys at Guddadarangavvanahalli (G. R. Halli) revealed many negative and positive centers trending with the outcrops of chalybitic trap rocks. Test pits revealed a lode of pyritiferous graphitic schist of unproved economic importance.
Spontaneous polarization, resistivity, and magnetic surveys at Ingaldhal revealed a belt of anomalies about 2, 000 feet long. Test pits here discovered a massive pyrite body estimated at over a million tons of pyrite suitable as sulfur ore. This is the first massive sulfide body to be discovered in the area.- V. S. N.
18!)-130. Suyama, Junji; Kobayashi, Hajime; and Takagi, Shinichiro. Report of the electrical prospecting at Seigoshi mine, Shizuoka Prefecture [in Japanese with English summary]: Japan Geol. Survey Bull., v. 10, no. 2, p. 49-60, 1959.
Self-potential and resistivity surveys were made over the area of the goldbearing quartz veins of the Seigoshi mine, Shizuoka Prefecture, Japan. Best results were obtained from the resistivity surveys; these outlined the mineralized zone. It was concluded that the silicified zone, which is encased in a low resistivity clayey zone, was formed at a stage later than that of the principal mineralization.- V. S. N.
180-131. Suyama, Junji, and Sugiyama, Mitsusuke. Report on the electric prospecting for Shimokawa deposit, Shirataki mine, Kochi Prefecture--! [in Japanese with English summary]: Japan Geol. Survey Bull., v. 10, no. 2, p. 61-66, 1959.
Self-potential and resistivity surveys were conducted in the area of the bedded cupriferous pyrite deposit of the Shirataki mine, Kochi Prefecture, Japan. A negative self-potential anomaly was found to be associated with the ore deposit and its marginal zone. Another negative anomaly characterized by low resistivity was found in an area of sericite schist. - V. S. N.
180-132. Odani, Yoshitaka; Takagi, Shinichiro; and Onodera, Koji. Geophysical prospecting at Shirousagi mine, Yamagata Prefecture [in Japanese with English summary]: Japan Geol. Survey Bull., v. 10, no. 5, p. 75-80, 1959.
To test the applicability of geophysical methods in prospecting for leadzinc deposits, self-potential and resistivity surveys were made in the area of the known deposits of the Shirousagi mine, Yamagata Prefecture, Japan. Results will be applied in future prospecting for similar deposits.-- V. S. N.
180-133. Murozumi, Masayoshi; Sugiyama, Kosuke; and Odani, Yoshitaka. Electrical prospecting on Tatemata mine, Akita Prefecture [in Japanese with English summary]: Japan Geol. Survey Bull., v. 10, no. 6, p. 33-37, 1959.
Resistivity and self-potential surveys were made at the Tatemata mine, a fissure -filling copper vein deposit in Akita Prefecture, Japan. Some anomalies and weak indications of self -potential seemingly are related to ore deposits or surrounding mineralized zones. The high resistivity distribution coincides approximately with the same zones. Further geophysical work is recommended in the areas of inadequate results. - V. S. N.
42 GEOPHYSICAL ABSTRACTS 180, JANUARY -MARCH 1960
180-134. Suyama, Junji, and Kobayashi, Hajime. Report on the electric prospecting for Shimokawa deposit, Shirataki mine, Kochi Prefecture--2 [in Japanese with English summary]: Japan Geol. Survey Bull., v. 10, no. 6, p. 73-80, 1959.
This paper is a continuation of the earlier report by Suyama and Sugiyama (see Geophys. Abs. 180-131} of the results from self-potential and resistivity surveys of the bedded cupriferous pyrite deposits of the Shimokawa deposit, Koehl Prefecture, Japan. The results of further self -potential surveys are discussed. The association of negative self -potential anomalies with the ore deposit is illustrated by one which clearly outlines an excellent outcrop of ore. The topographic effect on the distribution of self-potential is noted; it seems to be influenced by schistosity. The negative self-potential zones associated with the sericite schist zone, noted in the previous paper, seem to be associated with the intercalation of sericite and graphite. - V. S. N.
180-135. Horvath, J[osef]. Geophysical investigation of a copper-nickel field near Zeehan, Tasmania, Australia, in Methods and case histories in mining geophysics: [Canada] Commonwealth Mining and Metall. Cong. (6th}, p. 89-94, 1957.
The Cuni copper-nickel deposits are on the west coast of Tasmania where th~ bedrock is Lower to Middle Cambrian shales, argillites, and tuffs intruded by dikes and sills of pyroxenite and gabbro. The ore occurs on the footwall side of the ultrabasic dikes and is disseminated as much as 20 feet into the hangingwall side. Self-potential and electromagnetic surveys revealed a persistent anomaly around the Cuni North workings, and drilling disclosed thicknesses of 3-4 feet of high-grade ore with even greater thicknesses of disseminated copper-nickel sulfides. This discovery made it possible to reopen the field.- V. S. N.
Davidson, R. J., Williams, L. W., Loh, R. P., Horvath, J[osef], and Keunecke, 0. Geophysical survey of the Renison Bell tin field, Tasmania. See Geophys. Abs. 180-319.
ELECTRICAL LOGGING
180-136. Morozov, G. S. Metodika opredeleniya poristosti, pronitsayemosti i udel'noy poverkhnosti vodonosnykli porod po dannym elektricheskogo karotazha [Methods of determination of porosity, permeability, and specific surface of water-bearing rocks from electrical well-logging data]: PrikladnayaGeofizika, no. 19, p. 170-185, 1958.
In evaluating the reservoir properties of certain formations, Morozov introduces a new concept of relative electrical resistivity of rocks; it is determined not only by porosity but also by specific surface, which is closely related to perme!ibility. This concept is believed to lead to a better agreement with the experimental data. The specific electrical resistivity of water -bearing rocks is determined by formulas that are essentially different from known relationships. Formulas are derived showing the relationship of relative electrical resistivity of rocks to permeability and specific surface. -S.T.V.
180-137. Kulinkovich, A. E. 0 vliyanii zony proniknoveniya na rezul'taty karotazha plasta konechnoy moshchnosti [The effect of a zone of
ELECTRICAL LOGGING 43
permeation on the logging results of a layer of finite thickness]: Razvedochnayai Promyslovaya Geofizika, no. 27, p. 79-90, 1959.
An analysis of theoretical curves of apparent resistivity and of the curves obtained from electric logging of a layer of finite thickness having a "permeation zone 11 is given. The "permeation zone" is a cylindrical layer along the axis of the borehole permeated with drilling-mud filtrate. Since the "permeation zone 11 differs in resistance both from the drilling mud and from the rock investigated, the problem is one of three layers and must be analyzed in terms of resistivity and thickness of the rock investigated, resistivity of the underlying layer, mud resistivity, borehole diameter, specific resistivity and diameter of the "permeation zone," and probe length. Graphs of the calculated curves, master charts of the sounding curves, and pertinent tables are given. -A.J.S.
180-138. Kukharenko, N. K. Otsenka udel'nogo soprotivleniya plastov v zonakh ekranirovaniya [Evaluation of resistivity of strata in screened zones]: Razvedochnaya i Promyslovaya Geofizika, no. 16, p. 3-11, 1956.
The problem of determining the resistivity by laterlog of a layer of moderate thickness overlain and underlain by several layers of different resistivities is discussed, and a method of an approximate determination of the layer's resistivity is proposed. -A. J. S.
180-139. Leont'ev, V. M. 0 nekotorykh osobennostyakh interpretatsii diagramm mikrozondov v karbonatnykh razrezakh [Some features of interpretation of microsonde logs in carbonate s·ections]: Geologiya Nefti, no. 4, p. 46-49, 1959.
The problem of determination of cavernous and fractured limestone from the microlog is discussed. Low apparent resistivity commonly results from enlargement of a hole owing to washout of fractures or to cavities in. limestone; the readings for such places record only the specific resistivity of the drilling mud. Therefore, a caliper log must be made in order to interpret correctly a micro sonde reading. - J. W. C.
180-140. Bernstein, F., and Scala, C. Some aspects of the streaming potential and the electrochemical SP in shales: Jour. Petroleum Technology, v. 11, no. 12, p. 76-77, 1959.
General expressions are derived relating the streaming and electrochemical potentials of permeable junction separating two electrolytic solutions. These expressions were checked experimentally for shale junctions. The results are presented in a table. There is good agreement between the calculated and experimental values; this provides additional confirmation of the presence and magnitude of the streaming potential in shales. - J. W. C.
180-141. Swift, Gilbert. Dip -log computer chart: Jour. Petroleum Technology, v. 11, no. 9, p. 23-28, 1959.
Two charts are provided for accurate determination of dip over a wide range of angles; one is intended for use where the dip is less than 56° and the other for greater dips. The step- by- step procedure for use of the charts is presented. - J. W. C.
44 GEOPHYSICAL ABSTRACTS 180, JANUARY -MARCH 1960
180-142. Voskoboynik, N. I. 0 skorosti electricheskogo karotazha pri kompleksnykh izmereniyakh s vremennym razdeleniyem [On the rate of electric logging with combined measurements at time intervals]: Prikladnaya Geofizika, no. 23, p. 202-216, 1959.
The problem of the intercommunication between sondes in boreholes arid the controlling and recording apparatus on the surface by means of three-strand and single - strand cables is discussed. It was found possible to construct a cycle commutation system that sends information from a logging device to several recorders successively. The problem of the optimum frequency of commutation is analyzed mathematically, and intervals between measurements and speed of logging are determined from the limiting frequencies of logging curves. -A. J. S.
180-143. McCrossan, R. G. Resistivity mapping of the subsurface Upper Devonian inter- reef Ireton formation of Alberta: Alberta Soc. Petroleum Geologists Jour., v. 7, no. 6, p. 121-130, 1959.
Resistivity in the Ireton section of the Upper Devonian Woodbend group increases in the vicinity of all major reefs in the Edmonton basin as a result of the increasing lime content of this section. In general, if there is good correlation between resistivity and the lime or quartz content of a shale zone, this type of resistivity mapping will be sensitive to gradual facies change and will be of possible use for predicting the direction toward a reef or shoal area. Results should be carefully tied in with sample and core examination. -V.S.N.
180-144. Chernyshev, N. I. Korrelyatsiya verkhnepermskikh razrezov pri pomoshchi karotazhnykh diagramm [Correlation of Upper Permian sections by means of electric logs]: Geologiya Nefti, no. 2, p. 52-54, 1958.
The Upper Permian section of the Ural River region is composed of four units. These units are well defined on the resistivity logs, particularly their contacts. Structural drilling need be extended only into the second unit from the top in order to reveal the structure of the section. - J. W. C.
Becker, Alfred. Geophysical borehole investigations in the main Zechstein dolomite. See Geophys. Abs. 180-157.
180-145. Dolitskiy, V. A., and Yakovlev, B. M. Izucheniye oprokinutykh skladok severo - zapadnogo Predkavkaz 'ya po materialam karotazha [Study of the overturned folds of the northwestern Cis-Caucasus according to data of electrical logging]: Vyssh. Ucheb. Zavedeniy Izv., Neft' i Gaz, no. ll, p. 23-30, 1959.
Deep drilling during recent years in the Krasnodar district has revealed many intensively deformed folds, some of which are overturned. Electrical logging has been very successful in this area in working out stratigraphic subdivisions and in determining the structure. Examples of electrical logs are presented in which the section has been repeated by folding. - J. W. C.
180-146. Grechukhin, V. V. Zakonomernosti regional'nogo izmeneniya elektricheskogo soprotivleniya porod v Pechorskom ugol'nom basseyne [Regularities of the regional variation of the electrical resistivity of rocks in the Pechora coal basin]: Razvedka i Okhrana Nedr, no. 6, p. 34-40, 1959.
EXPLORATION SUMMARIES AND STATISTICS 45
Since the Pechora coal basin is covered by thick Quaternary deposits, which are 200m thickin places, the possibility of predictingthe quality of coalfrom data obtained by surface geophysical surveying is very important. For this purpose a detailed investigation was made of the specific resistivity of formations in the northeastern portion of the basin; the electric resistivity of individual strata was determined by lateral logging, mostly with gradient probes and in some cases with potential probes. The ratio (K) of the actual to apparent resistivity was found to be 1. 2 for argillite, 1. 3 for siltstone, and 2. 0 for sandstone over the entire region. It was also found that the electrical resistivity of these formations and of coal increases toward the east and northeast. A similar regularity was found in the metamorphism of coal seams. On the basis of numerous measurements and tests, curves were constructed of the specific electrical resistivity of coals for different localities of the Pechora basin; these reflect very accurately the quality and character of various co8.1 seams. - S. T.V.
EXPLORATION SUMMARIES AND STATISTICS
180-147. White, J. E., and Press, Frank. Geophysical research and progress in exploitation: Geophysics, v. 25, no. 1, p. 168-180, 1960.
This is the fourth in a series of review papers dealing with technological developments in exploration and with geophysical research at universities and industrial laboratories. Exploration developments include computer processing of seismic data; surface-ship and airborne gravity meters; the protonprecession magnetometer (the rubidium-vapor magnetometer is not yet usable in the field); velocity logging, density logging, reverse-wetting logging, and a resistivity logger that can be pumped down the drill pipe; an underwater seep detector; and Doppler positioning of aircraft.
The major trends in academic research have emphasized worldwide field measurements, use of electronic computers in data reduction and analysis, and development of improved instrumentation. Research at home and abroad, particularly in the U. S. S. R. , is summarized. -D. B. V.
180-148. Nielsen, Hardy. Round Table no. 1 "Geophysics": Oil in Canada, v. 12, no. 13, p. 22-25, 28-29, 1959.
This paper is a summary of a discussion by nine representatives of the Canadian geophysical industry on the present problems and future prospects of the industry. During the past 4 years the geophysical contractor in Canada has found full employment for his men and equipment for only about 3 months of the year. It was the conclusion of the panel that the seasonal cycle will continue for the present. Basically the goals of the companies must be to encourage preplanning of exploration by the oil companies and to improve equipment in order to work in all seasons of the year. Three possibilities of greater geophysical activity are in exploration of the Arctic regions, in the reworking of parts of the plains regions, and in the steadily increasing activity expected in the Northwest Territories.- V. S. N.
180-149. Gangloff, A. M., Collin, C. R., Grimbert, A[rnold], and Sanselme, H. Application of geophysical and geochemical methods to the search for uranium: United Nations Internat. Conf., on the Peaceful Uses of Atomic Energy, 2d, Geneva, 1958, Proc., v. 2, p. 140-147 J 1958.
The various geophysical methods used by the French Atomic Energy Commission are reviewed, and their integration with geochemical methods is dis-
557043 0 - 60 - 4
46 GEOPHYSICAL ABSTRACTS 180, JANUARY -MARCH 1960
cussed. The seismic-refraction, magnetic, and electric logging methods are used in the conventional way for elucidation of structures. Resistivity maps reflect ore veins directly; three maps are presented in which such veins appear as areas of higher resistance.- J. W. C.
180-150. Keller, G[eorge] V. Geophysical investigations by the U.S. Geol. logical Survey on T-3: Proceedings of the First Annual Arctic Planning Session, November 1958 (J. H. Hartshorn, editor), U. S. Air Force Cambridge Research Center, Geophysics Research Directorate Research Notes, no. 15, p. 26-30, 1959.
Geophysical studies were conducted by the U.S. Geological Survey. on Fletcher's Ice Island, T-3, in the Arctic Ocean from May 1 to October 10, 1958. The program consisted of seismic measurements of ocean depths and subsurface structure, electrical measurements of bottom resistivity, and gravity and magnetic -vector measurements. These operations and the instruments used are described.- J. W. C.
180-151. Wagner, W. R. Catalog of deep-well samples and geophysical logs to January 1, 1959: Pennsylvania Geol. Survey Inf. Circ. 16, ser. 4, 84 p. ' 1959.
Deep wells in Pennsylvania are defined as those that reach the Tully limestone, which occurs at the top of the Middle Devonian; actual depth is not a criterion. The deep wells for which geophysical logs or samples are available are listed alphabetically by counties, and the counties are subdivided alphabetically by quadrangles. The listing of geophysical logs of Pennsylvania consists of 131 citations. A listing for neighboring states includes 32 for New York, 22 for Ohio, 24 for West Virginia, and 15 for Maryland. -- J. W. C.
180-152. Oil in Canada. Geophysical work trend down: Oil in Canada, v. 12, no. 6, p. ll, 1959.
Geophysical activity in western Canada in 1959 declined 24 percent from the average maintained during 1958. - V. S. N.
180-153. Morley, L. W. Mining geophysics and its future in Canada, in Methods and case histories in mining geophysics: [Canada) Commonwealth Mining and Metal!. Cong, (6th), p. ll7 -122, 1957.
A brief discussion is presented of the impetus that mining geophysics has received in Canada in recent years resulting from: (a) the high demand for minerals due to the depletion of reserves .in the United States and Europe, (b) the willingness of mining companies to invest more in geophysical prospecting because of recent successes achieved by the geophysical methods,and (c) the favorable natural and political conditions for prospecting and mining in Canada. - V. S. N.
180-154. Ward, S[tanley] H. The role of geophysics in exploration in New Brunswick, in Methods and case histories in mining geophysics: [Canada] Commonwealth Mining and Metal!. Cong. (6th), p. 221-226, 1957.
This paper is also p)lblished in the Canadian Mining and Met all. Bull. , v. 51, no. 551, p. 162-166, 1958; and Trans., v. 61, p. 90-94, 1958 (see GeoAbs. 174-145). - V. S. N.
EXPLORATION SUMMARIES AND STATISTICS 47
180-155. Seigel, H[arold] 0., Winkler, H. A., and Boniwell, J. B. Discovery of the Mobrun Copper Ltd. , sulphide deposit, Noranda Mining district, Quebec, in Methods and case histories in mining geophysics: [Canada] Commonwealth Mining and Metall. Cong.(6 th), p. 237-245, 1957.
The Mob run sulfide deposit was discovered by an electromagnetic survey conducted by vehicle-borne instruments. After the discovery, detailed electromagnetic, gravimetric, resistivity, magnetometer, spontaneous polarization, and geochemical soil surveys were made. Before the first drill hole was put down, it was established from the interpretation of the electromagnetic, gravimetric, and resistivity surveys that a body containing about 4 million tons of near-massive pyrite had been found at a depth of less than 1, 000 feet. This body was indicated as dipping steeply northward and being about 1, 000 feet long, 100 feet wide at the center, and at least 600 feet deep. Later drilling proved the ~ccuracy of geophysical results to be remarkable.- V. S. N.
180-156. Chisholm, Edward 0. Geophysical exploration of a lead-zinc deposit in Yukon Territory, in Methods and case histories in mining geophysics: [Canada] Commonwealth Mining and Metall.Cong. (6th), p. 269-277,1957.
Self -potential and magnetometer surveys were followed by a gravimetric survey in the northwestern Cordillera to outline successfully a flat-lying leadzinc sulfide replacement deposit beneath 50 feet of glacial overburden. The site of the survey is 125 miles northeast of Whitehorse, Yukon Territory, in mountainous terrain. Detailed diamond drilling verified the accuracy of the survey both as to boundaries and estimated tonnage of the deposit. Auxiliary surveys were carried out by aeromagnetic and geochemical methods. Graphitic schist interfered with the self-potential readings, but geochemical and magnetic res~lts were helpful for indicating favorable terrain.- Author's abstract
180-157. Becker, Alfred. Bohrlochmessungen in Zechstein-Hauptdolomit [Geophysical borehole investigations in the main Zechstein dolomite]: Zeitschr. Angew. Geologie, v. 5, no. 10, p. 445-450, 1959.
The logging curves obtained in petroleum and gas exploration in Thuringia differ substantially from those of north Germany for two reasons: the Thuringian wells are generally flushed with highly concentrated, low-resistance salt water to prevent leaching of the numerous salt deposits within the Zechstein; and the Zechstein in Thuringia differs considerably in its physical properties (specific resistance, formation factor, porosity, density, and elastic constants) from the sandy-clayey formations of north Germany. The results obtained by various electrical- and radioactive-logging techniques are discussed from the standpoint of their usefulness and effectiveness in view of the special conditions of the area.
Conventional resistivitylogging gives only approximate estimates of resistivity values. Focused measurements (laterolog) give a much better picture of water saturation of a reservoir layer. Quantitative results are not obtainable with the microlog. Gamma logging is just as effective as in north Germany, being independent of the resistivity of the drilling fluid; if the contrast in gamma-ray intensity is sufficiently great, the contact between two layers can be located exactly. Neutron-gamma logging can give a quantitative determination of porosity; in special cases the flowing neutron log and reversewetting technique are advantageous. -D. B. V.
48 GEOPHYSICAL ABSTRACTS 180, JANUARY -MARCH 1960
180-158. Oszlaczky, Szilard. Einige geophysikalische Probleme der ungarischen Kohlenwasserstoff -Forschung [Some geophysical problems of Hungarian hydrocarbon investigation]: Freiberger Forschungshefte, C60 Geophysik, p. 30-34, 1959.
As most of Hungary is flat or gently hilly and covered by Neogene sediments, geophysical methods are particularly important in petroleum exploration. The historyof geophysical exploration in that countryis reviewedbriefly.-D. B. V.
180-159. BtHteky, Lajos. A lyukszelvenyezes gyakorlati alkalmazasa a hazai vfzfeltar6 furasoknal [The practical application of well logging in Hungarian water wells (with German summary)]: Geofiz. Kozlemeneyek, v. 8, no. 1-2, p. 19-32, 1959.
Geophysical well logging has been applied to the Hungarian artesian wells for the last five years. Several practical examples are given of the numerous possibilities for applying geophysical investigations to water wells; in addition, it is shown that in a few years the geophysical procedures completely altered the existing methods of water-well drilling and made possible the perfection of considerably cheaper and at the same time more efficient well development. -Author's summary, D. B. V.
180-160. Zaccara, G[aetano], Raimondi, C[arlo], Morelli, C[arlo], Diceglie, S., and Cotecchia, V. Studio geofisico della regione pugliese [Geophysical study of the Puglia region]: Metana, v. 10, no. 10, p. 529-571, 1956.
The structural features of the Puglia region (Apulia) in Italy are worked out on the basis of magnetic, gravity, and seismic evidence. Vertical magnetic anomalies were measured with a magnetic variometer in a new first order network; Bouguer anomalies were calculated from the first-order gravity network (1 station per 100 km2) with new measurements on land and sea; and seismicity was deduced from macroscopic data. Measurement data are tabulated, and results are presented in five maps showing the itinerary of the magnetic survey, vertical magnetic anomalies, Bouguer anomalies, seismicity for the period 1700-1950, and geology. The relation of anomalies and seismicity to structure is discussed. -D. B. V.
180-161. Pustil'nikov, M. R. Rezul'taty geofizicheskikh rabat v Krasnodarskom, Stavropol' skarn krayakh i Stalingradskoy oblasti. Plan 19 58 g. Perspektivy na 1959-1965 gg [Results of geophysical operations in Krasnodar, Stavropol Territories and Stalingrad Region. Plan for 1958. Prospects for 1959-65], in Perspektivy Neftegazonosnosti Severnogo Kavkaza i Predkavkaz'ya: Moscow, Gostoptekhizdat, p. 27-41, 1959.
Seismic exploration in 1957 has revealed a large number of uplifts in the northwest of the Cis-Caucasus (Krasnodar), in the central Cis-Caucasus (Stavropol), and in the Tersin depression (Stalingrad); these are described and evaluated. In 1958 the Krasnodarneftegeofizika Trust was to continue surveying these 3 areas using 24 seismic parties, 1 gravity party, 1 radiogeodetic party, and 10 "thematic'' parties; the latter were concerned with correlation of seismic and logging data.- J. W. C.
EXPLORATION SUMMARIES AND STATISTICS 49
180-162. Sungurov, A. M. Glubinnaya struktura Pitnyakskogo rayona po dannym geofizicheskikh issledovaniy i perspektivy yego gazoneftenosnosti [Deep structure of the Pitnyak region according to data of geophysical investigations and its gas-oil prospects]: Geologiya Nefti, no. 1, p. 40-46, 1958.
The subsurface structure of the Pitnyak area has been determined largely from geophysical data. Extensive magnetic and gravity surveys have been made and the structure outlined in general. In 1956 a total of 240 km of refraction profiles was run transverse to the trend of the gravity anomalies; an area of 4, 500 sq km was thus covered. Characteristic boundary velocities of different levels in the section were determined. - J. W. C.
180-163. Ostrovskiy, V. D. Predvaritel'nyye rezul'taty geofizicheskikh rabot 1957 g. v vostochnoy chasti Kalmytskoy ASSR i Astrakhanskoy oblasti. Plan rabot 1958 g. Perspektivy na 1959-1965 gg. [Provisional results of geophysical operations of 1957 in the east part of the Kalmyk ASSR and the Astrakhan Region. Plan of operations for 1958. Prospects for 1959-65], in Perspektivy Neftegazonosnosti Severnogo Kavkaza i Predkavkaz'ya: Moscow, Gostoptekhizdat, p. 154-160, 195B.
The areas covered by seismic and gravity surveys in 1957 as well as those slated to be covered in 1958 and for the period 1959-65 are shown on a map. A large area in the Caspian Sea just off the Volga delta is to be gravity surveyed for the purpose of preparing the area for marine seismic exploration. The seismic exploration is designed for locating uplifts in the Tertiary, Mesozoic, and Permo-Triassic sediments. The volume of the seismic work should increase from 11 parties and 1, 7 50 km of seismic profiles in 1959 to 16 parties and 2, 500 km in 1965. - J. W. C.
180-164. Rakitov, A. I. Itogi geologorazvedochnykh rabot na neft' i gaz v Astrakhanskoy oblasti. Plan na 1958 g. Perspektivy na 1959-1965 gg [Results of geological exploration work for oil and gas in the Astrakhan Region. Plan for 1958. Prospects for 1959-65], in Perspektivy Neftegazonosnosti Severnogo Kavkaza i Predkavkaz'ya: Moscow, Gostoptekhizdat, p. 144-153, 1959.
All of the Astrakhan Region with the exception of the Volga delta has been covered by gravity survey, but onlythe southwest part and individual areas of the northern part have been studied by seismic survey. This geophysical work has revealed a large number of structures favorable for oil and gas. --J.W.C.
180-165. Buryakovskiy, L. A. Litologicheskiye osobennosti mestorozhdeniya Neftyanyye Kamni po dannym promyslovoy geofiziki [Lithologic features of the Neftyanyye Kamni field according to geophysical logging data]: Vyssh. Ucheb. Zavedeniy Izv., Neft' i Gaz, no. 12, p. 19-24, 1959.
A detailed study is presented of the lithologic character, as determined by geophysical logging, of the Pliocene section of the Neftyanyye Kamni oil field, an offshore field in the Caspian Sea near Baku. The water-bearing sands are distinguished by lower resistivities and by the lower negative SP anomalies. The water-bearing sandy-clayey strata have somewhat higher resistivity.
In the zone of oil-saturation, maximum resistivity corresponds to oil reservoirs and minimum to clayey rocks. A relation is observed between re-
50 GEOPHYSICAL ABSTRACTS 180, JANUARY -MARCH 1960
sistivity and grain size of the rocks in the sandy-clayey section; a lower apparent resistivity is observed in water- bearing strata that contain a finegrained fraction. The connection here is indirect; the phenomenon is due to the larger amount of combined water in the rock. - J. W. C.
180-166. Yepinat 1yeva, A. M., and Kosminskaya, I. P. 0 seysmo-razvedke v Kitaye [Seismic exploration in China]: Akad. Nauk SSSR Izv. Ser. Geofiz., no. ll, p. 1673-1683, 1959.
In the fall of 1958 Yepinat 1yeva and Kosminskaya made a trip to China and visited several regions where geophysical explorations were in progress. Application of seismic methods of exploration were introduced into China only about 10 years ago, mostly in exploration for oil. Some of the areas visited present very difficult conditions for geophysical exploration in that they are covered with deposits which are as much as 10-15 km thick (Tsaydam depression). Other difficulties facing the geophysicist here are absence of roads, uninhabited deserts, deficiency of even drinking water, high heat in summer, and severe cold in winter. The' basic method of seismic exploration is by reflected waves; other seismic methods are rarely employed. The instruments used in these surveys are largely of Russian manufacture; some Chinese -made instruments could be seen. As a rule, the Chinese instruments are adjusted to lower frequencies than are their Russian prototypes. Yepinat 1yeva and Kosminskaya conclude that the Chinese geophysicists have attained great suecess in their short period of activity, and that they work with great p~rserverance and show great efficiency even under very difficult conditions. - S. T.V.
180-167. Kobayashi, Hajime; Ono, Yoshihiko; and Suyama, Junji. Geophysical survey of uranium ore deposit at Nodatamagawa mine, Iwate Prefecture [in Japanese with English summary]: Japan Geol. Survey Bull., v. 10, no. 3, p. 35-42, 1959.
Geophysical techniques of exploration for uranium ore were tested at the Nodatamagawa mine, Iwate Prefecture, Japan. Radioactivity, self-potential, and resistivity surveys were made of a known ore body. The radioactivity anomaly ,zones were found to correspond to negative self-potential anomalies; these an6malies in turn were found to correspond to pyrite-impregnated faulted and sheared zones in hornfels. The resistivity results, on the other hand, identified the phyllite and massive chert zones that form the host rock of this ore'deposit. - V. S.N.
180-168. Odani, Yoshitaka; Horikawa, Yoshio; Homma, lchiro; and Shibata, Kihei. Geophysical explorations at Ozasa and Abe mines, Okayama Prefecture [in Japanese withEnglish summary]: JapanGeol. Survey Bull., v. 10, no. 3, p. 43-52, 1959.
Geophysical techniques of exploration for uranium -bearing metal deposits were tested at the Ozasa and Abe mines, Okayama Prefecture, Japan. At the Ozasa mine self- potential results in the mine drifts clearly indicated the mineralized zones but on the surface indications were weak. In the drifts no apparent difference could be noted in the self -potential variation between the secondary oxidized zone and the primary sulfide zone. The resistivity survey revealed low resistivity zones corresponding to the deposits; these are paralleled by zones of rather: high resistivity. High radioactivity was also found to .correspond to the ore zones in the drifts, but no definite radioactivity variations could be noted on the surface. The lack of surface radioactivity is thought to result from the irregular distribution of debris from old mine drifts.
GENERAL 51
In the Abe mine the self-potential and radioactivity results generally, indicated the mineralized zones; resistivity surveys were omitted. Electric logs of two wells showed high resistivity for granite and low resistivity for the mineralized zones; no definitive results were obtained from the self-potential curves. - V.S.N.
180-169. Odani, Yoshitaka, and Takagi, Shinichiro. Geophysical exploration at Oizumi mine, Yamagata Prefecture [in Japanese with English summary]: Japan Geol. Survey Bull., v. 10, no. 5, p. 81-88, 1959.
The applicability of geophysical methods to prospecting for lead-zinc ores was tested by electrical and magnetic surveys of the known deposits of the Oizumi copper -lead- zinc mine, Yamagata Prefecture, Japan. In general, results from electrical methods were good. Results from magnetic methods, although showing interesting anomalies, were not always easy to interpret without a better understanding of the distribution of magnetite throughout the deposit.
A scintillometer survey was made in the mine adits to study the relation between radioactivity and variety of rock or mineralization. Results were satisfactory. - V. S. N.
180-170. Modriniak, N., and Studt, F. E. Geological structure and volcanism of the Taupo-Tarawera district: New Zealand Jour. Geology and Geophysics, v. 2, no. 4, p. 654-684, 1959.
The structure and volcanism of the Quaternary volcanic belt in the TaupoTarawera district are discussed in the light of geophysical evidence. Two major structural fe.atures were outlined by a gravity survey: the Kaingaroa Plateau, in which the Mesozoic basement is above sea level, and the TaupoWhite Island •depression, in which the basement reaches depths of at least 12, 000 feet. Between the two structural features are basement blocks at various stages of subsidence. Seismic and magnetic surveys showed that the hydrothermal fields are genetically related to basement faults. Any future search for hydrothermal resources outside the known fields should be concentrated along established lineations. Magnetic surveys showed that the volcanic rocks are concentrated in the depressions; the distribution of the different types suggests an andesite - rhyolite sequence that was repeated as subsidence progressed from one part of the area to another. -D. B. V.
GENERAL
180-171. McCollum, E. V. Geophysical parameters: Geophysics, v. 25, no. 1, p. 92-94, 1960.
Information on density, velocity, resistivity, magnetic susceptibility, and other physical parameters of rocks obtained in place by well logging is more accurate than that obtained from laboratory measurements. The better determination of these parameters in boreholes, through improved instruments and techniques, will contribute to a better knowledge of the earth and facilitate discovery of new petroleum and mineral deposits. - D. B. V.
180-172. Kirby, J. E., Culver, R. C., and Mattei, J. B. Profitable application of well logs: Jour. Petroleum Technology, v. 12, no. 1, p. 17-22, 1960.
The composition of logging programs is discussed from the standpoint of obtaining maximum data on formation characteristics at a minimum of test-
52 GEOPHYSICAL ABSTRACTS 180, JANUARY -MARCH 1960
ing. The more commonly used methods ofinhole surveys are reviewed; these include focused contact, conventional contact, sonic, induction, focused resistivity, conventional resistivity, and nuclear logging. The importance of correlating logging data with core analysis and formation test data is emphasized. - J. W. C.
180-173. Dunlap, H[enry] F., Bradley, J. S., and Moore, T. F. Marine seep detection--a new reconnaissance exploration method: Geophysics, v. 25, no. 1, p. 275-282, 1960.
An effective and inexpensive instrumental technique for locating gas seeps has been developed for use in water-covered areas. If a seep is present, some of the methane dissolves in the water as the gas rises to the surface, and currents spread this methane-enriched water into a long plume. A boat samples the water continuously along traverses at right angles to the current. Navigational radar is used for location. The gas is broken out of solution, and trace concentrations are detected by means of an infrared analyzer.
Surveys in domestic and foreign waters using various vessels from a 14-foot outboard- powered skiff to a coastwise freighter detected seeps at distances as great as 6 miles. The costis only a few cents an acre. - D. B. V.
180-174. Chapman, Sydney. IGY: Year of discovery: Ann Arbor, Univ. of Michigan Press, lll p., 1959.
This book presents a popular account of some scientific aspects ofthe earth and sun studied during the International Geophysical Year of 1957- 58. As much of the International Geophysical Year data is still in the process of being computed, the book for the most part discusses only the general results of the studies. The seven chapters include the following titles: the earth and oceans; the solid and liquid earth; the atmosphere; the ionosphere; cosmic rays, the sun, and nuclear radiation; the growth of natural science; and the International Geophysical Year. - V. S. N.
180-175. Den Geofysiske Kommisjon. Geophysical research in Norway 1957-58: [Norway) Geof. Komm. Ann. Rept. no. 8, 15 p., 1958.
This is a listing of geophysical research organizations, serial publications, and individual publications for 1957-58 in Norway. - J. W.C.
GEODESY
180-176. Cook, A[lan] H[ugh]. Developments in dynamical geodesy: Royal Astron. Soc. Geophys. Jour., v. 2, no. 3, p. 222-240, 1959.
Progress in dynamical geodesy over the last 10 years is reviewed with particular attention to the significance of observations of the orbits of artificial satellites and of direct measurement of the distance to the moon by radar. As a result of these observations together with a great increase in the number of gravity observations, especially at sea, and with more extensive areas of geodetic triangulation, the ellipticity of the earth can be determined to one part in 3, 000 and the radius to a few parts in 100, 000. It is suggested that the earth's gravitational field should be specified by the parameter J in the spherical harmonic expansion rathe!' than by the derived ellipticity and that the mean rather than the equatorial values ofthe radius and sea-level gravity should be employed. -Author's summary
GEODESY 53
180-177. Boaga, Giovanni. Osservasioni su una formula del campo gravitazionale del Somigliana [Observations on a formula of Somigliana' s gravitational field]: Annali Geofisica, v. 12, no. 2, p. 155-159, 1959.
Somigliana's formula, which relates the values of normal ellipsoidal gravity, theoretical gravity, and observed gravity at three different latitudes and the value of the earth's eccentricity, is not suitable for determining polar flattening nor for determining the ratio of the equatorial and polar semiaxes of the earth ellipsoid as a function of observed gravity. The formula is extremely sensitive to the value of the earth's eccentricity, which is influenced directly by the existence of gravity anomalies. -D. B. V.
180-178. Vening Meinesz, F. A. The outside gravity field up to great distance from the earth: Koninkl. Nederlandse Akad. Wetensch. Proc., ser. B, v. 62, no. 2, p. 109-114, 1959.
New and more detailed formulas are derived for the earth's external gravity field. The real earth departs from an ellipsoid of rotation in three ways: (1) the equilibrium spheroid is not exactly the ellipsoid of rotation; (2) the geoid does not coincide precisely with the equilibrium spheroid; and (3) the earth's topographic surface does not coincide with the geoid. The first and third are negligible for purposes of these calculations; the largest deviations are caused by the second. It is shown that the effect of the earth's disturbing masses on the external gravity potential is appreciable only to very small distances above the earth's surface; for belts of strong negative anomalies such as the Indonesian and West Indian island arcs, for instance, the anomalies shrink to one percent at an elevation of 400-500 km.- D. B. V.
180-179. Cook, A[lan] H[ugh]. The external gravity field of a rotating spheroid to the order of e3: Royal Astron. Soc. Geophys. Jour., v. 2, no. 3, p. 199-214, 1959.
The theory of the external gravity field of a rotating body bounded by a spheroidal equipotential surface is carried to terms of the order of e3. The potential is expanded in functions that are orthogonal in the space outside an oblate spheroid. It is found that the terms of the order e3 in the gravity formula andinthe relation between J, e, and mare mostlyverysmall.-Author's summary
180-180. Orlin, H. The three components of the external anomalous gravity field: Jour. Geophys. Research, v. 64, no. 12, p. 2393-2399, 1959.
By means of a surface density or coating determined from gravity anomalies at sea level and from geoid heights, the three components of the external anomalous gravity field are computed. The coating method becomes more feasible as additionalgravity andgeoid-height databecome available. In practice, a radius of 600 km plus the height of the station might be adopted as the extent of the field required for determination of these components at a particular elevation. Outside this region some balance can be hoped for, but any systematic effect due to large anomaly patterns or a persistent geoid gradient should be considered.
It has been suggested that where geoid heights are not available the potential can be computed from the anomalies alone, and preliminary geoid heights determined. These heights could be included in the coating, and the computation for the potential could be repeated; the process-- continuing until the
54 GEOPHYSICAL ABSTRACTS 180, JANUARY-MARCH 1960
change in geoid heights is negligible. However, it might be preferable to determine the geoid heights from Stokes' function and use the coating to refine these quantities as more gravity data become available.- D. B. V.
180-181. Arnold, Kurt. Die Bewegung der Knotenlinie einer Satellitenbahnebene auf Grund der Schwereanomalien [The movement of the nodal lines of a satellite orbital plane on the basis of gravity anomalies (with English and German summaries)]: Gerlands Beitr. Geophysik, v. 68, no. 4, p. 193-203, 1959.
It is shown that in the determination of the flattening of the mean-earth ellipsoid from satellite observations, the spherical harmonics of the fourth and higher orders should not be neglected in the development of the gravity anomalies. -Author's German summary, D. B. V.
180-182. Kaula, W[illiam] M. Statistical and harmonic analysis o( gravity: Jour. Geophys. Research, v. 64, no. 12, p. 2401-2421, 1959.
Markov theory is developed in terms of two correlated functions, the freeair gravity anomaly and the elevation of the topography. The Markov methods are applied to the mean anomalies of 1° X 1° blocks to extrapqlate from all available observations to obtain estimates of mean anomalies of 10°Xl0° blocks world-wide. These estimates are adjusted sothat the even-degree zonal harmonics are consistent with the precession of the node of satellite 19S8-J3 and so that the inadmissible first- and second-degree harmonics are absent. Spherical harmonic coefficients up to the eighth degree (P8 8 terms} for free-air gravity are computed. '
An independent autocorrelation analysis is made in order to estimate the variance of mean anomalies of blocks and the variance of each degree of the spherical harmonics. This analysis is utilized as a control on the error variances and covariances of the mean anomaly estimates made by the Markov method.
The results are used in conjunction with the zonal harmonics derived from satellite motions to obtain a best estimate of the exterior potential in spherical harmonics from terrestrial gravimetry up to June 1958 and satellite data up to December 1958. It is planned to revise this estimate periodically as new observational data become available. -Author's abstract
180-183. O'Keefe, John A. Zonal harmonics of the earth's gravitational field and the basic hypothesis of geodesy: Jour. Geophys. Research, v. 64, no. 12, p. 2389-2392, 1959.
The basic hypothesis of geodesy as stated by Vening Meinesz and Heiskanen [see Geophys. Abs. 175-191] calls for an extremely smooth gravitational field for the earth as a whole, apart from local irregularities. From satellite measurements of zonal harmonics of orders 2, 3, anc:l 4 it is shown that the actual roughness is about an order of magnitude greater than that demanded by the basic hypothesis of geodesy.- Author's abstract
180-184. Carey, S. Warren. North-south asymmetry of the earth's figure: Science, v. 130, no. 3381, p. 978-979, 1959.
O'Keefe, John A. North-south asymmetry of the earth's figure: ibid, p. 979, 1959.
Carey claimsthat the new pear-shaped figure of the earth (see Geophys. Abs. 176-159} can be reconciled with the Heiskanen-Vening Meinesz concept
GEODESY 55
that the gravitational field is very nearly that of a fluid in equilibrium (see Geophys. Abs. 175-191), if it is assumed that the mean density of the mantle in the southern hemisphere is a little less than that in the northern. Such a density variation is consistent with tectonic hypotheses based on an expanding earth (see Geophys. Abs. 178-217).
In reply, O'Keefe maintains that it is impossible to have hydrostatic equilibrium at the same time that the density is less at a given depth in the northern hemisphere than it is in the southern.- D. B. V.
180-185. International Geophysical Year Bulletin (No. 22). Earth's shape: Am. Geophys. Union Trans., v. 40, no. 2, p. 172-173, 1959.
The substance of this report was published in Science, v. 129, no. 3348, p. 565-566, 1959 (see Geophys. Abs. 176-159).- D. B. V.
180-186. Rice, Donald A. Gravity and gravity reduction, in Contemporary geodesy: Am. Geophys. Union Geophys. Mon., no. 4, p. 40-41, 1959.
A gravity measurement by itself is hardly useful in geodesy; before the Stokes formula can be applied, the surface-gravity measurements must be transferred to the geoid whose shape is being measured. Corrections must be calculated for the effect of masses above sea level either by abolishing them, condensing them on the geoid, or transferring them within it. To date most large -scale applications of the Stokes formula have used the condensation reduction; its chief disadvantage is that gravity anomalies tend to be strongly correlated with topography, and close station spaCing is necessary to obtain good anomaly averages in highly dissected regions. There are theoretical weaknesses in all the conventional reductions. The new approach is to use gravity data directly as observed on the physical boundary of the earth. For convenience the physical surface would be smoothed without changing the total mass. The anomalies would be gotten by comparison with theoretical gravity projected upward, using geopotential-height measurements. Under these conditions the integral formulas would ultimately yield the form of the smoothed physical surface of the earth with respect to the ideal gravity model; the earth's shape would be better defined, and gravimetric deflections of the vertical would be comparable to astrogeodetic deflections observed on the ground.- D. B. V.
180-187. Chovitz, Bernard, and Fischer, Irene. The influence of the distant topography on the deflection of the vertical: Bull. Geod., no. 54, p. 37-43, 1959.
The U. S. Army Map Service has worked out a generalized method for computing the effect of topography as applied to isostatic reductions with respect to astronomic deflections of the vertical. The end result of the work is a rule of procedure and a set of graphs. This paper is a brief explanation of the purpose, derivation, application, and significance of this rule and of the graphs.
The rule may be summed up as follows: In computing the topographic deflection (isostatically reduced according to the Pratt-Hayford theory; depth of compensation, ll3. 7 km) at a station, neglecting all topography beyond Hayford zone 7 will introduce an error of as much as 0. "3 in either component of the deflection. If results more accurate than 0. 113 are desired, an accuracy of 0. "1 may be obtained by use of the graphs.- D. B. V.
56 GEOPHYSICAL ABSTRACTS 180, JANUARY-MARCH 1960
180-188. Fischer, Irene. The Hough ellipsoid or the figure of the earth from geoidal heights: Bull. Geod., no. 54, p. 45-52, 1959.
Enough geoidal contour maps for large contiguous areas are now available to provide material to use geoidal heights in a study of the figure of the earth. With the aid of the UNIVAC computer, 131 observation equations of the type of the de Graaff-Hunter formula were formed for points at 5° intervals for the western hemisphere, and 128 for the eastern hemisphere. Separate solutions were computedfor each set, varying all five parameters--deflection of meridian at origin, flattening (f), separation between geoid and reference ellipsoid, length of semimajor axis (a), and deflection of prime vertical at origin-as well as varying only four while keeping the flattening fixed at 1/297.
The results are as follows: for western hemisphere, f = l/297.ll ±. 22 and a = 6, 378, 239 ± 16 m, or f = 1/297 and a = 6, 378, 247 ± 6 m; for eastern hemisphere, f = 1/297.37 ± .19 and a= 6, 378,248 ±10m, or f = 1/297 and a= 6, 378, 259 ± 9 m. For a good figure of the earth to be used in problems of worldwide extent, as in project Vanguard, it is suggested that the round values of f = 1/297 and a = 6, 378,270 m be used as the best values at present; this ellipsoid is called the "Hough ellipsoid" in honor of the former chief of the Geodetic Division at Army Map Service.- D. B. V.
180-189. Plakhov, Yu. Solnechnyye zatmeniya i figura Zemli. Obshchaya teoriya [Solar eclipses and figure of the earth. General theory]: Moskov. In st. Inzhenerov Geodezii Ae rofotos "yemki i Kartografii Trudy, no. 30, p. 23-30, 1958.
A mathematical theory is developed for determination of' the figure of the earth by means of measuring the chord joining the horns of the sun's crescent during partial solar eclipses and comparing the observed length of the chord with its theoretical value. The probable error of this method is found to be 126m in linear measure or 0. 07" in angular measure. A combination of this method with coronographic observations should produce a reliable result.- A. J. S.
180-190. Plakhov, Yu. Nekotoryye voprosy teorii opredeleniya polyarnogo szhatiya Zemli iz lunnogo parallaksa [Certain problems of the theory of determination of the earth's polar flattening from lunar parallax]: Moskov. Inst. Inzhenerov Geodezii Aerofotos "yemki i Kartografii Trudy, no. 30, p. 31-34, 1958.
The generally accepted opinion that the probable error of determination of the earth's polar flattening by lunar parallax is 500 m because lunar parallax is known only to an accuracy of 0. 05" is shown to be erroneous. Plakhov shows how a theoretical probable error of ±0. 01" in the denominator of the polar-flattening ratio can be achieved.- A. J. S.
180-191. Ewing, Maurice, Worzel, J. Lamar, and Talwani, Manik. Some aspects of physical geodesy, in Contemporary geodesy: Am. Geophys. Union Geophys. Mon., no. 4, p. 8-19, 1959.
Methods are proposed for establishment of benchmarks in the ocean that would be the basis of intercontinental geodetic ties. These would form the base stations for location of secondary points anywhere in the ocean. The distance between such benchmarks can probably be measured with an accuracy of one part in 200, 000, as required for first order geodetic work. The benchmarks would be made by placing a transponder at each of the corners of
GEODESY 57
an equilateral triangle; a ship within the triangle can transmit acoustic signals which the transponders can repeat back without delay. The benchmark would be defined as the point on the water's surface from which the round trip traveltime to all three vertices is equal. -D. B. V.
180-192. Meade, Buford K. Geodetic networks, in Contemporary geodesy: Am. Geophys. Union Geophys. Mon., no. 4, p. 30-31, 1959.
The factors entering into establishment of a national geodetic control systern are discussed. By obtaining sufficient ties between continental datums already established and by cooperation from all countries involved, a new world datum including all networks would furnish valuable information concerning the shape and size of the earth.- D. B. V.
180-193. Izotov, A. A. Reference-ellipsoid and the standard geodetic datum adopted in the USSR: Bull. Geod., no. 53, p. 1-6, 1959.
The reference ellipsoid adopted for geodetic work in the U.S.S.R. is Krassovsky's biaxial ellipsoid whose major semiaxis = 6, 378, 245 ± 15 m and whose polarflattening =1/298. 3 ± 0.4. The Pulkovo observatory is the standard datum; it has a geodetic position of lat 59°46'18. 55" N., long 30°19'42. 09 11
E., and an azimuth to Bugry of 121°40'38. 79" (deflection of the vertical at Pulkovo is + 0. 16 11 ± 0. 12 11 in the meridian and -: 1. 78" ± 0.10" in the prime vertical). In the new general adjustment of the U.S.S.R. state triangulations, performed after the dimensions of the new reference ellipsoid and new standard geodetic datum were adopted, the base lines and angles measured were reduced to the surface of the reference ellipsoid by the projection method, and heights above the geoid relative to the reference ellipsoid were determined by astrogravimetric leveling. Astronomic stations are usually determined every 70-100 km; heights above the geoid even in the remotest parts of the U.S.S.R. are determined with an error not exceeding 4. 5 m. Deflections of the vertical are determined by interpolating values observed at available astrogeodetic stations, using gravimetric data to interpolate the nonlinear part of the variations of observed deflections of the vertical. Corrections for deflections of the vertical are not negligible in many cases. -D. B. V.
180-194. Braaten, Norman F. Orthometric, heights, in Contemporary geodesy: phys. Mon., no. 4, p. 36-37, 1959.
dynamic, and barometric Am. Geophys. Union Geo-
Orthometric elevations, used in most engineering work, are defined as geometric heights above the geoid surface. Because level surfaces at different altitudes are not parallel, the orthometric concept has disadvantages. The dynamic system, in which each level surface is given a number of its own proportional to the work required to raise a unit mass from sea level to that surface, offers an alternative. The International AssociationofGeodesy has recently recommended that each country compute and adjust its leveling network on a dynamic basis referred to surface measurements of gravity to provide values adequate for scientific work, then convert these to orthometric values for general use. When the U.S. Coast and Geodetic Survey will adopt this recommendation depends on how soon gravity is measured along all leveling routes. A releveling program is also necessary. In an absolutely calm atmosphere a particular isobaric surface would coincide with a level surface of particular isobaric number; dynamic heights, therefore, are often determined from barometric heights in upper atmosphere studies.- D. B. V.
58 GEOPHYSICAL ABSTRACTS 180, JANUARY -MARCH 1960
180-195. Nemeth, Ferenc. Szintvclltozasok es szintezesi adatok [Variations in level and leveling data (with German summary)]: Geodezia es Kartografia, v. ll, no. 3, p. 183-187, 1959.
Geodesists have long drawn attention to the fact that leveling data should be used as evidence of crustal movements only with caution. The differences in altitude of leveling sections are mostly reliable only to the order of a millimeter because of measurement error; however, movements of ground and structures can multiply the measurement error. A difference in compared altitude values can also stemfrom adjustment of different-leveling networks. For investigation of changes of level, only one and the same networlt specially stabilized for this purpose and always measured by the same methods is suitable.- Author's summary, D. B. V.
GEOTECTONICS
180-196. Vening Meinesz, F. Jl:.. The results of the development ofthe earth's topography in spherical harmonics up to the 31st order; provisional conclusions: Koninkl. Nederlandse Akad. Wetensch. Proc., ser. B, v. 62, no. 2, p. ll5-125, 1959.
Results of development in spherical harmonics up to the 31st order of the earth's topographic elevation above sea level are analyzed. Two graphs show the curves for continental (e), oceanic (s), and total topography (t); and for the curves of L, S, and T computed by multiplying these values, respectively, by nl/2(n + 1)1/2. The values for n = 10, 14, 17, 21, 26, and 30 appear to correspond to convection currents inl/2, 1/3, 1/4, 1/6, and 1/7 parts of the thickness of the mantle. The values n = 14, 17, 21, 26, and 30 all correspond to the topographies of larger and smaller island -arc basins; the fairly rapid subsidence of these basins to great depths can best be explained by the relatively quick phase changes in the transition layer. These basins are surrounded by geosynclinal belts under which rising columns of convection currents are situated. The peaks for n = 14, 17, 21, 26, and 30 must correspond to the distribution of present geosyncline belts, and great folded mountain ranges also must contribute to these peaks.- D. B. V.
180-197. Vening Meinesz, F. A. The results of the development of the earth's topography in spherical harmonics up to the 31st order; provisional conclusions. II. The plastic-elastic deformation and flow in the mantle: Koninkl. Nederlandse Akad. Wetensch. Proc., ser. B, v. 62, no. 2, p. 126-136, 1959.
Results of the spherical-harmonic analysis of the earth's topography indicate a vertical distribution of many different convection cells in successive layers downwards in the mantle (see Geophys. Abs. 180-196). The mantle behaves as a crystalline layer having a limit of elasticity that can flow plastically only if the stress deviator exceeds this limit. In this paper Vening Meinesz treats- mathematically the problem of a plane plastic layer subject to a small type of convection with a vertical division into several layers of cells, assuming that adjacent cells rotate in an inverse sense.
The results of his analysis suggest that the energy needed for a multilayered type of convection-current system depends more on the temperature gradient near the lower boundary of the mantle than on the gradient near the crust. It may be assumed that during the Tertiary period a large convection current turned over the whole mantle and brought lower temperature matter down and into contact with the core, higher temperature matter up and into contact with
GEOTECTONICS 59
the crust. The resulting high-temperature gradients in both contact zones would have led to convections of smaller size. It follows that deep island-arc basins of preferred size can originate only in a geological period following one in which the great half -turn convection current reversed the whole mantle. The required trigger effect can be provided by the horizontal temperature gradient attendant on heat produced by concentration of sial (which is richer in radioactive constituents) by folding in a geosynclinal belt. The evidence of deep earthquake focuses supports the supposition that the deep basins of the Indonesian Archipelago are brought about by the small convection cells. -D. B. V.
180-198. Kraus, Ernst [C. ]. Die Entwicklungsgeschichte der Kontinente und Ozeane [The developmental history of the continents and oceans]: Berlin, Akademie Verlag, 285 p., 1959.
The developmental history of the earth is treated comprehensively. The first section deals with various ideas proposed for the origin of the earth; these include the Kant-LaPlace, planetesimal, contraction, tetrahedral, Wegener, Staub, and Ampferer hypotheses. In the second section the observational bases for synthesis are outlined. General observations are discussed from the standpoint of geophysical principles and of the growth of continents through geosynclinal development. Regional observations consist of a review of the large structural elements of the continents and oceans. The third section is devoted to theories, syntheses, and discussion of the significance of the orogen.- J. W. C.
180-199. Chin, Chen. On the geotectonic areal divisions and oil prospects of the North China plain and its related regions (in Chinese with English summary]: Acta. Geol. Sinica, v. 38, no. 2, p. 232-249, i958.
The geologic history and tectonic subdivisions of the North China plain as revealed by geological and geophysical studies are discussed briefly. Paleozoic sediments were folded during the Variscan orogeny; the principal tectonic activity has been vertical movement of the basement. Three large depressions are listed, and the depths to horizons of high electrical resistivity are given. - J. W. C.
180-200. Bubnoff [Bubnov], Serge [N. ) von. Die tektonischen Phasen und der Charakter der Deformationsvorgange der Erde. Eine Diskussionsbemerkung [The tectonic phases and the character of the deformation processes of the earth. A discussion]: Geologie, v. 8, no. 2, p. 207-210, 1959.
This is a German version of a paper originally published in the Moskov. Obshch. Ispitateley Prirody Byull., v. 63, Otdel Geol., v. 33, no. 1, p. 3-6, 1958 (see Geophys. Abs. 179-189).- D. B. V.
Carey, S. Warren. North-south asymmetry of the earth's figure. See Geophys. Abs. 180-184.
Tomaschek, Rudolf. Oscillations of tectonic blocks as a result of barometric load variations. See Geophys. Abs. 180-221.
Mend one; a Dias, A. A. de. A crustal deforming agent and the mechanism of the volcanic activity in the Azores. See Geophys. Abs. 180-402.
60 GEOPHYSICAL ABSTRACTS 180, JANUARY-MARCH 1960
Petrushevskiy, B. A. Ural- Siberian epi- Hercynian platform and the Tien Shan. See Geophys. Abs. 180-46.
180-201. Lensen, G. J. Secondary faulting and transcurrent splay-faulting at transcurrent fault intersections: New Zealand Jour. Geology and Geophysics, v. 2, no. 4, p. 729-734, 1959.
Two principles are put forward to explain secondary faulting and transcurrent splay faulting at the intersections of clockwise with anticlockwise transcurrent faults. The first is based on the convergence and divergence of material in the compressional and tensional sectors between the intersecting transcurrent faults. The second principle is based on the opposed sense of lateral displacement at the intersection of transcurrent faults. Either or both can be used to explain given examples.
The first principle may explain the presence of isolated volcanoes apparently not associated with volcanic pelts. The fact that secondary faulting is usually confined to one sector in both compressive and tensional regions is explained if it is assumed that one side of each fault remains stationary while the other moves intermittently. Applied to California, it becomes apparent that it is the Pacific side that moves, thus defining the "mobile belt" more clearly. This conclusion is compatible with current theories of anticlockwise rotation of the entire Pacific basin (see Geophys. Abs. 178-73, -74). -D.B.V.
180-202. Drake, C[harles] L., Ewing, M[aurice], and Sutton, G[eorge] H. Continental margins and geosynclines: the east coast of North America north of Cape Hatteras, in Physics and chemistry of the earth: New York, Pergamon Press, v. 3, p. ll0-198, 1959.
The results of seismic refraction measurements off the east coast of North America north of Cape Hatteras are reviewed, and the data are presented in a table. These studies have revealed the presence of two sedimentary troughs parallel to the coast separated· by a basement ridge. This sedimentary system is quite comparable to the Appalachian system as restored for the Early Paleozoic. The sediments of the inner and outer troughs are similar to those of the Appalachianmiogeosyncline and eugeosyncline, respectively, and the basement ridge resembles the Precambrian axis which separated the two troughs in the Appalachians. While there is no active volcanism in the outer(eugeosynclinal) trough at the present time, evidence of past volcanism is present in the form of partially buried seamounts, which have large circular magnetic anomalies. Conditions in the Appalachian eugeosyncline appear to have been similar. - J. W.C.
180-203. Berg, E. Tectonique et seismicite du Western Rift Valley [Tectonics and seismicity of the Western Rift Valley]: Folia Sci. Africae Centralis, no. 1, p. 9-12, 1959.
Some areas of the Western Rift Valley are marked by very active faults; there are also stable regions. The active volcanoes are located in areas of very little movement. Most of the seismic focuses in this _region are alined approximately N. 30°-35° E. , which is transverse to the surface trend. It is thereby concluded that the transvers.e structures present have no surface tectonic expression. A series of leveling profiles reestablished every 5-6 years is recommended for revealing the nature of these recurring movements.J.W.C.
GLACIERS 61
180-204. Emiliani, Cesare, and Geiss, Johannes. On glaciations and their causes: Geol. Rundschau, v. 46, no. 2, p. 576-601, 1957.
The causes of glaciation are reviewed on the basis of recent advances in paleotemperature analysis, radiocarbon dating, and stratigraphy of deep-sea deposits. Orogenesis and uplift increase the earth's albedo and decrease the temperature. Astronomical causes become operative after the temperature drops to a certain threshold value. Two time- delay factors are believed to be responsible for glacial oscillations; these are plastic flow of the ice and crustal warping. Summer- insolation variation in the high latitudes is believed to be a more likely cause of glacial oscillations than variation in solar radiation. - J. W. C.
180-205. Gosselink, John G. What caused the ice age?: Indiana Acad. Sci. Proc., v. 68, p. 294-297, 1958.
It is suggested that water vapor is the dominant factor in creating the "Greenhouse effect" in the earth's atmosphere; therefore, long- range climatic variations might be explained in terms of the fluctuating water-vapor content of the atmosphere. The cycle postulated should develop conditions of unstable equilibrium at both ends of the fluctuation and should cause the climate to change very rapidly when the equilibrium becomes upset. Evidence from ocean-bottom cores seems to corroborate this sharp change. -D. B. V.
180-206. Nye, J. F. The distribution of stress and velocity in glaciers and ice-sheets: Royal Soc. London Proc., ser. A., v. 239, no. 1216, p. ll3-133, 1957.
In this paper the distribution of stress and velocity within the moving mass of a glacier or ice sheet is theoretically examined and the results compared with those of an experiment. A block of ice resting upon a rough slope forms the theoretical model of the glacier or ice sheet, the sides of the valley being ignored. A general flow law is used throughout, and the equations for steady flow, with r (the longitudinal velocity gradient) allowed to be nonzero, are found. Possible variations of density, temperature, or flow law with depth are allowed for. If the density and the flow law are known as functions of depth in any region, and if the surface slope, surface velocity, and value of r are known, the equations give the stresses and velocity as functions of depth.
A reinterpretation is made of the experiment (Gerrard and others, 1952) in which the variation of longitudinal velocity with depth in a glacier was measured directly from a vertical hole melted in the Jungfrau firn. From the observed value of r and from Glen's laboratory flow law for ice, a theoretical curve for the result of the experiment is calculated and is compared with the experimental curve. At a depth of 50 m the effect of ignoring r, as has been done hitherto, is to underestimate the shear rate by a factor of 50; on the present theory it is overestimated by a factor of 1. 33. The remaining discrepancy is probably due to the effect of the glacier sides. - V. S. N.
180-207. Nye, J. F. The motion of ice sheets and glaciers: Jour. Glaciology, v. 3, no. 26, p. 493-507, 1959.
The velocity of a point on the surface of an ice sheet is a result of two factors: one, the sliding of the ice sheet over its bed; and the other, differential shear motion within the bulk of the ice. In this paper it is argued that in the ice sheets of Antarctica and Greenland the motion is made up entirely of sliding; the ice sheet theory presented here is based upon this assumption.
557043 0 - 60 - 5
62 GEOPHYSICAL ABSTRACTS 180, JANUARY -MARCH 1960
Using a suitable law of sliding, a study is made of the flow of a general ice sheet of irregular outline on an irregular bed in both a steady and a nonsteady state. The theory is set up in such a waythat previous results, obtained from the approximation of perfect plasticity, appear as special cases.
In other cases, possibly including most glaciers, the differential shear motion cannot be ignored. Application of the law of sliding to these cases makes it possible to calculate the longitudinal strain rate, which previously has been an undetermined parameter of the theory. - V.S.N.
180-208. Butkovich, T. R., and Landauer, J. K. A grid technique for measuring ice tunnel deformation: Jour. Glaciology, v. 3, np. 26, p. 508-5ll, 1959.
A new method for measuring deformation and closure of an ice tunnel has been devised that makes the movement readily visible. Gridlines are installed on a smooth section of the tunnel wall by cutting slots into the wall, forcing wet dyed string into the slots, and subsequently freezing the string in the slots. Results of measurements, 1 year after installation, are given in a table for each -of 13 grids installed throughout a 366- meter ice tunnel. Two important visual observations were made: no differential shearing was found, that is, strong shearing. is not associated with dirt banding; and heavy dirt bands, occurring throughout the tunnel, had extruded as much as several centimeters into the tunnel opening, the amount appearing to increase relative to the concentr~tion of dirt. A probable explanation is that dirty ice is more plastic than clean ice. - V.S.N.
180-209. Wallerstein, George. Movement observations on the Greenland ice cap: U.S. Army Corps Engineers, Greenland Ice Cap Research Program Studies (1955-1956), v. 2, SIPRE Rept. 24, 4 p., 1958.
A number of accumulation stakes established by the French in 1951 from the French Central Station on the Greenland Ice Cap westward for 190 miles to the vicinity of Camp VI were relocated in the summer of 1955 by a SIPRE expedition. A table gives the position (in latitude and longitude) in 1951 and in 1955, the total motion (in km) from 1951 to 1955, and the direction of motion for each station. - V. S. N.
180-210. Landauer, J[oseph] K. On the deformation of excavations in the Greenland neve: U.S. Army Corps Engineers, Greenland Ice Cap Research Program Studies (1955-1956), v. 2, SIPRE Rept. 30, 14 p.' 1958.
This repo_rt presents the results of measurements over a period of 2 years of deformation in a tunnel, 2 trenches, and a 30-m deep pit excavated in the Greenland neve in 1954. Observed deformations in the tunnel and pit closure are in fair agreement with a theoretical calculation using a modification of existing theories for the deformation of an elastic, compressible, thickwalled cylinder. From this agreement it appears that the flow behavior of the neve can be· described on the basis of a Newtonian viscosity. The trench closure is described as a squeezing out of horizontal layers, fixed at some distance from the trench and modified only slightly by the drag of neighboring layers. - V.S.N.
180-211. Landauer, Joseph K. Some preliminary observations on the plasticity of Greenland glaciers: U.S. Army Corps Engineers, Green-
GLACIERS 63
land Ice Cap Research Program Studies (1955-1956), v. 2, SIPRE Rept. 33, 6 p., 1958, also in Jour. Glaciology, v. 3, no. 26, p. 468-474, 1959.
A series of deformation measurements obtained in Red Rock and TUTO tunnels, excavated in northwest Greenland in the summer of 1955, have been selected for preliminary studies on the plasticity of Greenland glacier ice. Although measurements made up to the end of the 1956 summer season are of limited reliability, certain trends appear in data collected from the shearing of an initially vertical peg system at Red Rock, from the deformation of core holes at TUTO, and from tunnel closure at both sites. These data are mathematically analyzed on the basis of laminar flow of the Nye type. - V. S. N.
180-212. Rausch, Donald 0. Ice tunnel, TUTO area, Greenland, 1956: U.S. Army Corps Engineers, Greenland Ice Cap Research Program Studies (1955-1956), v. 2, SIPRE Rept. 44, 34 p., 1958.
The feasibility of constructing large openings within the Greenland Ice Cap was demonstrated during 195~. A room was excavated with a floor space of 3, 600 sq ft and a height of 25 ft. Excessive deformation of this opening did not occur at the overburden depth of 180 feet that was eventually reached in the tunnel extension. - V. S. N.
180-213. Finsterwalder, Richard. Expedition glaciologique international au Greenland 1959-60 (E. G. I. G.) [International Glaciological Expedition to Greenland 1959-60 (E. G. I. G.)]: Jour. Glaciology, v. 3, no. 26, p. 542-546, 1959.
This is a detailed account of the work by the International Glaciological Expedition to Greenland to be undertaken during 1959 and part of 1960, and to be participated in by scientists from Denmark, France, Switzerland, Austria, and Germany. Most of the fieldwork was scheduled for the summer of 1959 with a wintering party of six men remaining through 1960. Five major fields of study are to be covered: geodesy, mass balance of the icecap; the glaciology of the inland ice; geophysical and meteorological research including seismic, gravimetric, and electrical measurements; and topographic mappingbased on a photogrammetric survey. Results are to be published in the periodical Meddelelser om Grt'mland. - V.S.N.
180-214. Mathews, W. H. Vertical distribution of velocity in Salmon Glacier, British Columbia: Jour. Glaciology, v. 3, no. 26, p. 448-454, 1959.
Observations have been made in one of several deep holes drilled in Salmon Glacier in the course of mining development. Surveys, particularly of the displacement of a 481. 5 m length of pipe in this hole over a 94- day period, show movement diminishing downward from a maximum value of 0. 225m per day at the surface, through a slightly lower value at mid- depth to 45 percent of this value at the bottom of the pipe. By extrapolation, movement on the glacier floor, 490 m below the surface, is believed to be almost 44 percent .of the surface rate. The data closely approximate Nye's (1952) theoretical formula for laminar flow. Maximum shear stress at the glacier floor is calculated to be about 1. 42 bars. - V. S. N.
180-215. Mellor, Malcolm. Creep tests on Antarctic glacier ice: Nature, v. 184, no. 4687, supp. 10, p. 717, 1959.
64 GEOPHYSICAL ABSTRACTS 180, JANUARY -MARCH 1960
Compression creep tests in the stress range 2 -15 bars were conducted on randomly oriented Antarctic ice at a temperature of -30°C. This ice is characterized by the inclusion of air under pressure in small bubbles (about 0. 6-mm diameter); density is about 0. 87 g per cm3. The exponent n for flow of this ice (according to the simple flow law e: = kcrn, where e: is strain rate, a is stress, and k is constant for a given temperature) was found to be 4. 2, suggesting that the cellular structure does not significantly alterthe power in the relation between strain rate and stress.
Experimental results give k = 5 X 10⁻⁴ at - 30°C, more than an order of magnitude larger than the value extrapolated from Glen's inverse relationship between strain rate and temperature. This indicates that the presence of air bubbles facilitates deformation. -D. B. V.
GRAVITY
180-216. Raspopov, 0. M. Metodika redutsirovaniya znacheniy sily tyazhesti s uchetom anomal'nogo vertikal'nogo gradiyenta [Method of reduction of gravity values taking into account the anomalous vertical gradient]: Leningrad Univ. Uchenyye Zapiski, Ser. Fiz. i Geol. Nauk, v. 249, no. 10, p. 248-260, 1958.
To improve the accuracy of gravity determinations from the given value at one point in space to another and to make free-air reduction more dependable, the use of the anomalous part of the normal value of the vertical gradient is recommended, and a formula for this purpose is presented. For a spherical disturbing body 5 km in radius, 10 km in depth, and more than 1. 0 g per cm3 in density, the correction given by the formula ranges from 15 mgal directly above the sphere to 0 mgal at a horizontal distance between 16 and 21 km. A.J.S.
180-217. Talwani, Manik, and Ewing, Maurice. Rapid computation of gravitational attraction of three -dimensional bodies of arbitrary shape: Geophysics, v. 25, no. 1, p. 203-225, 1960.
An expressionis derived forthe gravity anomalyat an externalpoint caused by a horizontal lamina with the boundary of an irregular polygon, in a form suitable for computation by a high- speed digital computer. By making the number of sides of the polygon sufficiently large, any irregular outline can be closely approximated. Any three-dimensional body can be represented by contours. The anomaly caused by replacing each contour with a polygonal lamina ·can be obtained at any external point. By using a system of interpolation between contours combined with a numerical integration, the gravity anomaly caused by a three-:-dimensional body can be calculated with a high degree of precision.
This method may also be used for the rapid computation of terrain corrections on a flat earth and, with a small modification, for computation of terrain corrections and local isostatic compensation (Airy) up to the radius of the Hayford zone 0 on a spherical earth.
The expression for the anomaly caused by a horizontal polygonal lamina is obtained for the special case where the lamina can be divided into a number of rectangular laminae; a chart is given for hand computation of the anomaly in this case. - D. B. V.
O'Keefe, John A. Zonal harmonics of the earth's gravitational field andthe basic hypothesis of geodesy. See Geophys. Abs. 180-183.
GRAVITY 65
Chovitz, Bernard, and Fischer, Irene. The influence of the distant topography on the deflection of the vertical. See Geophys. Abs. 180-187.
180-218. Matsuda, Takeo, and Suda, Yoshiro. On the comparison of analysis methods in gravitational prospecting: Japan Geol.SurveyBull., v. 10, no. 4, p. 57-62, 1959.
This paper presents results of a study made of the many methods of analysis of isogal maps to determine an effective correlation between them. It is concluded that the running-mean method of Seya and the second-derivative method of Henderson and Zietz are better than all other analytical methods. -V.S.N.
180-219. Balabushevich, I. A. K voprosu o klassifikatsii gravitatsionnykh i magnitnykh anomaliy [On the problem of classification of gravity and magnetic anomalies]: Akad. Nauk Beloruss. SSR, Inst. Geol. Nauk Trudy, no. 1, p. 108-ll8, 1958.
Balabushevich attempts to develop a classification of gravity and magnetic anomalies by selecting a unique system of relationships between geological data and the regional distribution of the elements of physical fields. Regional anomalies are subdivided into 3 orders of magnit~de (1st, 2d, and 3d) and include 2 classes: mosaic anomalies, characterized by an unsystematic distribution of 2d order elements, and strip anomalies of clearly elongate trend. These two classes of anomalistic fields are correlated with geological structures. The mosaic elements of the 2d order are found to correspond to platform and crystalline shield tectonics. The strip anomalies seem to reflect structures of sedimentary strata and deep-basement tectonics.-- A. J. S.
180-220. Roy, Amalendu. Optical analogue of gravity and magnetic fields: Geophys. Prosp., v. 7, no. 4, p. 414-421, 1959.
Gravity anomalies due to given mass distributions have been simulated by optical models that utilize the fact that both the light intensity and the gravitational field due to point sources obey the inverse square law. The technique is somewhat different from that used by Gerrard and others (see Geophys. Abs. 169-161). With new modifications described here, the method is simpler, faster, more accurate (minimum discrepancy 2 percent), and much more economical than any other method so far devised for determination of gravity anomalies of low-relief structures. It is also applicable to magnetic anomalies and, with a little modification, can be applied to anomalies of large-relief structures.- D. B. V.
180-221. Tomaschek, Rudolf. Schwankungen tektonischer Schollen infolge barometrischer Belastungsanderung [Oscillations of tectonic blocks as a result of barometric load variations]: Freiberger Forschungshefte C60 Geophysik, p. 35-55, 1959.
It is shown that the distribution of barometric pressure over a large area, extending from Greenland to the European Continent, has a strong correlation with variations in inclination and vertical displacement measured at Winsford in the British Isles. In its mainlines this correlation is opposite to what would be expected for elastic pressure deformation. It can be understood only if it is assumed that tilting of vast, more or less completely mobile bloeks takes place on axes at least 300 km northwest of the station. The explana-
66 GEOPHYSICAL ABSTRACTS 180, JANUARY -MARCH 1960
tion is based on the structure of this area and confirmed by residual movements due to earth tide at other observation points on the European Continent. The existence of simultaneous elastic deformation is also shown. The rigidity coefficients calculated from this are strikingly low, on the order of 1010 d per cm2. It is further shown that the assumed movements fit within the framework of present knowledge. Quantitative results can be obtained only on the basis of simultaneous observations of all three components of gravity at selected stations; these could yield information on the structure of the deeper crustal layers.
From a practical standpoint it is shown that owing to the meteorological pressure effects on the crust over rather large areas, gravity variations up to 0.1 mgal or more may occur at a given station even within 12 hr; therefore, measurements made at different times and at long intervals would contain an error if pressure conditions were not at least comparable over an area several thousand kilometers in diameter. -Author's summary, D. B. V.
Service Hydrographique de la Marine and Companie Generale de Geophysique. Tidal gravity corrections for 1960. See Geophys. Abs. 180-72.
180-222. Pemberton, Roger. Gravity meter surveys, in Methods and case histories in mining geophysics: [Canada] Commonwealth Mining and Metal!. Cong. (6th), p. 35-38, 1957.
The gravimeter measures natural physical forces at the earth's surface without the application of an artificial extraneous field. The basic principles of a gravimeter are described, and field procedure, reduction of data, and depth determination are discussed. - V. S. N.
1~0-223. Dimitrov, L. V. Sposob uskorennoyobrabotki nablyudeniy s gravimetrami SN -3 i N~rgaard [A method of rapid analysis of observations with the SN-3 and N~rgaard gravimeters]: Akad. Nauk SSSR Izv. Ser. Geofiz., no~ 10, p. 1248-1249, 1958.
When using the N~rgaard gravimeter or its Russian equivalent, the SN-3, the computation of the relative value of the gravity force (gr) necessitates a cumbersome arithmetical operation that has to be repeated for every station. Dimitrov here suggests a more rapid graphic method of computing the gr values. He constructs a parabola, described by the customarily used equation, which is determined by insertions corresponding to the necessary range of g \ralues. From the nomograph given, constructed for an interval (~B) of 100 calibrations of the micrometer screw, it is possible to find the corresponding value of gr with an accuracy of± 0. 05 mgal. Accuracy can be improved by using a smaller interval; for example, .D.B = 50. Two tables are given of the numerical values necessary for constructing the parabola. S.T.V.
180-224. Nettleton, L. L., LaCoste, Lucien, and Harrison, J[ohn] C. Tests of an airborne gravity meter: Geophysics, v. 25, no. 1, p. 181-202,. 1960.
Aerial gravity measurements have been made using a LaCoste and Romberg instrument similar to that recently tested on a surface ship (see Geophys. Abs. 179-211). The instrument was installed in a B-17 aircraft equipped with a precision radar altime~er and aerial mapping cameras. A map with a contour interval of 20 mgal has been constructed for 12, 000 feet elevation. A series of nine lines over the Imperial Valley gave results believed to be ac-
GRAVITY 67
curate to within 10 or more mgal. Short -period disturbances owing to acceleration of the aircraft are averaged
over a certain time interval. This results in an "uncertainty principle'' in which the accuracy of observation increases as the time interval is lengthened; however, details of gravity variation are lost owing to the increased distance traveled during each measurement. The values reported are for an averaging time of about 3 minutes, which corresponds to about 10 miles. The quality of results is adequate for geodetic purposes and possibly for certain regional geophysical problems. -D. B. V.
180-225. Lozinskaya, A. M .. Strunnyy gravimetr dlya izmereniya sily tyazhesti na more [A string gravimeter for gravity measurements at sea]: Akad. Nauk SSSR Izv. Ser. Geofiz., no. 3, p. 398-409, 1959.
A model of a new type gravimeter has been built, the main element of which is a thin beryllium-bronze wire. It is 0. 37 mm in diameter, 52 mm in length, and is loaded with a 72- mg weight. The natural frequency of its oscillations is adjusted to 1, 000 cycles per sec and changes with variation in gravity. The deviation of the frequency is ·continuously recorded. This model measures only the vertical acceleration of the gravity. It worked very satisfactorily in calm seas. The model was tested on several trips from Baku to Astrakhan (Caspian Sea) on a tanker of 15, 000 ton displacement. The results of the tests were encouraging, and in the near future additional elements will be built that will take into account the horizontal accelerations of the ship. - S. T.V.
180-226. Veselov, K. Ye. Opredeleniye plotnosti gornykh porod po gravimetricheskim izmereniyam v skvazhinakh [Determination of density of rocks by gravimetric measurements in boreholes]: Razv.edochnaya i Promyslovaya Geofizika, v. 16, p. 58-62, 1956.
The problem of density determination of horizontal layers by gravity logging with a gravimeter accurate to ± 0. 1 mgal is discussed. To improve the accuracy of density determination of layered rocks, Veselov suggests analytical extension ofthe anomalous gravity field beyond the bottom of the borehole from which core samples ofthe rocks are taken. The density of the rock cores in the external gravity field is determined, and these data are then used in evaluation of the measurements made in the borehole. -A. J. S.
180-227. Hales, A. L. , and Gough, D. I. Gravity anomalies and crustal structure in South Africa: Royal Astron. Soc. Geophys. Jour., v. 2, no. 4, p. 324-336, 1959.
In this paper an account is given of the isostatic -anomaly field in South Africa. Estimates of crustal thickness are made by using the regressioncoefficient criterion proposed by Heiskanen, the minimum sum of squares criterion proposed by Bowie, and a new criterion based on minimum sum of squares of departure from the regression lines. It is found that the regression- coefficient criterion is not satisfactory because it is sensitive to systematic effects such as arise in South Africa near the escarpment. The other criteria yield results that are consistent with the seismically inferred crustal structure, that is with a crustal thickness of 30-40 km. -Author's summary
Weiss, Oscar. Geophysical surveys discover Stilfontein gold mine in South Africa. See Geophys. Abs. 307.
68 GEOPHYSICAL ABSTRACTS 180, JANUARY-MARCH 1960
180-228. Stoenescu, Scarlat, and Airinei, §tefan. Studii geofizice asupra zacamintului de sare de la Slanic-Prahova [Geophysical study of the rock-salt deposits at Slanic-Prahova (with Russian and French summaries) ] : Acad. Romine Studii §li Cercetari de Geologie -Geografie, v. 4, no. 1, p. 113-126, 1959.
A description and interpretation of five geophysical maps showing salt deposits are given for the Slanic-Prahova region. The first results of gravity vertical-gradient determinations and the anomaly of this vertical gradient for the main salt massif of Slanic are discussed. A close correlation was found between data of gravimetric and magnetic observations. Almost a complete correspondence was observed between the map data on residual gravity anomalies and the vertical component ~Z of the geomagnetic field. It was established that the "salt-breccia" shows a considerable deviation in density and intensity of magnetization from the surrounding geologic masses. - A. J. S.
180-229. Stoyenesku [Stoenescu]. S[carlat], and Airiney [Airinei] Sh. [~tefan]. Geofizicheskiye dannyye k izucheniyu substrata Khatsegskogo basseyna [Geophysical data on the study of the substrata of the Hatega basin]: Acad. Roumaine Rev. Geol. -Geog., v. 3, no. 1, p. 127-137, 1959.
This is a Russian version of essentially the same paper published previously in Acad. Romfne Bul. Stiint., Sec. Geol. ~i. Geog., v. 2, no. 2, p. 275-287, 1957 {see Geophys. Abs. 175-217). - J. W. C.
180-230. Tarkov, A. P. Priroda anomal'nogo gravitatsionnogo polya Minusinskikh kotlovin [Nature of the anomalous gravity field of the Minusin trough]: Prikladnaya Geofizika, no. 23, p. 136-140, 1959.
The Minusin trough is an intermontane depression filled by Middle and Upper Paleozoic sediments that are as much as 7 km thick. The vertical displacement of individual blocks of the basement reaches 5 km. Three main density interfaces can be distinguished: the surface of the basement, the surface of the Devonian sedimentary -volcanic complex, and the surface of the Upper Paleozoic terrestrial unit. These are illustrated diagrammatically. The gravity field ofthe Minusin trough is governed by the form of these three surfaces, and thus is controlled indirectly by the basement. - J. W. C.
180-231. Volodarskiy, R. F. Nekotoryye voprosy interpretatsii rezul'tatov gravitatsionnoy s "yemki rayonov zapadnoy Bashkirii i vostochnoy Tatarii [Some questions of interpretation ofthe results of a gravity survey of the regions of western Bashkiria and eastern Tatary]: Moskov. Univ. Vestnik, no. 1, p. 177-181, 1959.
All known buried structures of the areas in question are disposed in a zone of relative gravity minimum or occur on the periphery of regional anomalies. Magnetic anomalies are completely absent in zones of steep gravity gradients, where a number of structures are located. It can be taken as a working hypothesis that zones of steep gravity gradient are the site of relative vertical movements of blocks of the basement. Analysis of the gravity survey of the regions of western Bashir A. S. S. R. and eastern Tatar' A. S. S. R. indicates the necessity of an eightfold or te¢old increase in the accuracy of existing apparatus; isoanomaly maps on a scale of 0. 1-0. 2 mgal can then be constructed and smaller buried structures revealed. - J. W. C.
HEAT AND HEAT FLOW 69
180-232. Vasil 'yev, V. G. 0 metodike opredeleniya vozrasta platformy [Method of determination of the age of a platform]: Geologiya Nefti, no. 3, p. 24-30, 1958.
The developmental history of platforms is discussed with special emphasis on the relationship of the gravity field to crustal thickness. The average gravity anomaly of the Siberian platform is -38 mgal, and the average in the south of this platform is -105 mgal. Areas of estimated greater crustal thickness correspond to the higher negative gravity values. The age of the platform is taken as the age of the first epicontinental basin that developed on this structural unit. Platforms in process of further development begin to be regenerated in separate parts and pass over into other structural forms such as depressions. - J. W. C.
180:...233. Dooley, J. C., and Everingham, I. B. Detailed gravity survey of Rough Range anticline near Learmonth, Western Australia: Australia Bur. Mineral Resources, Geology and Geophysics Rept., no. 43, p. 1-7, 1959.
A gravity survey of the Rough Range anticline was conducted to assist in the interpretation of results from an earlier seismic survey. An elongate anomaly high is thought to be associated with a· high feature in Cretaceous sediments or with a buried fault upthrown on the east side. A well drilled on the west flank of the anomaly high located oil at a depth of about 3, 600 feet. -V.S.N.
180-234. Shumskiy, P. A. Is Antarctica a continent or an archipelago?: Jour. Glaciology, v. 3, no. 26, p. 455-457, 1959.
Geologic and gravimetric investigations prove that East Antarctica (the Atlantic Ocean- Indian Ocean side of Antarctica} is a typical continent submerged by the weight of a thick ice sheet to a depth of several hundred meters and in some parts to below sea level. Only in West Antarctica is there the probability that a chain of mountainous islands is joined to the East Antarctic continent by the overlying ice sheet.
Cross sections of the surface and base of the Antarctic ice sheet, based on seismic and gravimetric data from the second and third U.S.S.R. Antarctic Expeditions, are shown for the Mirnyy- Vostok route (lat 66°33' S., long 93°00' E. to lat 78°27' S., long 106°53' E.} and for the Komsomol'skaya-Pole ofRelativelnaccessibility route(lat 74°05 1 S., long 97°29' E. to lat 82°06' S., long 54°58' E.}. - V.S.N.
HEAT AND HEAT FLOW
180-235. Hayakawa, Masami. Study of the thermal state in the upper part of earth crust [in Japanese with English summary]: Volcanol. Soc. Japan Bull., ser. 2, v. 4, no. 1, p. 1-19, 1959.
The fundamental geophysical studies of the thermal state in the earth's upper crust described in this paper are preliminary results of work on the utilization of geothermal energy for electric power. The problem of geothermal energy can be solved only by coordinated study of magma, of the state of interstitial water, and of the characteristics of rock formations. A spherical body of magma is assumed as the source of heat, which gradually dissipates into the country rock with consequent cooling of the magma. The temperature decrease is calculated and is found to be in accord with the average life of a volcanic cycle, 104 or 105 yr. Calculations are made (a} of the relation
70 GEOPHYSICAL ABSTRACTS 180, JANUARY -MARCH 1960
between vapor pressure, temperature, and possible content of the volatile component of the magma in relation to depth; (b) of the distribution of permeable pressure and temperature, and temperature distribution by heat conduction; and (c) of the temperature and pressures inside the heat reservoir. Calculated results are compared with practical examples from drilling and good agreement is found. Only an approximate geothermal state may be determined within the subsurface because of the many combinations of heat flow (transportation, conduction, convection) with rock-formation characteristics (porosity and permeability) and with the condition of H20 (liquid, vapor, or a mixture).
The necessity of applying geophysical and geochemical logging together with conventional prospecting methods is emphasized. - V. S. N.
180-236. Jaeger, J. C. The use of complete temperature-time curves for the determination of thermal conductivity with particular reference to rocks: Australian Jour. Physics, v. 12, no. 3·, p. 203-217, 1959.
Most present methods of determining thermal conductivity involve study of the asymptote of a temperature-time curve; relatively long periods of experiment are requii'ed and no use is made of information from temperature me asurements made during shorter periods. A simple meth.od of reducing observat-ions is described here; it uses measurements made at equally spaced time intervals, together with a theoretically calculated curve. Such curves are given for a number of experimental situations likely to be useful in measurement of thermal conductivities of rocks. These include line sources in a semiinfinite solid, along the axis of a cylinder and along the surface of a cylip.der. Values are obtained for both thermal conductivity and diffusivity.
The application ofthe method tothethermal conductivityprobe and to measurement of diffusivity of solid slabs and cylinders is discussed, and an alternative method in which use is made of the times at which specific temperatures are attained is also described. - D. B. V.
180-237. Kappelmeyer, Oskar. Temperaturfeldmessungen im Grubenbetrieb [Temperature field measurements in mine workings]: Kali u. Steinsalz, v. 2, no. 10, p. 317-323, 1959.
The effect of geothermal gradient on the temperature in mines is discussed. The aifficulty in determining the original rock temperature is examined first; then the flow of heat from the rock into atmosphere in the mine is treated mathematically. - J. W. C.
180-238. Zemtsov, A. A. 0 rasprostranenii mnogoletnemerzlykh gornykh porod v zapadnoy Sibiri [On· the distribution of relict permafrost in western Siberia]: Ministerstvo Vyssh. Obrazovaniya SSSR, Nauch. Doklady Vyssh. Shkoly, Geol. -Geog. Nauki, v. 3, p. 190-194, 1958.
Boreholes drilled in the central and northeastern parts of the West Siberian Lowland showed that at many places in the depression there exists a second layer of permafrost at a depth ranging from 50 to 200 m below the contemporary permafrost, which lies 12-25 m below the surface and is 7 m thick. The layers are separated by a thick thawed layer. Mordvinoc (1937) considers that the upper layer began to freeze 2, 000-3, 000 years ago, after a comparactively mild period. In places, the relict permafrost was found to extend as far south as lat 60°30" N. -A. J. S.
INTERNAL CONSTITUTION OF THE EARTH 71
180-239. Khaskind, M. D. Promerzaniye grunta pod isolirovannoy poverkhnost 'yu [Freezing of the ground under an insulating surface]: Akad. Nauk SSSR Doklady, v. 125, no. 4, p. 782-785, 1959.
Khaskind solves the problem of heat escape from a cold body placed on the ground protected by an insulating stratum. The problem is of immense importance in northern countries when residential buildings are to be erected on frozen ground. A general solution of the problem can be obtained from a complete system of orthogonal functions similartothe classical Stefan's problem. Khaskind presents the solution in the form of a curve reproduced in the article. -s. T.V.
180-240. Pavlov, B. S. Opyt inzhenerno-geologicheskoy klassifikatsii mnogoletne merzlykh porod na primere Noril'skogo rayone [Experience in engineering geologic classification of permafrost exemplified by the Noril'sk region]: Sovetskaya Geologiya, no. 4, p. 133-144, 1959.
The properties of different types of permafrost as found in many places of northern Siberia are discussed· and the classification suggested by Savarenskiy in 1939 is analysed. This classification has been upheld by Pavlov's experiences in the vast construction program ·that has been carried out during the last 15 years in Noril 1 sk. Numerous experimental data are quoted concerning permafrost as a possible foundation for industrial. constructions.-- S. T.V.
Studt, F. E. Magnetic survey of the Wairakei hydrothermal field. See Geo. phys. Abs. 180-318.
INTERNAL CONSTITUTION OF THE EARTH
180-241. Knopoff, Leon. Velocity of sound in two-component systems: Jour. Geophys. Research, v. 64, no. 3, p. 359-361, 1959.
The velocity of sound has been measured between the liquidus and solidus temperatures in two-component systems. For high frequencies, the results show the transitions to be second-order transitions. On this basis, the decrease in velocity in region F of the earth's core, reported by Jeffreys, is shown to be inconsistent with the assumption of a simple iron-nickel composition for both the solid inner and liquid outer core.- Author's abstract
180-242. Nanda, J. N. Depth of isostatic compensation and Mohorovicic discontinuity, etc., in continental and oceanic areas: Nature, v. 184, no. 4686, supp. 9, p. 629, 1959.
It is shown that the seismic-velocity gradient decreases with depth; this differs somewhat from current ideas of velocity variation with depth. The seismic data can be analyzed to a first-order approximation on the basis of a uniform velocity gradient. Seismologists have preferred not to do so in crustal seismology, as the analysis is rather insensitive and an independent justification for going beyond the simpler zeroth-order approximation was lacking. An independent justification has now been provided by analysis of reverberation data (see Geophys. Abs. 180-367); this gives an accurate estimate of the average velocity gradient from the decay of reverberation observed close to a shot point.
P-wave velocities of the order of 8. 8 kmps found in oceanic records can reasonably be assumed to be the velocity in the heavier rock into which the roots of continental blocks extend. Presumably the velocity gradient is very small once this velocity is reached. Taking 0. 04 kmps per km as the small-
72 GEOPHYSICAL ABSTRACTS 180, JANUARY-MARCH 1960
est average gradient observed and 5. 6 kmps as the velocity in the top layers, the depth of isostatic compensation, or deepest penetration of the roots of the land in question, seems to be of the order of 80 km. Recent work in the Andes and Himalayas requires such deep roots. From existing data one can see that the velocity of 8. 8 kmps will be reached at 5-15 + km in oceanic areas and at 30-80 km in continental areas. The depths that give rise to Mohorovicic-type effects over certain continental areas seem to range from 10 to 20 km; thus these depths and the depths under oceans where the velocity reaches 8. 8 kmps are of the same order, and this perhaps corresponds to the thickness of the sediments.
The patchy nature of Mohorovicic phenomena can be understood more easily. In certain areas the gradual velocity increase with depth in sediments may lead to velocities greater than those of the crustal rock in the area; this may give rise to the so-called low-velocity layer, as well as focusing due to an increase of velocity after sudden decrease. The thickness of the sediments · over land would probably be approximately the same as in oceanic geosynclines that exist now or are reflected in oceanic rises. The above considerations also help resolve the paradox of almost equal heat flow from beneath oceanic and continental areas.- D. B. V.
Goedicke, T. R. Probing for "Moho". See Geophys. Abs. 180-388.
180-243. Officer, C[harles] B. [Jr.], Ewing, J. I., Hennion, J. F., Harkrider, D. G., and Miller, D. E. Geophysical investigations in the eastern Caribbean: Summary of 1955 and 1956 crui$es, in Physics and chemistry of the earth: New York, Pergamon Press, v. 3, p. 17-109, 1959.
This paper is concerned with an intensive examination of an island arc and deep-sea trench with its associated interior basin using seismic refraction techniques. The area lies in the eastern part of the Caribbean Sea; the locations of the seismic refraction profiles are shown on a map.
The crustal structure in the eastern Caribbean, particularly in the deeper parts, has been found to be similar to oceanic structure; however, there are significant differences. In particular, the high-velocity crustal rock does not occur as a single layer with the same velocity throughout as in an oceanic section; but instead is constituted so that the lower part has an appreciably higher velocity than does the upper part.
The results of the present study are in accordance with the previous interpretation that the Caribbean area has never been continental, that it is an altered oceanic area (see Geophys. Abs. 169-198, 170-212). The hypothesis is favored that the primary mechanism in the formation of the eastern Caribbean, and presumably other such features, has been the introduction into the upper mantle and crustal layers of a differentiate of lighter material rising from depth in the mantle.- J. W. C.
180-244. Kosminskaja [Kosminskaya], I. P., Michota [Mikhota], G. G., and Tulina, Ju [Yu. I V. Der Aufbau der Erdkruste in der Pamir-Alai zone nach den Ergebnissen der seismischen Tiefensondierung [The structure of the earth Is crust in the Pamir-Alai zone according to the results of deep seismic sounding]: Bergakademie, v. ll, no. ll, p. 669-672, 1959.
This is a German version of a paper published previously in Akad. Nauk SSSR Izv. Ser. Geofiz. no. 10, p. 1162-1180, 1958 (see Geophys. Abs. 176-236). - W. L. G.
ISOTOPE GEOLOGY 73
Hales, A. L., and Gough, D. I. Gravity anomalies and crustal structure in South Africa. See Geophys. Abs. 180-227.
Research Group for Explosion Seismology [Japan]. waves from four explosions near the K.amaisi mine. 99.
Observations of seismic See Geophys. Abs. 180-
Doyle, H. A., Everingham, I. B., and Hogan, T. K. Seismic recording of large explosions in south-eastern Australia. See Geophys. Abs. 180-102.
ISOTOPE GEOLOGY
180-245. Cameron, A. G. W. The origin of the elements, in Physics and chemistry of the earth: New York, Pergamon Press, v. 3, p. 199-223, 1959.
Nuclide abundances are discussed in connection with the development of elements during the course of evolution of stars.- J. W. C.
Hoffman, John H., and Nier, Alfred 0. Production of helium in iron meteorites by the action of cosmic rays. See Geophys .. Abs. 180-23.
180-246. Starik, I. Ye., Sobotovich, E. V., Lovtsyus, G. P., Lovtsyus, A. V., and Avdezeyko, G. V. K voprosu o forme nakhozhdeniya svintsa v prirodnykh obrazovaniyakh [On the question of the mode of occurrence of lead in natural formations]: Geokhimiya, no. 7, p. 584-591, 1957.
Investigations show that there are different modes of occurrence of lead in minerals and rocks. On sublimation under different conditions, fractionation of lead isotopes takes place; some specimens become enriched in admixed lead (lead-204 and lead-208), others depleted. Study of the modes of occurrence bythis method may help solvethe problem of age and genesis of deposits. -D. B. V.
180-247. Vinogradov, A. P., Tarasov, L. S., and Zykov. S. I. Izotopnyy sostav rudnogo svintsa Altaya i Kazakhstana [Isotopic composition of lead ore of the Altay and Kazakhstan]: Geokhimiya, no. 1, p. 3-22, 1957.
The results of determinations by various authors of the isotopic compositions of 90 samples of lead ore from the Altay and from the K.azakh S. S. R. are summarized in tables. In the Altay all the deposits are Hercynian in age, but in the Kazakh S. S. R. there were three epochs of mineralization--Precambrian, Caledonian, and Hercynian. In both regions the isotopic composition of the Hercynian ores depends on the age of the host rock or of the underlying rock.- D. B. V.
180-248. Baranov, V[ladimir] I. Izokhrony svintsa dlya gornykh porod i vozrast zemnoy kory [Lead isochrones for rocks and age of the earth's crust]: Geokhimiya, no. 7, p. 638-639, 1957.
If rocks of different uranium content were formed by differentiation from a single primary substance, data on the isotopic composition of lead from these rocks should show a linear relationship of Pb206 = f(Pb207). This relationship can be plotted on a straight line whose inclination can be defined by an
74 GEOPHYSICAL ABSTRACTS 180, JANUARY-MARCH 1960
angular coefficient depending on age (t). Published data on the lead isotopic composition of rocks of the Altay and Kazakhastan (see Geophys. Abs. 180-247) fall on the straight line whose inclination corresponds tot = 4 X 10⁹ yr; this figure is the age of the crust in this area. The isotopic composition of lead from the Canyon Diablo iron meteorite does not fall on the same line; this indicates that the isotopic composition of meteoritic lead is different from that of the primary lead of rocks. -D. B. V.
180-249. Gonfiantini, R. , and Picciotto, E. [E). Oxygen isotope variations in Antarctic snow samples: Nature, v. 184, no. 4678, supp. no. 20, p. 1557-1558, 1959.
The o 18 ;ol6 ratios have been measured in samples of recent snow (precipitated snow, drift snow, and rime) collected in known meteorological conditions on the coast of Antarctica. Results are tabulated. The average permil deviation is about 6 = -2 5, which is in good agreement with the multiplestage distillation model. A strong seasonal variation is obvious; the summer samples are richer in oxygen-18 than the winter. The largest variation in precipitated snow is 6 = 16, corresponding to an observed temperature variation of 20°C.
The seasonal variation of 6 would be accounted for by the seasonal variation in the range of cooling of an air mass saturated with oceanic water vapor. The .ol8 ;ol6 ratio in snow drifts follows the same seasonal trend indicating that the. drifts are formed from recently precipitated snow and not from an average· mixed source. It is also interesting that the ratio in drift snow is not systematically lower than in precipitated snow; this shows that the snow drifts do not come from very far south, where one would expect lower values of 6. -D. B. V.
180-250. Compston, W., and Jeffery, P. M. Anomalous "common strontium" in granite: Nature, v. 184, no. 4701, supp. no. 23, p. 1792-1793, 1959.
Two common strontium minerals isolated from a Precambrian granite near Perth, Western Australia, show strontium-87 abundances some 8 percent higher than the "normal" value, whereas the common strontium for the granite as a whole apparentlyis somel5percent higher. This discovery was made in the course of rubidium-strontium age determinations on biotite, microcline, and total rock samples. When the normal figure for strontium-87 abundance (Sr87 /Sr86=o. 71) was used, apparent ages increased with increasing common strontium content; biotite, 650 X 106 yr; microcline, 1, 290 X 106 yr; total rock, 2, 430 X 106 yr.
In a graph relating the sr87 /Rb87 ratio to variations in the common Sr87 I Sr86 ratio, the 3 straight lines re~resenting the 3 age determinations intersect at a point corresponding to Sr 7 /Sr86 = 0. 82. Using this figure in correcting for common strontium, a concordant age of about 520 X 106 yr is ob-. tained for all three samples. These data are interpreted as meaning that the granite crystalliz~d 2, 400 X106 yr ago but was metamorphosed about 520 X 106
yr ago. -D. B. V.
180-251. Vinogradov, A. P., Chupakhin, M. S., and Grinenko, V. A. Nekotoryye dannyye na izotopnom sostave sery sul'fidov [Some data on the isotopic composition of the sulfur of sulfides]: Geokhimiya, no. 3, p. 183-i86, 1957.
The s32 ;s34 ratios in some magmatic sulfide ores, in meteorites, and in volcanic sulfur have been studied. The sulfurs in stone and iron meteorites
MAGNETIC FIELD OF THE EARTH 75
have identical ratios of 20. 20. The terrestrial sulfurs have isotope ratios ranging from 22. 089 to 22. 253 (average 22.12), indicating that they have been subjected to complicated differentiation processes that do not occur in meteorites.- D. B. V.
180-252. Golebchina, M. N.. Rabinovich, A. V., and Murtazina, T. M. Isotopnyy sostav talliya magmaticheskikh porod [Isotopic composition of thallium in magmatic rocks]: Geokhimiya, no. 3, p. 191-192, 1957.
The results of mass spectrometric determinations of the Tl205/ T1203. ratio in 5 granites, 1 granodiorite, and 1 "dioritic porphyrite" from various parts of the U.S.S.R. are tabulated; values are almost identical ranging from 2. 443 to 2. 458. -D. B. V.
MAGNETIC FIELD OF THE EARTH
180-253. Bock, R. A European field of the normal geomagnetic vertical intensity and its secular variation: Geophys. Prosp., v. 7, no. 4, p. 389-413, 1959.
Using data from epochs 1938. 5, 1941.'5, 1944. 5, 1947. 5, 1950. 5, 1953. 5, and 1956. 5, Bock has derived a uniform field of the normal geomagnetic vertical intensity for Europe and its norm~ first- and second-order dependence on latitude and longitude. The results are shown on maps. It is suggested that vertical magnetic anomalies should be given according to this field in order to obtain in the course of time a coherent picture of the magnetic effect of the European continent.- D. B. V.
180-254. Dooley, J. C. Centenary of Melbourne-Toolangi Magnetic Observatory: Jour. Geophys. Research, v. 63, no. 4, p. 731-735, 1958.
A brief history of the Melbourne-Toolangi Magnetic Observatory (founded in 1858) is given on the occasion of the lOOth year of continuous magnetic work in Victoria, Australia. -D. B. V.
180-255. Pai."kinson, W. D. Isogonic map of Australia and New Guinea showing predicted values for the epoch 1960. 5: Australia Bur. Mineral Resources, Geology and Geophysics Rept., no. 42, p. 1-3, 1959.
This report is accompanied by an isoporic map of Australia and New Guinea that shows the declination predicted for the epoch 1960. 5, and an isoporic chart that shows the expected annual rate of change of declination for the epoch. These isogonic maps are published at 5-year intervals.-- V. S. N.
180-256. Milea, Nicolae, Steflea, Vladimir, and Steflea, Ligia. Valori magnetice absolut~ 1n Dobrogea si estul 'Munteniei (valabile pentru 1957, 5) [Absolute magnetic values in Dobrogea and the eastern part of Muntania (effective in 1957. 5) (with Russian and French summaries)]: Acad. Romine Studii si Cercetari de Geologie.;. Geographie, v. 4, no. 1, p. 163-183, 1959.
Absolute magnetic values from measurements made in 1957 in Dobrogea and neighboring parts of Muntenia for the horizontal component H, inclination I, declination D, vertical component Z, their remanent magnetization, and the total field T are given. The secular magnetic variation in Dobrogea is discussed, and the approximate magnitude for different periods is indicated. -A.J.S.
76 GEOPHYSICAL ABSTRACTS 180, JANUARY -MARCH 1960
180-257. Dessler, A. J., and Parker, E. N. Hydromagnetic theory of geomagnetic storms: Jour. Geophys. Research, v. 64, no. 12, p. 2239-2252, 1959.
In the theory proposed, a magnetic storm is caused by a sudden increase in intensity of the solar wind. Stresses are then set up in the geomagnetic field by the solar plasma that impinges on the geomagnetic field and becomes trapped in it. These stresses, propagated to the earth as hydromagnetic waves, explain the observed average magnetic storm variations. Sudden commencement is due to a hydromagnetic wave generated by the impact of solar plasma on the geomagnetic field. The initial phase of the storm, during which the field is above average. intensity, is due to increased solar wind pressure. During the initial phase, instability causes small plasma clouds to become embedded in the magnetic field; they break up and diffuse into the magnetic field to form a belt of trapped particles, principally protons and electrons. The trapped protons ·set up stresses, due mainly to centrifugal force, which account for the main phase of the magnetic storm. Recovery from the main phase is attributed to relief of stress on the geomagnetic field by transfer of the energy of the trapped protons to neutral hydrogen by ionatom charge exchange. The correct recovery time for the magnetic storm is predicted from the measured cross section of the ion-atom charge-exchange process and the hydrogen density values around the earth deduced from scattering of solar Lyman-alpha radiation. -D. B. V.
180-258. Hines, C. 0., and Storey, L. R. 0. Time constants in the geomagnetic storm effect: Jour. Geophys. Research, v. 63, no. 4, p. 671-682, 1958.
Parker, E. N. Inadequacy of ring-current theory for the main phase of a geomagnetic storm: ibid, v. 63, no. 4, p. 683-689, 1958.
Hines, C. 0., and Parker, E. N. Statement of differences regarding the ring-current effect: ibid., v. 63, no. 4, p. 691-692, 1958.
In the first paper, the delay that may elapse between the formation of a ring current and the occurrence of the resulting geomagnetic storm at the earth's surface, due to the shielding effect of the conducting medium in the outer ionosphere, is calculated. If proper account is taken of the fluidity of the medium and of the presence of the main geomagnetic field, the anticipated delay, previously estimated to be as much as several months, becomes so small (of the order of 10 min) that it no longer provides a basis for objection to the ring-current theory of geomagnetic storms.
In the second paper it is demonstrated that there apparently is not enough dissipation to allow significant diffusion, during a magnetic storm, of the magnetic fields in the vicinity of the earth. It is then demonstrated that a ring-current field can only increase the horizontal component of the geomagnetic field, and so cannot account for the main phase of a geomagnetic storm.
The object of the third note is to clarify the essential points of difference between these opposing views. Parker deduces that the field of a newly created ring current cannot immediately penetrate the surrounding gas and so will push back the gas and the preexistent magnetic field lines. In Hines' view the picture is that which would result if a current were established in a dielectric which was already penetrated by a magnetic field. Parker's view implies only an increase of magnetic field within the conducting medium; Hines implies both increases and decreases according to location.-- D. B. V.
180-259. Nicholson, Seth B. , and Wulf, Oliver R. The diurnal variation of irregular geomagnetic fluctuations--II: Jour. Geophys. Research, v. 63, no. 4, p. 803-806, 1958.
MAGNETIC FIELD OF THE EARTH 77
Using the eight daily 3 -hr range indices for six observatories of moderately low latitude and of fairly well distributed longitude, a universal-time component of the daily variation of irregular geomagnetic fluctuations that has an apparently significant amplitude in the yearly average is found in the data for the years 1940-48. It is suggested that this yearly-average universal-time component may be due to the production of part of the magnetic disturbance the dynamo action in the ionosphere. (See also Geophys. Abs. 164-226).D.B.V.
180-260. Rao, K. S. Raja. On the seat of the L currents causing geomagnetic tides: Jour. Geophys. Research, v. 64, no. 3, p. 384-385, 1959.
Results of investigations of geomagnetic tides at Kodaikanal (see Geophys. Abs.l80-262) are compared with results obtained by Martyn at Huancayo (1947). Lunar foF2 variations are found to be nearly in phase with the geomagnetic variations in the geomagnetic equatorial region. On the other hand, the L variations in theE layer as shown by Appleton and Weekes (1939) are given by the expression 0. 93 sin(2t + ll2°) km, which shows that the semidiurnallunar oscillations in the E layer show a phase difference of 151° with the L variations in the geomagnetic field. As the latitudes are different, the results may not be directly comparable.
The maximum amplitude of the foF2 variations should correspond to the maximum electron density and hence to the maximum ionospheric current. It is possible that these L currents in the F2 layer, caused by the gravitational action of the moon, produced the (lunar) semidiurnal oscillations in the geomagnetic field.
It is likely that the S and L current systems are not situated in the same ionospheric layer. As the seat of the S current system is known to be in the E layer, the L system can be located in the F2 layer.- D. B. V.
180-261. Yacob, A. Some features of magnetic elements at Trivandum and Annamalainagar, situated near the geomagnetic equator in the Indian Peninsula: Indian Jour. Meteorology and Geophysics, v. 10, no. 4, p. 377-392, 1959.
The Sq diurnal variations in the horizontal and vertical geomagnetic elements at Trivandrum and Annamalainagar in India are compared with those at Alibag, farther from the magnetic equator, for December 1957, February 5-6, 1958, and March and June 1958. The Sq variations in Hare found to be abnormally large near the magnetic equator; those in V are not abnormal but are consistently larger at Trivandrum than at Alibag. Magnetic activity during night hours is of the same order at all three observatories but during the day is noticeable greater near the magnetic equator. For any disturbance the H elements at all three places respond in a similar sense, but the magnitude of V increases at Annamalainagar when it decreases at Trivandrum and Alibag, and vice versa.
The lines of force of the disturbance field in a longitudinal plane over the Indian Peninsula appear to be smooth curves, concave upwards with their turning points between Annamalainagar and Alibag during the day and close to Alibag during the night.- D. B. V.
180-262. Rao, K. S. Raja, and Sivaraman, K. R. Lunar geomagnetic tides at Kodaikanal: Jour. Geophys. Research, v. 63, no. 4, p. 727-730, 1958.
557043 0 - 60 - 6
78 GEOPHYSICAL ABSTRACTS 180, JANUARY-MARCH 1960
The lunar semidiurnal variation of the horizontal intensity of the geomagnetic field at Kodaikanal, India, is worked out for the hourly values of horizontal intensity for the period 1950-54. An expression is obtained for the lunar semidiurnal wave, and a graph of t::. H versus age of the moon is drawn. This graph shows that the amplitude of the lunar geomagnetic tide is maximum when the sun and moon are 135° apart. The solar diurnal variation is also determined up to four harmonics.- D. B. V.
180-263. Uyeda, H., Maeda, H[iroshi], Kimpara, A., Obayashi, T., Ishikawa, S., and Kawabata, Y. Geophysical effects associated with the high-altitude nuclear explosion: Jour. Geomagnetism and Geoelectricity, v. 11, no. 2, p. 39-63, 1959.
Various geophysical effects of the high-altitude nuclear explosions on Johnston Island on August 1 and 12, 1958, have been investigated in Japan; these include geomagnetic, acoustic, and seismic effects. The mechanisms of generation of each phenomenon seem to be very complicated and interrelated. There seem to be 3 distinct periods in the time elapsed after the blast; typical examples are the 2 stages of magnetic d~sturbance (SSC* and main phase) and the ionospheric disturbance which appeared several hours later and lasted more than 10 hr.
Acoustic-wave oscillations were observed all over Japan. From seismicwave (P and L) arrivals observed at the Matsushiro obse'rvatory, origin times of the blasts were calculated. -D. B. V.
180-264. Yamaguchi, Yushin. A note of the effect on the geomagnetic field of the solar eclipse: Kakioka Magnetic Observatory Mem., v. 9, no. 1, p. 41-45, 1959.
It is shown that the effects of a solar eclipse on the Sq-field can be deduced from the dynamo theory, even near the center of the Sq-current system. Computations maybe simplified in practice by neglectinghigher order terms. This paper considers the geographic distribution of the deformed conductivity at one instant of time during an eclipse; the time changes of the affected field at one station may be calculated for many different instants by repeated use of the equation. If the locus of the zone of maximum eclipse is expressed explicitly by a simple function of time, the effects may be calculated with only a few alterations of the results.- D. B. V.
180-265. Yamaguchi, Y[ushin], Banno, N[oboru], Oshima, H., and Araki, T. Effect of the solar eclipse, 19th April, 1958 on the geomagnetic field and earth-current: Kakioka Magnetic Observatory Mem., v. 9, no. 1, p. 33-40, 1959.
The effects of the solar eclipse of Aprill9, 1958, on the geomagnetic Sqfield and on earth currents are examined in the records obtained at Kakioka, Memambetsu, and Kanoya observatories in Japan. Results are not conclusive owing to disturb~d geomagnetic conditions at the time, but the observed effects coincide fairly well with calculated values. -D. B. V.
180-266. Rikitake, T[suneji]. Anomaly of geomagnetic variations in Japan: Royal Astron. Soc. Geophys. Jour., v. 2, no. 4, p. 276-287,1959.
The anomalous features found in both rapid and slow geomagnetic variations are described on the basis of observations at well-distributed observatories in Japan. The underground conditions beneath Japan that best explain
MAGNETIC PROPERTIES AND PALEOMAGNETISM 79
the anomalies consist of a conducting circuit in the form of a loop about 1, 000 km long and 200 km wide; this must be underlain by a flow-conducting wedge in the mantle that extends to a depth of 700 km. These complicated structures seem to have an important bearing on the geophysical interpretation of the relationship between deep-focus earthquakes, orogenic activity, volcanic zones, and so on. -D. B. V.
MAGNETIC PROPERTIES AND PALEOMAGNETISM
180-267. Verhoogen, John. The origin of thermoremanent magnetization: Jour. Geophys. Research, v. 64, no. 12, p. 2441-2449, 1959.
Thermoremanent magnetization (trm) generally has several components characterized by a range of coercive force. The component that has the highest stability with respect to a-c demagnetization is believed to reside in stressed regions surrounding dislocations. This most stable component of trm is directly proportional to the number of dislocations per unit volume; this number in turn should depend on the history of the rock and should be smaller in well-annealed materials or rocks that have cooled very slowly. This may explain why the stable component of trm of mafic plutonic rocks is generally an order of magnitude less than that of their extrusive equivalents, and greater in the chilled margins of a lava flow than in its interior. Metamorphic rocks, which recrystallize after deformation and cool slowly, should similarly have a relatively small trm of low stability in spite of a large magnetite content and normal value of susceptibility. -D. B. V.
180-268. Angenheister, G[ustav]. Die Magnetisierung und-das magnetische Storfeld basischer Gesteine [The magnetization and the magnetic disturbing field of basic rocks]: Deutsche Geol. Gesell. Zeitsahr., v. lll, pt. 1, p. 175-181, 1959.
The mafic igneous rocks can be divided into three groups according to the nature of their natural remanent magnetization. In the first group the induced and remanent magnetization are approximately equal, as in the Lahnmulde diabase (see Geophys. Abs. 173-297); the question whether these rocks have lost an originally higher thermoremanent magnetization, or never had it, cannot yet be resolved. In the second group the remanent magnetization is higher than the induced, as in all the Tertiary basalts of the earth, and is thermoremanent. In the third group the natural remanent magnetization is abnormally high owing to lightning or, in some places, to weathering.
In regions of active volcanism the magnetization of bodies of mafic rocks fluctuates with changes in temperature; it decreases as temperature (that is, volcanic activity) increases, giving rise to temporal variations of the magnetic field at the surface. Rikitake (see Geophys. Abs. 148-13412, -13413) has calculated the depth and dimensions of the magma chamber underlying Ooshima, Japan, from magnetic measurements.
Recent magnetic surveys suggest that a thermoremanently magnetized layer underlies the oceans; a theoretical estimate of the intensity of its magnetization is 400 X 10- 5 gauss, only a little higher than that of Tertiary basalts on the continents. There is evidence that a similar layer might also underlie the continents. Its effect could be determined statistically. -D. B. V.
180-269. Yelanskiy, L. N. 0 svyazi gravitatsionnykh i magnitnykh anomaliy s protsessom granitizatsii [Relationship of gravity and magnetic anomalies to the process of granitization]: Geologiya Nefti, no. 2, P• 54-57 I 1958.
80 GEOPHYSICAL ABSTRACTS 180, JANUARY -MARCH 1960
Areas of granitization become areas of uplift. The most important result of the granitization process is the loss of iron in the uplifted areas accompanied by a decrease in the density of the rocks and a weakening of their magnetic properties. The iron is transferred either by erosion or by hydrothermal solutions to the flanks of the uplifted granitized areas. Deposition of iron thus marginal to the uplift may produce the linear magnetic anomalies that are so common in the basement. The granitization process may account for the decrease with time of the residual magnetization of igneous rocks. -J.W.C.
180-270. Metallova, V. V. Otritsatel'naya namagnichennost' gornykh porod [Negative magnetization of rocks]: Leningrad Univ. Uchenyye Zapiski, Ser. Fiz. i Geol. Nauk, v. 249, no. 10, p. 169-193, 1958.
In an effort to determine whether the negative or reverse magnetization of rocks is caused by a reversal of -the earth's magnetic field or by thermoremanent phenomena, a study of the Angara-llim negative magnetic anomaly in Siberia was carried out in the field and laboratory on several hundred rock samples. Measurements were made in the field of the susceptibilities and the vectors of remanent magnetization, and laboratory observations were made of the changes of magnetism in the rocks heated to or above the Curie point and then cooled. Results of the research gave evidence in favor of Neel's theory of reverse thermoremanent magnetization (see Geophys. Abs. 148-13319), rather than to reversals of the main geomagnetic field. -- A. J. S.
180-271. Ishikawa, Yoshikazu, and Akimoto, Syun-iti. Magnetic properties of the FeTi03-Fe2o3 solid solution series: Phys. Soc. Japan Jour., v. 12, no. 10, p. 1083-1098, 1957.
Magnetic properties of the synthesized solid solution xFeTi03· (1-x) Fe203 of ilmenite (FeTi03) and hematite (Fe 203) are investigated for the whole range of 0 ~ x ~ 1. It is found that magnetic properties of the solid solution, x FeTiOr (1-x) Fe203 can be divided into 3 parts, x = 1, 1 > x ~ 0. 5, and 0. 5 > x ""0. Pure ilmenite (FeTi03) is antiferromagnetic below 55° K, very strongly ferromagnetic for 1 > x ~ 0. 5, and again antiferromagnetic with fee• ble parasitic ferromagnetism superimposed for 0. 5 > x ~ 0.
These magnetic properties are discussed using the approximation of molecular field. -An outline of the magnetic properties of the solid solution can be explained if it is assumed that the tetravalent titanium ions always occupy 1 of the 2. sublattices in the specimens for 1 ~ x ~ 0. 5, while such an ordering of tita.rlium ions and iron ions is disturbed for 0. 5 > x ~ 0. - V. S. N.
180-272. Ishikawa, Yoshikazu. Magnetic properties of NiTi03-Fe203 solid solution series: Phys. Soc. Japan Jour., v. 12, no.lO, p. 1165, 1957.
The magnetic properties of the solid solutions between NiTi03 and Fe203 are investigated to determine whether or not they have their origin in the crystal structures as is the case with the solid solutions between FeTi03 and Fe203. A comparison with the FeTi03 series shows the following similarities: the specimens become strongly ferromagnetic only in a limited region of composition, that is, xNiTi03 -(l-x)Fe203 is ferromagnetic only for 0. 9 ~ x ~ 0. 6; thermomagnetic curves are similar and magnetization is largest for x.:::::: 0. 7; and the rate of change of the Curie temperatures with composition seems to be the same. On the other hand, the magnetic susceptibilities of this series were found to obey the Curie-Weiss law at high temperature, and they vary almost linearly with composition which is not the case for the FeTi03 series. For the NiTi03 series the magnetization of the specimen for x = 0. 6
MAGNETIC PROPERTIES AND PALEOMAGNETISM 81
is very weak, whereas for the FeTi03 series the specimen of 0. 6 FeTi03-0. 4 Fe203 is strongly ferromagnetic. This may be attributed to the fact that in the case of the FeTi03 series, the conductivity being relatively high, the ordering of Fe+2 and Fe+3 ions can occur merely by electron transfer. In the NiTi03 series, however, Ni+2 and Fe+3 ions are fixed to lattice sites at the time of formation of the specimens.- V. S. N.
180-273. Ishikawa, Yoshikazu. An order-disorder transformation phenomenon in the FeTi03-Fe203 solid solution series: Phys. Soc. Japan Jour., v. 13, no. 8, p. 828-837, 1958.
The effects of heat treatments on the magnetic properties of the synthesized solid solution xFeTi03-(l-x)Fe203 of ilmenite and hematite were examined in detail for compositions x around 0. 5. It confirmed that a transformation from an ordered state (ferrimagnetic one) into a disordered state (antiferromagnetic one) takes place cooperatively at a distinct transition point. This transformation temperature is lowered with decrease in the ilmenite content from 1, l00°C for x = 0. 65 to 600°C for x = 0. 45. The completely disordered specimens could not be obtained for the composition x ~ 0. 6 by the quench method while the completely ordered state could not be attained in the specimens with x ~ 0. 5 because of decrease of the transformation temperature for these specimens and a reduction of the ratio ofiondiffusion at such low temperatures. The results obtained were discussed by using the Bragg-Williams approximation. It was noted briefly that the reverse thermoremanent magnetism found in this system is closely related to the order-disorder transformation phenomenon which exists in this system. -Author's abstract
180-274. Ishikawa, Yoshikazu, and Akimoto, Syun-iti. Magnetic property and crystal chemistry of ilmenite (MeTi03) and hematite (Fe203) system. Part 1, Crystal chemistry: Phys. Soc. Japan Jour., v. 13, no. 10, p. 1110-1118, 1958. Part 2, Magnetic property: ibid., v. 13, no. 11, p. 1298-1310, 1958.
The first paper discusses an investigation by X-ray analysis of the crystal structure of the solid solutions of ilmenite (MgTi03, MnTi03, FeTi03, CoTi03, and NiTi03). It was found that, in the solid solution, specimens of the ilmenite side (MnTi03, MgTi03, and CoTi03 series) and the hematite side have different crystal symmetries, R3 and R3c, respectively, and a miscibility gap exists between them; in the NiTi03 series, ilmenite and hematite make a complete solid solution in the whole range of composition and the crystal symmetry changes from R3 to R3c continuously; in the FeTi03 series the ranges of crystal symmetries R3 and R3c of the solid solution overlap each other and a transformationfrom R3 to R3c is observed in one specimen. Such differences may result from differences in ionic radii, in electronic conductivity, and in the stability of two other solid-solution series with spinel and pseudobrookite structures which exist in a ternary system of MgO-Fe203-Ti02.
The second paper discusses an investigation of the magnetic properties of synthesized solid solutions of ilmenite and hematite and confirms the division of the series into three parts: pure ilmenite, solid solutions with R3 crystal symmetry, and those with R3c crystal symmetry. Pure specimens of ilmenite, with the exception of MgTi03, are antiferromagnetic with Neel temperature below 80°K. The Neel temperature of MnTi03 was determined to be 41°K. Solid solutions with R3 symmetry are ferrimagnetic except for the MgTiQs series which is paramagnetic. Solid solutions with R3c symmetry are again antiferromagnetic with feeble ferromagnetism superimposed.
82 GEOPHYSICAL ABSTRACTS 180, JANUARY-MARCH 1960
By means of this analysis of magnetic properties of ferrimagnetic specimens, the sign of superexchange interaction with the coupling angle (Me-0-Me) of goo was determined. - V. S. N.
180-275. Saito, Tomosaburo. Magnetic properties of some pyrrhotites from Yanahara mine, Okayama Prefecture [in Japanese with English summary]: Japan Geol. Survey Bull., v. 10, no. 3, p. 53-60, 1959.
A section of the main ore deposit of the Yanahara mine, northeast of Okayama City, Okayama Prefecture, Japan, where the ore ranges from pyrite to pyrrhotite to magnetite within 5 meters, was sampled to determine specific magnetic susceptibilities and thermomagnetic curves, particularly of the pyrrhotite samples. The values of the specific magnetic susceptibilities of two samples from the center of the pyrrhotite ore body are smaller than those of other samples, and the thermomagnetic curves of these two samples are of the peak type, that is, they have a single sharp peak at 220°C-230°C. The thermomagnetic curves of two 'pyrrhotite samples from near the pyrite body show both the Weiss type and peak type curves. Thus the samples are probably composed of two thermomagnetically different pyrrhotites, and the relatively large values of specific magnetic susceptibility found may be related to pyrrhotite, the thermomagnetic curve of which is of the Weiss type. Two pyrrhotite samples from near the magnetite body show almost a peak type of thermomagnetic curve but still retain a fair amount of magnetizati"on at the Curie-point of pyrrhotite (3l0°C - 320°C). The ferromagnetic constituent, separated from the original sample, was found to have the Curie-point at 580°C -590°C nearly coinciding with that of pure magnetite and demonstrating that the samples, although mainly composed of pyrrhotite with a peak type thermomagnetic curve, contain a small amount of magnetite as a ferromagnetic impurity. - V. S. N.
180-276. Jenness, Stuart E. "Magnetic" chromite from Shoal Pond, northeastern Newfoundland: Econ. Geology, v. 54, no. 7, p. 1298-1301, 1959.
Magnetism associated with chromite from northeastern Newfoundland is due to maghetite which fills fractures in the Ghromite. Fine crushing of chromite specimens yielded two distinct components, a black strongly magnetic powder composed of magnetite, and a more abundant chalky-brown, nonmagnetic powdered chromite. Two photomicrographs show the textural relationship of the magnetite veins to the chromite.- J. W. C.
180-277. Hellbardt, Gunter. Das astatische Magnetometer und seine Verwendung zur Messung sehr -schwacher Gesteinsmagnetisierungen [The astatic magnetometer and its application to the measurement of very weak rock magnetization]: Geol. Jahrb., v. 75, p. 319-346, 1958(1959).
An astatic magnetometer with a special device for varying the sensitivit~ has been designed for measurement of weakly magnetized rocks (lo-5 - 10-gauss). The instrument is described with photographs and diagrams, and its theory is discussed. The results of measurements on German samples (Buntsandstein samples. cores from the Fortuna 28 and 29 boreholes, and decomposed basalt from the Vogelsberg) are presented. -D. B. V.
MAGNETIC PROPERTIES AND PALEOMAGNETISM 83
180-278. Kobayashi, Kazuo. Chemical remanent magnetization of ferromagnetic minerals and its application to rock magnetism: Tokyo Univ. Geophys. Inst. Geophys. Notes, v. 12, no. 1, contr. no. 3, 1g5g,
This is a reprint of a paper published in the Jour. Geomagnetism and Geeelectricity [Kyoto], v. 10, no. 3, p. gg -ll7, 1g5g (see Geophys. Abs. 178-28g).- D. B. V.
180-27g, Akimoto, S[yun-iti), Horai, K., and Boku, T. Magnetic susceptibility of orthopyroxenes: Tokyo Univ. Geophys. Inst. Geophys. Notes, v. 12, no. 1, contr. no. 1, 1g5g,
This is a reprint of a paper published in the Jour. Geomagnetism and Geeelectricity [Kyoto], v. 10, no. 1, p. 7-ll, 1g58 (see Geophys. Abs. 178-2go). -D.B.V.
180-280. Akimoto, Syun-iti, and Katsura, Takashi. Magneto-chemical study of the generalized titanomagnetite in volcanic rocks: Tokyo Univ. Geophys. Inst. Geophys. Notes, v. 12, no. 1, contr. no. 2, 1g5g,
This is a reprint of a paper published in the Jour. Geomagnetism and Geeelectricity [Kyoto], v. 10, no. 3, p. 6g-go, 1g5g (see Geophys. Abs. 178-288).
180-281. Creer, K. M., Irving, E., and Nairn, A, E. M. Palaeomagnetism of the Great Whin sill: Royal Astron. Soc. Geophys. Jour., v. 2, no. 4, p. 306-323, 1g5g,
Samples of the Great Whin sill (intruded in Late Carboniferous to Early Permian times) froin 36 sites in Northumberland and Durham have been found to be magnetically stable; the site mean direction of magnetization proves to be 187. 8° - 4. go and the mean pole position indicated is lat 37. 3° N. and long 168. go E. Distribution of mean directions of magnetization at these sites is oval, but the poles calculated from the site mean directions of magnetization have a circular distribution. This observation leads to a proposal of a method of calculating errors associated with paleomagnetic pole positions.- D. B. V.
180-282. Creer, K. M. A. C. demagnetization of unstable Triassic Keuper marls from S. W. England: Royal Astron. Soc. Geophys. Jour., v. 2, no. 4, p. 261-275, 1g5g,
Remeasurement after 3 years of storage in field free space of 65 of the 329 rock disks cut from samples collected in 1953 from Keuper marl from Sidmouth, Devonshire, (see Geophys. Abs. 173-2g5) showed that the temporary component of the natural remanent magnetization had decayed. In further experiments the same 65 samples were demagnetized in alternating magnetic fields of peak value up to 1, 200 oersteds. As the intensity of the demagnetizing field increased, the directions of magnetization, originally strung out along the great circle between the primary and secondary directions, progressively coalesced into two opposed groups. In many cases the secondary magnetization was almost completely destroyed and in the remainder of cases it was considerably reduced in comparison with the primary magnetization. The method of a. c. demagnetization is described.- D. B. V.
180-283. Girdler, R. W. A paleomagnetic study of some Lower Jurassic rocks of N. W. Europe: Royal Astron. Soc. Geophys. Jour., v. 2, no. 4, p. 353-363, 1959.
84 GEOPHYSICAL ABSTRACTS 180, JANUARY-MARCH 1960
The natural remanent magnetization of the Upper Lias Sands of England is considered to be stable. Study of its direction shows that the geomagnetic field. in Early JurassiC time was significantly different from that of the present field, having an eastward declination and an inclination of 64° - 70°. Similar measurements were made on Lower Jurassic volcanic rocks from southern France; the results are in general agreement with those for England. The magnetic pole in Early Jurassic time must have been in the region of the Caspian basin. - D. B. V.
180-284. Harland, W. B., and Bidgood, D. E. T. Palaeomagnetism in some Norwegian sparagmites and the late Precambrian ice age: Nature, v. 184, no. 4702, supp. no. 24, p. 1860-1862, 1959.
The results of paleomagnetic measurements on 29 samples collected from the sparagmites on Lake Mjosen in southern Norway are presented and discussed in the light of work on material from other Precambrian tillites from Greenland and Spitzbergen. Significant results were obtained from only ll of the samples. Four rocks collected at 2 sites have a mean direction close to that of the present geomagnetic field and are thought to be partially magnetized in the direction of the present field. The other specimens, 5 of which are normal and 2 reversed, give a mean declination of 191° and inclination of 21°, with a 24° semiangle of the cone of 95 percent confidence. The corresponding pole position is lat 18° N., long 179° E., close to that obtained for the Cambrian of Great Britain and for tillites from Greenland, and intermediate between pole positions for the Silurian and Late Precambrianofthe United States. These results are interpreted as evidence that the marine tillites were formed near the equator in Late Precambrian time; this and their worldwide distribution suggests a Late Precambrian ice age far more severe than any later ice age.- D. B. V.
180-285. Everdingen, R. 0. van, and Zijderveld, J. D. A. Palaomagnetismus in den Rhombenporphyren von Oslo und in den Rhyoliten, Doleriten und Sedimenten des Esterel [Paleomagnetism in the rhomb-porphyries ofOslo and in the rhyolites, dolerites and sediments of the Esterel]: Geol. Rundschau, v. 48, p. 195-205, 1959.
Some results are reported on paleomagnetic investigations that have been carried on by the Mineralogic-Geologic Institute in Utrecht in cooperation with the Royal Netherlands Meteorological Institute in de Bilt. During demagnetization experiments it was shown that many rock samples have disturbing secondary magnetic components in the direction of the present earth's field in addition to the primary magnetization which apparently was acquired during deposition. These secondary components can be removed completely by partial demagnetization; the primary component of the magnetization thereby becomes smaller, but the decrease is significant only if high temperatures and very strong alternating fields are applied. In this way these rocks become usable for the determination of the magnetic field.- Authors' summary, D. B. V.
180-286. Schmucker, Ulrich. Gesteinsmagnetische Untersuchungen an permischen Nahe-Eruptiven [Paleomagnetic investigations on the Permian Nahe eruptives}: Geol. Rundschau, v. 48, p. 184-195, 1959.
The natural remanent magnetization of some Permian eruptive rocks of the Nahe region (southwest Germany) has been measured and its stability investigated. From the direction of its magnetization, which was found to be
MAGNETIC PROPERTIES AND PALEOMAGNETISM 85
stable, the position of the Permian geomagnetic pole is calculated as long 174° E. and lat 42° N. (southeast of Kamchatka). This corresponds to the Permian geographic pole position obtained from paleoclimatic considerations . ..,....Author's summary, D. B. V.
180-287. Thellier, E[mile], and Thellier, O[dette]. Ob intensivnosti magnitnogo polya zemli v istoricheskom i geologicheskom proshlom [On the intensity of the magnetic field of the earth in the historic and geologic past]: Akad. Nauk SSSR Izv. Ser. Geofiz., no. 9, p. 1296-1331, 1959.
A procedure has been suggested for the investigation of remanent magnetization of ancient ceramic products (vases and bricks), which permits determination of the intensity and the direction of the geomagnetic field at the time when these objects were magnetized. It is shown that a continuous decrease of the magnetic moment of the earth has taken place during the last 2, 000 years. For certain regions this decrease is as much as 65 percent.- S. T.V.
180-288. Pospelova, G. A. Ostatochnaya namagnichennost' tretichnykh i chetvertichnykh izverzhennykh porod [Remanent magnetization of Tertiary and Quaternary igneous rocks]: Akad. Nauk SSSR Izv. Ser. Geofiz., no. 11, p. 1591-1598, 1959.
Remanent magnetization of the Quaternary and Tertiary lavas of Armenia, of Kurile Islands, and the Kamchatka Peninsula has been investigated. It was found that the Quaternary rocks are magnetized normally, whereas the rocks close to the Quaternary-Pliocene age boundary are magnetized in the opposite sense. This is in agreement with the hypothesis of a reversal of the geomagnetic field at this time. The determination of the position of the poles corresponding to the age of these rocks is in good agreement with the data from other investigations. On the basis of the alternation of normal and reverse magnetization of rocks, it was possible to determine the precise age of many rocks, which would have been difficult to do on the basis of geologic data alone.- S. T.V.
180-289. Nairn, A. E. M. A palaeomagnetic survey of the Karroo system: Overseas Geology and Mineral Resources, v. 7, no. 4, p. 398-410, 1959.
A paleomagnetic survey of Mrican Karroo sediments and lavas (in Rhodesia, Bechuanaland, Swaziland, and Kenya)· was begun in 1954 with the assistance of the Overseas Geological Surveys. Orientated samples were collected from every division of the Karro, and the direction of permanent magnetism was measured. Unfortunately, a high proportion of the samples proved to be magnetically unstable, presumably due to the effects of weathering. For each group of samples the mean direction and associated confidence limits together with the mean pole and its precision were calculated. Results appear to indicate a movement of the Mrican Continent from a near-polar to an equatorial situation during the period from Late Carboniferous to Late Triassic times, this movement being associated with an anticlockwise rotation of nearly 90°.- Author's abstract
180-290. Nagata, Takesi; Akimoto, Sun-iti [Syun-iti]; Shimizu, Yoshio; and Kobayashi, Kazuo. Palaeomagnetic studies on Tertiary and Cretaceous rocks in Japan: Japan Acad. Proc., v. 35, no. 7, p. 378-383, 1959.
86 GEOPHYSICAL ABSTRACTS 180, JANUARY-MARCH 1960
This study of the paleomagnetism of Tertiary igneous rocks and Cretaceous sedimentary rocks in Japan is a continuation of earlier studies on Quaternary rocks in Japan (see Geophys. Abs. 171-269, 175-295). The Tertiary samples were collected at 10 sites in 5 localities on the island of Honshu, and the Cretaceous samples from the red shales of the Inkstone series in Yamaguchi Prefecture, Honshu. The samples embrace almost the whole of the Neogene and the Middle or Early Cretaceous. Results show that the pole position lies at a greater distance from the present geographic pole as the geologic age is older. The approximate path of polar wandering from Cretaceous to present obtained from Japanese data is compared with paths obtained from European, North American, Indian, and Australian data, and it is concluded that the tendency for greater departure of the pole position from the present position with greater geologic age is true in the case of all 5 paths although no two of the paths coincide with each other in position. This mutual discrepancy in the location of the paths of polar wandering derived from Japanese and foreign data may be attributed to continental drift accompanied by rotation. The fact that the distance of the Miocene pole positions from the present geographic pole, as determined from Japanese data, is appreciable greater than that determined from the European or North American data suggests a fairly large relative movement, probably rotational, of the Japanese Islands relative to the continents since the Miocene.- V. S. N.
180-291. Nagata, T[akesi). and Shimizu, Y[asuo]. Natural remanent magnetization of Precambrian gneiss of Ongul Islands in the Antarctic: Nature, v. 184, no. 4697, supp. no. 19, p. 1472-1473, 1959.
The magnetic properties of samples of Precambrian gneiss collected from three sites in East Ongul Island have been measured. The intensity and direction of magnetization are tabulated for the 18 specimens that were found to have stable magnetization. The pole position calculated from these data is lat 3° N., long 107° W., with a radius of the circle of 5 percent confitlence of 7°. This position agrees rather well with that derived from. South African data (see Geophys. Abs. 168-244) but not from Australian data (see Geophys. Abs. 173-290). -D. B. V.
180-292. Blundell, D. J., and Stephenson, P. J. Palaeomagnetism of some dolerite intrusions· from the Theron Mountains and Whichaway Nunataks, Antarctica: Nature, v. 184, no. 4702, supp. no. 24, p. 1860, 1959.
The directions of remanent magnetization have_ been measured on eight oriented samples collected from Antarctic ·dolerite sills and dikes that are considered to be of the same age as the Karroo dolerites of South Africa and the Tasmanian sills. The directions fall into two groups, normal and reversed. These groups have been combined by reversing the polarity of those with downward dips, giving a mean direction of magnetization of N. 64° E. and a dip of 68° up; the circle of 95 percent confidence has a radius of 12°. Comparison with Jurassic pole positions calculated for South Africa, Tasmania, India, and Brazil (see Geophys. Abs. 170-255, 166-280, 172-168, 179-321) shows a scatter which is interpreted as evidence of continental drift. -D.B.V.
MAGNETIC SURVEYS
180-293. Hoylman, H. Wayne, and Erfle, M. E. Airborne magnetometer surveys useful in north: Oilweek, v. 10, no. 39, p. 16-20, 1959.
MAGNETIC SURVEYS 87
With the development of oil and gas activity in the Canadian north, airborne-magnetometer surveys with improvements in techniques are becoming an increasingly vital tool. It has become evident that periods suitable for conducting surveys in northern latitudes are very limited due to the daily magnetic variations not beinglinearfor a sufficient length of time; moreover, one of the only accurate means of controlling petroleum magnetometer surveys, where short pulsations of significant magnitude occur sporadically, i~;~
to use base stations in the survey area and absolu~e recording instruments both in the aircraft and on the ground.- V. S. N.
180-294. Scott, H. S. The airborne magnetometer, in Methods and case histories in mining geophysics: [Canada] Commonwealth Mining and Metall. Cong. (6th), p. 26-34, 1957.
The historical development of airborne magnetometer surveying, instruments used, survey procedures, reduction and plotting of dafa, significance of aeromagnetic data, and interpretation of aeromagnetic data are discussed. The most valuable contribution of aeremagnetics is the broad continuous me asurement of fundamental physicalproperties of formations in an area. The interpretation of the aeromagnetic maps themselves cannot be unique because there are too many unknown variables in the interpretational equation. Therefore, the maps must be studied in conjunction with data from other sources of similar broad coverage such as electromagnetic surveying and aerial photography.- V. S. N.
180-295. Smellie, D. W., and Faessler, C. W. The magnetometer, in Methods and case histories in mining geophysics: [Canada] Commonwealth Mining and Metall. Cong. (6th), p. 25-26, 1957.
The magnetometer is described briefly and the principles underlying its use discussed. The ground magnetometer may be used to detect ore bodies directly or indirectly associated with magnetic anomalies or to outline geological structure and formations masked by overburden.- V. S. N.
180-296. Wahl, W. George. The compass and the magnet, in Methods and case histories in mmmg geophysics: [Canada] Commonwealth Mining and Metall. Cong. (6th), p. 21-22, 1957.
This is a brief discussion of the application of the compass and magnet as basic tools in geophysical prospecting to detect the presence of magnetic forces. - V. S. N.
180-297. Westrick, E. W. The dip needle, in Methods and case histories in mining geophysics: [Canada] Commonwealth Miningand Metall. Cong. (6th), p. 23-24, 1957.
The dip needle is described and a brief outline of the techniques employed in its field use is given. The dip needle is most applicable to rapid reconnaissance investigation for magnetic anomalies associated with or reflecting geological structures, rock types, or mineral distribution. It may be used in locating i:oon deposits, in tracing faults in highly magnetic material, in tracing dikes and igneous contacts, and in assisting in delimiting units in general geological mapping where outcrops are scattered.- V. S. N.
Balabushevich, I. A. On the problem of classification of gravity and magnetic anomalies. See Geophys. Abs. 180-219.
88 GEOPHYSICAL ABSTRACTS 180, JANUARY -MARCH 1960
Roy, Amalendu. Optical analogue of gravity and magnetic fields. See Geophys. Abs. 180-220.
180-298. King, Elizabeth R. Regional magnetic map of Florida: Am. Assoc. Petroleum Geologists Bull., v. 43, no. 12, p. 2844-2854, 1959.
A regional magnetic map of Florida reflects the structural trends of the magnetically heterogeneous Paleozoic and Precambrian rocks underlying the coastal plain rocks. Many trends and features on the magnetic map have gravity counterparts, indicating a common source. On the basis of the regional magnetic trends, Florida is divided into two tectonic provinces with an intervening zone of intrusive rocks. Depth estimates from aeromagnetic data suggest the possibility that faulting may be a factor in the profound downwarping and accumulation of sediments in the southern province. The trends of the northern province parallel those of the Appalachian system to which they are probably related. The southern province, distinguished by northwest trends, is structurally discordant with the northern province. The magnetic evidence suggests that the southern province is a continuation of the Ouachita system which has been traced beneath the Gulf Coastal Plain to within 60 miles of the subsurface extension of the Appalachian system in Mississippi, where the two systems approach each other at nearly a right angle. -Author's abstract
180-299. Low, John H. Magnetic prospecting methods in asbestos exploration, in Methods and case histories in mining geophysics: [Canada] Commonwealth Mining and Metall. Cong. (6th), p. 122-134, 1957.
This is the same as the paper published in Canadian Mining Metall. Bull., v. 44, no. 473, p. 610-617, 1951 (see Geophys. Abs. 148-13439). -- V. S. N.
180-300. Conn, H. K. Magnetic prospecting for asbestos deposits, in Methods and case histories in mining geophysics: [Canada] Commonwealth Mining and Metall. Cong. (6th), p. 135-140, 1957.
A ground magnetic survey was carried out on an asbestos prospect in Garrison Twonship, Ontario. The data from part of the survey are shown and the basis of the interpretation is presented for comparison with the actual interpretation. A drilling program planned from the interpretation of the ground magnetic data discovered and localized an important chrysotile asbestos deposit buried under more than 20 feet of overburden.-- Author's abstract
180-301. Wahl, W. G[eorge], and Lake, S. Airborne magnetometer survey discovers Marmora magnetite deposit, in Methods and case histories in mining geophysics: [Canada] Commonwealth Mining and Metall. Cong. (6th), p. 155-162, 1957.
The Marmora magnetite deposit, midway between Toronto and Ottawa, Canada, was discovered as a result of an airborne magnetometer survey. Following the initial survey the property was surveyed by compass, dip needle, magnetometer, gravity meter, and again by airborne magnetometer. Data from the compass and dip-needle surveys made it possible to define the causative body but in neither case was the source directly underneath the anomaly peak. The magnetometer and gravity surveys, however, defined the ore body as to location, attitude, length, width, and depth of burial. Data from 9 airborne magnetometer surveys flown at elevations of 100 to 5, 000 feet" are presented.
MAGNETIC SURVEYS 89
The intensity was found to vary inversely as the square of the distance. A method is presented whereby anomalies from causative bodies of the same or different depths of burial may be ranked according to their relative worth. The following formula was used to determine the intensity per unit area of a
t. 1 . (depth)2 X anomaly intensity V S N magne 1c anoma y. area . - . . .
180-302. Moyd, Louis. The negative magnetic anomalies of Riviere Portneuf and Lac Pauline, Chicoutimi County, Quebec, in Methods and case histories in mining geophysics: [Canada] Commonwealth Mining and Metall. Cong. (6th), p. 163-168, 1957.
Airborne magnetometer, ground magnetometer, and dip-needle surveys were used in conjunction with geological mapping in exploration for titanium in anorthositic areas in eastern Quebec. Several negative anomalies-diagnostic of titanium mineralization-were mapped and drilled. The surveys showed that localized disseminations of hematite-ilmenite caused the negative anomalies and titaniferous magnetite the positive anomalies.
Petrographic studies and measurements of the magnetic properties of core specimens were made to explain the negative anomalies and their association with ilmenite mineralization. Two of these causes are discussed.- Author's abstract
180-303. Koulomzine, T., and Brossard, Leo. Magnetometer surveys in the area of the Bourlamaque batholith and its satellites, in Methods and case histories in mining geophysics: [Canada] Commonwealth Mining and Metall. Cong. (6th), p. 176-184, 1957.
A combination of information derived from, ground magnetometer surveys, surface geological surveys, and diamond drilling has made it possible to outline the contacts of the Bourlamaque batholith and its satellites. The complementary roles of ground magnetometer surveys and airborne magnetometer surveys are well illustrated by a comparison of the ground data with results of an airborne magnetometer survey covering the Val d'Or district conducted by the Geological Survey of Canada. Some of these data are presented. - V. S. N.
180-304. Westrick, E. W., and Parsons, G. E. Integrated exploration finds columbium deposits in Chewett and Collins Townships, Ontario, in Methods and case histories in mining geophysics: [Canada] Commonwealth Mining and Metall. Cong. (6th), p. 184-195, 1957.
An airborne . magnetometer survey was made of an area of gneiss near Chapleau, Ontario, to locate areas of niobium (columbium) mineralization commonly associated with circular alkalic plugs and diatremes surrounded by magnetic aureoles. An aureole of alteration surrounding an alkalic plug was located near Lake Nemegosenda in Chewett township. Detailed ground magnetometer and scintillometer surveys outlined the magnetite and columbium-bearing zones; a pyroxenitic zone around the syenite contact zone proved to be the principal carrier of the columbium mineralization.
Two principal ore areas have been discovered to date. A large, apparently favorable area awaits further testing. - V. S. N.
180-305. Ratcliffe, J[ohn] H. The Boston township iron range, in Methods and case histories in Mining Geophysics: [Canadal Commonwealth Mining and Metall. Cong. (6th), p. 195-209, 1957.
90 GEOPHYSICAL ABSTRACTS 180, JANUARY -MARCH 1960
A concentrated exploration of the Boston township iron range in 1951 by aeromagnetic and ground magnetometer surveys and by geological mapping led to the development of 213, 000, 000 tons of iron ore averaging 20. 6 percent magnetite that can be magnetically concentrated to produce a high-grade product. Steep magnetic gradients encountered and extreme magnetic intensities, both positive and negative, measured by the ground magnetometer suggested the possibility of outlining potential magnetite ore zones by comparison of ground magnetometer data with information from detailed geological mapping. With this comparison it was possible to select a cutoff value of 40, 000 gamma above base level as an aid in outlining possible magnetite ore zones. Recent diamond drilling has demonstrated the success of this method. -V.S.N.
180-306. Kelly, Sherwin F. Resistivity and magnetic surveys in 1936 on the Broulan-Porcupine gold prospect, South Porcupine, Ontario, in Methods and case histories in mining geophysics: [Canada] Commonwealth Mining and Metall. Cong. (6th), p. 283-289, 1957.
In 1936 electrical resistivity and magnetic surveys were made of the newly developed eastern extension of the Timmins gold-producing area in eastern Ontario to outline potential gold-bearing zones. The gold mineralization in the district was known to occur near lava-sediment contacts in association with quartz veins and zones of silicification. The ma:gnetic surveys helped to locate the lava-sediment contact and the electrical resistivity survey defined the silicified zones. Subsequent drilling resulted in the discovery of the Broulan-Porcupine ore bodies, underlying the high-resistivity areas. -V.S.N.
Bergey, W. R., Clark, A. R., Frantz, J. C., Keevil, N. B., and Smith, F. Gordon. Discovery of copper-nickel ore bodies at the Temagami mine, Ontario. See Geophys. Abs. 180-125.
180-307. Weiss, Oscar. Geophysical surveys discover Stilfontein gold mine in SouthMrica, in Methods and case histories in mining geophysics: [Canada] Commonwealth Mining and Metall. Cong. (6th), p. 341-345, 1957.
The results are given of gravimeter, ground, and aerial magnetometer surveys of the new Stilfontein gold mine area in the Klerksdorp district, Transvaal, Union of South Mrica. Gravity anomalies suggest that a block of of Upper Witwatersrand quartzite has been faulted up between dolomite and Ventersdorp lava. Boreholes penetrate to. the quartzite and intersect the Gold Estates Reef and the highly valuable Vaal Reef. The mine developed on the Vaal Reef is expected to have a capa-city of 100, 000 tons of ore per month and a lifetime of 30-35 yrs.- V. S. N.
180-308. King, Anthony J. A geophysical investigation of auriferous reefs in s9uthern Tanganyika, in Methods and case histories in mining geophysics: [Canada] Commonwealth Mining and Metall. Cong. (6th), p. 347-352, 1957.
This paper has been published in the Tanganyika Geological Survey Records, v. 5, p. 60-62, 1955(1958). See Geophys. Abs. 177-148.- V; S. N.
180-309. Gaibar-Puertas, C[onstantino]. Estudio geologico de los diapiros de Bolturina, El Grado yNaval y prospeccion geomagnetica de los afloriamentos eruptivos relacionados con las dos Ultimas estruc-
MAGNETIC SURVEYS 91
turas [Geologic study of the Bolturina, El Grado, and Naval diapirs and geomagnetic exploration of the igneous outcrops related to thetwolast structures]: Rev. Geof{sica, v. 17, no. 68, p. 381-491, 1958.
In connection with geologic study of three diapirs in Huesca province, Spain, magnetic studies were made of the El Grado and Naval structures. The problem was to ascertain whether the mafic igneous rocks associated with these diapirs are blocks of Triassic trap forced up with the nuclei of the diapirs, or whether they are later intrusions. The rocks in question are olivine-quartz diabase carrying 3.12-4. 71 percent by weight of magnetite; the magnetic susceptibility is 2, 916 - 3, 920 X w-6 cgs.
The procedure, results, and interpretation of the magnetic surveys are discussed in great detail. In the case of the El Grado structure two roots or dikes were found: one dipping at 45° S., and the other at 80° S., and magnetized in different directions; this shows that they represent eruptions fairly widely spaced in time. The small outcrop near Naval was shown to be the tip of a dike that dips about 70° S. These intrusions were probably emplaced after formation of the diapirs; therefore, they are Mio-Pliocene in age.D. B. V.
180-310. Cipa, Walter. Erdmagnetische Vermessungeiniger Lavastrome und Tuffschlote in der Vorder-Eifel [Geomagnetic survey of some lava flows and tuff vents in the fore-Eifel]: Geol. Jahrb., v. 75, p. 663-698, 1958(1959).
The use of vertical magnetic surveys in conjunction with detailed geologic mapping in the fore-Eifel, Germany, made it possible to trace the Dockweiler, Alftal, and Gerolstein flows, to locate the Wollersberg vent beneath the alluvium, and to help determine the form of the Muhlenberg, Dreiser Weiher, Strohner Mactrchen, and Trautzberger Maars. Remanent magnetization and magnetic susceptibility were measured on basalt and tuff samples in order to facilitate interpretation of the data.
The basalts show a wide range of values of remanent magnetization (both direction and intensity) and of susceptibility. Their average remanent magnetization is as high as or higher than their average induced magnetization. The tuffs show a uniform susceptibility, which is lower than that of the basalts. Anomalies over tuff are commonly as high as over basalt, but they can be distinguished by the amplitude variations of AZ values. Over tuff the range hardly ever exceeds 100 'Y, whereas over basalt it is several times greater. See also Geophys. Abs. 165-285.- D. B. V.
180-311. Airiney [Airinei], Sh [~tefan]. Karta magnitnoy anomalii A Z Dobrudzhi, yuzhnoy Moldovy i vostochnoy chasti Rumynskoy ravniny [Map of the A Z magnetic anomaly of Dobrogea, southern Moldavia, and the eastern part of the Rumanian Plain): Acad. Roumaine Rev. Geol. -Geog., v. 2, no. 1, p. 221-247, 1958.
This paper is a cartographic and interpretational supplement to the map of A Z of this area published earlier (see Geophys. Abs. 178-312). Leaving out the details and concentrating on new facts, additional interpretations are possible. Correction of measured values of Z of the normal geomagnetic field was made, and these corrected values served to define regional and local magnetic anomalies. On a basis of the distribution of these anomalies the region under study was divided into seven magnetic areas or zones. Each area is characterized from the physical point of view by an average level of magnetic
92 GEOPHYSICAL ABSTRACTS 180, JANUARY -MARCH 1960
anomaly and by the orientation of the residual magnetic field. The zonal character of the magnetic anomalies reflects largely the tectonics of the ancient magnetized crystalline basement. It is assumed that each zone of magnetic anomaly corresponds to a definite block of the basement.- J. W. C.
Stoenescu, Scarlat, and Airinei, Stefan. Geophysical study of the rock-salt deposits at Slanic-Prahova. See ~ophys. Abs. 180-2.28.
180-312. Rao, M. B. Ramachandra, and Sinha, S. C. Magnetic surveys for the exploration of manganese ores in India, in Methods and case histories in mining geophysics: [Canada] Commonwealth Mining and Metall. Cong. (6th), p. 301-312, 1957.
This report is a discussion of the results of a magnetic survey, one of several geophysical surveys conducted by the Geological Survey of India, to complete exploration of India's tnost important manganese field in Madhya Pradesh State (formerly the Central Provinces). Manganese ores, mostly braunite and psilomelane, occur in Archean rocks and are believed to be the result of weathering of manganese-bearing metasediments. Two types of anomalies were obtained: strong, elongated features generally due to bands of magnetite-quartzite or schists of no economic significance; and circular to irregular features believed due to the presence of jacobsite, a magnesiumiron manganate. Investigation of the irregular anomalies of isolated character has located 50, 000 tons of probable ore, which occurs largely as float. Gravitational surveys could be used to advantage in supplementing the magnetic work.- V. S. N.
180-313. Agocs, W[illiam] B. Structure and basement type from aeromagnetics--Corregidor, Philippines, to Labuan, North Borneo: Philippine Jour. Sci., v. 87, no. 2, p. 179-186, 1959.
An airborne-magnetometer survey was made in February 1957 from Corregidor, Philippines, to Labuan, North Borneo, via Cape Calavite, Mindoro, Dumaran, and southwestward along the coast of Palawan. Determinations of depth to basement made from magnetic anomalies along the length of the profile are given. Quantitative study of the profile confirms the presence of a structural complexity in the vicinity of northwestern Mindoro Island and indicates a northeast trending fault at about Dumaran Island, downthrown to the east. The Palawan fault, downthrown to the northwest, possibly extends southwestward to the northwest shore of North Borneo suggesting a southwestward extension of the Palawan graben.
A regional airborne-magnetometer survey of the territorial waters of the Philippines is recommended to resolve numerous geological problems and to aid in the economic development of the whole area.- V. S. N.
180-314. Agocs, W[illiam] B., Paton, J. R., and Alexander, J. B. Airborne magnetometer and scintillation counter survey over parts of Perak, Selangor, and Negri Sembilan (Areal): Federation Malaya Geol. Survey Econ. Bull. C-1.1, 30 p., 1958.
This is the first of a series of publications resporting the results of airborne -magnetometer and scintillation-counter surveys conducted during 19 56-57 over nearlyl6, 000 sq mi of Malaya (see Geophys. Abs. 178-315). The purpose of the survey was to locate possible sites of tin deposits, sulfide mineralization, and concentrations of uranium and thorium minerals. The report includes: a discussion by Paton of the general geology and mineral resources
MAGNETIC SURVEYS 93
of the Federation of Malaya, in particular of Area 1 which covers approximately 1, 800 sq mi on the west coast of Malaya; an interpretation by Agocs of the magnetic and radioactivity results in Area 1; and an interpretative summary by Alexander. Results from South Perak do not suggest any mineral deposits of major economic value except for a possible zone west of Changkat Besout where nonferrous minerals maybe found. In North Selangortwo strong magnetic lows, although minor features, merit investigation because of their proximity to the Batang Berjuntai alluvial tin field. In southern Selangor and northwestern Negri Sembilan there are two strong magnetic lows, one west of Bukit Cheting in the Tanjong Duablas Malay Reserve Extension and the other between Kajang and Pubhong south of the Sungei Besi-Serdang tin field. The causes of these anomalies are probably rises in the granite basement; there is a possibility of mineral deposits of economic value at depth in the shallow contact zone indicated in the Tanjong Duablas Malay Reserve Extension. -V.S.N.
180-315. Agocs, W[illiam] B., Paton, J. R., and Alexander, J. B. Airborne magnetometer and scintillation counter survey over parts of Trengganu and Pahang (Area 2): Federation of Malaya Geol. Survey Econ. Bull., C-1. 2, 33 p., 1959.
This is the second in a series of publications reporting the results of airborne-magnetometer and scintillation-counter surveys conducted during 1956-57 over nearly 16, 000 sq mi of Malaya. This report follows the same outline as that used in Bulletin C-1.1 (see Geophys. Abs. 180-314). Area 2 comprises 2, 396 sq mi which includes a long north-south strip of Trengganu, the most easterly State of the Federation, and a small part of the extreme northeast of Pahang. This area was selected for surveying because of the large iron mine at Bukit Besi; this suggested the possibility of other deposits in less accessible areas. The survey revealed several anomalies that indicate possible mineralization such as that to the east-southeast of Bukit Besi and immediately west of Paka.- V. S. N.
180-316. Smellie, D. W. Peko copper orebody, Tennant Creek, Northern Territory, Australia, in Methods and case histories in mining geophysics: [Canada] Commonwealth Mining and Metal!. Cong. (6th), p. 83-88, 1957.
A magnetic survey in the vicinity of the Peko shaft near Tennant Creek, Northern Territory, Australia, revealed a strong anomaly immediately over the outcropping quartz-hematite lode and a 5, 500 gamma anomaly from a source which appeared to top at about 300 feet below the surface. Drilling and subsequent mine development disclosed that the anomaly was due to the unoxidized portion of a pipelike ore zone where chalcopyrite and other sulfides had partially replaced a banded quartz-magnetite rock.-- Author's abstract
180-317. Horvath, J[osef]. Magnetic survey of Rye Park scheelite deposit, New South Wales, Australia, in Methods and case histories in mining geophysics: [Canada] Commonwealth Mining and Met all. Cong. (6th), p. l09-ll5, 1957.
The Rye Park scheelite deposit, 12 miles southeast of Boorowa, New South Wales, Australia, is in an area of Silurian porphyries and dacitic tuffs intruded by two small granite cupolas. Scheelite accompanied by magnetite has replaced certain beds in the volcanic suite. A magnetic survey was used to
557043 0 - 60 - 7
94 GEOPHYSICAL ABSTRACTS 180, JANUARY -MARCH 1960
delimit the areas of ore occurrence. Strong magnetic anomalies of limited extent were found in the marginal area around the north granite cupola and were interpreted as indicating near-horizontal magnetic bodies of limited dimensions at shallow depth. Drilling revealed one main, nearly horizontal body 10 - 20 feet thick overlain by a smaller one. Values in tungsten vary more or less with the magnetic intensities.- V. S. N.
180-318. Studt, F. E. Magnetic survey of the Wairakei hydrothermal field: New Zealand Jour. Geology and Geophysics, v. 2, no. 4, p. 746-754, 1959.
Drill holes penetrating below the hot aquifer at Wairakei encountered diminishing temperatures, suggesting that the source of the hot water is not directly below the area now being exploited. A magnetic survey of the field indicates that hydrothermal alteration by which magnetite is converted to pyrite extends to the greatest depths in the west half of the field,. that H2S which is responsible for this conversion is therefore more abundant at depth in the west, and consequently this is the most likely feed source for the hot aquifer. The hot springs and drill holes draw on waterpercolatingthrough the aquifer from this feed source.- Author's summary
180-319. Davidson, R. J., Williams, L. W., Loh, R. P., Horvath, J[osef], and Keunecke, 0. Geophysical survey of the Renison Bell tin field, Tasmania: Australia Bur. Mineral Resources, -Geology, and Geophysics Bull., no. 43, 16 p., 1957.
Magnetic and self -potential surveys were made of the Renison Bell tin field in the west coast region of Tasmania to assist in locating new ore bodies. Numerous intense, well-defined anomalies were obtained by each method, and in many places the two sets of anomalies agree in position. The anomalies provide strong indications of sulfide mineralization containing pyrrhotite, but testing by drill holes and trenches is recommended before the surveys are extended to other parts of the field. - V. S. N.
MICROSEISMS
180-320. Gutenberg, B[eno]. Two types of microseisms: Jour. Geophys. Research, v. 63, no. 3, p. 595-597,_1958.
A tripartite system established on Mount Palomar to determine the direction of microseisms and investigate their characteristics in more detail is described. The microseisms of 6-sec period are of two types, Rayleigh and shear. Tho.se of 2-sec period, with waveiengths between a third and a half that of the 6-sec waves andpracticallythe same velocity, probably originate on the continental shelf. -D. B. V.
180-321. Kisslinger, Carl. Seismograms associated with the near passage of tornadoes: Jour. Geophys. Research, v. 65, no. 2, p. 721-728, 1960; also a short version published in Earthquake Notes, v. 30, no. 3, p. 34, 1959.
The principal features found on seismograms obtained on three occasions when a tornado passed near the station are described. Long periods, 50 sec and greater, predominate, with periods of 30 sec and less and bursts of very short activity superimposed. The classical solution for a vertical load on an elastic half-space is applied, and the results indicate that elastic tilts due to
RADIOACTIVITY 95
the static loading effect of the tornado contribute substantially to the basic form of the record. The shorter periods are ascribed to the dynamic loading of the high winds on obstacles in the path. Part of the activity is not ground motion but is due to the buoyancy effect caused by the rapid pressure fluctuations. -Author's abstract
180-322. Tabulevich, V. N. 0 prirode microseysm Kaspiyskogo basseyna [The nature of microseisms in the Caspian Basin]: Akad. Nauk SSSR Izv. Ser. Geofiz., no. 11, p. 1694-1698, 1959.
This is a report on investigations of microseisms occurring within the basin of the Caspian Sea. The behavior of 96 local Caspian cyclones during the year 1956 and the effect of their coincidence with atmospheric cold fronts was studied. In 70 cases the same pattern of the variation of atmospheric conditions has led to the production of local microseisms. It is concluded that the microseisms of the Caspian Basin reflect local atmospheric conditions, and the intensity of microseisms increases when a cyclone coincides with an atmospheric cold front. The source of the most intensive microseisms appears to be the western portion of .the Derbent Gulf and the sea near Derbent, because the meeting of atmospheric fronts with cyclones occurs here. A combination of these meteorologic conditions often appears on the northeast slopes of the Caucasus. - S. T.V.
180-323. MacDowall, J. A note on the relation between wind velocity and the amplitude of microseisms on the coast of Antarctica: Royal Astron. Soc. Geophys. Jour., v. 2, no. 4, p. 364-368, 1959.
Considerable mi~roseismic activity was observed at Halley Bay, Antarctica, during the three summer months (December 1957 to February 1958), particularly during tmshore winds. For the rest of the year microseisms were active only during prolonged spells of the strongest winds. It is concluded that these microseisms originate at the ice front and that the sea-ice cover damps out this movement for three quarters of the year.- D. B. V.
RADIOACTIVITY
180-324. Voyutskiy, V. S. Sposob asinkhronnogo nakopleniya v primenenii k obnaruzheniyu slabykh radioaktivnostey [A method of asynchronous accumulation as applied to a detection of weak radioactivity]: Razvedochnaya i Promyslovaya Geofizika, no. 17, p. 20, 1957.
An electric-current impulse is induced by a radioactive source in the circuit of 2 photoelectric multipliers connected in coincidence; the superimposed interferences are transformed into 2-way impulses of opposite polarities, and then added and subtracted in the 2 channels. Two quadratic detectors and integrating cells introduced in the circuit average the impulses, and the observed differences in the electric current at the outlets of the channels lead to the function of their mutual correlation. Background impulses are canceled because their positive and negative values are equally probable. -A. J. S.
180-325. Kogan, P. M. Ob odnom sposobe vychisleniya moshchnosti vozdushnoy dozy"Y-izlucheniya v odnorodnykh geologicheskikh sredakh [On a method of computing the intensity of the air portions of gamma radiation in homogeneous geologic media]: Akad. Nauk SSSR Izv. Ser. Geofiz., no. 7, p. 988-994, 1959.
96 GEOPHYSICAL ABSTRACTS 180, JANUARY -MARCH 1960
A simple method of computingthe amount of gamma ray emission in homogeneous geologic media is suggested; it is based on an energy relationship between the concentration of gamma radiating elements in homogeneous media and the intensity of gamma radiation in the air. It is shown that for homogeneous rocks having an effective atomic number not exceeding 15, when the
.'1 energy of primary gamma quanta is 0. 3-3. 0 Mev, an analogous simple re-,
1 lationship can be used for approximate calculation of the intensity of the air portion (5 -10 percent error). -A. J. S.
180-326. Hayase, Ichikazu. The radioactivity of rocks and minerals studied with nuclear emulsion: Pt. 7, Radioactivity of granitic sphene: Kyoto Uni;,r. Coll. Sci. Mem., ser. B, v. 25, no. 4, p. 205-213, 1959.
The radioactivity of sphene in samples of alkalic granite from Korea and hornblende granite and quartz diorite from Japan was studied by means of autoradiography of thin sections. Because of the feeble radioactivity of the sphene, long exposures were necessary; in one case an exposure of 311 days was made. Results showed that granitic sphenes range in radioactivity from T a = 0. OOOn to 0. 1165 regardless of rock type; the radioactivity of sphene varies with its color and with the nature of adjacent minerals; and the feeble radioactivity around grains of sphene in granite must not be neglected. The thorium-uranium ratio in sphene is about l. (See also Geophys. Abs. 160-169, 162-202, 172-206, 174-300, 175-345, 176-301, 178-322.) -- V. S. N.
180-327. Abdulgafarov, K. K., and Cherdyntsev, V. V. Issledovaniye vydeleniya radioaktivnykh emanatsiy i geliya iz prirodnykh mineralov v zavisimosti ot temperatury [Investigation of the emission of radioactive emanations andheliumfrom natural minerals depending on temperature]: Vyssh. Ucheb. Zavedniy Izv., Geologiya i Razvedka, no. 9, p. 107-117, 1958.
Emission of helium from uraninite, monazite, zircon, tantalite, and beryl was measured at temperatures from l00°C to 1, l00°C. The radiogenic helium is given off over a wide range at a relatively high temperature (500°C-l, 000°C with a maximum at 600°C-700°C) whereas the nonradiogenic helium of beryl is given off over a narrow range at a lower temperature (400°C-500°C). Experiments on emission of helium and radon from monazite at different temperatures showed minimums on the curve at 900°C and at 1, 100°C. A minimum for radon emission from uraninite occurs at 900°C.
The curves for emission of thoron (radon-220) and actinon (radon-219) from monazite and uraninite have a maximum at 200°C. These emanations are probably liberated along miCrofractures· and not by diffusion through the crystallattice. - J. W. C.
180-328. Shmonin, L. I., Cherdyntsev, V. V., Kashkarov, L. L., and Ostapenko, V. F. Issledovaniya neytronnogo potoka zemnoy kory [Investigation of the neutron flux of the earth's crust (with English summary)]: Geokhimiya, no. 2, p. 105-109, 1959.
The neutron flux stimulated by nuclear processes in the earth's crust has been investigated in underground mine workings by means of BF3-filled neutron counters. Intensities of both rapid and slow neutrons that were not less than 0.1 - 0. 3 neutrons per cm2 per hr could be measured. Neutron flux is usually small in terrestrial rocks; it exceeds the limits of measurement error only in some ore bodies. The results of measurements in deposits in the Kazakh, Kirgiz, Armenian, and GeorgianS. S. R. are tabulated. In the
RADIOACTIVITY g7
Aktyus deposits (Kirgiz S. S. R. )the rapid neutron flux is up to 32.4 neutrons per cm2 per hr. On the average, neutron flux increases in proprotion to gamma activity of the medium. The chief source of neutrons in the crust is the reaction of alpha radiation with light nuclei such as oxygen or fluorine. -D.B.V.
180-32g, Burling, R. Q., and Farner, D. M. A section of 14c activities of sea water between go S. and 60° S. in the South-West Pacific Ocean: New Zealand Jour. Geology and Geophysics, v. 2, no. 4, p. 7gg-824, lg5g,
Carbon-14 activities of 16 surface and 22 subsurface samples have been determined since late lg56. The distribution of these activities along a section extending from lat go S. to 60° S. through the Southwest Pacific is described and· compared with ideas on the nature and movements of water masses inferred from conventional oceanographic data.- D. B. V.
180-330. Israel, Hans. Der Diffusionskoeffizient des Radons in der Bodenluft (Bemerkungen zur Arbeit von E. Budde: "Bestimmung des Beweglichkeits-Koeffizienten der Radium-Emanation in Lockergesteinen") [The diffusion coefficient of radon in soil air (Remarks on E. Budde's work "Deter~ination of the coefficientof diffusion of radium emanation in porous rocks")]: Zeitschr. Geophysik, v. 25, no. 2, p. 104-108, 1g5g,
From practically zero at the surface of the earth, radon concentration in soil air exponentially approaches a limiting value a/>. as depth Z increases (a = production of radon per cm3 of soil air per sec, ). = decay constant of radon). If the "half -value depth" Z = ln2 I ~X I k is calculated on the basis of the values of the diffusion coefficient k determined in the laboratory by Budde (see Geophys. Abs. 174-314), the results do not agree with observed values. Either Budde's laboratory conditions did not truly represent natural conditions, or else other effects besides pure gas-kinetic diffusion are present that lead to exaggeration of the true diffusion phenomenon. -D. B. V.
180-331. Lockhart, Luther B., Jr. Atmospheric radioactivity levels at Yokosuka, Japan, lg54-lg58: Jour. Geophys. Research, v. 64, no. 10, p. 1445-144g, lg5g,
The results are presented of measurements of concentrations of some natural radioactive materials and of gross fission products in the air at ground level at Yokosuka, Japan, during the period lg54-58. The datasupportthe conclusions that the concentrations of both natural and fission products vary widely from time to time, that the change in the concentration of the natural radioactivity is related in a general wayto the phenomena that control p·recipitation, and that the trend of the fission-product concentration has been upward during the past few years.- D. B. V.
180-332. Baranovskiy, V. I., Larionov, 0. V., Nikitin, M. K., and Tkachenko, A. A. K voprosu o yestestvennoy neytronnoy aktivnosti mysh'yaka i sur'my [On the question of natural neutron activity of arsenic and antimony]: Leningrad Univ. Vestnik, Ser. Fiziki i Khimii, no. 10, p. 25-26, 1g5g,
It is demonstrated that natural neutron activity is not possible for arsenic and antimony.- J. W. C.
55 7043 0 - 60 - s
98 GEOPHYSICAL ABSTRACTS 180, JANUARY-MARCH 1960
RADIOACTIVITY SURVEYING AND LOGGING
180-333. Stroud, Stanley G., and Schaller, Herman E. for the determination of reservoir salinity: Technology, v. 12, no. 2, p. 37-41, 1960.
A new nuclear log Jour. Petroleum
The salinity log utilizes the basic principle that neutrons are affected in a different manner by different elements and that the scintillation detector permits these responses to be measured and recorded. By utilizing a conventional neutron source and selectively recording information measured by the detector, curves can be obtained that reflect the presence of several E)lements.
The salinity log consists of two curves whose responses reflect the presence of hydrogen and chlorine. By energy discrimination, the thermal neutrons that return to the well-bore are recorded as the "hydrogen" curve; its primary use is to indicate porosity and to serve as a reference to which the "chlorine" curve can be compared. The chlorine curve reflects the ·relatively high probability that slow neutrons will be captured by chlorine. When the chlorine nuclei capture slow neutrons, they give off secondary gamma rays that are of sufficiently high energy that they can be distinguished and recorded separately from the natural gamma radiation and from the capture gamma rays from hydrogen. Thus, an increase in chlorine will result in a corresponding increase in the response of the chlorine curve. - J. W. C.
180-334. Anderson, R. H. Applications of the densilog: Shale Shaker Digest II (1955-1958), p. 410-413, 1958.
This paper discusses the principles, applications, interpretation, and limitations of the densilog method. (See also Geophys. Abs. 176-310.)- V. S. N.
180-335. Zaporozhets, V. M., and Filippov, E. M. Ispol'zovaniye uskoriteley zaryazhennykh chastits pri issledovanii skvazhin metodami radioaktivnogo karotazh [Use of accelerated charged particles in investigations of wells by radioactive logging methods]: Prikladnaya Geofizika, no. 20, p. 234-258, 1958.
The spectrum of the gamma-radiation arising from the inelastic collision of neutrons. of an energy of 14 Mev with the atoms of rock-makingminerals is a basis for identification of the elements present: The differentiated spectra are presented for graphite, water, iron, magnesium, aluminum, calcium, and silicon.
A schematic diagram of the conventional borehole neutron generator is given, and several methods of evacuating the ac~elerator tube are discussed. A cobalt gartuna-quanta source with an energy of 1. 25 Mev is not strong enough; a source of 15 Mev is the optimum. An electron beam from a betatron may be used for electron logging.
Use of neutron and gamma-quanta generators in radioactive logging permits considerable improvement in the effectiveness of neutron logging and gammagamma logging. It also allows introduction of new methods; gamma-neutron and electron logging. This greatly broadens the range of problems that can be solved by radioactivity logging. The possibilities of the radioactive methods can also be expanded greatly by creation of a powerful controllable source of neutrons in the form of a small-scale borehole reactor. - J. W. C.
180-336. Nedostup, G. A., Prokof'yev, F. N., Kholin, A. I., and Tsitovich, A. P. Ispol 'zovaniye different sial 'noy gamma-spektrometrii v neftyanoy geologii [Use of differential gamma-spectrometry in oil geology]: Prikladnaya Geofizika, no. 23, p. 193-201, 1959.
RADIOACTIVITY SURVEYING AND LOGGING 99
Spectral analysis of gamma radiation arising from entrapment of neutrons by the nuclei of elements in rocks is one of the most favorable areas for development of radiometry of wells. The presence of sharp maximums in the spectrums of the principal rock-forming elements (Si, Ca, H, Cl, and others) presents the possibility not only of a qualitative but also of a quantitative estimate of their content in the rocks. Laboratory investigations were carried out to evaluate this method. A 1 m by 1 m by l. 3 m model was filled with sand, which was first saturated with fresh water and then with water comparable to formation water. The results are presented on a graph. The curves of secondary gamma radiation for both water types have peaks characteristic of hydrogen, silicon, and chlorine. This method appears to be particularly useful for determination of the composition of the liquid in reservoir rocks.
A schematic diagram of the borehole instrument is given, and the function of the various components is described. The instrument was tested in the Tuymazy oil field. The secondary gamma spectrums of water-bearing sand, oil -bearing sand, and of cement -filled caves were measured. The results agree essentially with the results obtained with the model. The potential of this method is estimated as very high, particularly for determination of the nature of the fluids in the rocks. - J. W. C.
180-337. Zaporozhets, V. M., and Sulin, V. V. Metodika etalonirovaniya krivykh gamma- karotazh (GK) i neytronnogo gamma- karotazh (NGK) [Methods of standardization of gamma -logging (GK) and neutron gamma-logging (NGK) curves}:. Razvedochnaya i Promyslovaya Geofizika, no. 17, p. 73-79, 1957.
The values obtained in radioactive logging depend not only on the intensity of the gamma radiation but also on the characteristics of individual instruments. Zaporozhets and Sulin propose standardization of counters in microroentgens per hour instead of impulses per minute, and suggest procedures for this standardization. Two nomograms and a master chart are given to aid in conversion from impulses per minute to microroentgens per hour. -A.J.S.
180-338. Oil in Canada. Gamma ray toolfor perforating gun through Schlumberger: Oil in Canada, v. 11, no. 49, p. 38, 1959.
Schlumberger of Canada has developed a highly shockproof 3 3/8-inch gamma-ray tool, which may be attached to a perforating gun for use on the same trip into the hole as the one on which the shooting is done. A magnetic casing- collar locator is included. At present, the log obtained is specifically for perforation-depth control. - V o SoN 0
180-339. Edwards, J. M. Quantitative evaluation of the density log in the Rocky Mountain area: Jour. Petroleum Technology, v. ll, no. 12, p. 29-34, 1959.
Experience in the use of a radioactive density -logging device in the Paradox, San Juan, and Green River basins is evaluated. The sonde is described and a cut - away diagram presented. A nomogram is illustrated whereby the effect of a mud cake can be discounted. A caliper log should also be made to determine washed-out sections. Porosity determinations based on the radioactive density logs are compared with data of core analysis; agreement is strikingly good. - J. W. Co
180-340. Sen•ko- Bulatnyy, I. N. Neytronometriya skvazhin na mestorozhdeniyakh margantsa i boksitov [Neutron measurements in bore-
100 GEOPHYSICAL ABSTRACTS 180, JANUARY-MARCH 1960
holes in manganese and bauxite deposits]: Akad. Nauk SSSR Izv. Ser. Geofiz., no. 3, p. 476-479, 1959.
The results of logging of manganese and bauxite deposits by various methods are presented. These investigations were made using gamma logging, neutrongamma logging, and the method of induced activity. Procedures are described. Surveys were made by all three methods in each of two areas in the northern Kazakh S. S. R. The curves obtained are reproduced. Clearer indications were obtained with neutron-gamma logging. - S. T.V.
Becker, Alfred. Geophysical borehole investigations in the main Zechstein dolomite. See Geophys. Abs. 180-157.
180-341. Kartashov, N. P. Uranovyye ekvivalenty kaliya po gamma- i betaizlucheniyu [Uranium equivalents of potassium according to gamma- and beta- radiation]: Akad. Nauk SSSR Vostoch. Filial Izv., no. 4-5, p. 62-70, 1957.
A method of differentiation between beta and gamma radiation from uranium plus thorium and that from potassium-40 as recorded in airborne gamma surveying, or, in general, from radioactive rocks with less than 20-30 J.1. r per hr radiation, is discussed. The ratio NFK/NFu + Th can be used as an additional parameter in interpretation of airborne surveying data and their correlation with the geological data (NFK and NFu + Th are natural backgrounds of K40 and U + Th radiation, respectively). Mter correlating the primary potassium- 40 and uranium radiations Kartashov discusses the theoretical values of natural background gamma radiation from rocks. As the mean maximum energy of beta particles is 2.06 Mev for uranium and 1. 70 Mev for thorium, whereas the mean maximum of beta- particle energy of potassium is only 1. 34 Mev, beta radiation from K and (U + Th) can be separated by filtering the radiation through an aluminum filter; beta radiation from potassium-40 was found to be completely absorbed by a filter of 0. 25 g per cm2, whereas for (U + Th) beta radiation to be completely absorbed, a filter of 0. 7 g per cm2 is required. -A.J.S.
180-342. Eife, Karl-Heinz. Die Bestimmung des Raumgewichtes von Boden und Gesteinen durch Gamma- Strahlen [The determination of the density of soils and rocks by means of gamma rays]: Freiberger Forschungshefte C61 Geophysik, 92 p., 1958.
This is a compilation of information on methods of determining the density of unconsolidated soils and consolidated rocks by means of measurements of gamma-ray absorption and scattering. The seven chapters deal with the basic principles involved, the application of the gamma-ray absorption method to unconsolidated soils to a depth of 70 em, the application of the gamma-ray scattering method to thin superficial layers, density determination of unconsolidated soils to a depth of about 30 m, the application of gamma-ray scattering to boreholes, measuring instruments and techniques, and determination of water content by the neutron-neutron method. - D. B. V.
180-343. Oilweek. Small, inexpensive gadget spots radioactivity traces: Oilweek, v. 10, no. 52, p. 38, 1960.
A new tool that will detect and measure nuclear radiation quickly, accurately, and at a cost of lessthanten dollars will soonbe available. Described as a "solid state ionization chamber" it is essentially a piece of doped silicon so thin that it is barely discernible to the naked eye. When a charged nuclear
RADIOACTIVITY SURVEYING AND LOGGING 101
particle strikes the device, an electrical impulse capable of measurement and analysis is emitted. The kind of radiation, its intensity, and the amount of energy it possesses is detected almost immediately. - V. S. N.
180-344. Brownell, G[eorge] M. Nuclear radiation in prospecting, in Methods and case histories in mining geophysics: [Canada] Commonwealth Mining and Metall. Cong. (6th), p. 45-51, 1957.
The development of the Geiger and scintillation counters has made possible the discovery of numerous commercial deposits of uranium in recent years. The scintillation counter with its greater efficiency in detecting gamma rays has largely superseded the Geiger counter. The scintillation counter is described, the sources of radioactivity in nature--the uranium series, potassium, and thorium-- are discussed, and the techniques used in both ground and airborne surveys for locating radioactive sources are briefly described. -V.S.N.
180-345. Bigotte, G. Guides et methodes de recherches pour les matieres premieres minerales de l'energie atomique du Mrique franc;aise [Prospecting guides and methods for raw materials of atomic energy in French Mrica (in French with parallel English translation)]: Chronique des Mines d'Outre- Mer, v. 27, no. 279, p. 284-296, 1959.
Airborne prospecting is a necessity in reconnaissance for radioactive ores in French Mrica. Light" planes equipped with sensitive scintillometers fly lines lkm apart at an altitude of 75m (280ft) and speed of200kmph (125mph). Because of the high cost of ground prospecting in Mrica, more detailed surveys of anomalies are made at a lower altitude from a slower light plane carrying an experienced geologist and equipped with a sensitive scintillometer; this more detailed survey eliminates anomalies caused by rock masses of high background radiation or outcrops that might contain refractory thorium ore. Remaining anomalies are then studied by a ground party equipped with aerial photographs. Helicopters have been used successfully in the Sahara; they are practical only in desert or semidesert zones where one can land almost anywhere. The great advantage of combining reconnaissance and detailed prospecting in a survey justifies the high cost.
Ground-survey methods include digging, radioactivity grading, drilling, and general study of the surrounding area. Carborne-scintillometer surveys have been useful in flat-desert zones or wherever there is a sufficiently dense network of roads. - D. B. V.
180-346. Cawley, A. Uranium and thorium in Uganda [with parallel French translation]: Chronique des Mines d'Outre-Mer, v. 27, no. 279, p. 319-324, 1959.
Radioactivity- exploration methods used by the Uganda Geological Survey are outlined briefly, followed by a description of various prospects. Panax T. R. 56 and T. R. 33 field counters and Ericsson 1368A counters are replacing older types of instruments. One Ericsson instrument is kept for beta-probe assays, and a special probe is used in boreholes. All samples submitted from any source are passed through a Panax Decade 1, 000 c Scaler, and those showing a count of more than 10 percent above background are investigated further. A few chosen localities have been surveyed from the air. - D. B. V.
180-347. Nel, L. T. Uranium and thorium in the Union of South Mrica [with parallel French translation]: Chronique des Mines d'Outre-Mer,
102 GEOPHYSICAL ABSTRACTS 180, JANUARY -MARCH 1960
v. 27, no. 279, p. 325-331, 1959.
Prospecting for radioactive minerals bythe Atomic Energy Board of South Africa has been restricted to the use of various types of Geiger -Muller and scintillation counters in the field (both ground and airborne} and in boreholes. Airborne surveys have been carried out on a trial basis only, but several mining companies have made more intensive airborne surveys. Fieldwork includes reconnaissance surveys to determine differences in radioactivitybetween different formations over hundreds of square miles and economic surveys of known or reported anomalies. In the latter, detailed grid traversing is attempted and the results are plotted in isorad maps. The choice of instruments depends on the characteristics of each area surveyed. - D. B. V.
180-348. Iwasaki, Shoji; Kojima, Seishi; Kanaya, Hiroshi; and Komai, Jiro Airborne radiometric survey in the southern part of Kitakami area, Iwata Prefecture [in Japanese with English summary]: Ja-pan Geol. Survey Bull., v. 10, no. 1, p. 1-8, 1959. ·
This is the first in a series of reports by members of the Geological Survey of Japan on results of radiometric surveys to locate possible uranium deposits. A scintiUation counter of the Mt. Sopris SC-188 DA type equipped with dual heads and a radio altimeter was used. The airplane used and techniques employed are also discussed. No specific anomalous ar-eas are identified. -V.S.N ..
180-349. Iwasaki, Shoji; Kojima, Seishi; Kanaya, Hiroshi; and Komai, Jiro. Airborne radiometric survey in the southern part of Yamaguchi Prefecture [in Japanese with English summary] : Japan Geol. Survey Bull., v. 10, no. 1, p. 9-16, 1959.
The same instruments and procedures were used in this survey as in that of the southern Kitakami area (Geophys. Abs. 180-348}. Anomalous areas were found at Hofu and Ube on the southern coast of Yamaguchi Prefecture. -V.S.N.
180-350. Iwasaki, Shoji; Kanaya, Hiroshi; and Takahashi, Tan. Airborne radiometric survey in the eastern part of Kitakami area, Iwate Prefecture: Japan Geol. Survey Bull., v. 10, no. 1, p. 17-23, 1959.
The same instruments and procedures were used in this survey as in that of the southern Kitakami area (see Geophys. Abs. 180-348}. The radioactivity of the· granites is lower than that of the ·sediments of this area. Some anomalous zones were found in the Pale~zoic rocks adjacent to the granites. - V.S.N.
180-351. Sugiyama, Tomonori, and Komai, Jiro. Airborne radiometric survey in the southern part of Hiroshima Prefecture and Takanawa Peninsula, Ehime Prefecture [in Japanese with English summary]: Japan Geol. Survey Bull., v. 10, no. 1, p. 25-27, 1959.
The same instruments and procedures were used in this survey as in earlier ones (see Geophys. Abs. 180-348, -349, -350}. Anomalies showing an intensity of 1, 200 counts per sec were located in the western part of Fukuyama City, in the northern part of Innoshima (island}, in the southeastern part of Omishima (island}, and in the central part of Kurahashi -to (island}, Japan.V.S.N.
RADIOACTIVITY SURVEYING AND LOGGING 103
180-352. Kaneko, Tetsuichi; Seya, Kiyoshi; and Komai, Jiro. Airborne radiometric survey in Shimane Prefecture [in Japanese with English summary]: Japan Geol. Survey Bull., v. 10, no. 1, p. 29-30, 1959.
The instruments and procedures used in this survey were the same as those used in the earlier surveys (see Geophys. Abs. 180-348). Two anomalous areas were located; maximum intensities occur in the vicinity of Kigi-machi. These areas of maximum intensity also corresponded to areas of maximum value located during a carborne scintillation survey.- V. S. N.
180-353. Iwasaki, Shoji; Kojima, Seishi; Kanaya, Hiroshi; and Komai, Jiro. Airborne radiometric survey in north Kyushu area [in Japanese with English summary]: Japan Geol. Survey Bull., v. 10, no. 1, p. 31-34, 1959.
A survey over an area of 7, 000 km 2 was conducted from February to March 1958 using the same instruments and procedures as in previous surveys (see Geophys. Abs. 180-348). The Hiroshima-type granite in southeastern Fukuoka Prefecture gave the highest radioactivity counts in the area. In general, counts over Paleozoic and Cenozoic formations were lower than over granite, and counts over mafic rocks were even lower.- V. S. N.
180-354. Ujiie, Akira; Ogawa, Kenzo; and Tanaka, Akiyoshi. Radiometric survey with car-mounted instrument in Kesenuma area, Miyagi Prefecture [in Japanese with English summary]: Japan Geol. Survey Bull., v. 10, no. 1, p. 35-37, 1959.
A radiometric survey using a car-mounted Mt. Sopris SC-156A type scintillometer was carried out in the vicinity of Kesenuma City and Matsuiwa mine. Several anomalies were located on the east side of Kesenuma City. Radioactivity of the granitic rocks in this area is generally low as compared with that of other granitic areas of Japan.- V. S. N.
180-355. Horikawa, Yoshio, and Ujiie, Akira. Radiometric survey with carmounted instrument in the northeastern part of Iwate Prefecture [in Japanese with English summary]: Japan Geol. Survey Bull., v. 10, no. 1, p. 39-44, 1959.
A scintillometer survey in November-December 1957 covered 3, 200 km2 over Paleozoic and silicic rocks. Two anomalous areas of high radioactivity (1, 300 counts per sec) were found in the vicinity of Kitanomata, Miyako, and Shimoatsuka Nada. The first of the two anomalies is recommended for a detailed geological and geophysical survey. - V. S. N.
180-356. Nakai, Junji, and Ujiie, Akira. Radiometric survey with carmounted instrument in Hida Province, Gifu Prefecture [in Japanese with English summary]: Japan Geol. Survey Bull., v. 10, no. 1, p. 45-49, 1959.
The district covered by this survey is mainly one of granites, gneisses, and Paleozoic and Mesozoic sediments. In general the radioactivity of granites was 8, 000-ll, 000 counts per minute. Some of the higher values, in counts per minute, were as follows: Funatsu granite near Kamioka,6, 000-13,000; granite in Moriyasu-tani, 20, 000-22, 000; granite along Kogeu River in Hosogae about 13, 000-18, 000; quartz porphyry in southern Hida Plateau, 9, 000-12, 000, and a few points 15, 000-16, 000; and Tetori series (Jurassic) in northern Gifu Prefecture, 12, 000-13, 000. - V. S. N.
104 GEOPHYSICAL ABSTRACTS 180, JANUARY-MARCH 1960
180-357. Horikawa, Yoshio. Radiometric survey with car-mounted instrument in the eastern part of Shimane Prefecture and western part of Tottori Prefecture [in Japanese with English summaryl: Japan Geol. Survey Bull., v. 10, no. 1, p. 51-56, 1959.
This survey covered an area of 4, 000 km2 in an area of silicic rocks, Paleozoic slates and phyllites, and Cenozoic sediments and volcanic rocks. The granitic rocks have an average high intensity at 700-1, 000 counts per sec. In the granite region of Kisuki and Kawamoto, however, maximum counts of 1, 300 counts per sec were found, and the area is recommended for further work.- V. S. N.
180-358. Iwasaki, Shoji; Hosono, Takeo; and Takahashi, Tan. Radiometric survey with car-mounted instrument in the central part of Shikoku district [in Japanese with English summary]: Japan Geol. Survey Bull., v. 10, no. 1, p: 57-60, 1959.
The Upper Paleozoic metamorphic rocks and the Upper Cretaceous formations, which are widely distributed in this area, show low radioactivity intensities in general. An exception is the Upper Paleozoic phyllite at Nakatsu, Ehime Prefecture, which shows distinctly higher counts.- V. S. N.
180-359. Nakai, Junji; Ujiie, Akira; and Hosono, Takeo. Radiometric survey with car-mounted instrument in Chikuho district, Fukuoka Prefecture [in Japanese with English summary]: Japan Geol. Survey Bull., v. 10, no. 1, p. 61-64, 1959.
No outstanding radioactivity anomaly was found in this area although the Asakura granodiorite in the southwestern part of Iizuka City showed a slight radioactivity high, which may be caused by the presence of aplite in the granodiorite.- V. S. N.
180-360. Harris, J. L. Airborne radiometric survey of portion of the Olary Province: South Australia Dept. Mines Mining Rev., no. 105, p. 10-22, 1958.
An airborne radiometric survey for uranium was flown at levels below 100 feet over parts of the Glenorchy, Plumbago, Kalabity, and Radium Hill areas in Olary Province, South Australia, at intervals from late 1954 through June 19 56. Ground checking proved most of the anomalies detected in the Glenorchy and Plumbago areas to be caused by solid angle or mass effects due to widely disseminated thorium mineralization in granites; others were caused by uranium-thorium pegmatitic minerals. Many mass effects were also recorded in the Kalabity and Radium Hill areas.- V. S. N.
Agocs, W[illiam] B., Patton, J. R., and Alexander, J. B. Airborne magnetometer and scintillation counter survey over parts of Perak, Selangor, and Negri Sembilan (Area 1). See Geophys. Abs. 180-314.
Agocs, W[illiam] B., Patton, J. R., and Alexander, J. B. Airborne magnetometer and scintillation counter survey over parts of Trengganu and Pahang (Area 2). See Geophys. Abs. 180-3f5.
SEISMIC EXPLORATION
180-361. Lindsey, J. P. Elimination of seismic ghost reflections by means of a linear filter: Geophysics, v. 25, no. 1, p. 130-140, 1960.
SEISMIC EXPLORATION 105
A technique is described for the elimination of ghost reflections on magnetically recorded seismograph records by means of a linear filter. The application of this filter does not alter the character of primary reflections, although it does eliminate the ghost reflections. The principal assumption is that the effect of automatic gain control in altering the amplitude ratio of primary and ghost reflections is uniform for all record time.
A realization of the required filter is given and a measurement technique is outlined for detecting the existence of ghost reflections based on the autocorrelation function of the seismograph trace.- D. B. V.
180-362. Musgrave, A[lbert] W., Woolley, W. C., and Gray, Helen. Outlining of salt masses by refraction methods: Geophysics, v. 25, no. l, p. 141-167, 1960.
Short surface-to-surface refraction lines define the top of a shallow salt dome previously located by reflection methods. A map is made from the results of a number of longer refraction lines radiating from the center of the dome. The increased accuracy of this system is primarily dependent upon the accurate determination of velocities and distances.
Flank wells are used for further refraction shooting which yield more accurate velocity inf~rmation and more detailed salt profiling. A map from this integrated information permits exploitation at a minimum risk, even though every location is essentially a wildcat. -Authors' abstract
180-363. Graebner, R. J. Seismic data enhancement--a case history: Geophysics, v. 25, no. l, p. 283-3ll, 1960.
A series of analytical tests were designed to discover the cause of poor records in a particular area, to examine the effect of the signal-to-noise ratio, and to evaluate the solutions predicted by theory. The tests showed that the poor record quality was attributable chiefly to relatively strong surface and near-surface waves propagating outward from the shot. Wavelength filtering by means of suitable shot and seismometer patterns and compositing through data processing methods greatly improved record quality and permitted magnetic recording of reflected signals over a broad frequency range. The tests established, inthe allotted time, that the quality ofthe dat'a would meet specified performance standards.
Experience has shown that better seismic data can generally be obtained when the design of techniques is based on the special character of the signal and noise determined from simple tests rather than on general assumptions. -D.B.V.
180-364. Savit, Carl H. Preliminary report--A stratigraphic seismogram: Geophysics, v. 25, no. l, p. 312-321, 1960.
An attempt is made to use some of the previously unused information in seismic signals to produce a record that can be correlated with some aspects of stratigraphy. The apparatus used is the Summarizer. Basically, the Summarizer produces an output that is a function of the total energy received by a seismometer spread. Under ordinary circumstances the Summarizer record is produced simultaneously with a conventional reflection record.
Two examples demonstrate results so far produced under conditions of known stratigraphic change. Investigations are under way to demonstrate experimentally and theoretically the effects of move out, irregular weathering patterns, spread dimensions, and other field conditions on the Summarizer output. Another line of investigation is the application of the Summa-
106 GEOPHYSICAL ABSTRACTS 180, JANUARY -MARCH 1960
rizer to very poor or NR record areas. -D. B. V.
180-365. Sengbush, R. L. Comments on "Frequency analysis of seismic pulses 11
, section I (Theory): Geophysics, v. 25, no. 1, p. 322-323, 1960.
Howell, B. F., Jr. Author's reply: ibid., v. 25, no. 1, p. 324, 19~0.
Referring to the paper on photomechanical frequency analysis of seismic pulses by Howell, Andrews, and Huber (Geophys. Abs. 179-371), Sengbush objects to the statement "a transient pulse does not have the property of frequency, 11 and shows that discrete spectra cannot possibly describe the transient and that it is necessary to consider amplitude density rather than amplitude in the transient case. If sampling of the time waveform is done properly, the resulting Fourier spectra will characterize the sampled waveform which in turn specifies the continuous waveform.
In reply, Howell states that the real pulse has the property of frequency only in the analytical sense, as it is not in general a sum of parts. The photomechanical method has inher~nt inaccuracies, but for the ·same amount of time and effort as in the Fourier method, which is also an approximation, it gives more terms of the Fourier analysis with equal or greater accuracy. -D.B.V.
180-366. Kindij, Eugene. Discussion on the electroseismic effect: Geophysics, v. 25, no. 1, p. 325, 1960.
Commenting on the paper by Martner and Sparks on the electroseismic effect (Geophys. Abs. 177-345), Kindij points out the possibility of using this phenomenon to determine permeability of formations other than the weathering zone. The first attack might be on cores; an acoustic source applied on the core would create potentials that could be measured, and the measured amplitudes should be directly related to permeability. At present, the weak acoustic sources available would hardly give measureable electric potentials in boreholes. Further research on this application is suggested. -D. B. V.
180-367. Nanda, J. N. Conversion of seismic wave::;: Jour. Geophys. Research, v. 64, no. ll, p. 2032, 1959.
The decay of reverberation intensity in a record obtained close to a seismic shot cannot be explained on the basis of partial conversion of compressional waves into Rayleigh waves, as proposed by Tatel and Tuve (see Geophys. Abs. 160-93), but can be explained if the conversion is assumed to be into shear· waves (Nanda, in press). The conversion into shear waves and the explanation of reverberation decay in crustal seismology is important inasmuch as it will now become necessary to assume a l'airly high rate of average increase of velocity with depth in the crust. This eventually will alter the usual computation of depth of penetration for high- intensity reflections (focusing effects) under land to a much smaller value. For example, the depth to the M discontinuity was deteFmined by this method to be about 14 km, whereas a depth of 37 km is obtained according to the hypothesis of crustal layers of fairly uniform velocity. - D. B. V,
180-368. !ida, Kumizi, and Aoki, Harumi. Elastic waves near explosive seismic origin [in Japanese with English summary]: Zisin, ser. 2, v. ll, no. 4, p. 192-202, 1958.
SEISMIC EXPLORATION 107
The state of stress and seismic -wave attenuation near an explosion in a viscoelastic medium was investigated by means of analysis of seismic records obtained by the Seismic Exploration Group of Japan in experiments using a SIE magnetic tape-recording system and ETL three-element-type detector. The records were made at points 15, 45, 75, and 105m from the source and 12 m below the surface.
Wave-attenuation characteristics were obtained by comparison of Fourier components of body waves at various distances from the shot point, and the attenuation law was approximately explained by the viscoelasticity of a Voigt type of medium. An approximate law for the decrease in amplitude (a) with the distance (r) was found to be intermediate between j. e-ar and r-n (n :: 2. 22).
The state of stress near the shot point was deduced from the wave velocity and coefficient of viscosity; the model of wave-generation mechanism was assumed. The theoretical wave motion resulting from application of a spherical source agrees with the observed motion if the radius of the spherical cavity is assumed to be 5-10 m (see Geophys. Abs. 165-80). -V.S.N.
180-369. Radzhabov, M. M. 0 tochnosti opredeleniya granichnykh skorostey po sisteme nagonyayushchikh godografov prelomlennykh voln II [On the accuracy of the determination of boundary velocities, using the system of traveltime curves shot from consecutive points and belonging to refracted waves, part 2]: Akad. Nauk SSSR Izv. Ser. Geofiz., no. 3, p. 450-458, 1959.
This is the continuation of the study by Radzhabov of the determination of boundary velocities, using a system of traveltime curves of refracted waves (see Geophys. Abs. 177-340). Radzhabov evaluates the magnitude of the error of this procedur:e. The boundary velocity is determined graphically from the inclination of the segment of the straight line representing the difference of the observed moments of time. This segment is an element of the traveltime curve. In this procedure the fundamental condition of the method of least squares is approximately fulfilled. The accuracy of determination of boundary velocity in this case is dependent mainly upon the length of the base line of measurements and upon the angle 4> of the inclination of the given segment of the traveltime curve. Radzhabov also determines the necessary length of the base line that determines the boundary velocity with an error not exceeding 10 percent; the greater the length of the base line, the greater the accuracy of the determination. A theoretical comparison of two methods is presented, namely, when a system of reversed traveltime curves is used, shot from opposite ends of the observation line, and when a system of traveltime curves is used, shot from consecutive points of a line perpendicular to the line of observation. Radzhabov finds that the second procedure gives a slightly higher accuracy. On the basis of the experience gained with the procedure, Radzhabov recommends its use in all cases where the refracting boundary is not too sharply curved. - S. T.V.
180-370. Berzon, I. S. 0 nekotorykh spektral'nykh osobennostyakh voln, otrazhennykh ot tonkikh sloyev [ On some peculiarities of the spectra of waves, reflected from thin strata]: Akad. Nauk SSSR Izv. Ser. Geofiz. 1 no. 5, p. 641-657 1 1959.
The kinematic and dynamic conditions that make possible the use of Rayleigh formulas for the determination of the spectra of reflected waves are discussed. These formulas were derived for the case, often found in acoustics, of the reflection of plane sinusoidal steady waves from a thin stratum. Using these formulas, spectral characteristics of reflected waves are analyzed for different velocity contrasts of the mediums and for various angles
108 GEOPHYSICAL ABSTRACTS 180, JANUARY -MARCH 1960
of incidence of the waves to the thin stratum. Also the effect of absorption by the medium covering the stratum on the spectra of reflected waves is considered. The spectra of the waves reflected from a thin stratum are dependent upon the ratio of the velocities in the surrounding medium and that of the stratum. The spectra of the waves reflected from a thin stratum of low velocity change more sharply than is the case with a stratum characterized by a high velocity. The determining factor is the ratio of the thickness of the stratum to the wavelength. - S. T.V.
180-371. Nikitin, V. N. Opyt registratsii obmennykh prelomlennykh voln tipa P1S2P1 s tsel'yu vychisleniya uprugikh postoyannykh diabazov, skrytykh pod nanosami [Test of the recording of converted refracted waves of the type P1S2P 1 for the purpose of determination of the elastic constants of diabases buried under alluvium]: Akad. Nauk SSSR Izv. Ser. Geofiz., no. 8, p. lll4-1126, 1959.
During construction work in the central part of European U.S.S.R., Nikitin made experiments on the determination of Young's modulus of diabase on which foundations were to be erected, using measured values of the velocity ofthe converted P1S2P1 wave. During field experiments over a two-layer medium with sharp velocity contrast (V1/V2 = 0. 08-0. 40), converted refracted waves of the type P 1 s 2 P1 were recorded that had amplitudes several times greater than the longitudinal wave P121. The observed ratio of the intensities of the P1S2P1 and P121 waves is greater than that calculated theoretically; this can be due to the different frequency spectra and to the use of low frequency filters. The converted waves were recorded simultaneously with longitudinal waves.
The converted refracted wave can be used for the determination of the transverse-wave velocityin strata covered with alluvium or underwater (in winter work with river ice). Simultaneous determination of the velocities of the longitudinal and transverse waves in the same layer gives a better characterization of the rock studied. The Young's modulus and Poisson's coefficient of diabase were determined from the P- and S-velocities. The statistical processing of the results of observation has shown that for diabase the ratio Vp/Vs is not equal to J3, but in most cases is greater ( 1. 8 - 1. 9 on the shores and 2. 2 - 2. 3 in the riverbed). Poisson's coefficient was found to be 0. 277 - 0. 308 on shore and 0. 370 - 0. 384 in the riverbed. - S. T.V.
180-372. Riznichenko, Yu. V. 0 rasseyannykh otrazhenno- prelomlennykh seysmicheskikh volnakh [On scattered reflected-refracted seismic waves]: Akad. Nauk SSSR Doklady, v. 126, no. 4, p. 759-762, 1959.
The problem of scattering of seismic waves by reflection and refraction at boundaries within a medium overlying a boundary that is being investigated (somewhat analogous to the scattering of light in a turbid medium) cannot be solved by ordinary methods applicable to optical and ultrasonic problems; this is due in part to the impulse nature of seismic waves. Some variants of the seismic problem have recently been examined by Yepinat 'yeva (see Geophys. Abs. 179-364). In this paper a different variant is solved, taking into account the free surface of the earth. A solution is given for points of observation or excitation of oscillations encountered at any point of the scattering medium. Formulas for the sums of series, by means of which a number of waves reflected and refracted in different combinations can be determined, are given in final form. - D. B. V.
180-373. Berry, James E. Acoustic velocity in porous media: Jour. Petroleum Technology, v. 11, no. 10, p. 262-270, 1959.
SEISMIC EXPLORATION 109
The use of the continuous-velocity log for porosity measurements is evaluated, and it is concluded that porosity is the primary factor affecting velocity. Plots of field-observed velocities versus core-measured porosities for sandstones and a limestone produced a linear relationship; the velocity log thus furnishes a useful measure for the determination of porosity.
A comparison of porosity determined from velocity logs and determined from the formation resistivity factor from electrical logs reveals an empirical relationship between these two rock properties. This relationship is a basis for using porosity as determined by the velocity log for interpreting an electrical resistivity survey. A graph is presented whereby a qualitative and even an approximate quantitative interpretation of porosity and hydrocarbon saturation can be determined from the resistivity and velocity logs. Two examples of this technique are given. One revealed a gas-water contact that is quit-e obscure on the logs.- J. W. C.
180-374. Pickett, G. R. The use of acoustic logs in the evaluation of sandstone reservoirs: Geophysics, v. 25, no. 1, p. 250-274, 1960.
Acoustic velocities in sandstone are shown to be dependent primarily on porosity, shaliness, and pressure differential between overburden and fluid pressure. Usable porosity predictions can be made from acoustic logs if measured velocities are corrected for pressure differential and shaliness.
A theoretical relation between acoustic velocity and pressure differential in a hexagonal packing cif spheres has been empirically extended by correlation of laboratory measurements on cores with borehole measurements. A system of empirical relations among acoustic velocity, porosity, and SP of sandstone is developed. Resistivity of water in permeable rocks can be estimated from the velocity in and resistivity of adjoining shales; where this is possible, the SP log can be used to estimate the shaliness of a sandstone for correction of velocities for porosity estimates.- D. B. V.
180-375. Millican, Marcus L. The sonic log and the Delaware sand: Jour. Petroleum Technology, v. 12, no. 1, p. 71-75, 1960.
In the Delaware basin the large majority of wells drilled to the uppermost sands of the Bell Canyon group employ salt muds as the drilling fluid. A comparison of porosity values in these sands, as determined by core analysis, with sonic log readings has indicated that a correction for the shaliness of the sand is needed. This correction could be made from the SP curve, were determination of this parameter not precluded by the salt mud. The gammaray log under these local conditions may then be considered as a means of measuring the shale content, as the gamma radiation is apparently emitted primarily by the minerals in the shale. The shale content thus measured may be considered as an additive to the sand matrix and as such may be included as part of the matrix in any proposed relationship between sonic velocity and porosity. A chart is presented that provides for amending the conventional porosity resolution of the sonic log to compensate for the presence of shale. The resulting porosity value may then be used in conjunction with a knowledge of the formation resistivity to determine water saturation.
A correlation has been observed between the porosity of the Delaware sand, its shale content, and its permeability. Although this relationship is empirical, the results from its use have thus far been consistent and have been found to agree reasonably well with core analysis.- J. W. C.
180-376. Neprochnov, Yu. P., and Udintsev, G. B. Izrriereniya skorosti rasprostraneyiya uprugikh voln v rykhlykh morskikh otlozheni-
llO GEOPHYSICAL ABSTRACTS 180, JANUARY -MARCH 1960
yakh [Measurements of the velocity of propagation of elastic waves through unconsolidated marine deposits]: Akad. N auk SSSR Izv. Ser. Geofiz .• no. ll, p. 1699-1701, 1959.
The Institute of Oceanology of the Russian Academy of Sciences has made determinations of the velocity of propagation of elastic waves over measured distances in sediments on the ocean bottom. The same determinations were also made in the laboratory on specimens taken from these deposits. For the production and reception of impulses an ultrasonic seismoscope designed by the Institute of Physics of the Earth (see Geophys.Abs. 152-14284) has been used.
The apparatus for the measurements at sea consisted of a frame on which an emitter and a receiver of impulses were rigidly fixed at a desired distance and provided with crystals of Seignette's salt and knives which could penetrate into the bottom to a certain depth. The first series· of experiments was made in 1957 in the Sea of Japan and in the adjoining open areas of the Pacific Ocean. Later the measurements were continued on the bottom of the Black Sea. The measurements were rriade mostly on argillaceous and silt deposits. The velocity of the acoustic waves was found to range from 1, 430 to 1, 620 meters per sec. In some cases the acoustic velocity in the bottom deposits was found to be ·smaller than that in the water at the corresponding depth. This confirms the observations of Press and Ewing in the Atlantic Ocean (see Geophys. Abs. 151-14044). The discrepancies between the results of determination of the acoustic velocity in laboratories and those at the ocearl bottom were not over 5 percent. On the whole Neprochnov and Udintsev recommend the data obtained on the sea bottom as representing the true physical properties of the deposits.- S. T.V.
180-377. Zhuk, I. Ya. K metodike polucheniya otrazheniy v zonakh razmyva, vypolnennykh tretichnymi otlozeniyami [On the methods of obtaining reflections in zones of erosion filled with Tertiary deposits]: Razvedochnaya i Promyslovaya Geofizika, no. 18, p. 3-16, 1957.
This is a study of elastic-wave reflections from explosions in and under a sedimentary layer. In the first case the layer serves to some extent as a wave guide, and the seismograms show intensive interfering multiple reflections that are too·chaotic to have definite waves identified. This is especially so if the Neogene deposits have indurated limestone or sandstone at the base. In the second casethe charge is placed 20-30 mbelow the bottom of sedimentary deposits, and the quality of reflections from deep boundaries of the Carboniferous and Devonian strata allow an identification of the waves. In explosions near the top surface of the sedimentary layer multiple reflections decrease, but the intensity of surface waves increases and prevents identification of the waves reflected from the deep layers. -A. J. S.
180-378. Oil in Canada. Single-trace mapping method: Oil in Canada, v. 12, no. 6, p. ll, 1959; also in Oilweek, v. 10, no. 42, p. 33, 1959.
Progress in mapping stratigraphic formations by integrating the data from all 24 seismometer groups of a seismic spread into a single trace is reported. The apparatus used is called the Summarizer and, although still in the experimental stage, its effectiveness has been demonstrated by comparison of its records with know~formations in a stratigraphic-trap oil field in western Canada. The process, in contrast to older methods, reveals important changes in formation character, such as porosity, between one shot point and its neighbor.
SEISMIC EXPLORATION lll
The Summarizer accepts conventional broad-band signals from each seismometer group, regulates signal amplitude by means of a controllable fixedrate expander, and converts the signal to a function of energy. Energy signals from all groups are then summed and integrated with respect to time. The instrument may be used in the field as well as in data reduction centers. -V.S.N.
180-379. Crawford, John M., Doty, William E. N., and Lee, Milford R. Continuous signal seismograph: Geophysics, v. 25, no. 1, p. 95-105, 1960.
This ·paper describes the "Vibroseis" seismic method, in which a continuous signal vibrator replaces dynamite as the source of energy. Cross correlation of the input and received signals provides time resolution and, in addition, enhances the signal-to-noise ratio at a rate proportional to the square root of the total vibration time. However, a rather formidable computing step is added to the conventional record-processing operation.
The theory of the method is discussed, and field operations with one type of equipment now being tested are described. The theoretical implications of some aspects of the method are attractive enough to warrant further development. -D. B. V.
180-380. Wuenschel, P. C. Seismogram synthesis including multiples and transmission coefficients: Geophysics, v. 25, no. 1, p. 106-129, 1960.
Synthetic seismograms that include multiples and transmission coefficients have been obtained by solvingthe boundary-value problem of the multilayered half space exactly for the plane-wave case at normal incidence. Computations of four seismograms, for which the detector was buried or at the surface of the half space and for which the surface was or was not stress free, have been programmed for the IBM 704 computer. The computer programs were evaluated by comparing computer with analytical solutions of simple problems.
The significance of multiples of the total reflected signal depends on the vertical distribution of acoustic impedance. For small contrasts in acoustic impedance distributed throughout the section, multiples are relatively insignificant; for moderate contrasts similarly distributed multiples can produce discrete events, cause phase shifts in large-amplitude direct reflections, and alter the frequency of a weak direct reflected signal. If near-surface contrasts are large, multiples can produce "ringing" or "wave training." Comparison of synthetic seismograms including multiples with field seismograms shows that the predicted multiple combination is often greater than that actually present; evidently the mathematical model is not yet adequately realistic. - D. B. V.
180-381. Myers, Wm. Howard. Obtaining geological data from seismograms: Oil week, v. 10, no. 43, p. 32-37, 1959.
In the search for the more complex types of structural stratigraphic traps, it is imperative that additional data be obtained from seismic records that can be correlated or interpreted directly or indirectly in the light of the geology. The most insignificant data on seismograms, when given a geological interpretation, may mean the difference between finding or missing an oil field.
In addition to the use of seismograms for obtaining accurate time to various acoustic horizons for the preparation of structure and isopach maps, the records can be qualitatively studied for other geologic~! data. Qualitative
112 GEOPHYSICAL ABSTRACTS 180, JANUARY -MARCH 1960
study of the various energy bands will also evaluate the reliability of the various structure maps produced from the seismic work and help differentiate between true reflected energy bands and those produced extraneously. With this differentiation, more accurate and reliable structure and isopach maps can be prepared for geological use, and such geological phenomena as facies changes, reef edges, and unconformities can be mapped. If these structures can be mapped by the seismograph, then it should be possible to meet the challenge of the present search for oil in the more complex structural and stratigraphic traps. Examples are given to illustrate qualitative interpretation of seismograms.- V. S. N.
180-382. Willis, D. E., and Johnson, J. C. Some seismic results us-ing magnetic tape recording: Earthquake Notes, v. 30, no. 3, p. 21-25, 1959.
The techniques of using and ana1yzing magnetic-tape recordings of seismic disturbances are illustrated by a discussion of recordings made of seismic waves from the detonation of a 30-ton charge of dynamite in the St. Lawrence Seaway channel near Cornwall, Ontario, in July 1958. The use of magnetictape recordings by seismologists has been limited as a prospecting tool due to the limited recording time and the relatively high initial cost and maintenance of the equipment. The major advantage of such signal storage, however, is that the original event can be recreated at any future time and thus lends itself to reduction of the data in many different ways. The more useful treatments include frequency analyses, autocorrelation or crosscorrelation processes, and direct comparison or summation of signals received by separate detectors. The greatest use of magnetic-tape recordings has been in detailed frequency analyses; it is believed that these frequency-analyses techniques have achieved more accurate results than could have been achieved by conventional and available computer techniques.- V. S. N.
180-383. McLaughlin, Rowland, and Prout, James. A portable seismic magnetic tape recorder: Earthquake Notes, v. 30, no. 3, p. 26-33, 1959.
This paper gives a detailed description, amply illustrated, of the AMPEX 601 tape recorder adapted as a portable magnetic tape recorder for seismic work. The recording system described has been used in a laboratory for 18 months and has provedhelpful in gathering datafor studying seismic phenomena. - V. S. N.
180-384. Mori, Kyoshi; Furuya, Shigemasa; and Inami, Kazui. On the multichannel oscilloscope of seismic recordings [in Japanese with English summary]: Japan Geol. Survey Bull., v. 10, no. 4, p. 37-46, 1959.
A new instrument is described that uses a single gun cathode ray tube for viewing multiple-channel seismic data to avoid the wasteful photographic procedure required in the conventional methods of playing back magnetically recorded seismic data.- V. S. N.
180-385. Gol'tsman, F. M. 0 vybore chastotnykh kharakteristik fil'trov seysmicheskikh signalov [On the selection of the frequency charasteristics of filters of seismic signals]: Akad. Nauk. SSSR Izv. Ser. Geofiz., no. 4, p. 549-559, 1959.
SEISMIC EXPLORATION ll3
A criterion is given for determining the beginning and end of a seismic signal from its spectrum and for determining the limiting frequency of the spectrum. The effective width of a spectrum of function F (t) and the effective duration of a signal with spectrum S (w) can be obtained by comparison of the appropriate calculated functions with the given functions at the points (n + l/2).!lt or (n + l/2).!lw. A nomogram is given for evaluating the functions of these values at these points.
Analysis of the functions of the values shows that the limiting frequency of the spectrum is determined by the steepness of the fronts of individual extremes of the given function F (t). The effective duration of the signal is determined by the steepness of the fronts of the extremes of the combined spectra A ( w) and B (w ). This circumstance is used for obtaining a rough estimate of the effective width or duration from the shape of the given curves.
From the results obtained, general conclusions can be drawn that are important in designing filters, especially high-frequency filters.- S. T.V.
180-386. Brown, P. D., and Robertshaw, J[ack]. The seismic refraction method, in Methods and case histories in mining geophysics: [Canada] Commonwealth Mining and Metall. Cong. (6th), p. 79-80, 1957.
The principles of the seismic -refraction method are briefly described and illustrated.- V. S. N.
180-387. Matuzawa, Takeo. Movements of a galvanometer directly coupled to an electromagnetic seismograph pendulum [in Japanese with English summary]: Tokyo Univ. Geophys. Inst. Geophys. Notes, v. 12, no. 1, contr. no. 6, 1959.
This is a reprint of a paper published in Zisin, ser. 2, v. 11, no. 4, p. 185-191, 1958 (see Geophys. Abs. 179-107).- D. B. V.
180-388. Goedicke, T. R. Probing for "Moho": Sea Frontiers, v. 5, no. 4, p. 205-215, 1959.
This paper describes the general techniques used in conducting a preliminary test for the "Mohole Project,'' a plan to bore a hole into the earth's mantle at the ocean bottom in an area 150 miles north of Puerto Rico called the Outer Ridge. The seismic refraction and reflection surveys were made from four oceanographic research vessels, representing Columbia University's Lamont Geological Observatory, the Woods Hole Oceanographic Institution, the Hudson Laboratories, and Texas A. and M. College.- V. S. N.
180-389. Deutsch, E. R. Geophysical lecture [Seismic Problems in the (Alberta) Foothills]: Alberta Soc. Petroleum Geologists Jour., v. 7, no. 8, p. 178-179, 1959.
This is a summary of a lecture "Seismic Problems in the [Alberta] Foothills" presented by T. C. Richards to a joint meeting of the Alberta Society of Petroleum Geologists and the Canadian Society of Exploration Geophysicists. Richards discussed the seismic method used in exploration for oil and gas horizons in the Mississippian limestone of the Alberta foothills. The seismic refraction method, ideally suited to problems in belts of disturbed rock, was used in general, but because the Mississippian limestone is deeply buried in many areas, a "second events" method that registers the refrac-
557043 0 - 60 - 9
114 GEOPHYSICAL ABSTRACTS 180, JANUARY -MARCH 1960
tions from the Mississippian as late arrivals was also employed. Truly refracted second events can rarely be traced; therefore, the ones picked up and correlated are really wide -angle reflections. It is important to determine whether the events are refractions or wide-angle reflections because anisotropy of seismic velocities significantly affects the two modes of travel which correspond to different ray paths.
The method of broadside shooting, used to define buried structures such as faults or homoclines, was demonstrated in detail.- V. S. N.
180-390. Brown, P. D., and Robertshaw, J[ack}. Determining the thickness of unconsolidated deposits overlying shallow mine workings by seismic refraction, in Methods and case histories in mining geophysics: [Canada] Commonwealth Mining and Metall. Cong. (6th}. p. 295-300, 1957.
Seismic refraction was used to determine the thickness of the weathered and unconsolidated deposits overlying the coal measures in two National Coal Board coal fields. Velocities· measured at the two sites ranged from 1, 600 feet per sec to 3, 000 feet per sec for the weathered layer, 4, 200 feet per sec to 5, 500 feet per sec for the glacial deposits, and 7, 400 feet per sec to 11, 500 feet per sec for .the consolidated rock. A 50 percent anisotropy was shown in one sandstone bed by measurements made in two directions. A low-speed layer within the glacial deposits was distinguished on the basis of discontinuities in the time-distance curves. It was necessaryto estimate both velocity and thickness of this layer in order to find the depth to the underlying rock. Calculated depths to bedrock agreed to within 6 percent with depths determined by boreholes.- V. S. N.
180-391. Viktorov, B. N. Rezul 'taty razvedochnykh geofizicheskikh rabot tresta Grozneftegeofizika. Plan 1958 g. Perspektivy na 1959-1965 gg [Results of exploration geophysical operations of the Grozneftegeofizika Trust. Plan for 1958. Prospects for 1959-65], in Perspektivy Neftegazonosnosti Severnogo Kavkaza i Predkavkaz'ya: Moscow, Gostoptekhizdat, p. 131-135, 1959.
A large number of structures have been reveaied by seismic exploration, and the method of areal seismic sounding (MPZ) appears to be effective here. All seismic parties are scheduled to be equipped with 60-channel seismic ap-paratus by 1961.- J. W. C. -
180-392. Neprochnov, Yu. P. Vybor optimal'nykh usloviy registratsii pri morskikh seysmicheskikh issledovaniyakh [Selection of optimum· conditions of recording in marine seismic investigations]: Akad. Nauk SSSR Inst. Okeanologii Trudy, v. 35, p. 190-205, 1959.
Optimum conditions required for recording seismic waves at sea by hydrophones are discussed, and experimental data obtained during seismic exploration for oil in the Caspian Sea are given. A discussion treats the selection of a suitable type of hydrophone (piezoelectric or with preliminary amplification), the effect of direction, the recording of reflected and refracted (head) waves, suggestions for further improvements in the effective sensitivity of hydrophones, and various sources and types of interferences and their prevention or elimination.- A. J. S.
180-393. Rybin, A. I. Tektonicheskoye rayonirovaniye Ferganskoy vpadiny po geofizicheskim rabotam [Tectonic regionalization of the Fergana depression according to geophysical work]: Uzbek. Geol. Zhur., no. 5, p. 79-89, 1959.
STRENGTH AND PLASTICITY 115
The tectonic regionalization proposed in this paper was accomplished by seismic operations, as this method alone gives reliable quantitative data such as depth and angle of dipunderthe geologic conditions of the Fergana depression. This regionalization is based largely on the character of the deformation of the surface of the basement. It is true that seismic work generally reveals the structure o~ the top of the Cretaceous; however, the regional structural elements of the Cretaceous are also governed by movements of the basement and more or less conform to the configuration of the top of the basement. The various structural elements are shown on a map, and each is discussed in the text.- J. W. C.
180-394. Yoshikawa, Soji. Seismic exploration in the vicinity of the crater of Nakadake, Aso Volcano [in Japanese with English abstract]: Volcano!. Soc. Japan Bull., ser. 2, v. 4, no. 1, p. 20-32, 1959.
A seismic refraction survey was made in the vicinity of Nakadake Crater, Aso Volcano, Japan, in an effort to analyse the volcanic microtremors and earthquakes bydeterminingthe velocity distributions and consequentlythe underground structures of the volcano. Seismic velocities ranged from 1. 4 to 1. 6 kmps in the upper layers increasing to 2 or 3 kmps with depth. The upper layers seem to be composed of tuff partly overlain by thin layers of smaller velocity (volcanic ash, lapilli, and weathered rocks}.- V. S. N.
180-395. Harris, J. L., and Milton, B. E. Seismic reflection and refraction tests -- Lower Yorke Peninsula: South Australia Dept. Mines Mining Rev., no. 107, p. 57-68, 1957(1959}.
Seismic-reflection and -refraction surveys were carried out from June through August 1957 at selected sites on the Lower Yorke Peninsula as a part of a program to locate oil and to determine the degree of correlation with a recent gravity survey. No success was obtained with the reflection method but depths calculated from the refraction method at 2 of the 4 stratigraphic boresites agreed reasonably well with the geologic logs. No further work is recommended until the completion of the other two bores, at which time both seismic and gravity results should be reevaluated.- V. S. N.
STRENGTH AND PLASTICITY
180-396. Matsushima, Syogo. On the deformation and fracture of granites (parts 1, 2, and 3} [in Japanese with English summary]: Zisin, ser. 2, v. 8, no. 4, p. 173-183, 1956; (part 2} v. 10, no. 3-4, p. 113-122, 1957; and (part 3} v. 12, no. 2, p. 45-48, 1959.
To study the problem of deformation and fracture of silicate rocks, Matsushima has made various experiments on granites. Part 1 discusses results of short-time simple compression tests. It was found that for granites near rupture, the strain ratio of the longitudinal to lateral direction is generally more than 0. 5. This effect does not occur instantly with loading but depends on plastic flow after addition of stress; the longer the duration, the larger the volume inflation.
Part 2 discusses the results of creep tests made on granite under uniaxial compression. It was found, as previously suggested, that with increasing load the lateral-flow rate becomes larger than the axial, and near or in the fracture range the rate is some hundred times as large. A study of the recovery and stress-strain curves suggests that granite is elastic in the direction of the applied stress and plastic in the direction perpendicular to it.
116 GEOPHYSICAL ABSTRACTS 180, JANUARY -MARCH 1960
Part 3 reports on the accurate measurements of creep in granite. Creep was measured in both longitudinal and lateral directions with an electrical resistance strain gauge for a time duration of 2 million sec; empirical equations showing the connection between creep strain and time were derived: The creep curve for granite has three stages separated by distinct discontinuities caused by microcracks which rupture in the final stages. -- V. S. N.
180-397. Mogi, Kiyoo. Experimental study of deformation and fracture of marble (1st paper). On the fluctuation of compression strength of marble and the relation to the rate of stress application: Tokyo Univ. Earthquake Research Inst. Bull .• v. 37. pt. 1, p. 155-170, 1959.
The fracture strength and elasticity in compression were measured on 192 test specimens cut from a block of marble having a simple chemical composition and nearly uniform structur·e. The results show that the compressive fracture strength rises with increase in rate of stress application, but not as remarkably as in the case of concrete. The variation of fracture strength in this homogeneous marble is 2-3 percent, much smaller than the variation for steel and glass. The mean fracture strength (average of 9 samples) is distributed similarly to elasticity (Young's modulus) and seems to depend on the macroscopic inhomogeneity. The linear part of the stress-strain curve in compression represents the stage of elastic deformation and the nonlinear part, the superposition of nonelastic deformation. The stress-strain relation for repeated compression shows remarkable hysteresis only for nonlinear deformation; this also indicates that the nonlinear deformation is inelastic. -D. B. V.
180-398. Jaeger, J. C. The frictional properties of joints in rocks: Geofisica Pura e Appl.. v. 43, p. 148-158, 1959.
The conditions for sliding over artificial joint surfaces have been studied experimentally by cutting rock cylinders at various angles to their axes and studying slip over these surfaces in a triaxial testing apparatus. Three types of joints were used: plaster filled, bare surfaces ground flat, and natural surfaces across which shear failure has taken place. The results agree reasonably well with the simple theory for a constant coefficient of friction. · Measured coefficients of friction range from 0. 5 to 0. 8 and differ surprisingly little between the 3 surfaces tested. Subsidiary failures cutting across joint surfaces frequently occurred.
Experiments of this type may be useful in determining the mechanical properties to be expected of "destressed 11 rock in deep mining and the behavior of different types of rock in crushers. - D. B. V.
Konstantinova, A. G. The shape of elastic impulses accompanying the disintegration of rocks. See Geophys. Abs. 180-91.
Vinogradov, S. D. Elastic impulses produced in a mass under pressure. See Geophys. Abs. 180-90.
SUBMARINE GEOLOGY
180-399. International Geophysical Year Bulletin (no. 22). .The floor of the Arctic Ocean: Am. Geophys. Union Trans., v. 40, no. 2, p. 159-162, 1959.
VOLCANOLOGY ll7
This report presents some results of investigations by Drifting Station Alpha of the Arctic Ocean floor and of the upper few feet of underlying sediment. Echo sounding showed the presence of a broad ridge, subparallel to the Lomonosov Ridge, that is higher and more rugged than first realized. The nature of the bottom was studied by means of submarine photographs and core samples. A carbon-14 analysis of a grab sample of carbonate material in the upper layer yielded an age of 9, 300 ± 180 yr; this age is postglacial and probably represents an average for all of the postglacial sediment in the Arctic Ocean.- D. B. V.
180-400. Lisitsyn, A. P. Osobennosti morskikh geologicheskikh issledovaniy v Antarktike [Features of marine geological research inthe Antarctic): Akad. Nauk SSSR Inst. Okeanologii Trudy, v. 35, p. 121-152, 1959.
Geological data on the Antarctic Ocean floor obtained by the "Ob" Antarctic expedition of 1955-57 are reported. The sea floor deposits in the Antarctic are characterized by widespread layers of volcanic ash. The Antarctic continent has a shelf that descends to 1, 200 m, and the average depth is 400-700 min contrast to the 100 fathoms typical of other continents. Exploratory work carried out in rough seas is described, including the methods of bottom sampling, acoustic depth sounding, and seismoacoustic measurements.- A. J. S.
180-401. Zenk.ovich, V. Sea bed: Moscow, Foreign Languages Publishing House, 61 p., 1959.
A popular discussion of submarine geology is presented. The subjects treated are the structure and composition of the seafloor, sonic depth finders, bottom sampling apparatus, the continental platform, the continental slope, submarine canyons, gravity measurements, atolls, and submarine mountain ranges and deeps. The treatment is worldwide, although the activity of Russian scientists and the use of Russian instruments is emphasized.J.W.C.
Drake, C[harles) L., Ewing, M[aurice], and Sutton, G[eorge] H. Continental margins and geosynclines: the east coast of North America north of Cape Hatteras. See Geophys. Abs. 180-202.
Mendon9a Dias, A. A. de. A crustal deforming agent and the mechanism of the activity in the Azores. See Geophys. Abs. 180-402.
VOLCANOLOGY
180-402. Mendonca Dias, A. A. de. A crustal deforming agent and the mechanism, of the volcanic activity in the Azores: Bull. Volcano!., v. 21, p. 95-102, 1959.
Morphological analysis of the submarine topography in the vicinity of the Azores Archipelago suggests that southeast-northwest tangential forces in the mantle have given rise to folds in the plastic zones and to a fault system in the rigid blocks. The folds parallel those of the Iberian Peninsula and northwestern Africa and of the submerged area between those continents and the Azores. The islands have been built up by eruptive activity along the faults. Geomagnetic evidence and the migration of earthquake epicenters support the idea of tangential stresses. -D. B. V.
ll8 GEOPHYSICAL ABSTRACTS 180, JANUARY -MARCH 1960
180-403. Svyatlovskiy, A. Ye. Atlas vulkanov SSSR [Atlas of the volcanoes of the U.S.S.R. (with English summary)]: Moscow, Akad. Nauk SSSR, 174 p., 1959.
There are several areas of Quaternary and Recent volcanic activity in the U. S. S. R. Active volcanoes are located in the Kamchatka Peninsula and in The Kurile Islands; extinct volcanoes are known in the Caucasus, Trans-Caucasus, and other regions.
About 100 great volcanoes plus many hundreds of cinder cones with lava flows formed on the vast lava plateaus of Kamchatka during the Quaternary. Only 13 volcanoes of Kamchatka are known to have erupted during historic times, and most of these were not accompanied by lava flows; 14 volcanoes are now in the solfataric stage.
There are 60 volcanoes in the Kurile Islands of which 39 are active (recently active or in solfataric stage).
The high mountainous regions of the Caucasus displayed strong volcanic activity during the Early Pleistocene; a chain of great volcanoes developed in the Front Caucasus Range. The region to the south of the watershed of this range is covered by several lava flows to form the Kelskoye Plateau. The well-preserved volcanoes Kasbek and Elbrus ceased to erupt in postglacial time.
Tertiary and Quaternary volcanic activity embraced vast regions of the Lesser Caucasus: southern Georgia, Armenia, and Azerbaijan. The volcanic cones tower above lava plateaus and form two rows. Activity ceased. in postglaciai time.
This atlas is copiously illustrated with excellent photographs and maps. -J.W.C.
180-404. Ramirez, Jesus Emilio. El volcan submarino de Galerazamba [The submarine volcano of Galerazamba]: Acad. Columbiana Cienc. Exactas, Fis. y Nat. Rev., v. 10, no. 41, p. 301-313, 1959.
The eruption of a submarine volcano at Galerazamba on the Caribbean coast of Columbia on November 9, 1958, is described. This eruption was recorded in detail by the Galerazamba seismic station, which is 8 km from the point of the explosions. The seismograms of the events are reproduced. A photograph shows a huge flame and smoke rising above the water. A history of volc€lJlic activity in the. region is also outlined; this dates back to observations by Humbolt in 1839.- J. W. C.
180-405. lilies, Henning. Die Entstehungsgeschichte eines Maares in SudChile. Ein aktuo-geologischer Beitrag zum Problem des MaarVulkanismus [The story C?f the origin of a maar in southern Chile. An actuo-geologic contribution to the problem of maar volcanism]: Geol. Rundschau, v. 48, p. 232-247, 1959.
The explosive eruption of July 27, 1955, that created the Carran maar in southern Chile is described. A debris-laden cloud rose vertically and then mushroomed. The heavier fragments fell straight back; a wall of coarse ash was formed on the lee side of the crater rim, and finer particles were carried far away. The crater quickly filled with ground water; weathering and erosion of the tuff are proceeding rapidly. Comparisons are drawn with the Eifel maars of Germany. - D. B. V.
VOLCANOLOGY 119
180-406. Gorshkov, G. S. Kamchatka Valley of Ten Thousand Smokes: Volcano!. Soc. Japan Bull., ser. 2, v. 3, no. 2, p. 154-156, 1959.
The giant explosion of Bezymyanny Volcano of the Klyuchevskaya group in Kamchatka on March 30, 1956, is described (see Geophys. Abs. 178-434). As a result of the explosion the volcano has changed from a slightly truncated cone into a semicircular caldera. The most interesting consequence of the explosion was the formation of a big agglomerate flow with thousands of secondary fumaroles in the Sukhaya Khapitsa River valley; this is called the Kamchatka Valley of Ten Thousand Smokes because of its resemblance to the famous Katmai flow in Alaska. Comparison of this recent agglomerate flow with the Katmai flow indicates that the latter flow came from the central craters of Katmai and Novarupta and not fromfissures in the valley as has been assumed in past studies.- V. S. N.
180-407. Taneda, S[adakatu]; Matsumoto, T.; Miyachi, S.; Miyachi, M.; Ishibashi, K. ; and Kojima, M. The 1958 eruption of Volcano Aso [in Japanese with English summary]: Volcano!. Soc. Japan Bull., ser. 2, v. 3, no. 2, p. 136-146, 1959.
Nakadake crater of Aso volcano exploded suddenly on June 24, 1958. The initial velocity of the ejecta, which amounted to about 380, 000 tons, is estimated to have been 100 miles per sec and, therefore, the explosive energy was about 1019 ergs. The ejected material, largely derived from crater-filling tuff and lava blocks, is intermediate in character between ash fall and pumice flow. The temperature of the ash at 1, 000 m from the crater was over 50°C. -V.S.N.
180-408. Yoshikawa·, Soji. On the short period volcanic micro-tremors at Vqlcano Aso [in Japanese with English summary]: Volcano!. Soc. Japan Bull., ser. 2, v. 3, no. 2, p. 147-153, 1959.
Tripartite observations were made of the short -period microtremors at Aso volcano for 1 month following the eruption of June 24, 1958. The predominant periods and propagating velocities of the microtremors were 0. 25 sec and 1. 5-4.0 kmps, respectively, at Hondo and the Volcano Museum west of the crater and 0. 2 sec and 0. 5-3. 0 kmps, respectively, at Sunasenri south of the crater. From the rate of variations in propagating velocities near the crater, the depth of origin of the microtremors was determined to be 700-900 m below the surface. The predominant direction of oscillation of the microtremors was perpendicular to the direction of propagation.- V. S. N.
180-409. Yamasaki, Masao. Role of water in volcanic eruption [in Japanese with English summary]: Volcano!. Soc. Japan Bull., ser. ·2, v. 3, no. 2, p. 95-106, 1959.
Eruptions of pyroclastic fall, pyroclastic flow, and lava often occur in succession in a single cycle of volcanic eruption. The type of eruption depends upon the amount of vesiculation in the vent, andthe amount of vesiculation depends in turn upon the amount of water in the magma--the smaller the water· content, the lesser the vesiculation. Due to gravity the water content of magma is greater in the higher levels of the magma column, and thus the earlier phases of the eruptions are pyroclastic in character. The order of successive events for 17 historic and prehistoric eruptions of 15 volcanoes is given in a table, and the actual order of eruption is shown to be in harmony with the theory presented above.
120 GEOPHYSICAL ABSTRACTS 180, JANUARY -MARCH 1960
In many calderas the volume of collapsed material is found to be greater than that of the erupted materials. Yamasaki proposes that the volume difference between the collapsed and the erupted materials corresponds to the volume of water dissolved in the magma prior to the eruption.- V. S. N.
180-410. Suwa, Akira, and Tanaka, Yasuhiro. The changes in the temperatures of the fumaroles in the crater of Miharayama, Oshima, in connection with the activities of the volcano [in Japanese with English summary]: Volcano!. Soc. Japan Bull., ser. 2, v. 3, no. 2, p. 107-118, 1959.
Temperature measurements made at scores of permanent observation points in the summit crater of Mihara Volcano, Oshima, Japan, from 1952 to 1947 are analyzed to study the relationship of changes in temperature of the ground to the surface volcanic activity, earthquakes, and tremors. Temperature changes observed in the zone of the pits, active from 1952 through 1956, and in the marginal zone of the central sink seem to be of particular significance because of a similarity of change associated with eruptions and earthquakes. Such changes may be caused by an increase in underground activity or by a shallow intrusion of magma and, therefore, systematic temperature measurements may be useful in the prediction of volcanic eruptions.- V. S. N.
180-411. Mizutani, Y., and Matsuo, S. Successive observations of chemical components in the condensed water from a fumarole of volcano Showa-Shinzan [in Japanese with English summary]: Volcano!. Soc. Japan Bull., ser. 2, v. 3, no. 2, p. 119-127, 1959.
Sampling of condensed water for chemica! analysis and measurement of temperature and relative flow rate were made at ihtervals of 1 hr over a 24-hr period at a fumarole of Showa-Shinzan volcano, Hokkaido, Japan, to determine whether or not the chemical compositionof fumarolic gas is constant over a short period (10-20 hr) and to examine the feasibility of forecasting a volcanic eruption from the chemical behavior of fumarolic gases in c~m periods. -
The temperature of the fumarolic gas remained almost constant over the period of observation at 635°C ± 2°C. Chemical analysis showed the normal sample to have an almost constant Cl:F:B ratio. Abnormal samples were classified into three types: KCl-contaminated, KN03-contaminated, and water-diluted. No ultimate cause could be found for the occurrence of abnormal samples.- V. S. N.
180-412. Seino, Masaaki. Studies on volcanic gas emission, part 1 [in Japanese with English summary]: Volcano!. Soc. Japan Bull., ser. 2, v. 3, no. 2, p. 128-135, 1959.
Observations were made of such parameters as the temperature, density, and velocity of gas emitted from fumaroles at Showa-Shinzan, Tarumae, and Me'akandake volcanoes, Hokkaido, Japan, to determine the nature of the heat source of the fumaroles. Calculations based on the time variation of the temperature of the Kamenokoiwa fumarole in the Showa-Shinzail area give an estimated 2. 3 X 10⁷ tons or a spherical rock mass of density 2. 5, radius 130 m for the heat source of this fumarole. This estimate is based on the assumption that the heat is transferred only by the emitted gas and that the amount of this gas is nearly constant. Calculation of the initial water content of the source leads to the conclusion that the water vapor emitted from the Kamenokoiwa fumarole contains not only juvenile but also ground water.
VOLCANOLOGY 121
The static pressure, 38 atm, of the emitted gas at the fumarole on the dome side of Tarumae is comparable to pressures of explosions during recorded eruptions of this volcano.- V. S. N.
180-413. Nakamura, Hisayoshi. On the regional properties of hot springs in Japan. 2. Hot springs other than those of Quaternary volcanic areas [in Japanese with English summary]: Jour. Geography [Tokyo], v. 68, no. 2 (712), p. 47-67, 1959.
Hot springs in Japan, other than those associated with Quaternary volcanic areas occur largely in Tertiary volcanic, plutonic, and hypabyssal rocks in Tertiary oil field and nonigneous rock areas or in pre -Tertiary granite areas. The chemical compositions of the springs indicate whether the waters are emitted from younger or older altered rock areas and whether from the central or outside parts of these areas. Hot springs of the Cl- and Cl--HC03- types, characteristic of the central area of older altered rocks, are seemingly related to hydrothermal solutions from highly concentrated magmatic waters formed below critical temperature under high pressure.
The ratios of Na+ to !0" and of Br- to Cl- are also important in understanding the regional p'roperties of hot springs. The latter ratio helps to distinguish thermal waters of igneous origin from sea or fossil waters. The ratio of halogens and alkali metals in thermal waters may also be valuable in a study such as this.- V. S. N.

INDEX
Abstract Abdulgafarov, K. K----------- 327 Abdurashitova, Z------------- 58 Agocs, W. B-------- 313, 314, 315 Airinei, §tefan ------ 228, 229, 311 Ald, Keiiti------------------- 55 Ak.imoto, Syun-iti ------------ 271
274, 279, 280, 290 Alexander, J. B --------- 314, 315 AI.nbraseys, N. N ------------ 68 Anderson, R. H-------------- 334 Angenheister, Gustav--------- 268 Aoki, Haruxni---------------- 368
Araki, T -------------------- 265 Arkhangel'skiy, V. T --------- 65 Arnold, Kurt----------------- 181 Asano, Shuzo ------------ 100, 101 Avdezeyko, G. V ------------- 246
Balabushevich, I. A ---------- 219 Balaki.ila, L. M -------------- 47 Banno, Noboru--------------- 265 Baranov, V. I --------------- 248 Baranovskiy, V. I------------ 332 Bath, Markus---------------- 62 Beard, D. B ----------------- 28 Becker, Alfred -------------- 157 Belluigi, Arnaldo ------------ 103 Belteky, Lajos --------------- 159 Benioff, Hugo---------------- 61 Berg, E --------------------- 203 Berg, J. W., Jr ------------- 97 Bergey, W. R --------------- 125 Bernstein, F ---------------- 140 Berry, J. E ----------------- 373 Berzon, I. S ----------------- 370 Bidgood, D. E. T ------------ 284 Bigotte, G-- ----------------- 345 Blundell, D. J --------------- 292 Boaga, Giovanni-------------- 177 Bock, R --------------------- 253 Boku, T --------------------- 279 Boniwell, J. B...;______________ 155
Borodachev, N. M ----------- 82 Braaten, N. F -·------------- 194 Bradley, J. 8---------------- 173 Brazee, R. J ---------------- 33 Broecker, W. S -------------- 19 Brossard, Leo--------------- 303
Brower, D ------------------ 75 Brown, P. D ------------ 386, 390
Abstract Brownell, G. M-------------- 344 Bryunelli, B. Ye------------- 29 Bubnov, S. N. von ----------- 200 Burling, R. Q --------------- 329 Buryakovskiy, L. A---------- 165 Butkovich, T. R ------------- 208
Cameron, A. G. W----------- 245 Carder, D. S ---------------- 95 Carey, S .. W----------------- 184 Cawley, A------------------- 346 Chapman, Sydney-·----------- 174 Cherdyntsev, V. V ------- 327, 328 Chernyshev, N. I ------------ 144 Chin, Chen------------------ 199 Chisholm, E. 0-------------- 156 Chovitz, Bernard ------------ 187 Chupakhin, M. S ------------ 251 Cipa, Walter---------------- 310 Clark, A. R ---------------- 125 Cloud, W. K ------------- 33, 95 Collin, C. R ---------------- 149 Compston, W ---------------- 250 Conn, H. K ----------------- 300 Cook, A. H ------------- 176, 179 Cook, K. L ----------------- 97 Cotecchia, V ---------------- 160 Crawford, J. M ------------- 379 Cree~ K. M ------------ 281, 282 Culver, R. C ---------------- 172
Danilevich, S. I ------------- 5, 6 Davidson, C. F -------------- 2 Davidson; R. J -------------- 319 Davies, R. M --------------- 83 Delibrias, Georgette --------- 20 Den Geofysiske Kommisjon---- 175· Den, Nozomu --------------- 100 Dessler, A. J --------------- 257 Deutsch, E. R -------------- 389 Diceglie, S ----------------- 160 Dimitrov, L. V -------------- 223 Dix, S. H ------------------- 86 Dolitskiy, V. A-------------- 145 Dooley, J. C ------------ 233, 254 Doty, W. E. N -------------- 379 Doyle, H. A ---------------- 102
Drake, C. L ---------------- 202 Droste, Zofia --------------- 53 Dubrovskiy, V. G ------------ 51
123
124 GEOPHYSICAL ABSTRACTS 180, JANUARY -MARCH 1960
Abstract Dunlap, H. F ---------------- 173 Dupuy, Mlle ----------------- 31 D'yak.onov, B. P ------------- 111 Dzhafarov, Kh. D ------------ 109
Eaton, J. P ----------------- 35 Edwards, J. M -------------- 339 Eife, K. H ------------------ 342 Emiliani, Cesare ------------ 204 Erfle, M. E ---------------- 293 Everdingen, R. 0. van ------- 285 Everingham, I. B -------- 102, 233 Ewing, J. I ----------------- 243 Ewing, Maurice ------ 191, 202, 217
Faessler, C. W ------------- 295 Farner, D. M --------------- 329 Faul, Henry----------------- 13 Fedorov, Ye. P ------- 78; 79, 80 Fedorova, V. A ------------- 7 Filippov, E. M -------------- 335 Filippov, M. S -------------- 5, 6 Finsterwalder, Richard ------ 213 Fischer, Irene ---------- 187, 188 Frantz, J. C ---------------- 125 Frischknecht, F. C ---------- 128 Furuya, Shigemasa ---------- 3 84
Gaibar-Puertas, Constantino-- 309 Gangloff, A. •M -------------- 149 Gastil, Gordon -------------- 3 Gayskiy, V. N ------------ 38, 58 Geiss, Johannes ------------- 204 Gerling, E. K --------------- 10 Giletti, B. J ---------------- 11 Girdler, R. W --------------- 283 Gledhill, T. R --------------- 115 Goedicke, T. R -------------- 388 Golebchina, M. N ------------ 252 Gol'tsman, F. M ------------ 385 Gonfiantini, R --------------- 249 Gorshkov, G. S -------------- 406 Gosselink, J. G ------------- 205 Gottfried, David----------- 16, 17 Gough, D. I ---------------- 227 Graebner, R. J -------------- 363 Gray, Helen ---------------- 362 Grechukhin, V. V ------------ 146 Grimbert, Arnold------------ 149 Grinenko, V. A ------------- 251 Gubin, I. Ye ---------------- 41 Gutenberg, Beno ------------56, 320
Hales, A. L ---------------- 227 Harkrider, D. G ------------- 243
Abstract Harland, W. B -------------- 284 Harris, J. L ------------ 360, 395 Harrison, J. C -------------- 224 Haubrich, Richard, Jr ------- 73 Hayak.awa, Masami ---------Hayase, Ichikazu -----------Hedstrom, E. H ------------Hellbardt, Gunter------------
Hennion, J. F ---------------Hines, C. 0 ----------------Hintenberger, H ------------Hoffman, J. H --------------Hogan, T. K ---------------Holmes, Arthur--------------Homma, Ichiro --------------
235 326 113 277 243 258
15 23
102 1
168 Horai, K ------------------- 279 Horikawa, Yoshio ---- 168, 355, 357 Horvath, Josef ------ 135, 317, 319 Hosono, Tak.eo ---------- 358, 359 Howell, B. F., Jr ----------- 365 Hoylman, H. W ------------- 293
Iida, Kumizi ---------------- 368 lilies, Henning -------------- 405 Inami, Kazui ---------------- 384 International Geophysical Year
Bulletin -------------- 185, 399 Irving, E ------------------- 281 Ishibashi, K ----------------- 407 Ishida, Tamotsu ----------- 93, 94 Ishikawa, S ----------------- 263 Ishikawa, Yosbikazu --------- 271
272, 273, 274 Islamov, S. Sh -------------- 37 Israel, Hans ---------------- 330 Ivanova, K. S --------------- 5, 6 Iwasaki, Shoji --------------- 348
349, 350, 353, 358 Izotov, A. A ---------------- 193
Jaeger, J. C ------------ 236, 398 Jaffe, H. W ------------- 16, 17 Jager, Emilie --------------- 13 Jeffer~ P. M --------------- 250 Jeffreys, Harold--------- 76, 77 Jenness, S. E --------------- 276 Johnson, J. C --------------- 382 Jones, 0. S ----------------- 45
Kamitsuki, Akira ---------- 59, 60 Kanaya, Hiroshi ------------- 348
349, 350, 353 Kaneko, Tetsuichi ----------- 352 Kapitanov, Yu. T ------------ 18 Kappelmeyer, Oskar --------- 237
INDEX 125
Abstract Kartashov, N. P ------------- 341 Kashkarov, L. L------------- 328 Katok, A. P ----------------- 38 Katsura, Takashi------------- 280 Kaula, W. M ---------------- 182 Kawabata, Y ----------------- 263 Keevil, N. B ---------------- 125 Keller, G. V-------- 122, 123, 150 Kelly, S. F --------- 105, 126, 306 Keunecke, 0----------------- 319 Khalfin, L. A---------------- 85 Khaskind, M. D -------------- 239 Khaykovich, I. M ------------ 85 Kholin, A. I----------------- 336 Kimpara, A ----------------- '263 Kindij, Eugene--------------- 366
King, A. J ------------------ 308 King, E. R ------------------ 298 Kinyapina, T. A ------------- 41 Kirby, J. E ----------------- 172 Kisslinger, Carl ------------- 321 Klima, Karel ---------------- 98 Knopoff, Leon ------------ 87, 241 Knorre, K. G --------------- 4 Kobayashi, Hajime --- 130, 134, 167 Kobayashi, Kazuo -------- 278, 290 Kogan, P. M ---------------- 325 Kojima, M ------------------ 407 Kojima, Seishi ------- 348, 349, 353 Komai, Jiro ----------------- 348
349, 351, 352, 353 Komlev, L. V ------------- 5, 6 Kon'kov, A. A --------------- 42 Konstantinova, A. G ---------- 91 Kortsenshteyn, V. N --------- 22 Kosminskaya, I. P ------- 166, 244 Koulomzine, T --------------- 303 Kovach, R. L ---------------- 64 Kozlov, A. B ---------------- 67 Kramer, M. V --------------- 70 Kraus, E. C ----------------- 198 Krivoy, H. L ---------------- 35 Kuchina, G. N --------------- 5 Kukharenko, N. K ------------ 138 Kukhtikova, T. I ------------- 39 Kulinkovich, A. E ------------ 137 Kvasha, L. G --------------- 25
Labeyrie,_Jacques ----------- 20 LaCoste, Lucien ------------- 224 Lake, S --------------------- 301 Landauer, J. K ------ 208, 210, 211 Larionov, 0. V -------------- 332 Ledent, D ------------------ 9 Lee, M. R ------------------ 379
Abstract Lehmann, Inge --------------- 57 Lensen, G. J ---------------- 201 Leonov, N. N ---------------- 43 Leont'ev, V. M -------------- 139 Lindsey, J. P --------------- 361 Lisitsyn, A. P --------------- 400 Lisowski, A ----------------- 89 Lockhart, L. B., Jr --------- 331 Loh, R. P ------------------ 319 Longman, I. M -------------- 71 Lovtsyus, A. V -------------- 246 Lovtsyus, G. P -------------- 246 Low, J. H ------------------ 299 Lozinskaya, A. M ------------ 225 Lundberg, Hans-------------- 124
McCollum, E. V ------------- 171 McCrossan, R. G ------------ 143 MacDowall, J ---------------- 323 McLaughlin, Rowland--------- 383 Maeda, Hiroshi -------------- 263 Mathews, W. H -------------- 214 Matsuda, Takeo -------------- 218 Matsumoto, T --------------- 407 Matsuo, S ------------------- 411 Matsushima, Syogo ----------- 396 Mattei, J. B ---------------- 172 Matuzawa, Takeo ------------ 387 Mavritskiy, B. F ------------ 21 Meade, B. K ---------------- 192 Medvedev, S. V -------------- 69 Melchior, P. J -------------- 74 Mellor, Malcolm ------------ 215 Mendonc;a Dias, A. A. de ----- 402 Menzel, Heinz --------------- 84 Metallova, V. V ------------- 270 Mikhalevskaya, A. D --------- 5, 6 Mikhota, G. G --------------- 244 Mikumo, Takeshi --------- 54, 100 Milea, Nicolae --------------- 256 Miller, D. E ---------------- 243 Millican, M. L -------------- 375 Milton, B. E ---------------- 395 Miyachi, M ----------------- 407 Miyachi, S ------------------ 407 Mizutani, Y ----------------- 411 Modriniak, N ---------------- 170 Mogi, Kiyoo ----------------- 397 Molochnov, G. V ------------- 112 Mooney, H: M -------------- 114 Moore, T. F ---------------- 173 Morelli, Carlo--------------- 160 Mori, Kyoshi ---------------- 384 Morley, L. W --------------- 153 Morozov, G. S --------------- 136
126 GEOPHYSICAL ABSTRACTS 180, JANUARY -MARCH 1960
Abstract Moyd, Louis ---------------- 302 Munk, W. H ---------------- 73 Murin, A. N ---------------- 24 M~rozumi, Masayoshi -------- 133 Murtazina, T. M ------------- 252 Musgrave, A. W ------------- 362 Myers, W. H ---------------- 381
Nagata, Takesi ---------- 290, 291 Nairn, A. E. M ---------- 281, 289 Nakai, Junji ------------- 356, 359 Nakamura, Hisayoshi--------- 413 Nanda, J. N ------------- 242, 367 Nedostup, G. A -------------- 336 Nel, L. T ------------------- 347 Nemeth, Ferenc ------------- 195 Neprochnov, Yu. P ------- 376, 392 Nettleton, L. L -------------- 224 Nicholson, S. B -------------- 259 Nielsen, Hardy -------------- 148 Nier, A. 0 ----------------- 23 Nikitin, M. K ---------------- 332 Nikitin, V. N ---------------- 371 Novozhilova, M. Ye ------ 117, 120 Nye, J. F --------------- 206, 207
Obayashi, T ----------------- 263 Odani, Yoshitaka ------------- 132
133, 168, 169 Officer, C. B., Jr ----------- 243 Ogawa, Kenzo --------------- 354 Oil in Canada -------- 152, 338, 378 Oilweek --------------------- 343 O'Keefe, J. A ------------ 183, 184 Olson, E. A ----------------- 19 Ono, Yoshihiko -------------- 167 Onodera, Koji --------------- 132 O'Reilly, John --------------- 34 Orlin, H -------------------- 180 Orr, P. C ------------------- 19 Oshima, H ------------------ 265 Ostapenko, V. F ------------- 328 Ostrovskiy, V. D ------------ 163 Oszlaczky, Szilard ----------- 158
Pachadzhanova, G. N --------- 66 Parasnis, D. S -------------- 113 Pariyskiy, N. N-------------- 70 Parker, E. N ------------- 257, 258 Parkinson, W. D ------------- 255 Parsons, G. E --------------- 304 Pasechnik, I. P -------------- 44 Paton, J. R ------------- 314, 315 Pavlov, B. S ---------------- 240
Abstract Pelletier, Henri------------- 20 Pemberton, Roger----------- 222 Perquis, M. T -------------- 20 Pertsev, B. P -------------- 70 Petrushevskiy, B. A--------- 46 Picciotto, E. E ------------- 249 Pickett, G. R --------------- 374 Plakhov, Yu ------------- 189, 190 Popov, G. I ---------------- 49 Pospelova, G. A ------------ 288 Press, Frank --------------- 147 Prokof'yev, F. N ------------ 336 Prout, James --------------- 383 Pustil'nikov, M. R ---------- 161
Rabinovich, A. V ------------ 252 Radzhabov, M. M------------ 369 Raimondi, Carlo ------------ 160 Rakitov, A. I --------------- 164 Ramirez, J. E -------------- 404 Rao, K. S. R ------------ 260, 262 Rao, M. B. R ----------- 129, 312 Rao, M. N. S -------------- 129 Raspopov, 0. M ------------ 216 Ratcliffe, J. H -------------- 305 Rausch, D. 0 --------------- 212 Repsold, Hans -------------- 30 Research Group for Exploration
Seismology [Japan]--------- 99 Rice, D. A------------------ 186 Richter, C. F --------------- 81 Rikitake, Tsuneji ------------ 266 Riznichenko, Yu. V ---------- 372 Robertshaw, Jack--------- 386, 390 Rodionov,P. F -------------- 116 Rokityanskiy, I. I------------ 107 Romney, Carl--------------- 96 Roy, Amalendu -------------- 220 Rudel, Aime ---------------- 20 Rybakova, Ye. V ------------ 110 Rybin, A. I ----------------- 393
Saito, Tomosaburo ---------- 275 Sanselme, H ---------------- 149 Sardarov, S. S -------------- 14 Sato, Motoaki --------------- 114 Sato, Yasuo ----------------- 63 Savarenskiy, Ye. F ---------- 48 Savit, C. H ----------------- 364 Savonenkov, V. G ----------- 6 Scala, C -------------------- 140 Schaller, H. E -------------- 333 Schmucker, Ulrich---------- 286 Scott, H. S ----------------- 294
INDEX 127
Abstract Seigel, H. 0 ------------ 119, 155 Seino, Masaaki -------------- 412 Semenov, A. A-------------- 40 Semenov, A. S -------------- 120 Senftle, F. E --------------- 16 Sengbush, R. L-------------- 365 Sen'ko-Bulatnyy, I. N -------- 340 Serdyukova, A. S ------------ 18 Service Hydrographique de la
Marine and Companie Generale de Geophysique --- 72
Seya, Kiyoshi --------------- 352 Shakhsuvarov, D. N ---------- 110 Shamina, 0. G -------------- 92 Shebalin, N. V -------------- 50 Shibato, Kihei ----------- 118, 168 Shima, Etsuzo --------------- 100 Shimizu, Yasuo -------------- 291 Shimizu, Yoshio ------------- 290 Shmonin, L. I -.-------------- 328 Shukolyukov, Yu. A---------- 10 Shumskiy, P. A-------------- 234 Siriha,. S. C ----------------- 312 Sivaraman, K. R ------------ 262 Smellie, D. W ----------- 295, 316 Smith, F. G ---------------- 125 Smith, W. E. T --~---------- 32 Sobotovich, E. V ------------ 246 Solov'yev, S. L -------------- 50 Starik, I. Ye ---------------- 246 ~teflea, Ligia --------------- 256 ~teflea, Vladimir ------------ 256 Stephenson, P. J ------------ 292 Stern, T. W ---------------- 8 Stieff, L. R ---------------- 8 Stoenescu, Scarlat ------- 228, 229 Storey, L. R. 0 ------------- 258 Stovas, M. V ---------------- 52 Strick, E ------------------- 88 Stroud, S. G ---------------- 333 Studenikova, z. V ----------- 4 Studt, F. E ------------- 170, 318 Suda, Yoshiro --------------- 218 Sugiyama, Kosuke ----------- 133 Sugiyama, Mitsusuke --------- 131 Sugiyama, Tomonori --------- 3 51 Sulin, V. V ----------------- 337 Sultanov, F. S --------------- 37 Sungurov, A. M ------------- 162 Sutton, G. H ---------------- 202 Suwa, Akira ---------------- 410 Suyama, Junji --------------- 130
'131, 134, 167 Svyatlovskiy, A. Ye ---------- 403 Swift, Gilbert --------------- 141
Abstract Tabulevich, V. N ----------- 322 Takagi, Shinichiro --- 130, 132, 169 Takahashi, Tan --------- 350, 358 Talwani, Manik --------- 191, 217 Tanaka, Akiyoshi ----------- 354 Tanaka, Yasuhiro ----------- 410 Taneda, Sadakatu ----------- 407 Tarasov, L. S -------------- 247 Tarkov~ A. P -------------- 230 Teisseyre, Roman ---------- 53 Thellier, Emile ------------ 287 Thellier, Odette ------------ 287 Tikhonov, A. N ------------- 110 Tkachenko, A. A------------ 332 Tomaschek, Rudolf..; ___ --- .. -- 221 Trapp, Erich --------------- 36 Tsitovich, A. P ------------- 336 Tugarinov, A. I ------------ 7 Tulina, Yu. V -------------- 244
Udintsev, G. B ------------- 376 Ujiie, Akira --------------- 354
355,·356, 359 Urey, H. C ---------------- 27 Usami, Tatsuo -------------- 100 Utzmann, Rene ------------- 104 Uyeda, H ------------------- 263
Vanek, JiH ---------------- 98 Van'yan, L. L -------------- 108 Vasil'yev, V. G------------- 232 Vening Meinesz, F. A------- 178
196, 197 Verhoogen, John ------------ 267 Versey, H. R -------------- 127 Veselov, K. Ye ------------- 226 Viktorov, B. N ------------- 391 Vincenz,· S. A -------------- 127 Vinogradov, A. P ----- 7, 247, 251 Vinogradov, S. D ----------- 90 Volodarskiy, R. F ---------- 231 Voshage, H ---------------- 15 Voskoboynik, N. I----------- 142 Voyutskiy, V. A ------------ 324
Wagner, W. R -------------- 151 Wahl, W. G ------------ 296, 301 Wallerstein, George--------- 209 Ward, S. H--------- 115, 121, 154 Waring, C. L --------------- 17 Wasserburg, G. J ----------- 12 Weiss, Oscar -------------- 307 Westrick, E. W ---------- 297, 304 Wetherill, G. W ------------ 12 White, J. E ---------------- 147
128 GEOPHYSICAL ABSTRACTS 180, JANUARY -MARCH 1960
Abstract Williams, L. W ------------- 319 Willis, D. E ---------------- 382 Windsor, M. W -------------- 26 Winkler, H. A--------------- 155 Woolley, W. C -------------- 362 Worthing, H. w· ------------- 17 Worze1, J. L --------------- 191 Wright, L. A --------------- 12 Wuensche1, P. C ------------ 380 Wulf, 0. R ----------------- 259
Yacob, A ------------------- 261 Yakov1ev, B. M ------------- 145 Yamaguchi, Yushin ------- 264, 265 Yamasaki, Masao ----------- 409
Abstract Yanovskiy, B. U --------- 29, 112 Yelanskiy, L. N ------------ 269 Yepinat'yeva, A. M --------- 166 Yoshikawa, Soji --------- 394, 408 Yutlandov, I. A ------------- 24
Zaccara, Gaetano ----------- 160 Zagarmistr, A. M ---------- 106 Zaporozhets, V. M ------- 335, 337 Zemtsov, A. A ------------- 238 Zenkovich, V --------------- 401 Zhuk, I. Ya ---------------- 377 Zijderve1d, J. D. A --------- 285 Zykov, S. I ----------- 5, 7, 247
U.S. GOVERNMENT PRINTING OFFICE: 1960 0- 557043