geographical and depth-related patterns in nematode communities from some italian marine protected...
TRANSCRIPT

Italian Journal of Zoology, December 2011; 78(4): 505–516
Geographical and depth-related patterns in nematode communitiesfrom some Italian Marine Protected Areas
ROBERTO SANDULLI1*, CRISTIANA DE LEONARDIS2, MAGDA VINCX3, & JANVANAVERBEKE3
1Department of Sciences for the Environment, Naples University ‘Parthenope’, Napoli, Italy, 2Department of Zoology,University of Bari, Bari, Italy, and 3Marine Biology Section, Gent University, Gent, Belgium
(Received 3 November 2009; accepted 24 January 2011)
AbstractA study on the meiobenthic nematode assemblages from three Italian Marine Protected Areas (Miramare, Adriatic Sea;Porto Cesareo, Ionian Sea; and Capo Caccia, Western Mediterranean Sea) was carried out at three different depth rangesfrom the low intertidal to the shallow subtidal. Nematode community composition was analysed at the genus level, anddiversity and taxonomic distinctness were studied to detect possible differences among the MPAs and between intertidaland shallow subtidal zones. There were differences in granulometric variables between sampling depths: medium and coarsefractions were often dominant in the sites at the low intertidal and shallow subtidal, while very shallow subtidal sites werecharacterised by fine and very fine sand. Nematode densities and diversities were generally high in all sampling areas.Nematode communities changed when different depths were compared. This was due to a decrease in deposit-feedingnematodes coupled with a higher abundance of predators and epigrowth feeders with increasing depths, from the lowintertidal to the shallow subtidal. The shallow subtidal is characterised by the presence of a stout nematode community(Length/Width ratio <15) dominated by Epsilonematidae (39%), Desmoscolecidae (16%) and Selachinematidae (9%).The high dominance of the epsilonematids is probably due to the occurrence of coarse sediments. Our study also reveals apossible relationship between body proportions and feeding groups. Changes in depth and sand grain size do not seem tocause drastic variations of diversity. Both �+ and �+ seem to be more sensitive than other diversity indices in discriminatingamong different sites, as a consequence of different environmental physical features. The concept of isocommunities mightexplain the similarities found in the three Italian Marine Protected Areas nematode assemblages; in fact, the same dominantfamilies and genera were recorded in geographically spaced sites at similar depth ranges.
Keywords: Meiofauna, nematode communities, isocommunities, morphometry, Italian Marine Protected Areas
Introduction
In many coastal and nearshore marine areas, humanactivities may produce severe alterations in the dif-ferent trophic levels of the ecosystems. In order toprevent pollution and to conserve stocks and habi-tats, Mediterranean countries have adopted a seriesof measures, among which is the implementationof Marine Protected Areas (MPAs). MPAs havebecome a widely advocated form of marine conserva-tion, because they preserve biodiversity and preventenvironmental degradation; hence their number isconstantly increasing worldwide (e.g. Fraschetti et al.2002).
Most of the faunal research on sandy shore, and inparticular within MPAs, has been mainly restricted to
*Correspondence: R. Sandulli, Department of Sciences for the Environment, Naples University ‘Parthenope’, C.D. Is. C4, 80143 Napoli, Italy. Email:[email protected]
macrofauna (e.g. McLachlan & Jaramillo 1995 andreferences therein), while there are only a few stud-ies on meiobenthic communities of MPA. Previousmeiofauna research on sandy sediments was focussedmainly at the higher taxon level (e.g. Martens 1984;Martens et al. 1985; Jouk et al. 1988; Olafsson 1991;Rodriguez et al. 2001; Menn 2002) or at factorsinfluencing the interstitial habitats (e.g. Blome et al.1999; Sandulli & Pinckney 1999). Meiobenthic eco-logical research at genus and/or species level is ratherscarce and limited to a few beaches (Gheskiere et al.2004; 2005a; 2006; Sandulli et al. 2010).
The dominant taxa of the sandy shore meiofaunaare generally nematodes, harpacticoid copepods andturbellarians, followed by several other groups of
ISSN 1125-0003 print/ISSN 1748-5851 online © 2011 Unione Zoologica Italianahttp://dx.doi.org/10.1080/11250003.2011.560580
506 R. Sandulli et al.
variable importance (Giere 2009). Nematodes arean excellent taxon to use as ecological indicators forbenthic environments (Heip et al. 1985; Sandulli &de Nicola 1991; Schratzberger et al. 2000) becausethey have a ubiquitous distribution, high abundance,high diversity, short generation times, continuousreproduction, and they are restricted to the sedi-ments throughout their life. Therefore the state andcomposition of nematode assemblages may reflectthe general health of the benthos (e.g. Kennedy &Jacoby 1999) and be used as reference in ecosys-tem functioning studies (Bongers & Ferris 1999).The theoretical and practical advantages and dis-advantages of using meiofauna and nematodes asbioindicators are summarised in Schratzberger et al.(2000). However, an important disadvantage in theuse of nematodes as biological indicators is their dif-ficult taxonomy, which makes them identification bynon-specialists difficult. Recently, Vanaverbeke et al.(2003) demonstrated that this problem can be over-come by using an alternative method: the biomassspectra. As their length and width are easily mea-sured using non-destructive methods (Soetaert et al.2002), nematodes are especially suitable for body-size distribution analyses. Moreover, the ratio ofnematodes length to the maximal width (L/W) offersa quantitative measure of their shape.
This research aims at gathering information onthe nematode communities of three Italian MPA(Miramare, Porto Cesareo and Capo Caccia), inves-tigating both structural (community composition,densities, diversity) and functional (feeding typecomposition, morphometric features) attributes inrelation to granulometric variables and water depth.Moreover, we examined the occurrence of conver-gent communities (isocommunities) between thesegeographically spaced Italian MPAs.
Material and methods
Study area
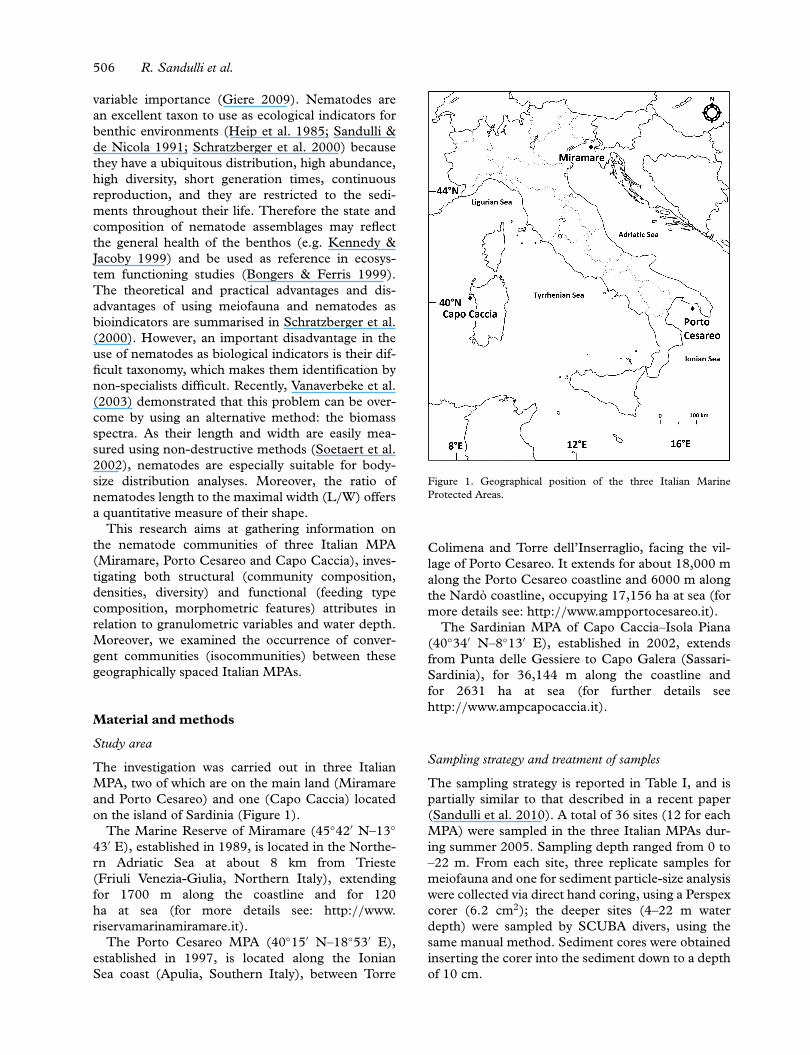
The investigation was carried out in three ItalianMPA, two of which are on the main land (Miramareand Porto Cesareo) and one (Capo Caccia) locatedon the island of Sardinia (Figure 1).
The Marine Reserve of Miramare (45◦42′ N–13◦43′ E), established in 1989, is located in the Northe-rn Adriatic Sea at about 8 km from Trieste(Friuli Venezia-Giulia, Northern Italy), extendingfor 1700 m along the coastline and for 120ha at sea (for more details see: http://www.riservamarinamiramare.it).
The Porto Cesareo MPA (40◦15′ N–18◦53′ E),established in 1997, is located along the IonianSea coast (Apulia, Southern Italy), between Torre
Figure 1. Geographical position of the three Italian MarineProtected Areas.
Colimena and Torre dell’Inserraglio, facing the vil-lage of Porto Cesareo. It extends for about 18,000 malong the Porto Cesareo coastline and 6000 m alongthe Nardò coastline, occupying 17,156 ha at sea (formore details see: http://www.ampportocesareo.it).
The Sardinian MPA of Capo Caccia–Isola Piana(40◦34′ N–8◦13′ E), established in 2002, extendsfrom Punta delle Gessiere to Capo Galera (Sassari-Sardinia), for 36,144 m along the coastline andfor 2631 ha at sea (for further details seehttp://www.ampcapocaccia.it).
Sampling strategy and treatment of samples
The sampling strategy is reported in Table I, and ispartially similar to that described in a recent paper(Sandulli et al. 2010). A total of 36 sites (12 for eachMPA) were sampled in the three Italian MPAs dur-ing summer 2005. Sampling depth ranged from 0 to–22 m. From each site, three replicate samples formeiofauna and one for sediment particle-size analysiswere collected via direct hand coring, using a Perspexcorer (6.2 cm2); the deeper sites (4–22 m waterdepth) were sampled by SCUBA divers, using thesame manual method. Sediment cores were obtainedinserting the corer into the sediment down to a depthof 10 cm.
Nematode communities patterns in MPAs 507
Table I. Sampling strategy. At each site three sediment samples for meiofauna analyses plus one for granulometric analyses were collected.
Marine Protected Area Depth range Depth range Depth range Total sites (36)
Miramare 4 sites at 0 m (MI1–MI4) 4 sites at 1–4 m (MI5–MI8) 4 sites at 12–22 m (MI9–MI12) 12Porto Cesareo 4 sites at 0 m (PC1–PC4) 4 sites at 1–4 m (PC5–PC8) 4 sites at 12–22 m (PC9–PC12) 12Capo Caccia 4 sites at 0 m (CC1–CC4) 4 sites at 1–4 m (CC5–CC8) 4 sites at 12–22 m (CC9–CC12) 12
All meiofaunal samples were immediatelypreserved with a neutral formaldehyde–seawatersolution (final concentration: 5%). In the laboratory,meiobenthic organisms were extracted from thesediment by manual centrifugation, retained ona 42 mm sieve, stained with Rose Bengal, andsorted into the major taxa. From two replicates, 100nematodes were randomly picked out, transferred toglycerine and mounted on slides for identificationto genus level according to Vincx (1996). When lessthan 100 individuals were present, all nematodeswere identified. The identification to the genus levelwas obtained using the pictorial keys by Platt andWarwick (1983, 1988), Warwick et al. (1998), andthe NeMys online identification key (Steyaert et al.2005). A feeding type was assigned to all nema-tode genera according to Wieser’s (1953) trophicclassification: selective (1A) and non-selective(1B) deposit feeders, epigrowth feeders (2A) andpredators/omnivores (2B). Length and width ofall nematode specimens were measured using amicroscope coupled with image-analyser software(Quantimet 500+). All nematodes were identified asslender or stout, according to Soetaert et al. (2002)and Vanaverbeke et al. (2004).
Sediment samples for particle-size distributionanalysis were washed with distilled water and dried inan oven at 80◦C for 24–36 h, and successively sievedfor 20 min through a series of sieves from 841 to74 µm mesh size. The sediment fractions were thenweighed using an analytical balance, and weightswere converted to percentages. Sediment fractionswere defined according to the Wentworth size classes(Buchanan 1984).
Data analysis
Patterns in granulometric data were analysed usingPrincipal Components Analysis (PCA) based onsediment fractions, using a similarity matrix con-structed with Euclidean distance.
The nematode community structure was anal-ysed using non-metric Multi-Dimensional Scaling(MDS), using the Bray–Curtis similarity measure onsquare root-transformed abundances. Formal signif-icance tests for differences in nematode communityamong the three MPAs (12 sites per MPA) and
among three chosen depth groups [0 m: low inter-tidal (12 sites; four sites per MPA); 1–4 m: veryshallow subtidal (12 sites; four sites per MPA) and12–22 m: shallow subtidal (12 sites; four sites perMPA)] were performed using the two-way crossedANOSIM tests considering three replicates at eachsite (Clarke 1993). This allows for testing for pos-sible differences between areas while allowing fordifferences between depths and vice versa. Two-waycrossed ANOSIM was used to test for significant dif-ferences on nematode communities among four sed-iment fractions (coarse sand, medium sand, mediumfine sand and fine sand) across all MPA groups. Thespecies contributing to similarities among depthswere investigated via the similarity-percentages pro-cedure (SIMPER: Clarke 1993), using nematodegenus abundance raw data.
Nematode genus abundance data (ind.·10 cm–2)were used to calculate a surrogate of the numberof species per sample (S), Margalef species rich-ness (d), the Shannon–Wiener diversity index (H′),the Pielou’s evenness (J) and Simpson index (1–λ′).The Average Taxonomic Diversity (TD, �), AverageTaxonomic Distinctness (AvTD, �+) and Variationin Taxonomic Distinctness (VarTD, �+) (Warwick& Clarke 1995) were also calculated. The AverageTaxonomic Distinctness (�+) is a measure of tax-onomic spread rather than species richness (Clarke& Warwick 1998), while the Variation in TaxonomicDistinctness (�+) can be seen as the evenness ofthe distribution of taxa across the nematode taxo-nomic tree (Warwick & Clarke 1998, 2001; Clarke& Warwick 2001).
Differences in Margalef species richness (d),Shannon–Wiener diversity (H′), Pielou’s evenness(J), Simpson index (1–λ′), TD (�), AvTD (�+) andVarTD (�+) among the three MPAs and amongthe depth groups within each MPA were analysedusing two-way ANOVA, after testing for the assump-tions of ANOVA. The taxonomic indices (�+ and�+) were calculated, using simulated subsamplesof different numbers of species from the masternematode list (1000 and 10,000 max. random selec-tions). Equal step-lengths between each taxonomiclevel were assumed, and in total six taxonomic lev-els were used (genus, family, order, subclass, classand phylum). The taxonomic indices (�+ and �+)
508 R. Sandulli et al.
were analysed using probability funnels against whichdistinctness and variation of distinctness values for allstudy sites were checked.
All multivariate analyses and calculation of diver-sity indices was done using PRIMER 6 (Clarke& Gorley 2006). The univariate analyses wereperformed using the STATISTICA 6 software pack-age (StatSoft 1995).
Results
Sediment characteristics
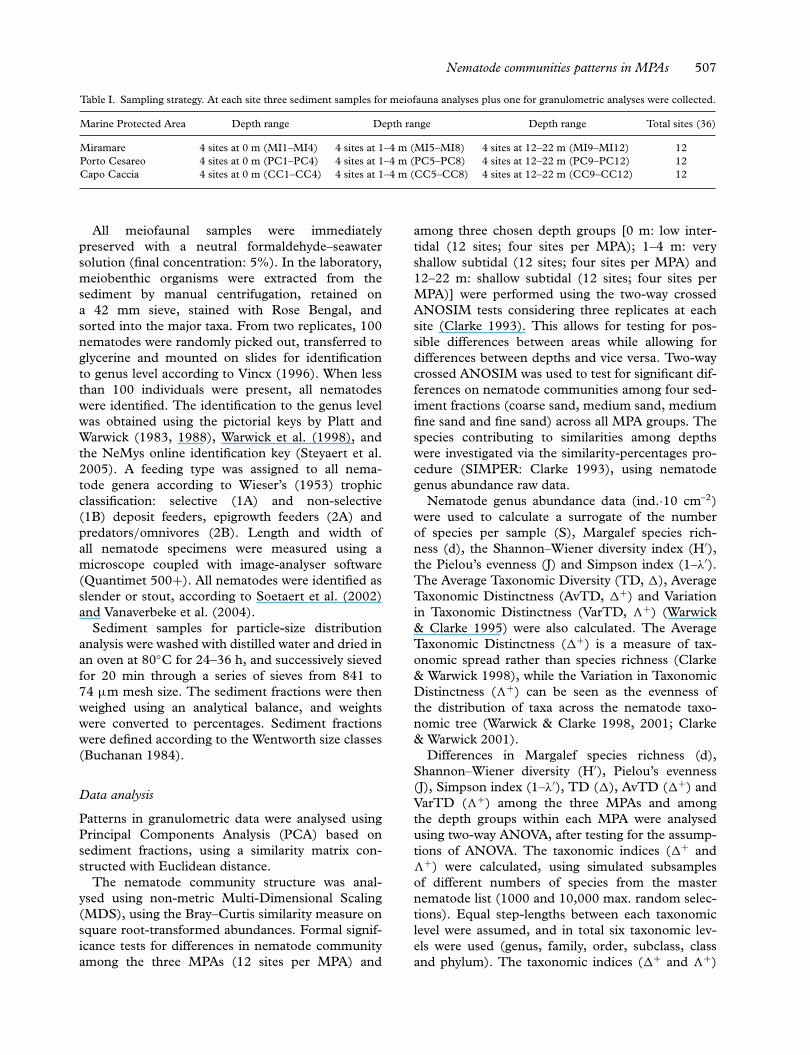
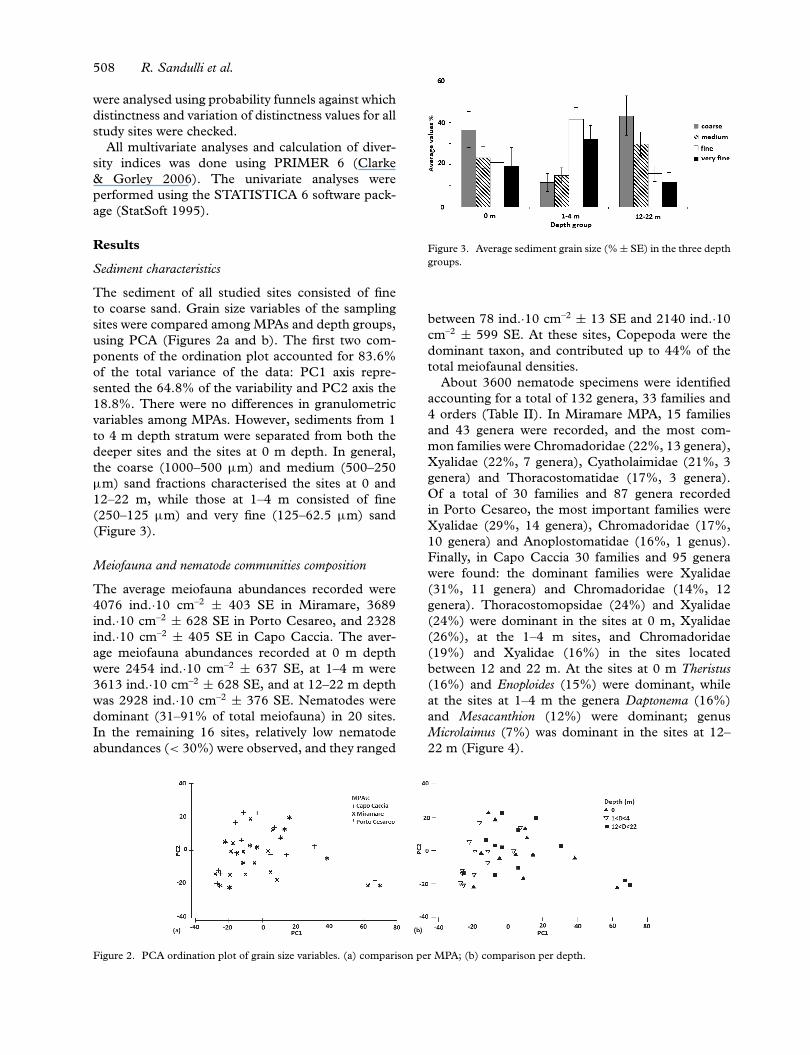
The sediment of all studied sites consisted of fineto coarse sand. Grain size variables of the samplingsites were compared among MPAs and depth groups,using PCA (Figures 2a and b). The first two com-ponents of the ordination plot accounted for 83.6%of the total variance of the data: PC1 axis repre-sented the 64.8% of the variability and PC2 axis the18.8%. There were no differences in granulometricvariables among MPAs. However, sediments from 1to 4 m depth stratum were separated from both thedeeper sites and the sites at 0 m depth. In general,the coarse (1000–500 µm) and medium (500–250µm) sand fractions characterised the sites at 0 and12–22 m, while those at 1–4 m consisted of fine(250–125 µm) and very fine (125–62.5 µm) sand(Figure 3).
Meiofauna and nematode communities composition
The average meiofauna abundances recorded were4076 ind.·10 cm–2 ± 403 SE in Miramare, 3689ind.·10 cm–2 ± 628 SE in Porto Cesareo, and 2328ind.·10 cm–2 ± 405 SE in Capo Caccia. The aver-age meiofauna abundances recorded at 0 m depthwere 2454 ind.·10 cm–2 ± 637 SE, at 1–4 m were3613 ind.·10 cm–2 ± 628 SE, and at 12–22 m depthwas 2928 ind.·10 cm–2 ± 376 SE. Nematodes weredominant (31–91% of total meiofauna) in 20 sites.In the remaining 16 sites, relatively low nematodeabundances (< 30%) were observed, and they ranged
Figure 3. Average sediment grain size (% ± SE) in the three depthgroups.
between 78 ind.·10 cm–2 ± 13 SE and 2140 ind.·10cm–2 ± 599 SE. At these sites, Copepoda were thedominant taxon, and contributed up to 44% of thetotal meiofaunal densities.
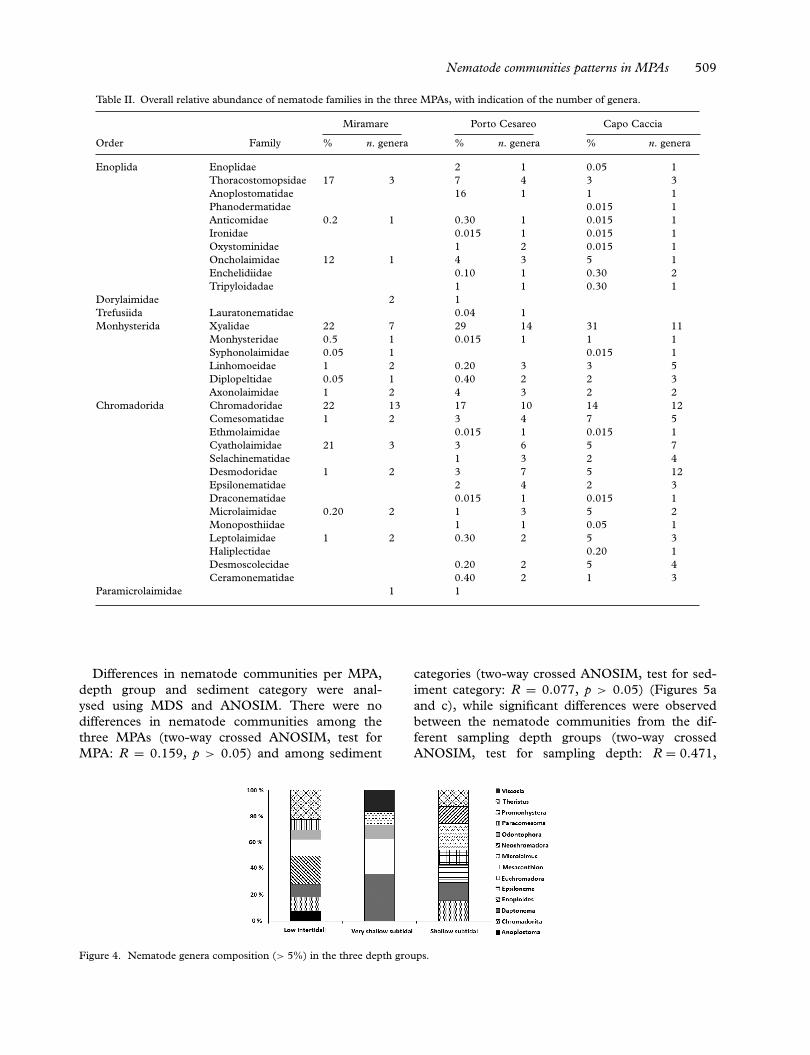
About 3600 nematode specimens were identifiedaccounting for a total of 132 genera, 33 families and4 orders (Table II). In Miramare MPA, 15 familiesand 43 genera were recorded, and the most com-mon families were Chromadoridae (22%, 13 genera),Xyalidae (22%, 7 genera), Cyatholaimidae (21%, 3genera) and Thoracostomatidae (17%, 3 genera).Of a total of 30 families and 87 genera recordedin Porto Cesareo, the most important families wereXyalidae (29%, 14 genera), Chromadoridae (17%,10 genera) and Anoplostomatidae (16%, 1 genus).Finally, in Capo Caccia 30 families and 95 generawere found: the dominant families were Xyalidae(31%, 11 genera) and Chromadoridae (14%, 12genera). Thoracostomopsidae (24%) and Xyalidae(24%) were dominant in the sites at 0 m, Xyalidae(26%), at the 1–4 m sites, and Chromadoridae(19%) and Xyalidae (16%) in the sites locatedbetween 12 and 22 m. At the sites at 0 m Theristus(16%) and Enoploides (15%) were dominant, whileat the sites at 1–4 m the genera Daptonema (16%)and Mesacanthion (12%) were dominant; genusMicrolaimus (7%) was dominant in the sites at 12–22 m (Figure 4).
Figure 2. PCA ordination plot of grain size variables. (a) comparison per MPA; (b) comparison per depth.
Nematode communities patterns in MPAs 509
Table II. Overall relative abundance of nematode families in the three MPAs, with indication of the number of genera.
Miramare Porto Cesareo Capo Caccia
Order Family % n. genera % n. genera % n. genera
Enoplida Enoplidae 2 1 0.05 1Thoracostomopsidae 17 3 7 4 3 3Anoplostomatidae 16 1 1 1Phanodermatidae 0.015 1Anticomidae 0.2 1 0.30 1 0.015 1Ironidae 0.015 1 0.015 1Oxystominidae 1 2 0.015 1Oncholaimidae 12 1 4 3 5 1Enchelidiidae 0.10 1 0.30 2Tripyloidadae 1 1 0.30 1
Dorylaimidae 2 1Trefusiida Lauratonematidae 0.04 1Monhysterida Xyalidae 22 7 29 14 31 11
Monhysteridae 0.5 1 0.015 1 1 1Syphonolaimidae 0.05 1 0.015 1Linhomoeidae 1 2 0.20 3 3 5Diplopeltidae 0.05 1 0.40 2 2 3Axonolaimidae 1 2 4 3 2 2
Chromadorida Chromadoridae 22 13 17 10 14 12Comesomatidae 1 2 3 4 7 5Ethmolaimidae 0.015 1 0.015 1Cyatholaimidae 21 3 3 6 5 7Selachinematidae 1 3 2 4Desmodoridae 1 2 3 7 5 12Epsilonematidae 2 4 2 3Draconematidae 0.015 1 0.015 1Microlaimidae 0.20 2 1 3 5 2Monoposthiidae 1 1 0.05 1Leptolaimidae 1 2 0.30 2 5 3Haliplectidae 0.20 1Desmoscolecidae 0.20 2 5 4Ceramonematidae 0.40 2 1 3
Paramicrolaimidae 1 1
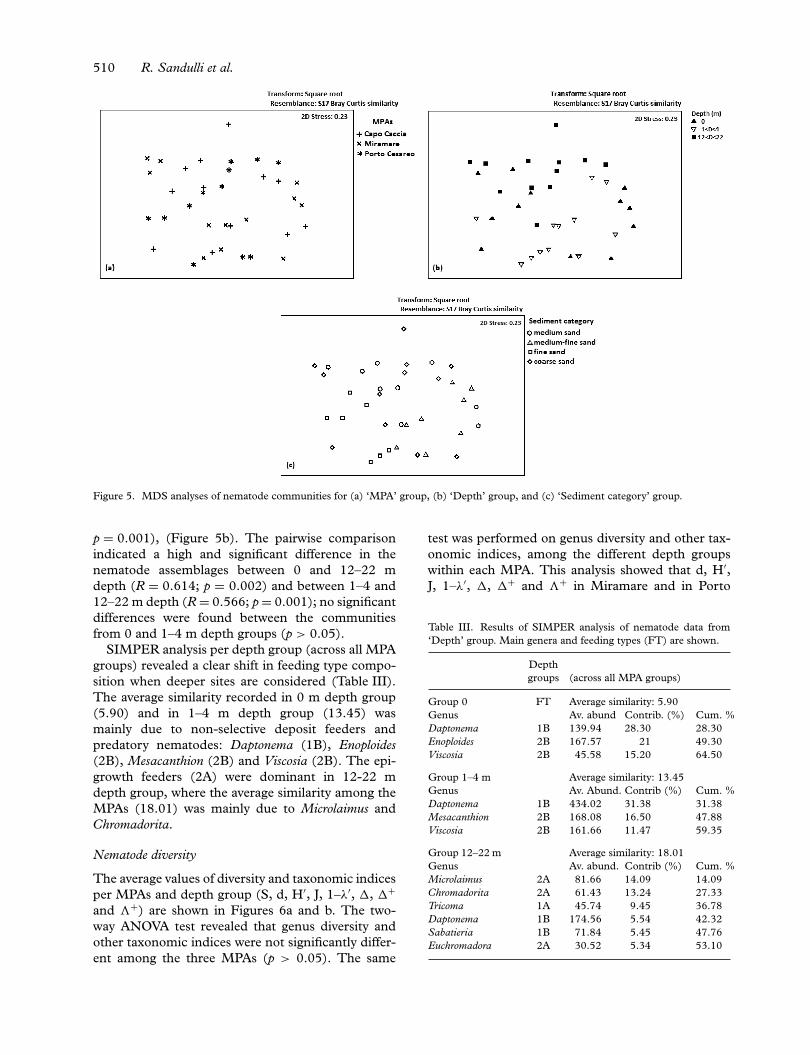
Differences in nematode communities per MPA,depth group and sediment category were anal-ysed using MDS and ANOSIM. There were nodifferences in nematode communities among thethree MPAs (two-way crossed ANOSIM, test forMPA: R = 0.159, p > 0.05) and among sediment
categories (two-way crossed ANOSIM, test for sed-iment category: R = 0.077, p > 0.05) (Figures 5aand c), while significant differences were observedbetween the nematode communities from the dif-ferent sampling depth groups (two-way crossedANOSIM, test for sampling depth: R = 0.471,
Figure 4. Nematode genera composition (> 5%) in the three depth groups.
510 R. Sandulli et al.
Figure 5. MDS analyses of nematode communities for (a) ‘MPA’ group, (b) ‘Depth’ group, and (c) ‘Sediment category’ group.
p = 0.001), (Figure 5b). The pairwise comparisonindicated a high and significant difference in thenematode assemblages between 0 and 12–22 mdepth (R = 0.614; p = 0.002) and between 1–4 and12–22 m depth (R = 0.566; p = 0.001); no significantdifferences were found between the communitiesfrom 0 and 1–4 m depth groups (p > 0.05).
SIMPER analysis per depth group (across all MPAgroups) revealed a clear shift in feeding type compo-sition when deeper sites are considered (Table III).The average similarity recorded in 0 m depth group(5.90) and in 1–4 m depth group (13.45) wasmainly due to non-selective deposit feeders andpredatory nematodes: Daptonema (1B), Enoploides(2B), Mesacanthion (2B) and Viscosia (2B). The epi-growth feeders (2A) were dominant in 12-22 mdepth group, where the average similarity among theMPAs (18.01) was mainly due to Microlaimus andChromadorita.
Nematode diversity
The average values of diversity and taxonomic indicesper MPAs and depth group (S, d, H′, J, 1–λ′, �, �+and �+) are shown in Figures 6a and b. The two-way ANOVA test revealed that genus diversity andother taxonomic indices were not significantly differ-ent among the three MPAs (p > 0.05). The same
test was performed on genus diversity and other tax-onomic indices, among the different depth groupswithin each MPA. This analysis showed that d, H′,J, 1–λ′, �, �+ and �+ in Miramare and in Porto
Table III. Results of SIMPER analysis of nematode data from‘Depth’ group. Main genera and feeding types (FT) are shown.
Depthgroups (across all MPA groups)
Group 0 FT Average similarity: 5.90Genus Av. abund Contrib. (%) Cum. %Daptonema 1B 139.94 28.30 28.30Enoploides 2B 167.57 21 49.30Viscosia 2B 45.58 15.20 64.50
Group 1–4 m Average similarity: 13.45Genus Av. Abund. Contrib (%) Cum. %Daptonema 1B 434.02 31.38 31.38Mesacanthion 2B 168.08 16.50 47.88Viscosia 2B 161.66 11.47 59.35
Group 12–22 m Average similarity: 18.01Genus Av. abund. Contrib (%) Cum. %Microlaimus 2A 81.66 14.09 14.09Chromadorita 2A 61.43 13.24 27.33Tricoma 1A 45.74 9.45 36.78Daptonema 1B 174.56 5.54 42.32Sabatieria 1B 71.84 5.45 47.76Euchromadora 2A 30.52 5.34 53.10
Nematode communities patterns in MPAs 511
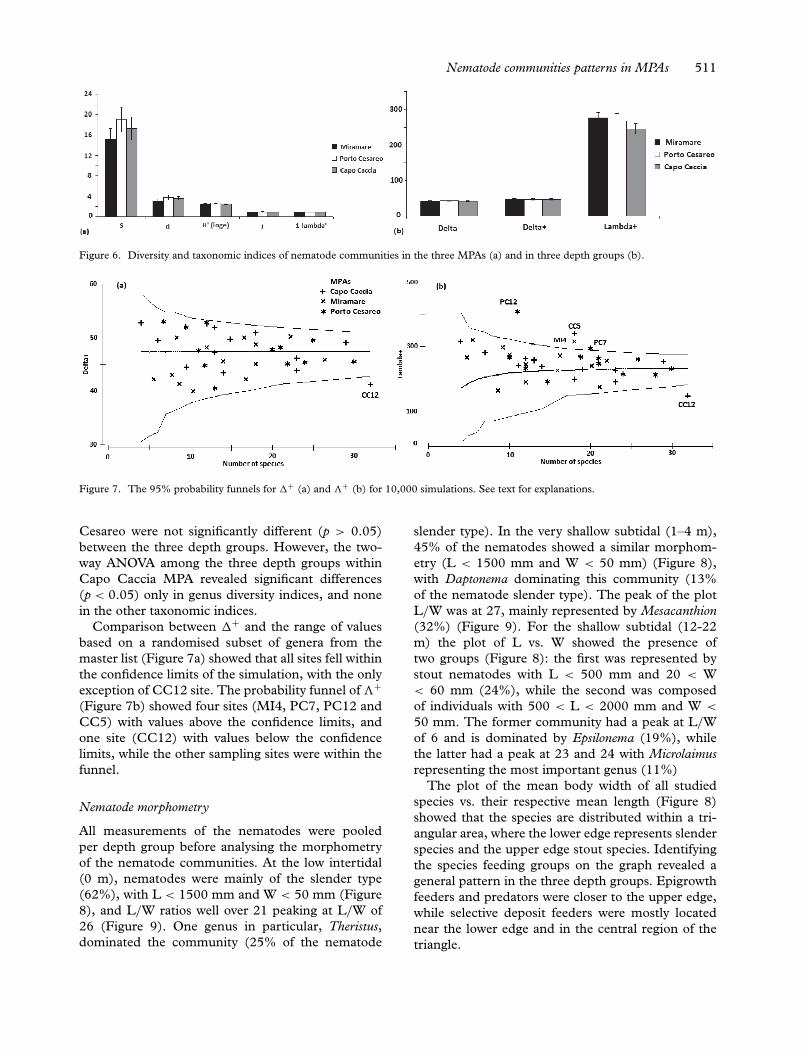
Figure 6. Diversity and taxonomic indices of nematode communities in the three MPAs (a) and in three depth groups (b).
Figure 7. The 95% probability funnels for �+ (a) and �+ (b) for 10,000 simulations. See text for explanations.
Cesareo were not significantly different (p > 0.05)between the three depth groups. However, the two-way ANOVA among the three depth groups withinCapo Caccia MPA revealed significant differences(p < 0.05) only in genus diversity indices, and nonein the other taxonomic indices.
Comparison between �+ and the range of valuesbased on a randomised subset of genera from themaster list (Figure 7a) showed that all sites fell withinthe confidence limits of the simulation, with the onlyexception of CC12 site. The probability funnel of �+(Figure 7b) showed four sites (MI4, PC7, PC12 andCC5) with values above the confidence limits, andone site (CC12) with values below the confidencelimits, while the other sampling sites were within thefunnel.
Nematode morphometry
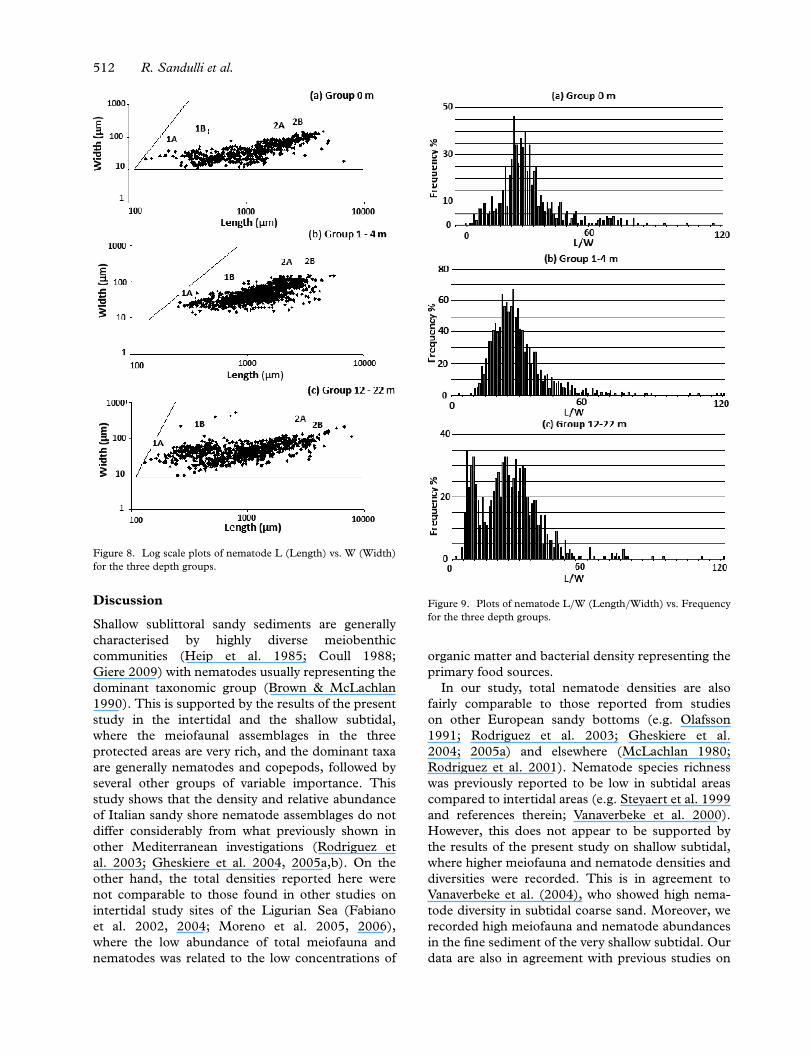
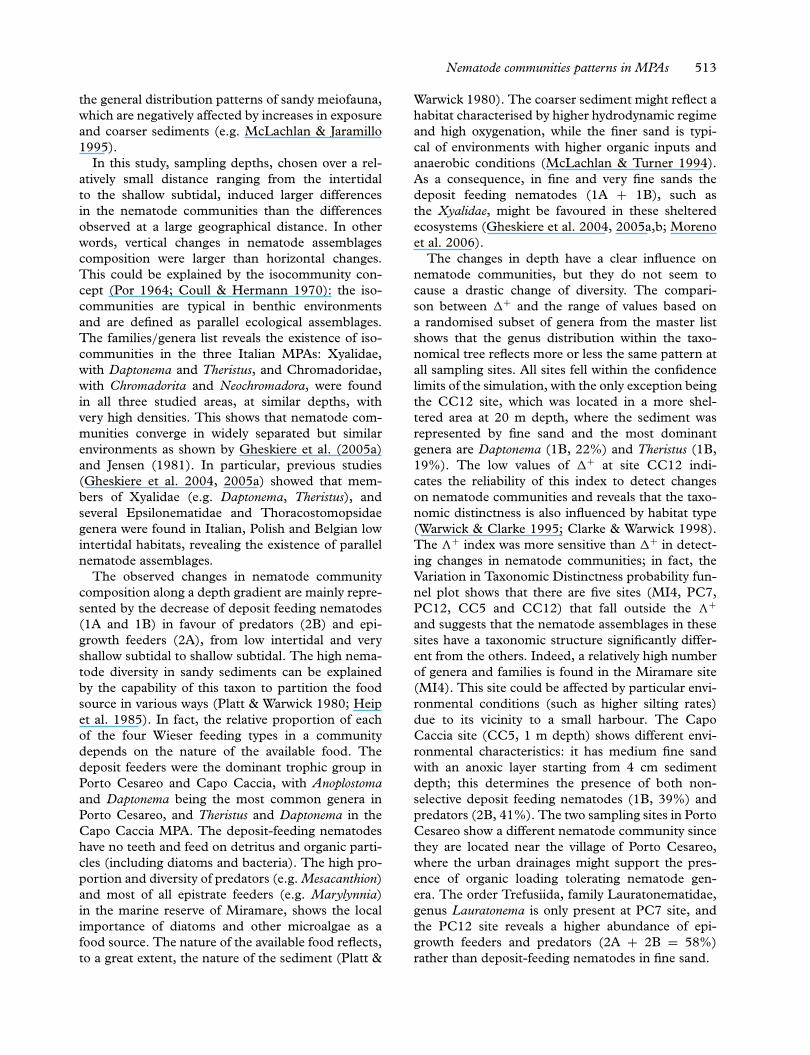
All measurements of the nematodes were pooledper depth group before analysing the morphometryof the nematode communities. At the low intertidal(0 m), nematodes were mainly of the slender type(62%), with L < 1500 mm and W < 50 mm (Figure8), and L/W ratios well over 21 peaking at L/W of26 (Figure 9). One genus in particular, Theristus,dominated the community (25% of the nematode
slender type). In the very shallow subtidal (1–4 m),45% of the nematodes showed a similar morphom-etry (L < 1500 mm and W < 50 mm) (Figure 8),with Daptonema dominating this community (13%of the nematode slender type). The peak of the plotL/W was at 27, mainly represented by Mesacanthion(32%) (Figure 9). For the shallow subtidal (12-22m) the plot of L vs. W showed the presence oftwo groups (Figure 8): the first was represented bystout nematodes with L < 500 mm and 20 < W< 60 mm (24%), while the second was composedof individuals with 500 < L < 2000 mm and W <
50 mm. The former community had a peak at L/Wof 6 and is dominated by Epsilonema (19%), whilethe latter had a peak at 23 and 24 with Microlaimusrepresenting the most important genus (11%)
The plot of the mean body width of all studiedspecies vs. their respective mean length (Figure 8)showed that the species are distributed within a tri-angular area, where the lower edge represents slenderspecies and the upper edge stout species. Identifyingthe species feeding groups on the graph revealed ageneral pattern in the three depth groups. Epigrowthfeeders and predators were closer to the upper edge,while selective deposit feeders were mostly locatednear the lower edge and in the central region of thetriangle.
512 R. Sandulli et al.
Figure 8. Log scale plots of nematode L (Length) vs. W (Width)for the three depth groups.
Discussion
Shallow sublittoral sandy sediments are generallycharacterised by highly diverse meiobenthiccommunities (Heip et al. 1985; Coull 1988;Giere 2009) with nematodes usually representing thedominant taxonomic group (Brown & McLachlan1990). This is supported by the results of the presentstudy in the intertidal and the shallow subtidal,where the meiofaunal assemblages in the threeprotected areas are very rich, and the dominant taxaare generally nematodes and copepods, followed byseveral other groups of variable importance. Thisstudy shows that the density and relative abundanceof Italian sandy shore nematode assemblages do notdiffer considerably from what previously shown inother Mediterranean investigations (Rodriguez etal. 2003; Gheskiere et al. 2004, 2005a,b). On theother hand, the total densities reported here werenot comparable to those found in other studies onintertidal study sites of the Ligurian Sea (Fabianoet al. 2002, 2004; Moreno et al. 2005, 2006),where the low abundance of total meiofauna andnematodes was related to the low concentrations of
Figure 9. Plots of nematode L/W (Length/Width) vs. Frequencyfor the three depth groups.
organic matter and bacterial density representing theprimary food sources.
In our study, total nematode densities are alsofairly comparable to those reported from studieson other European sandy bottoms (e.g. Olafsson1991; Rodriguez et al. 2003; Gheskiere et al.2004; 2005a) and elsewhere (McLachlan 1980;Rodriguez et al. 2001). Nematode species richnesswas previously reported to be low in subtidal areascompared to intertidal areas (e.g. Steyaert et al. 1999and references therein; Vanaverbeke et al. 2000).However, this does not appear to be supported bythe results of the present study on shallow subtidal,where higher meiofauna and nematode densities anddiversities were recorded. This is in agreement toVanaverbeke et al. (2004), who showed high nema-tode diversity in subtidal coarse sand. Moreover, werecorded high meiofauna and nematode abundancesin the fine sediment of the very shallow subtidal. Ourdata are also in agreement with previous studies on
Nematode communities patterns in MPAs 513
the general distribution patterns of sandy meiofauna,which are negatively affected by increases in exposureand coarser sediments (e.g. McLachlan & Jaramillo1995).
In this study, sampling depths, chosen over a rel-atively small distance ranging from the intertidalto the shallow subtidal, induced larger differencesin the nematode communities than the differencesobserved at a large geographical distance. In otherwords, vertical changes in nematode assemblagescomposition were larger than horizontal changes.This could be explained by the isocommunity con-cept (Por 1964; Coull & Hermann 1970): the iso-communities are typical in benthic environmentsand are defined as parallel ecological assemblages.The families/genera list reveals the existence of iso-communities in the three Italian MPAs: Xyalidae,with Daptonema and Theristus, and Chromadoridae,with Chromadorita and Neochromadora, were foundin all three studied areas, at similar depths, withvery high densities. This shows that nematode com-munities converge in widely separated but similarenvironments as shown by Gheskiere et al. (2005a)and Jensen (1981). In particular, previous studies(Gheskiere et al. 2004, 2005a) showed that mem-bers of Xyalidae (e.g. Daptonema, Theristus), andseveral Epsilonematidae and Thoracostomopsidaegenera were found in Italian, Polish and Belgian lowintertidal habitats, revealing the existence of parallelnematode assemblages.
The observed changes in nematode communitycomposition along a depth gradient are mainly repre-sented by the decrease of deposit feeding nematodes(1A and 1B) in favour of predators (2B) and epi-growth feeders (2A), from low intertidal and veryshallow subtidal to shallow subtidal. The high nema-tode diversity in sandy sediments can be explainedby the capability of this taxon to partition the foodsource in various ways (Platt & Warwick 1980; Heipet al. 1985). In fact, the relative proportion of eachof the four Wieser feeding types in a communitydepends on the nature of the available food. Thedeposit feeders were the dominant trophic group inPorto Cesareo and Capo Caccia, with Anoplostomaand Daptonema being the most common genera inPorto Cesareo, and Theristus and Daptonema in theCapo Caccia MPA. The deposit-feeding nematodeshave no teeth and feed on detritus and organic parti-cles (including diatoms and bacteria). The high pro-portion and diversity of predators (e.g. Mesacanthion)and most of all epistrate feeders (e.g. Marylynnia)in the marine reserve of Miramare, shows the localimportance of diatoms and other microalgae as afood source. The nature of the available food reflects,to a great extent, the nature of the sediment (Platt &
Warwick 1980). The coarser sediment might reflect ahabitat characterised by higher hydrodynamic regimeand high oxygenation, while the finer sand is typi-cal of environments with higher organic inputs andanaerobic conditions (McLachlan & Turner 1994).As a consequence, in fine and very fine sands thedeposit feeding nematodes (1A + 1B), such asthe Xyalidae, might be favoured in these shelteredecosystems (Gheskiere et al. 2004, 2005a,b; Morenoet al. 2006).
The changes in depth have a clear influence onnematode communities, but they do not seem tocause a drastic change of diversity. The compari-son between �+ and the range of values based ona randomised subset of genera from the master listshows that the genus distribution within the taxo-nomical tree reflects more or less the same pattern atall sampling sites. All sites fell within the confidencelimits of the simulation, with the only exception beingthe CC12 site, which was located in a more shel-tered area at 20 m depth, where the sediment wasrepresented by fine sand and the most dominantgenera are Daptonema (1B, 22%) and Theristus (1B,19%). The low values of �+ at site CC12 indi-cates the reliability of this index to detect changeson nematode communities and reveals that the taxo-nomic distinctness is also influenced by habitat type(Warwick & Clarke 1995; Clarke & Warwick 1998).The �+ index was more sensitive than �+ in detect-ing changes in nematode communities; in fact, theVariation in Taxonomic Distinctness probability fun-nel plot shows that there are five sites (MI4, PC7,PC12, CC5 and CC12) that fall outside the �+and suggests that the nematode assemblages in thesesites have a taxonomic structure significantly differ-ent from the others. Indeed, a relatively high numberof genera and families is found in the Miramare site(MI4). This site could be affected by particular envi-ronmental conditions (such as higher silting rates)due to its vicinity to a small harbour. The CapoCaccia site (CC5, 1 m depth) shows different envi-ronmental characteristics: it has medium fine sandwith an anoxic layer starting from 4 cm sedimentdepth; this determines the presence of both non-selective deposit feeding nematodes (1B, 39%) andpredators (2B, 41%). The two sampling sites in PortoCesareo show a different nematode community sincethey are located near the village of Porto Cesareo,where the urban drainages might support the pres-ence of organic loading tolerating nematode gen-era. The order Trefusiida, family Lauratonematidae,genus Lauratonema is only present at PC7 site, andthe PC12 site reveals a higher abundance of epi-growth feeders and predators (2A + 2B = 58%)rather than deposit-feeding nematodes in fine sand.
514 R. Sandulli et al.
It is assumed that similar morphometrical featuresof nematode species may be anatomical expres-sions of specific adaptations to particular lifestyles.Therefore, the morphometric study of nematodesoffers fundamental information on functional aspectsof the meiofauna system. In this study, the nematodebody width was considered as the morphologicaladaptation to a given lifestyle (interstitial or burrow-ing). The nematode morphometric study shows thatthe low intertidal and very shallow subtidal com-munities were dominated by one morphotype (L <
1500 mm and W < 60 mm; L/W = 26 and 27). Boththese communities are characterised by the familyXyalidae, with the genus Theristus and the genusDaptonema, respectively. The morphometric data onshallow subtidal nematodes show the coexistence oftwo different morphotypes. The first community isrepresented by slender nematodes (500 < L < 2000mm and W < 60 mm; L/W = 23 and 24), the latterby stout nematodes (L < 500 mm and W < 60 mm;L/W = 6), as observed previously by Ratsimbazafy etal. (1994) and Soetaert et al. (2002) The differenceamong the low intertidal and the shallow subtidalin this study is represented by the presence of anematode community with morphotypes L/W = 6at 12–22 m depth. Whereas on the Ligurian shelfand slope (Mediterranean Sea) the stout nematodeassemblage consisted of families Desmoscolecidae(Tricoma spp., 26%, and Desmoscolex spp., 24%) andSelachinematidae (Richtersia spp., 30%) (Soetaertet al. 2002), in our study this morphotype con-sisted mainly of Epsilonematidae (39%: Epsilonema(19%), Perepsilonema (12%), Bathyepsilonema(5%) and Metepsilonema (3%)), Desmoscolecidae(16%: Tricoma (10%) and Desmoscolex (6%)), andSelachinematidae (Richtersia 9%), all belonging tothe order Chromadorida. Our results are supportedby Vanaverbeke et al. (2004) on the shallow subtidalof the Southern North Sea (20 m). The predomi-nance of the epsilonematids in this study is probablydue to the occurrence of coarse sediments imposedby a high hydrodynamic regime. Soetaert et al.(2002) further hypothesised that stout nematodecommunities evolved as an adaptation to reducepredation pressure, as they combined large bodywidth with armoured cuticulae. Similarly, the repre-sentatives of the stout nematodes at shallow subtidalsite of this study combined a stout shape witharmour. The ε-like body shape of epsilonematids,together with the presence of long setae, makes themdifficult to be swallowed by a predator. Moreover,our study reveals that there should be a relationshipbetween body proportions and feeding groups. Thenon-selective deposit feeders feed mainly on bacteriaand they have a small L/W, while the epigrowth
feeders and predators feed on diatoms and othersmall invertebrates, respectively, and have a higherL/W ratio. These results are also supported by thestudy of Tita et al. (1999).
It is concluded that different nematode communi-ties associated with increasing depths, from the lowintertidal, very shallow subtidal to the shallow subti-dal, are present. No changes in nematode diversityand taxonomic indices were revealed in the threeMPAs. In fact, the concept of isocommunities is heremaintained for the Italian nematode assemblages: thesame dominant families and genera were found inthe geographically distant Italian Marine ProtectedAreas. Moreover, it is suggested that the dissimilarityin the taxonomic structure of nematode communi-ties might be dependent on habitat characteristics,and therefore is not necessarily linked to pollution oranthropogenic disturbance (Warwick & Clarke 1995;Clarke & Warwick 1998).
Finally, we suggest the use of a functional descrip-tor of nematode communities, the morphometry, asan alternative and sensible technique for describingand comparing benthic communities (e.g. Drgas etal. 1998; Duplisea 2000).
Acknowledgements
The first two authors wish to acknowledge the sup-port by the Italian Ministry of Education, Universityand Research through PRIN-COFIN (2004) funds.Moreover, the authors recognise the additional sup-port by the MarBEF Network of Excellence ‘MarineBiodiversity and Ecosystem Functioning’, fundedby the Sustainable Development, Global Changeand Ecosystems Programme of the EuropeanCommunity’s Sixth Framework Programme.
References
Blome D, Schleier U, von Bernem K-U. 1999. Analysis of thesmall-scale spatial patterns of free-living marine nematodesfrom tidal flats in the East Frisian Wadden Sea. Marine Biology133:717–726.
Bongers T, Ferris H. 1999. Nematode community structure as abioindicator in environmental monitoring. Tree 14:224–228.
Brown AC, McLachlan A. 1990. Ecology of sandy shores.Amsterdam: Elsevier. 328 pp.
Buchanan JB. 1984. Sediment analysis. In: Holme NA, McIntyreAD, editors. Methods for the study of marine benthos. Oxford:Blackwell Scientific Publications. pp. 41–65.
Clarke KR 1993. Non-parametric multivariate analyses of changesin community structure. Australian Journal of Ecology 18:117–143.
Clarke KR, Gorley RN. 2006. PRIMER v 6b: Usermanual/tutorial. PRIMER-E. Plymouth Marine Laboratory,UK. 91 pp.
Nematode communities patterns in MPAs 515
Clarke KR, Warwick RM. 1998. A taxonomic distinctness indexand its statistical properties. Journal of Applied Ecology35:523–531.
Clarke KR, Warwick RM. 2001. A further biodiversity indexapplicable to species lists: Variation in taxonomic distinctness.Marine Ecology Progress Series 216:265–278.
Coull BC. 1988. Ecology of the marine meiofauna. In: HigginsRP, Thiel H, editors. Introduction to the study of meiofauna.Washington, DC: Smithsonian Institution Press. pp. 18–38.
Coull BC, Herman SS. 1970. Zoogeography and parallellevel-bottom communities of the meiobenthic Harpacticoida(Crustacea, Copepoda) of Bermuda. Oecologia 5:392–399.
Drgas A, Radziejewska T, Warzocha J. 1998. Biomass size spectraof near-shore shallow-water benthic communities in the Gulfof Gdansk (Southern Baltic Sea). P.S.Z.N I: Marine Ecology19:209–228.
Duplisea D. 2000. Benthic organism biomass size-spectra in theBaltic Sea in relation to the sediment environment. Limnologyand Oceanography 45:558–568.
Fabiano M, Marin V, Misic C, Moreno M, Salvo VS,Vezzulli L. 2004. Sedimentary organic matter and bacte-rial community in microtidal mixed beaches of the LigurianSea (NW Mediterranean). Chemistry and Ecology 20:423–435.
Fabiano M, Misic C, Moreno M, Salvo VS, Covazzi A. 2002.Ecological features of Ligurian beaches exposed to differ-ent hydrodynamic forcing. In: Özhan E, editor. Proceedingsof the International MEDCOAST Workshop on Beaches ofthe Mediterranean and Black Sea: Dynamics, Regeneration,Ecology and Management. Kusadası: Middle East TechnicalUniversity, Ankara, Turkey. pp. 201–213.
Fraschetti S, Terlizzi A, Micheli F, Benedetti-Cecchi L, Boero F.2002. Marine protected areas in the Mediterranean: Objectiveseffectiveness and monitoring. P.S.Z.N. I: Marine Ecology23:190–200.
Gheskiere T, Hoste E, Vanaverbeke J, Vincx M, Degraer S. 2004.Horizontal zonation patterns and feeding structure of marinenematode assemblages on a macrotidal, ultra-dissipative sandybeach De Panne, Belgium. Journal of Sea Research 52:211–226.
Gheskiere T, Vincx M, Pison G, Degraer S. 2006. Are strandlinemeiofaunal assemblages affected by a once-only mechanicalbeach cleaning? Experimental findings. Marine EnvironmentalResearch 61:245–264.
Gheskiere T, Vincx M, Urban-Malinga B, Rossano C, ScapiniF, Degraer S. 2005a. Nematodes from wave-dominated sandybeaches: Diversity, zonation patterns and testing of the iso-communities concept. Estuarine, Coastal and Shelf Science62:365–375.
Gheskiere T, Vincx M, Weslawski JM, Scapini F, Degraer S.2005b. Meiofauna as descriptor of tourism-induced changes atsandy beaches. Marine Environmental Research 60:245–265.
Giere O. 2009. Meiobenthology, the microscopic motile fauna inaquatic sediments. 2nd edition. Berlin: Springer-Verlag. 527pp.
Heip C, Vincx M, Vranken G. 1985. The ecology of marine nema-todes. Oceanography and Marine Biology an Annual Review23:399–489.
Jensen P. 1981. Species, distribution and a microhabitat the-ory for marine mud dwelling Comesomatidae (Nematoda) inEuropean waters. Cahiers de Biologie Marine 22:231–241.
Jouk PEH, Martens PM, Schockaert E. 1988. Horizontal dis-tribution of the Platyhelminthes in a sandy beach of theBelgian coast. Fortschritte der Zoologie – Progress in Zoology36:481–487.
Kennedy AD, Jacoby CA. 1999. Biological indicators of marineenvironmental health, meiofauna a neglected benthic compo-nent? Environmental Monitoring and Assessment 54:47–68.
Martens PM 1984. Comparison of three different extractionmethods for Turbellaria. Marine Ecology Progress Series4:229–334.
Martens PM, Jouk PEH, Huys R, Herman R. 1985. Short note onthe relative abundance of the Turbellaria in the meiofauna ofsandy habitats in the Southern Bight of the North Sea and onBelgian sandy beaches. In: Grieken R van, Wollast R, editors.Progress in Belgian oceanographic research. Brussels: RoyalAcademy of Sciences. pp. 341–342.
McLachlan A. 1980. Intertidal zonation of macrofauna and strat-ification of meiofauna on high energy sandy beaches in theEastern Cape, South Africa. Transactions of the Royal Societyof South Africa 44:2213–2230.
McLachlan A, Jaramillo E. 1995. Zonation on sandy beaches.Oceanography and Marine Biology an Annual Review 33:305–335.
McLachlan A, Turner I. 1994. The interstitial environment ofsandy beaches. Marine Ecology 15:177–221.
Menn I. 2002. Beach morphology and food web structure:Comparison of an eroding and accreting sandy shore in theNorth Sea. Helgoland Marine Research 56:177–189.
Moreno M, Ferrero TJ, Granelli V, Marin V, Albertelli G, FabianoM. 2006. Across shore variability and trophodynamic featuresof meiofauna in microtidal beaches of the NW Mediterranean.Estuarine Coastal and Shelf Science 66:357–367.
Moreno M, Granelli V, Albertelli G, Fabiano M. 2005.Meiofaunal distribution in microtidal mixed beaches ofthe Ligurian Sea (NW Mediterranean). Meiofauna Marina14:131–137.
Olafsson E, 1991. Intertidal meiofauna on four sandy beaches inIceland. Ophelia 33:55–65.
Platt HM, Warwick RM. 1980. The significance of free-livingnematodes to the littoral Ecosystem. In: Price JH, IrvineDEG, Farnham WF, editors. The shore environment, Vol.2. Ecosystem. London and New York, NY: Academic Press.pp. 729–759.
Platt HM, Warwick RM. 1983. Free-living marine nematodes.Part. I. British Enoplids. Synopses of the British fauna (newseries), No. 28. Cambridge: Cambridge University Press. 307pp.
Platt HM, Warwick RM. 1988. Free-living marine nematodes.Part. II. British Chromadorids. Synopses of the British fauna(new series), No. 38. Leiden: EJ Brill/Dr W. Backhuys. 502 pp.
Por FD. 1964. A study of the Levantine and PontineHarpacticoida Crustacea, Copepoda. ZoologischeVerhandelingen Leiden 64:1–128.
Ratsimbazafy R, Boucher G, Dauvin JC. 1994. Mesures indirectesde la biomasse des nématodes du meiobenthos subtidal de laManche. Les Cahiers de Biologie Marine 35:511–523.
Rodriguez JG, Lastra M, Lopez J. 2003. Meiofauna distributionalong a gradient of sandy beaches in northern Spain. Estuarine,Coastal and Shelf Science 58:63–69.
Rodriguez JG, Lopez J, Jaramillo E. 2001. Community structureof the intertidal meiofauna along a gradient of morphody-namic sandy beach types in southern Chile. Revista Chilenade Historia Natural 74:885–897.
Sandulli R, De Leonardis C, Vanaverbeke J. 2010. Meiobenthiccommunities in the shallow subtidal of three Italian marineprotected areas. Italian Journal of Zoology 77:186–196.
Sandulli R, de Nicola M. 1991. Responses of meiobenthiccommunities along a gradient of sewage pollution. MarinePollution Bulletin 22:463–467.
516 R. Sandulli et al.
Sandulli R, Pinckney J. 1999. Patch sizes and spatial patternsof meiobenthic copepods and benthic microalgae in sandysediments: A microscale approach. Journal of Sea Research41:179–187.
Schratzberger M, Gee JM, Rees HL, Boyd SE, Wall CM. 2000.The structure and taxonomic composition of sublittoral meio-fauna assemblages as an indicator of the status of marine envi-ronments. Journal Marine Biology Association of the UnitedKingdom 80:969–980.
Soetaert K, Muthumbi A, Heip C. 2002. Size and shape of oceanmargins nematodes: morphological diversity and depth-relatedpatterns. Marine Ecology Progress Series 242:179–193.
StatSoft Inc. 1995. STATISTICA for the Windows OperatingSystem. Release 5.5 Statsoft Inc., Tulsa, OK, USA.
Steyaert M, Deprez T, Raes M, Bezerra T, Demesel I, Derycke S,Desmet G, Fonceca G, de Assunção Franco M, Gheskiere T,et al. 2005. Electronic key to the free-living marine Nematodes.www.nemys.ugent.be.
Steyaert M, Garner N, Van Gansbeke D, Vincx M. 1999.Nematode communities from the North Sea, environmentalcontrols on species diversity and vertical distribution within thesediment. Journal Marine Biology Association of the UnitedKingdom 79:253–264.
Tita G, Vincx M, Desrosiers G. 1999. Size spectra, body widthand morphotypes of intertidal nematodes: An ecological inter-pretation. Journal of the Marine Biology Association of theUnited Kingdom 79:1007–1015.
Vanaverbeke J, Gheskiere T, Vincx M. 2000. The meiobenthos ofsubtidal sandbanks on the Belgian continental shelf (SouthernBight of the North Sea). Estuarine, Coastal and Shelf Science52:637–649.
Vanaverbeke J, Steyaert M, Soetaert K, Rousseau V, VanGansbeke D, Parent JY, Vincx M. 2004. Changes in mor-phometric characteristics of nematode communities duringa spring phytoplankton bloom deposition. Journal of SeaResearch 52:281–292.
Vanaverbeke J, Steyaert M, Vanreusel A, Vincx M. 2003.Nematode biomass spectra as descriptors of functional changesdue to human and natural impact. Marine Ecology ProgressSeries 249:157–170.
Vincx M. 1996. Meiofauna in marine and freshwater sediments.In: Hall GS, editor. Methods for the examination of organ-ismal diversity in soils and sediments. Wallingford: CABInternational. pp. 187–195.
Warwick RM, Clarke KR. 1995. New ‘biodiversity’ mea-sures reveal a decrease in taxonomic distinctness withincreasing stress. Marine Ecology Progress Series 129:301–305.
Warwick RM, Clarke KR. 1998. Taxonomic distinctness andenvironmental assessment. Journal of Applied Ecology 35:532–543.
Warwick RM, Clarke KR. 2001. Practical measures ofmarine biodiversity based on the relatedness of species.Oceanography and Marine Biology an Annual Review 39:207–231.
Warwick RM, Platt HM, Somerfield PJ. 1998. Free-living marinenematodes. Part. III. Monhysterids. Synopses of the Britishfauna (new series), No. 53. Leiden: EJ Brill/Dr W. Backhuys.296 pp.
Wieser W. 1953. Die Bezichung zwischen Mundhöhlengestalt,Ernährungsweise und Vorkommen freilebenden marinenNematoden. Arkiv für Zoology 4:439–483.