genomic correlates of relationship qtl involved in fore- versus hind limb divergence in mice
TRANSCRIPT

Genomic Correlates of Relationship QTL Involved in
Fore- versus Hind Limb Divergence in Mice
Mihaela Pavlicev1,2,*, Gunter P. Wagner3, James P. Noonan4, Benedikt Hallgrımsson5, andJames M. Cheverud6
1Konrad Lorenz Institute for Evolution and Cognition Research, Altenberg, Austria2Department of Pediatrics, Cincinnati Children‘s Hospital Medical Center, Cincinnati, Ohio3Yale Systems Biology Institute and Department of Ecology and Evolutionary Biology, Yale University4Department of Genetics, Yale University School of Medicine5Department of Cell Biology and Anatomy, The McCaig Institute for Bone and Joint Health and the Alberta Children’s Hospital Research
Institute for Child and Maternal Health, University of Calgary, Calgary, Canada6Department of Anatomy and Neurobiology, Washington University
*Corresponding author: E-mail: [email protected].
Accepted: September 13, 2013
Abstract
Divergence of serially homologous elements of organisms is a common evolutionary pattern contributing to increased phenotypic
complexity. Here, we study the genomic intervals affecting the variational independence of fore- and hind limb traits within an
experimentalmousepopulation.Weuseanadvanced intercrossof inbredmouse strains tomapthe loci associatedwith thedegreeof
autonomybetween fore-andhind limb longbone lengths (loci affecting the relationshipbetween traits, relationshipquantitative trait
loci [rQTL]). These locihavebeenproposedto interact locallywith theproductsofpleiotropicgenes, thereby freeing the local trait from
the variational constraint due to pleiotropic mutations. Using the known polymorphisms (single nucleotide polymorphisms [SNPs])
between the parental strains, we characterized and compared the genomic regions in which the rQTL, as well as their interaction
partners (intQTL), reside. We find that these two classes of QTL intervals harbor different kinds of molecular variation. SNPs in rQTL
intervals more frequently reside in limb-specific cis-regulatory regions than SNPs in intQTL intervals. The intQTL loci modified by the
rQTL, in contrast, show the signature of protein-coding variation. This result is consistent with the widely accepted view that protein-
coding mutations have broader pleiotropic effects than cis-regulatory polymorphisms. For both types of QTL intervals, the underlying
candidate genes are enriched for genes involved in protein binding. This finding suggests that rQTL effects are caused by local
interactions among the products of the causal genes harbored in rQTL and intQTL intervals. This is the first study to systematically
document the population-level molecular variation underlying the evolution of character individuation.
Key words: autonomy, pleiotropy, constraint, genetic interaction, character.
Introduction
The individuation and divergence of parts is fundamental in
the evolution of complex organisms, whether at the level of
cell types, body segments (e.g., in arthropods), body sides
(asymmetry), repeated body parts (fore- and hind limbs), or
sexes (sexual dimorphism) (Pavlicev and Wagner 2012). The
underlying principle is intuitive: diversification into genetically
individualized parts requires that the developmental effects of
the genes shared between similar parts become modified
differently in the diverging parts. At the population level, the
pleiotropic mutations in shared genes cause parts to covary
(Lande 1980). Accordingly, the evolutionary divergence of
body parts is associated with decreasing genetic covariance
of these parts (Berg 1960; Hansen et al. 2003; Young et al.
2010). The evolution of character covariance is thus a key
process in evolution of complex organisms. We know from
comparative studies that evolution of covariance is common
and has adaptive value by refocusing the direction in which
variation is produced (Porto et al. 2009; Young et al. 2010;
Grabowski et al. 2011). Specifically, integration of phenotypic
characters is advantageous when the characters are under
correlated selective pressure (Pavlicev et al. 2011). In contrast,
GBE
� The Author(s) 2013. Published by Oxford University Press on behalf of the Society for Molecular Biology and Evolution.
This is an Open Access article distributed under the terms of the Creative Commons Attribution Non-Commercial License (http://creativecommons.org/licenses/by-nc/3.0/), which permits
non-commercial re-use, distribution, and reproduction in any medium, provided the original work is properly cited. For commercial re-use, please contact [email protected]
1926 Genome Biol. Evol. 5(10):1926–1936. doi:10.1093/gbe/evt144 Advance Access publication September 23, 2013

a low correlation of mutational effects on the characters is
beneficial when independent selection responses are required
(Cheverud 1996; Wagner 1996). An example of divergence
is limb evolution in birds and bats where the forelimbs are
selected for flight, whereas the hind limbs are selected for
perching or walking (Young and Hallgrimsson 2005). But
what mechanism enables such divergence?
Phenotypic effects of genes are mediated by physical inter-
actions among gene products in development (regulation,
protein interaction, signaling, etc.). Thus, it is plausible to sug-
gest that specific genetic interactions, rather than specific
genes per se, constitute the unique genetic basis of individual
characters. A well-established example is the role of Hox genes
in diversification of arthropod body plan. Hox genes determine
the identity of body regions along anterior–posterior body
axis. Yet, their numerous effects on morphology of segments,
such as whether and which extremities are produced, are not
inherent to Hox genes alone but are mediated by the interac-
tions with local cofactors (Hughes and Kaufman 2002; Mann
et al. 2009; Ohde et al. 2013). These local interactions of local
cofactors with Hox genes specify activation or suppression of
downstream genes and the segment-specific morphology.
Similar local modification is assumed for vertebrate limbs
(Ruvinsky and Gibson-Brown 2000; Minguillon et al. 2009;
Duboc and Logan 2011a; reviewed in Duboc and Logan
2011b). Moreover, evolution of local interaction may be in-
volved in the initial individuation of a character, for example,
the sex comb in Drosophila (Kopp 2011). A pattern of local
interactions is furthermore manifest in protein interaction net-
works, where gene products are often involved in multiple
characters, yet in very specific interactions in each character
(Hanetal. 2004; Luscombeet al. 2004;Bossi andLehner2009).
It is, however, unknown how such topology of develop-
mental interactions evolves and how it relates to the
variational patterns at the population level. Generally, devel-
opmental regulation is thought to naturally result in pleiotropy
of, and epistasis between, the effects of genetic polymor-
phisms on the phenotypic traits (Gibson 1996; Gjuvsland
et al. 2007). Here, we build on a recent model of evolution
of pleiotropy by epistatic interactions (Pavlicev and Wagner
2012). This model suggests that covariance evolves in
two steps: a selection response in a focal trait and epistatic
compensatory modification of correlated side effects in
another trait (fig. 1B); hence the name selection–pleiotropy–
compensation or SPC model. Due to epistasis, the contribu-
tion of pleiotropic mutation to trait covariance changes from
pre- to post-compensatory genetic background. In this model,
genetic individuation of characters occurs by coadaptation
between the pleiotropic and the local compensatory gene.
When alleles at the pleiotropic and the compensatory locus
segregate, such topology is detected as genetic variation in
pleiotropic effects.
The underlying genetic loci can be mapped using relation-
ship quantitative trait locus (rQTL) mapping, combined with
the mapping of the loci interacting with the rQTL, the
so-called intQTL (Cheverud et al. 2004; Pavlicev et al. 2008;
Leamy et al. 2009). The capacity of this model to respond to
selection and indeed change covariance has been modeled in
a population genetic context previously (Pavlicev et al. 2011).
Due to the nature of mapping, the resulting two categories
of mapped loci differ in the way they affect the phenotypic
variation, either conditional on the second trait (rQTL) or con-
ditional on the genotype at the second locus (intQTL). SPC
model provides the hypothesis how this specific variation
may be produced, namely as a result of trait-specific modifi-
cation of more global effect. Here, we show that the loci
involved indeed have genomic signatures supporting this
model. The loci modified by the rQTL, the intQTL, include ge-
nomic regions with high density of nonsynonymous coding
mutations, and rQTL, are more likely to have cis-regulatory
variation. Furthermore, rQTL intervals are enriched for single-
nucleotide polymorphism (SNPs) in limb-specific H3K27ac
marks, representing putative limb-specific enhancers. This is,
to our knowledge, the first study to systematically connect the
variational study of trait divergence to its genomic basis.
Materials and Methods
Population and Phenotyping
Mapping was conducted in the 34th generation of intercross
consisting of 1,134 individuals (Wustl: LG, SM-G34). The in-
tercross was initiated by crossing inbred house mouse strains
LG/J and SM/J that were previously selected for high and low
body weight at 60 days of age. The intercross and the specific
generation are described in detail in Norgard et al. (2008,
FIG. 1.—The topology and evolution of pleiotropy. (A) The phenotypic
domain of pleiotropic locus (intQTL; blue) is modified by the local action of
rQTL (red). (B) Evolutionary scenario: selection on trait 1 (black arrow)
results in a change in pleiotropic locus, which propagates to trait 2 (U-
shaped arrow) and is followed in the next step by a local compensation of
side effects in non-focal traits.
Genomics of Evolutionary Limb Divergence in Mice GBE
Genome Biol. Evol. 5(10):1926–1936. doi:10.1093/gbe/evt144 Advance Access publication September 23, 2013 1927
2011). The limb bones on the right side were removed at
necropsy, and the lengths of the femur, tibia, humerus, and
ulna were measured immediately to the nearest 0.01 mm.
As the mice were part of dietary study, the effect of diet as
well as of sex was removed by multiple regression of these
variables on the phenotypic traits and addition of the residuals
to the trait means.
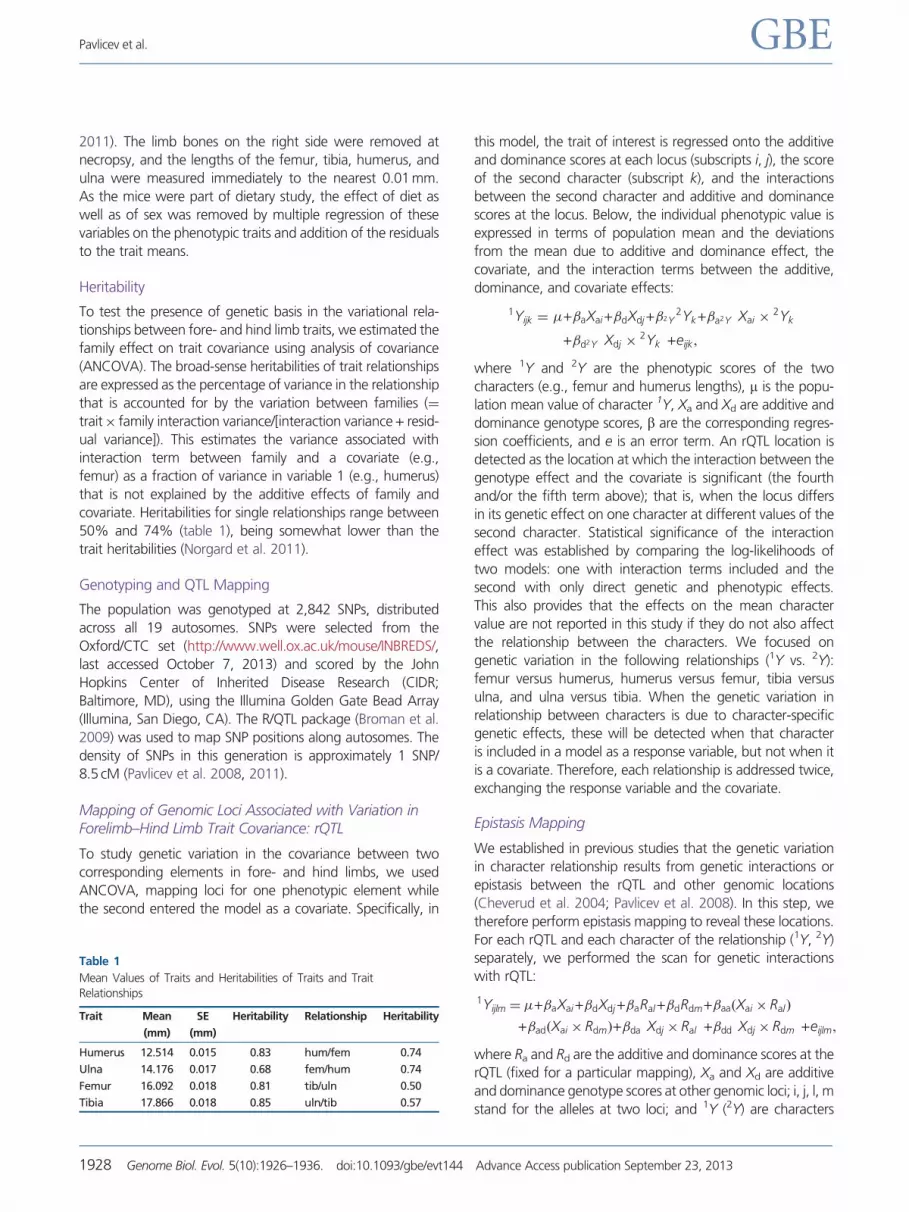
Heritability
To test the presence of genetic basis in the variational rela-
tionships between fore- and hind limb traits, we estimated the
family effect on trait covariance using analysis of covariance
(ANCOVA). The broad-sense heritabilities of trait relationships
are expressed as the percentage of variance in the relationship
that is accounted for by the variation between families (¼
trait� family interaction variance/[interaction variance + resid-
ual variance]). This estimates the variance associated with
interaction term between family and a covariate (e.g.,
femur) as a fraction of variance in variable 1 (e.g., humerus)
that is not explained by the additive effects of family and
covariate. Heritabilities for single relationships range between
50% and 74% (table 1), being somewhat lower than the
trait heritabilities (Norgard et al. 2011).
Genotyping and QTL Mapping
The population was genotyped at 2,842 SNPs, distributed
across all 19 autosomes. SNPs were selected from the
Oxford/CTC set (http://www.well.ox.ac.uk/mouse/INBREDS/,
last accessed October 7, 2013) and scored by the John
Hopkins Center of Inherited Disease Research (CIDR;
Baltimore, MD), using the Illumina Golden Gate Bead Array
(Illumina, San Diego, CA). The R/QTL package (Broman et al.
2009) was used to map SNP positions along autosomes. The
density of SNPs in this generation is approximately 1 SNP/
8.5 cM (Pavlicev et al. 2008, 2011).
Mapping of Genomic Loci Associated with Variation inForelimb–Hind Limb Trait Covariance: rQTL
To study genetic variation in the covariance between two
corresponding elements in fore- and hind limbs, we used
ANCOVA, mapping loci for one phenotypic element while
the second entered the model as a covariate. Specifically, in
this model, the trait of interest is regressed onto the additive
and dominance scores at each locus (subscripts i, j), the score
of the second character (subscript k), and the interactions
between the second character and additive and dominance
scores at the locus. Below, the individual phenotypic value is
expressed in terms of population mean and the deviations
from the mean due to additive and dominance effect, the
covariate, and the interaction terms between the additive,
dominance, and covariate effects:
1Yijk ¼ �+�aXai+�dXdj+�2Y2Yk+�a2Y Xai �
2Yk
� �
+�d2Y Xdj �2Yk
� �+eijk,
where 1Y and 2Y are the phenotypic scores of the two
characters (e.g., femur and humerus lengths), m is the popu-
lation mean value of character 1Y, Xa and Xd are additive and
dominance genotype scores, b are the corresponding regres-
sion coefficients, and e is an error term. An rQTL location is
detected as the location at which the interaction between the
genotype effect and the covariate is significant (the fourth
and/or the fifth term above); that is, when the locus differs
in its genetic effect on one character at different values of the
second character. Statistical significance of the interaction
effect was established by comparing the log-likelihoods of
two models: one with interaction terms included and the
second with only direct genetic and phenotypic effects.
This also provides that the effects on the mean character
value are not reported in this study if they do not also affect
the relationship between the characters. We focused on
genetic variation in the following relationships (1Y vs. 2Y):
femur versus humerus, humerus versus femur, tibia versus
ulna, and ulna versus tibia. When the genetic variation in
relationship between characters is due to character-specific
genetic effects, these will be detected when that character
is included in a model as a response variable, but not when it
is a covariate. Therefore, each relationship is addressed twice,
exchanging the response variable and the covariate.
Epistasis Mapping
We established in previous studies that the genetic variation
in character relationship results from genetic interactions or
epistasis between the rQTL and other genomic locations
(Cheverud et al. 2004; Pavlicev et al. 2008). In this step, we
therefore perform epistasis mapping to reveal these locations.
For each rQTL and each character of the relationship (1Y, 2Y)
separately, we performed the scan for genetic interactions
with rQTL:
1Yijlm ¼ �+�aXai+�dXdj+�aRal+�dRdm+�aa Xai � Ralð Þ
+�ad Xai � Rdmð Þ+�da Xdj � Ral
� �+�dd Xdj � Rdm
� �+eijlm,
where Ra and Rd are the additive and dominance scores at the
rQTL (fixed for a particular mapping), Xa and Xd are additive
and dominance genotype scores at other genomic loci; i, j, l, m
stand for the alleles at two loci; and 1Y (2Y) are characters
Table 1
Mean Values of Traits and Heritabilities of Traits and Trait
Relationships
Trait Mean
(mm)
SE
(mm)
Heritability Relationship Heritability
Humerus 12.514 0.015 0.83 hum/fem 0.74
Ulna 14.176 0.017 0.68 fem/hum 0.74
Femur 16.092 0.018 0.81 tib/uln 0.50
Tibia 17.866 0.018 0.85 uln/tib 0.57
Pavlicev et al. GBE
1928 Genome Biol. Evol. 5(10):1926–1936. doi:10.1093/gbe/evt144 Advance Access publication September 23, 2013

involved in varying relationship. The locus at which either
of the interaction effects (terms 5–8 above) were significant
is detected as epistatically interacting with the particular rQTL.
As above, the statistical significance of the interaction effects
was established by comparing the log-likelihoods of the model
with interaction terms included, with the second model with
only direct genetic effects of either locus (i.e., only including
first four terms above). The chromosome of rQTL was
excluded from the scan to avoid associations due to linkage.
Single locus significance thresholds for the association
between SNP variation and phenotypes were adjusted for
multiple tests to avoid false positives. The adjustment of the
threshold significance value was calculated using the correla-
tion between genotypes along the chromosomes, following
Li and Ji (2005), resulting in chromosome-wide thresholds
of 2.71–3.13 LPR (LPR¼�log10[probability of observing the
particular F-ratio under null hypothesis of no effect on pheno-
type]). These chromosome-wide thresholds were used in rQTL
mapping as well as in epistasis mapping (discussed later). Note
that when an epistasis scan involves a fixed, previously deter-
mined, position, the threshold equivalent of single locus scan
can be applied. In all subsequent analyses, we refer to the QTL
interval meaning the interval around the peak position and
including the confidence region spanning one unit LPR drop
from the peak.
We used a mixed-effects linear regression model (R; version
2.9.0; package lme4) to estimate the above models. As the
individuals in advanced intercross generations are variably
related, we furthermore included family as a random variable.
Genomic Analyses of QTL Regions
We identified the genome coordinates of SNPs flanking the
QTL intervals and downloaded the sequence (coding regions,
introns, 50-UTR, 30-UTR, and 10 kb upstream and downstream
of the genes) for these genomic intervals from the University
of California Santa Cruz Genome Bioinformatics website
(http://genome.ucsc.edu/ [last accessed October 7, 2013]; as-
sembly mm9). To derive the polymorphism densities in differ-
ent genic regions, we intersected QTL intervals and associated
genomic annotations with SNPs at which the parental lines
LG/J and SM/J differ. These SNPs were previously identified by
comparing the full genomic sequences of LG/J and SM/J with
C57BL6/J (Lawson et al. 2011). This list of SNPs is available at
dbSNP (Sherry et al. 2001) under the handle “cheverud.” We
used transcription factor binding site (TFBS) track (Yale/
Stanford ENCODE [Euskirchen et al. 2007]) in UCSC
genome browser to retrieve predicted TFBSs. Intersections
were performed using UCSC Table browser, custom R scripts
(ver. 2.15.1), and Galaxy (Giardine et al. 2005; Blankenberg
et al. 2010).
To relate the coding SNPs with the numbers of synonymous
and nonsynonymous sites in the coding regions (dN/dS),
we extracted the coding exons within the QTL intervals from
the UCSC and used the maximum likelihood approach in
program codonml (package PAML [Yang 1997]) to assess
the synonymous and nonsynonymous sites.
All analyses of gene ontology enrichment within sets of
genes were conducted with Gostat (http://gostat.wehi.edu.
au/, last accessed October 7, 2013 [Beissbarth and Speed
2004]), using Mouse Genome Informatics (MGI) gene collec-
tion and the false discovery rate correction for multiple testing.
To inspect the cis-regulatory regions we used 1) MEME and
TOMTOM for the analysis of enriched binding motifs and their
comparison with the motif databases (for both: http://meme.
nbcr.net/meme/, last accessed October 7, 2013) and 2) GREAT
to examine the genes potentially regulated by the identified
polymorphic cis-regulatory regions (http://bejerano.stanford.
edu/great/, last accessed October 7, 2013).
The significance of enrichment of various elements was
tested using hypergeometric test. For example, the enrich-
ment of enhancers in rQTL was calculated by estimating the
probability of detecting an overlap of k enhancers in n¼ loci
(or total sequence length), given a total number of enhancers
K in a total genome.
Results and Discussion
Genetic Basis of Trait Relationship: rQTL and intQTL
We measured femur and tibia lengths to represent the hind
limb and humerus and ulna lengths for the forelimb. We refer
to these measurements as traits representing the characters,
the fore- and hind limbs. The relationships refer to the varia-
tional relationships between the corresponding traits in the
fore- and hind limbs.
We confirmed the genetic nature of differences in varia-
tional relationships between fore- and hind limb traits by
estimating the family effect on trait covariance (table 1). To
study the genetic basis of covariance in more detail, we map
the rQT loci affecting the variational relationships between
the corresponding bone elements in the fore- and hind limb
(humerus/femur, ulna/tibia). In rQTL mapping, the genotypic
value is the regression coefficient of one trait on the other in a
given genotype, rather than the trait mean as in standard
mapping. Subsequent epistasis mapping reveals loci (intQTL)
interacting with rQTL (Pavlicev et al. 2008, 2011). Mappings
were carried out in the 34th generation of the intercross
between small (SM/J) and large (LG/J) mouse inbred lines.
rQTL
Overall, 26 distinct rQTL exceed the chromosome-wide detec-
tion thresholds. Of these, 16 affect the relationship between
the stylopodial traits (femur, humerus) and 10 the relationship
between zeugopodial traits (ulna, tibia). The loci positions,
confidence intervals, and trait relationships affected are
detailed in supplementary table S1, Supplementary Material
online. We find no overlap between stylopodial and
Genomics of Evolutionary Limb Divergence in Mice GBE
Genome Biol. Evol. 5(10):1926–1936. doi:10.1093/gbe/evt144 Advance Access publication September 23, 2013 1929

zeugopodial rQTL, suggesting that a different set of loci
modify pleiotropic effects in distal and proximal limb parts.
Only three rQTL overlap with main-effect loci, which were
reported for this population in Norgard et al. (2011): r.4 for
humerus/femur, r.23 for tibia/ulna, and r.28 for femur/-
humerus overlap with main-effect loci Lbn4.3 for femur and
humerus, Lbn1.3 for tibia, and Lbn14.1 for femur and hu-
merus. This suggests that rQTL tend to have, at most, small
direct effects on the traits, a pattern described previously
(Pavlicev et al. 2008).
The genomic intervals within 1 LOD (logarithm of the odds)
drop of the peak signal range in length from 0.11 to 11.49
Mbp (median 2.52), encompassing 4–158 annotated genes
(median 18). Of a total of 983 genes in all rQTL, 569 are
polymorphic between the LG/J and SM/J lines (median
11/locus). This list includes genes with SNPs in exons, introns,
UTR regions, and in the 10 kb regions up- and downstream of
the gene. 73–83% of the polymorphic genes within rQTL
carry SNPs in intronic regions, and those within 10 kb
up- and downstream of the gene, SNPs in UTR regions are
found in 34% (30UTR) and 16% (50UTR) and nonsynonymous
exonic SNPs are found in 29% of the polymorphic genes. SNPs
in coding regions represent 0.2% of all polymorphisms in the
rQTL intervals. According to the MGI database, at least 129
(23%) of the 569 polymorphic genes in rQTL intervals have
known expression in limbs in development (table 3).
For feasibility, we include a subset of 12 nonoverlapping
rQTL in epistasis scans for interactions with rQTL. These loci
were chosen due to the strongest association with traits.
The description of the intervals (supplementary table S1,
Supplementary Material online) and the intersection with
gene expression data (discussed later) nevertheless refer to
the complete set of 26 rQTL.
intQTL
We mapped epistatic interactions with each of the 12 rQTL to
uncover genes modified by the rQTL. For example, for each
rQTL detected for the relationship humerus/femur, we
scanned for interactions between the rQTL and other loci,
separately for the effects on humerus and femur. This scan
reveals loci, at which the effect on the trait changes with the
genotype at rQTL. We detected 48 intQTL, including 11 loci
whose interactions with rQTL affect ulna, 8 for tibia, 14 for
humerus, and 15 for femur (on average 4 loci/rQTL). All but
four interactions detectably affect only one trait of the rela-
tionship (92%). Exceptions are two interactions affecting
humerus and femur and two interactions affecting ulna and
tibia (supplementary table S2, Supplementary Material online);
however, the effect size or the pattern of shared interactions
differ between traits (i.e., whether additive� additive, addi-
tive�dominance, etc., interaction is significant [Routman and
Cheverud 1997]).
The genomic intervals within 1-LOD drop of the peak signal
range for intQTL from 0.4 to 12.7 Mbp (median 1.79 Mbp). Of
the total of 1,371 genes within intQTL, 721 (median 12/locus)
are polymorphic between the parental lines, in intronic,
exonic, 30-UTR, 50-UTR region, or in the 10 kbp intervals
up- or downstream from the gene (supplementary table S2,
Supplementary Material online). At least 253 of the polymor-
phic genes (supplementary table S3, Supplementary Material
online) are expressed in limbs during development (MGI).
Furthermore, 22 of 48 intQTL (46%) overlap with known
QTL for bone defects or density, long bone length, body
size, or growth. This is noteworthy as these studies involved
strains with distinct genetic variation. Also, the known loss-of-
function mutations in the intQTL include bone (42 genes),
growth (84 genes), and limb-specific defects (30 genes).
Only three intQTL (int.13, int.107, and int. 42) overlap with
the main effect loci in the same population (Lbn2.1c, Lbn3.2a,
and Lbn18.1a [Norgard et al. 2011]). All three have been de-
tected as pleiotropic for the trait pair of concern.
Genomic Characterization of the rQTL and intQTLIntervals
In the genomic analyses, we take advantage of the available
information on SNPs between the parental strains (table 2).
We compare the distribution of SNPs in both sets of genomic
intervals, with the rationale that the pattern of SNPs shared
among and distinct between the rQTL and intQTL reveals the
role of the two sets of loci and potentially the molecular mech-
anisms of trait individuation.
The rQTL intervals are on average longer than intQTL (sup-
plementary tables S1 and S2, Supplementary Material online),
mostly due to longer intergenic regions in rQTL. The relative
lengths of exonic, intronic, and UTR regions are similar in both
types (fig. 2). The loci are also similar in GC content (rQTL:
median 0.41, range 0.37–0.52; intQTL: median 0.42, range
0.37–0.48) and in distribution along the chromosomes (sup-
plementary fig. S1, Supplementary material online). The GC
content is further uncorrelated with the level of polymorphism
in either set of loci.
SNP Densities in Genic Subregions
To understand whether SNP densities vary consistently across
all subregions of the intervals, we tested correlations of SNP
densities between the subregions (e.g., exons, introns, and
UTRs) within and between the two sets of loci (fig. 3B). If a
subregion is related to the function of a QTL type, for example,
rQTL, we expect that its SNP density will not follow the over-
all variation of SNP densities across the other subregions.
For rQTL, the SNP densities are highly positively correlated
across most subregions, i.e., loci either have high or low
SNP densities across all subregions. The exceptions are intronic
regions, with lower or no correlation with other regions.
This is different in intQTL, where the correlations between
Pavlicev et al. GBE
1930 Genome Biol. Evol. 5(10):1926–1936. doi:10.1093/gbe/evt144 Advance Access publication September 23, 2013

the SNP densities in most regions are also uniformly high, the
clear exception being the exonic nonsynonymous positions.
These are uncorrelated with SNP densities in all other subre-
gions (fig. 3B).
The correlations of SNP densities between the pairs of
interacting rQTL–intQTL reveal that rQTL with high SNPs
density in 30UTR tend to interact with intQTL with high density
of SNPs in transcription factor binding sites. The implications
of this observation are unclear and will be examined in future
studies (fig. 3B).
Figure 4 shows single-gene nonsynonymous versus synon-
ymous substitution rates (dN/dS ratio) within rQTL and intQTL.
Although the bulk of genes in rQTL and intQTL have compa-
rable distribution of dN/dS, single genes in intQTL consistently
lie above the cloud, indicating that intQTL harbor genes with
higher relative density of nonsynonymous SNPs. We also ob-
serve a trend to higher density of SNPs in rQTL for most re-
gions, except for the nonsynonymous exonic SNPs. This effect
is weak, yet consistent across the regions (fig. 3A; six genic
regions analyzed; P¼ 0.55¼ 0.031). Together, these results
demonstrate a distinct character of exonic nonsynonymous
variation in intQTL and intronic variation in rQTL. Note that
the mutations in coding regions are thought to be associated
with higher pleiotropy on average than the mutations in
Table 2
Overview of Genomic Analyses and Results
Feature rQTL intQTL
Median length (range) 2.52 (0.11–11.5) Mbp 1.79 (0.42–12.7) Mbp
GC content (range) 0.41 (0.37–0.52) 0.42 (0.37–0.48)
Interval composition
Intergenic 67.7% 60.1%
UTR 1.4% 1.9%
Coding exon 1.1% 1.2%
Intron 29.8% 37.1%
SNP density (median)
nsyn SNP/N 5.53 E�4 (0–0.01) 5.96 E�4 (0–0.02)
syn SNP/S 4.54 E�3 (0–0.05) 4.42 E�3 (0–0.04)
SNP/intron 2.94 E�1 1.14 E�3
SNP/30-UTR 6.50 E�3 6.74 E�4
SNP/50-UTR 2.95 E�3 6.84 E�2
SNP/TFBS 1.46 E�3 1.20 E�3
Correlation of sequence-type SNP
densities
High correlation of SNP densities between all parts
of the sequence, except with introns
High correlation of SNP densities between all
parts of the sequence, except with exons
Overlap with genes differentially
expressed in limbs (Cotney
et al. 2012)
22 genes (P¼6.2 E�5) 30 genes (P¼2.1 E�7)
Overlap with limb-specific en-
hancers (Cotney et al. 2012)
Total enhancers: 535; polymorphic: 224 (high over-
lap); polymorphic enhancers present in 70% rQTL
Total enhancers: 1,100; polymorphic: 140; poly-
morphic enhancers present in 12% intQTL
Overlap with limb-type -specific
enhancers (Cotney et al. 2012)
Total enhancers: 39; polymorphic: 7; polymorphic en-
hancers present in 15% rQTL
Total enhancers: 69; polymorphic: 8; polymorphic
enhancers present in 8% intQTL
FIG. 2.—Composition of QTL intervals in relationship and interaction loci. The mean proportions of sequence types within the rQTL and intQTL. Note that
intQTL have greater portion of introns and rQTL greater portion of intergenic regions (“rest”).
Genomics of Evolutionary Limb Divergence in Mice GBE
Genome Biol. Evol. 5(10):1926–1936. doi:10.1093/gbe/evt144 Advance Access publication September 23, 2013 1931

FIG. 3.—SNP densities in rQTL and intQTL. (A) The density of SNPs in subregions, in rQTL and intQTL. Note the low density of SNPs in rQTL nonsynon-
ymous exonic sites, despite a general trend toward higher SNP densities in rQTL. (B) The Pearson correlation between SNP densities within and across
interaction partners. Within-QTL type correlations are in the upper left for intQTL and lower right for rQTL and are higher than the correlations between the
corresponding interacting loci. All within-intQTL correlations with nonsynonymous SNP density and all within-intQTL correlations with intronic SNP density
are low. This implies a divergence of SNP pattern in rQTL introns and intQTL exons (r.: rQTL, int.: intQTL, s.exon: synonymous sites, ns.exon: nonsynonymous
sites, sign: significant at the 95% confidence level).
FIG. 4.—Exonic SNP densities in rQTL and intQTL. Distribution of dN/dS in coding genes in both intervals. Genes from rQTL are shown as red triangles and
genes from intQTL intervals as black dots. Although many genes from both intervals overlap, the genes high in nonsynonymous substitution rate are genes
from intQTL intervals.
Pavlicev et al. GBE
1932 Genome Biol. Evol. 5(10):1926–1936. doi:10.1093/gbe/evt144 Advance Access publication September 23, 2013

noncoding regions (Prud’homme et al. 2007). The detected
pattern of exonic SNPs in intQTL and intronic SNPs in rQTL thus
is consistent with the prediction of the SPC model (Pavlicev
and Wagner 2012) that intQTL cause more pleiotropic and
rQTL more character-specific variation.
Consistent differences between QTL types provide evi-
dence that heritable variation in this cross is due to many,
rather than single, SNPs in each QTL interval. If, in contrast,
the variation were due to single mutations, the signal would
be overwhelmed by other variation and we would not observe
consistent patterns of SNP density and distribution. Although
we cannot exclude single large-effect mutations, these alone
cannot explain the observed pattern. The two intercrossed
lines thus differ in the multiple alleles involved in trait diver-
gence. Our interpretation of this result is that opposite selec-
tion on body size in the parental lines caused changes in
size-related pleiotropic genes, and the differences among
limbs were maintained within each line by line-specific rQTL
changes. These changes nevertheless affected the similar
pathways in both lines.
It is perhaps not surprising that the limb divergence is a
complex evolutionary step involving many genetic factors.
This may complicate the search for the actual genes involved;
and it is the value of the present approach to nevertheless
characterize the nature of these changes.
Gene Expression in rQTL and intQTL
We suggested that the genes underlying rQTL are involved in
character-specific modification of pleiotropic genes (Pavlicev
et al. 2011; Pavlicev and Wagner 2012). Character-specific
effects can arise from variation in coding regions of locally
expressed genes or from variation in cis-regulatory elements
driving local gene expression. To test whether QTL intervals
encompass genes with limb-type-specific gene expression, we
intersected them with the transcriptome (Taher et al. 2011;
Cotney et al. 2012) and chromatin mark (Cotney et al. 2012)
data for murine fore- and hind limbs.
rQTL and intQTL Encompass DifferentiallyExpressed Genes
We intersected the QTL intervals with the set of genes
differentially expressed between fore- and hind limbs (Taher
et al. 2011; Cotney et al. 2012). Differential expression was
established by the comparisons of early developmental tran-
scriptomes (stages E9.5–E13.5) of fore- and hind limb buds
(Taher et al. 2011: microarray; Cotney et al. 2012: RNA Seq).
We find 20 of the candidate genes to be significantly
differentially expressed between fore- and hind limbs
at E10.5 (raw P<0.05; (supplementary table S2,
Supplementary Material online) in Cotney et al. [2012]) and
two additional genes in the later stages (Taher et al. 2011).
These genes are located in 11 rQTL, of which 6 rQTL are
associated with the relationship between proximal and 5
between the distal limb parts (table 3, boldface). Twenty is a
significantly higher portion (11%) of differentially expressed
genes than expected by sampling random intervals of the
same size (hypergeometric test, P< 6.2�10�5). In intQTL,
30 genes are differentially expressed (hypergeometric test,
P<2.1�10�7). Thus, both rQTL and intQTL are enriched
in genes differentially expressed in early development of
mice limbs.
rQTL Are Enriched for Polymorphic Limb Enhancers
To address whether the QTL harbor limb-specific polymorphic
enhancers, we intersected the intervals with the chromatin
mark data reported by Cotney et al. (2012). The authors
used chromatin state marks H3K27ac and H3K27me3 to
map active and repressed enhancers in limbs during develop-
mental stages E10.5, E11.5. Putative limb-specific enhancers
were detected as more strongly marked in limb tissues than in
embryonic stem cells or in neuronal progenitor cells.
Intersecting the limb-specific enhancers with rQTL revealed
that a total of 535 limb enhancers (160 at E10.5 and 375
at E11.5) map into 23 rQTL. Of these, 224 (42%) are poly-
morphic in our population, located within 18 rQTL. This is sig-
nificant enrichment of SNPs in limb-specific enhancers, relative
to the rest of the genome (hypergeometric test,
P¼1.3�10�10). In contrast, we find no enrichment of
polymorphic limb enhancers in intQTL: although 1,100 limb
enhancers map into intQTL (297 at E10.5 and 803 at E11.5),
of these only 140 (38 at E10.5 and 102 at E11.5) are
polymorphic, found in six intQTL. This finding is remarkable
because intQTL are enriched in limb enhancers (hypergeomet-
ric test, P¼1.6�10�5), indicating the presence of limb-
expressed genes; however, these enhancers tend not to
be polymorphic. In summary, we find that 70% of rQTL
harbor polymorphic limb-specific enhancers, whereas this
is the case in only 12.5% of intQTL (fig. 5). These results sug-
gest that cis-regulatory limb-specific variation underlies rQTL
but not intQTL.
We used GREAT (McLean et al. 2010) to characterize genes
associated with the polymorphic limb-specific enhancers
in intQTL and rQTL. In intQTL, these genes are enriched 117-
fold for genes involved in developmental cell growth, as ex-
pected for H3K27ac marking the enhancers near developmen-
tal genes. In rQTL, the low number of genes (114) associated
with limb-specific enhancers precluded enrichment analysis.
Note that the expression and chromatin mark data used
capture early developmental processes, whereas the QTL are
mapped on the adult variation. The degree to which these
data sets can overlap depends on the developmental stages in
which variation and divergence occurs. Although general
opinion on the topic is ambiguous (Hall and Miyake 2000;
Mariani and Martin 2003; Rolian 2008; Sanger et al. 2011;
Cooper et al. 2013), our data suggest that some of it occurs
in early developmental stages.
Genomics of Evolutionary Limb Divergence in Mice GBE
Genome Biol. Evol. 5(10):1926–1936. doi:10.1093/gbe/evt144 Advance Access publication September 23, 2013 1933

Overall, the data show that cis-regulatory variation in rQTL
is likely causing the fore-/hind limb-specific effects. As we
find no indication that genes underlying intQTL directly bind
to these regions as transcriptional regulators, we speculate
that the interaction is downstream of rQTL function, poten-
tially by protein–protein interactions between the products
of rQTL and intQTL genes. This interpretation is supported
by the enrichment of protein binding functions among
the candidate genes in both QTL intervals (GO:0005509;
intQTL: P<5�10�3; rQTL: P<2�10�7).
Conclusion
In this study, our goal was to discover the molecular nature
of the mutations involved in character individuation,
specifically the individuation of fore- and hind limbs in mice.
We hypothesized that character individuation results from the
character-specific modification of the effects of pleiotropic
genes (fig. 6). In our QTL mapping approach, the modifying
genes are identified as rQTL and the pleiotropic genes as
genes interacting with rQTL, called intQTL. For genes in
Table 3
Polymorphic Limb-Expressed Genes within the rQTL Regions
rQTL ID Underlying Polymorphic Genes (Limb Expression Documented)
r.1 Ptprd, Tle1, Megf9
r.2 Ift74, Tek
r.3 Tns3
r.4 Dach1, Dis3, Mzt1, Pcdh9
r.8 Pold1, Lrrc4b, Mybpc2, Nr1h2
r.9 Gas2, Nav2
r.10 Git1, Aldoc, Bhlha9, Cpd, Phf12, Spag5, Traf4, Rpl23a, Trp53i13
r.11 E2f6, Rock2, Trib2
r.12 Dnajb9, Stxbp6, Lrrn3
r.13 Plcxd2, Pvrl3
r.15 Eprs, Bpnt1, Mark1, Mosc2, Rab3gap2
r.16 Igsf10, Mbnl1, Serp1, Wwtr1
r.17 Gars, 2410066E13Rik, Aqp1, Fam188b, Ggct, Pde1c, Inmt
r.18 Cotl1, Plcg2, 2310061C15Rik, Cdh13, Cenpn, Gan, Gcsh, Mbtps1, Mphosph6, Sdr42e1, Wfdc1, Bcmo1, Maf
r.21 Boc, Zbtb20, BC002163, Ccdc52
r.23 Tpr, 1200016B10Rik, BC003331, Ivns1abp, Pdc, Prg4, Pla2g4a, Hmcn1
r.25 Capn2, Dusp10, Trp53bp2
r.26 Ltbr
r.27 Apex1, Mrpl52, Prmt5, Psmc6, Supt16h, Ang2, Bmp4, Cnih, Dad1, Ear7 (Thra), Gch1, Gnpnat1, Haus4, Lgals3, Lrp10, Mmp14,
Ndrg2, Otx2, Peli2, Pnp, Ptger2, Rem2, Rnase1, Slc7a8, Tep1, Zfp219, Ttc5, Txndc16
r.29 Apc, Ik, Matr3, Ndufa2, Wdr55, Egr1, Brd8, Cd14, Ctnna1, Dnd1, Fgf1, Hars, Hdac3, Pcdhb10, Pcdhb5, Pcdhga12, Pcdhga9,
Pfdn1, Pura, Spry4, Wnt8a, 0610009O20Rik, Cdc23, Pcdhb11, Pcdhb19, Pcdhb3, Slc35a4, Taf7
r.30 Smc3, Pdcd4, Adra2a, Mxi1, Add3
NOTE.—Genes differentially expressed between forelimb and hind limb at E10.5 are in bold.
FIG. 6.—The suggested genetic architecture of divergent traits affects
trait covariance. (A) Undifferentiated limbs with fully shared genetic basis
(left) and coordinated change in the mean values of both traits (right) as
the genetic basis changes (I!I0). (B) Local interaction with shared genetic
basis (left) generates the potential in forelimb (FL) to individualize the
variation as interacting locus varies (R!R0!R00).
FIG. 5.—Proportion of loci with SNPs in limb-specific enhancers.
The proportion of loci harboring the limb-specifically marked enhancers
in the subset of rQTL (N¼ 26) and intQTL (N¼ 48). Although comparable
proportions of intQTL and rQTL regions harbor limb-specific enhancers,
much greater proportion of these is variable in rQTL.
Pavlicev et al. GBE
1934 Genome Biol. Evol. 5(10):1926–1936. doi:10.1093/gbe/evt144 Advance Access publication September 23, 2013

intQTL intervals, we find sequences with a high density of
nonsynonymous SNPs but no enrichment of SNPs in putative
cis-regulatory regions. In contrast, rQTL intervals have a geno-
mic signature that suggests cis-regulatory variation. We
thus conclude that, in our system, pleiotropic mutations
tend to affect protein coding sequences, whereas mutations
causing rQTL effects are more likely cis-regulatory. The specific
molecular nature of the modification of pleiotropic effects by
rQTL genes cannot be inferred from the current data, except
that it likely occurs downstream of both types of genes.
Supplementary Material
Supplementary tables S1–S3 and figure S1 are available at
Genome Biology and Evolution online (http://www.gbe.
oxfordjournals.org/).
Acknowledgments
The authors thank Gloria Fawcett, Elizabeth Norgard, and the
Cheverud Lab for data collection. SNPs were scored by the
John Hopkins Center of Inherited Disease Research (Baltimore,
MD). This work was funded by the Postdoctoral Fellowship
at the Konrad Lorenz Institute for Evolution and Cognition
Research (to M.P.), the program in Foundational Questions
in Evolutionary Biology of the National Philanthropic Trust
(grant number RFP12-23 to G.P.W.), the National Science
Foundation (grant number GM094780 to J.P.N. and grant
number BCS-0725068 to J.M.C.), and the Discovery grant
of the Natural Sciences and Engineering Research Council of
Canada (grant number 238992 to B.H.).
Literature CitedBeissbarth T, Speed TP. 2004. GOstat: find statistically overrepresented
Gene Ontologies within a group of genes. Bioinformatics 20:
1464–1465.
Berg R. 1960. The ecological significance of correlation pleiades. Evolution
17:171–180.
Blankenberg D, et al. 2010. Manipulation of FASTQ data with Galaxy.
Bioinformatics 26:1783–1785.
Bossi A, Lehner B. 2009. Tissue specificity and the human protein interac-
tion network. Mol Syst Biol. 5:260.
Broman KW, Sen S, SpringerLink (Online service). 2009. A guide to QTL
mapping with R/qtl. New York, London: Springer.
Cheverud JM. 1996. Developmental integration and the evolution of
pleiotropy. Am Zool. 36:44–50.
Cheverud JM, et al. 2004. Pleiotropic effects on mandibular morphology II:
differential epistasis and genetic variation in morphological integra-
tion. J Exp Zool B Mol Dev Evol. 302:424–435.
Cooper KL, et al. 2013. Multiple phases of chondrocyte enlarge-
ment underlie differences in skeletal proportions. Nature 495:
375–378.
Cotney J, et al. 2012. Chromatin state signatures associated with tissue-
specific gene expression and enhancer activity in the embryonic limb.
Genome Res. 22:1069–1080.
Duboc V, Logan MP. 2011a. Pitx1 is necessary for normal initiation of
hindlimb outgrowth through regulation of Tbx4 expression and
shapes hindlimb morphologies via targeted growth control.
Development 138:5301–5309.
Duboc V, Logan MP. 2011b. Regulation of limb bud initiation and limb-
type morphology. Dev Dyn. 240:1017–1027.
Euskirchen GM, et al. 2007. Mapping of transcription factor binding
regions in mammalian cells by ChIP: comparison of array- and
sequencing-based technologies. Genome Res. 17:898–909.
Giardine B, et al. 2005. Galaxy: a platform for interactive large-scale
genome analysis. Genome Res. 15:1451–1455.
Gibson G. 1996. Epistasis and pleiotropy as natural properties of transcrip-
tional regulation. Theor Popul Biol. 49:58–89.
Gjuvsland AB, Hayes BJ, Omholt SW, Carlborg O. 2007. Statistical epistasis
is a generic feature of gene regulatory networks. Genetics 175:
411–420.
Grabowski MW, Polk JD, Roseman CC. 2011. Divergent patterns of
integration and reduced constraint in the human hip and the origins
of bipedalism. Evolution 65:1336–1356.
Hall BK, Miyake T. 2000. All for one and one for all: condensations and
the initiation of skeletal development. Bioessays 22:138–147.
Han JD, et al. 2004. Evidence for dynamically organized modularity in
the yeast protein-protein interaction network. Nature 430:88–93.
Hansen TF, Pelabon C, Armbruster WS, Carlson ML. 2003. Evolvability and
genetic constraint in Dalechampia blossoms: components of variance
and measures of evolvability. J Evol Biol. 16:754–766.
Hughes CL, Kaufman TC. 2002. Hox genes and the evolution of the
arthropod body plan. Evol Dev. 4:459–499.
Kenney-Hunt JP, et al. 2006. Quantitative trait loci for body size compo-
nents in mice. Mamm Genome. 17:526–537.
Kopp A. 2011. Drosophila sex combs as a model of evolutionary innova-
tions. Evol Dev. 13:504–522.
Lande R. 1980. The genetic covariance between characters maintained by
pleiotropic mutations. Genetics 94:203–215.
Lawson HA, et al. 2011. Genetic effects at pleiotropic loci are context-
dependent with consequences for the maintenance of genetic
variation in populations. PLoS Genet. 7:e1002256.
Leamy LJ, Pomp D, Lightfoot JT. 2009. Genetic variation for body weight
change in mice in response to physical exercise. BMC Genet. 10:58.
Li J, Ji L. 2005. Adjusting multiple testing in multilocus analyses using the
eigenvalues of a correlation matrix. Heredity 95:221–227.
Luscombe NM, et al. 2004. Genomic analysis of regulatory network
dynamics reveals large topological changes. Nature 431:308–312.
Mann RS, Lelli KM, Joshi R. 2009. Hox specificity unique roles for cofactors
and collaborators. Curr Top Dev Biol. 88:63–101.
Mariani FV, Martin GR. 2003. Deciphering skeletal patterning: clues from
the limb. Nature 423:319–325.
McLean CY, et al. 2010. GREAT improves functional interpretation of
cis-regulatory regions. Nat Biotechnol. 28:495–501.
Minguillon C, Gibson-Brown JJ, Logan MP. 2009. Tbx4/5 gene duplication
and the origin of vertebrate paired appendages. Proc Natl Acad Sci
U S A. 106:21726–21730.
Norgard EA, et al. 2011. Genetic factors and diet affect long-bone length
in the F34 LG,SM advanced intercross. Mamm Genome. 22:178–196.
Norgard EA, et al. 2008. Identification of quantitative trait loci affecting
murine long bone length in a two-generation intercross of LG/J and
SM/J Mice. J Bone Miner Res. 23:887–895.
Ohde T, Yaginuma T, Niimi T. 2013. Insect morphological diversification
through the modification of wing serial homologs. Science 340:
495–498.
Pavlicev M, Cheverud JM, Wagner GP. 2011. Evolution of adaptive
phenotypic variation patterns by direct selection for evolvability.
Proc Biol Sci. 278:1903–1912.
Pavlicev M, et al. 2008. Genetic variation in pleiotropy: differential epistasis
as a source of variation in the allometric relationship between long
bone lengths and body weight. Evolution 62:199–213.
Pavlicev M, Norgard EA, Fawcett GL, Cheverud JM. 2011. Evolution of
pleiotropy: epistatic interaction pattern supports a mechanistic model
Genomics of Evolutionary Limb Divergence in Mice GBE
Genome Biol. Evol. 5(10):1926–1936. doi:10.1093/gbe/evt144 Advance Access publication September 23, 2013 1935

underlying variation in genotype-phenotype map. J Exp Zool B Mol
Dev Evol. 316:371–385.
Pavlicev M, Wagner GP. 2012. A model of developmental evolution: se-
lection, pleiotropy and compensation. Trends Ecol Evol. 27:316–322.
Porto A, et al. 2009. The evolution of modularity in the mammalian skull I:
morphological integraton patterns and magnitudes. Evol Biol. 36:
118–135.
Prud’homme B, Gompel N, Carroll SB. 2007. Emerging principles of regu-
latory evolution. Proc Natl Acad Sci U S A. 104(Suppl 1): 8605–8612.
Rolian C. 2008. Developmental basis of limb length in rodents: evidence
for multiple divisions of labor in mechanisms of endochondral bone
growth. Evol Dev. 10:15–28.
Routman EJ, Cheverud JM. 1997. Gene effects on a quantitative trait:
two-locus epistatic effects measured at microsatellite markers and
at estimated QTL. Evolution 51:1654–1662.
Ruvinsky I, Gibson-Brown JJ. 2000. Genetic and developmental bases
of serial homology in vertebrate limb evolution. Development 127:
5233–5244.
Sanger TJ, et al. 2011. Developmental and genetic origins of
murine long bone length variation. J Exp Zool B Mol Dev Evol. 316B:
146–161.
Sherry ST, et al. 2001. dbSNP: the NCBI database of genetic variation.
Nucleic Acids Res. 29:308–311.
Taher L, et al. 2011. Global gene expression analysis of murine limb
development. PLoS One 6:e28358.
Wagner GP. 1996. Homologues, natural kinds and the evolution of
modularity. Am Zool. 36:36–43.
Yang Z. 1997. PAML: a program package for phylogenetic analysis by
maximum likelihood. Comput Appl Biosci. 13:555–556.
Young NM, Hallgrimsson B. 2005. Serial homology and the evolution of
mammalian limb covariation structure. Evolution 59:2691–2704.
Young NM, Wagner GP, Hallgrimsson B. 2010. Development and
the evolvability of human limbs. Proc Natl Acad Sci U S A. 107:
3400–3405.
Associate editor: Bill Martin
Pavlicev et al. GBE
1936 Genome Biol. Evol. 5(10):1926–1936. doi:10.1093/gbe/evt144 Advance Access publication September 23, 2013