genome-wide profiling reveals remarkable parallels
TRANSCRIPT

original article Official journal of the American Society of Gene & Cell Therapy
The inherent risks associated with vector insertion in gene therapy need to be carefully assessed. We ana-lyzed the genome-wide distributions of Sleeping Beauty (SB) and piggyBac (PB) transposon insertions as well as MLV retrovirus and HIV lentivirus insertions in human CD4+ T cells with respect to a panel of 40 chromatin states. The distribution of SB transposon insertions dis-played the least deviation from random, while the PB transposon and the MLV retrovirus showed unexpected parallels across all chromatin states. Both MLV and PB insertions are enriched at transcriptional start sites (TSSs) and co-localize with BRD4-associated sites. We demon-strate physical interaction between the PB transposase and bromodomain and extraterminal domain pro-teins (including BRD4), suggesting convergent evolu-tion of a tethering mechanism that directs integrating genetic elements into TSSs. We detect unequal biases across the four systems with respect to targeting genes whose deregulation has been previously linked to seri-ous adverse events in gene therapy clinical trials. The SB transposon has the highest theoretical chance of target-ing a safe harbor locus in the human genome. The data underscore the significance of vector choice to reduce the mutagenic load on cells in clinical applications.
Received 28 July 2015; accepted 6 January 2016; advance online publication 9 February 2016. doi:10.1038/mt.2016.11
INTRODUCTIONThe ability to efficiently deliver foreign genes into cells offers opportunities to use gene therapy to correct genetic diseases and to augment cellular processes to achieve a therapeutic effect (reviewed in refs. 1,2). Hematopoietic stem cell (HSC)-based gene therapy has clearly provided therapeutic benefit in primary immunodeficiencies (including SCID-X1, ADA-SCID), thalas-semia, and leukodystrophies.3–6 However, uncontrolled integra-tion of contemporary retroviral gene therapy vectors may result in insertional mutagenesis by activating oncogenes,7,8 as observed in clinical trials for SCID-X19–12, X-CGD,13 and WAS.14 In contrast to
HSC-based gene therapy, leukemia was never observed in preclin-ical animal models or clinical trials involving gene transfer into peripheral blood-derived T lymphocytes.15,16 Thus, mature T cells seem to be less susceptible to transformation by genotoxic events than are HSCs, and retroviral gene therapy in T cells therefore has not been thought to involve a major risk of insertional mutagene-sis and development of cancer. Importantly, however, recent stud-ies indicate that some HIV integrations into genes associated with cancer or cell cycle regulation may confer a survival advantage of HIV-infected cells and thus a clonal imbalance of HIV integra-tions in AIDS patients.17,18
The risk of insertional oncogenesis in gene therapy is inher-ently linked to a fundamental step of the life cycle of mobile genetic elements (retroviruses and transposons): genomic inser-tion. Vector architecture, the enhancer/promoter elements used to drive transgene transcription, copy numbers, the underlying disease, and insertion site selection properties of the vectors can strongly influence the actual risk of insertional oncogenesis. There is a wide spectrum of specificity in target site selection by mobile genetic elements. For example, retroviral/lentiviral integration displays little specificity on the primary DNA sequence level but biased patterns of distribution on the genome level, which is likely due to interaction of the viral components with certain host pro-teins or recognition of different chromatin states of the chromo-somes during integration.19 For example, the bias of HIV toward integration into active cellular transcription units20 was proposed to be due to tethering interactions with cellular proteins rather than to chromatin accessibility. In particular, the cellular lens epithelium-derived growth factor (LEDGF)/p75 was shown to influence HIV target site selection.21
Similar studies showed that MLV has a strong preference for integrating into regions surrounding transcriptional start sites (TSSs).22 However, a recently generated, high-resolution inser-tion site map based on >3 million unique integration events in two ENCODE-characterized human cell lines revealed that a subset of strong enhancers and active promoters characterized by high enrichment of multiple marks of active chromatin (includ-ing H3K4me1, H3K4me2, H3K4me3, H3K27ac, and H3K9ac)
The first two authors contributed equally to this work.Correspondence: Zoltan Ivics, Paul Ehrlich Institute, Paul Ehrlich Str. 51–59, D-63225 Langen, Germany. E-mail: [email protected]
Genome-wide Profiling Reveals Remarkable Parallels Between Insertion Site Selection Properties of the MLV Retrovirus and the piggyBac Transposon in Primary Human CD4+ T CellsAndreas Gogol-Döring1,2, Ismahen Ammar3, Saumyashree Gupta4, Mario Bunse3, Csaba Miskey5, Wei Chen3, Wolfgang Uckert3, Thomas F Schulz4, Zsuzsanna Izsvák3 and Zoltán Ivics5
1Institute of Computer Science, Martin Luther University Halle-Wittenberg, Wittenberg, Germany; 2German Centre for Integrative Biodiversity Research (iDiv) Halle-Jena-Leipzig, Leipzig, Germany; 3Max Delbrück Center for Molecular Medicine, Berlin, Germany; 4Institute of Virology, Hannover Medical School, Hannover, Germany; 5Division of Medical Biotechnology, Paul Ehrlich Institute, Langen, Germany
MTOpen
592 www.moleculartherapy.org vol. 24 no. 3, 592–606 mar. 2016

Official journal of the American Society of Gene & Cell TherapyComparative Genome-wide Profiling of Transposon and Retrovirus Integration Sites in Human T Cells
are preferentially targeted, and thus, these regions are better pre-dictors of MLV integration than TSSs.23 Finally, it was recently reported that the cellular bromodomain and extraterminal (BET) domain proteins (BRD2, BRD3, and BRD4) physically interact
with the MLV IN.24–26 The N-terminal bromodomains of BET proteins bind to acetylated H3 and H4 tails,27 which are associ-ated with TSSs. Thus, MLV integration site distribution parallels the chromatin-binding profile of BET proteins. Furthermore,
Tran
scrip
tion
fact
ors
DN
A r
epai
rH
isto
ne m
ethy
latio
nH
isto
ne a
cety
latio
nD
eace
tyla
ses
Ace
tyla
ses
Tran
scrip
tion
Gen
es
States
Genome coverageDepleted Not significant Enriched
Coverage0%
0.1
0.1
1
PB
10
100
1 10
MLV
Genomic features
R 2 = 0.95
R 2 = 0.91
100
0.1
0.1
1
PB
PB
10
100
1 10
MLV
Datasets
100
R 2 = 0.85
0.1
0.1
1
10
100
1 10
MLV
States
100
100%Gen
omic
feat
ures
Dat
aset
s
TS
ST
ES
a
d
e
g
fb
c
Molecular Therapy vol. 24 no. 3 mar. 2016 593

Official journal of the American Society of Gene & Cell TherapyComparative Genome-wide Profiling of Transposon and Retrovirus Integration Sites in Human T Cells
disruption of the interaction with BET proteins through truncated IN mutants was recently shown to affect the genome-wide integra-tion profile of MLV vectors.28 Finally, expression of an engineered fusion protein composed of the IN-binding domain of BET and the chromatin interaction domain of the lentiviral targeting factor LEDGF/p75 was shown to retarget MLV integration away from TSSs and into the body of actively transcribed genes, resembling the HIV integration pattern.25 These data collectively suggest that the BET proteins act as bimodal tethers that link MLV IN to TSSs in chromatin.
Sleeping Beauty (SB) is the most thoroughly studied vertebrate transposon to date, and it has shown highly efficient transposition in different somatic tissues of a wide range of vertebrate species including humans (reviewed in refs. 29,30). SB has been shown to provide long-term transgene expression in preclinical animal models (see refs. 31–33 for recent reviews) and is currently under clinical evaluation as an integrating, nonviral vector system for gene therapy.34,35 The SB transposon preferentially inserts into TA dinucleotides and shows additional target site preferences based on physical properties of the DNA.36,37 On the genomic scale, SB transposons exhibit a close-to-random integration profile with a slight bias toward integration into genes and their upstream regulatory sequences in cultured mammalian cell lines;38–43 this tendency, however, is not as pronounced as seen for viral vectors. The piggyBac (PB) element, a DNA transposon isolated from the cabbage looper moth, has shown transpositional activity in mouse and human cells and thus also has a potential as a vector in gene therapy.44 PB preferentially integrates into TTAA sequences,45 with a significant bias toward transcriptionally active regions includ-ing genes, TSSs, and DNaseI hypersensitive sites in mammalian cells39,43,44,46–48 and in Drosophila.49 Target site selection properties of the SB and PB transposons together with the Mouse Mammary Tumor Virus (MMTV) have been comparatively analyzed in great detail in mouse embryonic stem (ES) cells;50 however, a similar analysis of these transposons in therapeutically relevant human cell types and against retroviral vector systems that are cur-rently used in several gene therapy clinical trials (Journal of Gene Medicine Clinical Trial Database, 2015) has been lacking.
Although characterization of the target site selection proper-ties of different vector systems still falls short of predicting the actual risk of insertional oncogenesis in a clinical trial, it is highly useful for ranking the different vector types and designs according to their genotoxic potential.2 Thus, we have undertaken a com-parative study addressing target site selection properties of the SB and PB transposons as well as the MLV and HIV viral systems in primary human CD4+ T cells. We have chosen this cell type due to the availability of the rich genome-wide mapping data for chromatin marks as well as other genomic features and because
currently running phase 1 gene therapy clinical trials with SB use this cell type as target.35 We find that, in contrast to PB, MLV and HIV that all show biased insertion patterns into expressed genes, the SB transposon displays a close-to-random insertion profile, thereby supporting relative safety of SB in human applications. The PB transposon shows an intriguing, MLV-like profile with pronounced preference for integrating into the 5′-transcriptional regulatory regions of genes, and we show that this is largely shaped by physical interaction between the transposase and BET proteins. We describe an additional tethering mechanism that involves chromatin-associated transposase molecules in SB trans-position. In sum, our findings have important implications for the safety of these integration systems for genome engineering, including human gene therapy.
RESULTSGenomic states define chromosomal regions preferred for integrationIn order to generate datasets representing de novo transpo-son integration sites, primary human CD4+ T cells were elec-troporated with pairs of transposase and transposon plasmids of the SB and the PB systems (Supplementary Figure S1a). Linear amplification-mediated PCR was used for the recov-ery of genomic transposon integrations, and the PCR librar-ies were sequenced using the Illumina/Solexa HiSeq Platform (Supplementary Figure S1b). The retrieved transposon integra-tion sites (Supplementary Figure S1c) for the SB (8,290 sites) and PB (8,954 sites) systems were used together with datasets gen-erated in CD4+ human T cells with the MLV retrovirus (66,764 sites)51 and with the HIV lentivirus (7,765 sites)52 in a comparative manner for all downstream analyses (schematic maps of all four vectors are shown in Supplementary Figure S1d). Consensus sequences at transposon integration sites revealed that the highly preferred TA target site dinucleotides for SB and the TTAA tetra-nucleotide motif for PB are embedded in AT-rich DNA, as noted previously43,53 (Supplementary Figure S2a). In contrast, the viral systems display very weak preferences at the primary DNA sequence level for integration (Supplementary Figure S2a,b).
Mapping of SB and PB insertions on the human chromo-some set revealed an overall wide distribution across the human genome (Supplementary Figure S3). In the context of describ-ing insertional preferences on a genome-wide scale, it has been recently shown that chromatin “states” defined by co-occur-rence of multiple chromatin marks are far better predictors for integration than any of those marks separately.23 Keeping this in mind, we used an unsupervised machine-learning approach (ChromHMM, which applies a Hidden Markov Model)54 in order to define 40 different genomic states, each characterized
Figure 1 Analysis of chromatin states. The ChromHMM software (which uses a Hidden Markov Model (HMM)) was applied to derive 40 different genomic states from 70 empirical datasets including histone marks, DNA methylation, chromatin accessibility, or the binding sites of numerous tran-scription factors, polymerases, histone acetylases, and deacetylases. (a) The output probabilities of the trained HMM. Black: the state is completely covered by regions defined in the given dataset; white: the state and the dataset are disjoint. (b) Enrichments of each state for a set of genomic regions, computed using the OverlapEnrichment function of ChromHMM. (c) Genome coverage of states. More frequent states correspond to darker colors. (d–f) Enrichment of integration sites versus control sites at the different (d) states, (e) dataset regions, or (f) genomic features. Blue: deple-tion of integration sites at the given regions; red: enrichment of integration sites. If the depletion/enrichment of integration sites at a given region is not significant (i.e., Fisher’s exact test P value > 0.05), then the field is marked gray. (g) Comparison of PB and MLV. The scatter plots show the fold enrichments of integration sites versus control sites of MLV compared to PB at 40 states, 70 datasets, and 16 genomic features, as described in a–f. Gray dots correspond to region sets in which PB or MLV show no significant enrichment/depletion of integrations.
594 www.moleculartherapy.org vol. 24 no. 3 mar. 2016

Official journal of the American Society of Gene & Cell TherapyComparative Genome-wide Profiling of Transposon and Retrovirus Integration Sites in Human T Cells
by a coherent pattern of presence or absence of genomic characteristics specified in 70 different datasets (Figure 1a). Although it is not obvious how to assign a clear definition to each of these automatically generated states, one can get hints about possible functions of the different states from Figure 1b, which shows the level of enrichment or depletion of states within certain genomic features. For example, state 1 represents the genomic (intergenic) background without a marked asso-ciation with any specific measured characteristics. States 2–7 correspond to heterochromatic regions, where state 6 specifi-cally covers methylated DNA. States 11–13 are weak enhancer regions, mainly inside gene bodies, while states 27, 33, and 34 are strong enhancers located in intergenic regions. States 34 and 37–40 are promoter regions, whereas state 39 is associated with
a strong histone acetylation signal. State 34 marks active pro-moters, whereas promoters in state 37 feature a less accessible chromatin and tend to be associated with low or unexpressed genes. States 16, 17, 31, and 32 correspond to transcriptional ends of active genes. The tool then assigned to each genomic region one of these states. The states cover between 25 % (state 1) and 0.01% (state 33) of the genome (Figure 1c). We then determined the fold enrichments of integration sites versus control sites at the different states (Figure 1d), dataset regions (Figure 1e), and genomic features (Figure 1f). Unexpectedly, the enrichments for PB and MLV are very tightly correlated in all three cases (coefficients of determination R2 between 0.90 and 0.95; Figure 1g). In contrast, SB and PB display much weaker correlation (R2 between 0.18 and 0.43, data not shown).
Figure 2 Analysis of integration frequencies relative to annotated genes. (a) Distribution of distance between integration sites outside of genes and the nearest gene. The figures were created using the R density function with Gaussian kernel and bandwidth 0.2 on the log10 distances. The dashed lines show the median distances for SB (48.1 kb), PB (24.3 kb), HIV (13.2 kb), MLV (12.4 kb), and the random controls (85.6 kb). (b) Fold enrichments (i.e., the proportion of experimentally determined integration sites falling into a given set of regions divided by the proportion of control sites falling into the same set of regions) of integrations sites within RefSeq genes and of integration sites found upstream (−50 kb to −1 kb) or downstream (1 kb to 50 kb) of RefSeq genes. The horizontal line at 1 represents the value expected for random sites. With exception of the integration frequency of SB and HIV into 1 and 2 kb around RefSeq genes, the comparison between the experimentally determined integration sites and the random integration sites achieved in all panels P ≤ 0.001 (Fisher’s exact test). (c) The fold enrichments of SB, PB, HIV, and MLV insertion sites are plotted over the gene body from the 5′ to the 3′ end. Each gene was split into 40 equal bits, and fold enrichment of integration was calculated for each bit. The figure shows fold enrichments of insertion per bit averaged over all RefSeq genes. The dashed line marks fold enrichment of 1. (d) Insertions around transcriptional start sites (TSSs). The figure shows fold enrichment of insertions around RefSeq TSSs. The numbers of sites at each distance was averaged over all RefSeq genes and smoothed by computing the mean in a 500-bp rolling window using the R zoo package. The fold changes were computed after smoothing. The transcription starts at position 0 and proceeds to the right, i.e., positive x values represent the transcribed region, while negative x values represent regions upstream of the TSSs.
0.5
0.4
0.3
0.2
0.1
0.0
10 100 1 k 10 k 100 k
Distance from genes (bp)
1 M 10 M
SB
PB
HIV
MLV
SBPBHIVMLV
SBPBHIVMLV
SB
PB
HIV
MLV
Randomcontrols
Den
sity
of i
nteg
ratio
ns o
utsi
de o
f gen
es
0.2550 5020 2010 105 52 21 1Genes
Upstream of genes (kb) Downstream of genes (kb)
0.5
1
2
4
8
16
Enr
ichm
ent o
f int
egra
tions
0.2
0.5
1
2
5
10
20
Enr
ichm
ent o
f int
egra
tions
1
5′ 3′Genes
−5 −4 −3 −2 −1 0
Distance to TSS (kb)
1 2 3 4 5
2
4
8
Enr
ichm
ent o
f int
egra
tions
insi
de g
enes
a b
c d
Molecular Therapy vol. 24 no. 3 mar. 2016 595
Official journal of the American Society of Gene & Cell TherapyComparative Genome-wide Profiling of Transposon and Retrovirus Integration Sites in Human T Cells
Distribution of vector integration sites with respect to genes and TSSsWe next determined the frequencies of integration into genomic features including genes, exons, introns, TSSs (TSS ± 1 kbp), CpG islands and DNaseI hypersensitive sites relative to computer-generated random data sets matched for each of the four vector systems (Figure 2 and Supplementary Figure S4). Distribution of distance between integration sites outside of genes and the nearest gene revealed that intergenic insertions tend to be closer to genes than the control datasets (Figure 2a). For example, the median distance for HIV integration sites is around 13 kb, whereas for the control dataset, it is 85 kb. Out of the four systems, the SB transposon insertions are the farthest away from genes (median distance 48 kb), suggesting a very low preference for inte-grating near gene sequences. For PB and MLV, Figure 2a shows a bimodal shape reflecting the difference between integration sites close to TSS (left peak) and sites more distal to genes (right peak). Insertions by all four systems were enriched in genes (Figure 2b) (both in exons and introns; Supplementary Figure S4). The pref-erence of HIV to target genes is well described.20 Remarkably, the PB transposon displayed an MLV retrovirus-like insertion profile with respect to preferentially targeting the upstream regions of genes, whereas the SB transposon displayed the weakest prefer-ence toward genes (Figure 2b). In the case of MLV, we found a significant orientation bias (6% more MLV integrations into genes in sense than in antisense direction). Plotting insertion sites over the gene bodies revealed high enrichment of both MLV and PB insertions at the 5′-ends of genes, whereas HIV insertions tend to be enriched in the gene bodies and relatively disfavored at the 5′- and 3′-ends of genes (Figure 2c). Finally, both PB and MLV are enriched (with no significant difference between the frequen-cies of insertions with sense and antisense orientation) and HIV depleted around TSSs (Figure 2d and Supplementary Figure S4).
Interestingly, the MLV insertions concentrate at two peaks up- and downstream of the actual TSSs leaving a small drop of insertions at the TSSs, whereas PB insertions map directly at TSSs (Figure 2d). The bimodal MLV integration pattern can be explained by (i) a tendency of retroviruses to direct integration into outward-facing major grooves on nucleosome-wrapped DNA51,55 and (ii) TSSs of expressed genes are nucleosome depleted.56 In contrast, high-density integration profiling of the Hermes trans-poson in Saccharomyces cerevisiae and in Schizosaccharomyces pombe revealed a strong association of Hermes integration sites with nucleosome-free chromatin.57,58 Target site choice by the SB and PB transposons with respect to nucleosomal versus nucleosome-free DNA has not been investigated.
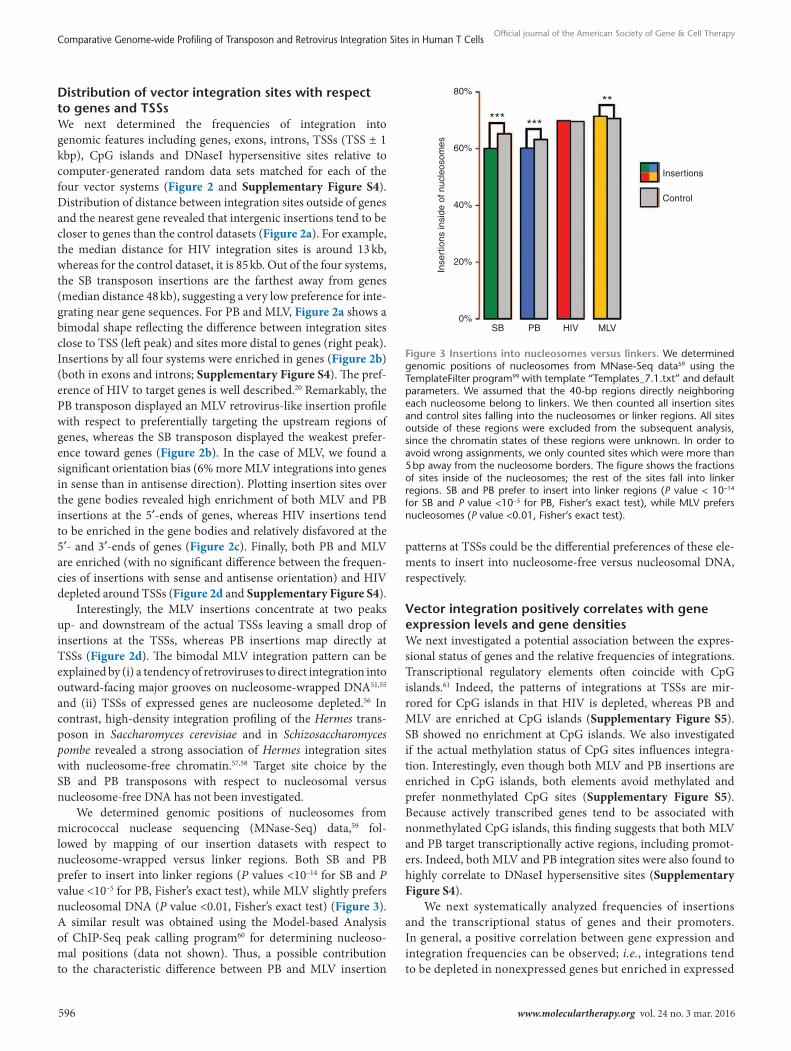
We determined genomic positions of nucleosomes from micrococcal nuclease sequencing (MNase-Seq) data,59 fol-lowed by mapping of our insertion datasets with respect to nucleosome-wrapped versus linker regions. Both SB and PB prefer to insert into linker regions (P values <10–14 for SB and P value <10–5 for PB, Fisher’s exact test), while MLV slightly prefers nucleosomal DNA (P value <0.01, Fisher’s exact test) (Figure 3). A similar result was obtained using the Model-based Analysis of ChIP-Seq peak calling program60 for determining nucleoso-mal positions (data not shown). Thus, a possible contribution to the characteristic difference between PB and MLV insertion
patterns at TSSs could be the differential preferences of these ele-ments to insert into nucleosome-free versus nucleosomal DNA, respectively.
Vector integration positively correlates with gene expression levels and gene densitiesWe next investigated a potential association between the expres-sional status of genes and the relative frequencies of integrations. Transcriptional regulatory elements often coincide with CpG islands.61 Indeed, the patterns of integrations at TSSs are mir-rored for CpG islands in that HIV is depleted, whereas PB and MLV are enriched at CpG islands (Supplementary Figure S5). SB showed no enrichment at CpG islands. We also investigated if the actual methylation status of CpG sites influences integra-tion. Interestingly, even though both MLV and PB insertions are enriched in CpG islands, both elements avoid methylated and prefer nonmethylated CpG sites (Supplementary Figure S5). Because actively transcribed genes tend to be associated with nonmethylated CpG islands, this finding suggests that both MLV and PB target transcriptionally active regions, including promot-ers. Indeed, both MLV and PB integration sites were also found to highly correlate to DNaseI hypersensitive sites (Supplementary Figure S4).
We next systematically analyzed frequencies of insertions and the transcriptional status of genes and their promoters. In general, a positive correlation between gene expression and integration frequencies can be observed; i.e., integrations tend to be depleted in nonexpressed genes but enriched in expressed
Figure 3 Insertions into nucleosomes versus linkers. We determined genomic positions of nucleosomes from MNase-Seq data59 using the TemplateFilter program99 with template “Templates_7.1.txt” and default parameters. We assumed that the 40-bp regions directly neighboring each nucleosome belong to linkers. We then counted all insertion sites and control sites falling into the nucleosomes or linker regions. All sites outside of these regions were excluded from the subsequent analysis, since the chromatin states of these regions were unknown. In order to avoid wrong assignments, we only counted sites which were more than 5 bp away from the nucleosome borders. The figure shows the fractions of sites inside of the nucleosomes; the rest of the sites fall into linker regions. SB and PB prefer to insert into linker regions (P value < 10−14 for SB and P value <10−5 for PB, Fisher’s exact test), while MLV prefers nucleosomes (P value <0.01, Fisher’s exact test).
80%
*** ***
**
60%
Insertions
Control
SB PB HIV MLV
Inse
rtio
ns in
side
of n
ucle
osom
es
40%
20%
0%
596 www.moleculartherapy.org vol. 24 no. 3 mar. 2016

Official journal of the American Society of Gene & Cell TherapyComparative Genome-wide Profiling of Transposon and Retrovirus Integration Sites in Human T Cells
Figure 4 Correlation between gene expression and integration into genes and transcriptional start sites. (a) Fold enrichment (i.e., the pro-portion of experimentally determined integration sites falling into a given set of regions divided by the proportion of control sites falling into the same set of regions) of integrations into not expressed (absent = A; 5,603 genes), marginal (M; 5,253 genes), and clearly expressed (present = P; 6,947 genes) genes. The gene expression levels were determined by59 using Affymetrix Human Genome U133 Plus 2.0 Arrays. The classification into A, M, and P genes was done by Schones et al.59 using the Affymetrix GCOS software package. (b) Fold enrichment of integrations for genes of different expression level. We split the set of 12,200 marginal or clearly expressed genes into 10 groups (each of 1,220 genes) according to their expression level from the lowest (left) to the highest (right) genes. The enrichment is higher for higher expression levels. (c) Fold enrichment (i.e., the proportion of experimentally determined integration sites into a window from −1 kb to +1 kb around the TSSs falling into a given set of regions divided by the proportion of control sites falling into the same set of regions) of integrations into genes categorized as above. (d) Fold enrichment of integrations for genes of different expression levels. HIV was omitted from this plot since the total number of HIV insertions close to TSSs was too low. (e) Chromosomal densities of insertions. The relative insertion densities, i.e., the fraction of insertions falling in a certain chromosome divided by the fraction of possible insertions falling in this chromosome. In the case of SB, all occurrences of TA dinucleotides are possible insertion sites. In the case of PB, all occurrences of TTAA are possible insertion sites. HIV and MLV could integrate at any genomic position. The relative insertion density compares the density of insertion to the density of all possible insertion sites. For completely random insertions, the relative insertion density would be 1; values above 1 mean an enrichment of insertions, values below 1 mean a depletion of insertions. (f) Gene densities, i.e., number of RefSeq genes/isoforms per chromosome divided by the chromosomal length (in million bp).
100
10
Enr
ichm
ent o
f ins
ertio
ns
1
0.1
100
10
Enr
ichm
ent o
f ins
ertio
ns
1
0.1
100
0.25
50
40
30
20
10
0
0.5
1
2
4
10
Enr
ichm
ent o
f ins
ertio
ns
1
0.1Lowest Gene expression level Highest
100
10
Enr
ichm
ent o
f ins
ertio
ns
Rel
ativ
e in
sert
ion
dens
ityG
ene
dens
ity
1
0.1Lowest Gene expression level Highest
SB
0.8 1.
1 1.7
0.5
1.3 2.
4
0.2
1.7
4.5
0.4
1.3
2.6
1.3
1.4
1.4 2.
2
10.3 17
.0
0.3 0.
5
0.5
2.3
12.2
27.4
PB HIV
Genes Promotors
Absent (A)
Marginal (M)
Present (P)
SB
PB
HIV
MLV
SB
PB
HIV
MLV
chr1
chr2
chr3
chr4
chr5
chr6
chr7
chr8
chr9
chr1
0
chr1
1
chr1
2
chr1
3
chr1
4
chr1
5
chr1
6
chr1
7
chr1
8
chr1
9
chr2
0
chr2
1
chr2
2
chrX
chrY
chr1
chr2
chr3
chr4
chr5
chr6
chr7
chr8
chr9
chr1
0
chr1
1
chr1
2
chr1
3
chr1
4
chr1
5
chr1
6
chr1
7
chr1
8
chr1
9
chr2
0
chr2
1
chr2
2
chrX
chrY
MLV SB PB HIV MLV
a c
b d
e
f
Molecular Therapy vol. 24 no. 3 mar. 2016 597

Official journal of the American Society of Gene & Cell TherapyComparative Genome-wide Profiling of Transposon and Retrovirus Integration Sites in Human T Cells
genes (Figure 4a). Moreover, the enrichment is higher in highly expressed than in marginally expressed genes. In other words, the stronger a gene is expressed, the more likely it would be targeted by any of the four integration systems analyzed here, by HIV displaying the most significant correlation (Figure 4a and Supplementary Figure S6). Breaking down gene expres-sion levels into a larger number of categories indicates that the enrichment in insertion frequencies gradually grows with increasing expression level (Figure 4b). This is interesting for MLV and PB, since they are enriched at TSSs and not in the gene bodies. Thus, we also looked at association between the expressional status of genes and frequencies of integrations into TSSs. Figure 4c shows that HIV is always depleted and PB and MLV are always enriched around TSSs, but in all three cases, the number of insertions increases with the expression levels. However, the level of enrichment for PB and MLV reaches a plateau at a certain level of gene expression (Figure 4d). This is a hint that for PB and MLV the gene expression level itself is less important than the open chromatin state at promoter regions. Interestingly, frequencies of SB insertions into TSSs do not seem to correlate with the expression levels of the targeted genes (Figure 4c,d).
Having seen an overall correlation of integration frequencies and genes, we analyzed gene densities across chromosomes and found that insertion densities correlate very well with the gene densities (Pearson correlation coefficients are between 0.87 and 0.94; Figure 4e). That is, gene-rich chromosomes including chr17, chr19, and chr22 are more frequently hit by insertions, with HIV showing the highest enrichment per gene-rich chromosome (Figure 4f). The insertion density also correlated with gene cover-age, i.e., the fraction of bases per chromosome covered by RefSeq genes (Pearson correlation coefficients between 0.53 and 0.74, data not shown).
Integration sites and chromatin stateWe took advantage of the available genome-wide annotation of histone mark distributions in human CD4+ T cells62,63 to inves-tigate potential association with virus/transposon integrations. We concentrated on analyzing transposon integration frequencies
with regard to H3 K4 mono- and trimethylation, a marker for active promoter (H3K4me3) and enhancer regions (H3K4me1), H3 K27 acetylation (H3K27ac) associated with open chromatin,64 and trimethylated H3 K27 (H3K27me3) and trimethylated H3 K9 (H3K9me3), markers for condensed chromatin regions associ-ated with gene repression.62 The bioinformatic analysis revealed an almost random integration profile for SB with only a slight bias for euchromatin marks and no bias with respect to hetero-chromatin marks (Figure 5a). In contrast, the PB transposon as well as the MLV and HIV viruses avoid heterochromatin marks and are enriched in chromosomal regions characterized by open chromatin (Figure 5a). Both PB and MLV are highly enriched in chromatin marks associated with TSSs (H3K4me3) and enhancer regions (H3K4me1). Differences between PB and MLV become visible when inspecting the density of histone marks as a func-tion of the distance to insertion sites (Figure 5b). In case of marks prominent at TSSs, i.e., H3K4me3, Pol II, and CTCF, MLV inte-gration sites have the characteristic “shifted” peak at a distance of about 500–1,000 bp (Figure 5b). A similar distribution of MLV insertions was seen with respect to DNaseI cleavage sites, consis-tent with DNaseI preferentially cleaving nucleosome-free DNA, while MLV preferentially inserts into nucleosome-bound DNA. Finally, consistent with preferential integration into gene bodies, HIV integration sites are highly associated with open chromatin characterized by H3K36me3.
Tethering mechanisms affecting SB and PB integrationsChromosomal tethering by interaction of the integration machin-ery of transposable elements and viruses with host cell-encoded, DNA- or chromatin-binding factors may introduce an insertional bias in target site selection. Such targeting mechanism, based on interactions between LEDGF/p75 and HIV IN, and between BET domain proteins and MLV IN is known to play a role in target site distribution of HIV21 and MLV,24–26 respectively. Although SB is a fish transposon, and the human genome does not contain SB-like transposons, DNA sequences resembling the transposase-binding sites at the ends of the transposon may occur in human DNA by chance, and such sites might be bound by the SB transposase. Can
Figure 5 Correlation between chromatin state and insertions. (a) Fold enrichment of insertion sites versus control sites in DNaseI hypersensitive regions, regions featuring histone modification, and Pol II and CTCF-binding regions. The regions (“tag islands”) were determined by Boyle et al.,63 Barski et al.62 and Wang et al.94 (b) Fold enrichment of DNase-Seq and ChIP-Seq read densities around insertion sites versus control sites.
Enr
ichm
ent o
f int
egra
tion
Distance to sites (kb)
Rea
d de
nsity
fold
a
b
5 1.0
0.8
0.6
0.5
0.4
1.0
0.8
0.6
0.5
0.4
0 1 2 3 4 5 0 1 2 3 4 5 0 1 2 3 4
2.0
17.4
100
SB
PB
HIV
MLV
10
1
0.1
18.1
1.7
1.0
0.69
0.18
0.34
0.98
0.45 0.54
0.22
2.2
17.2
21.2
2.0 2.
6
9.1
4.2
14.1
35.8
28.9
2.5
2.5
1.6
1.3
5.1
1.3
2.8
15.7
4.3
19.7
1.8
13.6
6.6
0.80
5 0 1 2 3 4 5 0 1 2 3 4 5 0 1 2 3 4 5 0 1 2 3 4 5 0 1 2 3 4 5 0 1 2 3 4 5
105
21
105
21
105
21 1
24
53
10
2.5
2.0
1.5
1.0
52
1
43
21
598 www.moleculartherapy.org vol. 24 no. 3 mar. 2016

Official journal of the American Society of Gene & Cell TherapyComparative Genome-wide Profiling of Transposon and Retrovirus Integration Sites in Human T Cells
it then be that, in an analogous fashion, the transpositional com-plex is tethered to chromosomal regions bound by excess trans-posase molecules during transposition?
We addressed this possibility by mapping our insertion data-sets with respect to the 5′ GTTTACATACAC 3′sequence motif representing the SB transposase core binding site, allowing one mismatch in the motif. In total, we found 20,188 occurrences of this motif in the human genome. We detected a highly significant enrichment of SB insertions within 100 bp of the motifs (Figure 6),
consistent with a tethering mechanism, in which the transposi-tional complex is anchored to certain chromosomal sites bound by excess transposase molecules (Supplementary Figure S7). Neither PB nor the MLV and HIV insertions displayed enrichment close to SB transposase-binding sites (Figure 6). Highly significant enrich-ments of SB insertions could also be found for different window sizes and for alternative definitions of SB transposase-binding sites (e.g., all occurrences of 5′ GTTTACATACAC 3′ with up to
Figure 6 Enrichment of insertions near chromosomal SB transposase-binding sites in the human genome. (a) Fold enrichments of insertion sites compared to random controls in up to 100-bp distance of SB transposase-binding sites, i.e., genomic occurrences of 5′ GTTTACATACAC 3′ with up to one mismatch. SB integrations are significantly enriched (P value < 1 × 1025, Fisher’s exact test), while the integration frequencies of PB, HIV, and MLV compared to their respective backgrounds are not significantly changed. (b) Fold enrichments of insertions sites compared to random controls around SB transposase-binding sites, i.e., genomic occurrences of 5′ GTTTACATACAC 3′ with up to three mismatches. The numbers of sites at each distance was averaged over all RefSeq genes and smoothed by computing the mean in a 100-bp rolling window using the R zoo package. The displayed fold changes were computed after smoothing. There are 3.2 million genomic occurrences of 5′ GTTTACATACAC 3′ with up to three mismatches. Four hundred and eighteen out of 8,290 (5%) SB insertions fell directly inside of one of these SB transposase-binding sites, which is a highly significant enrichment (P value < 1 × 10¹⁵ Fisher’s exact test, fold change 2.02) compared to random controls. The human reference genome (hg18) was screened for SB transposase-binding sites using Bowtie.88
SB−2,000 −1,000 0
Distance to SB transposase binding sites (bp)
1,000
SBPBHIVMLV
2,000
3 1.8
1.6
1.4
1.2
Enr
ichm
ent o
f int
egra
tions
1.0
0.8
2
Enr
ichm
ent o
f int
egra
tions
at S
B tr
ansp
osas
e bi
ndin
g si
tes ***
1
0PB HIV MLV
a b
Figure 7 Interaction of the transposase with BET proteins targets piggyBac insertions to BRD4-binding sites. (a) Enrichment of PB and MLV insertions near BRD4-associated sites. The fold enrichment of insertions around 33,544 BRD4-binding sites detected by Zhang et al.65 The figure was created with the same method as in Figure 2d for TSSs. The numbers of sites at each distance were averaged over all RefSeq genes and smoothed by computing the mean in a 500-bp rolling window using the R zoo package. The fold changes were computed after smoothing. The profiles for PB and MLV resemble the pattern observed for TSSs. Fifty-three percent of the BRD4-binding sites are inside of RefSeq genes, this explains the relative high number of HIV integrations nearby. (b) The PB transposase interacts with the BET proteins BRD2 and BRD4. Extracts of HEK293T cells expressing PB-HA along with GFP-tagged BRD2 or BRD4 were immunoprecipitated (IP) with a GFP affinity matrix, and immunoprecipitates were analyzed by Western blotting (WB) using rat anti-HA or mouse anti-GFP antibody as indicated.
75kDa BRD2
BRD4
GFP
150
25
75
25
Lane
−5,000 −4,000 −3,000 −2,000 −1,000 0
Distance to BRD4 binding sites (bp)
1,000 2,000 3,000 4,000 5,000
SB20
10
5
Enr
ichm
ent o
f int
egra
tions
2
1
PBHIVMLV
1 2 3
IP: α-GFP (BRD2, BRD4)WB: α-HA (PB)
IP: α-GFP (BRD2, BRD4)WB: α-GFP (BRD2, BRD4)
PB-HA
BRD2, BRD4
GFP
Input150
a b
Molecular Therapy vol. 24 no. 3 mar. 2016 599
Official journal of the American Society of Gene & Cell TherapyComparative Genome-wide Profiling of Transposon and Retrovirus Integration Sites in Human T Cells
2 or 3 mismatches, or all occurrences of 6-mers or 8-mers of 5′ GTTTACATACAC 3′; data not shown).
Given the highly similar patterns of PB and MLV insertions in our datasets with respect to proximity to TSSs (Figure 2d), we wondered if PB insertions are also enriched at sites associated with BET proteins. Thus, we next evaluated whether there is a correla-tion between PB integration sites and the chromatin-binding sites of BET proteins mapped using ChIP-Seq data obtained in CD4+ T cells.65 Figure 7a shows a significant co-localization of BRD4-binding sites, MLV integration sites, and PB integration sites. The data also revealed a very strong enrichment and positioning of PB insertion sites directly at the BRD4-binding sites, whereas MLV insertions are positioned at the flanks of the BRD4-binding sites. Thus, the correlation between PB and MLV insertions with respect to BRD4-binding sites is very similar to the distribution of insertions with respect to TSSs as shown in Figure 2d. These results suggest that PB, in a fashion analogous to MLV, is possi-bly targeted to TSSs through a tethering mechanism dictated by chromatin-bound BRD4.
To investigate a possible physical interaction between the PB transposase and BET proteins, a co-imunoprecipitation experi-ment was performed (Figure 7b). Cell extracts were prepared from HEK293T cells expressing HA-tagged PB transposase and GFP-tagged BET proteins, BRD2 and BRD4. An antibody against GFP was used for immunoprecipitation. Precipitated proteins were subsequently detected with an antibody against the HA tag of the PB transposase. PB transposase was co-precipitated with BRD2 and BRD4, but not with control (GFP) (Figure 7b, lanes 1, 2, and 3, respectively). Thus, we conclude that PB transposase interacts with BET proteins. We further found that the C-termini of BET proteins spanning their highly conserved ET domains that are required for interaction with the MLV IN (aa640-801 for BRD2, aa539-726 for BRD3, and aa607-722 for BRD4)24–26 was sufficient to interact with the PB transposase (Supplementary Figure S8a). Finally, we tested if the residues in the BRD2 ET domain that con-tribute to binding to MLV IN and FeLV IN24 are also involved in binding to the PB transposase. We found that none of the residues involved in binding to INs are important for interaction with the PB transposase (Supplementary Figure S8b). Thus, although PB transposase interacts with the ET domain, it does so in a manner different from MLV IN and FeLV IN.
Potential deregulation of gene expression upon integration and genomic safe harborsIntegration of therapeutic gene constructs into safe sites in the human genome would prevent insertional mutagenesis and asso-ciated risks of oncogenesis in gene therapy. Genomic “safe har-bors” (GSHs) are regions of the human genome that are able to accommodate the predictable expression of newly integrated DNA without adverse effects on the host cell or organism. It was previ-ously proposed that GSHs should meet the following five criteria: (i) distance of at least 50 kb from the 5′-end of any gene, (ii) dis-tance of at least 300 kb from any cancer-related gene, (iii) distance of at least 300 kb from any microRNA (miRNA), (iv) location out-side a transcription unit, and (v) location outside ultraconserved regions of the human genome.66,67 We compiled our datasets to investigate the relative frequencies of integration into a GSH by
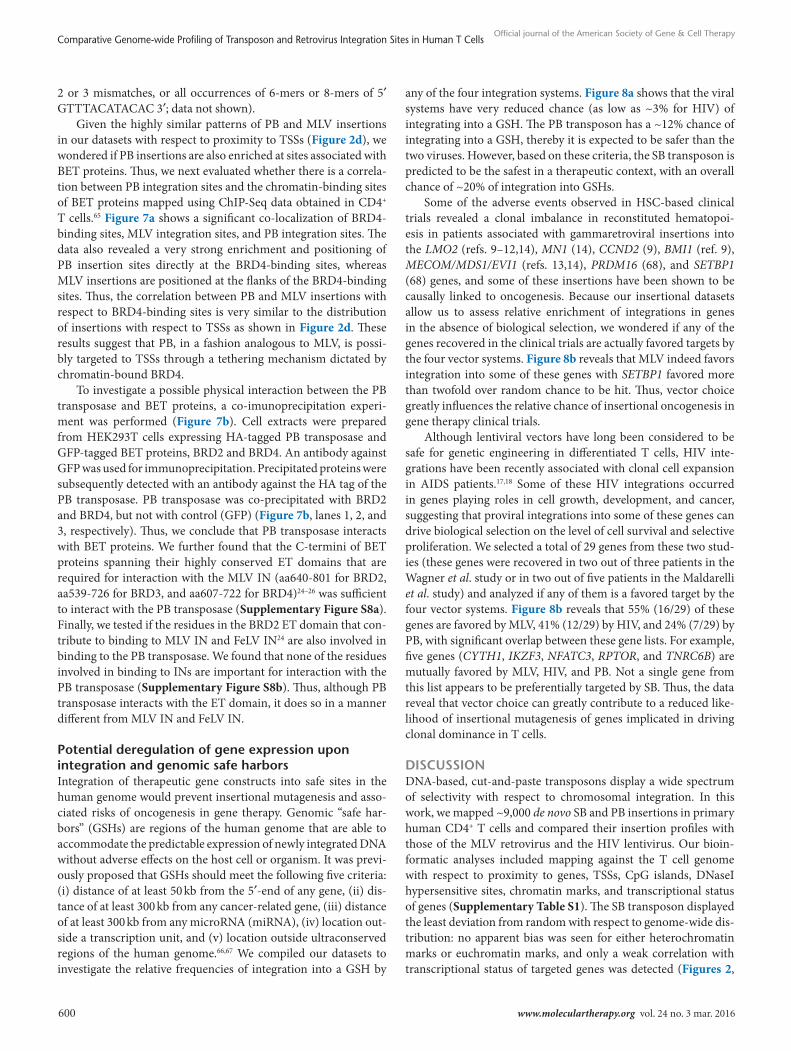
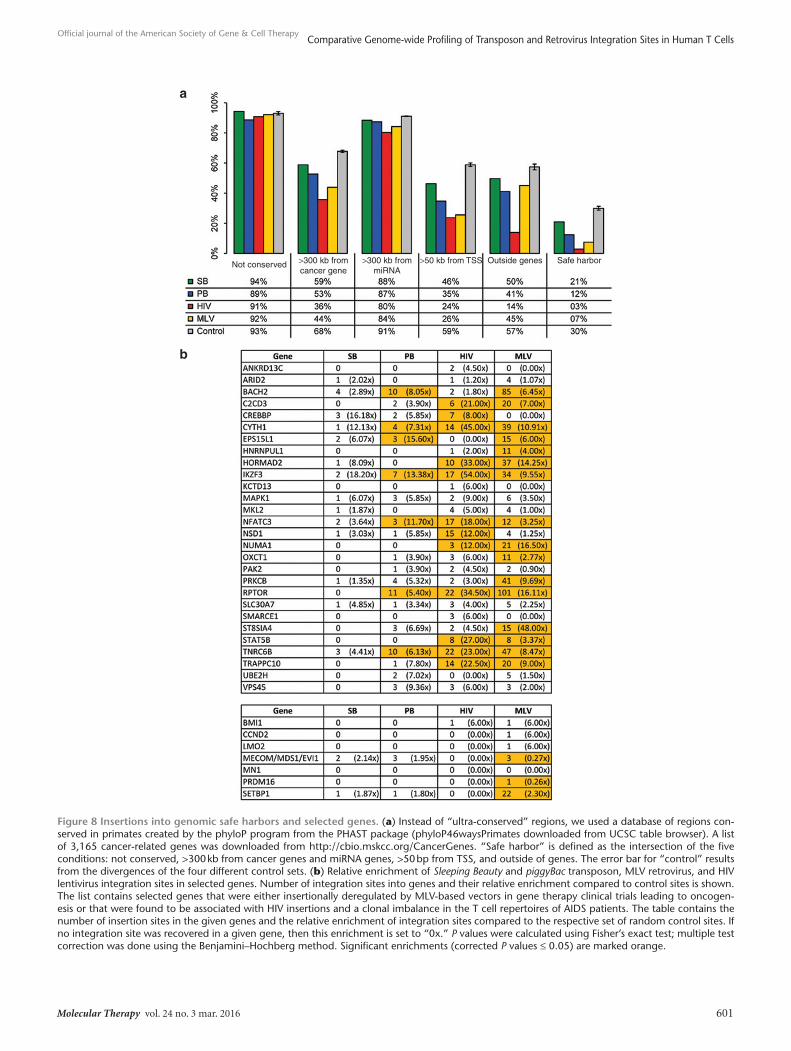
any of the four integration systems. Figure 8a shows that the viral systems have very reduced chance (as low as ~3% for HIV) of integrating into a GSH. The PB transposon has a ~12% chance of integrating into a GSH, thereby it is expected to be safer than the two viruses. However, based on these criteria, the SB transposon is predicted to be the safest in a therapeutic context, with an overall chance of ~20% of integration into GSHs.
Some of the adverse events observed in HSC-based clinical trials revealed a clonal imbalance in reconstituted hematopoi-esis in patients associated with gammaretroviral insertions into the LMO2 (refs. 9–12,14), MN1 (14), CCND2 (9), BMI1 (ref. 9), MECOM/MDS1/EVI1 (refs. 13,14), PRDM16 (68), and SETBP1 (68) genes, and some of these insertions have been shown to be causally linked to oncogenesis. Because our insertional datasets allow us to assess relative enrichment of integrations in genes in the absence of biological selection, we wondered if any of the genes recovered in the clinical trials are actually favored targets by the four vector systems. Figure 8b reveals that MLV indeed favors integration into some of these genes with SETBP1 favored more than twofold over random chance to be hit. Thus, vector choice greatly influences the relative chance of insertional oncogenesis in gene therapy clinical trials.
Although lentiviral vectors have long been considered to be safe for genetic engineering in differentiated T cells, HIV inte-grations have been recently associated with clonal cell expansion in AIDS patients.17,18 Some of these HIV integrations occurred in genes playing roles in cell growth, development, and cancer, suggesting that proviral integrations into some of these genes can drive biological selection on the level of cell survival and selective proliferation. We selected a total of 29 genes from these two stud-ies (these genes were recovered in two out of three patients in the Wagner et al. study or in two out of five patients in the Maldarelli et al. study) and analyzed if any of them is a favored target by the four vector systems. Figure 8b reveals that 55% (16/29) of these genes are favored by MLV, 41% (12/29) by HIV, and 24% (7/29) by PB, with significant overlap between these gene lists. For example, five genes (CYTH1, IKZF3, NFATC3, RPTOR, and TNRC6B) are mutually favored by MLV, HIV, and PB. Not a single gene from this list appears to be preferentially targeted by SB. Thus, the data reveal that vector choice can greatly contribute to a reduced like-lihood of insertional mutagenesis of genes implicated in driving clonal dominance in T cells.
DISCUSSIONDNA-based, cut-and-paste transposons display a wide spectrum of selectivity with respect to chromosomal integration. In this work, we mapped ~9,000 de novo SB and PB insertions in primary human CD4+ T cells and compared their insertion profiles with those of the MLV retrovirus and the HIV lentivirus. Our bioin-formatic analyses included mapping against the T cell genome with respect to proximity to genes, TSSs, CpG islands, DNaseI hypersensitive sites, chromatin marks, and transcriptional status of genes (Supplementary Table S1). The SB transposon displayed the least deviation from random with respect to genome-wide dis-tribution: no apparent bias was seen for either heterochromatin marks or euchromatin marks, and only a weak correlation with transcriptional status of targeted genes was detected (Figures 2,
600 www.moleculartherapy.org vol. 24 no. 3 mar. 2016
Official journal of the American Society of Gene & Cell TherapyComparative Genome-wide Profiling of Transposon and Retrovirus Integration Sites in Human T Cells
Figure 8 Insertions into genomic safe harbors and selected genes. (a) Instead of “ultra-conserved” regions, we used a database of regions con-served in primates created by the phyloP program from the PHAST package (phyloP46waysPrimates downloaded from UCSC table browser). A list of 3,165 cancer-related genes was downloaded from http://cbio.mskcc.org/CancerGenes. “Safe harbor” is defined as the intersection of the five conditions: not conserved, >300 kb from cancer genes and miRNA genes, >50 bp from TSS, and outside of genes. The error bar for “control” results from the divergences of the four different control sets. (b) Relative enrichment of Sleeping Beauty and piggyBac transposon, MLV retrovirus, and HIV lentivirus integration sites in selected genes. Number of integration sites into genes and their relative enrichment compared to control sites is shown. The list contains selected genes that were either insertionally deregulated by MLV-based vectors in gene therapy clinical trials leading to oncogen-esis or that were found to be associated with HIV insertions and a clonal imbalance in the T cell repertoires of AIDS patients. The table contains the number of insertion sites in the given genes and the relative enrichment of integration sites compared to the respective set of random control sites. If no integration site was recovered in a given gene, then this enrichment is set to “0x.” P values were calculated using Fisher’s exact test; multiple test correction was done using the Benjamini–Hochberg method. Significant enrichments (corrected P values ≤ 0.05) are marked orange.
Not conserved >300 kb fromcancer gene
>300 kb frommiRNA
>50 kb from TSS Outside genes Safe harbor
a
b
Molecular Therapy vol. 24 no. 3 mar. 2016 601

Official journal of the American Society of Gene & Cell TherapyComparative Genome-wide Profiling of Transposon and Retrovirus Integration Sites in Human T Cells
4, and 5). This is in marked contrast to target site distributions of several other transposons including Tol2 (refs. 39,41), TcBuster,43 SPIN,43 and PB39,41,43,48 that all show significant difference from random insertion with respect to favored integration into genes and near chromatin marks characteristic of active transcription units (e.g., H3K27 acetylation and H3K4 monomethylation) and disfavored integration near marks characteristic of inactive chro-matin (e.g., H3K27 trimethylation). The PB transposon, in par-ticular, has been shown to favor open chromatin, expressed genes, and TSSs (±5 kb) associated with DNaseI hypersensitive sites, H3K4me3 marks, and Pol II-bound regions in mouse and human cells.44,46–48,50,53
We have identified remarkable parallels between integration site distributions of the PB transposon and the MLV retrovirus across 40 different chromatin states defined by combinations of genomic features specified in 70 datasets (Figure 1). Both PB and MLV were highly enriched in chromatin marks associated with TSSs (H3K4me3), in regions characterized by Pol II and CTCF binding, in proximity to expressed genes and in genes with higher expression levels (Figures 2, 4, and 5), suggesting that a major determining factor of insertion site distribution is physical acces-sibility of chromatin. Our studies, however, also highlight the potential involvement of an active mechanism of shaping the characteristic, MLV-like insertion profile of the PB transposon. Namely, PB insertions co-localize with BRD4-associated sites at TSSs, and the PB transposase interacts with BET proteins, includ-ing BRD4 (Figure 7). Recent studies revealed the role of an inter-action of the MLV IN with BET domain proteins in tethering the viral pre-integration complex to TSSs,24–26 and our results sug-gest a similar mechanism influencing PB integration. Although both the PB transposase and the MLV IN are DDE recombinases, these two proteins are only distantly related; therefore, a BRD/BET protein-dependent tethering mechanism in their chromo-somal integration process is likely a result of convergent evolution. Indeed, in addition to MLV, some other viruses exploit cellular BET proteins for different aspects of their life cycle (reviewed in ref. 69). One prominent mechanism is anchoring of the episomal genomes of papillomaviruses,70,71 Kaposi’s sarcoma-associated her-pesvirus,72–75 and Epstein–Barr virus76 to either interphase chro-matin or mitotic chromosomes by interactions of viral proteins with BET domain proteins. Thus, tethering mechanisms relying on interactions between virally encoded factors and BET proteins appear to have independently arisen during viral evolution.
Despite the similarities, a close inspection of the integration sites of PB and MLV at TSSs revealed a characteristic difference: the MLV insertions map at two peaks just up- and downstream of the TSSs, whereas PB insertions map directly at TSSs (Figure 2d). The bimodal MLV integration pattern is likely the result of a preference of MLV to integrate into nucleosome-wrapped DNA51,55 and that TSSs of expressed genes tend to be nucleosome depleted.56 We have shown that, in contrast to MLV, PB insertions favor nucleosome-free DNA (Figure 3), thereby providing a likely explanation for the characteristic difference between PB and MLV insertion patterns at TSSs.
We provide evidence for enriched insertion of the SB transpo-son near chromosomal sites that resemble binding sites of the SB transposase (Figure 6). These data are consistent with a tethering
mechanism that involves interaction of the transpositional nucleo-protein complex with chromatin-bound excess transposase mol-ecules (Supplementary Figure S7). It has been proposed that SB transposition involves a transposase tetramer associated with the transposon ends.77 Can it be that this tetrameric complex can establish contacts with additional transposase molecules bound elsewhere in the genome? Although the relative contributions of the four transposase monomers to the catalytic steps of transpo-sition have not been elucidated, it is possible that not all mono-mers are equally engaged in the reaction. Indeed, the bacterial Mu transposase forms a stable tetramer with the Mu DNA ends but only two of the active sites within the tetramer are involved in catalysis.78–80 Although the other two subunits of the tetramer do not supply DDE residues to the active sites, they are likely to play other important roles, including maintaining the structural integ-rity of the transpososome.81,82 Similarly, the foamy virus retrovi-ral intasome structure revealed a tetramer of IN, but the catalytic DDE residues are contributed by only two IN subunits.83 Thus, other mobile elements (including SB) may also require “surplus” recombinase subunits for temporarily stabilizing pairing of the transposon ends and for the formation of a catalytically primed synaptic complex.
Finally, our data allow us to estimate the relative safety of the four integrating genetic elements in the context of human appli-cations (Figure 8). Our compiled datasets allow us to rank these vector systems with respect to their projected relative “safety” based on the frequencies of integration into GSHs (Figure 8a) as well as into selected genes that were targeted by retroviral inser-tions in gene therapy clinical trials leading to serious adverse events or by HIV insertions on AIDS patients leading to a clonal imbalance in their T cell repertoire (Figure 8b). Our analyses col-lectively establish a favorable integration profile of the SB transpo-son. It has to be noted that those insertions that are not in GSHs are not necessarily equally genotoxic. Indeed, it has been dem-onstrated that MLV-based gammaretroviral insertions, although they target GSHs >2-fold more frequently than HIV-based len-tiviral vectors (Figure 8a), were approximately threefold more likely to trigger transformation of primary HSCs in a cell-based immortalization assay.84 This suggests that an MLV insertion next to a TSSs tends to be more genotoxic than an HIV insertion in a gene body. Furthermore, the mutagenic potential of any integrat-ing gene vector will ultimately be defined not only by its inser-tional pattern, but also by its cargo (including the transcriptional regulatory elements that drive transgene expression) and by vec-tor copy number per genome. Importantly, vector copy number can be experimentally adjusted by titrating the components of the SB transposon system in the electroporation reactions to yield pri-marily one or two insertions per cell,39 very much like multiplicity of infection largely determines vector copy number in viral vec-tor transductions. Finally, important steps have been made toward introducing an experimental bias into the natural target site selec-tion properties of integrating gene vector systems. First, for both the SB42 and the PB85 transposon systems, it has been shown that engineered DNA-binding domains can drive at least a fraction of integration events into a chromosomal locus or region defined by sequence-specific DNA–protein interactions, suggesting a pos-sibility to target vector integrations into validated GSHs in the
602 www.moleculartherapy.org vol. 24 no. 3 mar. 2016

Official journal of the American Society of Gene & Cell TherapyComparative Genome-wide Profiling of Transposon and Retrovirus Integration Sites in Human T Cells
future. Second, disrupting the interaction of BET proteins with the MLV preintegration complex by targeted mutagenesis of IN has been shown to result in detargeting of TSSs, thereby yielding a potentially safer genome-wide insertion profile.86 Thus, continu-ing efforts of vector engineering will likely have a considerable impact on the safety of future vector designs.
MATERIALS AND METHODSVector construction. Transposase expression vectors pCaggs-SB100 and pCaggs-pB were kindly provided by Grabundzija.39 The transposon vectors pUC19SBCaggsGFP and pUC19pBCaggsGFP were generated by replac-ing the SV40neo cassette in pUC19SBneo and pUC19pBneo39 by a Caggs promoter-driven GFP expression cassette.
Isolation of human peripheral blood mononuclear cells and enrich-ment of CD4+ T cells. After obtaining informed consent, venous blood from healthy volunteers was drawn into ethylenediaminetetraacetic acid-containing tubes (S-Monovette, Sarstedt, Nümbrecht, Germany) and diluted 1:2 with buffer (phosphate-buffered saline (PBS), 2% heat-inactivated fetal calf serum). The diluted blood was layered onto Biocoll separating solution (Biochrom AG, Berlin, Germany) at a volume ratio of 2:1, and after centrifugation for 20 minutes at 648 x g without brake and low acceleration, the layer of mononuclear cells was aspirated. Peripheral blood mononuclear cells were washed twice with buffer (first cycle, 10 minutes at 300 xg; second cycle, 10 minutes at 200 xg), and the cell density was adjusted to 5 × 10⁷/ml.
CD4+ T cells were isolated from peripheral blood mononuclear cells by negative immunomagnetic selection using the EasySep Human CD4+ T Cell Enrichment Kit (Stemcell Technologies, Grenoble, France) according to the manufacturer’s instructions. Hundred microliter antibody cocktail were added to 1 × 10⁸ peripheral blood mononuclear cells in 2 ml buffer and incubated for 10 minutes at room temperature. Hundred microliter magnetic particles were added, and after 5 minutes of incubation at room temperature, the cell suspension was adjusted to 2.5 ml by adding buffer. The tube was placed into the EasySep magnet (Stemcell Technologies, Grenoble, France), and after 5 minutes, the unlabeled CD4+ T-cell fraction was poured off into a new tube.
Electroporation, activation, and expansion of T cells. T cells were electroporated using the Nucleofector I device and the Human T cell Nucleofector Kit (Lonza, Cologne, Germany) following the instructions of the manual except for cell number and DNA amount. 6 × 10⁶ cells were mixed with 10 μg plasmid DNA (transposon to transposase ratio of 1:2) in 100 μl DNA-nucleofector solution and electroporated using the program U-14. RPMI 1640 Glutamax (Life Techologies, Darmstadt, Germany) supplemented with 10% heat-inactivated fetal calf serum (Biochrom, Berlin, Germany) and 10 mmol/l HEPES was used as T cell medium (TCM). Immediately after the electroporation, 0.5 ml TCM was added to the cuvette, the cell suspension was transferred into a 24-well tissue cul-ture plate containing 1.5 ml pre-warmed TCM, and cultured overnight in a humidified incubator at 37 °C and 5% CO2.
T cells were activated 24 hours after electroporation by transfer into a new plate precoated with 5 μg/ml anti-CD3 and 1 μg/ml anti-CD28 antibodies (BD Pharmingen, Heidelberg, Germany) and addition of 100 UI/ml IL-2 (Proleukin, Novatis, Basel, Switzerland). After 3–4 days, the activated T cells were transferred into a new cell culture flask, and 2–3 ml TCM supplemented with 100 UI/ml IL-2 was added daily.
Analysis of T cells by flow cytometry. The transposon vectors were tagged with a GFP expression cassette that allowed an estimation of the respective transfection and transpositional efficiencies at day 1 and day 10 post elec-troporation. Sustained GFP expression, as judged by fluorescence-activated cell sorting (FACS) analysis, in the presence of the respective transposases is indicative of stable, transposon-mediated genetic modification of
human CD4+ T cells (Supplementary Figure S1a). Both transposon sys-tems were about equally efficient in stable gene transfer and resulted in ~40% GFP+ cells. For FACS analysis, cells were washed and incubated with APC-labeled anti-human CD4 antibody (BD Pharmingen, Heidelberg, Germany) in FACS buffer (PBS, 2% fetal calf serum, 2 mmol/l ethylene-diaminetetraacetic acid, 0.05% NaN3) for 30 minutes at 4 °C and washed twice afterwards. Before measurement, SYTOX blue (Life Technologies, Darmstadt, Germany) was added to stain dead cells. Flow cytometry data was acquired using a FACS canto II (BD Bioscience, Heidelberg, Germany), and data were analyzed with FlowJo software (TreeStar, Ashland, OR).
Recovery of integration sites. Unsorted cell populations at day 10 post-electroporation were harvested for genomic DNA preparation. Two variations of the linear amplification-mediated PCR87 were performed to amplify the vector–genomic DNA junctions. For both approaches, T cells were harvested 10 days after electroporation, and genomic DNA was extracted using the DNeasy kit (Qiagen, Hilden, Germany). Five micro-gram of genomic DNA was either predigested with DpnI and BamHI (SB) or DpnI and KpnI (PB) or sonicated to small pieces ranging from 100 to 500 bp, with an average size of 250 bp using the Covartis S2 sonica-tion device. Thereafter, the sonicated DNA was ethanol precipitated. The digested DNA was subjected to gel electrophoresis, and the genomic DNA was isolated from 0.7% agarose gel and purified using GenElute Gel extrac-tion kit (Sigma-Aldrich, St Louis, MO). For both, 500 ng DNA was used for linear amplification-mediated PCR. Biotinylated SB- and PB- transposon inverted terminal repeat-specific primers (see Supplementary Materials for primer sequences) were used in 50 rounds of linear amplification to enrich DNA species containing transposon–chromosomal DNA junctions. The single-stranded products were immobilized on streptadivin-coated magnetic beads using the Dynabeads kilobase BINDER kit (Invitrogen, Carlsbad, CA). All subsequent steps were performed on the magnetic bead-bound DNA. Repeated washing steps with water followed each reaction. Second strand synthesis was performed with random hexamer oligos (Roche, Basel, Switzerland) using Klenow (New England Biolabs, Ipswich, MA). The free ends of the double-stranded sonicated DNA were blunt ended and phosphorylated using the End-ItDNA End-Repair kit (Epicentre, Madison, WI). Klenow fragment exo- (New England Biolabs) and dATP were used to add a single “A” nucleotide to the 3′ ends. The double-stranded DNA of the second approach was subjected to restric-tion digests with MboI, HpaII, or CviQI. The DNA fragments with an “A” overhang were ligated to linkers with a “T” overhang, whereas the digested DNA was ligated with linkers having the equivalent overhang created by the respective restriction enzyme. Next, the bead-bound DNA was sub-jected to a PCR using primers specific for the inverted terminal repeat sequences and the linkers. During the amplification, we used barcoded primers so that we could pool different libraries. Finally, primers corre-sponding to Illumina adapter sequences were used to yield a directional library, in which sequences complementary to the Illumina genomic DNA sequence primers were located upstream to the transposon inverted ter-minal repeats. Thus, the resulting libraries could be pooled and sequenced on a single flow cell lane on the Illumina HiSeq platform with single end run settings.40
Analysis of sequencing data. We selected all sequencing reads which passed the quality filter of the Illumina real-time analysis program and which started with the barcode (exact sequence) and the transposon inverted terminal repeat-specific primer sequences (with up to one mis-matches). The rest of the reads (27 bp for SB starting with TA dinucleotide, and 30 bp for PB starting with TTAA) were mapped to the human genome (hg18, downloaded from genome.ucsc.edu) using the following procedure to avoid spurious insertion sites. First, we determined all sequencing reads mapping exactly to one or more positions within the reference genome using Bowtie.88 The resulting reads were mapped against each other and then clustered such that any two reads with up to two mismatches belong to the same cluster. We kept only reads which occurred at least twice and
Molecular Therapy vol. 24 no. 3 mar. 2016 603

Official journal of the American Society of Gene & Cell TherapyComparative Genome-wide Profiling of Transposon and Retrovirus Integration Sites in Human T Cells
contributed at least one-fifths of the total number of reads within their cluster. From the resulting reads, we kept only those which mapped exactly to a unique position in the reference genome. Reads mapping to the same TA (in the case of SB) or TTAA (in the case of PB) sequence in the genome were then merged together. Sequence data is accessible in the GEO data-base at http://www.ncbi.nlm.nih.gov/geo/query/acc.cgi?token=wtsfakacnvyfroz&acc=GSE58744.
Generation of control sites. We created sets of control sites for SB and PB separately; 12 control sites per insertion site. The four protocol vari-ants, i.e., using sonication or digestion with MboI, HpaII, or CviQI, require slightly different methods of control site selection. For insertion sites found by sonication, we randomly selected the control sites from all occurrences of TA (in the case of SB) or TTAA (in the case of PB) in the genome. For insertion sites found by enzyme digestion, we selected occurrences of TA/TTAA having the same distance to the closest enzyme restriction site as the original insertion site. Since each insertion site could be found by any of these four protocol variants, we adjusted the number of control sites accordingly: if, for example, one insertion site was found both by soni-cation and Mbol, then we created six control sites using the sonication method and six control sites using the Mbol method. We then retrieved the genomic sequences at the control sites, 27 bp in the case of SB and 30 bp in the case of PB, and then processed them in the same way as the sequenc-ing reads (see above) keeping at the end only the uniquely mapped control sites. For HIV and MLV, we used the random control sites described by Roth et al.51
ChromHMM analysis. The following ChIP-Seq data sets were retrieved from various public repositories: BRG1 (ref. 89), CTCF, H2BK5me1, H3K27me1, H3K27me2, H3K27me3, H3K36me1, H3K36me3, H3K4me1, H3K4me2, H3K4me3, H3K79me1, H3K79me2, H3K79me3, H3K9me1, H3K9me2, H3K9me3, H3R2me1, H3R2me2, H4K20me1, H4K20me3, H4R3me2 (ref. 62), PolIII,90 HMGN1, YY1 (ref. 91), STAT1, STAT4, STAT5A, STAT5B,92 gH2AX, H2AX, H2AZ, INO80, SRCAP,93 H2AK5ac, H2AK9ac, H2BK120ac, H2BK12ac, H2BK20ac, H2BK5ac, H3K14ac, H3K18ac, H3K23ac, H3K27ac, H3K36ac, H3K4ac, H3K9ac, H4K12ac, H4K16ac, H4K5ac, H4K8ac, H4K91ac,94 CBP, MOF, p300, PCAF, Tip60, HDAC1, HDAC2, HDAC3, HDAC6 (ref. 95), BRD4, PolII, PolIIS2P, and PolIIS5P.65 Moreover, we used DNase-Seq data,63 total RNA-Seq90 and polyA RNA-Seq data,65 and MRE and MeDIP assays measuring DNA methylation.96
For creating sets of genomic features, we downloaded genome annotation files from the UCSC Genome Bioinformatics Site (http://genome.ucsc.edu). The splitting of genes into the groups “absent,” “marginal,” and “present” according to their expression levels was done as described in ref. 59. DNase hypersensitive sites were taken from ref. 63. The set of enhancer regions (called “permissive enhancers”) was taken from FANTOM 5 data base.97 Lamina-associated domains were taken from ref. 98. Conserved regions and safe harbors were defined as described in refs. 66,67.
Co-imunoprecipitations. HEK293T cells were co-transfected, using Fugene 6 (Roche, Mannheim, Germany), with 1 μg of DNA of expres-sion vectors for HA-tagged PB transposase and GFP-tagged BRD2, BRD4, the C-terminal domains of BRD2 (aa640-801), BRD3 (aa539-726), BRD4 (aa607-722), or BRD2 mutants, as described previously.24 Forty-eight hours after transfection, cells were lysed once in cold PBS and lysed in 300 μl of RIPA buffer (25 mmol/l Tris, pH 7.4, 150 mmol/l NaCl, 10 mmol/l MgCl2, 10 mmol/l DTT, 0.5% NP-40). A polyclonal antibody to GFP (Clontech, Saint-Germain-en-Laye, France) was immobilized on Protein A sepharose beads (GE Healthcare, Freiburg, Germany) by washing 100 μl of beads three times with 500 μl of RIPA buffer, adding 200 μg of anti-GFP antibody diluted in 45 μl PBS containing 4% sucrose and 0.02% Na-azide, incu-bating the beads for 15 minutes, adjusting the volume to 300 μl PBS/4% sucrose/0.02% Na-azide and allowing the antibody to bind to the beads
overnight at 4 °C on a roller-shaker. Following three washes in RIPA buf-fer, beads were resuspended in 250 μl of RIPA buffer, 250 μl of cell extract was mixed with 20 μl of anti-GFP beads and incubated overnight at 4 °C. Afterwards, beads were washed eight times with 500 μl RIPA buffer with protease inhibitors, bound proteins eluted with sodium dodecyl sulfate-polyacrylamide gel electrophoresis sample buffer, and analyzed by sodium dodecyl sulfate-polyacrylamide gel electrophoresis and western blot.
SUPPLEMENTARY MATERIALFigure S1. Sustained GFP expression in human CD4+ T cells after genetic modification using the Sleeping Beauty and piggyBac transpo-son systems.Figure S2. Local sequence information content at vector integration sites.Figure S3. Genome-wide mapping of Sleeping Beauty and piggyBac integrations in primary human T cells.Figure S4. Insertions into genomic features.Figure S5. Integration and DNA-methylation.Figure S6. Correlation between gene expression and integration into genes.Figure S7. A model for a tethering mechanism in Sleeping Beauty transposon integration that involves interaction between the trans-positional nucleoprotein complex and chomatin-bound excess trans-posase molecules.Figure S8. The PB transposase interacts with the BET proteins BRD2 and BRD4 via their C-termini.Table S1. Summary of genomic features around insertion sites.Materials and Methods
ACKNOWLEDGMENTSWe thank N. Malani and F. Bushman for kindly providing raw inser-tional datasets for MLV and HIV obtained in T cells. This work was sup-ported by EU FP7 (PERSIST, grant number 222878) and grants from the Deutsche Forschungsgemeinschaft “Mechanisms of gene vector entry and persistence” (SPP1230, grant number IV 21/4-2), Collaborative Research Centre “Chronic Infections: Microbial Persistence and its Control” (SFB900 TP C1), and from the Bundesministerium für Bildung und Forschung (NGFNplus ENGINE, grant number 01GS08199).The authors declare no conflict of interest.
REFERENCES 1. Mavilio, F and Ferrari, G (2008). Genetic modification of somatic stem cells. The
progress, problems and prospects of a new therapeutic technology. EMBO Rep 9 (suppl. 1): S64–S69.
2. Naldini, L (2011). Ex vivo gene transfer and correction for cell-based therapies. Nat Rev Genet 12: 301–315.
3. Aiuti, A, Biasco, L, Scaramuzza, S, Ferrua, F, Cicalese, MP, Baricordi, C et al. (2013). Lentiviral hematopoietic stem cell gene therapy in patients with Wiskott-Aldrich syndrome. Science 341: 1233151.
4. Biffi, A, Montini, E, Lorioli, L, Cesani, M, Fumagalli, F, Plati, T et al. (2013). Lentiviral hematopoietic stem cell gene therapy benefits metachromatic leukodystrophy. Science 341: 1233158.
5. Cavazzana-Calvo, M, Payen, E, Negre, O, Wang, G, Hehir, K, Fusil, F et al. (2010). Transfusion independence and HMGA2 activation after gene therapy of human β-thalassaemia. Nature 467: 318–322.
6. Cartier, N, Hacein-Bey-Abina, S, Bartholomae, CC, Veres, G, Schmidt, M, Kutschera, I et al. (2009). Hematopoietic stem cell gene therapy with a lentiviral vector in X-linked adrenoleukodystrophy. Science 326: 818–823.
7. Baum, C, von Kalle, C, Staal, FJ, Li, Z, Fehse, B, Schmidt, M et al. (2004). Chance or necessity? Insertional mutagenesis in gene therapy and its consequences. Mol Ther 9: 5–13.
8. Deichmann, A, Hacein-Bey-Abina, S, Schmidt, M, Garrigue, A, Brugman, MH, Hu, J et al. (2007). Vector integration is nonrandom and clustered and influences the fate of lymphopoiesis in SCID-X1 gene therapy. J Clin Invest 117: 2225–2232.
9. Hacein-Bey-Abina, S, Garrigue, A, Wang, GP, Soulier, J, Lim, A, Morillon, E et al. (2008). Insertional oncogenesis in 4 patients after retrovirus-mediated gene therapy of SCID-X1. J Clin Invest 118: 3132–3142.
10. Howe, SJ, Mansour, MR, Schwarzwaelder, K, Bartholomae, C, Hubank, M, Kempski, H et al. (2008). Insertional mutagenesis combined with acquired somatic mutations causes leukemogenesis following gene therapy of SCID-X1 patients. J Clin Invest 118: 3143–3150.
11. Hacein-Bey-Abina, S, Von Kalle, C, Schmidt, M, McCormack, MP, Wulffraat, N, Leboulch, P et al. (2003). LMO2-associated clonal T cell proliferation in two patients after gene therapy for SCID-X1. Science 302: 415–419.
604 www.moleculartherapy.org vol. 24 no. 3 mar. 2016

Official journal of the American Society of Gene & Cell TherapyComparative Genome-wide Profiling of Transposon and Retrovirus Integration Sites in Human T Cells
12. Thrasher, AJ, Gaspar, HB, Baum, C, Modlich, U, Schambach, A, Candotti, F et al. (2006). Gene therapy: X-SCID transgene leukaemogenicity. Nature 443: E5–6; discussion E6.
13. Stein, S, Ott, MG, Schultze-Strasser, S, Jauch, A, Burwinkel, B, Kinner, A et al. (2010). Genomic instability and myelodysplasia with monosomy 7 consequent to EVI1 activation after gene therapy for chronic granulomatous disease. Nat Med 16: 198–204.
14. Braun, CJ, Boztug, K, Paruzynski, A, Witzel, M, Schwarzer, A, Rothe, M et al. (2014). Gene therapy for Wiskott-Aldrich syndrome–long-term efficacy and genotoxicity. Sci Transl Med 6: 227ra33.
15. Recchia, A, Bonini, C, Magnani, Z, Urbinati, F, Sartori, D, Muraro, S et al. (2006). Retroviral vector integration deregulates gene expression but has no consequence on the biology and function of transplanted T cells. Proc Natl Acad Sci USA 103: 1457–1462.
16. Newrzela, S, Cornils, K, Li, Z, Baum, C, Brugman, MH, Hartmann, M et al. (2008). Resistance of mature T cells to oncogene transformation. Blood 112: 2278–2286.
17. Maldarelli, F, Wu, X, Su, L, Simonetti, FR, Shao, W, Hill, S et al. (2014). HIV latency. Specific HIV integration sites are linked to clonal expansion and persistence of infected cells. Science 345: 179–183.
18. Wagner, TA, McLaughlin, S, Garg, K, Cheung, CY, Larsen, BB, Styrchak, S et al. (2014). HIV latency. Proliferation of cells with HIV integrated into cancer genes contributes to persistent infection. Science 345: 570–573.
19. Mitchell, RS, Beitzel, BF, Schroder, AR, Shinn, P, Chen, H, Berry, CC et al. (2004). Retroviral DNA integration: ASLV, HIV, and MLV show distinct target site preferences. PLoS Biol 2: E234.
20. Schröder, AR, Shinn, P, Chen, H, Berry, C, Ecker, JR and Bushman, F (2002). HIV-1 integration in the human genome favors active genes and local hotspots. Cell 110: 521–529.
21. Ciuffi, A, Llano, M, Poeschla, E, Hoffmann, C, Leipzig, J, Shinn, P et al. (2005). A role for LEDGF/p75 in targeting HIV DNA integration. Nat Med 11: 1287–1289.
22. Wu, X, Li, Y, Crise, B and Burgess, SM (2003). Transcription start regions in the human genome are favored targets for MLV integration. Science 300: 1749–1751.
23. LaFave, MC, Varshney, GK, Gildea, DE, Wolfsberg, TG, Baxevanis, AD and Burgess, SM (2014). MLV integration site selection is driven by strong enhancers and active promoters. Nucleic Acids Res 42: 4257–4269.
24. Gupta, SS, Maetzig, T, Maertens, GN, Sharif, A, Rothe, M, Weidner-Glunde, M et al. (2013). Bromo- and extraterminal domain chromatin regulators serve as cofactors for murine leukemia virus integration. J Virol 87: 12721–12736.
25. De Rijck, J, de Kogel, C, Demeulemeester, J, Vets, S, El Ashkar, S, Malani, N et al. (2013). The BET family of proteins targets moloney murine leukemia virus integration near transcription start sites. Cell Rep 5: 886–894.
26. Sharma, A, Larue, RC, Plumb, MR, Malani, N, Male, F, Slaughter, A et al. (2013). BET proteins promote efficient murine leukemia virus integration at transcription start sites. Proc Natl Acad Sci USA 110: 12036–12041.
27. Filippakopoulos, P, Qi, J, Picaud, S, Shen, Y, Smith, WB, Fedorov, O et al. (2010). Selective inhibition of BET bromodomains. Nature 468: 1067–1073.
28. Aiyer, S, Swapna, GV, Malani, N, Aramini, JM, Schneider, WM, Plumb, MR et al. (2014). Altering murine leukemia virus integration through disruption of the integrase and BET protein family interaction. Nucleic Acids Res 42: 5917–5928.
29. Ivics, Z, Li, MA, Mátés, L, Boeke, JD, Nagy, A, Bradley, A et al. (2009). Transposon-mediated genome manipulation in vertebrates. Nat Methods 6: 415–422.
30. Ivics, Z and Izsvák, Z (2010). The expanding universe of transposon technologies for gene and cell engineering. Mob DNA 1: 25.
31. Hackett, PB, Largaespada, DA and Cooper, LJ (2010). A transposon and transposase system for human application. Mol Ther 18: 674–683.
32. Ivics, Z and Izsvák, Z (2011). Nonviral gene delivery with the sleeping beauty transposon system. Hum Gene Ther 22: 1043–1051.
33. Hackett, PB Jr, Aronovich, EL, Hunter, D, Urness, M, Bell, JB, Kass, SJ et al. (2011). Efficacy and safety of Sleeping Beauty transposon-mediated gene transfer in preclinical animal studies. Curr Gene Ther 11: 341–349.
34. Izsvák, Z, Hackett, PB, Cooper, LJ and Ivics, Z (2010). Translating Sleeping Beauty transposition into cellular therapies: victories and challenges. Bioessays 32: 756–767.
35. Singh, H, Huls, H, Kebriaei, P and Cooper, LJ (2014). A new approach to gene therapy using Sleeping Beauty to genetically modify clinical-grade T cells to target CD19. Immunol Rev 257: 181–190.
36. Vigdal, TJ, Kaufman, CD, Izsvák, Z, Voytas, DF and Ivics, Z (2002). Common physical properties of DNA affecting target site selection of sleeping beauty and other Tc1/mariner transposable elements. J Mol Biol 323: 441–452.
37. Liu, G, Geurts, AM, Yae, K, Srinivasan, AR, Fahrenkrug, SC, Largaespada, DA et al. (2005). Target-site preferences of Sleeping Beauty transposons. J Mol Biol 346: 161–173.
38. Yant, SR, Wu, X, Huang, Y, Garrison, B, Burgess, SM and Kay, MA (2005). High-resolution genome-wide mapping of transposon integration in mammals. Mol Cell Biol 25: 2085–2094.
39. Grabundzija, I, Irgang, M, Mátés, L, Belay, E, Matrai, J, Gogol-Döring, A et al. (2010). Comparative analysis of transposable element vector systems in human cells. Mol Ther 18: 1200–1209.
40. Moldt, B, Miskey, C, Staunstrup, NH, Gogol-Döring, A, Bak, RO, Sharma, N et al. (2011). Comparative genomic integration profiling of Sleeping Beauty transposons mobilized with high efficacy from integrase-defective lentiviral vectors in primary human cells. Mol Ther 19: 1499–1510.
41. Ammar, I, Gogol-Döring, A, Miskey, C, Chen, W, Cathomen, T, Izsvák, Z et al. (2012). Retargeting transposon insertions by the adeno-associated virus Rep protein. Nucleic Acids Res 40: 6693–6712.
42. Voigt, K, Gogol-Döring, A, Miskey, C, Chen, W, Cathomen, T, Izsvák, Z et al. (2012). Retargeting sleeping beauty transposon insertions by engineered zinc finger DNA-binding domains. Mol Ther 20: 1852–1862.
43. Li, X, Ewis, H, Hice, RH, Malani, N, Parker, N, Zhou, L et al. (2013). A resurrected mammalian hAT transposable element and a closely related insect element are highly active in human cell culture. Proc Natl Acad Sci USA 110: E478–E487.
44. Wilson, MH, Coates, CJ and George, AL Jr (2007). PiggyBac transposon-mediated gene transfer in human cells. Mol Ther 15: 139–145.
45. Mitra, R, Fain-Thornton, J and Craig, NL (2008). piggyBac can bypass DNA synthesis during cut and paste transposition. EMBO J 27: 1097–1109.
46. Li, MA, Pettitt, SJ, Eckert, S, Ning, Z, Rice, S, Cadiñanos, J et al. (2013). The piggyBac transposon displays local and distant reintegration preferences and can cause mutations at noncanonical integration sites. Mol Cell Biol 33: 1317–1330.
47. Liang, Q, Kong, J, Stalker, J and Bradley, A (2009). Chromosomal mobilization and reintegration of Sleeping Beauty and PiggyBac transposons. Genesis 47: 404–408.
48. Huang, X, Guo, H, Tammana, S, Jung, YC, Mellgren, E, Bassi, P et al. (2010). Gene transfer efficiency and genome-wide integration profiling of Sleeping Beauty, Tol2, and piggyBac transposons in human primary T cells. Mol Ther 18: 1803–1813.
49. Bellen, HJ, Levis, RW, He, Y, Carlson, JW, Evans-Holm, M, Bae, E et al. (2011). The Drosophila gene disruption project: progress using transposons with distinctive site specificities. Genetics 188: 731–743.
50. de Jong, J, Akhtar, W, Badhai, J, Rust, AG, Rad, R, Hilkens, J et al. (2014). Chromatin landscapes of retroviral and transposon integration profiles. PLoS Genet 10: e1004250.
51. Roth, SL, Malani, N and Bushman, FD (2011). Gammaretroviral integration into nucleosomal target DNA in vivo. J Virol 85: 7393–7401.
52. Wang, GP, Levine, BL, Binder, GK, Berry, CC, Malani, N, McGarrity, G et al. (2009). Analysis of lentiviral vector integration in HIV+ study subjects receiving autologous infusions of gene modified CD4+ T cells. Mol Ther 17: 844–850.
53. Wang, H, Mayhew, D, Chen, X, Johnston, M and Mitra, RD (2012). “Calling cards” for DNA-binding proteins in mammalian cells. Genetics 190: 941–949.
54. Ernst, J and Kellis, M (2012). ChromHMM: automating chromatin-state discovery and characterization. Nat Methods 9: 215–216.
55. Maskell, DP, Renault, L, Serrao, E, Lesbats, P, Matadeen, R, Hare, S et al. (2015). Structural basis for retroviral integration into nucleosomes. Nature 523: 366–369.
56. Struhl, K and Segal, E (2013). Determinants of nucleosome positioning. Nat Struct Mol Biol 20: 267–273.
57. Guo, Y, Park, JM, Cui, B, Humes, E, Gangadharan, S, Hung, S et al. (2013). Integration profiling of gene function with dense maps of transposon integration. Genetics 195: 599–609.
58. Gangadharan, S, Mularoni, L, Fain-Thornton, J, Wheelan, SJ and Craig, NL (2010). DNA transposon Hermes inserts into DNA in nucleosome-free regions in vivo. Proc Natl Acad Sci USA 107: 21966–21972.
59. Schones, DE, Cui, K, Cuddapah, S, Roh, TY, Barski, A, Wang, Z et al. (2008). Dynamic regulation of nucleosome positioning in the human genome. Cell 132: 887–898.
60. Zhang, Y, Liu, T, Meyer, CA, Eeckhoute, J, Johnson, DS, Bernstein, BE et al. (2008). Model-based analysis of ChIP-Seq (MACS). Genome Biol 9: R137.
61. Deaton, AM and Bird, A (2011). CpG islands and the regulation of transcription. Genes Dev 25: 1010–1022.
62. Barski, A, Cuddapah, S, Cui, K, Roh, TY, Schones, DE, Wang, Z et al. (2007). High-resolution profiling of histone methylations in the human genome. Cell 129: 823–837.
63. Boyle, AP, Davis, S, Shulha, HP, Meltzer, P, Margulies, EH, Weng, Z et al. (2008). High-resolution mapping and characterization of open chromatin across the genome. Cell 132: 311–322.
64. Heintzman, ND, Stuart, RK, Hon, G, Fu, Y, Ching, CW, Hawkins, RD et al. (2007). Distinct and predictive chromatin signatures of transcriptional promoters and enhancers in the human genome. Nat Genet 39: 311–318.
65. Zhang, W, Prakash, C, Sum, C, Gong, Y, Li, Y, Kwok, JJ et al. (2012). Bromodomain-containing protein 4 (BRD4) regulates RNA polymerase II serine 2 phosphorylation in human CD4+ T cells. J Biol Chem 287: 43137–43155.
66. Papapetrou, EP, Lee, G, Malani, N, Setty, M, Riviere, I, Tirunagari, LM et al. (2011). Genomic safe harbors permit high β-globin transgene expression in thalassemia induced pluripotent stem cells. Nat Biotechnol 29: 73–78.
67. Sadelain, M, Papapetrou, EP and Bushman, FD (2012). Safe harbours for the integration of new DNA in the human genome. Nat Rev Cancer 12: 51–58.
68. Ott, MG, Schmidt, M, Schwarzwaelder, K, Stein, S, Siler, U, Koehl, U et al. (2006). Correction of X-linked chronic granulomatous disease by gene therapy, augmented by insertional activation of MDS1-EVI1, PRDM16 or SETBP1. Nat Med 12: 401–409.
69. Weidner-Glunde, M, Ottinger, M and Schulz, TF (2010). WHAT do viruses BET on? Front Biosci (Landmark Ed) 15: 537–549.
70. Baxter, MK, McPhillips, MG, Ozato, K and McBride, AA (2005). The mitotic chromosome binding activity of the papillomavirus E2 protein correlates with interaction with the cellular chromosomal protein, Brd4. J Virol 79: 4806–4818.
71. McPhillips, MG, Ozato, K and McBride, AA (2005). Interaction of bovine papillomavirus E2 protein with Brd4 stabilizes its association with chromatin. J Virol 79: 8920–8932.
72. Viejo-Borbolla, A, Ottinger, M, Brüning, E, Bürger, A, König, R, Kati, E et al. (2005). Brd2/RING3 interacts with a chromatin-binding domain in the Kaposi’s Sarcoma-associated herpesvirus latency-associated nuclear antigen 1 (LANA-1) that is required for multiple functions of LANA-1. J Virol 79: 13618–13629.
73. You, J, Srinivasan, V, Denis, GV, Harrington, WJ Jr, Ballestas, ME, Kaye, KM et al. (2006). Kaposi’s sarcoma-associated herpesvirus latency-associated nuclear antigen interacts with bromodomain protein Brd4 on host mitotic chromosomes. J Virol 80: 8909–8919.
74. Ottinger, M, Christalla, T, Nathan, K, Brinkmann, MM, Viejo-Borbolla, A and Schulz, TF (2006). Kaposi’s sarcoma-associated herpesvirus LANA-1 interacts with the short variant of BRD4 and releases cells from a BRD4- and BRD2/RING3-induced G1 cell cycle arrest. J Virol 80: 10772–10786.
75. Hellert, J, Weidner-Glunde, M, Krausze, J, Richter, U, Adler, H, Fedorov, R et al. (2013). A structural basis for BRD2/4-mediated host chromatin interaction and oligomer assembly of Kaposi sarcoma-associated herpesvirus and murine gammaherpesvirus LANA proteins. PLoS Pathog 9: e1003640.
76. Lin, A, Wang, S, Nguyen, T, Shire, K and Frappier, L (2008). The EBNA1 protein of Epstein-Barr virus functionally interacts with Brd4. J Virol 82: 12009–12019.
Molecular Therapy vol. 24 no. 3 mar. 2016 605

Official journal of the American Society of Gene & Cell TherapyComparative Genome-wide Profiling of Transposon and Retrovirus Integration Sites in Human T Cells
77. Izsvák, Z, Khare, D, Behlke, J, Heinemann, U, Plasterk, RH and Ivics, Z (2002). Involvement of a bifunctional, paired-like DNA-binding domain and a transpositional enhancer in Sleeping Beauty transposition. J Biol Chem 277: 34581–34588.
78. Namgoong, SY and Harshey, RM (1998). The same two monomers within a MuA tetramer provide the DDE domains for the strand cleavage and strand transfer steps of transposition. EMBO J 17: 3775–3785.
79. Chaconas, G and Harshey, RM (2002). Transposition of phage Mu DNA. In: Craig, NL, Craigie, R, Gellert, M, and Lambowitz, AM (eds.). Mobile DNA II. ASM Press: Washington, DC. pp. 384–402.
80. Montaño, SP, Pigli, YZ and Rice, PA (2012). The μ transpososome structure sheds light on DDE recombinase evolution. Nature 491: 413–417.
81. Lavoie, BD, Chan, BS, Allison, RG and Chaconas, G (1991). Structural aspects of a higher order nucleoprotein complex: induction of an altered DNA structure at the Mu-host junction of the Mu type 1 transpososome. EMBO J 10: 3051–3059.
82. Williams, TL, Jackson, EL, Carritte, A and Baker, TA (1999). Organization and dynamics of the Mu transpososome: recombination by communication between two active sites. Genes Dev 13: 2725–2737.
83. Hare, S, Gupta, SS, Valkov, E, Engelman, A and Cherepanov, P (2010). Retroviral intasome assembly and inhibition of DNA strand transfer. Nature 464: 232–236.
84. Modlich, U, Navarro, S, Zychlinski, D, Maetzig, T, Knoess, S, Brugman, MH et al. (2009). Insertional transformation of hematopoietic cells by self-inactivating lentiviral and gammaretroviral vectors. Mol Ther 17: 1919–1928.
85. Kettlun, C, Galvan, DL, George, AL Jr, Kaja, A and Wilson, MH (2011). Manipulating piggyBac transposon chromosomal integration site selection in human cells. Mol Ther 19: 1636–1644.
86. El Ashkar, S, De Rijck, J, Demeulemeester, J, Vets, S, Madlala, P, Cermakova, K et al. (2014). BET-independent MLV-based vectors target away from promoters and regulatory elements. Mol Ther Nucleic Acids 3: e179.
87. Schmidt, M, Schwarzwaelder, K, Bartholomae, C, Zaoui, K, Ball, C, Pilz, I et al. (2007). High-resolution insertion-site analysis by linear amplification-mediated PCR (LAM-PCR). Nat Methods 4: 1051–1057.
88. Langmead, B (2010). Aligning short sequencing reads with Bowtie. Curr Protoc Bioinformatics Chapter 11: Unit 11.7.
89. Abraham, BJ, Cui, K, Tang, Q and Zhao, K (2013). Dynamic regulation of epigenomic landscapes during hematopoiesis. BMC Genomics 14: 193.
90. Barski, A, Chepelev, I, Liko, D, Cuddapah, S, Fleming, AB, Birch, J et al. (2010). Pol II and its associated epigenetic marks are present at Pol III-transcribed noncoding RNA genes. Nat Struct Mol Biol 17: 629–634.
91. Cuddapah, S, Schones, DE, Cui, K, Roh, TY, Barski, A, Wei, G et al. (2011). Genomic profiling of HMGN1 reveals an association with chromatin at regulatory regions. Mol Cell Biol 31: 700–709.
92. Liao, W, Lin, JX, Wang, L, Li, P and Leonard, WJ (2011). Modulation of cytokine receptors by IL-2 broadly regulates differentiation into helper T cell lineages. Nat Immunol 12: 551–559.
93. Seo, J, Kim, K, Chang, DY, Kang, HB, Shin, EC, Kwon, J et al. (2014). Genome-wide reorganization of histone H2AX toward particular fragile sites on cell activation. Nucleic Acids Res 42: 1016–1025.
94. Wang, Z, Zang, C, Rosenfeld, JA, Schones, DE, Barski, A, Cuddapah, S et al. (2008). Combinatorial patterns of histone acetylations and methylations in the human genome. Nat Genet 40: 897–903.
95. Wang, Z, Zang, C, Cui, K, Schones, DE, Barski, A, Peng, W et al. (2009). Genome-wide mapping of HATs and HDACs reveals distinct functions in active and inactive genes. Cell 138: 1019–1031.
96. Bernstein, BE, Stamatoyannopoulos, JA, Costello, JF, Ren, B, Milosavljevic, A, Meissner, A et al. (2010). The NIH Roadmap Epigenomics Mapping Consortium. Nat Biotechnol 28: 1045–1048.
97. Andersson, R, Gebhard, C, Miguel-Escalada, I, Hoof, I, Bornholdt, J, Boyd, M et al.; FANTOM Consortium. (2014). An atlas of active enhancers across human cell types and tissues. Nature 507: 455–461.
98. Guelen, L, Pagie, L, Brasset, E, Meuleman, W, Faza, MB, Talhout, W et al. (2008). Domain organization of human chromosomes revealed by mapping of nuclear lamina interactions. Nature 453: 948–951.
99. Weiner, A, Hughes, A, Yassour, M, Rando, OJ and Friedman, N (2010). High-resolution nucleosome mapping reveals transcription-dependent promoter packaging. Genome Res 20: 90–100.
This work is licensed under a Creative Commons
Attribution-NonCommercial-NoDerivs 4.0
International License. The images or other third party
material in this article are included in the article’s Creative
Commons license, unless indicated otherwise in the credit
line; if the material is not included under the Creative
Commons license, users will need to obtain permission
from the license holder to reproduce the material. To view a
copy of this license, visit http://creativecommons.org/
licenses/by-nc-nd/4.0/
606 www.moleculartherapy.org vol. 24 no. 3 mar. 2016