genome assembly, structural variants, and genetic
TRANSCRIPT
HAL Id: hal-03659679https://hal.archives-ouvertes.fr/hal-03659679
Submitted on 4 Jun 2022
HAL is a multi-disciplinary open accessarchive for the deposit and dissemination of sci-entific research documents, whether they are pub-lished or not. The documents may come fromteaching and research institutions in France orabroad, or from public or private research centers.
L’archive ouverte pluridisciplinaire HAL, estdestinée au dépôt et à la diffusion de documentsscientifiques de niveau recherche, publiés ou non,émanant des établissements d’enseignement et derecherche français ou étrangers, des laboratoirespublics ou privés.
Distributed under a Creative Commons Attribution - NonCommercial - ShareAlike| 4.0International License
Genome assembly, structural variants, and geneticdifferentiation between lake whitefish young species
pairs (Coregonus sp.) with long and short readsClaire Mérot, Kristina S R Stenløkk, Clare Venney, Martin Laporte, Michel
Moser, Eric Normandeau, Mariann Árnyasi, Matthew Kent, ClémentRougeux, Jullien M Flynn, et al.
To cite this version:Claire Mérot, Kristina S R Stenløkk, Clare Venney, Martin Laporte, Michel Moser, et al.. Genomeassembly, structural variants, and genetic differentiation between lake whitefish young species pairs(Coregonus sp.) with long and short reads. Molecular Ecology, Wiley, 2022, �10.1111/mec.16468�.�hal-03659679�
Molecular Ecology. 2022;00:1–20. | 1wileyonlinelibrary.com/journal/mec
Received: 15 January 2022 | Revised: 24 March 2022 | Accepted: 1 April 2022
DOI: 10.1111/mec.16468
S P E C I A L I S S U E
Genome assembly, structural variants, and genetic differentiation between lake whitefish young species pairs (Coregonus sp.) with long and short reads
Claire Mérot1,2 | Kristina S. R. Stenløkk3 | Clare Venney1 | Martin Laporte1,4 | Michel Moser3 | Eric Normandeau1 | Mariann Árnyasi3 | Matthew Kent3 | Clément Rougeux1 | Jullien M. Flynn5 | Sigbjørn Lien3 | Louis Bernatchez1
This is an open access article under the terms of the Creative Commons Attribution- NonCommercial License, which permits use, distribution and reproduction in any medium, provided the original work is properly cited and is not used for commercial purposes.© 2022 The Authors. Molecular Ecology published by John Wiley & Sons Ltd.
1Département de Biologie, Institut de Biologie Intégrative et des Systèmes (IBIS), Université Laval, Québec, Québec, Canada2UMR 6553 Ecobio, OSUR, CNRS, Université de Rennes, Rennes, France3Department of Animal and Aquacultural Sciences (IHA), Faculty of Life Sciences (BIOVIT), Centre for Integrative Genetics (CIGENE), Norwegian University of Life Sciences (NMBU), Ås, Norway4Ministère des Forêts, de la Faune et des Parcs (MFFP) du Québec, Québec, Québec, Canada5Department of Molecular Biology and Genetics, Cornell University, Ithaca, New York, USA
CorrespondenceClaire Mérot, Département de biologie, Institut de Biologie Intégrative et des Systèmes (IBIS), Université Laval, Québec, QC, Canada.Email: [email protected]
Funding informationThis research was supported by a Discovery research grant from the Natural Sciences and Engineering Research Council of Canada (NSERC) to L.B., the Canadian Research Chair in genomics and conservation of aquatic resources, as well as Ressources Aquatiques Québec (RAQ). C.M. was supported by a Banting Postdoctoral fellowship from the Government of Canada.
Handling Editor: Loren Rieseberg
AbstractNascent pairs of ecologically differentiated species offer an opportunity to get a bet-ter glimpse at the genetic architecture of speciation. Of particular interest is our re-cent ability to consider a wider range of genomic variants, not only single- nucleotide polymorphisms (SNPs), thanks to long- read sequencing technology. We can now identify structural variants (SVs) such as insertions, deletions and other rearrange-ments, allowing further insights into the genetic architecture of speciation and how different types of variants are involved in species differentiation. Here, we investi-gated genomic patterns of differentiation between sympatric species pairs (Dwarf and Normal) belonging to the lake whitefish (Coregonus clupeaformis) species complex. We assembled the first reference genomes for both C. clupeaformis sp. Normal and C. clupeaformis sp. Dwarf, annotated the transposable elements and analysed the ge-nomes in the light of related coregonid species. Next, we used a combination of long- and short- read sequencing to characterize SVs and genotype them at the population scale using genome- graph approaches, showing that SVs cover five times more of the genome than SNPs. We then integrated both SNPs and SVs to investigate the genetic architecture of species differentiation in two different lakes and highlighted an excess of shared outliers of differentiation. In particular, a large fraction of SVs differentiat-ing the two species correspond to insertions or deletions of transposable elements (TEs), suggesting that TE accumulation may represent a key component of genetic divergence between the Dwarf and Normal species. Together, our results suggest that SVs may play an important role in speciation and that, by combining second- and third- generation sequencing, we now have the ability to integrate SVs into speciation genomics.
K E Y W O R D Spopulation genomics, speciation, structural variants, teleost, transposable elements, whole genome sequencing
2 | MÉROT eT al.
1 | INTRODUC TION
Understanding the processes underlying the evolution of species and how genomes diverge during speciation is a fundamental goal of evolutionary genomics (Jiggins, 2019; Seehausen et al., 2014). The accumulation of genomic data has allowed scientists to test evolu-tionary scenarios and infer the timing and circumstances of species divergence (Wolf & Ellegren, 2017). Reciprocally, knowledge about the ecological, geographical and demographic context of speciation helps to interpret the patterns of genetic differentiation between species (Jiggins, 2019; Ravinet et al., 2017). However, the genome- wide landscape of differentiation should be interpreted with cau-tion as it results from complex interactions between gene flow, recombination, demography and selection (Cruickshank & Hahn, 2014; Ravinet et al., 2017; Stevison & McGaugh, 2020). Analysing differentiation between evolutionarily “young” pairs of species has nevertheless proven to be informative, revealing widespread heterogeneity among and between chromosomes (Henderson & Brelsford, 2020; Martin et al., 2019), sometimes identifying genes underlying reproductive isolation (Hejase et al., 2020), and informing about the number and distribution of divergent loci (Dufresnes et al., 2021). Cases of “natural replicates,” including species pairs with sim-ilar ecological and phenotypic divergence, are of particular interest, along with instances of repeated hybridization due to secondary contacts. These instances provide important insights into the ge-nomic architecture of species differentiation (Nadeau & Kawakami, 2019) and have revealed that similar patterns between pairs of spe-cies may be the result of both (i) shared genetic features such as low- recombination areas in which intraspecific diversity is depleted by linked selection and interspecific FST is inflated (Burri et al., 2015); and (ii) shared barrier loci under divergent selection or involved in reproductive isolation (Marques et al., 2016; Meier et al., 2018).
Most of our knowledge on speciation genomics is based on single- nucleotide polymorphisms (SNPs), mainly because such variants are easily accessible with short- read sequencing (Ho et al., 2019; Mérot et al., 2020). However, genomes also vary in structure with loss, gain or rearrangement of sequences between individuals and between species. Such structural variants (SVs) are now recognized to be ubiquitous and to affect a larger fraction of the genomes than SNPs (Catanach et al., 2019; Feulner et al., 2013). SVs may also have large phenotypic effects, may impact recombination and may be involved in speciation (Feulner & De- Kayne, 2017; Kirkpatrick & Barton, 2006; Wellenreuther & Bernatchez, 2018). The best recognized cases are large chromosomal rearrangements such as inversions or fusions, which are hypothesized to favour speciation by preventing recom-bination between alternative haplotypes (Faria & Navarro, 2010). This is supported by empirical evidence that large rearrangements can accumulate genetic incompatibilities between closely related species of Drosophila (Noor et al., 2001) or fish (Berdan et al., 2021). Whole- genome duplication events are particularly prone to favour rapid diversification (Landis et al., 2018) because the rediploidization of duplicated paralogues may differ between lineages and generate hybrid incompatibilities, as observed in yeast (Scannell et al., 2006).
However, small SVs, such as insertions, deletions and small duplica-tions, may also contribute to reproductive isolation. For instance, a duplicated gene in Drosophila melanogaster leads to hybrid male ste-rility (Ting et al., 2004) while in crows a 2.25- kb transposon indel un-derlies plumage differences, a trait involved in mate choice between two crow species (Weissensteiner et al., 2020). More generally, the insertion, deletion, duplication and/or misregulation of transposable elements (TEs) appear to be responsible for bursts of diversifica-tion and various pre- and postzygotic barriers, particularly in plants (Serrato- Capuchina & Matute, 2018) but also in vertebrates (Laporte et al., 2019). Overall, a better understanding of the genomic archi-tecture of species differentiation requires the integration of SVs into speciation genomics (Feulner & De- Kayne, 2017; Mérot et al., 2020; Nadeau & Kawakami, 2019). Moreover, considering both SNPs and SVs is essential to understand the cumulative effects of those differ-ent forms of genetic variation on speciation.
Two aspects of long- read sequencing, combined with the de-velopment of new bioinformatics tools, have made it possible to investigate SVs between genomes (Ho et al., 2019; Logsdon et al., 2020). First, long- reads have improved the contiguity and quality of genome assemblies, which is particularly relevant for large and com-plex genomes as well as for regions riddled with repeated elements (Huddleston et al., 2014). Second, long reads can be directly used to detect SVs by aligning the sequences on a reference and analys-ing split- reads and coverage (Mahmoud et al., 2019). Together, these have proven very powerful for making catalogues of SVs within and between species. For instance, a human genome carries on average 4,442 SVs detected by short reads (Abel et al., 2020) and 27,662 SVs detected with long reads (Chaisson et al., 2019). Potential re-strictions when generating long reads are the requirement for high- molecular- weight DNA, and potentially higher costs and lower quality. Consequently, population- level analysis of SVs via long reads is not as accessible as short- read sequencing. One promising pos-sibility is to combine technologies by performing a first step of SV discovery on a limited set of high- quality samples sequenced with long reads, and a second step of SV genotyping on more samples se-quenced with short reads (Logsdon et al., 2020; Mérot et al., 2020).
The lake whitefish, Coregonus clupeaformis, is a species complex present in numerous cold water lakes throughout North America. In the northeastern part of the continent, it comprises two repro-ductively isolated species, referred to as C. clupeaformis sp. Normal and C. clupeaformis sp. Dwarf, which differ ecologically by occupying the benthic and the limnetic habitat, respectively (Bernatchez et al., 2010a; Gagnaire et al., 2013a). Demographic modelling and the anal-ysis of mitochondrial lineages showed that the two species originated from two glacial lineages that started to diverge in allopatry during the last glaciation, roughly 60,000 years ago, before coming into secondary contact about 12,000 years ago (Bernatchez & Dodson, 1990; Jacobsen et al., 2012; Rougeux et al., 2017). This secondary contact occurred independently in several lakes of a suture zone of northeastern America, and provoked a strong character displace-ment in the Dwarf species toward the use of the planktonic trophic niche, further enhancing speciation through ecological divergence
| 3MÉROT eT al.
(Bernatchez et al., 2010b; Landry et al., 2007). The two species show limited gene flow (estimated between one and 30 migrants per gen-eration in the two lakes under study; Rougeux et al., 2017), and the rare hybrids have low fitness due to malformation, early mortality, ecological mismatch and reduced fertility (Bernatchez et al., 2010a; Renaut & Bernatchez, 2011; Rogers & Bernatchez, 2006). Habitat divergence is associated with species differences in a series of mor-phological, life- history, physiological, transcriptomic and cytologi-cal traits (Dalziel et al., 2017; Dion- Côté et al., 2015; Laporte et al., 2015, 2016; Rogers & Bernatchez, 2007; Rogers et al., 2002). The process of ecological and phenotypic divergence following second-ary contact probably occurred independently, but with the same ge-netic background, in several postglacial lakes (Rougeux et al., 2017). Multiple pairs of sympatric species thus provide valuable natural replicates to investigate parallelism and the genetic architecture of speciation. Moreover, as for all salmonid species, C. clupeaformis an-cestors have undergone a past whole- genome duplication about 80– 100 million years ago followed by ongoing rediploidization (Allendorf & Thorgaard, 1984; Lien et al., 2016; Macqueen & Johnston, 2014), resulting in a large, complex genome of ~2.4– 3.5 Gb depending on the estimates (Hardie & Hebert, 2003; Lockwood et al., 1991). Therefore, structural genetic polymorphism is expected to be exten-sive in C. clupeaformis, though current studies have not assessed the contribution of SVs to differentiation between Dwarf and Normal species.
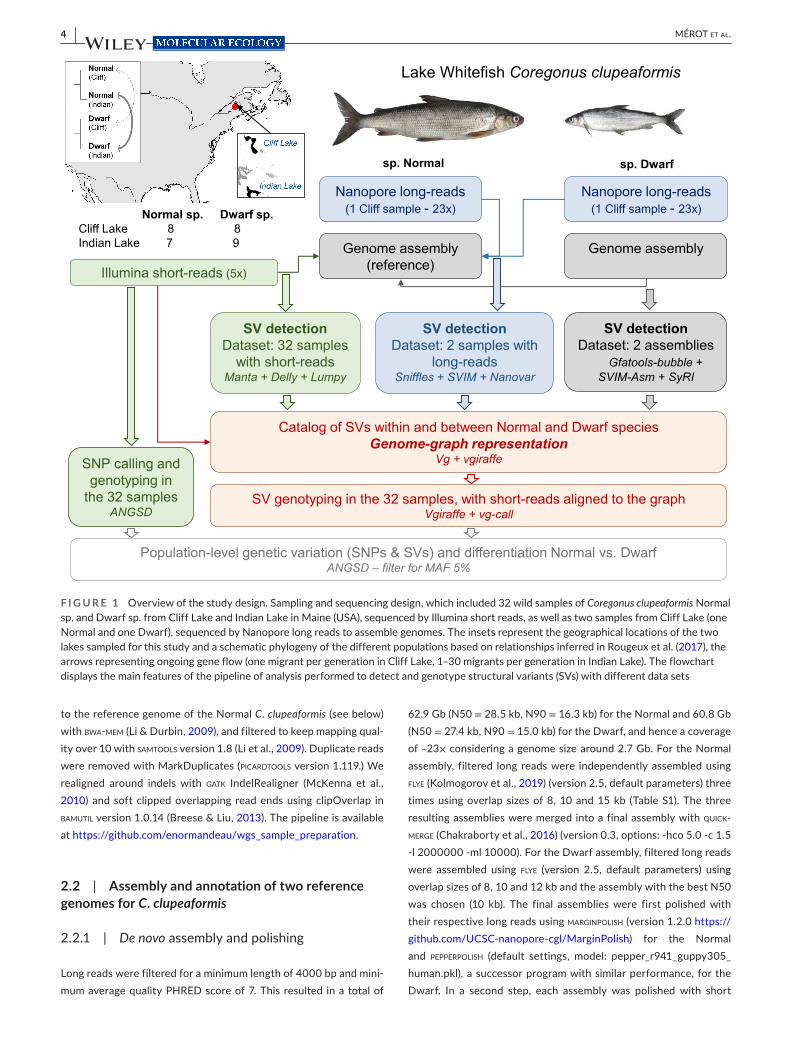
In this study, we used a combination of long- and short- read sequencing (Figure 1) to investigate the genetic architecture of speciation and address the contribution of SVs to the genomic differ-entiation of C. clupeaformis sp. Normal and C. clupeaformis sp. Dwarf. The main goal was to provide high- quality genomic resources for C. clupeaformis in order to investigate parallel and nonparallel genomic patterns of differentiation between Dwarf and Normal species in two independent North American lakes. First, we assembled the reference genome of C. clupeaformis sp. Normal based on one sam-ple sequenced with long reads and a genetic map. We documented the specificities of the genome to explore the remaining traces of previous whole- genome duplication and annotated the whitefish TEs. Second, we generated a catalogue of SVs varying between and within Dwarf and Normal species using three data sets: assembly comparison with a de novo assembly of a sympatric C. clupeaformis sp. Dwarf individual, high- quality long reads of two samples (one Dwarf and one Normal), and short reads of 32 samples (17 Dwarf and 15 Normal) at medium coverage (5×). Third, we analysed genome- wide landscapes of differentiation between Dwarf and Normal spe-cies in two lakes by genotyping the whole catalogue of SVs using genome- graph- based mapping, as well as SNPs, in the 32 samples sequenced with short reads. We tested the hypothesis that the two lakes would show parallel patterns of differentiation between Dwarf and Normal and compared signals observed with different kinds of variants (SNPs vs. SVs). Our study provides a unique opportunity to characterize the contribution of both SNPs and SVs to differentia-tion between young species pairs, with important implications for our understanding of speciation in general.
2 | METHODS
2.1 | Sampling, DNA extraction, and sequencing of Coregonus clupeaformis
2.1.1 | Long- read sequencing
For long- read sequencing and the assembly of both reference ge-nomes, we sampled one adult of C. clupeaformis sp. Normal and one adult C. clupeaformis sp. Dwarf from Cliff Lake, Maine (46.3991, −69.2491). Fish were caught live with gillnets, killed, immediately dis-sected to obtain fresh tissue samples and sexed following a protocol described previously in Evans and Bernatchez (2012). Muscle sam-ples were flash frozen in liquid nitrogen and later stored at −80°C. High- molecular- weight DNA was extracted from 40 mg frozen liver from both species using a Qiagen Genomic Tip 100/G kit (Qiagen). DNA integrity was assessed visually by separating fragments on a 0.5% TAE agarose gel, which revealed a predominant band of high- molecular- weight DNA >45 kb. Smaller fragments were removed by performing size selection, with >20- kb cutoff, using a High Pass Plus cassette (BPLUS10) run on a Blue Pippin (Sage Scientific). Using 1.6 µg of size- selected DNA, four sequencing libraries were indepen-dently generated for each sample using the SQK- LSK109 sequencing kit (Oxford Nanopore Technologies), according to the “Genomic DNA by Ligation Nanopore” protocol. For each species, three PromethION flow cells (vR9.4.1; ONT) were loaded with library material. Run per-formance was monitored, and once the number of sequencing pores dropped below 10% of the starting number, the run was stopped and a nuclease flush was performed using the NFL_9076_v109_revA Nuclease Flush protocol from Oxford Nanopore. Additional library material was loaded onto flow- cells (by species) and sequencing was initiated. In total, three flow cells were used to sequence the Dwarf sample (with three reloads among them) and three flow cells for the Normal sample (with three reloads). Raw nanopore reads were base- called using guppy (version 3.0.5. flip- flop HAC model). Data metrics before quality filtering were 72.1 Gb (N50 = 27.1 kb) for the Dwarf sample and 80 Gb (N50 = 27.9 kb) for the Normal sample.
2.1.2 | Short- read sequencing
For population- level analysis, we sampled and sequenced 32 C. clupea-formis including eight Normal and eigfht Dwarf from Cliff Lake, Maine (46.3991, −69.2491), and seven Normal and nine Dwarf from Indian Lake, Maine (46.2574, −69.2987) with Illumina short reads. Fish were caught live with gillnets, killed and immediately dissected to obtain fresh tissue samples. Samples were stored in RNAlater and DNA was extracted using a modified version of a salt extraction protocol (Aljanabi & Martinez, 1997). Shotgun libraries were prepared and sequenced aim-ing for 5× coverage with 150- bp paired- end reads on a HiSeq4000 in-strument at the McGill Genome Québec Innovation center (Montréal).
Paired short reads were trimmed and filtered for quality with fastp version 0.20.0 using default parameters (Chen et al., 2018), aligned
4 | MÉROT eT al.
to the reference genome of the Normal C. clupeaformis (see below) with bwa- mem (Li & Durbin, 2009), and filtered to keep mapping qual-ity over 10 with samtools version 1.8 (Li et al., 2009). Duplicate reads were removed with MarkDuplicates (picardtools version 1.119.) We realigned around indels with gatk IndelRealigner (McKenna et al., 2010) and soft clipped overlapping read ends using clipOverlap in bamutil version 1.0.14 (Breese & Liu, 2013). The pipeline is available at https://github.com/enorm andea u/wgs_sample_prepa ration.
2.2 | Assembly and annotation of two reference genomes for C. clupeaformis
2.2.1 | De novo assembly and polishing
Long reads were filtered for a minimum length of 4000 bp and mini-mum average quality PHRED score of 7. This resulted in a total of
62.9 Gb (N50 = 28.5 kb, N90 = 16.3 kb) for the Normal and 60.8 Gb (N50 = 27.4 kb, N90 = 15.0 kb) for the Dwarf, and hence a coverage of ~23× considering a genome size around 2.7 Gb. For the Normal assembly, filtered long reads were independently assembled using flye (Kolmogorov et al., 2019) (version 2.5, default parameters) three times using overlap sizes of 8, 10 and 15 kb (Table S1). The three resulting assemblies were merged into a final assembly with quick-merge (Chakraborty et al., 2016) (version 0.3, options: - hco 5.0 - c 1.5 - l 2000000 - ml 10000). For the Dwarf assembly, filtered long reads were assembled using flye (version 2.5, default parameters) using overlap sizes of 8, 10 and 12 kb and the assembly with the best N50 was chosen (10 kb). The final assemblies were first polished with their respective long reads using marginpolish (version 1.2.0 https://github.com/UCSC- nanop ore- cgl/Margi nPolish) for the Normal and pepperpolish (default settings, model: pepper_r941_guppy305_human.pkl), a successor program with similar performance, for the Dwarf. In a second step, each assembly was polished with short
F I G U R E 1 Overview of the study design. Sampling and sequencing design, which included 32 wild samples of Coregonus clupeaformis Normal sp. and Dwarf sp. from Cliff Lake and Indian Lake in Maine (USA), sequenced by Illumina short reads, as well as two samples from Cliff Lake (one Normal and one Dwarf), sequenced by Nanopore long reads to assemble genomes. The insets represent the geographical locations of the two lakes sampled for this study and a schematic phylogeny of the different populations based on relationships inferred in Rougeux et al. (2017), the arrows representing ongoing gene flow (one migrant per generation in Cliff Lake, 1– 30 migrants per generation in Indian Lake). The flowchart displays the main features of the pipeline of analysis performed to detect and genotype structural variants (SVs) with different data sets
| 5MÉROT eT al.
reads using pilon (Walker et al., 2014) requiring a minimal coverage of 3× to polish (version 1.23, - - mindepth 3). busco (Benchmarking Universal Single- Copy Orthologs) scores were computed to assess gene space completeness by looking for the presence or absence of highly conserved genes (busco version 3.0.2, reference database: actinopterygii_odb9 - sp zebrafish). busco scores for the flye- polished assemblies were C: 94.4% [S: 50.9%, D: 43.5%], F: 1.7%, M: 3.9%, n: 4,584 for the Normal and C: 94.6% [S: 59.1%, D: 35.5%], F: 0.9%, M: 4.5%, n: 4,584 for the Dwarf. In other words, out of 4584 searched busco gene groups about 94% were detected as singletons (S) or du-plicates (D), a small fraction were missing (M) or fragmented (F).
2.2.2 | Scaffolding into chromosomes with a genetic map
To anchor the contigs into chromosomes, we rebuilt a linkage map from previously published data (Gagnaire et al., 2013a; Rogers et al., 2007). The map is based on a backcross family whose mother is a Dwarf × Normal hybrid and father is a pure Dwarf (all details in Rogers et al., 2007). The 100 full- sibs and their two parents were sequenced with reduced- representation sequencing in a previous study (Gagnaire, Normandeau, et al., 2013). Raw reads were aligned on the new contig- level assembly of the Normal genome with bwa- mem using the default parameters (Li & Durbin, 2009). Genotype likelihoods were obtained with samtools mpileup (Li et al., 2009) fol-lowing the pipeline and parameters provided in lep- map3 documen-tation (Rastas, 2017). Only positions with at least 3× coverage were kept. A linkage map was built using lep- map3 (Rastas, 2017) follow-ing a pipeline available at https://github.com/clair emero t/lepma p3_pipeline. With the Filtering module, markers with more than 50% of missing data, that were noninformative, and with extreme segre-gation distortion (χ2 test, p < 10−12) were excluded. Markers were assigned to linkage groups (LGs) using the SeparateChromosomes module with increasing values of the logarithm of the odds (LOD) from 8 to 11 and a minimum size of 20 markers. Markers unassigned to LGs, or released from LG correction, were subsequently joined to LGs using the module JoinSingle with decreasing values of LOD until LOD = 3 and a minimum LOD difference of 1. This procedure assigned 5188 markers into 40 LGs. Within each LG, markers were ordered with 10 iterations of the OrderMarker module. The marker order from the run with the best likelihood was retained and refined 10 times with the evaluateOrder flag with five iterations each. To ac-count for the lower recombination rate in male salmonids compared to females, we adjusted the parameter of recombination rates ac-cordingly (recombination1 = 0.0005; recombination2 = 0.0025). Exploration for more stringent filtering for missing data, different values of LOD or by keeping only female- informative markers re-sulted in very consistent and collinear maps but with fewer markers, whose density is critical to accurately scaffold the genome.
Since C. clupeaformis sp. Normal and sp. Dwarf have the same number of chromosomes (Dion- Côté et al., 2015) and the genetic
map was built from a backcross family, we used the same map to an-chor both the Normal and the Dwarf genome assemblies. Scaffolds were assembled into chromosomes using Chromonomer (Catchen et al., 2020), which anchors and orients scaffolds based on the order of markers in the linkage map. Default parameters were used. In both assemblies, chromosomes were renamed to match homolo-gous chromosomes in the reference genome of the European sister species, C. lavaretus “Balchen” (De- Kayne et al., 2020), as detailed in Table S2. For all subsequent analyses, the Normal whitefish ge-nome was chosen as the reference because of its higher contigu-ity (N50 = 6.1 Mb for the Normal, N50 = 2.2 Mb for the Dwarf) and because a higher fraction of the genome could be anchored into chromosomes in the Normal (83%) than the Dwarf (73%). It is also worth noting that, by using the same linkage map to anchor chromosomes in both the Dwarf and Normal genome, the current assemblies do not allow us to investigate large- scale chromosomal rearrangements.
2.2.3 | Annotation for genes and TEs
Gene content annotation of both genomes was made with the NCBI Prokaryotic Genome Annotation Pipeline using the following tran-scriptome sources available on NCBI: Dion- Côté: PRJNA237376; Rougeux: 72 liver RNA samples from 2018, NCBI: PRJNA448004; Carruthers: SRR6321817, SRR6321818, SRR6321819, SRR6321820, SRR6321821, SRR6321822, SRR6321823, SRR6321824; Pasquier: SRP058861 lake whitefish, SRP045143 European whitefish.
We used repeatmodeler2 (Flynn et al., 2020) to build a library of TEs from the C. clupeaformis sp. Normal assembly. We had to slightly modify the repeatmodeler LTR pipeline because ltrharvest failed for an unknown reason. We instead substituted it with an equivalent program, ltrfinder- parallel (Ou & Jiang, 2019), to iden-tify long terminal repeats (LTRs) in the genome. We combined the LTR- specific library with the general repeat library as done in canonical repeatmodeler2. After obtaining the TE library, we rela-belled the fasta headers of sequences that were identified in the LTR pipeline but were assigned an “Unknown” classification due to lack of homology to database sequences, to broadly classify them as LTR elements.
We then used repeatmasker to annotate the locations of each re-peat family in both the Normal and the Dwarf genomes. We used parseRM.pl (https://github.com/4urel iek/Parsi ng- Repea tMask er- Outpu ts/blob/maste r/parse RM.pl) to summarize the genomic abun-dance of each TE subclass (LTR, LINE, SINE, DNA- TIR, Helitron), correcting for overlapping masking which sometimes occurs with repeatmasker. We also used parseRM.pl to produce a landscape plot of the genome composition, where the TE- subclass composition is shown in 1% divergence windows (compared to each TE copy's respective consensus sequence), where low- divergence sequences suggest more recent insertions and higher divergence sequences suggest older insertions.

6 | MÉROT eT al.
2.2.4 | Synteny, map, chromosomes and genome analysis
To analyse synteny with related species, we first compared the linkage map to the previously published maps of C. clupeaformis (Gagnaire, Normandeau, et al., 2013), C. lavaretus “Albock” (De- Kayne & Feulner, 2018) and C. artedii (Blumstein et al., 2020) using mapcomp (Sutherland et al., 2016), a program designed to compare syntenic relationships among markers between linkage maps of any related species using an intermediate genome, here our reference genome. Correspondence between chromosomes and linkage groups across maps of different Coregonus sp. is provided in Table S2 and Figures S1– S3.
Next, we aligned the repeat- masked C. clupeaformis sp. Normal and sp. Dwarf genomes to the European whitefish reference, C. lavaretus sp. Balchen (De- Kayne et al., 2020), and to each other, with nucmer (- l 100 - c 500; Marçais et al., 2018) and used symap version 4.2 (Soderlund et al., 2011) to extract syntenic blocks along the genome. Syntenic blocks were visualized in R using the package Circlize (Gu et al., 2014).
To investigate chromosome types (acrocentric, metacentric), we used phased information from the linkage map by applying a method developed by Limborg et al. (2016), which uses phased progeny genotypes to detect individual recombination events. The cumula-tive number of recombination events between the first marker and increasingly distant markers was computed from both extremities of each chromosome and this recombination frequency (RFm) is ex-pected to reach a plateau over a chromosome arm (see Limborg et al. (2016) for details and Figure S4).
As salmonids have experienced an ancestral whole- genome du-plication, most of the chromosomes are expected to be homologous to another one, and some pairs still recombine to a certain extent, resulting in pseudotetrasomal regions or chromosomes (Glasauer & Neuhauss, 2014; Lien et al., 2016; Sutherland et al., 2016). To investi-gate this homology, we explored self- synteny by aligning the repeat- masked C. clupeaformis sp. Normal genome on itself with nucmer (- maxmatch - l 100 - c 500; Marçais et al., 2018) and extracted syntenic blocks with symap version 4.2 (Soderlund et al., 2011). The degree of sequence similarity within each of the syntenic blocks was calculated after a subsequent alignment with lastz (Harris, 2007), following the procedure described in Lien et al. (2016). To assign C. clupeaformis chromosomes to ancestral chromosomes following the nomenclature proposed by Sutherland et al. (2016) based on northern pike (Esox Lucius) linkage groups, we aligned the repeat- masked Normal genome to the northern pike reference genome with minimap2 (Li, 2018) and visualized alignment using d- genies (Cabanettes & Klopp, 2018).
We further explored whether the assembly included duplicated or collapsed regions by quantifying variation of coverage along the genome. Total depth of aligned short reads across the 32 samples was calculated using angsd (Korneliussen et al., 2014) at each po-sition with the option – doDepth – dumpCounts, and averaged by sliding windows of 100 kb. The coordinates of putatively collapsed regions, defined as regions having a depth greater than the average depth plus twice the standard deviation and showing no homology with another chromosome, are provided in Table S3.
2.3 | Detection and characterisation of SVs
We performed SV detection based on three data sets: (i) the ge-nome assemblies of the Normal and the Dwarf; (ii) the long reads of the two samples (Normal and Dwarf) used to build the genome assemblies; and (iii) the short reads of 32 samples (Normal and Dwarf). SV detection with the three data sets shared consistent features. First, all SVs were defined relative to the reference ge-nome of C. clupeaformis sp Normal. Second, to enhance SV detec-tion, SVs were detected by three independent software packages, but to better limit the amount of false positives, we kept only SVs detected by at least two out of three SV callers in each data set as proposed previously (De Coster et al., 2019; Weissensteiner et al., 2020). Third, we focused on variants over 50 bp (Ho et al., 2019) and restricted our analysis to insertions (INS), deletions (DEL), duplications (DUP) and inversions (INV) to simplify the use of multiple tools, including merging software and genome- graph representations. Fourth, to avoid artefacts due to genome misas-semblies, we filtered out SVs which overlapped a scaffold junction (characterized by a gap of 10 Ns).
2.3.1 | SV detection based on the comparison of de novo assemblies
SVs between the Normal and the Dwarf haploid assemblies were identified using three independent approaches detailed below. All methods included an alignment step of the query assembly (C. clu-peaformis sp. Dwarf) on the reference assembly (C. clupeaformis sp. Normal). To avoid artefacts due to scaffolding with a map, we chose to use the contig- level assembly for the Dwarf genome.
(i) We built a genome- graph with the two assemblies using mini-graph (Li et al., 2020) with the - xggs options and retrieved SVs in bed format with gfatools- bubble. The graph with variants was fur-ther reformatted into a vcf with full sequence information using vg suite (Hickey et al., 2020).
(ii) We aligned the assemblies with minimap2 (Li, 2018) and parame-ters - a - x asm5 - - cs - r2k, and extracted SVs with svim- asm (Heller & Vingron, 2020) and the following parameters: - - haploid - - min_sv_size 50 - - max_sv_size 200000 - - tandem_duplications_as_insertions - - interspersed_duplications_as_insertions.
(iii) We ordered the scaffolds of the Dwarf assembly according to the Normal reference using ragtag (Alonge et al., 2019) and aligned the assemblies with minimap2 (Li, 2018) and parame-ters “- ax asm5” and ran syri (Goel et al., 2019) with standard parameters.
After filtering, the three VCFs were joined using jasmine (Kirsche et al., 2021) using the following parameters: “- - ignore_strand - - mutual_distance - - max_dist_linear=0.5 - - min_dist=100,” and we kept SVs detected by at least two approaches. All scripts are avail-able at https://github.com/clair emero t/assem bly_SV.
| 7MÉROT eT al.
2.3.2 | SV detection based on long reads
We mapped long reads from both the Dwarf and the Normal sam-ples to the Normal reference using winnowmap2 version 2.0 with the “- - MD” flag to better resolve repetitive regions of the genome (Jain et al., 2020). SAM files were sorted and converted into BAM files with samtools version 1.3.1 (Li et al., 2009). SV detection was performed with three long- read- specific SV calling programs: snif-fles version 1.0.12 (Sedlazeck et al., 2018) (- l 50 - s 7 - n −1), svim version 1.2.0 (Heller & Vingron, 2019) (- - insertion_sequences) and nanovar version 1.3.9 (Tham et al., 2020) with default settings. VCF files were filtered using custom R scripts to remove excess informa-tion and read names were added to preserve insertion sequences in the final VCF. We kept SVs detected by at least two callers after merging with jasmine version 1.1.0 (Kirsche et al., 2021) including re-finement of insertion sequences with iris “max_dist_linear=0.1 min_dist=50 - - default_zero_genotype - - mutual_distance min_support=2 - - output_genotypes - - normalize_type - - run_iris iris_args=- - keep_long_variants.” All scripts are available at https://github.com/krist inast enlok k/long_read_SV.
2.3.3 | SV detection based on short reads
SVs among the 32 samples sequenced with short reads were iden-tified using three independent approaches: (i) manta (Chen et al., 2016), (ii) the smoove pipeline (https://github.com/brent p/smoove) which is based on lumpy (Layer et al., 2014) and (iii) delly (Rausch et al., 2012). All of the approaches rely on the filtered bam files resulting from the alignment of the short reads to the Normal ref-erence (as described above). All SV callers were run with default parameters except for smoove which was run by subsets of chro-mosomes, and delly by subsets of individuals. VCF outputs were formatted and filtered with custom scripts called “delly_filter,” “manta_filter,” and “smoove_filter” to include full sequence infor-mation. The three VCFs were joined using jasmine (Kirsche et al., 2021) and the following parameters: “- - ignore_strand - - mutual_distance - - max_dist_linear=0.5 - - min_dist=50 - - max_dist=5000 - - allow_intrasample,” and we kept SVs detected by at least two approaches. All scripts are available at https://github.com/clair emero t/SR_SV.
2.3.4 | Analysis and annotation of SVs
SVs detected by the three kinds of data sets (assembly comparison, long reads, short reads) were joined using jasmine (Kirsche et al., 2021) and the following parameters: “- - ignore_strand - - mutual_dis-tance - - max_dist_linear=0.5 - - min_dist=100 - - min_overlap 0.5.” This merging tool represents the set of all SVs as a network, and uses a modified minimum spanning forest algorithm to determine the best way of merging the variants based on position information (chro-mosome, start, end, length) and their type (DEL, INS, DUP, INV),
requiring a minimum overlap between SVs and a maximum distance between breakpoints. We explored different parameter values without noticing major differences in the final merging, and hence the final choice of intermediate parameters (50% of the length). We reported the overlap of SVs detected in more than one data set ac-cording to its type and its size. The sequences included in SVs (e.g., the reference sequence in the case of a deletion, or the alternative sequence in the case of an insertion) were annotated for TEs using repeatmasker and the TE library of the Normal C. clupeaformis (see above). We explored the length of SV sequences covered by TE or simple repeats quantitatively (Tables S4 and S5) and also categorized them as associated with TE or other kinds of repeats if more than 50% of the SV sequence was covered by a given TE family or other kind of repeats.
2.4 | Analysis of single- nucleotide and structural polymorphisms
2.4.1 | SNP calling and genotyping
To detect SNPs and genotype them, we analysed the short reads of the 32 samples, in bam format, with the program angsd version 0.931 (Korneliussen et al., 2014), which accounts for genotype un-certainty and is appropriate for medium- coverage whole genome sequencing (Lou et al., 2020). Input reads were filtered to remove low- quality reads and to keep mapping quality above 30 and base quality above 20. Genotype likelihoods were estimated with the gatk method (- GL 2). The major allele was the most frequent allele (- doMajorMinor 1). We filtered to keep positions covered by at least one read in at least 50% of individuals, with a total coverage below 800 (25 times the number of individuals) to avoid including repeated regions in the analysis. From this list of variant and in-variant positions, we selected SNPs outside SVs and with a minor allele frequency (MAF) above 5%. We subsequently used this SNP list with their respective major and minor alleles for most analyses, including principal components analysis (PCA), FST and allelic fre-quency difference (AFD).
2.4.2 | SV genotyping
To genotype the identified SVs in the 32 samples, we used a genome- graph approach with the vg suite of tools (Garrison et al., 2018; Hickey et al., 2020). Briefly, the full catalogue of SVs discovered (through assembly comparison and long- and short- read SV calling) was combined with the reference genome to build a variant- aware graph using the module vg autoindex – giraffe. Short reads from the 32 samples were then aligned to the graph with the module vg giraffe (Sirén et al., 2020). For each SV represented in the graph through a reference and an alternative path, a genotype likelihood was cal-culated with the module vg call. We then combined the VCFs of SV genotype likelihoods across the 32 samples. For population- level
8 | MÉROT eT al.
analysis, mirroring the filters applied for SNPs, we retained SVs covered by at least one read in at least 50% of samples, and with an alternative allele frequency between 5% and 95%. The pipeline used is available at https://github.com/clair emero t/genot yping_SV. Subsequent analytical steps were performed in angsd, using the VCF of SV genotype likelihoods as input, to perform population- level analysis within a probabilistic framework to account for the uncer-tainty linked to medium coverage.
2.4.3 | Genetic differentiation according to lake and species
An individual covariance matrix was extracted from the genotype likelihoods of SNPs and SVs in beagle format using pcangsd (Meisner & Albrechtsen, 2018). The matrix was decomposed into PCs with R using a scaling 2 transformation which adds an eigenvalue correc-tion (Legendre & Legendre, 2012). Pairwise FST differentiation be-tween all populations was estimated based on the allele frequency spectrum per population (- doSaf) and using the realSFS function in angsd. Minor allelic frequencies per population (MAF) were es-timated based on genotype likelihoods using the function doMaf in angsd. We then computed AFD between sympatric species in each lake for each variant as AFD = MAF(Dwarf) − MAF(Normal). AFD is a polarized difference of frequency that varies between −1 and 1, meaning that when we compared AFD between lakes they can be ei-ther with the same sign (the same allele has a higher frequency in the same species in both lakes) or opposite sign (the allele more frequent in the Dwarf in one lake is more frequent in the Normal in the other lake). For FST and AFD estimates, positions were restricted to the polymorphic SNPs/SVs (>5% MAF) previously assigned as major or minor allele (options – sites and – doMajorMinor 3), and which were covered in at least 50% of the samples in each population. Given the high density of SNPs, FST and mean absolute AFD were also calcu-lated by windows of 100 kb for visualization and correlation tests. The most differentiated variants between species were defined in each lake as those within the upper 95% quantile for FST, and ei-ther below the 2.5% or above the 97.5% quantile for AFD. By chance only, we would expect that 0.25% of variants are in the upper FST quantile in both lakes (5% × 5%), 0.125% of variants are in AFD outli-ers in both lakes with the same sign (2.5% ×2.5% × 2), and 0.125% of variants are in AFD outliers in both lakes with opposite sign. We used Fisher's exact test to determine whether the number of outlier variants overlapping between lakes exceeded this expectation.
Using bedtools, we extracted the list of genes overlapping with the most differentiated SNPs/SVs. We then tested for the pres-ence of overrepresented GO terms using goatools (version 0.6.1, pval = .05) and filtered the outputs of goatools to keep only GO terms for biological processes with an FDR value of ≤0.1.
Using our annotation of TEs and repeated sequences on SVs, we tested whether some families of TEs were over- represented in the subset of outlier SVs relative to the whole pool of SVs studied at the population level using a Fisher exact test.
Finally, several quantitative trait loci (QTLs) for behavioural, morphological and life- history traits differentiating Normal and Dwarf previously identified in Gagnaire, Normandeau, et al. (2013) and Rogers et al. (2007) were positioned on the Normal reference genome. We compared the positions of those QTLs relative to the most differentiated regions and extracted the list of genes hit by an outlier variant and falling within a 1- Mb window around the QTL.
3 | RESULTS
3.1 | High- quality reference assembly for Coregonus clupeaformis sp. Normal
Using long- read sequencing, we built the first reference genome assembly for C. clupeaformis sp. Normal (ASM1839867v1). The de novo assembly showed good contiguity with an N50 of 6.1 Mb and a L50 of 101 contigs. A linkage map allowed us to anchor and orient 83% of the genome into 40 linkage groups, the expected number of chromosomes for C. clupeaformis (Dion- Côté et al., 2015; Phillips et al., 1996), although some of the linkage groups, chromosome 22 in particular, may only represent a fraction of a chromosome. Studying recombination along those linkage groups, we identified seven metacentric chromosomes, three putatively metacentric (or submetacentric) chromosomes and 30 acrocentric chromosomes (Figure S4; Figure 2a). The final assembly included 40 putative chro-mosomes and 6,427 unanchored scaffolds with an N50 of 57 Mb for a total genome size of 2.68 Gb (Table 1). This reference genome had a high level of completeness, with 94% of universal single- copy or-thologous genes in a busco analysis based on the actonipterygii data-base. A relatively high percentage of duplicated busco groups (44%) was observed, which is probably a consequence of the salmonid- specific whole genome duplication (Allendorf & Thorgaard, 1984; Smith et al., 2021).
The genome of C. clupeaformis sp. Normal was composed of 60.5% TEs (Figure S5, Table S4). The greatest TE subclass repre-sentation in terms of total base pairs was DNA- TIR elements, taking up 24% of the genome. LINEs and LTRs were approximately equally abundant at about 13% of the genome each. Elements that were un-classified took up 9% of the genome. SINEs took up <1% of the ge-nome, and rolling- circle/helitron elements were essentially absent. Our repeat identification pipeline identified 3490 distinct families. LTR elements were the most diverse with 1521 families identified, almost half the total number of families. Comparatively, 373 fami-lies were identified as DNA- TIR elements and 250 as LINEs. The ge-nome of C. clupeaformis sp. Normal is composed of TEs at a variety of stages of decomposition (Figure S6). A proxy for age of a given insertion is its sequence divergence from the consensus sequence, since the longer the insertions have been present, the more time there has been for accumulation of random mutations. The land-scape plot shows that an equal amount (in terms of bp) of LINEs, LTRs and DNA- TIRs are present in recent insertions (less than 1% diverged from the consensus sequence). DNA- TIR elements near
| 9MÉROT eT al.
the 5% divergence level are the most abundant, indicating an older burst of activity.
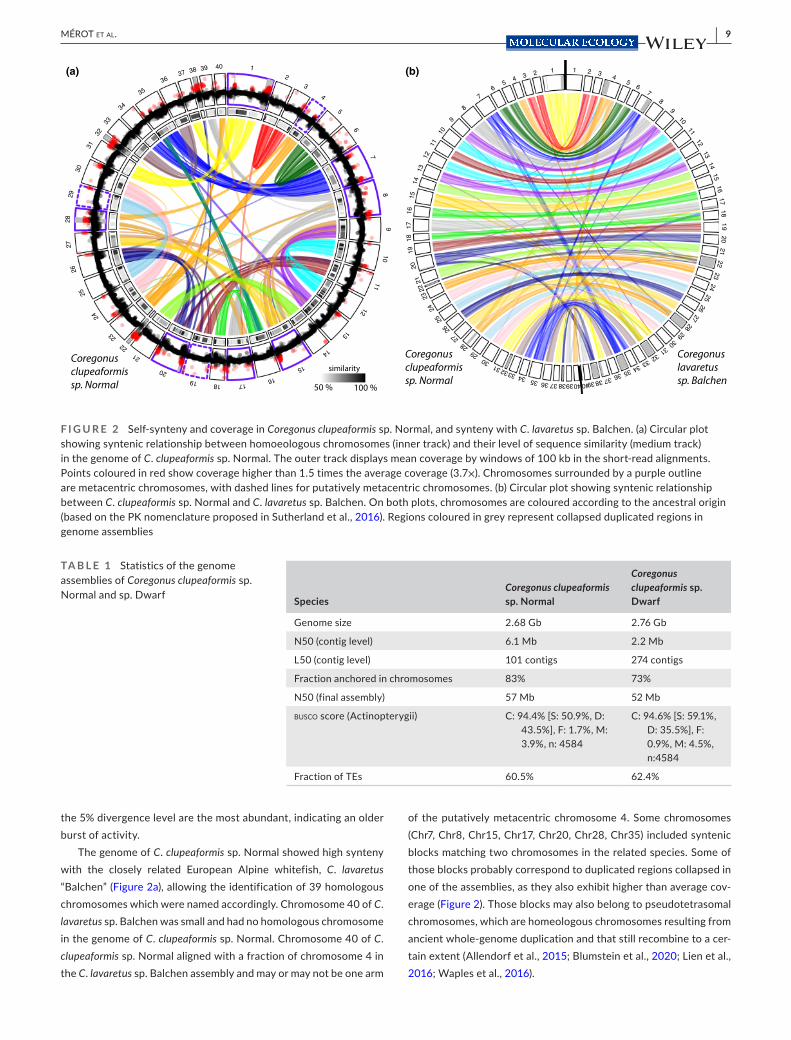
The genome of C. clupeaformis sp. Normal showed high synteny with the closely related European Alpine whitefish, C. lavaretus “Balchen” (Figure 2a), allowing the identification of 39 homologous chromosomes which were named accordingly. Chromosome 40 of C. lavaretus sp. Balchen was small and had no homologous chromosome in the genome of C. clupeaformis sp. Normal. Chromosome 40 of C. clupeaformis sp. Normal aligned with a fraction of chromosome 4 in the C. lavaretus sp. Balchen assembly and may or may not be one arm
of the putatively metacentric chromosome 4. Some chromosomes (Chr7, Chr8, Chr15, Chr17, Chr20, Chr28, Chr35) included syntenic blocks matching two chromosomes in the related species. Some of those blocks probably correspond to duplicated regions collapsed in one of the assemblies, as they also exhibit higher than average cov-erage (Figure 2). Those blocks may also belong to pseudotetrasomal chromosomes, which are homeologous chromosomes resulting from ancient whole- genome duplication and that still recombine to a cer-tain extent (Allendorf et al., 2015; Blumstein et al., 2020; Lien et al., 2016; Waples et al., 2016).
F I G U R E 2 Self- synteny and coverage in Coregonus clupeaformis sp. Normal, and synteny with C. lavaretus sp. Balchen. (a) Circular plot showing syntenic relationship between homoeologous chromosomes (inner track) and their level of sequence similarity (medium track) in the genome of C. clupeaformis sp. Normal. The outer track displays mean coverage by windows of 100 kb in the short- read alignments. Points coloured in red show coverage higher than 1.5 times the average coverage (3.7×). Chromosomes surrounded by a purple outline are metacentric chromosomes, with dashed lines for putatively metacentric chromosomes. (b) Circular plot showing syntenic relationship between C. clupeaformis sp. Normal and C. lavaretus sp. Balchen. On both plots, chromosomes are coloured according to the ancestral origin (based on the PK nomenclature proposed in Sutherland et al., 2016). Regions coloured in grey represent collapsed duplicated regions in genome assemblies
12
34
5
6
7
89
1011
12
13
14
1516
17181920
2122
23
24
2526
2728
2930
3132
3334
3536
37 38 39 40
Coregonusclupeaformissp. Normal
1 2 3 45 6
78
910
1112
1314
1516
1718
9120
2122
2324
2526
2728
29
3031
32333435363738394040393837363534333231
3029
28
2726
2524
232221
2019
1817
1615
1413
1211
109
8
76
5 4 3 2 1
Coregonusclupeaformissp. Normal
Coregonuslavaretussp. Balchen
100 %50 %
similarity
(a) (b)
SpeciesCoregonus clupeaformis sp. Normal
Coregonus clupeaformis sp. Dwarf
Genome size 2.68 Gb 2.76 Gb
N50 (contig level) 6.1 Mb 2.2 Mb
L50 (contig level) 101 contigs 274 contigs
Fraction anchored in chromosomes 83% 73%
N50 (final assembly) 57 Mb 52 Mb
busco score (Actinopterygii) C: 94.4% [S: 50.9%, D: 43.5%], F: 1.7%, M: 3.9%, n: 4584
C: 94.6% [S: 59.1%, D: 35.5%], F: 0.9%, M: 4.5%, n:4584
Fraction of TEs 60.5% 62.4%
TA B L E 1 Statistics of the genome assemblies of Coregonus clupeaformis sp. Normal and sp. Dwarf

10 | MÉROT eT al.
The identification of ancestral chromosomes by alignment to other linkage maps (Figures S1– S3) and to the northern pike genome (Figure S7), as well as self- synteny (Figure 2a), allowed us to further identify the pairs of homeologous chromosomes. A few regions (Chr22, Chr 32, the end of Chr1) show no matching region in the genome of C. clupeaformis sp. Normal but high coverage, suggest-ing that the assembly may have locally collapsed two highly similar regions (Figure 2a; Table S3). Self- synteny assessment also supports fusion events between ancestral chromosomes that were previ-ously reported in the three Coregonus species, C. lavaretus, C. artedi and C. clupeaformis (Blumstein et al., 2020; Sutherland et al., 2016) such as PK05– PK06 (Chr01), PK10– PK24 (chr8), PK11– PK21 (Chr7), PK01– PK14 (Chr15), PK16– PK23 (Chr4) and PK8– PK9 (Chr20), as well as putative complex rearrangements between PK10– PK20– PK23 (Chr17, Chr28, Chr4). Those eight chromosomes also correspond to those identified as metacentric in our study and in the Cisco artedii (Blumstein et al., 2020).
3.2 | Discovery of SVs using a combination of sequencing tools
To identify SVs between Normal and Dwarf species, we built a de novo assembly for C. clupeaformis sp. Dwarf (ASM2061545v1) based on long- read sequences. This assembly shows high contiguity with an N50 of 2.2 Mb and L50 of 274 contigs, of which 73% could be placed into chromosomes using the linkage map. The final Dwarf as-sembly included 40 chromosomes and 7,294 unanchored scaffolds with an N50 of 52 Mb for a total genome size of 2.76 Gb. The Dwarf genome also showed high synteny with C. lavaretus sp. Balchen (Figure S8). Like the Normal genome, the genome of C. clupeaformis sp. Dwarf was composed of about 61% TEs at various ages, with sim-ilar repartition between different class and families (Figures S5 and S6, Table S6). The Dwarf genome also contains a high fraction (95%) of universal single- copy orthologous genes (actinopterygii), among which 36% were duplicated. This fraction is nevertheless smaller than in the Normal genome (44%), which may possibly reflect more collapsed duplicated regions in the Dwarf.
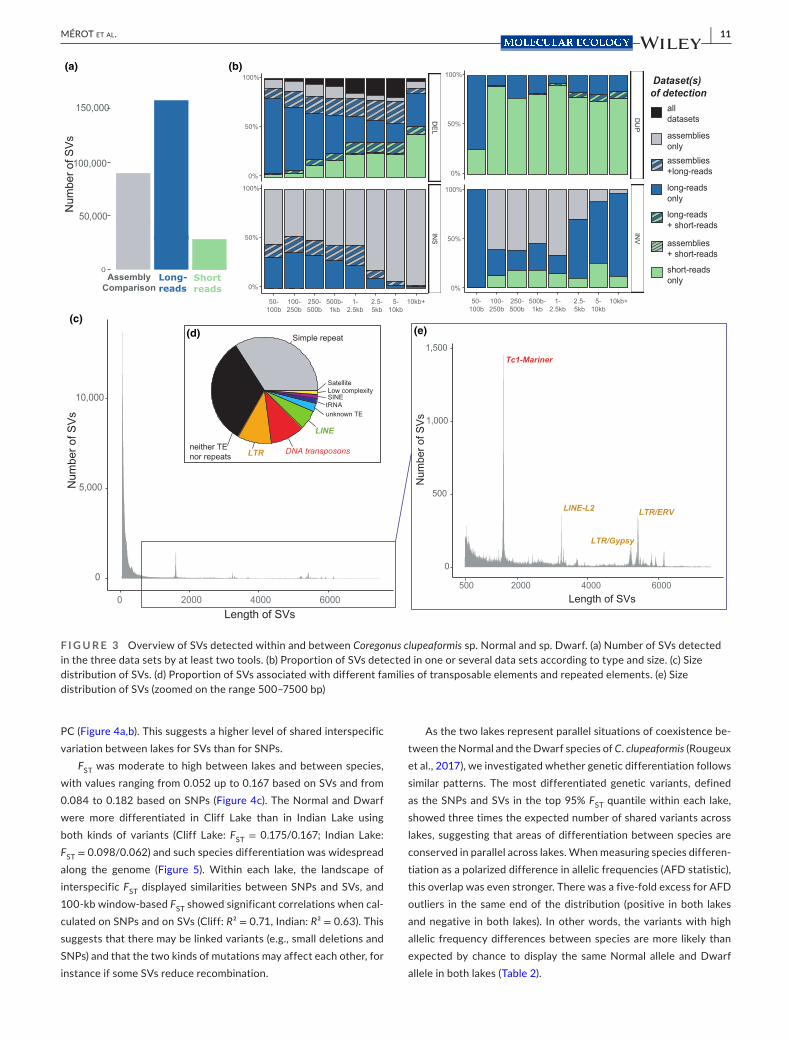
Comparison of the Dwarf assembly to the Normal reference revealed 244,717 SVs, of which 89,909 were detected by at least two tools and were kept as “high- confidence SVs.” Approximately half of the SVs were deletions and half were insertions (Figure 3a). Duplications were counted as insertions, and only a limited number of inversions were detected (2815, out of which only 77 were found by two tools).
Since a comparison of haploid assemblies is only able to detect SVs in the Dwarf relative to the Normal, and may be sensitive to assembly errors, we next investigated SV polymorphisms based on long reads. This revealed a higher number of high- confidence SVs with a total of 194,861 SVs detected by at least two tools. Those included SVs putatively heterozygous in the Normal and the Dwarf genomes and resulted in a high number of novel deletions and insertions.
Only two samples (one Dwarf and one Normal) were sequenced with long reads; hence we hoped to cover a wider range of popula-tion structural polymorphism by using short reads on 32 individuals (15 Normal and 17 Dwarf) to detect SVs. This method nevertheless ap-peared less powerful than SV detection based on long reads as 84,673 SVs were detected, with only 28,579 detected by at least two tools. This is possibly due to the smaller size of short reads and limited depth of sequencing in our data set (about 5×), which is suboptimal for SV calling. The large majority of SVs detected in this data set were dele-tions (n = 77,899; 92%), followed by duplications (n = 5,927; 7%), a few inversions (n = 24; 0.02%) and insertions (n = 15; 0.01%) (Figure 3a).
There was limited overlap between the different approaches with 7,525 SVs detected in the three data sets and 38,202 detected in two data sets out of a total of 222,927 SVs. This limited over-lap, which varies depending on type and size, probably reflects the different sensitivity and detection power of the calling methods as-sociated with each data set. Almost no overlap was observed for inversions and duplications, probably reflecting the difficulties in characterizing such SVs. For insertions, the overlap between long reads and assembly comparison approaches tended to decrease with size, possibly due to more approximate breakpoints, while for dele-tions it increased with size (Figure 3b).
The distribution of SV sizes was highly skewed towards smaller SVs below 500 bp (Figure 3c). We observed heterogeneous peaks in the SV size distribution corresponding to insertions or deletions of TEs (Figure 3e). The sequence of SVs around the 1600- bp peak matches with TC1- Mariner. SVs around 3700 bp correspond to Line- L2 indels while the peaks between 5000 and 6000 bp are differ-ent kinds of LTR (Gypsy, ERV1). Overall, TEs were important factors driving SVs in C. clupeaformis as their sequences were composed of 73% of TEs (compared to 60% for the entire genome, Table S4). This enrichment was mostly due to retroelements (49% in SV sequences compared to 25% in the genome), mostly LTR and Gypsy (Table S5). This resulted in about a third of all SVs in the catalogue being associ-ated with an insertion or deletion of a TE (Figure 3d). Satellite repeats and simple repeats (e.g., microsatellites) cover a smaller fraction of the SV sequences (5%, Table S4) but they were found in about a third of SVs. A third of SVs did not match any TE nor any repeated regions.
3.3 | Polymorphism and differentiation in C. clupeaformis sp. Normal and sp. Dwarf
To assess genetic variation at the population level, we estimated genotype likelihoods for SNPs and SVs in the 32 samples sequenced with short reads. Filtering for genetic variants with allelic frequency >5% retained 12,886,292 SNPs and 103,857 SVs. Those “frequent” SVs cover a total of 66 Mb, representing polymorphism affecting ap-proximately five times more nucleotides in the genome than SNPs.
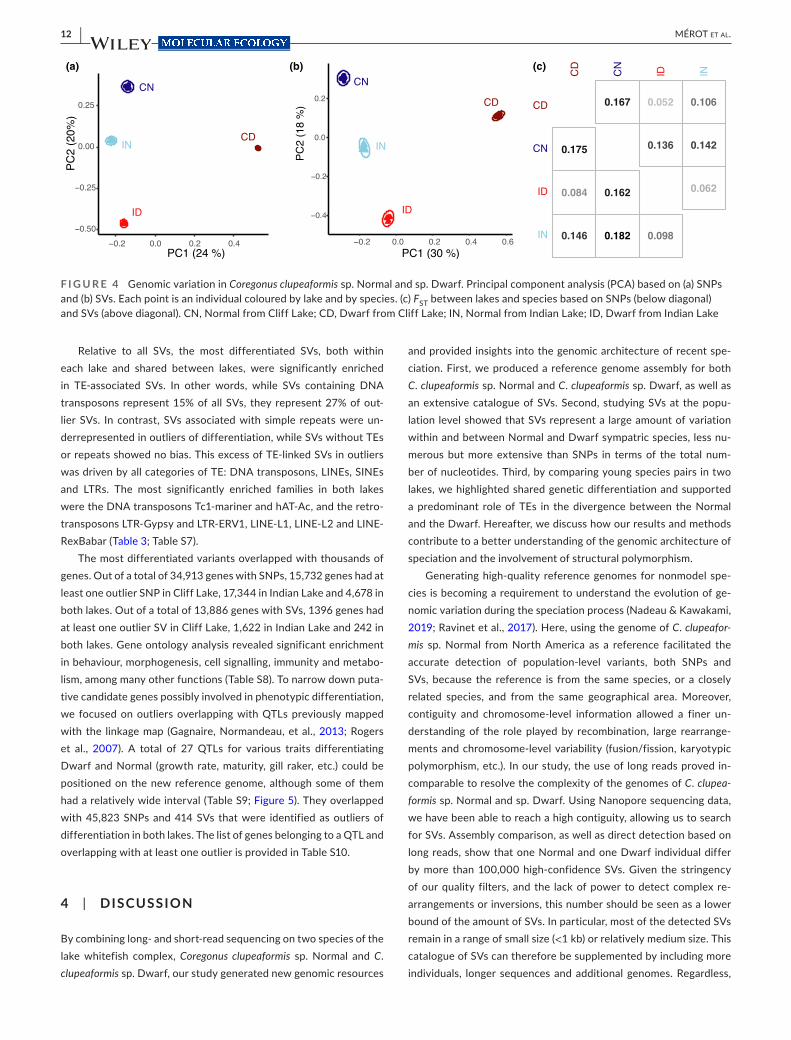
Decomposing genetic variation with a PCA revealed a strong clustering of individuals by species and by lake. This was consis-tent whether considering SNPs or SVs, although SVs tended to show greater separation between the two species along the first
| 11MÉROT eT al.
PC (Figure 4a,b). This suggests a higher level of shared interspecific variation between lakes for SVs than for SNPs.
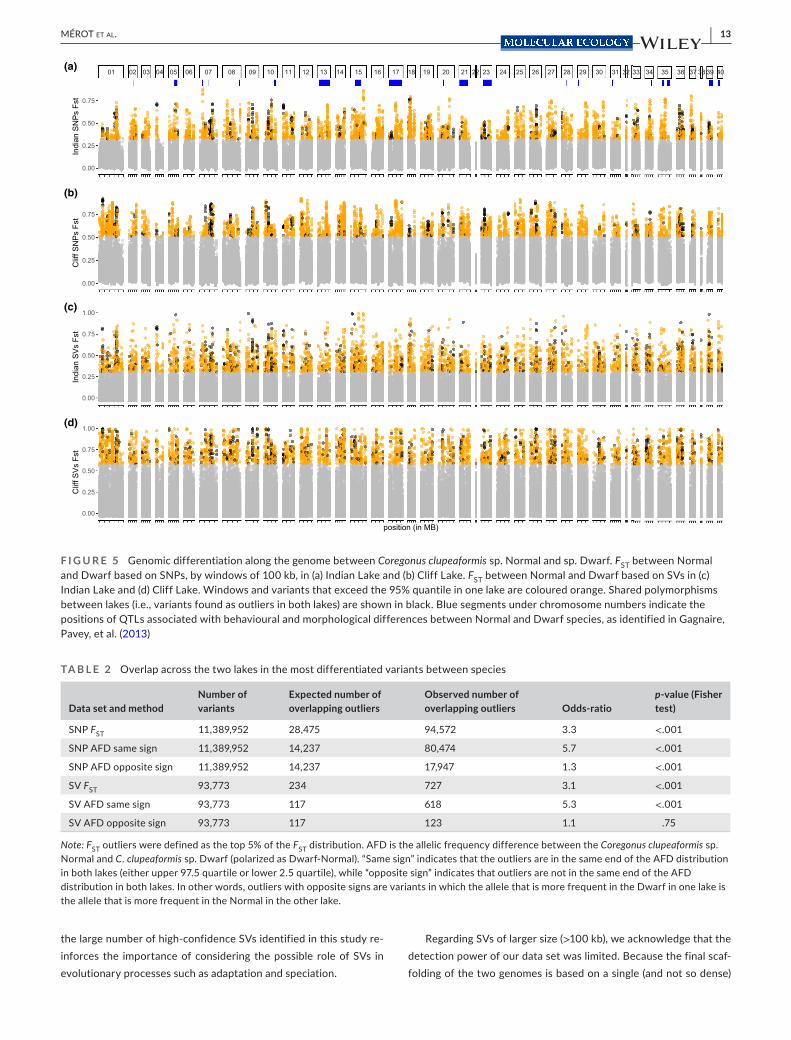
FST was moderate to high between lakes and between species, with values ranging from 0.052 up to 0.167 based on SVs and from 0.084 to 0.182 based on SNPs (Figure 4c). The Normal and Dwarf were more differentiated in Cliff Lake than in Indian Lake using both kinds of variants (Cliff Lake: FST = 0.175/0.167; Indian Lake: FST = 0.098/0.062) and such species differentiation was widespread along the genome (Figure 5). Within each lake, the landscape of interspecific FST displayed similarities between SNPs and SVs, and 100- kb window- based FST showed significant correlations when cal-culated on SNPs and on SVs (Cliff: R² = 0.71, Indian: R² = 0.63). This suggests that there may be linked variants (e.g., small deletions and SNPs) and that the two kinds of mutations may affect each other, for instance if some SVs reduce recombination.
As the two lakes represent parallel situations of coexistence be-tween the Normal and the Dwarf species of C. clupeaformis (Rougeux et al., 2017), we investigated whether genetic differentiation follows similar patterns. The most differentiated genetic variants, defined as the SNPs and SVs in the top 95% FST quantile within each lake, showed three times the expected number of shared variants across lakes, suggesting that areas of differentiation between species are conserved in parallel across lakes. When measuring species differen-tiation as a polarized difference in allelic frequencies (AFD statistic), this overlap was even stronger. There was a five- fold excess for AFD outliers in the same end of the distribution (positive in both lakes and negative in both lakes). In other words, the variants with high allelic frequency differences between species are more likely than expected by chance to display the same Normal allele and Dwarf allele in both lakes (Table 2).
F I G U R E 3 Overview of SVs detected within and between Coregonus clupeaformis sp. Normal and sp. Dwarf. (a) Number of SVs detected in the three data sets by at least two tools. (b) Proportion of SVs detected in one or several data sets according to type and size. (c) Size distribution of SVs. (d) Proportion of SVs associated with different families of transposable elements and repeated elements. (e) Size distribution of SVs (zoomed on the range 500– 7500 bp)
(a) (b)
(c)(d) (e)
12 | MÉROT eT al.
Relative to all SVs, the most differentiated SVs, both within each lake and shared between lakes, were significantly enriched in TE- associated SVs. In other words, while SVs containing DNA transposons represent 15% of all SVs, they represent 27% of out-lier SVs. In contrast, SVs associated with simple repeats were un-derrepresented in outliers of differentiation, while SVs without TEs or repeats showed no bias. This excess of TE- linked SVs in outliers was driven by all categories of TE: DNA transposons, LINEs, SINEs and LTRs. The most significantly enriched families in both lakes were the DNA transposons Tc1- mariner and hAT- Ac, and the retro-transposons LTR- Gypsy and LTR- ERV1, LINE- L1, LINE- L2 and LINE- RexBabar (Table 3; Table S7).
The most differentiated variants overlapped with thousands of genes. Out of a total of 34,913 genes with SNPs, 15,732 genes had at least one outlier SNP in Cliff Lake, 17,344 in Indian Lake and 4,678 in both lakes. Out of a total of 13,886 genes with SVs, 1396 genes had at least one outlier SV in Cliff Lake, 1,622 in Indian Lake and 242 in both lakes. Gene ontology analysis revealed significant enrichment in behaviour, morphogenesis, cell signalling, immunity and metabo-lism, among many other functions (Table S8). To narrow down puta-tive candidate genes possibly involved in phenotypic differentiation, we focused on outliers overlapping with QTLs previously mapped with the linkage map (Gagnaire, Normandeau, et al., 2013; Rogers et al., 2007). A total of 27 QTLs for various traits differentiating Dwarf and Normal (growth rate, maturity, gill raker, etc.) could be positioned on the new reference genome, although some of them had a relatively wide interval (Table S9; Figure 5). They overlapped with 45,823 SNPs and 414 SVs that were identified as outliers of differentiation in both lakes. The list of genes belonging to a QTL and overlapping with at least one outlier is provided in Table S10.
4 | DISCUSSION
By combining long- and short- read sequencing on two species of the lake whitefish complex, Coregonus clupeaformis sp. Normal and C. clupeaformis sp. Dwarf, our study generated new genomic resources
and provided insights into the genomic architecture of recent spe-ciation. First, we produced a reference genome assembly for both C. clupeaformis sp. Normal and C. clupeaformis sp. Dwarf, as well as an extensive catalogue of SVs. Second, studying SVs at the popu-lation level showed that SVs represent a large amount of variation within and between Normal and Dwarf sympatric species, less nu-merous but more extensive than SNPs in terms of the total num-ber of nucleotides. Third, by comparing young species pairs in two lakes, we highlighted shared genetic differentiation and supported a predominant role of TEs in the divergence between the Normal and the Dwarf. Hereafter, we discuss how our results and methods contribute to a better understanding of the genomic architecture of speciation and the involvement of structural polymorphism.
Generating high- quality reference genomes for nonmodel spe-cies is becoming a requirement to understand the evolution of ge-nomic variation during the speciation process (Nadeau & Kawakami, 2019; Ravinet et al., 2017). Here, using the genome of C. clupeafor-mis sp. Normal from North America as a reference facilitated the accurate detection of population- level variants, both SNPs and SVs, because the reference is from the same species, or a closely related species, and from the same geographical area. Moreover, contiguity and chromosome- level information allowed a finer un-derstanding of the role played by recombination, large rearrange-ments and chromosome- level variability (fusion/fission, karyotypic polymorphism, etc.). In our study, the use of long reads proved in-comparable to resolve the complexity of the genomes of C. clupea-formis sp. Normal and sp. Dwarf. Using Nanopore sequencing data, we have been able to reach a high contiguity, allowing us to search for SVs. Assembly comparison, as well as direct detection based on long reads, show that one Normal and one Dwarf individual differ by more than 100,000 high- confidence SVs. Given the stringency of our quality filters, and the lack of power to detect complex re-arrangements or inversions, this number should be seen as a lower bound of the amount of SVs. In particular, most of the detected SVs remain in a range of small size (<1 kb) or relatively medium size. This catalogue of SVs can therefore be supplemented by including more individuals, longer sequences and additional genomes. Regardless,
F I G U R E 4 Genomic variation in Coregonus clupeaformis sp. Normal and sp. Dwarf. Principal component analysis (PCA) based on (a) SNPs and (b) SVs. Each point is an individual coloured by lake and by species. (c) FST between lakes and species based on SNPs (below diagonal) and SVs (above diagonal). CN, Normal from Cliff Lake; CD, Dwarf from Cliff Lake; IN, Normal from Indian Lake; ID, Dwarf from Indian Lake
(a) (b) (c)
| 13MÉROT eT al.
the large number of high- confidence SVs identified in this study re-inforces the importance of considering the possible role of SVs in evolutionary processes such as adaptation and speciation.
Regarding SVs of larger size (>100 kb), we acknowledge that the detection power of our data set was limited. Because the final scaf-folding of the two genomes is based on a single (and not so dense)
F I G U R E 5 Genomic differentiation along the genome between Coregonus clupeaformis sp. Normal and sp. Dwarf. FST between Normal and Dwarf based on SNPs, by windows of 100 kb, in (a) Indian Lake and (b) Cliff Lake. FST between Normal and Dwarf based on SVs in (c) Indian Lake and (d) Cliff Lake. Windows and variants that exceed the 95% quantile in one lake are coloured orange. Shared polymorphisms between lakes (i.e., variants found as outliers in both lakes) are shown in black. Blue segments under chromosome numbers indicate the positions of QTLs associated with behavioural and morphological differences between Normal and Dwarf species, as identified in Gagnaire, Pavey, et al. (2013)
0.00
0.25
0.50
0.75
Indi
an S
NP
s Fs
t
0.00
0.25
0.50
0.75
Clif
f SN
Ps
Fst
0.00
0.25
0.50
0.75
1.00
Indi
an S
Vs
Fst
0.00
0.25
0.50
0.75
1.00
Clif
f SV
s Fs
t01 02 03 04 05 06 07 08 09 10 11 12 13 14 15 16 17 18 19 20 21 22 23 24 25 26 27 28 29 30 31 32 33 34 35 36 37 38 39 40
position (in MB)
(a)
(b)
(c)
(d)
TA B L E 2 Overlap across the two lakes in the most differentiated variants between species
Data set and methodNumber of variants
Expected number of overlapping outliers
Observed number of overlapping outliers Odds- ratio
p- value (Fisher test)
SNP FST 11,389,952 28,475 94,572 3.3 <.001
SNP AFD same sign 11,389,952 14,237 80,474 5.7 <.001
SNP AFD opposite sign 11,389,952 14,237 17,947 1.3 <.001
SV FST 93,773 234 727 3.1 <.001
SV AFD same sign 93,773 117 618 5.3 <.001
SV AFD opposite sign 93,773 117 123 1.1 .75
Note: FST outliers were defined as the top 5% of the FST distribution. AFD is the allelic frequency difference between the Coregonus clupeaformis sp. Normal and C. clupeaformis sp. Dwarf (polarized as Dwarf- Normal). “Same sign” indicates that the outliers are in the same end of the AFD distribution in both lakes (either upper 97.5 quartile or lower 2.5 quartile), while “opposite sign” indicates that outliers are not in the same end of the AFD distribution in both lakes. In other words, outliers with opposite signs are variants in which the allele that is more frequent in the Dwarf in one lake is the allele that is more frequent in the Normal in the other lake.

14 | MÉROT eT al.
linkage map, made from a Normal × Dwarf hybrid family (Gagnaire et al., 2013a; Rogers et al., 2007), we could not search for large chromosomal rearrangements simply by contrasting the two ge-nomes. This is unfortunate because large rearrangements such as inversions, fusions and translocations may be relevant for specia-tion as they often differ between closely- related sympatric species and contribute to reproductive isolation (Berdan et al., 2021; Faria & Navarro, 2010; Noor et al., 2001). In the case of C. clupeaformis, on the one hand, we do not expect a major effect of chromosomal rearrangements. First, the differentiation observed in SNPs and SVs is widespread along the genome and does not display the typical spatial clustering of differentiated regions observed between spe-cies pairs such as Littorina saxatilis (Morales et al., 2019) or Helianthus sp. (Todesco et al., 2020). Second, cytogenetic analysis showed that the C. clupeaformis sp. Normal and sp. Dwarf from these same lakes have an identical number of chromosomes (Dion- Côté et al., 2017). On the other hand, cytogenetic exploration showed subtle chromosomal polymorphism within and between them (Dion- Côté et al., 2017). For instance, chromosome 1 is longer in the Normal than in the Dwarf in Cliff Lake due to heterochromatin differences (Dion- Côté et al., 2017), a pattern that we also observed in the ge-nome (121 vs. 99 Mb, Figure S8). We also note some peculiarities such as Chr22, for which sequences in C. clupeaformis sp. Normal are homologous to sequences belonging to Chr22 in the genome of C. lavaretus sp. Balchen but which we never managed to order as a full linkage group, probably because of the lack of recombination in the family used for the linkage map. Since the mother used for the linkage map is a hybrid Dwarf × Normal, any rearrangement differing between species (and affecting recombination at the heterozygote stage) may be absent from the final map, and hence from the pres-ent genomes. These chromosomal differences may lead to issues
with recombination during meiosis (Dion- Côté et al., 2015; Faria & Navarro, 2010), contributing to reproductive isolation and specia-tion (Hoffmann & Rieseberg, 2008; Kirkpatrick & Barton, 2006). In the future, it would be worthwhile to explore large- scale chromo-somal rearrangements in C. clupeaformis sp. Normal and C. clupea-formis sp. Dwarf in depth to understand the role of chromosomal polymorphism in speciation. However, this will require improved genome scaffolding based on Hi- C chromatin contacts (which was attempted here without success) or separate linkage maps.
Beyond the contrast between C. clupeaformis sp. Normal and C. clupeaformis sp. Dwarf, the new genome assemblies also provide rel-evant information about the evolution of genomes at a higher tax-onomic level. Salmonids have experienced a recent whole- genome duplication, followed by different events of rediploidization, as well as important chromosomal rearrangements such as fusions (Blumstein et al., 2020; Glasauer & Neuhauss, 2014; Lien et al., 2016; Macqueen & Johnston, 2014). Here, as often observed in salmonids, synteny was high between C. clupeaformis sp. Normal, C. clupeaformis sp. Dwarf and closely related species such as the European whitefish C. lavaretus sp. Balchen. The same groups of chromosomes appear to be metacentric and bear residual tetrasomy in C. clupeaformis as in its related species C. ardetii (Blumstein et al., 2020). Chromosomal comparison with C. ardetii and C. lavaretus also suggested shared fusion and fission of ancestral chromosomes and a consistent karyotype between the different coregonids (Blumstein et al., 2020; De- Kayne & Feulner, 2018). This would suggest that the majority of redeploidization processes occurred before the split of the different Coregonus species, which would all share a relatively similar karyotype. That being said, it should be kept in mind that the residual tetrasomy observed on a subset of chromosomes makes it difficult to fully ascertain synteny vs. rearrangements within and
TA B L E 3 Enrichment in SVs associated with transposable elements in outliers of differentiation between Coregonus clupeaformis sp. Normal and C. clupeaformis sp. Dwarf
Type of SV
Population- scale analysis (MAF > 5%) FST outliers in both lakes
Number of SVsProportion of SVs
Number of SVs
Proportion of SVs Odd- ratio
p- value (Fisher test)
q value (B & H correction)
Neither TE nor repeats
30,082 32% 213 29% 0.9 .885 1.00
Simple repeats 24,142 26% 22 3% 0.1 .000 1.00
Satellite 35 0% 1 0% 3.7 .243 0.38
Low complexity 774 1% 2 0% 0.3 .982 1.00
RNA repeats 2,303 2% 24 3% 1.3 .100 0.18
TEs
dnaTE 13,970 15% 193 27% 1.8 <.001 <0.001
LINE 6,725 7% 70 10% 1.3 .014 0.03
SINE 2,254 2% 39 5% 2.2 <.001 <0.001
LTR 10,691 11% 120 17% 1.4 <.001 <0.001
Unknown TE 2,776 3% 43 6% 2.0 <.001 <0.001
RC/Helitron 21 0% NA NA 0.0 1.000 1.00
Lines in bold correspond to significant enrichment with p < .05.

| 15MÉROT eT al.
between species on those chromosomes. Moreover, C. clupeafor-mis genomes remain extremely complex with several regions that end up collapsed by genome assembly (at least 126 Mb, 5% of the chromosome- anchored genome), as was previously reported in other salmonid genomes (De- Kayne et al., 2020; Lien et al., 2016). Therefore, while the Coregonus reference genome assemblies pro-vide an important first step, refining the assemblies and comple-menting by cytogenetic or chromatin- contact data will be valuable to further explore the timing and modalities of rediploidization in coregonids, and its possible contribution to speciation.
Salmonid genomes are also littered with TEs and C. clupeaformis was no exception: interspersed repeats accounted for about 60% of the genome. This amount is comparable to Salmo salar (60%; Lien et al., 2016) and Coregonus lavaretus “Balchen” (52%; De- Kayne et al., 2020). Moreover, not all TE copies are shared by all individuals and our results highlighted that they were responsible for a third of the SVs detected within and between species. This is also consistent with observations made on other species, such as Atlantic salmon Salmo salar (Bertolotti et al., 2020) or crows Corvus sp. (Weissensteiner et al., 2020), in which young and active TEs generate numerous inser-tions and deletions between samples. It has been hypothesized that bursts of transposon activity may contribute to speciation (de Boer et al., 2007), or at least that TEs may rapidly generate genetic vari-ation differentiating species (Serrato- Capuchina & Matute, 2018). Our data strongly support this hypothesis since the most differen-tiated SVs between Dwarf and Normal in both lakes were enriched in several classes of TEs. A large part of the fixed genetic variation between species corresponds to an insertion or a deletion of a given TE. It is worth noting that this pattern is widespread across the ge-nome rather than centred on a few loci. Such extensive differentia-tion suggests a progressive and differential TE accumulation without gene flow, probably in allopatry during the Pleistocene glaciation (~15,000 generations/60,000 years ago) that may have contributed to the maintenance of reproductive isolation during the postgla-cial sympatric phase following secondary contact (~3000 genera-tions/12,000 years ago) (Jacobsen et al., 2012; Rougeux et al., 2017). Accumulations of different TEs between lineages may be quite rapid as active TEs have a high mutation rate, as observed in Daphnia with an order of 10−5 gain or loss per copy per generation (Ho et al., 2021). TEs can also contribute to reproductive isolation by altering gene structure, expression pattern and chromosome organization (Dubin et al., 2018; Goodier, 2016). In fact, TE deregulation is known to gen-erate postzygotic breakdown in Dwarf × Normal hybrids (Dion- Côté et al., 2014), which has been associated with epigenetic (DNA meth-ylation) reprogramming in hybrids (Laporte et al., 2019). Moreover, this supported the hypothesis that TE transcriptional derepression, perhaps due to different TE silencing mechanisms that evolved in allopatry, may be the cause for both massive misregulation of gene expression and abnormal embryonic development and death in hy-brids (Dion- Côté et al., 2014; Renaut et al., 2009). Both in previous studies and in our study, the same TE families emerged as associ-ated with species differentiation, namely Tc1- mariner and hAT- Ac as well as LTR- Gypsy, Line- L2 and Line- RexBabar. Together, cumulative
evidence points towards a major role of several TE families in the re-productive isolation of Dwarf and Normal, involving TEs distributed throughout the genome rather than in a few barrier loci.
A peculiarity of the speciation between C. clupeaformis sp. Normal and C. clupeaformis sp. Dwarf is the character displace-ment in the Acadian lineage towards a dwarf limnetic species upon secondary contact with the American lineage, a process which oc-curred independently in separate lakes of the suture zone, resulting in two ecologically distinct sympatric species, the Dwarf and the Normal (Bernatchez et al., 2010a; Landry et al., 2007; Rougeux et al., 2017). Previous work revealed that strong parallelism at the pheno-typic level between lakes was accompanied by weak parallelism at the genome level (Gagnaire, Pavey, et al., 2013; Lu & Bernatchez, 1999; Rougeux et al., 2019). With a higher density of variants being screened, our results corroborate those from these previous studies. The pattern of differentiation between species was indeed specific to each lake. However, it is worth noting the excess of shared out-liers of differentiation, for both SNPs and SVs, and that differences of allelic frequencies were more often in the same direction (e.g., higher allelic frequency in dwarf species in both lakes) than expected by chance. A large fraction of such parallelism probably reflects his-torical divergence between allopatric lineages, possibly reinforced by the result of comparable ecological response to selection. It is also possible that shared regions of differentiation reflect regions of the genome more resistant to gene flow, such as low recombina-tion regions, as observed in Ficedula flycatchers (Burri et al., 2015). General patterns of TE enrichment in outlier SVs, as well as gene ontology enrichment, also converged between lakes. This suggests that the processes driving genetic divergence between species were probably similar between lakes, namely through shared historical di-vergence and similar ecological selection imposed by the use of dis-tinct trophic niches (Bernatchez et al., 2010a). However, they were buffered by lake- specific contingency at finer molecular level, for in-stance, associated with the effect of genetic drift on available stand-ing genetic variation within each lake (Gagnaire, Pavey, et al., 2013).
Studying two types of genetic variants in tandem, SVs and SNPs, at the population level showed similar patterns and level of differen-tiation between species and between lakes. On the one hand, this confirms that evaluating population/species structure requires nei-ther a diversity of variants nor a large amount of markers. In fact, the FST values observed at the scale of the entire genome for both types of variants and in both lakes were strikingly similar to values mea-sured based on a much smaller subset of markers. For instance, based on the RADseq genotyping of about 2500 SNP loci, Gagnaire, Pavey, et al. (2013) reported FST values of 0.12 and 0.10 between Dwarf and Normal from Cliff Lake and from Indian Lake respectively, compared to values of 0.18 and 0.10 here for SNPs and 0.17 and 0.06 for SVs. On the other hand, studying different kinds of variants with similar filters shows a large amount of nonrare SVs (i.e., SVs found in more than two of 64 chromosomes; 32 diploid individuals). Because of their size, the accumulation of SVs at intermediate frequency in nat-ural populations thus represents a non- negligible aspect of genetic variation, as they covered at least five times more of the genome

16 | MÉROT eT al.
than SNPs. This point is increasingly underlined by studies in pop-ulation genomics and evolutionary genomics (Catanach et al., 2019; Mérot et al., 2020; Weissensteiner et al., 2020) and means that a full understanding of genetic variation cannot overlook SVs. However, it remains difficult to study SVs at the population level. Short reads are more accessible when sequencing a large number of individuals but they proved to be less powerful for characterizing SVs (Mahmoud et al., 2019). For instance, here we found around five times fewer SVs with 32 samples sequenced with short reads than with two sam-ples sequenced with long reads. Our study also used short reads at shallow/medium coverage (~5×) which may be suboptimal to detect and genotype SNPs and SVs with confidence. However, there are ways to handle the uncertainty associated with a low number of sup-porting reads, such as working within a genotype likelihood frame-work (Buerkle & Gompert, 2013; Lou et al., 2020). Recent studies have proposed relying on mixed data sets (e.g., combining long- and short- read sequence data, combining high and shallow coverage) to achieve together a good catalogue of SVs and then perform pop-ulation genomic studies based on their variation (Logsdon et al., 2020). We have achieved this in this study by first characterizing SVs using high- depth long reads on a limited number of samples, and second by genotyping known SVs with medium- coverage short reads on a greater number of samples. To achieve this, genome- graph- based approaches were particularly relevant, allowing us to build a variation- aware reference graph (Garrison et al., 2018), and then perform unbiased mapping of reads to this graph (Sirén et al., 2020). Such two- step approaches have also been used in a handful of studies looking at SVs in chocolate trees Theobroma cacao (Hämälä et al., 2021), soybeans Glycine max (Lemay et al., 2021) and potato beetle Leptinotarsa decemlineata (Cohen et al., 2021). Based on this, we believe that the combination of second- and third- generation sequencing is promising to study structural polymorphism within a population genomics framework and will allow the inclusion of SVs in studies of speciation and adaptation genomics.
ACKNOWLEDG EMENTSWe thank M. Suga for contributing to fieldwork, K. Wellband for help with annotation, M- A. Lemay for help with SV analysis, M. Leitwein for help with the analysis of metacentric chromosomes, and A- L. Ferchaud and R. De Kayne for their help with synteny analysis and plotting. We are very grateful to the teams that developed vg, gi-raffe and pggb for their guidance in using the genome- graph tools as well as J. Laroche at the IBIS Bioinformatic platform (www.ibis.ulaval.ca) for his support. We are also grateful to Editor L. Rieseberg and three anonymous reviewers for their extensive and constructive comments on a previous version of the manuscript.
CONFLIC T OF INTERE S TThe authors declare no conflict of interest.
AUTHOR CONTRIBUTIONSThis study is part of the long- term research programme of L.B. on the adaptive radiation and ecological speciation of lake whitefish.
L.B., C.R. and C.M. conceived the study. M.Á. and M.K. performed the Nanopore sequencing. M.M and S.L. assembled the genome and E.N. and C.M. scaffolded the genome. J.M.F. analysed the TEs. C.M. and K.S. did the analyses with contributions from C.V., E.N., M.L. and S.L. C.M. wrote the manuscript with contributions from all authors.
DATA AVAIL ABILIT Y S TATEMENTFinal genome assemblies are available on NCBI under the id ASM1839867v1 and ASM2061545v1. Long- and short- read se-quences are available on NCBI under project nos. PRJNA715481, PRJNA767633, PRJNA820751. Code is available on Github for the different pipelines listed in the methods (https://github.com/clair emero t/wgs_sample_prepa ration, https://github.com/clair emero t/lepma p3_pipeline, https://github.com/clair emero t/assem bly_SV, https://github.com/clair emero t/long_read_SV, https://github.com/clair emero t/SR_SV, https://github.com/clair emero t/genot yping_SV).
ORCIDClaire Mérot https://orcid.org/0000-0003-2607-7818
R E FE R E N C E SAbel, H. J., Larson, D. E., Regier, A. A., Chiang, C., Das, I., Kanchi, K. L., &
Reeves, C. (2020). Mapping and characterization of structural vari-ation in 17,795 human genomes. Nature, 583(7814), 83– 89.
Aljanabi, S. M., & Martinez, I. (1997). Universal and rapid salt- extraction of high quality genomic DNA for PCR- based techniques. Nucleic Acids Research, 25(22), 4692– 4693. https://doi.org/10.1093/nar/25.22.4692
Allendorf, F. W., Bassham, S., Cresko, W. A., Limborg, M. T., Seeb, L. W., & Seeb, J. E. (2015). Effects of crossovers between homeo-logs on inheritance and population genomics in polyploid- derived salmonid fishes. Journal of Heredity, 106(3), 217– 227. https://doi.org/10.1093/jhere d/esv015
Allendorf, F. W., & Thorgaard, G. H. (1984). Tetraploidy and the evolu-tion of salmonid fishes. In: B. J. Turner (Eds), Evolutionary genetics of fishes, Monographs in Evolutionary Biology (pp. 1– 53). Springer.
Alonge, M., Soyk, S., Ramakrishnan, S., Wang, X., Goodwin, S., Sedlazeck, F. J., Lippman, Z. B., & Schatz, M. C. (2019). RaGOO: Fast and ac-curate reference- guided scaffolding of draft genomes. Genome Biology, 20(1), 1– 17. https://doi.org/10.1186/s1305 9- 019- 1829- 6
Berdan, E. L., Fuller, R. C., & Kozak, G. M. (2021). Genomic landscape of reproductive isolation in Lucania killifish: The role of sex loci and salinity. Journal of Evolutionary Biology, 34(1), 157– 174.
Bernatchez, L., & Dodson, J. J. (1990). Allopatric origin of sympat-ric populations of lake whitefish (Coregonus clupeaformis) as re-vealed by mitochondrial- DNA restriction analysis. Evolution, 44(5), 1263– 1271.
Bernatchez, L., Renaut, S., Whiteley, A. R., Derome, N., Jeukens, J., Landry, L., & Rogers, S. M. (2010a). On the origin of spe-cies: Insights from the ecological genomics of lake white-fish. Philosophical Transactions of the Royal Society B: Biological Sciences, 365(1547), 1783– 1800.
Bernatchez, L., Renaut, S., Whiteley, A. R., Derome, N., Jeukens, J., Landry, L., & Rogers, S. M. (2010b). On the origin of species: Insights from the ecological genomics of lake whitefish. Philosophical Transactions of the Royal Society B: Biological Sciences, 365(1547), 1783– 1800.
Bertolotti, A. C., Layer, R. M., Gundappa, M. K., Gallagher, M. D., Pehlivanoglu, E., Nome, T., Robledo, D., Kent, M. P., Røsæg, L. L., Holen, M. M., Mulugeta, T. D., Ashton, T. J., Hindar, K., Sægrov, H., Florø- Larsen, B., Erkinaro, J., Primmer, C. R., Bernatchez, L., Martin,
| 17MÉROT eT al.
S. A. M., … Macqueen, D. J. (2020). The structural variation land-scape in 492 Atlantic salmon genomes. Nature Communications, 11(1), 5176. https://doi.org/10.1038/s4146 7- 020- 18972 - x
Blumstein, D. M., Campbell, M. A., Hale, M. C., Sutherland, B. J., McKinney, G. J., Stott, W., & Larson, W. A. (2020). Comparative ge-nomic analyses and a novel linkage map for cisco (Coregonus artedi) provide insights into chromosomal evolution and rediploidization across salmonids. G3: Genes, Genomes, Genetics, 10(8), 2863– 2878.
Breese, M. R., & Liu, Y. (2013). NGSUtils: A software suite for analyz-ing and manipulating next- generation sequencing data sets. Bioinformatics, 29(4), 494– 496. https://doi.org/10.1093/bioin forma tics/bts731
Buerkle, C., & Gompert, Z. (2013). Population genomics based on low coverage sequencing: How low should we go? Molecular Ecology, 22(11), 3028– 3035. https://doi.org/10.1111/mec.12105
Burri, R., Nater, A., Kawakami, T., Mugal, C. F., Olason, P. I., Smeds, L., & Garamszegi, L. Z. (2015). Linked selection and recombination rate variation drive the evolution of the genomic landscape of differ-entiation across the speciation continuum of Ficedula flycatchers. Genome Research, 25(11), 1656– 1665.
Cabanettes, F., & Klopp, C. (2018). D- GENIES: Dot plot large genomes in an interactive, efficient and simple way. PeerJ, 6, e4958. https://doi.org/10.7717/peerj.4958
Catanach, A., Crowhurst, R., Deng, C., David, C., Bernatchez, L., & Wellenreuther, M. (2019). The genomic pool of standing structural variation outnumbers single nucleotide polymorphism by threefold in the marine teleost Chrysophrys auratus. Molecular Ecology, 28(6), 1210– 1223.
Catchen, J., Amores, A., & Bassham, S. (2020). Chromonomer: A tool set for repairing and enhancing assembled genomes through integration of genetic maps and conserved synteny. G3 Genes|genomes|genetics, 10(11), 4115– 4128. https://doi.org/10.1534/g3.120.401485
Chaisson, M. J. P., Sanders, A. D., Zhao, X., Malhotra, A., Porubsky, D., Rausch, T., Gardner, E. J., Rodriguez, O. L., Guo, L. I., Collins, R. L., Fan, X., Wen, J., Handsaker, R. E., Fairley, S., Kronenberg, Z. N., Kong, X., Hormozdiari, F., Lee, D., Wenger, A. M., … Lee, C. (2019). Multi- platform discovery of haplotype- resolved structural variation in human genomes. Nature Communications, 10(1), 1– 16. https://doi.org/10.1038/s4146 7- 018- 08148 - z
Chakraborty, M., Baldwin- Brown, J. G., Long, A. D., & Emerson, J. (2016). Contiguous and accurate de novo assembly of metazoan genomes with modest long read coverage. Nucleic Acids Research, 44(19), e147.
Chen, S., Zhou, Y., Chen, Y., & Gu, J. (2018). fastp: An ultra- fast all- in- one FASTQ preprocessor. Bioinformatics, 34(17), i884– i890. https://doi.org/10.1093/bioin forma tics/bty560
Chen, X., Schulz- Trieglaff, O., Shaw, R., Barnes, B., Schlesinger, F., Källberg, M., Cox, A. J., Kruglyak, S., & Saunders, C. T. (2016). Manta: Rapid detection of structural variants and indels for germline and cancer sequencing applications. Bioinformatics, 32(8), 1220– 1222. https://doi.org/10.1093/bioin forma tics/btv710
Cohen, Z., Hawthorne, D., & Schoville, S. (2021). The role of structural variants in pest adaptation and genome evolution of the Colorado potato beetle, Leptinotarsa decemlineata (Say). Authorea Preprints.
Cruickshank, T. E., & Hahn, M. W. (2014). Reanalysis suggests that ge-nomic islands of speciation are due to reduced diversity, not re-duced gene flow. Molecular Ecology, 23(13), 3133– 3157. https://doi.org/10.1111/mec.12796
Dalziel, A. C., Laporte, M., Rougeux, C., Guderley, H., & Bernatchez, L. (2017). Convergence in organ size but not energy metabolism en-zyme activities among wild Lake Whitefish (Coregonus clupeaformis) species pairs. Molecular Ecology, 26(1), 225– 244.
de Boer, J. G., Yazawa, R., Davidson, W. S., & Koop, B. F. (2007). Bursts and horizontal evolution of DNA transposons in the speciation of pseudotetraploid salmonids. BMC Genomics, 8(1), 1– 10.
De Coster, W., De Rijk, P., De Roeck, A., De Pooter, T., D'Hert, S., Strazisar, M., Sleegers, K., & Van Broeckhoven, C. (2019). Structural variants identified by Oxford Nanopore PromethION sequencing of the human genome. Genome Research, 29(7), 1178– 1187. https://doi.org/10.1101/gr.244939.118
De- Kayne, R., & Feulner, P. G. (2018). A European whitefish link-age map and its implications for understanding genome- wide synteny between salmonids following whole genome duplica-tion. G3 Genes|genomes|genetics, 8(12), 3745– 3755. https://doi.org/10.1534/g3.118.200552
De- Kayne, R., Zoller, S., & Feulner, P. G. (2020). A de novo chromosome- level genome assembly of Coregonus sp. “Balchen”: One represen-tative of the Swiss Alpine whitefish radiation. Molecular Ecology Resources, 20(4), 1093– 1109.
Dion- Côté, A.- M., Renaut, S., Normandeau, E., & Bernatchez, L. (2014). RNA- seq reveals transcriptomic shock involving transposable el-ements reactivation in hybrids of young lake whitefish species. Molecular Biology and Evolution, 31(5), 1188– 1199. https://doi.org/10.1093/molbe v/msu069
Dion- Côté, A., Symonová, R., Lamaze, F. C., Pelikánová, Š., Ráb, P., & Bernatchez, L. (2017). Standing chromosomal variation in Lake Whitefish species pairs: The role of historical contingency and rele-vance for speciation. Molecular Ecology, 26(1), 178– 192.
Dion- Côté, A.- M., Symonová, R., Ráb, P., & Bernatchez, L. (2015). Reproductive isolation in a nascent species pair is associated with aneuploidy in hybrid offspring. Proceedings of the Royal Society B: Biological Sciences, 282(1802), 20142862. https://doi.org/10.1098/rspb.2014.2862
Dubin, M. J., Scheid, O. M., & Becker, C. (2018). Transposons: A bless-ing curse. Current Opinion in Plant Biology, 42, 23– 29. https://doi.org/10.1016/j.pbi.2018.01.003
Dufresnes, C., Brelsford, A., Jeffries, D. L., Mazepa, G., Suchan, T., Canestrelli, D., Nicieza, A., Fumagalli, L., Dubey, S., Martínez- Solano, I., Litvinchuk, S. N., Vences, M., Perrin, N., & Crochet, P.- A. (2021). Mass of genes rather than master genes underlie the genomic architecture of amphibian speciation. Proceedings of the National Academy of Sciences, 118(36), e2103963118. https://doi.org/10.1073/pnas.21039 63118
Evans, M., & Bernatchez, L. (2012). Oxidative phosphorylation gene transcription in whitefish species pairs reveals pat-terns of parallel and nonparallel physiological divergence. Journal of Evolutionary Biology, 25(9), 1823– 1834. https://doi.org/10.1111/j.1420- 9101.2012.02570.x
Faria, R., & Navarro, A. (2010). Chromosomal speciation revis-ited: Rearranging theory with pieces of evidence. Trends in Ecology & Evolution, 25(11), 660– 669. https://doi.org/10.1016/j.tree.2010.07.008
Feulner, P. G. D., Chain, F. J. J., Panchal, M., Eizaguirre, C., Kalbe, M., Lenz, T. L., Mundry, M., Samonte, I. E., Stoll, M., Milinski, M., Reusch, T. B. H., & Bornberg- bauer, E. (2013). Genome- wide pat-terns of standing genetic variation in a marine population of three- spined sticklebacks. Molecular Ecology, 22(3), 635– 649. https://doi.org/10.1111/j.1365- 294X.2012.05680.x
Feulner, P., & De- Kayne, R. (2017). Genome evolution, structural rear-rangements and speciation. Journal of Evolutionary Biology, 30(8), 1488– 1490. https://doi.org/10.1111/jeb.13101
Flynn, J. M., Hubley, R., Goubert, C., Rosen, J., Clark, A. G., Feschotte, C., & Smit, A. F. (2020). RepeatModeler2 for automated genomic dis-covery of transposable element families. Proceedings of the National Academy of Sciences, 117(17), 9451– 9457. https://doi.org/10.1073/pnas.19210 46117
Gagnaire, P., Normandeau, E., Pavey, S. A., & Bernatchez, L. (2013). Mapping phenotypic, expression and transmission ratio distortion QTL using RAD markers in the Lake Whitefish (Coregonus clupeafor-mis). Molecular Ecology, 22(11), 3036– 3048.
18 | MÉROT eT al.
Gagnaire, P., Pavey, S. A., Normandeau, E., & Bernatchez, L. (2013). The genetic architecture of reproductive isolation during speciation- with- gene- flow in lake whitefish species pairs assessed by RAD sequenc-ing. Evolution, 67(9), 2483– 2497. https://doi.org/10.1111/evo.12075
Garrison, E., Sirén, J., Novak, A. M., Hickey, G., Eizenga, J. M., Dawson, E. T., Jones, W., Garg, S., Markello, C., Lin, M. F., Paten, B., & Durbin, R. (2018). Variation graph toolkit improves read mapping by rep-resenting genetic variation in the reference. Nature Biotechnology, 36(9), 875– 879. https://doi.org/10.1038/nbt.4227
Glasauer, S. M., & Neuhauss, S. C. (2014). Whole- genome duplication in teleost fishes and its evolutionary consequences. Molecular Genetics and Genomics, 289(6), 1045– 1060. https://doi.org/10.1007/s0043 8- 014- 0889- 2
Goel, M., Sun, H., Jiao, W.- B., & Schneeberger, K. (2019). SyRI: finding genomic rearrangements and local sequence differences from whole- genome assemblies. Genome Biology, 20(1), 1– 13. https://doi.org/10.1186/s1305 9- 019- 1911- 0
Goodier, J. L. (2016). Restricting retrotransposons: A review. Mobile DNA, 7(1), 1– 30. https://doi.org/10.1186/s1310 0- 016- 0070- z
Gu, Z., Gu, L., Eils, R., Schlesner, M., & Brors, B. (2014). Circlize implements and enhances circular visualization in R. Bioinformatics, 30(19), 2811– 2812. https://doi.org/10.1093/bioin forma tics/btu393
Hämälä, T., Wafula, E. K., Guiltinan, M. J., Ralph, P. E., dePamphilis, C. W., & Tiffin, P. (2021). Genomic structural variants constrain and facilitate adaptation in natural populations of Theobroma cacao, the chocolate tree. Proceedings of the National Academy of Sciences, 118(35).
Hardie, D. C., & Hebert, P. D. (2003). The nucleotypic effects of cellular DNA content in cartilaginous and ray- finned fishes. Genome, 46(4), 683– 706. https://doi.org/10.1139/g03- 040
Harris, R. S. (2007). Improved pairwise alignment of genomic DNA. The Pennsylvania State University.
Hejase, H. A., Salman- Minkov, A., Campagna, L., Hubisz, M. J., Lovette, I. J., Gronau, I., & Siepel, A. (2020). Genomic islands of differentia-tion in a rapid avian radiation have been driven by recent selective sweeps. Proceedings of the National Academy of Sciences, 117(48), 30554. https://doi.org/10.1073/pnas.20159 87117
Heller, D., & Vingron, M. (2019). SVIM: structural variant identifica-tion using mapped long reads. Bioinformatics, 35(17), 2907– 2915. https://doi.org/10.1093/bioin forma tics/btz041
Heller, D., & Vingron, M. (2020). SVIM- asm: Structural variant detection from haploid and diploid genome assemblies. Bioinformatics, 36(22– 23), 5519– 5521.
Henderson, E. C., & Brelsford, A. (2020). Genomic differentiation across the speciation continuum in three hummingbird species pairs. BMC Evolutionary Biology, 20(1), 1– 11. https://doi.org/10.1186/s1286 2- 020- 01674 - 9
Hickey, G., Heller, D., Monlong, J., Sibbesen, J. A., Sirén, J., Eizenga, J., Dawson, E. T., Garrison, E., Novak, A. M., & Paten, B. (2020). Genotyping structural variants in pangenome graphs using the vg toolkit. Genome Biology, 21(1), 1– 17. https://doi.org/10.1186/s1305 9- 020- 1941- 7
Ho, E. K. H., Bellis, E. S., Calkins, J., Adrion, J. R., Latta, L. C. IV, & Schaack, S. (2021). Engines of change: Transposable element mutation rates are high and variable within Daphnia magna. PLOS Genetics, 17(11), e1009827. https://doi.org/10.1371/journ al.pgen.1009827
Ho, S. S., Urban, A. E., & Mills, R. E. (2019). Structural variation in the se-quencing era. Nature Reviews Genetics, 21(3), 171– 189. https://doi.org/10.1038/s4157 6- 019- 0180- 9
Hoffmann, A. A., & Rieseberg, L. H. (2008). Revisiting the impact of in-versions in evolution: From population genetic markers to drivers of adaptive shifts and speciation? Annual Review of Ecology, Evolution, and Systematics, 39, 21– 42. https://doi.org/10.1146/annur ev.ecols ys.39.110707.173532
Huddleston, J., Ranade, S., Malig, M., Antonacci, F., Chaisson, M., Hon, L., Sudmant, P. H., Graves, T. A., Alkan, C., Dennis, M. Y., Wilson, R.
K., Turner, S. W., Korlach, J., & Eichler, E. E. (2014). Reconstructing complex regions of genomes using long- read sequencing technol-ogy. Genome Research, , 24(4), 688– 696. https://doi.org/10.1101/gr.168450.113
Jacobsen, M. W., Hansen, M. M., Orlando, L., Bekkevold, D., Bernatchez, L., Willerslev, E., & Gilbert, M. T. P. (2012). Mitogenome sequencing reveals shallow evolutionary histories and recent divergence time between morphologically and ecologically distinct European white-fish (Coregonus spp.). Molecular Ecology, 21(11), 2727– 2742.
Jain, C., Rhie, A., Zhang, H., Chu, C., Walenz, B. P., Koren, S., & Phillippy, A. M. (2020). Weighted minimizer sampling improves long read mapping. Bioinformatics, 36(Suppl_1), i111– i118. https://doi.org/10.1093/bioin forma tics/btaa435
Jiggins, C. D. (2019). Can genomics shed light on the origin of species? PLoS Biology, 17(8), e3000394. https://doi.org/10.1371/journ al.pbio.3000394
Kirkpatrick, M., & Barton, N. (2006). Chromosome inversions, local ad-aptation and speciation. Genetics, 173(1), 419– 434. https://doi.org/10.1534/genet ics.105.047985
Kirsche, M., Prabhu, G., Sherman, R., Ni, B., Aganezov, S., & Schatz, M. C. (2021). Jasmine: Population- scale structural variant comparison and analysis. BioRxiv.
Kolmogorov, M., Yuan, J., Lin, Y., & Pevzner, P. A. (2019). Assembly of long, error- prone reads using repeat graphs. Nature Biotechnology, 37(5), 540– 546. https://doi.org/10.1038/s4158 7- 019- 0072- 8
Korneliussen, T. S., Albrechtsen, A., & Nielsen, R. (2014). ANGSD: anal-ysis of next generation sequencing data. BMC Bioinformatics, 15(1), 356. https://doi.org/10.1186/s1285 9- 014- 0356- 4
Landis, J. B., Soltis, D. E., Li, Z., Marx, H. E., Barker, M. S., Tank, D. C., & Soltis, P. S. (2018). Impact of whole- genome duplication events on diversification rates in angiosperms. American Journal of Botany, 105(3), 348– 363. https://doi.org/10.1002/ajb2.1060
Landry, L., Vincent, W., & Bernatchez, L. (2007). Parallel evolution of lake whitefish dwarf ecotypes in association with limnological features of their adaptive landscape. Journal of Evolutionary Biology, 20(3), 971– 984. https://doi.org/10.1111/j.1420- 9101.2007.01304.x
Laporte, M., Dalziel, A. C., Martin, N., & Bernatchez, L. (2016). Adaptation and acclimation of traits associated with swimming ca-pacity in Lake Whitefish (Coregonus clupeaformis) ecotypes. BMC Evolutionary Biology, 16(1), 1– 13. https://doi.org/10.1186/s1286 2- 016- 0732- y
Laporte, M., Le Luyer, J., Rougeux, C., Dion- Côté, A.- M., Krick, M., & Bernatchez, L. (2019). DNA methylation reprogramming, TE dere-pression, and postzygotic isolation of nascent animal species. Science. Advances, 5(10), eaaw1644. https://doi.org/10.1126/sciadv.aaw1644
Laporte, M., Rogers, S. M., Dion- Côté, A.- M., Normandeau, E., Gagnaire, P.- A., Dalziel, A. C., & Bernatchez, L. (2015). RAD- QTL mapping reveals both genome- level parallelism and different genetic ar-chitecture underlying the evolution of body shape in lake white-fish (Coregonus clupeaformis) species pairs. G3: Genes, Genomes, Genetics, 5(7), 1481– 1491.
Layer, R. M., Chiang, C., Quinlan, A. R., & Hall, I. M. (2014). LUMPY: A probabilistic framework for structural variant discovery. Genome Biology, 15(6), R84. https://doi.org/10.1186/gb- 2014- 15- 6- r84
Legendre, P., & Legendre, L. F. (2012). Numerical ecology, Vol. 24. Elsevier.Lemay, M.- A., Sibbesen, J. A., Torkamaneh, D., Hamel, J., Levesque, R. C.,
& Belzile, F. (2021). Combined use of Oxford Nanopore and Illumina sequencing yields insights into soybean structural variation biol-ogy. BioRxiv.
Li, H. (2018). Minimap2: Pairwise alignment for nucleotide sequences. Bioinformatics, 34(18), 3094– 3100. https://doi.org/10.1093/bioin forma tics/bty191
Li, H., & Durbin, R. (2009). Fast and accurate short read alignment with Burrows- Wheeler transform. Bioinformatics, 25(14), 1754– 1760. https://doi.org/10.1093/bioin forma tics/btp324
| 19MÉROT eT al.
Li, H., Feng, X., & Chu, C. (2020). The design and construction of ref-erence pangenome graphs with minigraph. Genome Biology, 21(1), 1– 19. https://doi.org/10.1186/s1305 9- 020- 02168 - z
Li, H., Handsaker, B., Wysoker, A., Fennell, T., Ruan, J., Homer, N., Marth, G., Abecasis, G., & Durbin, R. (2009). The sequence alignment/map format and SAMtools. Bioinformatics, 25(16), 2078– 2079. https://doi.org/10.1093/bioin forma tics/btp352
Lien, S., Koop, B. F., Sandve, S. R., Miller, J. R., Kent, M. P., Nome, T., & Zimin, A. (2016). The Atlantic salmon genome provides insights into rediploidization. Nature, 533(7602), 200– 205.
Limborg, M. T., McKinney, G. J., Seeb, L. W., & Seeb, J. E. (2016). Recombination patterns reveal information about centromere loca-tion on linkage maps. Molecular Ecology Resources, 16(3), 655– 661. https://doi.org/10.1111/1755- 0998.12484
Lockwood, S. F., Seavey, B. T., Dillinger, R. E. Jr, & Bickham, J. W. (1991). Variation in DNA content among age classes of broad whitefish (Coregonus nasus) from the Sagavanirktok River delta. Canadian Journal of Zoology, 69(5), 1335– 1338.
Logsdon, G. A., Vollger, M. R., & Eichler, E. E. (2020). Long- read human genome sequencing and its applications. Nature Reviews Genetics, 21(10), 597– 614. https://doi.org/10.1038/s4157 6- 020- 0236- x
Lou, R. N., Jacobs, A., Wilder, A., & Therkildsen, N. O. (2020). A begin-ner’s guide to low- coverage whole genome sequencing for popula-tion genomics. Molecular Ecology 30, 5966– 5993.
Lu, G., & Bernatchez, L. (1999). Correlated trophic specialization and ge-netic divergence in sympatric lake whitefish ecotypes (Coregonus clupeaformis): Support for the ecological speciation hypothesis. Evolution, 53(5), 1491– 1505.
Macqueen, D. J., & Johnston, I. A. (2014). A well- constrained estimate for the timing of the salmonid whole genome duplication reveals major decoupling from species diversification. Proceedings of the Royal Society B: Biological Sciences, 281(1778), 20132881. https://doi.org/10.1098/rspb.2013.2881
Mahmoud, M., Gobet, N., Cruz- Dávalos, D. I., Mounier, N., Dessimoz, C., & Sedlazeck, F. J. (2019). Structural variant calling: The long and the short of it. Genome Biology, 20(1), 246. https://doi.org/10.1186/s1305 9- 019- 1828- 7
Marçais, G., Delcher, A. L., Phillippy, A. M., Coston, R., Salzberg, S. L., & Zimin, A. (2018). MUMmer4: A fast and versatile genome alignment system. PLoS Computational Biology, 14(1), e1005944. https://doi.org/10.1371/journ al.pcbi.1005944
Marques, D. A., Lucek, K., Meier, J. I., Mwaiko, S., Wagner, C. E., Excoffier, L., & Seehausen, O. (2016). Genomics of rapid incipient speciation in sympatric threespine stickleback. PLoS Genetics, 12(2), e1005887. https://doi.org/10.1371/journ al.pgen.1005887
Martin, S. H., Davey, J. W., Salazar, C., & Jiggins, C. D. (2019). Recombination rate variation shapes barriers to introgression across butterfly genomes. PLoS Biology, 17(2), e2006288. https://doi.org/10.1371/journ al.pbio.2006288
McKenna, A., Hanna, M., Banks, E., Sivachenko, A., Cibulskis, K., Kernytsky, A., Garimella, K., Altshuler, D., Gabriel, S., Daly, M., & DePristo, M. A. (2010). The Genome Analysis Toolkit: A MapReduce framework for analyzing next- generation DNA sequencing data. Genome Research, 20(9), 1297– 1303. https://doi.org/10.1101/gr.107524.110
Meier, J. I., Marques, D. A., Wagner, C. E., Excoffier, L., & Seehausen, O. (2018). Genomics of parallel ecological speciation in Lake Victoria cichlids. Molecular Biology and Evolution, 35(6), 1489– 1506. https://doi.org/10.1093/molbe v/msy051
Meisner, J., & Albrechtsen, A. (2018). Inferring population structure and admixture proportions in low- depth NGS data. Genetics, 210(2), 719– 731. https://doi.org/10.1534/genet ics.118.301336
Mérot, C., Oomen, R. A., Tigano, A., & Wellenreuther, M. (2020). A road-map for understanding the evolutionary significance of structural genomic variation. Trends in Ecology & Evolution, 35(7), 561– 572. https://doi.org/10.1016/j.tree.2020.03.002
Morales, H. E., Faria, R., Johannesson, K., Larsson, T., Panova, M., Westram, A. M., & Butlin, R. K. (2019). Genomic architecture of parallel ecological divergence: Beyond a single environmental con-trast. Science Advances, 5(12), eaav9963. https://doi.org/10.1126/sciadv.aav9963
Nadeau, N. J., & Kawakami, T. (2019). Population genomics of speciation and admixture. In O. P. Rajora (Ed.), Population genomics: Concepts, approaches and applications (pp. 613– 653). Springer International Publishing.
Noor, M. A., Grams, K. L., Bertucci, L. A., Almendarez, Y., Reiland, J., & Smith, K. R. (2001). The genetics of reproductive isolation and the potential for gene exchange between Drosophila pseudoobscura and D. persimilis via backcross hybrid males. Evolution, 55(3), 512– 521.
Ou, S., & Jiang, N. (2019). LTR_FINDER_parallel: Parallelization of LTR_FINDER enabling rapid identification of long terminal repeat ret-rotransposons. Mobile DNA, 10(1), 1– 3. https://doi.org/10.1186/s1310 0- 019- 0193- 0
Phillips, R. B., Reed, K. M., & Ráb, P. (1996). Revised karyotypes and chro-mosome banding of coregonid fishes from the Laurentian Great Lakes. Canadian Journal of Zoology, 74(2), 323– 329. https://doi.org/10.1139/z96- 040
Rastas, P. (2017). Lep- MAP3: Robust linkage mapping even for low- coverage whole genome sequencing data. Bioinformatics, 33(23), 3726– 3732. https://doi.org/10.1093/bioin forma tics/btx494
Rausch, T., Zichner, T., Schlattl, A., Stütz, A. M., Benes, V., & Korbel, J. O. (2012). DELLY: structural variant discovery by integrated paired- end and split- read analysis. Bioinformatics, 28(18), i333– i339. https://doi.org/10.1093/bioin forma tics/bts378
Ravinet, M., Faria, R., Butlin, R. K., Galindo, J., Bierne, N., Rafajlović, M., Noor, M. A. F., Mehlig, B., & Westram, A. M. (2017). Interpreting the genomic landscape of speciation: A road map for finding barriers to gene flow. Journal of Evolutionary Biology, 30(8), 1450– 1477. https://doi.org/10.1111/jeb.13047
Renaut, S., & Bernatchez, L. (2011). Transcriptome- wide signature of hy-brid breakdown associated with intrinsic reproductive isolation in lake whitefish species pairs (Coregonus spp. Salmonidae). Heredity, 106(6), 1003– 1011. https://doi.org/10.1038/hdy.2010.149
Renaut, S., Nolte, A., & Bernatchez, L. (2009). Transcriptomic investiga-tion of post- zygotic isolation in lake whitefish (Coregonus clupeafor-mis). Molecular Biology and Evolution, 26, 925– 936.
Rogers, S., & Bernatchez, L. (2006). The genetic basis of intrinsic and extrinsic post- zygotic reproductive isolation jointly promoting spe-ciation in the lake whitefish species complex (Coregonus clupeafor-mis). Journal of Evolutionary Biology, 19(6), 1979– 1994. https://doi.org/10.1111/j.1420- 9101.2006.01150.x
Rogers, S., & Bernatchez, L. (2007). The genetic architecture of ecolog-ical speciation and the association with signatures of selection in natural lake whitefish (Coregonus sp. Salmonidae) species pairs. Molecular Biology and Evolution, 24(6), 1423– 1438. https://doi.org/10.1093/molbe v/msm066
Rogers, S. M., Gagnon, V., & Bernatchez, L. (2002). Genetically based phenotype- environment association for swimming behavior in lake whitefish ecotypes (Coregonus clupeaformis Mitchill). Evolution, 56(11), 2322– 2329. https://doi.org/10.1111/j.0014- 3820.2002.tb001 55.x
Rogers, S. M., Isabel, N., & Bernatchez, L. (2007). Linkage maps of the dwarf and normal lake whitefish (Coregonus clupeaformis) species complex and their hybrids reveal the genetic architecture of popu-lation divergence. Genetics, 175(1), 375– 398.
Rougeux, C., Bernatchez, L., & Gagnaire, P.- A. (2017). Modeling the multiple facets of speciation- with- gene- flow toward inferring the divergence history of lake whitefish species pairs (Coregonus clu-peaformis). Genome Biology and Evolution, 9(8), 2057– 2074. https://doi.org/10.1093/gbe/evx150
Rougeux, C., Gagnaire, P.- A., Praebel, K., Seehausen, O., & Bernatchez, L. (2019). Polygenic selection drives the evolution of convergent
20 | MÉROT eT al.
transcriptomic landscapes across continents within a Nearctic sis-ter species complex. Molecular Ecology, 28(19), 4388– 4403. https://doi.org/10.1111/mec.15226
Scannell, D. R., Byrne, K. P., Gordon, J. L., Wong, S., & Wolfe, K. H. (2006). Multiple rounds of speciation associated with reciprocal gene loss in polyploid yeasts. Nature, 440(7082), 341– 345.
Sedlazeck, F. J., Rescheneder, P., Smolka, M., Fang, H., Nattestad, M., Von Haeseler, A., & Schatz, M. C. (2018). Accurate detection of complex structural variations using single- molecule sequencing. Nature Methods, 15(6), 461– 468. https://doi.org/10.1038/s4159 2- 018- 0001- 7
Seehausen, O., Butlin, R. K., Keller, I., Wagner, C. E., Boughman, J. W., Hohenlohe, P. A., Peichel, C. L., Saetre, G.- P., Bank, C., Brännström, Å., Brelsford, A., Clarkson, C. S., Eroukhmanoff, F., Feder, J. L., Fischer, M. C., Foote, A. D., Franchini, P., Jiggins, C. D., Jones, F. C., … Widmer, A. (2014). Genomics and the origin of species. Nature Reviews Genetics, 15(3), 176– 192. https://doi.org/10.1038/nrg3644
Serrato- Capuchina, A., & Matute, D. R. (2018). The role of transposable elements in speciation. Genes, 9(5), 254. https://doi.org/10.3390/genes 9050254
Sirén, J., Monlong, J., Chang, X., Novak, A. M., Eizenga, J. M., Markello, C., & Carroll, A. (2020). Genotyping common, large structural varia-tions in 5,202 genomes using pangenomes, the Giraffe mapper, and the vg toolkit. BioRxiv.
Smith, S. R., Normandeau, E., Djambazian, H., Nawarathna, P. M., Berube, P., Muir, A. M., & Luikart, G. (2021). A chromosome- anchored ge-nome assembly for Lake Trout (Salvelinus namaycush). Molecular Ecology Resources, 22(2), 679– 694.
Soderlund, C., Bomhoff, M., & Nelson, W. M. (2011). SyMAP v3. 4: A turnkey synteny system with application to plant genomes. Nucleic Acids Research, 39(10), e68.
Stevison, L. S., & McGaugh, S. E. (2020). It’s time to stop sweeping re-combination rate under the genome scan rug. Molecular Ecology, 29(22), 4249– 4253. https://doi.org/10.1111/mec.15690
Sutherland, B. J. G., Gosselin, T., Normandeau, E., Lamothe, M., Isabel, N., Audet, C., & Bernatchez, L. (2016). Salmonid chromosome evo-lution as revealed by a novel method for comparing RADseq linkage maps. Genome Biology and Evolution, 8(12), 3600– 3617. https://doi.org/10.1093/gbe/evw262
Tham, C. Y., Tirado- Magallanes, R., Goh, Y., Fullwood, M. J., Koh, B. T. H., Wang, W., Ng, C. H., Chng, W. J., Thiery, A., Tenen, D. G., & Benoukraf, T. (2020). NanoVar: Accurate characterization of pa-tients’ genomic structural variants using low- depth nanopore se-quencing. Genome Biology, 21(1), 1– 15. https://doi.org/10.1186/s1305 9- 020- 01968 - 7
Ting, C.- T., Tsaur, S.- C., Sun, S., Browne, W. E., Chen, Y.- C., Patel, N. H., & Wu, C.- I. (2004). Gene duplication and speciation in Drosophila: Evidence from the Odysseus locus. Proceedings of the National Academy of Sciences, 101(33), 12232– 12235.
Todesco, M., Owens, G. L., Bercovich, N., Légaré, J.- S., Soudi, S., Burge, D. O., & Imerovski, I. (2020). Massive haplotypes underlie ecotypic differentiation in sunflowers. Nature, 584(7822), 602– 607.
Walker, B. J., Abeel, T., Shea, T., Priest, M., Abouelliel, A., Sakthikumar, S., Cuomo, C. A., Zeng, Q., Wortman, J., Young, S. K., & Earl, A. M. (2014). Pilon: An integrated tool for comprehensive microbial vari-ant detection and genome assembly improvement. PLoS One, 9(11), e112963. https://doi.org/10.1371/journ al.pone.0112963
Waples, R. K., Seeb, L. W., & Seeb, J. E. (2016). Linkage mapping with pa-ralogs exposes regions of residual tetrasomic inheritance in chum salmon (Oncorhynchus keta). Molecular Ecology Resources, 16(1), 17– 28.
Weissensteiner, M. H., Bunikis, I., Catalán, A., Francoijs, K.- J., Knief, U., Heim, W., Peona, V., Pophaly, S. D., Sedlazeck, F. J., Suh, A., Warmuth, V. M., & Wolf, J. B. W. (2020). Discovery and population genomics of structural variation in a songbird genus. Nature Communications, 11(1), 1– 11. https://doi.org/10.1038/s4146 7- 020- 17195 - 4
Wellenreuther, M., & Bernatchez, L. (2018). Eco- evolutionary genom-ics of chromosomal inversions. Trends in Ecology & Evolution, 33(6), 427– 440. https://doi.org/10.1016/j.tree.2018.04.002
Wolf, J. B., & Ellegren, H. (2017). Making sense of genomic islands of differentiation in light of speciation. Nature Reviews Genetics, 18(2), 87– 100. https://doi.org/10.1038/nrg.2016.133
SUPPORTING INFORMATIONAdditional supporting information may be found in the online version of the article at the publisher’s website.
How to cite this article: Mérot, C., Stenløkk, K. S. R., Venney, C., Laporte, M., Moser, M., Normandeau, E., Árnyasi, M., Kent, M., Rougeux, C., Flynn, J. M., Lien, S., & Bernatchez, L. (2022). Genome assembly, structural variants, and genetic differentiation between lake whitefish young species pairs (Coregonus sp.) with long and short reads. Molecular Ecology, 00, 1– 20. https://doi.org/10.1111/mec.16468