genetic insights into fatty acid components of traditional indian
TRANSCRIPT
Indian J. Genet., 79(4) 651-657 (2019)
DOI: 10.31742/IJGPB.79.4.2
*Corresponding author’s e-mail: [email protected] by the Indian Society of Genetics & Plant Breeding, A-Block, F2, First Floor, NASC Complex, IARI P.O., Pusa Campus, NewDelhi 110 012; Online management by www.isgpb.org; indianjournals.com
Genetic insights into fatty acid components of traditional Indian rice
(Oryza sativa L.) landraces from Chhattisgarh
Parmeshwar K. Sahu, Suvendu Mondal1, Deepak Sharma*, Richa Sao, Vikash Kumar
1 and Bikram K. Das
1
Department of Genetics and Plant Breeding, Indira Gandhi Krishi Vishwavidyalaya, Raipur 492 012; Chhattisgarh;1Nuclear Agriculture and Biotechnology Division, Bhabha Atomic Research Centre, Mumbai 400 085
(Received: July 2019; Revised: October 2019; Accepted: November 2019)
components mainly in the bran portion. Amount of
vitamin-B complexes such as niacin, riboflavin, and
thiamin has been also reported in rice bran.
Attentiveness on health benefits and nutritive value
and of rice is essential to increase the intake of rice in
the daily diet of human beings (Fresco 2005).
Nowadays, rice bran and its oil have been getting
special attention to use as a functional food due to
their nutritional properties viz., phenolic compounds,
beneficial fatty acids, vitamins, minerals and fibers
(Wilson et al. 2002). Rice bran is the outer aleuron
layer of the rice kernel which can be separated during
milling/ whitening of brown rice and accounted
approximately 10% of the weight of rice grain
(Rondanelli et al. 2011). Bran portion has ample amount
of antioxidants viz., tocopherols, tocotrienols, and ã-
oryzanol and phenolic compounds, which help to
reduce LDL cholesterol, protect cardiovascular
diseases and possess anticancer effects (Min et al.
2011).
Looking into the significance of bran oil, the
characterization of rice landraces for FA composition
may have great importance for future breeding
programs. Despite abundant genetic resources
available, breeders have utilized only limited rice
germplasm for the improvement of fatty acid
components, which cause their narrowed genetic base
in improved varieties and advance breeding materials.
Therefore, a study was conducted to characterize 215
rice landraces through genetic analysis based on fatty
acid composition in the bran fraction. It is expected
that the information obtained would help assure an
effective breeding program for developing rice varieties
Abstract
Knowledge about the contents and type of fatty acids (FAs)
in rice bran is beneficial, particularly from a nutritional and
health standpoint. An experiment was conducted to assess
the genetic variability and diversity for FA components in
215 rice landraces during kharif 2015 and kharif 2016 by
following the RCB design with two replications. Palmitic
(C16:0), oleic (C18:1) and linoleic (C18:2) were the major
fatty acids ranging from 12.59% to 20.25%, 37.60% to 49.17%
and 31.55% to 44.67%, respectively. Analysis of variance
revealed significant differences in all the FA components
except for linolenic acid. Results showed that environmental
factors play a significant impact on the expression of FA
contents. Fatty acid components showed intermediate to
low genotypic and phenotypic coefficient of variation,
intermediate to high heritability and low to moderate genetic
advance as percent of the mean. Oleic acid content was
negatively correlated with palmitic acid, stearic acid, and
linoleic acid contents. Principal component analysis and
cluster analysis discriminated the 215 rice landraces into
five main groups with a major contribution of oleic acid,
linoleic acid, and palmitic acid contents. Landraces
Kadamphool, Ratanchudi and Bathrash possessed the
highest amount of oleic acid/linoleic acid ratio. Information
generated through this study will be functionally useful in
developing rice varieties having high-quality bran oil.
Keywords: Bran oil, fatty acids, genetic variation,
landraces, rice
Introduction
Rice (Oryza sativa L.) is the major crop for the global
food and nutritional security and socio-economic
development, therefore, its production potentials have
to be enhanced significantly to feed the burgeoning
population along with good nutritional quality traits (FAO
2017). Carbohydrate is the major component of rice,
however, it has a reasonable amount of protein and oil

652 Parmeshwar K. Sahu et al. [Vol. 79, No. 4
having ample amount of desirable fatty acids.
Materials and methods
The experimental material comprises 213 traditional
landraces and two improved rice varieties (Mahamaya
and Rajeshwari as control) from Chhattisgarh state,
India (Supplementary Table S1). All the genotypes
were procured from R.H. Richharia Rice Biodiversity
unit of the Indira Gandhi Krishi Vishwavidyalaya
(IGKV), Raipur for research purpose. All 215 genotypes
were grown at the rice research field of IGKV, Raipur
for two years viz., kharif 2015 and kharif 2016 by
following the randomized complete block design
(RCBD) with two replications. Agronomic management
practices were performed as per the standard
evaluation system of IRRI, Philippines (IRRI 2002).
Genotypes were harvested separately, cleaned
properly, dried up to 12-14% moisture content and kept
at room temperature for further utilization.
Extraction of bran, sample processing andestimation of fatty acid components
Hulling and milling process of each rice genotype was
done by using a McGill No. 2 Huller & Miller (Rapsilver
Supply Co. Inc., Brookshire, TX) at R.H. Richharia
Rice Research Laboratory, Department of Genetics
and Plant Breeding, IGKV, Raipur (C.G.), India. Bran
of each sample of brown rice (decorticated rice) was
collected into a small stripped polythene bag and
labeled. Rice bran of each genotype was kept
immediately at 4oC to avoid the harmful activities of
lipase enzyme. Fatty acid estimation was done by
the base-catalyzed trans-esterification method (Mondal
et al. 2018) in Gas Chromatography (Shimadzu, Kyoto,
Japan) at Nuclear Agriculture and Biotechnology
Division (NA&BTD), Bhabha Atomic Research Centre
(BARC), Mumbai, India. About 200 mg of rice bran of
each genotype was taken into a 50 ml glass test tube
in duplicates. One milliliter (1ml) of methanol (AR) and
1ml of 0.5M sodium methoxide (AR) were added in
each tube. All the tubes were shaken thoroughly by
vortex and kept at room temperature for 20 minutes.
Then all the tubes were kept into a water bath at 50°C
for 1 hour. After water bath treatment, tubes were kept
for 10 min at room temperature for cooling. Thereafter,
2 ml of HPLC grade petroleum ether (boiling point =
60-80 ºC) and 2 ml of de-ionized water was poured in
each tube and vortexed for 1 min. Then tubes were
kept at room temperature for 30 min to allow the phase
separation. The upper petroleum ether phase was
extracted from each tube by using 1ml micro-pipette
and transferred them into 1.8 ml clear GC vials. Gas
chromatography (GC2010, Shimadzu, Japan)
technique was used to analyze the processed samples
and the final concentration of fatty acid components
were obtained from GC SOLUTION software
(Shimadzu, Japan) after normalization of peak areas
and the recorded data were converted into a percentage
value.
Statistical analysis
Proportional contents of fatty acids were transformed
by ArcSine transformation as per the method
suggested by Sokal and Rohlf (1995) to normalize the
dataset for further analysis. Descriptive statistics, box
plots, and histogram were made by using XLSTAT
v18.07 (Addinsoft, NY, USA). Analysis of variance
(ANOVA), genetic parameters of variability and
genotypic correlation coefficients were calculated by
software WINDOSTAT v9.3. Principal component
analysis (PCA) based on the covariance matrix and
agglomerative hierarchical cluster (AHC) analysis by
following the Euclidean distance and Ward’s algorithm
was performed in PAST v3.15 software (Hammer et
al. 2001).
Results
Gas chromatography (GC) analysis of rice bran oil
revealed five fatty acid components viz., oleic (C18:1),
linoleic (C18:2), palmitic (C16:0), stearic (C18:0), and
linolenic acid (C18:3). Analysis of variance (ANOVA)
reported high significant differences for palmitic,
stearic, oleic and linoleic acid during the year 2015,
2016 and over the year analysis, but they are non-
significant for linolenic acid in all the conditions (Table
1). ANOVA over the year showed highly significant
effects of the year for all the fatty acid components.
Genotype x year interaction was significant for fatty
acid components apart from for linolenic acid in rice
landraces.
Genetic analysis of fatty acid contents
Since fatty acid components are very sensitive to
environmental conditions therefore over the year
(pooled data) analysis is more appropriate for
describing the descriptive statistics, variability
parameters, correlations and diversity parameters in
the study. Pooled data may reduce the chances of
error and combine the overall effect of environmental
conditions. Palmitic acid ranged from 12.59% (Khajoor)
to 20.25% (Lajini Super) with an average of 17.54%
November, 2019] Fatty acid variations in rice landraces from Chhattisgarh, India 653
(±1.29%). Stearic acid ranged from 1.01% (Memri
Khedi) to 2.90% (Baiga Seeng) with an average 1.80%
(±0.29%). A total of 25 genotypes had more than 46%
oleic acid content and ranged from 37.60% (Antarved)
to 49.17% (Kadamphool) with an average of 43.90%
(±1.79%). Linoleic acid content ranged from 31.55%
(Ratanchudi) to 44.67% (Antarved) with an average of
35.56% (±1.83%) and a total of 16 genotypes had
more than 38% linoleic acid content. While linolenic
acid content ranged from 0.75% (Khajoor) to 2.0%
(Dadbanko) with average 1.19% (±0.18%) (Table 2).
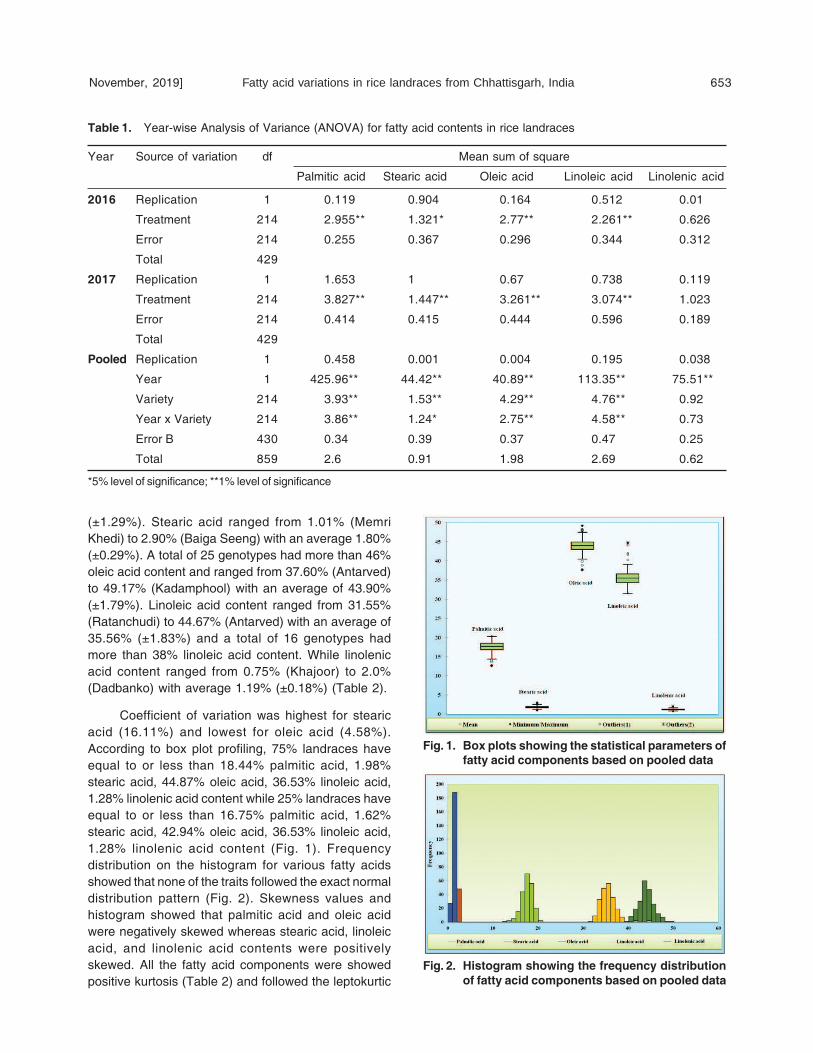
Coefficient of variation was highest for stearic
acid (16.11%) and lowest for oleic acid (4.58%).
According to box plot profiling, 75% landraces have
equal to or less than 18.44% palmitic acid, 1.98%
stearic acid, 44.87% oleic acid, 36.53% linoleic acid,
1.28% linolenic acid content while 25% landraces have
equal to or less than 16.75% palmitic acid, 1.62%
stearic acid, 42.94% oleic acid, 36.53% linoleic acid,
1.28% linolenic acid content (Fig. 1). Frequency
distribution on the histogram for various fatty acids
showed that none of the traits followed the exact normal
distribution pattern (Fig. 2). Skewness values and
histogram showed that palmitic acid and oleic acid
were negatively skewed whereas stearic acid, linoleic
acid, and linolenic acid contents were positively
skewed. All the fatty acid components were showed
positive kurtosis (Table 2) and followed the leptokurtic
Table 1. Year-wise Analysis of Variance (ANOVA) for fatty acid contents in rice landraces
Year Source of variation df Mean sum of square
Palmitic acid Stearic acid Oleic acid Linoleic acid Linolenic acid
2016 Replication 1 0.119 0.904 0.164 0.512 0.01
Treatment 214 2.955** 1.321* 2.77** 2.261** 0.626
Error 214 0.255 0.367 0.296 0.344 0.312
Total 429
2017 Replication 1 1.653 1 0.67 0.738 0.119
Treatment 214 3.827** 1.447** 3.261** 3.074** 1.023
Error 214 0.414 0.415 0.444 0.596 0.189
Total 429
Pooled Replication 1 0.458 0.001 0.004 0.195 0.038
Year 1 425.96** 44.42** 40.89** 113.35** 75.51**
Variety 214 3.93** 1.53** 4.29** 4.76** 0.92
Year x Variety 214 3.86** 1.24* 2.75** 4.58** 0.73
Error B 430 0.34 0.39 0.37 0.47 0.25
Total 859 2.6 0.91 1.98 2.69 0.62
*5% level of significance; **1% level of significance
Fig. 1. Box plots showing the statistical parameters of
fatty acid components based on pooled data
Fig. 2. Histogram showing the frequency distribution
of fatty acid components based on pooled data

654 Parmeshwar K. Sahu et al. [Vol. 79, No. 4
configurations. None of the traits showed mesokurtic
and platykurtic configuration.
Genotypic coefficient of variations (GCV) was
slightly lower than the corresponding phenotypic
coefficient of variation (PCV) for oleic acid, palmitic
acid, and linoleic acid content. Linolenic acid and
stearic acid showed intermediate PCV with low GCV
whereas Linoleic acid, oleic acid, and palmitic acid
contents showed low GCV and PCV (Table 2). High
heritability was expressed by oleic acid, palmitic acid,
and linoleic acid content. The highest heritability
exhibited for oleic acid content whereas moderate
genetic advance as percent of the mean was observed
for stearic acid, palmitic acid, and linolenic acid
content.
Genetic correlations and diversity analysis for fattyacid components
The correlation coefficients in all possible combination
of five fatty acids showed that Palmitic acid was
positively correlated with linolenic acid (r = 0.21;
P<0.01), while it is negatively correlated with oleic
acid content (r = –0.39; P<0.01) and linoleic acid
content (r = –0.29; P<0.05). Stearic acid is significant
negatively correlated with oleic acid (r = –0.12; P<0.05)
and linolenic acid content (r = –0.25; P<0.05). Oleic
acid is significantly negatively correlated with linoleic
acid (r = –0.75; P<0.01). Linoleic acid content is
significant negatively correlated with linolenic acid
content (r = –0.17; P<0.05) (Fig. 3).
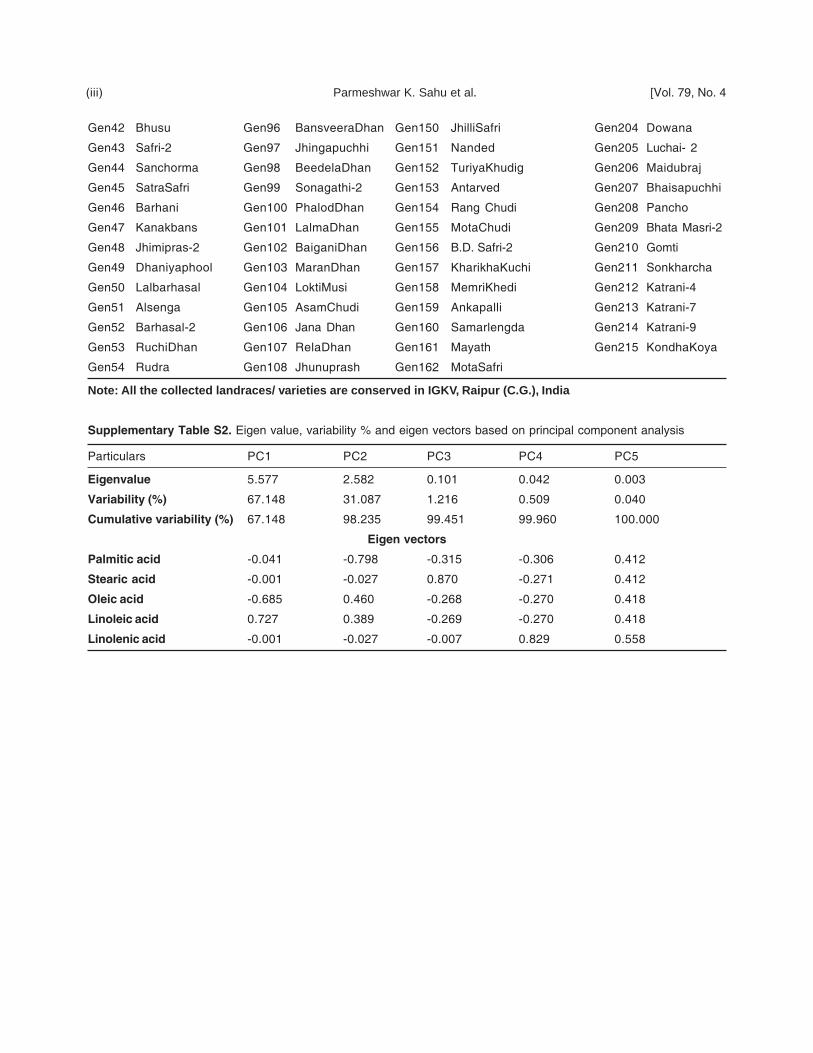
The principal component analysis (PCA) revealed
two major variables, which accounted for 98% of total
variation from all the fatty acids in the tested landraces.
The principal component (PC1) for the first set
contributed about 67.14% with eigenvalue 5.57 and
PC2 for the second set contributed about 31.08% with
eigenvalue 2.58. Rest of the PCs had less than 1
eigenvalue and less than 5% variability
(Supplementary Table S2). The analysis detected that
linoleic acid and oleic acid were the main contributory
traits for PC1 whereas palmitic acid and oleic acid are
the main contributing traits for PC2. Thus, it was
Table 2. Genetic parameters of fatty acid components in rice landraces over the years
Fatty acid contents Palmitic acid Stearic acid Oleic acid Linoleic acid Linolenic acid
Minimum 12.59 % 1.01% 37.60% 31.55% 0.75%
(Khajoor) (Memri Khedi) (Antarved) Ratanchudi (Khajoor)
Maximum 20.25 % 2.9 % (Baiga 49.17% 44.67% 2%
(Lajini Super) Seeng) (Kadamphool) (Antarved) (Dadbanko)
Mean 17.54 1.8 43.9 35.56 1.19
Standard deviation 1.29 0.29 1.79 1.83 0.18
Coefficient of variation 7.35 16.11 4.08 5.15 15.13
Skewness -0.56 0.37 -0.21 1.43 0.83
Kurtosis 0.7 0.95 1.11 4.78 2.47
Phenotypic coefficient of variation 5.90 12.81 3.67 4.41 12.33
Genotypic coefficient of variation 5.41 9.84 3.375 4.00 9.34
Heritability(bs) 84.18 59.08 84.26 82.06 57.35
Genetic advance 2.53 1.19 2.65 2.73 0.90
Genetic advance as % of mean 10.24 15.59 6.38 7.47 14.57
Fig. 3. Genotypic correlation plots among the fatty acid
components (pooled)
November, 2019] Fatty acid variations in rice landraces from Chhattisgarh, India 655
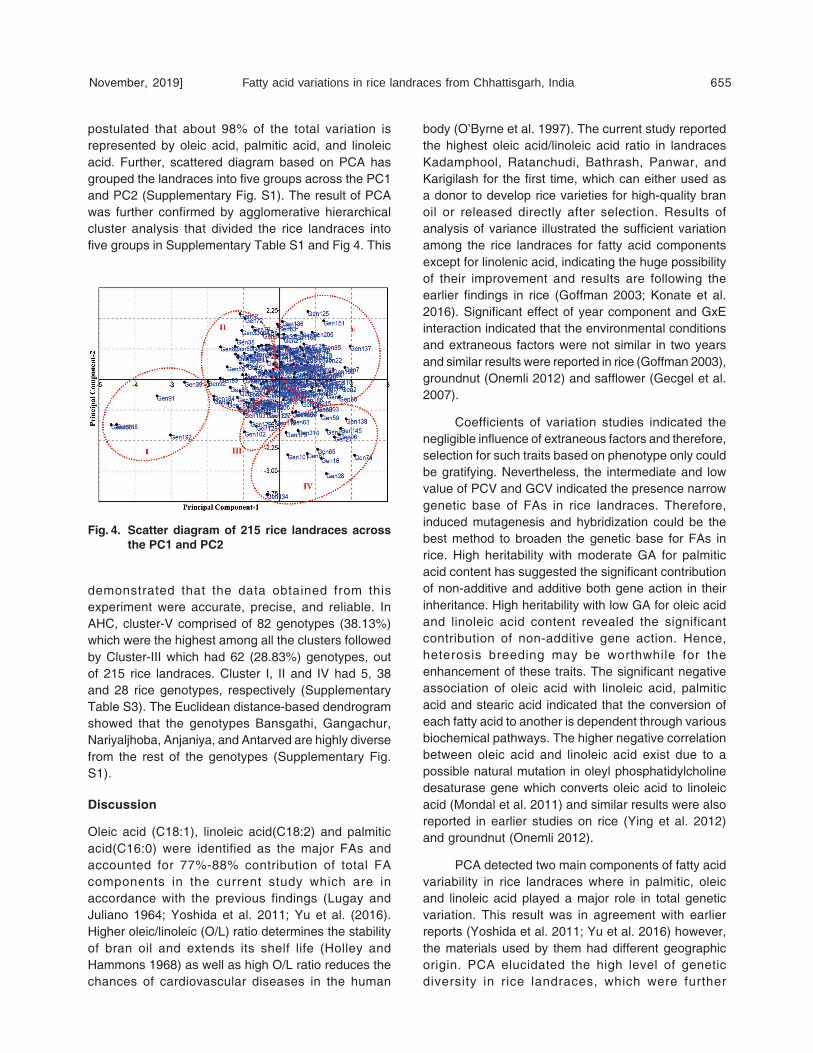
postulated that about 98% of the total variation is
represented by oleic acid, palmitic acid, and linoleic
acid. Further, scattered diagram based on PCA has
grouped the landraces into five groups across the PC1
and PC2 (Supplementary Fig. S1). The result of PCA
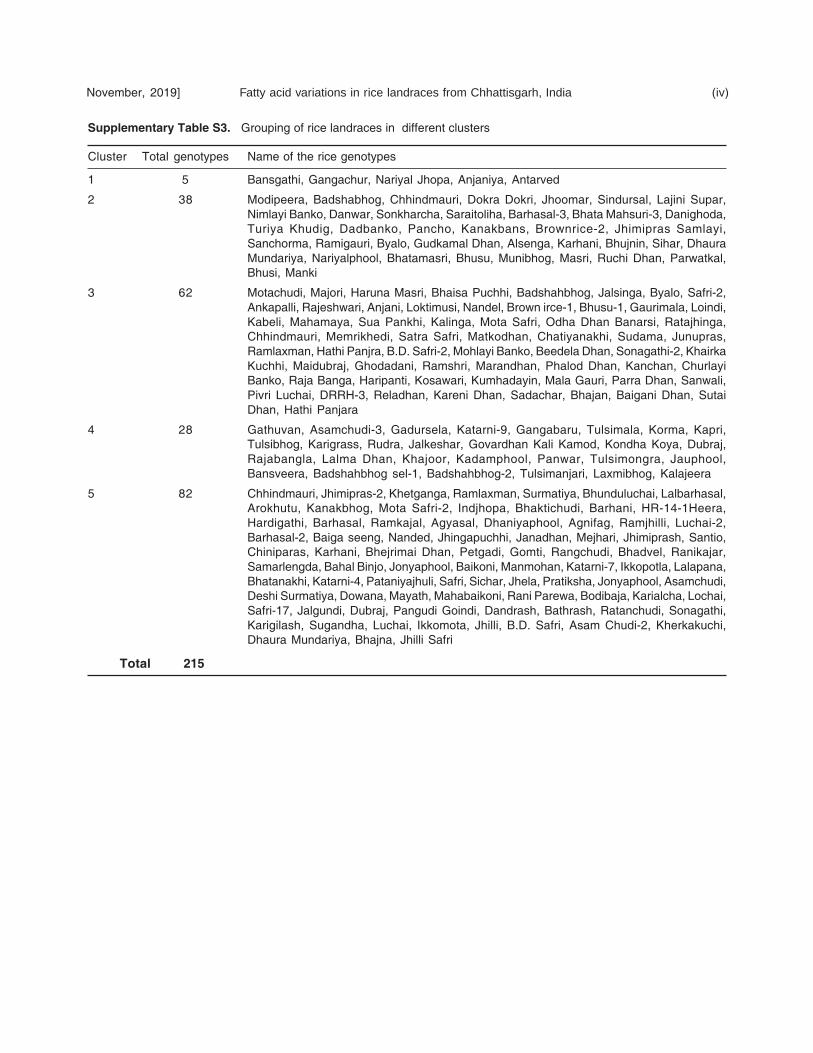
was further confirmed by agglomerative hierarchical
cluster analysis that divided the rice landraces into
five groups in Supplementary Table S1 and Fig 4. This
body (O’Byrne et al. 1997). The current study reported
the highest oleic acid/linoleic acid ratio in landraces
Kadamphool, Ratanchudi, Bathrash, Panwar, and
Karigilash for the first time, which can either used as
a donor to develop rice varieties for high-quality bran
oil or released directly after selection. Results of
analysis of variance illustrated the sufficient variation
among the rice landraces for fatty acid components
except for linolenic acid, indicating the huge possibility
of their improvement and results are following the
earlier findings in rice (Goffman 2003; Konate et al.
2016). Significant effect of year component and GxE
interaction indicated that the environmental conditions
and extraneous factors were not similar in two years
and similar results were reported in rice (Goffman 2003),
groundnut (Onemli 2012) and safflower (Gecgel et al.
2007).
Coefficients of variation studies indicated the
negligible influence of extraneous factors and therefore,
selection for such traits based on phenotype only could
be gratifying. Nevertheless, the intermediate and low
value of PCV and GCV indicated the presence narrow
genetic base of FAs in rice landraces. Therefore,
induced mutagenesis and hybridization could be the
best method to broaden the genetic base for FAs in
rice. High heritability with moderate GA for palmitic
acid content has suggested the significant contribution
of non-additive and additive both gene action in their
inheritance. High heritability with low GA for oleic acid
and linoleic acid content revealed the significant
contribution of non-additive gene action. Hence,
heterosis breeding may be worthwhile for the
enhancement of these traits. The significant negative
association of oleic acid with linoleic acid, palmitic
acid and stearic acid indicated that the conversion of
each fatty acid to another is dependent through various
biochemical pathways. The higher negative correlation
between oleic acid and linoleic acid exist due to a
possible natural mutation in oleyl phosphatidylcholine
desaturase gene which converts oleic acid to linoleic
acid (Mondal et al. 2011) and similar results were also
reported in earlier studies on rice (Ying et al. 2012)
and groundnut (Onemli 2012).
PCA detected two main components of fatty acid
variability in rice landraces where in palmitic, oleic
and linoleic acid played a major role in total genetic
variation. This result was in agreement with earlier
reports (Yoshida et al. 2011; Yu et al. 2016) however,
the materials used by them had different geographic
origin. PCA elucidated the high level of genetic
diversity in rice landraces, which were further
Fig. 4. Scatter diagram of 215 rice landraces across
the PC1 and PC2
demonstrated that the data obtained from this
experiment were accurate, precise, and reliable. In
AHC, cluster-V comprised of 82 genotypes (38.13%)
which were the highest among all the clusters followed
by Cluster-III which had 62 (28.83%) genotypes, out
of 215 rice landraces. Cluster I, II and IV had 5, 38
and 28 rice genotypes, respectively (Supplementary
Table S3). The Euclidean distance-based dendrogram
showed that the genotypes Bansgathi, Gangachur,
Nariyaljhoba, Anjaniya, and Antarved are highly diverse
from the rest of the genotypes (Supplementary Fig.
S1).
Discussion
Oleic acid (C18:1), linoleic acid(C18:2) and palmitic
acid(C16:0) were identified as the major FAs and
accounted for 77%-88% contribution of total FA
components in the current study which are in
accordance with the previous findings (Lugay and
Juliano 1964; Yoshida et al. 2011; Yu et al. (2016).
Higher oleic/linoleic (O/L) ratio determines the stability
of bran oil and extends its shelf life (Holley and
Hammons 1968) as well as high O/L ratio reduces the
chances of cardiovascular diseases in the human
656 Parmeshwar K. Sahu et al. [Vol. 79, No. 4
confirmed by agglomerative hierarchical cluster
analysis. A similar pattern of PCA and AHC was also
reported by Lasalita-Zapico et al. (2010) and Khatun
et al. (2015). The landrace viz., Antarved, Gangachur,
Nariyal Jhoba of cluster-I posses less oleic acid
components as compare to the landraces Kadamphool,
Panwar, Rudra, Kalajeera, which belong to cluster IV
which have higher oleic acid contents. Landraces of
these two clusters were genetically diverse and thus
could be useful in crossbreeding towards the
development of high yielding genotypes with higher
oleic acid content. It can, therefore, be concluded that
the identified landraces viz., Kadamphool, Ratanchudi,
Bathrash, Panwar and Karigilash with good
monounsaturated fatty acids and high O/L ratio as
well as landraces of the diverse group have the
enormous value in breeding program. Further, the
inverse relationship between oleic and linoleic acid
suggested that future targeted mutagenesis in oleyl
phosphatidylcholine desaturase or OsFAD2 which may
be useful in generating higher oleic acid-containing
genotypes in rice. The information, thus obtained,
would be highly supportive in planning an effective
rice-breeding program for developing rice varieties with
a high content of desirable fatty acids for human
welfare.
Authors’ contribution
Conceptualization of research (SM, DS); Designing of
the experiments (SM, VK, BKD); Contribution of
experimental materials (DS, SM, VK, BKD); Execution
of field/lab experiments and data collection (PKS, RS);
Analysis of data and interpretation (PKS, SM, RS);
Preparation of the manuscript (PKS, SM, RS).
Declaration
The authors declare no conflict of interest.
Acknowledgment
The research paper is the part of a Ph.D. program
supported by INSPIRE fellowship awarded to senior
author by the Department of Science and Technology,
GOI, New Delhi. Sincere thanks to Associate Director
(A), Bioscience Group and Head, NA&BTD, Bhabha
Atomic Research Centre, Mumbai for their support and
critical comments.
References
1. FAO. 2017. Rice market monitor. 20(1): 1-38. Data
accessed on 15 May 2017. Available at http://
www.fao.org/fileadmin/templates/est/COMM_
MARKETS_MONITORING/Rice/Images/RMM/
RMM_APR17_H.pdf.
Fresco L. 2005. Rice is life. J. Food Comp. Anal., 18(4):
249-253.
Gecgel U., Demirci M., Esendal E. and Tasan M. 2007.
Fatty acid composition of the oil from developing
seeds of different varieties of safflower (Carthamustinctorius L.). J. American Oil Chemists’ Soc., 84: 47-
54.
Goffman F. D., Pinson S. and Bergman C. 2003. Genetic
diversity for lipid content and fatty acid proûle in rice
bran. J. American Oil Chemists’ Soc., 80(5): 485-
490.
Hammer O., Harper D. A. T. and Ryan P. D. 2001. PAST:
Paleontological Statistics Software Package for
Education and Data Analysis. Palaeontologia Elect.,
4(1): 9.
Holley K.T. and Hammons R.O. 1968. Strain and seasonal
effects on peanut characteristics. Univ. Ga. Coll. Agric.
Exp. Sta. Res. Bull., pp 32.
IRRI. 2002. Standard evaluation system for rice.
International Rice Research Institute, Manila. pp 50.
Khatun M. T., Hanafi M. M., Yusop M. R., Wong M. Y.,
Salleh F. M. and Ferdous J. 2015. Genetic variation,
heritability, and diversity analysis of upland rice
(Oryza sativa L.) genotype based on quantitative
traits. BioMed Res. Int. pp 1-7.
Konate A. K., Zongo A., Kam H., Sanni A. and Audebert A.
2016. Genetic variability and correlation analysis of
rice (Oryza sativa L.) inbred lines based on agro-
morphological traits. African J. Agril. Res., 11(35):
3340-3346.
Lasalita-Zapico F. C., Namocatcat J. A. and Cari-no-Turner
J. L. 2010. Genetic diversity analysis of traditional
upland rice cultivars in Khan, Malapatan, Sarangani
Province, the Philippines using morphometric
markers. Philippine J. Sci., 139(2): 177-180.
Lugay J. C. and Juliano B. O. 1964. Fatty acid composition
of rice lipids by gas-liquid chromatography. J.
American Oil Chemists’ Soc., 41(12): 273-275.
Min B., McClung A. M. and Chen M. H. 2011.
Phytochemicals and antioxidant capacities in rice
brans of a different color. J. Food Sci., 76: C117-126.
Mondal S., Badigannavar A. M. and Dsouza S. F. 2011.
Induced variability for fatty acid profile and molecular
characterization of high oleate mutant in cultivated
groundnut (Arachis hypogaea L.). Plant Breed.,
130(2): 242-247.
Mondal S., Nazareth J., Bhad P. G. and Badigannavar A.
M. 2018. Isolation of high oleate recombinants in
peanut by Near Infra-Red Spectroscopy and
confirmation with allele-specific polymerase chain
reaction marker. J. American Oil Chemists’ Soc., 95:
113-121.
November, 2019] Fatty acid variations in rice landraces from Chhattisgarh, India 657
O’Byrne D. J., Knauft D. A. and Shireman R. B. 1997. Low
fat-monounsaturated rich diets containing high-oleic
peanuts improve serum lipoprotein profiles. Lipids,
32: 687-695.
Onemli F. 2012. Impact of climate change on oil fatty acid
composition of peanut (Arachis hypogaea L.) in three
market classes. Chilean J. Agril. Res., 72(4): 483-
488.
Rondanelli M., Perna S., Monteferrario F. and Opizzi A.
2011. Update on the therapeutic qualities of the rice
bran in the treatment of dyslipidemia and chemo-
prevention. Recent Prog. Med., 102: 310-313.
Sokal R. R. and Rohlf F. J. 1995. Biometry. Freeman, New
York, pp. 887.
Wilson T. A., Idreis H. M., Taylor C. M. and Nicolosi R. J.
2002. Whole fat rice bran reduces the development
of early aortic atherosclerosis in hyper-
cholesterolemic hamsters compared with wheat bran.
Nutr. Res., 22: 1319-1332.
XLSTAT. 2017. Data Analysis and Statistical Solution for
Microsoft Excel. Addinsoft, NY, USA.
Ying J. Z., Shan J. X., Gao J. P., Zhu M. Z., Shi M. and Lin
H. X. 2012. Identiûcation of quantitative trait loci for
lipid metabolism in rice seeds. Mol. Plant, 5(4): 865-
875.
Yoshida H., Tanigawa T., Kuriyama I., Yoshida N.,
Tomiyama Y. and Mizushima Y. 2011. Variation in
the fatty acid distribution of different acyl lipids in rice
(Oryza sativa L.) Brans. Nutrients, 3: 505-514.
Yu L., Li G., Li M., Xu F., Beta T. and Bao J. 2016. Genotypic
variation in phenolic acids, vitamin E and fatty acids
in whole grain rice. Food Chem., 197: 776-782.

Supplementary Fig. S1. Cluster diagram (dendrogram) for 215 rice landraces based on fatty acid components
based on pooled data
(i) Parmeshwar K. Sahu et al. [Vol. 79, No. 4

Supplementary Table S1. List of rice genotypes used for the investigation
S. No. Name S. No. Name S. No. Name S. No. Name
Gen1 Luchai Gen55 Bhunduluchai Gen109 OdhaDhanBanarsi Gen163 Kalinga
Gen2 Sonagathi Gen56 Barhasal-3 Gen110 B.D. Safri Gen164 Bhusu
Gen3 Kherkakuchi Gen57 Khetganga Gen111 Lochai Gen165 Kabeli
Gen4 Dadbanko Gen58 Bashabhog Gen112 GadurSela Gen166 Gatuvan
Gen5 Danighoda Gen59 Tulsibhog Gen113 KareniDhan Gen167 Baikoni
Gen6 Anjani Gen60 Nariyalphool Gen114 PivriLochai Gen168 ChinniParas
Gen7 Bathrash Gen61 Badshabhog-2 Gen115 Govardhan Kali Kamod 2 Gen169 Jalsinga
Gen8 Saraitoliha Gen62 Lajini Super Gen116 Loindi Gen170 Agni Fag
Gen9 Jonyaphool Gen63 Gangabaru Gen117 Santio Gen171 Lalapana
Gen10 Pratiksha Gen64 GudkamalDhan Gen118 Parra Dhan Gen172 BahalBinjo
Gen11 Bhadvel Gen65 TulsiManjari Gen119 Godadani Gen173 Kari Grass
Gen12 Ranikajal Gen66 Kanakbhog Gen120 Ramshri Gen174 Asam Chudi-2
Gen13 Bhajna Gen67 DRRH-3 Gen121 Danwar Gen175 Tulsi Mala
Gen14 Ratajhinga Gen68 Mahamaya Gen122 ChatiyaNakhi Gen176 Surmatiya
Gen15 Pataniyajhuli Gen69 Rajeshwari Gen123 BhathaMasri Gen177 Manmohan
Gen16 Laxmibhog Gen70 HR 14-1 Heera Gen124 Kanchan Gen178 Jalgundi
Gen17 Sawani Gen71 MatkoDhan Gen125 BaigaSeeng Gen179 HathiPinjara
Gen18 Jhilli Gen72 NimaliyaBanki Gen126 Mota Safri-2 Gen180 ChurlaiBanko
Gen19 Tulsimongra Gen73 Jonyaphool Gen127 MohlaiBanko Gen181 Safri-17
Gen20 DhauraMundariya Gen74 Kadamphool Gen128 SutaiDhan Gen182 Rani Kajar
Gen21 Jhimipras Gen75 Indjopa Gen129 Haripanti Gen183 ParwatKal
Gen22 PangudiGoindi Gen76 Ramigauri Gen130 Bhujnin Gen184 Jhoomar
Gen23 Safri Gen77 Brown Rice-1 Gen131 Manki Gen185 Asam Chudi-3
Gen24 Barhasal Gen78 Arokhutu Gen132 Sadachar Gen186 Jalkeshar
Gen25 Dubraj Gen79 Brown Rice-2 Gen133 Mahabaikoni Gen187 Sudama
Gen26 Agyasal Gen80 Dubraj Gen134 Khajoor Gen188 Hajan
Gen27 Jauphool Gen81 HathiPanjra Gen135 Kumhdayin Gen189 Ikkopatla
Gen28 Kalajeera Gen82 Modipeera Gen136 BhejrimaiDhan Gen190 HarunaMasri
Gen29 Byalo Gen83 Petgadi Gen137 RatanChudi Gen191 Kosawari
Gen30 Badshabhog Gen84 Ramlaxman Gen138 Panwar Gen192 Bansgathi
Gen31 Chhindmauri Gen85 Raja Banga Gen139 Chhindmauri Gen193 BhataNakhi
Gen32 Karhani Gen86 Kari Gilash Gen140 Rani Parewa Gen194 Masri
Gen33 Sihar Gen87 Muni Bhog Gen141 Ramlichonch Gen195 Ikkomota
Gen34 JhimiprasSamlayi Gen88 SuaPankhi Gen142 Mejhri Gen196 Gaurimala
Gen35 Nandel Gen89 Mala Gauri Gen143 Bodibaja Gen197 Ramjhilli
Gen36 Kapri Gen90 DokraDokri Gen144 Jela Gen198 Sichar
Gen37 Bhusi Gen91 NariyalJhoba Gen145 Badshabhog Selection-1 Gen199 Rajabangla
Gen38 DhauraMundariya Gen92 Sindursal Gen146 Kari Alcha Gen200 Majori
Gen39 Gangachur Gen93 Chhindmauri Gen147 DeshiSurmatiya Gen201 Hardigathi
Gen40 Karhani Gen94 Sugandha Gen148 Anjaniya Gen202 Ramlaxman
Gen41 Byalo Gen95 Dandrice Gen149 BaktiChudi Gen203 Korma
November, 2019] Fatty acid variations in rice landraces from Chhattisgarh, India (ii)
Gen42 Bhusu Gen96 BansveeraDhan Gen150 JhilliSafri Gen204 Dowana
Gen43 Safri-2 Gen97 Jhingapuchhi Gen151 Nanded Gen205 Luchai- 2
Gen44 Sanchorma Gen98 BeedelaDhan Gen152 TuriyaKhudig Gen206 Maidubraj
Gen45 SatraSafri Gen99 Sonagathi-2 Gen153 Antarved Gen207 Bhaisapuchhi
Gen46 Barhani Gen100 PhalodDhan Gen154 Rang Chudi Gen208 Pancho
Gen47 Kanakbans Gen101 LalmaDhan Gen155 MotaChudi Gen209 Bhata Masri-2
Gen48 Jhimipras-2 Gen102 BaiganiDhan Gen156 B.D. Safri-2 Gen210 Gomti
Gen49 Dhaniyaphool Gen103 MaranDhan Gen157 KharikhaKuchi Gen211 Sonkharcha
Gen50 Lalbarhasal Gen104 LoktiMusi Gen158 MemriKhedi Gen212 Katrani-4
Gen51 Alsenga Gen105 AsamChudi Gen159 Ankapalli Gen213 Katrani-7
Gen52 Barhasal-2 Gen106 Jana Dhan Gen160 Samarlengda Gen214 Katrani-9
Gen53 RuchiDhan Gen107 RelaDhan Gen161 Mayath Gen215 KondhaKoya
Gen54 Rudra Gen108 Jhunuprash Gen162 MotaSafri
Note: All the collected landraces/ varieties are conserved in IGKV, Raipur (C.G.), India
Supplementary Table S2. Eigen value, variability % and eigen vectors based on principal component analysis
Particulars PC1 PC2 PC3 PC4 PC5
Eigenvalue 5.577 2.582 0.101 0.042 0.003
Variability (%) 67.148 31.087 1.216 0.509 0.040
Cumulative variability (%) 67.148 98.235 99.451 99.960 100.000
Eigen vectors
Palmitic acid -0.041 -0.798 -0.315 -0.306 0.412
Stearic acid -0.001 -0.027 0.870 -0.271 0.412
Oleic acid -0.685 0.460 -0.268 -0.270 0.418
Linoleic acid 0.727 0.389 -0.269 -0.270 0.418
Linolenic acid -0.001 -0.027 -0.007 0.829 0.558
(iii) Parmeshwar K. Sahu et al. [Vol. 79, No. 4
Supplementary Table S3. Grouping of rice landraces in different clusters
Cluster Total genotypes Name of the rice genotypes
1 5 Bansgathi, Gangachur, Nariyal Jhopa, Anjaniya, Antarved
2 38 Modipeera, Badshabhog, Chhindmauri, Dokra Dokri, Jhoomar, Sindursal, Lajini Supar,
Nimlayi Banko, Danwar, Sonkharcha, Saraitoliha, Barhasal-3, Bhata Mahsuri-3, Danighoda,
Turiya Khudig, Dadbanko, Pancho, Kanakbans, Brownrice-2, Jhimipras Samlayi,
Sanchorma, Ramigauri, Byalo, Gudkamal Dhan, Alsenga, Karhani, Bhujnin, Sihar, Dhaura
Mundariya, Nariyalphool, Bhatamasri, Bhusu, Munibhog, Masri, Ruchi Dhan, Parwatkal,
Bhusi, Manki
3 62 Motachudi, Majori, Haruna Masri, Bhaisa Puchhi, Badshahbhog, Jalsinga, Byalo, Safri-2,
Ankapalli, Rajeshwari, Anjani, Loktimusi, Nandel, Brown irce-1, Bhusu-1, Gaurimala, Loindi,
Kabeli, Mahamaya, Sua Pankhi, Kalinga, Mota Safri, Odha Dhan Banarsi, Ratajhinga,
Chhindmauri, Memrikhedi, Satra Safri, Matkodhan, Chatiyanakhi, Sudama, Junupras,
Ramlaxman, Hathi Panjra, B.D. Safri-2, Mohlayi Banko, Beedela Dhan, Sonagathi-2, Khairka
Kuchhi, Maidubraj, Ghodadani, Ramshri, Marandhan, Phalod Dhan, Kanchan, Churlayi
Banko, Raja Banga, Haripanti, Kosawari, Kumhadayin, Mala Gauri, Parra Dhan, Sanwali,
Pivri Luchai, DRRH-3, Reladhan, Kareni Dhan, Sadachar, Bhajan, Baigani Dhan, Sutai
Dhan, Hathi Panjara
4 28 Gathuvan, Asamchudi-3, Gadursela, Katarni-9, Gangabaru, Tulsimala, Korma, Kapri,
Tulsibhog, Karigrass, Rudra, Jalkeshar, Govardhan Kali Kamod, Kondha Koya, Dubraj,
Rajabangla, Lalma Dhan, Khajoor, Kadamphool, Panwar, Tulsimongra, Jauphool,
Bansveera, Badshahbhog sel-1, Badshahbhog-2, Tulsimanjari, Laxmibhog, Kalajeera
5 82 Chhindmauri, Jhimipras-2, Khetganga, Ramlaxman, Surmatiya, Bhunduluchai, Lalbarhasal,
Arokhutu, Kanakbhog, Mota Safri-2, Indjhopa, Bhaktichudi, Barhani, HR-14-1Heera,
Hardigathi, Barhasal, Ramkajal, Agyasal, Dhaniyaphool, Agnifag, Ramjhilli, Luchai-2,
Barhasal-2, Baiga seeng, Nanded, Jhingapuchhi, Janadhan, Mejhari, Jhimiprash, Santio,
Chiniparas, Karhani, Bhejrimai Dhan, Petgadi, Gomti, Rangchudi, Bhadvel, Ranikajar,
Samarlengda, Bahal Binjo, Jonyaphool, Baikoni, Manmohan, Katarni-7, Ikkopotla, Lalapana,
Bhatanakhi, Katarni-4, Pataniyajhuli, Safri, Sichar, Jhela, Pratiksha, Jonyaphool, Asamchudi,
Deshi Surmatiya, Dowana, Mayath, Mahabaikoni, Rani Parewa, Bodibaja, Karialcha, Lochai,
Safri-17, Jalgundi, Dubraj, Pangudi Goindi, Dandrash, Bathrash, Ratanchudi, Sonagathi,
Karigilash, Sugandha, Luchai, Ikkomota, Jhilli, B.D. Safri, Asam Chudi-2, Kherkakuchi,
Dhaura Mundariya, Bhajna, Jhilli Safri
Total 215
November, 2019] Fatty acid variations in rice landraces from Chhattisgarh, India (iv)