genetic diversity assessment of bulgarian durum wheat (triticum durum desf.) landraces and modern...
TRANSCRIPT
RESEARCH ARTICLE
Genetic diversity assessment of Bulgarian durum wheat(Triticum durum Desf.) landraces and modern cultivarsusing microsatellite markers
Ganka Ganeva Æ Victor Korzun Æ Svetlana Landjeva ÆZaprjanka Popova Æ Nikolai K. Christov
Received: 19 July 2008 / Accepted: 30 July 2009 / Published online: 30 August 2009
� Springer Science+Business Media B.V. 2009
Abstract The genetic diversity in a Triticum durum
Desf. collection, consisting of 102 Bulgarian land-
races, nine Bulgarian and 25 introduced cultivars was
studied using 14 highly polymorphic microsatellite
markers. A total of 100 alleles were identified, with an
average of 7.14 alleles per marker. The gene diversity
values (He) of the markers for the total samples ranged
from 0.23 (WMS357 and WMS631) to 0.77 (WMS46),
with an average of 0.52. Within the landraces that were
collected from 18 sites in Southern Bulgaria showed 2–
11 alleles per locus with an average of 6.07. The
microsatellite analysis suggests that the genetic diver-
sity among landraces is lower compared to the
diversity levels for durum wheat in countries close to
the main centers of wheat domestication. Breeding
activities have caused significant reduction of the
allelic polymorphism, elimination of rare alleles, and
increase in the number of common alleles and the
frequency of dominating alleles.
Keywords Genetic diversity � Landrace �Microsatellites � Triticum durum
Introduction
Triticum durum Desf. is the second widespread
Triticum species constituting 10–11% of the world
wheat crop and accounting for about 8% of the total
wheat production. The countries in the areas where
the initial wheat domestication and cultivation took
place (The Mediterranean and Southern Europe, The
Balkans, North Africa, and South-Western Asia) are
still among the leaders of durum wheat production
(Ivanov 1927; Bozzini 1988; Srivastava et al. 1988;
Wang et al. 2007). The durum wheat growing area is
restricted because of the insufficient cold resistance
and spring growth habits of most of the traditional
and modern cultivars (Zhukovsky 1964). One of the
most important sources of genetic material for
improving plant adaptability and grain quality are
the local populations, a product of the natural
selection but also a result of the thorough domesti-
cation and artificial selection carried out by genera-
tions of farmers throughout the years.
In Bulgaria, the durum wheat has been known since
ancient times (Ivanov 1927). Seeds of durum wheat
were present in archaeo-botanical materials dated to
G. Ganeva � S. Landjeva
Institute of Genetics ‘‘Acad. Doncho Kostoff’’, Bulgarian
Academy of Sciences, Bulgaria Tzarigradsko shosse,
13 km, Sofia 1113, Bulgaria
V. Korzun
KWS LOCHOW GMBH, Grimsehl str. 31,
37574 Einbeck, Germany
Z. Popova
Institute for Plant Genetic Resources ‘‘K.Malkov’’,
Sadovo 4122, Bulgaria
N. K. Christov (&)
AgroBioInstitute, 8 Dragan Tsankov Blvd., Sofia 1164,
Bulgaria
e-mail: [email protected]
123
Genet Resour Crop Evol (2010) 57:273–285
DOI 10.1007/s10722-009-9468-5

the Early Bronze Age (Popova and Bozilova 1998).
The early studies in Bulgaria already showed that T.
durum consisted of a large number of botanical
varieties (Malkov 1906; Ivanov 1927). Some of the
original populations, used before the introduction of
the modern cultivars have been preserved at the
Institute of Plant Genetic Resources, Sadovo (Popova
2005). A database for reliable differentiation and agro-
biological characterization of those samples is needed
in order to guarantee their further preservation and
utilization in future genetic and breeding programmes.
The analysis of the genetic diversity of these local
and modern accessions is enabled by the development
and successful application of a large number of
molecular markers. Simple sequence repeats (SSRs)
markers (Tautz et al. 1986), or microsatellites, have
shown higher levels of polymorphism compared to
some other marker systems (storage proteins, isoen-
zymes, and RFLPs). In barley and wheat, microsatellite
markers have been used for construction of linkage
maps (Tautz and Renz 1984; Wang et al. 1994; Roder
et al. 1995, 1998; Korzun et al. 1998, 1999), analysis of
genetic diversity and identification of indigenous
landraces and modern cultivars (Donini et al. 2000;
Khanjari et al. 2007; Roder et al. 2002; Huang et al.
2002; Todorovska et al. 2004; Todorovska et al. 2005;
Landjeva et al. 2006; Wang et al. 2007). Numerous
studies have shown that the selective pressure of the
climate changes, the human activities, aiming at
domestication, and the intensive breeding have fixed
specific phenotypic and genotypic diversity amongst
the local wheats. (Donini et al. 2000; Ben Amer et al.
2001; Landjeva et al. 2006; Figliuolo et al. 2007).
The goal of the present study was to evaluate the
microsatellite-based gene diversity among the Bul-
garian landraces, Balgarian and introduced cultivars
as well as to compare genetic diversity within and
between eco-geographic regions.
Materials and methods
Plant material
In total 136 Triticum durum Desf. accessions, repre-
senting a part of the national durum wheat collection and
maintained at the Institute for Plant Genetic Resources
‘‘K. Malkov’’, Sadovo, were evaluated. The set con-
sisted of 102 landraces, grown in Bulgaria before the
introduction of modern cultivars and collected from 18
locations in a region spanning between 41�5 N to
42�29 N and 25 E to 26�50 E and 0 to 326 m above sea-
level (Table 1; Fig. 1), nine Bulgarian and 26 intro-
duced cultivars (Table 2). One accession of each
T. dicoccon and T. timopheevii were added only in
clustering and ordination analyses. For the statistical
analysis, the accessions, that were classified as
Bulgarian landraces, were divided into five spatial
groups according to the place of their sampling.
DNA isolation and microsatellite analysis
For each accession, 4–6 seedlings were pooled and
DNA was isolated by a mini-prep method adapted
from Rogowsky et al. (1991). A set of 14 highly
polymorphic wheat microsatellites (Roder et al.
1998) covering 11 chromosomes were used
(Table 3). Microsatellite designation, composition,
primer sequences and chromosome location of the
amplified loci were reported by Roder et al. (1998).
In general, a PCR protocol according to Roder
et al. (1998) with 35 instead of 45 cycles of 1 min
94�C denaturation, 1 min 50�C (or 55 or 60�C
according to primer) annealing and 1 min of 72�C
extension followed by a final extension step of 5 min
72�C was used.
Data analysis
The allele size at each microsatellite locus was scored
by using Genotyper� software (Applied Biosystem).
The gene diversity, also referred as expected hetero-
zigosity (He), was calculated using the formula:
Di = 1-P
Pij2, where Pij2 is the frequency of the
jth allele for ith locus summed across all alleles in the
locus, as implemented in the Power Marker v3.25
program (Liu and Muse 2005).
For cluster and ordination analyses, the microsatel-
lite markers were scored in binary (presence/absence)
format. The binary data were used to compute pair wise
similarity coefficient (Dice 1945). Dice similarity
matrix was used to perform cluster analysis with the
help of the Unweighted Pair Group Method with
Arithmetic Average (UPGMA) algorithm from
NTSYS (Numerical Taxonomy and Multivariate
Analysis System), ver. 2.29 for PC (Rohlf 2005).
Principal coordinate analysis (PCoA) was conducted
on the same matrix of Dice similarity coeeficients
using the modules DCENTER and EIGEN of the
274 Genet Resour Crop Evol (2010) 57:273–285
123

NTSYS-PC ver. 2.29 and the 3D plot was done using
the MOD3D module of the program.
Analysis of the molecular variance (AMOVA;
Excoffier et al. 1992) was performed to test the
significance of the partitioning of genetic variance
between and within the geographic groups. For this
purpose the populations were divided into four
regions according to their geographic origin with
landraces included into region 1 (Table 2, Fig. 2).
AMOVA was carried out using the software GenAl-
Ex V6 (Peakall and Smouse 2006).
To determine the effects of the local agro-ecological
conditions and the modern breeding, averaged data for
the following groups was calculated: I) the whole
Table 1 List of T. durum Desf. accession, collected from different districts of Bulgaria and used in SSR analyses
Districts Code Germplasm group and
number of accessions
Collection number
1. Group-Yambol
Yambol Y18 21 58E 125/4; 58E 125/5; 58E 125/7; 58E 125/11; 85E 125/13; 85E
125/14; 85E 125/17; 85E 125/19; 85E 125/22; 85E 125/24;
85E 125/25; 85E 126/5; 85E 126/6; 85E 126/10; 85E 128/2;
85E 128/29; 85E 128/30; 85E 128/30; 85E 128/30; 85E 129/9;
85E 129/9;
2. Group-Elhovo
Malomirovo MAL9 6 57E105/3; 57E105/9; 57E106/10; 57E108/30; 57E108/31;
57E108/40
Stefan karadjovo STK14 3 57E109/8; 57E109/13; 57E109/33;
Kamen Brjag KBr7 4 57E 110/5; 57E 110/7; 57E 110/8; 57E 110/15
Boljarovo BOL1 1 57E 111/18
Zlatinitsa ZL5 2 57E 112/4; 57E112/20
Bojanovo BOJ2 5 57E 113/4; 57E 113/7; 57E 113/12; 57E 113/13; 57E 113/13
Karavelovo Kar8 3 57E 114/17; 57E 114/19; 57E 114/23
Total 24
3. Group-Topolovgrad
Topolovgrad TO17 4 57E 103/1; 57E 91/10; 57E 91/18; 57E 91/20;
OrlovDol OrD11 10 57E 92/1; 7E 92/2;57E 92/4; 57E 92/5;57E 92/9; 57E 92/18; 57E
92/25; 57E 93/1; 57E 94/7; 57E 94/13;
Oreshnik OR12 1 57E /96/7
General Toshevo GT3 7 57E 99/25; 57E 99/26; 57E 99/27; 57E 99/30; 57E 100/5; 57E
101/28; 57E 101/30
Total 22
4. Group-Purvomai
Debur-Purvomai D4 3 58E 120/7; 58E 120/16; 58E 120/26
Tatarevo T16 1 58E 121/4
P. Eftimovo PEft13 2 58E 123/10; 58E 123/14
Izbegli IZ6 4 58E 124/2; 58E 124/3; 58E 124/4; 58E 124/5
Total 10
5. Group-Svilengrad
Sladun SL15 15 57E 73/5; 57E 73/10; 57E 73/17; 57E 74/6; 57E 74/7; 57E 74/11;
57E 74/13; 57E 74/15; 57E 74/25; 57E 74/26; 57E 74/31; 57E
75/4; 57E 75/12; 57E 75/15; 57E 75/24
Momkovo MO10 10 57E 84/16; 57E 84/17; 57E 84/23; 57E 84/27; 57E 84/31; 57E
85/2; 57E 87/5; 57E 87/11; 57E 87/21; 57E 88/4
Total 25
Total for all groups 102
Genet Resour Crop Evol (2010) 57:273–285 275
123

population of Bulgarian landraces; II) accessions from
geographically close locations, the samples being
divided into five groups according to their origin:
(1)—Yambol; (2)—Elhovo; (3)—Topolovgrad; (4)—
Purvomai and Asenovgrad; (5)—Svilengrad
(Table 1); III) modern Bulgarian cultivars; IV) intro-
duced cultivars (Table 2).
Results
Microsatellite polymorphism
By using a set of 14 highly polymorphic microsatellite
markers, a total of 100 alleles with an average of 6.67
per locus and 7.14 per marker were detected in the
Fig. 1 Geographic map showing the collection sites of Bulgarian landraces. The map was produced using Google Earth v.
5.0.11733.9347 with the server kh.google.com
Table 2 List of the used in this study Bulgarian and introduced cultivars of T. durum Desf. and their grouping according to
geographical location of the country where they are created
Cultivars name Country Region
Name and abbreviation Number in AMOVA
Beloslava, Yvor, Impuls, Progress, Zagorka, Lozen 6,
Saturn 1, Wuzhod, Sredets
Bulgaria Southeast Europe (SE_EU) 1
Mauragani iraklion, Moundros-2 Greece Southeast Europe (SE_EU) 1
Miraglia, Ellar, Italliano Rijo, Senatore Cappelli, HJS, Italy Southwest and Western Europe SW_EU 2
Agathe, ARJ76-142 France Southwest and Western Europe SW_EU 2
G8972 AE3-G, G8972 AE3-NG, G8972 AG2-G,
G8972 AG2-NG, G8973 AQ1-G, G8973 AQ1-NG Canada North America (N_America) 3
Langdon, Rugby, Edmore, Lloyd, USA North America (N_America) 3
Kuudusu 1149 Turkey West Asia (W_Asia) 4
Jordan col.86 Jordan West Asia (W_Asia) 4
Korifla Syria West Asia (W_Asia) 4
MJN.NJ2707 China West Asia (W_Asia) 4
Drujba, Hordeiphorme 189 Russia Russia 5
276 Genet Resour Crop Evol (2010) 57:273–285
123

studied set of 136 T. durum accessions including both
landraces and advanced improved cultivars (Table 3).
The number of alleles per marker found in the B
genome (7.22) was larger than that in A genome (5.83).
Among the employed set of SSR markers the most
polymorphic was WMS577 (7B) with 18 alleles and
the least polymorphic was WMS165 (4A) with only 2
alleles (Table 3). The highest number of rare alleles
was found in the loci WMS577 (6) and WMS0046 (5),
while markers WMS357, MW1B002 and WMS18 did
not identify any rare alleles. Lack of amplified products
(null alleles) occurred in the WMS155, WMS46 and
WMS577 loci. The total gene diversity (He) calculated
for all markers and accessions was 0.52 on average
(Table 3). Markers WMS357 and WMS631 showed
the lowest He values (0.23 and 0.24, resp.), while
WMS46 and WMS577 were the most informative
(0.77 and 0.73, respectively).
Genetic variations within and among
the agro-ecogeographic regions
To analyse the genetic diversity within the landraces
they were divided into five groups according to their
Table 3 Description of microsatellite markers employed including the number of alleles, rare alleles (with a frequency of\2%), size
range of alleles and gene diversity in all accessions including 102 Bulgarian landrace and 34 Bulgarian and introduced cultivars
Marker Chromosome Total no. of alleles
(rare alleles)
Size range of alleles
(bp)
Gene diversity
(He)
MW1A001 1A 7(2) 134–151 0.69 ± 0.14
WMS0357 1AL 5(0) 117–123 0.23 ± 0.28
MW1B002 1B 5(0) 214–247 0.59 ± 0.12
WMS0018 1BS 3(0) 179–181 0.41 ± 0.09
WMS0095 2AS 7(2) 105–124 0.58 ± 0.07
WMS0155 3AL 10(4) Null, 125–147 0.58 ± 0.13
WMS0389 3B 9(4) 116–133 0.64 ± 0.04
WMS0165 4A 2(1) 186–191 0.26 ± 0.23
WMS0165 4B 5(2) 252–264 0.44 ± 0.12
WMS0513 4BL 4(1) 139–144 0.51 ± 0.10
WMS0408 5BL 6(2) 144–180 0.62 ± 0.07
WMS0680 6B 5(2) 119–132 0.57 ± 0.04
WMS0631 7A 4(1) 190–211 0.24 ± 0.08
WMS0046 7BS 10(5) Null, 159–177 0.77 ± 0.07
WMS0577 7BL 18(6) Null, 128–213 0.73 ± 0.06
Total 100(32)
Average per markers Total 7.14 0.52 ± 0.01
A Genome 5.83
B Genome 7.22
Table 4 Total number of alleles, number of alleles per marker, PIC and heterozygosity calculated for 15 microsatellite loci for the
Bulgarian durum wheat landrace collection, originated from five different regions (groups)
Item Region (Group)
Yambol (1) Elhovo (2) Topolovgrad (3) Purvomai (4) Svilengrad (5) Total
No. of accession 21 24 22 10 25 102
Total no. of alleles 56 67 60 45 51 85
No. alleles per marker 4.0 4.8 4.3 4.5 3.6 6.1
Gene diversity (He) 0.58 ± 0.23 0.59 ± 0.22 0.59 ± 0.23 0.45 ± 0.19 0.50 ± 0.19 0.53 ± 0.19
Obs. heterozygosity (Ho) 1.3 1.4 1.2 1.2 1.1 1.24
Genet Resour Crop Evol (2010) 57:273–285 277
123

collection sites. The groups of accessions collected
from Yambol (1), Elhovo (2) and Topolovgrad (3)
showed similar average number of alleles per locus
(4–4.8) and He values (0.58–0.59; Table 4). Lower
average allele number per locus (3.6) was found in
the group of accessions from Svilengrad. The lowest
genetic diversity (He = 0.44) was detected in group
4 consisting of samples from Purvomai and Asenov-
grad, followed by the group 5 with mean He value of
0.50. The lower mean He values in the group 4
resulted from the reduced genetic diversity of all loci,
particularly evident in WMS577, WMS18, WMS631
and WMS357 (Table 7). Analysis of molecular
variance (AMOVA) of the microsatellite data showed
significantly higher values of the molecular variance
within the region (76%) as compared to that between
regions (5%) and population/region (19%; Fig. 2).
Amplification of more than one product occurring in
most of the Bulgarian landrace accessions indicated
their high heterogeneity. In total 32 rare alleles with
frequency less than 0.05 were identified in 11 out of
the 14 studied loci.
The data presented in Tables 5, and 6 clearly
demonstrate that the total number of alleles, the
average number of alleles per locus, the number of
rare and null alleles, and the mean heterozygosity are
considerably higher within landraces compared to the
commercial Bulgarian and introduced cultivars. The
highest total number of alleles was detected in
WMS577 locus in both landraces (11) and the
introduced cultivars (8), while in the group of modern
Bulgarian cultivars WMS389 locus showed the
highest number of alleles. The comparison of
Bulgarian landraces and modern cultivars showed
that breeding activities caused a decrease of the
number of private alleles and an increase of the
common alleles (Table 6). The percentage of poly-
morphic loci in modern cultivars was almost twofold
lower in comparison with the landraces. The
decreased number of alleles per locus results from
the small variation in all loci (Table 5). Only 3 loci
(WMS155, WMS46 and WMS577) showed consid-
erably reduced allele number.
The loci MW1B002, WMS408 and WMS680
showed similar pattern of allele size variation in
both Bulgarian and introduced varieties (Table 5).
Among the Bulgarian landraces the alleles 181 bp of
WMS18, 191 and 256 bp of WMS165 and 190 bp of
WMS631 were the most frequently observed (fre-
quency [ 0.80). The loci WM1B002, WMS389,
WMS155, WMS408, WMS46 and WMS577 showed
no clear dominating allele within the group of
landraces, suggesting that no selective pressure had
been exerted in the vicinity of these markers. On the
contrary, in the group of commercial cultivars one or
two alleles were prevailing in majority of loci.
The three groups of accessions showed similar gene
diversity (He = 0.51–0.53, Table 7). In the group of
landraces highest genetic diversity was observed in the
loci MW1A001 (He = 0.75), MW1B002 (He = 0.71)
and WMS155 (0.70), while in the group of modern
Bulgarian cultivars highest diversity was calculated for
the loci WMS46 (He = 0.81), MW1A001 (He =
0.79), WMS577 (He = 0.75). The loci WMS46
(He = 0.80), WMS577 (He = 0.77) were the most
diverse in the group of introduced cultivars. The lowest
He values were estimated for the locus WMS165 (0.11
and 0.15 in landraces and Bulgarian cultivars.
Cluster and ordination analysis
The employed 14 microsatellite markers successfully
distinguished 116 out of the 139 analyzed durum wheat
accessions (Fig. 3). The dendrogram consists of two
clusters and cluster I includes all accessions with the
exception of T. timopheevii which clusters as outgroup
into a second cluster. The cluster I is further divided
into 2 subclusters Ia and Ib. The subcluster Ib consists
of only Bulgarian landraces while Ia includes both
landraces and improved cultivars. Two additional sub
clusters (Ia1 and Ia2) are formed inside subcluster Ia.
The subcluster Ia1 includes the remaining landraces
together with all Bulgarian cultivars and few intro-
duced ones including Canadian cultivars G8972 AE3-
G, G8972 AE3-NG and G8972 AG2-NG and the
Percentages of Molecular Variance
AmongRegions
5%
Among
Pops/Regions
19%
Within Pops
76%
Fig. 2 Analysis of molecular variance among 137 samples
grouped by population and region
278 Genet Resour Crop Evol (2010) 57:273–285
123

French cultivar Agathe while subcluster Ia2 includes
all remaining introduced cultivars. The similarity
between subcluster Ia and Ib was 0.328 and between
subclusters Ia1 and Ia2 0.376. Although the landraces
separated into 2 distinct subclusters Ia and Ib, no
specific clustering according to collection site was
observed even when the SSR data of only landraces
was reanalyzed and a separate dendrogram was
Table 5 Total number of alleles, number of rare alleles, dominating alleles (bp) and their frequencies among the different groups of
T. durum Desf. Bulgarian landraces, Bulgarian cultivars and introduced cultivars
SSR Markers Chromosome Number of alleles
(rare alleles)
Size range of alleles (bp)/dominating
allele (bp) and its frequency
Bulgarian
landraces
Bulgarian
cultivars
Introduced
cultivars
Bulgarian
landraces
Bulgarian
cultivars
Introduced
cultivars
MW1A001 1A 7(2) 4(0) 4(0) 134–151
148(0.62)
142–148
151(0.78)
142–151
148(0.90)
WMS0357 1AL 4(0) 2(0) 2(0) 117–123
119(0.64)
117–119
119(1.00)
117–119
119(0.90)
MW1B002 1B 4(0) 3(0) 3(0) 214–247
247(0.36)
214–247
220(0.89)
214–247
247(0.67)
WMS0018 1BS 2(0) 2(0) 3(0) 179–181
181(0.85)
179–191
179(0.44)
179–181
179(0.67)
WMS0095 2AS 6(2) 4(0) 3(1) 114–124
116(0.60)
118–122
122(0.89)
105–122
118(0.77)
WMS0155 3AL 10(4) 3(0) 4(0) Null, 125–147
128(0.45)
125–141
128(0.78)
125–129
129(0.74)
WMS0389 3B 8(4) 6(0) 3(0) 116–133
127(0.46)
114–129
114;120(0.56)
114–131
127(0.53)
WMS0165 4A 2(1) 2(0) 2(0) 186–191
191(1.00)
186–191
191(0.89)
186–191
191(0.41)
WMS0165 4B 5(2) 2(0) 4(0) 252–264
256(0.85)
248–260
260(1.00)
256–264
260(0.56)
WMS0513 4BL 3(1) 2(0) 4(2) 140–144
142(0.78)
139–144
142(0.67)
142–144
142(0.50)
WMS0408 5BL 6(2) 3(0) 3(0) 144–180
145(0.45)
144–180
148(0.44)
146–180
145;148(0.29)
WMS0680 6B 5(2) 4(0) 3(0) 119–132
122(0.52)
120–132
122(0.78)
120–132
120(0.44)
WMS0631 7A 3(1) 2(0) 2(0) 190–200
190(0.88)
190–211
190(1.00)
190–211
190(0.79)
WMS0046 7BS 9(5) 4(0) 8(0) Null, 159–175
165(0.48)
Null, 163–177
171(0.67)
163–173
173(0.73)
WMS0577 7BL 11(6) 4(0) 8(0) Null, 128–213
141(0.43)
Null, 128–186
140(0.44)
130–211
152(0.35)
Total 85(32) 47(0) 56(5)
Average Total 6.07 3.13 4.00
A genome 4.17 2.83 2.83
B genome 5.89 3.33 4.33
Genet Resour Crop Evol (2010) 57:273–285 279
123

produced (data not shown). Principal coordinate anal-
ysis (PCoA) confirmed the results obtained by the
cluster analysis. The landraces are clearly separated in
a distinct group and the modern cultivars also tend to
form specific groups according to their geographic
location (Fig. 4a). The 3D plot of PCoA on Figure 4b
shows no clear separation of the landraces collected
from different sites and confirmed the results obtained
in the cluster analysis.
Discussion
The microsatellite analysis of the durum wheat
collection, comprising Bulgarian landraces and
modern cultivars along with representatives from Italy,
France, Greece, Turkey, Russia, Jordan, USA, Canada,
Algeria and China showed that the average number of
alleles per locus and the average He values were
comparable with the data reported for durum wheat
accessions from various geographic regions (Messele
2001; Alamerew et al. 2004; Maccaferri et al. 2003; Li
et al. 2006; Khanjari et al. 2007; Wang et al. 2007). The
higher polymorphism of the B-genome markers in the
durum wheat from Libya (Ben Amer et al. 2001), Italy
and the Mediterranean (Maccaferri et al. 2003), Oman
(Khanjari et al. 2007) and Ethiopia (Huang et al. 2002;
Alamerew et al. 2004; Yifru et al. 2006b) was also
confirmed in the present study.
Table 7 The gene diversity (He) among study groups of T.durum Desf. Bulgarian landraces which were collected from
the region of Yambol (group 1); Elhovo (group 2),
Topolovgrad (group 3), Purvomai (group 4), Svilengrad (group
5) and Bulgarian and introduced cultivars
Marker Bulgarian landraces (He) Bulgarian
cultivars (He)
Introduced
cultivars (He)Region (Group) Average
Yambol
(1)
Elhovo
(2)
Topolovgrad
(3)
Purvomai
(4)
Svilengrad
(5)
MW1A001 0.79 0.77 0.83 0.65 0.72 0.75 ± 0.07a 0.79 0.53
WMS0357 0.55 0.65 0.65 0.29 0.57 0.54 ± 0.15b 0.01 0.13
MW1B002 0.86 0.68 0.74 0.63 0.64 0.71 ± 0.09a 0.48 0.58
WMS0018 0.35 0.30 0.35 0.16 0.38 0.31 ± 0.09c 0.43 0.49
WMS0095 0.73 0.56 0.74 0.61 0.60 0.65 ± 0.08a 0.58 0.51
WMS0155 0.72 0.79 0.77 0.61 0.63 0.70 ± 0.08a 0.60 0.44
WMS0389 0.71 0.58 0.77 0.61 0.71 0.67 ± 0.08a 0.66 0.59
WMS0165 0.20 0 0 0.36 0 0.11 ± 0.16d 0.15 0.53
WMS0165 0.09 0.51 0.44 0.20 0.34 0.32 ± 0.17c 0.44 0.55
WMS0513 0.36 0.53 0.47 0.28 0.42 0.41 ± 0.10 0.50 0.61
WMS0408 0.74 0.72 0.65 0.60 0.53 0.65 ± 0.06a 0.67 0.54
WMS0680 0.65 0.66 0.49 0.58 0.51 0.52 ± 0.08 0.58 0.60
WMS0631 0.52 0.48 0.42 0.16 0.29 0.31 ± 0.15 0.16 0.26
WMS0046 0.74 0.83 0.75 0.56 0.55 0.69 ± 0.12 0.81 0.80
WMS0577 0.66 0.80 0.82 0.44 0.58 0.66 ± 0.16 0.75 0.77
Total 0.58 ± 0.23 0.59 ± 0.22 0.59 ± 0.23 0.44 ± 0.19 0.50 ± 0.19 0.53 ± 0.19 0.51 ± 0.24 0.53 ± 0.17
Table 6 Total for Binary Band Pattern by Groups of Bulgar-
ian landraces and Bulgarian and introduced cultivars
Item Bulgarian
landraces
Bulgarian
cultivars
Introduced
cultivars
No. alleles 85 47 56
No. alleles freq. C5% 53 47 55
No. private alleles 31 2 1
No. common alleles
(B25%)
18 13 8
No. common alleles
(B50%)
31 24 18
Mean heterozygosity 0.135 0.117 0.082
SE of mean heterozygosity 0.015 0.016 0.015
Polymorphic loci (%) 76.36 40.00 22.97
280 Genet Resour Crop Evol (2010) 57:273–285
123

In our study, markers WMS577, WMS155 and
WMS46, which have been reported to be highly
polymorphic (Messele 2001; Yifru et al. 2006a, b)
showed highest allele number (WMS577-18 alleles;
WMS155 and WMS46-10 alleles).
The genetic diversity among Bulgarian landraces,
cultivated before the introduction of modern culti-
vars, has been influenced by various factors, in
particular, peoples migration, seed trade, and long-
term selection, carried out for centuries by farmers
under the specific environmental conditions,
characteristic for the Balkan Peninsula. During the
second half of the 7th millennium B.C. some tribes
left the Near East and moving across Anatolia had
settled on the Balkan Peninsula. It is well known that
around the beginning of the 6th millennium certain
agricultural practices were widely used in Greece and
by the end of the same millennium cereal stands
occupied the region of Starchevo, a Bulgarian village
near Danube. T. durum seeds were found in archaeo-
botanical samples together with T. monococcum and
T. dicoccon seeds (Popova and Bozilova 1998).
The local populations were described as a mixture of
botanical varieties instead of being homogenous
(Malkoff 1906; Ivanov 1927). In our sample, consist-
ing of 102 preserved ancient landrace accessions,
grown in 18 locations of Southern Bulgaria, we found
85 alleles, their number varying between 2 and 11 with
an average of 6.07 alleles per marker. This number is
lower than the average number of alleles per locus,
reported for durum wheat collections in Ethiopia
Fig. 3 UPGMA cluster analysis of all studied T. durumaccessions
BG_landraceSE_EUN_AmericaSW_EUW_AsiaRussiaT. dicocconT. timopheevii
0.33 0.33 0.08 0.08 PCoord.-2 PCoord.-2
-0.17 -0.17 -0.42 -0.42 -0.67 -0.67 -0.51 -0.51 -0.56 -0.56
-0.28 -0.28
-0.05 -0.05 -3 PCoord.-3
0.18 0.18
0.41 0.41
- -0.27PCoord.-1 0.02
0.32 0.61
Pop. 5Pop. 3Pop.2 Pop. 4Pop. 1
0.45 0.45 0.23 0.23 PCoord.-2 PCoord.-2
0.02 0.02 -0.20 -0.20 -0.45 -0.45 -0.42 -0.42 -0.56
-0.20 -0.20
0.04 0.04 PCoord.-3 PCoord.-3
0.29 0.29
0.53 0.53
-0.270.03PCoord.-1
0.320.61
a
b
Fig. 4 Principal Coordinates Analysis (PCoA) of a all 139
accessions including Bulgarian landraces, Bulgarian and
foreign durum wheat varieties and b only Bulgarian landrace
accessions
Genet Resour Crop Evol (2010) 57:273–285 281
123

(7.9–11.0), Oman (7.1) and Anatolia, Turkey (Dograr
et al. 2000; Messele 2001; Alamerew et al. 2004; Yifru
et al. 2006a; Khanjari et al. 2007). It is, however, higher
than that estimated for durum wheat from Libya
(4.5, Ben Amer et al. 2001) and Italy (4.3, Figliolo
et al. 2007), and similar to that characteristic for the
Mediterranean durum wheat germplasm (Maccaferri
et al. 2003). The gene diversity of the Bulgarian durum
wheat varies from 0.11 to 0.75 per marker (0.53 on
average) and is less than the corresponding values for
the Ethiopian (0.72, Yifru et al. 2006b), Anatolian
(0.76, Dograr et al. 2000), Tunisian (0.68, Medini et al.
2005) and Oman (0.68, Khanjari et al. 2007) durum
wheats, yet it is similar to that of the durum wheat
accessions from the Mediterranean region (0.56,
Maccaferri et al. 2003). All Bulgarian durum wheat
accessions, including both landraces and cultivars,
showed lower total number of alleles and genetic
diversity, especially at loci WMS18, WMS357 and
WMS408, as compared to samples from Ethiopia
(Yifru et al. 2006a, b).
According to Vavilov (1966), there is a global
irregular distribution of the species diversity. The
diversity is less expressed in Central and Northern
Europe. The comparative analysis of T. aestivum
microsatellite diversity in 8 geographical regions
showed greater diversity among the samples from the
Near and Middle East as well as Southern Europe
(Huang et al. 2002). A collection consisting of 349
T. durum accessions from all over the world, with loci
encoding 13 enzymes was assessed by Asins and
Carbonell (1989) and their results corresponded to
what was expected for the primary and secondary
centers of the genetic diversity described by Vavilov
(1951). According to Asins and Carbonell (1989), the
genetic variation among the durum wheats in the
Near East, a region considered to be the center of
primary evolution, proved to be greater than the one
in the secondary centers, namely the Mediterranean
(Egypt, Greece, Tunisia, Spain, France and former
Yugoslavia) and Central Asia. The presented refer-
ences on genetic diversity, together with our data,
obtained through microsatellite analysis, confirmed
the trend of polymorphism decrease in the durum
wheat germplasm when moving north-westwards
from the original center of domestication. Despite
this trend of decreasing the diversity being away from
the centre of wheat domestication, the old Bulgarian
durum wheat landraces were described as highly
heterogeneous populations (Ivanov 1927). This sug-
gestion was recently supported by the data on gliadin
polymorphism (Melnikova et al. 2007) and diversity
of spike morphology (Ganeva et al. 2005). The results
of the present study also indicate higher molecular
variance (76%) in the estimated regions than among
them (5%) or population /region (19%). However, a
trend for regional differentiation of the populations is
evident. The accessions from the regions of Purvomai
and Asenovgrad (group 4) had reduced genetic
diversity (He = 0.44). In the case of the samples
from Svilengrad (group 5) the microsatellite analysis
revealed lower polymorphism and an average number
of alleles for locus similar to that characteristic for
the Italian ancient durum wheat accessions (Figliuolo
et al. 2007). Asins and Carbonell (1989) reported a
surprisingly low diversity in durum wheat from
Israel, a region situated close to the original area of
domestication, as well as in durum wheat from Italy
and Cyprus—the main regions of cultivation. The
domestication is a fast process, which is a part of the
human historical development and is strongly deter-
mined by the selective pressure of the environment
and the farming techniques. Higher levels of genetic
diversity in a particular region are probably associ-
ated with a relatively stronger presence of rare alleles
resulting from restricted artificial selection applied in
those areas (Roussel et al. 2004). It can be assumed
that the reduced genetic diversity in countries with
traditional durum wheat agriculture is due to both
agro-ecological factors and more efficient and con-
sistent selection, performed by the farmers through-
out the years, including their efforts to improve
uniformity and productivity of local populations. It is
highly probable that the lower genetic diversity and
the increased allele frequency at some of the micro-
satellite markers reflect the selective impact of the
agro-ecological conditions and the directed selection.
Artificial selection aiming at developing homoge-
neous, highly productive and suitable for modern
agricultural technologies cultivars caused variation in
the degree and nature of the genetic diversity in the
34 modern Bulgarian and introduced cultivars
included in the present study. Reliable information
about the genetic erosion is afforded by the genetic
diversity index, combined with the characterization
of the allele polymorphism, specific and rare alleles
(Figliuolo et al. 2007). According to Maccaferri et al.
(2003), the large number of rare alleles implies
282 Genet Resour Crop Evol (2010) 57:273–285
123
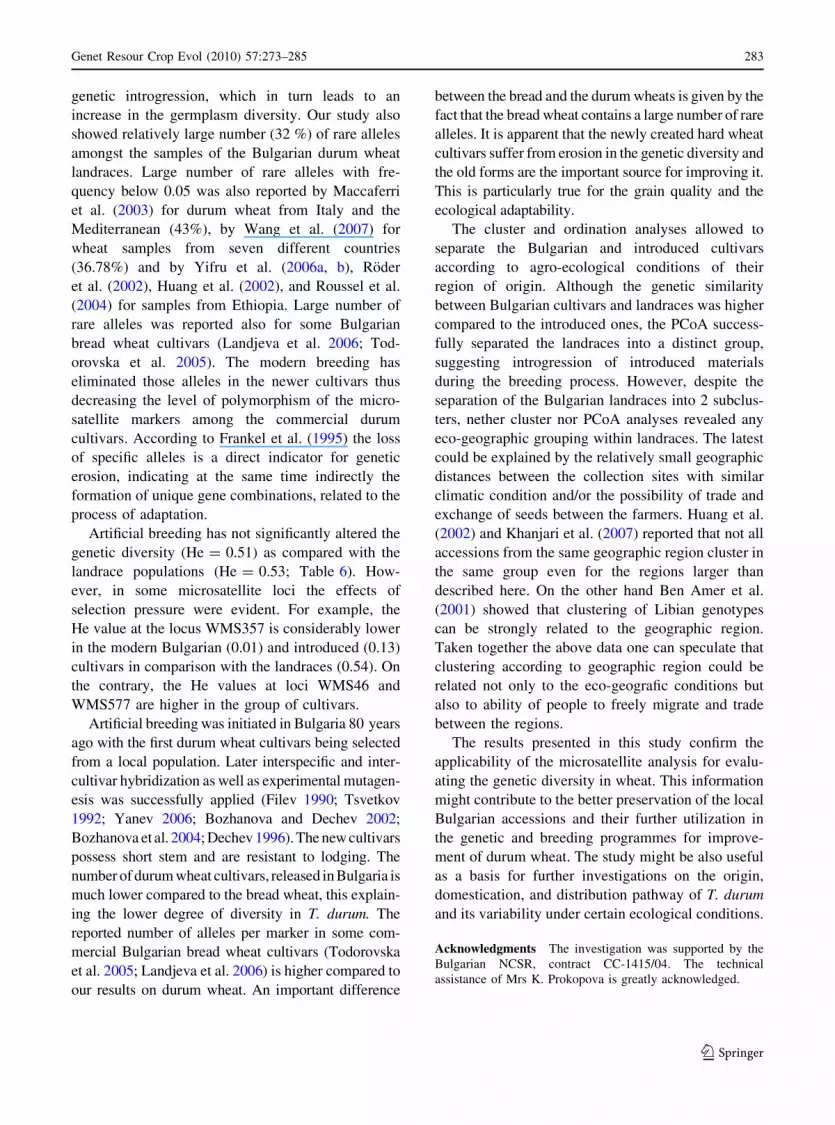
genetic introgression, which in turn leads to an
increase in the germplasm diversity. Our study also
showed relatively large number (32 %) of rare alleles
amongst the samples of the Bulgarian durum wheat
landraces. Large number of rare alleles with fre-
quency below 0.05 was also reported by Maccaferri
et al. (2003) for durum wheat from Italy and the
Mediterranean (43%), by Wang et al. (2007) for
wheat samples from seven different countries
(36.78%) and by Yifru et al. (2006a, b), Roder
et al. (2002), Huang et al. (2002), and Roussel et al.
(2004) for samples from Ethiopia. Large number of
rare alleles was reported also for some Bulgarian
bread wheat cultivars (Landjeva et al. 2006; Tod-
orovska et al. 2005). The modern breeding has
eliminated those alleles in the newer cultivars thus
decreasing the level of polymorphism of the micro-
satellite markers among the commercial durum
cultivars. According to Frankel et al. (1995) the loss
of specific alleles is a direct indicator for genetic
erosion, indicating at the same time indirectly the
formation of unique gene combinations, related to the
process of adaptation.
Artificial breeding has not significantly altered the
genetic diversity (He = 0.51) as compared with the
landrace populations (He = 0.53; Table 6). How-
ever, in some microsatellite loci the effects of
selection pressure were evident. For example, the
He value at the locus WMS357 is considerably lower
in the modern Bulgarian (0.01) and introduced (0.13)
cultivars in comparison with the landraces (0.54). On
the contrary, the He values at loci WMS46 and
WMS577 are higher in the group of cultivars.
Artificial breeding was initiated in Bulgaria 80 years
ago with the first durum wheat cultivars being selected
from a local population. Later interspecific and inter-
cultivar hybridization as well as experimental mutagen-
esis was successfully applied (Filev 1990; Tsvetkov
1992; Yanev 2006; Bozhanova and Dechev 2002;
Bozhanova et al. 2004; Dechev 1996). The new cultivars
possess short stem and are resistant to lodging. The
number of durum wheat cultivars, released in Bulgaria is
much lower compared to the bread wheat, this explain-
ing the lower degree of diversity in T. durum. The
reported number of alleles per marker in some com-
mercial Bulgarian bread wheat cultivars (Todorovska
et al. 2005; Landjeva et al. 2006) is higher compared to
our results on durum wheat. An important difference
between the bread and the durum wheats is given by the
fact that the bread wheat contains a large number of rare
alleles. It is apparent that the newly created hard wheat
cultivars suffer from erosion in the genetic diversity and
the old forms are the important source for improving it.
This is particularly true for the grain quality and the
ecological adaptability.
The cluster and ordination analyses allowed to
separate the Bulgarian and introduced cultivars
according to agro-ecological conditions of their
region of origin. Although the genetic similarity
between Bulgarian cultivars and landraces was higher
compared to the introduced ones, the PCoA success-
fully separated the landraces into a distinct group,
suggesting introgression of introduced materials
during the breeding process. However, despite the
separation of the Bulgarian landraces into 2 subclus-
ters, nether cluster nor PCoA analyses revealed any
eco-geographic grouping within landraces. The latest
could be explained by the relatively small geographic
distances between the collection sites with similar
climatic condition and/or the possibility of trade and
exchange of seeds between the farmers. Huang et al.
(2002) and Khanjari et al. (2007) reported that not all
accessions from the same geographic region cluster in
the same group even for the regions larger than
described here. On the other hand Ben Amer et al.
(2001) showed that clustering of Libian genotypes
can be strongly related to the geographic region.
Taken together the above data one can speculate that
clustering according to geographic region could be
related not only to the eco-geografic conditions but
also to ability of people to freely migrate and trade
between the regions.
The results presented in this study confirm the
applicability of the microsatellite analysis for evalu-
ating the genetic diversity in wheat. This information
might contribute to the better preservation of the local
Bulgarian accessions and their further utilization in
the genetic and breeding programmes for improve-
ment of durum wheat. The study might be also useful
as a basis for further investigations on the origin,
domestication, and distribution pathway of T. durum
and its variability under certain ecological conditions.
Acknowledgments The investigation was supported by the
Bulgarian NCSR, contract CC-1415/04. The technical
assistance of Mrs K. Prokopova is greatly acknowledged.
Genet Resour Crop Evol (2010) 57:273–285 283
123

References
Alamerew S, Chebotar S, Huang X, Roder MS, Borner A
(2004) Genetic diversity in Ethiopian hexaploid and tet-
raploid wheat germplasm assessed by microsatellite
markers. Genet Resour Crop Evol 51:559–567
Asins MJ, Carbonell EA (1989) Distribution of genetic vari-
ability in a durum wheat collection. Theor Appl Genet
77:287–294
Ben Amer IM, Borner A, Roder MS (2001) Detection of
genetics diversity in Libyan wheat genotypes using wheat
microsatellite markers. Genet Resour Crop Evol 48:
579–585
Bozhanova V, Dechev D (2002) Assessment of tissue culture-
derived durum wheat lines for somaclonal variation.
Cereal Res Commun 30:277–284
Bozhanova V, Dechev D, Deneva M, Lalev T, Ivanov P (2004)
Investigation of some Gramineae species for involvement
in durum wheat breeding program. Rasteniev Nauki
41:489–494 (in Bulgarian)
Bozzini A (1988) Origin, distribution, and production of durum
wheat in the world. In: Fabriani G, Lintas C (eds) Durum
wheat: chemistry and technology. American Association
of Cereal Chemistry, St. Paul, MN, pp 1–16
Dechev D (1996) Productivity of selection strategy in durum
wheat. 5th International Wheat Conference Abstracts,
June 10–14, Ankara
Dice LR (1945) Measures of the amount of ecologic associa-
tion between species. Ecology 26:297–302
Dograr N, Akin-Yalin S, Akkaya MS (2000) Discriminating
durum wheat cultivars using highly polymorphic simple
sequence repeat DNA markers. Plant Breed 119:360–362
Donini P, Law JR, Koebner RMD, Reeves JC, Cooke RJ
(2000) Temporal trends in the diversity of UK wheat.
Theor Appl Genet 100:912–917
Excoffier L, Smouse P, Quattro JM (1992) Analysis of
molecular variance inferred from metric distance among
DNA haplotypes: Application to human mitochondrial
DNA restriction data. Genetics 131:479–491
Figliuolo G, Mariarosaria M, Ivana G (2007) Temporal vari-
ation of diversity in Italian durum wheat germplasm.
Genet Resour Crop Evol 54:615–626
Filev K (1990) Successful use of mutation breeding in durum
wheat. Plant mutation breeding for crop improvement.
Proceedings of IAEA Conference. International sympo-
sium on the contribution of plant mutation breeding to
crop improvement. Vienna, Austria, 18–22 Jun 1990,
IAEA 1. pp. 295–299
Frankel OH, Brown AHD, Burdon JJ (1995) The conservation
of plant biodiversity. Cambridge University Press, Cam-
bridge, p 299
Ganeva G, Landjeva S, Popova Z (2005) Characterization of
the collection of local Triticum durum Desf. accessions
from Bulgaria. In: Merchinkov N (Ed) Proceedings of
Balkan scientific conference, ‘‘Breeding and Cultural
Practices of Crops.’’ 2. VI, 2005, Karnobat, 255–259 (in
Bulgarian)
Huang XQ, Borner A, Roder MS, Ganal MW (2002) Assessing
genetic diversity of wheat (Triticum aestivum L.)
germplasm using microsatellite markers. Theor Appl
Genet 105:699–707
Ivanov IV (1927) Der Hartweizen Bulgariens T. durum Desf.
Jahrbuch der Universitat Sofia, Landwirtschaftliche
Fakultat, Band V, 1926–1927, 147 pp
Khanjari S, Hammer K, Buerkert A, Roder MS (2007)
Molecular diversity of Omani wheat revealed by micro-
satellites: I. Tetraploid landraces. Genet Resour Crop Evol
54:1291–1300
Korzun VN, Roder MS, Ganal MW, Worland AJ, Law CN
(1998) Genetic analysis of the dwarfing gene (Rht8) in
wheat. Part I. Molecular mapping of Rht8 on the short arm
of chromosome 2D of bread wheat (Triticum aestivum L.).
Theor Appl Genet 96:1104–1109
Korzun V, Roder MS, Ganal MW, Wendehake K, Pasqualone
A, Lotri C (1999) Integration of dinucleotide microsatel-
lites from hexaploid bread wheat into a genetic linkage
map of durum wheat. Theor Appl Genet 98:1202–1207
Landjeva S, Korzun V, Ganeva G (2006) Evaluation of genetic
diversity among Bulgarian winter wheat (Triticum aestivumL.) cultivars during the period 1925–2003 using micro-
satellites. Genet Resour Crop Evol 53:1605–1614
Li W, Zhang DF, Wei YM, Yan ZH, Zheng Y (2006) Genetic
diversity of Triticum turgidum L. based on microsatellite
markers. Russ J Genet 42:311–316
Liu K, Muse SV (2005) PowerMarker: an integrated analysis
environment for genetic marker analysis. Bioinformatics
21(9):2128–2129
Maccaferri M, Sanguineti MC, Donini P, Tuberosa R (2003)
Microsatellite analysis reveals a progressive widening of
the genetic basis in the elite durum wheat germplasm.
Theor Appl Genet 107:783–797
Malkov, K (1906) Description of the local winter wheats.
Works of the state agricultural experimental station in
Sadovo. Cooperative ed. Plovdiv. No. 1
Medini M, Hamza S, Rebai A, Baum M (2005) Analysis of
genetic diversity in Tunisian durum wheat cultivars and
related wild species by SSR and AFLP markers. Genet
Crop Evol 52:21–31
Melnikova NV, Ganeva GD, Popova Z, Landjeva SP, Ku-
dryavtsev AM (2007) The geographical distribution of
allelic variants of gliadin blocks in Bulgarian landraces of
durum wheat. In: Kunah VA (ed) Proc Conference
‘‘120 years Vavilov MI’’, 09. 2007 Kiev, pp 145–148
Messele T (2001) Multidisciplinary approach in estimating
genetic diversity of Ethiopian tetraploid wheats (Triticumturgidum) landraces. PhD thesis, Wageningen University,
The Netherlands
Peakall R, Smouse PE (2006) GENALEX 6: genetic analysis in
Excel. Population genetic software for teaching and
research. Mol Ecol Notes 6:288–295
Popova Z (2005) Status of durum wheat collection in Sadovo,
Bulgaria. In: Merchinkov N (ed) Balkan scientific con-
ference, Breed and Cultural Pract. of the Crops, 2. VI,
2005, Karnobat, pp 252–254
Popova C, Bozilova E (1998) Palaeoecological and
palaeoethnobotanical data for the Bronze Age in Bulgaria.
In: Stefanovich M (ed) The steps of James Harvey Gaul.
James Harvey Gaul foundation, Sofia, V1, pp 391–397
284 Genet Resour Crop Evol (2010) 57:273–285
123

Roder MS, Plaschke J, Konig SU, Borner A, Sorrels ME,
Tanksley SD et al (1995) Abundance, variability and
chromosome location of microsatellites in wheat. Mol
Genet 246:327–333
Roder MS, Korzun V, Wendehake K, Plaschke J, Tixer M-H,
Leory P, Ganal MW (1998) A microsatellite map of
wheat. Genetics 149:2007–2023
Roder MS, Wendehake K, Korzun V, Bredemeijer G, Laborie
D, Bertrand L, Isaac P, Rendell S, Jackson J, Cooke RJ,
Vosman B, Ganal MW (2002) Construction and analysis
of microsatellite-based database of European wheat cul-
tivars. Theor Appl Genet 106:67–73
Rogowsky PM, Guidet FL, Langridge P, Shepherd KW,
Koebner RMD (1991) Isolation and characterisation of
wheat-rye recombinants involving chromosome arm 1DS
of wheat. Theor Appl Genet 82:537–544
Rohlf FJ (2005) Numerical taxonomy and multivariate analysis
system. NTSYS version 2.11X. Applied Biostatistics Inc,
New York
Roussel V, Koenig J, Beckert M, Balfourier F (2004) Molec-
ular diversity in French bread wheat accessions related to
temporal trends and breeding programmes. Theor Appl
Genet 108:920–930
Srivastava JP, Damania AB, Pecceti L (1988) Landraces, prim-
itive forms and wild progenitors of macaroni wheat,
Triticum durum: their use in dryland agriculture. In: Miller
TE, Koebner RMD (eds) Proc. 7th Int. Wheat Genet. Symp.
Oxford University Press, England, pp 153–159
Tautz D, Renz M (1984) Simple sequences are ubiquitous
repetitive components of eukaryotic genomes. Nucl Acids
Res 12:4127–4138
Tautz D, Trick M, Dover GA (1986) Cryptic simplicity in
DNA is a major source of genetic variation. Nature
322:652–656
Todorovska E, Christov N, Milkova V, Fasoula D, Ioannides I,
Jacquemin JM, Bojinov B, Atanassov A. (2004) Genetic
diversity assessment among Bulgarian and western
European wheat germplasm collections using
microsatellite markers. In: Vollmann J, Grausgruber H,
Ruckenbauer P (eds) Genetic variation for plant breeding,
Proceedings of the 17th EUCARPIA General Congress,
8–11 September 2004, Tulln, Austria. BOKU—University
of Natural Resources and Applied Life Sciences, Vienna,
Austria, p 142
Todorovska E, Abumhadi N, Kamenarova K, Jeleva D, Kost-
ova A, Christov N, Alexandrova N, Jacquemin J-M, Anzai
H, Nakamura C, Atanassov A (2005) Biotechnological
approaches for cereal crops improvement Part II: use of
molecular markers in cereal breeding. Biotechnol &
Biotechnol Eq 19(3):91–104
Tsvetkov S (1992) Utilization of short-stemmed common
wheat, Tom Pouce Blanc for common and durum wheat
breeding: I. Analysis in F1 and F2. Wheat Information
Service 75:31–35
Vavilov NI (1951) Phytogeographic basis of plant breeding.
The origin, variation, immunity and breeding of cultivated
plants. Chronica Bot 13:1–366
Vavilov NI (1966) Izbrannye sochineniya. Genetika i sele-
ktsiya [Selected works. Genetics and Breeding]. Kolos,
Moscow (in Russian)
Wang Z, Weber JL, Zhong G, Tanksley SD (1994) Survey of
plant short tandem DNA repeats. Theor Appl Genet 88:1–6
Wang HY, Wei YM, Yan ZH, Zheng YL (2007) EST_SSR
DNA polymorphism in durum wheat (Triticum durum L.)
collections. J Appl Genet 48:35–42
Yanev A (2006) Mutant durum wheat development in Bul-
garia. Plant mutant reports 1:23–24
Yifru T, Hammer K, Huang XQ, Roder MS (2006a) Analysis
of microsatellite diversity in Ethiopian tetraploid wheat
landraces. Genet Resour Crop Evolution 53:1115–1126
Yifru TY, Hammer K, Huang XQ, Roder MS (2006b) Regional
patterns of microsatellite diversity in Ethiopian tetraploid
wheat accessions. Plant Breed 125:125–130
Zhukovsky PM (1964) Cultivated plants and their relatives.
Kolos, Leningrad, USSR, (in Russian)
Genet Resour Crop Evol (2010) 57:273–285 285
123