genealogical relationships between early medieval and modern inhabitants of piedmont
TRANSCRIPT

RESEARCH ARTICLE
Genealogical Relationships between EarlyMedieval and Modern Inhabitants ofPiedmontStefania Vai1‡, Silvia Ghirotto2‡, Elena Pilli1, Francesca Tassi2, Martina Lari1,Ermanno Rizzi3, Laura Matas-Lalueza4, Oscar Ramirez4, Carles Lalueza-Fox4,Alessandro Achilli5, Anna Olivieri6, Antonio Torroni6, Hovirag Lancioni5,Caterina Giostra7, Elena Bedini8, Luisella Pejrani Baricco9, Giuseppe Matullo10,Cornelia Di Gaetano10, Alberto Piazza10, Krishna Veeramah11, Patrick Geary12,David Caramelli1, Guido Barbujani2*
1 Dipartimento di Biologia Evoluzionistica, Università di Firenze, 50122 Florence, Italy, 2 Dipartimento diScienze della Vita e Biotecnologie, Università di Ferrara, 44121 Ferrara, Italy, 3 Institute for BiomedicalTechnologies, National Research Council, 20090 Segrate, Milan, Italy, 4 Institut de Biologia Evolutiva,CSIC-UPF, Barcelona 08003, Spain, 5 Dipartimento di Chimica, Biologia e Biotecnologie, Università diPerugia, 06123 Perugia, Italy, 6 Dipartimento di Biologia e Biotecnologie “L. Spallanzani”, Università diPavia, 27100,Pavia,Italy, 7 Dipartimento di Storia, Archeologia e Storia dell’arte, Università Cattolica delSacro Cuore, 20123 Milano, Italy, 8 Anthropozoologica L.B.A. s.n.c., 57123 Livorno, Italy, 9 Soprintendenzaper i Beni Archeologici del Piemonte, 10122 Turin, Italy, 10 Human Genetics Foundation, 10125 Turin, Italy,11 Department of Ecology and Evolution, State University of New York, Stony Brook, New York 11794–5245, United States of America, 12 School of Historical Studies, Institute for Advanced Study, Princeton,New Jersey 08540, United States of America
‡ These authors contributed equally to this work.* [email protected]
AbstractIn the period between 400 to 800 AD, also known as the period of the Barbarian invasions,
intense migration is documented in the historical record of Europe. However, little is known
about the demographic impact of these historical movements, potentially ranging from negli-
gible to substantial. As a pilot study in a broader project on Medieval Europe, we sampled
102 specimens from 5 burial sites in Northwestern Italy, archaeologically classified as be-
longing to Lombards or Longobards, a Germanic people ruling over a vast section of the Ital-
ian peninsula from 568 to 774. We successfully amplified and typed the mitochondrial
hypervariable region I (HVR-I) of 28 individuals. Comparisons of genetic diversity with other
ancient populations and haplotype networks did not suggest that these samples are hetero-
geneous, and hence allowed us to jointly compare them with three isolated contemporary
populations, and with a modern sample of a large city, representing a control for the effects
of recent immigration. We then generated by serial coalescent simulations 16 millions of ge-
nealogies, contrasting a model of genealogical continuity with one in which the contempo-
rary samples are genealogically independent from the medieval sample. Analyses by
Approximate Bayesian Computation showed that the latter model fits the data in most
cases, with one exception, Trino Vercellese, in which the evidence was compatible with per-
sistence up to the present time of genetic features observed among this early medieval pop-
ulation. We conclude that it is possible, in general, to detect evidence of genealogical ties
PLOS ONE | DOI:10.1371/journal.pone.0116801 January 30, 2015 1 / 19
OPEN ACCESS
Citation: Vai S, Ghirotto S, Pilli E, Tassi F, Lari M,Rizzi E, et al. (2015) Genealogical Relationships be-tween Early Medieval and Modern Inhabitants ofPiedmont. PLoS ONE 10(1): e0116801. doi:10.1371/journal.pone.0116801
Academic Editor: Francesc Calafell, UniversitatPompeu Fabra, SPAIN
Received: July 7, 2014
Accepted: December 16, 2014
Published: January 30, 2015
Copyright: © 2015 Vai et al. This is an open accessarticle distributed under the terms of the CreativeCommons Attribution License, which permits unre-stricted use, distribution, and reproduction in any me-dium, provided the original author and source arecredited.
Data Availability Statement: All ancient sequencesare available in Genbank, accession numbersKP137645-KP137672. All modern sequences areavailable in Genbank, accession numbersKP151653-KP151874.
Funding: This work was supported by the Italian Min-istry for Universities and Research (MIUR), PRIN2012 funds to DC, AA, ATand GB, FIRB funds “Fu-turo in Ricerca” 2008 (RBFR08U07M) and 2012(RBFR126B8I) to AA, AO and ER; Compagnia di SanPaolo, Turin to DC; the Anneliese Maier ResearchAward of the Alexander von Humboldt Foundationand the German Federal Ministry for Education and

between medieval and specific modern populations. However, only seldom did mitochondri-
al DNA data allow us to reject with confidence either model tested, which indicates that
broader analyses, based on larger assemblages of samples and genetic markers, are
needed to understand in detail the effects of medieval migration.
IntroductionFew topics in European history are as controversial and disputed as the Barbarian migrationsinto the Roman world at the end of Antiquity. Historians have debated for centuries the magni-tude, nature, and impact of the movement of populations from the borders of the Roman Em-pire into its heart between the fifth and seventh centuries, a movement that brought theRomanWorld to an end and led to the foundation of Barbarian kingdoms that are perceived asthe precursors of modern nations [1].
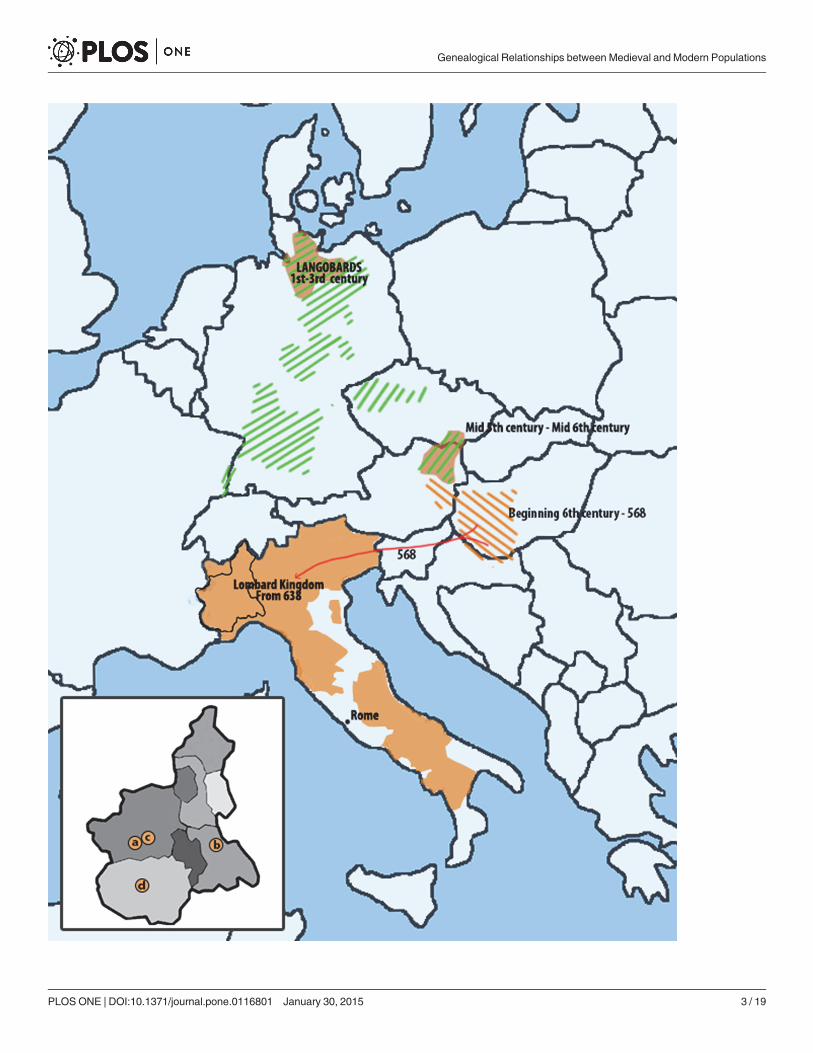
One of these kingdoms was that of the Lombards. According to written sources, Lombards(sometimes known as Longobards) were a Germanic people originally settled on lower Elbeduring the first century, who moved into Pannonia (a region encompassing modern day West-ern Hungary, Czech Republic and Eastern Austria) in the fifth and sixth centuries and then toItaly where they ruled on a large territory from 568 to 774 (Fig. 1). Archeologists commonlyidentify certain grave goods, settlement patterns, and burial customs as typically Lombard(though this is a matter of great debate, see [1,2,3] (but also [4]), thus suggesting a possiblemigration route from Northern Germany into Italy, and its approximate timing, the latter in-ferred from the appearance of these cultural markers in the new territories.
Traditional sources of information (i.e. written and archeological) are unable to answerquestions with regard to the impact of these putative migrations upon previously-settledpopulations, or the nature of these migrations themselves. The earliest sources are written ex-clusively by Romans who lacked firsthand knowledge of the Lombards, while the most elabo-rate account of the Lombards, that of Paul the Deacon (ca. 720 – ca. 799), was written over twocenturies after the events it claims to narrate, thus presenting a highly subjective image of thesecomplex processes [5]. In addition, the archaeological material, albeit abundant, is generallyambiguous. Material culture is open to widely different interpretations, and in particular it isunclear whether and to what extent attributes such as grave goods and burial traditions are in-dicators of ethnic and social identity. Moreover, the question of whether the spread of thesematerial markers across Europe during time is actually linked to population movements ratherthan to a cultural diffusion of practices remains open.
In this regard the parallel analysis of biological data (in particular genetic) from past andpresent populations alongside archaeological and historical information has the potential toprovide us with a better understanding of human population history (for example [6,7,8,9]).Modern-day European genomes appear to be made up of a mosaic of sequence fragments withgenetically distinct ancestral origins [10], indicating a complex network of interactions betweenpast populations, perhaps resulting from a mix of short- and long-range population move-ments, followed by extensive local gene flow [11]. Unfortunately, as genealogical evolution ishighly stochastic, it can be difficult to quantitatively associate modern genomic variation withspecific demographic events, especially in the recent past, and thus few studies have attemptedto address questions about human migrations in the historical era using genetic data frommodern individuals.
Genealogical Relationships between Medieval and Modern Populations
PLOS ONE | DOI:10.1371/journal.pone.0116801 January 30, 2015 2 / 19
Research to PG; FEDER and Spanish Governmentgrant BFU2012-34157 to CLF; European ResearchCouncil (ERC Advanced Grant No. 295733 “LanGe-Lin”) to GB. The funders had no role in study design,data collection and analysis, decision to publish, orpreparation of the manuscript.
Competing Interests: David Caramelli is a memberof the PLOS ONE editorial board, which does notalter the authors’ adherence to PLOS ONE Editorialpolicies and criteria; also, Elena Bedini is employedby a company, Anthropozoologica L.B.A. s.n.c., Li-vorno, Italy, which does not alter the authors’ adher-ence to PLOS ONE policies on sharing data andmaterials.
Genealogical Relationships between Medieval and Modern Populations
PLOS ONE | DOI:10.1371/journal.pone.0116801 January 30, 2015 3 / 19

The analysis of DNA from specimens thought to originate from a particular historicalpeople (i.e. ancient DNA or aDNA) has the potential to significantly increase the power ofsuch inferences. However, due to substantial technical hurdles with regard to DNA degradationand contamination, such analysis has previously been scarce, and no ancient DNA data is yetavailable from putative Lombards or any other Barbarian population. Fortunately, the abilityto extract aDNA is improving at a rapid rate. Given these advances and the rich historical in-formation potentially contained within aDNA, a broad project has been initiated that will at-tempt to extract and analyze aDNA from samples coming from several necropolisestraditionally identified by cultural anthropologists as Lombard as well as neighboring necropo-lises traditionally seen as non-Lombard in Europe, with the first results for samples fromNorthwestern Italy presented here. No claim is being made concerning the ethnic identity ofthese early medieval populations, ethnicity being in any case a function of culture and not ofgenetics.
In particular, Italy is interesting because of its substantial genetic and linguistic diversity,which has been related by various authors to numerous demographic events involving popula-tions from the pre-classic period [12,13,14,15]. Previous studies on ancient human DNA fromItaly showed that both genealogical continuity and discontinuity can be recognized in differentregions [6,8,9,16].
In this study we attempt to extract DNA from 102 samples from different early medievalsites in the Piedmont region spanning the sixth to the eighth centuries. In recent years, inten-sive archaeological surveys have been carried out focusing on the medieval contexts of this re-gion, followed by careful studies of cultural, material, and anthropological remains, includingpalaeogenetic analysis, already presented as preliminary results [17,18]. We then target the hy-pervariable region I of mitochondrial DNA (hereafter: HVR-I) and analyze the resulting dataalongside similar data from modern populations collected from the same geographic locationsin order to test different demographic scenarios, ranging from one in which the medieval pop-ulation comprises the majority of the current population’s ancestors, to one in which the medi-eval and modern populations are genetically independent.
Materials and Methods
DNA extraction and characterization of ancient samplesDNA extraction was attempted on 102 bone specimens (83 from Turin, 7 from Cuneo and12 from Alessandria territories) from five early medieval contexts, archeologically defined as“Lombard”: Rivoli Corso Levi [19], Rivoli La Perosa [20], Mombello Monferrato [21,22], Col-legno [19,23] and Centallo San Gervasio [24,25] (Table 1, where the GenBank accession num-bers of their control-region sequences are reported). These specimens belong to DirezioneRegionale per i Beni culturali del Piemonte, Soprintendenza per i Beni Archeologici del Pie-monte e del Museo Egizio, Turin, which can be contacted to ask for access to the samples; thepermit to analyze them was granted by a letter, protocol N MBAC-SBA-PE UFFPROT00554324/05/2012, CI34.04.07/74.1 of May 24th, 2012, signed by the superintendent, Dr. EgleMicheletto. In Italy, no ethical committee is required to authorize studies on ancient samples.The experts who analyzed the specimens, CG, EB and LPB, are among the authors of thisstudy, and an appropriate written informed consent was obtained from each of them. The
Figure 1. Map representing the Lombard kingdom in Italy (amber) and other areas of Europe in which cultures putatively related with Lombardshave been described (shaded areas). Piedmont localities where the ancient samples were excavated in the inset: a., Rivoli; b., Mombello Monferrato; c.,Collegno; d., Centallo.
doi:10.1371/journal.pone.0116801.g001
Genealogical Relationships between Medieval and Modern Populations
PLOS ONE | DOI:10.1371/journal.pone.0116801 January 30, 2015 4 / 19

collection and the analysis of their mtDNA was approved by the Ethics Committee for ClinicalExperimentation at the University of Pavia, Board minutes of April 11th, 2013.
All the specimens were represented by compact bone tissue; teeth were available only for asubset of the individuals, and most of them did not appear suitable for analysis because of rootdamages due to fractures and/or pathologies. Most of the specimens were not washed or ma-nipulated in any way; complete information on the handling history of each specimen is avail-able. HVS-1 sequences of all the archaeologists and the geneticists who have been in contact
Table 1. Samples analyzed by locality and their results.
Site (Province) Age N° ofsamplesanalyzed
N° of samplestyped for HVR-I
Samplecode
GenBankaccessionaumber
HVR-I motif16024–16384(−16000)
Haplogroup /Subhaplogroup
Rivoli, Corso Levi(Turin)
VII-VIII c. 37 9 riv22 KP137645 284G 294T H6a1b1
riv25s1 KP137646 126C 294T T
riv25s2 KP137647 069T 126C J
riv68 KP137648 129A 356C U4
riv70 KP137649 CRS H
riv85 KP137650 CRS H
riv90 KP137651 051G 129C256T
U2e1
riv103 KP137652 129A 256T 270T294T
U5a1b1e
riv116 KP137653 CRS H
Rivoli, La Perosa(Turin)
VI-VIII c. 10 4 per4 KP137667 362C H
per3F KP137668 114A 192T 256T270T 294T
U5a2a
per9F KP137669 311C H2b
per36 KP137670 CRS H
MombelloMonferrato(Alessandria)
VI-VII c. 12 5 mom7 KP137654 CRS H
mom9–1 KP137655 093C 126C153A
T2e
mom16 KP137656 293G 311C H24
mom20 * KP137657 069T 126C231C 311C
J2a2c
mom21–1 KP137658 069T 126C J
Collegno (Turin) I phase: 570–650 IIphase: 650–700 IIIphase: VIII c.
36 8 lonI4 KP137659 145A 223T325C 362C
I2a
lonI41 KP137660 235G H2a2b1
lonI48 KP137661 293G 311C H24
lonI63 KP137662 126C 153A183C 189C294T
T2e
lonII54 KP137663 069T 126C153A
J
lonIII2 KP137664 311C H2b
lonIII20 KP137665 CRS H
lonIII34 * KP137666 256T 270T 294T U5a1b1e
Centallo, SanGervasio (Cuneo)
VI-VII c. 7 2 cenII1 KP137671 311C H2b
cenII39 * KP137672 069T 126C J
HVR-I motifs relative to the CRS [29] are presented only for samples that gave results from at least two independent extractions. Samples marked with *
were analyzed a third time in Barcelona.
doi:10.1371/journal.pone.0116801.t001
Genealogical Relationships between Medieval and Modern Populations
PLOS ONE | DOI:10.1371/journal.pone.0116801 January 30, 2015 5 / 19

with the samples were determined in order to help identify possible sources of modern contam-ination. DNA extraction and amplification was performed in the Ancient DNA-PalaeogeneticLaboratory in Florence. This facility is exclusively dedicated to examining ancient DNA. Labo-ratory rooms for Pre- and Post-PCR work are strictly separated and the work was carried outwhile wearing clean overalls, disposable facemasks, face shields, gloves and over-shoes. Differ-ent sets of pipettes were used for DNA extraction, PCR amplification and analysis of the PCRproducts. All benches and rooms were routinely treated with bleach and UV-irradiated. Inorder to identify potential contamination, at least one extraction or amplification blank everyfive samples was routinely used as negative control. The specimens were cleaned by removingthe external surface with a micro-drill Marathon Multi 600 with disposable tools, UV-irradiat-ed (254nm wavelength) in a cross-linker on each side for 45 minutes and subsequently groundinto a fine powder with the micro-drill. DNA was extracted from bone powder by means of asilica-based protocol [26]. Two ml of extracted DNA was used for amplification of the HVR-Iregion by PCR [6 modified by using a polymerase with proofreading activity]. Three primerpairs (L15995-H16132, L16107-H16261, L16247-H 16402) were used to target a subdivided361 bp of the HVR-I via three overlapping fragments.This process was repeated for specimensreporting positive HVR-I result using a second anatomical element and a different silica-basedDNA extraction protocol [27]. A third anatomical element for 3 samples was also independent-ly examined in the Paleogenomic Lab of the Institut de Biologia Evolutiva in Barcelona. In thissecond laboratory, samples were extracted with a phenol-chlorophorm-based method [28] andthe HVR-I was amplified using two sets of overlapping primers: L16055-H16218 and L16185-H16378.
All PCR products were cloned using TOPO TA Cloning Kit (Invitrogen) according to themanufacturer’s instructions. Screening of white recombinant colonies was accomplished byPCR [6] and agarose gel electrophoresis. After purification of these PCR products, a volume of3 ml was cycle-sequenced using Forward M13 universal primer following the BigDye Termina-tor v1.1 Cycle Sequencing Kit (Applied Biosystems) supplier’s instructions. The sequence wasdetermined using an Applied BioSystems 3100 DNA sequencer. Different clones were se-quenced for each individual from whom there were two or three extractions (S1 Fig.). HVR-Isequences were then aligned and compared across clones in order to define the consensus se-quence. This consensus sequence was compared to the Cambridge Reference Sequence, CRS[29] in order to define the HVR-I mutational motif. Haplogroup assignment was carried outusing the software HaploGrep [30] (http://haplogrep.uibk.ac.at) with a further check based onthe mitochondrial haplogroup phylogeny in Phylotree [31] (http://www.phylotree.org).
DNA extraction and characterization of the researchersMtDNA genotypes of all experts who handled the ancient samples were determined. After theinformed consent of all donors, epithelial cells were collected from the mucosa on both sides ofthe oral cavity using FLOQSwabs forensic buccal swabs, DNA free (Copan flock technologies).DNA extraction as well as PCR and sequencing reaction setup involving modern samples wascarried out in a laboratory that was physically separated from the laboratory where the ancientsamples were analyzed. DNA was extracted using QIAmp DNA Investigator Kit (QIAGEN,Hagen, Germany) and the HVR-I was amplified by 28 cycles of PCR as reported in [32]. Theentire mtDNA HVR-I region was amplified using a single primer pair named L15995-H16402.The amplification products were purified with the MinElute PCR purification Kit (Qiagen)and then sequenced directly with the same amplification primers (forward and reverse) follow-ing the BigDye Terminator v1.1 Cycle Sequencing Kit supplier’s instructions.
Genealogical Relationships between Medieval and Modern Populations
PLOS ONE | DOI:10.1371/journal.pone.0116801 January 30, 2015 6 / 19

DNA extraction and characterization of modern samplesThe 75 samples from Trino Vercellese were collected in 1994 from individuals belonging to theAssociation “Partecipanza dei boschi”, whose members have been transmitting their member-ship from generation to generation since the Middle Age, and therefore have been settled in thesame archaeologically important area for at least 20–30 generations; the 89 samples fromPostua, also collected in 1994, were from individuals with Piedmontese surnames (and for thisreason living in the same area for many generations) with the purpose to act as controls for theprevious sample. The Authors involved in the collection were AP, GM and CDG. The samplesof Trino and Postua are used only for research purposes and their individual informed con-sents collected by the Authors above were approved by the Ethics Committee of the Universityof Turin. The 58 subjects from Val di Susa were unrelated on the maternal line for at least threegenerations. Also in this case, for all of them, appropriate written informed consent was ob-tained, and the study was approved by the Ethics Committee of the University of Turin. Thestudy of mtDNA variation of all these 222 Piedmontese samples was approved by the EthicsCommittee for Clinical Experimentation at the University of Pavia, Board minutes of April11th, 2013. The samples were anonymized prior to being accessed by the authors. Details aboutthese samples, including the GenBank accession numbers of their control-region sequences,are available in S1 Table.
Dataset of modern and ancient sequences for comparisonsPreviously published and unpublished data were compiled to produce a dataset consisting of7,249 sequences for 74 modern and 5 ancient populations, in order to test if the entire medievalsample could be considered a homogenous group. The dataset also comprised sequences fromthe Piedmont region that could be used in direct pairwise comparisons with our medieval sam-ples in order to test for population/genealogical continuity in the region. In addition to the 222modern individuals from Trino Vercellese, Postua and Val di Susa mentioned above, also 50sequences from Turin, a putatively cosmopolitan population were included in the ApproximateBayesian Computation analysis in order to account for the potential effects of recent immigra-tion [33] (S2 Table).
Phylogenetic and population analysisThe evolutionary relationships of medieval and modern samples were investigated throughmedian-joining networks of control-region haplotypes constructed with the Network 4.6 soft-ware (www.fluxus-engineering.com) [34] by using the reduced median algorithm (r = 2), fol-lowed by the median-joining algorithm (ε = 0). Nucleotide weighting (o) was adjusted toreflect well-known phylogenetic data: i) the C-stretch between 19182 and 19193 was downweighed; ii) all samples were grouped into four major clusters corresponding to macro-hap-logroups HV, UK, JT and IWX, based onto haplogroup classification reported in S1 Table. Theconsensus medieval sequences were compared with a dataset of 79 modern and ancient popu-lations from Europe, North Africa, Near East and Central Asia. Variability at the intra-popula-tion level was investigated using Arlequin 3.5.1.2 [35] by calculating haplotype diversity (orheterozygosity) and mean number of pairwise differences (MPWD) (S2 Table). A matrix ofpairwise φST distances (equivalent to an FST also considering molecular distances between al-leles) was estimated using the Kimura-2p model [36] using the same software, and a Multidi-mensional Scaling plot was obtained from that matrix using the R MASS package [37].
Genealogical Relationships between Medieval and Modern Populations
PLOS ONE | DOI:10.1371/journal.pone.0116801 January 30, 2015 7 / 19
Approximate Bayesian Computation analysisWe used an Approximate Bayesian Computation (ABC) framework [38] in order to investigatethe genealogical and evolutionary relationships among the medieval and modern Piedmontpopulations. ABC utilizes simulations in order to assess the probability of data given a particu-lar model and associated parameters (often in the absence of a tractable likelihood equation)[39]. Our ABC procedure [9] can be summarized as follows: 1 million genetic datasets are gen-erated with the same features of the observed one (i.e. number of individuals, age of the sam-ples, length of the sequences) by coalescent simulation for each demographic model underinvestigation (for a total of 16 million genealogies), drawing model parameters from the associ-ated prior distributions. The patterns of genetic variation in the observed and simulated dataare then compared via Euclidean distance using a set of summary statistics. Only the simula-tions generating summary statistics close to the observed ones (i.e. those associated with theshortest Euclidean distances), are then considered to estimate the posterior probabilities of thevarious models and parameters. For model comparison we used both the acceptance-rejectionprocedure (AR, [40] ) and the weighted multinomial logistic regression procedure (LR, [39]).Under the AR approach, the posterior probability of a model is obtained by considering only acertain number of “best” simulations, and then simply counting the proportion of these simu-lations that have been generated by each model under investigation. This method can be con-sidered reliable only when applied to simulations (usually few) showing an excellent fit withthe observed data (i.e. few hundreds, [41]). Alternatively, under the LR method, a logistic re-gression is fitted where the model is the categorical dependent variable and the summary statis-tics are the predictive variables (thus taking into account that some “best” simulations arecloser to the observed data than others). The regression is local around the vector of observedsummary statistics, and the probability of each model is finally evaluated in the point corre-sponding to the observed vector of summary statistics. The β coefficients of the regressionmodel are estimated by maximum likelihood; the standard error of the estimates is taken as ameasure of the accuracy of the method. To evaluate the stability of the so calculated models’posterior probabilities we considered different thresholds, i.e. different number of retained sim-ulations (100, 200, 300, 400, 500 best simulations for AR; 25000, 50000, 75000, 100000,125000, 150000 best simulations for LR). Model parameters were estimated by a locally weight-ed multivariate regression [38] after a logtan transformation [42] of the 1,000 best-fitting simu-lations from a specific model. The models’ posterior probabilities were estimated using Rscripts from http://code.google.com/p/popabc/source/browse/#svn%2Ftrunk%2Fscripts, mod-ified by SG.
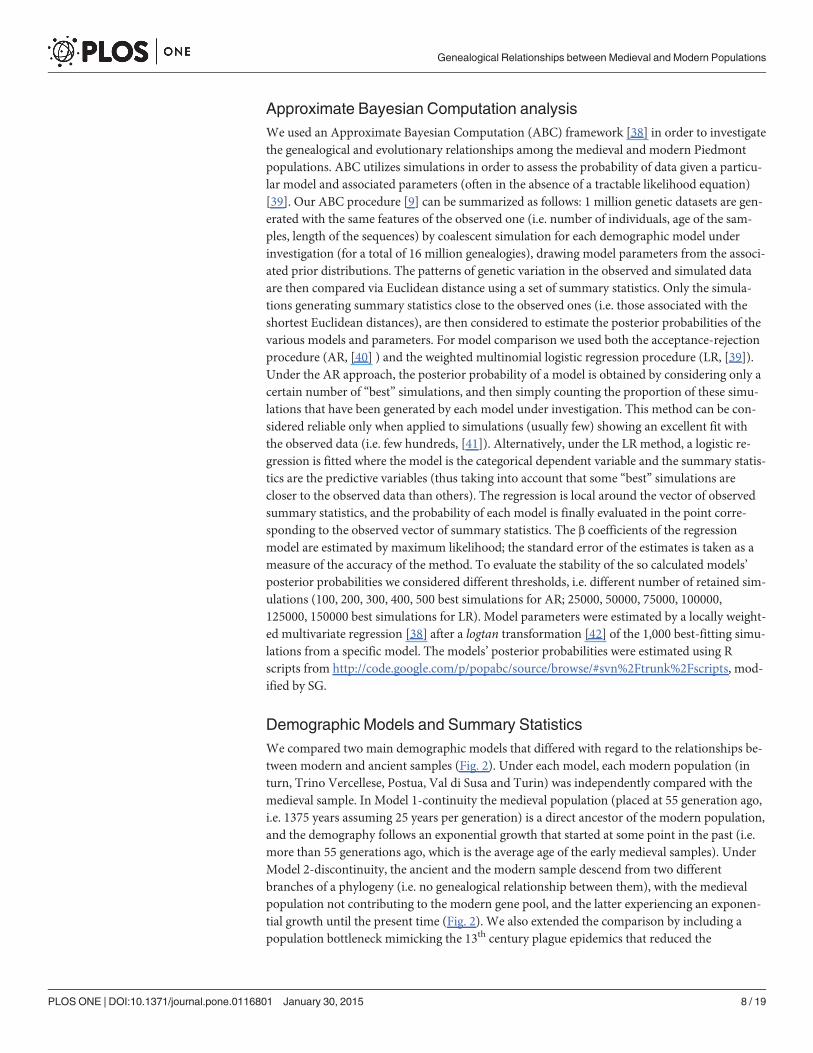
Demographic Models and Summary StatisticsWe compared two main demographic models that differed with regard to the relationships be-tween modern and ancient samples (Fig. 2). Under each model, each modern population (inturn, Trino Vercellese, Postua, Val di Susa and Turin) was independently compared with themedieval sample. In Model 1-continuity the medieval population (placed at 55 generation ago,i.e. 1375 years assuming 25 years per generation) is a direct ancestor of the modern population,and the demography follows an exponential growth that started at some point in the past (i.e.more than 55 generations ago, which is the average age of the early medieval samples). UnderModel 2-discontinuity, the ancient and the modern sample descend from two differentbranches of a phylogeny (i.e. no genealogical relationship between them), with the medievalpopulation not contributing to the modern gene pool, and the latter experiencing an exponen-tial growth until the present time (Fig. 2). We also extended the comparison by including apopulation bottleneck mimicking the 13th century plague epidemics that reduced the
Genealogical Relationships between Medieval and Modern Populations
PLOS ONE | DOI:10.1371/journal.pone.0116801 January 30, 2015 8 / 19
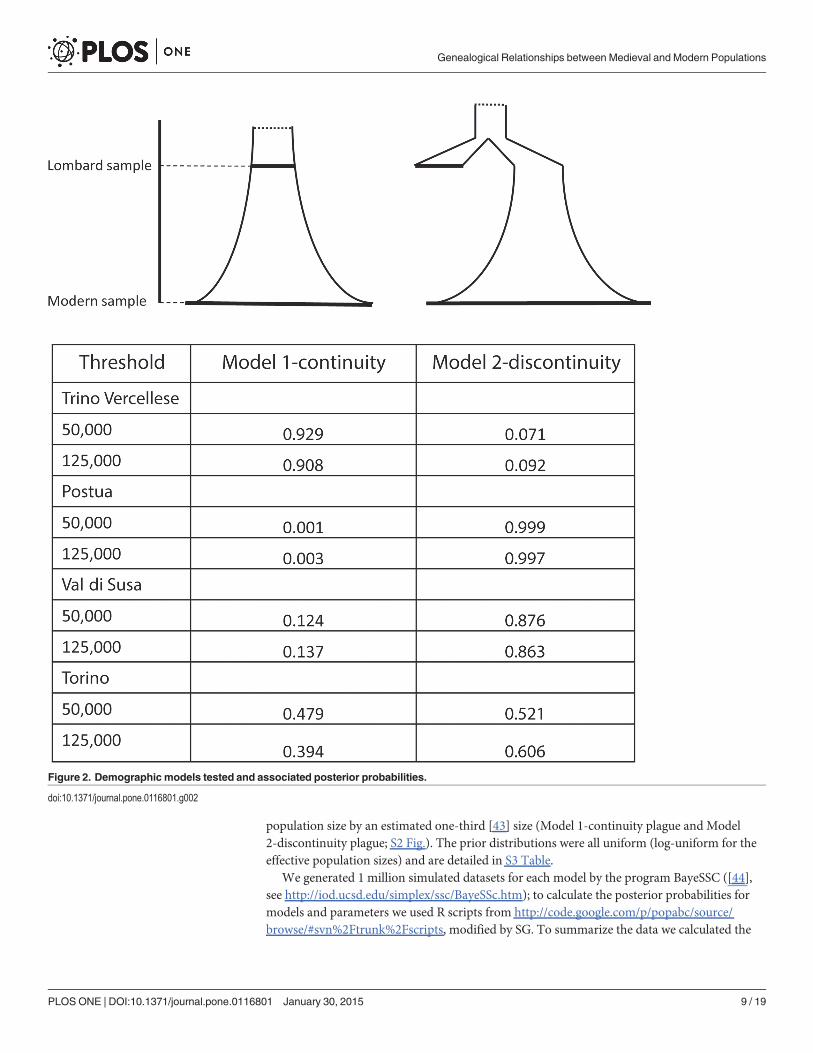
population size by an estimated one-third [43] size (Model 1-continuity plague and Model2-discontinuity plague; S2 Fig.). The prior distributions were all uniform (log-uniform for theeffective population sizes) and are detailed in S3 Table.
We generated 1 million simulated datasets for each model by the program BayeSSC ([44],see http://iod.ucsd.edu/simplex/ssc/BayeSSc.htm); to calculate the posterior probabilities formodels and parameters we used R scripts from http://code.google.com/p/popabc/source/browse/#svn%2Ftrunk%2Fscripts, modified by SG. To summarize the data we calculated the
Figure 2. Demographic models tested and associated posterior probabilities.
doi:10.1371/journal.pone.0116801.g002
Genealogical Relationships between Medieval and Modern Populations
PLOS ONE | DOI:10.1371/journal.pone.0116801 January 30, 2015 9 / 19

following six statistics using Arlequin ver. 3.5.1.2 [37]: the number of haplotypes for each pop-ulation, the number of private polymorphic sites per population, the mean pairwise differenceand gene diversity for each population, Hudson’s FST [45] and a measure of allele sharing, de-fined as the number of haplotypes of the modern sample also present in the ancient sample,scaled by the total number of haplotypes in the latter (S4 Table).
Type I Error and ROC analysisWe estimated the probability to reject the true null hypothesis (i.e Type I Error), by evaluatingthe proportion of cases in which 1,000 pseudo-observed datasets (PODs) randomly generatedunder each model were not correctly identified by the ABC analysis (both AR and LR proce-dures, 100 and 50,000 retained simulations in turn). The power of the model choice procedurewas evaluated using a wide range of decision probability thresholds to identify the support fora specific model, i.e. 0.5, 0.6, 0.7, 0.8, 0.9. In addition, we calculated a receiver operating charac-teristic (ROC) curve, as in Bazin et al. (2010) [46] and Sousa et al. (2012) [47]. The methodranks the 2,000 posterior probabilities (1000 from each model) coming from the Type I Erroranalysis for one model (say, e.g., Model 1-continuity) from the highest to the lowest. For eachof these posterior probabilities we know whether or not the data are generated by Model 1-continuity. At this point, the proportion of true and false positives is evaluated for decreasingthresholds, and the ROC curve is built as follows: first, we consider a posterior probability of1.0 as the threshold for deciding whether to classify the data as coming from Model 1-continui-ty, having a proportion 0.0 of the simulated Model 1-continuity cases correctly classified (truepositives), but also a proportion 0.0 of Model 2-discontinuity cases incorrectly classified (falsepositives). This represents the lower-left corner point of the ROC curve. Then we set 0.0 as thethreshold, and we have a proportion of 1.0 of all the Model 1-continuity PODs classified cor-rectly (true positives) and a proportion 1.0 of all the Model 2-discontinuity PODS incorrectlyclassified (false positives). This represents the point on the top right corner of the ROC curve.The remaining curve is then constructed by successively taking the posterior probabilities inthe list from highest to lowest and plotting the proportion of Model 1-continuity cases that arecorrectly classified (true positives) and the proportion of Model 2-discontinuity cases that areincorrectly classified (false positives). The ideal curve is built when all the Model 1-continuitycases occur first in the list (i.e. higher posterior probabilities for the true model), followed by allthe Model 2-discontinuity cases, in which case the area under the ROC curve (AUC) would be1. The ROC analysis was performed with the method implemented in the ROCR R package[48].
Results and DiscussionA total of 361 bp of the mitochondrial HVR-I was successfully sequenced in 28 samples (27%success rate; similar values have been retrieved in other comparable studies or climate condi-tions [6,9,49, 50] (Table 1). These 28 samples showed the same sequence in all amplicons (ex-cept for sporadic misincorporations) and were extracted and amplified at least twice fromdifferent anatomical elements (S1 Fig.). Some differences in misincorporation pattern are pres-ent between the sequences obtained from the third sample in Barcelona and the ones obtainedfrom the first two samples analyzed in Florence. These differences could be due to the differentconditions and treatments the samples were subjected to, to the different extraction methodsand, above all, to the different polymerase used in the PCR reaction. There are good reasons tobelieve that these 28 sequences are genuine: (i) before reaching the Paleogenetic Laboratorymost of the bones were not manipulated in any way, and possible handling could be trackeddown for the other samples; (ii) the sequences were generated following highly stringent
Genealogical Relationships between Medieval and Modern Populations
PLOS ONE | DOI:10.1371/journal.pone.0116801 January 30, 2015 10 / 19

criteria for ancient DNA authentication (see Materials and Methods) (iii) the sequences werecompared with the mtDNAmotifs of the people who worked in the Palaeogenetic Laboratory(S5 Table) and no matches were found except for sequences carrying a 16311 mutation: thismotif is shared between 3 medieval individuals and one of the laboratory operators. To verifythis result, analysis on the second anatomical element was performed by a second operator.The result obtained from this replicate, together with the negative controls results for all thesteps of both experiments suggested this haplotype as genuine; (iv) we performed each experi-ment at least twice, starting from different bones from the same individuals, and the result wasaccepted only if concordance was observed among all (either two or three) independent analy-ses; (v) all sequences make phylogenetic sense, i.e. do not appear to be a combination of differ-ent sequences resulting from contamination by exogenous DNA.
Mitochondrial variation of the samples studiedAmong the 28 medieval individuals sequenced we observed 18 distinct haplotypes with 23 seg-regating sites (S4A Table). Possible relationship between individuals presumed by archaeolo-gists has been verified using genetic data in order to avoid that possible kinship could affect thehaplotypic frequencies. Phylogenetic links between haplotypes and their distribution amongthe archeological sites are shown in a Median Joining Network (Fig. 3A). Comparing our an-cient dataset to the modern haplotypes, the phylogenetic network reported in Fig. 3B revealsthat five haplotypes are shared between medieval and modern samples. The 18 medieval haplo-types encompass almost the entire range of western Eurasian mtDNAmacro-haplogroups(Table 1). Similarly to most modern European populations, haplogroup H is by far the mostrepresented encompassing 50% of mtDNAs, while the remainders are members of I, J, T, U2e,U4 and U5a, all also commonly observed in Europeans [15], including the modern Piedmon-tese populations analyzed in this study (S1 Table).
In the Piedmont medieval sample, gene diversity (0.942) andMean Number of Pairwise Dif-ferences (3.484) are similar to, but both lower than, the average found for the other 79 (ancientand contemporary) populations (mean 0.957 and 4.067 respectively, see S2 Table). Among otherancient populations, estimates of internal genetic variation appear close in the Etruscans (0.943;2.966) [9] and lower in Bronze-age Sardinians (0.830; 1.390) [8], pre-Roman Iberians (gene di-versity not given; 2.120) [51] and in a Medieval sample from Tuscany (0.860; 1.971) [6].
Accordingly, we see no reason to suspect that the early medieval, or “Lombard” individualsmay represent a heterogeneous assemblage of people of different origins, even considering theirvicinity in space and time and their archaeological affinities, and from this point on we felt justi-fied in treating them as a single population. FST distances place Lombards in the middle of thearea in which most of the populations cluster, graphically represented in S3 Fig. by a MDS plot.
We calculated two measures of genetic distance between the medieval and the modern pop-ulations from Trino Vercellese, Postua, Val di Susa and Turin, namely Hudson’s FST and theAllele Sharing (S4B Table). The lowest value of FST and the highest value of allele sharing is be-tween medieval samples and Trino Vercellese, whereas the highest distances from the medievalsamples are with Postua. Postua is the least variable sample: of the 89 individuals analyzed only27 distinct sequences are found, and gene diversity is the lowest among the studied popula-tions, suggesting a likely reduction in population size and thus substantial genetic drift in thispopulation, at least along the maternal line, which may lower power if testing for continuity.The Val di Susa population shows levels of allele sharing with the Lombards similar to thoseobserved for Trino Vercellese but a higher FST, a seemingly contradictory result, possibly dueto the high number of mitochondrial haplotypes, making FST a less-than-optimal descriptor oftheir diversity.
Genealogical Relationships between Medieval and Modern Populations
PLOS ONE | DOI:10.1371/journal.pone.0116801 January 30, 2015 11 / 19

Genealogical Relationships between Medieval and Modern Populations
PLOS ONE | DOI:10.1371/journal.pone.0116801 January 30, 2015 12 / 19

Type I Error and Approximate Bayesian ComputationWe compared Model 1- continuity and Model 2-discontinuity (detailed in Methods) to verifywhether there is enough power in the data to discriminate between them using our ABC ap-proach. S6 Table (top and bottom panels) shows the probability of identifying the true modelwhen data are generated according to either Model 1-continuity or Model 2-discontinuity,both using the AR (100 simulations) and the LR (50,000 simulations) method. The power ofthe analysis was generally high; when the threshold was>0.9 (i.e. support for a model is as-signed when its posterior probability is higher than 90%) the proportion of false positives wasvery low (0.013 at maximum). Furthermore, when the decision probability threshold was 0.5,the probability to recognize the true model was never lower than 96%. The receiver operatingcharacteristic (ROC) curve analysis, shown in Fig. 4, confirmed the good performance of ouranalysis framework. For both the AR and the LR procedures, the ROC curve was close to theupper left corner of the plot, indicating that our ABC analysis efficiently identifies the modelthat generated the data. The capability to correctly predict the true model was also assessedcomparing at the same time Model1, Model2, Model1plague, and Model2plague. Consideringa decision probability threshold of 0.5, the power of our ABC procedure was generally high foreach comparison, with a decrease of power (depending on the model that has to be recognized)for higher decisional thresholds (data not shown).
We then compared the fit of both models to our data, examining the medieval populationalongside each of the four modern populations in separate analyses. We also repeated the anal-ysis including a genetic bottleneck in both models (Model 1-continuity plague and Model 2-discontinuity plague) (S1 File). In all cases models without bottleneck proved to better fit theobserved data than models including the bottleneck (S1 File). Fig. 2 shows the results of thecomparison between Model 1-continuity and Model 2-discontinuity respectively based on thebest-fitting 50,000 and 125,000 simulation experiments, under the LR procedure. We found ev-idence for genealogical continuity since Lombard times between our medieval sample andmodern samples only when considering the population of Trino Vercellese: the posterior prob-ability of Model 1-continuity ranged from 0.90 to 0.93. The principal component analysis(PCA) of the first 10,000 best simulations from each model (i.e. the 10,000 simulation closestto the observed dataset that are generated by each model) actually shows that the point corre-sponding to the observed data falls in the middle of the results obtained simulating genealogicalcontinuity (S4A Fig.). By contrast, for all the other modern populations the best supportedmodel was the one in which the medieval sample represents a separate branch of the genealogi-cal tree, i.e. Model 2-discontinuity. In some cases the probability associated to Model 2-discon-tinuity was consistently very high (Postua, S1 File), whereas in other cases the AR and LRmethods were at odds (Turin, S1 File), or returned quite different probabilities (Val di Susa,S1 File).
PCA plots (S4 Fig.) reflect the same situation. The signal for Val di Susa (S4C Fig.) is indeedquite noisy, and the observed value of Turin falls on the edge of the variation generated byModel 2-discontinuity with a slight overlap with Model 1-continuity (S4D Fig.), again empha-sizing the importance of weighting the simulations with respect to their distance from the ob-served dataset when assigning the models’ posterior probabilities (LR procedure). Even if it is
Figure 3. Median Joining Networks. Node sizes are proportional to haplotype frequencies. Variable positions are indicated along links that connecthaplotypes. Nucleotide changes are specified only in the case of transversions. (A) Median Joining Network for the medieval sample. Different colorsrepresent archaeological sites where the haplotype is present (see legend). Segregating sites are shown in red. (B) Median Joining Network of the ancient(colored in red) and modern samples (Trino Vercellese in grey; Postua in black and Val di Susa in white). Major haplogroups are named according to thecurrent nomenclature.
doi:10.1371/journal.pone.0116801.g003
Genealogical Relationships between Medieval and Modern Populations
PLOS ONE | DOI:10.1371/journal.pone.0116801 January 30, 2015 13 / 19

generally assumed that the logistic regression approach is more reliable than the straightfor-ward acceptance rejection algorithm in estimating posterior probabilities [39], to strengthenthese estimates we also evaluated the AR posterior probabilities for each model in a point cor-responding to twice the standard error associated with the β coefficients of the fitted regressionmodel (in both directions). For the Val di Susa sample the support was confirmed for Model 2-
Figure 4. Receiver operating characteristic (ROC) curve for Model 1-continuity and Model2.Dashed line: Acceptance Rejection approach; solid line:Logistic Regression approach.
doi:10.1371/journal.pone.0116801.g004
Genealogical Relationships between Medieval and Modern Populations
PLOS ONE | DOI:10.1371/journal.pone.0116801 January 30, 2015 14 / 19

discontinuity, whereas for Turin the confidence in the estimated posterior probabilities in-creased with the number of simulations retained, and a stable support for Model 2-discontinu-ity was reached when considering more than 100,000 simulations (data not shown).
These inconsistences in the probabilities estimated at different thresholds are not surprising,considering the ample degree of overlap between the models we were trying to discriminate. Itis probably necessary to analyze more data, both in term of loci and/or individuals, to be ableto reject a model with good statistical confidence. Overall these results, along with the PCAplots of the simulated and observed data (S4 Fig.), support a model in which people of Lom-bard times appear to have contributed little, if at all, to the ancestry of contemporary people inthree localities considered, and presumably over the whole area. There is, however, one re-markable exception, namely Trino Vercellese, where the genetic evidence suggests instead theexistence of genealogical ties across more than 1,500 years. One can speculate that the existencein Trino Vercellese of an association involving essentially all families since medieval timesmight have contributed to maintaining a comparatively high level of genetic continuity. Muchlike in previous ancient DNA analyses, notably in Sardinia [8] and Tuscany [9], this study sug-gests that the modern population is a patchwork of groups with different genealogical histories;instances of clear-cut, long-term genetic continuity, all the way back to the Early Middle Age(as in the case for Trino Vercellese), or even much earlier (as is the case for Sardinia and Tus-cany), exist and can be detected, but seem to represent less the rule than the exception.
ConclusionsWe have demonstrated that aDNA can be successfully extracted from Early Medieval Europeansamples from Northern Italy, and provided the first data concerning the genetic variation in ahuman group defined by material culture as Lombard. This work also provides preliminary in-formation about the correlation between this group and people who inhabit the same geo-graphical area today. In particular there was evidence of genealogical continuity between thismedieval population and the modern sample from Trino Vercellese, a finding that could be atleast in part explained by the particular origin of the samples from Trino Vercellese. They wereall members of the Comunanza dei Boschi, whose membership since medieval times is trans-mitted exclusively from fathers to sons. Such a patrilineal rule of inheritance, along with ourobservation that the mtDNA pool did not change in a significant manner, strongly argue for agenealogical continuity of the Trino population since early Medieval times. For the other mod-ern populations analyzed (Postua, Val di Susa and Turin), the most probable model was theone in which the ancient sample belongs to a separate branch of the genealogical tree. These re-sults were supported by different ABC model selection procedures; Type I error was very low,indicating that there is enough power in our data to distinguish among the models proposed.
Explaining why there is a better fit of models without a bottleneck is a matter of speculationat this stage. One may argue that even a dramatic reduction in population size may have limit-ed genetic consequences if the population is large (e.g., from 10,000 to 1,000 individuals),whereas many alleles will be lost under similar conditions in a small population (e.g. from 100to 10 individuals). Because here we considered Piedmont as a whole, it is conceivable that theblack death plague epidemic, although sharply reducing the overall population size, did nothave a substantial impact upon genetic diversity. In principle, many alternative scenarios, in-corporating other demographic shifts, can be conceived. However, it would be pointless tomodel and test them when, based on the currently available data, it proved so hard just to tellapart continuity from discontinuity.
In this study we have only examined a small portion of mtDNA, a single genetic locus forwhich we can only make very broad generalizations (i.e. maternal continuity vs discontinuity)
Genealogical Relationships between Medieval and Modern Populations
PLOS ONE | DOI:10.1371/journal.pone.0116801 January 30, 2015 15 / 19

and test very simple models (i.e. including just a handful of parameters). To describe morecomplex processes, possibly estimating parameters such as the number of migrating individu-als, the number of migration waves, and the presence of a genetic structure among migrants,we shall require more genetic information from the samples examined here, as well as datafrom other medieval (putatively Lombard and non-Lombard) populations.
To what extent these results fully reflect the demographic history of Piedmont is too early tosay. The analysis of mitochondrial diversity is an admittedly limited, yet usefull, starting pointfor all sorts of broader genetic analyses; if the ancient samples yield little mtDNA, or if there isevidence of extensive contamination, further proceeding in the analysis would be pointless (seee.g. [52]). Therefore, we now know that it is indeed possible to extend the analysis to broadergenomic regions, especially in the nucleus. Preliminary analyses are already in progress, andhave the potential to identify subtler aspects of historical population changes. For that purpose,this study shows that the samples so far considered probably contain sufficient amounts ofamplifiable DNA.
As for our general understanding of the demographic changes accompanying and followingthe collapse of the Roman Empire, it will be crucial to compare the Piedmont samples of thisstudy with the specimens retrieved in European burial sites archaeologically associated withthe Lombard culture. Only then it will be possible to understand the relative weight of migra-tional processes and cultural contacts in the spread of the Lombard culture. In addition, it iscrucial to identify and select a set of modern populations for which extensive historical infor-mation is available. Hence, starting from this first successful description of medieval mtDNAvariability, our aim will be to increase the number of samples covering the entire geographicarea that has putatively been suggested to involve Lombard habitation and migration, and toinvestigate variability along the whole mitochondrial genome variability, the Y chromosomeand at many loci across the autosomes in order to obtain a more powerful resolution of the ge-netic relationship during space and time regarding the migration era.
Supporting InformationS1 Fig. Amplicons of the 28 medieval sequences. DNA sequences from the clones analysedfor the 28 Lombard samples. The Cambridge reference sequence with the numbering of the nu-cleotide positions is at the top. Nucleotides identical to the Cambridge reference sequence areindicated by dots. The clones are identified by a code composed by the necropolis identificationand the burial number (as in Table 1) followed by the number of the extraction (1 and 2 in theFlorence Laboratory, 3 in Barcelona).(PDF)
S2 Fig. Alternative models of the genealogical relationships among past and present popu-lations: Model 1-continuity plague and Model 2-discontinuity plague.(PDF)
S3 Fig. Multidimensional Scaling plot for φST matrix. Populations are labelled as reported inS2 Table.(PDF)
S4 Fig. PCA of the 10,000 best simulations fromModel 1-continuity and Model 2-disconti-nuity. A: Trino Vercellese; B: Postua; C: Val di Susa; D: Turin.(PDF)
S1 File. Models’ posterior probabilities for each comparison for different thresholds.(XLSX)
Genealogical Relationships between Medieval and Modern Populations
PLOS ONE | DOI:10.1371/journal.pone.0116801 January 30, 2015 16 / 19

S1 Table. Control-region haplotypes and haplogroup/sub-haplogroup classification of the222 modern Piedmontese mtDNAs from Trino Vercellese, Postua and Val di Susa.(DOC)
S2 Table. Additional contemporary samples considered in the analyses. Sample size (n),gene diversity and Mean Pairwise Sequence Difference (MPWD) are given.(DOC)
S3 Table. Prior distributions of the simulated models. Some distributions, marked by the as-terisk, are model-specific.(DOCX)
S4 Table. Statistics summarizing intra (A) and inter (B) population genetic diversity. Thesevalues were used in the ABC analysis.(DOCX)
S5 Table. HVR-I motifs of the researchers who had been in contact with the ancient sam-ples.(DOCX)
S6 Table. Type I Error. Top panel: Acceptance-Rejection 100 simulations, Bottom panel: Lo-gistic Regression 50,000 simulations.(DOCX)
AcknowledgmentsWe are indebted to the communities of Trino Vercellese, Postua and Val di Susa, which madepossible this study by generously collaborating with us, and to the Academic Editor, FrancescCalafell, for several useful suggestions.
Author ContributionsConceived and designed the experiments: SV SG AT PG DC GB. Performed the experiments:SV EP ML ER LML OR CLF AA AO GM. Analyzed the data: SV SG FT HL. Contributed re-agents/materials/analysis tools: CG EB LPB GM CDG AP. Wrote the paper: SV SG AT KV PGDC GB.
References1. Pohl W, Erhart P, editors (2005) Die Langobarden. Herrschaft und Identität. Forschungen zur
Geschichte des Mittelalters 9. Wien.
2. Barbiera I (2005) Changing Lands in Changing Memories. Migration and Identity during the Lombard In-vasions. Florence: All’Insegna del Giglio. 189 p.
3. Brather S (2010) Bestattungen und Identitäten. Gruppierungen innerhalb frühmittelalterlicherGesellschaften. In: Pohl W, Mehoffer M, editors. Archaeology of Identity—Archäologie der Identität For-schungen zur Geschichte des Mittelalters 17. Wien. pp. 25–49.
4. Geary P (2002) The Myth of Nations: Princeton.
5. Giostra C (2011) Goths and Lombards in Italy: the potential of archaeology with respect to ethnoculturalidentification. Post-Classical Archaeologies, 1:7–36.
6. Guimaraes S, Ghirotto S, Benazzo A, Milani L, Lari M, et al. (2009) Genealogical discontinuities amongEtruscan, Medieval, and contemporary Tuscans. Mol Biol Evol 26: 2157–2166. doi: 10.1093/molbev/msp126 PMID: 19570745
7. Bramanti B, Thomas MG, HaakW, Unterlaender M, Jores P, et al, (2009) Genetic discontinuity be-tween local hunter-gatherers and central Europe’s first farmers. Science 2; 326(5949):137–40. doi: 10.1126/science.1176869 PMID: 19729620
Genealogical Relationships between Medieval and Modern Populations
PLOS ONE | DOI:10.1371/journal.pone.0116801 January 30, 2015 17 / 19

8. Ghirotto S, Mona S, Benazzo A, Paparazzo F, Caramelli D, et al. (2010) Inferring genealogical process-es from patterns of Bronze-Age and modern DNA variation in Sardinia. Mol Biol Evol 27: 875–886. doi:10.1093/molbev/msp292 PMID: 19955482
9. Ghirotto S, Tassi F, Fumagalli E, Colonna V, Sandionigi A, et al. (2013) Origins and evolution of theEtruscans’mtDNA. PLoS One 8: e55519. doi: 10.1371/journal.pone.0055519 PMID: 23405165
10. Henn BM, Cavalli-Sforza LL, FeldmanMW (2012) The great human expansion. Proc Natl Acad Sci U SA 109: 17758–17764. doi: 10.1073/pnas.1212380109 PMID: 23077256
11. Novembre J, Johnson T, Bryc K, Kutalik Z, Boyko AR, et al. (2008) Genes mirror geography within Eu-rope. Nature 456: 98–101. doi: 10.1038/nature07331 PMID: 18758442
12. Piazza A, Cappello N, Olivetti E, Rendine S (1988) A genetic history of Italy. Ann HumGenet 52: 203–213. doi: 10.1111/j.1469-1809.1988.tb01098.x PMID: 3074731
13. Barbujani G, Sokal RR (1991a) Genetic population structure of Italy. I. Geographic patterns of gene fre-quencies. Hum Biol 63: 253–272.PMID: 2055588
14. Barbujani G, Sokal RR (1991b) Genetic population structure of Italy. II. Physical and cultural barriers togene flow. Am J of HumGenet 48: 398–411.PMID: 1990846
15. Achilli A, Olivieri A, Pala M, Metspalu E, Fornarino S, et al. (2007) Mitochondrial DNA variation of mod-ern Tuscans supports the near eastern origin of Etruscans. Am J HumGenet 80: 759–768. doi: 10.1086/512822 PMID: 17357081
16. Belle EMS, Ramakrishnan U, Mountain J, Barbujani G (2006) Serial coalescent simulations suggestweak genealogical relationships between Etruscans and modern Tuscans. Proc Natl Acad Sci U S A103(21): 8012–8017. doi: 10.1073/pnas.0509718103 PMID: 16702560
17. Bedini E, Caramelli D, Giostra C, Lippi B, Mallegni F, et al. (2012) Per una conoscenza dei Longobardiin Italia: primi risultati delle analisi genetiche su individui provenienti da necropoli del Piemonte. In: RediF, Forgione A, editors; L’Aquila. pp. 448–451.
18. Vai S, Lari M, Ghirotto S, Rizzi E, Achilli A, et al. (2012) Diachronic and synchronic genetic analysis ofancient Piedmont population. J Biol Res 1 (LXXXV).
19. Pejrani Baricco L. (2007) Longobardi da guerrieri a contadini. Le ultime ricerche in Piemonte. In: Bro-giolo GP, Chavarria A, editors. Documenti di archeologia; Padova. Arnau. pp. 363–386.
20. Micheletto E., Pejrani Baricco L. (1997) Archeologia funeraria e insediativa in Piemonte tra V e VIIsecolo. In: Paroli L., editor; Ascoli Piceno. 6–7 ottobre 1995. Firenze: All’Insegna del Giglio. pp.295–344.
21. Giostra C (2007) Aspetti del rituale funerario. In: Micheletto E, editor. Longobardi in Monferrato Archeo-logia della “Iudiciaria Torrensis”. Casale Monferrato: Città di Casale Monferrato. pp. 43–62.
22. Micheletto E (2007) Lo scavo di Mombello e l’archeologia della Iudiciaria Torrensis. In: Micheletto E,editor. Longobardi in Monferrato Archeologia della “Iudiciaria Torrensis”. Casale Monferrato: Città diCasale Monferrato. pp. 99–138.
23. Pejrani Baricco L (2004) Presenze Longobarde. Collegno nell’alto medioevo; Soprintendenza per iBeni Archeologici del Piemonte, editor.
24. Bedini E, Bartoli F, Paglialunga L, Severini F, Vitiello F. (1997) Paleobiologia del gruppo umano altome-dievale della chiesa cimiteriale di Centallo (Cuneo) In: Paroli L., editor; Ascoli Piceno. 6–7 ottobre 1995.Firenze: All’Insegna del Giglio.
25. Pantò G, Pejrani Baricco L. (2001) Chiese nelle campagne del Piemonte in età tardolongobarda. In:Brogiolo GP, editor. Documenti di archeologia; Garda. Mantova: S.A.P. pp. 17–54.
26. Krings M, Stone A, Schmitz RW, Krainitzki H, Stoneking M, et al. (1997) Neandertal DNA sequencesand the origin of modern humans. Cell 90: 19–30. doi: 10.1016/S0092-8674(00)80310-4 PMID:9230299
27. Rohland N, Hofreiter M (2007) Ancient DNA extraction from bones and teeth. Nat Protoc 2: 1756–1762. doi: 10.1038/nprot.2007.247 PMID: 17641642
28. Lalueza-Fox C, Rosas A, Estalrrich A, Gigli E, Campos PF, et al. (2011) Genetic evidence for patrilocalmating behavior among Neandertal groups. Proc Natl Acad Sci U S A 108: 250–253. doi: 10.1073/pnas.1011553108 PMID: 21173265
29. Andrews RM, Kubacka I, Chinnery PF, Lightowlers RN, Turnbull DM, et al. (1999) Reanalysis and revi-sion of the Cambridge reference sequence for humanmitochondrial DNA. Nat Genet 23: 147. doi: 10.1038/13779 PMID: 10508508
30. Kloss-Brandstätter A, Pacher D, Schönherr S, Weissensteiner H, Binna R, et al. (2011) HaploGrep: Afast and reliable algorithm for automatic classification of mitochondrial DNA haplogroups. HumMutat32, 25–32 doi: 10.1002/humu.21382 PMID: 20960467
Genealogical Relationships between Medieval and Modern Populations
PLOS ONE | DOI:10.1371/journal.pone.0116801 January 30, 2015 18 / 19

31. van Oven M, Kayser M (2009) Updated comprehensive phylogenetic tree of global human mitochondri-al DNA variation. HumMutat 30, E386–E394. doi: 10.1002/humu.20921 PMID: 18853457
32. Pilli E, Modi A, Serpico C, Achilli A, Lancioni H, et al. (2013) Monitoring DNA contamination in handledvs. directly excavated ancient human skeletal remains. PLoS One 8: e52524. doi: 10.1371/journal.pone.0052524 PMID: 23372650
33. Turchi C, Buscemi L, Previdere C, Grignani P, Brandstatter A, et al. (2008) Italian mitochondrial DNAdatabase: results of a collaborative exercise and proficiency testing. Int J Legal Med 122: 199–204.doi: 10.1007/s00414-007-0207-1 PMID: 17952451
34. Bandelt HJ, Forster P, Rohl A (1999) Median-joining networks for inferring intraspecific phylogenies.Mol Biol Evol 16: 37–48. doi: 10.1093/oxfordjournals.molbev.a026036 PMID: 10331250
35. Excoffier L, Lischer HE (2010) Arlequin suite ver 3.5: a new series of programs to perform populationgenetics analyses under Linux andWindows. Mol Ecol Resour 10: 564–567. doi: 10.1111/j.1755-0998.2010.02847.x PMID: 21565059
36. Kimura M (1980) A simple method for estimating evolutionary rates of base substitutions through com-parative studies of nucleotide sequences. J Mol Evol 16: 111–120. doi: 10.1007/BF01731581 PMID:7463489
37. R-DevelopmentCoreTeam (2006) R: A Language and Environment for Statistical Computing. In:Computing VFfS, editor. www.r-project.org. Accessed 2014 Dec 17.
38. Beaumont MA, ZhangW, Balding DJ (2002) Approximate Bayesian computation in population genet-ics. Genetics 162: 2025–2035.PMID: 12524368
39. Beaumont MA (2010) Approximate Bayesian computation in evolution and ecology. Annu Rev EcolEvol Syst 41:379–406.
40. Pritchard JK, Seielstad MT, Perez-Lezaun A, Feldman MW (1999) Population growth of human Y chro-mosomes: a study of Y chromosome microsatellites. Mol Biol Evol 16: 1791–1798. doi: 10.1093/oxfordjournals.molbev.a026091 PMID: 10605120
41. Beaumont MA (2008) Joint determination of topology, divergence time and immigration in populationtrees. Simulations, genetics and human prehistory. Cambridge: McDonald Institute for ArchaeologicalResearch. 135–154.
42. Hamilton G, Stoneking M, Excoffier L (2005) Molecular analysis reveals tighter social regulation of im-migration in patrilocal populations than in matrilocal populations. Proc Natl Acad Sci U S A 102: 7476–7480. doi: 10.1073/pnas.0409253102 PMID: 15894624
43. Biraben J-N (1979) Essai sur l’evolution du nombre des hommes. Population (French ed) 34: 13–25.
44. Anderson CN, Ramakrishnan U, Chan YL, Hadly EA (2005) Serial SimCoal: a population geneticsmodel for data frommultiple populations and points in time. Bioinformatics 21: 1733–1734. doi: 10.1093/bioinformatics/bti154 PMID: 15564305
45. Hudson RR, Slatkin M, Maddison WP (1992) Estimation of levels of gene flow from DNA sequencedata. Genetics 132: 583–589.PMID: 1427045
46. Bazin E, Dawson KJ, Beaumont MA (2010) Likelihood-free inference of population structure and localadaptation in a Bayesian hierarchical model. Genetics 185: 587–602. doi: 10.1534/genetics.109.112391 PMID: 20382835
47. Sousa VC, BeaumontMA, Fernandes P, Coelho MM, Chikhi L (2012) Population divergence with orwithout admixture: selecting models using an ABC approach. Heredity 108: 521–530 doi: 10.1038/hdy.2011.116 PMID: 22146980
48. Sing T, Sander O, Beerenwinkel N, Lengauer T (2005) ROCR: visualizing classifier performance in R.Bioinformatics 21: 3940–3941. doi: 10.1093/bioinformatics/bti623 PMID: 16096348
49. Caramelli D, Vernesi C, Sanna S, Sampietro L, Lari M, et al. (2007) Genetic variation in prehistoric Sar-dinia. HumGenet 122: 327–336. doi: 10.1007/s00439-007-0403-6 PMID: 17629747
50. Pruvost M, Schwarz R, Bessa Correia V, Champlot S, Braguier S, et al. (2006) Freshly excavated fossilbones are best for amplification of ancient DNA. Proc Natl Acad Sci U S A 104: 739–744. doi: 10.1073/pnas.0610257104 PMID: 17210911
51. Sampietro ML, Caramelli D Lao O, Calafell F, Comas D, Lari M, et al. (2005) The genetics of the pre-Roman Iberian peninsula: A mtDNA study of ancient Iberians. Ann HumGenet 69:535–548 doi: 10.1111/j.1529-8817.2005.00194.x PMID: 16138912
52. Rasmussen M, Anzick SL, Waters MR, Skoglund P, DeGiorgio M, et al. (2014) The genome of a LatePleistocene human from a Clovis burial site in western Montana. Nature 506: 225–229. doi: 10.1038/nature13025 PMID: 24522598
Genealogical Relationships between Medieval and Modern Populations
PLOS ONE | DOI:10.1371/journal.pone.0116801 January 30, 2015 19 / 19