gene expression profiling in limb-girdle muscular dystrophy 2a
TRANSCRIPT

Gene Expression Profiling in Limb-Girdle MuscularDystrophy 2AAmets Saenz1*, Margarita Azpitarte1, Ruben Armananzas2, France Leturcq3, Ainhoa Alzualde1, Inaki
Inza2, Federico Garcıa-Bragado4, Gaspar De la Herran5, Julian Corcuera5, Ana Cabello6, Carmen
Navarro7, Carolina De la Torre8, Eduard Gallardo8, Isabel Illa9, Adolfo Lopez de Munain10
1 Experimental Unit, Hospital Donostia, Donostia-San Sebastian, Basque Country, Spain, 2 Department of Computer Science and Artificial Intelligence, Computer Science
Faculty, University of the Basque Country, San Sebastian, Basque Country, Spain, 3 Laboratoire de Biochimie et Genetique Moleculaire, Hopital Cochin, Groupe Hospitalier
Pitie-Salpetriere, Paris, France, 4 Department of Pathology, Hospital Virgen del Camino, Pamplona, Spain, 5 Department of Orthopedic Surgery, Hospital Donostia,
Donostia-San Sebastian, Basque Country, Spain, 6 Department of Pathology , Hospital 12 de Octubre, Madrid, Spain, 7 Department of Pathology , Hospital Meixoeiro, Vigo,
Spain, 8 Laboratory of Experimental Neurology, Hospital de la Santa Creu i Sant Pau, Barcelona, Spain, 9 Department of Neurology, Hospital de la Santa Creu i Sant Pau,
Barcelona, Spain, 10 Department of Neurology, Hospital Donostia, Donostia-San Sebastian, Basque Country, Spain
Abstract
Limb-girdle muscular dystrophy type 2A (LGMD2A) is a recessive genetic disorder caused by mutations in calpain 3 (CAPN3).Calpain 3 plays different roles in muscular cells, but little is known about its functions or in vivo substrates. The aim of thisstudy was to identify the genes showing an altered expression in LGMD2A patients and the possible pathways they areimplicated in. Ten muscle samples from LGMD2A patients with in which molecular diagnosis was ascertained wereinvestigated using array technology to analyze gene expression profiling as compared to ten normal muscle samples.Upregulated genes were mostly those related to extracellular matrix (different collagens), cell adhesion (fibronectin), muscledevelopment (myosins and melusin) and signal transduction. It is therefore suggested that different proteins located orparticipating in the costameric region are implicated in processes regulated by calpain 3 during skeletal muscledevelopment. Genes participating in the ubiquitin proteasome degradation pathway were found to be deregulated inLGMD2A patients, suggesting that regulation of this pathway may be under the control of calpain 3 activity. As frizzled-related protein (FRZB) is upregulated in LGMD2A muscle samples, it could be hypothesized that b-catenin regulation is alsoaltered at the Wnt signaling pathway, leading to an incorrect myogenesis. Conversely, expression of most transcriptionfactor genes was downregulated (MYC, FOS and EGR1). Finally, the upregulation of IL-32 and immunoglobulin genes mayinduce the eosinophil chemoattraction explaining the inflammatory findings observed in presymptomatic stages. Theobtained results try to shed some light on identification of novel therapeutic targets for limb-girdle muscular dystrophies.
Citation: Saenz A, Azpitarte M, Armananzas R, Leturcq F, Alzualde A, et al. (2008) Gene Expression Profiling in Limb-Girdle Muscular Dystrophy 2A. PLoS ONE 3(11):e3750. doi:10.1371/journal.pone.0003750
Editor: Antoni L. Andreu, Hospital Vall d’Hebron, Spain
Received August 29, 2008; Accepted October 25, 2008; Published November 18, 2008
Copyright: � 2008 Saenz et al. This is an open-access article distributed under the terms of the Creative Commons Attribution License, which permitsunrestricted use, distribution, and reproduction in any medium, provided the original author and source are credited.
Funding: Health Research Fund of the Spanish Ministry of Health (FIS CP06/00099); Gipuzkoako Foru Aldundia (Berrikuntzarako eta Jakintzaren GizarterakoDepartamentua, 76/06); European Union (FEDER Funds and CIBERNED); Instituto de Salud Carlos III. AS: Spanish Ministry of Health (FIS) and Basque Foundation forHealth Innovation and Research (BIOEF) promoted by the Basque Government Department of Health. RA: Basque Government (AE-BFI-05/430).
Competing Interests: The authors have declared that no competing interests exist.
* E-mail: [email protected]
Introduction
Limb-girdle muscular dystrophy type 2A (LGMD2A) is a
recessive genetic disorder caused by mutations in calpain 3
(CAPN3), a muscle-specific, calcium-dependent cystein protease.
Calpain 3 structure is similar to that of the ubiquitous calpains 1
and 2, but calpain 3 has specific regions (NS, IS1, and IS2) that
confer it special characteristics such as autocatalytic and nuclear
translocation capacity. Although calpain 3 was identified in 1989
[1], little is known about its function or its in vivo substrates. It has
been reported to play different roles in the cell. Calpain 3 has a
certain role in direct and indirect regulation of conventional
calpains by proteolytic degradation of calpains and calpastatin
respectively [2]. It may be involved in muscle contraction due to its
link to titin and to its regulation by calcium [3–7].
Calpain 3 was shown to be in complex with dysferlin, suggesting
a membrane homeostasis role of calpain 3 [8], and more recent
studies demonstrated that AHNAK, a novel component of the
dysferlin protein complex, serves as a direct substrate of calpain 3
in cell culture [9].
On the other hand, it has been confirmed that calpain 3 can cleave
the C-terminal portion of FLNC in vitro and suggested that FLNC
may be an in vivo substrate for calpain 3, functioning to regulate
protein-protein interactions with sarcoglycans. Thus, calpain-medi-
ated remodeling of cytoskeletal-membrane interactions, such as those
occurring during myoblast fusion and muscle repair, may involve
regulation of FLNC-sarcoglycan interactions [10].
Its presence in the nucleus has led to suggest that calpain 3 plays
an important role in regulation of transcription factors indirectly
controlling apoptotic processes [11,12]. Recent studies reported
that the antiapoptotic factor, cellular FLICE inhibitory protein (c-
FLIP), is NF-kB dependent and is only expressed when CAPN3 is
present [13]. However, other studies suggest that apoptosis may be
secondary to muscle damage and inflammatory response [14].
PLoS ONE | www.plosone.org 1 November 2008 | Volume 3 | Issue 11 | e3750

Based on the observation of the C3 knockout (C3KO) mice, it
has been suggested that calpain 3 is necessary for ubiquitination
and acts upstream of the ubiquitination machinery [15].
Inflammatory cells have been detected in muscle tissue from
patients with mutations in the CAPN3 gene in early stages [16] as
happen in other distrophies. The role of inflammation in many
dystrophies seems to be unexplained, and it has been related to the
presence of signaling factors (cytokines) that withstand inflamma-
tory mechanisms and regulatory phenomena [17–19].
In this study, the RNA expression profiling in muscle from
biopsies of LGMD2A patients and control subjects were compared
in order to determine the potential functions and the pathways in
which calpain 3 is implicated.
Materials and Methods
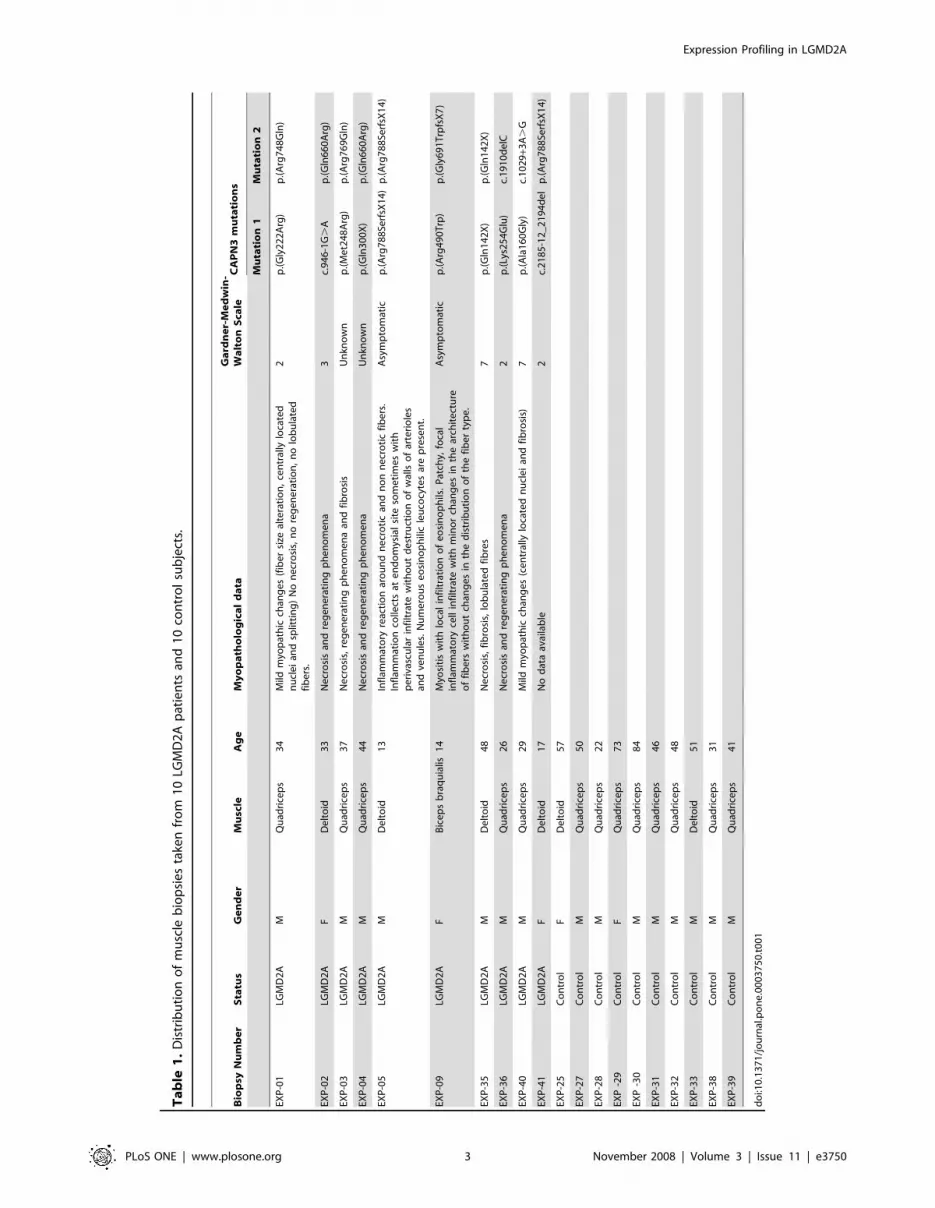
Muscle samples and RNA processingMuscle biopsies were taken from 10 LGMD2A patients (3
females and 7 males aged 13–48 years, mean age 29,5 years) and
10 controls (2 females and 8 males aged 22–84 years, mean age
50,2 years). Two out of the 10 LGMD2A patients showed an
inflammatory pattern with eosinophilic infiltrates in their biopsies.
For diagnostic purposes deltoid, quadriceps, and biceps muscle
specimens were collected using institutionally approved protocols
and after obtaining informed consent (Table 1). Muscle tissues
were snap frozen and stored at 280uC. Most of the 7 symptomatic
cases showed similar necrosis and regenerating phenomena (data
not available in one case).
The quality of all RNAs obtained from muscle biopsies
(RNAPlus, QBiogene) was verified using spectrophotometry and
the Bioanalyzer system (Agilent). All of them showed acceptable
quality and integrity (RIN above 7) to be eligible for the experiment.
All RNAs were reverse-transcribed, and biotinylated cRNA
probes were generated by in vitro transcription (Ambion, CA,
USA). Fragmented cRNA of each sample was hybridized
individually to human HG-U133A (22.283 probe sets) and HG-
U133B (22.645 probe sets) GeneChips (Affymetrix, Santa Clara,
California) in order to analyze the expression of 44.928 probes,
comprising more than 33.000 genes.
Data analysisIn-depth quality controls were performed to analyze the validity
of the hybridization processes in accordance with four criteria.
First, the correct presence of the signal corresponding to the spike
control BioB. Second, the expression ratio between the 39 and 59
ends of the housekeeping GAPDH should not exceed a value of
three. Third, the full percentage of presences detected by the
Affymetrix Detection algorithm for each array must be in the
range 40–60. And finally, the percentage of outlier probe sets
detected within each microarray should be less than 5%. All
hybridized arrays on the study met all four quality criteria,
demonstrating the reliability of data generated.
The hybridized arrays were scanned, and raw data were
extracted using the Microarray Analysis Suite 5.0 (MAS5;
Affymetrix). The raw data were normalized using RMA (Robust
Multichip Average) expression summary in Bioconductor [20].
RMA consists of three steps: a background adjustment, quantile
normalization, and finally summarization [21–23].
The sensitivity of microarray-generated data to noise from
experimental variables is well documented [24]. For the analysis,
the average values of each tested group (patients and controls)
were used in order to obtain the most homogeneous results, trying
to avoid variability between individual cases due to different
characteristics (genetic background, sex, age, muscles, mutations,
etc.). Two statistical methods were applied in order to distinguish
significant and substantial differential expression from noise and
variation due to either genetic heterogeneity or experimental
procedures.
First, in order to identify significantly different genes between
LGMD2A patients and normal controls, a geometric fold-change
analysis was used [24,25]. The threshold was set at a two-fold
change value. Using the criterion of fold-change implies that larger
fold changes are most likely to be real and no hypothesis is
assumed. Principal component analysis (PCA) was performed after
array normalization. PCA is a technique that summarizes a large
set of variables in a smaller set that retains the essential variance of
the original data set [26]. PCA derives an equivalent, uncorrelated
set of new variables from the original set of correlated variables
according to their contribution to a ranked set of principal
components [27].
Second, Class Comparison Difference Analyses were performed
using BRB-ArrayTools developed by Dr. Richard Simon and
BRB-ArrayTools Development Team. In order to identify probe
sets with significant intensity differences between disease classes, a
two-sample univariate t-test was applied to the unaffected control
data set vs. the LGMD2A data set. The use of p-values implies
hypothesis testing. It is assumed in the null hypothesis that there is
no fold change and then evidence was looked for to reject it using a
type-1 error. The threshold was set at p 0.001.
To minimize false positives, only the probe sets commonly
yielded by both methodologies were included into the final list of
genes differentially expressed in LGMD2A.
Moreover, as an additional supporting process, two machine
learning feature selection techniques were run. Symmetrical
uncertainty ranking [28] was first applied as an univariate
criterion to measure the worth of each probe set alone: this
computes the mutual information with respect to the class
phenotype and compensates for the bias of the information gain.
Correlation-based Feature Subset (CFS) selection [29], a multi-
variate feature selection that evaluates the merit of a probe set
subset by measuring the individual predictive power of each probe
set along with the redundancy within that subset, was then used.
CFS outputs a subset of features instead of individual relevances.
The same procedure was used to compare samples from
patients who were asymptomatic but had eosinophilic infiltrates in
their muscle biopsies (2 cases) and samples from healthy controls
(10 cases).
Microarray data have been submitted to the GEO (Gene
Expression Omnibus) public database (accession GSE11681).
Quantitative Real-Time PCRTo investigate the validity of array data, expression levels of the
differentially expressed genes were measured using the TaqMan
quantitative RT-PCR assay. Relative expression levels initially
determined with the cDNA microarrays were correlated to the
expression levels assessed using quantitative RT-PCR for each
patient sample.
Whereas microarrays identify target genes of interest among
thousands of genes, truly quantitative information relies on
quantitative RT-PCR. Some of the significantly regulated changes
found on the microarray could be replicated by quantitative RT-
PCR. Quantitative RT-PCR was performed using the 7900 HT
Fast Real-Time PCR System (Applied Biosystems). Because of the
limiting RNA amount isolated from muscle biopsies used for
microarray analysis, only a few samples (6 cases) were used for
confirmation with quantitative RT-PCR experiments.
The TaqMan Low Density Arrays (TLDA) were purchased
from Applied Biosystems, and the protocol recommended by the
Expression Profiling in LGMD2A
PLoS ONE | www.plosone.org 2 November 2008 | Volume 3 | Issue 11 | e3750
Ta
ble
1.
Dis
trib
uti
on
of
mu
scle
bio
psi
es
take
nfr
om
10
LGM
D2
Ap
atie
nts
and
10
con
tro
lsu
bje
cts.
Bio
psy
Nu
mb
er
Sta
tus
Ge
nd
er
Mu
scle
Ag
eM
yo
pa
tho
log
ica
ld
ata
Ga
rdn
er-
Me
dw
in-
Wa
lto
nS
cale
CA
PN
3m
uta
tio
ns
Mu
tati
on
1M
uta
tio
n2
EXP
-01
LGM
D2
AM
Qu
adri
cep
s3
4M
ildm
yop
ath
icch
ang
es
(fib
er
size
alte
rati
on
,ce
ntr
ally
loca
ted
nu
cle
ian
dsp
litti
ng
)N
on
ecr
osi
s,n
ore
ge
ne
rati
on
,n
olo
bu
late
dfi
be
rs.
2p
.(Gly
22
2A
rg)
p.(A
rg7
48
Gln
)
EXP
-02
LGM
D2
AF
De
lto
id3
3N
ecr
osi
san
dre
ge
ne
rati
ng
ph
en
om
en
a3
c.9
46
-1G
.A
p.(G
ln6
60
Arg
)
EXP
-03
LGM
D2
AM
Qu
adri
cep
s3
7N
ecr
osi
s,re
ge
ne
rati
ng
ph
en
om
en
aan
dfi
bro
sis
Un
kno
wn
p.(M
et2
48
Arg
)p
.(Arg
76
9G
ln)
EXP
-04
LGM
D2
AM
Qu
adri
cep
s4
4N
ecr
osi
san
dre
ge
ne
rati
ng
ph
en
om
en
aU
nkn
ow
np
.(Gln
30
0X
)p
.(Gln
66
0A
rg)
EXP
-05
LGM
D2
AM
De
lto
id1
3In
flam
mat
ory
reac
tio
nar
ou
nd
ne
cro
tic
and
no
nn
ecr
oti
cfi
be
rs.
Infl
amm
atio
nco
llect
sat
en
do
mys
ial
site
som
eti
me
sw
ith
pe
riva
scu
lar
infi
ltra
tew
ith
ou
td
est
ruct
ion
of
wal
lso
far
teri
ole
san
dve
nu
les.
Nu
me
rou
se
osi
no
ph
ilic
leu
cocy
tes
are
pre
sen
t.
Asy
mp
tom
atic
p.(A
rg7
88
Serf
sX1
4)
p.(A
rg7
88
Serf
sX1
4)
EXP
-09
LGM
D2
AF
Bic
ep
sb
raq
uia
lis1
4M
yosi
tis
wit
hlo
cal
infi
ltra
tio
no
fe
osi
no
ph
ils.
Pat
chy,
foca
lin
flam
mat
ory
cell
infi
ltra
tew
ith
min
or
chan
ge
sin
the
arch
ite
ctu
reo
ffi
be
rsw
ith
ou
tch
ang
es
inth
ed
istr
ibu
tio
no
fth
efi
be
rty
pe
.
Asy
mp
tom
atic
p.(A
rg4
90
Trp
)p
.(Gly
69
1T
rpfs
X7
)
EXP
-35
LGM
D2
AM
De
lto
id4
8N
ecr
osi
s,fi
bro
sis,
lob
ula
ted
fib
res
7p
.(Gln
14
2X
)p
.(Gln
14
2X
)
EXP
-36
LGM
D2
AM
Qu
adri
cep
s2
6N
ecr
osi
san
dre
ge
ne
rati
ng
ph
en
om
en
a2
p.(L
ys2
54
Glu
)c.
19
10
de
lC
EXP
-40
LGM
D2
AM
Qu
adri
cep
s2
9M
ildm
yop
ath
icch
ang
es
(ce
ntr
ally
loca
ted
nu
cle
ian
dfi
bro
sis)
7p
.(Ala
16
0G
ly)
c.1
02
9+3
A.
G
EXP
-41
LGM
D2
AF
De
lto
id1
7N
od
ata
avai
lab
le2
c.2
18
5-1
2_
21
94
de
lp
.(Arg
78
8Se
rfsX
14
)
EXP
-25
Co
ntr
ol
FD
elt
oid
57
EXP
-27
Co
ntr
ol
MQ
uad
rice
ps
50
EXP
-28
Co
ntr
ol
MQ
uad
rice
ps
22
EXP
-29
Co
ntr
ol
FQ
uad
rice
ps
73
EXP
-30
Co
ntr
ol
MQ
uad
rice
ps
84
EXP
-31
Co
ntr
ol
MQ
uad
rice
ps
46
EXP
-32
Co
ntr
ol
MQ
uad
rice
ps
48
EXP
-33
Co
ntr
ol
MD
elt
oid
51
EXP
-38
Co
ntr
ol
MQ
uad
rice
ps
31
EXP
-39
Co
ntr
ol
MQ
uad
rice
ps
41
do
i:10
.13
71
/jo
urn
al.p
on
e.0
00
37
50
.t0
01
Expression Profiling in LGMD2A
PLoS ONE | www.plosone.org 3 November 2008 | Volume 3 | Issue 11 | e3750
manufacturer was used. Customer-designed TLDAs were used in
order to test a series of 63 genes. In order to select these genes,
genes with unknown function, hypothetical proteins, and open
reading frame regions were excluded. Gene families were
represented including only some of the members, such as
collagens, etc. Moreover, genes showing differential expression
profiling in the comparison between patients with eosinophilic
infiltrates and healthy controls were included in the TLDA, as well
as genes with expression variation in other studies.
Expression levels for all transcripts were determined relative to
the internal housekeeping control gene GAPDH in the TLDAs
which, as expected, did not demonstrate altered expression
according to microarray analysis.
In order to identify probe sets with significant intensity
differences, the method applied to the unaffected control data
set vs. the LGMD2A data set was Benjamini-Hochberg method
using Stat Miner program (Integromics).
Results
After having adjusted the background, normalized and
summarized the data, the fold change obtained generates a list
by magnitude of response. As a result of this method, the fold
change analysis identified 156 differentially expressed probe sets in
LGMD2A skeletal muscle compared to control skeletal muscle. Of
these, 92 were significantly overexpressed and 64 showed a
reduced expression in LGMD2A patients compared to the
unaffected controls.
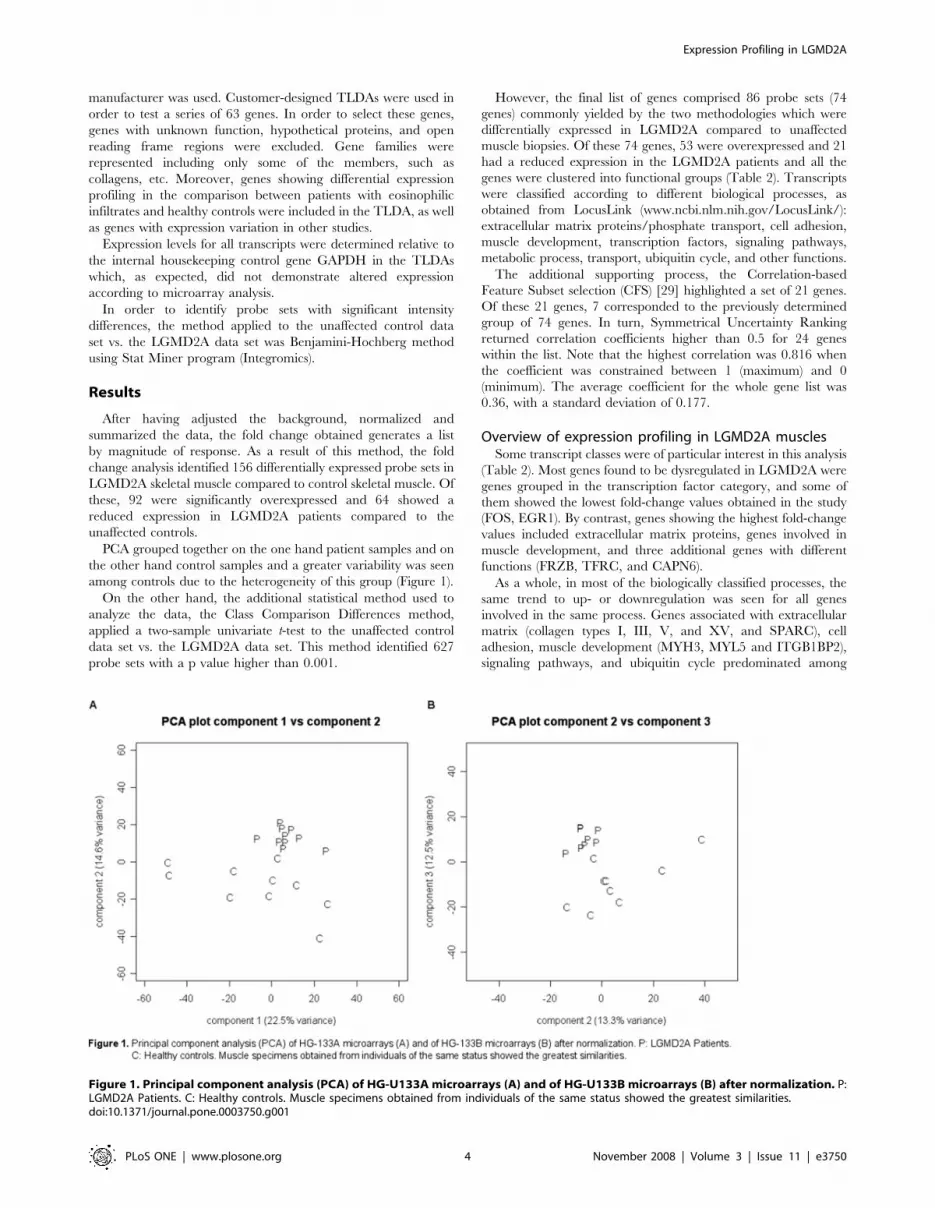
PCA grouped together on the one hand patient samples and on
the other hand control samples and a greater variability was seen
among controls due to the heterogeneity of this group (Figure 1).
On the other hand, the additional statistical method used to
analyze the data, the Class Comparison Differences method,
applied a two-sample univariate t-test to the unaffected control
data set vs. the LGMD2A data set. This method identified 627
probe sets with a p value higher than 0.001.
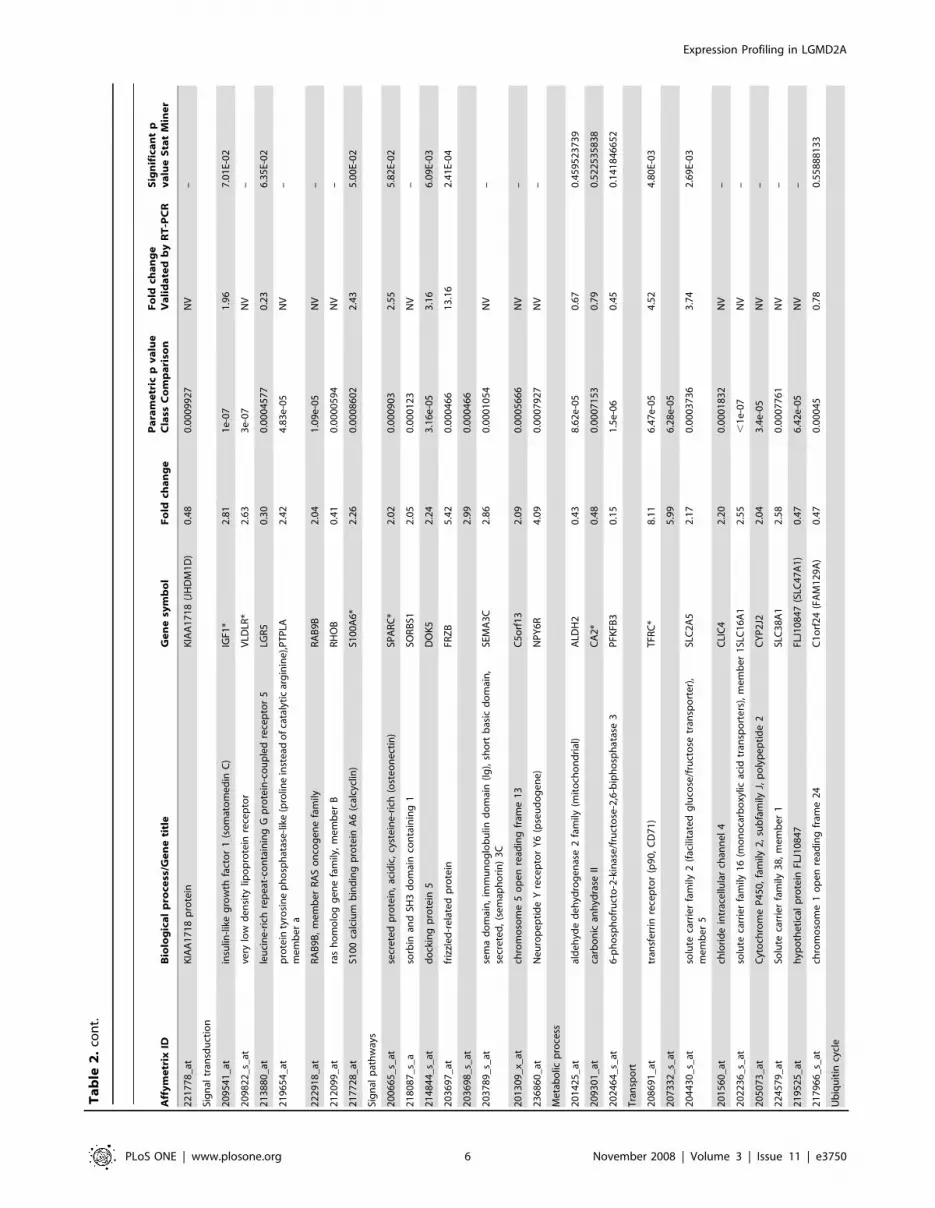
However, the final list of genes comprised 86 probe sets (74
genes) commonly yielded by the two methodologies which were
differentially expressed in LGMD2A compared to unaffected
muscle biopsies. Of these 74 genes, 53 were overexpressed and 21
had a reduced expression in the LGMD2A patients and all the
genes were clustered into functional groups (Table 2). Transcripts
were classified according to different biological processes, as
obtained from LocusLink (www.ncbi.nlm.nih.gov/LocusLink/):
extracellular matrix proteins/phosphate transport, cell adhesion,
muscle development, transcription factors, signaling pathways,
metabolic process, transport, ubiquitin cycle, and other functions.
The additional supporting process, the Correlation-based
Feature Subset selection (CFS) [29] highlighted a set of 21 genes.
Of these 21 genes, 7 corresponded to the previously determined
group of 74 genes. In turn, Symmetrical Uncertainty Ranking
returned correlation coefficients higher than 0.5 for 24 genes
within the list. Note that the highest correlation was 0.816 when
the coefficient was constrained between 1 (maximum) and 0
(minimum). The average coefficient for the whole gene list was
0.36, with a standard deviation of 0.177.
Overview of expression profiling in LGMD2A musclesSome transcript classes were of particular interest in this analysis
(Table 2). Most genes found to be dysregulated in LGMD2A were
genes grouped in the transcription factor category, and some of
them showed the lowest fold-change values obtained in the study
(FOS, EGR1). By contrast, genes showing the highest fold-change
values included extracellular matrix proteins, genes involved in
muscle development, and three additional genes with different
functions (FRZB, TFRC, and CAPN6).
As a whole, in most of the biologically classified processes, the
same trend to up- or downregulation was seen for all genes
involved in the same process. Genes associated with extracellular
matrix (collagen types I, III, V, and XV, and SPARC), cell
adhesion, muscle development (MYH3, MYL5 and ITGB1BP2),
signaling pathways, and ubiquitin cycle predominated among
Figure 1. Principal component analysis (PCA) of HG-U133A microarrays (A) and of HG-U133B microarrays (B) after normalization. P:LGMD2A Patients. C: Healthy controls. Muscle specimens obtained from individuals of the same status showed the greatest similarities.doi:10.1371/journal.pone.0003750.g001
Expression Profiling in LGMD2A
PLoS ONE | www.plosone.org 4 November 2008 | Volume 3 | Issue 11 | e3750

Ta
ble
2.
Sig
nif
ican
tly
dif
fere
nti
ally
reg
ula
ted
tran
scri
pts
,N
V:
No
tva
lidat
ed
by
TLD
As.
Aff
ym
etr
ixID
Bio
log
ica
lp
roce
ss/G
en
eti
tle
Ge
ne
sym
bo
lF
old
cha
ng
eP
ara
me
tric
pv
alu
eC
lass
Co
mp
ari
son
Fo
ldch
an
ge
Va
lid
ate
db
yR
T-P
CR
Sig
nif
ica
nt
pv
alu
eS
tat
Min
er
Extr
ace
llula
rm
atri
xp
rote
ins
20
23
10
_s_
atco
llag
en
,ty
pe
I,al
ph
a1
CO
L1A
1*
4.7
10
.00
03
48
25
.86
0.0
12
17
87
74
20
24
04
_s_
atco
llag
en
,ty
pe
I,al
ph
a2
CO
L1A
2*
4.7
26
.61
e-0
5N
V–
21
11
61
_s_
atco
llag
en
,ty
pe
III,
alp
ha
1C
OL3
A1
*7
.72
1.1
e-0
61
3.7
1–
20
18
52
_x_
at5
.12
7.4
e-0
6
21
50
76
_s_
at4
.79
3.4
8e
-05
21
24
88
_at
colla
ge
n,
typ
eV
,al
ph
a1
CO
L5A
12
.07
8.1
8e
-05
9.2
41
.13
E-0
4
22
17
29
_at
colla
ge
n,
typ
eV
,al
ph
a2
CO
L5A
23
.12
,1
e-0
7N
V–
22
17
30
_at
2.1
23
e-0
7
20
34
77
_at
colla
ge
n,
typ
eX
V,
alp
ha
1C
OL1
5A
1*
2.8
02
.36
e-0
5N
V–
22
56
81
_at
colla
ge
ntr
iple
he
lixre
pe
atco
nta
inin
g1
CT
HR
C1
2.9
63
.74
e-0
5N
V–
Ce
llad
he
sio
n
20
10
05
_at
CD
9an
tig
en
(p2
4)
CD
9*
2.3
86
.36
e-0
52
.16
5.7
1E-
02
21
20
63
_at
CD
44
anti
ge
n(h
om
ing
fun
ctio
nan
dIn
dia
nb
loo
dg
rou
psy
ste
m)
CD
44
*2
.35
0.0
00
27
03
2.2
30
.30
71
49
6
21
17
19
_x_
atfi
bro
ne
ctin
1FN
1*
2.3
30
.00
06
32
63
.30
1.1
6E-
02
21
04
95
_x_
at2
.30
0.0
00
10
08
21
64
42
_x_
at2
.21
0.0
00
13
07
Mu
scle
de
velo
pm
en
t
20
59
40
_at
myo
sin
,h
eav
yp
oly
pe
pti
de
3,
ske
leta
lm
usc
le,
em
bry
on
icM
YH
3*
11
.78
1.4
e-0
64
0.6
22
.15
E-0
4
20
51
45
_s_
atm
yosi
n,
ligh
tp
oly
pe
pti
de
5,
reg
ula
tory
MY
L54
.28
3.4
9e
-05
7.2
11
.83
E-0
2
20
41
73
_at
myo
sin
ligh
tch
ain
1sl
ow
aM
LC1
SA(=
MY
L6B
)2
.41
0.0
00
30
24
3.2
81
.77
E-0
2
21
98
29
_at
inte
gri
nb
eta
1b
ind
ing
pro
tein
(me
lusi
n)
2IT
GB
1B
P2
2.2
31
.3e
-06
2.5
00
.01
33
91
30
4
Tra
nsc
rip
tio
nfa
cto
rs
20
24
31
_s_
atv-
myc
mye
locy
tom
ato
sis
vira
lo
nco
ge
ne
ho
mo
log
(avi
an)
MY
C*
0.4
80
.00
06
58
70
.35
–
20
14
66
_s_
atv-
jun
sarc
om
avi
rus
17
on
cog
en
eh
om
olo
g(a
vian
)JU
N*
0.4
74
.98
e-0
50
.69
0.4
43
74
95
59
21
99
90
_at
E2F
tran
scri
pti
on
fact
or
8E2
F83
.22
0.0
00
11
05
4.5
24
.80
E-0
3
20
14
73
_at
jun
Bp
roto
-on
cog
en
eJU
NB
*0
.41
0.0
00
23
29
NV
–
20
91
89
_at
v-fo
sFB
Jm
uri
ne
ost
eo
sarc
om
avi
ral
on
cog
en
eh
om
olo
gFO
S*0
.12
7.5
2e
-05
0.1
0–
20
39
73
_s_
atC
CA
AT
/en
han
cer
bin
din
gp
rote
in(C
/EB
P),
de
lta
CEB
PD
*0
.39
0.0
00
91
74
1.6
10
.26
65
97
40
8
20
16
94
_s_
ate
arly
gro
wth
resp
on
se1
EGR
1*
0.3
15
.16
e-0
50
.13
1.7
4E-
03
22
74
04
_s_
at0
.12
8.1
1e
-05
20
93
57
_at
Cb
p/p
30
0-i
nte
ract
ing
tran
sact
ivat
or,
wit
hG
lu/A
sp-r
ich
carb
oxy
-te
rmin
ald
om
ain
,2
CIT
ED2
0.3
99
e-0
70
.57
0.2
55
17
16
53
21
04
79
_s_
atR
AR
-re
late
do
rph
anre
cep
tor
AR
OR
A0
.46
0.0
00
36
75
NV
–
20
23
93
_s_
atK
rup
pe
l-lik
efa
cto
r1
0K
LF1
00
.45
0.0
00
06
51
0.4
90
.13
08
62
23
6
Expression Profiling in LGMD2A
PLoS ONE | www.plosone.org 5 November 2008 | Volume 3 | Issue 11 | e3750
Aff
ym
etr
ixID
Bio
log
ica
lp
roce
ss/G
en
eti
tle
Ge
ne
sym
bo
lF
old
cha
ng
eP
ara
me
tric
pv
alu
eC
lass
Co
mp
ari
son
Fo
ldch
an
ge
Va
lid
ate
db
yR
T-P
CR
Sig
nif
ica
nt
pv
alu
eS
tat
Min
er
22
17
78
_at
KIA
A1
71
8p
rote
inK
IAA
17
18
(JH
DM
1D
)0
.48
0.0
00
99
27
NV
–
Sig
nal
tran
sdu
ctio
n
20
95
41
_at
insu
lin-l
ike
gro
wth
fact
or
1(s
om
ato
me
din
C)
IGF1
*2
.81
1e
-07
1.9
67
.01
E-0
2
20
98
22
_s_
atve
rylo
wd
en
sity
lipo
pro
tein
rece
pto
rV
LDLR
*2
.63
3e
-07
NV
–
21
38
80
_at
leu
cin
e-r
ich
rep
eat
-co
nta
inin
gG
pro
tein
-co
up
led
rece
pto
r5
LGR
50
.30
0.0
00
45
77
0.2
36
.35
E-0
2
21
96
54
_at
pro
tein
tyro
sin
ep
ho
sph
atas
e-l
ike
(pro
line
inst
ead
of
cata
lyti
car
gin
ine
),m
em
be
ra
PT
PLA
2.4
24
.83
e-0
5N
V–
22
29
18
_at
RA
B9
B,
me
mb
er
RA
So
nco
ge
ne
fam
ilyR
AB
9B
2.0
41
.09
e-0
5N
V–
21
20
99
_at
ras
ho
mo
log
ge
ne
fam
ily,
me
mb
er
BR
HO
B0
.41
0.0
00
05
94
NV
–
21
77
28
_at
S10
0ca
lciu
mb
ind
ing
pro
tein
A6
(cal
cycl
in)
S10
0A
6*
2.2
60
.00
08
60
22
.43
5.0
0E-
02
Sig
nal
pat
hw
ays
20
06
65
_s_
atse
cre
ted
pro
tein
,ac
idic
,cy
ste
ine
-ric
h(o
ste
on
ect
in)
SPA
RC
*2
.02
0.0
00
90
32
.55
5.8
2E-
02
21
80
87
_s_
aso
rbin
and
SH3
do
mai
nco
nta
inin
g1
SOR
BS1
2.0
50
.00
01
23
NV
–
21
48
44
_s_
atd
ock
ing
pro
tein
5D
OK
52
.24
3.1
6e
-05
3.1
66
.09
E-0
3
20
36
97
_at
friz
zle
d-r
ela
ted
pro
tein
FRZ
B5
.42
0.0
00
46
61
3.1
62
.41
E-0
4
20
36
98
_s_
at2
.99
0.0
00
46
6
20
37
89
_s_
atse
ma
do
mai
n,
imm
un
og
lob
ulin
do
mai
n(I
g),
sho
rtb
asic
do
mai
n,
secr
ete
d,
(se
map
ho
rin
)3
CSE
MA
3C
2.8
60
.00
01
05
4N
V–
20
13
09
_x_
atch
rom
oso
me
5o
pe
nre
adin
gfr
ame
13
C5
orf
13
2.0
90
.00
05
66
6N
V–
23
68
60
_at
Ne
uro
pe
pti
de
Yre
cep
tor
Y6
(pse
ud
og
en
e)
NP
Y6
R4
.09
0.0
00
79
27
NV
–
Me
tab
olic
pro
cess
20
14
25
_at
ald
eh
yde
de
hyd
rog
en
ase
2fa
mily
(mit
och
on
dri
al)
ALD
H2
0.4
38
.62
e-0
50
.67
0.4
59
52
37
39
20
93
01
_at
carb
on
ican
hyd
rase
IIC
A2
*0
.48
0.0
00
71
53
0.7
90
.52
25
35
83
8
20
24
64
_s_
at6
-ph
osp
ho
fru
cto
-2-k
inas
e/f
ruct
ose
-2,6
-bip
ho
sph
ata
se3
PFK
FB3
0.1
51
.5e
-06
0.4
50
.14
18
46
65
2
Tra
nsp
ort
20
86
91
_at
tran
sfe
rrin
rece
pto
r(p
90
,C
D7
1)
TFR
C*
8.1
16
.47
e-0
54
.52
4.8
0E-
03
20
73
32
_s_
at5
.99
6.2
8e
-05
20
44
30
_s_
atso
lute
carr
ier
fam
ily2
(fac
ilita
ted
glu
cose
/fru
cto
setr
ansp
ort
er)
,m
em
be
r5
SLC
2A
52
.17
0.0
00
37
36
3.7
42
.69
E-0
3
20
15
60
_at
chlo
rid
ein
trac
ellu
lar
chan
ne
l4
CLI
C4
2.2
00
.00
01
83
2N
V–
20
22
36
_s_
atso
lute
carr
ier
fam
ily1
6(m
on
oca
rbo
xylic
acid
tran
spo
rte
rs),
me
mb
er
1SL
C1
6A
12
.55
,1
e-0
7N
V–
20
50
73
_at
Cyt
och
rom
eP
45
0,
fam
ily2
,su
bfa
mily
J,p
oly
pe
pti
de
2C
YP
2J2
2.0
43
.4e
-05
NV
–
22
45
79
_at
Solu
teca
rrie
rfa
mily
38
,m
em
be
r1
SLC
38
A1
2.5
80
.00
07
76
1N
V–
21
95
25
_at
hyp
oth
eti
cal
pro
tein
FLJ1
08
47
FLJ1
08
47
(SLC
47
A1
)0
.47
6.4
2e
-05
NV
–
21
79
66
_s_
atch
rom
oso
me
1o
pe
nre
adin
gfr
ame
24
C1
orf
24
(FA
M1
29
A)
0.4
70
.00
04
50
.78
0.5
58
88
13
3
Ub
iqu
itin
cycl
e
Ta
ble
2.
con
t.
Expression Profiling in LGMD2A
PLoS ONE | www.plosone.org 6 November 2008 | Volume 3 | Issue 11 | e3750
Aff
ym
etr
ixID
Bio
log
ica
lp
roce
ss/G
en
eti
tle
Ge
ne
sym
bo
lF
old
cha
ng
eP
ara
me
tric
pv
alu
eC
lass
Co
mp
ari
son
Fo
ldch
an
ge
Va
lid
ate
db
yR
T-P
CR
Sig
nif
ica
nt
pv
alu
eS
tat
Min
er
21
83
06
_s_
ath
ect
(ho
mo
log
ou
sto
the
E6-A
P(U
BE3
A)
carb
oxy
lte
rmin
us)
do
mai
nan
dR
CC
1(C
HC
1)-
like
do
mai
n(R
LD)
1H
ERC
12
.22
0.0
00
00
45
2.4
52
.29
E-0
2
21
85
75
_at
An
aph
ase
pro
mo
tin
gco
mp
lex
sub
un
it1
AN
AP
C1
2.0
29
e-0
71
.31
0.4
47
26
83
23
22
92
67
_at
2.0
70
.00
01
62
9
Oth
er
fun
ctio
ns
21
82
73
_s_
atp
rote
inp
ho
sph
atas
e2
C,
mag
ne
siu
m-d
ep
en
de
nt,
cata
lyti
csu
bu
nit
(mit
och
on
dri
al)
PP
M2
C2
.49
1.5
5e
-05
3.0
82
.97
E-0
2
20
16
09
_x_
atis
op
ren
ylcy
ste
ine
carb
oxy
lm
eth
yltr
ansf
era
seIC
MT
*2
.25
7.2
e-0
6N
V–
20
16
11
_s_
at2
.00
1.8
8e
-05
20
29
65
_s_
atca
lpai
n6
CA
PN
62
.05
1.7
1e
-05
5.3
19
.12
E-0
4
21
28
48
_s_
atch
rom
oso
me
9o
pe
nre
adin
gfr
ame
3C
9o
rf3
2.0
10
.00
03
01
3N
V–
20
10
10
_s_
atT
hio
red
oxi
nin
tera
ctin
gp
rote
inT
XN
IP*
0.4
31
e-0
50
.49
0.1
33
79
09
06
20
10
09
_s_
at0
.42
0.0
00
99
04
20
29
17
_s_
atS1
00
calc
ium
bin
din
gp
rote
inA
8(c
alg
ran
ulin
A)
S10
0A
80
.34
0.0
00
21
79
0.2
71
.51
E-0
2
20
93
98
_at
his
ton
e1
,H
1c
HIS
T1
H1
C0
.45
0.0
00
30
89
0.7
60
.49
10
15
25
5
22
50
61
_at
Dn
aJ(H
sp4
0)
ho
mo
log
,su
bfa
mily
A,
me
mb
er
4D
NA
JA4
*2
.53
0.0
00
05
29
3.6
58
.54
E-0
3
20
95
96
_at
mat
rix-
rem
od
elli
ng
asso
ciat
ed
5M
XR
A5
2.9
05
e-0
7N
V–
21
90
87
_at
asp
ori
n(L
RR
clas
s1
)A
SPN
4.5
84
e-0
7N
V–
23
50
22
_at
chro
mo
som
e1
8o
pe
nre
adin
gfr
ame
19
C1
8o
rf1
92
.34
1e
-07
NV
–
21
88
20
_at
chro
mo
som
e1
4o
pe
nre
adin
gfr
ame
13
2C
14
orf
13
22
.14
2.8
7e
-05
NV
–
20
20
16
_at
me
sod
erm
spe
cifi
ctr
ansc
rip
th
om
olo
g(m
ou
se)
MES
T2
.11
0.0
00
70
9N
V–
21
89
99
_at
hyp
oth
eti
cal
pro
tein
FLJ1
10
00
FLJ1
10
00
(TM
EM1
40
)0
.49
21
89
99
_at
NV
–
22
48
36
_at
tum
or
pro
tein
p5
3in
du
cib
len
ucl
ear
pro
tein
2T
P5
3IN
P2
*2
.46
0.0
00
38
53
NV
–
Un
kno
wn
fun
ctio
n
23
81
24
_at
Myo
me
sin
fam
ily,
me
mb
er
3M
YO
M3
2.3
00
.00
00
12
66
.74
1.8
6E-
04
23
02
84
_at
2.0
10
.00
00
00
3
20
27
59
_s_
atP
ALM
2-A
KA
P2
pro
tein
PA
LM2
-AK
AP
22
.16
0.0
00
00
07
NV
–
22
97
78
_at
Hyp
oth
eti
cal
pro
tein
MG
C1
09
46
MG
C1
09
46
(C1
2o
rf3
9)
2.7
50
.00
00
02
2N
V–
21
10
71
_s_
atm
yelo
id/l
ymp
ho
ido
rm
ixe
d-l
ine
age
leu
kem
ia(t
rith
ora
xh
om
olo
g,
Dro
sop
hila
);tr
ansl
oca
ted
to,
11
MLL
T1
13
.92
0.0
00
23
85
NV
–
21
88
76
_at
bra
insp
eci
fic
pro
tein
CG
I-3
8(T
PP
P3
)2
.86
0.0
00
08
67
NV
–
22
11
04
_s_
atn
ipsn
aph
om
olo
g3
B(C
,e
leg
ans)
NIP
SNA
P3
B2
.68
0.0
00
19
63
NV
–
22
52
42
_s_
atst
ero
idse
nsi
tive
ge
ne
1U
RB
(CC
DC
80
)3
.22
0.0
00
41
32
NV
–
* Dys
reg
ula
ted
ge
ne
sin
FSH
D,
DM
D,a
-sar
cog
lyca
n,
and
con
ge
nit
alm
yop
ath
ies
(Cam
pan
aro
et
al2
00
2,
Win
oku
re
tal
20
03
,H
asle
tte
tal
20
03
,T
anig
uch
ie
tal
20
06
,O
sbo
rne
et
al2
00
7).
do
i:10
.13
71
/jo
urn
al.p
on
e.0
00
37
50
.t0
02
Ta
ble
2.
con
t.
Expression Profiling in LGMD2A
PLoS ONE | www.plosone.org 7 November 2008 | Volume 3 | Issue 11 | e3750
upregulated genes. However, all genes involved in metabolic
processes and transcription factors (except for the E2F8 gene) were
downregulated (Table 2).
On the other hand, upregulation of IGF1, which is a regulator
of somatic growth and cell proliferation, was seen in this study.
IGFa is an inducer of different pathways such as the phosphati-
dylinositol 3-kinase survival (through activation of AKT1, AKT2),
the calcineurin.mediated signaling pathways, and of GATA2
activation.
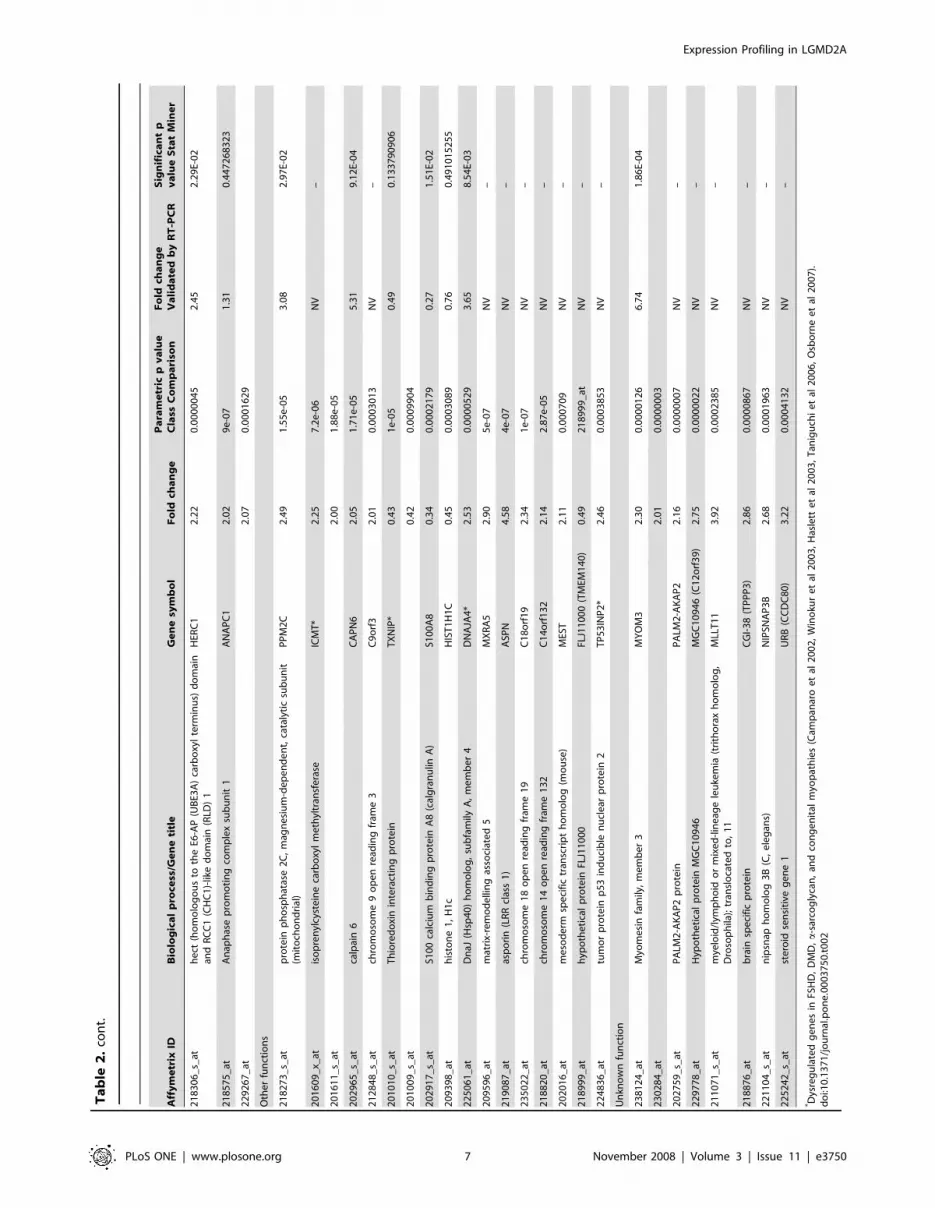
HERC1 and ANAPC1 are genes implicated in the ubiquitin
cycle and showed upregulation in LGMD2A muscle samples.
HERC1, ubiquitously expressed, is located in the cytosol in the
Golgi apparatus, stimulating guanine nucleotide, forming a
cytosolic ternary complex with clathrin and Hsp70, and is
involved in protein trafficking. ANAPC1 is a component of the
anaphase promoting complex/cyclosome (APC/C), a cell cycle-
regulated E3 ubiquitin ligase that controls progression through
mitosis and the G1 phase of the cell cycle.
There are two deregulated genes according to our results whose
cell location is the mitochondrion matrix, one of which is involved
in the metabolic process, ALDH2 (aldehyde dehydrogenase 2
family) (downregulated), while the other, the PPM2C gene (protein
phosphatase 2C, magnesium-dependent, catalytic subunit) (upre-
gulated) is implicated in protein amino acid dephosphorylation.
Expression changes in common with other musculardystrophies
Twenty four out of the 74 deregulated genes with altered
expression in LGMD2A were also deregulated in other muscular
dystrophies (DMD, a-SGD, FSHD, dysferlinopathies, Fukuyama-
type congenital muscular dystrophy, and laminin-a2 deficient
congenital muscular dystrophy) [24,30–35] (Table 2).
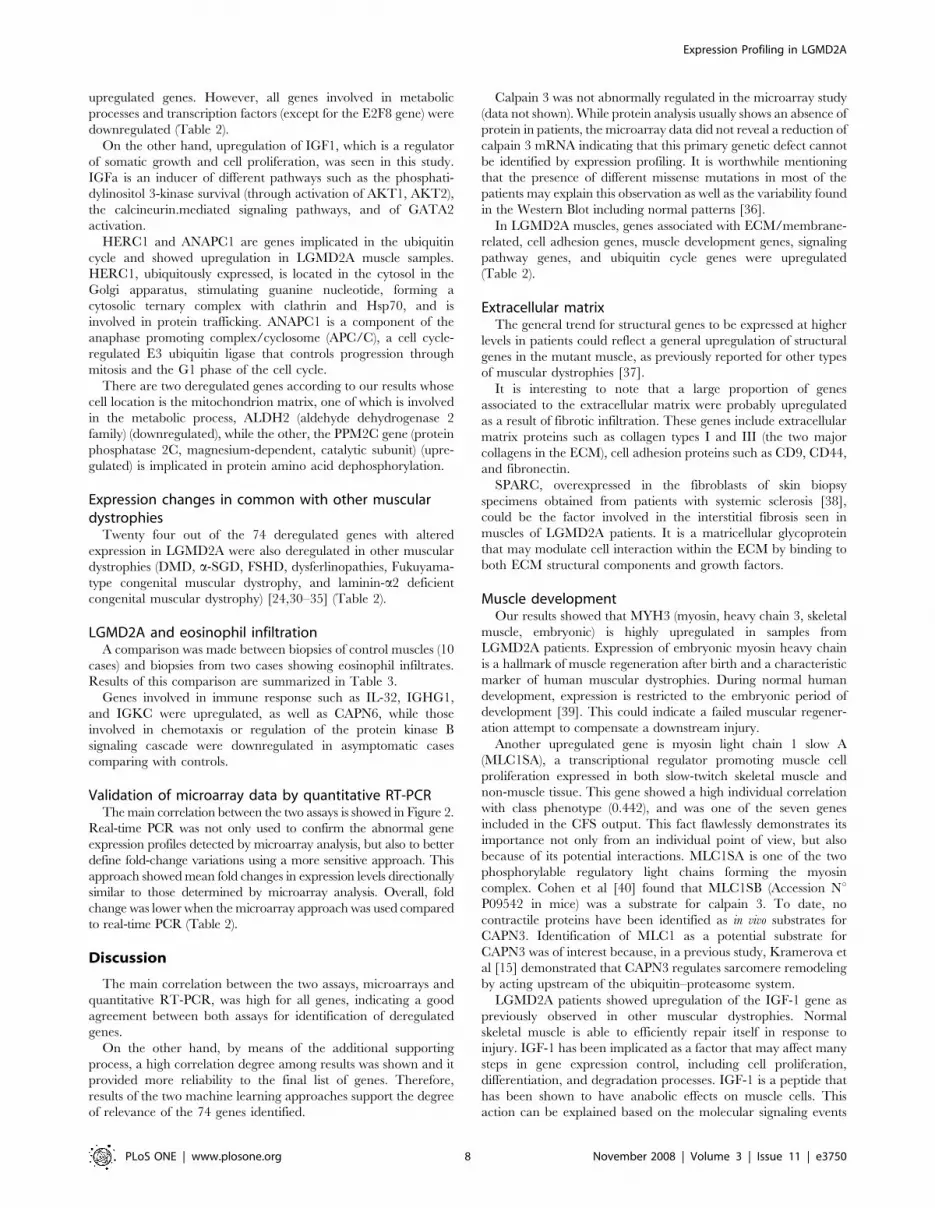
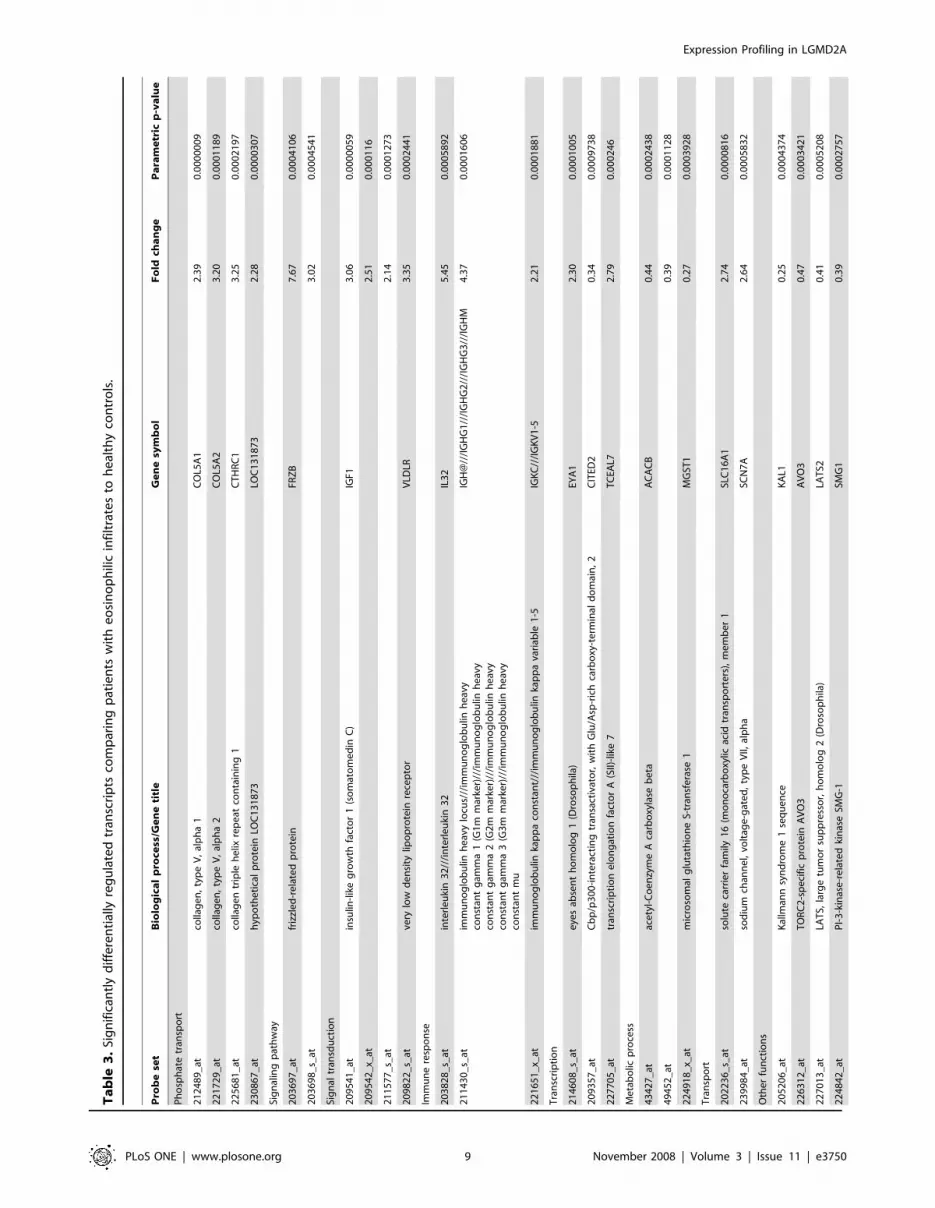
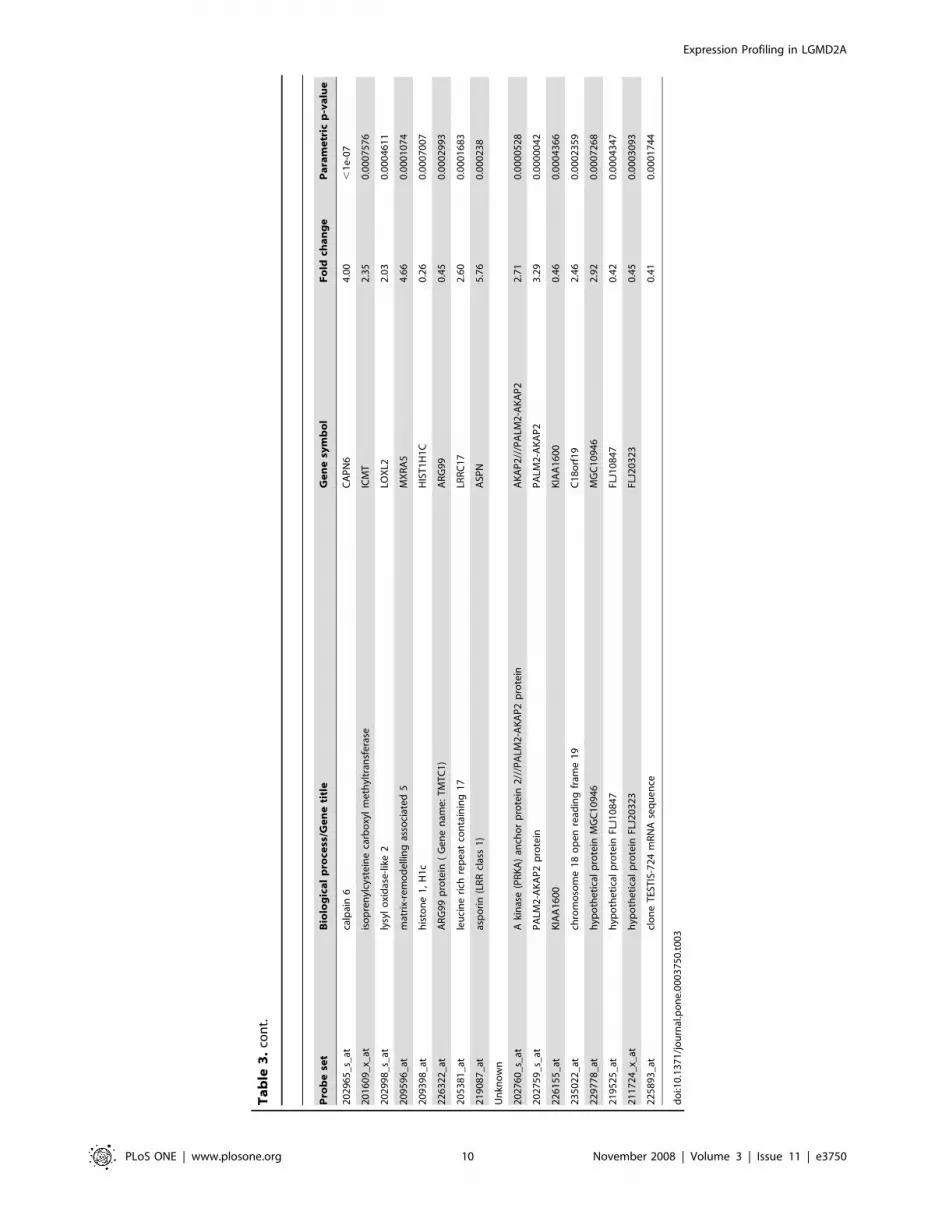
LGMD2A and eosinophil infiltrationA comparison was made between biopsies of control muscles (10
cases) and biopsies from two cases showing eosinophil infiltrates.
Results of this comparison are summarized in Table 3.
Genes involved in immune response such as IL-32, IGHG1,
and IGKC were upregulated, as well as CAPN6, while those
involved in chemotaxis or regulation of the protein kinase B
signaling cascade were downregulated in asymptomatic cases
comparing with controls.
Validation of microarray data by quantitative RT-PCRThe main correlation between the two assays is showed in Figure 2.
Real-time PCR was not only used to confirm the abnormal gene
expression profiles detected by microarray analysis, but also to better
define fold-change variations using a more sensitive approach. This
approach showed mean fold changes in expression levels directionally
similar to those determined by microarray analysis. Overall, fold
change was lower when the microarray approach was used compared
to real-time PCR (Table 2).
Discussion
The main correlation between the two assays, microarrays and
quantitative RT-PCR, was high for all genes, indicating a good
agreement between both assays for identification of deregulated
genes.
On the other hand, by means of the additional supporting
process, a high correlation degree among results was shown and it
provided more reliability to the final list of genes. Therefore,
results of the two machine learning approaches support the degree
of relevance of the 74 genes identified.
Calpain 3 was not abnormally regulated in the microarray study
(data not shown). While protein analysis usually shows an absence of
protein in patients, the microarray data did not reveal a reduction of
calpain 3 mRNA indicating that this primary genetic defect cannot
be identified by expression profiling. It is worthwhile mentioning
that the presence of different missense mutations in most of the
patients may explain this observation as well as the variability found
in the Western Blot including normal patterns [36].
In LGMD2A muscles, genes associated with ECM/membrane-
related, cell adhesion genes, muscle development genes, signaling
pathway genes, and ubiquitin cycle genes were upregulated
(Table 2).
Extracellular matrixThe general trend for structural genes to be expressed at higher
levels in patients could reflect a general upregulation of structural
genes in the mutant muscle, as previously reported for other types
of muscular dystrophies [37].
It is interesting to note that a large proportion of genes
associated to the extracellular matrix were probably upregulated
as a result of fibrotic infiltration. These genes include extracellular
matrix proteins such as collagen types I and III (the two major
collagens in the ECM), cell adhesion proteins such as CD9, CD44,
and fibronectin.
SPARC, overexpressed in the fibroblasts of skin biopsy
specimens obtained from patients with systemic sclerosis [38],
could be the factor involved in the interstitial fibrosis seen in
muscles of LGMD2A patients. It is a matricellular glycoprotein
that may modulate cell interaction within the ECM by binding to
both ECM structural components and growth factors.
Muscle developmentOur results showed that MYH3 (myosin, heavy chain 3, skeletal
muscle, embryonic) is highly upregulated in samples from
LGMD2A patients. Expression of embryonic myosin heavy chain
is a hallmark of muscle regeneration after birth and a characteristic
marker of human muscular dystrophies. During normal human
development, expression is restricted to the embryonic period of
development [39]. This could indicate a failed muscular regener-
ation attempt to compensate a downstream injury.
Another upregulated gene is myosin light chain 1 slow A
(MLC1SA), a transcriptional regulator promoting muscle cell
proliferation expressed in both slow-twitch skeletal muscle and
non-muscle tissue. This gene showed a high individual correlation
with class phenotype (0.442), and was one of the seven genes
included in the CFS output. This fact flawlessly demonstrates its
importance not only from an individual point of view, but also
because of its potential interactions. MLC1SA is one of the two
phosphorylable regulatory light chains forming the myosin
complex. Cohen et al [40] found that MLC1SB (Accession NuP09542 in mice) was a substrate for calpain 3. To date, no
contractile proteins have been identified as in vivo substrates for
CAPN3. Identification of MLC1 as a potential substrate for
CAPN3 was of interest because, in a previous study, Kramerova et
al [15] demonstrated that CAPN3 regulates sarcomere remodeling
by acting upstream of the ubiquitin–proteasome system.
LGMD2A patients showed upregulation of the IGF-1 gene as
previously observed in other muscular dystrophies. Normal
skeletal muscle is able to efficiently repair itself in response to
injury. IGF-1 has been implicated as a factor that may affect many
steps in gene expression control, including cell proliferation,
differentiation, and degradation processes. IGF-1 is a peptide that
has been shown to have anabolic effects on muscle cells. This
action can be explained based on the molecular signaling events
Expression Profiling in LGMD2A
PLoS ONE | www.plosone.org 8 November 2008 | Volume 3 | Issue 11 | e3750
Ta
ble
3.
Sig
nif
ican
tly
dif
fere
nti
ally
reg
ula
ted
tran
scri
pts
com
par
ing
pat
ien
tsw
ith
eo
sin
op
hili
cin
filt
rate
sto
he
alth
yco
ntr
ols
.
Pro
be
set
Bio
log
ica
lp
roce
ss/G
en
eti
tle
Ge
ne
sym
bo
lF
old
cha
ng
eP
ara
me
tric
p-v
alu
e
Ph
osp
hat
etr
ansp
ort
21
24
89
_at
colla
ge
n,
typ
eV
,al
ph
a1
CO
L5A
12
.39
0.0
00
00
09
22
17
29
_at
colla
ge
n,
typ
eV
,al
ph
a2
CO
L5A
23
.20
0.0
00
11
89
22
56
81
_at
colla
ge
ntr
iple
he
lixre
pe
atco
nta
inin
g1
CT
HR
C1
3.2
50
.00
02
19
7
23
08
67
_at
hyp
oth
eti
cal
pro
tein
LOC
13
18
73
LOC
13
18
73
2.2
80
.00
00
30
7
Sig
nal
ing
pat
hw
ay
20
36
97
_at
friz
zle
d-r
ela
ted
pro
tein
FRZ
B7
.67
0.0
00
41
06
20
36
98
_s_
at3
.02
0.0
00
45
41
Sig
nal
tran
sdu
ctio
n
20
95
41
_at
insu
lin-l
ike
gro
wth
fact
or
1(s
om
ato
me
din
C)
IGF1
3.0
60
.00
00
05
9
20
95
42
_x_
at2
.51
0.0
00
11
6
21
15
77
_s_
at2
.14
0.0
00
12
73
20
98
22
_s_
atve
rylo
wd
en
sity
lipo
pro
tein
rece
pto
rV
LDLR
3.3
50
.00
02
44
1
Imm
un
ere
spo
nse
20
38
28
_s_
atin
terl
eu
kin
32
///i
nte
rle
uki
n3
2IL
32
5.4
50
.00
05
89
2
21
14
30
_s_
atim
mu
no
glo
bu
linh
eav
ylo
cus/
//im
mu
no
glo
bu
linh
eav
yco
nst
ant
gam
ma
1(G
1m
mar
ker)
///i
mm
un
og
lob
ulin
he
avy
con
stan
tg
amm
a2
(G2
mm
arke
r)//
/im
mu
no
glo
bu
linh
eav
yco
nst
ant
gam
ma
3(G
3m
mar
ker)
///i
mm
un
og
lob
ulin
he
avy
con
stan
tm
u
IGH
@//
/IG
HG
1//
/IG
HG
2//
/IG
HG
3//
/IG
HM
4.3
70
.00
01
60
6
22
16
51
_x_
atim
mu
no
glo
bu
linka
pp
aco
nst
ant/
//im
mu
no
glo
bu
linka
pp
ava
riab
le1
-5IG
KC
///I
GK
V1
-52
.21
0.0
00
18
81
Tra
nsc
rip
tio
n
21
46
08
_s_
ate
yes
abse
nt
ho
mo
log
1(D
roso
ph
ila)
EYA
12
.30
0.0
00
10
05
20
93
57
_at
Cb
p/p
30
0-i
nte
ract
ing
tran
sact
ivat
or,
wit
hG
lu/A
sp-r
ich
carb
oxy
-te
rmin
ald
om
ain
,2
CIT
ED2
0.3
40
.00
09
73
8
22
77
05
_at
tran
scri
pti
on
elo
ng
atio
nfa
cto
rA
(SII)
-lik
e7
TC
EAL7
2.7
90
.00
02
46
Me
tab
olic
pro
cess
43
42
7_
atac
ety
l-C
oe
nzy
me
Aca
rbo
xyla
seb
eta
AC
AC
B0
.44
0.0
00
24
38
49
45
2_
at0
.39
0.0
00
11
28
22
49
18
_x_
atm
icro
som
alg
luta
thio
ne
S-tr
ansf
era
se1
MG
ST1
0.2
70
.00
03
92
8
Tra
nsp
ort
20
22
36
_s_
atso
lute
carr
ier
fam
ily1
6(m
on
oca
rbo
xylic
acid
tran
spo
rte
rs),
me
mb
er
1SL
C1
6A
12
.74
0.0
00
08
16
23
99
84
_at
sod
ium
chan
ne
l,vo
ltag
e-g
ate
d,
typ
eV
II,al
ph
aSC
N7
A2
.64
0.0
00
58
32
Oth
er
fun
ctio
ns
20
52
06
_at
Kal
lman
nsy
nd
rom
e1
seq
ue
nce
KA
L10
.25
0.0
00
43
74
22
63
12
_at
TO
RC
2-s
pe
cifi
cp
rote
inA
VO
3A
VO
30
.47
0.0
00
34
21
22
70
13
_at
LAT
S,la
rge
tum
or
sup
pre
sso
r,h
om
olo
g2
(Dro
sop
hila
)LA
TS2
0.4
10
.00
05
20
8
22
48
42
_at
PI-
3-k
inas
e-r
ela
ted
kin
ase
SMG
-1SM
G1
0.3
90
.00
02
75
7
Expression Profiling in LGMD2A
PLoS ONE | www.plosone.org 9 November 2008 | Volume 3 | Issue 11 | e3750
Pro
be
set
Bio
log
ica
lp
roce
ss/G
en
eti
tle
Ge
ne
sym
bo
lF
old
cha
ng
eP
ara
me
tric
p-v
alu
e
20
29
65
_s_
atca
lpai
n6
CA
PN
64
.00
,1
e-0
7
20
16
09
_x_
atis
op
ren
ylcy
ste
ine
carb
oxy
lm
eth
yltr
ansf
era
seIC
MT
2.3
50
.00
07
57
6
20
29
98
_s_
atly
syl
oxi
das
e-l
ike
2LO
XL2
2.0
30
.00
04
61
1
20
95
96
_at
mat
rix-
rem
od
elli
ng
asso
ciat
ed
5M
XR
A5
4.6
60
.00
01
07
4
20
93
98
_at
his
ton
e1
,H
1c
HIS
T1
H1
C0
.26
0.0
00
70
07
22
63
22
_at
AR
G9
9p
rote
in(
Ge
ne
nam
e:
TM
TC
1)
AR
G9
90
.45
0.0
00
29
93
20
53
81
_at
leu
cin
eri
chre
pe
atco
nta
inin
g1
7LR
RC
17
2.6
00
.00
01
68
3
21
90
87
_at
asp
ori
n(L
RR
clas
s1
)A
SPN
5.7
60
.00
02
38
Un
kno
wn
20
27
60
_s_
atA
kin
ase
(PR
KA
)an
cho
rp
rote
in2
///P
ALM
2-A
KA
P2
pro
tein
AK
AP
2//
/PA
LM2
-AK
AP
22
.71
0.0
00
05
28
20
27
59
_s_
atP
ALM
2-A
KA
P2
pro
tein
PA
LM2
-AK
AP
23
.29
0.0
00
00
42
22
61
55
_at
KIA
A1
60
0K
IAA
16
00
0.4
60
.00
04
36
6
23
50
22
_at
chro
mo
som
e1
8o
pe
nre
adin
gfr
ame
19
C1
8o
rf1
92
.46
0.0
00
23
59
22
97
78
_at
hyp
oth
eti
cal
pro
tein
MG
C1
09
46
MG
C1
09
46
2.9
20
.00
07
26
8
21
95
25
_at
hyp
oth
eti
cal
pro
tein
FLJ1
08
47
FLJ1
08
47
0.4
20
.00
04
34
7
21
17
24
_x_
ath
ypo
the
tica
lp
rote
inFL
J20
32
3FL
J20
32
30
.45
0.0
00
30
93
22
58
93
_at
clo
ne
TES
TIS
-72
4m
RN
Ase
qu
en
ce0
.41
0.0
00
17
44
do
i:10
.13
71
/jo
urn
al.p
on
e.0
00
37
50
.t0
03
Ta
ble
3.
con
t.
Expression Profiling in LGMD2A
PLoS ONE | www.plosone.org 10 November 2008 | Volume 3 | Issue 11 | e3750

initiated by its receptor, a tyrosine kinase activated on IGF-1
binding, and transmitted through a cascade of intracellular events,
leading to a general increase in protein synthesis [41,42].
Integrin b1 binding protein (ITGB1BP2 = melusin), also
upregulated in LGMD2A muscles, is present in a costamere-like
pattern consisting of two rows flanking a-actinin at Z line. Melusin
expression is upregulated during in vitro differentiation of the
C2C12 murine myogenic cell line, and is regulated during in vivo
skeletal muscle development [43]. Upregulation of the melusin
gene may alter a process that is tightly controlled in muscle
development, leading to inadequate muscle differentiation and
maturation. The generalized inhibition of terminal stages of
myogenic differentiation in C3KO myotubes affects at least two
events: sarcomere formation and integrin isoform replacement
[44]. During myogenesis, two isoforms of b1 integrin are
expressed: b1A is expressed in myoblasts and is downregulated
during myogenesis, while b1D appears after fusion and eventually
displaces b1A in mature myotubes [45]. Neither b1A nor b1D
were cleaved by CAPN3, suggesting that changes in the level of
integrin isoforms are not a direct result of calpain 3 absence [44].
Ubiquitin cycle and protein degradationIt is still unclear whether CAPN3 directly cleaves proteins to
make them available for ubiquitination or whether the effect of
CAPN3 is indirect (i.e. through regulation of other proteins
involved in ubiquitination) [15]. In LGMD2A muscle samples, the
HERC1 and ANAPC1 genes involved in the ubiquitin cycle are
upregulated, suggesting that their regulation may be under the
control of calpain 3.
Moreover, Ono et al [46] found proteolysis of proteasome
regulatory subunit RPS6A by calpain 3, which may indicate that the
ubiquitin-proteasome system is subject to regulation by calpain.
As ubiquitination tags proteins for degradation, decreased
ubiquitination may lead to excessive accumulation of the proteins
that should otherwise be degraded. This in turn could trigger a cell
stress response, one manifestation of which is upregulation of heat
shock proteins [15]. According to the reported data, the DnaJ
(Hsp40) homolog, subfamily A member 4 (DNAJA4), that showed
upregulation, may regulate the chaperone function of Hsp70
proteins [47].
Signaling pathwaysThe protein coded by HERC1, upregulated in LGMD2A
patients, has a C-terminal HECT (homologous to E6-AP C-
terminus) domain, which suggests that it has an ubiquitin ligase
activity.
b-catenin plays a critical role in many cellular and morphogenic
processes by performing two distinct functions: in the nucleus, it
acts as a mandatory coactivator of TCF/LEF transcription factors
in response to Wnt signaling during both embryonic development
and adult muscle regeneration, while at the cell membrane, b-
catenin associates with the cadherin complex that links adhesion
molecules to the cytoskeleton. In both cases, the concentration of
b-catenin has been shown to be tightly regulated through
ubiquitin-mediated degradation [44].
Two distinct ubiquitin ligase complexes control b-catenin levels
in cytoplasm and at the membrane [48]. Ubiquitination and
degradation of the cytosolic pool of b-catenin are under the
control of Wnt signaling. Degradation of the membrane pool of b-
catenin in skeletal muscle is mediated by the Ozz-E3 ubiquitin
ligase complex [49]. Thus, it may be suggested that membrane b-
catenin is indirectly regulated by CAPN3. It should also be noted
that Trim32, found mutated in limb-girdle muscular dystrophy
type 2H, is another putative E3-ubiquitin-ligase [50].
On the other hand, frizzled-related protein (FRZB) is
upregulated in LGMD2A muscle samples. It could therefore be
hypothesized that b-catenin regulation is also altered at the Wnt
signaling pathway, leading to an abnormal myotube fusion or
incorrect myogenesis.
Deregulation of mitochondrial genesIn our results, the mitochondrial genes found to be deregulated
were ALDH2 and PPM2C. ALDH2 was downregulated in patient
samples and is implicated in the glycolysis/gluconeogenesis
pathway. On the contrary, expression of the PPM2C mitochon-
drial gene was upregulated in our study. Protein phosphatase 1J
(PPM1J_mouse, PP2C family) was found to be an in vivo substrate
for calpain 3 [40].
In later stages of the disease, the muscle pathology is
characterized mainly by the presence of lobulated fibers (LF),
which are composed of misaligned myofibrils that form a lobular
pattern, in addition to fiber size variation and interstitial fibrosis.
Lobulated muscle fibers reflect an abnormal spatial distribution of
the intermyofibrillar mitochondria network [51]. In C3KO mice,
abnormal A-bands were seen, suggesting a role for calpain 3 in
correct formation of sarcomeres or maintenance of sarcomere
alignment [14].
mRNA expression profiles were specifically altered in LGMD2A
muscles with lobulated fibers Keira et al [52]. Genes encoding for
extracellular matrix (ECM)/membrane-related, cytoskeletal, or
sarcomeric proteins were also upregulated in LF muscles.
According to these results, identification of these mitochondrial
proteins suggests that CAPN3 may be involved in mitochondrial
protein turnover.
Common genes with altered expression in differentmuscular dystrophies
According to Table 2, LGMD2A can be characterized as an
active fibrotic disease with suppressed muscle regeneration, since
LGMD2A cases share upregulation of the extracellular matrix
Figure 2. Comparison between expression data obtained frommicroarray experiments and data obtained from quantitativeRT-PCR.doi:10.1371/journal.pone.0003750.g002
Expression Profiling in LGMD2A
PLoS ONE | www.plosone.org 11 November 2008 | Volume 3 | Issue 11 | e3750
(ECM) components with congenital muscular dystrophy cases and
share downregulation of the transcription factors with Duchenne
muscular dystrophies.
In muscles from patients with Duchenne muscular dystrophy,
upregulated genes were mostly those related to immune response,
sarcomeric, ECM, and cell growth, whereas downregulated genes
were associated to energy metabolism, transcription/translation,
signaling, and proteasomes [32].
c-fos and c-jun proteins have been described as showing strong
cytoplasmic expression related to the degeneration process
occurring in Duchenne and Becker muscular dystrophies [53].
However our results contradict the previously published results
and they showed a strong downregulation of c-fos and c-jun in our
samples.
Recently Gan et al [54] reported that Dishevelled (Dvl) and c-
Jun form a complex with b-catenin-T-cell factor 4 (TCF-4) on the
promoter of Wnt target genes and regulate gene transcription. c-
Jun mediates Dvl association with the functional TCF-b-catenin
complex and functions as a key component of Wnt signaling in vivo.
Since genes coding for proteins in this pathway are dysregulated in
LGMD2A patients, it may be suggested that the downregulation
of c-jun and other transcription factors observed in LGMD2A
patients are regulated in an indirect way by calpain 3.
TFRC (transferrin receptor) and VLDLR (very low density
lipoprotein receptor) are upregulated in LGMD2A patients as
occurred in FSHD muscles [33]. Transferrin is a key myoblast
trophic factor, initially promoting myoblast proliferation and
subsequently supporting myogenic differentiation. However,
TXNIP (thioredoxin-interacting protein) is downregulated in
LGMD2A muscles and was also downregulated in FSHD samples
[33]. Since TXNIP acts as an oxidative stress mediator, this
finding is consistent with the enhanced vulnerability to oxidative
stress seen in LGMD2A, as observed in FSHD myoblasts [33].
Many of the genes deregulated in facioscapulohumeral muscular
dystrophy (FSHD) are involved in myogenesis, cell differentiation,
and cell-cycle control.
According to the available information, it could be suggested
that FSHD shared the greatest quantity of differentially expressed
genes and the deregulation tendencies (up/downregulation) are
the same and in a similar range of variation. However it would be
difficult to establish any correlation given that in the FSHD, even
in patients with the same deletion fragment, high variability of
impairment and of muscle affectation grade is observed.
Therefore, the data depend enormously on the place and on the
moment that biopsy has been taken.
S100A6 (calcyclin) and S100A8 (calgranulin A), dysregulated in
LGMD2A muscles, are involved in various intracellular and
extracellular regulatory activities [55]. Upregulation of S100A6
expression was seen also in LGMD2B and as in other muscular
dystrophies, the structural defect causes a general membrane
instability that leads to an altered uptake of calcium ions into the
muscle fibers [31]. Since calpain 3 interacts with dysferlin and
AHNAK, a role of calpain 3 in membrane homeostasis has been
suggested [8,9]. The increased Ca2+ concentration probably
influences expression of various signaling molecules whose
transcription is sensitive to calcium concentration.
Dysferlin was not abnormally regulated in LGMD2A patients in
the microarray study. The value obtained for the expression of the
DYSF gene did not fulfil the established criteria to be considered
as differently expressed (data not shown).
In this study mRNA levels are analysed, not protein quantities.
Even if the protein is reduced in the Western Blot, this reduction
may not be regulated at a transcriptional level, it may happen at a
post-translation level. Since calpain 3 was shown to be in complex
with dysferlin and it has been demonstrated that AHNAK, a novel
component of the dysferlin protein complex, serves as a direct
substrate of calpain 3 in cell culture, the lack of one of these
proteins may justify the reduction of the other.
As described in previous works [31] while western blotting tests
showed a reduction or the absence of dysferlin protein in most
LGMD2B patients, the microarray data showed a reduction of
dysferlin mRNA for some of the patients analysed. This could be
due to the different types of mutations of the gene that affects the
translation efficiency of the mRNA or the stability of the protein.
Additionally, while protein analysis usually shows an absence of
protein in the C57BL/10.SJL-Dysf mice, the microarray data did
not reveal a reduction of dysferlin mRNA indicating that this
primary genetic defect cannot be identified by expression profiling
[37]. Moreover, it has been observed that neither calpain-3 nor
caveolin was consistently reduced in dysferlinopathies.
The vast majority of upregulated genes in Fukuyama-type
congenital muscular dystrophy (FCMD) and laminin-a2 deficient
congenital muscular dystrophy (MDC1A) encode extracellular
matrix components, presumably related to fibrotic change.
However, mature muscle components were extremely downreg-
ulated in congenital muscular dystrophies [34].
Muscle regeneration is also a process that depends on the
skeletal muscle basement membrane. Basement membrane is
thought to not only maintain cell integrity but also to mediate
signal transmission in cell differentiation, growth, attachment,
survival, polarity, proliferation, and apoptosis [56,57]. It is
hypothesized that upregulation of ECM genes might arise from
signal transduction defects due to basement membrane dysfunc-
tion. It is possible that muscle fibers keep high transcription levels
of ECM to create basement membrane components [34].
Costameric proteins can interact with many components of both
the sarcolemma and cytoskeleton. Different publications support a
role for the costamere/Z-disk axis in mechanotransduction, the
dynamic process through which mechanical stimuli are sensed by
muscle cells and converted into biochemical responses [57].
Based on our results and since collagens, melusin and
fibronectin, were deregulated, we may hypothesize that upregula-
tion of ECM genes found in LGMD2A patients may result from
signal transduction defects due to basement membrane dysfunc-
tion. Calpain 3 recognizes a wide range of substrates, including
cytoskeletal proteins and myofibrillar proteins [40,46]. These
cytoskeletal proteins and matrix proteins contribute to cell shape,
mechanical resistance, and morphological integrity of muscle cells,
and are part of a complex network of filaments and tubules that
transmit mechanical and chemical stimuli between cells. The
cytoskeleton is not only involved in cell stability and integrity, but
also plays a significant role in signal transmission from the cell
membrane to the nucleus.
LGMD2A and eosinophilic infiltrationsPresence of eosinophilic cells has recently been detected in muscle
tissue from patients with mutations in the CAPN3 gene [16].
In our study, IL-32 was upregulated in LGMD2A patients with
eosinophilic infiltrates (Table 3). Although IL-32 does not share
sequence homology with known cytokine families, IL-32 induces
various cytokines, human TNFa, and IL-8 in THP-1 monocytic
cells. IL-32 activates typical cytokine signal pathways of nuclear
factor-kappa B (NF-kB) and p38 mitogen-activated protein kinase
[58]. The neutrophil-derived proteinase 3 (PR3) was identified as a
putative IL-32 receptor [59], supporting the possibility that IL-32
upregulation in muscle may be chemoattractant for eosinophilic
cells.
Expression Profiling in LGMD2A
PLoS ONE | www.plosone.org 12 November 2008 | Volume 3 | Issue 11 | e3750
Eosinophilia has also been reported as a prominent feature of
the necrotic phase in dystrophin-deficient mdx mice. This study
suggested that eosinophilia was promoted by at least perforin-
dependent cytotoxicity of effector T cells and T-cell production of
interleukin-5 (IL-5) [60]. However these authors concluded that
some eosinophilia of mdx muscle is independent from perforin-
mediated processes and that it may be suggested that a similar
mechanism of calpain 3 could act in this process.
Inflammatory features may be seen in some muscular
dystrophies, such as facioscapulohumeral muscular dystrophy
[17] and dysferlinopathies [19]. Moreover, a Becker muscular
dystrophy presenting eosinophilic inflammatory myopathy was
described by Weinstock et al [18].
Although the comparison between gene expression profiles
between LGMD2A with and without eosinophilia would be
interesting, it was not possible to perform. The methods used needed
a higher quantity of samples to obtain significant results. Moreover,
when a PCA plot was performed for LGMD2A patients only
(including cases with and without eosinophilia), no different groups
were created and this may be due to the low sample number too.
It seems that the comparison between asymptomatic patients
with eosinophilia with control samples is more indicated to shed
some light onto the initial mechanism that triggers the eosinophilic
cell attraction to muscle. The comparison between asymptomatic
patients and controls allows a clearer view due to a lower
interfering expression variation.
In a first approach asymptomatic cases were considered as
affected and were included into the patient group in the general
analysis. These cases were included in the affected group due to
their abnormal muscle biopsy pattern. Additionally reinforcing this
decision, the PCA plots clustered together the LGMD2A case with
or without eosinophilia.
Finally in an additional analysis, however, it was decided to
consider them as a different group compared to the controls in
order to obtain information about eosinofilic attraction in the early
stage of the disease.
ConclusionsIn conclusion, upregulated genes were mostly those related to
extracellular matrix, cell adhesion, sarcomeric proteins, and signal
transduction. It is therefore suggested that different proteins
located at or participating in the costameric region are involved in
processes regulated by calpain 3 during skeletal muscle develop-
ment. Upregulation of these proteins may indicate a compensatory
attempt of the muscle, and since most of these genes are also
upregulated in other dystrophic processes, upregulation might be
relatively nonspecific.
It was also found that genes participating in the ubiquitin
proteasome degradation pathway are deregulated in LGMD2A
patients, which suggests that regulation of this pathway may be
under the control of calpain 3 activity.
Finally, the upregulation of IL-32 and immunoglobulin genes
may cause the eosinophil chemoattraction observed in the
inflammatory findings in presymptomatic stages. This upregula-
tion seems to disappear when the disease progresses. However,
they might be quite specific markers for the disease.
Though samples taken from different muscles could add
variability to the results of the expression array analysis,
correlation of the results with the quantitative RT-PCR results
gave strength to the findings. Gene expression profiling is
presented as a useful approach to mine new data and hopefully
open new perspectives for muscular disorders, shedding some light
on identification of novel therapeutic targets for limb-girdle
muscular dystrophies.
Looking ahead, each of these methods should be individually
analyzed in the animal model and in cell models.
This analysis gives a total of 24 genes that may be considered as
potential diagnostic or evolutionary biomarkers of the disease.
However, this question will not be solved until the predictive value
of these markers is proved in a series of patients with different
evolutive status and secondly until the consistency of the results in
different muscles and different laboratories is proved.
Acknowledgments
We would like to thank Nathalie Deburgrave and Caroline Beugnet for
their technical assistance, Harry Zuzan for discussions on data analysis and
Daisy E. Hilton (Celer Soluciones) for manuscript editing.
Author Contributions
Conceived and designed the experiments: AS. Performed the experiments:
AS MA FL. Analyzed the data: AS MA RA AA IInza ALdM. Contributed
reagents/materials/analysis tools: AS MA FL FGB GDlH JC AC CN
CDlT EG IIlla ALdM. Wrote the paper: AS RA ALdM.
References
1. Sorimachi H, Imajoh-Ohmi S, Emori Y, Kawasaki H, Ohno S, et al. (1989)
Molecular cloning of a novel mammalian calcium-dependent protease distinct
from both m- and mu-types. Specific expression of the mRNA in skeletal muscle.
J Biol Chem 264: 20106–20111.
2. Ono Y, Kakinuma K, Torii F, Irie A, Nakagawa K, et al. (2004) Possible
regulation of the conventional calpain system by skeletal muscle-specific calpain,
p94/calpain 3. J Biol Chem 279: 2761–2771.
3. Kinbara K, Sorimachi H, Ishiura S, Suzuki K (1998) Skeletal muscle-specific
calpain, p94: structure and physiological function. Biochem Pharmacol 56:
415–420.
4. Garcıa Dıaz BE, Gauthier S, Davies PL (2006) Ca2+ dependency of calpain 3
(p94) activation. Biochemistry 45: 3714–3722.
5. Sorimachi H, Kinbara K, Kimura S, Takahashi M, Ishiura S, et al. (1995)
Muscle-specific calpain, p94, responsible for limb girdle muscular dystrophy type
2A, associates with connectin through IS2, a p94-specific sequence. J Biol Chem
270: 31158–31162.
6. Ono Y, Torii F, Ojima K, Doi N, Yoshioka K, et al. (2006) Suppressed
disassembly of autolyzing p94/CAPN3 by N2A connectin/titin in a genetic
reporter system. J Biol Chem 281: 18519–18531.
7. Hayashi C, Ono Y, Doi N, Kitamura F, Tagami M, et al. (2008) Multiple molecular
interactions implicate connectin/titin N2A region as a modulating scaffold for p94/
calpain 3 activity in skeletal muscle. J Biol Chem 283: 14801–14814.
8. Huang Y, Verheesen P, Roussis A, Frankhuizen W, Ginjaar I, et al. (2005)
Protein studies in dysferlinopathy patients using llama-derived antibody
fragments selected by phage display. Eur J Hum Genet 13: 721–730.
9. Huang Y, de Morree A, van Remoortere A, Bushby K, Frants RR, et al. (2008)
Calpain 3 is a modulator of the dysferlin protein complex in skeletal muscle.
Hum Mol Genet 17: 1855–1866.
10. Guyon JR, Kudryashova E, Potts A, Dalkilic I, Brosius MA, et al. (2003) Calpain
3 cleaves filamin C and regulates its ability to interact with gamma- and delta-
sarcoglycans. Muscle Nerve 28: 472–483.
11. Baghdiguian S, Martin M, Richard I, Pons F, Astier C, et al. (1999) Calpain 3
deficiency is associated with myonuclear apoptosis and profound perturbation of
the IkappaB alpha/NF-kappaB pathway in limb-girdle muscular dystrophy type
2A. Nat Med 5: 503–511.
12. Baghdiguian S, Richard I, Martin M, Coopman P, Beckmann JS, et al. (2001)
Pathophysiology of limb girdle muscular dystrophy type 2A: hypothesis and new
insights into the IkappaBalpha/NF-kappaB survival pathway in skeletal muscle.
J Mol Med 79: 254–261.
13. Benayoun B, Baghdiguian S, Lajmanovich A, Bartoli M, Daniele N, et al. (2008)
NF-kappaB-dependent expression of the antiapoptotic factor c-FLIP is regulated
by calpain 3, the protein involved in limb-girdle muscular dystrophy type 2A.
FASEB J 22: 1521–1529.
14. Kramerova I, Kudryashova E, Tidball JG, Spencer MJ (2004) Null mutation of
calpain 3 (p94) in mice causes abnormal sarcomere formation in vivo and in
vitro. Hum Mol Genet 13: 1373–1388.
15. Kramerova I, Kudryashova E, Venkatraman G, Spencer MJ (2005)
Calpain 3 participates in sarcomere remodeling by acting upstream of
the ubiquitin-proteasome pathway. Hum Mol Genet 14: 2125–
2134.
Expression Profiling in LGMD2A
PLoS ONE | www.plosone.org 13 November 2008 | Volume 3 | Issue 11 | e3750
16. Krahn M, Lopez de Munain A, Streichenberger N, Bernard R, Pecheux C, et al.
(2006) CAPN3 mutations in patients with idiopathic eosinophilic myositis. AnnNeurol 59: 905–911.
17. Arahata K, Ishihara T, Fukunaga H, Orimo S, Lee JH, et al. (1995)
Inflammatory response in facioscapulohumeral muscular dystrophy (FSHD):immunocytochemical and genetic analyses. Muscle Nerve 2: S56–66.
18. Weinstock A, Green C, Cohen BH, Prayson RA (1997) Becker musculardystrophy presenting as eosinophilic inflammatory myopathy in an infant.
J Child Neurol 12: 146–147.
19. Gallardo E, Rojas-Garcıa R, de Luna N, Pou A, Brown RH Jr, et al. (2001)Inflammation in dysferlin myopathy: immunohistochemical characterization of
13 patients. Neurology 57: 2136–2138.20. Gentleman R, Carey V, Huber W, Irizarry R, Dudoit S (2005) Bioinformatics
and Computational Biology Solutions Using R and Bioconductor. Springer.21. Irizarry RA, Hobbs B, Collin F, Beazer-Barclay YD, Antonellis KJ, et al. (2003)
Exploration, normalization, and summaries of high density oligonucleotide array
probe level data. Biostatistics 4: 249–264.22. Irizarry RA, Bolstad BM, Collin F, Cope LM, Hobbs B, et al. (2003) Summaries
of Affymetrix GeneChip probe level data. Nucleic Acids Res 31: e15.23. Bolstad BM, Irizarry R A, Astrand M, Speed TP (2003) A Comparison of
Normalization Methods for High Density Oligonucleotide Array Data Based on
Bias and Variance. Bioinformatics 19: 185–193.24. Haslett JN, Sanoudou D, Kho AT, Han M, Bennett RR, et al. (2003) Gene
expression profiling of Duchenne muscular dystrophy skeletal muscle. Neuro-genetics 4: 163–171.
25. Bakay M, Chen YW, Borup R, Zhao P, Nagaraju K, et al. (2002) Sources ofvariability and effect of experimental approach on expression profiling data
interpretation. BMC Bioinformatics 3: 4.
26. Duda RO, Hart PE, Stork DG (2000) Pattern classification. New York: Wiley-Interscience.
27. Kang PB, Kho AT, Sanoudou D, Haslett JN, Dow CP, et al. (2005) Variationsin gene expression among different types of human skeletal muscle. Muscle
Nerve 32: 483–491.
28. Wang Y, Tetko IV, Hall MA, Frank E, Facius A, et al. (2005) Gene selectionfrom microarray data for cancer classification – a machine learning approach.
Comput Biol Chem 29: 37–46.29. Hall MA, Smith LA (1997) Feature Subset Selection: A Correlation Based Filter
Approach, Proceedings of the Fourth International Conference on NeuralInformation Processing and Intelligent Information Systems, 855–858.
30. Chen YW, Zhao P, Borup R, Hoffman EP (2000) Expression profiling in the
muscular dystrophies: identification of novel aspects of molecular pathophysi-ology. J Cell Biol 151: 1321–1336.
31. Campanaro S, Romualdi C, Fanin M, Celegato B, Pacchioni B, et al. (2002)Gene expression profiling in dysferlinopathies using a dedicated muscle
microarray. Hum Mol Genet 11: 3283–3298.
32. Noguchi S, Tsukahara T, Fujita M, Kurokawa R, Tachikawa M, et al. (2003)cDNA microarray analysis of individual Duchenne muscular dystrophy patients.
Hum Mol Genet 12: 595–600.33. Winokur ST, Chen YW, Masny PS, Martin JH, Ehmsen JT, et al. (2003)
Expression profiling of FSHD muscle supports a defect in specific stages ofmyogenic differentiation. Hum Mol Genet 12: 2895–2907.
34. Taniguchi M, Kurahashi H, Noguchi S, Sese J, Okinaga T, et al. (2006)
Expression profiling of muscles from Fukuyama-type congenital musculardystrophy and laminin-alpha 2 deficient congenital muscular dystrophy; is
congenital muscular dystrophy a primary fibrotic disease? Biochem Biophys ResCommun 342: 489–502.
35. Osborne RJ, Welle S, Venance SL, Thornton CA, Tawil R (2007) Expression
profile of FSHD supports a link between retinal vasculopathy and musculardystrophy. Neurology 68: 569–577.
36. Saenz A, Leturcq F, Cobo AM, Poza JJ, Ferrer X, et al. (2005) LGMD2A:genotype-phenotype correlations based on a large mutational survey on the
calpain 3 gene. Brain 128: 732–742.
37. von der Hagen M, Laval SH, Cree LM, Haldane F, Pocock M, et al. (2005) Thedifferential gene expression profiles of proximal and distal muscle groups are
altered in pre-pathological dysferlin-deficient mice. Neuromuscul Disord 15:863–877.
38. Zhou X, Tan FK, Guo X, Arnett FC (2006) Attenuation of collagen production
with small interfering RNA of SPARC in cultured fibroblasts from the skin of
patients with scleroderma. Arthritis Rheum 54: 2626–2631.
39. Karsch-Mizrachi I, Travis M, Blau H, Leinwand AL (1989) Expression and
DNA sequence analysis of a human embryonic skeletal muscle myosin heavy
chain gene. Nucleic Acids Res 17: 6167–6179.
40. Cohen N, Kudryashova E, Kramerova I, Anderson LV, Beckmann JS, et al.
(2006) Identification of putative in vivo substrates of calpain 3 by comparative
proteomics of overexpressing transgenic and nontransgenic mice. Proteomics 6:6075–6084.
41. Marotta M, Sarria Y, Ruiz-Roig C, Munell F, Roig-Quilis M (2007) Laser
microdissection-based expression analysis of key genes involved in muscleregeneration in mdx mice. Neuromuscul Disord 17: 707–718.
42. Baldwin KM, Haddad F (2002) Skeletal muscle plasticity: cellular and molecular
responses to altered physical activity paradigms. Am J Phys Med Rehabil 81:S40–51.
43. Brancaccio M, Guazzone S, Menini N, Sibona E, Hirsch E, et al. (1999) Melusin
is a new muscle-specific interactor for beta(1) integrin cytoplasmic domain. J BiolChem 274: 29282–29288.
44. Kramerova I, Kudryashova E, Wu B, Spencer MJ (2006) Regulation of the M-
cadherin-beta-catenin complex by calpain 3 during terminal stages of myogenicdifferentiation. Mol Cell Biol 26: 8437–8447.
45. Belkin AM, Zhidkova NI, Balzac F, Altruda F, Tomatis D, et al. (1996) Beta 1D
integrin displaces the beta 1A isoform in striated muscles: localization atjunctional structures and signaling potential in nonmuscle cells. J Cell Biol 132:
211–226.
46. Ono Y, Hayashi C, Doi N, Kitamura F, Shindo M, et al. (2007) Comprehensive
survey of p94/calpain 3 substrates by comparative proteomics--possible
regulation of protein synthesis by p94. Biotechnol J 2: 565–576.
47. Cyr DM, Langer T, Douglas MG (1994) DnaJ-like proteins: molecular
chaperones and specific regulators of Hsp70. Trends Biochem Sci 19: 176–181.
48. Wu G, Liu C, He X (2004) Ozz: a new name on the long list of beta-catenin’snemeses. Mol Cell 13: 451–453.
49. Nastasi T, Bongiovanni A, Campos Y, Mann L, Toy JN, et al. (2004) Ozz-E3, a
muscle-specific ubiquitin ligase, regulates beta-catenin degradation duringmyogenesis. Dev Cell 6: 269–282.
50. Frosk P, Weiler T, Nylen E, Sudha T, Greenberg CR, et al. (2002) Limb-girdle
muscular dystrophy type 2H associated with mutation in TRIM32, a putativeE3-ubiquitin-ligase gene. Am J Hum Genet 70: 663–672.
51. Figarella-Branger D, El-Dassouki M, Saenz A, Cobo AM, Malzac P, et al. (2002)
Myopathy with lobulated muscle fibers: evidence for heterogeneous etiology andclinical presentation. Neuromuscul Disord 12: 4–12.
52. Keira Y, Noguchi S, Kurokawa R, Fujita M, Minami N, et al. (2007)
Characterization of lobulated fibers in limb girdle muscular dystrophy type 2Aby gene expression profiling. Neurosci Res 57: 513–521.
53. Olive M, Martinez-Matos JA, Pirretas P, Povedano M, Navarro C, et al. (1997)
Expression of myogenic regulatory factors (MRFs) in human neuromusculardisorders. Neuropathol Appl Neurobiol. 23: 475–482.
54. Gan XQ, Wang JY, Xi Y, Wu ZL, Li YP, et al. (2008) Nuclear Dvl, c-Jun, beta-
catenin, and TCF form a complex leading to stabilization of beta-catenin-TCFinteraction. J Cell Biol. 180: 1087–1100.
55. Donato R (2001) S100: a multigenic family of calcium-modulated proteins of the
EF-hand type with intracellular and extracellular functional roles. Int. J.Biochem. Cell Biol 33: 637–668.
56. Campbell KP, Stull JT (2003) Skeletal muscle basement membrane-sarcolem-
ma-cytoskeleton interaction minireview series. J Biol Chem 278: 12599–12600.
57. Ervasti JM (2003) Costameres: the Achilles’ heel of Herculean muscle. J BiolChem 278: 13591–13594.
58. Kim SH, Han SY, Azam T, Yoon DY, Dinarello CA (2005) Interleukin-32: a
cytokine and inducer of TNFalpha. Immunity 22: 131–142.
59. Dinarello CA, Kim SH (2006) IL-32, a novel cytokine with a possible role indisease. Ann Rheum Dis 65: iii61–64.
60. Cai B, Spencer MJ, Nakamura G, Tseng-Ong L, Tidball JG (2000) Eosinophilia
of dystrophin-deficient muscle is promoted by perforin-mediated cytotoxicity byT cell effectors. Am J Pathol 156: 1789–1796.
Expression Profiling in LGMD2A
PLoS ONE | www.plosone.org 14 November 2008 | Volume 3 | Issue 11 | e3750