gas-phase chemistry of methyl-substituted silanes in a hot
TRANSCRIPT
University of Calgary
PRISM: University of Calgary's Digital Repository
Graduate Studies The Vault: Electronic Theses and Dissertations
2013-08-27
Gas-phase Chemistry of Methyl-Substituted Silanes in
a Hot-wire Chemical Vapour Deposition Process
Toukabri, Rim
Toukabri, R. (2013). Gas-phase Chemistry of Methyl-Substituted Silanes in a Hot-wire Chemical
Vapour Deposition Process (Unpublished doctoral thesis). University of Calgary, Calgary, AB.
doi:10.11575/PRISM/26257
http://hdl.handle.net/11023/891
doctoral thesis
University of Calgary graduate students retain copyright ownership and moral rights for their
thesis. You may use this material in any way that is permitted by the Copyright Act or through
licensing that has been assigned to the document. For uses that are not allowable under
copyright legislation or licensing, you are required to seek permission.
Downloaded from PRISM: https://prism.ucalgary.ca
UNIVERSITY OF CALGARY
Gas-phase Chemistry of Methyl-Substituted Silanes in a Hot-wire Chemical Vapour
Deposition Process
by
Rim Toukabri
A THESIS
SUBMITTED TO THE FACULTY OF GRADUATE STUDIES
IN PARTIAL FULFILMENT OF THE REQUIREMENTS FOR THE
DEGREE OF DOCTOR OF PHILOSOPHY
DEPARTMENT OF CHEMISTRY
CALGARY, ALBERTA
August, 2013
© Rim Toukabri 2013
ii
Abstract
The primary decomposition and secondary gas-phase reactions of methyl-
substituted silane molecules, including monomethylsilane (MMS), dimethylsilane
(DMS), trimethylsilane (TriMS) and tetramethylsilane (TMS), in hot-wire chemical
vapour deposition (HWCVD) processes have been studied using laser ionization methods
in combination with time of flight mass spectrometry (TOF-MS). For all four molecules,
methyl radical formation and hydrogen molecule formation have been found to be the
common decomposition steps on both tungsten (W) and tantalum (Ta) filaments. The
apparent activation energy ranges from 51.1 to 84.7 kJ · mol-1 for the methyl radical
formation and 55.4 to 70.7 kJ · mol-1 for the formation of H2. Both activation energy
values increase with the number of methyl substitutions in the precursor molecules on W
and Ta filaments. The formation of these two species is initiated by Si-H bond cleavage.
This cleavage is then followed by Si-CH3 bond breakage producing methyl radical,
whereas two H adsorbates on the surface of the filament recombine releasing H2 into the
gas phase, following Langmuir-Hinshelwood mechanism.
The secondary gas-phase reactions of MMS and DMS in a HWCVD reactor have
also been investigated. For DMS as a precursor gas, a competition between silene/
silylene chemistry occurring at low temperature and radical chain mechanism present at
high temperature is observed. For MMS, its gas-phase chemistry involves exclusively
silylene species, characterized by its insertion and dimerization reactions. It is concluded
that both free-radical and silenes/silylenes intermediates play important roles in the gas-
phase chemistry of methyl-substituted silanes. A comparison of the secondary gas-phase
iii
reactions of TMS, TriMS, DMS, and MMS revealed a switch in dominance from free-
radical chemistry to silene/silylene chemistry as the number of methyl substitution on the
precursor molecule is decreased. A study of the effect of deposition parameters, including
precursor pressure and filament material, has shown that these parameters influenced
significantly the gas-phase chemistry of TriMS and DMS. This is due to the competition
between free-radical reactions and silylene/silene reactions. However, these parameters
do not affect the gas-phase chemistry of MMS since it involves only one type of
intermediate.
iv
Acknowledgements
I would like to take this opportunity to present my appreciation to the people that
provided me the possibility to accomplish my PhD study.
Foremost I would like to express my sincere gratitude to my supervisor, Dr. Yujun Shi,
for giving me the opportunity to complete my graduate study in her group and for her
guidance throughout these years.
Beside my supervisor, I would like to forward my gratitude to my committee members
Dr. Hans Osthoff and Dr. Peter Kusalik for their encouragement, and insightful
discussions.
It has been a great pleasure to work along each of Dr. Shi’s group members, past and
present. I would like to thank Brett and Ling for teaching me about the instrument and
their help when I started with the lab work. I am also pleased to know Martin, Watheq,
Chris, Jimmy, Ismail and Ebenezer. Your company and friendship kept enriched my life
with laughter and joy. I specially thank Ismail for his help and contribution in the
theoretical calculation carried out in this work.

v
I would like to thank my friends Yiota, Angela and Samar, who were always great
support in all my struggles and frustrations, as well as my achievements through these
years. Yiota, even though you are far, your friendship and support is greatly appreciated.
Ibro, I could never thank you enough, you were always there for me.
My sincere thanks go to Bonnie King for her countless hours of support and motivation. I
would like to thank also Andy Read and Todd Willis from the science workshop for their
tremendous help in fixing and adjusting my instrument, as well as Edward Cairns and
Mike Siewert for providing me with assistance with all sorts of electronics.
Last but not least, I would like to thank my parents, Hatem Toukabri and Samira Kedadi
for always believing in me. Their love and encouragement provided me with inspiration
and driving force to complete this important stage of my life. I also would like to thank
my siblings, Ala and Mariem Toukabri, and their families for their understanding and
support throughout these last years.

vi
Dedication
To my parents Hatem Toukabri and Samira Kedadi
vii
Table of Contents
Abstract ............................................................................................................................... ii Acknowledgements ............................................................................................................ iv Dedication .......................................................................................................................... vi Table of Contents .............................................................................................................. vii List of Tables .......................................................................................................................x List of Figures and Illustrations ......................................................................................... xi List of Schemes .............................................................................................................. xviii List of Symbols, Abbreviations and Nomenclature ......................................................... xix Epigraph ........................................................................................................................... xxi
CHAPTER ONE: INTRODUCTION AND BACKGROUND ...........................................1 1.1 Thin Film Deposition Processes ................................................................................1
1.1.1 Physical Vapour Deposition ..............................................................................1 1.1.2 Chemical Vapour Deposition ............................................................................3
1.2 Hot-Wire Chemical Vapour Deposition (HWCVD) .................................................4 1.3 HWCVD of Silicon Carbide Thin Films .................................................................10
1.3.1 Silicon Carbide (SiC) Thin Films ....................................................................10 1.3.2 Growth of SiC Thin Films Using HWCVD Processes ....................................12 1.3.3 HWCVD of SiC Thin Films Using Methyl-Substituted Silanes .....................14
1.4 Gas-Phase Chemistry in HWCVD System ..............................................................15 1.4.1 Detecting the Gas-Phase Reaction Products in a HWCVD Process ...............15 1.4.2 Gas-Phase Chemistry in HWCVD Using Methyl-Substituted Silanes ...........19 1.4.3 Chemical Trapping of the Active Intermediates .............................................21
1.5 Objectives of this Thesis ..........................................................................................25
CHAPTER TWO: EXPERIMENTAL DETAILS .............................................................27 2.1 HWCVD Sources .....................................................................................................28
2.1.1 A Collision-Free Setup to Detect Decomposition Species on the Filament ....28 2.1.2 A Reactor Setup to Detect Species from Secondary Gas-phase Reactions .....30
2.2 Ionization Sources ....................................................................................................31 2.2.1 The Single Photon Ionization (SPI) Source .....................................................31 2.2.2 The Dual Single Photon Ionization and Laser Induced Electron Ionization
(SPI/LIEI) Source ............................................................................................32 2.3 TOF Mass Spectra Collection ..................................................................................34 2.4 Synthesis of MMS-d3, DMS-d2 and TriMS-d1 ........................................................36 2.5 Sample Preparation and Introduction ......................................................................39 2.6 Computational Methods ...........................................................................................41
CHAPTER THREE: FORMATION OF METHYL RADICALS FROM DECOMPOSITION OF METHYL-SUBSTITUTED SILANES OVER TUNGSTEN AND TANTALUM FILAMENTS .....................................................43
3.1 Motivations ..............................................................................................................43 3.2 The Intensity Profile of Methyl Radical on W Filament .........................................45 3.3 The Activation Energy of Forming Methyl Radicals on W - Effect of Molecular
Structures ...............................................................................................................50
viii
3.4 Effect of Filament Material - W vs Ta .....................................................................55 3.5 Summary ..................................................................................................................58
CHAPTER FOUR: STUDY OF HYDROGEN ELIMINATION FROM THE DECOMPOSITION OF METHYL-SUBSTITUTED SILANES OVER TUNGSTEN AND TANTALUM FILAMENT SURFACES ..................................60
4.1 Motivations ..............................................................................................................60 4.2 Comparison of the Two Ionization Sources ............................................................64 4.3 H2 Formation during the Decomposition of Methyl-Substituted Silanes on a
Heated W Filament ................................................................................................69 4.4 Experiments with MMS-d3, DMS-d2 and TriMS-d1 ................................................78 4.5 The Activation Energy of Forming H2 Molecules on W and Ta .............................84 4.6 1,1-H2 and 1,2-H2 Elimination: A Theoretical Study ..............................................86 4.7 Summary ................................................................................................................106
CHAPTER FIVE: ROLE OF FREE-RADICAL AND METHYLSILENE/DIMETHYLSILYLENE IN THE REACTION CHEMISTRY OF DIMETHYLSILANE IN A HOT-WIRE CHEMICAL VAPOUR DEPOSITION PROCESS .....................................................................108
5.1 Motivations ............................................................................................................108 5.2 Primary Decomposition on Ta and W Filament ....................................................111 5.3 Secondary Gas-Phase Reactions on a Ta Filament ................................................112
5.3.1 Possible Secondary Reactions .......................................................................116 5.3.1.1 Hydrogen Abstraction and Biradical Recombination Reactions .........116 5.3.1.2 Reactions Involving Silene and Silylene Intermediates ......................117
5.3.2 Formation of the Main Products ....................................................................119 5.3.2.1 Formation of 1,1,2,2-Tetramethyldisilane at Low Filament
Temperatures .........................................................................................121 5.3.2.2 Formation of 1,3-Dimethyl-1,3-disilacyclobutane at High Filament
Temperatures .........................................................................................124 5.3.2.3 Formation of Trimethylsilane and Tetramethylsilane at High
Filament Temperatures .........................................................................128 5.3.3 Trapping of Active Intermediates ..................................................................133
5.3.3.1 Trapping Experiment with 1,3-Butadiene ...........................................134 5.3.3.2 Trapping Experiments with Ammonia ................................................140
5.4 Effect of Precursor Gas Pressure on DMS Gas-Phase Chemistry .........................145 5.5 Effect of Filament Material on DMS Gas-Phase Chemistry .................................157 5.6 Summary ................................................................................................................162
CHAPTER SIX: GAS-PHASE CHEMISTRY OF MONOMETHYLSILANE IN A HWCVD REACTOR ..............................................................................................165
6.1 Motivations ............................................................................................................165 6.2 Primary Decomposition of MMS on W and Ta Filaments ....................................168 6.3 Secondary Gas-Phase Reaction of MMS in a HWCVD Reactor on Ta Filament .171
6.3.1 Possible Secondary Gas-phase Reactions .....................................................174 6.3.1.1 Hydrogen Abstraction Reactions and Biradical Combinations ...........174 6.3.1.2 Reactions Involving Silene and Methylsilylene Intermediates ............175
ix
6.3.2 Formation of the Main Products ....................................................................178 6.3.2.1 Formation of 1,2-Dimethyldisilane ......................................................180 6.3.2.2 Formation of 1,3-Disilacyclobutane ....................................................182
6.3.3 Trapping of Active Intermediates .................................................................183 6.3.3.1 Trapping Experiments with 1,3-Butadiene ..........................................183 6.3.3.2 Trapping Experiments with Ammonia ................................................186
6.4 Effect of Filament Materials on MMS Gas-Phase Chemistry ...............................192 6.5 Effect of Source Gas Pressure on MMS Gas-Phase Chemistry .............................194 6.6 Comparison of Gas-Phase Chemistry with Four Methyl-Substituted Silane
Molecules .............................................................................................................197 6.7 Summary ................................................................................................................200
CHAPTER SEVEN: EFFECT OF TRIMETHYLSILANE PRESSURE ON THE GAS-PHASE REACTION CHEMISTRY IN THE HWCVD PROCESS .............202
7.1 Motivations ............................................................................................................202 7.2 Gas-Phase Reaction Products from Trimethylsilane in a HWCVD Reactor .........203 7.3 Formation of Methane and other Small Hydrocarbon Molecules .........................208 7.4 Formation of Hydrogen Molecules ........................................................................213 7.5 Effect on the Radical Recombination and Disproportionation Reactions .............215 7.6 Summary ................................................................................................................221
CHAPTER EIGHT: CONCLUSIONS AND FUTURE WORK .....................................223
APPENDICES .................................................................................................................232
REFERENCES ................................................................................................................236
x
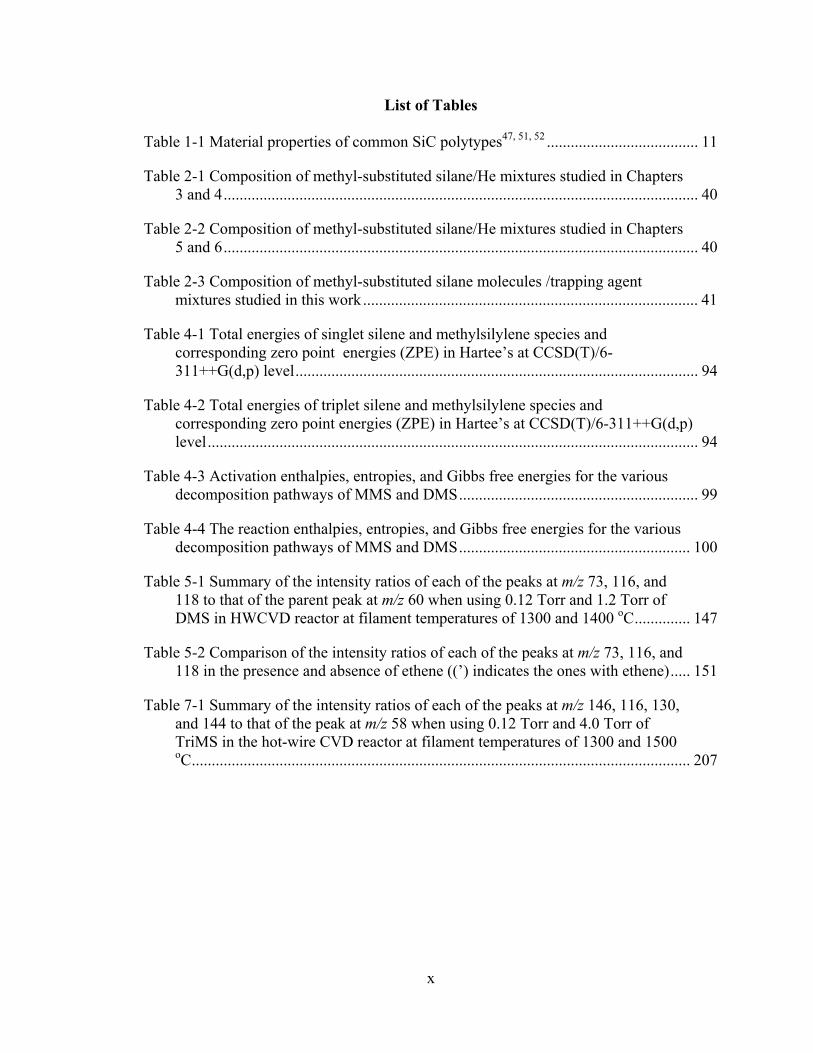
List of Tables
Table 1-1 Material properties of common SiC polytypes47, 51, 52 ...................................... 11
Table 2-1 Composition of methyl-substituted silane/He mixtures studied in Chapters 3 and 4 ....................................................................................................................... 40
Table 2-2 Composition of methyl-substituted silane/He mixtures studied in Chapters 5 and 6 ....................................................................................................................... 40
Table 2-3 Composition of methyl-substituted silane molecules /trapping agent mixtures studied in this work .................................................................................... 41
Table 4-1 Total energies of singlet silene and methylsilylene species and corresponding zero point energies (ZPE) in Hartee’s at CCSD(T)/6-311++G(d,p) level ..................................................................................................... 94
Table 4-2 Total energies of triplet silene and methylsilylene species and corresponding zero point energies (ZPE) in Hartee’s at CCSD(T)/6-311++G(d,p) level ........................................................................................................................... 94
Table 4-3 Activation enthalpies, entropies, and Gibbs free energies for the various decomposition pathways of MMS and DMS ............................................................ 99
Table 4-4 The reaction enthalpies, entropies, and Gibbs free energies for the various decomposition pathways of MMS and DMS .......................................................... 100
Table 5-1 Summary of the intensity ratios of each of the peaks at m/z 73, 116, and 118 to that of the parent peak at m/z 60 when using 0.12 Torr and 1.2 Torr of DMS in HWCVD reactor at filament temperatures of 1300 and 1400 oC .............. 147
Table 5-2 Comparison of the intensity ratios of each of the peaks at m/z 73, 116, and 118 in the presence and absence of ethene ((’) indicates the ones with ethene) ..... 151
Table 7-1 Summary of the intensity ratios of each of the peaks at m/z 146, 116, 130, and 144 to that of the peak at m/z 58 when using 0.12 Torr and 4.0 Torr of TriMS in the hot-wire CVD reactor at filament temperatures of 1300 and 1500 oC ............................................................................................................................. 207
xi
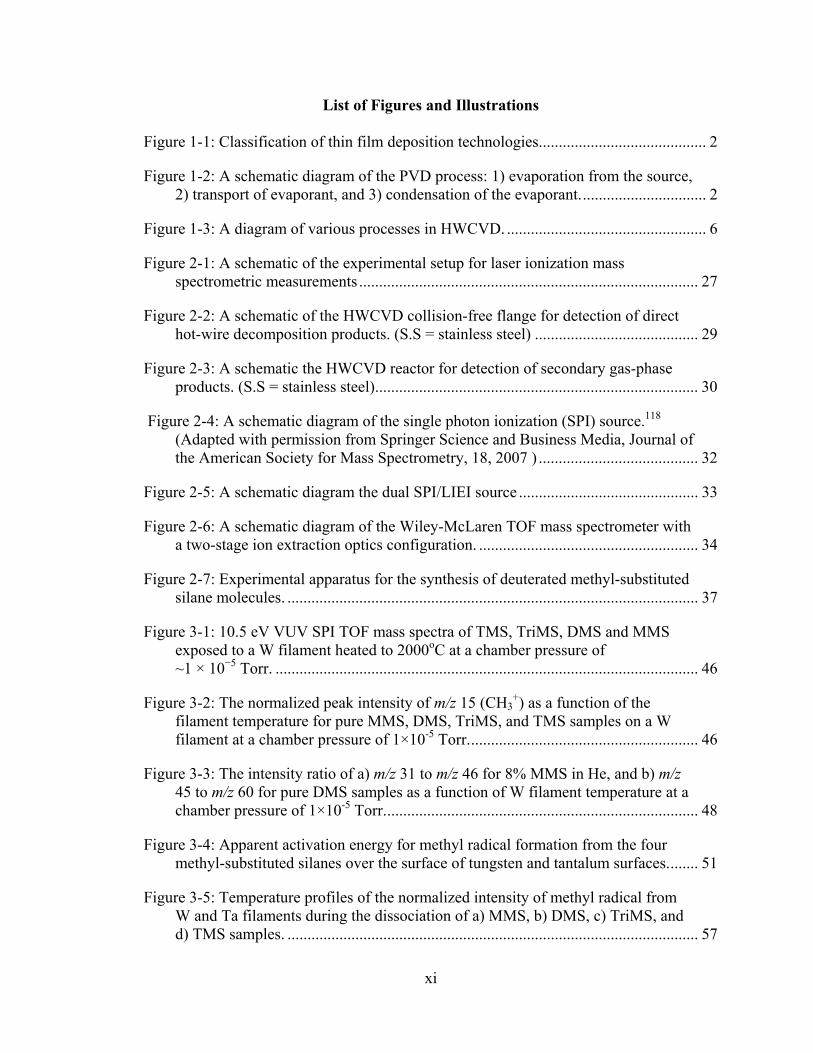
List of Figures and Illustrations
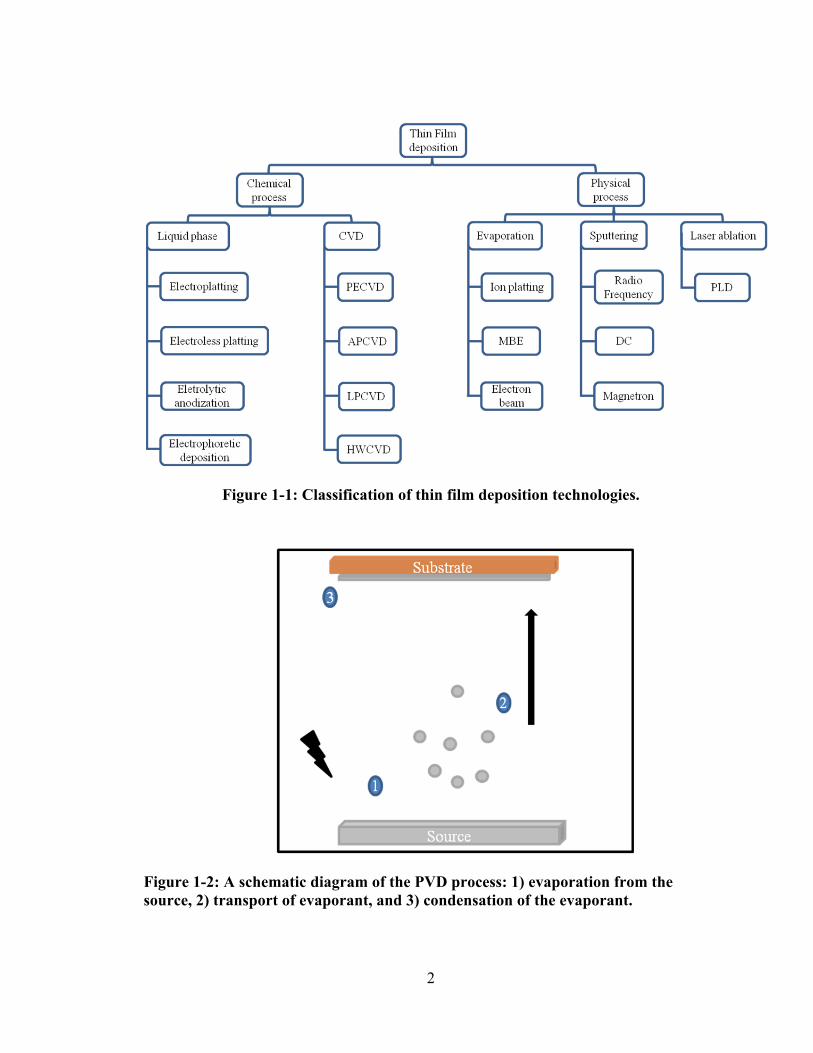
Figure 1-1: Classification of thin film deposition technologies. ......................................... 2
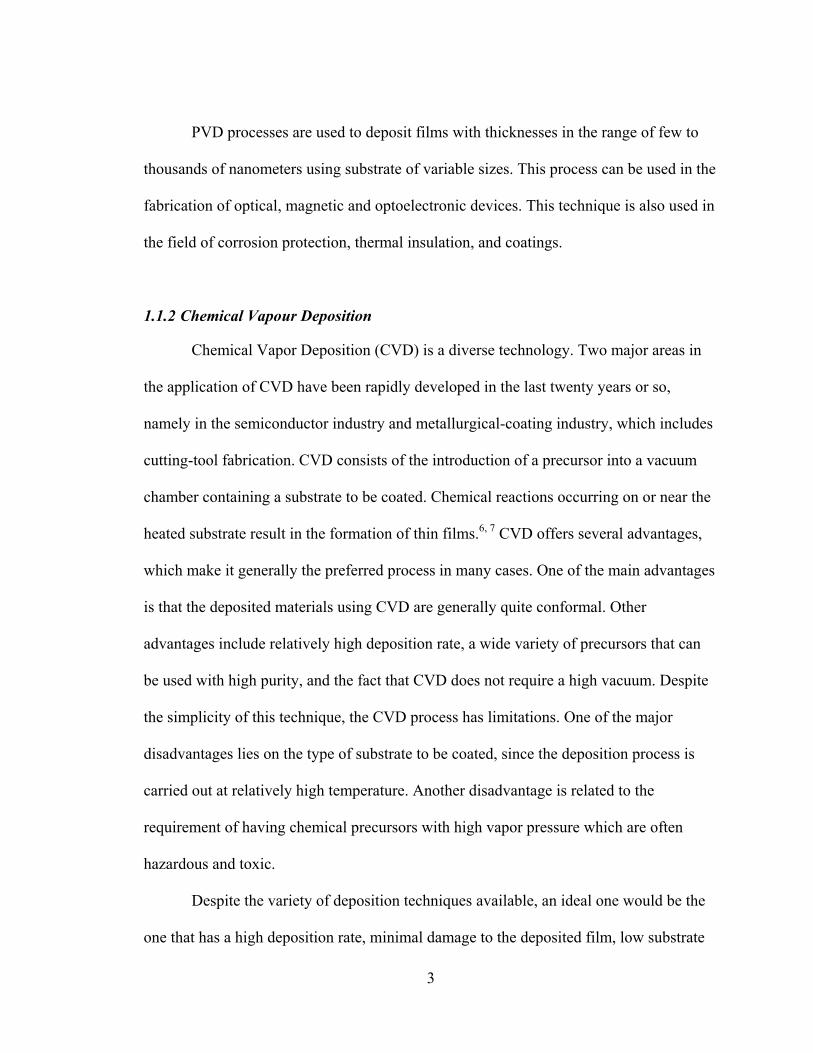
Figure 1-2: A schematic diagram of the PVD process: 1) evaporation from the source, 2) transport of evaporant, and 3) condensation of the evaporant. ............................... 2
Figure 1-3: A diagram of various processes in HWCVD. .................................................. 6
Figure 2-1: A schematic of the experimental setup for laser ionization mass spectrometric measurements ..................................................................................... 27
Figure 2-2: A schematic of the HWCVD collision-free flange for detection of direct hot-wire decomposition products. (S.S = stainless steel) ......................................... 29
Figure 2-3: A schematic the HWCVD reactor for detection of secondary gas-phase products. (S.S = stainless steel) ................................................................................. 30
Figure 2-4: A schematic diagram of the single photon ionization (SPI) source.118 (Adapted with permission from Springer Science and Business Media, Journal of the American Society for Mass Spectrometry, 18, 2007 ) ........................................ 32
Figure 2-5: A schematic diagram the dual SPI/LIEI source ............................................. 33
Figure 2-6: A schematic diagram of the Wiley-McLaren TOF mass spectrometer with a two-stage ion extraction optics configuration. ....................................................... 34
Figure 2-7: Experimental apparatus for the synthesis of deuterated methyl-substituted silane molecules. ....................................................................................................... 37
Figure 3-1: 10.5 eV VUV SPI TOF mass spectra of TMS, TriMS, DMS and MMS exposed to a W filament heated to 2000oC at a chamber pressure of ~1 × 10⁻⁵ Torr. .......................................................................................................... 46
Figure 3-2: The normalized peak intensity of m/z 15 (CH3+) as a function of the
filament temperature for pure MMS, DMS, TriMS, and TMS samples on a W filament at a chamber pressure of 1×10⁻⁵ Torr. ......................................................... 46
Figure 3-3: The intensity ratio of a) m/z 31 to m/z 46 for 8% MMS in He, and b) m/z 45 to m/z 60 for pure DMS samples as a function of W filament temperature at a chamber pressure of 1×10⁻⁵ Torr. .............................................................................. 48
Figure 3-4: Apparent activation energy for methyl radical formation from the four methyl-substituted silanes over the surface of tungsten and tantalum surfaces. ....... 51
Figure 3-5: Temperature profiles of the normalized intensity of methyl radical from W and Ta filaments during the dissociation of a) MMS, b) DMS, c) TriMS, and d) TMS samples. ....................................................................................................... 57
xii
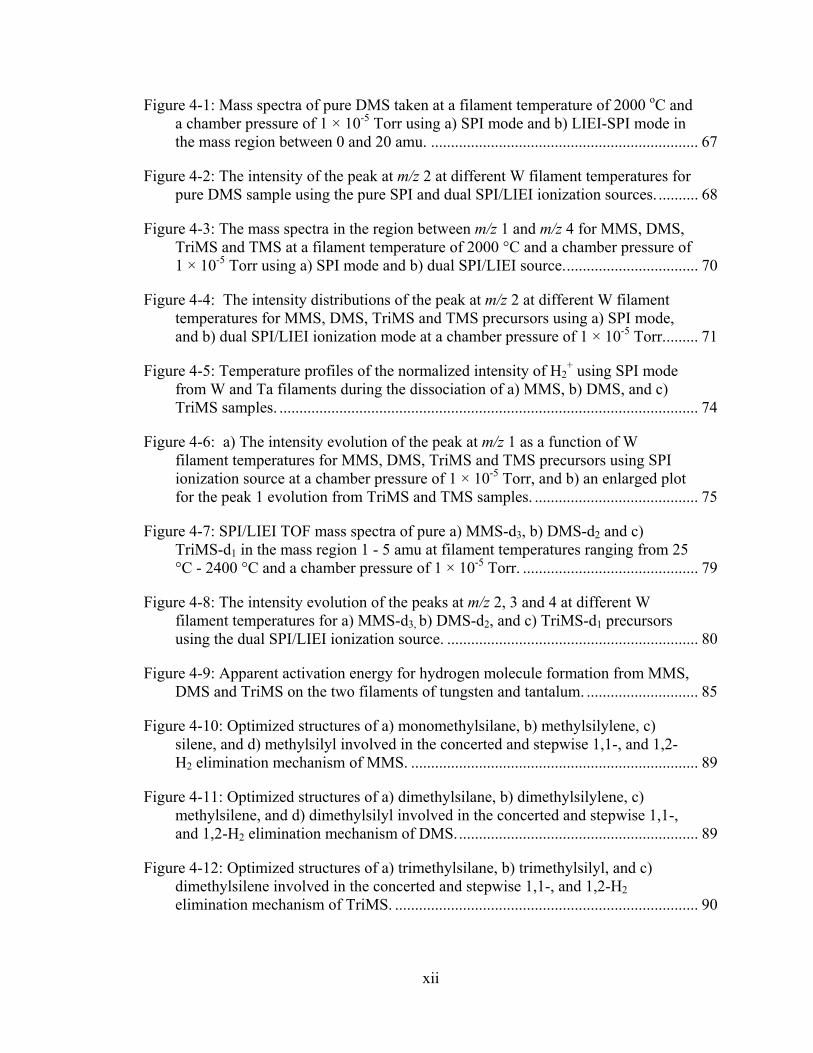
Figure 4-1: Mass spectra of pure DMS taken at a filament temperature of 2000 oC and a chamber pressure of 1 × 10⁻⁵ Torr using a) SPI mode and b) LIEI-SPI mode in the mass region between 0 and 20 amu. ................................................................... 67
Figure 4-2: The intensity of the peak at m/z 2 at different W filament temperatures for pure DMS sample using the pure SPI and dual SPI/LIEI ionization sources. .......... 68
Figure 4-3: The mass spectra in the region between m/z 1 and m/z 4 for MMS, DMS, TriMS and TMS at a filament temperature of 2000 °C and a chamber pressure of 1 × 10⁻⁵ Torr using a) SPI mode and b) dual SPI/LIEI source. ................................. 70
Figure 4-4: The intensity distributions of the peak at m/z 2 at different W filament temperatures for MMS, DMS, TriMS and TMS precursors using a) SPI mode, and b) dual SPI/LIEI ionization mode at a chamber pressure of 1 × 10⁻⁵ Torr. ........ 71
Figure 4-5: Temperature profiles of the normalized intensity of H2+ using SPI mode
from W and Ta filaments during the dissociation of a) MMS, b) DMS, and c) TriMS samples. ......................................................................................................... 74
Figure 4-6: a) The intensity evolution of the peak at m/z 1 as a function of W filament temperatures for MMS, DMS, TriMS and TMS precursors using SPI ionization source at a chamber pressure of 1 × 10⁻⁵ Torr, and b) an enlarged plot for the peak 1 evolution from TriMS and TMS samples. ......................................... 75
Figure 4-7: SPI/LIEI TOF mass spectra of pure a) MMS-d3, b) DMS-d2 and c) TriMS-d1 in the mass region 1 - 5 amu at filament temperatures ranging from 25 °C - 2400 °C and a chamber pressure of 1 × 10⁻⁵ Torr. ............................................ 79
Figure 4-8: The intensity evolution of the peaks at m/z 2, 3 and 4 at different W filament temperatures for a) MMS-d3, b) DMS-d2, and c) TriMS-d1 precursors using the dual SPI/LIEI ionization source. ............................................................... 80
Figure 4-9: Apparent activation energy for hydrogen molecule formation from MMS, DMS and TriMS on the two filaments of tungsten and tantalum. ............................ 85
Figure 4-10: Optimized structures of a) monomethylsilane, b) methylsilylene, c) silene, and d) methylsilyl involved in the concerted and stepwise 1,1-, and 1,2-H2 elimination mechanism of MMS. ........................................................................ 89
Figure 4-11: Optimized structures of a) dimethylsilane, b) dimethylsilylene, c) methylsilene, and d) dimethylsilyl involved in the concerted and stepwise 1,1-, and 1,2-H2 elimination mechanism of DMS. ............................................................ 89
Figure 4-12: Optimized structures of a) trimethylsilane, b) trimethylsilyl, and c) dimethylsilene involved in the concerted and stepwise 1,1-, and 1,2-H2 elimination mechanism of TriMS. ............................................................................ 90
xiii
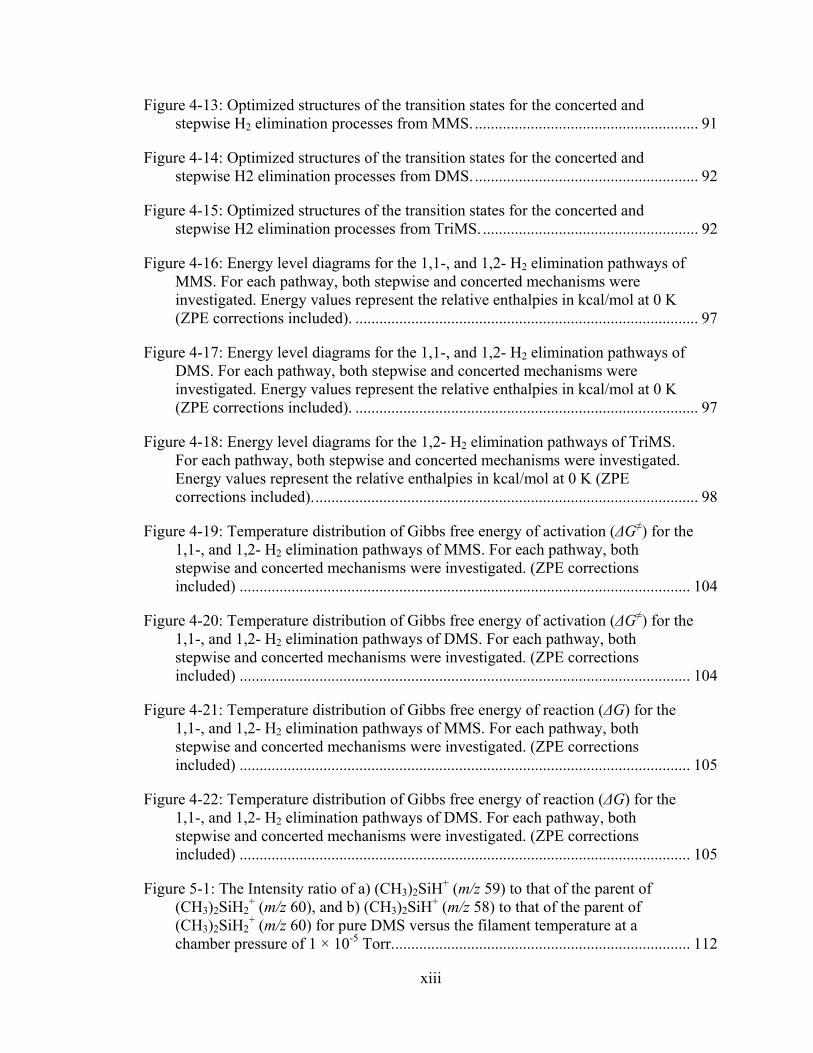
Figure 4-13: Optimized structures of the transition states for the concerted and stepwise H2 elimination processes from MMS. ........................................................ 91
Figure 4-14: Optimized structures of the transition states for the concerted and stepwise H2 elimination processes from DMS. ........................................................ 92
Figure 4-15: Optimized structures of the transition states for the concerted and stepwise H2 elimination processes from TriMS. ...................................................... 92
Figure 4-16: Energy level diagrams for the 1,1-, and 1,2- H2 elimination pathways of MMS. For each pathway, both stepwise and concerted mechanisms were investigated. Energy values represent the relative enthalpies in kcal/mol at 0 K (ZPE corrections included). ...................................................................................... 97
Figure 4-17: Energy level diagrams for the 1,1-, and 1,2- H2 elimination pathways of DMS. For each pathway, both stepwise and concerted mechanisms were investigated. Energy values represent the relative enthalpies in kcal/mol at 0 K (ZPE corrections included). ...................................................................................... 97
Figure 4-18: Energy level diagrams for the 1,2- H2 elimination pathways of TriMS. For each pathway, both stepwise and concerted mechanisms were investigated. Energy values represent the relative enthalpies in kcal/mol at 0 K (ZPE corrections included). ................................................................................................ 98
Figure 4-19: Temperature distribution of Gibbs free energy of activation (ΔG≠) for the 1,1-, and 1,2- H2 elimination pathways of MMS. For each pathway, both stepwise and concerted mechanisms were investigated. (ZPE corrections included) ................................................................................................................. 104
Figure 4-20: Temperature distribution of Gibbs free energy of activation (ΔG≠) for the 1,1-, and 1,2- H2 elimination pathways of DMS. For each pathway, both stepwise and concerted mechanisms were investigated. (ZPE corrections included) ................................................................................................................. 104
Figure 4-21: Temperature distribution of Gibbs free energy of reaction (ΔG) for the 1,1-, and 1,2- H2 elimination pathways of MMS. For each pathway, both stepwise and concerted mechanisms were investigated. (ZPE corrections included) ................................................................................................................. 105
Figure 4-22: Temperature distribution of Gibbs free energy of reaction (ΔG) for the 1,1-, and 1,2- H2 elimination pathways of DMS. For each pathway, both stepwise and concerted mechanisms were investigated. (ZPE corrections included) ................................................................................................................. 105
Figure 5-1: The Intensity ratio of a) (CH3)2SiH+ (m/z 59) to that of the parent of (CH3)2SiH2
+ (m/z 60), and b) (CH3)2SiH+ (m/z 58) to that of the parent of (CH3)2SiH2
+ (m/z 60) for pure DMS versus the filament temperature at a chamber pressure of 1 × 10⁻⁵ Torr. .......................................................................... 112
xiv
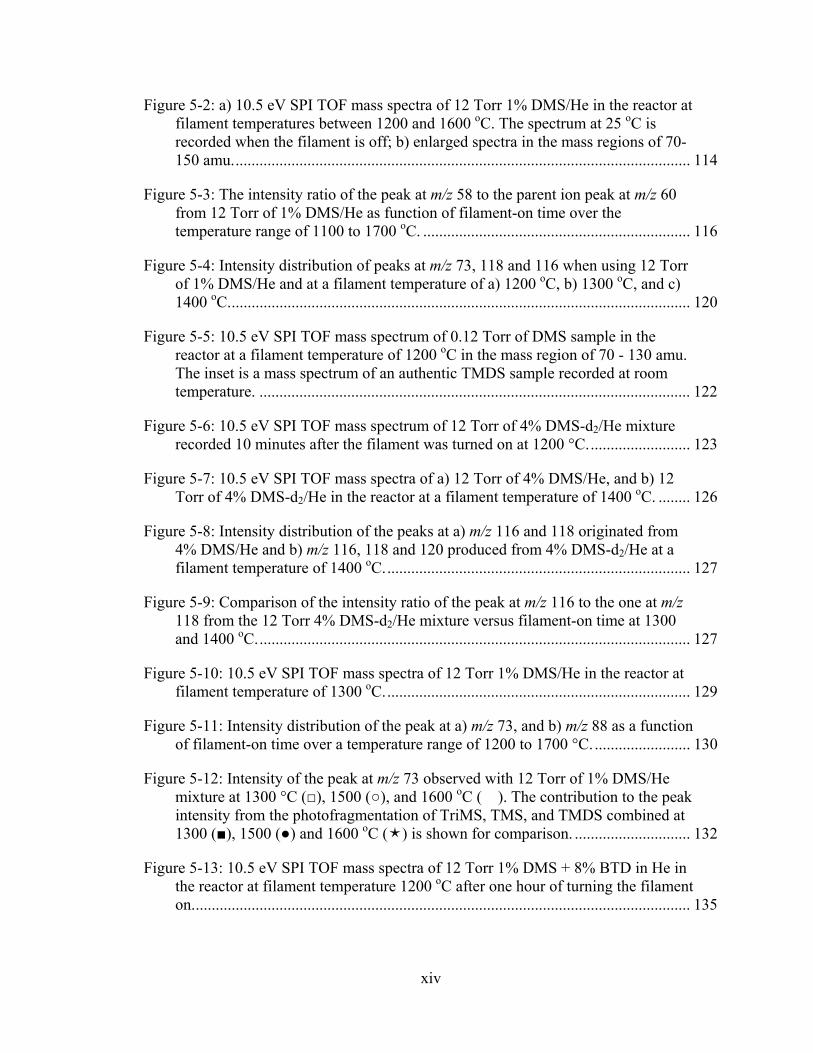
Figure 5-2: a) 10.5 eV SPI TOF mass spectra of 12 Torr 1% DMS/He in the reactor at filament temperatures between 1200 and 1600 oC. The spectrum at 25 oC is recorded when the filament is off; b) enlarged spectra in the mass regions of 70-150 amu. .................................................................................................................. 114
Figure 5-3: The intensity ratio of the peak at m/z 58 to the parent ion peak at m/z 60 from 12 Torr of 1% DMS/He as function of filament-on time over the temperature range of 1100 to 1700 oC. ................................................................... 116
Figure 5-4: Intensity distribution of peaks at m/z 73, 118 and 116 when using 12 Torr of 1% DMS/He and at a filament temperature of a) 1200 oC, b) 1300 oC, and c) 1400 oC. ................................................................................................................... 120
Figure 5-5: 10.5 eV SPI TOF mass spectrum of 0.12 Torr of DMS sample in the reactor at a filament temperature of 1200 oC in the mass region of 70 - 130 amu. The inset is a mass spectrum of an authentic TMDS sample recorded at room temperature. ............................................................................................................ 122
Figure 5-6: 10.5 eV SPI TOF mass spectrum of 12 Torr of 4% DMS-d2/He mixture recorded 10 minutes after the filament was turned on at 1200 °C. ......................... 123
Figure 5-7: 10.5 eV SPI TOF mass spectra of a) 12 Torr of 4% DMS/He, and b) 12 Torr of 4% DMS-d2/He in the reactor at a filament temperature of 1400 oC. ........ 126
Figure 5-8: Intensity distribution of the peaks at a) m/z 116 and 118 originated from 4% DMS/He and b) m/z 116, 118 and 120 produced from 4% DMS-d2/He at a filament temperature of 1400 oC. ............................................................................ 127
Figure 5-9: Comparison of the intensity ratio of the peak at m/z 116 to the one at m/z 118 from the 12 Torr 4% DMS-d2/He mixture versus filament-on time at 1300 and 1400 oC. ............................................................................................................ 127
Figure 5-10: 10.5 eV SPI TOF mass spectra of 12 Torr 1% DMS/He in the reactor at filament temperature of 1300 oC. ............................................................................ 129
Figure 5-11: Intensity distribution of the peak at a) m/z 73, and b) m/z 88 as a function of filament-on time over a temperature range of 1200 to 1700 °C. ........................ 130
Figure 5-12: Intensity of the peak at m/z 73 observed with 12 Torr of 1% DMS/He mixture at 1300 °C (□), 1500 (○), and 1600 oC ( ). The contribution to the peak intensity from the photofragmentation of TriMS, TMS, and TMDS combined at 1300 (■), 1500 (●) and 1600 oC () is shown for comparison. ............................. 132
Figure 5-13: 10.5 eV SPI TOF mass spectra of 12 Torr 1% DMS + 8% BTD in He in the reactor at filament temperature 1200 oC after one hour of turning the filament on. ............................................................................................................................ 135
xv
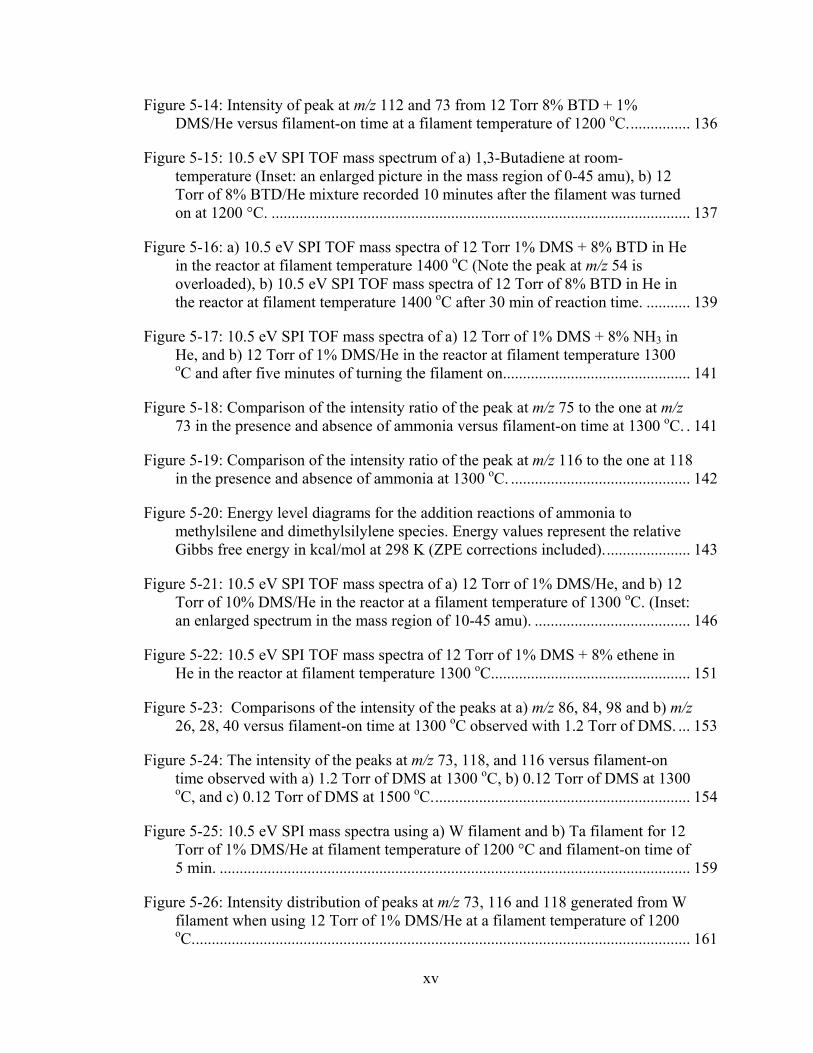
Figure 5-14: Intensity of peak at m/z 112 and 73 from 12 Torr 8% BTD + 1% DMS/He versus filament-on time at a filament temperature of 1200 oC. ............... 136
Figure 5-15: 10.5 eV SPI TOF mass spectrum of a) 1,3-Butadiene at room-temperature (Inset: an enlarged picture in the mass region of 0-45 amu), b) 12 Torr of 8% BTD/He mixture recorded 10 minutes after the filament was turned on at 1200 °C. ......................................................................................................... 137
Figure 5-16: a) 10.5 eV SPI TOF mass spectra of 12 Torr 1% DMS + 8% BTD in He in the reactor at filament temperature 1400 oC (Note the peak at m/z 54 is overloaded), b) 10.5 eV SPI TOF mass spectra of 12 Torr of 8% BTD in He in the reactor at filament temperature 1400 oC after 30 min of reaction time. ........... 139
Figure 5-17: 10.5 eV SPI TOF mass spectra of a) 12 Torr of 1% DMS + 8% NH3 in He, and b) 12 Torr of 1% DMS/He in the reactor at filament temperature 1300 oC and after five minutes of turning the filament on............................................... 141
Figure 5-18: Comparison of the intensity ratio of the peak at m/z 75 to the one at m/z 73 in the presence and absence of ammonia versus filament-on time at 1300 oC. . 141
Figure 5-19: Comparison of the intensity ratio of the peak at m/z 116 to the one at 118 in the presence and absence of ammonia at 1300 oC. ............................................. 142
Figure 5-20: Energy level diagrams for the addition reactions of ammonia to methylsilene and dimethylsilylene species. Energy values represent the relative Gibbs free energy in kcal/mol at 298 K (ZPE corrections included). ..................... 143
Figure 5-21: 10.5 eV SPI TOF mass spectra of a) 12 Torr of 1% DMS/He, and b) 12 Torr of 10% DMS/He in the reactor at a filament temperature of 1300 oC. (Inset: an enlarged spectrum in the mass region of 10-45 amu). ....................................... 146
Figure 5-22: 10.5 eV SPI TOF mass spectra of 12 Torr of 1% DMS + 8% ethene in He in the reactor at filament temperature 1300 oC. ................................................. 151
Figure 5-23: Comparisons of the intensity of the peaks at a) m/z 86, 84, 98 and b) m/z 26, 28, 40 versus filament-on time at 1300 oC observed with 1.2 Torr of DMS. ... 153
Figure 5-24: The intensity of the peaks at m/z 73, 118, and 116 versus filament-on time observed with a) 1.2 Torr of DMS at 1300 oC, b) 0.12 Torr of DMS at 1300 oC, and c) 0.12 Torr of DMS at 1500 oC. ................................................................ 154
Figure 5-25: 10.5 eV SPI mass spectra using a) W filament and b) Ta filament for 12 Torr of 1% DMS/He at filament temperature of 1200 °C and filament-on time of 5 min. ...................................................................................................................... 159
Figure 5-26: Intensity distribution of peaks at m/z 73, 116 and 118 generated from W filament when using 12 Torr of 1% DMS/He at a filament temperature of 1200 oC. ............................................................................................................................ 161
xvi
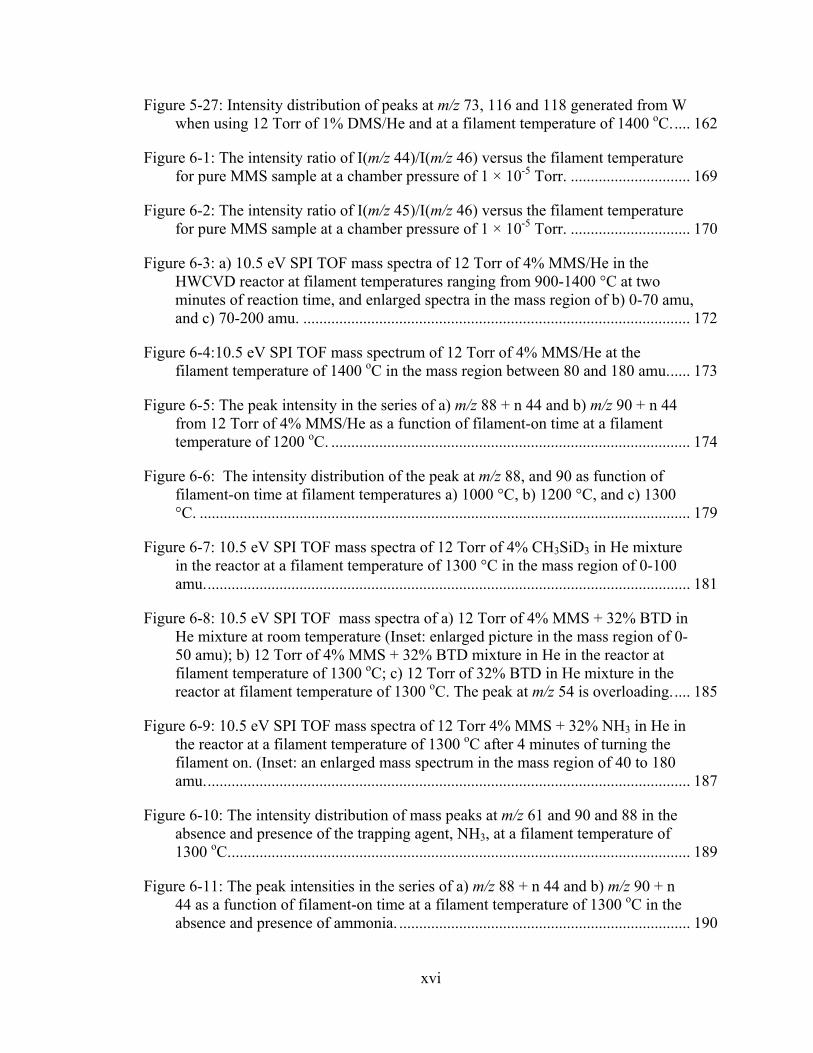
Figure 5-27: Intensity distribution of peaks at m/z 73, 116 and 118 generated from W when using 12 Torr of 1% DMS/He and at a filament temperature of 1400 oC. .... 162
Figure 6-1: The intensity ratio of I(m/z 44)/I(m/z 46) versus the filament temperature for pure MMS sample at a chamber pressure of 1 × 10⁻⁵ Torr. .............................. 169
Figure 6-2: The intensity ratio of I(m/z 45)/I(m/z 46) versus the filament temperature for pure MMS sample at a chamber pressure of 1 × 10⁻⁵ Torr. .............................. 170
Figure 6-3: a) 10.5 eV SPI TOF mass spectra of 12 Torr of 4% MMS/He in the HWCVD reactor at filament temperatures ranging from 900-1400 °C at two minutes of reaction time, and enlarged spectra in the mass region of b) 0-70 amu, and c) 70-200 amu. ................................................................................................. 172
Figure 6-4:10.5 eV SPI TOF mass spectrum of 12 Torr of 4% MMS/He at the filament temperature of 1400 oC in the mass region between 80 and 180 amu. ..... 173
Figure 6-5: The peak intensity in the series of a) m/z 88 + n 44 and b) m/z 90 + n 44 from 12 Torr of 4% MMS/He as a function of filament-on time at a filament temperature of 1200 oC. .......................................................................................... 174
Figure 6-6: The intensity distribution of the peak at m/z 88, and 90 as function of filament-on time at filament temperatures a) 1000 °C, b) 1200 °C, and c) 1300 °C. ........................................................................................................................... 179
Figure 6-7: 10.5 eV SPI TOF mass spectra of 12 Torr of 4% CH3SiD3 in He mixture in the reactor at a filament temperature of 1300 °C in the mass region of 0-100 amu. ......................................................................................................................... 181
Figure 6-8: 10.5 eV SPI TOF mass spectra of a) 12 Torr of 4% MMS + 32% BTD in He mixture at room temperature (Inset: enlarged picture in the mass region of 0-50 amu); b) 12 Torr of 4% MMS + 32% BTD mixture in He in the reactor at filament temperature of 1300 oC; c) 12 Torr of 32% BTD in He mixture in the reactor at filament temperature of 1300 oC. The peak at m/z 54 is overloading. .... 185
Figure 6-9: 10.5 eV SPI TOF mass spectra of 12 Torr 4% MMS + 32% NH3 in He in the reactor at a filament temperature of 1300 oC after 4 minutes of turning the filament on. (Inset: an enlarged mass spectrum in the mass region of 40 to 180 amu. ......................................................................................................................... 187
Figure 6-10: The intensity distribution of mass peaks at m/z 61 and 90 and 88 in the absence and presence of the trapping agent, NH3, at a filament temperature of 1300 oC. ................................................................................................................... 189
Figure 6-11: The peak intensities in the series of a) m/z 88 + n 44 and b) m/z 90 + n 44 as a function of filament-on time at a filament temperature of 1300 oC in the absence and presence of ammonia. ......................................................................... 190
xvii
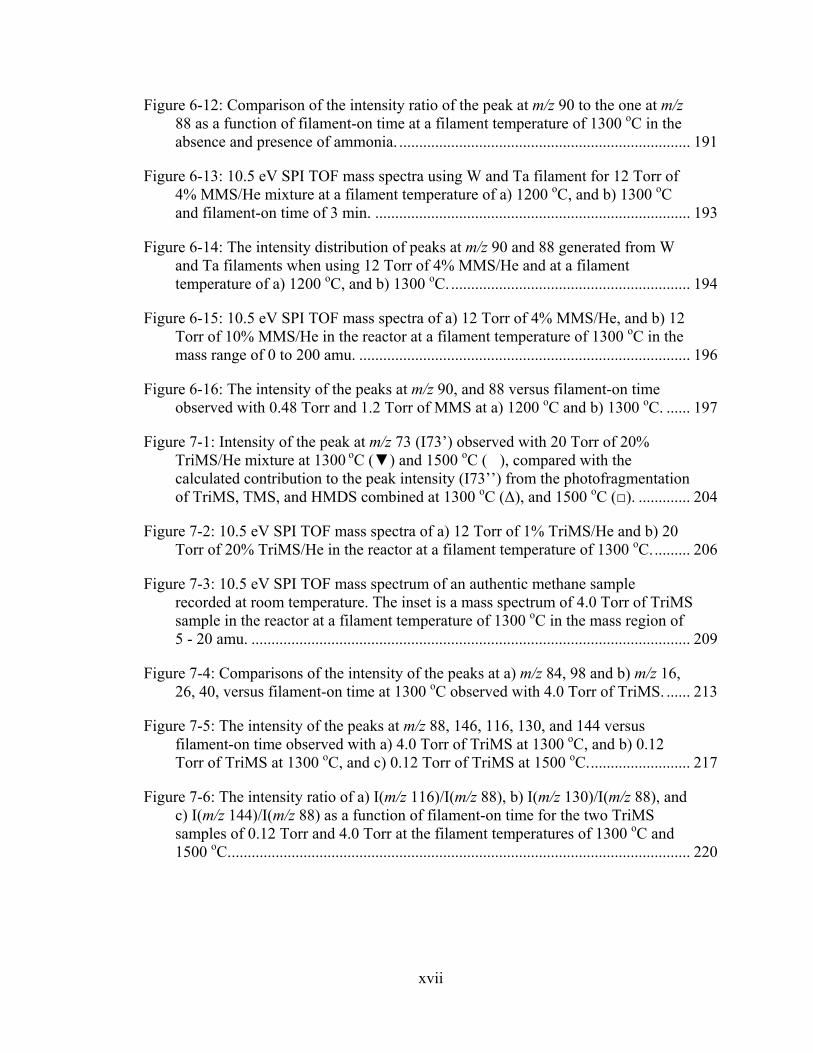
Figure 6-12: Comparison of the intensity ratio of the peak at m/z 90 to the one at m/z 88 as a function of filament-on time at a filament temperature of 1300 oC in the absence and presence of ammonia. ......................................................................... 191
Figure 6-13: 10.5 eV SPI TOF mass spectra using W and Ta filament for 12 Torr of 4% MMS/He mixture at a filament temperature of a) 1200 oC, and b) 1300 oC and filament-on time of 3 min. ............................................................................... 193
Figure 6-14: The intensity distribution of peaks at m/z 90 and 88 generated from W and Ta filaments when using 12 Torr of 4% MMS/He and at a filament temperature of a) 1200 oC, and b) 1300 oC. ............................................................ 194
Figure 6-15: 10.5 eV SPI TOF mass spectra of a) 12 Torr of 4% MMS/He, and b) 12 Torr of 10% MMS/He in the reactor at a filament temperature of 1300 oC in the mass range of 0 to 200 amu. ................................................................................... 196
Figure 6-16: The intensity of the peaks at m/z 90, and 88 versus filament-on time observed with 0.48 Torr and 1.2 Torr of MMS at a) 1200 oC and b) 1300 oC. ...... 197
Figure 7-1: Intensity of the peak at m/z 73 (I73’) observed with 20 Torr of 20% TriMS/He mixture at 1300 oC (▼) and 1500 oC (�), compared with the calculated contribution to the peak intensity (I73’’) from the photofragmentation of TriMS, TMS, and HMDS combined at 1300 oC (Δ), and 1500 oC (□). ............. 204
Figure 7-2: 10.5 eV SPI TOF mass spectra of a) 12 Torr of 1% TriMS/He and b) 20 Torr of 20% TriMS/He in the reactor at a filament temperature of 1300 oC. ......... 206
Figure 7-3: 10.5 eV SPI TOF mass spectrum of an authentic methane sample recorded at room temperature. The inset is a mass spectrum of 4.0 Torr of TriMS sample in the reactor at a filament temperature of 1300 oC in the mass region of 5 - 20 amu. .............................................................................................................. 209
Figure 7-4: Comparisons of the intensity of the peaks at a) m/z 84, 98 and b) m/z 16, 26, 40, versus filament-on time at 1300 oC observed with 4.0 Torr of TriMS. ...... 213
Figure 7-5: The intensity of the peaks at m/z 88, 146, 116, 130, and 144 versus filament-on time observed with a) 4.0 Torr of TriMS at 1300 oC, and b) 0.12 Torr of TriMS at 1300 oC, and c) 0.12 Torr of TriMS at 1500 oC. ......................... 217
Figure 7-6: The intensity ratio of a) I(m/z 116)/I(m/z 88), b) I(m/z 130)/I(m/z 88), and c) I(m/z 144)/I(m/z 88) as a function of filament-on time for the two TriMS samples of 0.12 Torr and 4.0 Torr at the filament temperatures of 1300 oC and 1500 oC. ................................................................................................................... 220
xviii
List of Schemes
Scheme 3-1 Adsorption and decomposition of monomethylsilane on a W or Ta surface ....................................................................................................................... 53
Scheme 4-1 Chemisorption and decomposition of MMS on a metal surface................... 77
Scheme 4-2 Chemisorption and decomposition of TMS over a metal surface ................. 77
Scheme 4-3 Chemisorption and decomposition of MMS-d3 on a metal surface .............. 82
Scheme 4-4 Stepwise and concerted 1,1- and 1,2-H2 elimination reactions for MMS .... 87
Scheme 4-5 Stepwise and concerted 1,1-, and 1,2-H2 elimination reactions for DMS .... 88
Scheme 4-6 Stepwise and concerted 1,2-H2 elimination reactions for TriMS ................. 88
Scheme 5-1 Photofragmentation mechanism of 1,1,2,2-tetramethyldisilane. ................ 122
Scheme 5-2 Formation of small hydrocarbons ............................................................... 148
Scheme 6-1 Methylsilylene insertion reactions into Si-H bond of 1,2-dimethyldisilane 177
Scheme 6-2 Methylsilylene insertion reactions into Si-H bond of 1,3-disilacyclobutane ..................................................................................................... 178
Scheme 6-3 Reaction of 1,3-butadiene with methylsilylene and silene species. ............ 184
Scheme 7-1 Disproportionation reactions between Si-containing radicals .................... 215
xix
List of Symbols, Abbreviations and Nomenclature
Symbol Definition AE Appearance potential Amu Atomic mass unit APCVD Atmospheric pressure chemical vapour deposition a-SiC:H Amorphous silicon carbide BTD 1,3-butadiene cat-CVD Catalytic chemical vapour deposition CCSD(T) Coupled cluster with single, double and triple excitation CRDS Cavity ring down spectroscopy CVD Chemical vapour deposition DMDS 1, 2-Dimethyldisilane DMDSCB 1,1-Dimethyl-1-disilacyclobutane DMS Dimethylsilane DMSCB 1,1-dimethyl-1-silacyclobutane Ea
APP Apparent activation energy EI Electron ionization ESD Evaporative surface decomposition HMDS Hexamethyldisilane HWCVD Hot-wire chemical vapor deposition IE Ionization energy LIF Laser induced fluorescence LiF Lithium Fluoride LIEI Laser induced electron ionization LOD Limit of detection LPCVD Low pressure chemical vapour deposition MBE Molecular beam epitaxy MMS Monomethylsilane MP2 Second-order Møller-Plesset MP4 Fourth-order Møller-Plesset MPI Multiphoton ionization MS Mass spectrometry MSCB 1-Methylsilacyclobutane Nd:YAG Neodymium: yttrium aluminum garnet pc-Si Polycrystalline silicon PECVD Plasma enhanced chemical vapor deposition PLD Pulsed laser deposition PVD Physical vapour deposition SCB Silacyclobutane SiC Silicon carbide SiGex Silicon germanium SiNx Silicon nitride SPI Single photon ionization SS Stainless steel TIMS Threshold ionization mass spectrometry

xx
TMDSCB 1,1,3,3-Tetramethyl-1,3-disilacyclobutane TMS Tetramethylsilane TOF Time-of-flight TriMS Trimethylsilane UV Ultraviolet VUV Vacuum ultraviolet ZPE Zero-point energy
xxi
Epigraph
Scientific discovery and scientific knowledge have been achieved only by those who have gone in pursuit of them without any practical purpose whatsoever in view.
Max Karl Ernst Planck
1
Chapter One: Introduction and Background
1.1 Thin Film Deposition Processes
The advancement of the electronic industry has been significantly impacted by the
deposition technology, since this technology involves the creation of materials critical for
the functionality of electronic devices, such as computers, semiconductors, etc.
Deposition technology has seen a significant growth for the past twenty years. This
growth is due to the development of the deposition methods and characterization
techniques, which provides a better understanding on the properties of the deposited
materials. This leads to an expansion in the applications that incorporates these
materials.1
A significant number of deposition technologies exist.2-4 These technologies can
be categorized as either chemical or physical process. Chemical methods are based on the
chemical reactions in the gas phase, whereas physical techniques depend on the
evaporation of the material from a source. The classification of these thin film deposition
techniques is illustrated in Figure 1-1.
1.1.1 Physical Vapour Deposition
Physical Vapor Deposition (PVD) is a deposition process in which an evaporant is
created from a solid or liquid source in the form of atoms or molecules, and transported
to the substrate where it condenses to form the thin film deposit.5 The deposition process
in PVD occurs by condensation mechanism. A schematic diagram of the PVD process is
shown in Figure 1-2.
2
Figure 1-1: Classification of thin film deposition technologies.
Figure 1-2: A schematic diagram of the PVD process: 1) evaporation from the source, 2) transport of evaporant, and 3) condensation of the evaporant.
3
PVD processes are used to deposit films with thicknesses in the range of few to
thousands of nanometers using substrate of variable sizes. This process can be used in the
fabrication of optical, magnetic and optoelectronic devices. This technique is also used in
the field of corrosion protection, thermal insulation, and coatings.
1.1.2 Chemical Vapour Deposition
Chemical Vapor Deposition (CVD) is a diverse technology. Two major areas in
the application of CVD have been rapidly developed in the last twenty years or so,
namely in the semiconductor industry and metallurgical-coating industry, which includes
cutting-tool fabrication. CVD consists of the introduction of a precursor into a vacuum
chamber containing a substrate to be coated. Chemical reactions occurring on or near the
heated substrate result in the formation of thin films.6, 7 CVD offers several advantages,
which make it generally the preferred process in many cases. One of the main advantages
is that the deposited materials using CVD are generally quite conformal. Other
advantages include relatively high deposition rate, a wide variety of precursors that can
be used with high purity, and the fact that CVD does not require a high vacuum. Despite
the simplicity of this technique, the CVD process has limitations. One of the major
disadvantages lies on the type of substrate to be coated, since the deposition process is
carried out at relatively high temperature. Another disadvantage is related to the
requirement of having chemical precursors with high vapor pressure which are often
hazardous and toxic.
Despite the variety of deposition techniques available, an ideal one would be the
one that has a high deposition rate, minimal damage to the deposited film, low substrate
4
temperature, and low equipment and preparation cost. Recently, a new technique, known
as hot-wire CVD (HWCVD) or catalytic CVD (cat-CVD), has been developed that meets
these requirements.
1.2 Hot-Wire Chemical Vapour Deposition (HWCVD)
The concept of using catalytic reactions in CVD processes first appeared in a
patent by Yamazaki in 1970.8 He proposed to insert a catalyst in a conventional thermal
CVD apparatus to improve film quality and decrease the deposition temperature for
silicon nitride film. However, the deposition temperature for obtaining films was similar
to that for simple thermal CVD process in his case. Later in 1979, Wiesmann et al.9
reported that they could obtain silicon (Si) films from silane (SiH4) and heated Tungsten
(W) wires or carbon (C) rods. However, their results were not encouraging, due to the
inferior electronic properties of their films in comparison with those prepared by plasma
enhanced CVD (PECVD).These discouraging results led to several years of inactivity in
this field until Matsumura and Tachibana10 demonstrated in 1985 high-quality
hydrofluorinated amorphous silicon (a-Si:F:H) films using silicon tetrafluoride (SiF4) and
hydrogen (H2) as gas precursors. They claimed that the reaction of H2 with the heated W
filament was catalytic in nature, and thus termed the entire process catalytic CVD (cat-
CVD). In a follow-up study in 1986,11 Matsumura was able to grow high-quality a-Si:H
using deposition conditions similar to those used in the a-Si:F:H study. These
encouraging results renewed interest in the technique. High-quality a-Si was also grown
by Doyle et al.12 under slightly different conditions from those of Matsumura. They
named the process as evaporative surface decomposition (ESD), due to the highly
5
efficient dissociation of the low-pressure feed gas and consequently large flux of
deposition radicals. The term “hot wire chemical vapour deposition” was formally
introduced by Mahan et al. in 199113 in a study where the superior properties of
amorphous silicon films deposited from HWCVD was demonstrated in comparison to
those obtained from PECVD. The work of this group was influential in demonstrating the
advantages of this growth method and has led to tremendous growth in this field of
research in the past two decades.
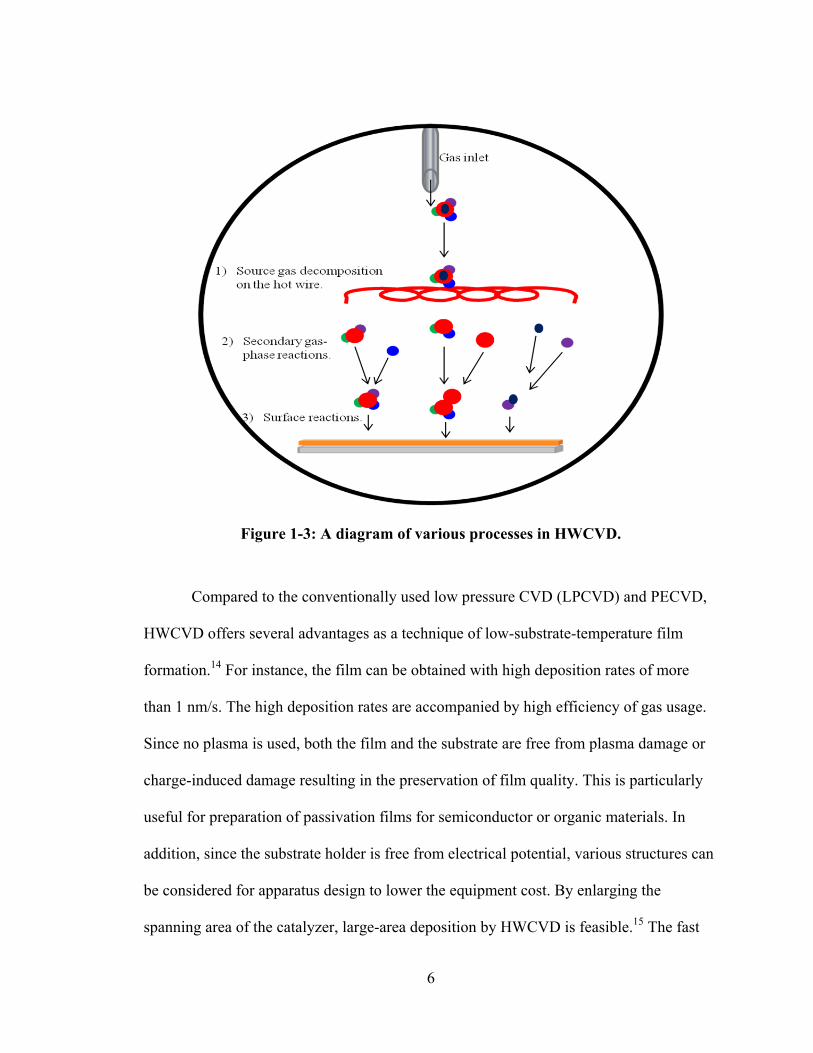
In general, the process of HWCVD is quite straightforward. In this technique, the
precursor gas is introduced into a vacuum chamber, where a filament, made of either W
or tantalum (Ta) typically, is resistively heated up to temperatures between 1500-2000
ºC. The molecules impinging on the hot filament are dissociated by a catalytic process,
from which mainly reactive radicals are released from the filament surface into the gas
phase. Some of these radicals released from the filament can reach the substrate without
encountering any collision, whereas some other undergo secondary reactions as they
travel from the filament to the substrate. Secondary gas-phase reactions may occur with
other generated radicals or with parent molecule. Products resulting from these reactions
and reaching the substrate affect the properties of the growing film.14 A schematic
diagram of the various processes in HWCVD is shown in Figure 1-3.
6
Figure 1-3: A diagram of various processes in HWCVD.
Compared to the conventionally used low pressure CVD (LPCVD) and PECVD,
HWCVD offers several advantages as a technique of low-substrate-temperature film
formation.14 For instance, the film can be obtained with high deposition rates of more
than 1 nm/s. The high deposition rates are accompanied by high efficiency of gas usage.
Since no plasma is used, both the film and the substrate are free from plasma damage or
charge-induced damage resulting in the preservation of film quality. This is particularly
useful for preparation of passivation films for semiconductor or organic materials. In
addition, since the substrate holder is free from electrical potential, various structures can
be considered for apparatus design to lower the equipment cost. By enlarging the
spanning area of the catalyzer, large-area deposition by HWCVD is feasible.15 The fast
7
developing research interest in HWCVD owes a great deal to its advantages. This interest
in HWCVD has increased worldwide, particularly in Japan,15 the United States,16
and
Europe,17 for the deposition of silicon, silicon germanium (SiGex),18-23silicon nitride
(SiNx),24-27 and silicon carbide (SiC)28-32
films.
While knowledge regarding the primary decomposition products from the
filament is crucial, ultimately it is the reactions of these primary species with each other
and with the source gas itself that produce the final growth precursors. The gas-phase
process can be affected by various factors related to the deposition parameters. These
include source gas composition, source gas flow rate, gas pressure, filament materials,
filament temperature, filament geometry, the distance between the filament and substrate,
substrate temperature, substrate morphology, and HWCVD reactor geometry.
Among all of the parameters mentioned above, filament materials and
temperature are considered the most critical in studying the gas-phase chemistry in a
HWCVD process. Tange et al. 33 have studied the decomposition of silane on the surface
of three metal filaments: Mo, Ta, and W. They have shown that the Si atoms were the
main species desorbed from the W filament at filament temperatures below 1700 K and
SiH2 is the next most abundant radical, followed by SiH3. From their results, they were
able to obtain the activation energy for Si atom production from silane, which was 60 ±
15 kcal/mol (i.e., a 251± 63 kJ/mol) , 23 ± 6 kcal/mol (i.e., a 96± 25 kJ/mol), and 17 ± 5
kcal/mol (i.e., a 71± 21 kJ/mol), for Mo, Ta and W, respectively. These values were
significantly lower than the binding energy between Si and metal surface (e.g., 127
kcal/mol (i.e., a 531 kJ/mol) for Si-W system) and depended on the nature of the metal
8
filament. Their results showed that SiH4 is catalytically decomposed by the filament
rather than through thermal decompositions.
Additionally, Holt et al.34, 35 studied the effect of filament aging on the
decomposition chemistry. They have found that with a new wire, Si is produced as the
predominant species for temperatures above 1500 K, with a minor contribution from SiH3
of a low activation energy of 8 kcal/mol (i.e., a 33 kJ/mol), suggesting that the
decomposition of the source gas is a catalytic process. When the filament was aged, the
gas-phase chemistry is still dominated by the production of Si radical at temperatures
above 2100 K, but the high temperature activation energy implies that evaporation from
liquid silicon occurred. The recent work of Duan et al.36 on the influence of filament
material on radical production from SiH4 showed the activation energies for Si formation
to be 50 – 60 kcal/mol (i.e., a 209 – 251kJ/mol) for W, 40 – 60 kcal/mol (i.e., a 167 –
251kJ/mol) for Re, 120 – 160 kcal/mol (i.e., a 502 – 669 kJ/mol) for Mo, and 140 – 180
kcal/mol (i.e., a 586 – 753 kJ/mol) for Ta. The difference among the activation energies
was attributed to the different catalytic capabilities of metals. It should be noted that the
energy needed to break Si-H bonds in SiH4 is 308 kcal/mol (i.e., a 1289 kJ/mol),37 which
is much higher than the activation energy of Si formation on different metal wires. This
once again supports the conclusion that the decomposition of SiH4 is a catalytic process.
Presently, the most common filament materials are W and Ta. In addition to these
materials, Mo, V, Pt and graphite were used as filament materials by Matsumura38 and
Morrison39 during the deposition of a-Si:H materials. Duan et al.36 and Van Veenendaal
et al.40, 41 have used Re as the filament material for the deposition of amorphous,
microcrystalline, and polycrystalline silicon films. From these studies it was concluded
9
that filament materials influence the gas-phase chemistry due to the difference in their
catalytic capabilities and film properties depend strongly on the filament materials.
In addition to filament materials, filament temperature also plays an important
role in HWCVD, for controlling the decomposition of the source gas and the resulting
film growth, heat transfer in the gas and secondary gas-phase reaction rates, while also
affecting the filament lifetime and contamination of deposited films.42 HWCVD of a-Si:H
films is typically carried out using filament temperatures between 1750 and 1900 oC.42 It
was found that at lower filament temperatures, the filament is easy to break owing to the
formation of silicide, while at high filament temperatures the contamination from the
vaporization of the filament should be considered.43
Beside the two parameters mentioned above, the effect of precursor pressure is
also considered an important factor during the HWCVD process. As reported by
Molenbroek et al.,44 the secondary gas-phase reactions, which are responsible for
determining the nature of the growth precursor, depend strongly on the mean free path.
As the pressure is increased, the mean free path is decreased due to the increased density
of molecules in the reaction chamber, yielding a more active gas-phase chemistry. In a
study to explore the effect of process condition during the deposition of a-Si:H films in a
HWCVD process, Pant et al.45 have noticed a transition from a-Si:H to polycrystalline-Si
(pc-Si) thin films with increasing precursor pressure. This transition is explained by the
fact that the increase of pressure resulted in a higher consumption of SiH4 accompanied
with an increase in the concentration of the H2 in the reaction, which in turn is indicative
of an increase in the concentration of adsorbed H. These adsorbed H atoms undergo
rearrangement reaction at the surface, leading to the formation of pc-Si films.
10
Despite the extensive number of studies in the field of HWCVD, a clear
understanding of the gas-phase process and the effect of various deposition parameters is
still lacking. Therefore, a closer examination of the physical and chemical processes
occurring at the surface of the wire and in the gas-phase is important for developing a
clear understanding of the process.
1.3 HWCVD of Silicon Carbide Thin Films
1.3.1 Silicon Carbide (SiC) Thin Films
Silicon carbide is an extremely hard compound that does exist in nature, as it can
be found in meteorites. The earliest observation of SiC compounds goes back to 1824
when Jöns Jacob Berzelius burnt an unknown compound and observed an equal number
of silicon and carbon atoms.46 SiC is one of the leading contenders among the wide
bandgap semiconductors that can revolutionize electronic devices. This role is also
attributed to its superior electrical and mechanical properties as compared to Si. Since its
discovery, especially in the last twenty years, considerable efforts have been made by
researchers, who are attracted by its appealing physical properties, to explore synthesis
techniques and applications of SiC.
Silicon carbide has been regarded as a promising material for high-temperature,
high-power, and high-frequency devices due to its wide bandgap, high thermal
conductivity, and stability under severe thermal, chemical and electromagnetic radiation.
47 In addition to its physical properties, another exciting feature of SiC is its occurrence in
many different polytypes that depend on the stacking sequence of the SiC bilayer.48, 49
Over 200 polytypes have been observed having a cubic (C), hexagonal (H), or
11
rhombohedral (R) Bravais lattice, and only a few are commonly grown in a reproducible
form acceptable for use as an electronic semiconductor. The most common polytypes of
SiC presently being developed for electronics are 3C- SiC, 4H- SiC, and 6H- SiC. The
number in the notation determines the number of layer before the sequence repeats itself
and the letter indicates the resulting structure of the crystal. The numerous polytypes of
SiC imply a diverse range of electrical characteristics. However, they all share the quality
of having a wide bandgap with a high breakdown voltage and a high saturation electron
drift velocity which aids in the ability to make suitable high-temperature, high-power,
and high-frequency electronic devices. While all SiC polytypes have similar physical and
thermal properties, their electrical and optical properties differ.47, 50 Depending on the
designated application, one polytype may have more suitable characteristics than the
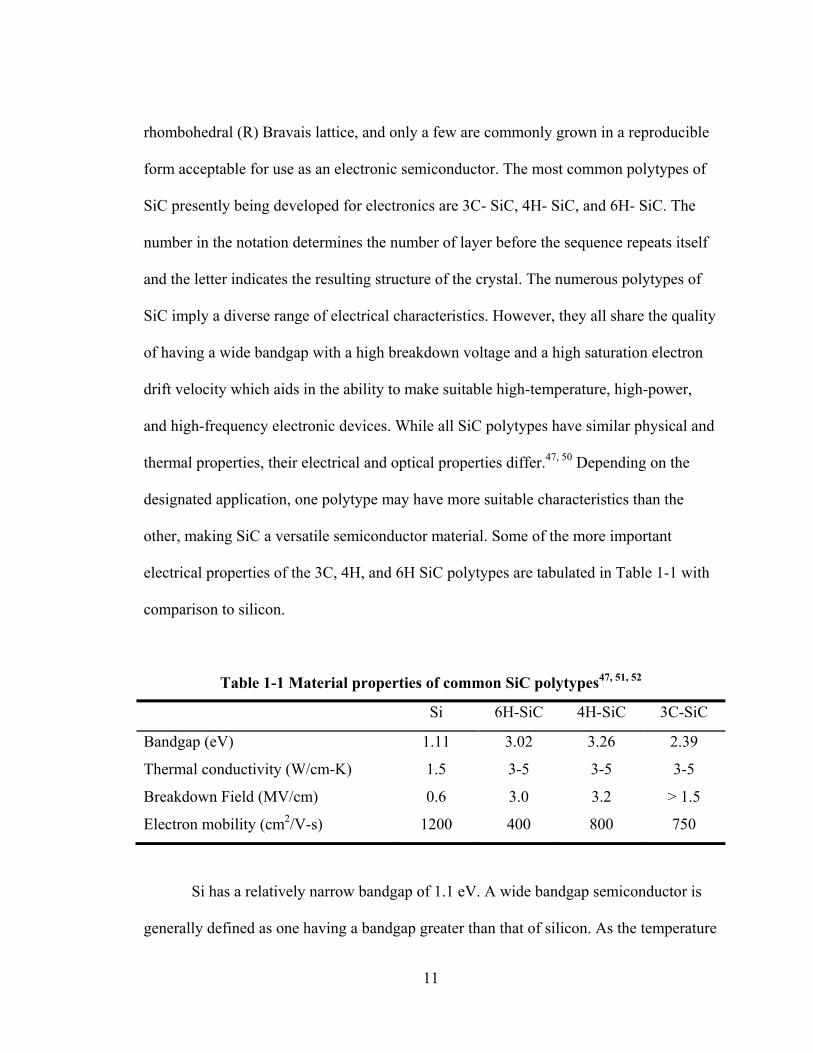
other, making SiC a versatile semiconductor material. Some of the more important
electrical properties of the 3C, 4H, and 6H SiC polytypes are tabulated in Table 1-1 with
comparison to silicon.
Table 1-1 Material properties of common SiC polytypes47, 51, 52
Si 6H-SiC 4H-SiC 3C-SiC
Bandgap (eV) 1.11 3.02 3.26 2.39
Thermal conductivity (W/cm-K) 1.5 3-5 3-5 3-5
Breakdown Field (MV/cm) 0.6 3.0 3.2 > 1.5
Electron mobility (cm2/V-s) 1200 400 800 750
Si has a relatively narrow bandgap of 1.1 eV. A wide bandgap semiconductor is
generally defined as one having a bandgap greater than that of silicon. As the temperature
12
increases above 300 oC, significant thermal excitation may occur. This is the major
reason why Si-based devices fail at temperatures above 250 oC. The larger bandgap
provides energy barrier against thermal excitation and allows SiC device operation at
temperatures close to 750 oC. Another critical parameter for power producing devices is
thermal conductivity. The outstanding thermal conductivity of SiC (approximately three
times better than Si) allows SiC-based devices to more efficiently remove waste heat, and
to operate at a lower junction temperature, which improves device lifetime and reliability.
Furthermore, its tight chemical bonding in the diamond-like structure is chemically
inactive even at elevated temperatures. Although the electron mobility of SiC is not as
good as Si, it is sufficient in the high electric filed regimes where SiC devices typically
operate. 51, 52
These important physical properties of silicon carbide ensure a large range of
applications from improved high voltage switching for energy savings in public electric
power distribution and electric vehicles, to more powerful microwaves electronics for
radar and communications, to sensors and more fuel-efficient combustion chambers for
jet aircraft, automobile engines, and for stationary power plants.
1.3.2 Growth of SiC Thin Films Using HWCVD Processes
Conventionally, the formation of SiC thin films in PECVD or HWCVD requires
the usage of a mixture of separate Si- (SiH4, Si2H6, or SiH2Cl2) and C-bearing (CH4,
C2H4, or C2H2) source gases. Ferreira et al.53 prepared hydrogenated amorphous SiC (a-
SiC:H) by using the gas mixture of C2H4 and SiH4 with PECVD. They obtained a film
with bandgaps ranging from 1.85-3.5 eV by controlling the percentage of C2H4 in the
13
mixture. a-SiC:H was also fabricated using the SiH4 and C2H2 mixture with HWCVD in
a study by Swain et al. on the effect of filament temperature,54 the process pressure,28 H2
dilution55 and substrate temperature.56 They found that the C content as well as the
bandgap increased with the increase of pressure, H2 dilution, and filament temperature,
while it decreased with the increase of the substrate temperature. Similarly, Tataba et
al.30, 57 prepared nanocrystalline cubic SiC (nc-3C-SiC) from a mixture of SiH4/CH4/H2
by HWCVD. They found that the filament temperature,58 total gas pressure, gas flow
rates of SiH4/CH4/H2, 59
and the filament-to-substrate distance30 affected the structures of
the formed SiC films. Despite the existence of these numerous studies, the use of
mixtures presents several drawbacks. For instance, the use of mixtures requires
independent flow control of each precursor since the optimum composition of the mixture
will vary with deposition temperature, pressure, etc. Additionally, silane and hydrocarbon
compounds are either pyrophoric or explosive. In order to circumvent these problems,
investigation of alternative single-source precursors containing both Si and C, e.g.,
organosilicon compounds, has been performed.31, 32, 60-63 The major advantage in using
organosilicon molecules compared to multiple-source precursors is the possibility of
preserving Si-C bonds in the grown film. This can potentially translate into improvement
in the ratio of Si to C ratio in the resultant films and subsequently in the quality of the
film.64-66 Furthermore, the organosilicon precursors are much safer to handle, and
generally need less energy for decomposition than the competing mixtures.
14
1.3.3 HWCVD of SiC Thin Films Using Methyl-Substituted Silanes
Recently, successful studies in using open chain methyl-substituted silane
molecules ((CH3)4-xSiHx, x =0-3) as precursors for growing SiC thin films using various
CVD techniques have emerged. Monomethylsilane (MMS),31, 32, 39, 61, 67-73 dimethylsilane
(DMS),61, 70 trimethylsilane (TriMS),32, 61, 67, 70, 73
tetramethylsilane (TMS),32, 61, 74-77 and
hexamethyldisilane (HMDS)74, 78 have been studied. Among all of these precursors, MMS
has been widely used as a single source gas in the preparation of SiC thin films in both
PECVD39, 70 and HWCVD.31, 32, 39, 68, 69, 73 Lee and Bent31, 32, 73 studied the effect of
different precursor structures (MMS, TriMS, and TMS) on the growth of a-SiC:H by
HWCVD. They have shown that the growth mechanism of a-SiC:H film proceeds via Si-
H bond cleavage and is dependent on the reaction chemistry of the precursors. They have
found that among the three studied materials, TriMS produced thin films with the highest
methyl concentration. When Nakayama et al.60 used DMS as a source gas to prepare SiC
thin films, they found that filament materials affected the film composition, and the
growth rate depended on the filament temperature. Furthermore, the influence of hydrogen
dilution, filament temperature and deposition pressure on the deposition rate, the structural
and the optoelectronic properties of microcrystalline SiC was investigated by Klein et
al.69, 79, 80 using MMS diluted in H2 in HWCVD system. They have found that with
increasing MMS concentration a transition from high to low fraction of crystalline SiC
was observed. Additionally, they have determined that high deposition rates without
deterioration of the material quality was achieved by the application of low filament
temperatures (< 1800 °C) in combination with shorter distance between the filament and
the substrate.
15
1.4 Gas-Phase Chemistry in HWCVD System
Most of the research on HWCVD is focused on the deposition process and the
characterization of the films by examining the electrical and physical properties of the
deposited films and correlating these properties to the deposition parameters. However,
as mentioned in the previous sections, film growth in HWCVD is believed to be induced
by precursors generated from direct decomposition on the filament and/or from
secondary gas-phase reactions. The properties and quality of the deposited films are
determined by these gas-phase precursor species. Therefore, for a better understanding of
the HWCVD process and a rational optimization of film deposition process, it is essential
to identify the gas-phase chemical species and to study their formation mechanisms and
kinetics.
1.4.1 Detecting the Gas-Phase Reaction Products in a HWCVD Process
In a HWCVD system, the decomposition of source gases on the filament results in
the formation of radicals, which are difficult to detect because these reactive species have
fast rate losses and small number densities in comparison to their molecular precursors.81
Their detection has become possible after the introduction of several modern, in-situ,
real-time analytical techniques. These methods can be divided into three categories:
electron-in-ion-out, photon-in-photon-out, and photon-in-ion-out. In electron-in-ion-out
method, electrons with an energy above the ionization energy (IE) are used to ionize the
species of interest. The conventional 70 eV electron ionization (EI) belongs to this
category. This technique has been considered to be a universal ionization method since it
can ionize almost all compounds. However, the significant fragmentation that often
16
accompanies the ionization can greatly complicate the mass spectrum, making it very
difficult to identify single components in a complex mixture system. An alternative
technique of this type, called “threshold ionization mass spectrometry” (TIMS), can be
used. In this technique, the electron energy is chosen to lie just above the IE, which is
typically below the appearance energy (AE) of fragment ions. In this way, the only
signals obtained are those from ionization of neutral species, and not from their
fragmentation.81 Another method that belongs to this category is laser induced electron
ionization (LIEI), developed in the Shi laboratory.82 The LIEI source consists of a
stainless steel rod held 10 mm away from a copper mesh. In this technique, a 355 nm
laser radiation is focused onto the stainless steel rod by a quartz lens, and photoelectrons
generated by thermionic emission are accelerated towards the ionization regions. This
technique has been demonstrated to produce EI-type mass spectra with approximately 70
eV fragmentation patterns, excellent mass resolution, and very high sensitivity. The LIEI
source is well suited for studying stable species, which can be readily detected to very
low concentrations.
The technique in the second category, photon-in-photon-out, is one where a
species is excited by the absorption of a photon followed by relaxation and emission of a
new photon, which is indicative of the species of interest. Laser induced fluorescence
(LIF) and cavity ring down spectroscopy (CRDS) fall into this category.83 Both of these
techniques have high sensitivity, however only one species can be detected at a time and
any photon emission from sources other than the target species can interfere with the
detection process.
17
Photon-in-ion-out technique uses photons energy instead of electron energy for
ionization. It involves the use of one, or many, photons from a laser radiation to ionize
the neutral species, followed by the ion detection by a mass spectrometer. Two laser
ionization methods, known as resonance enhanced multiphoton ionization (REMPI) and
SPI, have been used. REMPI involves the excitation of the species of interest to a real
energy level, followed by the absorption of a second photon for ionization. This makes
the REMPI technique very sensitive and selective. SPI uses a single photon of sufficient
energy to ionize the target species, but low enough to avoid fragmentation for most
species, thus avoiding convoluted mass spectra.84 It is considered to be a soft ionization
method, because only modest amounts of excess energy are deposited in the resulting
ions, and efficient ionization can occur with relatively low laser intensities, minimizing
the probability of multiphoton absorption. The ionization selectivity of this technique is
given by the ionization energy of the compound and the availability of a wide range of
wavelengths. Hence, only those compounds that have an IE lower than the photon energy
can be ionized without fragmenting it. Typically, SPI with a VUV laser radiation at 118
nm (10.5 eV), which is the ninth harmonic of the fundamental 1064 nm output of an
Nd:YAG laser, is used in HWCVD of SiC thin films, since most of the Si and C
containing species have an IE below or at 10.5 eV. In addition, with this wavelength, SPI
will not ionize typical background gases, such as He, N2, O2, H2O, or CO2. SPI has been
demonstrated to be a soft and near universal analytical technique, since it provides
spectra with reduced background noise and it can ionize most of the species of interest
with little or no fragmentation.85, 86
18
Although there are a variety of techniques available for the detection of various
species, a careful choice must be made in selecting the most appropriate one for
investigating the gas-phase chemistry in the process of HWCVD. Among all of the
aforementioned methods, the principle of TIMS is straightforward, however, it requires a
very long time for data acquisition and calibration can be a lengthy and complex process.
LIF or CRDS are both quite sensitive techniques. Since the foreknowledge of the species
to be examined is required and they often can only detect one species at a time, they
cannot be effectively applied to study a complex chemistry in an unknown system.
Ultimately, it is SPI that has emerged as the most suitable technique for studying the
HWCVD chemistry. The “soft” nature of SPI makes it a good choice for the analysis of a
complex system, characteristic of a HWCVD or a PECVD system. Furthermore, one-
photon ionization cross sections are more uniform from species to species than those
using MPI, which makes quantitative analysis feasible by using SPI. In addition to the
established SPI method, a new ionization source has also been developed in the Shi
laboratory87 to study the HWCVD chemistry. This source consisted of both LIEI and SPI
modes in one, and is therefore called the dual SPI/LIEI source. In this source, the
ionization is achieved by directing an unfocused laser beam containing both 118 nm
VUV and 355 nm UV radiations to the repeller plate in a TOF mass spectrometer. It is
found that the SPI source due to the 118 nm VUV light coexists in the LIEI source. This
dual SPI/LIEI source allows for simultaneous observations of all species with IP below
and above 10.5 eV, and has therefore proven to be very useful in studying the gas-phase
chemistry in the HWCVD processes. Based on these facts, SPI along with the dual
SPI/LIEI ionization sources are the two techniques used in this study.
19
1.4.2 Gas-Phase Chemistry in HWCVD Using Methyl-Substituted Silanes
In their work on the decomposition of methyl-substituted silanes, including MMS,
DMS, TriMS, and TMS along with 1,1-dimethyl-1-dilacyclobutane (DMSCB) on W and
Re filament in a HWCVD process, Zaharias et al.61 detected the formation of Si and
methyl radicals as the two major products during the primary decomposing process by
probing the gas-phase species using vacuum ultraviolet (VUV) single photon ionization
(SPI) at filament temperatures between 1000 and 1950 oC. The reaction rate of the
aforementioned precursors on the filament decreased with increasing number of methyl
groups in the molecule. They have also determined the apparent activation energy (Eaapp)
of Si formation, and its value increased with increasing methyl substitution in the
precursors. For the DMSCB precursor, its decomposition resulted in much lower Eaapp
value for Si formation due to Si being a part of a four- membered ring leading to a lower
barrier. For the methyl production, they have found that MMS, DMS and TriMS
produced similar concentrations of CH3, whereas negligible CH3 resulted from TMS
dissociation. However, they were not able to extract any values for the activation energy
for methyl formation since this radical did not follow an Arrhenius behavior under their
experimental conditions. Using similar technique as Zaharias, Sharma et al.62 detected
SiH2, CH3SiH, CH3, and CH3Si radicals as the fragmentation products from TriMS and
TMS under low-pressure conditions (2.3 × 10⁻⁶ Torr).
However, all of these detections were carried out under very low pressures where
gas-phase reactions are negligible. Typical deposition pressures for SiC films using
HWCVD with either gaseous mixtures of silane and hydrocarbons or single-source
precursors range from 0.1 Torr to several Torr.54, 88 At these relatively high pressures,
20
secondary gas-phase reactions between the various species produced from the primary
decomposition become relevant in understanding the entire process and affect the quality
of the deposited film. Unfortunately, little is known about the nature of secondary gas-
phase reactions and their products. As a result, the gas-phase chemistry is not fully
understood, and details regarding the growth mechanism are unclear.
To gain better insights into the deposition chemistry in HWCVD, the Shi group
has previously studied the decomposition and secondary gas-phase reaction chemistry
using both open-chain methyl-substituted silanes and four-membered ring
(di)silacyclobutane molecules with both W and Ta filaments. In their work, the gas phase
chemistry involved in the decomposition of TMS,89 TriMS,67 HMDS,82 silacyclobutane
(SCB),90 DMSCB,91 1,1,3,3-tetramethyl-1,3-disilacyclobutane (TMDSCB)92 and 1-
methylsilacyclobutane (MSCB)93 on a hot W filament and secondary gas-phase reactions
in a HWCVD reactor has been investigated using VUV laser SPI coupled with time-of-
flight (TOF) mass spectrometry (MS). Among all of these molecules, TMS and TriMS
belong to methyl-substituted silane molecules. It was found that TMS decomposed on the
W filament to methyl and trimethylsilyl radicals, which react with the abundant parent
molecules in the HWCVD reactor, producing more radical species. Self- and cross-
combinations of the primary and secondary radicals are the dominant gas-phase reaction
pathways. These reactions lead to the generation of small alkenes (CnH2n, n ≤ 4), alkyl-
substituted silanes, and silyl-substituted alkanes. Si-C bond is found to be the major bond
connection in the reaction products of high mass. The study of TriMS revealed the effect
of the Si-H bond on the gas-phase reactions. It was found that TriMS decomposed into
(CH3)2HSi, and CH3 radicals. Similar to TMS, these primary radical products react with
21
the parent molecule in the reactor, generating more radical compounds. The biradical
combination reactions are again found to be responsible for most of the molecules
detected in the HWCVD reactor with TriMS. These studies also showed the involvement
of silene intermediates in the gas-phase reactions with the two methyl-substituted silane
precursors. Silene is a very reactive species which is expected to play an important role in
SiC film deposition. Silacyclobutane (SCB), a four-membered ring compound, is known
to decompose to produce silene upon pyrolysis. The study of the SCB decomposition on
a hot W filament conducted in the Shi group has demonstrated that reactions involving
silene and its isomer silylene dominate.
1.4.3 Chemical Trapping of the Active Intermediates
It has been shown that several reactive intermediates, including free radicals,
silene, and silylene species, are produced in the primary decomposition of methyl-
substituted silane molecules in the HWCVD process. These intermediates are believed to
be the driving force in the secondary gas-phase chemistry using these precursors.
Therefore, understanding the involvement of these intermediates can provide some
insights into their roles in the HWCVD process. Chemical trapping is a useful technique
to identify the role of each of the reactive intermediates in the reaction mechanism.
Free radicals play an important role in the pyrolysis chemistry of methyl-
substituted silane molecules. Neudorfl and Strausz94 studied the pyrolysis of MMS and
DMS in the presence of ethene as a radical scavenger. In the presence of ethene, the
suppression of free-radical chain reaction is observed, while the reaction involving
silene/silylene intermediates is still occurring. This suggests that the competition between
22
radical chain and silene/silylene mechanism in the pyrolysis of these precursors is taking
place. Rickborn et al.95 used toluene to quench radical chain reaction during the
pyrolysis of DMS. However, they have found that toluene is an excellent trapping agent
only at low temperatures, and with increasing temperature, this trapping agent can itself
become a radical source. Another radical scavenger is nitric oxide. Several studies96-98
showed the effect of NO on the gas-phase chemistry involved in the photolysis of methyl-
substituted silanes. It has been found that the products generated from free-radical
reactions are suppressed upon using NO, while the ones produced from silene/silylene
mechanism are left unaffected.
In addition to free radicals, silylene and silene are believed to play a significant
role in the gas-phase chemistry of methyl-substitued silanes, as has been discussed
earlier. Silylenes (R2Si:) have drawn much attention since they were first suggested as
reaction intermediates in the decomposition chemistry of methyl-substituted silane
compounds.99 Silylene species have similar geometric structures, electronic
configurations, and reactivity similar to carbene. These species are defined as having two
covalent bonds and two non-bonding electrons distributed between two non-bonding
orbitals. These electrons may occupy the same non-bonding orbital or they may reside in
two different non-bonding orbitals. In the lowest singlet state, the electrons have anti-
parallel spins and occupy the same nonbonding orbital. In the lowest triplet state, the
electrons are distributed between the two non-bonding orbitals. This leads to differences
in their chemical behaviour.100
Although insertions of silylenes into single bonds can occur, intermolecular
insertion into C-H bonds does not take place, except for intramolecular insertions at high
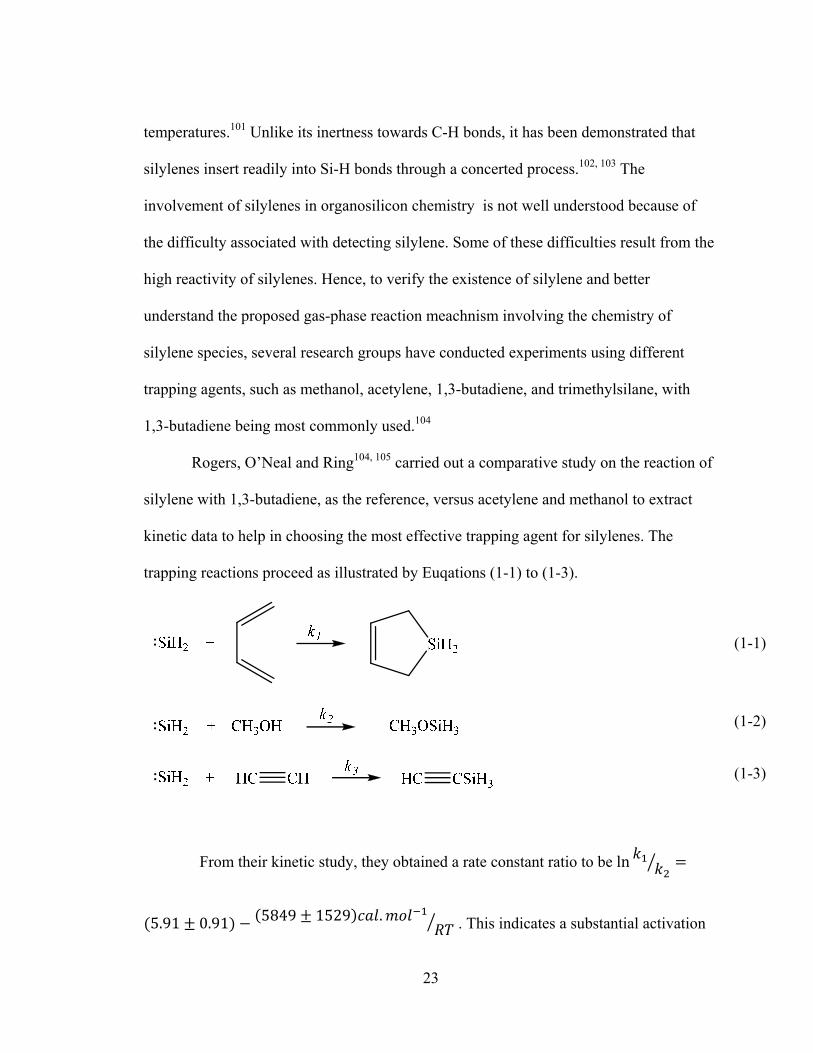
23
temperatures.101 Unlike its inertness towards C-H bonds, it has been demonstrated that
silylenes insert readily into Si-H bonds through a concerted process.102, 103 The
involvement of silylenes in organosilicon chemistry is not well understood because of
the difficulty associated with detecting silylene. Some of these difficulties result from the
high reactivity of silylenes. Hence, to verify the existence of silylene and better
understand the proposed gas-phase reaction meachnism involving the chemistry of
silylene species, several research groups have conducted experiments using different
trapping agents, such as methanol, acetylene, 1,3-butadiene, and trimethylsilane, with
1,3-butadiene being most commonly used.104
Rogers, O’Neal and Ring104, 105 carried out a comparative study on the reaction of
silylene with 1,3-butadiene, as the reference, versus acetylene and methanol to extract
kinetic data to help in choosing the most effective trapping agent for silylenes. The
trapping reactions proceed as illustrated by Euqations (1-1) to (1-3).
(1-1)
(1-2)
(1-3)
From their kinetic study, they obtained a rate constant ratio to be ln
5.91 0.91 5849 1529 . . This indicates a substantial activation
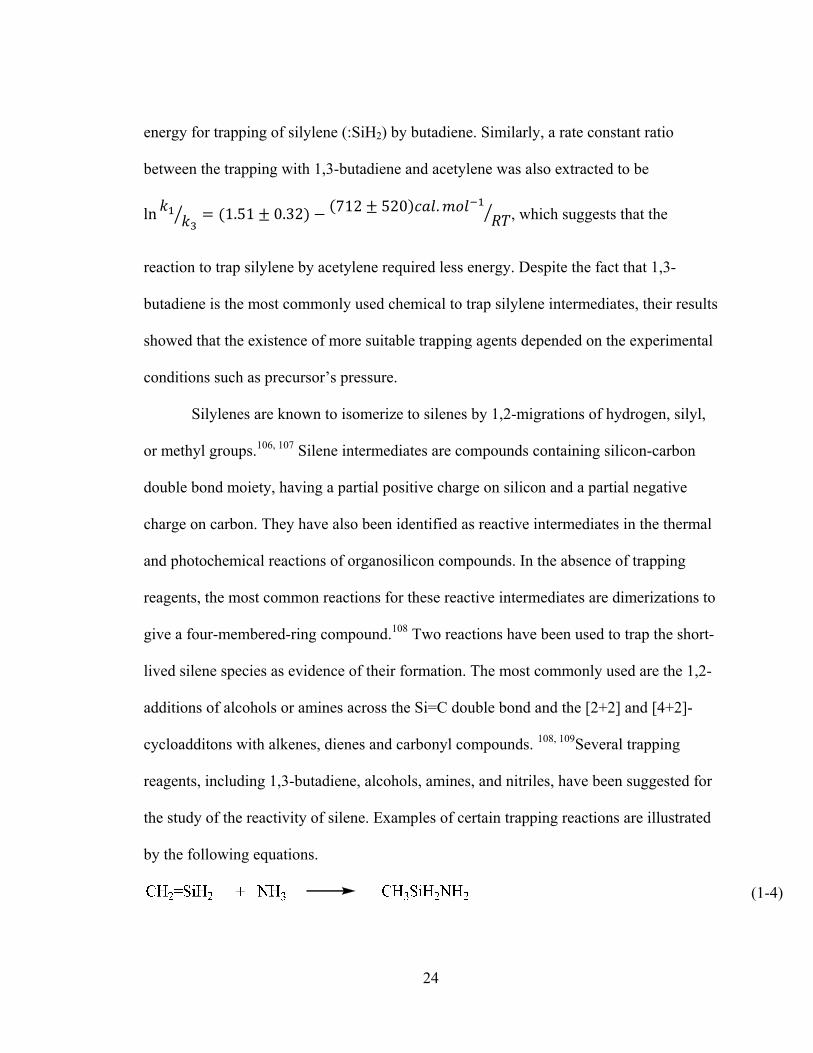
24
energy for trapping of silylene (:SiH2) by butadiene. Similarly, a rate constant ratio
between the trapping with 1,3-butadiene and acetylene was also extracted to be
ln 1.51 0.32 712 520 . , which suggests that the
reaction to trap silylene by acetylene required less energy. Despite the fact that 1,3-
butadiene is the most commonly used chemical to trap silylene intermediates, their results
showed that the existence of more suitable trapping agents depended on the experimental
conditions such as precursor’s pressure.
Silylenes are known to isomerize to silenes by 1,2-migrations of hydrogen, silyl,
or methyl groups.106, 107 Silene intermediates are compounds containing silicon-carbon
double bond moiety, having a partial positive charge on silicon and a partial negative
charge on carbon. They have also been identified as reactive intermediates in the thermal
and photochemical reactions of organosilicon compounds. In the absence of trapping
reagents, the most common reactions for these reactive intermediates are dimerizations to
give a four-membered-ring compound.108 Two reactions have been used to trap the short-
lived silene species as evidence of their formation. The most commonly used are the 1,2-
additions of alcohols or amines across the Si=C double bond and the [2+2] and [4+2]-
cycloadditons with alkenes, dienes and carbonyl compounds. 108, 109Several trapping
reagents, including 1,3-butadiene, alcohols, amines, and nitriles, have been suggested for
the study of the reactivity of silene. Examples of certain trapping reactions are illustrated
by the following equations.
(1-4)
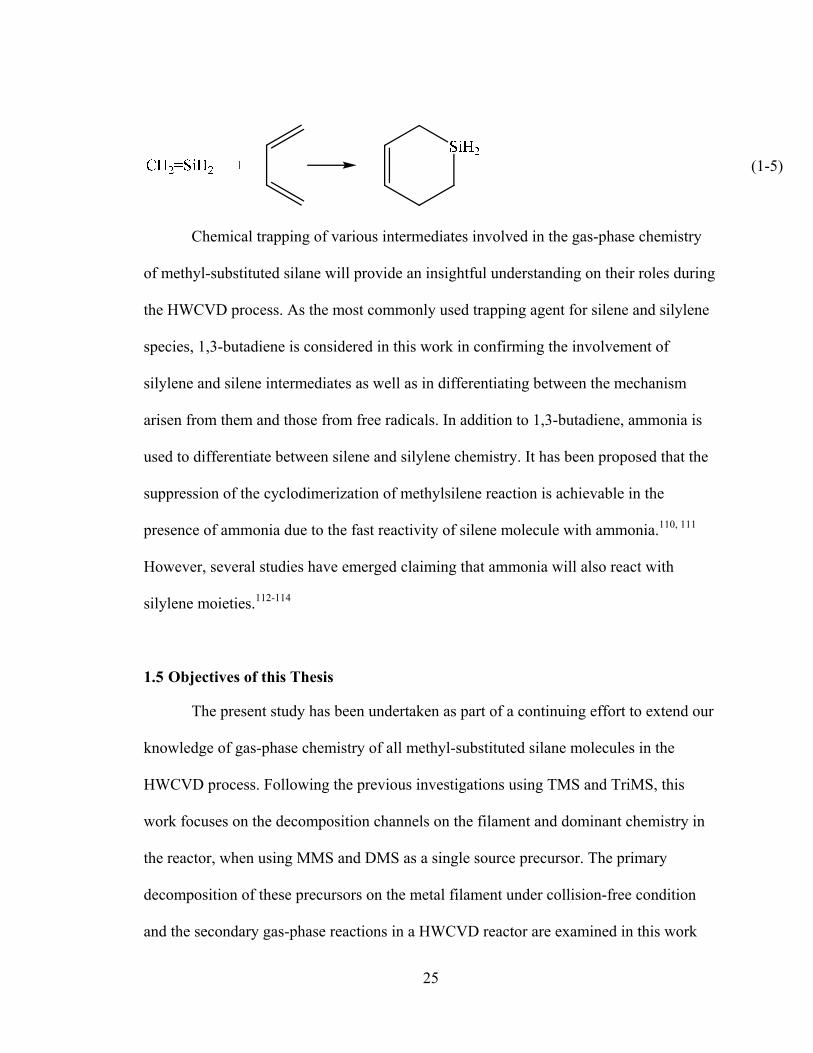
25
(1-5)
Chemical trapping of various intermediates involved in the gas-phase chemistry
of methyl-substituted silane will provide an insightful understanding on their roles during
the HWCVD process. As the most commonly used trapping agent for silene and silylene
species, 1,3-butadiene is considered in this work in confirming the involvement of
silylene and silene intermediates as well as in differentiating between the mechanism
arisen from them and those from free radicals. In addition to 1,3-butadiene, ammonia is
used to differentiate between silene and silylene chemistry. It has been proposed that the
suppression of the cyclodimerization of methylsilene reaction is achievable in the
presence of ammonia due to the fast reactivity of silene molecule with ammonia.110, 111
However, several studies have emerged claiming that ammonia will also react with
silylene moieties.112-114
1.5 Objectives of this Thesis
The present study has been undertaken as part of a continuing effort to extend our
knowledge of gas-phase chemistry of all methyl-substituted silane molecules in the
HWCVD process. Following the previous investigations using TMS and TriMS, this
work focuses on the decomposition channels on the filament and dominant chemistry in
the reactor, when using MMS and DMS as a single source precursor. The primary
decomposition of these precursors on the metal filament under collision-free condition
and the secondary gas-phase reactions in a HWCVD reactor are examined in this work
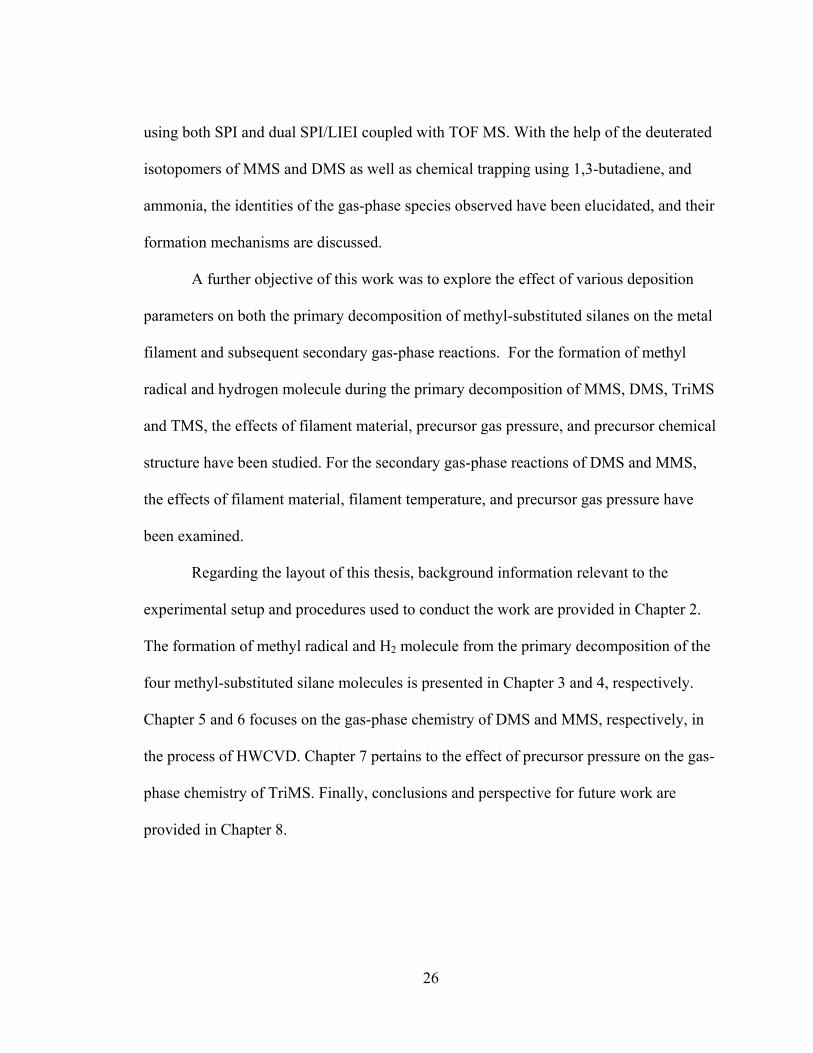
26
using both SPI and dual SPI/LIEI coupled with TOF MS. With the help of the deuterated
isotopomers of MMS and DMS as well as chemical trapping using 1,3-butadiene, and
ammonia, the identities of the gas-phase species observed have been elucidated, and their
formation mechanisms are discussed.
A further objective of this work was to explore the effect of various deposition
parameters on both the primary decomposition of methyl-substituted silanes on the metal
filament and subsequent secondary gas-phase reactions. For the formation of methyl
radical and hydrogen molecule during the primary decomposition of MMS, DMS, TriMS
and TMS, the effects of filament material, precursor gas pressure, and precursor chemical
structure have been studied. For the secondary gas-phase reactions of DMS and MMS,
the effects of filament material, filament temperature, and precursor gas pressure have
been examined.
Regarding the layout of this thesis, background information relevant to the
experimental setup and procedures used to conduct the work are provided in Chapter 2.
The formation of methyl radical and H2 molecule from the primary decomposition of the
four methyl-substituted silane molecules is presented in Chapter 3 and 4, respectively.
Chapter 5 and 6 focuses on the gas-phase chemistry of DMS and MMS, respectively, in
the process of HWCVD. Chapter 7 pertains to the effect of precursor pressure on the gas-
phase chemistry of TriMS. Finally, conclusions and perspective for future work are
provided in Chapter 8.
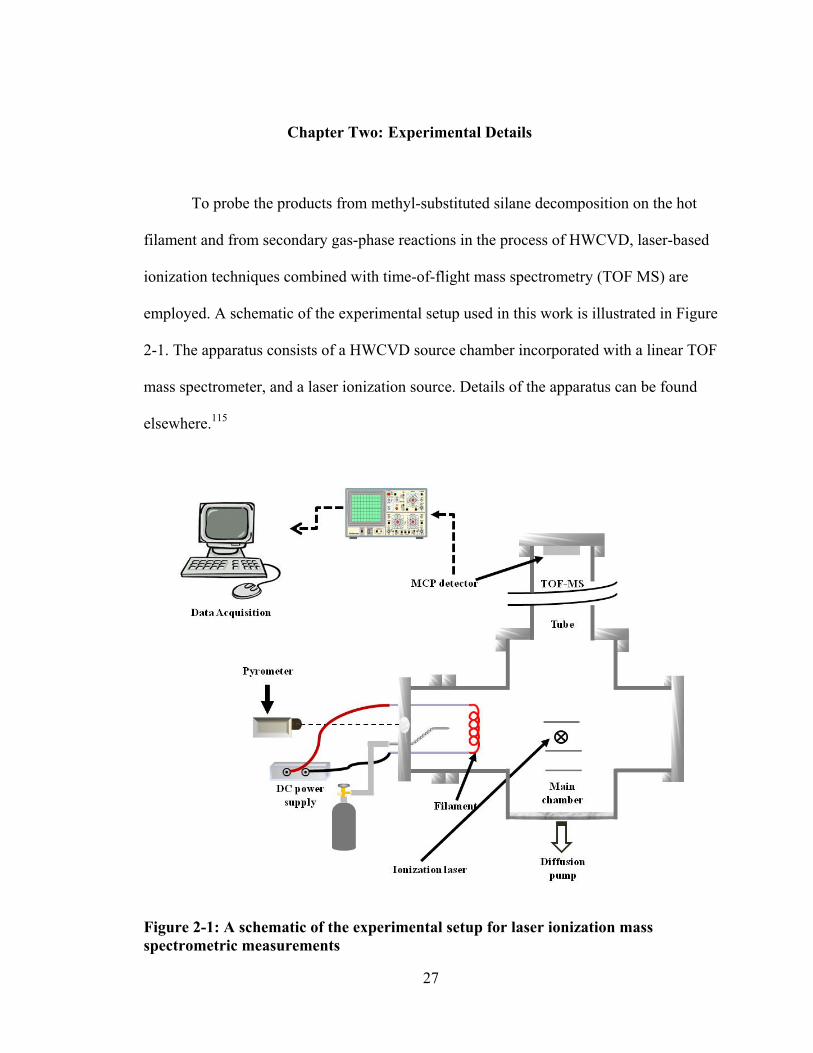
27
Chapter Two: Experimental Details
To probe the products from methyl-substituted silane decomposition on the hot
filament and from secondary gas-phase reactions in the process of HWCVD, laser-based
ionization techniques combined with time-of-flight mass spectrometry (TOF MS) are
employed. A schematic of the experimental setup used in this work is illustrated in Figure
2-1. The apparatus consists of a HWCVD source chamber incorporated with a linear TOF
mass spectrometer, and a laser ionization source. Details of the apparatus can be found
elsewhere.115
Figure 2-1: A schematic of the experimental setup for laser ionization mass spectrometric measurements
28
The main chamber is a six-way stainless steel cross (10 inch diameter). The top
port of the chamber is coupled with the flight tube (1 m length) of the TOF mass
spectrometer (R.M. Jordan Inc.), and the bottom port is connected to a diffusion pump
(VHS-6, Varian) through a gate valve. An Ar/Xe gas cell, where the 118 nm laser is
generated, is attached to the front port. A quartz window is placed in the center of the
flange mounted onto the back port to avoid the electron emission as a result of the laser
beam striking on the metal surface. The port on the right is connected to a mechanical
pump which acts as both the roughing pump for the chamber and the backing pump for
the diffusion pump, while the port on the left is connected with the HWCVD source,
which will be described in detail below.
2.1 HWCVD Sources
To detect gas-phase species formed directly from the decomposition of source
gases on a hot filament and those from secondary gas-phase reactions, two different
setups were used as HWCVD sources, i.e., a collision-free setup and a reaction chamber.
2.1.1 A Collision-Free Setup to Detect Decomposition Species on the Filament
The collision-free setup was used for detection of species produced directly from
the hot filament. In this setup, a W or Ta filament (10 cm length, 0.5 cm diameter) was
placed directly in the main chamber through two copper feedthroughs as shown in Figure
2-2. The filament was resistively heated by a DC power supply and its temperature was
measured by a two color pyrometer (Chino Works) through an IR-grade quartz window.
In addition, a stainless steel plate of about 18 cm in diameter with a hole in the centre (D
29
= 1.0 cm) was placed between the filament and the ion optics of the TOF mass
spectrometer as a shield to prevent the electrons generated from the hot filament from
interfering with the electric fields in the ion optics of the TOF MS. Source gases were
introduced through a ¼ inch stainless steel tubing whose outlet was positioned 5 cm from
the filament.
Figure 2-2: A schematic of the HWCVD collision-free flange for detection of direct hot-wire decomposition products. (S.S = stainless steel)
The base pressures in the main chamber and the TOF tube were maintained at
l.0 × l0-7 Torr and l.0 × l0-8 Torr, respectively, by a diffusion pump and a turbo pump.
During the experiment, the operating pressure was ~ 1.0 × 10⁻⁵ Torr in the main chamber
and ~ l.0 × l0-6 in the TOF tube, respectively. Under this experimental condition, a
collision-free condition was maintained; therefore, the secondary gas-phase reactions
were avoided.
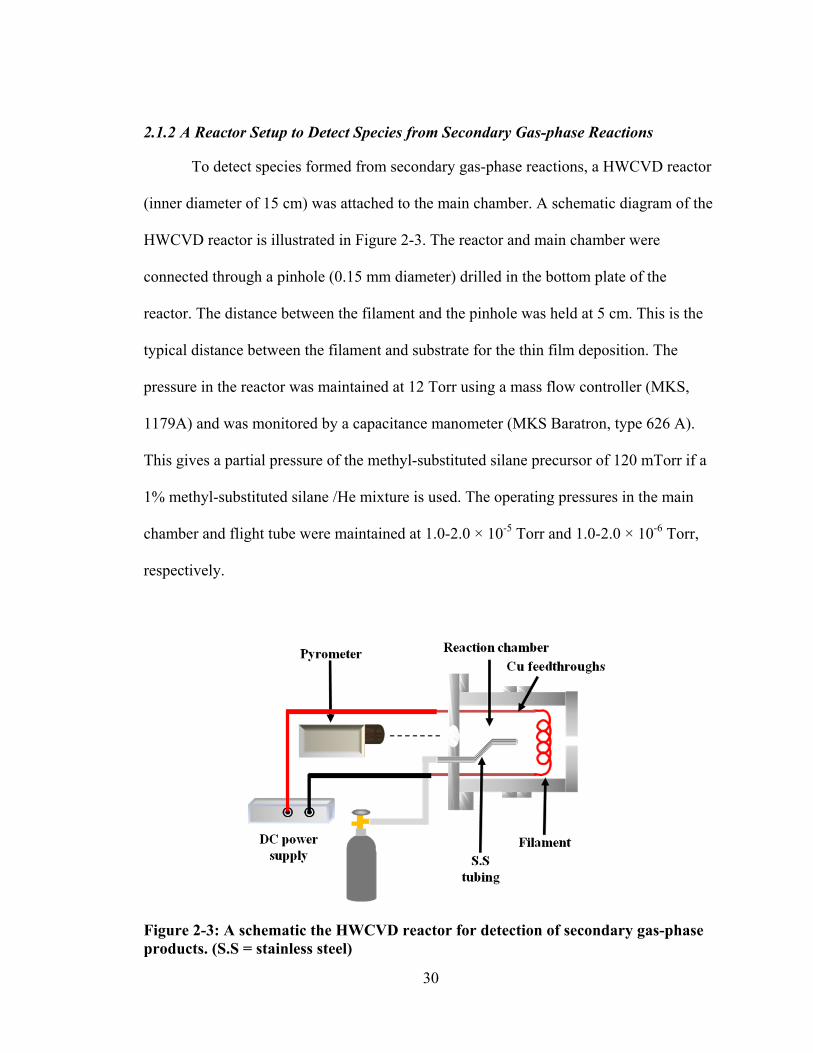
30
2.1.2 A Reactor Setup to Detect Species from Secondary Gas-phase Reactions
To detect species formed from secondary gas-phase reactions, a HWCVD reactor
(inner diameter of 15 cm) was attached to the main chamber. A schematic diagram of the
HWCVD reactor is illustrated in Figure 2-3. The reactor and main chamber were
connected through a pinhole (0.15 mm diameter) drilled in the bottom plate of the
reactor. The distance between the filament and the pinhole was held at 5 cm. This is the
typical distance between the filament and substrate for the thin film deposition. The
pressure in the reactor was maintained at 12 Torr using a mass flow controller (MKS,
1179A) and was monitored by a capacitance manometer (MKS Baratron, type 626 A).
This gives a partial pressure of the methyl-substituted silane precursor of 120 mTorr if a
1% methyl-substituted silane /He mixture is used. The operating pressures in the main
chamber and flight tube were maintained at 1.0-2.0 × 10⁻⁵ Torr and 1.0-2.0 × 10⁻⁶ Torr,
respectively.
Figure 2-3: A schematic the HWCVD reactor for detection of secondary gas-phase products. (S.S = stainless steel)
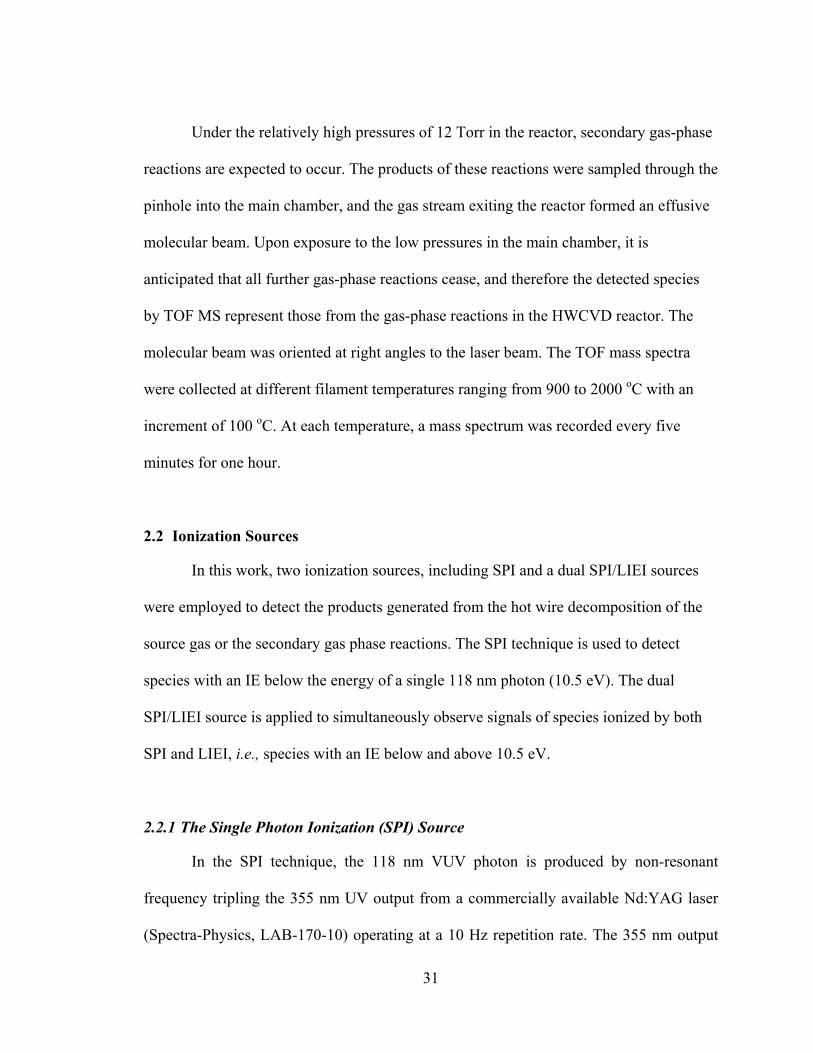
31
Under the relatively high pressures of 12 Torr in the reactor, secondary gas-phase
reactions are expected to occur. The products of these reactions were sampled through the
pinhole into the main chamber, and the gas stream exiting the reactor formed an effusive
molecular beam. Upon exposure to the low pressures in the main chamber, it is
anticipated that all further gas-phase reactions cease, and therefore the detected species
by TOF MS represent those from the gas-phase reactions in the HWCVD reactor. The
molecular beam was oriented at right angles to the laser beam. The TOF mass spectra
were collected at different filament temperatures ranging from 900 to 2000 oC with an
increment of 100 oC. At each temperature, a mass spectrum was recorded every five
minutes for one hour.
2.2 Ionization Sources
In this work, two ionization sources, including SPI and a dual SPI/LIEI sources
were employed to detect the products generated from the hot wire decomposition of the
source gas or the secondary gas phase reactions. The SPI technique is used to detect
species with an IE below the energy of a single 118 nm photon (10.5 eV). The dual
SPI/LIEI source is applied to simultaneously observe signals of species ionized by both
SPI and LIEI, i.e., species with an IE below and above 10.5 eV.
2.2.1 The Single Photon Ionization (SPI) Source
In the SPI technique, the 118 nm VUV photon is produced by non-resonant
frequency tripling the 355 nm UV output from a commercially available Nd:YAG laser
(Spectra-Physics, LAB-170-10) operating at a 10 Hz repetition rate. The 355 nm output
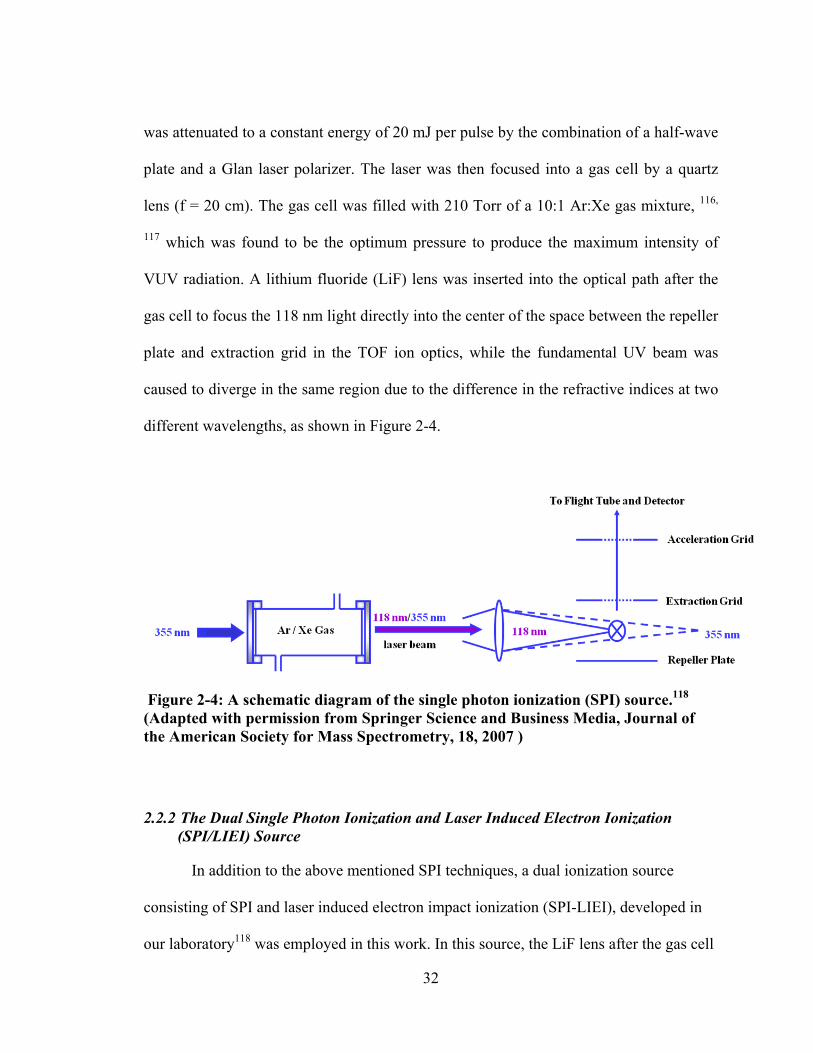
32
was attenuated to a constant energy of 20 mJ per pulse by the combination of a half-wave
plate and a Glan laser polarizer. The laser was then focused into a gas cell by a quartz
lens (f = 20 cm). The gas cell was filled with 210 Torr of a 10:1 Ar:Xe gas mixture, 116,
117 which was found to be the optimum pressure to produce the maximum intensity of
VUV radiation. A lithium fluoride (LiF) lens was inserted into the optical path after the
gas cell to focus the 118 nm light directly into the center of the space between the repeller
plate and extraction grid in the TOF ion optics, while the fundamental UV beam was
caused to diverge in the same region due to the difference in the refractive indices at two
different wavelengths, as shown in Figure 2-4.
Figure 2-4: A schematic diagram of the single photon ionization (SPI) source.118 (Adapted with permission from Springer Science and Business Media, Journal of the American Society for Mass Spectrometry, 18, 2007 )
2.2.2 The Dual Single Photon Ionization and Laser Induced Electron Ionization
(SPI/LIEI) Source
In addition to the above mentioned SPI techniques, a dual ionization source
consisting of SPI and laser induced electron impact ionization (SPI-LIEI), developed in
our laboratory118 was employed in this work. In this source, the LiF lens after the gas cell
33
was removed, allowing both VUV (118 nm) and UV (355 nm) radiations to diverge and
the path of the laser was adjusted in a way that the laser beam was aimed at the repeller
plate of the TOF at a shallow angle, as illustrated in Figure 2-5. The 355 nm UV light
scattered from the repeller plate generated photoelectrons from nearby metal surfaces,
which were subsequently accelerated by the strong electric fields present in the ionization
region. These high-energy photoelectrons led to the ionization of the sample species. In
the dual ionization source, both 118 nm and 355 nm radiations are present simultaneously
in the laser beam, resulting in the co-existence of both SPI and LIEI processes. This
technique is versatile and capable of ionizing all species of interest. In addition, it is
achieved in one source, without the need to switch between the SPI and LIEI modes.
Figure 2-5: A schematic diagram the dual SPI/LIEI source.
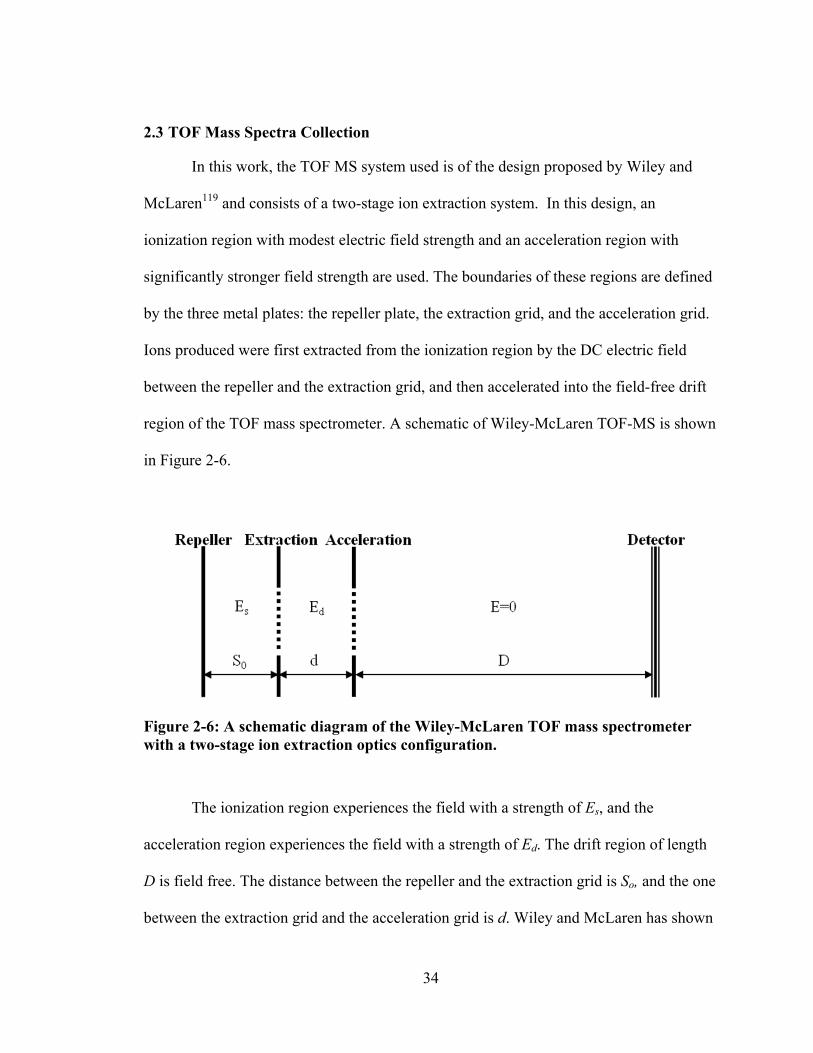
34
2.3 TOF Mass Spectra Collection
In this work, the TOF MS system used is of the design proposed by Wiley and
McLaren119 and consists of a two-stage ion extraction system. In this design, an
ionization region with modest electric field strength and an acceleration region with
significantly stronger field strength are used. The boundaries of these regions are defined
by the three metal plates: the repeller plate, the extraction grid, and the acceleration grid.
Ions produced were first extracted from the ionization region by the DC electric field
between the repeller and the extraction grid, and then accelerated into the field-free drift
region of the TOF mass spectrometer. A schematic of Wiley-McLaren TOF-MS is shown
in Figure 2-6.
Figure 2-6: A schematic diagram of the Wiley-McLaren TOF mass spectrometer with a two-stage ion extraction optics configuration.
The ionization region experiences the field with a strength of Es, and the
acceleration region experiences the field with a strength of Ed. The drift region of length
D is field free. The distance between the repeller and the extraction grid is So, and the one
between the extraction grid and the acceleration grid is d. Wiley and McLaren has shown
35
that the location at which maximum resolution can be obtained is described by Equation
(2-1):119
2 11
(2-1)
where k0 is defined by:
(2-2)
The values for Es and Ed must be determined experimentally, and in this work
were found to be optimally defined at Es = 175 V · cm-1 and Ed = 2185 V · cm-1, which
corresponds to a repeller voltage of 2997 V, an extraction grid voltage of 2775 V, and the
acceleration grid voltage at ground potential. The distance between the plates was 1.27
cm for both the Es and Ed regions. These values were determined for a length of the drift
region D being fixed at 1 m.
Ions produces from VUV SPI or SPI/LIEI sources were detected by a micro-
channel plate (MCP) detector at the end of the flight tube. Signals were preamplified
using a preamplifier (SRS, SR445A) and displayed on a 300 MHz digital oscilloscope
(Tektronics, TDS 3032B). Signals were averaged over 512 laser pulses before being
saved into a computer using e-Scope.
Initially, the TOF mass spectra obtained from the computer were recorded in units
of time-of-flight. A conversion from times-of-flight (t) values to mass-to-charge ratio

36
(m/z) was obtained by using known m/z values and their corresponding time-of-flight.
The calibration was accomplished by fitting the known data to the following equation:
⁄ (2-3)
where A and B are the slope and y-intercept, respectively, from the linear fit. The
calibration was performed for every collected TOF spectrum.
2.4 Synthesis of MMS-d3, DMS-d2 and TriMS-d1
Four methyl-substituted silane molecules were studied in this work. They are
TMS (99.9+%, NMR grade, Sigma-Aldrich), TriMS (UHP grade, 99.99% (volume),
Voltaix Inc.), DMS (ABCR, 97 %), and MMS (Gelest, 99.9%). They were used without
further purification. To confirm the mechanisms proposed for the primary decomposition
and secondary gas-phase reactions, their corresponding isotopomers, MMS-d3
(CH3SiD3), DMS-d2 ((CH3)2SiD2), and TriMS-d1 ((CH3)3SiD), were used. These
isotopomers are not commercially available and were synthesized following an
established method by Tannenbaum et al.120 and Sidorov et al.121. In this method, the
corresponding chlorosilanes were reduced by an excess of lithium aluminum deuteride,
LiAlD4. For example, the reduction of dimethyldichlorosilane follows Equation (2-4).
(2-4)
The experimental apparatus for the synthesis is shown in Figure 2-7.
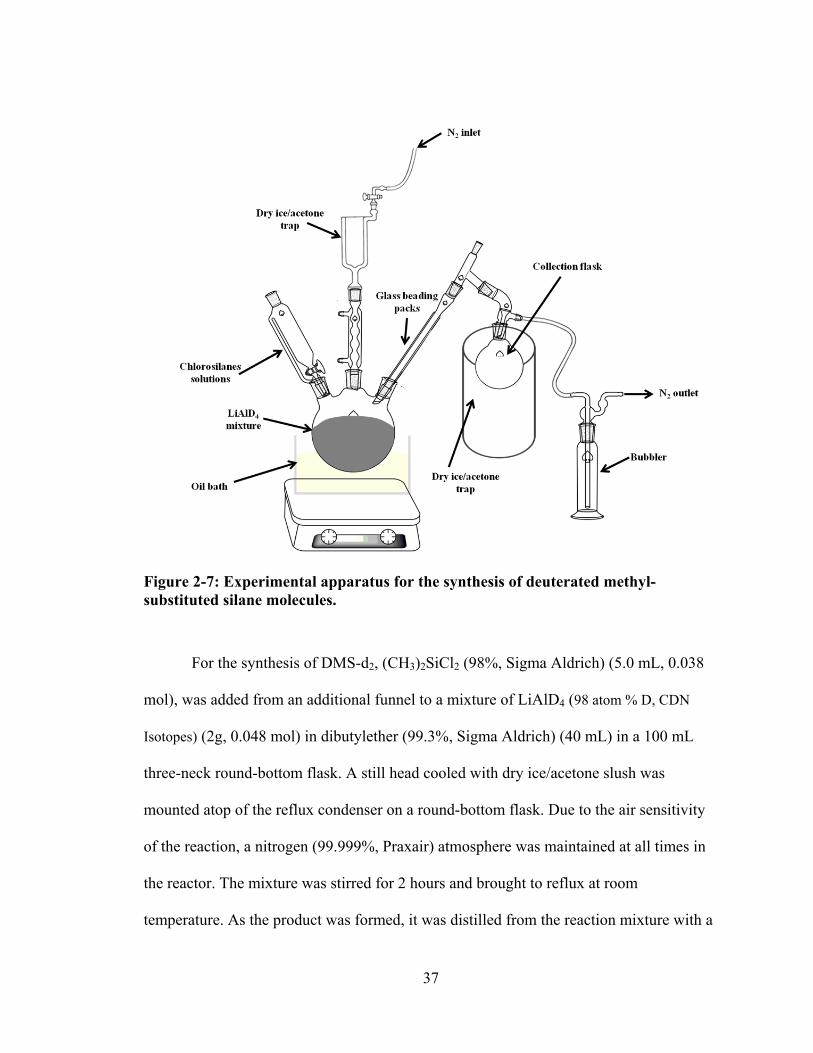
37
Figure 2-7: Experimental apparatus for the synthesis of deuterated methyl-substituted silane molecules.
For the synthesis of DMS-d2, (CH3)2SiCl2 (98%, Sigma Aldrich) (5.0 mL, 0.038
mol), was added from an additional funnel to a mixture of LiAlD4 (98 atom % D, CDN
Isotopes) (2g, 0.048 mol) in dibutylether (99.3%, Sigma Aldrich) (40 mL) in a 100 mL
three-neck round-bottom flask. A still head cooled with dry ice/acetone slush was
mounted atop of the reflux condenser on a round-bottom flask. Due to the air sensitivity
of the reaction, a nitrogen (99.999%, Praxair) atmosphere was maintained at all times in
the reactor. The mixture was stirred for 2 hours and brought to reflux at room
temperature. As the product was formed, it was distilled from the reaction mixture with a
38
dry ice/acetone cold trap. Due to the high volatility of the product, its purity was
examined mainly with our own mass spectrometer. The data obtained from our in-situ
analysis of the room-temperature mass spectra of DMS-d2 showed that the intensity ratio
of the molecular ion peak of DMS (m/z 60) to that of DMS-d2 (m/z 62) is 4.21 ± 0.01%
indicating an isotope purity of 96% for our synthesized DMS-d2 sample.
Following the same procedure, the synthesis of TriMS-d1 was accomplished by
the reaction between trimethylchlorosilane, (CH3)3SiCl (98%, Sigma-Aldrich), and LiAlD4.
(CH3)3SiCl (3.4 mL, 0.027 mol) was added from an additional funnel to a mixture of
LiAlD4 (2 g, 0.048 mol) in toluene (30 mL) in a 100 mL three-necked round bottom flask
placed in an oil bath to maintain the temperature of the reaction at 80 oC. A reflux
condenser on the round bottom flask was connected to a dry ice/acetone cold trap, where
the product was collected. Since both reactants and product are air sensitive, the synthesis
was carried out under inert atmosphere using N2. The addition of the reactants lasted for
about 1 hour. The purity of the sample was examined mainly with our mass
spectrometer. The data obtained from our in-situ analysis of the room-temperature mass
spectra showed that the intensity ratio of TriMS (m/z 74) to that of TriMS-d1 (m/z 75) is
5.14 ± 0.02% resulting in an isotope purity of 95%.
Similarly, the synthesis of MMS-d3, CH3SiD3, proceeded by the reduction
reaction of methyltrichlorosilane, CH3SiCl3, (99%, Sigma Aldrich) by LiAlD4. The
synthesis apparatus consisted of 100 mL three-necked round bottom flask containing a
mixture of LiAlD4 (2.5 g, 0.06 mol) in dibutylether (50 mL). The side necks of the flask
provided an opening for a dropping funnel, a condenser and a collection flask. A still
head cooled with dry ice/acetone slush was mounted atop the condenser. Due to the air
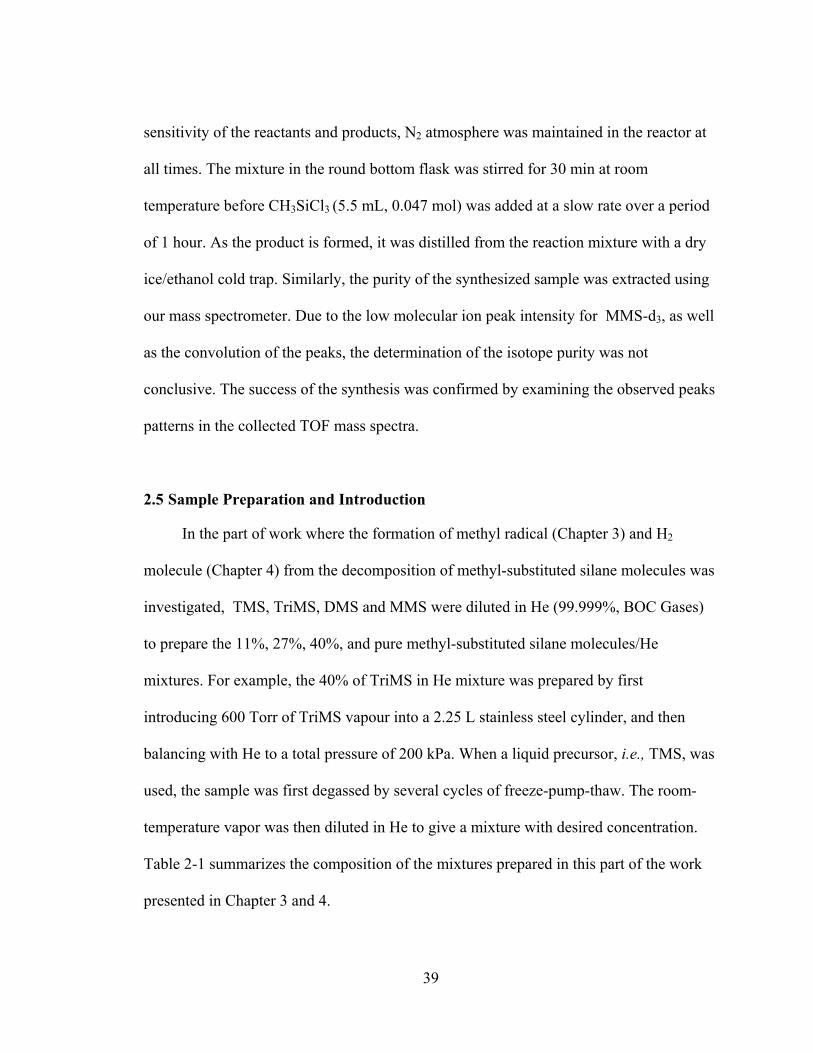
39
sensitivity of the reactants and products, N2 atmosphere was maintained in the reactor at
all times. The mixture in the round bottom flask was stirred for 30 min at room
temperature before CH3SiCl3 (5.5 mL, 0.047 mol) was added at a slow rate over a period
of 1 hour. As the product is formed, it was distilled from the reaction mixture with a dry
ice/ethanol cold trap. Similarly, the purity of the synthesized sample was extracted using
our mass spectrometer. Due to the low molecular ion peak intensity for MMS-d3, as well
as the convolution of the peaks, the determination of the isotope purity was not
conclusive. The success of the synthesis was confirmed by examining the observed peaks
patterns in the collected TOF mass spectra.
2.5 Sample Preparation and Introduction
In the part of work where the formation of methyl radical (Chapter 3) and H2
molecule (Chapter 4) from the decomposition of methyl-substituted silane molecules was
investigated, TMS, TriMS, DMS and MMS were diluted in He (99.999%, BOC Gases)
to prepare the 11%, 27%, 40%, and pure methyl-substituted silane molecules/He
mixtures. For example, the 40% of TriMS in He mixture was prepared by first
introducing 600 Torr of TriMS vapour into a 2.25 L stainless steel cylinder, and then
balancing with He to a total pressure of 200 kPa. When a liquid precursor, i.e., TMS, was
used, the sample was first degassed by several cycles of freeze-pump-thaw. The room-
temperature vapor was then diluted in He to give a mixture with desired concentration.
Table 2-1 summarizes the composition of the mixtures prepared in this part of the work
presented in Chapter 3 and 4.
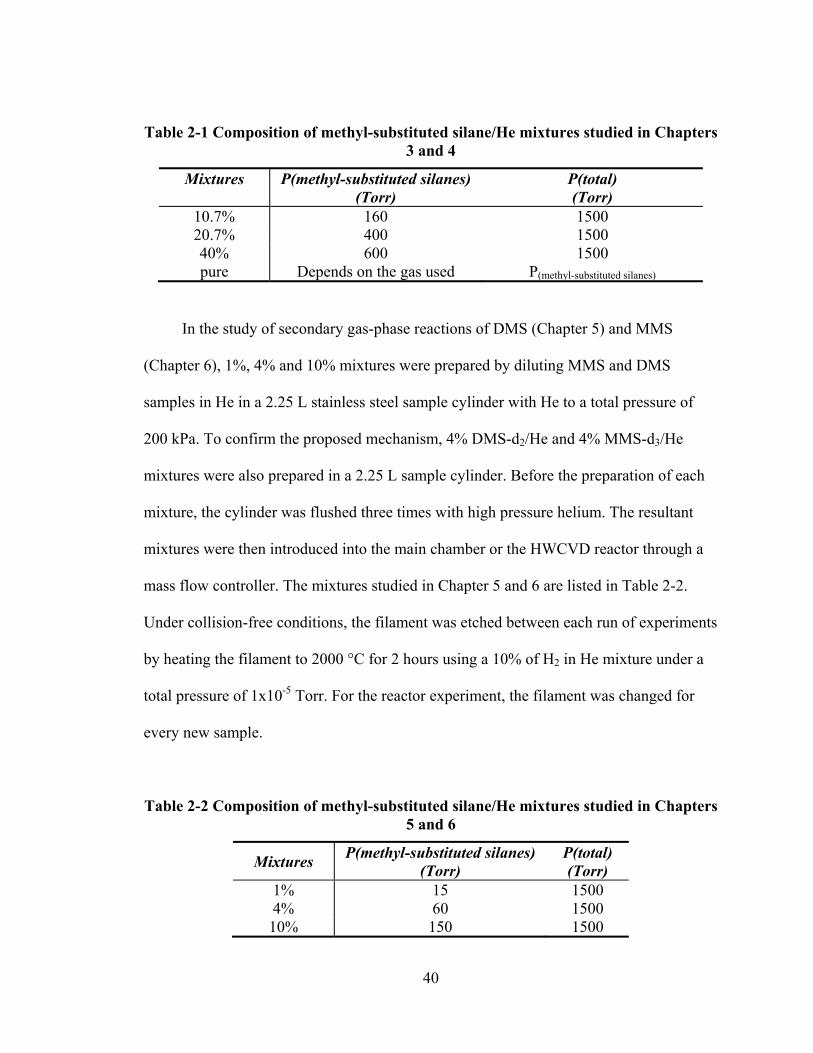
40
Table 2-1 Composition of methyl-substituted silane/He mixtures studied in Chapters 3 and 4
Mixtures P(methyl-substituted silanes) (Torr)
P(total) (Torr)
10.7% 160 1500 20.7% 400 1500 40% 600 1500 pure Depends on the gas used P(methyl-substituted silanes)
In the study of secondary gas-phase reactions of DMS (Chapter 5) and MMS
(Chapter 6), 1%, 4% and 10% mixtures were prepared by diluting MMS and DMS
samples in He in a 2.25 L stainless steel sample cylinder with He to a total pressure of
200 kPa. To confirm the proposed mechanism, 4% DMS-d2/He and 4% MMS-d3/He
mixtures were also prepared in a 2.25 L sample cylinder. Before the preparation of each
mixture, the cylinder was flushed three times with high pressure helium. The resultant
mixtures were then introduced into the main chamber or the HWCVD reactor through a
mass flow controller. The mixtures studied in Chapter 5 and 6 are listed in Table 2-2.
Under collision-free conditions, the filament was etched between each run of experiments
by heating the filament to 2000 °C for 2 hours using a 10% of H2 in He mixture under a
total pressure of 1x10⁻⁵ Torr. For the reactor experiment, the filament was changed for
every new sample.
Table 2-2 Composition of methyl-substituted silane/He mixtures studied in Chapters 5 and 6
Mixtures P(methyl-substituted silanes)
(Torr) P(total) (Torr)
1% 15 1500 4% 60 1500 10% 150 1500
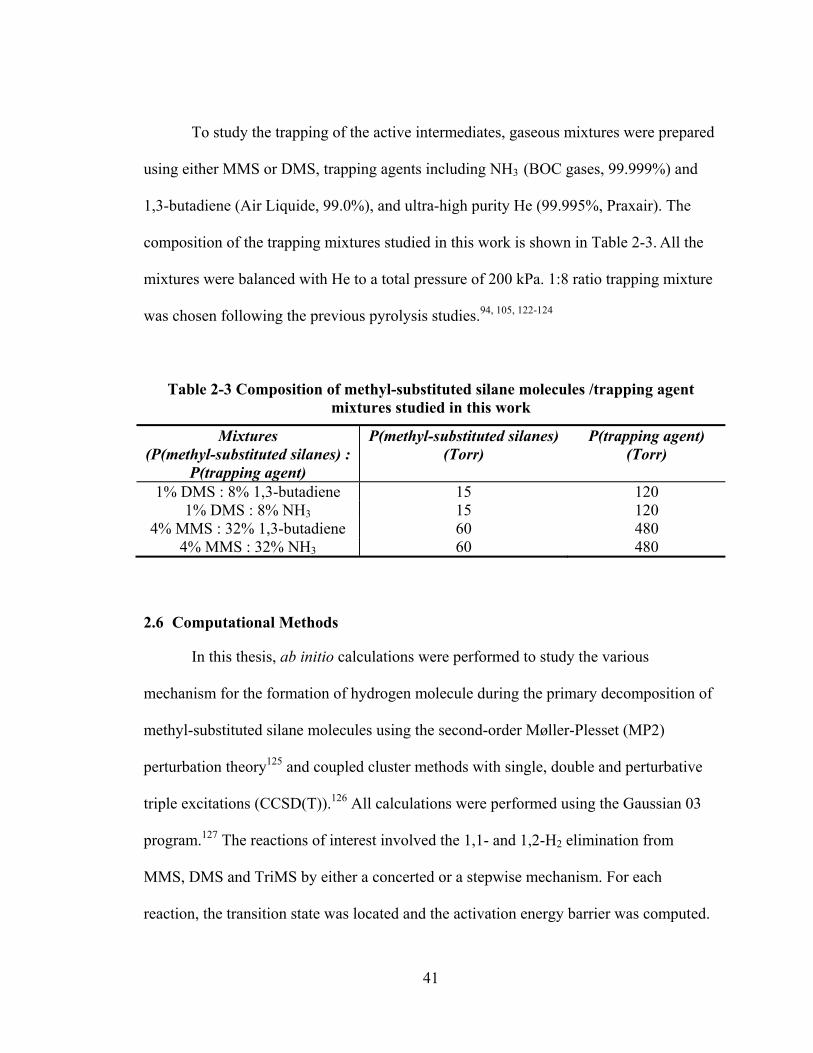
41
To study the trapping of the active intermediates, gaseous mixtures were prepared
using either MMS or DMS, trapping agents including NH3 (BOC gases, 99.999%) and
1,3-butadiene (Air Liquide, 99.0%), and ultra-high purity He (99.995%, Praxair). The
composition of the trapping mixtures studied in this work is shown in Table 2-3. All the
mixtures were balanced with He to a total pressure of 200 kPa. 1:8 ratio trapping mixture
was chosen following the previous pyrolysis studies.94, 105, 122-124
Table 2-3 Composition of methyl-substituted silane molecules /trapping agent
mixtures studied in this work
Mixtures (P(methyl-substituted silanes) :
P(trapping agent)
P(methyl-substituted silanes) (Torr)
P(trapping agent) (Torr)
1% DMS : 8% 1,3-butadiene 15 120 1% DMS : 8% NH3 15 120
4% MMS : 32% 1,3-butadiene 60 480 4% MMS : 32% NH3 60 480
2.6 Computational Methods
In this thesis, ab initio calculations were performed to study the various
mechanism for the formation of hydrogen molecule during the primary decomposition of
methyl-substituted silane molecules using the second-order Møller-Plesset (MP2)
perturbation theory125 and coupled cluster methods with single, double and perturbative
triple excitations (CCSD(T)).126 All calculations were performed using the Gaussian 03
program.127 The reactions of interest involved the 1,1- and 1,2-H2 elimination from
MMS, DMS and TriMS by either a concerted or a stepwise mechanism. For each
reaction, the transition state was located and the activation energy barrier was computed.
42
In addition, reaction enthalpies, Gibbs free energies and entropies were calculated in
order to provide a thermochemical understanding of the reactions studied.
In our study, the geometries of all the reactants, products and transition states
were optimized using the MP2 method and 6-311++G(d,p) basis set. The transition states
(TS) were located by performing a TS search followed by geometry optimization and
vibration frequency calculation. The TS was identified by the number of imaginary
vibration frequency and verified by performing the intrinsic reactions coordinate (IRC)
for each reaction to confirm that each TS certainly connected the two desired minima.
The energies for all the reactants, products, and transition states were computed using the
CCSD(T)/6-311++G(3d,2p) on the MP2/6-311++G(d,p) geometries. Zero-point energies
(ZPE) were determined at the MP2/6-311++G(d,p) level of theory and were scaled by a
factor of 0.9748, as proposed by Scott and Radom128 for the MP2-fc/6-311G(d,p) level of
theory. In addition, thermochemical analysis was explored at 0 K and room temperature
of 298 K. In this part, enthalpies at 298 K (H298) were obtained by adding the quantity
(H298-H0) to the enthalpies at 0 K (H0). The quantity (H298-H0) was computed by
subtracting the unscaled ZPE from the thermal correction to enthalpy. Gibbs free energies
at 298 K (G298) was also obtained following the same procedure using the thermal
correction to the Gibbs free energy. Entropy values at 298 K (S298) were calculated from
the values of enthalpy and Gibbs free energy at 298 K.
43
Chapter Three: Formation of Methyl Radicals from Decomposition of Methyl-substituted Silanes over Tungsten and Tantalum Filaments
3.1 Motivations
As stated in Chapter 1, methyl-substituted silanes ((CH3)4-xSiHx, x =0-3),
including monomethylsilane (MMS),66, 129, 130 dimethylsilane (DMS),131, 132
trimethylsilane (TriMS),71, 133 and tetramethylsilane (TMS),75, 134 have been widely used
as single-source precursors in various CVD processes, including HWCVD,31, 32, 135, 136 to
form silicon carbide thin films. Despite these numerous studies, only few discuss the
radical formation and detection with methyl-substituted silanes. Zaharias et al.61 detected
Si and methyl radicals as the two primary products during the decomposition of MMS,
DMS, TriMS, TMS, and DMSCB on W and Re filaments. They have also determined the
apparent activation energy for the formation of Si radical, which was found to increase
with higher methyl substitution in methyl-substituted silanes. The activation energy for
the methyl production was not determined in their work.
Recently, our group has examined the gas-phase reaction chemistry involved in
using organosilicon compounds, including TriMS,67 TMS,89 HMDS,82 1-methyl-1-
silacyclobuatne,137 DMSCB,138 and 1,1,3,3-tetramethyl-1,3-disilacylobutane,92 in the
HWCVD process. For all the studied precursors, the formation of methyl radical has been
found to be a common step in their primary decomposition on the W filament. The
activation energy for the methyl formation has been determined for all the above
precursors except for TMS.
44
Methyl radicals are important growth intermediates in diamond thin film
formation using CVD. Initially, it was believed that both acetylene and methyl were the
two major key players in the diamond deposition process.139 Further research carried out
using kinetic modeling140, 141 and experiments142-145 has led several researchers to claim
that methyl radicals are the dominant growth species in the CVD diamond formation
process. The role of •CH3 in the deposition of SiC thin films is currently unclear. Our
previous study on the gas-phase reaction chemistry using organosilicon compounds67, 82,
89, 92, 137, 138 in HWCVD has shown that the formation of •CH3 from their hot-wire
decomposition initiates a short chain reaction in the gas phase. Furthermore, •CH3 can
also serve as an excellent carbon source to carburize the heated tungsten filament used in
hot-wires CVD.146, 147
This work reports a systematic study on the formation of methyl radical from
MMS, DMS, TriMS, and TMS from their decomposition on W and Ta filament surfaces.
The decomposition products are detected using laser ionization MS. The effect of
filament temperature on the •CH3 production is studied by examining its intensity profile
at different temperatures. From the Arrhenius behavior in the temperature-dependent
evolution of •CH3 radical, the apparent activation energies were obtained. The effect of
molecular structure, filament material, and sample pressure on the activation energy is
also explored, which sheds lights onto the mechanism of the methyl radical formation on
the metal filament surfaces.
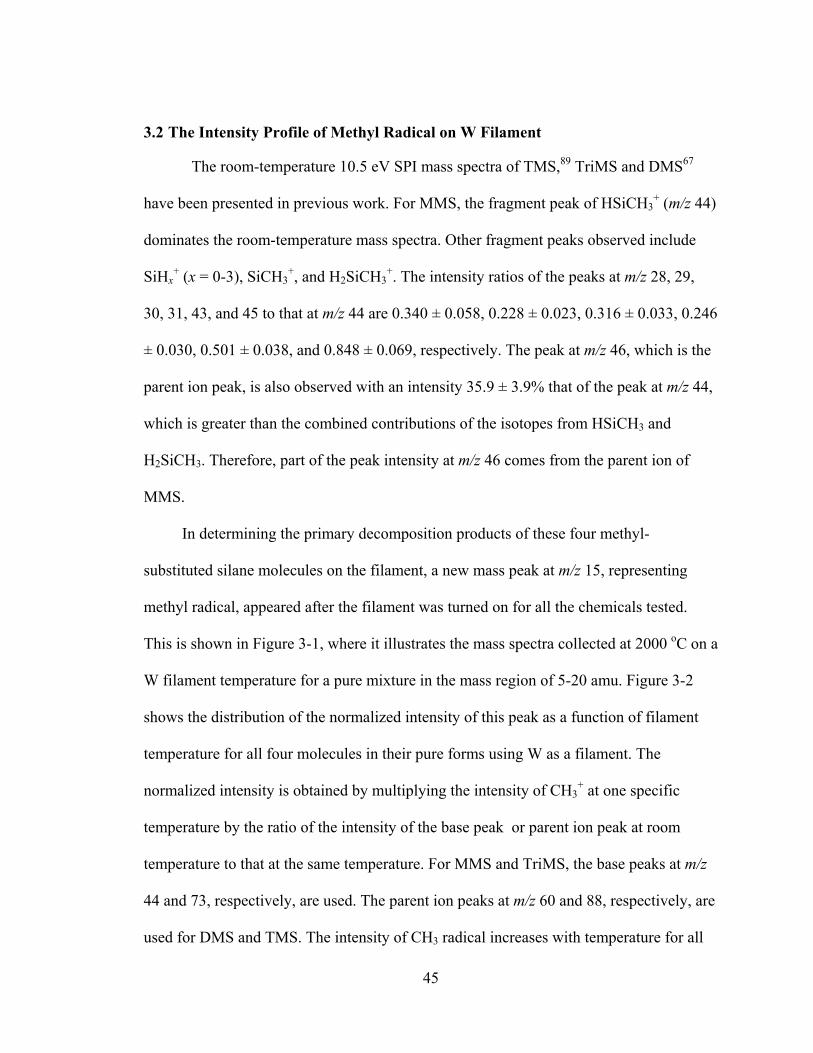
45
3.2 The Intensity Profile of Methyl Radical on W Filament
The room-temperature 10.5 eV SPI mass spectra of TMS,89 TriMS and DMS67
have been presented in previous work. For MMS, the fragment peak of HSiCH3+ (m/z 44)
dominates the room-temperature mass spectra. Other fragment peaks observed include
SiHx+ (x = 0-3), SiCH3
+, and H2SiCH3+. The intensity ratios of the peaks at m/z 28, 29,
30, 31, 43, and 45 to that at m/z 44 are 0.340 ± 0.058, 0.228 ± 0.023, 0.316 ± 0.033, 0.246
± 0.030, 0.501 ± 0.038, and 0.848 ± 0.069, respectively. The peak at m/z 46, which is the
parent ion peak, is also observed with an intensity 35.9 ± 3.9% that of the peak at m/z 44,
which is greater than the combined contributions of the isotopes from HSiCH3 and
H2SiCH3. Therefore, part of the peak intensity at m/z 46 comes from the parent ion of
MMS.
In determining the primary decomposition products of these four methyl-
substituted silane molecules on the filament, a new mass peak at m/z 15, representing
methyl radical, appeared after the filament was turned on for all the chemicals tested.
This is shown in Figure 3-1, where it illustrates the mass spectra collected at 2000 oC on a
W filament temperature for a pure mixture in the mass region of 5-20 amu. Figure 3-2
shows the distribution of the normalized intensity of this peak as a function of filament
temperature for all four molecules in their pure forms using W as a filament. The
normalized intensity is obtained by multiplying the intensity of CH3+ at one specific
temperature by the ratio of the intensity of the base peak or parent ion peak at room
temperature to that at the same temperature. For MMS and TriMS, the base peaks at m/z
44 and 73, respectively, are used. The parent ion peaks at m/z 60 and 88, respectively, are
used for DMS and TMS. The intensity of CH3 radical increases with temperature for all
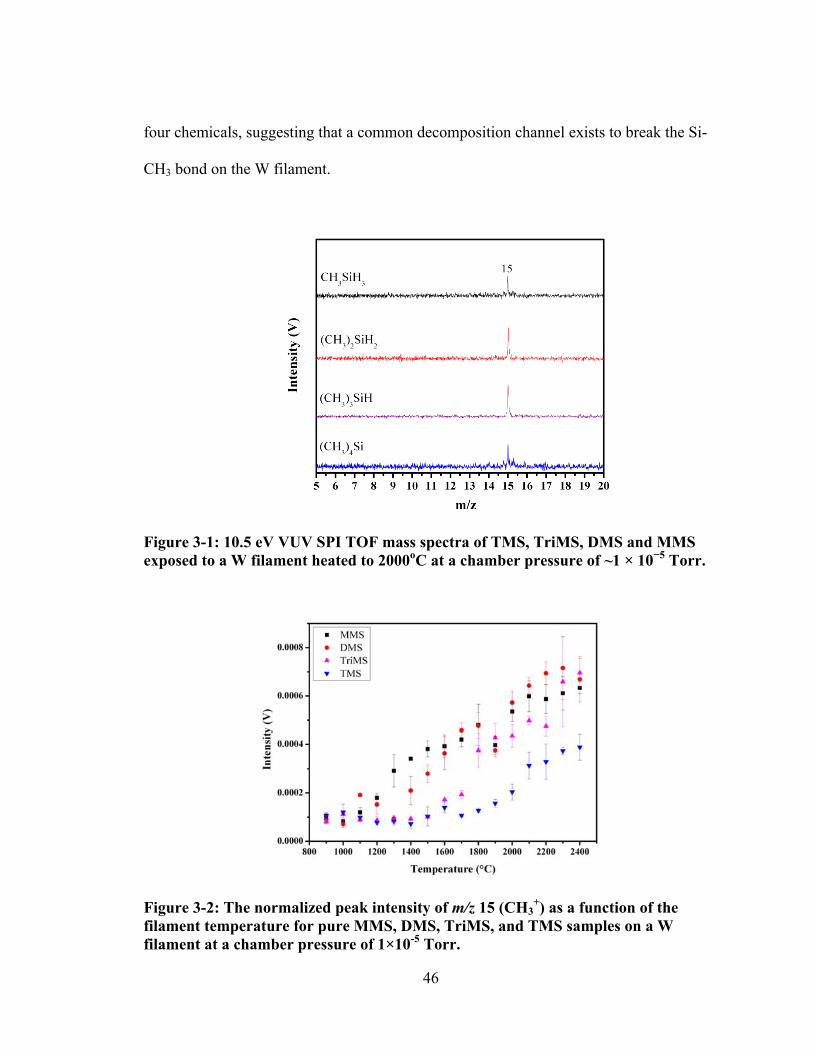
46
four chemicals, suggesting that a common decomposition channel exists to break the Si-
CH3 bond on the W filament.
Figure 3-1: 10.5 eV VUV SPI TOF mass spectra of TMS, TriMS, DMS and MMS exposed to a W filament heated to 2000oC at a chamber pressure of ~1 × 10⁻⁵ Torr.
Figure 3-2: The normalized peak intensity of m/z 15 (CH3+) as a function of the
filament temperature for pure MMS, DMS, TriMS, and TMS samples on a W filament at a chamber pressure of 1×10⁻⁵ Torr.
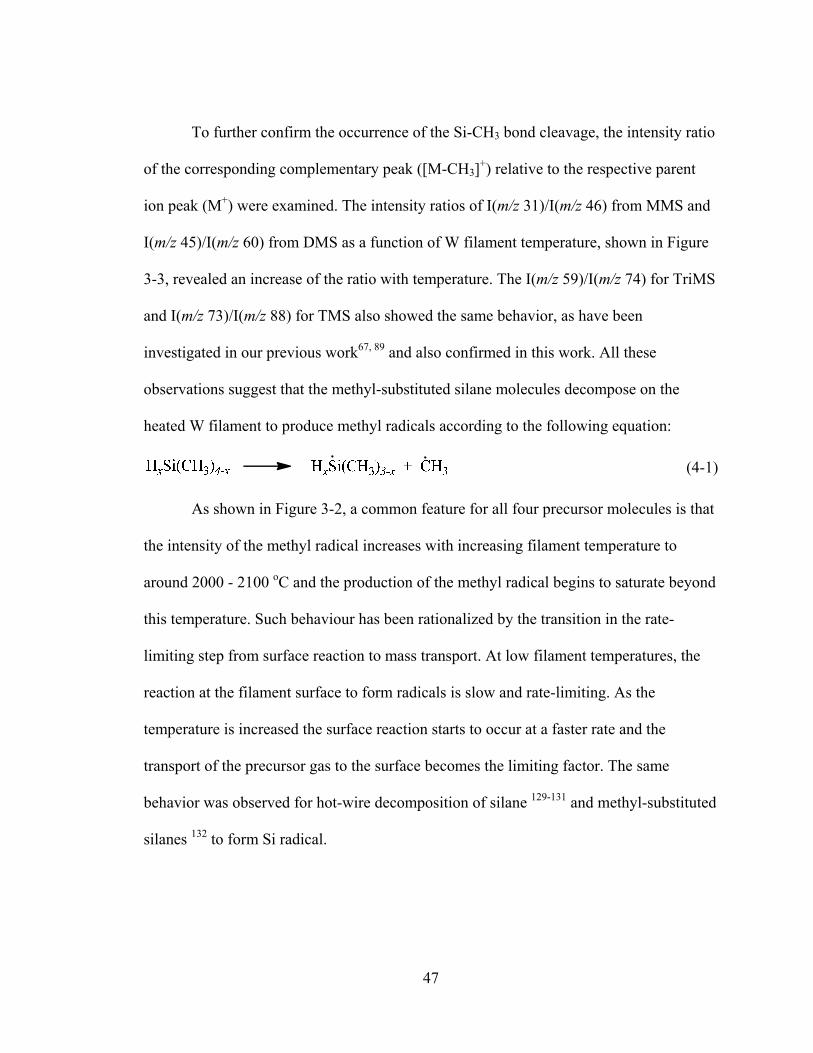
47
To further confirm the occurrence of the Si-CH3 bond cleavage, the intensity ratio
of the corresponding complementary peak ([M-CH3]+) relative to the respective parent
ion peak (M+) were examined. The intensity ratios of I(m/z 31)/I(m/z 46) from MMS and
I(m/z 45)/I(m/z 60) from DMS as a function of W filament temperature, shown in Figure
3-3, revealed an increase of the ratio with temperature. The I(m/z 59)/I(m/z 74) for TriMS
and I(m/z 73)/I(m/z 88) for TMS also showed the same behavior, as have been
investigated in our previous work67, 89 and also confirmed in this work. All these
observations suggest that the methyl-substituted silane molecules decompose on the
heated W filament to produce methyl radicals according to the following equation:
(4-1)
As shown in Figure 3-2, a common feature for all four precursor molecules is that
the intensity of the methyl radical increases with increasing filament temperature to
around 2000 - 2100 oC and the production of the methyl radical begins to saturate beyond
this temperature. Such behaviour has been rationalized by the transition in the rate-
limiting step from surface reaction to mass transport. At low filament temperatures, the
reaction at the filament surface to form radicals is slow and rate-limiting. As the
temperature is increased the surface reaction starts to occur at a faster rate and the
transport of the precursor gas to the surface becomes the limiting factor. The same
behavior was observed for hot-wire decomposition of silane 129-131 and methyl-substituted
silanes 132 to form Si radical.
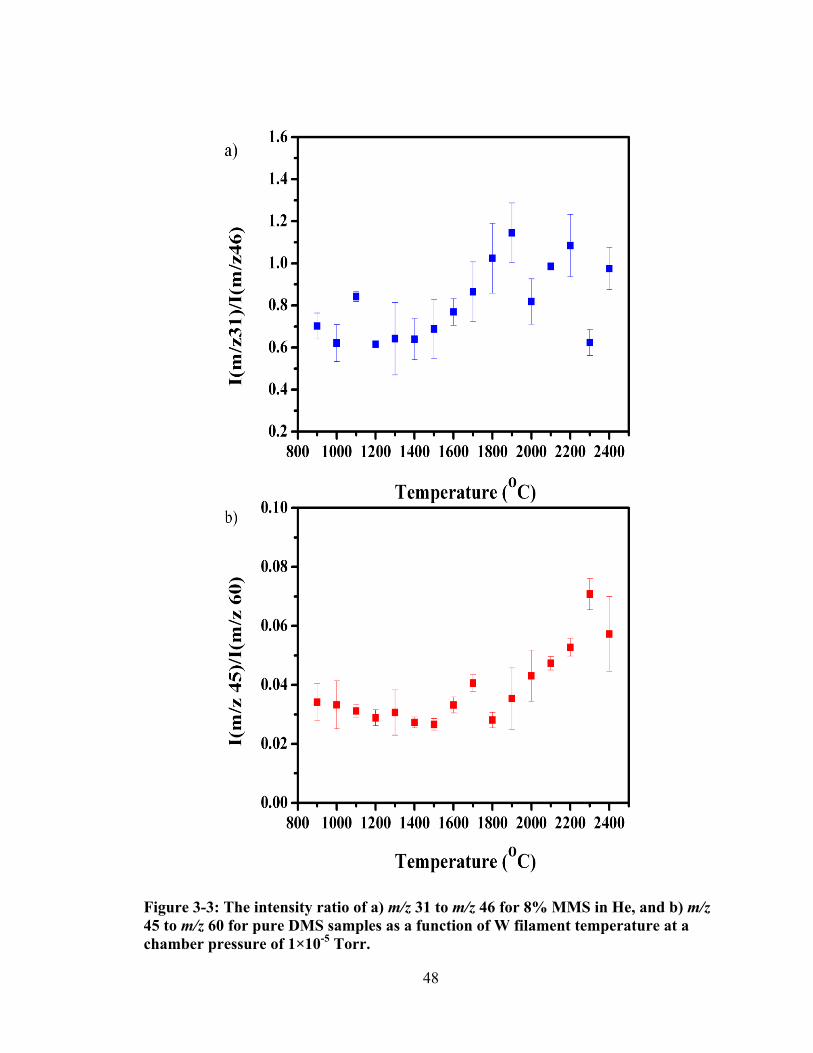
48
Figure 3-3: The intensity ratio of a) m/z 31 to m/z 46 for 8% MMS in He, and b) m/z 45 to m/z 60 for pure DMS samples as a function of W filament temperature at a chamber pressure of 1×10⁻⁵ Torr.
49
A comparison of the intensity profile for methyl radicals, when using the four
methyl-substituted silane molecules in Figure 3-2, shows that TMS produces the least
amount of methyl radicals. The intensity profiles for the •CH3 radical peak are quite
similar for MMS, DMS and TriMS. This is different from the perspective that the
intensity of •CH3 radical would be higher as the number of methyl groups present in the
precursor increases. Our results are in good agreement with a previous study by Zaharias
et al.61 From the intensity profile shown in Figure 3-2, it is further observed that with
increasing number of methyl group in the precursor compounds the temperature at which
the methyl peak start to increase is shifted to the high temperature value. For MMS, the
peak at m/z 15 started to appear at around 1200 oC, whereas this temperature was 1500 -
1600 oC for TMS. For DMS and TriMS, the observation of an increase in methyl peak
intensity started at filament temperatures of 1300 - 1400 oC.
It should be mentioned that for MMS, 1% of benzene (98%, Sigma Aldrich) was
added to each sample mixtures as an internal standard for optimum laser ionization
conditions. The effect of benzene on the formation of methyl radicals was investigated by
comparing the intensity profile of methyl peaks obtained from pure MMS samples mixed
with benzene and in the absence of benzene. It is found that the presence of benzene had
negligibly affected the intensity of methyl peak as both intensity profiles follow the same
trend and the difference in intensity is minimal. Furthermore, the apparent activation
energy for the formation of methyl radical was determined to be 51.4 ± 2.8 kJ·mol-1 and
50.5 ± 2.8 kJ·mol-1, respectively, for samples without and with benzene. Therefore, the
presence of benzene did not affect the apparent activation energy for the formation of
50
methyl radicals. As a result, the data obtained in the presence of 1% of benzene are used
for MMS in the remaining discussions.
3.3 The Activation Energy of Forming Methyl Radicals on W - Effect of Molecular Structures
The temperature dependence of the normalized intensity of CH3+ peak shows an
Arrhenius behavior in the region where there is a monotonic increase. From this, the
apparent activation energy (Eaapp) for the formation for •CH3 was determined. Similar to
the results from our previous study on TriMS,67 using mixtures of different
concentrations of the same molecule resulted in comparable Eaapp values. The averaged
Eaapp value from all tested mixtures for each precursor was found to be 51.1 ± 4.0, 61.0 ±
4.9, 78.8 ± 4.2, and 84.7 ± 4.0 kJ · mol-1 for MMS, DMS, TriMS and TMS, respectively.
This is illustrated in a bar diagram in Figure 3-4. A comparison of the determined Eaapp
values and the Si-CH3 bond dissociation energy (BDE) in methyl-substituted silanes37
demonstrates the catalytic nature of the formation of methyl radicals from their
decomposition on the W filament.
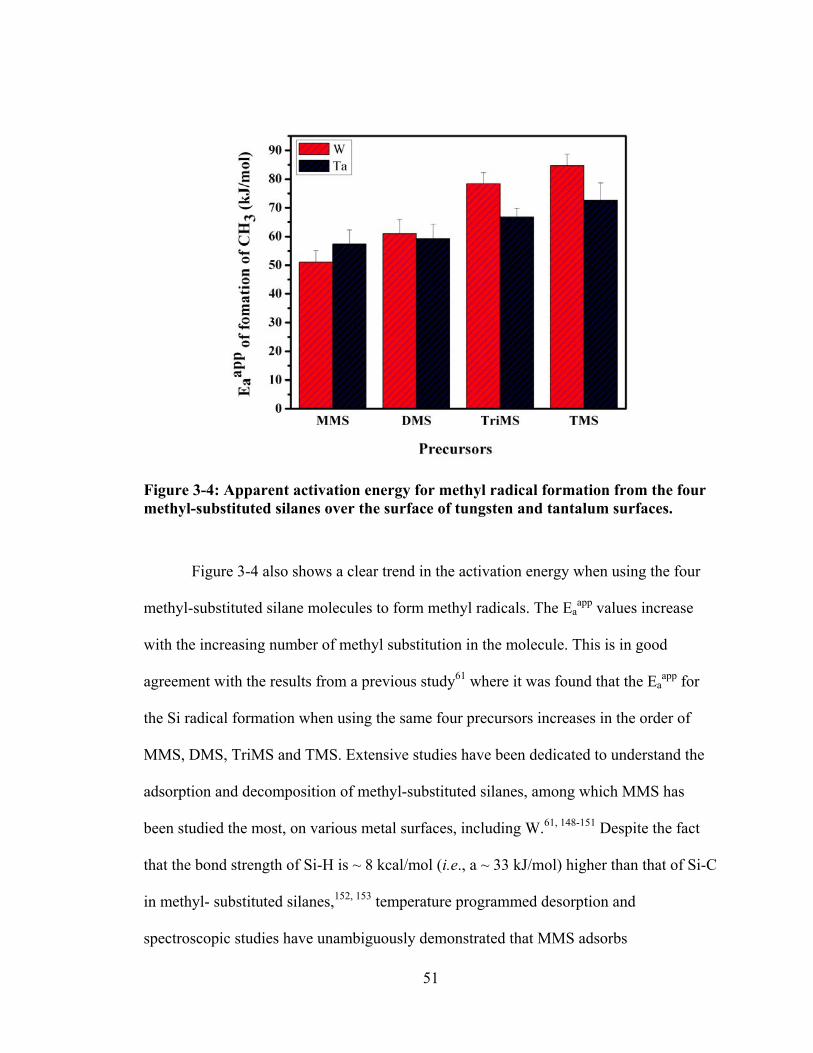
51
Figure 3-4: Apparent activation energy for methyl radical formation from the four methyl-substituted silanes over the surface of tungsten and tantalum surfaces.
Figure 3-4 also shows a clear trend in the activation energy when using the four
methyl-substituted silane molecules to form methyl radicals. The Eaapp values increase
with the increasing number of methyl substitution in the molecule. This is in good
agreement with the results from a previous study61 where it was found that the Eaapp for
the Si radical formation when using the same four precursors increases in the order of
MMS, DMS, TriMS and TMS. Extensive studies have been dedicated to understand the
adsorption and decomposition of methyl-substituted silanes, among which MMS has
been studied the most, on various metal surfaces, including W.61, 148-151 Despite the fact
that the bond strength of Si-H is ~ 8 kcal/mol (i.e., a ~ 33 kJ/mol) higher than that of Si-C
in methyl- substituted silanes,152, 153 temperature programmed desorption and
spectroscopic studies have unambiguously demonstrated that MMS adsorbs
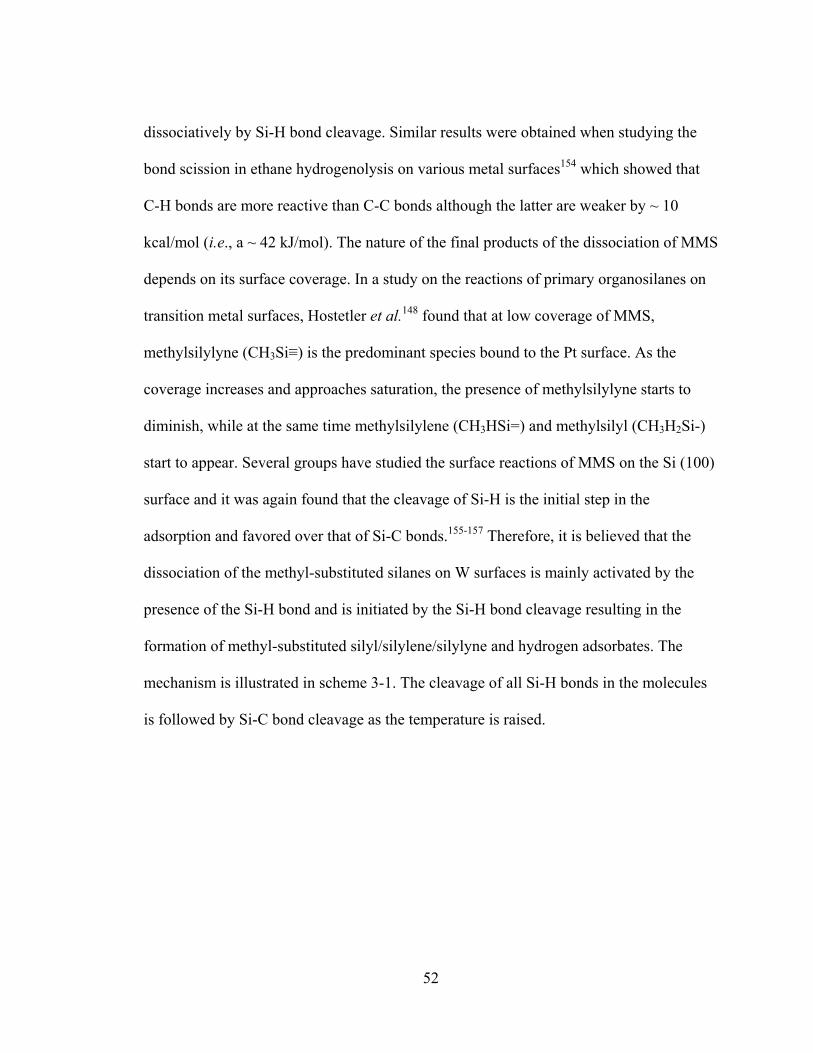
52
dissociatively by Si-H bond cleavage. Similar results were obtained when studying the
bond scission in ethane hydrogenolysis on various metal surfaces154 which showed that
C-H bonds are more reactive than C-C bonds although the latter are weaker by ~ 10
kcal/mol (i.e., a ~ 42 kJ/mol). The nature of the final products of the dissociation of MMS
depends on its surface coverage. In a study on the reactions of primary organosilanes on
transition metal surfaces, Hostetler et al.148 found that at low coverage of MMS,
methylsilylyne (CH3Si≡) is the predominant species bound to the Pt surface. As the
coverage increases and approaches saturation, the presence of methylsilylyne starts to
diminish, while at the same time methylsilylene (CH3HSi=) and methylsilyl (CH3H2Si-)
start to appear. Several groups have studied the surface reactions of MMS on the Si (100)
surface and it was again found that the cleavage of Si-H is the initial step in the
adsorption and favored over that of Si-C bonds.155-157 Therefore, it is believed that the
dissociation of the methyl-substituted silanes on W surfaces is mainly activated by the
presence of the Si-H bond and is initiated by the Si-H bond cleavage resulting in the
formation of methyl-substituted silyl/silylene/silylyne and hydrogen adsorbates. The
mechanism is illustrated in scheme 3-1. The cleavage of all Si-H bonds in the molecules
is followed by Si-C bond cleavage as the temperature is raised.
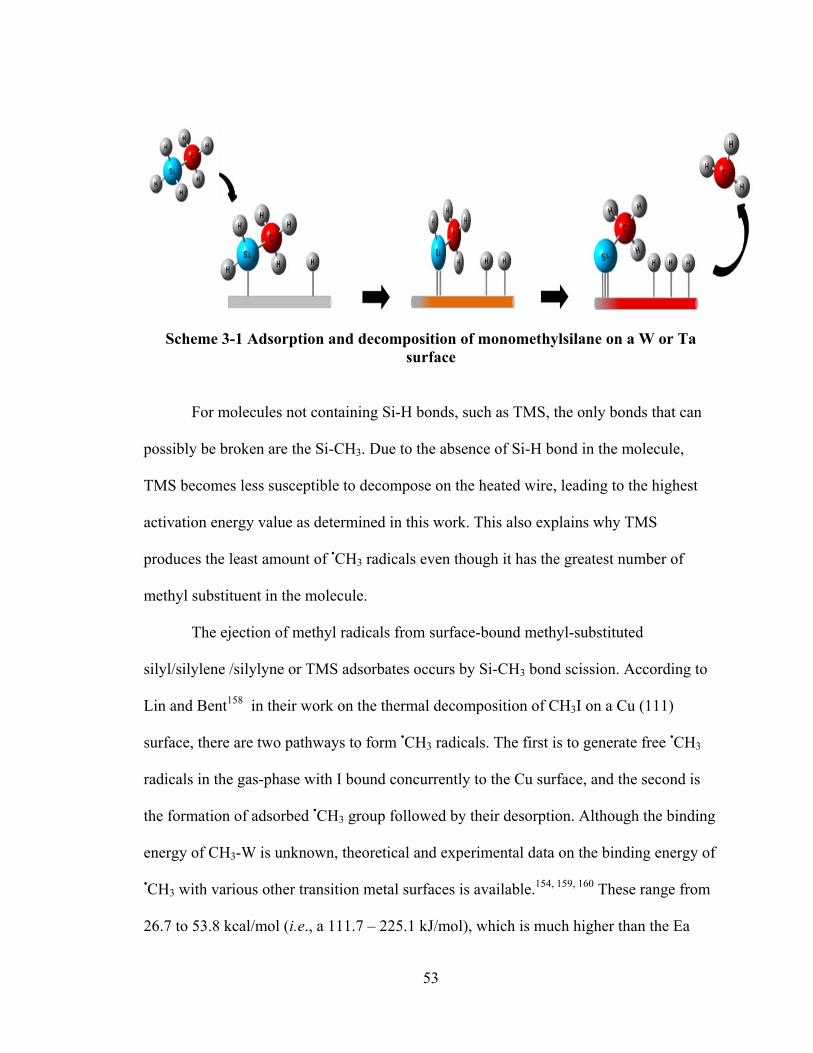
53
Scheme 3-1 Adsorption and decomposition of monomethylsilane on a W or Ta surface
For molecules not containing Si-H bonds, such as TMS, the only bonds that can
possibly be broken are the Si-CH3. Due to the absence of Si-H bond in the molecule,
TMS becomes less susceptible to decompose on the heated wire, leading to the highest
activation energy value as determined in this work. This also explains why TMS
produces the least amount of •CH3 radicals even though it has the greatest number of
methyl substituent in the molecule.
The ejection of methyl radicals from surface-bound methyl-substituted
silyl/silylene /silylyne or TMS adsorbates occurs by Si-CH3 bond scission. According to
Lin and Bent158 in their work on the thermal decomposition of CH3I on a Cu (111)
surface, there are two pathways to form •CH3 radicals. The first is to generate free •CH3
radicals in the gas-phase with I bound concurrently to the Cu surface, and the second is
the formation of adsorbed •CH3 group followed by their desorption. Although the binding
energy of CH3-W is unknown, theoretical and experimental data on the binding energy of
•CH3 with various other transition metal surfaces is available.154, 159, 160 These range from
26.7 to 53.8 kcal/mol (i.e., a 111.7 – 225.1 kJ/mol), which is much higher than the Ea
54
value determined from our work. This strongly suggests that Si-CH3 bond scission does
not form surface-bound •CH3 groups. As mentioned before, the obtained activation
energy for forming •CH3 radicals from this work is much lower than the Si-CH3 bond
dissociation energy. This indicates that the ejection of CH3 radicals follows the first
pathway where the bond cleavage is accompanied by the formation of a Si moiety bound
to the W surface. Our results are in excellent agreement with Lin and Bent's work where
they determined that the activation energy is low at 8.5 kcal/mol (i.e., a 35.6 kJ/mol).
In a theoretical study on the effect of the electronic structure of substituent at the
silicon atom on the structure and bond energies of methylhydrosilanes and silenes,
Gusel'nikov et al.153 have concluded that the Si-X (X=H and CH3) bond becomes shorter
and stronger with an increase in the electronegativity (χ) of the substituent. Considering
that the χ for methyl and H substituent is 2.5 and 2.2, respectively, both Si-C and Si-H
bonds are the strongest for TMS and weakest for MMS. They have found that the Si-C
bond strength increased by 0.9 kcal/mol (i.e., a 3.8 kJ/mol) per additional methyl.
Casserly and Gleason152 computed the Si-H and Si-C BDE of methyl-substituted silane
molecules using density functional theory. They have found that the BDE was increased
per additional methyl substitution by ca. 0.6 and 0.9 kcal/mol (i.e., a 2.5 – 3.8 kJ/mol),
respectively, for Si-H and Si-C bond. These data support the observed trend for the Ea
values obtained in this work. The strengthening in both Si-C and Si-H bonds due to the
increasing number of methyl group attached to the Si atom results in an increase in the
energy required to form •CH3 radicals.
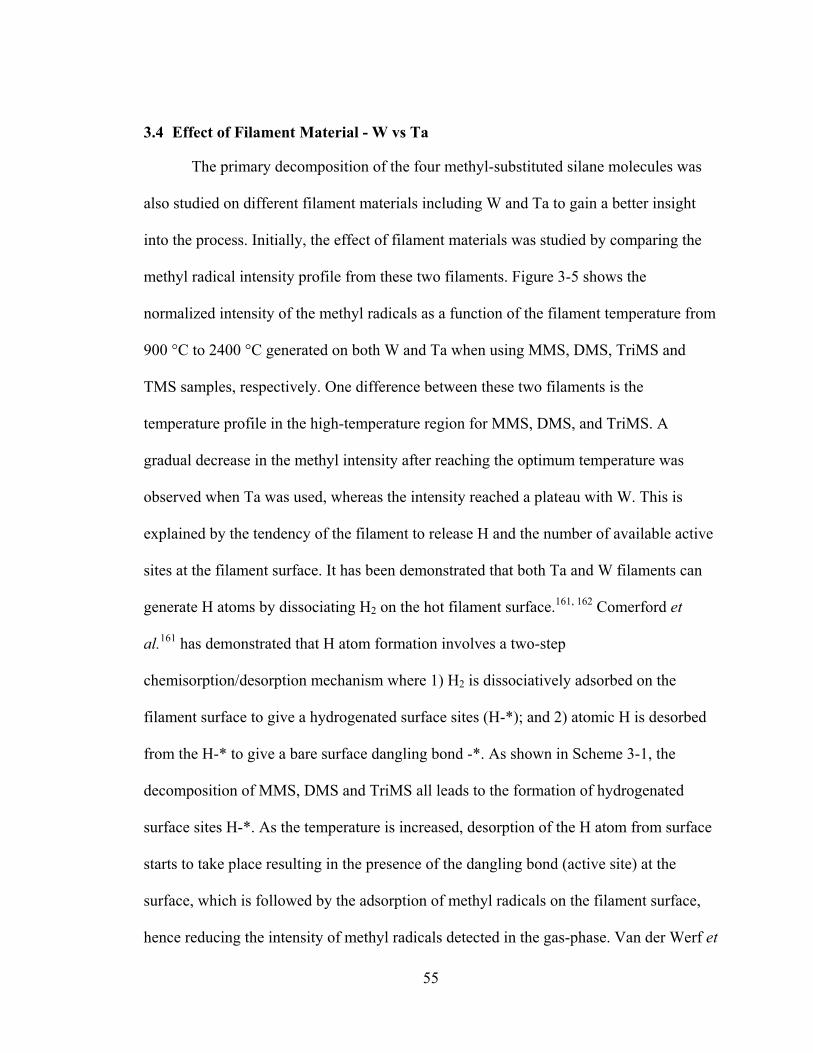
55
3.4 Effect of Filament Material - W vs Ta
The primary decomposition of the four methyl-substituted silane molecules was
also studied on different filament materials including W and Ta to gain a better insight
into the process. Initially, the effect of filament materials was studied by comparing the
methyl radical intensity profile from these two filaments. Figure 3-5 shows the
normalized intensity of the methyl radicals as a function of the filament temperature from
900 °C to 2400 °C generated on both W and Ta when using MMS, DMS, TriMS and
TMS samples, respectively. One difference between these two filaments is the
temperature profile in the high-temperature region for MMS, DMS, and TriMS. A
gradual decrease in the methyl intensity after reaching the optimum temperature was
observed when Ta was used, whereas the intensity reached a plateau with W. This is
explained by the tendency of the filament to release H and the number of available active
sites at the filament surface. It has been demonstrated that both Ta and W filaments can
generate H atoms by dissociating H2 on the hot filament surface.161, 162 Comerford et
al.161 has demonstrated that H atom formation involves a two-step
chemisorption/desorption mechanism where 1) H2 is dissociatively adsorbed on the
filament surface to give a hydrogenated surface sites (H-*); and 2) atomic H is desorbed
from the H-* to give a bare surface dangling bond -*. As shown in Scheme 3-1, the
decomposition of MMS, DMS and TriMS all leads to the formation of hydrogenated
surface sites H-*. As the temperature is increased, desorption of the H atom from surface
starts to take place resulting in the presence of the dangling bond (active site) at the
surface, which is followed by the adsorption of methyl radicals on the filament surface,
hence reducing the intensity of methyl radicals detected in the gas-phase. Van der Werf et
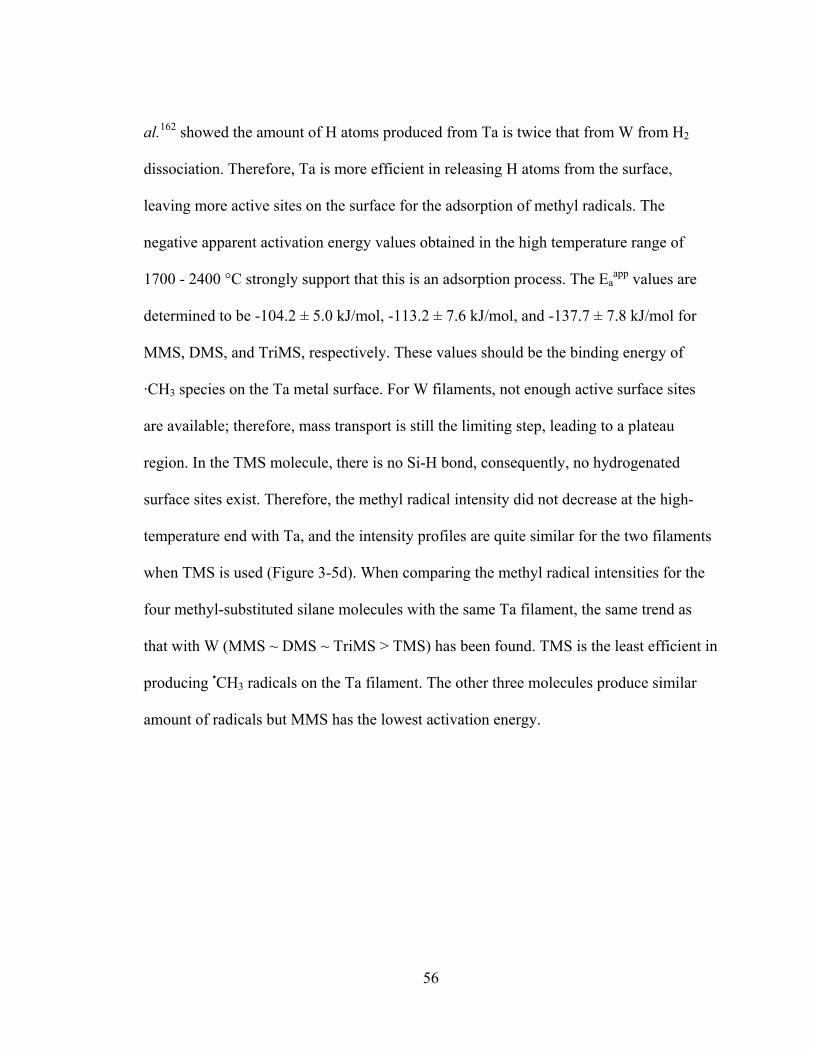
56
al.162 showed the amount of H atoms produced from Ta is twice that from W from H2
dissociation. Therefore, Ta is more efficient in releasing H atoms from the surface,
leaving more active sites on the surface for the adsorption of methyl radicals. The
negative apparent activation energy values obtained in the high temperature range of
1700 - 2400 °C strongly support that this is an adsorption process. The Eaapp values are
determined to be -104.2 ± 5.0 kJ/mol, -113.2 ± 7.6 kJ/mol, and -137.7 ± 7.8 kJ/mol for
MMS, DMS, and TriMS, respectively. These values should be the binding energy of
·CH3 species on the Ta metal surface. For W filaments, not enough active surface sites
are available; therefore, mass transport is still the limiting step, leading to a plateau
region. In the TMS molecule, there is no Si-H bond, consequently, no hydrogenated
surface sites exist. Therefore, the methyl radical intensity did not decrease at the high-
temperature end with Ta, and the intensity profiles are quite similar for the two filaments
when TMS is used (Figure 3-5d). When comparing the methyl radical intensities for the
four methyl-substituted silane molecules with the same Ta filament, the same trend as
that with W (MMS ~ DMS ~ TriMS > TMS) has been found. TMS is the least efficient in
producing •CH3 radicals on the Ta filament. The other three molecules produce similar
amount of radicals but MMS has the lowest activation energy.
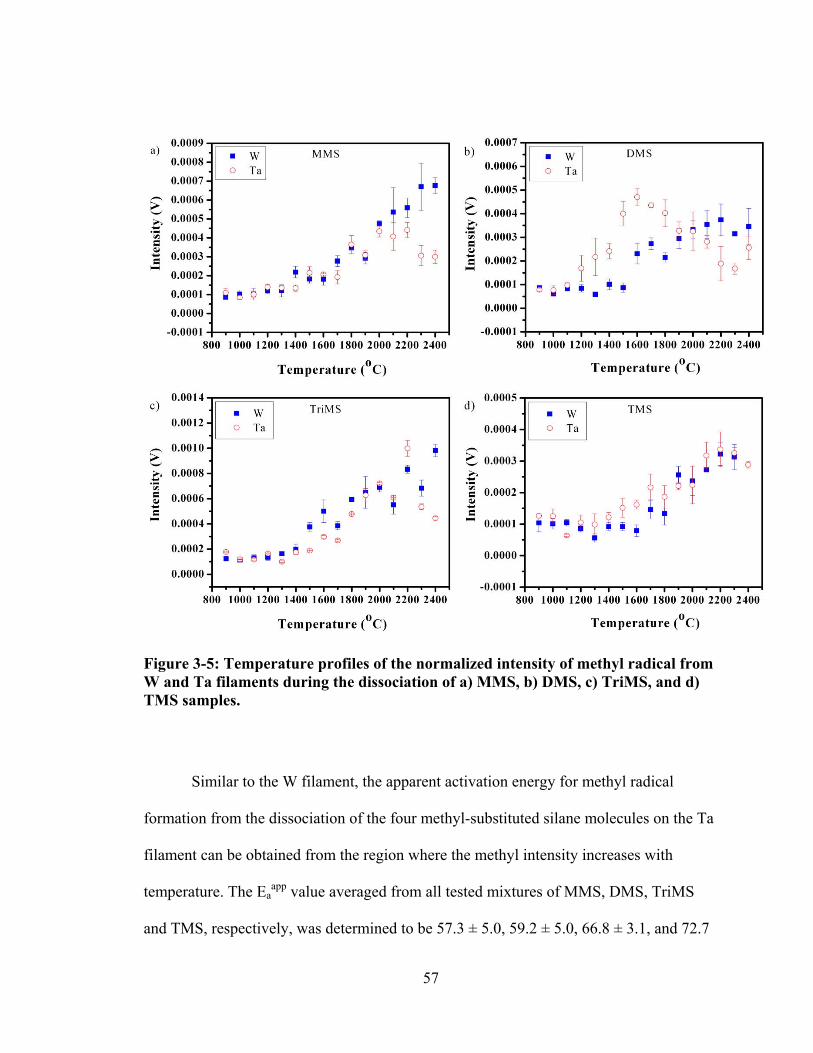
57
Figure 3-5: Temperature profiles of the normalized intensity of methyl radical from W and Ta filaments during the dissociation of a) MMS, b) DMS, c) TriMS, and d) TMS samples.
Similar to the W filament, the apparent activation energy for methyl radical
formation from the dissociation of the four methyl-substituted silane molecules on the Ta
filament can be obtained from the region where the methyl intensity increases with
temperature. The Eaapp value averaged from all tested mixtures of MMS, DMS, TriMS
and TMS, respectively, was determined to be 57.3 ± 5.0, 59.2 ± 5.0, 66.8 ± 3.1, and 72.7
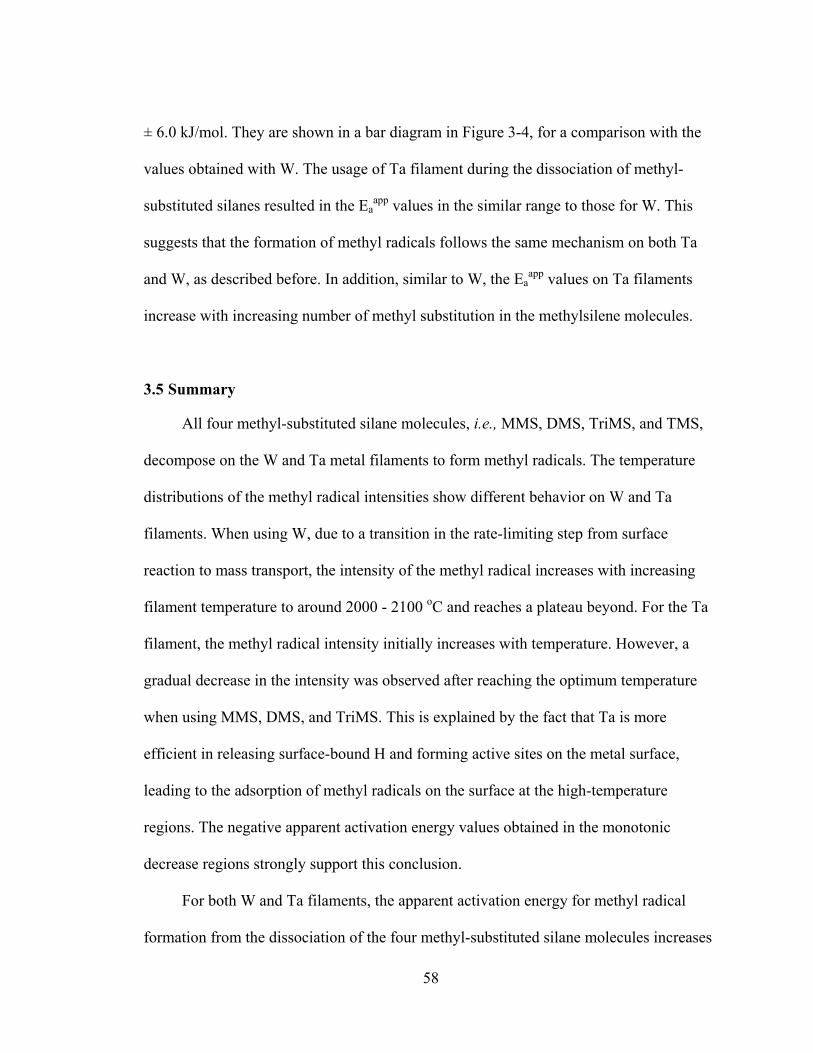
58
± 6.0 kJ/mol. They are shown in a bar diagram in Figure 3-4, for a comparison with the
values obtained with W. The usage of Ta filament during the dissociation of methyl-
substituted silanes resulted in the Eaapp values in the similar range to those for W. This
suggests that the formation of methyl radicals follows the same mechanism on both Ta
and W, as described before. In addition, similar to W, the Eaapp values on Ta filaments
increase with increasing number of methyl substitution in the methylsilene molecules.
3.5 Summary
All four methyl-substituted silane molecules, i.e., MMS, DMS, TriMS, and TMS,
decompose on the W and Ta metal filaments to form methyl radicals. The temperature
distributions of the methyl radical intensities show different behavior on W and Ta
filaments. When using W, due to a transition in the rate-limiting step from surface
reaction to mass transport, the intensity of the methyl radical increases with increasing
filament temperature to around 2000 - 2100 oC and reaches a plateau beyond. For the Ta
filament, the methyl radical intensity initially increases with temperature. However, a
gradual decrease in the intensity was observed after reaching the optimum temperature
when using MMS, DMS, and TriMS. This is explained by the fact that Ta is more
efficient in releasing surface-bound H and forming active sites on the metal surface,
leading to the adsorption of methyl radicals on the surface at the high-temperature
regions. The negative apparent activation energy values obtained in the monotonic
decrease regions strongly support this conclusion.
For both W and Ta filaments, the apparent activation energy for methyl radical
formation from the dissociation of the four methyl-substituted silane molecules increases
59
with the increasing number of methyl substitution. The dissociation of the methyl-
substituted silanes on W and Ta surfaces to form methyl radicals is believed to be
initiated by the Si-H bond cleavage resulting in the formation of methyl-substituted
silyl/silylene/silylyne and hydrogen adsorbates and followed by Si-CH3 bond cleavage.
The obtained low activation energy values for methyl radical formation in the range of
51.1 – 84.7 kJ · mol-1 suggests that the ejection of CH3 radicals is accompanied by the
formation of a Si moiety bound to the metal surface. Overall, TMS produces the least
amount of methyl radicals on both filaments with the highest activation energy. The
amount of methyl radicals produced when using MMS, DMS, and TriMS are similar but
MMS gives the lowest activation energy.
60
Chapter Four: Study of Hydrogen Elimination from the Decomposition of Methyl-Substituted Silanes over Tungsten and Tantalum Filament Surfaces
4.1 Motivations
Several studies have found that hydrogen plays a crucial role during diamond
CVD.163, 164 These investigations revealed that atomic hydrogen are perhaps the most
critical determinants of the quality and growth rate of CVD diamond. The major
importance of H2 during diamond CVD is to prevent surface graphitization by etching the
graphite layer co-deposited with the diamond.165-168 In addition to diamond CVD, several
studies reported the effect of hydrogen on the properties of silicon thin films. In a study
carried out by Ciffre et al.169 on the deposition of polycrystalline silicon (pc-Si) films
using HWCVD, they found that the dilution of silane mixture with H2 resulted in the
formation of pc-Si film in comparison to amorphous Si film when pure silane was used.
The obtainment of such polycrystalline films in a HWCVD system provides the
possibility of fabricating efficient polycrystalline solar cells of low cost and large area
that can be extended to application of optoelectronic devices and photovoltaic solar cells.
To better understand the role of H2 during the deposition of silicon films, Pant et al.45
have studied the effect of process condition during the deposition of pc-Si films by
monitoring the morphology of the films while increasing the concentration of hydrogen.
Their results showed that with an increase in hydrogen dilution, the crystallinity of the
deposited film increases. This enhancement is explained by the more efficient conversion
of silane by hydrogen abstraction reaction in the gas phase leading to the deposition of
pc-Si films. The same conclusion was reached by this group when the pressure of pure
61
silane in the reactor was increased, since this led to higher production of H2 in the gas
phase.
Furthermore, during the deposition of a-Si:H or SiC thin films in a HWCVD
system, the silicidation of the used filaments is unpreventable and this filament poisoning
will result in the deposition of poor-quality thin films.12, 170, 171 This problem was
overcome by exposing the filament to hydrogen, which reacted with the silicide on the
surface of the filament and etched it.162, 172, 173 These issues can also be extended to the
deposition process of a-SiC:H, one form of SiC materials.174, 175 Hence, it is critical to
understand the process for the production of H2 in order to relate it to the properties of the
a-SiC:H thin films. One type of precursor suitable for the deposition of these films is
methyl-substituted silane since they contain the three elements needed for the deposition
of a-SiC:H films.
In several studies carried out on the pyrolysis of MMS94, 176-178 and DMS95, 179, it
has been suggested that the formation of H2 occurs via molecular elimination, and that
both 1,1- and 1,2-hydrogen eliminations exist during the decomposition of theses
precursors, with the 1,1- process being more dominant. Sawrey et al.122-124 estimated the
yield for the primary dissociation process for MMS under static conditions to be ϕ1,1 ≅
0.7 for the 1,1-H2 elimination and ϕ1,2 ≅ 0.16 for the 1,2-H2 elimination. To gain further
insight into the reactions involved in the primary decomposition of MMS, Gordon et
al.180 presented a theoretical study on eight competing primary decomposition reactions
for MMS using full fourth-order Møller-Plesset (MP4) perturbation theory and the
combined McLean-Chandler/6-311G basis set, augmented by polarization functions on

62
all atoms. From the calculations, this group concluded that, besides the homolytic
cleavage of Si-C and Si-H, 1,1-H2 elimination and methane formation required less
amount of activation energy than the 1,2- H2 elimination reaction, even though these
reactions appeared to be thermodynamically competitive. Kinetically, they have found
that the activation energy for the 1,2-H2 elimination is nearly 25 kcal/mol (i.e., a 105
kJ/mol) greater than that for the 1,1-H2 elimination reaction. This group has concluded
that silylene extrusion reaction is kinetically more favourable than the 1,2-H2 elimination,
which is in agreement with the study of Sawrey et al.122 and O’Neal et al.176 Unlike MMS
and DMS, the formation of H2 molecules during the decomposition of TriMS is believed
to take place via a radical chain reaction, as proposed by Davidson et al.181, 182 and
supported by various other pyrolysis studies.183, 184 Therefore, from these various studies,
the formation of H2 molecule can be categorized into two groups: molecular elimination
for MMS and DMS, and radical chain reactions for TriMS. The interest in studying the
formation of H2 from the decomposition of methyl-substituted silanes has continued and
expanded to the HWCVD technique in order to bring some insights on these dissociation
steps in the presence of a metal surface.
In a HWCVD system, the presence of a metal filament is crucial in studying the
gas-phase chemistry; however, its role is still unclear. In the hope to provide an
understanding on the reaction of the precursor molecules on metal surface, several
research groups studied the adsorption and decomposition of methyl-substituted silanes
on various metal surfaces.148-151 Bradshaw et al. examined the adsorption process of
MMS on Au and Mo,185 as well as on W, Ni and Rh.150 From both studies, they have
found that hydrogen and methane evolved upon the exposure of the metal surfaces to
63
MMS. Tounderstand the mechanism by which these two species are formed, they have
carried out the same study using deuterated sample and their results showed that
adsorption occurred through the silicon atom and the evolution of H2(g) was due to
dehydrogenation from the Si atom rather than the methyl moiety.
The decomposition of TMS over W and Fe surfaces was investigated by Roberts
et al.151 and they found that TMS is irreversibly and rapidly adsorbed on the W surface at
293 K. Gaseous hydrogen and methane were detected, which were desorbed upon heating
the surface up to 420 K. They have concluded that the presence of H2(g) and CH4(g) is a
clear evidence for the cleavage of C-H and C-Si bond. Similarly, Dubois and Zegarski186
examined the low-temperature decomposition and adsorption of methyl-substituted
silanes of the formula SiMenH4-n (1 ≤ n≤ 4) as well as hexamethyldisilane (HMDS) using
temperature programmed desorption (TPD) and Auger electron spectroscopy (AES) on
Ni(1 0 0) surface. They have found that species with n ≤ 3 underwent substantial
decomposition accompanied with significant amount of H2 being released in the gas
phase while for both TMS and HMDS, where the molecule becomes so sterically
hindered that bonding to the surface is weakened, only methyl desorption was observed
indicating that radical desorption predominated at low temperature. Their TPD
experiments indicated that methyl-substituted silanes adsorbed dissociatively with the
cleavage of Si–H bonds. The common finding extracted from these studies is the
dominance of the formation of gaseous hydrogen during the decomposition of methyl-
substituted silanes via Si-H bond cleavage as an initial step for species containing Si-H
bond within their frame, and for species lacking this bond their dissociation is initiated by
the rupture of the Si-C bond followed by the cleavage of C-H bond.
64
In this work, we examined the primary decomposition of TMS, TriMS, DMS, and
MMS on a heated W and Ta filament in a HWCVD process using laser ionization MS.
The main focus of this chapter is to examine the formation of H2 molecule from the
decomposition of these precursor molecules on a heated W and Ta filament. The
production of H2 is detected using both SPI and dual SPI/LIEI ionization sources. To
determine the process leading to the formation of H2, experiments with the isotopomers,
MM-d3, DMS-d2, and TriMS-d1, were carried out under the same experimental conditions
using the dual SPI/LIEI source. The effect of filament temperature on H2 production is
studied by evaluating its intensity profile at different temperatures. From the temperature-
dependent study, the apparent activation energy is extracted. In addition, the effect of
filament material, molecular structure, and sample pressure on the formation of H2 and its
activation energy is explored, which provides an understanding on this process and a
mechanism for the production of H2 on a metal filament surface.
4.2 Comparison of the Two Ionization Sources
In the current study, two complementary ionization sources, i.e., non-resonant SPI
using a VUV wavelength at 118 nm and dual SPI/ LIEI, were employed to study the
formation of hydrogen via the decomposition of MMS, DMS, TriMS and TMS. The SPI
source has been proven to ionize mainly species that have an IE below 10.5 eV and had
uniform detection sensitivity for these compounds. The dual ionization source is effective
in detecting all possible decomposition products with IE below and above 10.5 eV. It is
worth noting that in pure SPI mode, the EI contribution from the photoelectrons is still
present but minimal. Despite the fact that, in this mode, the 118 nm laser beam is focused
65
into the ionization region, the possibility of the scattered UV or VUV radiation striking
either the repeller plate or the extraction grid in the TOF optics is inevitable. Therefore,
this generates a minimal contribution from the LIEI. In order to quantify the EI
contribution, an intensity ratio of the peak at m/z 4 representing He+, which is caused by
EI contribution since the IE of He is greater than 10.5 eV, to the base peak at m/z 73 in
TriMS, which is originated from SPI, is computed and found to be only 0.036%. Similar
ratio with a value of 0.034% was obtained with respect to the base peak at m/z 73 in
TMS. Therefore, these values suggest that the contribution from UV photon-induced EI is
minor when using the pure SPI source. The advantages and disadvantages of using these
two ionization techniques were demonstrated by comparing the mass spectra collected
during the decomposition of DMS samples on a heated W filament when using these two
modes. DMS has an IE value of 11.2 eV.187
Figure 4-1 shows the mass spectra of pure DMS in the mass region between 0 and
20 amu at a filament temperature of 2000 oC and a chamber pressure of 1.0 × 10⁻⁵ Torr
using SPI and dual SPI/LIEI modes. After the filament was turned on, two new peaks
appeared at m/z 2 and 15 corresponding to H2+ and CH3
+, respectively. Comparison of the
two spectra in Figure 4-1 demonstrates the impact of the LIEI source on the mass spectra.
The employment of LIEI significantly enhances the signal intensity of H2+, which has an
IE of 15.4 eV,188 at an expense of a lower resolution. The mass resolution (m/Δm) of the
H2+ peak observed with LIEI source is found to be around 103, which is lower than the
mass resolution for the He+ peak recorded using SPI method, where a value of 145 was
calculated. This is because the electrons produced during the LIEI process are not
spatially controlled, and it is expected that peaks from the produced signals are broadened
66
as compared to those of the SPI signals generated from a tightly focused laser beam. The
enhancement in the intensity for H2+ and He+ peaks is indicative of the dominance of the
electron ionization in the dual mode, where the LiF lens was pulled out and the laser
beam was guided to the repeller plate. This difference in the H2+ intensity from the two
sources is more clearly illustrated by Figure 4-2, where the intensity profile of the peak at
m/z 2 is plotted at various filament temperatures.
As mentioned in Section 2.5, the filament was etched with 10% H2/He for two
hours between each run of experiment. In order to eliminate the contribution of this
etching process to H2 formation during the decomposition of methyl-substituted silanes, a
control experiment was carried out to heat the etched filament in vacuum from 900 to
2400 oC. The analysis of this control experiment revealed the absence of any H2 gas
being desorbed from the surface of the filament. In addition, another control experiment
was carried out with DMS sample after etching the filament with pure He instead of 10%
H2/He. It was found that the evolution of H2 from the filament etched with He was
comparable to the one obtained from the actual experiment. This suggests that the
filament etching with 10% H2/He does not contribute to the intensity of H2 molecule
formed during the decomposition of methyl-substituted silane molecules.
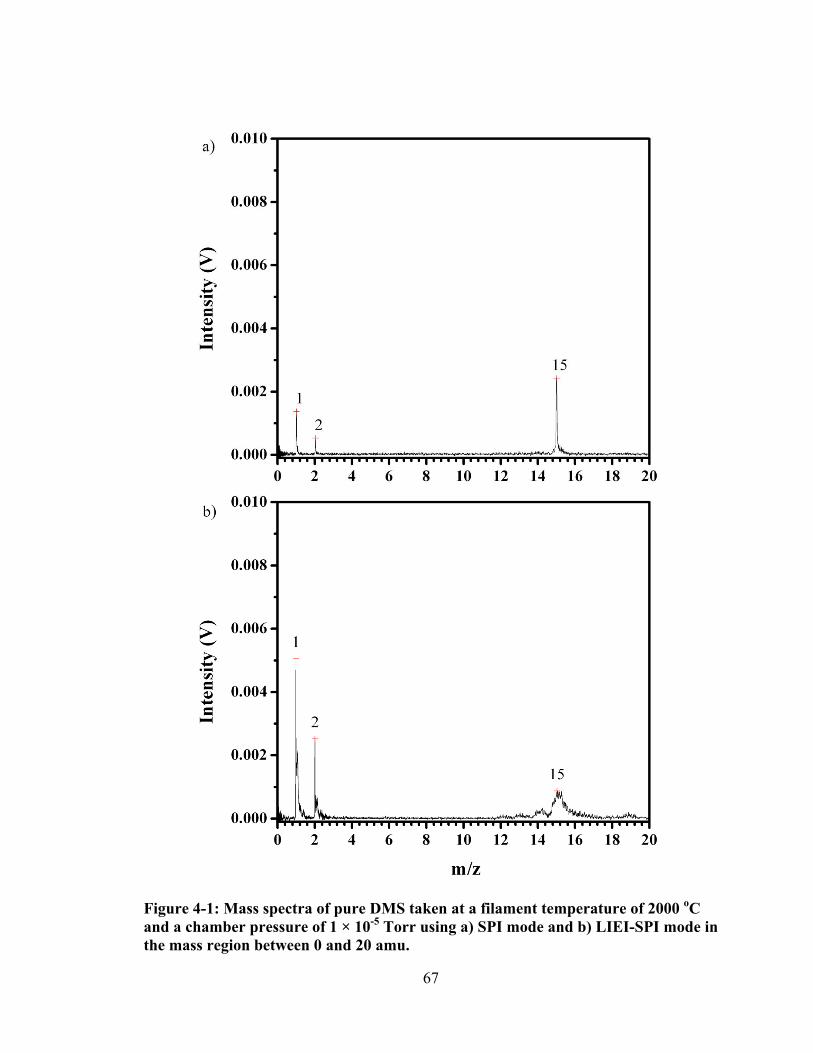
67
Figure 4-1: Mass spectra of pure DMS taken at a filament temperature of 2000 oC and a chamber pressure of 1 × 10⁻⁵ Torr using a) SPI mode and b) LIEI-SPI mode in the mass region between 0 and 20 amu.

68
Figure 4-2: The intensity of the peak at m/z 2 at different W filament temperatures for pure DMS sample using the pure SPI and dual SPI/LIEI ionization sources.
In contrast to the intensity of the H2+ peak, as seen in Figure 4-1, the intensity of
the CH3+ peaks, which has an IE of 9.84 eV,189 was reduced from 2.4 mV with SPI to
0.88 mV with the dual ionization source. In SPI mode, the 118 nm VUV light is tightly
focused resulting in the intensity of 10.5 eV radiations to be high, whereas it is divergent
in the dual SPI/LIEI mode. This entails that the intensity of any peak representing a
species with an IE below 10.5 eV will be reduced with the dual ionization source.
However, with SPI mode, any species that cannot be ionized by 10.5 eV photons would
give a relatively weak intensity, which originated from the ionization by the
photoelectron as stated earlier. Evidently, any species with IE < 10.5 eV have enhanced
signal intensities when SPI is used, and those with IP > 10.5 eV can only be effectively
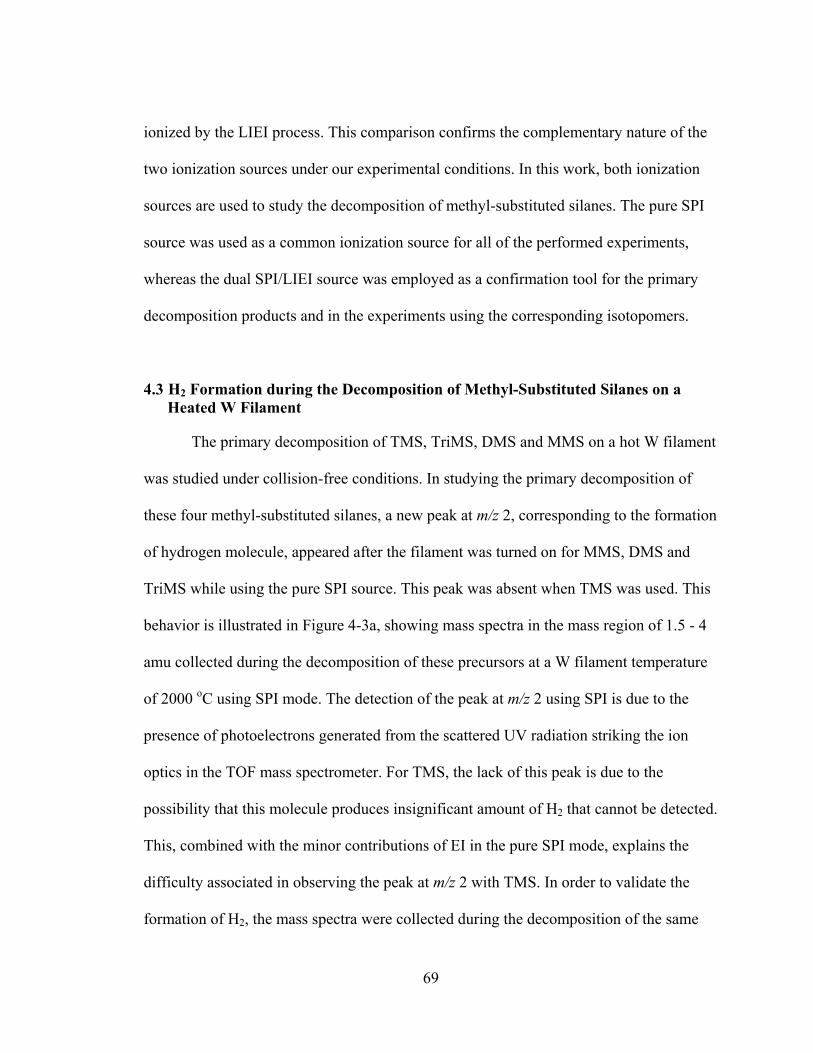
69
ionized by the LIEI process. This comparison confirms the complementary nature of the
two ionization sources under our experimental conditions. In this work, both ionization
sources are used to study the decomposition of methyl-substituted silanes. The pure SPI
source was used as a common ionization source for all of the performed experiments,
whereas the dual SPI/LIEI source was employed as a confirmation tool for the primary
decomposition products and in the experiments using the corresponding isotopomers.
4.3 H2 Formation during the Decomposition of Methyl-Substituted Silanes on a Heated W Filament
The primary decomposition of TMS, TriMS, DMS and MMS on a hot W filament
was studied under collision-free conditions. In studying the primary decomposition of
these four methyl-substituted silanes, a new peak at m/z 2, corresponding to the formation
of hydrogen molecule, appeared after the filament was turned on for MMS, DMS and
TriMS while using the pure SPI source. This peak was absent when TMS was used. This
behavior is illustrated in Figure 4-3a, showing mass spectra in the mass region of 1.5 - 4
amu collected during the decomposition of these precursors at a W filament temperature
of 2000 oC using SPI mode. The detection of the peak at m/z 2 using SPI is due to the
presence of photoelectrons generated from the scattered UV radiation striking the ion
optics in the TOF mass spectrometer. For TMS, the lack of this peak is due to the
possibility that this molecule produces insignificant amount of H2 that cannot be detected.
This, combined with the minor contributions of EI in the pure SPI mode, explains the
difficulty associated in observing the peak at m/z 2 with TMS. In order to validate the
formation of H2, the mass spectra were collected during the decomposition of the same
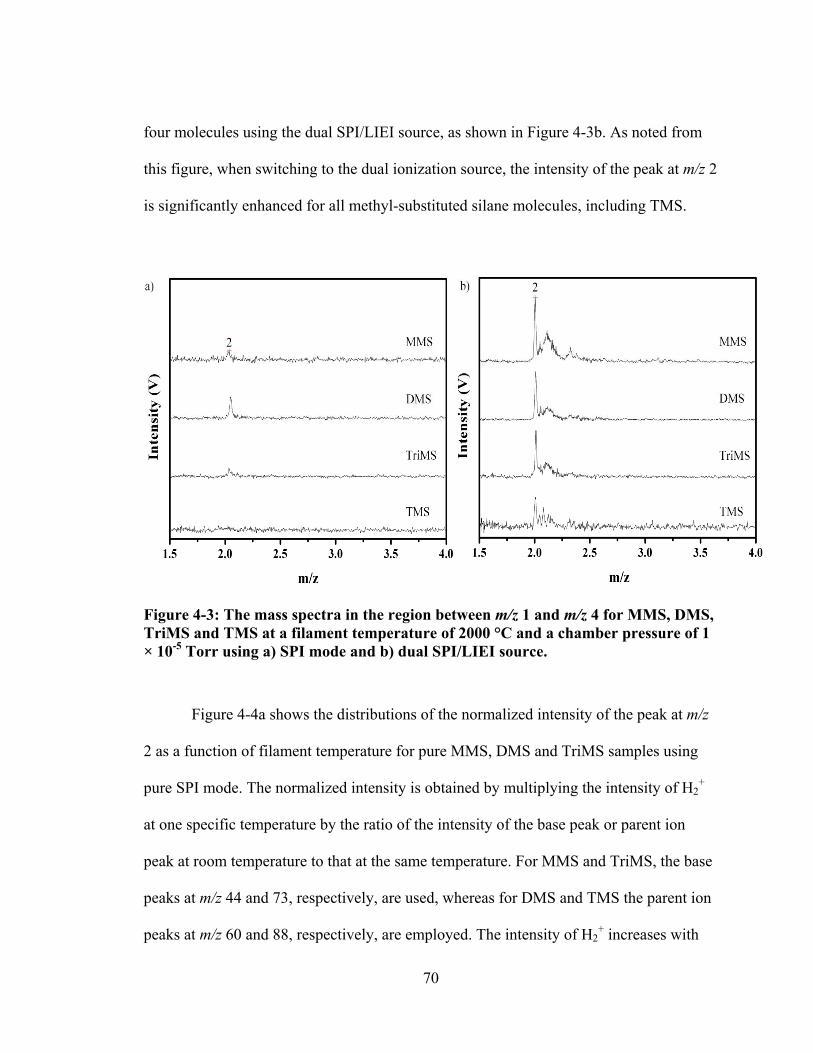
70
four molecules using the dual SPI/LIEI source, as shown in Figure 4-3b. As noted from
this figure, when switching to the dual ionization source, the intensity of the peak at m/z 2
is significantly enhanced for all methyl-substituted silane molecules, including TMS.
Figure 4-3: The mass spectra in the region between m/z 1 and m/z 4 for MMS, DMS, TriMS and TMS at a filament temperature of 2000 °C and a chamber pressure of 1 × 10⁻⁵ Torr using a) SPI mode and b) dual SPI/LIEI source.
Figure 4-4a shows the distributions of the normalized intensity of the peak at m/z
2 as a function of filament temperature for pure MMS, DMS and TriMS samples using
pure SPI mode. The normalized intensity is obtained by multiplying the intensity of H2+
at one specific temperature by the ratio of the intensity of the base peak or parent ion
peak at room temperature to that at the same temperature. For MMS and TriMS, the base
peaks at m/z 44 and 73, respectively, are used, whereas for DMS and TMS the parent ion
peaks at m/z 60 and 88, respectively, are employed. The intensity of H2+ increases with
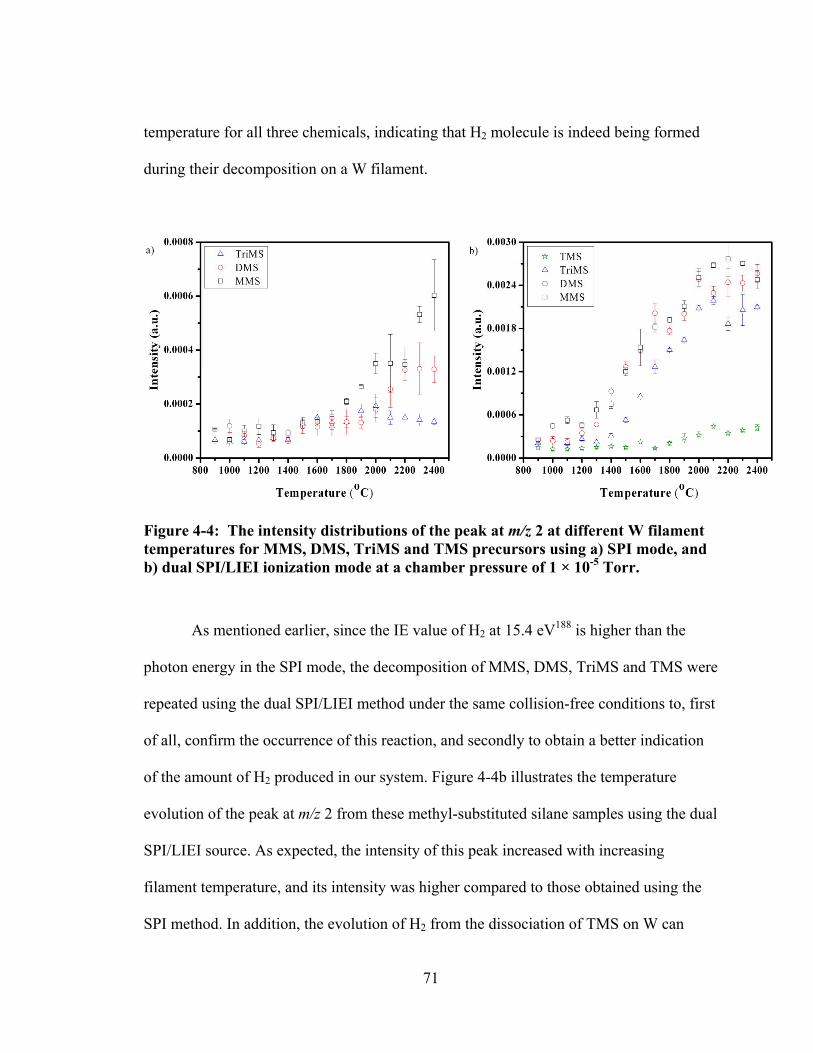
71
temperature for all three chemicals, indicating that H2 molecule is indeed being formed
during their decomposition on a W filament.
Figure 4-4: The intensity distributions of the peak at m/z 2 at different W filament temperatures for MMS, DMS, TriMS and TMS precursors using a) SPI mode, and b) dual SPI/LIEI ionization mode at a chamber pressure of 1 × 10⁻⁵ Torr.
As mentioned earlier, since the IE value of H2 at 15.4 eV188 is higher than the
photon energy in the SPI mode, the decomposition of MMS, DMS, TriMS and TMS were
repeated using the dual SPI/LIEI method under the same collision-free conditions to, first
of all, confirm the occurrence of this reaction, and secondly to obtain a better indication
of the amount of H2 produced in our system. Figure 4-4b illustrates the temperature
evolution of the peak at m/z 2 from these methyl-substituted silane samples using the dual
SPI/LIEI source. As expected, the intensity of this peak increased with increasing
filament temperature, and its intensity was higher compared to those obtained using the
SPI method. In addition, the evolution of H2 from the dissociation of TMS on W can
72
clearly be seen from Figure 4-4b. Therefore, it was further confirmed that hydrogen
molecule was produced during the decomposition of MMS, DMS, TriMS and TMS on a
heated filament in a HWCVD process.
As shown in Figure 4-4, a comparison of the intensity profile for H2 production
from the four precursors showed that the intensity of hydrogen molecule increased with
increasing filament temperature to around 2000 – 2100 oC and beyond this temperature,
the production of the H2 molecule from these molecules started to plateau. This behaviour
is explained by the transition in the rate-limiting step from surface reaction to mass
transport.36 At low filament temperatures, the reactions at the surface of the filament is
dominating and occurring at a lower rate, and as the temperature is increased these
surface reaction starts to occur at a faster rate and the transport of the gas to the surface
becomes the limiting factor. This behavior was also observed in the study on Si radical
formation during the hot-wire decomposition of silane42, 81 and methyl-substituted
silanes77, 129 as well as for methyl radical formation from these precursors, as explained in
Chapter 3.
Additionally, the examination of the intensity profiles in Figure 4-4 reveals that
among the four methyl-substituted silane molecules, TMS produces the least amount of
hydrogen molecule, while the intensity distribution for the H2 molecule peak is the
highest with MMS, followed by DMS and then TriMS. It is also noticed from this figure
that with increasing methyl substitution in the molecule, the temperature at which the
peak at m/z 2 starts to appear is shifted to a higher value. For MMS and DMS, the peak at
m/z 2 starts to appear at around 1400 oC, whereas this temperature was shifted to 1800 oC
for TMS. The formation of H2 molecules started at 1500-1600 oC for TriMS.

73
In addition to the W filament, the primary decomposition of MMS, DMS and
TriMS was also studied on a Ta filament. The effect of filament material on the
decomposition was illustrated by comparing the H2 molecule intensity profile from these
two filaments as a function of filament temperature from 900 to 2400 oC, as shown in
Figure 4-5. It was found that the intensity profile of H2 evolution from both filaments is
comparable to each other. For both filaments, the intensity of H2 increased with
increasing filament temperature until reaching a plateau at higher temperatures. This
suggests that both filaments are equally efficient in forming H2 molecule. In addition, the
hydrogen molecule intensities for the three methyl-substituted silane molecule from the
Ta filament has the same trend, i.e., MMS > DMS > TriMS, as the one from W.
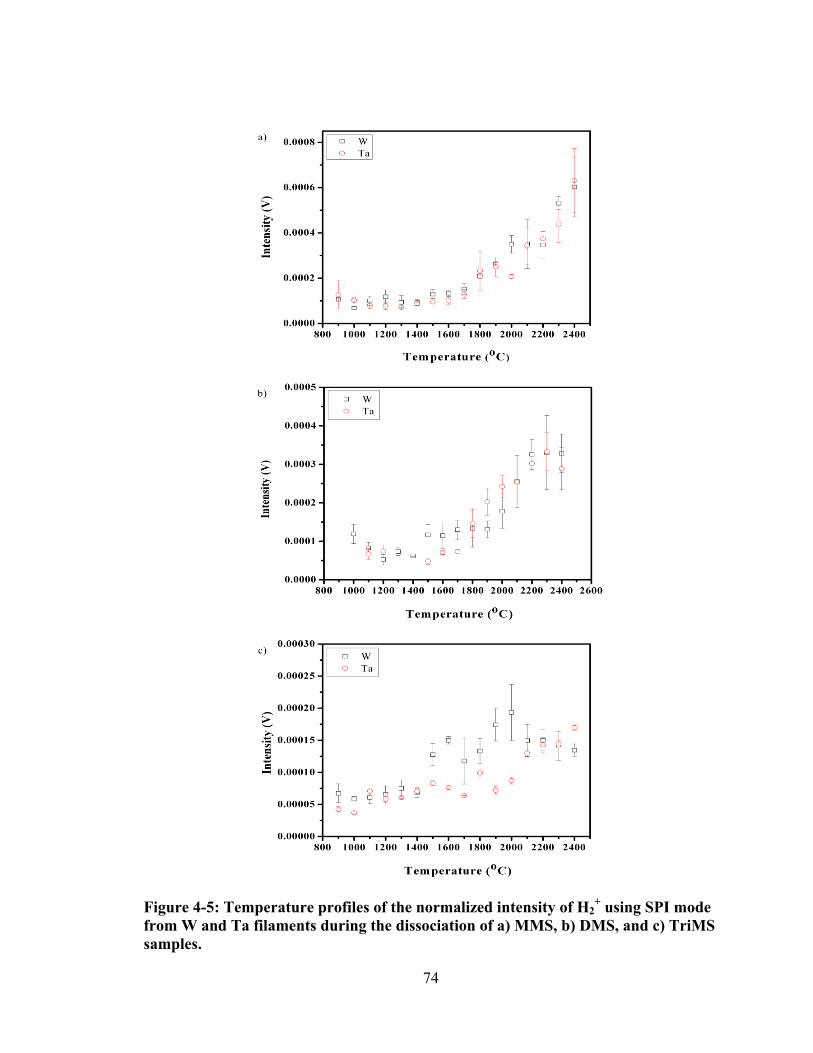
74
Figure 4-5: Temperature profiles of the normalized intensity of H2+ using SPI mode
from W and Ta filaments during the dissociation of a) MMS, b) DMS, and c) TriMS samples.
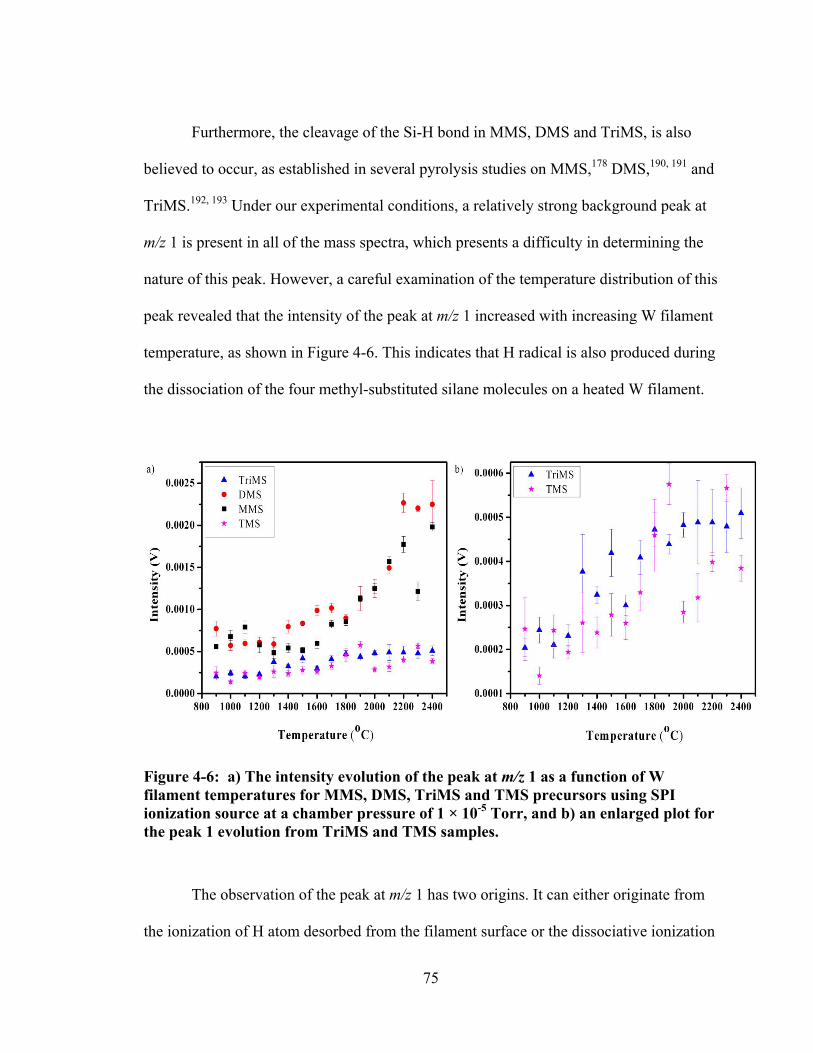
75
Furthermore, the cleavage of the Si-H bond in MMS, DMS and TriMS, is also
believed to occur, as established in several pyrolysis studies on MMS,178 DMS,190, 191 and
TriMS.192, 193 Under our experimental conditions, a relatively strong background peak at
m/z 1 is present in all of the mass spectra, which presents a difficulty in determining the
nature of this peak. However, a careful examination of the temperature distribution of this
peak revealed that the intensity of the peak at m/z 1 increased with increasing W filament
temperature, as shown in Figure 4-6. This indicates that H radical is also produced during
the dissociation of the four methyl-substituted silane molecules on a heated W filament.
Figure 4-6: a) The intensity evolution of the peak at m/z 1 as a function of W filament temperatures for MMS, DMS, TriMS and TMS precursors using SPI ionization source at a chamber pressure of 1 × 10⁻⁵ Torr, and b) an enlarged plot for the peak 1 evolution from TriMS and TMS samples.
The observation of the peak at m/z 1 has two origins. It can either originate from
the ionization of H atom desorbed from the filament surface or the dissociative ionization
76
of the formed H2 molecule. These two possible mechanisms are indicated by the Equation
(4-1) and (4-2), respectively.
(4-1)
(4-2)
In order to distinguish between these two origins, examination of the ratio of the
peak at m/z 1 with respect to one for H2+ molecule indicated that this ratio actually
decreased with increasing filament temperature. With DMS as a precursor, this ratio
varied from 8.9 at 900 oC to 3.1 at 2400 oC. Similar values were obtained from TriMS
and MMS. The decrease in the ratio suggests that less amount of H+ species are produced
in the gas phase with increasing temperature as compared to H2. Since the value of the
ratio was not constant, it was concluded that H radical formation proceed via Equation
(4-1), which represents the direct ionization of the desorbed H species.
From the results obtained in Chapter 3, it was concluded that the dissociation of
methyl-substituted silanes molecules containing Si-H bond on a metal surface proceeds
via the breakage of Si-H bond. This initial bond rupture results in the formation of
methyl-substituted silyl/silylene/silylyne and hydrogen adsorbates. As the filament
surface is covered with hydrogen moieties and the temperature of the filament is
increased, desorption of H2 molecule from the surface takes place. The mechanism is
illustrated in scheme 4-1, with MMS as a precursor. This process is found to follow the
Langmuir-Hinshelwood mechanism.194

77
Scheme 4-1 Chemisorption and decomposition of MMS on a metal surface
The detection of H2 molecule during the decomposition of TMS on a heated W
filament indicates that C-H bond in CH3 is broken, since TMS does not contain Si-H
bonds in its structure. Roberts et al.151 found that at low coverage weakly adsorbed
methyl-substituted silyl species exist together with reversibly adsorbed hydrogen on
tungsten at 293 K, but with an increased coverage only reversible hydrogen exists
together with irreversibly adsorbed carbon- and silicon-containing species. Therefore, the
dissociation of TMS on W surface proceeds via the cleavage of Si-CH3 bond and C-H
bond resulting in the formation of methyl-substituted silyl/silyl-CH2(ads)/silylene-
CH2(ads), and hydrogen adsorbates. The mechanism is illustrated by scheme 4-2.
Scheme 4-2 Chemisorption and decomposition of TMS over a metal surface
78
Hence, it is believed that, unlike the pyrolysis studies, the H2-elimination process
of methyl-substituted silanes in the HWCVD process takes place on the surface of the
filament rather than in the gas phase. This mechanism is further supported by the
experiments performed using the isotopomers under the same experimental conditions,
which is discussed in the next section.
4.4 Experiments with MMS-d3, DMS-d2 and TriMS-d1
To better understand the mechanism involved in the H2-elimination process,
experiments with the deuterated isotopomers, including TriMS-d1, DMS-d2 and MMS-d3,
were carried out using the dual SPI/LIEI ionization source. After turning the W filament
on, a careful examination of the mass spectra in the low mass region revealed the
appearance of new mass peaks at m/z 2, 3 and 4 for MMS-d3 and DMS-d2 samples, and
peaks only at m/z 2 and 3 for TriMS-d1. Figure 4-7a shows the mass spectra for MMS-d3
where it presents the evolution of these new peaks at different filament temperatures.
Similar mass spectra were collected for DMS-d2 (Figure 4-7b) and TriMS-d1 (Figure 4-
7c). The peaks at m/z 2, 3 and 4 are associated with the formation of D, HD and D2
species, respectively, during the decomposition of MMS-d3, DMS-d2 and TriMS-d1 on a
W filament, and their intensities were plotted at different filament temperatures, as
illustrated in Figure 4-8. From the intensity profiles, it was noticed that the intensity of
the peaks at m/z 2, 3 and 4 increased with increasing filament temperature.
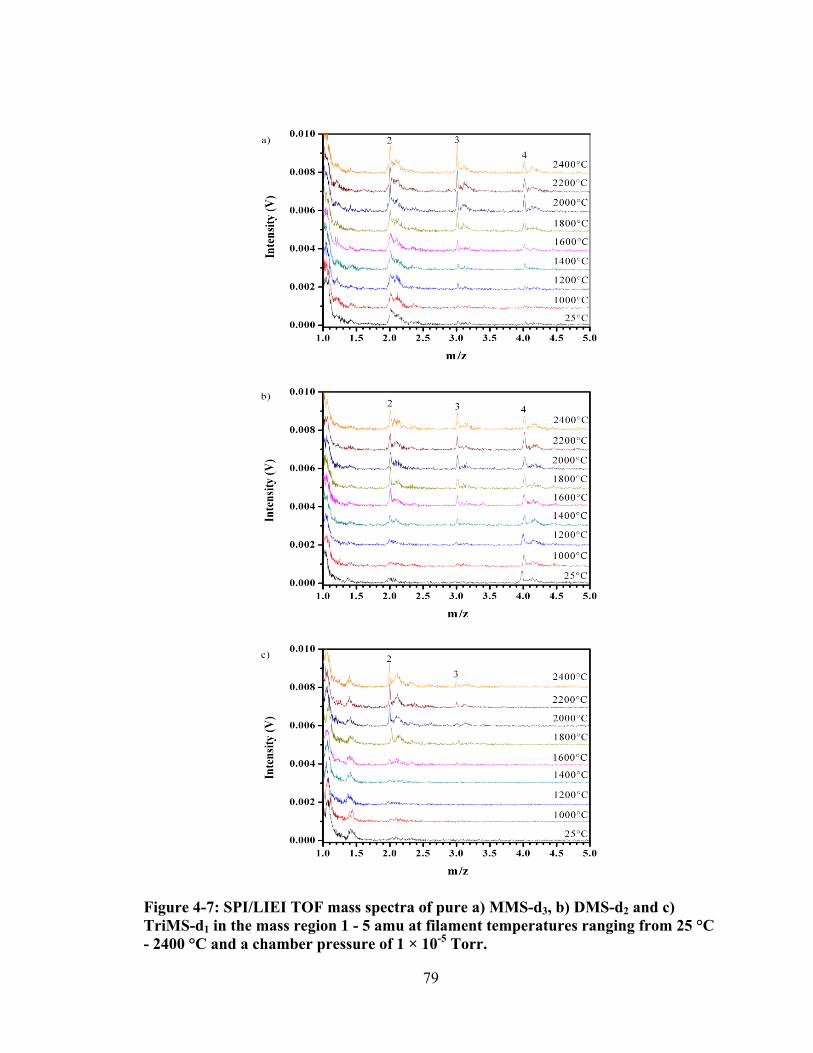
79
Figure 4-7: SPI/LIEI TOF mass spectra of pure a) MMS-d3, b) DMS-d2 and c) TriMS-d1 in the mass region 1 - 5 amu at filament temperatures ranging from 25 °C - 2400 °C and a chamber pressure of 1 × 10⁻⁵ Torr.
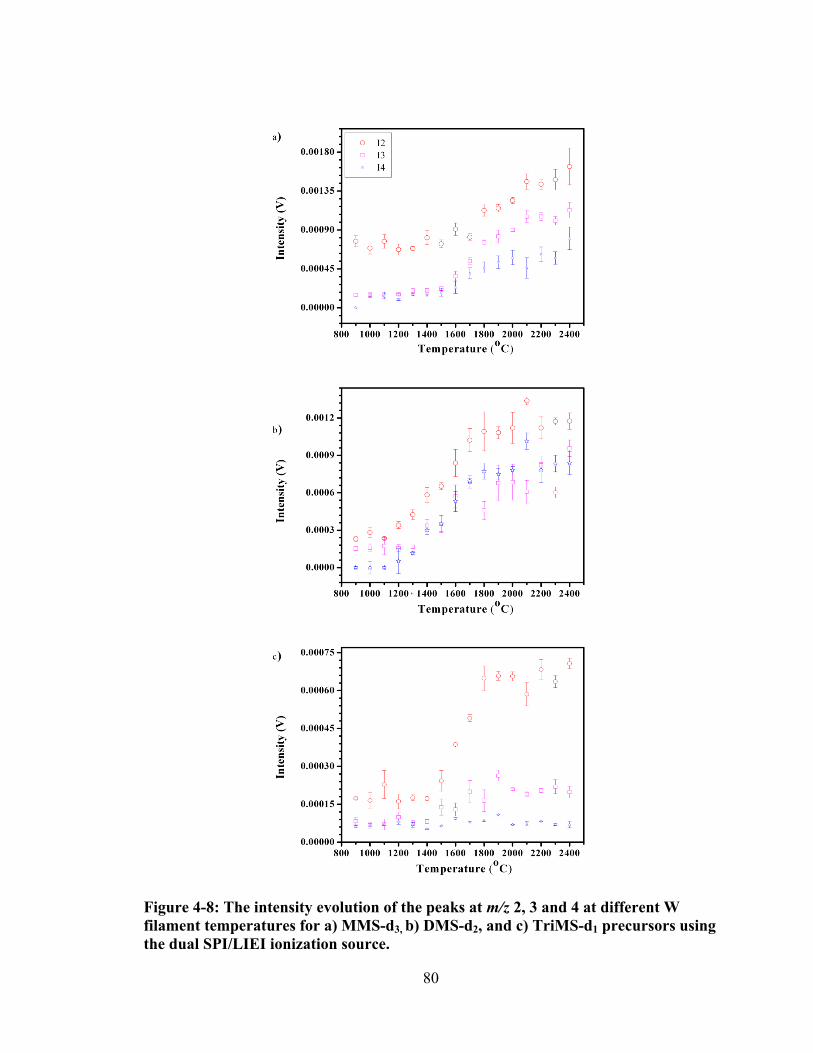
80
Figure 4-8: The intensity evolution of the peaks at m/z 2, 3 and 4 at different W filament temperatures for a) MMS-d3, b) DMS-d2, and c) TriMS-d1 precursors using the dual SPI/LIEI ionization source.
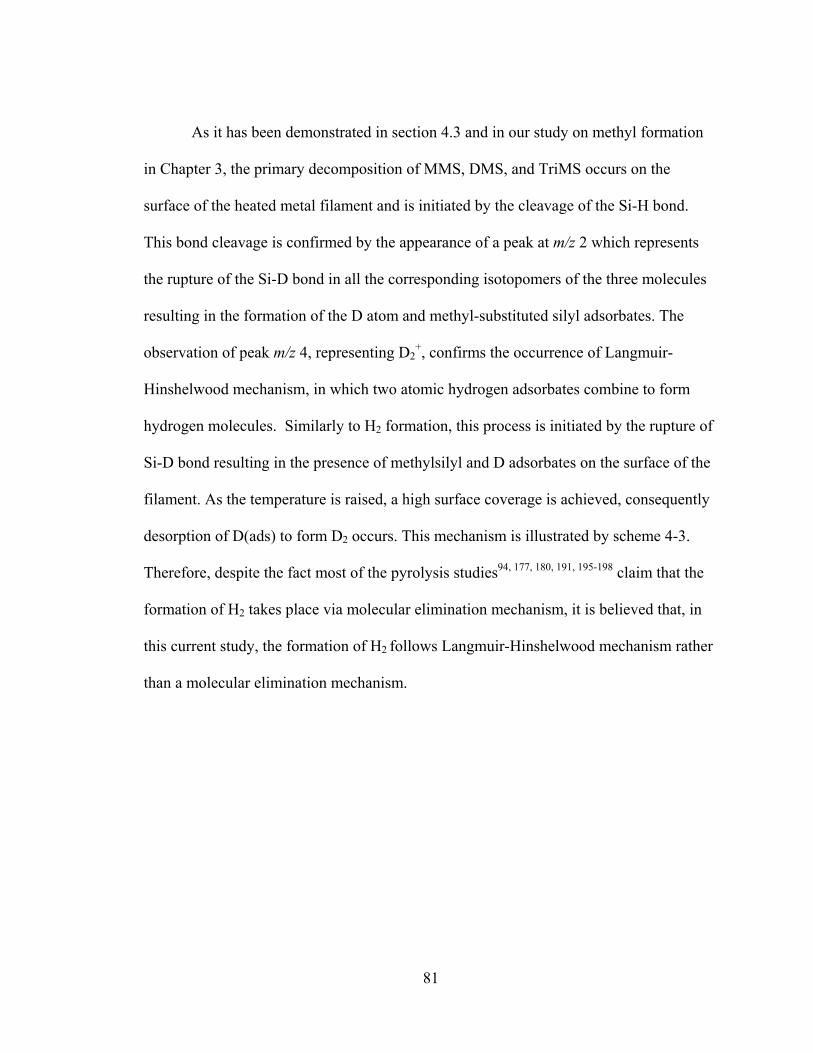
81
As it has been demonstrated in section 4.3 and in our study on methyl formation
in Chapter 3, the primary decomposition of MMS, DMS, and TriMS occurs on the
surface of the heated metal filament and is initiated by the cleavage of the Si-H bond.
This bond cleavage is confirmed by the appearance of a peak at m/z 2 which represents
the rupture of the Si-D bond in all the corresponding isotopomers of the three molecules
resulting in the formation of the D atom and methyl-substituted silyl adsorbates. The
observation of peak m/z 4, representing D2+, confirms the occurrence of Langmuir-
Hinshelwood mechanism, in which two atomic hydrogen adsorbates combine to form
hydrogen molecules. Similarly to H2 formation, this process is initiated by the rupture of
Si-D bond resulting in the presence of methylsilyl and D adsorbates on the surface of the
filament. As the temperature is raised, a high surface coverage is achieved, consequently
desorption of D(ads) to form D2 occurs. This mechanism is illustrated by scheme 4-3.
Therefore, despite the fact most of the pyrolysis studies94, 177, 180, 191, 195-198 claim that the
formation of H2 takes place via molecular elimination mechanism, it is believed that, in
this current study, the formation of H2 follows Langmuir-Hinshelwood mechanism rather
than a molecular elimination mechanism.
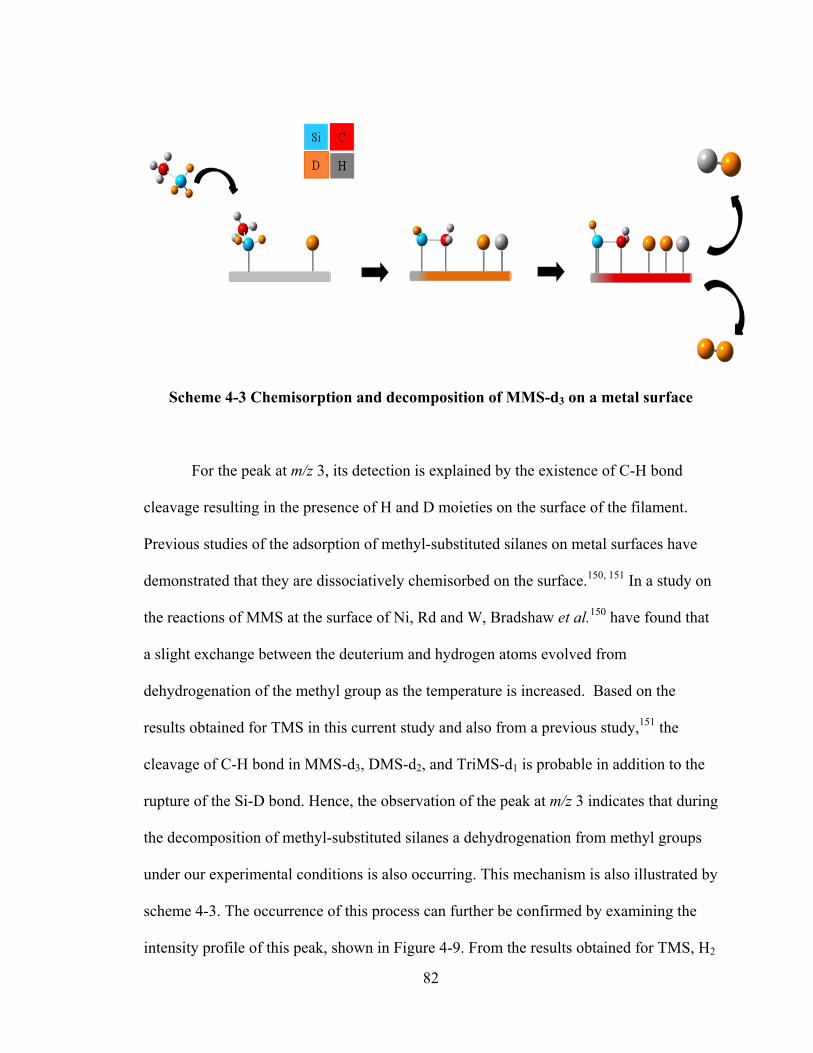
82
Scheme 4-3 Chemisorption and decomposition of MMS-d3 on a metal surface
For the peak at m/z 3, its detection is explained by the existence of C-H bond
cleavage resulting in the presence of H and D moieties on the surface of the filament.
Previous studies of the adsorption of methyl-substituted silanes on metal surfaces have
demonstrated that they are dissociatively chemisorbed on the surface.150, 151 In a study on
the reactions of MMS at the surface of Ni, Rd and W, Bradshaw et al.150 have found that
a slight exchange between the deuterium and hydrogen atoms evolved from
dehydrogenation of the methyl group as the temperature is increased. Based on the
results obtained for TMS in this current study and also from a previous study,151 the
cleavage of C-H bond in MMS-d3, DMS-d2, and TriMS-d1 is probable in addition to the
rupture of the Si-D bond. Hence, the observation of the peak at m/z 3 indicates that during
the decomposition of methyl-substituted silanes a dehydrogenation from methyl groups
under our experimental conditions is also occurring. This mechanism is also illustrated by
scheme 4-3. The occurrence of this process can further be confirmed by examining the
intensity profile of this peak, shown in Figure 4-9. From the results obtained for TMS, H2
83
molecule started to be formed at a temperature around 1600-1800 oC. This temperature is
indicative of C-H bond rupture taking place. By examining the temperature profile of
peak at m/z 3 for the three deuterated methyl-substituted silanes, it was noted that this
peak started to appear within the similar temperature range, which coincides with C-H
bond cleavage. Hence, this observation confirms that during the decomposition of
methyl-substituted silane molecules, the rupture of the C-H bond is also taking place
during the HWCVD process
In addition to obtaining an understanding of the mechanism involved in the
process of hydrogen elimination, the dominance of bond cleavage of Si-H (Si-D) versus
C-H is also examined. An analysis of the intensity profile of the peaks at m/z 2, 3 and 4
obtained in our system, shown in Figure 4-8, revealed that the rupture of Si-D bond,
which was represented by a peak at m/z 2, was the major initiation step occurring during
the decomposition of MMS, DMS and TriMS on a heated W filament, assuming the
ionization cross sections for peaks at m/z 2, 3 and 4 are the same. Therefore, the presence
and the dominance of the peak at m/z 2, representing deuterium atom, from the
isotopomer experiments suggest that under our experimental conditions H2 formation
proceeds in a stepwise mechanism by the formation of hydrogen adsorbates on the metal
filament surface. This adsorption process is in agreement with the previous studies on the
exposure of the metal surface to methyl-substituted silanes.156 As the temperature of the
filament is increased, a recombination reaction between adjacent H atoms takes place
releasing H2 molecule to the gas phase, following Langmuir-Hinshelwood mechanism. In
addition, the observation of peak at m/z 3 suggests the occurrence of C-H bond cleavage
in methyl-substituted silane molecules in a HWCVD process.
84
4.5 The Activation Energy of Forming H2 Molecules on W and Ta
Under the collision-free conditions, where the gas flow rate is constant, the
detected hydrogen molecule intensity shown in Figure 4-4 is proportional to the net
production rate of the hydrogen molecule.199 An examination of the temperature
evolution for the formation of H2 during the decomposition of TriMS, DMS and MMS
under collision-free conditions revealed an Arrhenius behaviour.
From the plotted data, the apparent activation energy (EaAPP) of H2 production
from W filament was extracted and found to be 70.7 ± 7.4 kJ · mol-1 for TriMS, 68.1 ±
5.8 kJ · mol-1 for DMS, and 55.4 ± 5.4 kJ · mol-1 for MMS in the filament temperatures
ranging from 1200 - 1500 oC to 2200 - 2400 oC. This is illustrated in a bar diagram in
Figure 4-9. These values are significantly lower than their respective Si-H bond
dissociation energies (BDE) which are 374.89, 374.05, and 377.82 kJ · mol-1 for MMS,
DMS and TriMS, respectively.37 This comparison indicates that the elimination of H2
during the decomposition of MMS, DMS and TriMS on a heated filament is a catalytic
process. For TMS, the H2+ peak intensity was extremely weak so that it was not possible
to extract meaningful activation energies values.
An examination of Eaapp values in Figure 4-9 revealed that the apparent activation
energy for the formation of H2 molecules increased with increasing methyl group present
in the precursor molecule. This trend implies that the decrease in the number of methyl
group and the corresponding increase in the number of H atoms results in a lowering in
the apparent energy barrier required for the cleavage of the Si-H bond. This is in good
agreement with the results from the previous study61 where it was found that the Ea for
the Si radical formation when using the same four precursor increases with increasing
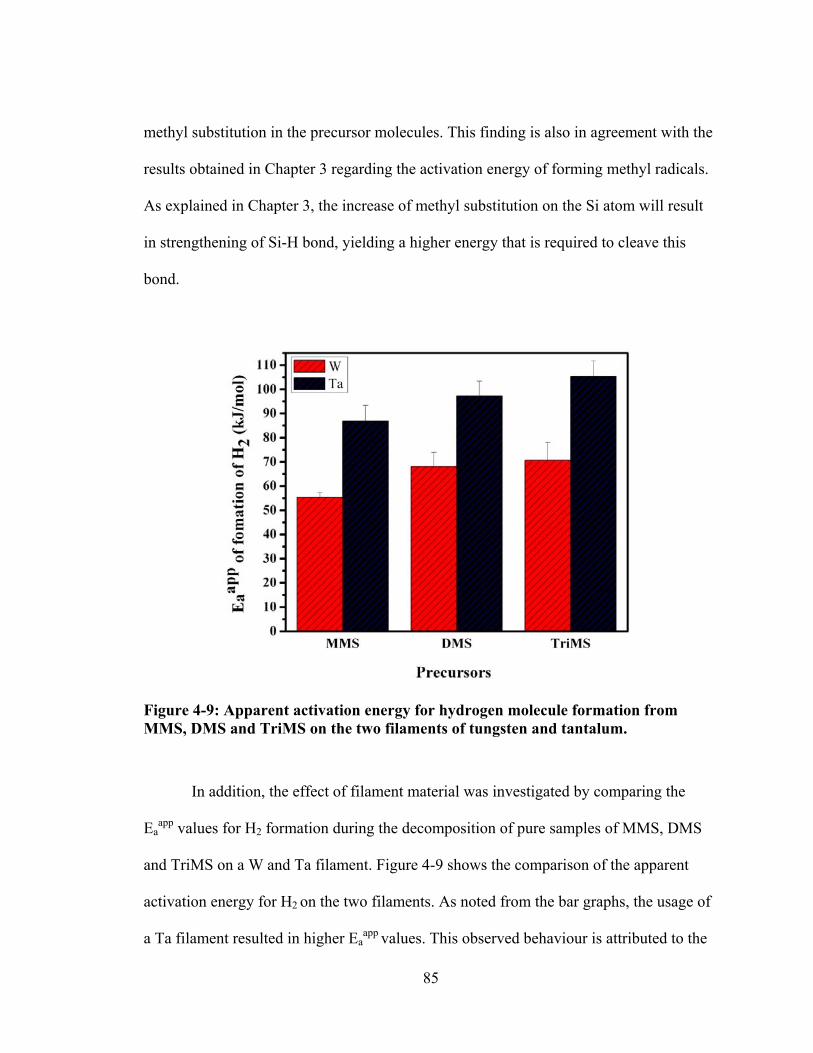
85
methyl substitution in the precursor molecules. This finding is also in agreement with the
results obtained in Chapter 3 regarding the activation energy of forming methyl radicals.
As explained in Chapter 3, the increase of methyl substitution on the Si atom will result
in strengthening of Si-H bond, yielding a higher energy that is required to cleave this
bond.
Figure 4-9: Apparent activation energy for hydrogen molecule formation from MMS, DMS and TriMS on the two filaments of tungsten and tantalum.
In addition, the effect of filament material was investigated by comparing the
Eaapp values for H2 formation during the decomposition of pure samples of MMS, DMS
and TriMS on a W and Ta filament. Figure 4-9 shows the comparison of the apparent
activation energy for H2 on the two filaments. As noted from the bar graphs, the usage of
a Ta filament resulted in higher Eaapp values. This observed behaviour is attributed to the
86
different strength of the binding energy of H atom to either of the metal surfaces. Both
theoretical200 and experimental201 studies have stated that the binding energy of H on Ta
has a value of 93 – 99 kcal/mol (i.e., a 389 – 414 kJ/mol) and 75 – 76 kcal/mol (i.e., a
314 – 318 kJ/mol)on W. This explains the difference in Eaapp values obtained under our
experimental conditions. In a way, it will require more energy to break the bond between
H and Ta than the H-W bond. Additionally, the value of desorption energy of H2 from a
metal surface was examined. It was found that the desorption energy from W varies from
1.7 to 2.0 eV (i.e., a 164.0 – 190.0 kJ/mol), and from Ta this value was between 2.9 and
3.1 eV (i.e., a 279.8 – 299.1 kJ/mol).202 A comparison between these values showed that
the obtained Eaapp values for the formation of H2 molecules under our experimental
conditions is much lower than both the H2 desorption energy and relevant bond breaking
energy. These lower energy values are attributed to the formation of Si-X (X= W or Ta)
bond occurring concurrently with Si-H bond scission, resulting in the lowering of the
energy barrier.158 The same conclusion was obtained for methyl radical formation, as
explained in Chapter 3.
4.6 1,1-H2 and 1,2-H2 Elimination: A Theoretical Study
From the previous discussions, it was demonstrated that the process of hydrogen
formation during the decomposition of methyl-substituted silane molecules in a HWCVD
system occurs at the surface of the heated metal filament and follows the Langmuir-
Hinshelwood mechanism. However, the results from pyrolysis studies in the literature
claim that the evolution of H2 proceeds via molecular elimination process. To confirm the
role of the metal surface, ab initio calculations on the formation of H2 in the gas phase
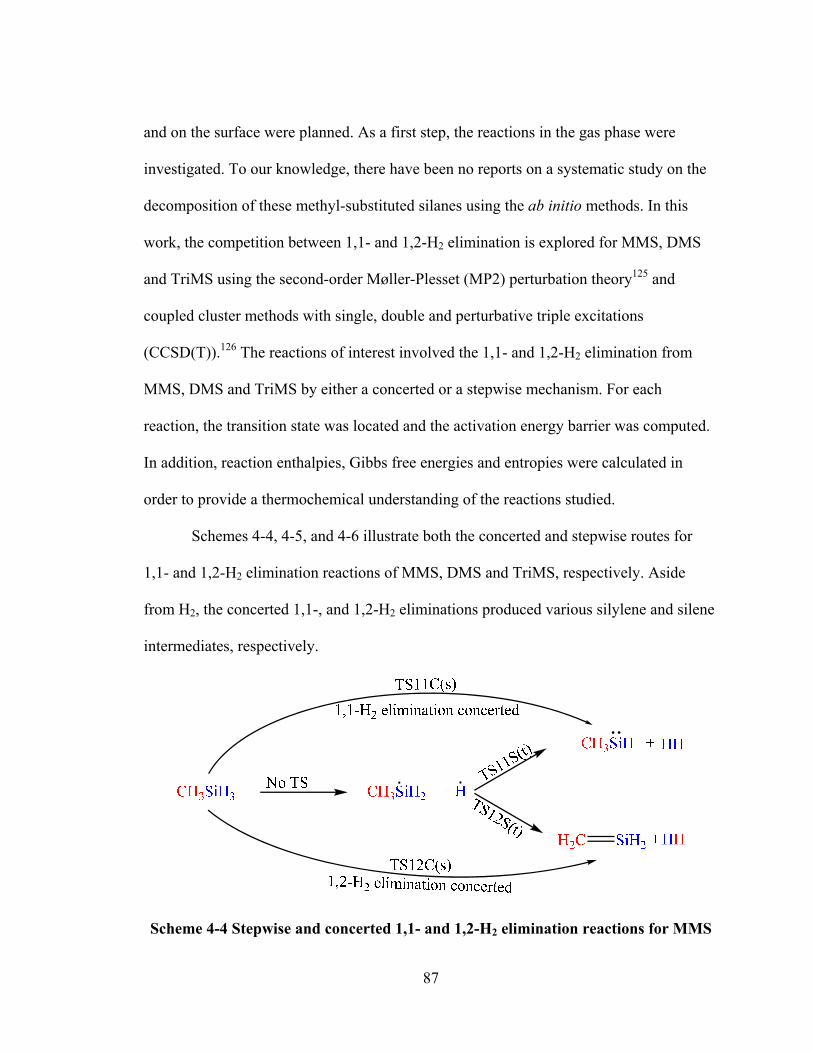
87
and on the surface were planned. As a first step, the reactions in the gas phase were
investigated. To our knowledge, there have been no reports on a systematic study on the
decomposition of these methyl-substituted silanes using the ab initio methods. In this
work, the competition between 1,1- and 1,2-H2 elimination is explored for MMS, DMS
and TriMS using the second-order Møller-Plesset (MP2) perturbation theory125 and
coupled cluster methods with single, double and perturbative triple excitations
(CCSD(T)).126 The reactions of interest involved the 1,1- and 1,2-H2 elimination from
MMS, DMS and TriMS by either a concerted or a stepwise mechanism. For each
reaction, the transition state was located and the activation energy barrier was computed.
In addition, reaction enthalpies, Gibbs free energies and entropies were calculated in
order to provide a thermochemical understanding of the reactions studied.
Schemes 4-4, 4-5, and 4-6 illustrate both the concerted and stepwise routes for
1,1- and 1,2-H2 elimination reactions of MMS, DMS and TriMS, respectively. Aside
from H2, the concerted 1,1-, and 1,2-H2 eliminations produced various silylene and silene
intermediates, respectively.
Scheme 4-4 Stepwise and concerted 1,1- and 1,2-H2 elimination reactions for MMS
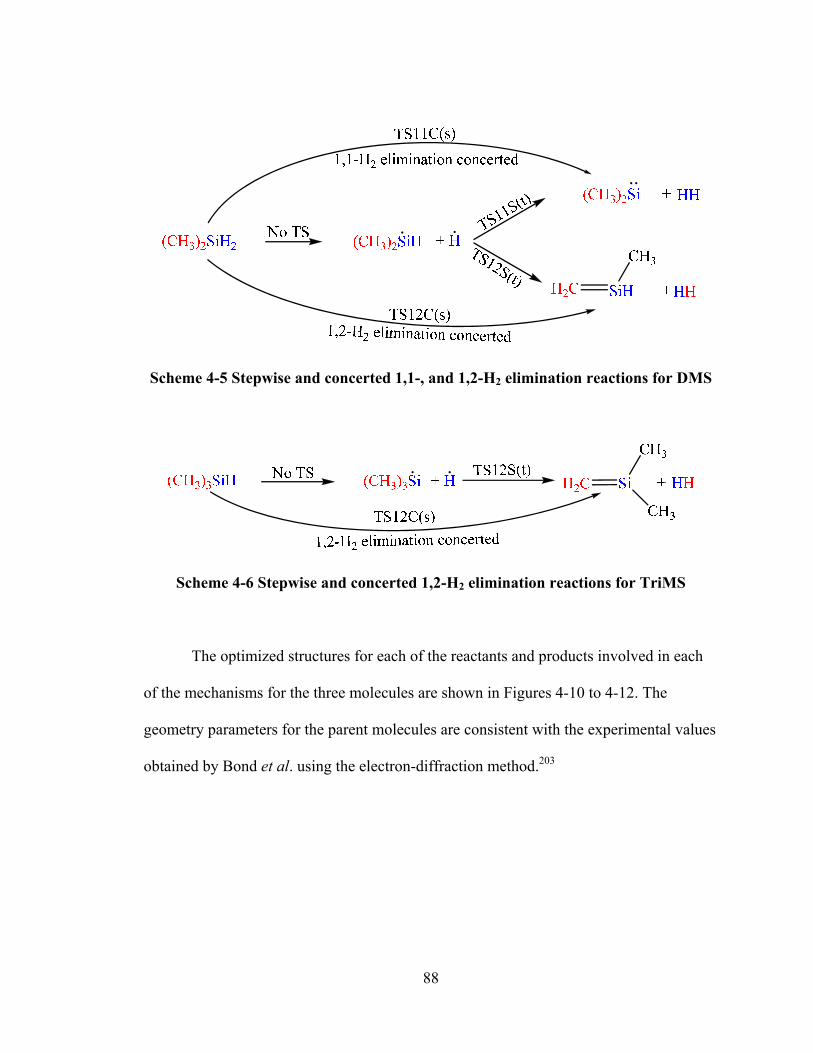
88
Scheme 4-5 Stepwise and concerted 1,1-, and 1,2-H2 elimination reactions for DMS
Scheme 4-6 Stepwise and concerted 1,2-H2 elimination reactions for TriMS
The optimized structures for each of the reactants and products involved in each
of the mechanisms for the three molecules are shown in Figures 4-10 to 4-12. The
geometry parameters for the parent molecules are consistent with the experimental values
obtained by Bond et al. using the electron-diffraction method.203
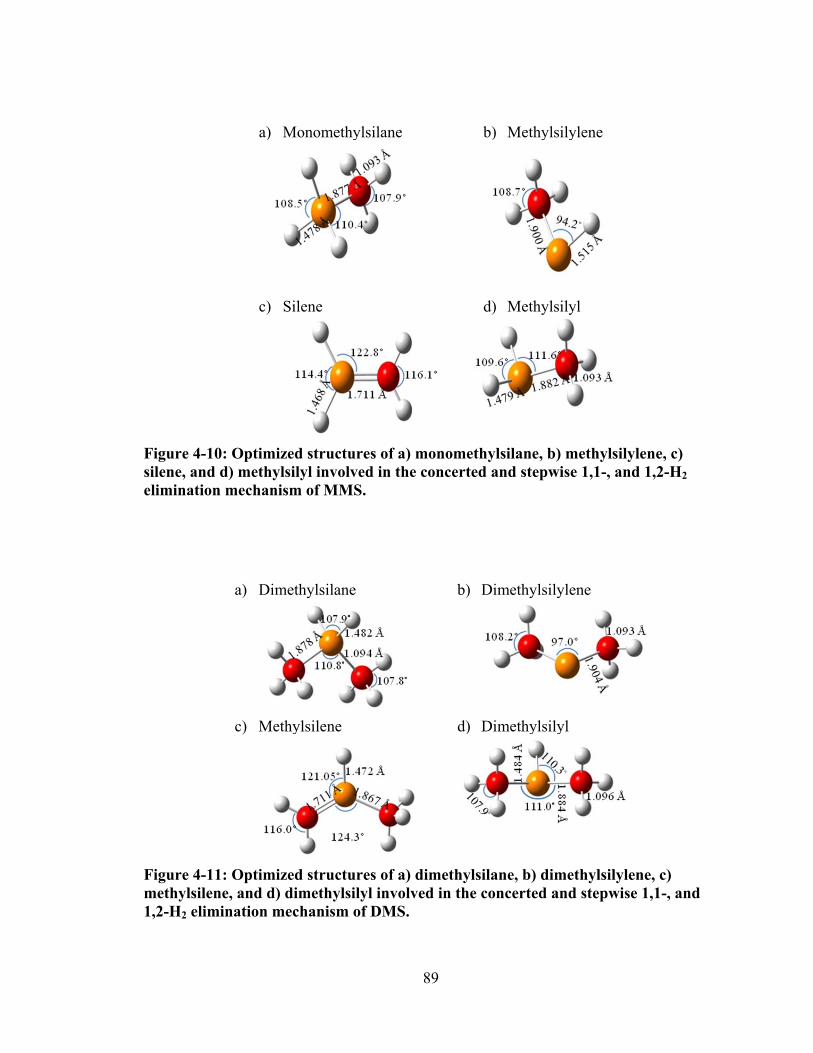
89
a) Monomethylsilane
b) Methylsilylene
c) Silene d) Methylsilyl
Figure 4-10: Optimized structures of a) monomethylsilane, b) methylsilylene, c) silene, and d) methylsilyl involved in the concerted and stepwise 1,1-, and 1,2-H2 elimination mechanism of MMS.
a) Dimethylsilane
b) Dimethylsilylene
c) Methylsilene d) Dimethylsilyl
Figure 4-11: Optimized structures of a) dimethylsilane, b) dimethylsilylene, c) methylsilene, and d) dimethylsilyl involved in the concerted and stepwise 1,1-, and 1,2-H2 elimination mechanism of DMS.
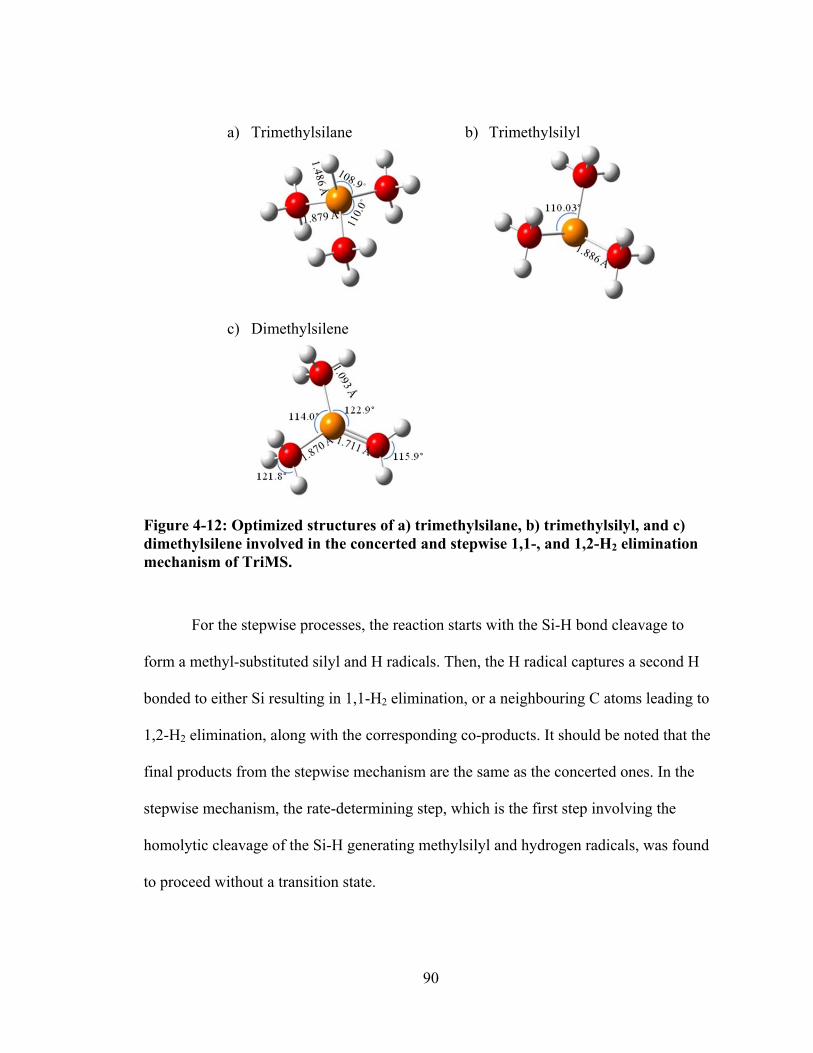
90
a) Trimethylsilane
b) Trimethylsilyl
c) Dimethylsilene
Figure 4-12: Optimized structures of a) trimethylsilane, b) trimethylsilyl, and c) dimethylsilene involved in the concerted and stepwise 1,1-, and 1,2-H2 elimination mechanism of TriMS.
For the stepwise processes, the reaction starts with the Si-H bond cleavage to
form a methyl-substituted silyl and H radicals. Then, the H radical captures a second H
bonded to either Si resulting in 1,1-H2 elimination, or a neighbouring C atoms leading to
1,2-H2 elimination, along with the corresponding co-products. It should be noted that the
final products from the stepwise mechanism are the same as the concerted ones. In the
stepwise mechanism, the rate-determining step, which is the first step involving the
homolytic cleavage of the Si-H generating methylsilyl and hydrogen radicals, was found
to proceed without a transition state.
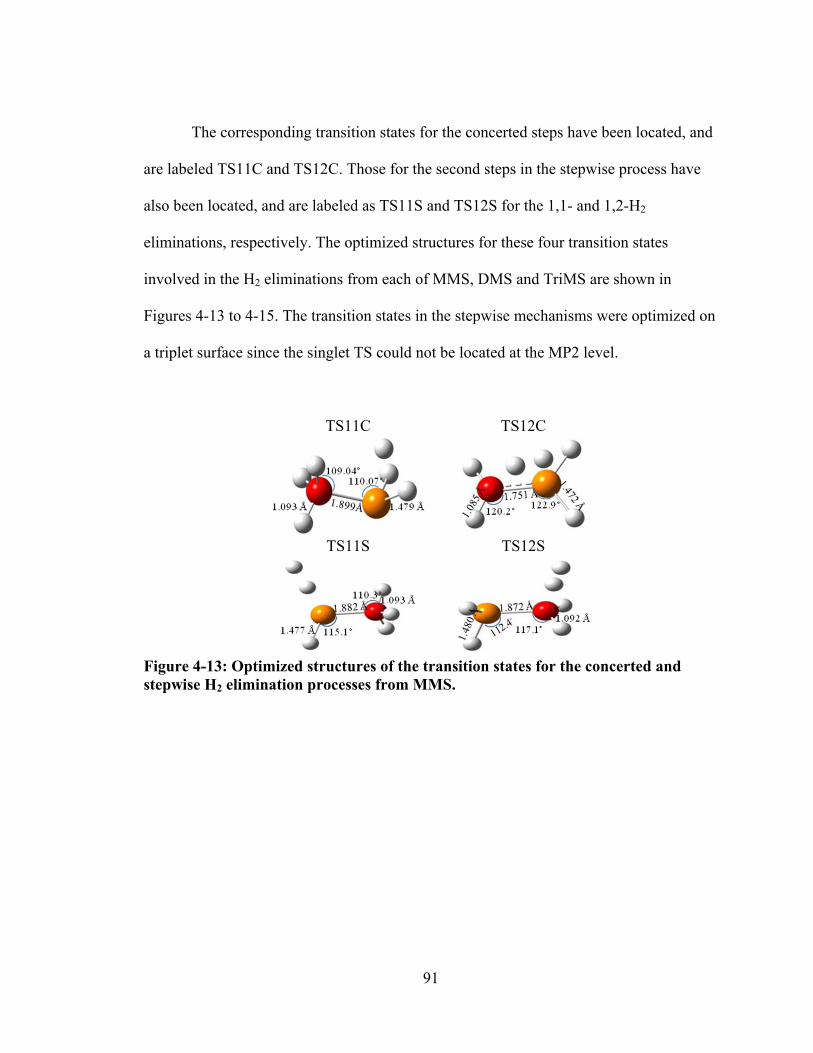
91
The corresponding transition states for the concerted steps have been located, and
are labeled TS11C and TS12C. Those for the second steps in the stepwise process have
also been located, and are labeled as TS11S and TS12S for the 1,1- and 1,2-H2
eliminations, respectively. The optimized structures for these four transition states
involved in the H2 eliminations from each of MMS, DMS and TriMS are shown in
Figures 4-13 to 4-15. The transition states in the stepwise mechanisms were optimized on
a triplet surface since the singlet TS could not be located at the MP2 level.
TS11C TS12C
TS11S TS12S
Figure 4-13: Optimized structures of the transition states for the concerted and stepwise H2 elimination processes from MMS.
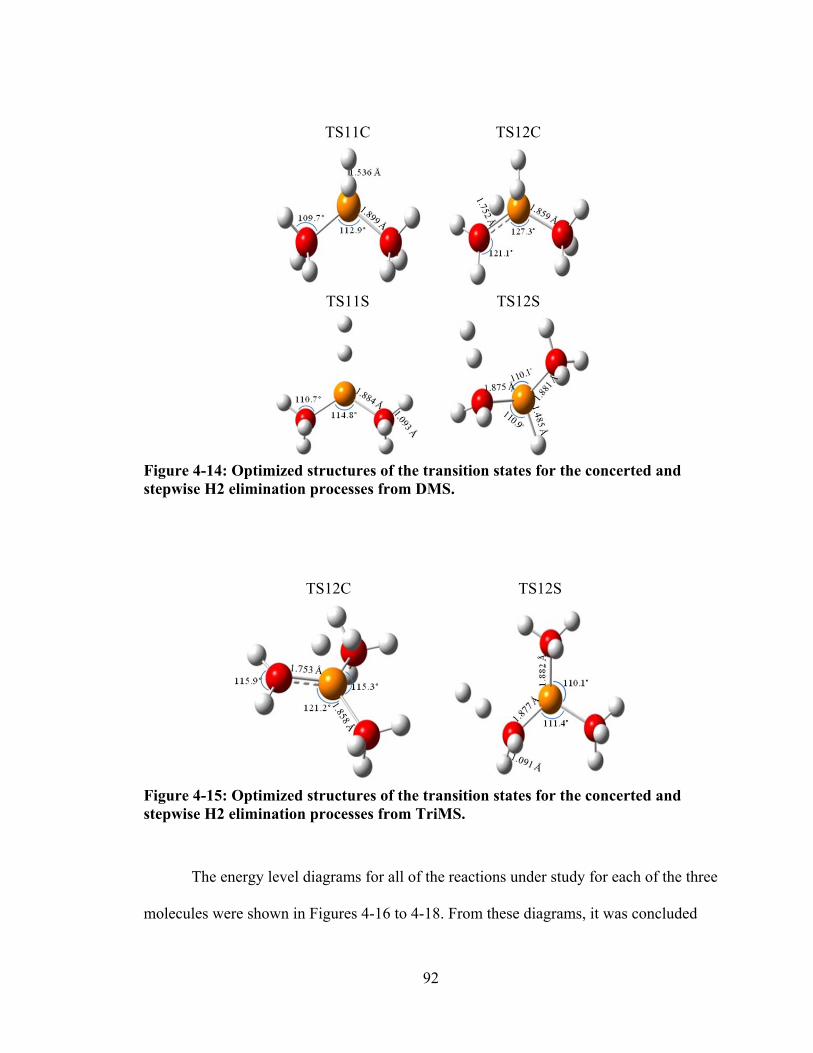
92
TS11C TS12C
TS11S TS12S
Figure 4-14: Optimized structures of the transition states for the concerted and stepwise H2 elimination processes from DMS.
TS12C TS12S
Figure 4-15: Optimized structures of the transition states for the concerted and stepwise H2 elimination processes from TriMS.
The energy level diagrams for all of the reactions under study for each of the three
molecules were shown in Figures 4-16 to 4-18. From these diagrams, it was concluded
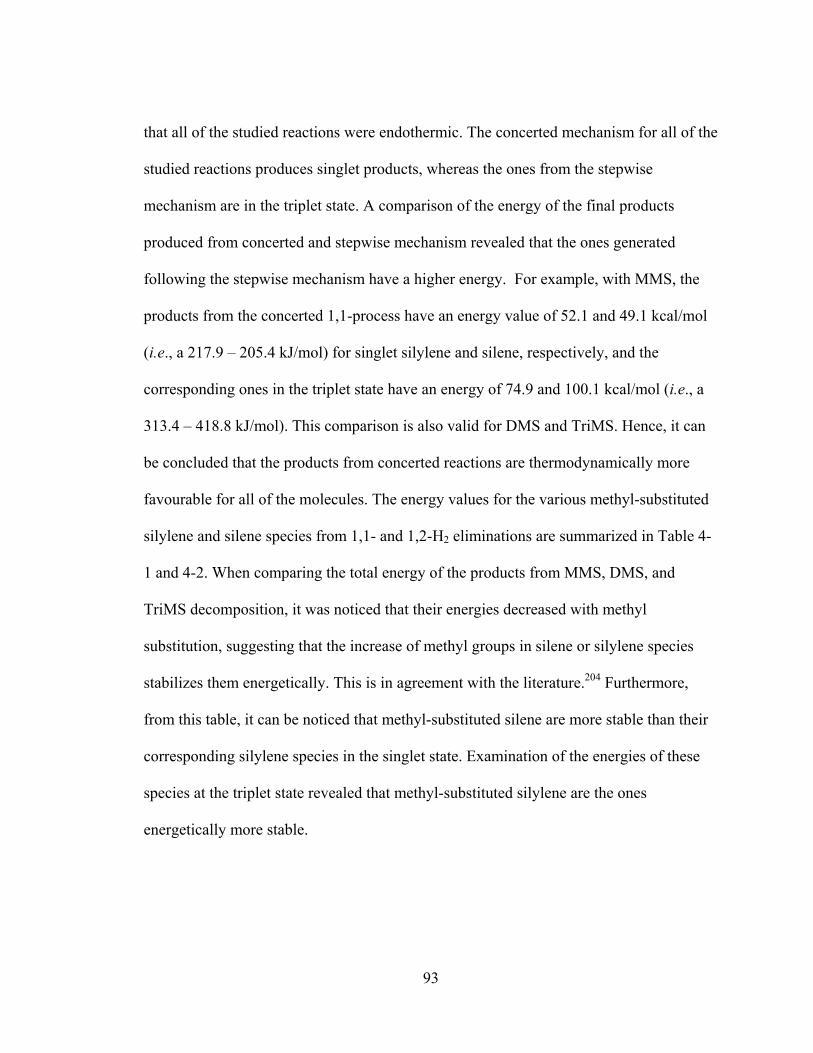
93
that all of the studied reactions were endothermic. The concerted mechanism for all of the
studied reactions produces singlet products, whereas the ones from the stepwise
mechanism are in the triplet state. A comparison of the energy of the final products
produced from concerted and stepwise mechanism revealed that the ones generated
following the stepwise mechanism have a higher energy. For example, with MMS, the
products from the concerted 1,1-process have an energy value of 52.1 and 49.1 kcal/mol
(i.e., a 217.9 – 205.4 kJ/mol) for singlet silylene and silene, respectively, and the
corresponding ones in the triplet state have an energy of 74.9 and 100.1 kcal/mol (i.e., a
313.4 – 418.8 kJ/mol). This comparison is also valid for DMS and TriMS. Hence, it can
be concluded that the products from concerted reactions are thermodynamically more
favourable for all of the molecules. The energy values for the various methyl-substituted
silylene and silene species from 1,1- and 1,2-H2 eliminations are summarized in Table 4-
1 and 4-2. When comparing the total energy of the products from MMS, DMS, and
TriMS decomposition, it was noticed that their energies decreased with methyl
substitution, suggesting that the increase of methyl groups in silene or silylene species
stabilizes them energetically. This is in agreement with the literature.204 Furthermore,
from this table, it can be noticed that methyl-substituted silene are more stable than their
corresponding silylene species in the singlet state. Examination of the energies of these
species at the triplet state revealed that methyl-substituted silylene are the ones
energetically more stable.
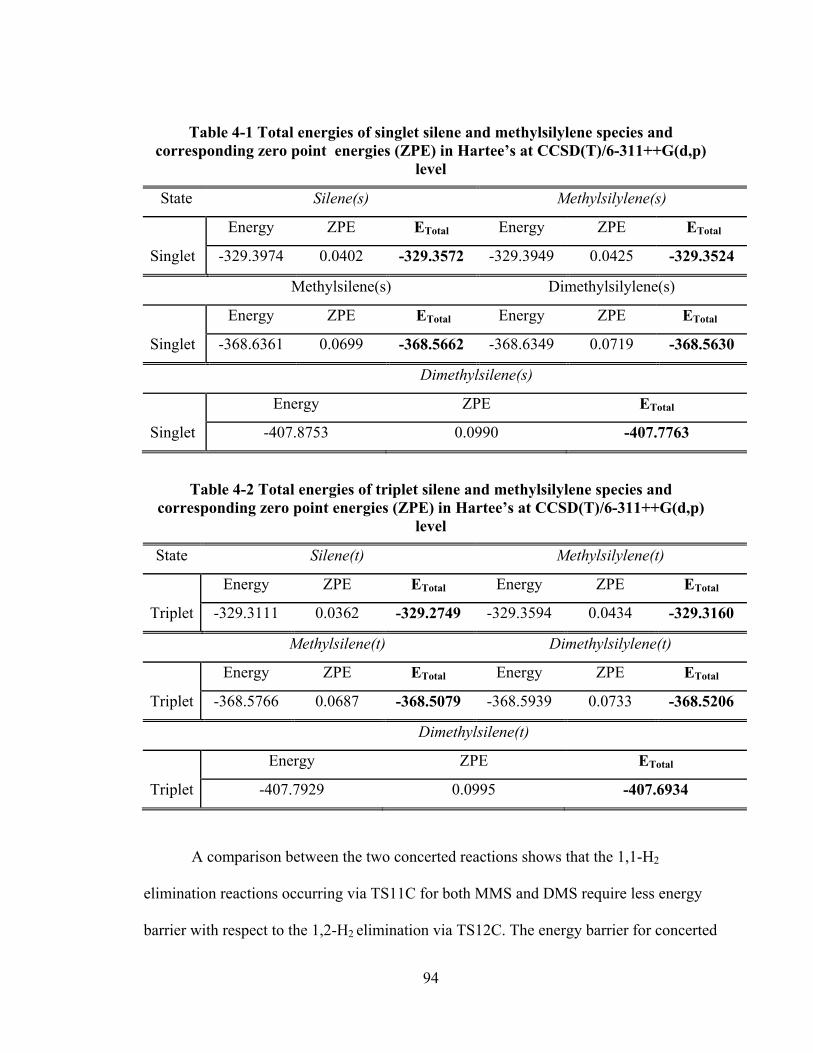
94
Table 4-1 Total energies of singlet silene and methylsilylene species and corresponding zero point energies (ZPE) in Hartee’s at CCSD(T)/6-311++G(d,p)
level
State Silene(s) Methylsilylene(s)
Energy ZPE ETotal Energy ZPE ETotal
Singlet -329.3974 0.0402 -329.3572 -329.3949 0.0425 -329.3524
Methylsilene(s) Dimethylsilylene(s)
Energy ZPE ETotal Energy ZPE ETotal
Singlet -368.6361 0.0699 -368.5662 -368.6349 0.0719 -368.5630
Dimethylsilene(s)
Energy ZPE ETotal
Singlet -407.8753 0.0990 -407.7763
Table 4-2 Total energies of triplet silene and methylsilylene species and corresponding zero point energies (ZPE) in Hartee’s at CCSD(T)/6-311++G(d,p)
level
State Silene(t) Methylsilylene(t)
Energy ZPE ETotal Energy ZPE ETotal
Triplet -329.3111 0.0362 -329.2749 -329.3594 0.0434 -329.3160
Methylsilene(t) Dimethylsilylene(t)
Energy ZPE ETotal Energy ZPE ETotal
Triplet -368.5766 0.0687 -368.5079 -368.5939 0.0733 -368.5206
Dimethylsilene(t)
Energy ZPE ETotal
Triplet -407.7929 0.0995 -407.6934
A comparison between the two concerted reactions shows that the 1,1-H2
elimination reactions occurring via TS11C for both MMS and DMS require less energy
barrier with respect to the 1,2-H2 elimination via TS12C. The energy barrier for concerted
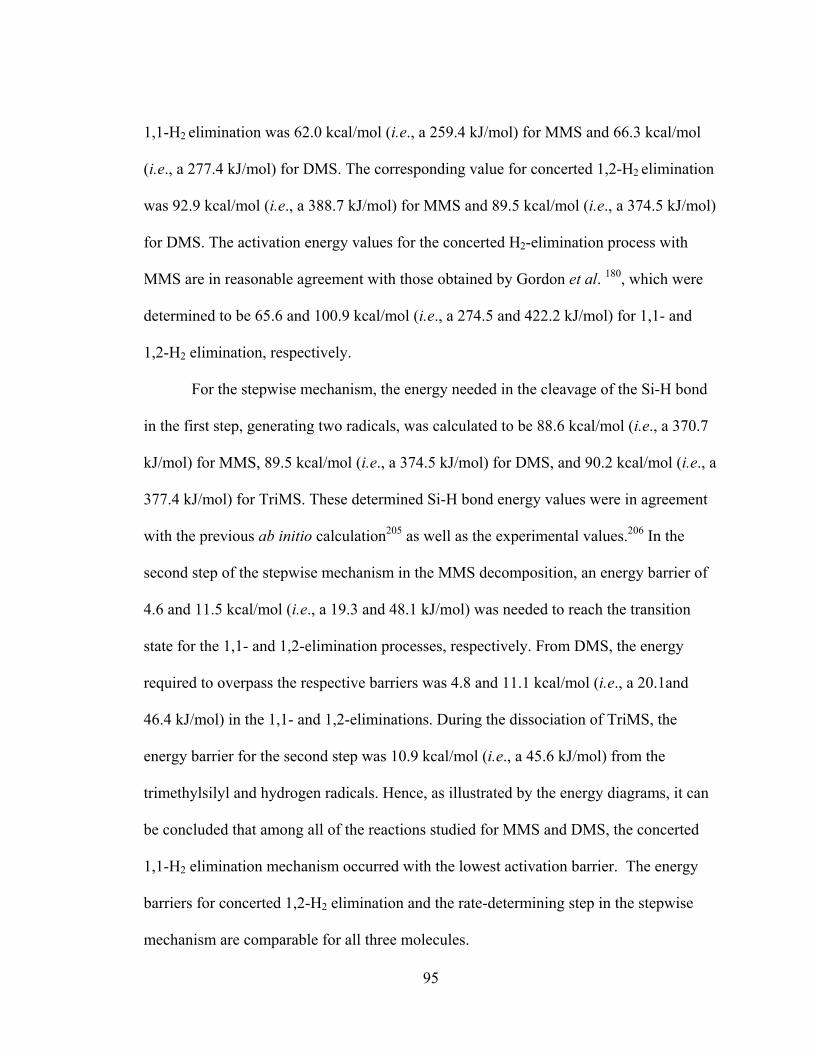
95
1,1-H2 elimination was 62.0 kcal/mol (i.e., a 259.4 kJ/mol) for MMS and 66.3 kcal/mol
(i.e., a 277.4 kJ/mol) for DMS. The corresponding value for concerted 1,2-H2 elimination
was 92.9 kcal/mol (i.e., a 388.7 kJ/mol) for MMS and 89.5 kcal/mol (i.e., a 374.5 kJ/mol)
for DMS. The activation energy values for the concerted H2-elimination process with
MMS are in reasonable agreement with those obtained by Gordon et al. 180, which were
determined to be 65.6 and 100.9 kcal/mol (i.e., a 274.5 and 422.2 kJ/mol) for 1,1- and
1,2-H2 elimination, respectively.
For the stepwise mechanism, the energy needed in the cleavage of the Si-H bond
in the first step, generating two radicals, was calculated to be 88.6 kcal/mol (i.e., a 370.7
kJ/mol) for MMS, 89.5 kcal/mol (i.e., a 374.5 kJ/mol) for DMS, and 90.2 kcal/mol (i.e., a
377.4 kJ/mol) for TriMS. These determined Si-H bond energy values were in agreement
with the previous ab initio calculation205 as well as the experimental values.206 In the
second step of the stepwise mechanism in the MMS decomposition, an energy barrier of
4.6 and 11.5 kcal/mol (i.e., a 19.3 and 48.1 kJ/mol) was needed to reach the transition
state for the 1,1- and 1,2-elimination processes, respectively. From DMS, the energy
required to overpass the respective barriers was 4.8 and 11.1 kcal/mol (i.e., a 20.1and
46.4 kJ/mol) in the 1,1- and 1,2-eliminations. During the dissociation of TriMS, the
energy barrier for the second step was 10.9 kcal/mol (i.e., a 45.6 kJ/mol) from the
trimethylsilyl and hydrogen radicals. Hence, as illustrated by the energy diagrams, it can
be concluded that among all of the reactions studied for MMS and DMS, the concerted
1,1-H2 elimination mechanism occurred with the lowest activation barrier. The energy
barriers for concerted 1,2-H2 elimination and the rate-determining step in the stepwise
mechanism are comparable for all three molecules.
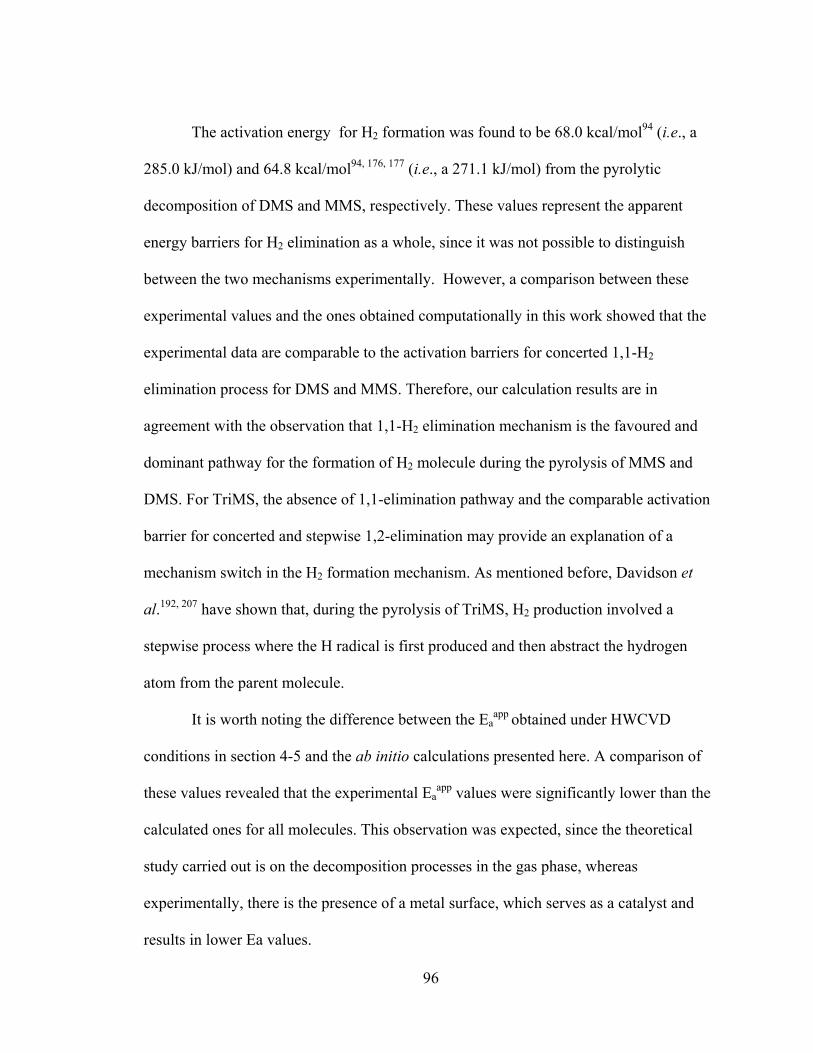
96
The activation energy for H2 formation was found to be 68.0 kcal/mol94 (i.e., a
285.0 kJ/mol) and 64.8 kcal/mol94, 176, 177 (i.e., a 271.1 kJ/mol) from the pyrolytic
decomposition of DMS and MMS, respectively. These values represent the apparent
energy barriers for H2 elimination as a whole, since it was not possible to distinguish
between the two mechanisms experimentally. However, a comparison between these
experimental values and the ones obtained computationally in this work showed that the
experimental data are comparable to the activation barriers for concerted 1,1-H2
elimination process for DMS and MMS. Therefore, our calculation results are in
agreement with the observation that 1,1-H2 elimination mechanism is the favoured and
dominant pathway for the formation of H2 molecule during the pyrolysis of MMS and
DMS. For TriMS, the absence of 1,1-elimination pathway and the comparable activation
barrier for concerted and stepwise 1,2-elimination may provide an explanation of a
mechanism switch in the H2 formation mechanism. As mentioned before, Davidson et
al.192, 207 have shown that, during the pyrolysis of TriMS, H2 production involved a
stepwise process where the H radical is first produced and then abstract the hydrogen
atom from the parent molecule.
It is worth noting the difference between the Eaapp obtained under HWCVD
conditions in section 4-5 and the ab initio calculations presented here. A comparison of
these values revealed that the experimental Eaapp values were significantly lower than the
calculated ones for all molecules. This observation was expected, since the theoretical
study carried out is on the decomposition processes in the gas phase, whereas
experimentally, there is the presence of a metal surface, which serves as a catalyst and
results in lower Ea values.
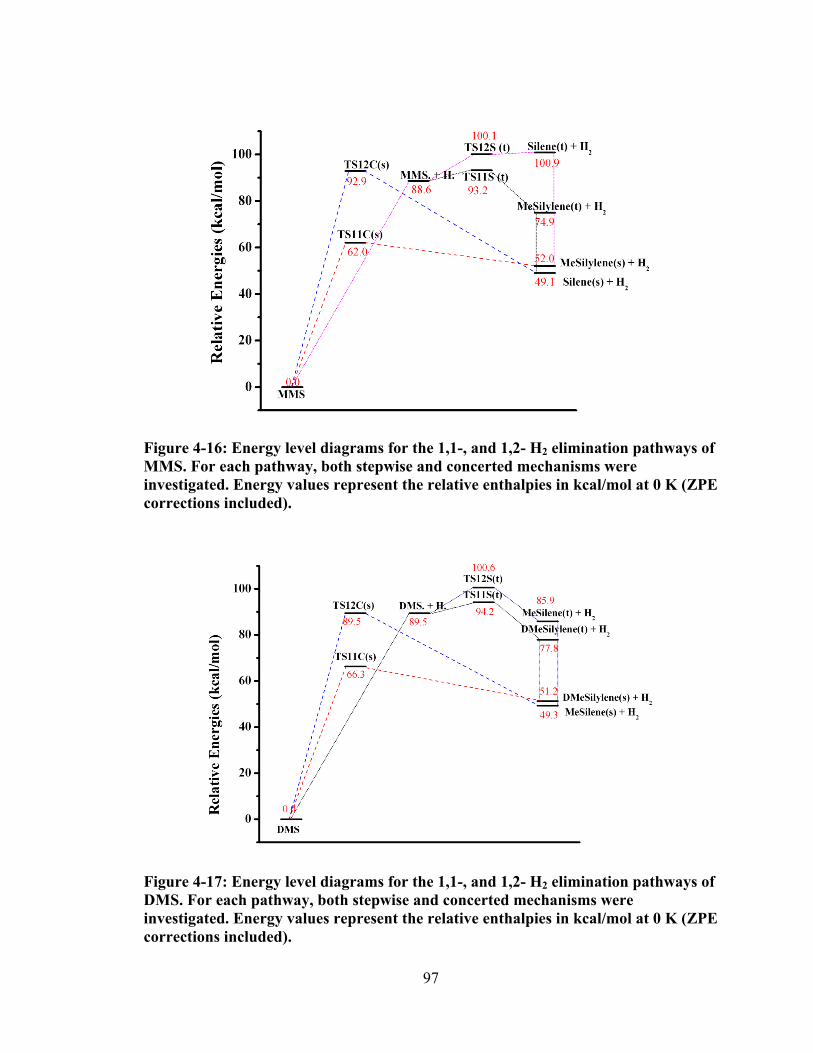
97
Figure 4-16: Energy level diagrams for the 1,1-, and 1,2- H2 elimination pathways of MMS. For each pathway, both stepwise and concerted mechanisms were investigated. Energy values represent the relative enthalpies in kcal/mol at 0 K (ZPE corrections included).
Figure 4-17: Energy level diagrams for the 1,1-, and 1,2- H2 elimination pathways of DMS. For each pathway, both stepwise and concerted mechanisms were investigated. Energy values represent the relative enthalpies in kcal/mol at 0 K (ZPE corrections included).
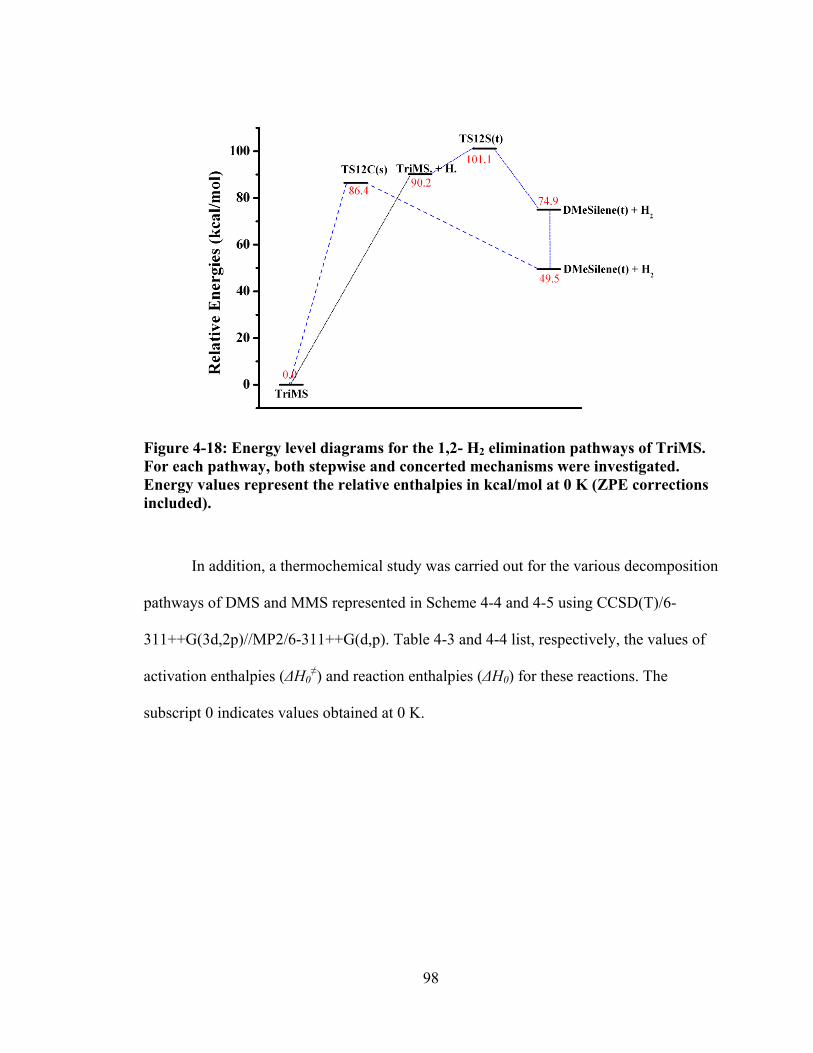
98
Figure 4-18: Energy level diagrams for the 1,2- H2 elimination pathways of TriMS. For each pathway, both stepwise and concerted mechanisms were investigated. Energy values represent the relative enthalpies in kcal/mol at 0 K (ZPE corrections included).
In addition, a thermochemical study was carried out for the various decomposition
pathways of DMS and MMS represented in Scheme 4-4 and 4-5 using CCSD(T)/6-
311++G(3d,2p)//MP2/6-311++G(d,p). Table 4-3 and 4-4 list, respectively, the values of
activation enthalpies (ΔH0≠) and reaction enthalpies (ΔH0) for these reactions. The
subscript 0 indicates values obtained at 0 K.
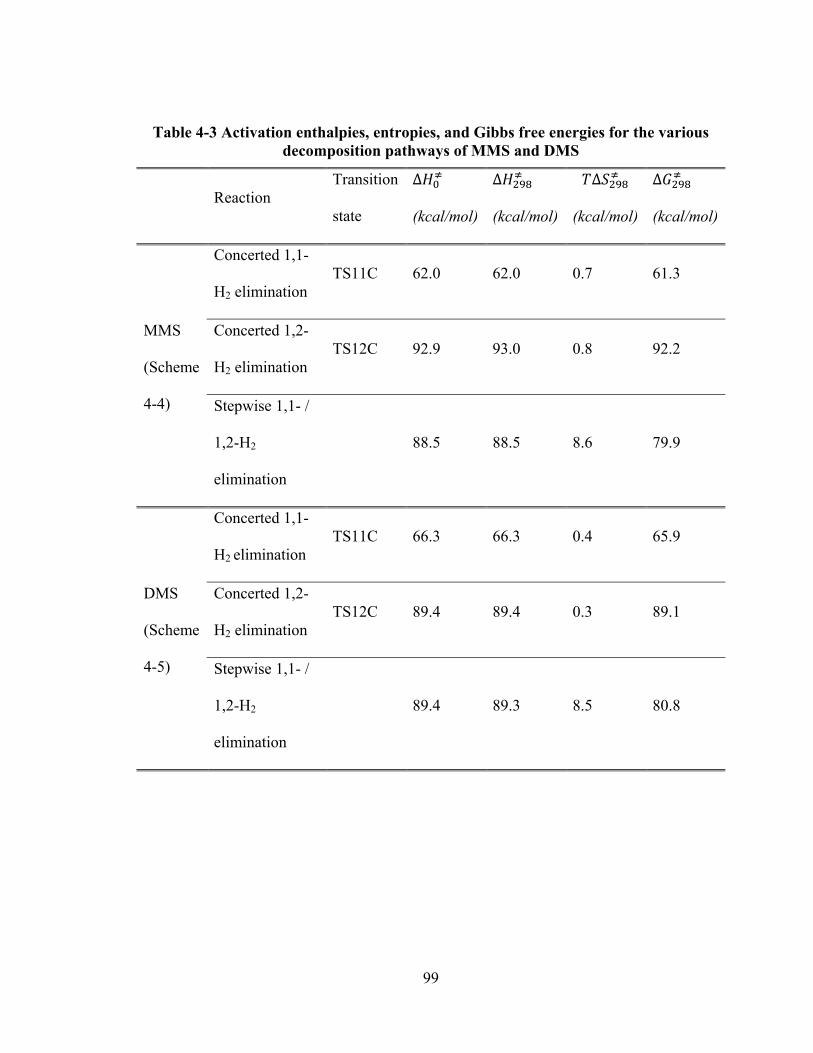
99
Table 4-3 Activation enthalpies, entropies, and Gibbs free energies for the various decomposition pathways of MMS and DMS
Reaction Transition
state
∆
(kcal/mol)
∆
(kcal/mol)
∆
(kcal/mol)
∆
(kcal/mol)
MMS
(Scheme
4-4)
Concerted 1,1-
H2 elimination TS11C 62.0 62.0 0.7 61.3
Concerted 1,2-
H2 elimination TS12C 92.9 93.0 0.8 92.2
Stepwise 1,1- /
1,2-H2
elimination
88.5 88.5 8.6 79.9
DMS
(Scheme
4-5)
Concerted 1,1-
H2 elimination TS11C 66.3 66.3 0.4 65.9
Concerted 1,2-
H2 elimination TS12C 89.4 89.4 0.3 89.1
Stepwise 1,1- /
1,2-H2
elimination
89.4 89.3 8.5 80.8
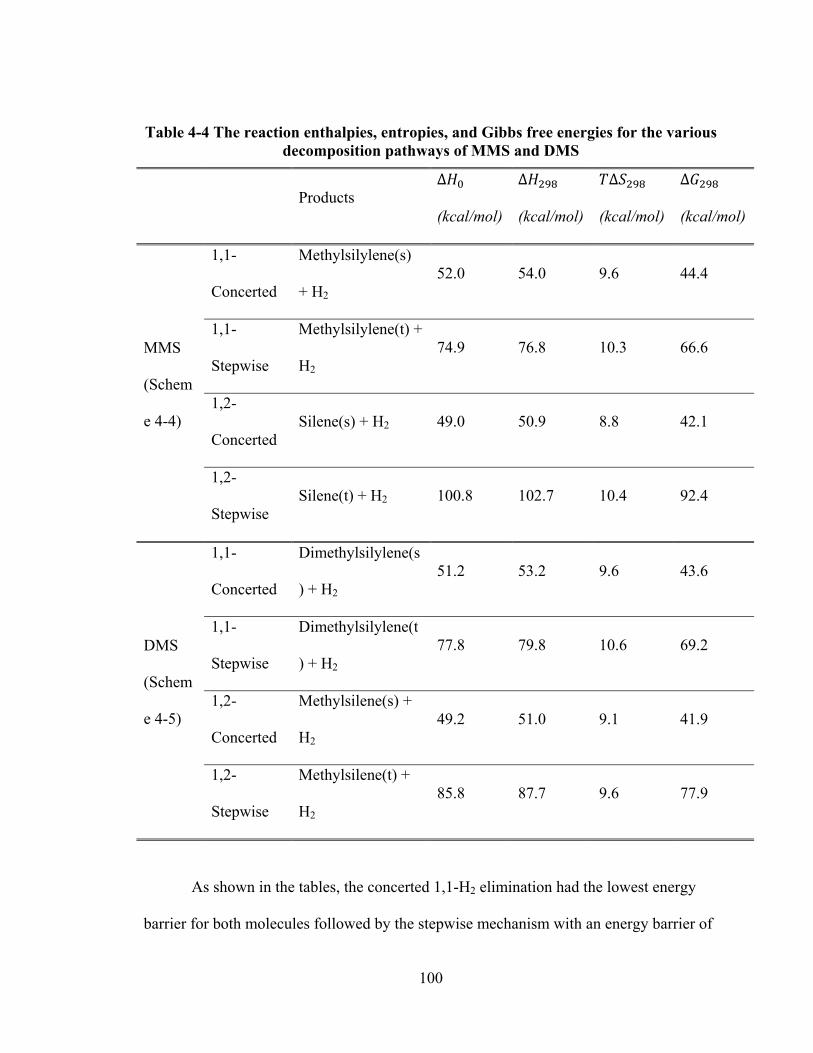
100
Table 4-4 The reaction enthalpies, entropies, and Gibbs free energies for the various decomposition pathways of MMS and DMS
Products ∆
(kcal/mol)
∆
(kcal/mol)
∆
(kcal/mol)
∆
(kcal/mol)
MMS
(Schem
e 4-4)
1,1-
Concerted
Methylsilylene(s)
+ H2 52.0 54.0 9.6 44.4
1,1-
Stepwise
Methylsilylene(t) +
H2 74.9 76.8 10.3 66.6
1,2-
Concerted Silene(s) + H2 49.0 50.9 8.8 42.1
1,2-
Stepwise Silene(t) + H2 100.8 102.7 10.4 92.4
DMS
(Schem
e 4-5)
1,1-
Concerted
Dimethylsilylene(s
) + H2 51.2 53.2 9.6 43.6
1,1-
Stepwise
Dimethylsilylene(t
) + H2 77.8 79.8 10.6 69.2
1,2-
Concerted
Methylsilene(s) +
H2 49.2 51.0 9.1 41.9
1,2-
Stepwise
Methylsilene(t) +
H2 85.8 87.7 9.6 77.9
As shown in the tables, the concerted 1,1-H2 elimination had the lowest energy
barrier for both molecules followed by the stepwise mechanism with an energy barrier of
101
88.5 kcal/mol (i.e., a 370.3 kJ/mol) for MMS and 89.4 kcal/mol (i.e., a 374.1 kJ/mol) for
DMS. Interestingly, the concerted mechanism for the 1,2-H2 elimination resulted in the
highest activation barrier of 92.9 and 89.4 kcal/mol (i.e., a 388.7 and 374.1 kJ/mol) for
MMS and DMS, respectively. Examination of the reaction enthalpy for the same
reactions revealed that the endothermicity of the concerted reactions was comparable,
with the 1,2-H2 elimination forming silene molecules slightly less endorthermic than the
respective 1,1-H2 elimination process.
The effect of temperature change on the activation and reaction enthalpy (ΔH≠ ,
ΔH), entropy (ΔS≠ , ΔS) and Gibbs free energy (ΔG≠ , ΔG) was also examined by
calculating these parameters at a room temperature of 298 K. Tables 4-3 and 4-4 also list
the thermochemical and kinetic parameters obtained at 298 K. As noted in these tables,
all of the entropies of activations are positive. This observation is explained by the fact
that the reactions involved in Scheme 4-4 and 4-5 are decomposition reactions. For both
molecules, the concerted mechanism showed lower ∆ value in comparison to the
stepwise mechanism. The magnitude of entropy values is believed to be related to the
transition state structure. If ∆ is relatively high, this indicates a loose structure of the
transition state; and if ∆ is relatively low, the structure of the transition state is
considered to be tight in nature.208 Furthermore, it was noted that the increase of
temperature from 0 to 298 K did not exert any effect on the sequence of either the
reaction enthalpy or activation enthalpy for both molecules. In terms of the Gibbs free
energies of activation, it was concluded that the enthalpy term is the major contributor by
comparing the values of ΔH298≠ with ∆ . Among all of the reactions studied, the
102
concerted 1,1-H2 elimination process provided the lowest ∆ value for both
molecules.
A comparison of the values of entropy of activation ∆ and reaction entropy
∆ showed that the latter was higher. This is attributed to the fact that in the overall
reactions one reactant molecule decomposes to form two different species as products,
thus increasing the reaction entropy. The increased difference between ∆ and ∆
is indicative that the reaction entropy started to contribute more to the Gibb free energy.
This contribution is expected to increase significantly with further increase in
temperature. Based on the ab initio calculations, increasing the temperature to 298 K did
not affect the preference towards the concerted 1,1-H2 elimination process, which is the
most kinetically and thermodynamically favourable.
To better understand the process of H2 formation and relate it to our experimental
results, the thermochemical study was also performed at a temperature range between
298 K to 2000 K. Figure 4-19 and 4-20 illustrate the temperature distribution of Gibbs
free energy of activation (ΔG≠) for the concerted and stepwise H2 elimination processes
from DMS and MMS decomposition. From these two Figures, it was noticed that the
increase in the temperature only affected majorly the stepwise mechanisms due to the
significant contributions of the entropy term to the Gibbs free energy term. Examining
the entropy values in Table 4-3, it was noticed that at 298 K this term is in the range of
0.4 to 0.8 kcal/mol for the concerted mechanism and for the stepwise mechanism this
value is increased to 8.5 and 8.6 kcal/mol. This difference is further enhanced with
increasing temperature. The energy for the concerted pathway is relatively constant
throughout the entire temperature range. As demonstrated previously, the concerted
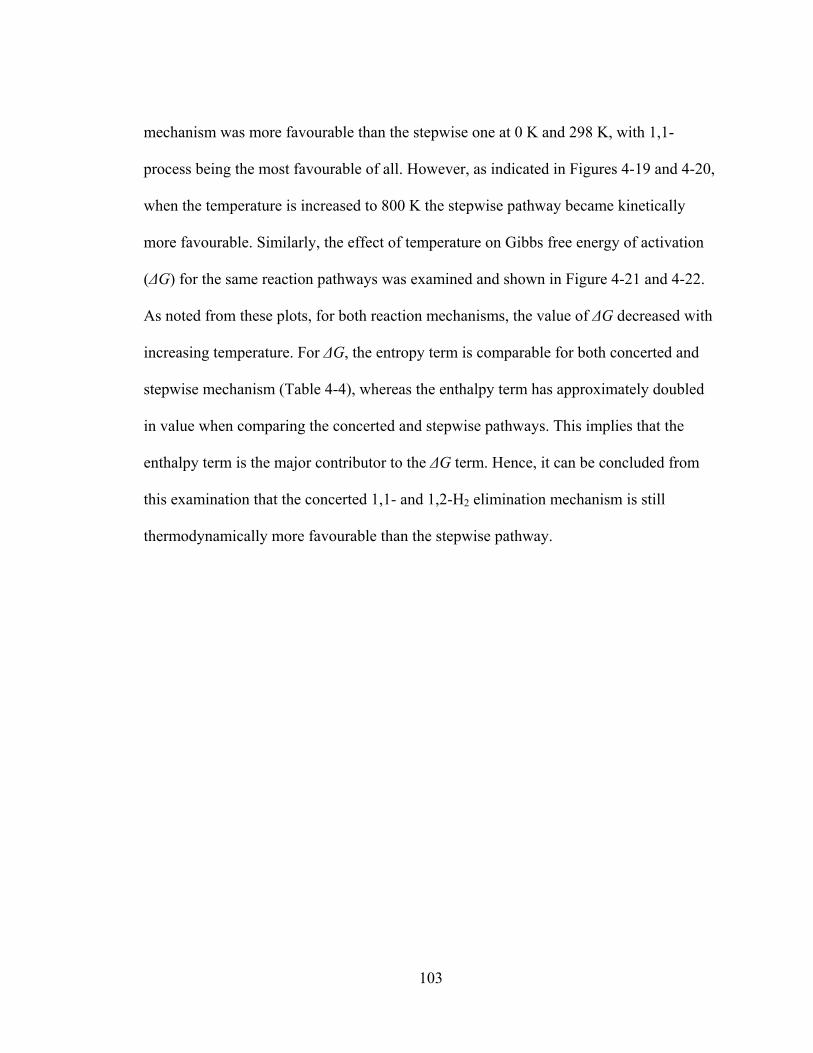
103
mechanism was more favourable than the stepwise one at 0 K and 298 K, with 1,1-
process being the most favourable of all. However, as indicated in Figures 4-19 and 4-20,
when the temperature is increased to 800 K the stepwise pathway became kinetically
more favourable. Similarly, the effect of temperature on Gibbs free energy of activation
(ΔG) for the same reaction pathways was examined and shown in Figure 4-21 and 4-22.
As noted from these plots, for both reaction mechanisms, the value of ΔG decreased with
increasing temperature. For ΔG, the entropy term is comparable for both concerted and
stepwise mechanism (Table 4-4), whereas the enthalpy term has approximately doubled
in value when comparing the concerted and stepwise pathways. This implies that the
enthalpy term is the major contributor to the ΔG term. Hence, it can be concluded from
this examination that the concerted 1,1- and 1,2-H2 elimination mechanism is still
thermodynamically more favourable than the stepwise pathway.
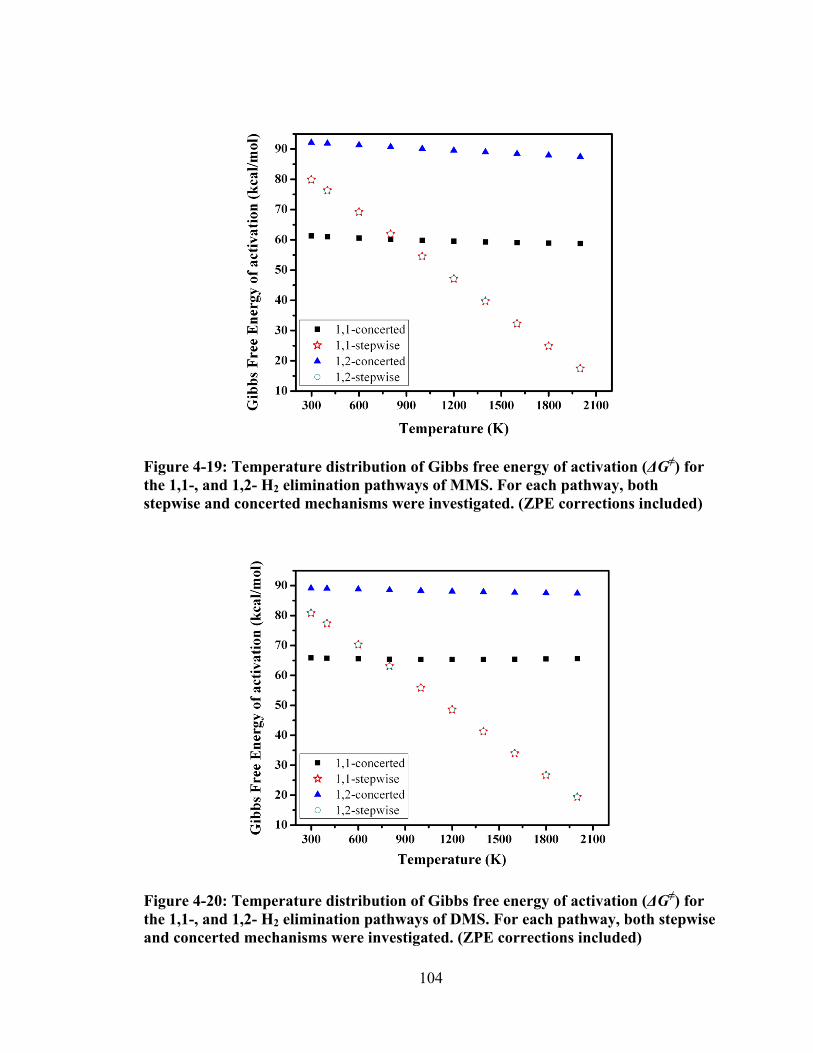
104
Figure 4-19: Temperature distribution of Gibbs free energy of activation (ΔG≠) for the 1,1-, and 1,2- H2 elimination pathways of MMS. For each pathway, both stepwise and concerted mechanisms were investigated. (ZPE corrections included)
Figure 4-20: Temperature distribution of Gibbs free energy of activation (ΔG≠) for the 1,1-, and 1,2- H2 elimination pathways of DMS. For each pathway, both stepwise and concerted mechanisms were investigated. (ZPE corrections included)
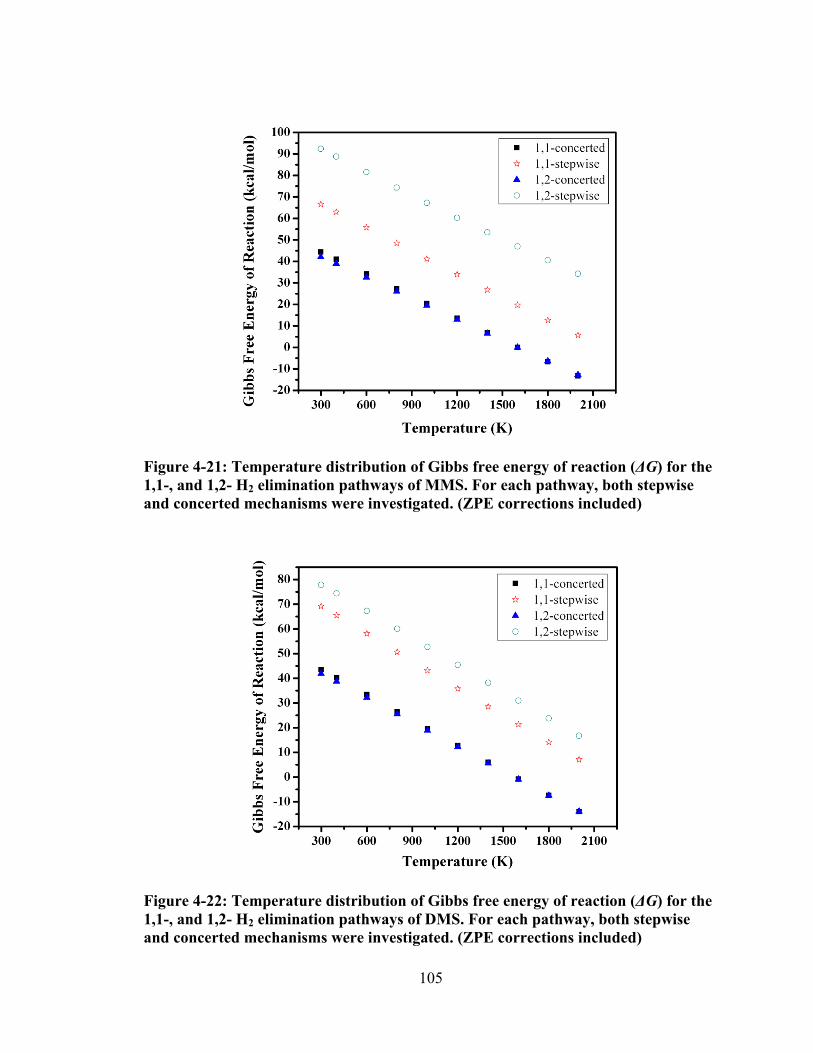
105
Figure 4-21: Temperature distribution of Gibbs free energy of reaction (ΔG) for the 1,1-, and 1,2- H2 elimination pathways of MMS. For each pathway, both stepwise and concerted mechanisms were investigated. (ZPE corrections included)
Figure 4-22: Temperature distribution of Gibbs free energy of reaction (ΔG) for the 1,1-, and 1,2- H2 elimination pathways of DMS. For each pathway, both stepwise and concerted mechanisms were investigated. (ZPE corrections included)
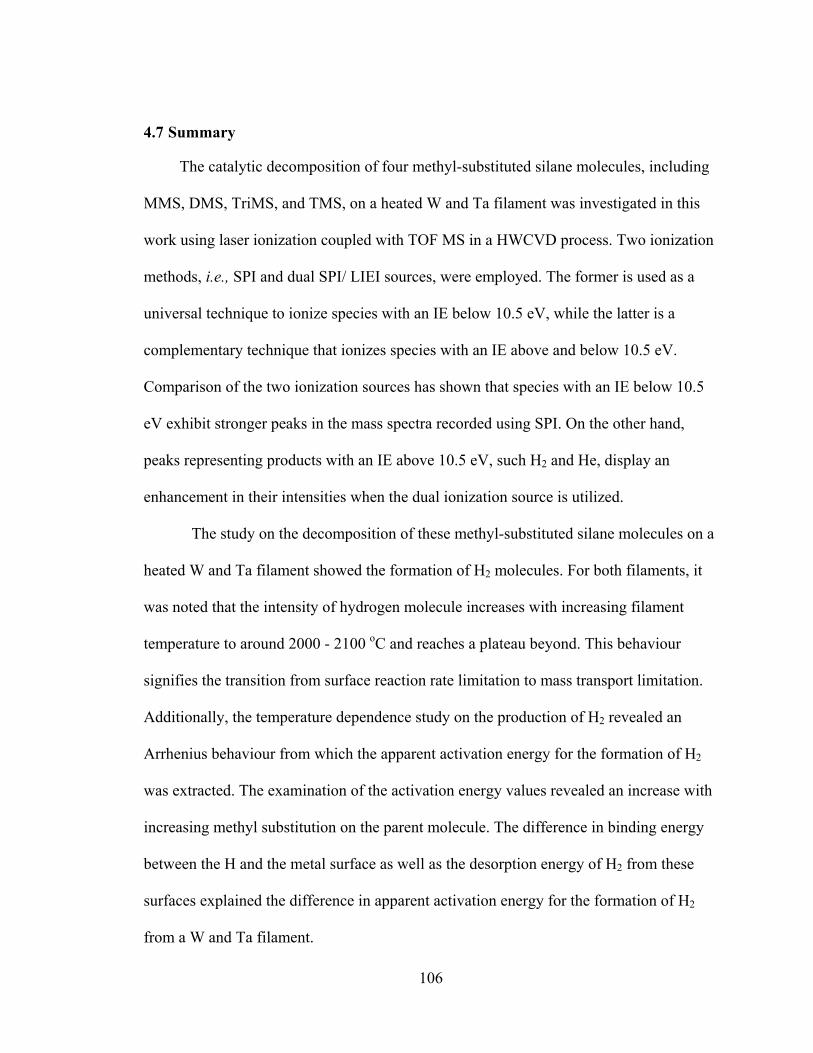
106
4.7 Summary
The catalytic decomposition of four methyl-substituted silane molecules, including
MMS, DMS, TriMS, and TMS, on a heated W and Ta filament was investigated in this
work using laser ionization coupled with TOF MS in a HWCVD process. Two ionization
methods, i.e., SPI and dual SPI/ LIEI sources, were employed. The former is used as a
universal technique to ionize species with an IE below 10.5 eV, while the latter is a
complementary technique that ionizes species with an IE above and below 10.5 eV.
Comparison of the two ionization sources has shown that species with an IE below 10.5
eV exhibit stronger peaks in the mass spectra recorded using SPI. On the other hand,
peaks representing products with an IE above 10.5 eV, such H2 and He, display an
enhancement in their intensities when the dual ionization source is utilized.
The study on the decomposition of these methyl-substituted silane molecules on a
heated W and Ta filament showed the formation of H2 molecules. For both filaments, it
was noted that the intensity of hydrogen molecule increases with increasing filament
temperature to around 2000 - 2100 oC and reaches a plateau beyond. This behaviour
signifies the transition from surface reaction rate limitation to mass transport limitation.
Additionally, the temperature dependence study on the production of H2 revealed an
Arrhenius behaviour from which the apparent activation energy for the formation of H2
was extracted. The examination of the activation energy values revealed an increase with
increasing methyl substitution on the parent molecule. The difference in binding energy
between the H and the metal surface as well as the desorption energy of H2 from these
surfaces explained the difference in apparent activation energy for the formation of H2
from a W and Ta filament.

107
It was also demonstrated that the dissociation of these methyl-substituted silanes
on W and Ta surfaces is initiated by the Si-H bond cleavage, and as the temperature is
raised, C-H bond is also ruptured. The cleavage of these two bonds resulted in the
presence of H adsorbates on the filament surface. The recombination reaction of two
adsorbed H atoms leads to the formation H2 molecule, following the Langmuir-
Hinshelwood mechanism. This mechanism has been confirmed using the isotopomer of
MMS, DMS and TriMS where the formation of the peaks at m/z 3 and 4, representing HD
and D2, is observed.
Ab initio calculations on the possible H2 elimination pathways using MMS, DMS,
and TriMS were also carried out. Both concerted and stepwise 1,1- and 1,2-H2
elimination mechanisms were explored using ab initio methods at the CCSD(T)/6-
311++G(3d,2p)//MP2/6-311++G(d,p) level of theory. The results from theoretical
calculations suggest that the concerted 1,1-H2 elimination is the most kinetically
favorable of all pathways for MMS and DMS. The activation barriers for concerted 1,2-
H2 elimination and the rate-determining step in the stepwise mechanism are comparable
for all three molecules. Thermodynamically, the concerted mechanism is favourable. A
detailed thermodynamic and kinetic study was performed by examining the enthalpy
(ΔH≠), entropy (ΔS≠), and Gibbs free energy (ΔG≠) of activation along with reaction
enthalpy (ΔH), entropy (ΔS), and Gibbs free energy (ΔG) at both 0 K and 298 K. The
concerted 1,1- H2 elimination was found to be the most kinetically and
thermodynamically favourable route for the formation of H2 during the decomposition of
MMS and DMS at both temperatures.
108
Chapter Five: Role of Free-Radical and Methylsilene/Dimethylsilylene in the Reaction Chemistry of Dimethylsilane in a Hot-Wire Chemical Vapour Deposition
Process
5.1 Motivations
There have been several studies on the gas-phase chemistry during the pyrolysis
of dimethylsilane (DMS). Ring et al.176 studied the pyrolysis of DMS in a continuous
flow reactor and proposed that the decomposition of this precursor is initiated by either
molecular elimination to produce silylene (R2Si:)/silene (CH2=SiR2) or bond cleavage to
produce free radicals. The major primary dissociation reactions are represented by
Equations (5-1) to (5-4).
(5-1)
(5-2)
(5-3)
(5-4)
Rickborn et al.95 studied the shock-induced pyrolysis of DMS at 1135-1290 K and
concluded that the secondary reactions involved both free radical and silylene chain
reactions, with the latter being the dominant participant even when trapping agents are
added. Under stirred flow conditions, they found that the major products are
monomethylsilane and trimethylsilane with traces of ethene and acetylene. It has been
suggested that the two major products are the results of both dimethylsilylene ((CH3)2Si:)
and free radical reaction, while the minor ones come mainly from dimethylsilylene
decomposition through the intermediacy of a silirane and silacyclopropene. They also
109
concluded that the main primary dissociation reactions of DMS are H2 and methane
elimination, with methane elimination accounting for about 17% of the total primary
dissociation. The major involvement of silylene chemistry during the decomposition of
DMS was also supported by the study carried out by O’Neal and Ring.179 Their
mechanism is based on unimolecular and bimolecular reaction of silylene intermediates,
which explains the production of the complex linear and cyclic carbosilane products
observed during their study.
Despite its simple structure, DMS has received less attention than the other
methyl-substituted silanes as a possible precursor for the deposition of SiC thin films. In
an attempt to study the influence of filament materials, Nakayama et al.60 used DMS as a
source gas to prepare Si1-xCx thin films using Cat-CVD with four different filaments: W,
Ta, Mo and Pt. They found that filament materials affected the film composition. The
composition ratio C/Si in Si–C alloy films showed the maximum content for Pt.
Additionally, the growth rate was also found to depend on the filament materials; among
all filaments studied, W showed the maximum growth rate. Their results also showed the
activation energy to break the Si-C bond on W filament surface to be 3.89 eV, which is
lower than the Si-C bond dissociation energy of 4.68 eV. They concluded that the W
filament acted as a catalyst to lower the dissociation energy of Si-C bond through the
dissociation /adsorption processes. Furthermore, under conditions similar to the one used
in this thesis, Zaharias et al.61 identified the filament decomposition products of several
single source precursors, including MMS, DMS, TriMS and TMS. The major
decomposition products released from W or Re filaments with all of these precursors
were found to be Si and CH3. C and H radicals were also expected to be produced but
110
could not be detected. To correlate the gas-phase chemistry with deposited thin films
using the same precursors, Zaharias et al. collected infrared spectra of the grown films
and observed the presence of CH3 symmetric and antisymmetric stretching modes along
with a broad band assigned to SiH2. This silicon hydride was only detected in the films
grown from MMS, DMS and TriMS, and its origin is related to the hydrogenation of the
Si radicals, which were found to be the dominant species in the gas phase. They also
postulated that H radical, which is an important species in the film growth, is also
produced during the hot-wire decomposition of these precursors. The deposition
mechanism of SiC thin films with these single-source gases is not clear so far.
To gain better insights into the deposition chemistry of DMS in HWCVD, the
decomposition and secondary gas-phase reaction chemistry using DMS with both W and
Ta filaments has been studied in this work. Here, detection of decomposition products
released directly from the hot filament made of either W or Ta was carried out under
collision free-conditions for filament temperatures ranging from 900 °C to 2400 °C.
Mixtures with various concentrations of 1%, 4 %, and 10% DMS seeded in He were used
for the detection of gas-phase reaction products with a total gas pressure of 12 Torr in the
HWCVD reactor. Both W and Ta were used as filament materials. The filament
temperatures tested varied from 900 °C to 1800 °C. In order to confirm the assignments
of the mass peaks detected using DMS, spectra were also collected using a 4% DMS-
d2/He mixture. Several trapping agents, including 1,3-butadiene and ammonia, were used
to trap silylene and silene intermediates, as stated in Chapter 1. This serves to provide a
better understanding of the reaction mechanism and help confirm the involvement of
silene and silylene intermediates.
111
5.2 Primary Decomposition on Ta and W Filament
As described in a previous publication,67 the room-temperature TOF mass spectra
with DMS show predominantly two peaks at m/z 58 (Si(CH3)2+) and 60 (parent
H2Si(CH3)2+), with an intensity ratio of I(m/z 58)/I(m/z 60) = 2.13 ± 0.09. It is noted that
the parent ion peak intensity was much higher than the combined isotope contribution
from the peaks at m/z 58 and 59. In determining the primary decomposition products of
DMS, it was found that a new mass peak at m/z 15, assigned to methyl radical, appeared
after the filament was turned on for both W and Ta filaments. The mechanism for the
formation of this species is discussed in details in Chapter 3. It has been shown in
Chapter 3 that DMS dissociates on the hot W and Ta filament to methylsilyl and methyl
radicals, as represented by Equation (5-4).
In addition, we have demonstrated in Chapter 4 that DMS dissociates to form H
radical and also H2 molecule. The formation of H radicals via Si-H bond cleavage, as
represented by Equation (5-5), has been observed in previous pyrolysis studies95, 176, 177,
179, 183, 192, 207, 209 and during HWCVD processes.67, 89
(5-5)
The presence of the complementary fragment, i.e., dimethylsilyl radical ((CH3)2SiH•),
was confirmed by examining the ratio of this peak with respect to the parent ion peak
([M]+), shown in Figure 5-1a. This ratio increased with filament temperature, indicating
the presence of dimethylsilyl radical in the gas phase.
The H2 formation from the hot-wire decomposition of DMS follows the
Langmuir-Hinshelwood mechanism, as discussed in Chapter 4. Figure 5-1b shows the
plot of the intensity ratio of the fragment peak ([M-2]+) with respect to the parent ion
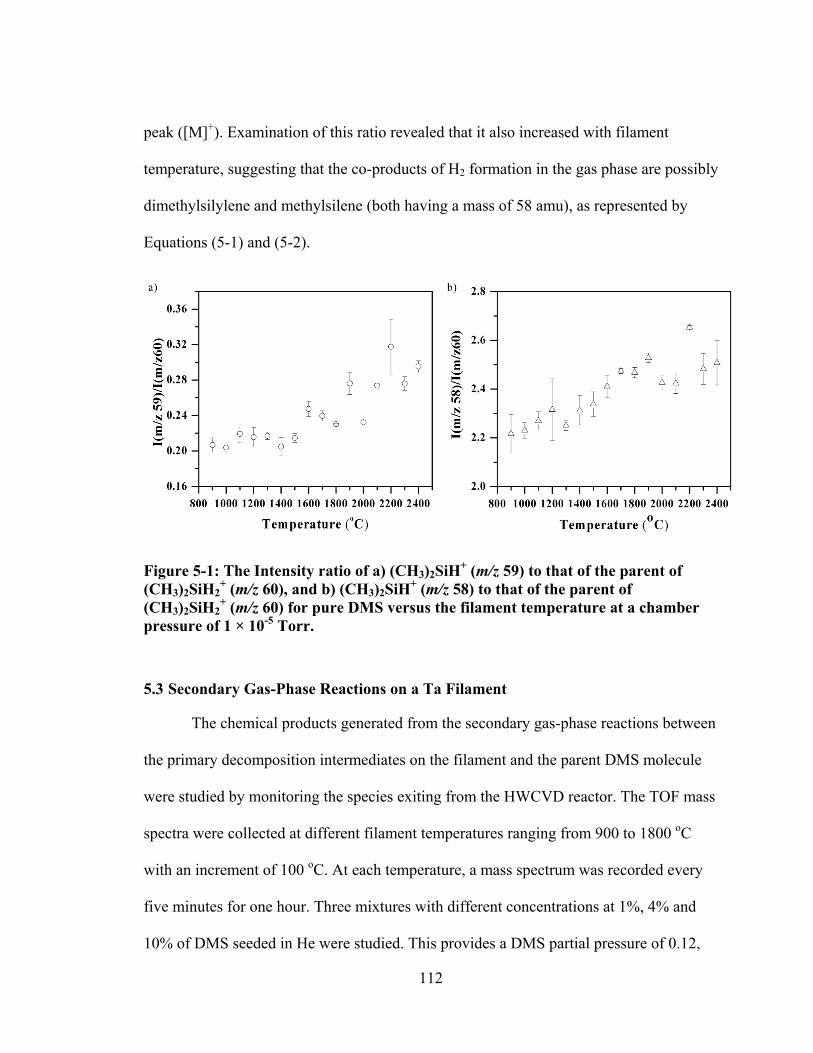
112
peak ([M]+). Examination of this ratio revealed that it also increased with filament
temperature, suggesting that the co-products of H2 formation in the gas phase are possibly
dimethylsilylene and methylsilene (both having a mass of 58 amu), as represented by
Equations (5-1) and (5-2).
Figure 5-1: The Intensity ratio of a) (CH3)2SiH+ (m/z 59) to that of the parent of (CH3)2SiH2
+ (m/z 60), and b) (CH3)2SiH+ (m/z 58) to that of the parent of (CH3)2SiH2
+ (m/z 60) for pure DMS versus the filament temperature at a chamber pressure of 1 × 10⁻⁵ Torr.
5.3 Secondary Gas-Phase Reactions on a Ta Filament
The chemical products generated from the secondary gas-phase reactions between
the primary decomposition intermediates on the filament and the parent DMS molecule
were studied by monitoring the species exiting from the HWCVD reactor. The TOF mass
spectra were collected at different filament temperatures ranging from 900 to 1800 oC
with an increment of 100 oC. At each temperature, a mass spectrum was recorded every
five minutes for one hour. Three mixtures with different concentrations at 1%, 4% and
10% of DMS seeded in He were studied. This provides a DMS partial pressure of 0.12,
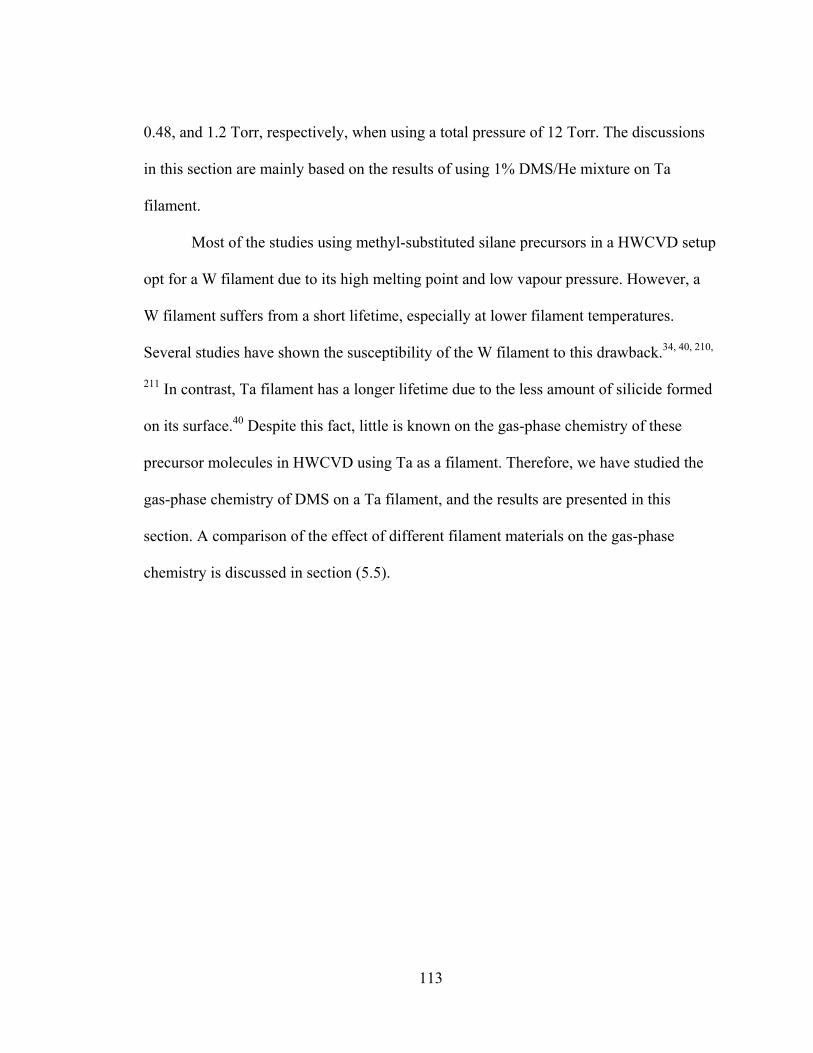
113
0.48, and 1.2 Torr, respectively, when using a total pressure of 12 Torr. The discussions
in this section are mainly based on the results of using 1% DMS/He mixture on Ta
filament.
Most of the studies using methyl-substituted silane precursors in a HWCVD setup
opt for a W filament due to its high melting point and low vapour pressure. However, a
W filament suffers from a short lifetime, especially at lower filament temperatures.
Several studies have shown the susceptibility of the W filament to this drawback.34, 40, 210,
211 In contrast, Ta filament has a longer lifetime due to the less amount of silicide formed
on its surface.40 Despite this fact, little is known on the gas-phase chemistry of these
precursor molecules in HWCVD using Ta as a filament. Therefore, we have studied the
gas-phase chemistry of DMS on a Ta filament, and the results are presented in this
section. A comparison of the effect of different filament materials on the gas-phase
chemistry is discussed in section (5.5).
114
Figure 5-2: a) 10.5 eV SPI TOF mass spectra of 12 Torr 1% DMS/He in the reactor at filament temperatures between 1200 and 1600 oC. The spectrum at 25 oC is recorded when the filament is off; b) enlarged spectra in the mass regions of 70-150 amu.
115
Figure 5-2 shows the TOF mass spectra recorded for 12 Torr of 1% DMS/He
sample at different temperatures ranging from 1200 and 1600 oC at a filament-on time of
10 minutes. After the filament was turned on, the parent and its photofragment ion peak
[Si(CH3)2+ (m/z 58)], dominated in the room-temperature mass spectrum of DMS
decreased with increasing filament temperature, indicating that the parent DMS
molecules were decomposed on the filament and consumed in secondary gas-phase
reactions in the reactor. This decrease was observed to start at ∼1200 oC, which was
lower than those for TMS89 and HMDS,82 but higher than the lowest decomposition
temperatures when using two four-membered-ring compounds, i.e., silacyclobutane90 and
1,1-dimethyl-1-silacyclobutane.91 When the intensity of the parent molecule decreased, a
variety of new mass peaks appeared after the filament was turned on, e.g., those at m/z
73, 88, 103, 116, and 118.
In order to closely examine the extent to which the intensity of the Si(CH3)2+
peak decreased relative to that of parent SiH2(CH3)2+, the intensity ratio of peak at m/z 58
to that at m/z 60 was calculated and plotted versus the filament-on time for different
filament temperatures. This plot is illustrated in Figure 5-3. As noted in the graph, the
intensity ratio was found to be higher than that for filament off (2.13 ± 0.09) at the
decomposition temperature of 1200 oC, and the increase of the ratio is more accentuated
as the filament temperature is increased. This suggests that other sources than the
photofragmentation of DMS contribute to the peak at m/z 58. This will be discussed in
later sections.
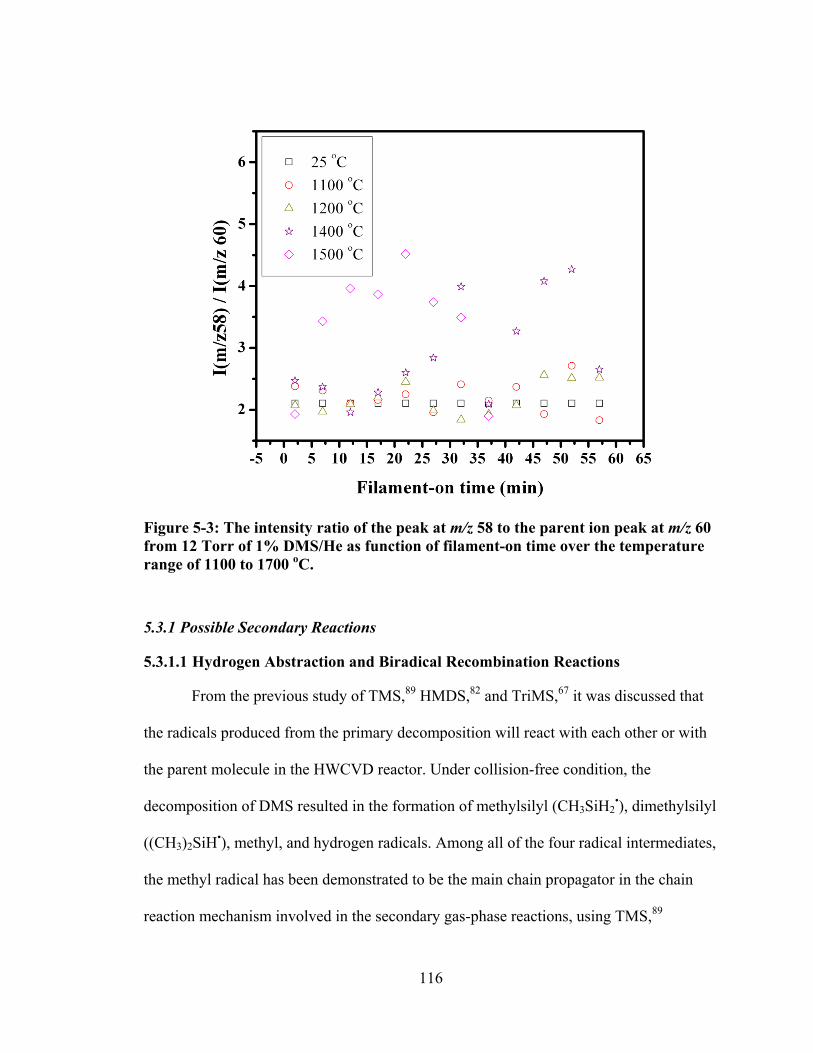
116
Figure 5-3: The intensity ratio of the peak at m/z 58 to the parent ion peak at m/z 60 from 12 Torr of 1% DMS/He as function of filament-on time over the temperature range of 1100 to 1700 oC.
5.3.1 Possible Secondary Reactions
5.3.1.1 Hydrogen Abstraction and Biradical Recombination Reactions
From the previous study of TMS,89 HMDS,82 and TriMS,67 it was discussed that
the radicals produced from the primary decomposition will react with each other or with
the parent molecule in the HWCVD reactor. Under collision-free condition, the
decomposition of DMS resulted in the formation of methylsilyl (CH3SiH2•), dimethylsilyl
((CH3)2SiH•), methyl, and hydrogen radicals. Among all of the four radical intermediates,
the methyl radical has been demonstrated to be the main chain propagator in the chain
reaction mechanism involved in the secondary gas-phase reactions, using TMS,89
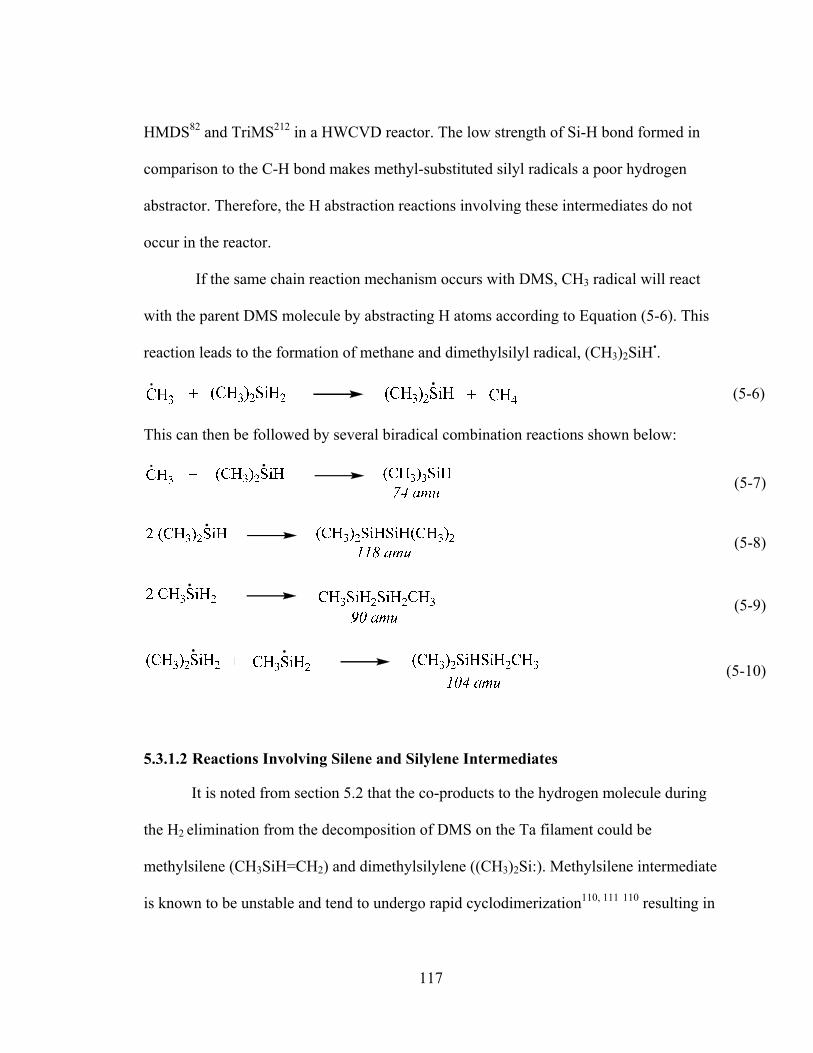
117
HMDS82 and TriMS212 in a HWCVD reactor. The low strength of Si-H bond formed in
comparison to the C-H bond makes methyl-substituted silyl radicals a poor hydrogen
abstractor. Therefore, the H abstraction reactions involving these intermediates do not
occur in the reactor.
If the same chain reaction mechanism occurs with DMS, CH3 radical will react
with the parent DMS molecule by abstracting H atoms according to Equation (5-6). This
reaction leads to the formation of methane and dimethylsilyl radical, (CH3)2SiH•.
(5-6)
This can then be followed by several biradical combination reactions shown below:
(5-7)
(5-8)
(5-9)
(5-10)
5.3.1.2 Reactions Involving Silene and Silylene Intermediates
It is noted from section 5.2 that the co-products to the hydrogen molecule during
the H2 elimination from the decomposition of DMS on the Ta filament could be
methylsilene (CH3SiH=CH2) and dimethylsilylene ((CH3)2Si:). Methylsilene intermediate
is known to be unstable and tend to undergo rapid cyclodimerization110, 111 110 resulting in
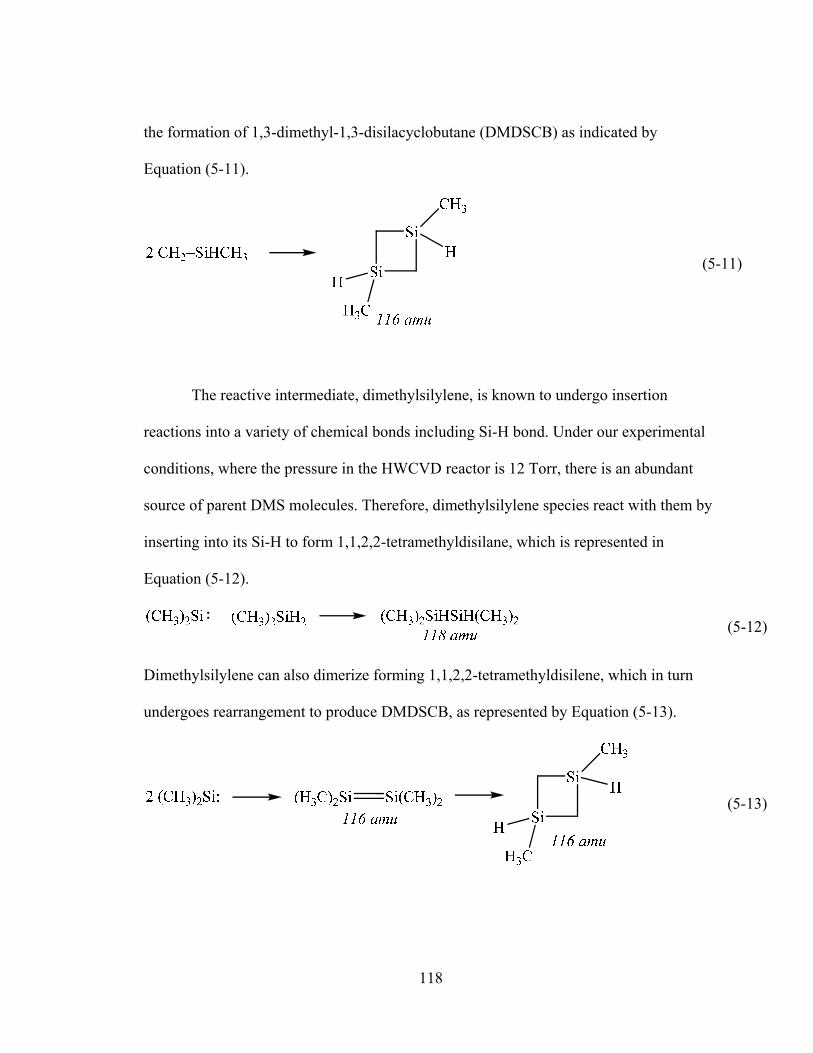
118
the formation of 1,3-dimethyl-1,3-disilacyclobutane (DMDSCB) as indicated by
Equation (5-11).
(5-11)
The reactive intermediate, dimethylsilylene, is known to undergo insertion
reactions into a variety of chemical bonds including Si-H bond. Under our experimental
conditions, where the pressure in the HWCVD reactor is 12 Torr, there is an abundant
source of parent DMS molecules. Therefore, dimethylsilylene species react with them by
inserting into its Si-H to form 1,1,2,2-tetramethyldisilane, which is represented in
Equation (5-12).
(5-12)
Dimethylsilylene can also dimerize forming 1,1,2,2-tetramethyldisilene, which in turn
undergoes rearrangement to produce DMDSCB, as represented by Equation (5-13).
(5-13)
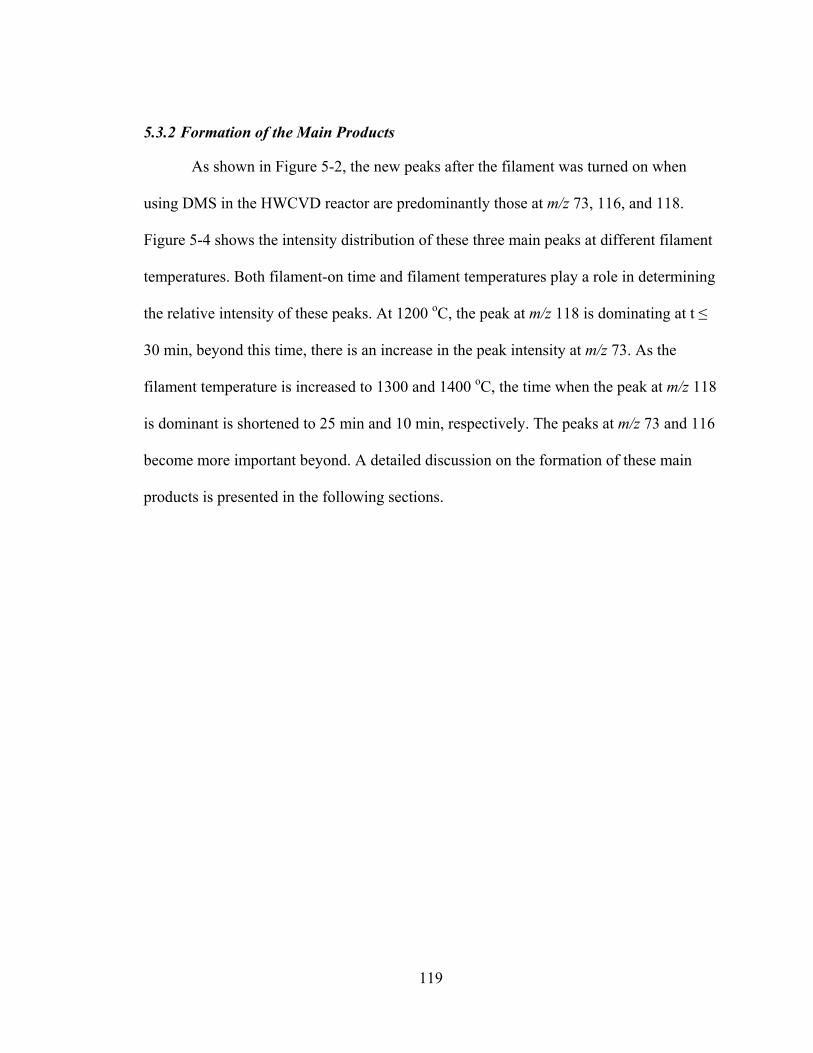
119
5.3.2 Formation of the Main Products
As shown in Figure 5-2, the new peaks after the filament was turned on when
using DMS in the HWCVD reactor are predominantly those at m/z 73, 116, and 118.
Figure 5-4 shows the intensity distribution of these three main peaks at different filament
temperatures. Both filament-on time and filament temperatures play a role in determining
the relative intensity of these peaks. At 1200 oC, the peak at m/z 118 is dominating at t ≤
30 min, beyond this time, there is an increase in the peak intensity at m/z 73. As the
filament temperature is increased to 1300 and 1400 oC, the time when the peak at m/z 118
is dominant is shortened to 25 min and 10 min, respectively. The peaks at m/z 73 and 116
become more important beyond. A detailed discussion on the formation of these main
products is presented in the following sections.
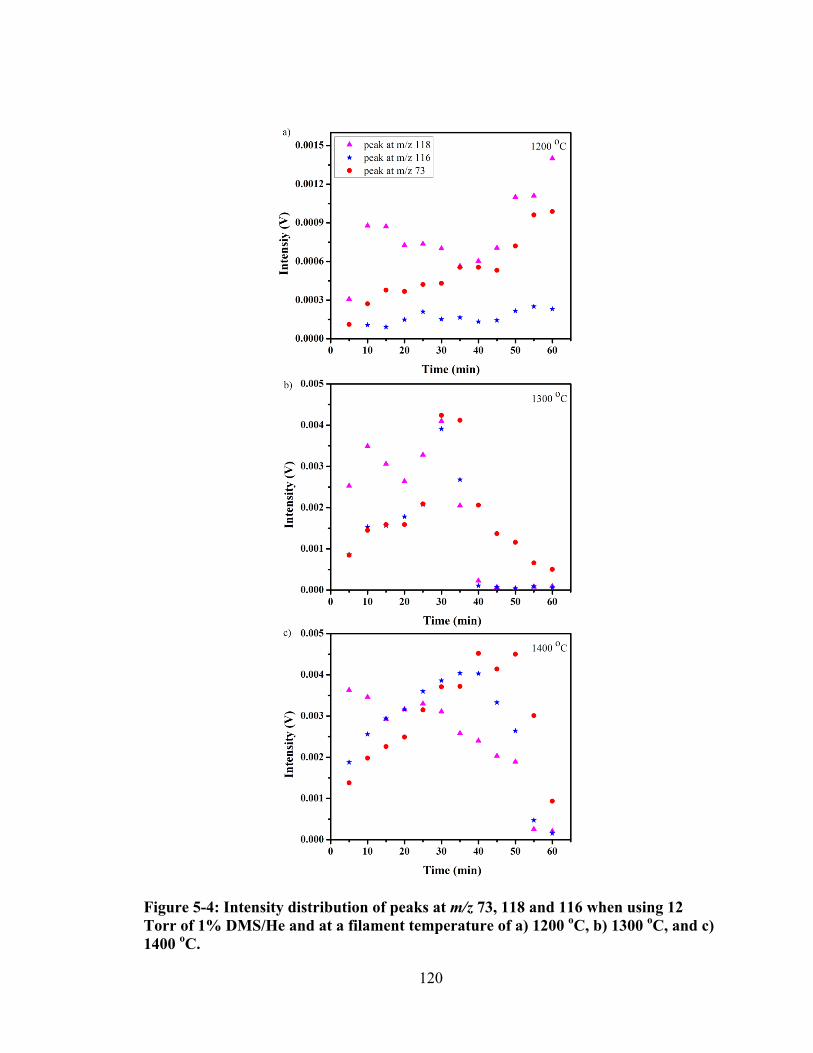
120
Figure 5-4: Intensity distribution of peaks at m/z 73, 118 and 116 when using 12 Torr of 1% DMS/He and at a filament temperature of a) 1200 oC, b) 1300 oC, and c) 1400 oC.
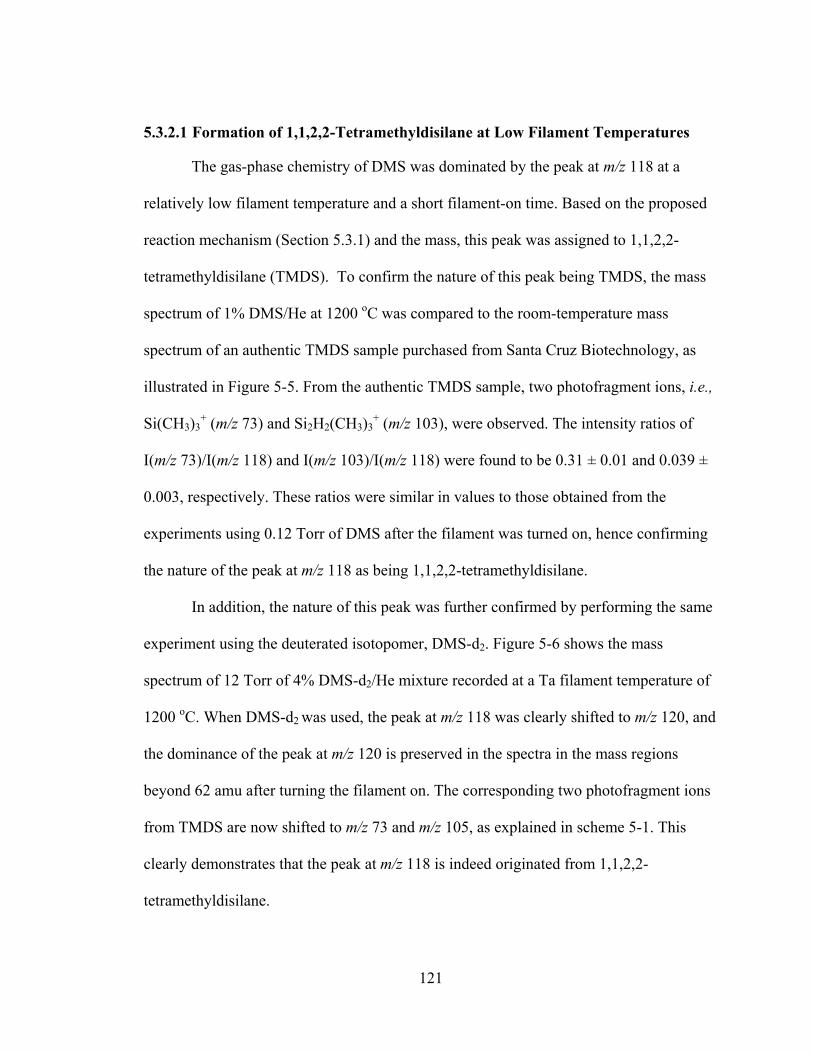
121
5.3.2.1 Formation of 1,1,2,2-Tetramethyldisilane at Low Filament Temperatures
The gas-phase chemistry of DMS was dominated by the peak at m/z 118 at a
relatively low filament temperature and a short filament-on time. Based on the proposed
reaction mechanism (Section 5.3.1) and the mass, this peak was assigned to 1,1,2,2-
tetramethyldisilane (TMDS). To confirm the nature of this peak being TMDS, the mass
spectrum of 1% DMS/He at 1200 oC was compared to the room-temperature mass
spectrum of an authentic TMDS sample purchased from Santa Cruz Biotechnology, as
illustrated in Figure 5-5. From the authentic TMDS sample, two photofragment ions, i.e.,
Si(CH3)3+ (m/z 73) and Si2H2(CH3)3
+ (m/z 103), were observed. The intensity ratios of
I(m/z 73)/I(m/z 118) and I(m/z 103)/I(m/z 118) were found to be 0.31 ± 0.01 and 0.039 ±
0.003, respectively. These ratios were similar in values to those obtained from the
experiments using 0.12 Torr of DMS after the filament was turned on, hence confirming
the nature of the peak at m/z 118 as being 1,1,2,2-tetramethyldisilane.
In addition, the nature of this peak was further confirmed by performing the same
experiment using the deuterated isotopomer, DMS-d2. Figure 5-6 shows the mass
spectrum of 12 Torr of 4% DMS-d2/He mixture recorded at a Ta filament temperature of
1200 oC. When DMS-d2 was used, the peak at m/z 118 was clearly shifted to m/z 120, and
the dominance of the peak at m/z 120 is preserved in the spectra in the mass regions
beyond 62 amu after turning the filament on. The corresponding two photofragment ions
from TMDS are now shifted to m/z 73 and m/z 105, as explained in scheme 5-1. This
clearly demonstrates that the peak at m/z 118 is indeed originated from 1,1,2,2-
tetramethyldisilane.
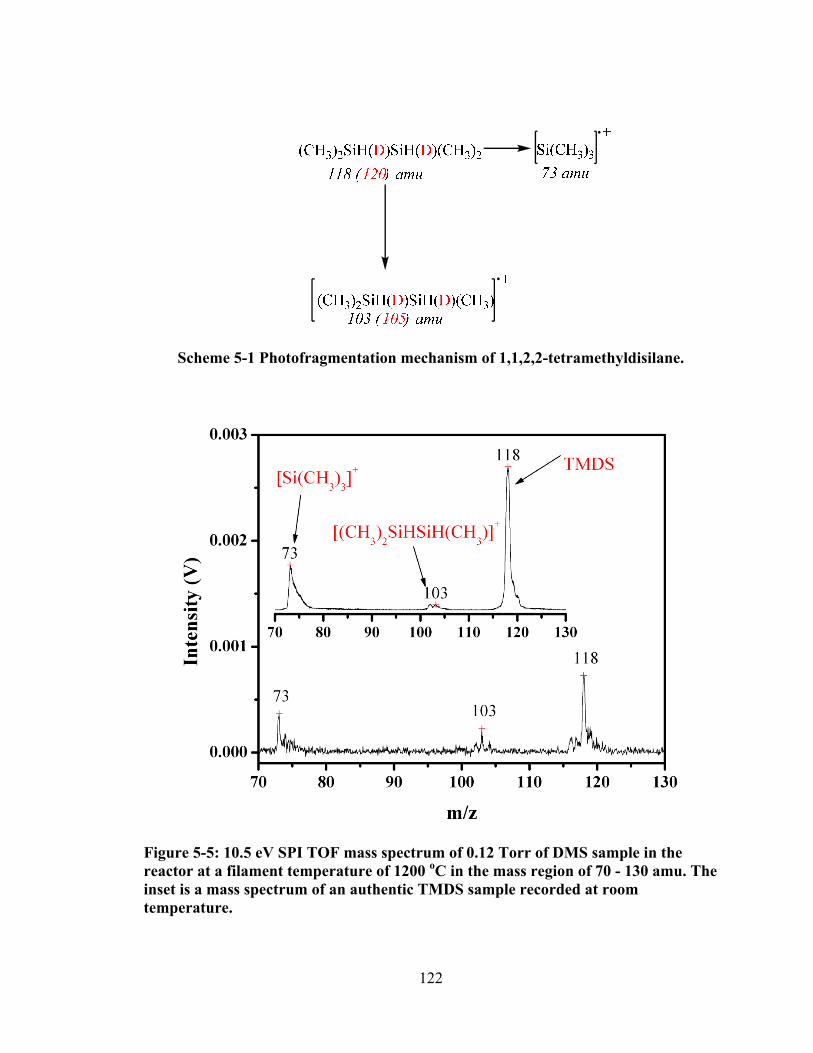
122
Scheme 5-1 Photofragmentation mechanism of 1,1,2,2-tetramethyldisilane.
Figure 5-5: 10.5 eV SPI TOF mass spectrum of 0.12 Torr of DMS sample in the reactor at a filament temperature of 1200 oC in the mass region of 70 - 130 amu. The inset is a mass spectrum of an authentic TMDS sample recorded at room temperature.
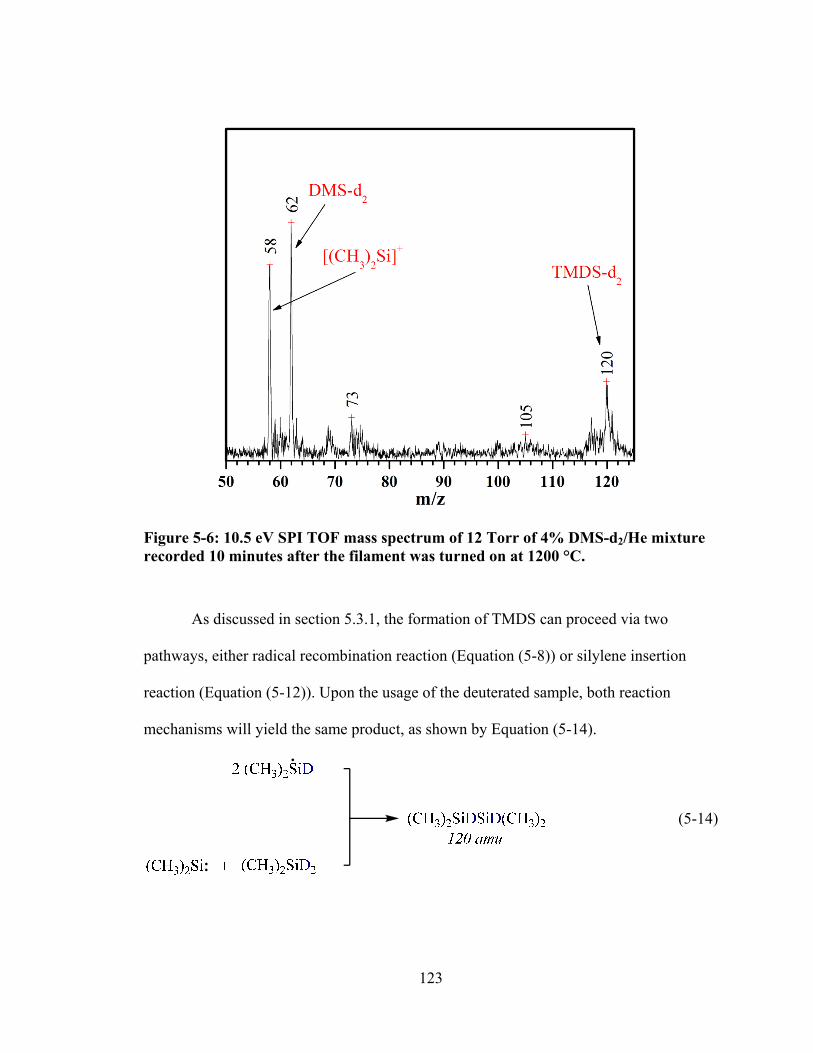
123
Figure 5-6: 10.5 eV SPI TOF mass spectrum of 12 Torr of 4% DMS-d2/He mixture recorded 10 minutes after the filament was turned on at 1200 °C.
As discussed in section 5.3.1, the formation of TMDS can proceed via two
pathways, either radical recombination reaction (Equation (5-8)) or silylene insertion
reaction (Equation (5-12)). Upon the usage of the deuterated sample, both reaction
mechanisms will yield the same product, as shown by Equation (5-14).
(5-14)
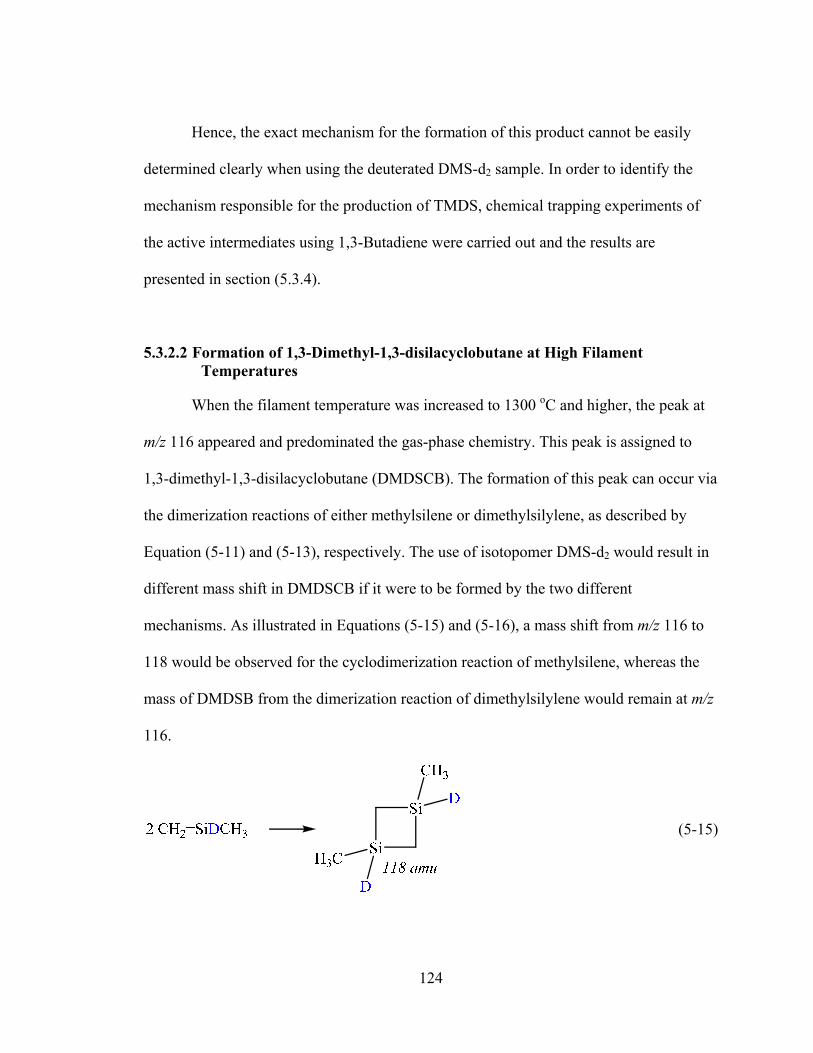
124
Hence, the exact mechanism for the formation of this product cannot be easily
determined clearly when using the deuterated DMS-d2 sample. In order to identify the
mechanism responsible for the production of TMDS, chemical trapping experiments of
the active intermediates using 1,3-Butadiene were carried out and the results are
presented in section (5.3.4).
5.3.2.2 Formation of 1,3-Dimethyl-1,3-disilacyclobutane at High Filament Temperatures
When the filament temperature was increased to 1300 oC and higher, the peak at
m/z 116 appeared and predominated the gas-phase chemistry. This peak is assigned to
1,3-dimethyl-1,3-disilacyclobutane (DMDSCB). The formation of this peak can occur via
the dimerization reactions of either methylsilene or dimethylsilylene, as described by
Equation (5-11) and (5-13), respectively. The use of isotopomer DMS-d2 would result in
different mass shift in DMDSCB if it were to be formed by the two different
mechanisms. As illustrated in Equations (5-15) and (5-16), a mass shift from m/z 116 to
118 would be observed for the cyclodimerization reaction of methylsilene, whereas the
mass of DMDSB from the dimerization reaction of dimethylsilylene would remain at m/z
116.
(5-15)
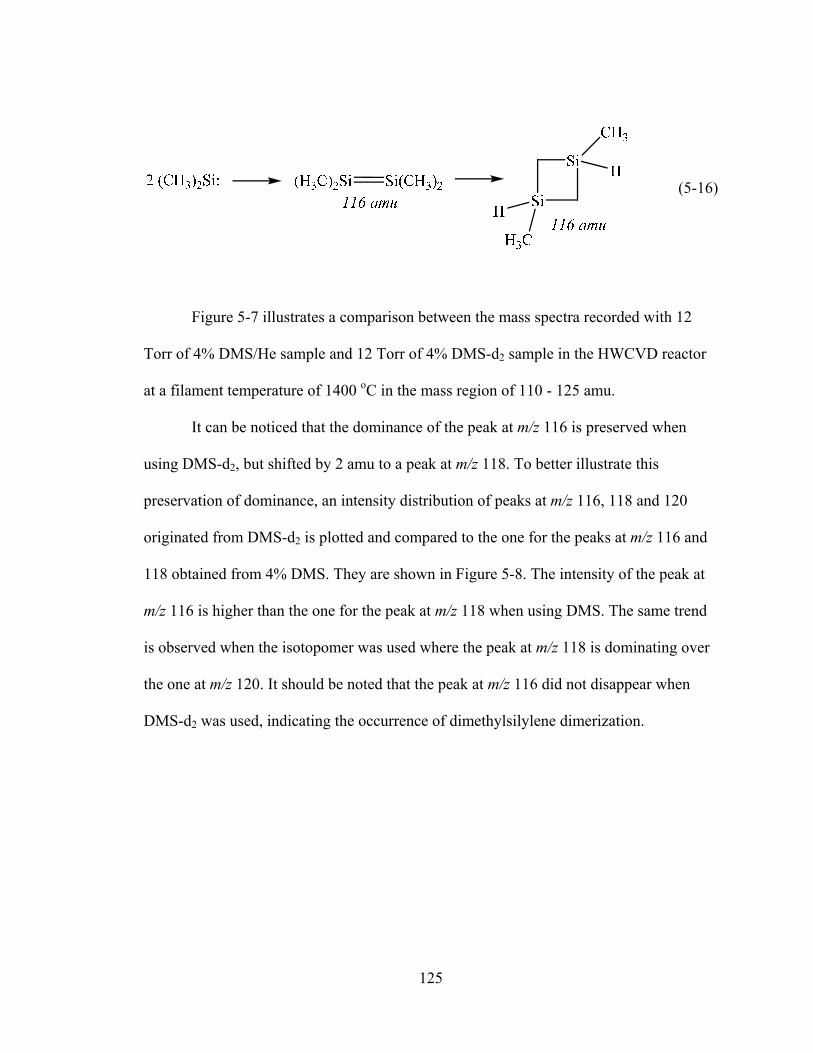
125
(5-16)
Figure 5-7 illustrates a comparison between the mass spectra recorded with 12
Torr of 4% DMS/He sample and 12 Torr of 4% DMS-d2 sample in the HWCVD reactor
at a filament temperature of 1400 oC in the mass region of 110 - 125 amu.
It can be noticed that the dominance of the peak at m/z 116 is preserved when
using DMS-d2, but shifted by 2 amu to a peak at m/z 118. To better illustrate this
preservation of dominance, an intensity distribution of peaks at m/z 116, 118 and 120
originated from DMS-d2 is plotted and compared to the one for the peaks at m/z 116 and
118 obtained from 4% DMS. They are shown in Figure 5-8. The intensity of the peak at
m/z 116 is higher than the one for the peak at m/z 118 when using DMS. The same trend
is observed when the isotopomer was used where the peak at m/z 118 is dominating over
the one at m/z 120. It should be noted that the peak at m/z 116 did not disappear when
DMS-d2 was used, indicating the occurrence of dimethylsilylene dimerization.
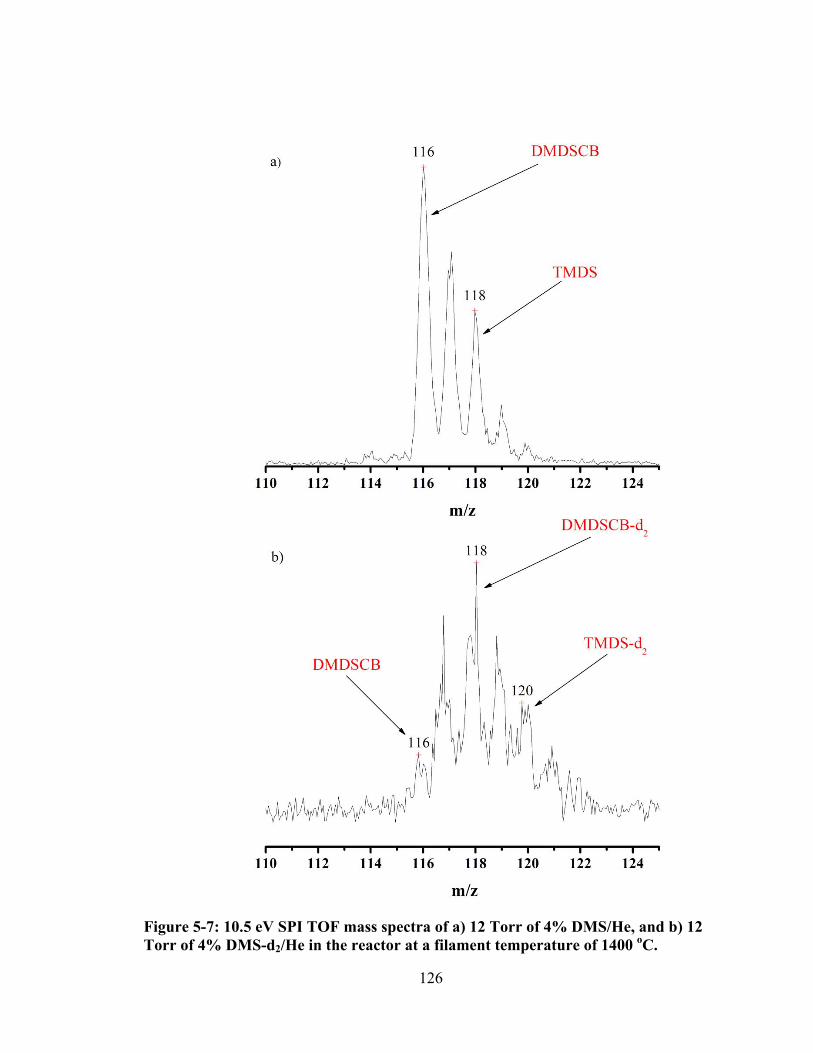
126
Figure 5-7: 10.5 eV SPI TOF mass spectra of a) 12 Torr of 4% DMS/He, and b) 12 Torr of 4% DMS-d2/He in the reactor at a filament temperature of 1400 oC.
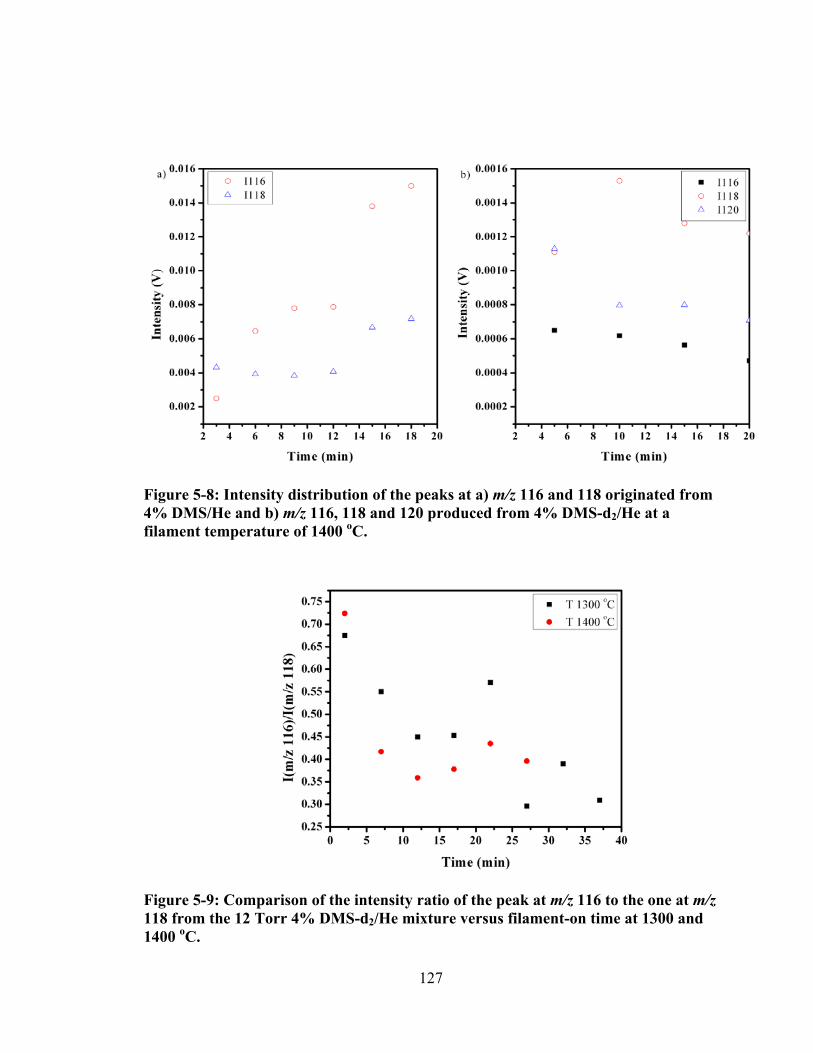
127
Figure 5-8: Intensity distribution of the peaks at a) m/z 116 and 118 originated from 4% DMS/He and b) m/z 116, 118 and 120 produced from 4% DMS-d2/He at a filament temperature of 1400 oC.
Figure 5-9: Comparison of the intensity ratio of the peak at m/z 116 to the one at m/z 118 from the 12 Torr 4% DMS-d2/He mixture versus filament-on time at 1300 and 1400 oC.
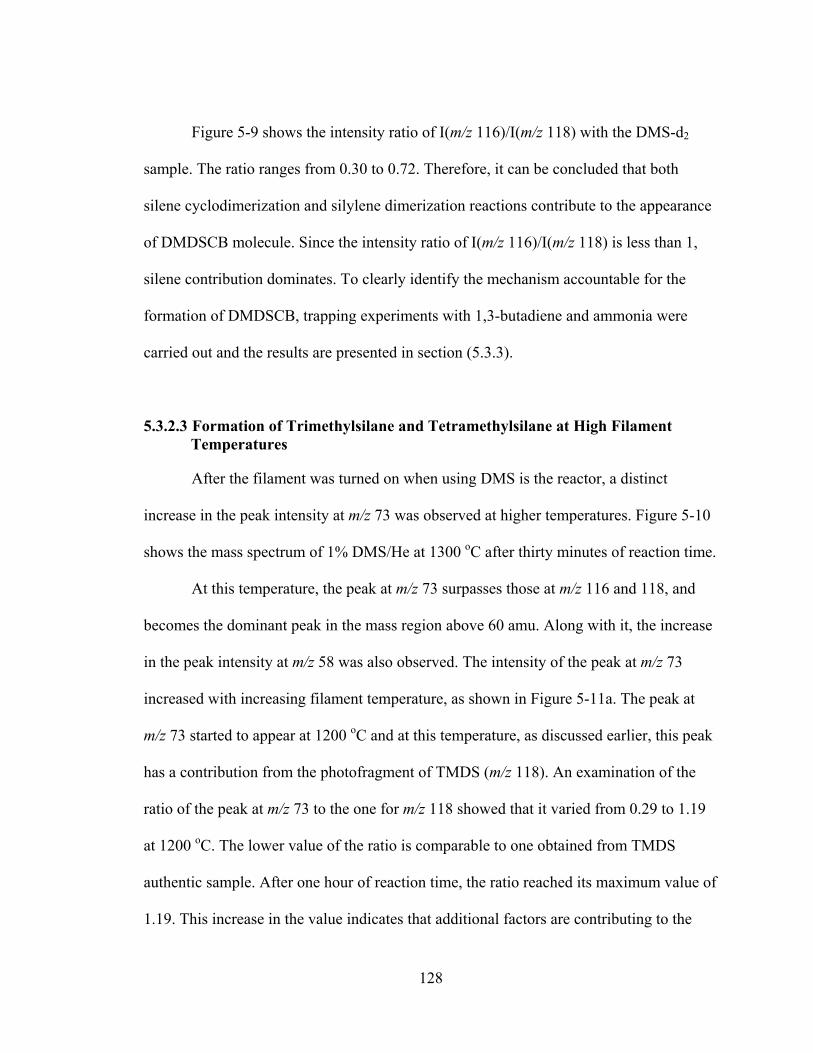
128
Figure 5-9 shows the intensity ratio of I(m/z 116)/I(m/z 118) with the DMS-d2
sample. The ratio ranges from 0.30 to 0.72. Therefore, it can be concluded that both
silene cyclodimerization and silylene dimerization reactions contribute to the appearance
of DMDSCB molecule. Since the intensity ratio of I(m/z 116)/I(m/z 118) is less than 1,
silene contribution dominates. To clearly identify the mechanism accountable for the
formation of DMDSCB, trapping experiments with 1,3-butadiene and ammonia were
carried out and the results are presented in section (5.3.3).
5.3.2.3 Formation of Trimethylsilane and Tetramethylsilane at High Filament Temperatures
After the filament was turned on when using DMS is the reactor, a distinct
increase in the peak intensity at m/z 73 was observed at higher temperatures. Figure 5-10
shows the mass spectrum of 1% DMS/He at 1300 oC after thirty minutes of reaction time.
At this temperature, the peak at m/z 73 surpasses those at m/z 116 and 118, and
becomes the dominant peak in the mass region above 60 amu. Along with it, the increase
in the peak intensity at m/z 58 was also observed. The intensity of the peak at m/z 73
increased with increasing filament temperature, as shown in Figure 5-11a. The peak at
m/z 73 started to appear at 1200 oC and at this temperature, as discussed earlier, this peak
has a contribution from the photofragment of TMDS (m/z 118). An examination of the
ratio of the peak at m/z 73 to the one for m/z 118 showed that it varied from 0.29 to 1.19
at 1200 oC. The lower value of the ratio is comparable to one obtained from TMDS
authentic sample. After one hour of reaction time, the ratio reached its maximum value of
1.19. This increase in the value indicates that additional factors are contributing to the
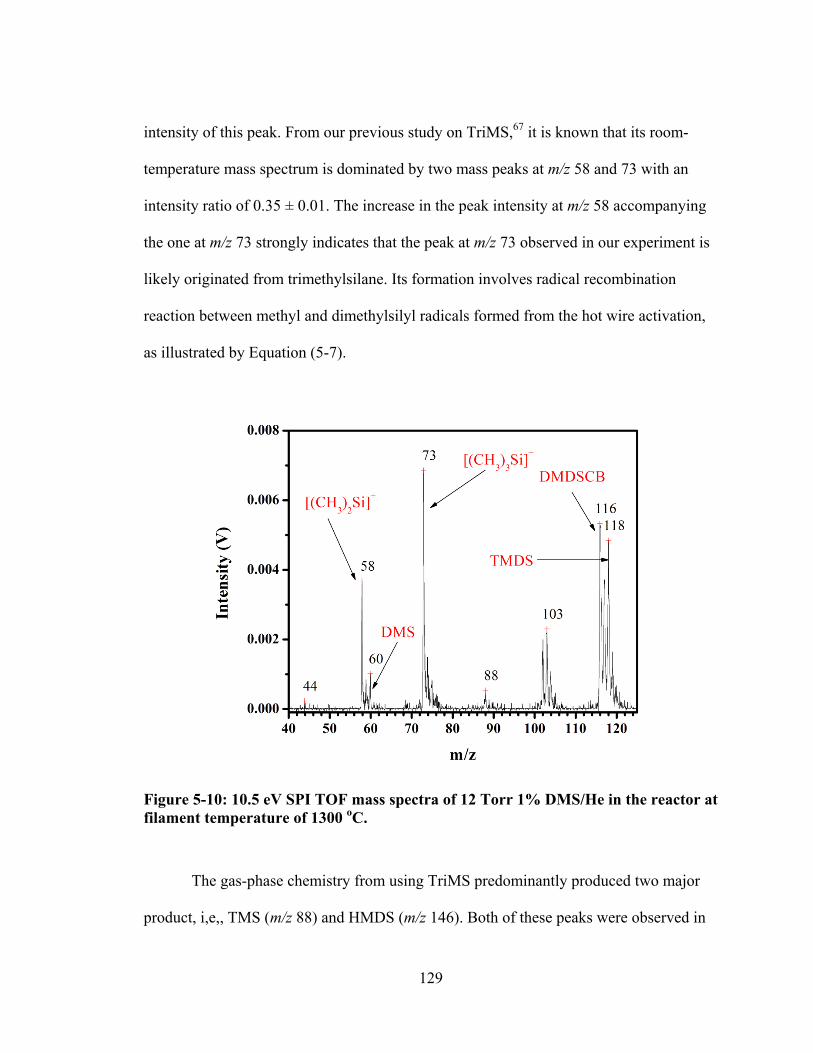
129
intensity of this peak. From our previous study on TriMS,67 it is known that its room-
temperature mass spectrum is dominated by two mass peaks at m/z 58 and 73 with an
intensity ratio of 0.35 ± 0.01. The increase in the peak intensity at m/z 58 accompanying
the one at m/z 73 strongly indicates that the peak at m/z 73 observed in our experiment is
likely originated from trimethylsilane. Its formation involves radical recombination
reaction between methyl and dimethylsilyl radicals formed from the hot wire activation,
as illustrated by Equation (5-7).
Figure 5-10: 10.5 eV SPI TOF mass spectra of 12 Torr 1% DMS/He in the reactor at filament temperature of 1300 oC.
The gas-phase chemistry from using TriMS predominantly produced two major
product, i,e,, TMS (m/z 88) and HMDS (m/z 146). Both of these peaks were observed in
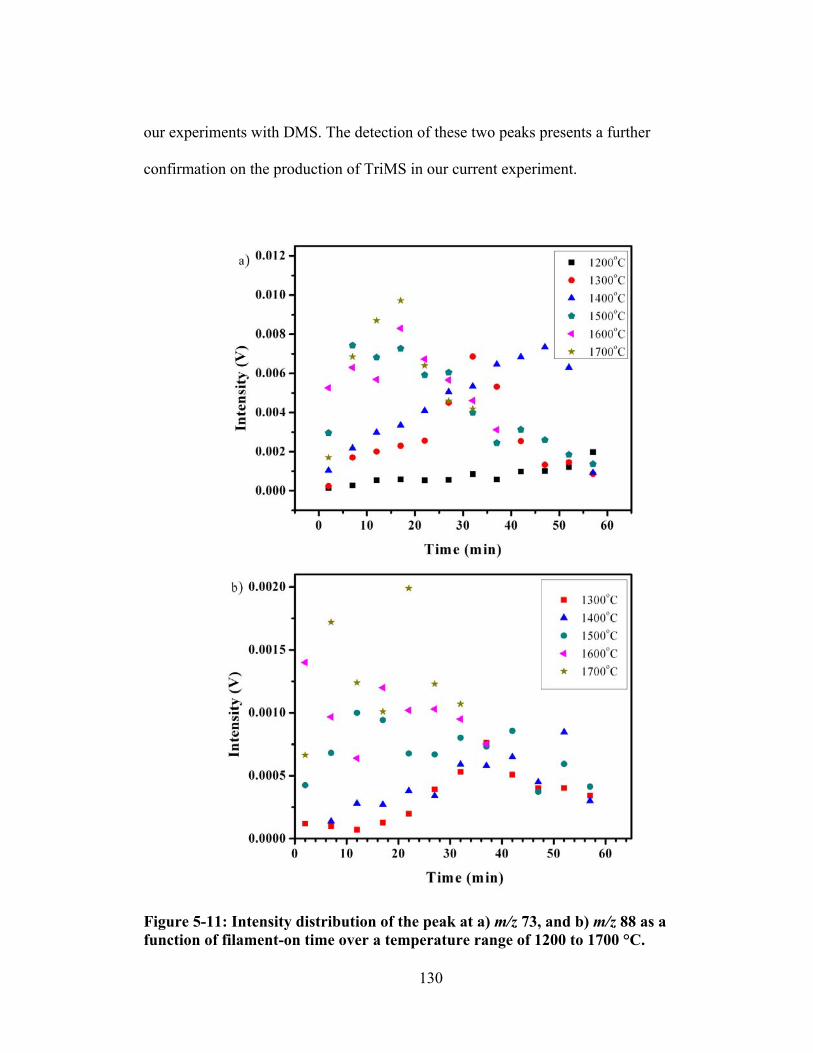
130
our experiments with DMS. The detection of these two peaks presents a further
confirmation on the production of TriMS in our current experiment.
Figure 5-11: Intensity distribution of the peak at a) m/z 73, and b) m/z 88 as a function of filament-on time over a temperature range of 1200 to 1700 °C.
131
The weak intensity of the peak at m/z 88 is due to the fact that TMS is a product
from TriMS chemistry rather from DMS precursor. The formation of TMS from TriMS is
further confirmed by examining the intensity distributions of the TMS peak at m/z 88
shown in Figure 5-11b and by comparing them with those of the peak at m/z 73 (Figure
5-11a). TMS started to form at 1300 oC and its intensity reached a maximum after 35
minutes of reaction time. This time coincided with the decrease in the intensity of the
peak at m/z 73, which is indicative that TriMS is decomposing and undergoing secondary
gas-phase reactions.
From our current and previous studies, it is known that the contribution to the
intensity of the peak at m/z 73 comes from the photofragmentation of more than one
molecule. Aside from TriMS and TMS, 1,1,2,2-tetramethyldisilane (m/z 118) was also
produced in a significant amount when using DMS in the reactor. As shown in Figure 5-5
and discussed previously, TMDS photo-fragments to produce a peak at m/z 73 with an
intensity ratio of I(m/z 73)/I(118) to be equal to 0.32. The only characteristic
photofragment peaks of TMS from 118 nm VUV SPI TOF is at m/z 73 and the intensity
ratio of the peak at m/z 73 to the parent TMS ion peak at m/z 88 is 4 : 189 when the
filament is off.
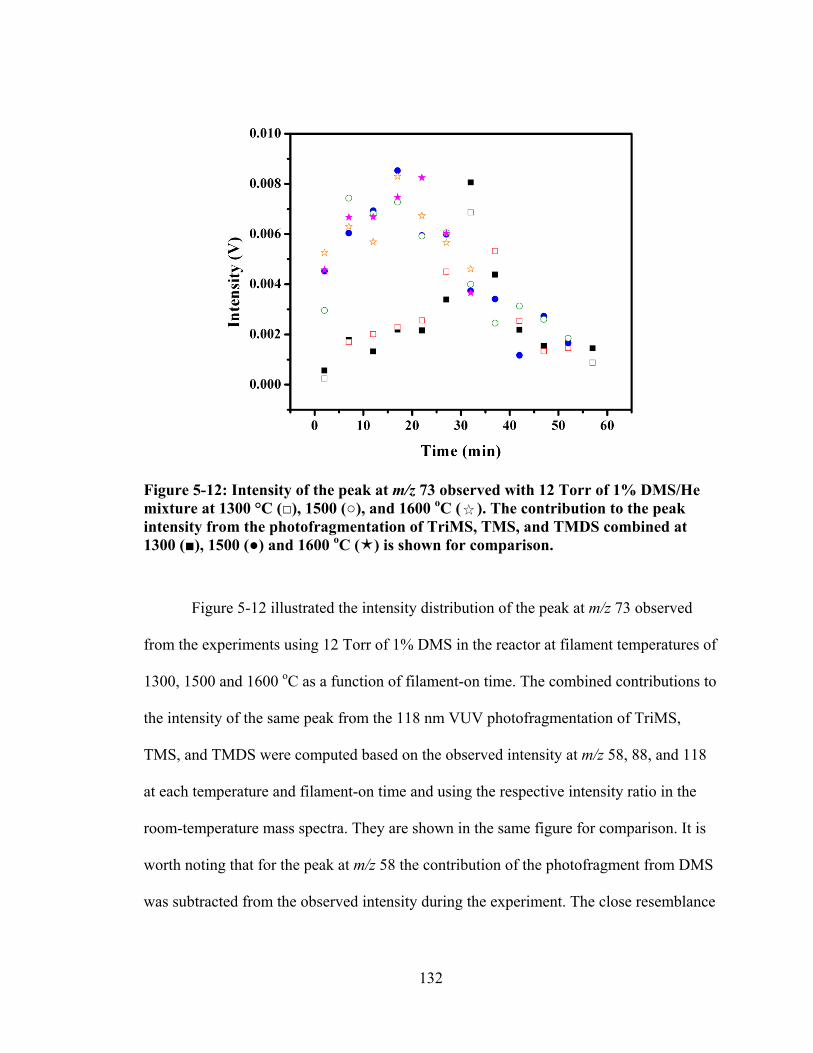
132
Figure 5-12: Intensity of the peak at m/z 73 observed with 12 Torr of 1% DMS/He mixture at 1300 °C (□), 1500 (○), and 1600 oC ( ). The contribution to the peak intensity from the photofragmentation of TriMS, TMS, and TMDS combined at 1300 (■), 1500 (●) and 1600 oC () is shown for comparison.
Figure 5-12 illustrated the intensity distribution of the peak at m/z 73 observed
from the experiments using 12 Torr of 1% DMS in the reactor at filament temperatures of
1300, 1500 and 1600 oC as a function of filament-on time. The combined contributions to
the intensity of the same peak from the 118 nm VUV photofragmentation of TriMS,
TMS, and TMDS were computed based on the observed intensity at m/z 58, 88, and 118
at each temperature and filament-on time and using the respective intensity ratio in the
room-temperature mass spectra. They are shown in the same figure for comparison. It is
worth noting that for the peak at m/z 58 the contribution of the photofragment from DMS
was subtracted from the observed intensity during the experiment. The close resemblance
133
of observed intensities with those from calculations strongly that both TriMS and TMS
were produced in our HWCVD reactor when using DMS as a source gas.
5.3.3 Trapping of Active Intermediates
From the above discussions, it was demonstrated that three major products, i.e.,
1,1,2,2-tetramethyldisilane (TMDS, m/z 118), 1,3-dimethyl-1,3-disilacyclobutane
(DMDSCB, m/z 116), and trimethylsilane (TriMS, m/z 74), were formed during the
secondary gas-phase reactions of DMS. However, the formation of these major products
involved more than one possible mechanism. In order to have a better understanding on
the identity of the mechanism responsible for the formation of these products, trapping
experiments with 1,3-butadiene (BTD) and ammonia (NH3) were carried out to trap the
intermediates involved in these mechanisms. These experiments were performed by
mixing DMS with 8-fold of trapping agents at a filament temperature of 1200 and 1400
oC. The reason behind the choice of temperature is due to the difference in behaviour of
the gas-phase chemistry of DMS. As discussed earlier, the peak at m/z 118 was
predominantly present at 1200 oC, whereas the peak at m/z 116 was dominating along
with the one at m/z 73 at a filament temperature of 1400 oC. The trapping experiments
were performed in the HWCVD reactor. For each temperature a mass spectrum was
collected every five minutes for one hour. Prior to each trapping experiment, a control
experiment with 1% DMS/He and trapping agents, respectively, was done separately as a
reference under the same experimental conditions.
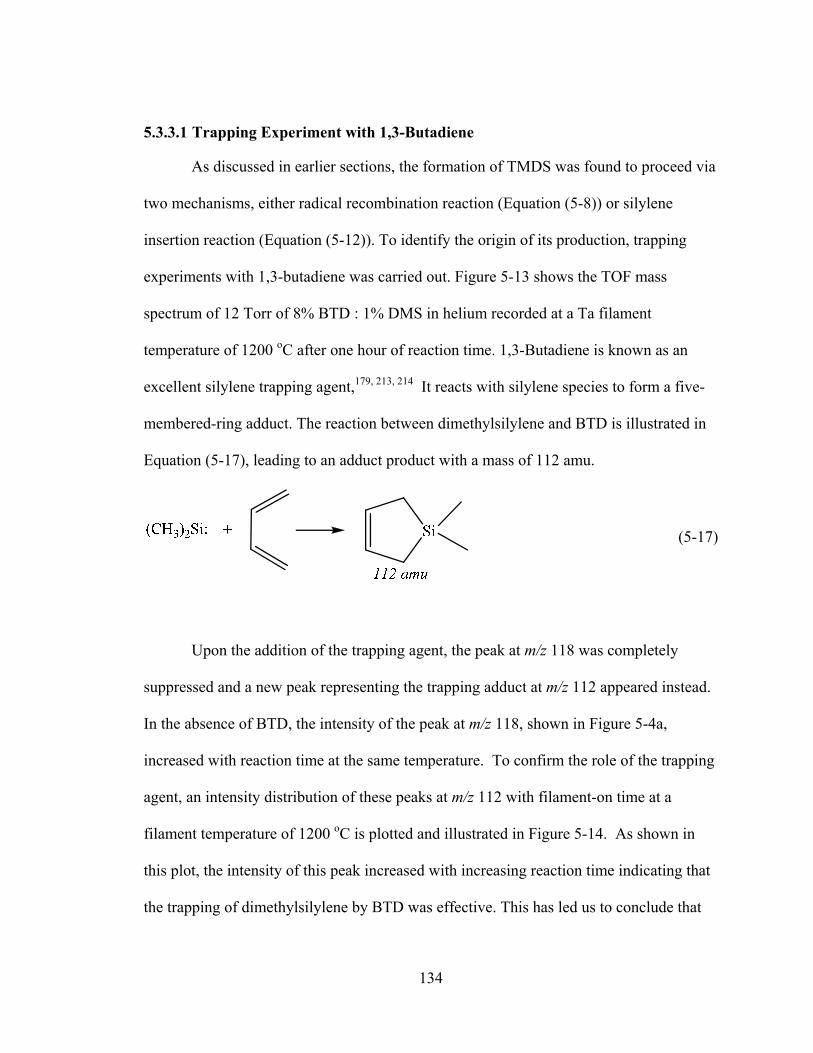
134
5.3.3.1 Trapping Experiment with 1,3-Butadiene
As discussed in earlier sections, the formation of TMDS was found to proceed via
two mechanisms, either radical recombination reaction (Equation (5-8)) or silylene
insertion reaction (Equation (5-12)). To identify the origin of its production, trapping
experiments with 1,3-butadiene was carried out. Figure 5-13 shows the TOF mass
spectrum of 12 Torr of 8% BTD : 1% DMS in helium recorded at a Ta filament
temperature of 1200 oC after one hour of reaction time. 1,3-Butadiene is known as an
excellent silylene trapping agent,179, 213, 214 It reacts with silylene species to form a five-
membered-ring adduct. The reaction between dimethylsilylene and BTD is illustrated in
Equation (5-17), leading to an adduct product with a mass of 112 amu.
(5-17)
Upon the addition of the trapping agent, the peak at m/z 118 was completely
suppressed and a new peak representing the trapping adduct at m/z 112 appeared instead.
In the absence of BTD, the intensity of the peak at m/z 118, shown in Figure 5-4a,
increased with reaction time at the same temperature. To confirm the role of the trapping
agent, an intensity distribution of these peaks at m/z 112 with filament-on time at a
filament temperature of 1200 oC is plotted and illustrated in Figure 5-14. As shown in
this plot, the intensity of this peak increased with increasing reaction time indicating that
the trapping of dimethylsilylene by BTD was effective. This has led us to conclude that
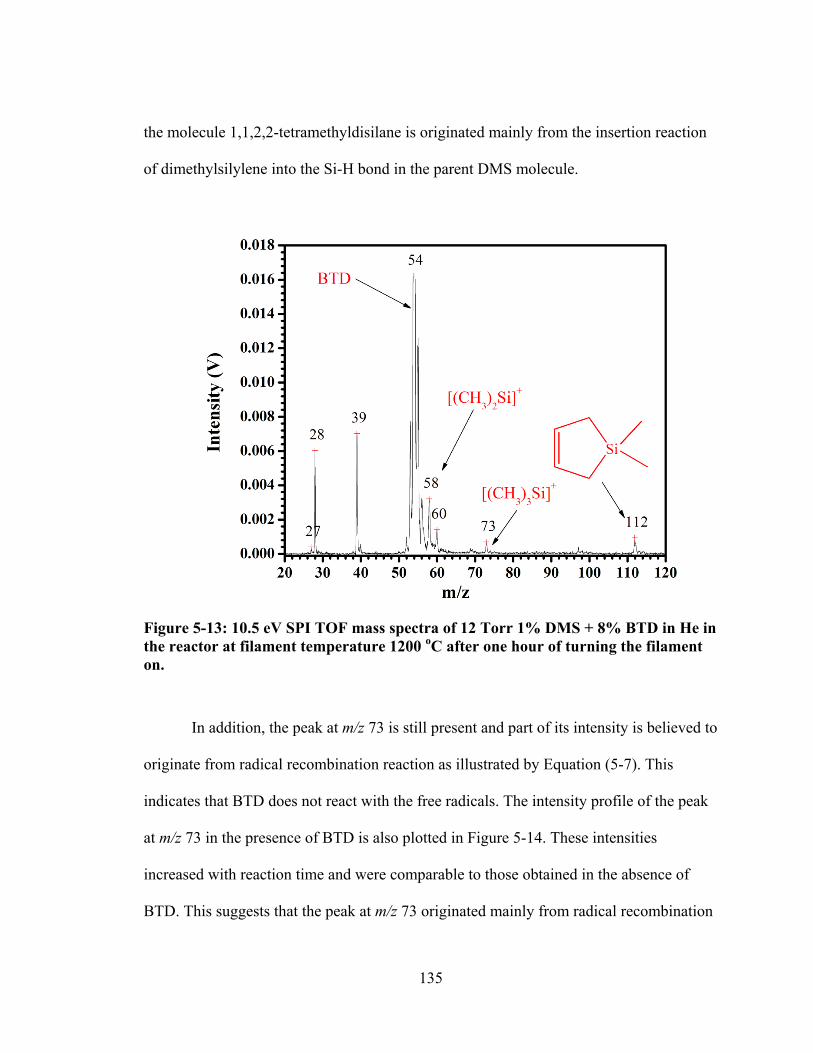
135
the molecule 1,1,2,2-tetramethyldisilane is originated mainly from the insertion reaction
of dimethylsilylene into the Si-H bond in the parent DMS molecule.
Figure 5-13: 10.5 eV SPI TOF mass spectra of 12 Torr 1% DMS + 8% BTD in He in the reactor at filament temperature 1200 oC after one hour of turning the filament on.
In addition, the peak at m/z 73 is still present and part of its intensity is believed to
originate from radical recombination reaction as illustrated by Equation (5-7). This
indicates that BTD does not react with the free radicals. The intensity profile of the peak
at m/z 73 in the presence of BTD is also plotted in Figure 5-14. These intensities
increased with reaction time and were comparable to those obtained in the absence of
BTD. This suggests that the peak at m/z 73 originated mainly from radical recombination
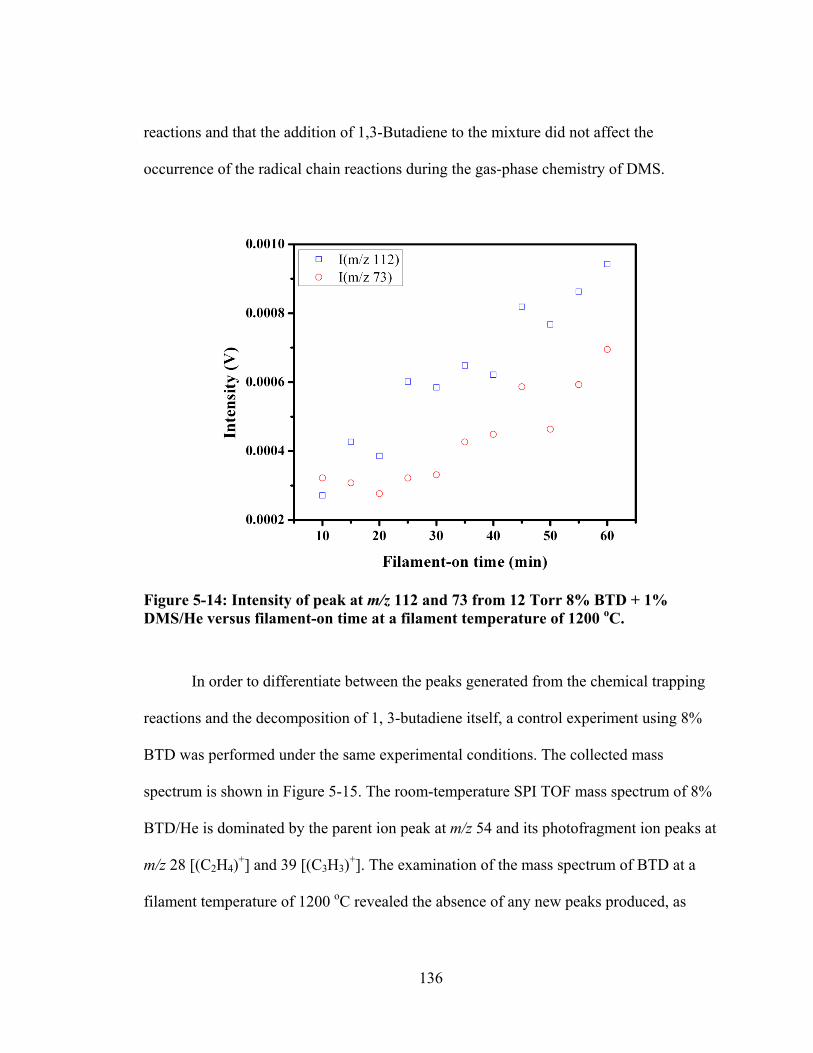
136
reactions and that the addition of 1,3-Butadiene to the mixture did not affect the
occurrence of the radical chain reactions during the gas-phase chemistry of DMS.
Figure 5-14: Intensity of peak at m/z 112 and 73 from 12 Torr 8% BTD + 1% DMS/He versus filament-on time at a filament temperature of 1200 oC.
In order to differentiate between the peaks generated from the chemical trapping
reactions and the decomposition of 1, 3-butadiene itself, a control experiment using 8%
BTD was performed under the same experimental conditions. The collected mass
spectrum is shown in Figure 5-15. The room-temperature SPI TOF mass spectrum of 8%
BTD/He is dominated by the parent ion peak at m/z 54 and its photofragment ion peaks at
m/z 28 [(C2H4)+] and 39 [(C3H3)
+]. The examination of the mass spectrum of BTD at a
filament temperature of 1200 oC revealed the absence of any new peaks produced, as
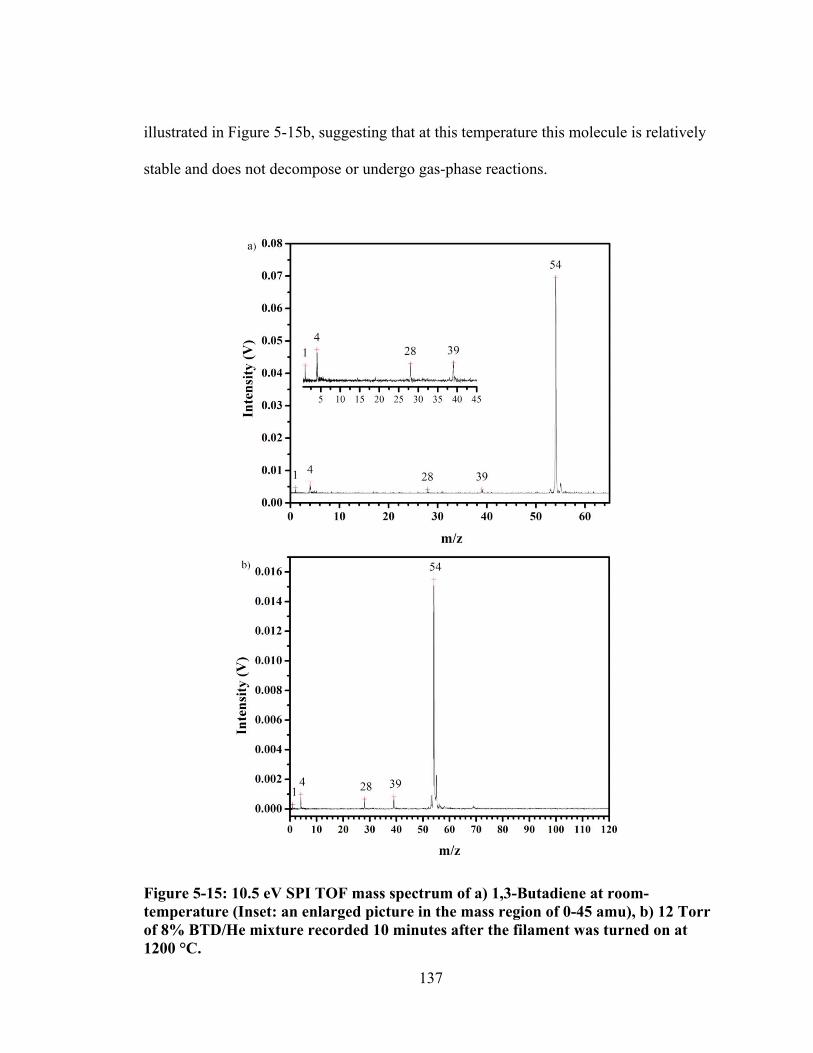
137
illustrated in Figure 5-15b, suggesting that at this temperature this molecule is relatively
stable and does not decompose or undergo gas-phase reactions.
Figure 5-15: 10.5 eV SPI TOF mass spectrum of a) 1,3-Butadiene at room-temperature (Inset: an enlarged picture in the mass region of 0-45 amu), b) 12 Torr of 8% BTD/He mixture recorded 10 minutes after the filament was turned on at 1200 °C.
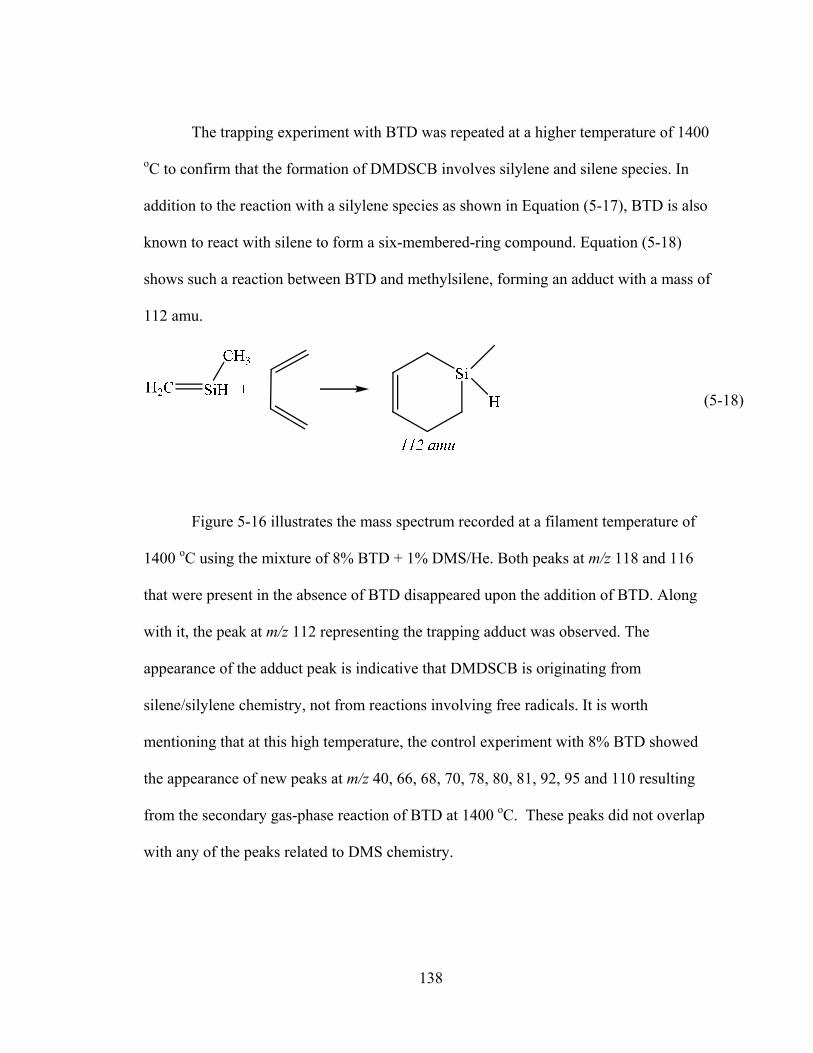
138
The trapping experiment with BTD was repeated at a higher temperature of 1400
oC to confirm that the formation of DMDSCB involves silylene and silene species. In
addition to the reaction with a silylene species as shown in Equation (5-17), BTD is also
known to react with silene to form a six-membered-ring compound. Equation (5-18)
shows such a reaction between BTD and methylsilene, forming an adduct with a mass of
112 amu.
(5-18)
Figure 5-16 illustrates the mass spectrum recorded at a filament temperature of
1400 oC using the mixture of 8% BTD + 1% DMS/He. Both peaks at m/z 118 and 116
that were present in the absence of BTD disappeared upon the addition of BTD. Along
with it, the peak at m/z 112 representing the trapping adduct was observed. The
appearance of the adduct peak is indicative that DMDSCB is originating from
silene/silylene chemistry, not from reactions involving free radicals. It is worth
mentioning that at this high temperature, the control experiment with 8% BTD showed
the appearance of new peaks at m/z 40, 66, 68, 70, 78, 80, 81, 92, 95 and 110 resulting
from the secondary gas-phase reaction of BTD at 1400 oC. These peaks did not overlap
with any of the peaks related to DMS chemistry.
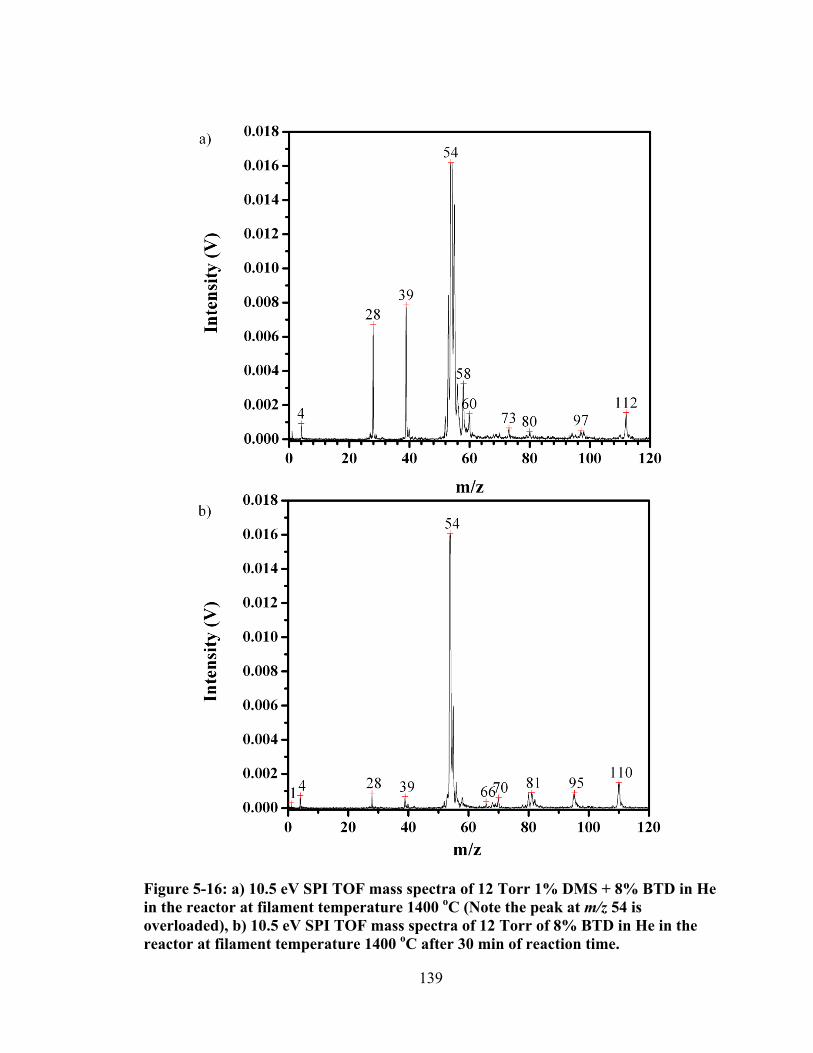
139
Figure 5-16: a) 10.5 eV SPI TOF mass spectra of 12 Torr 1% DMS + 8% BTD in He in the reactor at filament temperature 1400 oC (Note the peak at m/z 54 is overloaded), b) 10.5 eV SPI TOF mass spectra of 12 Torr of 8% BTD in He in the reactor at filament temperature 1400 oC after 30 min of reaction time.
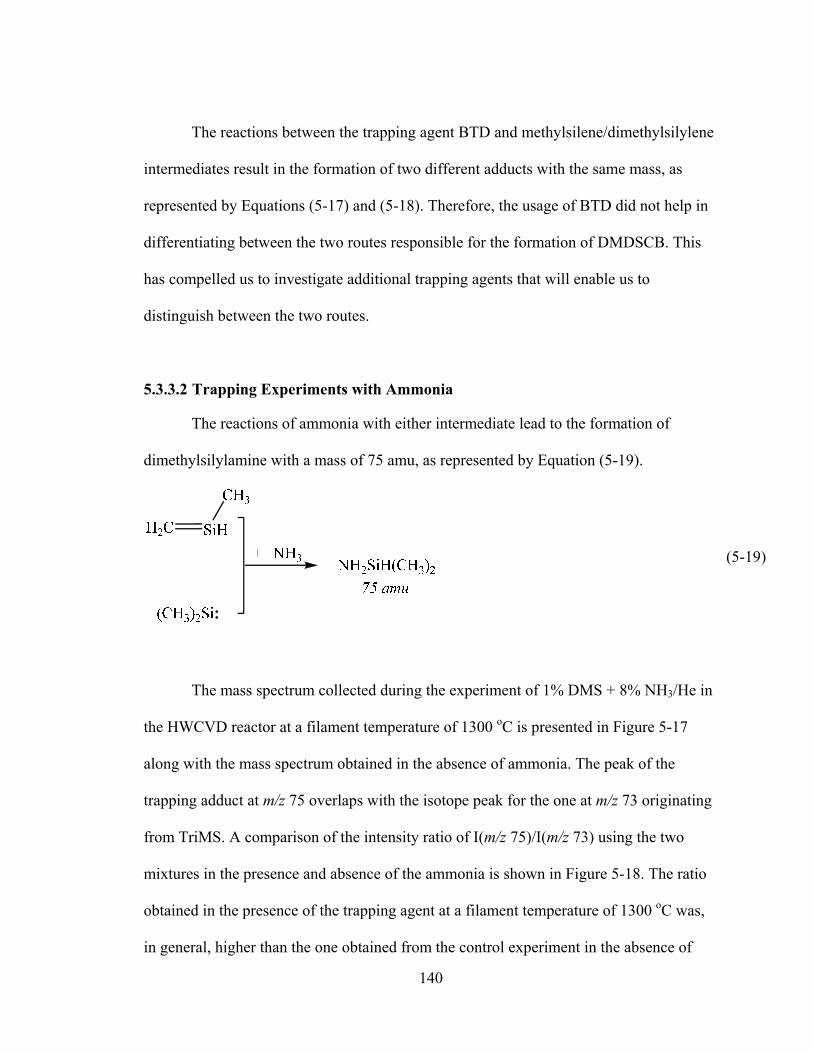
140
The reactions between the trapping agent BTD and methylsilene/dimethylsilylene
intermediates result in the formation of two different adducts with the same mass, as
represented by Equations (5-17) and (5-18). Therefore, the usage of BTD did not help in
differentiating between the two routes responsible for the formation of DMDSCB. This
has compelled us to investigate additional trapping agents that will enable us to
distinguish between the two routes.
5.3.3.2 Trapping Experiments with Ammonia
The reactions of ammonia with either intermediate lead to the formation of
dimethylsilylamine with a mass of 75 amu, as represented by Equation (5-19).
(5-19)
The mass spectrum collected during the experiment of 1% DMS + 8% NH3/He in
the HWCVD reactor at a filament temperature of 1300 oC is presented in Figure 5-17
along with the mass spectrum obtained in the absence of ammonia. The peak of the
trapping adduct at m/z 75 overlaps with the isotope peak for the one at m/z 73 originating
from TriMS. A comparison of the intensity ratio of I(m/z 75)/I(m/z 73) using the two
mixtures in the presence and absence of the ammonia is shown in Figure 5-18. The ratio
obtained in the presence of the trapping agent at a filament temperature of 1300 oC was,
in general, higher than the one obtained from the control experiment in the absence of
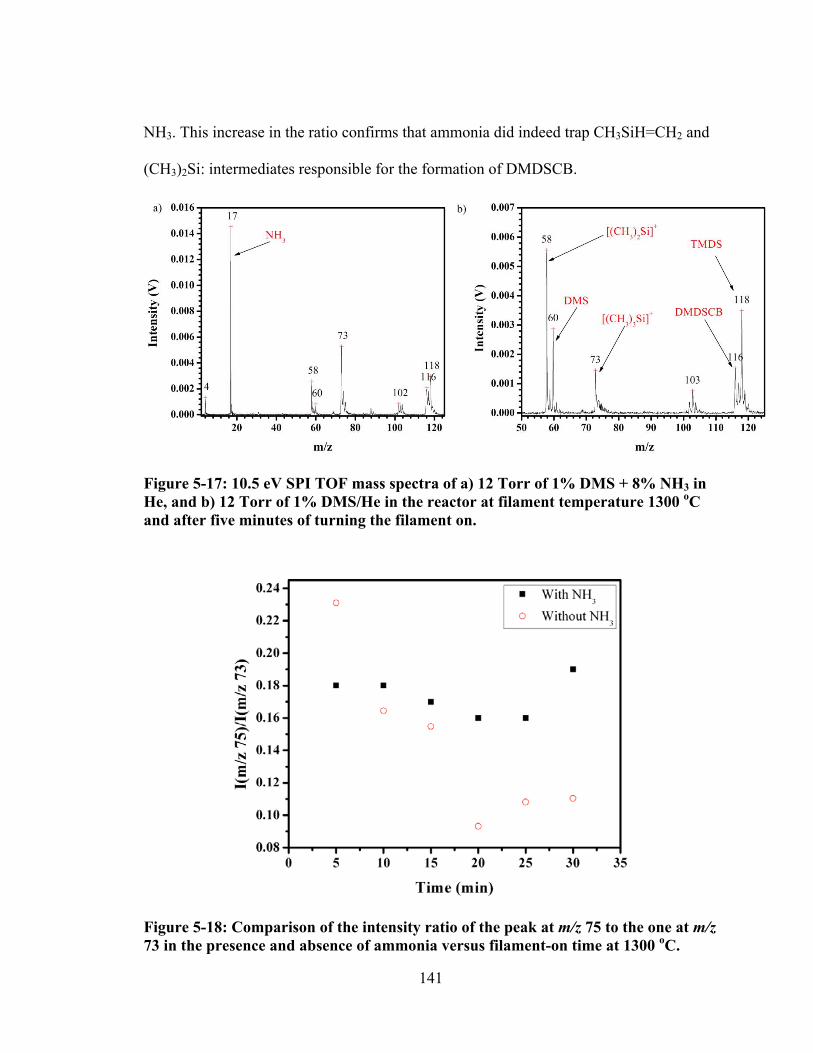
141
NH3. This increase in the ratio confirms that ammonia did indeed trap CH3SiH=CH2 and
(CH3)2Si: intermediates responsible for the formation of DMDSCB.
Figure 5-17: 10.5 eV SPI TOF mass spectra of a) 12 Torr of 1% DMS + 8% NH3 in He, and b) 12 Torr of 1% DMS/He in the reactor at filament temperature 1300 oC and after five minutes of turning the filament on.
Figure 5-18: Comparison of the intensity ratio of the peak at m/z 75 to the one at m/z 73 in the presence and absence of ammonia versus filament-on time at 1300 oC.
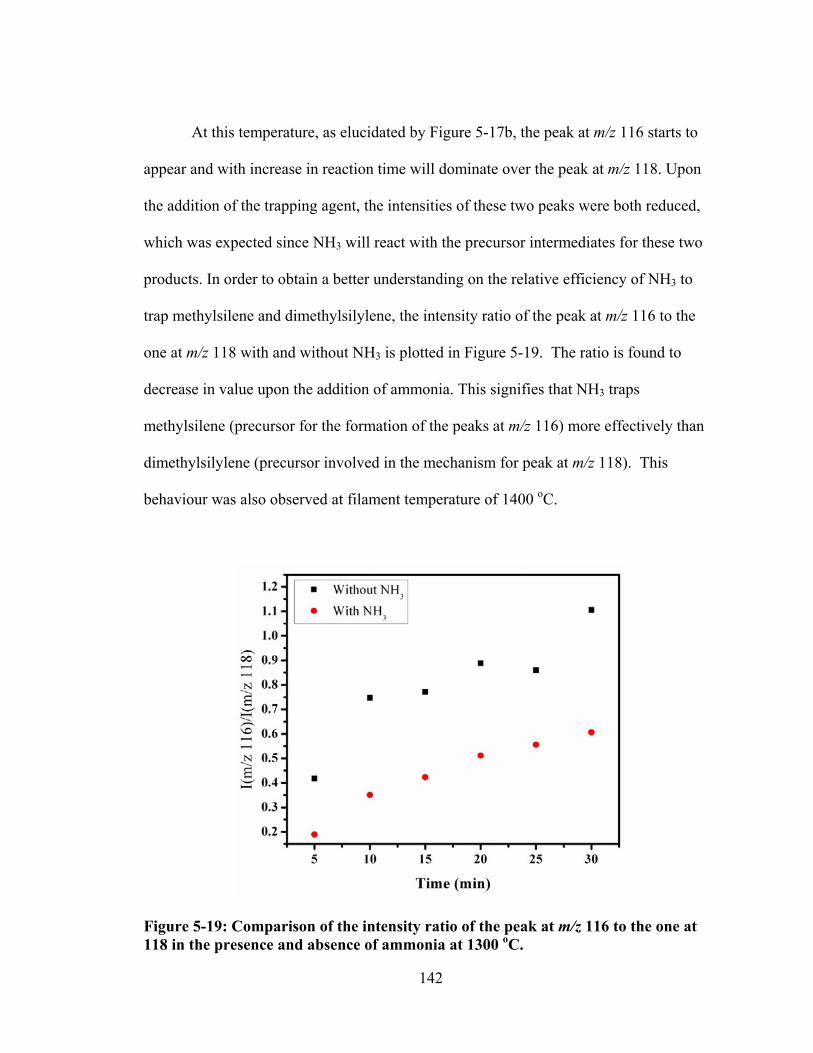
142
At this temperature, as elucidated by Figure 5-17b, the peak at m/z 116 starts to
appear and with increase in reaction time will dominate over the peak at m/z 118. Upon
the addition of the trapping agent, the intensities of these two peaks were both reduced,
which was expected since NH3 will react with the precursor intermediates for these two
products. In order to obtain a better understanding on the relative efficiency of NH3 to
trap methylsilene and dimethylsilylene, the intensity ratio of the peak at m/z 116 to the
one at m/z 118 with and without NH3 is plotted in Figure 5-19. The ratio is found to
decrease in value upon the addition of ammonia. This signifies that NH3 traps
methylsilene (precursor for the formation of the peaks at m/z 116) more effectively than
dimethylsilylene (precursor involved in the mechanism for peak at m/z 118). This
behaviour was also observed at filament temperature of 1400 oC.
Figure 5-19: Comparison of the intensity ratio of the peak at m/z 116 to the one at 118 in the presence and absence of ammonia at 1300 oC.
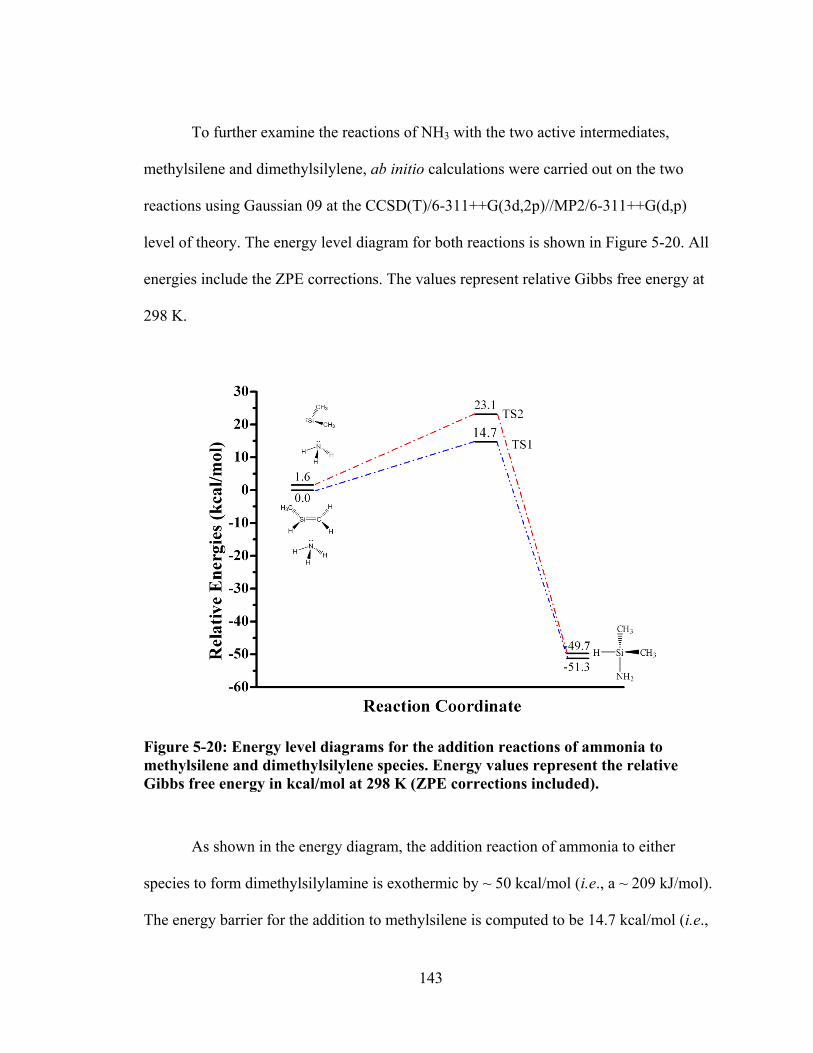
143
To further examine the reactions of NH3 with the two active intermediates,
methylsilene and dimethylsilylene, ab initio calculations were carried out on the two
reactions using Gaussian 09 at the CCSD(T)/6-311++G(3d,2p)//MP2/6-311++G(d,p)
level of theory. The energy level diagram for both reactions is shown in Figure 5-20. All
energies include the ZPE corrections. The values represent relative Gibbs free energy at
298 K.
Figure 5-20: Energy level diagrams for the addition reactions of ammonia to methylsilene and dimethylsilylene species. Energy values represent the relative Gibbs free energy in kcal/mol at 298 K (ZPE corrections included).
As shown in the energy diagram, the addition reaction of ammonia to either
species to form dimethylsilylamine is exothermic by ~ 50 kcal/mol (i.e., a ~ 209 kJ/mol).
The energy barrier for the addition to methylsilene is computed to be 14.7 kcal/mol (i.e.,
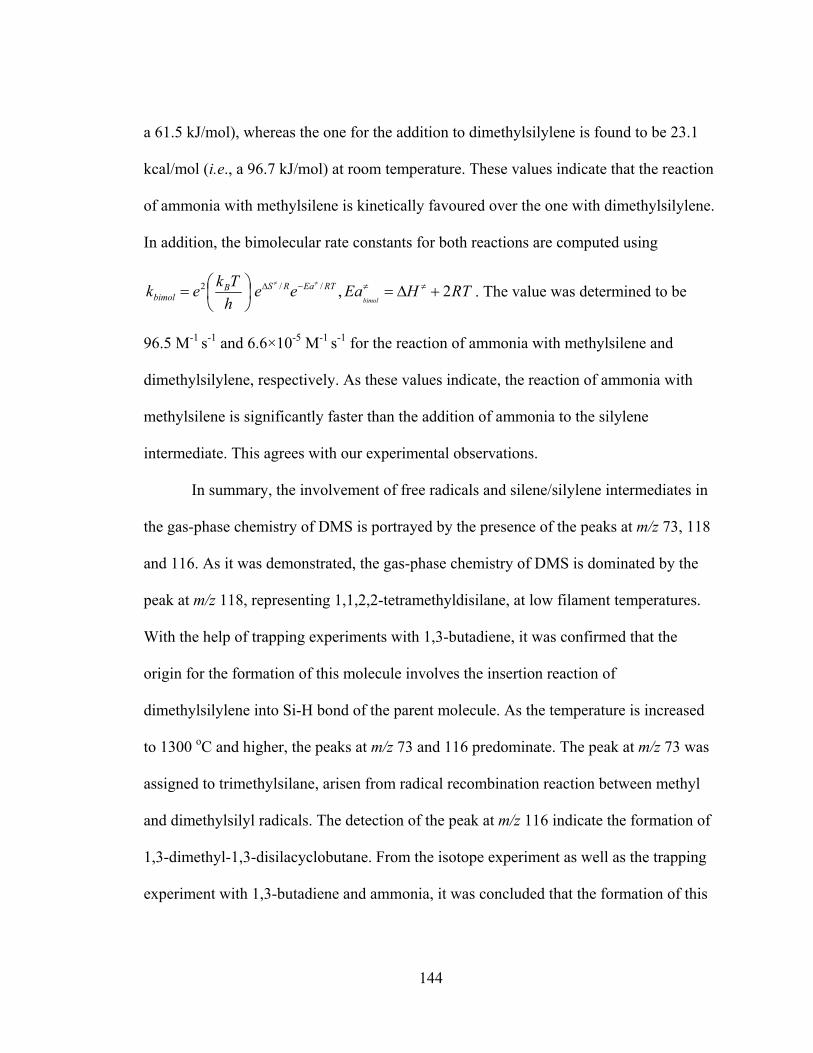
144
a 61.5 kJ/mol), whereas the one for the addition to dimethylsilylene is found to be 23.1
kcal/mol (i.e., a 96.7 kJ/mol) at room temperature. These values indicate that the reaction
of ammonia with methylsilene is kinetically favoured over the one with dimethylsilylene.
In addition, the bimolecular rate constants for both reactions are computed using
RTHEaeeh
Tkek
bimol
RTEaRSBbimol 2,//2
. The value was determined to be
96.5 M-1 s-1 and 6.6×10⁻⁵ M-1 s-1 for the reaction of ammonia with methylsilene and
dimethylsilylene, respectively. As these values indicate, the reaction of ammonia with
methylsilene is significantly faster than the addition of ammonia to the silylene
intermediate. This agrees with our experimental observations.
In summary, the involvement of free radicals and silene/silylene intermediates in
the gas-phase chemistry of DMS is portrayed by the presence of the peaks at m/z 73, 118
and 116. As it was demonstrated, the gas-phase chemistry of DMS is dominated by the
peak at m/z 118, representing 1,1,2,2-tetramethyldisilane, at low filament temperatures.
With the help of trapping experiments with 1,3-butadiene, it was confirmed that the
origin for the formation of this molecule involves the insertion reaction of
dimethylsilylene into Si-H bond of the parent molecule. As the temperature is increased
to 1300 oC and higher, the peaks at m/z 73 and 116 predominate. The peak at m/z 73 was
assigned to trimethylsilane, arisen from radical recombination reaction between methyl
and dimethylsilyl radicals. The detection of the peak at m/z 116 indicate the formation of
1,3-dimethyl-1,3-disilacyclobutane. From the isotope experiment as well as the trapping
experiment with 1,3-butadiene and ammonia, it was concluded that the formation of this
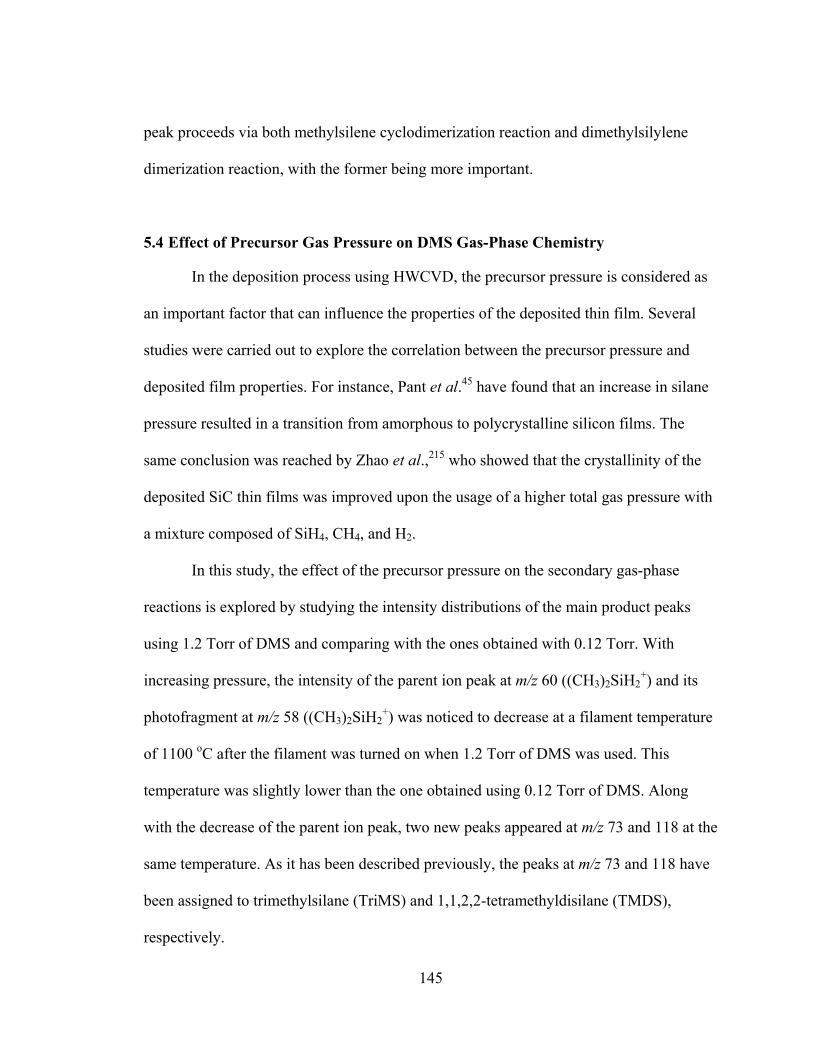
145
peak proceeds via both methylsilene cyclodimerization reaction and dimethylsilylene
dimerization reaction, with the former being more important.
5.4 Effect of Precursor Gas Pressure on DMS Gas-Phase Chemistry
In the deposition process using HWCVD, the precursor pressure is considered as
an important factor that can influence the properties of the deposited thin film. Several
studies were carried out to explore the correlation between the precursor pressure and
deposited film properties. For instance, Pant et al.45 have found that an increase in silane
pressure resulted in a transition from amorphous to polycrystalline silicon films. The
same conclusion was reached by Zhao et al.,215 who showed that the crystallinity of the
deposited SiC thin films was improved upon the usage of a higher total gas pressure with
a mixture composed of SiH4, CH4, and H2.
In this study, the effect of the precursor pressure on the secondary gas-phase
reactions is explored by studying the intensity distributions of the main product peaks
using 1.2 Torr of DMS and comparing with the ones obtained with 0.12 Torr. With
increasing pressure, the intensity of the parent ion peak at m/z 60 ((CH3)2SiH2+) and its
photofragment at m/z 58 ((CH3)2SiH2+) was noticed to decrease at a filament temperature
of 1100 oC after the filament was turned on when 1.2 Torr of DMS was used. This
temperature was slightly lower than the one obtained using 0.12 Torr of DMS. Along
with the decrease of the parent ion peak, two new peaks appeared at m/z 73 and 118 at the
same temperature. As it has been described previously, the peaks at m/z 73 and 118 have
been assigned to trimethylsilane (TriMS) and 1,1,2,2-tetramethyldisilane (TMDS),
respectively.
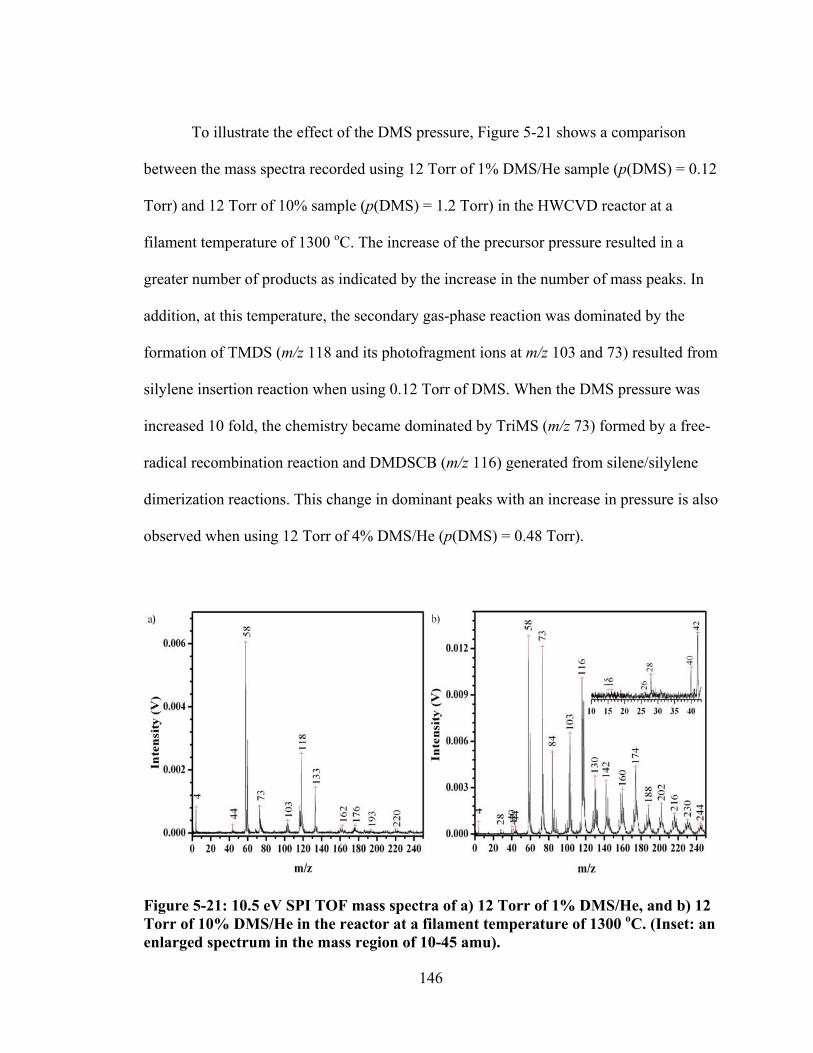
146
To illustrate the effect of the DMS pressure, Figure 5-21 shows a comparison
between the mass spectra recorded using 12 Torr of 1% DMS/He sample (p(DMS) = 0.12
Torr) and 12 Torr of 10% sample (p(DMS) = 1.2 Torr) in the HWCVD reactor at a
filament temperature of 1300 oC. The increase of the precursor pressure resulted in a
greater number of products as indicated by the increase in the number of mass peaks. In
addition, at this temperature, the secondary gas-phase reaction was dominated by the
formation of TMDS (m/z 118 and its photofragment ions at m/z 103 and 73) resulted from
silylene insertion reaction when using 0.12 Torr of DMS. When the DMS pressure was
increased 10 fold, the chemistry became dominated by TriMS (m/z 73) formed by a free-
radical recombination reaction and DMDSCB (m/z 116) generated from silene/silylene
dimerization reactions. This change in dominant peaks with an increase in pressure is also
observed when using 12 Torr of 4% DMS/He (p(DMS) = 0.48 Torr).
Figure 5-21: 10.5 eV SPI TOF mass spectra of a) 12 Torr of 1% DMS/He, and b) 12 Torr of 10% DMS/He in the reactor at a filament temperature of 1300 oC. (Inset: an enlarged spectrum in the mass region of 10-45 amu).
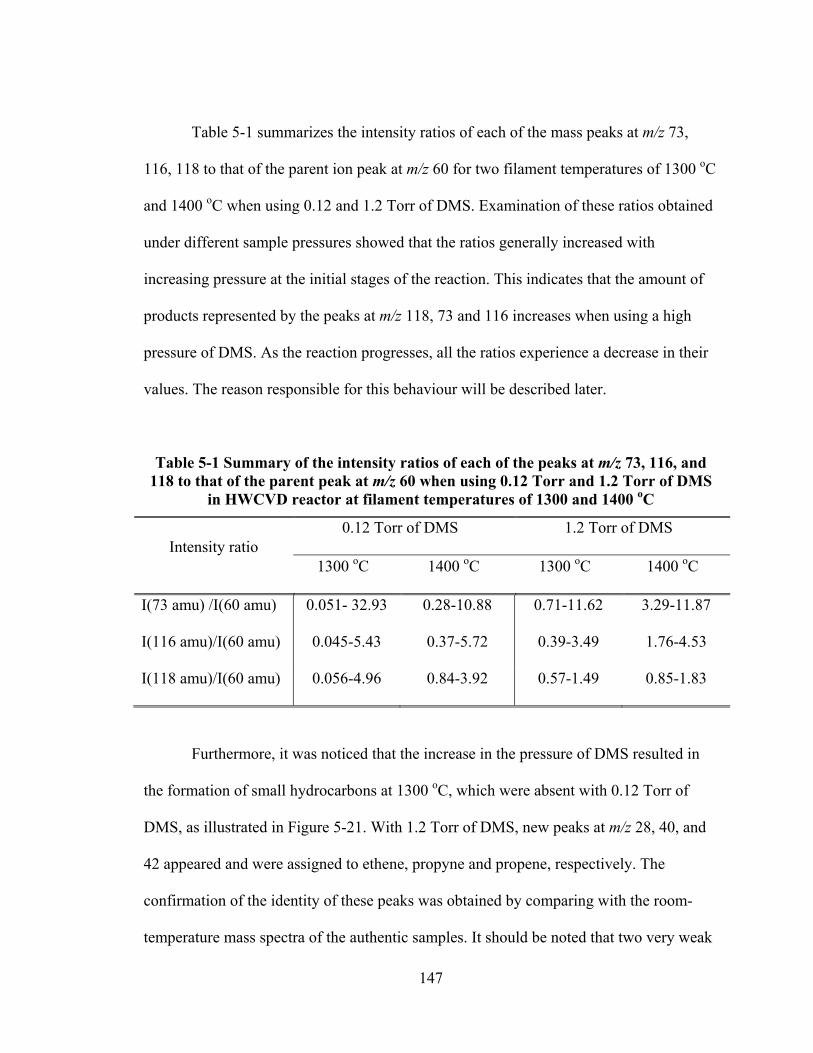
147
Table 5-1 summarizes the intensity ratios of each of the mass peaks at m/z 73,
116, 118 to that of the parent ion peak at m/z 60 for two filament temperatures of 1300 oC
and 1400 oC when using 0.12 and 1.2 Torr of DMS. Examination of these ratios obtained
under different sample pressures showed that the ratios generally increased with
increasing pressure at the initial stages of the reaction. This indicates that the amount of
products represented by the peaks at m/z 118, 73 and 116 increases when using a high
pressure of DMS. As the reaction progresses, all the ratios experience a decrease in their
values. The reason responsible for this behaviour will be described later.
Table 5-1 Summary of the intensity ratios of each of the peaks at m/z 73, 116, and 118 to that of the parent peak at m/z 60 when using 0.12 Torr and 1.2 Torr of DMS
in HWCVD reactor at filament temperatures of 1300 and 1400 oC
Intensity ratio 0.12 Torr of DMS 1.2 Torr of DMS
1300 oC 1400 oC 1300 oC 1400 oC
I(73 amu) /I(60 amu) 0.051- 32.93 0.28-10.88 0.71-11.62 3.29-11.87
I(116 amu)/I(60 amu) 0.045-5.43 0.37-5.72 0.39-3.49 1.76-4.53
I(118 amu)/I(60 amu) 0.056-4.96 0.84-3.92 0.57-1.49 0.85-1.83
Furthermore, it was noticed that the increase in the pressure of DMS resulted in
the formation of small hydrocarbons at 1300 oC, which were absent with 0.12 Torr of
DMS, as illustrated in Figure 5-21. With 1.2 Torr of DMS, new peaks at m/z 28, 40, and
42 appeared and were assigned to ethene, propyne and propene, respectively. The
confirmation of the identity of these peaks was obtained by comparing with the room-
temperature mass spectra of the authentic samples. It should be noted that two very weak
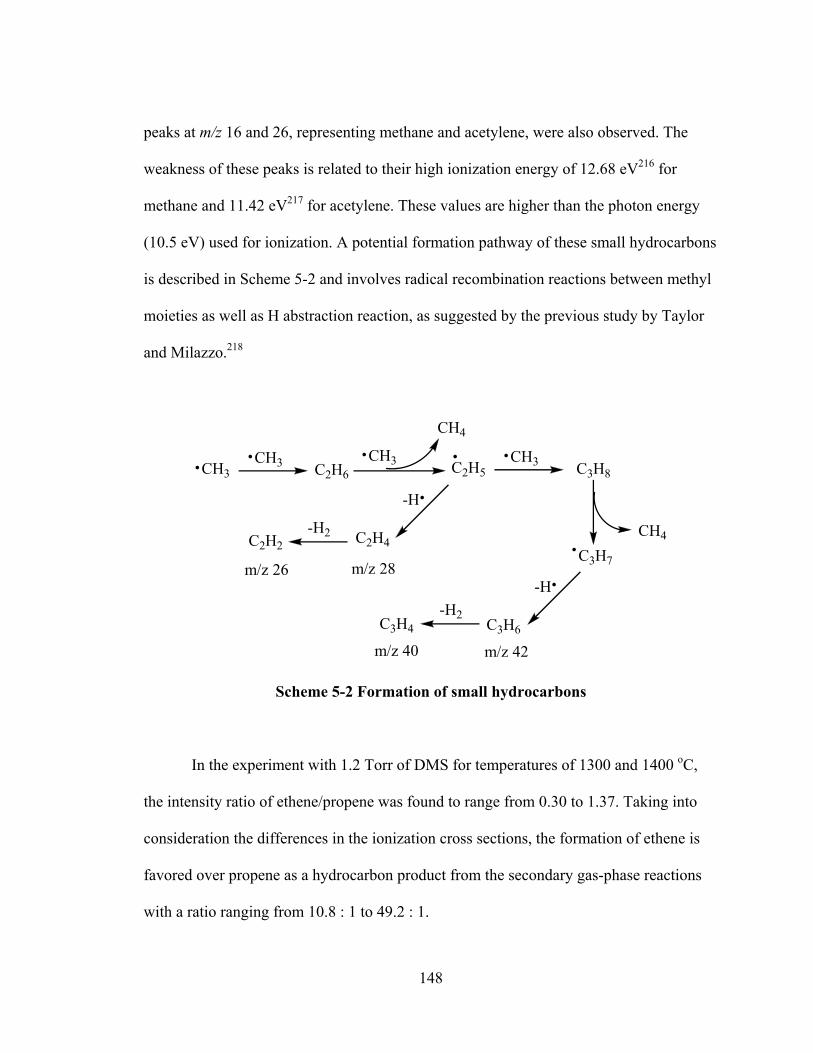
148
peaks at m/z 16 and 26, representing methane and acetylene, were also observed. The
weakness of these peaks is related to their high ionization energy of 12.68 eV216 for
methane and 11.42 eV217 for acetylene. These values are higher than the photon energy
(10.5 eV) used for ionization. A potential formation pathway of these small hydrocarbons
is described in Scheme 5-2 and involves radical recombination reactions between methyl
moieties as well as H abstraction reaction, as suggested by the previous study by Taylor
and Milazzo.218
CH3CH3 C2H6
CH3
CH4
C2H5CH3 C3H8
CH4
C3H7
C3H6
-H
C3H4
-H2
-H
C2H4-H2
C2H2
m/z 26 m/z 28
m/z 42m/z 40
Scheme 5-2 Formation of small hydrocarbons
In the experiment with 1.2 Torr of DMS for temperatures of 1300 and 1400 oC,
the intensity ratio of ethene/propene was found to range from 0.30 to 1.37. Taking into
consideration the differences in the ionization cross sections, the formation of ethene is
favored over propene as a hydrocarbon product from the secondary gas-phase reactions
with a ratio ranging from 10.8 : 1 to 49.2 : 1.
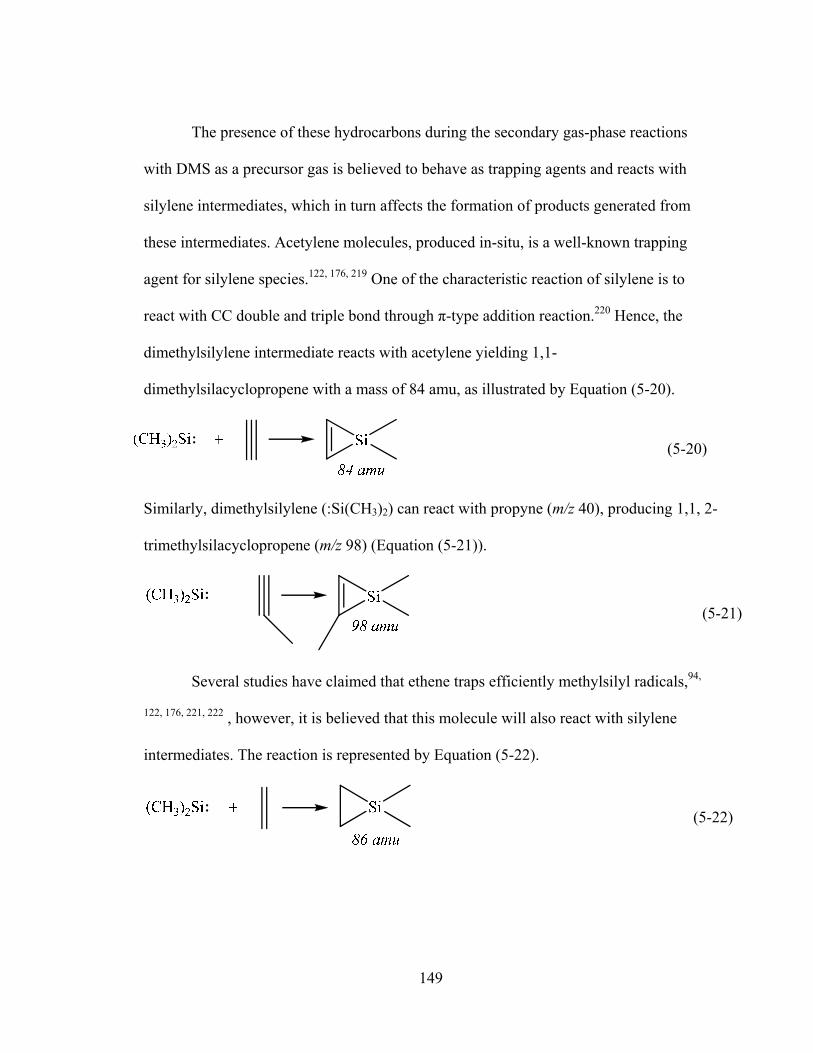
149
The presence of these hydrocarbons during the secondary gas-phase reactions
with DMS as a precursor gas is believed to behave as trapping agents and reacts with
silylene intermediates, which in turn affects the formation of products generated from
these intermediates. Acetylene molecules, produced in-situ, is a well-known trapping
agent for silylene species.122, 176, 219 One of the characteristic reaction of silylene is to
react with CC double and triple bond through π-type addition reaction.220 Hence, the
dimethylsilylene intermediate reacts with acetylene yielding 1,1-
dimethylsilacyclopropene with a mass of 84 amu, as illustrated by Equation (5-20).
(5-20)
Similarly, dimethylsilylene (:Si(CH3)2) can react with propyne (m/z 40), producing 1,1, 2-
trimethylsilacyclopropene (m/z 98) (Equation (5-21)).
(5-21)
Several studies have claimed that ethene traps efficiently methylsilyl radicals,94,
122, 176, 221, 222 , however, it is believed that this molecule will also react with silylene
intermediates. The reaction is represented by Equation (5-22).
(5-22)
150
To confirm the occurrence of the reactions of ethene with both silylene and silyl
species, a trapping experiment with 8 fold of ethene was conducted and the collected
mass spectrum is presented in Figure 5-22. The reaction of ethene with dimethylsilylene
and dimethylsilyl radical will yield the formation of 1,2-dimethylsilacyclopropane (m/z
86) and 1-dimethylethylsilane (m/z 88), respectively. As shown in Figure 5-22, these two
peaks were observed. A comparison of the intensity distributions of the main product
peaks at m/z 73, 116, and 118 from using DMS showed that their intensities were reduced
in the presence of ethene, indicating that this trapping agent reacts with both
dimethylsilyl radical and dimethylsilylene intermediates. In order to elucidate the
trapping efficiency of either intermediate by ethene, the intensity ratio of the respective
peaks in the presence and absence of ethene was examined. Table 5-2 lists these intensity
ratios. All of the obtained ratios were less than 1, which confirms that ethene trapped
dimethylsilyl radical and dimethylsilylene species. The ratio obtained with the peak at
m/z 118, which originated from dimethylsilylene insertion reaction, was the lowest
among the three. This signifies that ethene trapped more efficiently dimethylsilylene
intermediates, which contradicts with the literature94, 122, 176, 221, 222 claiming that ethene
scavenges mainly methylsilyl radicals.
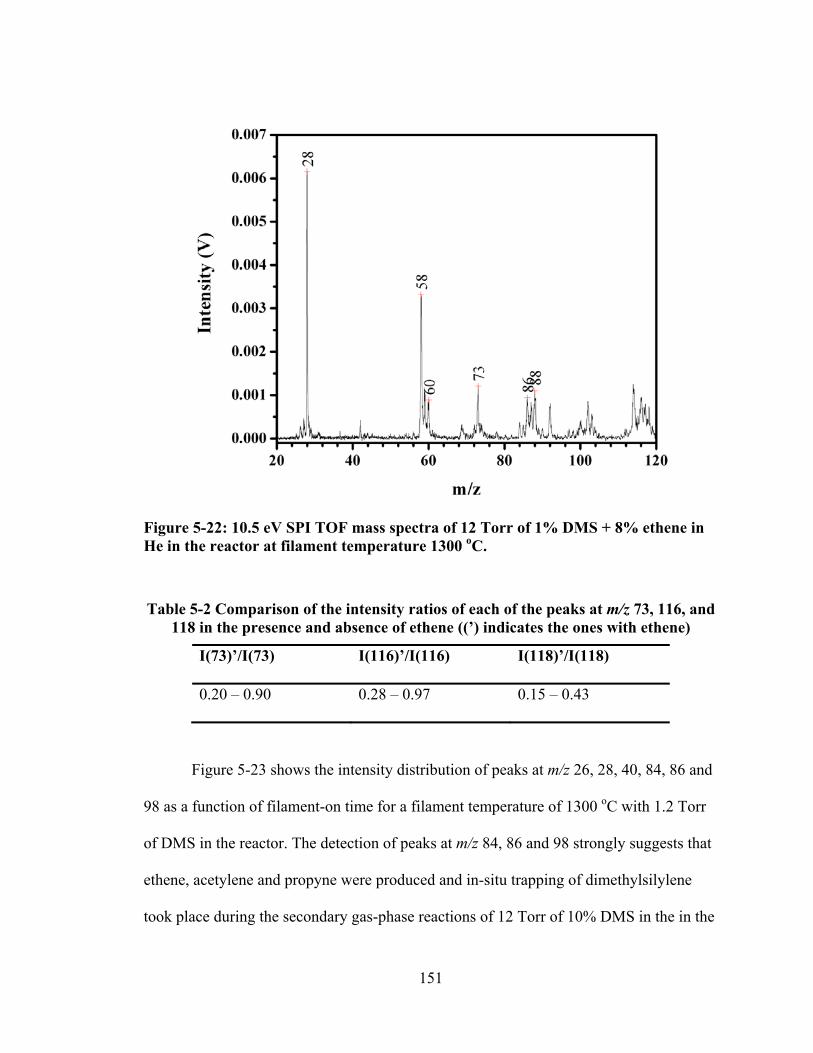
151
Figure 5-22: 10.5 eV SPI TOF mass spectra of 12 Torr of 1% DMS + 8% ethene in He in the reactor at filament temperature 1300 oC.
Table 5-2 Comparison of the intensity ratios of each of the peaks at m/z 73, 116, and 118 in the presence and absence of ethene ((’) indicates the ones with ethene)
I(73)’/I(73) I(116)’/I(116) I(118)’/I(118)
0.20 – 0.90 0.28 – 0.97 0.15 – 0.43
Figure 5-23 shows the intensity distribution of peaks at m/z 26, 28, 40, 84, 86 and
98 as a function of filament-on time for a filament temperature of 1300 oC with 1.2 Torr
of DMS in the reactor. The detection of peaks at m/z 84, 86 and 98 strongly suggests that
ethene, acetylene and propyne were produced and in-situ trapping of dimethylsilylene
took place during the secondary gas-phase reactions of 12 Torr of 10% DMS in the in the
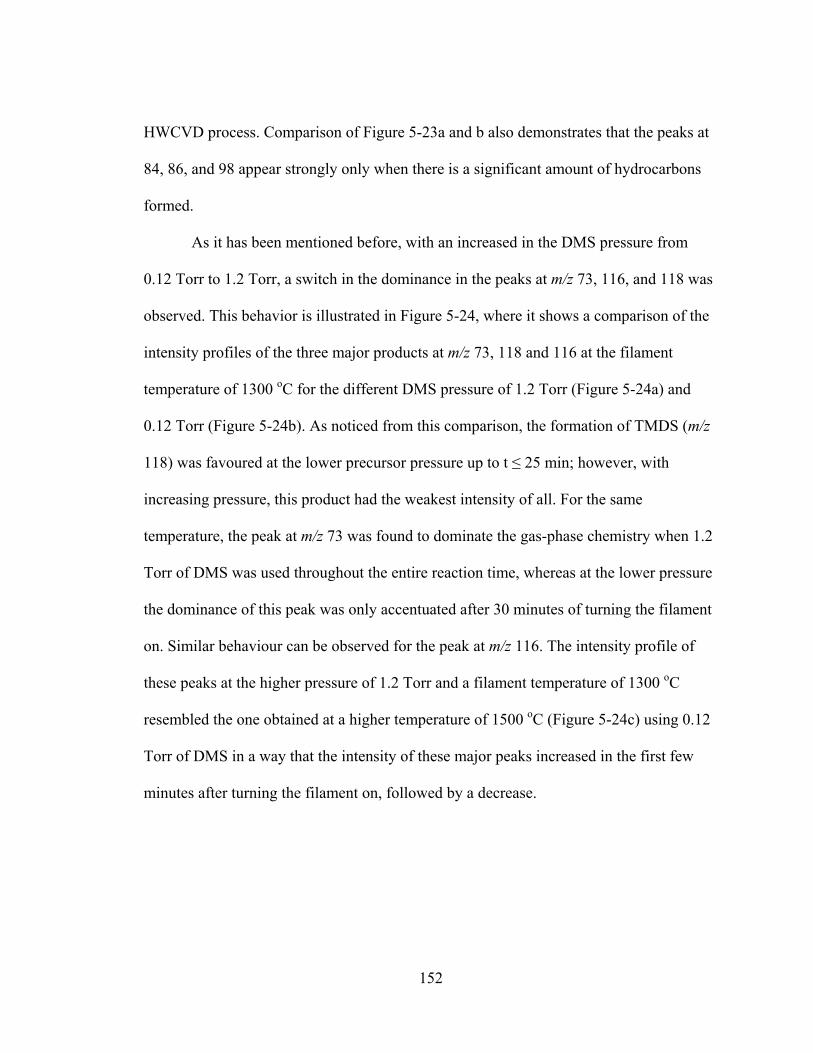
152
HWCVD process. Comparison of Figure 5-23a and b also demonstrates that the peaks at
84, 86, and 98 appear strongly only when there is a significant amount of hydrocarbons
formed.
As it has been mentioned before, with an increased in the DMS pressure from
0.12 Torr to 1.2 Torr, a switch in the dominance in the peaks at m/z 73, 116, and 118 was
observed. This behavior is illustrated in Figure 5-24, where it shows a comparison of the
intensity profiles of the three major products at m/z 73, 118 and 116 at the filament
temperature of 1300 oC for the different DMS pressure of 1.2 Torr (Figure 5-24a) and
0.12 Torr (Figure 5-24b). As noticed from this comparison, the formation of TMDS (m/z
118) was favoured at the lower precursor pressure up to t ≤ 25 min; however, with
increasing pressure, this product had the weakest intensity of all. For the same
temperature, the peak at m/z 73 was found to dominate the gas-phase chemistry when 1.2
Torr of DMS was used throughout the entire reaction time, whereas at the lower pressure
the dominance of this peak was only accentuated after 30 minutes of turning the filament
on. Similar behaviour can be observed for the peak at m/z 116. The intensity profile of
these peaks at the higher pressure of 1.2 Torr and a filament temperature of 1300 oC
resembled the one obtained at a higher temperature of 1500 oC (Figure 5-24c) using 0.12
Torr of DMS in a way that the intensity of these major peaks increased in the first few
minutes after turning the filament on, followed by a decrease.
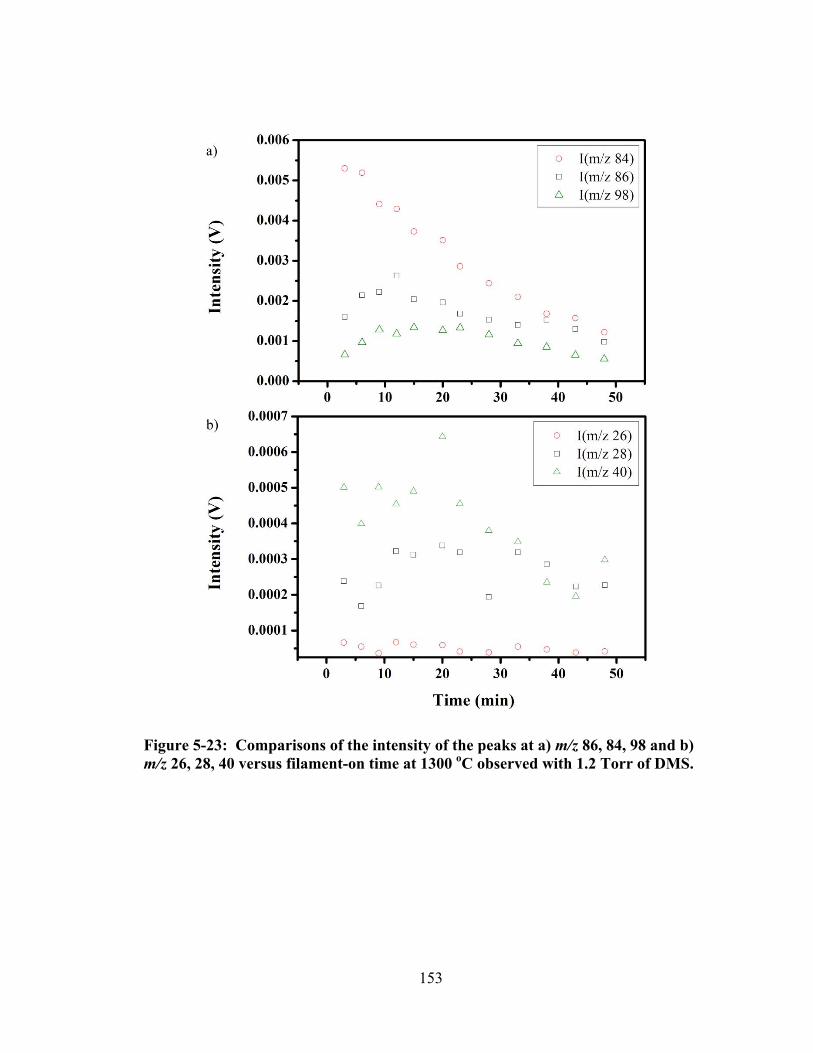
153
Figure 5-23: Comparisons of the intensity of the peaks at a) m/z 86, 84, 98 and b) m/z 26, 28, 40 versus filament-on time at 1300 oC observed with 1.2 Torr of DMS.
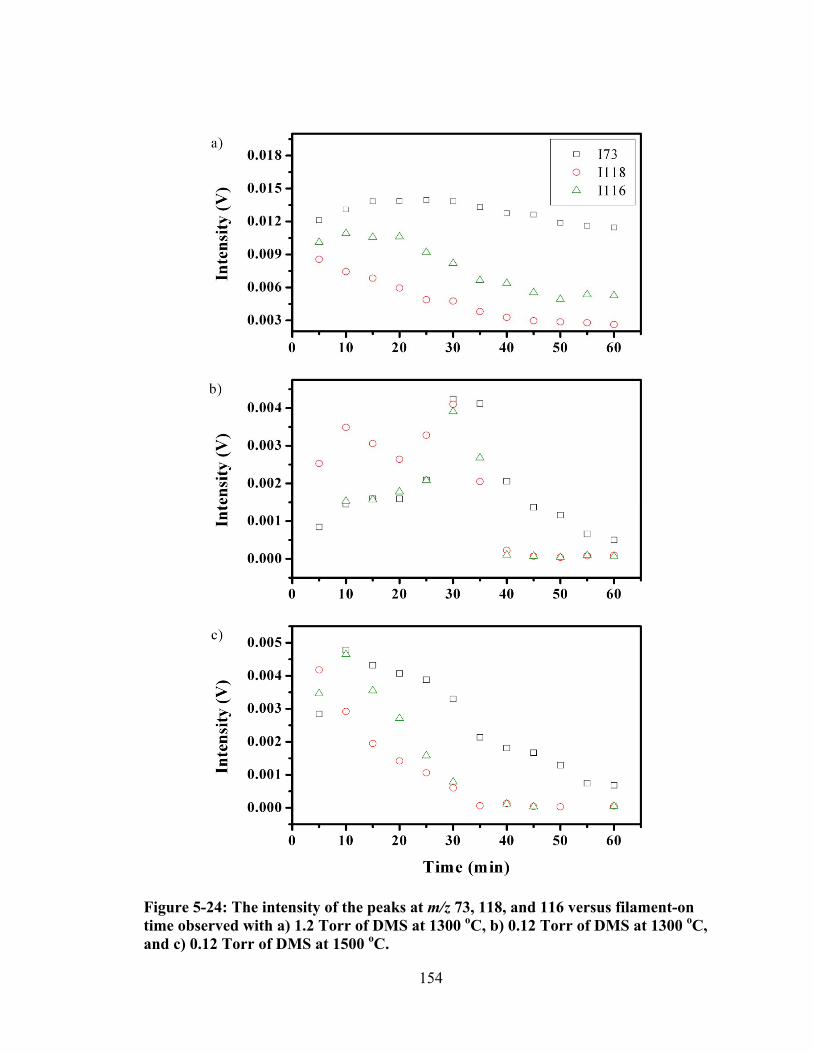
154
Figure 5-24: The intensity of the peaks at m/z 73, 118, and 116 versus filament-on time observed with a) 1.2 Torr of DMS at 1300 oC, b) 0.12 Torr of DMS at 1300 oC, and c) 0.12 Torr of DMS at 1500 oC.
155
The change in trend in the evolution of these peaks suggests a competition
between free-radical reactions and silylene chemistry. As it has been previously
discussed, the usage of high precursor pressure resulted in the production of several small
hydrocarbon molecules, including methane, ethene, acetylene, propene, and propyne.
Acetylene122 has been known to react with silylene species, while ethene94, 122 and
propene122 was claimed to react mainly with free radicals. Therefore, their presence
during the secondary gas-phase reactions of DMS will affect the formation of all the
products involving these intermediates. This effect is reflected on the intensity profile of
the peak at m/z 118, which was observed to decrease when these hydrocarbon were
simultaneously formed. From Figure 5-23, it can be seen that the peaks 26, 28 and 40
representing acetylene, ethene and propyne, reached their maximum intensity at 25 min.
This time also coincides with the formation of the trapping products with m/z 84 and 98
amu. Therefore, before 25 min, the amount of hydrocarbon produced was not significant
to react with dimethylsilylene. The observed increase in the intensity of the peak at m/z
118 when comparing both Figures 5-24a and 5-24b within the first 25 min of reaction
time is due to the significant abundance of dimethylsilylene intermediate when the
precursor pressure is increased. When the trapping reactions between silylene species and
the various hydrocarbons started to take place at t ≥ 25 min, a decrease in the formation
of TMDS (m/z 118) was observed (Figure 5-24a). This explanation can be extended to
explain the behaviour for the other two peaks. As it can be noted from Figure 5-24, the
intensity profile of peaks at m/z 73 and 116 showed an increase when switching from low
to high precursor pressure in the 30 minutes of reaction time. As the reaction progresses
and a good amount of hydrocarbon is present, a decrease in the intensity of these peaks is
156
observed due to the trapping of the corresponding intermediates by the hydrocarbon
molecules. Furthermore, the presence of the hydrocarbon molecules at high precursor
pressure did not affect the formation of the major peaks to the same extent. As stated
earlier, the intensity of the peak at m/z 118 was the lowest of all with increasing precursor
pressure. This is due to the fact that the mechanism of this peak involves solely
dimethylsilylene species, which is consumed by the various hydrocarbon molecules,
hence, reducing its participation in the formation of TMDS. On the other hand, the major
contributor to the peak at m/z 73 is dimethylsilyl radical recombination reaction with
methyl radical. Among all of the hydrocarbons produced, only ethene and propene would
have an effect on the production of trimethylsilane by reacting with dimethylsilyl radical.
For the formation of DMDSCB (m/z 116), aside from dimethylsilylene, there is an
additional contribution from methylsilene. The formed hydrocarbons would only react
with dimethylsilylene moieties, while not affecting methylsilene. Therefore, the peak at
m/z 118 is affected the most by the production of small hydrocarbons with the increase in
the DMS pressure.
In summary, the increase in the sample pressure has yielded the formation of
small hydrocarbons including methane, ethene, acetylene, propene and propyne. This
leads to a switch from silylene dominant chemistry to a free-radical dominant chemistry
with the increase in the sample pressure at a low filament temperature of 1200 oC. At the
low pressure, the formation of 1,1,2,2-tetramethyldisilane (m/z 118) by dimethylsilylene
insertion reaction into Si-H bond in the DMS molecule was favoured over
trimethylsilane (m/z 73) produced from a free-radical recombination reaction. However,
157
when the pressure is increased by 10 times, the gas-phase chemistry was dominated by
the formation of trimethylsilane. This is explained by the trapping of the corresponding
active intermediates by the small hydrocarbons, ethene, propyne and acetylene produced
in-situ.
5.5 Effect of Filament Material on DMS Gas-Phase Chemistry
The nature of the filament material is believed to play a role in the decomposition
of the gas precursors in the HWCVD system. In the study of the influence of filament
material on the deposition of polycrystalline silicon thin films, it was found that thin
films grown by HWCVD using W and Ta as filament materials show different material
properties, and this difference is caused by the different surface reaction and catalytic
properties of the filament material.40 In addition, Duan et al.36 has studied the effect of
filament material on the decomposition of silane by monitoring the production of Si
radical from W, Re, Mo and Ta filaments. Their results showed that the different material
provided different apparent activation energy values for Si formation, suggesting that
different mechanisms may be active. Additionally, in a study carried out to examine the
effect of filament material including W, Ta, Mo and Pt on the deposition of SiC thin films
using dimethylsilane, Nakayama et al.60 found that among all chosen filaments, W was
the most effective catalyzer with the highest growth rate. It was also shown that Mo and
Pt produced large precursors leading to high carbon content in the film, while W and Ta
decomposed DMS to form small precursors, reducing the carbon composition in the
film.60 Hence, as the key component in HWCVD is the filament at which the catalytic
decomposition of the source gas occurs, the possible use of different materials is
158
investigated. In this study, the gas-phase chemistry of dimethylsilane was examined on a
W filament using 12 Torr of 1% DMS/He and 10% DMS/He mixtures, and the results
were compared those obtained with the Ta filament.
From the previous discussions, it was concluded that the secondary gas-phase
reactions of DMS on Ta filament are dominated by three major products, i.e.,
trimethylsilane at m/z 73, 1,1,2,2-tetramethyldisilane at m/z 118, and 1,3-dimethyl-1,3-
disilacyclobutane at m/z 116. From the examination of the gas-phase reaction chemistry
with W filament, it was found that the same gas-phase species have been detected.
However, the effect of the filament material is determined based on which product is
formed initially and the temperature at which the gas-phase chemistry becomes active.
Figure 5-25 shows two mass spectra collected for 12 Torr of 1% DMS/He mixture under
the same conditions using W and Ta filaments. As noted from this figure, when the W
filament was used, a peak at m/z 73 appeared first, whereas, with Ta filament, the peak at
m/z 118 was detected initially.
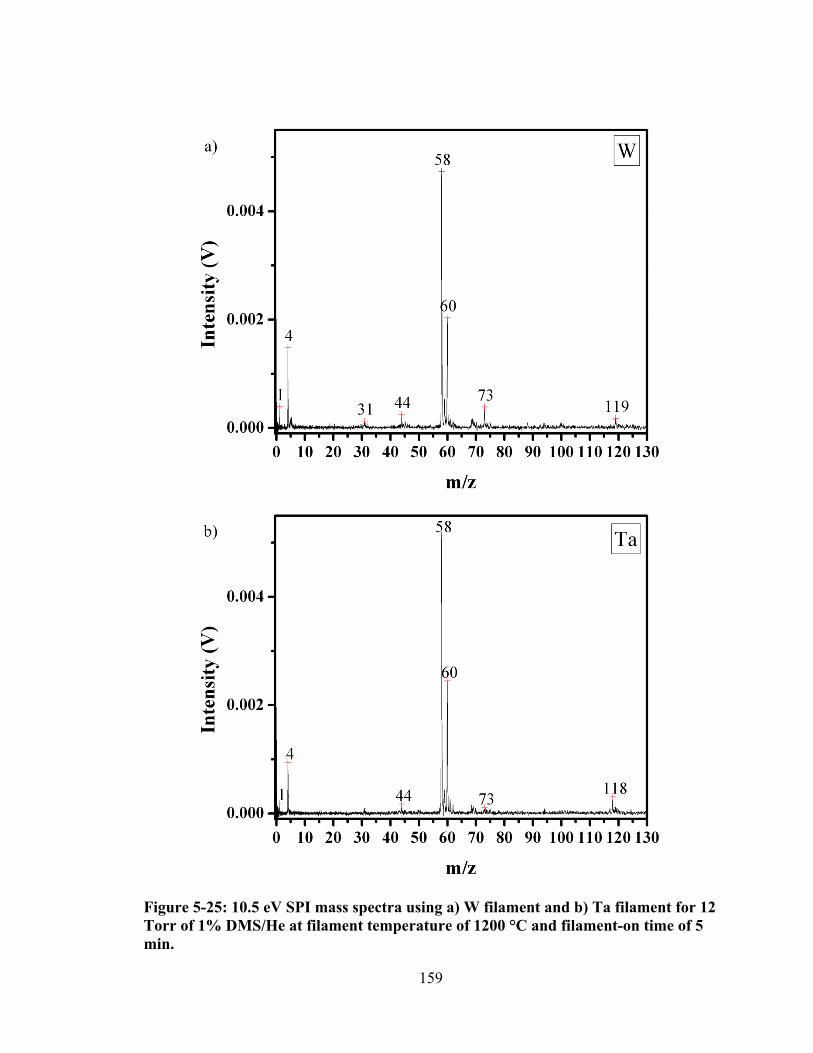
159
Figure 5-25: 10.5 eV SPI mass spectra using a) W filament and b) Ta filament for 12 Torr of 1% DMS/He at filament temperature of 1200 °C and filament-on time of 5 min.
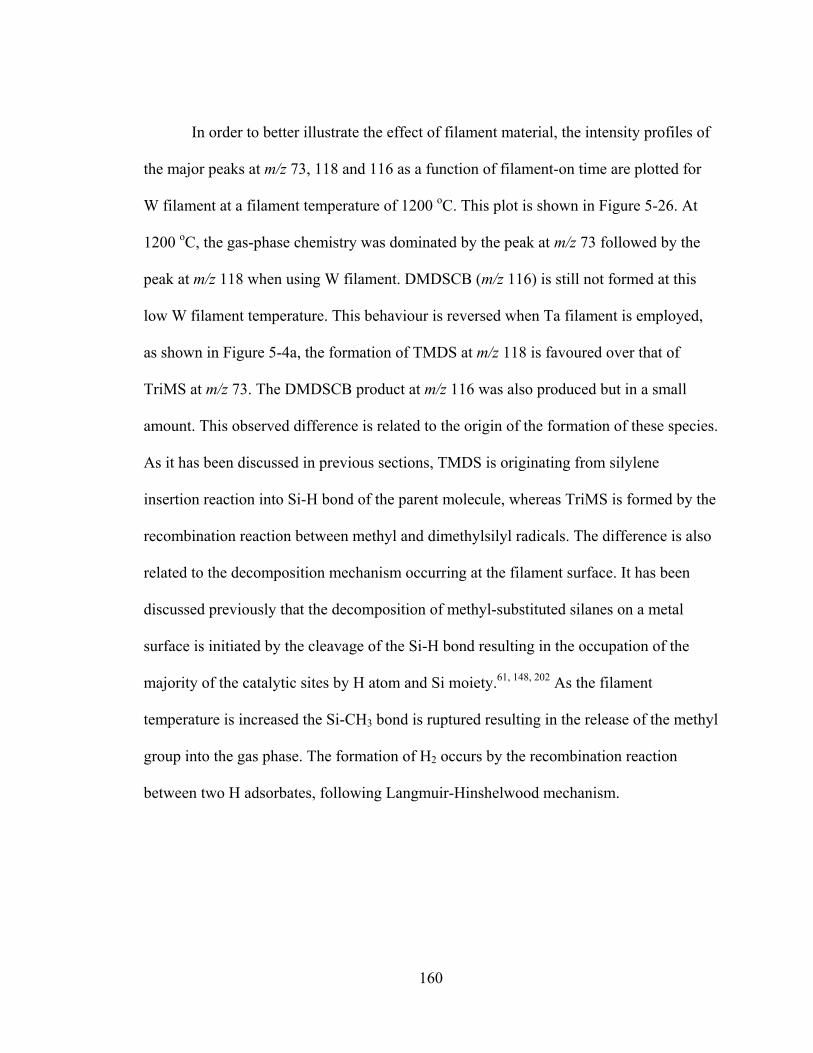
160
In order to better illustrate the effect of filament material, the intensity profiles of
the major peaks at m/z 73, 118 and 116 as a function of filament-on time are plotted for
W filament at a filament temperature of 1200 oC. This plot is shown in Figure 5-26. At
1200 oC, the gas-phase chemistry was dominated by the peak at m/z 73 followed by the
peak at m/z 118 when using W filament. DMDSCB (m/z 116) is still not formed at this
low W filament temperature. This behaviour is reversed when Ta filament is employed,
as shown in Figure 5-4a, the formation of TMDS at m/z 118 is favoured over that of
TriMS at m/z 73. The DMDSCB product at m/z 116 was also produced but in a small
amount. This observed difference is related to the origin of the formation of these species.
As it has been discussed in previous sections, TMDS is originating from silylene
insertion reaction into Si-H bond of the parent molecule, whereas TriMS is formed by the
recombination reaction between methyl and dimethylsilyl radicals. The difference is also
related to the decomposition mechanism occurring at the filament surface. It has been
discussed previously that the decomposition of methyl-substituted silanes on a metal
surface is initiated by the cleavage of the Si-H bond resulting in the occupation of the
majority of the catalytic sites by H atom and Si moiety.61, 148, 202 As the filament
temperature is increased the Si-CH3 bond is ruptured resulting in the release of the methyl
group into the gas phase. The formation of H2 occurs by the recombination reaction
between two H adsorbates, following Langmuir-Hinshelwood mechanism.
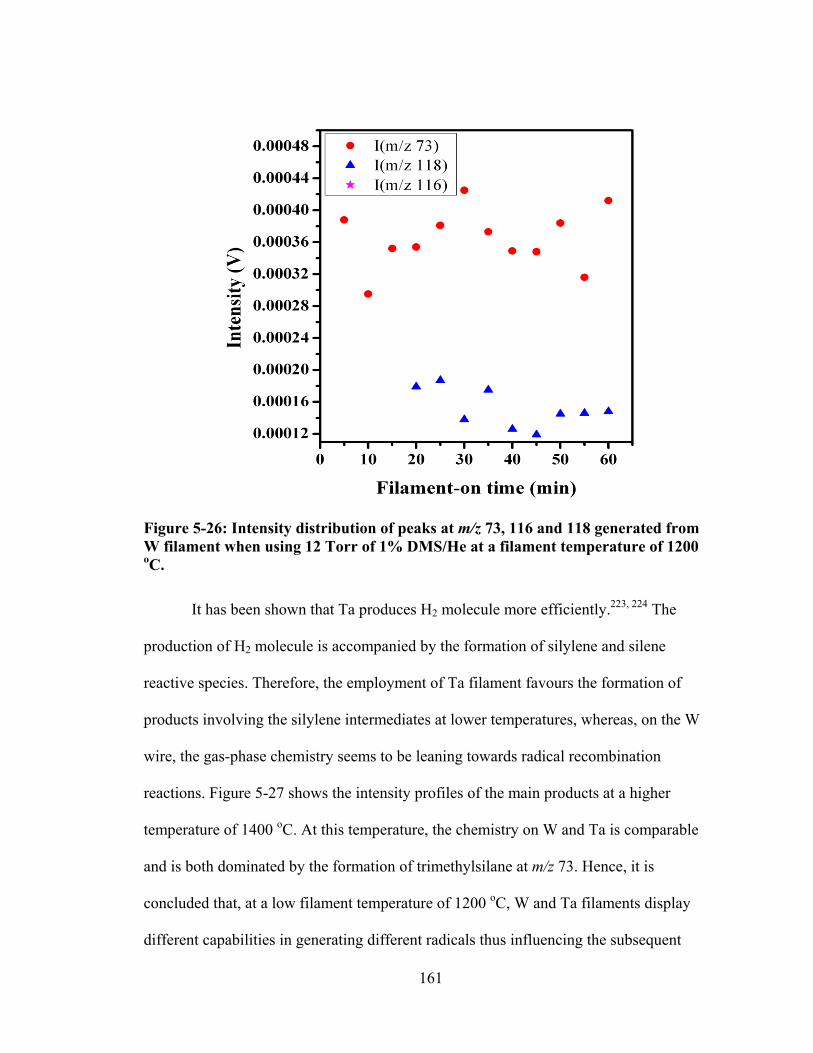
161
Figure 5-26: Intensity distribution of peaks at m/z 73, 116 and 118 generated from W filament when using 12 Torr of 1% DMS/He at a filament temperature of 1200 oC.
It has been shown that Ta produces H2 molecule more efficiently.223, 224 The
production of H2 molecule is accompanied by the formation of silylene and silene
reactive species. Therefore, the employment of Ta filament favours the formation of
products involving the silylene intermediates at lower temperatures, whereas, on the W
wire, the gas-phase chemistry seems to be leaning towards radical recombination
reactions. Figure 5-27 shows the intensity profiles of the main products at a higher
temperature of 1400 oC. At this temperature, the chemistry on W and Ta is comparable
and is both dominated by the formation of trimethylsilane at m/z 73. Hence, it is
concluded that, at a low filament temperature of 1200 oC, W and Ta filaments display
different capabilities in generating different radicals thus influencing the subsequent
162
secondary gas-phase chemistry. This difference no longer exists with increasing
temperatures.
Figure 5-27: Intensity distribution of peaks at m/z 73, 116 and 118 generated from W when using 12 Torr of 1% DMS/He and at a filament temperature of 1400 oC.
5.6 Summary
In this study, the decomposition of dimethylsilane (DMS) on a hot W and Ta
filament was explored using laser ionization mass spectrometry. The decomposition of
DMS on a W and Ta filament under collision-free conditions proceeds via two major
pathways, i.e., methyl and methylsilyl radical (•CH3SiH2) formation, and elimination of
H2 yielding dimethylsilylene ((CH3)2Si:) and methylsilene ((CH3)HSi=CH2).
163
Under a DMS partial pressure of 0.12 Torr in the HWCVD reactor, secondary
gas-phase reactions are dominated by silylene insertion reaction into Si-H bond of the
parent molecule at low temperatures, illustrated by the appearance of 1,1,2,2-
tetramethyldisilane at m/z 118. As the filament temperature is increased, the secondary
gas-phase chemistry is governed by the H abstraction reaction between methyl radicals
and the parent DMS molecules, followed by radical combination reactions. This is
indicated by the detection of peak m/z 73 assigned to trimethylsilane. It has also been
demonstrated that 1,1-dimethyl-1,3-disilacyclobutane (m/z 116) is produced in the reactor
when using DMS as a source gas. This species is believed to be formed from the
cyclodimerization reactions of methylsilene and also from dimethylsilylene dimerization.
The mechanism for the formation of the major products were confirmed by using the
deuterated isotopomer, DMS-d2, as well as chemical trapping with 1,3-butadiene and
ammonia. Our study of the reaction chemistry of DMS has shown that both free radicals
and silenes/silylenes intermediates play important roles in the gas-phase chemistry. The
competition between these two types of intermediates depends heavily on the filament
temperature.
The effect of source gas pressure on the gas-phase chemistry has been studied by
investigating the behavior of two mixtures of DMS in He with different DMS
concentrations. It is found that with a decrease in DMS partial pressures, less gas-phase
reaction products were detected, due to less efficient collisions between the source gas
molecules and the filament and between species in the gas-phase. As the precursor
pressure is increased, small hydrocarbons, including methane, ethene, acetylene, propene,
and propyne were produced. The presence of these molecules affects the gas-phase
164
chemistry of DMS by switching from silylene dominant chemistry to free-radical
dominant chemistry at a low filament temperature of 1200 oC. At low pressure regime
and low filament temperature, i.e., 0.12 Torr and 1200 oC, respectively, the gas-phase
chemistry is dominated by TMDS formation. As the pressure is increased to 1.2 Torr,
TriMS production predominates. This switch in chemistry is explained by the in-situ
trapping of the various intermediates by the formed hydrocarbons molecules, specifically,
ethene, acetylene, and propyne.
The comparison between DMS gas-phase chemistry obtained using W and Ta as
the filament material shows that same gas-phase species have been detected with
different filament material for 1% DMS/He. However, the formation of these species
occurs at different filament temperature and reaction time. This indicates that the filament
material influences its decomposition capability to form different species on the filament
and affect the secondary gas-phase reactions in the HWCVD reactor. For Ta filament, the
production of silylene species is favoured at a low temperature, whereas at the same
filament temperature, W promotes radical formation.
165
Chapter Six: Gas-Phase Chemistry of Monomethylsilane in a HWCVD Reactor
6.1 Motivations
Several studies on the reaction kinetics and mechanism of the pyrolysis of
monomethylsilane (MMS) are documented in the literature. The kinetics on the thermal
decomposition of MMS were previously studied by Neudorfl and Strausz94 in a
conventional static system at 613 to 713 K, and by Davidson and Ring 177 in a low-
pressure static system at 842 to 1000 K. From these studies, it has been found that the
major products were hydrogen molecule (H2), 1, 2-dimethyldisilane (DMDS), DMS and
silane. DMDS was produced from silylene insertion reaction into the Si-H bond, while
DMS and SiH4 were postulated to arise from a free-radical chain reaction.
Sawrey et al.122-124 revisited the decomposition of MMS in order to determine the
nature and yields of the primary decomposition processes. They have carried out a study
in a single-pulse shock tube at a total pressure of 4700 Torr in the temperature range of
1125-1250 K. They have determined, for the primary dissociations processes, the yield
for the 1,1-H2 elimination (a molecular elimination of H2 with the formation of
methylsilylene, :SiHCH3, intermediate) to be ϕ1,1 ≅ 0.7, for the 1,2-H elimination (a
molecular elimination of H2 with the formation of silene, CH2=SiH2, intermediate) to be
ϕ1,2 ≅ 0.16, and for the methane elimination to be ϕ ≅ 0.06. Methane was not a
reported reaction product by Neudorfl et al.94 In addition to the primary dissociation
processes, Sawrey et al. have examined the secondary reactions in order to isolate the
primary mechanism for the formation of the major products. They have conducted their
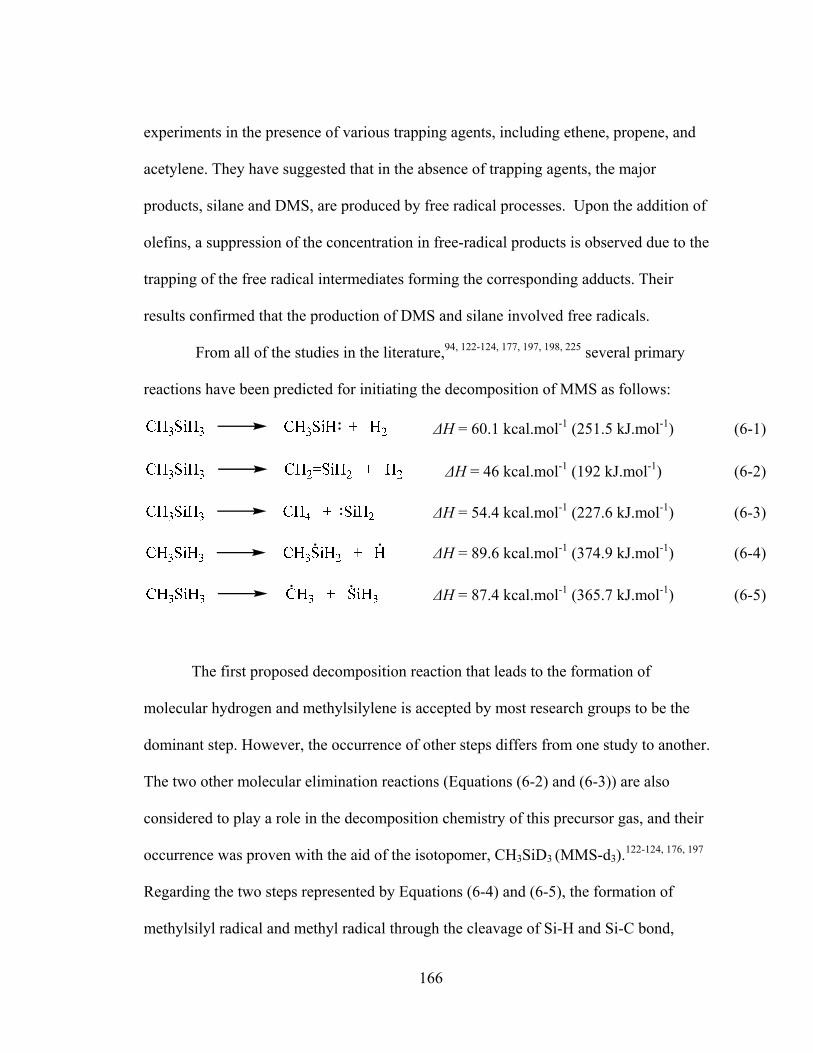
166
experiments in the presence of various trapping agents, including ethene, propene, and
acetylene. They have suggested that in the absence of trapping agents, the major
products, silane and DMS, are produced by free radical processes. Upon the addition of
olefins, a suppression of the concentration in free-radical products is observed due to the
trapping of the free radical intermediates forming the corresponding adducts. Their
results confirmed that the production of DMS and silane involved free radicals.
From all of the studies in the literature,94, 122-124, 177, 197, 198, 225 several primary
reactions have been predicted for initiating the decomposition of MMS as follows:
ΔH = 60.1 kcal.mol-1 (251.5 kJ.mol-1) (6-1)
ΔH = 46 kcal.mol-1 (192 kJ.mol-1) (6-2)
ΔH = 54.4 kcal.mol-1 (227.6 kJ.mol-1) (6-3)
ΔH = 89.6 kcal.mol-1 (374.9 kJ.mol-1) (6-4)
ΔH = 87.4 kcal.mol-1 (365.7 kJ.mol-1) (6-5)
The first proposed decomposition reaction that leads to the formation of
molecular hydrogen and methylsilylene is accepted by most research groups to be the
dominant step. However, the occurrence of other steps differs from one study to another.
The two other molecular elimination reactions (Equations (6-2) and (6-3)) are also
considered to play a role in the decomposition chemistry of this precursor gas, and their
occurrence was proven with the aid of the isotopomer, CH3SiD3 (MMS-d3).122-124, 176, 197
Regarding the two steps represented by Equations (6-4) and (6-5), the formation of
methylsilyl radical and methyl radical through the cleavage of Si-H and Si-C bond,
167
respectively, was discounted on thermochemical grounds as indicated by the reaction
enthalpy values.94, 178 Under pyrolysis conditions, these two reactions would require high
energy and it was proposed that these bond cleavage reactions might occur to a small
extent in the presence of a highly active surface. Hence, free radicals formed during the
decomposition of MMS are produced heterogeneously, whereas molecular elimination
reactions involve homogeneous chemistry. Therefore, it is concluded that the primary
process involved in the pyrolysis of MMS is the molecular elimination along with the
generation of silylene or silene species.
Studies of homogeneous decomposition of MMS122-124, 176, 178 have shown that the
primary product is methylsilylene with yields ranging from 98% at 700 oC to 70% at 900
oC. Silene is also produced but its formation is relatively minor varying from about 1% to
15% over the same temperature range. Regarding the secondary gas-phase reactions,
these studied have agreed that the formation of 1,2-dimethyldisilane, being one of the
dominant products, involves mainly methylsilylene insertion reaction rather than radical
recombination reaction. This conclusion is supported by the study carried out by Obi et
al.,226 where he examined the photolysis of MMS in the presence of nitric oxide, an
efficient methylsilyl radical scavenger. They found that the concentration of DMDS was
not affected upon the addition of NO. Despite the presence of the large number of studies
on MMS, none of the studies mentioned the formation of 1,3-disilacyclobutane. Sawrey
et al.123 speculated its formation by the dimerization of dimethylsilylene and not silene
cycloaddition.
MMS, the smallest open-chain methyl-substituted silane, was found to be a
promising precursor for the deposition of SiC thin films with 1:1 Si to C ratio. MMS has
168
been used as a precursor for the deposition of SiC films by PECVD,66, 227 LPCVD,228
thermal CVD,72, 229, 230 rapid thermal CVD (RTCVD)231 and HWCVD.31, 32, 61 From these
studies, it was found that the deposited SiC film has a polymethylsilane structure.
Recently, Lee et al.31 have studied the bonding in SiC film grown by MMS in a HWCVD
process. From the multiple internal reflection infrared spectroscopy study, they showed
that the dominant species in the film are silicon hydrides (SiH, SiH2 and SiH3) and intact
CH3 groups. Under their experimental conditions, they have also found that the growth of
the film network proceeds via Si-H bond rather than C-H bond breakage, and that the
formation of polysilane-like material (Si-Si backbone) is favoured.
Although MMS has been used as a source gas in different CVD processes, the
gas-phase chemistry involved in generating the precursors for the deposition of SiC films
is not well understood. In this study, SPI with the 118 nm VUV wavelength in tandem
with TOF MS is used to study MMS decomposition on hot W and Ta filaments. The
mechanisms for the formation of secondary gas-phase reaction products, which are
generated from the reactions between the species from the primary decomposition, are
also investigated. The proposed mechanism is supported by the usage of the isotopomer,
MMS-d3, under the same experimental conditions, and chemical trapping experiments
using 1,3-butadiene and ammonia.
6.2 Primary Decomposition of MMS on W and Ta Filaments
Under pyrolysis conditions, the decomposition of MMS (m/z 46) proceeds
through the molecular elimination of H2 as represented by Equations (6-1) and (6-2). As
discussed in Chapter 4, the evolution of H2 molecule was also observed during the
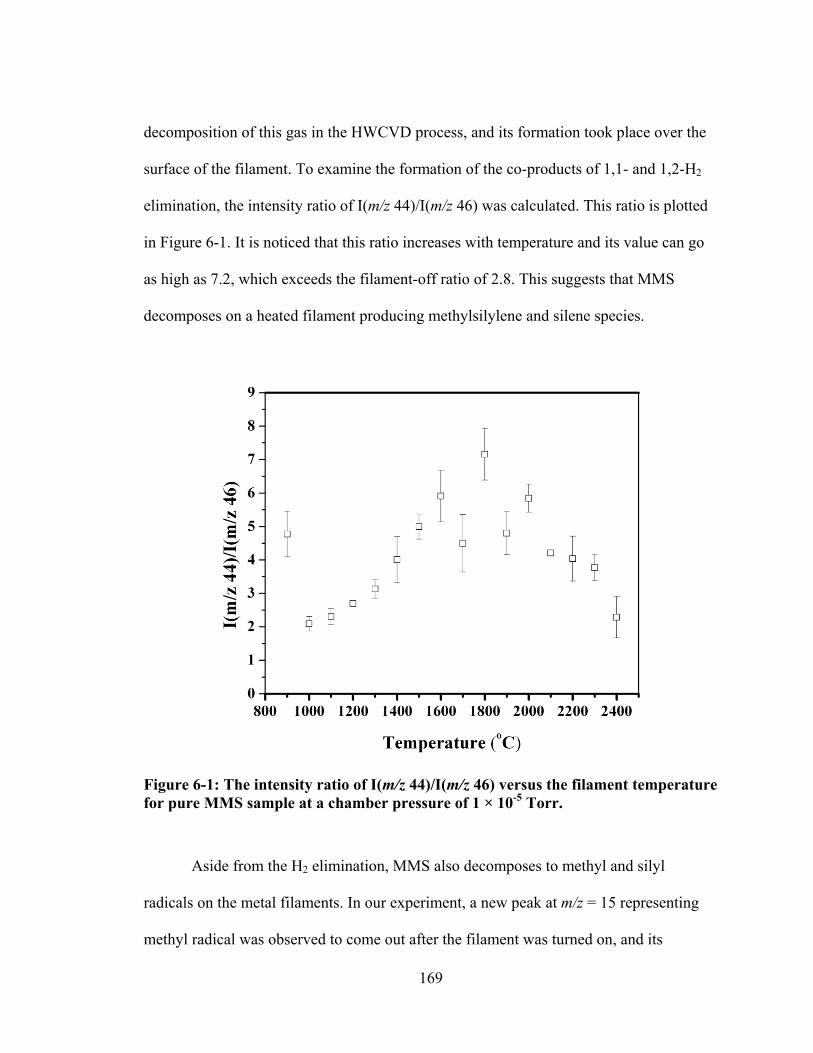
169
decomposition of this gas in the HWCVD process, and its formation took place over the
surface of the filament. To examine the formation of the co-products of 1,1- and 1,2-H2
elimination, the intensity ratio of I(m/z 44)/I(m/z 46) was calculated. This ratio is plotted
in Figure 6-1. It is noticed that this ratio increases with temperature and its value can go
as high as 7.2, which exceeds the filament-off ratio of 2.8. This suggests that MMS
decomposes on a heated filament producing methylsilylene and silene species.
Figure 6-1: The intensity ratio of I(m/z 44)/I(m/z 46) versus the filament temperature for pure MMS sample at a chamber pressure of 1 × 10⁻⁵ Torr.
Aside from the H2 elimination, MMS also decomposes to methyl and silyl
radicals on the metal filaments. In our experiment, a new peak at m/z = 15 representing
methyl radical was observed to come out after the filament was turned on, and its
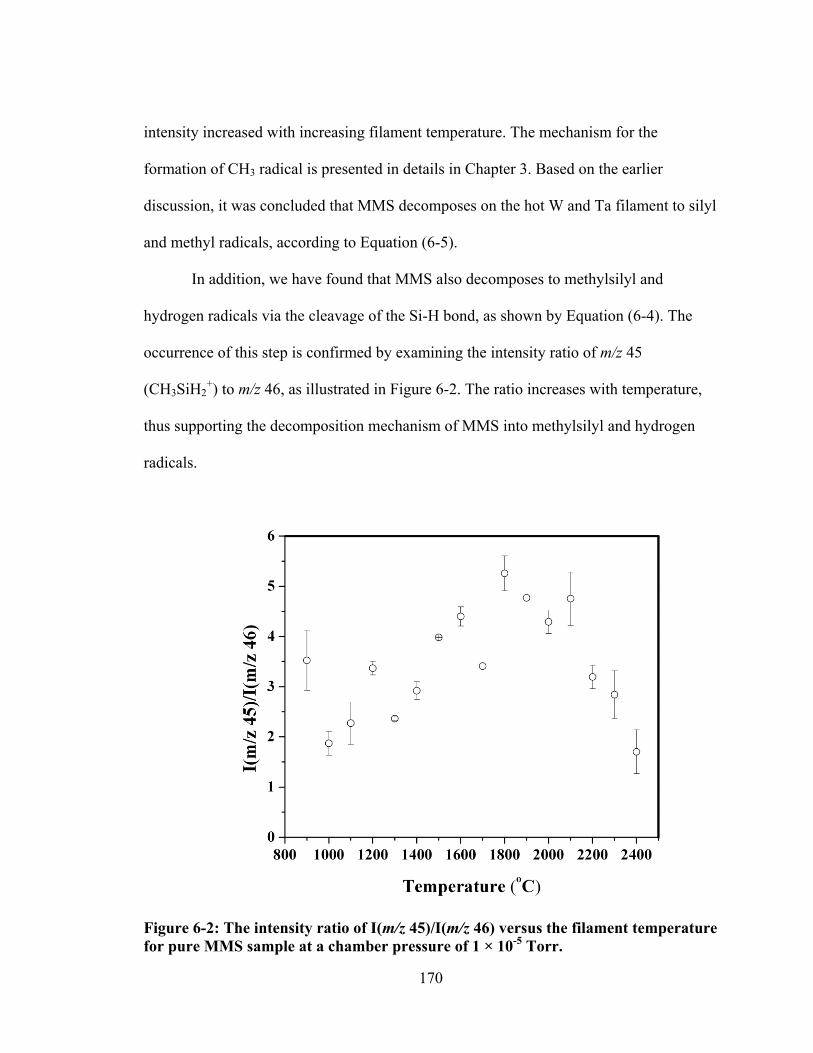
170
intensity increased with increasing filament temperature. The mechanism for the
formation of CH3 radical is presented in details in Chapter 3. Based on the earlier
discussion, it was concluded that MMS decomposes on the hot W and Ta filament to silyl
and methyl radicals, according to Equation (6-5).
In addition, we have found that MMS also decomposes to methylsilyl and
hydrogen radicals via the cleavage of the Si-H bond, as shown by Equation (6-4). The
occurrence of this step is confirmed by examining the intensity ratio of m/z 45
(CH3SiH2+) to m/z 46, as illustrated in Figure 6-2. The ratio increases with temperature,
thus supporting the decomposition mechanism of MMS into methylsilyl and hydrogen
radicals.
Figure 6-2: The intensity ratio of I(m/z 45)/I(m/z 46) versus the filament temperature for pure MMS sample at a chamber pressure of 1 × 10⁻⁵ Torr.
171
6.3 Secondary Gas-Phase Reaction of MMS in a HWCVD Reactor on Ta Filament
To study the secondary gas-phase reactions, 12 Torr of 4% MMS diluted in He
was introduced in the HWCVD reactor, and the mass spectra were collected at different
filament temperatures ranging from 900-1800 °C. For each temperature, a mass spectrum
was recorded every two minutes for 60 minutes. Figure 6-3 shows the mass spectra
recorded for 12 Torr of 4% MMS/He sample in the HWCVD reactor at different
temperatures ranging from 900 to 1700 °C. As can be seen from Figure 6-3a, the intensity
of the predominant fragment peak of the parent MMS at m/z 44 decreases with increasing
filament temperatures. This indicates that the parent MMS molecules decompose on the
filament and are consumed in the secondary gas-phase reactions in the HWCVD reactor.
It was found that the intensity of the peak at m/z 44 started to decrease at a filament
temperature of 1000 °C, and simultaneously two new peaks appeared at m/z =88 and 90,
respectively. Compared to the lowest temperature of 1400 °C for the decomposition of
TMS,89 and 1200 oC for TriMS67 and DMS, this temperature is indeed lower. This is
probably due to the increase of the number of hydrogen bonds present in the molecule
which facilitates the various bond rupture, producing the intermediates for the secondary
gas-phase reactions. At temperatures higher than 1600 °C, all peaks including the base
peak at m/z 44 disappeared as soon as the filament was turned on.
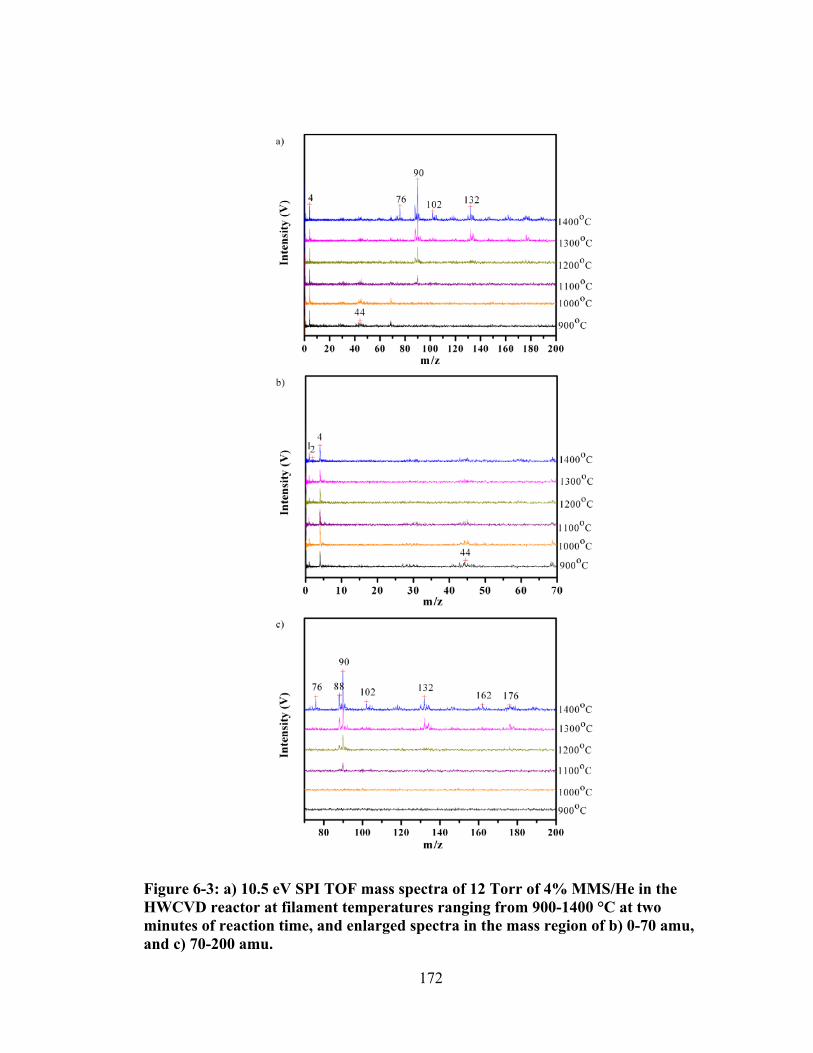
172
Figure 6-3: a) 10.5 eV SPI TOF mass spectra of 12 Torr of 4% MMS/He in the HWCVD reactor at filament temperatures ranging from 900-1400 °C at two minutes of reaction time, and enlarged spectra in the mass region of b) 0-70 amu, and c) 70-200 amu.
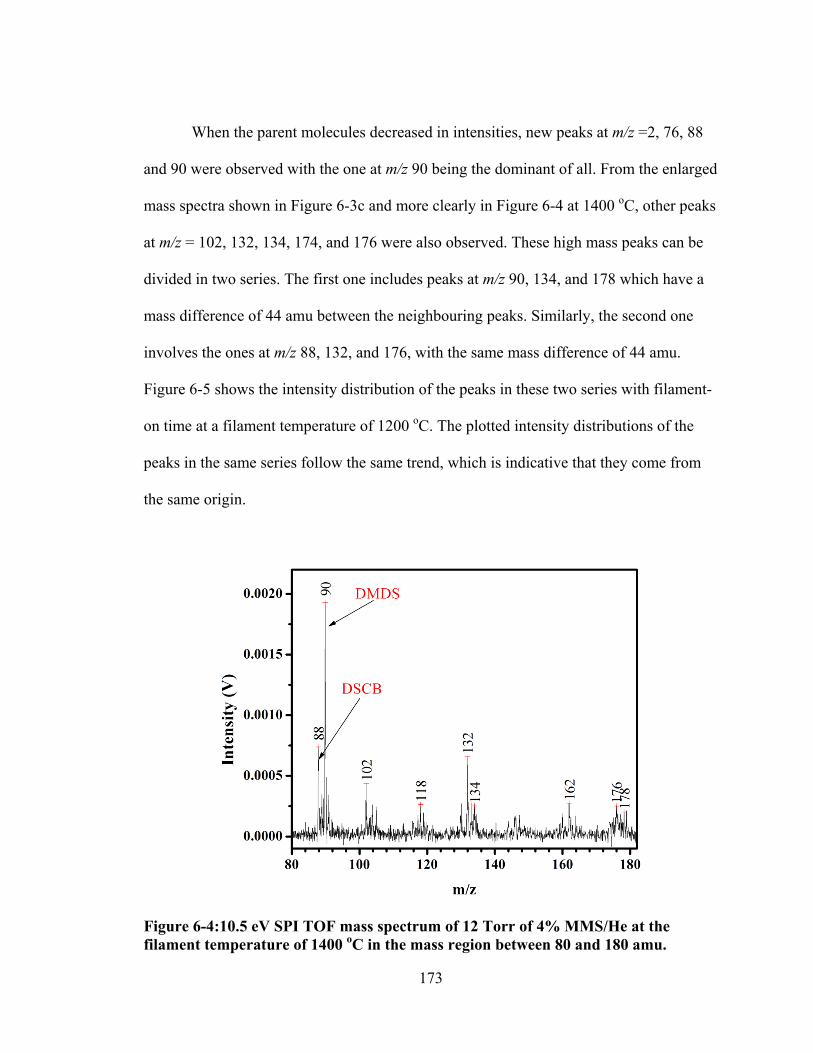
173
When the parent molecules decreased in intensities, new peaks at m/z =2, 76, 88
and 90 were observed with the one at m/z 90 being the dominant of all. From the enlarged
mass spectra shown in Figure 6-3c and more clearly in Figure 6-4 at 1400 oC, other peaks
at m/z = 102, 132, 134, 174, and 176 were also observed. These high mass peaks can be
divided in two series. The first one includes peaks at m/z 90, 134, and 178 which have a
mass difference of 44 amu between the neighbouring peaks. Similarly, the second one
involves the ones at m/z 88, 132, and 176, with the same mass difference of 44 amu.
Figure 6-5 shows the intensity distribution of the peaks in these two series with filament-
on time at a filament temperature of 1200 oC. The plotted intensity distributions of the
peaks in the same series follow the same trend, which is indicative that they come from
the same origin.
Figure 6-4:10.5 eV SPI TOF mass spectrum of 12 Torr of 4% MMS/He at the filament temperature of 1400 oC in the mass region between 80 and 180 amu.
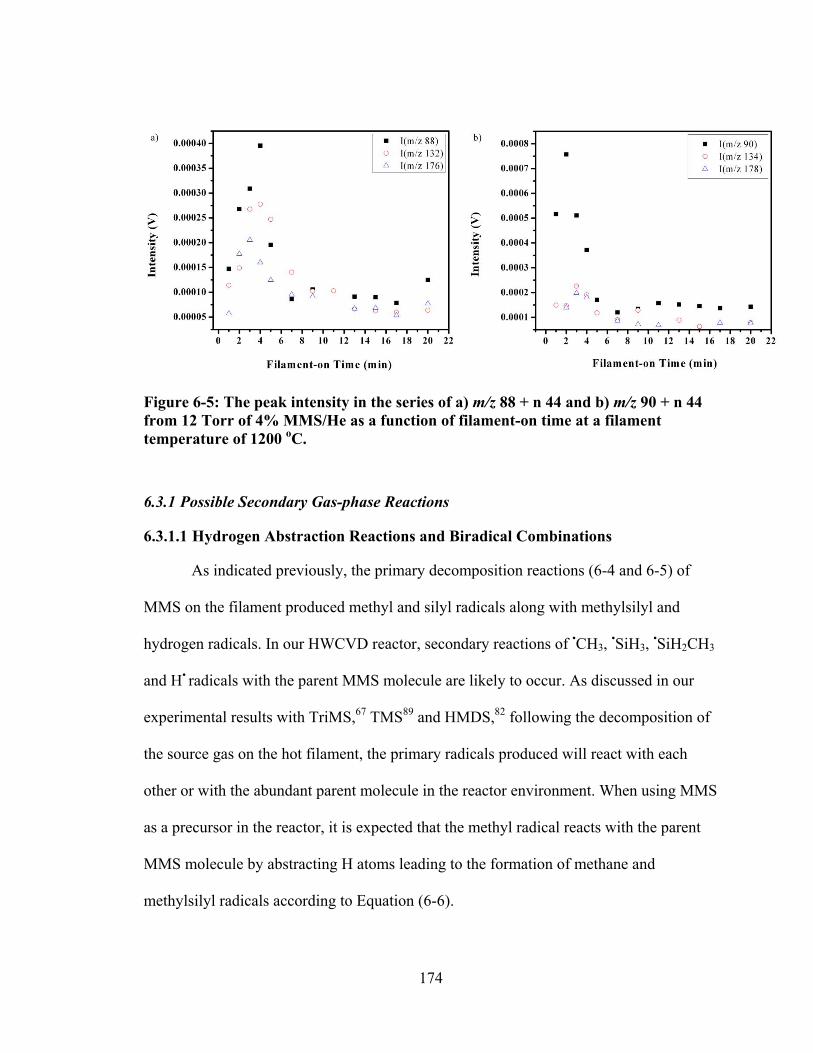
174
Figure 6-5: The peak intensity in the series of a) m/z 88 + n 44 and b) m/z 90 + n 44 from 12 Torr of 4% MMS/He as a function of filament-on time at a filament temperature of 1200 oC.
6.3.1 Possible Secondary Gas-phase Reactions
6.3.1.1 Hydrogen Abstraction Reactions and Biradical Combinations
As indicated previously, the primary decomposition reactions (6-4 and 6-5) of
MMS on the filament produced methyl and silyl radicals along with methylsilyl and
hydrogen radicals. In our HWCVD reactor, secondary reactions of •CH3, •SiH3,
•SiH2CH3
and H• radicals with the parent MMS molecule are likely to occur. As discussed in our
experimental results with TriMS,67 TMS89 and HMDS,82 following the decomposition of
the source gas on the hot filament, the primary radicals produced will react with each
other or with the abundant parent molecule in the reactor environment. When using MMS
as a precursor in the reactor, it is expected that the methyl radical reacts with the parent
MMS molecule by abstracting H atoms leading to the formation of methane and
methylsilyl radicals according to Equation (6-6).
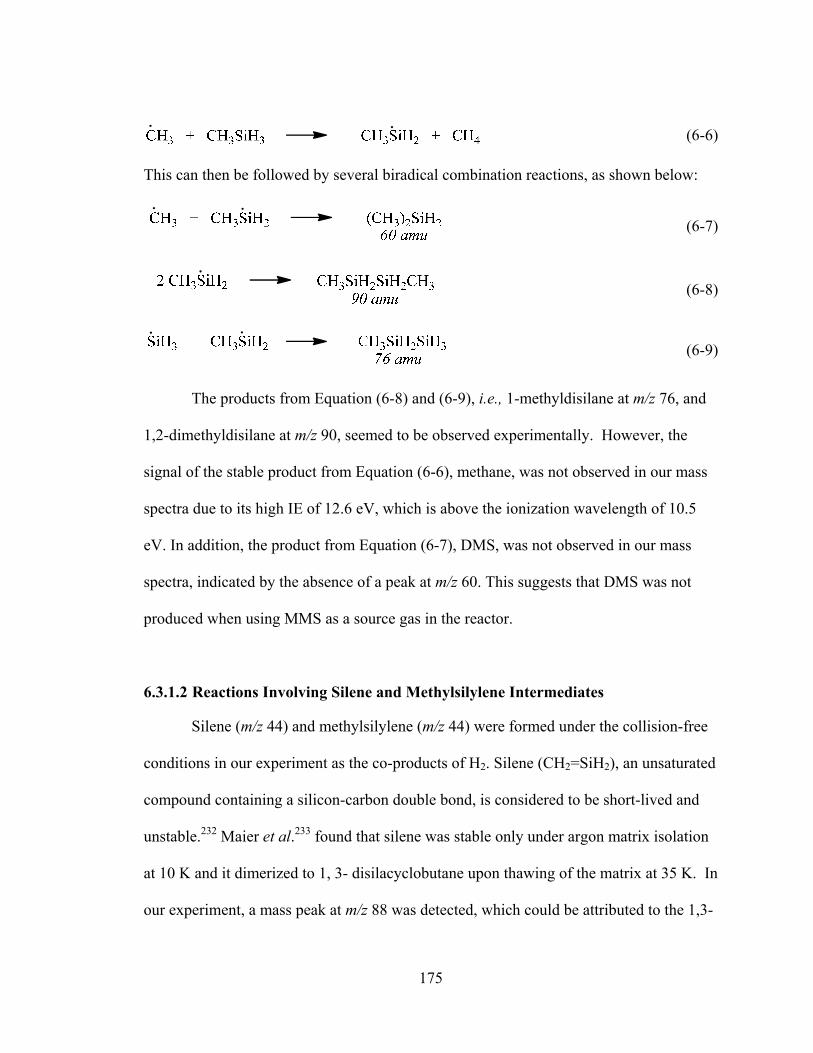
175
(6-6)
This can then be followed by several biradical combination reactions, as shown below:
(6-7)
(6-8)
(6-9)
The products from Equation (6-8) and (6-9), i.e., 1-methyldisilane at m/z 76, and
1,2-dimethyldisilane at m/z 90, seemed to be observed experimentally. However, the
signal of the stable product from Equation (6-6), methane, was not observed in our mass
spectra due to its high IE of 12.6 eV, which is above the ionization wavelength of 10.5
eV. In addition, the product from Equation (6-7), DMS, was not observed in our mass
spectra, indicated by the absence of a peak at m/z 60. This suggests that DMS was not
produced when using MMS as a source gas in the reactor.
6.3.1.2 Reactions Involving Silene and Methylsilylene Intermediates
Silene (m/z 44) and methylsilylene (m/z 44) were formed under the collision-free
conditions in our experiment as the co-products of H2. Silene (CH2=SiH2), an unsaturated
compound containing a silicon-carbon double bond, is considered to be short-lived and
unstable.232 Maier et al.233 found that silene was stable only under argon matrix isolation
at 10 K and it dimerized to 1, 3- disilacyclobutane upon thawing of the matrix at 35 K. In
our experiment, a mass peak at m/z 88 was detected, which could be attributed to the 1,3-
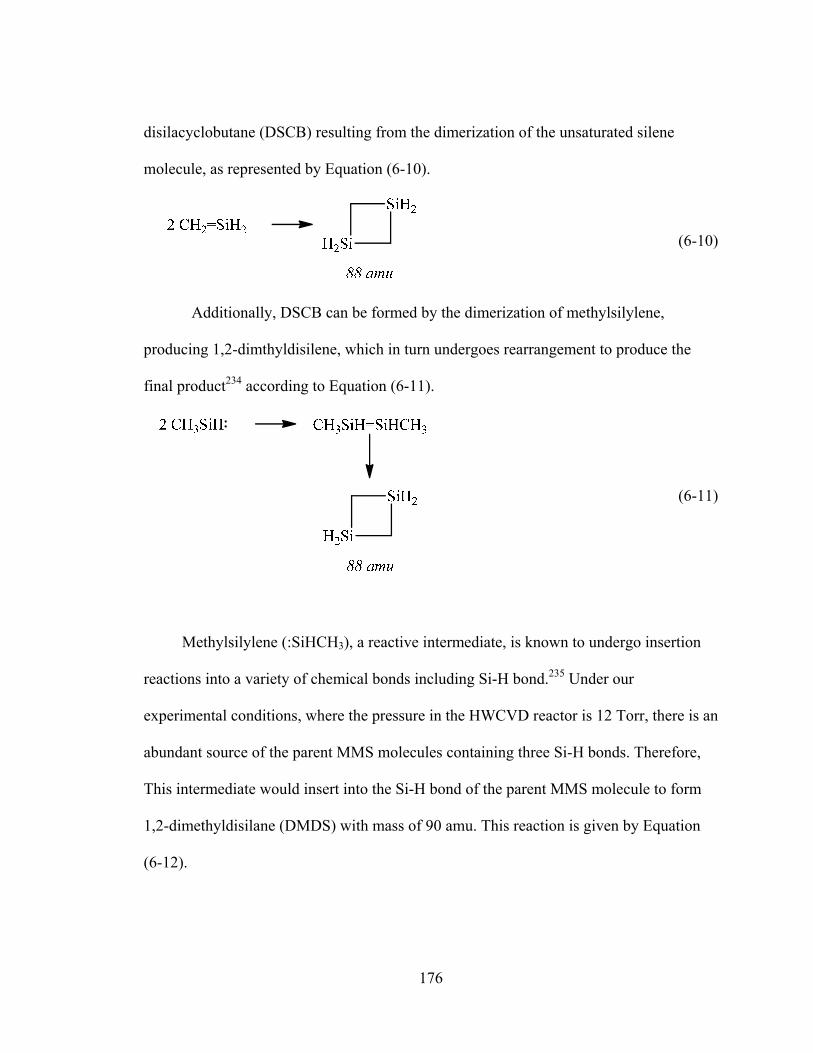
176
disilacyclobutane (DSCB) resulting from the dimerization of the unsaturated silene
molecule, as represented by Equation (6-10).
(6-10)
Additionally, DSCB can be formed by the dimerization of methylsilylene,
producing 1,2-dimthyldisilene, which in turn undergoes rearrangement to produce the
final product234 according to Equation (6-11).
(6-11)
Methylsilylene (:SiHCH3), a reactive intermediate, is known to undergo insertion
reactions into a variety of chemical bonds including Si-H bond.235 Under our
experimental conditions, where the pressure in the HWCVD reactor is 12 Torr, there is an
abundant source of the parent MMS molecules containing three Si-H bonds. Therefore,
This intermediate would insert into the Si-H bond of the parent MMS molecule to form
1,2-dimethyldisilane (DMDS) with mass of 90 amu. This reaction is given by Equation
(6-12).
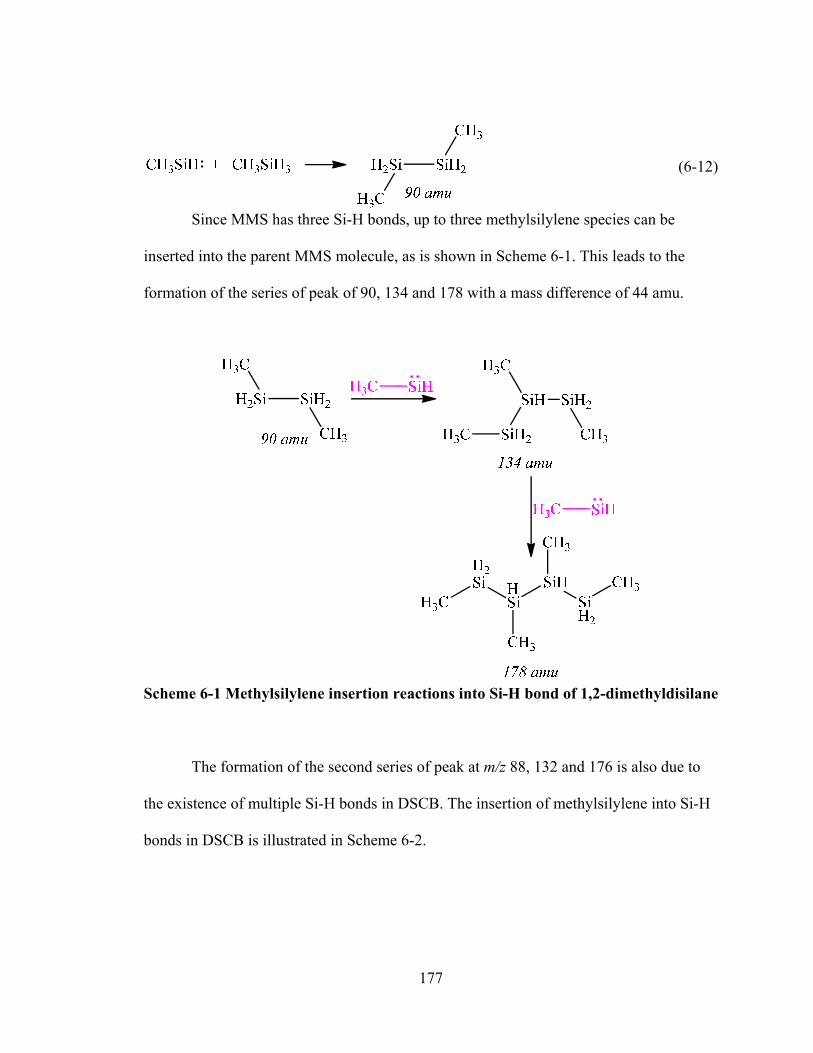
177
(6-12)
Since MMS has three Si-H bonds, up to three methylsilylene species can be
inserted into the parent MMS molecule, as is shown in Scheme 6-1. This leads to the
formation of the series of peak of 90, 134 and 178 with a mass difference of 44 amu.
Scheme 6-1 Methylsilylene insertion reactions into Si-H bond of 1,2-dimethyldisilane
The formation of the second series of peak at m/z 88, 132 and 176 is also due to
the existence of multiple Si-H bonds in DSCB. The insertion of methylsilylene into Si-H
bonds in DSCB is illustrated in Scheme 6-2.
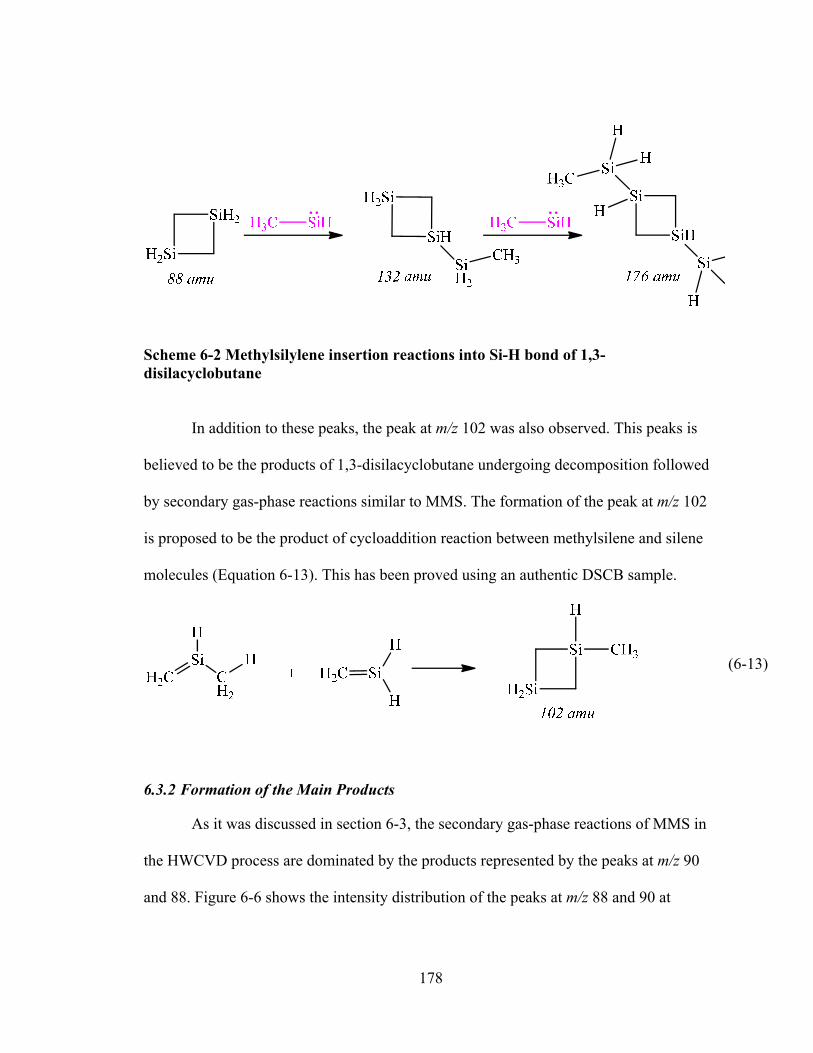
178
Scheme 6-2 Methylsilylene insertion reactions into Si-H bond of 1,3-disilacyclobutane
In addition to these peaks, the peak at m/z 102 was also observed. This peaks is
believed to be the products of 1,3-disilacyclobutane undergoing decomposition followed
by secondary gas-phase reactions similar to MMS. The formation of the peak at m/z 102
is proposed to be the product of cycloaddition reaction between methylsilene and silene
molecules (Equation 6-13). This has been proved using an authentic DSCB sample.
(6-13)
6.3.2 Formation of the Main Products
As it was discussed in section 6-3, the secondary gas-phase reactions of MMS in
the HWCVD process are dominated by the products represented by the peaks at m/z 90
and 88. Figure 6-6 shows the intensity distribution of the peaks at m/z 88 and 90 at
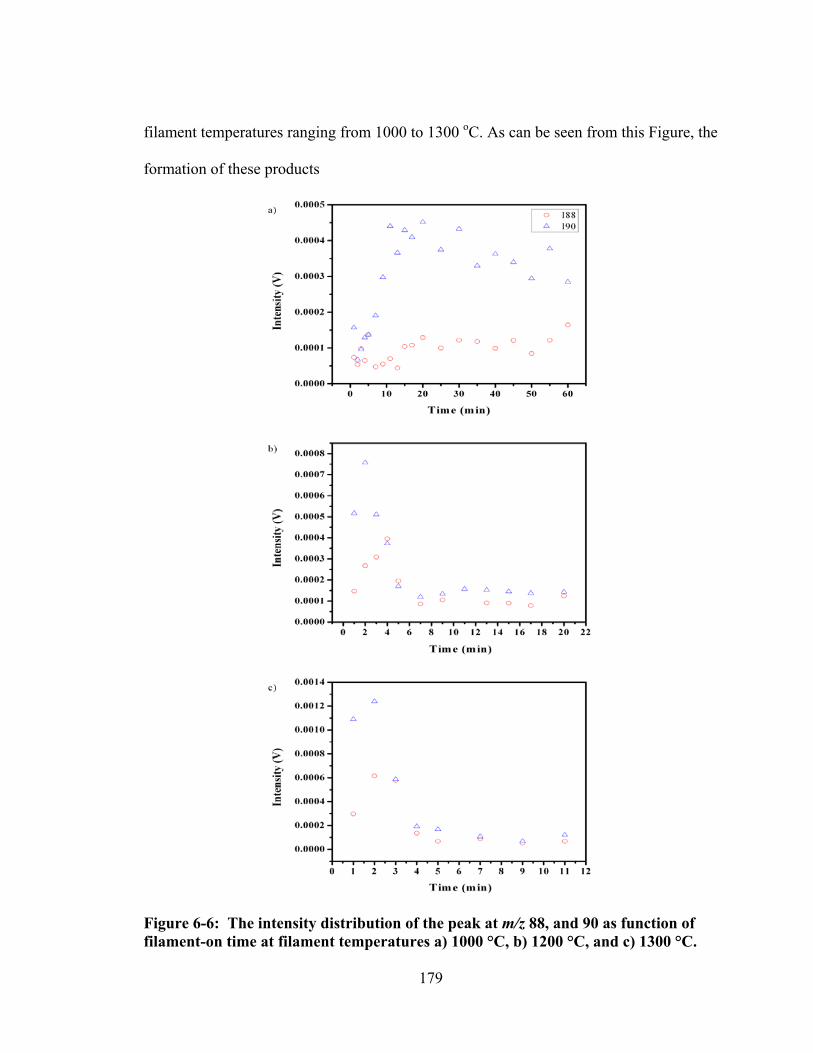
179
filament temperatures ranging from 1000 to 1300 oC. As can be seen from this Figure, the
formation of these products
Figure 6-6: The intensity distribution of the peak at m/z 88, and 90 as function of filament-on time at filament temperatures a) 1000 °C, b) 1200 °C, and c) 1300 °C.
180
started as early at 1000 oC. At this temperature, the peak intensities first increase with
time and reach a plateau at t ≥ 20 min. As the filament temperature in increased, the
intensity decreased after about one to three minutes of turning on the filament. This
indicates that, once formed in the reactor, these species themselves can undergo primary
decomposition and secondary gas-phase reactions, similar to the parent molecule MMS.
A detailed discussion on the mechanisms for the formation of these two main products is
presented in this section.
6.3.2.1 Formation of 1,2-Dimethyldisilane
The peak at m/z 90 is the dominant product throughout the entire temperature
range and reaction time when using MMS in the reactor. This peak is assigned to 1,2-
dimethyldisilane (DMDS). The mechanism for the formation of this product can occur
either by biradical recombination reaction of methylsilyl radical as indicated by Equation
(6-8) or by methylsilylene insertion reaction with the parent molecule as represented by
Equation (6-12).
In order to isolate the mechanism responsible for its formation, experiments with
the isotopomer, MMS-d3, was carried out under the same experimental conditions. 12
Torr of 4% MMS-d3 seeded in He was prepared and mass spectra were recorded every
two minutes after the filament was turned on in the filament temperature range of 900 to
1500 oC. Figure 6-7 shows the mass spectrum of 12 Torr of 4% MMS-d3/He mixture
recorded at a filament temperature of 1300 °C after two minutes of reaction time. As
above mentioned, with 4% MMS/He, the gas-phase chemistry was dominated by the peak
at m/z 90. When MMS was replaced with MMS-d3, the peak at m/z 90 was clearly shifted
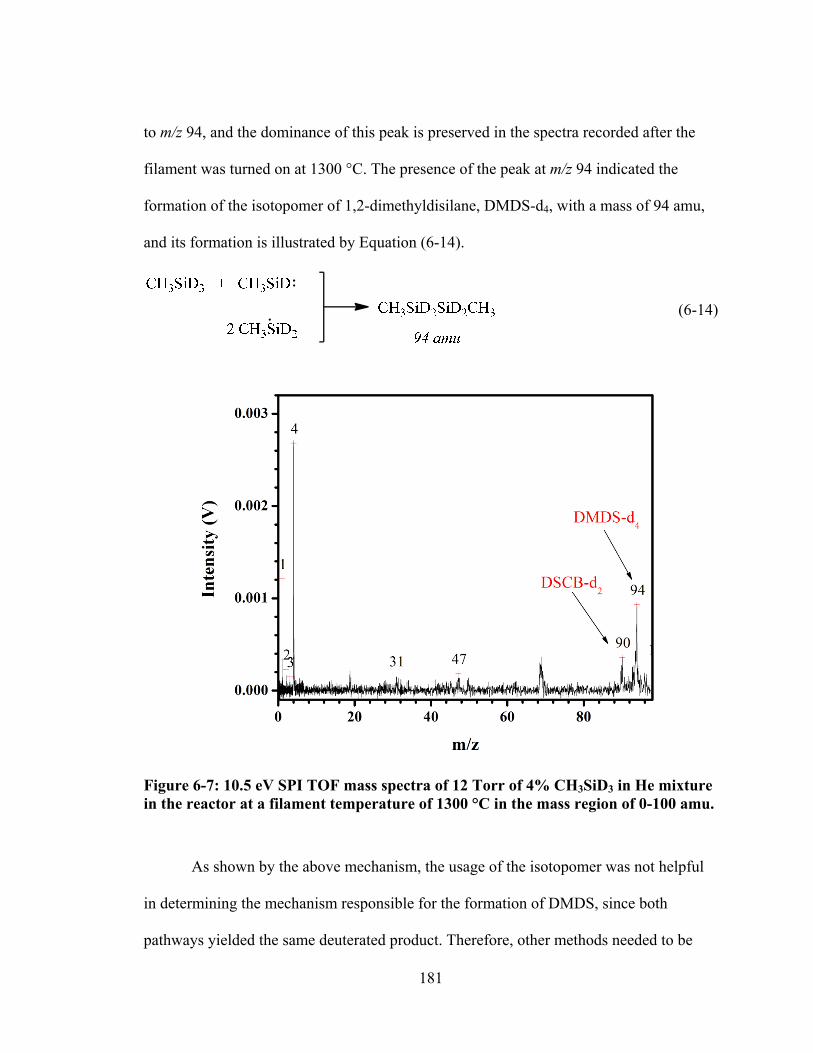
181
to m/z 94, and the dominance of this peak is preserved in the spectra recorded after the
filament was turned on at 1300 °C. The presence of the peak at m/z 94 indicated the
formation of the isotopomer of 1,2-dimethyldisilane, DMDS-d4, with a mass of 94 amu,
and its formation is illustrated by Equation (6-14).
(6-14)
Figure 6-7: 10.5 eV SPI TOF mass spectra of 12 Torr of 4% CH3SiD3 in He mixture in the reactor at a filament temperature of 1300 °C in the mass region of 0-100 amu.
As shown by the above mechanism, the usage of the isotopomer was not helpful
in determining the mechanism responsible for the formation of DMDS, since both
pathways yielded the same deuterated product. Therefore, other methods needed to be
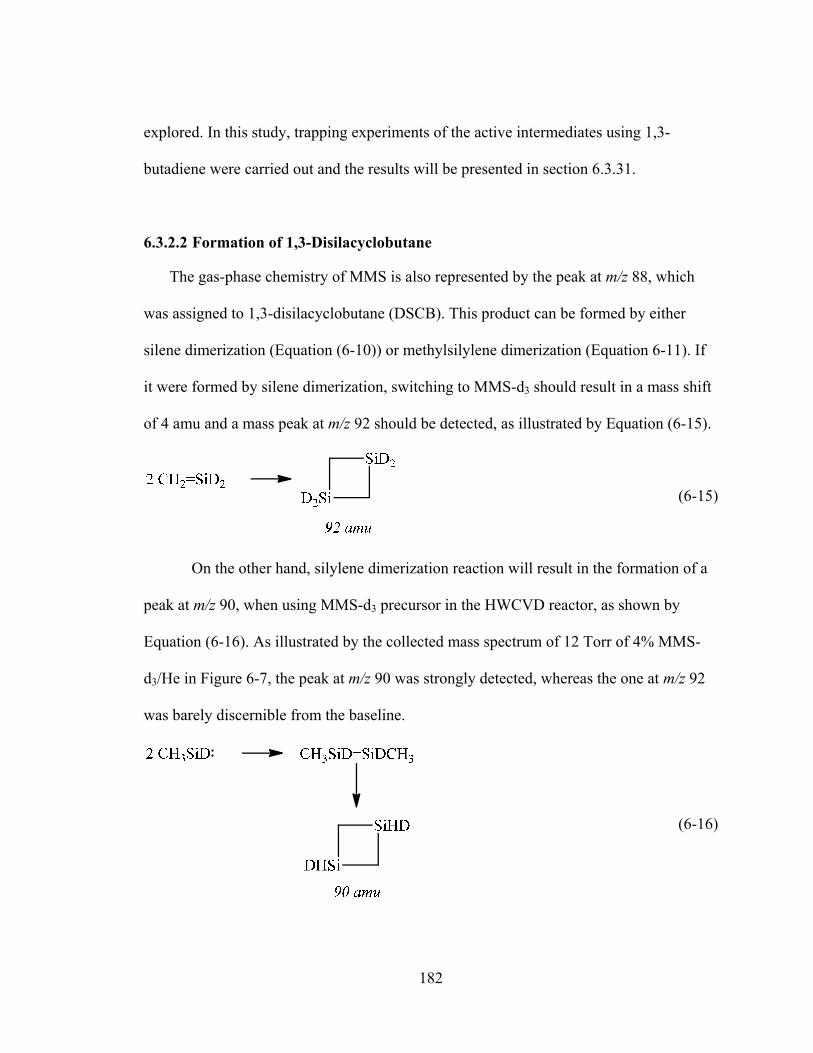
182
explored. In this study, trapping experiments of the active intermediates using 1,3-
butadiene were carried out and the results will be presented in section 6.3.31.
6.3.2.2 Formation of 1,3-Disilacyclobutane
The gas-phase chemistry of MMS is also represented by the peak at m/z 88, which
was assigned to 1,3-disilacyclobutane (DSCB). This product can be formed by either
silene dimerization (Equation (6-10)) or methylsilylene dimerization (Equation 6-11). If
it were formed by silene dimerization, switching to MMS-d3 should result in a mass shift
of 4 amu and a mass peak at m/z 92 should be detected, as illustrated by Equation (6-15).
(6-15)
On the other hand, silylene dimerization reaction will result in the formation of a
peak at m/z 90, when using MMS-d3 precursor in the HWCVD reactor, as shown by
Equation (6-16). As illustrated by the collected mass spectrum of 12 Torr of 4% MMS-
d3/He in Figure 6-7, the peak at m/z 90 was strongly detected, whereas the one at m/z 92
was barely discernible from the baseline.
(6-16)
183
Based on the results obtained using the isotopomer, it was concluded that
dimerization reaction of methylsilylene is the major channel for the formation of DSCB
molecule. The weakness in the peak at m/z 92 strongly suggests that the dimerization of
methylsilene does not play a significant role in the formation of DSCB. In order to firmly
confirm these statement, trapping experiment with 1,3-Butadiene and ammonia are
carried out and the results are presented in section 6.3.3.
6.3.3 Trapping of Active Intermediates
In order to verify the existence of silylene and better understand the proposed gas-
phase reaction meachnism involving the chemistry of silylene species, experiments using
different trapping agents are conducted. As it has been discussed in previous sections, the
formation of the major products at m/z 88 and 90 can occur via two different routes.
Therefore, in order to determine which mechanism is responsible for their formation, and
to confirm the involvement of silylene, 1,3-butadiene and ammonia were used as
chemical agents to trap the various intermediates.
6.3.3.1 Trapping Experiments with 1,3-Butadiene
In this work, a mixture of 4% MMS and 32% 1,3-butadiene (BTD) was prepared.
The trapping experiments on the Ta filament were performed by monitoring the species
exiting a HWCVD reactor as described in Chapter 2. Mass spectra for filament
temperatures ranging from 1200 to 1400 °C were recorded. For each temperature, a mass
spectrum was collected every two minutes for 30 minutes. Figure 6-8a and b shows the
mass spectra collected from 12 Torr of 4% MMS: 32% BTD/He mixture at room
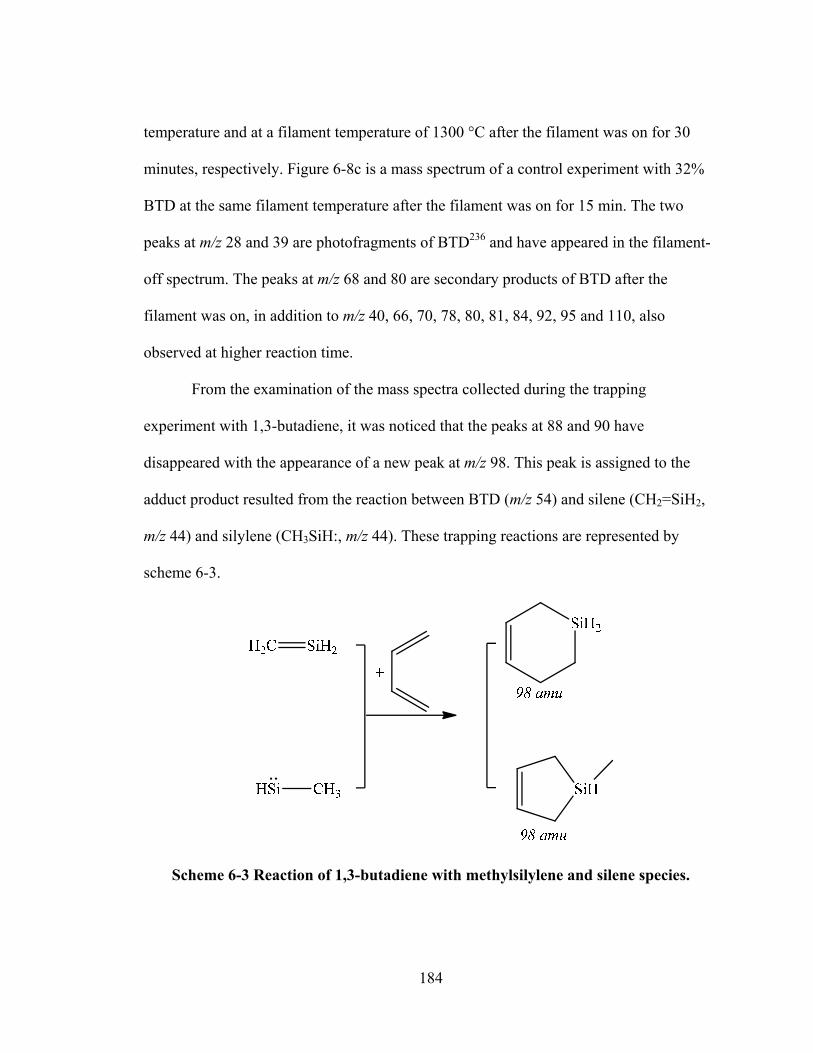
184
temperature and at a filament temperature of 1300 °C after the filament was on for 30
minutes, respectively. Figure 6-8c is a mass spectrum of a control experiment with 32%
BTD at the same filament temperature after the filament was on for 15 min. The two
peaks at m/z 28 and 39 are photofragments of BTD236 and have appeared in the filament-
off spectrum. The peaks at m/z 68 and 80 are secondary products of BTD after the
filament was on, in addition to m/z 40, 66, 70, 78, 80, 81, 84, 92, 95 and 110, also
observed at higher reaction time.
From the examination of the mass spectra collected during the trapping
experiment with 1,3-butadiene, it was noticed that the peaks at 88 and 90 have
disappeared with the appearance of a new peak at m/z 98. This peak is assigned to the
adduct product resulted from the reaction between BTD (m/z 54) and silene (CH2=SiH2,
m/z 44) and silylene (CH3SiH:, m/z 44). These trapping reactions are represented by
scheme 6-3.
Scheme 6-3 Reaction of 1,3-butadiene with methylsilylene and silene species.
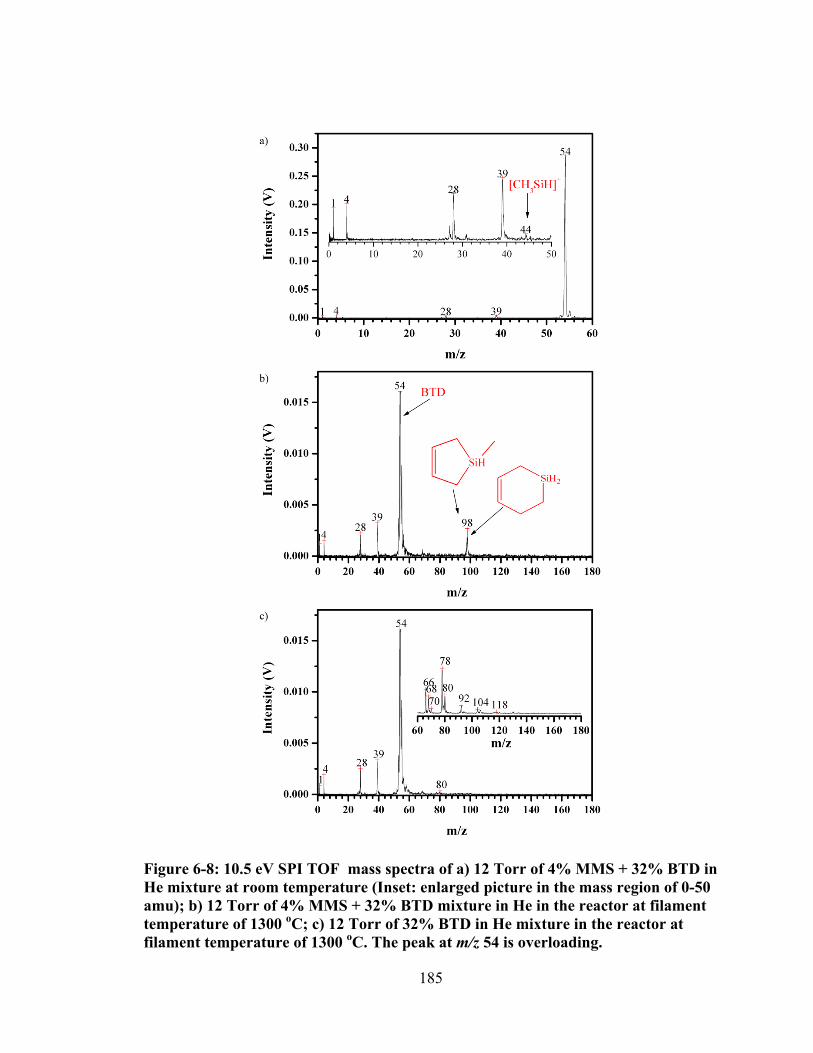
185
Figure 6-8: 10.5 eV SPI TOF mass spectra of a) 12 Torr of 4% MMS + 32% BTD in He mixture at room temperature (Inset: enlarged picture in the mass region of 0-50 amu); b) 12 Torr of 4% MMS + 32% BTD mixture in He in the reactor at filament temperature of 1300 oC; c) 12 Torr of 32% BTD in He mixture in the reactor at filament temperature of 1300 oC. The peak at m/z 54 is overloading.
186
As has been discussed earlier, DMDS (m/z 90) can be formed either from silylene
insertion (Equation 6-12) or from radical recombination reaction (Equation (6-8)). Since
1, 3-butadiene can only react with silylene and silene moieties, not the free radicals, the
complete absence of the peak at m/z 90 upon the addition of 1,3-BTD strongly suggests
that DMDS is produced solely by methylsilylene insertion reaction into the parent
molecule, not by the recombination reaction of methylsilyl radicals.
The absence of the peak at m/z 88 and the ones at higher mass, e.g., those at m/z
132 and 176, in the mass spectra of 4% MMS + 32% BTD (Figure 6-8b) is indicative that
their production entails silylene and silene intermediates, as predicted in earlier section.
However, since BTD reacts with both silene and silylene intermediates, a differentiation
between the two mechanisms is not possible when using this trapping agent.
6.3.3.2 Trapping Experiments with Ammonia
As demonstrated by the previous study on the trapping experiment with DMS in
Chapter 5, ammonia was to react with both silene and silylene species, with a higher
efficiency towards silene intermediates. In this work, a mixture of 4% MMS and 32%
NH3 was prepared and mass spectra were collected at filament temperatures ranging from
1200 to 1400 oC. Figure 6-9 shows the mass spectrum obtained during the trapping
experiment with NH3 at 1300 oC and after four minutes of turning the filament on.
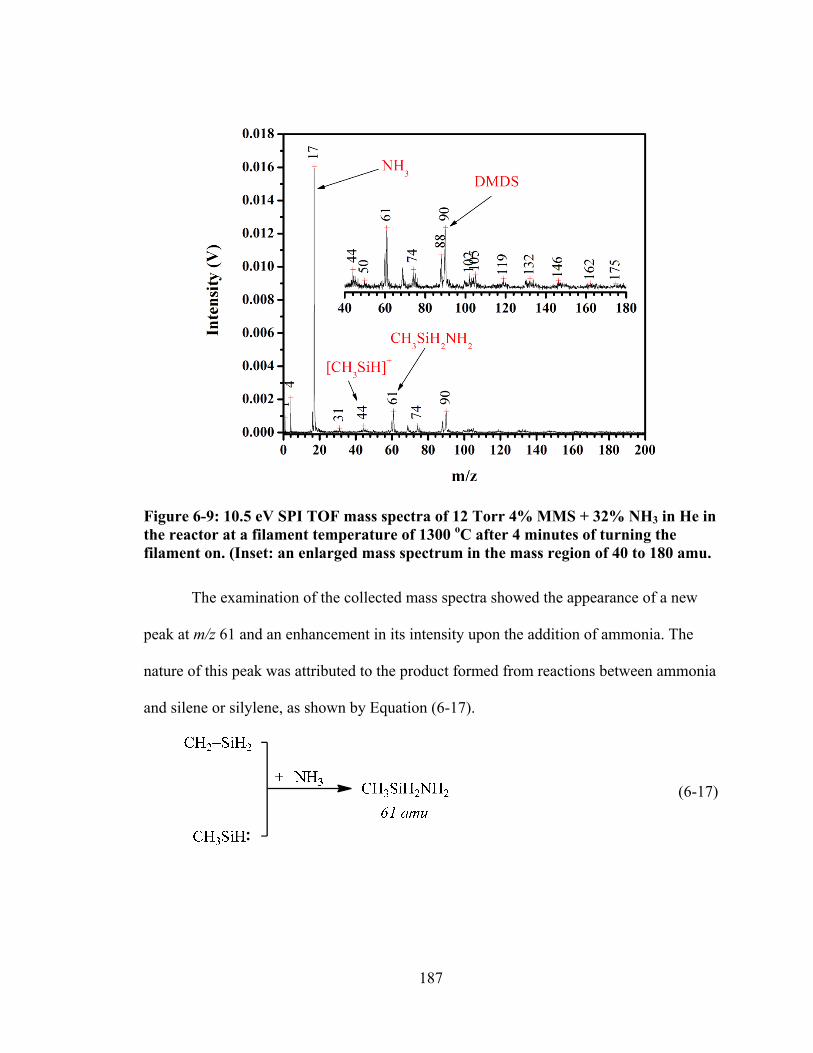
187
Figure 6-9: 10.5 eV SPI TOF mass spectra of 12 Torr 4% MMS + 32% NH3 in He in the reactor at a filament temperature of 1300 oC after 4 minutes of turning the filament on. (Inset: an enlarged mass spectrum in the mass region of 40 to 180 amu.
The examination of the collected mass spectra showed the appearance of a new
peak at m/z 61 and an enhancement in its intensity upon the addition of ammonia. The
nature of this peak was attributed to the product formed from reactions between ammonia
and silene or silylene, as shown by Equation (6-17).
(6-17)
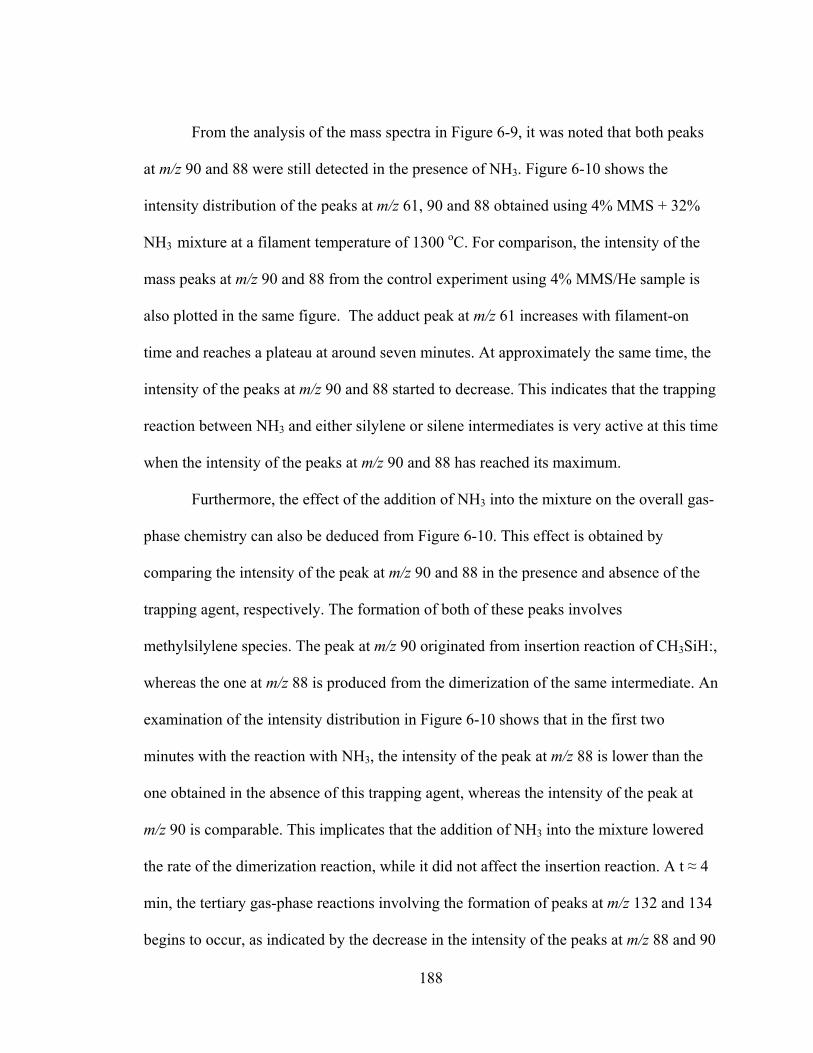
188
From the analysis of the mass spectra in Figure 6-9, it was noted that both peaks
at m/z 90 and 88 were still detected in the presence of NH3. Figure 6-10 shows the
intensity distribution of the peaks at m/z 61, 90 and 88 obtained using 4% MMS + 32%
NH3 mixture at a filament temperature of 1300 oC. For comparison, the intensity of the
mass peaks at m/z 90 and 88 from the control experiment using 4% MMS/He sample is
also plotted in the same figure. The adduct peak at m/z 61 increases with filament-on
time and reaches a plateau at around seven minutes. At approximately the same time, the
intensity of the peaks at m/z 90 and 88 started to decrease. This indicates that the trapping
reaction between NH3 and either silylene or silene intermediates is very active at this time
when the intensity of the peaks at m/z 90 and 88 has reached its maximum.
Furthermore, the effect of the addition of NH3 into the mixture on the overall gas-
phase chemistry can also be deduced from Figure 6-10. This effect is obtained by
comparing the intensity of the peak at m/z 90 and 88 in the presence and absence of the
trapping agent, respectively. The formation of both of these peaks involves
methylsilylene species. The peak at m/z 90 originated from insertion reaction of CH3SiH:,
whereas the one at m/z 88 is produced from the dimerization of the same intermediate. An
examination of the intensity distribution in Figure 6-10 shows that in the first two
minutes with the reaction with NH3, the intensity of the peak at m/z 88 is lower than the
one obtained in the absence of this trapping agent, whereas the intensity of the peak at
m/z 90 is comparable. This implicates that the addition of NH3 into the mixture lowered
the rate of the dimerization reaction, while it did not affect the insertion reaction. A t ≈ 4
min, the tertiary gas-phase reactions involving the formation of peaks at m/z 132 and 134
begins to occur, as indicated by the decrease in the intensity of the peaks at m/z 88 and 90
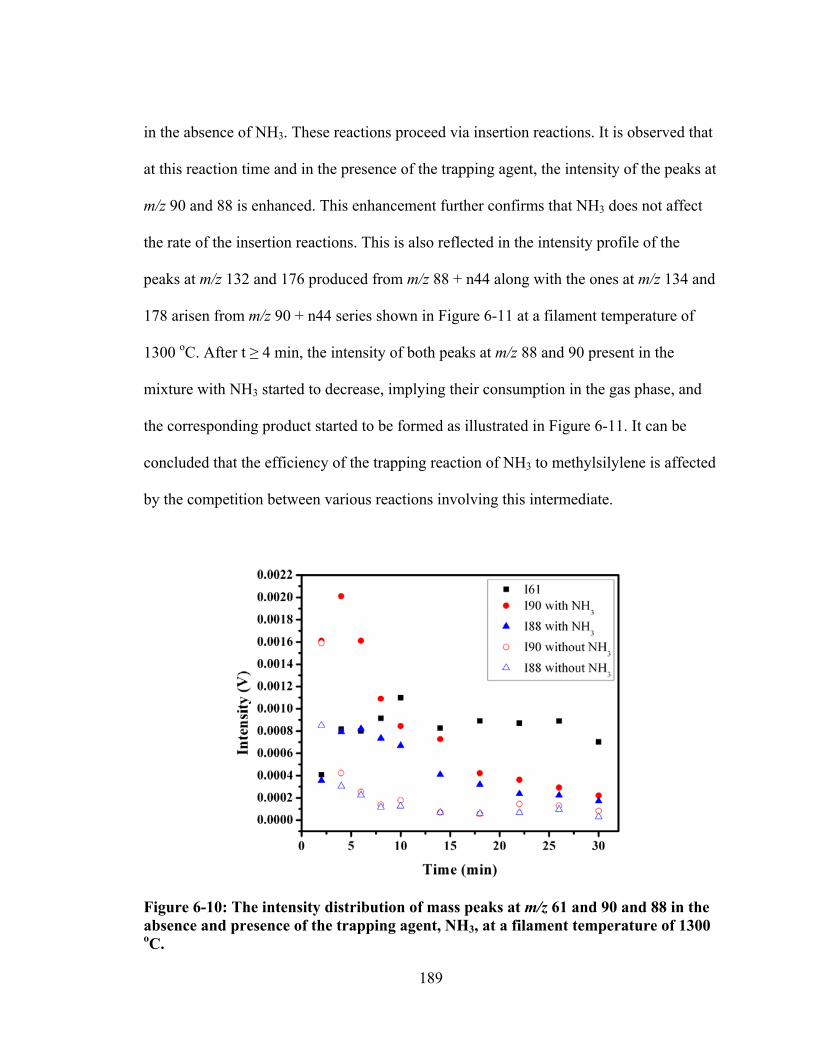
189
in the absence of NH3. These reactions proceed via insertion reactions. It is observed that
at this reaction time and in the presence of the trapping agent, the intensity of the peaks at
m/z 90 and 88 is enhanced. This enhancement further confirms that NH3 does not affect
the rate of the insertion reactions. This is also reflected in the intensity profile of the
peaks at m/z 132 and 176 produced from m/z 88 + n44 along with the ones at m/z 134 and
178 arisen from m/z 90 + n44 series shown in Figure 6-11 at a filament temperature of
1300 oC. After t ≥ 4 min, the intensity of both peaks at m/z 88 and 90 present in the
mixture with NH3 started to decrease, implying their consumption in the gas phase, and
the corresponding product started to be formed as illustrated in Figure 6-11. It can be
concluded that the efficiency of the trapping reaction of NH3 to methylsilylene is affected
by the competition between various reactions involving this intermediate.
Figure 6-10: The intensity distribution of mass peaks at m/z 61 and 90 and 88 in the absence and presence of the trapping agent, NH3, at a filament temperature of 1300 oC.
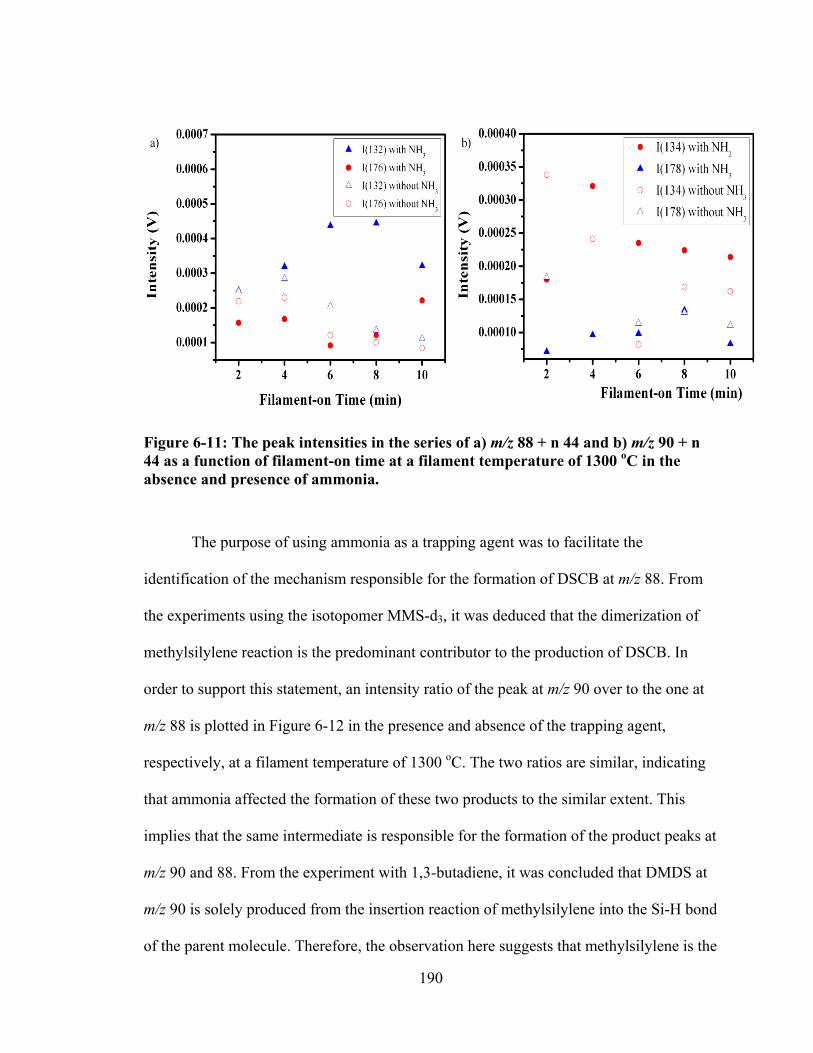
190
Figure 6-11: The peak intensities in the series of a) m/z 88 + n 44 and b) m/z 90 + n 44 as a function of filament-on time at a filament temperature of 1300 oC in the absence and presence of ammonia.
The purpose of using ammonia as a trapping agent was to facilitate the
identification of the mechanism responsible for the formation of DSCB at m/z 88. From
the experiments using the isotopomer MMS-d3, it was deduced that the dimerization of
methylsilylene reaction is the predominant contributor to the production of DSCB. In
order to support this statement, an intensity ratio of the peak at m/z 90 over to the one at
m/z 88 is plotted in Figure 6-12 in the presence and absence of the trapping agent,
respectively, at a filament temperature of 1300 oC. The two ratios are similar, indicating
that ammonia affected the formation of these two products to the similar extent. This
implies that the same intermediate is responsible for the formation of the product peaks at
m/z 90 and 88. From the experiment with 1,3-butadiene, it was concluded that DMDS at
m/z 90 is solely produced from the insertion reaction of methylsilylene into the Si-H bond
of the parent molecule. Therefore, the observation here suggests that methylsilylene is the
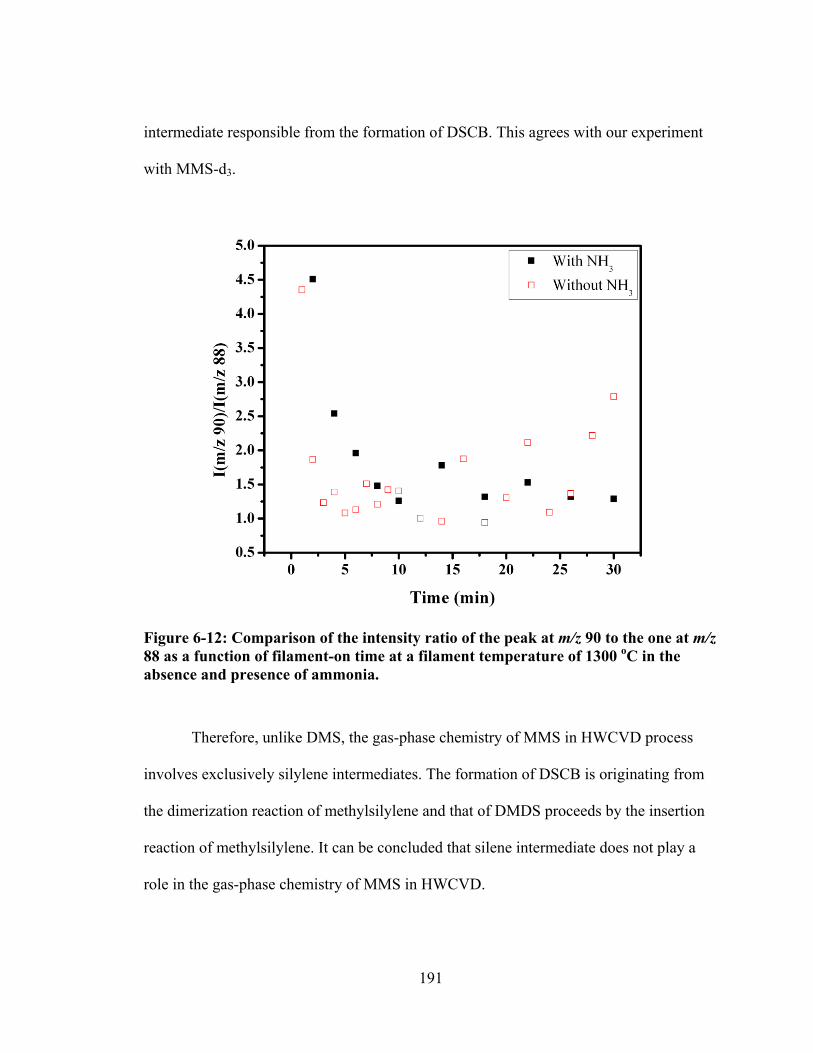
191
intermediate responsible from the formation of DSCB. This agrees with our experiment
with MMS-d3.
Figure 6-12: Comparison of the intensity ratio of the peak at m/z 90 to the one at m/z 88 as a function of filament-on time at a filament temperature of 1300 oC in the absence and presence of ammonia.
Therefore, unlike DMS, the gas-phase chemistry of MMS in HWCVD process
involves exclusively silylene intermediates. The formation of DSCB is originating from
the dimerization reaction of methylsilylene and that of DMDS proceeds by the insertion
reaction of methylsilylene. It can be concluded that silene intermediate does not play a
role in the gas-phase chemistry of MMS in HWCVD.
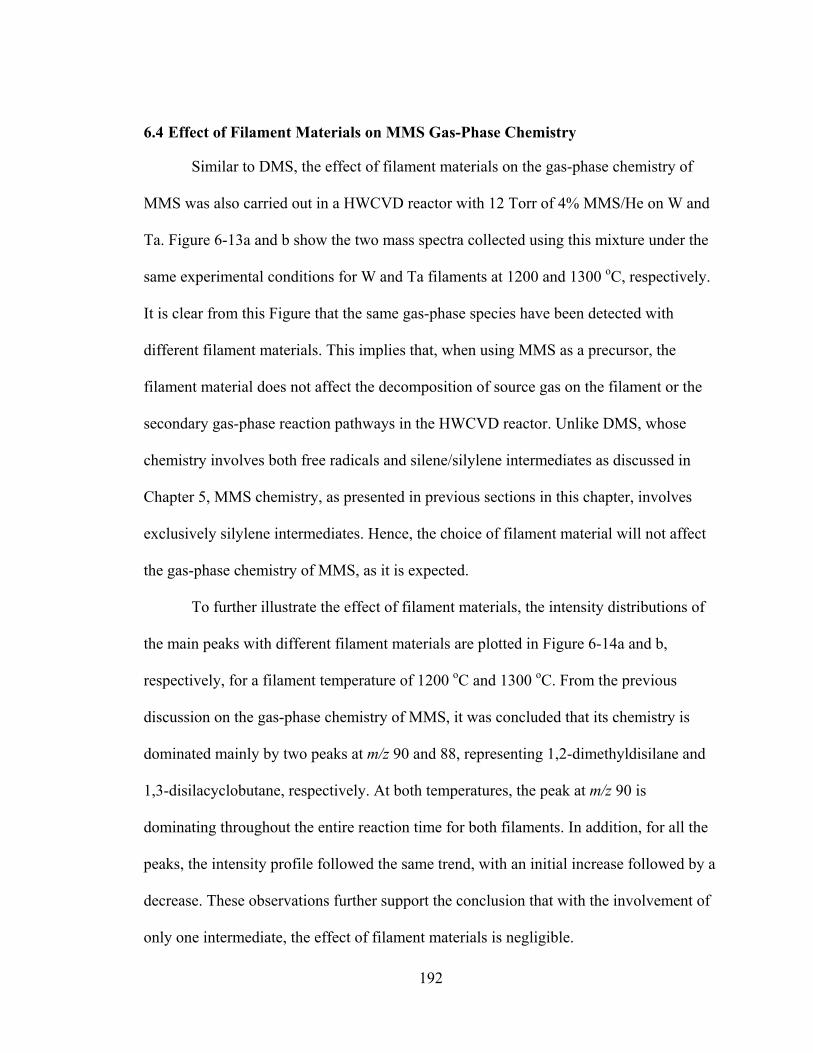
192
6.4 Effect of Filament Materials on MMS Gas-Phase Chemistry
Similar to DMS, the effect of filament materials on the gas-phase chemistry of
MMS was also carried out in a HWCVD reactor with 12 Torr of 4% MMS/He on W and
Ta. Figure 6-13a and b show the two mass spectra collected using this mixture under the
same experimental conditions for W and Ta filaments at 1200 and 1300 oC, respectively.
It is clear from this Figure that the same gas-phase species have been detected with
different filament materials. This implies that, when using MMS as a precursor, the
filament material does not affect the decomposition of source gas on the filament or the
secondary gas-phase reaction pathways in the HWCVD reactor. Unlike DMS, whose
chemistry involves both free radicals and silene/silylene intermediates as discussed in
Chapter 5, MMS chemistry, as presented in previous sections in this chapter, involves
exclusively silylene intermediates. Hence, the choice of filament material will not affect
the gas-phase chemistry of MMS, as it is expected.
To further illustrate the effect of filament materials, the intensity distributions of
the main peaks with different filament materials are plotted in Figure 6-14a and b,
respectively, for a filament temperature of 1200 oC and 1300 oC. From the previous
discussion on the gas-phase chemistry of MMS, it was concluded that its chemistry is
dominated mainly by two peaks at m/z 90 and 88, representing 1,2-dimethyldisilane and
1,3-disilacyclobutane, respectively. At both temperatures, the peak at m/z 90 is
dominating throughout the entire reaction time for both filaments. In addition, for all the
peaks, the intensity profile followed the same trend, with an initial increase followed by a
decrease. These observations further support the conclusion that with the involvement of
only one intermediate, the effect of filament materials is negligible.
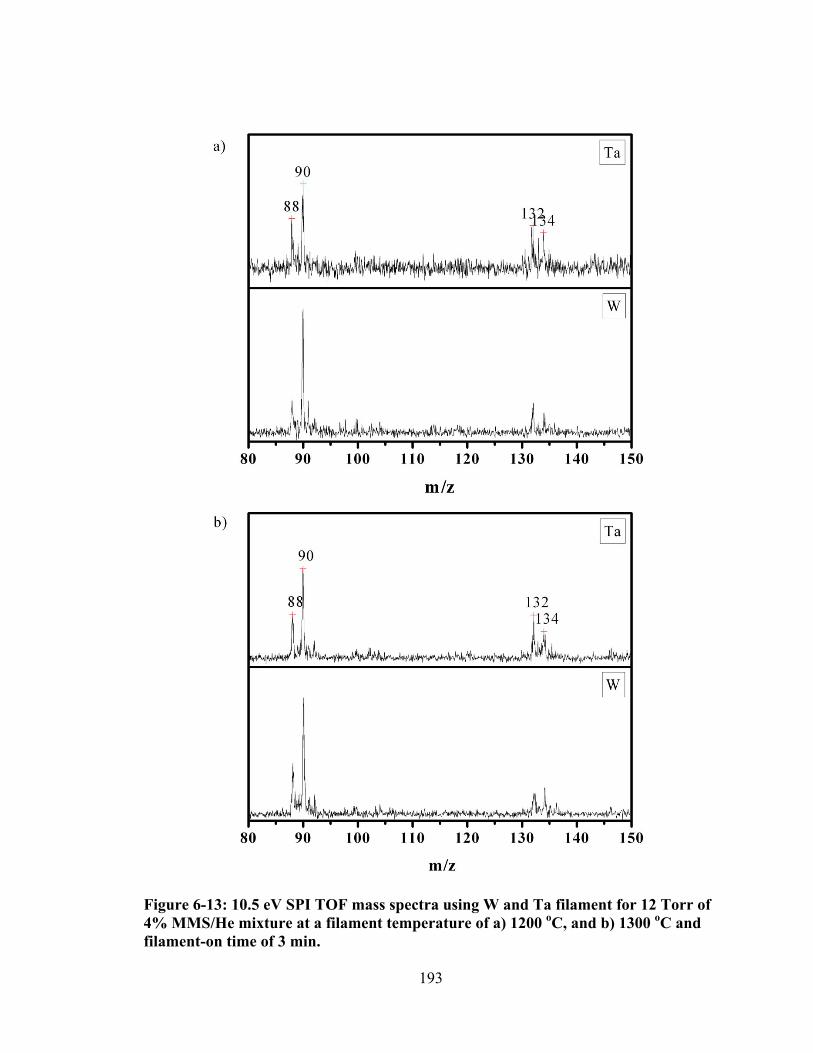
193
Figure 6-13: 10.5 eV SPI TOF mass spectra using W and Ta filament for 12 Torr of 4% MMS/He mixture at a filament temperature of a) 1200 oC, and b) 1300 oC and filament-on time of 3 min.
194
Figure 6-14: The intensity distribution of peaks at m/z 90 and 88 generated from W and Ta filaments when using 12 Torr of 4% MMS/He and at a filament temperature of a) 1200 oC, and b) 1300 oC.
6.5 Effect of Source Gas Pressure on MMS Gas-Phase Chemistry
Similar to the work done with DMS, the effect of source gas pressure is
conducted by comparing the gas-phase chemistry of 12 Torr 10% MMS/He to the one of
12 Torr 4% MMS/He on Ta filament. The effect of source gas pressure is illustrated in
Figure 6-15, where mass spectra recorded using 12 Torr of 4% MMS/He sample
(p(MMS) = 0.48 Torr) and 12 Torr of 10% sample (p(MMS) = 1.2 Torr) in the HWCVD
reactor at a filament temperature of 1300 oC are plotted. This comparison showed that, at
both pressures, the gas-phase chemistry is still dominated by the peaks at m/z 90 and 88,
formed from methylsilylene insertion and methylsilylene dimerization reactions,
respectively. In addition, the increase in the precursor pressure did not alter the
mechanisms occurring in the gas-phase chemistry. As it can be observed from this figure,
the insertion reactions of methylsilylene into the Si-H bond of DMDS and DSCB
195
yielding the formation of the peaks at m/z 132, 134, 176 and 178 are still occurring with
increase precursor pressure. Furthermore, the change in the pressure did not result in the
formation of small hydrocarbon molecules, as it was the case with DMS. The lack of
detecting hydrocarbon molecules with increasing the pressure of MMS is probably due to
the fact that free radicals do not participate in the gas-phase chemistry of this specific
molecule as discussed earlier.
Figure 6-16 shows the intensity distribution of the main peaks plotted for p(MMS)
of 0.48 Torr and p(MMS) of 1.2 Torr at filament temperatures of 1200 and 1300 oC. The
preservation of the chemistry can clearly be observed, since throughout the entire
reaction time, the peak at m/z 90 is dominating over the one at m/z 88. Additionally, it can
be noticed from this plot that the intensity distribution of these peaks followed the same
trend at different precursor pressures. This further confirms that the change in the
precursor pressure did not affect the gas-phase chemistry of MMS.
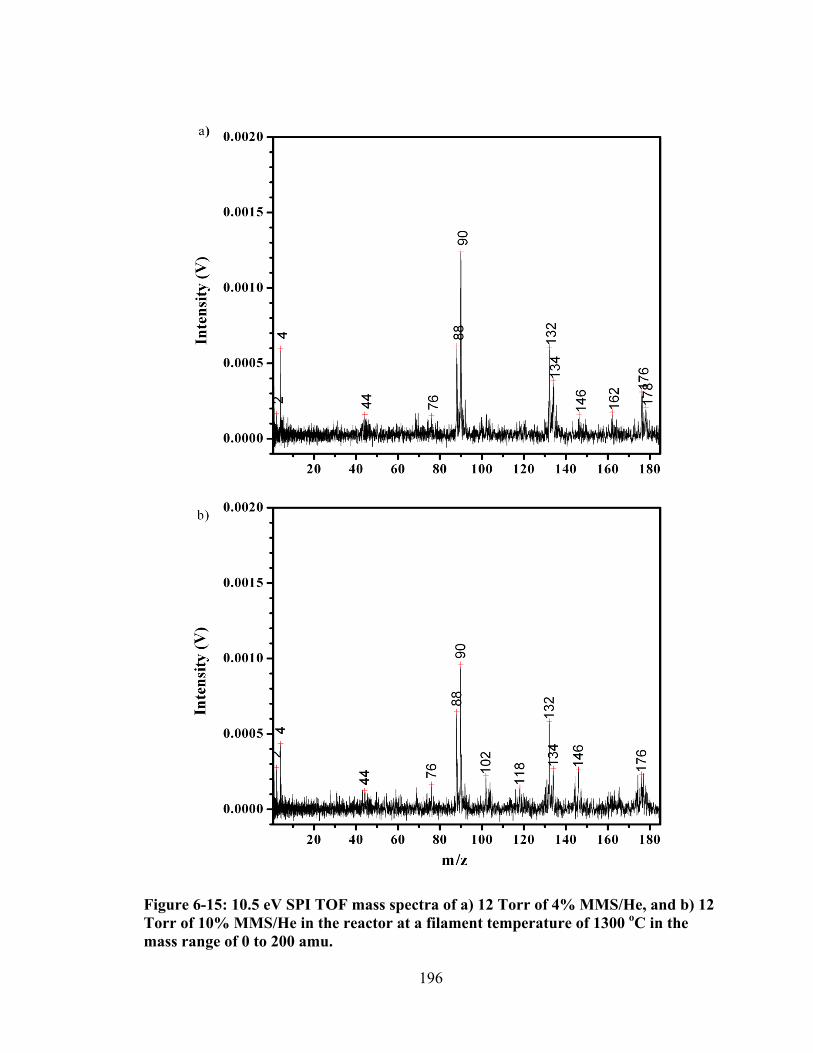
196
Figure 6-15: 10.5 eV SPI TOF mass spectra of a) 12 Torr of 4% MMS/He, and b) 12 Torr of 10% MMS/He in the reactor at a filament temperature of 1300 oC in the mass range of 0 to 200 amu.
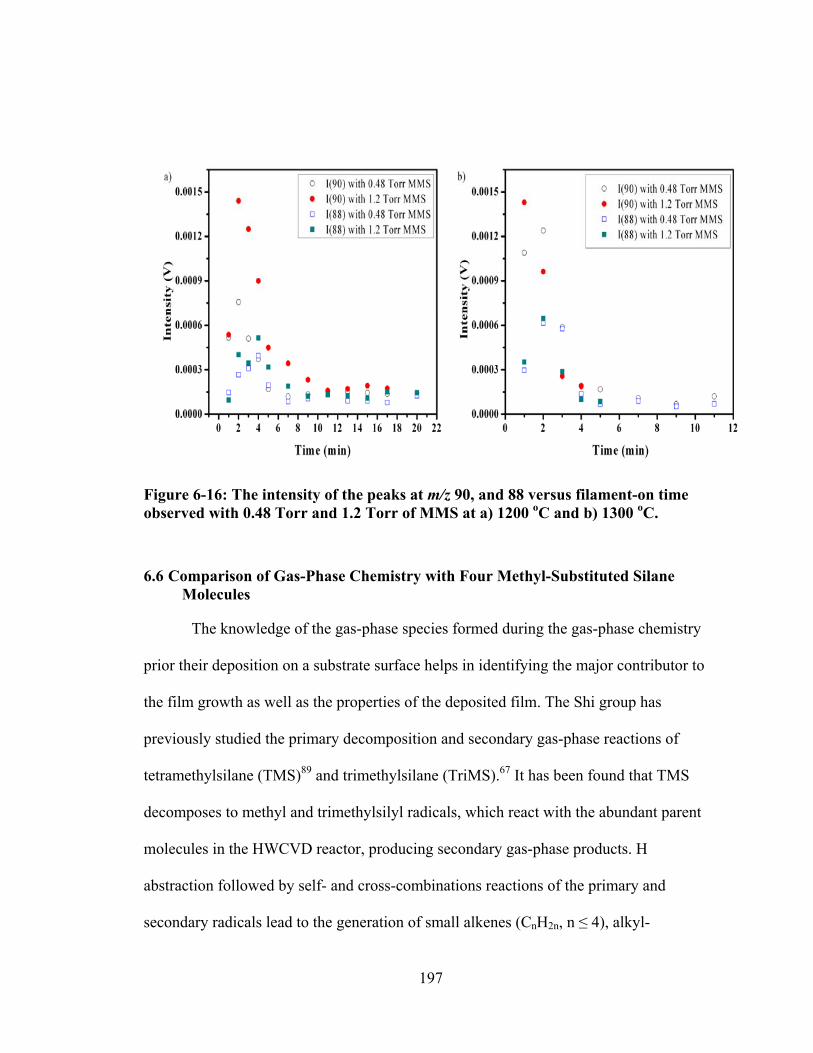
197
Figure 6-16: The intensity of the peaks at m/z 90, and 88 versus filament-on time observed with 0.48 Torr and 1.2 Torr of MMS at a) 1200 oC and b) 1300 oC.
6.6 Comparison of Gas-Phase Chemistry with Four Methyl-Substituted Silane Molecules
The knowledge of the gas-phase species formed during the gas-phase chemistry
prior their deposition on a substrate surface helps in identifying the major contributor to
the film growth as well as the properties of the deposited film. The Shi group has
previously studied the primary decomposition and secondary gas-phase reactions of
tetramethylsilane (TMS)89 and trimethylsilane (TriMS).67 It has been found that TMS
decomposes to methyl and trimethylsilyl radicals, which react with the abundant parent
molecules in the HWCVD reactor, producing secondary gas-phase products. H
abstraction followed by self- and cross-combinations reactions of the primary and
secondary radicals lead to the generation of small alkenes (CnH2n, n ≤ 4), alkyl-
198
substituted silanes, and silyl-substituted alkanes. The study of TriMS revealed the effect
of the Si-H on the gas-phase reaction products. It was found that TriMS decomposed into
(CH3)2HSi, and CH3 radicals. When using TriMS as a source gas in HWCVD reactor, the
radical chain reactions were still the major pathway in the gas-phase chemistry. This is
supported by the detection of TMS (m/z 88) and hexamethyldisilane (HMDS, m/z 146),
which are considered the two major products formed from the radical recombination
reactions in the termination steps. In addition, it is found that there is a more active,
although minor, involvement of the reactive silene intermediates, based on the detection
of three methyl-substituted disilacyclobutane molecules, i.e., 1,3-dimethyl-1,3-
disilacyclobutane,1,1,3-trimethyl-1,3-disilacyclobutane, and 1,1,3,3-tetramethyl-1,3-
disilacyclobutane. This shows that upon the introduction of a Si-H bond into the
molecule, the chemistry involving silene and silylene intermediates started to play a role
in the gas-phase chemistry. This role is further enhanced when DMS and MMS are used
as source gases. As discussed in Chapter 5, DMS chemistry is dominated by the
formation of TriMS (m/z 73) via H-abstraction followed by radical recombination
reaction, 1,1,2,2-tetramethyldisilane (m/z 118) and 1,3-dimethyl-1,3-disilacyclobutane
(m/z 116), which are the products of silylene insertion and silene cycloaddition reactions,
respectively. It has also been shown that at low filament temperatures, the peak at m/z
118 dominates the gas-phase chemistry of DMS. As the filament temperature is
increased, the secondary gas-phase chemistry is governed by the formation of peaks at
m/z 73 and 116. This clearly demonstrates the competitions between reactions involving
free radicals and those with silene/silylene species. As the number of Si-H in the
molecule is increased, the involvement of silene and silylene is more accentuated with
199
DMS than with TriMS or TMS. For MMS, as discussed in this chapter, it is found that
the chemistry is exclusively controlled by silylene chemistry. This is concluded based on
the fact that the major peaks, 1,2-dimethyldisilane (m/z 90) and 1,3-disilacyclobutane
(m/z 88), come from methylsilylene insertion into Si-H bond of the parent molecule and
dimerization reactions, respectively. Therefore, with the increase of Si-H bond in the
source gas, a switch from radical-dominated chemistry to silylene-dominated chemistry
takes place. This change should also be reflected in the structure of the deposited film.
The correlation between the gas-phase reaction chemistry and film structure can
be investigated by examining the film structures deposited by Zaharias et al. 61 and Lee et
al.32 when using these methyl-substituted silane molecules. Lee et al. carried out a
spectroscopic study using MMS, TriMS and TMS. The IR spectra of the films grown
using MMS and TriMS showed the same C-H and Si-H absorption frequencies implying
that the same functional groups are present in deposited films. The main difference
between the films grown from these two precursors lies on the amount of Si-H and C-H
bond which was obtained from the relative integrated area of SiHx and CH3 stretching
modes. They have found that the concentration of methyl groups present in the film’s
network is two times more when using TriMS than MMS. In addition, they have
confirmed that the Si-H bond cleavage is responsible for network propagation. The
reactivity of TMS is found to be much lower than the other two precursors, and the film
grown using TMS is mainly composed of CH2 and CH3 groups. Their results suggest that
C-H bond cleavage is the major pathway to film growth when using TMS, which is less
favourable than Si-H bond cleavage. These results were comparable to the ones obtained
from Zaharias et al., where they found that the concentration of SiHx species present in
200
the grown films from these precursors increased with decreasing methyl group present in
the precursor molecules. The structure of the grown films in these two studies clearly
demonstrates the effect of Si-H bonds in the precursor molecule. As the number of Si-H
bond is increased, the grown film switched from C-rich to Si-rich material, which is
related to the intermediates produced in the gas phase. As stated earlier, with an increase
in methyl substitution in the precursor molecule, there is a switch from silylene/silene
dominated chemistry to free radical dominated one. This is reflected in the structures of
the deposited films.
6.7 Summary
The decomposition of MMS and secondary gas-phase reactions in the HWCVD
reactor when using W and Ta filaments were examined using laser ionization mass
spectrometry. It is found that MMS decomposes on the metal filament to form methyl
and silyl radicals. In addition, MMS decomposed to form short-lived methylsilylene and
silene intermediates with H2 as a concomitant product. Under a MMS partial pressure of
0.48 Torr in the HWCVD reactor, secondary gas-phase reactions are dominated by
silylene insertion and dimerization reactions. These reactions lead to the formation of 1,2-
dimethyldisilane (m/z 90) and 1,3-disilacyclobutane (m/z 88), as well as high-mass
methyl-substituted disilanes (m/z 132, 134) and trisilanes(m/z 176, and 178). The
decomposition temperature for MMS in the reactor is found to be as low as 1000 °C. The
usage of the deuterated isotopomer, MMS-d3, and chemical trapping with 1,3-butadiene
and ammonia helps in confirming the pathways responsible for the formation of the
major species. It is concluded that 1,2-dimethyldisilane originates from methylsilylene
201
insertion reaction into the Si-H bond of the parent molecule, while the formation of 1,3-
dimethyl-1-disilacyclobutane involves the dimerization reaction of the same intermediate.
This leads to the conclusion that in the gas-phase chemistry of MMS, free radical and
silene intermediates do not play an important role.
In addition, the effect of filament materials on the gas-phase chemistry of MMS
has been investigated. Since the gas-phase chemistry only involves one type of
intermediates, silylene, the filament material is found not to be a factor. Study on the
effect of precursor pressure shows that an increase in the pressure of MMS does not
affect the gas-phase chemistry for the same reason.
202
Chapter Seven: Effect of Trimethylsilane Pressure on the Gas-phase Reaction Chemistry in the HWCVD process
7.1 Motivations
The mechanisms and kinetics of the pyrolysis of trimethylsilane (TriMS) have
been well studied in the literature.183, 184, 192, 207 Methane and hydrogen (H2) were
observed as the main products in all studies. It was believed that the formation of CH4
and H2 is initiated by the dissociation of Si- CH3 and Si-H bond, respectively. The direct
molecular elimination from TriMS was discounted as a possible channel to form these
two molecules in pyrolysis. Other products in the TriMS pyrolysis include several
methyl-substituted disilacylobutanes that are formed from the silicon- carbon double-
bonded (silene) intermediates. Closed related to the pyrolysis of TriMS is its use in
thermal chemical vapor deposition (CVD). Indeed, TriMS has been used as a single
precursor with existing Si-C bonds in rapid thermal CVD71, 237 for the deposition of
silicon carbide films. In addition, it has also been employed for the same purpose in
PECVD70, atomic hydrogen-induced CVD133, 238 and HWCVD.32, 73
In a previous study from our group,67 the decomposition chemistry of TriMS on
a hot W filament and secondary reaction chemistry in a hot-wire CVD reactor have been
systematically investigated using laser ionization mass spectrometry. It is found that
TriMS decomposes on the hot filament via Si-H and Si-CH3 bond cleavages, forming
CH3, H, and methyl-substituted silyl radicals. In the reactor where the partial pressure of
TriMS is 0.12 Torr, the major products in the gas-phase are found to be
hexamethyldisilane (HMDS) and tetramethylsilane (TMS) formed from radical
203
recombination reactions. Cycloaddition reactions of methyl-substituted silene
intermediates produce three disilacyclobutane molecules, including 1,3-dimethyl-1,3-
disilacyclobutane (DMDSCB, m/z 116), 1,1,3-trimethyl-1,3-disilacyclobutane
(TriMDSCB, m/z 130), and 1,1,3,3- tetramethyl-1,3-disilacyclobutane (TMDSCB, m/z
144), as the minor products. The formation of methane and H2 was not examined in our
previous study with 0.12 Torr of TriMS.
In this work, the effect of TriMS pressure in the hot-wire CVD process on the
secondary gas-phase reactions is explored by examining the product distributions at an
increased pressure of 4.0 Torr and comparing with those at 0.12 Torr. The formation of
methane and hydrogen molecules was also investigated. The intensity distributions of the
five major products observed in the hot-wire CVD reactor as a function of reaction time
and filament temperature for both sample pressures were investigated. The reasons why
different trends were observed for the five high-mass products were provided.
7.2 Gas-Phase Reaction Products from Trimethylsilane in a HWCVD Reactor
As has been described in our previous study,67 the room-temperature 10.5 eV SPI
TOF mass spectrum of TriMS is predominated by two photofragment ions at m/z 73
(Si(CH3)3+) and 58 (Si(CH3)2
+·). After turning the filament on, it was noticed that the
intensity of these two photofragment ions started to decrease at a filament temperature of
1100 oC when using 4.0 Torr of TriMS and simultaneously two new peaks appeared at
m/z 88 and 146. This temperature was comparable to the one obtained with 0.12 Torr of
TriMS, which was ~ 1200 oC. Main contribution to the two new peaks at m/z 88 and 146
has been assigned, respectively, to TMS and HMDS, in our previous study.67 To confirm
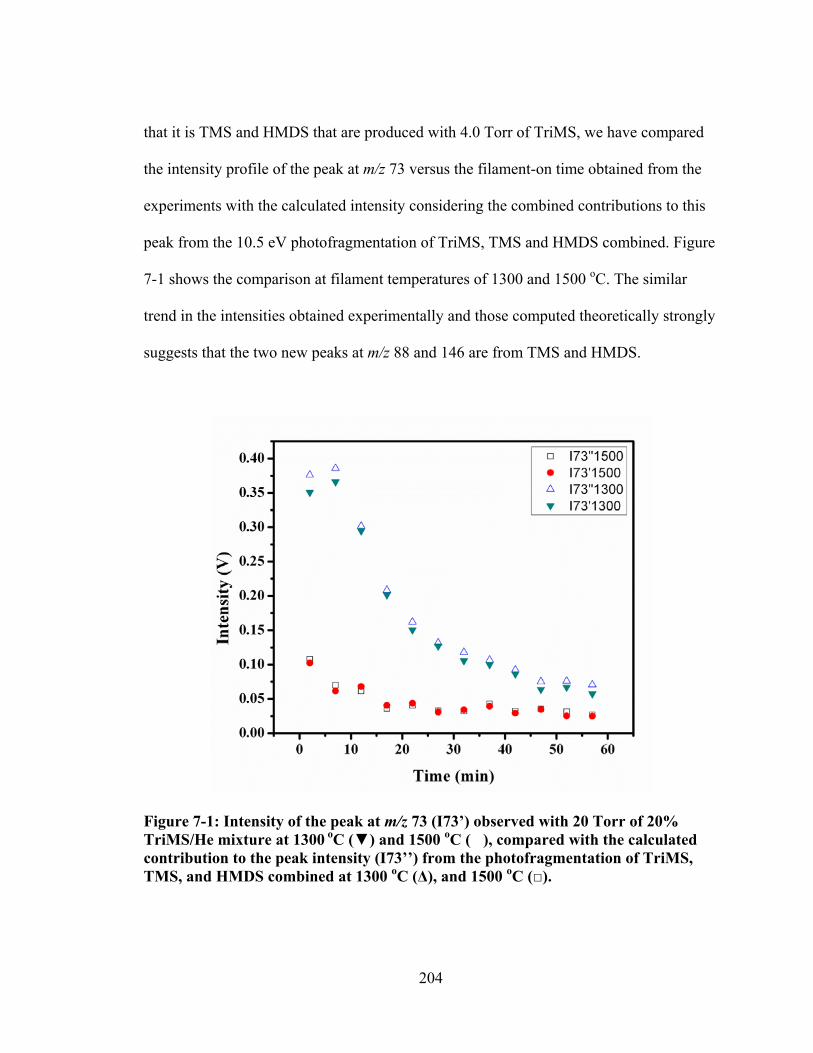
204
that it is TMS and HMDS that are produced with 4.0 Torr of TriMS, we have compared
the intensity profile of the peak at m/z 73 versus the filament-on time obtained from the
experiments with the calculated intensity considering the combined contributions to this
peak from the 10.5 eV photofragmentation of TriMS, TMS and HMDS combined. Figure
7-1 shows the comparison at filament temperatures of 1300 and 1500 oC. The similar
trend in the intensities obtained experimentally and those computed theoretically strongly
suggests that the two new peaks at m/z 88 and 146 are from TMS and HMDS.
Figure 7-1: Intensity of the peak at m/z 73 (I73’) observed with 20 Torr of 20% TriMS/He mixture at 1300 oC (▼) and 1500 oC (�), compared with the calculated contribution to the peak intensity (I73’’) from the photofragmentation of TriMS, TMS, and HMDS combined at 1300 oC (Δ), and 1500 oC (□).
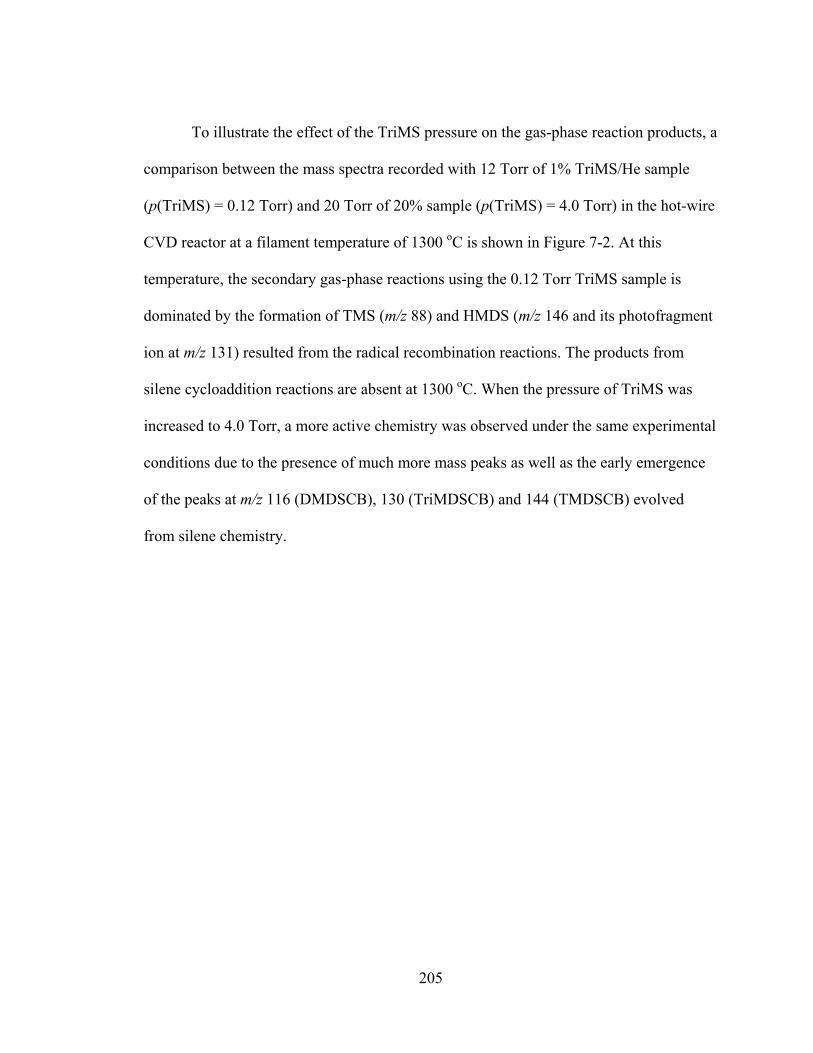
205
To illustrate the effect of the TriMS pressure on the gas-phase reaction products, a
comparison between the mass spectra recorded with 12 Torr of 1% TriMS/He sample
(p(TriMS) = 0.12 Torr) and 20 Torr of 20% sample (p(TriMS) = 4.0 Torr) in the hot-wire
CVD reactor at a filament temperature of 1300 oC is shown in Figure 7-2. At this
temperature, the secondary gas-phase reactions using the 0.12 Torr TriMS sample is
dominated by the formation of TMS (m/z 88) and HMDS (m/z 146 and its photofragment
ion at m/z 131) resulted from the radical recombination reactions. The products from
silene cycloaddition reactions are absent at 1300 oC. When the pressure of TriMS was
increased to 4.0 Torr, a more active chemistry was observed under the same experimental
conditions due to the presence of much more mass peaks as well as the early emergence
of the peaks at m/z 116 (DMDSCB), 130 (TriMDSCB) and 144 (TMDSCB) evolved
from silene chemistry.
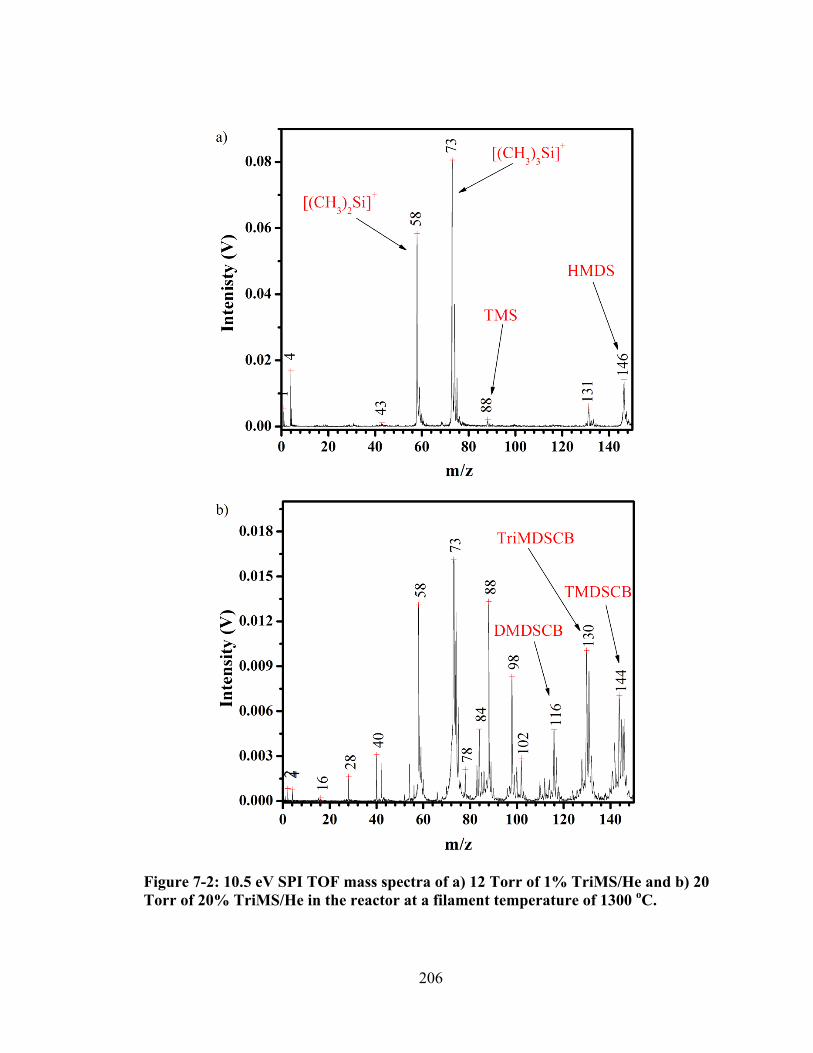
206
Figure 7-2: 10.5 eV SPI TOF mass spectra of a) 12 Torr of 1% TriMS/He and b) 20 Torr of 20% TriMS/He in the reactor at a filament temperature of 1300 oC.
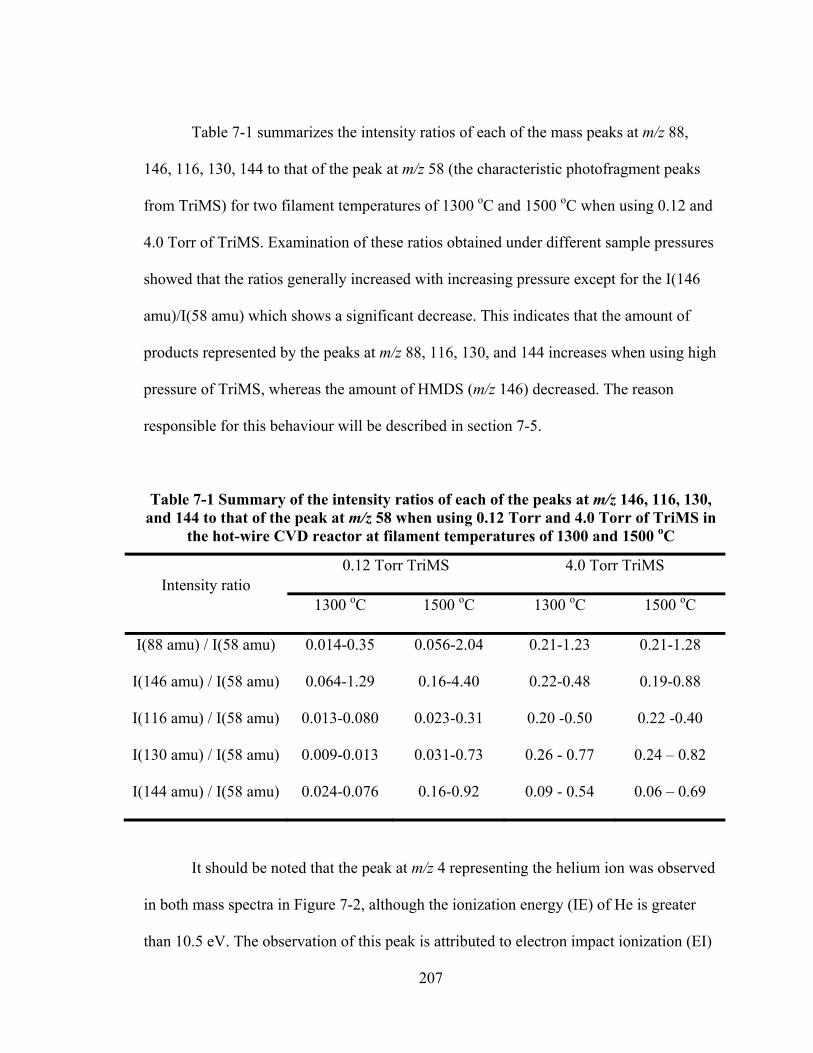
207
Table 7-1 summarizes the intensity ratios of each of the mass peaks at m/z 88,
146, 116, 130, 144 to that of the peak at m/z 58 (the characteristic photofragment peaks
from TriMS) for two filament temperatures of 1300 oC and 1500 oC when using 0.12 and
4.0 Torr of TriMS. Examination of these ratios obtained under different sample pressures
showed that the ratios generally increased with increasing pressure except for the I(146
amu)/I(58 amu) which shows a significant decrease. This indicates that the amount of
products represented by the peaks at m/z 88, 116, 130, and 144 increases when using high
pressure of TriMS, whereas the amount of HMDS (m/z 146) decreased. The reason
responsible for this behaviour will be described in section 7-5.
Table 7-1 Summary of the intensity ratios of each of the peaks at m/z 146, 116, 130, and 144 to that of the peak at m/z 58 when using 0.12 Torr and 4.0 Torr of TriMS in
the hot-wire CVD reactor at filament temperatures of 1300 and 1500 oC
Intensity ratio 0.12 Torr TriMS 4.0 Torr TriMS
1300 oC 1500 oC 1300 oC 1500 oC
I(88 amu) / I(58 amu) 0.014-0.35 0.056-2.04 0.21-1.23 0.21-1.28
I(146 amu) / I(58 amu) 0.064-1.29 0.16-4.40 0.22-0.48 0.19-0.88
I(116 amu) / I(58 amu) 0.013-0.080 0.023-0.31 0.20 -0.50 0.22 -0.40
I(130 amu) / I(58 amu) 0.009-0.013 0.031-0.73 0.26 - 0.77 0.24 – 0.82
I(144 amu) / I(58 amu) 0.024-0.076 0.16-0.92 0.09 - 0.54 0.06 – 0.69
It should be noted that the peak at m/z 4 representing the helium ion was observed
in both mass spectra in Figure 7-2, although the ionization energy (IE) of He is greater
than 10.5 eV. The observation of this peak is attributed to electron impact ionization (EI)
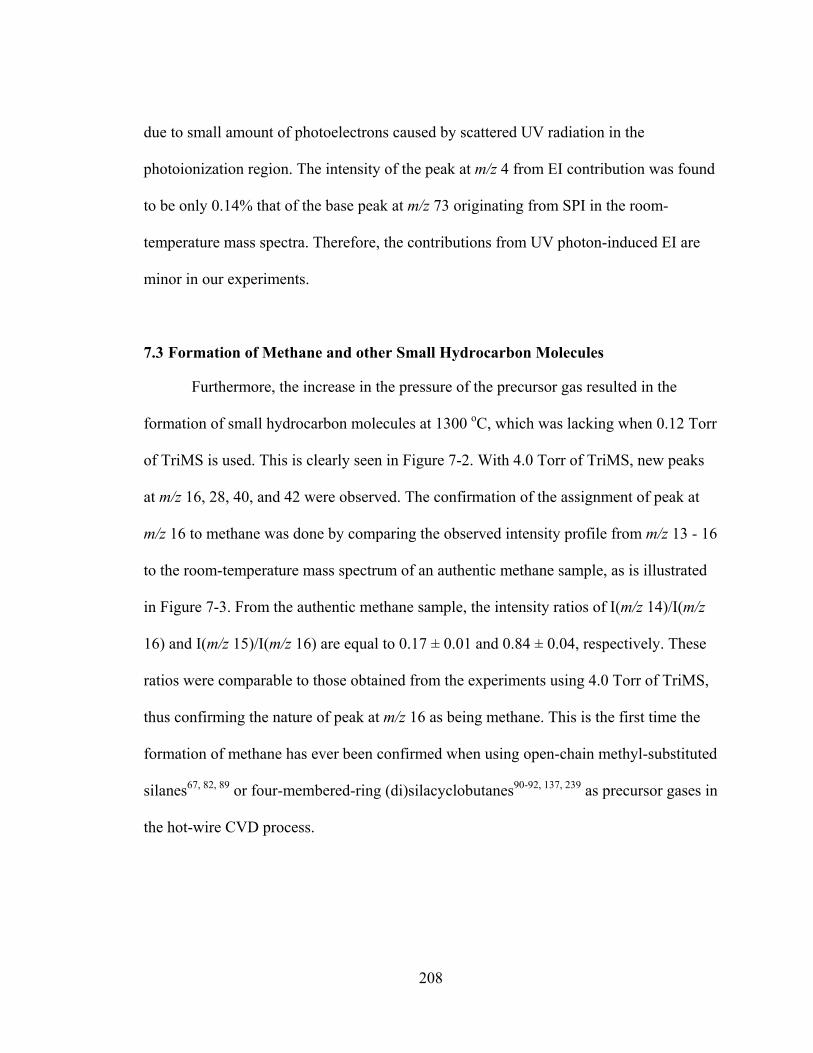
208
due to small amount of photoelectrons caused by scattered UV radiation in the
photoionization region. The intensity of the peak at m/z 4 from EI contribution was found
to be only 0.14% that of the base peak at m/z 73 originating from SPI in the room-
temperature mass spectra. Therefore, the contributions from UV photon-induced EI are
minor in our experiments.
7.3 Formation of Methane and other Small Hydrocarbon Molecules
Furthermore, the increase in the pressure of the precursor gas resulted in the
formation of small hydrocarbon molecules at 1300 oC, which was lacking when 0.12 Torr
of TriMS is used. This is clearly seen in Figure 7-2. With 4.0 Torr of TriMS, new peaks
at m/z 16, 28, 40, and 42 were observed. The confirmation of the assignment of peak at
m/z 16 to methane was done by comparing the observed intensity profile from m/z 13 - 16
to the room-temperature mass spectrum of an authentic methane sample, as is illustrated
in Figure 7-3. From the authentic methane sample, the intensity ratios of I(m/z 14)/I(m/z
16) and I(m/z 15)/I(m/z 16) are equal to 0.17 ± 0.01 and 0.84 ± 0.04, respectively. These
ratios were comparable to those obtained from the experiments using 4.0 Torr of TriMS,
thus confirming the nature of peak at m/z 16 as being methane. This is the first time the
formation of methane has ever been confirmed when using open-chain methyl-substituted
silanes67, 82, 89 or four-membered-ring (di)silacyclobutanes90-92, 137, 239 as precursor gases in
the hot-wire CVD process.
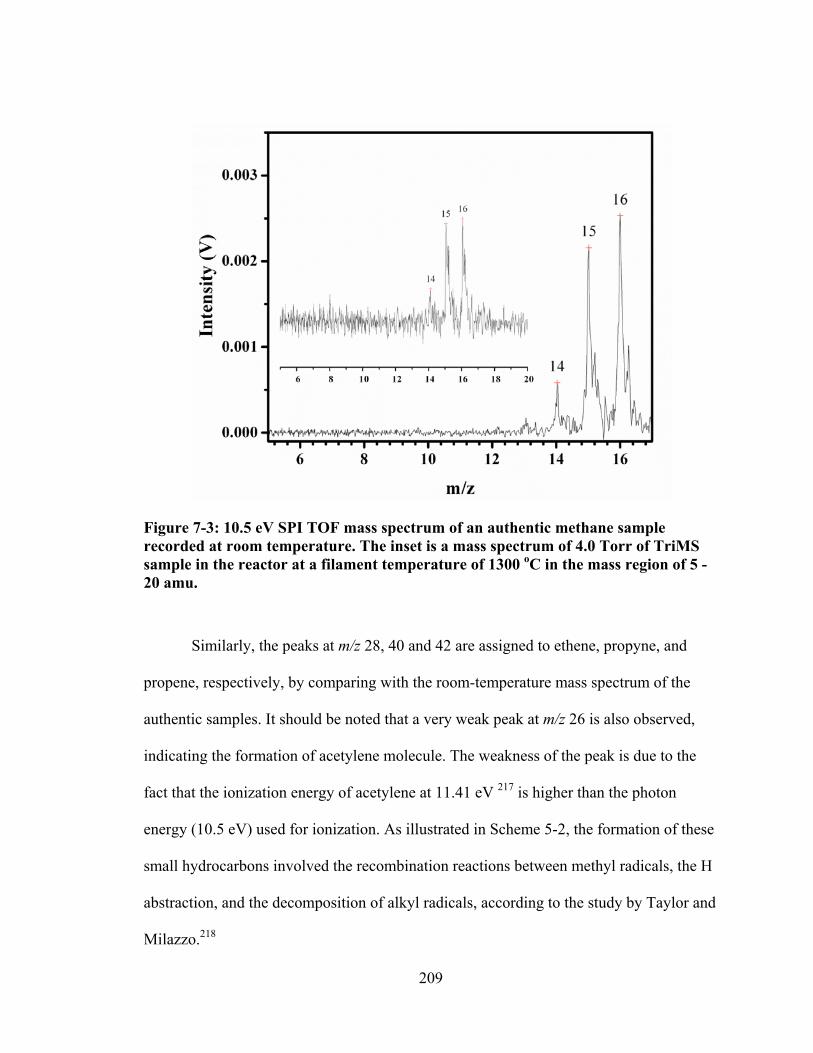
209
Figure 7-3: 10.5 eV SPI TOF mass spectrum of an authentic methane sample recorded at room temperature. The inset is a mass spectrum of 4.0 Torr of TriMS sample in the reactor at a filament temperature of 1300 oC in the mass region of 5 - 20 amu.
Similarly, the peaks at m/z 28, 40 and 42 are assigned to ethene, propyne, and
propene, respectively, by comparing with the room-temperature mass spectrum of the
authentic samples. It should be noted that a very weak peak at m/z 26 is also observed,
indicating the formation of acetylene molecule. The weakness of the peak is due to the
fact that the ionization energy of acetylene at 11.41 eV 217 is higher than the photon
energy (10.5 eV) used for ionization. As illustrated in Scheme 5-2, the formation of these
small hydrocarbons involved the recombination reactions between methyl radicals, the H
abstraction, and the decomposition of alkyl radicals, according to the study by Taylor and
Milazzo.218
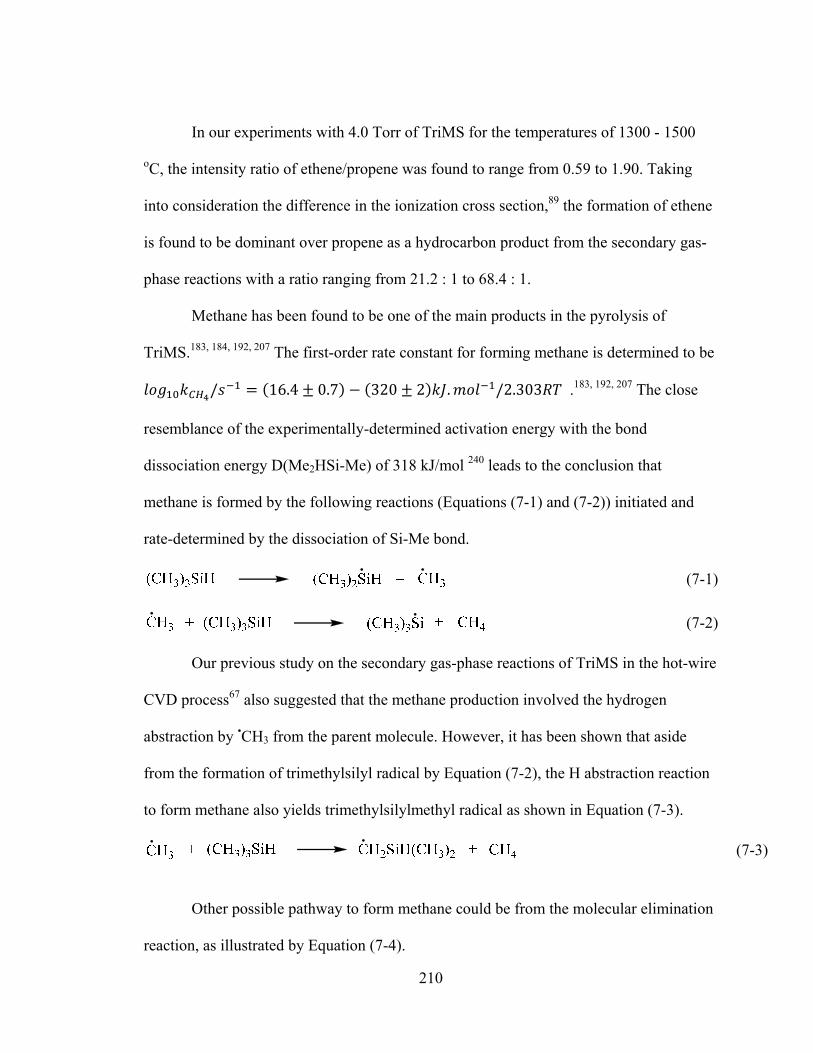
210
In our experiments with 4.0 Torr of TriMS for the temperatures of 1300 - 1500
oC, the intensity ratio of ethene/propene was found to range from 0.59 to 1.90. Taking
into consideration the difference in the ionization cross section,89 the formation of ethene
is found to be dominant over propene as a hydrocarbon product from the secondary gas-
phase reactions with a ratio ranging from 21.2 : 1 to 68.4 : 1.
Methane has been found to be one of the main products in the pyrolysis of
TriMS.183, 184, 192, 207 The first-order rate constant for forming methane is determined to be
/ 16.4 0.7 320 2 . /2.303 .183, 192, 207 The close
resemblance of the experimentally-determined activation energy with the bond
dissociation energy D(Me2HSi-Me) of 318 kJ/mol 240 leads to the conclusion that
methane is formed by the following reactions (Equations (7-1) and (7-2)) initiated and
rate-determined by the dissociation of Si-Me bond.
(7-1)
(7-2)
Our previous study on the secondary gas-phase reactions of TriMS in the hot-wire
CVD process67 also suggested that the methane production involved the hydrogen
abstraction by •CH3 from the parent molecule. However, it has been shown that aside
from the formation of trimethylsilyl radical by Equation (7-2), the H abstraction reaction
to form methane also yields trimethylsilylmethyl radical as shown in Equation (7-3).
(7-3)
Other possible pathway to form methane could be from the molecular elimination
reaction, as illustrated by Equation (7-4).
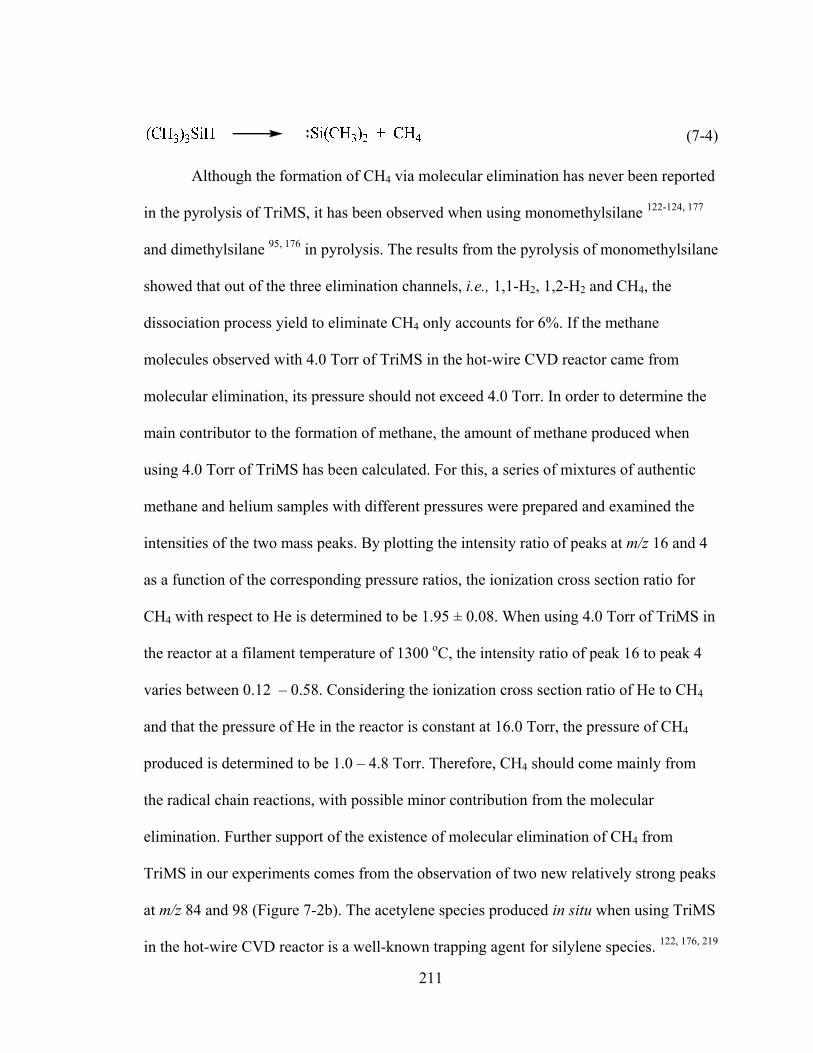
211
(7-4)
Although the formation of CH4 via molecular elimination has never been reported
in the pyrolysis of TriMS, it has been observed when using monomethylsilane 122-124, 177
and dimethylsilane 95, 176 in pyrolysis. The results from the pyrolysis of monomethylsilane
showed that out of the three elimination channels, i.e., 1,1-H2, 1,2-H2 and CH4, the
dissociation process yield to eliminate CH4 only accounts for 6%. If the methane
molecules observed with 4.0 Torr of TriMS in the hot-wire CVD reactor came from
molecular elimination, its pressure should not exceed 4.0 Torr. In order to determine the
main contributor to the formation of methane, the amount of methane produced when
using 4.0 Torr of TriMS has been calculated. For this, a series of mixtures of authentic
methane and helium samples with different pressures were prepared and examined the
intensities of the two mass peaks. By plotting the intensity ratio of peaks at m/z 16 and 4
as a function of the corresponding pressure ratios, the ionization cross section ratio for
CH4 with respect to He is determined to be 1.95 ± 0.08. When using 4.0 Torr of TriMS in
the reactor at a filament temperature of 1300 oC, the intensity ratio of peak 16 to peak 4
varies between 0.12 – 0.58. Considering the ionization cross section ratio of He to CH4
and that the pressure of He in the reactor is constant at 16.0 Torr, the pressure of CH4
produced is determined to be 1.0 – 4.8 Torr. Therefore, CH4 should come mainly from
the radical chain reactions, with possible minor contribution from the molecular
elimination. Further support of the existence of molecular elimination of CH4 from
TriMS in our experiments comes from the observation of two new relatively strong peaks
at m/z 84 and 98 (Figure 7-2b). The acetylene species produced in situ when using TriMS
in the hot-wire CVD reactor is a well-known trapping agent for silylene species. 122, 176, 219
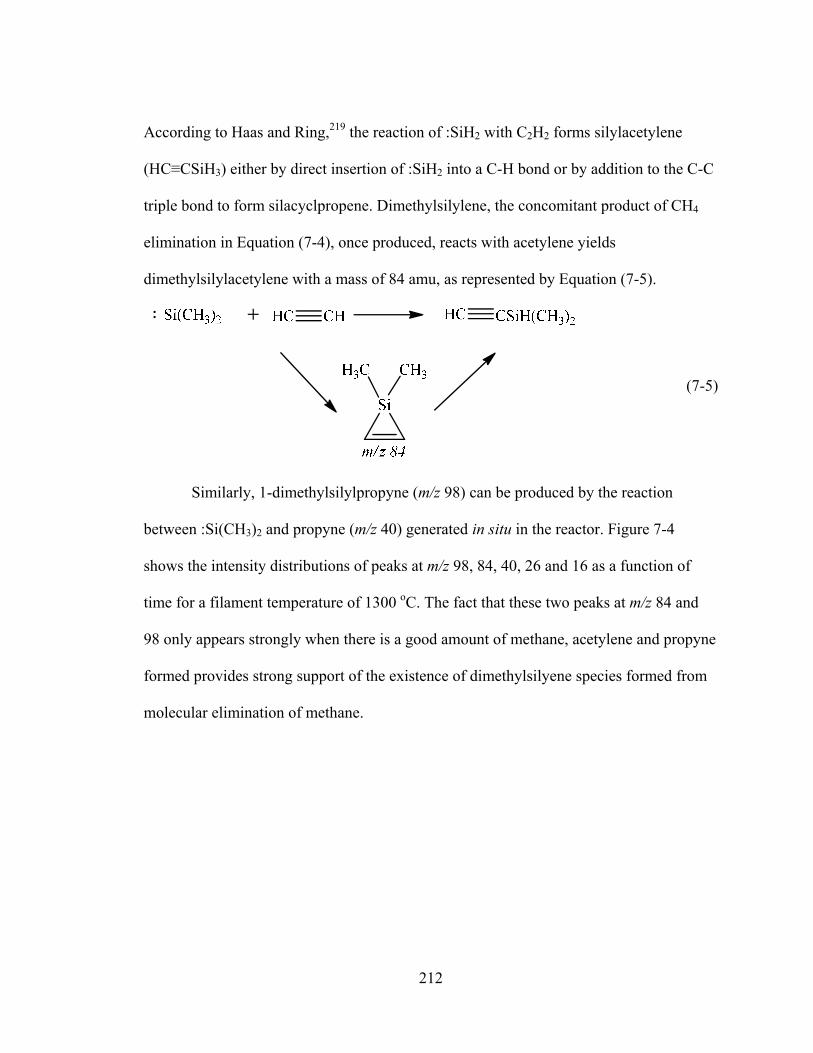
212
According to Haas and Ring,219 the reaction of :SiH2 with C2H2 forms silylacetylene
(HC≡CSiH3) either by direct insertion of :SiH2 into a C-H bond or by addition to the C-C
triple bond to form silacyclpropene. Dimethylsilylene, the concomitant product of CH4
elimination in Equation (7-4), once produced, reacts with acetylene yields
dimethylsilylacetylene with a mass of 84 amu, as represented by Equation (7-5).
(7-5)
Similarly, 1-dimethylsilylpropyne (m/z 98) can be produced by the reaction
between :Si(CH3)2 and propyne (m/z 40) generated in situ in the reactor. Figure 7-4
shows the intensity distributions of peaks at m/z 98, 84, 40, 26 and 16 as a function of
time for a filament temperature of 1300 oC. The fact that these two peaks at m/z 84 and
98 only appears strongly when there is a good amount of methane, acetylene and propyne
formed provides strong support of the existence of dimethylsilyene species formed from
molecular elimination of methane.
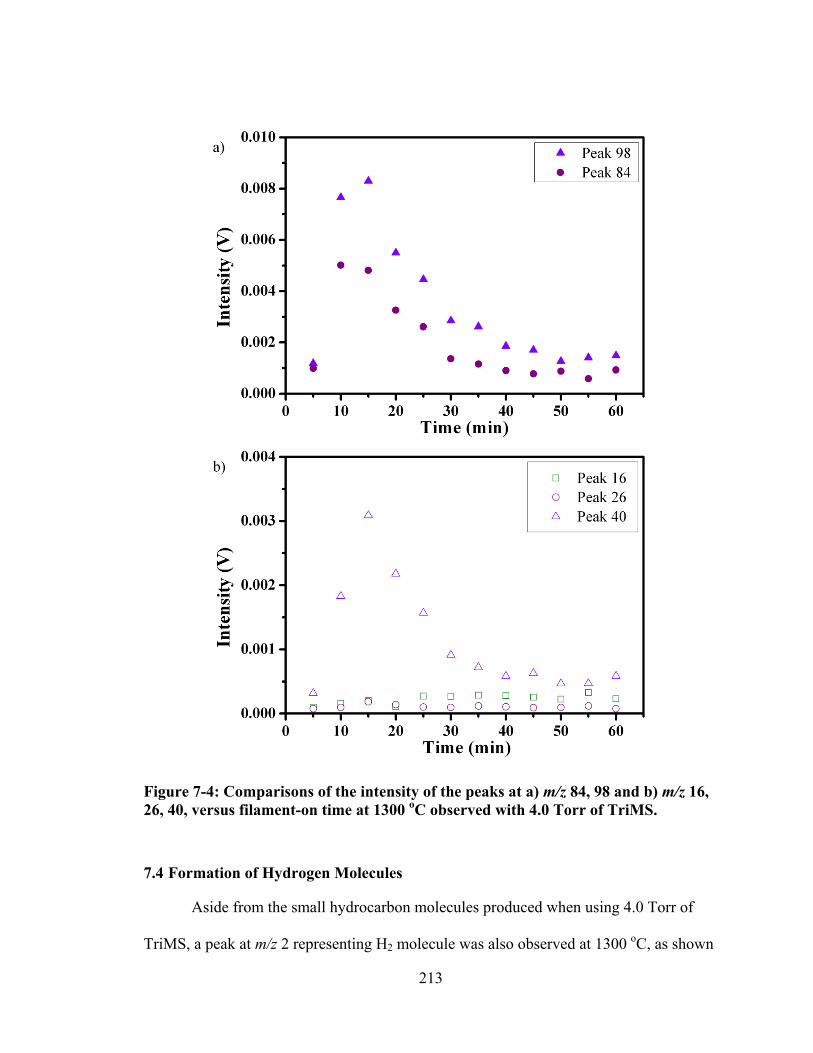
213
Figure 7-4: Comparisons of the intensity of the peaks at a) m/z 84, 98 and b) m/z 16, 26, 40, versus filament-on time at 1300 oC observed with 4.0 Torr of TriMS.
7.4 Formation of Hydrogen Molecules
Aside from the small hydrocarbon molecules produced when using 4.0 Torr of
TriMS, a peak at m/z 2 representing H2 molecule was also observed at 1300 oC, as shown
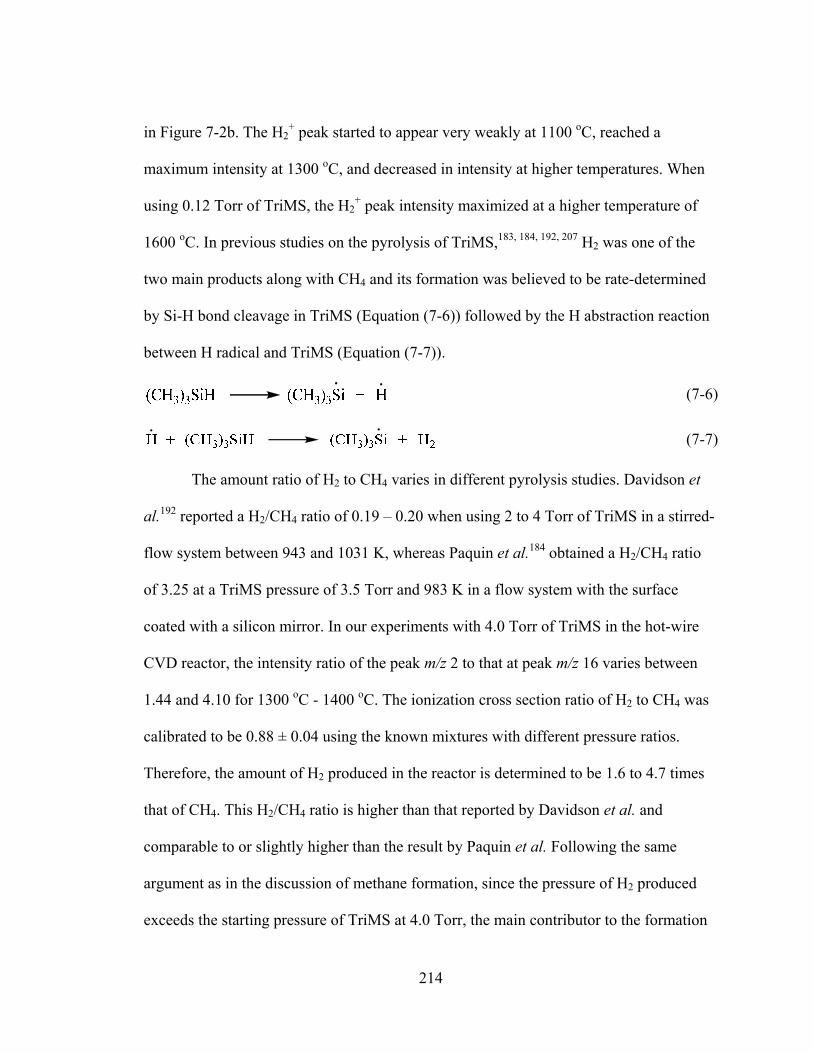
214
in Figure 7-2b. The H2+ peak started to appear very weakly at 1100 oC, reached a
maximum intensity at 1300 oC, and decreased in intensity at higher temperatures. When
using 0.12 Torr of TriMS, the H2+ peak intensity maximized at a higher temperature of
1600 oC. In previous studies on the pyrolysis of TriMS,183, 184, 192, 207 H2 was one of the
two main products along with CH4 and its formation was believed to be rate-determined
by Si-H bond cleavage in TriMS (Equation (7-6)) followed by the H abstraction reaction
between H radical and TriMS (Equation (7-7)).
(7-6)
(7-7)
The amount ratio of H2 to CH4 varies in different pyrolysis studies. Davidson et
al.192 reported a H2/CH4 ratio of 0.19 – 0.20 when using 2 to 4 Torr of TriMS in a stirred-
flow system between 943 and 1031 K, whereas Paquin et al.184 obtained a H2/CH4 ratio
of 3.25 at a TriMS pressure of 3.5 Torr and 983 K in a flow system with the surface
coated with a silicon mirror. In our experiments with 4.0 Torr of TriMS in the hot-wire
CVD reactor, the intensity ratio of the peak m/z 2 to that at peak m/z 16 varies between
1.44 and 4.10 for 1300 oC - 1400 oC. The ionization cross section ratio of H2 to CH4 was
calibrated to be 0.88 ± 0.04 using the known mixtures with different pressure ratios.
Therefore, the amount of H2 produced in the reactor is determined to be 1.6 to 4.7 times
that of CH4. This H2/CH4 ratio is higher than that reported by Davidson et al. and
comparable to or slightly higher than the result by Paquin et al. Following the same
argument as in the discussion of methane formation, since the pressure of H2 produced
exceeds the starting pressure of TriMS at 4.0 Torr, the main contributor to the formation
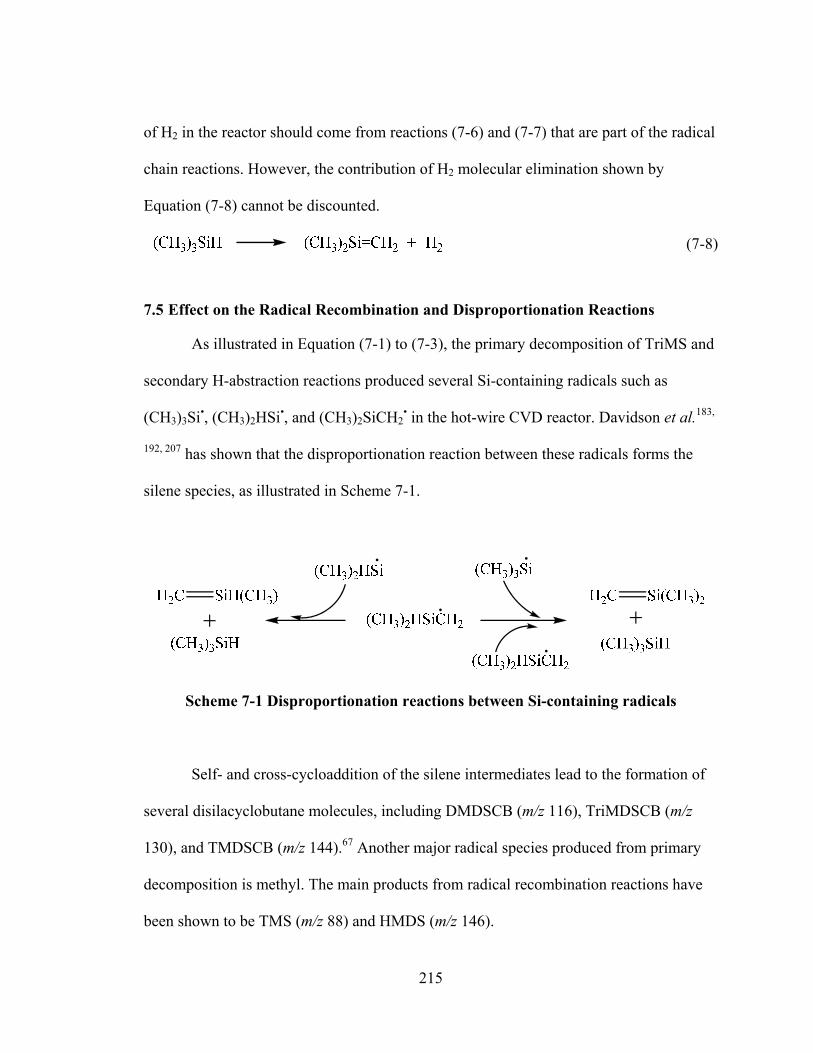
215
of H2 in the reactor should come from reactions (7-6) and (7-7) that are part of the radical
chain reactions. However, the contribution of H2 molecular elimination shown by
Equation (7-8) cannot be discounted.
(7-8)
7.5 Effect on the Radical Recombination and Disproportionation Reactions
As illustrated in Equation (7-1) to (7-3), the primary decomposition of TriMS and
secondary H-abstraction reactions produced several Si-containing radicals such as
(CH3)3Si•, (CH3)2HSi•, and (CH3)2SiCH2• in the hot-wire CVD reactor. Davidson et al.183,
192, 207 has shown that the disproportionation reaction between these radicals forms the
silene species, as illustrated in Scheme 7-1.
Scheme 7-1 Disproportionation reactions between Si-containing radicals
Self- and cross-cycloaddition of the silene intermediates lead to the formation of
several disilacyclobutane molecules, including DMDSCB (m/z 116), TriMDSCB (m/z
130), and TMDSCB (m/z 144).67 Another major radical species produced from primary
decomposition is methyl. The main products from radical recombination reactions have
been shown to be TMS (m/z 88) and HMDS (m/z 146).
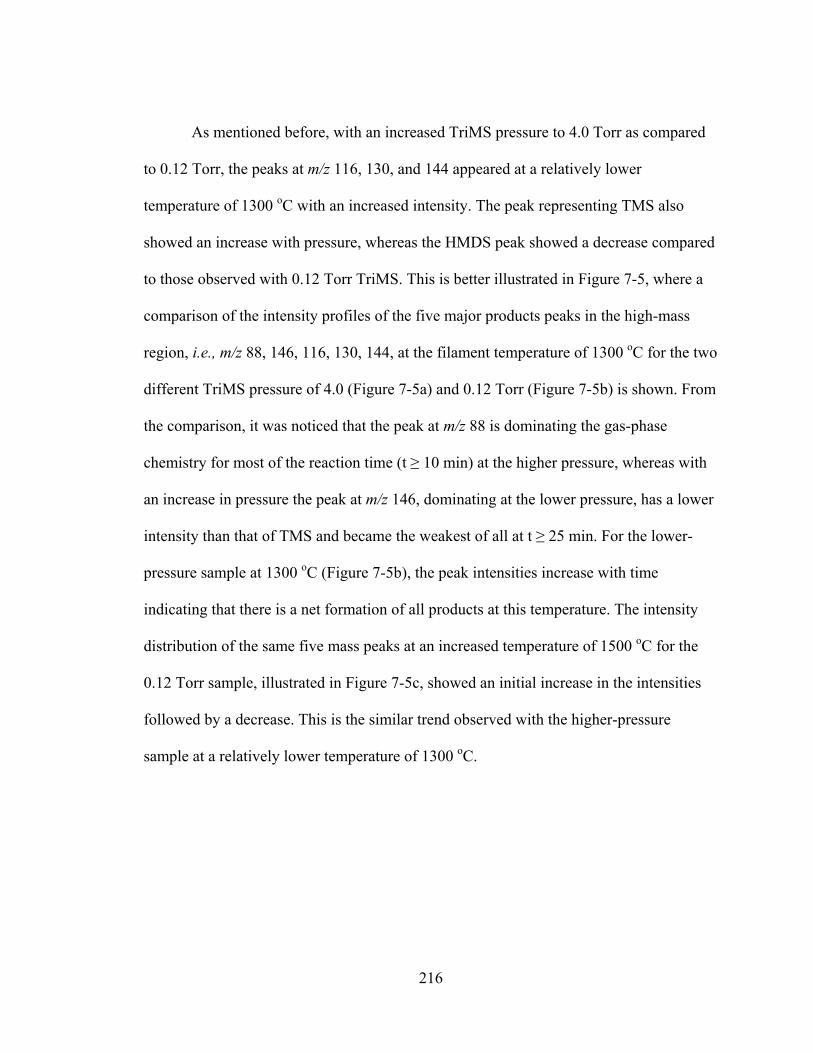
216
As mentioned before, with an increased TriMS pressure to 4.0 Torr as compared
to 0.12 Torr, the peaks at m/z 116, 130, and 144 appeared at a relatively lower
temperature of 1300 oC with an increased intensity. The peak representing TMS also
showed an increase with pressure, whereas the HMDS peak showed a decrease compared
to those observed with 0.12 Torr TriMS. This is better illustrated in Figure 7-5, where a
comparison of the intensity profiles of the five major products peaks in the high-mass
region, i.e., m/z 88, 146, 116, 130, 144, at the filament temperature of 1300 oC for the two
different TriMS pressure of 4.0 (Figure 7-5a) and 0.12 Torr (Figure 7-5b) is shown. From
the comparison, it was noticed that the peak at m/z 88 is dominating the gas-phase
chemistry for most of the reaction time (t ≥ 10 min) at the higher pressure, whereas with
an increase in pressure the peak at m/z 146, dominating at the lower pressure, has a lower
intensity than that of TMS and became the weakest of all at t ≥ 25 min. For the lower-
pressure sample at 1300 oC (Figure 7-5b), the peak intensities increase with time
indicating that there is a net formation of all products at this temperature. The intensity
distribution of the same five mass peaks at an increased temperature of 1500 oC for the
0.12 Torr sample, illustrated in Figure 7-5c, showed an initial increase in the intensities
followed by a decrease. This is the similar trend observed with the higher-pressure
sample at a relatively lower temperature of 1300 oC.
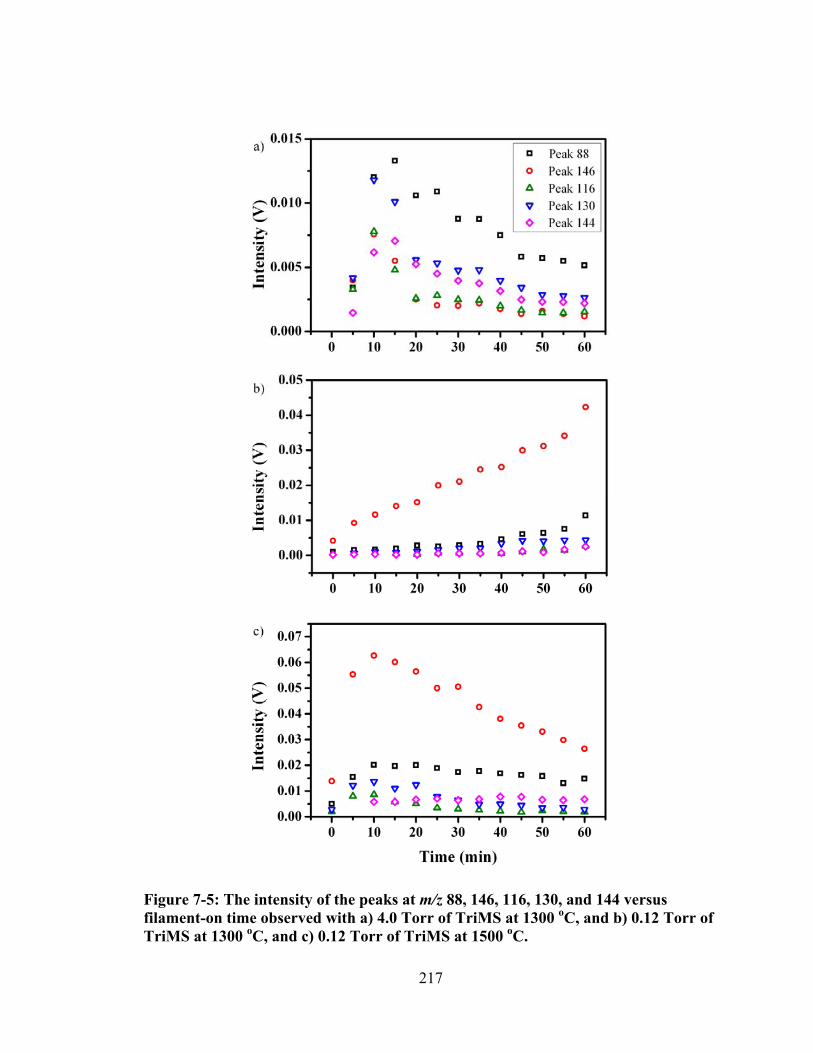
217
Figure 7-5: The intensity of the peaks at m/z 88, 146, 116, 130, and 144 versus filament-on time observed with a) 4.0 Torr of TriMS at 1300 oC, and b) 0.12 Torr of TriMS at 1300 oC, and c) 0.12 Torr of TriMS at 1500 oC.
218
The formation of all five products examined here involves the free radicals
produced in the reactor. Among these radicals, some are methyl substituted silyl radicals
(e.g., (CH3)3Si•, (CH3)2HSi•), others are (silyl substituted)alkyl radicals (e.g.,
(CH3)2SiHCH2•, •CH3). As mentioned before, with an increased TriMS pressure of 4.0
Torr, several small hydrocarbon molecules including methane, ethene, acetylene, propene
and propyne have been produced. Ethene 94, 122, 176, 221, 222 and propene 122, 176 have been
known to be good free radical scavengers. Therefore, it is believed that the presence of
ethene and propene molecules affect significantly the availability of free radicals. Choo
and Gaspar221 have studied the addition reaction of trimethylsilyl radical to ethene in a
flash photolysis system using electron spin resonance spectroscopy. They have concluded
that ethene can act as an efficient silyl radical scavenger. Furthermore, the rate of this
addition reaction is much faster than that of the addition of the simple alkyl radicals (e.g.,
methyl, ethyl, n-propyl) to ethene. This fact is in agreement with the work done by
Pollock et al.222 where they have found that the trapping reaction of silyl radical (•SiH3)
by ethene is two to three orders of magnitude faster than its addition to alkyl radials and
also more rapid than the addition reaction of the trimethylsilyl radical to ethene. Based on
these observations, the formed ethene molecule will react as a silyl radical scavenger to
•Si(CH3)3 and •SiH(CH3)2 radicals present in the reactor. Both HMDS and TMS originate
from the radical recombination reactions; however, the self-combination reaction of
trimethylsilyl radicals forms HMDS, and the combination of trimethylsilyl and methyl
radicals yields TMS. The rate of the former reaction depends quadratically on the
concentration of trimethylsilyl radical and that of latter exhibits a linear dependence. This
219
leads to a more significant decrease in the intensity of peak at m/z 146 relative to the one
at m/z 88, as shown in Figure 7-5.
The occurrence of ethene scavenging reactions with •Si(CH3)3 and •SiH(CH3)2
radicals has also a direct effect on the rate of disproportionation reactions represented in
Scheme 7-1. Two out of the three pathways forming dimethylsilene and methylsilene
involve, respectively, •Si(CH3)3 and •SiH(CH3)2 radicals, and both rates depends linearly
on the concentration of the methyl-substituted silyl radicals. A comparison of the peak
intensity ratio of I(m/z 116)/I(m/z 88), I(m/z 130)/I(m/z 88), and I(m/z 144)/I(m/z 88) at
filament temperatures of 1300 and 1500 oC for both sample pressures as a function of
filament-on time is shown in Figure 7-6. At 1300 oC, at the first 20 minutes, the I(m/z
116)/I(m/z 88) ratio is higher for the higher TriMS pressure. This might be due to the
additional contribution to the peak of m/z 116 from the dimethylsilylene species produced
from the molecular elimination of CH4 as illustrated in Equation (7-4). From Figure 7-4,
it can be seen that the peak at m/z 40 representing propyne reached its maximum intensity
at 20 minutes. Therefore, at a time shorter than 20 minutes, the produced propyne and
also acetylene did not trap the dimethylsilylene completely. Beyond 20 minutes, the I(m/z
116)/I(m/z 88) ratio is comparable for the two TriMS pressures. This indicates that the
main contributor to the peak intensity at m/z 116 is from the radical disproportionation
reaction and due to the ethene scavenging the radicals, its intensity changes
proportionately with the TMS (m/z 88) originated from radical combination reaction.
Similar is found for the ratio of I(m/z 130)/I(m/z 88) as shown in Figure 7-6b.
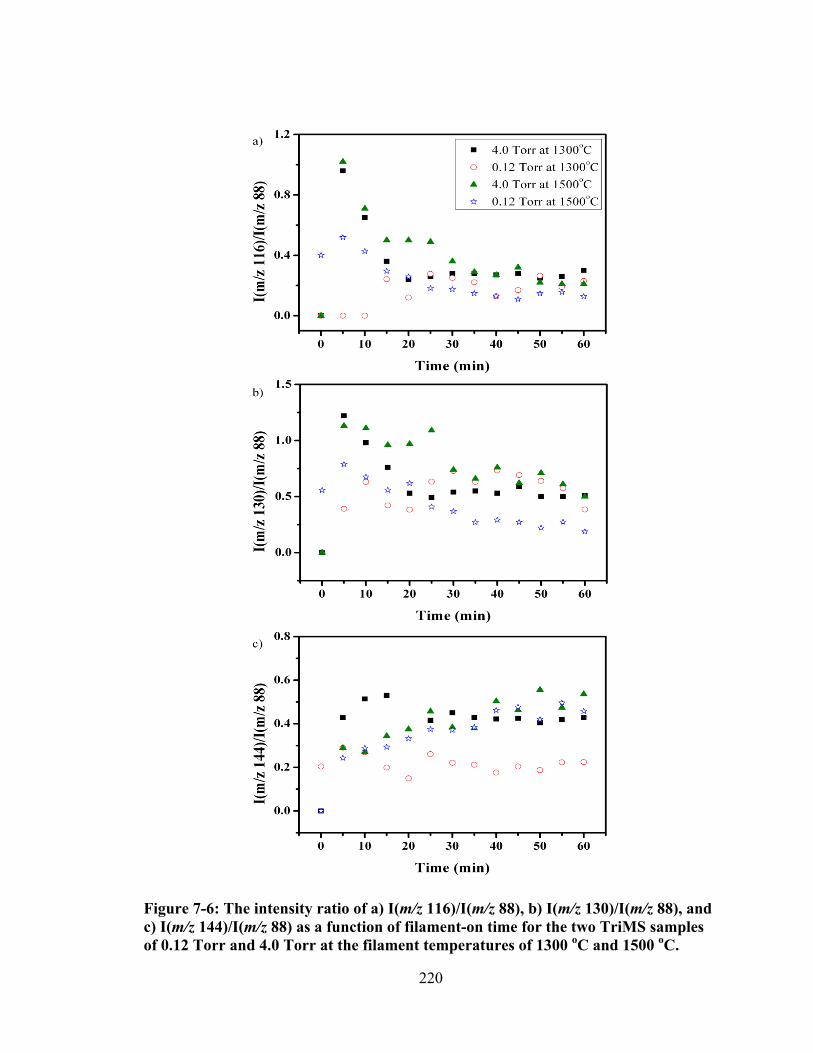
220
Figure 7-6: The intensity ratio of a) I(m/z 116)/I(m/z 88), b) I(m/z 130)/I(m/z 88), and c) I(m/z 144)/I(m/z 88) as a function of filament-on time for the two TriMS samples of 0.12 Torr and 4.0 Torr at the filament temperatures of 1300 oC and 1500 oC.
221
However, as illustrated in Figure 7-6c, the ratio of I(m/z 144)/I(m/z 88) shows a
completely different trend from the other two. Here, for the lower sample pressure of
0.12 Torr, the ratio is much higher with the higher pressure for the entire reaction time of
1 hour, and the peak at m/z 144 only appeared at a later time (t ≥ 45 min). The reason for
this is that 1,1,3,3-tetramethyl-1,3-disilacyclobutane (m/z 144) is the product of
dimerization of dimethylsilene which can be formed from self-disproportionation of
dimethylsilylmethyl radical [(CH3)2SiHCH2•] (Scheme 7-1). Dimethylsilylmethyl radical,
being an alkyl radical, reacted with the free radical scavenger - ethene much less
efficiently. Therefore, the amount of 1,1,3,3-tetramethyl-1,3-disilacyclobutane was not
affected much as compared to those of TMS (m/z 88) and the other two disilacyclobutane
molecules. This gives the observed increase in the ratio of I(m/z 144)/I(m/z 88) with the
higher-pressure sample at 1300 oC. With an increasing temperature to 1500 oC, the three
ratios generally increase with sample pressure. This indicates that the rate of
disproportionation reactions with respect to the recombination reactions is enhanced with
increasing pressure.
7.6 Summary
The gas-phase reaction chemistry of a 4.0 Torr of TriMS precursor gas in a hot-
wire CVD reactor has been studied in this work and the results are compared with that of
a 0.12 Torr of TriMS studied previously. The increase in the sample pressure leads to the
formation of methane which is the first time this has been confirmed when using open-
chain methyl-substituted silanes and four-membered-ring (di)silacyclobutane molecules
as a precursor gas in the hot-wire CVD reactor. The formation of methane is mainly from
222
the radical chain reactions. However, minor contributions from molecular elimination
have also been demonstrated by the chemical trapping of the concomitant silylene species
from the acetylene/propyne molecules produced in-situ. Other small hydrocarbon
molecules, including ethene and propene, were observed with the 4.0 Torr sample. In
addition, the formation of H2 is enhanced with increasing sample pressure.
Furthermore, the increase in the sample pressure has a direct effect on the radical
recombination and disproportionation reactions. The radicals involved in these two types
of reactions belong to either methyl substituted silyl radicals (e.g., (CH3)3Si•, (CH3)2HSi•)
or (silyl substituted)alkyl radicals (e.g., (CH3)2SiHCH2•, •CH3). The availability of these
radicals is significantly affected by the in situ produced ethene and propene, the well-
known free radical scavengers. Ethene and propene traps the silyl radicals much more
efficiently than the alkyl radicals, therefore, the five major products originated from the
radical recombination (TMS and HMDS) and disproportionation reactions (DMDSCB,
TriMDSCB, and TMDSCB) show different behavior when examining their intensity
distributions as a function of reaction time and filament temperature for both sample
pressures. The intensity of product peaks of TMS, DMDSCB, TriMDSCB, and
TMDSCB all increases and the formation of TMS dominates the gas-phase chemistry for
most of the reaction time (t ≥ 10 min) when using high pressure of TriMS, whereas with
an increase in TriMS pressure the HMDS peak, dominating at the lower pressure,
decreases in intensity and becomes the weakest of all at t ≥ 25 min.
223
Chapter Eight: Conclusions and Future work
Hot-wire chemical vapour deposition (HWCVD) has emerged as a new and
promising technique to achieve device quality Si-based thin films. The popularity of this
technique over the commonly-used deposition methods, such as PECVD and thermal
CVD, is due to its numerous advantages, including high deposition rate, high gas
utilization efficiency, low substrate temperature, low equipment cost, and lack of plasma
induced damages to the film and the substrate. The process of HWCVD involves three
main steps. The source gases are catalytically decomposed at a resistively heated wire,
resulting in the formation of highly reactive radical species. These species, then, react
with each other and with the abundant source gas molecules in secondary gas-phase
reactions to form a variety of products. Film growth in HWCVD is believed to be
induced by precursors generated from direct decomposition on the filament and/or from
secondary gas-phase reactions. These final precursors dictate the resultant properties of
the film that grows in the final stage of the HWCVD process. Therefore, for a better
understanding of the HWCVD process and a rational optimization of film deposition, it is
essential to identify the gas-phase chemical species and to study their formation
mechanisms.
Among all the materials deposited by HWCVD, silicon carbide (SiC) alloy thin
films have attracted a great deal of interest owing to their superior mechanical property
and chemical stability as well as their applications in electronic devices. Most SiC growth
proceeds through the use of separate Si- (SiH4, Si2H6, or SiH2Cl2) and C-bearing (CH4,
C2H4, C3H8) precursors. However, the use of mixtures requires independent flow control
224
of each precursor. In addition, silanes and chlorosilanes are both pyrophoric and highly
toxic. This has spurred a lot of interest in the investigation of alternative single-source
precursors for SiC film deposition. An ideal single-source precursor would contain direct
Si-C bonds and would decompose at relatively low temperatures. The simplest
organosilicon compounds containing Si-C bonds are methyl-substituted silane molecules.
In this study, the primary decomposition pathways of four open chain methyl-
substituted silanes, i.e., monomethylsilane (MMS), dimethylsilane (DMS),
trimethylsilane (TriMS), and tetramethylsilane (TMS), on heated tungsten (W) and
Tantalum (Ta) filaments have been investigated by using laser ionization coupled with
TOF mass spectrometry. Two complimentary ionization techniques, namely single
photon ionization (SPI) using a VUV wavelength of 118 nm and a dual ionization source
incorporating both SPI and laser induced electron ionization (LIEI), have been employed
in this work. A common decomposition pathway, resulting in the formation of methyl
and methyl-substituted silyl radicals, was found from these four precursors on W and Ta
filaments. The dissociation process of these molecules on a heated metal surface is
believed to be initiated by the Si-H bond cleavage and followed by Si-CH3 bond
breaking. It has been shown that the methyl radical intensity increased with temperature
for both filaments in the low-temperature region, however, beyond the optimum
temperature, a gradual decrease in the methyl intensity was observed for MMS, DMS,
and TriMS when using Ta, whereas the intensity reaches a plateau with W. This is due to
the fact that Ta is more efficient in releasing surface-bound H and forming active sites,
leading to the adsorption of methyl radicals on the metal surface in the high-temperature
regions. The apparent activation energy for methyl radical formation from the
225
dissociation of MMS, DMS, TriMS, TMS molecules on both W and Ta filaments
increases with the increasing number of methyl substitution. The obtained low activation
energy values for methyl radical formation in the range of 51.1 - 84.7 kJ · mol-1 suggests
that the ejection of CH3 radicals is accompanied by the formation of a Si moiety bound to
the metal surface. Overall, TMS produces the least amount of methyl radicals on both
filaments with the highest activation energy. The amount of methyl radicals produced
when using MMS, DMS, and TriMS are similar but MMS gives the lowest activation
energy.
In addition to methyl radical, H2 molecule was also produced during the
dissociation of these methyl-substituted silanes over W and Ta filament surfaces.
Examination of the intensity of the H2+ peak from the four molecules has shown that it
increases with temperature until reaching a plateau at around 2000 - 2100 oC. Similar
trend has been obtained from both filaments. The effect of methyl substitution is reflected
on the temperature at which the H2+ peak starts to appear and on the apparent activation
energy (Ea) for the formation of H2. The temperature is shifted to high end with
increasing methyl substitution. The value of this activation energy is also increased from
MMS to TMS. The formation of H2 has been demonstrated to follow Langmuir-
Hinshelwood mechanism, which consists of the recombination reaction between two
adsorbed H atoms at the surface of the filament releasing H2 into the gas phase. A
confirmation of this mechanism is obtained by performing experiments with the
deuterated isotopomers of MMS, DMS and TriMS, where the formation of D, HD and D2
species is observed. The activation energy is also affected by the filament material. It has
been found that a higher Ea value was obtained with Ta than with W. This is due to the
226
difference in binding energy between the H and the metal surface. In order to obtain a
better understanding of this mechanism, the formation of H2 molecule during the
decomposition of MMS, DMS and TriMS is examined first in the gas-phase using ab
initio methods. The role of the metal surface will be investigated in later stages. In this
current study, ab initio methods at the CCSD(T)/6-311++G(3d,2p)//MP2/6-311++G(d,p)
level of theory were carried out to explore the concerted and stepwise 1,1- and 1,2-H2
elimination processes, resulting in the formation of silylene and silene species,
respectively, as concomitants to H2 in the gas-phase chemistry. These calculations
showed that the concerted 1,1-H2 elimination is the most kinetically favorable of all
pathways for MMS and DMS. A comparison between the concerted and stepwise
mechanism for MMS, DMS and TriMS revealed that the concerted pathway is
thermodynamically favourable. From the thermodynamic and kinetic study, where the
enthalpy (ΔH≠), entropy (ΔS≠), and Gibbs free energy (ΔG≠) of activation along with
reaction enthalpy (ΔH), entropy (ΔS), and Gibbs free energy (ΔG) at both 0 K and 298 K
were examined, it was found that the concerted 1,1- H2 elimination was the most
kinetically and thermodynamically favourable pathway for the formation of H2 during the
decomposition of MMS and DMS molecules at both temperatures.
The products from the secondary gas-phase reactions are as important as those
from the primary decomposition on the metal filaments in defining the properties of the
deposited films. Therefore, it is crucial to identify these products and understand the
mechanism of their formation. In this work, the secondary gas-phase reactions when
using DMS and MMS as a source in a HWCVD reactor have been studied. The
identification of the mechanism responsible for the formation of the main products during
227
the secondary gas-phase reactions using these precursors is accomplished by using the
corresponding isotopomers and chemical trapping. In addition, the effect of deposition
parameters, including filament material and precursor pressure on these mechanisms, was
investigated. When examining the secondary gas-phase reactions for DMS, a competition
between radical chain mechanism and silene/silylene mechanism is observed. At low
filament temperatures, the gas-phase chemistry is dominated by the formation of 1,1,2,2-
tetramethyldisilane (TMDS, 118 amu). As the filament temperature is increased,
trimethylsilane and 1,3-dimethyl-1,3-disilacyclobutane (DMDSCB, 116 amu) become
dominating. It has been demonstrated that TMDS is formed through silylene insertion
reaction into the Si-H bond of DMS, TriMS is produced from the radical recombination
reactions in the termination steps of a radical chain reaction, and the formation of
DMDSCB is attributed to silene and dimethylsilylene dimerization. In addition, the effect
of sample pressure on the gas-phase reaction chemistry of DMS in the HWCVD process
has been studied by examining the reaction products in a reactor with 1.2 Torr and 0.12
Torr of DMS, respectively. From the comparison, it has been shown that silylene
insertion reaction dominates the gas-phase chemistry when the pressure and temperature
are low. As the precursor pressure is increased to 1.2 Torr, the gas-phase chemistry of
DMS is governed by the radical recombination reactions. The increase in the pressure
also resulted in the formation of small hydrocarbon molecules, including methane,
ethene, acetylene, propene, and propyne. The in situ trapping of the silylene intermediates
by these species is responsible for the observed switch from silylene-dominant chemistry
at low pressure regime to radical-dominant chemistry at high pressure regime. The effect
of another deposition parameter, which is the filament material, on the gas-phase
228
chemistry has also been studied. Ta filament is found to promote the formation of
products generated from silylene chemistry at low temperature, whereas W filament
favours radical recombination reactions at the same temperature.
The secondary gas-phase reactions with MMS in the HWCVD reactor is found to
be dominated mainly by the formation of two products: 1,2-dimethyldisilane (DMDS, 90
amu) formed from methylsilylene insertion reaction into the Si-H bond in the parent
molecule, and 1,3-disilacyclobutane (DSCB, 88 amu) produced from methylsilylene
dimerization. Further reactions of these products with the methylsilylene intermediate
produce high-mass methyl-substituted disilanes (132, 134 amu) and trisilanes (176, and
178 amu). The involvement of various possible active intermediates, such as methylsilyl
radical, methylsilylene, and silene, has been investigated by experiments with the
deuterated isotopomer (MMS-d3) and chemical trapping using 1,3-butadiene and
ammonia. It has been shown that the secondary gas-phase reaction chemistry with MMS
involves exclusively methylsilylene species. This explains the results when examining
the effect of different deposition parameters, including precursor pressure and filament
material, which indicate that these parameters do not affect the chemistry at all.
Finally, the effect of sample pressure on the gas-phase reaction chemistry of
TriMS in the HWCVD process has also been studied by examining the secondary gas-
phase reaction products in a reactor with 4.0 Torr of TriMS and comparing with our
previous results at 0.12 Torr. The increase in the sample pressure leads to the formation
of other small hydrocarbon molecules including methane acetylene, ethene, propyne, and
propene. The detection of methane has been confirmed for the first time when using
open-chain methyl-substituted silanes and four-membered-ring (di)silacyclobutane
229
molecules as precursors in the HWCVD reactor. It was also demonstrated that the
formation of hydrogen molecules is enhanced when the sample pressure is increased. In
addition, the change in the sample pressure was found to have an effect on the radical
recombination and disproportionation reactions, which is reflected in the different
behavior assumed by the main products from these two reactions, tetramethylsilane
(TMS), hexamethyldisilane (HMDS) from the former and three methyl-substituted
disilacyclobutane (MDSCBs) from the latter. The trapping of free radicals resulted from
the in situ produced ethene and propene molecules are responsible for the observed
difference.
Identification of gas-phase reactive species and study of the secondary gas-phase
reactions are considered to be essential for elucidation of the mechanism of Si-containing
thin film growth in HWCVD processes. In future work, a kinetic study will help develop
a comprehensive deposition model and give better insights into the optimization of thin
film deposition. Previous study on TMS, TriMS and HMDS has indicated that the
reaction mechanisms all fit the form of a Rice-Herzfeld mechanism. Applying the steady-
state approximation in methyl radical formation, where the rate of the initiation step
would be equal to the sum of the rates of the termination reactions, the rate constant of
the initiation step can be determined. Experimentally, the steady-state rate of formation of
the termination products could be achieved by monitoring the change in their intensities
over a period of time. In this way, the rate constant of the initiation step at different
pressures and temperatures can be determined. The pressure dependence of k1 will be
230
studied using the factorization method of Troe241-245, from which the high-pressure and
low-pressure limit rate constant of the initiation step could be determined.
In addition, the experimental results can be compared with those from simulations
using CHEMKIN,246 a modeling program for chemical kinetics. This program can be
used in HWCVD reactor systems and provides information describing chemical reaction
kinetics, whether in terms of elementary reactions or global reaction mechanisms,
through a group of different packages that is designed to facilitate the incorporation of
complex gas-phase chemical reaction mechanisms into numerical simulations.247-250
CHEMKIN will also help in predicting the most suitable conditions (e.g., pressure and
temperature ranges) for film deposition or gas-phase reaction optimization. Furthermore,
thermochemical kinetics can be employed in determining the rate constant of a reaction
not available from experiments or literatures by using thermodynamic properties (e.g.,
standard reaction entropy ∆So and enthalpy ∆Ho). The kinetic data obtained
experimentally could also help establish the thermodynamic properties for various
reactions involved in the mechanism, therefore contribute to the expansion of
thermodynamic database.
Finally, filament aging due to silicide and carbide formation seems to be a
drawback with the HWCVD technique at low temperatures.24, 34, 40, 211 The Shi group has
studied the aging of W filament using silane and silacyclobutane molecules as source
gases. When using silane and silacyclobutane (SCB) as a source gas, filament aging was
found to be caused by the formation of Si or Si-W alloy.174, 175 With 1,1,3,3-tetramethyl-
1,3-disilacyclobutane (TMDSCB) as a source gas, carburization of W filament was
observed, which was mainly caused by the interaction of methyl radicals with the heated
231
filament.174 Hence, in order to obtain a better understanding on filament aging due to the
formation of metal alloys, a study using the open chain methyl-substituted silane
molecules needs to be conducted. A comparison between these open chain methyl-
substituted silanes and silacyclobutanes on the filament aging process will provide a
better understanding on this issue and to explore the possibility that these methyl-
substituted silane molecules could be more suitable precursors for the deposition of SiC.
232
Appendices
SPRINGER LICENSE TERMS AND CONDITIONS
This is a License Agreement between Rim Toukabri ("You") and Springer ("Springer") provided by Copyright Clearance Center ("CCC"). The license consists of your order details, the terms and conditions provided by Springer, and the payment terms and conditions.
All payments must be made in full to CCC. For payment instructions, please see information listed at the bottom of this form.
License Number 3176021485932
License date Jun 25, 2013
Licensed content publisher Springer
Licensed content publication Journal of The American Society for Mass Spectrometry
Licensed content title Application of laser induced electron impact ionization to the deposition chemistry in the hot-wire chemical vapor deposition process with SiH4-NH3 gas mixtures
Licensed content author Brett Eustergerling
Licensed content date Jan 1, 2007
Volume number 18
Issue number 11
Type of Use Thesis/Dissertation
Portion Figures
Author of this Springer article No
Order reference number
Title of your thesis / dissertation
Gas-phase Chemistry of Methyl-substituted silanes in a Hot-wire Chemical Vapour Deposition process
Expected completion date Jul 2013
Estimated size(pages) 270
Total 0.00 CAD

233
Terms and Conditions
Introduction The publisher for this copyrighted material is Springer Science + Business Media. By clicking "accept" in connection with completing this licensing transaction, you agree that the following terms and conditions apply to this transaction (along with the Billing and Payment terms and conditions established by Copyright Clearance Center, Inc. ("CCC"), at the time that you opened your Rightslink account and that are available at any time at http://myaccount.copyright.com).
Limited License With reference to your request to reprint in your thesis material on which Springer Science and Business Media control the copyright, permission is granted, free of charge, for the use indicated in your enquiry.
Licenses are for one-time use only with a maximum distribution equal to the number that you identified in the licensing process.
This License includes use in an electronic form, provided its password protected or on the university’s intranet or repository, including UMI (according to the definition at the Sherpa website: http://www.sherpa.ac.uk/romeo/). For any other electronic use, please contact Springer at ([email protected] or [email protected]).
The material can only be used for the purpose of defending your thesis, and with a maximum of 100 extra copies in paper.
Although Springer holds copyright to the material and is entitled to negotiate on rights, this license is only valid, subject to a courtesy information to the author (address is given with the article/chapter) and provided it concerns original material which does not carry references to other sources (if material in question appears with credit to another source, authorization from that source is required as well).
Permission free of charge on this occasion does not prejudice any rights we might have to charge for reproduction of our copyrighted material in the future.
Altering/Modifying Material: Not Permitted You may not alter or modify the material in any manner. Abbreviations, additions, deletions and/or any other alterations shall be made only with prior written authorization of the author(s) and/or Springer Science + Business Media. (Please contact Springer at ([email protected] or [email protected])
Reservation of Rights Springer Science + Business Media reserves all rights not specifically granted in the combination of (i) the license details provided by you and accepted in the course of this

234
licensing transaction, (ii) these terms and conditions and (iii) CCC's Billing and Payment terms and conditions.
Copyright Notice:Disclaimer You must include the following copyright and permission notice in connection with any reproduction of the licensed material: "Springer and the original publisher /journal title, volume, year of publication, page, chapter/article title, name(s) of author(s), figure number(s), original copyright notice) is given to the publication in which the material was originally published, by adding; with kind permission from Springer Science and Business Media"
Warranties: None
Example 1: Springer Science + Business Media makes no representations or warranties with respect to the licensed material.
Example 2: Springer Science + Business Media makes no representations or warranties with respect to the licensed material and adopts on its own behalf the limitations and disclaimers established by CCC on its behalf in its Billing and Payment terms and conditions for this licensing transaction.
Indemnity You hereby indemnify and agree to hold harmless Springer Science + Business Media and CCC, and their respective officers, directors, employees and agents, from and against any and all claims arising out of your use of the licensed material other than as specifically authorized pursuant to this license.
No Transfer of License This license is personal to you and may not be sublicensed, assigned, or transferred by you to any other person without Springer Science + Business Media's written permission.
No Amendment Except in Writing This license may not be amended except in a writing signed by both parties (or, in the case of Springer Science + Business Media, by CCC on Springer Science + Business Media's behalf).
Objection to Contrary Terms Springer Science + Business Media hereby objects to any terms contained in any purchase order, acknowledgment, check endorsement or other writing prepared by you, which terms are inconsistent with these terms and conditions or CCC's Billing and Payment terms and conditions. These terms and conditions, together with CCC's Billing and Payment terms and conditions (which are incorporated herein), comprise the entire agreement between you and Springer Science + Business Media (and CCC) concerning this licensing transaction. In the event of any conflict between your obligations established by these terms and
235
conditions and those established by CCC's Billing and Payment terms and conditions, these terms and conditions shall control.
Jurisdiction All disputes that may arise in connection with this present License, or the breach thereof, shall be settled exclusively by arbitration, to be held in The Netherlands, in accordance with Dutch law, and to be conducted under the Rules of the 'Netherlands Arbitrage Instituut' (Netherlands Institute of Arbitration).OR:
All disputes that may arise in connection with this present License, or the breach thereof, shall be settled exclusively by arbitration, to be held in the Federal Republic of Germany, in accordance with German law.
Other terms and conditions:
v1.3
If you would like to pay for this license now, please remit this license along with your payment made payable to "COPYRIGHT CLEARANCE CENTER" otherwise you will be invoiced within 48 hours of the license date. Payment should be in the form of a check or money order referencing your account number and this invoice number RLNK501051172. Once you receive your invoice for this order, you may pay your invoice by credit card. Please follow instructions provided at that time. Make Payment To: Copyright Clearance Center Dept 001 P.O. Box 843006 Boston, MA 02284-3006 For suggestions or comments regarding this order, contact RightsLink Customer Support:[email protected] or +1-877-622-5543 (toll free in the US) or +1-978-646-2777.
Gratis licenses (referencing $0 in the Total field) are free. Please retain this printable license for your reference. No payment is required.
236
References
1. Martin, P. M., Handbook of Deposition Technologies for Films and Coatings: Science, Applications and Technology. Elsevier Science: 2009.
2. Maissel, L. I.; Glang, R., Handbook of thin film technology. McGraw-Hill: 1970. 3. Seshan, K., Handbook of Thin Film Deposition Processes and Techniques.
Elsevier Science: 2001. 4. Vossen, J. L.; Kern, W., Thin film processes II. Academic Press: 1991. 5. Mattox, D. M., Handbook of Physical Vapor Deposition (PVD) Processing.
Elsevier Science: 2010. 6. Park, J. H.; Sudarshan, T. S., Chemical Vapor Deposition. A S M International:
2001. 7. Pierson, H. O., Handbook of chemical vapor deposition (CVD): principles,
technology, and applications. Noyes Publications: 1992. 8. Yamazaki, S.; Wada, K.; Taniguch.I, Silicon nitride prepared by SiH4-NH3
reaction with catalysts. Japanese Journal of Applied Physics 1970, 9, (12), 1467. 9. Wiesmann, H.; Ghosh, A. K.; McMahon, T.; Strongin, M., a-Si-H produced by
high-temperature thermal-decomposition of silane. Journal of Applied Physics 1979, 50, (5), 3752.
10. Matsumura, H.; Tachibana, H., Amorphous silicon produced by a new thermal chemical vapor deposition method using intermediate species SiF2. Applied Physics Letters 1985, 47, (8), 833.
11. Matsumura, H., Catalytic chemical vapor-deposition (CTL-CVD) method producing high-quality hydrogenated amorphous-silicon. Japanese Journal of Applied Physics Part 2-Letters 1986, 25, (12), L949.
12. Doyle, J.; Robertson, R.; Lin, G. H.; He, M. Z.; Gallagher, A., Production of high-quality amorphous-silicon films by evaporative silane surface decomposition. Journal of Applied Physics 1988, 64, (6), 3215.
13. Mahan, A. H.; Carapella, J.; Nelson, B. P.; Crandall, R. S.; Balberg, I., Deposition of device quality, low H content amorphous silicon. Journal of Applied Physics 1991, 69, (9), 6728.
14. Van Veenendaal, P.; Schropp, R. E. I., Processes in silicon deposition by hot-wire chemical vapor deposition. Current Opinion in Solid State & Materials Science 2002, 6, (5), 465.
15. Matsumura, H., Summary of research in NEDO Cat-CVD project in Japan. Thin Solid Films 2001, 395, (1-2), 1.
16. Mahan, A. H., Status of Cat-CVD (Hot Wire CVD) research in the United States. Thin Solid Films 2001, 395, (1-2), 12.
17. Schropp, R. E. I., Status of Cat-CVD (Hot-Wire CVD) research in Europe. Thin Solid Films 2001, 395, (1-2), 17.
18. Doyle, J. R.; Xu, Y.; Reedy, R.; Branz, H. M.; Mahan, A. H., Film stoichiometry and gas dissociation kinetics in hot-wire chemical vapor deposition of a-SiGe : H. Thin Solid Films 2008, 516, (5), 526.
237
19. Mahan, A. H.; Xu, Y.; Gedvilas, L. M.; Reedy, R. C.; Williamson, D. L.; Datta, S.; Cohen, J. D.; Yan, B.; Branz, H. M.; Ieee, a-SiGe : H materials and devices deposited by hot wire CVD using a tantalum filament operated at low temperature. In Conference Record of the Thirty-First IEEE Photovoltaic Specialists Conference - 2005, 2005; pp 1397.
20. Mahan, A. H.; Xu, Y.; Gedvilas, L. M.; Williamson, D. L., A direct correlation between film structure and solar cell efficiency for HWCVD amorphous silicon germanium alloys. Thin Solid Films 2009, 517, (12), 3532.
21. Nelson, B. P.; Xu, Y. Q.; Williamson, D. L.; Von Roedern, B.; Mason, A.; Heck, S.; Mahan, A. H.; Schmitt, S. E.; Gallagher, A. C.; Webb, J.; Reedy, R., Hydrogenated amorphous silicon germanium alloys grown by the hot-wire chemical vapor deposition technique. In Amorphous and Microcrystalline Silicon Technology-1998, Schropp, R.; Branz, H. M.; Hack, M.; Shimizu, I.; Wagner, S., Eds. 1998; Vol. 507, pp 447.
22. Xu, Y. Q.; Mahan, A. H.; Gedvilas, L. M.; Reedy, R. C.; Branz, H. M., Deposition of photosensitive hydrogenated amorphous silicon-germanium films with a tantalum hot wire. Thin Solid Films 2006, 501, (1-2), 198.
23. Xu, Y. Q.; Yan, B. J.; Nelson, B. P.; Iwaniczko, E.; Reedy, R. C.; Mahan, A. H.; Branz, H., Devices fabrication with narrow-bandgap a-SiGe : H alloys deposited by HWCVD. In Amorphous and Nanocrystalline Silicon Science and Technology- 2004, Ganguly, G.; Kondo, M.; Schiff, E. A.; Carius, R.; Biswas, R., Eds. 2004; Vol. 808, pp 617.
24. Mahan, A. H.; Dillon, A. C.; Gedvilas, L. M.; Williamson, D. L.; Perkins, J. D., Properties of thin film silicon nitride deposited by hot wire chemical vapor deposition using silane, ammonia, and hydrogen gas mixtures. Journal of Applied Physics 2003, 94, (4), 2360.
25. Stannowski, B.; Rath, J. K.; Schropp, R. E. I., Hot-wire silicon nitride for thin-film transistors. Thin Solid Films 2001, 395, (1-2), 339.
26. Stannowski, B.; Rath, J. K.; Schropp, R. E. I., Growth process and properties of silicon nitride deposited by hot-wire chemical vapor deposition. Journal of Applied Physics 2003, 93, (5), 2618.
27. Van der Werf, C. H. M.; Goldbach, H. D.; Loffler, J.; Scarfo, A.; Kylner, A. M. C.; Stannowski, B.; ArnoldBik, W. M.; Weeber, A.; Rieffe, H.; Soppe, W. J.; Rath, J. K.; Schropp, R. E. I., Silicon nitride at high deposition rate by Hot Wire Chemical Vapor Deposition as passivating and antireflection layer on multi crystalline silicon solar cells. Thin Solid Films 2006, 501, (1-2), 51.
28. Swain, B. P., Influence of process pressure on HW-CVD deposited a-SiC : H films. Surface & Coatings Technology 2006, 201, (3-4), 1132.
29. Swain, B. P.; Dusane, R. O., Multiphase structure of hydrogen diluted a-SiC : H deposited by HWCVD. Materials Chemistry and Physics 2006, 99, (2-3), 240.
30. Tabata, A.; Komura, Y., Preparation of nanocrystalline cubic silicon carbide thin films by hot-wire CVD at various filament-to-substrate distances. Surface & Coatings Technology 2007, 201, (22-23), 8986.
238
31. Lee, M. S.; Bent, S. F., Bonding and thermal reactivity in thin a-SiC:H films grown by methylsilane CVD. Journal of Physical Chemistry B 1997, 101, (45), 9195.
32. Lee, M. S.; Bent, S. F., Spectroscopic and thermal studies of a-SiC : H film growth: Comparison of mono-, tri-, and tetramethylsilane. Journal of Vacuum Science & Technology a-Vacuum Surfaces and Films 1998, 16, (3), 1658.
33. Tange, S.; Inoue, K.; Tonokura, K.; Koshi, M., Catalytic decomposition of SiH4 on a hot filament. Thin Solid Films 2001, 395, (1-2), 42.
34. Holt, J. K.; Swiatek, M.; Goodwin, D. G.; Atwater, H. A., The aging of tungsten filaments and its effect on wire surface kinetics in hot-wire chemical vapor deposition. Journal of Applied Physics 2002, 92, (8), 4803.
35. Holt, J. K.; Swiatek, M.; Goodwin, D. G.; Atwater, H. A., The effect of aging on tungsten filament surface kinetics in hot-wire chemical vapor deposition of silicon. In Amorphous and Heterogeneous Silicon-Based Films-2002, Cohen, J. D.; Abelson, J. R.; Matsumura, H.; Robertson, J., Eds. 2002; Vol. 715, pp 165.
36. Duan, H. L.; Zaharias, G. A.; Bent, S. F., Effect of filament material on the decomposition of SiH4 in hot wire CVD of Si-based films. In Amorphous and Heterogeneous Silicon-Based Films-2002, Cohen, J. D.; Abelson, J. R.; Matsumura, H.; Robertson, J., Eds. 2002; Vol. 715, pp 21.
37. Walsh, R., Bond-Dissociation Energy Values in Silicon-Containing Compounds and Some of Their Implications. Accounts of Chemical Research 1981, 14, (8), 246.
38. Matsumura, H., Study on catalytic chemical vapor-deposition method to prepare hydrogenated amorphous-silicon. Journal of Applied Physics 1989, 65, (11), 4396.
39. Morrison, S.; Das, U.; Madan, A., Deposition of thin film silicon using the pulsed PECVD and HWCVD techniques. Solar Energy Materials and Solar Cells 2003, 76, (3), 281.
40. Van Veenendaal, P. A. T. T.; Gijzeman, O. L. J.; Rath, J. K.; Schropp, R. E. I., The influence of different catalyzers in hot-wire CVD for the deposition of polycrystalline silicon thin films. Thin Solid Films 2001, 395, (1–2), 194.
41. Van Veenendaal, P. A. T. T.; Van Der Werf, C. M. H.; Rath, J. K.; Schropp, R. E. I., Influence of grain environment on open circuit voltage of hot-wire chemical vapour deposited Si:H solar cells. Journal of Non-Crystalline Solids 2002, 299-302, (PART 2), 1184.
42. Duan, H. L.; Zaharias, G. A.; Bent, S. F., The effect of filament temperature on the gaseous radicals in the hot wire decomposition of silane. Thin Solid Films 2001, 395, (1-2), 36.
43. Bouree, J. E.; Guillet, J.; Grattepain, C.; Chaumont, J., Quantitative analysis of tungsten, oxygen and carbon concentrations in the microcrystalline silicon films deposited by hot-wire CVD. Thin Solid Films 2003, 430, (1-2), 110.
44. Molebroek, E. C.; Mahan, A. H.; Gallagher, A., Mechanisms influencing `hot-wire' deposition of hydrogenated amorphous silicon. Journal of Applied Physics 1997, 82, (4), 1909.
239
45. Pant, A.; Russell, T. W. F.; Huff, M. C.; Aparicio, R.; Birkmire, R. W., Hot-wire chemical vapor deposition of silicon from silane: Effect of process conditions. Industrial & Engineering Chemistry Research 2001, 40, (5), 1377.
46. Feng, Z. C., SiC Power Materials: Devices and Applications. Springer: 2004. 47. Shur, M. S.; Rumyantsev, S. L.; Levinshtein, M., Sic Materials and Devices -
Volume 1. World Scientific: 2006. 48. Baumhauer, H., Uber die kristalle des carborundums. Zeitschrift fur
Kristallographie 1912, 50, 33. 49. Baumhauer, H., Uber die verschiedenen Modifikationen des Carborundums und
die Erscheinung der Polytypie. Z. Krist 1915, 55, 249. 50. Chow, T. P.; Ramungul, N.; Ghezzo, M. In Recent advances in high-voltage SiC
power devices, High-Temperature Electronic Materials, Devices and Sensors Conference, 1998, 22-27 Feb 1998, 1998; 1998; pp 55.
51. Harris, G. L.; INSPEC, Properties of silicon carbide. INSPEC, Institution of Electrical Engineers: 1995.
52. Philip, N., SiC Technology. In The VLSI Handbook, CRC Press: 1999. 53. Ferreira, I.; Cabrita, A.; Fortunato, E.; Martins, R., Composition and structure of
silicon-carbide alloys obtained by hot wire and hot wire plasma assisted techniques. Vacuum 2002, 64, (3–4), 261.
54. Swain, B. P.; Dusane, R. O., Effect of filament temperature on HWCVD deposited a-SiC:H. Materials Letters 2006, 60, (24), 2915.
55. Swain, B. P.; Gundu Rao, T. K.; Roy, M.; Gupta, J.; Dusane, R. O., Effect of H2 dilution on Cat-CVD a-SiC:H films. Thin Solid Films 2006, 501, (1–2), 173.
56. Swain, B. P.; Dusane, R. O., Effect of substrate temperature on HWCVD deposited a-SiC : H film. Materials Letters 2007, 61, (25), 4731.
57. Tabata, A.; Komura, Y.; Hoshide, Y.; Narita, T.; Kondo, A., Properties of nanocrystalline cubic silicon carbide thin films prepared by hot-wire chemical vapor deposition using SiH4/CH4/H2 at various substrate temperatures. Japanese Journal of Applied Physics 2008, 47, (1), 561.
58. Komura, Y.; Tabata, A.; Narita, T.; Kanaya, M.; Kondo, A.; Mizutani, T., Film properties of nanocrystalline 3C-SiC thin films deposited on glass substrates by hot-wire chemical vapor deposition using CH4 as a carbon source. Japanese Journal of Applied Physics Part 1-Regular Papers Brief Communications & Review Papers 2007, 46, (1), 45.
59. Daimaru, T.; Tabata, A.; Mizutani, T., Structure of amorphous and microcrystalline silicon thin films prepared at various gas pressures and gas flow rates by hot-wire chemical vapor deposition. Thin Solid Films 2006, 501, (1-2), 102.
60. Nakayama, H.; Takatsuji, K.; Murakami, K.; Miura, Y.; Shimoyama, N.; Machida, H., Catalytic CVD growth of Si–C and Si–C–O alloy films by using alkylsilane and related compounds. Thin Solid Films 2003, 430, (1–2), 87.
61. Zaharias, G. A.; Duan, H. L.; Bent, S. F., Detecting free radicals during the hot wire chemical vapor deposition of amorphous silicon carbide films using single-source precursors. Journal of Vacuum Science & Technology A 2006, 24, (3), 542.
240
62. Sharma, R. C.; Koshi, M., Hot filament-dissociation of (CH3)3SiH and (CH3)4Si, probed by vacuum ultra violet laser time of flight mass spectroscopy. Spectrochimica Acta Part a-Molecular and Biomolecular Spectroscopy 2006, 65, (3-4), 787.
63. Yoshimura, S.; Toh, A.; Maeda, T.; Sugimoto, S.; Kiuchi, M.; Hamaguchi, S., Fragment ions of methylsilane produced by hot tungsten wires. Japanese Journal of Applied Physics Part 1-Regular Papers Brief Communications & Review Papers 2006, 45, (3A), 1813.
64. Larkin, D. J., An overview of SiC epitaxial growth. Mrs Bulletin 1997, 22, (3), 36.
65. Delplancke, M. P.; Powers, J. M.; Vandentop, G. J.; Salmeron, M.; Somorjai, G. A., Preparation and characterization of amorphous SiC-H thin-films. Journal of Vacuum Science & Technology a-Vacuum Surfaces and Films 1991, 9, (3), 450.
66. Delplancke, M. P.; Powers, J. M.; Vandentop, G. J.; Somorjai, G. A., Preparation of SixCyHz films from methylsilane by plasma-enhanced chemical vapor-deposition. Thin Solid Films 1991, 202, (2), 289.
67. Habuka, H.; Ando, Y., Mechanism of silicon carbide film deposition at room temperature using monomethylsilane gas. Journal of the Electrochemical Society 2011, 158, (4), H352.
68. Kaneko, T.; Hosokawa, Y.; Suga, T.; Miyakawa, N., Low-temperature growth of polycrystalline SiC by catalytic CVD from monomethylsilane. Microelectronic Engineering 2006, 83, (1), 41.
69. Klein, S.; Carius, R.; Finger, F.; Houben, L., Low substrate temperature deposition of crystalline SiC using HWCVD. Thin Solid Films 2006, 501, (1-2), 169.
70. Wu, Q. G.; Gleason, K. K., Plasma-enhanced chemical vapor deposition of low-k dielectric films using methylsilane, dimethylsilane, and trimethylsilane precursors. Journal of Vacuum Science & Technology A 2003, 21, (2), 388.
71. Madapura, S.; Steckl, A. J.; Loboda, M., Heteroepitaxial growth of SiC on Si(100) and (111) by chemical vapor deposition using trimethylsilane. Journal of the Electrochemical Society 1999, 146, (3), 1197.
72. Ohshita, Y., Reactants in sic chemical-vapor-deposition using CH3SiH3 as a source gas. Journal of Crystal Growth 1995, 147, (1-2), 111.
73. Lee, M. S.; Bent, S. F., Temperature effects in the hot wire chemical vapor deposition of amorphous hydrogenated silicon carbon alloy. Journal of Applied Physics 2000, 87, (9), 4600.
74. Fonseca, J. L. C.; Tasker, S.; Apperley, D. C.; Badyal, J. P. S., Plasma-enhanced chemical vapor deposition of organosilicon materials: A comparison of hexamethyldisilane and tetramethylsilane precursors. Macromolecules 1996, 29, (5), 1705.
75. Rynders, S. W.; Scheeline, A.; Bohn, P. W., Structure evolution in a-SiC-H films prepared from tetramethylsilane. Journal of Applied Physics 1991, 69, (5), 2951.
76. Tyczkowski, J.; Odrobina, E.; Kazimierski, P.; Bassler, H.; Kisiel, A.; Zema, N., Electronic-properties of plasma-deposited films prepared from tetramethylsilane. Thin Solid Films 1992, 209, (2), 250.
241
77. Yasui, K.; Fujita, A.; Akahane, T., Preparation of microcrystalline silicon-carbide films by hydrogen-radical-enhanced chemical vapor-deposition using tetramethylsilane. Japanese Journal of Applied Physics Part 2-Letters 1992, 31, (4A), L379.
78. Chiu, H. T.; Hsu, J. S., Low-pressure chemical-vapor-deposition of silicon-carbide thin-films from hexamethyldisilane. Thin Solid Films 1994, 252, (1), 13.
79. Klein, S.; Dasgupta, A.; Finger, F.; Carius, R.; Bronger, T., Electronic properties of low temperature microcrystalline silicon carbide prepared by Hot Wire CVD. Thin Solid Films 2008, 516, (5), 630.
80. Klein, S.; Finger, F.; Carius, R.; Lossen, J., Improved deposition rates for mu c-Si : H at low substrate temperature. Thin Solid Films 2006, 501, (1-2), 43.
81. Duan, H. L.; Zaharias, G. A.; Bent, S. F., Detecting reactive species in hot wire chemical vapor deposition. Current Opinion in Solid State & Materials Science 2002, 6, (5), 471.
82. Eustergerling, B. D.; Heden, M.; Shi, Y. J., Development of a new laser induced electron impact ionization source for studying the hot-wire chemical vapor deposition chemistry of silane-ammonia mixtures. Journal of Analytical Atomic Spectrometry 2008, 23, (12), 1590.
83. Duan, H. L.; Zaharias, G. A.; Bent, S. F., Detecting reactive species in hot wire chemical vapor deposition. Current Opinion in Solid State and Materials Science 2002, 6, (5), 471.
84. Lipson, R. H.; Dimov, S. S.; Wang, P.; Shi, Y. J.; Mao, D. M.; Hu, X. K.; Vanstone, J., Vacuum ultraviolet and extreme ultraviolet lasers: Principles, instrumentation, and applications. Instrumentation Science & Technology 2000, 28, (2), 85.
85. Shi, Y. J.; Hu, X. K.; Mao, D. M.; Dimov, S. S.; Lipson, R. H., Analysis of xanthate derivatives by vacuum ultraviolet laser time-of-flight mass spectrometry. Analytical Chemistry 1998, 70, (21), 4534.
86. Shi, Y. J.; Consta, S.; Das, A. K.; Mallik, B.; Lacey, D.; Lipson, R. H., A 118 nm vacuum ultraviolet laser/time-of-flight mass spectroscopic study of methanol and ethanol clusters in the vapor phase. Journal of Chemical Physics 2002, 116, (16), 6990.
87. Eustergerling, B.; Heden, M.; Shi, Y., Application of laser induced electron impact ionization to the deposition chemistry in the hot-wire chemical vapor deposition process with SiH4-NH3 gas mixtures. Journal of the American Society for Mass Spectrometry 2007, 18, (11), 1950.
88. Komura, Y.; Tabata, A.; Narita, T.; Kondo, A.; Mizutani, T., Nanocrystalline cubic silicon carbide films prepared by hot-wire chemical vapor deposition using SiH4/CH4/H2 at a low substrate temperature. Journal of Non-Crystalline Solids 2006, 352, (9-20), 1367.
89. Li, X. M.; Eustergerling, B. D.; Shi, Y. J., Mass spectrometric study of gas-phase chemistry in a hot-wire chemical vapor deposition reactor with tetramethylsilane. International Journal of Mass Spectrometry 2007, 263, (2-3), 233.
90. Shi, Y. J.; Lo, B.; Tong, L.; Li, X.; Eustergerling, B. D.; Sorensen, T. S., In situ diagnostics of the decomposition of silacyclobutane on a hot filament by vacuum
242
ultraviolet laser ionization mass spectrometry. Journal of Mass Spectrometry 2007, 42, (5), 575.
91. Tong, L.; Shi, Y. J., Gas-phase reaction chemistry of 1,1-dimethyl-1-silacyclobutane as a precursor gas in the hot-wire chemical vapor deposition process - Formation of tetramethylsilane and trimethylsilane. Canadian Journal of Chemistry-Revue Canadienne De Chimie 2011, 89, (1), 19.
92. Tong, L.; Shi, Y. J., A mechanistic study of gas-phase reactions with 1,1,3,3-tetramethyl-1,3-disilacyclobutane in the hot-wire chemical vapor deposition process. Thin Solid Films 2009, 517, (12), 3461.
93. Badran, I.; Forster, T. D.; Roesler, R.; Shi, Y. J., Competition of silene/silylene chemistry with free radical chain reactions using 1-methylsilacyclobutane in the hot-wire chemical vapor deposition process. The Journal of Physical Chemistry A 2012, 116, (41), 10054.
94. Neudorfl, P. S.; Strausz, O. P., Pyrolysis of monomethysilane and dimethylsilane - role of molecular and radical processes. Journal of Physical Chemistry 1978, 82, (2), 241.
95. Rickborn, S. F.; Rogers, D. S.; Ring, M. A.; Oneal, H. E., Kinetic and product studies of the thermal-decomposition of dimethylsilane in a single-pulse shock-tube and in a stirred flow reactor. Journal of Physical Chemistry 1986, 90, (3), 408.
96. Alexander, A. G.; Strausz, O. P., Photochemistry of silicon-compounds .5. 147-nm photolysis of dimethylsilane. Journal of Physical Chemistry 1976, 80, (23), 2531.
97. Nay, M. A.; Woodall, G. N. C.; Strausz, O. P.; Gunning, H. E., Mercury 6(3p1) photosensitization of methylsilanes and silane. Journal of the American Chemical Society 1965, 87, (2), 179.
98. Strausz, O. P.; Obi, K.; Duholke, W. K., Photochemistry of silicon compounds .2. photolysis of methylsilane as a source of methylsilene. Journal of the American Chemical Society 1968, 90, (5), 1359.
99. Gaspar, P. P.; West, R., Silylenes. In The Chemistry of organic silicon compounds, Rappoport, Z.; Apeloig, Y., Eds. Wiley: Chichester, 1998; Vol. 2, p 2463.
100. Gaspar, P. P.; Xiao, M.; Pae, D. H.; Berger, D. J.; Haile, T.; Chen, T.; Lei, D.; Winchester, W. R.; Jiang, P., The quest for triplet ground state silylenes. Journal of Organometallic Chemistry 2002, 646, (1–2), 68.
101. Wulff, W. D.; Goure, W. F.; Barton, T. J., The role of trimethylsilylmethylsilylene in the gas-phase reactions of tetramethyldisilene. Journal of the American Chemical Society 1978, 100, (19), 6236.
102. Skell, P. S.; Goldstein, E. J., Dimethylsilene: CH3SiCH3. Journal of the American Chemical Society 1964, 86, (7), 1442.
103. Cox, B.; Purnell, H., Arrhenius parameters for silene insertion into silicon-hydrogen bonds. Journal of the Chemical Society, Faraday Transactions 1: Physical Chemistry in Condensed Phases 1975, 71, (0), 859.
243
104. Rogers, D. S.; Oneal, H. E.; Ring, M. A., Comparative trapping kinetics of silylene .1. silylene reactions with 1,3-butadiene and acetylene and with 1,3-butadiene and methanol. Organometallics 1986, 5, (7), 1467.
105. Rogers, D. S.; Walker, K. L.; Ring, M. A.; Oneal, H. E., Silylene reactions with ethylene and butadiene - mechanism and kinetics. Organometallics 1987, 6, (11), 2313.
106. Barton, T. J.; Burns, S. A.; Burns, G. T., Thermochemistry of di- and trisilanyl radicals. Observations and comments on silene-to-silylene rearrangements. Organometallics 1982, 1, (1), 210.
107. Barton, T. J.; Revis, A.; Davidson, I. M. T.; Ijadimaghsoodi, S.; Hughes, K. J.; Gordon, M. S., Pyrolytic, kinetic, and theoretical-studies on the isomerization of Me2HSiCH2 to Me3Si. Journal of the American Chemical Society 1986, 108, (14), 4022.
108. Brook, A. G.; Brook, M. A., The Chemistry of Silenes. In Advances in Organometallic Chemistry, F. Gordon, A. S.; Robert, W., Eds. Academic Press: 1996; Vol. Volume 39, pp 71.
109. Ziche, W.; Auner, N.; Behm, J., Silaheterocycles. 15. Cycloaddition behavior of 1,1-dichloro-2-neopentyl-2-(trimethylsilyl)silene. Organometallics 1992, 11, (7), 2494.
110. Coleman, B.; Jones, M., Silenes. Reviews of Chemical Intermediates 1981, 4, (1-4), 297.
111. Gusel'nikov, L. E., Hetero-π-systems from 2+2 cycloreversions. Part 1. Gusel'nikov–Flowers route to silenes and origination of the chemistry of doubly bonded silicon. Coordination Chemistry Reviews 2003, 244, (1–2), 149.
112. Conlin, R. T.; Laakso, D.; Marshall, P., A theoretical investigation of donor-acceptor bonding between amines and silylenes. Organometallics 1994, 13, (3), 838.
113. Kostina, S. S.; Singh, T.; Leigh, W. J., Kinetics and mechanisms of the reactions of transient silylenes with amines. Journal of Physical Organic Chemistry 2011, 24, (10), 937.
114. O'Neal, H. E.; Ring, M. A.; Martin, J. G.; Navio, M. T., Kinetics of silylene insertion into N−H bonds and the mechanism and kinetics of the pyrolysis of dimethylsilylamine. The Journal of Physical Chemistry A 1998, 102, (44), 8493.
115. Li, X. Investigation of gas phase chemistry of alkylsilane molecules in a hot wire chemical vapor deposition reactor. M.Sc., University of Calgary (Canada), Ann Arbor, 2008.
116. Kung, A. H., Generation of tunable picosecond VUV radiation. Applied Physics Letters 1974, 25, (11), 653.
117. Schuhle, U.; Pallix, J. B.; Becker, C. H., Surface analysis of bulk polymers using single and multiple photon ionization. Journal of Vacuum Science & Technology A: Vacuum, Surfaces, and Films 1988, 6, (3), 936.
118. Eustergerling, B.; Heden, M.; Shi, Y. J., Application of laser induced electron impact ionization to the deposition chemistry in the hot-wire chemical vapor deposition process with SiH4-NH3 gas mixtures. Journal of the American Society for Mass Spectrometry 2007, 18, (11), 1950.
244
119. Wiley, W. C.; McLaren, I. H., Time-of-flight mass spectrometer with improved resolution. Review of Scientific Instruments 1955, 26, (12), 1150.
120. Tannenbaum, S.; Kaye, S.; Lewenz, G. F., Synthesis and properties of some alkylsilanes. Journal of the American Chemical Society 1953, 75, (15), 3753.
121. Sidorov, D. V.; Storozhenko, P. A.; Shutova, O. G.; Kozhevnikov, B. E., Synthesis of high-purity alkylsilanes. Theoretical Foundations of Chemical Engineering 2007, 41, (5), 668.
122. Sawrey, B. A.; Oneal, H. E.; Ring, M. A., The gas-phase decomposition of methylsilane .2. mechanisms of decomposition under static system conditions. International Journal of Chemical Kinetics 1984, 16, (1), 23.
123. Sawrey, B. A.; Oneal, H. E.; Ring, M. A.; Coffey, D., The gas-phase decomposition of methylsilane .1. mechanism of decomposition under shock-tube conditions. International Journal of Chemical Kinetics 1984, 16, (1), 7.
124. Sawrey, B. A.; Oneal, H. E.; Ring, M. A.; Coffey, D., The gas-phase decomposition of methylsilane .3. kinetics. International Journal of Chemical Kinetics 1984, 16, (1), 31.
125. Binkley, J. S.; Pople, J. A., Møller–Plesset theory for atomic ground state energies. International Journal of Quantum Chemistry 1975, 9, (2), 229.
126. Bartlett, R. J., Coupled-cluster approach to molecular structure and spectra: a step toward predictive quantum chemistry. The Journal of Physical Chemistry 1989, 93, (5), 1697.
127. Frisch, M. J.; Trucks, G. W.; Schlegel, H. B.; Scuseria, G. E.; Robb, M. A.; Cheeseman, J. R.; Montgomery, J. A.; Vreven, T.; Kudin, K. N.; Burant, J. C.; Millam, J. M.; Iyengar, S. S.; Tomasi, J.; Barone, V.; Mennucci, B.; Cossi, M.; Scalmani, G.; Rega, N.; Petersson, G. A.; Nakatsuji, H.; Hada, M.; Ehara, M.; Toyota, K.; Fukuda, R.; Hasegawa, J.; Ishida, M.; Nakajima, T.; Honda, Y.; Kitao, O.; Nakai, H.; Klene, M.; Li, X.; Knox, J. E.; Hratchian, H. P.; Cross, J. B.; Bakken, V.; Adamo, C.; Jaramillo, J.; Gomperts, R.; Stratmann, R. E.; Yazyev, O.; Austin, A. J.; Cammi, R.; Pomelli, C.; Ochterski, J. W.; Ayala, P. Y.; Morokuma, K.; Voth, G. A.; Salvador, P.; Dannenberg, J. J.; Zakrzewski, V. G.; Dapprich, S.; Daniels, A. D.; Strain, M. C.; Farkas, O.; Malick, D. K.; Rabuck, A. D.; Raghavachari, K.; Foresman, J. B.; Ortiz, J. V.; Cui, Q.; Baboul, A. G.; Clifford, S.; Cioslowski, J.; Stefanov, B. B.; Liu, G.; Liashenko, A.; Piskorz, P.; Komaromi, I.; Martin, R. L.; Fox, D. J.; Keith, T.; Laham, A.; Peng, C. Y.; Nanayakkara, A.; Challacombe, M.; Gill, P. M. W.; Johnson, B.; Chen, W.; Wong, M. W.; Gonzalez, C.; Pople, J. A., Gaussian 03, Revision C.02. In 2003.
128. Scott, A. P.; Radom, L., HARMONIC vibrational frequencies: An evaluation of Hartree−Fock, Møller−Plesset, quadratic configuration interaction, density functional theory, and semiempirical scale factors. The Journal of Physical Chemistry 1996, 100, (41), 16502.
129. Johnson, A. D.; Perrin, J.; Mucha, J. A.; Ibbotson, D. E., Kinetics of SiC CVD - surface decomposition of silacyclobutane and methylsilane. Journal of Physical Chemistry 1993, 97, (49), 12937.
130. Wu, Q.; Gleason, K. K., Plasma-enhanced chemical vapor deposition of low-k dielectric films using methylsilane, dimethylsilane, and trimethylsilane
245
precursors. Journal of Vacuum Science & Technology A: Vacuum, Surfaces, and Films 2003, 21, (2), 388.
131. Yasui, K.; Asada, K.; Akahane, T., Epitaxial growth of 3C-SiC films on Si substrates by triode plasma CVD using dimethylsilane. Applied Surface Science 2000, 159–160, (0), 556.
132. Joubert, O.; Fuard, D.; Monget, C.; Weidman, T., Plasma polymerized methylsilane. III. Process optimization for 193 nm lithography applications. Journal of Vacuum Science & Technology B 2000, 18, (2), 793.
133. Wrobel, A. M.; Walkiewicz-Pietrzykowska, A., Mechanism of the initiation step in atomic hydrogen-induced CVD of amorphous hydrogenated silicon-carbon films from single-source precursors. Chemical Vapor Deposition 1998, 4, (4), 133.
134. Herlin, N.; Lefebvre, M.; Pealat, M.; Perrin, J., Investigation of the chemical vapor-deposition of silicon-carbide from tetramethylsilane by insitu temperature and gas-composition measurements. Journal of Physical Chemistry 1992, 96, (17), 7063.
135. Itoh, T.; Kawasaki, T.; Takai, Y.; Yoshida, N.; Nonomura, S., Properties of hetero-structured SiCX films deposited by hot-wire CVD using SiH3CH3 as carbon source. Thin Solid Films 2008, 516, (5), 641.
136. Chen, T.; Kohler, F.; Heidt, A.; Huang, Y.; Finger, F.; Carius, R., Microstructure and electronic properties of microcrystalline silicon carbide thin films prepared by hot-wire CVD. Thin Solid Films 2011, 519, (14), 4511.
137. Badran, I.; Forster, T. D.; Roesler, R.; Shi, Y. J., Competition of silene/silylene chemistry with free radical chain reactions using 1-methylsilacyclobutane in the hot-wire chemical vapor deposition process. Journal of Physical Chemistry A 2012, 116, (41), 10054.
138. Tong, L.; Shi, Y. J., Decomposition of 1,1-dimethyl-1-silacyclobutane on a tungsten filament - evidence of both ring C-C and ring Si-C bond cleavages. Journal of Mass Spectrometry 2010, 45, (2), 215.
139. Harris, S. J.; Weiner, A. M.; Perry, T. A., Measurement of stable species present during filament-assisted diamond growth. Applied Physics Letters 1988, 53, (17), 1605.
140. Goodwin, D. G., Simulations of high-rate diamond synthesis - methyl as growth species. Applied Physics Letters 1991, 59, (3), 277.
141. Harris, S. J.; Martin, L. R., Methyl versus acetylene as diamond growth species. Journal of Materials Research 1990, 5, (11), 2313.
142. Martin, L. R.; Hill, M., A flow-tube study of diamond film growth: methane versus acetylene. Journal of Materials Science Letters 1990, 9, (6), 621.
143. Harris, S. J., Mechanism for diamond growth from methyl radicals. Applied Physics Letters 1990, 56, (23), 2298.
144. Winters, H. F.; Seki, H.; Rye, R. R.; Coltrin, M. E., Interaction of hydrogen, methane, ethylene, and cyclopentane with hot tungsten - implications for the growth of diamond films. Journal of Applied Physics 1994, 76, (2), 1228.
145. Harris, S. J.; Weiner, A. M., Methyl radical and h-atom concentrations during diamond growth. Journal of Applied Physics 1990, 67, (10), 6520.
246
146. Tong, L.; Shi, Y. J., Carburization of tungsten filaments in a hot-wire chemical vapor deposition process using 1,1,3,3-tetramethyl-1,3-disilacyclobutane. ACS Applied Materials & Interfaces 2009, 1, (9), 1919.
147. Shi, Y. J.; Badran, I.; Tkalych, A.; Kan, W. H.; Thangadurai, V., Growth of crystalline tungsten carbides using 1,1,3,3-tetramethyl-1,3-disilacyclobutane on a heated tungsten filament. Journal of Physical Chemistry C 2013, 117, (7), 3389.
148. Hostetler, M. J.; Nuzzo, R. G.; Girolami, G. S., Reactions of primary organosilanes on transition-metal surfaces - identification of the first surface-bound silylynes. Journal of the American Chemical Society 1994, 116, (25), 11608.
149. Spencer, M. J. S.; Nyberg, G. L., Adsorption of methylsilane on copper surfaces. Surface Science 2003, 543, (1-3), 162.
150. Bradshaw, D. I.; Moyes, R. B.; Wells, P. B., Reactions of methylsilane at the surfaces of nickel, rhodium and tungsten. Journal of the Chemical Society-Faraday Transactions I 1980, 76, 979.
151. Roberts, M. W.; Ross, J. R. H., Chemisorption and decomposition of tetramethylsilane over tungsten and iron surfaces. Journal of the Chemical Society-Faraday Transactions I 1972, 68, (591), 221.
152. Casserly, T. B.; Gleason, K. K., Enthalpies of formation and reaction for primary reactions of methyl- and methylmethoxysilanes from density functional theory. Plasma Processes and Polymers 2005, 2, (9), 669.
153. Gusel'nikov, L. E.; Avakyan, V. G.; Gusel'nikov, S. L., Effect of the electronic structure of substituents at the silicon atom on the structure and bond energies of methylhydrosilanes and silenes. Russian Journal of General Chemistry 2001, 71, (12), 1933.
154. Zeigarnik, A. V.; Valdes-Perez, R. E.; Myatkovskaya, O. N., C-C bond scission in ethane hydrogenolysis. Journal of Physical Chemistry B 2000, 104, (45), 10578.
155. Foster, M.; Darlington, B.; Scharff, J.; Campion, A., Surface chemistry of alkylsilanes on Si(100)2x1. Surface Science 1997, 375, (1), 35.
156. Shinohara, M.; Maehama, T.; Niwano, M., Adsorption and decomposition of methylsilanes on Si(100). Applied Surface Science 2000, 162, 161. 157. Takatsuka, T.; Fujiu, M.; Sakuraba, M.; Matsuura, T.; Murota, J., Surface reaction
of CH3SiH3 on Ge(100) and Si(100). Applied Surface Science 2000, 162, 156. 158. Lin, J. L.; Bent, B. E., Two mechanisms for formation of methyl radicals during
the thermal decomposition of methyl iodide on a copper surface. The Journal of Physical Chemistry 1993, 97, (38), 9713.
159. Wang, G. C.; Li, J.; Xu, X. F.; Li, R. F.; Nakamura, J., The relationship between adsorption energies of methyl on metals and the metallic electronic properties: A first-principles DFT study. Journal of Computational Chemistry 2005, 26, (9), 871.
160. Kua, J.; Faglioni, F.; Goddard, W. A., Thermochemistry for hydrocarbon intermediates chemisorbed on metal surfaces: CHn-m(CH3)m with n=1, 2, 3 and m <= n on Pt, Ir, Os, Pd, Ph, and Ru. Journal of the American Chemical Society 2000, 122, (10), 2309.
247
161. Comerford, D. W.; Smith, J. A.; Ashfold, M. N. R.; Mankelevich, Y. A., On the mechanism of H atom production in hot filament activated H2 and CH4/H2 gas mixtures. Journal of Chemical Physics 2009, 131, (4).
162. Van der Werf, C. H. M.; van Veenendaal, P. A. T. T.; van Veen, M. K.; Hardeman, A. J.; Rusche, M. Y. S.; Rath, J. K.; Schropp, R. E. I., The influence of the filament temperature on the structure of hot-wire deposited silicon. Thin Solid Films 2003, 430, (1–2), 46.
163. Celii, F. G.; Butler, J. E., Hydrogen-atom detection in the filament-assisted diamond deposition environment. Applied Physics Letters 1989, 54, (11), 1031.
164. Ferreira, I.; Aguas, H.; Mendes, L.; Martins, R., Role of the hot wire filament temperature on the structure and morphology of the nanocrystalline silicon p-doped films. Applied Surface Science 1999, 144-45, 690.
165. Banholzer, W., Understanding the mechanism of cvd diamond. Surface & Coatings Technology 1992, 53, (1), 1.
166. Liu, H. M.; Dandy, D. S., Studies on nucleation process in diamond cvd - an overview of recent developments. Diamond and Related Materials 1995, 4, (10), 1173.
167. May, P. W., Diamond thin films: a 21st-century material. Philosophical Transactions of the Royal Society of London Series a-Mathematical Physical and Engineering Sciences 2000, 358, (1766), 473.
168. Lee, S. T.; Lin, Z. D.; Jiang, X., CVD diamond films: nucleation and growth. Materials Science & Engineering R-Reports 1999, 25, (4), 123.
169. Cifre, J.; Bertomeu, J.; Puigdollers, J.; Polo, M. C.; Andreu, J.; Lloret, A., Polycrystalline silicon films obtained by hot-wire chemical vapour deposition. Applied Physics A 1994, 59, (6), 645.
170. Matsumura, H., Formation of silicon-based thin films prepared by catalytic chemical vapor deposition (Cat-CVD) method. Japanese Journal of Applied Physics Part 1-Regular Papers Short Notes & Review Papers 1998, 37, (6A), 3175.
171. Mahan, A. H.; Yang, J.; Guha, S.; Williamson, D. L., Structural changes in a-Si : H film crystallinity with high H dilution. Physical Review B 2000, 61, (3), 1677.
172. Honda, K.; Ohdaira, K.; Matsumura, H., A novel method for suppressing silicidation of tungsten catalyzer during silane decomposition in Cat-CVD. Thin Solid Films 2008, 516, (5), 826.
173. Knoesen, D.; Arendse, C.; Halindintwali, S.; Muller, T., Extension of the lifetime of tantalum filaments in the hot-wire (Cat) chemical vapor deposition process. Thin Solid Films 2008, 516, (5), 822.
174. Shi, Y. J.; Tong, L.; Eustergerling, B. D.; Li, X. M., Silicidation and carburization of the tungsten filament in HWCVD with silacyclobutane precursor gases. Thin Solid Films 2011, 519, (14), 4442.
175. Tong, L.; Sveen, C. E.; Shi, Y. J., Study of tungsten filament aging in hot-wire chemical vapor deposition with silacyclobutane as a source gas and the H2 etching effect. Journal of Applied Physics 2008, 103, (12).
248
176. Ring, M. A.; Oneal, H. E.; Rickborn, S. F.; Sawrey, B. A., Kinetics of the high-temperature thermal-decomposition of silanes and alkylsilanes. Organometallics 1983, 2, (12), 1891.
177. Davidson, I. M. T.; Ring, M. A., Primary processes in the low-pressure pyrolysis of methylsilane. Journal of the Chemical Society-Faraday Transactions I 1980, 76, 1520.
178. Neudorfl, P. S.; Lown, E. M.; Safarik, I.; Jodhan, A.; Strausz, O. P., Mechanism of the gas-phase thermolysis of monomethylsilane. Journal of the American Chemical Society 1987, 109, (19), 5780.
179. Oneal, H. E.; Ring, M. A., Mechanism of the thermal-decomposition of dimethylsilane at atmospheric pressures in the gas-phase. Organometallics 1988, 7, (5), 1017.
180. Gordon, M. S.; Truong, T. N., Potential primary pyrolysis processes of methylsilane. Chemical Physics Letters 1987, 142, (1-2), 110.
181. Davidson, I. M. T.; Lambert, C. A., Mechanisms of pyrolysis and bond dissociation energies in trimethylsilane. Journal of the Chemical Society A: Inorganic, Physical, Theoretical 1971, 0, (0), 882.
182. Davidson, I. M. T.; Lambert, C. A., A kinetic study of the pyrolysis of trimethylsilane. Journal of the Chemical Society D: Chemical Communications 1969, 0, (21), 1276.
183. Baldwin, A. C.; Davidson, I. M. T.; Reed, M. D., Mechanism of thermolysis of tetramethylsilane and trimethylsilane. Journal of the Chemical Society-Faraday Transactions I 1978, 74, 2171.
184. Paquin, D. P.; Oconnor, R. J.; Ring, M. A., Pyrolysis of trimethylgermane and trimethylsilane. Journal of Organometallic Chemistry 1974, 80, (3), 341.
185. Bradshaw, D. I.; Moyes, R. B.; Wells, P. B., Fast catalysis of a hydrogen-exchange reaction at low-temperatures by gold. Journal of the Chemical Society-Chemical Communications 1975, (5), 137.
186. Dubois, L. H.; Zegarski, B. R., The decomposition of alkyl silanes (SiMenH4-n,0-less-than-or-equal-to-n-less-than-or-equal-to-4) on Ni(100). Journal of Vacuum Science & Technology a-Vacuum Surfaces and Films 1988, 6, (3), 870.
187. Roberge, R.; Sandorfy, C.; Matthews, J. I.; Strausz, O. P., Far ultraviolet and hel photoelectron-spectra of alkyl and fluorine substituted silane derivatives. Journal of Chemical Physics 1978, 69, (11), 5105.
188. Herzberg, G., Dissociation energy and ionization potential of molecular hydrogen. Physical Review Letters 1969, 23, (19), 1081.
189. Berkowitz, J.; Ellison, G. B.; Gutman, D., Three methods to measure RH bond energies. The Journal of Physical Chemistry 1994, 98, (11), 2744.
190. Hase, W. L.; Mazac, C. J.; Simons, J. W., Decomposition kinetics of chemically activated dimethylsilane and ethylsilane. Journal of the American Chemical Society 1973, 95, (11), 3454.
191. Alexander, A. G.; Strausz, O. P., Photochemistry of silicon compounds. 5. The 147-nm photolysis of dimethylsilane. The Journal of Physical Chemistry 1976, 80, (23), 2531.
249
192. Davidson, I. M.; Lambert, C. A., Mechanisms of pyrolysis and bond dissociation energies in trimethylsilane. Journal of the Chemical Society a -Inorganic Physical Theoretical 1971, (7), 882.
193. Paquin, D. P.; O'Connor, R. J.; Ring, M. A., The pyrolysis of trimethylgermane and trimethylsilane. Journal of Organometallic Chemistry 1974, 80, (3), 341.
194. Morisset, S.; Aguillon, F.; Sizun, M.; Sidis, V., Wave-packet study of H2 formation on a graphite surface through the Langmuir--Hinshelwood mechanism. The Journal of Chemical Physics 2005, 122, (19), 194702.
195. Obi, K.; Clement, A.; Gunning, H. E.; Strausz, O. P., Photochemistry of silicon compounds. III. Vacuum-ultraviolet photolysis of methylsilane. Journal of the American Chemical Society 1969, 91, (7), 1622.
196. Ring, M. A.; Oneal, H. E., Mechanism of the thermally induced gas-phase decomposition of silane - a revisitation. Journal of Physical Chemistry 1992, 96, (26), 10848.
197. Kohanek, J. J.; Estacio, P.; Ring, M. A., Pyrolysis of methylgermane and methylsilane. Inorganic Chemistry 1969, 8, (11), 2516.
198. Ring, M. A.; Puentes, M. J.; Oneal, H. E., Pyrolysis of monosilane. Journal of the American Chemical Society 1970, 92, (16), 4845.
199. Tong, L. Gas-phase chemistry and tungsten filament aging in hot-wire chemical vapor deposition with silacyclobutanes. M.Sc., University of Calgary (Canada), Canada, 2009.
200. Frese, K. W., Calculation of surface binding-energy for hydrogen, oxygen, and carbon-atoms on metallic surfaces. Surface Science 1987, 182, (1-2), 85.
201. Toyoshima, I.; Somorjai, G. A., Heats of Chemisorption of O2, H2, CO, CO2, and N2 on Polycrystalline and Single Crystal Transition Metal Surfaces. Catalysis Reviews 1979, 19, (1), 105.
202. Reynolds, T. W.; Aeronautics, U. S. N.; Administration, S., Adsorption-desorption behavior of homogeneous and heterogeneous metal surfaces. National Aeronautics and Space Administration: 1968.
203. Bond, A. C.; Brockway, L. O., The molecular structures of mono-, di- and trimethylsilane1. Journal of the American Chemical Society 1954, 76, (12), 3312.
204. Owens, T. R.; Harrington, C. R.; Pace, T. C. S.; Leigh, W. J., Steric effects on silene reactivity. The effects of ortho-methyl substituents on the kinetics and mechanisms of the reactions of 1,1-diarylsilenes with nucleophiles. Organometallics 2003, 22, (26), 5518.
205. Wu, Y.-D.; Wong, C.-L., Substituent effect on the dissociation energy of the Si-H bond: a density functional study. The Journal of Organic Chemistry 1995, 60, (4), 821.
206. Walsh, R., Thermochemistry. In Organic Silicon Compounds (1989), John Wiley & Sons, Ltd: 2004; pp 371.
207. Davidson, I. M.; Lambert, C. A., A kinetic study of pyrolysis of trimethylsilane. Journal of the Chemical Society D-Chemical Communications 1969, (21), 1276.
208. Badran, I.; Rauk, A.; Shi, Y. J., Theoretical study on the ring-opening of 1,3-disilacyclobutane and H2 elimination. The Journal of Physical Chemistry A 2012, 116, (48), 11806.
250
209. Clifford, R. P.; Gowenloc.Bg; Stevenso.J; Johnson, C. A. F., Pyrolysis of organometallic compounds .4. kinetic studies of decomposition of tetramethylsilane. Journal of Organometallic Chemistry 1972, 34, (1), 53.
210. Mahan, A. H., Hot wire chemical vapor deposition of Si containing materials for solar cells. Solar Energy Materials and Solar Cells 2003, 78, (1-4), 299.
211. Fonrodona, M.; Soler, D.; Asensi, J.; Bertomeu, J.; Andreu, J., Studies on grain boundaries in nanocrystalline silicon grown by hot-wire CVD. Journal of Non-Crystalline Solids 2002, 299, 14.
212. Shi, Y. J.; Li, X. M.; Toukabri, R.; Tong, L., Effect of Si–H bond on the gas-phase chemistry of trimethylsilane in the hot wire chemical vapor deposition process. The Journal of Physical Chemistry A 2011, 115, (37), 10290.
213. Clarke, M. P.; Davidson, I. M. T., Mechanism of addition of silanediyls (silylenes) to buta-1,3-diene. Journal of the Chemical Society-Chemical Communications 1988, (3), 241.
214. Conlin, R. T.; Wood, D. L., Evidence for the isomerization of 1-methylsilene to dimethylsilylene. Journal of the American Chemical Society 1981, 103, (7), 1843.
215. Zhao, Q.; Li, J. C.; Zhou, H.; Wang, H.; Wang, B.; Yan, H., Parameters determining crystallinity in β-SiC thin films prepared by catalytic chemical vapor deposition. Journal of Crystal Growth 2004, 260, (1–2), 176.
216. Berkowitz, J.; Greene, J. P.; Cho, H.; Ruscic, B., The ionization potentials of CH4 and CD4. The Journal of Chemical Physics 1987, 86, (2), 674.
217. Plessis, P.; Marmet, P., Electroionization study of acetylene and fragment ions. International Journal of Mass Spectrometry and Ion Processes 1986, 70, (1), 23.
218. Taylor, J. E.; Milazzo, T. S., A comparative study of the pyrolyses of the tetramethyl derivatives of silicon, germanium, and tin using a wall-less reactor. The Journal of Physical Chemistry 1978, 82, (8), 847.
219. Haas, C. H.; Ring, M. A., Reaction of silyl radical and silylene with acetylene and application of orbital symmetry to the pyrolysis of silane and disilane. Inorganic Chemistry 1975, 14, (9), 2253.
220. Al-Rubaiey, N.; Carpenter, I. W.; Walsh, R.; Becerra, R.; Gordon, M. S., Direct gas-phase kinetic studies of silylene addition reactions: SiH2+C3H6, SiH2+i-C4H8, and SiMe2+C2H4. The effects of methyl substitution on strain energies in siliranes. Journal of Physical Chemistry A 1998, 102, (44), 8564.
221. Choo, K. Y.; Gaspar, P. P., Addition of trimethylsilyl radical to ethylene. Flash photolysis-electron spin resonance kinetic study. Journal of the American Chemical Society 1974, 96, (5), 1284.
222. Pollock, T. L.; Sandhu, H. S.; Jodhan, A.; Strausz, O. P., Photochemistry of silicon compounds. IV. Mercury photosensitization of disilane. Journal of the American Chemical Society 1973, 95, (4), 1017.
223. Oliphant, C.; Arendse, C.; Prins, S.; Malgas, G.; Knoesen, D., Structural evolution of a Ta-filament during hot-wire chemical vapour deposition of Silicon investigated by electron backscatter diffraction. Journal of Materials Science 2012, 47, (5), 2405.
224. Oliphant, C. J.; Arendse, C. J.; Malgas, G. F.; Motaung, D. E.; Muller, T. F. G.; Halindintwali, S.; Julies, B. A.; Knoesen, D., Filament poisoning at typical carbon
251
nanotube deposition conditions by hot-filament CVD. Journal of Materials Science 2009, 44, (10), 2610.
225. Davidson, I. M., Factors influencing formation of silylenes in pyrolysis of silicon compounds. Journal of Organometallic Chemistry 1970, 24, (1), 97.
226. Obi, K.; Clement, A.; Gunning, H. E.; Strausz, O. P., Photochemistry of silicon compounds .3. vacuumm-ultraviolet photolysis of methylsilane. Journal of the American Chemical Society 1969, 91, (7), 1622.
227. Loboda, M. J.; Seifferly, J. A.; Dall, F. C., Plasma-enhanced chemical-vapor-deposition of a-SiC-H films from organosilicon precursors. Journal of Vacuum Science & Technology a-Vacuum Surfaces and Films 1994, 12, (1), 90.
228. Ohshita, Y., Low-temperature p-doped SiC growth by chemical-vapor-deposition using CH3SiH3/Ph3 gas. Journal of the Electrochemical Society 1995, 142, (3), 1002.
229. Krotz, G.; Legner, W.; Muller, G.; Grueninger, H. W.; Smith, L.; Leese, B.; Jones, A.; Rushworth, S., Structural and electronic characterization of beta-SiC films on si grown from mono-methylsilane precursors. Materials Science and Engineering B-Solid State Materials for Advanced Technology 1995, 29, (1-3), 154.
230. Johnson, A. D.; Perrin, J.; Mucha, J. A.; Ibbotson, D. E., Chemical vapor-deposition of SiC from silacyclobutane and methylsilane. In Chemical Perspectives of Microelectronic Materials Iii, Abernathy, C. R.; Bates, C. W.; Bohling, D. A.; Hobson, W. S., Eds. 1993; Vol. 282, pp 451.
231. Liu, C. W.; Sturm, J. C., Low temperature chemical vapor deposition growth of beta-SiC on (100) Si using methylsilane and device characteristics. Journal of Applied Physics 1997, 82, (9), 4558.
232. Guselnikov, L. E.; Nametkin, N. S.; Vdovin, V. M., Unstable silicon analogs of unsaturated-compounds. Accounts of Chemical Research 1975, 8, (1), 18.
233. Maier, G.; Mihm, G.; Reisenauer, H. P., Silaethene. Angewandte Chemie-International Edition in English 1981, 20, (6-7), 597.
234. Conlin, R. T.; Gaspar, P. P., Evidence for the dimerization of dimethylsilylene to tetramethyldisilene. Journal of the American Chemical Society 1976, 98, (3), 868.
235. Apeloig, Y., Theoretical aspects of organosilicon compounds. In The Chemistry of Organosilicon Compounds, Wiley, J., Ed. S. Patai and Z. Rappoport: New York, 1989; Vol. 1, pp 57.
236. Chambreau, S. D.; Lemieux, J.; Wang, L.; Zhang, J., Mechanistic studies of the pyrolysis of 1,3-butadiene, 1,3-butadiene-1,1,4,4-d4, 1,2-butadiene, and 2-butyne by supersonic jet/photoionization mass spectrometry. The Journal of Physical Chemistry A 2005, 109, (10), 2190.
237. Shinohara, M.; Kimura, Y.; Shoji, D.; Niwano, M., Infrared study of carbon incorporation during chemical vapor deposition of SiC using methylsilanes. Applied Surface Science 2001, 175, 591.
238. Wrobel, A. M.; Walkiewicz-Pietrzykowska, A.; Stasiak, M.; Aoki, T.; Hatanaka, Y.; Szumilewicz, J., Reactivity of alkylsilanes and alkylcarbosilanes in atomic hydrogen-induced chemical vapor deposition. Journal of the Electrochemical Society 1998, 145, (3), 1060.
252
239. Tong, L.; Shi, Y. J., Decomposition of 1,1-dimethyl-1-silacyclobutane on a tungsten filament—evidence of both ring C-C and ring Si-C bond cleavages. Journal of Mass Spectrometry 2010, 45, (2), 215.
240. Band, S. J.; Davidson, I. M.; Lambert, C. A., Bond dissociation energies - electron impact studies on some trimethylsilyl compounds. Journal of the Chemical Society a -Inorganic Physical Theoretical 1968, (9), 2068.
241. Malko, M. W.; Troe, J., Analysis of the unimolecular reaction N2O5 + M reversible NO2 + NO3 + M. International Journal of Chemical Kinetics 1982, 14, (4), 399.
242. Cawood, C. N.; Furue, H.; Mousavipour, S. H.; Pacey, P. D., Comment on "Initiation and abstraction reactions in the pyrolysis of acetone". Journal of Physical Chemistry A 2003, 107, (11), 1896.
243. Cawood, C. N.; Furue, H.; Mousavipour, S. H.; Pacey, P. D., Comment on "initiation and abstraction reactions in the pyrolysis of acetone". Journal of Physical Chemistry B 2003, 107, (11), 2618.
244. Mousavipour, S. H.; Pacey, P. D., Initiation and abstraction reactions in the pyrolysis of acetone. Journal of Physical Chemistry 1996, 100, (9), 3573.
245. Mousavipour, S. H.; Saheb, V.; Ramezani, S., Kinetics and mechanism of pyrolysis of methyltrichlorosilane. Journal of Physical Chemistry A 2004, 108, (11), 1946.
246. Kee, R.; Rupley, F.; Miller, J.; Coltrin, M.; Grcar, J.; Meeks, E.; Moffat, H.; Lutz, A.; Dixon-Lewis, G.; Smooke, M., Chemkin Collection. Reaction Design Inc., San Diego, CA 2000.
247. Coltrin, M. E.; Ho, P.; Moffat, H. K.; Buss, R. J., Chemical kinetics in chemical vapor deposition: growth of silicon dioxide from tetraethoxysilane (TEOS). Thin Solid Films 2000, 365, (2), 251.
248. Tsang, R. S.; May, P. W.; Ashfold, M. N. R., Modelling of the gas phase chemistry during diamond CVD: the role of different hydrocarbon species. Diamond and Related Materials 1999, 8, (2–5), 242.
249. Tsang, R. S.; May, P. W.; Cole, J.; Ashfold, M. N. R., Simulations of the hot-filament diamond CVD gas-phase environment: direct comparison with experimental measurements. Diamond and Related Materials 1999, 8, (8–9), 1388.
250. Coltrin, M. E.; Kee, R. J.; Rupley, F. M., Surface chemkin: A general formalism and software for analyzing heterogeneous chemical kinetics at a gas-surface interface. International Journal of Chemical Kinetics 1991, 23, (12), 1111.