gas and oil production from waterflood residual oil: effects of wettability and oil spreading...
TRANSCRIPT

www.elsevier.com/locate/jpetscieng
Journal of Petroleum Science and Engineering 39 (2003) 297–308
Gas and oil production from waterflood residual oil: effects of
wettability and oil spreading characteristics
Carlos A. Grattonia,*, Richard A. Daweb,1
aDepartment of Earth Science and Engineering, Imperial College, Prince Consort Road, London SW7 2AZ, UKbChemical Engineering Department, University of West Indies, St. Augustine, Trinidad and Tobago
Received 12 March 2002; received in revised form 4 October 2002
Abstract
In the depressurisation of reservoirs already produced to waterflooded residual oil, solution gas is released when the reservoir
pressure drops to below the bubble point. This gas becomes mobilised when the critical gas saturation has been reached.
Additionally, the oil itself can become mobile from its residual state and can also be produced under suitable physical conditions.
The critical gas saturation, the rate of saturation change, and the gas saturation remaining at the end of the depressurisation process
(unrecoverable gas) are important parameters in determining the overall economic performance when depressurising a reservoir.
In this, and previous work, we are demonstrating that these quantities depend additionally upon other factors which affect
the fluid distribution and the rate of gas generation, particularly the surface and interfacial properties. For instance, earlier visual
experiments in glass micromodels suggested that wettability and oil spreading coefficient could substantially influence both the
value of the critical gas saturation and the growth pattern for the developing gas bubbles, and thus the gas flow. In order to
confirm these observations and to provide quantitative data, further experiments in large sintered packs, with different matrix
wettability and with oils having different spreading coefficients (e.g. oil spreading onto a gas–water interface), have been
carried out and are reported here. These new experiments show that the magnitude of the critical gas saturation for a water-wet
system is about the same irrespective of whether the oil is spreading or non-spreading, but it is much higher than for the oil-wet
case. In addition, oil is also produced but the rate of production is dependent upon the rock wettability and the oil
characteristics. We find that in a water-wet medium, for spreading oils, the physical form of the oil becomes transformed from
being immobile ganglia into mobile oil films, which can then be transported by the gas. For non-spreading oils, oil has to be
pushed out by the gas as discontinuous ganglia so less is oil produced. In contrast, in an oil-wet system, the oil phase already
exists as a continuous film on the surface of the solid so that the generation of gas effectively expands the oil phase, enabling the
oil to be produced in larger quantities even at lower gas saturations.
These new experiments give further evidence that rock wettability has an important influence on the performance of gas
production from residual oil. Additionally, significant amounts of oil may be recovered after waterflooding from the residual
condition, which could have a beneficial impact on the economics of the depressurisation.
D 2003 Elsevier Science B.V. All rights reserved.
Keywords: Waterflooded; Residual oil; Depressurisation; Gas production; Wettability
0920-4105/03/$ - see front matter D 2003 Elsevier Science B.V. All rights reserved.
doi:10.1016/S0920-4105(03)00070-6
* Corresponding author. Fax: +44-207-594-7444.
E-mail addresses: [email protected] (C.A. Grattoni), [email protected] (R.A. Dawe).1 Fax: +1-868-662-4414.
C.A. Grattoni, R.A. Dawe / Journal of Petroleum Science and Engineering 39 (2003) 297–308298
1. Introduction
After the economic limit for oil production by
waterflooding has been reached, significant quantities
of hydrocarbons can be left in the reservoir. Reser-
voirs with a high solution gas–oil ratio, which have
been waterflooded above the bubble point, are good
candidates for depressurisation. During depressurisa-
tion, solution gas is released from residual oil when
the reservoir pressure drops to below the bubble point.
The gas starts to flow only after the critical gas
saturation has been reached. The critical gas saturation
is thus an important parameter in determining the
economic viability of depressurising a reservoir after
it has been waterflooded. If the value of the critical
gas saturation is high, some considerable time elapses
before any gas is produced, so that its discounted
economic value is reduced, whereas a low value of
critical gas saturation produces an early return on the
investment (Dumore, 1970; Moulu and Longeron,
1989; Beecroft et al., 1999). The rate of gas produc-
tion is controlled by the relative permeabilities,
mainly the gas values. This affects the ultimate gas
saturation, gas remaining at the end of the depressur-
isation, and ultimately the economic viability of the
process (Ligthelm et al., 1997; Naylor et al., 2000).
The evolution of gas saturation in three-phase
systems has been studied under a wide range of
conditions, particularly the critical gas saturation
(Moulu and Longeron, 1989; Kortekaas and van
Poelgeest, 1991; Li and Yortsos, 1991; Kashchiev
and Firoozabadi, 1993). It is worth noting that exter-
nal gas injection processes are intrinsically different
from internal gas generation and bubble growth into
gas clusters. When gas is released from waterflooding
residual oil, the gas saturation has to reach a critical
value before it can start to move (Kortekaas and van
Poelgeest, 1991; Firoozabadi et al., 1992; Li and
Yortsos, 1993; Egermann and Vizika, 2000). This
critical gas saturation is highly dependent on the rate
of pressure depletion (Scherpenisse et al., 1994).
Earlier studies of the physical processes of nucleation,
growth and mobilisation of the gas released from
solution showed that the gas and oil mobility are
controlled by the oil–water interfacial tension if the
oil has a positive spreading coefficient and the matrix
is water-wet (Hawes et al., 1996). This scenario is
consistent with the results from high-pressure core
experiments (Kortekaas and van Poelgeest, 1991;
Braithwaite and Schulte, 1992; Scherpenisse et al.,
1994). In previous work, using glass micromodels,
Hawes et al. (1996, 1997) indicated that both rock
wettability and the oil spreading coefficient could
substantially influence the value of the critical gas
saturation and the growth pattern of the developing
gas bubbles. Naylor et al. (2000) performed exper-
imental studies in aged cores and suggested that
wettability might play an important role in hydro-
carbon recovery. Further experiments for oil-spread-
ing oils in water-wet beadpacks (Grattoni et al., 2001)
showed that the gas relative permeability is much
smaller, up to an order of magnitude, than those
obtained from displacement experiments or from
calculations using traditional correlations. These low
values of relative permeabilities are consistent with
published data on depressurisation of cores at reser-
voir conditions (Naylor et al., 2000; Drummond et al.,
2001). If this occurs within the reservoir, then low gas
flow rates will occur at the early stages of depressur-
isation.
The fluid distribution and flow within a porous
media is controlled by the fluid–fluid interactions
(interfacial tensions) and fluid–solid interactions
(wettability). The combination of all these interactions
will determine the topology and morphology of the
fluids within the porous media. The spreading coef-
ficient of a fluid, So, is the imbalance between the
interfacial tensions (forces) acting along a single line
(contact line between fluid phases). For the gas–oil–
water system, the oil spreading coefficient on a
water–gas interface can be defined as (Rowlinson
and Widom, 1982):
So ¼ cwg � cow � cog ð1Þ
where cwg is the water–gas surface tension, cow is
the oil–water interfacial tension and cog is the oil–
gas surface tension. The spreading coefficient is
really the difference between the work of adhesion
and cohesion. An oil positive spreading coefficient
indicates that oil will form a spreading film on the
gas–water interface. If the oil has a negative coef-
ficient (non-spreading), the fluids will form a non-
zero contact angle with the other two phases along
the contact line. In three-phase systems, only two
contact angles can be independent (Blunt, 2001).
C.A. Grattoni, R.A. Dawe / Journal of Petroleum Science and Engineering 39 (2003) 297–308 299
Some examples of fluid distributions for different
wettability conditions, spreading coefficients and
flow mechanisms can be found elsewhere (Grattoni
et al., 1997).
Many experiments have been performed on the
effect of wetting and spreading for gas injection
displacement processes (Grader and O’meara, 1988;
Oak, 1990, 1991; Vizika and Lombard, 1996; Dicarlo
et al., 2000), but data on the internal gas production or
depressurisation process are more scarce. In view of
this, an experimental study has been undertaken at
Imperial College using large sintered packs with
different matrix wettability, and for oils with different
spreading coefficients (e.g. oil spreading onto a gas–
water interface). This paper reports the results on the
influence of wettability and oil spreading character-
istics on critical gas saturation, ultimate gas saturation
and oil recovery for gas production from waterflooded
residual oil.
Table 1
Fluid interfacial tensions, spreading coefficients and densities at
35 jC
Spreading system,
n-pentane +
heavy paraffin +
distilled water
Non-spreading system,
n-pentane + heavy
paraffin + distilled
water + n-butyl alcohol
cgw (mN/m) 55.6 30.1
cow (mN/m) 29.3 8.5
cgo (mN/m) 23.6 22.8
So (mN/m) + 2.7 � 1.2
qo (kg/m3) 777 779
qw (kg/m3) 1003 993
qg (kg/m3) 2 2
2. Experimental approach
The experiments to observe and quantify the oil–
water–gas dynamic behaviour were performed in
large rectangular, core-scale, sintered packs of 13
cm width, 30 cm length and 0.4 cm depth, containing
more than 200,000 randomly packed but sintered
glass beads of 0.85–1.23 mm in diameter. Although
these homogeneous test sections are a simplistic
representation of the pore space, we believe that they
accurately represent the main flow characteristics of
reservoir rocks and have the merit of being transparent
so that any movement of the fluids can be observed.
During the sintering process, the test sections were
heated to a temperature of 730 jC, so making the
surfaces of the models strongly water-wet. Strongly
oil-wet conditions could be achieved by treating the
surfaces with a commercially available water-repel-
lent, 2% dimethyl dichlorosilane in 1-1-1 trichloro-
ethane (Repelcote from Merck). The wettability was
preserved by first contacting the test section with the
wetting fluid.
Before starting any experiment, the sintered pack
was first filled with CO2 and, for the water-wet
condition, flooded with degassed water until it was
fully saturated. It was then flooded with oil to irredu-
cible water saturation and re-flooded with degassed
water to produce residual oil saturation. For the oil-
wet condition, the test section was first filled with
CO2 then flooded with several pore volumes of oil,
and re-flooded with degassed water to the residual oil
saturation.
As in our previous experiments, the oleic phase
was modelled as a simple hydrocarbon mixture
consisting of n-pentane dissolved in heavy paraffin
(nonvolatile oil) in a volumetric ratio 40:60 (Hawes
et al., 1996; Grattoni et al., 2001). For gas gener-
ation, we have adopted the procedure of heating the
mixture to produce gas from the oil phase. The
physics involved and effects we are wishing to
observe are identical to those in pressure reduction
(actual reservoir behaviour), but the experimental
procedures are simpler than performing experiments
by pressure reduction where the gas would be
released from solution by reducing the pressure
below the bubble point. The three-phase mixture that
was created (oil –gas–water) had a positive oil
spreading coefficient. Non-spreading oil conditions
were obtained by adding a small amount of n-butyl
alcohol to the mixture. Table 1 gives the properties
of the fluids. The oil–water phase was pre-equili-
brated for a week before use.
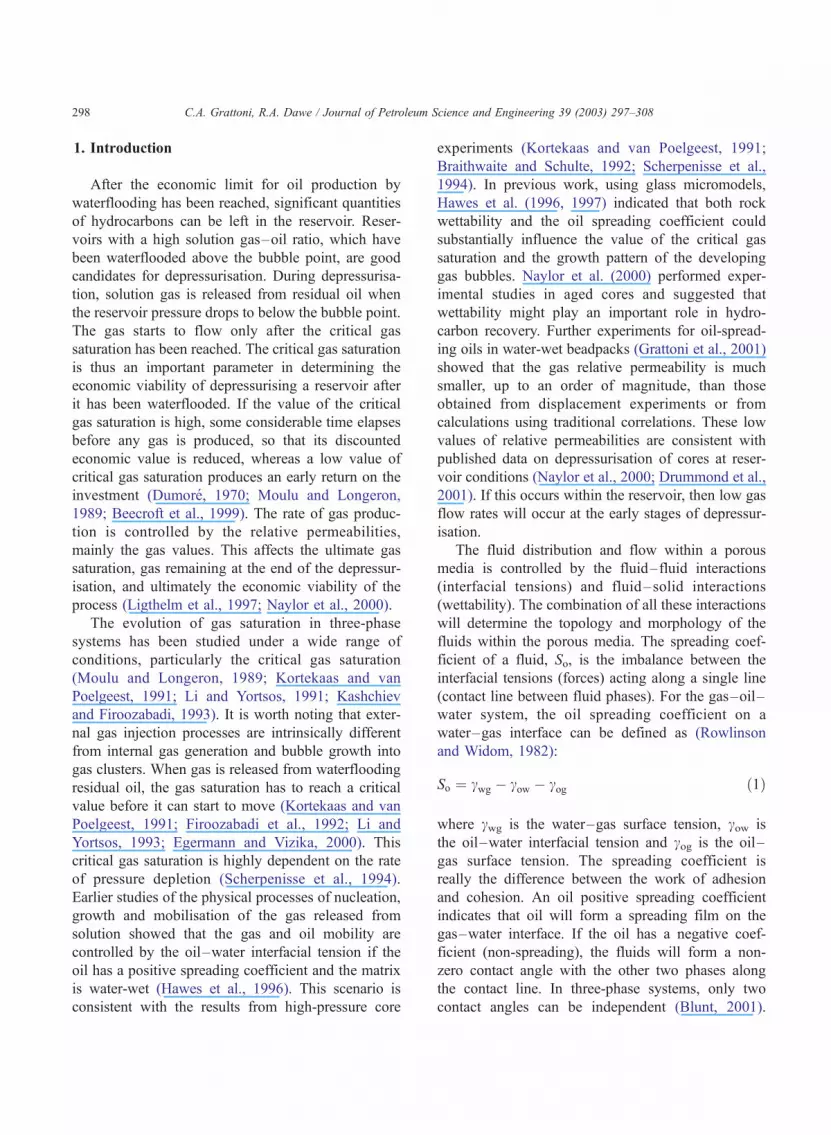
A diagram of the experimental arrangement is
shown in Fig. 1. The test section was mounted
vertically in a temperature controlled water bath
and the outlet was connected to a condensing sec-
tion, which was kept at low temperature (i18 jC)by circulating water through an outer jacket. During
the experiment, the temperature of the water bath
was slowly increased from 30 up to 46 jC at a
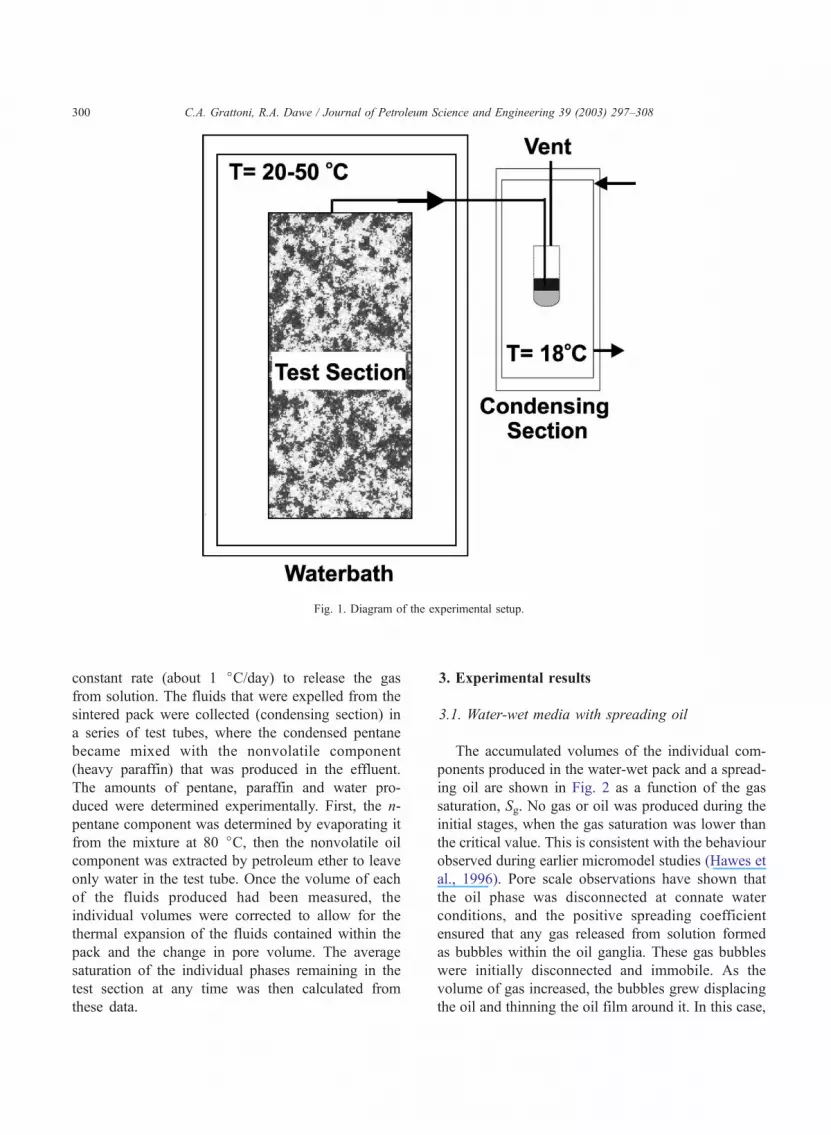
Fig. 1. Diagram of the experimental setup.
C.A. Grattoni, R.A. Dawe / Journal of Petroleum Science and Engineering 39 (2003) 297–308300
constant rate (about 1 jC/day) to release the gas
from solution. The fluids that were expelled from the
sintered pack were collected (condensing section) in
a series of test tubes, where the condensed pentane
became mixed with the nonvolatile component
(heavy paraffin) that was produced in the effluent.
The amounts of pentane, paraffin and water pro-
duced were determined experimentally. First, the n-
pentane component was determined by evaporating it
from the mixture at 80 jC, then the nonvolatile oil
component was extracted by petroleum ether to leave
only water in the test tube. Once the volume of each
of the fluids produced had been measured, the
individual volumes were corrected to allow for the
thermal expansion of the fluids contained within the
pack and the change in pore volume. The average
saturation of the individual phases remaining in the
test section at any time was then calculated from
these data.
3. Experimental results
3.1. Water-wet media with spreading oil
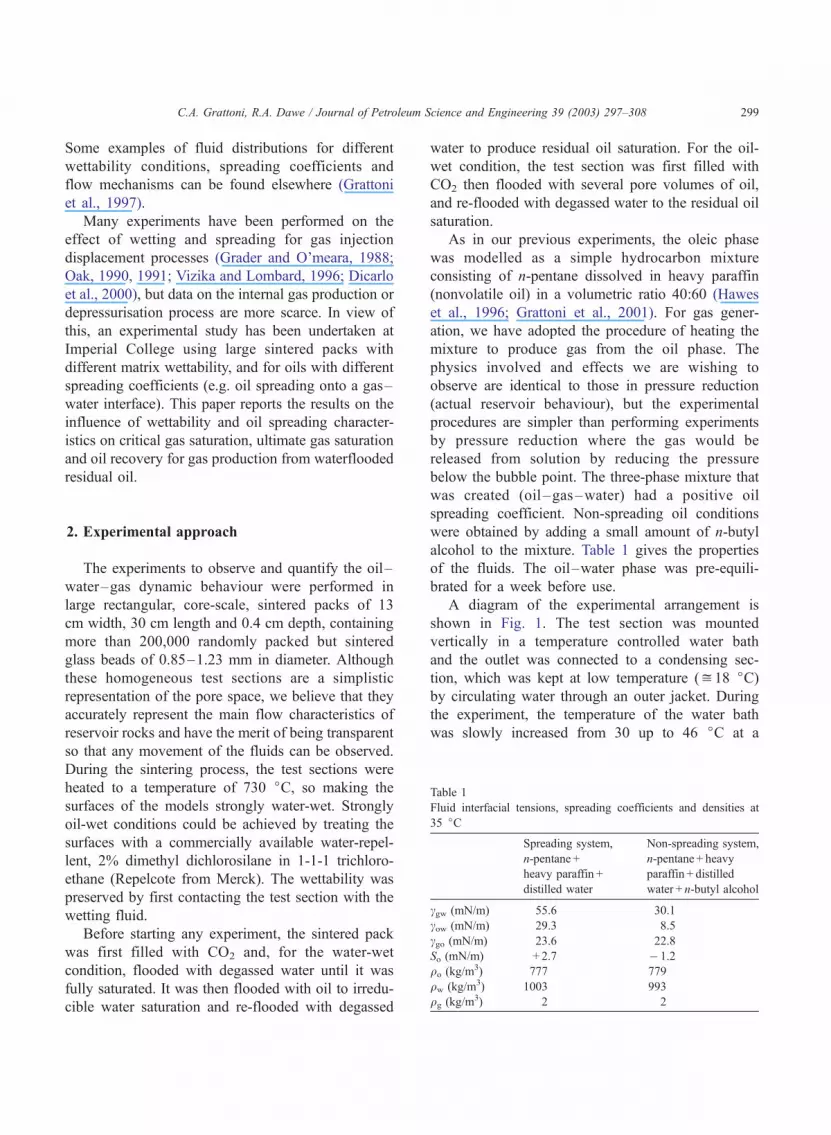
The accumulated volumes of the individual com-
ponents produced in the water-wet pack and a spread-
ing oil are shown in Fig. 2 as a function of the gas
saturation, Sg. No gas or oil was produced during the
initial stages, when the gas saturation was lower than
the critical value. This is consistent with the behaviour
observed during earlier micromodel studies (Hawes et
al., 1996). Pore scale observations have shown that
the oil phase was disconnected at connate water
conditions, and the positive spreading coefficient
ensured that any gas released from solution formed
as bubbles within the oil ganglia. These gas bubbles
were initially disconnected and immobile. As the
volume of gas increased, the bubbles grew displacing
the oil and thinning the oil film around it. In this case,
Fig. 2. Cumulative effluent production for water-wet media and spreading oil. (A) Gas production; (B) oil and water production.
C.A. Grattoni, R.A. Dawe / Journal of Petroleum Science and Engineering 39 (2003) 297–308 301
the controlling parameter for gas mobility is the oil–
water interfacial tension, because as the oil is spread-
ing, the gas–oil interface always precedes the oil–gas
interface, Fig. 3. During the initial stage, only water
was produced, until the gas saturation reached 9%.
Then a sufficient number of bubbles had become
connected to allow gas to flow through the matrix
and out of the sintered pack (we define this as the
critical saturation). It was observed that although the
gas started to flow when the saturation reached 9%,
Fig. 3. Oil, gas and water distribution for a water-wet
the critical saturation, both the gas flow rate and gas
saturation continued to increase as more gas was
released from solution, until the gas saturation reached
an ultimate value of 30%. It was also noticed that
some of the nonvolatile oil was produced as soon as
gas flowed out of the core, and at the end of the
experiment, oil accounted for about 32% of the total
liquid collected. Thus, the nucleation and expansion
of the gas bubbles had mobilised oil ganglia that were
initially trapped within the matrix by interfacial
media. (A) Spreading oil; (B) non-spreading oil.
C.A. Grattoni, R.A. Dawe / Journal of Petroleum Science and Engineering 39 (2003) 297–308302
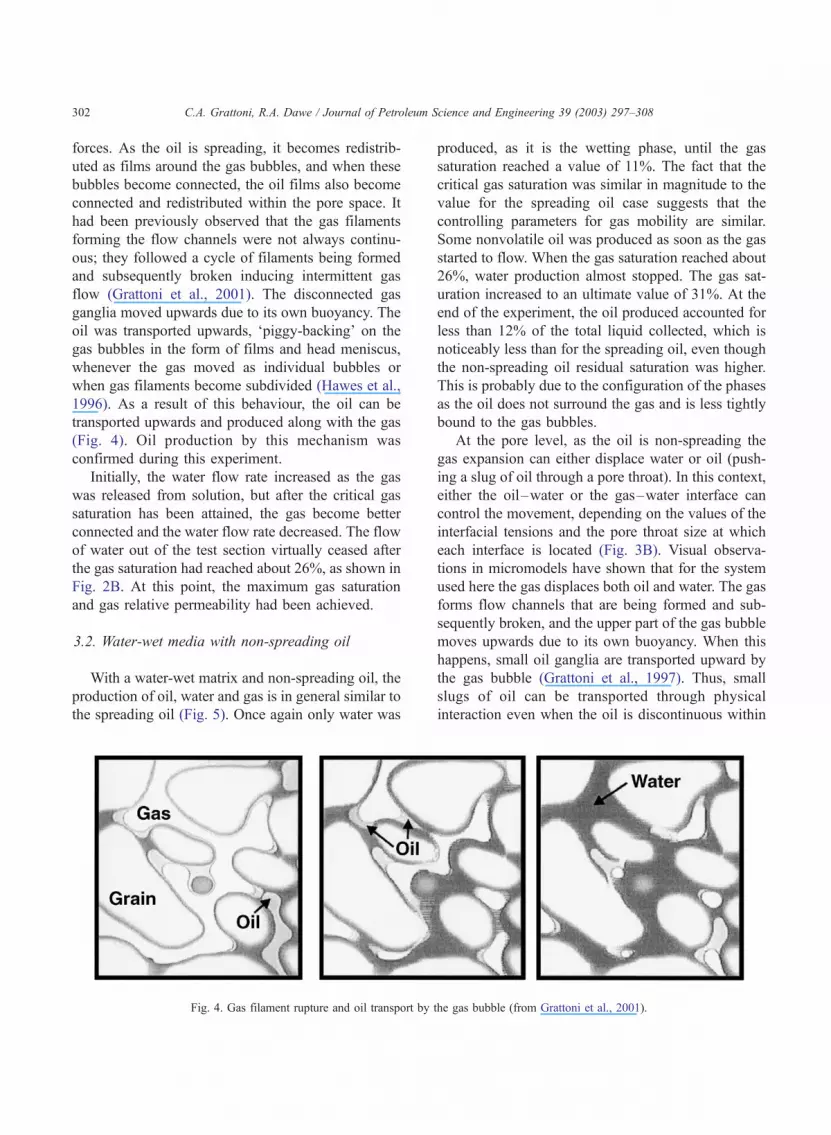
forces. As the oil is spreading, it becomes redistrib-
uted as films around the gas bubbles, and when these
bubbles become connected, the oil films also become
connected and redistributed within the pore space. It
had been previously observed that the gas filaments
forming the flow channels were not always continu-
ous; they followed a cycle of filaments being formed
and subsequently broken inducing intermittent gas
flow (Grattoni et al., 2001). The disconnected gas
ganglia moved upwards due to its own buoyancy. The
oil was transported upwards, ‘piggy-backing’ on the
gas bubbles in the form of films and head meniscus,
whenever the gas moved as individual bubbles or
when gas filaments become subdivided (Hawes et al.,
1996). As a result of this behaviour, the oil can be
transported upwards and produced along with the gas
(Fig. 4). Oil production by this mechanism was
confirmed during this experiment.
Initially, the water flow rate increased as the gas
was released from solution, but after the critical gas
saturation has been attained, the gas become better
connected and the water flow rate decreased. The flow
of water out of the test section virtually ceased after
the gas saturation had reached about 26%, as shown in
Fig. 2B. At this point, the maximum gas saturation
and gas relative permeability had been achieved.
3.2. Water-wet media with non-spreading oil
With a water-wet matrix and non-spreading oil, the
production of oil, water and gas is in general similar to
the spreading oil (Fig. 5). Once again only water was
Fig. 4. Gas filament rupture and oil transport by
produced, as it is the wetting phase, until the gas
saturation reached a value of 11%. The fact that the
critical gas saturation was similar in magnitude to the
value for the spreading oil case suggests that the
controlling parameters for gas mobility are similar.
Some nonvolatile oil was produced as soon as the gas
started to flow. When the gas saturation reached about
26%, water production almost stopped. The gas sat-
uration increased to an ultimate value of 31%. At the
end of the experiment, the oil produced accounted for
less than 12% of the total liquid collected, which is
noticeably less than for the spreading oil, even though
the non-spreading oil residual saturation was higher.
This is probably due to the configuration of the phases
as the oil does not surround the gas and is less tightly
bound to the gas bubbles.
At the pore level, as the oil is non-spreading the
gas expansion can either displace water or oil (push-
ing a slug of oil through a pore throat). In this context,
either the oil–water or the gas–water interface can
control the movement, depending on the values of the
interfacial tensions and the pore throat size at which
each interface is located (Fig. 3B). Visual observa-
tions in micromodels have shown that for the system
used here the gas displaces both oil and water. The gas
forms flow channels that are being formed and sub-
sequently broken, and the upper part of the gas bubble
moves upwards due to its own buoyancy. When this
happens, small oil ganglia are transported upward by
the gas bubble (Grattoni et al., 1997). Thus, small
slugs of oil can be transported through physical
interaction even when the oil is discontinuous within
the gas bubble (from Grattoni et al., 2001).
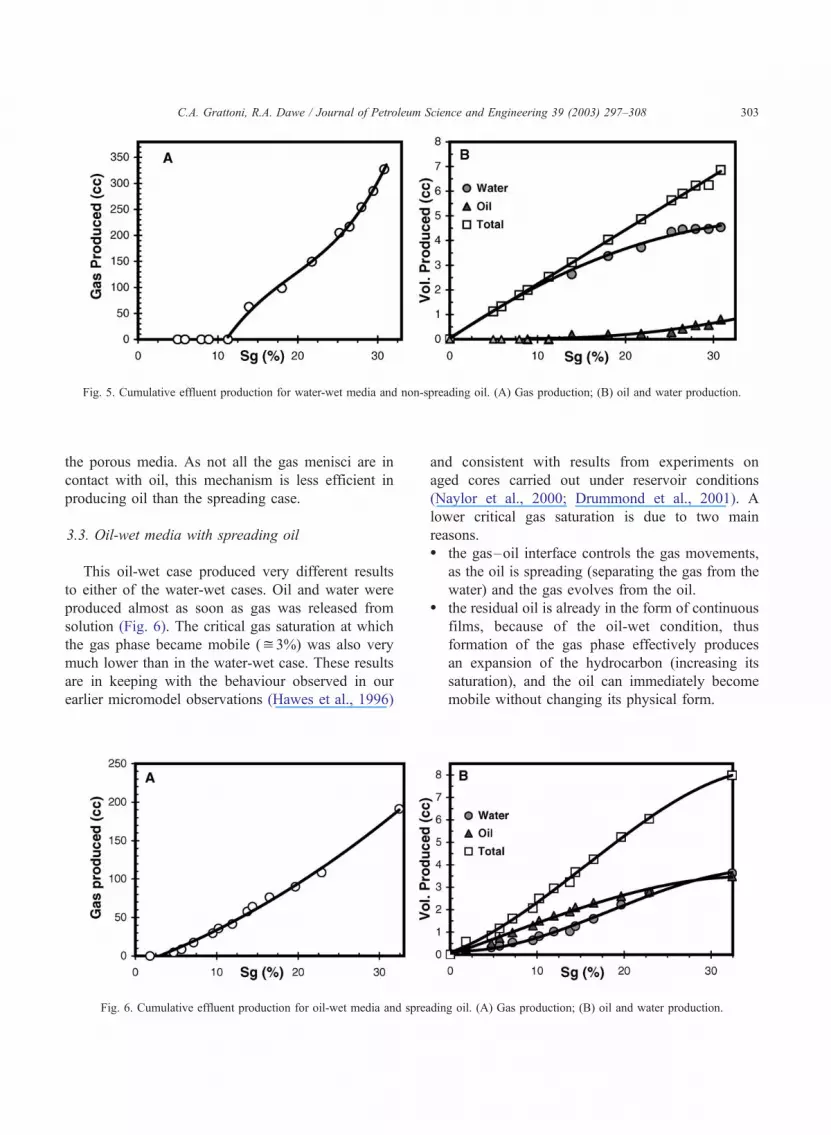
Fig. 5. Cumulative effluent production for water-wet media and non-spreading oil. (A) Gas production; (B) oil and water production.
C.A. Grattoni, R.A. Dawe / Journal of Petroleum Science and Engineering 39 (2003) 297–308 303
the porous media. As not all the gas menisci are in
contact with oil, this mechanism is less efficient in
producing oil than the spreading case.
3.3. Oil-wet media with spreading oil
This oil-wet case produced very different results
to either of the water-wet cases. Oil and water were
produced almost as soon as gas was released from
solution (Fig. 6). The critical gas saturation at which
the gas phase became mobile (i3%) was also very
much lower than in the water-wet case. These results
are in keeping with the behaviour observed in our
earlier micromodel observations (Hawes et al., 1996)
Fig. 6. Cumulative effluent production for oil-wet media and sprea
and consistent with results from experiments on
aged cores carried out under reservoir conditions
(Naylor et al., 2000; Drummond et al., 2001). A
lower critical gas saturation is due to two main
reasons.� the gas–oil interface controls the gas movements,
as the oil is spreading (separating the gas from the
water) and the gas evolves from the oil.� the residual oil is already in the form of continuous
films, because of the oil-wet condition, thus
formation of the gas phase effectively produces
an expansion of the hydrocarbon (increasing its
saturation), and the oil can immediately become
mobile without changing its physical form.
ding oil. (A) Gas production; (B) oil and water production.
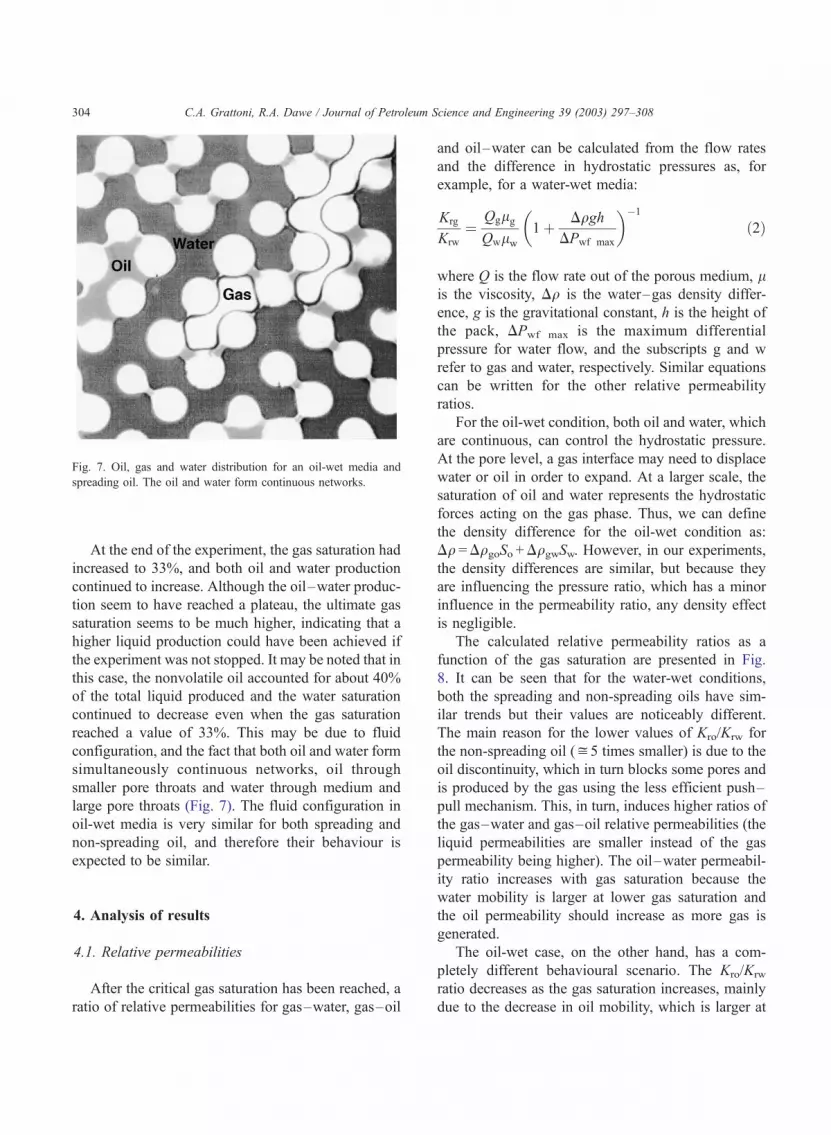
Fig. 7. Oil, gas and water distribution for an oil-wet media and
spreading oil. The oil and water form continuous networks.
C.A. Grattoni, R.A. Dawe / Journal of Petroleum Science and Engineering 39 (2003) 297–308304
At the end of the experiment, the gas saturation had
increased to 33%, and both oil and water production
continued to increase. Although the oil–water produc-
tion seem to have reached a plateau, the ultimate gas
saturation seems to be much higher, indicating that a
higher liquid production could have been achieved if
the experiment was not stopped. It may be noted that in
this case, the nonvolatile oil accounted for about 40%
of the total liquid produced and the water saturation
continued to decrease even when the gas saturation
reached a value of 33%. This may be due to fluid
configuration, and the fact that both oil and water form
simultaneously continuous networks, oil through
smaller pore throats and water through medium and
large pore throats (Fig. 7). The fluid configuration in
oil-wet media is very similar for both spreading and
non-spreading oil, and therefore their behaviour is
expected to be similar.
4. Analysis of results
4.1. Relative permeabilities
After the critical gas saturation has been reached, a
ratio of relative permeabilities for gas–water, gas–oil
and oil–water can be calculated from the flow rates
and the difference in hydrostatic pressures as, for
example, for a water-wet media:
Krg
Krw
¼Qglg
Qwlw
1þ DqghDPwf max
� ��1
ð2Þ
where Q is the flow rate out of the porous medium, lis the viscosity, Dq is the water–gas density differ-
ence, g is the gravitational constant, h is the height of
the pack, DPwf max is the maximum differential
pressure for water flow, and the subscripts g and w
refer to gas and water, respectively. Similar equations
can be written for the other relative permeability
ratios.
For the oil-wet condition, both oil and water, which
are continuous, can control the hydrostatic pressure.
At the pore level, a gas interface may need to displace
water or oil in order to expand. At a larger scale, the
saturation of oil and water represents the hydrostatic
forces acting on the gas phase. Thus, we can define
the density difference for the oil-wet condition as:
Dq =DqgoSo +DqgwSw. However, in our experiments,
the density differences are similar, but because they
are influencing the pressure ratio, which has a minor
influence in the permeability ratio, any density effect
is negligible.
The calculated relative permeability ratios as a
function of the gas saturation are presented in Fig.
8. It can be seen that for the water-wet conditions,
both the spreading and non-spreading oils have sim-
ilar trends but their values are noticeably different.
The main reason for the lower values of Kro/Krw for
the non-spreading oil (i5 times smaller) is due to the
oil discontinuity, which in turn blocks some pores and
is produced by the gas using the less efficient push–
pull mechanism. This, in turn, induces higher ratios of
the gas–water and gas–oil relative permeabilities (the
liquid permeabilities are smaller instead of the gas
permeability being higher). The oil–water permeabil-
ity ratio increases with gas saturation because the
water mobility is larger at lower gas saturation and
the oil permeability should increase as more gas is
generated.
The oil-wet case, on the other hand, has a com-
pletely different behavioural scenario. The Kro/Krw
ratio decreases as the gas saturation increases, mainly
due to the decrease in oil mobility, which is larger at
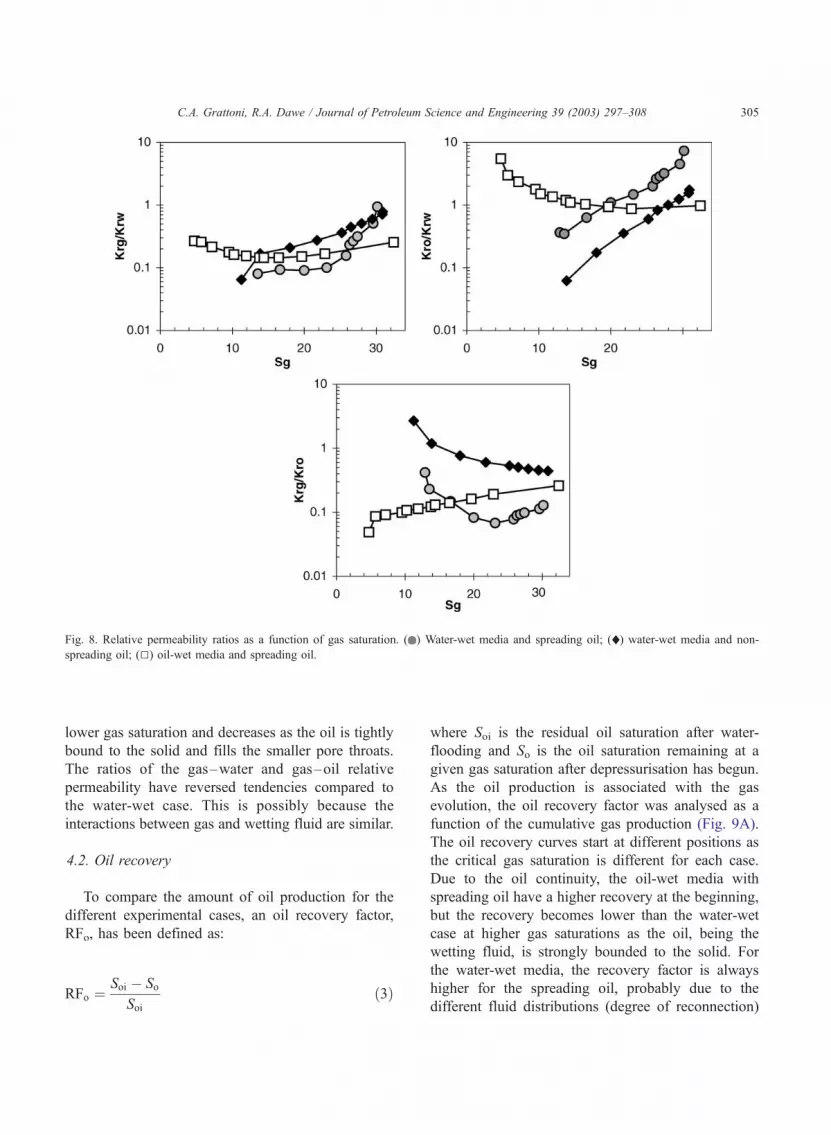
Fig. 8. Relative permeability ratios as a function of gas saturation. ( ) Water-wet media and spreading oil; (x) water-wet media and non-
spreading oil; (5) oil-wet media and spreading oil.
C.A. Grattoni, R.A. Dawe / Journal of Petroleum Science and Engineering 39 (2003) 297–308 305
lower gas saturation and decreases as the oil is tightly
bound to the solid and fills the smaller pore throats.
The ratios of the gas–water and gas–oil relative
permeability have reversed tendencies compared to
the water-wet case. This is possibly because the
interactions between gas and wetting fluid are similar.
4.2. Oil recovery
To compare the amount of oil production for the
different experimental cases, an oil recovery factor,
RFo, has been defined as:
RFo ¼Soi � So
Soið3Þ
where Soi is the residual oil saturation after water-
flooding and So is the oil saturation remaining at a
given gas saturation after depressurisation has begun.
As the oil production is associated with the gas
evolution, the oil recovery factor was analysed as a
function of the cumulative gas production (Fig. 9A).
The oil recovery curves start at different positions as
the critical gas saturation is different for each case.
Due to the oil continuity, the oil-wet media with
spreading oil have a higher recovery at the beginning,
but the recovery becomes lower than the water-wet
case at higher gas saturations as the oil, being the
wetting fluid, is strongly bounded to the solid. For
the water-wet media, the recovery factor is always
higher for the spreading oil, probably due to the
different fluid distributions (degree of reconnection)
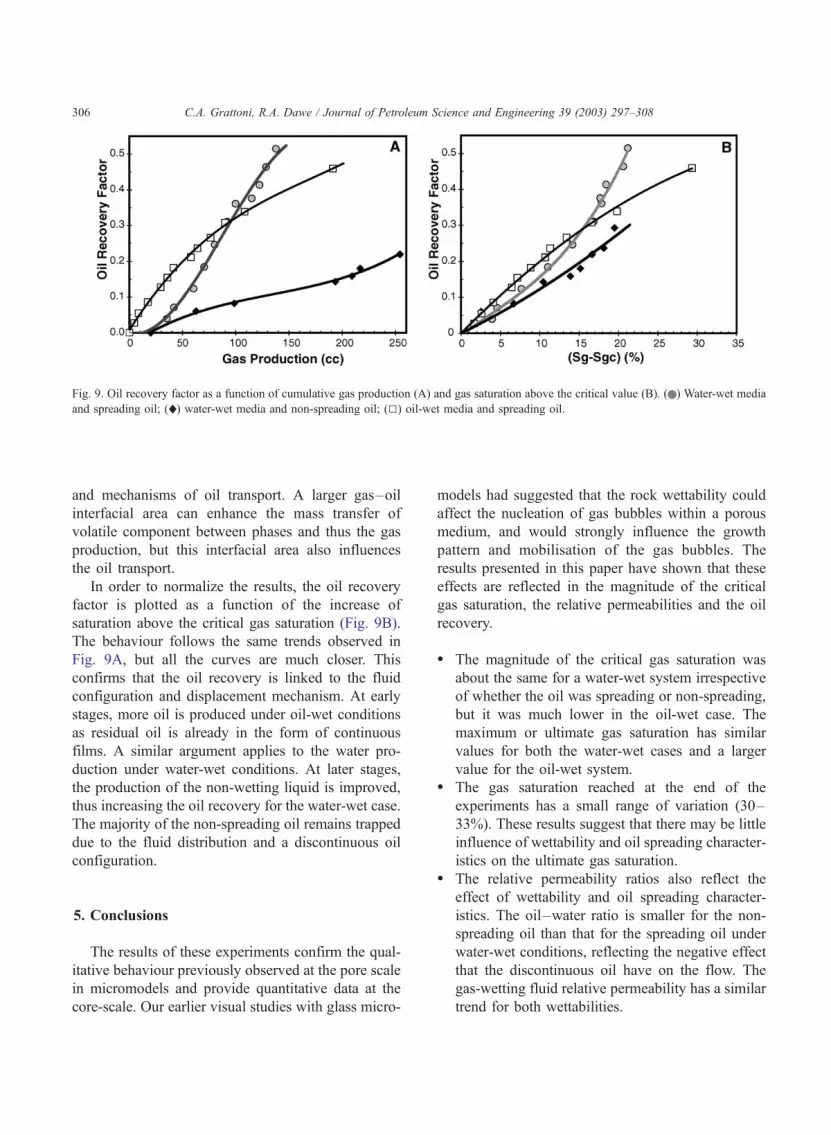
Fig. 9. Oil recovery factor as a function of cumulative gas production (A) and gas saturation above the critical value (B). ( ) Water-wet media
and spreading oil; (x) water-wet media and non-spreading oil; (5) oil-wet media and spreading oil.
C.A. Grattoni, R.A. Dawe / Journal of Petroleum Science and Engineering 39 (2003) 297–308306
and mechanisms of oil transport. A larger gas–oil
interfacial area can enhance the mass transfer of
volatile component between phases and thus the gas
production, but this interfacial area also influences
the oil transport.
In order to normalize the results, the oil recovery
factor is plotted as a function of the increase of
saturation above the critical gas saturation (Fig. 9B).
The behaviour follows the same trends observed in
Fig. 9A, but all the curves are much closer. This
confirms that the oil recovery is linked to the fluid
configuration and displacement mechanism. At early
stages, more oil is produced under oil-wet conditions
as residual oil is already in the form of continuous
films. A similar argument applies to the water pro-
duction under water-wet conditions. At later stages,
the production of the non-wetting liquid is improved,
thus increasing the oil recovery for the water-wet case.
The majority of the non-spreading oil remains trapped
due to the fluid distribution and a discontinuous oil
configuration.
5. Conclusions
The results of these experiments confirm the qual-
itative behaviour previously observed at the pore scale
in micromodels and provide quantitative data at the
core-scale. Our earlier visual studies with glass micro-
models had suggested that the rock wettability could
affect the nucleation of gas bubbles within a porous
medium, and would strongly influence the growth
pattern and mobilisation of the gas bubbles. The
results presented in this paper have shown that these
effects are reflected in the magnitude of the critical
gas saturation, the relative permeabilities and the oil
recovery.
� The magnitude of the critical gas saturation was
about the same for a water-wet system irrespective
of whether the oil was spreading or non-spreading,
but it was much lower in the oil-wet case. The
maximum or ultimate gas saturation has similar
values for both the water-wet cases and a larger
value for the oil-wet system.� The gas saturation reached at the end of the
experiments has a small range of variation (30–
33%). These results suggest that there may be little
influence of wettability and oil spreading character-
istics on the ultimate gas saturation.� The relative permeability ratios also reflect the
effect of wettability and oil spreading character-
istics. The oil–water ratio is smaller for the non-
spreading oil than that for the spreading oil under
water-wet conditions, reflecting the negative effect
that the discontinuous oil have on the flow. The
gas-wetting fluid relative permeability has a similar
trend for both wettabilities.
C.A. Grattoni, R.A. Dawe / Journal of Petroleum S
� The behaviour of the oil phase and the rate of
recovery depend upon the rock wettability, and on
the oil spreading characteristics. Although the oil is
transported by the gas and produced in all the
experiments, the results suggest that this may be
achieved by different mechanisms. In water-wet
systems, for spreading oils, the physical form of
the oil becomes transformed from being immobile
ganglia into films in which the oil is mobile and
can be transported by the gas phase. For a non-
spreading case, less oil is produced. Under this
condition, the oil remains discontinuous, but is re-
mobilised as small droplets or slugs that are
transported by push–pull by the gas. In contrast,
in the oil-wet system, the oil already exists as
continuous films on the surface of the solid, and
formation of the gas phase effectively expands the
hydrocarbon phase. As a result, oil becomes
mobile and is produced as soon as gas is released
from solution.
The experiments have confirmed that rock wett-
ability and oil spreading characteristics influence the
critical gas saturation, the recovery rates and the
ultimate gas saturation when gas is released from
residual oil after waterflooding, such as during the
depressurisation of waterflooded reservoirs. Clearly,
care is needed in the choice of values of the gas
critical saturation and relative permeabilities for
simulating reservoir performance, as well as estimat-
ing the feasibility or economic performance of the
gas and oil production from reservoir waterflooded
residual oil.
Nomenclature
g gravitational constant, m/s2
h height of the pack, m
K relative permeability
P pressure, Pa
Q flow rate, m3/s
RFo oil recovery factor
S saturation
So oil spreading coefficient, N/m
Greek symbols
c surface or interfacial tension, N/m
l viscosity, Pa s
q density, kg/m3
Subscripts
g gas
i initial at residual oil saturation
o oil
r relative
w water
cience and Engineering 39 (2003) 297–308 307
Acknowledgements
The authors wish to thank Dr. X.D. Jing and Dr.
R.W. Zimmerman for encouragement, R.I. Hawes for
valuable discussions, and EPSRC for financial sup-
port.
References
Beecroft, W.J., Mani, V., Wood, A.R.O., Rusinek, I., 1999. Evalua-
tion of depressurisation, Miller field, North Sea. SPE 56692,
SPE Tech. Conf. and Exhibition, Houston, TX.
Blunt, M.J., 2001. Constraints on contact angles for multiple phases
in thermodynamic equilibrium. Journal of Colloid and Interface
Science 239, 281–282.
Braithwaite, C.I.M., Schulte, W.M., 1992. Transforming the future
of the Brent field; depressurisation—the next development
phase. SPE 25026, SPE European Petroleum Conference, Can-
nes, France.
Dicarlo, D.A., Sahni, A., Blunt, M.J., 2000. Three-phase relative
permeability of water-wet, oil-wet and mixed-wet sandpacks.
SPE Journal 5, 82–91.
Drummond, A., Fishlock, T., Naylor, P., Rothkopf, B., 2001. An
evaluation of post-waterflood depressurisation of the South Brae
field, North Sea. SPE 71487, SPE Tech. Conf. and Exhibition,
New Orleans, LA.
Dumore, J.M., 1970. Development of gas-saturation during solu-
tion-gas drive in an oil layer below a gas cap. SPE Journal 10,
211–218.
Egermann, P., Vizika, O., 2000. Critical gas saturation and relative
permeability during depressurisation in the far field and the
near-wellbore region. SPE 63149, SPE Tech. Conf. and Exhibi-
tion, Dallas, TX.
Firoozabadi, A., Ottesen, B., Mikkelsen, M., 1992. Measurement of
supersaturation and critical gas saturation. SPE Formation Eval-
uation 7, 337–344.
Grader, A.S., O’meara Jr., D.J., 1988. Dynamic displacement meas-
urements of three-phase relative permeabilities using three im-
miscible liquids. SPE 18293, SPE Tech. Conf. and Exhibition,
Houston, TX.
Grattoni, C.A., Pingo Almada, M.B., Dawe, R.A., 1997. Pore and
core-scale displacement mechanisms with spreading and wetting
effects during three-phase flow. SPE 39032, SPE V LACPEC,
Rio Janeiro, Brazil.
Grattoni, C.A., Hawes, R.I., Dawe, R.A., 2001. Production of gas
C.A. Grattoni, R.A. Dawe / Journal of Petroleum Science and Engineering 39 (2003) 297–308308
from waterflood residual oil –gas saturation build-up and rela-
tive permeabilities. Petroleum Geoscience 7, 131–136.
Hawes, R.I., Dawe, R.A., Evans, R.N., Grattoni, C.A., 1996. The
depressurisation of waterflooded reservoirs: wettability and crit-
ical gas saturation. Petroleum Geoscience 2, 117–123.
Hawes, R.I., Dawe, R.A., Evans, R.N., 1997. The release of
solution gas from waterflooded residual oil. SPE Journal 2,
379–388.
Kashchiev, D., Firoozabadi, A., 1993. Kinetics of the initial stage of
isothermal gas phase formation. Journal of Chemical Physics
98, 4690–4699.
Kortekaas, T.F., van Poelgeest, F., 1991. Liberation of solution gas
during pressure depletion of virgin and watered out oil reser-
voirs. SPE Reservoir Engineering 6, 329–335.
Li, X., Yortsos, Y., 1991. Visualisation and numerical studies of
bubble growth during pressure reduction. SPE 22589, SPE 66th
Ann. Tech. Conf. and Exhibition, Dallas, TX.
Li, X., Yortsos, Y., 1993. Critical gas saturation: modeling and
sensitivity studies. SPE 26662, SPE 68th Ann. Tech. Conf.
and Exhibition, Houston, TX.
Ligthelm, D.J., Reijnen, G.C.A.M., Wit, K., Weisenborn, A.J.,
Scherpenisse, W., 1997. Critical gas saturation during depres-
surisation and its importance in the Brent field. SPE 38475,
Offshore Europe Conf., Aberdeen, Scotland.
Moulu, J.C., Longeron, D.L., 1989. Solution gas drive: experiments
and simulation. Fifth European Symposium on Improved Oil
Recovery, Budapest, 145–154.
Naylor, P., Fishlock, T., Mogford, D., Smith, R., 2000. Relative
permeability measurements for post-waterflood depressurisation
of the Miller field, North Sea. SPE 63148, SPE Tech. Conf. and
Exhibition, Dallas, TX.
Oak, M.J., 1990. Three-phase relative permeability of water-wet
Berea sandstone. SPE 20183, SPE/DOE Seventh Symposium
on Enhanced Oil Recovery, Tulsa, OK, April 22–25.
Oak, M.J., 1991. Three-phase relative permeability of intermediate-
wet Berea sandstone. SPE 22599, SPE Tech. Conf. and Exhibi-
tion, Dallas, TX.
Rowlinson, J.S., Widom, B., 1982. Molecular Theory of Capillarity.
International Series of Monographs on Chemistry. Clarendon
Press, Oxford, pp. 207–212.
Scherpenisse, W., Wit, K., Zweers, A.E., Snoei, G., Van Wolfswin-
kel, A., 1994. Predicting gas saturation build-up during depres-
surisation of a North Sea oil reservoir. SPE 28842, SPE Europec,
London.
Vizika, O., Lombard, J.M., 1996. Wettability and spreading: two
key parameters in oil recovery with three-phase gravity drain-
age. SPE Reservoir Engineering 11, 54–60.