gali benchmarking tool user guide
TRANSCRIPT

Benchmarking Tool User Guide
About GALIThe Global Accelerator Learning Initiative (GALI) is a project of the Aspen Network of Development Entrepreneurs (ANDE) designed to study early-stage entrepreneurship and acceleration. The initiative was launched in partnership with Emory University and builds upon Emory’s Entrepreneurship Database Program, which worked with accelerator programs around the world between 2013 and 2020 to collect data describing the entrepreneurs that they attract and support.
About the DataBetween 2013 – 2020, Emory University partnered with more than 360 acceleration programs to collect detailed data from more than 23,000 entrepreneurs that had submitted to their respective application processes. The Emory team then resurveyed these entrepreneurs on an annual basis to gather valuable follow-up data, regardless of whether they had been accepted and participated in the program to which they applied.
This dataset, containing detailed information on early-stage ventures from over 100 countries, has now been anonymized and aggregated to allow accelerators from around the world to benchmark their venture outcomes against those in similar regions, sectors, and stages. The dataset accessible through the benchmarking tool contains the 8,658 ventures that provided one-year follow-up data, allowing for analyses of performance in metrics like revenue, employees, and fundraising.
To learn more and see a list of participating programs, visit www.galidata.org/entrepreneurs.
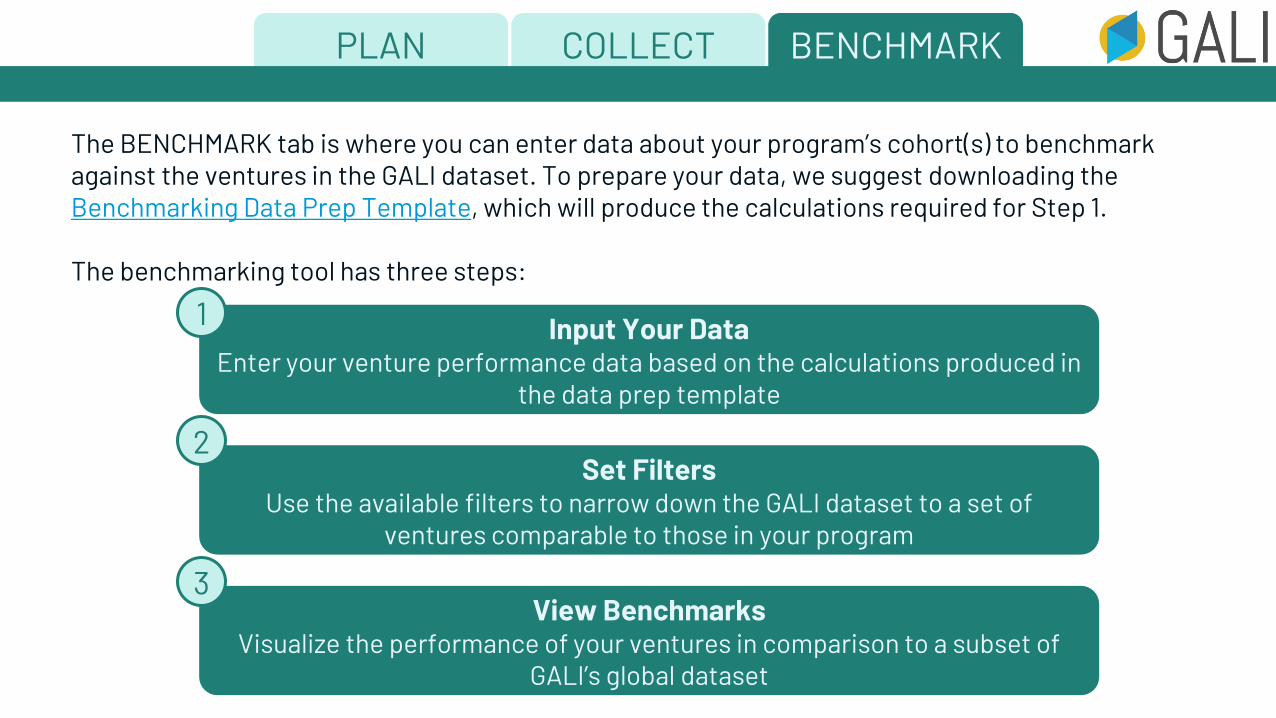
PLAN COLLECT BENCHMARK
Input Your Data Enter your venture performance data based on the calculations produced in
the data prep template
1
Set Filters Use the available filters to narrow down the GALI dataset to a set of
ventures comparable to those in your program
2
View Benchmarks Visualize the performance of your ventures in comparison to a subset of
GALI’s global dataset
3
The BENCHMARK tab is where you can enter data about your program’s cohort(s) to benchmark against the ventures in the GALI dataset. To prepare your data, we suggest downloading the Benchmarking Data Prep Template, which will produce the calculations required for Step 1.
The benchmarking tool has three steps:
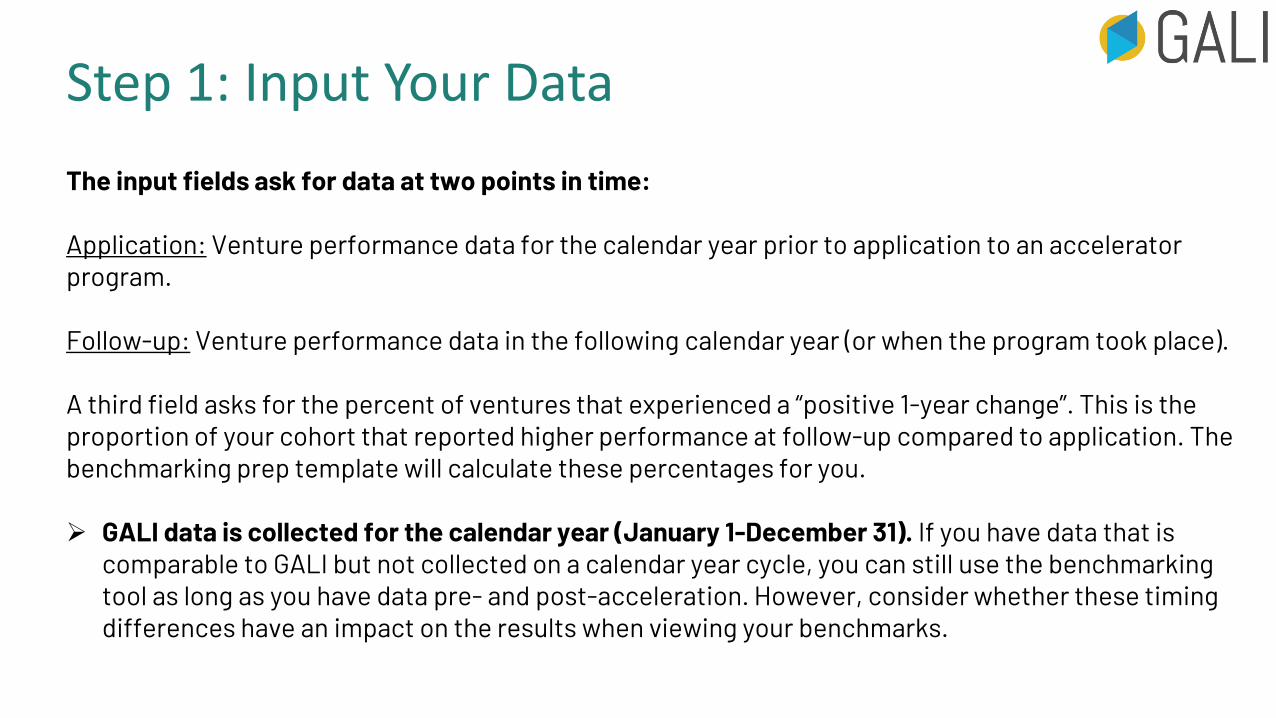
The input fields ask for data at two points in time:
Application: Venture performance data for the calendar year prior to application to an accelerator program.
Follow-up: Venture performance data in the following calendar year (or when the program took place).
A third field asks for the percent of ventures that experienced a “positive 1-year change”. This is the proportion of your cohort that reported higher performance at follow-up compared to application. The benchmarking prep template will calculate these percentages for you.
➢ GALI data is collected for the calendar year (January 1-December 31). If you have data that is comparable to GALI but not collected on a calendar year cycle, you can still use the benchmarking tool as long as you have data pre- and post-acceleration. However, consider whether these timing differences have an impact on the results when viewing your benchmarks.
Step 1: Input Your Data
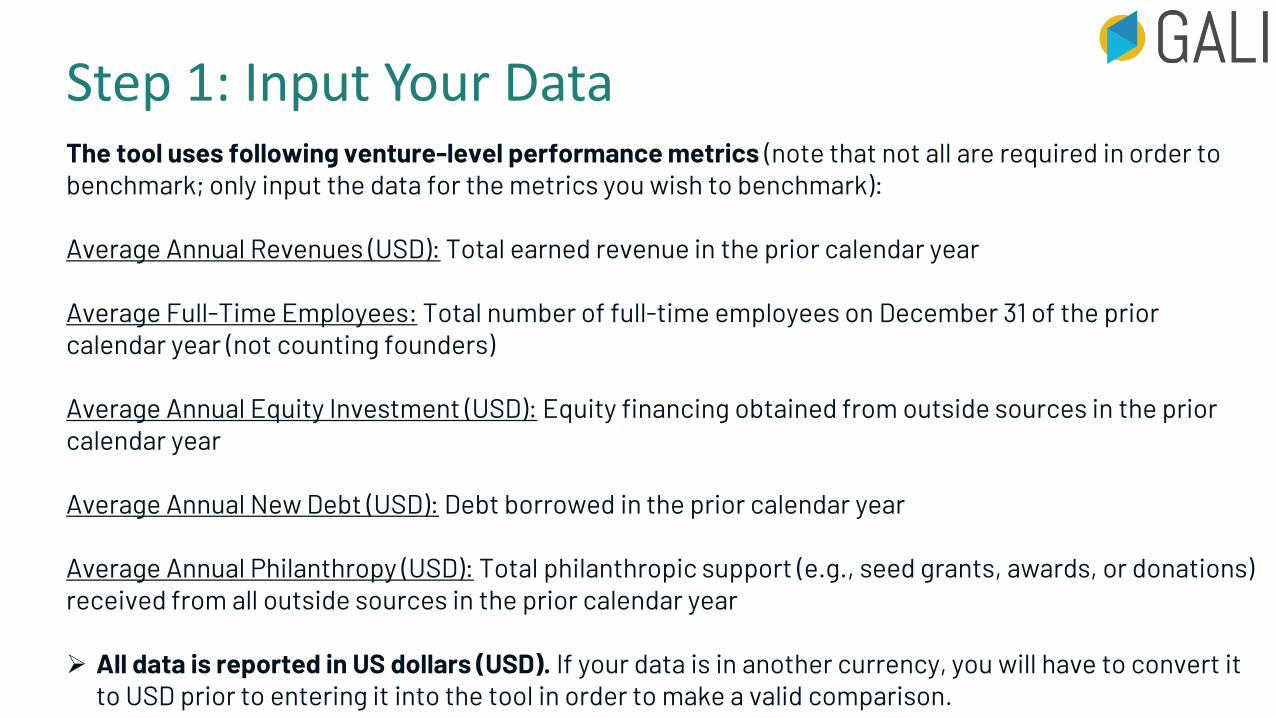
Step 1: Input Your DataThe tool uses following venture-level performance metrics (note that not all are required in order to benchmark; only input the data for the metrics you wish to benchmark):
Average Annual Revenues (USD): Total earned revenue in the prior calendar year
Average Full-Time Employees: Total number of full-time employees on December 31 of the prior calendar year (not counting founders)
Average Annual Equity Investment (USD): Equity financing obtained from outside sources in the prior calendar year
Average Annual New Debt (USD): Debt borrowed in the prior calendar year
Average Annual Philanthropy (USD): Total philanthropic support (e.g., seed grants, awards, or donations) received from all outside sources in the prior calendar year
➢ All data is reported in US dollars (USD). If your data is in another currency, you will have to convert it to USD prior to entering it into the tool in order to make a valid comparison.
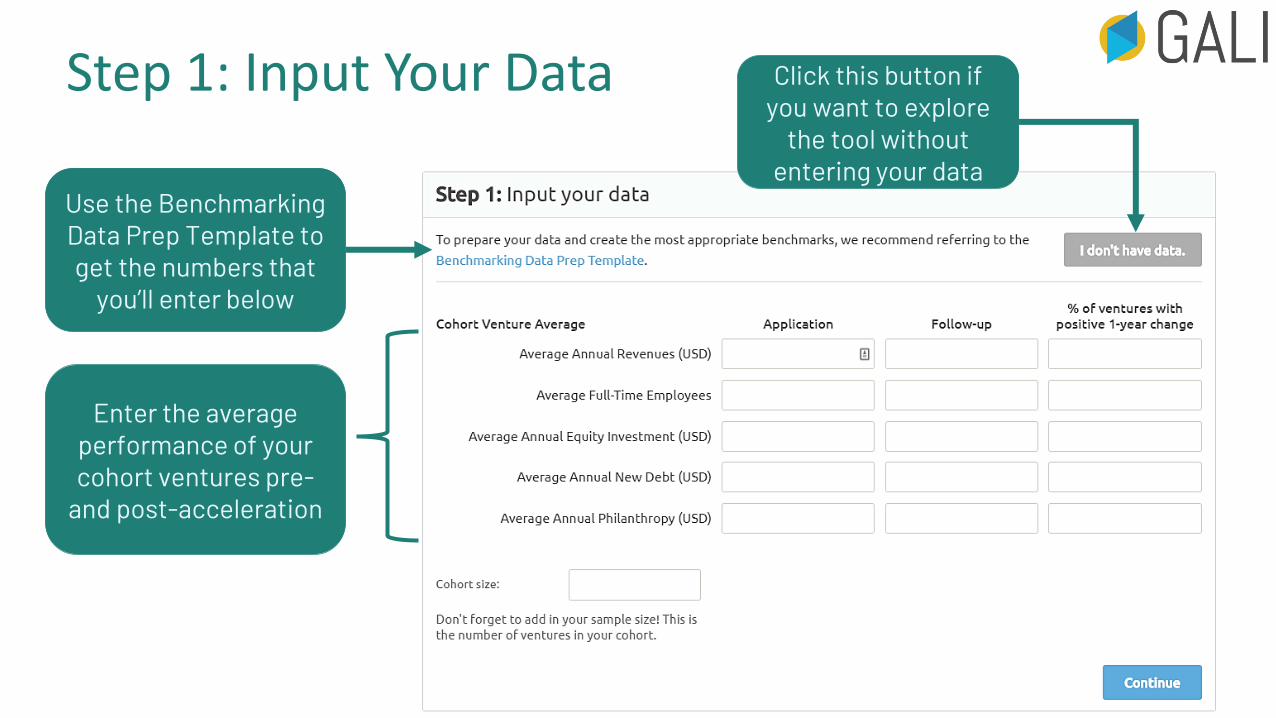
Enter the average performance of your cohort ventures pre-
and post-acceleration
Use the Benchmarking Data Prep Template to get the numbers that
you’ll enter below
Click this button if you want to explore
the tool without entering your data
Step 1: Input Your Data

The filters allow you to narrow down the GALI dataset to a group of ventures that are similar to those in your program. Note that the more filters you set, the smaller the sample of benchmark ventures becomes. To maintain an adequate benchmark sample size, you may need to make tradeoffs between which filters you set.
➢ How do I know if my sample size is too small? The tool will alert you when you have set filters that result in a sample size below our recommended threshold.
➢ Do I have to set filters? You do not have to set filters, you are welcome to benchmark against the full GALI dataset.
Step 2: Set Your Filters

Use the Program Filters to narrow the sample to
ventures that applied to programs similar to yours
Use the Venture Filters to narrow the sample to
ventures with characteristics (stage, sector, etc.) similar to
those in your cohort
As you set filters, the values in this box will change to reflect how your benchmark sample is changing, including:
• From how many programs data is being pulled
• The number of accelerated ventures• The number of non-accelerated ventures
(those that applied to an accelerator but did not participate)
• The total number ventures
Step 2: Set Your Filters
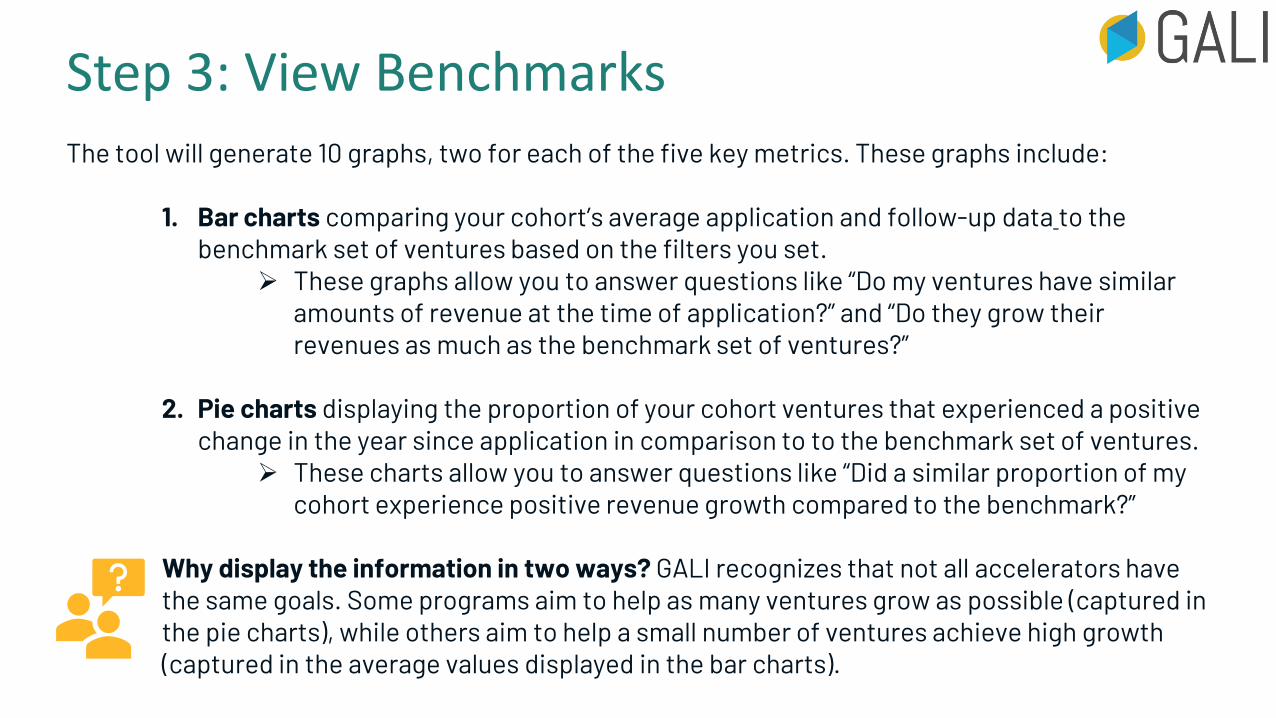
The tool will generate 10 graphs, two for each of the five key metrics. These graphs include:
1. Bar charts comparing your cohort’s average application and follow-up data to the benchmark set of ventures based on the filters you set.
➢ These graphs allow you to answer questions like “Do my ventures have similar amounts of revenue at the time of application?” and “Do they grow their revenues as much as the benchmark set of ventures?”
2. Pie charts displaying the proportion of your cohort ventures that experienced a positive change in the year since application in comparison to to the benchmark set of ventures.
➢ These charts allow you to answer questions like “Did a similar proportion of my cohort experience positive revenue growth compared to the benchmark?”
Why display the information in two ways? GALI recognizes that not all accelerators have the same goals. Some programs aim to help as many ventures grow as possible (captured in the pie charts), while others aim to help a small number of ventures achieve high growth (captured in the average values displayed in the bar charts).
Step 3: View Benchmarks
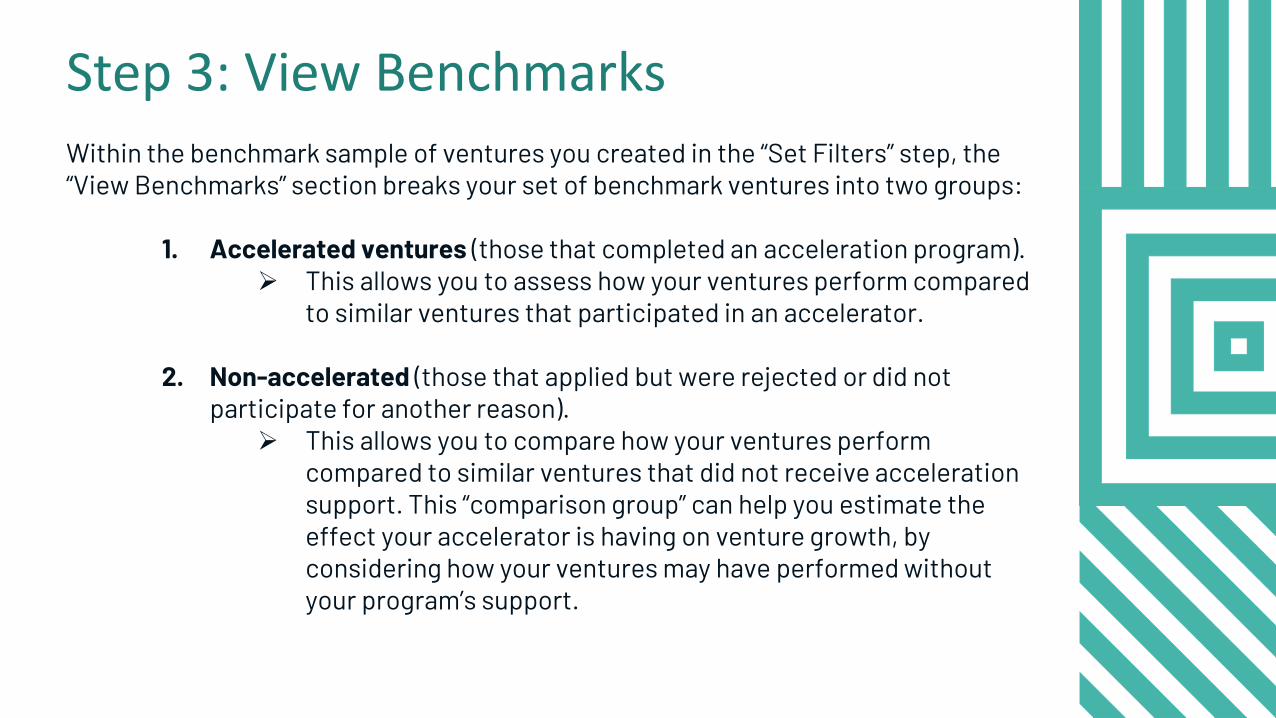
Within the benchmark sample of ventures you created in the “Set Filters” step, the “View Benchmarks” section breaks your set of benchmark ventures into two groups:
1. Accelerated ventures (those that completed an acceleration program). ➢ This allows you to assess how your ventures perform compared
to similar ventures that participated in an accelerator.
2. Non-accelerated (those that applied but were rejected or did not participate for another reason).
➢ This allows you to compare how your ventures perform compared to similar ventures that did not receive acceleration support. This “comparison group” can help you estimate the effect your accelerator is having on venture growth, by considering how your ventures may have performed without your program’s support.
Step 3: View Benchmarks
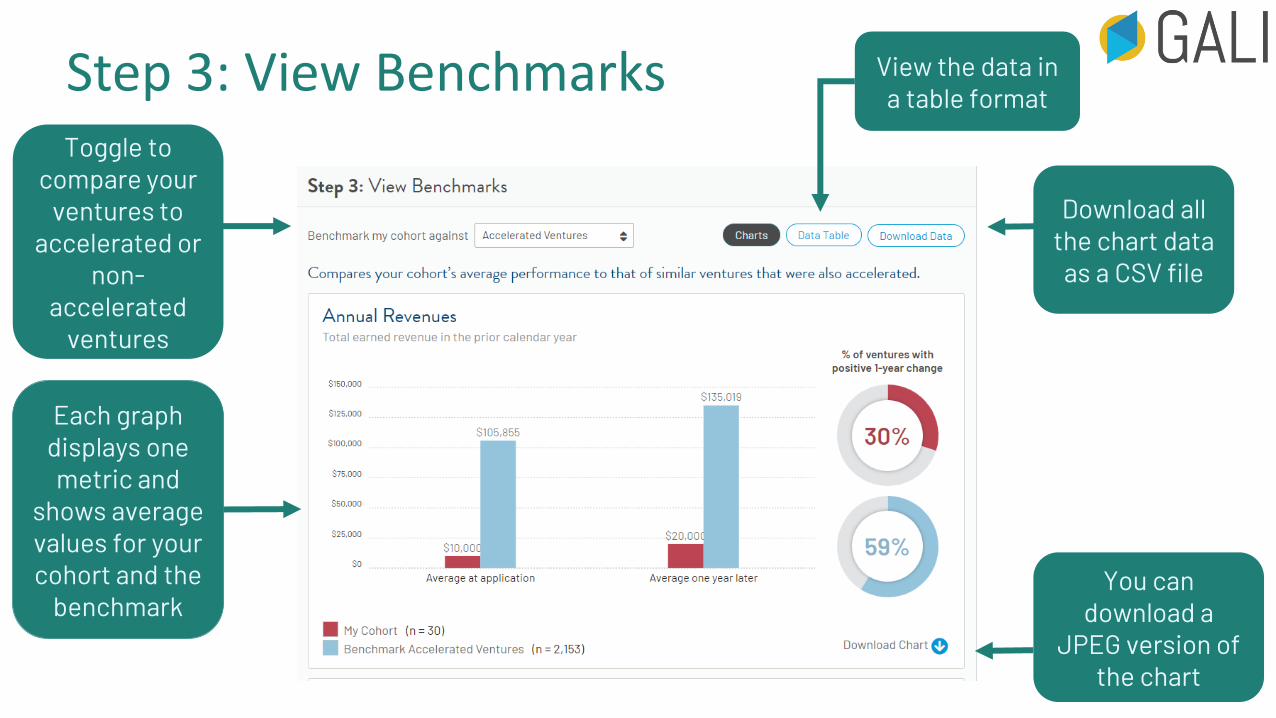
Toggle to compare your
ventures to accelerated or
non-accelerated
ventures
Each graph displays one metric and
shows average values for your cohort and the
benchmarkYou can
download a JPEG version of
the chart
Download all the chart data as a CSV file
View the data in a table format
Step 3: View Benchmarks
➢ Does GALI store my data? The GALI site does not store or have access to any of the information you input in this tool. Your data and resulting benchmarks are only available to you.
➢ Can I use the tool if I don’t have data? The tool can be used to explore the GALI dataset, without inputting your data. Simply click “I don’t have data” on the top right corner of the “Input Your Data” tab.
➢ If I use all the filters, my sample size is too small. How do I decide which filters to include? You likely will only be able to select 3-5 filters before the sample size becomes too small to produce a meaningful benchmark. We suggest selecting the filters that are most crucial to ensuring the benchmark ventures are similar to your cohort.
➢ Can the tool rank my program? This tool is designed to benchmark venture-level data, not program/operational data. We also keep all data anonymous, so ranking is not possible.
Frequently Asked Questions
➢ The full GALI dataset has over 23,000 ventures; why are there fewer in the benchmarking tool? The full GALI dataset contains all ventures for which we have application (baseline) data, while the benchmarking tool is limited to ventures for which we have application and follow-up (1 year later) information, along with adequate program-level information.
➢ Is the GALI data validated? The GALI data is all self-reported. However, the GALI team removed 139 ventures from the benchmarking data set due to revenue, employee, or investment information that was irreconcilable with the rest of the sample (i.e. likely incorrectly entered).
➢ Does GALI address changes in currency valuation? All self-reported data is provided in USD, so any currency inflation/deflation cannot be taken into consideration. Potential impacts of currency changes on the benchmark should be mitigated by using the filters moderately (therefore keeping a large benchmark sample size).
Frequently Asked Questions

For more information about GALI or the benchmarking tool, please visit
galidata.org/ask-a-question