galaxy zoo green peas: discovery of a class of compact extremely star-forming galaxies
TRANSCRIPT
arX
iv:0
907.
4155
v1 [
astr
o-ph
.CO
] 23
Jul
200
9Mon. Not. R. Astron. Soc.000, 1–18 (2009) Printed 23 July 2009 (MN LaTEX style file v2.2)
Galaxy Zoo Green Peas: Discovery of A Class of CompactExtremely Star-Forming Galaxies⋆
Carolin Cardamone1,2†, Kevin Schawinski2,3, Marc Sarzi4, Steven P. Bamford5,Nicola Bennert6, C. M. Urry2,3, Chris Lintott7, William C. Keel8, John Parejko9,Robert C. Nichol10, Daniel Thomas10, Dan Andreescu11, Phil Murray12, M. Jor-dan Raddick13, Anze Slosar14, Alex Szalay13, Jan VandenBerg131Astronomy Department, Yale University 208121, New Haven, CT 06520, U.S.A.2Yale Center for Astronomy and Astrophysics, Departments ofPhysics and Astronomy, Yale University, New Haven, CT 06520, USA3Department of Physics, Yale University, P.O. Box 208121, New Haven, CT 06520, USA.4Centre for Astrophysics Research, University of Hertfordshire, College Lane, Hatfield, Herts AL10 9AB, UK.5Centre for Astronomy and Particle Theory, University of Nottingham, University Park, Nottingham, NG7 2RD, UK.6Department of Physics, University of California, Santa Barbara, CA 93106, USA.7Department of Physics, University of Oxford, Oxford OX1 3RH, UK.8Department of Physics and Astronomy, University of Alabama, Tuscaloosa, AL, 35487, USA.9 Department of Physics, Drexel University, Philadelphia, PA 19104, USA.10Institute of Cosmology & Gravitation, University of Portsmouth, Portsmouth, PO1 2EG, UK.11LinkLab, 4506 Graystone Ave., Bronx, NY 10471, USA.12Fingerprint Digital Media, 9 Victoria Close, Newtownards,Co. Down, Northern Ireland, BT23 7GY, UK.13Department of Physics and Astronomy, The Johns Hopkins University, Baltimore, MD 21218, USA.14Berkeley Center for Cosmological Physics, Lawrence Berkeley National Lab, 1 Cyclotron Road, MS 50-5005, Berkeley, CA 94720, USA
23 July 2009
ABSTRACTWe investigate a class of rapidly growing emission line galaxies, known as “Green Peas,”first noted by volunteers in the Galaxy Zoo project because oftheir peculiar bright greencolour and small size, unresolved in SDSS imaging. Their appearance is due to very strongoptical emission lines, namely [O III]λ5007 A, with an unusually large equivalent widthof up to∼1000A. We discuss a well-defined sample of 251 colour-selected objects, mostof which are strongly star forming, although there are some AGN interlopers including 8newly discovered Narrow Line Seyfert 1 galaxies. The star-forming Peas are low mass galax-ies (M∼ 108.5 − 1010 M⊙) with high star formation rates (∼ 10 M⊙yr−1), low metallicities(log[O/H] + 12∼8.7) and low reddening (E(B − V) 6 0.25) and they reside in low densityenvironments. They have some of the highest specific star formation rates (up to∼ 10−8
yr−1) seen in the local Universe, yielding doubling times for their stellar mass of hundreds ofMyrs. The few star-forming Peas with HST imaging appear to have several clumps of brightstar-forming regions and low surface density features thatmay indicate recent or ongoingmergers. The Peas are similar in size, mass, luminosity and metallicity to Luminous BlueCompact Galaxies. They are also similar to high redshift UV-luminous galaxies, e.g., Lyman-break galaxies and Lyman-α emitters, and therefore provide a local laboratory with which tostudy the extreme star formation processes that occur in high-redshift galaxies. Studying star-bursting galaxies as a function of redshift is essential to understanding the build up of stellarmass in the Universe.
Key words: galaxies: evolution, galaxies: formation, galaxies: starburst, galaxies: dwarf,galaxies: high-redshift, galaxies: Seyfert
⋆ This publication has been made possible by the partici-pation of more than 200,000 volunteers in the Galaxy Zoo
project. Their contributions are individually acknowledged athttp://www.galaxyzoo.org/Volunteers.aspx.† [email protected]
c© 2009 RAS
2 Cardamone et al.
1 INTRODUCTION
In this paper, we report on the discovery of an intriguing class of ob-jects discovered by the Galaxy Zoo project. The Galaxy Zoo project(Lintott et al. 2008) has enlisted the help of over 200,000 mem-bers of the public to morphologically classify almost106 galax-ies from the Sloan Digital Sky Survey (SDSS; York et al. 2000).The Galaxy Zoo website1 provides a randomly selectedgri com-posite colour image from the SDSS main galaxy sample and asksthe volunteers to classify the morphology of the displayed ob-ject. One advantage of this distributed approach to classificationis the fact that each object will receive multiple, independent clas-sifications, and so one can treat the distribution of classificationsfor each object in a statistical sense. These classifications haveled to numerous results in galaxy formation and cosmology (e.g.,Skibba et al. 2008; Land et al. 2008; Bamford et al. 2009; Lintott2009; Schawinski et al. 2009; Slosar et al. 2009; Darg et al. 2009).
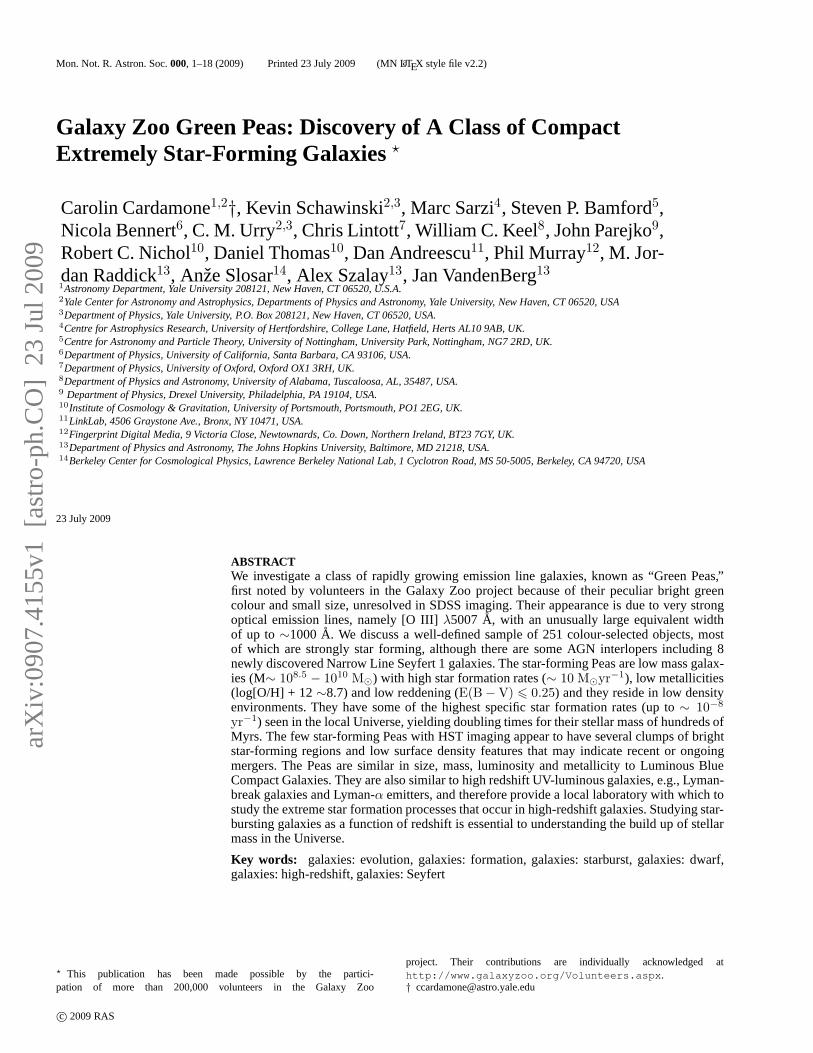
In addition to the website used for classification, Galaxy Zooalso provides an online discussion forum2 where volunteers mayask questions about unusual or challenging objects. This allows usto tap into another advantage of human classifiers: they can easilyidentify and then investigate odd objects. One such class ofhighlyunusual objects was named ‘Green Peas’ as they appeared to beunresolved round point sources that looked green in thegri com-posite. Figure 1 shows three example Pea images found by users, aswell as a more typical galaxy at the same redshift (z∼0.2). The vol-unteers rapidly assembled over a hundred of these objects ina ded-icated discussion thread3. Most of these were classified as stars inthe SDSS photometric pipeline (Lupton et al. 2001). It quickly be-came apparent that these objects represent a distinct group: they allhad galaxy-type spectral features (as opposed to broad-line quasarspectra or stellar spectra), and their green colour was driven by avery powerful [OIII] λ5007 Aemission line that substantially in-creased ther-band luminosity relative to the adjacentg andi band(green being the colour represented by ther-band in the SDSScolour composites). As a result of this selection, the Peas are foundat redshifts0.112 ∼< z ∼< 0.360, mostly beyond the main galaxysample but much nearer than luminous quasars. This discoveryprompted our investigation into the nature of these small [OIII]-emitters.
In Section 2, we present the sample selection, and analysetheir photometric properties (§ 2.1), space density (§ 2.2), mor-phologies in SDSS (§ 2.3), environments (§ 2.4), spectral properties(§2.5-§2.6) and HST imaging morphologies (§ 2.7). The Peas turnout to be largely star-forming objects with some AGN interlopers.We look into the nature of the few AGN Peas in Section 3. We studythe nature of the star-forming galaxies in Section 4 and comparethem to other known samples of galaxies in Section 5. Throughoutthis paper we assumeH0 = 71 km s−1 Mpc−1, Ωm = 0.3 andΩΛ = 0.7, consistent with theWilkinson Microwave AnisotropyProbe3-year results in combination with other cosmology probes(Spergel et al. 2007).
1 http://www.galaxyzoo.org2 http://www.galaxyzooforum.org3 We wish to thank the “Peas Corps” for “giving Peas a chance:” includ-ing, Elisabeth Baeten, Gemma Coughlin, Dan Goldstein, Brian Legg, MarkMcCallum, Christian Manteuffel, Richard Nowell, Richard Proctor, AliceSheppard, Hanny van Arkel.
2 DATA
2.1 Sample Selection
Our sample of Peas is taken from the SDSS DR7 spectroscopicsample (Abazajian et al. 2009). A survey of a quarter of the sky,the SDSS provides photometry of 357 million unique objects in fivefilters, u, g, r, i andz (Fukugita et al. 1996) and spectroscopy ofmany objects. Using the CasJobs4 application provided by SDSS,we uniformly searched the DR7 spectroscopic sample for Peas(originally noticed by eye in Galaxy Zoo) in the redshift range0.112 < z < 0.360 where the [O III]λ5007 Aline is in ther-band filter.
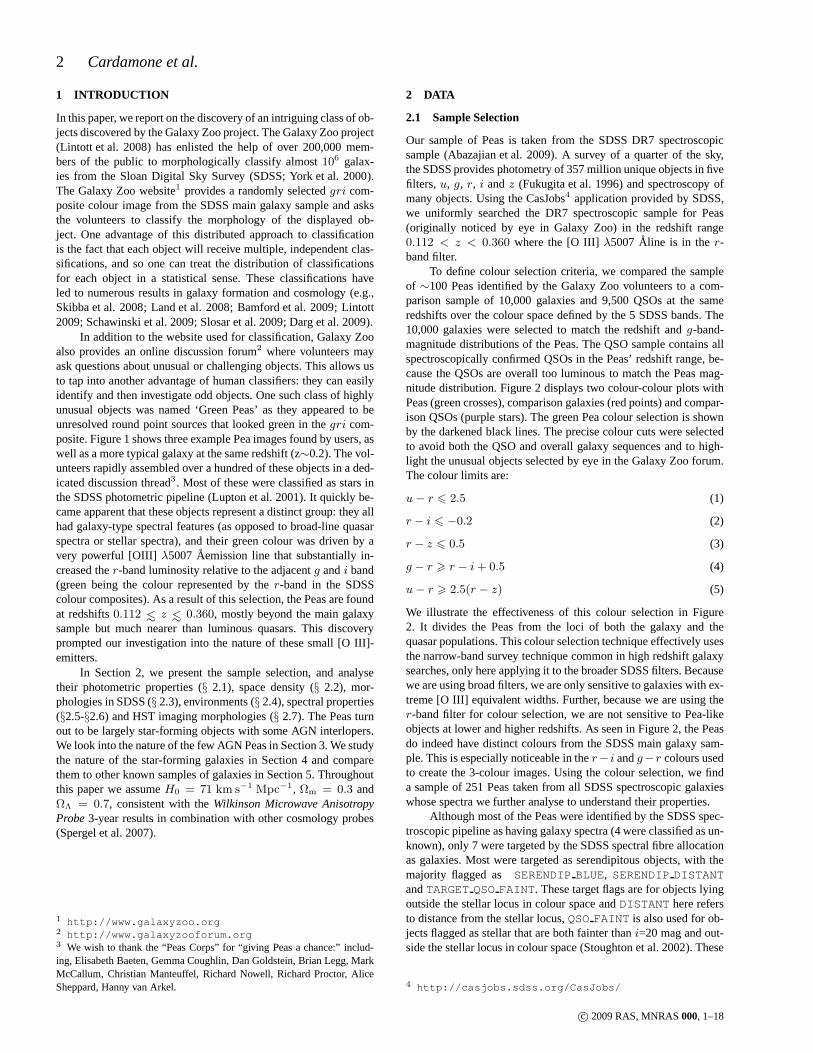
To define colour selection criteria, we compared the sampleof ∼100 Peas identified by the Galaxy Zoo volunteers to a com-parison sample of 10,000 galaxies and 9,500 QSOs at the sameredshifts over the colour space defined by the 5 SDSS bands. The10,000 galaxies were selected to match the redshift andg-band-magnitude distributions of the Peas. The QSO sample contains allspectroscopically confirmed QSOs in the Peas’ redshift range, be-cause the QSOs are overall too luminous to match the Peas mag-nitude distribution. Figure 2 displays two colour-colour plots withPeas (green crosses), comparison galaxies (red points) andcompar-ison QSOs (purple stars). The green Pea colour selection is shownby the darkened black lines. The precise colour cuts were selectedto avoid both the QSO and overall galaxy sequences and to high-light the unusual objects selected by eye in the Galaxy Zoo forum.The colour limits are:
u − r 6 2.5 (1)
r − i 6 −0.2 (2)
r − z 6 0.5 (3)
g − r > r − i + 0.5 (4)
u − r > 2.5(r − z) (5)
We illustrate the effectiveness of this colour selection inFigure2. It divides the Peas from the loci of both the galaxy and thequasar populations. This colour selection technique effectively usesthe narrow-band survey technique common in high redshift galaxysearches, only here applying it to the broader SDSS filters. Becausewe are using broad filters, we are only sensitive to galaxies with ex-treme [O III] equivalent widths. Further, because we are using ther-band filter for colour selection, we are not sensitive to Pea-likeobjects at lower and higher redshifts. As seen in Figure 2, the Peasdo indeed have distinct colours from the SDSS main galaxy sam-ple. This is especially noticeable in ther− i andg−r colours usedto create the 3-colour images. Using the colour selection, we finda sample of 251 Peas taken from all SDSS spectroscopic galaxieswhose spectra we further analyse to understand their properties.
Although most of the Peas were identified by the SDSS spec-troscopic pipeline as having galaxy spectra (4 were classified as un-known), only 7 were targeted by the SDSS spectral fibre allocationas galaxies. Most were targeted as serendipitous objects, with themajority flagged as SERENDIP BLUE, SERENDIP DISTANTandTARGET QSO FAINT. These target flags are for objects lyingoutside the stellar locus in colour space andDISTANT here refersto distance from the stellar locus,QSO FAINT is also used for ob-jects flagged as stellar that are both fainter thani=20 mag and out-side the stellar locus in colour space (Stoughton et al. 2002). These
4 http://casjobs.sdss.org/CasJobs/
c© 2009 RAS, MNRAS000, 1–18
Galaxy Zoo Green Peas 3
Figure 1. Exampleg,r,i composite colour 50′′x 50′′ SDSS images classified by Pea hunters, with ther-band representing green light. The distinctly greencolour and compact morphology makes the Peas (left 3 images)easily distinguishable from the classical elliptical (right image). The elliptical galaxy is clearlyred and has a smooth profile, while the Peas arer-band dominated and unresolved in these images, appearing like stellar point sources. All objects shown hereare at z∼0.2.
Figure 2. Left: r − i vs g − r colour-colour diagram for 251 Peas (green crosses) and a sample of normal galaxies (red points) matched inz andg-bandmagnitude, and all QSOs (purple points) which lie in the sameredshift range as the Peas,0.112 < z < 0.36. Right: r − z vs u − r colour for the sameclasses. The Peas are most cleanly separated in ther− i, g− r colour diagram, where they stand out as particularly brightin ther-band. The colour cuts wereselected to include the Peas identified by the Galaxy Zoo volunteers and to exclude both galaxies and QSOs.
objects were targeted by fibers as they became available in a givenfield, so their selection function is not well determined. Without auniform selection for the Peas across the sky, their absolute spacedensity cannot be accurately assessed.
2.2 How common are the Peas?
Because the spectroscopic selection is biased in unquantifiableways, i.e., based on the availability of a spectral fibre in a givenpointing, the space density of the Peas is difficult to assess. In or-der to estimate the space density of the Peas in SDSS, we needto search the entire SDSS photometric catalogue for objectswithour colour selection criteria. We note that the Pea colour selectioncan also return much higher redshift objects by finding otheremis-sion lines in ther-band filter. Therefore we first search the spectro-
scopic sample to help understand these contaminants. Dropping thePea redshift selection limits, we find 198 objects at higher redshiftin the spectoscopic sample which fall into our colour-selection re-gion. These are mostly QSOs (only 4 have a spectral type labelledasgalaxy by the SDSS pipeline), which cluster at redshifts z=1.2,where the 2800A Mg II line falls into ther-band, and z=3.0, wherethe 1546A CIV line falls into ther-band. Very roughly, in the en-tire spectroscopic database, there are comparable numbersof Peasand higher-z QSOs in the colour-selection region. Searching the en-tire SDSS photometric catalogue (PhotoObj) regardless of spec-troscopic information, we limit ourselves to objects with the samer-band magnitude range as the Peas (186 r 620.5) and to ob-jects with similar compactness (petrorad r6 2.0 ′′), in order tolimit the contaminants from other redshifts. We further added therequirement of smallg, r andi band photometric errors to avoid thescattering of contaminants with poor photometry into the colour se-
c© 2009 RAS, MNRAS000, 1–18
4 Cardamone et al.
lection region. This search returns 40,222 objects. The unique areaof the SDSS DR7 footprint covers 8423 sq. deg, so this impliesa rough spatial density estimate of 5 per square degree. Strictlyspeaking this is an upper limit because our selection likelystill con-tains QSOs from higher redshifts. Looking at QSO number counts,we would expect to see∼3 per sq. degree in our magnitude range(Richards et al. 2005), leaving two Peas per square degree brighterthan 20.5 magnitudes. Therefore, we conclude the Peas are rare ob-jects.
2.3 Morphology from SDSS imaging
Of the 251 Peas in our sample, 215 were classified as morpholog-ical typeSTAR and not as extended objects by the SDSS pipeline.Compared to the size of the galaxies as measured by the SDSSPipeline (Petrosian radius: Blanton et al. 2001; Yasuda et al. 2001),they are significantly smaller. This is expected because thespectro-scopic galaxy sample was selected to be both resolved and brighterthan the faintest Pea (Strauss et al. 2002). The typical resolution ofthe SDSS images is large (∼> 1′′), just below the peak of the sizesof the Peas as measured by the SDSS Petrosian radius. At the typi-cal redshifts of the Peas, this angular scale corresponds toan upperlimit on the physical half-light radius of approximately 5 kpc.
2.4 Environment
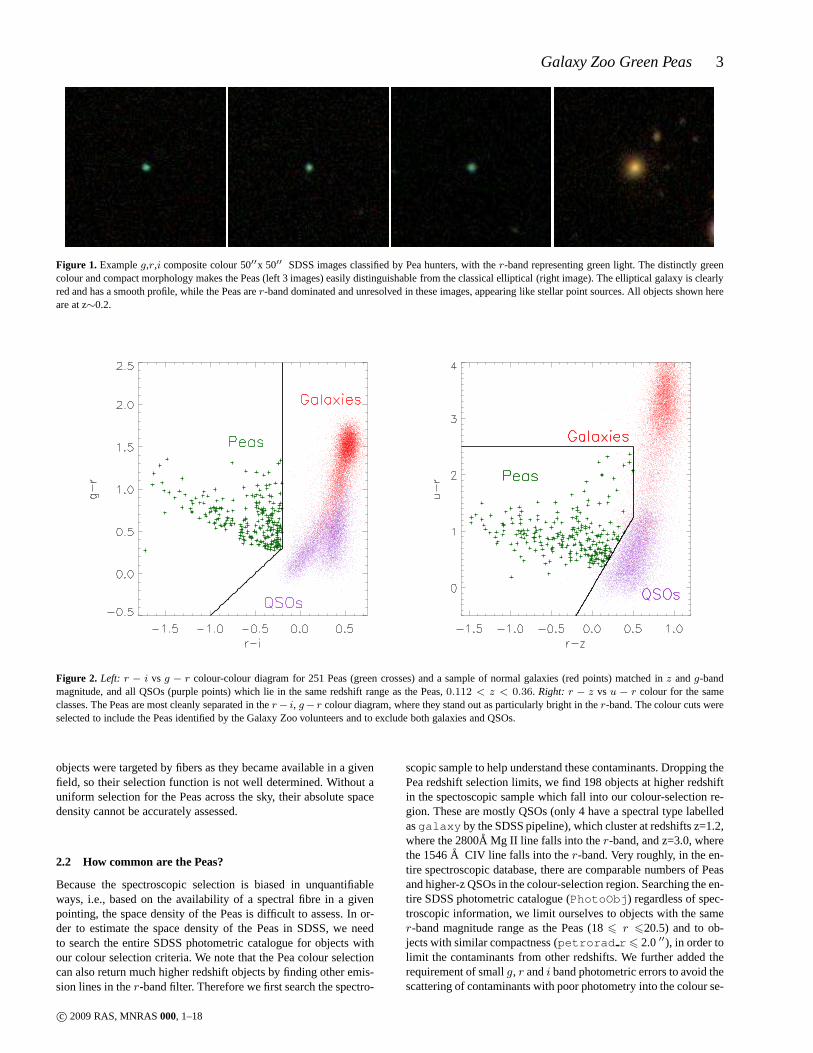
Because the Peas are at redshifts higher than the main spectroscopicgalaxy sample, we measure the projected densities around the Peasand a sample of random galaxies matched in both luminosity andredshift, counting the number of projected neighbours within a ra-dius of 1 Mpc and brighter than an absolutei-band magnitude of-20.5 at the redshift of the target are counted. This magnitude limitwas selected to be well above the detection limit of the highest red-shift Peas. Figure 3 shows the cumulative distribution of neighbourcounts for the Peas (solid line) and the control sample of galaxies(dotted line). Although this is a simple test, neglecting foregroundand background contamination in the neighbour counts, and henceunderestimating the difference between high and low density envi-ronments, it is clear that the Peas inhabit significantlylower den-sity regions than typical galaxies of the samei-band luminosity.A Kolmogorov-Smirnov test indicates that the difference issignifi-cant at a greater than 8-σ level. We find the median environmentaldensity around the Peas is less than two-thirds of that around nor-mal galaxies.
2.5 Spectral Analysis
We downloaded all of the Peas’ spectra from the DR7 archiveand carefully re-fit them, paying close attention to both thecon-tinuum and emission lines. We fit the stellar continuum andionised-gas emission, following the technique of Sarzi et al. (2006),using the corresponding PPXF (PENALISED PIXEL FITTING;Cappellari & Emsellem 2004) and GANDALF (GAS AND A B-SORPTIONL INE FITTING) IDL (Interactive Data Language) codesadapted for dealing with SDSS data5. Stellar population templates(Tremonti et al. 2004) and Gaussian emission-line templates weresimultaneously fitted to the data. When it improved the overall fit (9
5 Both codes can be downloaded fromhttp://www.strw.leidenuniv.nl/sauron/
Figure 3. The cumulative distribution of neighbour counts for the Peas(solid line) is significantly different than a comparison galaxy sample (dot-ted line). No Peas live in the highest density environments.
cases), the Gaussian emission line templates included bothbroad-line and narrow-line components for the Balmer Series.
To ensure acceptable fits, we limit our spectroscopic sampletothose Peas with a S/N greater than 3 in the continuum near the Hβand Hα regions (specifically, measuring the S/N in the bands 6350-6500A and 5100-5250A). Additionally, we limited our emission-line classification sample to those Peas with a S/N> 3 detectionin each of the emission lines: Hα, Hβ, [O III] λ5007 Aand [NII] λ6583A, following Kauffmann et al. (2003). We note that formany of our objects near z∼0.3, sky lines fall on top of the [OIII] line and the Hβ line, and we removed all of these objects fromour sample. One of these objects has broad Balmer lines, withbothsky lines falling inside the Hβ profile. This object is identified as aNarrow Line Seyfert 1 (NLS1) in the literature (Zhou et al. 2006),but we do not consider it further in this paper. These cuts resultin a sample of 103 narrow-line objects to be further analysed(see§ 2.6) plus nine objects best fit by a two-component Gaussian intheBalmer lines. The width of the broad Gaussian components rangedfrom just over 600km s−1 to ∼5000km s−1. Eight of these ob-jects have FWHM narrower than 2000km s−1 and are thus classi-fied as Narrow Line Seyfert 1s (see§3). These eight SDSS spectro-scopic objects have not previously been identified as NLS1s,(e.g.,Williams et al. 2002; Zhou et al. 2006). Three examples of spectralfits are shown in Figure 4. The top 2 spectra are of narrow line ob-jects and the bottom spectra shows a NLS1 object. In all threecasesone can easily see a prominent [O III] doublet near5007 A.
In summary, we have 9 Peas with two component fits, (1 broadLine Seyfert 1 and 8 Narrow Line Seyfert 1s) and 103 narrow linePeas.
2.6 Spectral Classification
The SDSS spectra cover the observed range 3800–9200A at a re-solving power of R∼1800. At the Peas’ redshifts, this range in-
c© 2009 RAS, MNRAS000, 1–18
Galaxy Zoo Green Peas 5
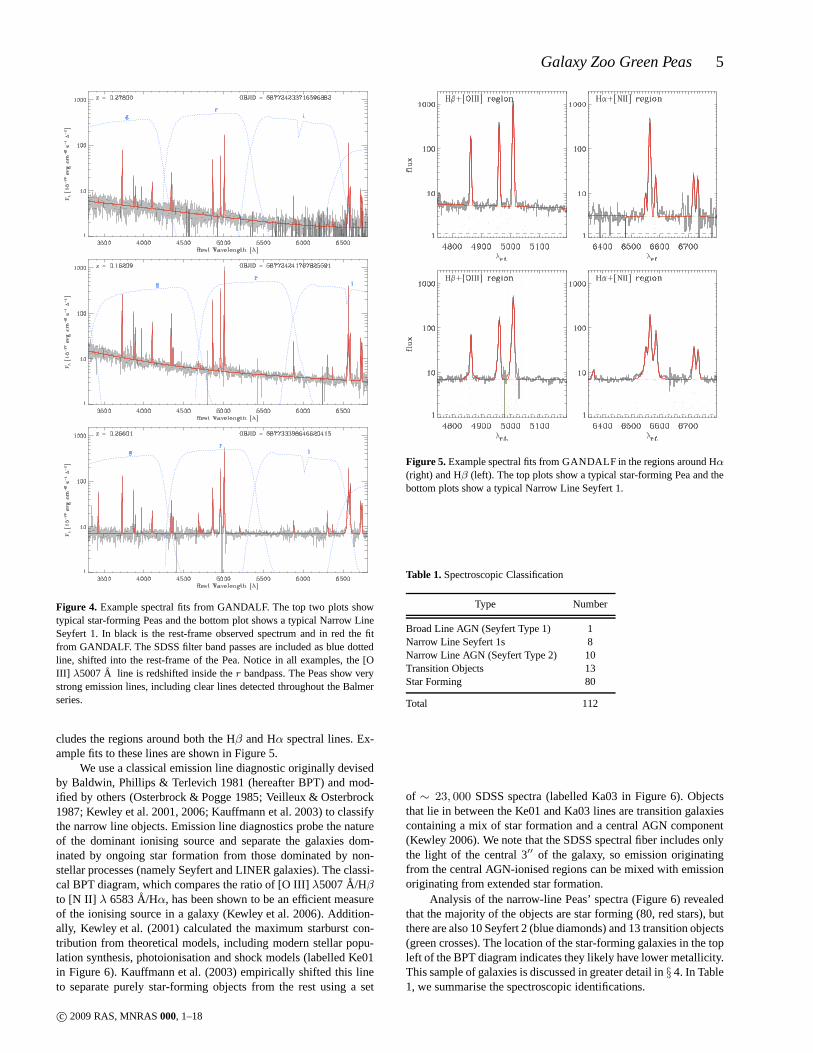
Figure 4. Example spectral fits from GANDALF. The top two plots showtypical star-forming Peas and the bottom plot shows a typical Narrow LineSeyfert 1. In black is the rest-frame observed spectrum and in red the fitfrom GANDALF. The SDSS filter band passes are included as bluedottedline, shifted into the rest-frame of the Pea. Notice in all examples, the [OIII] λ5007A line is redshifted inside ther bandpass. The Peas show verystrong emission lines, including clear lines detected throughout the Balmerseries.
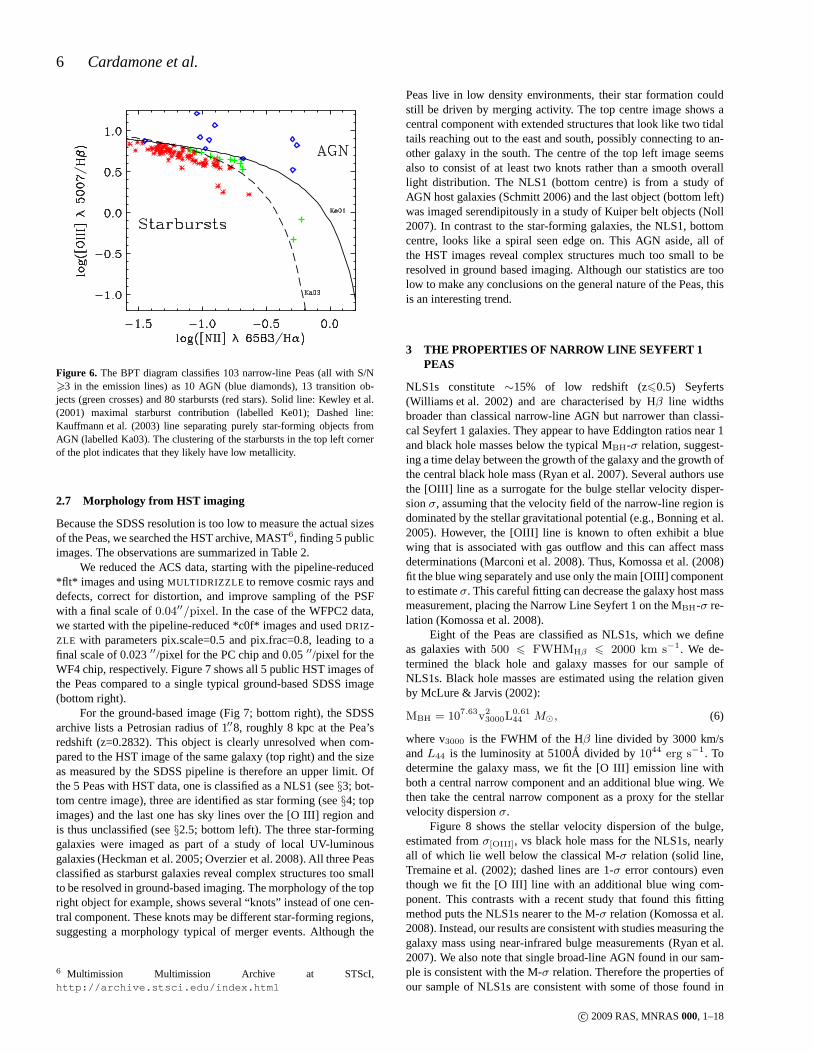
cludes the regions around both the Hβ and Hα spectral lines. Ex-ample fits to these lines are shown in Figure 5.
We use a classical emission line diagnostic originally devisedby Baldwin, Phillips & Terlevich 1981 (hereafter BPT) and mod-ified by others (Osterbrock & Pogge 1985; Veilleux & Osterbrock1987; Kewley et al. 2001, 2006; Kauffmann et al. 2003) to classifythe narrow line objects. Emission line diagnostics probe the natureof the dominant ionising source and separate the galaxies dom-inated by ongoing star formation from those dominated by non-stellar processes (namely Seyfert and LINER galaxies). Theclassi-cal BPT diagram, which compares the ratio of [O III]λ5007A/Hβto [N II] λ 6583A/Hα, has been shown to be an efficient measureof the ionising source in a galaxy (Kewley et al. 2006). Addition-ally, Kewley et al. (2001) calculated the maximum starburstcon-tribution from theoretical models, including modern stellar popu-lation synthesis, photoionisation and shock models (labelled Ke01in Figure 6). Kauffmann et al. (2003) empirically shifted this lineto separate purely star-forming objects from the rest usinga set
Figure 5. Example spectral fits from GANDALF in the regions around Hα
(right) and Hβ (left). The top plots show a typical star-forming Pea and thebottom plots show a typical Narrow Line Seyfert 1.
Table 1.Spectroscopic Classification
Type Number
Broad Line AGN (Seyfert Type 1) 1Narrow Line Seyfert 1s 8Narrow Line AGN (Seyfert Type 2) 10Transition Objects 13Star Forming 80
Total 112
of ∼ 23, 000 SDSS spectra (labelled Ka03 in Figure 6). Objectsthat lie in between the Ke01 and Ka03 lines are transition galaxiescontaining a mix of star formation and a central AGN component(Kewley 2006). We note that the SDSS spectral fiber includes onlythe light of the central 3′′ of the galaxy, so emission originatingfrom the central AGN-ionised regions can be mixed with emissionoriginating from extended star formation.
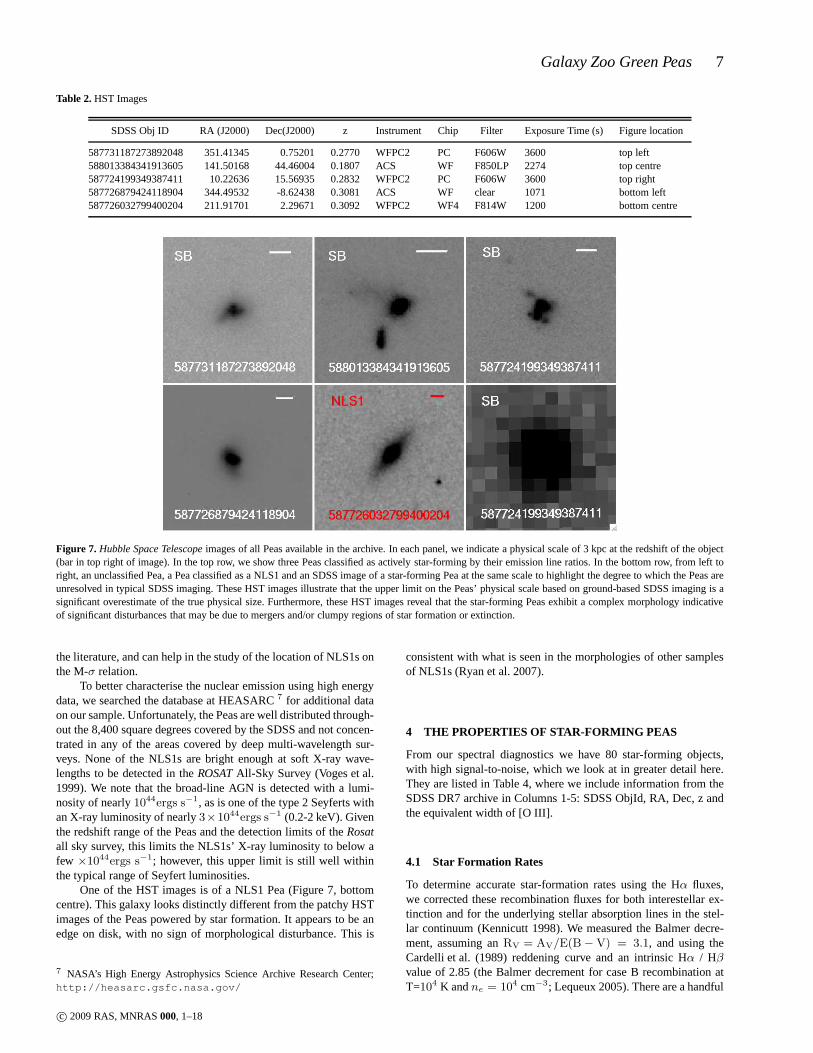
Analysis of the narrow-line Peas’ spectra (Figure 6) revealedthat the majority of the objects are star forming (80, red stars), butthere are also 10 Seyfert 2 (blue diamonds) and 13 transitionobjects(green crosses). The location of the star-forming galaxiesin the topleft of the BPT diagram indicates they likely have lower metallicity.This sample of galaxies is discussed in greater detail in§ 4. In Table1, we summarise the spectroscopic identifications.
c© 2009 RAS, MNRAS000, 1–18
6 Cardamone et al.
Figure 6. The BPT diagram classifies 103 narrow-line Peas (all with S/N>3 in the emission lines) as 10 AGN (blue diamonds), 13 transition ob-jects (green crosses) and 80 starbursts (red stars). Solid line: Kewley et al.(2001) maximal starburst contribution (labelled Ke01); Dashed line:Kauffmann et al. (2003) line separating purely star-forming objects fromAGN (labelled Ka03). The clustering of the starbursts in thetop left cornerof the plot indicates that they likely have low metallicity.
2.7 Morphology from HST imaging
Because the SDSS resolution is too low to measure the actual sizesof the Peas, we searched the HST archive, MAST6, finding 5 publicimages. The observations are summarized in Table 2.
We reduced the ACS data, starting with the pipeline-reduced*flt* images and usingMULTIDRIZZLE to remove cosmic rays anddefects, correct for distortion, and improve sampling of the PSFwith a final scale of0.04′′/pixel. In the case of the WFPC2 data,we started with the pipeline-reduced *c0f* images and usedDRIZ-ZLE with parameters pix.scale=0.5 and pix.frac=0.8, leading to afinal scale of 0.023′′/pixel for the PC chip and 0.05′′/pixel for theWF4 chip, respectively. Figure 7 shows all 5 public HST images ofthe Peas compared to a single typical ground-based SDSS image(bottom right).
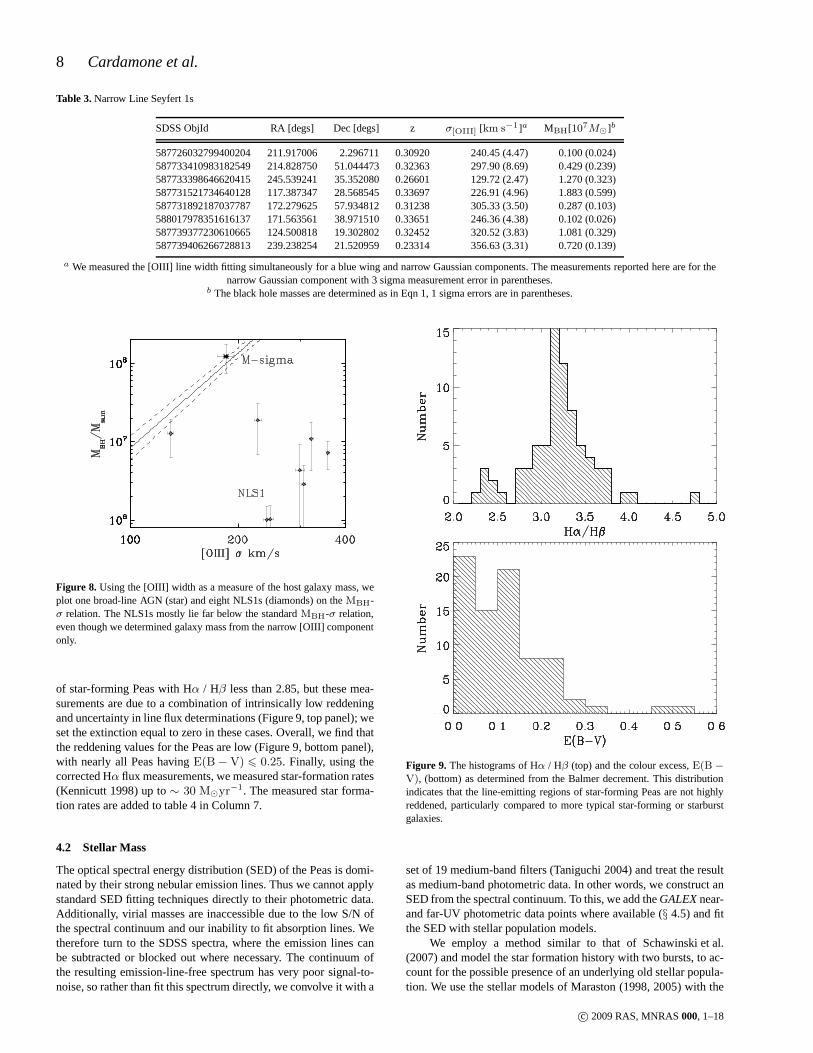
For the ground-based image (Fig 7; bottom right), the SDSSarchive lists a Petrosian radius of 1.′′8, roughly 8 kpc at the Pea’sredshift (z=0.2832). This object is clearly unresolved when com-pared to the HST image of the same galaxy (top right) and the sizeas measured by the SDSS pipeline is therefore an upper limit.Ofthe 5 Peas with HST data, one is classified as a NLS1 (see§3; bot-tom centre image), three are identified as star forming (see§4; topimages) and the last one has sky lines over the [O III] region andis thus unclassified (see§2.5; bottom left). The three star-forminggalaxies were imaged as part of a study of local UV-luminousgalaxies (Heckman et al. 2005; Overzier et al. 2008). All three Peasclassified as starburst galaxies reveal complex structurestoo smallto be resolved in ground-based imaging. The morphology of the topright object for example, shows several “knots” instead of one cen-tral component. These knots may be different star-forming regions,suggesting a morphology typical of merger events. Althoughthe
6 Multimission Multimission Archive at STScI,http://archive.stsci.edu/index.html
Peas live in low density environments, their star formationcouldstill be driven by merging activity. The top centre image shows acentral component with extended structures that look like two tidaltails reaching out to the east and south, possibly connecting to an-other galaxy in the south. The centre of the top left image seemsalso to consist of at least two knots rather than a smooth overalllight distribution. The NLS1 (bottom centre) is from a studyofAGN host galaxies (Schmitt 2006) and the last object (bottomleft)was imaged serendipitously in a study of Kuiper belt objects(Noll2007). In contrast to the star-forming galaxies, the NLS1, bottomcentre, looks like a spiral seen edge on. This AGN aside, all ofthe HST images reveal complex structures much too small to beresolved in ground based imaging. Although our statistics are toolow to make any conclusions on the general nature of the Peas,thisis an interesting trend.
3 THE PROPERTIES OF NARROW LINE SEYFERT 1PEAS
NLS1s constitute∼15% of low redshift (z60.5) Seyferts(Williams et al. 2002) and are characterised by Hβ line widthsbroader than classical narrow-line AGN but narrower than classi-cal Seyfert 1 galaxies. They appear to have Eddington ratiosnear 1and black hole masses below the typical MBH-σ relation, suggest-ing a time delay between the growth of the galaxy and the growth ofthe central black hole mass (Ryan et al. 2007). Several authors usethe [OIII] line as a surrogate for the bulge stellar velocitydisper-sionσ, assuming that the velocity field of the narrow-line region isdominated by the stellar gravitational potential (e.g., Bonning et al.2005). However, the [OIII] line is known to often exhibit a bluewing that is associated with gas outflow and this can affect massdeterminations (Marconi et al. 2008). Thus, Komossa et al. (2008)fit the blue wing separately and use only the main [OIII] componentto estimateσ. This careful fitting can decrease the galaxy host massmeasurement, placing the Narrow Line Seyfert 1 on the MBH-σ re-lation (Komossa et al. 2008).
Eight of the Peas are classified as NLS1s, which we defineas galaxies with500 6 FWHMHβ 6 2000 km s−1. We de-termined the black hole and galaxy masses for our sample ofNLS1s. Black hole masses are estimated using the relation givenby McLure & Jarvis (2002):
MBH = 107.63v23000L
0.6144 M⊙, (6)
where v3000 is the FWHM of the Hβ line divided by 3000 km/sandL44 is the luminosity at 5100A divided by 1044 erg s−1. Todetermine the galaxy mass, we fit the [O III] emission line withboth a central narrow component and an additional blue wing.Wethen take the central narrow component as a proxy for the stellarvelocity dispersionσ.
Figure 8 shows the stellar velocity dispersion of the bulge,estimated fromσ[OIII], vs black hole mass for the NLS1s, nearlyall of which lie well below the classical M-σ relation (solid line,Tremaine et al. (2002); dashed lines are 1-σ error contours) eventhough we fit the [O III] line with an additional blue wing com-ponent. This contrasts with a recent study that found this fittingmethod puts the NLS1s nearer to the M-σ relation (Komossa et al.2008). Instead, our results are consistent with studies measuring thegalaxy mass using near-infrared bulge measurements (Ryan et al.2007). We also note that single broad-line AGN found in our sam-ple is consistent with the M-σ relation. Therefore the properties ofour sample of NLS1s are consistent with some of those found in
c© 2009 RAS, MNRAS000, 1–18
Galaxy Zoo Green Peas 7
Table 2.HST Images
SDSS Obj ID RA (J2000) Dec(J2000) z Instrument Chip Filter Exposure Time (s) Figure location
587731187273892048 351.41345 0.75201 0.2770 WFPC2 PC F606W 3600 top left588013384341913605 141.50168 44.46004 0.1807 ACS WF F850LP 2274 top centre587724199349387411 10.22636 15.56935 0.2832 WFPC2 PC F606W 3600 top right587726879424118904 344.49532 -8.62438 0.3081 ACS WF clear 1071 bottom left587726032799400204 211.91701 2.29671 0.3092 WFPC2 WF4 F814W 1200 bottom centre
Figure 7. Hubble Space Telescopeimages of all Peas available in the archive. In each panel, weindicate a physical scale of 3 kpc at the redshift of the object(bar in top right of image). In the top row, we show three Peas classified as actively star-forming by their emission line ratios. In the bottom row, from left toright, an unclassified Pea, a Pea classified as a NLS1 and an SDSS image of a star-forming Pea at the same scale to highlight the degree to which the Peas areunresolved in typical SDSS imaging. These HST images illustrate that the upper limit on the Peas’ physical scale based onground-based SDSS imaging is asignificant overestimate of the true physical size. Furthermore, these HST images reveal that the star-forming Peas exhibit a complex morphology indicativeof significant disturbances that may be due to mergers and/orclumpy regions of star formation or extinction.
the literature, and can help in the study of the location of NLS1s onthe M-σ relation.
To better characterise the nuclear emission using high energydata, we searched the database at HEASARC7 for additional dataon our sample. Unfortunately, the Peas are well distributedthrough-out the 8,400 square degrees covered by the SDSS and not concen-trated in any of the areas covered by deep multi-wavelength sur-veys. None of the NLS1s are bright enough at soft X-ray wave-lengths to be detected in theROSATAll-Sky Survey (Voges et al.1999). We note that the broad-line AGN is detected with a lumi-nosity of nearly1044ergs s−1, as is one of the type 2 Seyferts withan X-ray luminosity of nearly3×1044ergs s−1 (0.2-2 keV). Giventhe redshift range of the Peas and the detection limits of theRosatall sky survey, this limits the NLS1s’ X-ray luminosity to below afew ×1044ergs s−1; however, this upper limit is still well withinthe typical range of Seyfert luminosities.
One of the HST images is of a NLS1 Pea (Figure 7, bottomcentre). This galaxy looks distinctly different from the patchy HSTimages of the Peas powered by star formation. It appears to beanedge on disk, with no sign of morphological disturbance. This is
7 NASA’s High Energy Astrophysics Science Archive Research Center;http://heasarc.gsfc.nasa.gov/
consistent with what is seen in the morphologies of other samplesof NLS1s (Ryan et al. 2007).
4 THE PROPERTIES OF STAR-FORMING PEAS
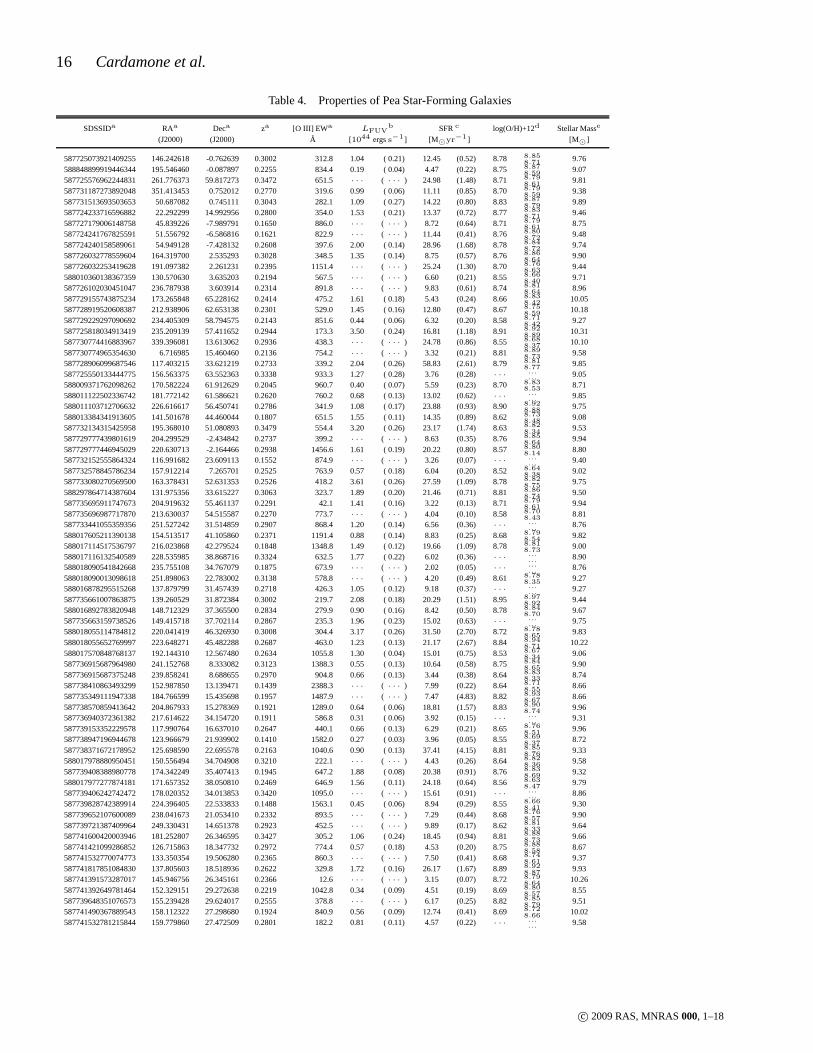
From our spectral diagnostics we have 80 star-forming objects,with high signal-to-noise, which we look at in greater detail here.They are listed in Table 4, where we include information fromtheSDSS DR7 archive in Columns 1-5: SDSS ObjId, RA, Dec, z andthe equivalent width of [O III].
4.1 Star Formation Rates
To determine accurate star-formation rates using the Hα fluxes,we corrected these recombination fluxes for both interestellar ex-tinction and for the underlying stellar absorption lines inthe stel-lar continuum (Kennicutt 1998). We measured the Balmer decre-ment, assuming anRV = AV/E(B − V) = 3.1, and using theCardelli et al. (1989) reddening curve and an intrinsic Hα / Hβvalue of 2.85 (the Balmer decrement for case B recombinationatT=104 K andne = 104 cm−3; Lequeux 2005). There are a handful
c© 2009 RAS, MNRAS000, 1–18
8 Cardamone et al.
Table 3.Narrow Line Seyfert 1s
SDSS ObjId RA [degs] Dec [degs] z σ[OIII] [km s−1]a MBH[107M⊙]b
587726032799400204 211.917006 2.296711 0.30920 240.45 (4.47) 0.100 (0.024)587733410983182549 214.828750 51.044473 0.32363 297.90 (8.69) 0.429 (0.239)587733398646620415 245.539241 35.352080 0.26601 129.72 (2.47) 1.270 (0.323)587731521734640128 117.387347 28.568545 0.33697 226.91 (4.96) 1.883 (0.599)587731892187037787 172.279625 57.934812 0.31238 305.33 (3.50) 0.287 (0.103)588017978351616137 171.563561 38.971510 0.33651 246.36 (4.38) 0.102 (0.026)587739377230610665 124.500818 19.302802 0.32452 320.52 (3.83) 1.081 (0.329)587739406266728813 239.238254 21.520959 0.23314 356.63 (3.31) 0.720 (0.139)
a We measured the [OIII] line width fitting simultaneously fora blue wing and narrow Gaussian components. The measurements reported here are for thenarrow Gaussian component with 3 sigma measurement error inparentheses.
b The black hole masses are determined as in Eqn 1, 1 sigma errors are in parentheses.
Figure 8. Using the [OIII] width as a measure of the host galaxy mass, weplot one broad-line AGN (star) and eight NLS1s (diamonds) ontheMBH-σ relation. The NLS1s mostly lie far below the standardMBH-σ relation,even though we determined galaxy mass from the narrow [OIII]componentonly.
of star-forming Peas with Hα / Hβ less than 2.85, but these mea-surements are due to a combination of intrinsically low reddeningand uncertainty in line flux determinations (Figure 9, top panel); weset the extinction equal to zero in these cases. Overall, we find thatthe reddening values for the Peas are low (Figure 9, bottom panel),with nearly all Peas havingE(B − V) 6 0.25. Finally, using thecorrected Hα flux measurements, we measured star-formation rates(Kennicutt 1998) up to∼ 30 M⊙yr−1. The measured star forma-tion rates are added to table 4 in Column 7.
4.2 Stellar Mass
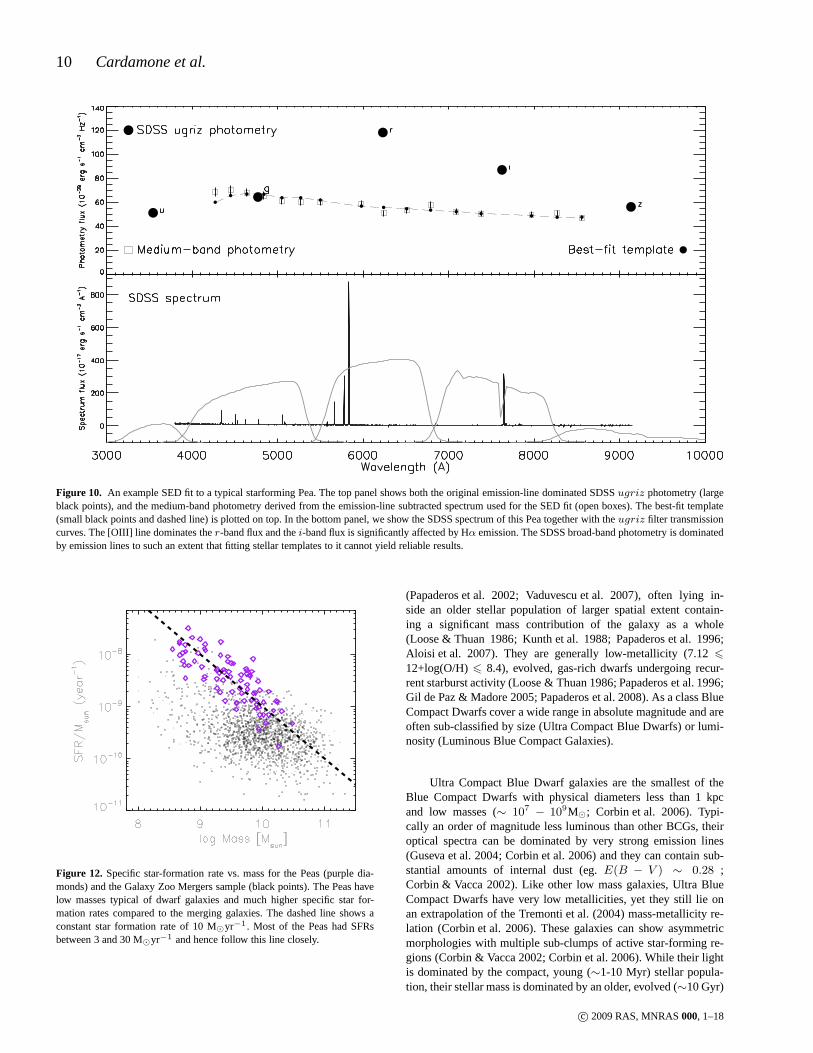
The optical spectral energy distribution (SED) of the Peas is domi-nated by their strong nebular emission lines. Thus we cannotapplystandard SED fitting techniques directly to their photometric data.Additionally, virial masses are inaccessible due to the lowS/N ofthe spectral continuum and our inability to fit absorption lines. Wetherefore turn to the SDSS spectra, where the emission linescanbe subtracted or blocked out where necessary. The continuumofthe resulting emission-line-free spectrum has very poor signal-to-noise, so rather than fit this spectrum directly, we convolveit with a
Figure 9. The histograms of Hα / Hβ (top) and the colour excess,E(B −
V), (bottom) as determined from the Balmer decrement. This distributionindicates that the line-emitting regions of star-forming Peas are not highlyreddened, particularly compared to more typical star-forming or starburstgalaxies.
set of 19 medium-band filters (Taniguchi 2004) and treat the resultas medium-band photometric data. In other words, we construct anSED from the spectral continuum. To this, we add theGALEXnear-and far-UV photometric data points where available (§ 4.5) and fitthe SED with stellar population models.
We employ a method similar to that of Schawinski et al.(2007) and model the star formation history with two bursts,to ac-count for the possible presence of an underlying old stellarpopula-tion. We use the stellar models of Maraston (1998, 2005) withthe
c© 2009 RAS, MNRAS000, 1–18
Galaxy Zoo Green Peas 9
Salpeter IMF and a range of metallicities. We also account for dustextinction following the Calzetti et al. (2000) law and fit the result-ing model photometry to the data and compute theχ2 statistic. Af-ter marginalising over all parameters, we obtain a stellar mass andan estimate of its error. Higher S/N spectra are required to constrainthe mass ratio between with older and younger stellar components.Therefore our systematic errors are much larger than the computedformal statistical errors. To quantify this uncertainty, we comparedour mass estimates using a second SED-fitting code (Kriek et al.2009), again using a Salpeter IMF and Maraston (1998, 2005) mod-els. The second code fits a single model template and thereforemeasures only a young stellar population component, excluding theadditional free parameter of a second older stellar population fromSchawinski et al. (2007). The single stellar population fitsresult ina total stellar mass 0.75 dex lower on average. This result isnotunexpected as a younger stellar population is more luminousandcan account for the same amount of light with a smaller mass con-tribution. Accounting for the average 0.75 offset between the twomass measurements, the residual dispersion was just under 0.3 dex.Therefore each individual mass measurement is uncertain atthisminimum level. Because two stellar populations are more likelyto reside in these galaxies (§ 5.1), we quote the masses from thetwo-burst model for the results in this paper acknowledgingtheiruncertainty. Figure 10 shows an example stellar populationfit. Themedian stellar mass of a Pea in our sample∼ 109.5M⊙ and theyrange from108.5M⊙ to nearly1010.5M⊙, indicating the Peas as aclass are significantly less massive than an L⋆ galaxy. Galaxy massestimates are also included in Table 4, Column 9.
4.3 Metallicity
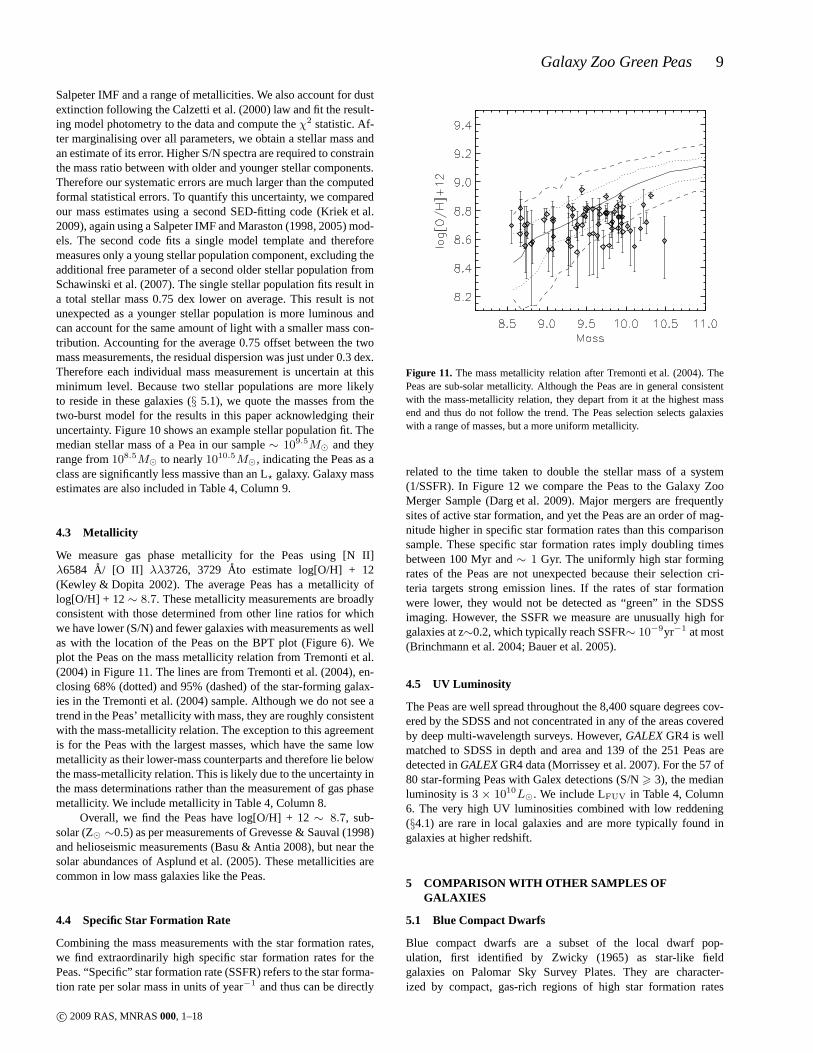
We measure gas phase metallicity for the Peas using [N II]λ6584 A/ [O II] λλ3726, 3729Ato estimate log[O/H] + 12(Kewley & Dopita 2002). The average Peas has a metallicity oflog[O/H] + 12∼ 8.7. These metallicity measurements are broadlyconsistent with those determined from other line ratios forwhichwe have lower (S/N) and fewer galaxies with measurements as wellas with the location of the Peas on the BPT plot (Figure 6). Weplot the Peas on the mass metallicity relation from Tremontiet al.(2004) in Figure 11. The lines are from Tremonti et al. (2004), en-closing 68% (dotted) and 95% (dashed) of the star-forming galax-ies in the Tremonti et al. (2004) sample. Although we do not see atrend in the Peas’ metallicity with mass, they are roughly consistentwith the mass-metallicity relation. The exception to this agreementis for the Peas with the largest masses, which have the same lowmetallicity as their lower-mass counterparts and therefore lie belowthe mass-metallicity relation. This is likely due to the uncertainty inthe mass determinations rather than the measurement of gas phasemetallicity. We include metallicity in Table 4, Column 8.
Overall, we find the Peas have log[O/H] + 12∼ 8.7, sub-solar (Z⊙ ∼0.5) as per measurements of Grevesse & Sauval (1998)and helioseismic measurements (Basu & Antia 2008), but nearthesolar abundances of Asplund et al. (2005). These metallicities arecommon in low mass galaxies like the Peas.
4.4 Specific Star Formation Rate
Combining the mass measurements with the star formation rates,we find extraordinarily high specific star formation rates for thePeas. “Specific” star formation rate (SSFR) refers to the star forma-tion rate per solar mass in units of year−1 and thus can be directly
Figure 11. The mass metallicity relation after Tremonti et al. (2004).ThePeas are sub-solar metallicity. Although the Peas are in general consistentwith the mass-metallicity relation, they depart from it at the highest massend and thus do not follow the trend. The Peas selection selects galaxieswith a range of masses, but a more uniform metallicity.
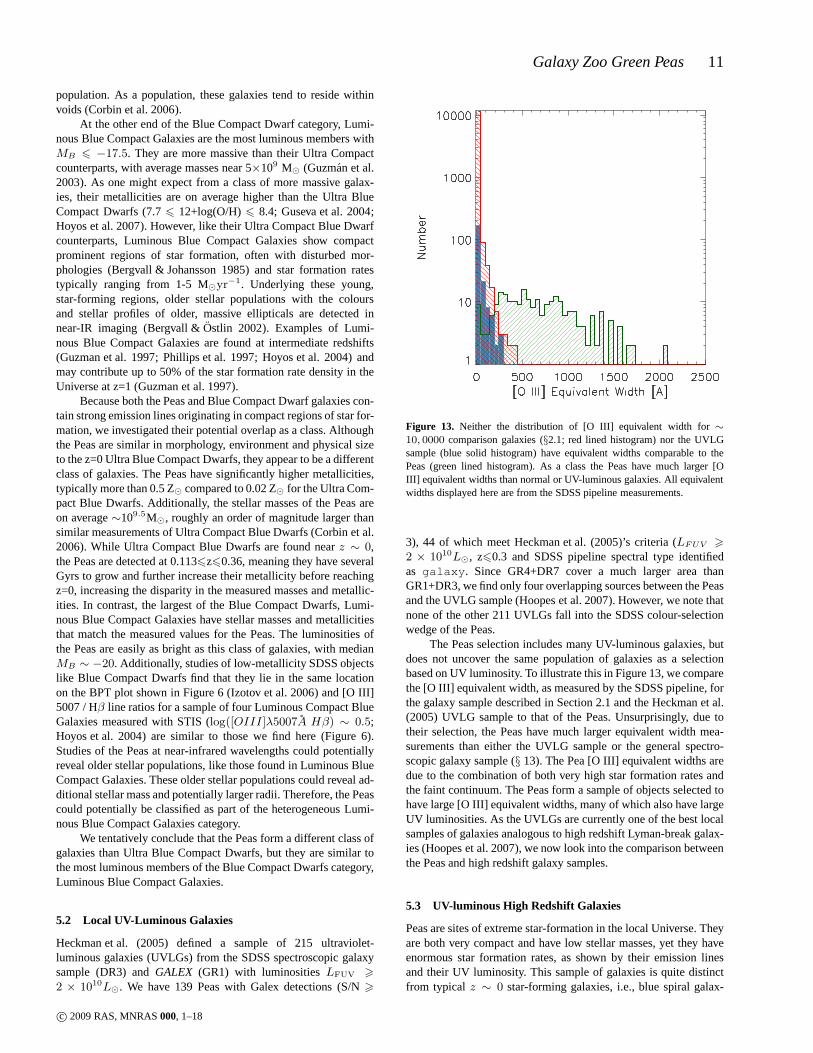
related to the time taken to double the stellar mass of a system(1/SSFR). In Figure 12 we compare the Peas to the Galaxy ZooMerger Sample (Darg et al. 2009). Major mergers are frequentlysites of active star formation, and yet the Peas are an order of mag-nitude higher in specific star formation rates than this comparisonsample. These specific star formation rates imply doubling timesbetween 100 Myr and∼ 1 Gyr. The uniformly high star formingrates of the Peas are not unexpected because their selectioncri-teria targets strong emission lines. If the rates of star formationwere lower, they would not be detected as “green” in the SDSSimaging. However, the SSFR we measure are unusually high forgalaxies at z∼0.2, which typically reach SSFR∼ 10−9yr−1 at most(Brinchmann et al. 2004; Bauer et al. 2005).
4.5 UV Luminosity
The Peas are well spread throughout the 8,400 square degreescov-ered by the SDSS and not concentrated in any of the areas coveredby deep multi-wavelength surveys. However,GALEXGR4 is wellmatched to SDSS in depth and area and 139 of the 251 Peas aredetected inGALEXGR4 data (Morrissey et al. 2007). For the 57 of80 star-forming Peas with Galex detections (S/N> 3), the medianluminosity is3 × 1010L⊙. We include LFUV in Table 4, Column6. The very high UV luminosities combined with low reddening(§4.1) are rare in local galaxies and are more typically found ingalaxies at higher redshift.
5 COMPARISON WITH OTHER SAMPLES OFGALAXIES
5.1 Blue Compact Dwarfs
Blue compact dwarfs are a subset of the local dwarf pop-ulation, first identified by Zwicky (1965) as star-like fieldgalaxies on Palomar Sky Survey Plates. They are character-ized by compact, gas-rich regions of high star formation rates
c© 2009 RAS, MNRAS000, 1–18
10 Cardamone et al.
Figure 10. An example SED fit to a typical starforming Pea. The top panel shows both the original emission-line dominated SDSSugriz photometry (largeblack points), and the medium-band photometry derived fromthe emission-line subtracted spectrum used for the SED fit (open boxes). The best-fit template(small black points and dashed line) is plotted on top. In thebottom panel, we show the SDSS spectrum of this Pea together with theugriz filter transmissioncurves. The [OIII] line dominates ther-band flux and thei-band flux is significantly affected by Hα emission. The SDSS broad-band photometry is dominatedby emission lines to such an extent that fitting stellar templates to it cannot yield reliable results.
Figure 12. Specific star-formation rate vs. mass for the Peas (purple dia-monds) and the Galaxy Zoo Mergers sample (black points). ThePeas havelow masses typical of dwarf galaxies and much higher specificstar for-mation rates compared to the merging galaxies. The dashed line shows aconstant star formation rate of 10 M⊙yr−1. Most of the Peas had SFRsbetween 3 and 30 M⊙yr−1 and hence follow this line closely.
(Papaderos et al. 2002; Vaduvescu et al. 2007), often lying in-side an older stellar population of larger spatial extent contain-ing a significant mass contribution of the galaxy as a whole(Loose & Thuan 1986; Kunth et al. 1988; Papaderos et al. 1996;Aloisi et al. 2007). They are generally low-metallicity (7.12 6
12+log(O/H)6 8.4), evolved, gas-rich dwarfs undergoing recur-rent starburst activity (Loose & Thuan 1986; Papaderos et al. 1996;Gil de Paz & Madore 2005; Papaderos et al. 2008). As a class BlueCompact Dwarfs cover a wide range in absolute magnitude and areoften sub-classified by size (Ultra Compact Blue Dwarfs) or lumi-nosity (Luminous Blue Compact Galaxies).
Ultra Compact Blue Dwarf galaxies are the smallest of theBlue Compact Dwarfs with physical diameters less than 1 kpcand low masses (∼ 107 − 109M⊙; Corbin et al. 2006). Typi-cally an order of magnitude less luminous than other BCGs, theiroptical spectra can be dominated by very strong emission lines(Guseva et al. 2004; Corbin et al. 2006) and they can contain sub-stantial amounts of internal dust (eg.E(B − V ) ∼ 0.28 ;Corbin & Vacca 2002). Like other low mass galaxies, Ultra BlueCompact Dwarfs have very low metallicities, yet they still lie onan extrapolation of the Tremonti et al. (2004) mass-metallicity re-lation (Corbin et al. 2006). These galaxies can show asymmetricmorphologies with multiple sub-clumps of active star-forming re-gions (Corbin & Vacca 2002; Corbin et al. 2006). While their lightis dominated by the compact, young (∼1-10 Myr) stellar popula-tion, their stellar mass is dominated by an older, evolved (∼10 Gyr)
c© 2009 RAS, MNRAS000, 1–18
Galaxy Zoo Green Peas 11
population. As a population, these galaxies tend to reside withinvoids (Corbin et al. 2006).
At the other end of the Blue Compact Dwarf category, Lumi-nous Blue Compact Galaxies are the most luminous members withMB 6 −17.5. They are more massive than their Ultra Compactcounterparts, with average masses near 5×10⁹ M⊙ (Guzman et al.2003). As one might expect from a class of more massive galax-ies, their metallicities are on average higher than the Ultra BlueCompact Dwarfs (7.76 12+log(O/H)6 8.4; Guseva et al. 2004;Hoyos et al. 2007). However, like their Ultra Compact Blue Dwarfcounterparts, Luminous Blue Compact Galaxies show compactprominent regions of star formation, often with disturbed mor-phologies (Bergvall & Johansson 1985) and star formation ratestypically ranging from 1-5 M⊙yr−1. Underlying these young,star-forming regions, older stellar populations with the coloursand stellar profiles of older, massive ellipticals are detected innear-IR imaging (Bergvall &Ostlin 2002). Examples of Lumi-nous Blue Compact Galaxies are found at intermediate redshifts(Guzman et al. 1997; Phillips et al. 1997; Hoyos et al. 2004) andmay contribute up to 50% of the star formation rate density intheUniverse at z=1 (Guzman et al. 1997).
Because both the Peas and Blue Compact Dwarf galaxies con-tain strong emission lines originating in compact regions of star for-mation, we investigated their potential overlap as a class.Althoughthe Peas are similar in morphology, environment and physical sizeto the z=0 Ultra Blue Compact Dwarfs, they appear to be a differentclass of galaxies. The Peas have significantly higher metallicities,typically more than 0.5 Z⊙ compared to 0.02 Z⊙ for the Ultra Com-pact Blue Dwarfs. Additionally, the stellar masses of the Peas areon average∼109.5M⊙, roughly an order of magnitude larger thansimilar measurements of Ultra Compact Blue Dwarfs (Corbin et al.2006). While Ultra Compact Blue Dwarfs are found nearz ∼ 0,the Peas are detected at 0.1136z60.36, meaning they have severalGyrs to grow and further increase their metallicity before reachingz=0, increasing the disparity in the measured masses and metallic-ities. In contrast, the largest of the Blue Compact Dwarfs, Lumi-nous Blue Compact Galaxies have stellar masses and metallicitiesthat match the measured values for the Peas. The luminosities ofthe Peas are easily as bright as this class of galaxies, with medianMB ∼ −20. Additionally, studies of low-metallicity SDSS objectslike Blue Compact Dwarfs find that they lie in the same locationon the BPT plot shown in Figure 6 (Izotov et al. 2006) and [O III]5007 / Hβ line ratios for a sample of four Luminous Compact BlueGalaxies measured with STIS (log([OIII ]λ5007A Hβ) ∼ 0.5;Hoyos et al. 2004) are similar to those we find here (Figure 6).Studies of the Peas at near-infrared wavelengths could potentiallyreveal older stellar populations, like those found in Luminous BlueCompact Galaxies. These older stellar populations could reveal ad-ditional stellar mass and potentially larger radii. Therefore, the Peascould potentially be classified as part of the heterogeneousLumi-nous Blue Compact Galaxies category.
We tentatively conclude that the Peas form a different classofgalaxies than Ultra Blue Compact Dwarfs, but they are similar tothe most luminous members of the Blue Compact Dwarfs category,Luminous Blue Compact Galaxies.
5.2 Local UV-Luminous Galaxies
Heckman et al. (2005) defined a sample of 215 ultraviolet-luminous galaxies (UVLGs) from the SDSS spectroscopic galaxysample (DR3) andGALEX (GR1) with luminositiesLFUV >
2 × 10¹⁰L⊙. We have 139 Peas with Galex detections (S/N>
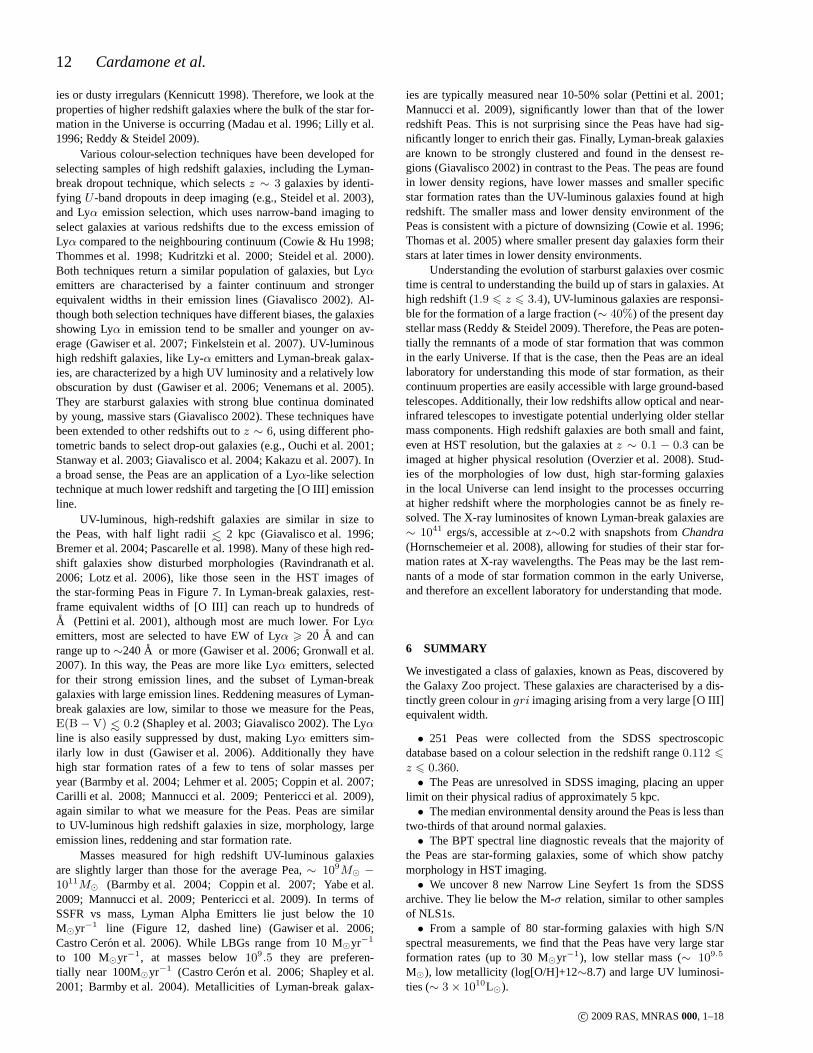
Figure 13. Neither the distribution of [O III] equivalent width for∼10, 0000 comparison galaxies (§2.1; red lined histogram) nor the UVLGsample (blue solid histogram) have equivalent widths comparable to thePeas (green lined histogram). As a class the Peas have much larger [OIII] equivalent widths than normal or UV-luminous galaxies. All equivalentwidths displayed here are from the SDSS pipeline measurements.
3), 44 of which meet Heckman et al. (2005)’s criteria (LF UV >
2 × 10¹⁰L⊙, z60.3 and SDSS pipeline spectral type identifiedas galaxy. Since GR4+DR7 cover a much larger area thanGR1+DR3, we find only four overlapping sources between the Peasand the UVLG sample (Hoopes et al. 2007). However, we note thatnone of the other 211 UVLGs fall into the SDSS colour-selectionwedge of the Peas.
The Peas selection includes many UV-luminous galaxies, butdoes not uncover the same population of galaxies as a selectionbased on UV luminosity. To illustrate this in Figure 13, we comparethe [O III] equivalent width, as measured by the SDSS pipeline, forthe galaxy sample described in Section 2.1 and the Heckman etal.(2005) UVLG sample to that of the Peas. Unsurprisingly, due totheir selection, the Peas have much larger equivalent widthmea-surements than either the UVLG sample or the general spectro-scopic galaxy sample (§ 13). The Pea [O III] equivalent widths aredue to the combination of both very high star formation ratesandthe faint continuum. The Peas form a sample of objects selected tohave large [O III] equivalent widths, many of which also havelargeUV luminosities. As the UVLGs are currently one of the best localsamples of galaxies analogous to high redshift Lyman-breakgalax-ies (Hoopes et al. 2007), we now look into the comparison betweenthe Peas and high redshift galaxy samples.
5.3 UV-luminous High Redshift Galaxies
Peas are sites of extreme star-formation in the local Universe. Theyare both very compact and have low stellar masses, yet they haveenormous star formation rates, as shown by their emission linesand their UV luminosity. This sample of galaxies is quite distinctfrom typical z ∼ 0 star-forming galaxies, i.e., blue spiral galax-
c© 2009 RAS, MNRAS000, 1–18
12 Cardamone et al.
ies or dusty irregulars (Kennicutt 1998). Therefore, we look at theproperties of higher redshift galaxies where the bulk of thestar for-mation in the Universe is occurring (Madau et al. 1996; Lillyet al.1996; Reddy & Steidel 2009).
Various colour-selection techniques have been developed forselecting samples of high redshift galaxies, including theLyman-break dropout technique, which selectsz ∼ 3 galaxies by identi-fying U -band dropouts in deep imaging (e.g., Steidel et al. 2003),and Lyα emission selection, which uses narrow-band imaging toselect galaxies at various redshifts due to the excess emission ofLyα compared to the neighbouring continuum (Cowie & Hu 1998;Thommes et al. 1998; Kudritzki et al. 2000; Steidel et al. 2000).Both techniques return a similar population of galaxies, but Lyαemitters are characterised by a fainter continuum and strongerequivalent widths in their emission lines (Giavalisco 2002). Al-though both selection techniques have different biases, the galaxiesshowing Lyα in emission tend to be smaller and younger on av-erage (Gawiser et al. 2007; Finkelstein et al. 2007). UV-luminoushigh redshift galaxies, like Ly-α emitters and Lyman-break galax-ies, are characterized by a high UV luminosity and a relatively lowobscuration by dust (Gawiser et al. 2006; Venemans et al. 2005).They are starburst galaxies with strong blue continua dominatedby young, massive stars (Giavalisco 2002). These techniques havebeen extended to other redshifts out toz ∼ 6, using different pho-tometric bands to select drop-out galaxies (e.g., Ouchi et al. 2001;Stanway et al. 2003; Giavalisco et al. 2004; Kakazu et al. 2007). Ina broad sense, the Peas are an application of a Lyα-like selectiontechnique at much lower redshift and targeting the [O III] emissionline.
UV-luminous, high-redshift galaxies are similar in size tothe Peas, with half light radii∼< 2 kpc (Giavalisco et al. 1996;Bremer et al. 2004; Pascarelle et al. 1998). Many of these high red-shift galaxies show disturbed morphologies (Ravindranathet al.2006; Lotz et al. 2006), like those seen in the HST images ofthe star-forming Peas in Figure 7. In Lyman-break galaxies,rest-frame equivalent widths of [O III] can reach up to hundreds ofA (Pettini et al. 2001), although most are much lower. For Lyαemitters, most are selected to have EW of Lyα > 20 A and canrange up to∼240A or more (Gawiser et al. 2006; Gronwall et al.2007). In this way, the Peas are more like Lyα emitters, selectedfor their strong emission lines, and the subset of Lyman-breakgalaxies with large emission lines. Reddening measures of Lyman-break galaxies are low, similar to those we measure for the Peas,E(B − V) ∼< 0.2 (Shapley et al. 2003; Giavalisco 2002). The Lyαline is also easily suppressed by dust, making Lyα emitters sim-ilarly low in dust (Gawiser et al. 2006). Additionally they havehigh star formation rates of a few to tens of solar masses peryear (Barmby et al. 2004; Lehmer et al. 2005; Coppin et al. 2007;Carilli et al. 2008; Mannucci et al. 2009; Pentericci et al. 2009),again similar to what we measure for the Peas. Peas are similarto UV-luminous high redshift galaxies in size, morphology,largeemission lines, reddening and star formation rate.
Masses measured for high redshift UV-luminous galaxiesare slightly larger than those for the average Pea,∼ 109M⊙ −
1011M⊙ (Barmby et al. 2004; Coppin et al. 2007; Yabe et al.2009; Mannucci et al. 2009; Pentericci et al. 2009). In termsofSSFR vs mass, Lyman Alpha Emitters lie just below the 10M⊙yr−1 line (Figure 12, dashed line) (Gawiser et al. 2006;Castro Ceron et al. 2006). While LBGs range from 10 M⊙yr−1
to 100 M⊙yr−1, at masses below109.5 they are preferen-tially near 100M⊙yr−1 (Castro Ceron et al. 2006; Shapley et al.2001; Barmby et al. 2004). Metallicities of Lyman-break galax-
ies are typically measured near 10-50% solar (Pettini et al.2001;Mannucci et al. 2009), significantly lower than that of the lowerredshift Peas. This is not surprising since the Peas have hadsig-nificantly longer to enrich their gas. Finally, Lyman-breakgalaxiesare known to be strongly clustered and found in the densest re-gions (Giavalisco 2002) in contrast to the Peas. The peas arefoundin lower density regions, have lower masses and smaller specificstar formation rates than the UV-luminous galaxies found athighredshift. The smaller mass and lower density environment ofthePeas is consistent with a picture of downsizing (Cowie et al.1996;Thomas et al. 2005) where smaller present day galaxies form theirstars at later times in lower density environments.
Understanding the evolution of starburst galaxies over cosmictime is central to understanding the build up of stars in galaxies. Athigh redshift (1.9 6 z 6 3.4), UV-luminous galaxies are responsi-ble for the formation of a large fraction (∼ 40%) of the present daystellar mass (Reddy & Steidel 2009). Therefore, the Peas arepoten-tially the remnants of a mode of star formation that was commonin the early Universe. If that is the case, then the Peas are anideallaboratory for understanding this mode of star formation, as theircontinuum properties are easily accessible with large ground-basedtelescopes. Additionally, their low redshifts allow optical and near-infrared telescopes to investigate potential underlying older stellarmass components. High redshift galaxies are both small and faint,even at HST resolution, but the galaxies atz ∼ 0.1 − 0.3 can beimaged at higher physical resolution (Overzier et al. 2008). Stud-ies of the morphologies of low dust, high star-forming galaxiesin the local Universe can lend insight to the processes occurringat higher redshift where the morphologies cannot be as finelyre-solved. The X-ray luminosites of known Lyman-break galaxies are∼ 1041 ergs/s, accessible at z∼0.2 with snapshots fromChandra(Hornschemeier et al. 2008), allowing for studies of their star for-mation rates at X-ray wavelengths. The Peas may be the last rem-nants of a mode of star formation common in the early Universe,and therefore an excellent laboratory for understanding that mode.
6 SUMMARY
We investigated a class of galaxies, known as Peas, discovered bythe Galaxy Zoo project. These galaxies are characterised bya dis-tinctly green colour ingri imaging arising from a very large [O III]equivalent width.
• 251 Peas were collected from the SDSS spectroscopicdatabase based on a colour selection in the redshift range0.112 6
z 6 0.360.• The Peas are unresolved in SDSS imaging, placing an upper
limit on their physical radius of approximately 5 kpc.• The median environmental density around the Peas is less than
two-thirds of that around normal galaxies.• The BPT spectral line diagnostic reveals that the majority of
the Peas are star-forming galaxies, some of which show patchymorphology in HST imaging.• We uncover 8 new Narrow Line Seyfert 1s from the SDSS
archive. They lie below the M-σ relation, similar to other samplesof NLS1s.• From a sample of 80 star-forming galaxies with high S/N
spectral measurements, we find that the Peas have very large starformation rates (up to 30 M⊙yr−1), low stellar mass (∼ 109.5
M⊙), low metallicity (log[O/H]+12∼8.7) and large UV luminosi-ties (∼ 3 × 10¹⁰L⊙).
c© 2009 RAS, MNRAS000, 1–18
Galaxy Zoo Green Peas 13
• The Peas form a different class of galaxies than Ultra BlueCompact Dwarfs, but may be similar to the most luminous mem-bers of the Blue Compact Dwarfs category. Luminous Blue Com-pact Galaxies are similar to the Peas in their masses, morphologies,metallicities, luminosities and redshifts. It would be interesting tostudy the Peas at NIR wavelengths to see if they have older underly-ing stellar populations like those found in Luminous Blue CompactGalaxies.• The Peas share properties similar to local UV-selected sam-
ples in Sloan, but uncover a different population with more extremeequivalent widths of [O III] emission line.• The Peas are similar to UV-luminous high redshift galaxies
such as Lyman-break Galaxies and Lyα emitters. However, thesehigh redshift galaxies are higher in mass, lower in metallicity andfound in the densest regions. The smaller mass and lower densityenvironment of the Peas is consistent with a picture of downsizing,where smaller present day galaxies form their stars at latertimes inlower density environments. If the underlying processes occurringin the Peas is similar to that found in the UV-luminous high red-shift galaxies, the Peas may be the last remnants of a mode of starformation common in the early Universe.
7 ACKNOWLEDGEMENTS
We wish to thank the “Peascorps” for all their hard work: including,Elisabeth Baeten, Gemma Coughlin, Dan Goldstein, Brian Legg,Mark McCallum, Christian Manteuffel, Richard Nowell, RichardProctor, Alice Sheppard, Hanny van Arkel and Alice Sheppardforher help gathering information about the discovery of the Peas inGalaxy Zoo. We also thank Bethany Cobb for help with the editingof this paper. We would also like to thank Eric Gawiser, Pieter vanDokkum, Erin Bonning, Soo Lee, Sarbani Basu and Sugata Kavirajfor helpful comments and our anonymous referee for constructiveand knowledgeable comments which have contributed to the dis-cussion.
Support from NSF grant #AST0407295 and Yale Universityis gratefully acknowledged. CJL acknowledges support fromtheSTFC Science in Society Programme.
Funding for the SDSS and SDSS-II has been provided bythe Alfred P. Sloan Foundation, the Participating Institutions, theNational Science Foundation, the U.S. Department of Energy,the National Aeronautics and Space Administration, the JapaneseMonbukagakusho, the Max Planck Society, and the Higher Ed-ucation Funding Council for England. The SDSS Web Site ishttp://www.sdss.org/.
The SDSS is managed by the Astrophysical Research Con-sortium for the Participating Institutions. The Participating Institu-tions are the American Museum of Natural History, AstrophysicalInstitute Potsdam, University of Basel, University of Cambridge,Case Western Reserve University, University of Chicago, DrexelUniversity, Fermilab, the Institute for Advanced Study, the JapanParticipation Group, Johns Hopkins University, the Joint Institutefor Nuclear Astrophysics, the Kavli Institute for ParticleAstro-physics and Cosmology, the Korean Scientist Group, the ChineseAcademy of Sciences (LAMOST), Los Alamos National Labora-tory, the Max-Planck-Institute for Astronomy (MPIA), the Max-Planck-Institute for Astrophysics (MPA), New Mexico StateUni-versity, Ohio State University, University of Pittsburgh,Universityof Portsmouth, Princeton University, the United States Naval Ob-servatory, and the University of Washington.
REFERENCES
Abazajian K. N., Adelman-McCarthy J. K., Agueros M. A., Al-lam S. S., Allende Prieto C., An D., Anderson K. S. J., AndersonS. F., Annis J., Bahcall N. A., Bailer-Jones C. A. L., BarentineJ. C., Bassett B. A., Becker A. C., Beers T. C., Bell E. F., Be-lokurov V., Berlind A. A., Berman E. F., Bernardi M., BickertonS. J., Bizyaev D., Blakeslee J. P., Blanton M. R., Bochanski J. J.,Boroski W. N., Brewington H. J., Brinchmann J., Brinkmann J.,Brunner R. J., Budavari T., Carey L. N., Carliles S., Carr M.A.,Castander F. J., Cinabro D., Connolly A. J., Csabai I., CunhaC. E., Czarapata P. C., Davenport J. R. A., de Haas E., DildayB., Doi M., Eisenstein D. J., Evans M. L., Evans N. W., FanX., Friedman S. D., Frieman J. A., Fukugita M., Gansicke B. T.,Gates E., Gillespie B., Gilmore G., Gonzalez B., Gonzalez C.F.,Grebel E. K., Gunn J. E., Gyory Z., Hall P. B., Harding P., Har-ris F. H., Harvanek M., Hawley S. L., Hayes J. J. E., HeckmanT. M., Hendry J. S., Hennessy G. S., Hindsley R. B., Hoblitt J.,Hogan C. J., Hogg D. W., Holtzman J. A., Hyde J. B., IchikawaS.-i., Ichikawa T., Im M., IvezicZ., Jester S., Jiang L., John-son J. A., Jorgensen A. M., Juric M., Kent S. M., Kessler R.,Kleinman S. J., Knapp G. R., Konishi K., Kron R. G., Krzesin-ski J., Kuropatkin N., Lampeitl H., Lebedeva S., Lee M. G., LeeY. S., Leger R. F., Lepine S., Li N., Lima M., Lin H., LongD. C., Loomis C. P., Loveday J., Lupton R. H., Magnier E.,Malanushenko O., Malanushenko V., Mandelbaum R., MargonB., Marriner J. P., Martınez-Delgado D., Matsubara T., McGe-hee P. M., McKay T. A., Meiksin A., Morrison H. L., MullallyF., Munn J. A., Murphy T., Nash T., Nebot A., Neilsen E. H.,Newberg H. J., Newman P. R., Nichol R. C., Nicinski T., Nieto-Santisteban M., Nitta A., Okamura S., Oravetz D. J., OstrikerJ. P., Owen R., Padmanabhan N., Pan K., Park C., Pauls G.,Peoples J., Percival W. J., Pier J. R., Pope A. C., Pourbaix D.,Price P. A., Purger N., Quinn T., Raddick M. J., Fiorentin P. R.,Richards G. T., Richmond M. W., Riess A. G., Rix H.-W., Rock-osi C. M., Sako M., Schlegel D. J., Schneider D. P., Scholz R.-D., Schreiber M. R., Schwope A. D., Seljak U., Sesar B., Shel-don E., Shimasaku K., Sibley V. C., Simmons A. E., SivaraniT., Smith J. A., Smith M. C., Smolcic V., Snedden S. A., Steb-bins A., Steinmetz M., Stoughton C., Strauss M. A., Subba RaoM., Suto Y., Szalay A. S., Szapudi I., Szkody P., Tanaka M.,Tegmark M., Teodoro L. F. A., Thakar A. R., Tremonti C. A.,Tucker D. L., Uomoto A., Vanden Berk D. E., Vandenberg J.,Vidrih S., Vogeley M. S., Voges W., Vogt N. P., Wadadekar Y.,Watters S., Weinberg D. H., West A. A., White S. D. M., Wil-hite B. C., Wonders A. C., Yanny B., Yocum D. R., York D. G.,Zehavi I., Zibetti S., Zucker D. B., 2009, ApJS, 182, 543
Aloisi A., Clementini G., Tosi M., Annibali F., Contreras R.,Fiorentino G., Mack J., Marconi M., Musella I., Saha A., Siri-anni M., van der Marel R. P., 2007, ApJ, 667, L151
Asplund M., Grevesse N., Sauval A. J., 2005, in AstronomicalSo-ciety of the Pacific Conference Series, Vol. 336, Cosmic Abun-dances as Records of Stellar Evolution and Nucleosynthesis,Barnes III T. G., Bash F. N., eds., pp. 25–+
Bamford S. P., Nichol R. C., Baldry I. K., Land K., Lintott C. J.,Schawinski K., Slosar A., Szalay A. S., Thomas D., Torki M.,Andreescu D., Edmondson E. M., Miller C. J., Murray P., Rad-dick M. J., Vandenberg J., 2009, MNRAS, 393, 1324
Barmby P., Huang J.-S., Fazio G. G., Surace J. A., Arendt R. G.,Hora J. L., Pahre M. A., Adelberger K. L., Eisenhardt P., ErbD. K., Pettini M., Reach W. T., Reddy N. A., Shapley A. E.,Steidel C. C., Stern D., Wang Z., Willner S. P., 2004, ApJS, 154,
c© 2009 RAS, MNRAS000, 1–18
14 Cardamone et al.
97Basu S., Antia H. M., 2008, Physics Reports, 457, 217Bauer A. E., Drory N., Hill G. J., Feulner G., 2005, ApJ, 621, L89Bergvall N., Johansson L., 1985, A&A, 149, 475Bergvall N.,Ostlin G., 2002, A&A, 390, 891Blanton M. R., Dalcanton J., Eisenstein D., Loveday J., StraussM. A., SubbaRao M., Weinberg D. H., Anderson Jr. J. E., AnnisJ., Bahcall N. A., et al., 2001, AJ, 121, 2358
Bonning E. W., Shields G. A., Salviander S., McLure R. J., 2005,ApJ, 626, 89
Bremer M. N., Lehnert M. D., Waddington I., Hardcastle M. J.,Boyce P. J., Phillipps S., 2004, MNRAS, 347, L7
Brinchmann J., Charlot S., White S. D. M., Tremonti C., Kauff-mann G., Heckman T., Brinkmann J., 2004, MNRAS, 351, 1151
Calzetti D., Armus L., Bohlin R. C., Kinney A. L., Koornneef J.,Storchi-Bergmann T., 2000, ApJ, 533, 682
Cappellari M., Emsellem E., 2004, PASP, 116, 138Cardelli J. A., Clayton G. C., Mathis J. S., 1989, ApJ, 345, 245Carilli C. L., Lee N., Capak P., Schinnerer E., Lee K.-S., Mc-Craken H., Yun M. S., Scoville N., Smolcic V., Giavalisco M.,Datta A., Taniguchi Y., Urry C. M., 2008, ApJ, 689, 883
Castro Ceron J. M., Michałowski M. J., Hjorth J., Watson D.,Fynbo J. P. U., Gorosabel J., 2006, ApJ, 653, L85
Coppin K. E. K., Swinbank A. M., Neri R., Cox P., Smail I., EllisR. S., Geach J. E., Siana B., Teplitz H., Dye S., Kneib J.-P., EdgeA. C., Richard J., 2007, ApJ, 665, 936
Corbin M. R., Vacca W. D., 2002, ApJ, 581, 1039Corbin M. R., Vacca W. D., Cid Fernandes R., Hibbard J. E.,Somerville R. S., Windhorst R. A., 2006, ApJ, 651, 861
Cowie L. L., Hu E. M., 1998, AJ, 115, 1319Cowie L. L., Songaila A., Hu E. M., Cohen J. G., 1996, AJ, 112,839
Darg D. W., Kaviraj S., Lintott C. J., Schawinski K., Sarzi M.,Bamford S., Silk J., Andreescu D., Murray P., Nichol R. C., Rad-dick M. J., Slosar A., Szalay A. S., Thomas D., Vandenberg J.,2009, arXiv:0903.5057
Finkelstein S. L., Rhoads J. E., Malhotra S., Pirzkal N., Wang J.,2007, ApJ, 660, 1023
Fukugita M., Ichikawa T., Gunn J. E., Doi M., Shimasaku K.,Schneider D. P., 1996, AJ, 111, 1748
Gawiser E., Francke H., Lai K., Schawinski K., Gronwall C., Ciar-dullo R., Quadri R., Orsi A., Barrientos L. F., Blanc G. A., FazioG., Feldmeier J. J., Huang J.-s., Infante L., Lira P., Padilla N.,Taylor E. N., Treister E., Urry C. M., van Dokkum P. G., ViraniS. N., 2007, ApJ, 671, 278
Gawiser E., van Dokkum P. G., Gronwall C., Ciardullo R., BlancG. A., Castander F. J., Feldmeier J., Francke H., Franx M.,Haberzettl L., Herrera D., Hickey T., Infante L., Lira P., MazaJ., Quadri R., Richardson A., Schawinski K., Schirmer M., Tay-lor E. N., Treister E., Urry C. M., Virani S. N., 2006, ApJ, 642,L13
Giavalisco M., 2002, ARA&A, 40, 579Giavalisco M., Dickinson M., Ferguson H. C., Ravindranath S.,Kretchmer C., Moustakas L. A., Madau P., Fall S. M., GardnerJ. P., Livio M., Papovich C., Renzini A., Spinrad H., Stern D.,Riess A., 2004, ApJ, 600, L103
Giavalisco M., Livio M., Bohlin R. C., Macchetto F. D., StecherT. P., 1996, AJ, 112, 369
Gil de Paz A., Madore B. F., 2005, ApJS, 156, 345Grevesse N., Sauval A. J., 1998, Space Science Reviews, 85, 161Gronwall C., Ciardullo R., Hickey T., Gawiser E., FeldmeierJ. J.,van Dokkum P. G., Urry C. M., Herrera D., Lehmer B. D., In-
fante L., Orsi A., Marchesini D., Blanc G. A., Francke H., LiraP., Treister E., 2007, ApJ, 667, 79
Guseva N. G., Papaderos P., Izotov Y. I., Noeske K. G., FrickeK. J., 2004, A&A, 421, 519
Guzman R., Gallego J., Koo D. C., Phillips A. C., Lowenthal J.D.,Faber S. M., Illingworth G. D., Vogt N. P., 1997, ApJ, 489, 559
Guzman R.,Ostlin G., Kunth D., Bershady M. A., Koo D. C.,Pahre M. A., 2003, ApJ, 586, L45
Heckman T. M., Hoopes C. G., Seibert M., Martin D. C., SalimS., Rich R. M., Kauffmann G., Charlot S., Barlow T. A., BianchiL., Byun Y.-I., Donas J., 2005, ApJ, 619, L35
Hoopes C. G., Heckman T. M., Salim S., Seibert M., TremontiC. A., Schiminovich D., Rich R. M., Lee Y.-W., Madore B. F.,Milliard B., Szalay A. S., Welsh B. Y., Yi S. K., 2007, ApJS,173, 441
Hornschemeier A. E., Heckman T., Ptak A., Grimes J., Strick-land D., Salim S., Rich R. M., Mallery R., 2008, in AmericanInstitute of Physics Conference Series, Vol. 1010, A PopulationExplosion: The Nature & Evolution of X-ray Binaries in DiverseEnvironments, Bandyopadhyay R. M., Wachter S., Gelino D.,Gelino C. R., eds., pp. 291–297
Hoyos C., Guzman R., Bershady M. A., Koo D. C., Dıaz A. I.,2004, AJ, 128, 1541
Hoyos C., Guzman R., Dıaz A. I., Koo D. C., Bershady M. A.,2007, AJ, 134, 2455
Izotov Y. I., Stasinska G., Meynet G., Guseva N. G., Thuan T.X.,2006, A&A, 448, 955
Kakazu Y., Cowie L. L., Hu E. M., 2007, ApJ, 668, 853Kauffmann G., Heckman T. M., Tremonti C., Brinchmann J.,Charlot S., White S. D. M., Ridgway S. E., Brinkmann J.,Fukugita M., Hall P. B., IvezicZ., Richards G. T., SchneiderD. P., 2003, MNRAS, 346, 1055
Kennicutt Jr. R. C., 1998, ARA&A, 36, 189Kewley L. J., Dopita M. A., 2002, ApJS, 142, 35Kewley L. J., Dopita M. A., Sutherland R. S., Heisler C. A.,Trevena J., 2001, ApJ, 556, 121
Kewley L. J., Groves B., Kauffmann G., Heckman T., 2006, MN-RAS, 372, 961
Komossa S., Xu D., Zhou H., Storchi-Bergmann T., Binette L.,2008, ApJ, 680, 926
Kriek M., van Dokkum P. G., Labbe I., Franx M., IllingworthG. D., Marchesini D., Quadri R. F., 2009, ArXiv e-prints
Kudritzki R.-P., Mendez R. H., Feldmeier J. J., Ciardullo R., Ja-coby G. H., Freeman K. C., Arnaboldi M., Capaccioli M., Ger-hard O., Ford H. C., 2000, ApJ, 536, 19
Kunth D., Maurogordato S., Vigroux L., 1988, A&A, 204, 10Land K., Slosar A., Lintott C., Andreescu D., Bamford S., MurrayP., Nichol R., Raddick M. J., Schawinski K., Szalay A., ThomasD., Vandenberg J., 2008, MNRAS, 388, 1686
Lehmer B. D., Brandt W. N., Alexander D. M., Bauer F. E., Con-selice C. J., Dickinson M. E., Giavalisco M., Grogin N. A.,Koekemoer A. M., Lee K.-S., Moustakas L. A., Schneider D. P.,2005, AJ, 129, 1
Lequeux J., 2005, The interstellar medium. The interstellarmedium, Translation from the French language edition of: LeMilieu Interstellaire by James Lequeux, EDP Sciences, 2003Edited by J. Lequeux. Astronomy and astrophysics library,Berlin: Springer, 2005
Lilly S. J., Le Fevre O., Hammer F., Crampton D., 1996, ApJ, 460,L1+
Lintott C. J., Schawinski K., Slosar A., Land K., Bamford S.,Thomas D., Raddick M. J., Nichol R. C., Szalay A., Andreescu
c© 2009 RAS, MNRAS000, 1–18
Galaxy Zoo Green Peas 15
D., Murray P., Vandenberg J., 2008, MNRAS, 389, 1179Lintott C. J. e. a., 2009, in prep,Loose H.-H., Thuan T. X., 1986, ApJ, 309, 59Lotz J. M., Madau P., Giavalisco M., Primack J., Ferguson H. C.,2006, ApJ, 636, 592
Lupton R., Gunn J. E., Ivezic Z., Knapp G. R., Kent S., 2001, inAstronomical Society of the Pacific Conference Series, Vol.238,Astronomical Data Analysis Software and Systems X, HarndenJr. F. R., Primini F. A., Payne H. E., eds., pp. 269–+
Madau P., Ferguson H. C., Dickinson M. E., Giavalisco M., Stei-del C. C., Fruchter A., 1996, MNRAS, 283, 1388
Mannucci F., Cresci G., Maiolino R., Marconi A., Pastorini G.,Pozzetti L., Gnerucci A., Risaliti G., Schneider R., Lehnert M.,Salvati M., 2009, arXiv:0902.2398
Maraston C., 1998, MNRAS, 300, 872—, 2005, MNRAS, 362, 799Marconi A., Axon D. J., Maiolino R., Nagao T., Pastorini G.,Pietrini P., Robinson A., Torricelli G., 2008, ApJ, 678, 693
McLure R. J., Jarvis M. J., 2002, MNRAS, 337, 109Morrissey P., Conrow T., Barlow T. A., Small T., Seibert M.,Wyder T. K., Budavari T., Rich R. M., Szalay A. S., Welsh B. Y.,Yi S. K., 2007, ApJS, 173, 682
Noll K., 2007, in HST Proposal, pp. 11113–+Osterbrock D. E., Pogge R. W., 1985, ApJ, 297, 166Ouchi M., Shimasaku K., Okamura S., Doi M., Furusawa H.,Hamabe M., Kimura M., Komiyama Y., Miyazaki M., MiyazakiS., Nakata F., Sekiguchi M., Yagi M., Yasuda N., 2001, ApJ, 558,L83
Overzier R. A., Heckman T. M., Kauffmann G., Seibert M., RichR. M., Basu-Zych A., Lotz J., Aloisi A., Charlot S., Hoopes C.,Martin D. C., Schiminovich D., Madore B., 2008, ApJ, 677, 37
Papaderos P., Guseva N. G., Izotov Y. I., Fricke K. J., 2008, A&A,491, 113
Papaderos P., Izotov Y. I., Thuan T. X., Noeske K. G., Fricke K. J.,Guseva N. G., Green R. F., 2002, A&A, 393, 461
Papaderos P., Loose H.-H., Fricke K. J., Thuan T. X., 1996, A&A,314, 59
Pascarelle S. M., Lanzetta K. M., Fernandez-Soto A., 1998,ApJ,508, L1
Pentericci L., Grazian A., Fontana A., Castellano M., GiallongoE., Salimbeni S., Santini P., 2009, A&A, 494, 553
Pettini M., Shapley A. E., Steidel C. C., Cuby J.-G., DickinsonM., Moorwood A. F. M., Adelberger K. L., Giavalisco M., 2001,ApJ, 554, 981
Phillips A. C., Guzman R., Gallego J., Koo D. C., Lowenthal J.D.,Vogt N. P., Faber S. M., Illingworth G. D., 1997, ApJ, 489, 543
Ravindranath S., Giavalisco M., Ferguson H. C., Conselice C.,Katz N., Weinberg M., Lotz J., Dickinson M., Fall S. M.,Mobasher B., Papovich C., 2006, ApJ, 652, 963
Reddy N. A., Steidel C. C., 2009, ApJ, 692, 778Richards G. T., Croom S. M., Anderson S. F., Bland-HawthornJ., Boyle B. J., De Propris R., Drinkwater M. J., Fan X., GunnJ. E., IvezicZ., Jester S., Loveday J., Meiksin A., Miller L., et al.,2005, MNRAS, 360, 839
Ryan C. J., De Robertis M. M., Virani S., Laor A., Dawson P. C.,2007, ApJ, 654, 799
Sarzi M., Falcon-Barroso J., Davies R. L., Bacon R., BureauM.,Cappellari M., de Zeeuw P. T., Emsellem E., Fathi K., KrajnovicD., Kuntschner H., McDermid R. M., Peletier R. F., 2006, MN-RAS, 366, 1151
Schawinski K., Lintott C., Thomas D., Sarzi M., Andreescu D.,Bamford S. P., Kaviraj S., Khochfar S., Land K., Murray P.,
Nichol R. C., Raddick M. J., Slosar A., Szalay A., VandenbergJ., Yi S. K., 2009, MNRAS, 690
Schawinski K., Thomas D., Sarzi M., Maraston C., Kaviraj S.,JooS.-J., Yi S. K., Silk J., 2007, MNRAS, 382, 1415
Schmitt H., 2006, in HST Proposal, pp. 10880–+Shapley A. E., Steidel C. C., Adelberger K. L., Dickinson M.,Giavalisco M., Pettini M., 2001, ApJ, 562, 95
Shapley A. E., Steidel C. C., Pettini M., Adelberger K. L., 2003,ApJ, 588, 65
Skibba R. A., Bamford S. P., Nichol R. C., Lintott C. J., AndreescuD., Edmondson E. M., Murray P., Raddick M. J., SchawinskiK., Slosar A., Szalay A. S., Thomas D., Vandenberg J., 2008,arXiv:0811.3970
Slosar A., Land K., Bamford S., Lintott C., Andreescu D., MurrayP., Nichol R., Raddick M. J., Schawinski K., Szalay A., ThomasD., Vandenberg J., 2009, MNRAS, 392, 1225
Spergel D. N., Bean R., Dore O., Nolta M. R., 2007, ApJS, 170,377
Stanway E. R., Bunker A. J., McMahon R. G., 2003, MNRAS,342, 439
Steidel C. C., Adelberger K. L., Shapley A. E., Pettini M., Dick-inson M., Giavalisco M., 2000, ApJ, 532, 170
—, 2003, ApJ, 592, 728Stoughton C., Lupton R. H., Bernardi M., Blanton M. R., BurlesS., Castander F. J., Connolly A. J., York D. G., Zehavi I., ZhengW., 2002, AJ, 123, 485
Strauss M. A., Weinberg D. H., Lupton R. H., 2002, AJ, 124, 1810Taniguchi Y., 2004, in Studies of Galaxies in the Young Universewith New Generation Telescope, Arimoto N., Duschl W. J., eds.,pp. 107–111
Thomas D., Maraston C., Bender R., Mendes de Oliveira C., 2005,ApJ, 621, 673
Thommes E., Meisenheimer K., Fockenbrock R., Hippelein H.,Roeser H.-J., Beckwith S., 1998, MNRAS, 293, L6
Tremaine S., Gebhardt K., Bender R., Bower G., Dressler A.,Faber S. M., Filippenko A. V., Green R., Grillmair C., Ho L. C.,Kormendy J., Lauer T. R., Magorrian J., Pinkney J., RichstoneD., 2002, ApJ, 574, 740
Tremonti C. A., Heckman T. M., Kauffmann G., Brinchmann J.,Charlot S., White S. D. M., Seibert M., Peng E. W., SchlegelD. J., Uomoto A., Fukugita M., Brinkmann J., 2004, ApJ, 613,898
Vaduvescu O., McCall M. L., Richer M. G., 2007, AJ, 134, 604Veilleux S., Osterbrock D. E., 1987, ApJS, 63, 295Venemans B. P., Rottgering H. J. A., Miley G. K., Kurk J. D., DeBreuck C., Overzier R. A., van Breugel W. J. M., Carilli C. L.,Ford H., Heckman T., Pentericci L., McCarthy P., 2005, A&A,431, 793
Voges W., Aschenbach B., Boller T., Brauninger H., Trumper J.,Zimmermann H. U., 1999, A&A, 349, 389
Williams R. J., Pogge R. W., Mathur S., 2002, AJ, 124, 3042Yabe K., Ohta K., Iwata I., Sawicki M., Tamura N., Akiyama M.,Aoki K., 2009, ApJ, 693, 507
Yasuda N., Fukugita M., Narayanan V. K., Lupton R. H., 2001,AJ, 122, 1104
York D. G., Adelman J., Anderson Jr. J. E., Anderson S. F., AnnisJ., Bahcall N. A., Bakken J. A., 2000, AJ, 120, 1579
Zhou H., Wang T., Yuan W., Lu H., Dong X., Wang J., Lu Y.,2006, ApJS, 166, 128
Zwicky F., 1965, ApJ, 142, 1293
c© 2009 RAS, MNRAS000, 1–18
16 Cardamone et al.
Table 4. Properties of Pea Star-Forming Galaxies
SDSSIDa RAa Deca za [O III] EWa LFUVb SFRc log(O/H)+12d Stellar Masse
(J2000) (J2000) A [1044 ergss−1 ] [M⊙yr−1 ] [M⊙]
587725073921409255 146.242618 -0.762639 0.3002 312.8 1.04 ( 0.21) 12.45 (0.52) 8.78 8.85
8.719.76
588848899919446344 195.546460 -0.087897 0.2255 834.4 0.19 ( 0.04) 4.47 (0.22) 8.75 8.87
8.599.07
587725576962244831 261.776373 59.817273 0.3472 651.5· · · ( · · · ) 24.98 (1.48) 8.71 8.79
8.619.81
587731187273892048 351.413453 0.752012 0.2770 319.6 0.99( 0.06) 11.11 (0.85) 8.70 8.79
8.599.38
587731513693503653 50.687082 0.745111 0.3043 282.1 1.09 (0.27) 14.22 (0.80) 8.83 8.87
8.799.89
587724233716596882 22.292299 14.992956 0.2800 354.0 1.53( 0.21) 13.37 (0.72) 8.77 8.83
8.719.46
587727179006148758 45.839226 -7.989791 0.1650 886.0· · · ( · · · ) 8.72 (0.64) 8.71 8.79
8.618.75
587724241767825591 51.556792 -6.586816 0.1621 822.9· · · ( · · · ) 11.44 (0.41) 8.76 8.80
8.729.48
587724240158589061 54.949128 -7.428132 0.2608 397.6 2.00( 0.14) 28.96 (1.68) 8.78 8.84
8.729.74
587726032778559604 164.319700 2.535293 0.3028 348.5 1.35( 0.14) 8.75 (0.57) 8.76 8.86
8.649.90
587726032253419628 191.097382 2.261231 0.2395 1151.4· · · ( · · · ) 25.24 (1.30) 8.70 8.76
8.639.44
588010360138367359 130.570630 3.635203 0.2194 567.5· · · ( · · · ) 6.60 (0.21) 8.55 8.66
8.409.71
587726102030451047 236.787938 3.603914 0.2314 891.8· · · ( · · · ) 9.83 (0.61) 8.74 8.81
8.648.96
587729155743875234 173.265848 65.228162 0.2414 475.2 1.61 ( 0.18) 5.43 (0.24) 8.66 8.83
8.4210.05
587728919520608387 212.938906 62.653138 0.2301 529.0 1.45 ( 0.16) 12.80 (0.47) 8.67 8.75
8.5910.18
587729229297090692 234.405309 58.794575 0.2143 851.6 0.44 ( 0.06) 6.32 (0.20) 8.58 8.71
8.429.27
587725818034913419 235.209139 57.411652 0.2944 173.3 3.50 ( 0.24) 16.81 (1.18) 8.91 8.92
8.8910.31
587730774416883967 339.396081 13.613062 0.2936 438.3· · · ( · · · ) 24.78 (0.86) 8.55 8.68
8.3710.10
587730774965354630 6.716985 15.460460 0.2136 754.2· · · ( · · · ) 3.32 (0.21) 8.81 8.89
8.739.58
587728906099687546 117.403215 33.621219 0.2733 339.2 2.04 ( 0.26) 58.83 (2.61) 8.79 8.81
8.779.85
587725550133444775 156.563375 63.552363 0.3338 933.3 1.27 ( 0.28) 3.76 (0.28) · · · ...
...
9.05588009371762098262 170.582224 61.912629 0.2045 960.7 0.40 ( 0.07) 5.59 (0.23) 8.70 8.83
8.538.71
588011122502336742 181.772142 61.586621 0.2620 760.2 0.68 ( 0.13) 13.02 (0.62) · · · ...
...
9.85588011103712706632 226.616617 56.450741 0.2786 341.9 1.08 ( 0.17) 23.88 (0.93) 8.90 8.92
8.889.75
588013384341913605 141.501678 44.460044 0.1807 651.5 1.55 ( 0.11) 14.35 (0.89) 8.62 8.73
8.489.08
587732134315425958 195.368010 51.080893 0.3479 554.4 3.20 ( 0.26) 23.17 (1.74) 8.63 8.82
8.349.53
587729777439801619 204.299529 -2.434842 0.2737 399.2· · · ( · · · ) 8.63 (0.35) 8.76 8.85
8.649.94
587729777446945029 220.630713 -2.164466 0.2938 1456.6 1.61 ( 0.19) 20.22 (0.80) 8.57 8.80
8.148.80
587732152555864324 116.991682 23.609113 0.1552 874.9· · · ( · · · ) 3.26 (0.07) · · · ...
...
9.40587732578845786234 157.912214 7.265701 0.2525 763.9 0.57( 0.18) 6.04 (0.20) 8.52 8.64
8.389.02
587733080270569500 163.378431 52.631353 0.2526 418.2 3.61 ( 0.26) 27.59 (1.09) 8.78 8.82
8.759.75
588297864714387604 131.975356 33.615227 0.3063 323.7 1.89 ( 0.20) 21.46 (0.71) 8.81 8.86
8.749.50
587735695911747673 204.919632 55.461137 0.2291 42.1 1.41( 0.16) 3.22 (0.13) 8.71 8.79
8.619.94
587735696987717870 213.630037 54.515587 0.2270 773.7· · · ( · · · ) 4.04 (0.10) 8.58 8.70
8.438.81
587733441055359356 251.527242 31.514859 0.2907 868.4 1.20 ( 0.14) 6.56 (0.36) · · · ...
...
8.76588017605211390138 154.513517 41.105860 0.2371 1191.4 0.88 ( 0.14) 8.83 (0.25) 8.68 8.79
8.549.82
588017114517536797 216.023868 42.279524 0.1848 1348.8 1.49 ( 0.12) 19.66 (1.09) 8.78 8.81
8.739.00
588017116132540589 228.535985 38.868716 0.3324 632.5 1.77 ( 0.22) 6.02 (0.36) · · · ...
...
8.90588018090541842668 235.755108 34.767079 0.1875 673.9· · · ( · · · ) 2.02 (0.05) · · · ...
...
8.76588018090013098618 251.898063 22.783002 0.3138 578.8· · · ( · · · ) 4.20 (0.49) 8.61 8.78
8.359.27
588016878295515268 137.879799 31.457439 0.2718 426.3 1.05 ( 0.12) 9.18 (0.37) · · · ...
...
9.27587735661007863875 139.260529 31.872384 0.3002 219.7 2.08 ( 0.18) 20.29 (1.51) 8.95 8.97
8.929.44
588016892783820948 148.712329 37.365500 0.2834 279.9 0.90 ( 0.16) 8.42 (0.50) 8.78 8.84
8.709.67
587735663159738526 149.415718 37.702114 0.2867 235.3 1.96 ( 0.23) 15.02 (0.63) · · · ...
...
9.75588018055114784812 220.041419 46.326930 0.3008 304.4 3.17 ( 0.26) 31.50 (2.70) 8.72 8.78
8.659.83
588018055652769997 223.648271 45.482288 0.2687 463.0 1.23 ( 0.13) 21.17 (2.67) 8.84 8.94
8.7110.22
588017570848768137 192.144310 12.567480 0.2634 1055.8 1.30 ( 0.04) 15.01 (0.75) 8.53 8.67
8.349.06
587736915687964980 241.152768 8.333082 0.3123 1388.3 0.55 ( 0.13) 10.64 (0.58) 8.75 8.84
8.659.90
587736915687375248 239.858241 8.688655 0.2970 904.8 0.66( 0.13) 3.44 (0.38) 8.64 8.83
8.338.74
587738410863493299 152.987850 13.139471 0.1439 2388.3· · · ( · · · ) 7.99 (0.22) 8.64 8.71
8.558.66
587735349111947338 184.766599 15.435698 0.1957 1487.9· · · ( · · · ) 7.47 (4.83) 8.82 8.93
8.678.66
587738570859413642 204.867933 15.278369 0.1921 1289.0 0.64 ( 0.06) 18.81 (1.57) 8.83 8.90
8.749.96
587736940372361382 217.614622 34.154720 0.1911 586.8 0.31 ( 0.06) 3.92 (0.15) · · · ...
...
9.31587739153352229578 117.990764 16.637010 0.2647 440.1 0.66 ( 0.13) 6.29 (0.21) 8.65 8.76
8.519.96
587738947196944678 123.966679 21.939902 0.1410 1582.0 0.27 ( 0.03) 3.96 (0.05) 8.55 8.69
8.378.72
587738371672178952 125.698590 22.695578 0.2163 1040.6 0.90 ( 0.13) 37.41 (4.15) 8.81 8.85
8.769.33
588017978880950451 150.556494 34.704908 0.3210 222.1· · · ( · · · ) 4.43 (0.26) 8.64 8.82
8.369.58
587739408388980778 174.342249 35.407413 0.1945 647.2 1.88 ( 0.08) 20.38 (0.91) 8.76 8.83
8.699.32
588017977277874181 171.657352 38.050810 0.2469 646.9 1.56 ( 0.11) 24.18 (0.64) 8.56 8.63
8.479.79
587739406242742472 178.020352 34.013853 0.3420 1095.0· · · ( · · · ) 15.61 (0.91) · · · ...
...
8.86587739828742389914 224.396405 22.533833 0.1488 1563.1 0.45 ( 0.06) 8.94 (0.29) 8.55 8.66
8.419.30
587739652107600089 238.041673 21.053410 0.2332 893.5· · · ( · · · ) 7.29 (0.44) 8.68 8.76
8.579.90
587739721387409964 249.330431 14.651378 0.2923 452.5· · · ( · · · ) 9.89 (0.17) 8.62 8.81
8.339.64
587741600420003946 181.252807 26.346595 0.3427 305.2 1.06 ( 0.24) 18.45 (0.94) 8.81 8.88
8.739.66
587741421099286852 126.715863 18.347732 0.2972 774.4 0.57 ( 0.18) 4.53 (0.20) 8.75 8.88
8.588.67
587741532770074773 133.350354 19.506280 0.2365 860.3· · · ( · · · ) 7.50 (0.41) 8.68 8.74
8.619.37
587741817851084830 137.805603 18.518936 0.2622 329.8 1.72 ( 0.16) 26.17 (1.67) 8.89 8.92
8.879.93
587741391573287017 145.946756 26.345161 0.2366 12.6· · · ( · · · ) 3.15 (0.07) 8.72 8.79
8.6410.26
587741392649781464 152.329151 29.272638 0.2219 1042.8 0.34 ( 0.09) 4.51 (0.19) 8.69 8.80
8.578.55
587739648351076573 155.239428 29.624017 0.2555 378.8· · · ( · · · ) 6.17 (0.25) 8.82 8.85
8.799.51
587741490367889543 158.112322 27.298680 0.1924 840.9 0.56 ( 0.09) 12.74 (0.41) 8.69 8.72
8.6610.02
587741532781215844 159.779860 27.472509 0.2801 182.2 0.81 ( 0.11) 4.57 (0.22) · · · ...
...
9.58
c© 2009 RAS, MNRAS000, 1–18
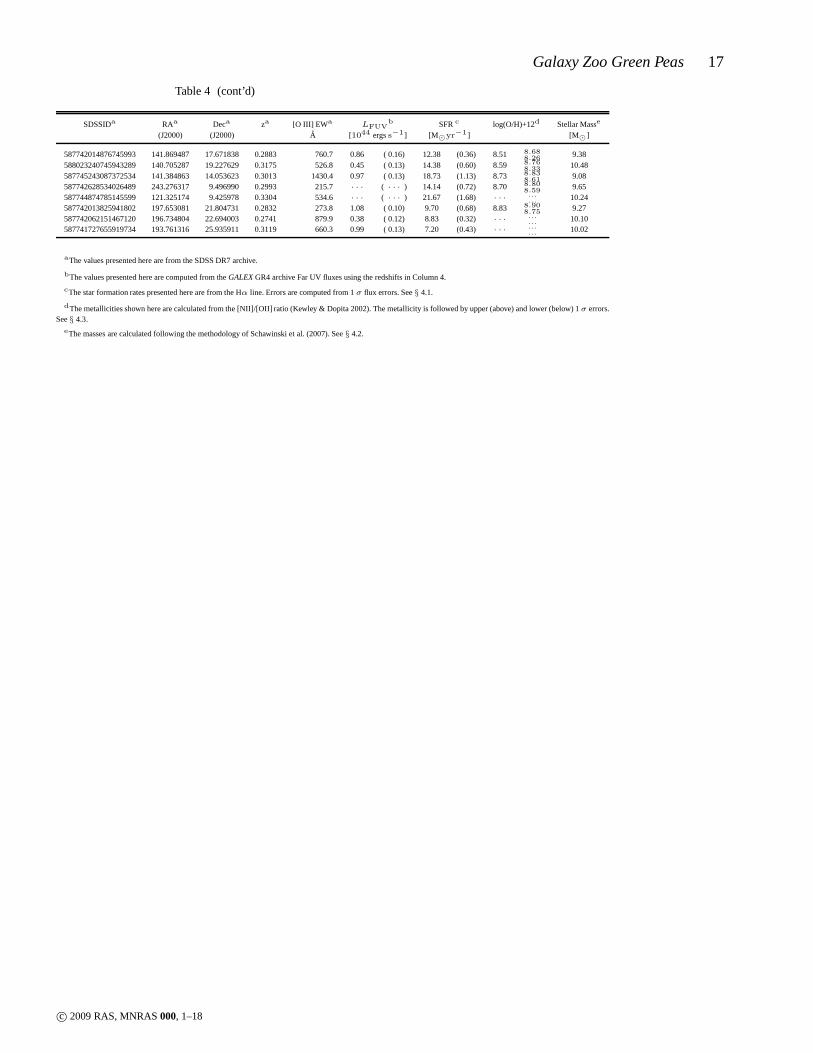
Galaxy Zoo Green Peas 17
Table 4 (cont’d)
SDSSIDa RAa Deca za [O III] EWa LFUVb SFRc log(O/H)+12d Stellar Masse
(J2000) (J2000) A [1044 ergss−1 ] [M⊙yr−1 ] [M⊙]
587742014876745993 141.869487 17.671838 0.2883 760.7 0.86 ( 0.16) 12.38 (0.36) 8.51 8.68
8.269.38
588023240745943289 140.705287 19.227629 0.3175 526.8 0.45 ( 0.13) 14.38 (0.60) 8.59 8.76
8.3310.48
587745243087372534 141.384863 14.053623 0.3013 1430.4 0.97 ( 0.13) 18.73 (1.13) 8.73 8.83
8.619.08
587742628534026489 243.276317 9.496990 0.2993 215.7· · · ( · · · ) 14.14 (0.72) 8.70 8.80
8.599.65
587744874785145599 121.325174 9.425978 0.3304 534.6· · · ( · · · ) 21.67 (1.68) · · · ...
...
10.24587742013825941802 197.653081 21.804731 0.2832 273.8 1.08 ( 0.10) 9.70 (0.68) 8.83 8.90
8.759.27
587742062151467120 196.734804 22.694003 0.2741 879.9 0.38 ( 0.12) 8.83 (0.32) · · · ...
...
10.10587741727655919734 193.761316 25.935911 0.3119 660.3 0.99 ( 0.13) 7.20 (0.43) · · · ...
...
10.02
aThe values presented here are from the SDSS DR7 archive.
bThe values presented here are computed from theGALEXGR4 archive Far UV fluxes using the redshifts in Column 4.
cThe star formation rates presented here are from the Hα line. Errors are computed from 1σ flux errors. See§ 4.1.
dThe metallicities shown here are calculated from the [NII]/[OII] ratio (Kewley & Dopita 2002). The metallicity is followed by upper (above) and lower (below) 1σ errors.See§ 4.3.
eThe masses are calculated following the methodology of Schawinski et al. (2007). See§ 4.2.
c© 2009 RAS, MNRAS000, 1–18
18 Cardamone et al.
This paper has been typeset from a TEX/ LaTEX file prepared by theauthor.
c© 2009 RAS, MNRAS000, 1–18