galaxies that shine: radiation-hydrodynamical simulations of disk galaxies
TRANSCRIPT
Mon. Not. R. Astron. Soc. 000, 000–000 (0000) Printed 21 January 2015 (MN LATEX style file v2.2)
Galaxies that Shine: radiation-hydrodynamical simulationsof disk galaxies
Joakim Rosdahl1?, Joop Schaye1, Romain Teyssier2, and Oscar Agertz31Leiden Observatory, Leiden University, P.O. Box 9513, 2300 RA, Leiden, The Netherlands2Institute for Computational Science, University of Zurich, Winterthurerstrasse 190, CH-8057 Zurich, Switzerland3Department of Physics, University of Surrey, Guildford, GU2 7XH Surrey, UK
21 January 2015
ABSTRACTRadiation feedback is typically implemented using subgrid recipes in hydrodynamicalsimulations of galaxies. Very little work has so far been performed using radiation-hydrodynamics (RHD), and there is no consensus on the importance of radiationfeedback in galaxy evolution. We present RHD simulations of isolated galaxy disks ofdifferent masses with a resolution of 18 pc. Besides accounting for supernova feedback,our simulations are the first galaxy-scale simulations to include RHD treatments ofphoto-ionisation heating and radiation pressure, from both direct optical/UV radiationand multi-scattered, re-processed infrared (IR) radiation. Photo-heating smooths andthickens the disks and suppresses star formation about as much as the inclusion of(“thermal dump”) supernova feedback does. These effects decrease with galaxy massand are mainly due to the prevention of the formation of dense clouds, as opposed totheir destruction. Radiation pressure, whether from direct or IR radiation, has littleeffect, but for the IR radiation we show that its impact is limited by our inability toresolve the high optical depths for which multi-scattering becomes important. Whileartificially boosting the IR optical depths does reduce the star formation, it doesso by smoothing the gas rather than by generating stronger outflows. We concludethat although higher-resolution simulations are needed for confirmation, our findingssuggest that radiation feedback is more gentle and less effective than is often assumedin subgrid prescriptions.
Key words: galaxies: evolution – methods: numerical – radiative transfer
1 INTRODUCTION
The formation of structure in the Universe is described, tozeroth order, by gravity (Peebles & Yu 1970; Zel’dovich1970). However, the formation of galaxies in dark matter(DM) halos also requires radiative cooling to relieve pres-sure and dissipate angular momentum (Binney 1977; Rees& Ostriker 1977; Silk 1977). It is also well established thatcounteracting feedback processes are required to halt thecollapse of gas into galaxies, dense substructures within thegalaxies, and, eventually, stars (e.g. White & Rees 1978).Without feedback, galaxies collapse and form stars too effi-ciently, compared to observations.
In the beginning, theoretical work focused on feedbackin the form of supernovae (SNe; e.g. Katz 1992; Navarro &White 1993) and later active galactic nuclei (e.g. Di Matteoet al. 2005; Booth & Schaye 2009; Dubois et al. 2010), wherethe latter is thought to be dominant in massive (“L∗”) galax-
? E-mail: [email protected]
ies (Bower et al. 2006). However, simulations still struggle toproduce galaxies that match observations in terms of theirstar formation histories and morphology, without feedback“boosts” (Scannapieco et al. 2012) to compensate for theefficient cooling and collapse of gas.
Analytical work by e.g. Thompson et al. (2005) andMurray et al. (2005, 2010, 2011) suggests that radiationfeedback may be an important missing ingredient. Recentsimulations therefore often enlist stellar radiation in theirfeedback models (e.g. Oppenheimer & Dave 2006; Petkova& Springel 2011; Wise et al. 2012a; Hopkins et al. 2012c;Brook et al. 2012; Agertz et al. 2013; Renaud et al. 2013;Kim et al. 2013b; Hasegawa & Semelin 2013; Pawlik et al.2013, 2015; Stinson et al. 2013; Roskar et al. 2014; Cev-erino et al. 2014; Kannan et al. 2014a,b; Moody et al. 2014;Wise et al. 2014; Hopkins et al. 2014; Agertz & Kravtsov2014). Usually, key factors that the added radiation feed-back provides are direct suppression of star formation, andan increase in galactic outflows, which can expel the gas al-together and enrich the intergalactic medium (IGM) with
c© 0000 RAS
arX
iv:1
501.
0463
2v1
[as
tro-
ph.G
A]
19
Jan
2015
2 Rosdahl, Schaye, Teyssier & Agertz
metals, and/or form a recycling chain, which in essence de-lays the formation of stars. The idea of radiation feedbackhas proven so successful that most cosmological simulationsnowadays invoke it in some form, although the implemen-tations vary a lot, and they are often empirically motivatedrather than physically. Radiation feedback on galactic scalesis usually modelled with subgrid recipes in otherwise purelyhydrodynamical (HD) codes. These HD recipes must makea number of assumptions about e.g. the absorption of pho-tons, mean free paths, and shielding. They can thus only toa limited degree be used to investigate how important radi-ation is for the formation and evolution of galaxies, and howthe radiation interacts with the baryons, i.e. how radiationfeedback actually works.
In the recent literature on simulations of galaxy evolu-tion, three radiation feedback processes are usually consid-ered: photoionisation heating of gas, direct pressure fromionising photons, and indirect pressure from reprocessed,multi-scattering, infrared (IR) photons. Simulations oftencontain only a subset of these processes, and there is nogeneral consensus on the importance of radiation feedbackas a whole, or on which of these processes dominate underwhich circumstances (see §4.4).
A more assumption-free and physically correct descrip-tion of radiation feedback requires the use of radiation-hydrodynamics (RHD), which models the emission andpropagation of photons and their interaction with the gasself-consistently. RHD can help tell us if and how radiationfeedback works, and this information can then be used toimprove HD subgrid recipes of radiation feedback.
However, RHD is both complex and costly compared toHD. For the most part, it has therefore not been used di-rectly in simulations of structure formation. In recent yearshowever, the use of RHD has been on the rise in computa-tional astronomy, and RHD implementations have evolvedtowards being usable in cosmological and galaxy-scale sim-ulations that resolve the interstellar medium (ISM) (Wiseet al. 2012b,a; Pawlik et al. 2013; Wise et al. 2014).
In Rosdahl et al. (2013, hereafter R13) we presentedan RHD implementation in the cosmological code ramses(Teyssier 2002), which we called ramses-rt. In that paperwe modelled the emission and propagation of photons andtheir interaction with hydrogen and helium via ionisationand heating. In Rosdahl & Teyssier (2014, hereafter R14),we added two aforementioned processes to the implementa-tion, which are though to be relevant for galactic feedback:radiation pressure, i.e. momentum transfer from photons togas, and the diffusion and trapping of multi-scattered IRradiation in optically thick gas.
In the present paper, we use the RHD implementationthat we have detailed in the two previous papers to studythe effect of stellar radiation feedback on galactic scales.We use a set of ramses-rt simulations of isolated galacticdisk simulations, where we include stellar radiation feed-back, combined with “thermal dump” SN feedback, whichis the simplest SN feedback recipe. The main questions weattempt to answer are:
• What role does stellar radiation feedback play in reg-ulating galaxy evolution, and how does this role vary withthe mass and metallicity of the galaxy?
• How does the interplay of radiation and SN feedbackwork? Specifically, does radiation boost the effect of SNe?• Where stellar radiation feedback plays a role, what is
the dominant physical process: photoionisation heating, di-rect pressure from the ionising photons on the gas, or in-direct pressure via dust particles UV and reprocessed IRradiation?
The current paper is exploratory in nature. Rather thantrying to produce realistic galaxies with realistic feedback,we somewhat blindly look at what happens if we “turn onthe light” in galaxies, while making minimal assumptionsabout what happens on unresolved scales. The current simu-lations model radiation feedback from “first principles” onlyin a limited sense, even though we try to make a minimumnumber of assumptions. While we model the emission andpropagation of radiation, we still make a number of approx-imations, both in the modelling of the radiation itself andin its interaction with gas and dust. These assumptions aremade to cut costs (e.g. the moment method of radiativetransfer, a reduced speed of light, crude radiation frequencybinning), to reduce the complexity (e.g. simplifying the con-tribution of metals to gas cooling), and because sometimeswe lack an understanding of the physics (e.g. the formationand abundance of dust and its exact opacity to radiation).Also, and importantly, although we resolve the ISM to someextent, we do not resolve molecular clouds, the scales atwhich the radiation feedback originates, and at which theradiation couples most efficiently with the gas. We expectthe current simulations to give us hints as to what radiationfeedback does in reality, but equally importantly to teach uswhat improvements in modelling and resolution are requiredin future work.
The structure of the paper is as follows. In §2 we presentan overview of the code, the setup of galaxy disks of threemasses, and details of the modelling of gas, stellar popu-lations, and feedback. In §3 we present the results, wherewe successively incorporate SN and radiation feedback pro-cesses and compare their effects on the galaxies. We focuson the suppression of star formation and the generation ofoutflows, study how radiation feedback plays a role, and ex-amine trends with galaxy mass and metallicity. In §4, wediscuss and justify our main findings on analytic grounds,demonstrate how they are limited by resolution, probe whateffects we can expect when the resolution is increased be-yond the current limits, and qualitatively compare our re-sults to previous publications. Finally, in §5 we summariseour main conclusions and discuss interesting future direc-tions. The appendices provide details on the model we usefor stellar population specific luminosities and convergencetests.
2 SIMULATIONS
We use ramses-rt (R13, R14), an RHD extension of theadaptive mesh refinement (AMR) code ramses (Teyssier2002). ramses models the interaction of dark matter, stel-lar populations and baryonic gas, via gravity, hydrodynam-ics and radiative cooling. The gas evolution is computedusing a second-order Godunov scheme for the Euler equa-tions, while trajectories of collisionless DM and stellar par-ticles are computed using a particle-mesh solver. ramses-rt
c© 0000 RAS, MNRAS 000, 000–000
Galaxies that Shine 3
Table 1. Simulation parameters for the three disk galaxies. The listed parameters are, from left to right: Galaxy acronym used throughout
the paper, vcirc: NFW circular velocity, for the IC generation, Rvir: halo virial radius (defined as the radius at which the DM density is
200 times the critical density at redshift zero), Lbox: simulation box length, Mhalo: DM halo mass, Mdisk: disk galaxy mass in baryons(stars+gas), fgas: disk gas fraction in the ICs, Mbulge: stellar bulge mass in the ICs, Npart: Number of DM/stellar particles in the ICs,
m∗: mass of stellar particles formed during the simulations, ∆xmax: coarsest cell resolution, ∆xmin: finest cell resolution, Zdisk: diskmetallicity.
Galaxy vcirc Rvir Lbox Mhalo Mdisk fgas Mbulge Npart m∗ ∆xmax ∆xmin Zdisk
acronym [km s−1] [kpc] [kpc] [M�] [M�] [M�] [M�] [kpc] [pc] [Z�]
g8 30 41 150 1010 3.5× 10⁸ 0.5 3.5× 10⁷ 105 600 2.3 18 0.1
g9 65 89 300 1011 3.5× 10⁹ 0.5 3.5× 10⁸ 106 600 2.3 18 0.1g10 140 192 600 1012 3.5× 10¹⁰ 0.3 3.5× 10⁹ 106 104 4.7 36 1
adds the propagation of photons and their on-the-fly inter-action with hydrogen and helium via photoionisation, heat-ing, and momentum transfer; and with dust particles viaheating and momentum transfer. The advection of photonsbetween grid cells is solved explicitly with a first order mo-ment method and the set of radiation transport equations isclosed with the M1 relation for the Eddington tensor. Thediffusion of multi-scattering IR radiation is described by thetrapped/streaming photon scheme presented in R14. Theradiation in a photon group, defined by a frequency inter-val, is described in each grid cell, by the radiation energydensity E (energy per unit volume) and the bulk radiationflux F (energy per unit area per unit time), which corre-sponds approximately to the radiation intensity integratedover all solid angles. ramses-rt solves the non-equilibriumevolution of the ionisation fractions of hydrogen and helium,along with photon fluxes and the gas temperature in eachgrid cell.
Because the timestep length, and therefore the com-putational load, scales inversely with the speed of light c,we apply the so-called reduced speed of light approximation(Gnedin & Abel 2001, R13) in runs that include radiation,to maintain a manageable computing time. In this work, weuse a light speed fraction fc = 1/200, i.e. free-streamingphotons are propagated at a speed c = c/200, such that thetimestep is most of the time limited by non-RT conditions,and the slow-down due to RT is only about a factor 2-3compared to HD simulations, depending on the number ofphoton groups and processes included (and the inclusion ofSN feedback, which limits the timestep as well). We showedin R13 that larger values for fc than we have chosen here arepreferable in simulations of galaxy evolution, but the lightspeed convergence tests presented in Appendix D indicatethat our results are robust with respect to the chosen lightspeed.
We run simulations of isolated rotating disk galaxiesof baryonic mass 3.5 × (108, 109, 1010) M� consisting of gasand stars embedded in DM halos of masses 1010, 1011,and 1012 M�, respectively. The simulation sets, named g8,g9, and g10, after the order-of-magnitude of the baryonicmasses, are presented in Table 1, and the parameters listedin the table are explained in what follows. The galaxies canbe thought of as representing three stages in the evolutiontowards the present-day Milky-Way (MW) Galaxy (∼ g10).
For g8 and g9, the disk galaxy masses are dispropor-tionally large for their host DM halos, compared to resultsfrom abundance-matching (Moster et al. 2013) and cosmo-logical simulations that match the observed galaxy mass
function (Schaye et al. 2014). Since we are primarily inter-ested in comparing the relative effects of different feedbackprocesses on the properties of the galaxy disk, for which thedark matter profile does not play an important role, this isnot an issue for the current work. We have run counterpartsof the least massive galaxy, g8, with a more realistic largerhalo mass, by a factor seven, which makes the simulationmore expensive for the same physical resolution, due to theincreased size of the simulation box, and confirmed that ourresults are not affected.
2.1 Initial conditions
The initial conditions (ICs) are generated with theMakeDisk1 code by Volker Springel (see Springel et al.2005; Kim et al. 2013a). The DM halos follow an NFWdensity profile (Navarro et al. 1997) with concentration pa-rameter c = 10 and spin parameter λ = 0.04. The darkmatter in each halo is modelled by Npart collisionless parti-cles of identical mass. The initial disk consists of gas cellsand Npart identical mass stellar particles, both set up withdensity profiles that are exponential in radius and Gaussianin height above the mid-plane. The galaxies also containstellar bulges with mass one tenth of the stellar disk mass,represented by 0.1Npart particles. The stellar particles thatare present at the beginning of the simulation do not per-form any feedback. The initial gas profiles do not enforceexact hydrostatic equilibrium. However, the initial (few mil-lion years) stabilisation of the galaxy, which manifests itselfin contraction of the inner dense gas and expansion of theouter diffuse gas, is minor, as can be inferred from plots ofthe star formation rate (e.g. Fig. 4). The initial tempera-ture of the gas disk is T = 104 K, and the disk metallicity,Zdisk, is set to a constant value, either 0.1 or 1 times So-lar (see Table 1), with the metal mass fraction in the Suntaken to be Z� = 0.02. The circumgalactic medium (CGM)initially consists of a homogeneous hot and diffuse gas, withnH = 10−6 cm−3, T = 106 K and zero metallicity. Thecutoffs for the disk’s radial and vertical gas profiles, whichmark the transition between the disk and CGM, are chosento minimize the density contrast between the disk edges andthe CGM.
1 Adapted to generate ramses-readable format by Romain
Teyssier and Damien Chapon.
c© 0000 RAS, MNRAS 000, 000–000
4 Rosdahl, Schaye, Teyssier & Agertz
2.2 Star formation
Star formation follows a standard Schmidt law. In each cellwhere the gas density exceeds the chosen star formationthreshold
n∗ = 10 cm−3, (1)
gas is converted into stars at a rate
ρ∗ = εffρ/tff , (2)
where ρ is the gas density and εff = 0.02 is the star for-mation efficiency per free fall time, tff = [3π/(32Gρ)]1/2,where G is the gravitational constant. Stellar populationsare represented by collisionless particles of mass m∗, whichare formed stochastically, drawing the probability of formingone from a Poissonian distribution (for details see Rasera &Teyssier 2006). The stellar particle masses used in the sim-ulations are listed in Table 1. In addition to the densitythreshold for star formation, we also do not allow stars toform in gas warmer than T/µ = 3000 K, where µ is theaverage particle mass in units of the proton mass. We note,however, that our results are insensitive to increasing or evenremoving the temperature threshold.
2.3 Supernova feedback
SN feedback is modelled with a single injection from eachstellar particle into its host cell, 5 Myr after the parti-cle’s birth, of mass mej = ηSN × m∗, and thermal energyεSN = ηSN×1051 erg m∗/10 M�. We use ηSN = 0.2, roughlycorresponding to a Chabrier (2003) stellar initial mass func-tion (IMF). We neglect the metal yield associated with stel-lar populations, i.e. the stellar particles inject zero metalsinto the gas.
At our resolution, the “thermal dump” SN feedbackmodel that we use is known to suffer from numerical over-cooling (e.g. Creasey et al. 2011; Dalla Vecchia & Schaye2012; Creasey et al. 2013), but we use it here, because it issimple and because it allows us to investigate how far radia-tion feedback can go to compensate for its low efficiency. Infuture work we will combine radiation feedback with moreefficient recipes for SN feedback, and study what combina-tion produces best agreement with observations (which isnot the point of this paper).
2.4 Gas thermochemistry
The thermochemistry is semi-implicitly evolved with themethod presented in R13. It tracks the non-equilibrium cool-ing rates of hydrogen and helium, here assuming zero incom-ing photon flux. The ionisation fractions of hydrogen andhelium are stored in each cell as three passive scalars, whichare advected with the gas. We assume hydrogen and heliummass fractions X = 0.76 and Y = 0.24, respectively, and So-lar ratios for the metal species, i.e. we track a single scalarrepresenting the metal mass fraction in each cell.
The contribution from metals to the cooling rate isadded using tables generated with cloudy (Ferland et al.1998), assuming photoionisation equilibrium with the red-shift zero Haardt & Madau (1996) UV background. Withmetal cooling, the gas can in principle cool non-adiabaticallyto ∼ 10 K. We do not model the change in the metal cooling
rate with the local radiation flux, which may affect galaxyevolution (e.g. Cantalupo 2010; Kannan et al. 2014b). Morerealistic metal cooling, which takes the local radiation fluxinto account, will be considered in future work.
2.5 Adaptive refinement
In the adaptive refinement scheme of ramses, cells can besplit into 8 child cells of width half that of the parent. Thewidth of a cell is determined by its refinement hierarchylevel `, by ∆x` = Lbox/2
`, where Lbox is the simulationbox width. The maximum and minimum cell widths, ∆xmax
and ∆xmin, are determined by the enforced minimum andmaximum allowed refinement levels in a simulation, whichin this work are ∆xmax = 2−5 kpc and ∆xmin = 18−36 pc,depending on the simulation set (see Table 1). Adaptive re-finement follows mass: a cell is refined if it contains 8 or morecollisionless particles, if the cell gas mass mcell > 12 m∗, orif ∆x is more than a quarter of the local Jeans length.
2.6 Artificial “Jeans pressure”
We impose a pressure floor on gas to prevent artificial frag-mentation below the Jeans scale (Truelove et al. 1997). TheJeans length scale for a self-gravitating cloud is
λJ =
√πcsGρ
= 16 pc
(T
1 K
)1/2 ( nH
1 cm−3
)−1/2
, (3)
where cs =√γkBT/mp is the sound speed, and we as-
sumed a ratio of specific heats of γ = 1.4, appropriate fora monatomic gas. From Eq. (3), the requirement that theJeans length is resolved by at least N cell widths becomes atemperature floor of the form
T
1 K>
nH
1 cm−3
(N∆x
16 pc
)2
(4)
We apply this floor in the form of an effective temperaturefunction,
TJ = T0 nH/n∗, (5)
where we use T0 = 500 K in all our simulations, ensuringthat the Jeans length is resolved by a minimum numberof 6 cell widths in g8 and g9 and 3 cell widths in g10.The pressure floor is non-thermal, and added to the physicaltemperature, T , and hence we can have T � TJ.
2.7 Radiation feedback
We include the emission and propagation of stellar radi-ation, and its interaction with the gas. The mass-, age-and metallicity-dependent stellar specific luminosities areextracted on the fly from the spectral energy distribution(SED) model of Bruzual & Charlot (2003), as described inR13, assuming a Chabrier (2003) IMF. Photons are injectedfrom the stellar particles into their host grid cells at everyfine RHD timestep.
The radiation is binned into five photon groups, de-fined by the photon energy intervals listed in Table 2. Thegroups are, in order of increasing energy, IR, optical, andthree groups of ionising ultraviolet (UV) photons, bracketedby the ionisation energies for Hi, Hei, and Heii. The first
c© 0000 RAS, MNRAS 000, 000–000
Galaxies that Shine 5
Table 2. Photon group energy intervals and dust opacities. The
energy intervals defined by the groups are indicated by ε0 and
ε1, while κ is the dust opacity. The gas opacity is assumed toscale with the gas metallicity, κi = κi Z/Z�, where i denotes the
photon group.
Photon group ε0 [eV] ε1 [eV] κ
IR 0.10 1.00 κIR = 10 cm2 g−1
Opt 1.00 13.60 κOpt = 103 cm2 g−1
UVHi 13.60 24.59 κUV = 103 cm2 g−1
UVHei 24.59 54.42 κUV = 103 cm2 g−1
UVHeii 54.42 ∞ κUV = 103 cm2 g−1
two groups are only included in runs with radiation-dustinteractions, while the three UV groups are included in allruns with radiation. The stellar emission and photon groupproperties derived from the SED model are described in Ap-pendix A.
An important advantage of the moment method thatwe use for the radiative transfer is that the computationalcost, i.e. the runtime of the simulations, is independent ofthe number of radiation sources. With the alternative classof ray-tracing methods (e.g. Wise & Abel 2011), the compu-tational cost increases more or less linearly with the numberof sources, which requires remedies to keep down the com-puting cost, such as merging of sources or rays (e.g. Pawlik& Schaye 2008) and/or turning them off after a few Myrs.Turning them off seems acceptable, considering that the lu-minosity of a stellar population has dimmed by orders ofmagnitude 10 Myrs after its birth (see Fig. A1). However,Kannan et al. (2014b) have pointed out that the cumula-tive radiation from many such dim old sources may play arole in stellar feedback. Since we do not have an issue withthe number of radiation sources in our implementation, stel-lar particles are never turned off after their birth, and thecumulative radiation from old populations is included.
Three “separate” radiation feedback processes, describ-ing different interactions between the radiation and gas, areimplemented:
(i) Photons ionise and heat the gas they interact with,following the thermochemistry described in R13, typicallyheating the ionised gas to ≈ 2 × 10⁴ K. This process isincluded in all our runs with radiation. We describe in Ap-pendix A how we use the SED model from Bruzual & Char-lot (2003) to derive photoionisation cross sections, which aretypically a few times 10−18 cm2 for Hi, Hei, and Heii.
(ii) Direct pressure, i.e. momentum transfer, from the ion-ising photons onto the gas.
(iii) Indirect radiation pressure on the gas, via dust par-ticles, from the ionising photons, optical photons, and fromreprocessed IR radiation, where the latter multi-scatters.
The implementation of the latter two processes, which in-cludes the diffusion, pressure, and work of multi-scatteredIR radiation, is described and tested in R14. Here, the dif-fusion of IR photons, where the mean free path becomesunresolved, is performed by a partition in every cell into free-streaming and trapped photons, where the trapped photonsdominate in the case of large optical depth on the scale ofthe cell width.
We will refer to the various radiation feedback processes
under the collective acronym of RT (radiative transfer) feed-back. RT feedback may thus refer to the inclusion of anyor all of the radiation feedback processes under considera-tion. We will successively add the three RT processes to oursimulations, to probe their respective importance. Alwaysincluded in RT feedback is photoionisation and photoionisa-tion heating, from the three UV photon groups. Onto thatwe add direct pressure from photoionisation (again only thethree UV groups). Finally, we add radiation-dust interac-tions, from all five groups.
Each photon group i has a dust-interaction opacity, κi,listed in Table 2. The opacities are physically motivated (Se-menov et al. 2003 for IR, Li & Draine 2001 for higher energyradiation) and similar values have been used in e.g. Hopkinset al. (2012c), Agertz et al. (2013), and Roskar et al. (2014)2.Photon momentum is absorbed by the gas (via dust), withthe gas opacity
κi = κi Z/Z�, (6)
i.e. in our model, the dust content simply scales with themetallicity of the gas. Higher energy photons (all but IR)absorbed by dust are reprocessed, i.e. re-emitted, into theIR group, while IR photons are (multi-) scattered by thedust.
There are two important exceptions from the defaultbehaviour of the implementation described in R14.
Firstly, our resolution of ∼ 10 pc does not allow us toaccurately capture the regime where dust is optically thickto photons, and radiation and dust are coupled via absorp-tion and blackbody emission. For this reason, and also forthe sake of simplicity, we exclude the dust temperature evo-lution (§2.3.2 in R14), where the gas temperature is coupleddirectly to the IR radiation temperature via the Planck crosssection. We decouple the dust temperature by simply settingthe Planck cross section to zero (while keeping a nonzeroRosseland opacity).
The second change is that we assume a fully directionalradiation in each cell for the free-streaming radiation pres-sure (R14, Eq. 28), by using a renormalised radiation fluxmagnitude of cE, rather than the actual radiation flux of|F| 6 cE. We do this to counter a resolution effect, as thereduced flux, fγ ≡ |F|/cE 6 1, takes a few (∼ 5) cell widthsto evolve to unity with our advection scheme, even with free-streaming radiation. We demonstrate this numerical effectwith a simple idealised experiment in Appendix B. For thecell containing the emitting source, this resolution artefactis obvious, since the radiation is isotropic and hence has zerobulk flux (only E is incremented with stellar emission). Thelack of bulk radiation flux very close to the emitting stellarparticles diminishes the effect of radiation pressure, espe-cially since it turns out that HII regions are often poorlyresolved in our simulations. Therefore, we apply this fullreduced flux approximation (fγ = 1) for the radiation pres-sure, to compensate for resolution effects. It can then beargued that we overestimate radiation pressure, especiallyin regions where cancellation effects are relevant, but sinceit turns out that radiation pressure is very weak in our sim-ulations, we prefer to be in danger of overestimating rather
2 The IR opacity we use, κIR = 10 cm2 g−1, is at the high-end of what is usually considered in the literature, with κIR ≈5− 10 cm2 g−1.
c© 0000 RAS, MNRAS 000, 000–000
6 Rosdahl, Schaye, Teyssier & Agertz
IR flux [erg cm−2 s−1]
10−4 10−3 10−2 10−1 100 101
250 Myr10 Kpc
Opt. flux [erg cm−2 s−1]
10−5 10−4 10−3 10−2 10−1 100
UVHI flux [erg cm−2 s−1]
10−7 10−6 10−5 10−4 10−3 10−2
UVHeI flux [erg cm−2 s−1]
10−7 10−6 10−5 10−4 10−3 10−2
UVHeII flux [erg cm−2 s−1]
10−11 10−10 10−9 10−8 10−7 10−6
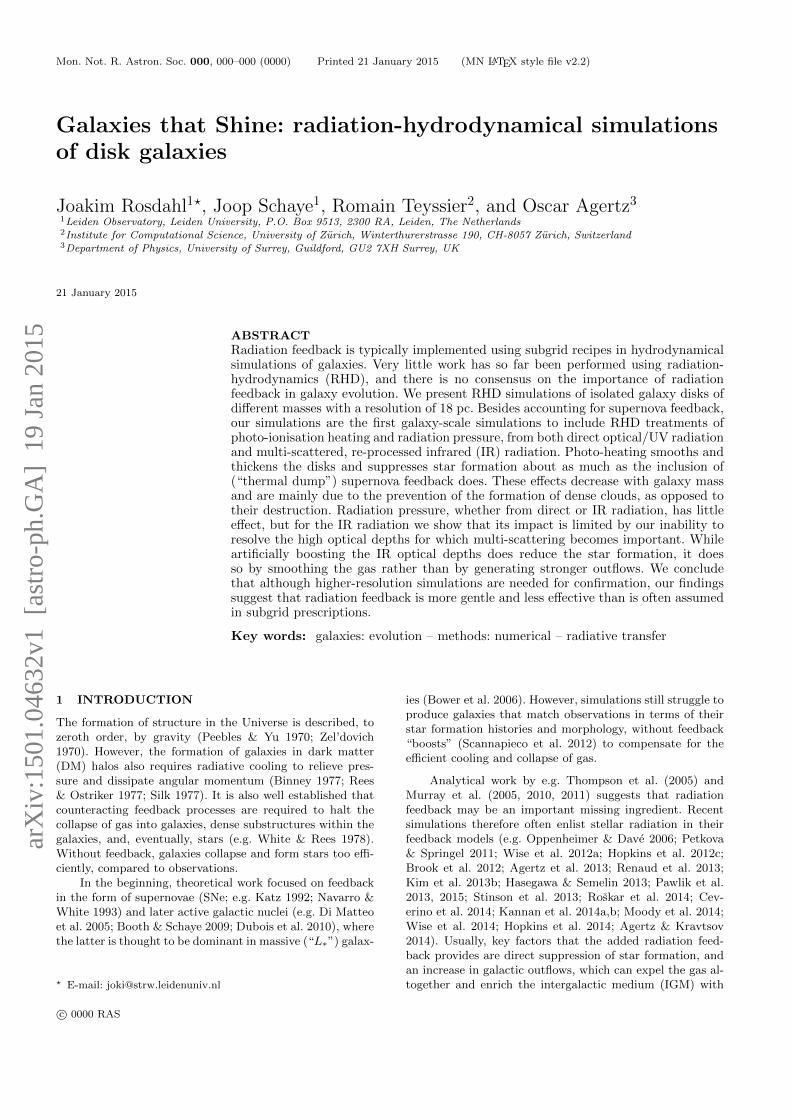
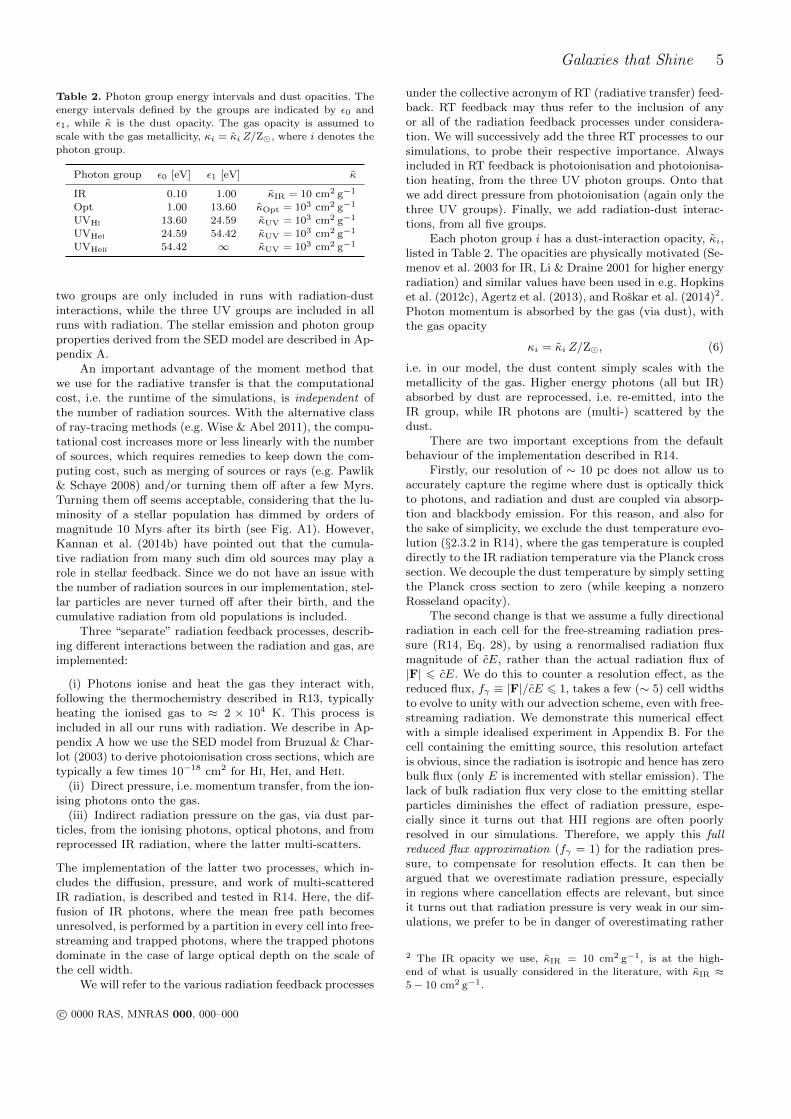
Figure 1. Illustration of radiation flux in the five photon groups included in this work. The maps show density-weighted solid-angleintegrated photon fluxes, cE, along the LOS in the g9 galaxy with SN and full RT feedback (g9 sn rhpd) at 250 Myr. The photon
groups are shown by increasing photon energy, from left to right. The upper row shows the galaxy face-on and the lower row shows itedge on. The much larger contrast in the fluxes of the ionising photons (three right-most panels), owes to their much shorter mean free
paths. Also, to a smaller degree, the optical photons have larger contrast than IR radiation, for the same reason. For the corresponding
distribution of stars and gas in the same snapshots, this figure can be compared to Fig. 3 (bottom left panel).
than the opposite. We do not apply the full reduced fluxapproximation for the IR photon group, since pressure fromthe IR radiation, in the limit where the optical depth is notresolved, is accurately captured by the radiation trappingscheme (R14).
Fig. 1 illustrates the distribution of photons, for the fiveradiation groups, in one of our runs of the intermediate massgalaxy disk (g9). The figure shows mass-weighted averagesalong lines-of-sight (LOS) of photon fluxes, integrated overall solid angles, i.e. the mapped quantity is cE, where c isthe reduced speed of light and E is the radiation energydensity. From left to right, the maps show photon groupswith increasing energy, starting with IR on the far left, theoptical, and finally the three ionising groups. The photonfluxes differ greatly between the photon groups, decreasingwith increasing photon energy. We use different color scales,such that the logarithmic range is the same, but the up-per limit roughly matches the maximum flux in each setof face-on/edge-on maps. For the highest energy group (farright) the low luminosity is simply due to the low emis-sivity from the stellar populations (see Fig. A1, where weplot the emissivity of the stellar populations). For the twolower energy ionising groups (second and third from right)the stellar emissivity is similar to that of the optical group,yet the galaxy luminosity is clearly much lower than in theoptical. This is due to the much more efficient absorption ofthe ionising photons. For photoionisation of hydrogen andhelium, the opacities are σ/mp ∼ 6 × 105 cm2 g−1, whereσ ∼ 10−18 cm2 is the photoionisation cross section (see Ap-pendix A) and mp is the proton mass, while for the opti-cal group the opacity is κOpt = κOptZ/Z� = 102 cm2 g−1.Hence the difference in opacities is more than three ordersof magnitude. While the ionising photons are absorbed closeto their emitting sources, the optical photons are much morefree to propagate through the disk and escape from it. Thedirect stellar IR emission is relatively dim, about three or-ders of magnitude lower than that of the optical group, yetthe maps on the far left show that the radiation energy fluxis highest in the IR group. This is because the IR photons
HII fraction
0.0 0.5 1.0
250 Myr10 Kpc
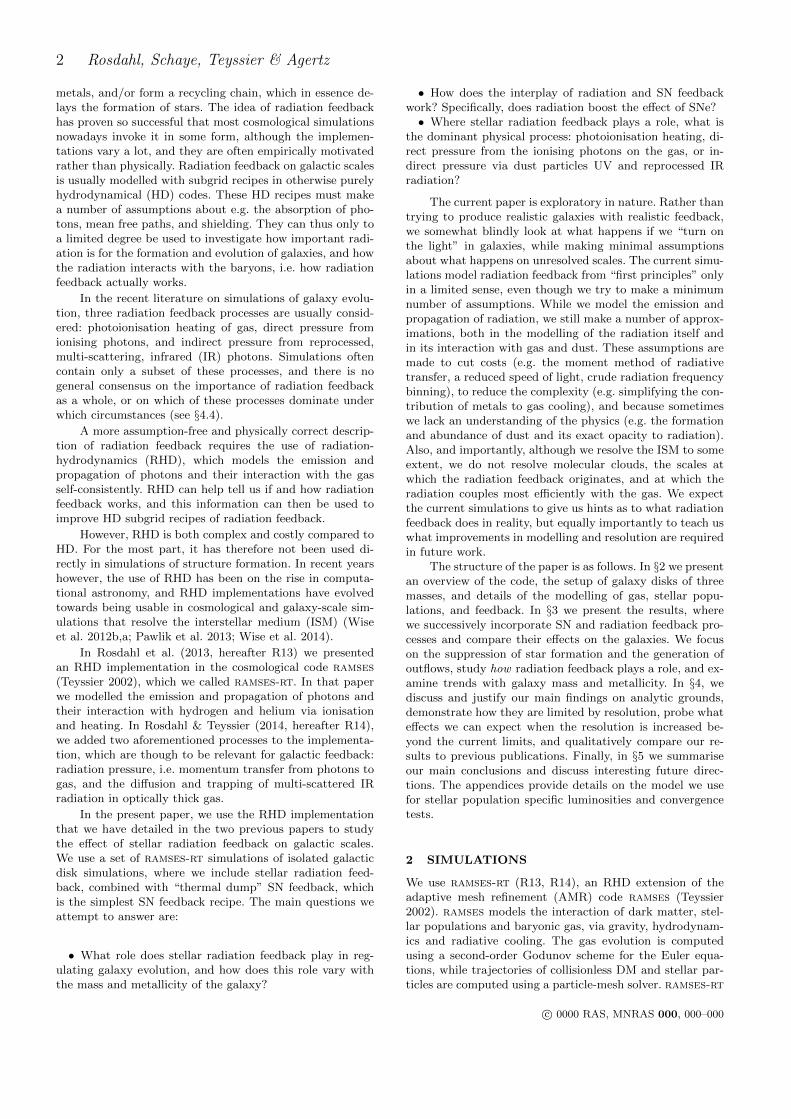
G9_SN G9_SN_RHPD
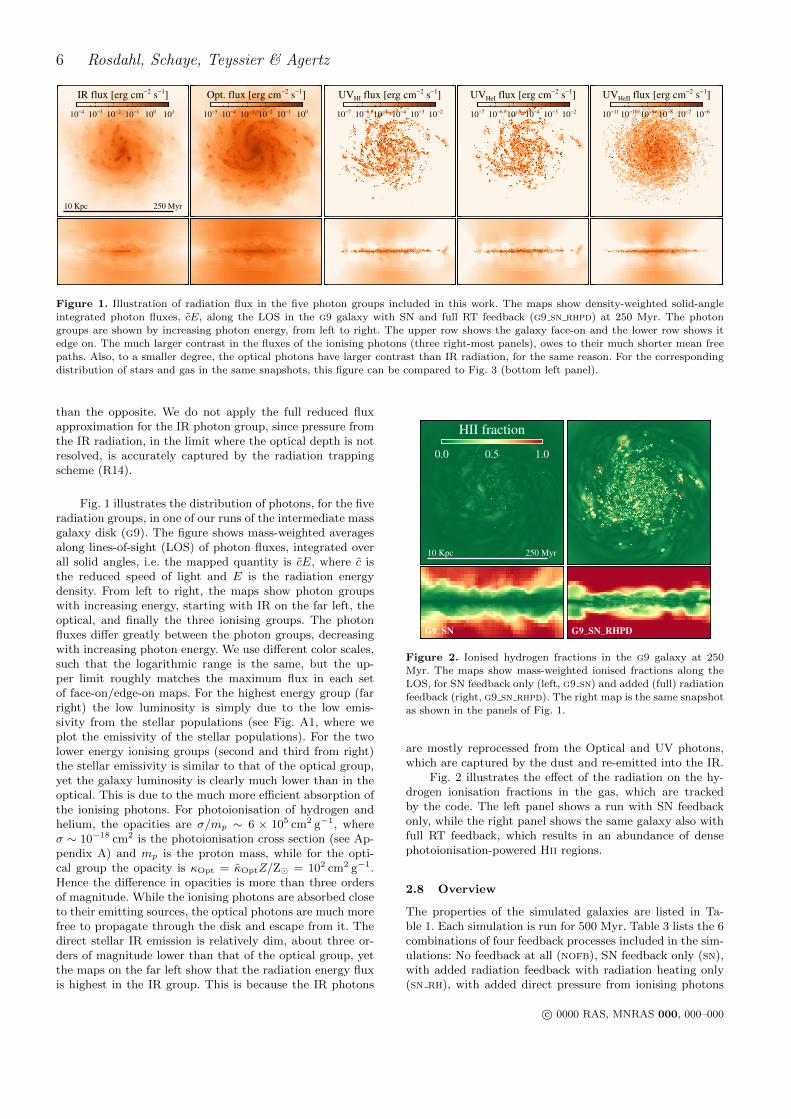
Figure 2. Ionised hydrogen fractions in the g9 galaxy at 250
Myr. The maps show mass-weighted ionised fractions along the
LOS, for SN feedback only (left, g9 sn) and added (full) radiationfeedback (right, g9 sn rhpd). The right map is the same snapshot
as shown in the panels of Fig. 1.
are mostly reprocessed from the Optical and UV photons,which are captured by the dust and re-emitted into the IR.
Fig. 2 illustrates the effect of the radiation on the hy-drogen ionisation fractions in the gas, which are trackedby the code. The left panel shows a run with SN feedbackonly, while the right panel shows the same galaxy also withfull RT feedback, which results in an abundance of densephotoionisation-powered Hii regions.
2.8 Overview
The properties of the simulated galaxies are listed in Ta-ble 1. Each simulation is run for 500 Myr. Table 3 lists the 6combinations of four feedback processes included in the sim-ulations: No feedback at all (nofb), SN feedback only (sn),with added radiation feedback with radiation heating only(sn rh), with added direct pressure from ionising photons
c© 0000 RAS, MNRAS 000, 000–000
Galaxies that Shine 7
Table 3. Feedback processes included in the simulations
Feedback SN Radiation Direct rad. Dust
acronym feedback heating pressure pressure
nofbsn 3
sn rh 3 3
sn rhp 3 3 3
sn rhpd 3 3 3 3
rhpd 3 3 3
(sn rhp), with added radiation pressure on dust, and opti-cal and (reprocessed) IR radiation groups (sn rhpd), and,finally, with all radiation feedback processes included, butwithout SN feedback (rhpd). The name of each run is acombination of the acronyms from Tables 1 and 3, e.g. thename g9 sn rhp represents the g9 galaxy (baryonic massof 3.5× 10⁹ M�), simulated with SN feedback and ionisingstellar radiation with heating and direct pressure.
3 RESULTS
We now turn to the simulated galaxy disks and examinethe impact of radiation feedback and the interplay of radia-tion and SN feedback. We start with the intermediate-massgalaxy, which has the highest resolution in terms of the num-ber of volume/particle elements, and then consider in turn,with somewhat less detail, the more massive g10 galaxy andthe less massive g8 galaxy.
3.1 G9: intermediate mass gas-rich galaxy
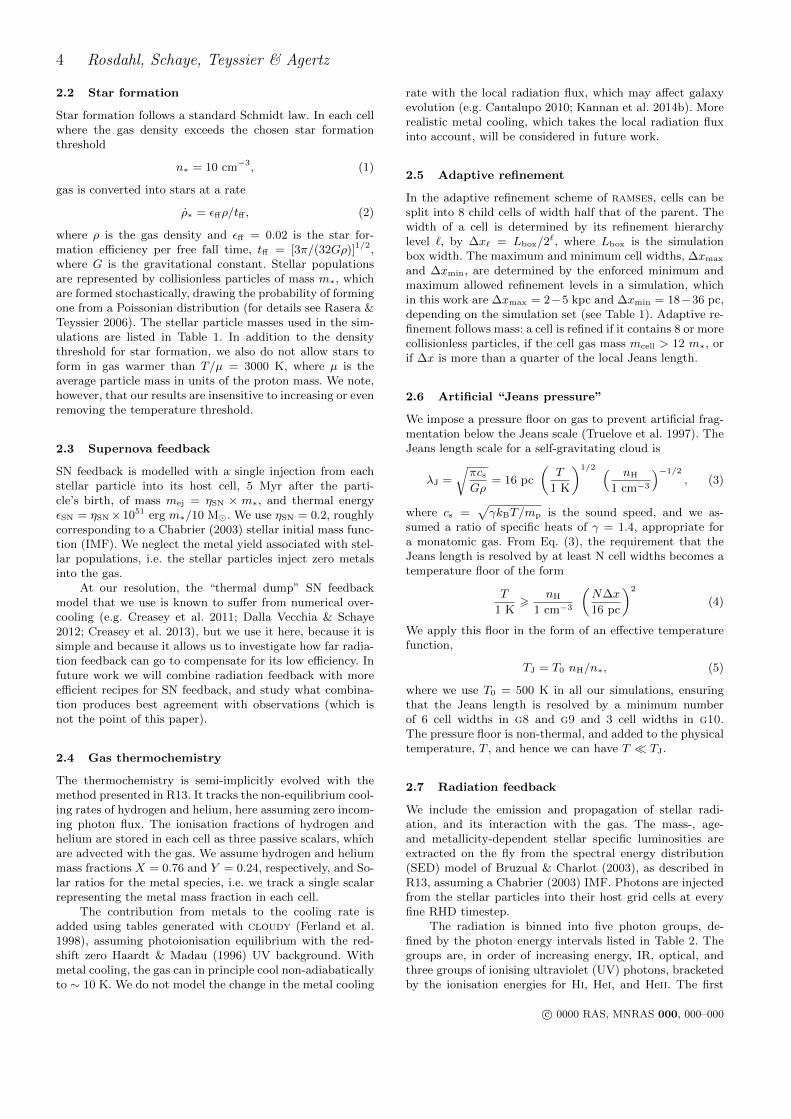
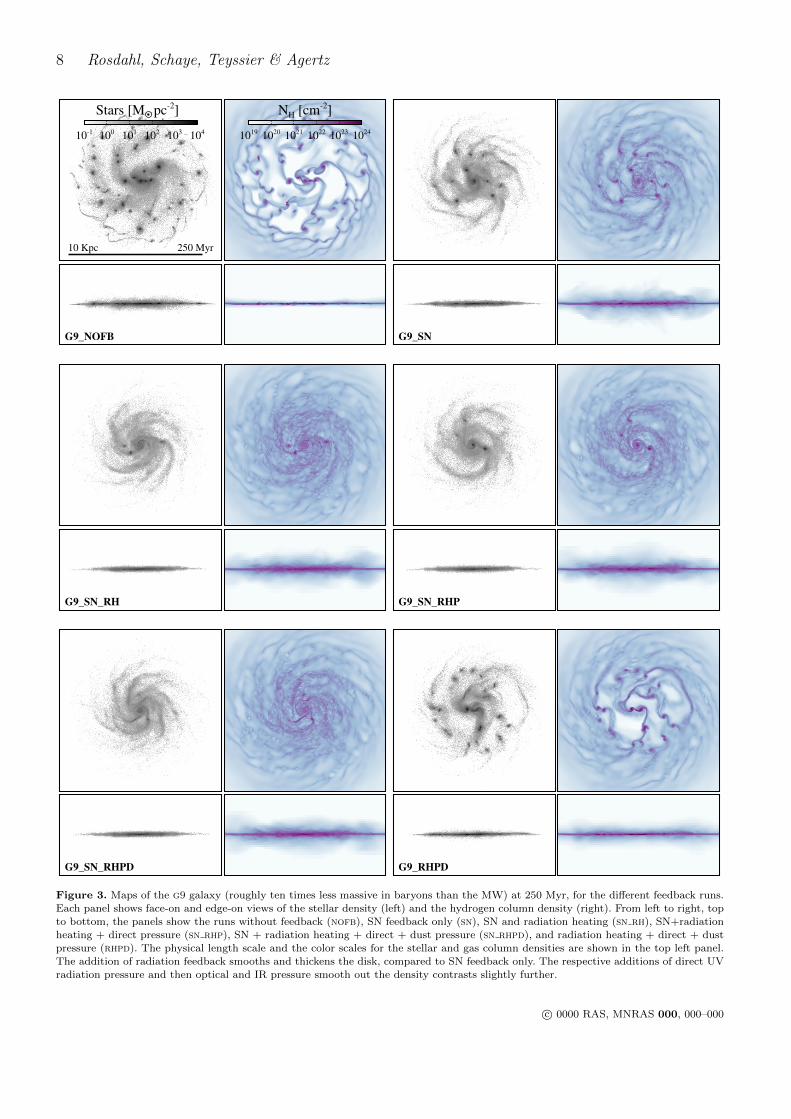
We first focus on the intermediate mass galaxy, g9 (≈ one-tenth the baryonic mass of the MW), and we begin by con-sidering the qualitative effects of the different feedback pro-cesses on the morphology of the disk. Fig. 3 shows mapsof stellar density and total hydrogen column density, faceon and edge on, at 250 Myr, which is half the run duration.Without feedback (top left panel), the galaxy contains manycold star-forming clumps interconnected by narrow gas fila-ments. SN feedback (top right panel) dramatically reducesstar and clump formation, especially at large radii, smoothsout the gas distribution and thickens the gas disk comparedto the no feedback case. The inner ∼ 3 kpc from the centerof the galaxy remain quite clumpy, however. The addition ofionising radiation and photoionisation heating (middle leftpanel) adds to the effect of SN feedback by further smooth-ing the morphology of the galaxy, and further reducing thenumber of clumps. The addition of radiation pressure, direct(middle right) and on dust (bottom left), has little impact,though the addition of dust pressure smooths the stellar anddust distribution marginally further. With SN feedback ex-cluded, radiation heating and pressure on its own (bottomright) is insufficient to prevent massive clump formation inthe galaxy, and it is noticeably more clumpy and thinnerthan with SN feedback only.
3.1.1 Star formation
Star formation is the most direct probe of the efficiencyof feedback processes. The more efficient the feedback, the
0
2.0×10⁸
4.0×10⁸
6.0×10⁸
8.0×10⁸
1.0×10⁹
1.2×10⁹
G9
0
2.0×10⁸
4.0×10⁸
6.0×10⁸
8.0×10⁸
1.0×10⁹
1.2×10⁹
M* [
MO •]
0 100 200 300 400 500
time [Myr]
10-2
10-1
100
101
dM
/dt
[MO • /
yr]
SFROutflow at 0.2 Rvir
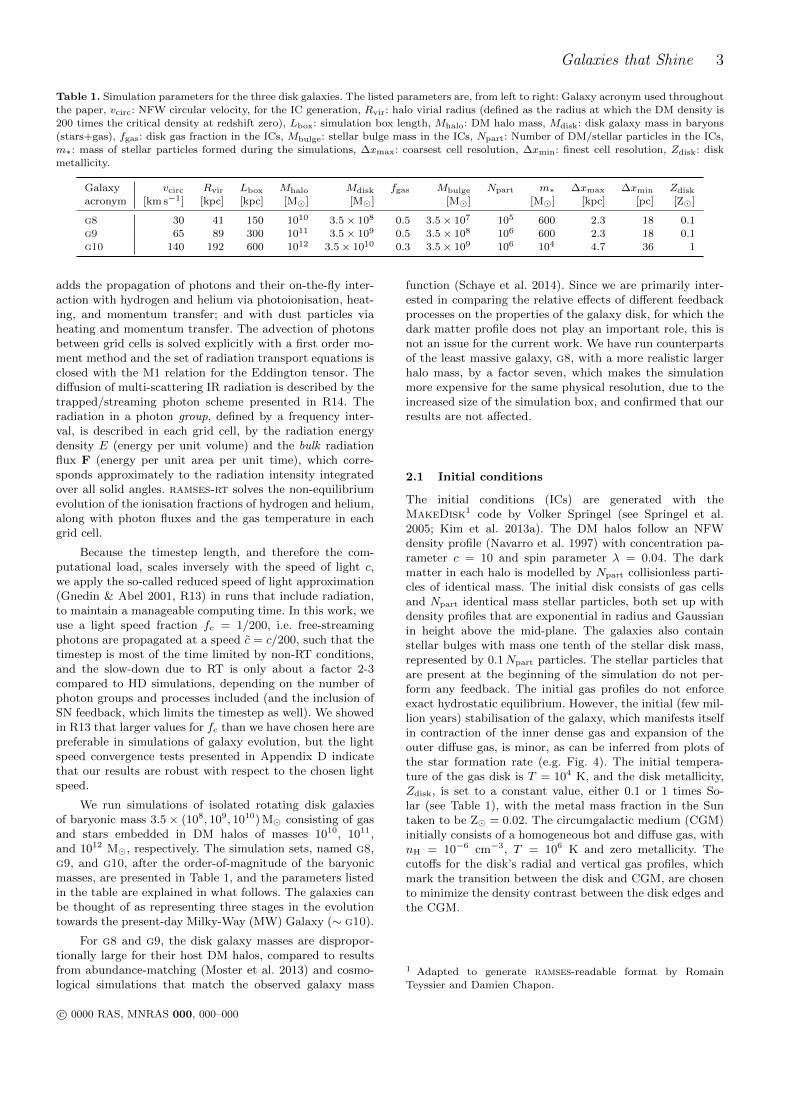
NOFBSNRHPDSN_RHSN_RHPSN_RHPD
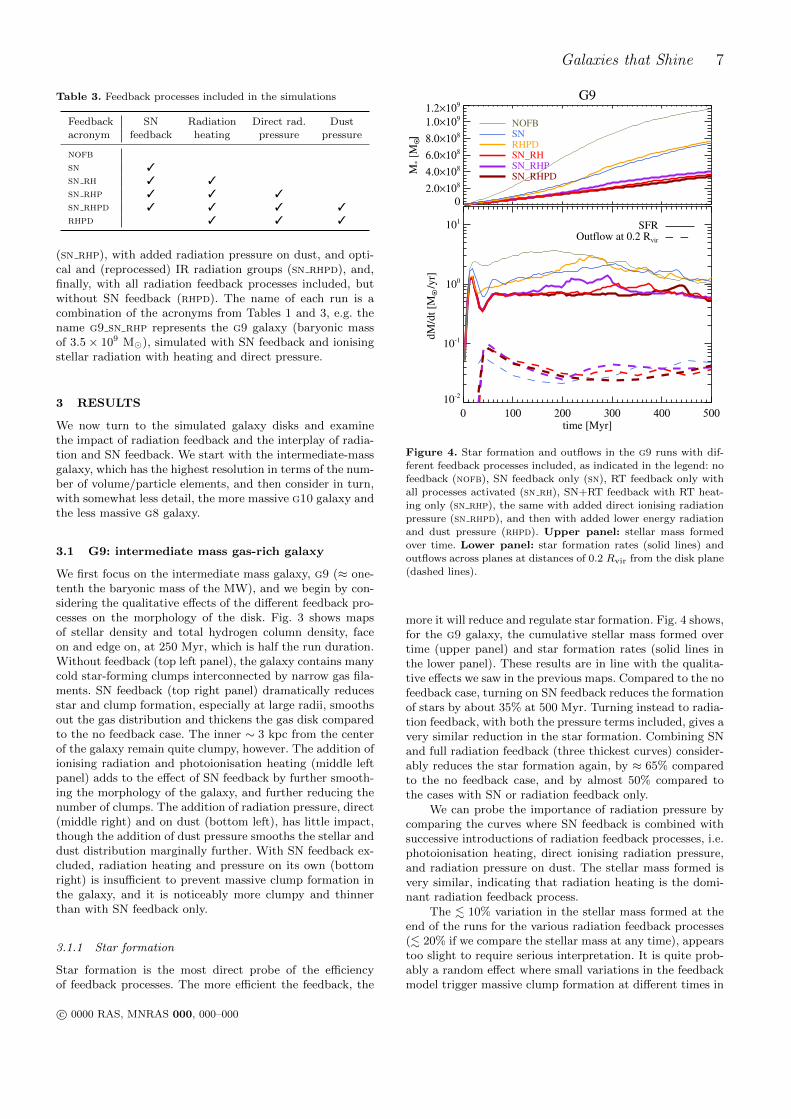
Figure 4. Star formation and outflows in the g9 runs with dif-
ferent feedback processes included, as indicated in the legend: no
feedback (nofb), SN feedback only (sn), RT feedback only withall processes activated (sn rh), SN+RT feedback with RT heat-
ing only (sn rhp), the same with added direct ionising radiation
pressure (sn rhpd), and then with added lower energy radiationand dust pressure (rhpd). Upper panel: stellar mass formed
over time. Lower panel: star formation rates (solid lines) and
outflows across planes at distances of 0.2 Rvir from the disk plane(dashed lines).
more it will reduce and regulate star formation. Fig. 4 shows,for the g9 galaxy, the cumulative stellar mass formed overtime (upper panel) and star formation rates (solid lines inthe lower panel). These results are in line with the qualita-tive effects we saw in the previous maps. Compared to the nofeedback case, turning on SN feedback reduces the formationof stars by about 35% at 500 Myr. Turning instead to radia-tion feedback, with both the pressure terms included, gives avery similar reduction in the star formation. Combining SNand full radiation feedback (three thickest curves) consider-ably reduces the star formation again, by ≈ 65% comparedto the no feedback case, and by almost 50% compared tothe cases with SN or radiation feedback only.
We can probe the importance of radiation pressure bycomparing the curves where SN feedback is combined withsuccessive introductions of radiation feedback processes, i.e.photoionisation heating, direct ionising radiation pressure,and radiation pressure on dust. The stellar mass formed isvery similar, indicating that radiation heating is the domi-nant radiation feedback process.
The . 10% variation in the stellar mass formed at theend of the runs for the various radiation feedback processes(. 20% if we compare the stellar mass at any time), appearstoo slight to require serious interpretation. It is quite prob-ably a random effect where small variations in the feedbackmodel trigger massive clump formation at different times in
c© 0000 RAS, MNRAS 000, 000–000
8 Rosdahl, Schaye, Teyssier & Agertz
Stars [MO • pc-2]
10-1 100 101 102 103 104
250 Myr10 Kpc
NH [cm-2]
1019 1020 1021 1022 1023 1024
G9_NOFB G9_SN
G9_SN_RH G9_SN_RHP
G9_SN_RHPD G9_RHPD
Figure 3. Maps of the g9 galaxy (roughly ten times less massive in baryons than the MW) at 250 Myr, for the different feedback runs.
Each panel shows face-on and edge-on views of the stellar density (left) and the hydrogen column density (right). From left to right, top
to bottom, the panels show the runs without feedback (nofb), SN feedback only (sn), SN and radiation heating (sn rh), SN+radiationheating + direct pressure (sn rhp), SN + radiation heating + direct + dust pressure (sn rhpd), and radiation heating + direct + dust
pressure (rhpd). The physical length scale and the color scales for the stellar and gas column densities are shown in the top left panel.
The addition of radiation feedback smooths and thickens the disk, compared to SN feedback only. The respective additions of direct UVradiation pressure and then optical and IR pressure smooth out the density contrasts slightly further.
c© 0000 RAS, MNRAS 000, 000–000
Galaxies that Shine 9
the simulations. Individual clumps can dominate the starformation for tens of Myrs, while they migrate to the cen-ter of the disk. Indeed, we see more clumps in the sn rhpgalaxy than in sn rh or sn rhpd in Fig. 3, at a time (250Myr) which coincides with an increase in star formation inthe sn rhp run. While these clump formations may well berandom, we cannot rule out the possibility that these effectsof successively added radiation feedback processes are sys-tematic. If the effect is real and non-stochastic, the way itworks is somewhat counter-intuitive. The addition of directradiation pressure over radiation heating boosts star forma-tion. This implies negative feedback, which can be explainedby a scenario where radiation pressure sweeps the gas intoconcentrated star-forming shells or clumps. However, addinglower energy radiation groups and dust pressure on top ofthis then goes in the opposite direction, reducing the forma-tion of stars slightly below the case with radiation heatingonly. Also, we do not see a negative feedback effect fromdirect radiation pressure in the other galaxies considered inthis paper. Hence we conclude that it is a random effect,rather than systematic.
Focusing on the star formation rates for the differentfeedback processes, in the bottom panel of Fig. 4, we seethat the combined SN+RT feedback flattens out the starformation history compared to the case of no feedback orindividual SN or RT feedback. The star formation rates de-cline in the latter half of the runs with no feedback or in-dividual SN or RT feedback. This is due to the galaxy diskstarting to be starved of gas. The initial disk gas mass is≈ 2 × 10⁹ M�, and it is clear from the upper panel thata considerable fraction of this mass has already been con-verted into stars at 500 Myr. This narrows the difference instar formation rates between the runs: while the rate is sup-pressed by a factor ≈ 2 at 500 Myr by the combination ofSN and RT feedback, and not suppressed at all by only SNor RT feedback, the suppression factor is much higher beforegas depletion sets in, peaking at a factor ≈ 5 at ≈ 150 Myrfor the combined feedback case and a factor 2 − 3 for the“single” feedback case (excluding the first ≈ 50 Myr, whenthe disc is relaxing).
3.1.2 Outflows
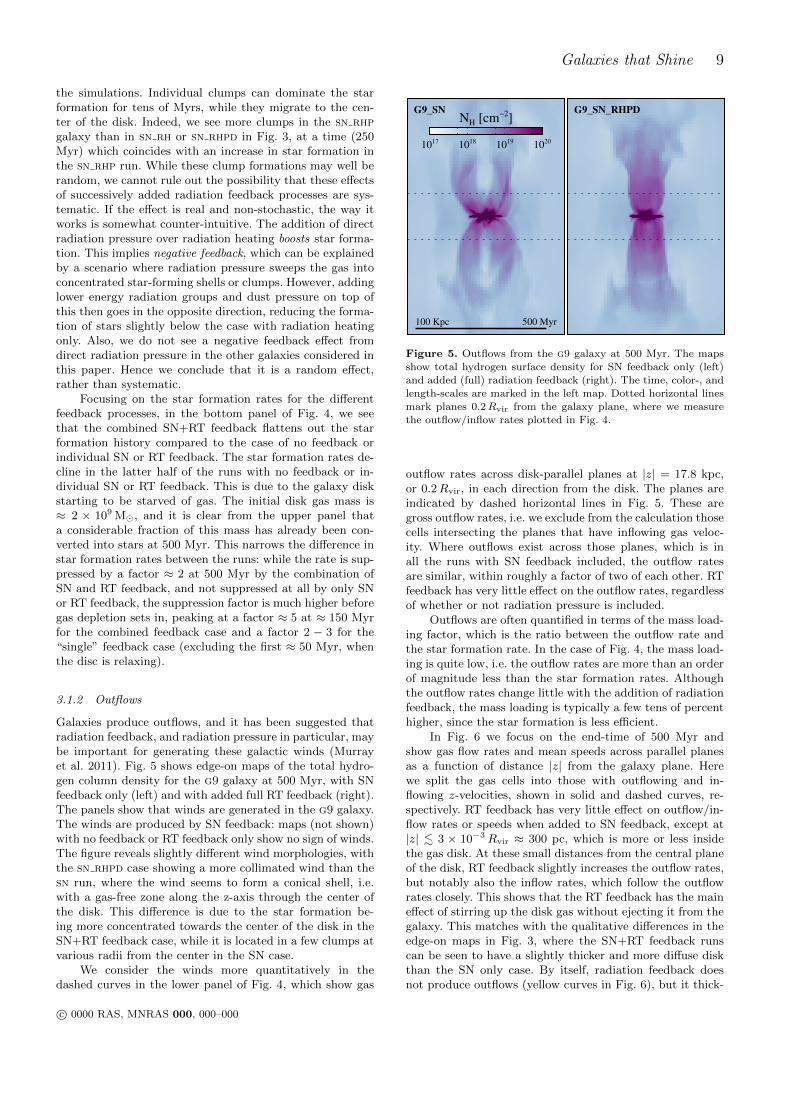
Galaxies produce outflows, and it has been suggested thatradiation feedback, and radiation pressure in particular, maybe important for generating these galactic winds (Murrayet al. 2011). Fig. 5 shows edge-on maps of the total hydro-gen column density for the g9 galaxy at 500 Myr, with SNfeedback only (left) and with added full RT feedback (right).The panels show that winds are generated in the g9 galaxy.The winds are produced by SN feedback: maps (not shown)with no feedback or RT feedback only show no sign of winds.The figure reveals slightly different wind morphologies, withthe sn rhpd case showing a more collimated wind than thesn run, where the wind seems to form a conical shell, i.e.with a gas-free zone along the z-axis through the center ofthe disk. This difference is due to the star formation be-ing more concentrated towards the center of the disk in theSN+RT feedback case, while it is located in a few clumps atvarious radii from the center in the SN case.
We consider the winds more quantitatively in thedashed curves in the lower panel of Fig. 4, which show gas
NH [cm−2]
1017 1018 1019 1020
500 Myr100 Kpc
G9_SN G9_SN_RHPD
Figure 5. Outflows from the g9 galaxy at 500 Myr. The maps
show total hydrogen surface density for SN feedback only (left)and added (full) radiation feedback (right). The time, color-, and
length-scales are marked in the left map. Dotted horizontal lines
mark planes 0.2Rvir from the galaxy plane, where we measurethe outflow/inflow rates plotted in Fig. 4.
outflow rates across disk-parallel planes at |z| = 17.8 kpc,or 0.2Rvir, in each direction from the disk. The planes areindicated by dashed horizontal lines in Fig. 5. These aregross outflow rates, i.e. we exclude from the calculation thosecells intersecting the planes that have inflowing gas veloc-ity. Where outflows exist across those planes, which is inall the runs with SN feedback included, the outflow ratesare similar, within roughly a factor of two of each other. RTfeedback has very little effect on the outflow rates, regardlessof whether or not radiation pressure is included.
Outflows are often quantified in terms of the mass load-ing factor, which is the ratio between the outflow rate andthe star formation rate. In the case of Fig. 4, the mass load-ing is quite low, i.e. the outflow rates are more than an orderof magnitude less than the star formation rates. Althoughthe outflow rates change little with the addition of radiationfeedback, the mass loading is typically a few tens of percenthigher, since the star formation is less efficient.
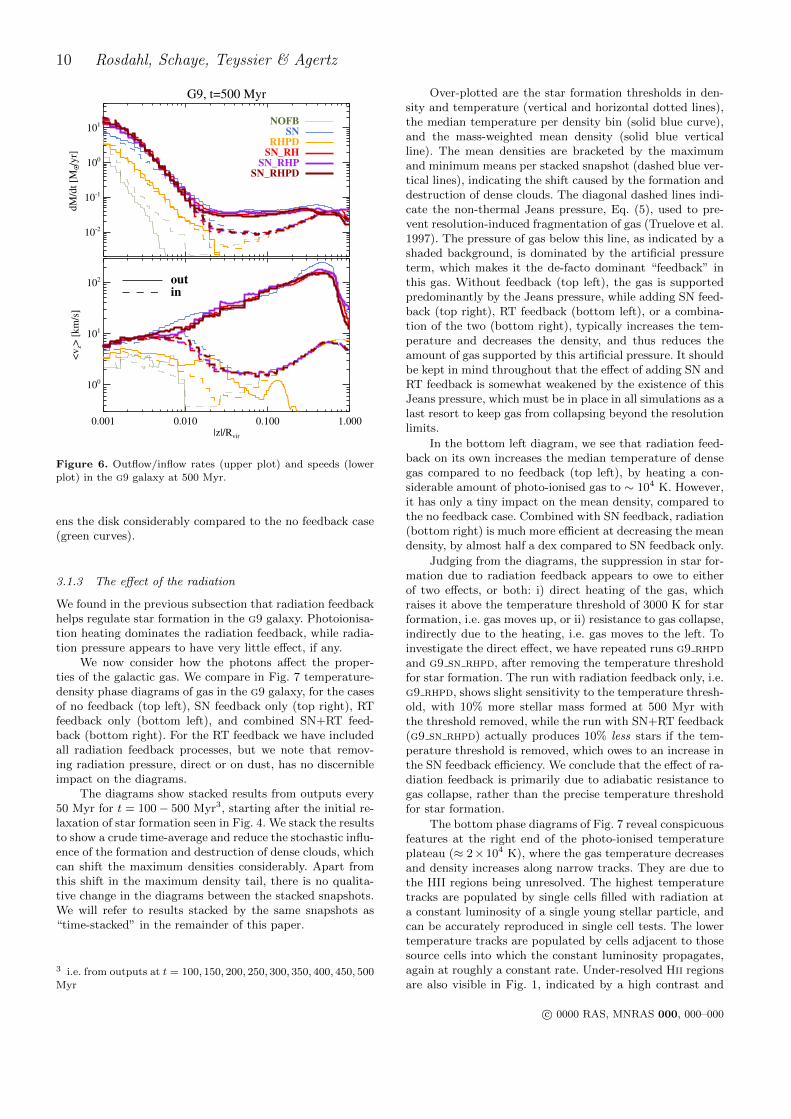
In Fig. 6 we focus on the end-time of 500 Myr andshow gas flow rates and mean speeds across parallel planesas a function of distance |z| from the galaxy plane. Herewe split the gas cells into those with outflowing and in-flowing z-velocities, shown in solid and dashed curves, re-spectively. RT feedback has very little effect on outflow/in-flow rates or speeds when added to SN feedback, except at|z| . 3 × 10⁻³ Rvir ≈ 300 pc, which is more or less insidethe gas disk. At these small distances from the central planeof the disk, RT feedback slightly increases the outflow rates,but notably also the inflow rates, which follow the outflowrates closely. This shows that the RT feedback has the maineffect of stirring up the disk gas without ejecting it from thegalaxy. This matches with the qualitative differences in theedge-on maps in Fig. 3, where the SN+RT feedback runscan be seen to have a slightly thicker and more diffuse diskthan the SN only case. By itself, radiation feedback doesnot produce outflows (yellow curves in Fig. 6), but it thick-
c© 0000 RAS, MNRAS 000, 000–000
10 Rosdahl, Schaye, Teyssier & Agertz
G9, t=500 Myr
10-2
10-1
100
101
dM
/dt
[MO •/y
r]
NOFBSN
RHPDSN_RH
SN_RHPSN_RHPD
0.001 0.010 0.100 1.000|z|/Rvir
100
101
102
<v
z> [
km
/s]
outin
Figure 6. Outflow/inflow rates (upper plot) and speeds (lower
plot) in the g9 galaxy at 500 Myr.
ens the disk considerably compared to the no feedback case(green curves).
3.1.3 The effect of the radiation
We found in the previous subsection that radiation feedbackhelps regulate star formation in the g9 galaxy. Photoionisa-tion heating dominates the radiation feedback, while radia-tion pressure appears to have very little effect, if any.
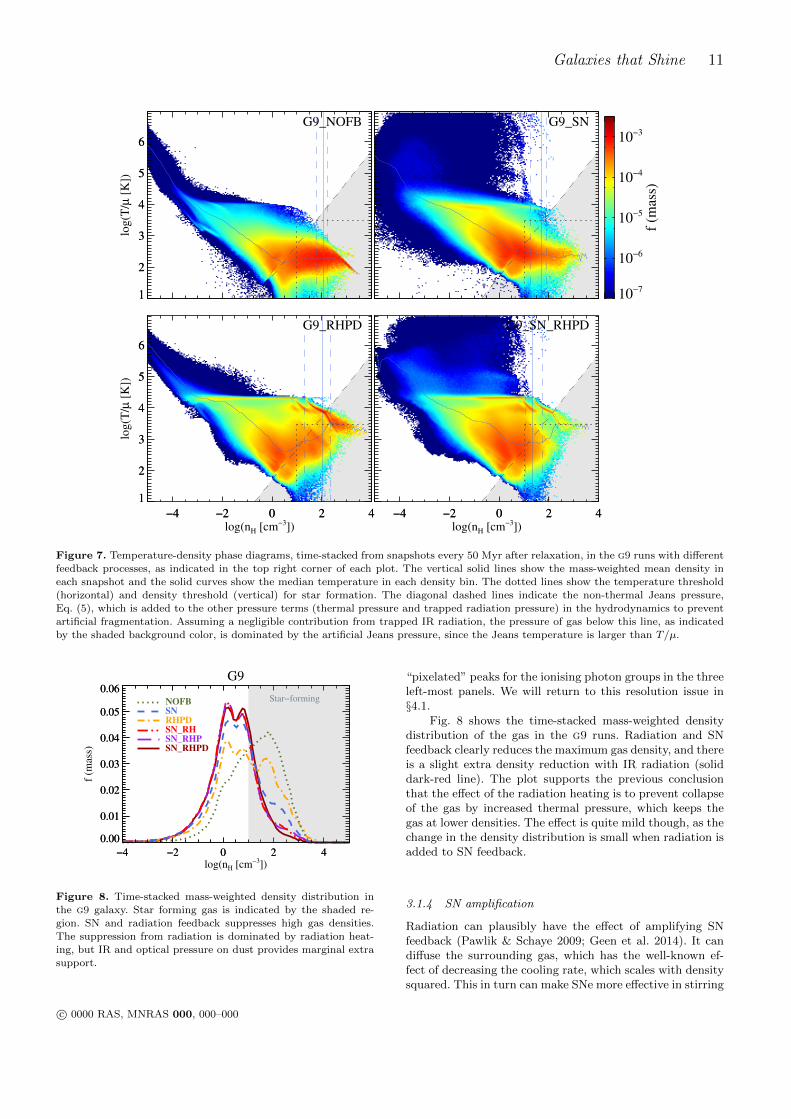
We now consider how the photons affect the proper-ties of the galactic gas. We compare in Fig. 7 temperature-density phase diagrams of gas in the g9 galaxy, for the casesof no feedback (top left), SN feedback only (top right), RTfeedback only (bottom left), and combined SN+RT feed-back (bottom right). For the RT feedback we have includedall radiation feedback processes, but we note that remov-ing radiation pressure, direct or on dust, has no discernibleimpact on the diagrams.
The diagrams show stacked results from outputs every50 Myr for t = 100− 500 Myr3, starting after the initial re-laxation of star formation seen in Fig. 4. We stack the resultsto show a crude time-average and reduce the stochastic influ-ence of the formation and destruction of dense clouds, whichcan shift the maximum densities considerably. Apart fromthis shift in the maximum density tail, there is no qualita-tive change in the diagrams between the stacked snapshots.We will refer to results stacked by the same snapshots as“time-stacked” in the remainder of this paper.
3 i.e. from outputs at t = 100, 150, 200, 250, 300, 350, 400, 450, 500
Myr
Over-plotted are the star formation thresholds in den-sity and temperature (vertical and horizontal dotted lines),the median temperature per density bin (solid blue curve),and the mass-weighted mean density (solid blue verticalline). The mean densities are bracketed by the maximumand minimum means per stacked snapshot (dashed blue ver-tical lines), indicating the shift caused by the formation anddestruction of dense clouds. The diagonal dashed lines indi-cate the non-thermal Jeans pressure, Eq. (5), used to pre-vent resolution-induced fragmentation of gas (Truelove et al.1997). The pressure of gas below this line, as indicated by ashaded background, is dominated by the artificial pressureterm, which makes it the de-facto dominant “feedback” inthis gas. Without feedback (top left), the gas is supportedpredominantly by the Jeans pressure, while adding SN feed-back (top right), RT feedback (bottom left), or a combina-tion of the two (bottom right), typically increases the tem-perature and decreases the density, and thus reduces theamount of gas supported by this artificial pressure. It shouldbe kept in mind throughout that the effect of adding SN andRT feedback is somewhat weakened by the existence of thisJeans pressure, which must be in place in all simulations as alast resort to keep gas from collapsing beyond the resolutionlimits.
In the bottom left diagram, we see that radiation feed-back on its own increases the median temperature of densegas compared to no feedback (top left), by heating a con-siderable amount of photo-ionised gas to ∼ 104 K. However,it has only a tiny impact on the mean density, compared tothe no feedback case. Combined with SN feedback, radiation(bottom right) is much more efficient at decreasing the meandensity, by almost half a dex compared to SN feedback only.
Judging from the diagrams, the suppression in star for-mation due to radiation feedback appears to owe to eitherof two effects, or both: i) direct heating of the gas, whichraises it above the temperature threshold of 3000 K for starformation, i.e. gas moves up, or ii) resistance to gas collapse,indirectly due to the heating, i.e. gas moves to the left. Toinvestigate the direct effect, we have repeated runs g9 rhpdand g9 sn rhpd, after removing the temperature thresholdfor star formation. The run with radiation feedback only, i.e.g9 rhpd, shows slight sensitivity to the temperature thresh-old, with 10% more stellar mass formed at 500 Myr withthe threshold removed, while the run with SN+RT feedback(g9 sn rhpd) actually produces 10% less stars if the tem-perature threshold is removed, which owes to an increase inthe SN feedback efficiency. We conclude that the effect of ra-diation feedback is primarily due to adiabatic resistance togas collapse, rather than the precise temperature thresholdfor star formation.
The bottom phase diagrams of Fig. 7 reveal conspicuousfeatures at the right end of the photo-ionised temperatureplateau (≈ 2× 10⁴ K), where the gas temperature decreasesand density increases along narrow tracks. They are due tothe HII regions being unresolved. The highest temperaturetracks are populated by single cells filled with radiation ata constant luminosity of a single young stellar particle, andcan be accurately reproduced in single cell tests. The lowertemperature tracks are populated by cells adjacent to thosesource cells into which the constant luminosity propagates,again at roughly a constant rate. Under-resolved Hii regionsare also visible in Fig. 1, indicated by a high contrast and
c© 0000 RAS, MNRAS 000, 000–000
Galaxies that Shine 11
1
2
3
4
5
6
log(T
/µ [
K])
1
2
3
4
5
6
G9_NOFB
10−7
10−6
10−5
10−4
10−3
f (m
ass
)
G9_SN
−4 −2 0 2 4log(nH [cm−3])
1
2
3
4
5
6
log(T
/µ [
K])
−4 −2 0 2 4
1
2
3
4
5
6
G9_RHPD
−4 −2 0 2 4log(nH [cm−3])
−4 −2 0 2 4
G9_SN_RHPD
Figure 7. Temperature-density phase diagrams, time-stacked from snapshots every 50 Myr after relaxation, in the g9 runs with different
feedback processes, as indicated in the top right corner of each plot. The vertical solid lines show the mass-weighted mean density ineach snapshot and the solid curves show the median temperature in each density bin. The dotted lines show the temperature threshold
(horizontal) and density threshold (vertical) for star formation. The diagonal dashed lines indicate the non-thermal Jeans pressure,
Eq. (5), which is added to the other pressure terms (thermal pressure and trapped radiation pressure) in the hydrodynamics to preventartificial fragmentation. Assuming a negligible contribution from trapped IR radiation, the pressure of gas below this line, as indicated
by the shaded background color, is dominated by the artificial Jeans pressure, since the Jeans temperature is larger than T/µ.
G9
−4 −2 0 2 4log(nH [cm−3])
0.00
0.01
0.02
0.03
0.04
0.05
0.06
f (m
ass)
Star−formingNOFBSNRHPDSN_RHSN_RHPSN_RHPD
−4 −2 0 2 4
0.00
0.01
0.02
0.03
0.04
0.05
0.06
Figure 8. Time-stacked mass-weighted density distribution in
the g9 galaxy. Star forming gas is indicated by the shaded re-
gion. SN and radiation feedback suppresses high gas densities.The suppression from radiation is dominated by radiation heat-
ing, but IR and optical pressure on dust provides marginal extra
support.
“pixelated” peaks for the ionising photon groups in the threeleft-most panels. We will return to this resolution issue in§4.1.
Fig. 8 shows the time-stacked mass-weighted densitydistribution of the gas in the g9 runs. Radiation and SNfeedback clearly reduces the maximum gas density, and thereis a slight extra density reduction with IR radiation (soliddark-red line). The plot supports the previous conclusionthat the effect of the radiation heating is to prevent collapseof the gas by increased thermal pressure, which keeps thegas at lower densities. The effect is quite mild though, as thechange in the density distribution is small when radiation isadded to SN feedback.
3.1.4 SN amplification
Radiation can plausibly have the effect of amplifying SNfeedback (Pawlik & Schaye 2009; Geen et al. 2014). It candiffuse the surrounding gas, which has the well-known ef-fect of decreasing the cooling rate, which scales with densitysquared. This in turn can make SNe more effective in stirring
c© 0000 RAS, MNRAS 000, 000–000
12 Rosdahl, Schaye, Teyssier & Agertz
0.00
0.02
0.04
0.06
0.08
0.10
0.12G9
0.00
0.02
0.04
0.06
0.08
0.10
0.12
f (s
tar
form
atio
n)
0.0
0.2
0.4
0.6
0.8
1.0
Cu
mu
lati
ve
−4 −2 0 2 4log(nH [cm−3])
0.00
0.02
0.04
0.06
0.08
0.10
0.12
f (S
N)
0.0
0.2
0.4
0.6
0.8
1.0
Cu
mula
tiv
e
Star−forming
0.00
0.02
0.04
0.06
0.08
0.10
0.12
−4 −2 0 2 4log(nH [cm−3])
0.00
0.02
0.04
0.06
0.08
0.10
0.12
f (S
N)
SNSN_RHPD
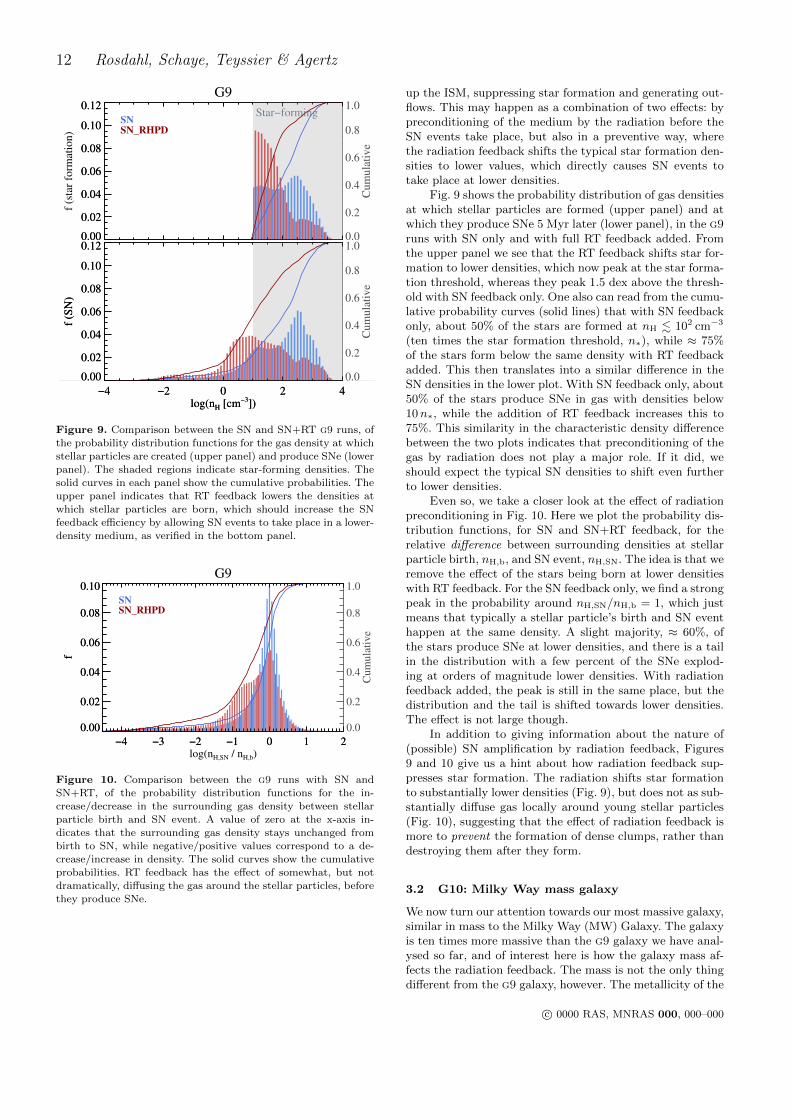
Figure 9. Comparison between the SN and SN+RT g9 runs, of
the probability distribution functions for the gas density at which
stellar particles are created (upper panel) and produce SNe (lowerpanel). The shaded regions indicate star-forming densities. The
solid curves in each panel show the cumulative probabilities. The
upper panel indicates that RT feedback lowers the densities atwhich stellar particles are born, which should increase the SN
feedback efficiency by allowing SN events to take place in a lower-
density medium, as verified in the bottom panel.
−4 −3 −2 −1 0 1 2
0.00
0.02
0.04
0.06
0.08
0.10G9
−4 −3 −2 −1 0 1 2
0.00
0.02
0.04
0.06
0.08
0.10
f
0.0
0.2
0.4
0.6
0.8
1.0
Cu
mu
lati
ve
−4 −3 −2 −1 0 1 2log(nH,SN / nH,b)
0.00
0.02
0.04
0.06
0.08
0.10
f
SNSN_RHPD
Figure 10. Comparison between the g9 runs with SN and
SN+RT, of the probability distribution functions for the in-crease/decrease in the surrounding gas density between stellar
particle birth and SN event. A value of zero at the x-axis in-
dicates that the surrounding gas density stays unchanged frombirth to SN, while negative/positive values correspond to a de-
crease/increase in density. The solid curves show the cumulativeprobabilities. RT feedback has the effect of somewhat, but not
dramatically, diffusing the gas around the stellar particles, before
they produce SNe.
up the ISM, suppressing star formation and generating out-flows. This may happen as a combination of two effects: bypreconditioning of the medium by the radiation before theSN events take place, but also in a preventive way, wherethe radiation feedback shifts the typical star formation den-sities to lower values, which directly causes SN events totake place at lower densities.
Fig. 9 shows the probability distribution of gas densitiesat which stellar particles are formed (upper panel) and atwhich they produce SNe 5 Myr later (lower panel), in the g9runs with SN only and with full RT feedback added. Fromthe upper panel we see that the RT feedback shifts star for-mation to lower densities, which now peak at the star forma-tion threshold, whereas they peak 1.5 dex above the thresh-old with SN feedback only. One also can read from the cumu-lative probability curves (solid lines) that with SN feedbackonly, about 50% of the stars are formed at nH . 102 cm−3
(ten times the star formation threshold, n∗), while ≈ 75%of the stars form below the same density with RT feedbackadded. This then translates into a similar difference in theSN densities in the lower plot. With SN feedback only, about50% of the stars produce SNe in gas with densities below10n∗, while the addition of RT feedback increases this to75%. This similarity in the characteristic density differencebetween the two plots indicates that preconditioning of thegas by radiation does not play a major role. If it did, weshould expect the typical SN densities to shift even furtherto lower densities.
Even so, we take a closer look at the effect of radiationpreconditioning in Fig. 10. Here we plot the probability dis-tribution functions, for SN and SN+RT feedback, for therelative difference between surrounding densities at stellarparticle birth, nH,b, and SN event, nH,SN. The idea is that weremove the effect of the stars being born at lower densitieswith RT feedback. For the SN feedback only, we find a strongpeak in the probability around nH,SN/nH,b = 1, which justmeans that typically a stellar particle’s birth and SN eventhappen at the same density. A slight majority, ≈ 60%, ofthe stars produce SNe at lower densities, and there is a tailin the distribution with a few percent of the SNe explod-ing at orders of magnitude lower densities. With radiationfeedback added, the peak is still in the same place, but thedistribution and the tail is shifted towards lower densities.The effect is not large though.
In addition to giving information about the nature of(possible) SN amplification by radiation feedback, Figures9 and 10 give us a hint about how radiation feedback sup-presses star formation. The radiation shifts star formationto substantially lower densities (Fig. 9), but does not as sub-stantially diffuse gas locally around young stellar particles(Fig. 10), suggesting that the effect of radiation feedback ismore to prevent the formation of dense clumps, rather thandestroying them after they form.
3.2 G10: Milky Way mass galaxy
We now turn our attention towards our most massive galaxy,similar in mass to the Milky Way (MW) Galaxy. The galaxyis ten times more massive than the g9 galaxy we have anal-ysed so far, and of interest here is how the galaxy mass af-fects the radiation feedback. The mass is not the only thingdifferent from the g9 galaxy, however. The metallicity of the
c© 0000 RAS, MNRAS 000, 000–000
Galaxies that Shine 13
Stars [MO • pc-2]
10-1 100 101 102 103 104
250 Myr10 Kpc
NH [cm-2]
1019 1020 1021 1022 1023 1024
G10_SN
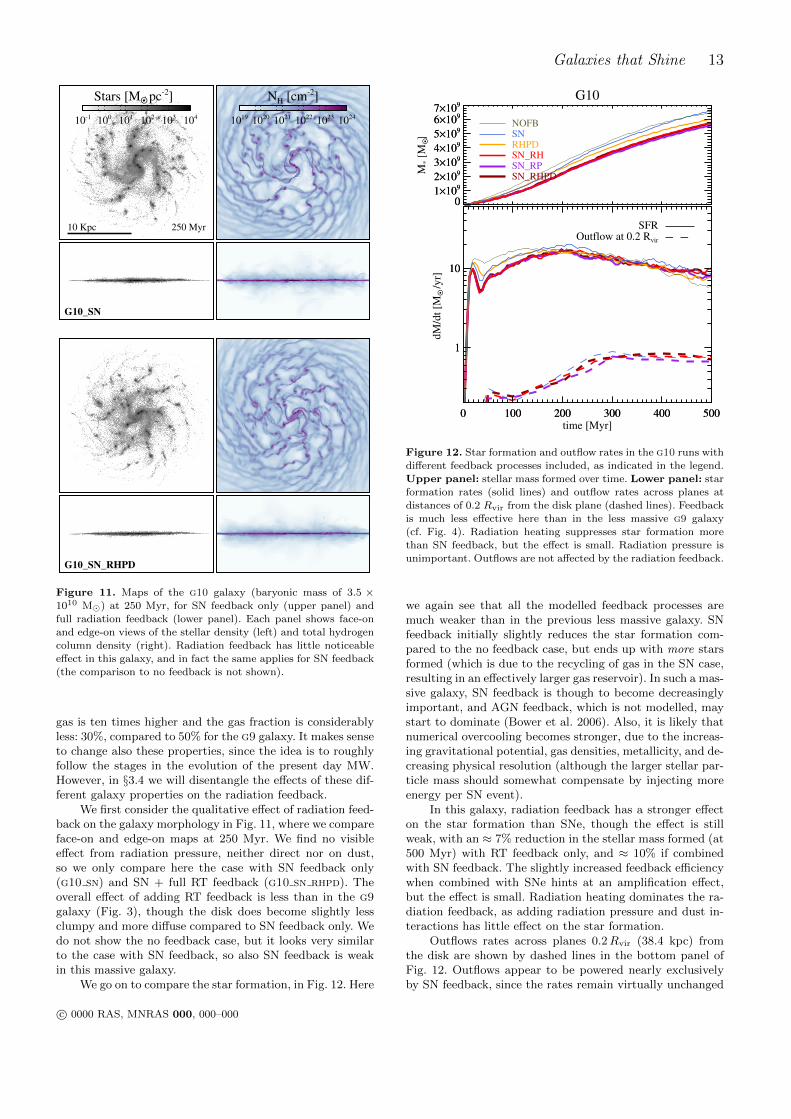
G10_SN_RHPD
Figure 11. Maps of the g10 galaxy (baryonic mass of 3.5 ×10¹⁰ M�) at 250 Myr, for SN feedback only (upper panel) and
full radiation feedback (lower panel). Each panel shows face-onand edge-on views of the stellar density (left) and total hydrogen
column density (right). Radiation feedback has little noticeable
effect in this galaxy, and in fact the same applies for SN feedback(the comparison to no feedback is not shown).
gas is ten times higher and the gas fraction is considerablyless: 30%, compared to 50% for the g9 galaxy. It makes senseto change also these properties, since the idea is to roughlyfollow the stages in the evolution of the present day MW.However, in §3.4 we will disentangle the effects of these dif-ferent galaxy properties on the radiation feedback.
We first consider the qualitative effect of radiation feed-back on the galaxy morphology in Fig. 11, where we compareface-on and edge-on maps at 250 Myr. We find no visibleeffect from radiation pressure, neither direct nor on dust,so we only compare here the case with SN feedback only(g10 sn) and SN + full RT feedback (g10 sn rhpd). Theoverall effect of adding RT feedback is less than in the g9galaxy (Fig. 3), though the disk does become slightly lessclumpy and more diffuse compared to SN feedback only. Wedo not show the no feedback case, but it looks very similarto the case with SN feedback, so also SN feedback is weakin this massive galaxy.
We go on to compare the star formation, in Fig. 12. Here
01×109
2×10⁹
3×10⁹
4×10⁹
5×10⁹
6×1097×109
G10
01×109
2×10⁹
3×10⁹
4×10⁹
5×10⁹
6×1097×109
M* [
MO •]
0 100 200 300 400 500time [Myr]
1
10
dM
/dt
[MO • /
yr]
SFROutflow at 0.2 Rvir
NOFBSNRHPDSN_RHSN_RPSN_RHPD
01×109
2×10⁹
3×10⁹
4×10⁹
5×10⁹
6×1097×109
0 100 200 300 400 500
1
10
Figure 12. Star formation and outflow rates in the g10 runs with
different feedback processes included, as indicated in the legend.
Upper panel: stellar mass formed over time. Lower panel: starformation rates (solid lines) and outflow rates across planes at
distances of 0.2 Rvir from the disk plane (dashed lines). Feedback
is much less effective here than in the less massive g9 galaxy(cf. Fig. 4). Radiation heating suppresses star formation more
than SN feedback, but the effect is small. Radiation pressure is
unimportant. Outflows are not affected by the radiation feedback.
we again see that all the modelled feedback processes aremuch weaker than in the previous less massive galaxy. SNfeedback initially slightly reduces the star formation com-pared to the no feedback case, but ends up with more starsformed (which is due to the recycling of gas in the SN case,resulting in an effectively larger gas reservoir). In such a mas-sive galaxy, SN feedback is though to become decreasinglyimportant, and AGN feedback, which is not modelled, maystart to dominate (Bower et al. 2006). Also, it is likely thatnumerical overcooling becomes stronger, due to the increas-ing gravitational potential, gas densities, metallicity, and de-creasing physical resolution (although the larger stellar par-ticle mass should somewhat compensate by injecting moreenergy per SN event).
In this galaxy, radiation feedback has a stronger effecton the star formation than SNe, though the effect is stillweak, with an ≈ 7% reduction in the stellar mass formed (at500 Myr) with RT feedback only, and ≈ 10% if combinedwith SN feedback. The slightly increased feedback efficiencywhen combined with SNe hints at an amplification effect,but the effect is small. Radiation heating dominates the ra-diation feedback, as adding radiation pressure and dust in-teractions has little effect on the star formation.
Outflows rates across planes 0.2Rvir (38.4 kpc) fromthe disk are shown by dashed lines in the bottom panel ofFig. 12. Outflows appear to be powered nearly exclusivelyby SN feedback, since the rates remain virtually unchanged
c© 0000 RAS, MNRAS 000, 000–000
14 Rosdahl, Schaye, Teyssier & Agertz
after the addition of radiation feedback (of any sort). Themass loading factor of the outflow remains at . 0.1, similarto the g9 galaxy.
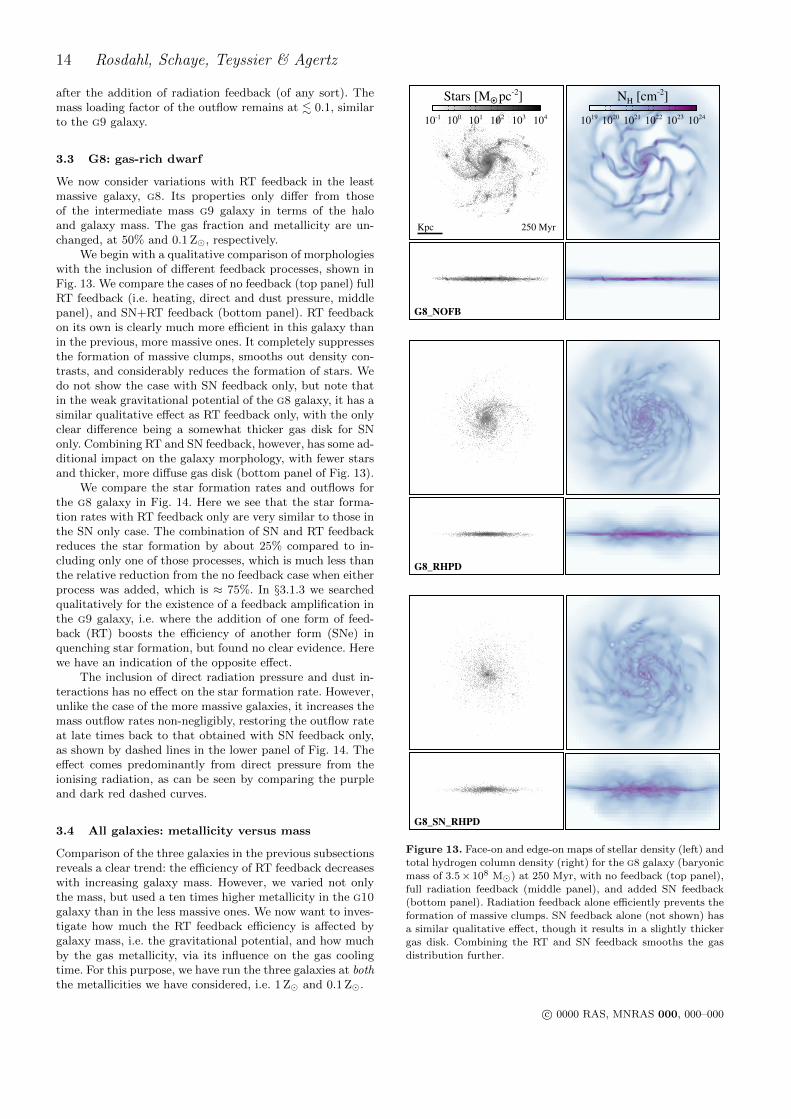
3.3 G8: gas-rich dwarf
We now consider variations with RT feedback in the leastmassive galaxy, g8. Its properties only differ from thoseof the intermediate mass g9 galaxy in terms of the haloand galaxy mass. The gas fraction and metallicity are un-changed, at 50% and 0.1 Z�, respectively.
We begin with a qualitative comparison of morphologieswith the inclusion of different feedback processes, shown inFig. 13. We compare the cases of no feedback (top panel) fullRT feedback (i.e. heating, direct and dust pressure, middlepanel), and SN+RT feedback (bottom panel). RT feedbackon its own is clearly much more efficient in this galaxy thanin the previous, more massive ones. It completely suppressesthe formation of massive clumps, smooths out density con-trasts, and considerably reduces the formation of stars. Wedo not show the case with SN feedback only, but note thatin the weak gravitational potential of the g8 galaxy, it has asimilar qualitative effect as RT feedback only, with the onlyclear difference being a somewhat thicker gas disk for SNonly. Combining RT and SN feedback, however, has some ad-ditional impact on the galaxy morphology, with fewer starsand thicker, more diffuse gas disk (bottom panel of Fig. 13).
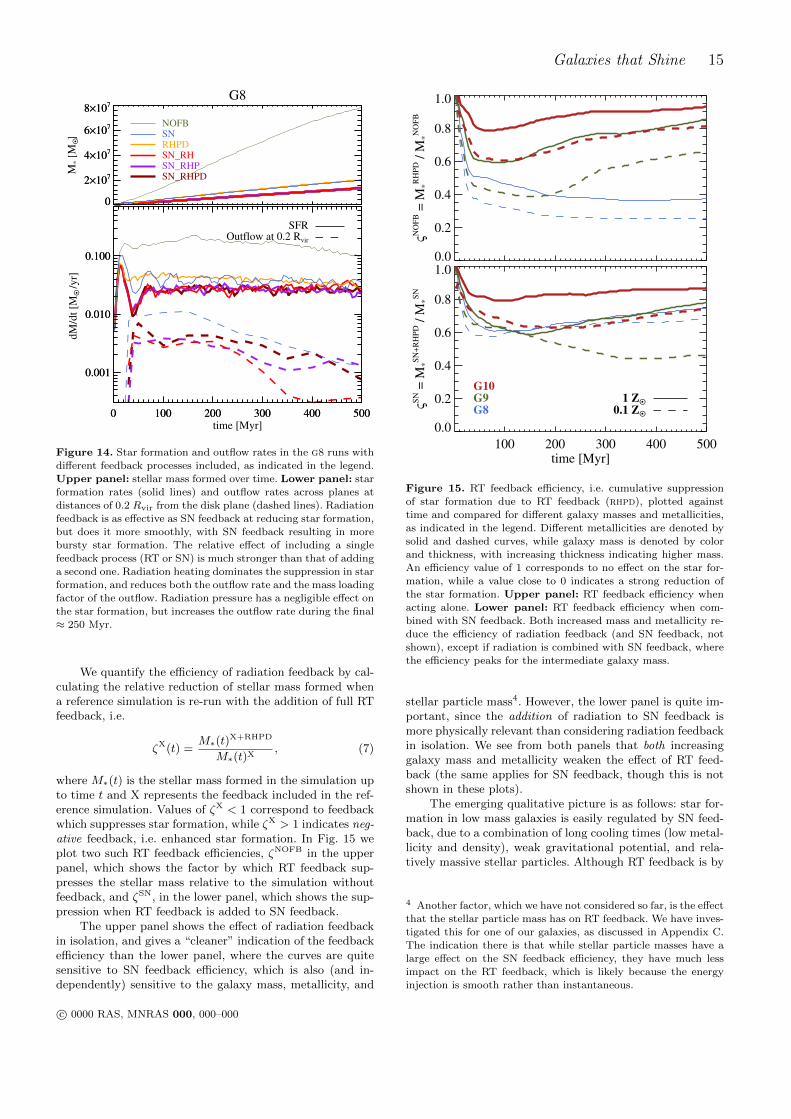
We compare the star formation rates and outflows forthe g8 galaxy in Fig. 14. Here we see that the star forma-tion rates with RT feedback only are very similar to those inthe SN only case. The combination of SN and RT feedbackreduces the star formation by about 25% compared to in-cluding only one of those processes, which is much less thanthe relative reduction from the no feedback case when eitherprocess was added, which is ≈ 75%. In §3.1.3 we searchedqualitatively for the existence of a feedback amplification inthe g9 galaxy, i.e. where the addition of one form of feed-back (RT) boosts the efficiency of another form (SNe) inquenching star formation, but found no clear evidence. Herewe have an indication of the opposite effect.
The inclusion of direct radiation pressure and dust in-teractions has no effect on the star formation rate. However,unlike the case of the more massive galaxies, it increases themass outflow rates non-negligibly, restoring the outflow rateat late times back to that obtained with SN feedback only,as shown by dashed lines in the lower panel of Fig. 14. Theeffect comes predominantly from direct pressure from theionising radiation, as can be seen by comparing the purpleand dark red dashed curves.
3.4 All galaxies: metallicity versus mass
Comparison of the three galaxies in the previous subsectionsreveals a clear trend: the efficiency of RT feedback decreaseswith increasing galaxy mass. However, we varied not onlythe mass, but used a ten times higher metallicity in the g10galaxy than in the less massive ones. We now want to inves-tigate how much the RT feedback efficiency is affected bygalaxy mass, i.e. the gravitational potential, and how muchby the gas metallicity, via its influence on the gas coolingtime. For this purpose, we have run the three galaxies at boththe metallicities we have considered, i.e. 1 Z� and 0.1 Z�.
Stars [MO • pc-2]
10-1 100 101 102 103 104
250 MyrKpc
NH [cm-2]
1019 1020 1021 1022 1023 1024
G8_NOFB�
G8_RHPD
G8_SN_RHPD
Figure 13. Face-on and edge-on maps of stellar density (left) andtotal hydrogen column density (right) for the g8 galaxy (baryonic
mass of 3.5× 10⁸ M�) at 250 Myr, with no feedback (top panel),
full radiation feedback (middle panel), and added SN feedback(bottom panel). Radiation feedback alone efficiently prevents theformation of massive clumps. SN feedback alone (not shown) has
a similar qualitative effect, though it results in a slightly thickergas disk. Combining the RT and SN feedback smooths the gas
distribution further.
c© 0000 RAS, MNRAS 000, 000–000
Galaxies that Shine 15
0
2×10⁷
4×10⁷
6×10⁷
8×10⁷G8
0
2×10⁷
4×10⁷
6×10⁷
8×10⁷
M* [
MO •]
0 100 200 300 400 500time [Myr]
0.001
0.010
0.100
dM
/dt
[MO • /
yr]
SFROutflow at 0.2 Rvir
NOFBSNRHPDSN_RHSN_RHPSN_RHPD
0
2×10⁷
4×10⁷
6×10⁷
8×10⁷
0 100 200 300 400 500
0.001
0.010
0.100
Figure 14. Star formation and outflow rates in the g8 runs with
different feedback processes included, as indicated in the legend.
Upper panel: stellar mass formed over time. Lower panel: starformation rates (solid lines) and outflow rates across planes at
distances of 0.2 Rvir from the disk plane (dashed lines). Radiation
feedback is as effective as SN feedback at reducing star formation,but does it more smoothly, with SN feedback resulting in more
bursty star formation. The relative effect of including a single
feedback process (RT or SN) is much stronger than that of addinga second one. Radiation heating dominates the suppression in star
formation, and reduces both the outflow rate and the mass loading
factor of the outflow. Radiation pressure has a negligible effect onthe star formation, but increases the outflow rate during the final
≈ 250 Myr.
We quantify the efficiency of radiation feedback by cal-culating the relative reduction of stellar mass formed whena reference simulation is re-run with the addition of full RTfeedback, i.e.
ζX(t) =M∗(t)
X+RHPD
M∗(t)X, (7)
where M∗(t) is the stellar mass formed in the simulation upto time t and X represents the feedback included in the ref-erence simulation. Values of ζX < 1 correspond to feedbackwhich suppresses star formation, while ζX > 1 indicates neg-ative feedback, i.e. enhanced star formation. In Fig. 15 weplot two such RT feedback efficiencies, ζNOFB in the upperpanel, which shows the factor by which RT feedback sup-presses the stellar mass relative to the simulation withoutfeedback, and ζSN, in the lower panel, which shows the sup-pression when RT feedback is added to SN feedback.
The upper panel shows the effect of radiation feedbackin isolation, and gives a “cleaner” indication of the feedbackefficiency than the lower panel, where the curves are quitesensitive to SN feedback efficiency, which is also (and in-dependently) sensitive to the galaxy mass, metallicity, and
0.0
0.2
0.4
0.6
0.8
1.0
ςN
OF
B =
M*R
HP
D /
M*N
OF
B
100 200 300 400 500time [Myr]
0.0
0.2
0.4
0.6
0.8
1.0
ςS
N =
M*
SN
+R
HP
D /
M*
SN
G8
G9
G10
0.1 ZO •
1 ZO •
Figure 15. RT feedback efficiency, i.e. cumulative suppressionof star formation due to RT feedback (rhpd), plotted against
time and compared for different galaxy masses and metallicities,
as indicated in the legend. Different metallicities are denoted bysolid and dashed curves, while galaxy mass is denoted by color
and thickness, with increasing thickness indicating higher mass.
An efficiency value of 1 corresponds to no effect on the star for-mation, while a value close to 0 indicates a strong reduction of
the star formation. Upper panel: RT feedback efficiency when
acting alone. Lower panel: RT feedback efficiency when com-bined with SN feedback. Both increased mass and metallicity re-
duce the efficiency of radiation feedback (and SN feedback, not
shown), except if radiation is combined with SN feedback, wherethe efficiency peaks for the intermediate galaxy mass.
stellar particle mass4. However, the lower panel is quite im-portant, since the addition of radiation to SN feedback ismore physically relevant than considering radiation feedbackin isolation. We see from both panels that both increasinggalaxy mass and metallicity weaken the effect of RT feed-back (the same applies for SN feedback, though this is notshown in these plots).
The emerging qualitative picture is as follows: star for-mation in low mass galaxies is easily regulated by SN feed-back, due to a combination of long cooling times (low metal-licity and density), weak gravitational potential, and rela-tively massive stellar particles. Although RT feedback is by
4 Another factor, which we have not considered so far, is the effect
that the stellar particle mass has on RT feedback. We have inves-tigated this for one of our galaxies, as discussed in Appendix C.
The indication there is that while stellar particle masses have alarge effect on the SN feedback efficiency, they have much lessimpact on the RT feedback, which is likely because the energy
injection is smooth rather than instantaneous.
c© 0000 RAS, MNRAS 000, 000–000
16 Rosdahl, Schaye, Teyssier & Agertz
G10
−4 −3 −2 −1 0 1 2log(τIR)
0.000
0.002
0.004
0.006
0.008
0.010
0.012
0.014
f (m
ass)
NOFBSN
RHPDSN_RH
SN_RHPSN_RHPD
−4 −3 −2 −1 0 1 2log(τIR)
0.000
0.002
0.004
0.006
0.008
0.010
0.012
0.014
f (m
ass)
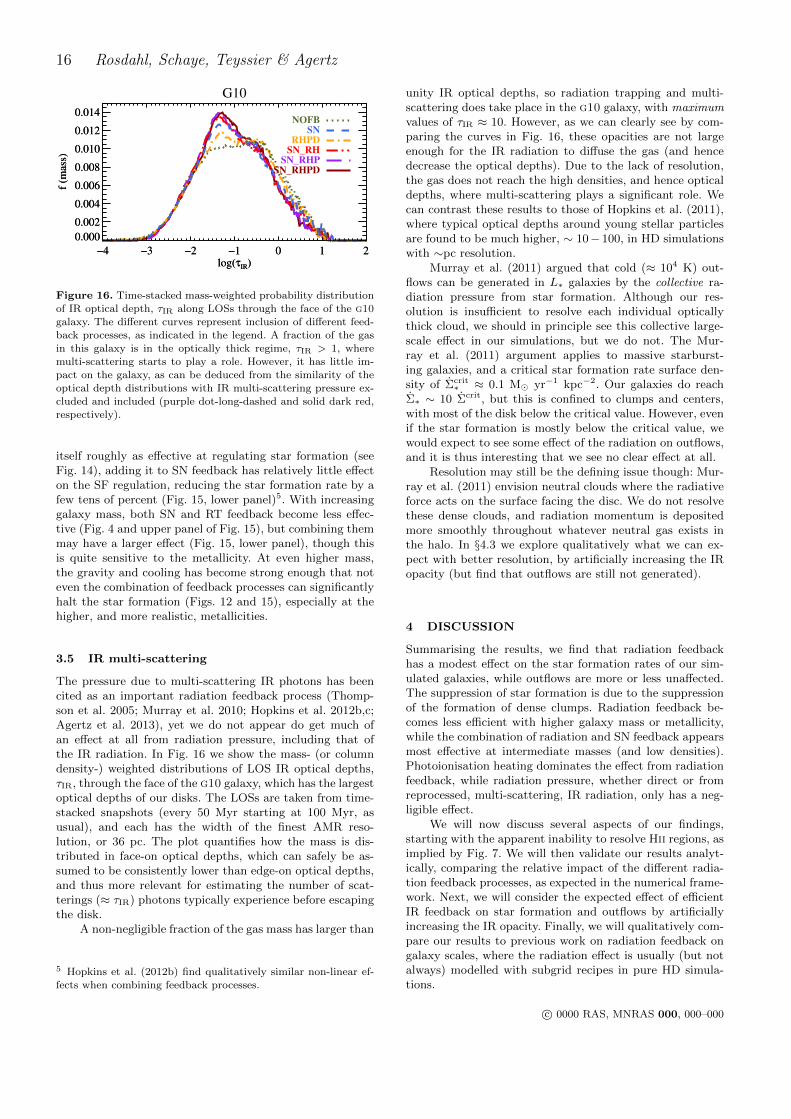
Figure 16. Time-stacked mass-weighted probability distributionof IR optical depth, τIR along LOSs through the face of the g10
galaxy. The different curves represent inclusion of different feed-
back processes, as indicated in the legend. A fraction of the gasin this galaxy is in the optically thick regime, τIR > 1, where
multi-scattering starts to play a role. However, it has little im-
pact on the galaxy, as can be deduced from the similarity of theoptical depth distributions with IR multi-scattering pressure ex-
cluded and included (purple dot-long-dashed and solid dark red,
respectively).
itself roughly as effective at regulating star formation (seeFig. 14), adding it to SN feedback has relatively little effecton the SF regulation, reducing the star formation rate by afew tens of percent (Fig. 15, lower panel)5. With increasinggalaxy mass, both SN and RT feedback become less effec-tive (Fig. 4 and upper panel of Fig. 15), but combining themmay have a larger effect (Fig. 15, lower panel), though thisis quite sensitive to the metallicity. At even higher mass,the gravity and cooling has become strong enough that noteven the combination of feedback processes can significantlyhalt the star formation (Figs. 12 and 15), especially at thehigher, and more realistic, metallicities.
3.5 IR multi-scattering
The pressure due to multi-scattering IR photons has beencited as an important radiation feedback process (Thomp-son et al. 2005; Murray et al. 2010; Hopkins et al. 2012b,c;Agertz et al. 2013), yet we do not appear do get much ofan effect at all from radiation pressure, including that ofthe IR radiation. In Fig. 16 we show the mass- (or columndensity-) weighted distributions of LOS IR optical depths,τIR, through the face of the g10 galaxy, which has the largestoptical depths of our disks. The LOSs are taken from time-stacked snapshots (every 50 Myr starting at 100 Myr, asusual), and each has the width of the finest AMR reso-lution, or 36 pc. The plot quantifies how the mass is dis-tributed in face-on optical depths, which can safely be as-sumed to be consistently lower than edge-on optical depths,and thus more relevant for estimating the number of scat-terings (≈ τIR) photons typically experience before escapingthe disk.
A non-negligible fraction of the gas mass has larger than
5 Hopkins et al. (2012b) find qualitatively similar non-linear ef-fects when combining feedback processes.
unity IR optical depths, so radiation trapping and multi-scattering does take place in the g10 galaxy, with maximumvalues of τIR ≈ 10. However, as we can clearly see by com-paring the curves in Fig. 16, these opacities are not largeenough for the IR radiation to diffuse the gas (and hencedecrease the optical depths). Due to the lack of resolution,the gas does not reach the high densities, and hence opticaldepths, where multi-scattering plays a significant role. Wecan contrast these results to those of Hopkins et al. (2011),where typical optical depths around young stellar particlesare found to be much higher, ∼ 10− 100, in HD simulationswith ∼pc resolution.
Murray et al. (2011) argued that cold (≈ 104 K) out-flows can be generated in L∗ galaxies by the collective ra-diation pressure from star formation. Although our res-olution is insufficient to resolve each individual opticallythick cloud, we should in principle see this collective large-scale effect in our simulations, but we do not. The Mur-ray et al. (2011) argument applies to massive starburst-ing galaxies, and a critical star formation rate surface den-sity of Σcrit
∗ ≈ 0.1 M� yr−1 kpc−2. Our galaxies do reachΣ∗ ∼ 10 Σcrit, but this is confined to clumps and centers,with most of the disk below the critical value. However, evenif the star formation is mostly below the critical value, wewould expect to see some effect of the radiation on outflows,and it is thus interesting that we see no clear effect at all.
Resolution may still be the defining issue though: Mur-ray et al. (2011) envision neutral clouds where the radiativeforce acts on the surface facing the disc. We do not resolvethese dense clouds, and radiation momentum is depositedmore smoothly throughout whatever neutral gas exists inthe halo. In §4.3 we explore qualitatively what we can ex-pect with better resolution, by artificially increasing the IRopacity (but find that outflows are still not generated).
4 DISCUSSION
Summarising the results, we find that radiation feedbackhas a modest effect on the star formation rates of our sim-ulated galaxies, while outflows are more or less unaffected.The suppression of star formation is due to the suppressionof the formation of dense clumps. Radiation feedback be-comes less efficient with higher galaxy mass or metallicity,while the combination of radiation and SN feedback appearsmost effective at intermediate masses (and low densities).Photoionisation heating dominates the effect from radiationfeedback, while radiation pressure, whether direct or fromreprocessed, multi-scattering, IR radiation, only has a neg-ligible effect.
We will now discuss several aspects of our findings,starting with the apparent inability to resolve Hii regions, asimplied by Fig. 7. We will then validate our results analyt-ically, comparing the relative impact of the different radia-tion feedback processes, as expected in the numerical frame-work. Next, we will consider the expected effect of efficientIR feedback on star formation and outflows by artificiallyincreasing the IR opacity. Finally, we will qualitatively com-pare our results to previous work on radiation feedback ongalaxy scales, where the radiation effect is usually (but notalways) modelled with subgrid recipes in pure HD simula-tions.
c© 0000 RAS, MNRAS 000, 000–000
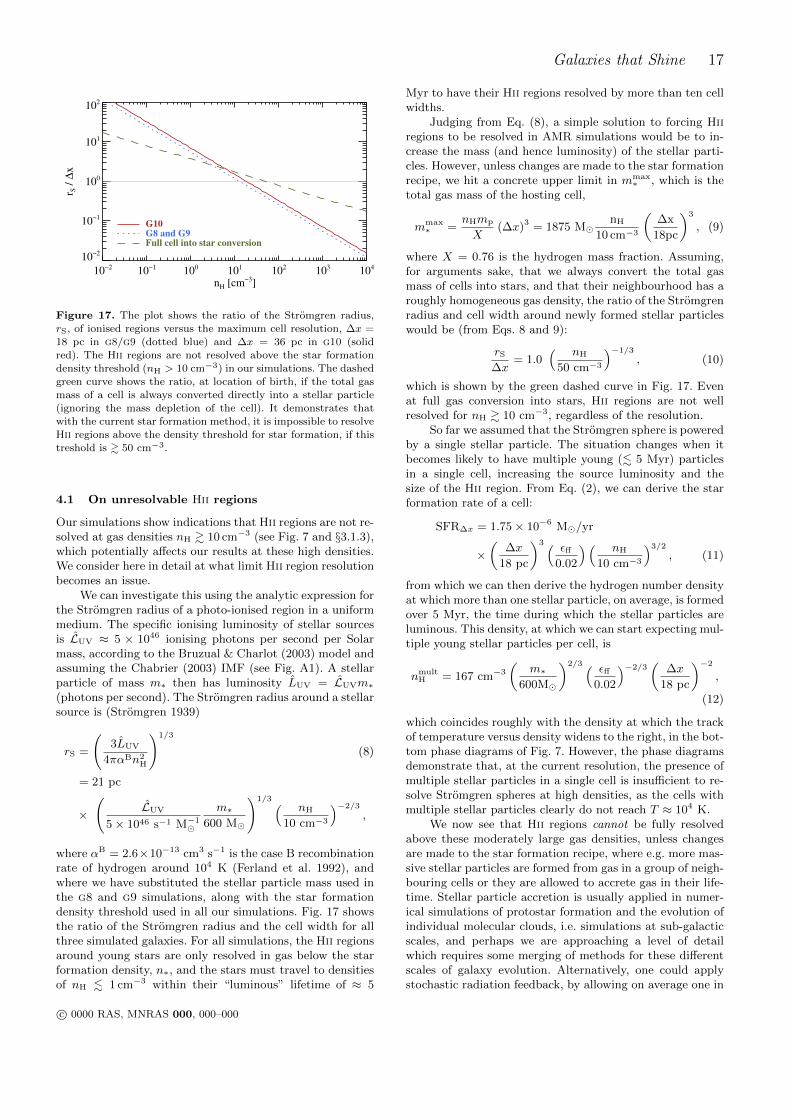
Galaxies that Shine 17
10−2
10−1
100
101
102
103
104
10−2
10−1
100
101
102
10−2
10−1
100
101
102
103
104
nH [cm−3
]
10−2
10−1
100
101
102
r S /
∆x
Full cell into star conversion
G8 and G9
G10
Figure 17. The plot shows the ratio of the Stromgren radius,rS, of ionised regions versus the maximum cell resolution, ∆x =
18 pc in g8/g9 (dotted blue) and ∆x = 36 pc in g10 (solid
red). The Hii regions are not resolved above the star formationdensity threshold (nH > 10 cm−3) in our simulations. The dashed
green curve shows the ratio, at location of birth, if the total gas
mass of a cell is always converted directly into a stellar particle(ignoring the mass depletion of the cell). It demonstrates that
with the current star formation method, it is impossible to resolve
Hii regions above the density threshold for star formation, if thistreshold is & 50 cm−3.
4.1 On unresolvable Hii regions
Our simulations show indications that Hii regions are not re-solved at gas densities nH & 10 cm−3 (see Fig. 7 and §3.1.3),which potentially affects our results at these high densities.We consider here in detail at what limit Hii region resolutionbecomes an issue.
We can investigate this using the analytic expression forthe Stromgren radius of a photo-ionised region in a uniformmedium. The specific ionising luminosity of stellar sourcesis LUV ≈ 5 × 1046 ionising photons per second per Solarmass, according to the Bruzual & Charlot (2003) model andassuming the Chabrier (2003) IMF (see Fig. A1). A stellarparticle of mass m∗ then has luminosity LUV = LUVm∗(photons per second). The Stromgren radius around a stellarsource is (Stromgren 1939)
rS =
(3LUV
4παBn2H
)1/3
(8)
= 21 pc
×
(LUV
5× 1046 s−1 M−1�
m∗600 M�
)1/3 ( nH
10 cm−3
)−2/3
,
where αB = 2.6×10⁻¹³ cm3 s−1 is the case B recombinationrate of hydrogen around 104 K (Ferland et al. 1992), andwhere we have substituted the stellar particle mass used inthe g8 and g9 simulations, along with the star formationdensity threshold used in all our simulations. Fig. 17 showsthe ratio of the Stromgren radius and the cell width for allthree simulated galaxies. For all simulations, the Hii regionsaround young stars are only resolved in gas below the starformation density, n∗, and the stars must travel to densitiesof nH . 1 cm−3 within their “luminous” lifetime of ≈ 5
Myr to have their Hii regions resolved by more than ten cellwidths.
Judging from Eq. (8), a simple solution to forcing Hiiregions to be resolved in AMR simulations would be to in-crease the mass (and hence luminosity) of the stellar parti-cles. However, unless changes are made to the star formationrecipe, we hit a concrete upper limit in mmax
∗ , which is thetotal gas mass of the hosting cell,
mmax∗ =
nHmp
X(∆x)3 = 1875 M�
nH
10 cm−3
(∆x
18pc
)3
, (9)
where X = 0.76 is the hydrogen mass fraction. Assuming,for arguments sake, that we always convert the total gasmass of cells into stars, and that their neighbourhood has aroughly homogeneous gas density, the ratio of the Stromgrenradius and cell width around newly formed stellar particleswould be (from Eqs. 8 and 9):
rS
∆x= 1.0
( nH
50 cm−3
)−1/3
, (10)
which is shown by the green dashed curve in Fig. 17. Evenat full gas conversion into stars, Hii regions are not wellresolved for nH & 10 cm−3, regardless of the resolution.
So far we assumed that the Stromgren sphere is poweredby a single stellar particle. The situation changes when itbecomes likely to have multiple young (. 5 Myr) particlesin a single cell, increasing the source luminosity and thesize of the Hii region. From Eq. (2), we can derive the starformation rate of a cell:
SFR∆x = 1.75× 10⁻⁶ M�/yr
×(
∆x
18 pc
)3 ( εff0.02
)( nH
10 cm−3
)3/2
, (11)
from which we can then derive the hydrogen number densityat which more than one stellar particle, on average, is formedover 5 Myr, the time during which the stellar particles areluminous. This density, at which we can start expecting mul-tiple young stellar particles per cell, is
nmultH = 167 cm−3
(m∗
600M�
)2/3 ( εff0.02
)−2/3(
∆x
18 pc
)−2
,
(12)
which coincides roughly with the density at which the trackof temperature versus density widens to the right, in the bot-tom phase diagrams of Fig. 7. However, the phase diagramsdemonstrate that, at the current resolution, the presence ofmultiple stellar particles in a single cell is insufficient to re-solve Stromgren spheres at high densities, as the cells withmultiple stellar particles clearly do not reach T ≈ 104 K.
We now see that Hii regions cannot be fully resolvedabove these moderately large gas densities, unless changesare made to the star formation recipe, where e.g. more mas-sive stellar particles are formed from gas in a group of neigh-bouring cells or they are allowed to accrete gas in their life-time. Stellar particle accretion is usually applied in numer-ical simulations of protostar formation and the evolution ofindividual molecular clouds, i.e. simulations at sub-galacticscales, and perhaps we are approaching a level of detailwhich requires some merging of methods for these differentscales of galaxy evolution. Alternatively, one could applystochastic radiation feedback, by allowing on average one in
c© 0000 RAS, MNRAS 000, 000–000
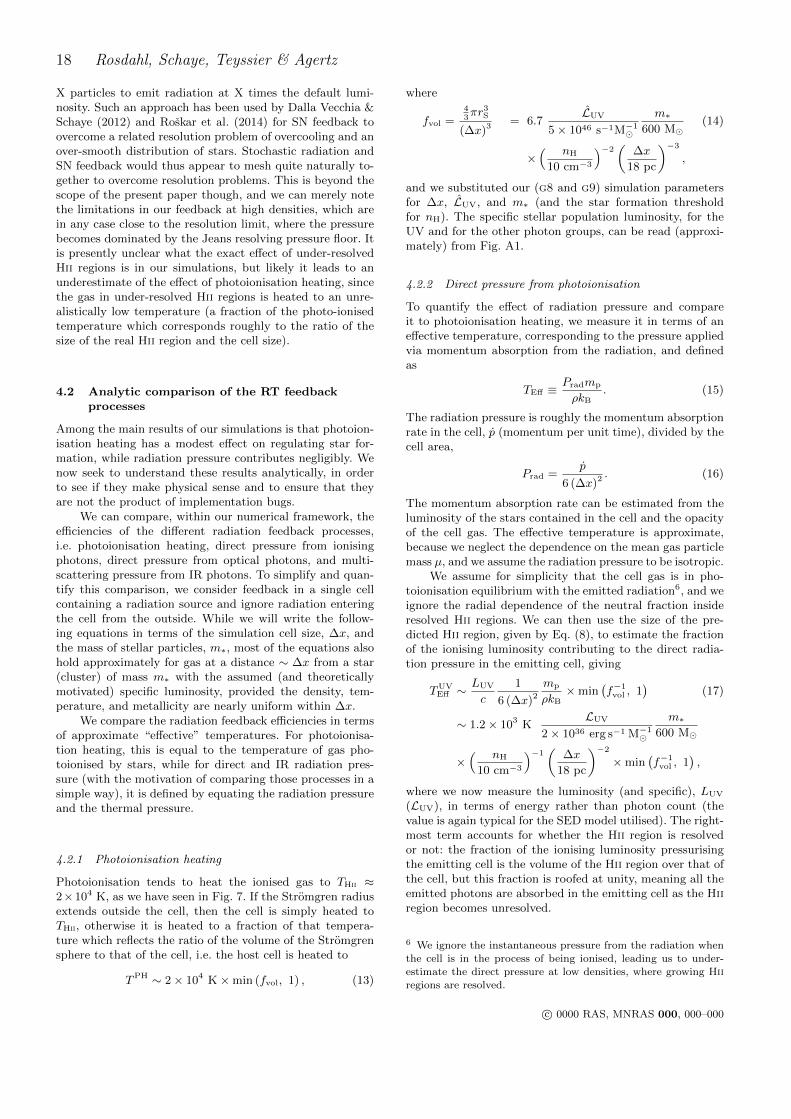
18 Rosdahl, Schaye, Teyssier & Agertz
X particles to emit radiation at X times the default lumi-nosity. Such an approach has been used by Dalla Vecchia &Schaye (2012) and Roskar et al. (2014) for SN feedback toovercome a related resolution problem of overcooling and anover-smooth distribution of stars. Stochastic radiation andSN feedback would thus appear to mesh quite naturally to-gether to overcome resolution problems. This is beyond thescope of the present paper though, and we can merely notethe limitations in our feedback at high densities, which arein any case close to the resolution limit, where the pressurebecomes dominated by the Jeans resolving pressure floor. Itis presently unclear what the exact effect of under-resolvedHii regions is in our simulations, but likely it leads to anunderestimate of the effect of photoionisation heating, sincethe gas in under-resolved Hii regions is heated to an unre-alistically low temperature (a fraction of the photo-ionisedtemperature which corresponds roughly to the ratio of thesize of the real Hii region and the cell size).
4.2 Analytic comparison of the RT feedbackprocesses
Among the main results of our simulations is that photoion-isation heating has a modest effect on regulating star for-mation, while radiation pressure contributes negligibly. Wenow seek to understand these results analytically, in orderto see if they make physical sense and to ensure that theyare not the product of implementation bugs.
We can compare, within our numerical framework, theefficiencies of the different radiation feedback processes,i.e. photoionisation heating, direct pressure from ionisingphotons, direct pressure from optical photons, and multi-scattering pressure from IR photons. To simplify and quan-tify this comparison, we consider feedback in a single cellcontaining a radiation source and ignore radiation enteringthe cell from the outside. While we will write the follow-ing equations in terms of the simulation cell size, ∆x, andthe mass of stellar particles, m∗, most of the equations alsohold approximately for gas at a distance ∼ ∆x from a star(cluster) of mass m∗ with the assumed (and theoreticallymotivated) specific luminosity, provided the density, tem-perature, and metallicity are nearly uniform within ∆x.
We compare the radiation feedback efficiencies in termsof approximate “effective” temperatures. For photoionisa-tion heating, this is equal to the temperature of gas pho-toionised by stars, while for direct and IR radiation pres-sure (with the motivation of comparing those processes in asimple way), it is defined by equating the radiation pressureand the thermal pressure.
4.2.1 Photoionisation heating
Photoionisation tends to heat the ionised gas to THii ≈2×10⁴ K, as we have seen in Fig. 7. If the Stromgren radiusextends outside the cell, then the cell is simply heated toTHii, otherwise it is heated to a fraction of that tempera-ture which reflects the ratio of the volume of the Stromgrensphere to that of the cell, i.e. the host cell is heated to
TPH ∼ 2× 10⁴ K×min (fvol, 1) , (13)
where
fvol =43πr3
S
(∆x)3 = 6.7LUV
5× 1046 s−1M−1�
m∗600 M�
(14)
×( nH
10 cm−3
)−2(
∆x
18 pc
)−3
,
and we substituted our (g8 and g9) simulation parametersfor ∆x, LUV, and m∗ (and the star formation thresholdfor nH). The specific stellar population luminosity, for theUV and for the other photon groups, can be read (approxi-mately) from Fig. A1.
4.2.2 Direct pressure from photoionisation
To quantify the effect of radiation pressure and compareit to photoionisation heating, we measure it in terms of aneffective temperature, corresponding to the pressure appliedvia momentum absorption from the radiation, and definedas
TEff ≡Pradmp
ρkB. (15)
The radiation pressure is roughly the momentum absorptionrate in the cell, p (momentum per unit time), divided by thecell area,
Prad =p
6 (∆x)2 . (16)
The momentum absorption rate can be estimated from theluminosity of the stars contained in the cell and the opacityof the cell gas. The effective temperature is approximate,because we neglect the dependence on the mean gas particlemass µ, and we assume the radiation pressure to be isotropic.
We assume for simplicity that the cell gas is in pho-toionisation equilibrium with the emitted radiation6, and weignore the radial dependence of the neutral fraction insideresolved Hii regions. We can then use the size of the pre-dicted Hii region, given by Eq. (8), to estimate the fractionof the ionising luminosity contributing to the direct radia-tion pressure in the emitting cell, giving
TUVEff ∼
LUV
c
1
6 (∆x)2
mp
ρkB×min
(f−1
vol , 1)
(17)
∼ 1.2× 10³ KLUV
2× 1036 erg s−1 M−1�
m∗600 M�
×( nH
10 cm−3
)−1(
∆x
18 pc
)−2
×min(f−1
vol , 1),
where we now measure the luminosity (and specific), LUV
(LUV), in terms of energy rather than photon count (thevalue is again typical for the SED model utilised). The right-most term accounts for whether the Hii region is resolvedor not: the fraction of the ionising luminosity pressurisingthe emitting cell is the volume of the Hii region over that ofthe cell, but this fraction is roofed at unity, meaning all theemitted photons are absorbed in the emitting cell as the Hiiregion becomes unresolved.
6 We ignore the instantaneous pressure from the radiation when
the cell is in the process of being ionised, leading us to under-estimate the direct pressure at low densities, where growing Hii
regions are resolved.
c© 0000 RAS, MNRAS 000, 000–000
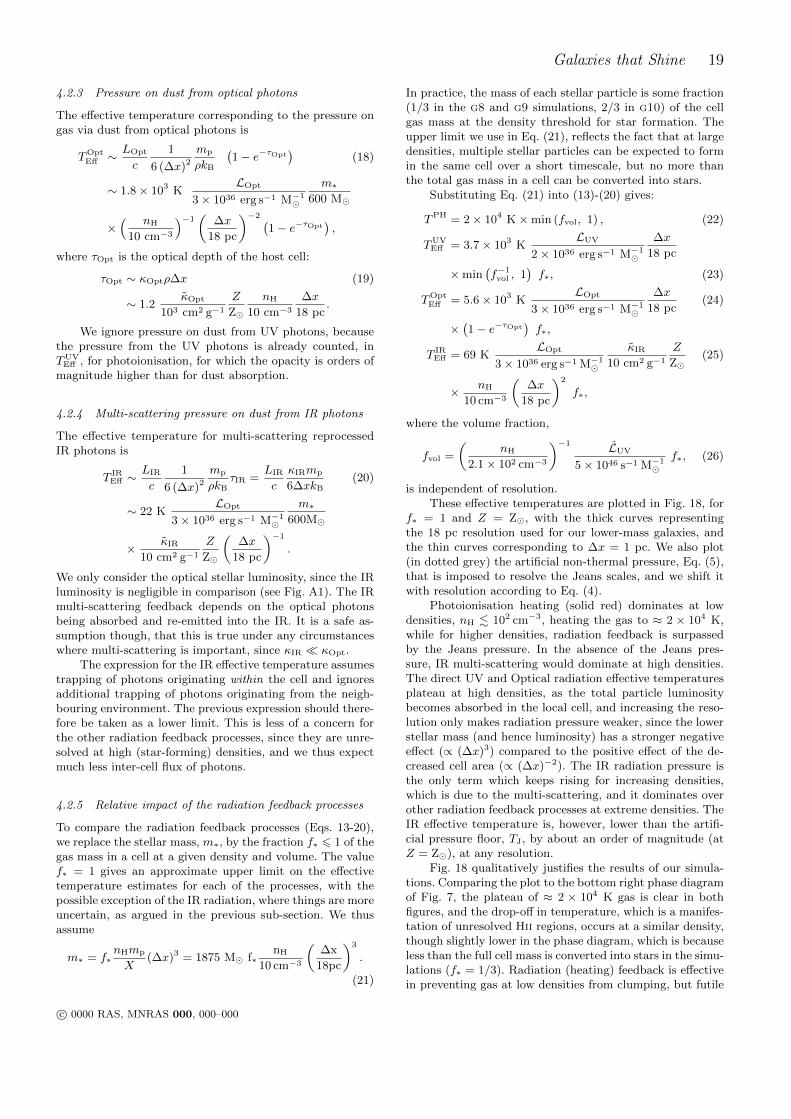
Galaxies that Shine 19
4.2.3 Pressure on dust from optical photons
The effective temperature corresponding to the pressure ongas via dust from optical photons is
TOptEff ∼
LOpt
c
1
6 (∆x)2
mp
ρkB
(1− e−τOpt
)(18)
∼ 1.8× 10³ KLOpt
3× 1036 erg s−1 M−1�
m∗600 M�
×( nH
10 cm−3
)−1(
∆x
18 pc
)−2 (1− e−τOpt
),
where τOpt is the optical depth of the host cell:
τOpt ∼ κOptρ∆x (19)
∼ 1.2κOpt
103 cm2 g−1
Z
Z�
nH
10 cm−3
∆x
18 pc.
We ignore pressure on dust from UV photons, becausethe pressure from the UV photons is already counted, inTUV
Eff , for photoionisation, for which the opacity is orders ofmagnitude higher than for dust absorption.
4.2.4 Multi-scattering pressure on dust from IR photons
The effective temperature for multi-scattering reprocessedIR photons is
T IREff ∼
LIR
c
1
6 (∆x)2
mp
ρkBτIR =
LIR
c
κIRmp
6∆xkB(20)
∼ 22 KLOpt
3× 1036 erg s−1 M−1�
m∗600M�
× κIR
10 cm2 g−1
Z
Z�
(∆x
18 pc
)−1
.
We only consider the optical stellar luminosity, since the IRluminosity is negligible in comparison (see Fig. A1). The IRmulti-scattering feedback depends on the optical photonsbeing absorbed and re-emitted into the IR. It is a safe as-sumption though, that this is true under any circumstanceswhere multi-scattering is important, since κIR � κOpt.
The expression for the IR effective temperature assumestrapping of photons originating within the cell and ignoresadditional trapping of photons originating from the neigh-bouring environment. The previous expression should there-fore be taken as a lower limit. This is less of a concern forthe other radiation feedback processes, since they are unre-solved at high (star-forming) densities, and we thus expectmuch less inter-cell flux of photons.
4.2.5 Relative impact of the radiation feedback processes
To compare the radiation feedback processes (Eqs. 13-20),we replace the stellar mass, m∗, by the fraction f∗ 6 1 of thegas mass in a cell at a given density and volume. The valuef∗ = 1 gives an approximate upper limit on the effectivetemperature estimates for each of the processes, with thepossible exception of the IR radiation, where things are moreuncertain, as argued in the previous sub-section. We thusassume
m∗ = f∗nHmp
X(∆x)3 = 1875 M� f∗
nH
10 cm−3
(∆x
18pc
)3
.
(21)
In practice, the mass of each stellar particle is some fraction(1/3 in the g8 and g9 simulations, 2/3 in g10) of the cellgas mass at the density threshold for star formation. Theupper limit we use in Eq. (21), reflects the fact that at largedensities, multiple stellar particles can be expected to formin the same cell over a short timescale, but no more thanthe total gas mass in a cell can be converted into stars.
Substituting Eq. (21) into (13)-(20) gives:
TPH = 2× 10⁴ K×min (fvol, 1) , (22)
TUVEff = 3.7× 10³ K
LUV
2× 1036 erg s−1 M−1�
∆x
18 pc
×min(f−1
vol , 1)f∗, (23)
TOptEff = 5.6× 10³ K
LOpt
3× 1036 erg s−1 M−1�
∆x
18 pc(24)
×(1− e−τOpt
)f∗,
T IREff = 69 K
LOpt
3× 1036 erg s−1 M−1�
κIR
10 cm2 g−1
Z
Z�(25)
× nH
10 cm−3
(∆x
18 pc
)2
f∗,
where the volume fraction,
fvol =
(nH
2.1× 102 cm−3
)−1 LUV
5× 1046 s−1 M−1�
f∗, (26)
is independent of resolution.These effective temperatures are plotted in Fig. 18, for
f∗ = 1 and Z = Z�, with the thick curves representingthe 18 pc resolution used for our lower-mass galaxies, andthe thin curves corresponding to ∆x = 1 pc. We also plot(in dotted grey) the artificial non-thermal pressure, Eq. (5),that is imposed to resolve the Jeans scales, and we shift itwith resolution according to Eq. (4).
Photoionisation heating (solid red) dominates at lowdensities, nH . 102 cm−3, heating the gas to ≈ 2 × 10⁴ K,while for higher densities, radiation feedback is surpassedby the Jeans pressure. In the absence of the Jeans pres-sure, IR multi-scattering would dominate at high densities.The direct UV and Optical radiation effective temperaturesplateau at high densities, as the total particle luminositybecomes absorbed in the local cell, and increasing the reso-lution only makes radiation pressure weaker, since the lowerstellar mass (and hence luminosity) has a stronger negativeeffect (∝ (∆x)3) compared to the positive effect of the de-creased cell area (∝ (∆x)−2). The IR radiation pressure isthe only term which keeps rising for increasing densities,which is due to the multi-scattering, and it dominates overother radiation feedback processes at extreme densities. TheIR effective temperature is, however, lower than the artifi-cial pressure floor, TJ, by about an order of magnitude (atZ = Z�), at any resolution.
Fig. 18 qualitatively justifies the results of our simula-tions. Comparing the plot to the bottom right phase diagramof Fig. 7, the plateau of ≈ 2 × 10⁴ K gas is clear in bothfigures, and the drop-off in temperature, which is a manifes-tation of unresolved Hii regions, occurs at a similar density,though slightly lower in the phase diagram, which is becauseless than the full cell mass is converted into stars in the simu-lations (f∗ = 1/3). Radiation (heating) feedback is effectivein preventing gas at low densities from clumping, but futile
c© 0000 RAS, MNRAS 000, 000–000
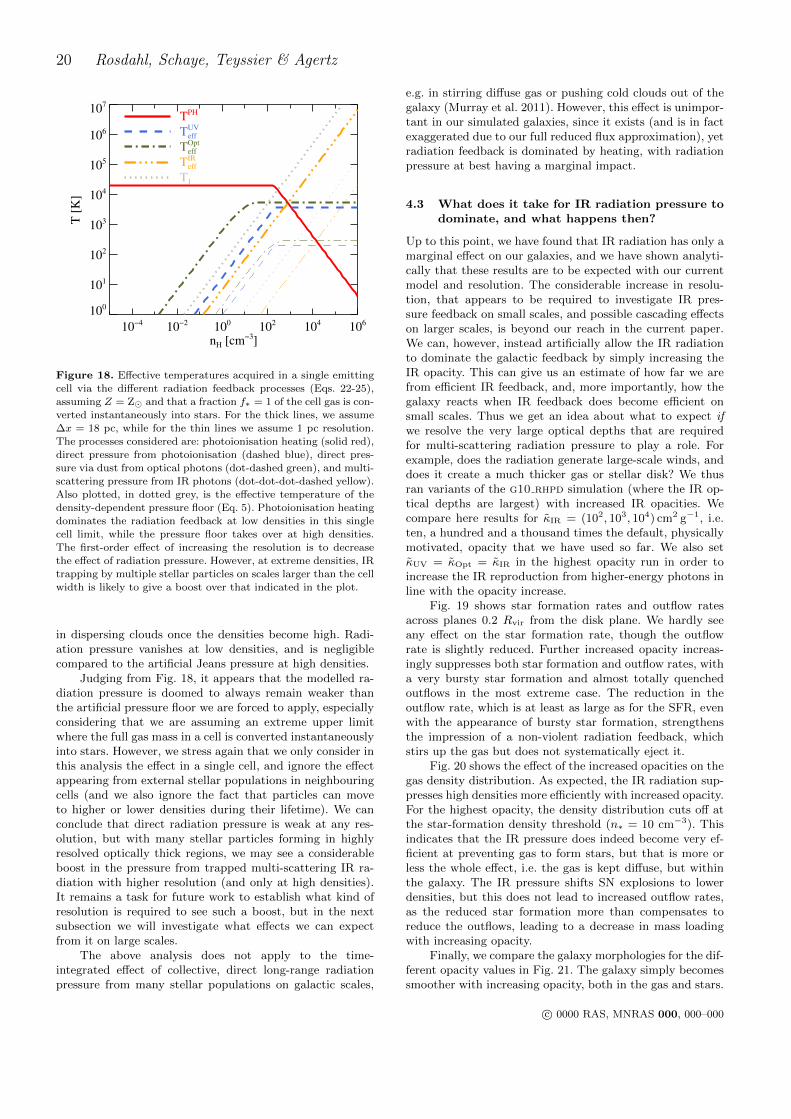
20 Rosdahl, Schaye, Teyssier & Agertz
10−4 10−2 100 102 104 106
100
101
102
103
104
105
106
107
10−4 10−2 100 102 104 106
nH [cm−3]
100
101
102
103
104
105
106
107
T [
K]
TPH
TeffUV
TeffOpt
TeffIR
TJ
Figure 18. Effective temperatures acquired in a single emittingcell via the different radiation feedback processes (Eqs. 22-25),
assuming Z = Z� and that a fraction f∗ = 1 of the cell gas is con-
verted instantaneously into stars. For the thick lines, we assume∆x = 18 pc, while for the thin lines we assume 1 pc resolution.
The processes considered are: photoionisation heating (solid red),direct pressure from photoionisation (dashed blue), direct pres-
sure via dust from optical photons (dot-dashed green), and multi-
scattering pressure from IR photons (dot-dot-dot-dashed yellow).Also plotted, in dotted grey, is the effective temperature of the
density-dependent pressure floor (Eq. 5). Photoionisation heating
dominates the radiation feedback at low densities in this singlecell limit, while the pressure floor takes over at high densities.
The first-order effect of increasing the resolution is to decrease
the effect of radiation pressure. However, at extreme densities, IRtrapping by multiple stellar particles on scales larger than the cell
width is likely to give a boost over that indicated in the plot.
in dispersing clouds once the densities become high. Radi-ation pressure vanishes at low densities, and is negligiblecompared to the artificial Jeans pressure at high densities.
Judging from Fig. 18, it appears that the modelled ra-diation pressure is doomed to always remain weaker thanthe artificial pressure floor we are forced to apply, especiallyconsidering that we are assuming an extreme upper limitwhere the full gas mass in a cell is converted instantaneouslyinto stars. However, we stress again that we only consider inthis analysis the effect in a single cell, and ignore the effectappearing from external stellar populations in neighbouringcells (and we also ignore the fact that particles can moveto higher or lower densities during their lifetime). We canconclude that direct radiation pressure is weak at any res-olution, but with many stellar particles forming in highlyresolved optically thick regions, we may see a considerableboost in the pressure from trapped multi-scattering IR ra-diation with higher resolution (and only at high densities).It remains a task for future work to establish what kind ofresolution is required to see such a boost, but in the nextsubsection we will investigate what effects we can expectfrom it on large scales.
The above analysis does not apply to the time-integrated effect of collective, direct long-range radiationpressure from many stellar populations on galactic scales,
e.g. in stirring diffuse gas or pushing cold clouds out of thegalaxy (Murray et al. 2011). However, this effect is unimpor-tant in our simulated galaxies, since it exists (and is in factexaggerated due to our full reduced flux approximation), yetradiation feedback is dominated by heating, with radiationpressure at best having a marginal impact.
4.3 What does it take for IR radiation pressure todominate, and what happens then?
Up to this point, we have found that IR radiation has only amarginal effect on our galaxies, and we have shown analyti-cally that these results are to be expected with our currentmodel and resolution. The considerable increase in resolu-tion, that appears to be required to investigate IR pres-sure feedback on small scales, and possible cascading effectson larger scales, is beyond our reach in the current paper.We can, however, instead artificially allow the IR radiationto dominate the galactic feedback by simply increasing theIR opacity. This can give us an estimate of how far we arefrom efficient IR feedback, and, more importantly, how thegalaxy reacts when IR feedback does become efficient onsmall scales. Thus we get an idea about what to expect ifwe resolve the very large optical depths that are requiredfor multi-scattering radiation pressure to play a role. Forexample, does the radiation generate large-scale winds, anddoes it create a much thicker gas or stellar disk? We thusran variants of the g10 rhpd simulation (where the IR op-tical depths are largest) with increased IR opacities. Wecompare here results for κIR = (102, 103, 104) cm2 g−1, i.e.ten, a hundred and a thousand times the default, physicallymotivated, opacity that we have used so far. We also setκUV = κOpt = κIR in the highest opacity run in order toincrease the IR reproduction from higher-energy photons inline with the opacity increase.
Fig. 19 shows star formation rates and outflow ratesacross planes 0.2 Rvir from the disk plane. We hardly seeany effect on the star formation rate, though the outflowrate is slightly reduced. Further increased opacity increas-ingly suppresses both star formation and outflow rates, witha very bursty star formation and almost totally quenchedoutflows in the most extreme case. The reduction in theoutflow rate, which is at least as large as for the SFR, evenwith the appearance of bursty star formation, strengthensthe impression of a non-violent radiation feedback, whichstirs up the gas but does not systematically eject it.
Fig. 20 shows the effect of the increased opacities on thegas density distribution. As expected, the IR radiation sup-presses high densities more efficiently with increased opacity.For the highest opacity, the density distribution cuts off atthe star-formation density threshold (n∗ = 10 cm−3). Thisindicates that the IR pressure does indeed become very ef-ficient at preventing gas to form stars, but that is more orless the whole effect, i.e. the gas is kept diffuse, but withinthe galaxy. The IR pressure shifts SN explosions to lowerdensities, but this does not lead to increased outflow rates,as the reduced star formation more than compensates toreduce the outflows, leading to a decrease in mass loadingwith increasing opacity.
Finally, we compare the galaxy morphologies for the dif-ferent opacity values in Fig. 21. The galaxy simply becomessmoother with increasing opacity, both in the gas and stars.
c© 0000 RAS, MNRAS 000, 000–000
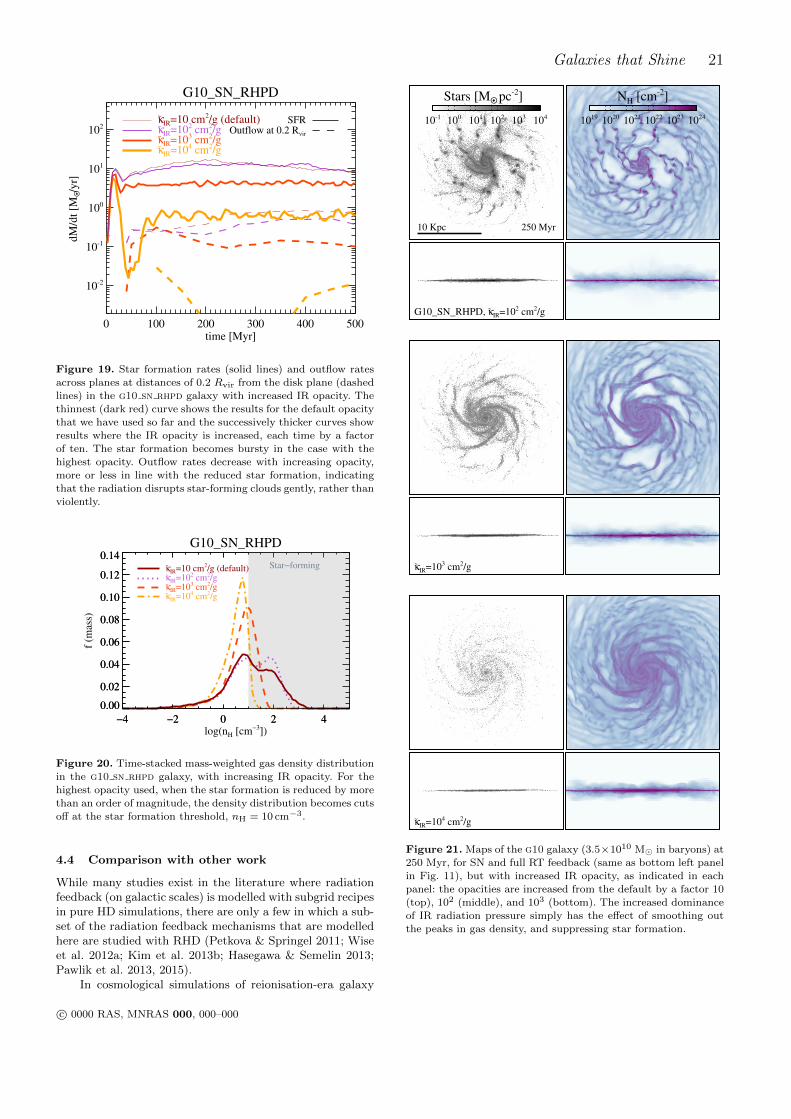
Galaxies that Shine 21
G10_SN_RHPD
0 100 200 300 400 500time [Myr]
10-2
10-1
100
101
102
dM
/dt
[MO •/y
r]
SFROutflow at 0.2 Rvir
κ~
IR=10 cm2/g (default)κ~
IR=102 cm2/gκ~
IR=103 cm2/gκ~
IR=104 cm2/g
Figure 19. Star formation rates (solid lines) and outflow rates
across planes at distances of 0.2 Rvir from the disk plane (dashed
lines) in the g10 sn rhpd galaxy with increased IR opacity. Thethinnest (dark red) curve shows the results for the default opacity
that we have used so far and the successively thicker curves show
results where the IR opacity is increased, each time by a factorof ten. The star formation becomes bursty in the case with the
highest opacity. Outflow rates decrease with increasing opacity,
more or less in line with the reduced star formation, indicatingthat the radiation disrupts star-forming clouds gently, rather than
violently.
G10_SN_RHPD
−4 −2 0 2 4log(nH [cm−3])
0.00
0.02
0.04
0.06
0.08
0.10
0.12
0.14
f (m
ass)
Star−formingκ~
IR=10 cm2/g (default)κ~
IR=102 cm2/gκ~
IR=103 cm2/gκ~
IR=104 cm2/g
−4 −2 0 2 4
0.00
0.02
0.04
0.06
0.08
0.10
0.12
0.14
Figure 20. Time-stacked mass-weighted gas density distributionin the g10 sn rhpd galaxy, with increasing IR opacity. For the
highest opacity used, when the star formation is reduced by more
than an order of magnitude, the density distribution becomes cutsoff at the star formation threshold, nH = 10 cm−3.
4.4 Comparison with other work
While many studies exist in the literature where radiationfeedback (on galactic scales) is modelled with subgrid recipesin pure HD simulations, there are only a few in which a sub-set of the radiation feedback mechanisms that are modelledhere are studied with RHD (Petkova & Springel 2011; Wiseet al. 2012a; Kim et al. 2013b; Hasegawa & Semelin 2013;Pawlik et al. 2013, 2015).
In cosmological simulations of reionisation-era galaxy
Stars [MO • pc-2]
10-1 100 101 102 103 104
250 Myr10 Kpc
NH [cm-2]
1019 1020 1021 1022 1023 1024
G10_SN_RHPD, κ~ IR=102 cm2/g
κ~
IR=103 cm2/g
κ~
IR=104 cm2/g
Figure 21. Maps of the g10 galaxy (3.5×10¹⁰ M� in baryons) at250 Myr, for SN and full RT feedback (same as bottom left panel
in Fig. 11), but with increased IR opacity, as indicated in each
panel: the opacities are increased from the default by a factor 10(top), 102 (middle), and 103 (bottom). The increased dominanceof IR radiation pressure simply has the effect of smoothing out
the peaks in gas density, and suppressing star formation.
c© 0000 RAS, MNRAS 000, 000–000
22 Rosdahl, Schaye, Teyssier & Agertz
formation, Wise et al. (2012a) found direct radiation pres-sure to play a major role, suppressing star formationstrongly and boosting outflow rates, but did not report onthe isolated effect of photo-ionisation heating, which was al-ways included, and they did not include IR radiation effects(which are likely weak in such metal-poor galaxies). Petkova& Springel (2011); Hasegawa & Semelin (2013); Pawlik et al.(2013) also modelled reionisation-era galaxies, but only in-cluded radiation heating. They all found that radiation heat-ing gently suppressed star formation, while they did not re-port on boosted outflows. Pawlik et al. (2015) consideredthe addition of SN feedback and found that it dominatedover the effect of radiation heating on star formation histo-ries. Kim et al. (2013b) used the RHD implementation fromWise et al. (2012a) on an isolated ∼ MW mass galaxy, andfound slight (∼ 20%) suppression of star formation, whichthey attributed to radiation heating, rather than radiationpressure.
A large amount of work exists where radiation feedbackhas been included in pure HD simulations in the form ofsubgrid recipes, which are often empirically motivated. Al-though there are quantitative, and sometimes qualitative,differences, these studies broadly agree that IR radiationpressure strongly suppresses star formation and generates(sometimes extremely massive) outflows (e.g. Stinson et al.2013; Hopkins et al. 2011, 2012c,b,a; Aumer et al. 2013;Agertz et al. 2013; Agertz & Kravtsov 2014; Roskar et al.2014). There are exceptions though: Ceverino et al. (2014)and Moody et al. (2014) found direct radiation pressure tomildly suppress star formation, while radiation heating andIR radiation pressure had a negligible effect. Trujillo-Gomezet al. (2015), on the other hand, found radiation heatingdominated over direct radiation pressure in suppressing starformation, while outflows were not affected by the radiation(and IR effects were not considered).
Our results do not show a wide and general agreementwith previous studies of the effects of radiation feedback ongalactic scales, which is not surprising, since there is no gen-eral agreement in the literature. The discrepancies probablylargely come down to resolution. It appears that both RHDand HD simulations that show a substantial effect from IRradiation pressure have either sub-pc resolution or a subgridmodel that boosts the optical depths. We lack sub-pc res-olution in the current paper, and we have so far made noattempt to compensate this with a subgrid model. Of thesetwo options, we prefer in future work to increase the reso-lution, to probe from first principles how radiation feedbackaffects small scales, and how this effect may (or may not)cascade to larger scales. The strongest general disagreementwe can find with other work concerns outflows. Where theyare studied in the literature, radiation feedback appears toboost outflows most of the time, which is in contrast withour simulations. Our experiments with boosted IR radiationopacities hint that increased resolution will still leave us witha lack of radiation-generated outflows, but in the end, thebest way to find out is to actually increase the resolution.
5 CONCLUSIONS AND FUTURE WORK
We ran and analysed adaptive mesh refinement simula-tions of isolated disk galaxies of baryonic masses 3.5 ×
(108, 109, 1010) M� (the largest mass being comparable tothat of the Milky Way), using a maximum resolution of18 pc. We studied the effects or stellar radiation feedback,which was modelled with radiation-hydrodynamics, actingon its own and also combined with (“thermal dump”) su-pernova feedback. We compared the effects of three separateradiation feedback processes: photoionisation heating, directradiation pressure from UV and optical photons, and pres-sure from multi-scattered, reprocessed IR radiation. Theseare the first galaxy-scale simulations which model all theseprocesses concurrently and with RHD. Our main findingsare the following:
• Stellar radiation feedback suppresses star formation inthe simulated galaxies. It does so predominantly by pre-venting the formation of star-forming clumps, rather thanby destroying those that form. The suppression of star for-mation with radiation feedback (ranging from a factor of 4for the low mass galaxy to only ∼ 0.1 for the most massiveone) is similar to that of “thermal dump” SN feedback.
• Radiation feedback does not significantly amplify theefficiency of SN feedback, and in fact there is a hint of theopposite effect in the lowest-mass galaxy we consider, wherethe combination of radiation and SN feedback results in aweaker star formation suppression than one would naivelyexpect from multiplying the individual suppression factors,although the combined effect does exceed that of the indi-vidual feedback processes.
• Radiation feedback has a negligible effect on galaxy out-flows. If anything, the outflow rates are slightly suppressed,owing to the reduced star formation and subsequent decreasein SN activity. The outflow mass loading factor, i.e. the ra-tio between the outflow rate and the star formation rate, istypically of the order of 10−1, which is very low compared tonon-RHD simulations that use subgrid recipes for radiationfeedback (e.g. Hopkins et al. 2012b).
• As with (“thermal dump”) SN feedback, the effect ofradiation feedback on star formation weakens with galaxymass and metallicity. The combined effect of SN and radia-tion feedback is strongest in our intermediate-mass galaxy,which has a baryonic mass of 3.5 × 10⁹M�, i.e. about one-tenth of the mass of our Milky-Way.
• The dominant form of radiation feedback is photoion-isation heating, while the effect of radiation pressure, bothdirect and on dust, is borderline negligible. We are able toexplain the relative efficiencies of the different radiation feed-back processes using simple analytic estimates within thecontext of our numerical models.
• The analytic estimates suggest that the effect of di-rect radiation pressure from ionising radiation on galaxiesis likely negligible in reality. However, multi-scattering ra-diation pressure from IR radiation is not properly capturedin our simulations. This is because our resolution (∼ 10 pc)does not allow the collapse to sufficiently large local densi-ties for the gas to become significantly optically thick to theIR radiation.
• To estimate the qualitative effects of multi-scattering IRradiation that may be revealed by future, higher-resolution,simulations, we ran simulations in which the IR opacitieswere boosted by orders of magnitude over realistic, physi-cally motivated, values. This boost makes multi-scatteringradiation effective at regulating star formation, but in a gen-
c© 0000 RAS, MNRAS 000, 000–000
Galaxies that Shine 23
tle way that merely smooths out the galaxy disk, withoutgenerating outflows.
• Resolution is also an issue for the ionising radiation.With the current method for forming stars, where stellarpopulation particles are instantaneously formed out of thegas in a single AMR cell, Hii regios are unresolved at den-sities nH & 10 cm−3, regardless of the numerical resolution.The consequence of the unresolved Hii regions is likely anunderestimate of the regulating effect of radiation heating onstar formation in dense gas, since the gas cells hosting youngstars are heated to temperatures lower than the ionisationtemperature. Possible ways to deal with this problem in thefuture include stochastic radiation feedback or a modifiedmethod for star formation.
• Although we have not considered this in detail, we findin the resolution tests described in Appendix C that radi-ation feedback is much less sensitive to the stellar particlemass than is (“thermal dump”) SN feedback. This makessense, since the radiation is continuous, while the SNe areinstantaneous, and for explosive feedback the radiative lossesdecrease for higher maximum temperatures.
An important caveat for our study is that our simulatedgalaxies do not have the high surface densities that occur inthe massive, starbursting galaxies that have been the focusof theoretical work which predicts efficient regulation of starformation and outflows by radiation pressure (e.g. Murrayet al. 2011). In the future we will expand our simulations toinclude more massive and gas-rich galaxies, which may bemore sensitive to radiation pressure.
There are many additional interesting paths to follow,such as improvements of our radiation feedback model, theinclusion of other sources of radiation than stars, and anexpansion to both larger and smaller physical scales.
An interesting model improvement is to consider the ef-fect of the local radiation field on metal cooling, which hasbeen suggested by Cantalupo (2010) to effectively quenchcooling and subsequently star formation in galaxies. Anotherimportant model improvement is the inclusion of the forma-tion and radiative dissociation of H2, which is highly rel-evant for studying star formation in detail. AGN feedbackmay be fundamentally radiative in origin, and it is quiteinteresting to see in what ways, if any, RHD experimentswould differ from subgrid recipes. It is relatively straightfor-ward to add AGN radiation to our simulations, as long as arecipe for black hole accretion is in place. Some additionalradiation processes, such as Compton scattering, are likelyimportant, and it is quite likely that it will remain difficultto resolve optically thick regions properly.
We intend to study radiation feedback on scales bothlarger and smaller than the current study. The larger scalesinvolve cosmological zoom RHD simulations, where the ef-fect of radiation feedback can be studied in galaxies thatevolve in their natural environment, and we can study theeffect on galaxy evolution, inflows, outflows, and the observ-able properties of the ISM and CGM. Going to smaller scaleswill allow us to properly resolve optically thick star-formingclouds and how they are affected by stellar radiation.
ACKNOWLEDGEMENTS
For discussions and suggestions contributing to this pa-per, we thank Jeremy Blaizot, Benoit Commercon, YohanDubois, and Alireza Rahmati. This work was fundedby the European Research Council under the EuropeanUnions Seventh Framework Programme (FP7/2007-2013)/ ERC Grant agreement 278594-GasAroundGalaxies, andthe Marie Curie Training Network CosmoComp (PITN-GA-2009-238356). The simulations were in part performedusing the DiRAC Data Centric system at Durham Uni-versity, operated by the Institute for Computational Cos-mology on behalf of the STFC DiRAC HPC Facility(www.dirac.ac.uk). This equipment was funded by BIS Na-tional E-infrastructure capital grant ST/K00042X/1, STFCcapital grant ST/H008519/1, and STFC DiRAC Operationsgrant ST/K003267/1 and Durham University. DiRAC ispart of the National E-Infrastructure. Computer resourcesfor this project have also been provided by the Gauss Centrefor Supercomputing/Leibniz Supercomputing Centre undergrant:pr83le. We further acknowledge PRACE for awardingus access to resource Supermuc based in Germany at LRZGarching (proposal number 2013091919).
REFERENCES
Agertz O., Kravtsov A. V., 2014, arXiv, 2613Agertz O., Kravtsov A. V., Leitner S. N., Gnedin N. Y.,2013, ApJ, 770, 25
Aumer M., White S. D. M., Naab T., Scannapieco C., 2013,MNRAS, 434, 3142
Binney J., 1977, Astrophysical Journal, 215, 483Booth C. M., Schaye J., 2009, MNRAS, 398, 53Bower R. G., Benson A. J., Malbon R., Helly J. C., FrenkC. S., Baugh C. M., Cole S., Lacey C. G., 2006, MNRAS,370, 645
Brook C. B., Stinson G., Gibson B. K., Wadsley J., QuinnT., 2012, MNRAS, 424, 1275
Bruzual G., Charlot S., 2003, MNRAS, 344, 1000Cantalupo S., 2010, MNRAS, 403, L16Ceverino D., Klypin A., Klimek E. S., Trujillo-Gomez S.,Churchill C. W., Primack J., Dekel A., 2014, MNRAS,442, 1545
Chabrier G., 2003, The Publications of the AstronomicalSociety of the Pacific, 115, 763
Creasey P., Theuns T., Bower R. G., 2013, MNRAS, 429,1922
Creasey P., Theuns T., Bower R. G., Lacey C. G., 2011,MNRAS, 415, 3706
Dalla Vecchia C., Schaye J., 2012, MNRAS, 426, 140Di Matteo T., Springel V., Hernquist L., 2005, Nature, 433,604
Dubois Y., Devriendt J., Slyz A., Teyssier R., 2010, MN-RAS, 409, 985
Ferland G. J., Korista K. T., Verner D. A., Ferguson J. W.,Kingdon J. B., Verner E. M., 1998, The Publications ofthe Astronomical Society of the Pacific, 110, 761
Ferland G. J., Peterson B. M., Horne K., Welsh W. F.,Nahar S. N., 1992, Astrophysical Journal, 387, 95
Geen S., Rosdahl J., Blaizot J., Devriendt J., Slyz A., 2014,arXiv
c© 0000 RAS, MNRAS 000, 000–000
24 Rosdahl, Schaye, Teyssier & Agertz
Gnedin N. Y., Abel T., 2001, New Astronomy, 6, 437Haardt F., Madau P., 1996, Astrophysical Journal v.461,461, 20
Hasegawa K., Semelin B., 2013, MNRAS, 428, 154Hopkins P. F., Keres D., Murray N., Quataert E., HernquistL., 2012a, MNRAS, 427, 968
Hopkins P. F., Keres D., Onorbe J., Faucher-Giguere C.-A., Quataert E., Murray N., Bullock J. S., 2014, MNRAS,445, 581
Hopkins P. F., Quataert E., Murray N., 2011, MNRAS,417, 950
Hopkins P. F., Quataert E., Murray N., 2012b, MNRAS,421, 3522
Hopkins P. F., Quataert E., Murray N., 2012c, MNRAS,421, 3488
Kannan R., Stinson G. S., Maccio A. V., Brook C., Wein-mann S. M., Wadsley J., Couchman H. M. P., 2014a, MN-RAS, 437, 3529
Kannan R. et al., 2014b, MNRAS, 437, 2882Katz N., 1992, Astrophysical Journal, 391, 502Kim J.-h. et al., 2013a, arXivKim J.-h., Krumholz M. R., Wise J. H., Turk M. J., Gold-baum N. J., Abel T., 2013b, ApJ, 779, 8
Li A., Draine B. T., 2001, Astrophys. J., 554, 778Moody C. E., Guo Y., Mandelker N., Ceverino D., MozenaM., Koo D. C., Dekel A., Primack J., 2014, MNRAS, 444,1389
Moster B. P., Naab T., White S. D. M., 2013, MNRAS,428, 3121
Murray N., Menard B., Thompson T. A., 2011, ApJ, 735,66
Murray N., Quataert E., Thompson T. A., 2005, ApJ, 618,569
Murray N., Quataert E., Thompson T. A., 2010, ApJ, 709,191
Navarro J. F., Frenk C. S., White S. D. M., 1997, Astro-physical Journal v.490, 490, 493
Navarro J. F., White S. D. M., 1993, MNRAS, 265, 271Oppenheimer B. D., Dave R., 2006, MNRAS, 373, 1265Pawlik A. H., Milosavljevic M., Bromm V., 2013, ApJ, 767,59
Pawlik A. H., Schaye J., 2008, MNRAS, 389, 651Pawlik A. H., Schaye J., 2009, MNRAS, 396, L46Pawlik A. H., Schaye J., Dalla Vecchia C., 2015, arXiv,1980
Peebles P. J. E., Yu J. T., 1970, Astrophysical Journal, 162,815
Petkova M., Springel V., 2011, MNRAS, 412, 935Rasera Y., Teyssier R., 2006, A&A, 445, 1Rees M. J., Ostriker J. P., 1977, MNRAS, 179, 541Renaud F. et al., 2013, MNRAS, 436, 1836Rosdahl J., Blaizot J., Aubert D., Stranex T., Teyssier R.,2013, MNRAS, 436, 2188
Rosdahl J., Teyssier R., 2014, arXivRoskar R., Teyssier R., Agertz O., Wetzstein M., MooreB., 2014, MNRAS, 444, 2837
Scannapieco C. et al., 2012, MNRAS, 423, 1726Schaye J. et al., 2014, arXiv, 7040Semenov D., Henning T., Helling C., Ilgner M., SedlmayrE., 2003, A&A, 410, 611
Silk J., 1977, Astrophysical Journal, 211, 638Springel V., Di Matteo T., Hernquist L., 2005, MNRAS,
361, 776Stinson G. S., Brook C., Maccio A. V., Wadsley J., QuinnT. R., Couchman H. M. P., 2013, MNRAS, 428, 129
Stromgren B., 1939, ApJ, 89, 526Teyssier R., 2002, A&A, 385, 337Thompson T. A., Quataert E., Murray N., 2005, ApJ, 630,167
Truelove J. K., Klein R. I., McKee C. F., Holliman J. H.,Howell L. H., Greenough J. A., 1997, ApJ, 489, L179
Trujillo-Gomez S., Klypin A., Colın P., Ceverino D., ArrakiK. S., Primack J., 2015, MNRAS, 446, 1140
Verner D. A., Ferland G. J., Korista K. T., Yakovlev D. G.,1996, Astrophysical Journal v.465, 465, 487
White S. D. M., Rees M. J., 1978, MNRAS, 183, 341Wise J. H., Abel T., 2011, MNRAS, 414, 3458Wise J. H., Abel T., Turk M. J., Norman M. L., SmithB. D., 2012a, MNRAS, 427, 311
Wise J. H., Demchenko V. G., Halicek M. T., NormanM. L., Turk M. J., Abel T., Smith B. D., 2014, MNRAS,442, 2560
Wise J. H., Turk M. J., Norman M. L., Abel T., 2012b,ApJ, 745, 50
Zel’dovich Y. B., 1970, A&A, 5, 84
APPENDIX A: STELLAR LUMINOSITIES ANDPHOTON PROPERTIES
The emission from each stellar particle is calculated on thefly for every fine timestep and injected into the host cell,adding to the radiation energy density of all photon groups.For the specific stellar luminosity (i.e. luminosity per unitmass) and photon group properties, we use the spectralemission distribution (SED) models of Bruzual & Charlot(2003), where we assume a Chabrier (2003) IMF. The de-pendence of the specific luminosities and radiation groupproperties on the stellar population’s age and metallicityare shown in Fig. A1. Each photon group’s properties (i.e.average energy and cross section) are updated every 5 coarsetimesteps, using luminosity-weighted averages of the exist-ing stellar particles’ emission in the corresponding bands us-ing the frequency dependent ionisation cross sections fromVerner et al. (1996) (see also the appendix of R13). This up-date of the photon groups and the stellar emission is doneas detailed in the appendix of R13, except that the specificluminosity is now in terms of emitted energy whereas it wasdone in terms of photon number count in R13 (which makesmore sense in pure ionisation calculations). The stellar emis-sion is thus energy-conserving, whereas it was photon num-ber conserving in R137.
7 This difference arises because the spectral shape of an individ-
ual stellar particle is not identical to the “average” shape which isassumed for our photon groups. Due to this difference, one mustchoose whether the emission is accurate in terms of photon count
or energy, and we have chosen energy.
c© 0000 RAS, MNRAS 000, 000–000
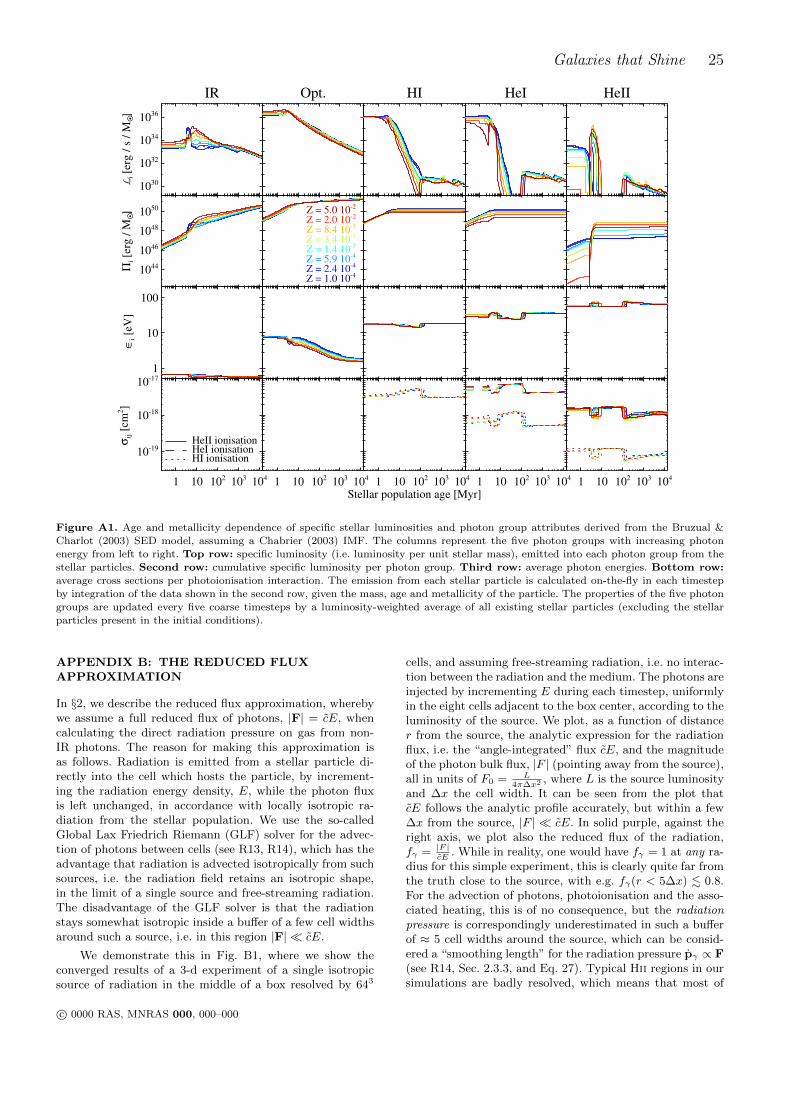
Galaxies that Shine 25
IR
1030
1032
1034
1036
Li [
erg /
s /
MO •]
Opt. HI HeI HeII
1044
1046
1048
1050
Πi [
erg /
MO •]
Z = 1.0 10-4Z = 2.4 10-4Z = 5.9 10-4Z = 1.4 10-3Z = 3.4 10-3Z = 8.4 10-3Z = 2.0 10-2Z = 5.0 10-2
1
10
100
∈i [
eV]
1 10 102 103 104
10-19
10-18
10-17
σij [
cm2]
HI ionisationHeI ionisationHeII ionisation
1 10 102 103 104 1 10 102 103 104
Stellar population age [Myr]1 10 102 103 104 1 10 102 103 104
Figure A1. Age and metallicity dependence of specific stellar luminosities and photon group attributes derived from the Bruzual &Charlot (2003) SED model, assuming a Chabrier (2003) IMF. The columns represent the five photon groups with increasing photon
energy from left to right. Top row: specific luminosity (i.e. luminosity per unit stellar mass), emitted into each photon group from thestellar particles. Second row: cumulative specific luminosity per photon group. Third row: average photon energies. Bottom row:
average cross sections per photoionisation interaction. The emission from each stellar particle is calculated on-the-fly in each timestep
by integration of the data shown in the second row, given the mass, age and metallicity of the particle. The properties of the five photongroups are updated every five coarse timesteps by a luminosity-weighted average of all existing stellar particles (excluding the stellar
particles present in the initial conditions).
APPENDIX B: THE REDUCED FLUXAPPROXIMATION
In §2, we describe the reduced flux approximation, wherebywe assume a full reduced flux of photons, |F| = cE, whencalculating the direct radiation pressure on gas from non-IR photons. The reason for making this approximation isas follows. Radiation is emitted from a stellar particle di-rectly into the cell which hosts the particle, by increment-ing the radiation energy density, E, while the photon fluxis left unchanged, in accordance with locally isotropic ra-diation from the stellar population. We use the so-calledGlobal Lax Friedrich Riemann (GLF) solver for the advec-tion of photons between cells (see R13, R14), which has theadvantage that radiation is advected isotropically from suchsources, i.e. the radiation field retains an isotropic shape,in the limit of a single source and free-streaming radiation.The disadvantage of the GLF solver is that the radiationstays somewhat isotropic inside a buffer of a few cell widthsaround such a source, i.e. in this region |F| � cE.
We demonstrate this in Fig. B1, where we show theconverged results of a 3-d experiment of a single isotropicsource of radiation in the middle of a box resolved by 643
cells, and assuming free-streaming radiation, i.e. no interac-tion between the radiation and the medium. The photons areinjected by incrementing E during each timestep, uniformlyin the eight cells adjacent to the box center, according to theluminosity of the source. We plot, as a function of distancer from the source, the analytic expression for the radiationflux, i.e. the “angle-integrated” flux cE, and the magnitudeof the photon bulk flux, |F | (pointing away from the source),all in units of F0 = L
4π∆x2, where L is the source luminosity
and ∆x the cell width. It can be seen from the plot thatcE follows the analytic profile accurately, but within a few∆x from the source, |F | � cE. In solid purple, against theright axis, we plot also the reduced flux of the radiation,fγ = |F |
cE. While in reality, one would have fγ = 1 at any ra-
dius for this simple experiment, this is clearly quite far fromthe truth close to the source, with e.g. fγ(r < 5∆x) . 0.8.For the advection of photons, photoionisation and the asso-ciated heating, this is of no consequence, but the radiationpressure is correspondingly underestimated in such a bufferof ≈ 5 cell widths around the source, which can be consid-ered a “smoothing length” for the radiation pressure pγ ∝ F(see R14, Sec. 2.3.3, and Eq. 27). Typical Hii regions in oursimulations are badly resolved, which means that most of
c© 0000 RAS, MNRAS 000, 000–000
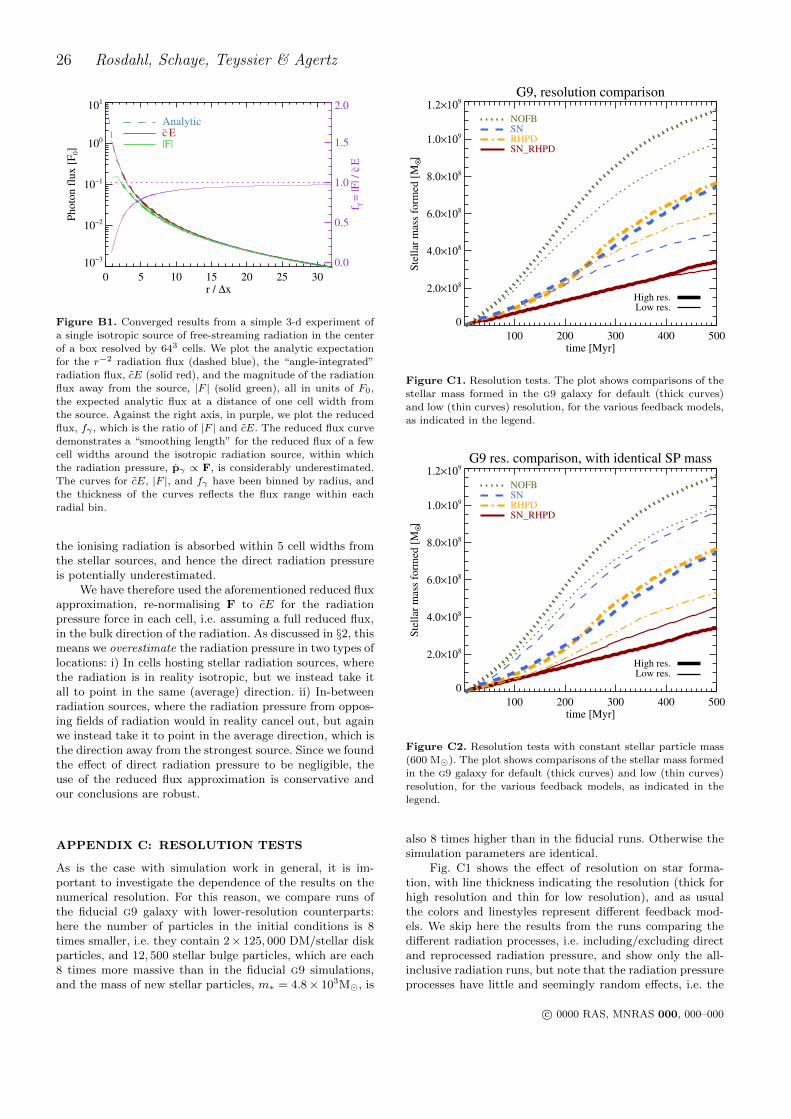
26 Rosdahl, Schaye, Teyssier & Agertz
0 5 10 15 20 25 30
10−3
10−2
10−1
100
101
0 5 10 15 20 25 30r / ∆x
10−3
10−2
10−1
100
101
Ph
oto
n f
lux
[F
0]
0.0
0.5
1.0
1.5
2.0
f γ =
|F| /
c~ E
Analyticc~ E|F|
Figure B1. Converged results from a simple 3-d experiment ofa single isotropic source of free-streaming radiation in the center
of a box resolved by 643 cells. We plot the analytic expectation
for the r−2 radiation flux (dashed blue), the “angle-integrated”radiation flux, cE (solid red), and the magnitude of the radiation
flux away from the source, |F | (solid green), all in units of F0,
the expected analytic flux at a distance of one cell width fromthe source. Against the right axis, in purple, we plot the reduced
flux, fγ , which is the ratio of |F | and cE. The reduced flux curve
demonstrates a “smoothing length” for the reduced flux of a fewcell widths around the isotropic radiation source, within which
the radiation pressure, pγ ∝ F, is considerably underestimated.The curves for cE, |F |, and fγ have been binned by radius, and
the thickness of the curves reflects the flux range within each
radial bin.
the ionising radiation is absorbed within 5 cell widths fromthe stellar sources, and hence the direct radiation pressureis potentially underestimated.
We have therefore used the aforementioned reduced fluxapproximation, re-normalising F to cE for the radiationpressure force in each cell, i.e. assuming a full reduced flux,in the bulk direction of the radiation. As discussed in §2, thismeans we overestimate the radiation pressure in two types oflocations: i) In cells hosting stellar radiation sources, wherethe radiation is in reality isotropic, but we instead take itall to point in the same (average) direction. ii) In-betweenradiation sources, where the radiation pressure from oppos-ing fields of radiation would in reality cancel out, but againwe instead take it to point in the average direction, which isthe direction away from the strongest source. Since we foundthe effect of direct radiation pressure to be negligible, theuse of the reduced flux approximation is conservative andour conclusions are robust.
APPENDIX C: RESOLUTION TESTS
As is the case with simulation work in general, it is im-portant to investigate the dependence of the results on thenumerical resolution. For this reason, we compare runs ofthe fiducial g9 galaxy with lower-resolution counterparts:here the number of particles in the initial conditions is 8times smaller, i.e. they contain 2× 125, 000 DM/stellar diskparticles, and 12, 500 stellar bulge particles, which are each8 times more massive than in the fiducial g9 simulations,and the mass of new stellar particles, m∗ = 4.8× 10³M�, is
G9, resolution comparison
100 200 300 400 500time [Myr]
0
2.0×10⁸
4.0×10⁸
6.0×10⁸
8.0×10⁸
1.0×10⁹
1.2×10⁹
Ste
llar
mas
s fo
rmed
[M
O •]
NOFBSNRHPDSN_RHPD
Low res.High res.
Figure C1. Resolution tests. The plot shows comparisons of the
stellar mass formed in the g9 galaxy for default (thick curves)
and low (thin curves) resolution, for the various feedback models,as indicated in the legend.
G9 res. comparison, with identical SP mass
100 200 300 400 500time [Myr]
0
2.0×10⁸
4.0×10⁸
6.0×10⁸
8.0×10⁸
1.0×10⁹
1.2×10⁹
Ste
llar
mas
s fo
rmed
[M
O •]
NOFBSNRHPDSN_RHPD
Low res.High res.
Figure C2. Resolution tests with constant stellar particle mass
(600 M�). The plot shows comparisons of the stellar mass formedin the g9 galaxy for default (thick curves) and low (thin curves)resolution, for the various feedback models, as indicated in the
legend.
also 8 times higher than in the fiducial runs. Otherwise thesimulation parameters are identical.
Fig. C1 shows the effect of resolution on star forma-tion, with line thickness indicating the resolution (thick forhigh resolution and thin for low resolution), and as usualthe colors and linestyles represent different feedback mod-els. We skip here the results from the runs comparing thedifferent radiation processes, i.e. including/excluding directand reprocessed radiation pressure, and show only the all-inclusive radiation runs, but note that the radiation pressureprocesses have little and seemingly random effects, i.e. the
c© 0000 RAS, MNRAS 000, 000–000
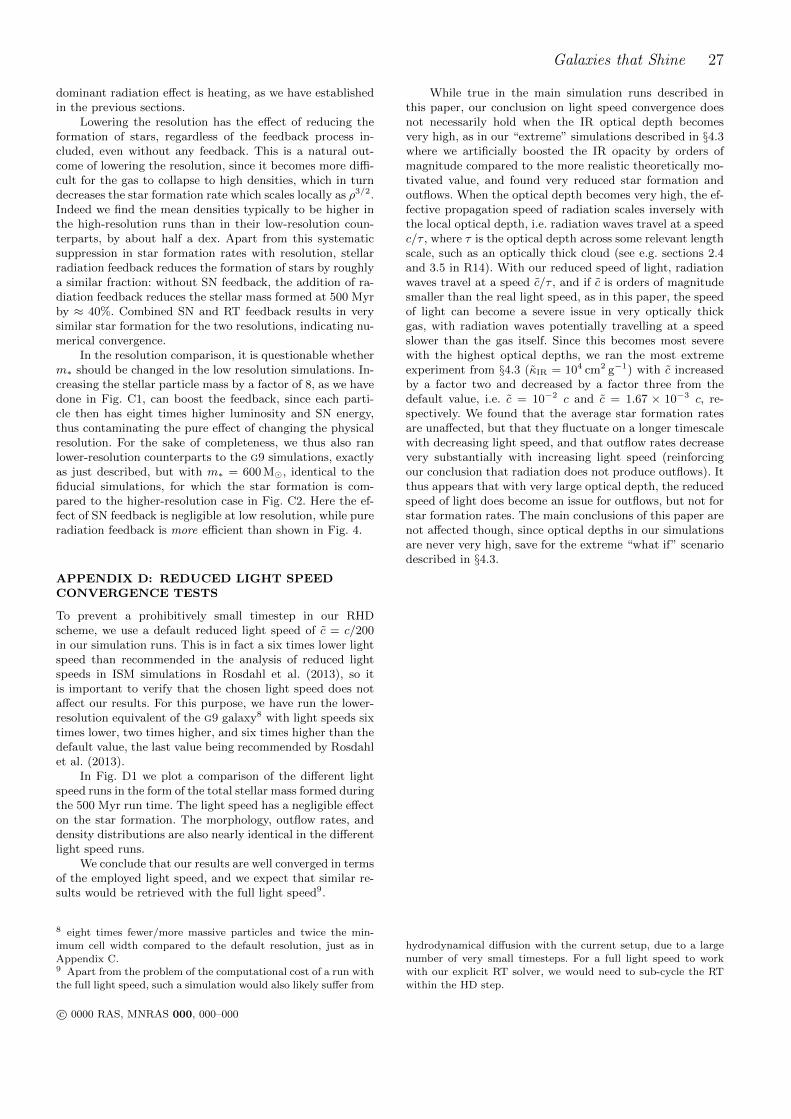
Galaxies that Shine 27
dominant radiation effect is heating, as we have establishedin the previous sections.
Lowering the resolution has the effect of reducing theformation of stars, regardless of the feedback process in-cluded, even without any feedback. This is a natural out-come of lowering the resolution, since it becomes more diffi-cult for the gas to collapse to high densities, which in turndecreases the star formation rate which scales locally as ρ3/2.Indeed we find the mean densities typically to be higher inthe high-resolution runs than in their low-resolution coun-terparts, by about half a dex. Apart from this systematicsuppression in star formation rates with resolution, stellarradiation feedback reduces the formation of stars by roughlya similar fraction: without SN feedback, the addition of ra-diation feedback reduces the stellar mass formed at 500 Myrby ≈ 40%. Combined SN and RT feedback results in verysimilar star formation for the two resolutions, indicating nu-merical convergence.
In the resolution comparison, it is questionable whetherm∗ should be changed in the low resolution simulations. In-creasing the stellar particle mass by a factor of 8, as we havedone in Fig. C1, can boost the feedback, since each parti-cle then has eight times higher luminosity and SN energy,thus contaminating the pure effect of changing the physicalresolution. For the sake of completeness, we thus also ranlower-resolution counterparts to the g9 simulations, exactlyas just described, but with m∗ = 600 M�, identical to thefiducial simulations, for which the star formation is com-pared to the higher-resolution case in Fig. C2. Here the ef-fect of SN feedback is negligible at low resolution, while pureradiation feedback is more efficient than shown in Fig. 4.
APPENDIX D: REDUCED LIGHT SPEEDCONVERGENCE TESTS
To prevent a prohibitively small timestep in our RHDscheme, we use a default reduced light speed of c = c/200in our simulation runs. This is in fact a six times lower lightspeed than recommended in the analysis of reduced lightspeeds in ISM simulations in Rosdahl et al. (2013), so itis important to verify that the chosen light speed does notaffect our results. For this purpose, we have run the lower-resolution equivalent of the g9 galaxy8 with light speeds sixtimes lower, two times higher, and six times higher than thedefault value, the last value being recommended by Rosdahlet al. (2013).
In Fig. D1 we plot a comparison of the different lightspeed runs in the form of the total stellar mass formed duringthe 500 Myr run time. The light speed has a negligible effecton the star formation. The morphology, outflow rates, anddensity distributions are also nearly identical in the differentlight speed runs.
We conclude that our results are well converged in termsof the employed light speed, and we expect that similar re-sults would be retrieved with the full light speed9.
8 eight times fewer/more massive particles and twice the min-
imum cell width compared to the default resolution, just as inAppendix C.9 Apart from the problem of the computational cost of a run withthe full light speed, such a simulation would also likely suffer from
While true in the main simulation runs described inthis paper, our conclusion on light speed convergence doesnot necessarily hold when the IR optical depth becomesvery high, as in our “extreme” simulations described in §4.3where we artificially boosted the IR opacity by orders ofmagnitude compared to the more realistic theoretically mo-tivated value, and found very reduced star formation andoutflows. When the optical depth becomes very high, the ef-fective propagation speed of radiation scales inversely withthe local optical depth, i.e. radiation waves travel at a speedc/τ , where τ is the optical depth across some relevant lengthscale, such as an optically thick cloud (see e.g. sections 2.4and 3.5 in R14). With our reduced speed of light, radiationwaves travel at a speed c/τ , and if c is orders of magnitudesmaller than the real light speed, as in this paper, the speedof light can become a severe issue in very optically thickgas, with radiation waves potentially travelling at a speedslower than the gas itself. Since this becomes most severewith the highest optical depths, we ran the most extremeexperiment from §4.3 (κIR = 104 cm2 g−1) with c increasedby a factor two and decreased by a factor three from thedefault value, i.e. c = 10−2 c and c = 1.67 × 10⁻³ c, re-spectively. We found that the average star formation ratesare unaffected, but that they fluctuate on a longer timescalewith decreasing light speed, and that outflow rates decreasevery substantially with increasing light speed (reinforcingour conclusion that radiation does not produce outflows). Itthus appears that with very large optical depth, the reducedspeed of light does become an issue for outflows, but not forstar formation rates. The main conclusions of this paper arenot affected though, since optical depths in our simulationsare never very high, save for the extreme “what if” scenariodescribed in §4.3.
hydrodynamical diffusion with the current setup, due to a largenumber of very small timesteps. For a full light speed to work
with our explicit RT solver, we would need to sub-cycle the RTwithin the HD step.
c© 0000 RAS, MNRAS 000, 000–000
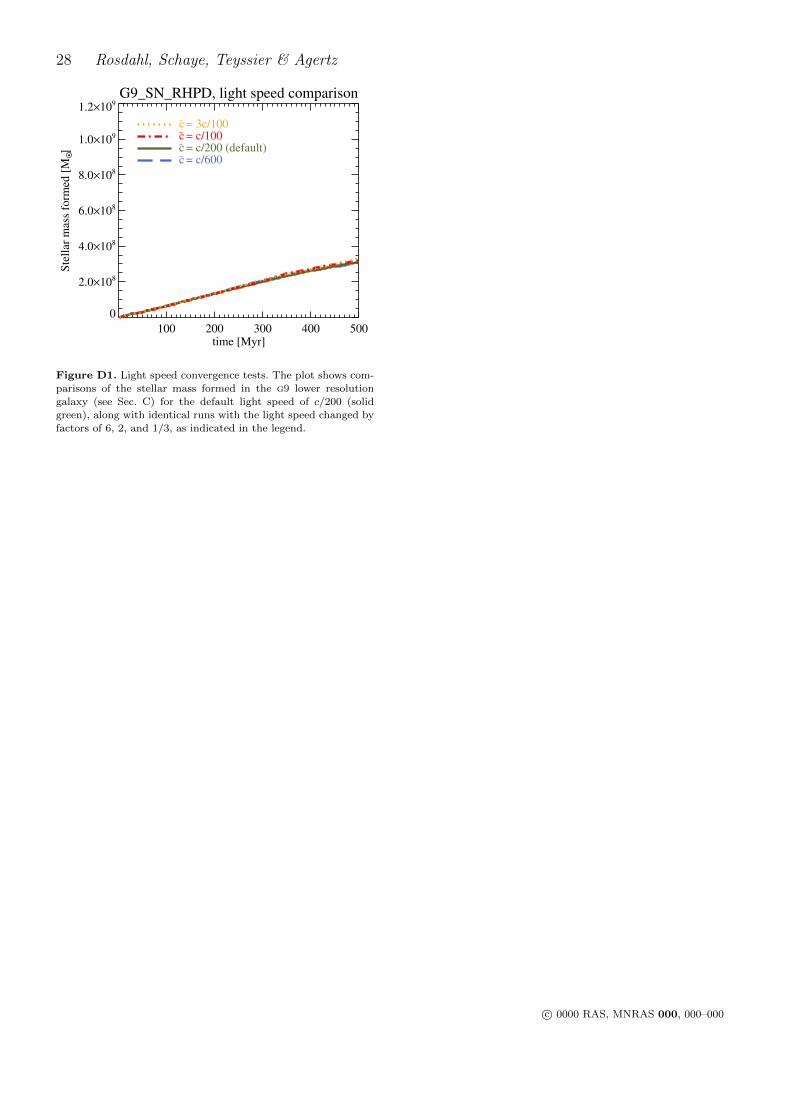
28 Rosdahl, Schaye, Teyssier & Agertz
G9_SN_RHPD, light speed comparison
100 200 300 400 500time [Myr]
0
2.0×10⁸
4.0×10⁸
6.0×10⁸
8.0×10⁸
1.0×10⁹
1.2×10⁹
Ste
llar
mas
s fo
rmed
[M
O •]
c~ = 3c/100c~ = c/100c~ = c/200 (default)c~ = c/600
Figure D1. Light speed convergence tests. The plot shows com-parisons of the stellar mass formed in the g9 lower resolution
galaxy (see Sec. C) for the default light speed of c/200 (solid
green), along with identical runs with the light speed changed byfactors of 6, 2, and 1/3, as indicated in the legend.
c© 0000 RAS, MNRAS 000, 000–000