gabor scalogram for robust whale song representation
TRANSCRIPT
8.4 Gabor Scalogram
for Robust Whale Song Representation
Randall Balestriero Hervé Glotin
Université de Toulon Inst. Universitaire de Franceav de l'Université Bt St Michel Paris
La Garde, France & Université de [email protected] [email protected] (correspond. author)
1 Introduction
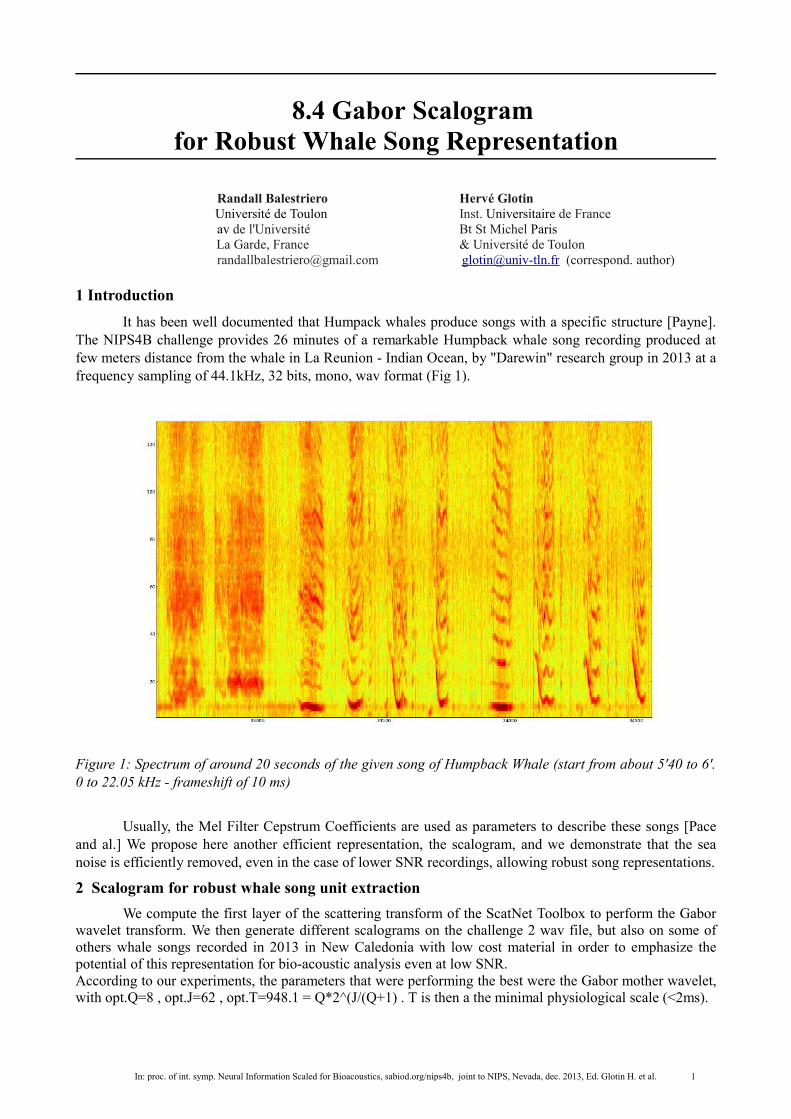
It has been well documented that Humpack whales produce songs with a specific structure [Payne]. The NIPS4B challenge provides 26 minutes of a remarkable Humpback whale song recording produced at few meters distance from the whale in La Reunion - Indian Ocean, by "Darewin" research group in 2013 at a frequency sampling of 44.1kHz, 32 bits, mono, wav format (Fig 1).
Figure 1: Spectrum of around 20 seconds of the given song of Humpback Whale (start from about 5'40 to 6'. 0 to 22.05 kHz - frameshift of 10 ms)
Usually, the Mel Filter Cepstrum Coefficients are used as parameters to describe these songs [Pace and al.] We propose here another efficient representation, the scalogram, and we demonstrate that the sea noise is efficiently removed, even in the case of lower SNR recordings, allowing robust song representations.
2 Scalogram for robust whale song unit extraction
We compute the first layer of the scattering transform of the ScatNet Toolbox to perform the Gabor wavelet transform. We then generate different scalograms on the challenge 2 wav file, but also on some of others whale songs recorded in 2013 in New Caledonia with low cost material in order to emphasize the potential of this representation for bio-acoustic analysis even at low SNR.According to our experiments, the parameters that were performing the best were the Gabor mother wavelet, with opt.Q=8 , opt.J=62 , opt.T=948.1 = Q*2^(J/(Q+1) . T is then a the minimal physiological scale (<2ms).
In: proc. of int. symp. Neural Information Scaled for Bioacoustics, sabiod.org/nips4b, joint to NIPS, Nevada, dec. 2013, Ed. Glotin H. et al. 1
Then the first layer appears to loose few units which are also missing in the other scattering layers, however it has a strong energy coefficient. However some specific patterns appear and could possibly be used to describe and identify the singer. For example, the chirps have a specific length and slope as shown with some examples extracted from 4 different samples recordings in the next sections (the original figure are at : http://sabiod.univ-tln.fr/pimc/rapport/ ).
We give the scalogram and spectrogram of around 2 minutes on each signals. For all the scalogram none additionnal non-linear transformation has been applied. This comparison emphasizes the strength of the scattering decomposition conpared to the spectrogram containing the sea noises.
We illustrate this with different occurrences of some specific patterns, computed on window lasting 2^16 samples which is the maximum window length we can use in ScatNet toolkit.
3 Challenge results
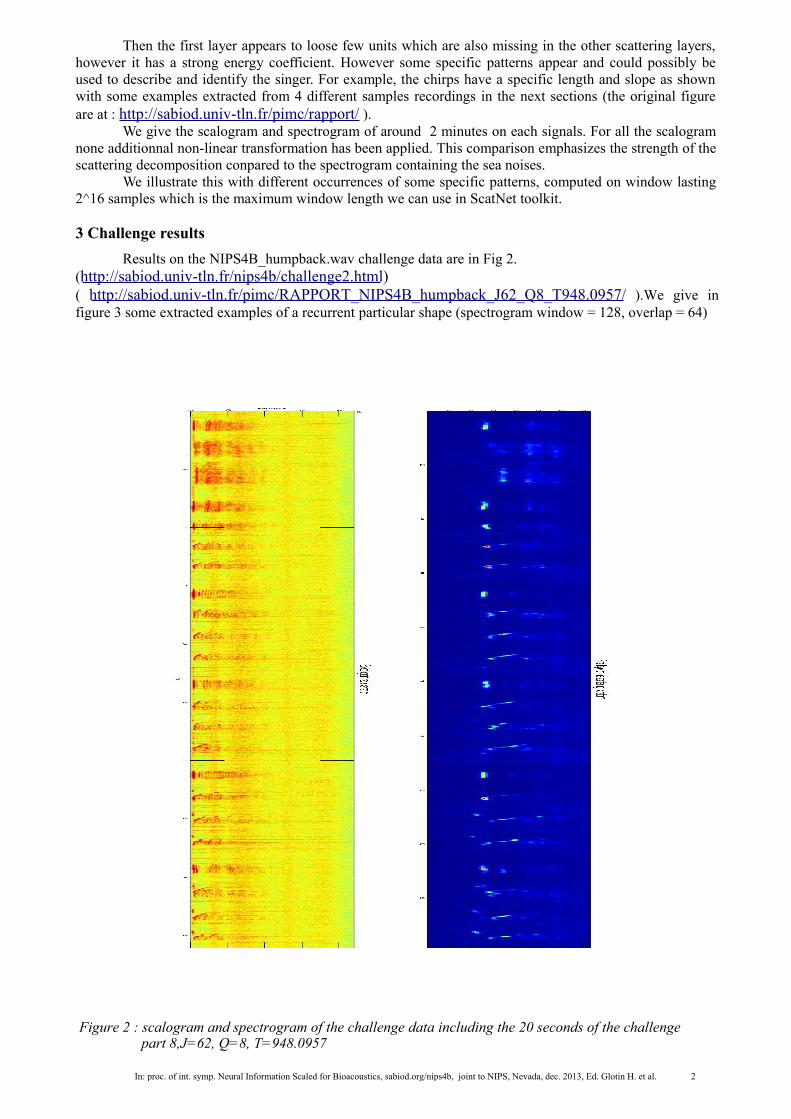
Results on the NIPS4B_humpback.wav challenge data are in Fig 2.(http://sabiod.univ-tln.fr/nips4b/challenge2.html) ( http://sabiod.univ-tln.fr/pimc/RAPPORT_NIPS4B_humpback_J62_Q8_T948.0957/ ).We give in figure 3 some extracted examples of a recurrent particular shape (spectrogram window = 128, overlap = 64)
Figure 2 : scalogram and spectrogram of the challenge data including the 20 seconds of the challengepart 8,J=62, Q=8, T=948.0957
In: proc. of int. symp. Neural Information Scaled for Bioacoustics, sabiod.org/nips4b, joint to NIPS, Nevada, dec. 2013, Ed. Glotin H. et al. 2
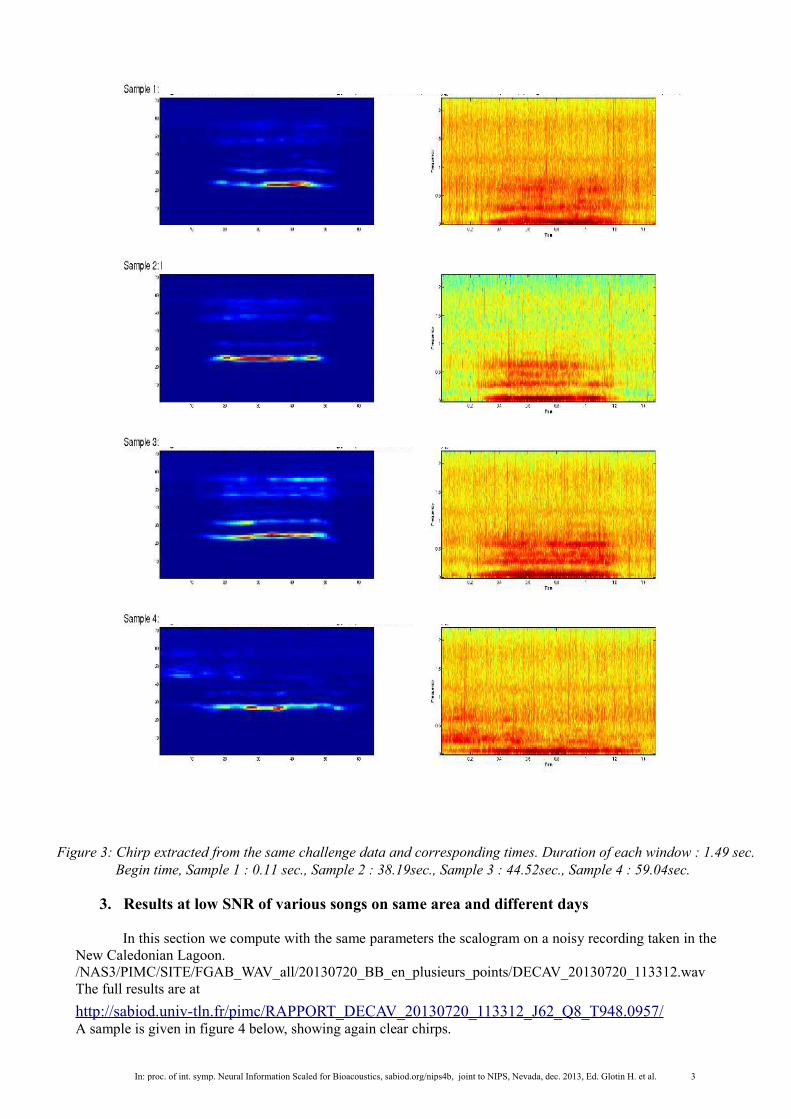
Figure 3: Chirp extracted from the same challenge data and corresponding times. Duration of each window : 1.49 sec. Begin time, Sample 1 : 0.11 sec., Sample 2 : 38.19sec., Sample 3 : 44.52sec., Sample 4 : 59.04sec.
3. Results at low SNR of various songs on same area and different days
In this section we compute with the same parameters the scalogram on a noisy recording taken in theNew Caledonian Lagoon. /NAS3/PIMC/SITE/FGAB_WAV_all/20130720_BB_en_plusieurs_points/DECAV_20130720_113312.wav The full results are at http://sabiod.univ-tln.fr/pimc/RAPPORT_DECAV_20130720_113312_J62_Q8_T948.0957/A sample is given in figure 4 below, showing again clear chirps.
In: proc. of int. symp. Neural Information Scaled for Bioacoustics, sabiod.org/nips4b, joint to NIPS, Nevada, dec. 2013, Ed. Glotin H. et al. 3
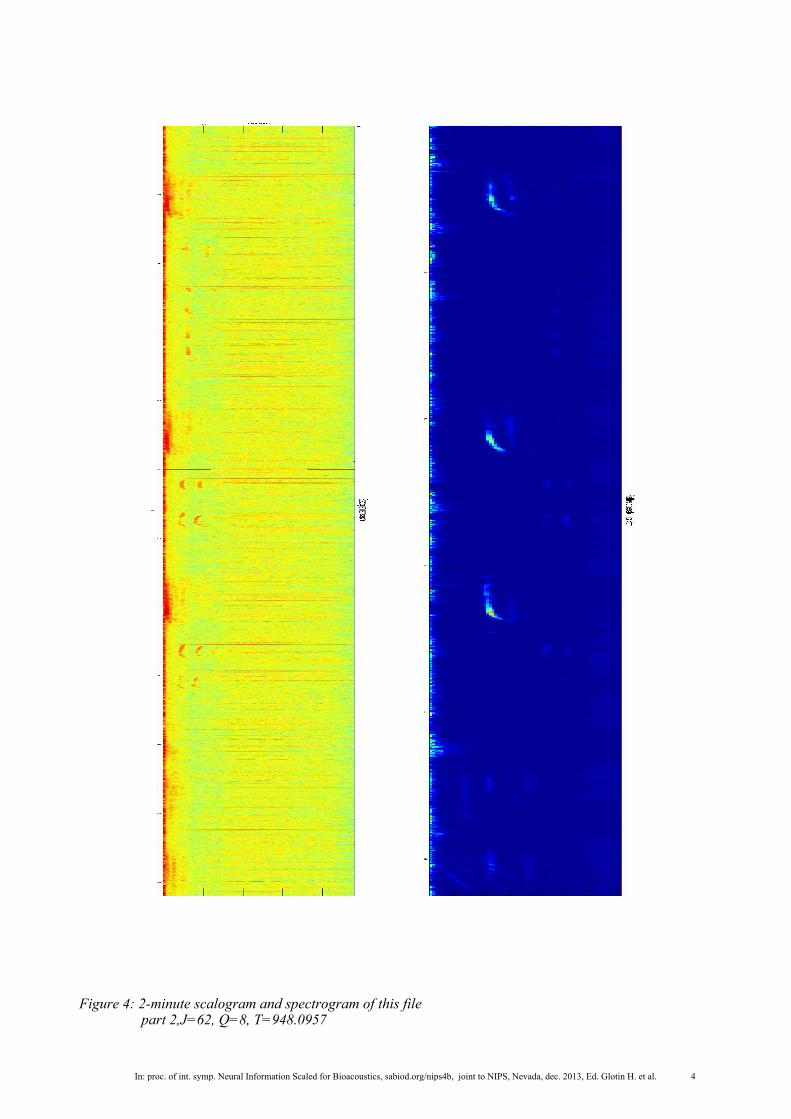
Figure 4: 2-minute scalogram and spectrogram of this filepart 2,J=62, Q=8, T=948.0957
In: proc. of int. symp. Neural Information Scaled for Bioacoustics, sabiod.org/nips4b, joint to NIPS, Nevada, dec. 2013, Ed. Glotin H. et al. 4
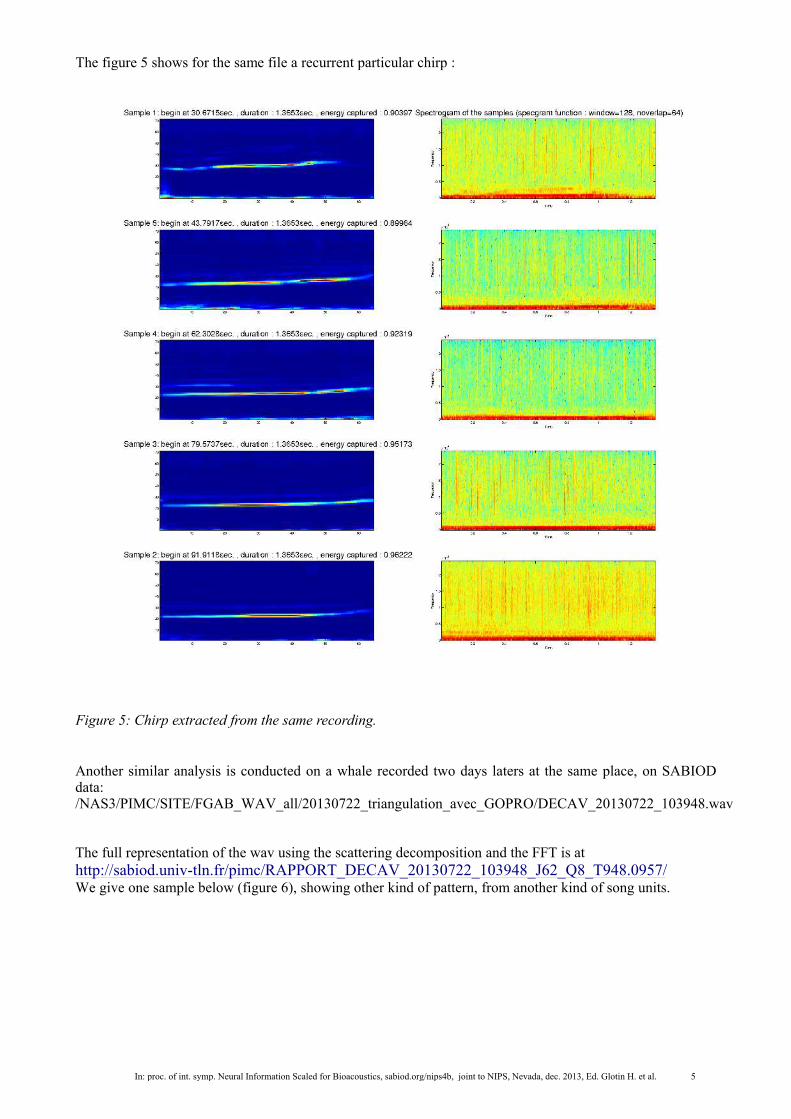
The figure 5 shows for the same file a recurrent particular chirp :
Figure 5: Chirp extracted from the same recording.
Another similar analysis is conducted on a whale recorded two days laters at the same place, on SABIOD data:/NAS3/PIMC/SITE/FGAB_WAV_all/20130722_triangulation_avec_GOPRO/DECAV_20130722_103948.wav
The full representation of the wav using the scattering decomposition and the FFT is at http://sabiod.univ-tln.fr/pimc/RAPPORT_DECAV_20130722_103948_J62_Q8_T948.0957/We give one sample below (figure 6), showing other kind of pattern, from another kind of song units.
In: proc. of int. symp. Neural Information Scaled for Bioacoustics, sabiod.org/nips4b, joint to NIPS, Nevada, dec. 2013, Ed. Glotin H. et al. 5
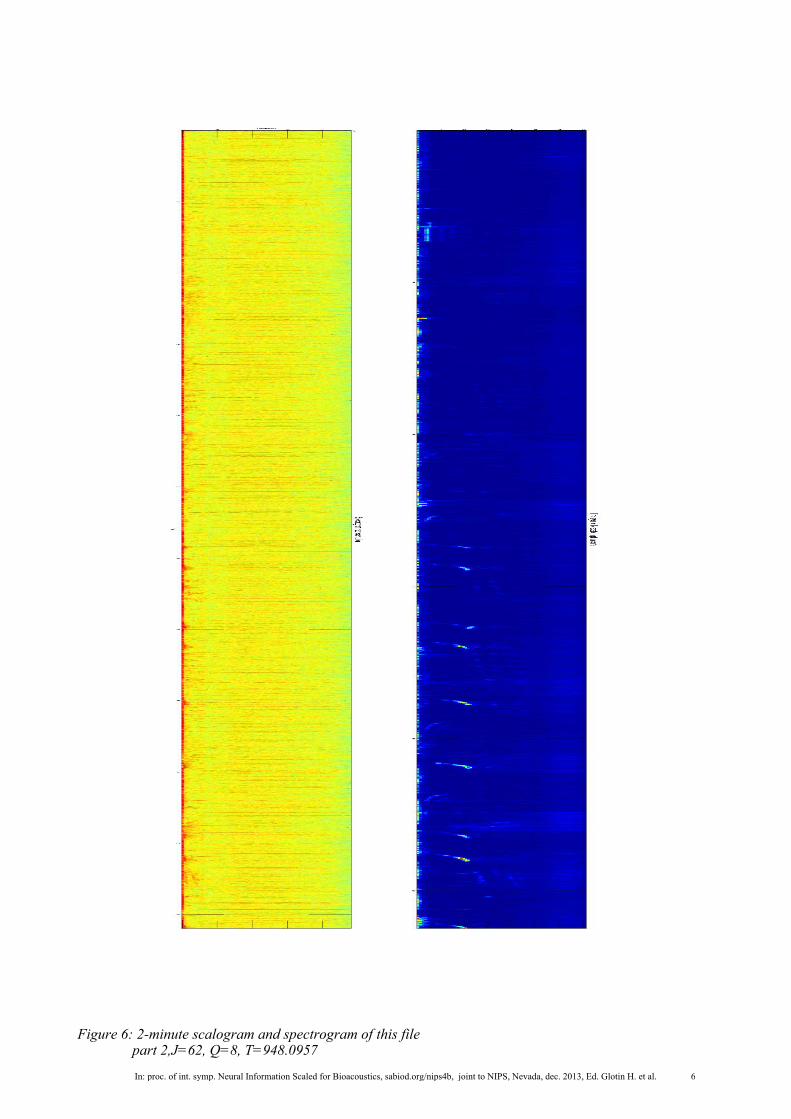
Figure 6: 2-minute scalogram and spectrogram of this file part 2,J=62, Q=8, T=948.0957
In: proc. of int. symp. Neural Information Scaled for Bioacoustics, sabiod.org/nips4b, joint to NIPS, Nevada, dec. 2013, Ed. Glotin H. et al. 6
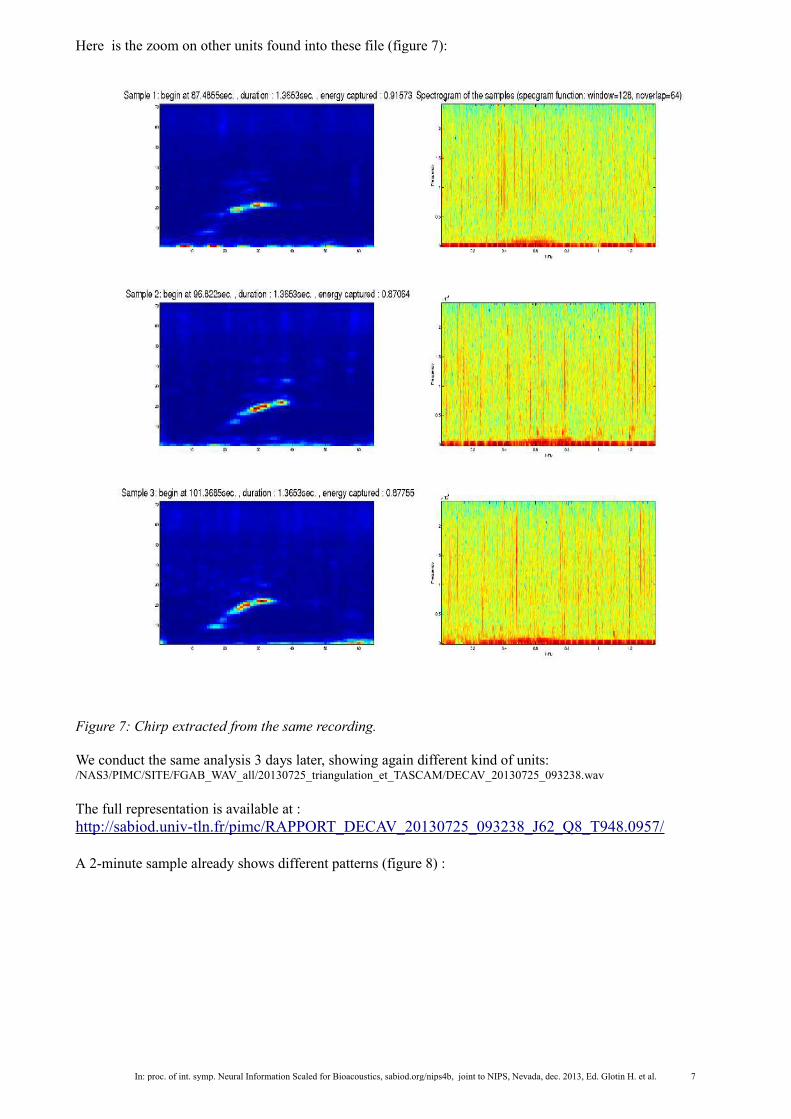
Here is the zoom on other units found into these file (figure 7):
Figure 7: Chirp extracted from the same recording.
We conduct the same analysis 3 days later, showing again different kind of units:/NAS3/PIMC/SITE/FGAB_WAV_all/20130725_triangulation_et_TASCAM/DECAV_20130725_093238.wav
The full representation is available at : http://sabiod.univ-tln.fr/pimc/RAPPORT_DECAV_20130725_093238_J62_Q8_T948.0957/
A 2-minute sample already shows different patterns (figure 8) :
In: proc. of int. symp. Neural Information Scaled for Bioacoustics, sabiod.org/nips4b, joint to NIPS, Nevada, dec. 2013, Ed. Glotin H. et al. 7
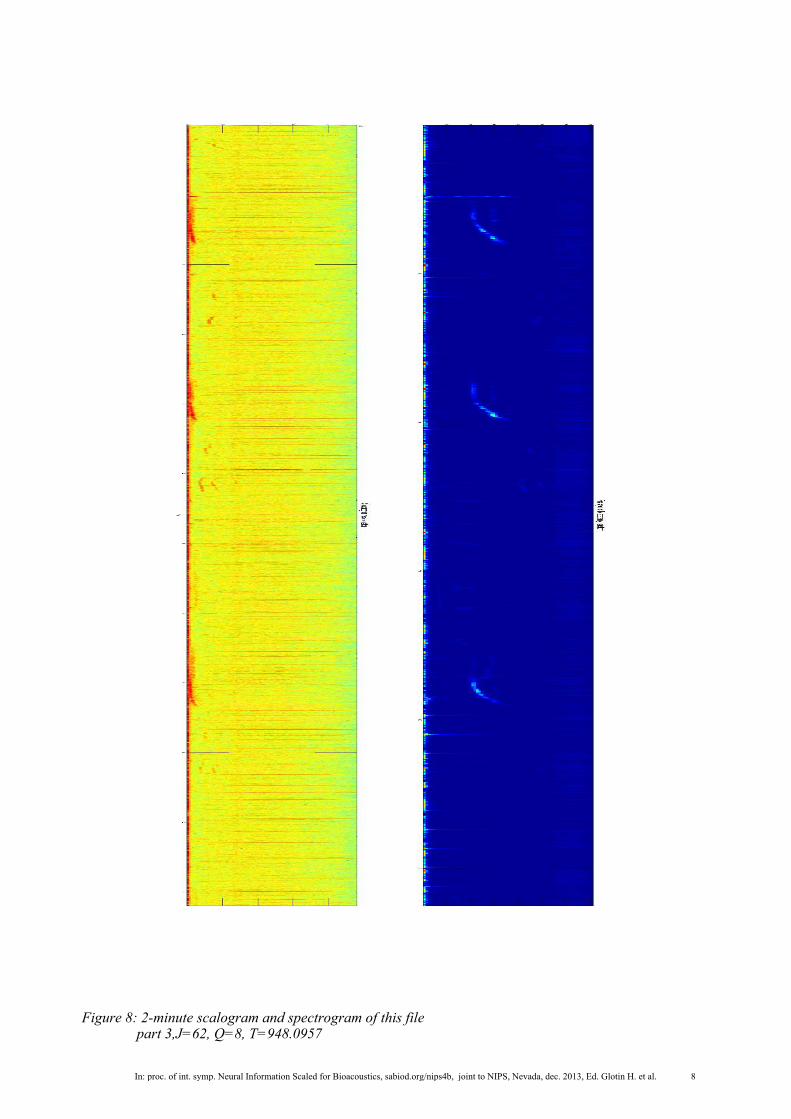
Figure 8: 2-minute scalogram and spectrogram of this file part 3,J=62, Q=8, T=948.0957
In: proc. of int. symp. Neural Information Scaled for Bioacoustics, sabiod.org/nips4b, joint to NIPS, Nevada, dec. 2013, Ed. Glotin H. et al. 8
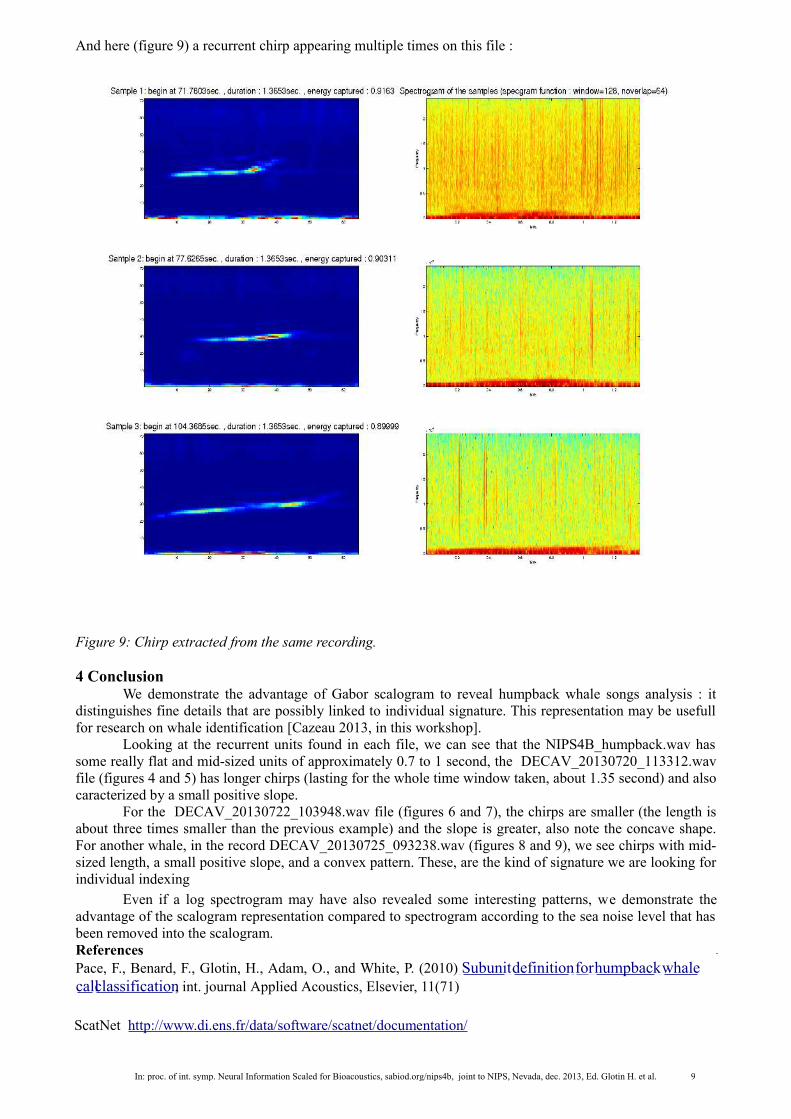
And here (figure 9) a recurrent chirp appearing multiple times on this file :
Figure 9: Chirp extracted from the same recording.
4 Conclusion We demonstrate the advantage of Gabor scalogram to reveal humpback whale songs analysis : it
distinguishes fine details that are possibly linked to individual signature. This representation may be usefull for research on whale identification [Cazeau 2013, in this workshop].
Looking at the recurrent units found in each file, we can see that the NIPS4B_humpback.wav has some really flat and mid-sized units of approximately 0.7 to 1 second, the DECAV_20130720_113312.wav file (figures 4 and 5) has longer chirps (lasting for the whole time window taken, about 1.35 second) and also caracterized by a small positive slope.
For the DECAV_20130722_103948.wav file (figures 6 and 7), the chirps are smaller (the length is about three times smaller than the previous example) and the slope is greater, also note the concave shape. For another whale, in the record DECAV_20130725_093238.wav (figures 8 and 9), we see chirps with mid-sized length, a small positive slope, and a convex pattern. These, are the kind of signature we are looking for individual indexing
Even if a log spectrogram may have also revealed some interesting patterns, we demonstrate the advantage of the scalogram representation compared to spectrogram according to the sea noise level that has been removed into the scalogram.References
Pace, F., Benard, F., Glotin, H., Adam, O., and White, P. (2010) Subunit definition for humpback whale call classification , int. journal Applied Acoustics, Elsevier, 11(71)
ScatNet http://www.di.ens.fr/data/software/scatnet/documentation/
In: proc. of int. symp. Neural Information Scaled for Bioacoustics, sabiod.org/nips4b, joint to NIPS, Nevada, dec. 2013, Ed. Glotin H. et al. 9