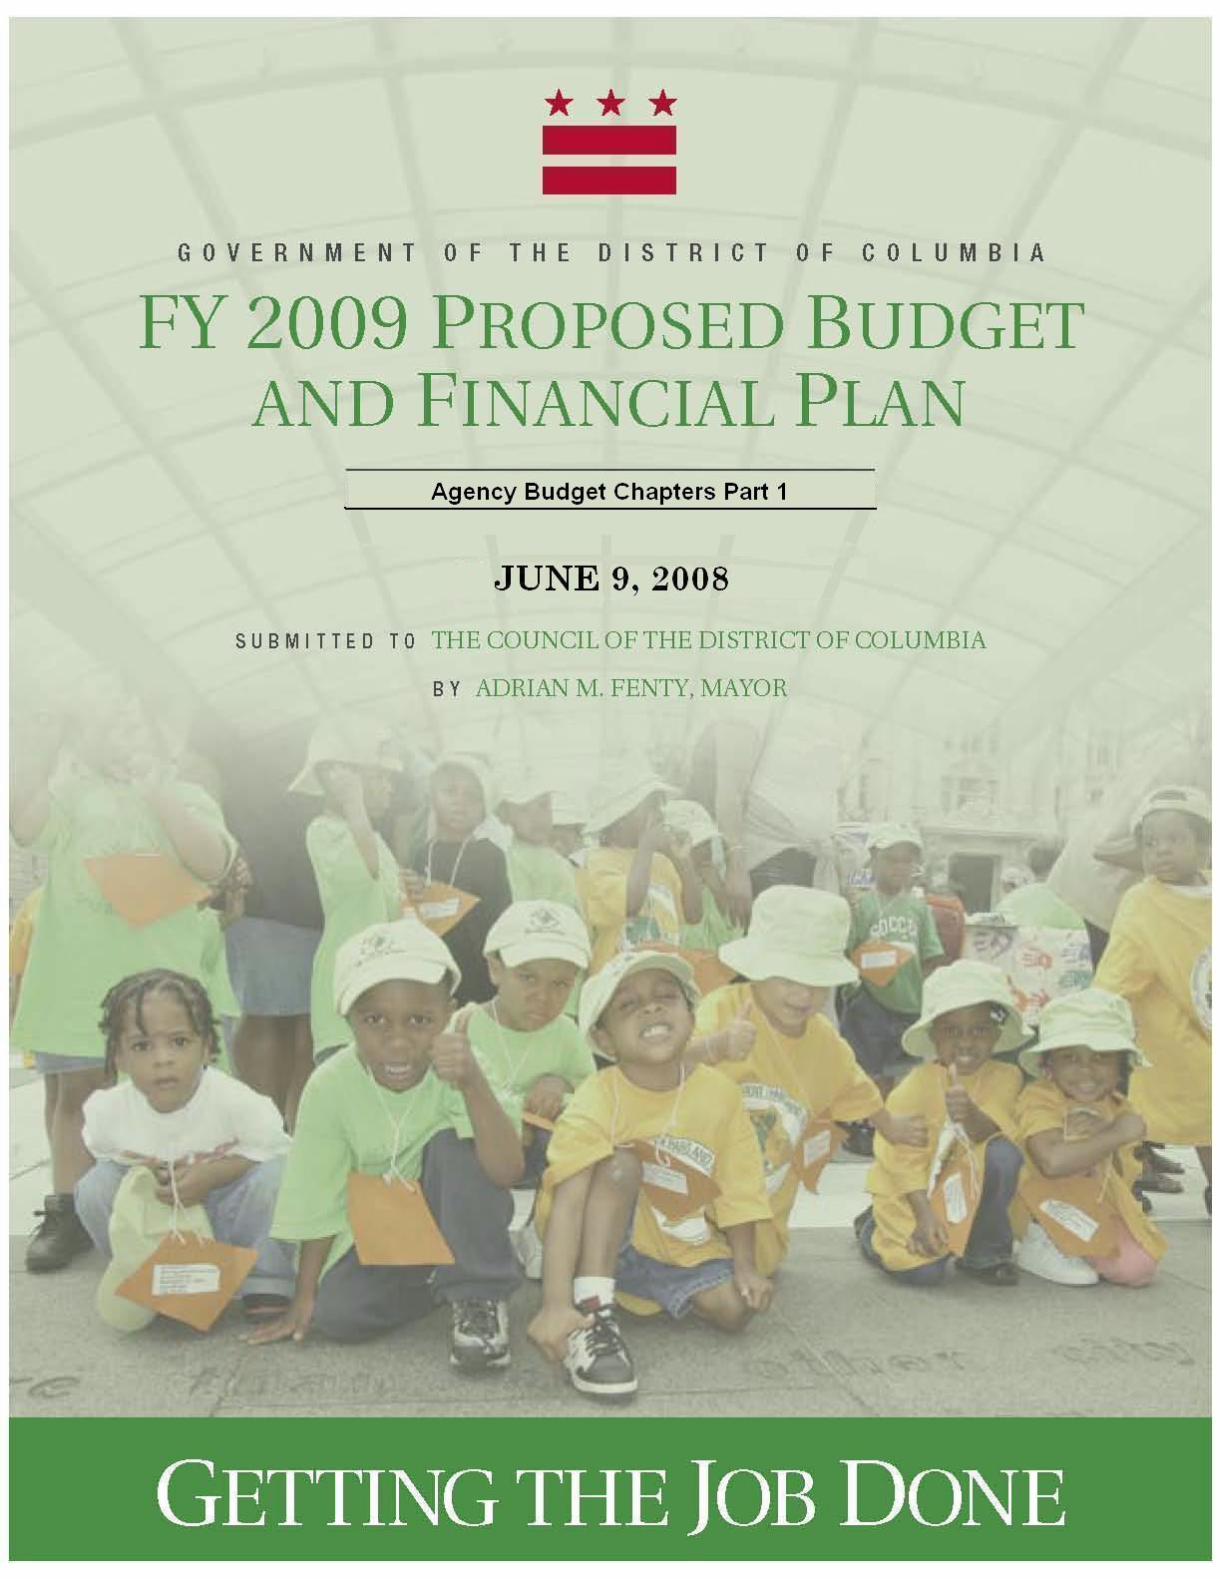
fy 2009 proposed budget and financial plan
TRANSCRIPT
Government of the District of Columbia
FY 2009 Proposed Budget
and Financial Plan
Getting the JobGetting the JobDoneDone
Volume 2
Agency Budget Chapters -Part ISubmitted to the
Congress of the United States
by the
Government of the District of Columbia
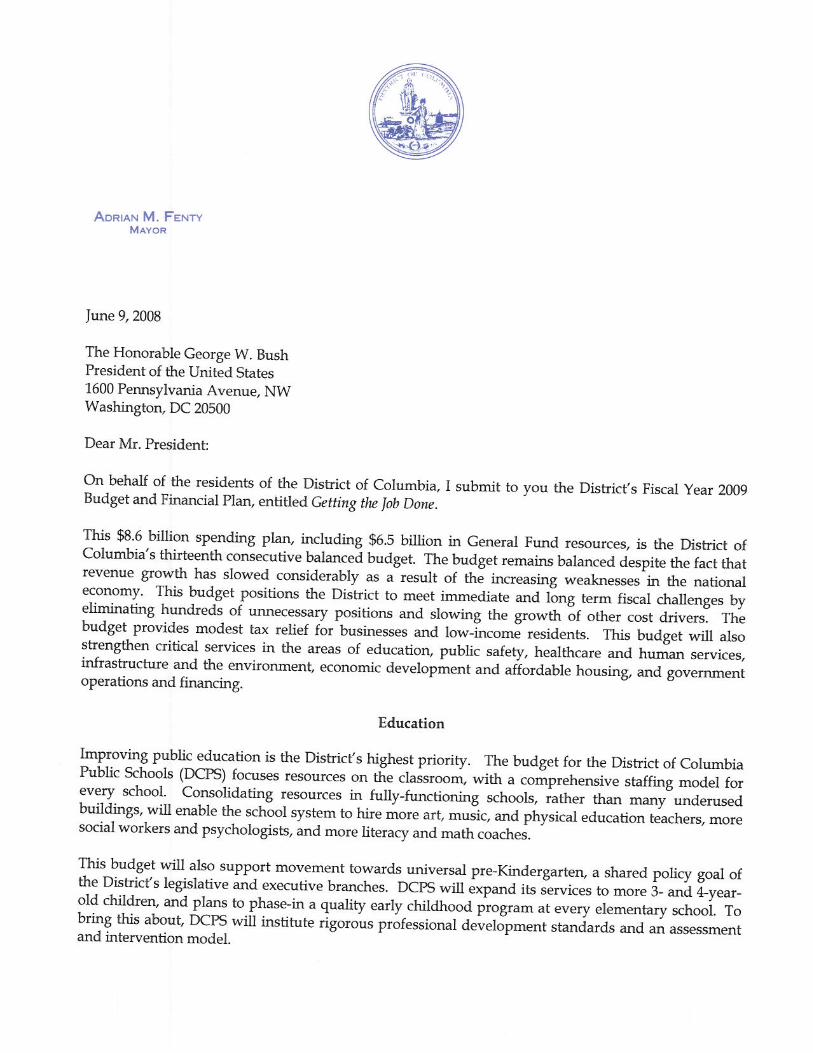
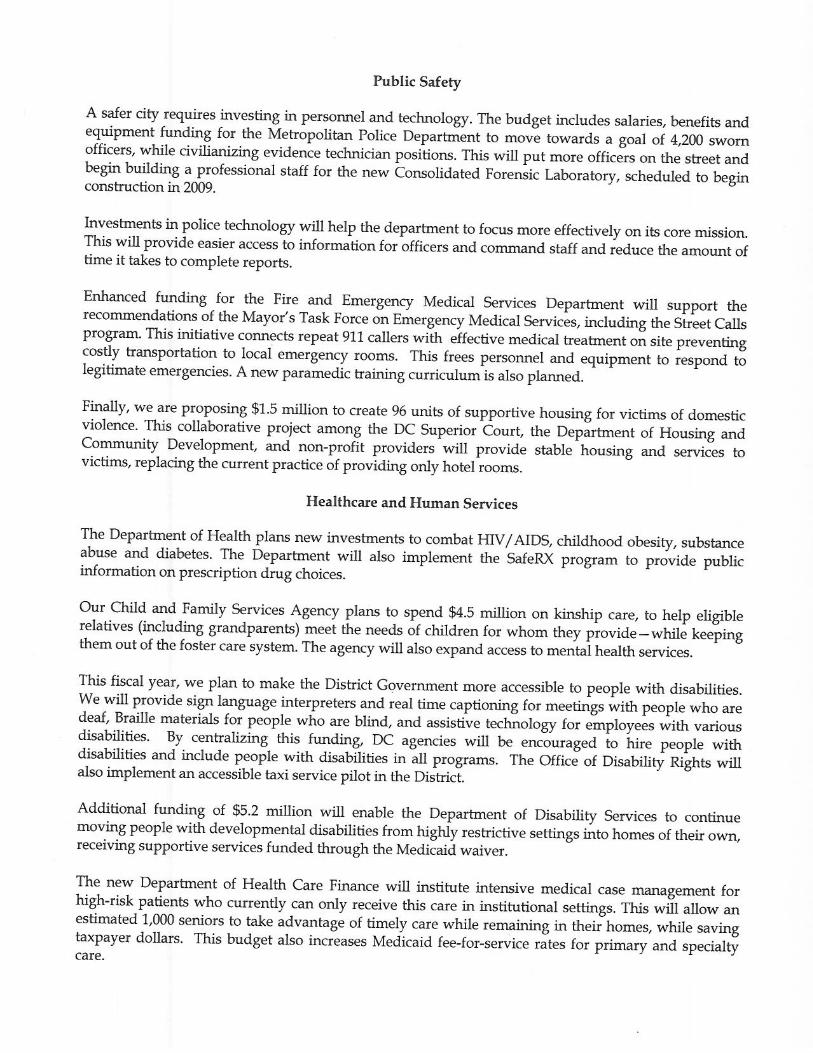
June 9, 2008
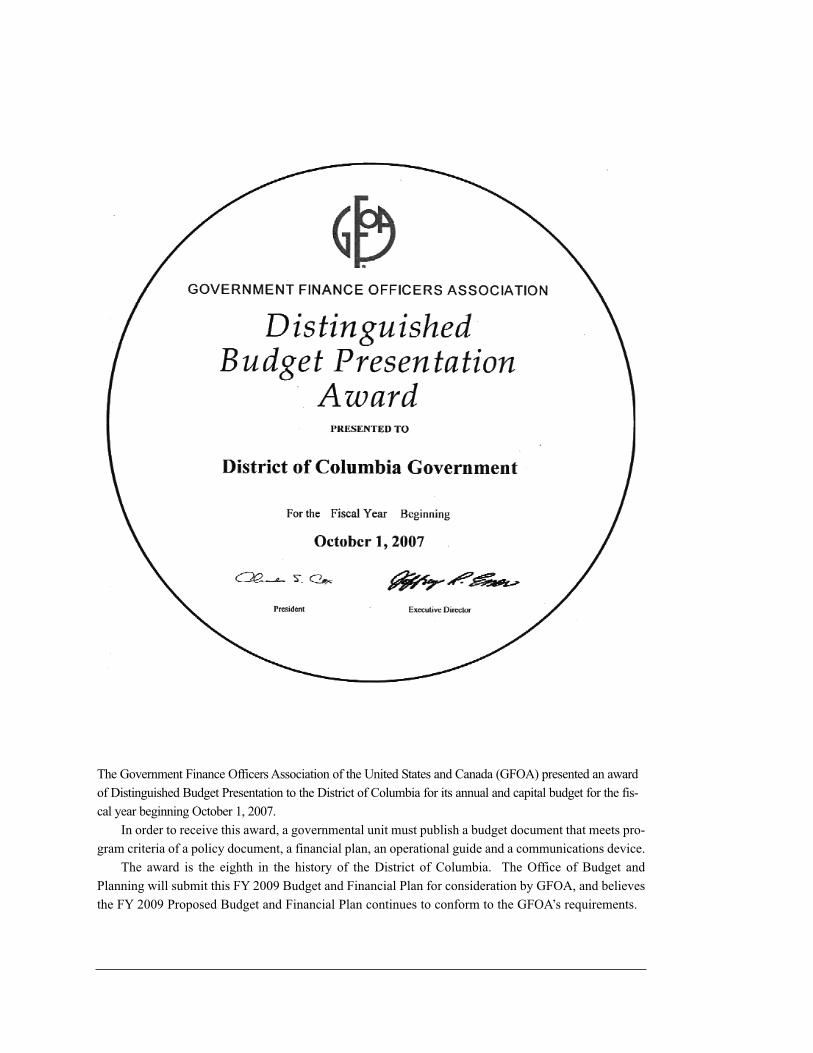
The Government Finance Officers Association of the United States and Canada (GFOA) presented an award
of Distinguished Budget Presentation to the District of Columbia for its annual and capital budget for the fis-
cal year beginning October 1, 2007.
In order to receive this award, a governmental unit must publish a budget document that meets pro-
gram criteria of a policy document, a financial plan, an operational guide and a communications device.
The award is the eighth in the history of the District of Columbia. The Office of Budget and
Planning will submit this FY 2009 Budget and Financial Plan for consideration by GFOA, and believes
the FY 2009 Proposed Budget and Financial Plan continues to conform to the GFOA’s requirements.
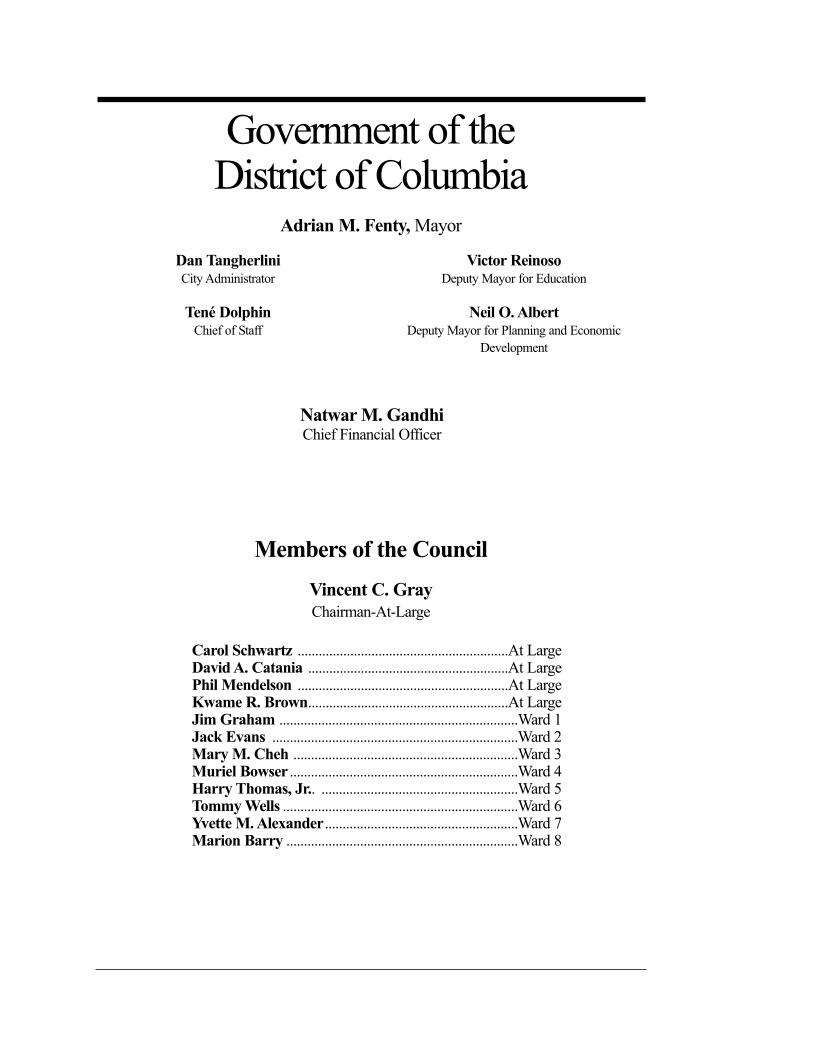
Government of the District of Columbia
Adrian M. Fenty, Mayor
Dan TangherliniCity Administrator
Tené DolphinChief of Staff
Victor ReinosoDeputy Mayor for Education
Neil O. AlbertDeputy Mayor for Planning and Economic
Development
Members of the Council
Vincent C. Gray
Chairman-At-Large
Carol Schwartz ............................................................At LargeDavid A. Catania .........................................................At LargePhil Mendelson ............................................................At LargeKwame R. Brown.........................................................At LargeJim Graham ....................................................................Ward 1Jack Evans ......................................................................Ward 2Mary M. Cheh ................................................................Ward 3Muriel Bowser .................................................................Ward 4Harry Thomas, Jr.. ........................................................Ward 5Tommy Wells ...................................................................Ward 6Yvette M. Alexander.......................................................Ward 7Marion Barry ..................................................................Ward 8
Natwar M. GandhiChief Financial Officer
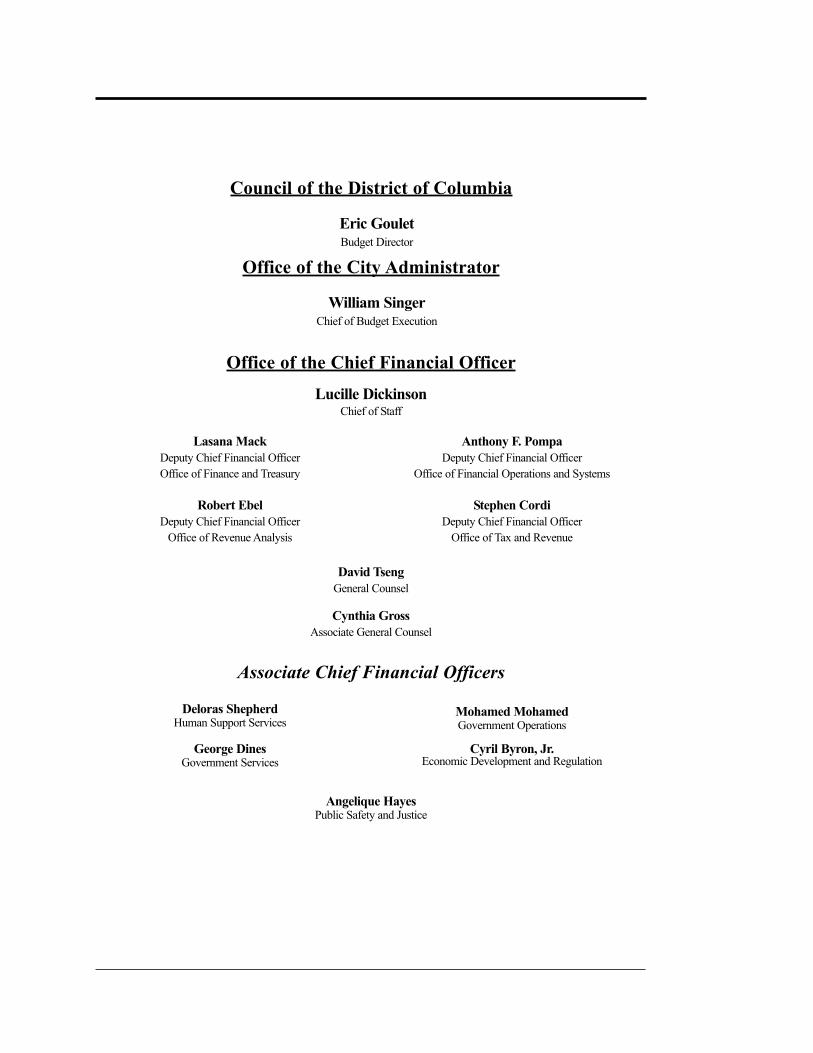
Deloras ShepherdHuman Support Services
George DinesGovernment Services
Mohamed MohamedGovernment Operations
Cyril Byron, Jr.Economic Development and Regulation
Lasana Mack
Deputy Chief Financial Officer
Office of Finance and Treasury
Robert Ebel
Deputy Chief Financial Officer
Office of Revenue Analysis
Anthony F. Pompa
Deputy Chief Financial Officer
Office of Financial Operations and Systems
Stephen Cordi
Deputy Chief Financial Officer
Office of Tax and Revenue
Associate Chief Financial Officers
Office of the Chief Financial Officer
Lucille DickinsonChief of Staff
Council of the District of Columbia
Eric GouletBudget Director
Angelique HayesPublic Safety and Justice
Cynthia Gross
Associate General Counsel
David Tseng
General Counsel
Office of the City Administrator
William SingerChief of Budget Execution
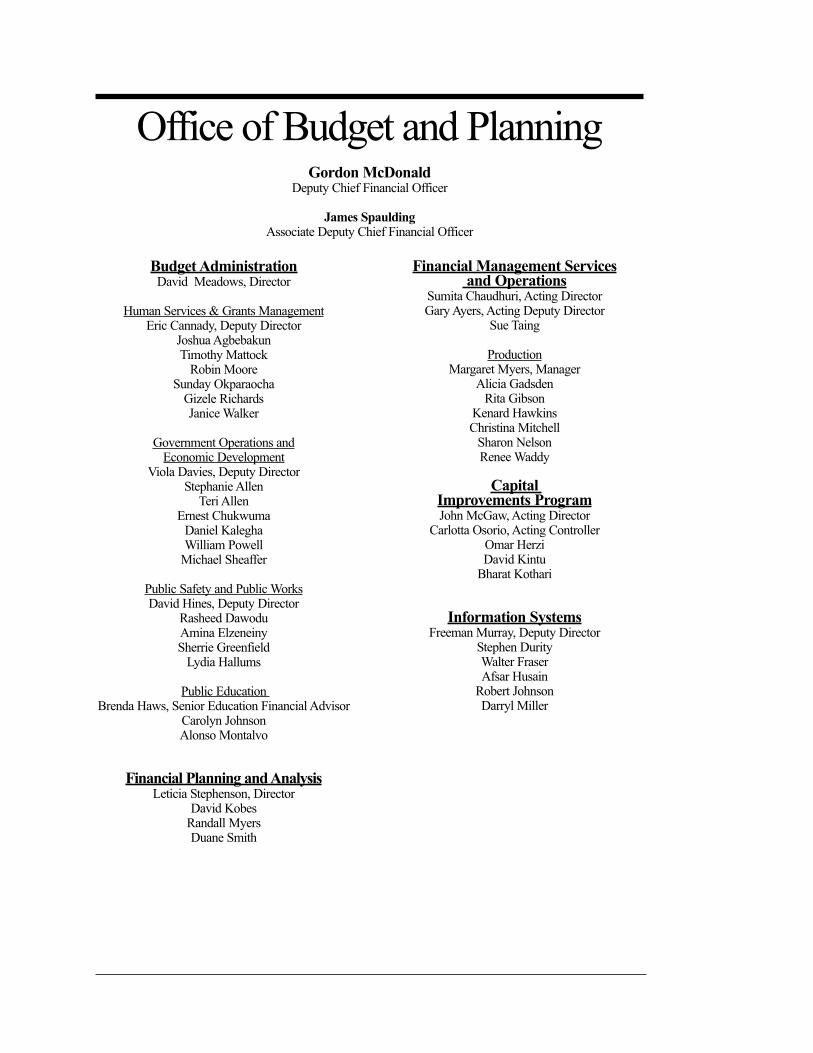
Office of Budget and PlanningGordon McDonald
Deputy Chief Financial Officer
James SpauldingAssociate Deputy Chief Financial Officer
Budget AdministrationDavid Meadows, Director
Human Services & Grants ManagementEric Cannady, Deputy Director
Joshua AgbebakunTimothy Mattock
Robin MooreSunday Okparaocha
Gizele RichardsJanice Walker
Government Operations andEconomic Development
Viola Davies, Deputy DirectorStephanie Allen
Teri AllenErnest Chukwuma
Daniel KaleghaWilliam Powell
Michael Sheaffer
Public Safety and Public WorksDavid Hines, Deputy Director
Rasheed DawoduAmina ElzeneinySherrie Greenfield
Lydia Hallums
Public Education Brenda Haws, Senior Education Financial Advisor
Carolyn JohnsonAlonso Montalvo
Financial Planning and AnalysisLeticia Stephenson, Director
David KobesRandall MyersDuane Smith
Financial Management Services and Operations
Sumita Chaudhuri, Acting DirectorGary Ayers, Acting Deputy Director
Sue Taing
ProductionMargaret Myers, Manager
Alicia GadsdenRita Gibson
Kenard HawkinsChristina Mitchell
Sharon NelsonRenee Waddy
Capital Improvements ProgramJohn McGaw, Acting Director
Carlotta Osorio, Acting ControllerOmar HerziDavid Kintu
Bharat Kothari
Information SystemsFreeman Murray, Deputy Director
Stephen DurityWalter FraserAfsar Husain
Robert JohnsonDarryl Miller
District of Columbia- Organization Chart
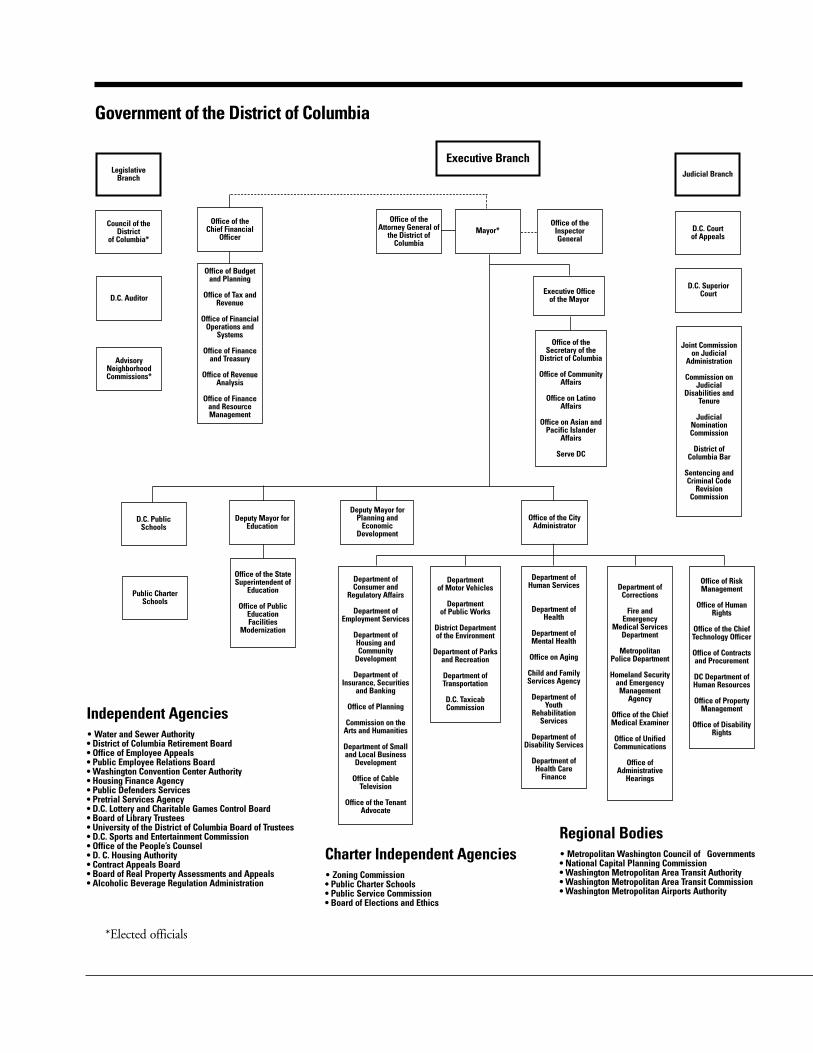
D.C. Auditor
Executive Branch
D.C. Court of Appeals
Council of theDistrict
of Columbia*
Joint Commissionon Judicial
Administration
Commission onJudicial
Disabilities andTenure
JudicialNominationCommission
District ofColumbia Bar
Sentencing andCriminal Code
RevisionCommission
D.C. Superior Court
AdvisoryNeighborhoodCommissions*
D.C. Public Schools
Judicial BranchLegislative Branch
Office of theChief Financial
Officer
Public CharterSchools
Office of Budgetand Planning
Office of Tax andRevenue
Office of FinancialOperations and
Systems
Office of Financeand Treasury
Office of RevenueAnalysis
Office of Financeand ResourceManagement
Mayor*
Executive Office of the Mayor
Office of theAttorney General of
the District ofColumbia
Office of theInspector General
Deputy Mayor forEducation
Office of the StateSuperintendent of
Education
Office of PublicEducationFacilities
Modernization
Deputy Mayor forPlanning and
EconomicDevelopment
Office of the CityAdministrator
Department ofCorrections
Fire andEmergency
Medical ServicesDepartment
MetropolitanPolice Department
Homeland Securityand EmergencyManagement
Agency
Office of the ChiefMedical Examiner
Office of UnifiedCommunications
Office ofAdministrative
Hearings
Department ofHuman Services
Department ofHealth
Department ofMental Health
Office on Aging
Child and FamilyServices Agency
Department ofYouth
RehabilitationServices
Department ofDisability Services
Department ofHealth Care
Finance
Department ofConsumer and
Regulatory Affairs
Department ofEmployment Services
Department ofHousing andCommunity
Development
Department ofInsurance, Securities
and Banking
Office of Planning
Commission on theArts and Humanities
Department of Smalland Local Business
Development
Office of CableTelevision
Office of the TenantAdvocate
Independent Agencies• Water and Sewer Authority• District of Columbia Retirement Board• Office of Employee Appeals• Public Employee Relations Board• Washington Convention Center Authority• Housing Finance Agency• Public Defenders Services• Pretrial Services Agency• D.C. Lottery and Charitable Games Control Board• Board of Library Trustees• University of the District of Columbia Board of Trustees• D.C. Sports and Entertainment Commission• Office of the People’s Counsel• D. C. Housing Authority• Contract Appeals Board• Board of Real Property Assessments and Appeals• Alcoholic Beverage Regulation Administration
Charter Independent Agencies• Zoning Commission• Public Charter Schools• Public Service Commission• Board of Elections and Ethics
Regional Bodies• Metropolitan Washington Council of Governments• National Capital Planning Commission• Washington Metropolitan Area Transit Authority• Washington Metropolitan Area Transit Commission• Washington Metropolitan Airports Authority
*Elected officials
Department of Motor Vehicles
Department of Public Works
District Departmentof the Environment
Department of Parksand Recreation
Department ofTransportation
D.C. TaxicabCommission
Government of the District of Columbia
Office of RiskManagement
Office of HumanRights
Office of the ChiefTechnology Officer
Office of Contractsand Procurement
DC Department ofHuman Resources
Office of PropertyManagement
Office of DisabilityRights
Office of theSecretary of the
District of Columbia
Office of CommunityAffairs
Office on LatinoAffairs
Office on Asian andPacific Islander
Affairs
Serve DC
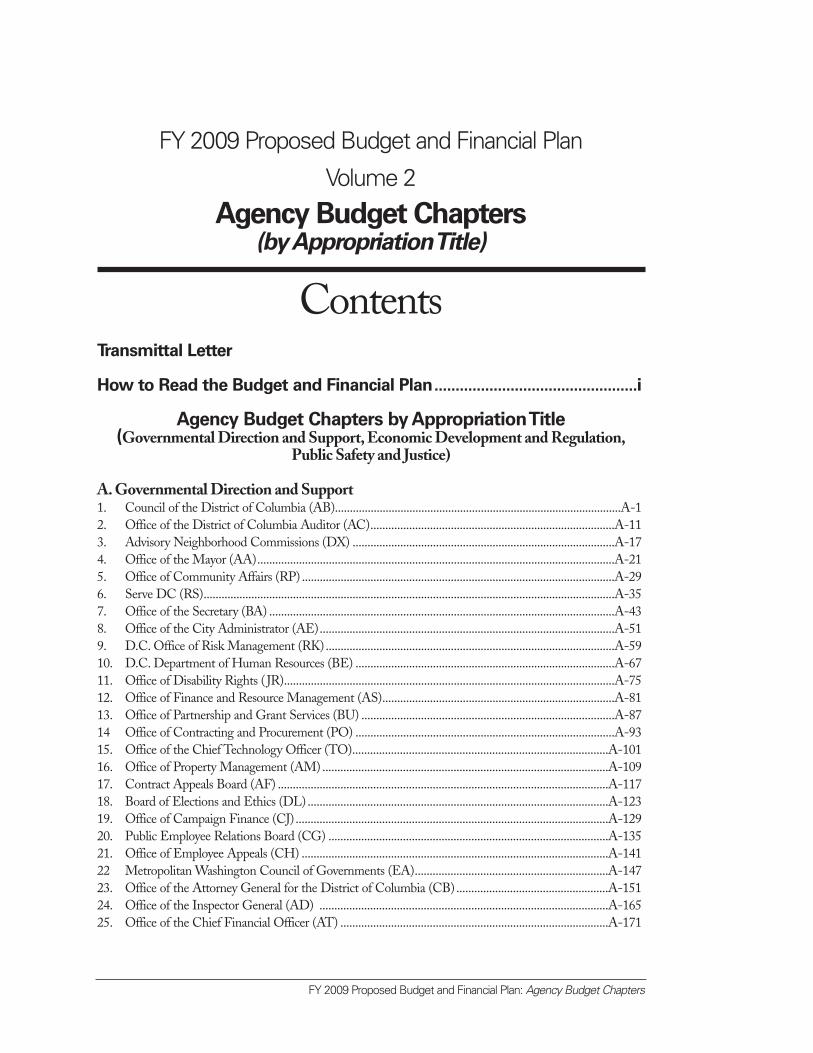
FY 2009 Proposed Budget and Financial Plan: Agency Budget Chapters
FY 2009 Proposed Budget and Financial Plan
Volume 2
Agency Budget Chapters(by Appropriation Title)
ContentsTransmittal Letter
How to Read the Budget and Financial Plan................................................i
Agency Budget Chapters by Appropriation Title(Governmental Direction and Support, Economic Development and Regulation,
Public Safety and Justice)
A. Governmental Direction and Support1. Council of the District of Columbia (AB)................................................................................................A-12. Office of the District of Columbia Auditor (AC)..................................................................................A-113. Advisory Neighborhood Commissions (DX) ........................................................................................A-174. Office of the Mayor (AA)........................................................................................................................A-215. Office of Community Affairs (RP) .........................................................................................................A-296. Serve DC (RS)..........................................................................................................................................A-357. Office of the Secretary (BA) ....................................................................................................................A-438. Office of the City Administrator (AE)...................................................................................................A-519. D.C. Office of Risk Management (RK).................................................................................................A-5910. D.C. Department of Human Resources (BE) .......................................................................................A-6711. Office of Disability Rights ( JR)...............................................................................................................A-7512. Office of Finance and Resource Management (AS)..............................................................................A-8113. Office of Partnership and Grant Services (BU) .....................................................................................A-8714 Office of Contracting and Procurement (PO) .......................................................................................A-9315. Office of the Chief Technology Officer (TO)......................................................................................A-10116. Office of Property Management (AM) ................................................................................................A-10917. Contract Appeals Board (AF) ...............................................................................................................A-11718. Board of Elections and Ethics (DL).....................................................................................................A-12319. Office of Campaign Finance (CJ).........................................................................................................A-12920. Public Employee Relations Board (CG) ..............................................................................................A-13521. Office of Employee Appeals (CH) .......................................................................................................A-14122 Metropolitan Washington Council of Governments (EA).................................................................A-14723. Office of the Attorney General for the District of Columbia (CB)...................................................A-15124. Office of the Inspector General (AD) .................................................................................................A-16525. Office of the Chief Financial Officer (AT) ..........................................................................................A-171
FY 2009 Proposed Budget and Financial Plan
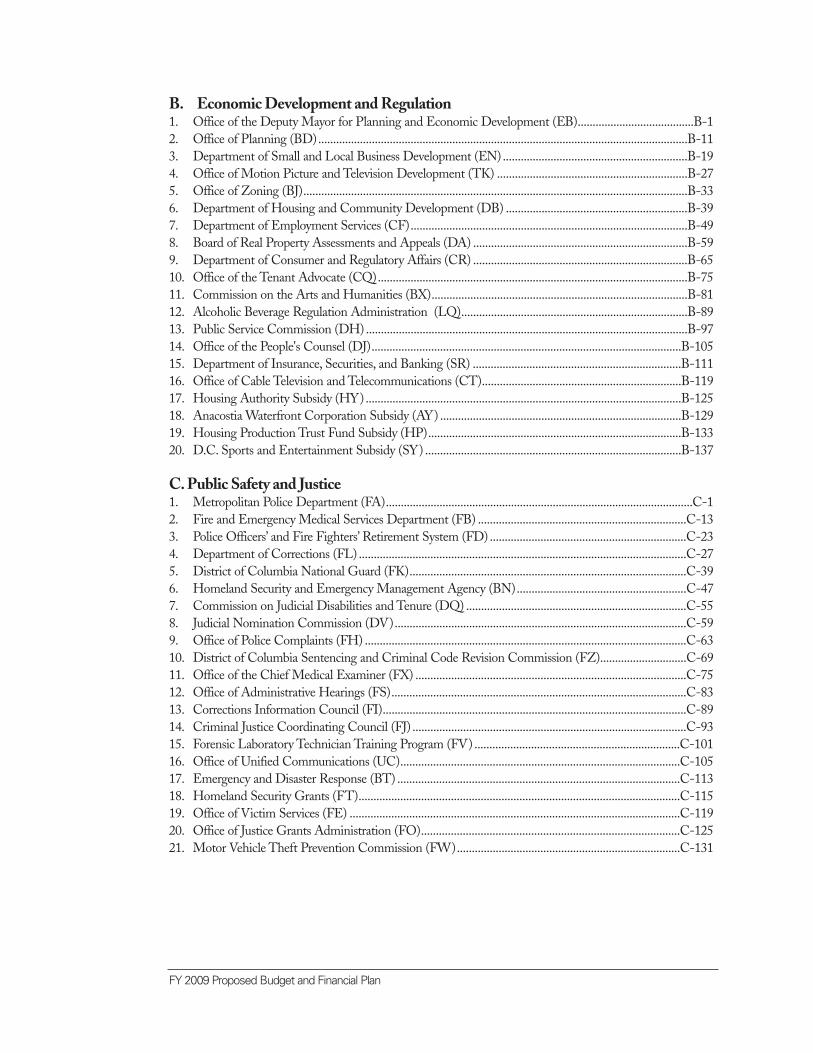
B. Economic Development and Regulation1. Office of the Deputy Mayor for Planning and Economic Development (EB).......................................B-12. Office of Planning (BD)............................................................................................................................B-113. Department of Small and Local Business Development (EN)..............................................................B-194. Office of Motion Picture and Television Development (TK) ................................................................B-275. Office of Zoning (BJ).................................................................................................................................B-336. Department of Housing and Community Development (DB) .............................................................B-397. Department of Employment Services (CF).............................................................................................B-498. Board of Real Property Assessments and Appeals (DA) ........................................................................B-599. Department of Consumer and Regulatory Affairs (CR) ........................................................................B-6510. Office of the Tenant Advocate (CQ)........................................................................................................B-7511. Commission on the Arts and Humanities (BX)......................................................................................B-8112. Alcoholic Beverage Regulation Administration (LQ)............................................................................B-8913. Public Service Commission (DH)............................................................................................................B-9714. Office of the People's Counsel (DJ)........................................................................................................B-10515. Department of Insurance, Securities, and Banking (SR) ......................................................................B-11116. Office of Cable Television and Telecommunications (CT)...................................................................B-11917. Housing Authority Subsidy (HY)..........................................................................................................B-12518. Anacostia Waterfront Corporation Subsidy (AY) .................................................................................B-12919. Housing Production Trust Fund Subsidy (HP).....................................................................................B-13320. D.C. Sports and Entertainment Subsidy (SY) ......................................................................................B-137
C. Public Safety and Justice1. Metropolitan Police Department (FA).......................................................................................................C-12. Fire and Emergency Medical Services Department (FB) ......................................................................C-133. Police Officers’ and Fire Fighters’ Retirement System (FD) ..................................................................C-234. Department of Corrections (FL) ..............................................................................................................C-275. District of Columbia National Guard (FK).............................................................................................C-396. Homeland Security and Emergency Management Agency (BN).........................................................C-477. Commission on Judicial Disabilities and Tenure (DQ) ..........................................................................C-558. Judicial Nomination Commission (DV)..................................................................................................C-599. Office of Police Complaints (FH) ............................................................................................................C-6310. District of Columbia Sentencing and Criminal Code Revision Commission (FZ).............................C-6911. Office of the Chief Medical Examiner (FX) ...........................................................................................C-7512. Office of Administrative Hearings (FS)...................................................................................................C-8313. Corrections Information Council (FI)......................................................................................................C-8914. Criminal Justice Coordinating Council (FJ) ............................................................................................C-9315. Forensic Laboratory Technician Training Program (FV) .....................................................................C-10116. Office of Unified Communications (UC)..............................................................................................C-10517. Emergency and Disaster Response (BT) ...............................................................................................C-11318. Homeland Security Grants (FT)............................................................................................................C-11519. Office of Victim Services (FE) ...............................................................................................................C-11920. Office of Justice Grants Administration (FO).......................................................................................C-12521. Motor Vehicle Theft Prevention Commission (FW)...........................................................................C-131

FY 2009 Proposed Budget and Financial Plan: Agency Budget Chapters
Volumes Bound SeparatelyVolume 1 - FY 2009 Proposed Budget and Financial Plan - Executive SummaryVolume 3 - FY 2009 Proposed Budget and Financial Plan - Agency Budget Chapters- Part IIVolume 4 - FY 2009 Proposed Budget and Financial Plan - Operating Appendices - Part IVolume 5 - FY 2009 Proposed Budget and Financial Plan - Operating Appendices - Part IIVolume 6 - FY 2009 Proposed Budget and Financial Plan - FY 2009 - FY 2014 Capital AppendicesVolume 7 - FY 2009 Proposed Budget and Financial Plan - FY 2009 - FY 2014 Highway Trust Fund

TransmittalLetter

How to Read the Budget
How to Read theBudget and FinancialPlan
How to Read the Budget andFinancial Plan
The District of Columbia’s FY 2009 Proposed Budget andFinancial Plan is a communication tool that presents andexplains policy priorities, agency operations, including pro-gram/organizational structures, as well as performance measuresin the context of the financial plan that shows the District’ssources of revenue and planned expenditures. Included are fore-casts of economic and financial conditions, current and plannedlong-term debt financing, policy decisions, and other importantfinancial information for the District's government. These ele-ments are essential for accurate financial reporting and soundmanagement of public resources.
Executive Summary (Volume 1) - Provides ahigh-level summary of the general budget andfinancial information, including sections describ-ing the new initiatives within the District's pro-posed budget, the transmittal letters from themayor and chief financial officer, information onthe strategic budgeting process, presents theDistrict’s 5-year financial plan, detailed informa-tion on the District’s projected revenue, expendi-tures and various appendices. In addition, thisvolume includes information about the District'sbudgetary and financial management policies,grant match and maintenance of efforts, statisti-cal profile of the District, glossary of budgetterms, budget summary tables by agency andfund type, and the Budget Request Act legisla-tion that serves as the basis for the District’s fed-eral appropriations act.
How to Read the Budget and Financial Plandescribes the sections of this budget volume thatdefine the budget priorities for the District.These sections are consistent with the NationalAdvisory Council on State and Local Budgeting’srecommended budget practices that call for apresentation of information that provides thereader with a guide to government programs andorganizational structure. Additionally, these sec-tions are consistent with the standards of theGovernment Finance Officers Association for theDistinguished Budget Presentation Award.
The FY 2009 Budget and Financial Plan ispresented in six volumes summarized as follows:
How to Read the Budget and Financial Plan
i
FY 2009 Proposed Budget and Financial Plan
ii
Agency Budget Chapters (Volumes 2 and 3) -Describes the operating budgets for each of theDistrict's agencies by appropriation title.Appropriation titles categorize the general areasof services provided by the District on behalf ofits citizens and are listed in the Table of Contents.Examples are Public Education System andHuman Support Services.
Operating Appendices (Volumes 4 and 5) -Includes detailed supporting tables displaying theproposed expenditures and full-time equivalentsin the operating budgets that are described inVolume 2.
Note: These volumes are available exclusively onthe Government of the District of Columbiawebsite at http://cfo.dc.gov/.
Capital Appendices (Volume 6) - Describes theDistrict’s proposed six-year capital improvementplan for all of the District's agencies (excludingthe Highway Trust Fund).
Highway Trust Fund (Volume 7) - Describes theDistrict's Highway Trust Fund, which is themain funding source for the 6-year capitalimprovement plan for federally eligible trans-portation projects. These funds are administeredby the District Department of Transportation.This volume is published only with the District’sproposed budget in June of each year.
Detailed information on the chapter contents ofeach volume include:
Volume 1: Executive Summary Includes:
Introduction: FY 2009 Proposed Budget andFinancial Plan
This chapter is a narrative and graphic summaryof the proposed budget and financial plan. Itdescribes the overall proposed budget, includingthe sources and uses of public funds versus theprior year's approved budget. The chapter alsoexplains the budget development process and cal-endar for FY 2009.
Strategic Budgeting
This chapter describes the initiatives that theDistrict is undertaking to improve budgeting andmanagement of resources. It includes a descrip-tion of the District's continued efforts andprogress in Performance-Based Budgeting(PBB), which is the District's initiative to alignresources with results, benchmarking, perfor-mance measurement, performance planning,and service-level budgeting. PBB greatlyimproves the District's ability to make policy andfunding decisions based on anticipated resultsand improve the District's ability to hold pro-gram managers accountable for achieving results.
Financial Plan
This Financial Plan summarizes planned rev-enues and expenditures for FY 2008-2012. Thischapter includes financing sources and uses andassumptions applied to derive the short-term andlong-term economic outlook. It also includes anassessment of the impact of budgetary decisionson the financial health of the District.
Revenue
This chapter shows current revenue projectionsfor each revenue type as certified by the Office ofthe Chief Financial Officer It also details theDistrict's revenue sources, provides an overviewof the District’s and regional economy and eco-nomic trends, and the outlook for revenuethrough FY 2012.
Operating Expenditures
This chapter describes the District's recent localexpenditures and future projections. It includesanalysis of expenditures between FY 2004 and2009, both by agency and by expense categorysuch as personnel, supplies, or fixed costs.Finally, it discusses expenditure projections forFY 2010 through 2012, based on the proposedFY 2009 budget, as presented in the financialplan.
How to Read the Budget and Financial Plan
iii
Appendices
This last section of the Executive Summary vol-ume contains a number of items to clarify theDistrict's budget:
■ The D.C. Comprehensive FinancialManagement Policy provides a frameworkfor fiscal decision-making by the District toensure that financial resources are available tomeet the present and future needs of Districtcitizens;
■ The Grant Match and Maintenance ofEffort section includes a table by agency andgrant number that provides the requiredgrant match and maintenance of effort con-tributions for federal and private grantsreceived by the District;
■ The Statistical Section provides tables thatreflect the financial trends, revenue capacity,debt capacity, demographic and economicinformation, and operating information ofthe District;
■ The Basis of Budgeting and Accounting sec-tion describes the basis of budgeting andaccounting, which allows the reader tounderstand the different presentation meth-ods of the District's finances;
■ The Glossary of Budget Terms sectiondescribes unique budgeting, accounting, andDistrict terms that may not be known by thegeneral reader;
■ The Summary Tables detail the District'sproposed operating budget by agency andfund type for both the budgeted dollars andpositions; and
■ The Budget Request Act is the legislationthat the District Council and Mayor enactthe District's budget via local law, and servesas the basis for the District’s federal appropri-
ations act to be enacted into law by theUnited States Congress and President via thefederal appropriations process.
Volumes 2 & 3: Agency BudgetChapters - Part I & IIIncludes:
Agency chapters illustrate available resources,what the resources are spent on, and the out-comes achieved and anticipated as a result ofthese expenditures.
Changes from the previous year include:
■ The FY 2009 Budget and Financial Plantransitioned the budget from a narrative for-mat to a table format and the bulk of thebudget detail is presented in tabular form.
■ The FY 2009 budget includes the transitionto agency performance plans. Please refer tothe Strategic Budgeting Chapter in Volume1 for more information.
■ For those agencies with performance plans, atable is included in the agency chapter thatcontains the agency’s performance measures.
Chapters are grouped by appropriation title andeach chapter contains the following sections:
Header Information: ■ Agency name and budget code; ■ Website address and telephone; and■ FY 2009 proposed operating budget table.
Introduction: ■ Agency mission; and ■ Performance Objectives, or Strategic Result
Goals, and agency program descriptions.
Financial and Program Information (FTEemployment levels): ■ Proposed Funding by Source table. ■ Proposed Full-Time Equivalents table.■ Proposed Expenditure by Comptroller
Source Group table.
FY 2009 Proposed Budget and Financial Plan
iv
■ Proposed Expenditure by Program (PBBagencies) table.
■ FY 2008 Approved Budget to FY 2009Proposed Budget reconciliation table.
■ Agency Performance Measures table.
To help the reader navigate the Agency BudgetChapter volume, an example of an agency nar-rative is presented at the end of this chapter.This example represents a performance planagency. Callout boxes highlight the features dis-cussed above.
Volumes 4 & 5: OperatingAppendices
These two volumes provide supporting tables toeach agency's proposed operating budget. Thetables generally include FY 2007 actual expendi-tures, FY 2008 approved budgets, the FY 2009proposed budget, and the change from FY 2008to FY 2009 (unless noted).
Note: These volumes are available exclusively on theGovernment of the District of Columbia website athttp://cfo.dc.gov/.
The following tables are provided for Agenciesthat have been converted to a performance-based budgeting format:
Schedule 30-PBB - Dollars summarized by pro-gram, activity, and governmental fund (govern-mental fund breakout is for FY 2009 only andincludes general fund detail);
Schedule 40-PBB - Dollars summarized by pro-gram, comptroller source group and governmen-tal fund;
Schedule 40G-PBB - Dollars summarized byprogram, comptroller source group and appro-priated fund within the general fund
Schedule 41 - Dollars and FTEs summarized bycomptroller source group and governmentalfund;
Schedule 41G - Dollars and FTEs summarizedby comptroller source group and appropriatedfund within the general fund; and
Schedule 80 - Dollars and FTEs summarized byrevenue type, appropriated fund, and revenuesource (for FY 2009 proposed budget only).
The following tables are provided for agenciesthat have not been converted to a PBB format:
Schedule 30 - Dollars summarized by controlcenter, responsibility center, and governmentalfund (governmental fund breakout is for FY2009 only and includes general fund detail);
Schedule 40 - Dollars summarized by controlcenter, comptroller source group and govern-mental fund;
Schedule 40G - Dollars summarized by controlcenter, comptroller source group and appropriat-ed fund within the general fund;
Schedule 41 - Dollars and FTEs summarized bycomptroller source group and governmentalfund;
Schedule 41G - Dollars and FTEs summarizedby comptroller source group and appropriatedfund within the general fund; and
Schedule 80 - Dollars and FTEs summarized byrevenue type, appropriated fund, and revenuesource (for FY 2009 proposed budget only).
Volume 6: Capital ImprovementPlan & Appendices
This volume covers the District's FY 2009-FY2014 Capital Improvements Plan (CIP), exclud-ing the Highway Trust Fund. The volumeincludes:
■ The Introduction chapter describes the over-all CIP including the sources and uses of cap-ital funds, the District's policies and proce-
How to Read the Budget and Financial Plan
v
dures for its capital budget and debt, the FY2009 planning process, and an overview ofthe District of Columbia's Water and SewerAuthority's FY 2007-FY 2016CIP.
■ The Project Description Forms, comprisethe major portion of the capital appendicesvolume. The project description forms pro-vide details on capital projects funded by gen-eral obligation bonds, pay-as-you-go (paygo)capital, the Master Equipment Lease pro-gram, and the Local Street MaintenanceFund. Each page shows one subproject'splanned allotments for fiscal years 2009through 2014, description, annual operatingimpact, milestone data, and location on amap.
■ The Appendices, provide supporting tablesand a glossary about the District's capitalbudget, including:
- The FY 2009 Planned Expendituresfrom New and Existing Allotments tablesummarizes all planned FY 2009 expen-ditures by agency and subproject for newallotments in FY 2009 versus prior years'allotments;
- The FY 2009-FY 2014 PlannedExpenditures From New Allotmentstable summarizes the new allotments'planned FY 2009-FY 2013 expendituresby agency, project, and subproject;
- The FY 2009-FY 2014 PlannedFunding table summarizes the FY 2009and six-year funding sources for all newallotments by agency, subproject, andfunding source;
- The Balance of Capital BudgetAuthority, All Projects table summarizesthe lifetime budget authority, life-to-dateexpenditures, total commitments, andbalance of budget authority for all ongo-ing capital projects by agency, project,and authority (District versus federal);
- The FY 2009 Appropriated BudgetAuthority Request table summarizes theproposed new projects and changes(increase or decrease) for ongoing projectsby agency, subproject, and fund (Localversus Local Street Maintenance); and
- The Glossary of Budget Terms describesterms used in the capital appendices.
Volume 7: Highway Trust Fund
This volume covers the District's FY 2009-FY2014 proposed Highway Trust Fund expendi-tures, including:
■ The Introduction chapter describes theHighway Trust Fund program, including thesources and uses of the funds, the District'spolicies and procedures for the trust fund,and the FY 2009 planning process.
■ The next section, the Project DescriptionForms, comprise the majority of theHighway Trust Fund volume. Each pageshows one sub-project's planned allotmentsfor fiscal years 2009 through 2014, descrip-tion, annual operating impact, milestonedata, and location on a map.
■ The last section, the Appendices, providessupporting tables about the District'sHighway Trust Fund program.
FY 2009 Proposed Budget and Financial Plan
vi
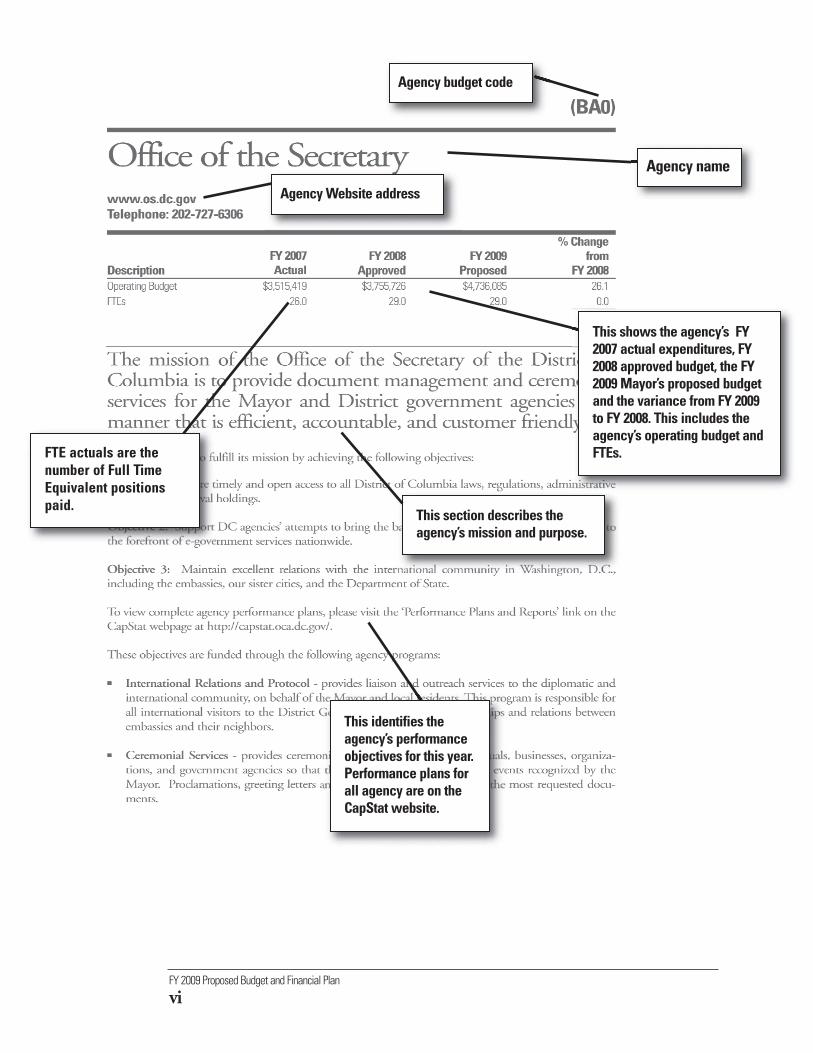
Agency budget code
Agency name
This identifies theagency’s performanceobjectives for this year.Performance plans forall agency are on theCapStat website.
Agency Website address
FTE actuals are thenumber of Full TimeEquivalent positionspaid.
This section describes theagency’s mission and purpose.
This shows the agency’s FY2007 actual expenditures, FY2008 approved budget, the FY2009 Mayor’s proposed budgetand the variance from FY 2009to FY 2008. This includes theagency’s operating budget andFTEs.
How to Read the Budget and Financial Plan
vii
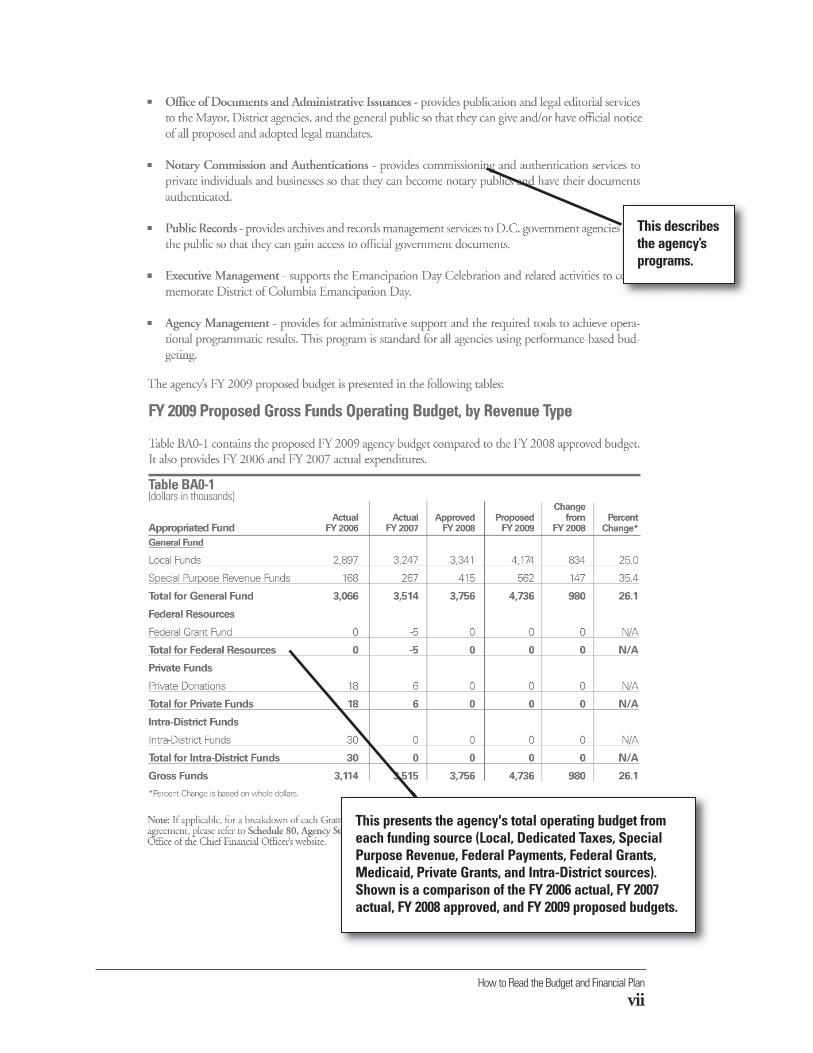
This describesthe agency’sprograms.
This presents the agency's total operating budget fromeach funding source (Local, Dedicated Taxes, SpecialPurpose Revenue, Federal Payments, Federal Grants,Medicaid, Private Grants, and Intra-District sources).Shown is a comparison of the FY 2006 actual, FY 2007actual, FY 2008 approved, and FY 2009 proposed budgets.
FY 2009 Proposed Budget and Financial Plan
viii
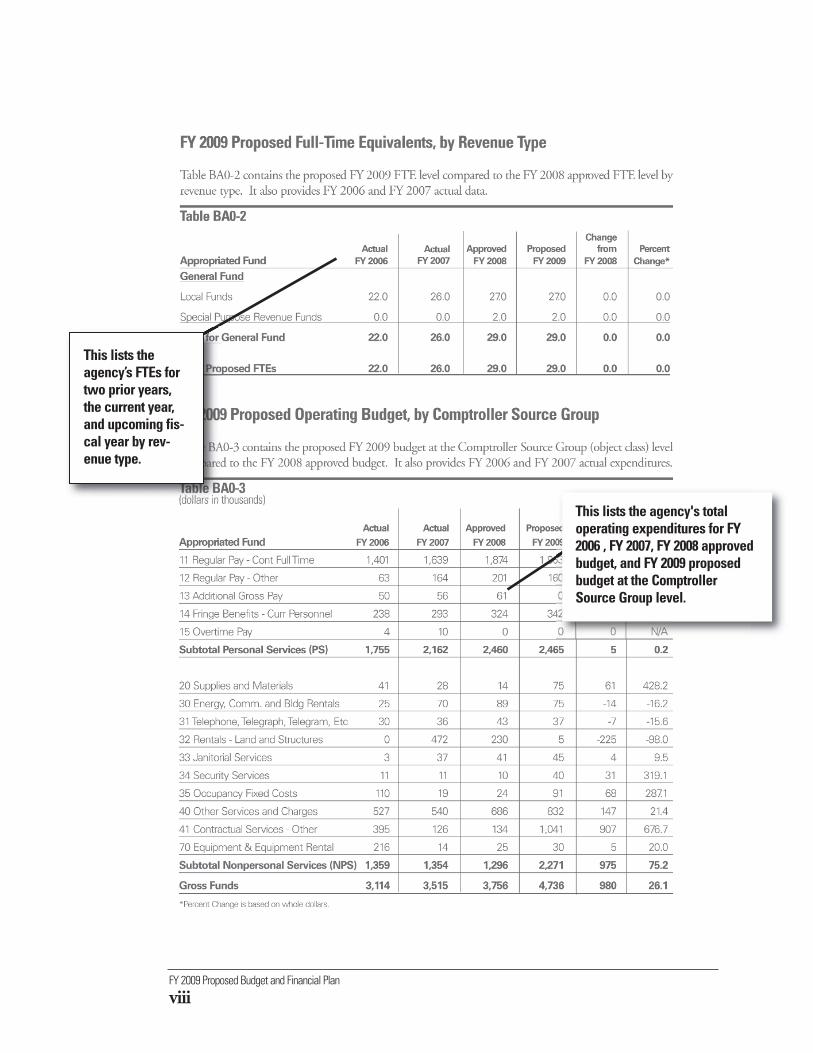
This lists theagency’s FTEs fortwo prior years,the current year,and upcoming fis-cal year by rev-enue type.
This lists the agency's totaloperating expenditures for FY2006 , FY 2007, FY 2008 approvedbudget, and FY 2009 proposedbudget at the ComptrollerSource Group level.
How to Read the Budget and Financial Plan
ix
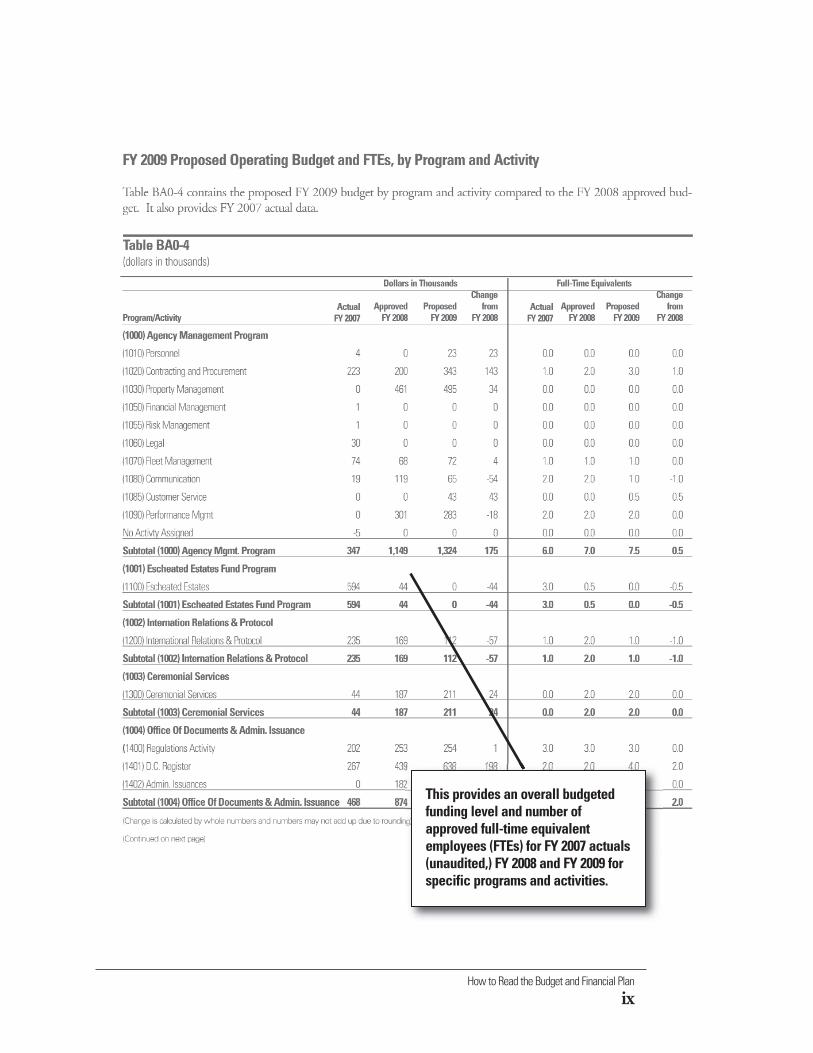
This provides an overall budgetedfunding level and number ofapproved full-time equivalentemployees (FTEs) for FY 2007 actuals(unaudited,) FY 2008 and FY 2009 forspecific programs and activities.
FY 2009 Proposed Budget and Financial Plan
x
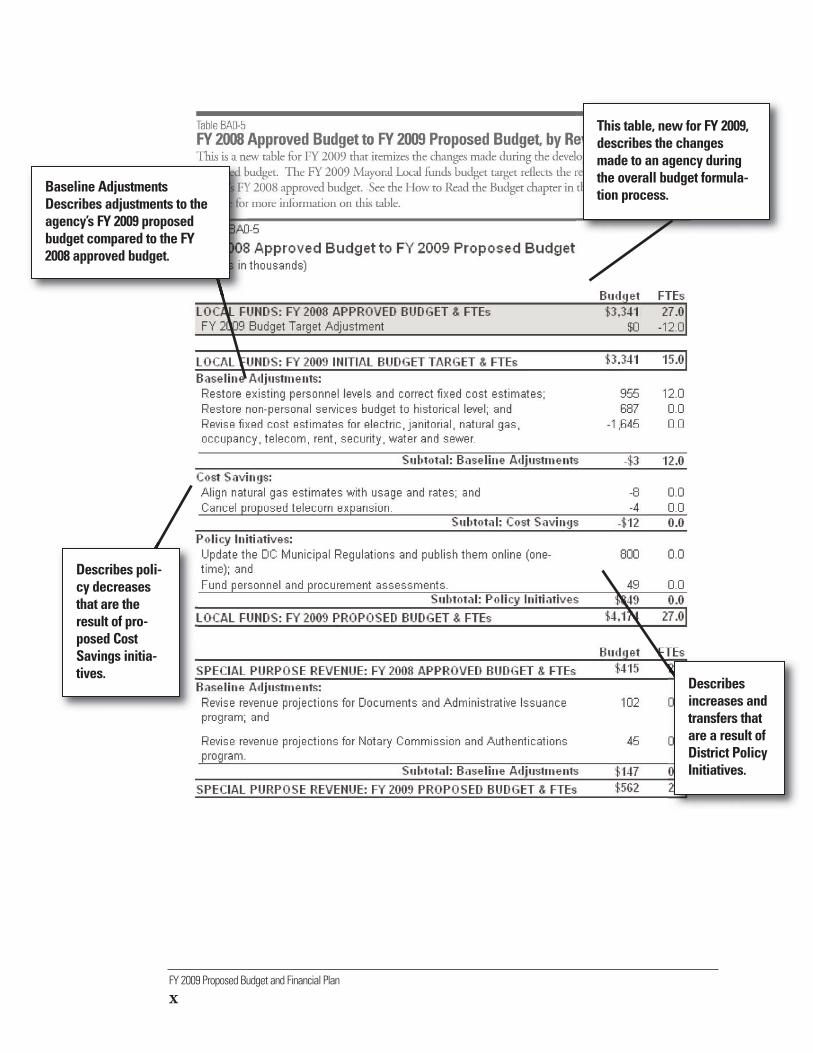
Describes poli-cy decreasesthat are theresult of pro-posed CostSavings initia-tives.
This table, new for FY 2009,describes the changesmade to an agency duringthe overall budget formula-tion process.
Describesincreases andtransfers thatare a result ofDistrict PolicyInitiatives.
Baseline Adjustments Describes adjustments to theagency’s FY 2009 proposedbudget compared to the FY2008 approved budget.
How to Read the Budget and Financial Plan
xi
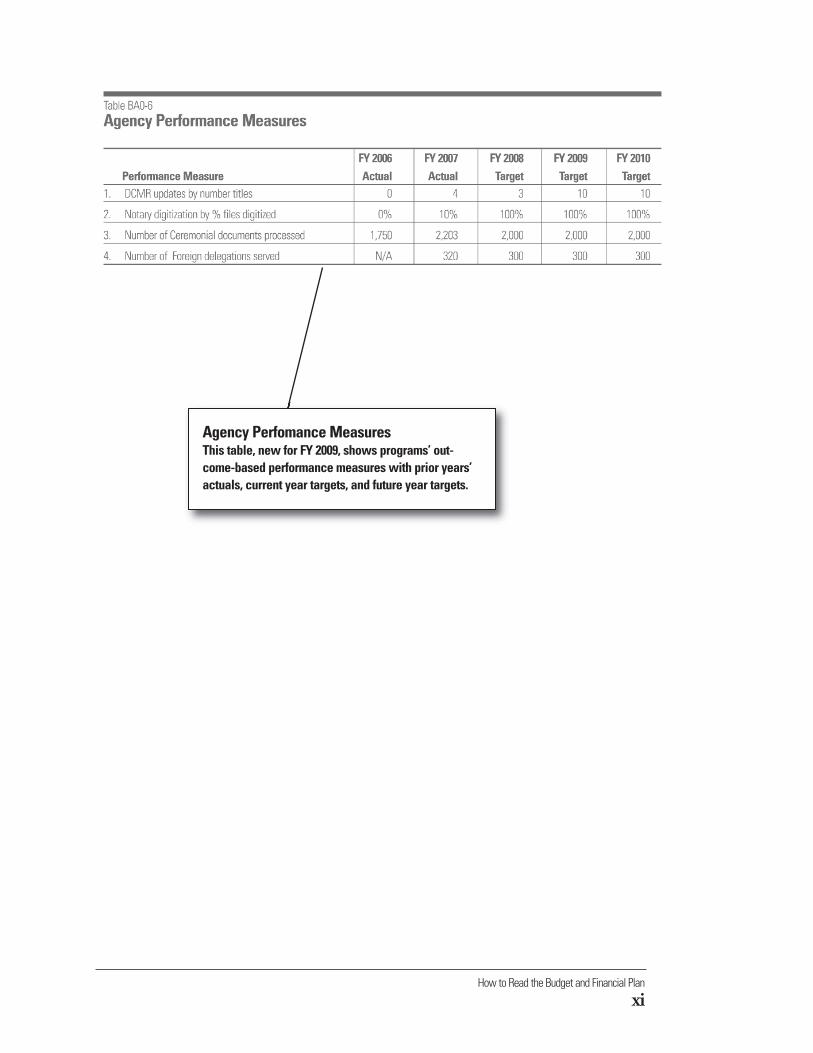
Agency Perfomance MeasuresThis table, new for FY 2009, shows programs’ out-come-based performance measures with prior years’actuals, current year targets, and future year targets.
Governmental Direction and Support
AGovernmentalDirection and SupportCouncil of the District of Columbia (AB).....................................................A-1Office of the District of Columbia Auditor (AC).......................................A-11Advisory Neighborhood Commissions (DX)..............................................A-17Office of the Mayor (AA).............................................................................A-21Office of Community Affairs (RP) ..............................................................A-29Serve DC (RS)...............................................................................................A-35Office of the Secretary (BA) .........................................................................A-43Office of the City Administrator (AE)........................................................A-51D.C. Office of Risk Management (RK) ......................................................A-59D.C. Department of Human Resources (BE).............................................A-67Office of Disability Rights ( JR)....................................................................A-75Office of Finance and Resource Management (AS)...................................A-81Office of Partnership and Grant Services ....................................................A-87Office of Contracting and Procurement (PO).............................................A-93Office of the Chief Technology Officer (TO)...........................................A-101Office of Property Management (AM) .....................................................A-109Contract Appeals Board (AF) ....................................................................A-117Board of Elections and Ethics (DL) ..........................................................A-123Office of Campaign Finance (CJ) ..............................................................A-129Public Employee Relations Board (CG)....................................................A-135Office of Employee Appeals (CH) ............................................................A-141Metropolitan Washington Council of Governments (EA)......................A-147Office of the Attorney General for the District of Columbia (CB) ........A-151Office of the Inspector General (AD) ......................................................A-165Office of the Chief Financial Officer (AT) ...............................................A-171
(AB0)
Council of the District of Columbiawww.dccouncil.usTelephone: 202-724-8000
DescriptionFY 2007 FY 2008 FY 2009 % ChangeActual Approved Proposed from FY 2008
Operating Budget $16,664,663 $16,651,000 $21,026,823 26.3FTEs 175.5 178.0 198.0 11.2(The FY 2008 revised budget for the Council of the District of Columbia is $19,201,000. The FY 2009 proposed budget of$21,026,823 represents a 9.5 percent increase over the FY 2008 revised budget.)
The mission of the Council of the District of Columbia is toprovide leadership to effectively serve community needs andposition the Council to be recognized as a strong and innovativelegislative body governing a leading city of the world. TheCouncil of the District of Columbia is the legislative branch ofthe District of Columbia government.
The agency plans to fulfill its mission by achieving the following objectives:
Objective 1Improve and enhance Council operations through the establishment of efficient and effective procedures,systems, and technology, and by building adequate staff capacities.
■ Secure and retain a competent, diverse and well-trained staff through enhanced selection and evalua-tion processes, resources, and professional development opportunities;
■ Increase skills and competence through professional development, education, technical assistance, andclearly defined roles and responsibilities;
■ Re-examine operating processes to strengthen the quality and effectiveness of operations and perfor-mance;
■ Improve Council information technologies to increase efficiency;
■ Review and improve the Council’s budget and procurement processes;
Council of the District of Columbia
A-1
FY 2009 Proposed Budget and Financial Plan
A-2
■ Expand information to the public on Council and committee activities;
■ Commemorate the 100th Anniversary of the Wilson Building;
■ Develop a physical space plan to determine the Council’s needs by the end of calendar year 2010;
■ Explore the feasibility of using electronic voting during legislative sessions;
■ Develop a process for receiving regular reports from Council appointees to Boards and Commissions;
■ Update the Council website;
■ Create a Council Intranet; and
■ Update and replace outdated technology and equipment.
Objective 2Develop a transparent, efficient budget review process to help the District maintain a balanced budget andsound fiscal performance, and conduct appropriate oversight, ensuring public confidence in the fiscalhealth of the District of Columbia.
■ Clearly define budget oversight priorities;
■ Provide important information to the public to improve the transparency of the budget process;
■ Ensure that the Office of the Budget Director has the capacity to serve as a resource for all Councilcommittees, Councilmembers, and the public;
■ Provide support needed for an efficient Council budget process;
■ Perform a fiscal analysis of all legislation and prepare fiscal impact statements;
■ Strengthen the process for review of Executive agency contracts and reprogrammings;
■ Monitor operations and capital budget spending;
■ Track legislation passed without funding; and
■ Monitor Medicaid reimbursements and federal grants.
Objective 3Establish protocols and outline legislative priorities to develop a legislative agenda that ensures attentionto critical issues.
■ Define key legislative priorities for each fiscal year by committee and by the Council as a whole;
■ Encourage each committee and committee chairperson to incorporate the Council’s priorities in reg-ular committee business and legislation;
Council of the District of Columbia
A-3
■ Develop an annual Council report to assess the Council’s success, priorities, and operations;
■ Continue to develop the capacity of, and resources for, the Office of Policy Analysis;
■ Increase transparency of committee activities for the Council as a whole and for the public;
■ Clarify and make uniform all legislative reports;
■ Review protocols for use of legislative procedures;
■ Continue to develop ways of engaging youth in the legislative process; and
■ Monitor legislative enactments to determine whether laws are being implemented, and make recom-mendations for improving the legislative process.
Objective 4Strengthen Council communications to promote the essential role of the Council and its legislative pri-orities and responsibilities.
■ Establish Council Office of Communications;
■ Improve current communications vehicles and visual branding tools; and
■ Develop a strategic communications plan.
Objective 5Ensure that Council and legislative priorities are linked to the delivery and quality of services.
■ Enhance constituent services capacity; and
■ Review and revise the Council’s role in providing technical assistance and support to AdvisoryNeighborhood Commissions.
To view the Council’s complete strategic plan, please visit the D.C. Council’s website (www.dccouncil.us).
These objectives are funded through the following agency programs:
■ Council Administration – includes the Council of the District of Columbia’s Benefits Account andFixed Costs Account.
This program contains the following two activities:- The Council’s Benefits Account activity contains funding for all Council fringe benefits.
- The Council’s Fixed Costs Account activity includes funding for all Council-wide fixed costs.These funds will be transferred as Intra-District funds to the Office of Finance and ResourceManagement at the beginning of the fiscal year.
FY 2009 Proposed Budget and Financial Plan
A-4
■ Council Central Offices – provides administrative support and technical expertise to the Council ofthe District of Columbia.
This program contains the following five activities:
- The Secretary to the Council is the chief administrative officer of the Council and is responsiblefor maintaining records of Council actions including the filing of bills and proposed resolutions,amendments to bills and resolutions, and requests for hearings, committee reports, and otherrecords and reports assigned by the Rules, the Council, or the Chairman and for proposing andadministering the fiscal year budget of the Council.
- The General Counsel is responsible for advising the Council on matters of parliamentary proce-dure, identifying legislative problems, providing members with alternatives in terms of policyoptions to solve those problems, representing the Council in any legal action to which it is a party,supervising the publication of the District of Columbia Official Code, making legislative draftingassistance available to all members, engrossing and enrolling measures, and making necessary tech-nical and conforming changes in measures during enrollment.
- The Office of the Budget Director is responsible for advising members of the Council on mattersrelated to the budget including the development of annual and multi-year budgets and financialplans, review of contracts, and analysis of the fiscal impact of legislation. The budget staff alsoserves as a resource for all Council committees and members.
- The Office of Policy Analysis provides comprehensive, nonpartisan, and objective research andanalysis on defined legislative/policy issues to members of the Council, as requested. The Officewas established to enhance and contribute to a more informed legislature. The Office is responsi-ble for providing impartial policy research and analysis for members of the Council.
- The Office of Communications, to be established in FY 2009, will provide communication sup-port services to the Council and actively work to provide information to constituents, the generalpublic, and news media.
■ Councilmembers – includes the budgets of the 13 elected Councilmembers of the District ofColumbia. Eight of the elected Councilmembers represent identified Wards in the District, and theremaining five members, including the Chairman of the Council, are elected at-large.
This program contains 13 activities:
- The Chairman is the presiding and chief executive officer of the Council; and
- Each of the 12 other elected officials is under an activity defining the Ward represented, or theirposition as an at-large representative.
■ Council Committees – includes 11 standing committees of the Council of the District of Columbia.Much of the work of the Council of the District of Columbia is conducted by ten standing commit-tees and the Committee of the Whole, which is chaired by the Chairman of the Council. Every
Council of the District of Columbia
A-5
Councilmember is a member of the Committee of the Whole. Committees are responsible for con-ducting hearings on proposed legislation and for oversight matters. This program contains the following 12 activities:
- Committee of the Whole;- Committee on Economic Development;- Committee on Finance and Revenue;- Committee on Health;- Committee on Housing and Urban Affairs;- Committee on Human Services;- Committee on Libraries, Parks, and Recreation;- Committee on Public Safety and the Judiciary;- Committee on Public Services and Consumer Affairs;- Committee on Public Works and the Environment; - Committee on Workforce Development and Government Operations; and- Committee on Development and Expansion.
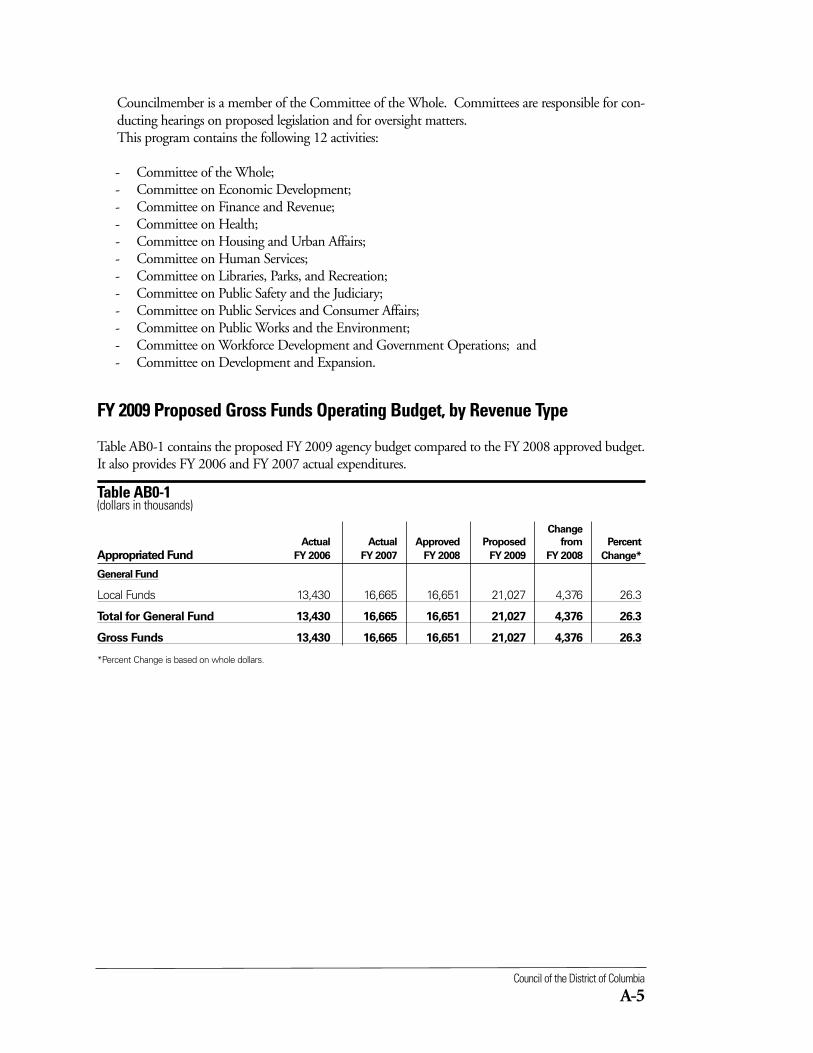
FY 2009 Proposed Gross Funds Operating Budget, by Revenue Type
Table AB0-1 contains the proposed FY 2009 agency budget compared to the FY 2008 approved budget.It also provides FY 2006 and FY 2007 actual expenditures.
Table AB0-1 (dollars in thousands)
Change
Actual Actual Approved Proposed from Percent
Appropriated Fund FY 2006 FY 2007 FY 2008 FY 2009 FY 2008 Change*
General Fund
Local Funds 13,430 16,665 16,651 21,027 4,376 26.3
Total for General Fund 13,430 16,665 16,651 21,027 4,376 26.3
Gross Funds 13,430 16,665 16,651 21,027 4,376 26.3
*Percent Change is based on whole dollars.
FY 2009 Proposed Budget and Financial Plan
A-6
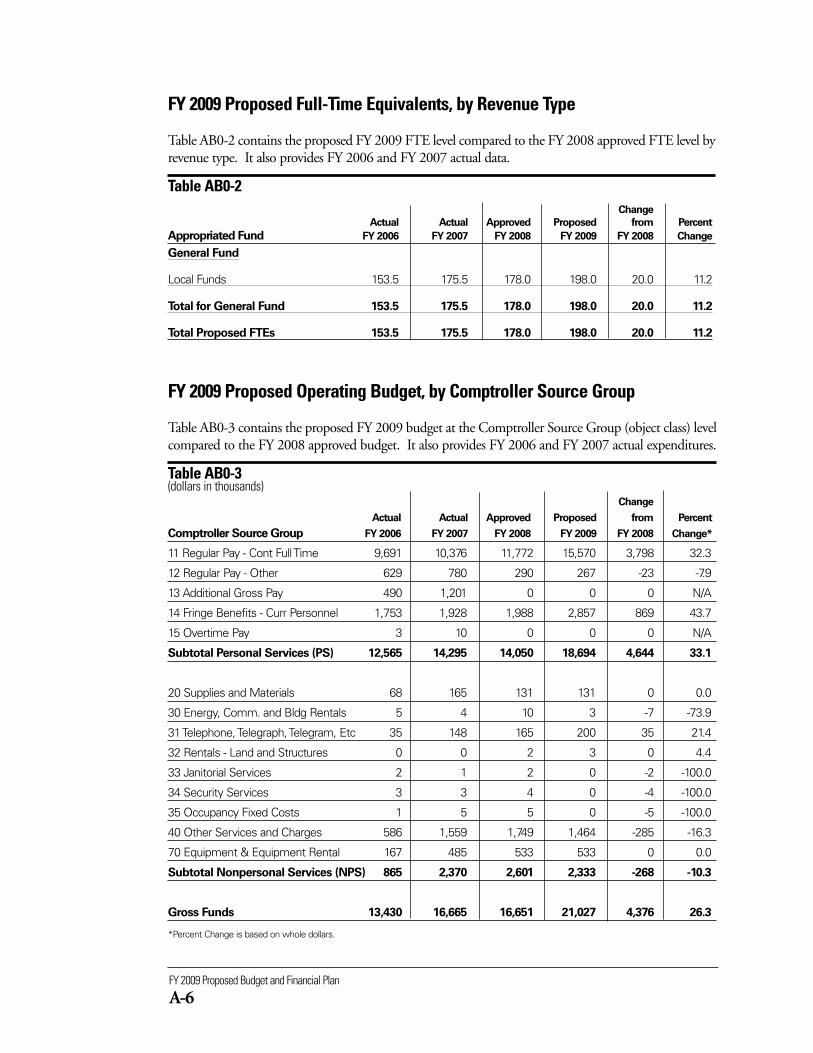
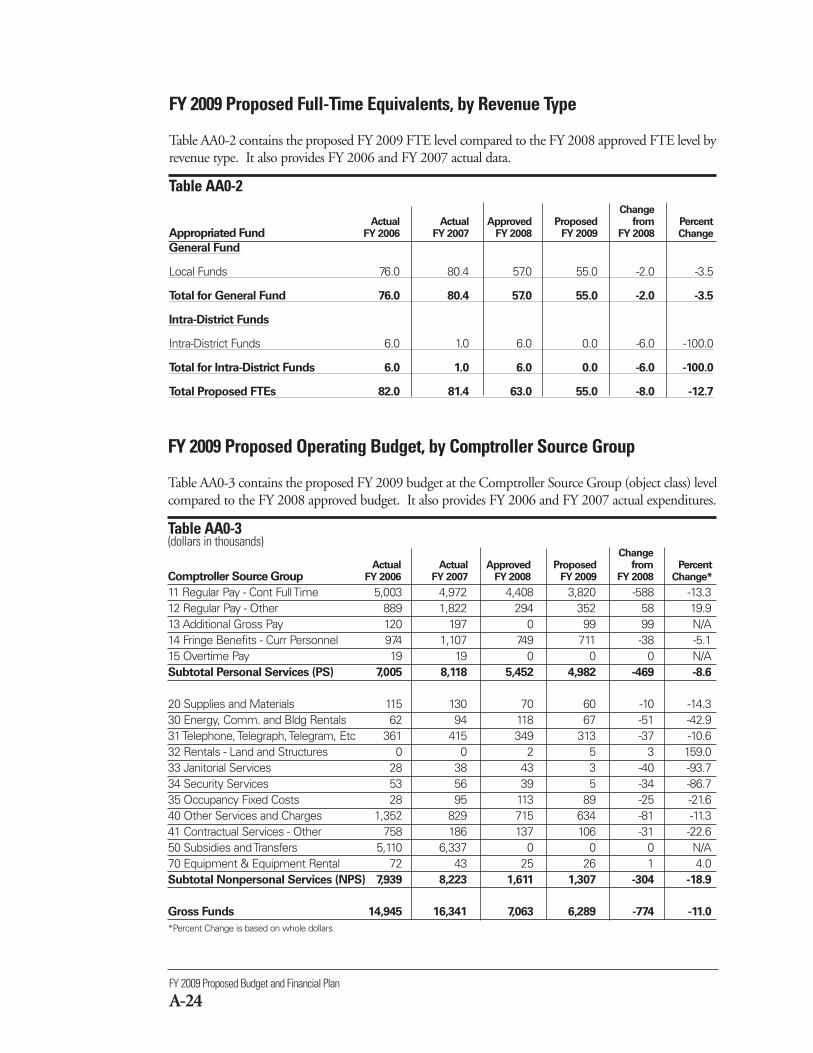
FY 2009 Proposed Operating Budget, by Comptroller Source Group
Table AB0-3 contains the proposed FY 2009 budget at the Comptroller Source Group (object class) levelcompared to the FY 2008 approved budget. It also provides FY 2006 and FY 2007 actual expenditures.
Table AB0-3(dollars in thousands)
Change
Actual Actual Approved Proposed from Percent
Comptroller Source Group FY 2006 FY 2007 FY 2008 FY 2009 FY 2008 Change*
11 Regular Pay - Cont Full Time 9,691 10,376 11,772 15,570 3,798 32.3
12 Regular Pay - Other 629 780 290 267 -23 -7.9
13 Additional Gross Pay 490 1,201 0 0 0 N/A
14 Fringe Benefits - Curr Personnel 1,753 1,928 1,988 2,857 869 43.7
15 Overtime Pay 3 10 0 0 0 N/A
Subtotal Personal Services (PS) 12,565 14,295 14,050 18,694 4,644 33.1
20 Supplies and Materials 68 165 131 131 0 0.0
30 Energy, Comm. and Bldg Rentals 5 4 10 3 -7 -73.9
31 Telephone, Telegraph, Telegram, Etc 35 148 165 200 35 21.4
32 Rentals - Land and Structures 0 0 2 3 0 4.4
33 Janitorial Services 2 1 2 0 -2 -100.0
34 Security Services 3 3 4 0 -4 -100.0
35 Occupancy Fixed Costs 1 5 5 0 -5 -100.0
40 Other Services and Charges 586 1,559 1,749 1,464 -285 -16.3
70 Equipment & Equipment Rental 167 485 533 533 0 0.0
Subtotal Nonpersonal Services (NPS) 865 2,370 2,601 2,333 -268 -10.3
Gross Funds 13,430 16,665 16,651 21,027 4,376 26.3
*Percent Change is based on whole dollars.
FY 2009 Proposed Full-Time Equivalents, by Revenue Type
Table AB0-2 contains the proposed FY 2009 FTE level compared to the FY 2008 approved FTE level byrevenue type. It also provides FY 2006 and FY 2007 actual data.
Table AB0-2 Change
Actual Actual Approved Proposed from Percent
Appropriated Fund FY 2006 FY 2007 FY 2008 FY 2009 FY 2008 Change
General Fund
Local Funds 153.5 175.5 178.0 198.0 20.0 11.2
Total for General Fund 153.5 175.5 178.0 198.0 20.0 11.2
Total Proposed FTEs 153.5 175.5 178.0 198.0 20.0 11.2
Council of the District of Columbia
A-7
Dollars in Thousands Full-Time EquivalentsChange Change
Actual Approved Proposed from Actual Approved Proposed from Program/Activity FY 2007 FY 2008 FY 2009 FY 2008 FY 2007 FY 2008 FY 2009 FY 2008
(1000) Council Administration
(1100) Council Administration 16,665 16,651 0 -16,651 175.5 178.0 0.0 -178.0
(1101) Council Benefits 0 0 2,850 2,850 0.0 0.0 0.0 0.0
(1102) Council Fixed Cost 0 0 205 205 0.0 0.0 0.0 0.0
Subtotal (1000) Council Administration 16,665 16,651 3,056 -13,595 175.5 178.0 0.0 -178.0
(2000) Council Administration
(0025) Secretary to the Council 0 0 3,631 3,631 0.0 0.0 28.0 28.0
(0026) General Counsel 0 0 1,101 1,101 0.0 0.0 10.0 10.0
(0027) Budget Director 0 0 657 657 0.0 0.0 7.0 7.0
(0028) Policy Office 0 0 477 477 0.0 0.0 6.0 6.0
(0029) Office of Communications 0 0 191 191 0.0 0.0 2.0 2.0
Subtotal (2000) Council Administration 0 0 6,057 6,057 0.0 0.0 53.0 53.0
(3000) Council Members
(0100) Councilmember Ward 1 0 0 453 453 0.0 0.0 6.0 6.0
(0200) Councilmember Ward 2 0 0 445 445 0.0 0.0 6.0 6.0
(0300) Councilmember Ward 3 0 0 453 453 0.0 0.0 6.0 6.0
(0400) Councilmember Ward 4 0 0 453 453 0.0 0.0 6.0 6.0
(0500) Councilmember Ward 5 0 0 453 453 0.0 0.0 6.0 6.0
(0600) Councilmember Ward 6 0 0 453 453 0.0 0.0 6.0 6.0
(0700) Councilmember Ward 7 0 0 453 453 0.0 0.0 6.0 6.0
(0800) Councilmember Ward 8 0 0 445 445 0.0 0.0 6.0 6.0
(0900) Councilmember at Large A 0 0 445 445 0.0 0.0 6.0 6.0
(1010) Councilmember at Large B 0 0 453 453 0.0 0.0 6.0 6.0
(1011) Councilmember at Large C 0 0 453 453 0.0 0.0 6.0 6.0
(1012) Councilmember at Large D 0 0 445 445 0.0 0.0 6.0 6.0
(1300) Chairman 0 0 809 809 0.0 0.0 10.0 10.0
Subtotal (3000) Council Members 0 0 6,215 6,215 0.0 0.0 82.0 82.0
(Continued on next page)
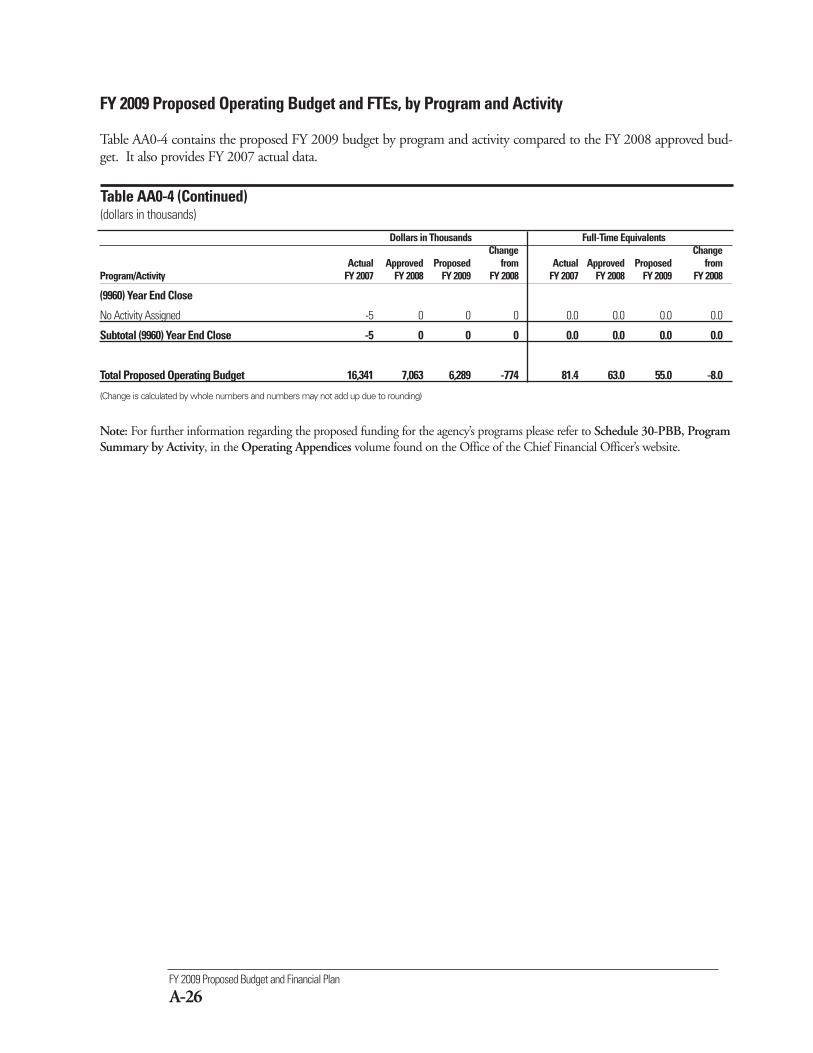
FY 2009 Proposed Operating Budget and FTEs, by Program and Activity
Table AB0-4 contains the proposed FY 2009 budget by program and activity compared to the FY 2008 approved bud-get. It also provides FY 2007 actual data.
Table AB0-4(dollars in thousands)
FY 2009 Proposed Budget and Financial Plan
A-8
Dollars in Thousands Full-Time EquivalentsChange Change
Actual Approved Proposed from Actual Approved Proposed from Program/Activity FY 2007 FY 2008 FY 2009 FY 2008 FY 2007 FY 2008 FY 2009 FY 2008
(4000) Committee
(4020) Committee of the Whole (COW) 0 0 838 838 0.0 0.0 10.0 10.0
(4025) Committee on Finance and Revenue 0 0 465 465 0.0 0.0 5.0 5.0
(4030) Committee on Economic Development 0 0 465 465 0.0 0.0 5.0 5.0
(4035) Committee on Health 0 0 465 465 0.0 0.0 5.0 5.0
(4040) Committee on Housing and Urban Affairs 0 0 465 465 0.0 0.0 5.0 5.0
(4045) Committee on Human Services 0 0 465 465 0.0 0.0 5.0 5.0
(4050) Committee on Libraries, Parks and Recreation 0 0 386 386 0.0 0.0 4.0 4.0
(4055) Committee on the Public Safety and the Judiciary 0 0 465 465 0.0 0.0 5.0 5.0
(4060) Committee on Public Srvc. and Consumer Affairs 0 0 465 465 0.0 0.0 5.0 5.0
(4065) Committee on Public Works and the Environment 0 0 465 465 0.0 0.0 5.0 5.0
(4070) Committee on Workforce Development and Govt. Ops. 0 0 465 465 0.0 0.0 5.0 5.0
(4090) Committee on Development and Expansion 0 0 289 289 0.0 0.0 4.0 4.0
Subtotal (4000) Committee 0 0 5,699 5,699 0.0 0.0 63.0 63.0
Total Proposed Operating Budget 16,665 16,651 21,027 4,376 175.5 178.0 198.0 20.0
(Change is calculated by whole numbers and numbers may not add up due to rounding)
Note: For further information regarding the proposed funding for the agency’s programs, please refer to Schedule 30-PBB,Program Summary by Activity, in the Operating Appendices volume found on the Office of the Chief Financial Officer’s website.
FY 2009 Proposed Operating Budget and FTEs, by Program and Activity
Table AB0-4 contains the proposed FY 2009 budget by program and activity compared to the FY 2008 approved bud-get. It also provides FY 2007 actual data.
Table AB0-4 (Continued)(dollars in thousands)
Council of the District of Columbia
A-9
FY 2008 Approved Budget to FY 2009 Proposed Budget, by Revenue Type
This is a new table for FY 2009 that itemizes the changes made during the development of the FY 2009proposed budget. The FY 2009 Mayoral Local funds budget target reflects the recurring elements of anagency’s FY 2008 approved budget. See the How to Read the Budget chapter in the Executive Summaryvolume for more information on this table.
The mission of the Office of the District of Columbia Auditor(ODCA) is to assist the Council of the District of Columbia inperforming its responsibilities by auditing the accounts and pro-grams of the government to ensure that effective programmaticand budgetary decisions are made.
Office of the D.C. Auditor
A-11
(AC0)
Office of the District of ColumbiaAuditorwww.dcauditor.orgTelephone: 202-727-3600
% ChangeFY 2007 FY 2008 FY 2009 from
Description Actual Approved Proposed FY 2008Operating Budget $1,948,700 $2,516,744 $4,164,510 65.5FTEs 16.0 18.0 30.0 66.7
The agency plans to fulfill its mission by achieving the following objectives:
Objective 1: Improve the efficiency of District government and the use of public funds by increasing theperformance audit program.
Objective 2: Improve the agency’s effectiveness by monitoring agencies’ compliance with ODCA recom-mendations.
To view complete agency performance plans, please visit the ‘Performance Plans and Reports’ link on theCapStat webpage at http://capstat.oca.dc.gov/.
These objectives are funded through the following agency program:
■ Audit, Financial Oversight and Investigations - provides assistance to the Council of the District ofColumbia in performing its oversight responsibilities; annually audits the accounts, operations andprograms of the District of Columbia government, pursuant to Section 455 of Public Law 93-198;and certifies revenue estimates in support of municipal bond issuances, pursuant to Section 603 ofPublic Law 93-198. Through this program, the agency is required by the Advisory NeighborhoodCommissions Act of 1975, as amended, to provide financial oversight and management to the Districtgovernment's 37 Advisory Neighborhood Commissions (ANCs) and to manage and administer theANC Security Fund. The Office of the District of Columbia Auditor is also required (by various laws)to conduct 17 additional audits.
FY 2009 Proposed Budget and Financial Plan
A-12
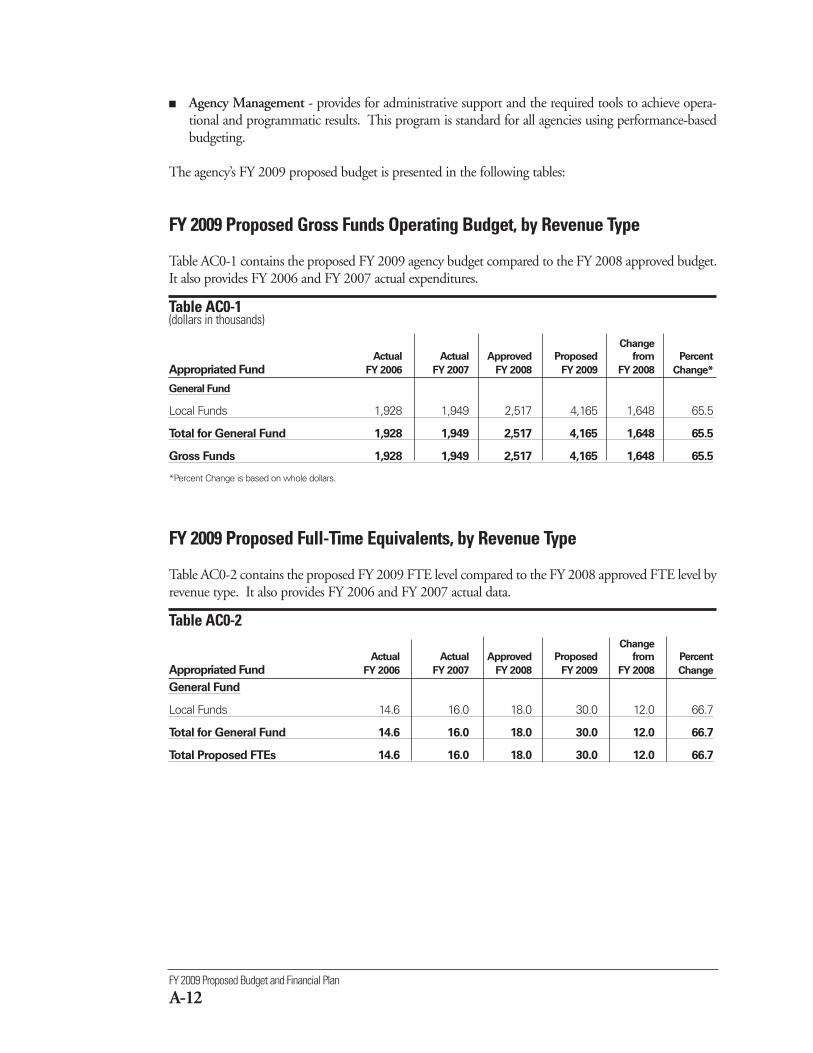
FY 2009 Proposed Gross Funds Operating Budget, by Revenue Type
Table AC0-1 contains the proposed FY 2009 agency budget compared to the FY 2008 approved budget.It also provides FY 2006 and FY 2007 actual expenditures.
Table AC0-1 (dollars in thousands)
Change
Actual Actual Approved Proposed from Percent
Appropriated Fund FY 2006 FY 2007 FY 2008 FY 2009 FY 2008 Change*
General Fund
Local Funds 1,928 1,949 2,517 4,165 1,648 65.5
Total for General Fund 1,928 1,949 2,517 4,165 1,648 65.5
Gross Funds 1,928 1,949 2,517 4,165 1,648 65.5
*Percent Change is based on whole dollars.
FY 2009 Proposed Full-Time Equivalents, by Revenue Type
Table AC0-2 contains the proposed FY 2009 FTE level compared to the FY 2008 approved FTE level byrevenue type. It also provides FY 2006 and FY 2007 actual data.
Table AC0-2 Change
Actual Actual Approved Proposed from Percent
Appropriated Fund FY 2006 FY 2007 FY 2008 FY 2009 FY 2008 Change
General Fund
Local Funds 14.6 16.0 18.0 30.0 12.0 66.7
Total for General Fund 14.6 16.0 18.0 30.0 12.0 66.7
Total Proposed FTEs 14.6 16.0 18.0 30.0 12.0 66.7
■ Agency Management - provides for administrative support and the required tools to achieve opera-tional and programmatic results. This program is standard for all agencies using performance-basedbudgeting.
The agency’s FY 2009 proposed budget is presented in the following tables:
Office of the D.C. Auditor
A-13
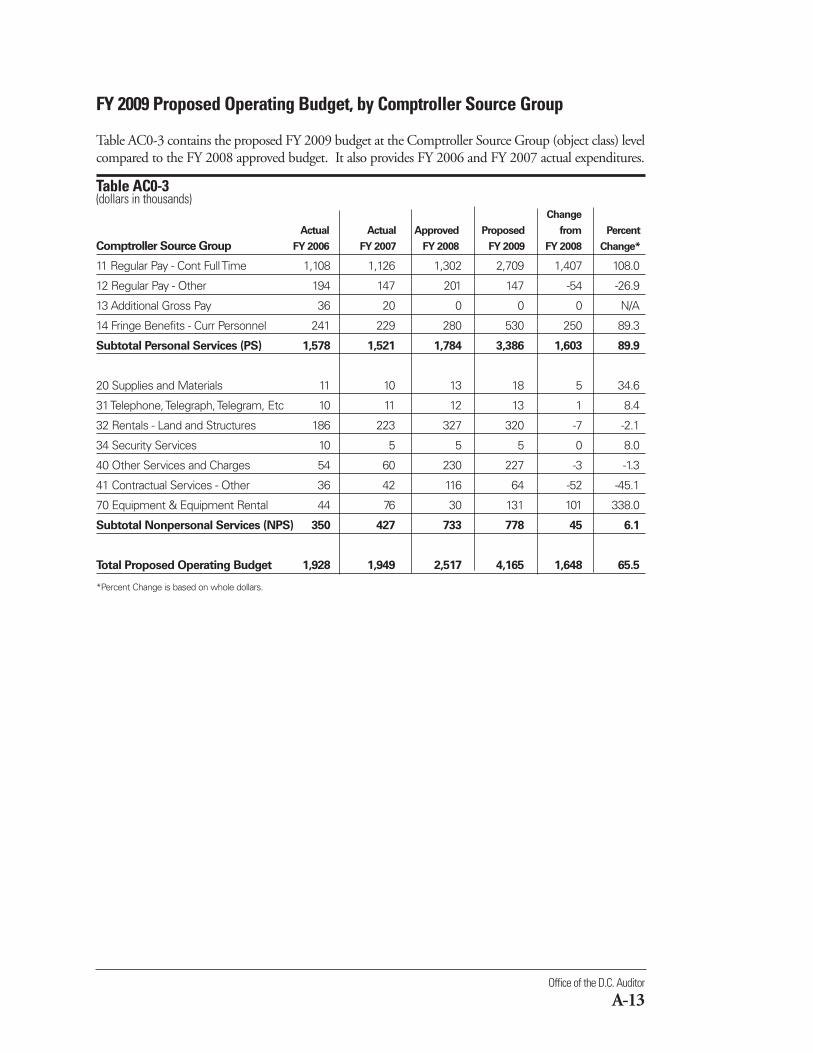
FY 2009 Proposed Operating Budget, by Comptroller Source Group
Table AC0-3 contains the proposed FY 2009 budget at the Comptroller Source Group (object class) levelcompared to the FY 2008 approved budget. It also provides FY 2006 and FY 2007 actual expenditures.
Table AC0-3(dollars in thousands)
Change
Actual Actual Approved Proposed from Percent
Comptroller Source Group FY 2006 FY 2007 FY 2008 FY 2009 FY 2008 Change*
11 Regular Pay - Cont Full Time 1,108 1,126 1,302 2,709 1,407 108.0
12 Regular Pay - Other 194 147 201 147 -54 -26.9
13 Additional Gross Pay 36 20 0 0 0 N/A
14 Fringe Benefits - Curr Personnel 241 229 280 530 250 89.3
Subtotal Personal Services (PS) 1,578 1,521 1,784 3,386 1,603 89.9
20 Supplies and Materials 11 10 13 18 5 34.6
31 Telephone, Telegraph, Telegram, Etc 10 11 12 13 1 8.4
32 Rentals - Land and Structures 186 223 327 320 -7 -2.1
34 Security Services 10 5 5 5 0 8.0
40 Other Services and Charges 54 60 230 227 -3 -1.3
41 Contractual Services - Other 36 42 116 64 -52 -45.1
70 Equipment & Equipment Rental 44 76 30 131 101 338.0
Subtotal Nonpersonal Services (NPS) 350 427 733 778 45 6.1
Total Proposed Operating Budget 1,928 1,949 2,517 4,165 1,648 65.5
*Percent Change is based on whole dollars.
FY 2009 Proposed Budget and Financial Plan
A-14
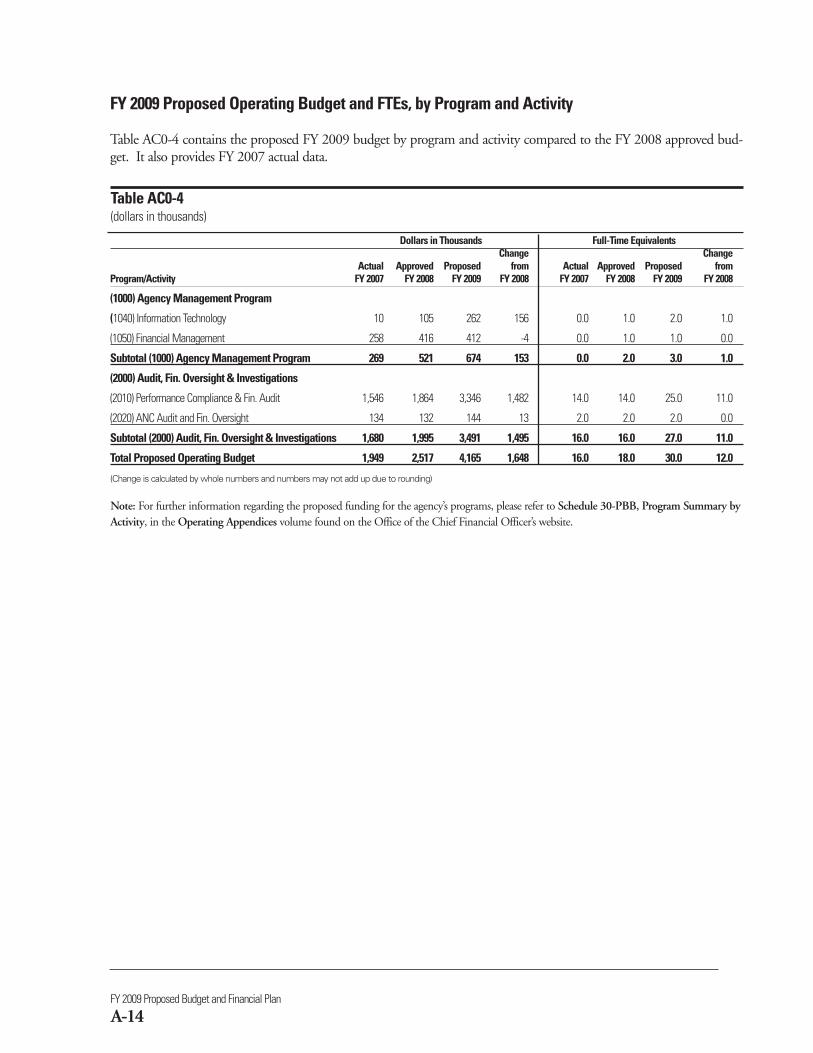
Dollars in Thousands Full-Time EquivalentsChange Change
Actual Approved Proposed from Actual Approved Proposed from Program/Activity FY 2007 FY 2008 FY 2009 FY 2008 FY 2007 FY 2008 FY 2009 FY 2008
(1000) Agency Management Program
(1040) Information Technology 10 105 262 156 0.0 1.0 2.0 1.0
(1050) Financial Management 258 416 412 -4 0.0 1.0 1.0 0.0
Subtotal (1000) Agency Management Program 269 521 674 153 0.0 2.0 3.0 1.0
(2000) Audit, Fin. Oversight & Investigations
(2010) Performance Compliance & Fin. Audit 1,546 1,864 3,346 1,482 14.0 14.0 25.0 11.0
(2020) ANC Audit and Fin. Oversight 134 132 144 13 2.0 2.0 2.0 0.0
Subtotal (2000) Audit, Fin. Oversight & Investigations 1,680 1,995 3,491 1,495 16.0 16.0 27.0 11.0
Total Proposed Operating Budget 1,949 2,517 4,165 1,648 16.0 18.0 30.0 12.0
(Change is calculated by whole numbers and numbers may not add up due to rounding)
FY 2009 Proposed Operating Budget and FTEs, by Program and Activity
Table AC0-4 contains the proposed FY 2009 budget by program and activity compared to the FY 2008 approved bud-get. It also provides FY 2007 actual data.
Table AC0-4(dollars in thousands)
Note: For further information regarding the proposed funding for the agency’s programs, please refer to Schedule 30-PBB, Program Summary byActivity, in the Operating Appendices volume found on the Office of the Chief Financial Officer’s website.
Office of the D.C. Auditor
A-15
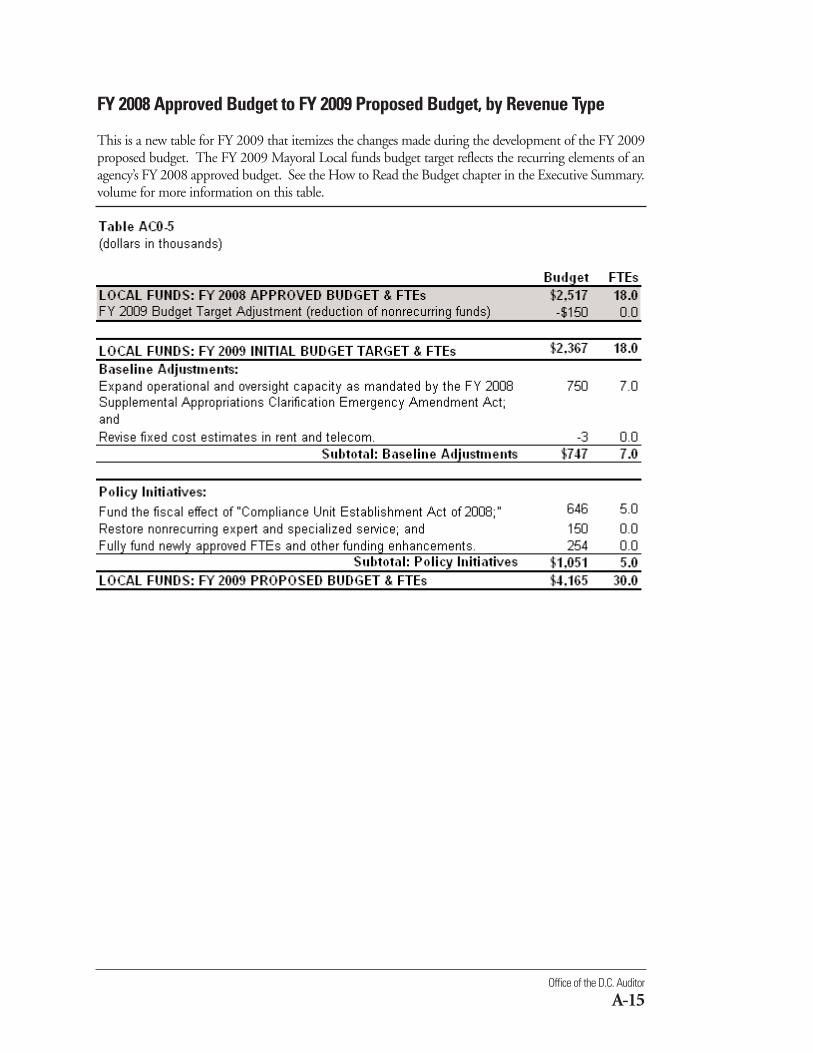
FY 2008 Approved Budget to FY 2009 Proposed Budget, by Revenue Type
This is a new table for FY 2009 that itemizes the changes made during the development of the FY 2009proposed budget. The FY 2009 Mayoral Local funds budget target reflects the recurring elements of anagency’s FY 2008 approved budget. See the How to Read the Budget chapter in the Executive Summary.volume for more information on this table.
FY 2009 Proposed Budget and Financial Plan
A-16
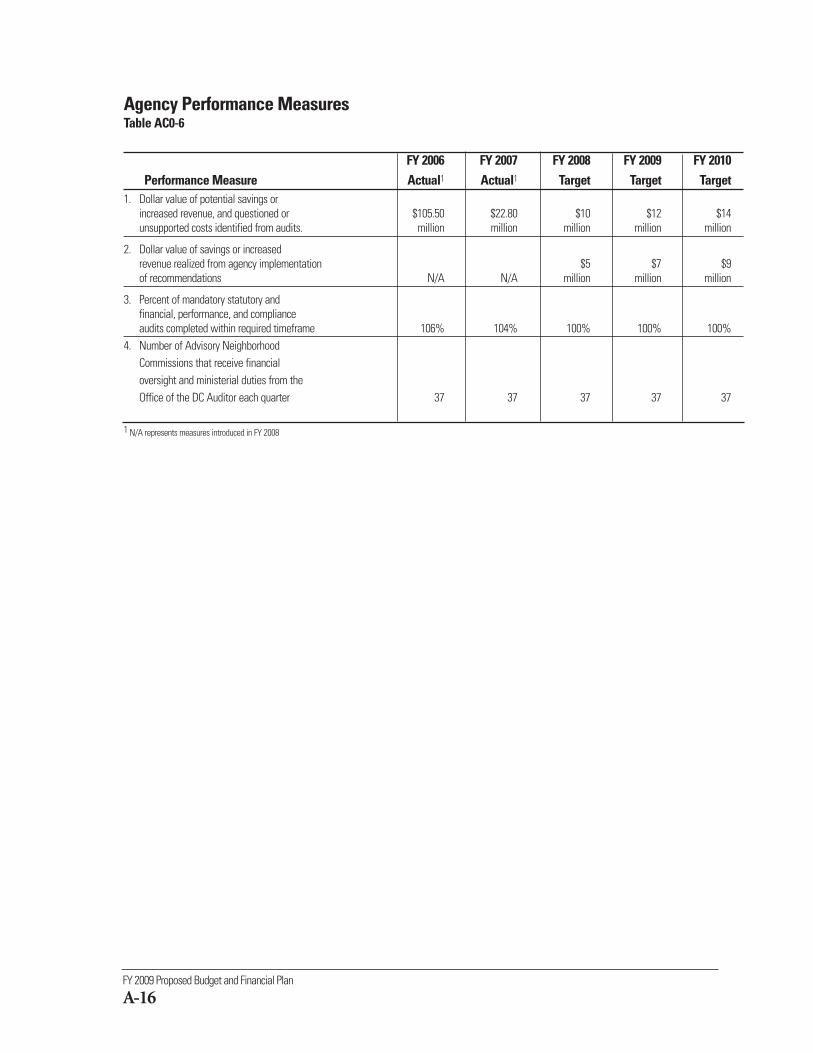
Agency Performance MeasuresTable AC0-6
FY 2006 FY 2007 FY 2008 FY 2009 FY 2010Performance Measure Actual1 Actual1 Target Target Target
1. Dollar value of potential savings or increased revenue, and questioned or $105.50 $22.80 $10 $12 $14unsupported costs identified from audits. million million million million million
2. Dollar value of savings or increased revenue realized from agency implementation $5 $7 $9of recommendations N/A N/A million million million
3. Percent of mandatory statutory and financial, performance, and compliance audits completed within required timeframe 106% 104% 100% 100% 100%
4. Number of Advisory NeighborhoodCommissions that receive financial oversight and ministerial duties from the Office of the DC Auditor each quarter 37 37 37 37 37
1 N/A represents measures introduced in FY 2008
Advisory Neighborhood Commissions
A-17
The mission of the Advisory Neighborhood Commissions(ANCs) is to advise the District government on matters of pub-lic policy, including decisions regarding planning, streets, recre-ation, social services programs, health, safety, and sanitation inrespective neighborhood areas. This mission, supported by theOffice of ANCs described below under Agency Management,includes reviewing and making recommendations on zoningchanges, variances, public improvements, licenses, and permitsof significance for neighborhood planning and development.
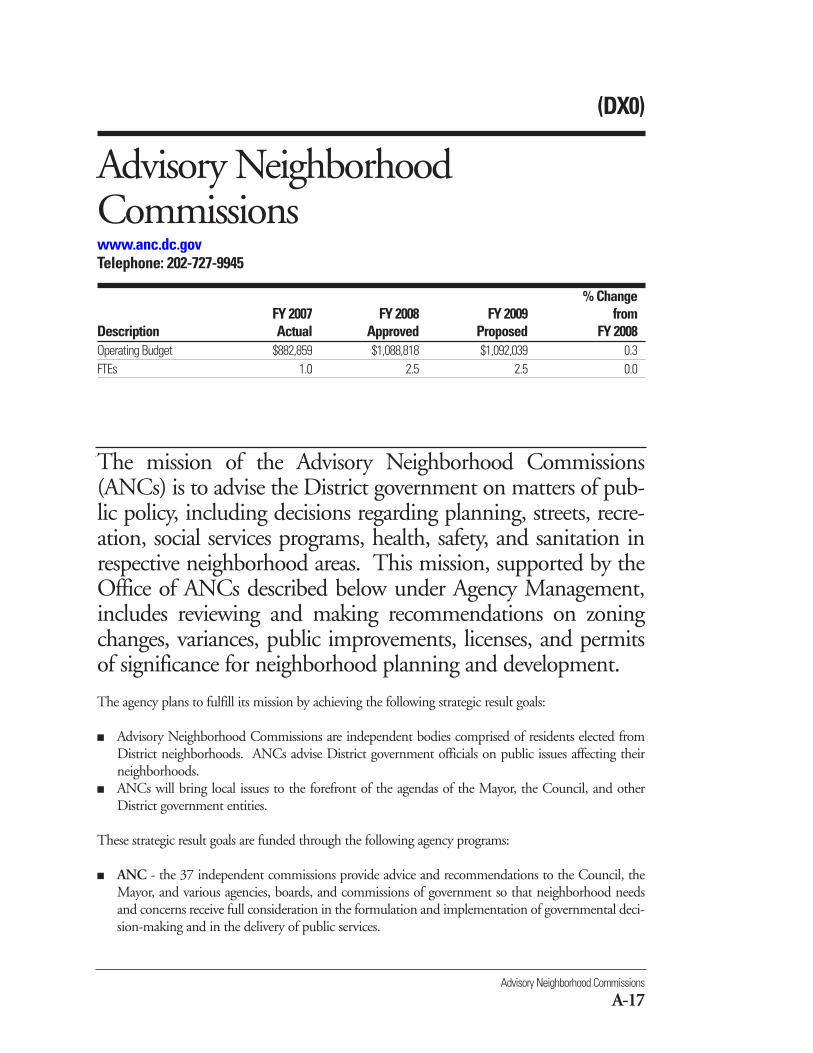
(DX0)
Advisory NeighborhoodCommissions www.anc.dc.govTelephone: 202-727-9945
% ChangeFY 2007 FY 2008 FY 2009 from
Description Actual Approved Proposed FY 2008Operating Budget $882,859 $1,088,818 $1,092,039 0.3FTEs 1.0 2.5 2.5 0.0
The agency plans to fulfill its mission by achieving the following strategic result goals:
■ Advisory Neighborhood Commissions are independent bodies comprised of residents elected fromDistrict neighborhoods. ANCs advise District government officials on public issues affecting theirneighborhoods.
■ ANCs will bring local issues to the forefront of the agendas of the Mayor, the Council, and otherDistrict government entities.
These strategic result goals are funded through the following agency programs:
■ ANC - the 37 independent commissions provide advice and recommendations to the Council, theMayor, and various agencies, boards, and commissions of government so that neighborhood needsand concerns receive full consideration in the formulation and implementation of governmental deci-sion-making and in the delivery of public services.
FY 2009 Proposed Budget and Financial Plan
A-18
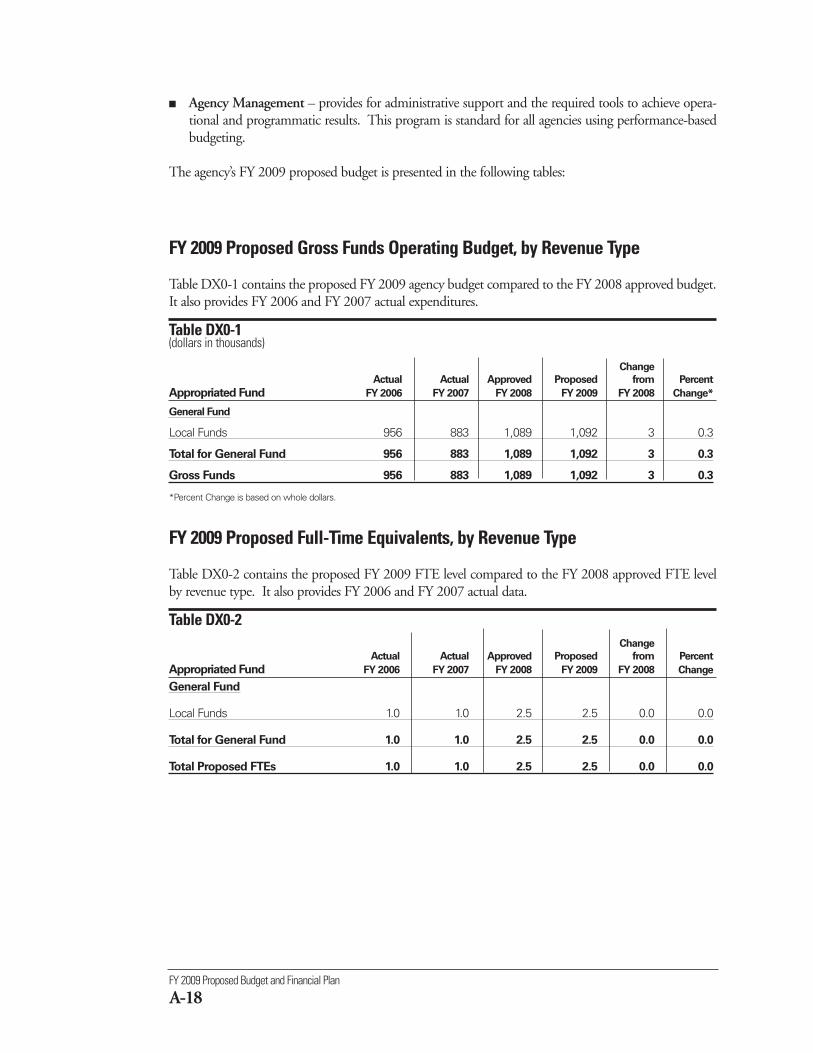
FY 2009 Proposed Gross Funds Operating Budget, by Revenue Type
Table DX0-1 contains the proposed FY 2009 agency budget compared to the FY 2008 approved budget.It also provides FY 2006 and FY 2007 actual expenditures.
Table DX0-1 (dollars in thousands)
Change
Actual Actual Approved Proposed from Percent
Appropriated Fund FY 2006 FY 2007 FY 2008 FY 2009 FY 2008 Change*
General Fund
Local Funds 956 883 1,089 1,092 3 0.3
Total for General Fund 956 883 1,089 1,092 3 0.3
Gross Funds 956 883 1,089 1,092 3 0.3
*Percent Change is based on whole dollars.
■ Agency Management – provides for administrative support and the required tools to achieve opera-tional and programmatic results. This program is standard for all agencies using performance-basedbudgeting.
The agency’s FY 2009 proposed budget is presented in the following tables:
FY 2009 Proposed Full-Time Equivalents, by Revenue Type
Table DX0-2 contains the proposed FY 2009 FTE level compared to the FY 2008 approved FTE levelby revenue type. It also provides FY 2006 and FY 2007 actual data.
Table DX0-2 Change
Actual Actual Approved Proposed from Percent
Appropriated Fund FY 2006 FY 2007 FY 2008 FY 2009 FY 2008 Change
General Fund
Local Funds 1.0 1.0 2.5 2.5 0.0 0.0
Total for General Fund 1.0 1.0 2.5 2.5 0.0 0.0
Total Proposed FTEs 1.0 1.0 2.5 2.5 0.0 0.0
Advisory Neighborhood Commissions
A-19
FY 2009 Proposed Operating Budget, by Comptroller Source Group
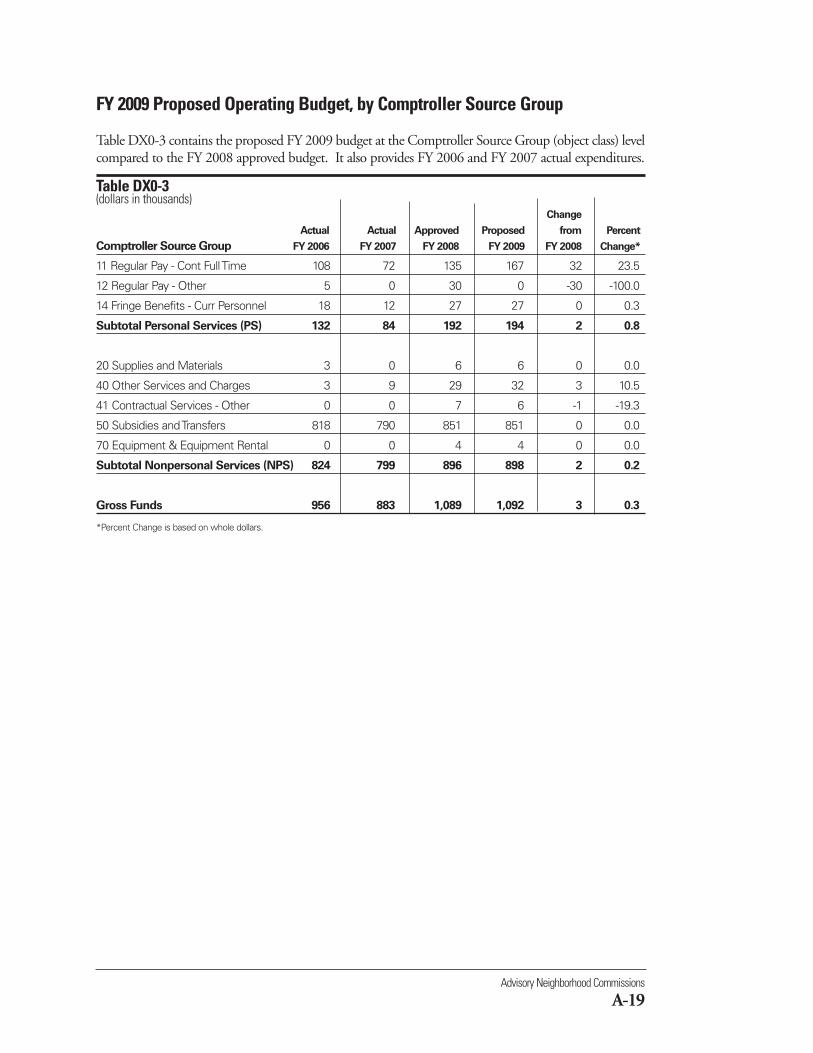
Table DX0-3 contains the proposed FY 2009 budget at the Comptroller Source Group (object class) levelcompared to the FY 2008 approved budget. It also provides FY 2006 and FY 2007 actual expenditures.
Table DX0-3(dollars in thousands)
Change
Actual Actual Approved Proposed from Percent
Comptroller Source Group FY 2006 FY 2007 FY 2008 FY 2009 FY 2008 Change*
11 Regular Pay - Cont Full Time 108 72 135 167 32 23.5
12 Regular Pay - Other 5 0 30 0 -30 -100.0
14 Fringe Benefits - Curr Personnel 18 12 27 27 0 0.3
Subtotal Personal Services (PS) 132 84 192 194 2 0.8
20 Supplies and Materials 3 0 6 6 0 0.0
40 Other Services and Charges 3 9 29 32 3 10.5
41 Contractual Services - Other 0 0 7 6 -1 -19.3
50 Subsidies and Transfers 818 790 851 851 0 0.0
70 Equipment & Equipment Rental 0 0 4 4 0 0.0
Subtotal Nonpersonal Services (NPS) 824 799 896 898 2 0.2
Gross Funds 956 883 1,089 1,092 3 0.3
*Percent Change is based on whole dollars.
FY 2009 Proposed Budget and Financial Plan
A-20
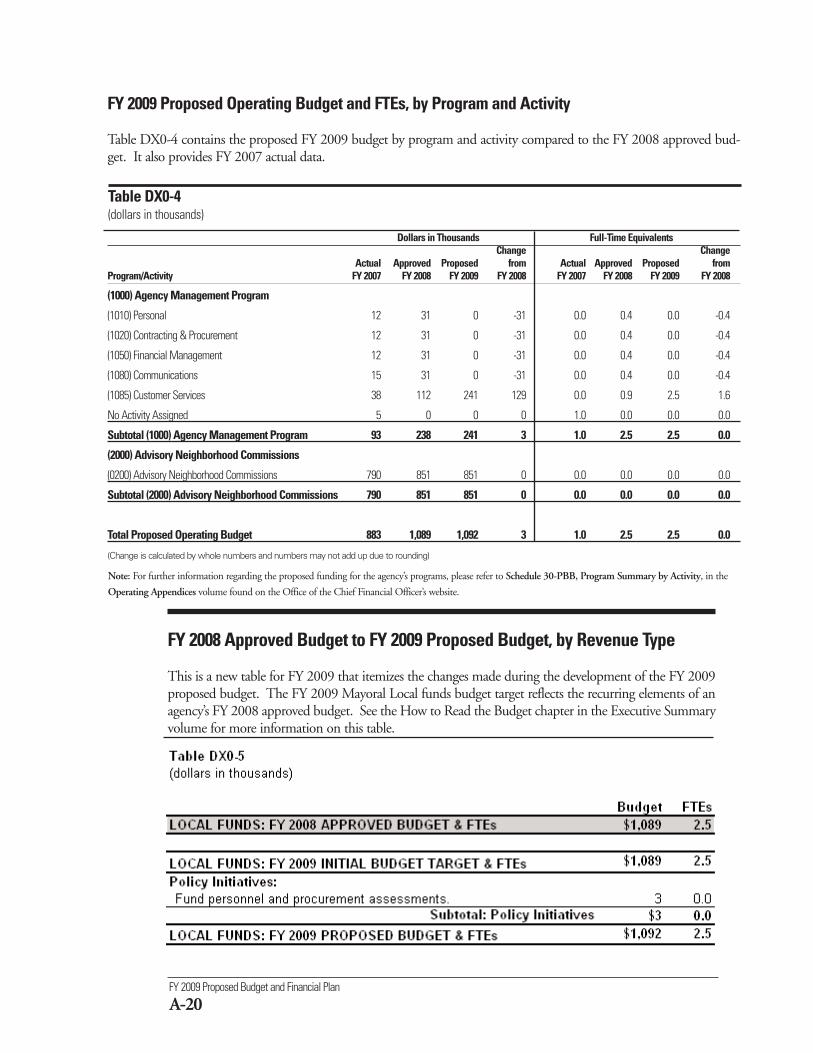
FY 2009 Proposed Operating Budget and FTEs, by Program and Activity
Table DX0-4 contains the proposed FY 2009 budget by program and activity compared to the FY 2008 approved bud-get. It also provides FY 2007 actual data.
Table DX0-4(dollars in thousands)
FY 2008 Approved Budget to FY 2009 Proposed Budget, by Revenue Type
This is a new table for FY 2009 that itemizes the changes made during the development of the FY 2009proposed budget. The FY 2009 Mayoral Local funds budget target reflects the recurring elements of anagency’s FY 2008 approved budget. See the How to Read the Budget chapter in the Executive Summaryvolume for more information on this table.
Dollars in Thousands Full-Time EquivalentsChange Change
Actual Approved Proposed from Actual Approved Proposed from Program/Activity FY 2007 FY 2008 FY 2009 FY 2008 FY 2007 FY 2008 FY 2009 FY 2008
(1000) Agency Management Program
(1010) Personal 12 31 0 -31 0.0 0.4 0.0 -0.4
(1020) Contracting & Procurement 12 31 0 -31 0.0 0.4 0.0 -0.4
(1050) Financial Management 12 31 0 -31 0.0 0.4 0.0 -0.4
(1080) Communications 15 31 0 -31 0.0 0.4 0.0 -0.4
(1085) Customer Services 38 112 241 129 0.0 0.9 2.5 1.6
No Activity Assigned 5 0 0 0 1.0 0.0 0.0 0.0
Subtotal (1000) Agency Management Program 93 238 241 3 1.0 2.5 2.5 0.0
(2000) Advisory Neighborhood Commissions
(0200) Advisory Neighborhood Commissions 790 851 851 0 0.0 0.0 0.0 0.0
Subtotal (2000) Advisory Neighborhood Commissions 790 851 851 0 0.0 0.0 0.0 0.0
Total Proposed Operating Budget 883 1,089 1,092 3 1.0 2.5 2.5 0.0
(Change is calculated by whole numbers and numbers may not add up due to rounding)
Note: For further information regarding the proposed funding for the agency’s programs, please refer to Schedule 30-PBB, Program Summary by Activity, in the
Operating Appendices volume found on the Office of the Chief Financial Officer’s website.
Office of the Mayor
A-21
The mission of the Office of the Mayor (EOM) is to serve thepublic by leading the District Government and ensuring resi-dents are served with efficiency, accountability, and transparency.
The agency plans to fulfill its mission by achieving the following objectives:
Objective 1: Ensure we have a city that focuses on core priorities including education, public safety,healthcare, human services, environment and infrastructure, and economic development and affordablehousing.
Objective 2: Provide leadership, strategic and policy direction to the Deputy Mayors and agencies.
Objective 3: Develop strong policy initiatives and forge relationships with the Council of the District ofColumbia, the United States Congress, and other government stakeholders.
Objective 4: Provide responsive action to new and persistent neighborhood issues and constituent serviceinquiries.
Objective 5: Share the Mayor’s vision for the District with constituents and in the press.
These objectives are funded through the following agency programs:
■ Office of the Mayor - provides leadership, strategic, and policy direction to the EOM, DeputyMayors, and agencies. This office ensures that the city focuses on core priorities including education,human services, economic development and affordable housing, infrastructure and environment, gov-ernment operations, healthcare and public safety. This program includes the following activities:
(AA0)
Office of the Mayorwww.dc.govTelephone: 202-727-1000
% ChangeFY 2007 FY 2008 FY 2009 from
Description Actual Approved Proposed FY 2008Operating Budget $16,340,642 $7,063,032 $6,289,393 -11.0FTEs 81.4 63.0 55.0 -12.7
- Support Services – provides operational support to EOM, Deputy Mayors, City Administrator,Criminal Justice Coordination Council, Office on Latino Affairs, Veterans Affairs, Asian PacificIslanders, Serve DC, Office of the Secretary, Office of Risk Management, and the Office of theState Superintendent of Education.
- Boards and Commissions – provides assistance to the Mayor in appointing citizens to boards andcommissions by recruiting quality candidates, timely processing of appointments, and by provid-ing customer service and support to each participant in the Mayoral appointment process.
- Office of Communications – provides media relations, public information, agency communica-tion review and coordination, and emergency preparedness response services to the public, mediaand District government in support of the administration’s vision, policies and initiatives.
- Policy and Legislative Affairs – provides advice, analysis and assistance to the Mayor and his cab-inet in successfully advocating a legislative and policy agenda. Responsibilities include Councilrelations policy development, federal relations, and legislative support.
- Mayor’s Correspondence Unit – answers written correspondence sent to the Mayor in a timely,thoughtful, and helpful manner. Responsibilities include researching within agencies to appro-priately answer constituent questions, disseminating, constituent consents to the appropriate loca-tion, and assuring constituents that matters will be addressed.
■ Agency Management - provides for administrative support and the required tools to achieve opera-tional and programmatic results. This program is standard for all agencies using performance-basedbudgeting.
The agency’s FY 2009 proposed budget is presented in the following tables:
FY 2009 Proposed Budget and Financial Plan
A-22
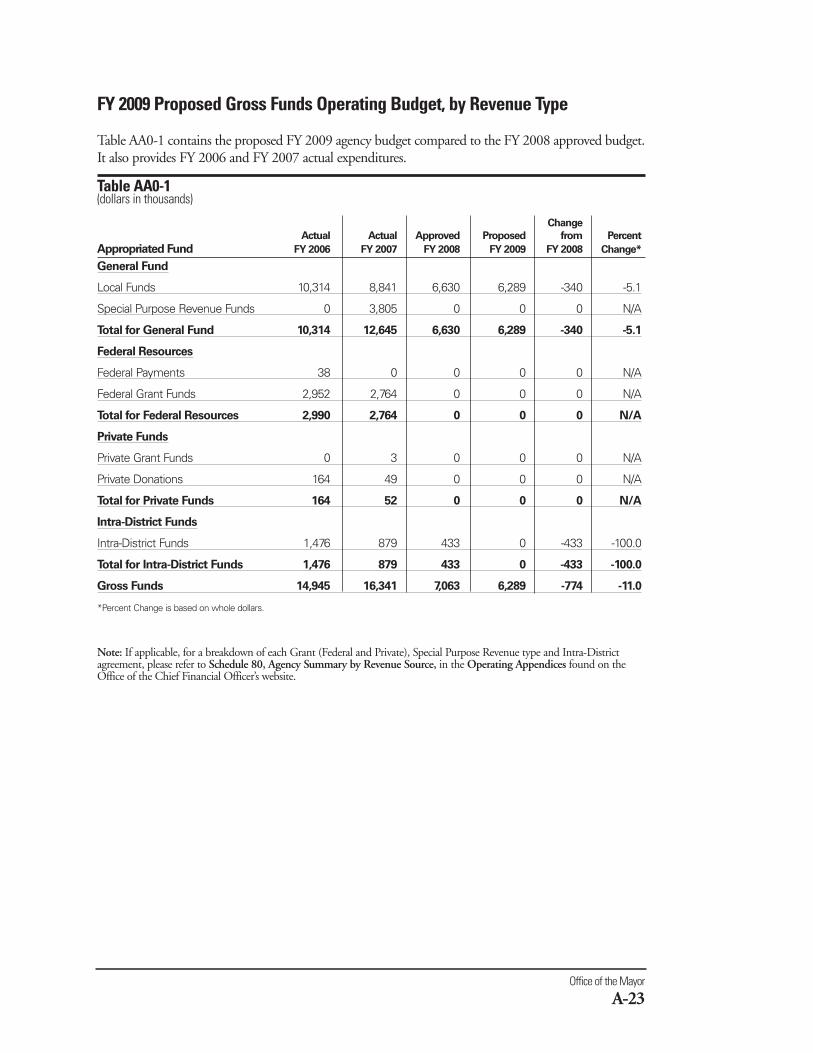
FY 2009 Proposed Gross Funds Operating Budget, by Revenue Type
Table AA0-1 contains the proposed FY 2009 agency budget compared to the FY 2008 approved budget.It also provides FY 2006 and FY 2007 actual expenditures.
Table AA0-1 (dollars in thousands)
Change
Actual Actual Approved Proposed from Percent
Appropriated Fund FY 2006 FY 2007 FY 2008 FY 2009 FY 2008 Change*
General Fund
Local Funds 10,314 8,841 6,630 6,289 -340 -5.1
Special Purpose Revenue Funds 0 3,805 0 0 0 N/A
Total for General Fund 10,314 12,645 6,630 6,289 -340 -5.1
Federal Resources
Federal Payments 38 0 0 0 0 N/A
Federal Grant Funds 2,952 2,764 0 0 0 N/A
Total for Federal Resources 2,990 2,764 0 0 0 N/A
Private Funds
Private Grant Funds 0 3 0 0 0 N/A
Private Donations 164 49 0 0 0 N/A
Total for Private Funds 164 52 0 0 0 N/A
Intra-District Funds
Intra-District Funds 1,476 879 433 0 -433 -100.0
Total for Intra-District Funds 1,476 879 433 0 -433 -100.0
Gross Funds 14,945 16,341 7,063 6,289 -774 -11.0
*Percent Change is based on whole dollars.
Note: If applicable, for a breakdown of each Grant (Federal and Private), Special Purpose Revenue type and Intra-Districtagreement, please refer to Schedule 80, Agency Summary by Revenue Source, in the Operating Appendices found on theOffice of the Chief Financial Officer’s website.
Office of the Mayor
A-23
FY 2009 Proposed Operating Budget, by Comptroller Source Group
Table AA0-3 contains the proposed FY 2009 budget at the Comptroller Source Group (object class) levelcompared to the FY 2008 approved budget. It also provides FY 2006 and FY 2007 actual expenditures.
Table AA0-3(dollars in thousands)
ChangeActual Actual Approved Proposed from Percent
Comptroller Source Group FY 2006 FY 2007 FY 2008 FY 2009 FY 2008 Change*
11 Regular Pay - Cont Full Time 5,003 4,972 4,408 3,820 -588 -13.312 Regular Pay - Other 889 1,822 294 352 58 19.913 Additional Gross Pay 120 197 0 99 99 N/A14 Fringe Benefits - Curr Personnel 974 1,107 749 711 -38 -5.115 Overtime Pay 19 19 0 0 0 N/ASubtotal Personal Services (PS) 7,005 8,118 5,452 4,982 -469 -8.6
20 Supplies and Materials 115 130 70 60 -10 -14.330 Energy, Comm. and Bldg Rentals 62 94 118 67 -51 -42.931 Telephone, Telegraph, Telegram, Etc 361 415 349 313 -37 -10.632 Rentals - Land and Structures 0 0 2 5 3 159.033 Janitorial Services 28 38 43 3 -40 -93.734 Security Services 53 56 39 5 -34 -86.735 Occupancy Fixed Costs 28 95 113 89 -25 -21.640 Other Services and Charges 1,352 829 715 634 -81 -11.341 Contractual Services - Other 758 186 137 106 -31 -22.650 Subsidies and Transfers 5,110 6,337 0 0 0 N/A70 Equipment & Equipment Rental 72 43 25 26 1 4.0Subtotal Nonpersonal Services (NPS) 7,939 8,223 1,611 1,307 -304 -18.9
Gross Funds 14,945 16,341 7,063 6,289 -774 -11.0
*Percent Change is based on whole dollars.
FY 2009 Proposed Full-Time Equivalents, by Revenue Type
Table AA0-2 contains the proposed FY 2009 FTE level compared to the FY 2008 approved FTE level byrevenue type. It also provides FY 2006 and FY 2007 actual data.
Table AA0-2 Change
Actual Actual Approved Proposed from PercentAppropriated Fund FY 2006 FY 2007 FY 2008 FY 2009 FY 2008 Change
General Fund
Local Funds 76.0 80.4 57.0 55.0 -2.0 -3.5
Total for General Fund 76.0 80.4 57.0 55.0 -2.0 -3.5
Intra-District Funds
Intra-District Funds 6.0 1.0 6.0 0.0 -6.0 -100.0
Total for Intra-District Funds 6.0 1.0 6.0 0.0 -6.0 -100.0
Total Proposed FTEs 82.0 81.4 63.0 55.0 -8.0 -12.7
FY 2009 Proposed Budget and Financial Plan
A-24
Office of the Mayor
A-25
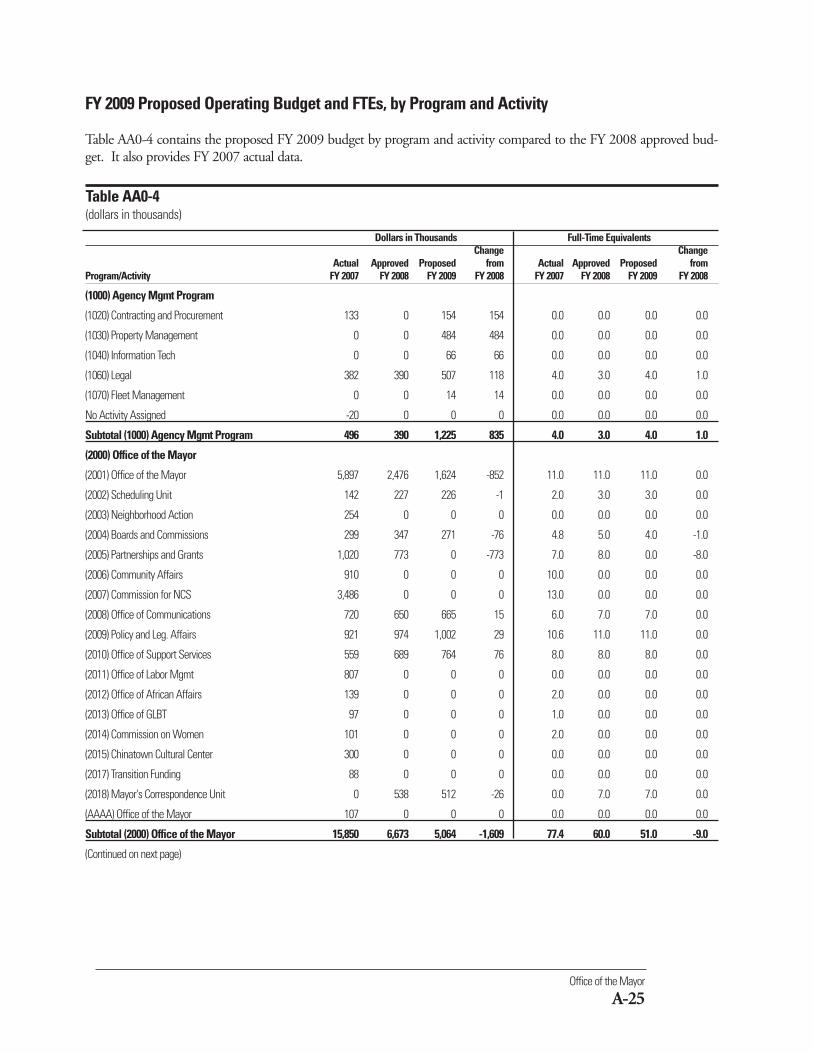
FY 2009 Proposed Operating Budget and FTEs, by Program and Activity
Table AA0-4 contains the proposed FY 2009 budget by program and activity compared to the FY 2008 approved bud-get. It also provides FY 2007 actual data.
Table AA0-4(dollars in thousands)
Dollars in Thousands Full-Time EquivalentsChange Change
Actual Approved Proposed from Actual Approved Proposed from Program/Activity FY 2007 FY 2008 FY 2009 FY 2008 FY 2007 FY 2008 FY 2009 FY 2008
(1000) Agency Mgmt Program
(1020) Contracting and Procurement 133 0 154 154 0.0 0.0 0.0 0.0
(1030) Property Management 0 0 484 484 0.0 0.0 0.0 0.0
(1040) Information Tech 0 0 66 66 0.0 0.0 0.0 0.0
(1060) Legal 382 390 507 118 4.0 3.0 4.0 1.0
(1070) Fleet Management 0 0 14 14 0.0 0.0 0.0 0.0
No Activity Assigned -20 0 0 0 0.0 0.0 0.0 0.0
Subtotal (1000) Agency Mgmt Program 496 390 1,225 835 4.0 3.0 4.0 1.0
(2000) Office of the Mayor
(2001) Office of the Mayor 5,897 2,476 1,624 -852 11.0 11.0 11.0 0.0
(2002) Scheduling Unit 142 227 226 -1 2.0 3.0 3.0 0.0
(2003) Neighborhood Action 254 0 0 0 0.0 0.0 0.0 0.0
(2004) Boards and Commissions 299 347 271 -76 4.8 5.0 4.0 -1.0
(2005) Partnerships and Grants 1,020 773 0 -773 7.0 8.0 0.0 -8.0
(2006) Community Affairs 910 0 0 0 10.0 0.0 0.0 0.0
(2007) Commission for NCS 3,486 0 0 0 13.0 0.0 0.0 0.0
(2008) Office of Communications 720 650 665 15 6.0 7.0 7.0 0.0
(2009) Policy and Leg. Affairs 921 974 1,002 29 10.6 11.0 11.0 0.0
(2010) Office of Support Services 559 689 764 76 8.0 8.0 8.0 0.0
(2011) Office of Labor Mgmt 807 0 0 0 0.0 0.0 0.0 0.0
(2012) Office of African Affairs 139 0 0 0 2.0 0.0 0.0 0.0
(2013) Office of GLBT 97 0 0 0 1.0 0.0 0.0 0.0
(2014) Commission on Women 101 0 0 0 2.0 0.0 0.0 0.0
(2015) Chinatown Cultural Center 300 0 0 0 0.0 0.0 0.0 0.0
(2017) Transition Funding 88 0 0 0 0.0 0.0 0.0 0.0
(2018) Mayor's Correspondence Unit 0 538 512 -26 0.0 7.0 7.0 0.0
(AAAA) Office of the Mayor 107 0 0 0 0.0 0.0 0.0 0.0
Subtotal (2000) Office of the Mayor 15,850 6,673 5,064 -1,609 77.4 60.0 51.0 -9.0
(Continued on next page)
Dollars in Thousands Full-Time EquivalentsChange Change
Actual Approved Proposed from Actual Approved Proposed from Program/Activity FY 2007 FY 2008 FY 2009 FY 2008 FY 2007 FY 2008 FY 2009 FY 2008
(9960) Year End Close
No Activity Assigned -5 0 0 0 0.0 0.0 0.0 0.0
Subtotal (9960) Year End Close -5 0 0 0 0.0 0.0 0.0 0.0
Total Proposed Operating Budget 16,341 7,063 6,289 -774 81.4 63.0 55.0 -8.0
(Change is calculated by whole numbers and numbers may not add up due to rounding)
Note: For further information regarding the proposed funding for the agency’s programs please refer to Schedule 30-PBB, ProgramSummary by Activity, in the Operating Appendices volume found on the Office of the Chief Financial Officer’s website.
FY 2009 Proposed Operating Budget and FTEs, by Program and Activity
Table AA0-4 contains the proposed FY 2009 budget by program and activity compared to the FY 2008 approved bud-get. It also provides FY 2007 actual data.
Table AA0-4 (Continued)(dollars in thousands)
FY 2009 Proposed Budget and Financial Plan
A-26
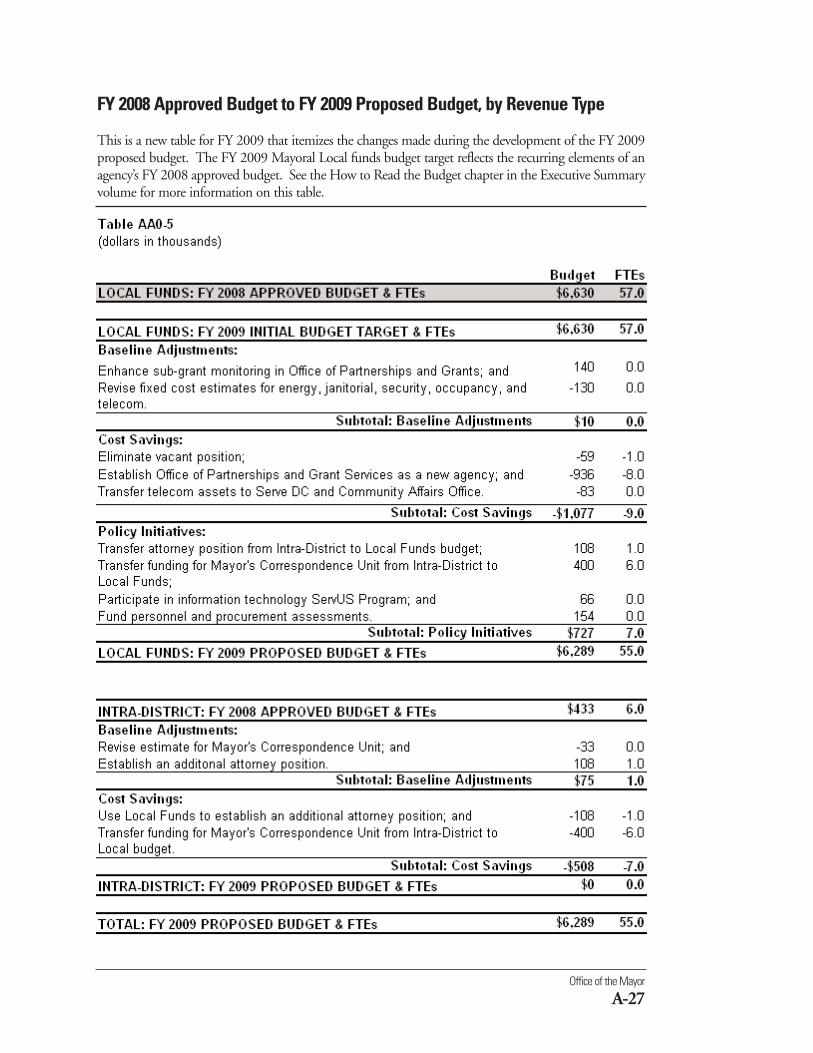
Office of the Mayor
A-27
FY 2008 Approved Budget to FY 2009 Proposed Budget, by Revenue Type
This is a new table for FY 2009 that itemizes the changes made during the development of the FY 2009proposed budget. The FY 2009 Mayoral Local funds budget target reflects the recurring elements of anagency’s FY 2008 approved budget. See the How to Read the Budget chapter in the Executive Summaryvolume for more information on this table.
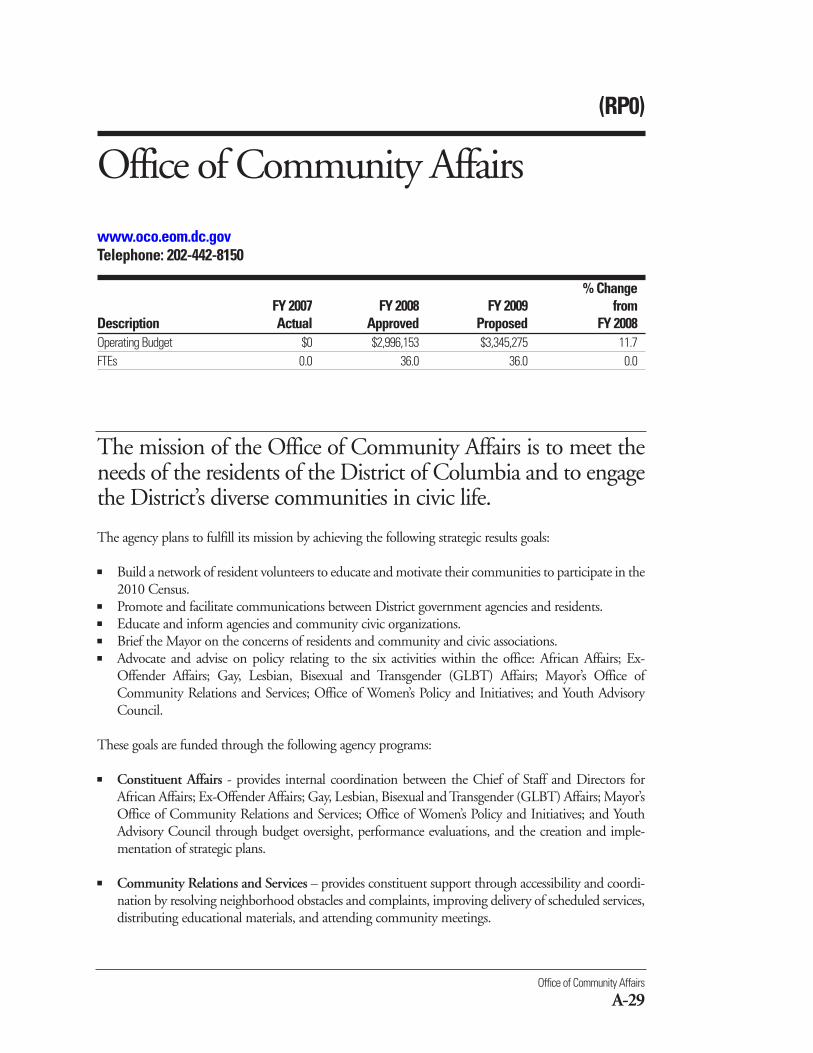
Office of Community Affairs
A-29
The agency plans to fulfill its mission by achieving the following strategic results goals:
■ Build a network of resident volunteers to educate and motivate their communities to participate in the2010 Census.
■ Promote and facilitate communications between District government agencies and residents.■ Educate and inform agencies and community civic organizations.■ Brief the Mayor on the concerns of residents and community and civic associations.■ Advocate and advise on policy relating to the six activities within the office: African Affairs; Ex-
Offender Affairs; Gay, Lesbian, Bisexual and Transgender (GLBT) Affairs; Mayor’s Office ofCommunity Relations and Services; Office of Women’s Policy and Initiatives; and Youth AdvisoryCouncil.
These goals are funded through the following agency programs:
■ Constituent Affairs - provides internal coordination between the Chief of Staff and Directors forAfrican Affairs; Ex-Offender Affairs; Gay, Lesbian, Bisexual and Transgender (GLBT) Affairs; Mayor’sOffice of Community Relations and Services; Office of Women’s Policy and Initiatives; and YouthAdvisory Council through budget oversight, performance evaluations, and the creation and imple-mentation of strategic plans.
■ Community Relations and Services – provides constituent support through accessibility and coordi-nation by resolving neighborhood obstacles and complaints, improving delivery of scheduled services,distributing educational materials, and attending community meetings.
(RP0)
Office of Community Affairs
www.oco.eom.dc.govTelephone: 202-442-8150
% ChangeFY 2007 FY 2008 FY 2009 from
Description Actual Approved Proposed FY 2008Operating Budget $0 $2,996,153 $3,345,275 11.7FTEs 0.0 36.0 36.0 0.0
The mission of the Office of Community Affairs is to meet theneeds of the residents of the District of Columbia and to engagethe District’s diverse communities in civic life.
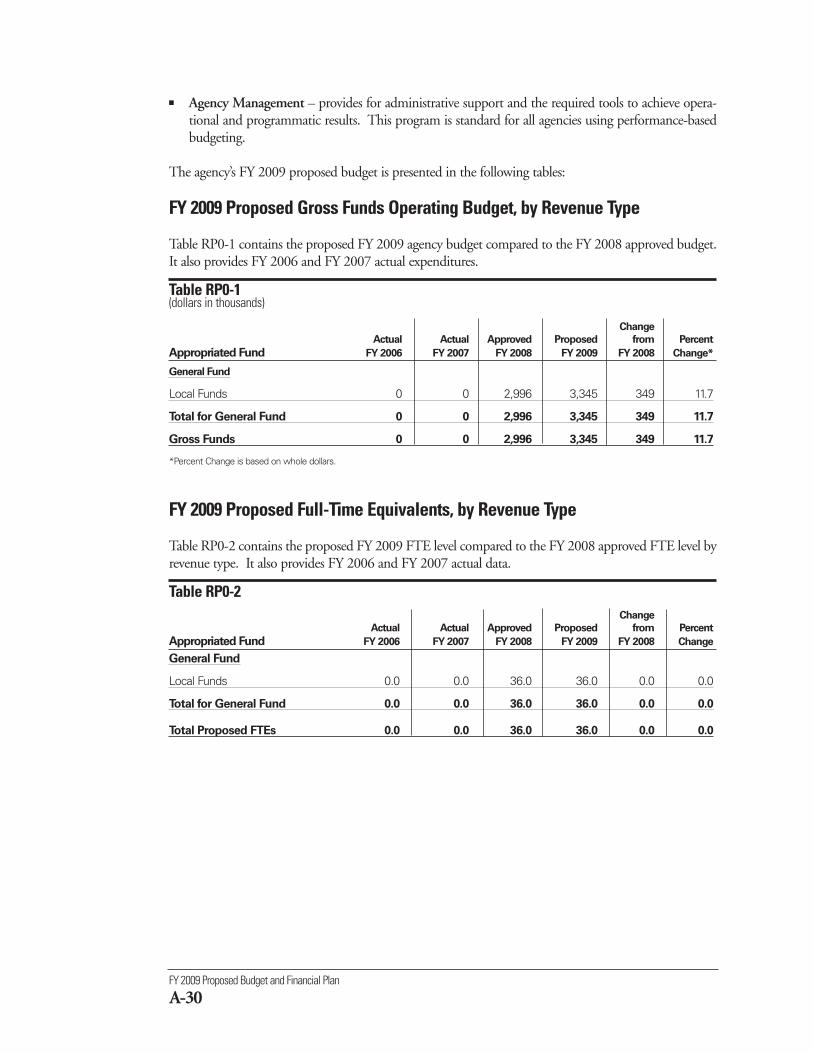
FY 2009 Proposed Budget and Financial Plan
A-30
FY 2009 Proposed Gross Funds Operating Budget, by Revenue Type
Table RP0-1 contains the proposed FY 2009 agency budget compared to the FY 2008 approved budget.It also provides FY 2006 and FY 2007 actual expenditures.
Table RP0-1 (dollars in thousands)
Change
Actual Actual Approved Proposed from Percent
Appropriated Fund FY 2006 FY 2007 FY 2008 FY 2009 FY 2008 Change*
General Fund
Local Funds 0 0 2,996 3,345 349 11.7
Total for General Fund 0 0 2,996 3,345 349 11.7
Gross Funds 0 0 2,996 3,345 349 11.7
*Percent Change is based on whole dollars.
FY 2009 Proposed Full-Time Equivalents, by Revenue Type
Table RP0-2 contains the proposed FY 2009 FTE level compared to the FY 2008 approved FTE level byrevenue type. It also provides FY 2006 and FY 2007 actual data.
Table RP0-2 Change
Actual Actual Approved Proposed from Percent
Appropriated Fund FY 2006 FY 2007 FY 2008 FY 2009 FY 2008 Change
General Fund
Local Funds 0.0 0.0 36.0 36.0 0.0 0.0
Total for General Fund 0.0 0.0 36.0 36.0 0.0 0.0
Total Proposed FTEs 0.0 0.0 36.0 36.0 0.0 0.0
■ Agency Management – provides for administrative support and the required tools to achieve opera-tional and programmatic results. This program is standard for all agencies using performance-basedbudgeting.
The agency’s FY 2009 proposed budget is presented in the following tables:
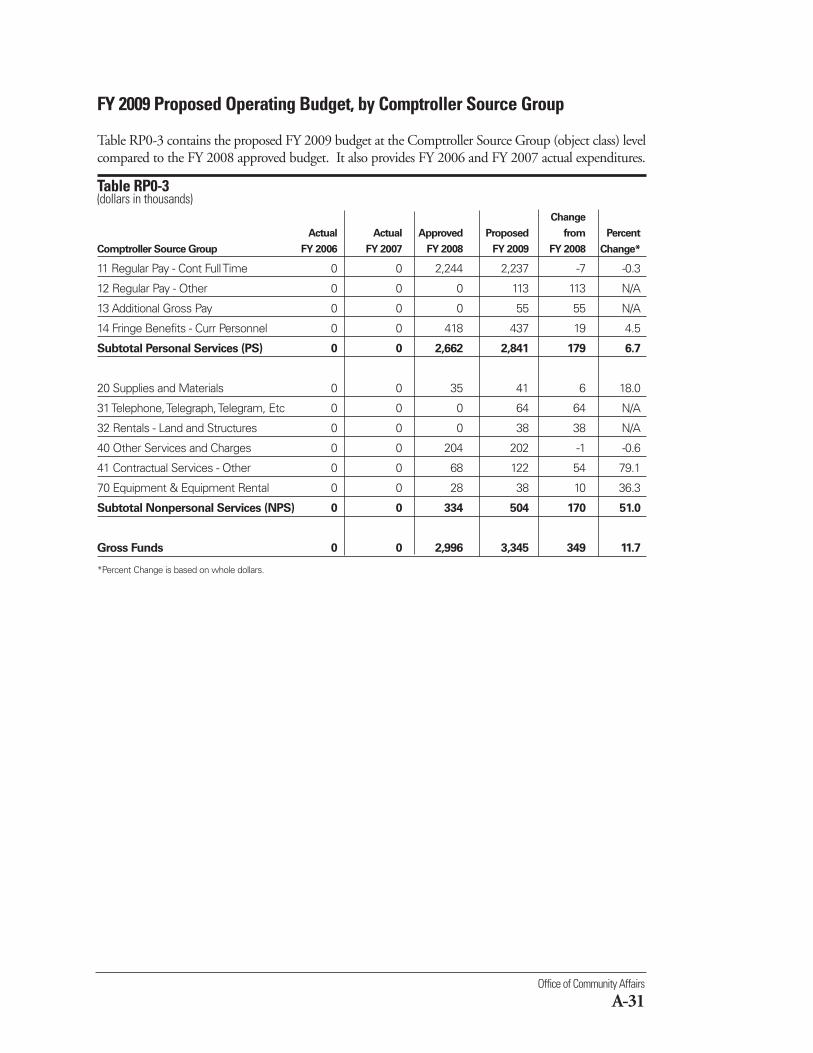
Office of Community Affairs
A-31
FY 2009 Proposed Operating Budget, by Comptroller Source Group
Table RP0-3 contains the proposed FY 2009 budget at the Comptroller Source Group (object class) levelcompared to the FY 2008 approved budget. It also provides FY 2006 and FY 2007 actual expenditures.
Table RP0-3 (dollars in thousands)
Change
Actual Actual Approved Proposed from Percent
Comptroller Source Group FY 2006 FY 2007 FY 2008 FY 2009 FY 2008 Change*
11 Regular Pay - Cont Full Time 0 0 2,244 2,237 -7 -0.3
12 Regular Pay - Other 0 0 0 113 113 N/A
13 Additional Gross Pay 0 0 0 55 55 N/A
14 Fringe Benefits - Curr Personnel 0 0 418 437 19 4.5
Subtotal Personal Services (PS) 0 0 2,662 2,841 179 6.7
20 Supplies and Materials 0 0 35 41 6 18.0
31 Telephone, Telegraph, Telegram, Etc 0 0 0 64 64 N/A
32 Rentals - Land and Structures 0 0 0 38 38 N/A
40 Other Services and Charges 0 0 204 202 -1 -0.6
41 Contractual Services - Other 0 0 68 122 54 79.1
70 Equipment & Equipment Rental 0 0 28 38 10 36.3
Subtotal Nonpersonal Services (NPS) 0 0 334 504 170 51.0
Gross Funds 0 0 2,996 3,345 349 11.7
*Percent Change is based on whole dollars.
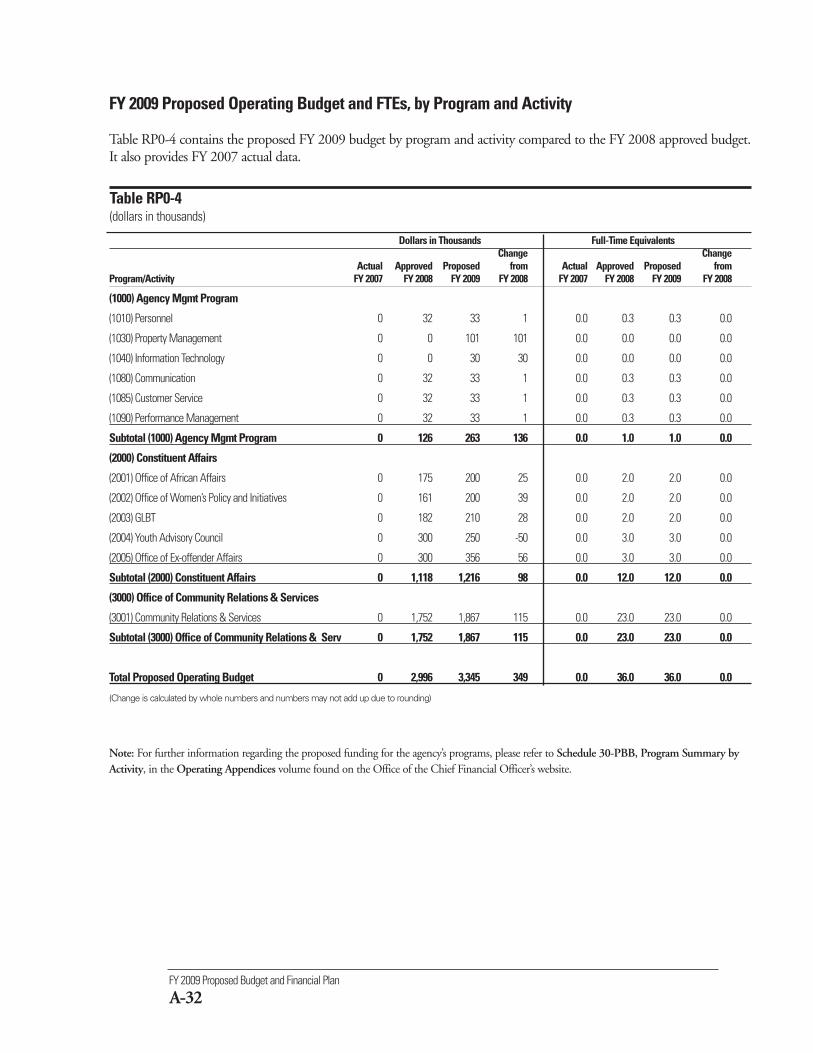
FY 2009 Proposed Budget and Financial Plan
A-32
FY 2009 Proposed Operating Budget and FTEs, by Program and Activity
Table RP0-4 contains the proposed FY 2009 budget by program and activity compared to the FY 2008 approved budget.It also provides FY 2007 actual data.
Table RP0-4(dollars in thousands)
Dollars in Thousands Full-Time EquivalentsChange Change
Actual Approved Proposed from Actual Approved Proposed from Program/Activity FY 2007 FY 2008 FY 2009 FY 2008 FY 2007 FY 2008 FY 2009 FY 2008
(1000) Agency Mgmt Program
(1010) Personnel 0 32 33 1 0.0 0.3 0.3 0.0
(1030) Property Management 0 0 101 101 0.0 0.0 0.0 0.0
(1040) Information Technology 0 0 30 30 0.0 0.0 0.0 0.0
(1080) Communication 0 32 33 1 0.0 0.3 0.3 0.0
(1085) Customer Service 0 32 33 1 0.0 0.3 0.3 0.0
(1090) Performance Management 0 32 33 1 0.0 0.3 0.3 0.0
Subtotal (1000) Agency Mgmt Program 0 126 263 136 0.0 1.0 1.0 0.0
(2000) Constituent Affairs
(2001) Office of African Affairs 0 175 200 25 0.0 2.0 2.0 0.0
(2002) Office of Women’s Policy and Initiatives 0 161 200 39 0.0 2.0 2.0 0.0
(2003) GLBT 0 182 210 28 0.0 2.0 2.0 0.0
(2004) Youth Advisory Council 0 300 250 -50 0.0 3.0 3.0 0.0
(2005) Office of Ex-offender Affairs 0 300 356 56 0.0 3.0 3.0 0.0
Subtotal (2000) Constituent Affairs 0 1,118 1,216 98 0.0 12.0 12.0 0.0
(3000) Office of Community Relations & Services
(3001) Community Relations & Services 0 1,752 1,867 115 0.0 23.0 23.0 0.0
Subtotal (3000) Office of Community Relations & Serv 0 1,752 1,867 115 0.0 23.0 23.0 0.0
Total Proposed Operating Budget 0 2,996 3,345 349 0.0 36.0 36.0 0.0
(Change is calculated by whole numbers and numbers may not add up due to rounding)
Note: For further information regarding the proposed funding for the agency’s programs, please refer to Schedule 30-PBB, Program Summary byActivity, in the Operating Appendices volume found on the Office of the Chief Financial Officer’s website.
Office of Community Affairs
A-33
FY 2008 Approved Budget to FY 2009 Proposed Budget, by Revenue Type
This is a new table for FY 2009 that itemizes the changes made during the development of the FY 2009proposed budget. The FY 2009 Mayoral Local funds budget target reflects the recurring elements of anagency’s FY 2008 approved budget. See the How to Read the Budget chapter in the Executive Summaryvolume for more information on this table.
Serve DC
A-35
The mission of Serve DC, the District of Columbia’sCommission on National and Community Service, is tostrengthen and promote the District of Columbia’s spirit of ser-vice through partnerships, national service and volunteerism.
(RS0)
Serve DCwww.serve.dc.govTelephone: 202-727-7925
% ChangeFY 2007 FY 2008 FY 2009 from
Description Actual Approved Proposed FY 2008Operating Budget $0 $3,897,801 $4,181,870 7.3FTEs 0.0 12.0 12.0 0.3
The agency plans to fulfill its mission by achieving the following objectives:
Objective 1: To expand the number of episodic volunteers engaged in service, increase the impact of sea-sons of service days and increase the number of affiliated volunteers associated with the DC Citizen CorpsPrograms.
Objective 2: To effectively and efficiently manage the current grant portfolio while increasing resourcedevelopment efforts to provide sustainability and expansion of the overall grant and program portfolio.
To view complete agency performance plans, please visit the ‘Performance Plans and Reports’ link on theCapStat webpage at http://capstat.oca.dc.gov/.
These objectives are funded through the following agency programs:
■ National Service - Administers AmeriCorps and Learn and Serve America programs in the District ofColumbia and facilitates collaboration among all national service programs including Senior Corps,AmeriCorps National Civilian Community Corps and AmeriCorps VISTA.
■ Initiatives - Develops partnerships among civic groups, government agencies, educational institutions,non-profit organizations, corporations, small businesses, and the faith-based community.
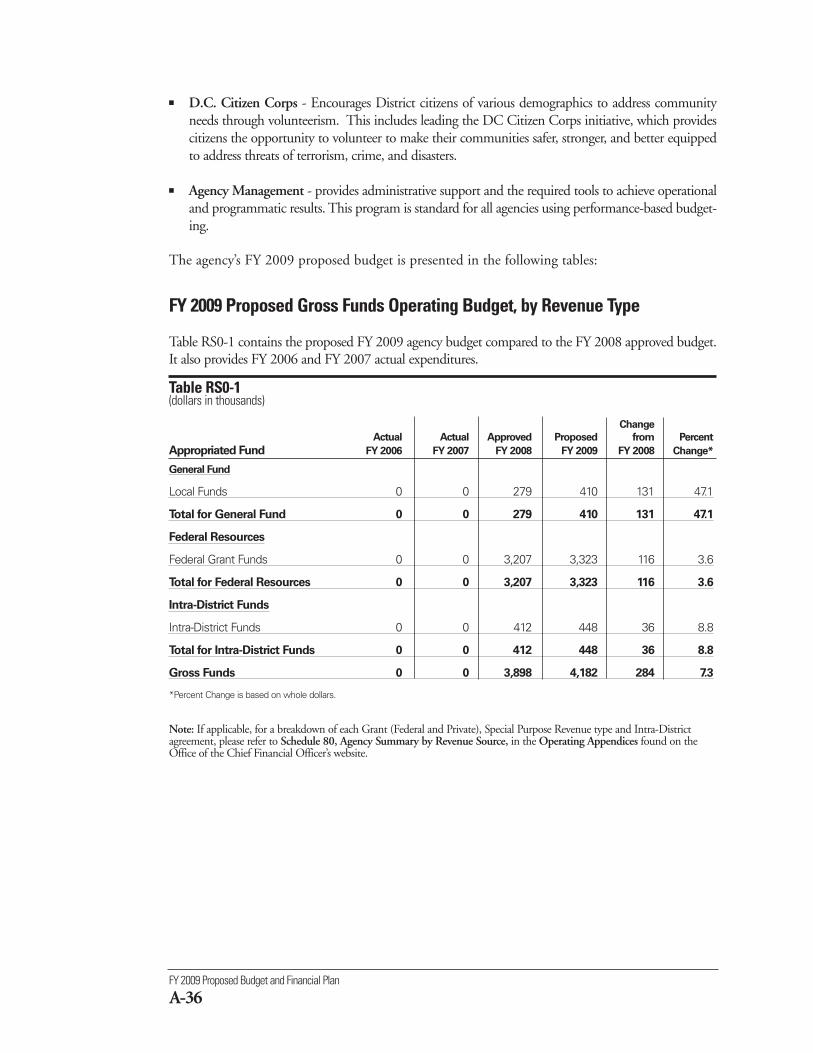
FY 2009 Proposed Budget and Financial Plan
A-36
FY 2009 Proposed Gross Funds Operating Budget, by Revenue Type
Table RS0-1 contains the proposed FY 2009 agency budget compared to the FY 2008 approved budget.It also provides FY 2006 and FY 2007 actual expenditures.
Table RS0-1 (dollars in thousands)
Change
Actual Actual Approved Proposed from Percent
Appropriated Fund FY 2006 FY 2007 FY 2008 FY 2009 FY 2008 Change*
General Fund
Local Funds 0 0 279 410 131 47.1
Total for General Fund 0 0 279 410 131 47.1
Federal Resources
Federal Grant Funds 0 0 3,207 3,323 116 3.6
Total for Federal Resources 0 0 3,207 3,323 116 3.6
Intra-District Funds
Intra-District Funds 0 0 412 448 36 8.8
Total for Intra-District Funds 0 0 412 448 36 8.8
Gross Funds 0 0 3,898 4,182 284 7.3
*Percent Change is based on whole dollars.
Note: If applicable, for a breakdown of each Grant (Federal and Private), Special Purpose Revenue type and Intra-Districtagreement, please refer to Schedule 80, Agency Summary by Revenue Source, in the Operating Appendices found on theOffice of the Chief Financial Officer’s website.
■ D.C. Citizen Corps - Encourages District citizens of various demographics to address communityneeds through volunteerism. This includes leading the DC Citizen Corps initiative, which providescitizens the opportunity to volunteer to make their communities safer, stronger, and better equippedto address threats of terrorism, crime, and disasters.
■ Agency Management - provides administrative support and the required tools to achieve operationaland programmatic results. This program is standard for all agencies using performance-based budget-ing.
The agency’s FY 2009 proposed budget is presented in the following tables:
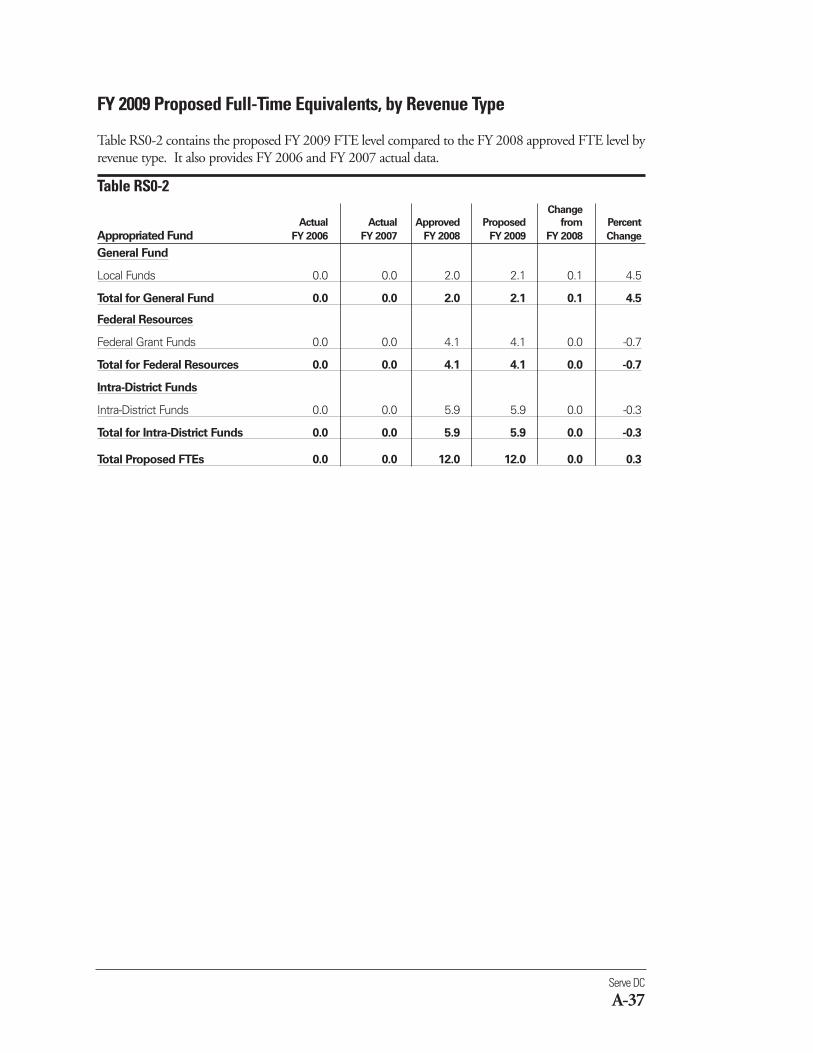
Serve DC
A-37
FY 2009 Proposed Full-Time Equivalents, by Revenue Type
Table RS0-2 contains the proposed FY 2009 FTE level compared to the FY 2008 approved FTE level byrevenue type. It also provides FY 2006 and FY 2007 actual data.
Table RS0-2 Change
Actual Actual Approved Proposed from Percent
Appropriated Fund FY 2006 FY 2007 FY 2008 FY 2009 FY 2008 Change
General Fund
Local Funds 0.0 0.0 2.0 2.1 0.1 4.5
Total for General Fund 0.0 0.0 2.0 2.1 0.1 4.5
Federal Resources
Federal Grant Funds 0.0 0.0 4.1 4.1 0.0 -0.7
Total for Federal Resources 0.0 0.0 4.1 4.1 0.0 -0.7
Intra-District Funds
Intra-District Funds 0.0 0.0 5.9 5.9 0.0 -0.3
Total for Intra-District Funds 0.0 0.0 5.9 5.9 0.0 -0.3
Total Proposed FTEs 0.0 0.0 12.0 12.0 0.0 0.3
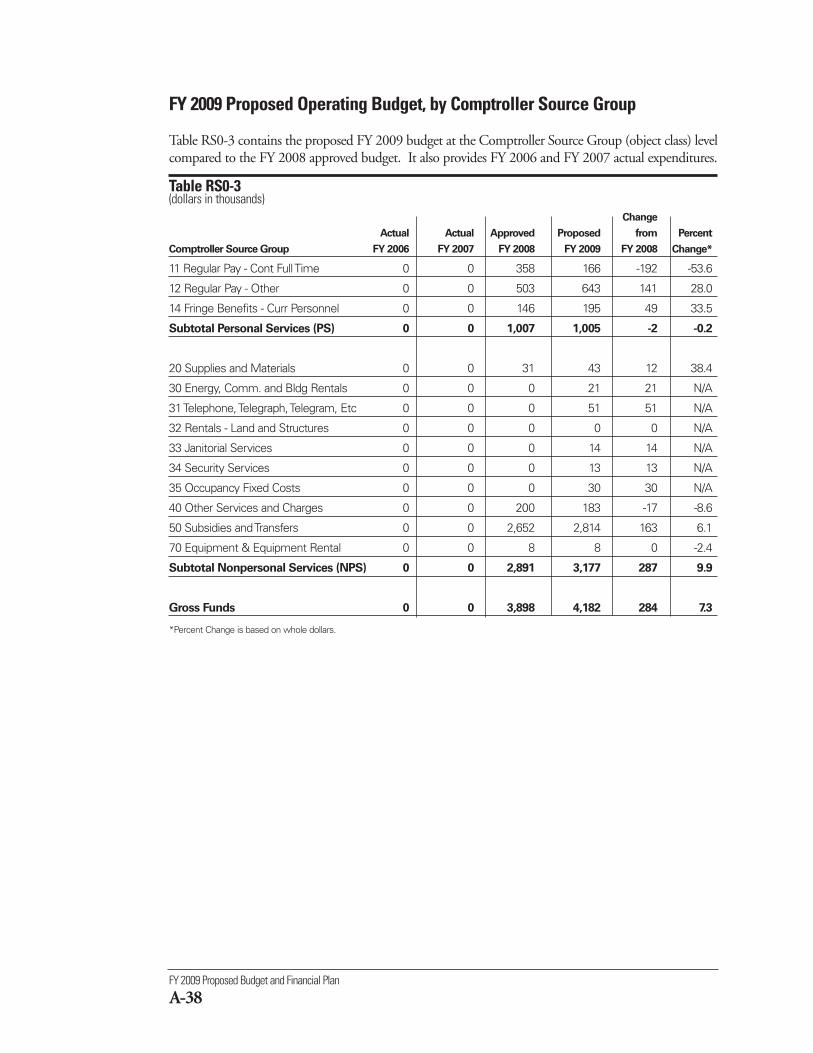
FY 2009 Proposed Budget and Financial Plan
A-38
FY 2009 Proposed Operating Budget, by Comptroller Source Group
Table RS0-3 contains the proposed FY 2009 budget at the Comptroller Source Group (object class) levelcompared to the FY 2008 approved budget. It also provides FY 2006 and FY 2007 actual expenditures.
Table RS0-3 (dollars in thousands)
Change
Actual Actual Approved Proposed from Percent
Comptroller Source Group FY 2006 FY 2007 FY 2008 FY 2009 FY 2008 Change*
11 Regular Pay - Cont Full Time 0 0 358 166 -192 -53.6
12 Regular Pay - Other 0 0 503 643 141 28.0
14 Fringe Benefits - Curr Personnel 0 0 146 195 49 33.5
Subtotal Personal Services (PS) 0 0 1,007 1,005 -2 -0.2
20 Supplies and Materials 0 0 31 43 12 38.4
30 Energy, Comm. and Bldg Rentals 0 0 0 21 21 N/A
31 Telephone, Telegraph, Telegram, Etc 0 0 0 51 51 N/A
32 Rentals - Land and Structures 0 0 0 0 0 N/A
33 Janitorial Services 0 0 0 14 14 N/A
34 Security Services 0 0 0 13 13 N/A
35 Occupancy Fixed Costs 0 0 0 30 30 N/A
40 Other Services and Charges 0 0 200 183 -17 -8.6
50 Subsidies and Transfers 0 0 2,652 2,814 163 6.1
70 Equipment & Equipment Rental 0 0 8 8 0 -2.4
Subtotal Nonpersonal Services (NPS) 0 0 2,891 3,177 287 9.9
Gross Funds 0 0 3,898 4,182 284 7.3
*Percent Change is based on whole dollars.
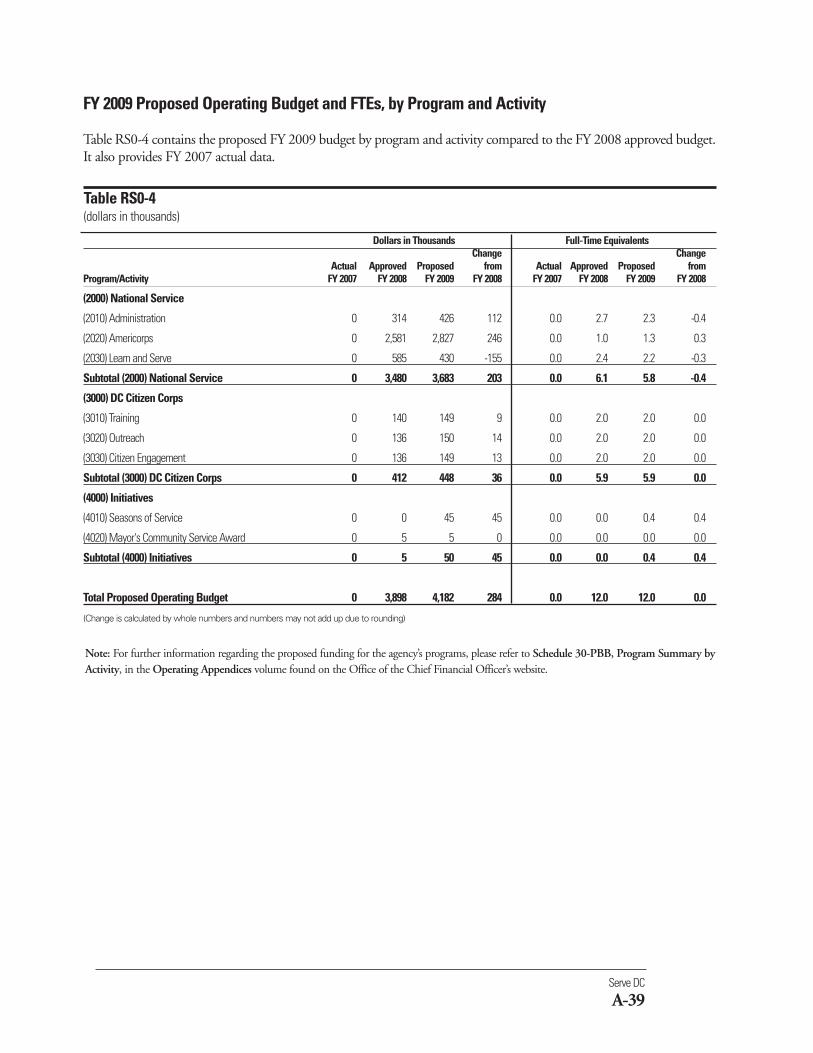
Serve DC
A-39
Dollars in Thousands Full-Time EquivalentsChange Change
Actual Approved Proposed from Actual Approved Proposed from Program/Activity FY 2007 FY 2008 FY 2009 FY 2008 FY 2007 FY 2008 FY 2009 FY 2008
(2000) National Service
(2010) Administration 0 314 426 112 0.0 2.7 2.3 -0.4
(2020) Americorps 0 2,581 2,827 246 0.0 1.0 1.3 0.3
(2030) Learn and Serve 0 585 430 -155 0.0 2.4 2.2 -0.3
Subtotal (2000) National Service 0 3,480 3,683 203 0.0 6.1 5.8 -0.4
(3000) DC Citizen Corps
(3010) Training 0 140 149 9 0.0 2.0 2.0 0.0
(3020) Outreach 0 136 150 14 0.0 2.0 2.0 0.0
(3030) Citizen Engagement 0 136 149 13 0.0 2.0 2.0 0.0
Subtotal (3000) DC Citizen Corps 0 412 448 36 0.0 5.9 5.9 0.0
(4000) Initiatives
(4010) Seasons of Service 0 0 45 45 0.0 0.0 0.4 0.4
(4020) Mayor's Community Service Award 0 5 5 0 0.0 0.0 0.0 0.0
Subtotal (4000) Initiatives 0 5 50 45 0.0 0.0 0.4 0.4
Total Proposed Operating Budget 0 3,898 4,182 284 0.0 12.0 12.0 0.0
(Change is calculated by whole numbers and numbers may not add up due to rounding)
FY 2009 Proposed Operating Budget and FTEs, by Program and Activity
Table RS0-4 contains the proposed FY 2009 budget by program and activity compared to the FY 2008 approved budget.It also provides FY 2007 actual data.
Table RS0-4(dollars in thousands)
Note: For further information regarding the proposed funding for the agency’s programs, please refer to Schedule 30-PBB, Program Summary byActivity, in the Operating Appendices volume found on the Office of the Chief Financial Officer’s website.
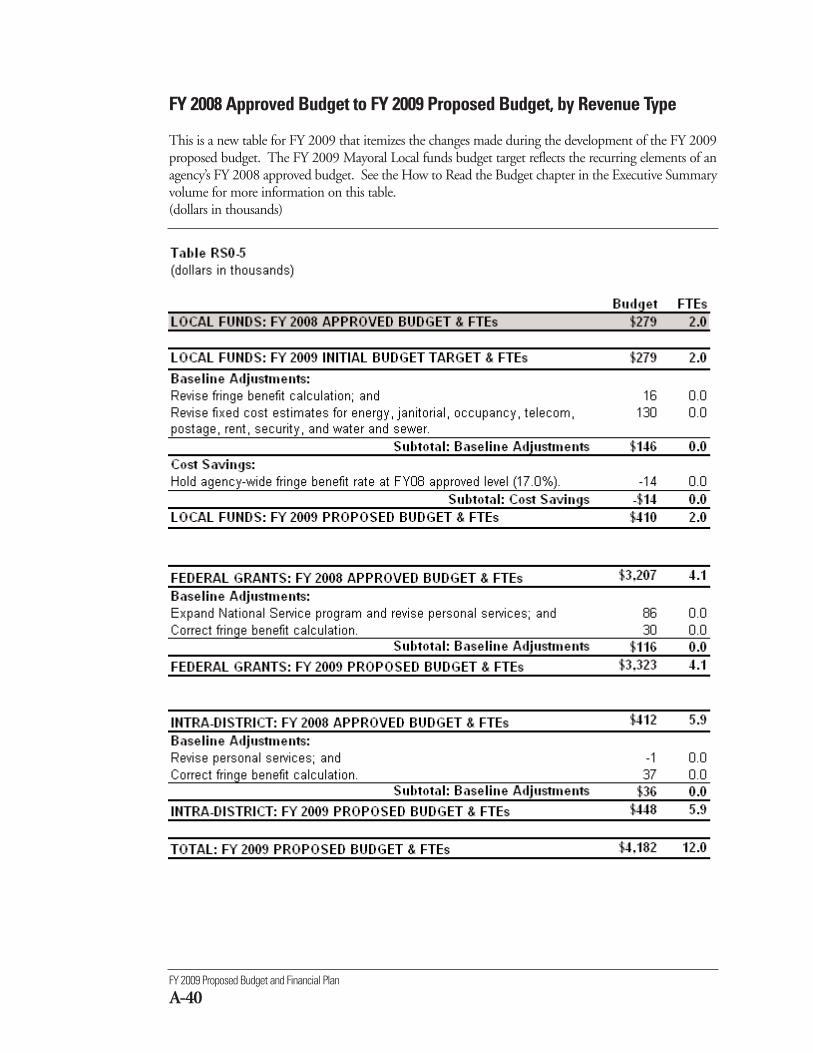
FY 2009 Proposed Budget and Financial Plan
A-40
FY 2008 Approved Budget to FY 2009 Proposed Budget, by Revenue Type
This is a new table for FY 2009 that itemizes the changes made during the development of the FY 2009proposed budget. The FY 2009 Mayoral Local funds budget target reflects the recurring elements of anagency’s FY 2008 approved budget. See the How to Read the Budget chapter in the Executive Summaryvolume for more information on this table. (dollars in thousands)
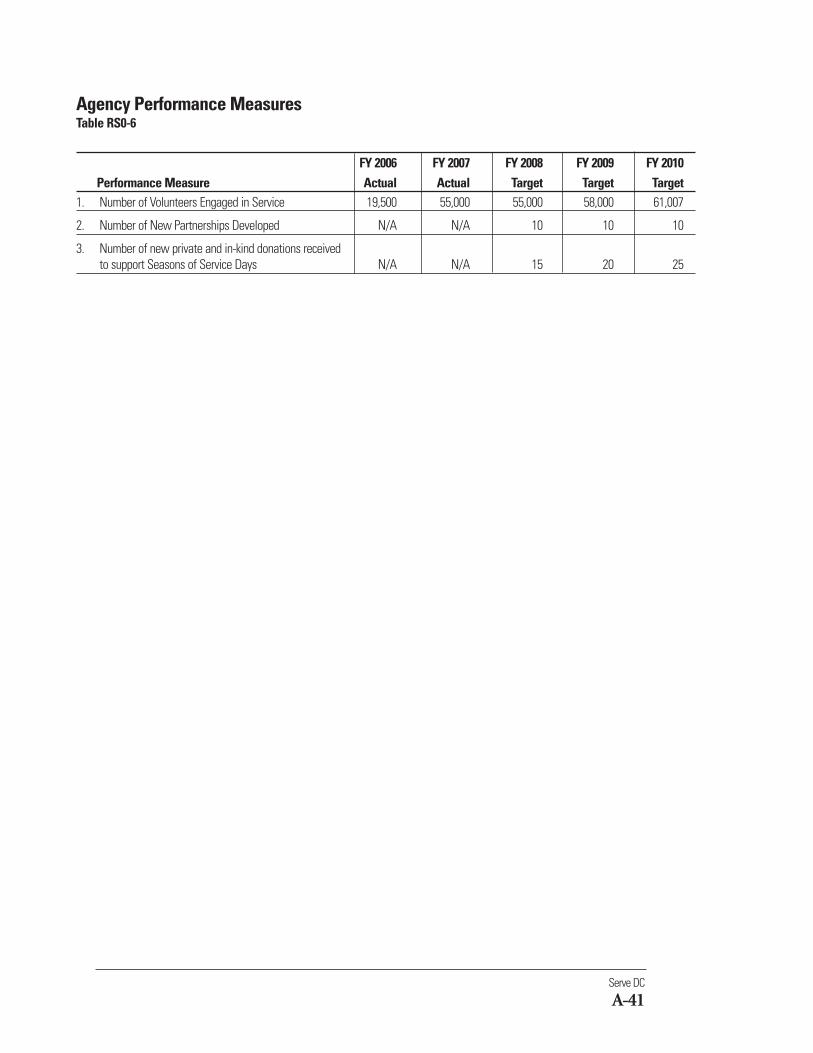
Serve DC
A-41
Agency Performance MeasuresTable RS0-6
FY 2006 FY 2007 FY 2008 FY 2009 FY 2010Performance Measure Actual Actual Target Target Target
1. Number of Volunteers Engaged in Service 19,500 55,000 55,000 58,000 61,007
2. Number of New Partnerships Developed N/A N/A 10 10 10
3. Number of new private and in-kind donations receivedto support Seasons of Service Days N/A N/A 15 20 25
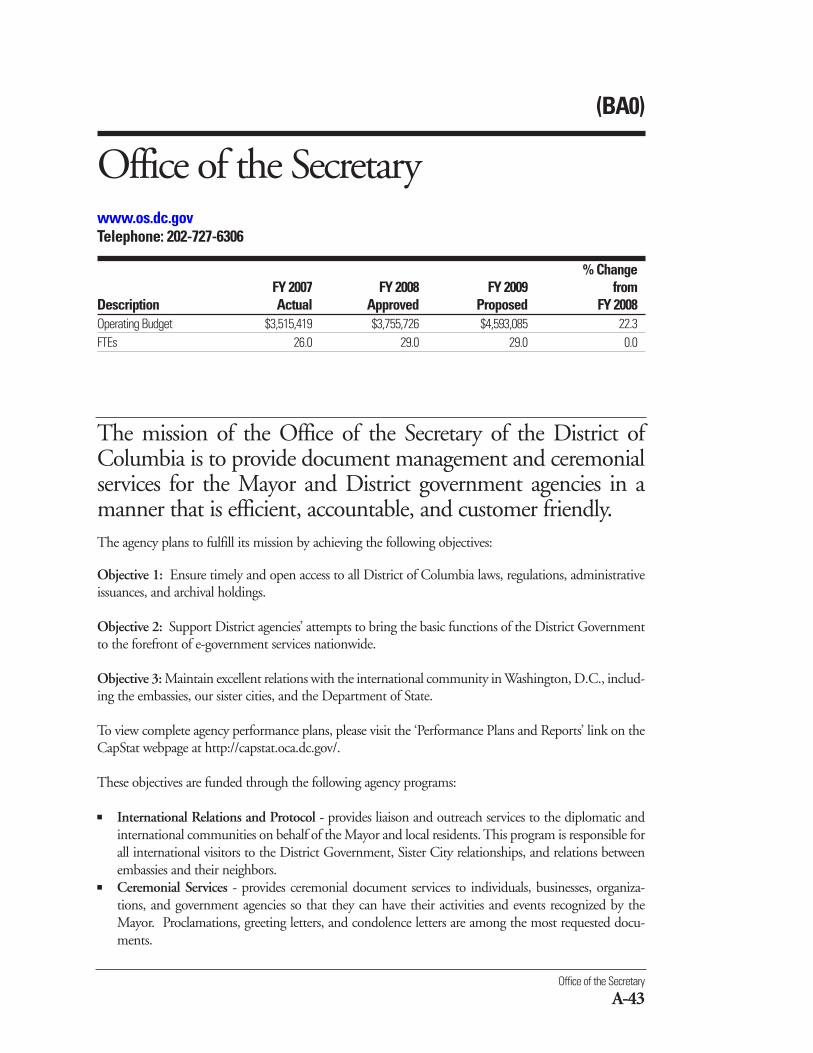
(BA0)
Office of the Secretarywww.os.dc.govTelephone: 202-727-6306
% ChangeFY 2007 FY 2008 FY 2009 from
Description Actual Approved Proposed FY 2008Operating Budget $3,515,419 $3,755,726 $4,593,085 22.3FTEs 26.0 29.0 29.0 0.0
The mission of the Office of the Secretary of the District ofColumbia is to provide document management and ceremonialservices for the Mayor and District government agencies in amanner that is efficient, accountable, and customer friendly.
Office of the Secretary
A-43
The agency plans to fulfill its mission by achieving the following objectives:
Objective 1: Ensure timely and open access to all District of Columbia laws, regulations, administrativeissuances, and archival holdings.
Objective 2: Support District agencies’ attempts to bring the basic functions of the District Governmentto the forefront of e-government services nationwide.
Objective 3: Maintain excellent relations with the international community in Washington, D.C., includ-ing the embassies, our sister cities, and the Department of State.
To view complete agency performance plans, please visit the ‘Performance Plans and Reports’ link on theCapStat webpage at http://capstat.oca.dc.gov/.
These objectives are funded through the following agency programs:
■ International Relations and Protocol - provides liaison and outreach services to the diplomatic andinternational communities on behalf of the Mayor and local residents. This program is responsible forall international visitors to the District Government, Sister City relationships, and relations betweenembassies and their neighbors.
■ Ceremonial Services - provides ceremonial document services to individuals, businesses, organiza-tions, and government agencies so that they can have their activities and events recognized by theMayor. Proclamations, greeting letters, and condolence letters are among the most requested docu-ments.
FY 2009 Proposed Budget and Financial Plan
A-44
FY 2009 Proposed Gross Funds Operating Budget, by Revenue Type
Table BA0-1 contains the proposed FY 2009 agency budget compared to the FY 2008 approved budget.It also provides FY 2006 and FY 2007 actual expenditures.
Table BA0-1 (dollars in thousands)
ChangeActual Actual Approved Proposed from Percent
Appropriated Fund FY 2006 FY 2007 FY 2008 FY 2009 FY 2008 Change*
General Fund
Local Funds 2,897 3,247 3,341 4,031 691 20.7
Special Purpose Revenue Funds 168 267 415 562 147 35.4
Total for General Fund 3,066 3,514 3,756 4,593 837 22.3
Federal Resources
Federal Grant Funds 0 -5 0 0 0 N/A
Total for Federal Resources 0 -5 0 0 0 N/A
Private Funds
Private Donations 18 6 0 0 0 N/A
Total for Private Funds 18 6 0 0 0 N/A
Intra-District Funds
Intra-District Funds 30 0 0 0 0 N/A
Total for Intra-District Funds 30 0 0 0 0 N/A
Gross Funds 3,114 3,515 3,756 4,593 837 22.3
*Percent Change is based on whole dollars.
■ Office of Documents and Administrative Issuances - provides publication and legal editorial servicesto the Mayor, District agencies, and the general public so that they can give and/or have official noticeof all proposed and adopted legal mandates.
■ Notary Commission and Authentications - provides commissioning and authentication services toprivate individuals and businesses so that they can become notary publics and have their documentsauthenticated.
■ Public Records - provides archives and records management services to District government agenciesand the public so that they can gain access to official government documents.
■ Executive Management - supports the Emancipation Day Celebration and related activities to com-memorate District of Columbia Emancipation Day.
■ Agency Management - provides for administrative support and the required tools to achieve opera-tional programmatic results. This program is standard for all agencies using performance-based bud-geting.
The agency’s FY 2009 proposed budget is presented in the following tables:
Note: If applicable, for a breakdown of each Grant (Federal and Private), Special Purpose Revenue type and Intra-Districtagreement, please refer to Schedule 80, Agency Summary by Revenue Source, in the Operating Appendices found on theOffice of the Chief Financial Officer’s website.
Office of the Secretary
A-45
FY 2009 Proposed Full-Time Equivalents, by Revenue Type
Table BA0-2 contains the proposed FY 2009 FTE level compared to the FY 2008 approved FTE level byrevenue type. It also provides FY 2006 and FY 2007 actual data.
Table BA0-2 Change
Actual Actual Approved Proposed from Percent
Appropriated Fund FY 2006 FY 2007 FY 2008 FY 2009 FY 2008 Change
General Fund
Local Funds 22.0 26.0 27.0 27.0 0.0 0.0
Special Purpose Revenue Funds 0.0 0.0 2.0 2.0 0.0 0.0
Total for General Fund 22.0 26.0 29.0 29.0 0.0 0.0
Total Proposed FTEs 22.0 26.0 29.0 29.0 0.0 0.0
FY 2009 Proposed Operating Budget, by Comptroller Source Group
Table BA0-3 contains the proposed FY 2009 budget at the Comptroller Source Group (object class) levelcompared to the FY 2008 approved budget. It also provides FY 2006 and FY 2007 actual expenditures.
Table BA0-3(dollars in thousands)
Change
Actual Actual Approved Proposed from Percent
Comptroller Source Group FY 2006 FY 2007 FY 2008 FY 2009 FY 2008 Change*
11 Regular Pay - Cont Full Time 1,401 1,639 1,874 2,018 144 7.7
12 Regular Pay - Other 63 164 201 108 -93 -46.2
13 Additional Gross Pay 50 56 61 0 -61 -100.0
14 Fringe Benefits - Curr Personnel 238 293 324 342 18 5.6
15 Overtime Pay 4 10 0 0 0 N/A
Subtotal Personal Services (PS) 1,755 2,162 2,460 2,468 8 0.3
20 Supplies and Materials 41 28 14 75 61 428.2
30 Energy, Comm. and Bldg Rentals 25 70 89 75 -14 -16.2
31 Telephone, Telegraph, Telegram, Etc 30 36 43 37 -7 -15.6
32 Rentals - Land and Structures 0 472 230 5 -225 -98.0
33 Janitorial Services 3 37 41 45 4 9.5
34 Security Services 11 11 10 40 31 319.1
35 Occupancy Fixed Costs 110 19 24 91 68 287.1
40 Other Services and Charges 527 540 686 697 11 1.7
41 Contractual Services - Other 395 126 134 855 721 538.2
70 Equipment & Equipment Rental 216 14 25 205 180 720.0
Subtotal Nonpersonal Services (NPS) 1,359 1,354 1,296 2,125 829 64.0
Gross Funds 3,114 3,515 3,756 4,593 837 22.3
*Percent Change is based on whole dollars.
FY 2009 Proposed Budget and Financial Plan
A-46
Dollars in Thousands Full-Time EquivalentsChange Change
Actual Approved Proposed from Actual Approved Proposed from Program/Activity FY 2007 FY 2008 FY 2009 FY 2008 FY 2007 FY 2008 FY 2009 FY 2008
(1000) Agency Management Program
No Activity Assigned -5 0 0 0 0.0 0.0 0.0 0.0
(1010) Personnel 4 0 23 23 0.0 0.0 0.0 0.0
(1020) Contracting and Procurement 223 200 265 65 1.0 2.0 2.0 0.0
(1030) Property Management 0 461 320 -141 0.0 0.0 0.0 0.0
(1040) Information Technology 0 0 17 17 0.0 0.0 0.0 0.0
(1050) Financial Management 1 0 0 0 0.0 0.0 0.0 0.0
(1055) Risk Management 1 0 0 0 0.0 0.0 0.0 0.0
(1060) Legal 30 0 0 0 0.0 0.0 0.0 0.0
(1070) Fleet Management 74 68 72 4 1.0 1.0 1.0 0.0
(1080) Communication 19 119 129 9 2.0 2.0 2.0 0.0
(1085) Customer Service 0 0 43 43 0.0 0.0 0.5 0.5
(1090) Performance Management 0 301 283 -18 2.0 2.0 2.0 0.0
Subtotal (1000) Agency Mgmt. Program 347 1,149 1,151 2 6.0 7.0 7.5 0.5
(1001) Escheated Estates Fund Program
(1100) Escheated Estates 594 44 0 -44 3.0 0.5 0.0 -0.5
Subtotal (1001) Escheated Estates Fund Program 594 44 0 -44 3.0 0.5 0.0 -0.5
(1002) International Relations & Protocol
(1200) International Relations & Protocol 235 169 162 -7 1.0 2.0 2.0 0.0
Subtotal (1002) International Relations & Protocol 235 169 162 -7 1.0 2.0 2.0 0.0
(1003) Ceremonial Services
(1300) Ceremonial Services 44 187 211 24 0.0 2.0 2.0 0.0
Subtotal (1003) Ceremonial Services 44 187 211 24 0.0 2.0 2.0 0.0
(1004) Office Of Documents & Admin. Issuance
(1400) Regulations Activity 202 253 254 1 3.0 3.0 3.0 0.0
(1401) D.C. Register 267 439 517 77 2.0 2.0 2.0 0.0
(1402) Admin. Issuances 0 182 179 -4 2.0 2.0 2.0 0.0
Subtotal (1004) Office Of Documents & Admin. Issuance 468 874 949 75 7.0 7.0 7.0 0.0
(Continued on next page)
FY 2009 Proposed Operating Budget and FTEs, by Program and Activity
Table BA0-4 contains the proposed FY 2009 budget by program and activity compared to the FY 2008 approved bud-get. It also provides FY 2007 actual data.
Table BA0-4(dollars in thousands)
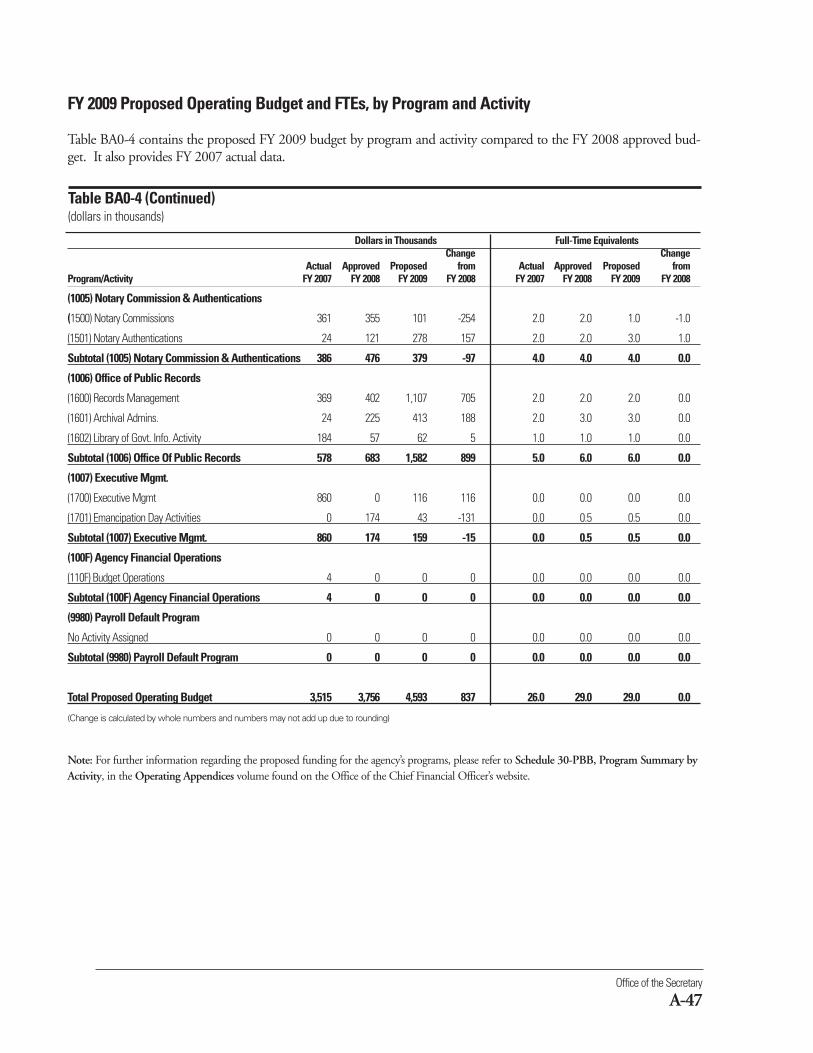
Office of the Secretary
A-47
FY 2009 Proposed Operating Budget and FTEs, by Program and Activity
Table BA0-4 contains the proposed FY 2009 budget by program and activity compared to the FY 2008 approved bud-get. It also provides FY 2007 actual data.
Table BA0-4 (Continued)(dollars in thousands)
Dollars in Thousands Full-Time EquivalentsChange Change
Actual Approved Proposed from Actual Approved Proposed from Program/Activity FY 2007 FY 2008 FY 2009 FY 2008 FY 2007 FY 2008 FY 2009 FY 2008
(1005) Notary Commission & Authentications
(1500) Notary Commissions 361 355 101 -254 2.0 2.0 1.0 -1.0
(1501) Notary Authentications 24 121 278 157 2.0 2.0 3.0 1.0
Subtotal (1005) Notary Commission & Authentications 386 476 379 -97 4.0 4.0 4.0 0.0
(1006) Office of Public Records
(1600) Records Management 369 402 1,107 705 2.0 2.0 2.0 0.0
(1601) Archival Admins. 24 225 413 188 2.0 3.0 3.0 0.0
(1602) Library of Govt. Info. Activity 184 57 62 5 1.0 1.0 1.0 0.0
Subtotal (1006) Office Of Public Records 578 683 1,582 899 5.0 6.0 6.0 0.0
(1007) Executive Mgmt.
(1700) Executive Mgmt 860 0 116 116 0.0 0.0 0.0 0.0
(1701) Emancipation Day Activities 0 174 43 -131 0.0 0.5 0.5 0.0
Subtotal (1007) Executive Mgmt. 860 174 159 -15 0.0 0.5 0.5 0.0
(100F) Agency Financial Operations
(110F) Budget Operations 4 0 0 0 0.0 0.0 0.0 0.0
Subtotal (100F) Agency Financial Operations 4 0 0 0 0.0 0.0 0.0 0.0
(9980) Payroll Default Program
No Activity Assigned 0 0 0 0 0.0 0.0 0.0 0.0
Subtotal (9980) Payroll Default Program 0 0 0 0 0.0 0.0 0.0 0.0
Total Proposed Operating Budget 3,515 3,756 4,593 837 26.0 29.0 29.0 0.0
(Change is calculated by whole numbers and numbers may not add up due to rounding)
Note: For further information regarding the proposed funding for the agency’s programs, please refer to Schedule 30-PBB, Program Summary byActivity, in the Operating Appendices volume found on the Office of the Chief Financial Officer’s website.
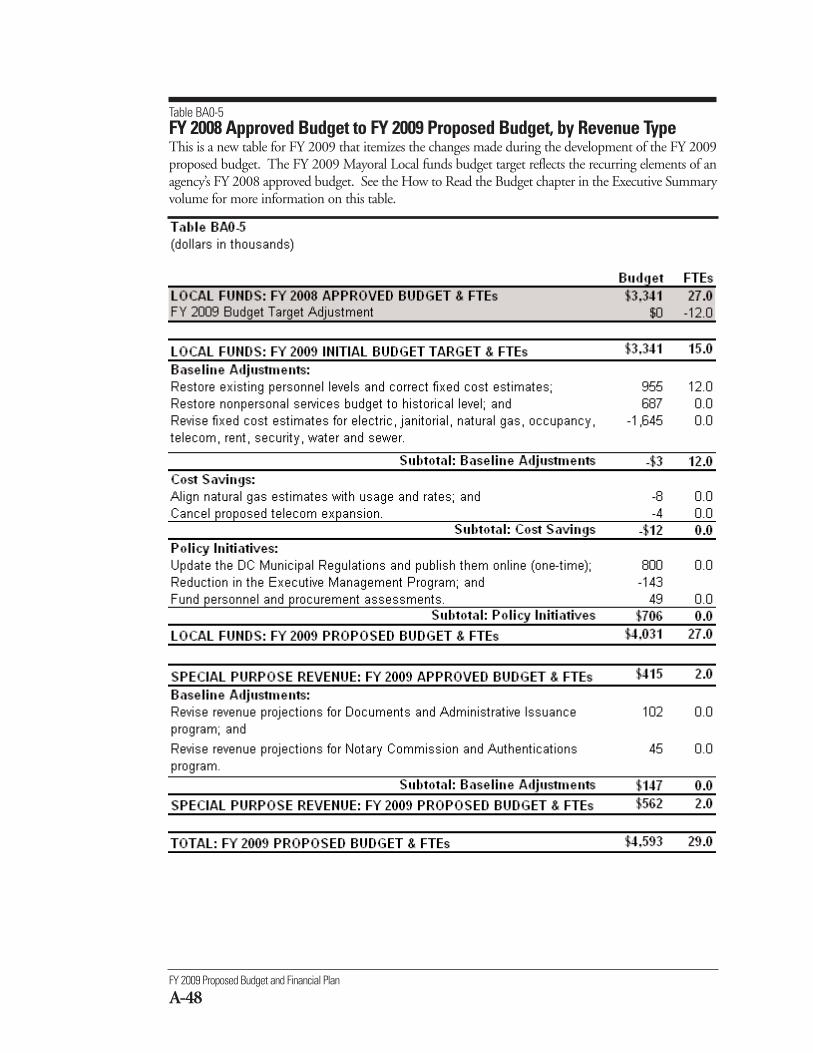
FY 2009 Proposed Budget and Financial Plan
A-48
Table BA0-5FY 2008 Approved Budget to FY 2009 Proposed Budget, by Revenue TypeThis is a new table for FY 2009 that itemizes the changes made during the development of the FY 2009proposed budget. The FY 2009 Mayoral Local funds budget target reflects the recurring elements of anagency’s FY 2008 approved budget. See the How to Read the Budget chapter in the Executive Summaryvolume for more information on this table.
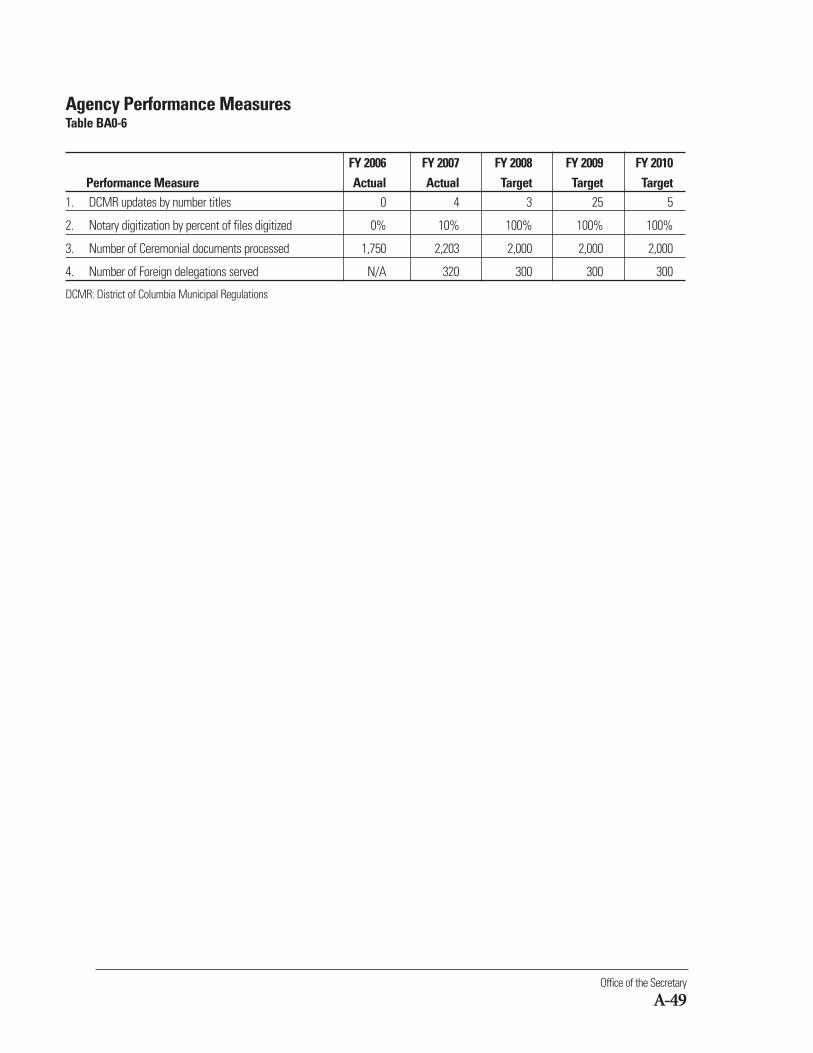
Office of the Secretary
A-49
Agency Performance MeasuresTable BA0-6
FY 2006 FY 2007 FY 2008 FY 2009 FY 2010Performance Measure Actual Actual Target Target Target
1. DCMR updates by number titles 0 4 3 25 5
2. Notary digitization by percent of files digitized 0% 10% 100% 100% 100%
3. Number of Ceremonial documents processed 1,750 2,203 2,000 2,000 2,000
4. Number of Foreign delegations served N/A 320 300 300 300
DCMR: District of Columbia Municipal Regulations
Office of the City Administrator
A-51
(AE0)
Office of the City Administratorwww.oca.dc.govTelephone: 202-478-9200
% ChangeFY 2007 FY 2008 FY 2009 from
Description Actual Approved Proposed FY 2008Operating Budget $114,952,054 $6,978,629 $6,616,808 -5.2FTEs 90.6 61.0 56.0 -8.2
The mission of the Office of the City Administrator (OCA) is tofacilitate the effective and efficient implementation of theMayor’s policies by providing leadership, support, and oversightof District agencies.The agency plans to fulfill its mission by achieving the following objectives:
Objective 1: Make the District government more responsive, accountable, transparent, and efficient.
Objective 2: Maintain effective labor relations with the District’s unionized workforce by administering acomprehensive labor management relations program.
Objective 3: Create a safe and quality work environment, which emphasizes safety and career advance-ment opportunities for all District employees.
To view complete agency performance plans, please visit the ‘Performance Plans and Reports’ link on theCapStat webpage at http://capstat.oca.dc.gov/.
These objectives are funded through the following agency programs:
■ City Administrator - provides oversight, support, and program evaluation to ensure the successful andefficient implementation of the Mayor’s policies.
■ Agency Management - provides for administrative support and the required tools to achieve anagency’s operational and programmatic results. This program is standard for all agencies using perfor-mance-based budgeting.
The agency’s FY 2009 proposed budget is presented in the following tables:
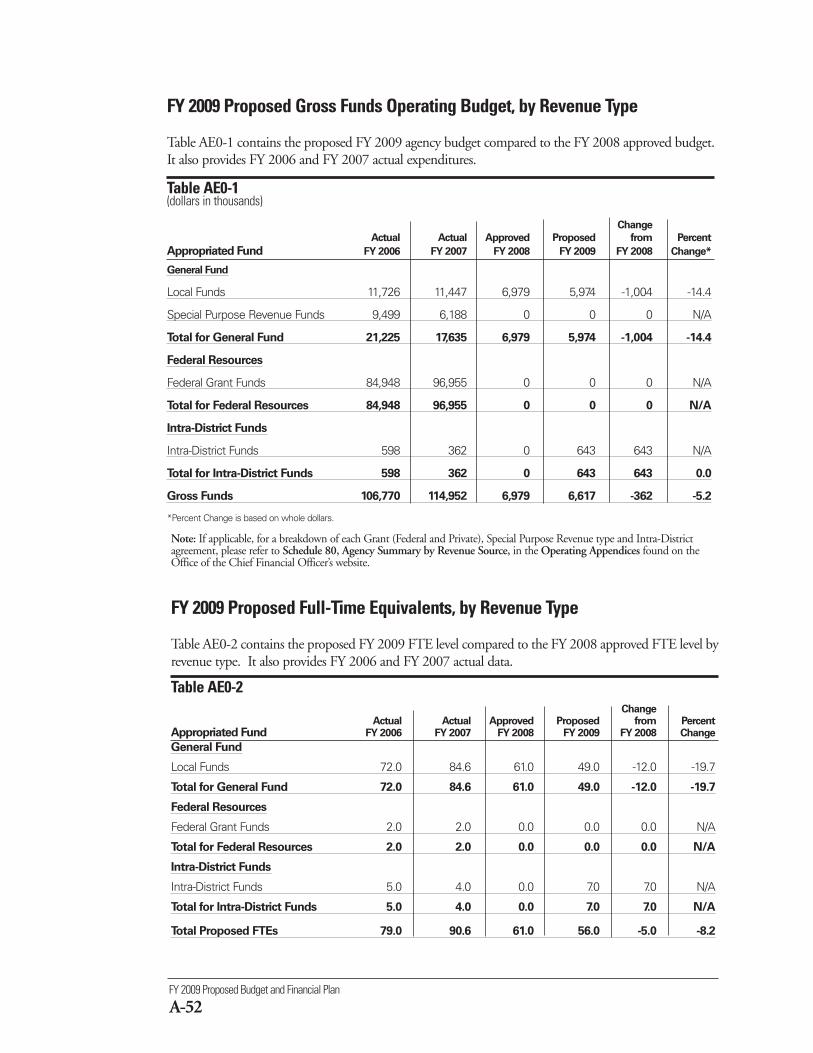
FY 2009 Proposed Budget and Financial Plan
A-52
FY 2009 Proposed Full-Time Equivalents, by Revenue Type
Table AE0-2 contains the proposed FY 2009 FTE level compared to the FY 2008 approved FTE level byrevenue type. It also provides FY 2006 and FY 2007 actual data.
Table AE0-2 Change
Actual Actual Approved Proposed from PercentAppropriated Fund FY 2006 FY 2007 FY 2008 FY 2009 FY 2008 Change
General Fund
Local Funds 72.0 84.6 61.0 49.0 -12.0 -19.7
Total for General Fund 72.0 84.6 61.0 49.0 -12.0 -19.7
Federal Resources
Federal Grant Funds 2.0 2.0 0.0 0.0 0.0 N/A
Total for Federal Resources 2.0 2.0 0.0 0.0 0.0 N/A
Intra-District Funds
Intra-District Funds 5.0 4.0 0.0 7.0 7.0 N/A
Total for Intra-District Funds 5.0 4.0 0.0 7.0 7.0 N/A
Total Proposed FTEs 79.0 90.6 61.0 56.0 -5.0 -8.2
FY 2009 Proposed Gross Funds Operating Budget, by Revenue Type
Table AE0-1 contains the proposed FY 2009 agency budget compared to the FY 2008 approved budget.It also provides FY 2006 and FY 2007 actual expenditures.
Table AE0-1 (dollars in thousands)
Change
Actual Actual Approved Proposed from Percent
Appropriated Fund FY 2006 FY 2007 FY 2008 FY 2009 FY 2008 Change*
General Fund
Local Funds 11,726 11,447 6,979 5,974 -1,004 -14.4
Special Purpose Revenue Funds 9,499 6,188 0 0 0 N/A
Total for General Fund 21,225 17,635 6,979 5,974 -1,004 -14.4
Federal Resources
Federal Grant Funds 84,948 96,955 0 0 0 N/A
Total for Federal Resources 84,948 96,955 0 0 0 N/A
Intra-District Funds
Intra-District Funds 598 362 0 643 643 N/A
Total for Intra-District Funds 598 362 0 643 643 0.0
Gross Funds 106,770 114,952 6,979 6,617 -362 -5.2
*Percent Change is based on whole dollars.
Note: If applicable, for a breakdown of each Grant (Federal and Private), Special Purpose Revenue type and Intra-Districtagreement, please refer to Schedule 80, Agency Summary by Revenue Source, in the Operating Appendices found on theOffice of the Chief Financial Officer’s website.
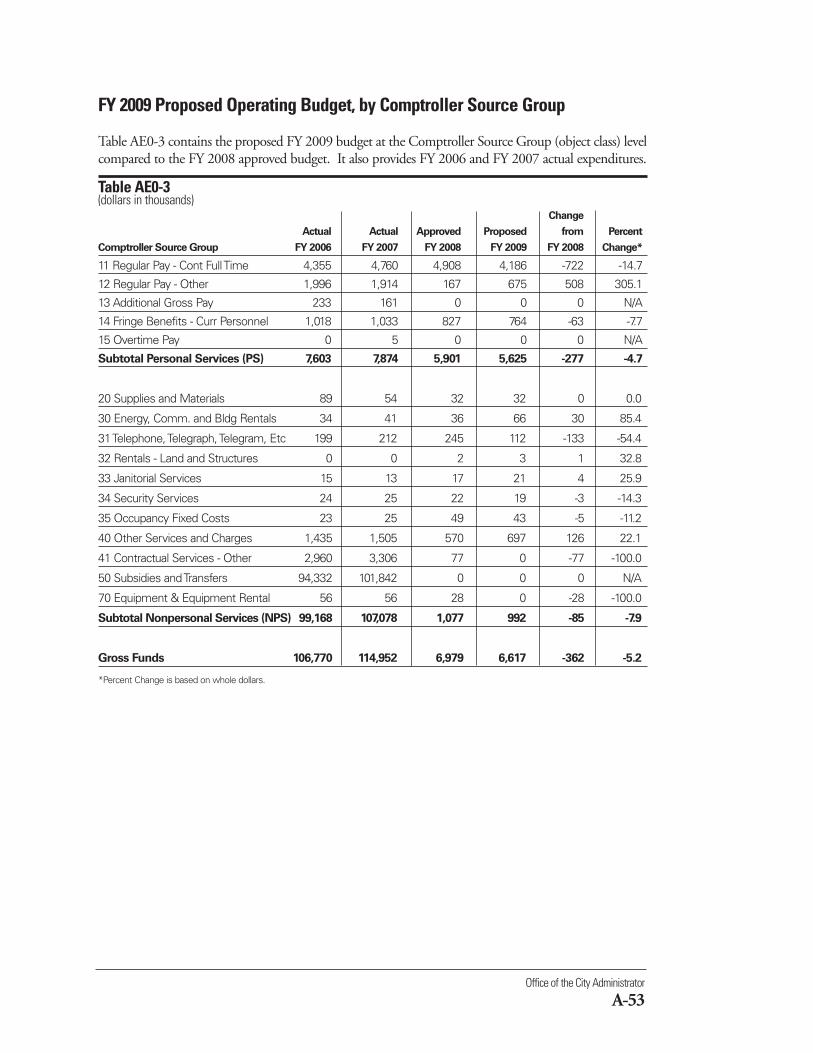
Office of the City Administrator
A-53
FY 2009 Proposed Operating Budget, by Comptroller Source Group
Table AE0-3 contains the proposed FY 2009 budget at the Comptroller Source Group (object class) levelcompared to the FY 2008 approved budget. It also provides FY 2006 and FY 2007 actual expenditures.
Table AE0-3(dollars in thousands)
Change
Actual Actual Approved Proposed from Percent
Comptroller Source Group FY 2006 FY 2007 FY 2008 FY 2009 FY 2008 Change*
11 Regular Pay - Cont Full Time 4,355 4,760 4,908 4,186 -722 -14.7
12 Regular Pay - Other 1,996 1,914 167 675 508 305.1
13 Additional Gross Pay 233 161 0 0 0 N/A
14 Fringe Benefits - Curr Personnel 1,018 1,033 827 764 -63 -7.7
15 Overtime Pay 0 5 0 0 0 N/A
Subtotal Personal Services (PS) 7,603 7,874 5,901 5,625 -277 -4.7
20 Supplies and Materials 89 54 32 32 0 0.0
30 Energy, Comm. and Bldg Rentals 34 41 36 66 30 85.4
31 Telephone, Telegraph, Telegram, Etc 199 212 245 112 -133 -54.4
32 Rentals - Land and Structures 0 0 2 3 1 32.8
33 Janitorial Services 15 13 17 21 4 25.9
34 Security Services 24 25 22 19 -3 -14.3
35 Occupancy Fixed Costs 23 25 49 43 -5 -11.2
40 Other Services and Charges 1,435 1,505 570 697 126 22.1
41 Contractual Services - Other 2,960 3,306 77 0 -77 -100.0
50 Subsidies and Transfers 94,332 101,842 0 0 0 N/A
70 Equipment & Equipment Rental 56 56 28 0 -28 -100.0
Subtotal Nonpersonal Services (NPS) 99,168 107,078 1,077 992 -85 -7.9
Gross Funds 106,770 114,952 6,979 6,617 -362 -5.2
*Percent Change is based on whole dollars.
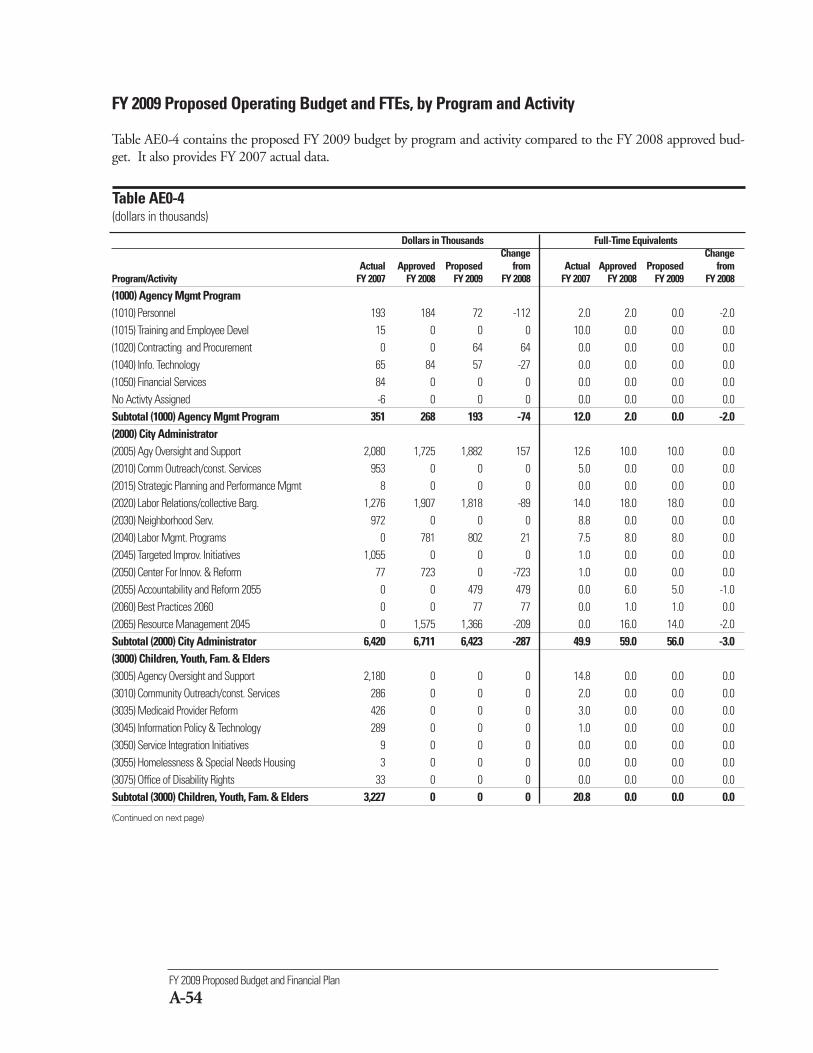
FY 2009 Proposed Budget and Financial Plan
A-54
Dollars in Thousands Full-Time EquivalentsChange Change
Actual Approved Proposed from Actual Approved Proposed from Program/Activity FY 2007 FY 2008 FY 2009 FY 2008 FY 2007 FY 2008 FY 2009 FY 2008
(1000) Agency Mgmt Program (1010) Personnel 193 184 72 -112 2.0 2.0 0.0 -2.0(1015) Training and Employee Devel 15 0 0 0 10.0 0.0 0.0 0.0(1020) Contracting and Procurement 0 0 64 64 0.0 0.0 0.0 0.0(1040) Info. Technology 65 84 57 -27 0.0 0.0 0.0 0.0(1050) Financial Services 84 0 0 0 0.0 0.0 0.0 0.0No Activty Assigned -6 0 0 0 0.0 0.0 0.0 0.0Subtotal (1000) Agency Mgmt Program 351 268 193 -74 12.0 2.0 0.0 -2.0(2000) City Administrator (2005) Agy Oversight and Support 2,080 1,725 1,882 157 12.6 10.0 10.0 0.0(2010) Comm Outreach/const. Services 953 0 0 0 5.0 0.0 0.0 0.0(2015) Strategic Planning and Performance Mgmt 8 0 0 0 0.0 0.0 0.0 0.0(2020) Labor Relations/collective Barg. 1,276 1,907 1,818 -89 14.0 18.0 18.0 0.0(2030) Neighborhood Serv. 972 0 0 0 8.8 0.0 0.0 0.0(2040) Labor Mgmt. Programs 0 781 802 21 7.5 8.0 8.0 0.0(2045) Targeted Improv. Initiatives 1,055 0 0 0 1.0 0.0 0.0 0.0(2050) Center For Innov. & Reform 77 723 0 -723 1.0 0.0 0.0 0.0(2055) Accountability and Reform 2055 0 0 479 479 0.0 6.0 5.0 -1.0(2060) Best Practices 2060 0 0 77 77 0.0 1.0 1.0 0.0(2065) Resource Management 2045 0 1,575 1,366 -209 0.0 16.0 14.0 -2.0Subtotal (2000) City Administrator 6,420 6,711 6,423 -287 49.9 59.0 56.0 -3.0(3000) Children, Youth, Fam. & Elders (3005) Agency Oversight and Support 2,180 0 0 0 14.8 0.0 0.0 0.0(3010) Community Outreach/const. Services 286 0 0 0 2.0 0.0 0.0 0.0(3035) Medicaid Provider Reform 426 0 0 0 3.0 0.0 0.0 0.0(3045) Information Policy & Technology 289 0 0 0 1.0 0.0 0.0 0.0(3050) Service Integration Initiatives 9 0 0 0 0.0 0.0 0.0 0.0(3055) Homelessness & Special Needs Housing 3 0 0 0 0.0 0.0 0.0 0.0(3075) Office of Disability Rights 33 0 0 0 0.0 0.0 0.0 0.0Subtotal (3000) Children, Youth, Fam. & Elders 3,227 0 0 0 20.8 0.0 0.0 0.0
(Continued on next page)
FY 2009 Proposed Operating Budget and FTEs, by Program and Activity
Table AE0-4 contains the proposed FY 2009 budget by program and activity compared to the FY 2008 approved bud-get. It also provides FY 2007 actual data.
Table AE0-4(dollars in thousands)
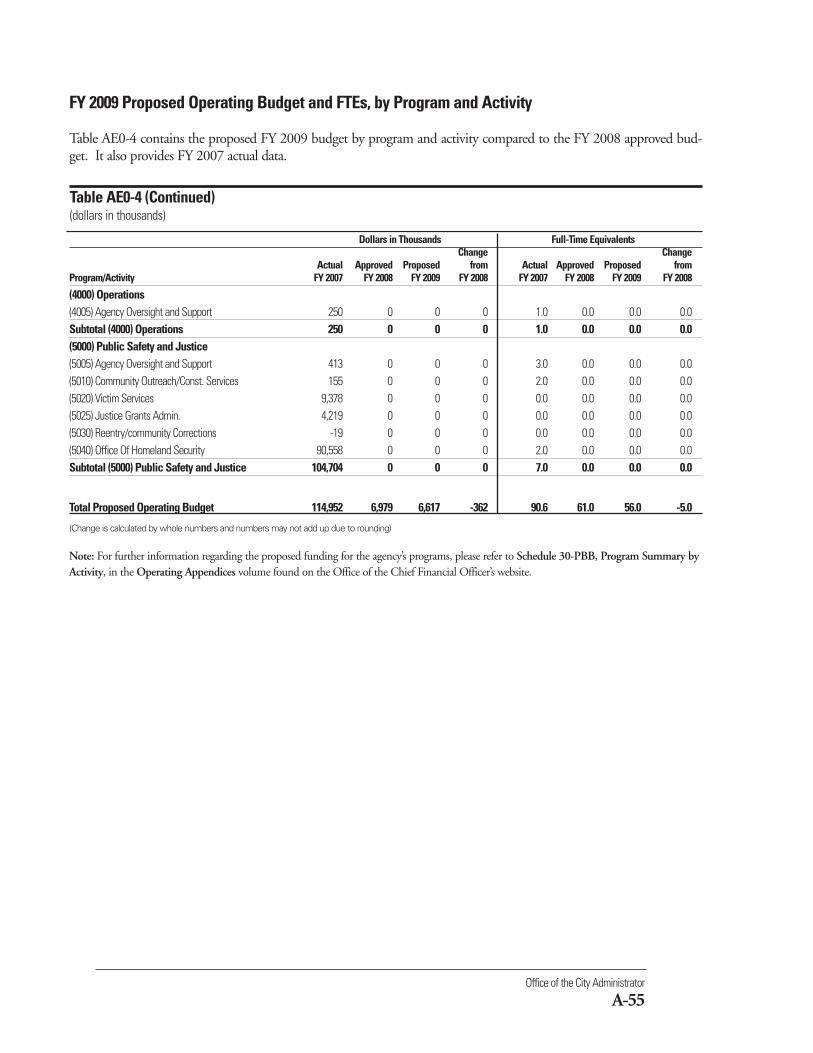
Office of the City Administrator
A-55
Note: For further information regarding the proposed funding for the agency’s programs, please refer to Schedule 30-PBB, Program Summary byActivity, in the Operating Appendices volume found on the Office of the Chief Financial Officer’s website.
Dollars in Thousands Full-Time EquivalentsChange Change
Actual Approved Proposed from Actual Approved Proposed from Program/Activity FY 2007 FY 2008 FY 2009 FY 2008 FY 2007 FY 2008 FY 2009 FY 2008
(4000) Operations (4005) Agency Oversight and Support 250 0 0 0 1.0 0.0 0.0 0.0Subtotal (4000) Operations 250 0 0 0 1.0 0.0 0.0 0.0(5000) Public Safety and Justice (5005) Agency Oversight and Support 413 0 0 0 3.0 0.0 0.0 0.0(5010) Community Outreach/Const. Services 155 0 0 0 2.0 0.0 0.0 0.0(5020) Victim Services 9,378 0 0 0 0.0 0.0 0.0 0.0(5025) Justice Grants Admin. 4,219 0 0 0 0.0 0.0 0.0 0.0(5030) Reentry/community Corrections -19 0 0 0 0.0 0.0 0.0 0.0(5040) Office Of Homeland Security 90,558 0 0 0 2.0 0.0 0.0 0.0Subtotal (5000) Public Safety and Justice 104,704 0 0 0 7.0 0.0 0.0 0.0
Total Proposed Operating Budget 114,952 6,979 6,617 -362 90.6 61.0 56.0 -5.0
(Change is calculated by whole numbers and numbers may not add up due to rounding)
FY 2009 Proposed Operating Budget and FTEs, by Program and Activity
Table AE0-4 contains the proposed FY 2009 budget by program and activity compared to the FY 2008 approved bud-get. It also provides FY 2007 actual data.
Table AE0-4 (Continued)(dollars in thousands)
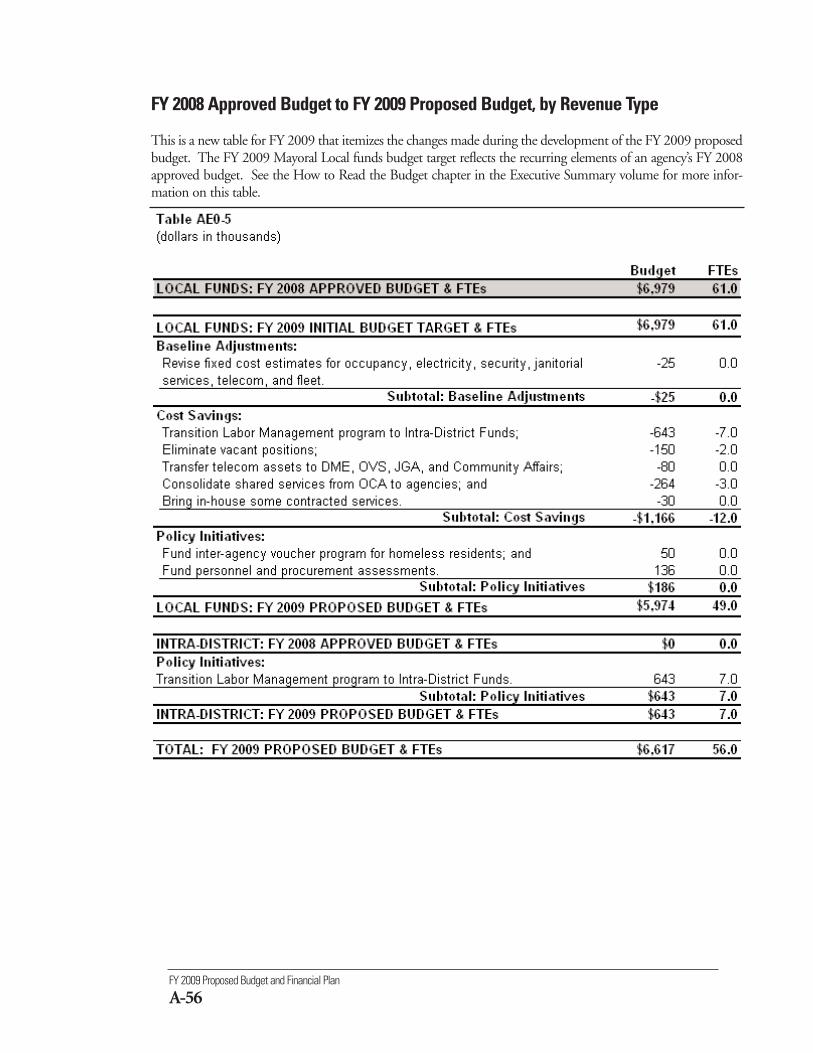
FY 2009 Proposed Budget and Financial Plan
A-56
FY 2008 Approved Budget to FY 2009 Proposed Budget, by Revenue Type
This is a new table for FY 2009 that itemizes the changes made during the development of the FY 2009 proposedbudget. The FY 2009 Mayoral Local funds budget target reflects the recurring elements of an agency’s FY 2008approved budget. See the How to Read the Budget chapter in the Executive Summary volume for more infor-mation on this table.
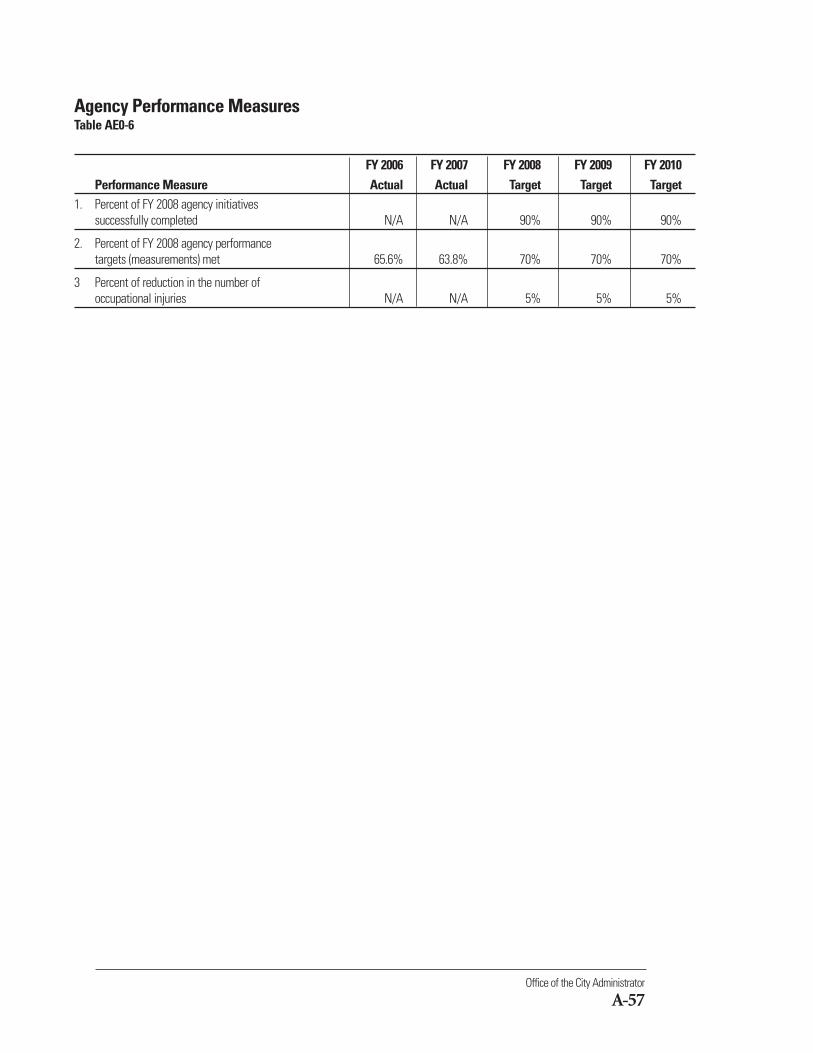
Office of the City Administrator
A-57
Agency Performance MeasuresTable AE0-6
FY 2006 FY 2007 FY 2008 FY 2009 FY 2010Performance Measure Actual Actual Target Target Target
1. Percent of FY 2008 agency initiatives successfully completed N/A N/A 90% 90% 90%
2. Percent of FY 2008 agency performance targets (measurements) met 65.6% 63.8% 70% 70% 70%
3 Percent of reduction in the number of occupational injuries N/A N/A 5% 5% 5%
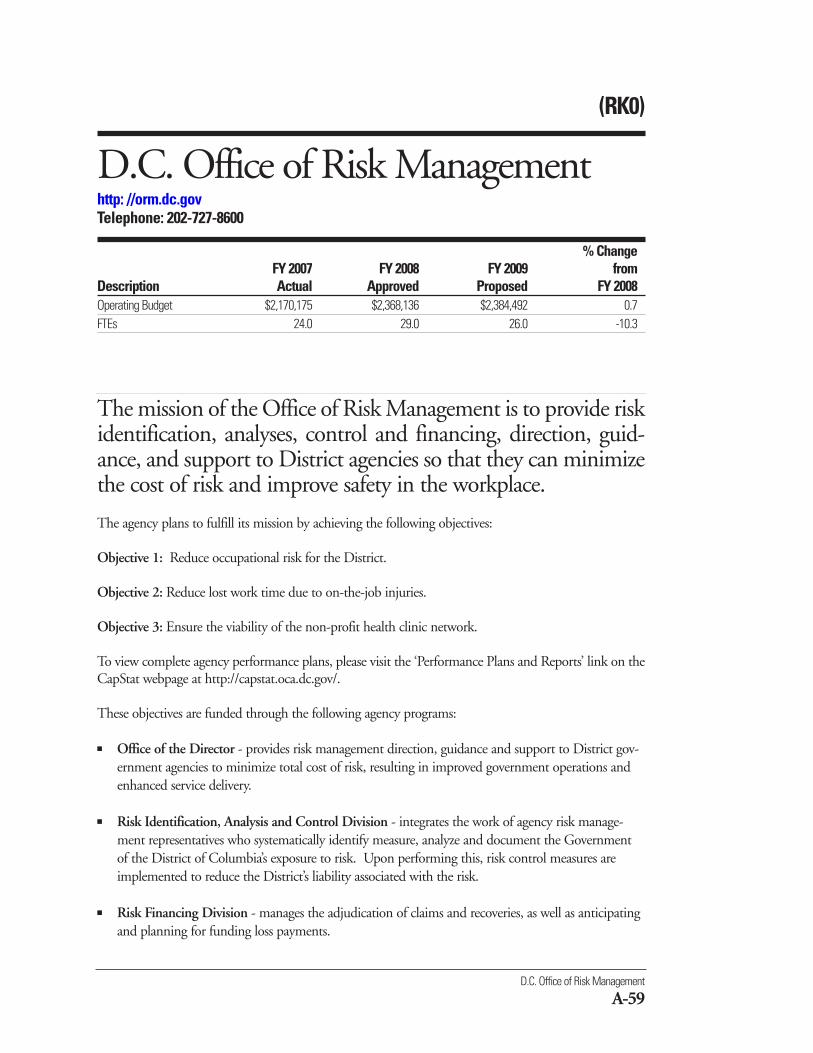
(RK0)
D.C. Office of Risk Managementhttp: //orm.dc.govTelephone: 202-727-8600
% ChangeFY 2007 FY 2008 FY 2009 from
Description Actual Approved Proposed FY 2008Operating Budget $2,170,175 $2,368,136 $2,384,492 0.7FTEs 24.0 29.0 26.0 -10.3
The mission of the Office of Risk Management is to provide riskidentification, analyses, control and financing, direction, guid-ance, and support to District agencies so that they can minimizethe cost of risk and improve safety in the workplace.
The agency plans to fulfill its mission by achieving the following objectives:
Objective 1: Reduce occupational risk for the District.
Objective 2: Reduce lost work time due to on-the-job injuries.
Objective 3: Ensure the viability of the non-profit health clinic network.
To view complete agency performance plans, please visit the ‘Performance Plans and Reports’ link on theCapStat webpage at http://capstat.oca.dc.gov/.
These objectives are funded through the following agency programs:
■ Office of the Director - provides risk management direction, guidance and support to District gov-ernment agencies to minimize total cost of risk, resulting in improved government operations andenhanced service delivery.
■ Risk Identification, Analysis and Control Division - integrates the work of agency risk manage-ment representatives who systematically identify measure, analyze and document the Governmentof the District of Columbia’s exposure to risk. Upon performing this, risk control measures areimplemented to reduce the District’s liability associated with the risk.
■ Risk Financing Division - manages the adjudication of claims and recoveries, as well as anticipatingand planning for funding loss payments.
D.C. Office of Risk Management
A-59
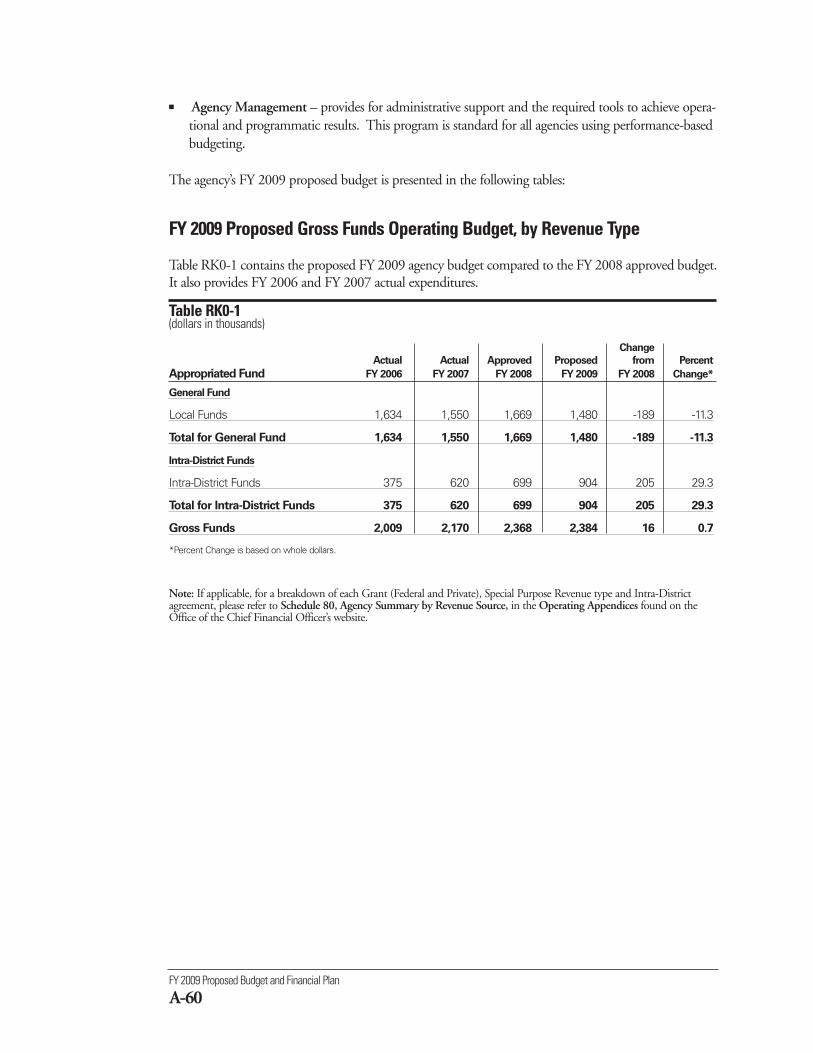
FY 2009 Proposed Budget and Financial Plan
A-60
FY 2009 Proposed Gross Funds Operating Budget, by Revenue Type
Table RK0-1 contains the proposed FY 2009 agency budget compared to the FY 2008 approved budget.It also provides FY 2006 and FY 2007 actual expenditures.
Table RK0-1 (dollars in thousands)
Change
Actual Actual Approved Proposed from Percent
Appropriated Fund FY 2006 FY 2007 FY 2008 FY 2009 FY 2008 Change*
General Fund
Local Funds 1,634 1,550 1,669 1,480 -189 -11.3
Total for General Fund 1,634 1,550 1,669 1,480 -189 -11.3
Intra-District Funds
Intra-District Funds 375 620 699 904 205 29.3
Total for Intra-District Funds 375 620 699 904 205 29.3
Gross Funds 2,009 2,170 2,368 2,384 16 0.7
*Percent Change is based on whole dollars.
Note: If applicable, for a breakdown of each Grant (Federal and Private), Special Purpose Revenue type and Intra-Districtagreement, please refer to Schedule 80, Agency Summary by Revenue Source, in the Operating Appendices found on theOffice of the Chief Financial Officer’s website.
■ Agency Management – provides for administrative support and the required tools to achieve opera-tional and programmatic results. This program is standard for all agencies using performance-basedbudgeting.
The agency’s FY 2009 proposed budget is presented in the following tables:
D.C. Office of Risk Management
A-61
FY 2009 Proposed Full-Time Equivalents, by Revenue Type
Table RK0-2 contains the proposed FY 2009 FTE level compared to the FY 2008 approved FTE level byrevenue type. It also provides FY 2006 and FY 2007 actual data.
Table RK0-2 Change
Actual Actual Approved Proposed from PercentAppropriated Fund FY 2006 FY 2007 FY 2008 FY 2009 FY 2008 Change
General Fund
Local Funds 22.0 24.0 20.6 14.5 -6.1 -29.6
Total for General Fund 22.0 24.0 20.6 14.5 -6.1 -29.6
Intra-District Funds
Intra-District Funds 0.0 0.0 8.4 11.5 3.1 36.9
Total for Intra-District Funds 0.0 0.0 8.4 11.5 3.1 36.9
Total Proposed FTEs 22.0 24.0 29.0 26.0 -3.0 -10.3
FY 2009 Proposed Operating Budget, by Comptroller Source Group
Table RK0-3 contains the proposed FY 2009 budget at the Comptroller Source Group (object class) levelcompared to the FY 2008 approved budget. It also provides FY 2006 and FY 2007 actual expenditures.
Table RK0-3(dollars in thousands)
Change
Actual Actual Approved Proposed from Percent
Comptroller Source Group FY 2006 FY 2007 FY 2008 FY 2009 FY 2008 Change*
11 Regular Pay - Cont Full Time 1,339 1,469 1,088 797 -291 -26.712 Regular Pay - Other 55 132 794 1,101 307 38.713 Additional Gross Pay 5 28 0 0 0 N/A14 Fringe Benefits - Curr Personnel 220 281 264 264 1 0.215 Overtime Pay 28 5 0 0 0 N/ASubtotal Personal Services (PS) 1,647 1,915 2,146 2,163 17 0.8
20 Supplies and Materials 15 9 10 5 -5 -47.430 Energy, Comm and Bldg Rentals 33 41 30 36 6 18.531 Telephone, Telegraph, Telegram, Etc 27 30 33 36 3 9.532 Rentals - Land and Structures 0 0 0 0 0 N/A33 Janitorial Services 9 16 17 24 7 43.034 Security Services 17 23 20 22 2 8.035 Occupancy Fixed Costs 9 26 50 50 0 0.040 Other Services and Charges 125 81 27 48 21 76.241 Contractual Services - Other 54 30 25 0 -25 -100.070 Equipment & Equipment Rental 74 0 10 0 -10 -100.0Subtotal Nonpersonal Services (NPS) 362 255 222 222 0 -0.2
Gross Funds 2,009 2,170 2,368 2,384 16 0.7
*Percent Change is based on whole dollars.
FY 2009 Proposed Budget and Financial Plan
A-62
Dollars in Thousands Full-Time EquivalentsChange Change
Actual Approved Proposed from Actual Approved Proposed from Program/Activity FY 2007 FY 2008 FY 2009 FY 2008 FY 2007 FY 2008 FY 2009 FY 2008
(1000) Agency Management Program
No Activity Assigned -10 0 0 0 0.0 0.0 0.0 0.0
(1010) Personnel 0 0 38 38 0.0 0.0 0.5 0.5
(1015) Training and Development 7 0 0 0 0.0 0.0 0.0 0.0
(1020) Contracting and Procurement 0 0 96 96 0.0 0.0 1.0 1.0
(1030) Property Management 135 150 169 18 0.0 0.0 0.0 0.0
(1050) Financial Management 40 62 0 -62 0.0 0.0 0.0 0.0
(1055) Risk Management 0 252 30 -222 0.0 3.6 0.0 -3.6
(1085) Customer Service 469 98 0 -98 6.0 2.0 0.0 -2.0
(1090) Performance Mgmt 0 152 339 186 0.0 1.0 3.0 2.0
Subtotal (1000) Agency Management Program 641 715 671 -43 6.0 6.6 4.5 -2.1
(2000) Risk Identification & Analysis
(2010) Coordination & Integ. of Armrs 654 699 577 -122 0.0 8.4 7.2 -1.2
(2020) Coordination Dcorm Council 36 0 60 60 0.0 0.0 0.7 0.7
(2030) Review & Guide RA Control Committee 347 333 172 -161 7.0 5.0 2.2 -2.8
(2040) Tech. Rm Expertise 49 0 0 0 0.0 0.0 0.0 0.0
(2050) Riad Training 21 1 0 -1 0.0 0.0 0.0 0.0
Subtotal (2000) Risk Identification & Analysis 1,108 1,032 809 -223 7.0 13.4 10.0 -3.4
(3000) Risk Control Division
(3010) Safety, Sec. Emerg. Planning 77 80 0 -80 1.0 1.0 0.0 -1.0
(3020) Compliance Monitoring 34 0 0 0 0.0 0.0 0.0 0.0
(3030) Risk Control Strategy 5 0 0 0 0.0 0.0 0.0 0.0
(3040) Reactive Consultation 41 0 0 0 0.0 0.0 0.0 0.0
(3050) Assessments 16 0 0 0 0.0 0.0 0.0 0.0
(3060) Training 112 4 0 -4 2.0 0.0 0.0 0.0
Subtotal (3000) Risk Control Division 285 84 0 -84 3.0 1.0 0.0 -1.0
(Continuted on next page)
FY 2009 Proposed Operating Budget and FTEs, by Program and Activity
Table RK0-4 contains the proposed FY 2009 budget by program and activity compared to the FY 2008 approved bud-get. It also provides FY 2007 actual data.
Table RK0-4(dollars in thousands)
D.C. Office of Risk Management
A-63
Dollars in Thousands Full-Time EquivalentsChange Change
Actual Approved Proposed from Actual Approved Proposed from Program/Activity FY 2007 FY 2008 FY 2009 FY 2008 FY 2007 FY 2008 FY 2009 FY 2008
(4000) Risk Financing Division
(4010) Claims Examination 120 482 700 218 8.0 7.0 9.5 2.5
(4040) Claims Management 17 55 204 149 0.0 1.0 2.0 1.0
Subtotal (4000) Risk Financing Division 136 537 904 367 8.0 8.0 11.5 3.5
(5000) Risk Admin. Division
(5010) External Communication 0 1 0 -1 0.0 0.0 0.0 0.0
Subtotal (5000) Risk Admin. Division 0 1 0 -1 0.0 0.0 0.0 0.0
Total Proposed Operating Budget 2,170 2,368 2,384 16 24.0 29.0 26.0 -3.0
(Change is calculated by whole numbers and numbers may not add up due to rounding)
FY 2009 Proposed Operating Budget and FTEs, by Program and Activity
Table RK0-4 contains the proposed FY 2009 budget by program and activity compared to the FY 2008 approved bud-get. It also provides FY 2007 actual data.
Table RK0-4 (Continued)(dollars in thousands)
Note: For further information regarding the proposed funding for the agency’s programs, please refer to Schedule 30-PBB, Program Summary byActivity, in the Operating Appendices volume found on the Office of the Chief Financial Officer’s website.
FY 2009 Proposed Budget and Financial Plan
A-64
FY 2008 Approved Budget to FY 2009 Proposed Budget, by Revenue Type
This is a new table for FY 2009 that itemizes the changes made during the development of the FY 2009proposed budget. The FY 2009 Mayoral Local funds budget target reflects the recurring elements of anagency’s FY 2008 approved budget. See the How to Read the Budget chapter in the Executive Summaryvolume for more information on this table.
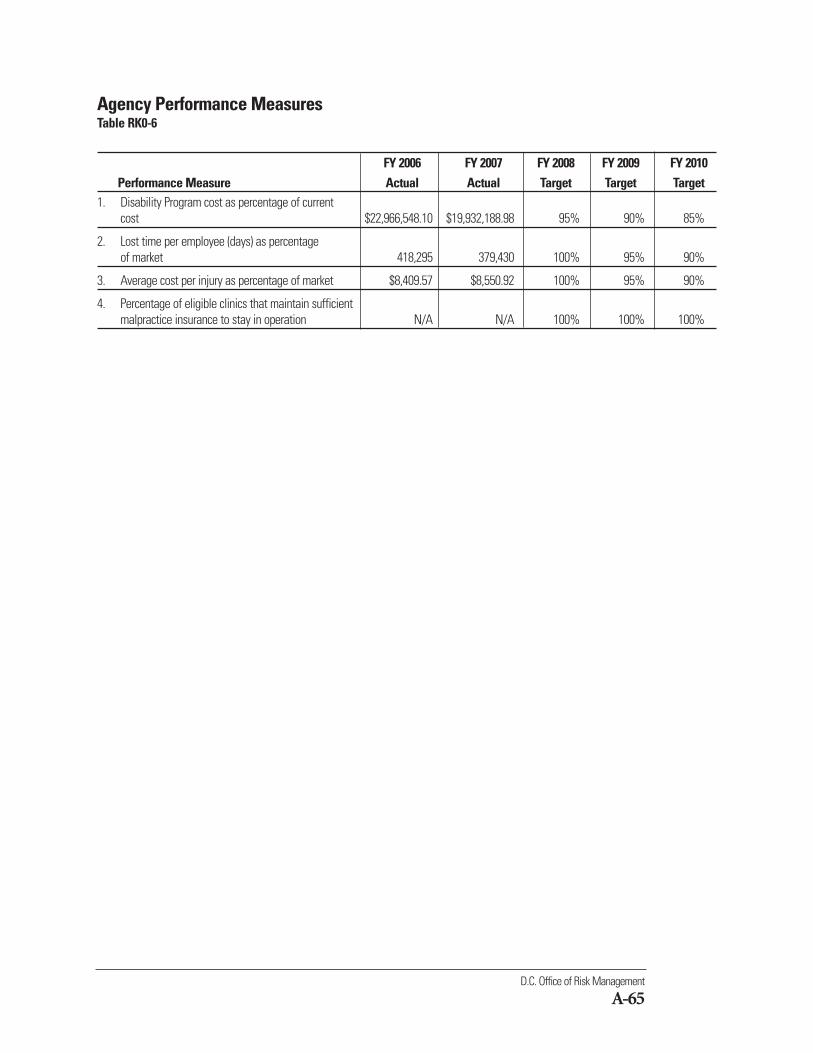
D.C. Office of Risk Management
A-65
Agency Performance MeasuresTable RK0-6
FY 2006 FY 2007 FY 2008 FY 2009 FY 2010Performance Measure Actual Actual Target Target Target
1. Disability Program cost as percentage of currentcost $22,966,548.10 $19,932,188.98 95% 90% 85%
2. Lost time per employee (days) as percentage of market 418,295 379,430 100% 95% 90%
3. Average cost per injury as percentage of market $8,409.57 $8,550.92 100% 95% 90%
4. Percentage of eligible clinics that maintain sufficientmalpractice insurance to stay in operation N/A N/A 100% 100% 100%
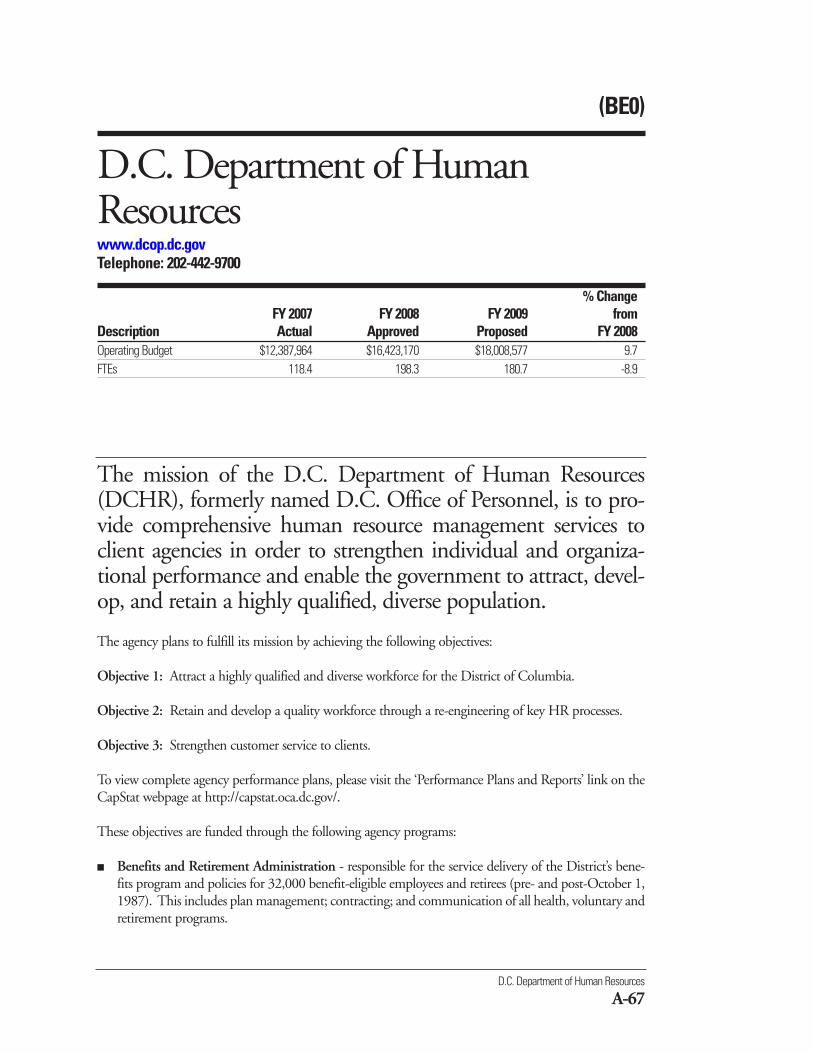
The mission of the D.C. Department of Human Resources(DCHR), formerly named D.C. Office of Personnel, is to pro-vide comprehensive human resource management services toclient agencies in order to strengthen individual and organiza-tional performance and enable the government to attract, devel-op, and retain a highly qualified, diverse population.
D.C. Department of Human Resources
A-67
(BE0)
D.C. Department of HumanResourceswww.dcop.dc.govTelephone: 202-442-9700
% ChangeFY 2007 FY 2008 FY 2009 from
Description Actual Approved Proposed FY 2008Operating Budget $12,387,964 $16,423,170 $18,008,577 9.7FTEs 118.4 198.3 180.7 -8.9
The agency plans to fulfill its mission by achieving the following objectives:
Objective 1: Attract a highly qualified and diverse workforce for the District of Columbia.
Objective 2: Retain and develop a quality workforce through a re-engineering of key HR processes.
Objective 3: Strengthen customer service to clients.
To view complete agency performance plans, please visit the ‘Performance Plans and Reports’ link on theCapStat webpage at http://capstat.oca.dc.gov/.
These objectives are funded through the following agency programs:
■ Benefits and Retirement Administration - responsible for the service delivery of the District’s bene-fits program and policies for 32,000 benefit-eligible employees and retirees (pre- and post-October 1,1987). This includes plan management; contracting; and communication of all health, voluntary andretirement programs.
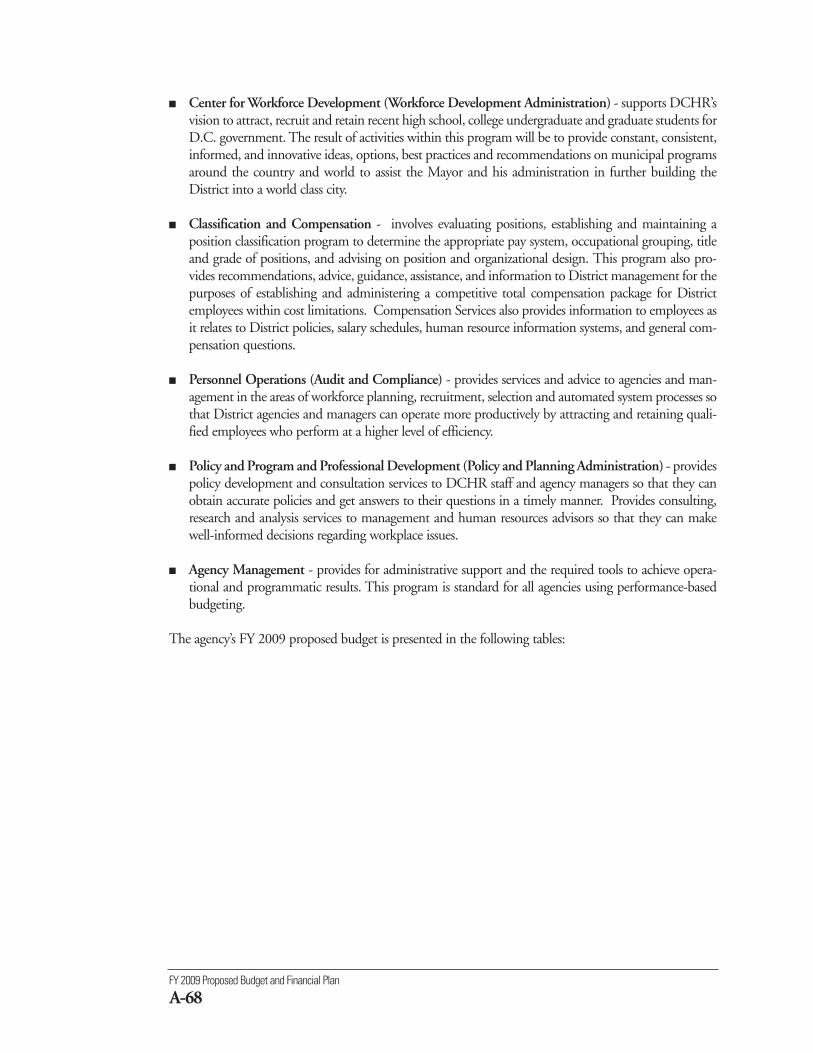
FY 2009 Proposed Budget and Financial Plan
A-68
■ Center for Workforce Development (Workforce Development Administration) - supports DCHR’svision to attract, recruit and retain recent high school, college undergraduate and graduate students forD.C. government. The result of activities within this program will be to provide constant, consistent,informed, and innovative ideas, options, best practices and recommendations on municipal programsaround the country and world to assist the Mayor and his administration in further building theDistrict into a world class city.
■ Classification and Compensation - involves evaluating positions, establishing and maintaining aposition classification program to determine the appropriate pay system, occupational grouping, titleand grade of positions, and advising on position and organizational design. This program also pro-vides recommendations, advice, guidance, assistance, and information to District management for thepurposes of establishing and administering a competitive total compensation package for Districtemployees within cost limitations. Compensation Services also provides information to employees asit relates to District policies, salary schedules, human resource information systems, and general com-pensation questions.
■ Personnel Operations (Audit and Compliance) - provides services and advice to agencies and man-agement in the areas of workforce planning, recruitment, selection and automated system processes sothat District agencies and managers can operate more productively by attracting and retaining quali-fied employees who perform at a higher level of efficiency.
■ Policy and Program and Professional Development (Policy and Planning Administration) - providespolicy development and consultation services to DCHR staff and agency managers so that they canobtain accurate policies and get answers to their questions in a timely manner. Provides consulting,research and analysis services to management and human resources advisors so that they can makewell-informed decisions regarding workplace issues.
■ Agency Management - provides for administrative support and the required tools to achieve opera-tional and programmatic results. This program is standard for all agencies using performance-basedbudgeting.
The agency’s FY 2009 proposed budget is presented in the following tables:
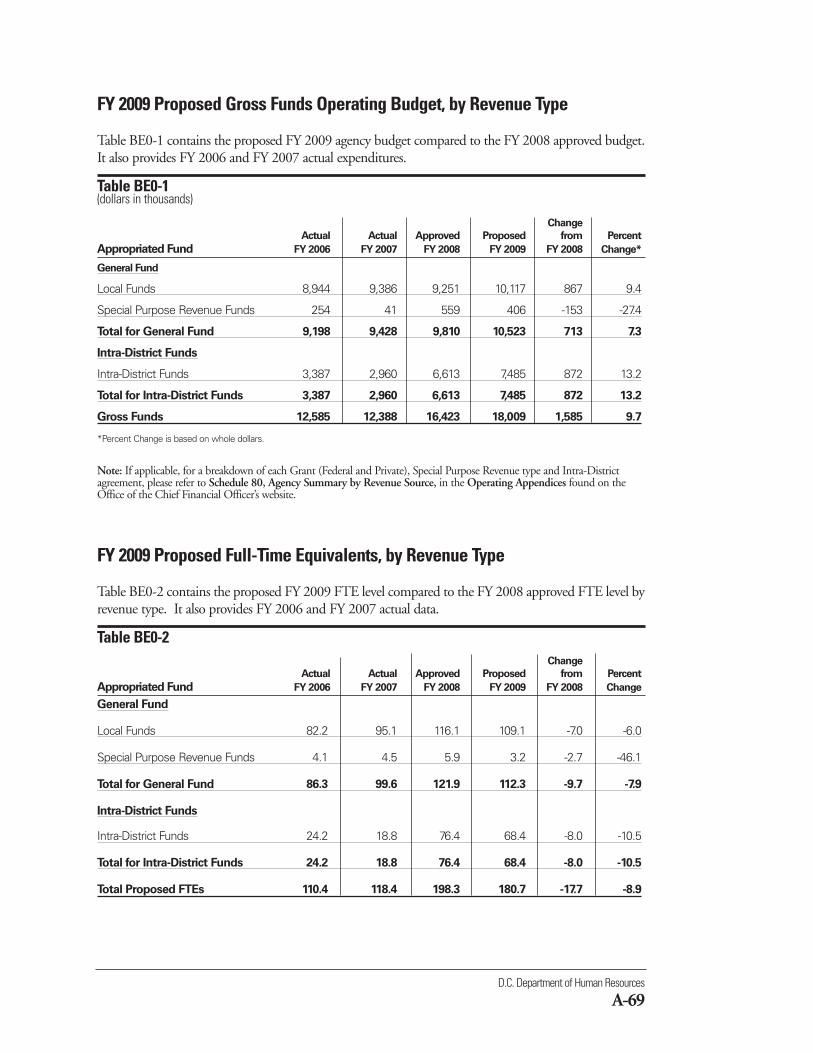
D.C. Department of Human Resources
A-69
FY 2009 Proposed Gross Funds Operating Budget, by Revenue Type
Table BE0-1 contains the proposed FY 2009 agency budget compared to the FY 2008 approved budget.It also provides FY 2006 and FY 2007 actual expenditures.
Table BE0-1 (dollars in thousands)
Change
Actual Actual Approved Proposed from Percent
Appropriated Fund FY 2006 FY 2007 FY 2008 FY 2009 FY 2008 Change*
General Fund
Local Funds 8,944 9,386 9,251 10,117 867 9.4
Special Purpose Revenue Funds 254 41 559 406 -153 -27.4
Total for General Fund 9,198 9,428 9,810 10,523 713 7.3
Intra-District Funds
Intra-District Funds 3,387 2,960 6,613 7,485 872 13.2
Total for Intra-District Funds 3,387 2,960 6,613 7,485 872 13.2
Gross Funds 12,585 12,388 16,423 18,009 1,585 9.7
*Percent Change is based on whole dollars.
Note: If applicable, for a breakdown of each Grant (Federal and Private), Special Purpose Revenue type and Intra-Districtagreement, please refer to Schedule 80, Agency Summary by Revenue Source, in the Operating Appendices found on theOffice of the Chief Financial Officer’s website.
FY 2009 Proposed Full-Time Equivalents, by Revenue Type
Table BE0-2 contains the proposed FY 2009 FTE level compared to the FY 2008 approved FTE level byrevenue type. It also provides FY 2006 and FY 2007 actual data.
Table BE0-2 Change
Actual Actual Approved Proposed from Percent
Appropriated Fund FY 2006 FY 2007 FY 2008 FY 2009 FY 2008 Change
General Fund
Local Funds 82.2 95.1 116.1 109.1 -7.0 -6.0
Special Purpose Revenue Funds 4.1 4.5 5.9 3.2 -2.7 -46.1
Total for General Fund 86.3 99.6 121.9 112.3 -9.7 -7.9
Intra-District Funds
Intra-District Funds 24.2 18.8 76.4 68.4 -8.0 -10.5
Total for Intra-District Funds 24.2 18.8 76.4 68.4 -8.0 -10.5
Total Proposed FTEs 110.4 118.4 198.3 180.7 -17.7 -8.9
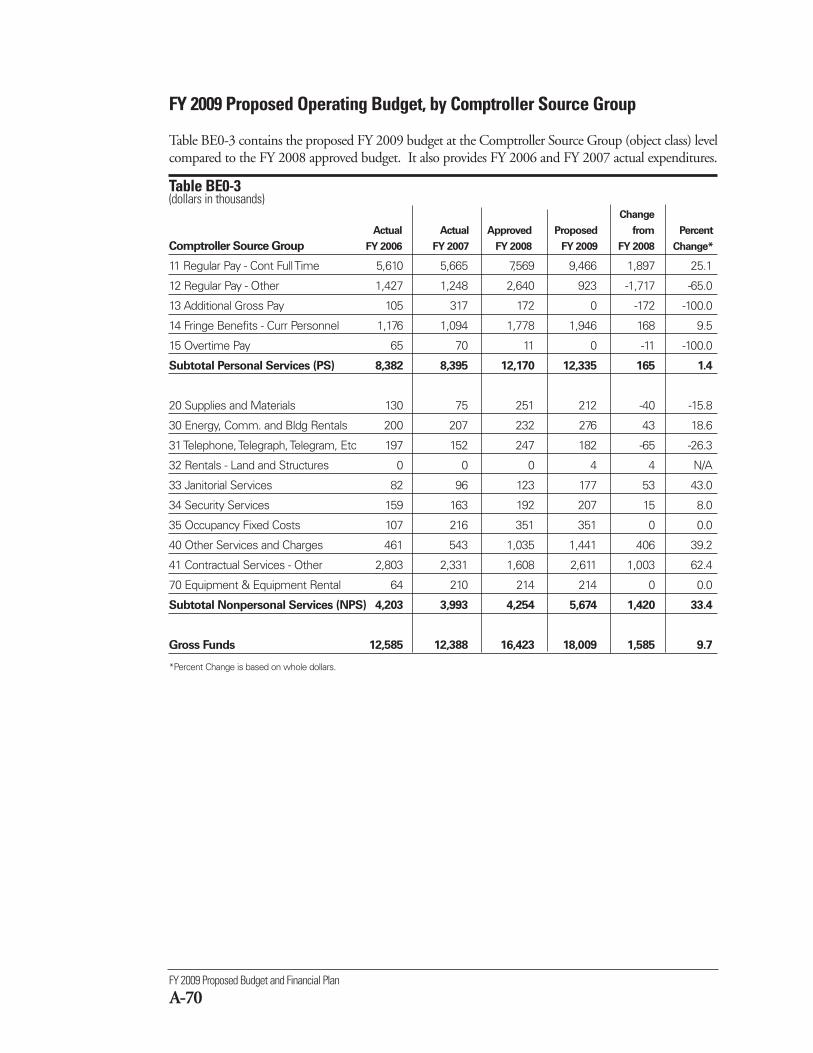
FY 2009 Proposed Budget and Financial Plan
A-70
FY 2009 Proposed Operating Budget, by Comptroller Source Group
Table BE0-3 contains the proposed FY 2009 budget at the Comptroller Source Group (object class) levelcompared to the FY 2008 approved budget. It also provides FY 2006 and FY 2007 actual expenditures.
Table BE0-3(dollars in thousands)
Change
Actual Actual Approved Proposed from Percent
Comptroller Source Group FY 2006 FY 2007 FY 2008 FY 2009 FY 2008 Change*
11 Regular Pay - Cont Full Time 5,610 5,665 7,569 9,466 1,897 25.1
12 Regular Pay - Other 1,427 1,248 2,640 923 -1,717 -65.0
13 Additional Gross Pay 105 317 172 0 -172 -100.0
14 Fringe Benefits - Curr Personnel 1,176 1,094 1,778 1,946 168 9.5
15 Overtime Pay 65 70 11 0 -11 -100.0
Subtotal Personal Services (PS) 8,382 8,395 12,170 12,335 165 1.4
20 Supplies and Materials 130 75 251 212 -40 -15.8
30 Energy, Comm. and Bldg Rentals 200 207 232 276 43 18.6
31 Telephone, Telegraph, Telegram, Etc 197 152 247 182 -65 -26.3
32 Rentals - Land and Structures 0 0 0 4 4 N/A
33 Janitorial Services 82 96 123 177 53 43.0
34 Security Services 159 163 192 207 15 8.0
35 Occupancy Fixed Costs 107 216 351 351 0 0.0
40 Other Services and Charges 461 543 1,035 1,441 406 39.2
41 Contractual Services - Other 2,803 2,331 1,608 2,611 1,003 62.4
70 Equipment & Equipment Rental 64 210 214 214 0 0.0
Subtotal Nonpersonal Services (NPS) 4,203 3,993 4,254 5,674 1,420 33.4
Gross Funds 12,585 12,388 16,423 18,009 1,585 9.7
*Percent Change is based on whole dollars.
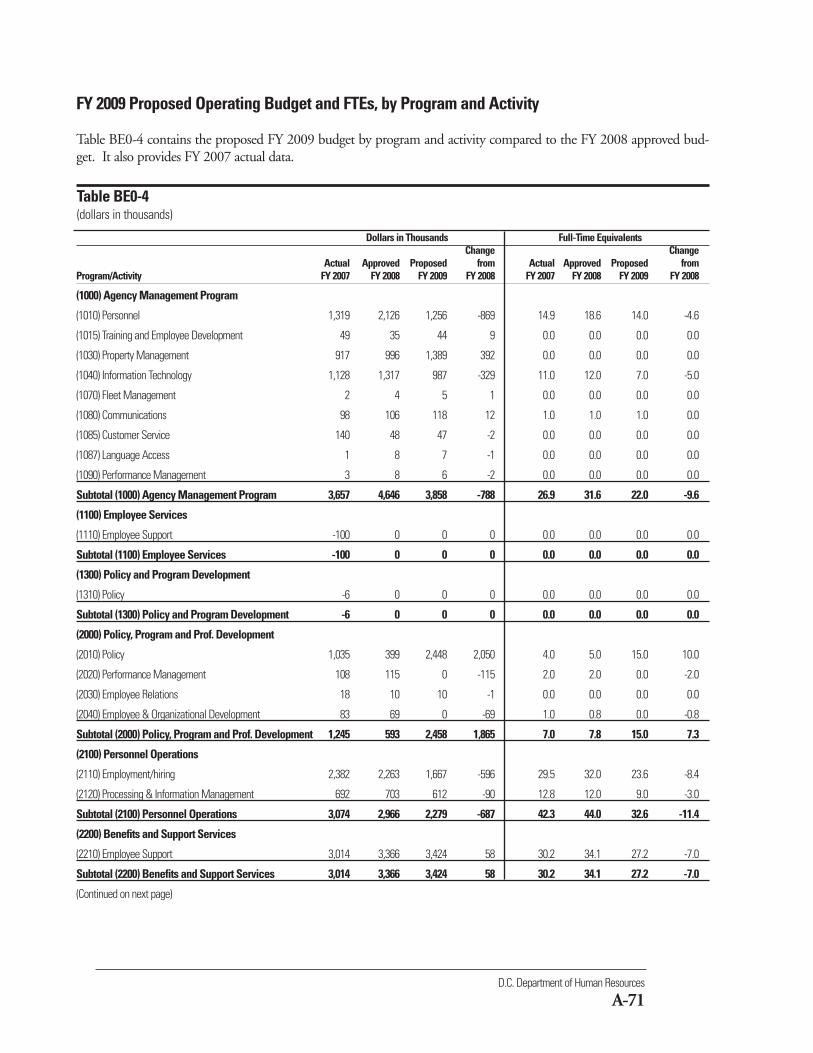
D.C. Department of Human Resources
A-71
Dollars in Thousands Full-Time EquivalentsChange Change
Actual Approved Proposed from Actual Approved Proposed from Program/Activity FY 2007 FY 2008 FY 2009 FY 2008 FY 2007 FY 2008 FY 2009 FY 2008
(1000) Agency Management Program
(1010) Personnel 1,319 2,126 1,256 -869 14.9 18.6 14.0 -4.6
(1015) Training and Employee Development 49 35 44 9 0.0 0.0 0.0 0.0
(1030) Property Management 917 996 1,389 392 0.0 0.0 0.0 0.0
(1040) Information Technology 1,128 1,317 987 -329 11.0 12.0 7.0 -5.0
(1070) Fleet Management 2 4 5 1 0.0 0.0 0.0 0.0
(1080) Communications 98 106 118 12 1.0 1.0 1.0 0.0
(1085) Customer Service 140 48 47 -2 0.0 0.0 0.0 0.0
(1087) Language Access 1 8 7 -1 0.0 0.0 0.0 0.0
(1090) Performance Management 3 8 6 -2 0.0 0.0 0.0 0.0
Subtotal (1000) Agency Management Program 3,657 4,646 3,858 -788 26.9 31.6 22.0 -9.6
(1100) Employee Services
(1110) Employee Support -100 0 0 0 0.0 0.0 0.0 0.0
Subtotal (1100) Employee Services -100 0 0 0 0.0 0.0 0.0 0.0
(1300) Policy and Program Development
(1310) Policy -6 0 0 0 0.0 0.0 0.0 0.0
Subtotal (1300) Policy and Program Development -6 0 0 0 0.0 0.0 0.0 0.0
(2000) Policy, Program and Prof. Development
(2010) Policy 1,035 399 2,448 2,050 4.0 5.0 15.0 10.0
(2020) Performance Management 108 115 0 -115 2.0 2.0 0.0 -2.0
(2030) Employee Relations 18 10 10 -1 0.0 0.0 0.0 0.0
(2040) Employee & Organizational Development 83 69 0 -69 1.0 0.8 0.0 -0.8
Subtotal (2000) Policy, Program and Prof. Development 1,245 593 2,458 1,865 7.0 7.8 15.0 7.3
(2100) Personnel Operations
(2110) Employment/hiring 2,382 2,263 1,667 -596 29.5 32.0 23.6 -8.4
(2120) Processing & Information Management 692 703 612 -90 12.8 12.0 9.0 -3.0
Subtotal (2100) Personnel Operations 3,074 2,966 2,279 -687 42.3 44.0 32.6 -11.4
(2200) Benefits and Support Services
(2210) Employee Support 3,014 3,366 3,424 58 30.2 34.1 27.2 -7.0
Subtotal (2200) Benefits and Support Services 3,014 3,366 3,424 58 30.2 34.1 27.2 -7.0
(Continued on next page)
FY 2009 Proposed Operating Budget and FTEs, by Program and Activity
Table BE0-4 contains the proposed FY 2009 budget by program and activity compared to the FY 2008 approved bud-get. It also provides FY 2007 actual data.
Table BE0-4(dollars in thousands)
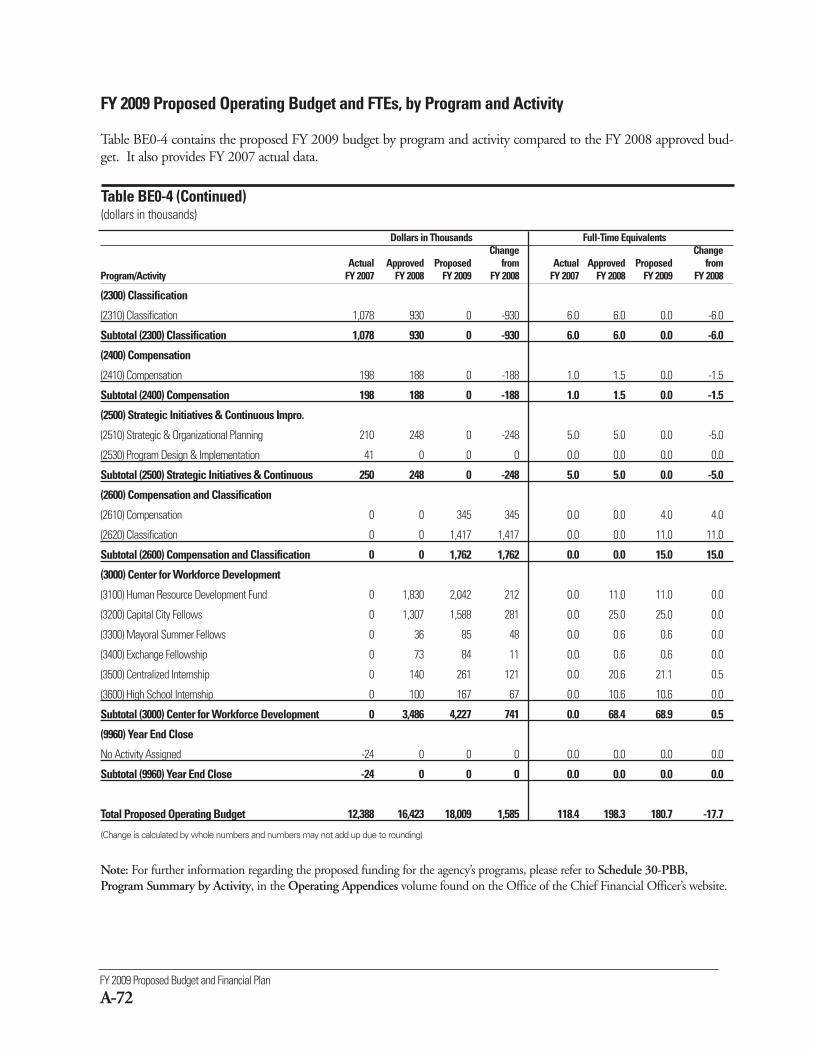
FY 2009 Proposed Budget and Financial Plan
A-72
Dollars in Thousands Full-Time EquivalentsChange Change
Actual Approved Proposed from Actual Approved Proposed from Program/Activity FY 2007 FY 2008 FY 2009 FY 2008 FY 2007 FY 2008 FY 2009 FY 2008
(2300) Classification
(2310) Classification 1,078 930 0 -930 6.0 6.0 0.0 -6.0
Subtotal (2300) Classification 1,078 930 0 -930 6.0 6.0 0.0 -6.0
(2400) Compensation
(2410) Compensation 198 188 0 -188 1.0 1.5 0.0 -1.5
Subtotal (2400) Compensation 198 188 0 -188 1.0 1.5 0.0 -1.5
(2500) Strategic Initiatives & Continuous Impro.
(2510) Strategic & Organizational Planning 210 248 0 -248 5.0 5.0 0.0 -5.0
(2530) Program Design & Implementation 41 0 0 0 0.0 0.0 0.0 0.0
Subtotal (2500) Strategic Initiatives & Continuous 250 248 0 -248 5.0 5.0 0.0 -5.0
(2600) Compensation and Classification
(2610) Compensation 0 0 345 345 0.0 0.0 4.0 4.0
(2620) Classification 0 0 1,417 1,417 0.0 0.0 11.0 11.0
Subtotal (2600) Compensation and Classification 0 0 1,762 1,762 0.0 0.0 15.0 15.0
(3000) Center for Workforce Development
(3100) Human Resource Development Fund 0 1,830 2,042 212 0.0 11.0 11.0 0.0
(3200) Capital City Fellows 0 1,307 1,588 281 0.0 25.0 25.0 0.0
(3300) Mayoral Summer Fellows 0 36 85 48 0.0 0.6 0.6 0.0
(3400) Exchange Fellowship 0 73 84 11 0.0 0.6 0.6 0.0
(3500) Centralized Internship 0 140 261 121 0.0 20.6 21.1 0.5
(3600) High School Internship 0 100 167 67 0.0 10.6 10.6 0.0
Subtotal (3000) Center for Workforce Development 0 3,486 4,227 741 0.0 68.4 68.9 0.5
(9960) Year End Close
No Activity Assigned -24 0 0 0 0.0 0.0 0.0 0.0
Subtotal (9960) Year End Close -24 0 0 0 0.0 0.0 0.0 0.0
Total Proposed Operating Budget 12,388 16,423 18,009 1,585 118.4 198.3 180.7 -17.7
(Change is calculated by whole numbers and numbers may not add up due to rounding)
Note: For further information regarding the proposed funding for the agency’s programs, please refer to Schedule 30-PBB,Program Summary by Activity, in the Operating Appendices volume found on the Office of the Chief Financial Officer’s website.
FY 2009 Proposed Operating Budget and FTEs, by Program and Activity
Table BE0-4 contains the proposed FY 2009 budget by program and activity compared to the FY 2008 approved bud-get. It also provides FY 2007 actual data.
Table BE0-4 (Continued)(dollars in thousands)
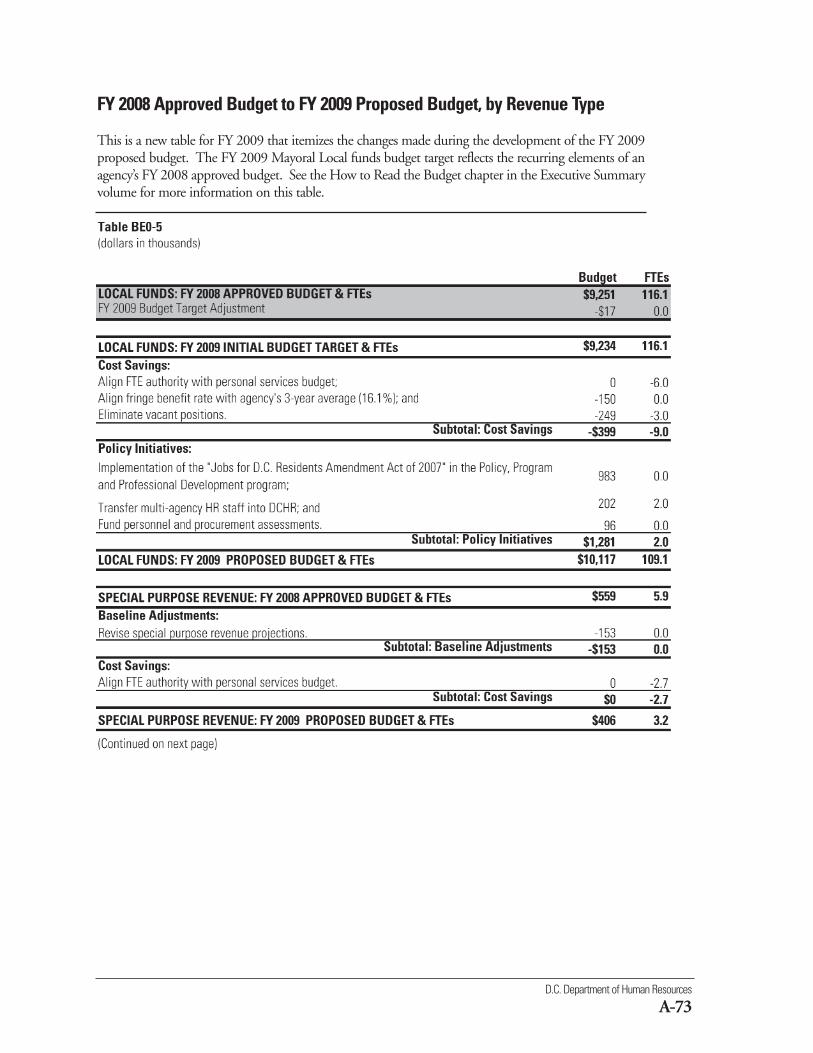
D.C. Department of Human Resources
A-73
FY 2008 Approved Budget to FY 2009 Proposed Budget, by Revenue Type
This is a new table for FY 2009 that itemizes the changes made during the development of the FY 2009proposed budget. The FY 2009 Mayoral Local funds budget target reflects the recurring elements of anagency’s FY 2008 approved budget. See the How to Read the Budget chapter in the Executive Summaryvolume for more information on this table.
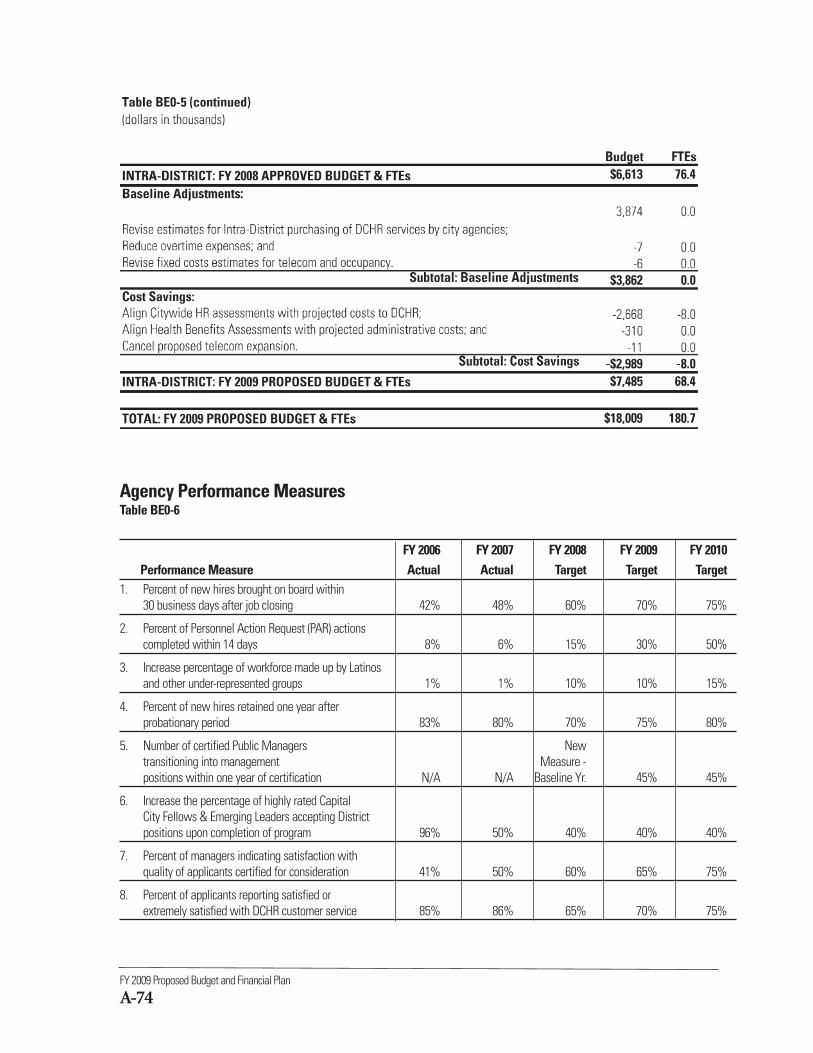
FY 2009 Proposed Budget and Financial Plan
A-74
Agency Performance MeasuresTable BE0-6
FY 2006 FY 2007 FY 2008 FY 2009 FY 2010Performance Measure Actual Actual Target Target Target
1. Percent of new hires brought on board within 30 business days after job closing 42% 48% 60% 70% 75%
2. Percent of Personnel Action Request (PAR) actions completed within 14 days 8% 6% 15% 30% 50%
3. Increase percentage of workforce made up by Latinos and other under-represented groups 1% 1% 10% 10% 15%
4. Percent of new hires retained one year afterprobationary period 83% 80% 70% 75% 80%
5. Number of certified Public Managers New transitioning into management Measure -positions within one year of certification N/A N/A Baseline Yr. 45% 45%
6. Increase the percentage of highly rated Capital City Fellows & Emerging Leaders accepting District positions upon completion of program 96% 50% 40% 40% 40%
7. Percent of managers indicating satisfaction with quality of applicants certified for consideration 41% 50% 60% 65% 75%
8. Percent of applicants reporting satisfied or extremely satisfied with DCHR customer service 85% 86% 65% 70% 75%
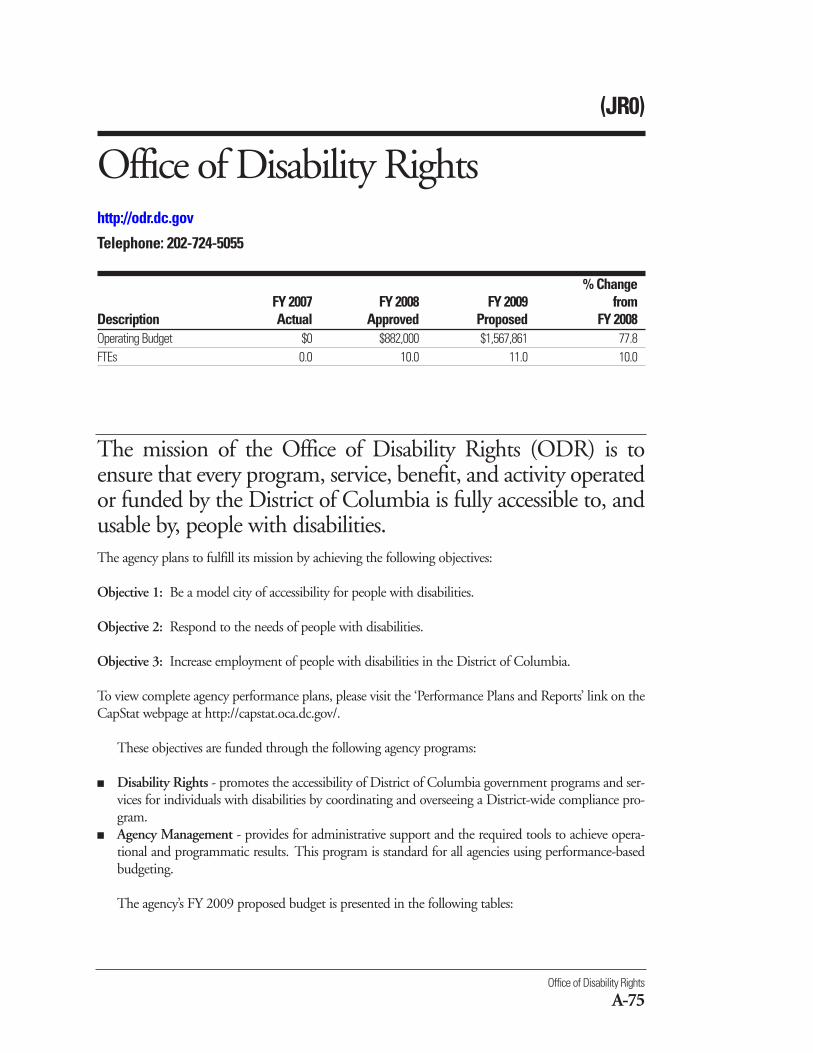
(JR0)
Office of Disability Rightshttp://odr.dc.gov
Telephone: 202-724-5055
% ChangeFY 2007 FY 2008 FY 2009 from
Description Actual Approved Proposed FY 2008Operating Budget $0 $882,000 $1,567,861 77.8FTEs 0.0 10.0 11.0 10.0
The agency plans to fulfill its mission by achieving the following objectives:
Objective 1: Be a model city of accessibility for people with disabilities.
Objective 2: Respond to the needs of people with disabilities.
Objective 3: Increase employment of people with disabilities in the District of Columbia.
To view complete agency performance plans, please visit the ‘Performance Plans and Reports’ link on theCapStat webpage at http://capstat.oca.dc.gov/.
These objectives are funded through the following agency programs:
■ Disability Rights - promotes the accessibility of District of Columbia government programs and ser-vices for individuals with disabilities by coordinating and overseeing a District-wide compliance pro-gram.
■ Agency Management - provides for administrative support and the required tools to achieve opera-tional and programmatic results. This program is standard for all agencies using performance-basedbudgeting.
The agency’s FY 2009 proposed budget is presented in the following tables:
The mission of the Office of Disability Rights (ODR) is toensure that every program, service, benefit, and activity operatedor funded by the District of Columbia is fully accessible to, andusable by, people with disabilities.
Office of Disability Rights
A-75
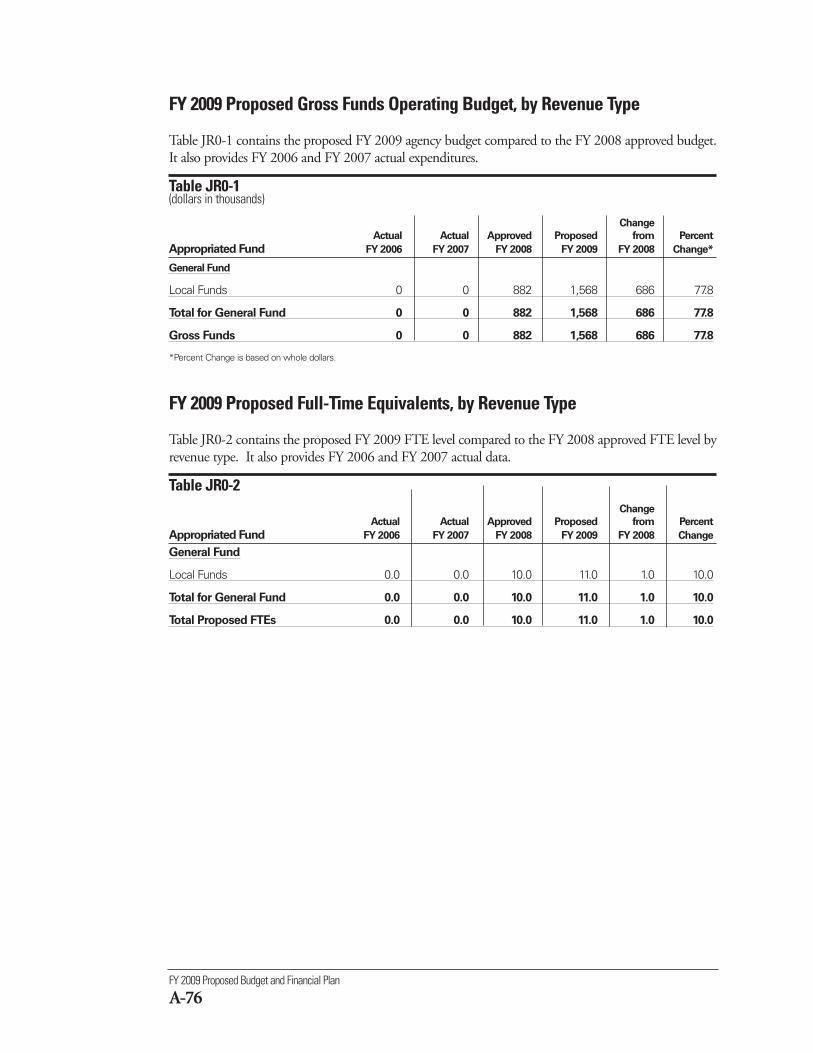
FY 2009 Proposed Budget and Financial Plan
A-76
FY 2009 Proposed Gross Funds Operating Budget, by Revenue Type
Table JR0-1 contains the proposed FY 2009 agency budget compared to the FY 2008 approved budget.It also provides FY 2006 and FY 2007 actual expenditures.
Table JR0-1 (dollars in thousands)
Change
Actual Actual Approved Proposed from Percent
Appropriated Fund FY 2006 FY 2007 FY 2008 FY 2009 FY 2008 Change*
General Fund
Local Funds 0 0 882 1,568 686 77.8
Total for General Fund 0 0 882 1,568 686 77.8
Gross Funds 0 0 882 1,568 686 77.8
*Percent Change is based on whole dollars.
FY 2009 Proposed Full-Time Equivalents, by Revenue Type
Table JR0-2 contains the proposed FY 2009 FTE level compared to the FY 2008 approved FTE level byrevenue type. It also provides FY 2006 and FY 2007 actual data.
Table JR0-2 Change
Actual Actual Approved Proposed from Percent
Appropriated Fund FY 2006 FY 2007 FY 2008 FY 2009 FY 2008 Change
General Fund
Local Funds 0.0 0.0 10.0 11.0 1.0 10.0
Total for General Fund 0.0 0.0 10.0 11.0 1.0 10.0
Total Proposed FTEs 0.0 0.0 10.0 11.0 1.0 10.0
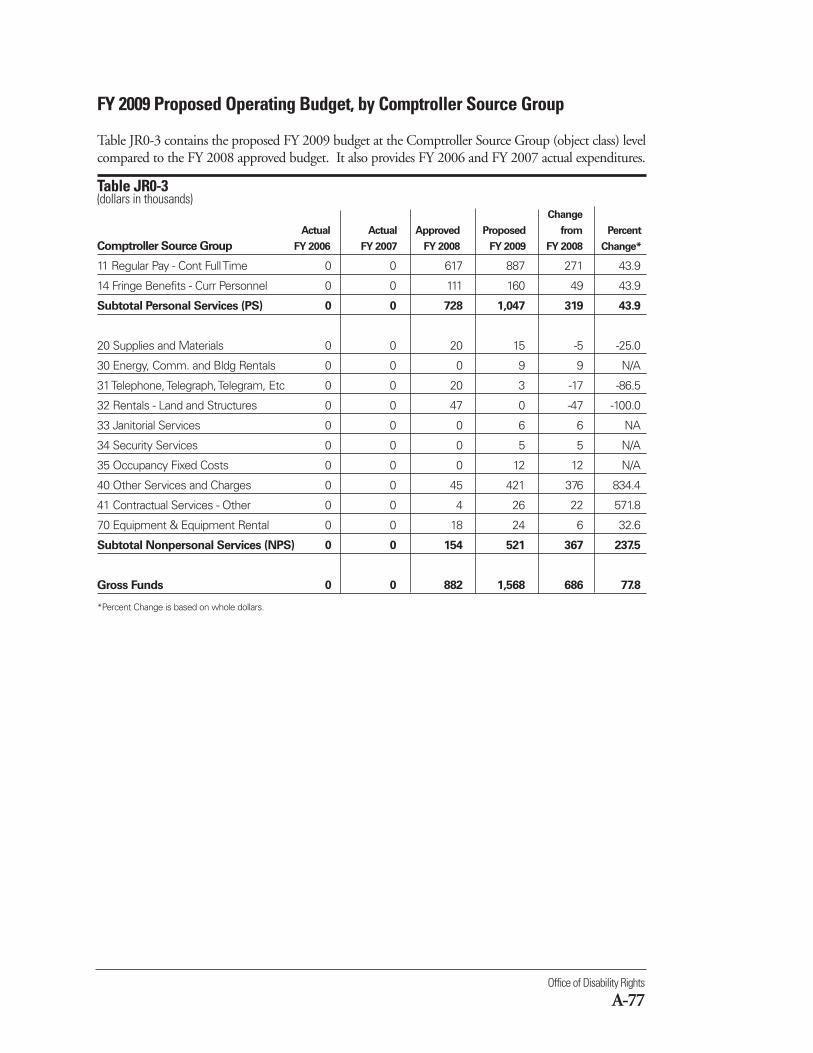
Office of Disability Rights
A-77
FY 2009 Proposed Operating Budget, by Comptroller Source Group
Table JR0-3 contains the proposed FY 2009 budget at the Comptroller Source Group (object class) levelcompared to the FY 2008 approved budget. It also provides FY 2006 and FY 2007 actual expenditures.
Table JR0-3(dollars in thousands)
Change
Actual Actual Approved Proposed from Percent
Comptroller Source Group FY 2006 FY 2007 FY 2008 FY 2009 FY 2008 Change*
11 Regular Pay - Cont Full Time 0 0 617 887 271 43.9
14 Fringe Benefits - Curr Personnel 0 0 111 160 49 43.9
Subtotal Personal Services (PS) 0 0 728 1,047 319 43.9
20 Supplies and Materials 0 0 20 15 -5 -25.0
30 Energy, Comm. and Bldg Rentals 0 0 0 9 9 N/A
31 Telephone, Telegraph, Telegram, Etc 0 0 20 3 -17 -86.5
32 Rentals - Land and Structures 0 0 47 0 -47 -100.0
33 Janitorial Services 0 0 0 6 6 NA
34 Security Services 0 0 0 5 5 N/A
35 Occupancy Fixed Costs 0 0 0 12 12 N/A
40 Other Services and Charges 0 0 45 421 376 834.4
41 Contractual Services - Other 0 0 4 26 22 571.8
70 Equipment & Equipment Rental 0 0 18 24 6 32.6
Subtotal Nonpersonal Services (NPS) 0 0 154 521 367 237.5
Gross Funds 0 0 882 1,568 686 77.8
*Percent Change is based on whole dollars.
FY 2009 Proposed Budget and Financial Plan
A-78
Dollars in Thousands Full-Time EquivalentsChange Change
Actual Approved Proposed from Actual Approved Proposed from Program/Activity FY 2007 FY 2008 FY 2009 FY 2008 FY 2007 FY 2008 FY 2009 FY 2008
(1000) Agency Management Program
(1030) Property Management 0 0 39 39 0.0 0.0 0.0 0.0
(1040) Information Technology 0 0 36 36 0.0 0.0 0.0 0.0
(1090) Performance Management 0 0 352 352 0.0 0.0 3.0 3.0
Subtotal (1000) Agency Management Program 0 0 427 427 0.0 0.0 3.0 3.0
(2000) Disability Rights
(2005) Operations 0 185 102 -83 0.0 1.8 1.0 -0.8
(2010) Training and Technical Assistance 0 218 158 -60 0.0 1.8 1.6 -0.2
(2015) Public Information and Outreach 0 185 5 -180 0.0 2.1 0.0 -2.1
(2020) Evaluation and Compliance 0 262 825 563 0.0 3.9 4.9 1.0
(2030) Investigations 0 32 52 19 0.0 0.5 0.5 0.0
Subtotal (2000) Disability Rights 0 882 1,141 259 0.0 10.0 8.0 -2.0
Total Proposed Operating Budget 0 882 1,568 686 0.0 10.0 11.0 1.0
(Change is calculated by whole numbers and numbers may not add up due to rounding)
Note: For further information regarding the proposed funding for the agency’s programs, please refer to Schedule 30-PBB,Program Summary by Activity, in the Operating Appendices volume found on the Office of the Chief Financial Officer’s website.
FY 2009 Proposed Operating Budget and FTEs, by Program and Activity
Table JR0-4 contains the proposed FY 2009 budget by program and activity compared to the FY 2008 approved budget.It also provides FY 2007 actual data.
Table JR0-4(dollars in thousands)
Office of Disability Rights
A-79
FY 2008 Approved Budget to FY 2009 Proposed Budget, by Revenue Type
This is a new table for FY 2009 that itemizes the changes made during the development of the FY 2009proposed budget. The FY 2009 Mayoral Local funds budget target reflects the recurring elements of anagency’s FY 2008 approved budget. See the How to Read the Budget chapter in the Executive Summaryvolume for more information on this table.
FY 2009 Proposed Budget and Financial Plan
A-80
Agency Performance MeasuresTable JR0-6
FY 2006 FY 2007 FY 2008 FY 2009 FY 2010Performance Measure Actual Actual Target Target Target
1. Number of DC-owned and leased buildings modified for accessibility N/A N/A 20 50 50
2. Number of accessible taxicabs in DC 0 0 0 10 15
3. Percent of text equivalents for non-text items on website N/A 1% 40% 75% 95%
4. Number of DC employees receiving ADA training N/A N/A 300 400 500
5. Number of technical assistance calls/complaints addressedwithin 30 days N/A N/A 200 400 500
6. Number of agency ADA Compliance Plans completed, reviewed, and rated N/A N/A 20 40 50
ADA = Americans with Disabilities Act
(AS0)
Office of Finance and Resource Managementwww.cfo.dc.govTelephone: 202-727-0333
% ChangeFY 2007 FY 2008 FY 2009 from
Description Actual Approved Proposed FY 2008Operating Budget $236,167,932 $268,259,212 $246,989,322 -7.9FTEs 44.3 51.0 53.0 3.9
The mission of the Office of Finance and Resource Management(OFRM) is to provide financial and resource management ser-vices to various District of Columbia Government agencies.OFRM will promote the effective management of the District'sresources by continuously seeking improvements in operationalefficiency on behalf of the government and the residents of theDistrict.
Office of Finance and Resource Management
A-81
The agency plans to fulfill its mission by achieving the following strategic result goals:
■ Continue bi-annual financial management workshops to include budget formulation and fiscal yearend closing for client agencies to promote fiscal understanding and accountability.
■ Continue to provide monthly fiscal reporting and utility bill payment analysis online for stakeholderreview.
■ Establish an automated tracking system for monitoring agency deliverables to include invoices,MOUs, revenue collections, Intra-District billing, and grant performance.
■ Continue to build and maintain partnerships with client agencies by improving communications,providing accurate and timely fiscal information, and developing OFRM staff to exceed client pro-gram and financial needs.
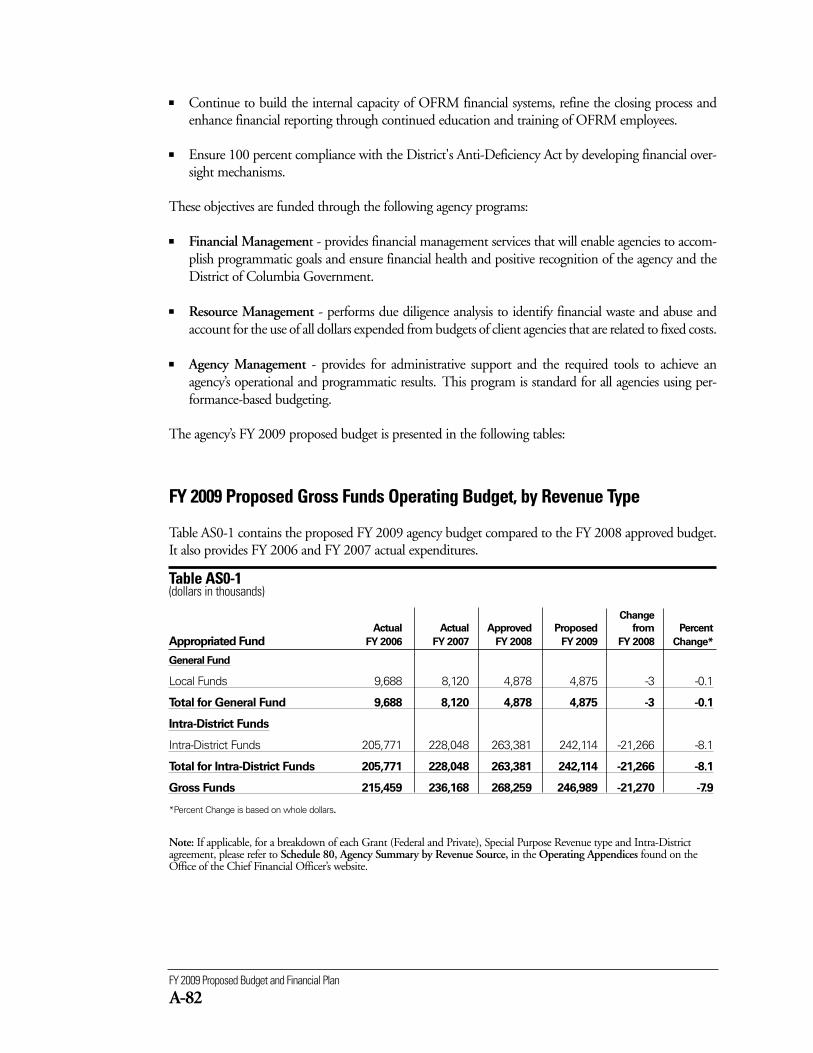
FY 2009 Proposed Budget and Financial Plan
A-82
■ Continue to build the internal capacity of OFRM financial systems, refine the closing process andenhance financial reporting through continued education and training of OFRM employees.
■ Ensure 100 percent compliance with the District's Anti-Deficiency Act by developing financial over-sight mechanisms.
These objectives are funded through the following agency programs:
■ Financial Management - provides financial management services that will enable agencies to accom-plish programmatic goals and ensure financial health and positive recognition of the agency and theDistrict of Columbia Government.
■ Resource Management - performs due diligence analysis to identify financial waste and abuse andaccount for the use of all dollars expended from budgets of client agencies that are related to fixed costs.
■ Agency Management - provides for administrative support and the required tools to achieve anagency’s operational and programmatic results. This program is standard for all agencies using per-formance-based budgeting.
The agency’s FY 2009 proposed budget is presented in the following tables:
FY 2009 Proposed Gross Funds Operating Budget, by Revenue Type
Table AS0-1 contains the proposed FY 2009 agency budget compared to the FY 2008 approved budget.It also provides FY 2006 and FY 2007 actual expenditures.
Table AS0-1 (dollars in thousands)
Change
Actual Actual Approved Proposed from Percent
Appropriated Fund FY 2006 FY 2007 FY 2008 FY 2009 FY 2008 Change*
General Fund
Local Funds 9,688 8,120 4,878 4,875 -3 -0.1
Total for General Fund 9,688 8,120 4,878 4,875 -3 -0.1
Intra-District Funds
Intra-District Funds 205,771 228,048 263,381 242,114 -21,266 -8.1
Total for Intra-District Funds 205,771 228,048 263,381 242,114 -21,266 -8.1
Gross Funds 215,459 236,168 268,259 246,989 -21,270 -7.9
*Percent Change is based on whole dollars.
Note: If applicable, for a breakdown of each Grant (Federal and Private), Special Purpose Revenue type and Intra-Districtagreement, please refer to Schedule 80, Agency Summary by Revenue Source, in the Operating Appendices found on theOffice of the Chief Financial Officer’s website.
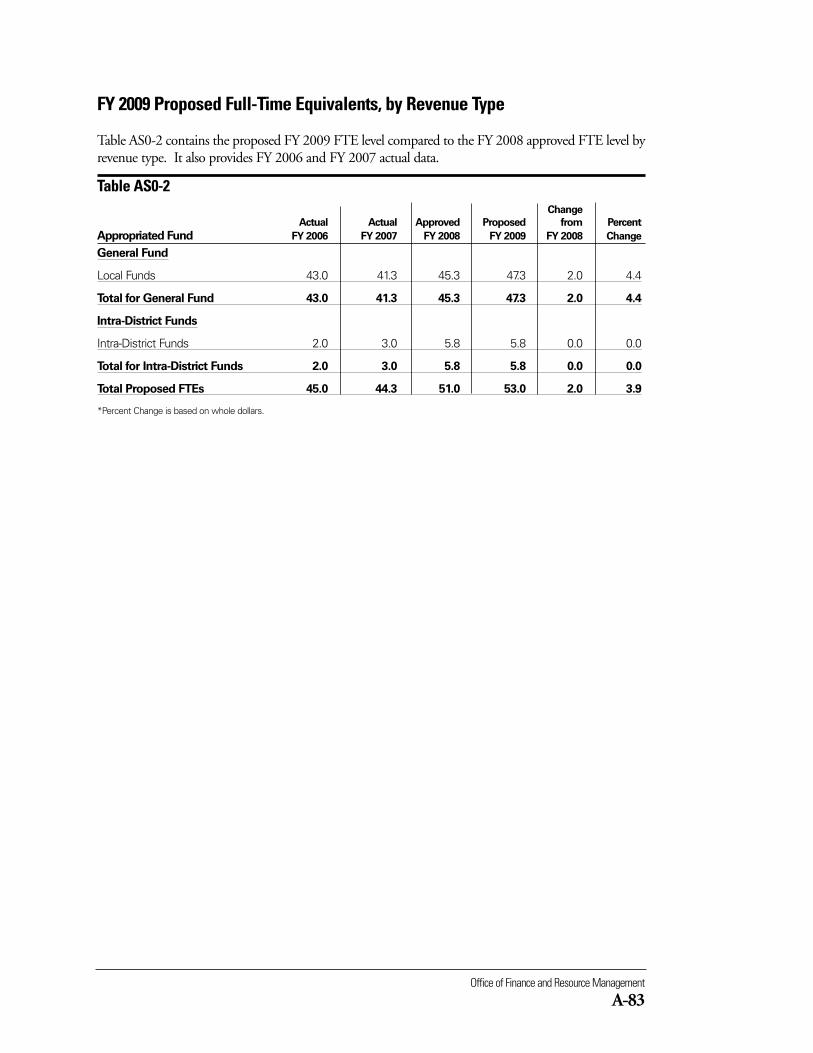
Office of Finance and Resource Management
A-83
FY 2009 Proposed Full-Time Equivalents, by Revenue Type
Table AS0-2 contains the proposed FY 2009 FTE level compared to the FY 2008 approved FTE level byrevenue type. It also provides FY 2006 and FY 2007 actual data.
Table AS0-2 Change
Actual Actual Approved Proposed from Percent
Appropriated Fund FY 2006 FY 2007 FY 2008 FY 2009 FY 2008 Change
General Fund
Local Funds 43.0 41.3 45.3 47.3 2.0 4.4
Total for General Fund 43.0 41.3 45.3 47.3 2.0 4.4
Intra-District Funds
Intra-District Funds 2.0 3.0 5.8 5.8 0.0 0.0
Total for Intra-District Funds 2.0 3.0 5.8 5.8 0.0 0.0
Total Proposed FTEs 45.0 44.3 51.0 53.0 2.0 3.9
*Percent Change is based on whole dollars.
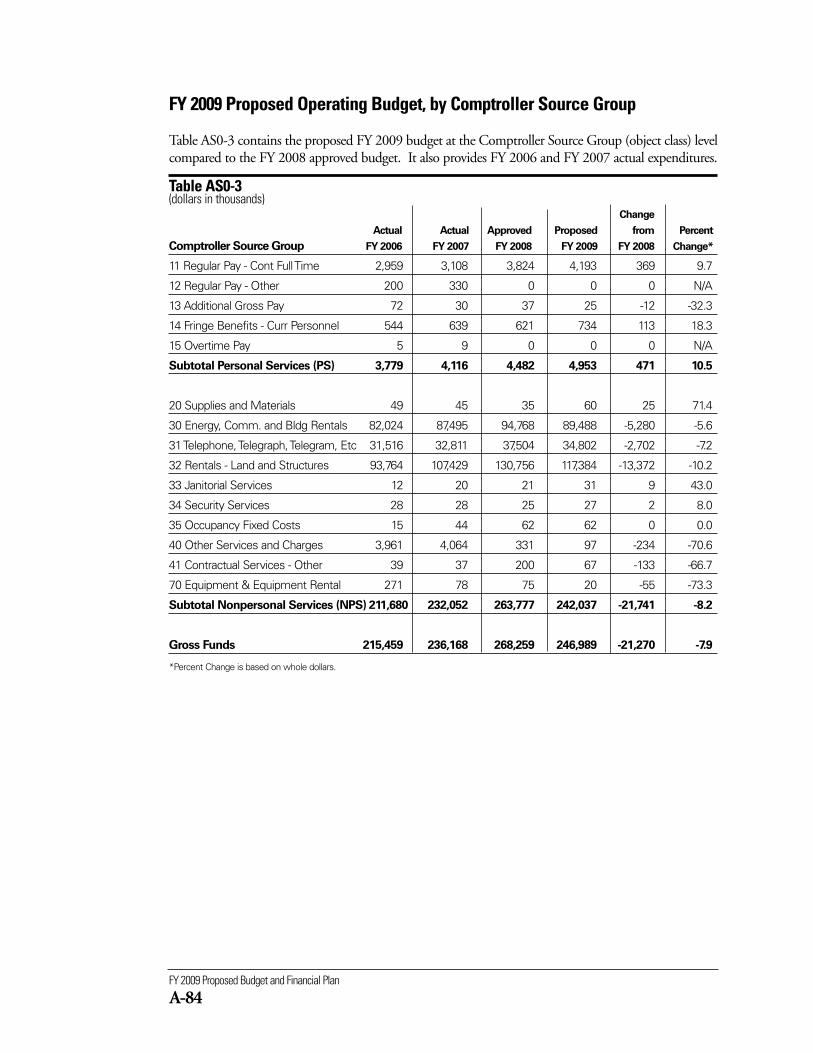
FY 2009 Proposed Budget and Financial Plan
A-84
FY 2009 Proposed Operating Budget, by Comptroller Source Group
Table AS0-3 contains the proposed FY 2009 budget at the Comptroller Source Group (object class) levelcompared to the FY 2008 approved budget. It also provides FY 2006 and FY 2007 actual expenditures.
Table AS0-3(dollars in thousands)
Change
Actual Actual Approved Proposed from Percent
Comptroller Source Group FY 2006 FY 2007 FY 2008 FY 2009 FY 2008 Change*
11 Regular Pay - Cont Full Time 2,959 3,108 3,824 4,193 369 9.7
12 Regular Pay - Other 200 330 0 0 0 N/A
13 Additional Gross Pay 72 30 37 25 -12 -32.3
14 Fringe Benefits - Curr Personnel 544 639 621 734 113 18.3
15 Overtime Pay 5 9 0 0 0 N/A
Subtotal Personal Services (PS) 3,779 4,116 4,482 4,953 471 10.5
20 Supplies and Materials 49 45 35 60 25 71.4
30 Energy, Comm. and Bldg Rentals 82,024 87,495 94,768 89,488 -5,280 -5.6
31 Telephone, Telegraph, Telegram, Etc 31,516 32,811 37,504 34,802 -2,702 -7.2
32 Rentals - Land and Structures 93,764 107,429 130,756 117,384 -13,372 -10.2
33 Janitorial Services 12 20 21 31 9 43.0
34 Security Services 28 28 25 27 2 8.0
35 Occupancy Fixed Costs 15 44 62 62 0 0.0
40 Other Services and Charges 3,961 4,064 331 97 -234 -70.6
41 Contractual Services - Other 39 37 200 67 -133 -66.7
70 Equipment & Equipment Rental 271 78 75 20 -55 -73.3
Subtotal Nonpersonal Services (NPS) 211,680 232,052 263,777 242,037 -21,741 -8.2
Gross Funds 215,459 236,168 268,259 246,989 -21,270 -7.9
*Percent Change is based on whole dollars.
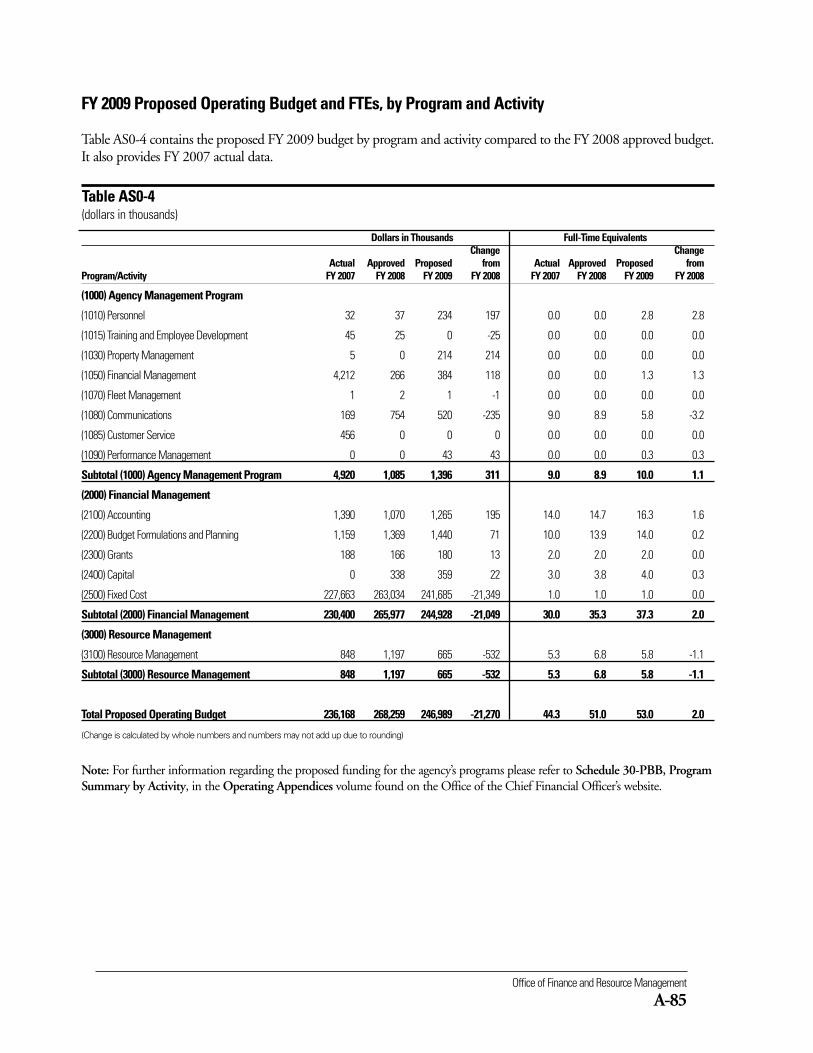
Office of Finance and Resource Management
A-85
Dollars in Thousands Full-Time EquivalentsChange Change
Actual Approved Proposed from Actual Approved Proposed from Program/Activity FY 2007 FY 2008 FY 2009 FY 2008 FY 2007 FY 2008 FY 2009 FY 2008
(1000) Agency Management Program
(1010) Personnel 32 37 234 197 0.0 0.0 2.8 2.8
(1015) Training and Employee Development 45 25 0 -25 0.0 0.0 0.0 0.0
(1030) Property Management 5 0 214 214 0.0 0.0 0.0 0.0
(1050) Financial Management 4,212 266 384 118 0.0 0.0 1.3 1.3
(1070) Fleet Management 1 2 1 -1 0.0 0.0 0.0 0.0
(1080) Communications 169 754 520 -235 9.0 8.9 5.8 -3.2
(1085) Customer Service 456 0 0 0 0.0 0.0 0.0 0.0
(1090) Performance Management 0 0 43 43 0.0 0.0 0.3 0.3
Subtotal (1000) Agency Management Program 4,920 1,085 1,396 311 9.0 8.9 10.0 1.1
(2000) Financial Management
(2100) Accounting 1,390 1,070 1,265 195 14.0 14.7 16.3 1.6
(2200) Budget Formulations and Planning 1,159 1,369 1,440 71 10.0 13.9 14.0 0.2
(2300) Grants 188 166 180 13 2.0 2.0 2.0 0.0
(2400) Capital 0 338 359 22 3.0 3.8 4.0 0.3
(2500) Fixed Cost 227,663 263,034 241,685 -21,349 1.0 1.0 1.0 0.0
Subtotal (2000) Financial Management 230,400 265,977 244,928 -21,049 30.0 35.3 37.3 2.0
(3000) Resource Management
(3100) Resource Management 848 1,197 665 -532 5.3 6.8 5.8 -1.1
Subtotal (3000) Resource Management 848 1,197 665 -532 5.3 6.8 5.8 -1.1
Total Proposed Operating Budget 236,168 268,259 246,989 -21,270 44.3 51.0 53.0 2.0
(Change is calculated by whole numbers and numbers may not add up due to rounding)
Note: For further information regarding the proposed funding for the agency’s programs please refer to Schedule 30-PBB, ProgramSummary by Activity, in the Operating Appendices volume found on the Office of the Chief Financial Officer’s website.
FY 2009 Proposed Operating Budget and FTEs, by Program and Activity
Table AS0-4 contains the proposed FY 2009 budget by program and activity compared to the FY 2008 approved budget.It also provides FY 2007 actual data.
Table AS0-4(dollars in thousands)
FY 2009 Proposed Budget and Financial Plan
A-86
FY 2008 Approved Budget to FY 2009 Proposed Budget, by Revenue Type
This is a new table for FY 2009 that itemizes the changes made during the development of the FY 2009proposed budget. The FY 2009 Mayoral Local funds budget target reflects the recurring elements of anagency’s FY 2008 approved budget. See the How to Read the Budget chapter in the Executive Summaryvolume for more information on this table.
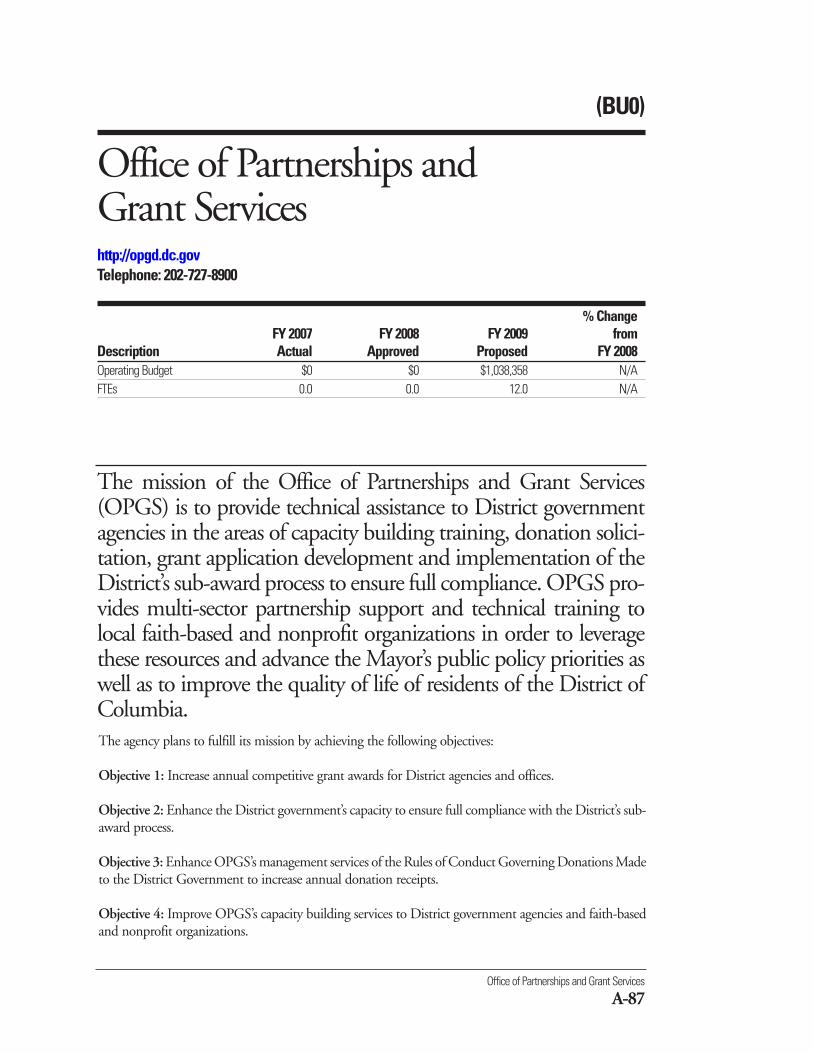
The agency plans to fulfill its mission by achieving the following objectives:
Objective 1: Increase annual competitive grant awards for District agencies and offices.
Objective 2: Enhance the District government’s capacity to ensure full compliance with the District’s sub-award process.
Objective 3: Enhance OPGS’s management services of the Rules of Conduct Governing Donations Madeto the District Government to increase annual donation receipts.
Objective 4: Improve OPGS’s capacity building services to District government agencies and faith-basedand nonprofit organizations.
Office of Partnerships and Grant Services
A-87
(BU0)
Office of Partnerships and Grant Serviceshttp://opgd.dc.govTelephone: 202-727-8900
% ChangeFY 2007 FY 2008 FY 2009 from
Description Actual Approved Proposed FY 2008Operating Budget $0 $0 $1,038,358 N/AFTEs 0.0 0.0 12.0 N/A
The mission of the Office of Partnerships and Grant Services(OPGS) is to provide technical assistance to District governmentagencies in the areas of capacity building training, donation solici-tation, grant application development and implementation of theDistrict’s sub-award process to ensure full compliance. OPGS pro-vides multi-sector partnership support and technical training tolocal faith-based and nonprofit organizations in order to leveragethese resources and advance the Mayor’s public policy priorities aswell as to improve the quality of life of residents of the District ofColumbia.
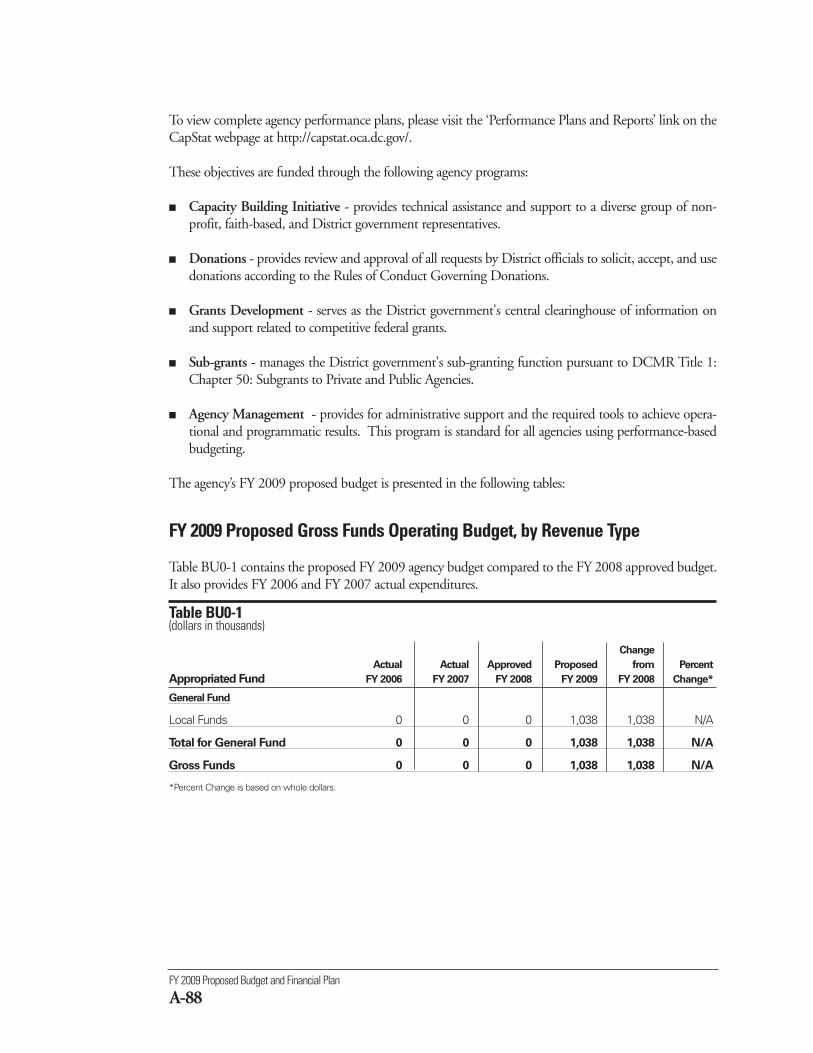
FY 2009 Proposed Budget and Financial Plan
A-88
FY 2009 Proposed Gross Funds Operating Budget, by Revenue Type
Table BU0-1 contains the proposed FY 2009 agency budget compared to the FY 2008 approved budget.It also provides FY 2006 and FY 2007 actual expenditures.
Table BU0-1 (dollars in thousands)
Change
Actual Actual Approved Proposed from Percent
Appropriated Fund FY 2006 FY 2007 FY 2008 FY 2009 FY 2008 Change*
General Fund
Local Funds 0 0 0 1,038 1,038 N/A
Total for General Fund 0 0 0 1,038 1,038 N/A
Gross Funds 0 0 0 1,038 1,038 N/A
*Percent Change is based on whole dollars.
To view complete agency performance plans, please visit the ‘Performance Plans and Reports’ link on theCapStat webpage at http://capstat.oca.dc.gov/.
These objectives are funded through the following agency programs:
■ Capacity Building Initiative - provides technical assistance and support to a diverse group of non-profit, faith-based, and District government representatives.
■ Donations - provides review and approval of all requests by District officials to solicit, accept, and usedonations according to the Rules of Conduct Governing Donations.
■ Grants Development - serves as the District government's central clearinghouse of information onand support related to competitive federal grants.
■ Sub-grants - manages the District government's sub-granting function pursuant to DCMR Title 1:Chapter 50: Subgrants to Private and Public Agencies.
■ Agency Management - provides for administrative support and the required tools to achieve opera-tional and programmatic results. This program is standard for all agencies using performance-basedbudgeting.
The agency’s FY 2009 proposed budget is presented in the following tables:
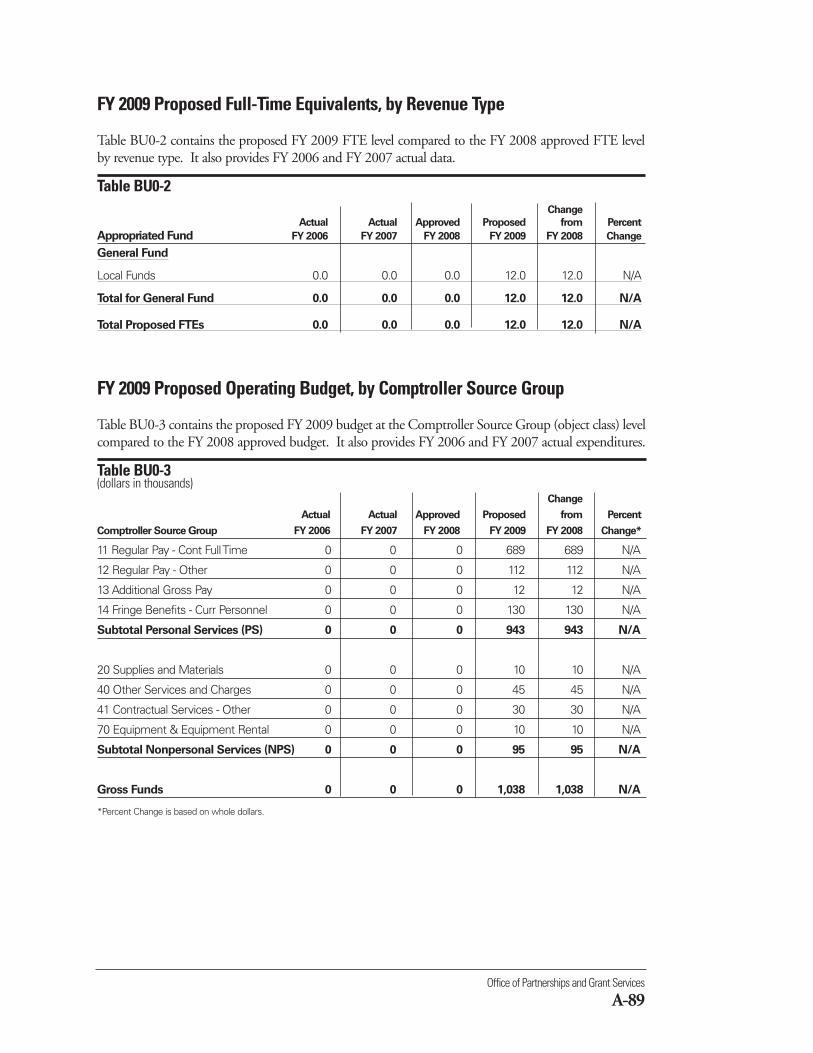
Office of Partnerships and Grant Services
A-89
FY 2009 Proposed Full-Time Equivalents, by Revenue Type
Table BU0-2 contains the proposed FY 2009 FTE level compared to the FY 2008 approved FTE levelby revenue type. It also provides FY 2006 and FY 2007 actual data.
Table BU0-2 Change
Actual Actual Approved Proposed from Percent
Appropriated Fund FY 2006 FY 2007 FY 2008 FY 2009 FY 2008 Change
General Fund
Local Funds 0.0 0.0 0.0 12.0 12.0 N/A
Total for General Fund 0.0 0.0 0.0 12.0 12.0 N/A
Total Proposed FTEs 0.0 0.0 0.0 12.0 12.0 N/A
FY 2009 Proposed Operating Budget, by Comptroller Source Group
Table BU0-3 contains the proposed FY 2009 budget at the Comptroller Source Group (object class) levelcompared to the FY 2008 approved budget. It also provides FY 2006 and FY 2007 actual expenditures.
Table BU0-3(dollars in thousands)
Change
Actual Actual Approved Proposed from Percent
Comptroller Source Group FY 2006 FY 2007 FY 2008 FY 2009 FY 2008 Change*
11 Regular Pay - Cont Full Time 0 0 0 689 689 N/A
12 Regular Pay - Other 0 0 0 112 112 N/A
13 Additional Gross Pay 0 0 0 12 12 N/A
14 Fringe Benefits - Curr Personnel 0 0 0 130 130 N/A
Subtotal Personal Services (PS) 0 0 0 943 943 N/A
20 Supplies and Materials 0 0 0 10 10 N/A
40 Other Services and Charges 0 0 0 45 45 N/A
41 Contractual Services - Other 0 0 0 30 30 N/A
70 Equipment & Equipment Rental 0 0 0 10 10 N/A
Subtotal Nonpersonal Services (NPS) 0 0 0 95 95 N/A
Gross Funds 0 0 0 1,038 1,038 N/A
*Percent Change is based on whole dollars.
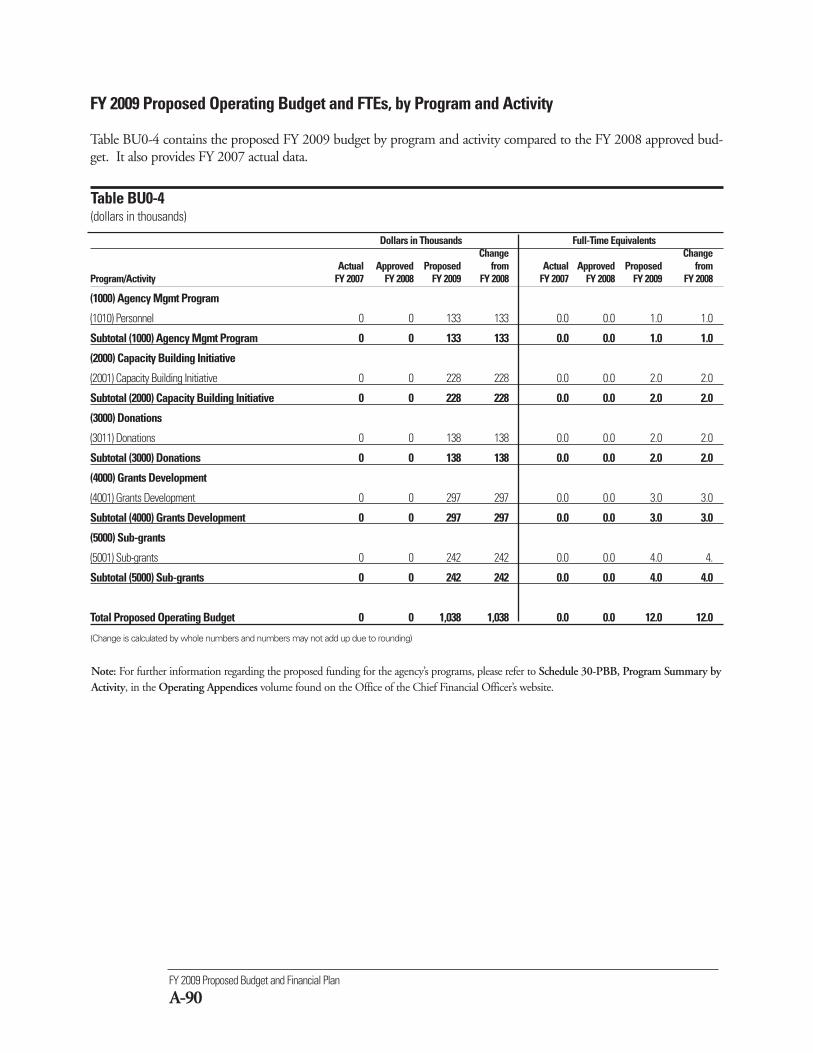
FY 2009 Proposed Budget and Financial Plan
A-90
FY 2009 Proposed Operating Budget and FTEs, by Program and Activity
Table BU0-4 contains the proposed FY 2009 budget by program and activity compared to the FY 2008 approved bud-get. It also provides FY 2007 actual data.
Table BU0-4(dollars in thousands)
Dollars in Thousands Full-Time EquivalentsChange Change
Actual Approved Proposed from Actual Approved Proposed from Program/Activity FY 2007 FY 2008 FY 2009 FY 2008 FY 2007 FY 2008 FY 2009 FY 2008
(1000) Agency Mgmt Program
(1010) Personnel 0 0 133 133 0.0 0.0 1.0 1.0
Subtotal (1000) Agency Mgmt Program 0 0 133 133 0.0 0.0 1.0 1.0
(2000) Capacity Building Initiative
(2001) Capacity Building Initiative 0 0 228 228 0.0 0.0 2.0 2.0
Subtotal (2000) Capacity Building Initiative 0 0 228 228 0.0 0.0 2.0 2.0
(3000) Donations
(3011) Donations 0 0 138 138 0.0 0.0 2.0 2.0
Subtotal (3000) Donations 0 0 138 138 0.0 0.0 2.0 2.0
(4000) Grants Development
(4001) Grants Development 0 0 297 297 0.0 0.0 3.0 3.0
Subtotal (4000) Grants Development 0 0 297 297 0.0 0.0 3.0 3.0
(5000) Sub-grants
(5001) Sub-grants 0 0 242 242 0.0 0.0 4.0 4.
Subtotal (5000) Sub-grants 0 0 242 242 0.0 0.0 4.0 4.0
Total Proposed Operating Budget 0 0 1,038 1,038 0.0 0.0 12.0 12.0
(Change is calculated by whole numbers and numbers may not add up due to rounding)
Note: For further information regarding the proposed funding for the agency’s programs, please refer to Schedule 30-PBB, Program Summary byActivity, in the Operating Appendices volume found on the Office of the Chief Financial Officer’s website.
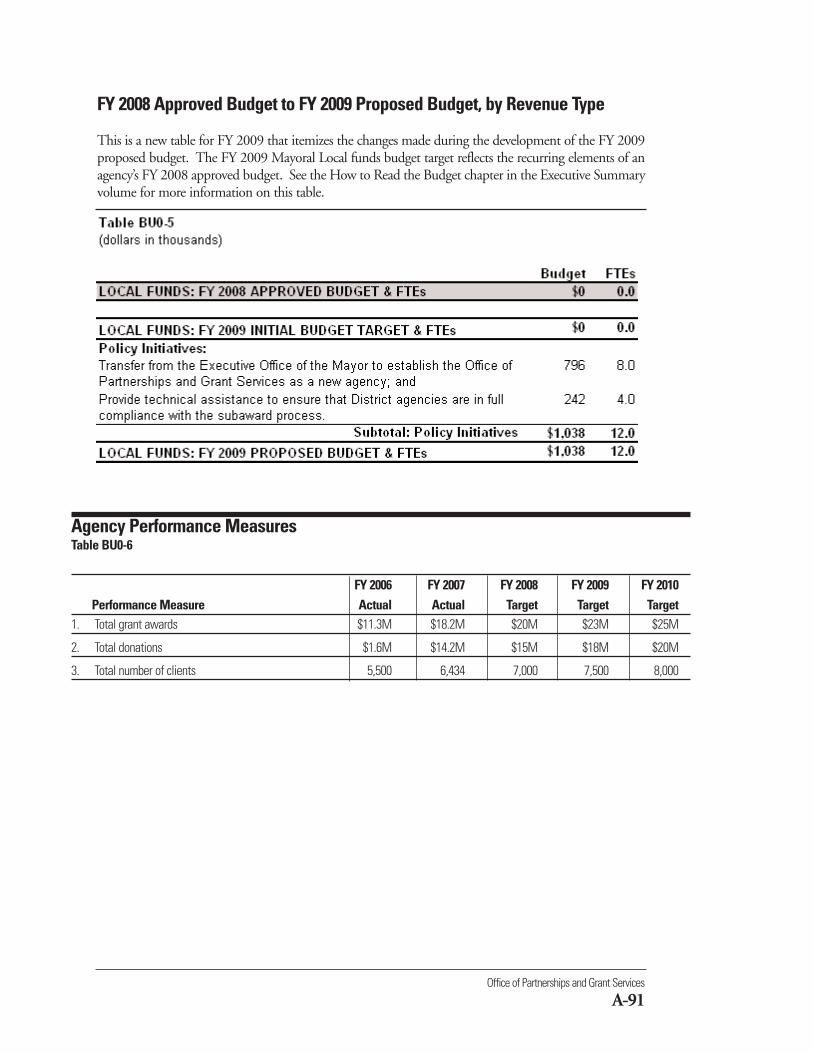
Office of Partnerships and Grant Services
A-91
FY 2008 Approved Budget to FY 2009 Proposed Budget, by Revenue Type
This is a new table for FY 2009 that itemizes the changes made during the development of the FY 2009proposed budget. The FY 2009 Mayoral Local funds budget target reflects the recurring elements of anagency’s FY 2008 approved budget. See the How to Read the Budget chapter in the Executive Summaryvolume for more information on this table.
Agency Performance MeasuresTable BU0-6
FY 2006 FY 2007 FY 2008 FY 2009 FY 2010Performance Measure Actual Actual Target Target Target
1. Total grant awards $11.3M $18.2M $20M $23M $25M
2. Total donations $1.6M $14.2M $15M $18M $20M
3. Total number of clients 5,500 6,434 7,000 7,500 8,000
Office of Contracting and Procurement
A-93
The mission of the Office of Contracting and Procurement(OCP) is to provide quality goods and services for Districtagencies through a coherent and streamlined procurementprocess that is responsive to the needs of its customers andsuppliers.
The agency plans to fulfill its mission by achieving the following objectives:
Objective 1: Streamline and simplify the procurement process.
Objective 2: Enhance customer satisfaction by authorizing procurement actions at the lowest reasonablelevel.
Objective 3: Increase the quality and value of goods and services procured by maximizing the use of thecompetitive market place.
To view complete agency performance plans, please visit the ‘Performance Plans and Reports’ link on theCapStat webpage at http://capstat.oca.dc.gov/.
These objectives are funded through the following agency programs:
■ Contracting – provides acquisition services to District agencies so that they can have the supplies andservices they need to support their missions.
■ Public Accountability – provides full disclosure of procurement information to the public to educate,inform and ensure transparency of the procurement process.
(PO0)
Office of Contracting and Procurementwww.ocp.dc.govTelephone: 202-727-0252
% ChangeFY 2007 FY 2008 FY 2009 from
Description Actual Approved Proposed FY 2008Operating Budget $13,913,810 $13,796,792 $15,416,323 11.7FTEs 133.0 152.0 142.0 -6.6
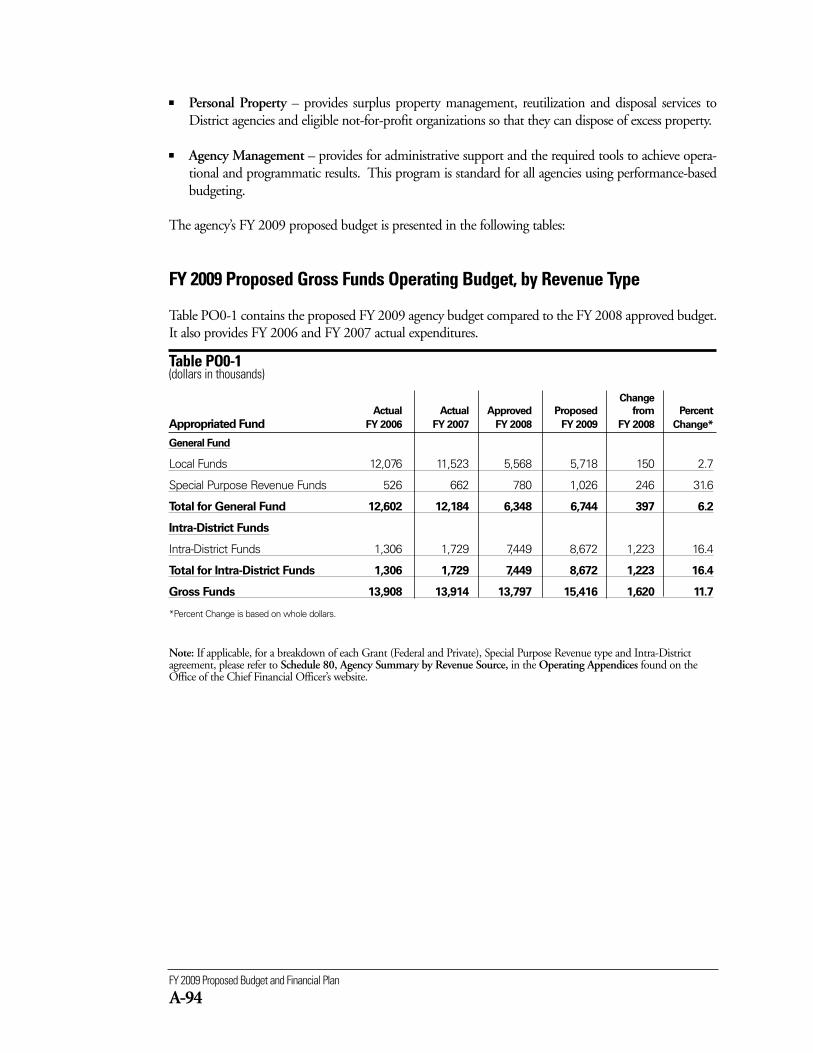
FY 2009 Proposed Budget and Financial Plan
A-94
■ Personal Property – provides surplus property management, reutilization and disposal services toDistrict agencies and eligible not-for-profit organizations so that they can dispose of excess property.
■ Agency Management – provides for administrative support and the required tools to achieve opera-tional and programmatic results. This program is standard for all agencies using performance-basedbudgeting.
The agency’s FY 2009 proposed budget is presented in the following tables:
FY 2009 Proposed Gross Funds Operating Budget, by Revenue Type
Table PO0-1 contains the proposed FY 2009 agency budget compared to the FY 2008 approved budget.It also provides FY 2006 and FY 2007 actual expenditures.
Table PO0-1 (dollars in thousands)
Change
Actual Actual Approved Proposed from Percent
Appropriated Fund FY 2006 FY 2007 FY 2008 FY 2009 FY 2008 Change*
General Fund
Local Funds 12,076 11,523 5,568 5,718 150 2.7
Special Purpose Revenue Funds 526 662 780 1,026 246 31.6
Total for General Fund 12,602 12,184 6,348 6,744 397 6.2
Intra-District Funds
Intra-District Funds 1,306 1,729 7,449 8,672 1,223 16.4
Total for Intra-District Funds 1,306 1,729 7,449 8,672 1,223 16.4
Gross Funds 13,908 13,914 13,797 15,416 1,620 11.7
*Percent Change is based on whole dollars.
Note: If applicable, for a breakdown of each Grant (Federal and Private), Special Purpose Revenue type and Intra-Districtagreement, please refer to Schedule 80, Agency Summary by Revenue Source, in the Operating Appendices found on theOffice of the Chief Financial Officer’s website.
Office of Contracting and Procurement
A-95
FY 2009 Proposed Full-Time Equivalents, by Revenue Type
Table PO0-2 contains the proposed FY 2009 FTE level compared to the FY 2008 approved FTE levelby revenue type. It also provides FY 2006 and FY 2007 actual data.
Table PO0-2 Change
Actual Actual Approved Proposed from Percent
Appropriated Fund FY 2006 FY 2007 FY 2008 FY 2009 FY 2008 Change
General Fund
Local Funds 119.7 128.0 63.0 43.0 -20.0 -31.7
Special Purpose Revenue Funds 4.0 5.0 6.0 6.0 0.0 0.0
Total for General Fund 123.7 133.0 69.0 49.0 -20.0 -29.0
Intra-District Funds
Intra-District Funds 13.0 0.0 83.0 93.0 10.0 12.0
Total for Intra-District Funds 13.0 0.0 83.0 93.0 10.0 12.0
Total Proposed FTEs 136.7 133.0 152.0 142.0 -10.0 -6.6

FY 2009 Proposed Budget and Financial Plan
A-96
FY 2009 Proposed Operating Budget, by Comptroller Source Group
Table PO0-3 contains the proposed FY 2009 budget at the Comptroller Source Group (object class) levelcompared to the FY 2008 approved budget. It also provides FY 2006 and FY 2007 actual expenditures.
Table PO0-3(dollars in thousands)
Change
Actual Actual Approved Proposed from Percent
Comptroller Source Group FY 2006 FY 2007 FY 2008 FY 2009 FY 2008 Change*
11 Regular Pay - Cont Full Time 9,524 9,842 10,360 11,141 781 7.5
12 Regular Pay - Other 306 278 386 264 -122 -31.5
13 Additional Gross Pay 202 178 95 0 -95 -100.0
14 Fringe Benefits - Curr Personnel 1,521 1,642 1,752 1,834 82 4.7
15 Overtime Pay 9 35 22 0 -22 -100.0
Subtotal Personal Services (PS) 11,562 11,976 12,615 13,239 624 4.9
20 Supplies and Materials 132 147 52 186 134 256.6
30 Energy, Comm. and Bldg Rentals 151 194 148 182 34 22.8
31 Telephone, Telegraph, Telegram, Etc 205 185 192 173 -18 -9.5
32 Rentals - Land and Structures 0 0 0 9 9 N/A
33 Janitorial Services 61 71 75 107 32 43.0
34 Security Services 155 160 155 167 12 8.0
35 Occupancy Fixed Costs 131 197 289 289 0 0.0
40 Other Services and Charges 1,236 406 70 363 293 421.5
41 Contractual Services - Other 175 488 156 292 136 86.7
70 Equipment & Equipment Rental 100 91 45 408 363 806.6
Subtotal Nonpersonal Services (NPS) 2,346 1,938 1,182 2,177 995 84.2
Gross Funds 13,908 13,914 13,797 15,416 1,620 11.7
*Percent Change is based on whole dollars.
Office of Contracting and Procurement
A-97
Dollars in Thousands Full-Time EquivalentsChange Change
Actual Approved Proposed from Actual Approved Proposed from Program/Activity FY 2007 FY 2008 FY 2009 FY 2008 FY 2007 FY 2008 FY 2009 FY 2008
(1000) Agency Management Program
(1010) Personnel 257 283 274 -9 3.0 3.0 3.0 0.0
(1015) Training and Employee Development 139 65 157 92 1.0 1.0 1.0 0.0
(1020) Contracting and Procurement 425 402 545 143 2.0 6.0 2.0 -4.0
(1030) Property Management 907 759 815 56 1.0 1.0 1.0 0.0
(1040) Information Technology 720 471 829 358 4.0 4.0 4.0 0.0
(1055) Risk Management 119 122 132 11 1.0 1.0 1.0 0.0
(1060) Legal 0 0 0 0 0.0 0.0 0.0 0.0
(1070) Fleet Management 82 46 118 72 1.0 1.0 1.0 0.0
(1080) Communications 77 121 0 -121 0.0 1.0 0.0 -1.0
(1085) Customer Service 329 233 256 23 4.0 6.0 4.0 -2.0
(1087) Language Access 35 0 35 35 0.0 0.0 0.0 0.0
(1090) Performance Management 503 279 695 416 3.0 5.0 5.0 0.0
Subtotal (1000) Agency Management Program 3,593 2,780 3,855 1,075 20.0 29.0 22.0 -7.0
(2000) Contracting
(2010) Pre-Solicitation 3,034 3,189 3,089 -100 28.0 34.0 31.0 -3.0
(2015) Solicitation 1,134 1,616 1,441 -175 14.0 19.0 16.0 -3.0
(2020) Pre-Award 1,491 1,445 1,715 269 17.0 16.0 18.0 2.0
(2030) Post Award 1,993 1,979 2,695 716 27.0 23.0 29.0 6.0
(2040) Award 1,346 1,204 1,428 224 16.0 14.0 16.0 2.0
(2050) Travel Card 135 301 0 -301 0.0 4.0 0.0 -4.0
(2055) Purchase Card 76 77 83 5 1.0 1.0 1.0 0.0
Subtotal (2000) Contracting 9,209 9,811 10,449 638 103.0 111.0 111.0 0.0
(3000) Public Accountability
(3010) Public Accountability 342 390 213 -177 3.0 4.0 2.0 -2.0
Subtotal (3000) Public Accountability 342 390 213 -177 3.0 4.0 2.0 -2.0
(4000) Personal Property
(4010) Personal Property 778 815 898 83 7.0 8.0 7.0 -1.0
Subtotal (4000) Personal Property 778 815 898 83 7.0 8.0 7.0 -1.0
(Continued on next page)
FY 2009 Proposed Operating Budget and FTEs, by Program and Activity
Table PO0-4 contains the proposed FY 2009 budget by program and activity compared to the FY 2008 approved bud-get. It also provides FY 2007 actual data.
Table PO0-4(dollars in thousands)
FY 2009 Proposed Budget and Financial Plan
A-98
Dollars in Thousands Full-Time EquivalentsChange Change
Actual Approved Proposed from Actual Approved Proposed from Program/Activity FY 2007 FY 2008 FY 2009 FY 2008 FY 2007 FY 2008 FY 2009 FY 2008
(9960) Year End Close
No Activity Assigned -9 0 0 0 0.0 0.0 0.0 0.0
Subtotal (9960) Year End Close -9 0 0 0 0.0 0.0 0.0 0.0
Total Proposed Operating Budget 13,914 13,797 15,416 1,620 133.0 152.0 142.0 -10.0
(Change is calculated by whole numbers and numbers may not add up due to rounding)
Note: For further information regarding the proposed funding for the agency’s programs please refer to Schedule 30-PBB, ProgramSummary by Activity, in the Operating Appendices volume found on the Office of the Chief Financial Officer’s website.
FY 2009 Proposed Operating Budget and FTEs, by Program and Activity
Table PO0-4 contains the proposed FY 2009 budget by program and activity compared to the FY 2008 approved bud-get. It also provides FY 2007 actual data.
Table PO0-4 (Continued)(dollars in thousands)
Office of Contracting and Procurement
A-99
FY 2008 Approved Budget to FY 2009 Proposed Budget, by Revenue Type
This is a new table for FY 2009 that itemizes the changes made during the development of the FY 2009proposed budget. The FY 2009 Mayoral Local funds budget target reflects the recurring elements of anagency’s FY 2008 approved budget. See the How to Read the Budget chapter in the Executive Summaryvolume for more information on this table.
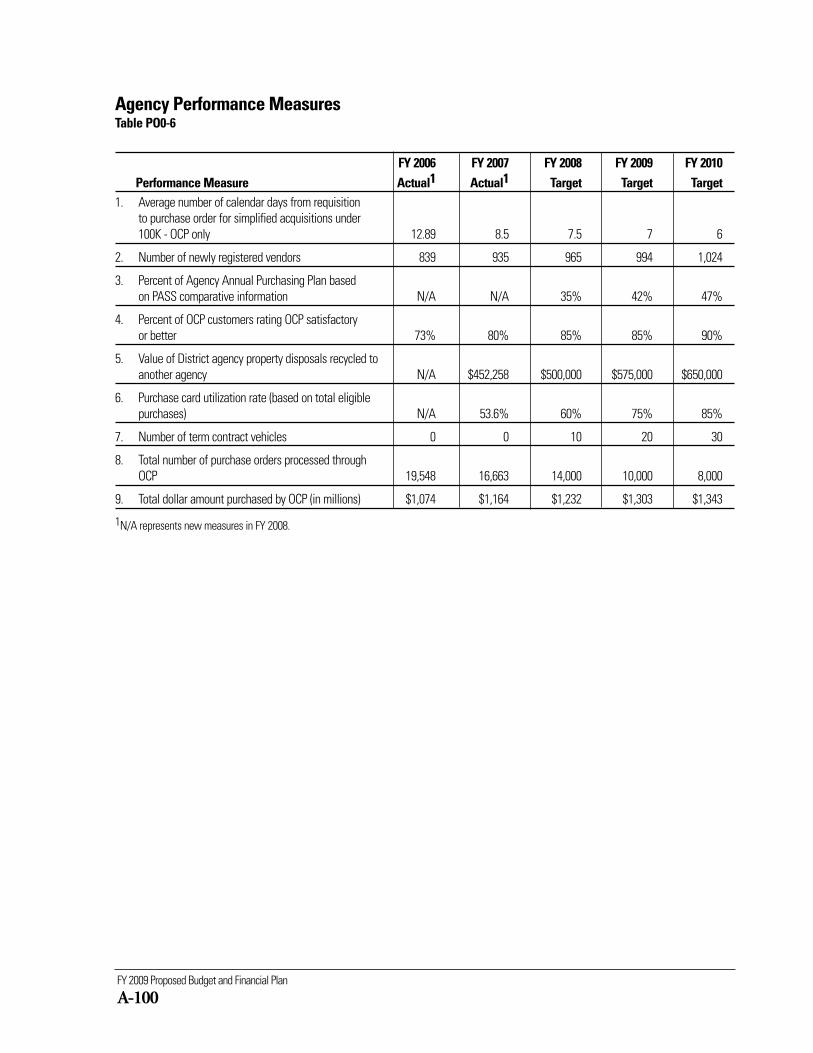
FY 2009 Proposed Budget and Financial Plan
A-100
Agency Performance MeasuresTable PO0-6
FY 2006 FY 2007 FY 2008 FY 2009 FY 2010Performance Measure Actual1 Actual1 Target Target Target
1. Average number of calendar days from requisition to purchase order for simplified acquisitions under 100K - OCP only 12.89 8.5 7.5 7 6
2. Number of newly registered vendors 839 935 965 994 1,024
3. Percent of Agency Annual Purchasing Plan basedon PASS comparative information N/A N/A 35% 42% 47%
4. Percent of OCP customers rating OCP satisfactoryor better 73% 80% 85% 85% 90%
5. Value of District agency property disposals recycled toanother agency N/A $452,258 $500,000 $575,000 $650,000
6. Purchase card utilization rate (based on total eligiblepurchases) N/A 53.6% 60% 75% 85%
7. Number of term contract vehicles 0 0 10 20 30
8. Total number of purchase orders processed throughOCP 19,548 16,663 14,000 10,000 8,000
9. Total dollar amount purchased by OCP (in millions) $1,074 $1,164 $1,232 $1,303 $1,343
1N/A represents new measures in FY 2008.
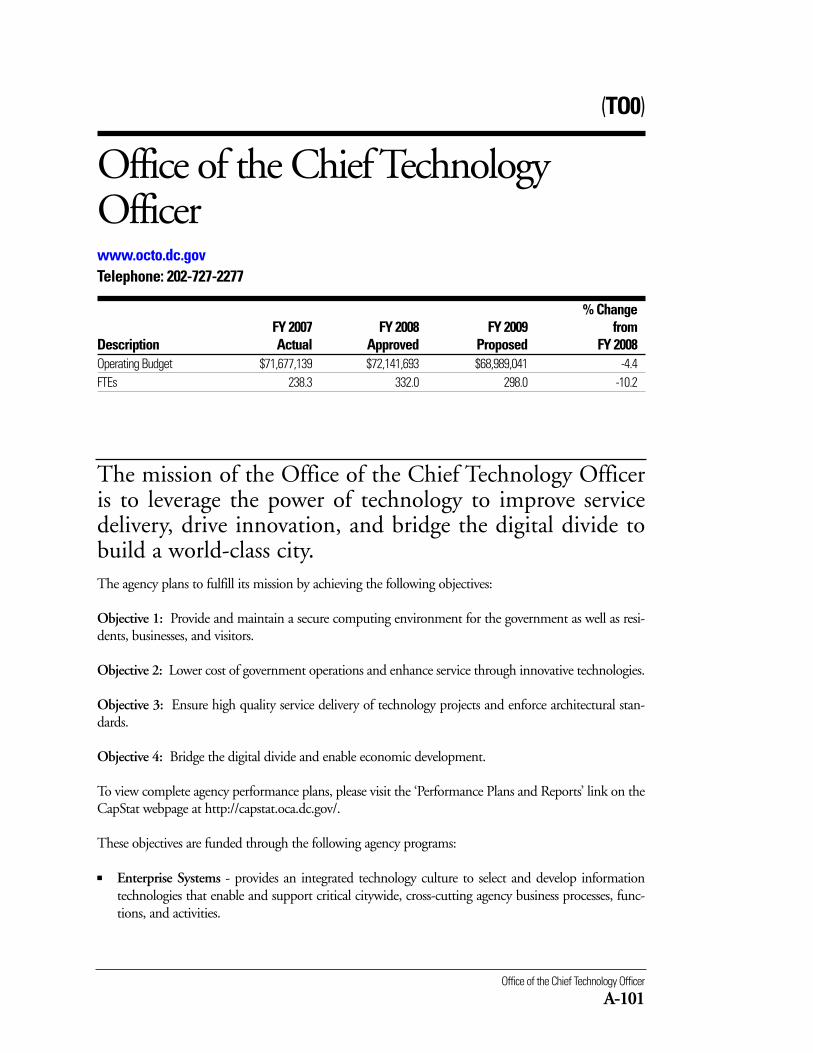
Office of the Chief Technology Officer
A-101
The mission of the Office of the Chief Technology Officeris to leverage the power of technology to improve servicedelivery, drive innovation, and bridge the digital divide tobuild a world-class city. The agency plans to fulfill its mission by achieving the following objectives:
Objective 1: Provide and maintain a secure computing environment for the government as well as resi-dents, businesses, and visitors.
Objective 2: Lower cost of government operations and enhance service through innovative technologies.
Objective 3: Ensure high quality service delivery of technology projects and enforce architectural stan-dards.
Objective 4: Bridge the digital divide and enable economic development.
To view complete agency performance plans, please visit the ‘Performance Plans and Reports’ link on theCapStat webpage at http://capstat.oca.dc.gov/.
These objectives are funded through the following agency programs:
■ Enterprise Systems - provides an integrated technology culture to select and develop informationtechnologies that enable and support critical citywide, cross-cutting agency business processes, func-tions, and activities.
(TO0)
Office of the Chief Technology Officerwww.octo.dc.govTelephone: 202-727-2277
% ChangeFY 2007 FY 2008 FY 2009 from
Description Actual Approved Proposed FY 2008Operating Budget $71,677,139 $72,141,693 $68,989,041 -4.4FTEs 238.3 332.0 298.0 -10.2
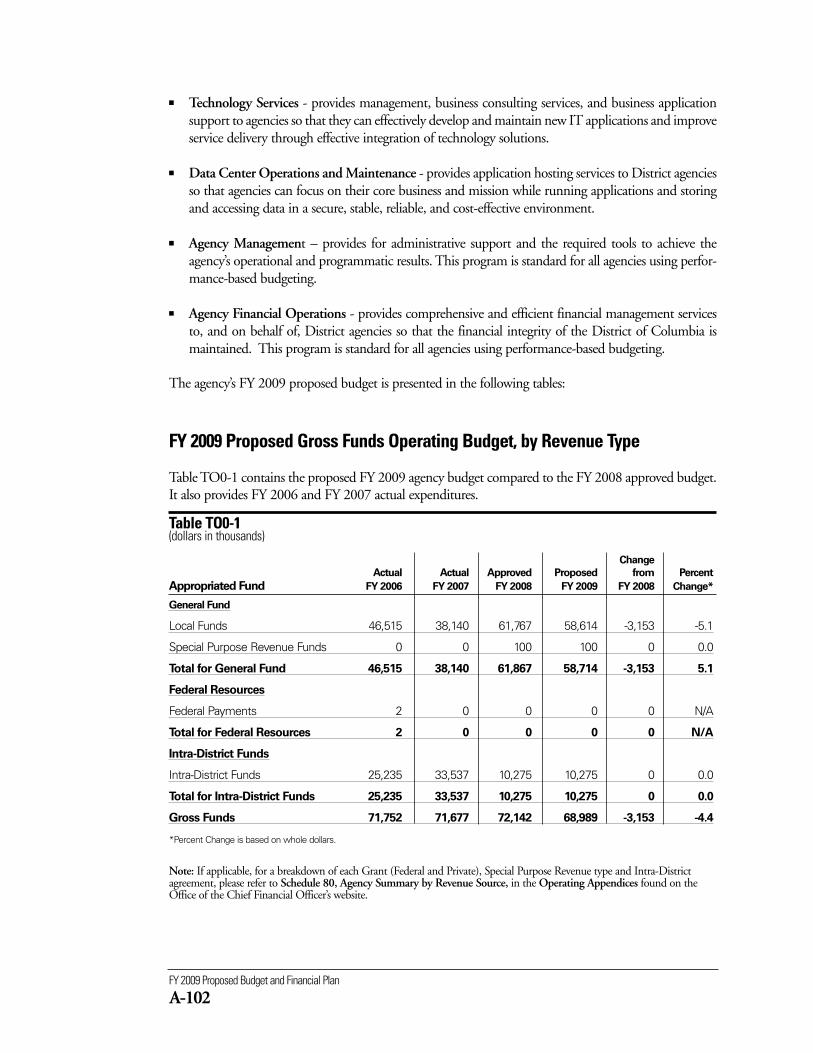
FY 2009 Proposed Budget and Financial Plan
A-102
■ Technology Services - provides management, business consulting services, and business applicationsupport to agencies so that they can effectively develop and maintain new IT applications and improveservice delivery through effective integration of technology solutions.
■ Data Center Operations and Maintenance - provides application hosting services to District agenciesso that agencies can focus on their core business and mission while running applications and storingand accessing data in a secure, stable, reliable, and cost-effective environment.
■ Agency Management – provides for administrative support and the required tools to achieve theagency’s operational and programmatic results. This program is standard for all agencies using perfor-mance-based budgeting.
■ Agency Financial Operations - provides comprehensive and efficient financial management servicesto, and on behalf of, District agencies so that the financial integrity of the District of Columbia ismaintained. This program is standard for all agencies using performance-based budgeting.
The agency’s FY 2009 proposed budget is presented in the following tables:
FY 2009 Proposed Gross Funds Operating Budget, by Revenue Type
Table TO0-1 contains the proposed FY 2009 agency budget compared to the FY 2008 approved budget.It also provides FY 2006 and FY 2007 actual expenditures.
Table TO0-1 (dollars in thousands)
Change
Actual Actual Approved Proposed from Percent
Appropriated Fund FY 2006 FY 2007 FY 2008 FY 2009 FY 2008 Change*
General Fund
Local Funds 46,515 38,140 61,767 58,614 -3,153 -5.1
Special Purpose Revenue Funds 0 0 100 100 0 0.0
Total for General Fund 46,515 38,140 61,867 58,714 -3,153 5.1
Federal Resources
Federal Payments 2 0 0 0 0 N/A
Total for Federal Resources 2 0 0 0 0 N/A
Intra-District Funds
Intra-District Funds 25,235 33,537 10,275 10,275 0 0.0
Total for Intra-District Funds 25,235 33,537 10,275 10,275 0 0.0
Gross Funds 71,752 71,677 72,142 68,989 -3,153 -4.4
*Percent Change is based on whole dollars.
Note: If applicable, for a breakdown of each Grant (Federal and Private), Special Purpose Revenue type and Intra-Districtagreement, please refer to Schedule 80, Agency Summary by Revenue Source, in the Operating Appendices found on theOffice of the Chief Financial Officer’s website.
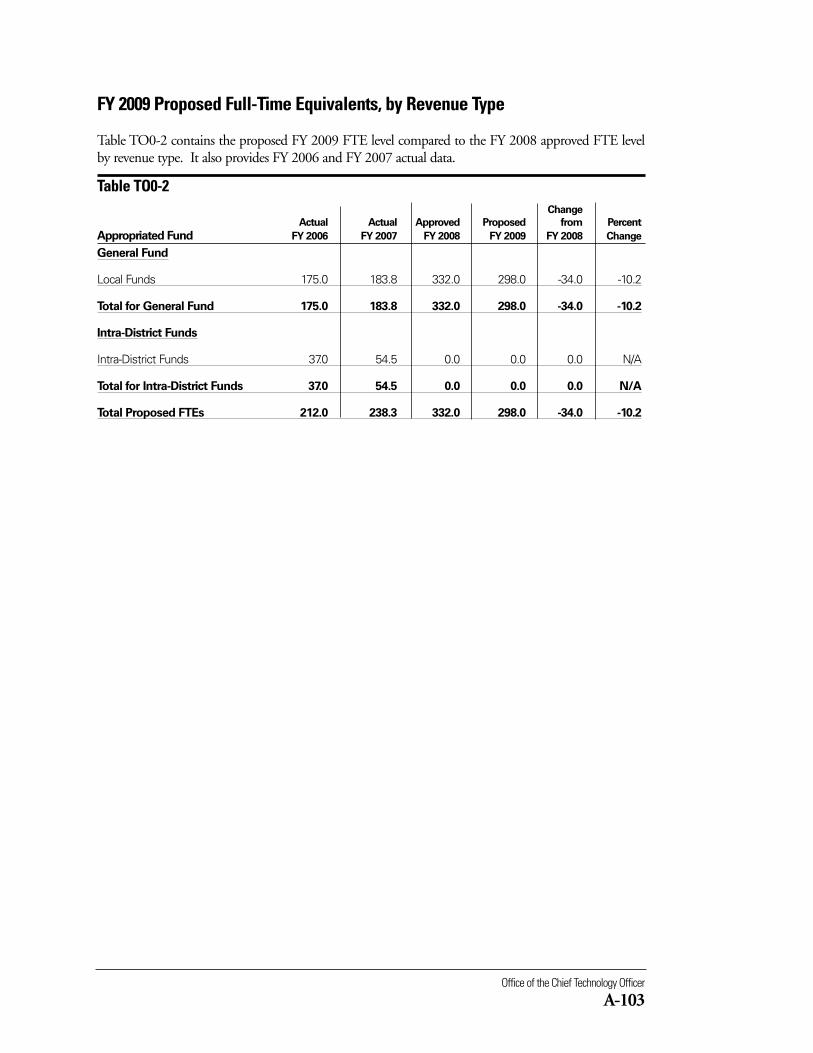
Office of the Chief Technology Officer
A-103
FY 2009 Proposed Full-Time Equivalents, by Revenue Type
Table TO0-2 contains the proposed FY 2009 FTE level compared to the FY 2008 approved FTE levelby revenue type. It also provides FY 2006 and FY 2007 actual data.
Table TO0-2 Change
Actual Actual Approved Proposed from Percent
Appropriated Fund FY 2006 FY 2007 FY 2008 FY 2009 FY 2008 Change
General Fund
Local Funds 175.0 183.8 332.0 298.0 -34.0 -10.2
Total for General Fund 175.0 183.8 332.0 298.0 -34.0 -10.2
Intra-District Funds
Intra-District Funds 37.0 54.5 0.0 0.0 0.0 N/A
Total for Intra-District Funds 37.0 54.5 0.0 0.0 0.0 N/A
Total Proposed FTEs 212.0 238.3 332.0 298.0 -34.0 -10.2
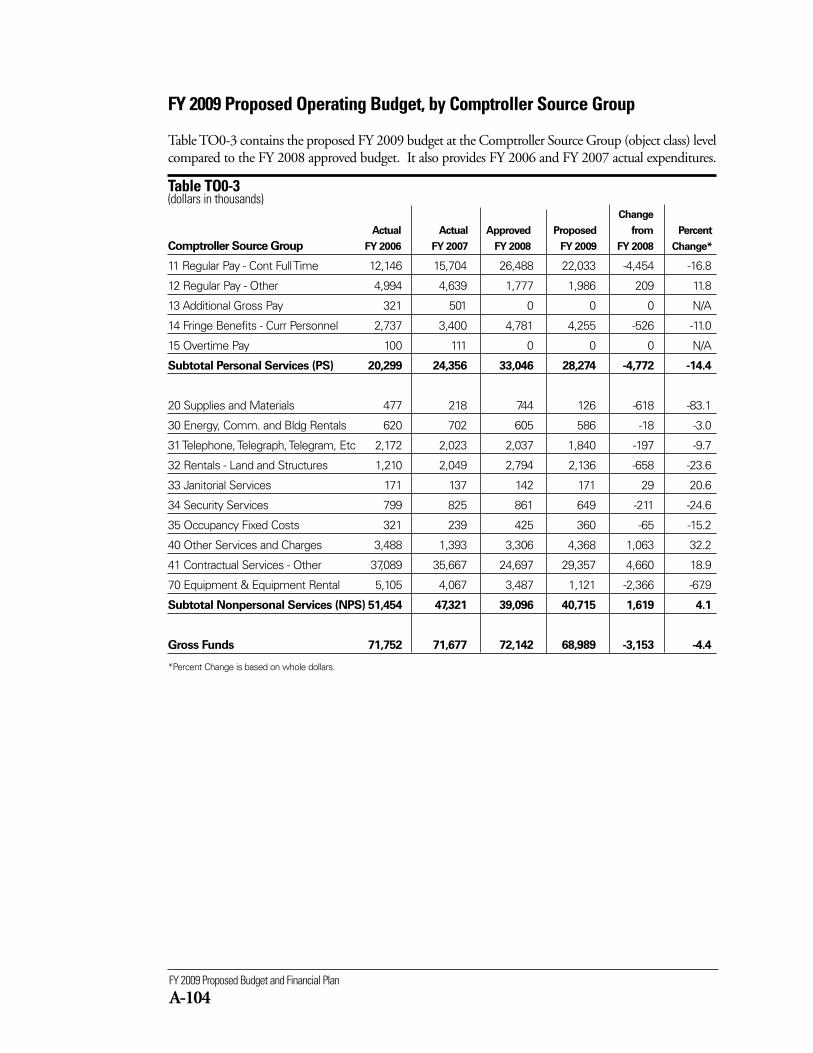
FY 2009 Proposed Budget and Financial Plan
A-104
FY 2009 Proposed Operating Budget, by Comptroller Source Group
Table TO0-3 contains the proposed FY 2009 budget at the Comptroller Source Group (object class) levelcompared to the FY 2008 approved budget. It also provides FY 2006 and FY 2007 actual expenditures.
Table TO0-3(dollars in thousands)
Change
Actual Actual Approved Proposed from Percent
Comptroller Source Group FY 2006 FY 2007 FY 2008 FY 2009 FY 2008 Change*
11 Regular Pay - Cont Full Time 12,146 15,704 26,488 22,033 -4,454 -16.8
12 Regular Pay - Other 4,994 4,639 1,777 1,986 209 11.8
13 Additional Gross Pay 321 501 0 0 0 N/A
14 Fringe Benefits - Curr Personnel 2,737 3,400 4,781 4,255 -526 -11.0
15 Overtime Pay 100 111 0 0 0 N/A
Subtotal Personal Services (PS) 20,299 24,356 33,046 28,274 -4,772 -14.4
20 Supplies and Materials 477 218 744 126 -618 -83.1
30 Energy, Comm. and Bldg Rentals 620 702 605 586 -18 -3.0
31 Telephone, Telegraph, Telegram, Etc 2,172 2,023 2,037 1,840 -197 -9.7
32 Rentals - Land and Structures 1,210 2,049 2,794 2,136 -658 -23.6
33 Janitorial Services 171 137 142 171 29 20.6
34 Security Services 799 825 861 649 -211 -24.6
35 Occupancy Fixed Costs 321 239 425 360 -65 -15.2
40 Other Services and Charges 3,488 1,393 3,306 4,368 1,063 32.2
41 Contractual Services - Other 37,089 35,667 24,697 29,357 4,660 18.9
70 Equipment & Equipment Rental 5,105 4,067 3,487 1,121 -2,366 -67.9
Subtotal Nonpersonal Services (NPS) 51,454 47,321 39,096 40,715 1,619 4.1
Gross Funds 71,752 71,677 72,142 68,989 -3,153 -4.4
*Percent Change is based on whole dollars.
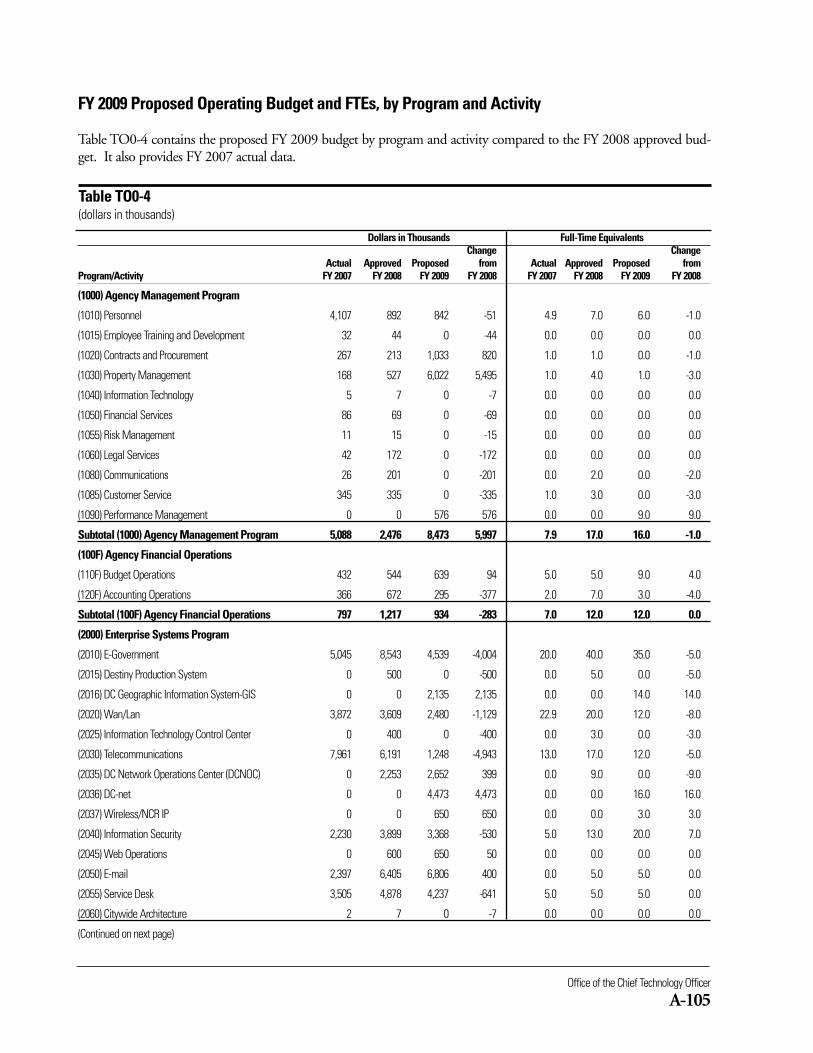
Office of the Chief Technology Officer
A-105
Dollars in Thousands Full-Time EquivalentsChange Change
Actual Approved Proposed from Actual Approved Proposed from Program/Activity FY 2007 FY 2008 FY 2009 FY 2008 FY 2007 FY 2008 FY 2009 FY 2008
(1000) Agency Management Program
(1010) Personnel 4,107 892 842 -51 4.9 7.0 6.0 -1.0
(1015) Employee Training and Development 32 44 0 -44 0.0 0.0 0.0 0.0
(1020) Contracts and Procurement 267 213 1,033 820 1.0 1.0 0.0 -1.0
(1030) Property Management 168 527 6,022 5,495 1.0 4.0 1.0 -3.0
(1040) Information Technology 5 7 0 -7 0.0 0.0 0.0 0.0
(1050) Financial Services 86 69 0 -69 0.0 0.0 0.0 0.0
(1055) Risk Management 11 15 0 -15 0.0 0.0 0.0 0.0
(1060) Legal Services 42 172 0 -172 0.0 0.0 0.0 0.0
(1080) Communications 26 201 0 -201 0.0 2.0 0.0 -2.0
(1085) Customer Service 345 335 0 -335 1.0 3.0 0.0 -3.0
(1090) Performance Management 0 0 576 576 0.0 0.0 9.0 9.0
Subtotal (1000) Agency Management Program 5,088 2,476 8,473 5,997 7.9 17.0 16.0 -1.0
(100F) Agency Financial Operations
(110F) Budget Operations 432 544 639 94 5.0 5.0 9.0 4.0
(120F) Accounting Operations 366 672 295 -377 2.0 7.0 3.0 -4.0
Subtotal (100F) Agency Financial Operations 797 1,217 934 -283 7.0 12.0 12.0 0.0
(2000) Enterprise Systems Program
(2010) E-Government 5,045 8,543 4,539 -4,004 20.0 40.0 35.0 -5.0
(2015) Destiny Production System 0 500 0 -500 0.0 5.0 0.0 -5.0
(2016) DC Geographic Information System-GIS 0 0 2,135 2,135 0.0 0.0 14.0 14.0
(2020) Wan/Lan 3,872 3,609 2,480 -1,129 22.9 20.0 12.0 -8.0
(2025) Information Technology Control Center 0 400 0 -400 0.0 3.0 0.0 -3.0
(2030) Telecommunications 7,961 6,191 1,248 -4,943 13.0 17.0 12.0 -5.0
(2035) DC Network Operations Center (DCNOC) 0 2,253 2,652 399 0.0 9.0 0.0 -9.0
(2036) DC-net 0 0 4,473 4,473 0.0 0.0 16.0 16.0
(2037) Wireless/NCR IP 0 0 650 650 0.0 0.0 3.0 3.0
(2040) Information Security 2,230 3,899 3,368 -530 5.0 13.0 20.0 7.0
(2045) Web Operations 0 600 650 50 0.0 0.0 0.0 0.0
(2050) E-mail 2,397 6,405 6,806 400 0.0 5.0 5.0 0.0
(2055) Service Desk 3,505 4,878 4,237 -641 5.0 5.0 5.0 0.0
(2060) Citywide Architecture 2 7 0 -7 0.0 0.0 0.0 0.0
(Continued on next page)
FY 2009 Proposed Operating Budget and FTEs, by Program and Activity
Table TO0-4 contains the proposed FY 2009 budget by program and activity compared to the FY 2008 approved bud-get. It also provides FY 2007 actual data.
Table TO0-4(dollars in thousands)
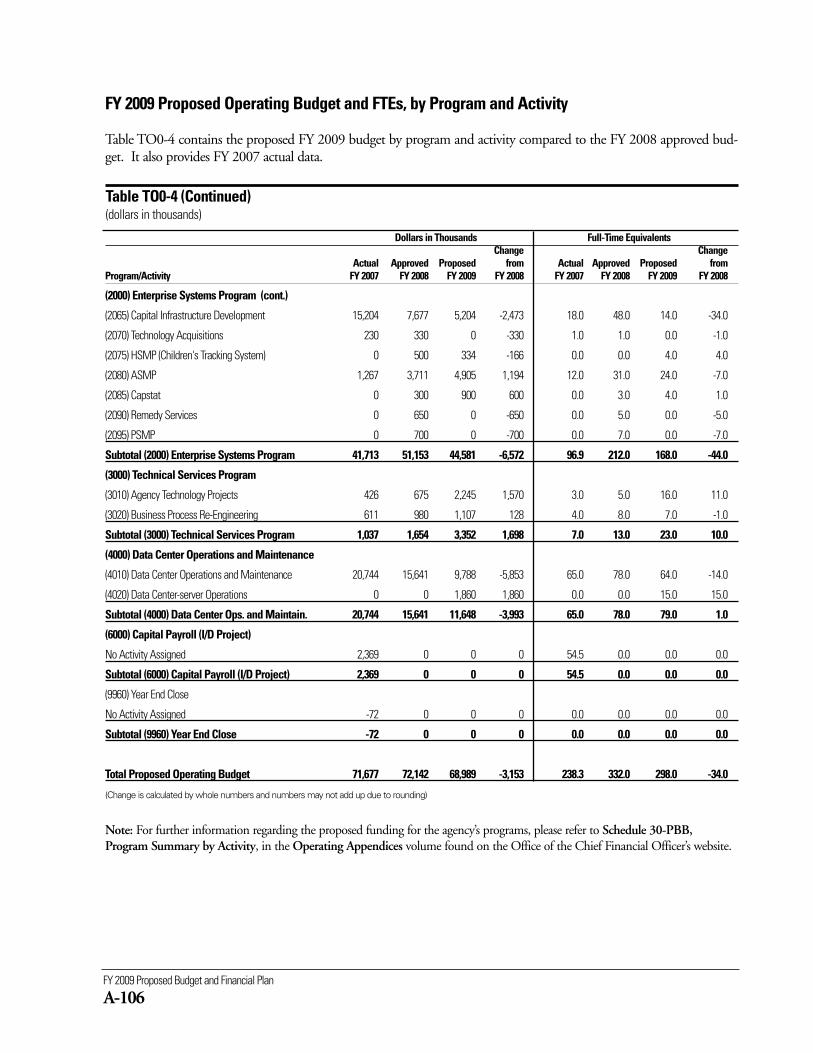
FY 2009 Proposed Budget and Financial Plan
A-106
Dollars in Thousands Full-Time EquivalentsChange Change
Actual Approved Proposed from Actual Approved Proposed from Program/Activity FY 2007 FY 2008 FY 2009 FY 2008 FY 2007 FY 2008 FY 2009 FY 2008
(2000) Enterprise Systems Program (cont.)
(2065) Capital Infrastructure Development 15,204 7,677 5,204 -2,473 18.0 48.0 14.0 -34.0
(2070) Technology Acquisitions 230 330 0 -330 1.0 1.0 0.0 -1.0
(2075) HSMP (Children's Tracking System) 0 500 334 -166 0.0 0.0 4.0 4.0
(2080) ASMP 1,267 3,711 4,905 1,194 12.0 31.0 24.0 -7.0
(2085) Capstat 0 300 900 600 0.0 3.0 4.0 1.0
(2090) Remedy Services 0 650 0 -650 0.0 5.0 0.0 -5.0
(2095) PSMP 0 700 0 -700 0.0 7.0 0.0 -7.0
Subtotal (2000) Enterprise Systems Program 41,713 51,153 44,581 -6,572 96.9 212.0 168.0 -44.0
(3000) Technical Services Program
(3010) Agency Technology Projects 426 675 2,245 1,570 3.0 5.0 16.0 11.0
(3020) Business Process Re-Engineering 611 980 1,107 128 4.0 8.0 7.0 -1.0
Subtotal (3000) Technical Services Program 1,037 1,654 3,352 1,698 7.0 13.0 23.0 10.0
(4000) Data Center Operations and Maintenance
(4010) Data Center Operations and Maintenance 20,744 15,641 9,788 -5,853 65.0 78.0 64.0 -14.0
(4020) Data Center-server Operations 0 0 1,860 1,860 0.0 0.0 15.0 15.0
Subtotal (4000) Data Center Ops. and Maintain. 20,744 15,641 11,648 -3,993 65.0 78.0 79.0 1.0
(6000) Capital Payroll (I/D Project)
No Activity Assigned 2,369 0 0 0 54.5 0.0 0.0 0.0
Subtotal (6000) Capital Payroll (I/D Project) 2,369 0 0 0 54.5 0.0 0.0 0.0
(9960) Year End Close
No Activity Assigned -72 0 0 0 0.0 0.0 0.0 0.0
Subtotal (9960) Year End Close -72 0 0 0 0.0 0.0 0.0 0.0
Total Proposed Operating Budget 71,677 72,142 68,989 -3,153 238.3 332.0 298.0 -34.0
(Change is calculated by whole numbers and numbers may not add up due to rounding)
Note: For further information regarding the proposed funding for the agency’s programs, please refer to Schedule 30-PBB,Program Summary by Activity, in the Operating Appendices volume found on the Office of the Chief Financial Officer’s website.
FY 2009 Proposed Operating Budget and FTEs, by Program and Activity
Table TO0-4 contains the proposed FY 2009 budget by program and activity compared to the FY 2008 approved bud-get. It also provides FY 2007 actual data.
Table TO0-4 (Continued)(dollars in thousands)
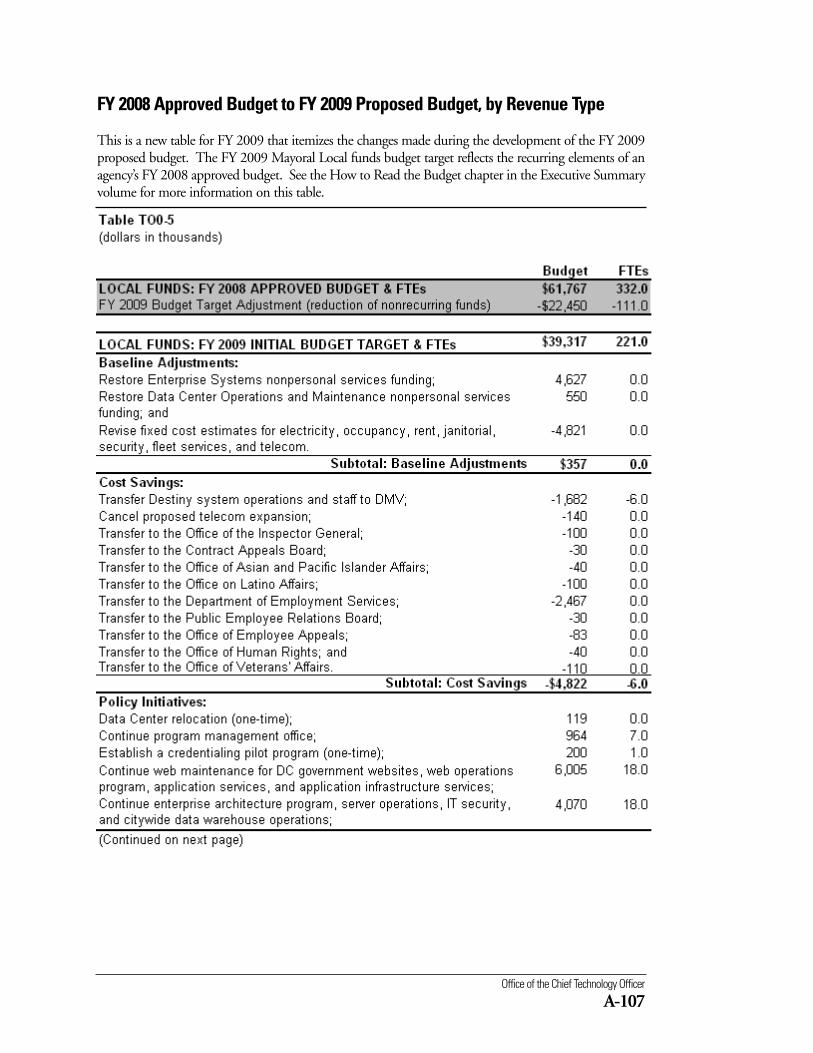
Office of the Chief Technology Officer
A-107
FY 2008 Approved Budget to FY 2009 Proposed Budget, by Revenue Type
This is a new table for FY 2009 that itemizes the changes made during the development of the FY 2009proposed budget. The FY 2009 Mayoral Local funds budget target reflects the recurring elements of anagency’s FY 2008 approved budget. See the How to Read the Budget chapter in the Executive Summaryvolume for more information on this table.
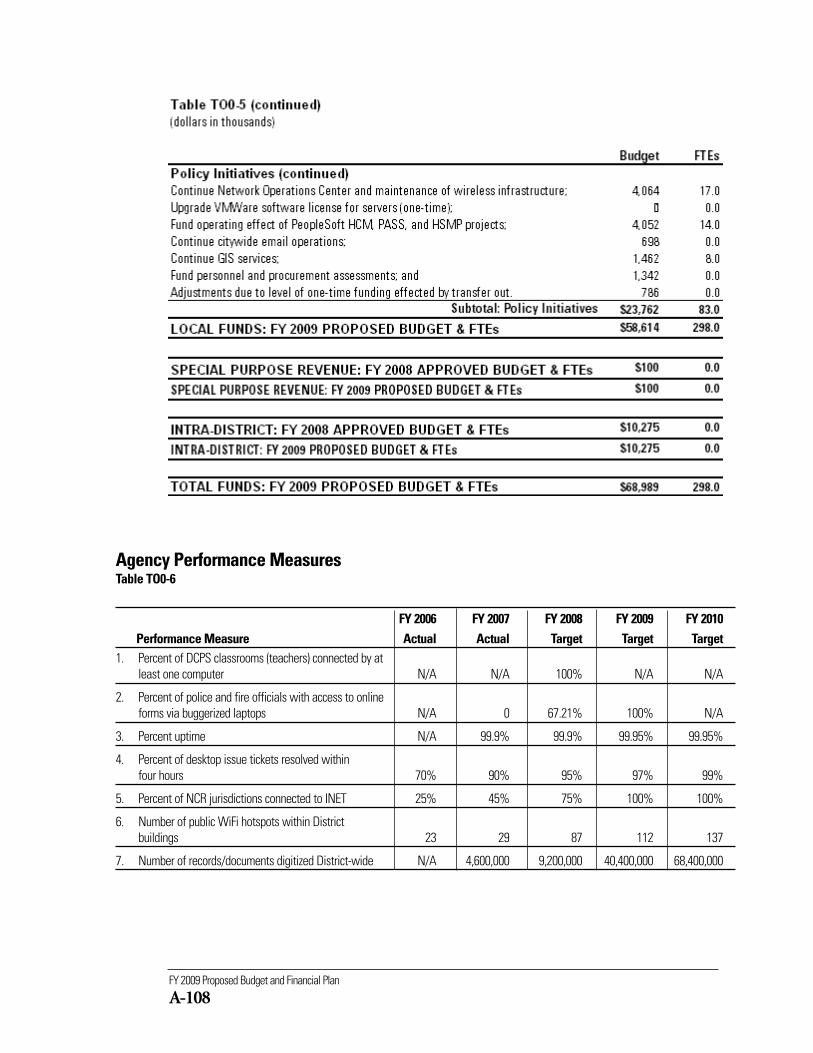
FY 2009 Proposed Budget and Financial Plan
A-108
Agency Performance MeasuresTable TO0-6
FY 2006 FY 2007 FY 2008 FY 2009 FY 2010Performance Measure Actual Actual Target Target Target
1. Percent of DCPS classrooms (teachers) connected by at least one computer N/A N/A 100% N/A N/A
2. Percent of police and fire officials with access to online forms via buggerized laptops N/A 0 67.21% 100% N/A
3. Percent uptime N/A 99.9% 99.9% 99.95% 99.95%
4. Percent of desktop issue tickets resolved within four hours 70% 90% 95% 97% 99%
5. Percent of NCR jurisdictions connected to INET 25% 45% 75% 100% 100%
6. Number of public WiFi hotspots within District buildings 23 29 87 112 137
7. Number of records/documents digitized District-wide N/A 4,600,000 9,200,000 40,400,000 68,400,000
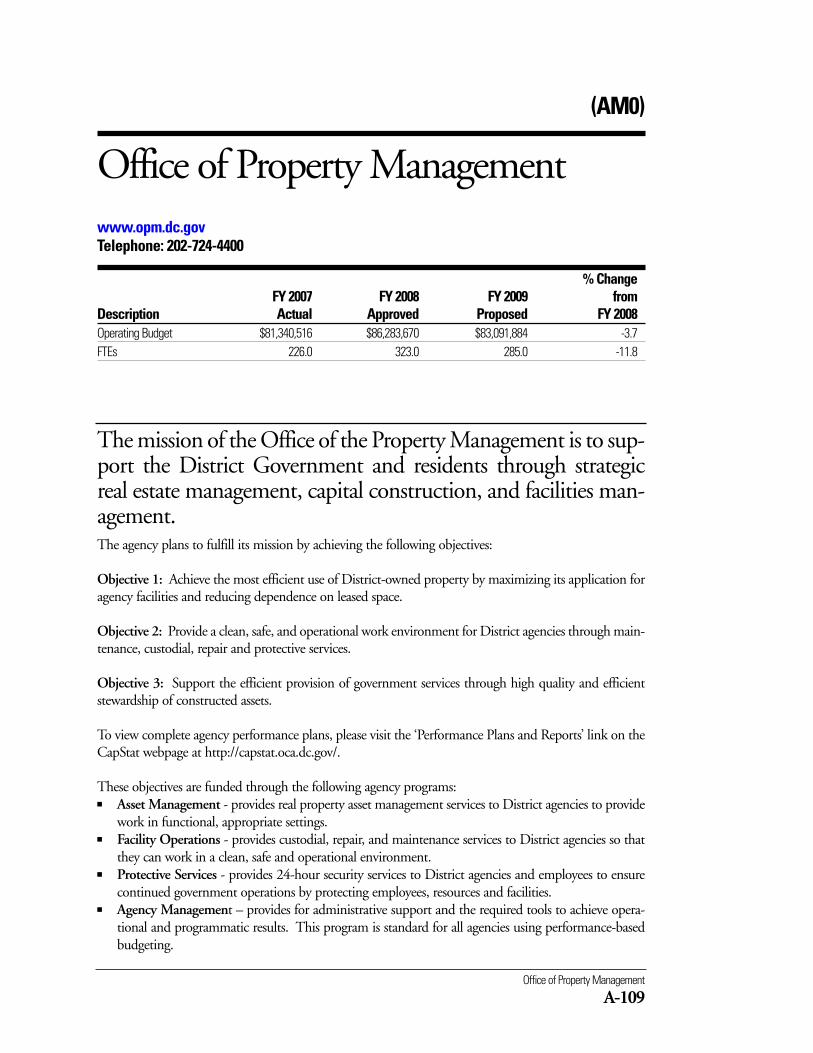
(AM0)
Office of Property Managementwww.opm.dc.govTelephone: 202-724-4400
% ChangeFY 2007 FY 2008 FY 2009 from
Description Actual Approved Proposed FY 2008Operating Budget $81,340,516 $86,283,670 $83,091,884 -3.7FTEs 226.0 323.0 285.0 -11.8
The mission of the Office of the Property Management is to sup-port the District Government and residents through strategicreal estate management, capital construction, and facilities man-agement.The agency plans to fulfill its mission by achieving the following objectives:
Objective 1: Achieve the most efficient use of District-owned property by maximizing its application foragency facilities and reducing dependence on leased space.
Objective 2: Provide a clean, safe, and operational work environment for District agencies through main-tenance, custodial, repair and protective services.
Objective 3: Support the efficient provision of government services through high quality and efficientstewardship of constructed assets.
To view complete agency performance plans, please visit the ‘Performance Plans and Reports’ link on theCapStat webpage at http://capstat.oca.dc.gov/.
These objectives are funded through the following agency programs:■ Asset Management - provides real property asset management services to District agencies to provide
work in functional, appropriate settings.■ Facility Operations - provides custodial, repair, and maintenance services to District agencies so that
they can work in a clean, safe and operational environment.■ Protective Services - provides 24-hour security services to District agencies and employees to ensure
continued government operations by protecting employees, resources and facilities. ■ Agency Management – provides for administrative support and the required tools to achieve opera-
tional and programmatic results. This program is standard for all agencies using performance-basedbudgeting.
Office of Property Management
A-109
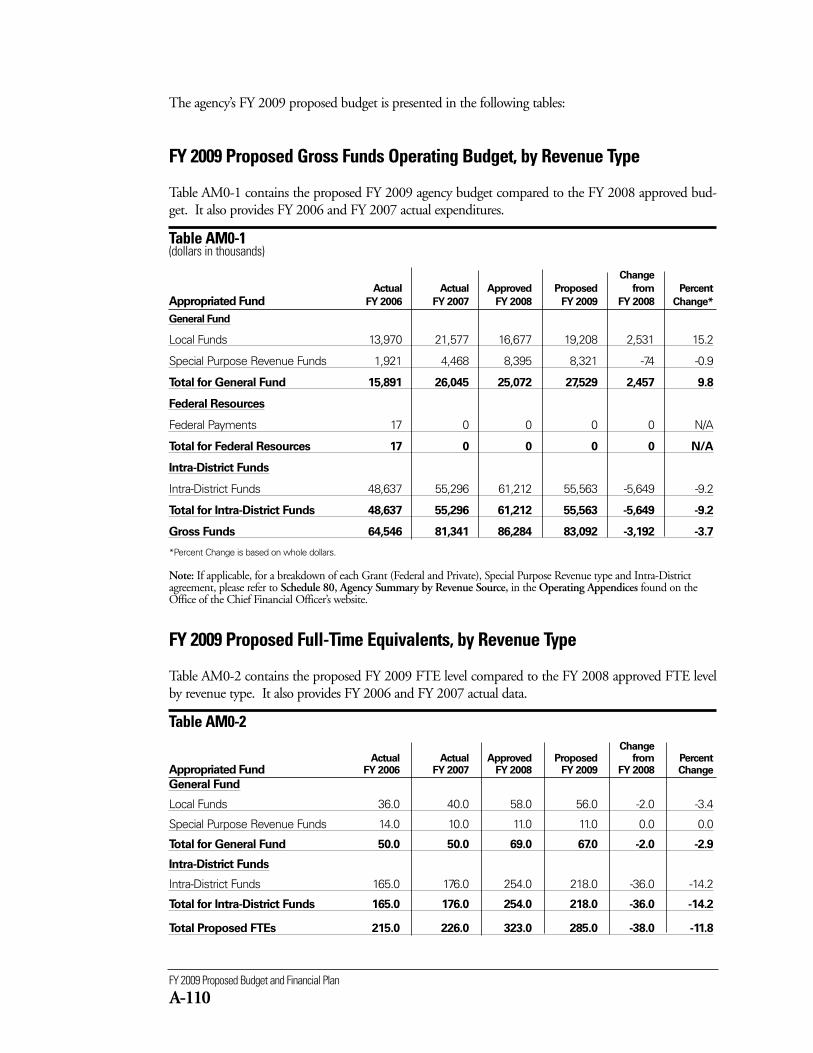
FY 2009 Proposed Budget and Financial Plan
A-110
FY 2009 Proposed Gross Funds Operating Budget, by Revenue Type
Table AM0-1 contains the proposed FY 2009 agency budget compared to the FY 2008 approved bud-get. It also provides FY 2006 and FY 2007 actual expenditures.
Table AM0-1 (dollars in thousands)
Change
Actual Actual Approved Proposed from Percent
Appropriated Fund FY 2006 FY 2007 FY 2008 FY 2009 FY 2008 Change*
General Fund
Local Funds 13,970 21,577 16,677 19,208 2,531 15.2
Special Purpose Revenue Funds 1,921 4,468 8,395 8,321 -74 -0.9
Total for General Fund 15,891 26,045 25,072 27,529 2,457 9.8
Federal Resources
Federal Payments 17 0 0 0 0 N/A
Total for Federal Resources 17 0 0 0 0 N/A
Intra-District Funds
Intra-District Funds 48,637 55,296 61,212 55,563 -5,649 -9.2
Total for Intra-District Funds 48,637 55,296 61,212 55,563 -5,649 -9.2
Gross Funds 64,546 81,341 86,284 83,092 -3,192 -3.7
*Percent Change is based on whole dollars.
FY 2009 Proposed Full-Time Equivalents, by Revenue Type
Table AM0-2 contains the proposed FY 2009 FTE level compared to the FY 2008 approved FTE levelby revenue type. It also provides FY 2006 and FY 2007 actual data.
Table AM0-2 Change
Actual Actual Approved Proposed from PercentAppropriated Fund FY 2006 FY 2007 FY 2008 FY 2009 FY 2008 Change
General Fund
Local Funds 36.0 40.0 58.0 56.0 -2.0 -3.4
Special Purpose Revenue Funds 14.0 10.0 11.0 11.0 0.0 0.0
Total for General Fund 50.0 50.0 69.0 67.0 -2.0 -2.9
Intra-District Funds
Intra-District Funds 165.0 176.0 254.0 218.0 -36.0 -14.2
Total for Intra-District Funds 165.0 176.0 254.0 218.0 -36.0 -14.2
Total Proposed FTEs 215.0 226.0 323.0 285.0 -38.0 -11.8
Note: If applicable, for a breakdown of each Grant (Federal and Private), Special Purpose Revenue type and Intra-Districtagreement, please refer to Schedule 80, Agency Summary by Revenue Source, in the Operating Appendices found on theOffice of the Chief Financial Officer’s website.
The agency’s FY 2009 proposed budget is presented in the following tables:
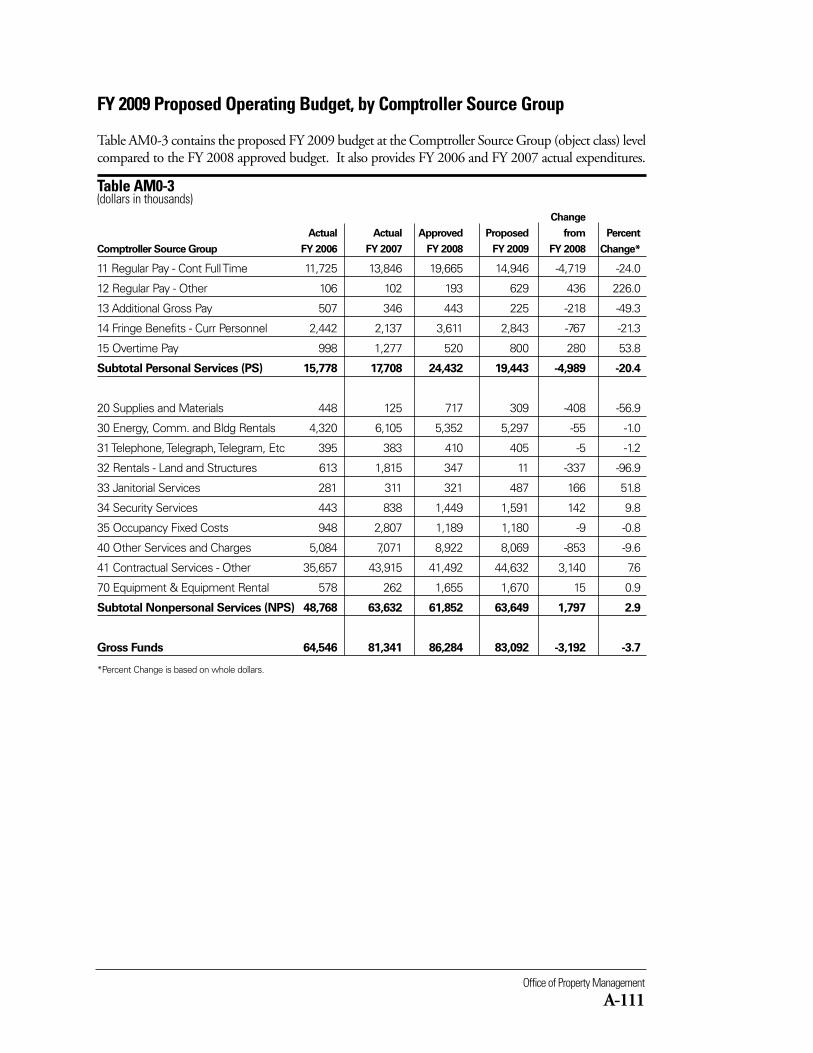
Office of Property Management
A-111
FY 2009 Proposed Operating Budget, by Comptroller Source Group
Table AM0-3 contains the proposed FY 2009 budget at the Comptroller Source Group (object class) levelcompared to the FY 2008 approved budget. It also provides FY 2006 and FY 2007 actual expenditures.
Table AM0-3 (dollars in thousands)
Change
Actual Actual Approved Proposed from Percent
Comptroller Source Group FY 2006 FY 2007 FY 2008 FY 2009 FY 2008 Change*
11 Regular Pay - Cont Full Time 11,725 13,846 19,665 14,946 -4,719 -24.0
12 Regular Pay - Other 106 102 193 629 436 226.0
13 Additional Gross Pay 507 346 443 225 -218 -49.3
14 Fringe Benefits - Curr Personnel 2,442 2,137 3,611 2,843 -767 -21.3
15 Overtime Pay 998 1,277 520 800 280 53.8
Subtotal Personal Services (PS) 15,778 17,708 24,432 19,443 -4,989 -20.4
20 Supplies and Materials 448 125 717 309 -408 -56.9
30 Energy, Comm. and Bldg Rentals 4,320 6,105 5,352 5,297 -55 -1.0
31 Telephone, Telegraph, Telegram, Etc 395 383 410 405 -5 -1.2
32 Rentals - Land and Structures 613 1,815 347 11 -337 -96.9
33 Janitorial Services 281 311 321 487 166 51.8
34 Security Services 443 838 1,449 1,591 142 9.8
35 Occupancy Fixed Costs 948 2,807 1,189 1,180 -9 -0.8
40 Other Services and Charges 5,084 7,071 8,922 8,069 -853 -9.6
41 Contractual Services - Other 35,657 43,915 41,492 44,632 3,140 7.6
70 Equipment & Equipment Rental 578 262 1,655 1,670 15 0.9
Subtotal Nonpersonal Services (NPS) 48,768 63,632 61,852 63,649 1,797 2.9
Gross Funds 64,546 81,341 86,284 83,092 -3,192 -3.7
*Percent Change is based on whole dollars.
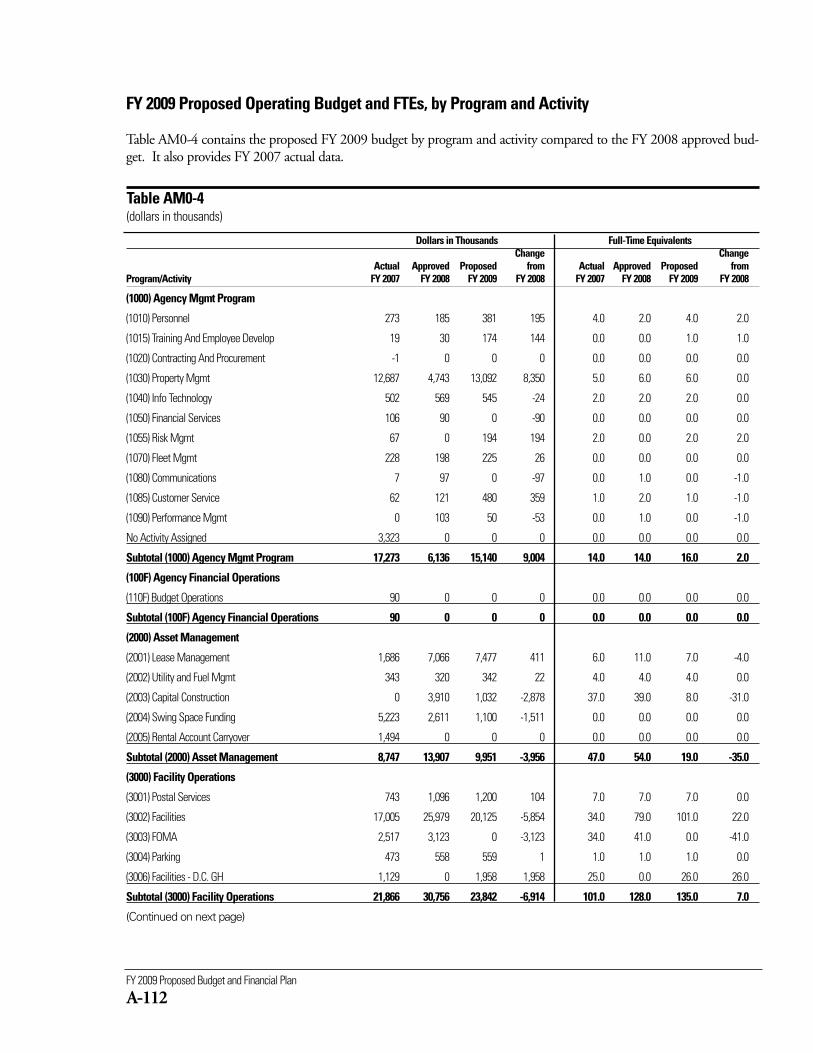
FY 2009 Proposed Budget and Financial Plan
A-112
Dollars in Thousands Full-Time EquivalentsChange Change
Actual Approved Proposed from Actual Approved Proposed from Program/Activity FY 2007 FY 2008 FY 2009 FY 2008 FY 2007 FY 2008 FY 2009 FY 2008
(1000) Agency Mgmt Program
(1010) Personnel 273 185 381 195 4.0 2.0 4.0 2.0
(1015) Training And Employee Develop 19 30 174 144 0.0 0.0 1.0 1.0
(1020) Contracting And Procurement -1 0 0 0 0.0 0.0 0.0 0.0
(1030) Property Mgmt 12,687 4,743 13,092 8,350 5.0 6.0 6.0 0.0
(1040) Info Technology 502 569 545 -24 2.0 2.0 2.0 0.0
(1050) Financial Services 106 90 0 -90 0.0 0.0 0.0 0.0
(1055) Risk Mgmt 67 0 194 194 2.0 0.0 2.0 2.0
(1070) Fleet Mgmt 228 198 225 26 0.0 0.0 0.0 0.0
(1080) Communications 7 97 0 -97 0.0 1.0 0.0 -1.0
(1085) Customer Service 62 121 480 359 1.0 2.0 1.0 -1.0
(1090) Performance Mgmt 0 103 50 -53 0.0 1.0 0.0 -1.0
No Activity Assigned 3,323 0 0 0 0.0 0.0 0.0 0.0
Subtotal (1000) Agency Mgmt Program 17,273 6,136 15,140 9,004 14.0 14.0 16.0 2.0
(100F) Agency Financial Operations
(110F) Budget Operations 90 0 0 0 0.0 0.0 0.0 0.0
Subtotal (100F) Agency Financial Operations 90 0 0 0 0.0 0.0 0.0 0.0
(2000) Asset Management
(2001) Lease Management 1,686 7,066 7,477 411 6.0 11.0 7.0 -4.0
(2002) Utility and Fuel Mgmt 343 320 342 22 4.0 4.0 4.0 0.0
(2003) Capital Construction 0 3,910 1,032 -2,878 37.0 39.0 8.0 -31.0
(2004) Swing Space Funding 5,223 2,611 1,100 -1,511 0.0 0.0 0.0 0.0
(2005) Rental Account Carryover 1,494 0 0 0 0.0 0.0 0.0 0.0
Subtotal (2000) Asset Management 8,747 13,907 9,951 -3,956 47.0 54.0 19.0 -35.0
(3000) Facility Operations
(3001) Postal Services 743 1,096 1,200 104 7.0 7.0 7.0 0.0
(3002) Facilities 17,005 25,979 20,125 -5,854 34.0 79.0 101.0 22.0
(3003) FOMA 2,517 3,123 0 -3,123 34.0 41.0 0.0 -41.0
(3004) Parking 473 558 559 1 1.0 1.0 1.0 0.0
(3006) Facilities - D.C. GH 1,129 0 1,958 1,958 25.0 0.0 26.0 26.0
Subtotal (3000) Facility Operations 21,866 30,756 23,842 -6,914 101.0 128.0 135.0 7.0
(Continued on next page)
FY 2009 Proposed Operating Budget and FTEs, by Program and Activity
Table AM0-4 contains the proposed FY 2009 budget by program and activity compared to the FY 2008 approved bud-get. It also provides FY 2007 actual data.
Table AM0-4(dollars in thousands)
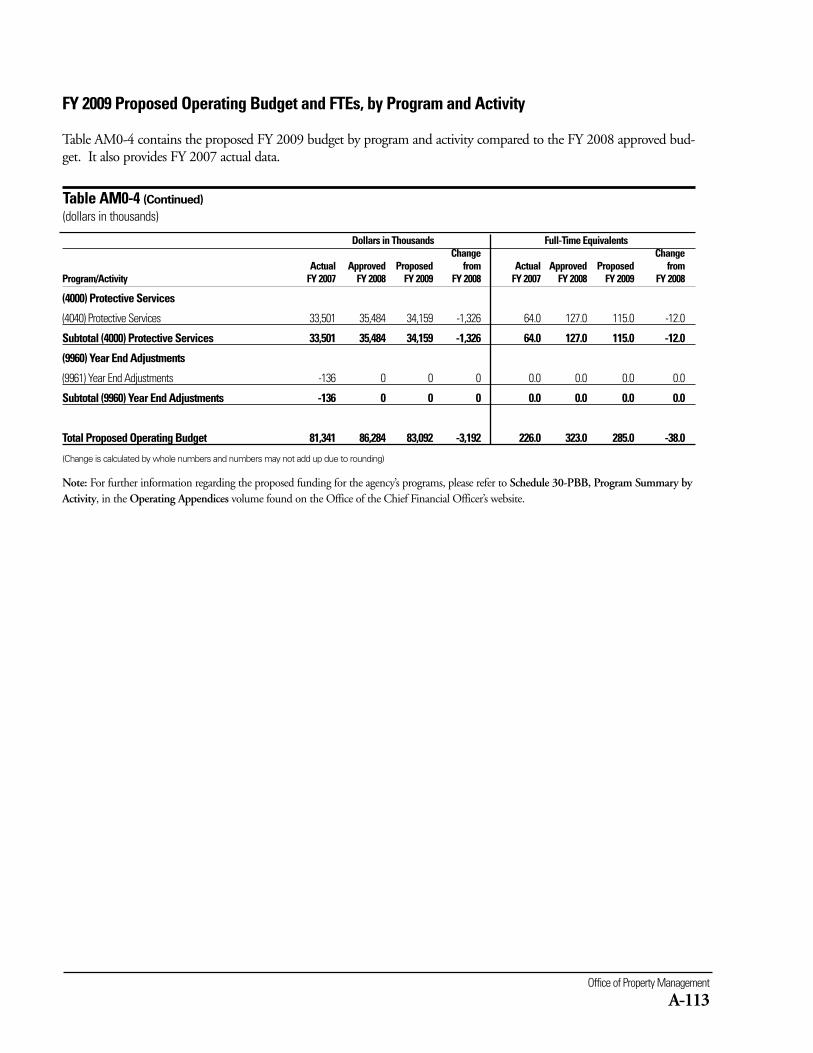
Office of Property Management
A-113
Dollars in Thousands Full-Time EquivalentsChange Change
Actual Approved Proposed from Actual Approved Proposed from Program/Activity FY 2007 FY 2008 FY 2009 FY 2008 FY 2007 FY 2008 FY 2009 FY 2008
(4000) Protective Services
(4040) Protective Services 33,501 35,484 34,159 -1,326 64.0 127.0 115.0 -12.0
Subtotal (4000) Protective Services 33,501 35,484 34,159 -1,326 64.0 127.0 115.0 -12.0
(9960) Year End Adjustments
(9961) Year End Adjustments -136 0 0 0 0.0 0.0 0.0 0.0
Subtotal (9960) Year End Adjustments -136 0 0 0 0.0 0.0 0.0 0.0
Total Proposed Operating Budget 81,341 86,284 83,092 -3,192 226.0 323.0 285.0 -38.0
(Change is calculated by whole numbers and numbers may not add up due to rounding)
FY 2009 Proposed Operating Budget and FTEs, by Program and Activity
Table AM0-4 contains the proposed FY 2009 budget by program and activity compared to the FY 2008 approved bud-get. It also provides FY 2007 actual data.
Table AM0-4 (Continued)
(dollars in thousands)
Note: For further information regarding the proposed funding for the agency’s programs, please refer to Schedule 30-PBB, Program Summary byActivity, in the Operating Appendices volume found on the Office of the Chief Financial Officer’s website.
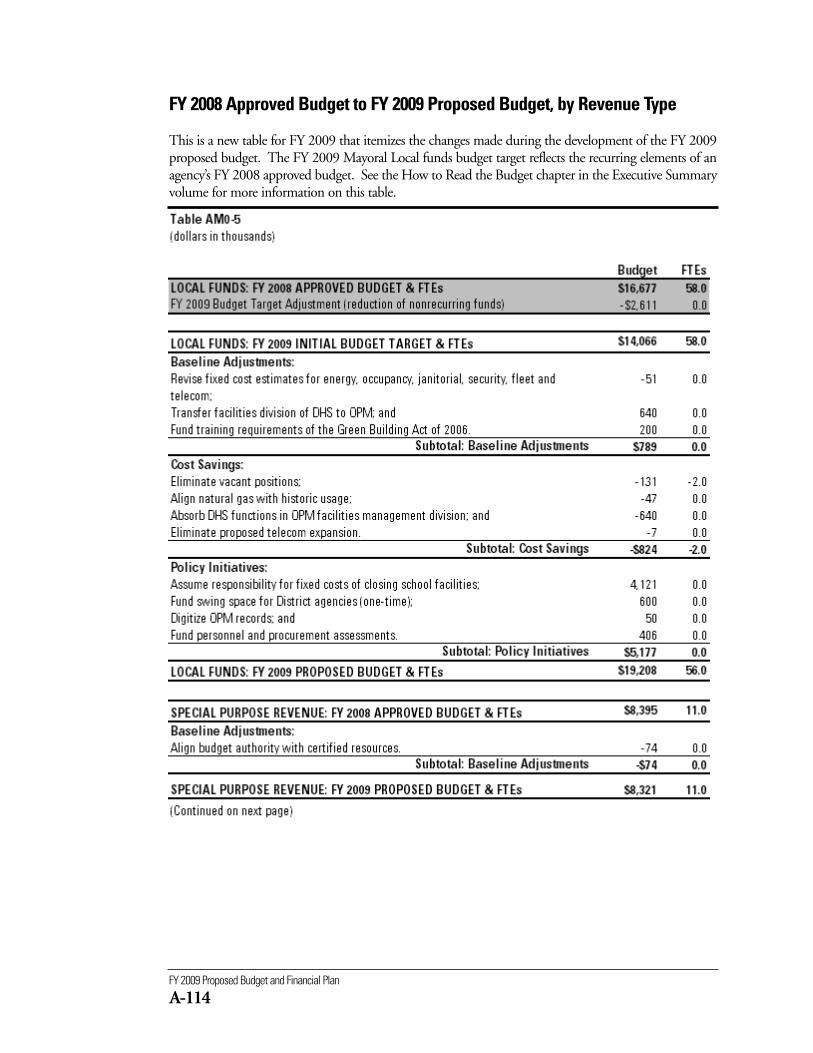
FY 2009 Proposed Budget and Financial Plan
A-114
FY 2008 Approved Budget to FY 2009 Proposed Budget, by Revenue Type
This is a new table for FY 2009 that itemizes the changes made during the development of the FY 2009proposed budget. The FY 2009 Mayoral Local funds budget target reflects the recurring elements of anagency’s FY 2008 approved budget. See the How to Read the Budget chapter in the Executive Summaryvolume for more information on this table.
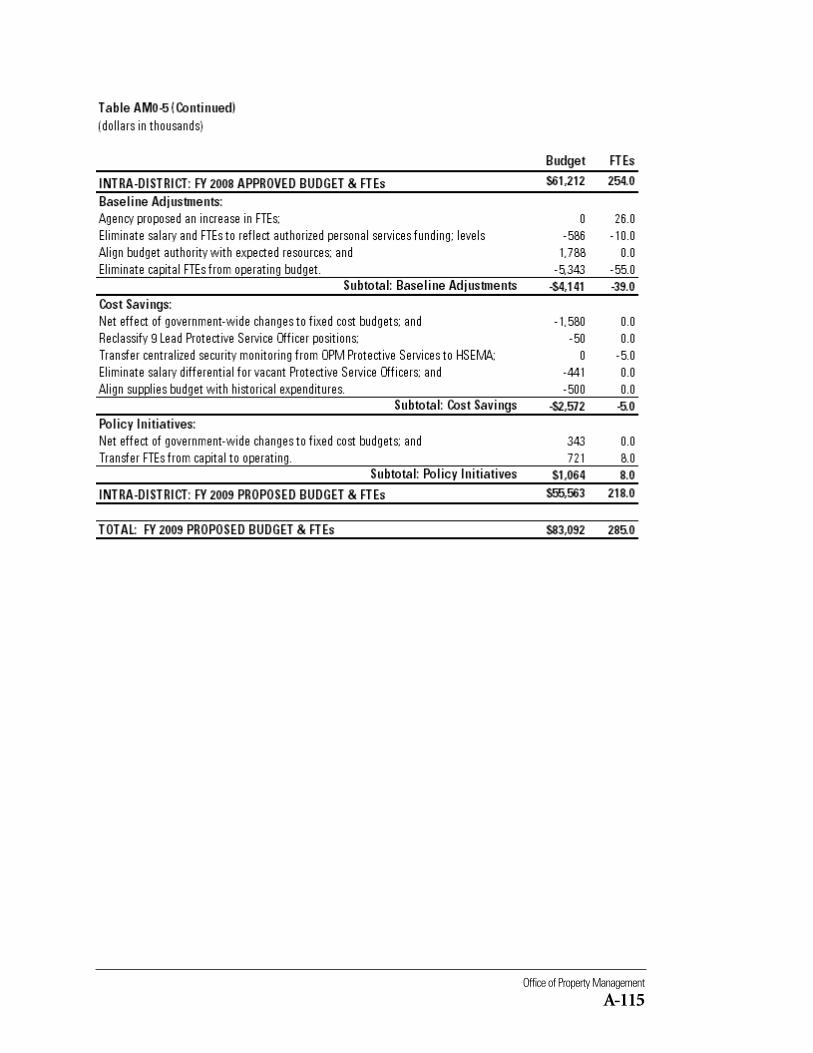
Office of Property Management
A-115
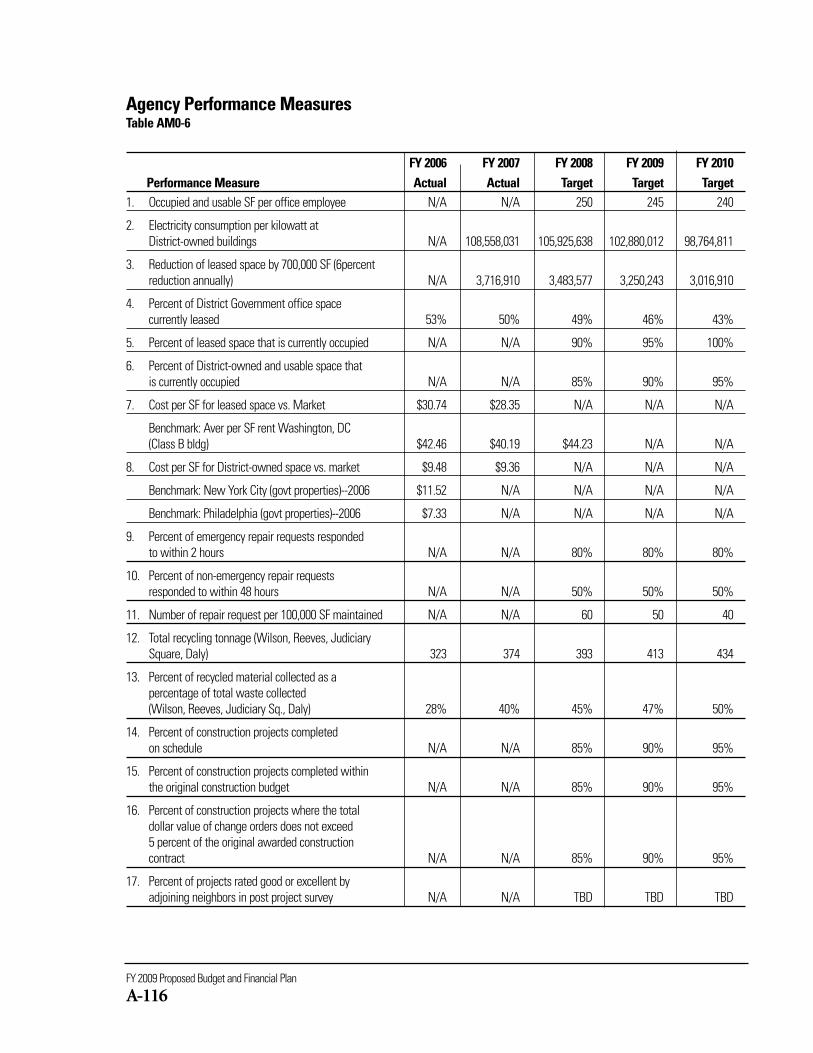
FY 2009 Proposed Budget and Financial Plan
A-116
Agency Performance MeasuresTable AM0-6
FY 2006 FY 2007 FY 2008 FY 2009 FY 2010Performance Measure Actual Actual Target Target Target
1. Occupied and usable SF per office employee N/A N/A 250 245 240
2. Electricity consumption per kilowatt at District-owned buildings N/A 108,558,031 105,925,638 102,880,012 98,764,811
3. Reduction of leased space by 700,000 SF (6percent reduction annually) N/A 3,716,910 3,483,577 3,250,243 3,016,910
4. Percent of District Government office space currently leased 53% 50% 49% 46% 43%
5. Percent of leased space that is currently occupied N/A N/A 90% 95% 100%
6. Percent of District-owned and usable space that is currently occupied N/A N/A 85% 90% 95%
7. Cost per SF for leased space vs. Market $30.74 $28.35 N/A N/A N/A
Benchmark: Aver per SF rent Washington, DC (Class B bldg) $42.46 $40.19 $44.23 N/A N/A
8. Cost per SF for District-owned space vs. market $9.48 $9.36 N/A N/A N/A
Benchmark: New York City (govt properties)--2006 $11.52 N/A N/A N/A N/A
Benchmark: Philadelphia (govt properties)--2006 $7.33 N/A N/A N/A N/A
9. Percent of emergency repair requests respondedto within 2 hours N/A N/A 80% 80% 80%
10. Percent of non-emergency repair requests responded to within 48 hours N/A N/A 50% 50% 50%
11. Number of repair request per 100,000 SF maintained N/A N/A 60 50 40
12. Total recycling tonnage (Wilson, Reeves, JudiciarySquare, Daly) 323 374 393 413 434
13. Percent of recycled material collected as a percentage of total waste collected (Wilson, Reeves, Judiciary Sq., Daly) 28% 40% 45% 47% 50%
14. Percent of construction projects completed on schedule N/A N/A 85% 90% 95%
15. Percent of construction projects completed withinthe original construction budget N/A N/A 85% 90% 95%
16. Percent of construction projects where the totaldollar value of change orders does not exceed 5 percent of the original awarded construction contract N/A N/A 85% 90% 95%
17. Percent of projects rated good or excellent by adjoining neighbors in post project survey N/A N/A TBD TBD TBD
(AF0)
Contract Appeals Boardhttp://cab.dc.govTelephone: 202-727-6597
% ChangeFY 2007 FY 2008 FY 2009 from
Description Actual Approved Proposed FY 2008Operating Budget $775,811 $998,843 $1,038,463 4.0FTEs 5.0 6.0 6.0 0.0
The mission of the Contract Appeals Board is to provide animpartial, expeditious, inexpensive, and knowledgeable forumfor hearing and resolving contractual disputes and protestsinvolving the District and its contracting communities.
The agency plans to fulfill its mission by achieving the following objectives:
Objective 1: Promote confidence in the integrity of the procurement process through equitable, timely,efficient, and legally correct adjudication of disputes and protests.
Objective 2: Assist parties with resolving disputes through negotiation and settlement by initiating earlycase intervention, focusing attention on critical facts, resolving threshold legal issues, and conducting reg-ular status conferences.
Objective 3: Educate government and private contracting parties on procurement policies of fair, open,and broad-based competition, the legal requirements for conducting proper procurements, and resolvingdisputes through traditional and alternative dispute resolution methods.
To view complete agency performance plans, please visit the ‘Performance Plans and Reports’ link on theCapStat webpage at http://capstat.oca.dc.gov/.
These objectives are funded through the following agency programs:
■ Adjudication - the Contract Appeals Board adjudicates protests of District contract solicitations andawards, appeals by contractors of District contracting officer final decisions, claims by the Districtagainst contractors, appeals by contractors of suspensions and debarments, and contractor appeals ofinterest payment claims under the Quick Payment Act; and
Contract Appeals Board
A-117
FY 2009 Proposed Gross Funds Operating Budget, by Revenue Type
Table AF0-1 contains the proposed FY 2009 agency budget compared to the FY 2008 approved budget.It also provides FY 2006 and FY 2007 actual expenditures.
Table AF0-1 (dollars in thousands)
Change
Actual Actual Approved Proposed from Percent
Appropriated Fund FY 2006 FY 2007 FY 2008 FY 2009 FY 2008 Change*
General Fund
Local Funds 746 776 999 1,038 40 4.0
Total for General Fund 746 776 999 1,038 40 4.0
Gross Funds 746 776 999 1,038 40 4.0
*Percent Change is based on whole dollars.
FY 2009 Proposed Budget and Financial Plan
A-118
■ Contract Appeals Board - provides for administrative support and the required tools to achieve oper-ational and programmatic results.
The agency’s FY 2009 proposed budget is presented in the following tables:
FY 2009 Proposed Full-Time Equivalents, by Revenue Type
Table AF0-2 contains the proposed FY 2009 FTE level compared to the FY 2008 approved FTE level byrevenue type. It also provides FY 2006 and FY 2007 actual data.
Table AF0-2 Change
Actual Actual Approved Proposed from Percent
Appropriated Fund FY 2006 FY 2007 FY 2008 FY 2009 FY 2008 Change
General Fund
Local Funds 5.0 5.0 6.0 6.0 0.0 0.0
Total for General Fund 5.0 5.0 6.0 6.0 0.0 0.0
Total Proposed FTEs 5.0 5.0 6.0 6.0 0.0 0.0
Contract Appeals Board
A-119
FY 2009 Proposed Operating Budget, by Comptroller Source Group
Table AF0-3 contains the proposed FY 2009 budget at the Comptroller Source Group (object class) levelcompared to the FY 2008 approved budget. It also provides FY 2006 and FY 2007 actual expenditures.
Table AF0-3(dollars in thousands)
Change
Actual Actual Approved Proposed from Percent
Comptroller Source Group FY 2006 FY 2007 FY 2008 FY 2009 FY 2008 Change*
11 Regular Pay - Cont Full Time 162 177 307 197 -110 -35.9
12 Regular Pay - Other 283 309 327 472 145 44.2
13 Additional Gross Pay 14 3 0 0 0 NA
14 Fringe Benefits - Curr Personnel 70 75 95 105 10 10.7
Subtotal Personal Services (PS) 529 564 729 774 45 6.2
20 Supplies and Materials 5 5 4 5 1 12.1
31 Telephone, Telegraph, Telegram, Etc 7 7 7 7 0 1.8
32 Rentals - Land and Structures 151 154 226 215 -11 -4.7
34 Security Services 3 4 5 5 0 8.0
40 Other Services and Charges 16 20 21 25 4 18.8
70 Equipment & Equipment Rental 35 22 7 7 0 4.0
Subtotal Nonpersonal Services (NPS) 217 212 270 264 -5 -2.0
Gross Funds 746 776 999 1,038 40 4.0
*Percent Change is based on whole dollars.
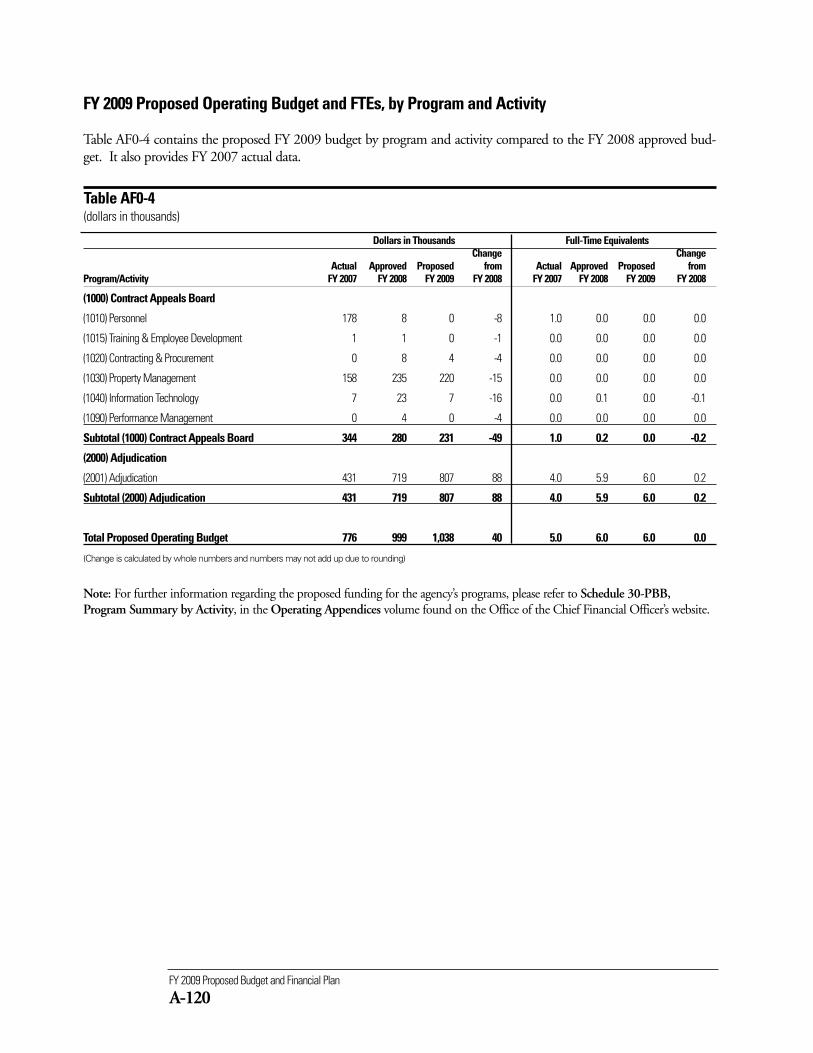
FY 2009 Proposed Budget and Financial Plan
A-120
Dollars in Thousands Full-Time EquivalentsChange Change
Actual Approved Proposed from Actual Approved Proposed from Program/Activity FY 2007 FY 2008 FY 2009 FY 2008 FY 2007 FY 2008 FY 2009 FY 2008
(1000) Contract Appeals Board
(1010) Personnel 178 8 0 -8 1.0 0.0 0.0 0.0
(1015) Training & Employee Development 1 1 0 -1 0.0 0.0 0.0 0.0
(1020) Contracting & Procurement 0 8 4 -4 0.0 0.0 0.0 0.0
(1030) Property Management 158 235 220 -15 0.0 0.0 0.0 0.0
(1040) Information Technology 7 23 7 -16 0.0 0.1 0.0 -0.1
(1090) Performance Management 0 4 0 -4 0.0 0.0 0.0 0.0
Subtotal (1000) Contract Appeals Board 344 280 231 -49 1.0 0.2 0.0 -0.2
(2000) Adjudication
(2001) Adjudication 431 719 807 88 4.0 5.9 6.0 0.2
Subtotal (2000) Adjudication 431 719 807 88 4.0 5.9 6.0 0.2
Total Proposed Operating Budget 776 999 1,038 40 5.0 6.0 6.0 0.0
(Change is calculated by whole numbers and numbers may not add up due to rounding)
Note: For further information regarding the proposed funding for the agency’s programs, please refer to Schedule 30-PBB,Program Summary by Activity, in the Operating Appendices volume found on the Office of the Chief Financial Officer’s website.
FY 2009 Proposed Operating Budget and FTEs, by Program and Activity
Table AF0-4 contains the proposed FY 2009 budget by program and activity compared to the FY 2008 approved bud-get. It also provides FY 2007 actual data.
Table AF0-4(dollars in thousands)
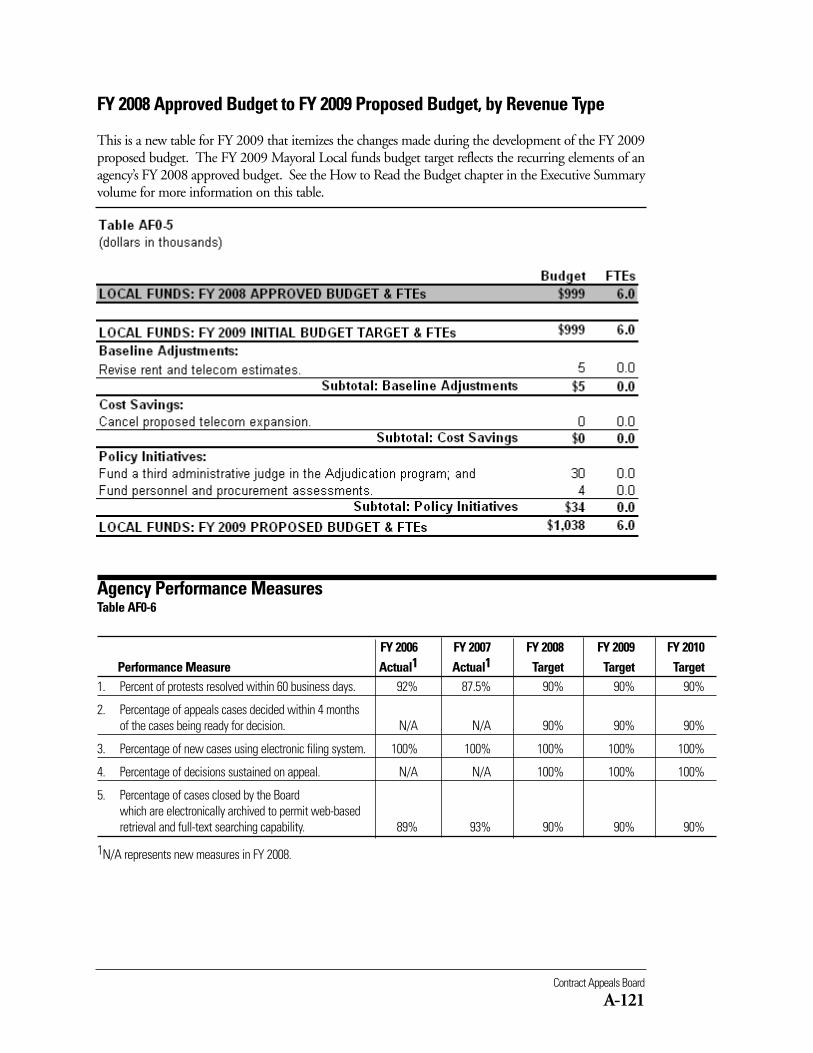
Contract Appeals Board
A-121
Agency Performance MeasuresTable AF0-6
FY 2006 FY 2007 FY 2008 FY 2009 FY 2010Performance Measure Actual1 Actual1 Target Target Target
1. Percent of protests resolved within 60 business days. 92% 87.5% 90% 90% 90%
2. Percentage of appeals cases decided within 4 months of the cases being ready for decision. N/A N/A 90% 90% 90%
3. Percentage of new cases using electronic filing system. 100% 100% 100% 100% 100%
4. Percentage of decisions sustained on appeal. N/A N/A 100% 100% 100%
5. Percentage of cases closed by the Board which are electronically archived to permit web-based retrieval and full-text searching capability. 89% 93% 90% 90% 90%
1N/A represents new measures in FY 2008.
FY 2008 Approved Budget to FY 2009 Proposed Budget, by Revenue Type
This is a new table for FY 2009 that itemizes the changes made during the development of the FY 2009proposed budget. The FY 2009 Mayoral Local funds budget target reflects the recurring elements of anagency’s FY 2008 approved budget. See the How to Read the Budget chapter in the Executive Summaryvolume for more information on this table.
(DL0)
Board of Elections and Ethicswww.dcboee.orgTelephone: 202-727-2525
% ChangeFY 2007 FY 2008 FY 2009 from
Description Actual Approved Proposed FY 2008Operating Budget $6,341,643 $5,254,000 $5,496,192 4.6FTEs 40.7 50.0 50.0 0.0
The mission of the Board of Elections and Ethics (BOEE) is toenfranchise eligible residents, conduct elections, and assure theintegrityof the electoral process. This mission, mandated by fed-eral and local statutes, is executed through the operation of theDistrict's voter registration system and by administration of theballot access process for candidates and measures. Also, it is exe-cuted through the delivery of comprehensive public, media, andvoter information services; by maintenance of technical systemsto support voting, ballot tabulation, and electronic mapping ofelection district boundaries; through the planning and imple-mentation of each District of Columbia election; and throughthe performance of legal counsel, rulemaking and adjudicationfunctions.
Board of Elections and Ethics
A-123
The agency plans to fulfill its mission by achieving the following strategic result goals:
■ To successfully conduct the November 7, 2008 Presidential General Election in order to elect theElectors for President and Vice President of the United States; Delegate to the United States House ofRepresentatives; Member of the Council for At-Large (two to be elected) and Wards 2, 4, 7 and 8;Members of the Board of Education for Wards 1 through 8; United States Representative; andAdvisory Neighborhood Commissioner (286 to be elected).
■ To continue to ensure that the Board’s process as it relates to voter registration, voter education, stafftraining and the overall administration of elections are in compliance with the Help America Vote Act(HAVA).
FY 2009 Proposed Budget and Financial Plan
A-124
■ To continue to maintain, update, expand, and monitor the effectiveness of the Board’s InternetWebsite by including interactive maps, a polling place locator with sites linked to maps, complete reg-istration statistics, and other voter registration information; to maximize public access of voter infor-mation and forms through the use of the Internet Web site; and to continue to update and expandthe Board’s Web site for its accessibility for individuals who are visually impaired.
■ To identify facilities, when relocating and identifying precincts, that may serve the disabled commu-nity and thereby increase the number of accessible precinct locations to 100 percent.
■ To expand the database of Election Day Workers to have qualified personnel available for all positionson the precinct team.
These goals are funded through the following agency programs:
■ Board of Supervisors - provides assistance to the Board of Elections and Ethics in carrying out theirduties. This program manages all activities relating to board meetings. The Board of Supervisors meetonce a month with the Office of the General Counsel and the Office of the Executive Director to dis-cuss any situation or concern that the BOEE may or may not have.
■ Election Operations - is responsible for the administrative functions of the agency’s overall operations.This program directs election-related program operations and support activities; conduct of elections,voter registration and services, voter roll maintenance, technology and information, and administra-tion and support.
■ Agency Management - provides for administrative support and the required tools to achieve opera-tional and programmatic results. This program is standard for all agencies using performance-basedbudgeting.
The agency’s FY 2009 proposed budget is presented in the following tables:
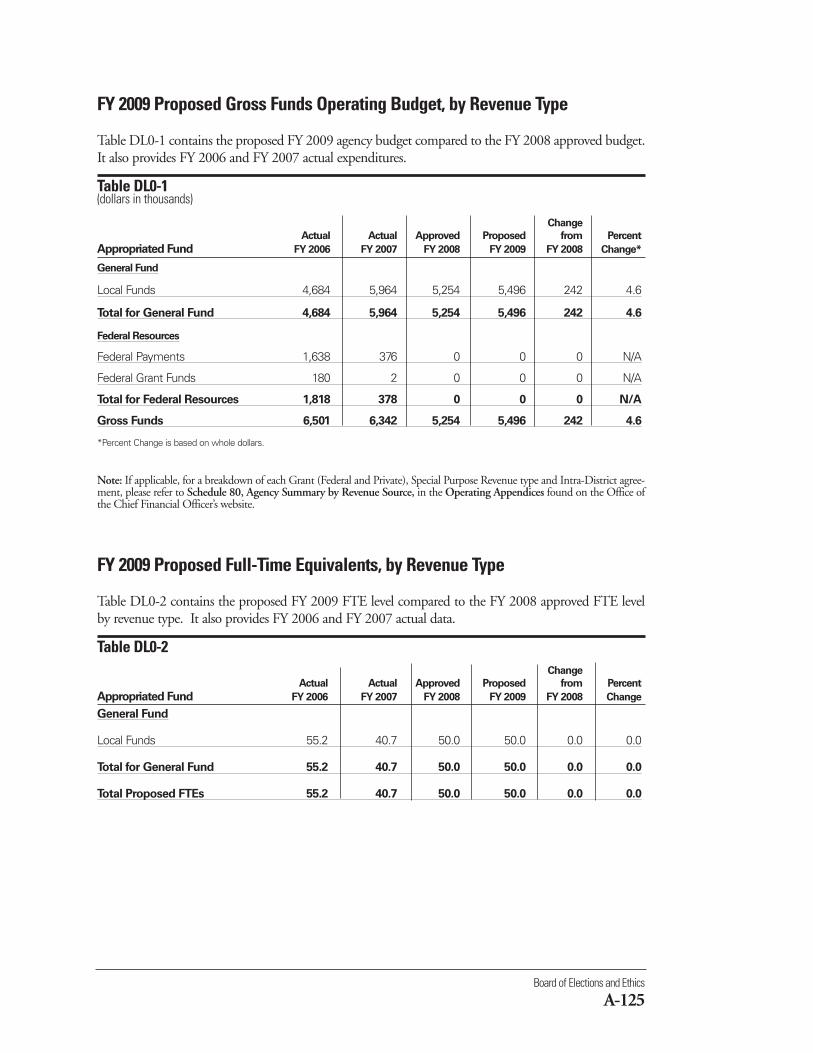
Board of Elections and Ethics
A-125
FY 2009 Proposed Gross Funds Operating Budget, by Revenue Type
Table DL0-1 contains the proposed FY 2009 agency budget compared to the FY 2008 approved budget.It also provides FY 2006 and FY 2007 actual expenditures.
Table DL0-1 (dollars in thousands)
Change
Actual Actual Approved Proposed from Percent
Appropriated Fund FY 2006 FY 2007 FY 2008 FY 2009 FY 2008 Change*
General Fund
Local Funds 4,684 5,964 5,254 5,496 242 4.6
Total for General Fund 4,684 5,964 5,254 5,496 242 4.6
Federal Resources
Federal Payments 1,638 376 0 0 0 N/A
Federal Grant Funds 180 2 0 0 0 N/A
Total for Federal Resources 1,818 378 0 0 0 N/A
Gross Funds 6,501 6,342 5,254 5,496 242 4.6
*Percent Change is based on whole dollars.
Note: If applicable, for a breakdown of each Grant (Federal and Private), Special Purpose Revenue type and Intra-District agree-ment, please refer to Schedule 80, Agency Summary by Revenue Source, in the Operating Appendices found on the Office ofthe Chief Financial Officer’s website.
FY 2009 Proposed Full-Time Equivalents, by Revenue Type
Table DL0-2 contains the proposed FY 2009 FTE level compared to the FY 2008 approved FTE levelby revenue type. It also provides FY 2006 and FY 2007 actual data.
Table DL0-2 Change
Actual Actual Approved Proposed from Percent
Appropriated Fund FY 2006 FY 2007 FY 2008 FY 2009 FY 2008 Change
General Fund
Local Funds 55.2 40.7 50.0 50.0 0.0 0.0
Total for General Fund 55.2 40.7 50.0 50.0 0.0 0.0
Total Proposed FTEs 55.2 40.7 50.0 50.0 0.0 0.0
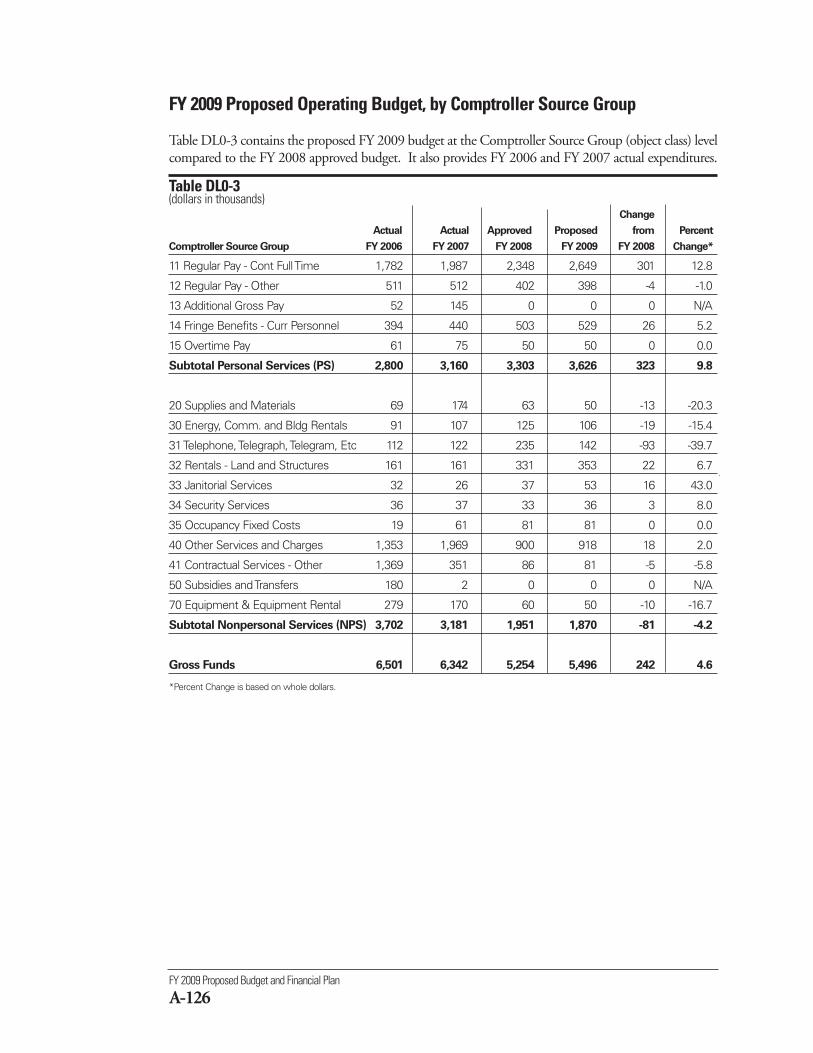
FY 2009 Proposed Budget and Financial Plan
A-126
FY 2009 Proposed Operating Budget, by Comptroller Source Group
Table DL0-3 contains the proposed FY 2009 budget at the Comptroller Source Group (object class) levelcompared to the FY 2008 approved budget. It also provides FY 2006 and FY 2007 actual expenditures.
Table DL0-3(dollars in thousands)
Change
Actual Actual Approved Proposed from Percent
Comptroller Source Group FY 2006 FY 2007 FY 2008 FY 2009 FY 2008 Change*
11 Regular Pay - Cont Full Time 1,782 1,987 2,348 2,649 301 12.8
12 Regular Pay - Other 511 512 402 398 -4 -1.0
13 Additional Gross Pay 52 145 0 0 0 N/A
14 Fringe Benefits - Curr Personnel 394 440 503 529 26 5.2
15 Overtime Pay 61 75 50 50 0 0.0
Subtotal Personal Services (PS) 2,800 3,160 3,303 3,626 323 9.8
20 Supplies and Materials 69 174 63 50 -13 -20.3
30 Energy, Comm. and Bldg Rentals 91 107 125 106 -19 -15.4
31 Telephone, Telegraph, Telegram, Etc 112 122 235 142 -93 -39.7
32 Rentals - Land and Structures 161 161 331 353 22 6.7
33 Janitorial Services 32 26 37 53 16 43.0
34 Security Services 36 37 33 36 3 8.0
35 Occupancy Fixed Costs 19 61 81 81 0 0.0
40 Other Services and Charges 1,353 1,969 900 918 18 2.0
41 Contractual Services - Other 1,369 351 86 81 -5 -5.8
50 Subsidies and Transfers 180 2 0 0 0 N/A
70 Equipment & Equipment Rental 279 170 60 50 -10 -16.7
Subtotal Nonpersonal Services (NPS) 3,702 3,181 1,951 1,870 -81 -4.2
Gross Funds 6,501 6,342 5,254 5,496 242 4.6
*Percent Change is based on whole dollars.
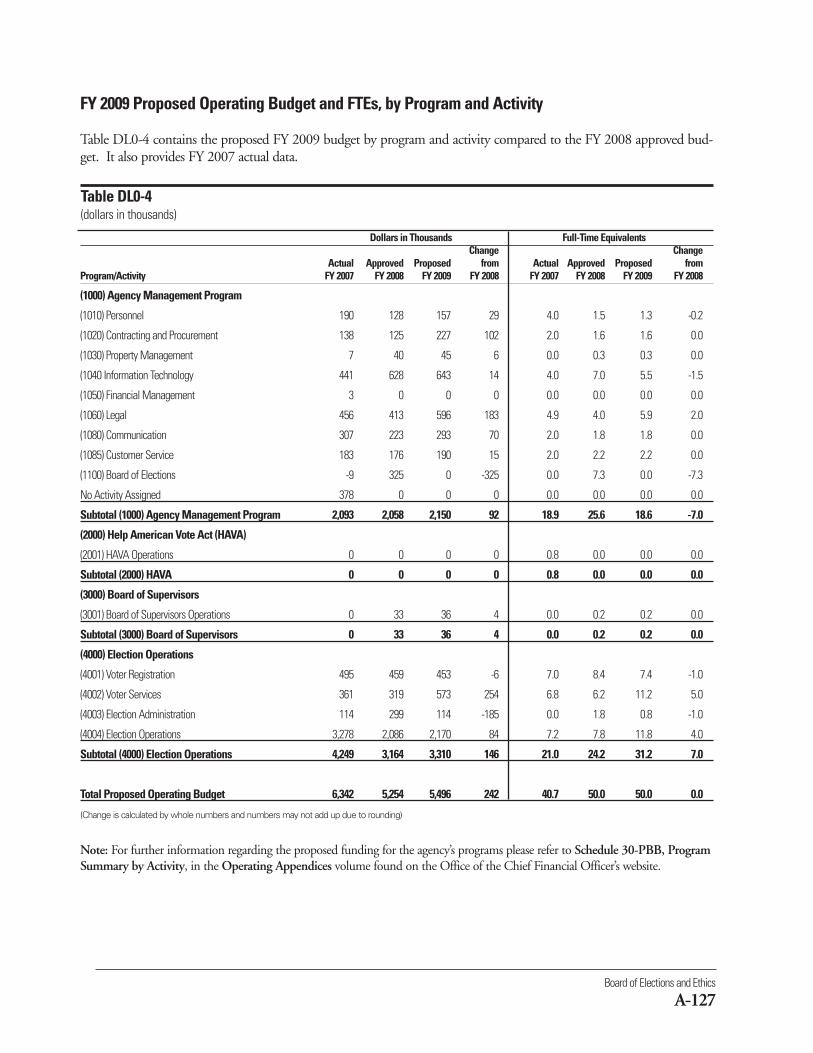
Board of Elections and Ethics
A-127
Dollars in Thousands Full-Time EquivalentsChange Change
Actual Approved Proposed from Actual Approved Proposed from Program/Activity FY 2007 FY 2008 FY 2009 FY 2008 FY 2007 FY 2008 FY 2009 FY 2008
(1000) Agency Management Program
(1010) Personnel 190 128 157 29 4.0 1.5 1.3 -0.2
(1020) Contracting and Procurement 138 125 227 102 2.0 1.6 1.6 0.0
(1030) Property Management 7 40 45 6 0.0 0.3 0.3 0.0
(1040 Information Technology 441 628 643 14 4.0 7.0 5.5 -1.5
(1050) Financial Management 3 0 0 0 0.0 0.0 0.0 0.0
(1060) Legal 456 413 596 183 4.9 4.0 5.9 2.0
(1080) Communication 307 223 293 70 2.0 1.8 1.8 0.0
(1085) Customer Service 183 176 190 15 2.0 2.2 2.2 0.0
(1100) Board of Elections -9 325 0 -325 0.0 7.3 0.0 -7.3
No Activity Assigned 378 0 0 0 0.0 0.0 0.0 0.0
Subtotal (1000) Agency Management Program 2,093 2,058 2,150 92 18.9 25.6 18.6 -7.0
(2000) Help American Vote Act (HAVA)
(2001) HAVA Operations 0 0 0 0 0.8 0.0 0.0 0.0
Subtotal (2000) HAVA 0 0 0 0 0.8 0.0 0.0 0.0
(3000) Board of Supervisors
(3001) Board of Supervisors Operations 0 33 36 4 0.0 0.2 0.2 0.0
Subtotal (3000) Board of Supervisors 0 33 36 4 0.0 0.2 0.2 0.0
(4000) Election Operations
(4001) Voter Registration 495 459 453 -6 7.0 8.4 7.4 -1.0
(4002) Voter Services 361 319 573 254 6.8 6.2 11.2 5.0
(4003) Election Administration 114 299 114 -185 0.0 1.8 0.8 -1.0
(4004) Election Operations 3,278 2,086 2,170 84 7.2 7.8 11.8 4.0
Subtotal (4000) Election Operations 4,249 3,164 3,310 146 21.0 24.2 31.2 7.0
Total Proposed Operating Budget 6,342 5,254 5,496 242 40.7 50.0 50.0 0.0
(Change is calculated by whole numbers and numbers may not add up due to rounding)
Note: For further information regarding the proposed funding for the agency’s programs please refer to Schedule 30-PBB, ProgramSummary by Activity, in the Operating Appendices volume found on the Office of the Chief Financial Officer’s website.
FY 2009 Proposed Operating Budget and FTEs, by Program and Activity
Table DL0-4 contains the proposed FY 2009 budget by program and activity compared to the FY 2008 approved bud-get. It also provides FY 2007 actual data.
Table DL0-4(dollars in thousands)
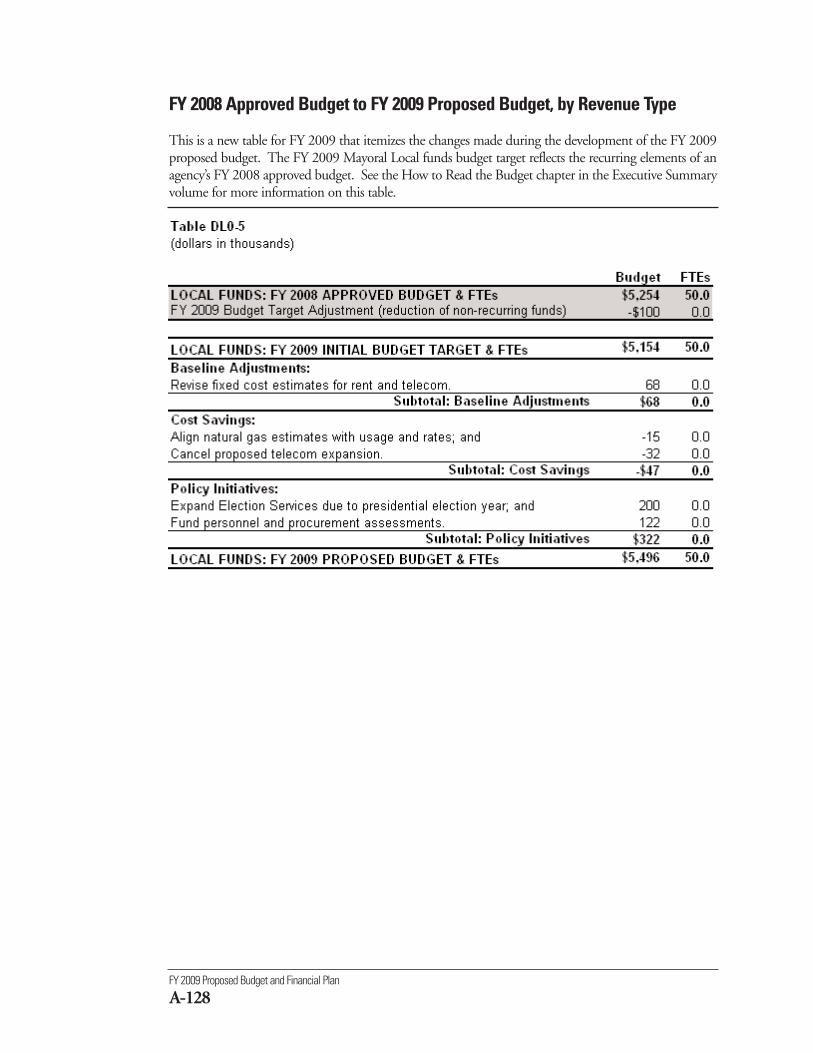
FY 2009 Proposed Budget and Financial Plan
A-128
FY 2008 Approved Budget to FY 2009 Proposed Budget, by Revenue Type
This is a new table for FY 2009 that itemizes the changes made during the development of the FY 2009proposed budget. The FY 2009 Mayoral Local funds budget target reflects the recurring elements of anagency’s FY 2008 approved budget. See the How to Read the Budget chapter in the Executive Summaryvolume for more information on this table.
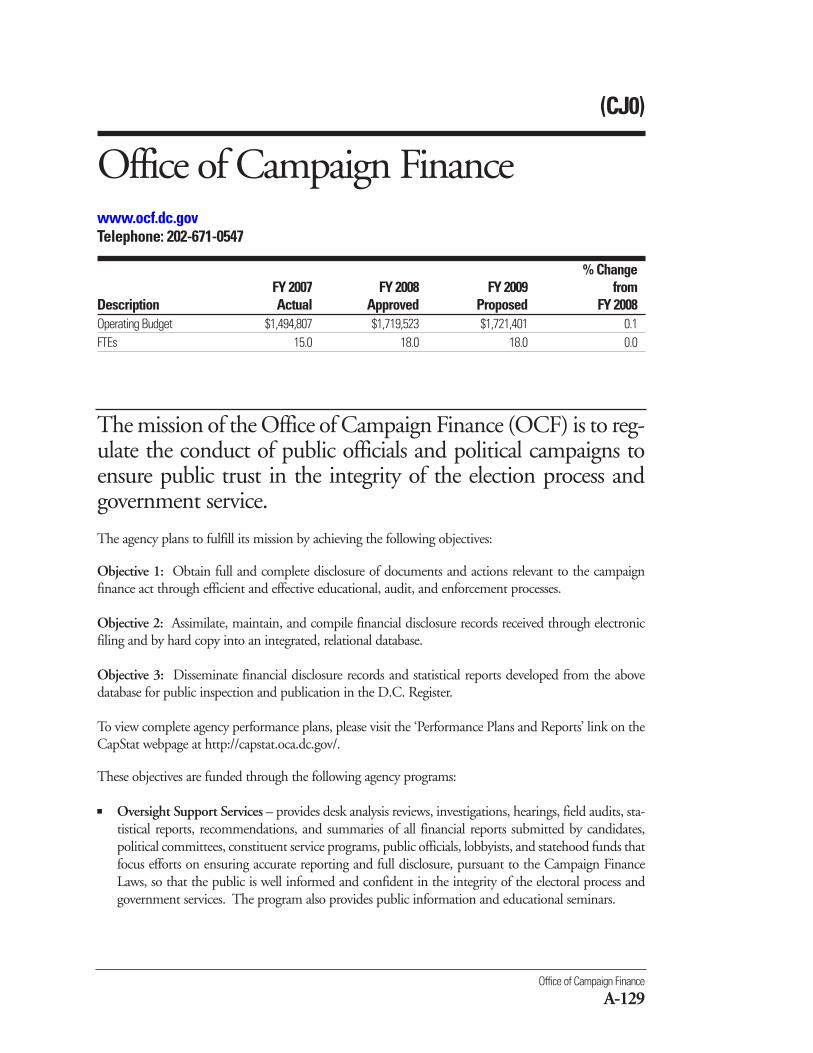
Office of Campaign Finance
A-129
(CJ0)
Office of Campaign Financewww.ocf.dc.govTelephone: 202-671-0547
% ChangeFY 2007 FY 2008 FY 2009 from
Description Actual Approved Proposed FY 2008Operating Budget $1,494,807 $1,719,523 $1,721,401 0.1FTEs 15.0 18.0 18.0 0.0
The mission of the Office of Campaign Finance (OCF) is to reg-ulate the conduct of public officials and political campaigns toensure public trust in the integrity of the election process andgovernment service.
The agency plans to fulfill its mission by achieving the following objectives:
Objective 1: Obtain full and complete disclosure of documents and actions relevant to the campaignfinance act through efficient and effective educational, audit, and enforcement processes.
Objective 2: Assimilate, maintain, and compile financial disclosure records received through electronicfiling and by hard copy into an integrated, relational database.
Objective 3: Disseminate financial disclosure records and statistical reports developed from the abovedatabase for public inspection and publication in the D.C. Register.
To view complete agency performance plans, please visit the ‘Performance Plans and Reports’ link on theCapStat webpage at http://capstat.oca.dc.gov/.
These objectives are funded through the following agency programs:
■ Oversight Support Services – provides desk analysis reviews, investigations, hearings, field audits, sta-tistical reports, recommendations, and summaries of all financial reports submitted by candidates,political committees, constituent service programs, public officials, lobbyists, and statehood funds thatfocus efforts on ensuring accurate reporting and full disclosure, pursuant to the Campaign FinanceLaws, so that the public is well informed and confident in the integrity of the electoral process andgovernment services. The program also provides public information and educational seminars.
FY 2009 Proposed Budget and Financial Plan
A-130
FY 2009 Proposed Gross Funds Operating Budget, by Revenue Type
Table CJ0-1 contains the proposed FY 2009 agency budget compared to the FY 2008 approved budget.It also provides FY 2006 and FY 2007 actual expenditures.
Table CJ0-1 (dollars in thousands)
Change
Actual Actual Approved Proposed from Percent
Comptroller Source Group FY 2006 FY 2007 FY 2008 FY 2009 FY 2008 Change*
General Fund
Local Funds 1,354 1,495 1,720 1,721 2 0.1
Total for General Fund 1,354 1,495 1,720 1,721 2 0.1
Intra-District Funds
Intra-District Funds 60 0 0 0 0 N/A
Total for Intra-District Funds 60 0 0 0 0 N/A
Gross Funds 1,414 1,495 1,720 1,721 2 0.1
*Percent Change is based on whole dollars.
Note: If applicable, for a breakdown of each Grant (Federal and Private), Special Purpose Revenue type and Intra-Districtagreement, please refer to Schedule 80, Agency Summary by Revenue Source, in the Operating Appendices found on theOffice of the Chief Financial Officer’s website.
■ Agency Management - provides for administrative support and the required tools to achieve opera-tional and programmatic results. This program is standard for all agencies using performance-basedbudgeting.
The agency’s FY 2009 proposed budget is presented in the following tables.
Office of Campaign Finance
A-131
FY 2009 Proposed Full-Time Equivalents, by Revenue Type
Table CJ0-2 contains the proposed FY 2009 FTE level compared to the FY 2008 approved FTE level byrevenue type. It also provides FY 2006 and FY 2007 actual data.
Table CJ0-2 Change
Actual Actual Approved Proposed from Percent
Appropriated Fund FY 2006 FY 2007 FY 2008 FY 2009 FY 2008 Change
General Fund
Local Funds 15.0 15.0 18.0 18.0 0.0 0.0
Total for General Fund 15.0 15.0 18.0 18.0 0.0 0.0
Total Proposed FTEs 15.0 15.0 18.0 18.0 0.0 0.0
FY 2009 Proposed Operating Budget, by Comptroller Source Group
Table CJ0-3 contains the proposed FY 2009 budget at the Comptroller Source Group (object class) levelcompared to the FY 2008 approved budget. It also provides FY 2006 and FY 2007 actual expenditures.
Table CJ0-3(dollars in thousands)
Change
Actual Actual Approved Proposed from Percent
Comptroller Source Group FY 2006 FY 2007 FY 2008 FY 2009 FY 2008 Change*
11 Regular Pay - Cont Full Time 967 1,024 1,214 1,169 -45 -3.7
12 Regular Pay - Other 19 13 0 28 28 N/A
13 Additional Gross Pay 13 32 6 0 -6 -100.0
14 Fringe Benefits - Curr Personnel 152 154 194 179 -16 -8.1
15 Overtime Pay 1 0 1 0 -1 -100.0
Subtotal Personal Services (PS) 1,153 1,223 1,415 1,376 -39 -2.7
20 Supplies and Materials 9 10 27 20 -7 -25.8
30 Energy, Comm. and Bldg Rentals 39 39 34 41 7 21.6
31 Telephone, Telegraph, Telegram, Etc 14 12 35 15 -20 -56.6
32 Rentals - Land and Structures 0 0 1 1 1 102.1
33 Janitorial Services 16 15 15 22 7 43.0
34 Security Services 48 38 37 39 3 8.0
35 Occupancy Fixed Costs 11 25 41 41 0 0.0
40 Other Services and Charges 117 90 91 95 4 4.5
41 Contractual Services - Other 0 34 4 59 56 1,541.6
70 Equipment & Equipment Rental 7 9 20 10 -10 -50.0
Subtotal Nonpersonal Services (NPS) 261 272 304 345 41 13.4
Gross Funds 1,414 1,495 1,720 1,721 2 0.1
*Percent Change is based on whole dollars.
FY 2009 Proposed Budget and Financial Plan
A-132
Dollars in Thousands Full-Time EquivalentsChange Change
Actual Approved Proposed from Actual Approved Proposed from Program/Activity FY 2007 FY 2008 FY 2009 FY 2008 FY 2007 FY 2008 FY 2009 FY 2008
(1000) Agency Management Program
(1010) Personnel 72 65 292 227 1.0 1.0 3.0 2.0
(1015) Training and Development 49 40 72 31 1.0 1.0 2.0 1.0
(1020) Contracting and Procurement 0 0 15 15 0.0 0.0 0.0 0.0
(1050) Financial Management 1 0 0 0 0.0 0.0 0.0 0.0
(1100) Office of Campaign Finance 1,101 1,189 0 -1,189 13.0 14.0 0.0 -14.0
Subtotal (1000) Agency Management Program 1,222 1,295 379 -916 15.0 16.0 5.0 -11.0
(2000) Oversight Support Services
(2010) Public Info. & Record Management 272 311 661 350 0.0 0.0 5.0 5.0
(2020) Report Analysis & Audit Div. 0 52 301 249 0.0 1.0 4.0 3.0
(2030) Office of the General Counsel 0 61 381 319 0.0 1.0 4.0 3.0
Subtotal (2000) Oversight Support Services 272 424 1,342 918 0.0 2.0 13.0 11.0
Total Proposed Operating Budget 1,495 1,720 1,721 2 15.0 18.0 18.0 0.0
(Change is calculated by whole numbers and numbers may not add up due to rounding)
FY 2009 Proposed Operating Budget and FTEs, by Program and Activity
Table CJ0-4 contains the proposed FY 2009 budget by program and activity compared to the FY 2008 approved budget.It also provides FY 2007 actual data.
Table CJ0-4(dollars in thousands)
Note: For further information regarding the proposed funding for the agency’s programs, please refer to Schedule 30-PBB, Program Summary byActivity, in the Operating Appendices volume found on the Office of the Chief Financial Officer’s website.
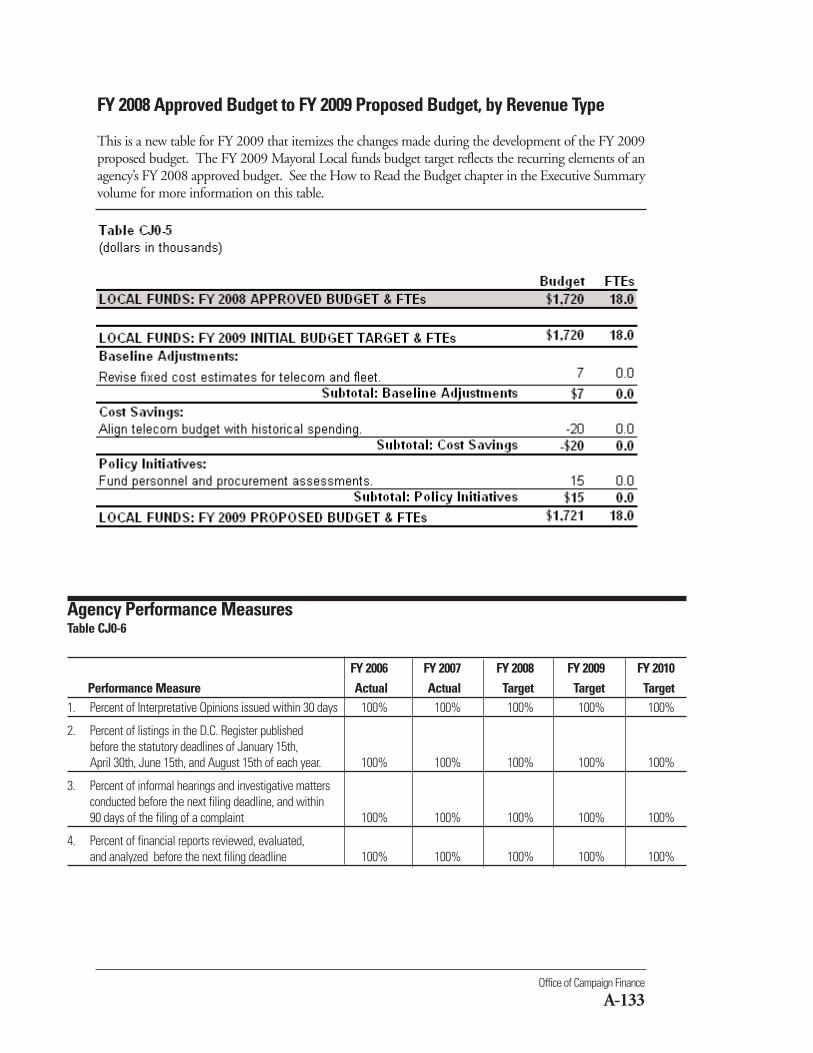
Office of Campaign Finance
A-133
FY 2008 Approved Budget to FY 2009 Proposed Budget, by Revenue Type
This is a new table for FY 2009 that itemizes the changes made during the development of the FY 2009proposed budget. The FY 2009 Mayoral Local funds budget target reflects the recurring elements of anagency’s FY 2008 approved budget. See the How to Read the Budget chapter in the Executive Summaryvolume for more information on this table.
Agency Performance MeasuresTable CJ0-6
FY 2006 FY 2007 FY 2008 FY 2009 FY 2010Performance Measure Actual Actual Target Target Target
1. Percent of Interpretative Opinions issued within 30 days 100% 100% 100% 100% 100%
2. Percent of listings in the D.C. Register published before the statutory deadlines of January 15th, April 30th, June 15th, and August 15th of each year. 100% 100% 100% 100% 100%
3. Percent of informal hearings and investigative mattersconducted before the next filing deadline, and within 90 days of the filing of a complaint 100% 100% 100% 100% 100%
4. Percent of financial reports reviewed, evaluated, and analyzed before the next filing deadline 100% 100% 100% 100% 100%
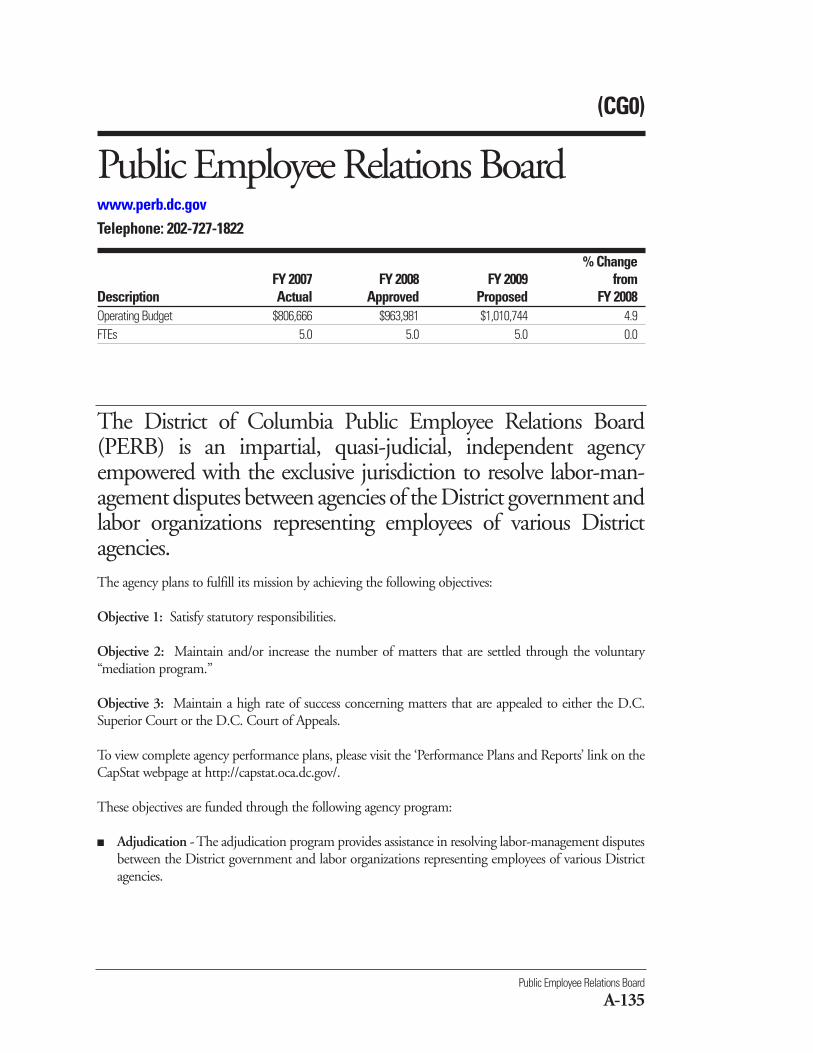
Public Employee Relations Board
A-135
(CG0)
Public Employee Relations Boardwww.perb.dc.govTelephone: 202-727-1822
% ChangeFY 2007 FY 2008 FY 2009 from
Description Actual Approved Proposed FY 2008Operating Budget $806,666 $963,981 $1,010,744 4.9FTEs 5.0 5.0 5.0 0.0
The District of Columbia Public Employee Relations Board(PERB) is an impartial, quasi-judicial, independent agencyempowered with the exclusive jurisdiction to resolve labor-man-agement disputes between agencies of the District government andlabor organizations representing employees of various Districtagencies.The agency plans to fulfill its mission by achieving the following objectives:
Objective 1: Satisfy statutory responsibilities.
Objective 2: Maintain and/or increase the number of matters that are settled through the voluntary“mediation program.”
Objective 3: Maintain a high rate of success concerning matters that are appealed to either the D.C.Superior Court or the D.C. Court of Appeals.
To view complete agency performance plans, please visit the ‘Performance Plans and Reports’ link on theCapStat webpage at http://capstat.oca.dc.gov/.
These objectives are funded through the following agency program:
■ Adjudication -The adjudication program provides assistance in resolving labor-management disputesbetween the District government and labor organizations representing employees of various Districtagencies.
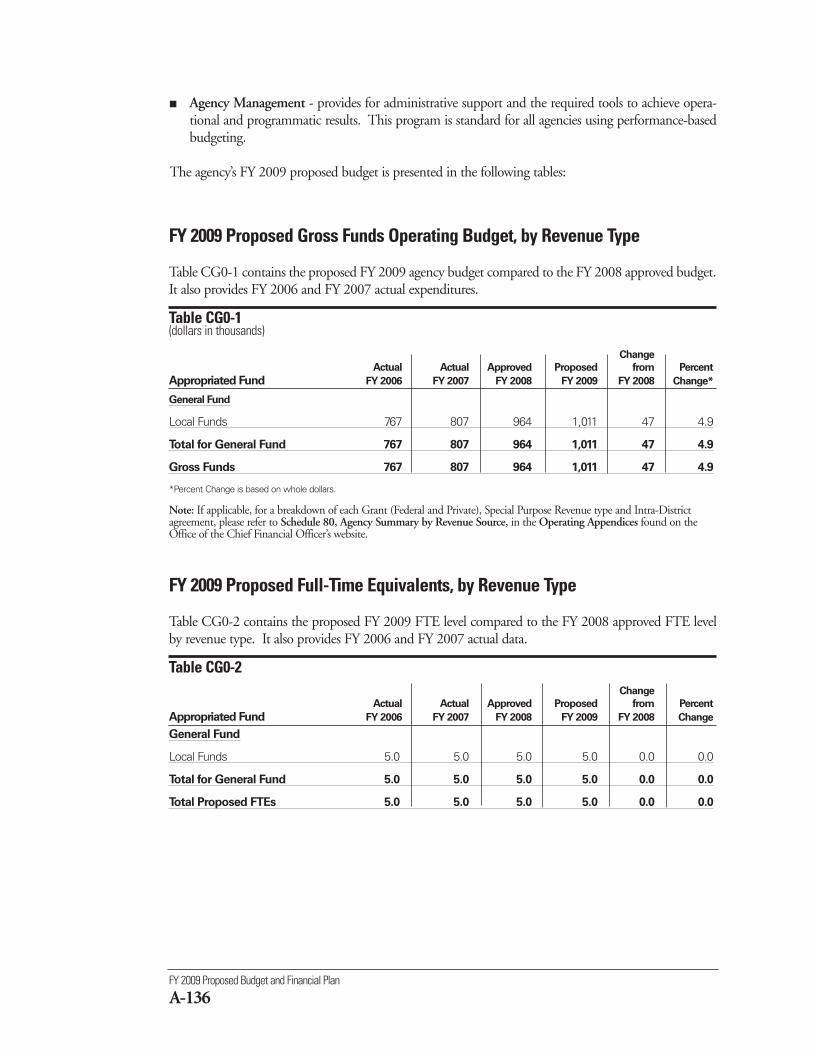
FY 2009 Proposed Budget and Financial Plan
A-136
■ Agency Management - provides for administrative support and the required tools to achieve opera-tional and programmatic results. This program is standard for all agencies using performance-basedbudgeting.
The agency’s FY 2009 proposed budget is presented in the following tables:
FY 2009 Proposed Gross Funds Operating Budget, by Revenue Type
Table CG0-1 contains the proposed FY 2009 agency budget compared to the FY 2008 approved budget.It also provides FY 2006 and FY 2007 actual expenditures.
Table CG0-1 (dollars in thousands)
Change
Actual Actual Approved Proposed from Percent
Appropriated Fund FY 2006 FY 2007 FY 2008 FY 2009 FY 2008 Change*
General Fund
Local Funds 767 807 964 1,011 47 4.9
Total for General Fund 767 807 964 1,011 47 4.9
Gross Funds 767 807 964 1,011 47 4.9
*Percent Change is based on whole dollars.
Note: If applicable, for a breakdown of each Grant (Federal and Private), Special Purpose Revenue type and Intra-Districtagreement, please refer to Schedule 80, Agency Summary by Revenue Source, in the Operating Appendices found on theOffice of the Chief Financial Officer’s website.
FY 2009 Proposed Full-Time Equivalents, by Revenue Type
Table CG0-2 contains the proposed FY 2009 FTE level compared to the FY 2008 approved FTE levelby revenue type. It also provides FY 2006 and FY 2007 actual data.
Table CG0-2 Change
Actual Actual Approved Proposed from Percent
Appropriated Fund FY 2006 FY 2007 FY 2008 FY 2009 FY 2008 Change
General Fund
Local Funds 5.0 5.0 5.0 5.0 0.0 0.0
Total for General Fund 5.0 5.0 5.0 5.0 0.0 0.0
Total Proposed FTEs 5.0 5.0 5.0 5.0 0.0 0.0
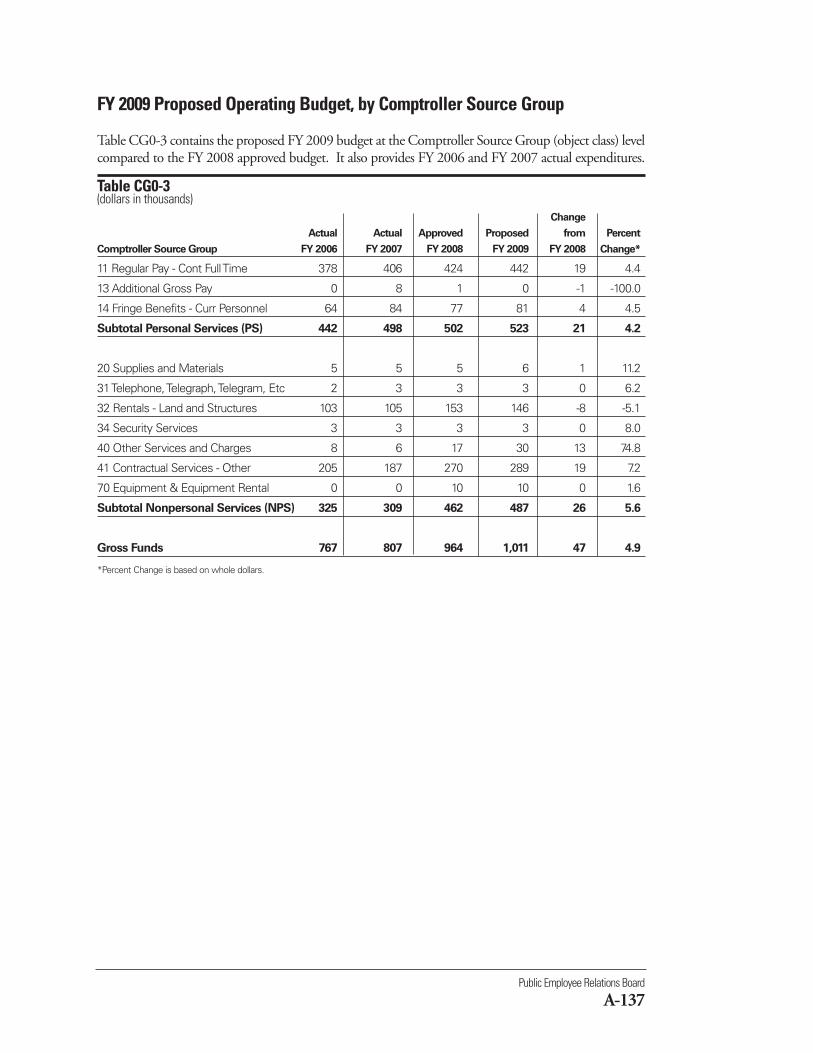
Public Employee Relations Board
A-137
FY 2009 Proposed Operating Budget, by Comptroller Source Group
Table CG0-3 contains the proposed FY 2009 budget at the Comptroller Source Group (object class) levelcompared to the FY 2008 approved budget. It also provides FY 2006 and FY 2007 actual expenditures.
Table CG0-3 (dollars in thousands)
Change
Actual Actual Approved Proposed from Percent
Comptroller Source Group FY 2006 FY 2007 FY 2008 FY 2009 FY 2008 Change*
11 Regular Pay - Cont Full Time 378 406 424 442 19 4.4
13 Additional Gross Pay 0 8 1 0 -1 -100.0
14 Fringe Benefits - Curr Personnel 64 84 77 81 4 4.5
Subtotal Personal Services (PS) 442 498 502 523 21 4.2
20 Supplies and Materials 5 5 5 6 1 11.2
31 Telephone, Telegraph, Telegram, Etc 2 3 3 3 0 6.2
32 Rentals - Land and Structures 103 105 153 146 -8 -5.1
34 Security Services 3 3 3 3 0 8.0
40 Other Services and Charges 8 6 17 30 13 74.8
41 Contractual Services - Other 205 187 270 289 19 7.2
70 Equipment & Equipment Rental 0 0 10 10 0 1.6
Subtotal Nonpersonal Services (NPS) 325 309 462 487 26 5.6
Gross Funds 767 807 964 1,011 47 4.9
*Percent Change is based on whole dollars.
FY 2009 Proposed Budget and Financial Plan
A-138
Dollars in Thousands Full-Time EquivalentsChange Change
Actual Approved Proposed from Actual Approved Proposed from Program/Activity FY 2007 FY 2008 FY 2009 FY 2008 FY 2007 FY 2008 FY 2009 FY 2008
(1000) Agency Management Program(1015) Training & Employee Development 1 2 2 0 0.0 0.0 0.0 0.0(1020) Contracting & Procurement 0 4 20 15 0.0 0.1 0.1 0.0(1030) Property Management 108 156 149 -8 0.0 0.0 0.0 0.0(1040) Information Technology 3 3 3 0 0.0 0.0 0.0 0.0(1085) Customer Service 2 40 38 -2 0.0 0.5 0.5 0.0(1090) Performance Management 0 11 11 0 0.0 0.1 0.1 0.0
Subtotal (1000) Agency Management Program 114 216 222 6 0.0 0.6 0.6 0.0(2000) Adjudication(2001) Adjudication 244 185 216 31 1.0 0.6 0.6 0.0(2002) Hearings 448 560 569 10 4.0 3.8 3.8 0.0(2003) Public Employee Relations Board 0 3 3 0 0.0 0.0 0.0 0.0Subtotal (2000) Adjudication 693 748 788 41 5.0 4.5 4.5 0.0
Total Proposed Operating Budget 807 964 1,011 47 5.0 5.0 5.0 0.0
(Change is calculated by whole numbers and numbers may not add up due to rounding)
Note: For further information regarding the proposed funding for the agency’s programs, please refer to Schedule 30-PBB, Program Summary byActivity, in the Operating Appendices volume found on the Office of the Chief Financial Officer’s website.
FY 2009 Proposed Operating Budget and FTEs, by Program and Activity
Table CG0-4 contains the proposed FY 2009 budget by program and activity compared to the FY 2008 approved bud-get. It also provides FY 2007 actual data.
Table CG0-4(dollars in thousands)
Public Employee Relations Board
A-139
Agency Performance MeasuresTable CG0-6
FY 2006 FY 2007 FY 2008 FY 2009 FY 2010Performance Measure Actual Actual Target Target Target
1. Percentage of cases decided within 120 days of submission to the Board. 95% 98% 100% 100% 100%
2. Percentage of decisions transmitted to the D.C. Register for publication within 60 days of issuance. 100% 90% 100% 100% 100%
3. Percentage of cases appealed to courts in which the Public Employee Relations Board prevailed. 100% 67% 80% 80% 80%
4. Percentage of compensation impasse resolutioncases that meet statutory time targets (e.g., mediation within 30 days, arbitration within45 days after the panel has been established). 100% 100% 100% 100% 100%
FY 2008 Approved Budget to FY 2009 Proposed Budget, by Revenue Type
This is a new table for FY 2009 that itemizes the changes made during the development of the FY 2009proposed budget. The FY 2009 Mayoral Local funds budget target reflects the recurring elements of anagency’s FY 2008 approved budget. See the How to Read the Budget chapter in the Executive Summaryvolume for more information on this table.
Office of Employee Appeals
A-141
(CH0)
Office of Employee Appealshttp://oea.dc.gov
Telephone: 202-727-0004
% ChangeFY 2007 FY 2008 FY 2009 from
Description Actual Approved Proposed FY 2008Operating Budget $1,651,724 $1,858,426 $1,862,794 0.2FTEs 12.8 14.2 14.2 0.0
The mission of the Office of Employee Appeals (OEA) is torender impartial, legally sufficient and timely decisions onappeals filed by District of Columbia Government employ-ees.The agency plans to fulfill its mission by achieving the following objectives:
Objective 1: Satisfy statutory responsibilities and maintain a certified pool of appeals judges.
Objective 2: Foster a transparent environment to inform the public of all initial decisions and Opinionand Orders issued by the Office of Employee Appeals.
To view complete agency performance plans, please visit the ‘Performance Plans and Reports’ link on theCapStat webpage at http://capstat.oca.dc.gov/.
These objectives are funded through the following agency programs:
■ Mediation – provides both parties an opportunity to resolve or settle disputes without going throughthe lengthy and costly adjudication process.
■ Adjudication – provides impartial, fair decisions to employees for timely resolution of their disputes.
■ Appeals - provides an impartial review by the Office of Employee Appeals Board, of initial decisionsissued by OEA’s Administrative Judges.
■ Agency Management - provides for administrative support and the required tools to achieve opera-tional and programmatic results. This program is standard for all agencies using performance-basedbudgeting.
FY 2009 Proposed Budget and Financial Plan
A-142
FY 2009 Proposed Gross Funds Operating Budget, by Revenue Type
Table CH0-1 contains the proposed FY 2009 agency budget compared to the FY 2008 approved bud-get. It also provides FY 2006 and FY 2007 actual expenditures.
Table CH0-1 (dollars in thousands)
Change
Actual Actual Approved Proposed from Percent
Appropriated Fund FY 2006 FY 2007 FY 2008 FY 2009 FY 2008 Change*
General Fund
Local Funds 1,578 1,652 1,858 1,863 4 0.2
Total for General Fund 1,578 1,652 1,858 1,863 4 0.2
Gross Funds 1,578 1,652 1,858 1,863 4 0.2
*Percent Change is based on whole dollars.
FY 2009 Proposed Full-Time Equivalents, by Revenue Type
Table CH0-2 contains the proposed FY 2009 FTE level compared to the FY 2008 approved FTE levelby revenue type. It also provides FY 2006 and FY 2007 actual data.
Table CH0-2 Change
Actual Actual Approved Proposed from Percent
Appropriated Fund FY 2006 FY 2007 FY 2008 FY 2009 FY 2008 Change
General Fund
Local Funds 13.0 12.8 14.2 14.2 0.0 0.0
Total for General Fund 13.0 12.8 14.2 14.2 0.0 0.0
Total Proposed FTEs 13.0 12.8 14.2 14.2 0.0 0.0
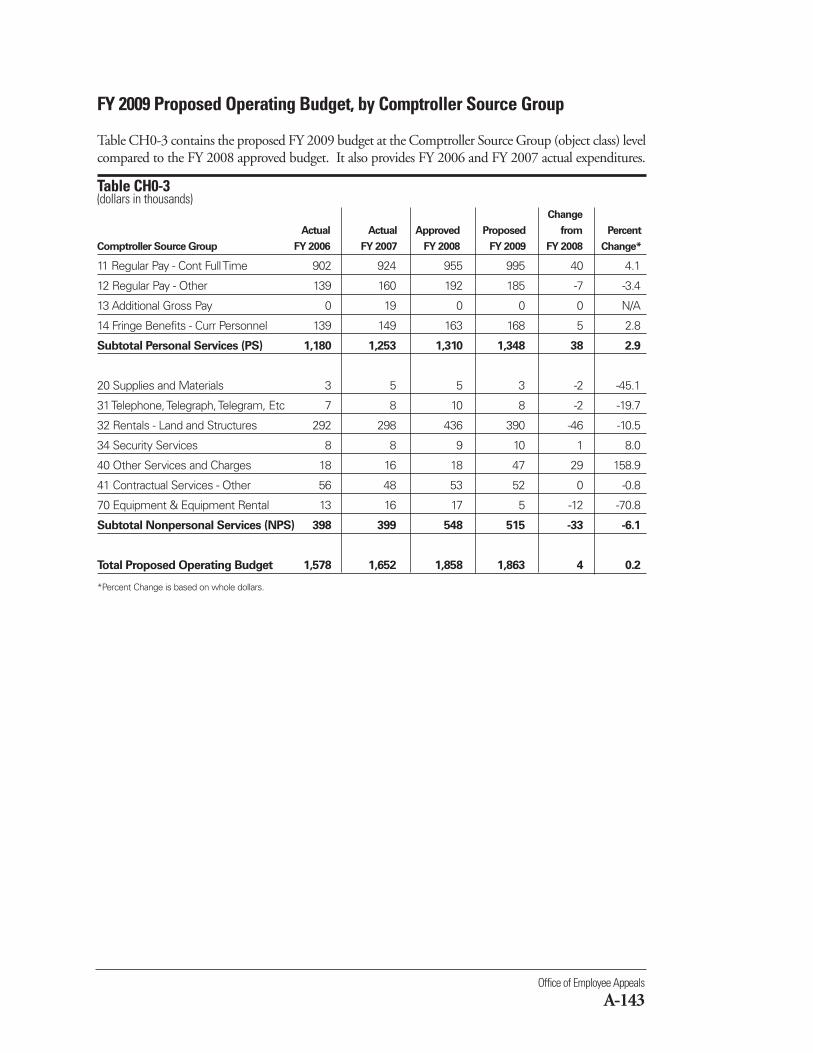
Office of Employee Appeals
A-143
FY 2009 Proposed Operating Budget, by Comptroller Source Group
Table CH0-3 contains the proposed FY 2009 budget at the Comptroller Source Group (object class) levelcompared to the FY 2008 approved budget. It also provides FY 2006 and FY 2007 actual expenditures.
Table CH0-3(dollars in thousands)
Change
Actual Actual Approved Proposed from Percent
Comptroller Source Group FY 2006 FY 2007 FY 2008 FY 2009 FY 2008 Change*
11 Regular Pay - Cont Full Time 902 924 955 995 40 4.1
12 Regular Pay - Other 139 160 192 185 -7 -3.4
13 Additional Gross Pay 0 19 0 0 0 N/A
14 Fringe Benefits - Curr Personnel 139 149 163 168 5 2.8
Subtotal Personal Services (PS) 1,180 1,253 1,310 1,348 38 2.9
20 Supplies and Materials 3 5 5 3 -2 -45.1
31 Telephone, Telegraph, Telegram, Etc 7 8 10 8 -2 -19.7
32 Rentals - Land and Structures 292 298 436 390 -46 -10.5
34 Security Services 8 8 9 10 1 8.0
40 Other Services and Charges 18 16 18 47 29 158.9
41 Contractual Services - Other 56 48 53 52 0 -0.8
70 Equipment & Equipment Rental 13 16 17 5 -12 -70.8
Subtotal Nonpersonal Services (NPS) 398 399 548 515 -33 -6.1
Total Proposed Operating Budget 1,578 1,652 1,858 1,863 4 0.2
*Percent Change is based on whole dollars.
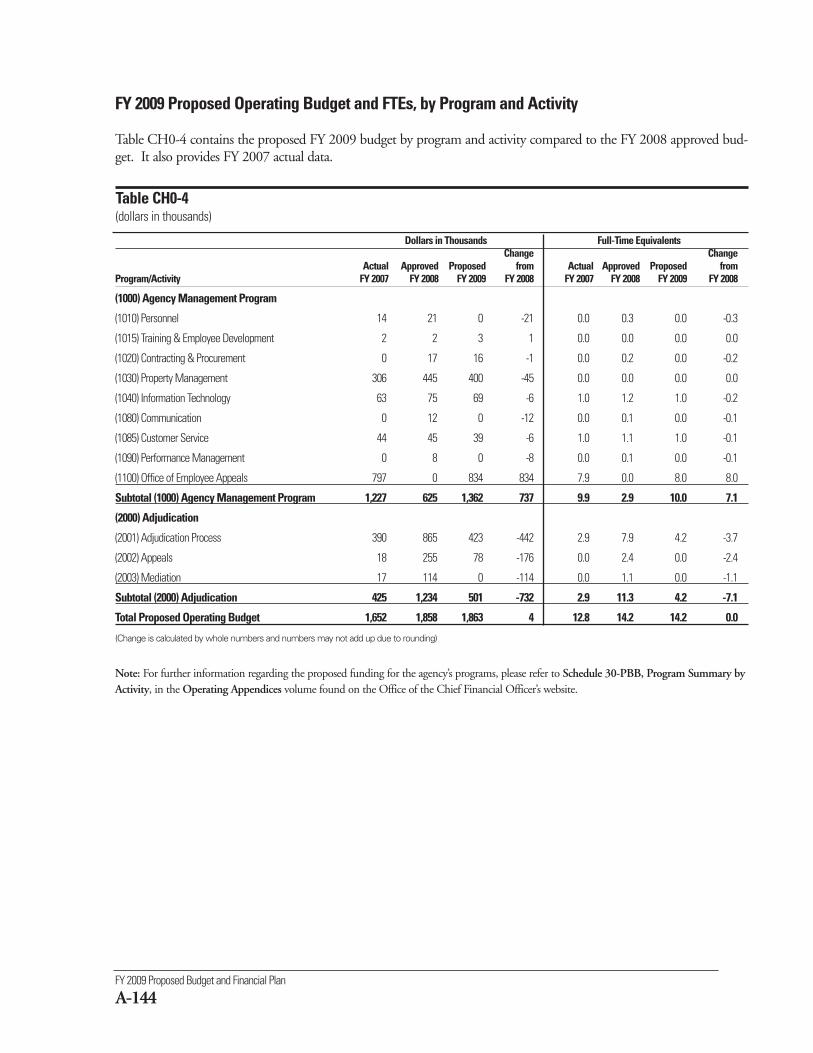
FY 2009 Proposed Budget and Financial Plan
A-144
Dollars in Thousands Full-Time EquivalentsChange Change
Actual Approved Proposed from Actual Approved Proposed from Program/Activity FY 2007 FY 2008 FY 2009 FY 2008 FY 2007 FY 2008 FY 2009 FY 2008
(1000) Agency Management Program
(1010) Personnel 14 21 0 -21 0.0 0.3 0.0 -0.3
(1015) Training & Employee Development 2 2 3 1 0.0 0.0 0.0 0.0
(1020) Contracting & Procurement 0 17 16 -1 0.0 0.2 0.0 -0.2
(1030) Property Management 306 445 400 -45 0.0 0.0 0.0 0.0
(1040) Information Technology 63 75 69 -6 1.0 1.2 1.0 -0.2
(1080) Communication 0 12 0 -12 0.0 0.1 0.0 -0.1
(1085) Customer Service 44 45 39 -6 1.0 1.1 1.0 -0.1
(1090) Performance Management 0 8 0 -8 0.0 0.1 0.0 -0.1
(1100) Office of Employee Appeals 797 0 834 834 7.9 0.0 8.0 8.0
Subtotal (1000) Agency Management Program 1,227 625 1,362 737 9.9 2.9 10.0 7.1
(2000) Adjudication
(2001) Adjudication Process 390 865 423 -442 2.9 7.9 4.2 -3.7
(2002) Appeals 18 255 78 -176 0.0 2.4 0.0 -2.4
(2003) Mediation 17 114 0 -114 0.0 1.1 0.0 -1.1
Subtotal (2000) Adjudication 425 1,234 501 -732 2.9 11.3 4.2 -7.1
Total Proposed Operating Budget 1,652 1,858 1,863 4 12.8 14.2 14.2 0.0
(Change is calculated by whole numbers and numbers may not add up due to rounding)
FY 2009 Proposed Operating Budget and FTEs, by Program and Activity
Table CH0-4 contains the proposed FY 2009 budget by program and activity compared to the FY 2008 approved bud-get. It also provides FY 2007 actual data.
Table CH0-4(dollars in thousands)
Note: For further information regarding the proposed funding for the agency’s programs, please refer to Schedule 30-PBB, Program Summary byActivity, in the Operating Appendices volume found on the Office of the Chief Financial Officer’s website.
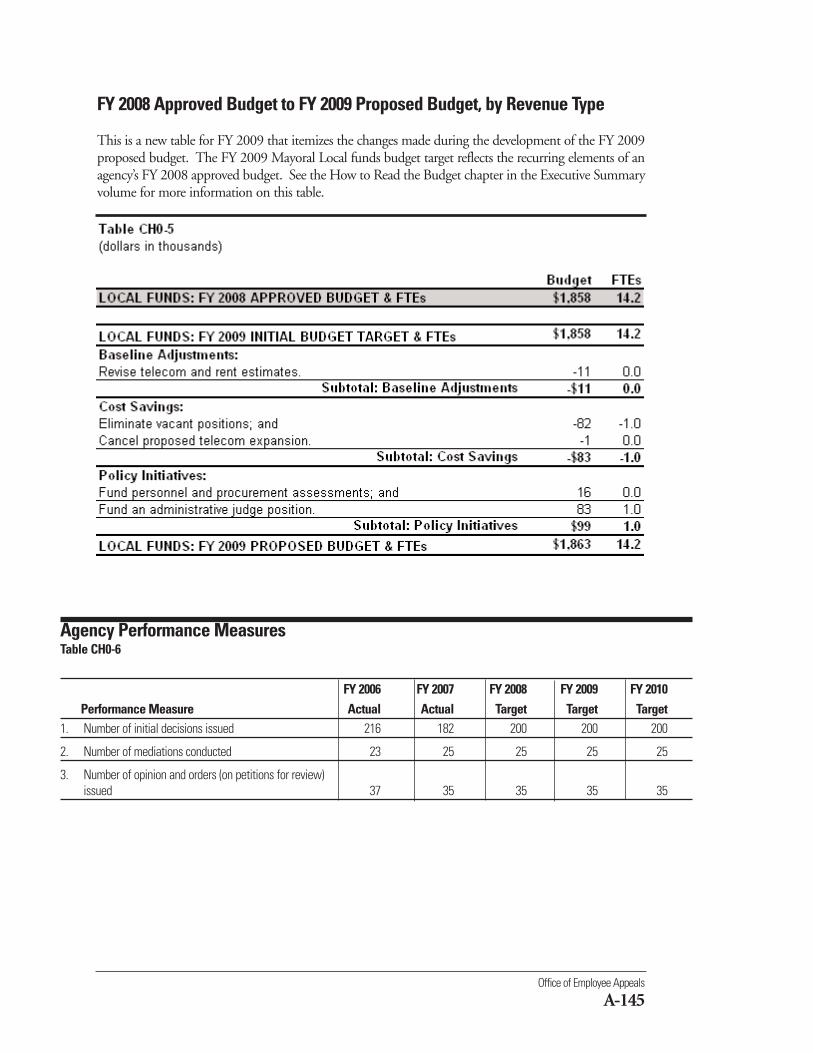
Office of Employee Appeals
A-145
Agency Performance MeasuresTable CH0-6
FY 2006 FY 2007 FY 2008 FY 2009 FY 2010Performance Measure Actual Actual Target Target Target
1. Number of initial decisions issued 216 182 200 200 200
2. Number of mediations conducted 23 25 25 25 25
3. Number of opinion and orders (on petitions for review)issued 37 35 35 35 35
FY 2008 Approved Budget to FY 2009 Proposed Budget, by Revenue Type
This is a new table for FY 2009 that itemizes the changes made during the development of the FY 2009proposed budget. The FY 2009 Mayoral Local funds budget target reflects the recurring elements of anagency’s FY 2008 approved budget. See the How to Read the Budget chapter in the Executive Summaryvolume for more information on this table.
(EA0)
Metropolitan Washington Council of Governmentswww.mwcog.orgTelephone: 202-962-3200
% ChangeFY 2007 FY 2008 FY 2009 from
Description Actual Approved Proposed FY 2008Operating Budget $421,000 $381,431 $396,431 3.9
The mission of the Metropolitan Washington Council ofGovernments (MWCOG) is to enhance the quality of life andcompetitive advantages of the Washington metropolitan regionin the global economy by providing a forum for consensus build-ing and policy-making; implementing intergovernmental poli-cies, plans, and programs; and supporting the region as an expertinformation resource.
The agency plans to fulfill its mission by achieving the following objectives:
Objective 1: Fostering cooperative relationships among government bodies throughout the metropolitanWashington area.
Objective 2: Advocating quality of life for all.
Objective 3: Promoting better air and water quality.
Objective 4: Promoting a multi-modal transportation system that prioritizes management, performance,maintenance and safety of all transit and road initiatives.
Objective 5: Promoting regional emergency response coordination planning.
Metropolitan Washington Council of Governments
A-147
FY 2009 Proposed Budget and Financial Plan
A-148
These objectives are funded through the following agency programs:
Note that the MWCOG budget represents only the District’s subsidy payment to the multi-jurisdictional agency.The programs below are those of the entire agency.
■ Transportation Planning - provides transportation planning for the metropolitan Washington area,through the Transportation Planning Board, in cooperation with the area's local governments and fed-eral, state, and regional agencies responsible for funding and implementing highway, bridge, transitand other projects.
■ Commuter Connections - coordinates programs aimed at alleviating road congestion and reducingvehicle emissions. Programs include ride matching services, employer outreach, telecommuting pro-grams, integrated ride-share information kiosks, and mass marketing campaigns to encourage alter-natives to driving alone.
■ Metropolitan Planning and Economic Development - assists local governments in developing theplanning databases and analytic tools needed to analyze regional economic and demographic change.The program provides MWCOG member jurisdictions with analysis of current and projected growthtrends, and provides data to the Transportation Planning Board as it develops transportation plans forthe region.
■ Housing Opportunities and Community Management - covers an array of issues that are importantto the policy developments of area local governments and their housing authorities. Data on theregion's housing stock, Section 8 housing, homelessness, and housing affordability are all addressed bythis program.
■ Homeland Security and Public Safety - coordinates regional programs and policies on a broad rangeof issues including law enforcement, fire safety, and emergency preparedness. Helps keep the regionsafe by supporting innovative regional policies and programs, developing regional mutual aid agree-ments, providing technical assistance and training to public safety officials, and developing public edu-cation and prevention measures.
■ Health and Human Services - meets a variety of human services needs in the areas of substance abuse,public health, family services and intervention, child care, foster care, and adoption.
■ Water Resources Planning and Management - facilitates efforts to clean the region's waterwaysincluding the Chesapeake Bay, Anacostia River watershed and the Potomac River. The programincludes water quality management policy, technical analysis, storm water management, water healthissues, drought coordination, and water-related homeland security planning.
■ Environmental Resources - provides support to local government programs in the region that addresssolid waste management and recycling, energy, airport noise, pollution, and alternative fuels.
■ Air Quality Planning - supports the Metropolitan Washington Air Quality Committee, which is cer-tified to prepare federally-mandated plans to clean the region's air. Also tracks pollution levels on adaily basis through the Air Quality Index, provides seasonal forecasts, and organizes public educationcampaigns.
The agency’s FY 2009 proposed budget is presented in the following tables:
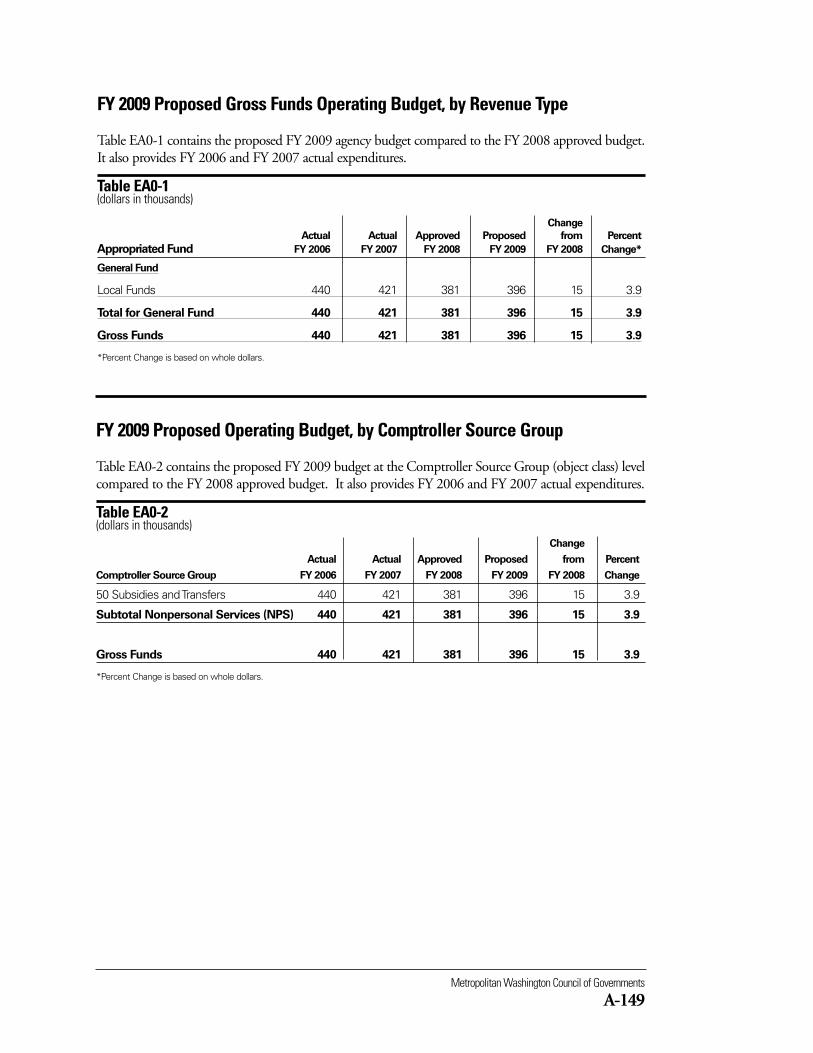
Metropolitan Washington Council of Governments
A-149
FY 2009 Proposed Gross Funds Operating Budget, by Revenue Type
Table EA0-1 contains the proposed FY 2009 agency budget compared to the FY 2008 approved budget.It also provides FY 2006 and FY 2007 actual expenditures.
Table EA0-1 (dollars in thousands)
Change
Actual Actual Approved Proposed from Percent
Appropriated Fund FY 2006 FY 2007 FY 2008 FY 2009 FY 2008 Change*
General Fund
Local Funds 440 421 381 396 15 3.9
Total for General Fund 440 421 381 396 15 3.9
Gross Funds 440 421 381 396 15 3.9
*Percent Change is based on whole dollars.
FY 2009 Proposed Operating Budget, by Comptroller Source Group
Table EA0-2 contains the proposed FY 2009 budget at the Comptroller Source Group (object class) levelcompared to the FY 2008 approved budget. It also provides FY 2006 and FY 2007 actual expenditures.
Table EA0-2 (dollars in thousands)
Change
Actual Actual Approved Proposed from Percent
Comptroller Source Group FY 2006 FY 2007 FY 2008 FY 2009 FY 2008 Change
50 Subsidies and Transfers 440 421 381 396 15 3.9
Subtotal Nonpersonal Services (NPS) 440 421 381 396 15 3.9
Gross Funds 440 421 381 396 15 3.9
*Percent Change is based on whole dollars.
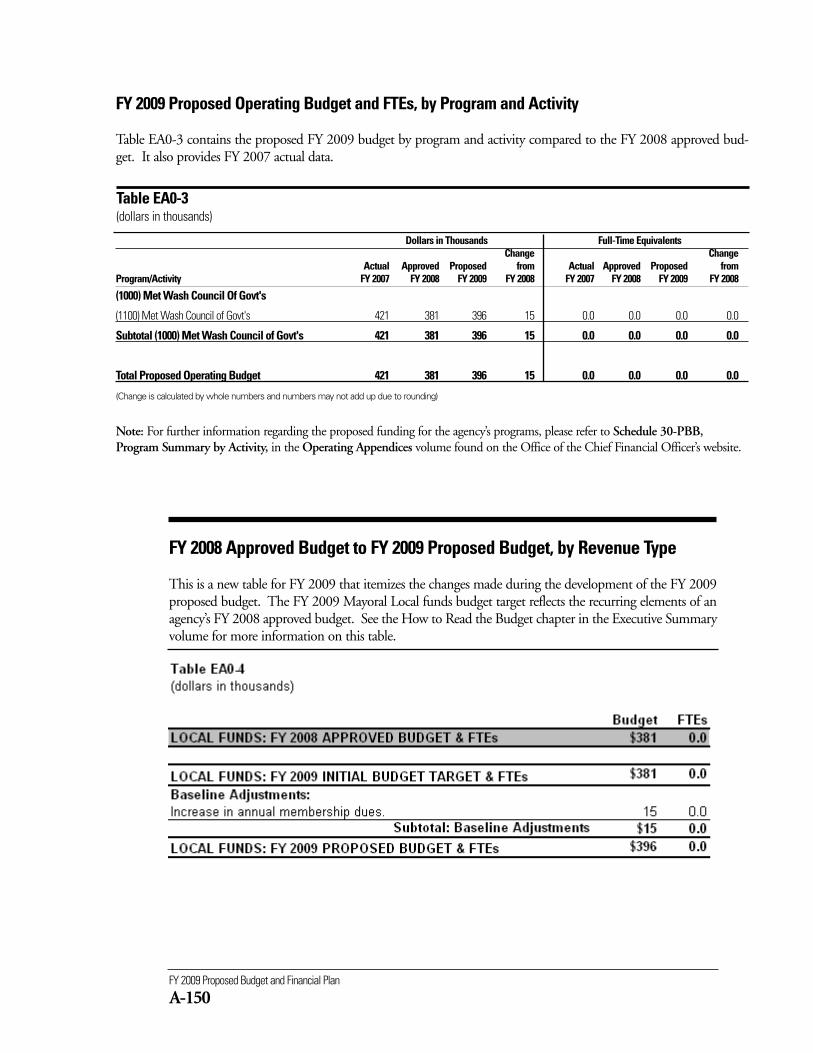
Dollars in Thousands Full-Time EquivalentsChange Change
Actual Approved Proposed from Actual Approved Proposed from Program/Activity FY 2007 FY 2008 FY 2009 FY 2008 FY 2007 FY 2008 FY 2009 FY 2008
(1000) Met Wash Council Of Govt's
(1100) Met Wash Council of Govt's 421 381 396 15 0.0 0.0 0.0 0.0
Subtotal (1000) Met Wash Council of Govt's 421 381 396 15 0.0 0.0 0.0 0.0
Total Proposed Operating Budget 421 381 396 15 0.0 0.0 0.0 0.0
(Change is calculated by whole numbers and numbers may not add up due to rounding)
Note: For further information regarding the proposed funding for the agency’s programs, please refer to Schedule 30-PBB,Program Summary by Activity, in the Operating Appendices volume found on the Office of the Chief Financial Officer’s website.
FY 2009 Proposed Operating Budget and FTEs, by Program and Activity
Table EA0-3 contains the proposed FY 2009 budget by program and activity compared to the FY 2008 approved bud-get. It also provides FY 2007 actual data.
FY 2009 Proposed Budget and Financial Plan
A-150
Table EA0-3(dollars in thousands)
FY 2008 Approved Budget to FY 2009 Proposed Budget, by Revenue Type
This is a new table for FY 2009 that itemizes the changes made during the development of the FY 2009proposed budget. The FY 2009 Mayoral Local funds budget target reflects the recurring elements of anagency’s FY 2008 approved budget. See the How to Read the Budget chapter in the Executive Summaryvolume for more information on this table.
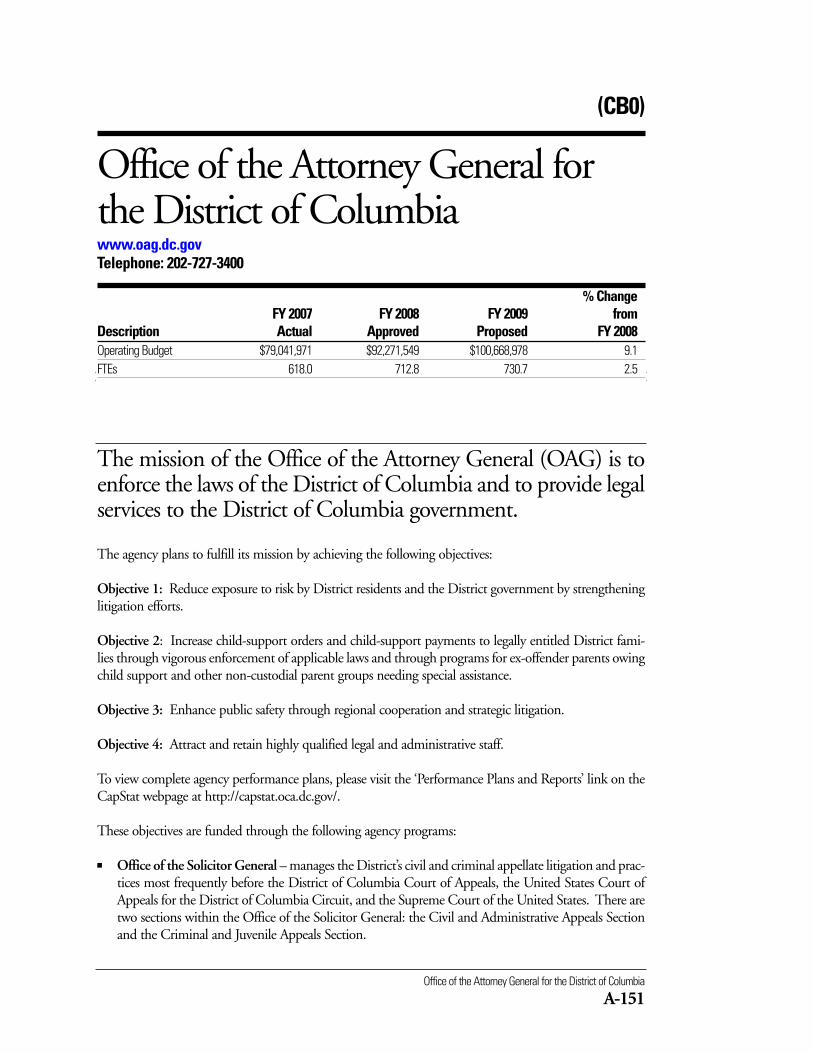
Office of the Attorney General for the District of Columbia
A-151
(CB0)
Office of the Attorney General forthe District of Columbiawww.oag.dc.govTelephone: 202-727-3400
% ChangeFY 2007 FY 2008 FY 2009 from
Description Actual Approved Proposed FY 2008Operating Budget $79,041,971 $92,271,549 $100,668,978 9.1FTEs 618.0 712.8 730.7 2.5
The mission of the Office of the Attorney General (OAG) is toenforce the laws of the District of Columbia and to provide legalservices to the District of Columbia government.
The agency plans to fulfill its mission by achieving the following objectives:
Objective 1: Reduce exposure to risk by District residents and the District government by strengtheninglitigation efforts.
Objective 2: Increase child-support orders and child-support payments to legally entitled District fami-lies through vigorous enforcement of applicable laws and through programs for ex-offender parents owingchild support and other non-custodial parent groups needing special assistance.
Objective 3: Enhance public safety through regional cooperation and strategic litigation.
Objective 4: Attract and retain highly qualified legal and administrative staff.
To view complete agency performance plans, please visit the ‘Performance Plans and Reports’ link on theCapStat webpage at http://capstat.oca.dc.gov/.
These objectives are funded through the following agency programs:
■ Office of the Solicitor General – manages the District’s civil and criminal appellate litigation and prac-tices most frequently before the District of Columbia Court of Appeals, the United States Court ofAppeals for the District of Columbia Circuit, and the Supreme Court of the United States. There aretwo sections within the Office of the Solicitor General: the Civil and Administrative Appeals Sectionand the Criminal and Juvenile Appeals Section.
FY 2009 Proposed Budget and Financial Plan
A-152
■ Child Support Services Division - authorized under Title IV-D (hereinafter, IV-D) of the SocialSecurity Act, provides services to assist families by locating absent parents, establishing paternity, estab-lishing monetary and medical support orders, collecting ongoing support orders, and enforcing delin-quent support orders.
■ Civil Litigation Division - represents the District of Columbia, its agencies and employees in civil law-suits, both jury and non-jury, filed in the federal and local courts. Its cases range from simple slip andfall and auto accident claims to extremely serious lawsuits, such as medical malpractice resulting inquadriplegia and brain damage. This division also handles constitutional challenges to governmentactions; civil rights actions under 42 U.S.C. § 1983 arising from alleged police misconduct, as well asrelated common law claims of false arrest and excessive force; and civil rights cases brought by employ-ees and others under Title VII of the 1964 Civil Rights Act (as amended), the Americans withDisabilities Act, and other federal and local anti-discrimination laws.
■ Commercial Division - provides legal services and advice for numerous core governmental functionsfrom procurement of essential goods and services and acquisition of real estate through support of eco-nomic development efforts, to financing of government operations through bonds and collection oftaxes. In addition, the division is responsible for oversight and coordination with the General Counselsof the following agencies: Department of Public Works; District Department of Transportation;Department of Parks and Recreation; Department of Motor Vehicles; Office of the Chief TechnologyOfficer; and Office of Cable Television.
■ Family Services Division - works on behalf of the District’s most vulnerable citizens: abused andneglected children; domestic violence victims; incapacitated adults who are being abused or who areself-neglecting; and people with mental illness and/or developmental disabilities. The unifying themeof the Family Services Division is that its attorneys represent the District’s human services agencies inthe D.C. Superior Court Family Court.
■ Health and Human Services Division - provides quality legal advice to its client agencies in supportof each agency’s mission to deliver statutorily mandated and necessary social services to the residentsof the District of Columbia and to protect the environment and enhance the natural resources of theDistrict of Columbia.
■ Legal Counsel Division - provides advice and opinions on any legal issue that arises from the perfor-mance of official duties, upon request, to the Mayor, the Executive Office of the Mayor, the AttorneyGeneral, department and agency heads, other executive employees, the Council of the District ofColumbia, the District of Columbia Courts, and in certain limited instances, members of the public,employees of private organizations, and employees of governments other than the District ofColumbia, and other public organizations.
■ Public Safety Division - focuses on the use of affirmative civil and criminal litigation to protect thepublic. This division initiates legal claims to protect the public and to seek restitution, where applica-ble, for those who have been harmed, including the Government of the District of Columbia.
■ Public Advocacy Division - focuses on the office’s efforts to use affirmative civil litigation to advancethe public interest. The division prosecutes judicial and administrative litigation in areas of vitalimportance to the District’s citizenry, including consumer protection, antitrust enforcement, environ-mental protection, and licensing of businesses and professionals.
Office of the Attorney General for the District of Columbia
A-153
■ Personnel, Labor and Employment Division - defends agencies in personnel-related matters such assuspensions, terminations for employee misconduct and reductions-in-force; provides training andprofessional development for all OAG employees in order to more effectively fulfill its mission; hiresand maintains excellent and diverse staff through on-campus interviews, interviews at job fairs, andtraditional acceptance of applications; ensures fairness and diversity in the workplace; processes allgrievances discipline; and serves as OAG’s chief negotiator on collective bargaining issues for the attor-ney union.
■ Support Services Division - consists of five sections and the Office of the Chief Administrative Officer.The five sections are: Human Resources, Information Technology, Operations, Investigations, andFinance. The Office of the Chief Administrative Officer is responsible for managing all support ser-vices within the Office of the Attorney General. Its primary responsibilities include ensuring that cus-tomers and clients receive timely and useful responses to telephone calls and written correspondence;managing OAG’s risk management function; providing administrative support to the SupportServices Division; and interfacing with other District agencies such as the Mayor’s CorrespondenceUnit, the Office of Risk Management, the Office of Contracting and Procurement, the Office of theChief Financial Officer, the D.C. Department of Human Resources, the Office of PropertyManagement and the Office of the Chief Technology Officer.
■ Policy and Operations Oversight - provides policy direction to the entire Office of the AttorneyGeneral so that it can provide high-quality, comprehensive legal services to the District of Columbiagovernment, its agencies, and employees.
■ Agency Management - provides for administrative support and the required tools to achieve opera-tional and programmatic results. This program is standard for all agencies using performance-basedbudgeting.
■ Agency Financial Operations - provides comprehensive and efficient financial management servicesto, and on behalf of, District agencies so that the financial integrity of the District of Columbia ismaintained. This program is standard for all agencies using performance-based budgeting.
The agency’s FY 2009 proposed budget is presented in the following tables:
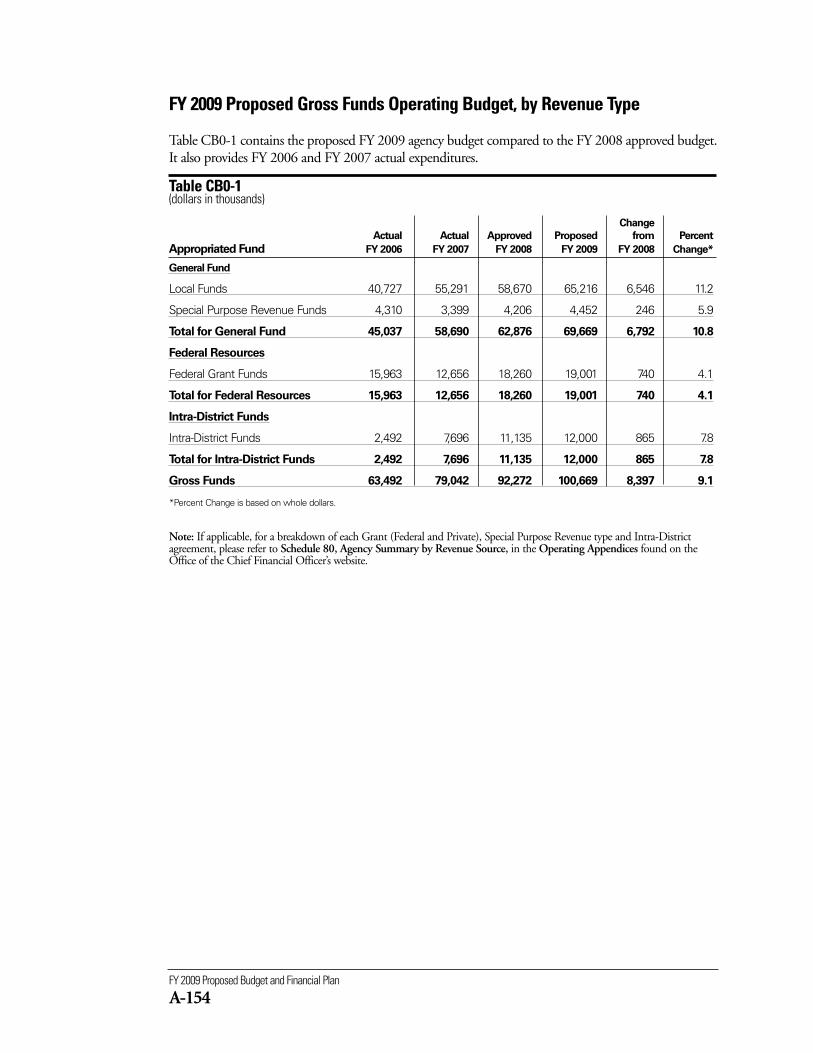
FY 2009 Proposed Budget and Financial Plan
A-154
FY 2009 Proposed Gross Funds Operating Budget, by Revenue Type
Table CB0-1 contains the proposed FY 2009 agency budget compared to the FY 2008 approved budget.It also provides FY 2006 and FY 2007 actual expenditures.
Table CB0-1 (dollars in thousands)
Change
Actual Actual Approved Proposed from Percent
Appropriated Fund FY 2006 FY 2007 FY 2008 FY 2009 FY 2008 Change*
General Fund
Local Funds 40,727 55,291 58,670 65,216 6,546 11.2
Special Purpose Revenue Funds 4,310 3,399 4,206 4,452 246 5.9
Total for General Fund 45,037 58,690 62,876 69,669 6,792 10.8
Federal Resources
Federal Grant Funds 15,963 12,656 18,260 19,001 740 4.1
Total for Federal Resources 15,963 12,656 18,260 19,001 740 4.1
Intra-District Funds
Intra-District Funds 2,492 7,696 11,135 12,000 865 7.8
Total for Intra-District Funds 2,492 7,696 11,135 12,000 865 7.8
Gross Funds 63,492 79,042 92,272 100,669 8,397 9.1
*Percent Change is based on whole dollars.
Note: If applicable, for a breakdown of each Grant (Federal and Private), Special Purpose Revenue type and Intra-Districtagreement, please refer to Schedule 80, Agency Summary by Revenue Source, in the Operating Appendices found on theOffice of the Chief Financial Officer’s website.
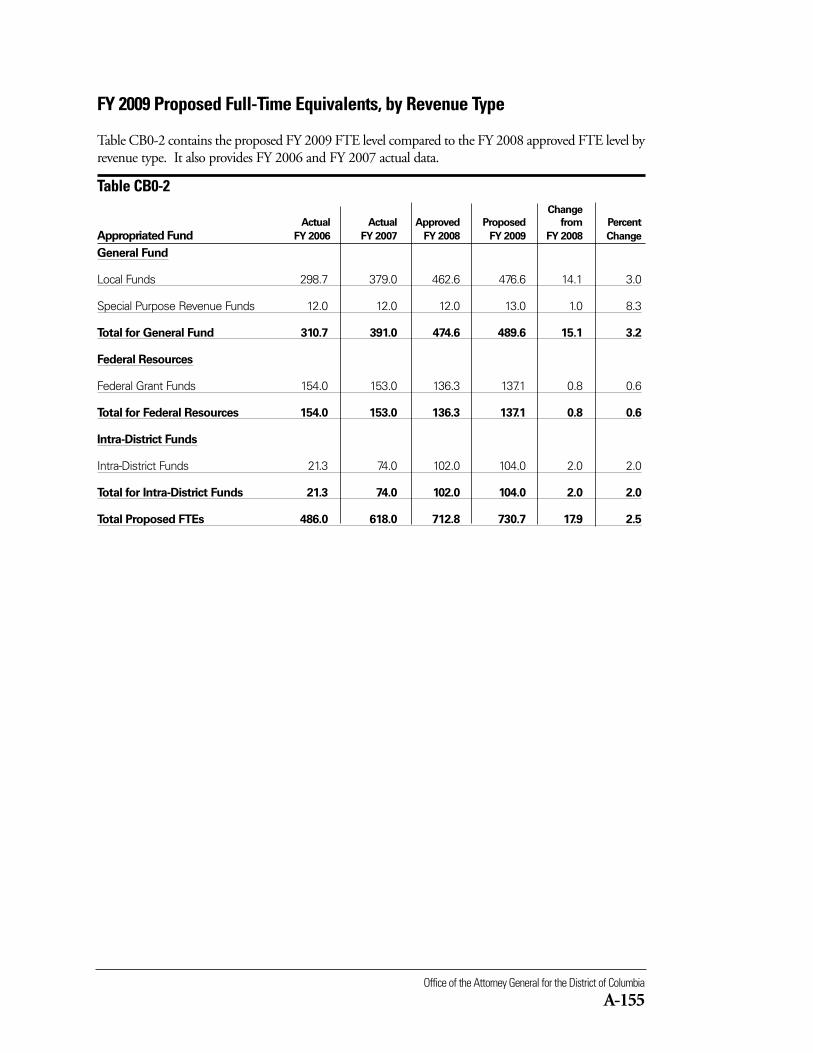
Office of the Attorney General for the District of Columbia
A-155
FY 2009 Proposed Full-Time Equivalents, by Revenue Type
Table CB0-2 contains the proposed FY 2009 FTE level compared to the FY 2008 approved FTE level byrevenue type. It also provides FY 2006 and FY 2007 actual data.
Table CB0-2 Change
Actual Actual Approved Proposed from Percent
Appropriated Fund FY 2006 FY 2007 FY 2008 FY 2009 FY 2008 Change
General Fund
Local Funds 298.7 379.0 462.6 476.6 14.1 3.0
Special Purpose Revenue Funds 12.0 12.0 12.0 13.0 1.0 8.3
Total for General Fund 310.7 391.0 474.6 489.6 15.1 3.2
Federal Resources
Federal Grant Funds 154.0 153.0 136.3 137.1 0.8 0.6
Total for Federal Resources 154.0 153.0 136.3 137.1 0.8 0.6
Intra-District Funds
Intra-District Funds 21.3 74.0 102.0 104.0 2.0 2.0
Total for Intra-District Funds 21.3 74.0 102.0 104.0 2.0 2.0
Total Proposed FTEs 486.0 618.0 712.8 730.7 17.9 2.5
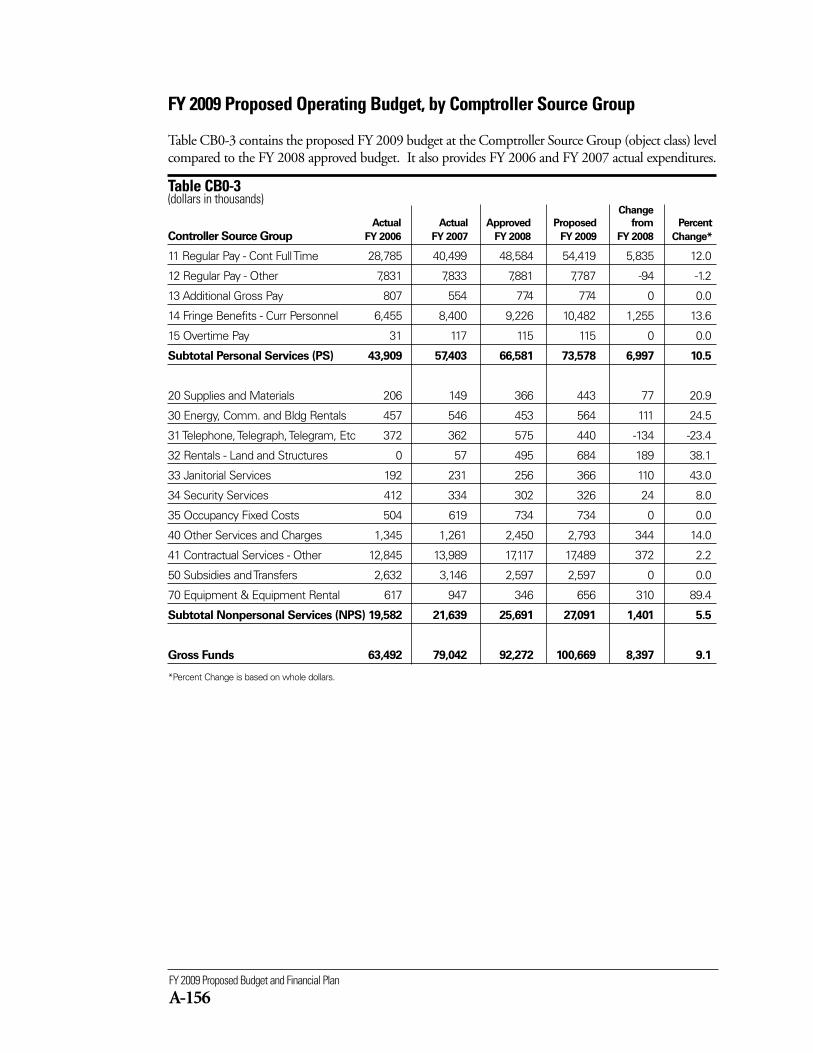
FY 2009 Proposed Budget and Financial Plan
A-156
FY 2009 Proposed Operating Budget, by Comptroller Source Group
Table CB0-3 contains the proposed FY 2009 budget at the Comptroller Source Group (object class) levelcompared to the FY 2008 approved budget. It also provides FY 2006 and FY 2007 actual expenditures.
Table CB0-3(dollars in thousands)
Change
Actual Actual Approved Proposed from Percent
Controller Source Group FY 2006 FY 2007 FY 2008 FY 2009 FY 2008 Change*
11 Regular Pay - Cont Full Time 28,785 40,499 48,584 54,419 5,835 12.0
12 Regular Pay - Other 7,831 7,833 7,881 7,787 -94 -1.2
13 Additional Gross Pay 807 554 774 774 0 0.0
14 Fringe Benefits - Curr Personnel 6,455 8,400 9,226 10,482 1,255 13.6
15 Overtime Pay 31 117 115 115 0 0.0
Subtotal Personal Services (PS) 43,909 57,403 66,581 73,578 6,997 10.5
20 Supplies and Materials 206 149 366 443 77 20.9
30 Energy, Comm. and Bldg Rentals 457 546 453 564 111 24.5
31 Telephone, Telegraph, Telegram, Etc 372 362 575 440 -134 -23.4
32 Rentals - Land and Structures 0 57 495 684 189 38.1
33 Janitorial Services 192 231 256 366 110 43.0
34 Security Services 412 334 302 326 24 8.0
35 Occupancy Fixed Costs 504 619 734 734 0 0.0
40 Other Services and Charges 1,345 1,261 2,450 2,793 344 14.0
41 Contractual Services - Other 12,845 13,989 17,117 17,489 372 2.2
50 Subsidies and Transfers 2,632 3,146 2,597 2,597 0 0.0
70 Equipment & Equipment Rental 617 947 346 656 310 89.4
Subtotal Nonpersonal Services (NPS) 19,582 21,639 25,691 27,091 1,401 5.5
Gross Funds 63,492 79,042 92,272 100,669 8,397 9.1
*Percent Change is based on whole dollars.
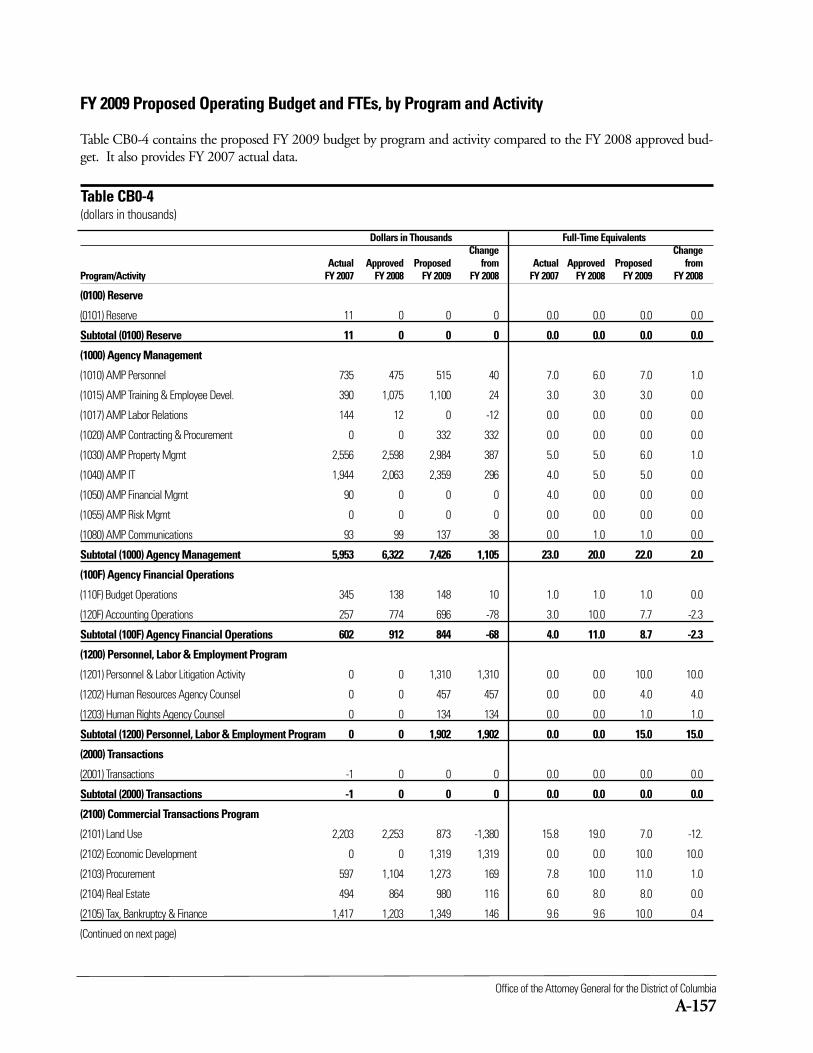
Office of the Attorney General for the District of Columbia
A-157
Dollars in Thousands Full-Time EquivalentsChange Change
Actual Approved Proposed from Actual Approved Proposed from Program/Activity FY 2007 FY 2008 FY 2009 FY 2008 FY 2007 FY 2008 FY 2009 FY 2008
(0100) Reserve
(0101) Reserve 11 0 0 0 0.0 0.0 0.0 0.0
Subtotal (0100) Reserve 11 0 0 0 0.0 0.0 0.0 0.0
(1000) Agency Management
(1010) AMP Personnel 735 475 515 40 7.0 6.0 7.0 1.0
(1015) AMP Training & Employee Devel. 390 1,075 1,100 24 3.0 3.0 3.0 0.0
(1017) AMP Labor Relations 144 12 0 -12 0.0 0.0 0.0 0.0
(1020) AMP Contracting & Procurement 0 0 332 332 0.0 0.0 0.0 0.0
(1030) AMP Property Mgmt 2,556 2,598 2,984 387 5.0 5.0 6.0 1.0
(1040) AMP IT 1,944 2,063 2,359 296 4.0 5.0 5.0 0.0
(1050) AMP Financial Mgmt 90 0 0 0 4.0 0.0 0.0 0.0
(1055) AMP Risk Mgmt 0 0 0 0 0.0 0.0 0.0 0.0
(1080) AMP Communications 93 99 137 38 0.0 1.0 1.0 0.0
Subtotal (1000) Agency Management 5,953 6,322 7,426 1,105 23.0 20.0 22.0 2.0
(100F) Agency Financial Operations
(110F) Budget Operations 345 138 148 10 1.0 1.0 1.0 0.0
(120F) Accounting Operations 257 774 696 -78 3.0 10.0 7.7 -2.3
Subtotal (100F) Agency Financial Operations 602 912 844 -68 4.0 11.0 8.7 -2.3
(1200) Personnel, Labor & Employment Program
(1201) Personnel & Labor Litigation Activity 0 0 1,310 1,310 0.0 0.0 10.0 10.0
(1202) Human Resources Agency Counsel 0 0 457 457 0.0 0.0 4.0 4.0
(1203) Human Rights Agency Counsel 0 0 134 134 0.0 0.0 1.0 1.0
Subtotal (1200) Personnel, Labor & Employment Program 0 0 1,902 1,902 0.0 0.0 15.0 15.0
(2000) Transactions
(2001) Transactions -1 0 0 0 0.0 0.0 0.0 0.0
Subtotal (2000) Transactions -1 0 0 0 0.0 0.0 0.0 0.0
(2100) Commercial Transactions Program
(2101) Land Use 2,203 2,253 873 -1,380 15.8 19.0 7.0 -12.
(2102) Economic Development 0 0 1,319 1,319 0.0 0.0 10.0 10.0
(2103) Procurement 597 1,104 1,273 169 7.8 10.0 11.0 1.0
(2104) Real Estate 494 864 980 116 6.0 8.0 8.0 0.0
(2105) Tax, Bankruptcy & Finance 1,417 1,203 1,349 146 9.6 9.6 10.0 0.4
(Continued on next page)
FY 2009 Proposed Operating Budget and FTEs, by Program and Activity
Table CB0-4 contains the proposed FY 2009 budget by program and activity compared to the FY 2008 approved bud-get. It also provides FY 2007 actual data.
Table CB0-4(dollars in thousands)
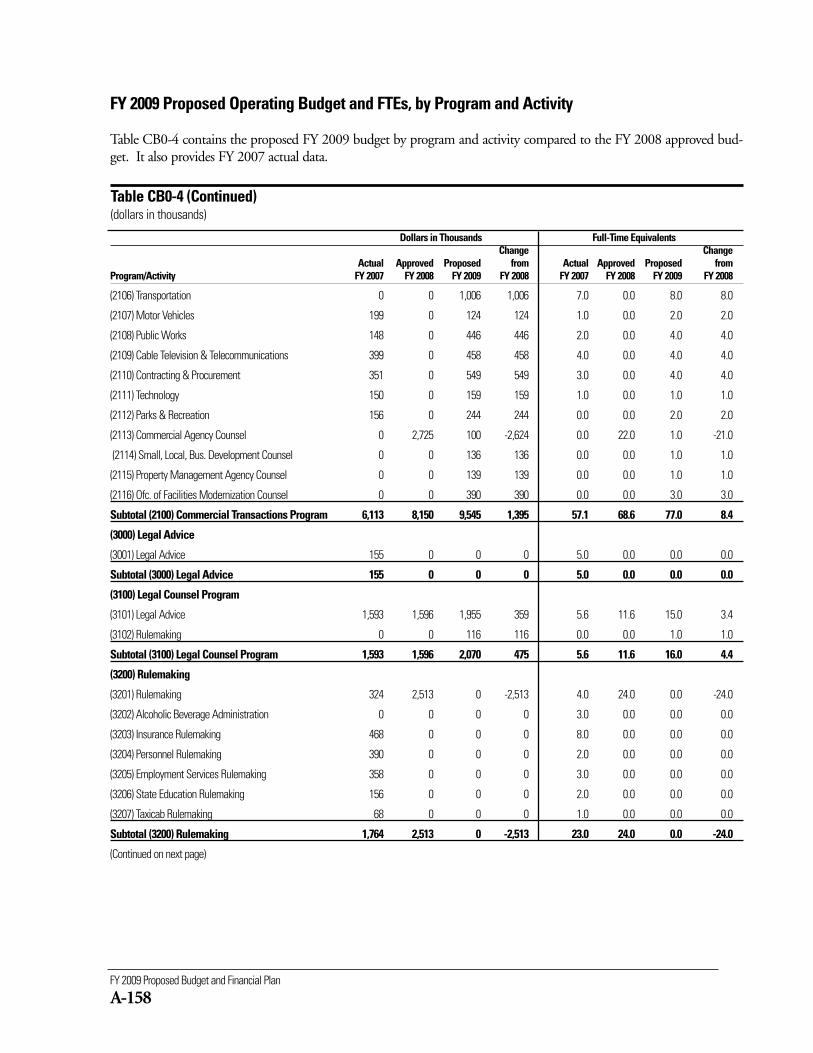
FY 2009 Proposed Budget and Financial Plan
A-158
Dollars in Thousands Full-Time EquivalentsChange Change
Actual Approved Proposed from Actual Approved Proposed from Program/Activity FY 2007 FY 2008 FY 2009 FY 2008 FY 2007 FY 2008 FY 2009 FY 2008
(2106) Transportation 0 0 1,006 1,006 7.0 0.0 8.0 8.0
(2107) Motor Vehicles 199 0 124 124 1.0 0.0 2.0 2.0
(2108) Public Works 148 0 446 446 2.0 0.0 4.0 4.0
(2109) Cable Television & Telecommunications 399 0 458 458 4.0 0.0 4.0 4.0
(2110) Contracting & Procurement 351 0 549 549 3.0 0.0 4.0 4.0
(2111) Technology 150 0 159 159 1.0 0.0 1.0 1.0
(2112) Parks & Recreation 156 0 244 244 0.0 0.0 2.0 2.0
(2113) Commercial Agency Counsel 0 2,725 100 -2,624 0.0 22.0 1.0 -21.0
(2114) Small, Local, Bus. Development Counsel 0 0 136 136 0.0 0.0 1.0 1.0
(2115) Property Management Agency Counsel 0 0 139 139 0.0 0.0 1.0 1.0
(2116) Ofc. of Facilities Modernization Counsel 0 0 390 390 0.0 0.0 3.0 3.0
Subtotal (2100) Commercial Transactions Program 6,113 8,150 9,545 1,395 57.1 68.6 77.0 8.4
(3000) Legal Advice
(3001) Legal Advice 155 0 0 0 5.0 0.0 0.0 0.0
Subtotal (3000) Legal Advice 155 0 0 0 5.0 0.0 0.0 0.0
(3100) Legal Counsel Program
(3101) Legal Advice 1,593 1,596 1,955 359 5.6 11.6 15.0 3.4
(3102) Rulemaking 0 0 116 116 0.0 0.0 1.0 1.0
Subtotal (3100) Legal Counsel Program 1,593 1,596 2,070 475 5.6 11.6 16.0 4.4
(3200) Rulemaking
(3201) Rulemaking 324 2,513 0 -2,513 4.0 24.0 0.0 -24.0
(3202) Alcoholic Beverage Administration 0 0 0 0 3.0 0.0 0.0 0.0
(3203) Insurance Rulemaking 468 0 0 0 8.0 0.0 0.0 0.0
(3204) Personnel Rulemaking 390 0 0 0 2.0 0.0 0.0 0.0
(3205) Employment Services Rulemaking 358 0 0 0 3.0 0.0 0.0 0.0
(3206) State Education Rulemaking 156 0 0 0 2.0 0.0 0.0 0.0
(3207) Taxicab Rulemaking 68 0 0 0 1.0 0.0 0.0 0.0
Subtotal (3200) Rulemaking 1,764 2,513 0 -2,513 23.0 24.0 0.0 -24.0
(Continued on next page)
FY 2009 Proposed Operating Budget and FTEs, by Program and Activity
Table CB0-4 contains the proposed FY 2009 budget by program and activity compared to the FY 2008 approved bud-get. It also provides FY 2007 actual data.
Table CB0-4 (Continued)(dollars in thousands)
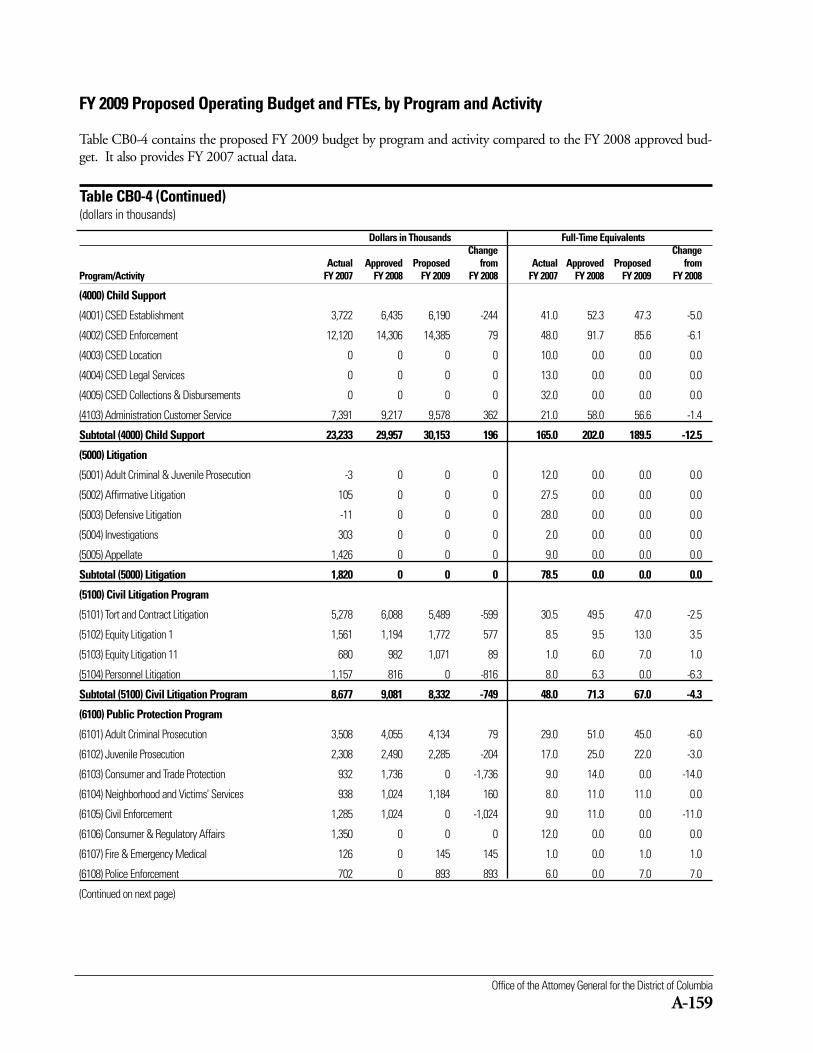
Office of the Attorney General for the District of Columbia
A-159
Dollars in Thousands Full-Time EquivalentsChange Change
Actual Approved Proposed from Actual Approved Proposed from Program/Activity FY 2007 FY 2008 FY 2009 FY 2008 FY 2007 FY 2008 FY 2009 FY 2008
(4000) Child Support
(4001) CSED Establishment 3,722 6,435 6,190 -244 41.0 52.3 47.3 -5.0
(4002) CSED Enforcement 12,120 14,306 14,385 79 48.0 91.7 85.6 -6.1
(4003) CSED Location 0 0 0 0 10.0 0.0 0.0 0.0
(4004) CSED Legal Services 0 0 0 0 13.0 0.0 0.0 0.0
(4005) CSED Collections & Disbursements 0 0 0 0 32.0 0.0 0.0 0.0
(4103) Administration Customer Service 7,391 9,217 9,578 362 21.0 58.0 56.6 -1.4
Subtotal (4000) Child Support 23,233 29,957 30,153 196 165.0 202.0 189.5 -12.5
(5000) Litigation
(5001) Adult Criminal & Juvenile Prosecution -3 0 0 0 12.0 0.0 0.0 0.0
(5002) Affirmative Litigation 105 0 0 0 27.5 0.0 0.0 0.0
(5003) Defensive Litigation -11 0 0 0 28.0 0.0 0.0 0.0
(5004) Investigations 303 0 0 0 2.0 0.0 0.0 0.0
(5005) Appellate 1,426 0 0 0 9.0 0.0 0.0 0.0
Subtotal (5000) Litigation 1,820 0 0 0 78.5 0.0 0.0 0.0
(5100) Civil Litigation Program
(5101) Tort and Contract Litigation 5,278 6,088 5,489 -599 30.5 49.5 47.0 -2.5
(5102) Equity Litigation 1 1,561 1,194 1,772 577 8.5 9.5 13.0 3.5
(5103) Equity Litigation 11 680 982 1,071 89 1.0 6.0 7.0 1.0
(5104) Personnel Litigation 1,157 816 0 -816 8.0 6.3 0.0 -6.3
Subtotal (5100) Civil Litigation Program 8,677 9,081 8,332 -749 48.0 71.3 67.0 -4.3
(6100) Public Protection Program
(6101) Adult Criminal Prosecution 3,508 4,055 4,134 79 29.0 51.0 45.0 -6.0
(6102) Juvenile Prosecution 2,308 2,490 2,285 -204 17.0 25.0 22.0 -3.0
(6103) Consumer and Trade Protection 932 1,736 0 -1,736 9.0 14.0 0.0 -14.0
(6104) Neighborhood and Victims' Services 938 1,024 1,184 160 8.0 11.0 11.0 0.0
(6105) Civil Enforcement 1,285 1,024 0 -1,024 9.0 11.0 0.0 -11.0
(6106) Consumer & Regulatory Affairs 1,350 0 0 0 12.0 0.0 0.0 0.0
(6107) Fire & Emergency Medical 126 0 145 145 1.0 0.0 1.0 1.0
(6108) Police Enforcement 702 0 893 893 6.0 0.0 7.0 7.0
(Continued on next page)
FY 2009 Proposed Operating Budget and FTEs, by Program and Activity
Table CB0-4 contains the proposed FY 2009 budget by program and activity compared to the FY 2008 approved bud-get. It also provides FY 2007 actual data.
Table CB0-4 (Continued)(dollars in thousands)
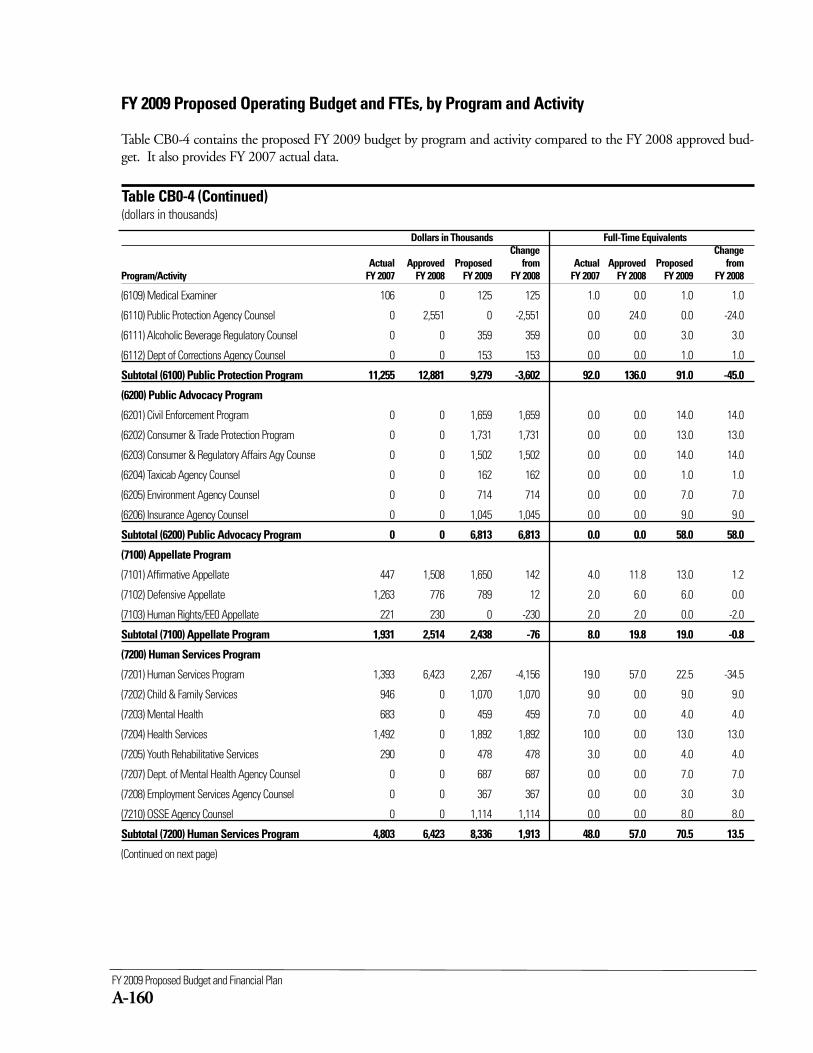
FY 2009 Proposed Budget and Financial Plan
A-160
Dollars in Thousands Full-Time EquivalentsChange Change
Actual Approved Proposed from Actual Approved Proposed from Program/Activity FY 2007 FY 2008 FY 2009 FY 2008 FY 2007 FY 2008 FY 2009 FY 2008
(6109) Medical Examiner 106 0 125 125 1.0 0.0 1.0 1.0
(6110) Public Protection Agency Counsel 0 2,551 0 -2,551 0.0 24.0 0.0 -24.0
(6111) Alcoholic Beverage Regulatory Counsel 0 0 359 359 0.0 0.0 3.0 3.0
(6112) Dept of Corrections Agency Counsel 0 0 153 153 0.0 0.0 1.0 1.0
Subtotal (6100) Public Protection Program 11,255 12,881 9,279 -3,602 92.0 136.0 91.0 -45.0
(6200) Public Advocacy Program
(6201) Civil Enforcement Program 0 0 1,659 1,659 0.0 0.0 14.0 14.0
(6202) Consumer & Trade Protection Program 0 0 1,731 1,731 0.0 0.0 13.0 13.0
(6203) Consumer & Regulatory Affairs Agy Counse 0 0 1,502 1,502 0.0 0.0 14.0 14.0
(6204) Taxicab Agency Counsel 0 0 162 162 0.0 0.0 1.0 1.0
(6205) Environment Agency Counsel 0 0 714 714 0.0 0.0 7.0 7.0
(6206) Insurance Agency Counsel 0 0 1,045 1,045 0.0 0.0 9.0 9.0
Subtotal (6200) Public Advocacy Program 0 0 6,813 6,813 0.0 0.0 58.0 58.0
(7100) Appellate Program
(7101) Affirmative Appellate 447 1,508 1,650 142 4.0 11.8 13.0 1.2
(7102) Defensive Appellate 1,263 776 789 12 2.0 6.0 6.0 0.0
(7103) Human Rights/EE0 Appellate 221 230 0 -230 2.0 2.0 0.0 -2.0
Subtotal (7100) Appellate Program 1,931 2,514 2,438 -76 8.0 19.8 19.0 -0.8
(7200) Human Services Program
(7201) Human Services Program 1,393 6,423 2,267 -4,156 19.0 57.0 22.5 -34.5
(7202) Child & Family Services 946 0 1,070 1,070 9.0 0.0 9.0 9.0
(7203) Mental Health 683 0 459 459 7.0 0.0 4.0 4.0
(7204) Health Services 1,492 0 1,892 1,892 10.0 0.0 13.0 13.0
(7205) Youth Rehabilitative Services 290 0 478 478 3.0 0.0 4.0 4.0
(7207) Dept. of Mental Health Agency Counsel 0 0 687 687 0.0 0.0 7.0 7.0
(7208) Employment Services Agency Counsel 0 0 367 367 0.0 0.0 3.0 3.0
(7210) OSSE Agency Counsel 0 0 1,114 1,114 0.0 0.0 8.0 8.0
Subtotal (7200) Human Services Program 4,803 6,423 8,336 1,913 48.0 57.0 70.5 13.5
(Continued on next page)
FY 2009 Proposed Operating Budget and FTEs, by Program and Activity
Table CB0-4 contains the proposed FY 2009 budget by program and activity compared to the FY 2008 approved bud-get. It also provides FY 2007 actual data.
Table CB0-4 (Continued)(dollars in thousands)
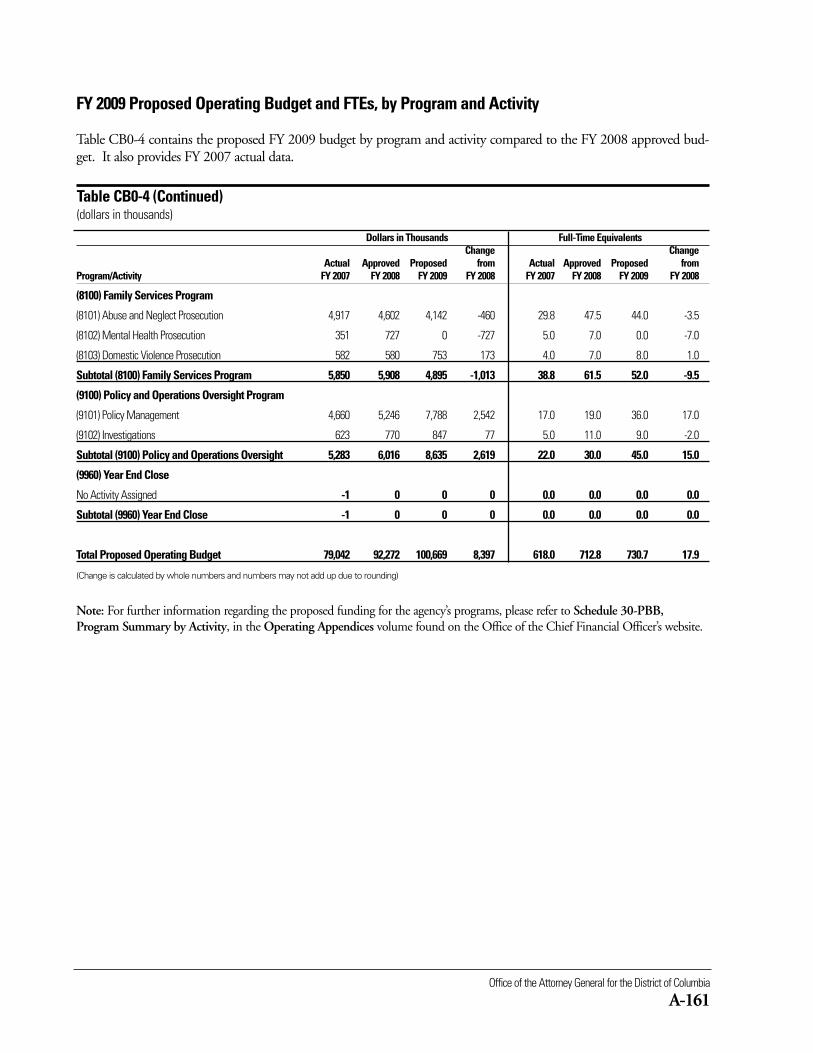
Office of the Attorney General for the District of Columbia
A-161
Dollars in Thousands Full-Time EquivalentsChange Change
Actual Approved Proposed from Actual Approved Proposed from Program/Activity FY 2007 FY 2008 FY 2009 FY 2008 FY 2007 FY 2008 FY 2009 FY 2008
(8100) Family Services Program
(8101) Abuse and Neglect Prosecution 4,917 4,602 4,142 -460 29.8 47.5 44.0 -3.5
(8102) Mental Health Prosecution 351 727 0 -727 5.0 7.0 0.0 -7.0
(8103) Domestic Violence Prosecution 582 580 753 173 4.0 7.0 8.0 1.0
Subtotal (8100) Family Services Program 5,850 5,908 4,895 -1,013 38.8 61.5 52.0 -9.5
(9100) Policy and Operations Oversight Program
(9101) Policy Management 4,660 5,246 7,788 2,542 17.0 19.0 36.0 17.0
(9102) Investigations 623 770 847 77 5.0 11.0 9.0 -2.0
Subtotal (9100) Policy and Operations Oversight 5,283 6,016 8,635 2,619 22.0 30.0 45.0 15.0
(9960) Year End Close
No Activity Assigned -1 0 0 0 0.0 0.0 0.0 0.0
Subtotal (9960) Year End Close -1 0 0 0 0.0 0.0 0.0 0.0
Total Proposed Operating Budget 79,042 92,272 100,669 8,397 618.0 712.8 730.7 17.9
(Change is calculated by whole numbers and numbers may not add up due to rounding)
Note: For further information regarding the proposed funding for the agency’s programs, please refer to Schedule 30-PBB,Program Summary by Activity, in the Operating Appendices volume found on the Office of the Chief Financial Officer’s website.
FY 2009 Proposed Operating Budget and FTEs, by Program and Activity
Table CB0-4 contains the proposed FY 2009 budget by program and activity compared to the FY 2008 approved bud-get. It also provides FY 2007 actual data.
Table CB0-4 (Continued)(dollars in thousands)
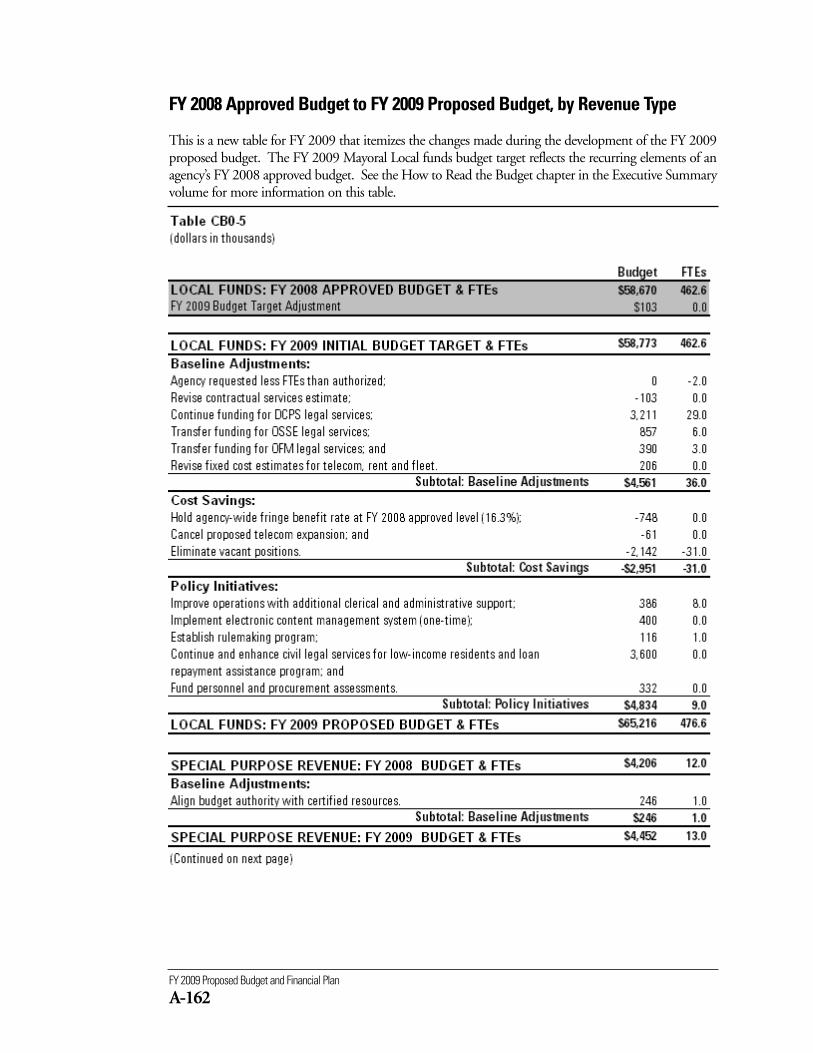
FY 2009 Proposed Budget and Financial Plan
A-162
FY 2008 Approved Budget to FY 2009 Proposed Budget, by Revenue Type
This is a new table for FY 2009 that itemizes the changes made during the development of the FY 2009proposed budget. The FY 2009 Mayoral Local funds budget target reflects the recurring elements of anagency’s FY 2008 approved budget. See the How to Read the Budget chapter in the Executive Summaryvolume for more information on this table.
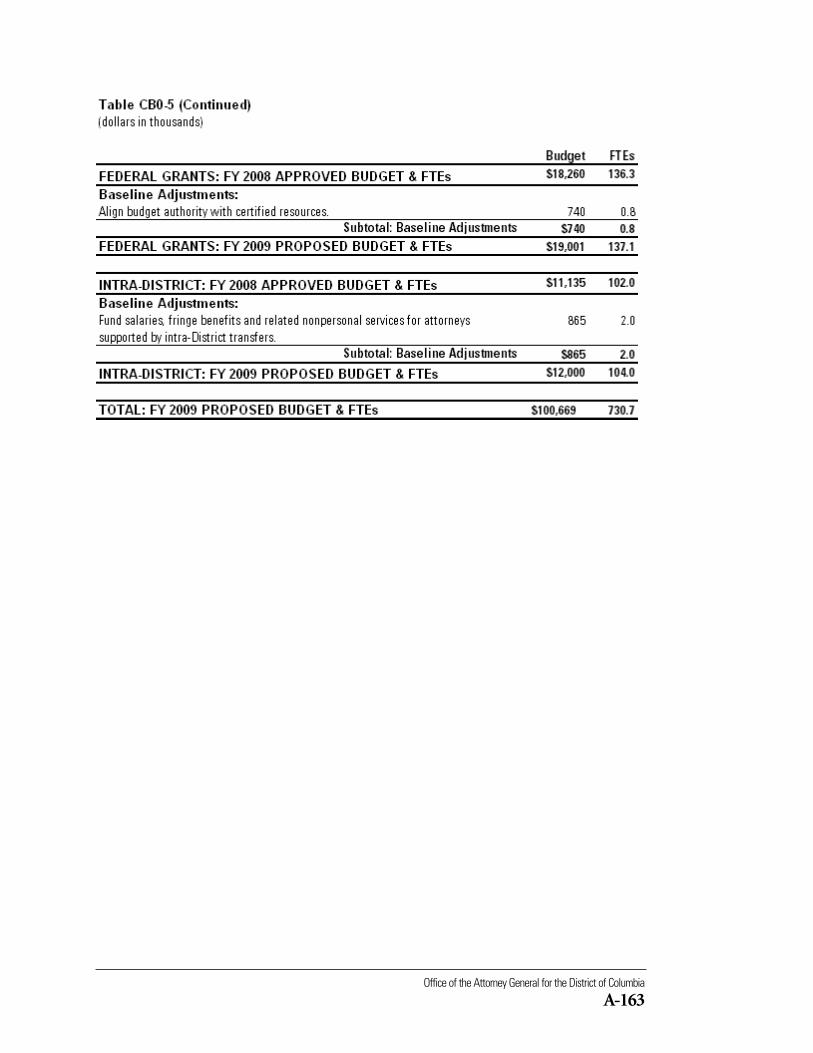
Office of the Attorney General for the District of Columbia
A-163
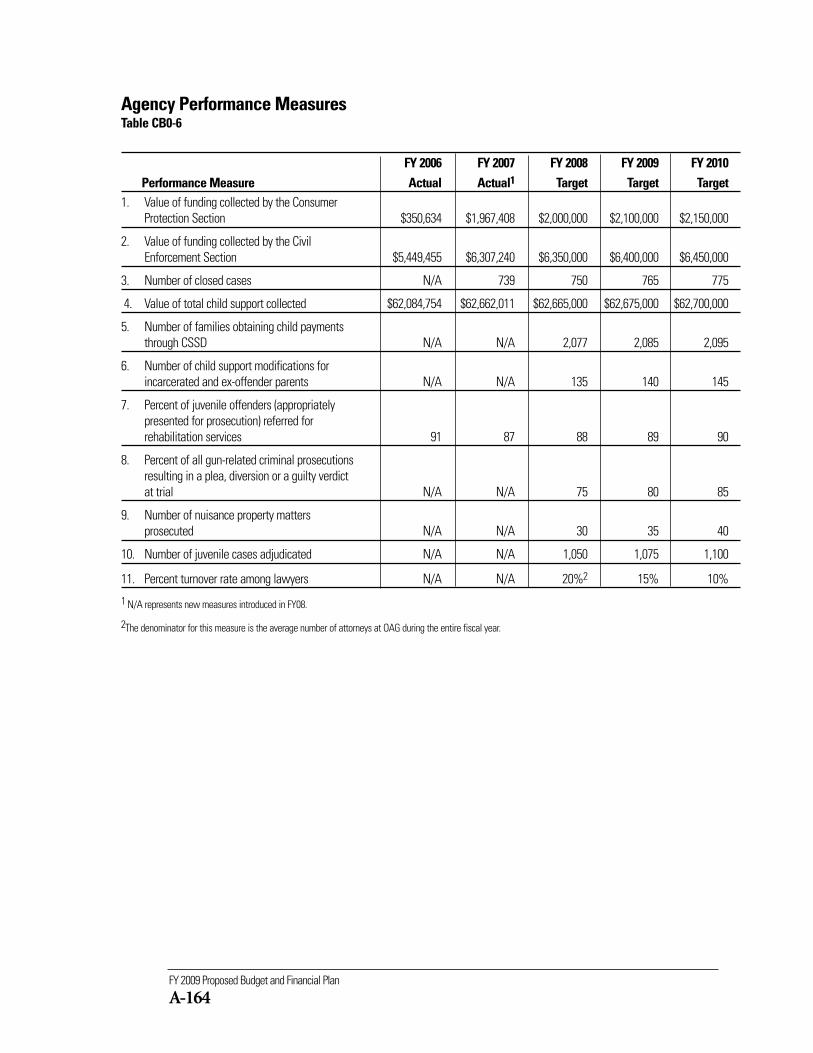
FY 2009 Proposed Budget and Financial Plan
A-164
Agency Performance MeasuresTable CB0-6
FY 2006 FY 2007 FY 2008 FY 2009 FY 2010Performance Measure Actual Actual1 Target Target Target
1. Value of funding collected by the Consumer Protection Section $350,634 $1,967,408 $2,000,000 $2,100,000 $2,150,000
2. Value of funding collected by the Civil Enforcement Section $5,449,455 $6,307,240 $6,350,000 $6,400,000 $6,450,000
3. Number of closed cases N/A 739 750 765 775
4. Value of total child support collected $62,084,754 $62,662,011 $62,665,000 $62,675,000 $62,700,000
5. Number of families obtaining child payments through CSSD N/A N/A 2,077 2,085 2,095
6. Number of child support modifications for incarcerated and ex-offender parents N/A N/A 135 140 145
7. Percent of juvenile offenders (appropriatelypresented for prosecution) referred for rehabilitation services 91 87 88 89 90
8. Percent of all gun-related criminal prosecutions resulting in a plea, diversion or a guilty verdictat trial N/A N/A 75 80 85
9. Number of nuisance property matters prosecuted N/A N/A 30 35 40
10. Number of juvenile cases adjudicated N/A N/A 1,050 1,075 1,100
11. Percent turnover rate among lawyers N/A N/A 20%2 15% 10%
1 N/A represents new measures introduced in FY08.
2The denominator for this measure is the average number of attorneys at OAG during the entire fiscal year.
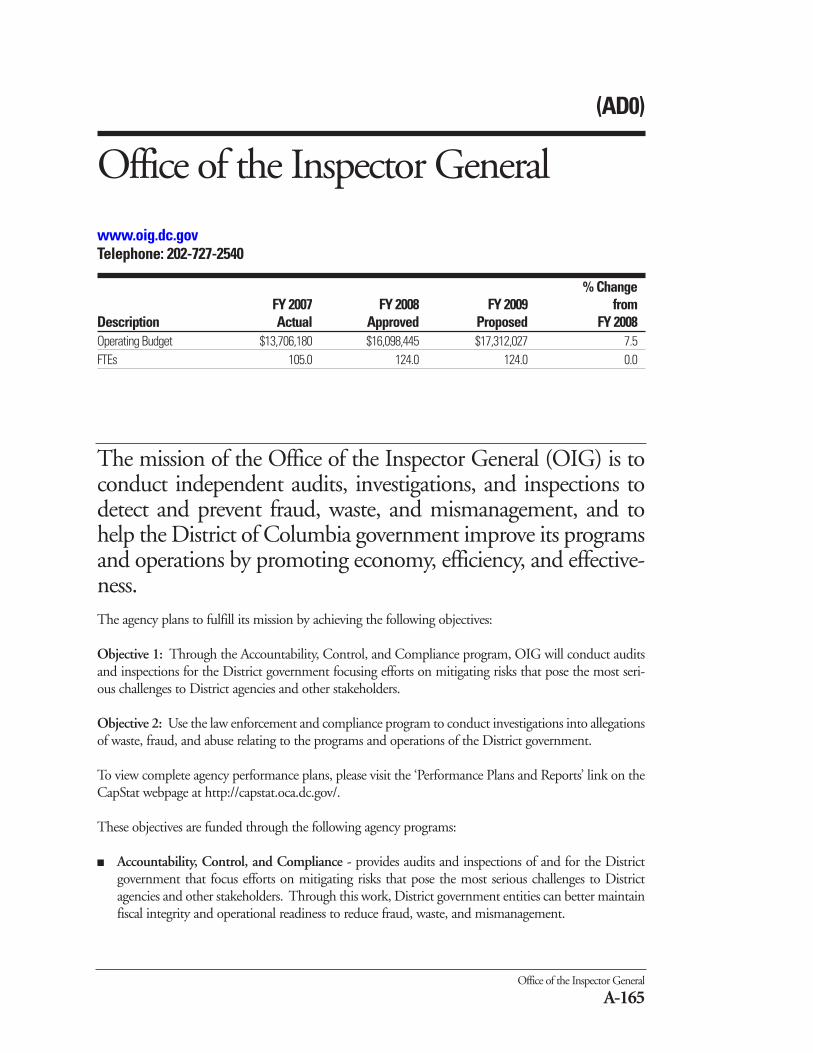
(AD0)
Office of the Inspector General
www.oig.dc.govTelephone: 202-727-2540
% ChangeFY 2007 FY 2008 FY 2009 from
Description Actual Approved Proposed FY 2008Operating Budget $13,706,180 $16,098,445 $17,312,027 7.5FTEs 105.0 124.0 124.0 0.0
The mission of the Office of the Inspector General (OIG) is toconduct independent audits, investigations, and inspections todetect and prevent fraud, waste, and mismanagement, and tohelp the District of Columbia government improve its programsand operations by promoting economy, efficiency, and effective-ness.
Office of the Inspector General
A-165
The agency plans to fulfill its mission by achieving the following objectives:
Objective 1: Through the Accountability, Control, and Compliance program, OIG will conduct auditsand inspections for the District government focusing efforts on mitigating risks that pose the most seri-ous challenges to District agencies and other stakeholders.
Objective 2: Use the law enforcement and compliance program to conduct investigations into allegationsof waste, fraud, and abuse relating to the programs and operations of the District government.
To view complete agency performance plans, please visit the ‘Performance Plans and Reports’ link on theCapStat webpage at http://capstat.oca.dc.gov/.
These objectives are funded through the following agency programs:
■ Accountability, Control, and Compliance - provides audits and inspections of and for the Districtgovernment that focus efforts on mitigating risks that pose the most serious challenges to Districtagencies and other stakeholders. Through this work, District government entities can better maintainfiscal integrity and operational readiness to reduce fraud, waste, and mismanagement.
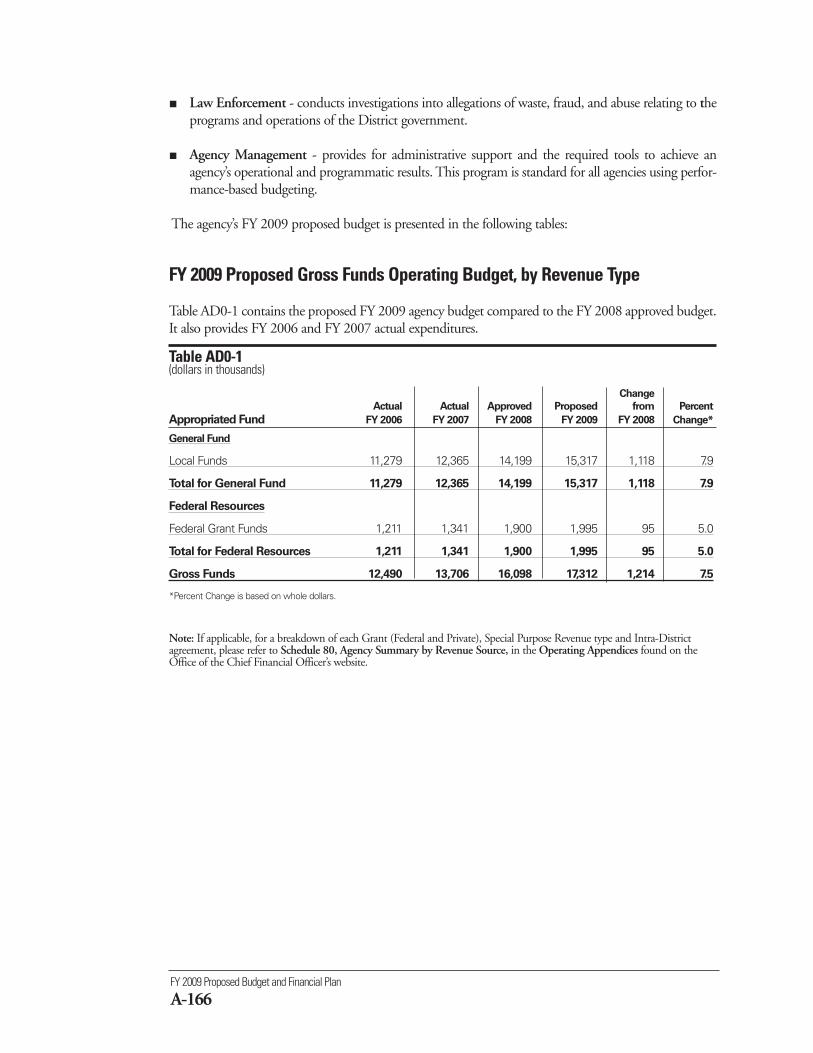
FY 2009 Proposed Budget and Financial Plan
A-166
FY 2009 Proposed Gross Funds Operating Budget, by Revenue Type
Table AD0-1 contains the proposed FY 2009 agency budget compared to the FY 2008 approved budget.It also provides FY 2006 and FY 2007 actual expenditures.
Table AD0-1 (dollars in thousands)
Change
Actual Actual Approved Proposed from Percent
Appropriated Fund FY 2006 FY 2007 FY 2008 FY 2009 FY 2008 Change*
General Fund
Local Funds 11,279 12,365 14,199 15,317 1,118 7.9
Total for General Fund 11,279 12,365 14,199 15,317 1,118 7.9
Federal Resources
Federal Grant Funds 1,211 1,341 1,900 1,995 95 5.0
Total for Federal Resources 1,211 1,341 1,900 1,995 95 5.0
Gross Funds 12,490 13,706 16,098 17,312 1,214 7.5
*Percent Change is based on whole dollars.
Note: If applicable, for a breakdown of each Grant (Federal and Private), Special Purpose Revenue type and Intra-Districtagreement, please refer to Schedule 80, Agency Summary by Revenue Source, in the Operating Appendices found on theOffice of the Chief Financial Officer’s website.
■ Law Enforcement - conducts investigations into allegations of waste, fraud, and abuse relating to theprograms and operations of the District government.
■ Agency Management - provides for administrative support and the required tools to achieve anagency’s operational and programmatic results. This program is standard for all agencies using perfor-mance-based budgeting.
The agency’s FY 2009 proposed budget is presented in the following tables:
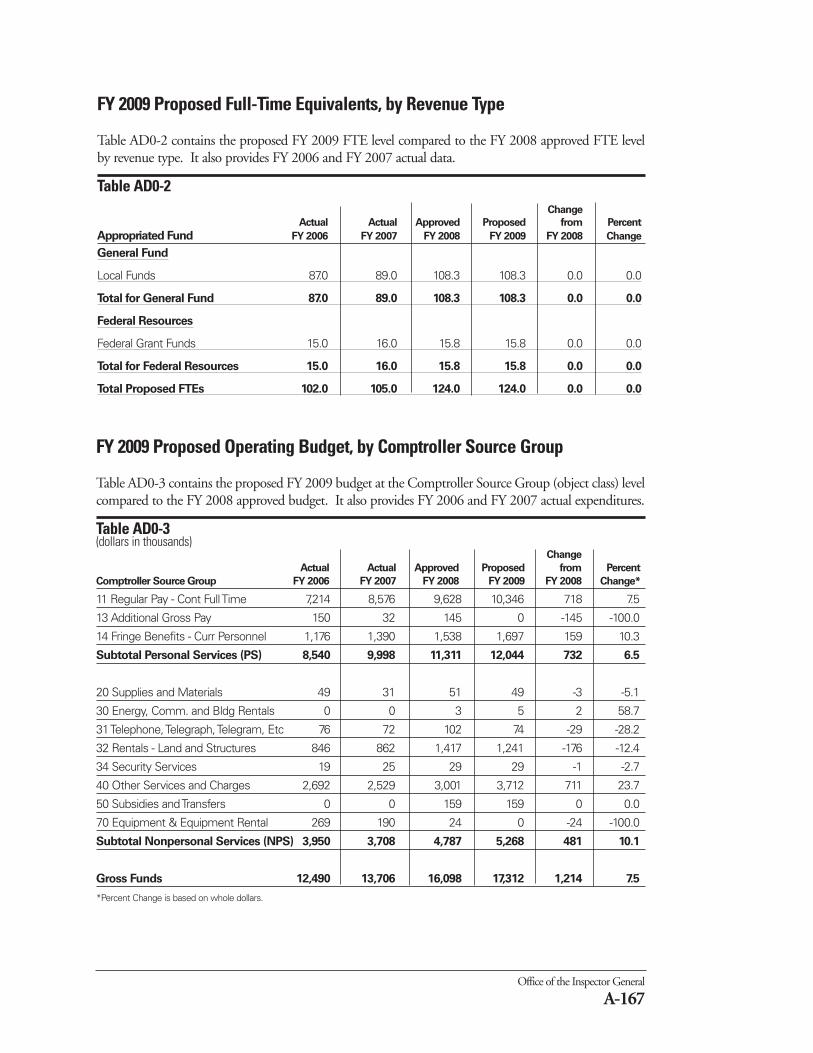
Office of the Inspector General
A-167
FY 2009 Proposed Full-Time Equivalents, by Revenue Type
Table AD0-2 contains the proposed FY 2009 FTE level compared to the FY 2008 approved FTE levelby revenue type. It also provides FY 2006 and FY 2007 actual data.
Table AD0-2 Change
Actual Actual Approved Proposed from Percent
Appropriated Fund FY 2006 FY 2007 FY 2008 FY 2009 FY 2008 Change
General Fund
Local Funds 87.0 89.0 108.3 108.3 0.0 0.0
Total for General Fund 87.0 89.0 108.3 108.3 0.0 0.0
Federal Resources
Federal Grant Funds 15.0 16.0 15.8 15.8 0.0 0.0
Total for Federal Resources 15.0 16.0 15.8 15.8 0.0 0.0
Total Proposed FTEs 102.0 105.0 124.0 124.0 0.0 0.0
FY 2009 Proposed Operating Budget, by Comptroller Source Group
Table AD0-3 contains the proposed FY 2009 budget at the Comptroller Source Group (object class) levelcompared to the FY 2008 approved budget. It also provides FY 2006 and FY 2007 actual expenditures.
Table AD0-3(dollars in thousands)
Change
Actual Actual Approved Proposed from Percent
Comptroller Source Group FY 2006 FY 2007 FY 2008 FY 2009 FY 2008 Change*
11 Regular Pay - Cont Full Time 7,214 8,576 9,628 10,346 718 7.5
13 Additional Gross Pay 150 32 145 0 -145 -100.0
14 Fringe Benefits - Curr Personnel 1,176 1,390 1,538 1,697 159 10.3
Subtotal Personal Services (PS) 8,540 9,998 11,311 12,044 732 6.5
20 Supplies and Materials 49 31 51 49 -3 -5.1
30 Energy, Comm. and Bldg Rentals 0 0 3 5 2 58.7
31 Telephone, Telegraph, Telegram, Etc 76 72 102 74 -29 -28.2
32 Rentals - Land and Structures 846 862 1,417 1,241 -176 -12.4
34 Security Services 19 25 29 29 -1 -2.7
40 Other Services and Charges 2,692 2,529 3,001 3,712 711 23.7
50 Subsidies and Transfers 0 0 159 159 0 0.0
70 Equipment & Equipment Rental 269 190 24 0 -24 -100.0
Subtotal Nonpersonal Services (NPS) 3,950 3,708 4,787 5,268 481 10.1
Gross Funds 12,490 13,706 16,098 17,312 1,214 7.5
*Percent Change is based on whole dollars.
FY 2009 Proposed Budget and Financial Plan
A-168
Dollars in Thousands Full-Time EquivalentsChange Change
Actual Approved Proposed from Actual Approved Proposed from Program/Activity FY 2007 FY 2008 FY 2009 FY 2008 FY 2007 FY 2008 FY 2009 FY 2008
(1000) Agency Management
(1010) Personnel 186 341 208 -134 2.0 1.5 1.5 0.0
(1020) Contracting and Procurement 254 265 276 11 2.0 2.5 2.5 0.0
(1030) Property Management 771 1,182 1,045 -137 0.0 0.0 0.0 0.0
(1040) Infro Tech 549 386 408 22 3.0 3.5 3.5 0.0
(1050) Financial Mgmt 234 325 273 -52 2.0 2.5 2.5 0.0
(1060) Legal 606 575 629 54 5.0 5.5 5.6 0.0
(1070) Fleet Mgmt. 11 9 8 -1 0.0 0.0 0.0 0.0
(1080) Communication 58 70 59 -10 0.0 0.0 0.0 0.0
(1085) Customer Service 102 132 134 2 2.0 1.8 1.8 0.0
(1100) Office of the Inspector General -2 0 0 0 0.0 0.0 0.0 0.0
Subtotal (1000) Agency Management 2,769 3,285 3,039 -245 16.0 17.4 17.4 0.0
(2000) Accountability,Control/Compliance
(2010) Audit 5,527 6,182 7,131 949 34.0 40.5 40.5 0.0
(2020) Investigations 2,427 0 0 0 25.0 0.0 0.0 0.0
(2030) Inspections and Evaluations 1,190 1,441 1,522 81 14.0 16.6 15.6 -1.0
(2040) MFCU 25%match 451 0 0 0 0.0 0.0 0.0 0.0
(2050) Medicaid Fraud Control Unit 1,365 0 0 0 16.0 0.0 0.0 0.0
Subtotal (2000) Accountability,Control/Compliance 10,961 7,623 8,653 1,030 89.0 57.1 56.1 -1.0
(3000) Law Enforcement and Compliance
(3010) Investigations 0 2,712 3,013 301 0.0 28.5 29.5 1.0
(3020) MFCU 25% matchs 0 579 612 33 0.0 5.3 5.3 0.0
(3030) Medicaid Fraud Control Unit 0 1,900 1,995 95 0.0 15.8 15.8 0.0
Subtotal (3000) Law Enforcement and Compliance 0 5,190 5,619 429 0.0 49.5 50.5 1.0
(9961) Year End Audit Adj
No Activty Assigned -24 0 0 0 0.0 0.0 0.0 0.0
Subtotal (9961) Year End Audit Adj -24 0 0 0 0.0 0.0 0.0 0.0
Total Proposed Operating Budget 13,706 16,098 17,312 1,214 105.0 124.0 124.0 0.0
(Change is calculated by whole numbers and numbers may not add up due to rounding)
FY 2009 Proposed Operating Budget and FTEs, by Program and Activity
Table AD0-4 contains the proposed FY 2009 budget by program and activity compared to the FY 2008 approved bud-get. It also provides FY 2007 actual data.
Table AD0-4(dollars in thousands)
Note: For further information regarding the proposed funding for the agency’s programs, please refer to Schedule 30-PBB, Program Summary byActivity, in the Operating Appendices volume found on the Office of the Chief Financial Officer’s website.
Office of the Inspector General
A-169
FY 2008 Approved Budget to FY 2009 Proposed Budget, by Revenue Type
This is a new table for FY 2009 that itemizes the changes made during the development of the FY 2009proposed budget. The FY 2009 Mayoral Local funds budget target reflects the recurring elements of anagency’s FY 2008 approved budget. See the How to Read the Budget chapter in the Executive Summaryvolume for more information on this table.
Agency Performance MeasuresTable AD0-6
FY 2006 FY 2007 FY 2008 FY 2009 FY 2010Performance Measure Actual Actual Target Target Target
1. Number of final audit reports issued (financial/performance). N/A N/A 24 26 28
2. Potential monetary benefits resulting from audits ($million). 31 47 15 15 15
3. Percent of all fiscal year assigned inspections/evaluations conducted. N/A N/A 80% 80% 80%
4. Percent of complaints evaluated with ten days of receipt in investigations. N/A N/A 80% 80% 80%
5. Number of criminal/civil resolutions obtained in Medicaid Fraud Control Unit cases. 13 17 10 14 16
The mission of the Office of the Chief Financial Officer(OCFO) is to provide financial management services to the gov-ernment and the people of the District of Columbia to sustainlong-term fiscal and economic viability.
Office of the Chief Financial Officer
A-171
The agency plans to fulfill its mission by achieving the following strategic result goals:
■ Ensure that District spending remains within approved budgets and/or available revenues for the fis-cal year so that no spending deficits occur;
■ Maintain adequate cash balances, minimize receivables balances, increase the tax base and otherincome sources, and remain within a maximum ratio of total debt service to general fund expendi-tures of 12 percent, as a component of managing the District's debt and finances in a manner thatprovides optimal opportunities to maximize bond ratings and minimize the cost of borrowed capital;
■ Improve tax compliance by increasing collections from the accounts receivable balance and the non-filer population, as measured by percentage change in delinquent collections;
■ Improve customer service by:- Increasing the number of taxpayers filing electronically;- Reducing customer wait time in telephone and walk-in centers; and- Improving customer access levels in the phone center, as measured by the rate of abandoned calls;
■ Develop and support financial management systems (budget, payroll, CFO$ource, SOAR, ITS, EIS)that provide accurate and timely information; and
■ Produce the District's Comprehensive Annual Financial Report (CAFR) on time with an unqualifiedclean opinion.
These goals are funded through the following agency programs:
(AT0)
Office of the Chief Financial Officerwww.cfo.dc.govTelephone: 202-727-2476
% ChangeFY 2007 FY 2008 FY 2009 from
Description Actual Approved Proposed FY 2008Operating Budget $144,698,532 $153,387,038 $164,654,698 7.3FTEs 956.6 1,047.9 1,077.9 2.9
FY 2009 Proposed Budget and Financial Plan
A-172
Financial Operations and Systems (OFOS)- responsible for the District’s accounting operations, includingcritical functions such as District-wide general ledger accounting, financial reporting, and pay/retirement ser-vices. The program is responsible for producing the Comprehensive Annual Financial Report (CAFR),which represents the District’s financial position at the end of each fiscal year. The program is also respon-sible for developing accounting policies and procedures, policies that support the System of Accountingand Reporting (SOAR), the District’s formal “books of record,” as well as policies and procedures for otherareas of financial management throughout the OCFO. Throughout the myriad functions of the programand its activities, the current financial position of the District can be ascertained by local District electedand appointed leaders, District agencies, and other stakeholders as warranted. This program providesrelated training, expertise and assistance on SOAR, PeopleSoft Payroll and PASS (the District’sProcurement System) for the OCFO central cluster employees and agency financial staff. Additionally,records of compensation and related payments for current District employees are provided to employeesat the end of each pay period of their review and records. This helps to ensure that all employees receiveaccurate and timely paychecks for services rendered. Finally, monthly annuity payments are disbursed toretired Federal law enforcement officers on a reimbursable agreement between the District and the applic-able federal agencies.
Budget Development and Execution (BDE) - prepares, monitors, analyzes, and executes the District gov-ernment's budget, including operating, capital, and enterprise funds, in a manner that facilitates fiscalintegrity and maximizes services to taxpayers. The BDE program also provides advice to policy makerson the District government's budget and has primary responsibility for expenditure forecasts. The pro-gram has responsibility for providing leadership and facilitating the development of such innovative bud-geting practices as performance-based budgeting to improve the quality of the District government's bud-geting processes, activities, and documents. Lastly, this program contributes to District-wide managementreform efforts, including the Administrative Services Modernization Project, pay-scale consolidation activ-ities, and performance management.
Research and Analysis - responsible for: 1) revenue estimation and revenue policy analysis; and 2) analy-sis supporting economic development. The program area is divided into two offices, both of which reportdirectly to the CFO: the Office of Revenue Analysis (ORA) and Economic Development Finance (EDF).Services included within this program area are: analysis of all revenue sources and development of revenueprojections; development of fiscal impact statements for legislation; economic analysis and research in sup-port of revenue estimation; and special studies such as the bi-annual Tax Expenditure Study. ORA isresponsible for the revenue estimation and certification component of the budget, including revenue fromtaxes, and all other sources. EDF is responsible for analyzing the financial feasibility of economic devel-opment projects in the District and for advising the CFO and the Mayor on proposed economic devel-opment debt issuances.
Tax Administration (OTR) - provides fair, efficient, and effective administration of the District's business,income, excise, and real property tax laws. The tax administration program is divided into the followingcore activities: external customer service, deed recordation, real property tax assessment, tax audits andinvestigations, revenue accounting, and receipts and collections.
Information Technology (IT) - develops and maintains state-of-the-art financial information systems forthe District of Columbia, payroll, pensions, SOAR tax system, and the Executive Information System.The principal objectives of the program are to maintain accurate systems, modify systems in response tothe changing needs of the District, and maintain compliance with federal, state and local regulations.Other objectives are to provide the availability of IT resources and needed performance to support theOCFO and the agency CFOs, track and resolve system problems, and comply with standard accounting
Office of the Chief Financial Officer
A-173
and audit policies practiced in the District. IT also maintains an operation that is in compliance withbasic IT policies and practices, maintains technical currency, avoids obsolescence, and promotes andencourages use of these systems as the official system of record. IT's program facilitates and extends accessto the District's financial data, provides tools that enable analysis of the financial status of the agencies andthe District in its entirety, and supports SOAR. This facilitates high-level financial oversight for seniorDistrict management and policy makers.
Office of Finance and Treasury (OFT) - manages the financial assets and liabilities of the Governmentof the District of Columbia. This includes investing, receiving, safe-keeping, disbursing, recording, andacquiring District financial resources. The program is divided into the following core activities: debt man-agement, (transaction) operations and banking management, and asset management.
Office of Integrity and Oversight (OIO) - ensures that accountability, integrity, and efficiency are main-tained in the District of Columbia's financial management and tax administration systems. Through itsaudit and investigative activities, OIO provides the Chief Financial Officer with an independent reviewand appraisal of OCFO operations and assures the maintenance of the highest standards of integrity andsecurity of OCFO employees.
Agency Management (AMP) - provides for administrative support and the required tools to achieve oper-ational and programmatic results. This program is standard for all agencies using performance-based bud-geting.
Agency Financial Operations (AFO) - provides comprehensive and efficient financial management ser-vices to, and on behalf of, District agencies so that the financial integrity of the District of Columbia ismaintained. This program is standard for all agencies using performance-based budgeting.
The agency’s FY 2009 proposed budget is presented in the following tables:
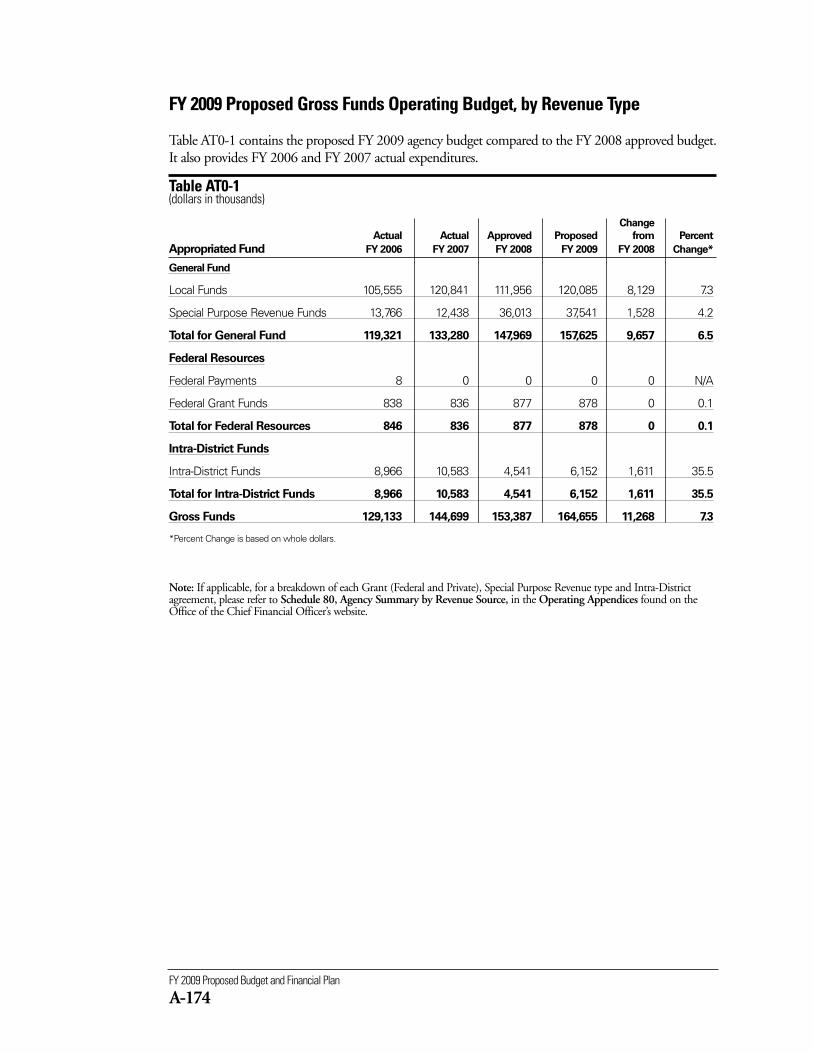
FY 2009 Proposed Budget and Financial Plan
A-174
Note: If applicable, for a breakdown of each Grant (Federal and Private), Special Purpose Revenue type and Intra-Districtagreement, please refer to Schedule 80, Agency Summary by Revenue Source, in the Operating Appendices found on theOffice of the Chief Financial Officer’s website.
FY 2009 Proposed Gross Funds Operating Budget, by Revenue Type
Table AT0-1 contains the proposed FY 2009 agency budget compared to the FY 2008 approved budget.It also provides FY 2006 and FY 2007 actual expenditures.
Table AT0-1 (dollars in thousands)
Change
Actual Actual Approved Proposed from Percent
Appropriated Fund FY 2006 FY 2007 FY 2008 FY 2009 FY 2008 Change*
General Fund
Local Funds 105,555 120,841 111,956 120,085 8,129 7.3
Special Purpose Revenue Funds 13,766 12,438 36,013 37,541 1,528 4.2
Total for General Fund 119,321 133,280 147,969 157,625 9,657 6.5
Federal Resources
Federal Payments 8 0 0 0 0 N/A
Federal Grant Funds 838 836 877 878 0 0.1
Total for Federal Resources 846 836 877 878 0 0.1
Intra-District Funds
Intra-District Funds 8,966 10,583 4,541 6,152 1,611 35.5
Total for Intra-District Funds 8,966 10,583 4,541 6,152 1,611 35.5
Gross Funds 129,133 144,699 153,387 164,655 11,268 7.3
*Percent Change is based on whole dollars.
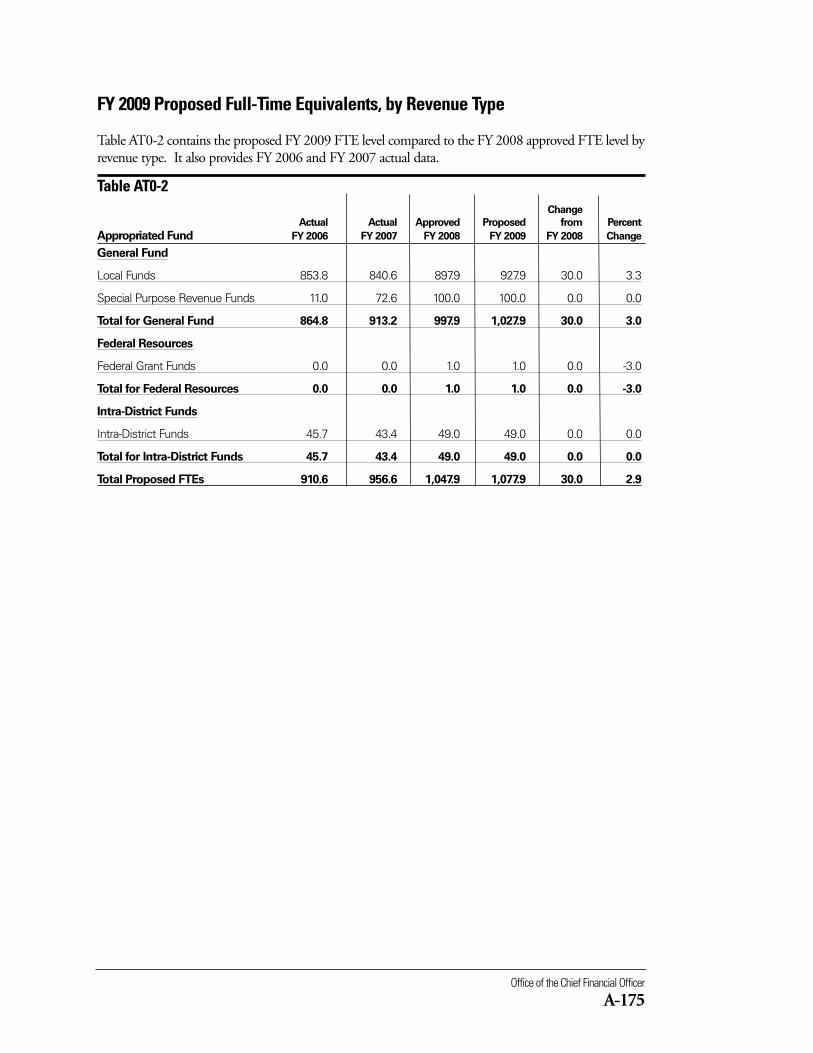
Office of the Chief Financial Officer
A-175
FY 2009 Proposed Full-Time Equivalents, by Revenue Type
Table AT0-2 contains the proposed FY 2009 FTE level compared to the FY 2008 approved FTE level byrevenue type. It also provides FY 2006 and FY 2007 actual data.
Table AT0-2 Change
Actual Actual Approved Proposed from Percent
Appropriated Fund FY 2006 FY 2007 FY 2008 FY 2009 FY 2008 Change
General Fund
Local Funds 853.8 840.6 897.9 927.9 30.0 3.3
Special Purpose Revenue Funds 11.0 72.6 100.0 100.0 0.0 0.0
Total for General Fund 864.8 913.2 997.9 1,027.9 30.0 3.0
Federal Resources
Federal Grant Funds 0.0 0.0 1.0 1.0 0.0 -3.0
Total for Federal Resources 0.0 0.0 1.0 1.0 0.0 -3.0
Intra-District Funds
Intra-District Funds 45.7 43.4 49.0 49.0 0.0 0.0
Total for Intra-District Funds 45.7 43.4 49.0 49.0 0.0 0.0
Total Proposed FTEs 910.6 956.6 1,047.9 1,077.9 30.0 2.9
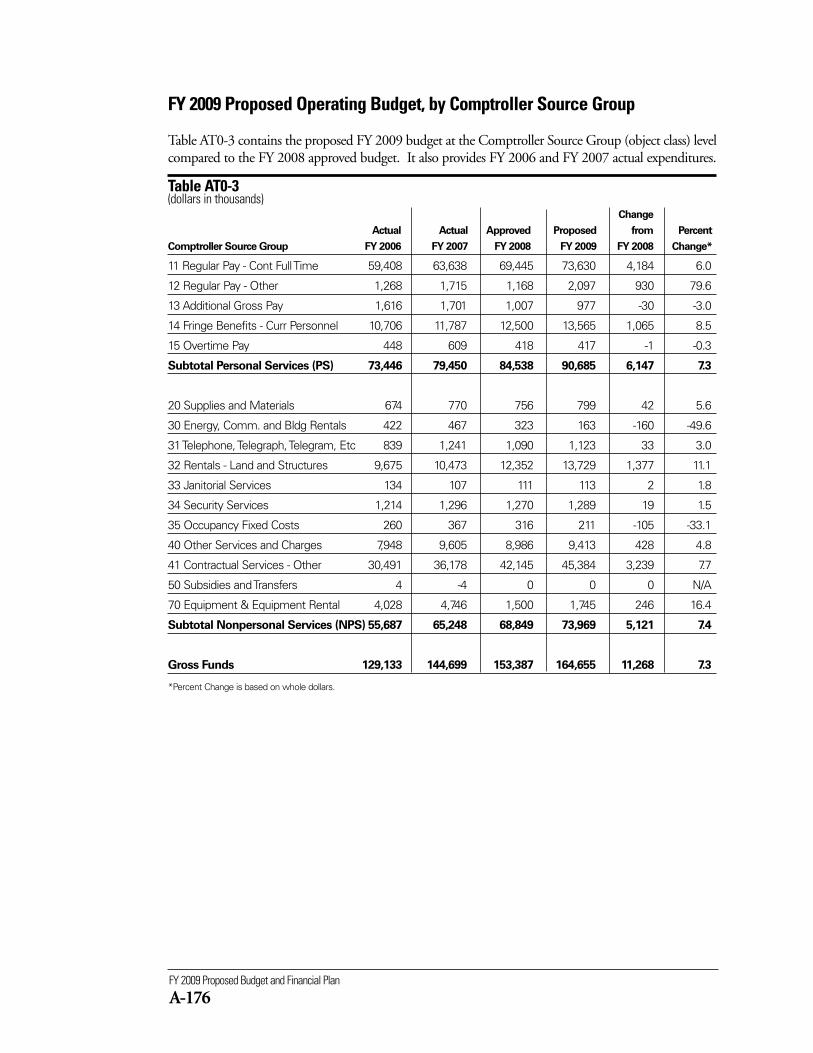
FY 2009 Proposed Budget and Financial Plan
A-176
FY 2009 Proposed Operating Budget, by Comptroller Source Group
Table AT0-3 contains the proposed FY 2009 budget at the Comptroller Source Group (object class) levelcompared to the FY 2008 approved budget. It also provides FY 2006 and FY 2007 actual expenditures.
Table AT0-3(dollars in thousands)
Change
Actual Actual Approved Proposed from Percent
Comptroller Source Group FY 2006 FY 2007 FY 2008 FY 2009 FY 2008 Change*
11 Regular Pay - Cont Full Time 59,408 63,638 69,445 73,630 4,184 6.0
12 Regular Pay - Other 1,268 1,715 1,168 2,097 930 79.6
13 Additional Gross Pay 1,616 1,701 1,007 977 -30 -3.0
14 Fringe Benefits - Curr Personnel 10,706 11,787 12,500 13,565 1,065 8.5
15 Overtime Pay 448 609 418 417 -1 -0.3
Subtotal Personal Services (PS) 73,446 79,450 84,538 90,685 6,147 7.3
20 Supplies and Materials 674 770 756 799 42 5.6
30 Energy, Comm. and Bldg Rentals 422 467 323 163 -160 -49.6
31 Telephone, Telegraph, Telegram, Etc 839 1,241 1,090 1,123 33 3.0
32 Rentals - Land and Structures 9,675 10,473 12,352 13,729 1,377 11.1
33 Janitorial Services 134 107 111 113 2 1.8
34 Security Services 1,214 1,296 1,270 1,289 19 1.5
35 Occupancy Fixed Costs 260 367 316 211 -105 -33.1
40 Other Services and Charges 7,948 9,605 8,986 9,413 428 4.8
41 Contractual Services - Other 30,491 36,178 42,145 45,384 3,239 7.7
50 Subsidies and Transfers 4 -4 0 0 0 N/A
70 Equipment & Equipment Rental 4,028 4,746 1,500 1,745 246 16.4
Subtotal Nonpersonal Services (NPS) 55,687 65,248 68,849 73,969 5,121 7.4
Gross Funds 129,133 144,699 153,387 164,655 11,268 7.3
*Percent Change is based on whole dollars.
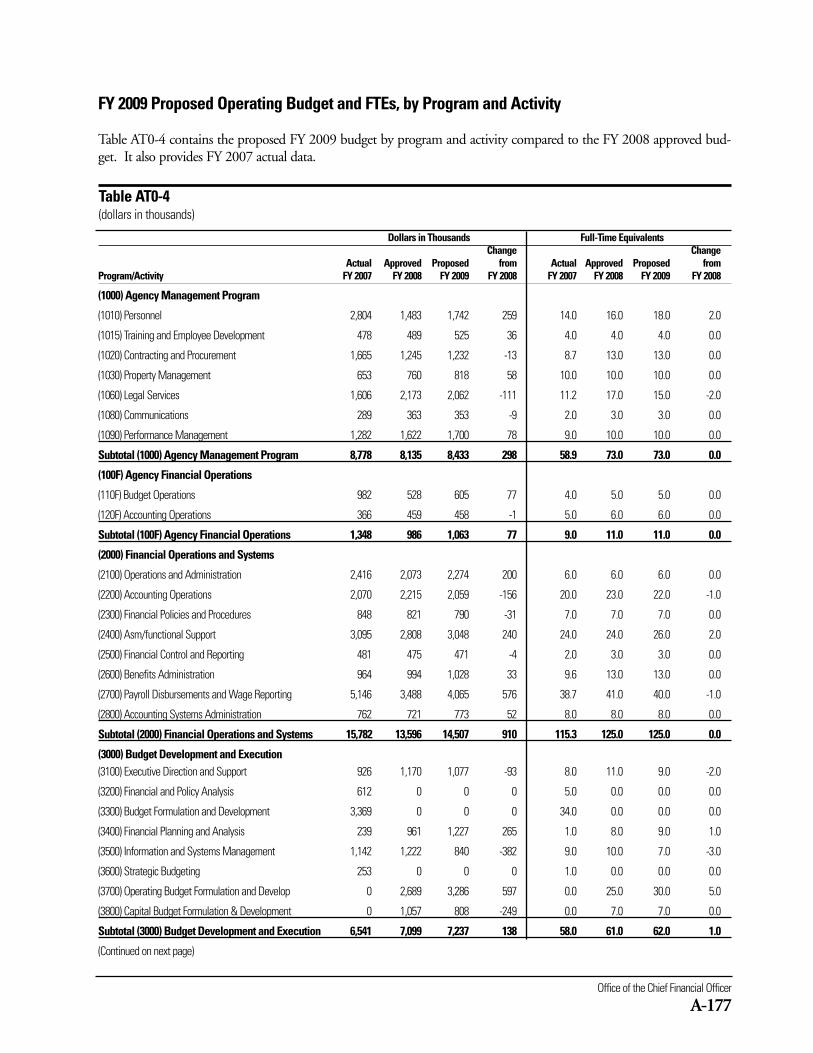
Office of the Chief Financial Officer
A-177
Dollars in Thousands Full-Time EquivalentsChange Change
Actual Approved Proposed from Actual Approved Proposed from Program/Activity FY 2007 FY 2008 FY 2009 FY 2008 FY 2007 FY 2008 FY 2009 FY 2008
(1000) Agency Management Program
(1010) Personnel 2,804 1,483 1,742 259 14.0 16.0 18.0 2.0
(1015) Training and Employee Development 478 489 525 36 4.0 4.0 4.0 0.0
(1020) Contracting and Procurement 1,665 1,245 1,232 -13 8.7 13.0 13.0 0.0
(1030) Property Management 653 760 818 58 10.0 10.0 10.0 0.0
(1060) Legal Services 1,606 2,173 2,062 -111 11.2 17.0 15.0 -2.0
(1080) Communications 289 363 353 -9 2.0 3.0 3.0 0.0
(1090) Performance Management 1,282 1,622 1,700 78 9.0 10.0 10.0 0.0
Subtotal (1000) Agency Management Program 8,778 8,135 8,433 298 58.9 73.0 73.0 0.0
(100F) Agency Financial Operations
(110F) Budget Operations 982 528 605 77 4.0 5.0 5.0 0.0
(120F) Accounting Operations 366 459 458 -1 5.0 6.0 6.0 0.0
Subtotal (100F) Agency Financial Operations 1,348 986 1,063 77 9.0 11.0 11.0 0.0
(2000) Financial Operations and Systems
(2100) Operations and Administration 2,416 2,073 2,274 200 6.0 6.0 6.0 0.0
(2200) Accounting Operations 2,070 2,215 2,059 -156 20.0 23.0 22.0 -1.0
(2300) Financial Policies and Procedures 848 821 790 -31 7.0 7.0 7.0 0.0
(2400) Asm/functional Support 3,095 2,808 3,048 240 24.0 24.0 26.0 2.0
(2500) Financial Control and Reporting 481 475 471 -4 2.0 3.0 3.0 0.0
(2600) Benefits Administration 964 994 1,028 33 9.6 13.0 13.0 0.0
(2700) Payroll Disbursements and Wage Reporting 5,146 3,488 4,065 576 38.7 41.0 40.0 -1.0
(2800) Accounting Systems Administration 762 721 773 52 8.0 8.0 8.0 0.0
Subtotal (2000) Financial Operations and Systems 15,782 13,596 14,507 910 115.3 125.0 125.0 0.0
(3000) Budget Development and Execution(3100) Executive Direction and Support 926 1,170 1,077 -93 8.0 11.0 9.0 -2.0
(3200) Financial and Policy Analysis 612 0 0 0 5.0 0.0 0.0 0.0
(3300) Budget Formulation and Development 3,369 0 0 0 34.0 0.0 0.0 0.0
(3400) Financial Planning and Analysis 239 961 1,227 265 1.0 8.0 9.0 1.0
(3500) Information and Systems Management 1,142 1,222 840 -382 9.0 10.0 7.0 -3.0
(3600) Strategic Budgeting 253 0 0 0 1.0 0.0 0.0 0.0
(3700) Operating Budget Formulation and Develop 0 2,689 3,286 597 0.0 25.0 30.0 5.0
(3800) Capital Budget Formulation & Development 0 1,057 808 -249 0.0 7.0 7.0 0.0
Subtotal (3000) Budget Development and Execution 6,541 7,099 7,237 138 58.0 61.0 62.0 1.0
(Continued on next page)
FY 2009 Proposed Operating Budget and FTEs, by Program and Activity
Table AT0-4 contains the proposed FY 2009 budget by program and activity compared to the FY 2008 approved bud-get. It also provides FY 2007 actual data.
Table AT0-4(dollars in thousands)
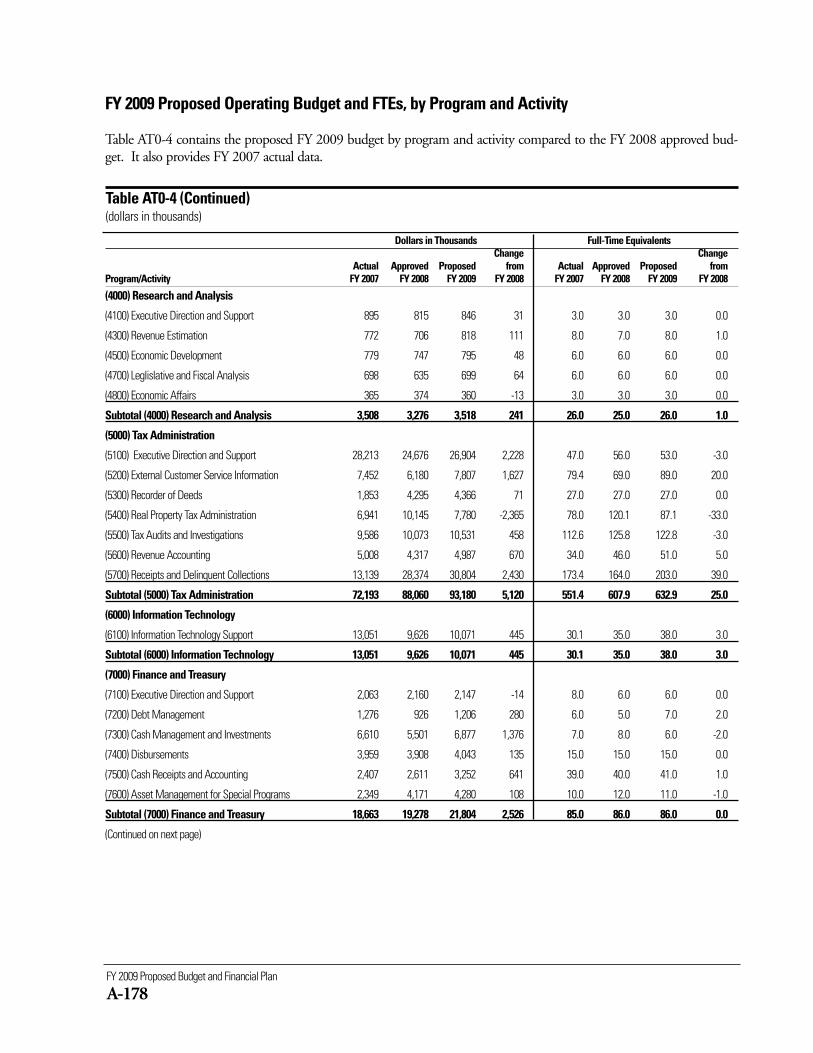
FY 2009 Proposed Budget and Financial Plan
A-178
Dollars in Thousands Full-Time EquivalentsChange Change
Actual Approved Proposed from Actual Approved Proposed from Program/Activity FY 2007 FY 2008 FY 2009 FY 2008 FY 2007 FY 2008 FY 2009 FY 2008
(4000) Research and Analysis
(4100) Executive Direction and Support 895 815 846 31 3.0 3.0 3.0 0.0
(4300) Revenue Estimation 772 706 818 111 8.0 7.0 8.0 1.0
(4500) Economic Development 779 747 795 48 6.0 6.0 6.0 0.0
(4700) Leglislative and Fiscal Analysis 698 635 699 64 6.0 6.0 6.0 0.0
(4800) Economic Affairs 365 374 360 -13 3.0 3.0 3.0 0.0
Subtotal (4000) Research and Analysis 3,508 3,276 3,518 241 26.0 25.0 26.0 1.0
(5000) Tax Administration
(5100) Executive Direction and Support 28,213 24,676 26,904 2,228 47.0 56.0 53.0 -3.0
(5200) External Customer Service Information 7,452 6,180 7,807 1,627 79.4 69.0 89.0 20.0
(5300) Recorder of Deeds 1,853 4,295 4,366 71 27.0 27.0 27.0 0.0
(5400) Real Property Tax Administration 6,941 10,145 7,780 -2,365 78.0 120.1 87.1 -33.0
(5500) Tax Audits and Investigations 9,586 10,073 10,531 458 112.6 125.8 122.8 -3.0
(5600) Revenue Accounting 5,008 4,317 4,987 670 34.0 46.0 51.0 5.0
(5700) Receipts and Delinquent Collections 13,139 28,374 30,804 2,430 173.4 164.0 203.0 39.0
Subtotal (5000) Tax Administration 72,193 88,060 93,180 5,120 551.4 607.9 632.9 25.0
(6000) Information Technology
(6100) Information Technology Support 13,051 9,626 10,071 445 30.1 35.0 38.0 3.0
Subtotal (6000) Information Technology 13,051 9,626 10,071 445 30.1 35.0 38.0 3.0
(7000) Finance and Treasury
(7100) Executive Direction and Support 2,063 2,160 2,147 -14 8.0 6.0 6.0 0.0
(7200) Debt Management 1,276 926 1,206 280 6.0 5.0 7.0 2.0
(7300) Cash Management and Investments 6,610 5,501 6,877 1,376 7.0 8.0 6.0 -2.0
(7400) Disbursements 3,959 3,908 4,043 135 15.0 15.0 15.0 0.0
(7500) Cash Receipts and Accounting 2,407 2,611 3,252 641 39.0 40.0 41.0 1.0
(7600) Asset Management for Special Programs 2,349 4,171 4,280 108 10.0 12.0 11.0 -1.0
Subtotal (7000) Finance and Treasury 18,663 19,278 21,804 2,526 85.0 86.0 86.0 0.0
(Continued on next page)
FY 2009 Proposed Operating Budget and FTEs, by Program and Activity
Table AT0-4 contains the proposed FY 2009 budget by program and activity compared to the FY 2008 approved bud-get. It also provides FY 2007 actual data.
Table AT0-4 (Continued)(dollars in thousands)
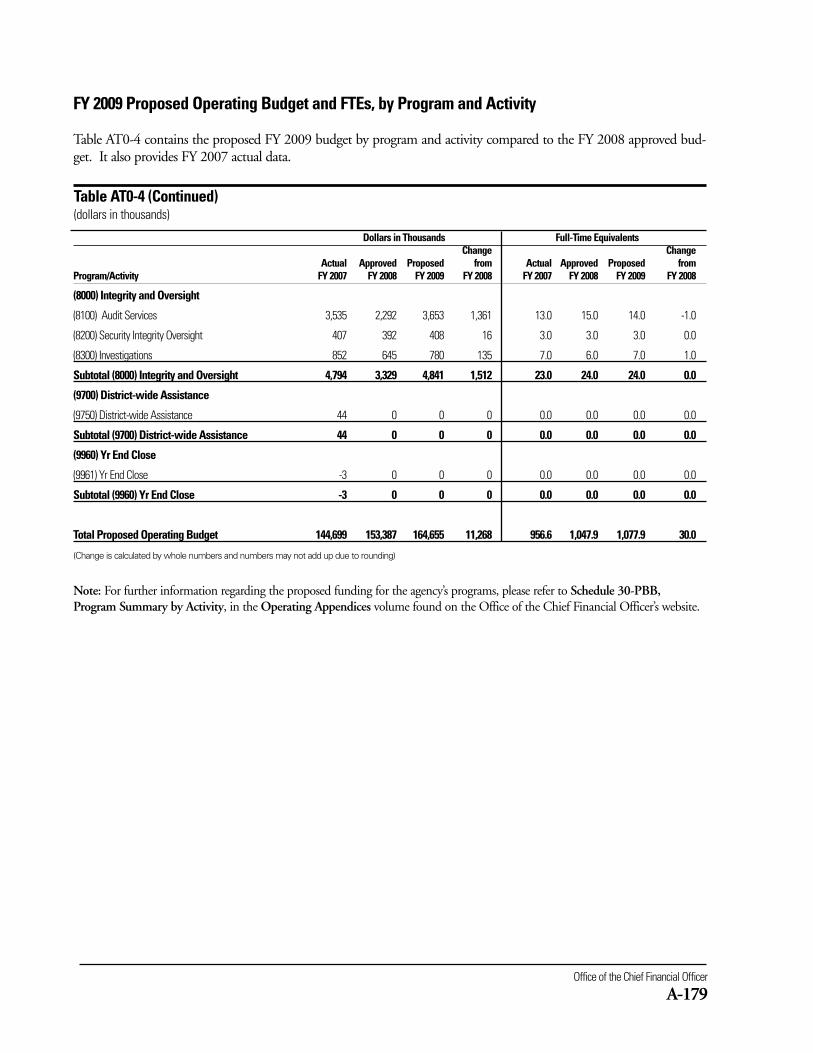
Office of the Chief Financial Officer
A-179
FY 2009 Proposed Operating Budget and FTEs, by Program and Activity
Table AT0-4 contains the proposed FY 2009 budget by program and activity compared to the FY 2008 approved bud-get. It also provides FY 2007 actual data.
Table AT0-4 (Continued)(dollars in thousands)
Dollars in Thousands Full-Time EquivalentsChange Change
Actual Approved Proposed from Actual Approved Proposed from Program/Activity FY 2007 FY 2008 FY 2009 FY 2008 FY 2007 FY 2008 FY 2009 FY 2008
(8000) Integrity and Oversight
(8100) Audit Services 3,535 2,292 3,653 1,361 13.0 15.0 14.0 -1.0
(8200) Security Integrity Oversight 407 392 408 16 3.0 3.0 3.0 0.0
(8300) Investigations 852 645 780 135 7.0 6.0 7.0 1.0
Subtotal (8000) Integrity and Oversight 4,794 3,329 4,841 1,512 23.0 24.0 24.0 0.0
(9700) District-wide Assistance
(9750) District-wide Assistance 44 0 0 0 0.0 0.0 0.0 0.0
Subtotal (9700) District-wide Assistance 44 0 0 0 0.0 0.0 0.0 0.0
(9960) Yr End Close
(9961) Yr End Close -3 0 0 0 0.0 0.0 0.0 0.0
Subtotal (9960) Yr End Close -3 0 0 0 0.0 0.0 0.0 0.0
Total Proposed Operating Budget 144,699 153,387 164,655 11,268 956.6 1,047.9 1,077.9 30.0
(Change is calculated by whole numbers and numbers may not add up due to rounding)
Note: For further information regarding the proposed funding for the agency’s programs, please refer to Schedule 30-PBB,Program Summary by Activity, in the Operating Appendices volume found on the Office of the Chief Financial Officer’s website.
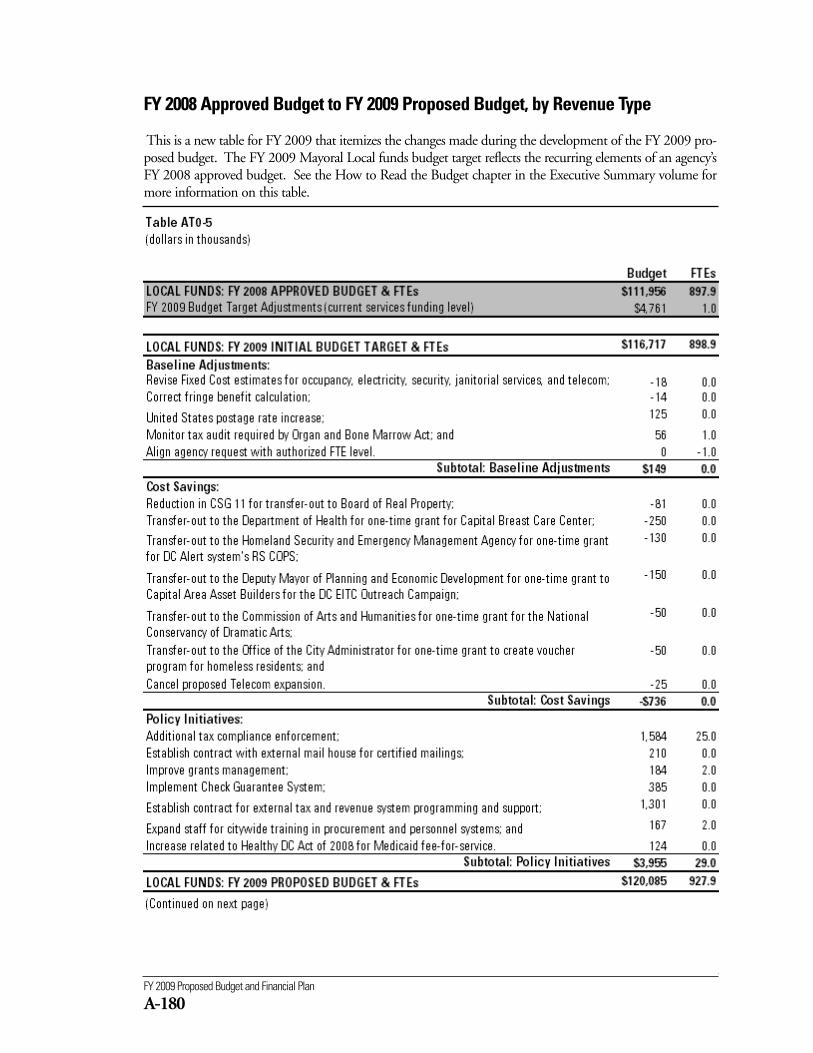
FY 2009 Proposed Budget and Financial Plan
A-180
FY 2008 Approved Budget to FY 2009 Proposed Budget, by Revenue Type
This is a new table for FY 2009 that itemizes the changes made during the development of the FY 2009 pro-posed budget. The FY 2009 Mayoral Local funds budget target reflects the recurring elements of an agency’sFY 2008 approved budget. See the How to Read the Budget chapter in the Executive Summary volume formore information on this table.
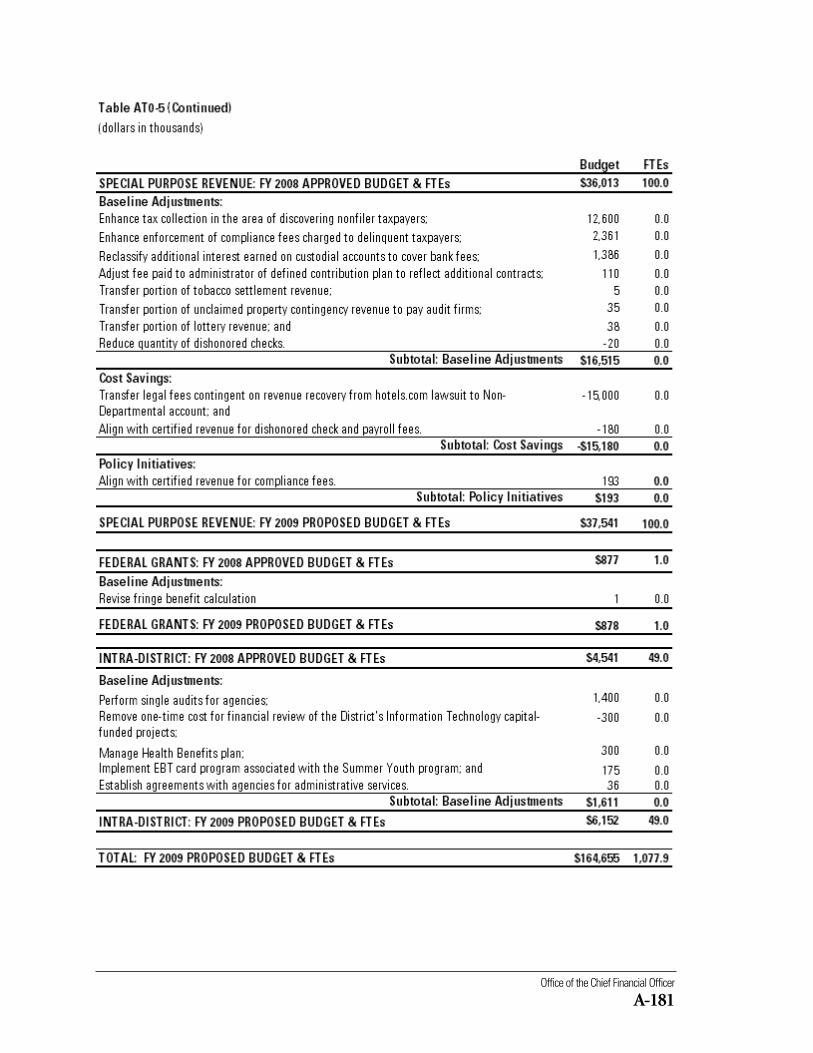
Office of the Chief Financial Officer
A-181
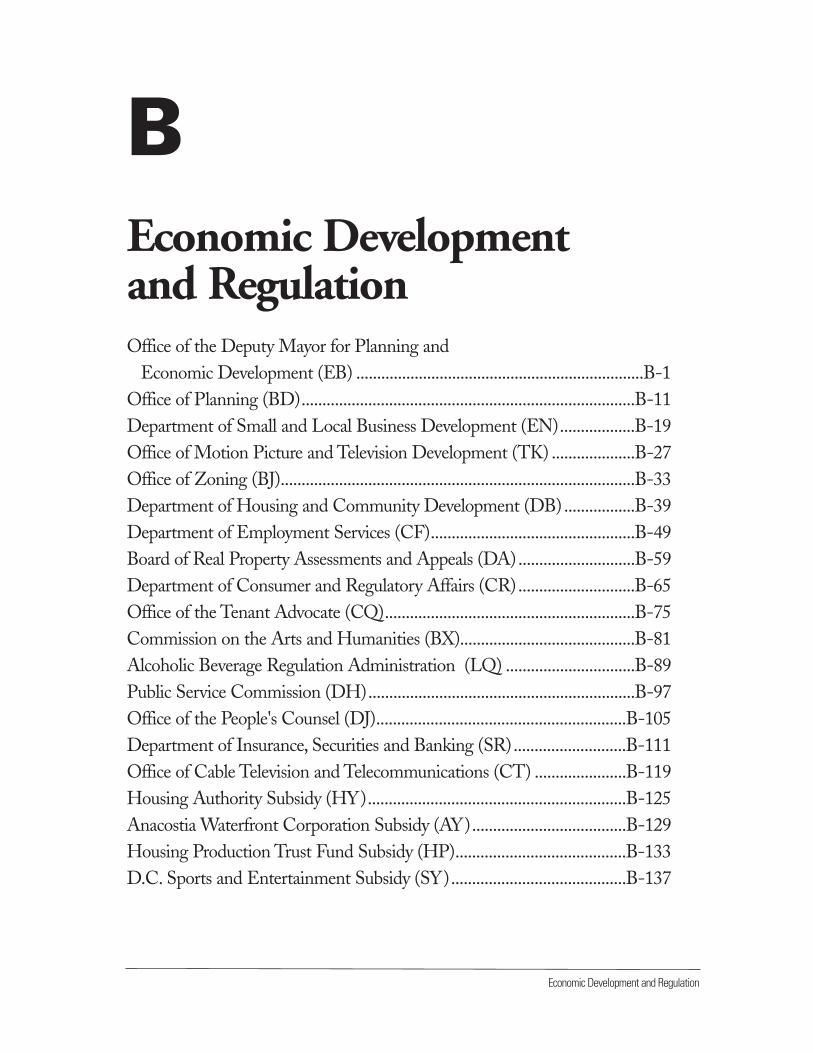
Economic Development and Regulation
BEconomic Development and RegulationOffice of the Deputy Mayor for Planning and
Economic Development (EB) .....................................................................B-1Office of Planning (BD)................................................................................B-11Department of Small and Local Business Development (EN)..................B-19Office of Motion Picture and Television Development (TK) ....................B-27Office of Zoning (BJ).....................................................................................B-33Department of Housing and Community Development (DB).................B-39Department of Employment Services (CF).................................................B-49Board of Real Property Assessments and Appeals (DA)............................B-59Department of Consumer and Regulatory Affairs (CR)............................B-65Office of the Tenant Advocate (CQ)............................................................B-75Commission on the Arts and Humanities (BX)..........................................B-81Alcoholic Beverage Regulation Administration (LQ) ...............................B-89Public Service Commission (DH)................................................................B-97Office of the People's Counsel (DJ)............................................................B-105Department of Insurance, Securities and Banking (SR)...........................B-111Office of Cable Television and Telecommunications (CT) ......................B-119Housing Authority Subsidy (HY)..............................................................B-125Anacostia Waterfront Corporation Subsidy (AY).....................................B-129Housing Production Trust Fund Subsidy (HP).........................................B-133D.C. Sports and Entertainment Subsidy (SY)..........................................B-137
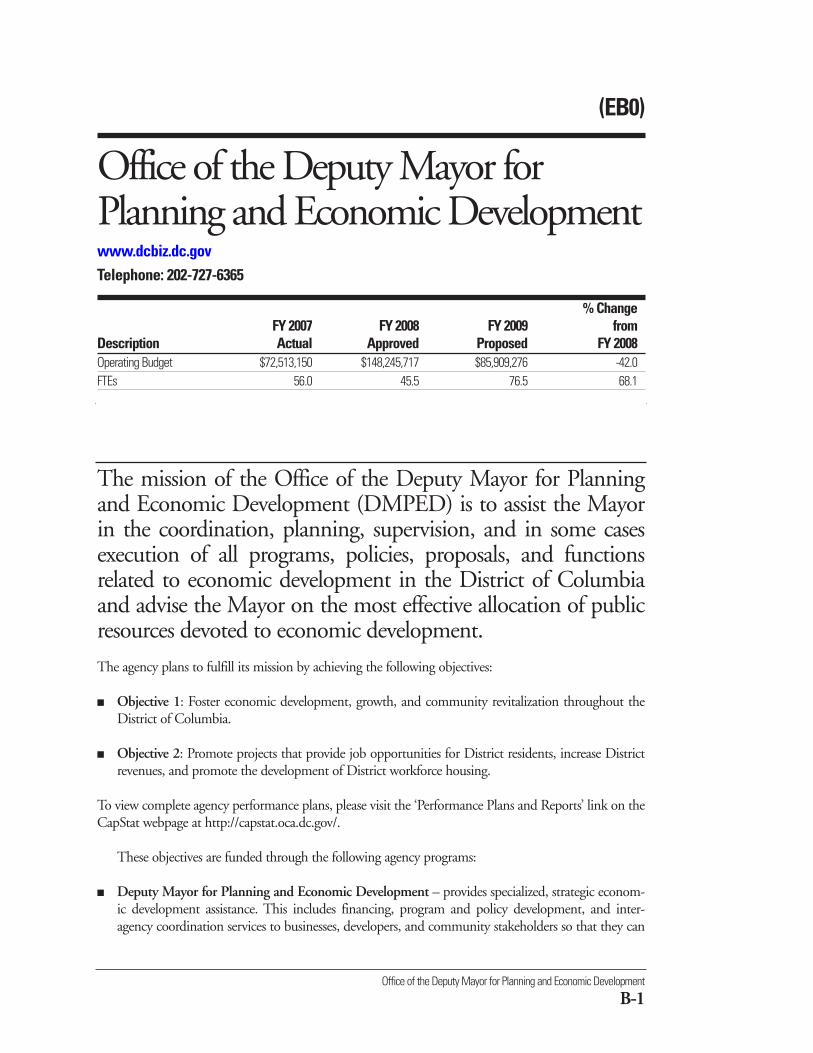
Office of the Deputy Mayor for Planning and Economic Development
B-1
The agency plans to fulfill its mission by achieving the following objectives:
■ Objective 1: Foster economic development, growth, and community revitalization throughout theDistrict of Columbia.
■ Objective 2: Promote projects that provide job opportunities for District residents, increase Districtrevenues, and promote the development of District workforce housing.
To view complete agency performance plans, please visit the ‘Performance Plans and Reports’ link on theCapStat webpage at http://capstat.oca.dc.gov/.
These objectives are funded through the following agency programs:
■ Deputy Mayor for Planning and Economic Development – provides specialized, strategic econom-ic development assistance. This includes financing, program and policy development, and inter-agency coordination services to businesses, developers, and community stakeholders so that they can
The mission of the Office of the Deputy Mayor for Planningand Economic Development (DMPED) is to assist the Mayorin the coordination, planning, supervision, and in some casesexecution of all programs, policies, proposals, and functionsrelated to economic development in the District of Columbiaand advise the Mayor on the most effective allocation of publicresources devoted to economic development.
(EB0)
Office of the Deputy Mayor forPlanning and Economic Developmentwww.dcbiz.dc.govTelephone: 202-727-6365
% ChangeFY 2007 FY 2008 FY 2009 from
Description Actual Approved Proposed FY 2008Operating Budget $72,513,150 $148,245,717 $85,909,276 -42.0FTEs 56.0 45.5 76.5 68.1
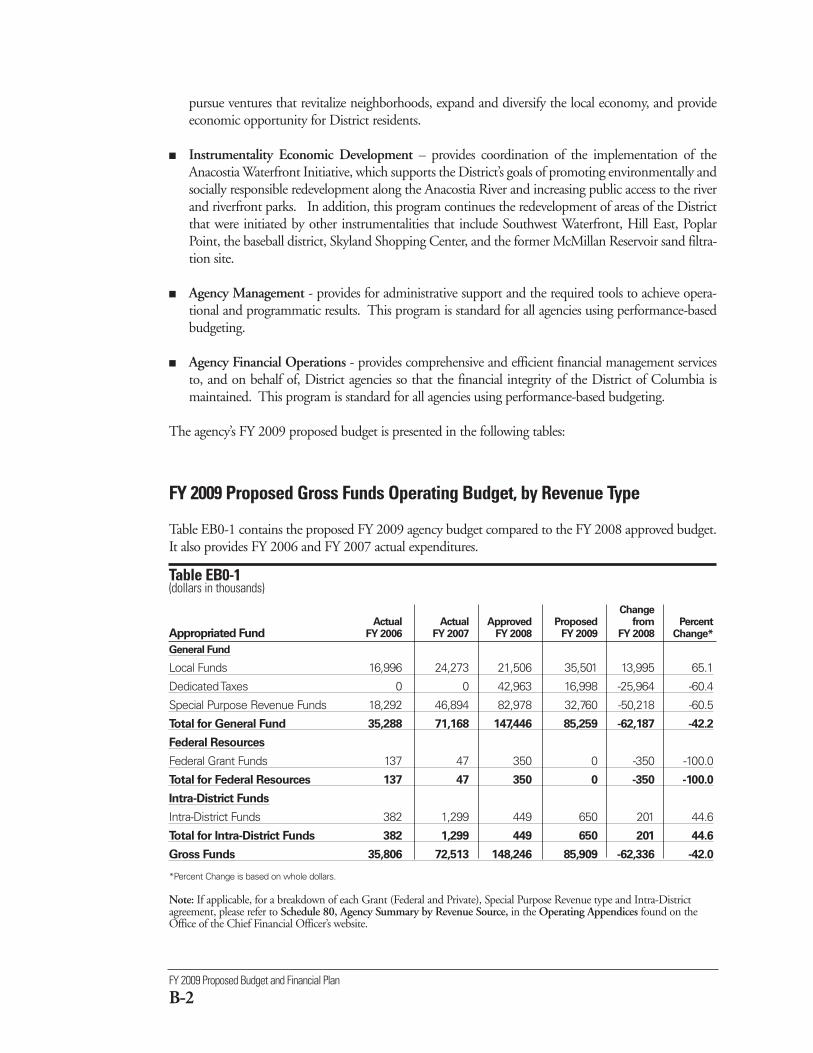
FY 2009 Proposed Budget and Financial Plan
B-2
pursue ventures that revitalize neighborhoods, expand and diversify the local economy, and provideeconomic opportunity for District residents.
■ Instrumentality Economic Development – provides coordination of the implementation of theAnacostia Waterfront Initiative, which supports the District’s goals of promoting environmentally andsocially responsible redevelopment along the Anacostia River and increasing public access to the riverand riverfront parks. In addition, this program continues the redevelopment of areas of the Districtthat were initiated by other instrumentalities that include Southwest Waterfront, Hill East, PoplarPoint, the baseball district, Skyland Shopping Center, and the former McMillan Reservoir sand filtra-tion site.
■ Agency Management - provides for administrative support and the required tools to achieve opera-tional and programmatic results. This program is standard for all agencies using performance-basedbudgeting.
■ Agency Financial Operations - provides comprehensive and efficient financial management servicesto, and on behalf of, District agencies so that the financial integrity of the District of Columbia ismaintained. This program is standard for all agencies using performance-based budgeting.
The agency’s FY 2009 proposed budget is presented in the following tables:
FY 2009 Proposed Gross Funds Operating Budget, by Revenue Type
Table EB0-1 contains the proposed FY 2009 agency budget compared to the FY 2008 approved budget.It also provides FY 2006 and FY 2007 actual expenditures.
Table EB0-1 (dollars in thousands)
ChangeActual Actual Approved Proposed from Percent
Appropriated Fund FY 2006 FY 2007 FY 2008 FY 2009 FY 2008 Change*
General Fund
Local Funds 16,996 24,273 21,506 35,501 13,995 65.1
Dedicated Taxes 0 0 42,963 16,998 -25,964 -60.4
Special Purpose Revenue Funds 18,292 46,894 82,978 32,760 -50,218 -60.5
Total for General Fund 35,288 71,168 147,446 85,259 -62,187 -42.2
Federal Resources
Federal Grant Funds 137 47 350 0 -350 -100.0
Total for Federal Resources 137 47 350 0 -350 -100.0
Intra-District Funds
Intra-District Funds 382 1,299 449 650 201 44.6
Total for Intra-District Funds 382 1,299 449 650 201 44.6
Gross Funds 35,806 72,513 148,246 85,909 -62,336 -42.0
*Percent Change is based on whole dollars.
Note: If applicable, for a breakdown of each Grant (Federal and Private), Special Purpose Revenue type and Intra-Districtagreement, please refer to Schedule 80, Agency Summary by Revenue Source, in the Operating Appendices found on theOffice of the Chief Financial Officer’s website.

Office of the Deputy Mayor for Planning and Economic Development
B-3
FY 2009 Proposed Full-Time Equivalents, by Revenue Type
Table EB0-2 contains the proposed FY 2009 FTE level compared to the FY 2008 approved FTE level byrevenue type. It also provides FY 2006 and FY 2007 actual data.
Table EB0-2 Change
Actual Actual Approved Proposed from Percent
Appropriated Fund FY 2006 FY 2007 FY 2008 FY 2009 FY 2008 Change
General Fund
Local Funds 28.0 26.0 29.5 22.5 -7.0 -23.7
Dedicated Taxes 0.0 0.0 6.0 4.0 -2.0 -33.3
Special Purpose Revenue Funds 10.0 27.0 7.0 47.0 40.0 571.4
Total for General Fund 38.0 53.0 42.5 73.5 31.0 72.9
Intra-District Funds
Intra-District Funds 3.0 3.0 3.0 3.0 0.0 0.0
Total for Intra-District Funds 3.0 3.0 3.0 3.0 0.0 0.0
Total Proposed FTEs 41.0 56.0 45.5 76.5 31.0 68.1
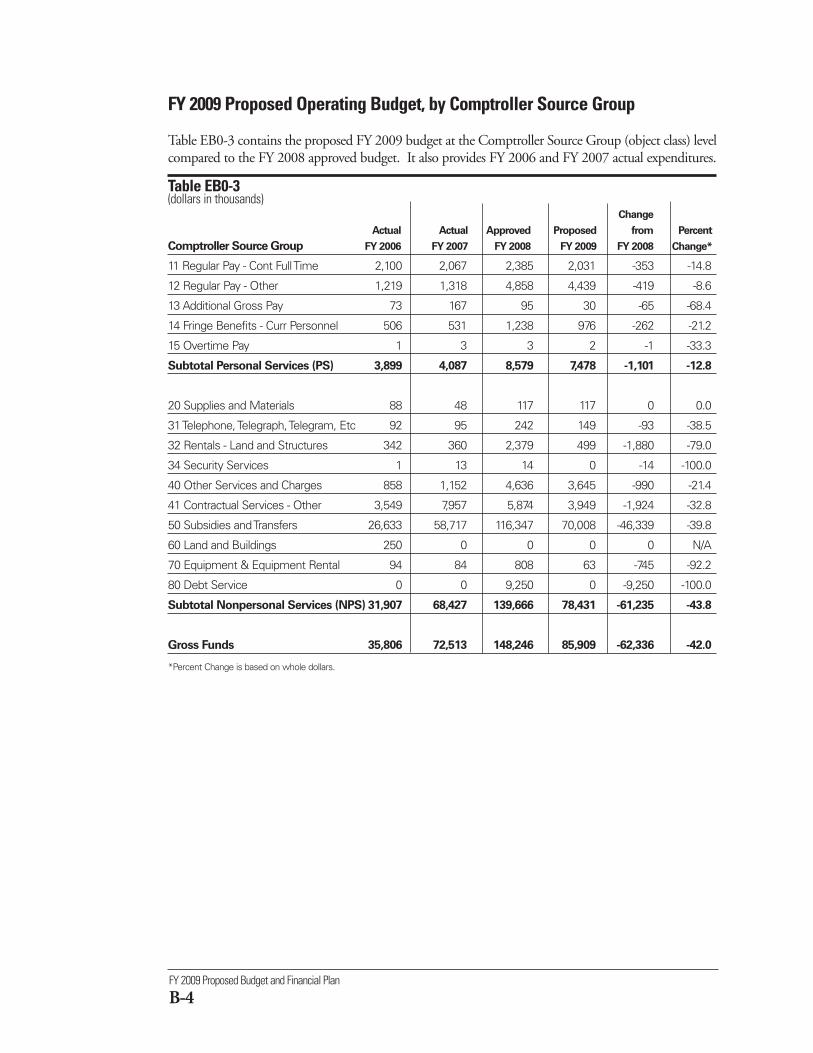
FY 2009 Proposed Budget and Financial Plan
B-4
FY 2009 Proposed Operating Budget, by Comptroller Source Group
Table EB0-3 contains the proposed FY 2009 budget at the Comptroller Source Group (object class) levelcompared to the FY 2008 approved budget. It also provides FY 2006 and FY 2007 actual expenditures.
Table EB0-3(dollars in thousands)
Change
Actual Actual Approved Proposed from Percent
Comptroller Source Group FY 2006 FY 2007 FY 2008 FY 2009 FY 2008 Change*
11 Regular Pay - Cont Full Time 2,100 2,067 2,385 2,031 -353 -14.8
12 Regular Pay - Other 1,219 1,318 4,858 4,439 -419 -8.6
13 Additional Gross Pay 73 167 95 30 -65 -68.4
14 Fringe Benefits - Curr Personnel 506 531 1,238 976 -262 -21.2
15 Overtime Pay 1 3 3 2 -1 -33.3
Subtotal Personal Services (PS) 3,899 4,087 8,579 7,478 -1,101 -12.8
20 Supplies and Materials 88 48 117 117 0 0.0
31 Telephone, Telegraph, Telegram, Etc 92 95 242 149 -93 -38.5
32 Rentals - Land and Structures 342 360 2,379 499 -1,880 -79.0
34 Security Services 1 13 14 0 -14 -100.0
40 Other Services and Charges 858 1,152 4,636 3,645 -990 -21.4
41 Contractual Services - Other 3,549 7,957 5,874 3,949 -1,924 -32.8
50 Subsidies and Transfers 26,633 58,717 116,347 70,008 -46,339 -39.8
60 Land and Buildings 250 0 0 0 0 N/A
70 Equipment & Equipment Rental 94 84 808 63 -745 -92.2
80 Debt Service 0 0 9,250 0 -9,250 -100.0
Subtotal Nonpersonal Services (NPS) 31,907 68,427 139,666 78,431 -61,235 -43.8
Gross Funds 35,806 72,513 148,246 85,909 -62,336 -42.0
*Percent Change is based on whole dollars.
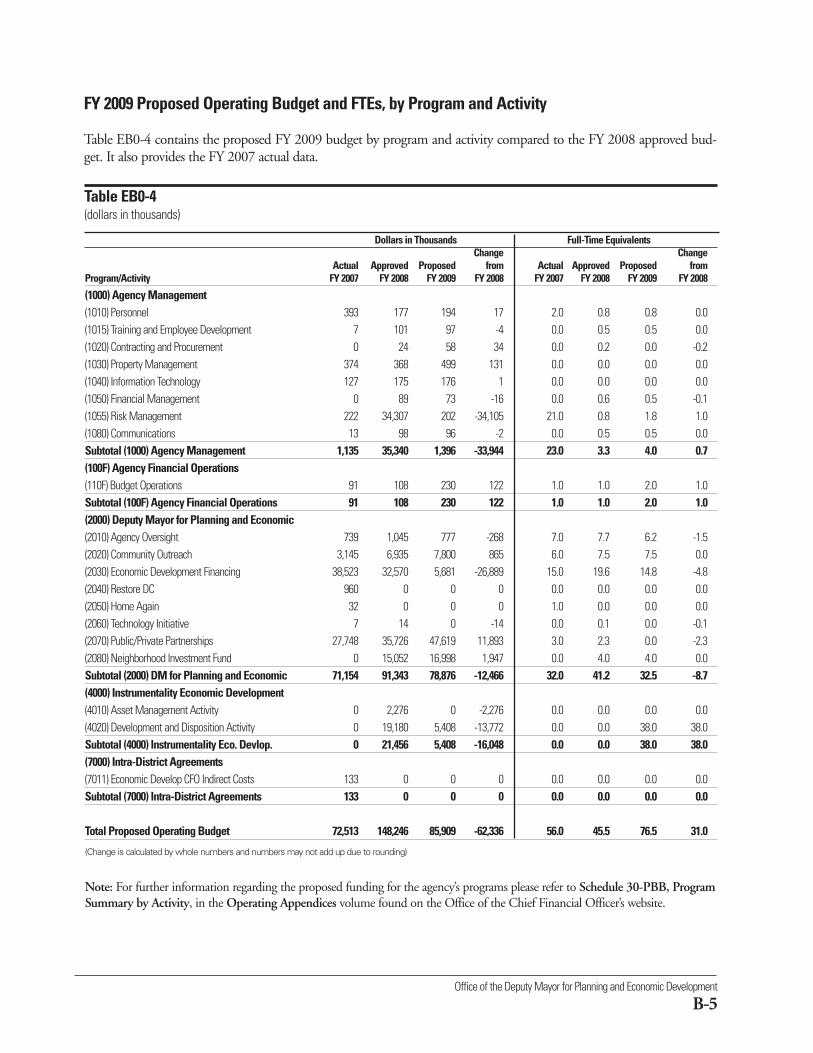
Office of the Deputy Mayor for Planning and Economic Development
B-5
FY 2009 Proposed Operating Budget and FTEs, by Program and Activity
Table EB0-4 contains the proposed FY 2009 budget by program and activity compared to the FY 2008 approved bud-get. It also provides the FY 2007 actual data.
Table EB0-4(dollars in thousands)
Dollars in Thousands Full-Time EquivalentsChange Change
Actual Approved Proposed from Actual Approved Proposed from Program/Activity FY 2007 FY 2008 FY 2009 FY 2008 FY 2007 FY 2008 FY 2009 FY 2008
(1000) Agency Management (1010) Personnel 393 177 194 17 2.0 0.8 0.8 0.0(1015) Training and Employee Development 7 101 97 -4 0.0 0.5 0.5 0.0(1020) Contracting and Procurement 0 24 58 34 0.0 0.2 0.0 -0.2(1030) Property Management 374 368 499 131 0.0 0.0 0.0 0.0(1040) Information Technology 127 175 176 1 0.0 0.0 0.0 0.0(1050) Financial Management 0 89 73 -16 0.0 0.6 0.5 -0.1(1055) Risk Management 222 34,307 202 -34,105 21.0 0.8 1.8 1.0(1080) Communications 13 98 96 -2 0.0 0.5 0.5 0.0Subtotal (1000) Agency Management 1,135 35,340 1,396 -33,944 23.0 3.3 4.0 0.7(100F) Agency Financial Operations (110F) Budget Operations 91 108 230 122 1.0 1.0 2.0 1.0Subtotal (100F) Agency Financial Operations 91 108 230 122 1.0 1.0 2.0 1.0(2000) Deputy Mayor for Planning and Economic (2010) Agency Oversight 739 1,045 777 -268 7.0 7.7 6.2 -1.5(2020) Community Outreach 3,145 6,935 7,800 865 6.0 7.5 7.5 0.0(2030) Economic Development Financing 38,523 32,570 5,681 -26,889 15.0 19.6 14.8 -4.8(2040) Restore DC 960 0 0 0 0.0 0.0 0.0 0.0(2050) Home Again 32 0 0 0 1.0 0.0 0.0 0.0(2060) Technology Initiative 7 14 0 -14 0.0 0.1 0.0 -0.1(2070) Public/Private Partnerships 27,748 35,726 47,619 11,893 3.0 2.3 0.0 -2.3(2080) Neighborhood Investment Fund 0 15,052 16,998 1,947 0.0 4.0 4.0 0.0Subtotal (2000) DM for Planning and Economic 71,154 91,343 78,876 -12,466 32.0 41.2 32.5 -8.7(4000) Instrumentality Economic Development (4010) Asset Management Activity 0 2,276 0 -2,276 0.0 0.0 0.0 0.0(4020) Development and Disposition Activity 0 19,180 5,408 -13,772 0.0 0.0 38.0 38.0Subtotal (4000) Instrumentality Eco. Devlop. 0 21,456 5,408 -16,048 0.0 0.0 38.0 38.0(7000) Intra-District Agreements (7011) Economic Develop CFO Indirect Costs 133 0 0 0 0.0 0.0 0.0 0.0Subtotal (7000) Intra-District Agreements 133 0 0 0 0.0 0.0 0.0 0.0
Total Proposed Operating Budget 72,513 148,246 85,909 -62,336 56.0 45.5 76.5 31.0
(Change is calculated by whole numbers and numbers may not add up due to rounding)
Note: For further information regarding the proposed funding for the agency’s programs please refer to Schedule 30-PBB, ProgramSummary by Activity, in the Operating Appendices volume found on the Office of the Chief Financial Officer’s website.
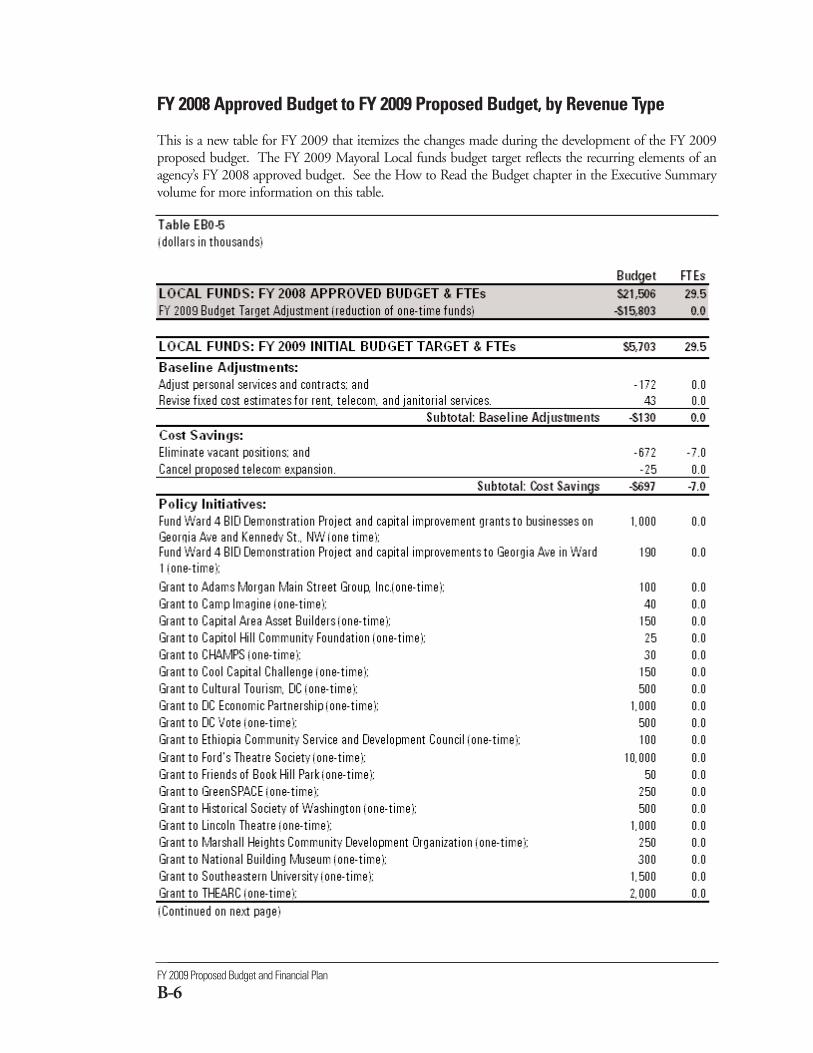
FY 2009 Proposed Budget and Financial Plan
B-6
FY 2008 Approved Budget to FY 2009 Proposed Budget, by Revenue Type
This is a new table for FY 2009 that itemizes the changes made during the development of the FY 2009proposed budget. The FY 2009 Mayoral Local funds budget target reflects the recurring elements of anagency’s FY 2008 approved budget. See the How to Read the Budget chapter in the Executive Summaryvolume for more information on this table.
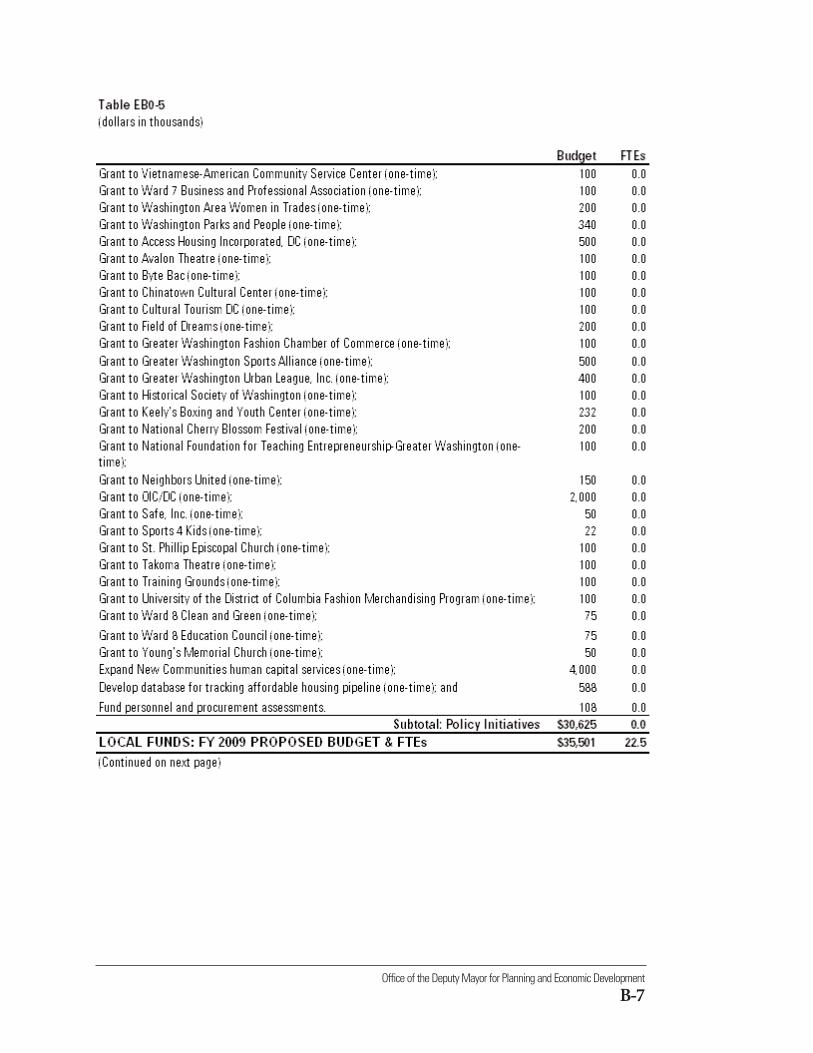
Office of the Deputy Mayor for Planning and Economic Development
B-7
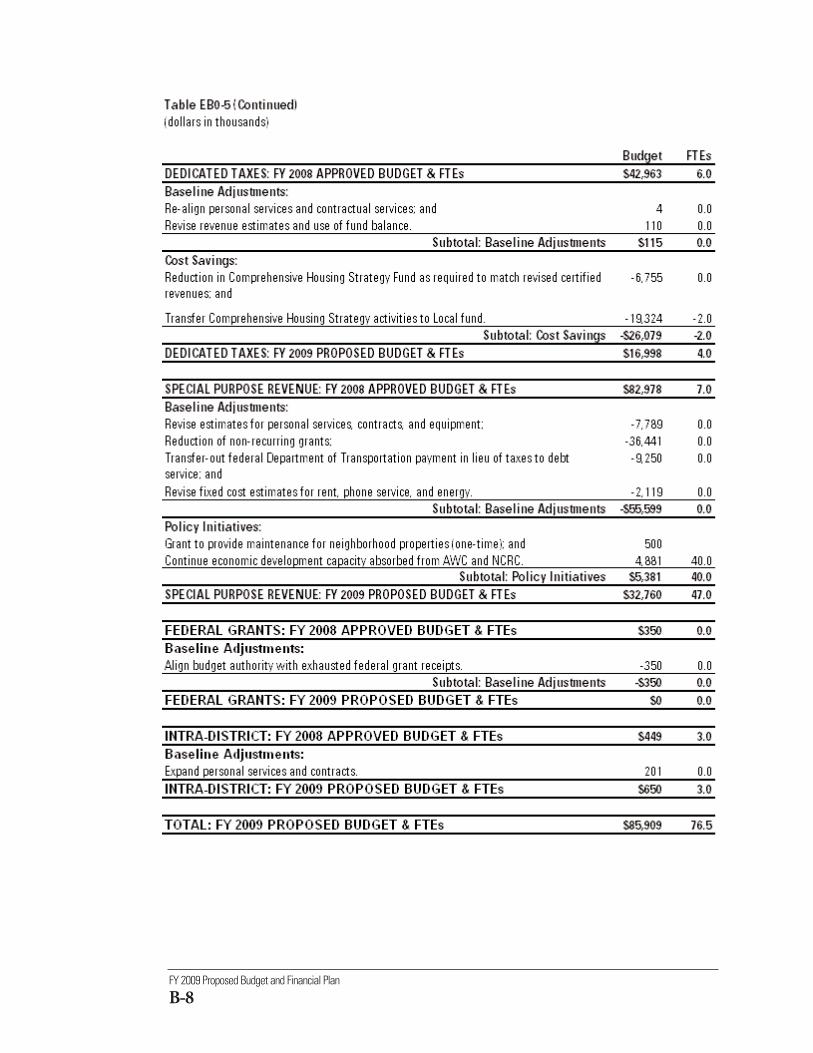
FY 2009 Proposed Budget and Financial Plan
B-8
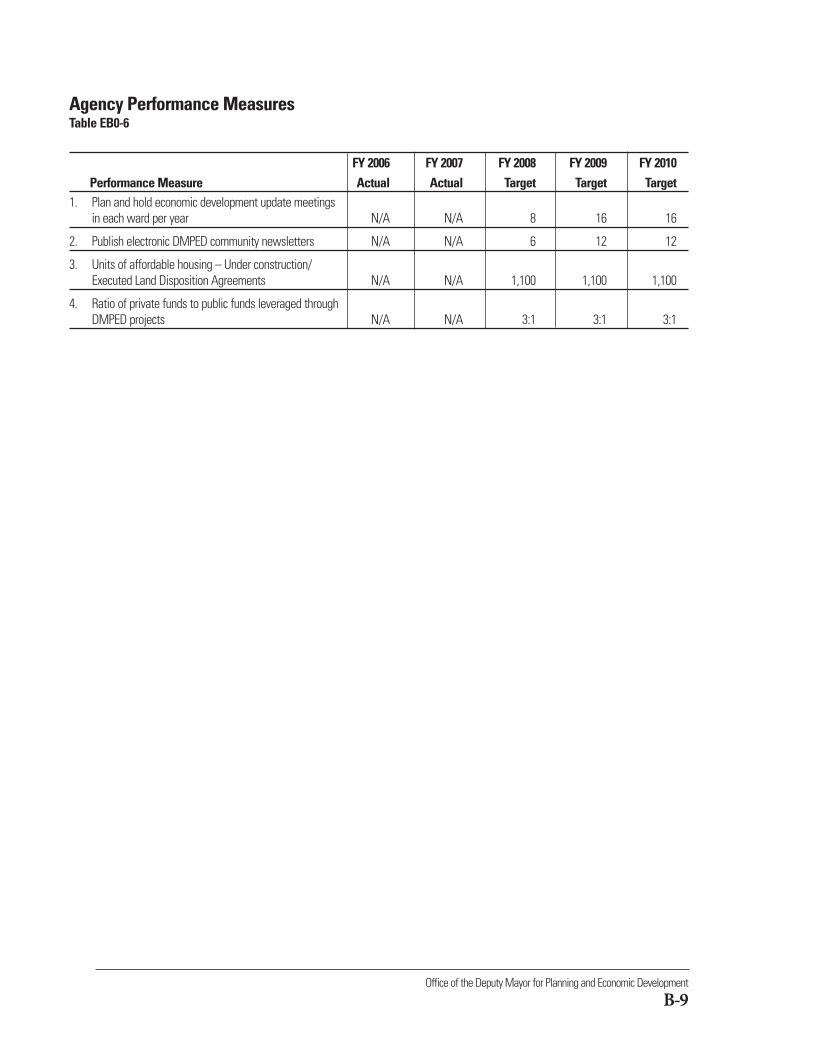
Office of the Deputy Mayor for Planning and Economic Development
B-9
Agency Performance MeasuresTable EB0-6
FY 2006 FY 2007 FY 2008 FY 2009 FY 2010Performance Measure Actual Actual Target Target Target
1. Plan and hold economic development update meetingsin each ward per year N/A N/A 8 16 16
2. Publish electronic DMPED community newsletters N/A N/A 6 12 12
3. Units of affordable housing – Under construction/Executed Land Disposition Agreements N/A N/A 1,100 1,100 1,100
4. Ratio of private funds to public funds leveraged throughDMPED projects N/A N/A 3:1 3:1 3:1
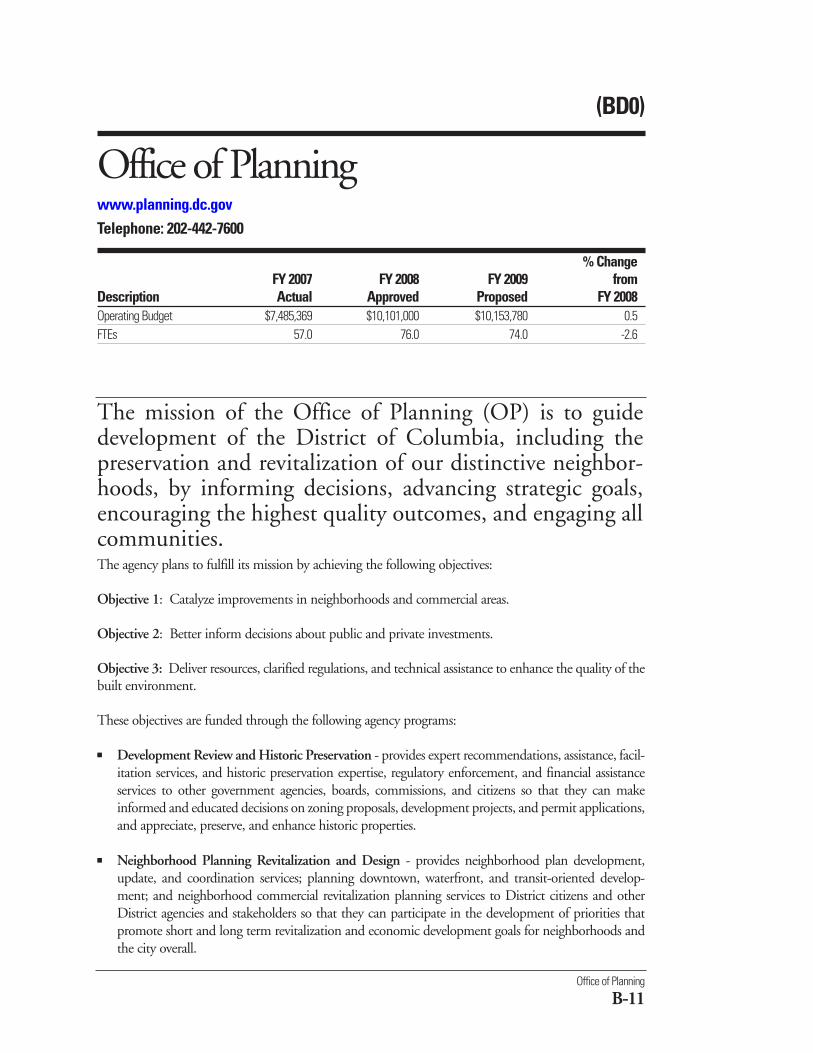
Office of Planning
B-11
The mission of the Office of Planning (OP) is to guidedevelopment of the District of Columbia, including thepreservation and revitalization of our distinctive neighbor-hoods, by informing decisions, advancing strategic goals,encouraging the highest quality outcomes, and engaging allcommunities.The agency plans to fulfill its mission by achieving the following objectives:
Objective 1: Catalyze improvements in neighborhoods and commercial areas.
Objective 2: Better inform decisions about public and private investments.
Objective 3: Deliver resources, clarified regulations, and technical assistance to enhance the quality of thebuilt environment.
These objectives are funded through the following agency programs:
■ Development Review and Historic Preservation - provides expert recommendations, assistance, facil-itation services, and historic preservation expertise, regulatory enforcement, and financial assistanceservices to other government agencies, boards, commissions, and citizens so that they can makeinformed and educated decisions on zoning proposals, development projects, and permit applications,and appreciate, preserve, and enhance historic properties.
■ Neighborhood Planning Revitalization and Design - provides neighborhood plan development,update, and coordination services; planning downtown, waterfront, and transit-oriented develop-ment; and neighborhood commercial revitalization planning services to District citizens and otherDistrict agencies and stakeholders so that they can participate in the development of priorities thatpromote short and long term revitalization and economic development goals for neighborhoods andthe city overall.
(BD0)
Office of Planningwww.planning.dc.govTelephone: 202-442-7600
% ChangeFY 2007 FY 2008 FY 2009 from
Description Actual Approved Proposed FY 2008Operating Budget $7,485,369 $10,101,000 $10,153,780 0.5FTEs 57.0 76.0 74.0 -2.6
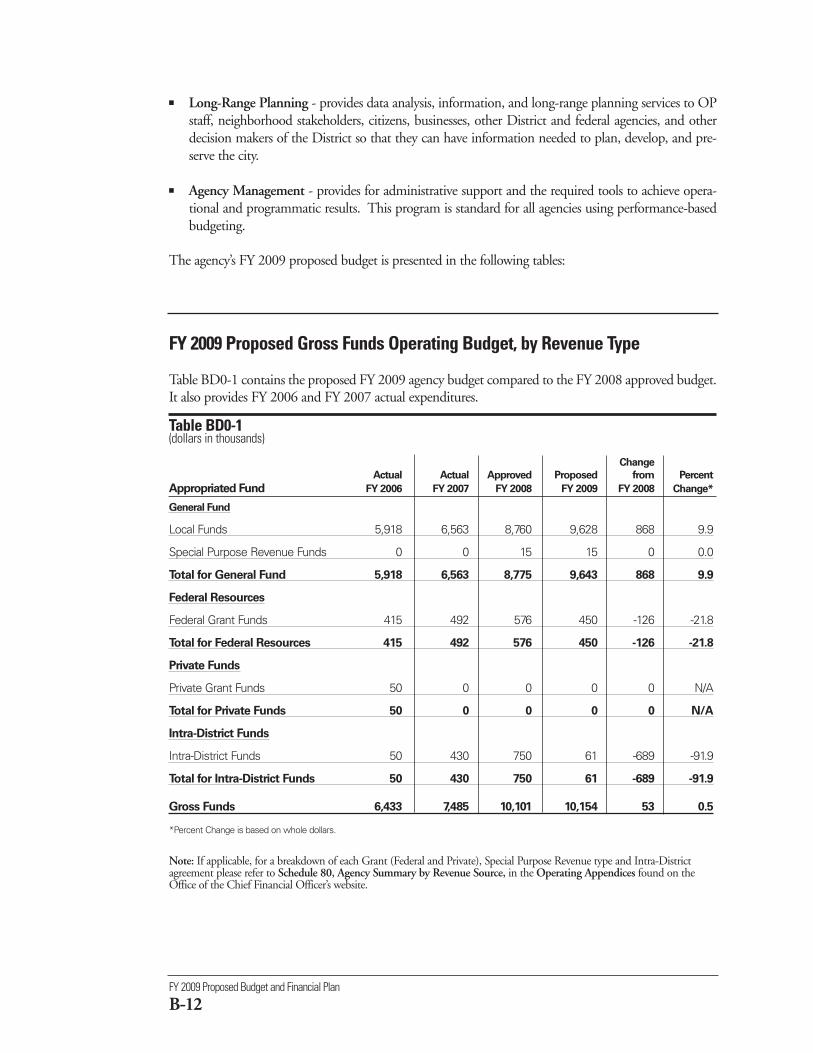
FY 2009 Proposed Budget and Financial Plan
B-12
■ Long-Range Planning - provides data analysis, information, and long-range planning services to OPstaff, neighborhood stakeholders, citizens, businesses, other District and federal agencies, and otherdecision makers of the District so that they can have information needed to plan, develop, and pre-serve the city.
■ Agency Management - provides for administrative support and the required tools to achieve opera-tional and programmatic results. This program is standard for all agencies using performance-basedbudgeting.
The agency’s FY 2009 proposed budget is presented in the following tables:
FY 2009 Proposed Gross Funds Operating Budget, by Revenue Type
Table BD0-1 contains the proposed FY 2009 agency budget compared to the FY 2008 approved budget.It also provides FY 2006 and FY 2007 actual expenditures.
Table BD0-1 (dollars in thousands)
Change
Actual Actual Approved Proposed from Percent
Appropriated Fund FY 2006 FY 2007 FY 2008 FY 2009 FY 2008 Change*
General Fund
Local Funds 5,918 6,563 8,760 9,628 868 9.9
Special Purpose Revenue Funds 0 0 15 15 0 0.0
Total for General Fund 5,918 6,563 8,775 9,643 868 9.9
Federal Resources
Federal Grant Funds 415 492 576 450 -126 -21.8
Total for Federal Resources 415 492 576 450 -126 -21.8
Private Funds
Private Grant Funds 50 0 0 0 0 N/A
Total for Private Funds 50 0 0 0 0 N/A
Intra-District Funds
Intra-District Funds 50 430 750 61 -689 -91.9
Total for Intra-District Funds 50 430 750 61 -689 -91.9
Gross Funds 6,433 7,485 10,101 10,154 53 0.5
*Percent Change is based on whole dollars.
Note: If applicable, for a breakdown of each Grant (Federal and Private), Special Purpose Revenue type and Intra-Districtagreement please refer to Schedule 80, Agency Summary by Revenue Source, in the Operating Appendices found on theOffice of the Chief Financial Officer’s website.
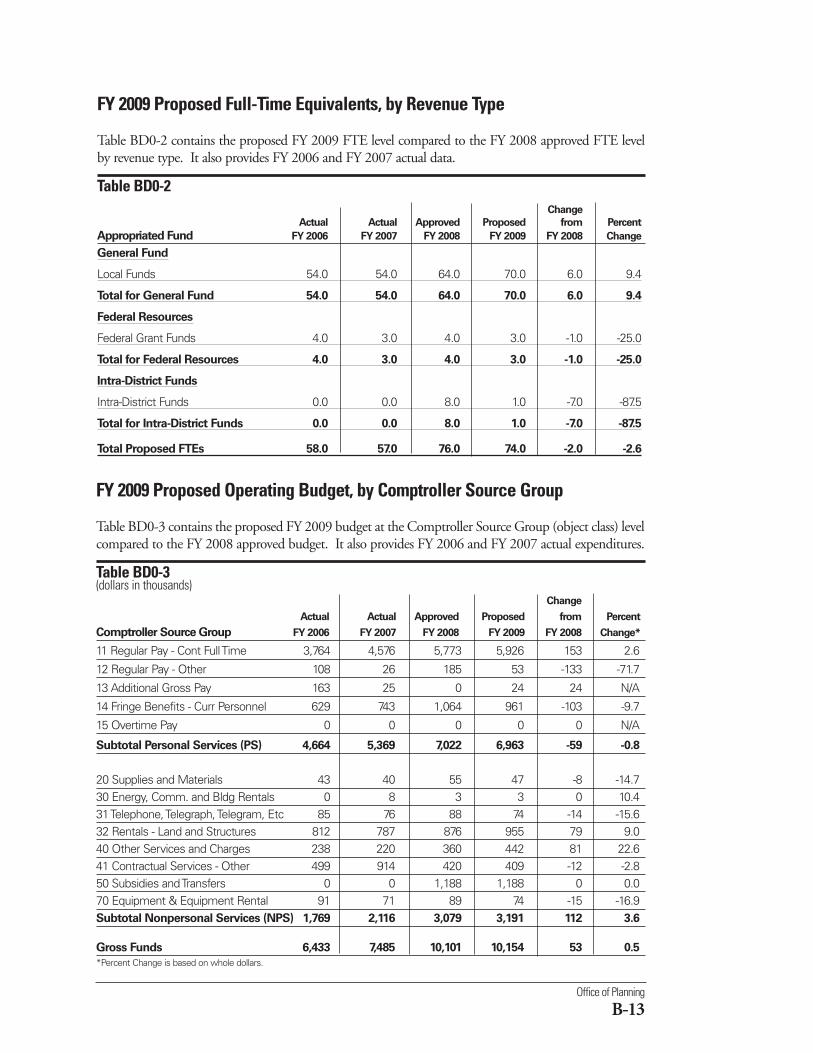
Office of Planning
B-13
FY 2009 Proposed Full-Time Equivalents, by Revenue Type
Table BD0-2 contains the proposed FY 2009 FTE level compared to the FY 2008 approved FTE levelby revenue type. It also provides FY 2006 and FY 2007 actual data.
Table BD0-2 Change
Actual Actual Approved Proposed from Percent
Appropriated Fund FY 2006 FY 2007 FY 2008 FY 2009 FY 2008 Change
General Fund
Local Funds 54.0 54.0 64.0 70.0 6.0 9.4
Total for General Fund 54.0 54.0 64.0 70.0 6.0 9.4
Federal Resources
Federal Grant Funds 4.0 3.0 4.0 3.0 -1.0 -25.0
Total for Federal Resources 4.0 3.0 4.0 3.0 -1.0 -25.0
Intra-District Funds
Intra-District Funds 0.0 0.0 8.0 1.0 -7.0 -87.5
Total for Intra-District Funds 0.0 0.0 8.0 1.0 -7.0 -87.5
Total Proposed FTEs 58.0 57.0 76.0 74.0 -2.0 -2.6
FY 2009 Proposed Operating Budget, by Comptroller Source Group
Table BD0-3 contains the proposed FY 2009 budget at the Comptroller Source Group (object class) levelcompared to the FY 2008 approved budget. It also provides FY 2006 and FY 2007 actual expenditures.
Table BD0-3(dollars in thousands)
Change
Actual Actual Approved Proposed from Percent
Comptroller Source Group FY 2006 FY 2007 FY 2008 FY 2009 FY 2008 Change*
11 Regular Pay - Cont Full Time 3,764 4,576 5,773 5,926 153 2.6
12 Regular Pay - Other 108 26 185 53 -133 -71.7
13 Additional Gross Pay 163 25 0 24 24 N/A
14 Fringe Benefits - Curr Personnel 629 743 1,064 961 -103 -9.7
15 Overtime Pay 0 0 0 0 0 N/A
Subtotal Personal Services (PS) 4,664 5,369 7,022 6,963 -59 -0.8
20 Supplies and Materials 43 40 55 47 -8 -14.730 Energy, Comm. and Bldg Rentals 0 8 3 3 0 10.431 Telephone, Telegraph, Telegram, Etc 85 76 88 74 -14 -15.632 Rentals - Land and Structures 812 787 876 955 79 9.040 Other Services and Charges 238 220 360 442 81 22.641 Contractual Services - Other 499 914 420 409 -12 -2.850 Subsidies and Transfers 0 0 1,188 1,188 0 0.070 Equipment & Equipment Rental 91 71 89 74 -15 -16.9Subtotal Nonpersonal Services (NPS) 1,769 2,116 3,079 3,191 112 3.6
Gross Funds 6,433 7,485 10,101 10,154 53 0.5
*Percent Change is based on whole dollars.
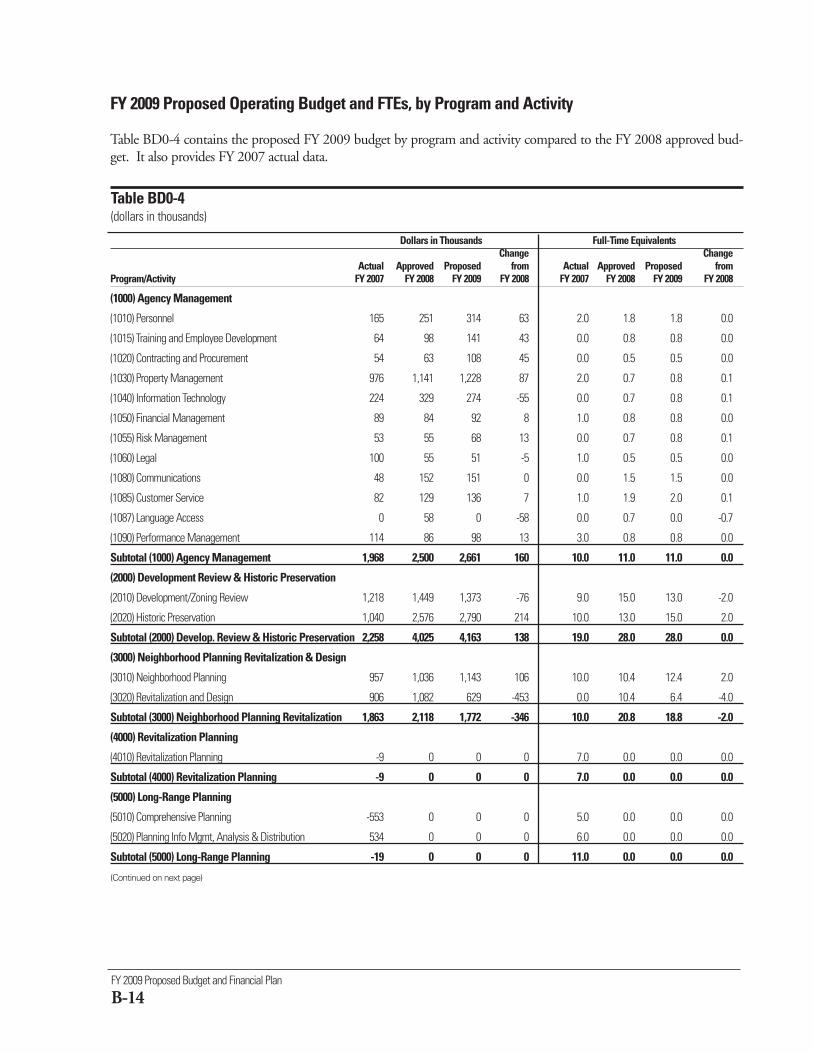
FY 2009 Proposed Budget and Financial Plan
B-14
Dollars in Thousands Full-Time EquivalentsChange Change
Actual Approved Proposed from Actual Approved Proposed from Program/Activity FY 2007 FY 2008 FY 2009 FY 2008 FY 2007 FY 2008 FY 2009 FY 2008
(1000) Agency Management
(1010) Personnel 165 251 314 63 2.0 1.8 1.8 0.0
(1015) Training and Employee Development 64 98 141 43 0.0 0.8 0.8 0.0
(1020) Contracting and Procurement 54 63 108 45 0.0 0.5 0.5 0.0
(1030) Property Management 976 1,141 1,228 87 2.0 0.7 0.8 0.1
(1040) Information Technology 224 329 274 -55 0.0 0.7 0.8 0.1
(1050) Financial Management 89 84 92 8 1.0 0.8 0.8 0.0
(1055) Risk Management 53 55 68 13 0.0 0.7 0.8 0.1
(1060) Legal 100 55 51 -5 1.0 0.5 0.5 0.0
(1080) Communications 48 152 151 0 0.0 1.5 1.5 0.0
(1085) Customer Service 82 129 136 7 1.0 1.9 2.0 0.1
(1087) Language Access 0 58 0 -58 0.0 0.7 0.0 -0.7
(1090) Performance Management 114 86 98 13 3.0 0.8 0.8 0.0
Subtotal (1000) Agency Management 1,968 2,500 2,661 160 10.0 11.0 11.0 0.0
(2000) Development Review & Historic Preservation
(2010) Development/Zoning Review 1,218 1,449 1,373 -76 9.0 15.0 13.0 -2.0
(2020) Historic Preservation 1,040 2,576 2,790 214 10.0 13.0 15.0 2.0
Subtotal (2000) Develop. Review & Historic Preservation 2,258 4,025 4,163 138 19.0 28.0 28.0 0.0
(3000) Neighborhood Planning Revitalization & Design
(3010) Neighborhood Planning 957 1,036 1,143 106 10.0 10.4 12.4 2.0
(3020) Revitalization and Design 906 1,082 629 -453 0.0 10.4 6.4 -4.0
Subtotal (3000) Neighborhood Planning Revitalization 1,863 2,118 1,772 -346 10.0 20.8 18.8 -2.0
(4000) Revitalization Planning
(4010) Revitalization Planning -9 0 0 0 7.0 0.0 0.0 0.0
Subtotal (4000) Revitalization Planning -9 0 0 0 7.0 0.0 0.0 0.0
(5000) Long-Range Planning
(5010) Comprehensive Planning -553 0 0 0 5.0 0.0 0.0 0.0
(5020) Planning Info Mgmt, Analysis & Distribution 534 0 0 0 6.0 0.0 0.0 0.0
Subtotal (5000) Long-Range Planning -19 0 0 0 11.0 0.0 0.0 0.0
(Continued on next page)
FY 2009 Proposed Operating Budget and FTEs, by Program and Activity
Table BD0-4 contains the proposed FY 2009 budget by program and activity compared to the FY 2008 approved bud-get. It also provides FY 2007 actual data.
Table BD0-4(dollars in thousands)
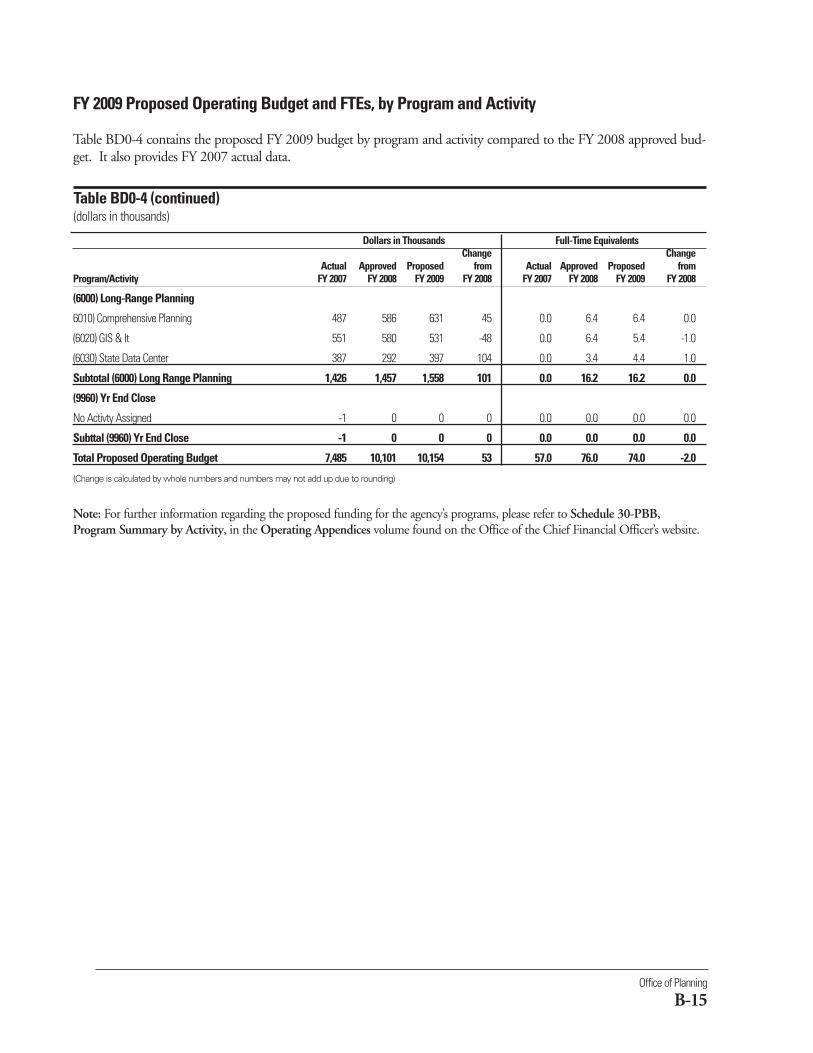
Office of Planning
B-15
Dollars in Thousands Full-Time EquivalentsChange Change
Actual Approved Proposed from Actual Approved Proposed from Program/Activity FY 2007 FY 2008 FY 2009 FY 2008 FY 2007 FY 2008 FY 2009 FY 2008
(6000) Long-Range Planning
6010) Comprehensive Planning 487 586 631 45 0.0 6.4 6.4 0.0
(6020) GIS & It 551 580 531 -48 0.0 6.4 5.4 -1.0
(6030) State Data Center 387 292 397 104 0.0 3.4 4.4 1.0
Subtotal (6000) Long Range Planning 1,426 1,457 1,558 101 0.0 16.2 16.2 0.0
(9960) Yr End Close
No Activty Assigned -1 0 0 0 0.0 0.0 0.0 0.0
Subttal (9960) Yr End Close -1 0 0 0 0.0 0.0 0.0 0.0
Total Proposed Operating Budget 7,485 10,101 10,154 53 57.0 76.0 74.0 -2.0
(Change is calculated by whole numbers and numbers may not add up due to rounding)
Note: For further information regarding the proposed funding for the agency’s programs, please refer to Schedule 30-PBB,Program Summary by Activity, in the Operating Appendices volume found on the Office of the Chief Financial Officer’s website.
FY 2009 Proposed Operating Budget and FTEs, by Program and Activity
Table BD0-4 contains the proposed FY 2009 budget by program and activity compared to the FY 2008 approved bud-get. It also provides FY 2007 actual data.
Table BD0-4 (continued)(dollars in thousands)
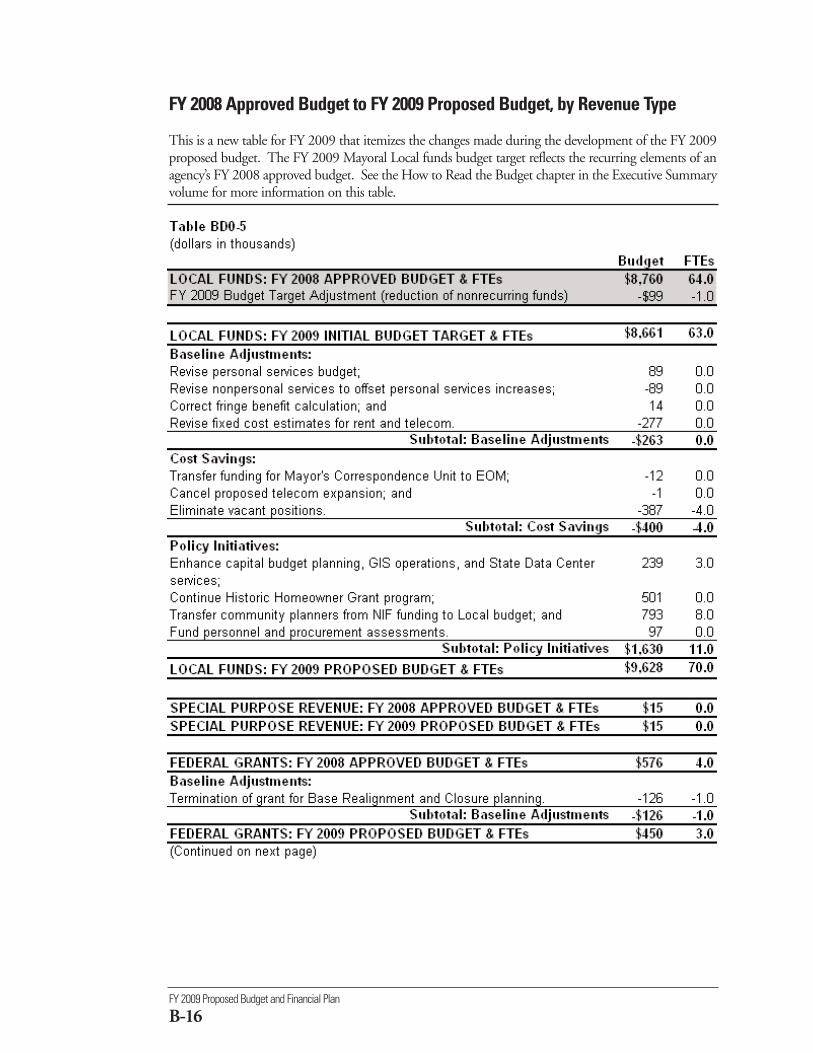
FY 2009 Proposed Budget and Financial Plan
B-16
FY 2008 Approved Budget to FY 2009 Proposed Budget, by Revenue Type
This is a new table for FY 2009 that itemizes the changes made during the development of the FY 2009proposed budget. The FY 2009 Mayoral Local funds budget target reflects the recurring elements of anagency’s FY 2008 approved budget. See the How to Read the Budget chapter in the Executive Summaryvolume for more information on this table.
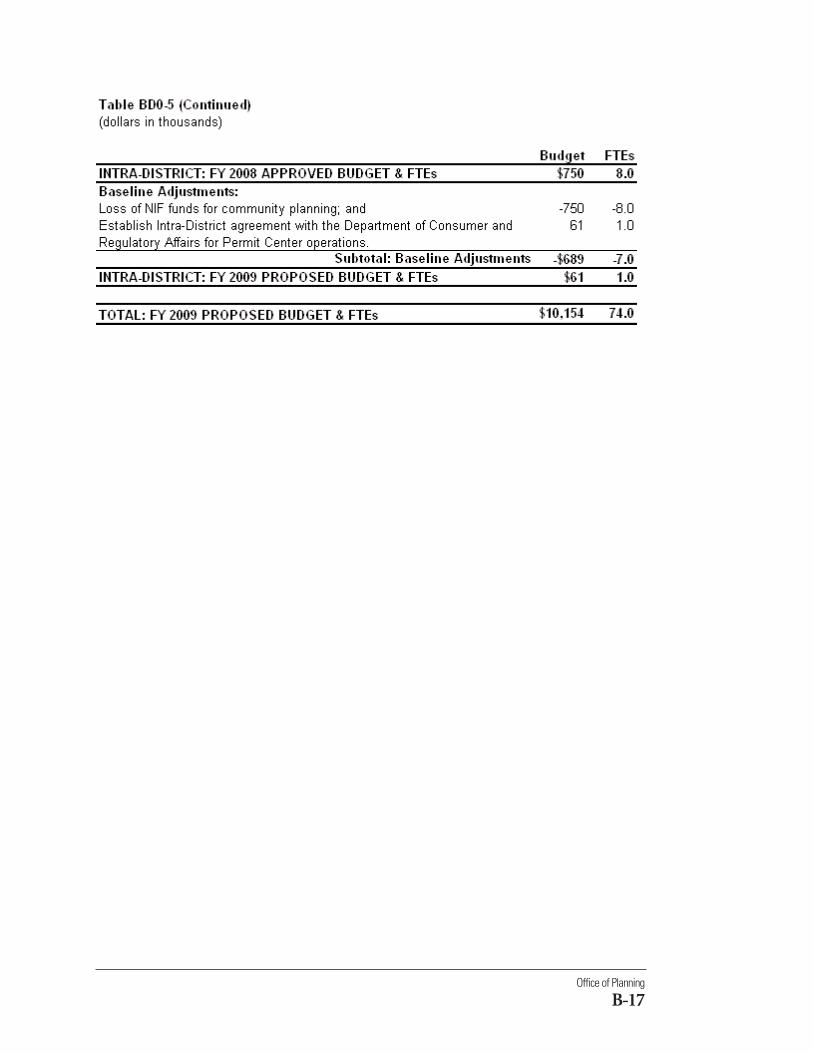
Office of Planning
B-17
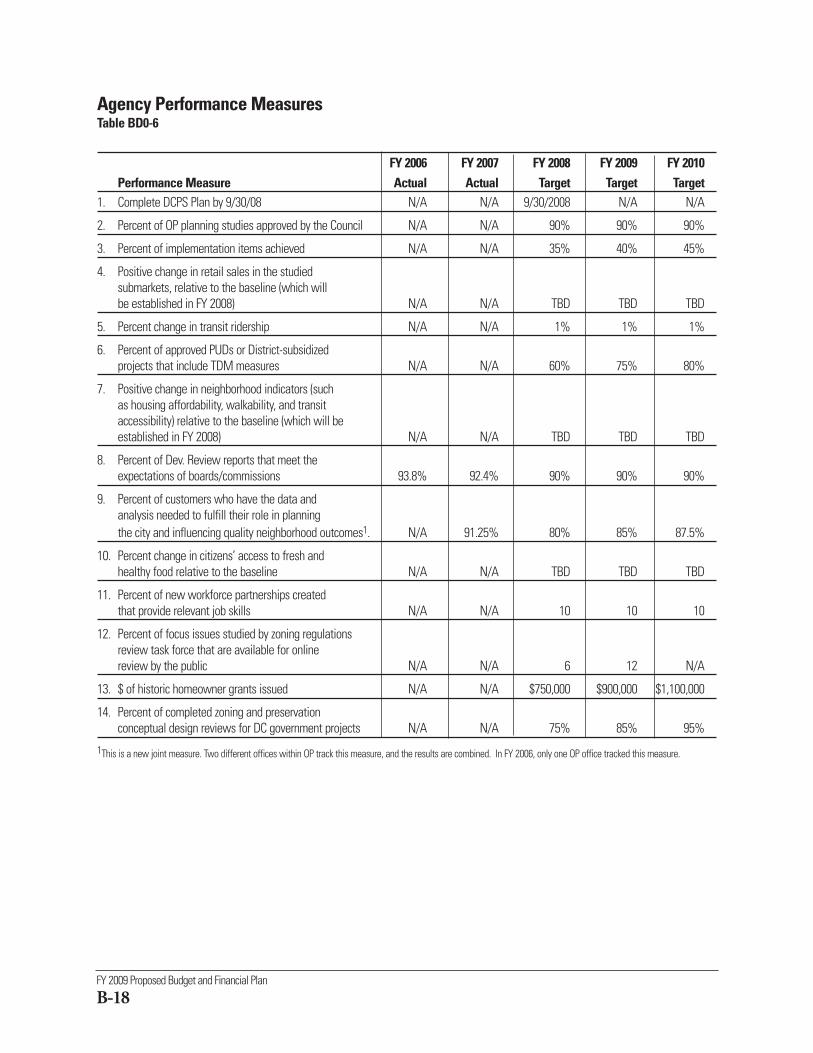
FY 2009 Proposed Budget and Financial Plan
B-18
Agency Performance MeasuresTable BD0-6
FY 2006 FY 2007 FY 2008 FY 2009 FY 2010Performance Measure Actual Actual Target Target Target
1. Complete DCPS Plan by 9/30/08 N/A N/A 9/30/2008 N/A N/A
2. Percent of OP planning studies approved by the Council N/A N/A 90% 90% 90%
3. Percent of implementation items achieved N/A N/A 35% 40% 45%
4. Positive change in retail sales in the studied submarkets, relative to the baseline (which will be established in FY 2008) N/A N/A TBD TBD TBD
5. Percent change in transit ridership N/A N/A 1% 1% 1%
6. Percent of approved PUDs or District-subsidized projects that include TDM measures N/A N/A 60% 75% 80%
7. Positive change in neighborhood indicators (suchas housing affordability, walkability, and transit accessibility) relative to the baseline (which will beestablished in FY 2008) N/A N/A TBD TBD TBD
8. Percent of Dev. Review reports that meet the expectations of boards/commissions 93.8% 92.4% 90% 90% 90%
9. Percent of customers who have the data and analysis needed to fulfill their role in planning the city and influencing quality neighborhood outcomes1. N/A 91.25% 80% 85% 87.5%
10. Percent change in citizens’ access to fresh and healthy food relative to the baseline N/A N/A TBD TBD TBD
11. Percent of new workforce partnerships createdthat provide relevant job skills N/A N/A 10 10 10
12. Percent of focus issues studied by zoning regulationsreview task force that are available for online review by the public N/A N/A 6 12 N/A
13. $ of historic homeowner grants issued N/A N/A $750,000 $900,000 $1,100,000
14. Percent of completed zoning and preservation conceptual design reviews for DC government projects N/A N/A 75% 85% 95%
1This is a new joint measure. Two different offices within OP track this measure, and the results are combined. In FY 2006, only one OP office tracked this measure.
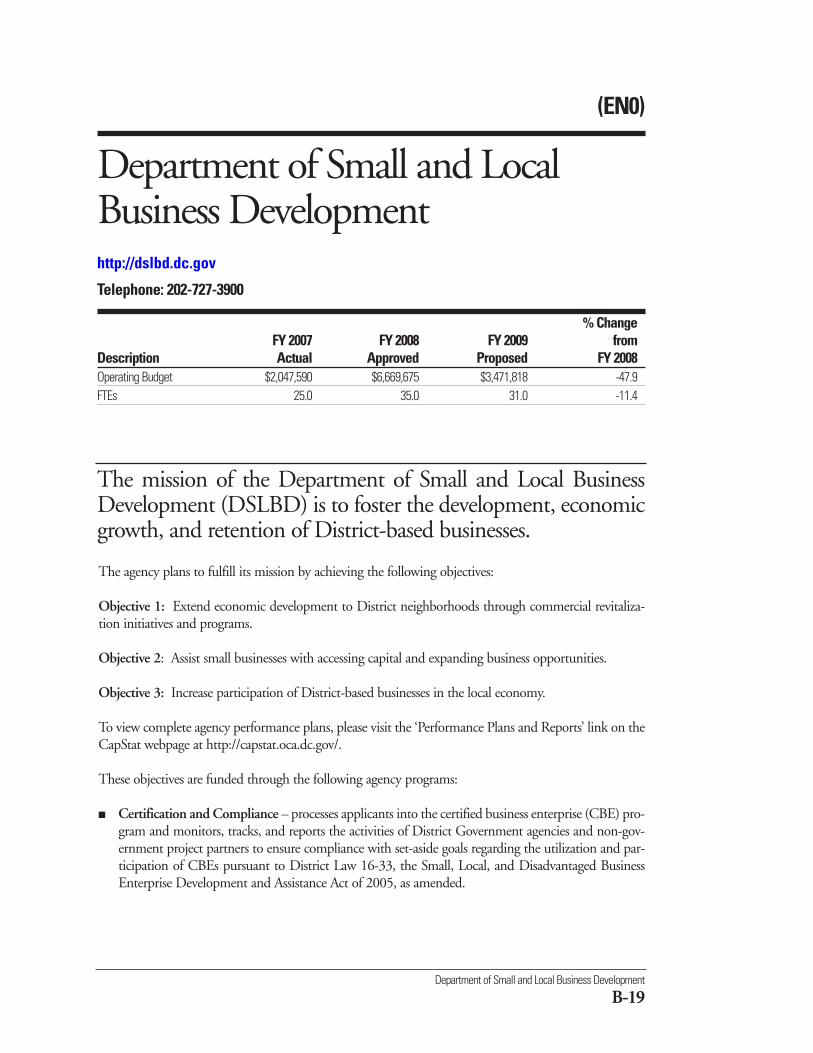
The mission of the Department of Small and Local BusinessDevelopment (DSLBD) is to foster the development, economicgrowth, and retention of District-based businesses.
The agency plans to fulfill its mission by achieving the following objectives:
Objective 1: Extend economic development to District neighborhoods through commercial revitaliza-tion initiatives and programs.
Objective 2: Assist small businesses with accessing capital and expanding business opportunities.
Objective 3: Increase participation of District-based businesses in the local economy.
To view complete agency performance plans, please visit the ‘Performance Plans and Reports’ link on theCapStat webpage at http://capstat.oca.dc.gov/.
These objectives are funded through the following agency programs:
■ Certification and Compliance – processes applicants into the certified business enterprise (CBE) pro-gram and monitors, tracks, and reports the activities of District Government agencies and non-gov-ernment project partners to ensure compliance with set-aside goals regarding the utilization and par-ticipation of CBEs pursuant to District Law 16-33, the Small, Local, and Disadvantaged BusinessEnterprise Development and Assistance Act of 2005, as amended.
Department of Small and Local Business Development
B-19
(EN0)
Department of Small and LocalBusiness Developmenthttp://dslbd.dc.gov
Telephone: 202-727-3900
% ChangeFY 2007 FY 2008 FY 2009 from
Description Actual Approved Proposed FY 2008Operating Budget $2,047,590 $6,669,675 $3,471,818 -47.9FTEs 25.0 35.0 31.0 -11.4
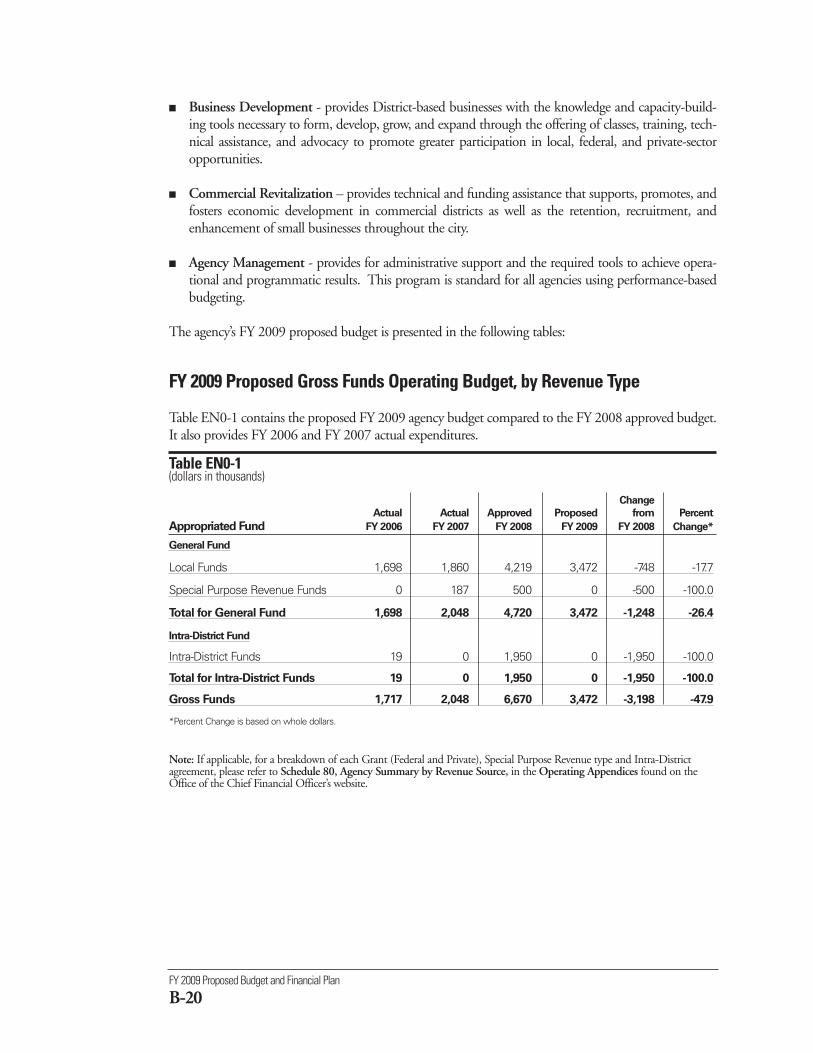
■ Business Development - provides District-based businesses with the knowledge and capacity-build-ing tools necessary to form, develop, grow, and expand through the offering of classes, training, tech-nical assistance, and advocacy to promote greater participation in local, federal, and private-sectoropportunities.
■ Commercial Revitalization – provides technical and funding assistance that supports, promotes, andfosters economic development in commercial districts as well as the retention, recruitment, andenhancement of small businesses throughout the city.
■ Agency Management - provides for administrative support and the required tools to achieve opera-tional and programmatic results. This program is standard for all agencies using performance-basedbudgeting.
The agency’s FY 2009 proposed budget is presented in the following tables:
FY 2009 Proposed Gross Funds Operating Budget, by Revenue Type
Table EN0-1 contains the proposed FY 2009 agency budget compared to the FY 2008 approved budget.It also provides FY 2006 and FY 2007 actual expenditures.
Table EN0-1 (dollars in thousands)
Change
Actual Actual Approved Proposed from Percent
Appropriated Fund FY 2006 FY 2007 FY 2008 FY 2009 FY 2008 Change*
General Fund
Local Funds 1,698 1,860 4,219 3,472 -748 -17.7
Special Purpose Revenue Funds 0 187 500 0 -500 -100.0
Total for General Fund 1,698 2,048 4,720 3,472 -1,248 -26.4
Intra-District Fund
Intra-District Funds 19 0 1,950 0 -1,950 -100.0
Total for Intra-District Funds 19 0 1,950 0 -1,950 -100.0
Gross Funds 1,717 2,048 6,670 3,472 -3,198 -47.9
*Percent Change is based on whole dollars.
Note: If applicable, for a breakdown of each Grant (Federal and Private), Special Purpose Revenue type and Intra-Districtagreement, please refer to Schedule 80, Agency Summary by Revenue Source, in the Operating Appendices found on theOffice of the Chief Financial Officer’s website.
FY 2009 Proposed Budget and Financial Plan
B-20
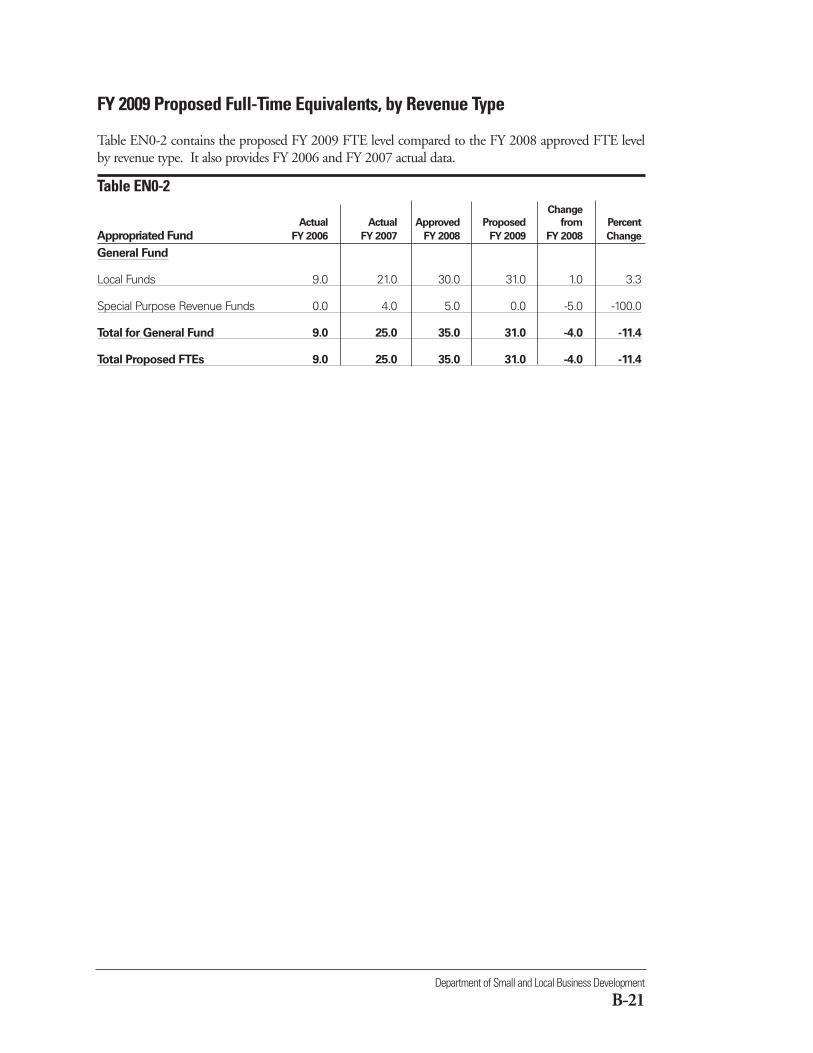
FY 2009 Proposed Full-Time Equivalents, by Revenue Type
Table EN0-2 contains the proposed FY 2009 FTE level compared to the FY 2008 approved FTE levelby revenue type. It also provides FY 2006 and FY 2007 actual data.
Table EN0-2 Change
Actual Actual Approved Proposed from Percent
Appropriated Fund FY 2006 FY 2007 FY 2008 FY 2009 FY 2008 Change
General Fund
Local Funds 9.0 21.0 30.0 31.0 1.0 3.3
Special Purpose Revenue Funds 0.0 4.0 5.0 0.0 -5.0 -100.0
Total for General Fund 9.0 25.0 35.0 31.0 -4.0 -11.4
Total Proposed FTEs 9.0 25.0 35.0 31.0 -4.0 -11.4
Department of Small and Local Business Development
B-21
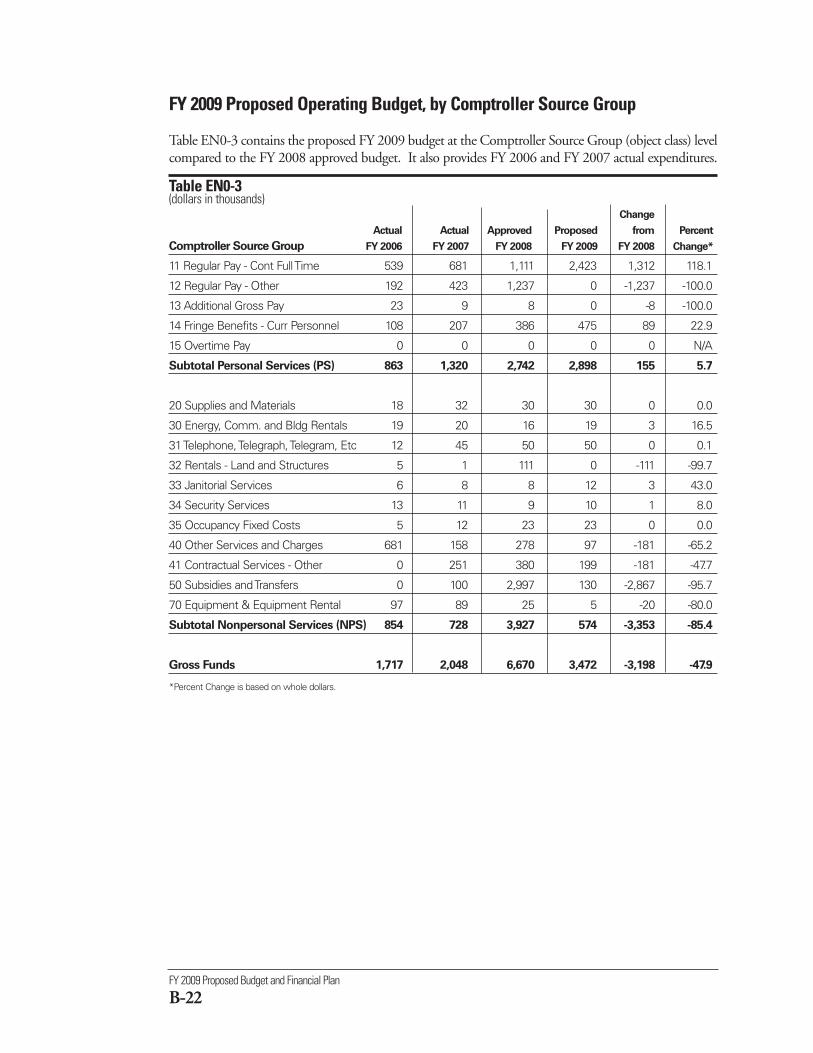
FY 2009 Proposed Operating Budget, by Comptroller Source Group
Table EN0-3 contains the proposed FY 2009 budget at the Comptroller Source Group (object class) levelcompared to the FY 2008 approved budget. It also provides FY 2006 and FY 2007 actual expenditures.
Table EN0-3(dollars in thousands)
Change
Actual Actual Approved Proposed from Percent
Comptroller Source Group FY 2006 FY 2007 FY 2008 FY 2009 FY 2008 Change*
11 Regular Pay - Cont Full Time 539 681 1,111 2,423 1,312 118.1
12 Regular Pay - Other 192 423 1,237 0 -1,237 -100.0
13 Additional Gross Pay 23 9 8 0 -8 -100.0
14 Fringe Benefits - Curr Personnel 108 207 386 475 89 22.9
15 Overtime Pay 0 0 0 0 0 N/A
Subtotal Personal Services (PS) 863 1,320 2,742 2,898 155 5.7
20 Supplies and Materials 18 32 30 30 0 0.0
30 Energy, Comm. and Bldg Rentals 19 20 16 19 3 16.5
31 Telephone, Telegraph, Telegram, Etc 12 45 50 50 0 0.1
32 Rentals - Land and Structures 5 1 111 0 -111 -99.7
33 Janitorial Services 6 8 8 12 3 43.0
34 Security Services 13 11 9 10 1 8.0
35 Occupancy Fixed Costs 5 12 23 23 0 0.0
40 Other Services and Charges 681 158 278 97 -181 -65.2
41 Contractual Services - Other 0 251 380 199 -181 -47.7
50 Subsidies and Transfers 0 100 2,997 130 -2,867 -95.7
70 Equipment & Equipment Rental 97 89 25 5 -20 -80.0
Subtotal Nonpersonal Services (NPS) 854 728 3,927 574 -3,353 -85.4
Gross Funds 1,717 2,048 6,670 3,472 -3,198 -47.9
*Percent Change is based on whole dollars.
FY 2009 Proposed Budget and Financial Plan
B-22
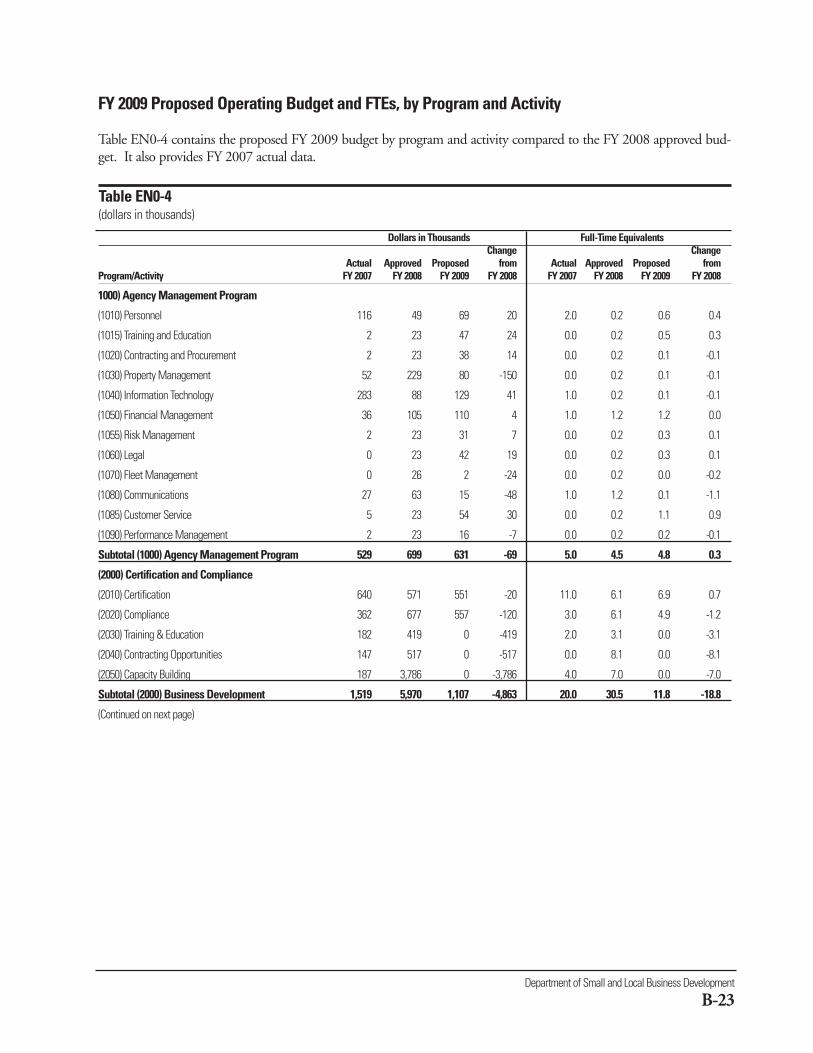
FY 2009 Proposed Operating Budget and FTEs, by Program and Activity
Table EN0-4 contains the proposed FY 2009 budget by program and activity compared to the FY 2008 approved bud-get. It also provides FY 2007 actual data.
Table EN0-4(dollars in thousands)
Dollars in Thousands Full-Time EquivalentsChange Change
Actual Approved Proposed from Actual Approved Proposed from Program/Activity FY 2007 FY 2008 FY 2009 FY 2008 FY 2007 FY 2008 FY 2009 FY 2008
1000) Agency Management Program
(1010) Personnel 116 49 69 20 2.0 0.2 0.6 0.4
(1015) Training and Education 2 23 47 24 0.0 0.2 0.5 0.3
(1020) Contracting and Procurement 2 23 38 14 0.0 0.2 0.1 -0.1
(1030) Property Management 52 229 80 -150 0.0 0.2 0.1 -0.1
(1040) Information Technology 283 88 129 41 1.0 0.2 0.1 -0.1
(1050) Financial Management 36 105 110 4 1.0 1.2 1.2 0.0
(1055) Risk Management 2 23 31 7 0.0 0.2 0.3 0.1
(1060) Legal 0 23 42 19 0.0 0.2 0.3 0.1
(1070) Fleet Management 0 26 2 -24 0.0 0.2 0.0 -0.2
(1080) Communications 27 63 15 -48 1.0 1.2 0.1 -1.1
(1085) Customer Service 5 23 54 30 0.0 0.2 1.1 0.9
(1090) Performance Management 2 23 16 -7 0.0 0.2 0.2 -0.1
Subtotal (1000) Agency Management Program 529 699 631 -69 5.0 4.5 4.8 0.3
(2000) Certification and Compliance
(2010) Certification 640 571 551 -20 11.0 6.1 6.9 0.7
(2020) Compliance 362 677 557 -120 3.0 6.1 4.9 -1.2
(2030) Training & Education 182 419 0 -419 2.0 3.1 0.0 -3.1
(2040) Contracting Opportunities 147 517 0 -517 0.0 8.1 0.0 -8.1
(2050) Capacity Building 187 3,786 0 -3,786 4.0 7.0 0.0 -7.0
Subtotal (2000) Business Development 1,519 5,970 1,107 -4,863 20.0 30.5 11.8 -18.8
(Continued on next page)
Department of Small and Local Business Development
B-23
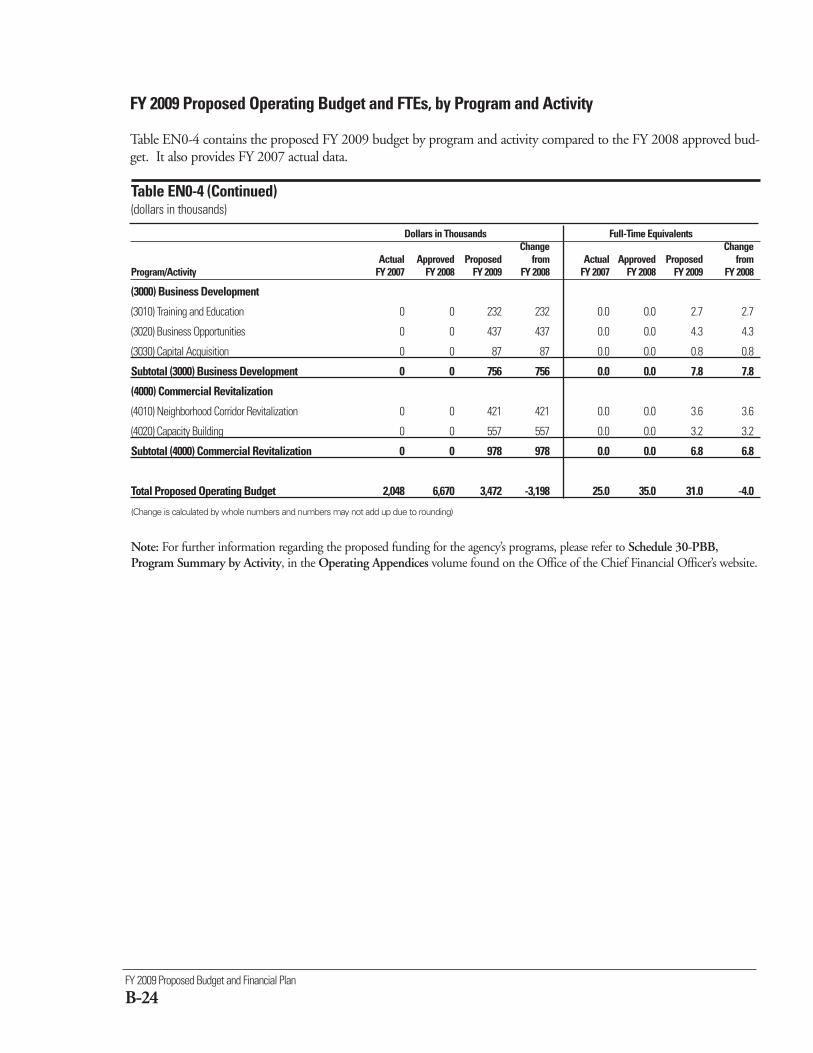
FY 2009 Proposed Budget and Financial Plan
B-24
FY 2009 Proposed Operating Budget and FTEs, by Program and Activity
Table EN0-4 contains the proposed FY 2009 budget by program and activity compared to the FY 2008 approved bud-get. It also provides FY 2007 actual data.
Dollars in Thousands Full-Time EquivalentsChange Change
Actual Approved Proposed from Actual Approved Proposed from Program/Activity FY 2007 FY 2008 FY 2009 FY 2008 FY 2007 FY 2008 FY 2009 FY 2008
(3000) Business Development
(3010) Training and Education 0 0 232 232 0.0 0.0 2.7 2.7
(3020) Business Opportunities 0 0 437 437 0.0 0.0 4.3 4.3
(3030) Capital Acquisition 0 0 87 87 0.0 0.0 0.8 0.8
Subtotal (3000) Business Development 0 0 756 756 0.0 0.0 7.8 7.8
(4000) Commercial Revitalization
(4010) Neighborhood Corridor Revitalization 0 0 421 421 0.0 0.0 3.6 3.6
(4020) Capacity Building 0 0 557 557 0.0 0.0 3.2 3.2
Subtotal (4000) Commercial Revitalization 0 0 978 978 0.0 0.0 6.8 6.8
Total Proposed Operating Budget 2,048 6,670 3,472 -3,198 25.0 35.0 31.0 -4.0
(Change is calculated by whole numbers and numbers may not add up due to rounding)
Note: For further information regarding the proposed funding for the agency’s programs, please refer to Schedule 30-PBB,Program Summary by Activity, in the Operating Appendices volume found on the Office of the Chief Financial Officer’s website.
Table EN0-4 (Continued)(dollars in thousands)
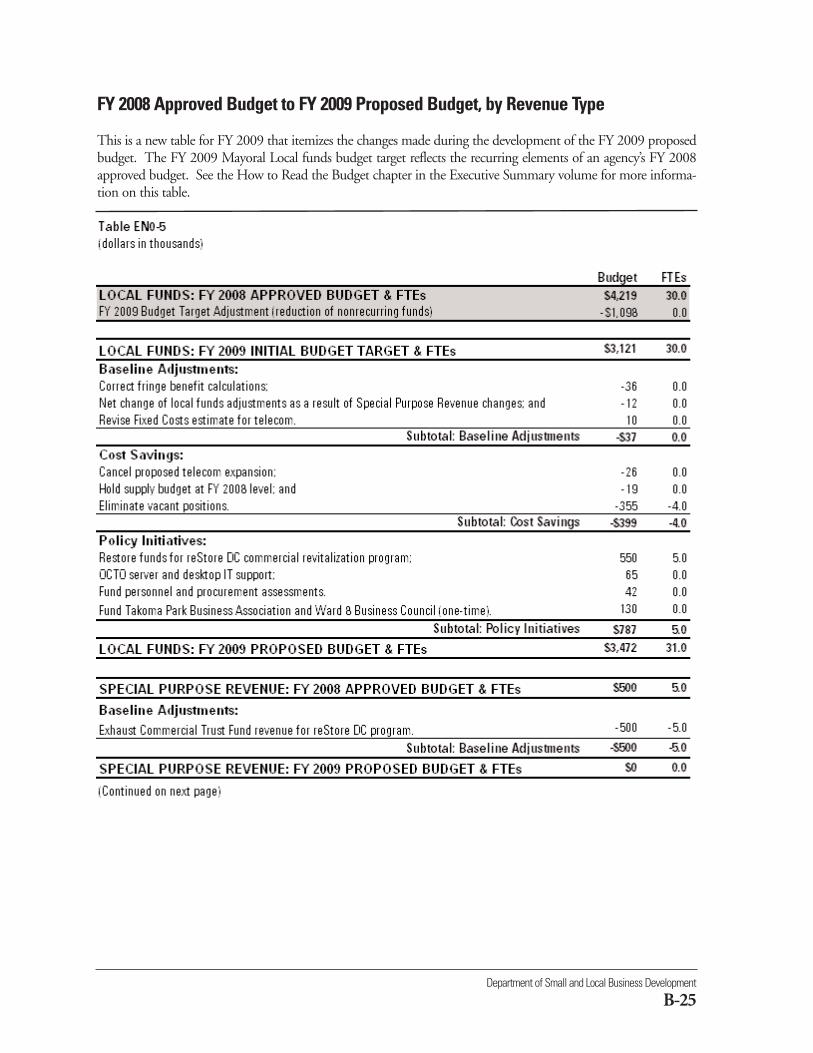
Department of Small and Local Business Development
B-25
FY 2008 Approved Budget to FY 2009 Proposed Budget, by Revenue Type
This is a new table for FY 2009 that itemizes the changes made during the development of the FY 2009 proposedbudget. The FY 2009 Mayoral Local funds budget target reflects the recurring elements of an agency’s FY 2008approved budget. See the How to Read the Budget chapter in the Executive Summary volume for more informa-tion on this table.
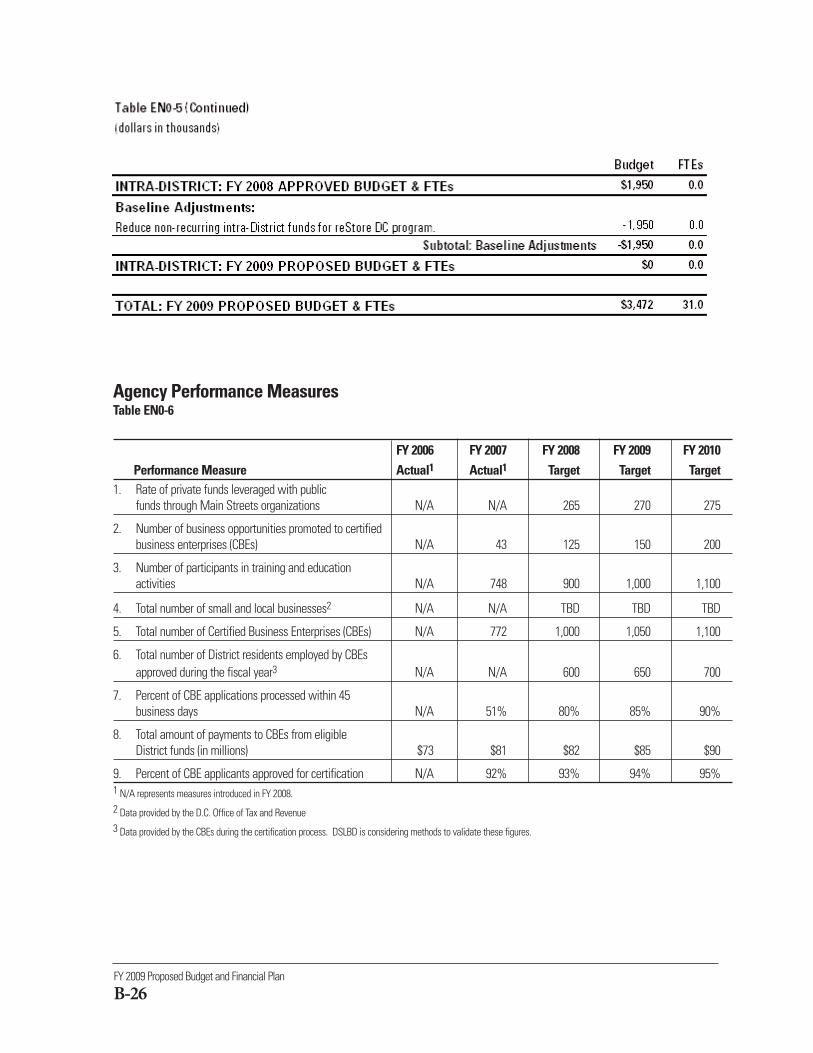
FY 2009 Proposed Budget and Financial Plan
B-26
Agency Performance MeasuresTable EN0-6
FY 2006 FY 2007 FY 2008 FY 2009 FY 2010Performance Measure Actual1 Actual1 Target Target Target
1. Rate of private funds leveraged with public funds through Main Streets organizations N/A N/A 265 270 275
2. Number of business opportunities promoted to certifiedbusiness enterprises (CBEs) N/A 43 125 150 200
3. Number of participants in training and education activities N/A 748 900 1,000 1,100
4. Total number of small and local businesses2 N/A N/A TBD TBD TBD
5. Total number of Certified Business Enterprises (CBEs) N/A 772 1,000 1,050 1,100
6. Total number of District residents employed by CBEsapproved during the fiscal year3 N/A N/A 600 650 700
7. Percent of CBE applications processed within 45 business days N/A 51% 80% 85% 90%
8. Total amount of payments to CBEs from eligible District funds (in millions) $73 $81 $82 $85 $90
9. Percent of CBE applicants approved for certification N/A 92% 93% 94% 95%1 N/A represents measures introduced in FY 2008.2 Data provided by the D.C. Office of Tax and Revenue3 Data provided by the CBEs during the certification process. DSLBD is considering methods to validate these figures.
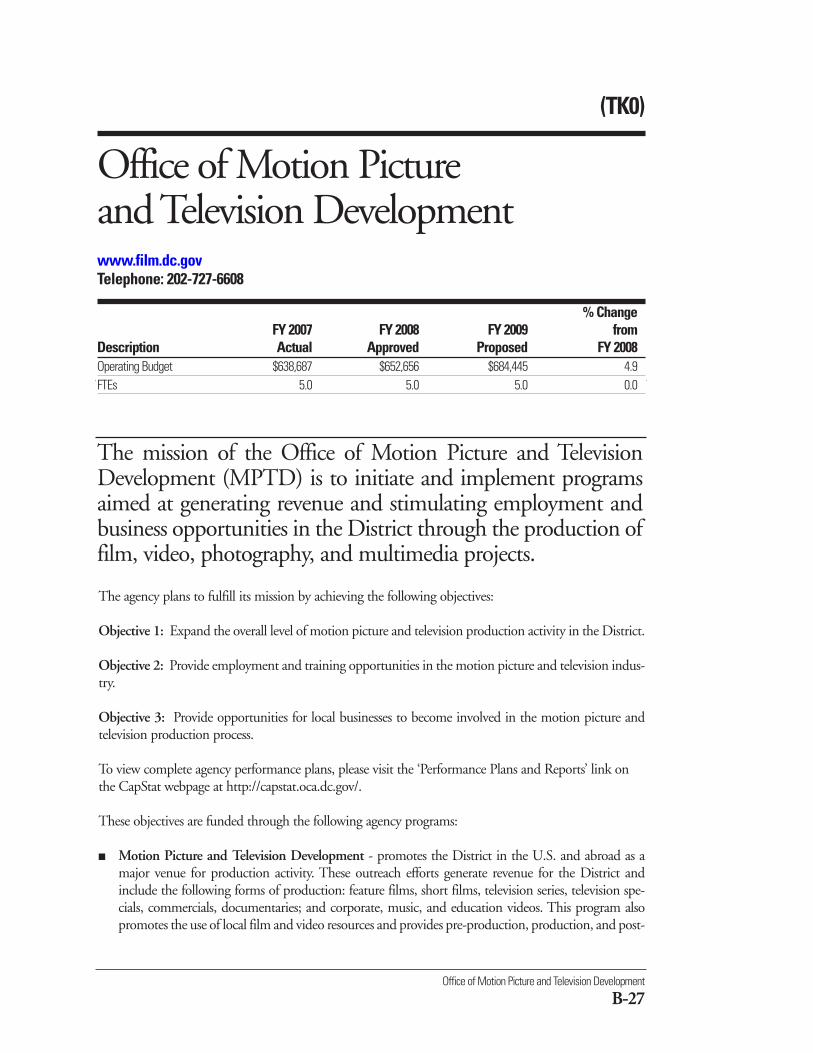
(TK0)
Office of Motion Picture and Television Developmentwww.film.dc.govTelephone: 202-727-6608
% ChangeFY 2007 FY 2008 FY 2009 from
Description Actual Approved Proposed FY 2008Operating Budget $638,687 $652,656 $684,445 4.9FTEs 5.0 5.0 5.0 0.0
The agency plans to fulfill its mission by achieving the following objectives:
Objective 1: Expand the overall level of motion picture and television production activity in the District.
Objective 2: Provide employment and training opportunities in the motion picture and television indus-try.
Objective 3: Provide opportunities for local businesses to become involved in the motion picture andtelevision production process.
To view complete agency performance plans, please visit the ‘Performance Plans and Reports’ link onthe CapStat webpage at http://capstat.oca.dc.gov/.
These objectives are funded through the following agency programs:
■ Motion Picture and Television Development - promotes the District in the U.S. and abroad as amajor venue for production activity. These outreach efforts generate revenue for the District andinclude the following forms of production: feature films, short films, television series, television spe-cials, commercials, documentaries; and corporate, music, and education videos. This program alsopromotes the use of local film and video resources and provides pre-production, production, and post-
Office of Motion Picture and Television Development
B-27
The mission of the Office of Motion Picture and TelevisionDevelopment (MPTD) is to initiate and implement programsaimed at generating revenue and stimulating employment andbusiness opportunities in the District through the production offilm, video, photography, and multimedia projects.
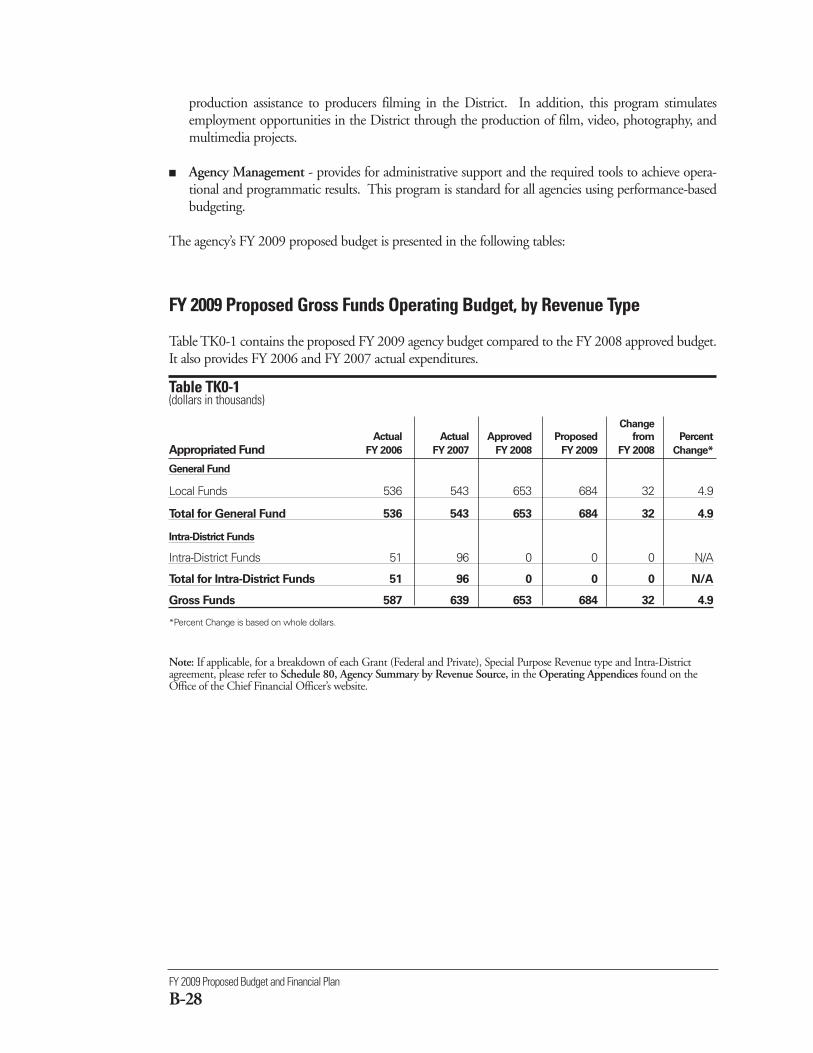
FY 2009 Proposed Budget and Financial Plan
B-28
production assistance to producers filming in the District. In addition, this program stimulatesemployment opportunities in the District through the production of film, video, photography, andmultimedia projects.
■ Agency Management - provides for administrative support and the required tools to achieve opera-tional and programmatic results. This program is standard for all agencies using performance-basedbudgeting.
The agency’s FY 2009 proposed budget is presented in the following tables:
FY 2009 Proposed Gross Funds Operating Budget, by Revenue Type
Table TK0-1 contains the proposed FY 2009 agency budget compared to the FY 2008 approved budget.It also provides FY 2006 and FY 2007 actual expenditures.
Table TK0-1 (dollars in thousands)
Change
Actual Actual Approved Proposed from Percent
Appropriated Fund FY 2006 FY 2007 FY 2008 FY 2009 FY 2008 Change*
General Fund
Local Funds 536 543 653 684 32 4.9
Total for General Fund 536 543 653 684 32 4.9
Intra-District Funds
Intra-District Funds 51 96 0 0 0 N/A
Total for Intra-District Funds 51 96 0 0 0 N/A
Gross Funds 587 639 653 684 32 4.9
*Percent Change is based on whole dollars.
Note: If applicable, for a breakdown of each Grant (Federal and Private), Special Purpose Revenue type and Intra-Districtagreement, please refer to Schedule 80, Agency Summary by Revenue Source, in the Operating Appendices found on theOffice of the Chief Financial Officer’s website.
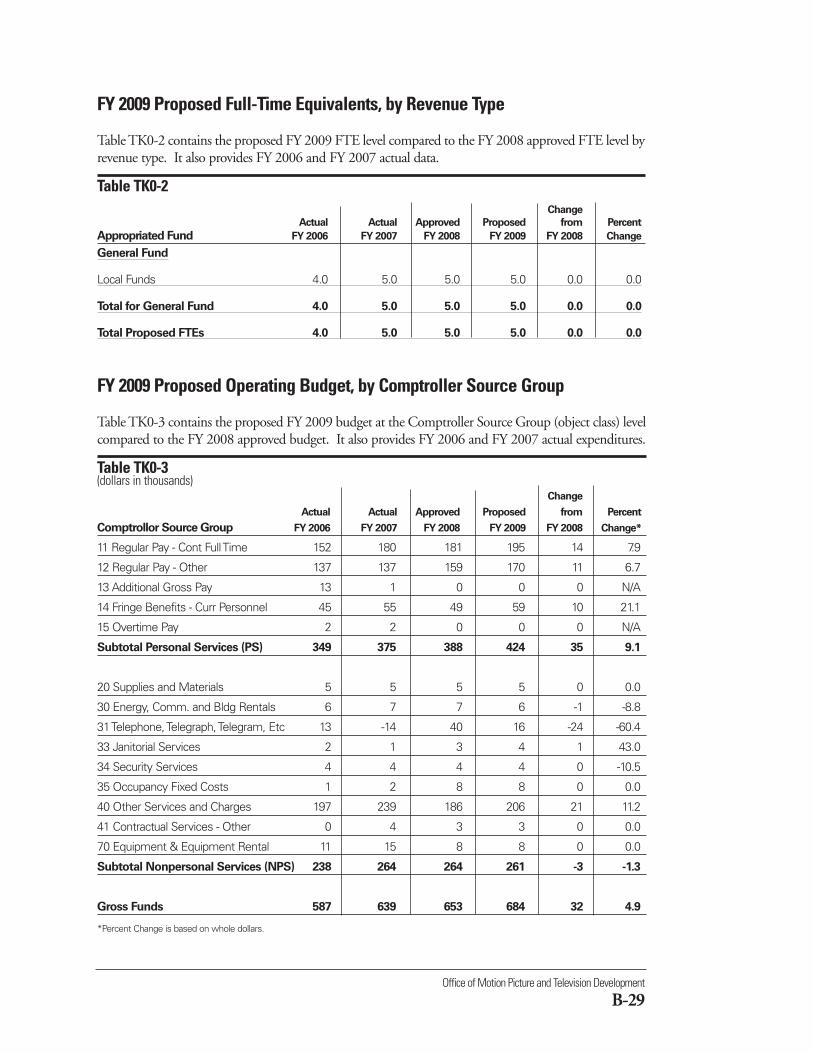
Office of Motion Picture and Television Development
B-29
FY 2009 Proposed Full-Time Equivalents, by Revenue Type
Table TK0-2 contains the proposed FY 2009 FTE level compared to the FY 2008 approved FTE level byrevenue type. It also provides FY 2006 and FY 2007 actual data.
Table TK0-2 Change
Actual Actual Approved Proposed from Percent
Appropriated Fund FY 2006 FY 2007 FY 2008 FY 2009 FY 2008 Change
General Fund
Local Funds 4.0 5.0 5.0 5.0 0.0 0.0
Total for General Fund 4.0 5.0 5.0 5.0 0.0 0.0
Total Proposed FTEs 4.0 5.0 5.0 5.0 0.0 0.0
FY 2009 Proposed Operating Budget, by Comptroller Source Group
Table TK0-3 contains the proposed FY 2009 budget at the Comptroller Source Group (object class) levelcompared to the FY 2008 approved budget. It also provides FY 2006 and FY 2007 actual expenditures.
Table TK0-3(dollars in thousands)
Change
Actual Actual Approved Proposed from Percent
Comptrollor Source Group FY 2006 FY 2007 FY 2008 FY 2009 FY 2008 Change*
11 Regular Pay - Cont Full Time 152 180 181 195 14 7.9
12 Regular Pay - Other 137 137 159 170 11 6.7
13 Additional Gross Pay 13 1 0 0 0 N/A
14 Fringe Benefits - Curr Personnel 45 55 49 59 10 21.1
15 Overtime Pay 2 2 0 0 0 N/A
Subtotal Personal Services (PS) 349 375 388 424 35 9.1
20 Supplies and Materials 5 5 5 5 0 0.0
30 Energy, Comm. and Bldg Rentals 6 7 7 6 -1 -8.8
31 Telephone, Telegraph, Telegram, Etc 13 -14 40 16 -24 -60.4
33 Janitorial Services 2 1 3 4 1 43.0
34 Security Services 4 4 4 4 0 -10.5
35 Occupancy Fixed Costs 1 2 8 8 0 0.0
40 Other Services and Charges 197 239 186 206 21 11.2
41 Contractual Services - Other 0 4 3 3 0 0.0
70 Equipment & Equipment Rental 11 15 8 8 0 0.0
Subtotal Nonpersonal Services (NPS) 238 264 264 261 -3 -1.3
Gross Funds 587 639 653 684 32 4.9
*Percent Change is based on whole dollars.
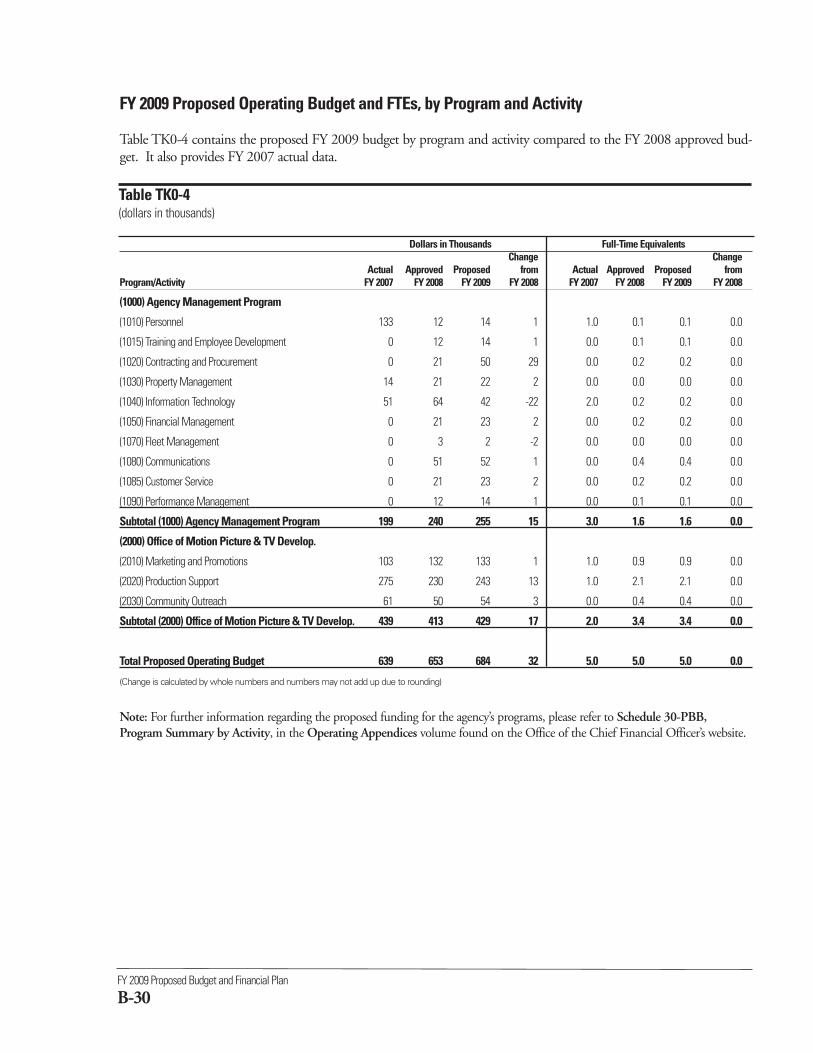
FY 2009 Proposed Budget and Financial Plan
B-30
Dollars in Thousands Full-Time EquivalentsChange Change
Actual Approved Proposed from Actual Approved Proposed from Program/Activity FY 2007 FY 2008 FY 2009 FY 2008 FY 2007 FY 2008 FY 2009 FY 2008
(1000) Agency Management Program
(1010) Personnel 133 12 14 1 1.0 0.1 0.1 0.0
(1015) Training and Employee Development 0 12 14 1 0.0 0.1 0.1 0.0
(1020) Contracting and Procurement 0 21 50 29 0.0 0.2 0.2 0.0
(1030) Property Management 14 21 22 2 0.0 0.0 0.0 0.0
(1040) Information Technology 51 64 42 -22 2.0 0.2 0.2 0.0
(1050) Financial Management 0 21 23 2 0.0 0.2 0.2 0.0
(1070) Fleet Management 0 3 2 -2 0.0 0.0 0.0 0.0
(1080) Communications 0 51 52 1 0.0 0.4 0.4 0.0
(1085) Customer Service 0 21 23 2 0.0 0.2 0.2 0.0
(1090) Performance Management 0 12 14 1 0.0 0.1 0.1 0.0
Subtotal (1000) Agency Management Program 199 240 255 15 3.0 1.6 1.6 0.0
(2000) Office of Motion Picture & TV Develop.
(2010) Marketing and Promotions 103 132 133 1 1.0 0.9 0.9 0.0
(2020) Production Support 275 230 243 13 1.0 2.1 2.1 0.0
(2030) Community Outreach 61 50 54 3 0.0 0.4 0.4 0.0
Subtotal (2000) Office of Motion Picture & TV Develop. 439 413 429 17 2.0 3.4 3.4 0.0
Total Proposed Operating Budget 639 653 684 32 5.0 5.0 5.0 0.0
(Change is calculated by whole numbers and numbers may not add up due to rounding)
Note: For further information regarding the proposed funding for the agency’s programs, please refer to Schedule 30-PBB,Program Summary by Activity, in the Operating Appendices volume found on the Office of the Chief Financial Officer’s website.
FY 2009 Proposed Operating Budget and FTEs, by Program and Activity
Table TK0-4 contains the proposed FY 2009 budget by program and activity compared to the FY 2008 approved bud-get. It also provides FY 2007 actual data.
Table TK0-4(dollars in thousands)
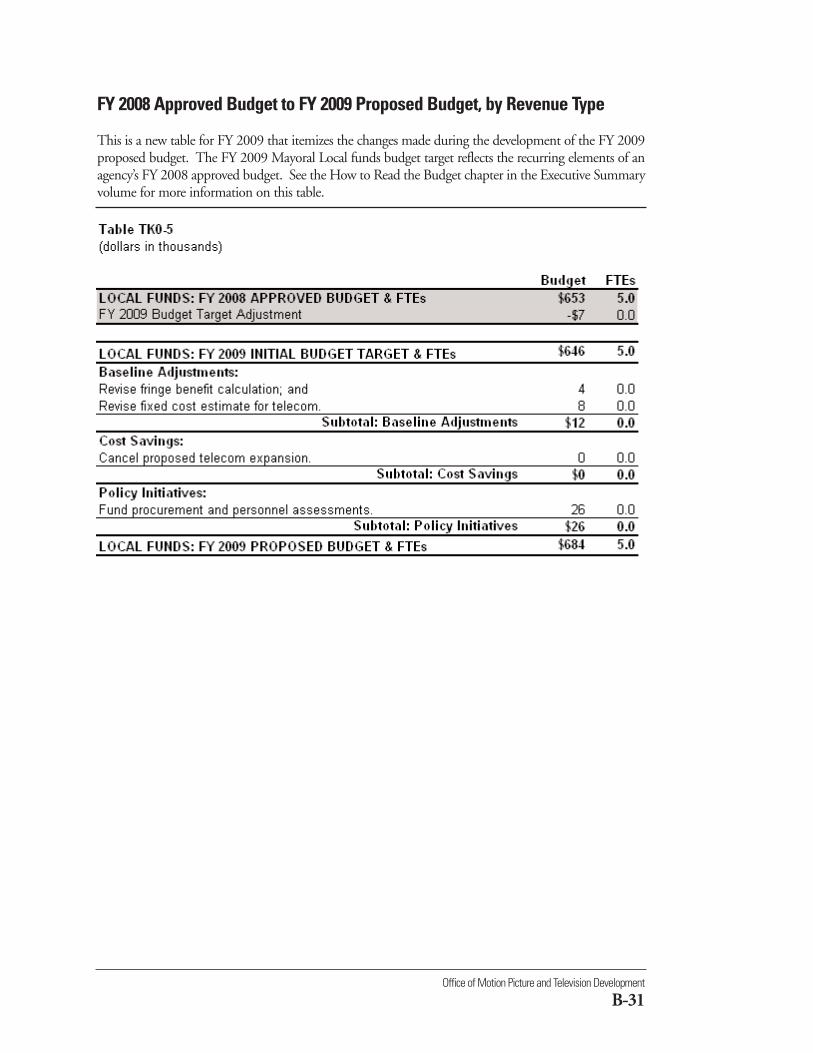
Office of Motion Picture and Television Development
B-31
FY 2008 Approved Budget to FY 2009 Proposed Budget, by Revenue Type
This is a new table for FY 2009 that itemizes the changes made during the development of the FY 2009proposed budget. The FY 2009 Mayoral Local funds budget target reflects the recurring elements of anagency’s FY 2008 approved budget. See the How to Read the Budget chapter in the Executive Summaryvolume for more information on this table.
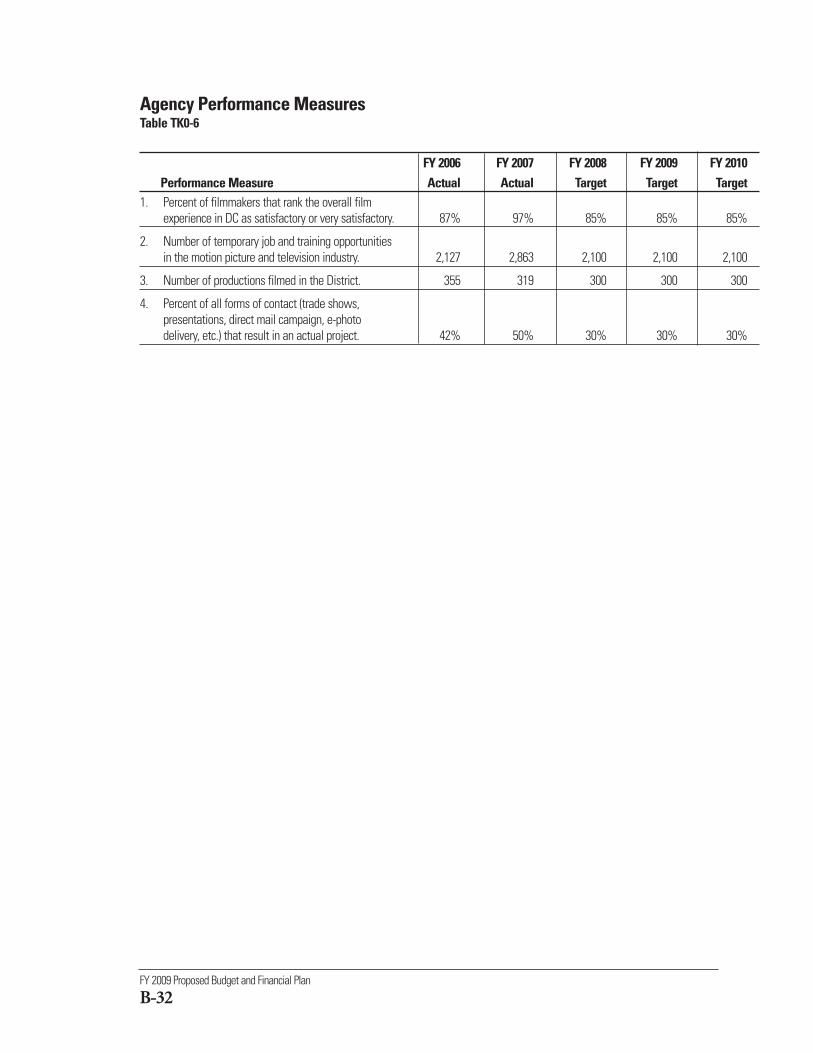
FY 2009 Proposed Budget and Financial Plan
B-32
Agency Performance MeasuresTable TK0-6
FY 2006 FY 2007 FY 2008 FY 2009 FY 2010Performance Measure Actual Actual Target Target Target
1. Percent of filmmakers that rank the overall filmexperience in DC as satisfactory or very satisfactory. 87% 97% 85% 85% 85%
2. Number of temporary job and training opportunities in the motion picture and television industry. 2,127 2,863 2,100 2,100 2,100
3. Number of productions filmed in the District. 355 319 300 300 300
4. Percent of all forms of contact (trade shows, presentations, direct mail campaign, e-photo delivery, etc.) that result in an actual project. 42% 50% 30% 30% 30%
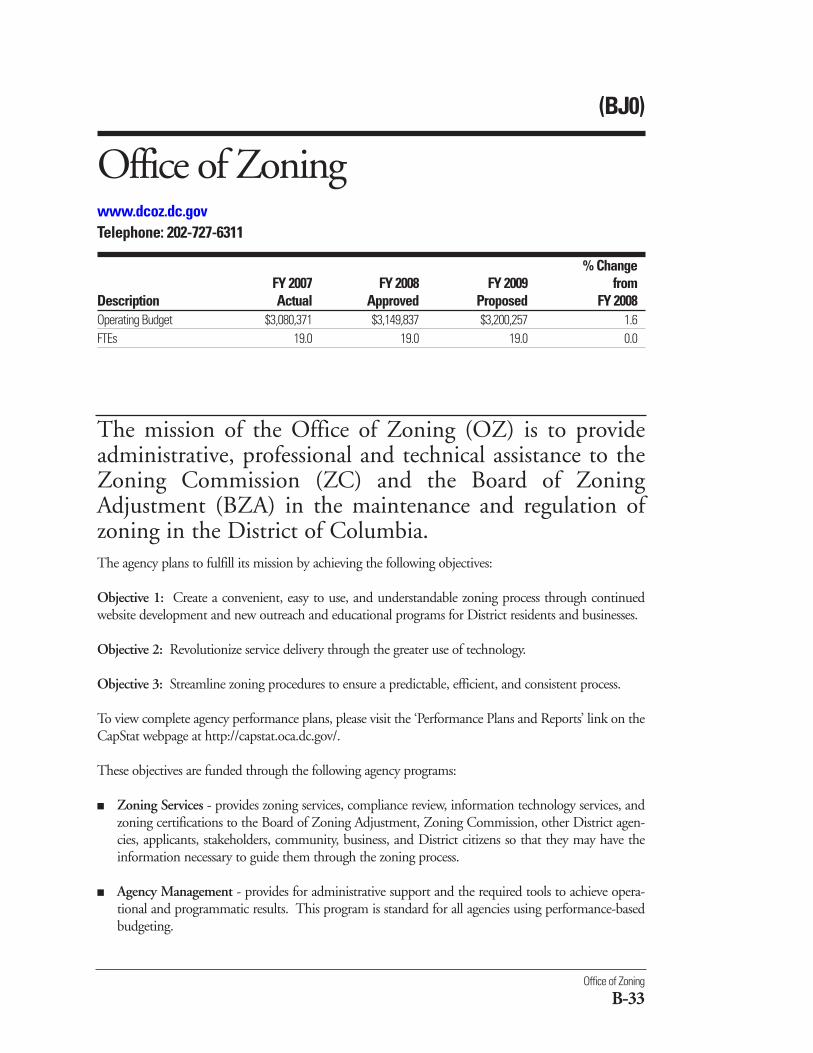
(BJ0)
Office of Zoningwww.dcoz.dc.govTelephone: 202-727-6311
% ChangeFY 2007 FY 2008 FY 2009 from
Description Actual Approved Proposed FY 2008Operating Budget $3,080,371 $3,149,837 $3,200,257 1.6FTEs 19.0 19.0 19.0 0.0
The agency plans to fulfill its mission by achieving the following objectives:
Objective 1: Create a convenient, easy to use, and understandable zoning process through continuedwebsite development and new outreach and educational programs for District residents and businesses.
Objective 2: Revolutionize service delivery through the greater use of technology.
Objective 3: Streamline zoning procedures to ensure a predictable, efficient, and consistent process.
To view complete agency performance plans, please visit the ‘Performance Plans and Reports’ link on theCapStat webpage at http://capstat.oca.dc.gov/.
These objectives are funded through the following agency programs:
■ Zoning Services - provides zoning services, compliance review, information technology services, andzoning certifications to the Board of Zoning Adjustment, Zoning Commission, other District agen-cies, applicants, stakeholders, community, business, and District citizens so that they may have theinformation necessary to guide them through the zoning process.
■ Agency Management - provides for administrative support and the required tools to achieve opera-tional and programmatic results. This program is standard for all agencies using performance-basedbudgeting.
Office of Zoning
B-33
The mission of the Office of Zoning (OZ) is to provideadministrative, professional and technical assistance to theZoning Commission (ZC) and the Board of ZoningAdjustment (BZA) in the maintenance and regulation ofzoning in the District of Columbia.
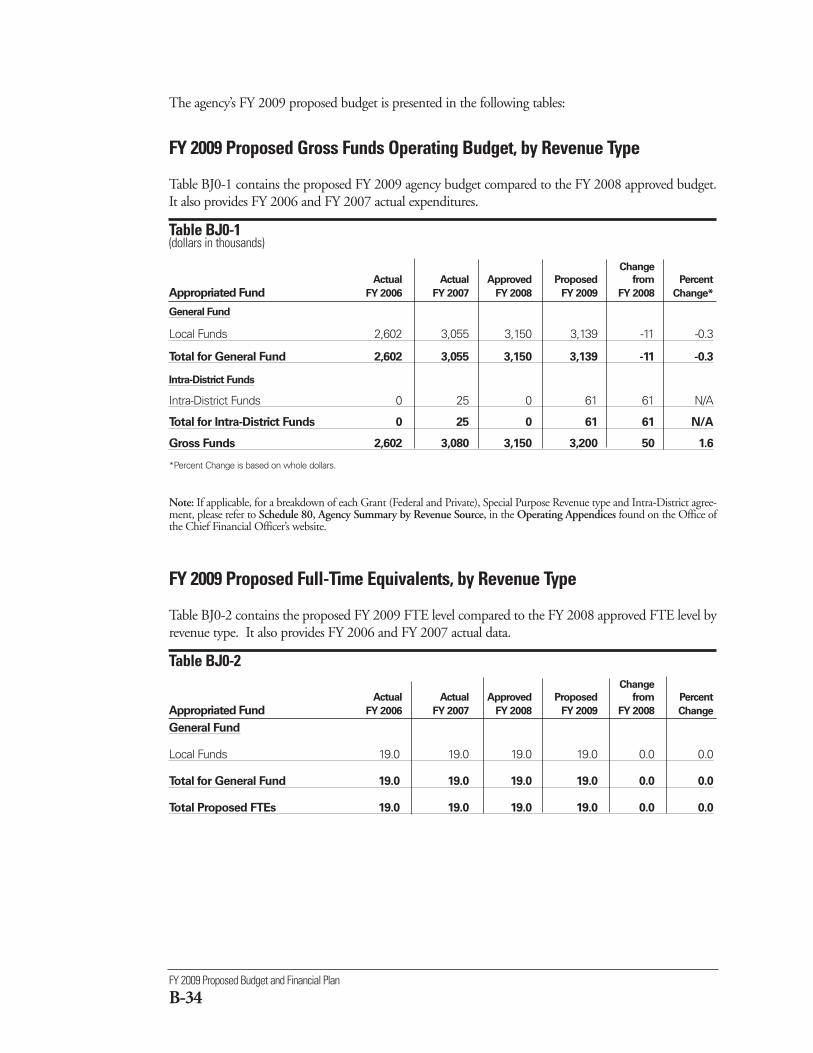
FY 2009 Proposed Budget and Financial Plan
B-34
FY 2009 Proposed Gross Funds Operating Budget, by Revenue Type
Table BJ0-1 contains the proposed FY 2009 agency budget compared to the FY 2008 approved budget.It also provides FY 2006 and FY 2007 actual expenditures.
Table BJ0-1 (dollars in thousands)
Change
Actual Actual Approved Proposed from Percent
Appropriated Fund FY 2006 FY 2007 FY 2008 FY 2009 FY 2008 Change*
General Fund
Local Funds 2,602 3,055 3,150 3,139 -11 -0.3
Total for General Fund 2,602 3,055 3,150 3,139 -11 -0.3
Intra-District Funds
Intra-District Funds 0 25 0 61 61 N/A
Total for Intra-District Funds 0 25 0 61 61 N/A
Gross Funds 2,602 3,080 3,150 3,200 50 1.6
*Percent Change is based on whole dollars.
Note: If applicable, for a breakdown of each Grant (Federal and Private), Special Purpose Revenue type and Intra-District agree-ment, please refer to Schedule 80, Agency Summary by Revenue Source, in the Operating Appendices found on the Office ofthe Chief Financial Officer’s website.
FY 2009 Proposed Full-Time Equivalents, by Revenue Type
Table BJ0-2 contains the proposed FY 2009 FTE level compared to the FY 2008 approved FTE level byrevenue type. It also provides FY 2006 and FY 2007 actual data.
Table BJ0-2 Change
Actual Actual Approved Proposed from Percent
Appropriated Fund FY 2006 FY 2007 FY 2008 FY 2009 FY 2008 Change
General Fund
Local Funds 19.0 19.0 19.0 19.0 0.0 0.0
Total for General Fund 19.0 19.0 19.0 19.0 0.0 0.0
Total Proposed FTEs 19.0 19.0 19.0 19.0 0.0 0.0
The agency’s FY 2009 proposed budget is presented in the following tables:
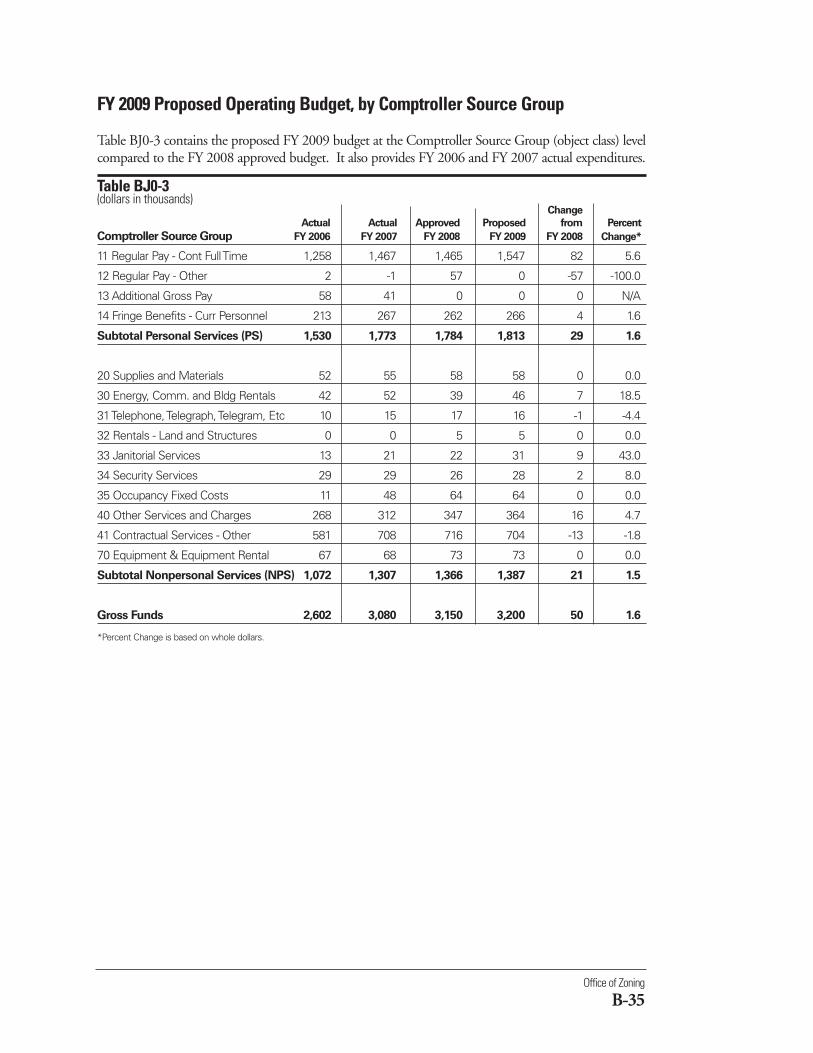
Office of Zoning
B-35
FY 2009 Proposed Operating Budget, by Comptroller Source Group
Table BJ0-3 contains the proposed FY 2009 budget at the Comptroller Source Group (object class) levelcompared to the FY 2008 approved budget. It also provides FY 2006 and FY 2007 actual expenditures.
Table BJ0-3(dollars in thousands)
Change
Actual Actual Approved Proposed from Percent
Comptroller Source Group FY 2006 FY 2007 FY 2008 FY 2009 FY 2008 Change*
11 Regular Pay - Cont Full Time 1,258 1,467 1,465 1,547 82 5.6
12 Regular Pay - Other 2 -1 57 0 -57 -100.0
13 Additional Gross Pay 58 41 0 0 0 N/A
14 Fringe Benefits - Curr Personnel 213 267 262 266 4 1.6
Subtotal Personal Services (PS) 1,530 1,773 1,784 1,813 29 1.6
20 Supplies and Materials 52 55 58 58 0 0.0
30 Energy, Comm. and Bldg Rentals 42 52 39 46 7 18.5
31 Telephone, Telegraph, Telegram, Etc 10 15 17 16 -1 -4.4
32 Rentals - Land and Structures 0 0 5 5 0 0.0
33 Janitorial Services 13 21 22 31 9 43.0
34 Security Services 29 29 26 28 2 8.0
35 Occupancy Fixed Costs 11 48 64 64 0 0.0
40 Other Services and Charges 268 312 347 364 16 4.7
41 Contractual Services - Other 581 708 716 704 -13 -1.8
70 Equipment & Equipment Rental 67 68 73 73 0 0.0
Subtotal Nonpersonal Services (NPS) 1,072 1,307 1,366 1,387 21 1.5
Gross Funds 2,602 3,080 3,150 3,200 50 1.6
*Percent Change is based on whole dollars.
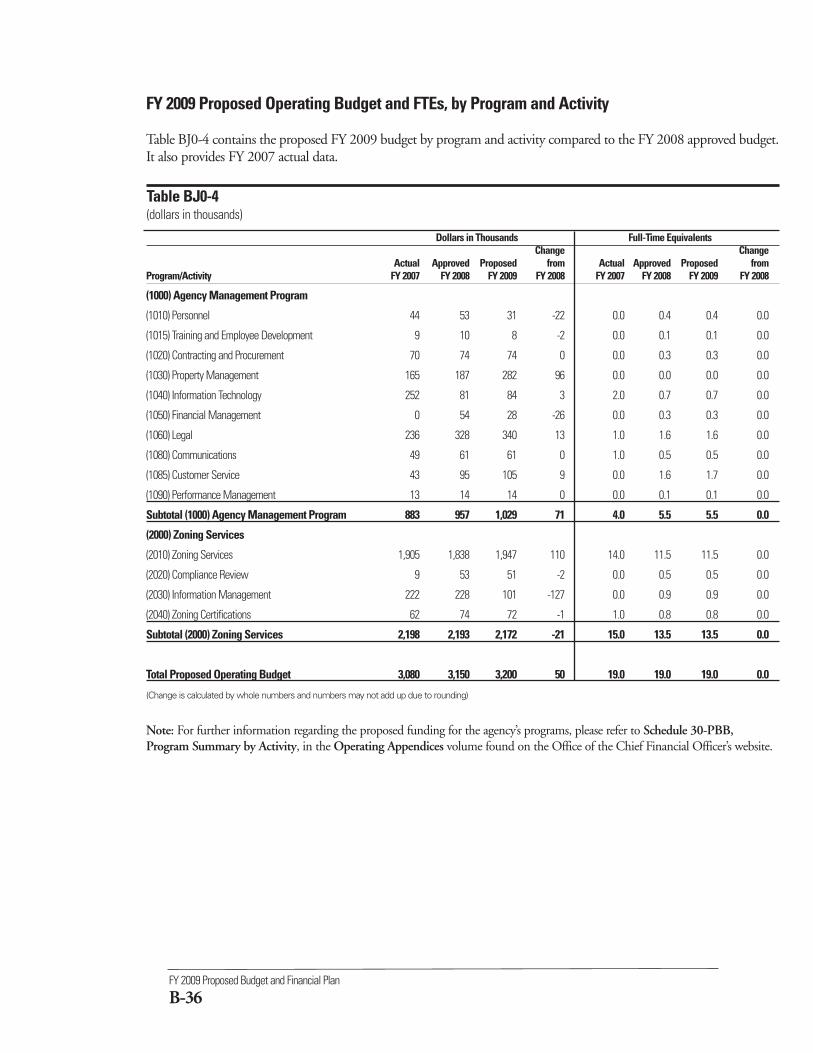
FY 2009 Proposed Budget and Financial Plan
B-36
Dollars in Thousands Full-Time EquivalentsChange Change
Actual Approved Proposed from Actual Approved Proposed from Program/Activity FY 2007 FY 2008 FY 2009 FY 2008 FY 2007 FY 2008 FY 2009 FY 2008
(1000) Agency Management Program
(1010) Personnel 44 53 31 -22 0.0 0.4 0.4 0.0
(1015) Training and Employee Development 9 10 8 -2 0.0 0.1 0.1 0.0
(1020) Contracting and Procurement 70 74 74 0 0.0 0.3 0.3 0.0
(1030) Property Management 165 187 282 96 0.0 0.0 0.0 0.0
(1040) Information Technology 252 81 84 3 2.0 0.7 0.7 0.0
(1050) Financial Management 0 54 28 -26 0.0 0.3 0.3 0.0
(1060) Legal 236 328 340 13 1.0 1.6 1.6 0.0
(1080) Communications 49 61 61 0 1.0 0.5 0.5 0.0
(1085) Customer Service 43 95 105 9 0.0 1.6 1.7 0.0
(1090) Performance Management 13 14 14 0 0.0 0.1 0.1 0.0
Subtotal (1000) Agency Management Program 883 957 1,029 71 4.0 5.5 5.5 0.0
(2000) Zoning Services
(2010) Zoning Services 1,905 1,838 1,947 110 14.0 11.5 11.5 0.0
(2020) Compliance Review 9 53 51 -2 0.0 0.5 0.5 0.0
(2030) Information Management 222 228 101 -127 0.0 0.9 0.9 0.0
(2040) Zoning Certifications 62 74 72 -1 1.0 0.8 0.8 0.0
Subtotal (2000) Zoning Services 2,198 2,193 2,172 -21 15.0 13.5 13.5 0.0
Total Proposed Operating Budget 3,080 3,150 3,200 50 19.0 19.0 19.0 0.0
(Change is calculated by whole numbers and numbers may not add up due to rounding)
Note: For further information regarding the proposed funding for the agency’s programs, please refer to Schedule 30-PBB,Program Summary by Activity, in the Operating Appendices volume found on the Office of the Chief Financial Officer’s website.
FY 2009 Proposed Operating Budget and FTEs, by Program and Activity
Table BJ0-4 contains the proposed FY 2009 budget by program and activity compared to the FY 2008 approved budget.It also provides FY 2007 actual data.
Table BJ0-4(dollars in thousands)
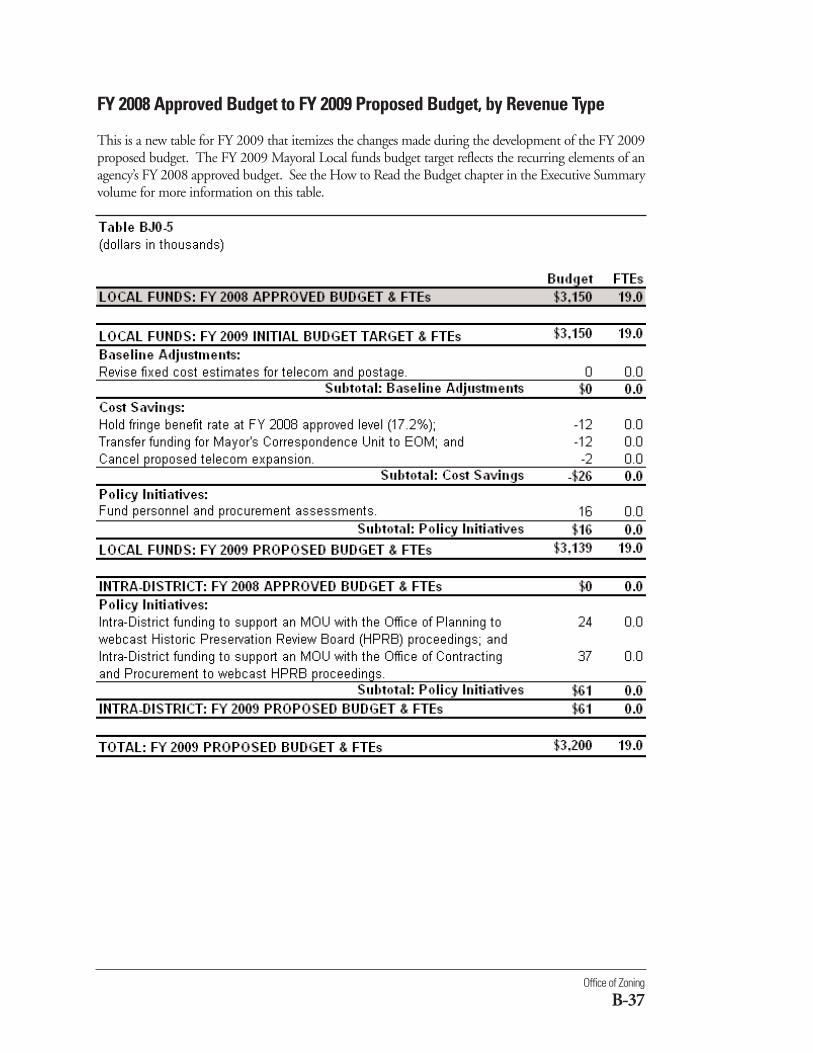
Office of Zoning
B-37
FY 2008 Approved Budget to FY 2009 Proposed Budget, by Revenue Type
This is a new table for FY 2009 that itemizes the changes made during the development of the FY 2009proposed budget. The FY 2009 Mayoral Local funds budget target reflects the recurring elements of anagency’s FY 2008 approved budget. See the How to Read the Budget chapter in the Executive Summaryvolume for more information on this table.
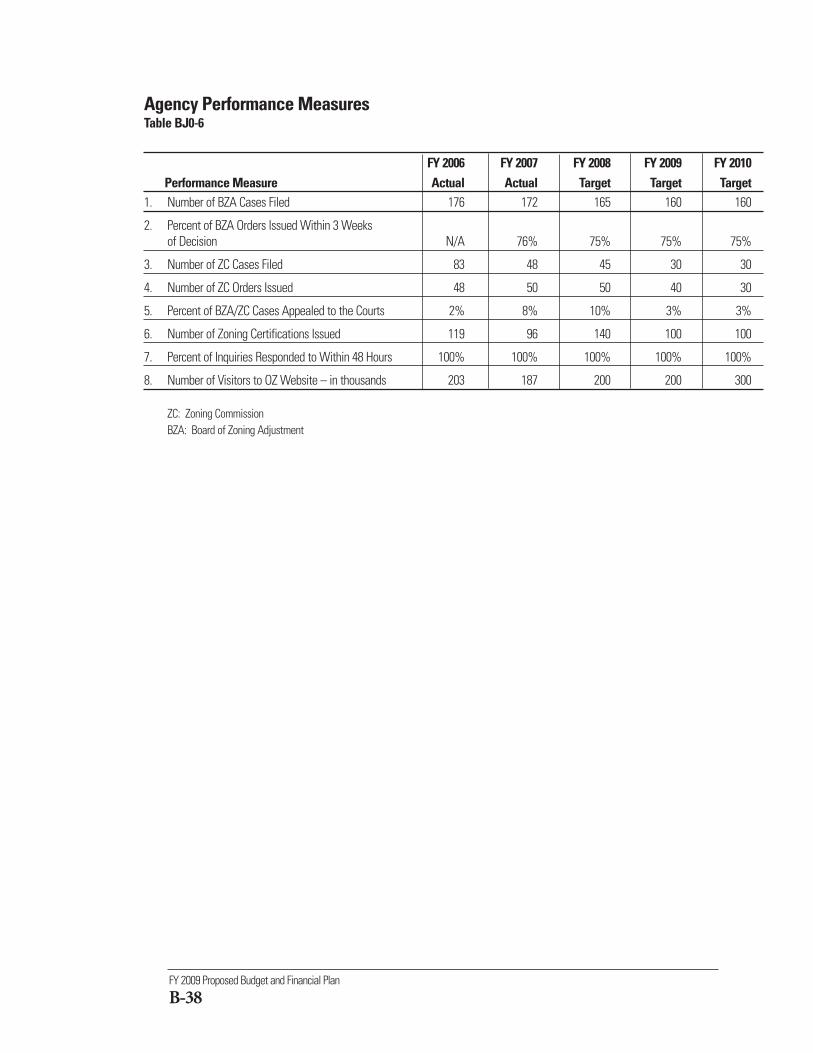
FY 2009 Proposed Budget and Financial Plan
B-38
Agency Performance MeasuresTable BJ0-6
FY 2006 FY 2007 FY 2008 FY 2009 FY 2010Performance Measure Actual Actual Target Target Target
1. Number of BZA Cases Filed 176 172 165 160 160
2. Percent of BZA Orders Issued Within 3 Weeks of Decision N/A 76% 75% 75% 75%
3. Number of ZC Cases Filed 83 48 45 30 30
4. Number of ZC Orders Issued 48 50 50 40 30
5. Percent of BZA/ZC Cases Appealed to the Courts 2% 8% 10% 3% 3%
6. Number of Zoning Certifications Issued 119 96 140 100 100
7. Percent of Inquiries Responded to Within 48 Hours 100% 100% 100% 100% 100%
8. Number of Visitors to OZ Website – in thousands 203 187 200 200 300
ZC: Zoning CommissionBZA: Board of Zoning Adjustment
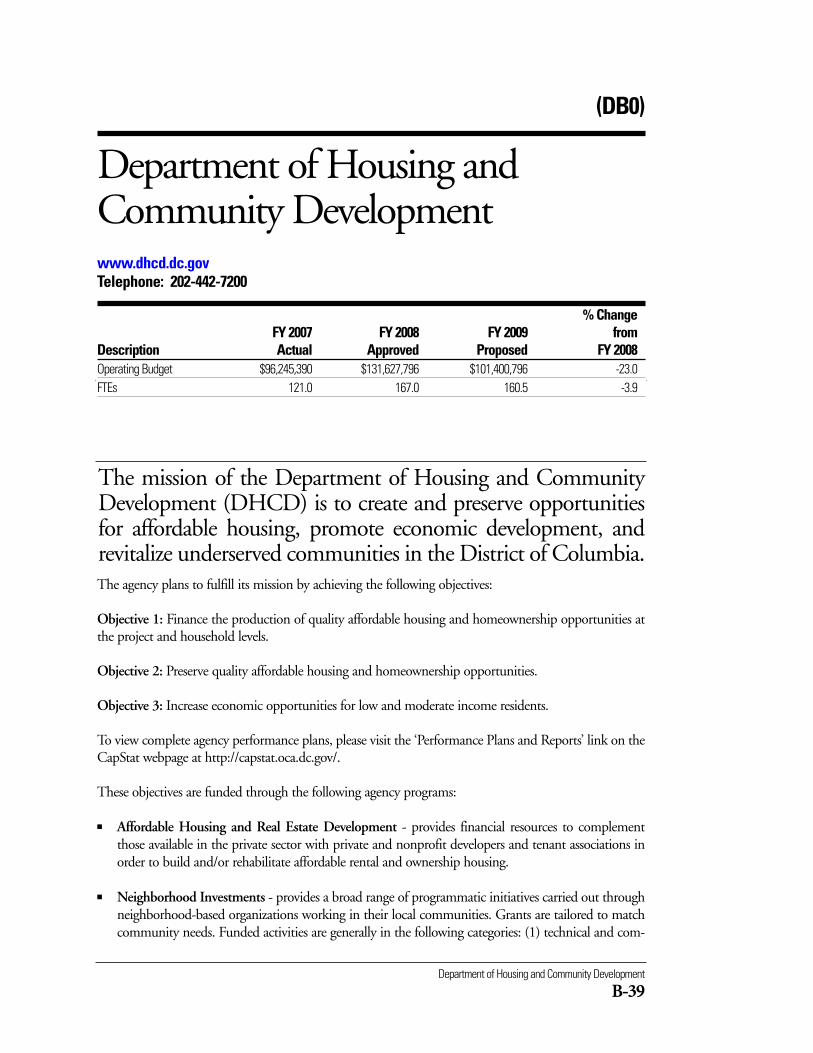
Department of Housing and Community Development
B-39
The mission of the Department of Housing and CommunityDevelopment (DHCD) is to create and preserve opportunitiesfor affordable housing, promote economic development, andrevitalize underserved communities in the District of Columbia.
(DB0)
Department of Housing andCommunity Developmentwww.dhcd.dc.govTelephone: 202-442-7200
% ChangeFY 2007 FY 2008 FY 2009 from
Description Actual Approved Proposed FY 2008Operating Budget $96,245,390 $131,627,796 $101,400,796 -23.0FTEs 121.0 167.0 160.5 -3.9
The agency plans to fulfill its mission by achieving the following objectives:
Objective 1: Finance the production of quality affordable housing and homeownership opportunities atthe project and household levels.
Objective 2: Preserve quality affordable housing and homeownership opportunities.
Objective 3: Increase economic opportunities for low and moderate income residents.
To view complete agency performance plans, please visit the ‘Performance Plans and Reports’ link on theCapStat webpage at http://capstat.oca.dc.gov/.
These objectives are funded through the following agency programs:
■ Affordable Housing and Real Estate Development - provides financial resources to complementthose available in the private sector with private and nonprofit developers and tenant associations inorder to build and/or rehabilitate affordable rental and ownership housing.
■ Neighborhood Investments - provides a broad range of programmatic initiatives carried out throughneighborhood-based organizations working in their local communities. Grants are tailored to matchcommunity needs. Funded activities are generally in the following categories: (1) technical and com-
FY 2009 Proposed Budget and Financial Plan
B-40
mercial development assistance to businesses and (2) services that provide and support affordablehousing and sustainable communities for income-eligible households.
■ Emergency Shelter Grant (ESG) Management - provides oversight, funding, and compliance mon-itoring services to the Community Partnership for the Prevention of Homelessness (the Partnership)to prevent homelessness and enable individuals and families to move toward independent living. TheESG grant is passed from the federal government through DHCD to the Partnership. In FY 2006,the ESG grant provided emergency assistance grants to 220 individuals and families and supported a45-unit family shelter that served 103 families.
■ Economic and Commercial Development - includes activities to promote economic developmentand to manage the acquisition, disposition and maintenance of property. Key services provided with-in this program include information services for potential loan clients; preparing, processing, under-writing, and servicing economic development loans; providing environmental assessments; managingcontracts for appraisals, title searches, maintenance and security services, and relocation; and moni-toring compliance.
■ Homeownership and Home Rehabilitation Assistance - provides financial assistance for low andmoderate-income households for the purpose of first-time home purchase and/or home rehabilitationand preservation. This program provides down-payment and closing cost loans to first-time homebuyers and rehabilitation loans/grants to owner-occupants of single-family homes.
■ Program Monitoring and Compliance - provides oversight of DHCD programs and projects toensure compliance and overall effectiveness of operations. Contract compliance monitors DHCDprojects to ensure that use of project funds fully complies with HUD and District regulations. QualityAssurance activities provide review and performance evaluation to DHCD and contractors so thatthey can operate in full compliance with regulations in the most effective and efficient manner possi-ble.
■ Agency Management - provides operational support and the required tools to achieve operational andprogrammatic results. This program is standard for all Performance-Based Budgeting agencies.
■ Agency Financial Operations - provides comprehensive and efficient financial management servicesto and on behalf of District agencies so that the financial integrity of the District of Columbia is main-tained. This program is standard for all Performance-Based Budgeting agencies.
The agency’s FY 2009 proposed budget is presented in the following tables:
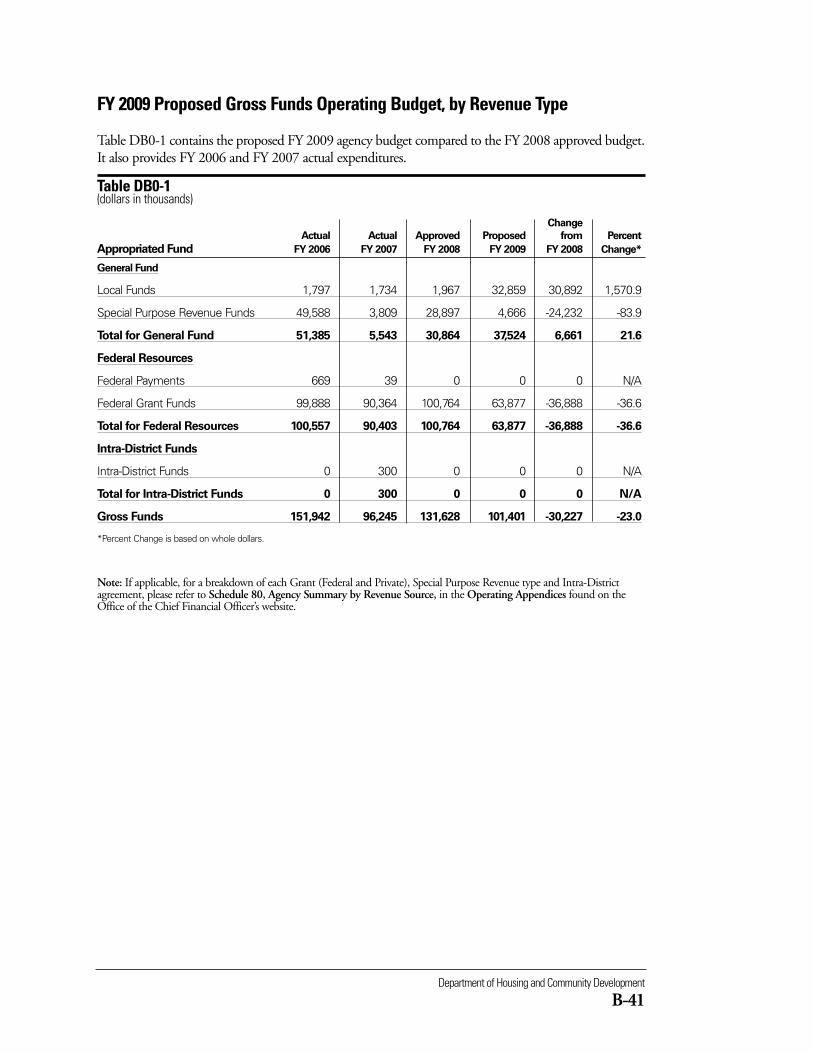
Department of Housing and Community Development
B-41
FY 2009 Proposed Gross Funds Operating Budget, by Revenue Type
Table DB0-1 contains the proposed FY 2009 agency budget compared to the FY 2008 approved budget.It also provides FY 2006 and FY 2007 actual expenditures.
Table DB0-1 (dollars in thousands)
Change
Actual Actual Approved Proposed from Percent
Appropriated Fund FY 2006 FY 2007 FY 2008 FY 2009 FY 2008 Change*
General Fund
Local Funds 1,797 1,734 1,967 32,859 30,892 1,570.9
Special Purpose Revenue Funds 49,588 3,809 28,897 4,666 -24,232 -83.9
Total for General Fund 51,385 5,543 30,864 37,524 6,661 21.6
Federal Resources
Federal Payments 669 39 0 0 0 N/A
Federal Grant Funds 99,888 90,364 100,764 63,877 -36,888 -36.6
Total for Federal Resources 100,557 90,403 100,764 63,877 -36,888 -36.6
Intra-District Funds
Intra-District Funds 0 300 0 0 0 N/A
Total for Intra-District Funds 0 300 0 0 0 N/A
Gross Funds 151,942 96,245 131,628 101,401 -30,227 -23.0
*Percent Change is based on whole dollars.
Note: If applicable, for a breakdown of each Grant (Federal and Private), Special Purpose Revenue type and Intra-Districtagreement, please refer to Schedule 80, Agency Summary by Revenue Source, in the Operating Appendices found on theOffice of the Chief Financial Officer’s website.
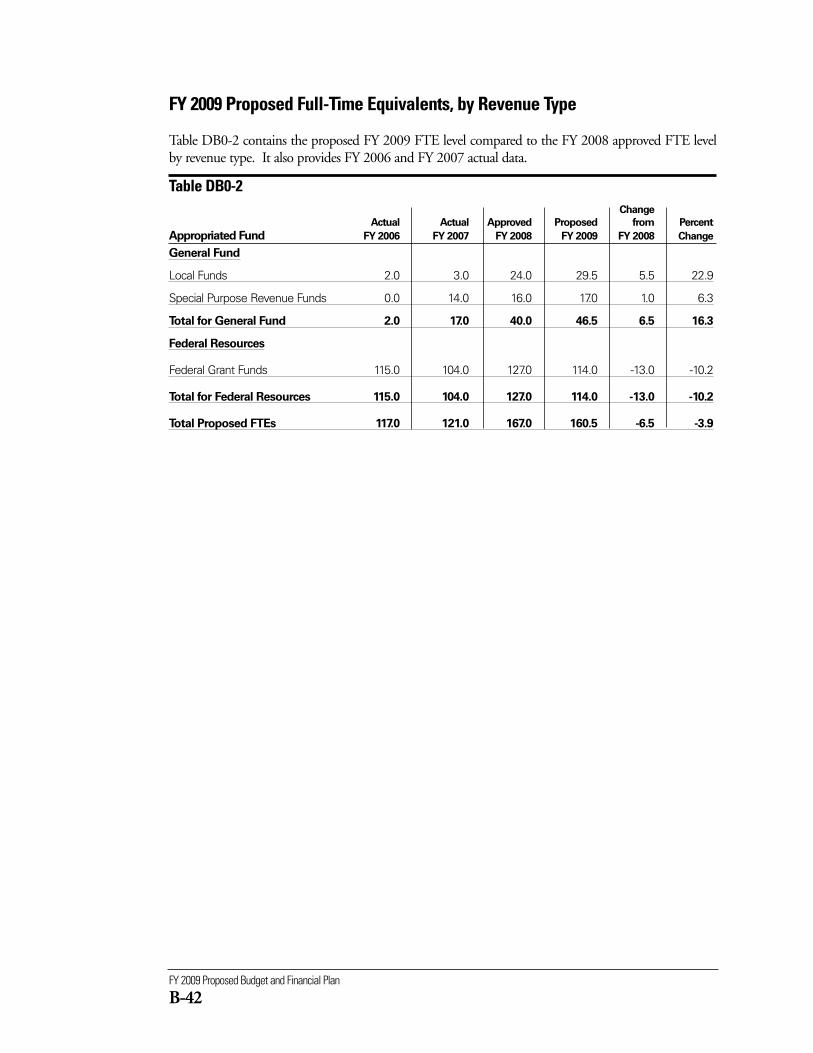
FY 2009 Proposed Budget and Financial Plan
B-42
FY 2009 Proposed Full-Time Equivalents, by Revenue Type
Table DB0-2 contains the proposed FY 2009 FTE level compared to the FY 2008 approved FTE levelby revenue type. It also provides FY 2006 and FY 2007 actual data.
Table DB0-2 Change
Actual Actual Approved Proposed from Percent
Appropriated Fund FY 2006 FY 2007 FY 2008 FY 2009 FY 2008 Change
General Fund
Local Funds 2.0 3.0 24.0 29.5 5.5 22.9
Special Purpose Revenue Funds 0.0 14.0 16.0 17.0 1.0 6.3
Total for General Fund 2.0 17.0 40.0 46.5 6.5 16.3
Federal Resources
Federal Grant Funds 115.0 104.0 127.0 114.0 -13.0 -10.2
Total for Federal Resources 115.0 104.0 127.0 114.0 -13.0 -10.2
Total Proposed FTEs 117.0 121.0 167.0 160.5 -6.5 -3.9

Department of Housing and Community Development
B-43
FY 2009 Proposed Operating Budget, by Comptroller Source Group
Table DB0-3 contains the proposed FY 2009 budget at the Comptroller Source Group (object class) levelcompared to the FY 2008 approved budget. It also provides FY 2006 and FY 2007 actual expenditures.
Table DB0-3 (dollars in thousands)
Change
Actual Actual Approved Proposed from Percent
Comptroller Source Group FY 2006 FY 2007 FY 2008 FY 2009 FY 2008 Change*
11 Regular Pay - Cont Full Time 7,292 7,356 9,974 10,791 817 8.2
12 Regular Pay - Other 961 1,029 1,569 1,090 -479 -30.5
13 Additional Gross Pay 97 52 77 77 0 0.0
14 Fringe Benefits - Curr Personnel 1,159 1,406 1,784 1,232 -552 -30.9
15 Overtime Pay -19 55 30 32 2 5.0
Subtotal Personal Services (PS) 9,490 9,898 13,433 13,221 -212 -1.6
20 Supplies and Materials 110 118 177 107 -70 -39.8
30 Energy, Comm. and Bldg Rentals 0 0 7 14 7 107.7
31 Telephone, Telegraph, Telegram, Etc 120 64 113 85 -27 -24.2
32 Rentals - Land and Structures 1,957 1,861 2,049 1,443 -606 -29.6
33 Janitorial Services 0 0 11 12 1 9.4
34 Security Services 85 78 83 14 -69 -83.0
40 Other Services and Charges 1,053 587 2,169 1,047 -1,121 -51.7
41 Contractual Services - Other 4,386 5,544 8,810 4,814 -3,996 -45.4
50 Subsidies and Transfers 134,618 77,359 104,405 80,364 -24,041 -23.0
70 Equipment & Equipment Rental 125 537 371 280 -92 -24.7
91 Expense Not Budgeted Others 0 198 0 0 0 N/A
Subtotal Nonpersonal Services (NPS) 142,452 86,347 118,195 88,180 -30,015 -25.4
Gross Funds 151,942 96,245 131,628 101,401 -30,227 -23.0
*Percent Change is based on whole dollars.
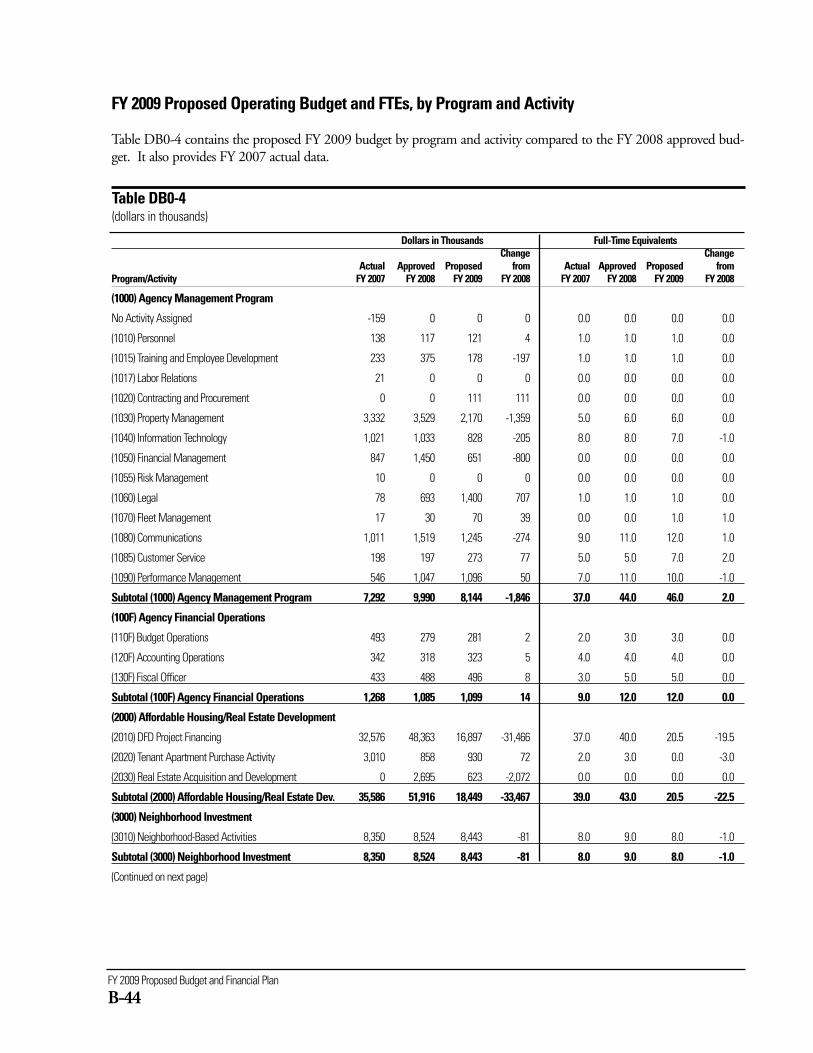
FY 2009 Proposed Budget and Financial Plan
B-44
Dollars in Thousands Full-Time EquivalentsChange Change
Actual Approved Proposed from Actual Approved Proposed from Program/Activity FY 2007 FY 2008 FY 2009 FY 2008 FY 2007 FY 2008 FY 2009 FY 2008
(1000) Agency Management Program
No Activity Assigned -159 0 0 0 0.0 0.0 0.0 0.0
(1010) Personnel 138 117 121 4 1.0 1.0 1.0 0.0
(1015) Training and Employee Development 233 375 178 -197 1.0 1.0 1.0 0.0
(1017) Labor Relations 21 0 0 0 0.0 0.0 0.0 0.0
(1020) Contracting and Procurement 0 0 111 111 0.0 0.0 0.0 0.0
(1030) Property Management 3,332 3,529 2,170 -1,359 5.0 6.0 6.0 0.0
(1040) Information Technology 1,021 1,033 828 -205 8.0 8.0 7.0 -1.0
(1050) Financial Management 847 1,450 651 -800 0.0 0.0 0.0 0.0
(1055) Risk Management 10 0 0 0 0.0 0.0 0.0 0.0
(1060) Legal 78 693 1,400 707 1.0 1.0 1.0 0.0
(1070) Fleet Management 17 30 70 39 0.0 0.0 1.0 1.0
(1080) Communications 1,011 1,519 1,245 -274 9.0 11.0 12.0 1.0
(1085) Customer Service 198 197 273 77 5.0 5.0 7.0 2.0
(1090) Performance Management 546 1,047 1,096 50 7.0 11.0 10.0 -1.0
Subtotal (1000) Agency Management Program 7,292 9,990 8,144 -1,846 37.0 44.0 46.0 2.0
(100F) Agency Financial Operations
(110F) Budget Operations 493 279 281 2 2.0 3.0 3.0 0.0
(120F) Accounting Operations 342 318 323 5 4.0 4.0 4.0 0.0
(130F) Fiscal Officer 433 488 496 8 3.0 5.0 5.0 0.0
Subtotal (100F) Agency Financial Operations 1,268 1,085 1,099 14 9.0 12.0 12.0 0.0
(2000) Affordable Housing/Real Estate Development
(2010) DFD Project Financing 32,576 48,363 16,897 -31,466 37.0 40.0 20.5 -19.5
(2020) Tenant Apartment Purchase Activity 3,010 858 930 72 2.0 3.0 0.0 -3.0
(2030) Real Estate Acquisition and Development 0 2,695 623 -2,072 0.0 0.0 0.0 0.0
Subtotal (2000) Affordable Housing/Real Estate Dev. 35,586 51,916 18,449 -33,467 39.0 43.0 20.5 -22.5
(3000) Neighborhood Investment
(3010) Neighborhood-Based Activities 8,350 8,524 8,443 -81 8.0 9.0 8.0 -1.0
Subtotal (3000) Neighborhood Investment 8,350 8,524 8,443 -81 8.0 9.0 8.0 -1.0
(Continued on next page)
FY 2009 Proposed Operating Budget and FTEs, by Program and Activity
Table DB0-4 contains the proposed FY 2009 budget by program and activity compared to the FY 2008 approved bud-get. It also provides FY 2007 actual data.
Table DB0-4(dollars in thousands)
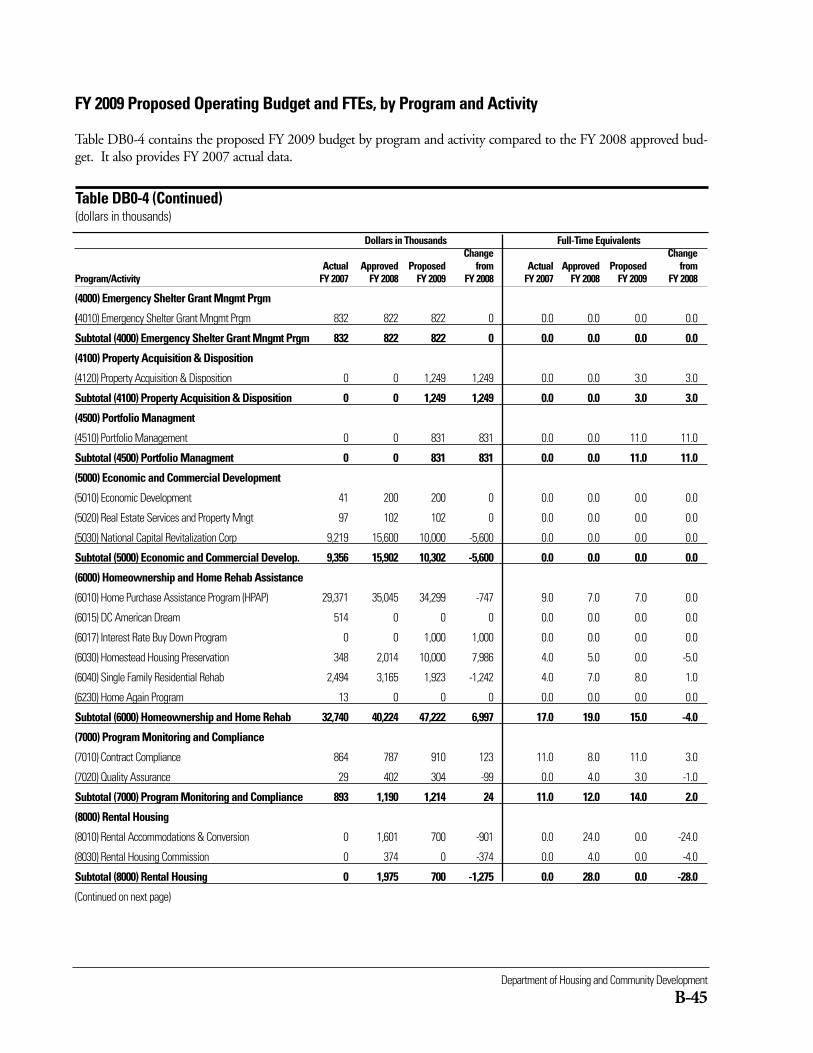
Department of Housing and Community Development
B-45
Dollars in Thousands Full-Time EquivalentsChange Change
Actual Approved Proposed from Actual Approved Proposed from Program/Activity FY 2007 FY 2008 FY 2009 FY 2008 FY 2007 FY 2008 FY 2009 FY 2008
(4000) Emergency Shelter Grant Mngmt Prgm
(4010) Emergency Shelter Grant Mngmt Prgm 832 822 822 0 0.0 0.0 0.0 0.0
Subtotal (4000) Emergency Shelter Grant Mngmt Prgm 832 822 822 0 0.0 0.0 0.0 0.0
(4100) Property Acquisition & Disposition
(4120) Property Acquisition & Disposition 0 0 1,249 1,249 0.0 0.0 3.0 3.0
Subtotal (4100) Property Acquisition & Disposition 0 0 1,249 1,249 0.0 0.0 3.0 3.0
(4500) Portfolio Managment
(4510) Portfolio Management 0 0 831 831 0.0 0.0 11.0 11.0
Subtotal (4500) Portfolio Managment 0 0 831 831 0.0 0.0 11.0 11.0
(5000) Economic and Commercial Development
(5010) Economic Development 41 200 200 0 0.0 0.0 0.0 0.0
(5020) Real Estate Services and Property Mngt 97 102 102 0 0.0 0.0 0.0 0.0
(5030) National Capital Revitalization Corp 9,219 15,600 10,000 -5,600 0.0 0.0 0.0 0.0
Subtotal (5000) Economic and Commercial Develop. 9,356 15,902 10,302 -5,600 0.0 0.0 0.0 0.0
(6000) Homeownership and Home Rehab Assistance
(6010) Home Purchase Assistance Program (HPAP) 29,371 35,045 34,299 -747 9.0 7.0 7.0 0.0
(6015) DC American Dream 514 0 0 0 0.0 0.0 0.0 0.0
(6017) Interest Rate Buy Down Program 0 0 1,000 1,000 0.0 0.0 0.0 0.0
(6030) Homestead Housing Preservation 348 2,014 10,000 7,986 4.0 5.0 0.0 -5.0
(6040) Single Family Residential Rehab 2,494 3,165 1,923 -1,242 4.0 7.0 8.0 1.0
(6230) Home Again Program 13 0 0 0 0.0 0.0 0.0 0.0
Subtotal (6000) Homeownership and Home Rehab 32,740 40,224 47,222 6,997 17.0 19.0 15.0 -4.0
(7000) Program Monitoring and Compliance
(7010) Contract Compliance 864 787 910 123 11.0 8.0 11.0 3.0
(7020) Quality Assurance 29 402 304 -99 0.0 4.0 3.0 -1.0
Subtotal (7000) Program Monitoring and Compliance 893 1,190 1,214 24 11.0 12.0 14.0 2.0
(8000) Rental Housing
(8010) Rental Accommodations & Conversion 0 1,601 700 -901 0.0 24.0 0.0 -24.0
(8030) Rental Housing Commission 0 374 0 -374 0.0 4.0 0.0 -4.0
Subtotal (8000) Rental Housing 0 1,975 700 -1,275 0.0 28.0 0.0 -28.0
(Continued on next page)
FY 2009 Proposed Operating Budget and FTEs, by Program and Activity
Table DB0-4 contains the proposed FY 2009 budget by program and activity compared to the FY 2008 approved bud-get. It also provides FY 2007 actual data.
Table DB0-4 (Continued)(dollars in thousands)
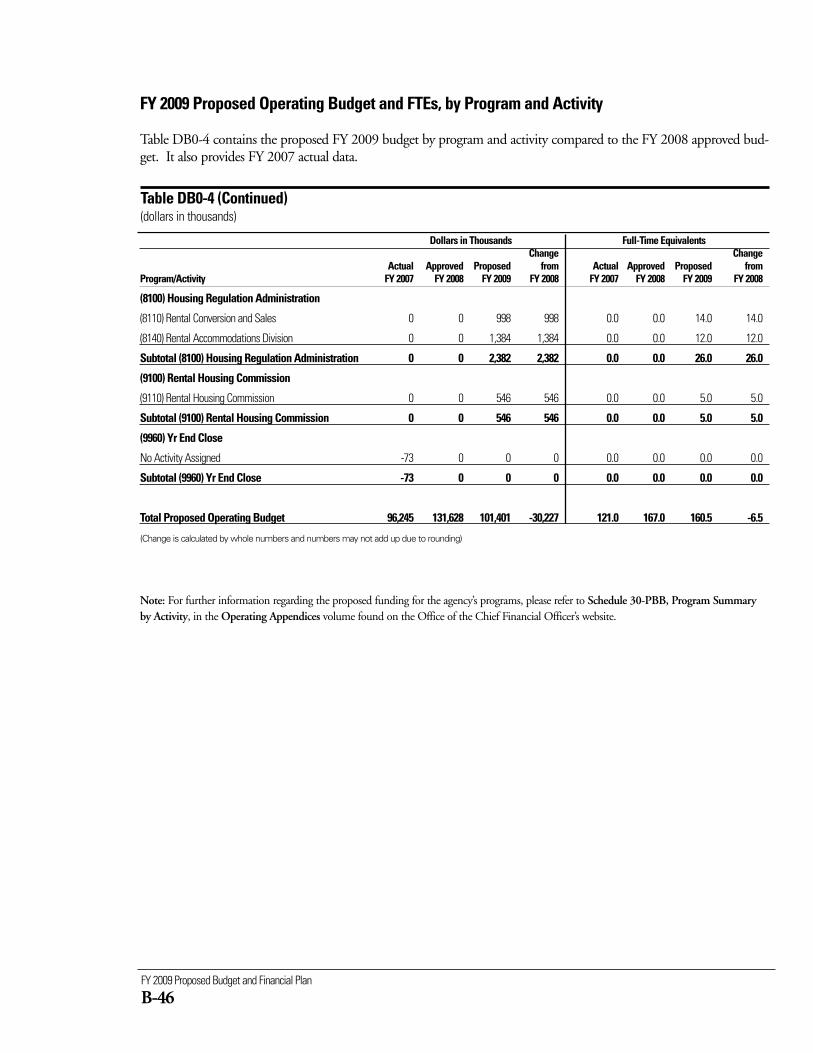
FY 2009 Proposed Budget and Financial Plan
B-46
Dollars in Thousands Full-Time EquivalentsChange Change
Actual Approved Proposed from Actual Approved Proposed from Program/Activity FY 2007 FY 2008 FY 2009 FY 2008 FY 2007 FY 2008 FY 2009 FY 2008
(8100) Housing Regulation Administration
(8110) Rental Conversion and Sales 0 0 998 998 0.0 0.0 14.0 14.0
(8140) Rental Accommodations Division 0 0 1,384 1,384 0.0 0.0 12.0 12.0
Subtotal (8100) Housing Regulation Administration 0 0 2,382 2,382 0.0 0.0 26.0 26.0
(9100) Rental Housing Commission
(9110) Rental Housing Commission 0 0 546 546 0.0 0.0 5.0 5.0
Subtotal (9100) Rental Housing Commission 0 0 546 546 0.0 0.0 5.0 5.0
(9960) Yr End Close
No Activity Assigned -73 0 0 0 0.0 0.0 0.0 0.0
Subtotal (9960) Yr End Close -73 0 0 0 0.0 0.0 0.0 0.0
Total Proposed Operating Budget 96,245 131,628 101,401 -30,227 121.0 167.0 160.5 -6.5
(Change is calculated by whole numbers and numbers may not add up due to rounding)
FY 2009 Proposed Operating Budget and FTEs, by Program and Activity
Table DB0-4 contains the proposed FY 2009 budget by program and activity compared to the FY 2008 approved bud-get. It also provides FY 2007 actual data.
Table DB0-4 (Continued)(dollars in thousands)
Note: For further information regarding the proposed funding for the agency’s programs, please refer to Schedule 30-PBB, Program Summaryby Activity, in the Operating Appendices volume found on the Office of the Chief Financial Officer’s website.
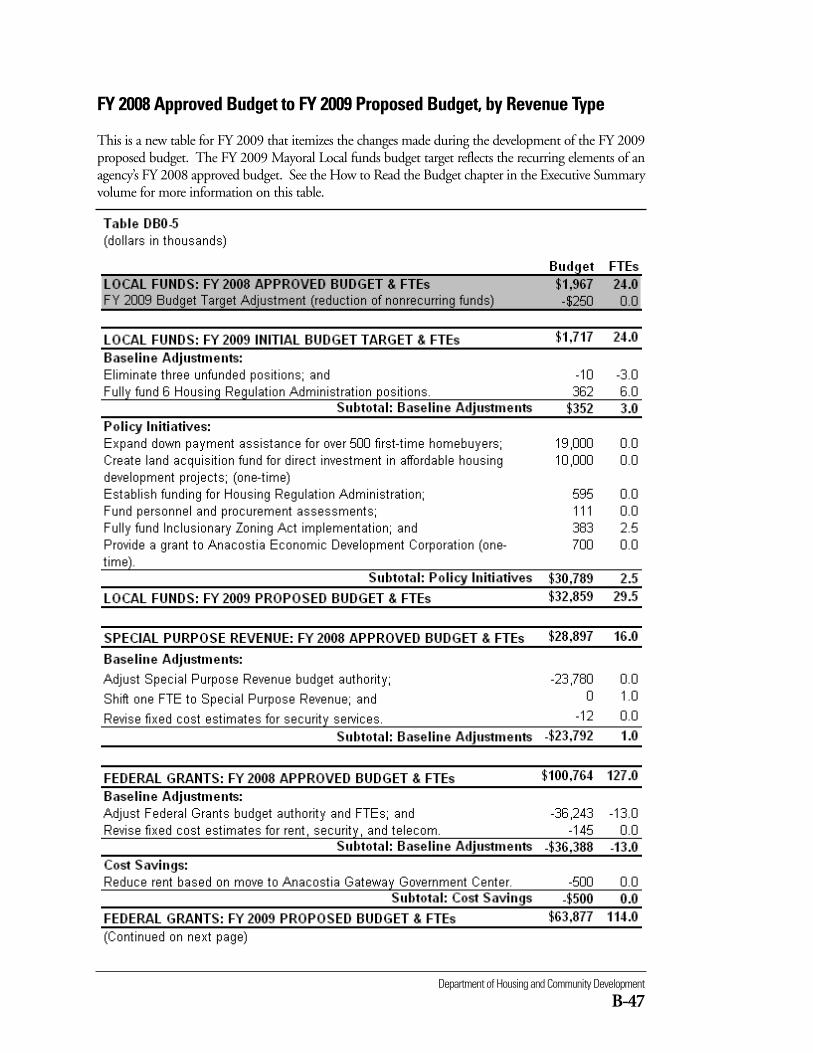
Department of Housing and Community Development
B-47
FY 2008 Approved Budget to FY 2009 Proposed Budget, by Revenue Type
This is a new table for FY 2009 that itemizes the changes made during the development of the FY 2009proposed budget. The FY 2009 Mayoral Local funds budget target reflects the recurring elements of anagency’s FY 2008 approved budget. See the How to Read the Budget chapter in the Executive Summaryvolume for more information on this table.
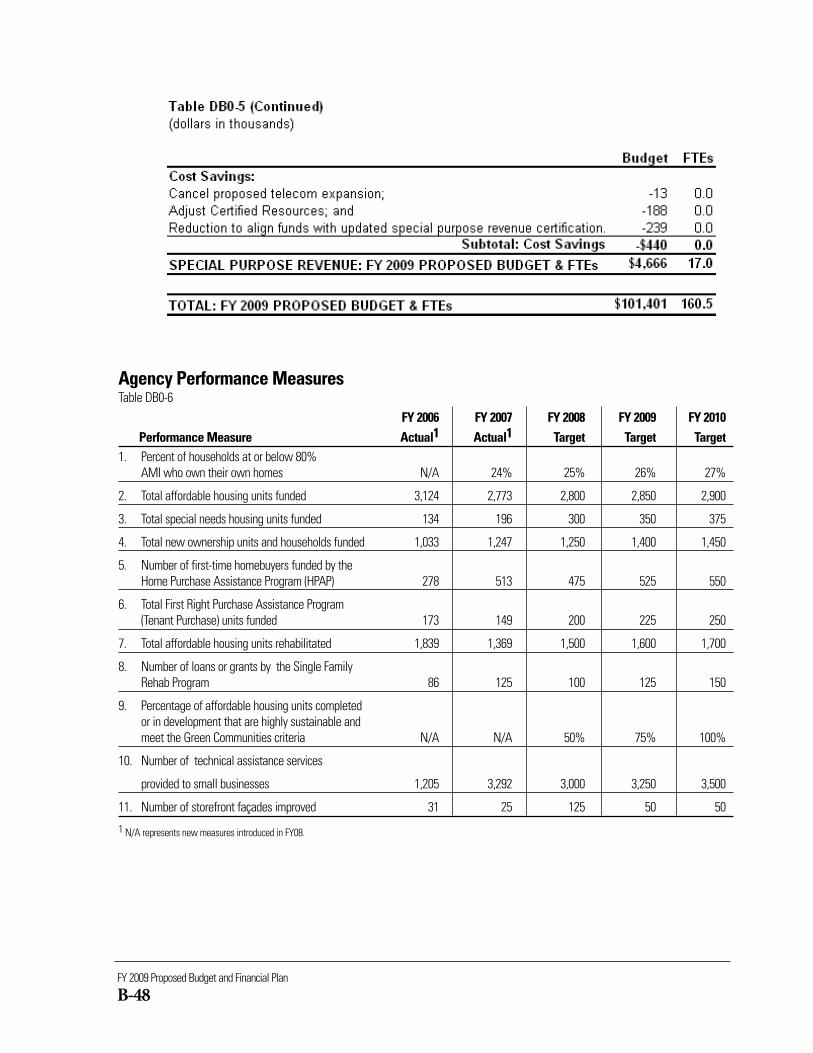
FY 2009 Proposed Budget and Financial Plan
B-48
Agency Performance MeasuresTable DB0-6
FY 2006 FY 2007 FY 2008 FY 2009 FY 2010Performance Measure Actual1 Actual1 Target Target Target
1. Percent of households at or below 80% AMI who own their own homes N/A 24% 25% 26% 27%
2. Total affordable housing units funded 3,124 2,773 2,800 2,850 2,900
3. Total special needs housing units funded 134 196 300 350 375
4. Total new ownership units and households funded 1,033 1,247 1,250 1,400 1,450
5. Number of first-time homebuyers funded by the Home Purchase Assistance Program (HPAP) 278 513 475 525 550
6. Total First Right Purchase Assistance Program (Tenant Purchase) units funded 173 149 200 225 250
7. Total affordable housing units rehabilitated 1,839 1,369 1,500 1,600 1,700
8. Number of loans or grants by the Single Family Rehab Program 86 125 100 125 150
9. Percentage of affordable housing units completed or in development that are highly sustainable and meet the Green Communities criteria N/A N/A 50% 75% 100%
10. Number of technical assistance services
provided to small businesses 1,205 3,292 3,000 3,250 3,500
11. Number of storefront façades improved 31 25 125 50 50
1 N/A represents new measures introduced in FY08.
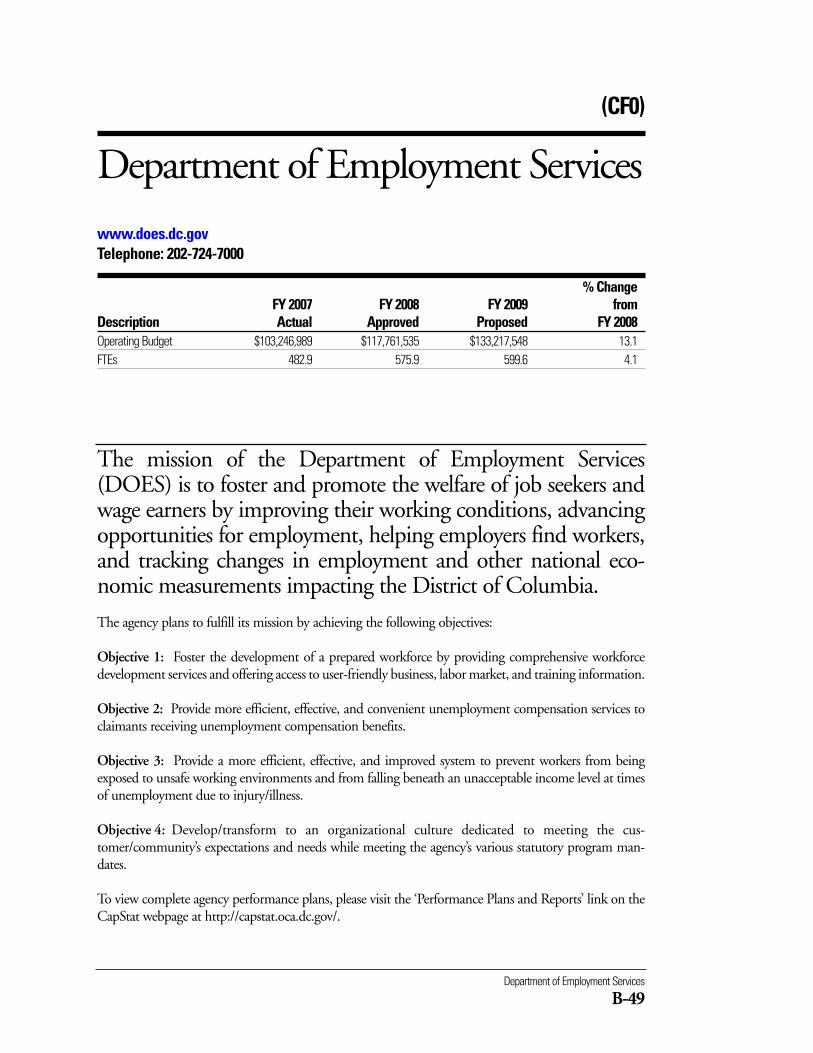
Department of Employment Services
B-49
The agency plans to fulfill its mission by achieving the following objectives:
Objective 1: Foster the development of a prepared workforce by providing comprehensive workforcedevelopment services and offering access to user-friendly business, labor market, and training information.
Objective 2: Provide more efficient, effective, and convenient unemployment compensation services toclaimants receiving unemployment compensation benefits.
Objective 3: Provide a more efficient, effective, and improved system to prevent workers from beingexposed to unsafe working environments and from falling beneath an unacceptable income level at timesof unemployment due to injury/illness.
Objective 4: Develop/transform to an organizational culture dedicated to meeting the cus-tomer/community’s expectations and needs while meeting the agency’s various statutory program man-dates.
To view complete agency performance plans, please visit the ‘Performance Plans and Reports’ link on theCapStat webpage at http://capstat.oca.dc.gov/.
(CF0)
Department of Employment Services
www.does.dc.govTelephone: 202-724-7000
% ChangeFY 2007 FY 2008 FY 2009 from
Description Actual Approved Proposed FY 2008Operating Budget $103,246,989 $117,761,535 $133,217,548 13.1FTEs 482.9 575.9 599.6 4.1
The mission of the Department of Employment Services(DOES) is to foster and promote the welfare of job seekers andwage earners by improving their working conditions, advancingopportunities for employment, helping employers find workers,and tracking changes in employment and other national eco-nomic measurements impacting the District of Columbia.
FY 2009 Proposed Budget and Financial Plan
B-50
These objectives are funded through the following agency programs:
■ Unemployment Insurance - provides income replacement services for workers unemployed throughno fault of their own so that they can maintain their purchasing power and thereby contribute to theeconomic stability of the Washington, D.C. metropolitan area.
■ Labor Standards - provides worker protection and dispute resolution services for the workers andemployers of the District of Columbia so that disputes are resolved fairly and the safety of the work-place is ensured.
■ Workforce Development - provides employment-related services for unemployed or underemployedpersons so that they can achieve economic security.
■ Agency Management - provides for administrative support and the required tools to achieve anagency’s operational and programmatic results. This program is standard for all agencies using per-formance-based budgeting.
■ Agency Financial Operations – provides comprehensive and efficient financial management servicesto, and on behalf of, District agencies so that the financial integrity of the District of Columbia ismaintained. This program is standard for all agencies using performance-based budgeting.
The agency’s FY 2009 proposed budget is presented in the following tables:
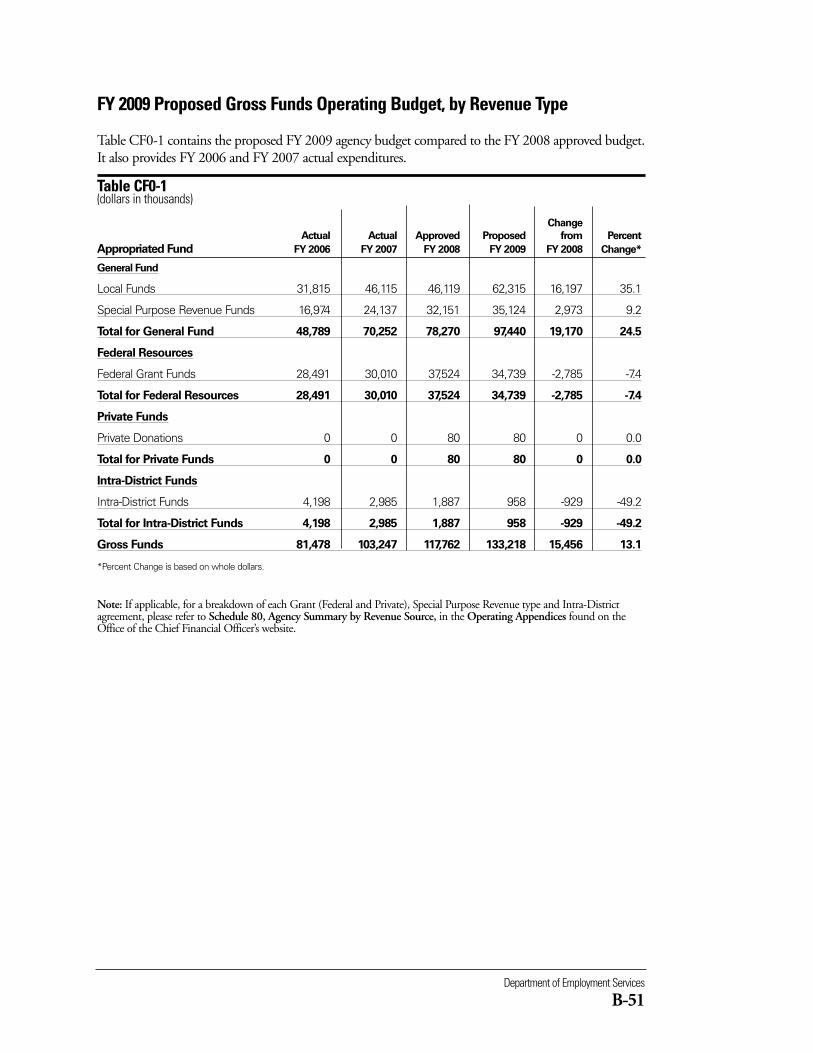
Department of Employment Services
B-51
FY 2009 Proposed Gross Funds Operating Budget, by Revenue Type
Table CF0-1 contains the proposed FY 2009 agency budget compared to the FY 2008 approved budget.It also provides FY 2006 and FY 2007 actual expenditures.
Table CF0-1 (dollars in thousands)
Change
Actual Actual Approved Proposed from Percent
Appropriated Fund FY 2006 FY 2007 FY 2008 FY 2009 FY 2008 Change*
General Fund
Local Funds 31,815 46,115 46,119 62,315 16,197 35.1
Special Purpose Revenue Funds 16,974 24,137 32,151 35,124 2,973 9.2
Total for General Fund 48,789 70,252 78,270 97,440 19,170 24.5
Federal Resources
Federal Grant Funds 28,491 30,010 37,524 34,739 -2,785 -7.4
Total for Federal Resources 28,491 30,010 37,524 34,739 -2,785 -7.4
Private Funds
Private Donations 0 0 80 80 0 0.0
Total for Private Funds 0 0 80 80 0 0.0
Intra-District Funds
Intra-District Funds 4,198 2,985 1,887 958 -929 -49.2
Total for Intra-District Funds 4,198 2,985 1,887 958 -929 -49.2
Gross Funds 81,478 103,247 117,762 133,218 15,456 13.1
*Percent Change is based on whole dollars.
Note: If applicable, for a breakdown of each Grant (Federal and Private), Special Purpose Revenue type and Intra-Districtagreement, please refer to Schedule 80, Agency Summary by Revenue Source, in the Operating Appendices found on theOffice of the Chief Financial Officer’s website.
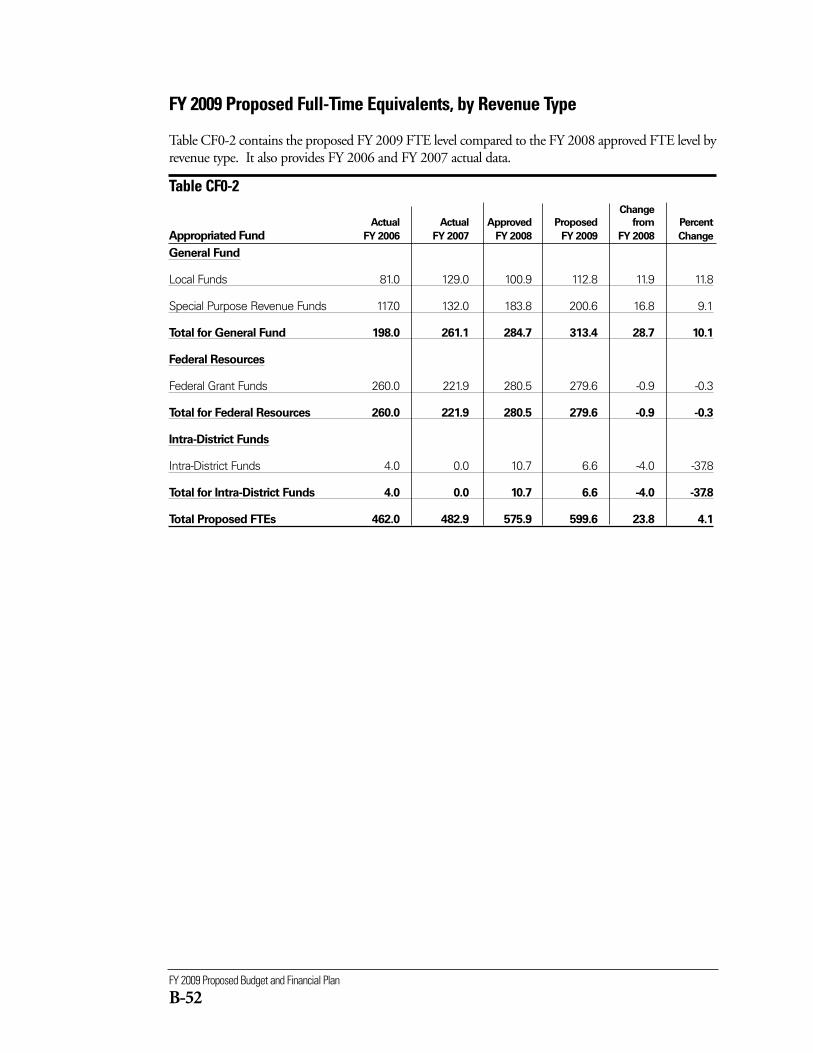
FY 2009 Proposed Budget and Financial Plan
B-52
FY 2009 Proposed Full-Time Equivalents, by Revenue Type
Table CF0-2 contains the proposed FY 2009 FTE level compared to the FY 2008 approved FTE level byrevenue type. It also provides FY 2006 and FY 2007 actual data.
Table CF0-2 Change
Actual Actual Approved Proposed from Percent
Appropriated Fund FY 2006 FY 2007 FY 2008 FY 2009 FY 2008 Change
General Fund
Local Funds 81.0 129.0 100.9 112.8 11.9 11.8
Special Purpose Revenue Funds 117.0 132.0 183.8 200.6 16.8 9.1
Total for General Fund 198.0 261.1 284.7 313.4 28.7 10.1
Federal Resources
Federal Grant Funds 260.0 221.9 280.5 279.6 -0.9 -0.3
Total for Federal Resources 260.0 221.9 280.5 279.6 -0.9 -0.3
Intra-District Funds
Intra-District Funds 4.0 0.0 10.7 6.6 -4.0 -37.8
Total for Intra-District Funds 4.0 0.0 10.7 6.6 -4.0 -37.8
Total Proposed FTEs 462.0 482.9 575.9 599.6 23.8 4.1
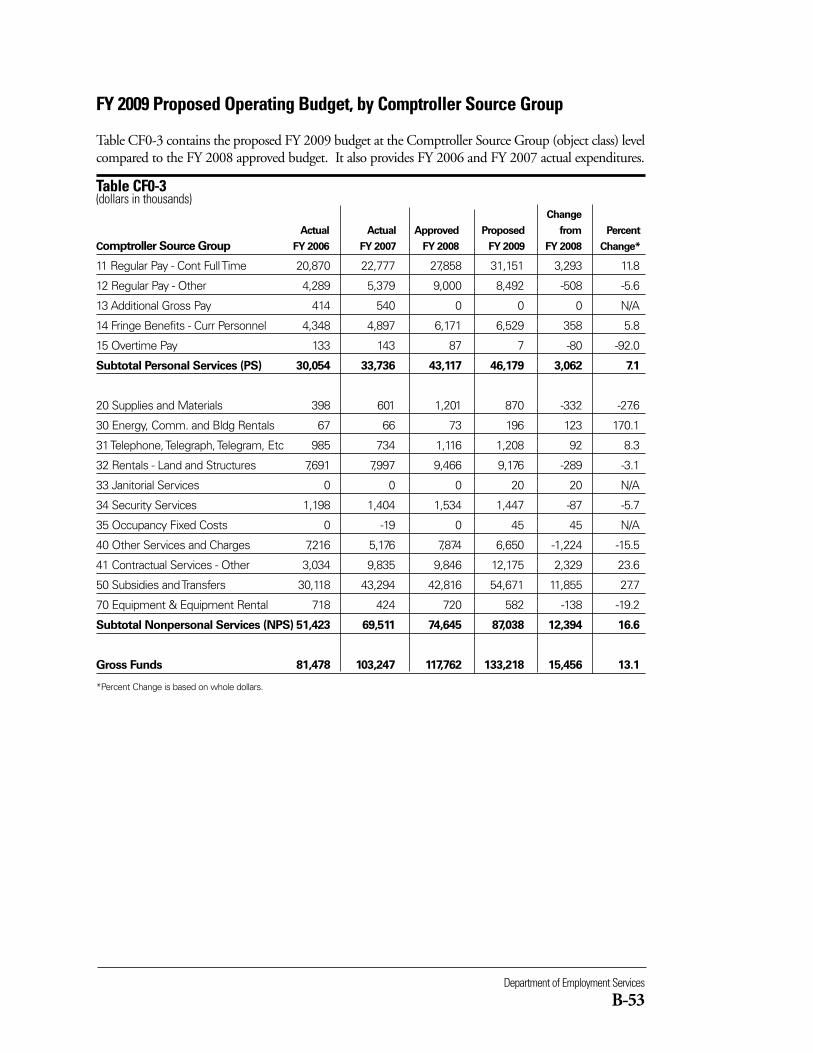
Department of Employment Services
B-53
FY 2009 Proposed Operating Budget, by Comptroller Source Group
Table CF0-3 contains the proposed FY 2009 budget at the Comptroller Source Group (object class) levelcompared to the FY 2008 approved budget. It also provides FY 2006 and FY 2007 actual expenditures.
Table CF0-3(dollars in thousands)
Change
Actual Actual Approved Proposed from Percent
Comptroller Source Group FY 2006 FY 2007 FY 2008 FY 2009 FY 2008 Change*
11 Regular Pay - Cont Full Time 20,870 22,777 27,858 31,151 3,293 11.8
12 Regular Pay - Other 4,289 5,379 9,000 8,492 -508 -5.6
13 Additional Gross Pay 414 540 0 0 0 N/A
14 Fringe Benefits - Curr Personnel 4,348 4,897 6,171 6,529 358 5.8
15 Overtime Pay 133 143 87 7 -80 -92.0
Subtotal Personal Services (PS) 30,054 33,736 43,117 46,179 3,062 7.1
20 Supplies and Materials 398 601 1,201 870 -332 -27.6
30 Energy, Comm. and Bldg Rentals 67 66 73 196 123 170.1
31 Telephone, Telegraph, Telegram, Etc 985 734 1,116 1,208 92 8.3
32 Rentals - Land and Structures 7,691 7,997 9,466 9,176 -289 -3.1
33 Janitorial Services 0 0 0 20 20 N/A
34 Security Services 1,198 1,404 1,534 1,447 -87 -5.7
35 Occupancy Fixed Costs 0 -19 0 45 45 N/A
40 Other Services and Charges 7,216 5,176 7,874 6,650 -1,224 -15.5
41 Contractual Services - Other 3,034 9,835 9,846 12,175 2,329 23.6
50 Subsidies and Transfers 30,118 43,294 42,816 54,671 11,855 27.7
70 Equipment & Equipment Rental 718 424 720 582 -138 -19.2
Subtotal Nonpersonal Services (NPS) 51,423 69,511 74,645 87,038 12,394 16.6
Gross Funds 81,478 103,247 117,762 133,218 15,456 13.1
*Percent Change is based on whole dollars.
FY 2009 Proposed Budget and Financial Plan
B-54
Dollars in Thousands Full-Time EquivalentsChange Change
Actual Approved Proposed from Actual Approved Proposed from Program/Activity FY 2007 FY 2008 FY 2009 FY 2008 FY 2007 FY 2008 FY 2009 FY 2008
(1000) Agency Management
(1010) Personnel 98 97 290 194 1.0 1.0 1.0 0.0
(1017) Labor Management Partnerships 37 158 174 16 1.0 2.0 2.0 0.0
(1020) Contracting and Procurement 0 0 340 340 0.0 0.0 0.0 0.0
(1030) Property Management 11,856 14,310 14,476 166 9.0 9.0 10.0 1.0
(1040) Information Technology 2,838 3,950 4,090 141 20.3 30.0 30.0 0.0
(1050) Financial Management -10 0 0 0 0.0 0.0 0.0 0.0
(1060) Legal 343 350 0 -350 0.0 3.0 0.0 -3.0
(1070) Fleet Management 466 444 578 133 6.0 5.8 6.0 0.2
(1080) Communications 68 68 603 534 1.0 1.0 6.0 5.0
(1085) Customer Service 992 901 467 -434 14.0 15.0 8.0 -7.0
(1087) Language Access 0 18 0 -18 0.0 0.0 0.0 0.0
(1090) Performance Management 2,081 2,261 3,222 961 22.5 25.0 31.9 6.9
Subtotal (1000) Agency Management 18,769 22,557 24,240 1,683 74.8 91.7 94.9 3.2
(100F) Agency Financial Operations
(110F) Budget Operations 1,272 1,137 1,121 -15 7.0 9.0 9.0 0.0
(120F) Accounting Operations 734 1,082 960 -122 8.0 10.0 10.0 0.0
Subtotal (100F) Agency Financial Operations 2,006 2,219 2,081 -137 15.0 19.0 19.0 0.0
(2000) Unemployment Insurance
(2100) Tax Collections 2,286 3,786 3,921 136 233.4 37.0 38.0 1.0
(2200) Benefits 12,065 11,502 14,093 2,591 1.0 44.0 57.0 13.0
(2300) Appeals 621 359 510 151 0.0 0.0 0.0 0.0
Subtotal (2000) Unemployment Insurance 14,972 15,646 18,524 2,878 234.4 81.0 95.0 14.0
(3000) Labor Standards
(3200) Office of Wage Hour 479 651 1,280 629 0.0 8.0 8.0 0.0
(3300) Office of Occupational Safety and Health 448 525 555 30 0.0 5.0 6.0 1.0
(3400) Office of Workers' Compensation 8,410 14,415 14,456 41 14.0 93.0 94.0 1.0
(3500) OAH: Administrative Hearings Division 2,603 2,725 3,123 399 36.0 29.0 31.0 2.0
(3600) OAH: Compensation Review Board 0 1,689 1,459 -229 0.0 17.0 17.0 0.0
Subtotal (3000) Labor Standards 11,940 20,005 20,874 870 50.0 152.0 156.0 4.0
(Continued on next page)
FY 2009 Proposed Operating Budget and FTEs, by Program and Activity
Table CF0-4 contains the proposed FY 2009 budget by program and activity compared to the FY 2008 approved bud-get. It also provides FY 2007 actual data.
Table CF0-4 (Continued)(dollars in thousands)
Department of Employment Services
B-55
Dollars in Thousands Full-Time EquivalentsChange Change
Actual Approved Proposed from Actual Approved Proposed from Program/Activity FY 2007 FY 2008 FY 2009 FY 2008 FY 2007 FY 2008 FY 2009 FY 2008
(4000) Workforce Development
(4100) Senior Services 521 513 519 6 1.0 1.0 1.0 0.0
(4200) Program Performance Monitoring 4,586 4,421 5,541 1,120 25.8 38.0 30.0 -8.0
(4300) Office of Apprenticeship Info & Training 1,045 1,293 1,566 273 0.0 7.0 7.0 0.0
(4400) Transitional Employment 6,909 11,555 14,194 2,639 1.0 22.0 21.0 -1.0
(4500) Employer Services 2,519 2,084 3,331 1,248 17.0 21.0 37.0 16.0
(4600) One-stop Operations 4,356 8,595 6,297 -2,298 51.9 82.2 84.0 1.8
(4700) Labor Market Information 829 905 900 -5 0.0 7.0 7.0 0.0
(4800) Youth Programs Information 34,871 27,970 35,150 7,180 12.0 54.0 47.7 -6.3
Subtotal (4000) Workforce Development 55,635 57,335 67,498 10,163 108.7 232.2 234.7 2.5
(9960) Year End Close
No Activity Assigned -75 0 0 0 0.0 0.0 0.0 0.0
Subtotal (9960) Year End Close -75 0 0 0 0.0 0.0 0.0 0.0
Total Proposed Operating Budget 103,247 117,762 133,218 15,456 482.9 575.9 599.6 23.8
(Change is calculated by whole numbers and numbers may not add up due to rounding)
Note: For further information regarding the proposed funding for the agency’s programs please refer to Schedule 30-PBB, ProgramSummary by Activity, in the Operating Appendices volume found on the Office of the Chief Financial Officer’s website.
FY 2009 Proposed Operating Budget and FTEs, by Program and Activity
Table CF0-4 contains the proposed FY 2009 budget by program and activity compared to the FY 2008 approved bud-get. It also provides FY 2007 actual data.
Table CF0-4 (Continued)(dollars in thousands)
FY 2009 Proposed Budget and Financial Plan
B-56
FY 2008 Approved Budget to FY 2009 Proposed Budget, by Revenue Type
This is a new table for FY 2009 that itemizes the changes made during the development of the FY 2009proposed budget. The FY 2009 Mayoral Local funds budget target reflects the recurring elements of anagency’s FY 2008 approved budget. See the How to Read the Budget chapter in the Executive Summaryvolume for more information on this table.
Department of Employment Services
B-57
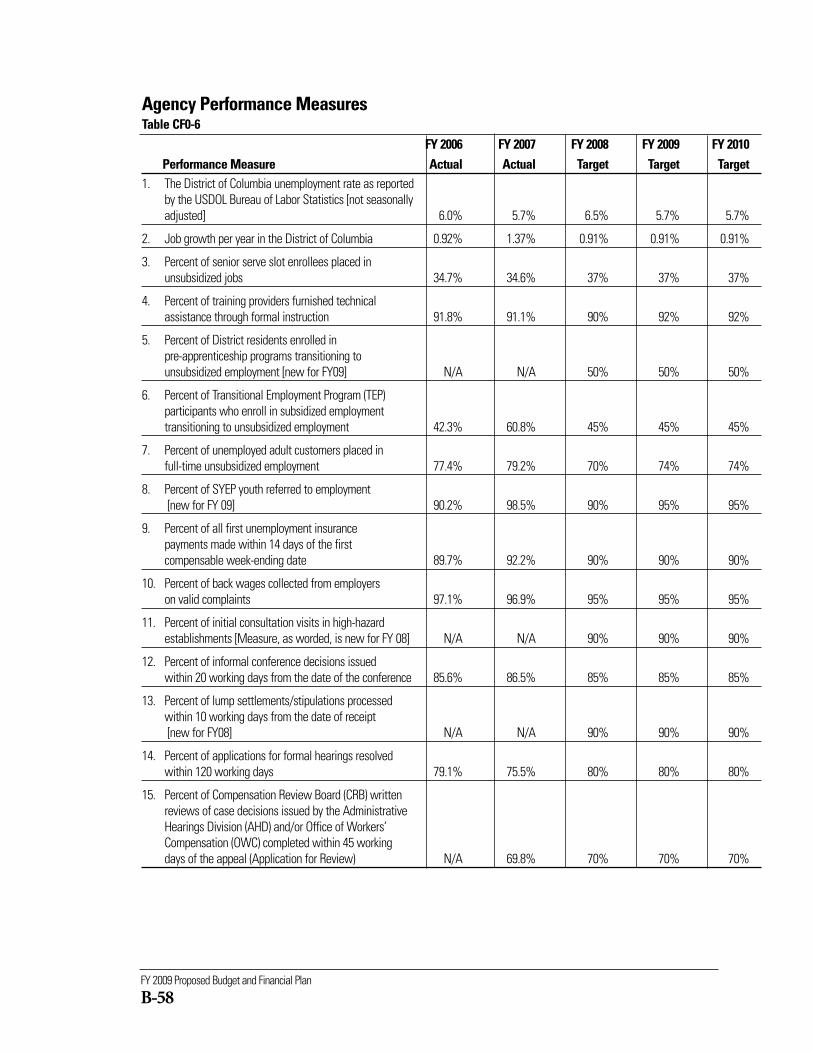
FY 2009 Proposed Budget and Financial Plan
B-58
Agency Performance MeasuresTable CF0-6
FY 2006 FY 2007 FY 2008 FY 2009 FY 2010Performance Measure Actual Actual Target Target Target
1. The District of Columbia unemployment rate as reportedby the USDOL Bureau of Labor Statistics [not seasonallyadjusted] 6.0% 5.7% 6.5% 5.7% 5.7%
2. Job growth per year in the District of Columbia 0.92% 1.37% 0.91% 0.91% 0.91%
3. Percent of senior serve slot enrollees placed in unsubsidized jobs 34.7% 34.6% 37% 37% 37%
4. Percent of training providers furnished technical assistance through formal instruction 91.8% 91.1% 90% 92% 92%
5. Percent of District residents enrolled in pre-apprenticeship programs transitioning to unsubsidized employment [new for FY09] N/A N/A 50% 50% 50%
6. Percent of Transitional Employment Program (TEP)participants who enroll in subsidized employmenttransitioning to unsubsidized employment 42.3% 60.8% 45% 45% 45%
7. Percent of unemployed adult customers placed infull-time unsubsidized employment 77.4% 79.2% 70% 74% 74%
8. Percent of SYEP youth referred to employment[new for FY 09] 90.2% 98.5% 90% 95% 95%
9. Percent of all first unemployment insurance payments made within 14 days of the first compensable week-ending date 89.7% 92.2% 90% 90% 90%
10. Percent of back wages collected from employerson valid complaints 97.1% 96.9% 95% 95% 95%
11. Percent of initial consultation visits in high-hazard establishments [Measure, as worded, is new for FY 08] N/A N/A 90% 90% 90%
12. Percent of informal conference decisions issued within 20 working days from the date of the conference 85.6% 86.5% 85% 85% 85%
13. Percent of lump settlements/stipulations processed within 10 working days from the date of receipt[new for FY08] N/A N/A 90% 90% 90%
14. Percent of applications for formal hearings resolved within 120 working days 79.1% 75.5% 80% 80% 80%
15. Percent of Compensation Review Board (CRB) written reviews of case decisions issued by the AdministrativeHearings Division (AHD) and/or Office of Workers’Compensation (OWC) completed within 45 workingdays of the appeal (Application for Review) N/A 69.8% 70% 70% 70%
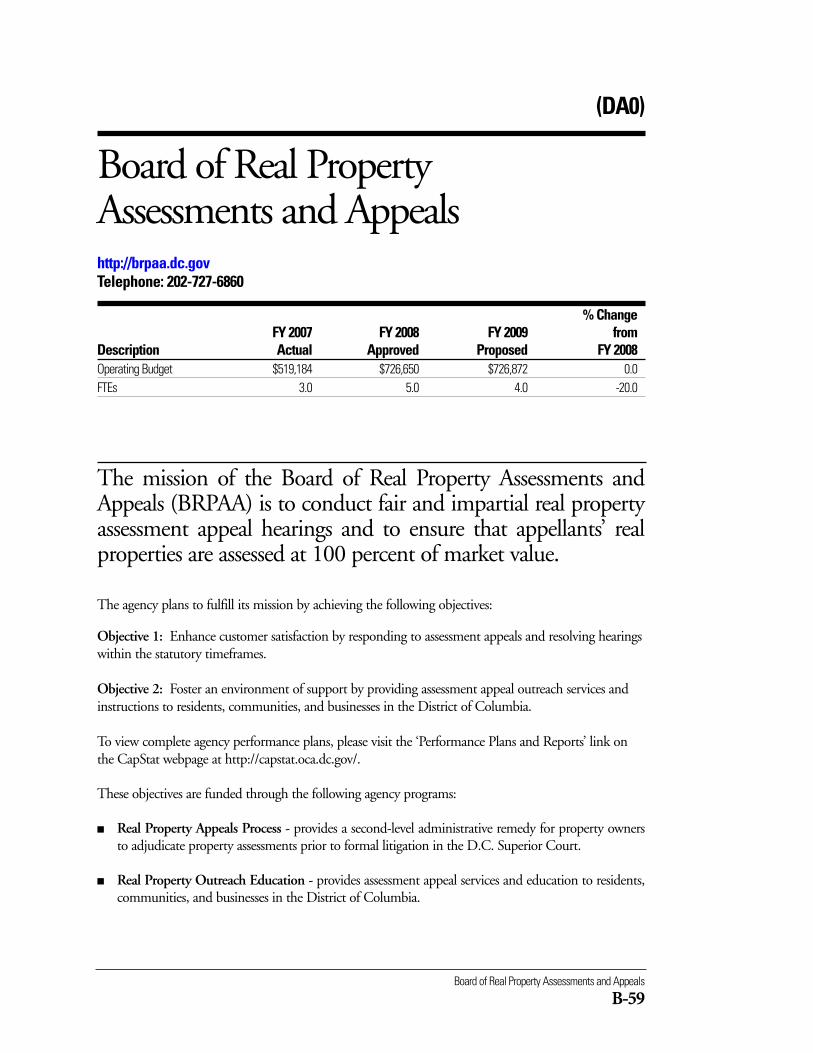
The agency plans to fulfill its mission by achieving the following objectives:
Objective 1: Enhance customer satisfaction by responding to assessment appeals and resolving hearingswithin the statutory timeframes.
Objective 2: Foster an environment of support by providing assessment appeal outreach services andinstructions to residents, communities, and businesses in the District of Columbia.
To view complete agency performance plans, please visit the ‘Performance Plans and Reports’ link onthe CapStat webpage at http://capstat.oca.dc.gov/.
These objectives are funded through the following agency programs:
■ Real Property Appeals Process - provides a second-level administrative remedy for property ownersto adjudicate property assessments prior to formal litigation in the D.C. Superior Court.
■ Real Property Outreach Education - provides assessment appeal services and education to residents,communities, and businesses in the District of Columbia.
Board of Real Property Assessments and Appeals
B-59
(DA0)
Board of Real Property Assessments and Appealshttp://brpaa.dc.govTelephone: 202-727-6860
% ChangeFY 2007 FY 2008 FY 2009 from
Description Actual Approved Proposed FY 2008Operating Budget $519,184 $726,650 $726,872 0.0FTEs 3.0 5.0 4.0 -20.0
The mission of the Board of Real Property Assessments andAppeals (BRPAA) is to conduct fair and impartial real propertyassessment appeal hearings and to ensure that appellants’ realproperties are assessed at 100 percent of market value.
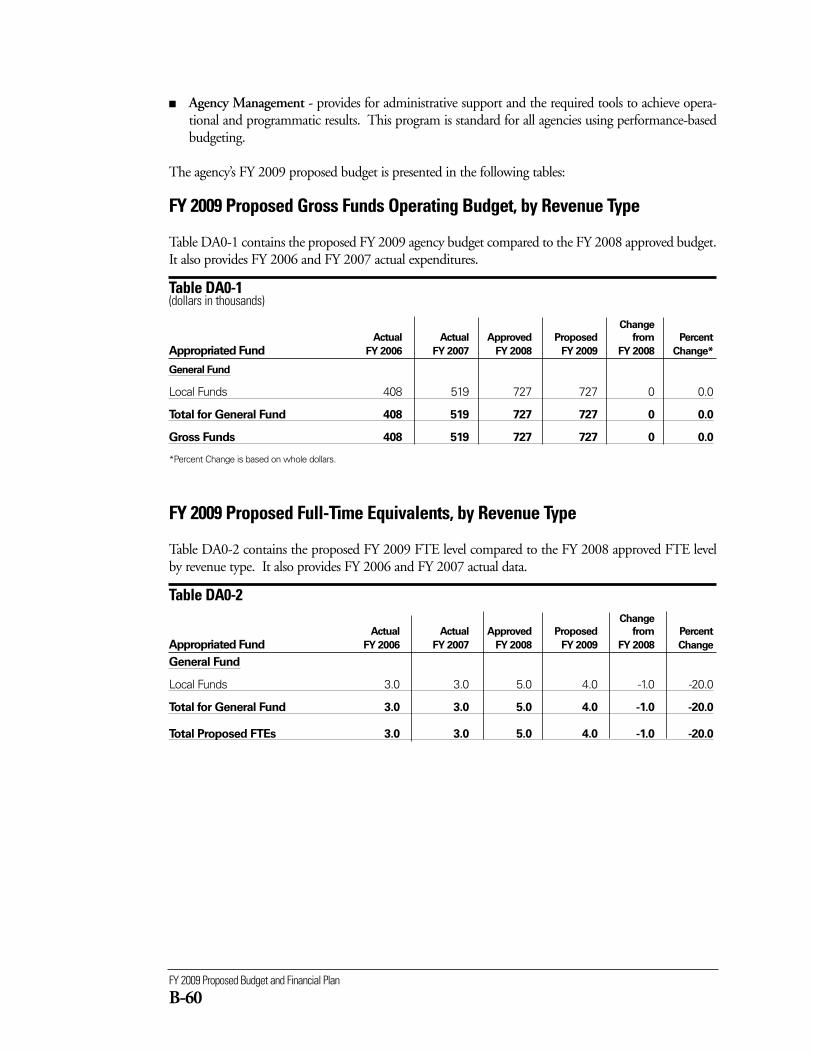
FY 2009 Proposed Budget and Financial Plan
B-60
FY 2009 Proposed Gross Funds Operating Budget, by Revenue Type
Table DA0-1 contains the proposed FY 2009 agency budget compared to the FY 2008 approved budget.It also provides FY 2006 and FY 2007 actual expenditures.
Table DA0-1 (dollars in thousands)
Change
Actual Actual Approved Proposed from Percent
Appropriated Fund FY 2006 FY 2007 FY 2008 FY 2009 FY 2008 Change*
General Fund
Local Funds 408 519 727 727 0 0.0
Total for General Fund 408 519 727 727 0 0.0
Gross Funds 408 519 727 727 0 0.0
*Percent Change is based on whole dollars.
FY 2009 Proposed Full-Time Equivalents, by Revenue Type
Table DA0-2 contains the proposed FY 2009 FTE level compared to the FY 2008 approved FTE levelby revenue type. It also provides FY 2006 and FY 2007 actual data.
Table DA0-2 Change
Actual Actual Approved Proposed from Percent
Appropriated Fund FY 2006 FY 2007 FY 2008 FY 2009 FY 2008 Change
General Fund
Local Funds 3.0 3.0 5.0 4.0 -1.0 -20.0
Total for General Fund 3.0 3.0 5.0 4.0 -1.0 -20.0
Total Proposed FTEs 3.0 3.0 5.0 4.0 -1.0 -20.0
■ Agency Management - provides for administrative support and the required tools to achieve opera-tional and programmatic results. This program is standard for all agencies using performance-basedbudgeting.
The agency’s FY 2009 proposed budget is presented in the following tables:
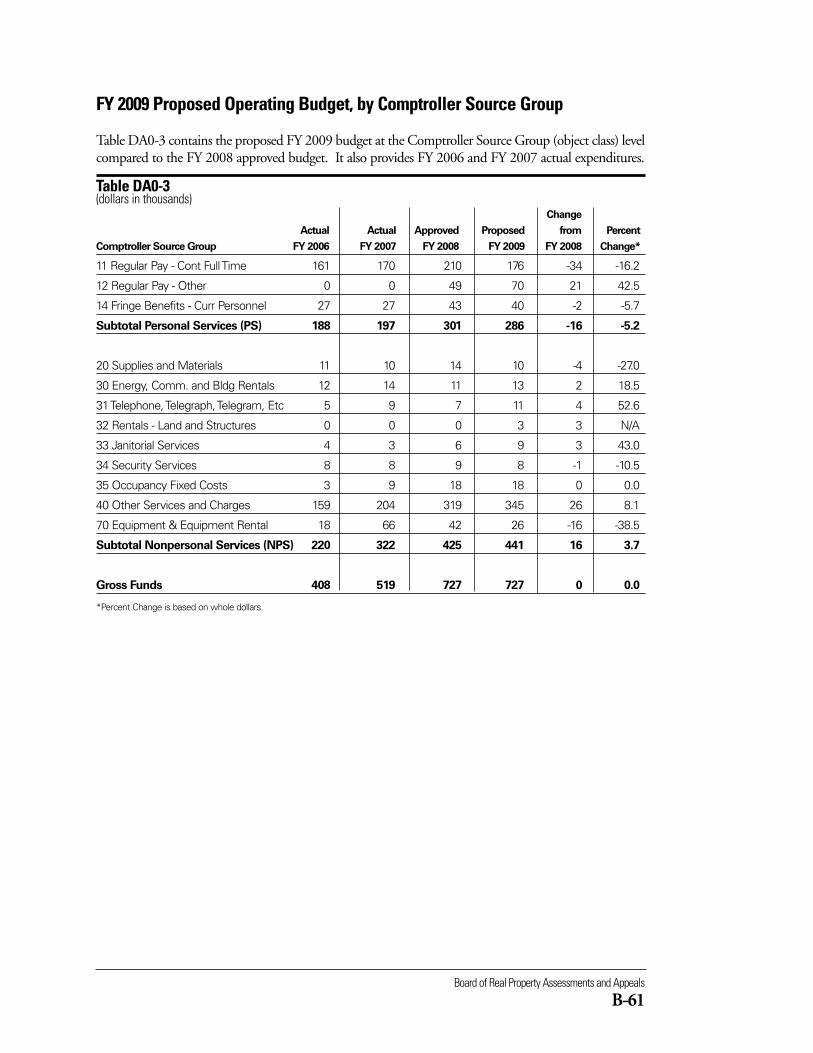
Board of Real Property Assessments and Appeals
B-61
FY 2009 Proposed Operating Budget, by Comptroller Source Group
Table DA0-3 contains the proposed FY 2009 budget at the Comptroller Source Group (object class) levelcompared to the FY 2008 approved budget. It also provides FY 2006 and FY 2007 actual expenditures.
Table DA0-3(dollars in thousands)
Change
Actual Actual Approved Proposed from Percent
Comptroller Source Group FY 2006 FY 2007 FY 2008 FY 2009 FY 2008 Change*
11 Regular Pay - Cont Full Time 161 170 210 176 -34 -16.2
12 Regular Pay - Other 0 0 49 70 21 42.5
14 Fringe Benefits - Curr Personnel 27 27 43 40 -2 -5.7
Subtotal Personal Services (PS) 188 197 301 286 -16 -5.2
20 Supplies and Materials 11 10 14 10 -4 -27.0
30 Energy, Comm. and Bldg Rentals 12 14 11 13 2 18.5
31 Telephone, Telegraph, Telegram, Etc 5 9 7 11 4 52.6
32 Rentals - Land and Structures 0 0 0 3 3 N/A
33 Janitorial Services 4 3 6 9 3 43.0
34 Security Services 8 8 9 8 -1 -10.5
35 Occupancy Fixed Costs 3 9 18 18 0 0.0
40 Other Services and Charges 159 204 319 345 26 8.1
70 Equipment & Equipment Rental 18 66 42 26 -16 -38.5
Subtotal Nonpersonal Services (NPS) 220 322 425 441 16 3.7
Gross Funds 408 519 727 727 0 0.0
*Percent Change is based on whole dollars.
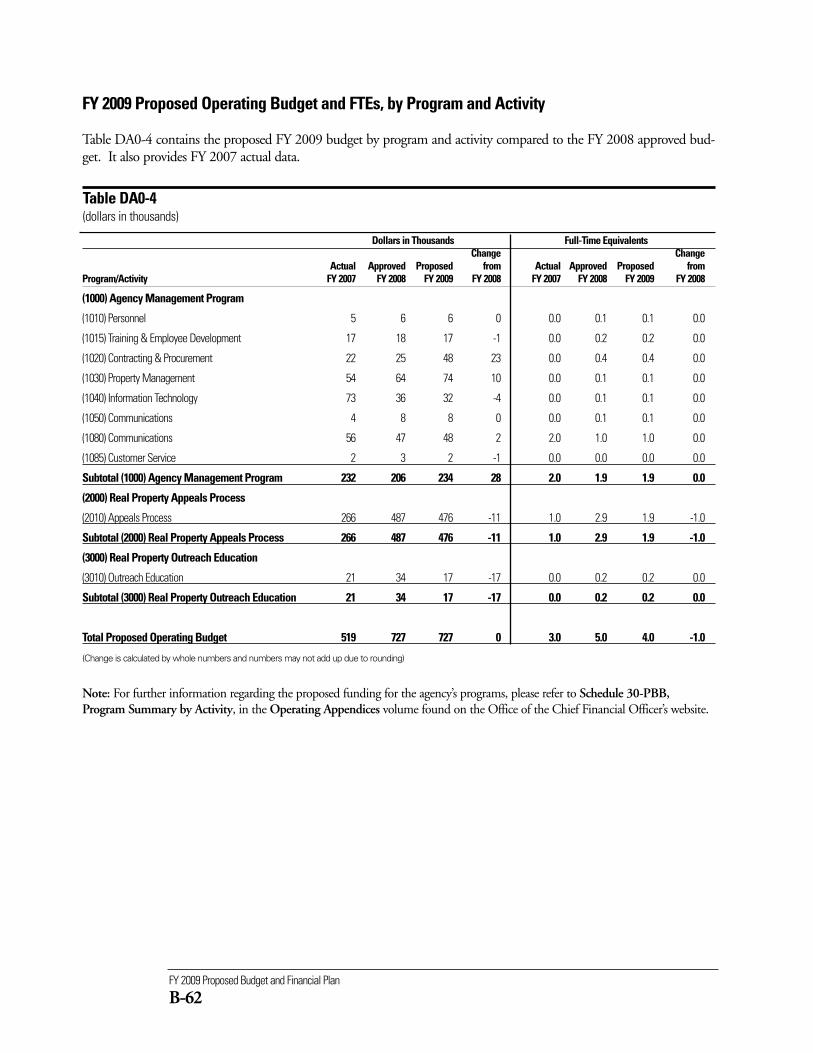
FY 2009 Proposed Budget and Financial Plan
B-62
Dollars in Thousands Full-Time EquivalentsChange Change
Actual Approved Proposed from Actual Approved Proposed from Program/Activity FY 2007 FY 2008 FY 2009 FY 2008 FY 2007 FY 2008 FY 2009 FY 2008
(1000) Agency Management Program
(1010) Personnel 5 6 6 0 0.0 0.1 0.1 0.0
(1015) Training & Employee Development 17 18 17 -1 0.0 0.2 0.2 0.0
(1020) Contracting & Procurement 22 25 48 23 0.0 0.4 0.4 0.0
(1030) Property Management 54 64 74 10 0.0 0.1 0.1 0.0
(1040) Information Technology 73 36 32 -4 0.0 0.1 0.1 0.0
(1050) Communications 4 8 8 0 0.0 0.1 0.1 0.0
(1080) Communications 56 47 48 2 2.0 1.0 1.0 0.0
(1085) Customer Service 2 3 2 -1 0.0 0.0 0.0 0.0
Subtotal (1000) Agency Management Program 232 206 234 28 2.0 1.9 1.9 0.0
(2000) Real Property Appeals Process
(2010) Appeals Process 266 487 476 -11 1.0 2.9 1.9 -1.0
Subtotal (2000) Real Property Appeals Process 266 487 476 -11 1.0 2.9 1.9 -1.0
(3000) Real Property Outreach Education
(3010) Outreach Education 21 34 17 -17 0.0 0.2 0.2 0.0
Subtotal (3000) Real Property Outreach Education 21 34 17 -17 0.0 0.2 0.2 0.0
Total Proposed Operating Budget 519 727 727 0 3.0 5.0 4.0 -1.0
(Change is calculated by whole numbers and numbers may not add up due to rounding)
Note: For further information regarding the proposed funding for the agency’s programs, please refer to Schedule 30-PBB,Program Summary by Activity, in the Operating Appendices volume found on the Office of the Chief Financial Officer’s website.
FY 2009 Proposed Operating Budget and FTEs, by Program and Activity
Table DA0-4 contains the proposed FY 2009 budget by program and activity compared to the FY 2008 approved bud-get. It also provides FY 2007 actual data.
Table DA0-4(dollars in thousands)
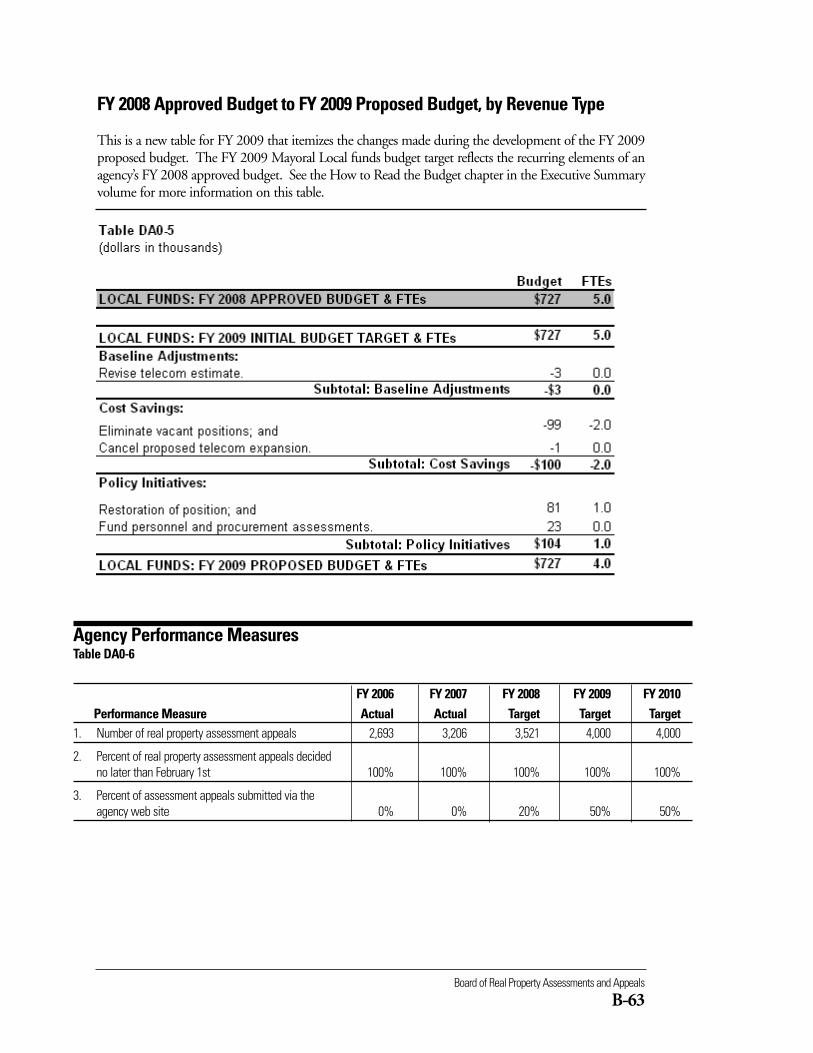
Board of Real Property Assessments and Appeals
B-63
Agency Performance MeasuresTable DA0-6
FY 2006 FY 2007 FY 2008 FY 2009 FY 2010Performance Measure Actual Actual Target Target Target
1. Number of real property assessment appeals 2,693 3,206 3,521 4,000 4,000
2. Percent of real property assessment appeals decidedno later than February 1st 100% 100% 100% 100% 100%
3. Percent of assessment appeals submitted via theagency web site 0% 0% 20% 50% 50%
FY 2008 Approved Budget to FY 2009 Proposed Budget, by Revenue Type
This is a new table for FY 2009 that itemizes the changes made during the development of the FY 2009proposed budget. The FY 2009 Mayoral Local funds budget target reflects the recurring elements of anagency’s FY 2008 approved budget. See the How to Read the Budget chapter in the Executive Summaryvolume for more information on this table.
Department of Consumer and Regulatory Affairs
B-65
The mission of the Department of Consumer and RegulatoryAffairs (DCRA) is to protect the health, safety, economic inter-ests and quality of life of residents, businesses, and visitors in theDistrict of Columbia by ensuring code compliance and regulat-ing businesses.
(CR0)
Department of Consumer and Regulatory Affairswww.dcra.dc.govTelephone: 202-442-4400
% ChangeFY 2007 FY 2008 FY 2009 from
Description Actual Approved Proposed FY 2008Operating Budget $42,215,644 $40,475,293 $39,156,601 -3.3FTEs 360.0 390.0 382.0 -2.1
The agency plans to fulfill its mission by achieving the following objectives:
Objective 1: Enhance customer satisfaction through efficient and effective regulatory and complianceprocesses.
Objective 2: Protect the health and safety of people who visit, live, and work in the District of Columbia.
Objective 3: Encourage economic growth that maintains the character of neighborhoods and the qualityof life of residents.
To view complete agency performance plans, please visit the ‘Performance Plans and Reports’ link on theCapStat webpage at http://capstat.oca.dc.gov/.
These objectives are funded through the following agency programs:
■ Permits – serves as a central point of the agency’s customer service intake and issuance responsibilitiesby maintaining information regarding permits, plan review, homeowner center and surveyor, toinclude all application forms and instructions; reviewing building plans to determine compliance withthe District’s Construction Codes; maintaining the District’s official plats and subdivisions; preparing
FY 2009 Proposed Budget and Financial Plan
B-66
and processing building plat drawings, subdivisions, street and alley closings, surveys, wall checks, and-deed analysis; and issuing Certificates of Occupancy certifying that the use of the buildings and struc-tures comply with the District’s Zoning Regulations.
■ Enforcement – responsible for implementing, coordinating, and monitoring the activities required tobring final resolution to decisions rendered regarding violations cited by the agency’s various regulato-ry programs. This office works closely with the Office of the Attorney General in ensuring that actionstaken are legally sufficient, registers and inspects vacant properties to encourage the return to produc-tive use, and condemns existing properties for the existence of unsafe and deteriorating conditions.This program also inspects all weighing and measuring devices used in commercial transactions to pro-tect the consuming public from unfair trade practices.
■ Inspection – inspects construction and land development activities to ensure compliance with theDistrict’s Residential and Construction Codes, to include Zoning Regulations; conducts inspectionsto ensure that owners of existing properties maintain their properties in a safe and decent manner;responds to complaints regarding illegal construction and land development to eliminate and reduceunplanned and undesired physical growth and development; and inspects residential property to pre-vent deterioration of the District’s housing stock.
■ Zoning – administers the District’s zoning regulations by approving applications for proposed landuse. This includes reviewing and approving building plans, conducting pre-design meetings, review-ing, and approving applications for Certificates of Occupancy and Home Occupation Permits.
■ Licensing – serves as a central point of the agency’s customer service intake and issuance responsibili-ties by maintaining information regarding occupational, professional, general business licenses andregistration, to include all application forms and instructions; regulating certain business activities inthe District of Columbia by reviewing and approving applications for licensure under the BasicBusiness License program; registering corporations, partnerships, and limited liability companies; reg-istering trade names; conducting examinations to determine the qualifications of those who intend toengage in various occupations and professions; and providing administrative and housekeeping sup-port to 16 professional boards and commissions.
■ Agency Management – provides for administrative support and the required tools to achieve opera-tional and programmatic results. This program is standard for all agencies using performance-basedbudgeting.
■ Agency Financial Operations - provides comprehensive and efficient financial management servicesto, and on behalf of, District agencies so that the financial integrity of the District of Columbia ismaintained. This program is standard for all agencies using performance-based budgeting.
The agency’s FY 2009 proposed budget is presented in the following tables:
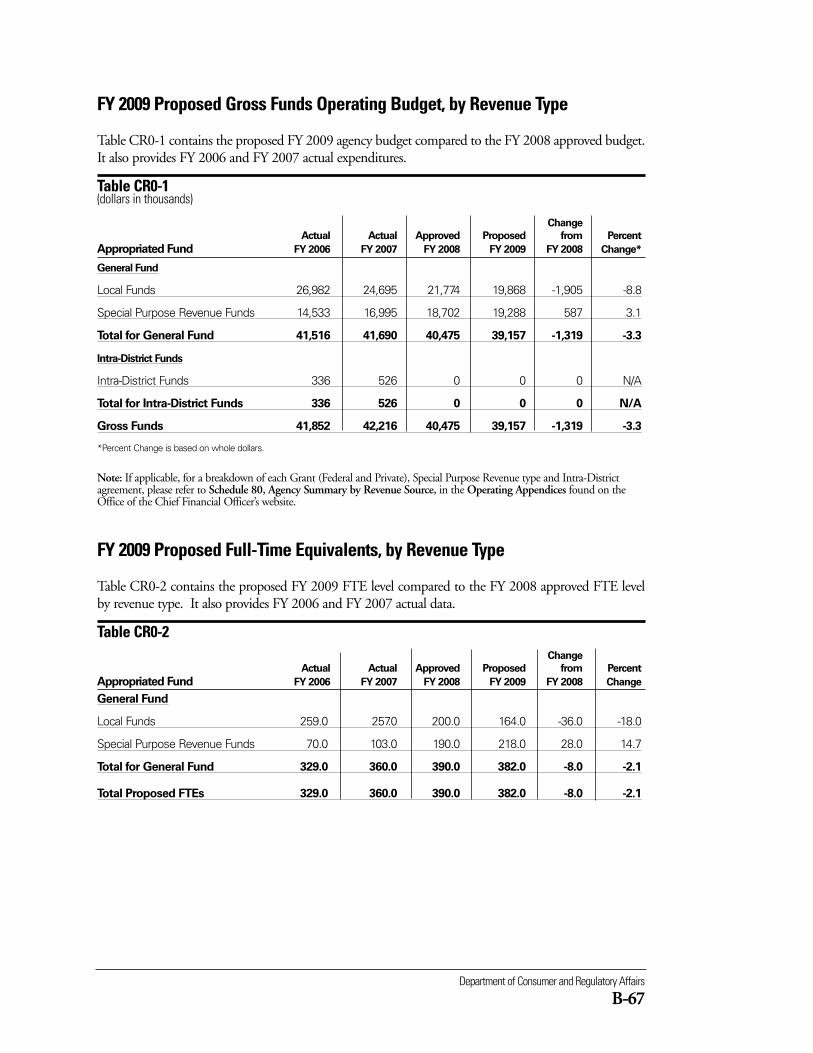
Department of Consumer and Regulatory Affairs
B-67
FY 2009 Proposed Gross Funds Operating Budget, by Revenue Type
Table CR0-1 contains the proposed FY 2009 agency budget compared to the FY 2008 approved budget.It also provides FY 2006 and FY 2007 actual expenditures.
Table CR0-1 (dollars in thousands)
Change
Actual Actual Approved Proposed from Percent
Appropriated Fund FY 2006 FY 2007 FY 2008 FY 2009 FY 2008 Change*
General Fund
Local Funds 26,982 24,695 21,774 19,868 -1,905 -8.8
Special Purpose Revenue Funds 14,533 16,995 18,702 19,288 587 3.1
Total for General Fund 41,516 41,690 40,475 39,157 -1,319 -3.3
Intra-District Funds
Intra-District Funds 336 526 0 0 0 N/A
Total for Intra-District Funds 336 526 0 0 0 N/A
Gross Funds 41,852 42,216 40,475 39,157 -1,319 -3.3
*Percent Change is based on whole dollars.
FY 2009 Proposed Full-Time Equivalents, by Revenue Type
Table CR0-2 contains the proposed FY 2009 FTE level compared to the FY 2008 approved FTE levelby revenue type. It also provides FY 2006 and FY 2007 actual data.
Table CR0-2 Change
Actual Actual Approved Proposed from Percent
Appropriated Fund FY 2006 FY 2007 FY 2008 FY 2009 FY 2008 Change
General Fund
Local Funds 259.0 257.0 200.0 164.0 -36.0 -18.0
Special Purpose Revenue Funds 70.0 103.0 190.0 218.0 28.0 14.7
Total for General Fund 329.0 360.0 390.0 382.0 -8.0 -2.1
Total Proposed FTEs 329.0 360.0 390.0 382.0 -8.0 -2.1
Note: If applicable, for a breakdown of each Grant (Federal and Private), Special Purpose Revenue type and Intra-Districtagreement, please refer to Schedule 80, Agency Summary by Revenue Source, in the Operating Appendices found on theOffice of the Chief Financial Officer’s website.
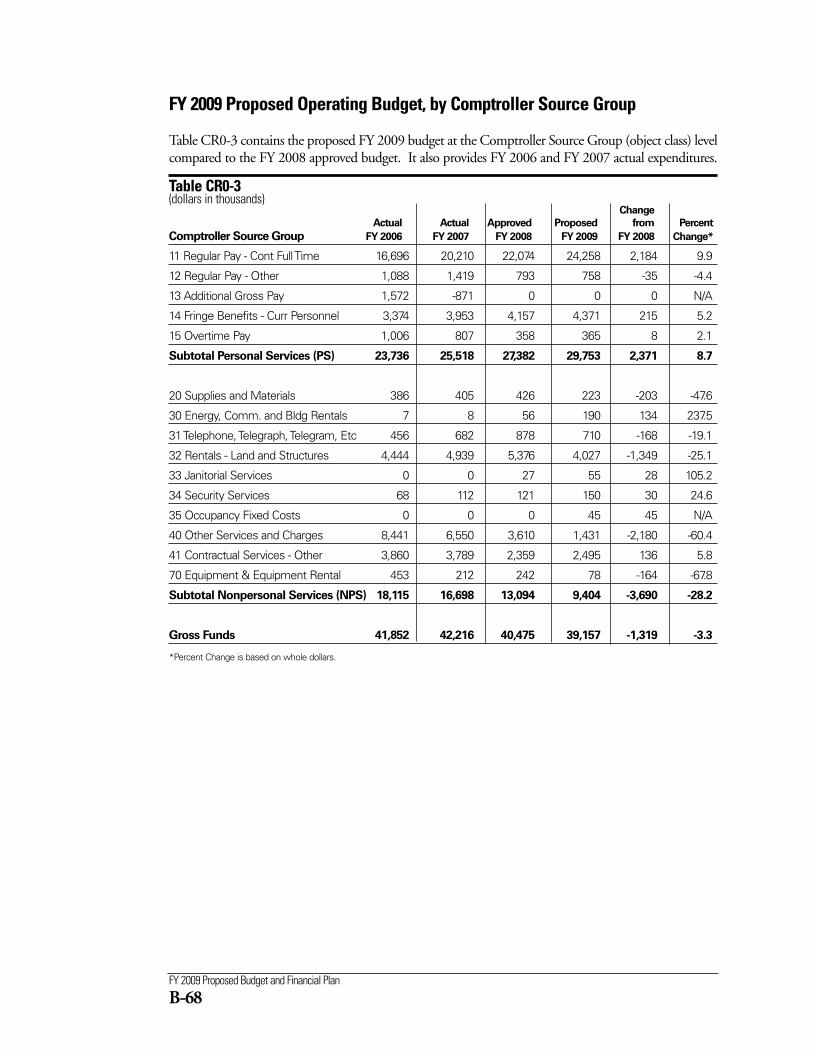
FY 2009 Proposed Budget and Financial Plan
B-68
FY 2009 Proposed Operating Budget, by Comptroller Source Group
Table CR0-3 contains the proposed FY 2009 budget at the Comptroller Source Group (object class) levelcompared to the FY 2008 approved budget. It also provides FY 2006 and FY 2007 actual expenditures.
Table CR0-3 (dollars in thousands)
Change
Actual Actual Approved Proposed from Percent
Comptroller Source Group FY 2006 FY 2007 FY 2008 FY 2009 FY 2008 Change*
11 Regular Pay - Cont Full Time 16,696 20,210 22,074 24,258 2,184 9.9
12 Regular Pay - Other 1,088 1,419 793 758 -35 -4.4
13 Additional Gross Pay 1,572 -871 0 0 0 N/A
14 Fringe Benefits - Curr Personnel 3,374 3,953 4,157 4,371 215 5.2
15 Overtime Pay 1,006 807 358 365 8 2.1
Subtotal Personal Services (PS) 23,736 25,518 27,382 29,753 2,371 8.7
20 Supplies and Materials 386 405 426 223 -203 -47.6
30 Energy, Comm. and Bldg Rentals 7 8 56 190 134 237.5
31 Telephone, Telegraph, Telegram, Etc 456 682 878 710 -168 -19.1
32 Rentals - Land and Structures 4,444 4,939 5,376 4,027 -1,349 -25.1
33 Janitorial Services 0 0 27 55 28 105.2
34 Security Services 68 112 121 150 30 24.6
35 Occupancy Fixed Costs 0 0 0 45 45 N/A
40 Other Services and Charges 8,441 6,550 3,610 1,431 -2,180 -60.4
41 Contractual Services - Other 3,860 3,789 2,359 2,495 136 5.8
70 Equipment & Equipment Rental 453 212 242 78 -164 -67.8
Subtotal Nonpersonal Services (NPS) 18,115 16,698 13,094 9,404 -3,690 -28.2
Gross Funds 41,852 42,216 40,475 39,157 -1,319 -3.3
*Percent Change is based on whole dollars.
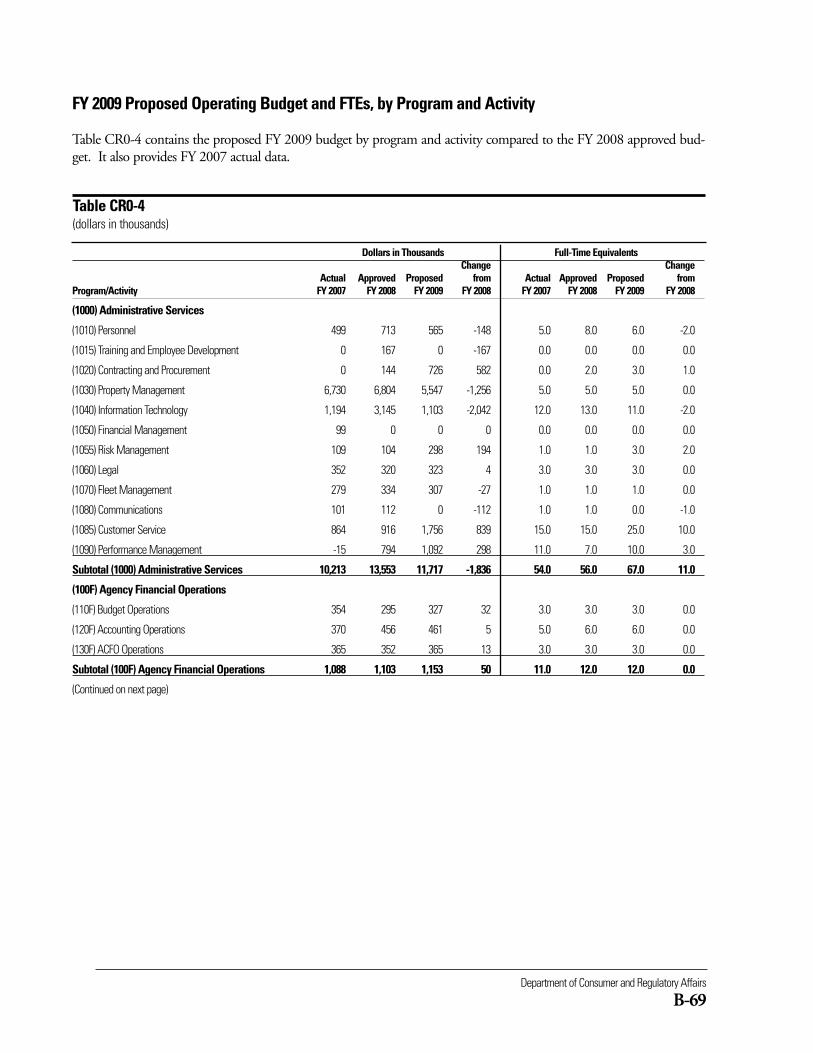
Department of Consumer and Regulatory Affairs
B-69
Dollars in Thousands Full-Time EquivalentsChange Change
Actual Approved Proposed from Actual Approved Proposed from Program/Activity FY 2007 FY 2008 FY 2009 FY 2008 FY 2007 FY 2008 FY 2009 FY 2008
(1000) Administrative Services
(1010) Personnel 499 713 565 -148 5.0 8.0 6.0 -2.0
(1015) Training and Employee Development 0 167 0 -167 0.0 0.0 0.0 0.0
(1020) Contracting and Procurement 0 144 726 582 0.0 2.0 3.0 1.0
(1030) Property Management 6,730 6,804 5,547 -1,256 5.0 5.0 5.0 0.0
(1040) Information Technology 1,194 3,145 1,103 -2,042 12.0 13.0 11.0 -2.0
(1050) Financial Management 99 0 0 0 0.0 0.0 0.0 0.0
(1055) Risk Management 109 104 298 194 1.0 1.0 3.0 2.0
(1060) Legal 352 320 323 4 3.0 3.0 3.0 0.0
(1070) Fleet Management 279 334 307 -27 1.0 1.0 1.0 0.0
(1080) Communications 101 112 0 -112 1.0 1.0 0.0 -1.0
(1085) Customer Service 864 916 1,756 839 15.0 15.0 25.0 10.0
(1090) Performance Management -15 794 1,092 298 11.0 7.0 10.0 3.0
Subtotal (1000) Administrative Services 10,213 13,553 11,717 -1,836 54.0 56.0 67.0 11.0
(100F) Agency Financial Operations
(110F) Budget Operations 354 295 327 32 3.0 3.0 3.0 0.0
(120F) Accounting Operations 370 456 461 5 5.0 6.0 6.0 0.0
(130F) ACFO Operations 365 352 365 13 3.0 3.0 3.0 0.0
Subtotal (100F) Agency Financial Operations 1,088 1,103 1,153 50 11.0 12.0 12.0 0.0
(Continued on next page)
FY 2009 Proposed Operating Budget and FTEs, by Program and Activity
Table CR0-4 contains the proposed FY 2009 budget by program and activity compared to the FY 2008 approved bud-get. It also provides FY 2007 actual data.
Table CR0-4(dollars in thousands)
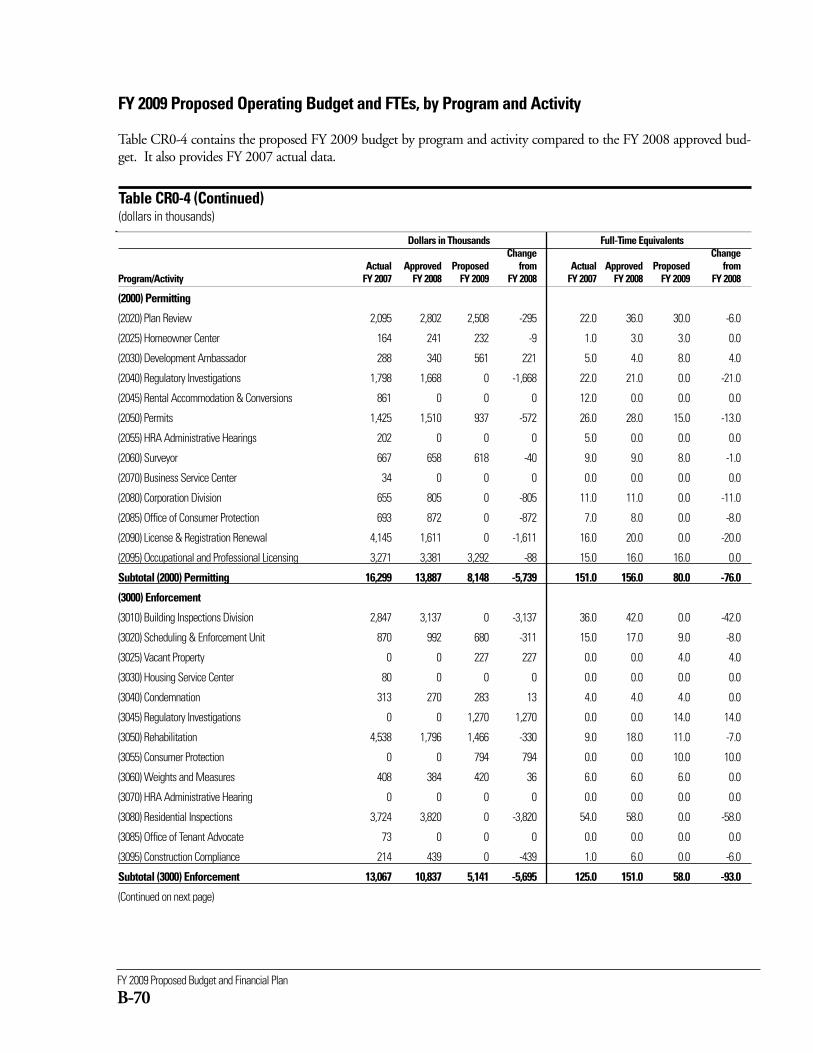
FY 2009 Proposed Budget and Financial Plan
B-70
Dollars in Thousands Full-Time EquivalentsChange Change
Actual Approved Proposed from Actual Approved Proposed from Program/Activity FY 2007 FY 2008 FY 2009 FY 2008 FY 2007 FY 2008 FY 2009 FY 2008
(2000) Permitting
(2020) Plan Review 2,095 2,802 2,508 -295 22.0 36.0 30.0 -6.0
(2025) Homeowner Center 164 241 232 -9 1.0 3.0 3.0 0.0
(2030) Development Ambassador 288 340 561 221 5.0 4.0 8.0 4.0
(2040) Regulatory Investigations 1,798 1,668 0 -1,668 22.0 21.0 0.0 -21.0
(2045) Rental Accommodation & Conversions 861 0 0 0 12.0 0.0 0.0 0.0
(2050) Permits 1,425 1,510 937 -572 26.0 28.0 15.0 -13.0
(2055) HRA Administrative Hearings 202 0 0 0 5.0 0.0 0.0 0.0
(2060) Surveyor 667 658 618 -40 9.0 9.0 8.0 -1.0
(2070) Business Service Center 34 0 0 0 0.0 0.0 0.0 0.0
(2080) Corporation Division 655 805 0 -805 11.0 11.0 0.0 -11.0
(2085) Office of Consumer Protection 693 872 0 -872 7.0 8.0 0.0 -8.0
(2090) License & Registration Renewal 4,145 1,611 0 -1,611 16.0 20.0 0.0 -20.0
(2095) Occupational and Professional Licensing 3,271 3,381 3,292 -88 15.0 16.0 16.0 0.0
Subtotal (2000) Permitting 16,299 13,887 8,148 -5,739 151.0 156.0 80.0 -76.0
(3000) Enforcement
(3010) Building Inspections Division 2,847 3,137 0 -3,137 36.0 42.0 0.0 -42.0
(3020) Scheduling & Enforcement Unit 870 992 680 -311 15.0 17.0 9.0 -8.0
(3025) Vacant Property 0 0 227 227 0.0 0.0 4.0 4.0
(3030) Housing Service Center 80 0 0 0 0.0 0.0 0.0 0.0
(3040) Condemnation 313 270 283 13 4.0 4.0 4.0 0.0
(3045) Regulatory Investigations 0 0 1,270 1,270 0.0 0.0 14.0 14.0
(3050) Rehabilitation 4,538 1,796 1,466 -330 9.0 18.0 11.0 -7.0
(3055) Consumer Protection 0 0 794 794 0.0 0.0 10.0 10.0
(3060) Weights and Measures 408 384 420 36 6.0 6.0 6.0 0.0
(3070) HRA Administrative Hearing 0 0 0 0 0.0 0.0 0.0 0.0
(3080) Residential Inspections 3,724 3,820 0 -3,820 54.0 58.0 0.0 -58.0
(3085) Office of Tenant Advocate 73 0 0 0 0.0 0.0 0.0 0.0
(3095) Construction Compliance 214 439 0 -439 1.0 6.0 0.0 -6.0
Subtotal (3000) Enforcement 13,067 10,837 5,141 -5,695 125.0 151.0 58.0 -93.0
(Continued on next page)
FY 2009 Proposed Operating Budget and FTEs, by Program and Activity
Table CR0-4 contains the proposed FY 2009 budget by program and activity compared to the FY 2008 approved bud-get. It also provides FY 2007 actual data.
Table CR0-4 (Continued)(dollars in thousands)
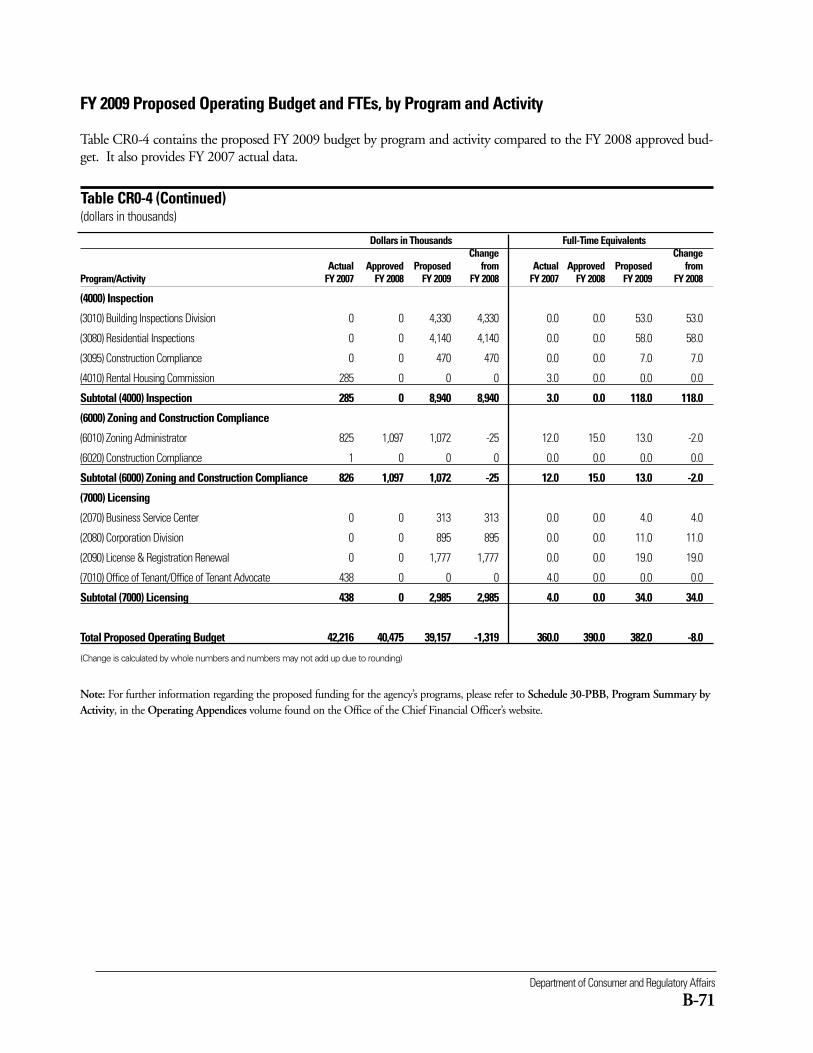
Department of Consumer and Regulatory Affairs
B-71
Dollars in Thousands Full-Time EquivalentsChange Change
Actual Approved Proposed from Actual Approved Proposed from Program/Activity FY 2007 FY 2008 FY 2009 FY 2008 FY 2007 FY 2008 FY 2009 FY 2008
(4000) Inspection
(3010) Building Inspections Division 0 0 4,330 4,330 0.0 0.0 53.0 53.0
(3080) Residential Inspections 0 0 4,140 4,140 0.0 0.0 58.0 58.0
(3095) Construction Compliance 0 0 470 470 0.0 0.0 7.0 7.0
(4010) Rental Housing Commission 285 0 0 0 3.0 0.0 0.0 0.0
Subtotal (4000) Inspection 285 0 8,940 8,940 3.0 0.0 118.0 118.0
(6000) Zoning and Construction Compliance
(6010) Zoning Administrator 825 1,097 1,072 -25 12.0 15.0 13.0 -2.0
(6020) Construction Compliance 1 0 0 0 0.0 0.0 0.0 0.0
Subtotal (6000) Zoning and Construction Compliance 826 1,097 1,072 -25 12.0 15.0 13.0 -2.0
(7000) Licensing
(2070) Business Service Center 0 0 313 313 0.0 0.0 4.0 4.0
(2080) Corporation Division 0 0 895 895 0.0 0.0 11.0 11.0
(2090) License & Registration Renewal 0 0 1,777 1,777 0.0 0.0 19.0 19.0
(7010) Office of Tenant/Office of Tenant Advocate 438 0 0 0 4.0 0.0 0.0 0.0
Subtotal (7000) Licensing 438 0 2,985 2,985 4.0 0.0 34.0 34.0
Total Proposed Operating Budget 42,216 40,475 39,157 -1,319 360.0 390.0 382.0 -8.0
(Change is calculated by whole numbers and numbers may not add up due to rounding)
FY 2009 Proposed Operating Budget and FTEs, by Program and Activity
Table CR0-4 contains the proposed FY 2009 budget by program and activity compared to the FY 2008 approved bud-get. It also provides FY 2007 actual data.
Table CR0-4 (Continued)(dollars in thousands)
Note: For further information regarding the proposed funding for the agency’s programs, please refer to Schedule 30-PBB, Program Summary byActivity, in the Operating Appendices volume found on the Office of the Chief Financial Officer’s website.
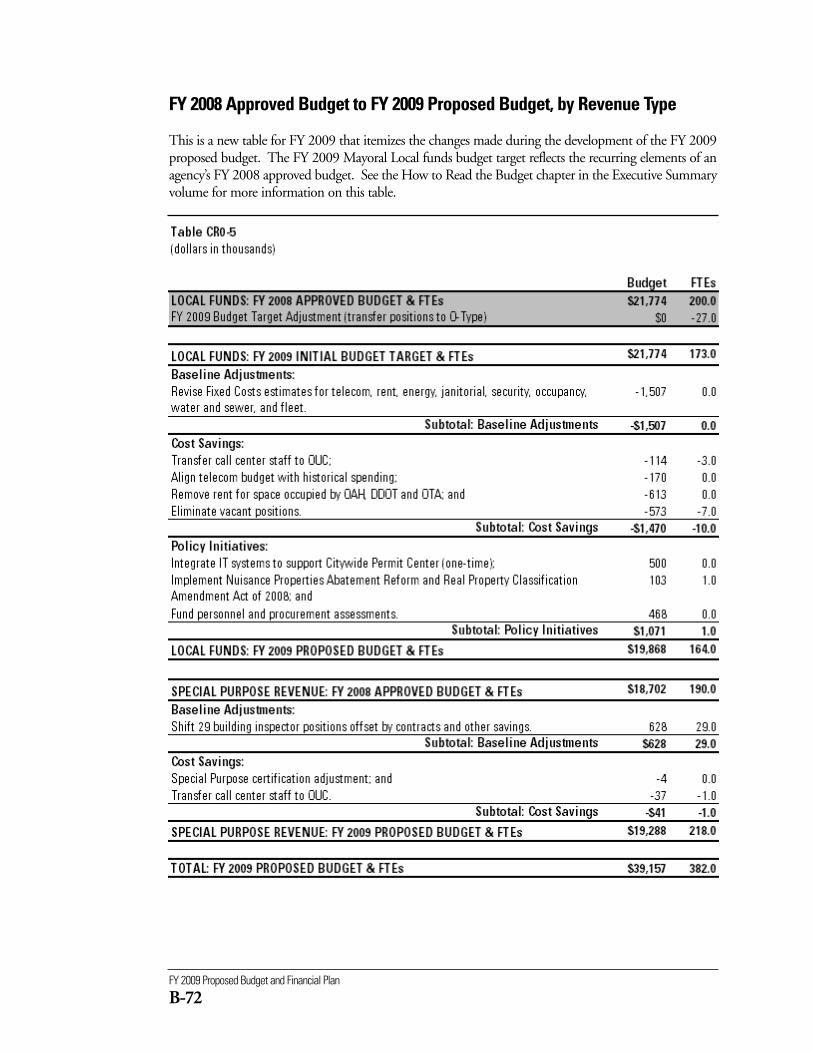
FY 2009 Proposed Budget and Financial Plan
B-72
FY 2008 Approved Budget to FY 2009 Proposed Budget, by Revenue Type
This is a new table for FY 2009 that itemizes the changes made during the development of the FY 2009proposed budget. The FY 2009 Mayoral Local funds budget target reflects the recurring elements of anagency’s FY 2008 approved budget. See the How to Read the Budget chapter in the Executive Summaryvolume for more information on this table.
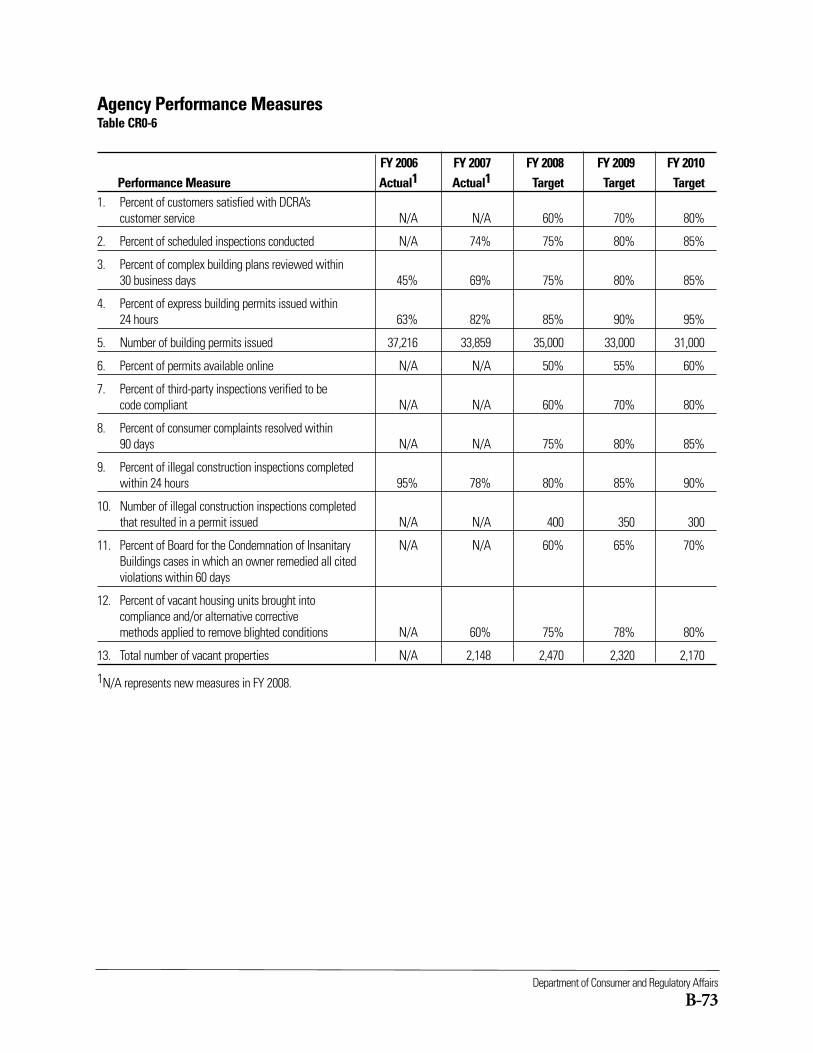
Department of Consumer and Regulatory Affairs
B-73
Agency Performance MeasuresTable CR0-6
FY 2006 FY 2007 FY 2008 FY 2009 FY 2010Performance Measure Actual1 Actual1 Target Target Target
1. Percent of customers satisfied with DCRA’s customer service N/A N/A 60% 70% 80%
2. Percent of scheduled inspections conducted N/A 74% 75% 80% 85%
3. Percent of complex building plans reviewed within 30 business days 45% 69% 75% 80% 85%
4. Percent of express building permits issued within 24 hours 63% 82% 85% 90% 95%
5. Number of building permits issued 37,216 33,859 35,000 33,000 31,000
6. Percent of permits available online N/A N/A 50% 55% 60%
7. Percent of third-party inspections verified to be code compliant N/A N/A 60% 70% 80%
8. Percent of consumer complaints resolved within 90 days N/A N/A 75% 80% 85%
9. Percent of illegal construction inspections completed within 24 hours 95% 78% 80% 85% 90%
10. Number of illegal construction inspections completed that resulted in a permit issued N/A N/A 400 350 300
11. Percent of Board for the Condemnation of Insanitary N/A N/A 60% 65% 70%Buildings cases in which an owner remedied all citedviolations within 60 days
12. Percent of vacant housing units brought into compliance and/or alternative corrective methods applied to remove blighted conditions N/A 60% 75% 78% 80%
13. Total number of vacant properties N/A 2,148 2,470 2,320 2,170
1N/A represents new measures in FY 2008.
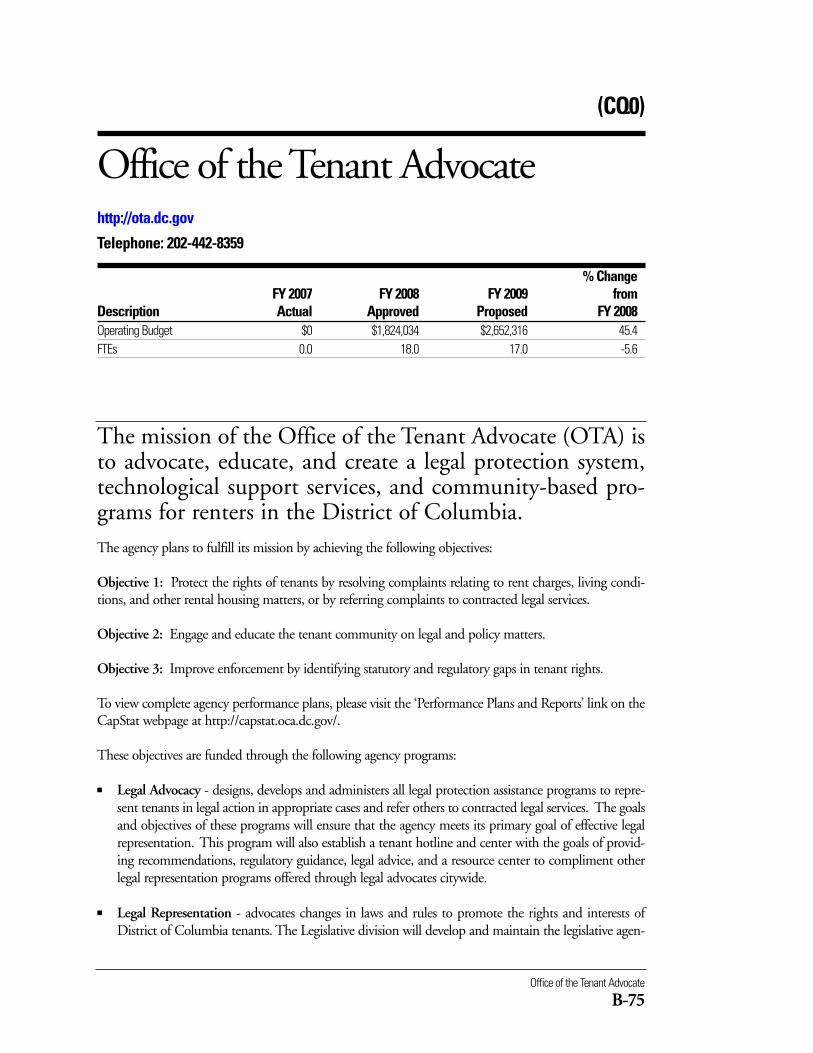
(CQ0)
Office of the Tenant Advocatehttp://ota.dc.gov
Telephone: 202-442-8359
% ChangeFY 2007 FY 2008 FY 2009 from
Description Actual Approved Proposed FY 2008Operating Budget $0 $1,824,034 $2,652,316 45.4FTEs 0.0 18.0 17.0 -5.6
The mission of the Office of the Tenant Advocate (OTA) isto advocate, educate, and create a legal protection system,technological support services, and community-based pro-grams for renters in the District of Columbia.
Office of the Tenant Advocate
B-75
The agency plans to fulfill its mission by achieving the following objectives:
Objective 1: Protect the rights of tenants by resolving complaints relating to rent charges, living condi-tions, and other rental housing matters, or by referring complaints to contracted legal services.
Objective 2: Engage and educate the tenant community on legal and policy matters.
Objective 3: Improve enforcement by identifying statutory and regulatory gaps in tenant rights.
To view complete agency performance plans, please visit the ‘Performance Plans and Reports’ link on theCapStat webpage at http://capstat.oca.dc.gov/.
These objectives are funded through the following agency programs:
■ Legal Advocacy - designs, develops and administers all legal protection assistance programs to repre-sent tenants in legal action in appropriate cases and refer others to contracted legal services. The goalsand objectives of these programs will ensure that the agency meets its primary goal of effective legalrepresentation. This program will also establish a tenant hotline and center with the goals of provid-ing recommendations, regulatory guidance, legal advice, and a resource center to compliment otherlegal representation programs offered through legal advocates citywide.
■ Legal Representation - advocates changes in laws and rules to promote the rights and interests ofDistrict of Columbia tenants. The Legislative division will develop and maintain the legislative agen-
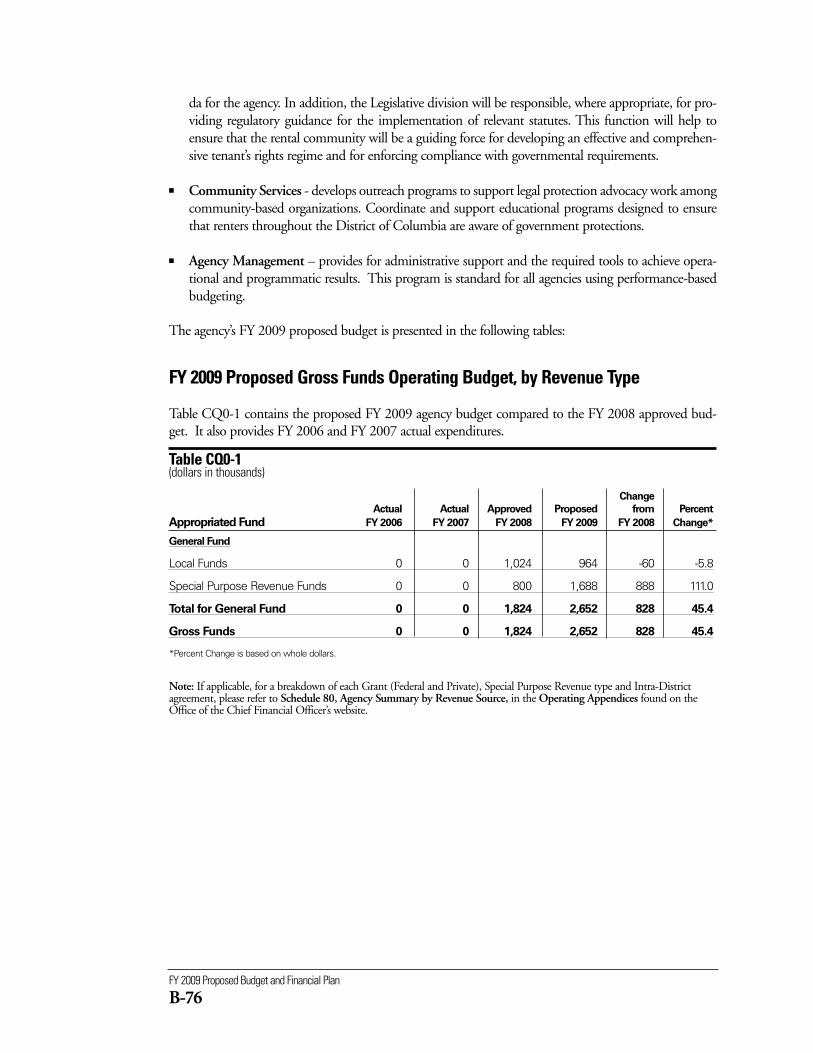
FY 2009 Proposed Budget and Financial Plan
B-76
da for the agency. In addition, the Legislative division will be responsible, where appropriate, for pro-viding regulatory guidance for the implementation of relevant statutes. This function will help toensure that the rental community will be a guiding force for developing an effective and comprehen-sive tenant’s rights regime and for enforcing compliance with governmental requirements.
■ Community Services - develops outreach programs to support legal protection advocacy work amongcommunity-based organizations. Coordinate and support educational programs designed to ensurethat renters throughout the District of Columbia are aware of government protections.
■ Agency Management – provides for administrative support and the required tools to achieve opera-tional and programmatic results. This program is standard for all agencies using performance-basedbudgeting.
The agency’s FY 2009 proposed budget is presented in the following tables:
FY 2009 Proposed Gross Funds Operating Budget, by Revenue Type
Table CQ0-1 contains the proposed FY 2009 agency budget compared to the FY 2008 approved bud-get. It also provides FY 2006 and FY 2007 actual expenditures.
Table CQ0-1 (dollars in thousands)
Change
Actual Actual Approved Proposed from Percent
Appropriated Fund FY 2006 FY 2007 FY 2008 FY 2009 FY 2008 Change*
General Fund
Local Funds 0 0 1,024 964 -60 -5.8
Special Purpose Revenue Funds 0 0 800 1,688 888 111.0
Total for General Fund 0 0 1,824 2,652 828 45.4
Gross Funds 0 0 1,824 2,652 828 45.4
*Percent Change is based on whole dollars.
Note: If applicable, for a breakdown of each Grant (Federal and Private), Special Purpose Revenue type and Intra-Districtagreement, please refer to Schedule 80, Agency Summary by Revenue Source, in the Operating Appendices found on theOffice of the Chief Financial Officer’s website.
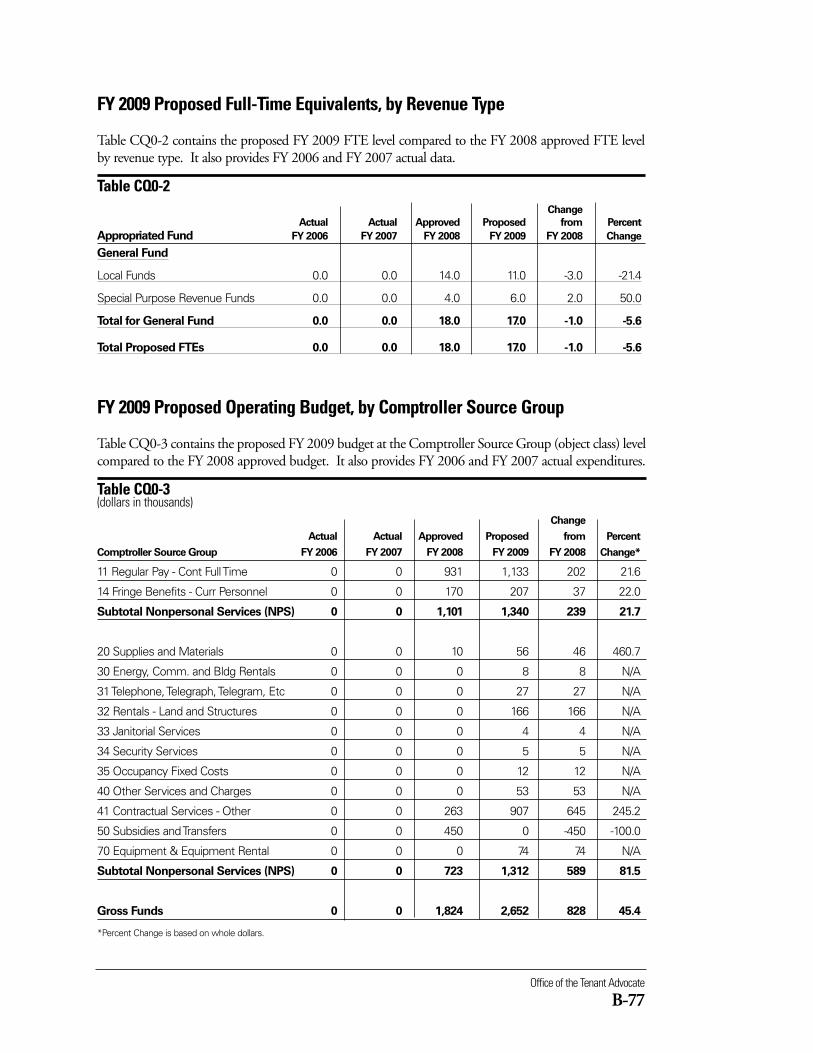
Office of the Tenant Advocate
B-77
FY 2009 Proposed Full-Time Equivalents, by Revenue Type
Table CQ0-2 contains the proposed FY 2009 FTE level compared to the FY 2008 approved FTE levelby revenue type. It also provides FY 2006 and FY 2007 actual data.
Table CQ0-2 Change
Actual Actual Approved Proposed from Percent
Appropriated Fund FY 2006 FY 2007 FY 2008 FY 2009 FY 2008 Change
General Fund
Local Funds 0.0 0.0 14.0 11.0 -3.0 -21.4
Special Purpose Revenue Funds 0.0 0.0 4.0 6.0 2.0 50.0
Total for General Fund 0.0 0.0 18.0 17.0 -1.0 -5.6
Total Proposed FTEs 0.0 0.0 18.0 17.0 -1.0 -5.6
FY 2009 Proposed Operating Budget, by Comptroller Source Group
Table CQ0-3 contains the proposed FY 2009 budget at the Comptroller Source Group (object class) levelcompared to the FY 2008 approved budget. It also provides FY 2006 and FY 2007 actual expenditures.
Table CQ0-3 (dollars in thousands)
Change
Actual Actual Approved Proposed from Percent
Comptroller Source Group FY 2006 FY 2007 FY 2008 FY 2009 FY 2008 Change*
11 Regular Pay - Cont Full Time 0 0 931 1,133 202 21.6
14 Fringe Benefits - Curr Personnel 0 0 170 207 37 22.0
Subtotal Nonpersonal Services (NPS) 0 0 1,101 1,340 239 21.7
20 Supplies and Materials 0 0 10 56 46 460.7
30 Energy, Comm. and Bldg Rentals 0 0 0 8 8 N/A
31 Telephone, Telegraph, Telegram, Etc 0 0 0 27 27 N/A
32 Rentals - Land and Structures 0 0 0 166 166 N/A
33 Janitorial Services 0 0 0 4 4 N/A
34 Security Services 0 0 0 5 5 N/A
35 Occupancy Fixed Costs 0 0 0 12 12 N/A
40 Other Services and Charges 0 0 0 53 53 N/A
41 Contractual Services - Other 0 0 263 907 645 245.2
50 Subsidies and Transfers 0 0 450 0 -450 -100.0
70 Equipment & Equipment Rental 0 0 0 74 74 N/A
Subtotal Nonpersonal Services (NPS) 0 0 723 1,312 589 81.5
Gross Funds 0 0 1,824 2,652 828 45.4
*Percent Change is based on whole dollars.
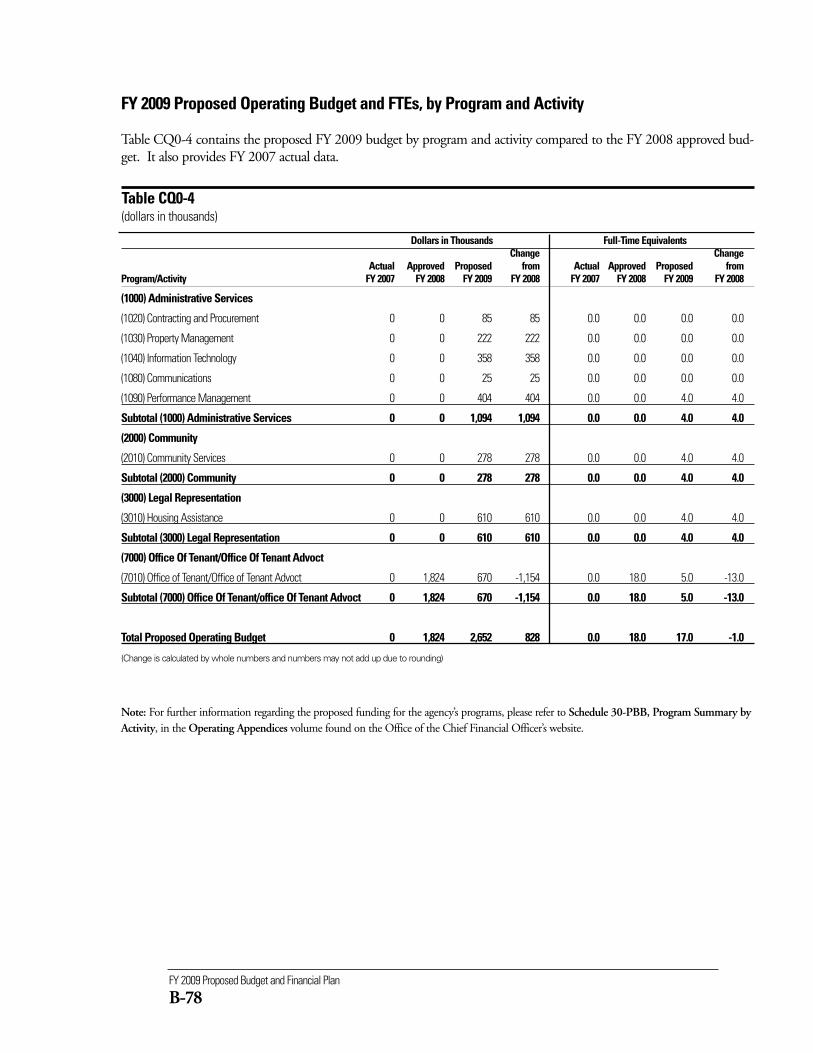
FY 2009 Proposed Budget and Financial Plan
B-78
Dollars in Thousands Full-Time EquivalentsChange Change
Actual Approved Proposed from Actual Approved Proposed from Program/Activity FY 2007 FY 2008 FY 2009 FY 2008 FY 2007 FY 2008 FY 2009 FY 2008
(1000) Administrative Services
(1020) Contracting and Procurement 0 0 85 85 0.0 0.0 0.0 0.0
(1030) Property Management 0 0 222 222 0.0 0.0 0.0 0.0
(1040) Information Technology 0 0 358 358 0.0 0.0 0.0 0.0
(1080) Communications 0 0 25 25 0.0 0.0 0.0 0.0
(1090) Performance Management 0 0 404 404 0.0 0.0 4.0 4.0
Subtotal (1000) Administrative Services 0 0 1,094 1,094 0.0 0.0 4.0 4.0
(2000) Community
(2010) Community Services 0 0 278 278 0.0 0.0 4.0 4.0
Subtotal (2000) Community 0 0 278 278 0.0 0.0 4.0 4.0
(3000) Legal Representation
(3010) Housing Assistance 0 0 610 610 0.0 0.0 4.0 4.0
Subtotal (3000) Legal Representation 0 0 610 610 0.0 0.0 4.0 4.0
(7000) Office Of Tenant/Office Of Tenant Advoct
(7010) Office of Tenant/Office of Tenant Advoct 0 1,824 670 -1,154 0.0 18.0 5.0 -13.0
Subtotal (7000) Office Of Tenant/office Of Tenant Advoct 0 1,824 670 -1,154 0.0 18.0 5.0 -13.0
Total Proposed Operating Budget 0 1,824 2,652 828 0.0 18.0 17.0 -1.0
(Change is calculated by whole numbers and numbers may not add up due to rounding)
FY 2009 Proposed Operating Budget and FTEs, by Program and Activity
Table CQ0-4 contains the proposed FY 2009 budget by program and activity compared to the FY 2008 approved bud-get. It also provides FY 2007 actual data.
Table CQ0-4(dollars in thousands)
Note: For further information regarding the proposed funding for the agency’s programs, please refer to Schedule 30-PBB, Program Summary byActivity, in the Operating Appendices volume found on the Office of the Chief Financial Officer’s website.
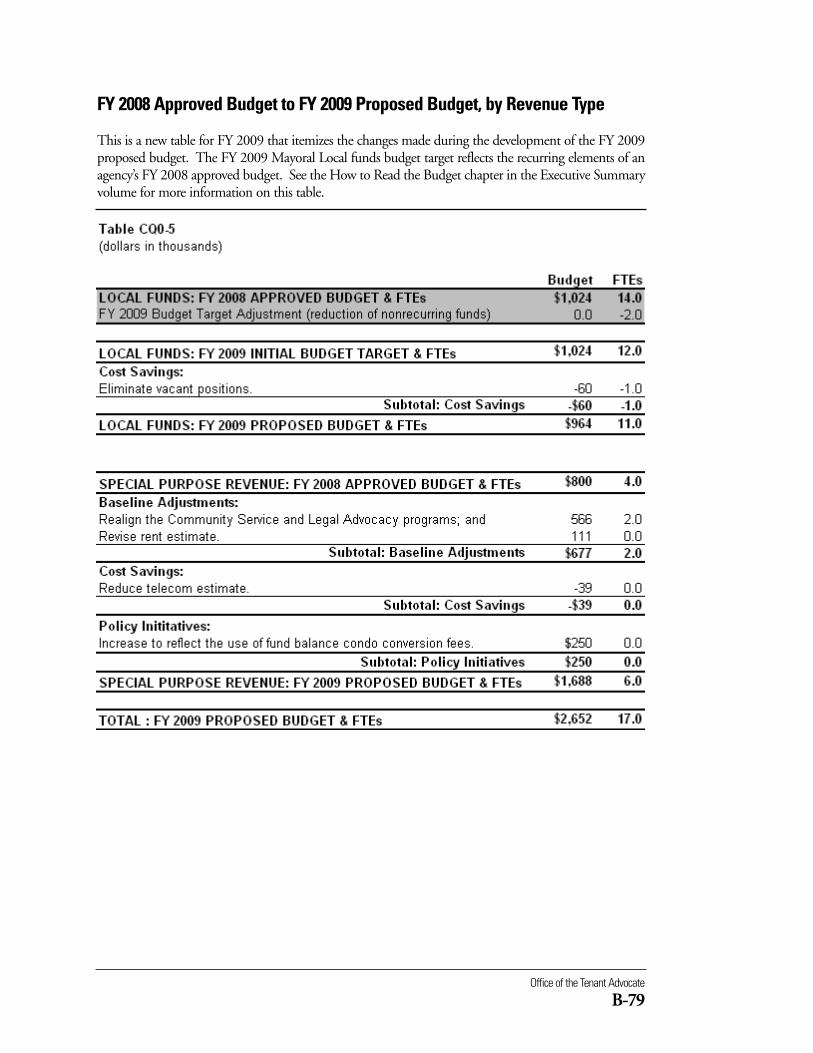
Office of the Tenant Advocate
B-79
FY 2008 Approved Budget to FY 2009 Proposed Budget, by Revenue Type
This is a new table for FY 2009 that itemizes the changes made during the development of the FY 2009proposed budget. The FY 2009 Mayoral Local funds budget target reflects the recurring elements of anagency’s FY 2008 approved budget. See the How to Read the Budget chapter in the Executive Summaryvolume for more information on this table.
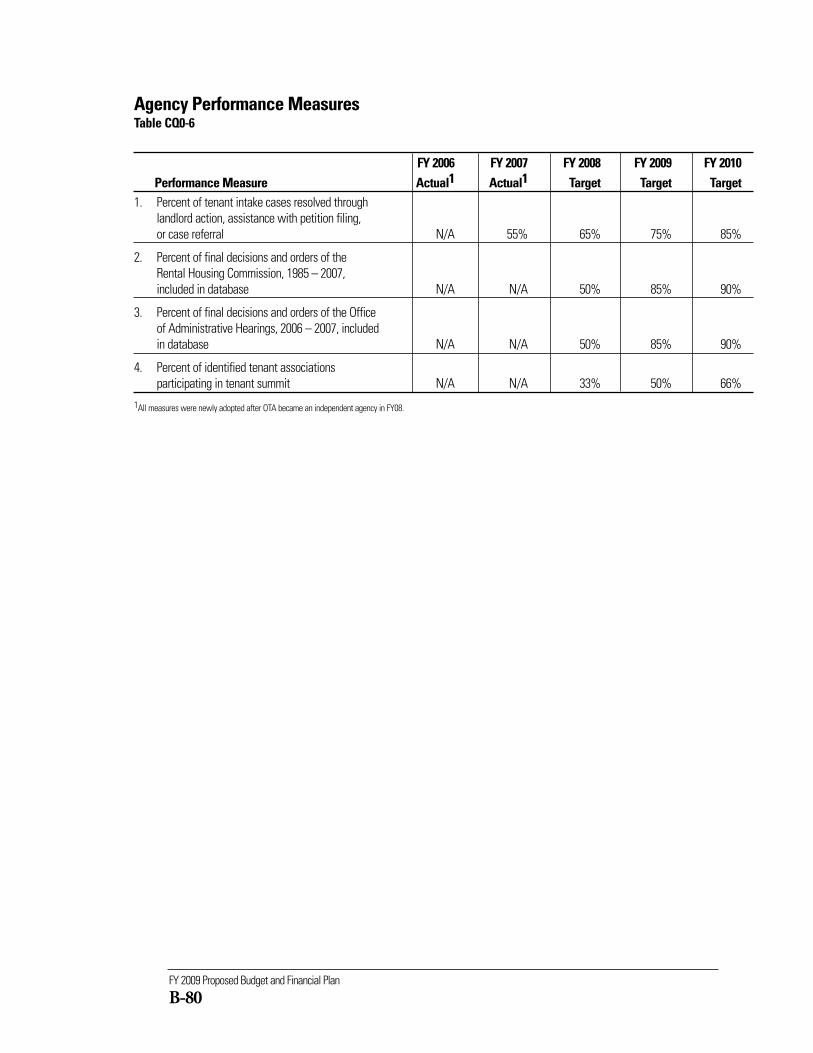
FY 2009 Proposed Budget and Financial Plan
B-80
Agency Performance MeasuresTable CQ0-6
FY 2006 FY 2007 FY 2008 FY 2009 FY 2010Performance Measure Actual1 Actual1 Target Target Target
1. Percent of tenant intake cases resolved throughlandlord action, assistance with petition filing, or case referral N/A 55% 65% 75% 85%
2. Percent of final decisions and orders of the Rental Housing Commission, 1985 – 2007, included in database N/A N/A 50% 85% 90%
3. Percent of final decisions and orders of the Office of Administrative Hearings, 2006 – 2007, included in database N/A N/A 50% 85% 90%
4. Percent of identified tenant associations participating in tenant summit N/A N/A 33% 50% 66%
1All measures were newly adopted after OTA became an independent agency in FY08.
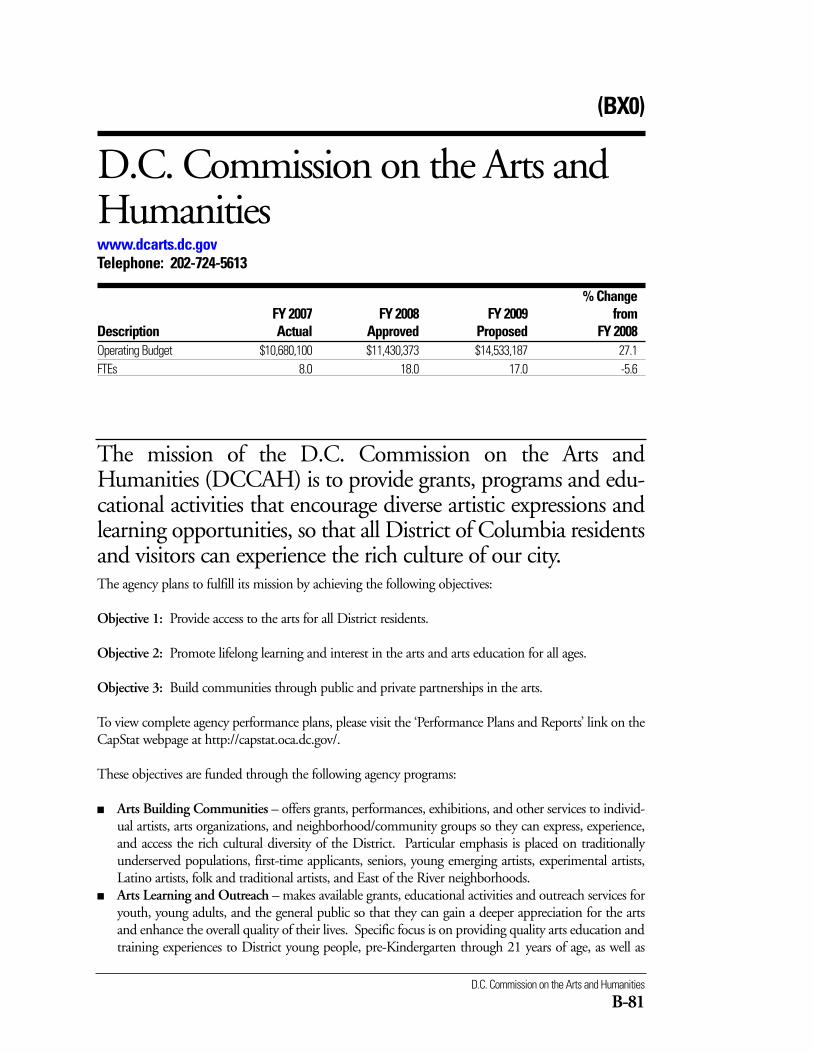
The mission of the D.C. Commission on the Arts andHumanities (DCCAH) is to provide grants, programs and edu-cational activities that encourage diverse artistic expressions andlearning opportunities, so that all District of Columbia residentsand visitors can experience the rich culture of our city.
D.C. Commission on the Arts and Humanities
B-81
The agency plans to fulfill its mission by achieving the following objectives:
Objective 1: Provide access to the arts for all District residents.
Objective 2: Promote lifelong learning and interest in the arts and arts education for all ages.
Objective 3: Build communities through public and private partnerships in the arts.
To view complete agency performance plans, please visit the ‘Performance Plans and Reports’ link on theCapStat webpage at http://capstat.oca.dc.gov/.
These objectives are funded through the following agency programs:
■ Arts Building Communities – offers grants, performances, exhibitions, and other services to individ-ual artists, arts organizations, and neighborhood/community groups so they can express, experience,and access the rich cultural diversity of the District. Particular emphasis is placed on traditionallyunderserved populations, first-time applicants, seniors, young emerging artists, experimental artists,Latino artists, folk and traditional artists, and East of the River neighborhoods.
■ Arts Learning and Outreach – makes available grants, educational activities and outreach services foryouth, young adults, and the general public so that they can gain a deeper appreciation for the artsand enhance the overall quality of their lives. Specific focus is on providing quality arts education andtraining experiences to District young people, pre-Kindergarten through 21 years of age, as well as
(BX0)
D.C. Commission on the Arts andHumanitieswww.dcarts.dc.govTelephone: 202-724-5613
% ChangeFY 2007 FY 2008 FY 2009 from
Description Actual Approved Proposed FY 2008Operating Budget $10,680,100 $11,430,373 $14,533,187 27.1FTEs 8.0 18.0 17.0 -5.6
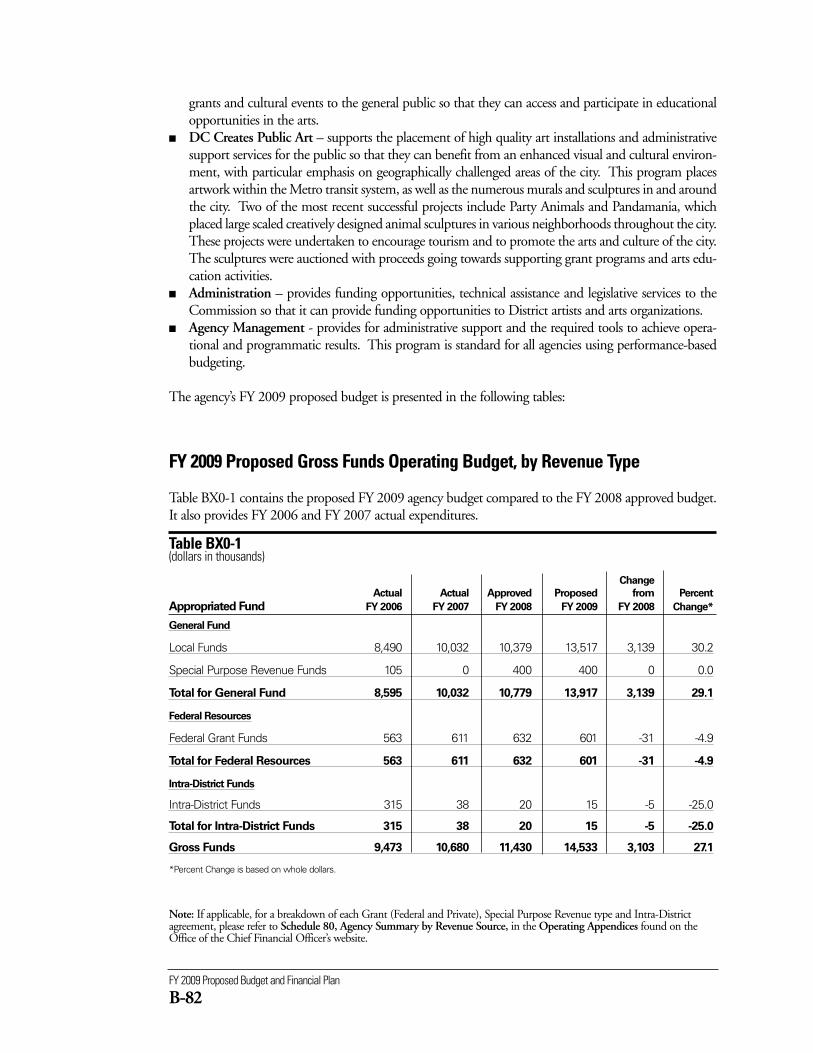
FY 2009 Proposed Budget and Financial Plan
B-82
grants and cultural events to the general public so that they can access and participate in educationalopportunities in the arts.
■ DC Creates Public Art – supports the placement of high quality art installations and administrativesupport services for the public so that they can benefit from an enhanced visual and cultural environ-ment, with particular emphasis on geographically challenged areas of the city. This program placesartwork within the Metro transit system, as well as the numerous murals and sculptures in and aroundthe city. Two of the most recent successful projects include Party Animals and Pandamania, whichplaced large scaled creatively designed animal sculptures in various neighborhoods throughout the city.These projects were undertaken to encourage tourism and to promote the arts and culture of the city.The sculptures were auctioned with proceeds going towards supporting grant programs and arts edu-cation activities.
■ Administration – provides funding opportunities, technical assistance and legislative services to theCommission so that it can provide funding opportunities to District artists and arts organizations.
■ Agency Management - provides for administrative support and the required tools to achieve opera-tional and programmatic results. This program is standard for all agencies using performance-basedbudgeting.
The agency’s FY 2009 proposed budget is presented in the following tables:
FY 2009 Proposed Gross Funds Operating Budget, by Revenue Type
Table BX0-1 contains the proposed FY 2009 agency budget compared to the FY 2008 approved budget.It also provides FY 2006 and FY 2007 actual expenditures.
Table BX0-1 (dollars in thousands)
Change
Actual Actual Approved Proposed from Percent
Appropriated Fund FY 2006 FY 2007 FY 2008 FY 2009 FY 2008 Change*
General Fund
Local Funds 8,490 10,032 10,379 13,517 3,139 30.2
Special Purpose Revenue Funds 105 0 400 400 0 0.0
Total for General Fund 8,595 10,032 10,779 13,917 3,139 29.1
Federal Resources
Federal Grant Funds 563 611 632 601 -31 -4.9
Total for Federal Resources 563 611 632 601 -31 -4.9
Intra-District Funds
Intra-District Funds 315 38 20 15 -5 -25.0
Total for Intra-District Funds 315 38 20 15 -5 -25.0
Gross Funds 9,473 10,680 11,430 14,533 3,103 27.1
*Percent Change is based on whole dollars.
Note: If applicable, for a breakdown of each Grant (Federal and Private), Special Purpose Revenue type and Intra-Districtagreement, please refer to Schedule 80, Agency Summary by Revenue Source, in the Operating Appendices found on theOffice of the Chief Financial Officer’s website.
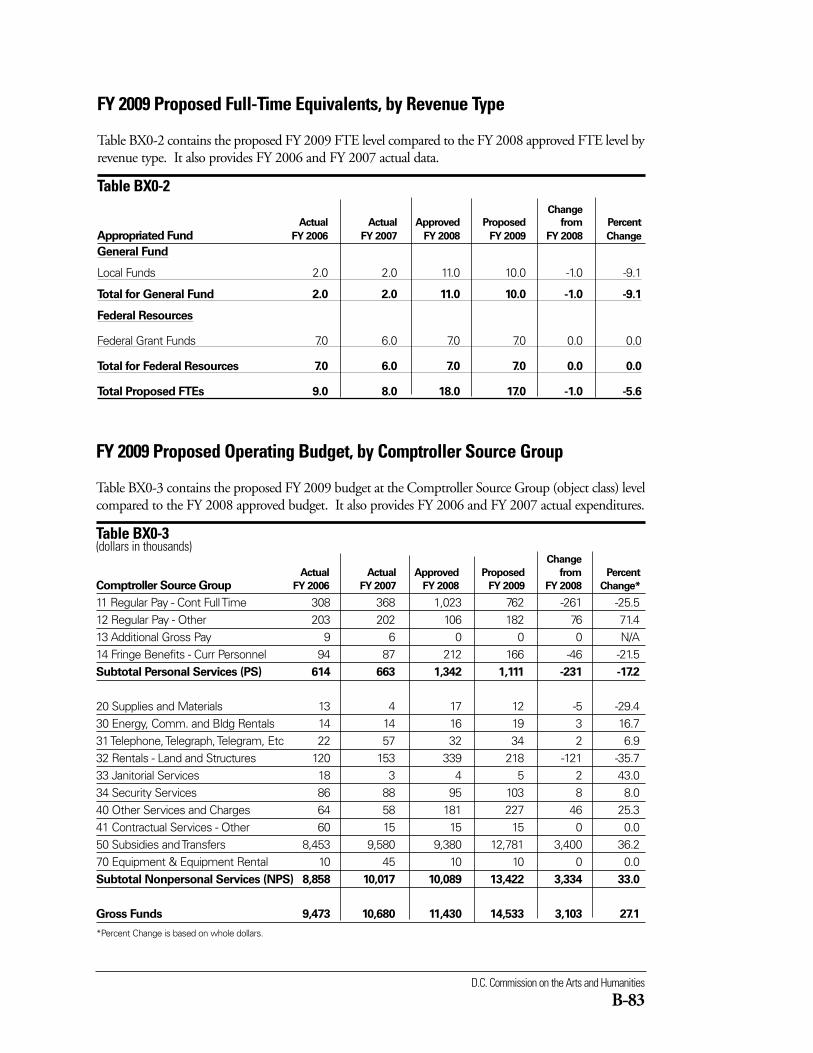
D.C. Commission on the Arts and Humanities
B-83
FY 2009 Proposed Full-Time Equivalents, by Revenue Type
Table BX0-2 contains the proposed FY 2009 FTE level compared to the FY 2008 approved FTE level byrevenue type. It also provides FY 2006 and FY 2007 actual data.
Table BX0-2 Change
Actual Actual Approved Proposed from Percent
Appropriated Fund FY 2006 FY 2007 FY 2008 FY 2009 FY 2008 Change
General Fund
Local Funds 2.0 2.0 11.0 10.0 -1.0 -9.1
Total for General Fund 2.0 2.0 11.0 10.0 -1.0 -9.1
Federal Resources
Federal Grant Funds 7.0 6.0 7.0 7.0 0.0 0.0
Total for Federal Resources 7.0 6.0 7.0 7.0 0.0 0.0
Total Proposed FTEs 9.0 8.0 18.0 17.0 -1.0 -5.6
FY 2009 Proposed Operating Budget, by Comptroller Source Group
Table BX0-3 contains the proposed FY 2009 budget at the Comptroller Source Group (object class) levelcompared to the FY 2008 approved budget. It also provides FY 2006 and FY 2007 actual expenditures.
Table BX0-3(dollars in thousands)
Change
Actual Actual Approved Proposed from Percent
Comptroller Source Group FY 2006 FY 2007 FY 2008 FY 2009 FY 2008 Change*
11 Regular Pay - Cont Full Time 308 368 1,023 762 -261 -25.512 Regular Pay - Other 203 202 106 182 76 71.413 Additional Gross Pay 9 6 0 0 0 N/A14 Fringe Benefits - Curr Personnel 94 87 212 166 -46 -21.5Subtotal Personal Services (PS) 614 663 1,342 1,111 -231 -17.2
20 Supplies and Materials 13 4 17 12 -5 -29.430 Energy, Comm. and Bldg Rentals 14 14 16 19 3 16.731 Telephone, Telegraph, Telegram, Etc 22 57 32 34 2 6.932 Rentals - Land and Structures 120 153 339 218 -121 -35.733 Janitorial Services 18 3 4 5 2 43.034 Security Services 86 88 95 103 8 8.040 Other Services and Charges 64 58 181 227 46 25.341 Contractual Services - Other 60 15 15 15 0 0.050 Subsidies and Transfers 8,453 9,580 9,380 12,781 3,400 36.270 Equipment & Equipment Rental 10 45 10 10 0 0.0Subtotal Nonpersonal Services (NPS) 8,858 10,017 10,089 13,422 3,334 33.0
Gross Funds 9,473 10,680 11,430 14,533 3,103 27.1
*Percent Change is based on whole dollars.
FY 2009 Proposed Budget and Financial Plan
B-84
Dollars in Thousands Full-Time EquivalentsChange Change
Actual Approved Proposed from Actual Approved Proposed from Program/Activity FY 2007 FY 2008 FY 2009 FY 2008 FY 2007 FY 2008 FY 2009 FY 2008
(1000) Agency Management Program
(1010) Personnel 6 35 18 -17 0.0 0.4 0.2 -0.2
(1015) Training & Employee Development 1 42 23 -18 0.0 0.4 0.2 -0.2
(1020) Contracting and Procurement 0 72 68 -4 0.0 0.3 0.1 -0.2
(1030) Property Management 349 548 405 -143 1.0 0.6 0.2 -0.4
(1040) Information Technology 7 6 6 0 0.0 0.0 0.0 0.0
(1050) Financial Services 29 43 39 -5 0.0 0.6 0.5 -0.1
(1055) Risk Management 10 16 16 0 0.0 0.2 0.2 0.0
(1080) Communications 28 69 45 -24 0.0 0.7 0.4 -0.3
(1085) Customer Service 24 51 47 -4 1.0 0.7 0.6 -0.1
(1090) Performance Management 56 111 74 -37 1.0 1.0 0.6 -0.4
Subtotal (1000) Agency Management Program 511 993 741 -252 3.0 4.9 3.0 -1.9
(2000) Arts Building Communities
(2010) Arts Building Communities 9,025 8,329 11,642 3,313 1.0 4.6 4.0 -0.6
Subtotal (2000) Arts Building Communities 9,025 8,329 11,642 3,313 1.0 4.6 4.0 -0.6
(3000) DC Creates Public Art
(3010) Neighborhood & Public Art 92 89 48 -41 1.0 1.2 0.6 -0.6
(3020) Art Placement Support 18 59 32 -27 0.0 0.8 0.4 -0.4
Subtotal (3000) DC Creates Public Art 110 148 80 -68 1.0 2.0 1.0 -1.0
(4000) Arts Learning and Outreach
(4010) Arts Learning for Youth 448 1,224 1,365 142 1.0 2.3 4.2 1.9
(4020) Lifelong Learning 388 478 516 39 1.0 2.6 4.3 1.7
(4030) Community Outreach 142 160 151 -9 0.0 0.3 0.2 -0.2
Subtotal (4000) Arts Learning and Outreach 977 1,862 2,032 171 2.0 5.2 8.6 3.4
(Continued on next page)
FY 2009 Proposed Operating Budget and FTEs, by Program and Activity
Table BX0-4 contains the proposed FY 2009 budget by program and activity compared to the FY 2008 approved bud-get. It also provides FY 2007 actual data.
Table BX0-4(dollars in thousands)
D.C. Commission on the Arts and Humanities
B-85
Dollars in Thousands Full-Time EquivalentsChange Change
Actual Approved Proposed from Actual Approved Proposed from Program/Activity FY 2007 FY 2008 FY 2009 FY 2008 FY 2007 FY 2008 FY 2009 FY 2008
(5000) Administration
(5010) Legislative and Grants Management 67 98 37 -61 1.0 1.4 0.5 -0.9
Subtotal (5000) Administration 67 98 37 -61 1.0 1.4 0.5 -0.9
(9960) Year End Close
No Activity Assigned -10 0 0 0 0.0 0.0 0.0 0.0
Subtotal (9960) Year End Close -10 0 0 0 0.0 0.0 0.0 0.0
Total Proposed Operating Budget 10,680 11,430 14,533 3,103 8.0 18.0 17.0 -1.0
(Change is calculated by whole numbers and numbers may not add up due to rounding)
Note: For further information regarding the proposed funding for the agency’s programs, please refer to Schedule 30-PBB,Program Summary by Activity, in the Operating Appendices volume found on the Office of the Chief Financial Officer’s website.
FY 2009 Proposed Operating Budget and FTEs, by Program and Activity
Table BX0-4 contains the proposed FY 2009 budget by program and activity compared to the FY 2008 approved bud-get. It also provides FY 2007 actual data.
Table BX0-4 (Continued)(dollars in thousands)
FY 2009 Proposed Budget and Financial Plan
B-86
FY 2008 Approved Budget to FY 2009 Proposed Budget, by Revenue Type
This is a new table for FY 2009 that itemizes the changes made during the development of the FY 2009proposed budget. The FY 2009 Mayoral Local funds budget target reflects the recurring elements of anagency’s FY 2008 approved budget. See the How to Read the Budget chapter in the Executive Summaryvolume for more information on this table.
D.C. Commission on the Arts and Humanities
B-87
Agency Performance MeasuresTable BX0-6
FY 2006 FY 2007 FY 2008 FY 2009 FY 2010Performance Measure Actual Actual Target Target Target
1. Percent of DC Public and Charter Schools served(through student or teacher attendance or participation in-school or after-school activities,events, exhibitions, workshops or seminars that are directly sponsored by DCCAH or that are provided by DCCAH grantees) 58% 63.32% 65% 68% 71%
2. Percent of applications received from new applicants (new applicants are those who have not received funding from DCCAH within the prior 5 years) 2.8% 4.3% 5% 5% 10%
3. Percent of grant payments processed on time1 92% 87% 85% 85% 90%
1 On time is defined as within the standard processing time of 8 weeks.
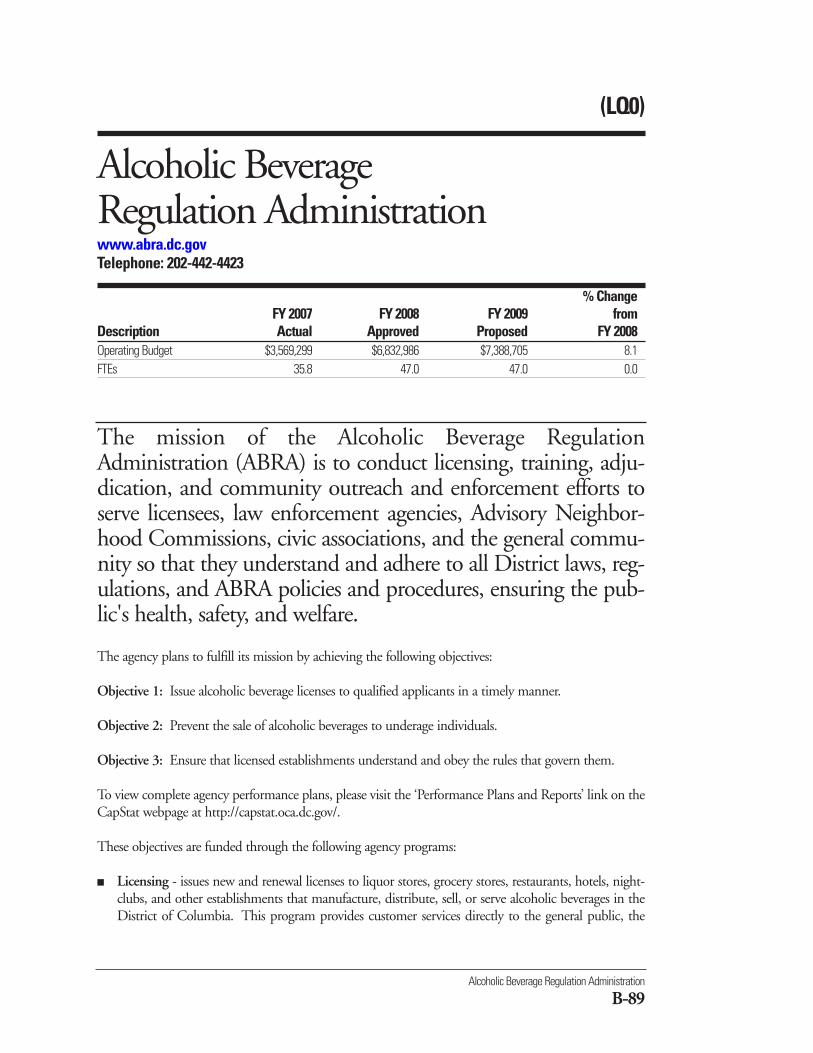
Alcoholic Beverage Regulation Administration
B-89
(LQ0)
Alcoholic Beverage Regulation Administrationwww.abra.dc.govTelephone: 202-442-4423
% ChangeFY 2007 FY 2008 FY 2009 from
Description Actual Approved Proposed FY 2008Operating Budget $3,569,299 $6,832,986 $7,388,705 8.1FTEs 35.8 47.0 47.0 0.0
The mission of the Alcoholic Beverage RegulationAdministration (ABRA) is to conduct licensing, training, adju-dication, and community outreach and enforcement efforts toserve licensees, law enforcement agencies, Advisory Neighbor-hood Commissions, civic associations, and the general commu-nity so that they understand and adhere to all District laws, reg-ulations, and ABRA policies and procedures, ensuring the pub-lic's health, safety, and welfare.
The agency plans to fulfill its mission by achieving the following objectives:
Objective 1: Issue alcoholic beverage licenses to qualified applicants in a timely manner.
Objective 2: Prevent the sale of alcoholic beverages to underage individuals.
Objective 3: Ensure that licensed establishments understand and obey the rules that govern them.
To view complete agency performance plans, please visit the ‘Performance Plans and Reports’ link on theCapStat webpage at http://capstat.oca.dc.gov/.
These objectives are funded through the following agency programs:
■ Licensing - issues new and renewal licenses to liquor stores, grocery stores, restaurants, hotels, night-clubs, and other establishments that manufacture, distribute, sell, or serve alcoholic beverages in theDistrict of Columbia. This program provides customer services directly to the general public, the
FY 2009 Proposed Budget and Financial Plan
B-90
business community, Advisory Neighborhood Commissions, and community groups and associa-tions, among others.
■ Enforcement - conducts regulatory and voluntary agreement compliance inspections; conductsunderage compliance checks; conducts joint investigations as needed with the Metropolitan PoliceDepartment (MPD), Fire and Emergency Medical Services Department (FEMS), the Office of Taxand Revenue (OTR), the Department of Consumer and Regulatory Affairs (DCRA), and others; andconducts various inspections associated with the licensing and adjudicatory processes such as final,compliance, placard, special event, and financial audit investigations. In FY 2007, ABRA entered intoan innovative Memorandum of Understanding with (OTR) to procure professional auditing servicesto audit licensee compliance with the food and alcoholic beverage sales and reporting requirementsfound in Title 25 of the D.C. Office Code and 23 DCMR. The program also participates inNeighborhood Core Meetings, meetings and briefings with MPD Districts, police roll calls, and otheractivities in order to facilitate interagency cooperation and knowledge sharing on matters of commonconcern.
■ Records Management - provides file, document and database information to ABRA staff, the AlcoholBeverage and Control (ABC) Board and the general public so that they can receive accurate informa-tion and files. The program provides customer service to the general public, licensees, AdvisoryNeighborhood Commissions, community groups and associations, and others, who rely upon thereceipt of timely and accurate information regarding ABRA and ABC Board activities. The programalso provides certification services, responds to and tracks Freedom of Information Act requests, andresponds to subpoena requests.
■ Agency Management - provides for administrative support and the required tools to achieve opera-tional and programmatic results. This program is standard for all agencies using performance-basedbudgeting.
The agency’s FY 2009 proposed budget is presented in the following tables:
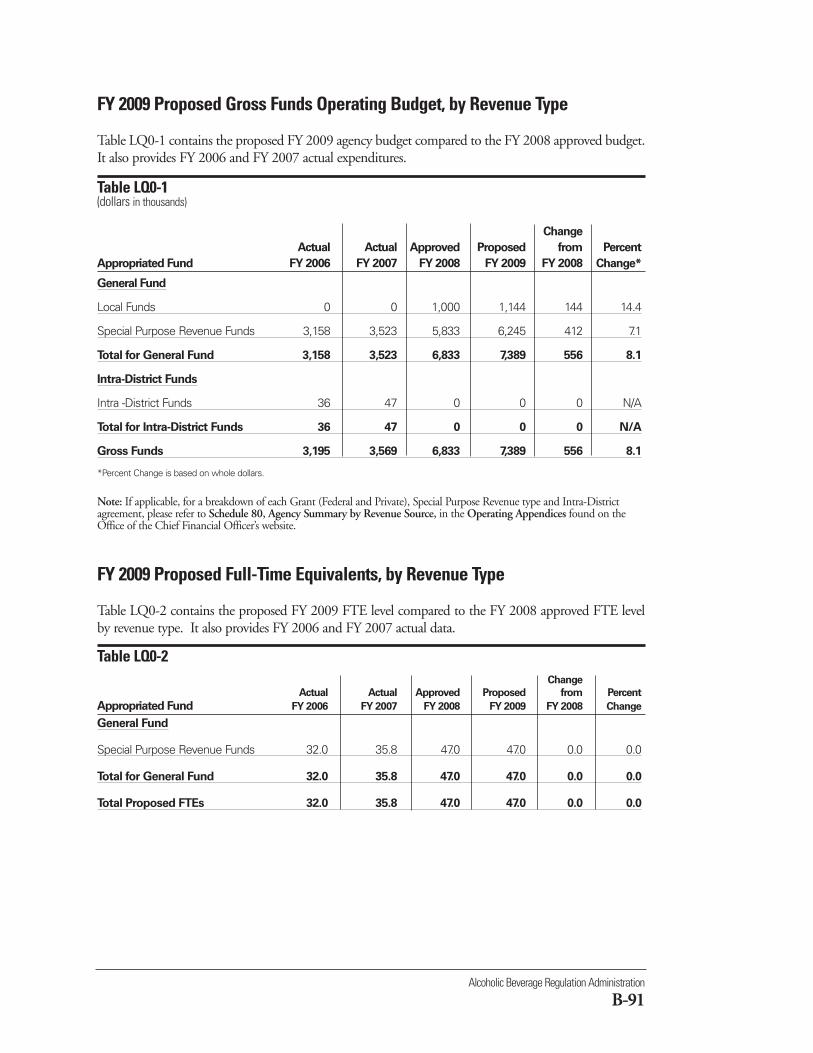
Alcoholic Beverage Regulation Administration
B-91
FY 2009 Proposed Gross Funds Operating Budget, by Revenue Type
Table LQ0-1 contains the proposed FY 2009 agency budget compared to the FY 2008 approved budget.It also provides FY 2006 and FY 2007 actual expenditures.
Table LQ0-1 (dollars in thousands)
Change
Actual Actual Approved Proposed from Percent
Appropriated Fund FY 2006 FY 2007 FY 2008 FY 2009 FY 2008 Change*
General Fund
Local Funds 0 0 1,000 1,144 144 14.4
Special Purpose Revenue Funds 3,158 3,523 5,833 6,245 412 7.1
Total for General Fund 3,158 3,523 6,833 7,389 556 8.1
Intra-District Funds
Intra -District Funds 36 47 0 0 0 N/A
Total for Intra-District Funds 36 47 0 0 0 N/A
Gross Funds 3,195 3,569 6,833 7,389 556 8.1
*Percent Change is based on whole dollars.
Note: If applicable, for a breakdown of each Grant (Federal and Private), Special Purpose Revenue type and Intra-Districtagreement, please refer to Schedule 80, Agency Summary by Revenue Source, in the Operating Appendices found on theOffice of the Chief Financial Officer’s website.
FY 2009 Proposed Full-Time Equivalents, by Revenue Type
Table LQ0-2 contains the proposed FY 2009 FTE level compared to the FY 2008 approved FTE levelby revenue type. It also provides FY 2006 and FY 2007 actual data.
Table LQ0-2 Change
Actual Actual Approved Proposed from Percent
Appropriated Fund FY 2006 FY 2007 FY 2008 FY 2009 FY 2008 Change
General Fund
Special Purpose Revenue Funds 32.0 35.8 47.0 47.0 0.0 0.0
Total for General Fund 32.0 35.8 47.0 47.0 0.0 0.0
Total Proposed FTEs 32.0 35.8 47.0 47.0 0.0 0.0
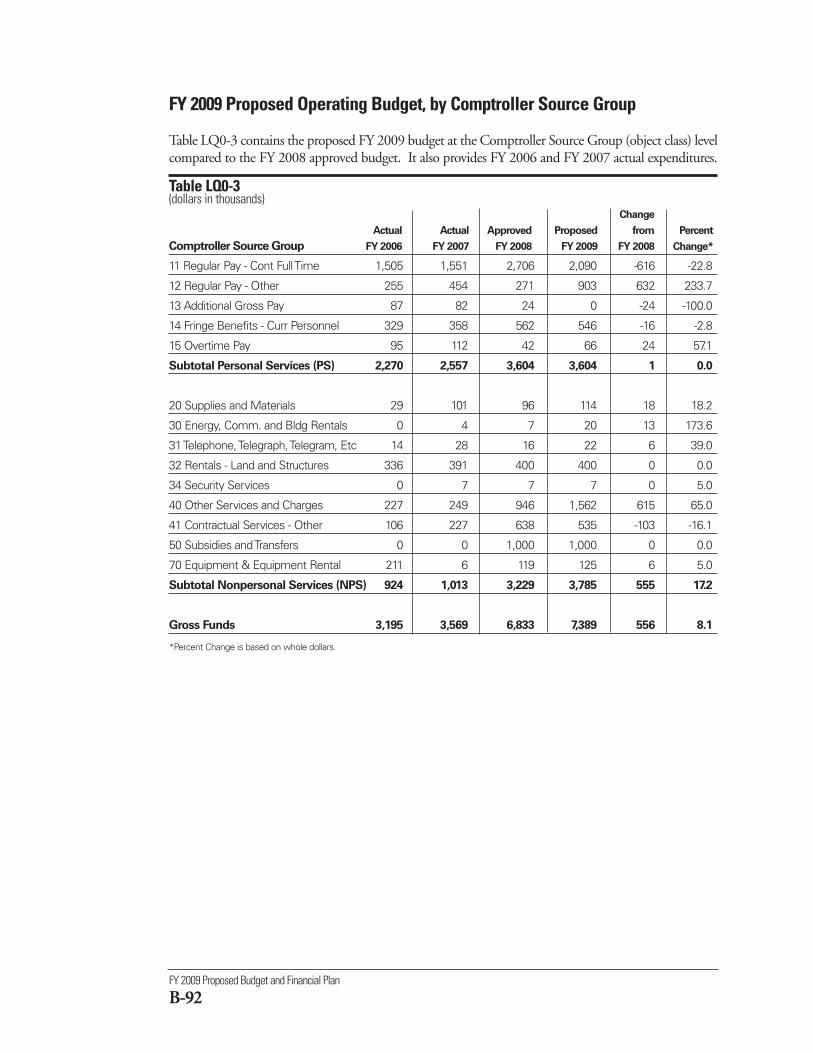
FY 2009 Proposed Budget and Financial Plan
B-92
FY 2009 Proposed Operating Budget, by Comptroller Source Group
Table LQ0-3 contains the proposed FY 2009 budget at the Comptroller Source Group (object class) levelcompared to the FY 2008 approved budget. It also provides FY 2006 and FY 2007 actual expenditures.
Table LQ0-3(dollars in thousands)
Change
Actual Actual Approved Proposed from Percent
Comptroller Source Group FY 2006 FY 2007 FY 2008 FY 2009 FY 2008 Change*
11 Regular Pay - Cont Full Time 1,505 1,551 2,706 2,090 -616 -22.8
12 Regular Pay - Other 255 454 271 903 632 233.7
13 Additional Gross Pay 87 82 24 0 -24 -100.0
14 Fringe Benefits - Curr Personnel 329 358 562 546 -16 -2.8
15 Overtime Pay 95 112 42 66 24 57.1
Subtotal Personal Services (PS) 2,270 2,557 3,604 3,604 1 0.0
20 Supplies and Materials 29 101 96 114 18 18.2
30 Energy, Comm. and Bldg Rentals 0 4 7 20 13 173.6
31 Telephone, Telegraph, Telegram, Etc 14 28 16 22 6 39.0
32 Rentals - Land and Structures 336 391 400 400 0 0.0
34 Security Services 0 7 7 7 0 5.0
40 Other Services and Charges 227 249 946 1,562 615 65.0
41 Contractual Services - Other 106 227 638 535 -103 -16.1
50 Subsidies and Transfers 0 0 1,000 1,000 0 0.0
70 Equipment & Equipment Rental 211 6 119 125 6 5.0
Subtotal Nonpersonal Services (NPS) 924 1,013 3,229 3,785 555 17.2
Gross Funds 3,195 3,569 6,833 7,389 556 8.1
*Percent Change is based on whole dollars.
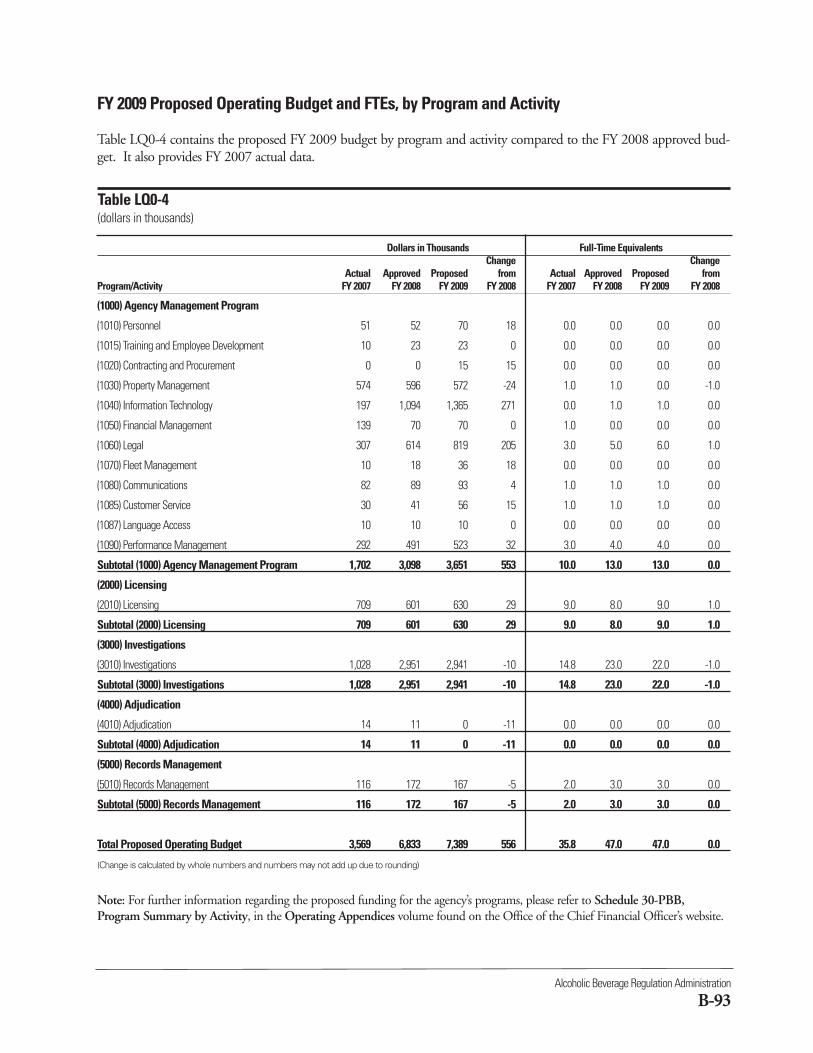
Alcoholic Beverage Regulation Administration
B-93
Dollars in Thousands Full-Time EquivalentsChange Change
Actual Approved Proposed from Actual Approved Proposed from Program/Activity FY 2007 FY 2008 FY 2009 FY 2008 FY 2007 FY 2008 FY 2009 FY 2008
(1000) Agency Management Program
(1010) Personnel 51 52 70 18 0.0 0.0 0.0 0.0
(1015) Training and Employee Development 10 23 23 0 0.0 0.0 0.0 0.0
(1020) Contracting and Procurement 0 0 15 15 0.0 0.0 0.0 0.0
(1030) Property Management 574 596 572 -24 1.0 1.0 0.0 -1.0
(1040) Information Technology 197 1,094 1,365 271 0.0 1.0 1.0 0.0
(1050) Financial Management 139 70 70 0 1.0 0.0 0.0 0.0
(1060) Legal 307 614 819 205 3.0 5.0 6.0 1.0
(1070) Fleet Management 10 18 36 18 0.0 0.0 0.0 0.0
(1080) Communications 82 89 93 4 1.0 1.0 1.0 0.0
(1085) Customer Service 30 41 56 15 1.0 1.0 1.0 0.0
(1087) Language Access 10 10 10 0 0.0 0.0 0.0 0.0
(1090) Performance Management 292 491 523 32 3.0 4.0 4.0 0.0
Subtotal (1000) Agency Management Program 1,702 3,098 3,651 553 10.0 13.0 13.0 0.0
(2000) Licensing
(2010) Licensing 709 601 630 29 9.0 8.0 9.0 1.0
Subtotal (2000) Licensing 709 601 630 29 9.0 8.0 9.0 1.0
(3000) Investigations
(3010) Investigations 1,028 2,951 2,941 -10 14.8 23.0 22.0 -1.0
Subtotal (3000) Investigations 1,028 2,951 2,941 -10 14.8 23.0 22.0 -1.0
(4000) Adjudication
(4010) Adjudication 14 11 0 -11 0.0 0.0 0.0 0.0
Subtotal (4000) Adjudication 14 11 0 -11 0.0 0.0 0.0 0.0
(5000) Records Management
(5010) Records Management 116 172 167 -5 2.0 3.0 3.0 0.0
Subtotal (5000) Records Management 116 172 167 -5 2.0 3.0 3.0 0.0
Total Proposed Operating Budget 3,569 6,833 7,389 556 35.8 47.0 47.0 0.0
(Change is calculated by whole numbers and numbers may not add up due to rounding)
Note: For further information regarding the proposed funding for the agency’s programs, please refer to Schedule 30-PBB,Program Summary by Activity, in the Operating Appendices volume found on the Office of the Chief Financial Officer’s website.
FY 2009 Proposed Operating Budget and FTEs, by Program and Activity
Table LQ0-4 contains the proposed FY 2009 budget by program and activity compared to the FY 2008 approved bud-get. It also provides FY 2007 actual data.
Table LQ0-4(dollars in thousands)
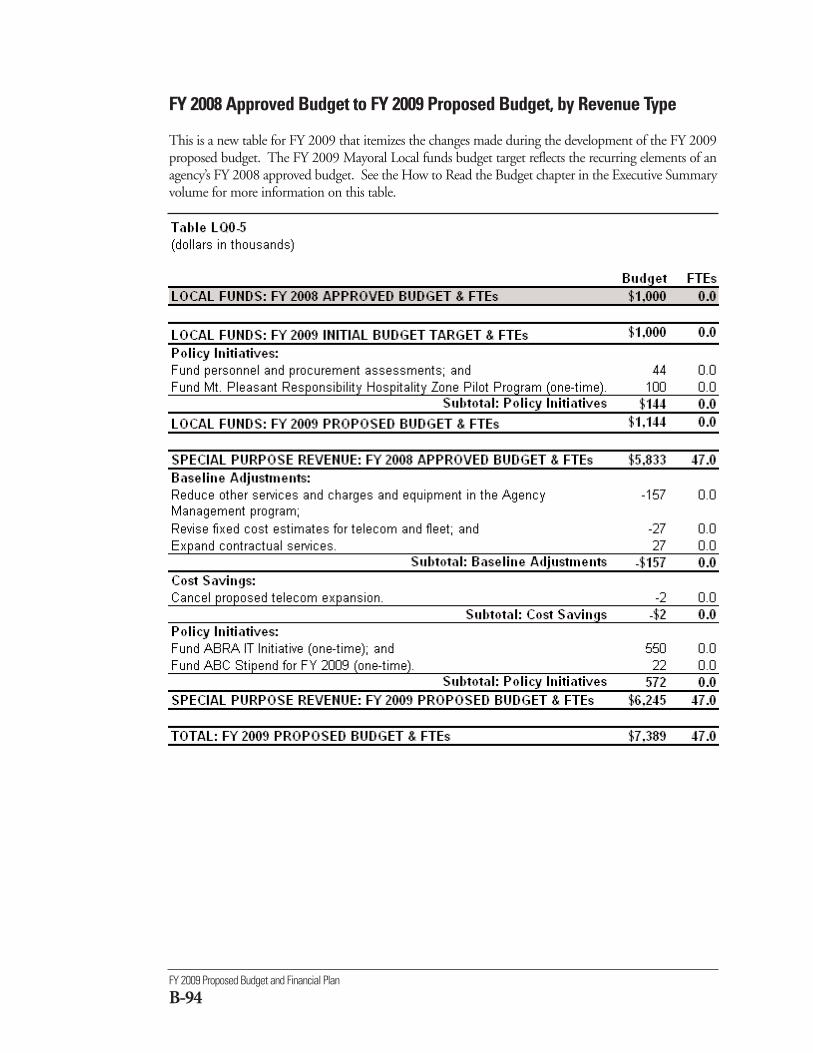
FY 2009 Proposed Budget and Financial Plan
B-94
FY 2008 Approved Budget to FY 2009 Proposed Budget, by Revenue Type
This is a new table for FY 2009 that itemizes the changes made during the development of the FY 2009proposed budget. The FY 2009 Mayoral Local funds budget target reflects the recurring elements of anagency’s FY 2008 approved budget. See the How to Read the Budget chapter in the Executive Summaryvolume for more information on this table.
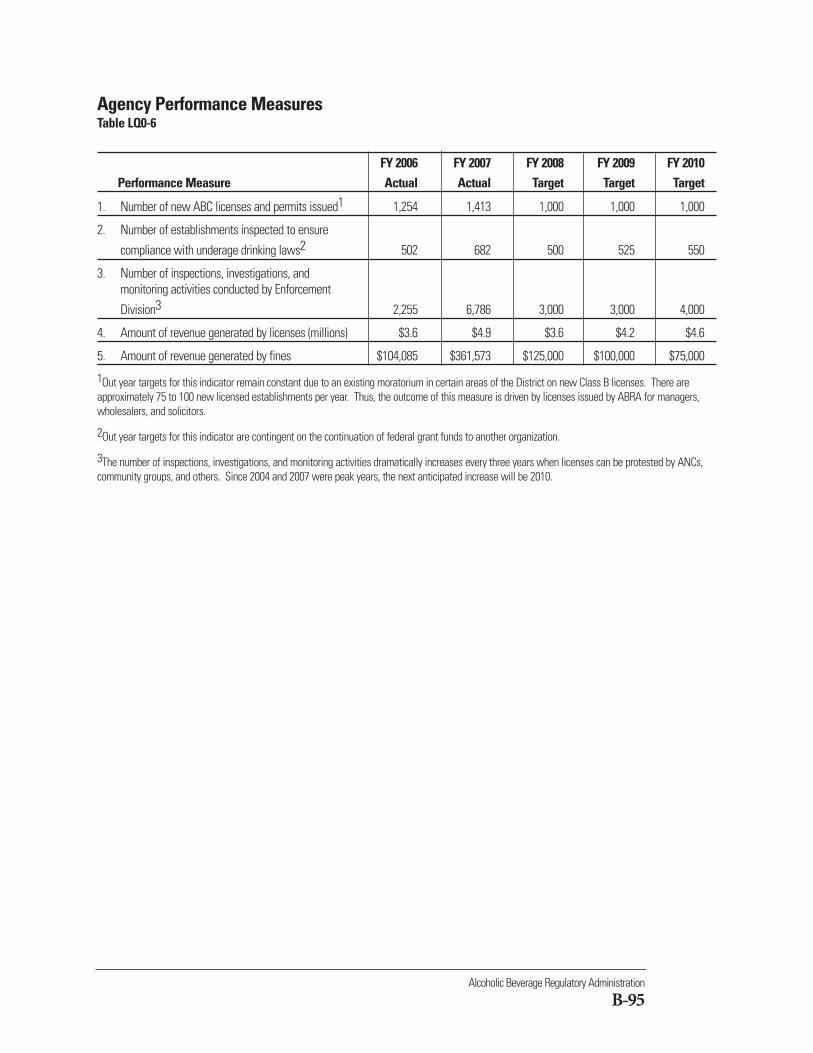
Alcoholic Beverage Regulatory Administration
B-95
Agency Performance MeasuresTable LQ0-6
FY 2006 FY 2007 FY 2008 FY 2009 FY 2010Performance Measure Actual Actual Target Target Target
1. Number of new ABC licenses and permits issued1 1,254 1,413 1,000 1,000 1,000
2. Number of establishments inspected to ensure
compliance with underage drinking laws2 502 682 500 525 550
3. Number of inspections, investigations, and monitoring activities conducted by Enforcement
Division3 2,255 6,786 3,000 3,000 4,000
4. Amount of revenue generated by licenses (millions) $3.6 $4.9 $3.6 $4.2 $4.6
5. Amount of revenue generated by fines $104,085 $361,573 $125,000 $100,000 $75,000
1Out year targets for this indicator remain constant due to an existing moratorium in certain areas of the District on new Class B licenses. There areapproximately 75 to 100 new licensed establishments per year. Thus, the outcome of this measure is driven by licenses issued by ABRA for managers,wholesalers, and solicitors.
2Out year targets for this indicator are contingent on the continuation of federal grant funds to another organization.
3The number of inspections, investigations, and monitoring activities dramatically increases every three years when licenses can be protested by ANCs,community groups, and others. Since 2004 and 2007 were peak years, the next anticipated increase will be 2010.
(DH0)
Public Service Commissionwww.dcpsc.org
Telephone: 202-626-5100
% ChangeFY 2007 FY 2008 FY 2009 from
Description Actual Approved Proposed FY 2008Operating Budget $7,917,539 $8,645,124 $9,971,963 15.3FTEs 54.0 67.6 67.6 0.0
The mission of the District of Columbia Public ServiceCommission (PSC) is to serve the public interest by ensur-ing that financially healthy electric, natural gas, andtelecommunications companies provide safe, reliable, andquality services at reasonable rates for District of Columbiaresidential, business, and government customers.
Public Service Commission
B-97
The agency plans to fulfill its mission by achieving the following objectives:
Objective 1: Ensure public safety by managing the Natural Gas Pipeline Safety Program and monitoringand investigating electric, natural gas, and telecommunications incidents.
Objective 2: Ensure just and reasonable rates and services by expediting and streamlining the adjudicativeprocess and thereby increasing the timeliness of rate cases and other proceedings.
Objective 3: Ensure quality electric, natural gas, and local telecommunications services by regulatingmonopoly services and fostering competition among all providers.
To view complete agency performance plans, please visit the ‘Performance Plans and Reports’ link on theCapStat webpage at http://capstat.oca.dc.gov/.
These objectives are funded through the following agency programs:
■ Natural Gas Pipeline Safety - provides inspections, investigations, audit, notices of probable viola-tions, and new standard services to Washington Gas so that they can provide safe and reliable naturalgas service to the District public in compliance with federal grant provisions in order to prevent harm-ful incidents.
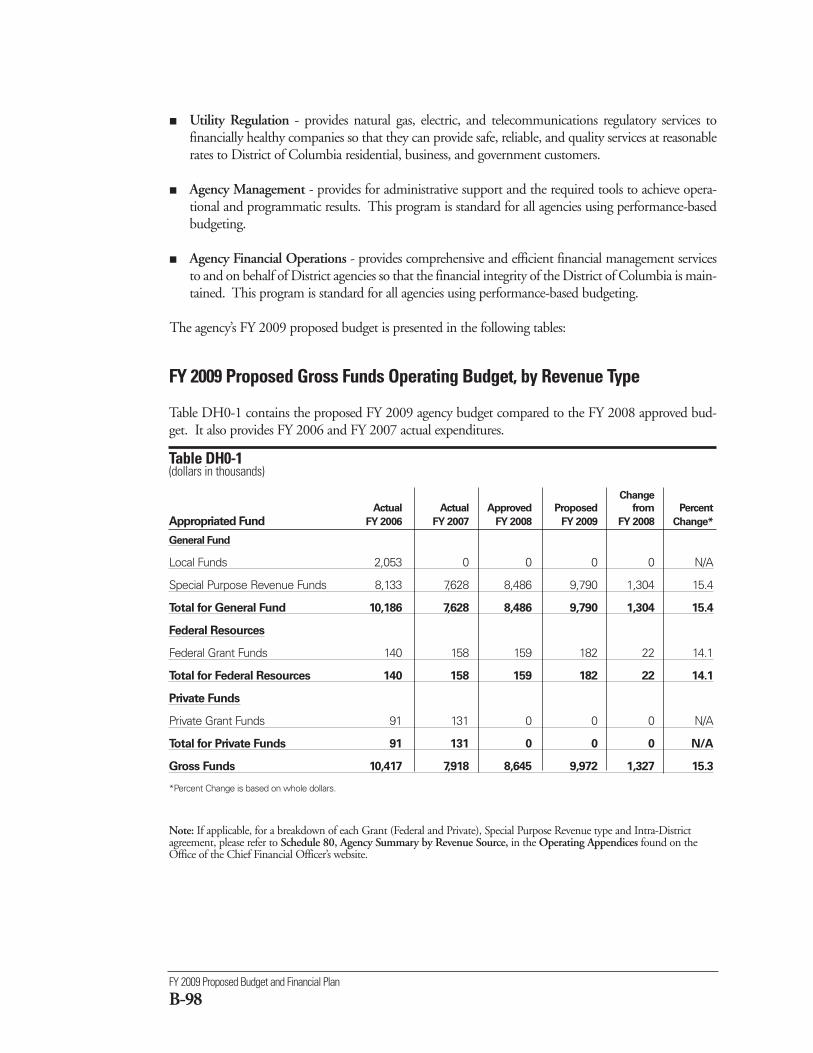
FY 2009 Proposed Budget and Financial Plan
B-98
FY 2009 Proposed Gross Funds Operating Budget, by Revenue Type
Table DH0-1 contains the proposed FY 2009 agency budget compared to the FY 2008 approved bud-get. It also provides FY 2006 and FY 2007 actual expenditures.
Table DH0-1 (dollars in thousands)
Change
Actual Actual Approved Proposed from Percent
Appropriated Fund FY 2006 FY 2007 FY 2008 FY 2009 FY 2008 Change*
General Fund
Local Funds 2,053 0 0 0 0 N/A
Special Purpose Revenue Funds 8,133 7,628 8,486 9,790 1,304 15.4
Total for General Fund 10,186 7,628 8,486 9,790 1,304 15.4
Federal Resources
Federal Grant Funds 140 158 159 182 22 14.1
Total for Federal Resources 140 158 159 182 22 14.1
Private Funds
Private Grant Funds 91 131 0 0 0 N/A
Total for Private Funds 91 131 0 0 0 N/A
Gross Funds 10,417 7,918 8,645 9,972 1,327 15.3
*Percent Change is based on whole dollars.
Note: If applicable, for a breakdown of each Grant (Federal and Private), Special Purpose Revenue type and Intra-Districtagreement, please refer to Schedule 80, Agency Summary by Revenue Source, in the Operating Appendices found on theOffice of the Chief Financial Officer’s website.
■ Utility Regulation - provides natural gas, electric, and telecommunications regulatory services tofinancially healthy companies so that they can provide safe, reliable, and quality services at reasonablerates to District of Columbia residential, business, and government customers.
■ Agency Management - provides for administrative support and the required tools to achieve opera-tional and programmatic results. This program is standard for all agencies using performance-basedbudgeting.
■ Agency Financial Operations - provides comprehensive and efficient financial management servicesto and on behalf of District agencies so that the financial integrity of the District of Columbia is main-tained. This program is standard for all agencies using performance-based budgeting.
The agency’s FY 2009 proposed budget is presented in the following tables:

Public Service Commission
B-99
FY 2009 Proposed Full-Time Equivalents, by Revenue Type
Table DH0-2 contains the proposed FY 2009 FTE level compared to the FY 2008 approved FTE levelby revenue type. It also provides FY 2006 and FY 2007 actual data.
Table DH0-2 Change
Actual Actual Approved Proposed from Percent
Appropriated Fund FY 2006 FY 2007 FY 2008 FY 2009 FY 2008 Change
General Fund
Special Purpose Revenue Funds 49.0 51.0 65.7 65.9 0.2 0.3
Total for General Fund 49.0 51.0 65.7 65.9 0.2 0.3
Federal Resources
Federal Grant Funds 2.0 3.0 1.9 1.7 -0.2 -11.2
Total for Federal Resources 2.0 3.0 1.9 1.7 -0.2 -11.2
Private Funds
Private Grant Funds 1.0 0.0 0.0 0.0 0.0 N/A
Total for Private Funds 1.0 0.0 0.0 0.0 0.0 N/A
Total Proposed FTEs 52.0 54.0 67.6 67.6 0.0 0.0

FY 2009 Proposed Budget and Financial Plan
B-100
FY 2009 Proposed Operating Budget, by Comptroller Source Group
Table DH0-3 contains the proposed FY 2009 budget at the Comptroller Source Group (object class) levelcompared to the FY 2008 approved budget. It also provides FY 2006 and FY 2007 actual expenditures.
Table DH0-3(dollars in thousands)
Change
Actual Actual Approved Proposed from Percent
Comptroller Source Group FY 2006 FY 2007 FY 2008 FY 2009 FY 2008 Change*
11 Regular Pay - Cont Full Time 3,470 4,024 4,831 5,200 368 7.6
12 Regular Pay - Other 701 740 882 960 78 8.9
13 Additional Gross Pay 25 28 0 11 11 N/A
14 Fringe Benefits - Curr Personnel 677 746 914 1,028 114 12.4
Subtotal Personal Services (PS) 4,872 5,538 6,627 7,199 572 8.6
20 Supplies and Materials 33 32 36 36 0 0.0
30 Energy, Comm. and Bldg Rentals 0 0 1 1 -1 -50.8
31 Telephone, Telegraph, Telegram, Etc 76 70 77 66 -11 -14.5
32 Rentals - Land and Structures 1,187 1,319 1,150 1,816 666 57.9
40 Other Services and Charges 218 205 205 306 101 49.3
41 Contractual Services - Other 401 608 417 417 0 0.0
50 Subsidies and Transfers 3,497 0 0 0 0 N/A
70 Equipment and Equipment Rental 132 145 131 131 0 0.0
Subtotal Nonpersonal Services (NPS) 5,545 2,380 2,018 2,773 755 37.4
Gross Funds 10,417 7,918 8,645 9,972 1,327 15.3
*Percent Change is based on whole dollars.
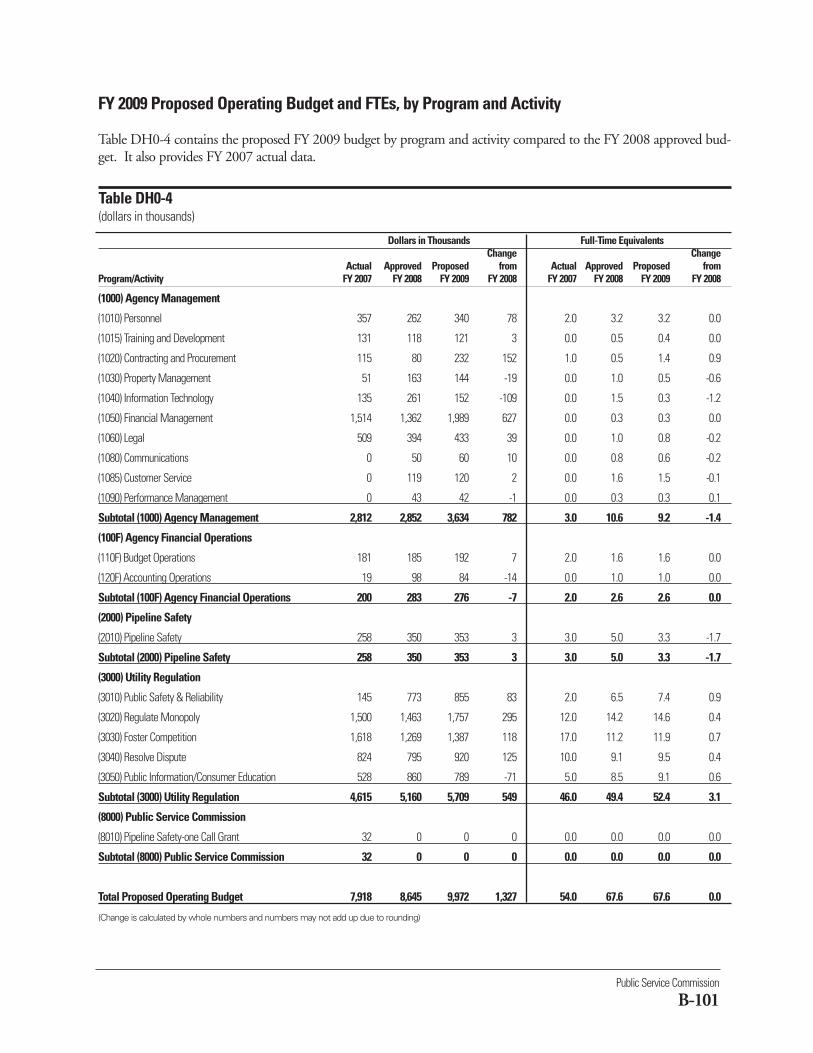
Public Service Commission
B-101
Dollars in Thousands Full-Time EquivalentsChange Change
Actual Approved Proposed from Actual Approved Proposed from Program/Activity FY 2007 FY 2008 FY 2009 FY 2008 FY 2007 FY 2008 FY 2009 FY 2008
(1000) Agency Management
(1010) Personnel 357 262 340 78 2.0 3.2 3.2 0.0
(1015) Training and Development 131 118 121 3 0.0 0.5 0.4 0.0
(1020) Contracting and Procurement 115 80 232 152 1.0 0.5 1.4 0.9
(1030) Property Management 51 163 144 -19 0.0 1.0 0.5 -0.6
(1040) Information Technology 135 261 152 -109 0.0 1.5 0.3 -1.2
(1050) Financial Management 1,514 1,362 1,989 627 0.0 0.3 0.3 0.0
(1060) Legal 509 394 433 39 0.0 1.0 0.8 -0.2
(1080) Communications 0 50 60 10 0.0 0.8 0.6 -0.2
(1085) Customer Service 0 119 120 2 0.0 1.6 1.5 -0.1
(1090) Performance Management 0 43 42 -1 0.0 0.3 0.3 0.1
Subtotal (1000) Agency Management 2,812 2,852 3,634 782 3.0 10.6 9.2 -1.4
(100F) Agency Financial Operations
(110F) Budget Operations 181 185 192 7 2.0 1.6 1.6 0.0
(120F) Accounting Operations 19 98 84 -14 0.0 1.0 1.0 0.0
Subtotal (100F) Agency Financial Operations 200 283 276 -7 2.0 2.6 2.6 0.0
(2000) Pipeline Safety
(2010) Pipeline Safety 258 350 353 3 3.0 5.0 3.3 -1.7
Subtotal (2000) Pipeline Safety 258 350 353 3 3.0 5.0 3.3 -1.7
(3000) Utility Regulation
(3010) Public Safety & Reliability 145 773 855 83 2.0 6.5 7.4 0.9
(3020) Regulate Monopoly 1,500 1,463 1,757 295 12.0 14.2 14.6 0.4
(3030) Foster Competition 1,618 1,269 1,387 118 17.0 11.2 11.9 0.7
(3040) Resolve Dispute 824 795 920 125 10.0 9.1 9.5 0.4
(3050) Public Information/Consumer Education 528 860 789 -71 5.0 8.5 9.1 0.6
Subtotal (3000) Utility Regulation 4,615 5,160 5,709 549 46.0 49.4 52.4 3.1
(8000) Public Service Commission
(8010) Pipeline Safety-one Call Grant 32 0 0 0 0.0 0.0 0.0 0.0
Subtotal (8000) Public Service Commission 32 0 0 0 0.0 0.0 0.0 0.0
Total Proposed Operating Budget 7,918 8,645 9,972 1,327 54.0 67.6 67.6 0.0
(Change is calculated by whole numbers and numbers may not add up due to rounding)
FY 2009 Proposed Operating Budget and FTEs, by Program and Activity
Table DH0-4 contains the proposed FY 2009 budget by program and activity compared to the FY 2008 approved bud-get. It also provides FY 2007 actual data.
Table DH0-4(dollars in thousands)
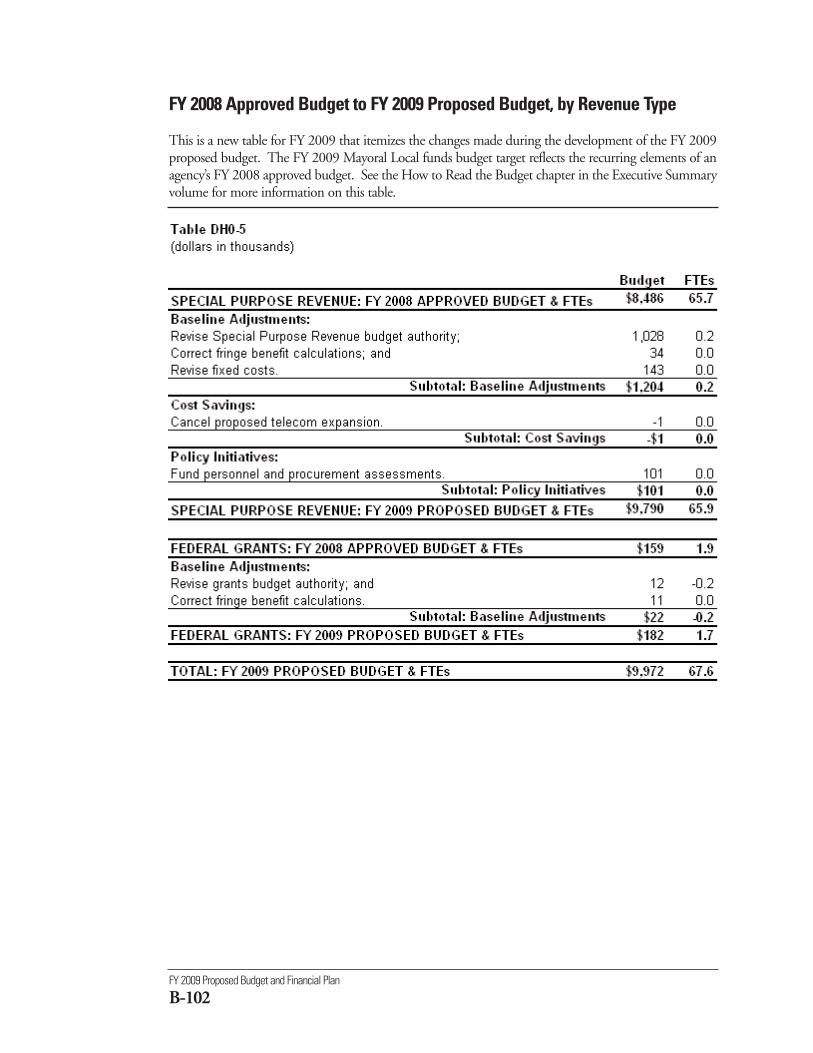
FY 2009 Proposed Budget and Financial Plan
B-102
FY 2008 Approved Budget to FY 2009 Proposed Budget, by Revenue Type
This is a new table for FY 2009 that itemizes the changes made during the development of the FY 2009proposed budget. The FY 2009 Mayoral Local funds budget target reflects the recurring elements of anagency’s FY 2008 approved budget. See the How to Read the Budget chapter in the Executive Summaryvolume for more information on this table.
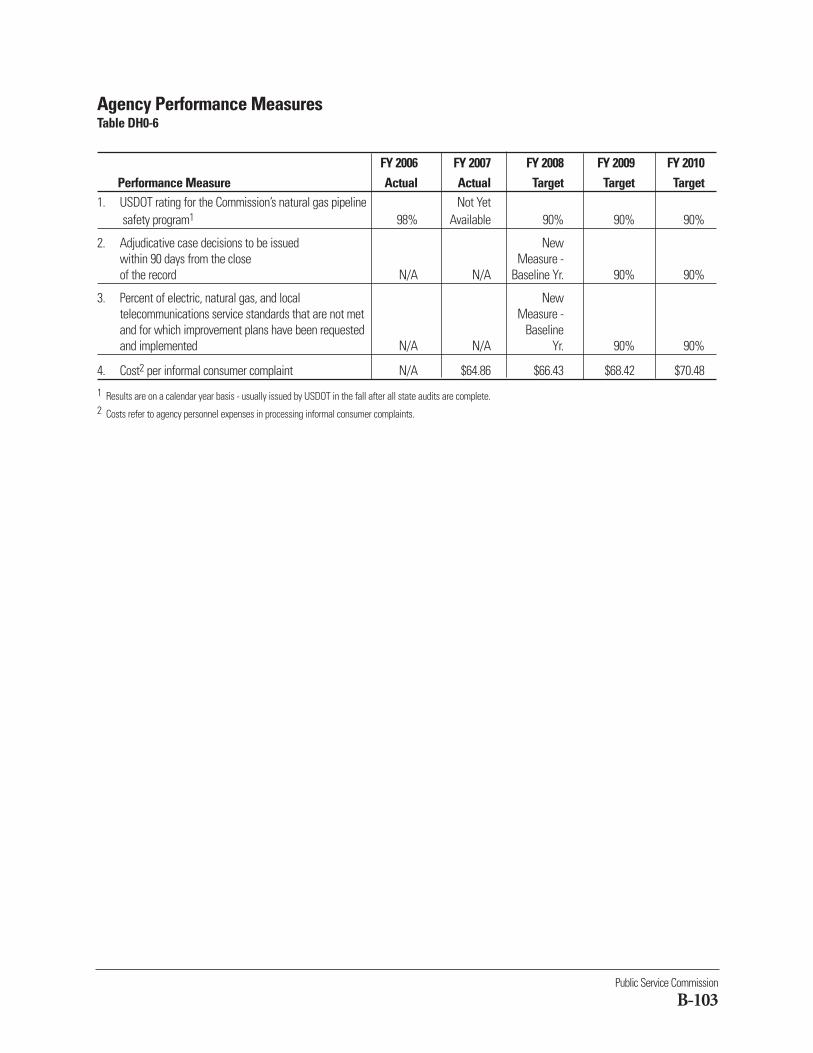
Public Service Commission
B-103
Agency Performance MeasuresTable DH0-6
FY 2006 FY 2007 FY 2008 FY 2009 FY 2010Performance Measure Actual Actual Target Target Target
1. USDOT rating for the Commission’s natural gas pipeline Not Yetsafety program1 98% Available 90% 90% 90%
2. Adjudicative case decisions to be issued Newwithin 90 days from the close Measure -of the record N/A N/A Baseline Yr. 90% 90%
3. Percent of electric, natural gas, and local New telecommunications service standards that are not met Measure -and for which improvement plans have been requested Baselineand implemented N/A N/A Yr. 90% 90%
4. Cost2 per informal consumer complaint N/A $64.86 $66.43 $68.42 $70.48
1 Results are on a calendar year basis - usually issued by USDOT in the fall after all state audits are complete.2 Costs refer to agency personnel expenses in processing informal consumer complaints.
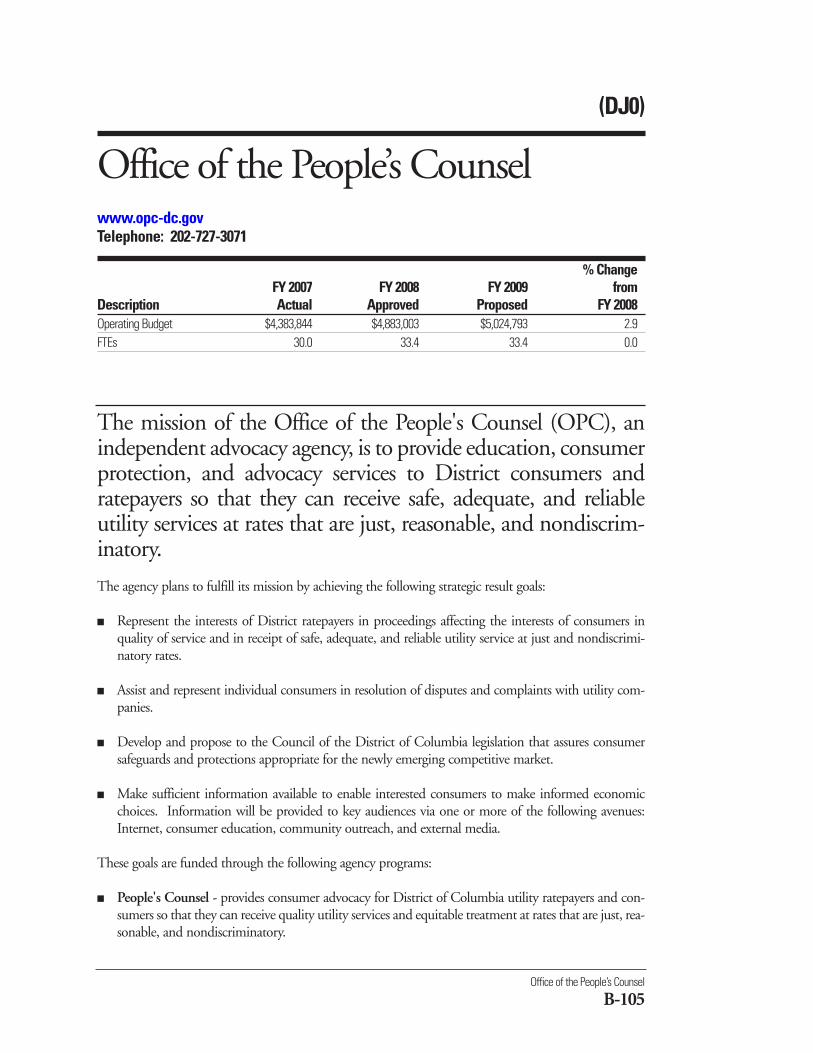
Office of the People’s Counsel
B-105
(DJ0)
Office of the People’s Counselwww.opc-dc.govTelephone: 202-727-3071
% ChangeFY 2007 FY 2008 FY 2009 from
Description Actual Approved Proposed FY 2008Operating Budget $4,383,844 $4,883,003 $5,024,793 2.9FTEs 30.0 33.4 33.4 0.0
The mission of the Office of the People's Counsel (OPC), anindependent advocacy agency, is to provide education, consumerprotection, and advocacy services to District consumers andratepayers so that they can receive safe, adequate, and reliableutility services at rates that are just, reasonable, and nondiscrim-inatory.
The agency plans to fulfill its mission by achieving the following strategic result goals:
■ Represent the interests of District ratepayers in proceedings affecting the interests of consumers inquality of service and in receipt of safe, adequate, and reliable utility service at just and nondiscrimi-natory rates.
■ Assist and represent individual consumers in resolution of disputes and complaints with utility com-panies.
■ Develop and propose to the Council of the District of Columbia legislation that assures consumersafeguards and protections appropriate for the newly emerging competitive market.
■ Make sufficient information available to enable interested consumers to make informed economicchoices. Information will be provided to key audiences via one or more of the following avenues:Internet, consumer education, community outreach, and external media.
These goals are funded through the following agency programs:
■ People's Counsel - provides consumer advocacy for District of Columbia utility ratepayers and con-sumers so that they can receive quality utility services and equitable treatment at rates that are just, rea-sonable, and nondiscriminatory.
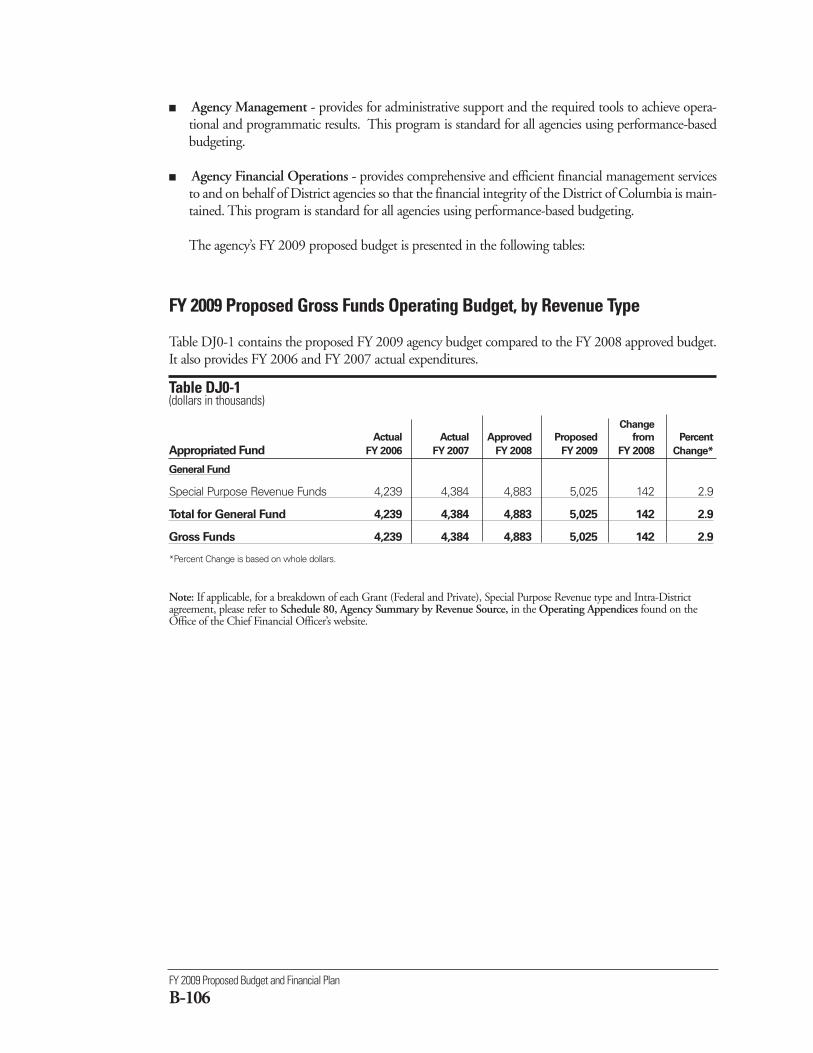
FY 2009 Proposed Budget and Financial Plan
B-106
■ Agency Management - provides for administrative support and the required tools to achieve opera-tional and programmatic results. This program is standard for all agencies using performance-basedbudgeting.
■ Agency Financial Operations - provides comprehensive and efficient financial management servicesto and on behalf of District agencies so that the financial integrity of the District of Columbia is main-tained. This program is standard for all agencies using performance-based budgeting.
The agency’s FY 2009 proposed budget is presented in the following tables:
FY 2009 Proposed Gross Funds Operating Budget, by Revenue Type
Table DJ0-1 contains the proposed FY 2009 agency budget compared to the FY 2008 approved budget.It also provides FY 2006 and FY 2007 actual expenditures.
Table DJ0-1 (dollars in thousands)
Change
Actual Actual Approved Proposed from Percent
Appropriated Fund FY 2006 FY 2007 FY 2008 FY 2009 FY 2008 Change*
General Fund
Special Purpose Revenue Funds 4,239 4,384 4,883 5,025 142 2.9
Total for General Fund 4,239 4,384 4,883 5,025 142 2.9
Gross Funds 4,239 4,384 4,883 5,025 142 2.9
*Percent Change is based on whole dollars.
Note: If applicable, for a breakdown of each Grant (Federal and Private), Special Purpose Revenue type and Intra-Districtagreement, please refer to Schedule 80, Agency Summary by Revenue Source, in the Operating Appendices found on theOffice of the Chief Financial Officer’s website.
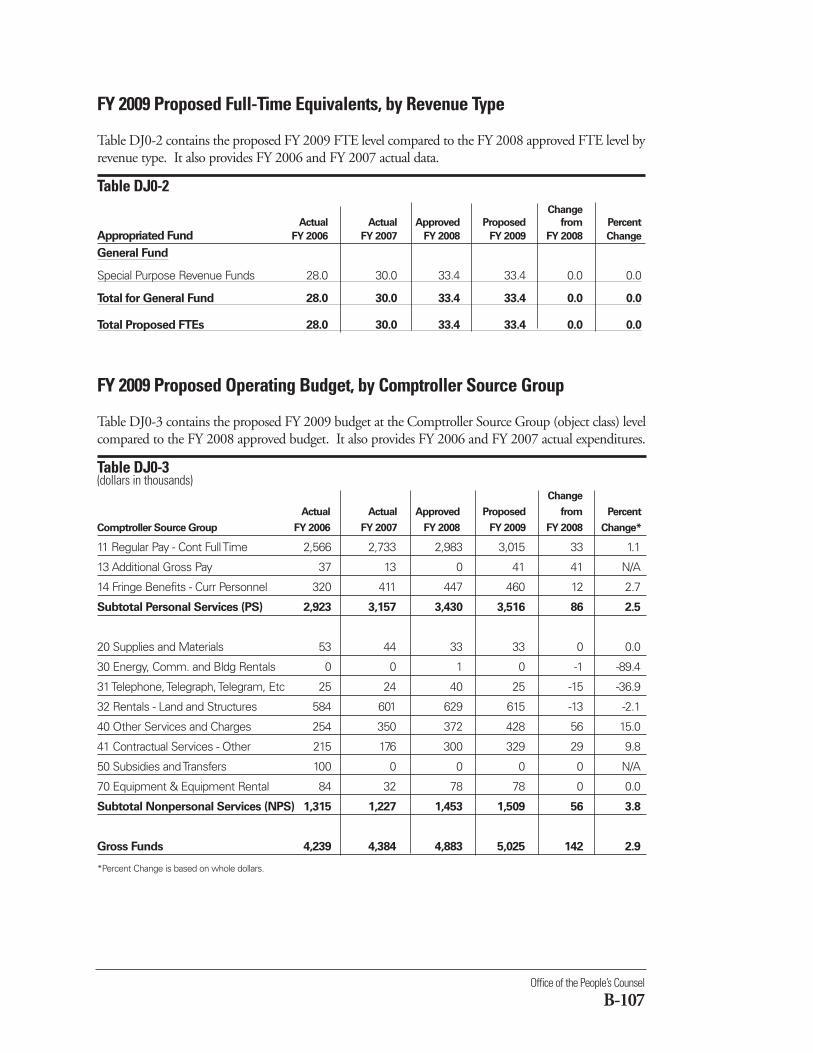
Office of the People’s Counsel
B-107
FY 2009 Proposed Full-Time Equivalents, by Revenue Type
Table DJ0-2 contains the proposed FY 2009 FTE level compared to the FY 2008 approved FTE level byrevenue type. It also provides FY 2006 and FY 2007 actual data.
Table DJ0-2 Change
Actual Actual Approved Proposed from Percent
Appropriated Fund FY 2006 FY 2007 FY 2008 FY 2009 FY 2008 Change
General Fund
Special Purpose Revenue Funds 28.0 30.0 33.4 33.4 0.0 0.0
Total for General Fund 28.0 30.0 33.4 33.4 0.0 0.0
Total Proposed FTEs 28.0 30.0 33.4 33.4 0.0 0.0
FY 2009 Proposed Operating Budget, by Comptroller Source Group
Table DJ0-3 contains the proposed FY 2009 budget at the Comptroller Source Group (object class) levelcompared to the FY 2008 approved budget. It also provides FY 2006 and FY 2007 actual expenditures.
Table DJ0-3(dollars in thousands)
Change
Actual Actual Approved Proposed from Percent
Comptroller Source Group FY 2006 FY 2007 FY 2008 FY 2009 FY 2008 Change*
11 Regular Pay - Cont Full Time 2,566 2,733 2,983 3,015 33 1.1
13 Additional Gross Pay 37 13 0 41 41 N/A
14 Fringe Benefits - Curr Personnel 320 411 447 460 12 2.7
Subtotal Personal Services (PS) 2,923 3,157 3,430 3,516 86 2.5
20 Supplies and Materials 53 44 33 33 0 0.0
30 Energy, Comm. and Bldg Rentals 0 0 1 0 -1 -89.4
31 Telephone, Telegraph, Telegram, Etc 25 24 40 25 -15 -36.9
32 Rentals - Land and Structures 584 601 629 615 -13 -2.1
40 Other Services and Charges 254 350 372 428 56 15.0
41 Contractual Services - Other 215 176 300 329 29 9.8
50 Subsidies and Transfers 100 0 0 0 0 N/A
70 Equipment & Equipment Rental 84 32 78 78 0 0.0
Subtotal Nonpersonal Services (NPS) 1,315 1,227 1,453 1,509 56 3.8
Gross Funds 4,239 4,384 4,883 5,025 142 2.9
*Percent Change is based on whole dollars.
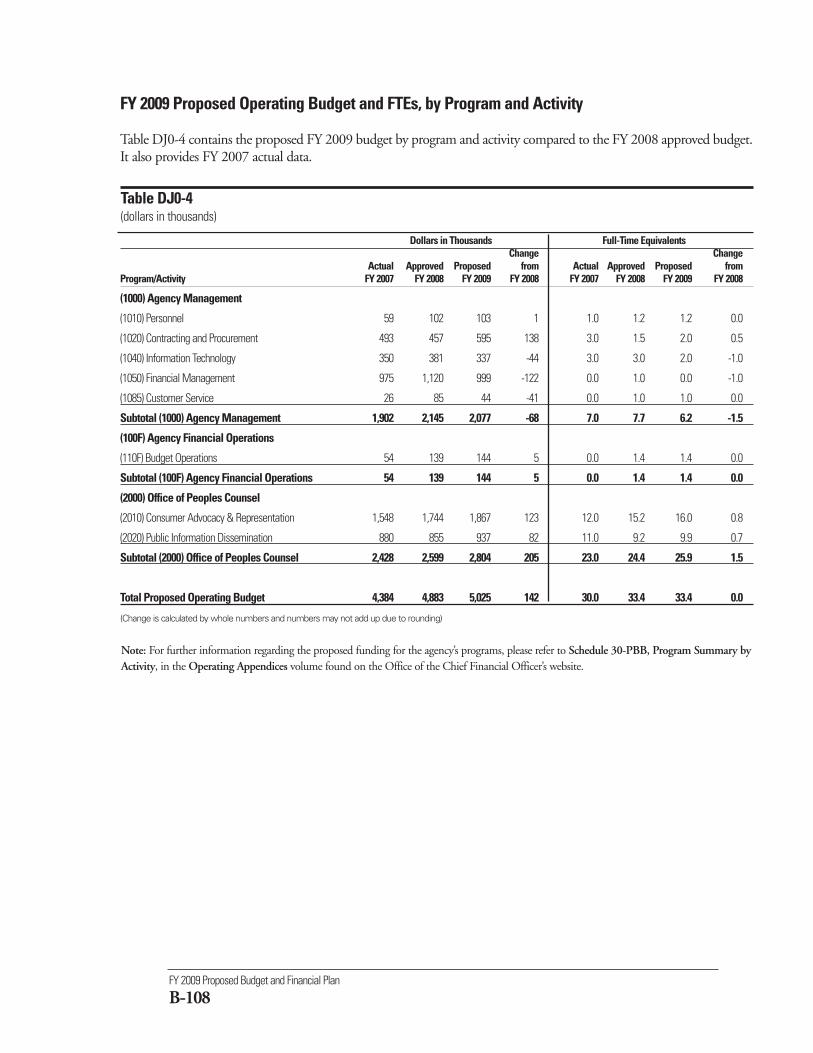
FY 2009 Proposed Budget and Financial Plan
B-108
Dollars in Thousands Full-Time EquivalentsChange Change
Actual Approved Proposed from Actual Approved Proposed from Program/Activity FY 2007 FY 2008 FY 2009 FY 2008 FY 2007 FY 2008 FY 2009 FY 2008
(1000) Agency Management
(1010) Personnel 59 102 103 1 1.0 1.2 1.2 0.0
(1020) Contracting and Procurement 493 457 595 138 3.0 1.5 2.0 0.5
(1040) Information Technology 350 381 337 -44 3.0 3.0 2.0 -1.0
(1050) Financial Management 975 1,120 999 -122 0.0 1.0 0.0 -1.0
(1085) Customer Service 26 85 44 -41 0.0 1.0 1.0 0.0
Subtotal (1000) Agency Management 1,902 2,145 2,077 -68 7.0 7.7 6.2 -1.5
(100F) Agency Financial Operations
(110F) Budget Operations 54 139 144 5 0.0 1.4 1.4 0.0
Subtotal (100F) Agency Financial Operations 54 139 144 5 0.0 1.4 1.4 0.0
(2000) Office of Peoples Counsel
(2010) Consumer Advocacy & Representation 1,548 1,744 1,867 123 12.0 15.2 16.0 0.8
(2020) Public Information Dissemination 880 855 937 82 11.0 9.2 9.9 0.7
Subtotal (2000) Office of Peoples Counsel 2,428 2,599 2,804 205 23.0 24.4 25.9 1.5
Total Proposed Operating Budget 4,384 4,883 5,025 142 30.0 33.4 33.4 0.0
(Change is calculated by whole numbers and numbers may not add up due to rounding)
FY 2009 Proposed Operating Budget and FTEs, by Program and Activity
Table DJ0-4 contains the proposed FY 2009 budget by program and activity compared to the FY 2008 approved budget.It also provides FY 2007 actual data.
Table DJ0-4(dollars in thousands)
Note: For further information regarding the proposed funding for the agency’s programs, please refer to Schedule 30-PBB, Program Summary byActivity, in the Operating Appendices volume found on the Office of the Chief Financial Officer’s website.
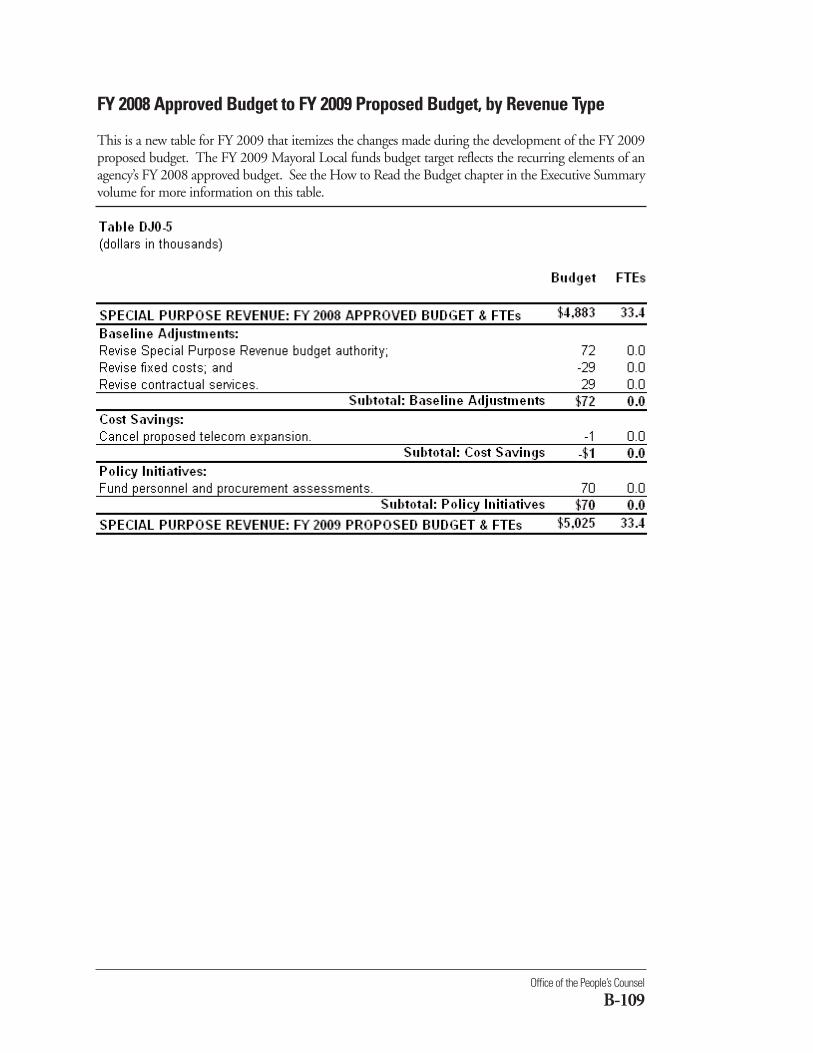
Office of the People’s Counsel
B-109
FY 2008 Approved Budget to FY 2009 Proposed Budget, by Revenue Type
This is a new table for FY 2009 that itemizes the changes made during the development of the FY 2009proposed budget. The FY 2009 Mayoral Local funds budget target reflects the recurring elements of anagency’s FY 2008 approved budget. See the How to Read the Budget chapter in the Executive Summaryvolume for more information on this table.
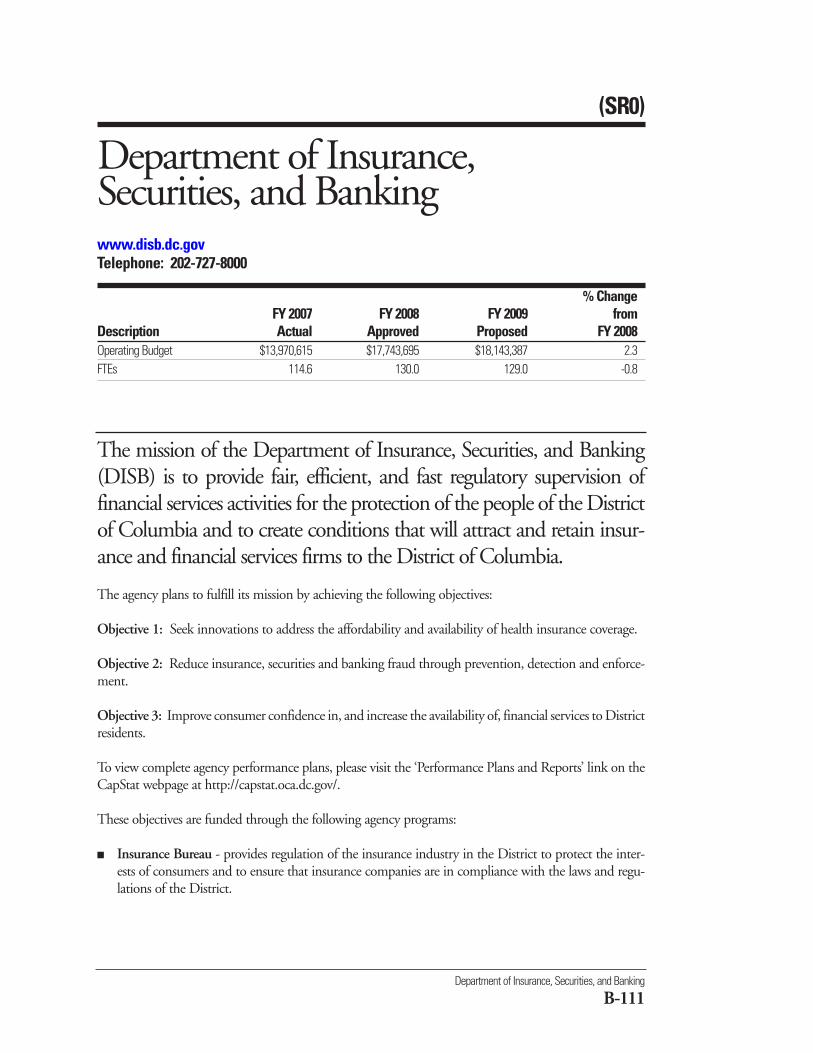
The mission of the Department of Insurance, Securities, and Banking(DISB) is to provide fair, efficient, and fast regulatory supervision offinancial services activities for the protection of the people of the Districtof Columbia and to create conditions that will attract and retain insur-ance and financial services firms to the District of Columbia.
Department of Insurance, Securities, and Banking
B-111
The agency plans to fulfill its mission by achieving the following objectives:
Objective 1: Seek innovations to address the affordability and availability of health insurance coverage.
Objective 2: Reduce insurance, securities and banking fraud through prevention, detection and enforce-ment.
Objective 3: Improve consumer confidence in, and increase the availability of, financial services to Districtresidents.
To view complete agency performance plans, please visit the ‘Performance Plans and Reports’ link on theCapStat webpage at http://capstat.oca.dc.gov/.
These objectives are funded through the following agency programs:
■ Insurance Bureau - provides regulation of the insurance industry in the District to protect the inter-ests of consumers and to ensure that insurance companies are in compliance with the laws and regu-lations of the District.
(SR0)
Department of Insurance, Securities, and Bankingwww.disb.dc.govTelephone: 202-727-8000
% ChangeFY 2007 FY 2008 FY 2009 from
Description Actual Approved Proposed FY 2008Operating Budget $13,970,615 $17,743,695 $18,143,387 2.3FTEs 114.6 130.0 129.0 -0.8
FY 2009 Proposed Budget and Financial Plan
B-112
■ Securities Bureau - provides regulation of the securities industry to ensure that it is in compliance withthe laws and regulations of the District.
■ Enforcement Bureau - provides enforcement of the District’s anti-fraud requirements by providinginvestigations, determinations, and referrals to the appropriate authorities relative to fraudulent insur-ance, securities, banking activities, as well as individuals suspected of fraud, in order to protect theinterests of the District of Columbia’s residents.
■ Banking Bureau - provides effective supervision and regulation of District chartered banks and othernon-depository financial institutions licensed by DISB, including mortgage brokers and lenders,money transmitters, check cashers, and money lenders.
■ Risk Finance Bureau - provides practical and innovative regulatory responses to captive insurancecompanies and other risk finance organizations seeking to establish operations or transact business inthe District.
■ Agency Management - provides for administrative support and the required tools to achieve opera-tional and programmatic results. This program is standard for all agencies using performance-basedbudgeting.
■ Agency Financial Operations - provides comprehensive and efficient financial management servicesto, and on behalf of, District agencies so that the financial integrity of the District of Columbia ismaintained. This program is standard for all agencies using performance-based budgeting.
The agency’s FY 2009 proposed budget is presented in the following tables:
FY 2009 Proposed Gross Funds Operating Budget, by Revenue Type
Table SR0-1 contains the proposed FY 2009 agency budget compared to the FY 2008 approved budget.It also provides FY 2006 and FY 2007 actual expenditures.
Table SR0-1 (dollars in thousands)
Change
Actual Actual Approved Proposed from Percent
Appropriated Fund FY 2006 FY 2007 FY 2008 FY 2009 FY 2008 Change*
General Fund
Special Purpose Revenue Funds 13,157 13,971 17,744 18,143 400 2.3
Total for General Fund 13,157 13,971 17,744 18,143 400 2.3
Intra-District Funds
Intra-District Funds 284 0 0 0 0 N/A
Total for Intra-District Funds 284 0 0 0 0 N/A
Gross Funds 13,441 13,971 17,744 18,143 400 2.3
*Percent Change is based on whole dollars.
Note: If applicable, for a breakdown of each Grant (Federal and Private), Special Purpose Revenue type and Intra-Districtagreement, please refer to Schedule 80, Agency Summary by Revenue Source, in the Operating Appendices found on theOffice of the Chief Financial Officer’s website.
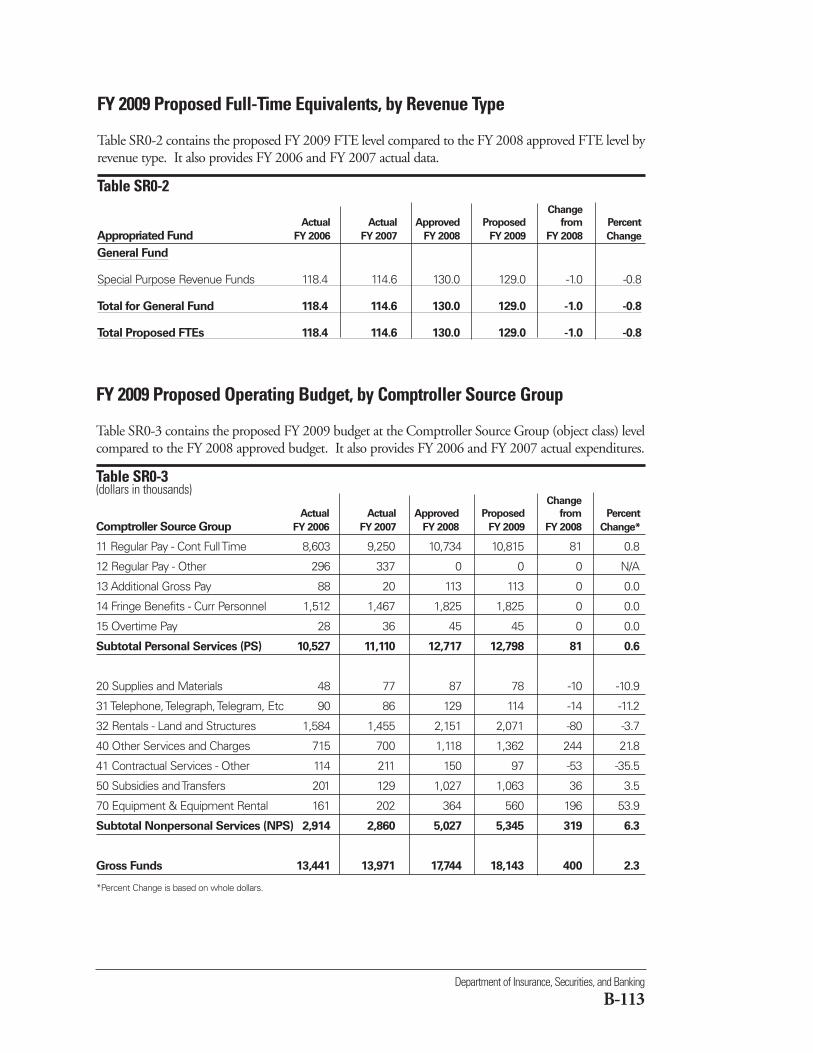
Department of Insurance, Securities, and Banking
B-113
FY 2009 Proposed Full-Time Equivalents, by Revenue Type
Table SR0-2 contains the proposed FY 2009 FTE level compared to the FY 2008 approved FTE level byrevenue type. It also provides FY 2006 and FY 2007 actual data.
Table SR0-2 Change
Actual Actual Approved Proposed from Percent
Appropriated Fund FY 2006 FY 2007 FY 2008 FY 2009 FY 2008 Change
General Fund
Special Purpose Revenue Funds 118.4 114.6 130.0 129.0 -1.0 -0.8
Total for General Fund 118.4 114.6 130.0 129.0 -1.0 -0.8
Total Proposed FTEs 118.4 114.6 130.0 129.0 -1.0 -0.8
FY 2009 Proposed Operating Budget, by Comptroller Source Group
Table SR0-3 contains the proposed FY 2009 budget at the Comptroller Source Group (object class) levelcompared to the FY 2008 approved budget. It also provides FY 2006 and FY 2007 actual expenditures.
Table SR0-3(dollars in thousands)
Change
Actual Actual Approved Proposed from Percent
Comptroller Source Group FY 2006 FY 2007 FY 2008 FY 2009 FY 2008 Change*
11 Regular Pay - Cont Full Time 8,603 9,250 10,734 10,815 81 0.8
12 Regular Pay - Other 296 337 0 0 0 N/A
13 Additional Gross Pay 88 20 113 113 0 0.0
14 Fringe Benefits - Curr Personnel 1,512 1,467 1,825 1,825 0 0.0
15 Overtime Pay 28 36 45 45 0 0.0
Subtotal Personal Services (PS) 10,527 11,110 12,717 12,798 81 0.6
20 Supplies and Materials 48 77 87 78 -10 -10.9
31 Telephone, Telegraph, Telegram, Etc 90 86 129 114 -14 -11.2
32 Rentals - Land and Structures 1,584 1,455 2,151 2,071 -80 -3.7
40 Other Services and Charges 715 700 1,118 1,362 244 21.8
41 Contractual Services - Other 114 211 150 97 -53 -35.5
50 Subsidies and Transfers 201 129 1,027 1,063 36 3.5
70 Equipment & Equipment Rental 161 202 364 560 196 53.9
Subtotal Nonpersonal Services (NPS) 2,914 2,860 5,027 5,345 319 6.3
Gross Funds 13,441 13,971 17,744 18,143 400 2.3
*Percent Change is based on whole dollars.
FY 2009 Proposed Budget and Financial Plan
B-114
Dollars in Thousands Full-Time EquivalentsChange Change
Actual Approved Proposed from Actual Approved Proposed from Program/Activity FY 2007 FY 2008 FY 2009 FY 2008 FY 2007 FY 2008 FY 2009 FY 2008
(1000) Agency Management Program
(1010) Personnel 62 93 95 2 1.0 1.0 1.0 0.0
(1017) Labor Patnership 42 59 60 1 1.0 1.0 1.0 0.0
(1040) Office of Info Tech & Support 779 1,153 1,164 11 13.0 15.0 15.0 0.0
(1050) Financial Services -2 0 0 0 0.0 0.0 0.0 0.0
(1055) Risk Management 271 515 583 68 4.0 4.0 5.0 1.0
(1060) Office of Legal Services 534 0 0 0 0.0 0.0 0.0 0.0
(1080) Public Affairs 353 503 444 -59 5.0 5.0 4.0 -1.0
(1085) Customer Services 5 0 0 0 0.0 0.0 0.0 0.0
(1090) Performance Management 258 560 556 -5 3.0 4.0 5.0 1.0
Subtotal (1000) Agency Management Program 2,302 2,883 2,901 18 27.0 30.0 31.0 1.0
(100F) Agency Financial Operations
(110F) Budget Operation 71 104 109 5 1.0 1.0 1.0 0.0
(120F) Accounting Operations 106 301 323 22 1.0 4.0 4.0 0.0
(130F) Agency Chief Financial Officer 113 154 162 8 1.0 1.0 1.0 0.0
Subtotal (100F) Agency Financial Operations 289 559 594 35 3.0 6.0 6.0 0.0
(2000) Insurance Program
(2010) Insurance Products 2,431 3,523 3,871 348 13.0 12.0 12.0 0.0
(2020) Consumer and Prof Licensing 1,061 1,201 1,236 35 12.0 13.0 13.0 0.0
(2030) Financial Examination 1,153 1,313 1,160 -153 10.8 11.0 11.0 0.0
(2040) Captives Insurance -1 0 0 0 0.0 0.0 0.0 0.0
(2050) HMO 583 693 819 125 3.8 5.0 5.0 0.0
Subtotal (2000) Insurance Program 5,226 6,730 7,085 355 39.6 41.0 41.0 0.0
(3000) Securities Program
(3010) Corporate Finance 1,331 1,610 1,613 3 7.0 6.5 6.5 0.0
(3020) Securities Examination 372 521 565 44 4.0 5.3 5.3 0.0
(3030) Securities Licensing 345 402 422 20 4.0 4.3 4.3 0.0
Subtotal (3000) Securities Program 2,047 2,533 2,599 66 15.0 16.0 16.0 0.0(Continued on next page)
FY 2009 Proposed Operating Budget and FTEs, by Program and Activity
Table SR0-4 contains the proposed FY 2009 budget by program and activity compared to the FY 2008 approved budget.It also provides FY 2007 actual data.
Table SR0-4(dollars in thousands)
Department of Insurance, Securities, and Banking
B-115
FY 2009 Proposed Operating Budget and FTEs, by Program and Activity
Table SR0-4 contains the proposed FY 2009 budget by program and activity compared to the FY 2008 approved budget.It also provides FY 2007 actual data.
Table SR0-4 (Continued)(dollars in thousands)
Dollars in Thousands Full-Time EquivalentsChange Change
Actual Approved Proposed from Actual Approved Proposed from Program/Activity FY 2007 FY 2008 FY 2009 FY 2008 FY 2007 FY 2008 FY 2009 FY 2008
(4000) Enforcement Program
(4010) Compliance 100 243 197 -46 1.0 1.8 1.5 -0.3
(4020) Investigative 917 803 869 66 9.0 8.2 8.5 0.3
Subtotal (4000) Enforcement Program 1,017 1,046 1,066 20 10.0 10.0 10.0 0.0
(5000) Banking
(5010) Depository 1,352 1,643 1,834 191 8.0 8.5 8.5 0.0
(5020) Non Depository 273 397 404 8 4.0 5.5 5.5 0.0
(5030) Commercial Lending Analysis 61 0 0 0 1.0 0.0 0.0 0.0
Subtotal (5000) Banking 1,686 2,039 2,238 199 13.0 14.0 14.0 0.0
(6000) Risk Finance
(6010) Compliance 917 1,214 1,001 -213 2.0 5.5 5.0 -0.5
(6020) Financial Analysis 486 739 659 -80 5.0 7.5 6.0 -1.5
Subtotal (6000) Risk Finance 1,403 1,953 1,660 -294 7.0 13.0 11.0 -2.0
Total Proposed Operating Budget 13,971 17,744 18,143 400 114.6 130.0 129.0 -1.0
(Change is calculated by whole numbers and numbers may not add up due to rounding)
Note: For further information regarding the proposed funding for the agency’s programs, please refer to Schedule 30-PBB, Program Summary byActivity, in the Operating Appendices volume found on the Office of the Chief Financial Officer’s website.
FY 2009 Proposed Budget and Financial Plan
B-116
FY 2008 Approved Budget to FY 2009 Proposed Budget, by Revenue Type
This is a new table for FY 2009 that itemizes the changes made during the development of the FY 2009proposed budget. The FY 2009 Mayoral Local funds budget target reflects the recurring elements of anagency’s FY 2008 approved budget. See the How to Read the Budget chapter in the Executive Summaryvolume for more information on this table.
Department of Insurance, Securities, and Banking
B-117
Agency Performance MeasuresTable SR0-6
FY 2006 FY 2007 FY 2008 FY 2009 FY 2010Performance Measure Actual1 Actual1 Target Target Target
1. Percent of mortgage foreclosure mitigation program participants that avoid foreclosure N/A N/A 75% 80% 85%
2. Number of customers receiving financial literacy training N/A N/A 400 500 600
3. Percent of DC-based investment advisor firms examined with 12 months 28.2% 34% 35% 40% 45%
4. Percent of written complaints resolved within 45 days of receipt 82% 81% 85% 90% 95%
5. Percentage of agent enforcement referrals investigated and referred to Office of Legal Affairs or Insurance Bureau within 60 days N/A N/A 80% 85% 90%
6. Percentage of open investigative cases reviewed within 90 days for correctness and compliance with investigative procedures 96% 98% 97% 98% 99%
7. Number of captive insurance policies issued to non-profit health centers N/A N/A 5 8 10
8. Number of health care providers receiving medical malpractice insurance from the captive insurance company N/A N/A 15 20 25
9. Number of residents insured by high risk health insurance pool N/A N/A 250 500 750
1N/A represents new measures in FY 2008.
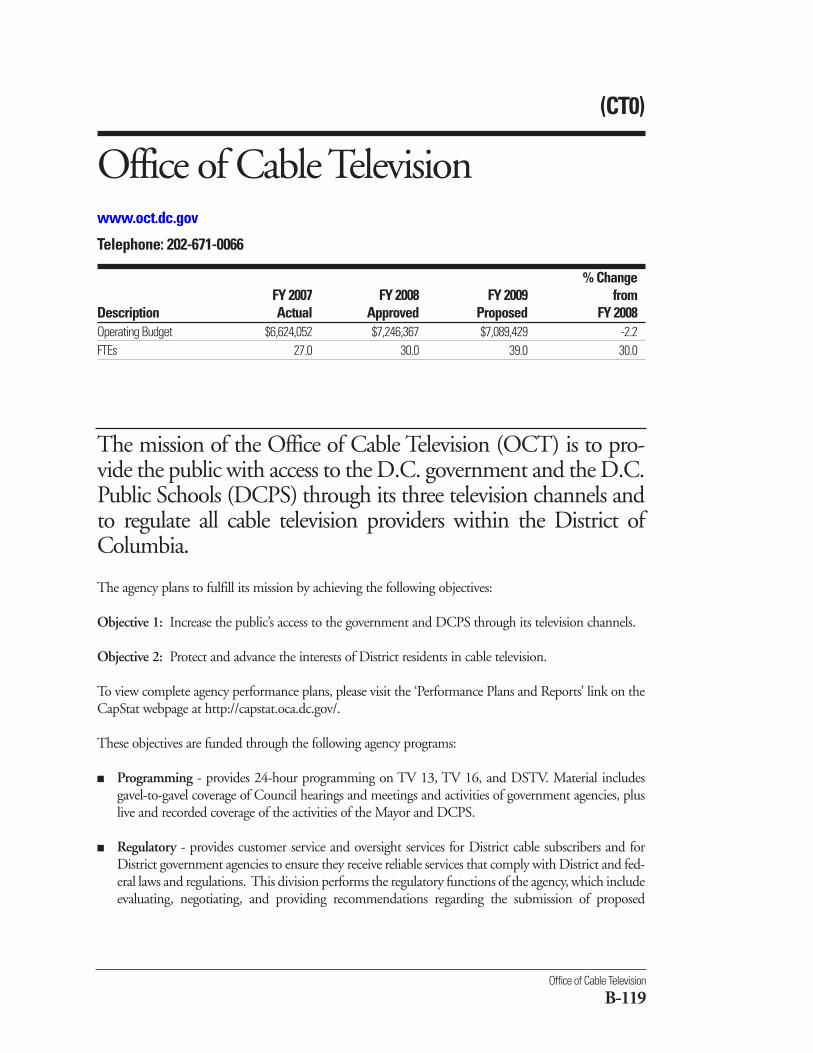
The agency plans to fulfill its mission by achieving the following objectives:
Objective 1: Increase the public’s access to the government and DCPS through its television channels.
Objective 2: Protect and advance the interests of District residents in cable television.
To view complete agency performance plans, please visit the ‘Performance Plans and Reports’ link on theCapStat webpage at http://capstat.oca.dc.gov/.
These objectives are funded through the following agency programs:
■ Programming - provides 24-hour programming on TV 13, TV 16, and DSTV. Material includesgavel-to-gavel coverage of Council hearings and meetings and activities of government agencies, pluslive and recorded coverage of the activities of the Mayor and DCPS.
■ Regulatory - provides customer service and oversight services for District cable subscribers and forDistrict government agencies to ensure they receive reliable services that comply with District and fed-eral laws and regulations. This division performs the regulatory functions of the agency, which includeevaluating, negotiating, and providing recommendations regarding the submission of proposed
Office of Cable Television
B-119
(CT0)
Office of Cable Television www.oct.dc.gov
Telephone: 202-671-0066
% ChangeFY 2007 FY 2008 FY 2009 from
Description Actual Approved Proposed FY 2008Operating Budget $6,624,052 $7,246,367 $7,089,429 -2.2FTEs 27.0 30.0 39.0 30.0
The mission of the Office of Cable Television (OCT) is to pro-vide the public with access to the D.C. government and the D.C.Public Schools (DCPS) through its three television channels andto regulate all cable television providers within the District ofColumbia.
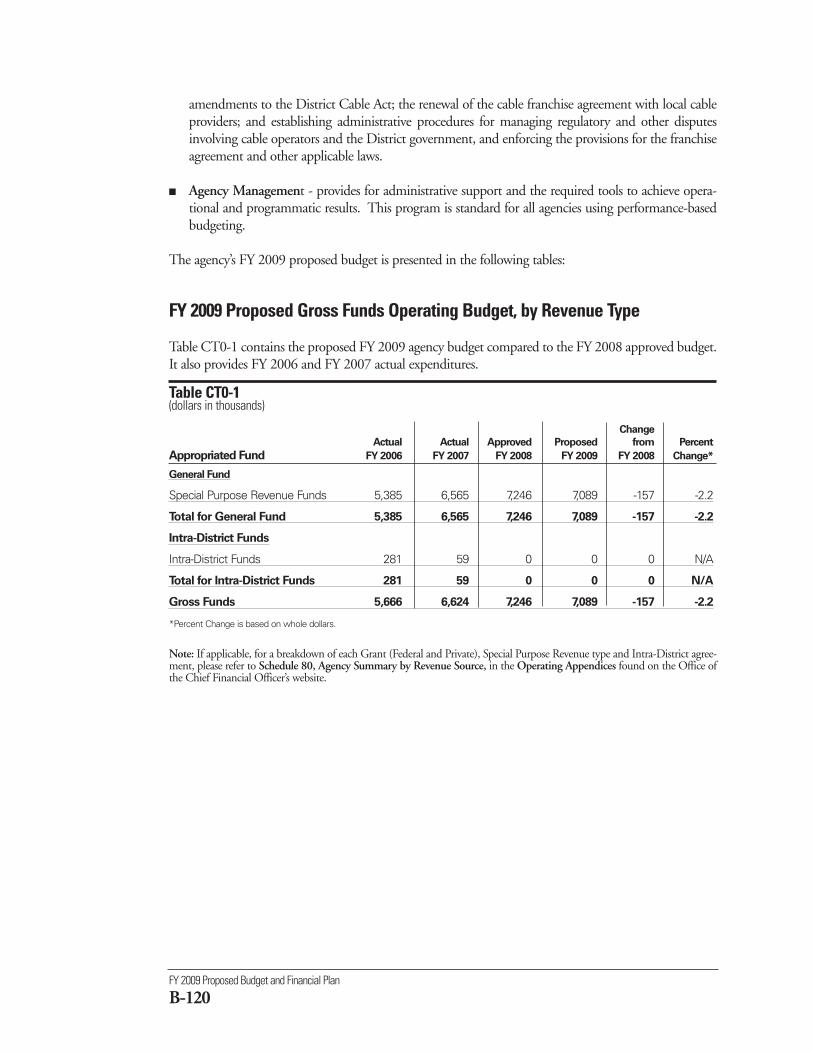
FY 2009 Proposed Budget and Financial Plan
B-120
amendments to the District Cable Act; the renewal of the cable franchise agreement with local cableproviders; and establishing administrative procedures for managing regulatory and other disputesinvolving cable operators and the District government, and enforcing the provisions for the franchiseagreement and other applicable laws.
■ Agency Management - provides for administrative support and the required tools to achieve opera-tional and programmatic results. This program is standard for all agencies using performance-basedbudgeting.
The agency’s FY 2009 proposed budget is presented in the following tables:
FY 2009 Proposed Gross Funds Operating Budget, by Revenue Type
Table CT0-1 contains the proposed FY 2009 agency budget compared to the FY 2008 approved budget.It also provides FY 2006 and FY 2007 actual expenditures.
Table CT0-1 (dollars in thousands)
Change
Actual Actual Approved Proposed from Percent
Appropriated Fund FY 2006 FY 2007 FY 2008 FY 2009 FY 2008 Change*
General Fund
Special Purpose Revenue Funds 5,385 6,565 7,246 7,089 -157 -2.2
Total for General Fund 5,385 6,565 7,246 7,089 -157 -2.2
Intra-District Funds
Intra-District Funds 281 59 0 0 0 N/A
Total for Intra-District Funds 281 59 0 0 0 N/A
Gross Funds 5,666 6,624 7,246 7,089 -157 -2.2
*Percent Change is based on whole dollars.
Note: If applicable, for a breakdown of each Grant (Federal and Private), Special Purpose Revenue type and Intra-District agree-ment, please refer to Schedule 80, Agency Summary by Revenue Source, in the Operating Appendices found on the Office ofthe Chief Financial Officer’s website.
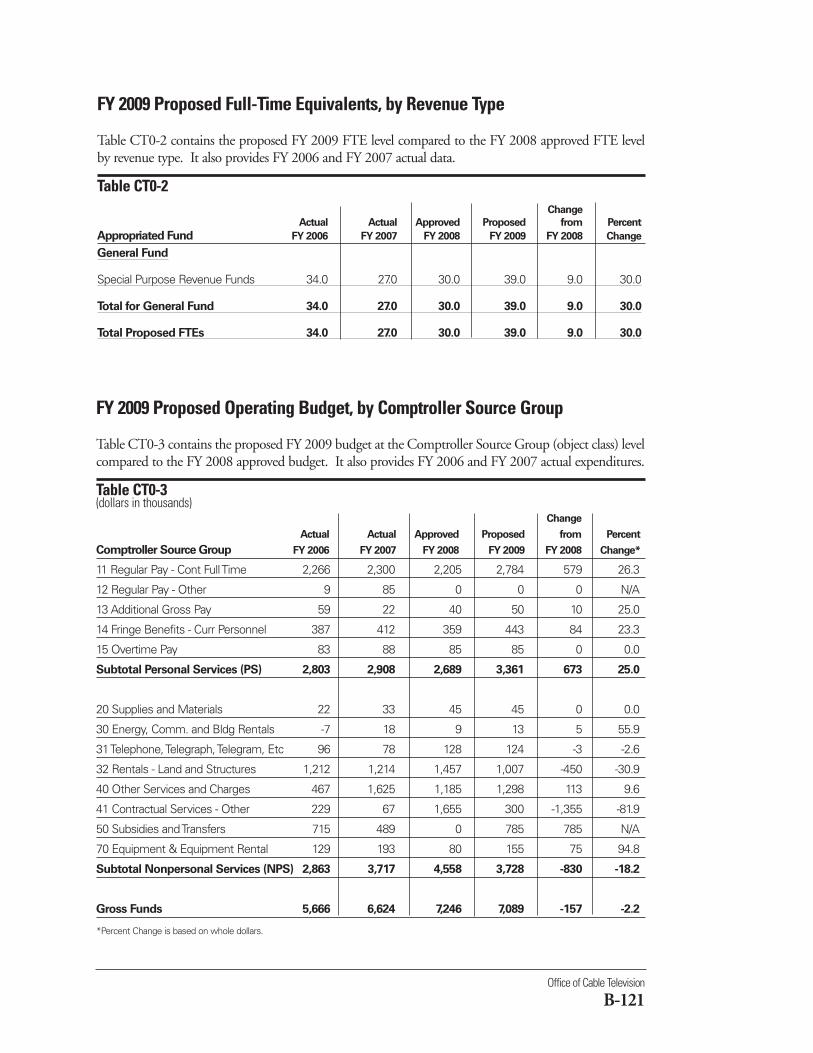
Office of Cable Television
B-121
FY 2009 Proposed Full-Time Equivalents, by Revenue Type
Table CT0-2 contains the proposed FY 2009 FTE level compared to the FY 2008 approved FTE levelby revenue type. It also provides FY 2006 and FY 2007 actual data.
Table CT0-2 Change
Actual Actual Approved Proposed from Percent
Appropriated Fund FY 2006 FY 2007 FY 2008 FY 2009 FY 2008 Change
General Fund
Special Purpose Revenue Funds 34.0 27.0 30.0 39.0 9.0 30.0
Total for General Fund 34.0 27.0 30.0 39.0 9.0 30.0
Total Proposed FTEs 34.0 27.0 30.0 39.0 9.0 30.0
FY 2009 Proposed Operating Budget, by Comptroller Source Group
Table CT0-3 contains the proposed FY 2009 budget at the Comptroller Source Group (object class) levelcompared to the FY 2008 approved budget. It also provides FY 2006 and FY 2007 actual expenditures.
Table CT0-3(dollars in thousands)
Change
Actual Actual Approved Proposed from Percent
Comptroller Source Group FY 2006 FY 2007 FY 2008 FY 2009 FY 2008 Change*
11 Regular Pay - Cont Full Time 2,266 2,300 2,205 2,784 579 26.3
12 Regular Pay - Other 9 85 0 0 0 N/A
13 Additional Gross Pay 59 22 40 50 10 25.0
14 Fringe Benefits - Curr Personnel 387 412 359 443 84 23.3
15 Overtime Pay 83 88 85 85 0 0.0
Subtotal Personal Services (PS) 2,803 2,908 2,689 3,361 673 25.0
20 Supplies and Materials 22 33 45 45 0 0.0
30 Energy, Comm. and Bldg Rentals -7 18 9 13 5 55.9
31 Telephone, Telegraph, Telegram, Etc 96 78 128 124 -3 -2.6
32 Rentals - Land and Structures 1,212 1,214 1,457 1,007 -450 -30.9
40 Other Services and Charges 467 1,625 1,185 1,298 113 9.6
41 Contractual Services - Other 229 67 1,655 300 -1,355 -81.9
50 Subsidies and Transfers 715 489 0 785 785 N/A
70 Equipment & Equipment Rental 129 193 80 155 75 94.8
Subtotal Nonpersonal Services (NPS) 2,863 3,717 4,558 3,728 -830 -18.2
Gross Funds 5,666 6,624 7,246 7,089 -157 -2.2
*Percent Change is based on whole dollars.
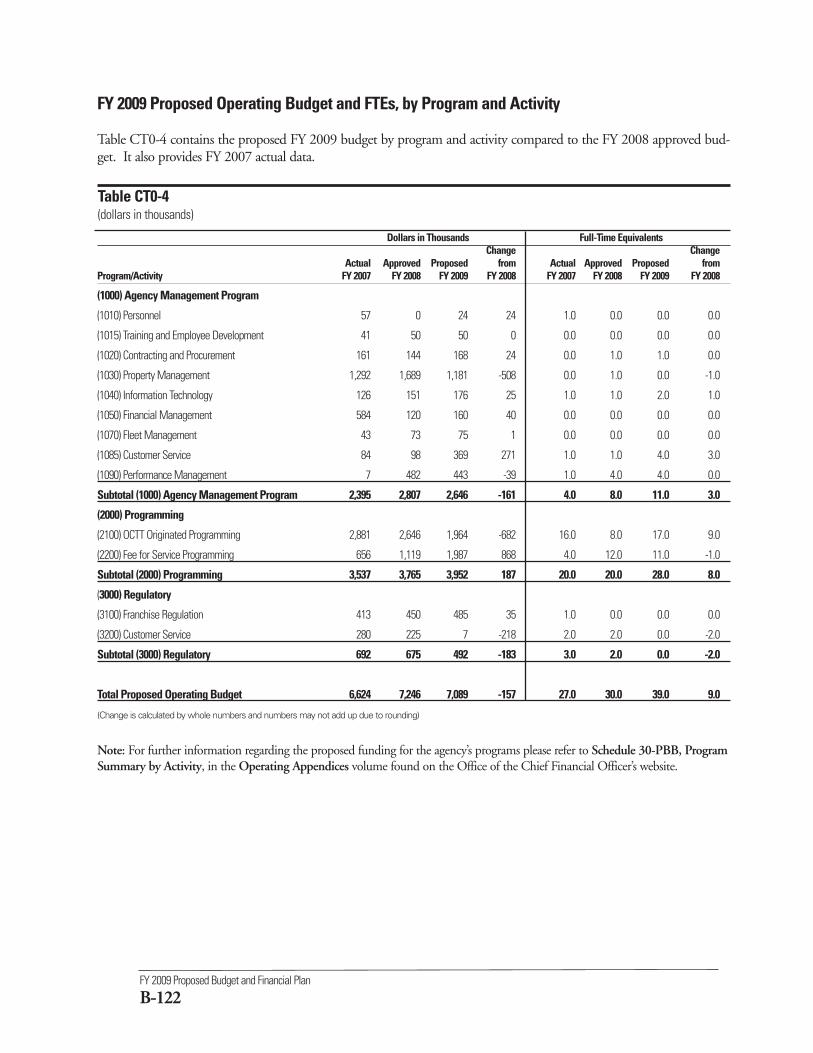
FY 2009 Proposed Budget and Financial Plan
B-122
FY 2009 Proposed Operating Budget and FTEs, by Program and Activity
Table CT0-4 contains the proposed FY 2009 budget by program and activity compared to the FY 2008 approved bud-get. It also provides FY 2007 actual data.
Table CT0-4(dollars in thousands)
Dollars in Thousands Full-Time EquivalentsChange Change
Actual Approved Proposed from Actual Approved Proposed from Program/Activity FY 2007 FY 2008 FY 2009 FY 2008 FY 2007 FY 2008 FY 2009 FY 2008
(1000) Agency Management Program
(1010) Personnel 57 0 24 24 1.0 0.0 0.0 0.0
(1015) Training and Employee Development 41 50 50 0 0.0 0.0 0.0 0.0
(1020) Contracting and Procurement 161 144 168 24 0.0 1.0 1.0 0.0
(1030) Property Management 1,292 1,689 1,181 -508 0.0 1.0 0.0 -1.0
(1040) Information Technology 126 151 176 25 1.0 1.0 2.0 1.0
(1050) Financial Management 584 120 160 40 0.0 0.0 0.0 0.0
(1070) Fleet Management 43 73 75 1 0.0 0.0 0.0 0.0
(1085) Customer Service 84 98 369 271 1.0 1.0 4.0 3.0
(1090) Performance Management 7 482 443 -39 1.0 4.0 4.0 0.0
Subtotal (1000) Agency Management Program 2,395 2,807 2,646 -161 4.0 8.0 11.0 3.0
(2000) Programming
(2100) OCTT Originated Programming 2,881 2,646 1,964 -682 16.0 8.0 17.0 9.0
(2200) Fee for Service Programming 656 1,119 1,987 868 4.0 12.0 11.0 -1.0
Subtotal (2000) Programming 3,537 3,765 3,952 187 20.0 20.0 28.0 8.0
(3000) Regulatory
(3100) Franchise Regulation 413 450 485 35 1.0 0.0 0.0 0.0
(3200) Customer Service 280 225 7 -218 2.0 2.0 0.0 -2.0
Subtotal (3000) Regulatory 692 675 492 -183 3.0 2.0 0.0 -2.0
Total Proposed Operating Budget 6,624 7,246 7,089 -157 27.0 30.0 39.0 9.0
(Change is calculated by whole numbers and numbers may not add up due to rounding)
Note: For further information regarding the proposed funding for the agency’s programs please refer to Schedule 30-PBB, ProgramSummary by Activity, in the Operating Appendices volume found on the Office of the Chief Financial Officer’s website.
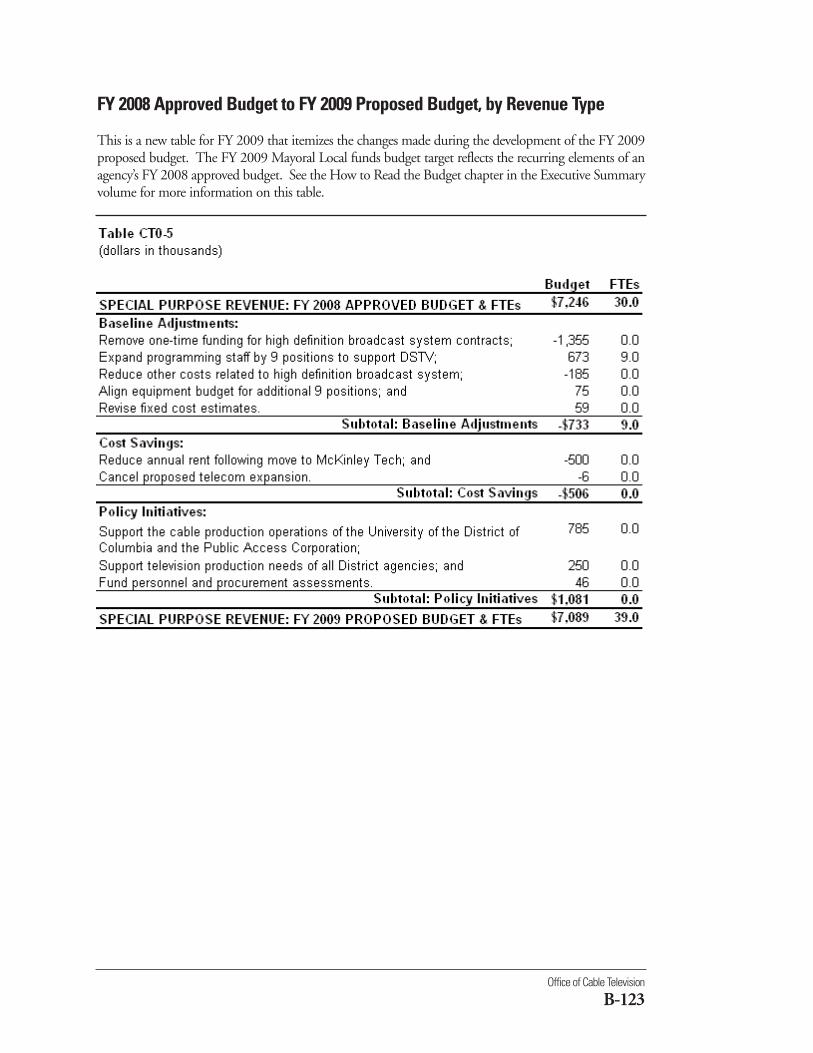
Office of Cable Television
B-123
FY 2008 Approved Budget to FY 2009 Proposed Budget, by Revenue Type
This is a new table for FY 2009 that itemizes the changes made during the development of the FY 2009proposed budget. The FY 2009 Mayoral Local funds budget target reflects the recurring elements of anagency’s FY 2008 approved budget. See the How to Read the Budget chapter in the Executive Summaryvolume for more information on this table.
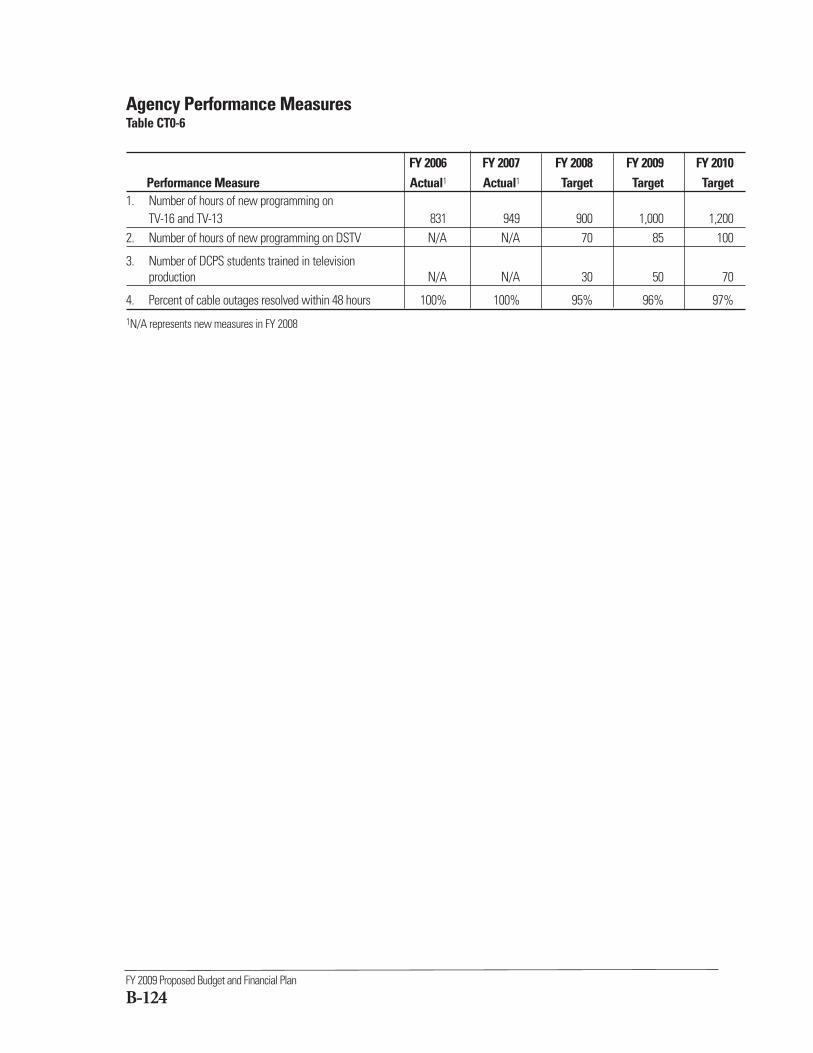
FY 2009 Proposed Budget and Financial Plan
B-124
Agency Performance MeasuresTable CT0-6
FY 2006 FY 2007 FY 2008 FY 2009 FY 2010Performance Measure Actual1 Actual1 Target Target Target
1. Number of hours of new programming on TV-16 and TV-13 831 949 900 1,000 1,200
2. Number of hours of new programming on DSTV N/A N/A 70 85 100
3. Number of DCPS students trained in televisionproduction N/A N/A 30 50 70
4. Percent of cable outages resolved within 48 hours 100% 100% 95% 96% 97%
1N/A represents new measures in FY 2008
The mission of the Housing Authority Subsidy is to provide addi-tional funding to the District of Columbia Housing Authority tosubsidize its operations due to anticipated losses in federal operat-ing funding for FY 2009.
(HY0)
Housing Authority Subsidywww.dchousing.orgTelephone: 202-535-1000
% ChangeFY 2007 FY 2008 FY 2009 from
Description Actual Approved Proposed FY 2008Operating Budget $22,730,000 $30,983,000 $32,983,000 6.5
Housing Authority Subsidy
B-125
The agency plans to fulfill its mission by achieving the following strategic result goals:
■ Provide decent, safe, and sanitary dwellings and related facilities for persons and families of low andmoderate income in the District of Columbia.
■ Mitigate the potential impact of federal budget cutbacks due to policy shifts in the Department ofHousing and Urban Development's allocation of voucher funding.
The agency’s FY 2009 proposed budget is presented in the following tables:
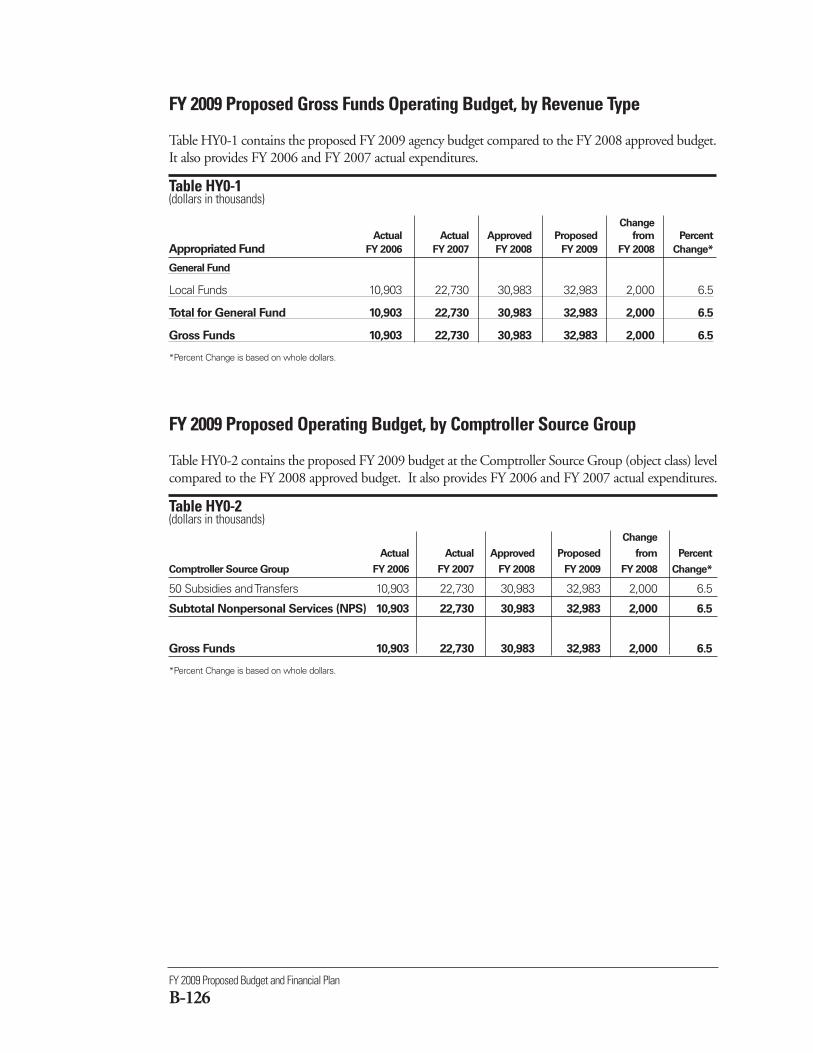
FY 2009 Proposed Budget and Financial Plan
B-126
FY 2009 Proposed Gross Funds Operating Budget, by Revenue Type
Table HY0-1 contains the proposed FY 2009 agency budget compared to the FY 2008 approved budget.It also provides FY 2006 and FY 2007 actual expenditures.
Table HY0-1 (dollars in thousands)
Change
Actual Actual Approved Proposed from Percent
Appropriated Fund FY 2006 FY 2007 FY 2008 FY 2009 FY 2008 Change*
General Fund
Local Funds 10,903 22,730 30,983 32,983 2,000 6.5
Total for General Fund 10,903 22,730 30,983 32,983 2,000 6.5
Gross Funds 10,903 22,730 30,983 32,983 2,000 6.5
*Percent Change is based on whole dollars.
FY 2009 Proposed Operating Budget, by Comptroller Source Group
Table HY0-2 contains the proposed FY 2009 budget at the Comptroller Source Group (object class) levelcompared to the FY 2008 approved budget. It also provides FY 2006 and FY 2007 actual expenditures.
Table HY0-2 (dollars in thousands)
Change
Actual Actual Approved Proposed from Percent
Comptroller Source Group FY 2006 FY 2007 FY 2008 FY 2009 FY 2008 Change*
50 Subsidies and Transfers 10,903 22,730 30,983 32,983 2,000 6.5
Subtotal Nonpersonal Services (NPS) 10,903 22,730 30,983 32,983 2,000 6.5
Gross Funds 10,903 22,730 30,983 32,983 2,000 6.5
*Percent Change is based on whole dollars.
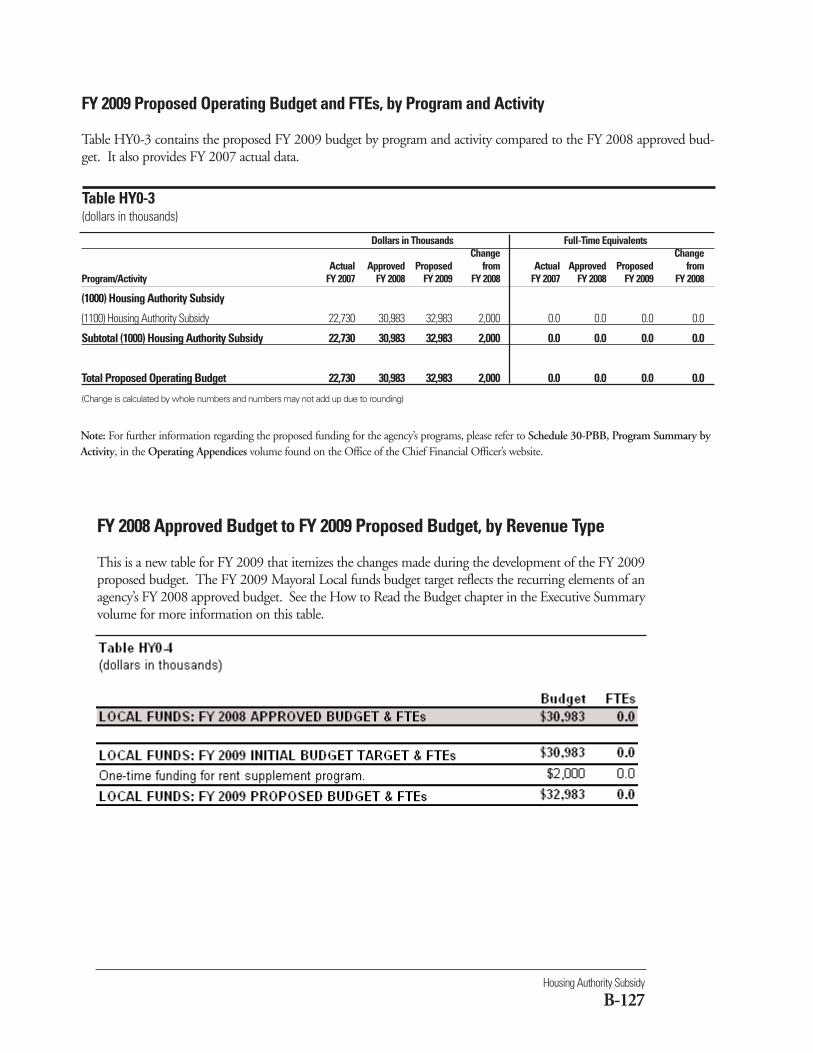
Housing Authority Subsidy
B-127
FY 2009 Proposed Operating Budget and FTEs, by Program and Activity
Table HY0-3 contains the proposed FY 2009 budget by program and activity compared to the FY 2008 approved bud-get. It also provides FY 2007 actual data.
Table HY0-3(dollars in thousands)
FY 2008 Approved Budget to FY 2009 Proposed Budget, by Revenue Type
This is a new table for FY 2009 that itemizes the changes made during the development of the FY 2009proposed budget. The FY 2009 Mayoral Local funds budget target reflects the recurring elements of anagency’s FY 2008 approved budget. See the How to Read the Budget chapter in the Executive Summaryvolume for more information on this table.
Dollars in Thousands Full-Time EquivalentsChange Change
Actual Approved Proposed from Actual Approved Proposed from Program/Activity FY 2007 FY 2008 FY 2009 FY 2008 FY 2007 FY 2008 FY 2009 FY 2008
(1000) Housing Authority Subsidy
(1100) Housing Authority Subsidy 22,730 30,983 32,983 2,000 0.0 0.0 0.0 0.0
Subtotal (1000) Housing Authority Subsidy 22,730 30,983 32,983 2,000 0.0 0.0 0.0 0.0
Total Proposed Operating Budget 22,730 30,983 32,983 2,000 0.0 0.0 0.0 0.0
(Change is calculated by whole numbers and numbers may not add up due to rounding)
Note: For further information regarding the proposed funding for the agency’s programs, please refer to Schedule 30-PBB, Program Summary byActivity, in the Operating Appendices volume found on the Office of the Chief Financial Officer’s website.
(AY0)
Anacostia Waterfront CorporationSubsidywww.anacostiawaterfront.net
% ChangeFY 2007 FY 2008 FY 2009 from
Description Actual Approved Proposed FY 2008Operating Budget $5,000,000 $0 $0 N/A
The Anacostia Waterfront Corporation Subsidy, which reflecteda local funds transfer to the Anacostia Waterfront Corporation tofulfill its operational obligations, was dissolved in fiscal year2008.
Anacostia Waterfront Corporation Subsidy
B-129
Pursuant to the National Capital Revitalization Corporation and Anacostia Waterfront CorporationReorganization Clarification Congressional Review Emergency Act of 2007, all property, records, unex-pended balances of appropriations, allocations, income, and other funds available to the AnacostiaWaterfront Corporation Subsidy transferred to the Office of the Deputy Mayor for Planning andEconomic Development (DMPED). Proposed programs and projects for fiscal year 2009 are shown inDMPED within the Instrumentality Economic Development program.
The agency’s FY 2009 proposed budget is presented in the following tables:
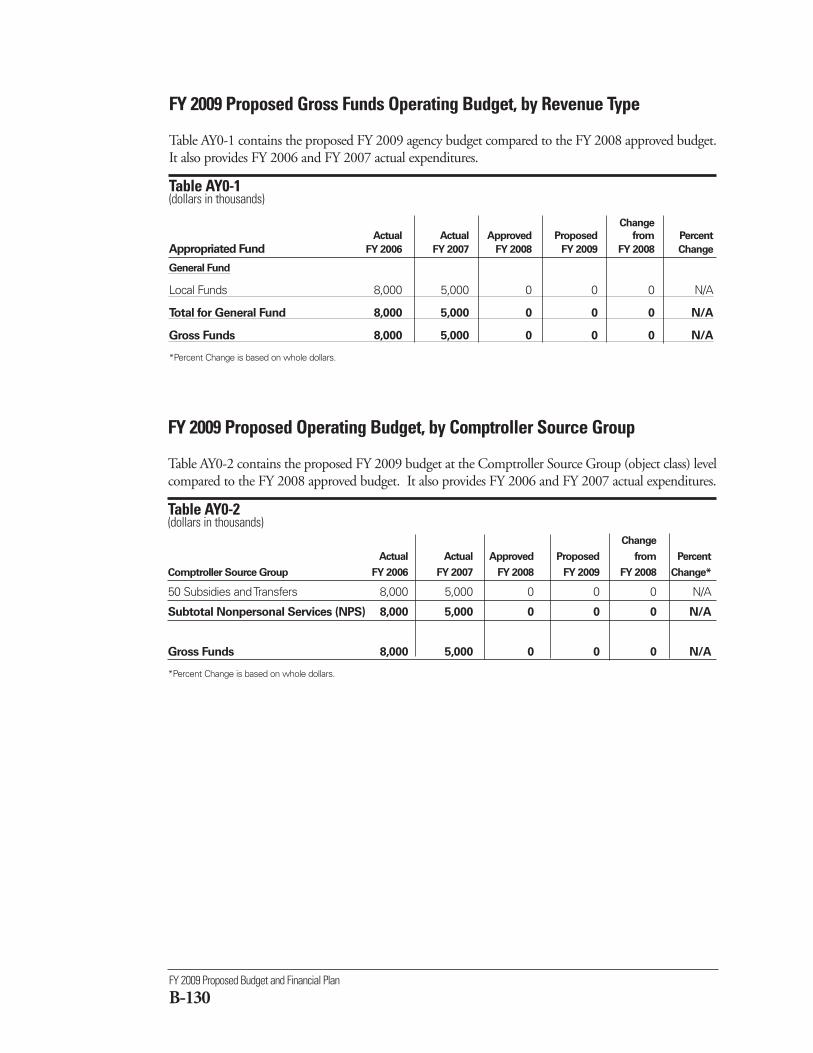
FY 2009 Proposed Budget and Financial Plan
B-130
FY 2009 Proposed Gross Funds Operating Budget, by Revenue Type
Table AY0-1 contains the proposed FY 2009 agency budget compared to the FY 2008 approved budget.It also provides FY 2006 and FY 2007 actual expenditures.
Table AY0-1 (dollars in thousands)
Change
Actual Actual Approved Proposed from Percent
Appropriated Fund FY 2006 FY 2007 FY 2008 FY 2009 FY 2008 Change
General Fund
Local Funds 8,000 5,000 0 0 0 N/A
Total for General Fund 8,000 5,000 0 0 0 N/A
Gross Funds 8,000 5,000 0 0 0 N/A
*Percent Change is based on whole dollars.
FY 2009 Proposed Operating Budget, by Comptroller Source Group
Table AY0-2 contains the proposed FY 2009 budget at the Comptroller Source Group (object class) levelcompared to the FY 2008 approved budget. It also provides FY 2006 and FY 2007 actual expenditures.
Table AY0-2 (dollars in thousands)
Change
Actual Actual Approved Proposed from Percent
Comptroller Source Group FY 2006 FY 2007 FY 2008 FY 2009 FY 2008 Change*
50 Subsidies and Transfers 8,000 5,000 0 0 0 N/A
Subtotal Nonpersonal Services (NPS) 8,000 5,000 0 0 0 N/A
Gross Funds 8,000 5,000 0 0 0 N/A
*Percent Change is based on whole dollars.
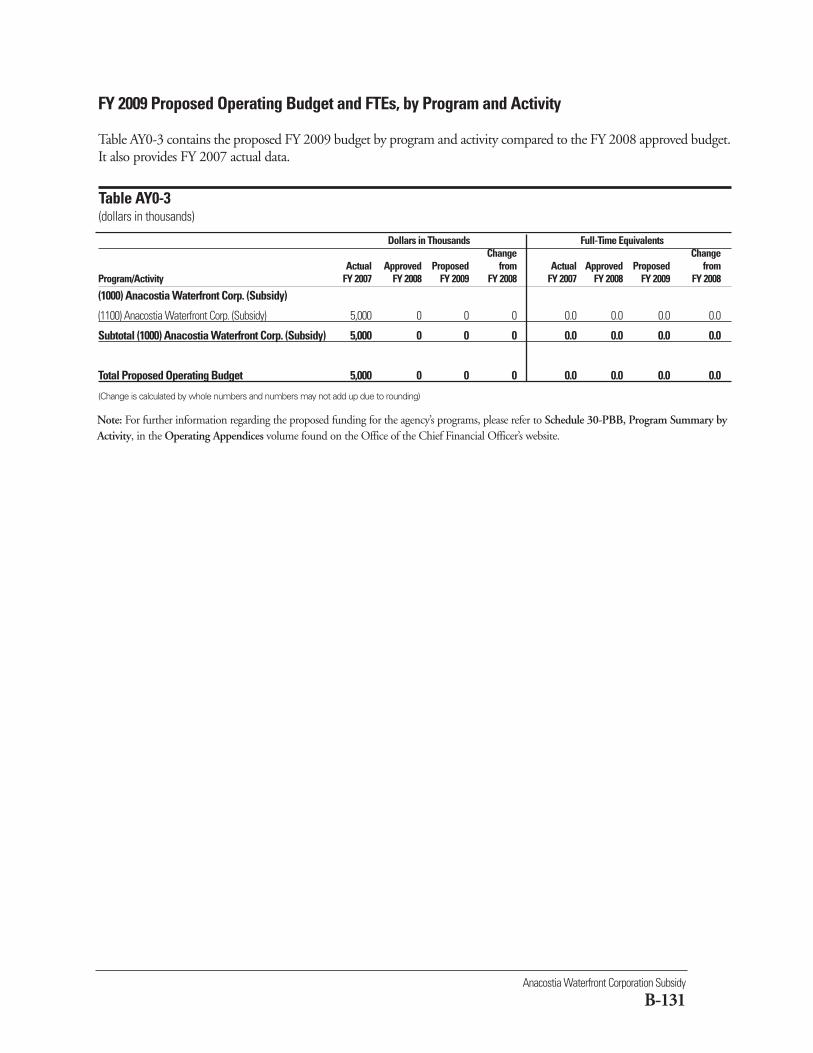
Anacostia Waterfront Corporation Subsidy
B-131
Dollars in Thousands Full-Time EquivalentsChange Change
Actual Approved Proposed from Actual Approved Proposed from Program/Activity FY 2007 FY 2008 FY 2009 FY 2008 FY 2007 FY 2008 FY 2009 FY 2008
(1000) Anacostia Waterfront Corp. (Subsidy)
(1100) Anacostia Waterfront Corp. (Subsidy) 5,000 0 0 0 0.0 0.0 0.0 0.0
Subtotal (1000) Anacostia Waterfront Corp. (Subsidy) 5,000 0 0 0 0.0 0.0 0.0 0.0
Total Proposed Operating Budget 5,000 0 0 0 0.0 0.0 0.0 0.0
(Change is calculated by whole numbers and numbers may not add up due to rounding)
FY 2009 Proposed Operating Budget and FTEs, by Program and Activity
Table AY0-3 contains the proposed FY 2009 budget by program and activity compared to the FY 2008 approved budget.It also provides FY 2007 actual data.
Table AY0-3(dollars in thousands)
Note: For further information regarding the proposed funding for the agency’s programs, please refer to Schedule 30-PBB, Program Summary byActivity, in the Operating Appendices volume found on the Office of the Chief Financial Officer’s website.
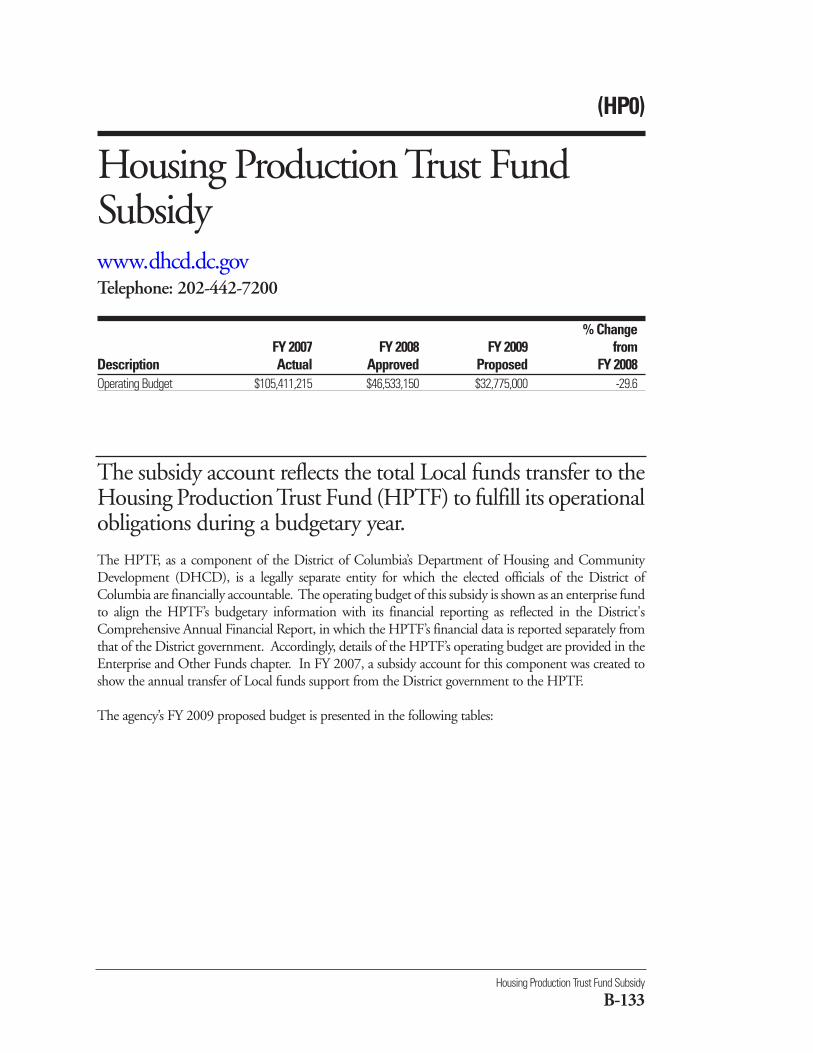
The HPTF, as a component of the District of Columbia’s Department of Housing and CommunityDevelopment (DHCD), is a legally separate entity for which the elected officials of the District ofColumbia are financially accountable. The operating budget of this subsidy is shown as an enterprise fundto align the HPTF’s budgetary information with its financial reporting as reflected in the District'sComprehensive Annual Financial Report, in which the HPTF’s financial data is reported separately fromthat of the District government. Accordingly, details of the HPTF’s operating budget are provided in theEnterprise and Other Funds chapter. In FY 2007, a subsidy account for this component was created toshow the annual transfer of Local funds support from the District government to the HPTF.
The agency’s FY 2009 proposed budget is presented in the following tables:
(HP0)
Housing Production Trust FundSubsidywww.dhcd.dc.govTelephone: 202-442-7200
% ChangeFY 2007 FY 2008 FY 2009 from
Description Actual Approved Proposed FY 2008Operating Budget $105,411,215 $46,533,150 $32,775,000 -29.6
The subsidy account reflects the total Local funds transfer to theHousing Production Trust Fund (HPTF) to fulfill its operationalobligations during a budgetary year.
Housing Production Trust Fund Subsidy
B-133
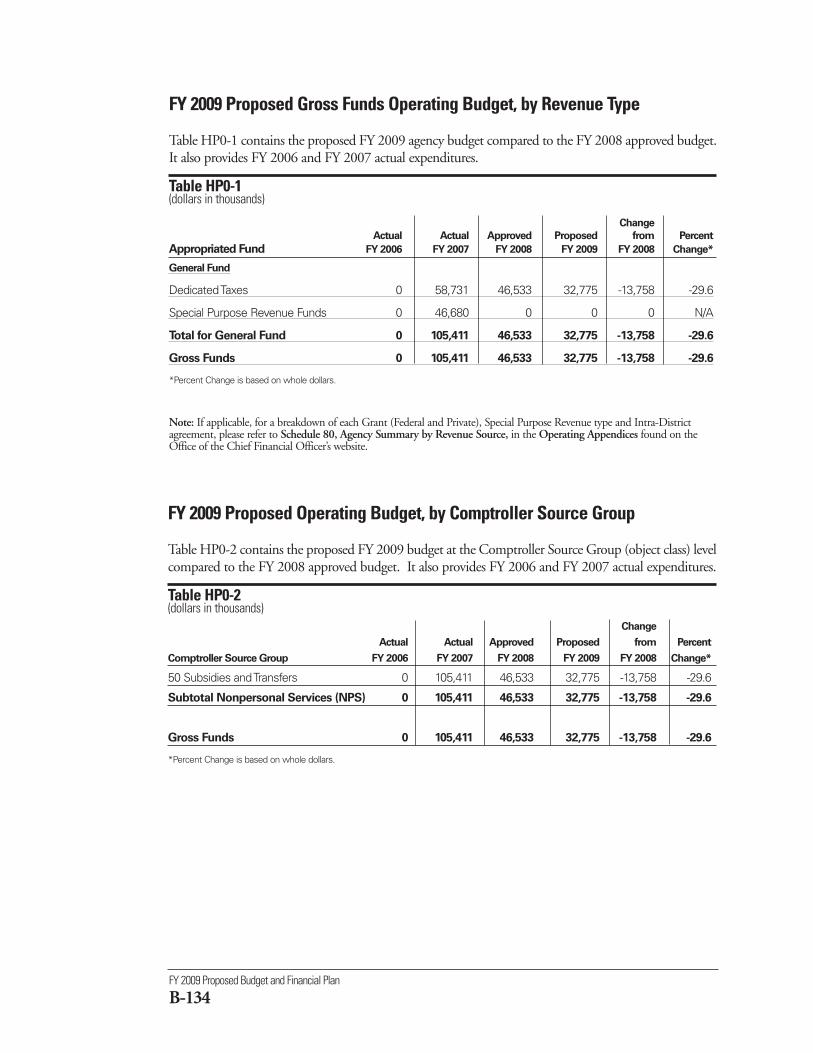
FY 2009 Proposed Budget and Financial Plan
B-134
FY 2009 Proposed Gross Funds Operating Budget, by Revenue Type
Table HP0-1 contains the proposed FY 2009 agency budget compared to the FY 2008 approved budget.It also provides FY 2006 and FY 2007 actual expenditures.
Table HP0-1 (dollars in thousands)
Change
Actual Actual Approved Proposed from Percent
Appropriated Fund FY 2006 FY 2007 FY 2008 FY 2009 FY 2008 Change*
General Fund
Dedicated Taxes 0 58,731 46,533 32,775 -13,758 -29.6
Special Purpose Revenue Funds 0 46,680 0 0 0 N/A
Total for General Fund 0 105,411 46,533 32,775 -13,758 -29.6
Gross Funds 0 105,411 46,533 32,775 -13,758 -29.6
*Percent Change is based on whole dollars.
Note: If applicable, for a breakdown of each Grant (Federal and Private), Special Purpose Revenue type and Intra-Districtagreement, please refer to Schedule 80, Agency Summary by Revenue Source, in the Operating Appendices found on theOffice of the Chief Financial Officer’s website.
FY 2009 Proposed Operating Budget, by Comptroller Source Group
Table HP0-2 contains the proposed FY 2009 budget at the Comptroller Source Group (object class) levelcompared to the FY 2008 approved budget. It also provides FY 2006 and FY 2007 actual expenditures.
Table HP0-2 (dollars in thousands)
Change
Actual Actual Approved Proposed from Percent
Comptroller Source Group FY 2006 FY 2007 FY 2008 FY 2009 FY 2008 Change*
50 Subsidies and Transfers 0 105,411 46,533 32,775 -13,758 -29.6
Subtotal Nonpersonal Services (NPS) 0 105,411 46,533 32,775 -13,758 -29.6
Gross Funds 0 105,411 46,533 32,775 -13,758 -29.6
*Percent Change is based on whole dollars.
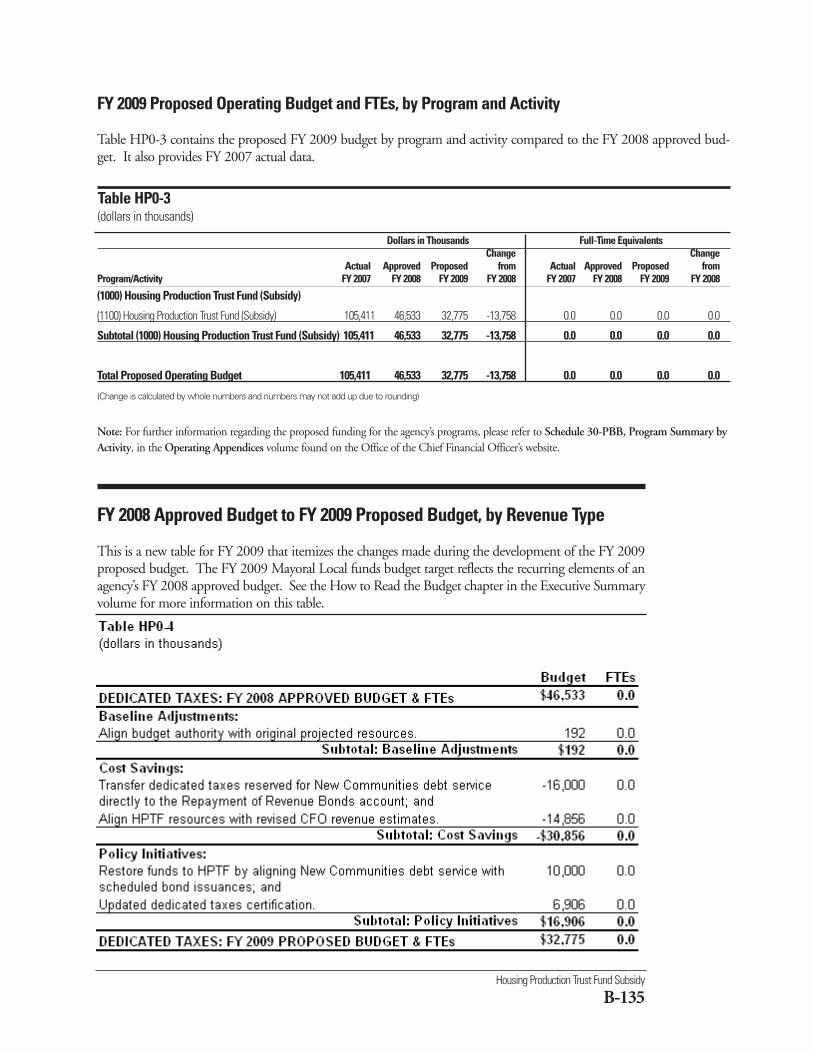
Housing Production Trust Fund Subsidy
B-135
Dollars in Thousands Full-Time EquivalentsChange Change
Actual Approved Proposed from Actual Approved Proposed from Program/Activity FY 2007 FY 2008 FY 2009 FY 2008 FY 2007 FY 2008 FY 2009 FY 2008
(1000) Housing Production Trust Fund (Subsidy)
(1100) Housing Production Trust Fund (Subsidy) 105,411 46,533 32,775 -13,758 0.0 0.0 0.0 0.0
Subtotal (1000) Housing Production Trust Fund (Subsidy) 105,411 46,533 32,775 -13,758 0.0 0.0 0.0 0.0
Total Proposed Operating Budget 105,411 46,533 32,775 -13,758 0.0 0.0 0.0 0.0
(Change is calculated by whole numbers and numbers may not add up due to rounding)
Note: For further information regarding the proposed funding for the agency’s programs, please refer to Schedule 30-PBB, Program Summary byActivity, in the Operating Appendices volume found on the Office of the Chief Financial Officer’s website.
FY 2009 Proposed Operating Budget and FTEs, by Program and Activity
Table HP0-3 contains the proposed FY 2009 budget by program and activity compared to the FY 2008 approved bud-get. It also provides FY 2007 actual data.
Table HP0-3(dollars in thousands)
FY 2008 Approved Budget to FY 2009 Proposed Budget, by Revenue Type
This is a new table for FY 2009 that itemizes the changes made during the development of the FY 2009proposed budget. The FY 2009 Mayoral Local funds budget target reflects the recurring elements of anagency’s FY 2008 approved budget. See the How to Read the Budget chapter in the Executive Summaryvolume for more information on this table.
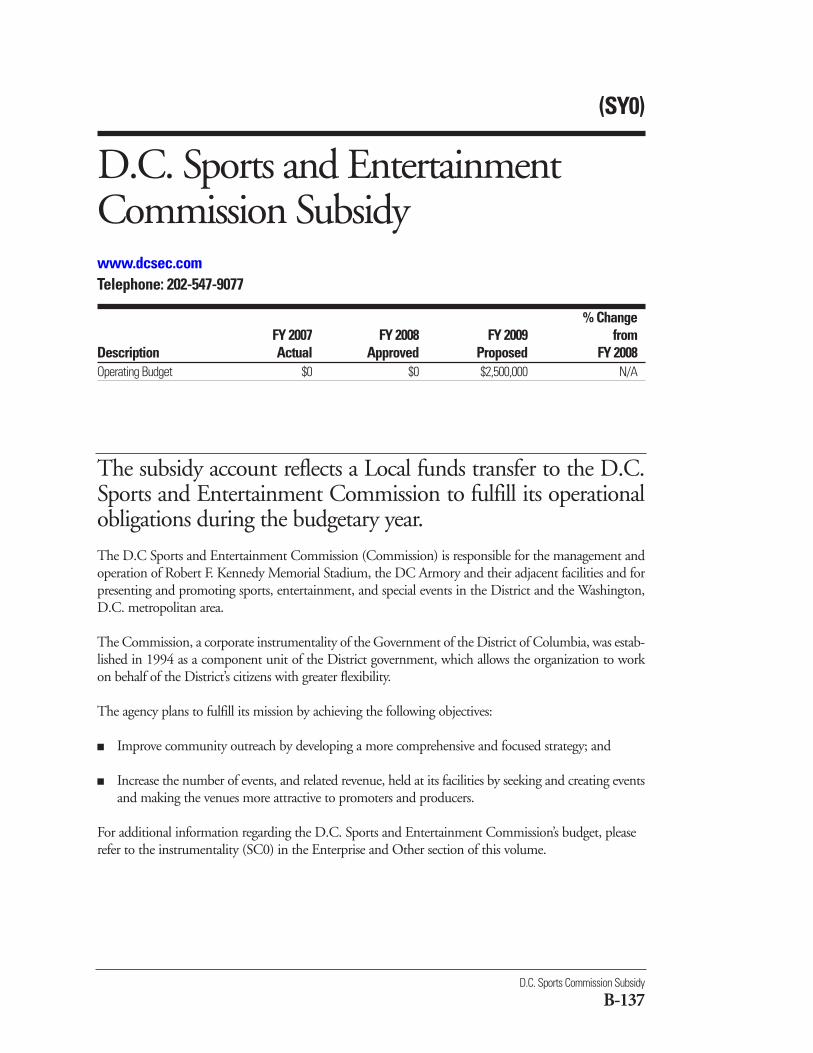
(SY0)
D.C. Sports and EntertainmentCommission Subsidywww.dcsec.comTelephone: 202-547-9077
% ChangeFY 2007 FY 2008 FY 2009 from
Description Actual Approved Proposed FY 2008Operating Budget $0 $0 $2,500,000 N/A
The subsidy account reflects a Local funds transfer to the D.C.Sports and Entertainment Commission to fulfill its operationalobligations during the budgetary year.
D.C. Sports Commission Subsidy
B-137
The D.C Sports and Entertainment Commission (Commission) is responsible for the management andoperation of Robert F. Kennedy Memorial Stadium, the DC Armory and their adjacent facilities and forpresenting and promoting sports, entertainment, and special events in the District and the Washington,D.C. metropolitan area.
The Commission, a corporate instrumentality of the Government of the District of Columbia, was estab-lished in 1994 as a component unit of the District government, which allows the organization to workon behalf of the District’s citizens with greater flexibility.
The agency plans to fulfill its mission by achieving the following objectives:
■ Improve community outreach by developing a more comprehensive and focused strategy; and
■ Increase the number of events, and related revenue, held at its facilities by seeking and creating eventsand making the venues more attractive to promoters and producers.
For additional information regarding the D.C. Sports and Entertainment Commission’s budget, pleaserefer to the instrumentality (SC0) in the Enterprise and Other section of this volume.
FY 2009 Proposed Budget and Financial Plan
B-138
FY 2009 Proposed Gross Funds Operating Budget, by Revenue Type
Table SY0-1 contains the proposed FY 2009 agency budget compared to the FY 2008 approved budget.It also provides FY 2006 and FY 2007 actual expenditures.
Table SY0-1 (dollars in thousands)
Change
Actual Actual Approved Proposed from Percent
Appropriated Fund FY 2006 FY 2007 FY 2008 FY 2009 FY 2008 Change*
General Fund
Local Funds 0 0 0 2,500 2,500 N/A
Total for General Fund 0 0 0 2,500 2,500 N/A
Gross Funds 0 0 0 2,500 2,500 N/A
*Percent Change is based on whole dollars.
FY 2009 Proposed Operating Budget, by Comptroller Source Group
Table SY0-2 contains the proposed FY 2009 budget at the Comptroller Source Group (object class) levelcompared to the FY 2008 approved budget. It also provides FY 2006 and FY 2007 actual expenditures.
Table SY0-2 (dollars in thousands)
Change
Actual Actual Approved Proposed from Percent
Comptroller Source Group FY 2006 FY 2007 FY 2008 FY 2009 FY 2008 Change*
50 Subsidies and Transfers 0 0 0 2,500 2,500 N/A
Subtotal Nonpersonal Services (NPS) 0 0 0 2,500 2,500 N/A
Gross Funds 0 0 0 2,500 2,500 N/A
*Percent Change is based on whole dollars.
The agency’s FY 2009 proposed budget is presented in the following tables:
D.C. Sports Commission Subsidy
B-139
Dollars in Thousands Full-Time EquivalentsChange Change
Actual Approved Proposed from Actual Approved Proposed from Program/Activity FY 2007 FY 2008 FY 2009 FY 2008 FY 2007 FY 2008 FY 2009 FY 2008
(1000) D.C. Sports Commission Subsidy
(1100) D.C. Sports Commission Subsidy 0 0 2,500 2,500 0.0 0.0 0.0 0.0
Subtotal (1000) D.C. Sports Commission Subsidy 0 0 2,500 2,500 0.0 0.0 0.0 0.0
Total Proposed Operating Budget 0 0 2,500 2,500 0.0 0.0 0.0 0.0
(Change is calculated by whole numbers and numbers may not add up due to rounding)
FY 2009 Proposed Operating Budget and FTEs, by Program and Activity
Table SY0-3 contains the proposed FY 2009 budget by program and activity compared to the FY 2008 approved budget.It also provides FY 2007 actual data.
Table SY0-3(dollars in thousands)
FY 2008 Approved Budget to FY 2009 Proposed Budget, by Revenue Type
This is a new table for FY 2009 that itemizes the changes made during the development of the FY 2009proposed budget. The FY 2009 Mayoral Local funds budget target reflects the recurring elements of anagency’s FY 2008 approved budget. See the How to Read the Budget chapter in the Executive Summaryvolume for more information on this table.
Note: For further information regarding the proposed funding for the agency’s programs, please refer to Schedule 30-PBB, Program Summary byActivity, in the Operating Appendices volume found on the Office of the Chief Financial Officer’s website.
Public Safety and Justice
CPublic Safety and JusticeMetropolitan Police Department (FA)...........................................................C-1Fire and Emergency Medical Services Department (FB)..........................C-13Police Officers’ and Fire Fighters’ Retirement System (FD)......................C-23Department of Corrections (FL)..................................................................C-27District of Columbia National Guard (FK).................................................C-39Homeland Security and Emergency Management Agency (BN).............C-47Commission on Judicial Disabilities and Tenure (DQ)..............................C-55Judicial Nomination Commission (DV)......................................................C-59Office of Police Complaints (FH)................................................................C-63District of Columbia Sentencing and Criminal Code
Revision Commission (FZ) .......................................................................C-69Office of the Chief Medical Examiner (FX)...............................................C-75Office of Administrative Hearings (FS).......................................................C-83Corrections Information Council (FI) .........................................................C-89Criminal Justice Coordinating Council (FJ)................................................C-93Forensic Laboratory Technician Training Program (FV).........................C-101Office of Unified Communications (UC) .................................................C-105Emergency and Disaster Response (BT)...................................................C-113Homeland Security Grants (FT) ...............................................................C-115Office of Victim Services (FE) ...................................................................C-119Justice Grants Administration (FO)...........................................................C-125Motor Vehicle Theft Prevention Commission (FW)...............................C-131
Metropolitan Police DepartmentC-1
(FA0)
Metropolitan Police Department www.mpdc.dc.govTelephone: 202-727-4218
911 (emergencies)311 (police non-emergencies)
% ChangeFY 2007 FY 2008 FY 2009 from
Description Actual Approved Proposed FY 2008Operating Budget $467,418,355 $497,893,461 $504,391,270 1.3FTEs 4,510.4 4,949.5 4,965.5 0.3
The agency plans to fulfill its mission by achieving the following objectives:
Objective 1: Safeguard the District of Columbia and protect its residents and visitors.
Objective 2: Provide the highest quality of police service with integrity, compassion, and a commitmentto innovation.
Objective 3: Improve police service to the public through the integration of the Department’s people,technology and business systems.
To view complete agency performance plans, please visit the ‘Performance Plans and Reports’ link on theCapStat webpage at http://capstat.oca.dc.gov/.
These objectives are funded through the following agency programs:
Note: MPD has substantially revised its program budget structure for FY 2009 based on an approvedreorganization plan; accordingly, the below-listed programs are different from those used in prior years(refer to table FA0-4 for program budgets of the current and prior years).
The mission of the Metropolitan Police Department (MPD) isto safeguard the District of Columbia and protect its residentsand visitors by providing the highest quality police service withintegrity, compassion, and a commitment to innovation thatintegrates people, technology and progressive business systems.
FY 2009 Proposed Budget and Financial Plan
C-2
■ Patrol Services & School Security Bureau - works to safeguard and protect residents of, and visitorsto, the District of Columbia by providing community policing services through the seven PatrolDistricts, Patrol Support Division, Nighthawk Operations, School Security Division, andCommunity Services and Youth Outreach Division.
■ Investigative Services Bureau - works with the community to solve crimes, help bring offenders tojustice, support the recovery of victims, and protect witnesses.
■ Corporate Support Bureau - oversees the major administrative, technical and business functions ofthe department that are critical to keeping a complex and large agency running effectively and effi-ciently.
■ Professional Development Bureau - integrates human resources, training, strategic analysis and plan-ning, and program development under a single Bureau to support the department and the city byidentifying and implementing innovative policing and business practices.
■ Internal Affairs Bureau - acts as the guardian of the Metropolitan Police Department’s reputation, andensures accountability through comprehensive investigations of misconduct and uses of force.
■ Homeland Security Bureau - integrates the intelligence and operational functions that will ensure thecity is well protected and prepared to respond to threats and critical
■ Agency Management - provides for administrative support and the required tools to achieve theagency’s operational and programmatic results. This program is standard for all agencies using perfor-mance-based budgeting.
■ Agency Financial Operations - provides comprehensive and efficient financial management servicesto, and on behalf of, District agencies so that the financial integrity of the District of Columbia ismaintained. This program is standard for all agencies using performance-based budgeting.
The agency’s FY 2009 proposed budget is presented in the following tables:
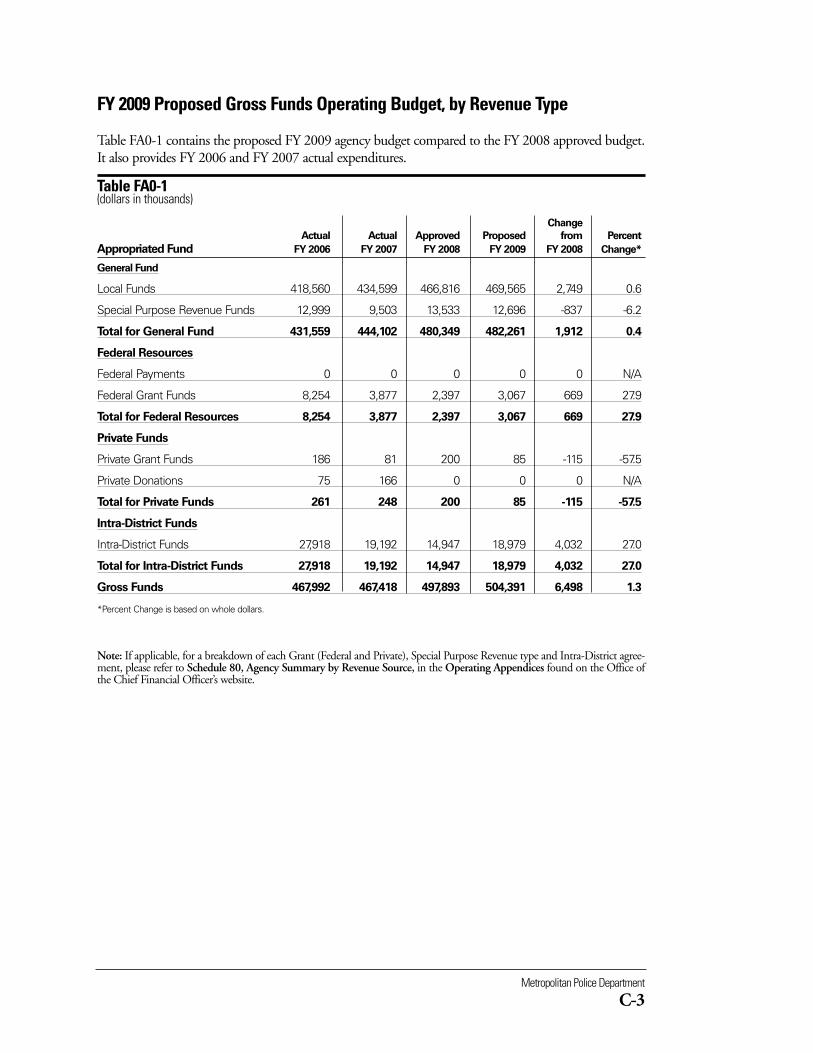
Metropolitan Police Department
C-3
FY 2009 Proposed Gross Funds Operating Budget, by Revenue Type
Table FA0-1 contains the proposed FY 2009 agency budget compared to the FY 2008 approved budget.It also provides FY 2006 and FY 2007 actual expenditures.
Table FA0-1 (dollars in thousands)
Change
Actual Actual Approved Proposed from Percent
Appropriated Fund FY 2006 FY 2007 FY 2008 FY 2009 FY 2008 Change*
General Fund
Local Funds 418,560 434,599 466,816 469,565 2,749 0.6
Special Purpose Revenue Funds 12,999 9,503 13,533 12,696 -837 -6.2
Total for General Fund 431,559 444,102 480,349 482,261 1,912 0.4
Federal Resources
Federal Payments 0 0 0 0 0 N/A
Federal Grant Funds 8,254 3,877 2,397 3,067 669 27.9
Total for Federal Resources 8,254 3,877 2,397 3,067 669 27.9
Private Funds
Private Grant Funds 186 81 200 85 -115 -57.5
Private Donations 75 166 0 0 0 N/A
Total for Private Funds 261 248 200 85 -115 -57.5
Intra-District Funds
Intra-District Funds 27,918 19,192 14,947 18,979 4,032 27.0
Total for Intra-District Funds 27,918 19,192 14,947 18,979 4,032 27.0
Gross Funds 467,992 467,418 497,893 504,391 6,498 1.3
*Percent Change is based on whole dollars.
Note: If applicable, for a breakdown of each Grant (Federal and Private), Special Purpose Revenue type and Intra-District agree-ment, please refer to Schedule 80, Agency Summary by Revenue Source, in the Operating Appendices found on the Office ofthe Chief Financial Officer’s website.
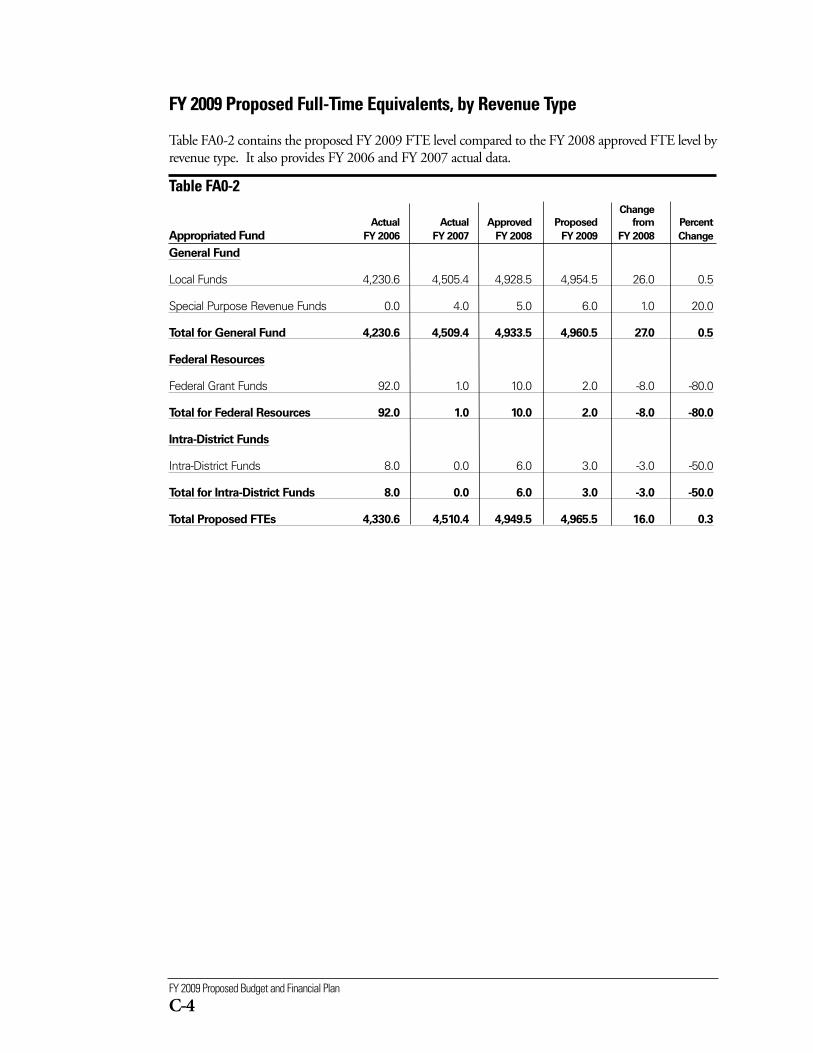
FY 2009 Proposed Budget and Financial Plan
C-4
FY 2009 Proposed Full-Time Equivalents, by Revenue Type
Table FA0-2 contains the proposed FY 2009 FTE level compared to the FY 2008 approved FTE level byrevenue type. It also provides FY 2006 and FY 2007 actual data.
Table FA0-2 Change
Actual Actual Approved Proposed from Percent
Appropriated Fund FY 2006 FY 2007 FY 2008 FY 2009 FY 2008 Change
General Fund
Local Funds 4,230.6 4,505.4 4,928.5 4,954.5 26.0 0.5
Special Purpose Revenue Funds 0.0 4.0 5.0 6.0 1.0 20.0
Total for General Fund 4,230.6 4,509.4 4,933.5 4,960.5 27.0 0.5
Federal Resources
Federal Grant Funds 92.0 1.0 10.0 2.0 -8.0 -80.0
Total for Federal Resources 92.0 1.0 10.0 2.0 -8.0 -80.0
Intra-District Funds
Intra-District Funds 8.0 0.0 6.0 3.0 -3.0 -50.0
Total for Intra-District Funds 8.0 0.0 6.0 3.0 -3.0 -50.0
Total Proposed FTEs 4,330.6 4,510.4 4,949.5 4,965.5 16.0 0.3
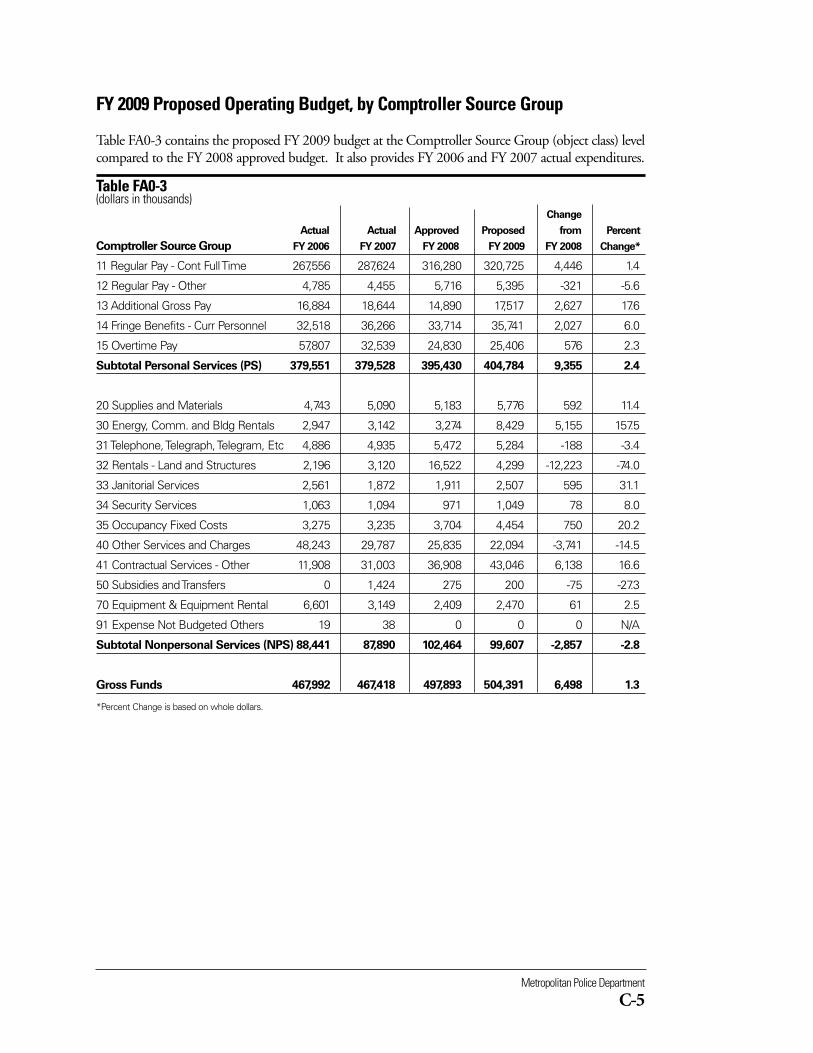
Metropolitan Police Department
C-5
FY 2009 Proposed Operating Budget, by Comptroller Source Group
Table FA0-3 contains the proposed FY 2009 budget at the Comptroller Source Group (object class) levelcompared to the FY 2008 approved budget. It also provides FY 2006 and FY 2007 actual expenditures.
Table FA0-3(dollars in thousands)
Change
Actual Actual Approved Proposed from Percent
Comptroller Source Group FY 2006 FY 2007 FY 2008 FY 2009 FY 2008 Change*
11 Regular Pay - Cont Full Time 267,556 287,624 316,280 320,725 4,446 1.4
12 Regular Pay - Other 4,785 4,455 5,716 5,395 -321 -5.6
13 Additional Gross Pay 16,884 18,644 14,890 17,517 2,627 17.6
14 Fringe Benefits - Curr Personnel 32,518 36,266 33,714 35,741 2,027 6.0
15 Overtime Pay 57,807 32,539 24,830 25,406 576 2.3
Subtotal Personal Services (PS) 379,551 379,528 395,430 404,784 9,355 2.4
20 Supplies and Materials 4,743 5,090 5,183 5,776 592 11.4
30 Energy, Comm. and Bldg Rentals 2,947 3,142 3,274 8,429 5,155 157.5
31 Telephone, Telegraph, Telegram, Etc 4,886 4,935 5,472 5,284 -188 -3.4
32 Rentals - Land and Structures 2,196 3,120 16,522 4,299 -12,223 -74.0
33 Janitorial Services 2,561 1,872 1,911 2,507 595 31.1
34 Security Services 1,063 1,094 971 1,049 78 8.0
35 Occupancy Fixed Costs 3,275 3,235 3,704 4,454 750 20.2
40 Other Services and Charges 48,243 29,787 25,835 22,094 -3,741 -14.5
41 Contractual Services - Other 11,908 31,003 36,908 43,046 6,138 16.6
50 Subsidies and Transfers 0 1,424 275 200 -75 -27.3
70 Equipment & Equipment Rental 6,601 3,149 2,409 2,470 61 2.5
91 Expense Not Budgeted Others 19 38 0 0 0 N/A
Subtotal Nonpersonal Services (NPS) 88,441 87,890 102,464 99,607 -2,857 -2.8
Gross Funds 467,992 467,418 497,893 504,391 6,498 1.3
*Percent Change is based on whole dollars.
FY 2009 Proposed Budget and Financial Plan
C-6
Dollars in Thousands Full-Time EquivalentsChange Change
Actual Approved Proposed from Actual Approved Proposed from Program/Activity FY 2007 FY 2008 FY 2009 FY 2008 FY 2007 FY 2008 FY 2009 FY 2008
(1000) Regional Field Operations
(1100) ROC Central 60,360 65,008 0 -65,008 764.5 896.4 0.0 -896.4
(1200) ROC North 83,090 94,220 0 -94,220 1,052.3 1,229.1 0.0 -1,229.1
(1300) ROC East 57,372 63,327 0 -63,327 721.8 830.5 0.0 -830.5
(1400) Regional Field Operations Support 22,533 24,998 0 -24,998 38.0 67.0 0.0 -67.0
No Activity Assigned 152 0 0 0 0.0 0.0 0.0 0.0
Subtotal (1000) Regional Field Operations 223,508 247,553 0 -247,553 2,576.7 3,022.9 0.0 -3,022.9
(1001) Patrol Services & School Security Bureau
(1500) Patrol Districts 0 0 211,538 211,538 0.0 0.0 2,620.0 2,620.0
(1600) Patrol Support Division 0 0 4,236 4,236 0.0 0.0 44.0 44.0
(1700) Community Services & Youth Outreach 0 0 20,418 20,418 0.0 0.0 50.0 50.0
Subtotal (1001) Patrol Services & School Security 0 0 236,192 236,192 0.0 0.0 2,714.0 2,714.0
(100F) Agency Financial Operations
(110F) Budget Operations 1,055 1,210 1,316 106 10.0 14.0 14.0 0.0
(120F) Accounting Operations 1,467 1,425 1,554 129 19.0 20.0 20.0 0.0
(130F) ACFO -5 0 69 69 0.0 0.0 1.0 1.0
Subtotal (100F) Agency Financial Operations 2,516 2,636 2,939 304 29.0 34.0 35.0 1.0
(2000) Investigative Field Operations
(2100) District Investigations 10,453 15,092 0 -15,092 81.0 167.9 0.0 -167.9
(2200) Special Investigations 22,886 20,537 0 -20,537 215.0 210.3 0.0 -210.3
(2300) Child Investigations 6,197 6,535 0 -6,535 61.0 67.0 0.0 -67.0
(2400) Narcotics and Special Investigations 9,691 9,159 0 -9,159 85.0 94.6 0.0 -94.6
(2500) Investigative Operations Support 22,320 16,170 0 -16,170 198.0 186.4 0.0 -186.4
Subtotal (2000) Investigative Field Operations 71,547 67,492 0 -67,492 640.0 726.1 0.0 -726.1
(2001) Investigative Services Bureau
(2600) Office of the Superintendent Detectives 0 0 47,078 47,078 0.0 0.0 513.0 513.0
(2700) Narcotics and Special Investigate Branch 0 0 13,452 13,452 0.0 0.0 124.0 124.0
(2800) Forensic Science Division 0 0 14,566 14,566 0.0 0.0 180.0 180.0
Subtotal (2001) Investigative Services Bureau 0 0 75,096 75,096 0.0 0.0 817.0 817.0
(Continued on next page)
FY 2009 Proposed Operating Budget and FTEs, by Program and Activity
Table FA0-4 contains the proposed FY 2009 budget by program and activity compared to the FY 2008 approved budget.It also provides FY 2007 actual data.
Table FA0-4(dollars in thousands)
Metropolitan Police Department
C-7
FY 2009 Proposed Operating Budget and FTEs, by Program and Activity
Table FA0-4 contains the proposed FY 2009 budget by program and activity compared to the FY 2008 approved budget.It also provides FY 2007 actual data.
Table FA0-4 (Continued)(dollars in thousands)
Dollars in Thousands Full-Time EquivalentsChange Change
Actual Approved Proposed from Actual Approved Proposed from Program/Activity FY 2007 FY 2008 FY 2009 FY 2008 FY 2007 FY 2008 FY 2009 FY 2008
(3000) Special Field Operations
(3100) Special Events 8,147 8,063 0 -8,063 87.0 79.3 0.0 -79.3
(3200) Tactical Patrol Unit 11,225 11,710 0 -11,710 111.0 121.6 0.0 -121.6
(3300) Emergency Services 773 0 0 0 2.0 0.0 0.0 0.0
(3400) SOCC/JOCC 2,418 0 0 0 2.0 0.0 0.0 0.0
(3500) Homeland Security & Counterterrorism 4,695 0 0 0 2.0 0.0 0.0 0.0
(3600) Traffic Safety 0 3,162 0 -3,162 0.0 15.0 0.0 -15.0
Subtotal (3000) Special Field Operations 27,258 22,935 0 -22,935 204.0 215.9 0.0 -215.9
(4000) Public Safety Communications Center
(4100) Call-taking and Dispatching 519 0 0 0 0.0 0.0 0.0 0.0
(4200) Telephone Reporting 130 0 0 0 0.0 0.0 0.0 0.0
Subtotal (4000) Public Safety Communications Center 649 0 0 0 0.0 0.0 0.0 0.0
(5000) Police Business Services
(5200) Police Personnel Services 14,773 13,319 0 -13,319 51.0 52.6 0.0 -52.6
(5300) Business Services 20,941 22,344 0 -22,344 181.0 223.1 0.0 -223.1
(5600) Police Training 26,469 24,033 0 -24,033 467.7 323.0 0.0 -323.0
(5700) Communications Liaison 2,235 2,920 0 -2,920 17.0 19.2 0.0 -19.2
Subtotal (5000) Police Business Services 64,419 62,615 0 -62,615 716.7 617.9 0.0 -617.9
(5001) Corporate Support Bureau
(5100) General Support Services Division 0 0 10,025 10,025 0.0 0.0 59.0 59.0
(5400) Police Business Services Division 0 0 11,994 11,994 0.0 0.0 168.0 168.0
Subtotal (5001) Corporate Support Bureau 0 0 22,019 22,019 0.0 0.0 227.0 227.0
(6000) Organization Change Program
(6200) Organizational Change 4,345 4,137 0 -4,137 36.0 42.0 0.0 -42.0
(6400) Office of Professional Responsibility 3,438 0 0 0 0.0 0.0 0.0 0.0
(6700) Police Training 2,253 0 0 0 0.0 0.0 0.0 0.0
Subtotal (6000) Organization Change Program 10,036 4,137 0 -4,137 36.0 42.0 0.0 -42.0
(Continued on next page)
FY 2009 Proposed Budget and Financial Plan
C-8
Dollars in Thousands Full-Time EquivalentsChange Change
Actual Approved Proposed from Actual Approved Proposed from Program/Activity FY 2007 FY 2008 FY 2009 FY 2008 FY 2007 FY 2008 FY 2009 FY 2008
(6001) Professional Development Bureau
(6300) Office of Human Resource Management 0 0 14,480 14,480 0.0 0.0 54.0 54.0
(6500) Office of Professional Development 0 0 1,914 1,914 0.0 0.0 20.0 20.0
(6600) Police Academy 0 0 34,319 34,319 0.0 0.0 533.0 533.0
(6800) Office of Strategic Change 0 0 2,339 2,339 0.0 0.0 26.5 26.5
Subtotal (6001) Professional Development Bureau 0 0 53,052 53,052 0.0 0.0 633.5 633.5
(7000) Professional Responsibility
(7100) Office of Professional Responsibility 4,243 7,715 0 -7,715 75.0 83.1 0.0 -83.1
Subtotal (7000) Professional Responsibility 4,243 7,715 0 -7,715 75.0 83.1 0.0 -83.1
(7001) Assistant Chief Internal Affairs Bureau
(7300) Internal Affairs Branch 0 0 3,004 3,004 0.0 0.0 28.0 28.0
(7400) Force Investigations Branch 0 0 744 744 0.0 0.0 5.0 5.0
(7500) EEOC Branch 0 0 161 161 0.0 0.0 2.0 2.0
(7600) Compliance Monitoring Team 0 0 3,816 3,816 0.0 0.0 45.0 45.0
Subtotal (7001) Assistant Chief Internal Affairs Bureau 0 0 7,725 7,725 0.0 0.0 80.0 80.0
(8000) Security Operations
(8100) Protective Services 109 10 0 -10 1.0 0.0 0.0 0.0
(8200) School Security 16,724 19,375 0 -19,375 39.0 45.5 0.0 -45.5
(8400) Youth Violence Prevention 950 720 0 -720 0.0 9.0 0.0 -9.0
Subtotal (8000) Security Operations 17,782 20,104 0 -20,104 40.0 54.5 0.0 -54.5
(9000) Homeland Security and Counter-Terrorism
(9100) Homeland Security and Counter-Terrorism 0 3,195 0 -3,195 0.0 33.0 0.0 -33.0
Subtotal (9000) HSCT- 0 3,195 0 -3,195 0.0 33.0 0.0 -33.0
(9001) Homeland Security Bureau
(9200) Special Operations Division 0 0 40,648 40,648 0.0 0.0 263.0 263.0
(9300) Intelligence Fusion Division 0 0 4,648 4,648 0.0 0.0 30.0 30.0
Subtotal (9001) Homeland Security Bureau 0 0 45,297 45,297 0.0 0.0 293.0 293.0
(Continued on next page)
FY 2009 Proposed Operating Budget and FTEs, by Program and Activity
Table FA0-4 contains the proposed FY 2009 budget by program and activity compared to the FY 2008 approved budget.It also provides FY 2007 actual data.
Table FA0-4 (Continued)(dollars in thousands)
Metropolitan Police Department
C-9
Dollars in Thousands Full-Time EquivalentsChange Change
Actual Approved Proposed from Actual Approved Proposed from Program/Activity FY 2007 FY 2008 FY 2009 FY 2008 FY 2007 FY 2008 FY 2009 FY 2008
(9960) Year End Close
No Activity Assigned -25 0 0 0 0.0 0.0 0.0 0.0
Subtotal (9960) Year End Close -25 0 0 0 0.0 0.0 0.0 0.0
(9980) Payroll Default Program
No Activity Assigned 5 0 0 0 0.0 0.0 0.0 0.0
Subtotal (9980) Payroll Default Program 5 0 0 0 0.0 0.0 0.0 0.0
(AMP1) Agency Management Program
(1010) Personnel 1,344 1,061 1,401 339 76.0 13.2 10.0 -3.2
(1015) Training and Employee Development 206 342 310 -33 0.0 1.0 1.0 0.0
(1017) Labor Management (IM) Partnership 469 508 444 -64 5.0 6.1 5.0 -1.1
(1020) Contracting and Procurement 385 387 608 221 3.0 7.0 1.0 -6.0
(1030) Property Management 19,812 34,049 23,180 -10,868 8.0 6.1 11.0 4.9
(1040) Information Technology 9,501 10,569 13,984 3,414 37.0 46.1 44.0 -2.1
(1050) Financial Services 202 185 62 -123 3.0 2.0 1.0 -1.0
(1055) Risk Management 85 274 98 -177 0.0 3.1 1.0 -2.1
(1060) Legal Services 199 680 129 -552 2.0 8.1 2.0 -6.1
(1070) Fleet Management 9,704 9,871 13,073 3,202 15.0 9.4 21.0 11.7
(1080) Communications 1,232 581 3,591 3,010 11.0 7.1 31.0 23.9
(1085) Customer Service 2,199 623 4,881 4,259 32.0 7.1 36.0 28.9
(1087) Language Access 55 235 222 -13 0.0 2.0 1.0 -1.0
(1090) Performance Management 88 144 88 -56 1.0 2.0 1.0 -1.0
Subtotal (AMP1) Agency Management Program 45,480 59,511 62,071 2,560 193.0 120.1 166.0 45.9
Total Proposed Operating Budget 467,418 497,893 504,391 6,498 4,510.4 4,949.5 4,965.5 16.0
(Change is calculated by whole numbers and numbers may not add up due to rounding)
Note: For further information regarding the proposed funding for the agency’s programs, please refer to Schedule 30-PBB,Program Summary by Activity, in the Operating Appendices volume found on the Office of the Chief Financial Officer’s website.
FY 2009 Proposed Operating Budget and FTEs, by Program and Activity
Table FA0-4 contains the proposed FY 2009 budget by program and activity compared to the FY 2008 approved budget.It also provides FY 2007 actual data.
Table FA0-4 (Continued)(dollars in thousands)
FY 2009 Proposed Budget and Financial Plan
C-10
FY 2008 Approved Budget to FY 2009 Proposed Budget, by Revenue Type
This is a new table for FY 2009 that itemizes the changes made during the development of the FY 2009proposed budget. The FY 2009 Mayoral Local funds budget target reflects the recurring elements of anagency’s FY 2008 approved budget. See the How to Read the Budget chapter in the Executive Summaryvolume for more information on this table.
Metropolitan Police Department
C-11
FY 2009 Proposed Budget and Financial Plan
C-12
Agency Performance MeasuresTable FA0-6
FY 2006 FY 2007 FY 2008 FY 2009 FY 2010Performance Measure Actual Actual Target Target Target
1 Percent change in DC Code Index violent crime 3.9% -4.3% -5.0% -5.0% -5.0%
2. Percent change in DC Code Index property crime -3.4% 2.2% -5.0% -5.0% -5.0%
3. Clearance rate for homicides 64.5% 70.2% 70.0% 70.0% 73.5%
4. Clearance rate for forcible rape 73.6% TBD 5.0% 5.0% 5.0%
5. Clearance rate for robbery 16.1% TBD 5.0% 5.0% 5.0%
6. Clearance rate for aggravated assault 52.5% TBD 5.0% 5.0% 5.0%
7. Clearance rate for burglary 17.4% TBD 5.0% 5.0% 5.0%
8. Clearance rate for larceny-theft 8.8% TBD 5.0% 5.0% 5.0%
9. Clearance rate for motor vehicle theft 2.1% TBD 5.0% 5.0% 5.0%
10. Percent increase of motor vehicle thefts resolved 16.6% TBD 5.0% 5.0% 5.0%
11. Rate of sustained citizen allegations of police misconduct per 1,000 sworn members 21.2% 15.7% -2.0% -2.0% -2.0%
12. Percent increase of citizen accounts on District listserves N/A N/A 10% 10% 10%
"All targets except the homicide clearance rate represent percent change from the previous year actual. The target for the homicide clearance rate is theactual percentage. Clearance rates are reported in compliance with FBI Uniform Crime Reporting (UCR) guidelines. These figures are calculated on a cal-endar year basis, and measure current year clearances, regardless of the year in which the offense took place, as a percentage of current year offenses.Please see http://www.fbi.gov/ucr/ucr.htm#cius for more information on the UCR program."
The mission of the Fire and Emergency Medical ServicesDepartment (FEMS) is to promote safety and health throughexcellent pre-hospital medical care, fire suppression, hazardousmaterials response, technical rescue, homeland security pre-paredness, and fire prevention and education in the District ofColumbia.
Fire and Emergency Medical Services Department
C-13
(FB0)
Fire and Emergency Medical ServicesDepartmentwww.fems.dc.govTelephone: 202-673-3320
% ChangeFY 2007 FY 2008 FY 2009 from
Description Actual Approved Proposed FY 2008Operating Budget $174,790,082 $178,904,689 $186,779,830 4.4 FTEs 2,070.0 2,208.6 2,262.6 2.4
The District of Columbia Fire and Emergency Medical Services Department is an all-hazards agency pro-viding emergency medical care and transportation (EMS), fire prevention, fire suppression, hazardousmaterial response, and technical rescue services to residents and visitors in the District of Columbia. FEMSresources are deployed from 33 neighborhood fire stations and include 37 EMS transport units, 33 enginecompanies, 16 ladder trucks, three heavy-rescue squads, one hazardous materials unit, and one fire boatcompany. Seventeen of these transport units and 19 of these engine companies are staffed by paramedicsproviding advanced life support (ALS) care.
The agency plans to fulfill its mission by achieving the following objectives:
Objective 1: Implement the recommendations of the Task Force on Emergency Medical Services.
Objective 2: Improve the quality of pre-hospital medical care delivered by the Fire and EmergencyMedical Services Department.
Objective 3: Connect citizens with appropriate and effective preventive and emergency medical care.
Objective 4: Promote a safer and healthier DC through prevention, education, inspections, investiga-tions, and world-class fire suppression and emergency response.
FY 2009 Proposed Budget and Financial Plan
C-14
Objective 5: Develop a world-class workforce.
To view complete agency performance plans, please visit the ‘Performance Plans and Reports’ link on theCapStat webpage at http://capstat.oca.dc.gov/.
These objectives are funded through the following agency programs:
■ Field Operations - provides emergency medical, fire/rescue, and special operations services to citizens,visitors, and employees in order to minimize loss of life and property.
■ Prevention and Education - provides investigation, public safety outreach, and inspection services toresidents, property owners, and businesses so that they can have the information needed to preventemergency incidents.
■ Employee Preparedness - provides employee wellness and specialized training services to employees sothat they can meet prescribed standards and are prepared to safely perform the mission of the agency.
■ Operations Support - provides emergency vehicle and facility maintenance and specialized networkmanagement services to employees so that they can perform their assigned duties in a safe, effective,and efficient manner.
■ Policy and Planning - establishes strategic directions and coordinates District consequential manage-ment on incidents. This program also identifies and addresses problems by developing initiatives toreduce mortality, property loss and hazardous conditions. This program develops and implements reg-ulations governing public safety, interagency response, intergovernmental coordination and mitigationefforts. This program is also responsible for compliance with policy and EEO regulations.
■ Agency Management - provides for administrative support and the required tools to achieve opera-tional and programmatic results. This program is standard for all agencies using performance-basedbudgeting.
■ Agency Financial Operations - provides comprehensive and efficient financial management servicesto, and on behalf of, District agencies so that the financial integrity of the District of Columbia ismaintained. This program is standard for all agencies using performance-based budgeting.
The agency’s FY 2009 proposed budget is presented in the following tables:
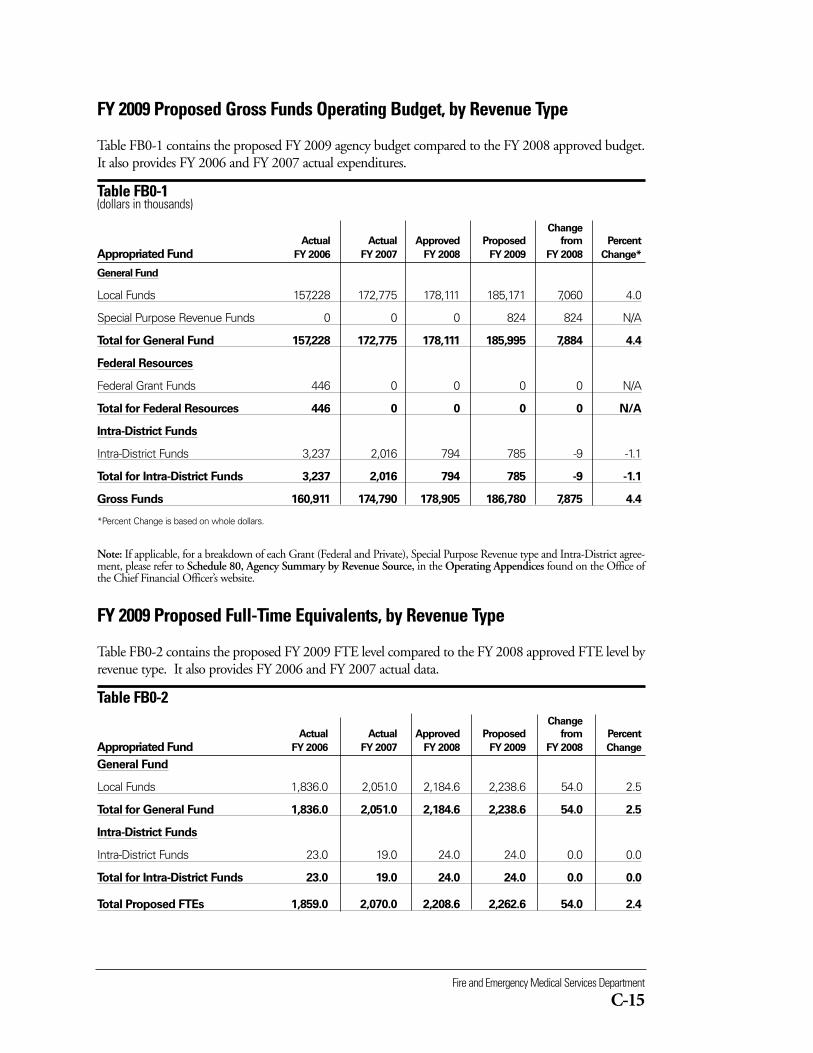
Fire and Emergency Medical Services Department
C-15
FY 2009 Proposed Gross Funds Operating Budget, by Revenue Type
Table FB0-1 contains the proposed FY 2009 agency budget compared to the FY 2008 approved budget.It also provides FY 2006 and FY 2007 actual expenditures.
Table FB0-1 (dollars in thousands)
Change
Actual Actual Approved Proposed from Percent
Appropriated Fund FY 2006 FY 2007 FY 2008 FY 2009 FY 2008 Change*
General Fund
Local Funds 157,228 172,775 178,111 185,171 7,060 4.0
Special Purpose Revenue Funds 0 0 0 824 824 N/A
Total for General Fund 157,228 172,775 178,111 185,995 7,884 4.4
Federal Resources
Federal Grant Funds 446 0 0 0 0 N/A
Total for Federal Resources 446 0 0 0 0 N/A
Intra-District Funds
Intra-District Funds 3,237 2,016 794 785 -9 -1.1
Total for Intra-District Funds 3,237 2,016 794 785 -9 -1.1
Gross Funds 160,911 174,790 178,905 186,780 7,875 4.4
*Percent Change is based on whole dollars.
Note: If applicable, for a breakdown of each Grant (Federal and Private), Special Purpose Revenue type and Intra-District agree-ment, please refer to Schedule 80, Agency Summary by Revenue Source, in the Operating Appendices found on the Office ofthe Chief Financial Officer’s website.
FY 2009 Proposed Full-Time Equivalents, by Revenue Type
Table FB0-2 contains the proposed FY 2009 FTE level compared to the FY 2008 approved FTE level byrevenue type. It also provides FY 2006 and FY 2007 actual data.
Table FB0-2 Change
Actual Actual Approved Proposed from Percent
Appropriated Fund FY 2006 FY 2007 FY 2008 FY 2009 FY 2008 Change
General Fund
Local Funds 1,836.0 2,051.0 2,184.6 2,238.6 54.0 2.5
Total for General Fund 1,836.0 2,051.0 2,184.6 2,238.6 54.0 2.5
Intra-District Funds
Intra-District Funds 23.0 19.0 24.0 24.0 0.0 0.0
Total for Intra-District Funds 23.0 19.0 24.0 24.0 0.0 0.0
Total Proposed FTEs 1,859.0 2,070.0 2,208.6 2,262.6 54.0 2.4
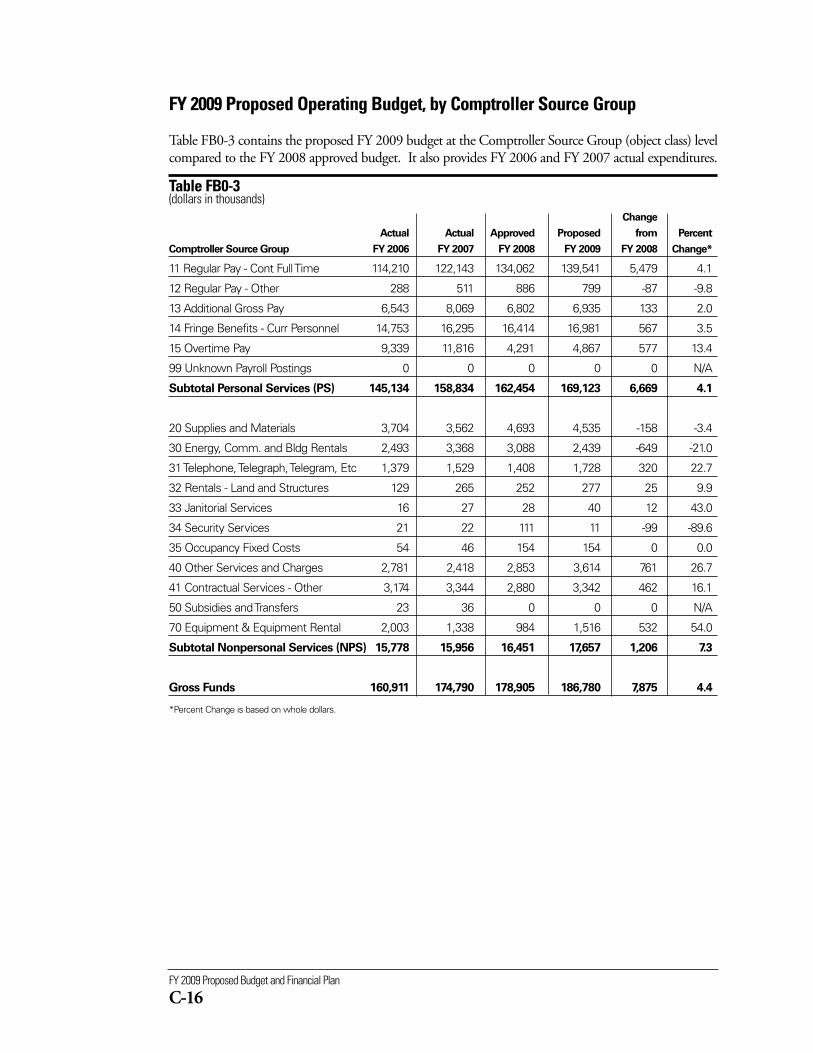
FY 2009 Proposed Budget and Financial Plan
C-16
FY 2009 Proposed Operating Budget, by Comptroller Source Group
Table FB0-3 contains the proposed FY 2009 budget at the Comptroller Source Group (object class) levelcompared to the FY 2008 approved budget. It also provides FY 2006 and FY 2007 actual expenditures.
Table FB0-3 (dollars in thousands)
Change
Actual Actual Approved Proposed from Percent
Comptroller Source Group FY 2006 FY 2007 FY 2008 FY 2009 FY 2008 Change*
11 Regular Pay - Cont Full Time 114,210 122,143 134,062 139,541 5,479 4.1
12 Regular Pay - Other 288 511 886 799 -87 -9.8
13 Additional Gross Pay 6,543 8,069 6,802 6,935 133 2.0
14 Fringe Benefits - Curr Personnel 14,753 16,295 16,414 16,981 567 3.5
15 Overtime Pay 9,339 11,816 4,291 4,867 577 13.4
99 Unknown Payroll Postings 0 0 0 0 0 N/A
Subtotal Personal Services (PS) 145,134 158,834 162,454 169,123 6,669 4.1
20 Supplies and Materials 3,704 3,562 4,693 4,535 -158 -3.4
30 Energy, Comm. and Bldg Rentals 2,493 3,368 3,088 2,439 -649 -21.0
31 Telephone, Telegraph, Telegram, Etc 1,379 1,529 1,408 1,728 320 22.7
32 Rentals - Land and Structures 129 265 252 277 25 9.9
33 Janitorial Services 16 27 28 40 12 43.0
34 Security Services 21 22 111 11 -99 -89.6
35 Occupancy Fixed Costs 54 46 154 154 0 0.0
40 Other Services and Charges 2,781 2,418 2,853 3,614 761 26.7
41 Contractual Services - Other 3,174 3,344 2,880 3,342 462 16.1
50 Subsidies and Transfers 23 36 0 0 0 N/A
70 Equipment & Equipment Rental 2,003 1,338 984 1,516 532 54.0
Subtotal Nonpersonal Services (NPS) 15,778 15,956 16,451 17,657 1,206 7.3
Gross Funds 160,911 174,790 178,905 186,780 7,875 4.4
*Percent Change is based on whole dollars.
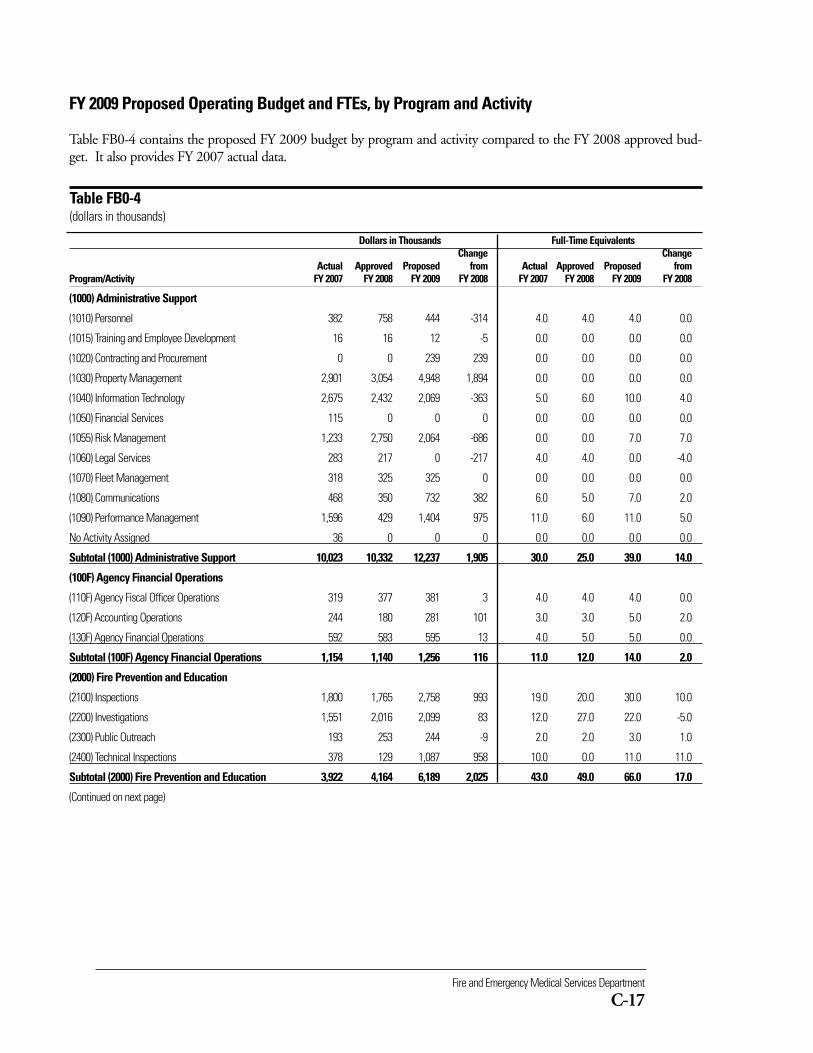
Fire and Emergency Medical Services Department
C-17
Dollars in Thousands Full-Time EquivalentsChange Change
Actual Approved Proposed from Actual Approved Proposed from Program/Activity FY 2007 FY 2008 FY 2009 FY 2008 FY 2007 FY 2008 FY 2009 FY 2008
(1000) Administrative Support
(1010) Personnel 382 758 444 -314 4.0 4.0 4.0 0.0
(1015) Training and Employee Development 16 16 12 -5 0.0 0.0 0.0 0.0
(1020) Contracting and Procurement 0 0 239 239 0.0 0.0 0.0 0.0
(1030) Property Management 2,901 3,054 4,948 1,894 0.0 0.0 0.0 0.0
(1040) Information Technology 2,675 2,432 2,069 -363 5.0 6.0 10.0 4.0
(1050) Financial Services 115 0 0 0 0.0 0.0 0.0 0.0
(1055) Risk Management 1,233 2,750 2,064 -686 0.0 0.0 7.0 7.0
(1060) Legal Services 283 217 0 -217 4.0 4.0 0.0 -4.0
(1070) Fleet Management 318 325 325 0 0.0 0.0 0.0 0.0
(1080) Communications 468 350 732 382 6.0 5.0 7.0 2.0
(1090) Performance Management 1,596 429 1,404 975 11.0 6.0 11.0 5.0
No Activity Assigned 36 0 0 0 0.0 0.0 0.0 0.0
Subtotal (1000) Administrative Support 10,023 10,332 12,237 1,905 30.0 25.0 39.0 14.0
(100F) Agency Financial Operations
(110F) Agency Fiscal Officer Operations 319 377 381 3 4.0 4.0 4.0 0.0
(120F) Accounting Operations 244 180 281 101 3.0 3.0 5.0 2.0
(130F) Agency Financial Operations 592 583 595 13 4.0 5.0 5.0 0.0
Subtotal (100F) Agency Financial Operations 1,154 1,140 1,256 116 11.0 12.0 14.0 2.0
(2000) Fire Prevention and Education
(2100) Inspections 1,800 1,765 2,758 993 19.0 20.0 30.0 10.0
(2200) Investigations 1,551 2,016 2,099 83 12.0 27.0 22.0 -5.0
(2300) Public Outreach 193 253 244 -9 2.0 2.0 3.0 1.0
(2400) Technical Inspections 378 129 1,087 958 10.0 0.0 11.0 11.0
Subtotal (2000) Fire Prevention and Education 3,922 4,164 6,189 2,025 43.0 49.0 66.0 17.0
(Continued on next page)
FY 2009 Proposed Operating Budget and FTEs, by Program and Activity
Table FB0-4 contains the proposed FY 2009 budget by program and activity compared to the FY 2008 approved bud-get. It also provides FY 2007 actual data.
Table FB0-4(dollars in thousands)
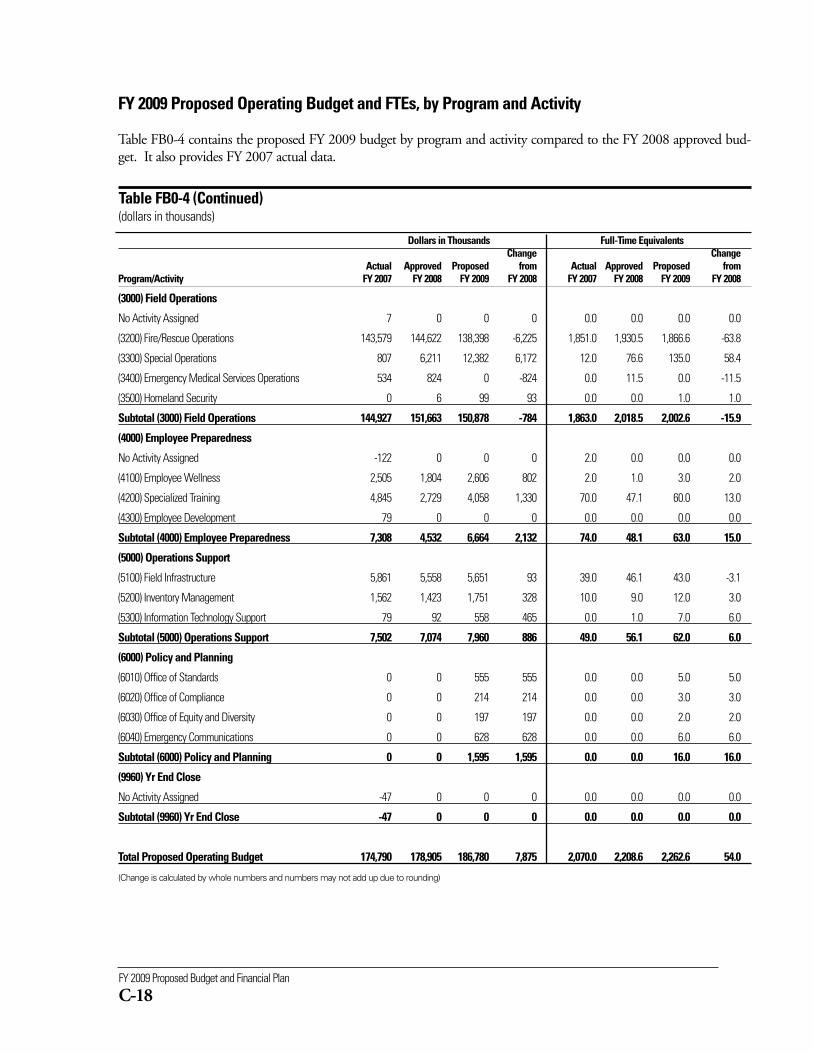
Dollars in Thousands Full-Time EquivalentsChange Change
Actual Approved Proposed from Actual Approved Proposed from Program/Activity FY 2007 FY 2008 FY 2009 FY 2008 FY 2007 FY 2008 FY 2009 FY 2008
(3000) Field Operations
No Activity Assigned 7 0 0 0 0.0 0.0 0.0 0.0
(3200) Fire/Rescue Operations 143,579 144,622 138,398 -6,225 1,851.0 1,930.5 1,866.6 -63.8
(3300) Special Operations 807 6,211 12,382 6,172 12.0 76.6 135.0 58.4
(3400) Emergency Medical Services Operations 534 824 0 -824 0.0 11.5 0.0 -11.5
(3500) Homeland Security 0 6 99 93 0.0 0.0 1.0 1.0
Subtotal (3000) Field Operations 144,927 151,663 150,878 -784 1,863.0 2,018.5 2,002.6 -15.9
(4000) Employee Preparedness
No Activity Assigned -122 0 0 0 2.0 0.0 0.0 0.0
(4100) Employee Wellness 2,505 1,804 2,606 802 2.0 1.0 3.0 2.0
(4200) Specialized Training 4,845 2,729 4,058 1,330 70.0 47.1 60.0 13.0
(4300) Employee Development 79 0 0 0 0.0 0.0 0.0 0.0
Subtotal (4000) Employee Preparedness 7,308 4,532 6,664 2,132 74.0 48.1 63.0 15.0
(5000) Operations Support
(5100) Field Infrastructure 5,861 5,558 5,651 93 39.0 46.1 43.0 -3.1
(5200) Inventory Management 1,562 1,423 1,751 328 10.0 9.0 12.0 3.0
(5300) Information Technology Support 79 92 558 465 0.0 1.0 7.0 6.0
Subtotal (5000) Operations Support 7,502 7,074 7,960 886 49.0 56.1 62.0 6.0
(6000) Policy and Planning
(6010) Office of Standards 0 0 555 555 0.0 0.0 5.0 5.0
(6020) Office of Compliance 0 0 214 214 0.0 0.0 3.0 3.0
(6030) Office of Equity and Diversity 0 0 197 197 0.0 0.0 2.0 2.0
(6040) Emergency Communications 0 0 628 628 0.0 0.0 6.0 6.0
Subtotal (6000) Policy and Planning 0 0 1,595 1,595 0.0 0.0 16.0 16.0
(9960) Yr End Close
No Activity Assigned -47 0 0 0 0.0 0.0 0.0 0.0
Subtotal (9960) Yr End Close -47 0 0 0 0.0 0.0 0.0 0.0
Total Proposed Operating Budget 174,790 178,905 186,780 7,875 2,070.0 2,208.6 2,262.6 54.0
(Change is calculated by whole numbers and numbers may not add up due to rounding)
FY 2009 Proposed Operating Budget and FTEs, by Program and Activity
Table FB0-4 contains the proposed FY 2009 budget by program and activity compared to the FY 2008 approved bud-get. It also provides FY 2007 actual data.
Table FB0-4 (Continued)(dollars in thousands)
FY 2009 Proposed Budget and Financial Plan
C-18
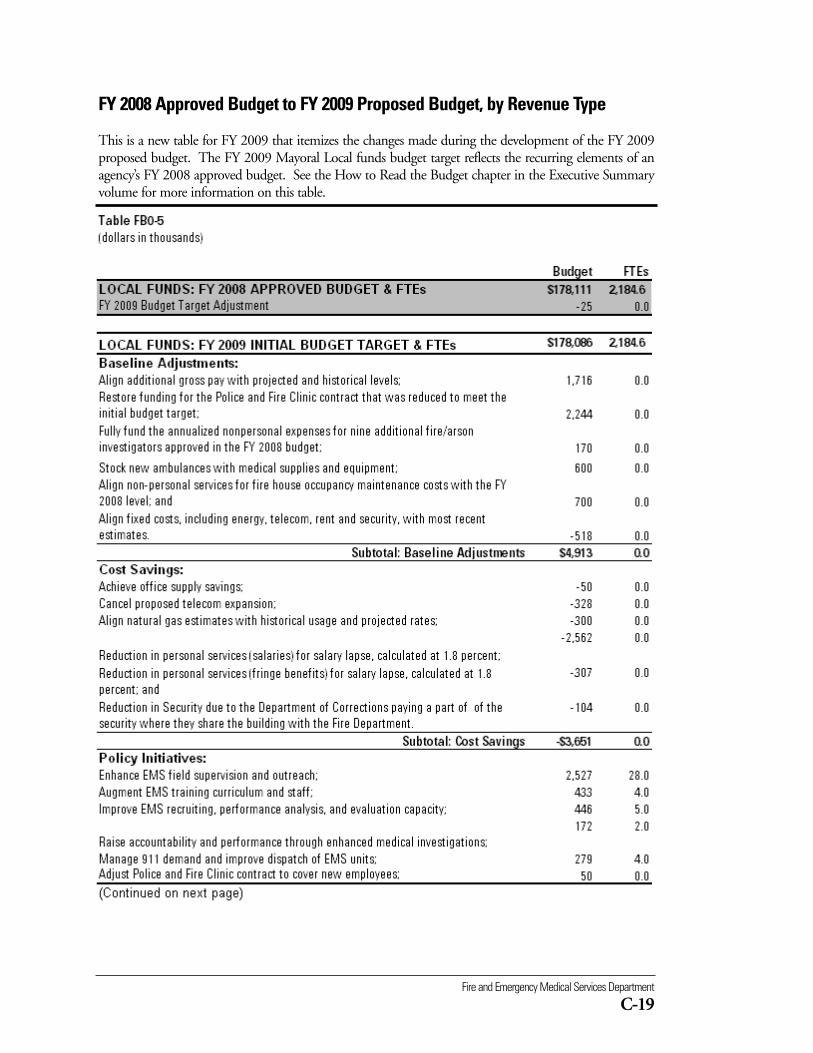
Fire and Emergency Medical Services Department
C-19
FY 2008 Approved Budget to FY 2009 Proposed Budget, by Revenue Type
This is a new table for FY 2009 that itemizes the changes made during the development of the FY 2009proposed budget. The FY 2009 Mayoral Local funds budget target reflects the recurring elements of anagency’s FY 2008 approved budget. See the How to Read the Budget chapter in the Executive Summaryvolume for more information on this table.
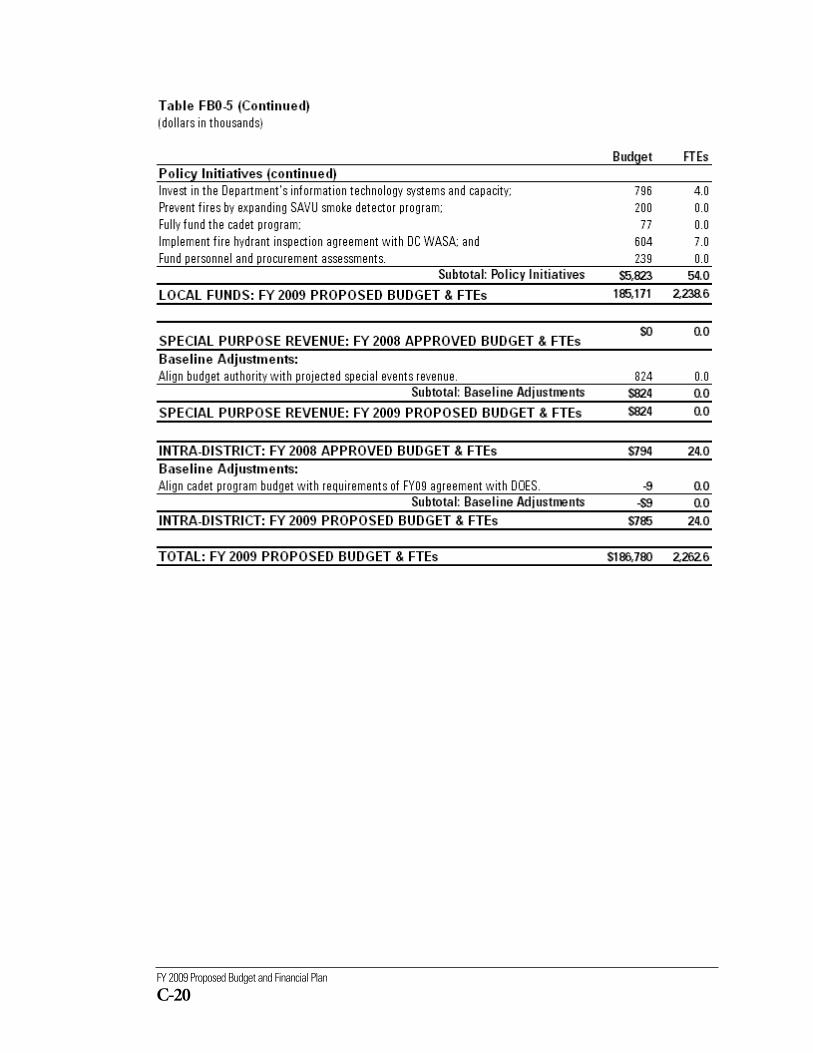
FY 2009 Proposed Budget and Financial Plan
C-20
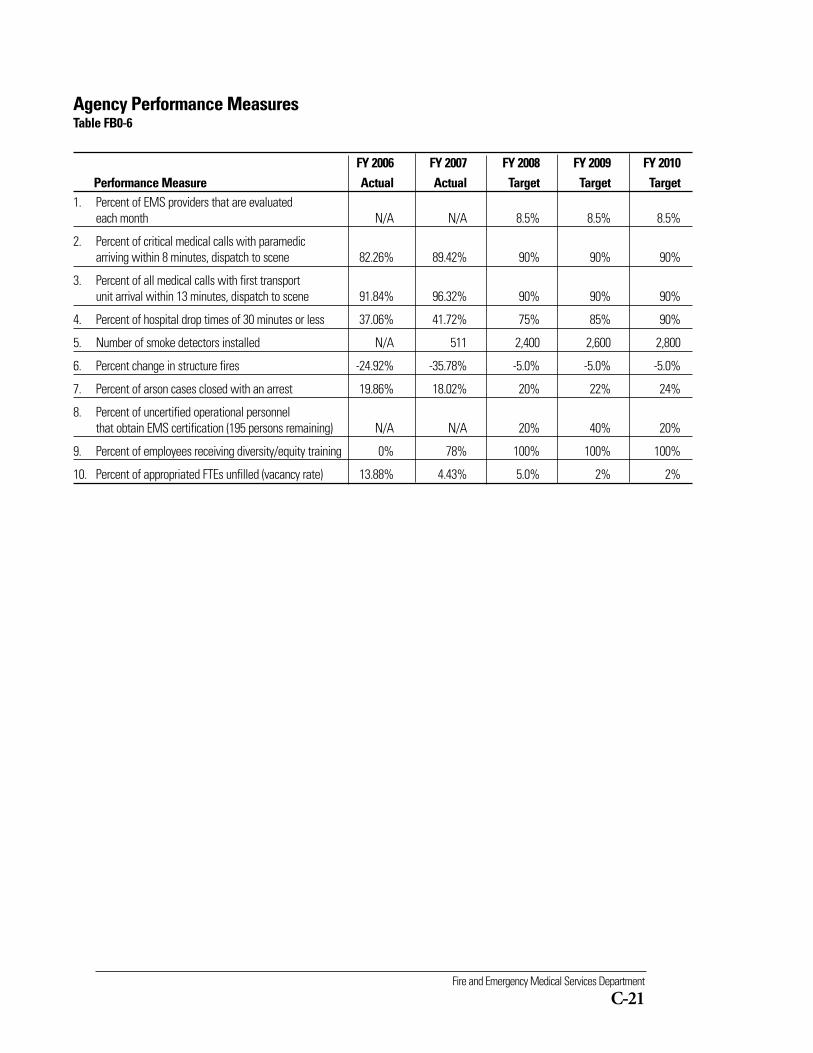
Fire and Emergency Medical Services Department
C-21
Agency Performance MeasuresTable FB0-6
FY 2006 FY 2007 FY 2008 FY 2009 FY 2010Performance Measure Actual Actual Target Target Target
1. Percent of EMS providers that are evaluated each month N/A N/A 8.5% 8.5% 8.5%
2. Percent of critical medical calls with paramedic arriving within 8 minutes, dispatch to scene 82.26% 89.42% 90% 90% 90%
3. Percent of all medical calls with first transport unit arrival within 13 minutes, dispatch to scene 91.84% 96.32% 90% 90% 90%
4. Percent of hospital drop times of 30 minutes or less 37.06% 41.72% 75% 85% 90%
5. Number of smoke detectors installed N/A 511 2,400 2,600 2,800
6. Percent change in structure fires -24.92% -35.78% -5.0% -5.0% -5.0%
7. Percent of arson cases closed with an arrest 19.86% 18.02% 20% 22% 24%
8. Percent of uncertified operational personnel that obtain EMS certification (195 persons remaining) N/A N/A 20% 40% 20%
9. Percent of employees receiving diversity/equity training 0% 78% 100% 100% 100%
10. Percent of appropriated FTEs unfilled (vacancy rate) 13.88% 4.43% 5.0% 2% 2%
(FD0)
Police Officers’ and Fire Fighters’ Retirement Systemwww.dcrb.dc.govTelephone: 202-343-3200
% ChangeFY 2007 FY 2008 FY 2009 from
Description Actual Approved Proposed FY 2008Operating Budget $140,100,000 $137,000,000 $110,900,000 -19.1
The Police Officers’ and Fire Fighters’ Retirement System pro-vides the District’s required contribution as the employer to thesetwo pension funds, which are administered by the District ofColumbia Retirement Board (DCRB).
Under provisions of the National Capital Revitalization and Self-Government Improvement Act of 1997,the federal government assumed the District's unfunded pension liability for the retirement plans of teach-ers, police officers, firefighters, and judges. Pursuant to the Act, the federal government will pay the retire-ment and death benefits, and a defined share of disability benefits, for employees for service accrued priorto June 30, 1997. The costs for benefits earned subsequently are the responsibility of the Government ofthe District of Columbia. This budget reflects the required annual District contribution to fund theseearned benefits.
Pursuant to District of Columbia Official Code (2001 edition) §1-907.02(a), the District is required tobudget the pension contribution at an amount equal to or greater than the amount certified by the DCRBon the basis of a prescribed actuarial study and formula calculation that is set forth in §1-907.03(a) of thecode. On January 4, 2008, the DCRB transmitted the certified contribution for inclusion in the District’sFY 2009 proposed budget as reflected in this chapter.
The agency’s FY 2009 proposed budget is presented in the following tables:
Police Officers’ and Fire Fighters’ Retirement System
C-23
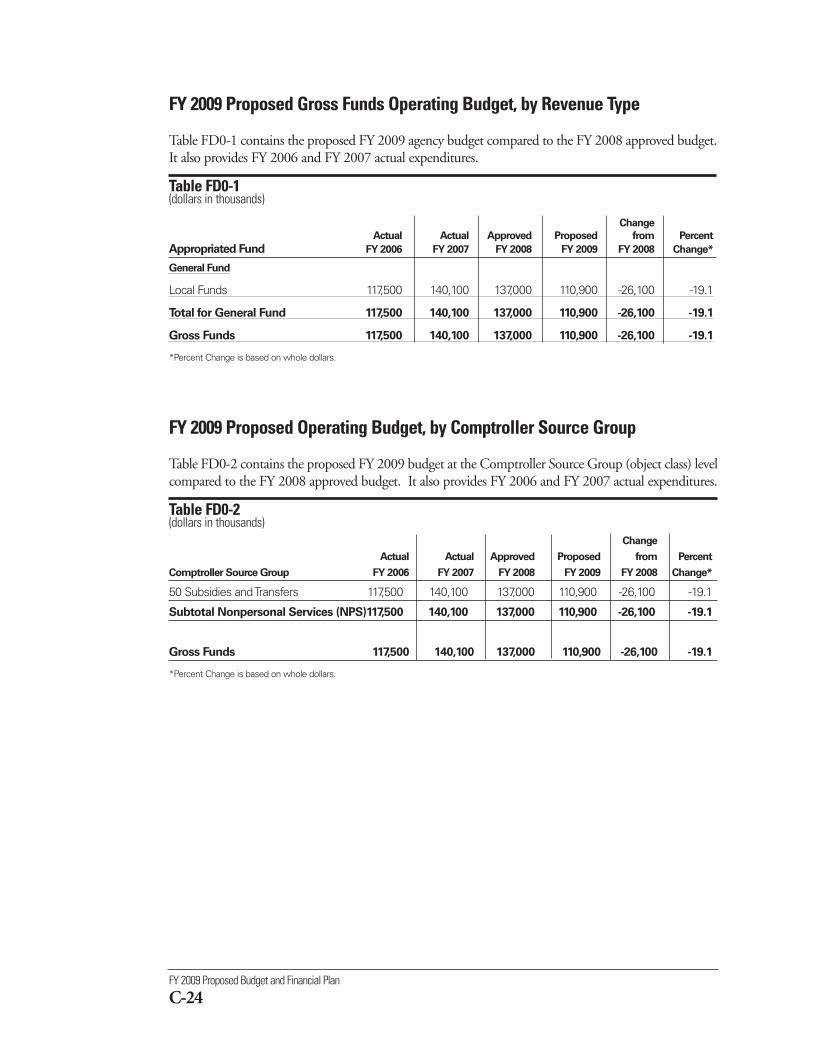
FY 2009 Proposed Budget and Financial Plan
C-24
FY 2009 Proposed Gross Funds Operating Budget, by Revenue Type
Table FD0-1 contains the proposed FY 2009 agency budget compared to the FY 2008 approved budget.It also provides FY 2006 and FY 2007 actual expenditures.
Table FD0-1 (dollars in thousands)
Change
Actual Actual Approved Proposed from Percent
Appropriated Fund FY 2006 FY 2007 FY 2008 FY 2009 FY 2008 Change*
General Fund
Local Funds 117,500 140,100 137,000 110,900 -26,100 -19.1
Total for General Fund 117,500 140,100 137,000 110,900 -26,100 -19.1
Gross Funds 117,500 140,100 137,000 110,900 -26,100 -19.1
*Percent Change is based on whole dollars.
FY 2009 Proposed Operating Budget, by Comptroller Source Group
Table FD0-2 contains the proposed FY 2009 budget at the Comptroller Source Group (object class) levelcompared to the FY 2008 approved budget. It also provides FY 2006 and FY 2007 actual expenditures.
Table FD0-2 (dollars in thousands)
Change
Actual Actual Approved Proposed from Percent
Comptroller Source Group FY 2006 FY 2007 FY 2008 FY 2009 FY 2008 Change*
50 Subsidies and Transfers 117,500 140,100 137,000 110,900 -26,100 -19.1
Subtotal Nonpersonal Services (NPS)117,500 140,100 137,000 110,900 -26,100 -19.1
Gross Funds 117,500 140,100 137,000 110,900 -26,100 -19.1
*Percent Change is based on whole dollars.
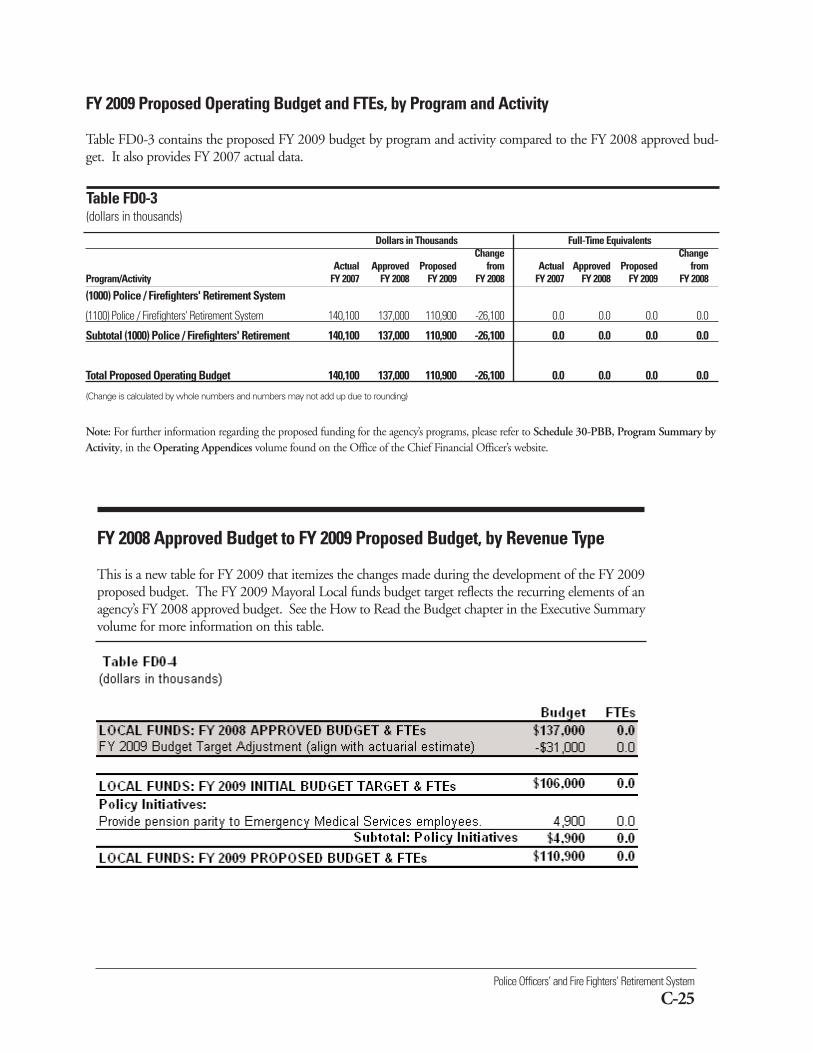
Police Officers’ and Fire Fighters’ Retirement System
C-25
Dollars in Thousands Full-Time EquivalentsChange Change
Actual Approved Proposed from Actual Approved Proposed from Program/Activity FY 2007 FY 2008 FY 2009 FY 2008 FY 2007 FY 2008 FY 2009 FY 2008
(1000) Police / Firefighters' Retirement System
(1100) Police / Firefighters' Retirement System 140,100 137,000 110,900 -26,100 0.0 0.0 0.0 0.0
Subtotal (1000) Police / Firefighters' Retirement 140,100 137,000 110,900 -26,100 0.0 0.0 0.0 0.0
Total Proposed Operating Budget 140,100 137,000 110,900 -26,100 0.0 0.0 0.0 0.0
(Change is calculated by whole numbers and numbers may not add up due to rounding)
Note: For further information regarding the proposed funding for the agency’s programs, please refer to Schedule 30-PBB, Program Summary byActivity, in the Operating Appendices volume found on the Office of the Chief Financial Officer’s website.
FY 2009 Proposed Operating Budget and FTEs, by Program and Activity
Table FD0-3 contains the proposed FY 2009 budget by program and activity compared to the FY 2008 approved bud-get. It also provides FY 2007 actual data.
Table FD0-3(dollars in thousands)
FY 2008 Approved Budget to FY 2009 Proposed Budget, by Revenue Type
This is a new table for FY 2009 that itemizes the changes made during the development of the FY 2009proposed budget. The FY 2009 Mayoral Local funds budget target reflects the recurring elements of anagency’s FY 2008 approved budget. See the How to Read the Budget chapter in the Executive Summaryvolume for more information on this table.
(FL0)
Department of Correctionswww.doc.dc.govTelephone: 202-673-7316
% ChangeFY 2007 FY 2008 FY 2009 from
Description Actual Approved Proposed FY 2008Operating Budget $147,373,670 $153,436,923 $149,773,804 -2.4FTEs 845.7 945.0 921.0 -2.5
The mission of the Department of Corrections (DOC) is to pro-vide a safe, secure, orderly, and humane environment for theconfinement of pretrial detainees and sentenced inmates, whileaffording those in custody meaningful rehabilitative opportuni-ties that will assist them to constructively re-integrate into thecommunity.The District’s Department of Corrections operates the following facilities:
■ The Central Detention Facility (CDF/DC Jail) is located at 1901 D Street, S.E. and was opened in1976. The majority of male and female inmates housed in the Central Detention Facility are await-ing adjudication of cases or are sentenced for misdemeanor offenses. As a result of the NationalCapital Revitalization and Self-Government Improvement Act of 1997, the District’s sentenced felonsare transferred into the Federal Bureau of Prisons.
■ The Correctional Treatment Facility (CTF), is an 8-story structure adjacent to the CDF. In March1997, the District of Columbia entered into a 20-year contract with the Corrections Corporation ofAmerica for the operation and management of the facility. This contract calls for the CTF to contin-ue to serve the DOC as a medium-security resource for male and female inmates and to serve otherspecialized confinement needs of the Department of Corrections.
■ Halfway Houses: DOC contracts with several Community Release Programs that operate facilitiesknown as community correctional centers or halfway houses. The department has contracts with fourprivate and independently operated halfway houses: Efforts From Ex-Convicts, Extended House, Inc.,Fairview, and Hope Village. The U.S. District Court for the District of Columbia and the SuperiorCourt of the District of Columbia place pretrial offenders and sentenced misdemeanants in halfwayhouses as an alternative to incarceration.
The agency plans to fulfill its mission by achieving the following objectives:
Department of Corrections
C-27
FY 2009 Proposed Budget and Financial Plan
C-28
Objective 1: Foster an environment that promotes safety for inmates, staff, visitors, and the communityat large.
Objective 2: Provide comprehensive services to inmates focusing on health care, behavioral restructur-ing, and post-release linkages to community-based resources.
Objective 3: Improve economy, efficiency, and effectiveness of agency operations.
To view complete agency performance plans, please visit the ‘Performance Plans and Reports’ link on theCapStat webpage at http://capstat.oca.dc.gov/.
These objectives are funded through the following agency programs:
■ Inmate Services - provides the services necessary to ensure humane, hygienic, and constitutionallymandated care of inmates.
■ Inmate Custody - detains pretrial defendants and sentenced misdemeanants safely and securely, andin accordance with constitutional requirements.
■ Institutional Support Services - provides direct support to the Inmate Custody and Inmate Servicesprograms by providing life safety, environmental, and facility support services, and documentation onevery inmate’s security risk and legal status.
■ Agency Management - provides for administrative support and the required tools to achieve anagency’s operational and programmatic results. This program is standard for all agencies using perfor-mance-based budgeting.
■ Agency Financial Operations - provides comprehensive and efficient financial management servicesto, and on behalf of, District agencies so that the financial integrity of the District of Columbia ismaintained. This program is standard for all agencies using performance-based budgeting.
The agency’s FY 2009 proposed budget is presented in the following tables:
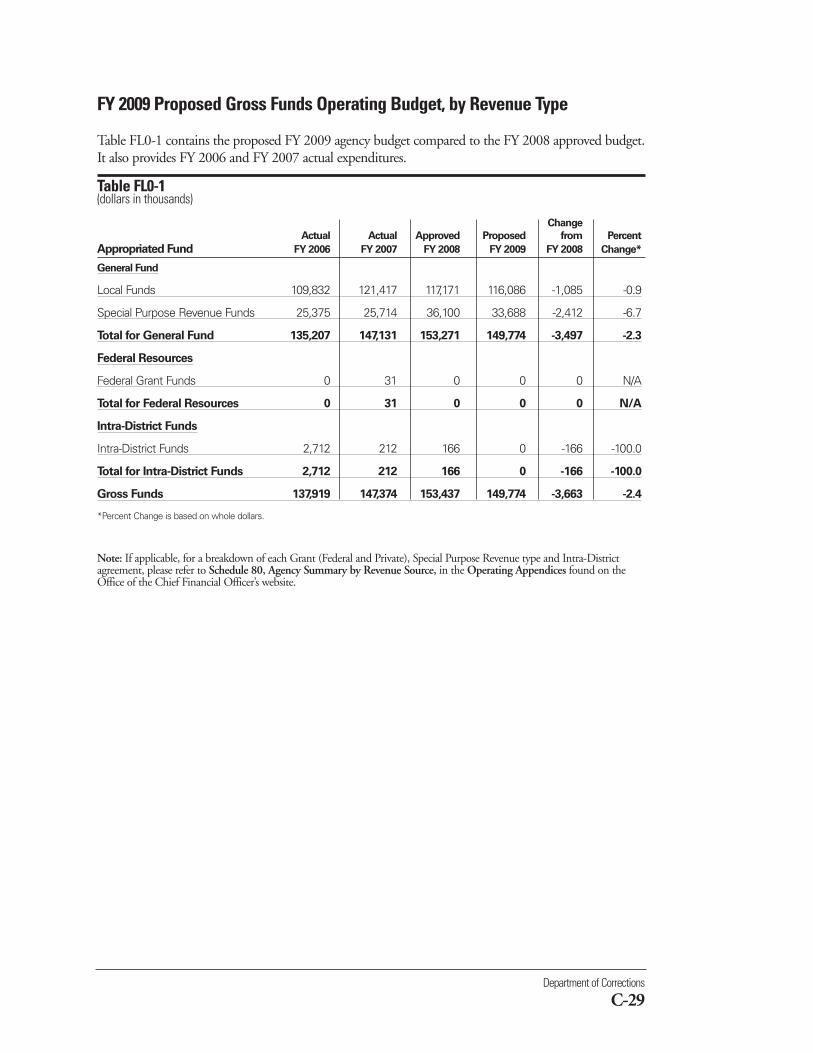
Department of Corrections
C-29
FY 2009 Proposed Gross Funds Operating Budget, by Revenue Type
Table FL0-1 contains the proposed FY 2009 agency budget compared to the FY 2008 approved budget.It also provides FY 2006 and FY 2007 actual expenditures.
Table FL0-1 (dollars in thousands)
Change
Actual Actual Approved Proposed from Percent
Appropriated Fund FY 2006 FY 2007 FY 2008 FY 2009 FY 2008 Change*
General Fund
Local Funds 109,832 121,417 117,171 116,086 -1,085 -0.9
Special Purpose Revenue Funds 25,375 25,714 36,100 33,688 -2,412 -6.7
Total for General Fund 135,207 147,131 153,271 149,774 -3,497 -2.3
Federal Resources
Federal Grant Funds 0 31 0 0 0 N/A
Total for Federal Resources 0 31 0 0 0 N/A
Intra-District Funds
Intra-District Funds 2,712 212 166 0 -166 -100.0
Total for Intra-District Funds 2,712 212 166 0 -166 -100.0
Gross Funds 137,919 147,374 153,437 149,774 -3,663 -2.4
*Percent Change is based on whole dollars.
Note: If applicable, for a breakdown of each Grant (Federal and Private), Special Purpose Revenue type and Intra-Districtagreement, please refer to Schedule 80, Agency Summary by Revenue Source, in the Operating Appendices found on theOffice of the Chief Financial Officer’s website.
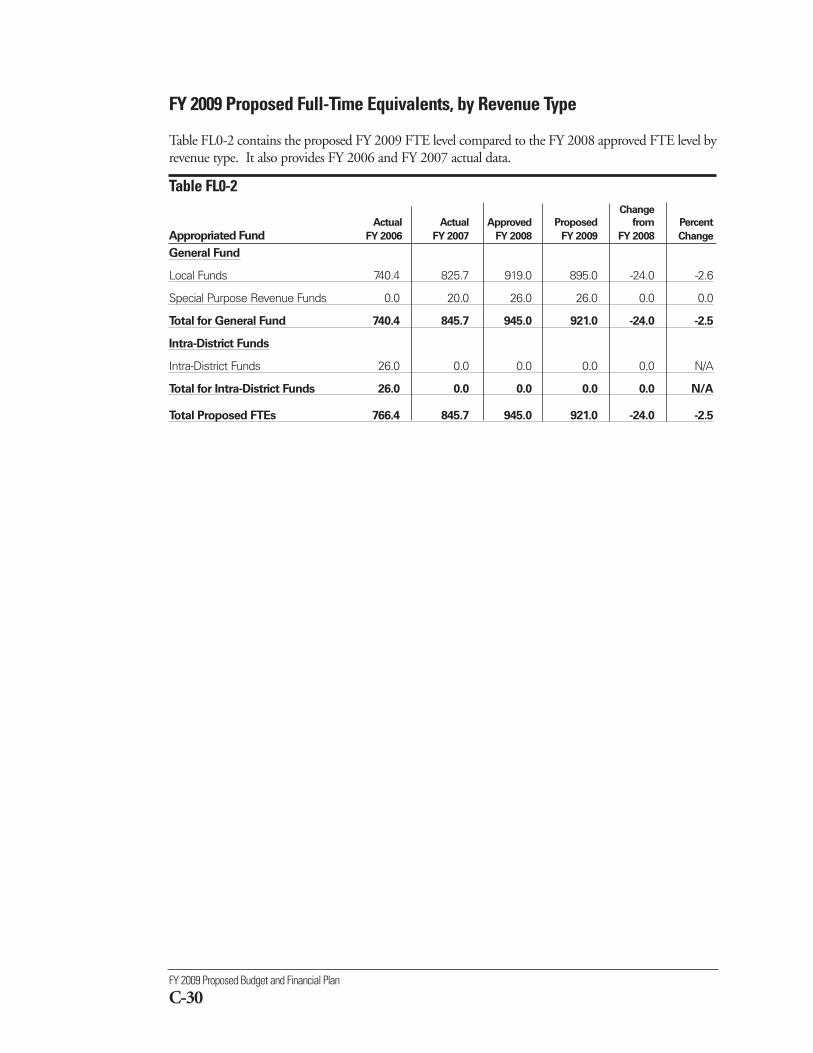
FY 2009 Proposed Budget and Financial Plan
C-30
FY 2009 Proposed Full-Time Equivalents, by Revenue Type
Table FL0-2 contains the proposed FY 2009 FTE level compared to the FY 2008 approved FTE level byrevenue type. It also provides FY 2006 and FY 2007 actual data.
Table FL0-2 Change
Actual Actual Approved Proposed from Percent
Appropriated Fund FY 2006 FY 2007 FY 2008 FY 2009 FY 2008 Change
General Fund
Local Funds 740.4 825.7 919.0 895.0 -24.0 -2.6
Special Purpose Revenue Funds 0.0 20.0 26.0 26.0 0.0 0.0
Total for General Fund 740.4 845.7 945.0 921.0 -24.0 -2.5
Intra-District Funds
Intra-District Funds 26.0 0.0 0.0 0.0 0.0 N/A
Total for Intra-District Funds 26.0 0.0 0.0 0.0 0.0 N/A
Total Proposed FTEs 766.4 845.7 945.0 921.0 -24.0 -2.5
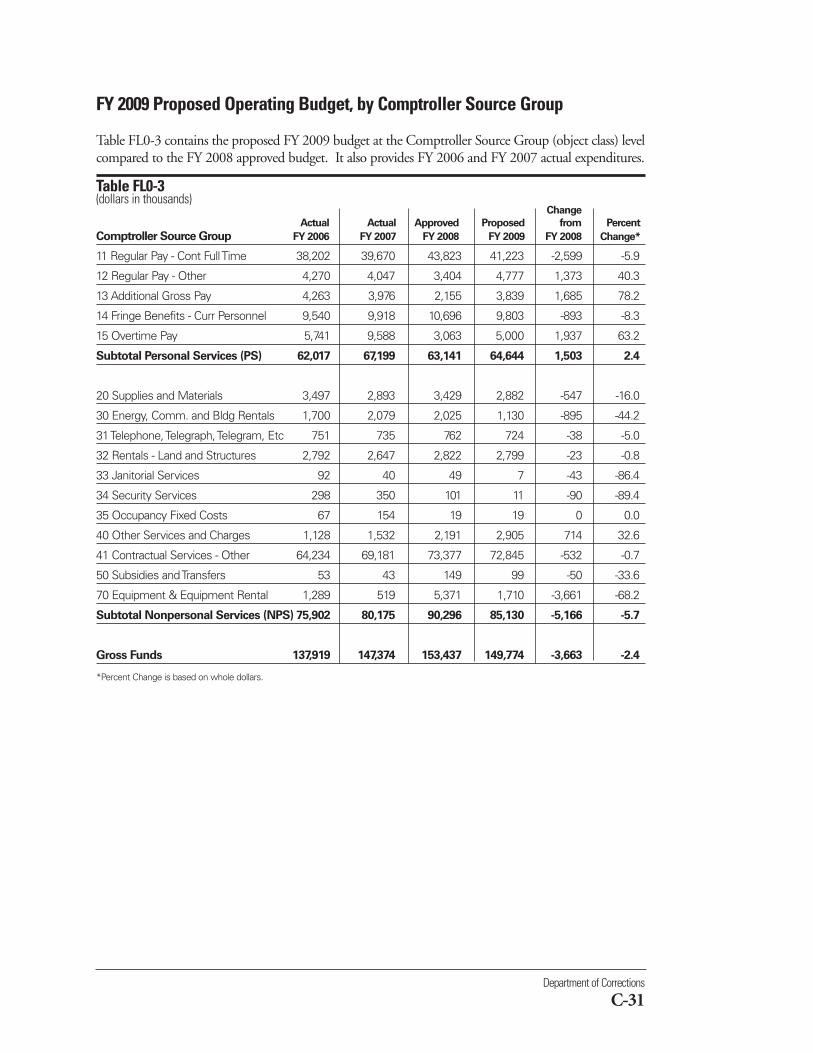
Department of Corrections
C-31
FY 2009 Proposed Operating Budget, by Comptroller Source Group
Table FL0-3 contains the proposed FY 2009 budget at the Comptroller Source Group (object class) levelcompared to the FY 2008 approved budget. It also provides FY 2006 and FY 2007 actual expenditures.
Table FL0-3(dollars in thousands)
Change
Actual Actual Approved Proposed from Percent
Comptroller Source Group FY 2006 FY 2007 FY 2008 FY 2009 FY 2008 Change*
11 Regular Pay - Cont Full Time 38,202 39,670 43,823 41,223 -2,599 -5.9
12 Regular Pay - Other 4,270 4,047 3,404 4,777 1,373 40.3
13 Additional Gross Pay 4,263 3,976 2,155 3,839 1,685 78.2
14 Fringe Benefits - Curr Personnel 9,540 9,918 10,696 9,803 -893 -8.3
15 Overtime Pay 5,741 9,588 3,063 5,000 1,937 63.2
Subtotal Personal Services (PS) 62,017 67,199 63,141 64,644 1,503 2.4
20 Supplies and Materials 3,497 2,893 3,429 2,882 -547 -16.0
30 Energy, Comm. and Bldg Rentals 1,700 2,079 2,025 1,130 -895 -44.2
31 Telephone, Telegraph, Telegram, Etc 751 735 762 724 -38 -5.0
32 Rentals - Land and Structures 2,792 2,647 2,822 2,799 -23 -0.8
33 Janitorial Services 92 40 49 7 -43 -86.4
34 Security Services 298 350 101 11 -90 -89.4
35 Occupancy Fixed Costs 67 154 19 19 0 0.0
40 Other Services and Charges 1,128 1,532 2,191 2,905 714 32.6
41 Contractual Services - Other 64,234 69,181 73,377 72,845 -532 -0.7
50 Subsidies and Transfers 53 43 149 99 -50 -33.6
70 Equipment & Equipment Rental 1,289 519 5,371 1,710 -3,661 -68.2
Subtotal Nonpersonal Services (NPS) 75,902 80,175 90,296 85,130 -5,166 -5.7
Gross Funds 137,919 147,374 153,437 149,774 -3,663 -2.4
*Percent Change is based on whole dollars.
FY 2009 Proposed Budget and Financial Plan
C-32
Dollars in Thousands Full-Time EquivalentsChange Change
Actual Approved Proposed from Actual Approved Proposed from Program/Activity FY 2007 FY 2008 FY 2009 FY 2008 FY 2007 FY 2008 FY 2009 FY 2008
(1000) Administrative Services Modernization Prog.
(1010) Personnel -8 0 0 0 0.0 0.0 0.0 0.0
(1015) Training and Employee Development 26 0 0 0 0.0 0.0 0.0 0.0
(1017) Labor Relations and Employee Development 63 0 0 0 1.0 0.0 0.0 0.0
(1020) Contracting and Procurement 6 0 0 0 0.0 0.0 0.0 0.0
(1030) Property Management -1 0 0 0 0.0 0.0 0.0 0.0
(1040) Information Technology 13 0 0 0 0.0 0.0 0.0 0.0
(1050) Financial Management 185 0 0 0 1.0 0.0 0.0 0.0
(1060) Legal -2 0 0 0 0.0 0.0 0.0 0.0
(1070) Fleet Management 0 0 0 0 0.0 0.0 0.0 0.0
(1080) Communications -2 0 0 0 0.0 0.0 0.0 0.0
(1085) Customer Services 5 0 0 0 0.0 0.0 0.0 0.0
(1090) Performance Management 282 0 0 0 2.0 0.0 0.0 0.0
Subtotal (1000) Administrative Srvs. Modernization Prog. 567 0 0 0 4.0 0.0 0.0 0.0
(100F) Agency Financial Operations
(110F) Budget Operations 202 223 224 1 3.0 2.0 2.0 0.0
(120F) Accounting Operations 246 266 275 8 3.0 4.0 4.0 0.0
(130F) ACFO 141 161 165 3 1.0 1.0 1.0 0.0
Subtotal (100F) Agency Financial Operations 590 651 663 13 7.0 7.0 7.0 0.0
(1100) Agency Management Programs
(1110) Executive Direction and Support 1,885 2,883 1,810 -1,073 20.0 34.0 19.0 -15.0
(1120) Human Resources Management 1,399 3,989 2,456 -1,534 14.0 48.0 19.0 -29.0
(1130) Management Control 910 1,650 2,070 420 9.0 11.0 13.0 2.0
(1140) Information Technology 3,842 6,878 5,253 -1,625 11.0 11.0 12.0 1.0
(1150) Agency Operations Support 3,292 5,150 6,703 1,553 8.0 9.0 9.0 0.0
Subtotal(1100) Agency Management Programs 11,329 20,551 18,292 -2,259 62.0 113.0 72.0 -41.0
(1FFF) Agency Financial Operations Program (B)
(13FF) ACFO Master (B) 0 0 0 0 0.0 0.0 0.0 0.0
Subtotal (1FFF) Agency Financial Operations Program (B) 0 0 0 0 0.0 0.0 0.0 0.0
(Continued on the next page)
FY 2009 Proposed Operating Budget and FTEs, by Program and Activity
Table FL0-4 contains the proposed FY 2009 budget by program and activity compared to the FY 2008 approved budget.It also provides FY 2007 actual data.
Table FL0-4(dollars in thousands)
Department of Corrections
C-33
Dollars in Thousands Full-Time EquivalentsChange Change
Actual Approved Proposed from Actual Approved Proposed from Program/Activity FY 2007 FY 2008 FY 2009 FY 2008 FY 2007 FY 2008 FY 2009 FY 2008
(2000) Institutional Custody Operations
(2010) Security and Control 139 0 0 0 1.0 0.0 0.0 0.0
(2011) US Marshals Transportation 31 0 0 0 0.0 0.0 0.0 0.0
(2020) Rules and Discipline 70 0 0 0 1.0 0.0 0.0 0.0
(2050) Violent Offender Incarceration\Truth -48 0 0 0 0.0 0.0 0.0 0.0
Subtotal (2000) Institutional Custody Operations 192 0 0 0 2.0 0.0 0.0 0.0
(22IS) Inmate Services
(2440) Inmate Personnel Services -33 0 0 0 0.0 0.0 0.0 0.0
(2550) Inmate Developmental & Adjustment Support -11 0 0 0 0.0 0.0 0.0 0.0
(2660) Inmate Health Services 2 0 0 0 0.0 0.0 0.0 0.0
Subtotal (22IS) Inmate Services -43 0 0 0 0.0 0.0 0.0 0.0
(2300) Management Information Systems
(2310) Management Information Systems -1 0 0 0 0.0 0.0 0.0 0.0
Subtotal (2300) Management Information Systems -1 0 0 0 0.0 0.0 0.0 0.0
(2500) Inmate Services
(2510) Inmate Personal Services 10,378 9,691 9,251 -440 34.0 47.0 38.0 -9.0
(2520) Inmate Adjustment/Developmental Support 2,210 1,853 1,848 -6 26.0 27.0 27.0 0.0
(2530) Inmate Health Services 34,435 32,320 34,961 2,641 74.5 59.0 79.0 20.0
Subtotal (2500) Inmate Services 47,024 43,864 46,060 2,196 134.5 133.0 144.0 11.0
(3000) Institutional Support Services
(3020) Offender Records 8 0 0 0 0.0 0.0 0.0 0.0
(3041) Food Services (Concession) -10 0 0 0 0.0 0.0 0.0 0.0
(3050) Sanitation and Hygiene 3 0 0 0 0.0 0.0 0.0 0.0
(3080) Youth Services Administration Security 0 0 0 0 0.0 0.0 0.0 0.0
Subtotal (3000) Institutional Support Services 1 0 0 0 0.0 0.0 0.0 0.0
(33IC) Inmate Custody
(3440) Internal Security & Control Services -158 0 0 0 0.0 0.0 0.0 0.0
(3550) External Security & Control Services -51 0 0 0 0.0 0.0 0.0 0.0
(3660) Community Corrections -2 0 0 0 0.0 0.0 0.0 0.0
Subtotal (33IC) Inmate Custody -211 0 0 0 0.0 0.0 0.0 0
(Continued on the next page)
FY 2009 Proposed Operating Budget and FTEs, by Program and Activity
Table FL0-4 contains the proposed FY 2009 budget by program and activity compared to the FY 2008 approved budget.It also provides FY 2007 actual data.
Table FL0-4 (Continued)(dollars in thousands)
FY 2009 Proposed Budget and Financial Plan
C-34
Dollars in Thousands Full-Time EquivalentsChange Change
Actual Approved Proposed from Actual Approved Proposed from Program/Activity FY 2007 FY 2008 FY 2009 FY 2008 FY 2007 FY 2008 FY 2009 FY 2008
(3600) Inmate Custody
(3610) Internal Security and Control Services 39,787 35,758 39,710 3,952 480.2 528.0 544.0 16.0
(3620) External Security and Control Services 35,452 40,650 32,114 -8,537 36.0 49.0 44.0 -5.0
(3630) Community Corrections 2,771 3,632 3,546 -86 3.0 8.0 4.0 -4.0
Subtotal (3600) Inmate Custody 78,011 80,040 75,369 -4,671 519.2 585.0 592.0 7.0
(4000) Inmate Services Programs
(4040) Recreation Services 3 0 0 0 0.0 0.0 0.0 0.0
(4080) Scaap Grant Federal 31 0 0 0 0.0 0.0 0.0 0.0
(4090) Residential Subs Abuse Treatment 0 0 0 0 0.0 0.0 0.0 0.0
Subtotal (4000) Inmate Services Programs 34 0 0 0 0.0 0.0 0.0 0.0
(4500) Correctional Center #4
(4510) Correctional Center #4 0 0 0 0 0.0 0.0 0.0 0.0
Subtotal (4500) Correctional Center #4 0 0 0 0 0.0 0.0 0.0 0.0
(4800) Institutional Support Services
(4810) Inmate Status Documentation 4,950 5,760 6,071 311 91.0 86.0 90.0 4.0
(4820) Facility Services 4,994 2,571 3,319 748 26.0 21.0 16.0 -5.0
Subtotal (4800) Institutional Support Services 9,944 8,331 9,390 1,059 117.0 107.0 106.0 -1.0
(4ISS) Institutional Support Services
(4440) Inmate Status Documentation -29 0 0 0 0.0 0.0 0.0 0.0
(4550) Facility Services -12 0 0 0 0.0 0.0 0.0 0.0
(4660) Logistical Support -2 0 0 0 0.0 0.0 0.0 0.0
(4770) Correctional System Control -17 0 0 0 0.0 0.0 0.0 0.0
Subtotal (4ISS) Institutional Support Services -60 0 0 0 0.0 0.0 0.0 0.0
(9960) Year End Close
No Activity Assigned -2 0 0 0 0.0 0.0 0.0 0.0
Subtotal (9960) Year End Close -2 0 0 0 0.0 0.0 0.0 0.0
Total Proposed Operating Budget 147,374 153,437 149,774 -3,663 845.7 945.0 921.0 -24.0
(Change is calculated by whole numbers and numbers may not add up due to rounding)
Note: For further information regarding the proposed funding for the agency’s programs, please refer to Schedule 30-PBB, Program Summary byActivity, in the Operating Appendices volume found on the Office of the Chief Financial Officer’s website.
FY 2009 Proposed Operating Budget and FTEs, by Program and Activity
Table FL0-4 contains the proposed FY 2009 budget by program and activity compared to the FY 2008 approved budget.It also provides FY 2007 actual data.
Table FL0-4 (Continued)(dollars in thousands)
Department of Corrections
C-35
FY 2008 Approved Budget to FY 2009 Proposed Budget, by Revenue Type
This is a new table for FY 2009 that itemizes the changes made during the development of the FY 2009proposed budget. The FY 2009 Mayoral Local funds budget target reflects the recurring elements of anagency’s FY 2008 approved budget. See the How to Read the Budget chapter in the Executive Summaryvolume for more information on this table.
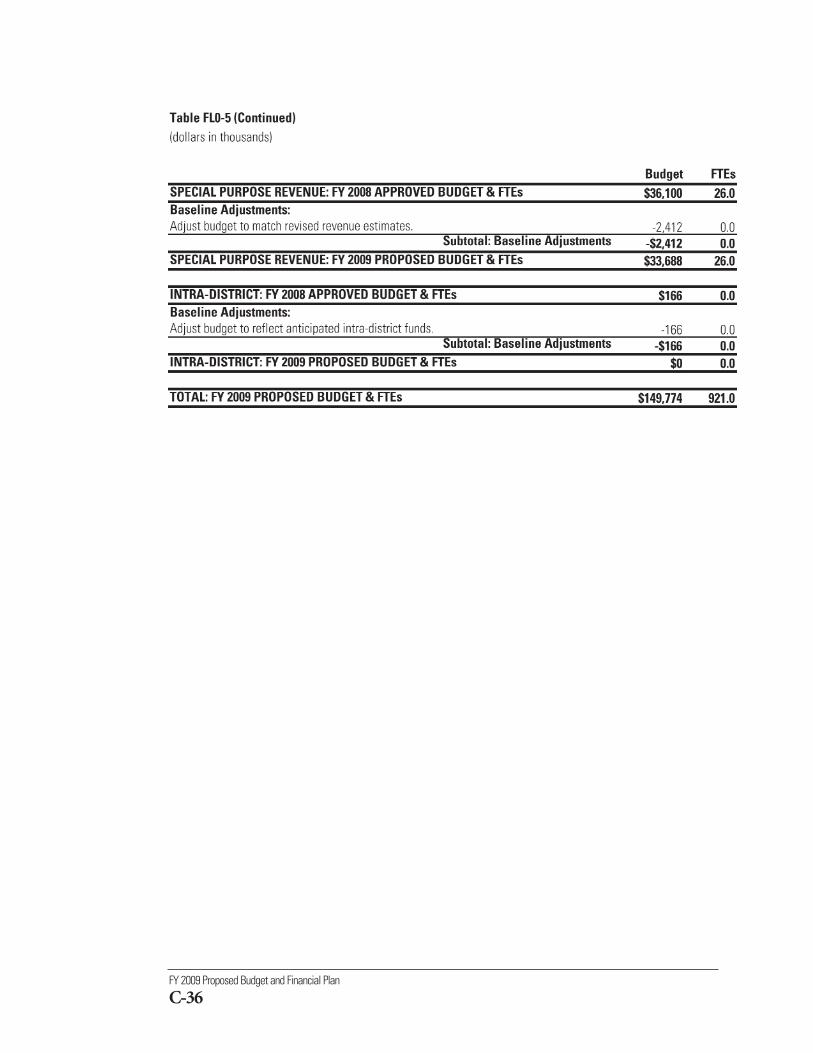
FY 2009 Proposed Budget and Financial Plan
C-36
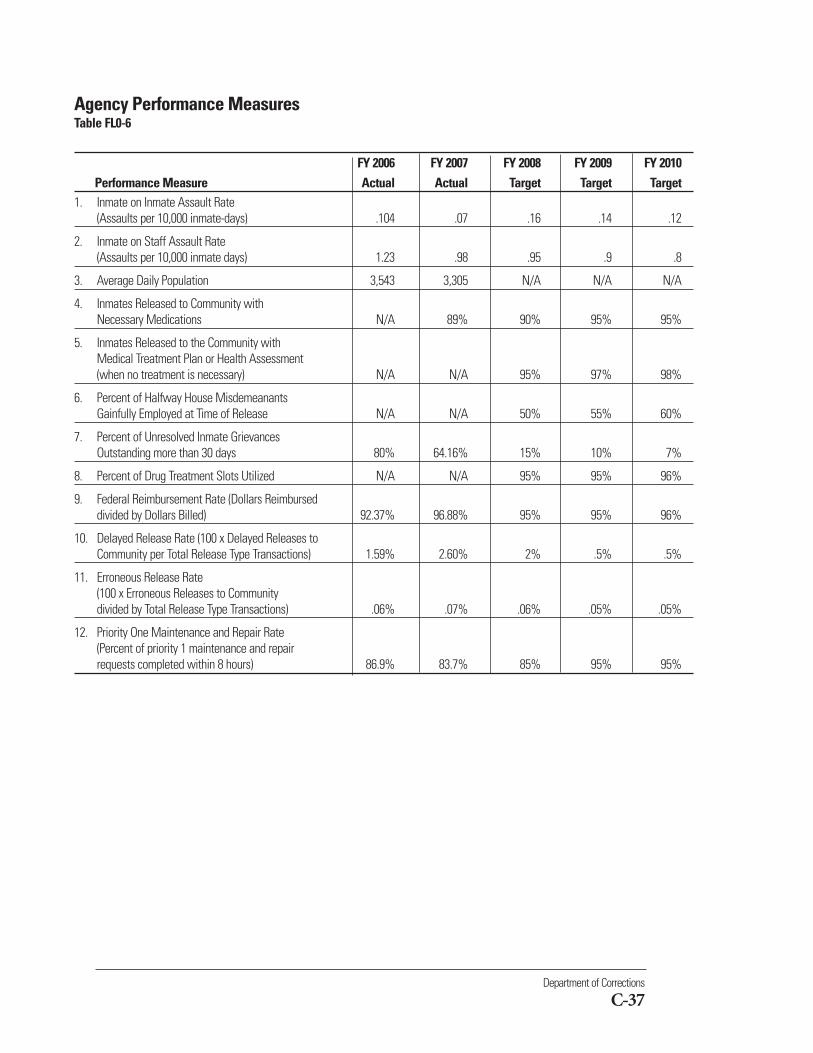
Department of Corrections
C-37
Agency Performance MeasuresTable FL0-6
FY 2006 FY 2007 FY 2008 FY 2009 FY 2010Performance Measure Actual Actual Target Target Target
1. Inmate on Inmate Assault Rate(Assaults per 10,000 inmate-days) .104 .07 .16 .14 .12
2. Inmate on Staff Assault Rate(Assaults per 10,000 inmate days) 1.23 .98 .95 .9 .8
3. Average Daily Population 3,543 3,305 N/A N/A N/A
4. Inmates Released to Community with Necessary Medications N/A 89% 90% 95% 95%
5. Inmates Released to the Community with Medical Treatment Plan or Health Assessment (when no treatment is necessary) N/A N/A 95% 97% 98%
6. Percent of Halfway House Misdemeanants Gainfully Employed at Time of Release N/A N/A 50% 55% 60%
7. Percent of Unresolved Inmate Grievances Outstanding more than 30 days 80% 64.16% 15% 10% 7%
8. Percent of Drug Treatment Slots Utilized N/A N/A 95% 95% 96%
9. Federal Reimbursement Rate (Dollars Reimbursed divided by Dollars Billed) 92.37% 96.88% 95% 95% 96%
10. Delayed Release Rate (100 x Delayed Releases to Community per Total Release Type Transactions) 1.59% 2.60% 2% .5% .5%
11. Erroneous Release Rate (100 x Erroneous Releases to Community divided by Total Release Type Transactions) .06% .07% .06% .05% .05%
12. Priority One Maintenance and Repair Rate (Percent of priority 1 maintenance and repair requests completed within 8 hours) 86.9% 83.7% 85% 95% 95%
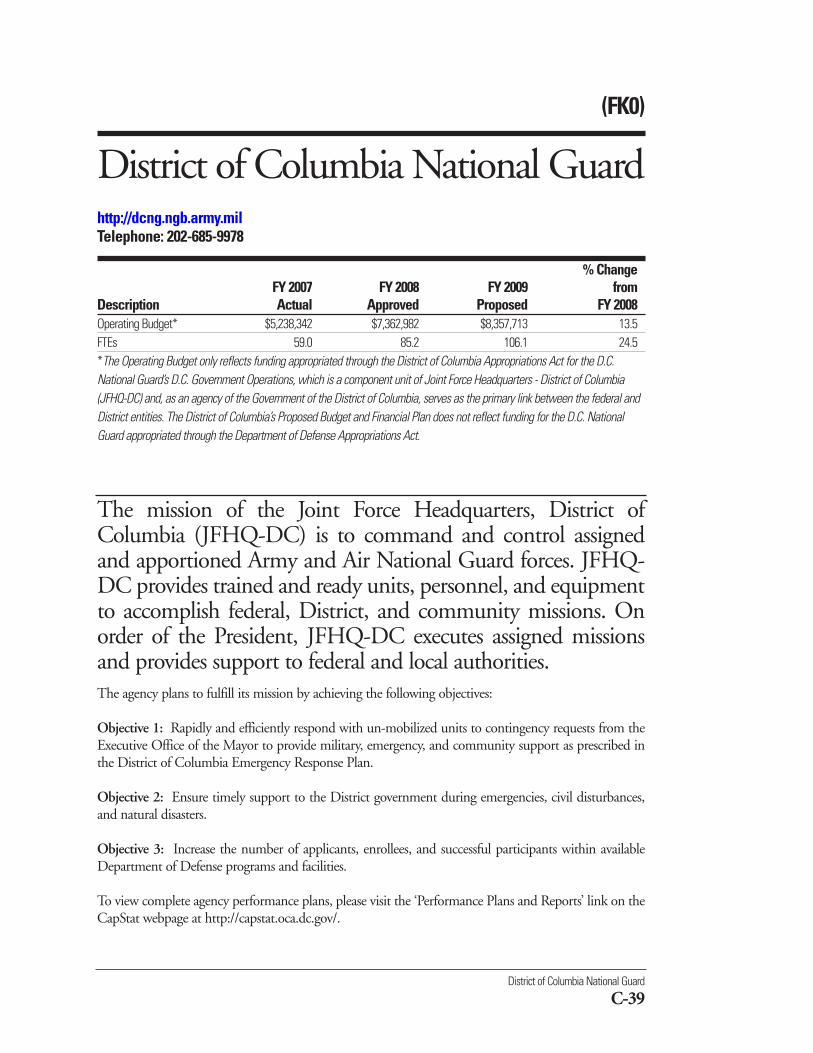
District of Columbia National Guard
C-39
(FK0)
District of Columbia National Guardhttp://dcng.ngb.army.milTelephone: 202-685-9978
% ChangeFY 2007 FY 2008 FY 2009 from
Description Actual Approved Proposed FY 2008Operating Budget* $5,238,342 $7,362,982 $8,357,713 13.5FTEs 59.0 85.2 106.1 24.5*The Operating Budget only reflects funding appropriated through the District of Columbia Appropriations Act for the D.C.National Guard’s D.C. Government Operations, which is a component unit of Joint Force Headquarters - District of Columbia(JFHQ-DC) and, as an agency of the Government of the District of Columbia, serves as the primary link between the federal andDistrict entities. The District of Columbia’s Proposed Budget and Financial Plan does not reflect funding for the D.C. NationalGuard appropriated through the Department of Defense Appropriations Act.
The mission of the Joint Force Headquarters, District ofColumbia (JFHQ-DC) is to command and control assignedand apportioned Army and Air National Guard forces. JFHQ-DC provides trained and ready units, personnel, and equipmentto accomplish federal, District, and community missions. Onorder of the President, JFHQ-DC executes assigned missionsand provides support to federal and local authorities.The agency plans to fulfill its mission by achieving the following objectives:
Objective 1: Rapidly and efficiently respond with un-mobilized units to contingency requests from theExecutive Office of the Mayor to provide military, emergency, and community support as prescribed inthe District of Columbia Emergency Response Plan.
Objective 2: Ensure timely support to the District government during emergencies, civil disturbances,and natural disasters.
Objective 3: Increase the number of applicants, enrollees, and successful participants within availableDepartment of Defense programs and facilities.
To view complete agency performance plans, please visit the ‘Performance Plans and Reports’ link on theCapStat webpage at http://capstat.oca.dc.gov/.
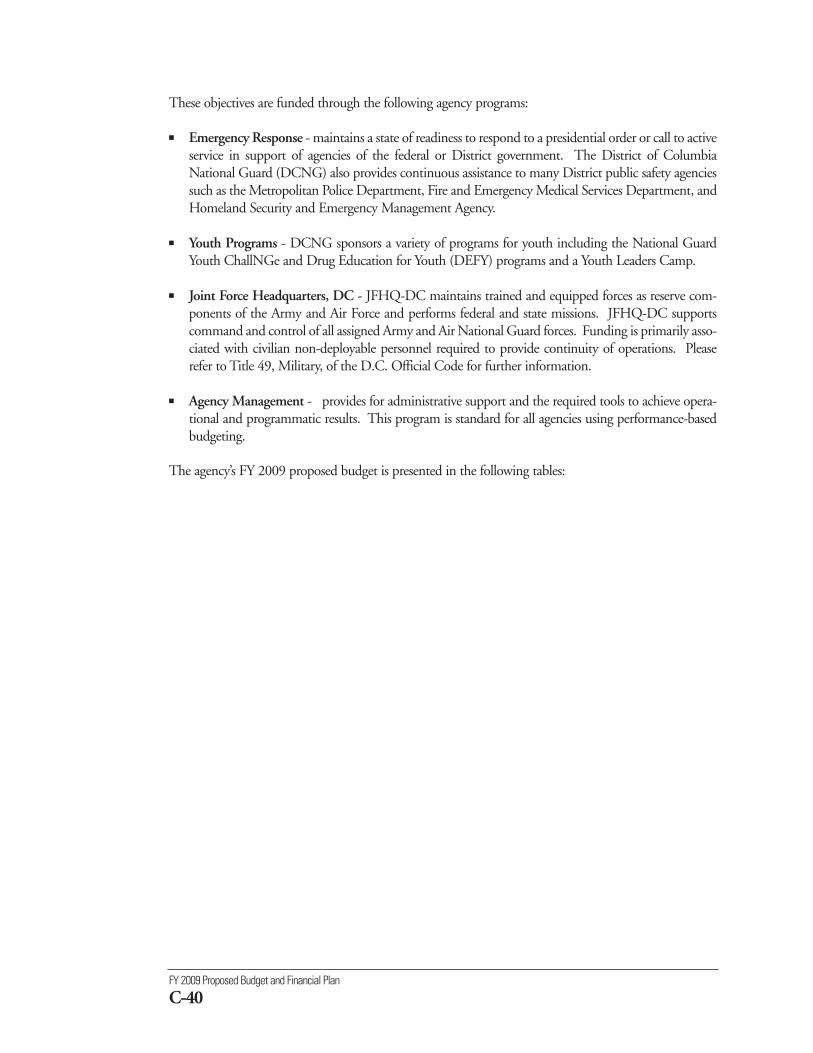
FY 2009 Proposed Budget and Financial Plan
C-40
These objectives are funded through the following agency programs:
■ Emergency Response - maintains a state of readiness to respond to a presidential order or call to activeservice in support of agencies of the federal or District government. The District of ColumbiaNational Guard (DCNG) also provides continuous assistance to many District public safety agenciessuch as the Metropolitan Police Department, Fire and Emergency Medical Services Department, andHomeland Security and Emergency Management Agency.
■ Youth Programs - DCNG sponsors a variety of programs for youth including the National GuardYouth ChallNGe and Drug Education for Youth (DEFY) programs and a Youth Leaders Camp.
■ Joint Force Headquarters, DC - JFHQ-DC maintains trained and equipped forces as reserve com-ponents of the Army and Air Force and performs federal and state missions. JFHQ-DC supportscommand and control of all assigned Army and Air National Guard forces. Funding is primarily asso-ciated with civilian non-deployable personnel required to provide continuity of operations. Pleaserefer to Title 49, Military, of the D.C. Official Code for further information.
■ Agency Management - provides for administrative support and the required tools to achieve opera-tional and programmatic results. This program is standard for all agencies using performance-basedbudgeting.
The agency’s FY 2009 proposed budget is presented in the following tables:
District of Columbia National Guard
C-41
FY 2009 Proposed Gross Funds Operating Budget, by Revenue Type
Table FK0-1 contains the proposed FY 2009 agency budget compared to the FY 2008 approved budget.It also provides FY 2006 and FY 2007 actual expenditures.
Table FK0-1 (dollars in thousands)
Change
Actual Actual Approved Proposed from Percent
Appropriated Fund FY 2006 FY 2007 FY 2008 FY 2009 FY 2008 Change*
General Fund
Local Funds 2,329 2,846 3,824 3,371 -454 -11.9
Total for General Fund 2,329 2,846 3,824 3,371 -454 -11.9
Federal Resources
Federal Payments 0 0 352 0 -352 -100.0
Federal Grant Funds 878 2,074 3,187 4,987 1,800 56.5
Total for Federal Resources 878 2,074 3,539 4,987 1,448 40.9
Intra-District Funds
Intra-District Funds 303 318 0 0 0 N/A
Total for Intra-District Funds 303 318 0 0 0 N/A
Gross Funds 3,509 5,238 7,363 8,358 995 13.5
*Percent Change is based on whole dollars.
Note: If applicable, for a breakdown of each Grant (Federal and Private), Special Purpose Revenue type and Intra-Districtagreement, please refer to Schedule 80, Agency Summary by Revenue Source, in the Operating Appendices found on theOffice of the Chief Financial Officer’s website.
FY 2009 Proposed Full-Time Equivalents, by Revenue Type
Table FK0-2 contains the proposed FY 2009 FTE level compared to the FY 2008 approved FTE level byrevenue type. It also provides FY 2006 and FY 2007 actual data.
Table FK0-2 Change
Actual Actual Approved Proposed from Percent
Appropriated Fund FY 2006 FY 2007 FY 2008 FY 2009 FY 2008 Change
General Fund
Local Funds 22.0 30.0 40.2 33.4 -6.8 -16.9
Total for General Fund 22.0 30.0 40.2 33.4 -6.8 -16.9
Federal Resources
Federal Grant Funds 21.0 29.0 45.0 72.7 27.7 61.4
Total for Federal Resources 21.0 29.0 45.0 72.7 27.7 61.4
Total Proposed FTEs 43.0 59.0 85.2 106.1 20.9 24.5
FY 2009 Proposed Budget and Financial Plan
C-42
FY 2009 Proposed Operating Budget, by Comptroller Source Group
Table FK0-3 contains the proposed FY 2009 budget at the Comptroller Source Group (object class) levelcompared to the FY 2008 approved budget. It also provides FY 2006 and FY 2007 actual expenditures.
Table FK0-3(dollars in thousands)
Change
Actual Actual Approved Proposed from Percent
Comptroller Source Group FY 2006 FY 2007 FY 2008 FY 2009 FY 2008 Change*
11 Regular Pay - Cont Full Time 1,658 2,049 2,658 3,324 667 25.1
12 Regular Pay - Other 65 656 764 1,485 721 94.4
13 Additional Gross Pay 21 144 24 50 26 108.8
14 Fringe Benefits - Curr Personnel 338 446 946 956 10 1.1
15 Overtime Pay 0 1 0 0 0 N/A
Subtotal Personal Services (PS) 2,081 3,297 4,392 5,815 1,424 32.4
20 Supplies and Materials 97 272 473 487 14 2.9
30 Energy, Comm. and Bldg Rentals 636 681 922 785 -137 -14.8
31 Telephone, Telegraph, Telegram, Etc 0 7 3 3 0 0.0
32 Rentals - Land and Structures 0 0 0 1 1 N/A
33 Janitorial Services 334 270 281 402 121 43.0
35 Occupancy Fixed Costs 60 147 151 151 0 0.0
40 Other Services and Charges 119 88 146 559 413 282.8
41 Contractual Services - Other 158 313 27 11 -16 -60.0
50 Subsidies and Transfers 0 48 752 48 -704 -93.6
70 Equipment & Equipment Rental 25 115 215 95 -120 -55.8
Subtotal Nonpersonal Services (NPS) 1,428 1,942 2,971 2,542 -429 -14.4
Gross Funds 3,509 5,238 7,363 8,358 995 13.5
*Percent Change is based on whole dollars.
District of Columbia National Guard
C-43
Dollars in Thousands Full-Time EquivalentsChange Change
Actual Approved Proposed from Actual Approved Proposed from Program/Activity FY 2007 FY 2008 FY 2009 FY 2008 FY 2007 FY 2008 FY 2009 FY 2008
(0110) DC National Guard
No Activity Assigned 68 0 0 0 0.0 0.0 0.0 0.0
Subtotal (0110) DC National Guard 68 0 0 0 0.0 0.0 0.0 0.0
(1000) Agency Management
(1010) Administrative Service 0 526 233 -293 0.0 8.0 3.0 -5.0
(1020) Contracting & Procurement 0 0 190 190 0.0 0.0 2.0 2.0
(1030) Property Management 1,098 1,355 683 -672 0.0 0.0 0.0 0.0
(1040) Information Technology 0 0 64 64 0.0 0.0 1.0 1.0
(1050) Financial Services 0 0 63 63 0.0 0.0 1.0 1.0
(1080) Communications 7 3 3 0 0.0 0.0 0.0 0.0
(110F) Agency Financial Operations 0 0 100 100 0.0 0.0 1.0 1.0
Subtotal (1000) Agency Management 1,105 1,884 1,336 -548 0.0 8.0 8.0 0.0
(2000) Emergency Response
(2010) Emergency Planning & Support Services 2,718 4,424 670 -3,754 52.0 67.0 0.0 -67.0
(2020) Event, Traffic & Crowd Control Services 64 0 0 0 0.0 0.0 0.0 0.0
Subtotal (2000) Emergency Response 2,782 4,424 670 -3,754 52.0 67.0 0.0 -67.0
(3000) Community Support
(3010) Youth Services 1,284 1,055 0 -1,055 7.0 10.2 0.0 -10.2
(3040) Community Displays & Outreach Efforts -2 0 0 0 0.0 0.0 0.0 0.0
Subtotal (3000) Community Support 1,282 1,055 0 -1,055 7.0 10.2 0.0 -10.2
(4000) Youth Programs
(4010) Challenge 0 0 2,794 2794 0.0 0.0 43.1 43.1
(4030) Youth Leaders Camp 0 0 59 59 0.0 0.0 1.0 1.0
Subtotal (4000) Youth Programs 0 0 2,854 2,854 0.0 0.0 44.1 44.1
(Continued on next page)
FY 2009 Proposed Operating Budget and FTEs, by Program and Activity
Table FK0-4 contains the proposed FY 2009 budget by program and activity compared to the FY 2008 approved bud-get. It also provides FY 2007 actual data.
Table FK0-4(dollars in thousands)
FY 2009 Proposed Budget and Financial Plan
C-44
Dollars in Thousands Full-Time EquivalentsChange Change
Actual Approved Proposed from Actual Approved Proposed from Program/Activity FY 2007 FY 2008 FY 2009 FY 2008 FY 2007 FY 2008 FY 2009 FY 2008
(6000) Joint Force Headquarters, DC
(6010) Command Element 0 0 73 73 0.0 0.0 2.0 2.0
(6011) State Judge Advocate General 0 0 77 77 0.0 0.0 1.0 1.0
(6012) US Property and Fiscal Office 0 0 54 54 0.0 0.0 5.0 5.0
(6020) AASF 0 0 110 110 0.0 0.0 2.0 2.0
(6030) J1 Personnel 0 0 164 164 0.0 0.0 2.0 2.0
(6040) Human Resource Office 0 0 122 122 0.0 0.0 2.0 2.0
(6050) State Surgeon 0 0 64 64 0.0 0.0 1.0 1.0
(6060) Department Of Engineering 0 0 2,463 2,463 0.0 0.0 33.0 33.0
(6070) 113th 0 0 88 88 0.0 0.0 2.0 2.0
(6080) J3/Operations 0 0 96 96 0.0 0.0 1.0 1.0
(6090) J6/IT 0 0 187 187 0.0 0.0 3.0 3.0
Subtotal (6000) Joint Force Headquarters, DC 0 0 3,498 3,498 0.0 0.0 54.0 54.0
(9960) Year End Close
No Activity Assigned 0 0 0 0 0.0 0.0 0.0 0.0
Subtotal (9960) Year End Close 0 0 0 0 0.0 0.0 0.0 0.0
Total Proposed Operating Budget 5,238 7,363 8,358 995 59.0 85.2 106.1 20.9
(Change is calculated by whole numbers and numbers may not add up due to rounding)
Note: For further information regarding the proposed funding for the agency’s programs, please refer to Schedule 30-PBB,Program Summary by Activity, in the Operating Appendices volume found on the Office of the Chief Financial Officer’s website.
FY 2009 Proposed Operating Budget and FTEs, by Program and Activity
Table FK0-4 contains the proposed FY 2009 budget by program and activity compared to the FY 2008 approved bud-get. It also provides FY 2007 actual data.
Table FK0-4 (Continued)(dollars in thousands)
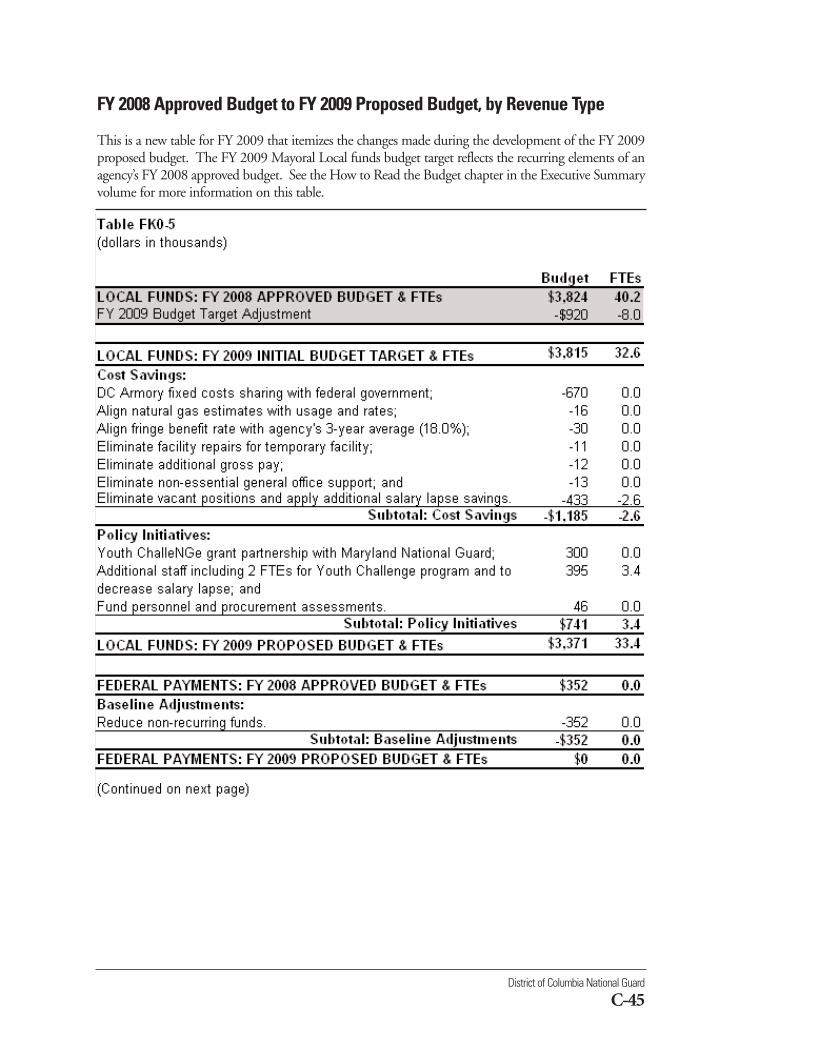
District of Columbia National Guard
C-45
FY 2008 Approved Budget to FY 2009 Proposed Budget, by Revenue Type
This is a new table for FY 2009 that itemizes the changes made during the development of the FY 2009proposed budget. The FY 2009 Mayoral Local funds budget target reflects the recurring elements of anagency’s FY 2008 approved budget. See the How to Read the Budget chapter in the Executive Summaryvolume for more information on this table.
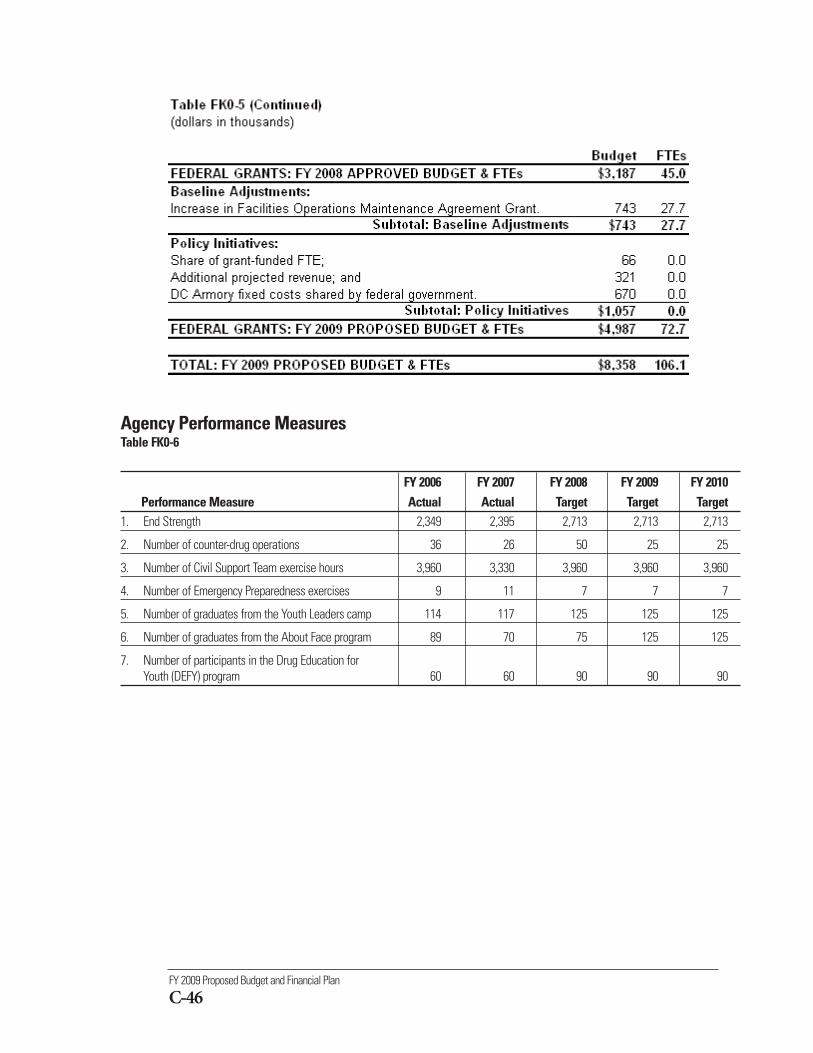
FY 2009 Proposed Budget and Financial Plan
C-46
Agency Performance MeasuresTable FK0-6
FY 2006 FY 2007 FY 2008 FY 2009 FY 2010Performance Measure Actual Actual Target Target Target
1. End Strength 2,349 2,395 2,713 2,713 2,713
2. Number of counter-drug operations 36 26 50 25 25
3. Number of Civil Support Team exercise hours 3,960 3,330 3,960 3,960 3,960
4. Number of Emergency Preparedness exercises 9 11 7 7 7
5. Number of graduates from the Youth Leaders camp 114 117 125 125 125
6. Number of graduates from the About Face program 89 70 75 125 125
7. Number of participants in the Drug Education for Youth (DEFY) program 60 60 90 90 90
The mission of the District of Columbia’s Homeland Securityand Emergency Management Agency (HSEMA) is to managethe District’s emergency operations to prevent, respond to, andrecover from natural and man-made emergencies.
Homeland Security and Emergency Management Agency
C-47
(BN0)
Homeland Security and EmergencyManagement Agency www.dcema.dc.govTelephone: 202-727-6161
% ChangeFY 2007 FY 2008 FY 2009 from
Description Actual Approved Proposed FY 2008Operating Budget $6,605,297 $95,494,913 $249,627,611 161.4FTEs 37.0 43.5 46.0 5.7
In addition to emergency/homeland security preparedness, management and planning, in accordancewith the Homeland Security, Risk Reduction and Preparedness Amendment Act of 2006, HSEMA receives,and is the state administrative agency for, the federal homeland security grants received for the District andthe National Capital Region.
The agency plans to fulfill its mission by achieving the following objectives:
Objective 1: Prepare executive leadership throughout the District government for timely and effectivedecision-making during emergencies.
Objective 2: Identify the District’s greatest risks, prioritize preparedness efforts according to those risks,and enhance capabilities that address the risks.
Objective 3: Develop preparedness plans, and train, exercise, and equip the District government to ablyimplement those plans.
Objective 4: Ensure a common operating picture during emergencies to facilitate good decision-makingand response. This common operating picture will provide situational awareness and, where possible,eliminate or minimize conflicting information received from numerous sources.
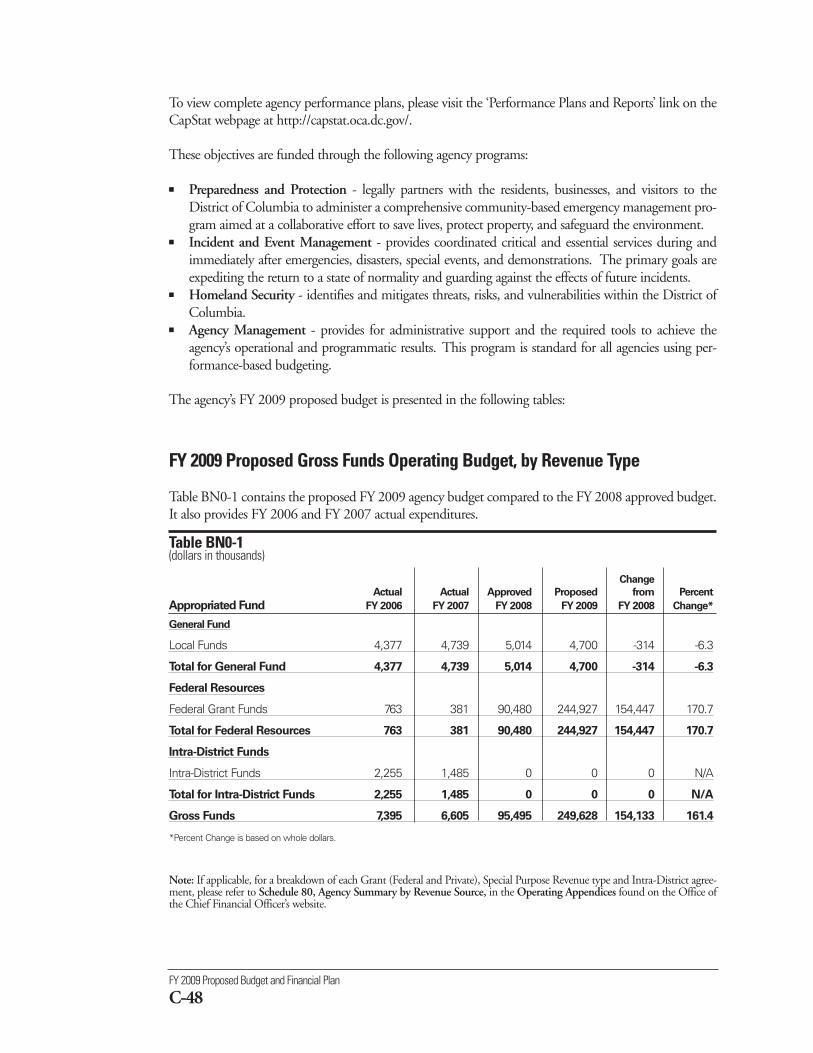
FY 2009 Proposed Budget and Financial Plan
C-48
To view complete agency performance plans, please visit the ‘Performance Plans and Reports’ link on theCapStat webpage at http://capstat.oca.dc.gov/.
These objectives are funded through the following agency programs:
■ Preparedness and Protection - legally partners with the residents, businesses, and visitors to theDistrict of Columbia to administer a comprehensive community-based emergency management pro-gram aimed at a collaborative effort to save lives, protect property, and safeguard the environment.
■ Incident and Event Management - provides coordinated critical and essential services during andimmediately after emergencies, disasters, special events, and demonstrations. The primary goals areexpediting the return to a state of normality and guarding against the effects of future incidents.
■ Homeland Security - identifies and mitigates threats, risks, and vulnerabilities within the District ofColumbia.
■ Agency Management - provides for administrative support and the required tools to achieve theagency’s operational and programmatic results. This program is standard for all agencies using per-formance-based budgeting.
The agency’s FY 2009 proposed budget is presented in the following tables:
FY 2009 Proposed Gross Funds Operating Budget, by Revenue Type
Table BN0-1 contains the proposed FY 2009 agency budget compared to the FY 2008 approved budget.It also provides FY 2006 and FY 2007 actual expenditures.
Table BN0-1 (dollars in thousands)
Change
Actual Actual Approved Proposed from Percent
Appropriated Fund FY 2006 FY 2007 FY 2008 FY 2009 FY 2008 Change*
General Fund
Local Funds 4,377 4,739 5,014 4,700 -314 -6.3
Total for General Fund 4,377 4,739 5,014 4,700 -314 -6.3
Federal Resources
Federal Grant Funds 763 381 90,480 244,927 154,447 170.7
Total for Federal Resources 763 381 90,480 244,927 154,447 170.7
Intra-District Funds
Intra-District Funds 2,255 1,485 0 0 0 N/A
Total for Intra-District Funds 2,255 1,485 0 0 0 N/A
Gross Funds 7,395 6,605 95,495 249,628 154,133 161.4
*Percent Change is based on whole dollars.
Note: If applicable, for a breakdown of each Grant (Federal and Private), Special Purpose Revenue type and Intra-District agree-ment, please refer to Schedule 80, Agency Summary by Revenue Source, in the Operating Appendices found on the Office ofthe Chief Financial Officer’s website.
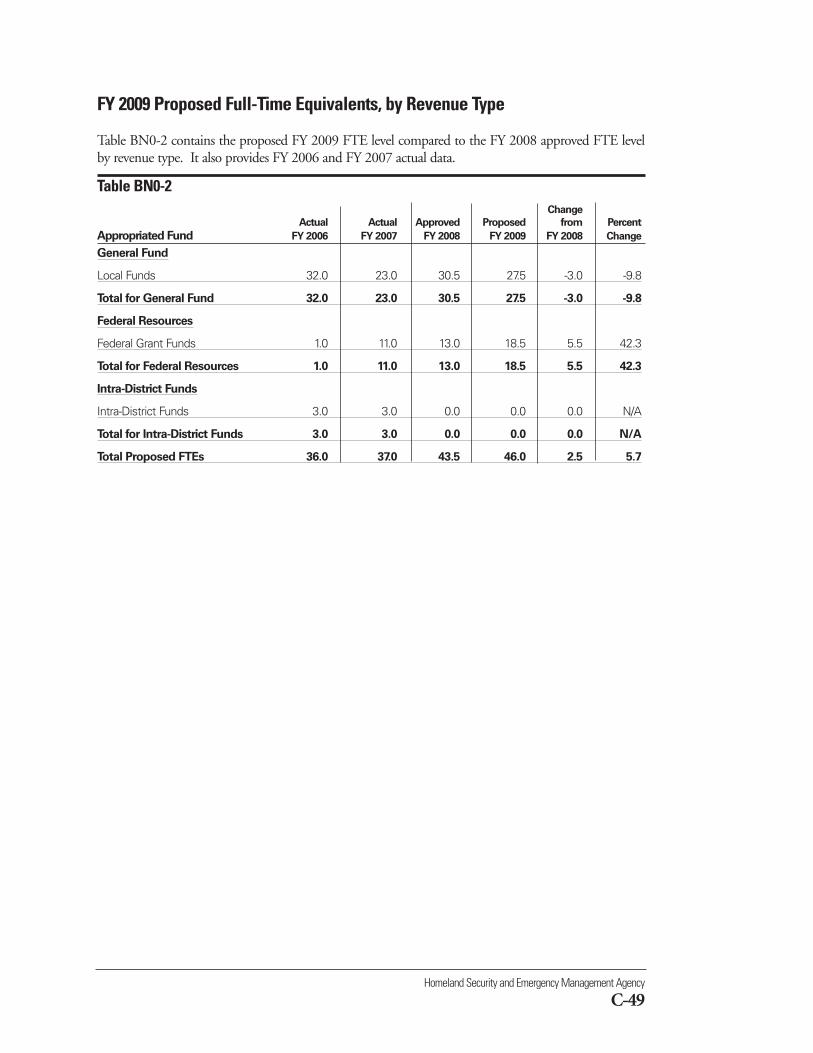
Homeland Security and Emergency Management Agency
C-49
FY 2009 Proposed Full-Time Equivalents, by Revenue Type
Table BN0-2 contains the proposed FY 2009 FTE level compared to the FY 2008 approved FTE levelby revenue type. It also provides FY 2006 and FY 2007 actual data.
Table BN0-2 Change
Actual Actual Approved Proposed from Percent
Appropriated Fund FY 2006 FY 2007 FY 2008 FY 2009 FY 2008 Change
General Fund
Local Funds 32.0 23.0 30.5 27.5 -3.0 -9.8
Total for General Fund 32.0 23.0 30.5 27.5 -3.0 -9.8
Federal Resources
Federal Grant Funds 1.0 11.0 13.0 18.5 5.5 42.3
Total for Federal Resources 1.0 11.0 13.0 18.5 5.5 42.3
Intra-District Funds
Intra-District Funds 3.0 3.0 0.0 0.0 0.0 N/A
Total for Intra-District Funds 3.0 3.0 0.0 0.0 0.0 N/A
Total Proposed FTEs 36.0 37.0 43.5 46.0 2.5 5.7
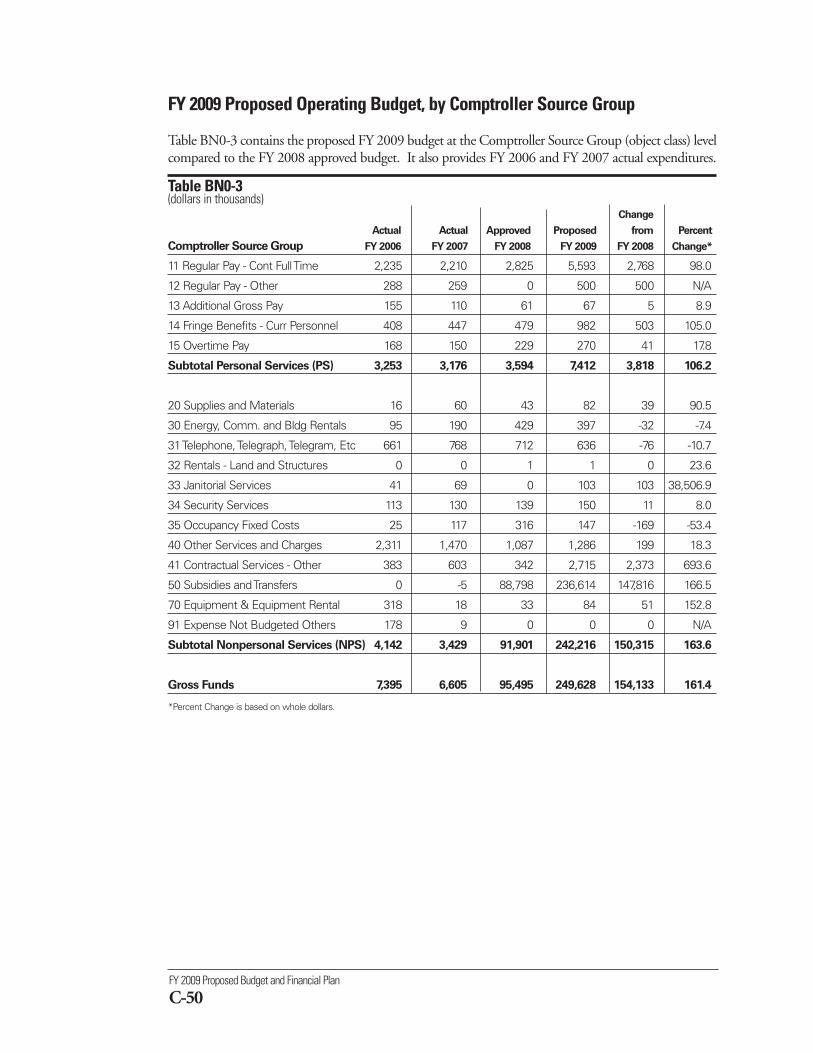
FY 2009 Proposed Budget and Financial Plan
C-50
FY 2009 Proposed Operating Budget, by Comptroller Source Group
Table BN0-3 contains the proposed FY 2009 budget at the Comptroller Source Group (object class) levelcompared to the FY 2008 approved budget. It also provides FY 2006 and FY 2007 actual expenditures.
Table BN0-3(dollars in thousands)
Change
Actual Actual Approved Proposed from Percent
Comptroller Source Group FY 2006 FY 2007 FY 2008 FY 2009 FY 2008 Change*
11 Regular Pay - Cont Full Time 2,235 2,210 2,825 5,593 2,768 98.0
12 Regular Pay - Other 288 259 0 500 500 N/A
13 Additional Gross Pay 155 110 61 67 5 8.9
14 Fringe Benefits - Curr Personnel 408 447 479 982 503 105.0
15 Overtime Pay 168 150 229 270 41 17.8
Subtotal Personal Services (PS) 3,253 3,176 3,594 7,412 3,818 106.2
20 Supplies and Materials 16 60 43 82 39 90.5
30 Energy, Comm. and Bldg Rentals 95 190 429 397 -32 -7.4
31 Telephone, Telegraph, Telegram, Etc 661 768 712 636 -76 -10.7
32 Rentals - Land and Structures 0 0 1 1 0 23.6
33 Janitorial Services 41 69 0 103 103 38,506.9
34 Security Services 113 130 139 150 11 8.0
35 Occupancy Fixed Costs 25 117 316 147 -169 -53.4
40 Other Services and Charges 2,311 1,470 1,087 1,286 199 18.3
41 Contractual Services - Other 383 603 342 2,715 2,373 693.6
50 Subsidies and Transfers 0 -5 88,798 236,614 147,816 166.5
70 Equipment & Equipment Rental 318 18 33 84 51 152.8
91 Expense Not Budgeted Others 178 9 0 0 0 N/A
Subtotal Nonpersonal Services (NPS) 4,142 3,429 91,901 242,216 150,315 163.6
Gross Funds 7,395 6,605 95,495 249,628 154,133 161.4
*Percent Change is based on whole dollars.
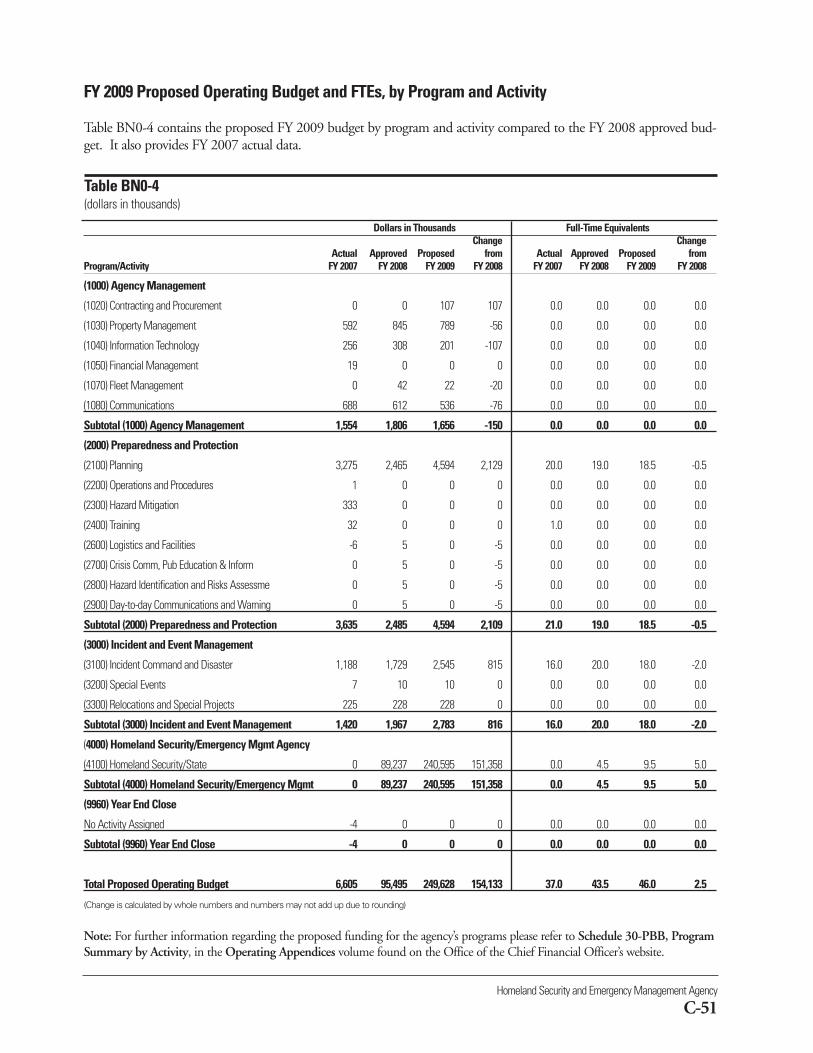
Homeland Security and Emergency Management Agency
C-51
Dollars in Thousands Full-Time EquivalentsChange Change
Actual Approved Proposed from Actual Approved Proposed from Program/Activity FY 2007 FY 2008 FY 2009 FY 2008 FY 2007 FY 2008 FY 2009 FY 2008
(1000) Agency Management
(1020) Contracting and Procurement 0 0 107 107 0.0 0.0 0.0 0.0
(1030) Property Management 592 845 789 -56 0.0 0.0 0.0 0.0
(1040) Information Technology 256 308 201 -107 0.0 0.0 0.0 0.0
(1050) Financial Management 19 0 0 0 0.0 0.0 0.0 0.0
(1070) Fleet Management 0 42 22 -20 0.0 0.0 0.0 0.0
(1080) Communications 688 612 536 -76 0.0 0.0 0.0 0.0
Subtotal (1000) Agency Management 1,554 1,806 1,656 -150 0.0 0.0 0.0 0.0
(2000) Preparedness and Protection
(2100) Planning 3,275 2,465 4,594 2,129 20.0 19.0 18.5 -0.5
(2200) Operations and Procedures 1 0 0 0 0.0 0.0 0.0 0.0
(2300) Hazard Mitigation 333 0 0 0 0.0 0.0 0.0 0.0
(2400) Training 32 0 0 0 1.0 0.0 0.0 0.0
(2600) Logistics and Facilities -6 5 0 -5 0.0 0.0 0.0 0.0
(2700) Crisis Comm, Pub Education & Inform 0 5 0 -5 0.0 0.0 0.0 0.0
(2800) Hazard Identification and Risks Assessme 0 5 0 -5 0.0 0.0 0.0 0.0
(2900) Day-to-day Communications and Warning 0 5 0 -5 0.0 0.0 0.0 0.0
Subtotal (2000) Preparedness and Protection 3,635 2,485 4,594 2,109 21.0 19.0 18.5 -0.5
(3000) Incident and Event Management
(3100) Incident Command and Disaster 1,188 1,729 2,545 815 16.0 20.0 18.0 -2.0
(3200) Special Events 7 10 10 0 0.0 0.0 0.0 0.0
(3300) Relocations and Special Projects 225 228 228 0 0.0 0.0 0.0 0.0
Subtotal (3000) Incident and Event Management 1,420 1,967 2,783 816 16.0 20.0 18.0 -2.0
(4000) Homeland Security/Emergency Mgmt Agency
(4100) Homeland Security/State 0 89,237 240,595 151,358 0.0 4.5 9.5 5.0
Subtotal (4000) Homeland Security/Emergency Mgmt 0 89,237 240,595 151,358 0.0 4.5 9.5 5.0
(9960) Year End Close
No Activity Assigned -4 0 0 0 0.0 0.0 0.0 0.0
Subtotal (9960) Year End Close -4 0 0 0 0.0 0.0 0.0 0.0
Total Proposed Operating Budget 6,605 95,495 249,628 154,133 37.0 43.5 46.0 2.5
(Change is calculated by whole numbers and numbers may not add up due to rounding)
Note: For further information regarding the proposed funding for the agency’s programs please refer to Schedule 30-PBB, ProgramSummary by Activity, in the Operating Appendices volume found on the Office of the Chief Financial Officer’s website.
FY 2009 Proposed Operating Budget and FTEs, by Program and Activity
Table BN0-4 contains the proposed FY 2009 budget by program and activity compared to the FY 2008 approved bud-get. It also provides FY 2007 actual data.
Table BN0-4(dollars in thousands)
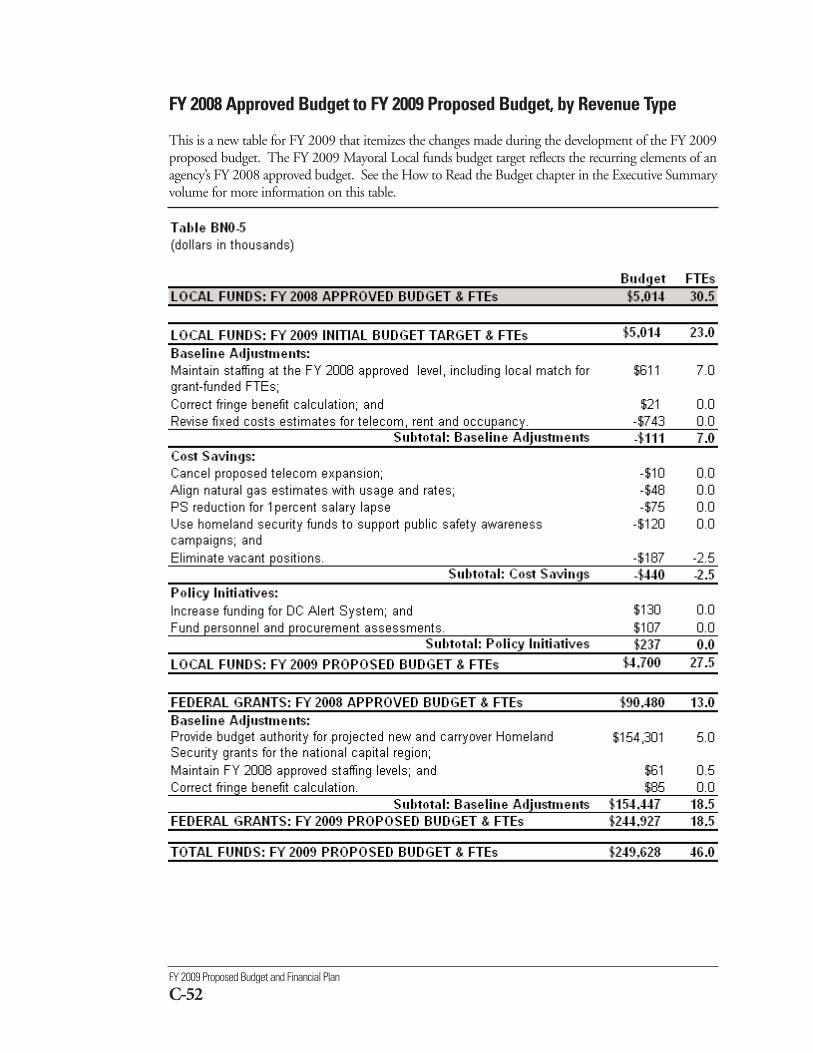
FY 2009 Proposed Budget and Financial Plan
C-52
FY 2008 Approved Budget to FY 2009 Proposed Budget, by Revenue Type
This is a new table for FY 2009 that itemizes the changes made during the development of the FY 2009proposed budget. The FY 2009 Mayoral Local funds budget target reflects the recurring elements of anagency’s FY 2008 approved budget. See the How to Read the Budget chapter in the Executive Summaryvolume for more information on this table.
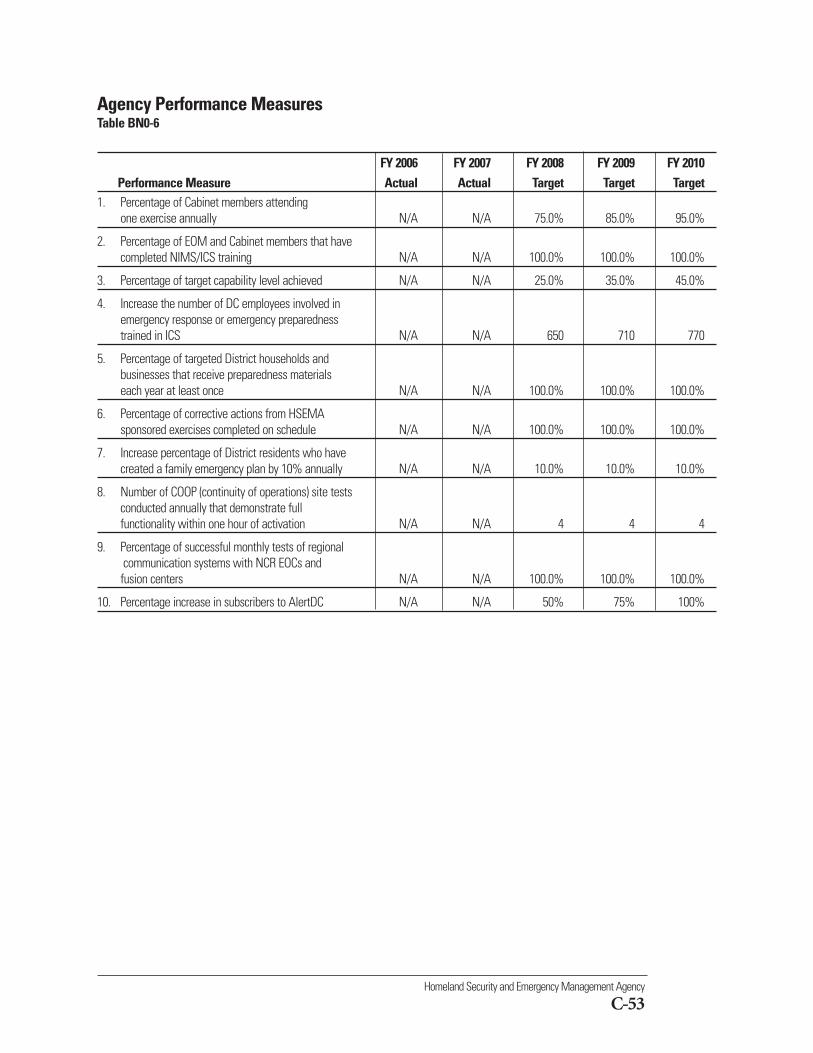
Homeland Security and Emergency Management Agency
C-53
Agency Performance MeasuresTable BN0-6
FY 2006 FY 2007 FY 2008 FY 2009 FY 2010Performance Measure Actual Actual Target Target Target
1. Percentage of Cabinet members attending one exercise annually N/A N/A 75.0% 85.0% 95.0%
2. Percentage of EOM and Cabinet members that have completed NIMS/ICS training N/A N/A 100.0% 100.0% 100.0%
3. Percentage of target capability level achieved N/A N/A 25.0% 35.0% 45.0%
4. Increase the number of DC employees involved in emergency response or emergency preparedness trained in ICS N/A N/A 650 710 770
5. Percentage of targeted District households and businesses that receive preparedness materials each year at least once N/A N/A 100.0% 100.0% 100.0%
6. Percentage of corrective actions from HSEMAsponsored exercises completed on schedule N/A N/A 100.0% 100.0% 100.0%
7. Increase percentage of District residents who have created a family emergency plan by 10% annually N/A N/A 10.0% 10.0% 10.0%
8. Number of COOP (continuity of operations) site testsconducted annually that demonstrate full functionality within one hour of activation N/A N/A 4 4 4
9. Percentage of successful monthly tests of regionalcommunication systems with NCR EOCs and fusion centers N/A N/A 100.0% 100.0% 100.0%
10. Percentage increase in subscribers to AlertDC N/A N/A 50% 75% 100%
(DQ0)
Commission on Judicial Disabilitiesand Tenurewww.cjdt.dc.govTelephone: 202-727-1363
% ChangeFY 2007 FY 2008 FY 2009 from
Description Actual Approved Proposed FY 2008Operating Budget $238,325 $247,770 $271,239 9.5FTEs 2.0 2.0 2.0 0.0
The mission of the Commission on Judicial Disabilities andTenure (CJDT) is to preserve an independent and fair judiciary.
The Commission plans to fulfill its mission by achieving the following objectives:
Objective 1: Review all judicial misconduct complaints, and conduct misconduct investigations con-cerning matters within the Commission’s jurisdiction.
Objective 2: Conduct performance and fitness reviews of retiring and senior judges eligible for reap-pointment to senior status.
Objective 3: Conduct reappointment evaluations of eligible associate judges.
To view complete agency performance plans, please visit the ‘Performance Plans and Reports’ link on theCapStat webpage at http://capstat.oca.dc.gov/.
These objectives are funded through the following agency programs:
■ Judicial Disabilities and Tenure - provides administrative support to the Judicial Disabilities andTenure Commission to ensure the Commission fulfills its mission, pursuant to section 11-1521 of theD.C. Official Code.
■ Agency Management - provides for administrative support and the required tools to achieve opera-tional and programmatic results. This program is standard for all agencies using performance-basedbudgeting.
Commission on Judicial Disabilities and Tenure
C-55
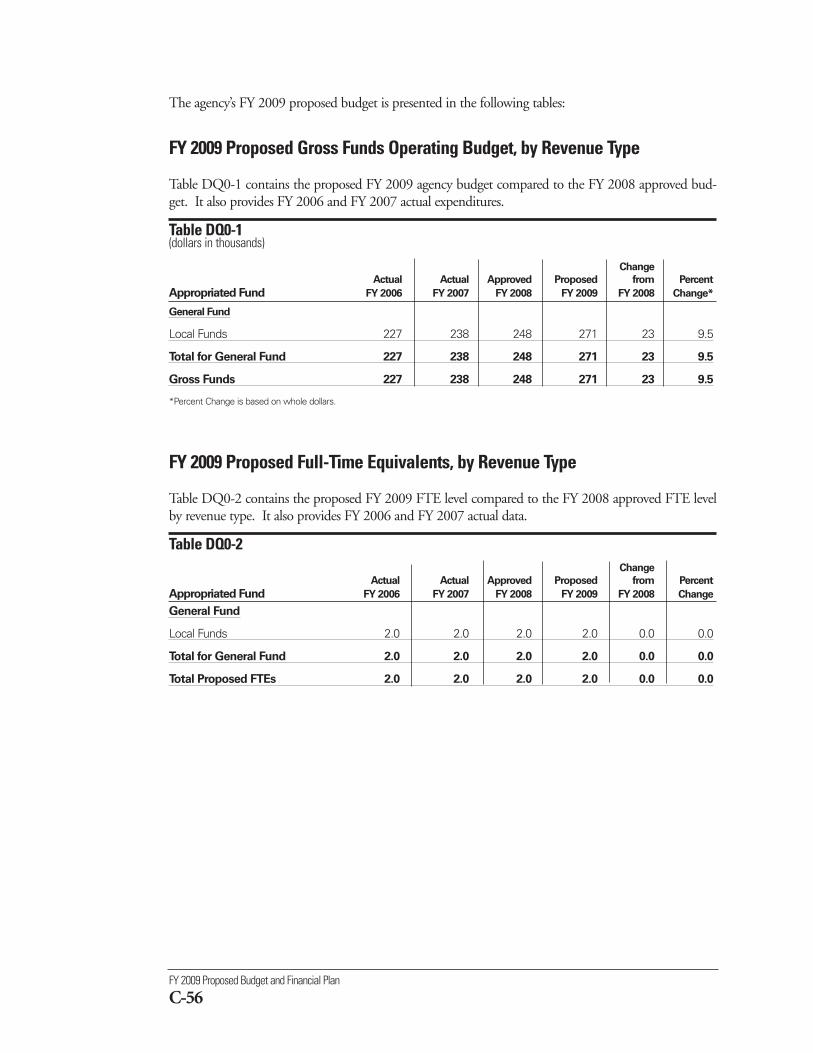
FY 2009 Proposed Budget and Financial Plan
C-56
FY 2009 Proposed Gross Funds Operating Budget, by Revenue Type
Table DQ0-1 contains the proposed FY 2009 agency budget compared to the FY 2008 approved bud-get. It also provides FY 2006 and FY 2007 actual expenditures.
Table DQ0-1 (dollars in thousands)
Change
Actual Actual Approved Proposed from Percent
Appropriated Fund FY 2006 FY 2007 FY 2008 FY 2009 FY 2008 Change*
General Fund
Local Funds 227 238 248 271 23 9.5
Total for General Fund 227 238 248 271 23 9.5
Gross Funds 227 238 248 271 23 9.5
*Percent Change is based on whole dollars.
FY 2009 Proposed Full-Time Equivalents, by Revenue Type
Table DQ0-2 contains the proposed FY 2009 FTE level compared to the FY 2008 approved FTE levelby revenue type. It also provides FY 2006 and FY 2007 actual data.
Table DQ0-2 Change
Actual Actual Approved Proposed from Percent
Appropriated Fund FY 2006 FY 2007 FY 2008 FY 2009 FY 2008 Change
General Fund
Local Funds 2.0 2.0 2.0 2.0 0.0 0.0
Total for General Fund 2.0 2.0 2.0 2.0 0.0 0.0
Total Proposed FTEs 2.0 2.0 2.0 2.0 0.0 0.0
The agency’s FY 2009 proposed budget is presented in the following tables:
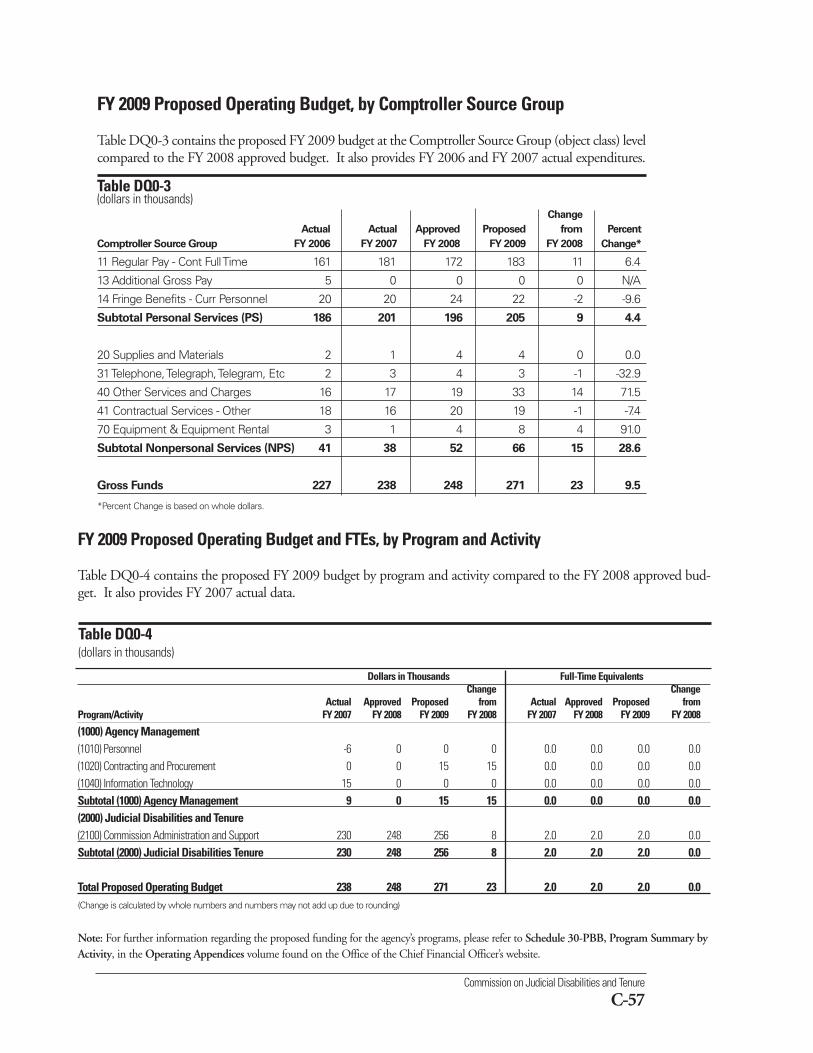
Commission on Judicial Disabilities and Tenure
C-57
FY 2009 Proposed Operating Budget, by Comptroller Source Group
Table DQ0-3 contains the proposed FY 2009 budget at the Comptroller Source Group (object class) levelcompared to the FY 2008 approved budget. It also provides FY 2006 and FY 2007 actual expenditures.
Table DQ0-3(dollars in thousands)
Change
Actual Actual Approved Proposed from Percent
Comptroller Source Group FY 2006 FY 2007 FY 2008 FY 2009 FY 2008 Change*
11 Regular Pay - Cont Full Time 161 181 172 183 11 6.4
13 Additional Gross Pay 5 0 0 0 0 N/A
14 Fringe Benefits - Curr Personnel 20 20 24 22 -2 -9.6
Subtotal Personal Services (PS) 186 201 196 205 9 4.4
20 Supplies and Materials 2 1 4 4 0 0.0
31 Telephone, Telegraph, Telegram, Etc 2 3 4 3 -1 -32.9
40 Other Services and Charges 16 17 19 33 14 71.5
41 Contractual Services - Other 18 16 20 19 -1 -7.4
70 Equipment & Equipment Rental 3 1 4 8 4 91.0
Subtotal Nonpersonal Services (NPS) 41 38 52 66 15 28.6
Gross Funds 227 238 248 271 23 9.5
*Percent Change is based on whole dollars.
Dollars in Thousands Full-Time EquivalentsChange Change
Actual Approved Proposed from Actual Approved Proposed from Program/Activity FY 2007 FY 2008 FY 2009 FY 2008 FY 2007 FY 2008 FY 2009 FY 2008
(1000) Agency Management (1010) Personnel -6 0 0 0 0.0 0.0 0.0 0.0(1020) Contracting and Procurement 0 0 15 15 0.0 0.0 0.0 0.0(1040) Information Technology 15 0 0 0 0.0 0.0 0.0 0.0Subtotal (1000) Agency Management 9 0 15 15 0.0 0.0 0.0 0.0(2000) Judicial Disabilities and Tenure (2100) Commission Administration and Support 230 248 256 8 2.0 2.0 2.0 0.0Subtotal (2000) Judicial Disabilities Tenure 230 248 256 8 2.0 2.0 2.0 0.0
Total Proposed Operating Budget 238 248 271 23 2.0 2.0 2.0 0.0(Change is calculated by whole numbers and numbers may not add up due to rounding)
Note: For further information regarding the proposed funding for the agency’s programs, please refer to Schedule 30-PBB, Program Summary byActivity, in the Operating Appendices volume found on the Office of the Chief Financial Officer’s website.
FY 2009 Proposed Operating Budget and FTEs, by Program and Activity
Table DQ0-4 contains the proposed FY 2009 budget by program and activity compared to the FY 2008 approved bud-get. It also provides FY 2007 actual data.
Table DQ0-4(dollars in thousands)
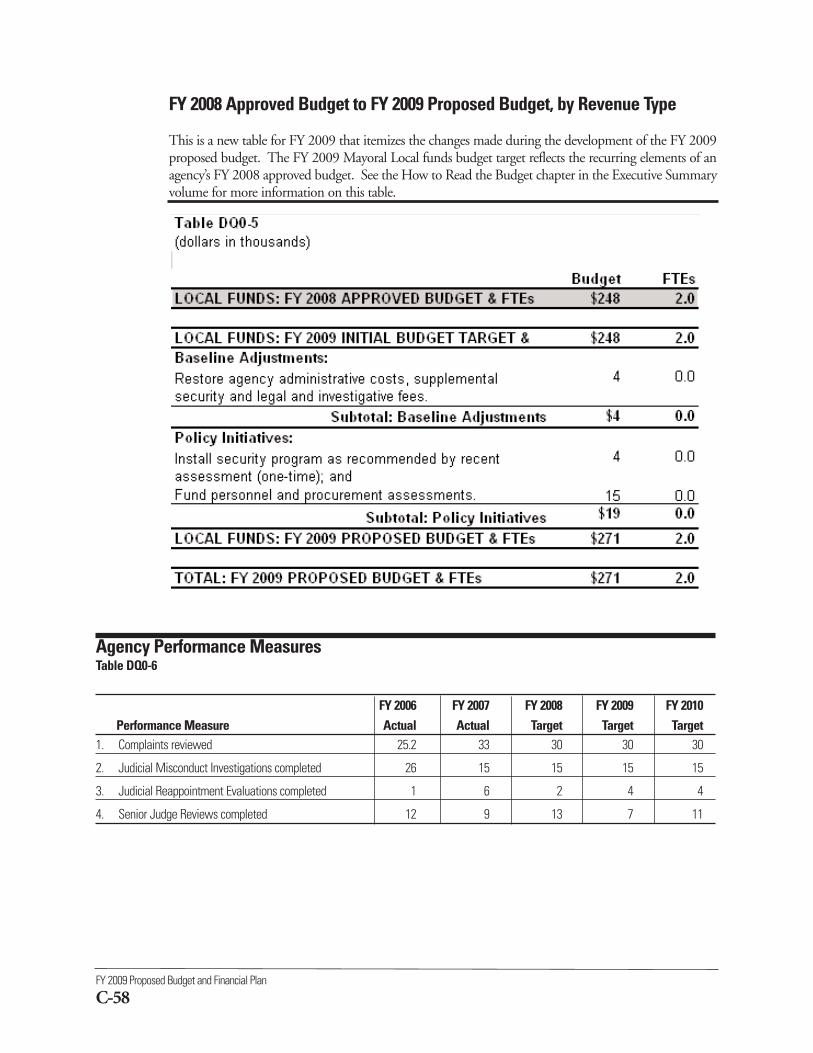
FY 2009 Proposed Budget and Financial Plan
C-58
FY 2008 Approved Budget to FY 2009 Proposed Budget, by Revenue Type
This is a new table for FY 2009 that itemizes the changes made during the development of the FY 2009proposed budget. The FY 2009 Mayoral Local funds budget target reflects the recurring elements of anagency’s FY 2008 approved budget. See the How to Read the Budget chapter in the Executive Summaryvolume for more information on this table.
Agency Performance MeasuresTable DQ0-6
FY 2006 FY 2007 FY 2008 FY 2009 FY 2010Performance Measure Actual Actual Target Target Target
1. Complaints reviewed 25.2 33 30 30 30
2. Judicial Misconduct Investigations completed 26 15 15 15 15
3. Judicial Reappointment Evaluations completed 1 6 2 4 4
4. Senior Judge Reviews completed 12 9 13 7 11
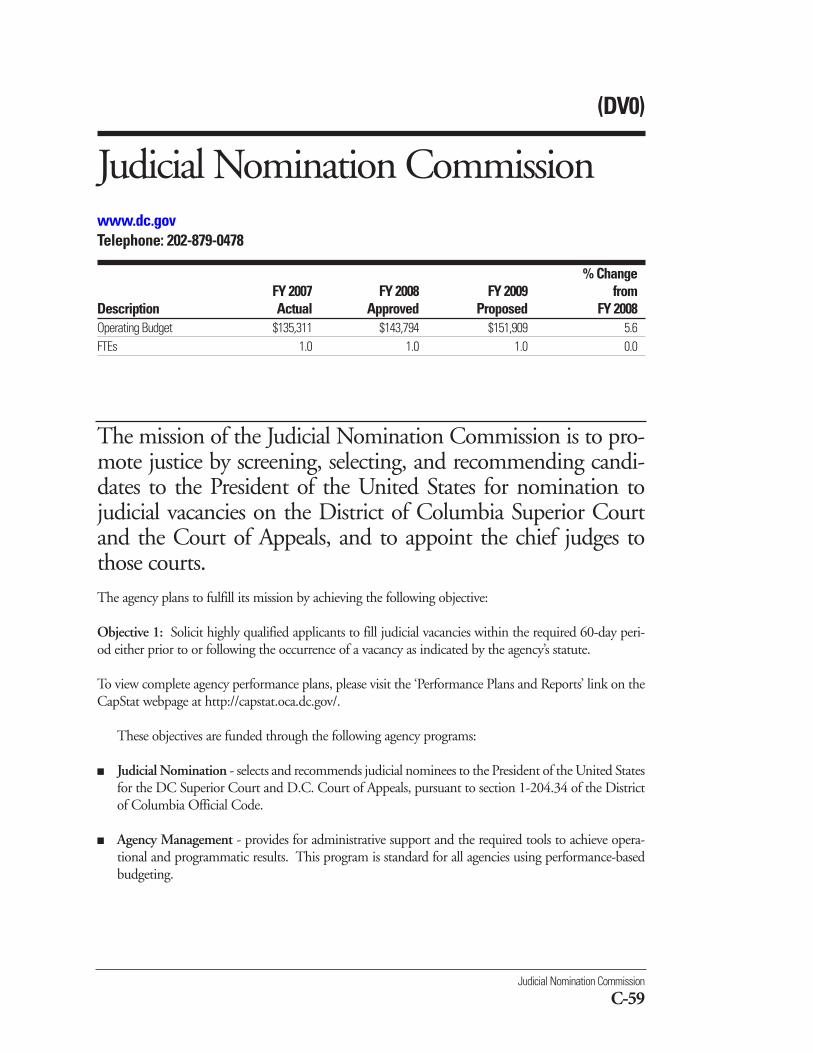
The mission of the Judicial Nomination Commission is to pro-mote justice by screening, selecting, and recommending candi-dates to the President of the United States for nomination tojudicial vacancies on the District of Columbia Superior Courtand the Court of Appeals, and to appoint the chief judges tothose courts.The agency plans to fulfill its mission by achieving the following objective:
Objective 1: Solicit highly qualified applicants to fill judicial vacancies within the required 60-day peri-od either prior to or following the occurrence of a vacancy as indicated by the agency’s statute.
To view complete agency performance plans, please visit the ‘Performance Plans and Reports’ link on theCapStat webpage at http://capstat.oca.dc.gov/.
These objectives are funded through the following agency programs:
■ Judicial Nomination - selects and recommends judicial nominees to the President of the United Statesfor the DC Superior Court and D.C. Court of Appeals, pursuant to section 1-204.34 of the Districtof Columbia Official Code.
■ Agency Management - provides for administrative support and the required tools to achieve opera-tional and programmatic results. This program is standard for all agencies using performance-basedbudgeting.
Judicial Nomination Commission
C-59
(DV0)
Judicial Nomination Commissionwww.dc.govTelephone: 202-879-0478
% ChangeFY 2007 FY 2008 FY 2009 from
Description Actual Approved Proposed FY 2008Operating Budget $135,311 $143,794 $151,909 5.6FTEs 1.0 1.0 1.0 0.0
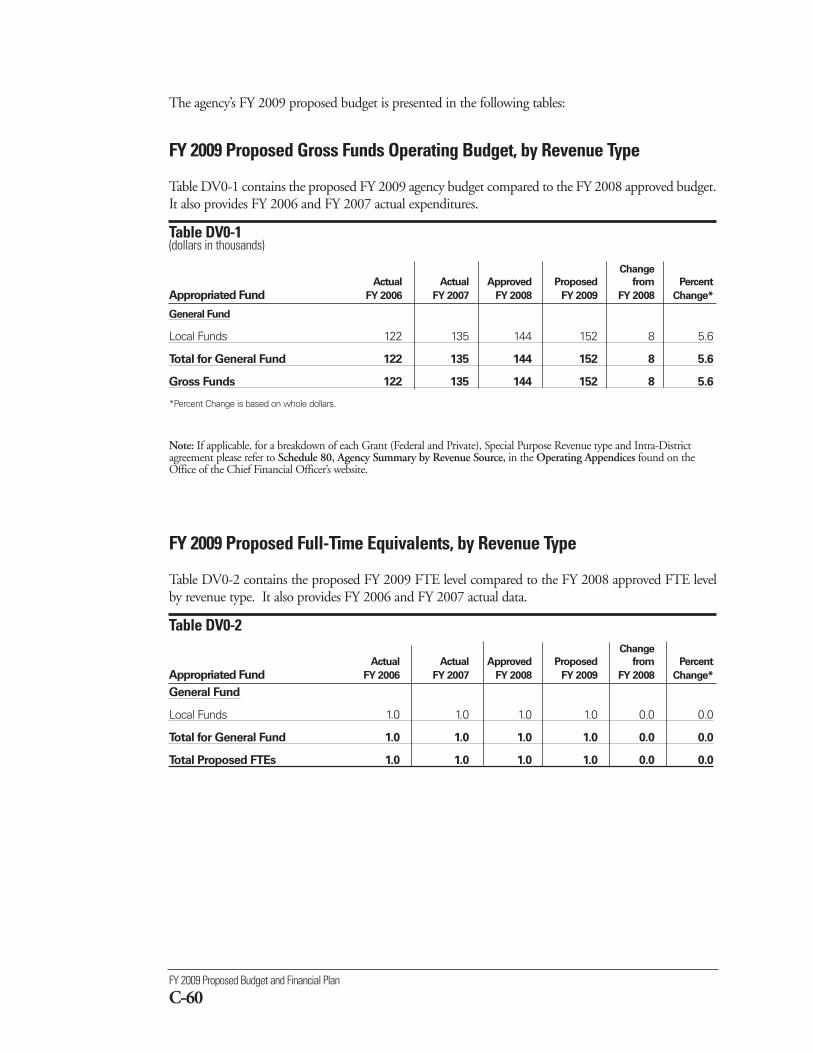
FY 2009 Proposed Budget and Financial Plan
C-60
FY 2009 Proposed Gross Funds Operating Budget, by Revenue Type
Table DV0-1 contains the proposed FY 2009 agency budget compared to the FY 2008 approved budget.It also provides FY 2006 and FY 2007 actual expenditures.
Table DV0-1 (dollars in thousands)
Change
Actual Actual Approved Proposed from Percent
Appropriated Fund FY 2006 FY 2007 FY 2008 FY 2009 FY 2008 Change*
General Fund
Local Funds 122 135 144 152 8 5.6
Total for General Fund 122 135 144 152 8 5.6
Gross Funds 122 135 144 152 8 5.6
*Percent Change is based on whole dollars.
Note: If applicable, for a breakdown of each Grant (Federal and Private), Special Purpose Revenue type and Intra-Districtagreement please refer to Schedule 80, Agency Summary by Revenue Source, in the Operating Appendices found on theOffice of the Chief Financial Officer’s website.
FY 2009 Proposed Full-Time Equivalents, by Revenue Type
Table DV0-2 contains the proposed FY 2009 FTE level compared to the FY 2008 approved FTE levelby revenue type. It also provides FY 2006 and FY 2007 actual data.
Table DV0-2 Change
Actual Actual Approved Proposed from Percent
Appropriated Fund FY 2006 FY 2007 FY 2008 FY 2009 FY 2008 Change*
General Fund
Local Funds 1.0 1.0 1.0 1.0 0.0 0.0
Total for General Fund 1.0 1.0 1.0 1.0 0.0 0.0
Total Proposed FTEs 1.0 1.0 1.0 1.0 0.0 0.0
The agency’s FY 2009 proposed budget is presented in the following tables:
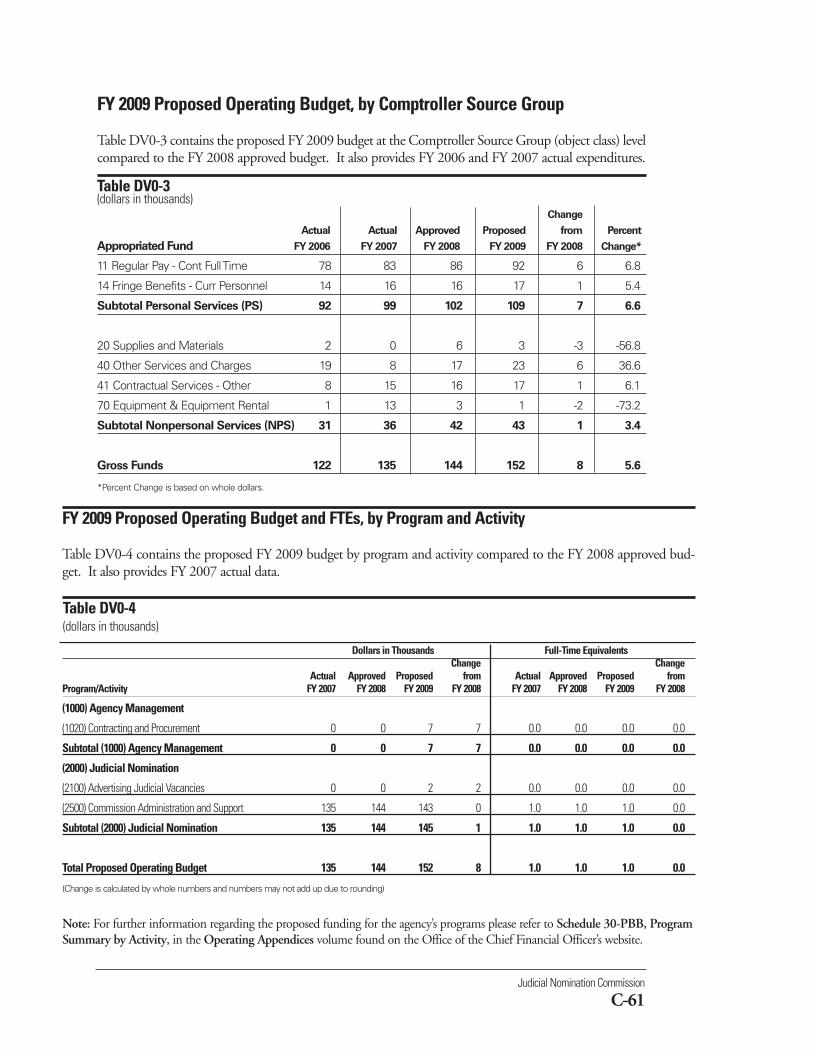
Judicial Nomination Commission
C-61
FY 2009 Proposed Operating Budget, by Comptroller Source Group
Table DV0-3 contains the proposed FY 2009 budget at the Comptroller Source Group (object class) levelcompared to the FY 2008 approved budget. It also provides FY 2006 and FY 2007 actual expenditures.
Table DV0-3(dollars in thousands)
Change
Actual Actual Approved Proposed from Percent
Appropriated Fund FY 2006 FY 2007 FY 2008 FY 2009 FY 2008 Change*
11 Regular Pay - Cont Full Time 78 83 86 92 6 6.8
14 Fringe Benefits - Curr Personnel 14 16 16 17 1 5.4
Subtotal Personal Services (PS) 92 99 102 109 7 6.6
20 Supplies and Materials 2 0 6 3 -3 -56.8
40 Other Services and Charges 19 8 17 23 6 36.6
41 Contractual Services - Other 8 15 16 17 1 6.1
70 Equipment & Equipment Rental 1 13 3 1 -2 -73.2
Subtotal Nonpersonal Services (NPS) 31 36 42 43 1 3.4
Gross Funds 122 135 144 152 8 5.6
*Percent Change is based on whole dollars.
Dollars in Thousands Full-Time EquivalentsChange Change
Actual Approved Proposed from Actual Approved Proposed from Program/Activity FY 2007 FY 2008 FY 2009 FY 2008 FY 2007 FY 2008 FY 2009 FY 2008
(1000) Agency Management
(1020) Contracting and Procurement 0 0 7 7 0.0 0.0 0.0 0.0
Subtotal (1000) Agency Management 0 0 7 7 0.0 0.0 0.0 0.0
(2000) Judicial Nomination
(2100) Advertising Judicial Vacancies 0 0 2 2 0.0 0.0 0.0 0.0
(2500) Commission Administration and Support 135 144 143 0 1.0 1.0 1.0 0.0
Subtotal (2000) Judicial Nomination 135 144 145 1 1.0 1.0 1.0 0.0
Total Proposed Operating Budget 135 144 152 8 1.0 1.0 1.0 0.0
(Change is calculated by whole numbers and numbers may not add up due to rounding)
Note: For further information regarding the proposed funding for the agency’s programs please refer to Schedule 30-PBB, ProgramSummary by Activity, in the Operating Appendices volume found on the Office of the Chief Financial Officer’s website.
FY 2009 Proposed Operating Budget and FTEs, by Program and Activity
Table DV0-4 contains the proposed FY 2009 budget by program and activity compared to the FY 2008 approved bud-get. It also provides FY 2007 actual data.
Table DV0-4(dollars in thousands)
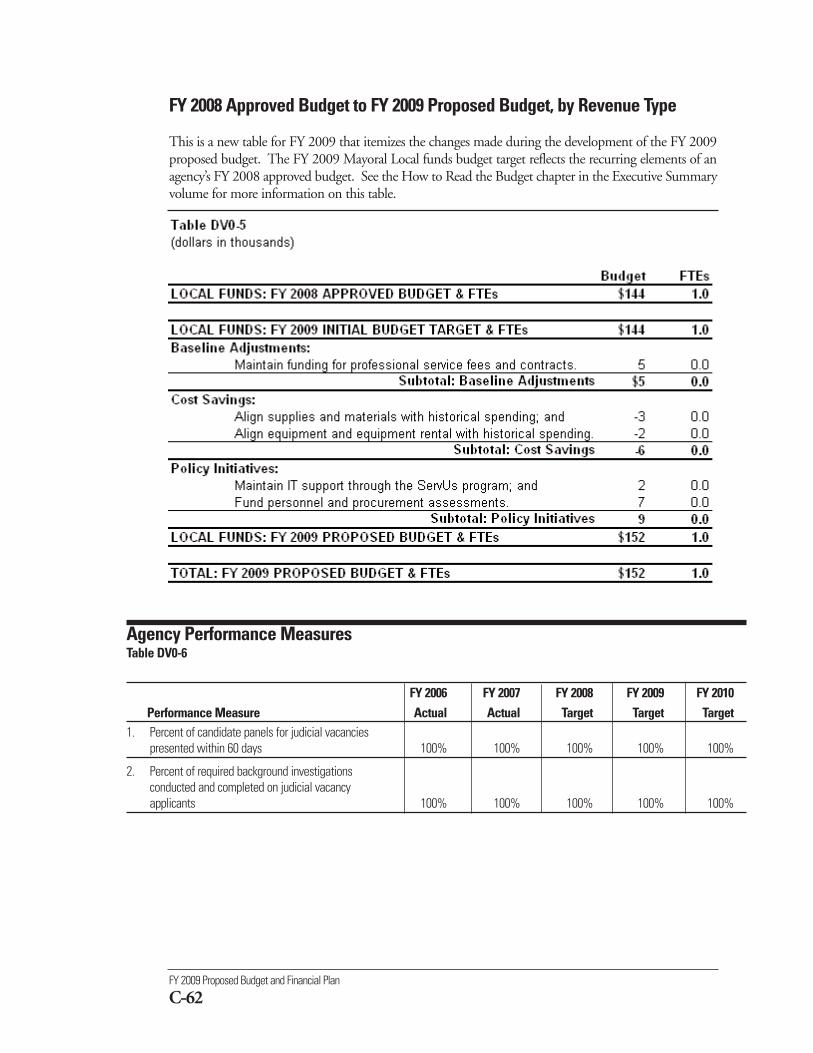
FY 2009 Proposed Budget and Financial Plan
C-62
FY 2008 Approved Budget to FY 2009 Proposed Budget, by Revenue Type
This is a new table for FY 2009 that itemizes the changes made during the development of the FY 2009proposed budget. The FY 2009 Mayoral Local funds budget target reflects the recurring elements of anagency’s FY 2008 approved budget. See the How to Read the Budget chapter in the Executive Summaryvolume for more information on this table.
Agency Performance MeasuresTable DV0-6
FY 2006 FY 2007 FY 2008 FY 2009 FY 2010Performance Measure Actual Actual Target Target Target
1. Percent of candidate panels for judicial vacancies presented within 60 days 100% 100% 100% 100% 100%
2. Percent of required background investigations conducted and completed on judicial vacancyapplicants 100% 100% 100% 100% 100%
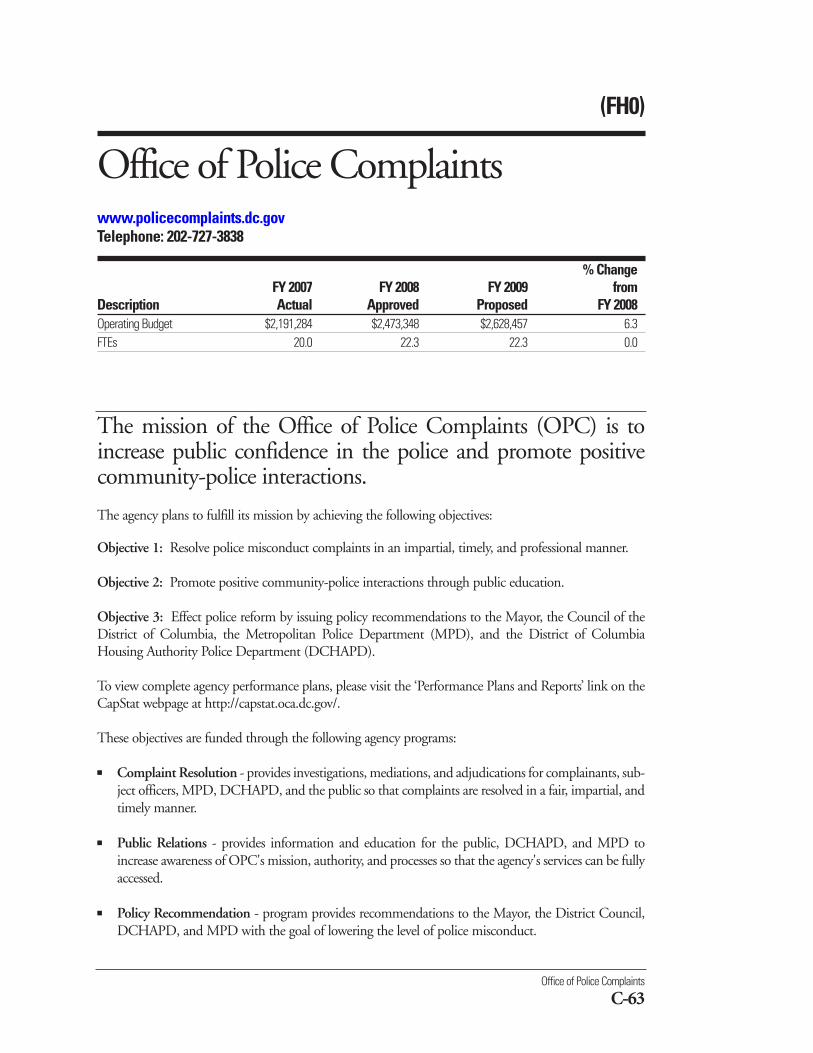
(FH0)
Office of Police Complaintswww.policecomplaints.dc.govTelephone: 202-727-3838
% ChangeFY 2007 FY 2008 FY 2009 from
Description Actual Approved Proposed FY 2008Operating Budget $2,191,284 $2,473,348 $2,628,457 6.3FTEs 20.0 22.3 22.3 0.0
The mission of the Office of Police Complaints (OPC) is toincrease public confidence in the police and promote positivecommunity-police interactions.
Office of Police Complaints
C-63
The agency plans to fulfill its mission by achieving the following objectives:
Objective 1: Resolve police misconduct complaints in an impartial, timely, and professional manner.
Objective 2: Promote positive community-police interactions through public education.
Objective 3: Effect police reform by issuing policy recommendations to the Mayor, the Council of theDistrict of Columbia, the Metropolitan Police Department (MPD), and the District of ColumbiaHousing Authority Police Department (DCHAPD).
To view complete agency performance plans, please visit the ‘Performance Plans and Reports’ link on theCapStat webpage at http://capstat.oca.dc.gov/.
These objectives are funded through the following agency programs:
■ Complaint Resolution - provides investigations, mediations, and adjudications for complainants, sub-ject officers, MPD, DCHAPD, and the public so that complaints are resolved in a fair, impartial, andtimely manner.
■ Public Relations - provides information and education for the public, DCHAPD, and MPD toincrease awareness of OPC's mission, authority, and processes so that the agency's services can be fullyaccessed.
■ Policy Recommendation - program provides recommendations to the Mayor, the District Council,DCHAPD, and MPD with the goal of lowering the level of police misconduct.
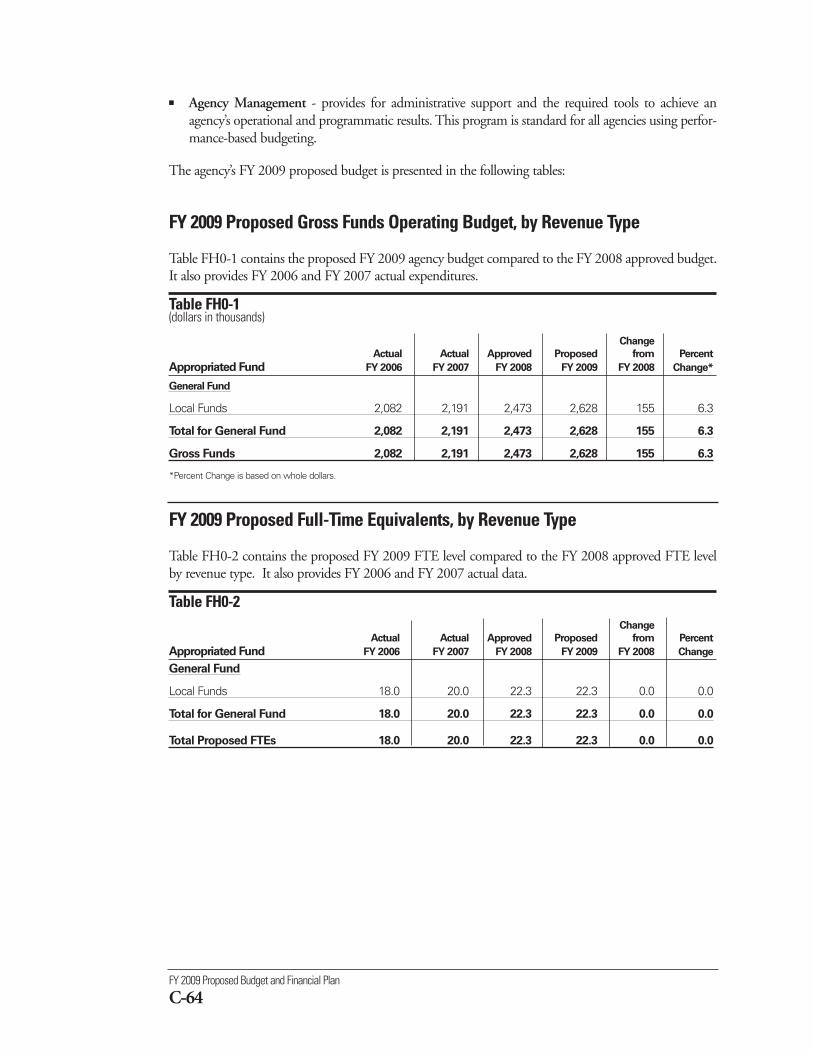
FY 2009 Proposed Budget and Financial Plan
C-64
■ Agency Management - provides for administrative support and the required tools to achieve anagency’s operational and programmatic results. This program is standard for all agencies using perfor-mance-based budgeting.
The agency’s FY 2009 proposed budget is presented in the following tables:
FY 2009 Proposed Gross Funds Operating Budget, by Revenue Type
Table FH0-1 contains the proposed FY 2009 agency budget compared to the FY 2008 approved budget.It also provides FY 2006 and FY 2007 actual expenditures.
Table FH0-1 (dollars in thousands)
Change
Actual Actual Approved Proposed from Percent
Appropriated Fund FY 2006 FY 2007 FY 2008 FY 2009 FY 2008 Change*
General Fund
Local Funds 2,082 2,191 2,473 2,628 155 6.3
Total for General Fund 2,082 2,191 2,473 2,628 155 6.3
Gross Funds 2,082 2,191 2,473 2,628 155 6.3
*Percent Change is based on whole dollars.
FY 2009 Proposed Full-Time Equivalents, by Revenue Type
Table FH0-2 contains the proposed FY 2009 FTE level compared to the FY 2008 approved FTE levelby revenue type. It also provides FY 2006 and FY 2007 actual data.
Table FH0-2 Change
Actual Actual Approved Proposed from Percent
Appropriated Fund FY 2006 FY 2007 FY 2008 FY 2009 FY 2008 Change
General Fund
Local Funds 18.0 20.0 22.3 22.3 0.0 0.0
Total for General Fund 18.0 20.0 22.3 22.3 0.0 0.0
Total Proposed FTEs 18.0 20.0 22.3 22.3 0.0 0.0
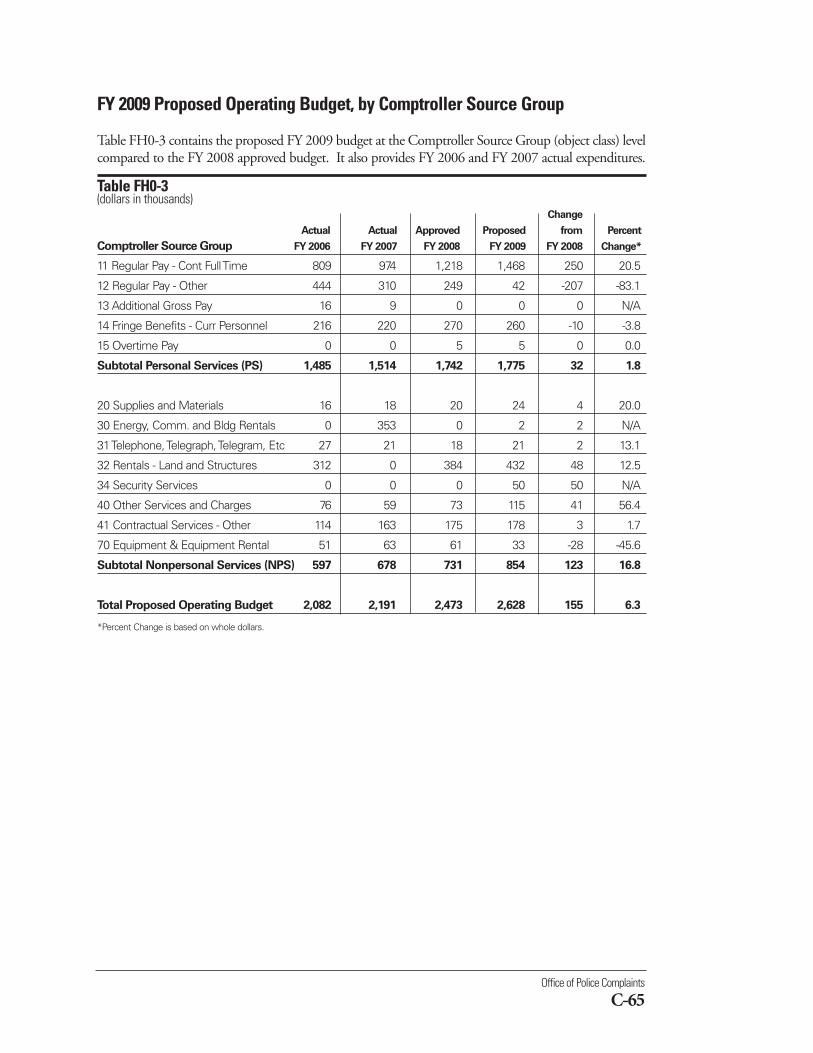
Office of Police Complaints
C-65
FY 2009 Proposed Operating Budget, by Comptroller Source Group
Table FH0-3 contains the proposed FY 2009 budget at the Comptroller Source Group (object class) levelcompared to the FY 2008 approved budget. It also provides FY 2006 and FY 2007 actual expenditures.
Table FH0-3(dollars in thousands)
Change
Actual Actual Approved Proposed from Percent
Comptroller Source Group FY 2006 FY 2007 FY 2008 FY 2009 FY 2008 Change*
11 Regular Pay - Cont Full Time 809 974 1,218 1,468 250 20.5
12 Regular Pay - Other 444 310 249 42 -207 -83.1
13 Additional Gross Pay 16 9 0 0 0 N/A
14 Fringe Benefits - Curr Personnel 216 220 270 260 -10 -3.8
15 Overtime Pay 0 0 5 5 0 0.0
Subtotal Personal Services (PS) 1,485 1,514 1,742 1,775 32 1.8
20 Supplies and Materials 16 18 20 24 4 20.0
30 Energy, Comm. and Bldg Rentals 0 353 0 2 2 N/A
31 Telephone, Telegraph, Telegram, Etc 27 21 18 21 2 13.1
32 Rentals - Land and Structures 312 0 384 432 48 12.5
34 Security Services 0 0 0 50 50 N/A
40 Other Services and Charges 76 59 73 115 41 56.4
41 Contractual Services - Other 114 163 175 178 3 1.7
70 Equipment & Equipment Rental 51 63 61 33 -28 -45.6
Subtotal Nonpersonal Services (NPS) 597 678 731 854 123 16.8
Total Proposed Operating Budget 2,082 2,191 2,473 2,628 155 6.3
*Percent Change is based on whole dollars.
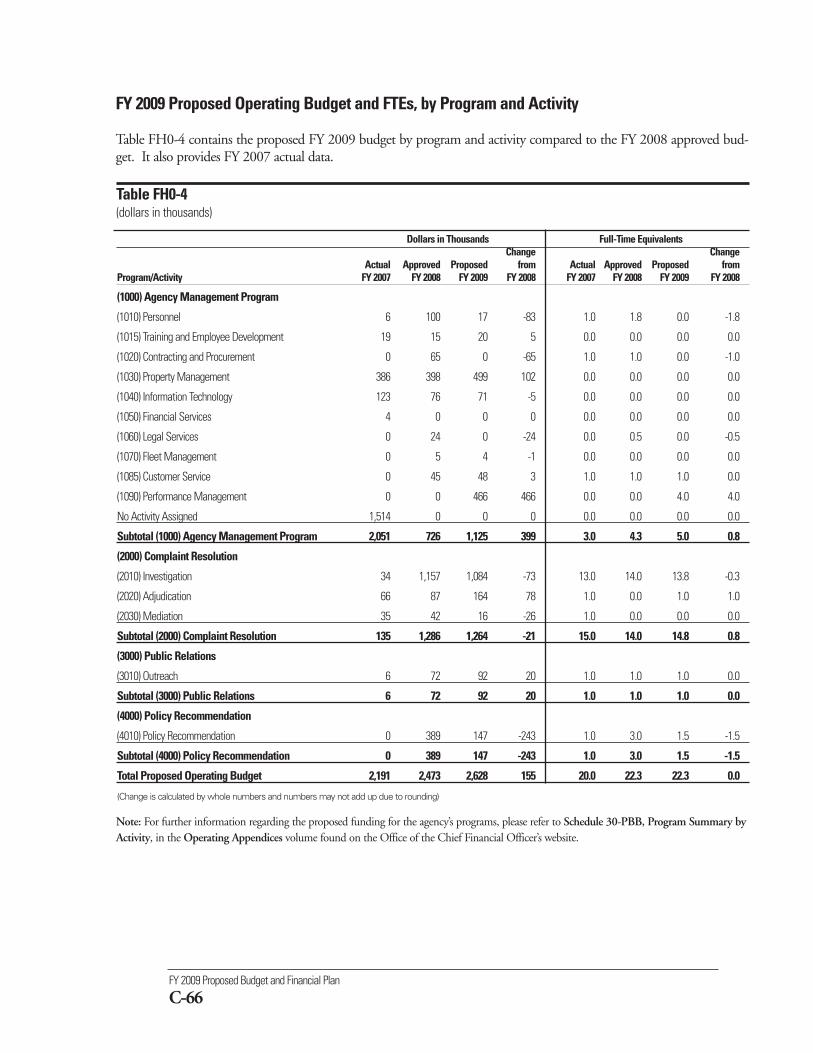
FY 2009 Proposed Budget and Financial Plan
C-66
FY 2009 Proposed Operating Budget and FTEs, by Program and Activity
Table FH0-4 contains the proposed FY 2009 budget by program and activity compared to the FY 2008 approved bud-get. It also provides FY 2007 actual data.
Table FH0-4(dollars in thousands)
Dollars in Thousands Full-Time EquivalentsChange Change
Actual Approved Proposed from Actual Approved Proposed from Program/Activity FY 2007 FY 2008 FY 2009 FY 2008 FY 2007 FY 2008 FY 2009 FY 2008
(1000) Agency Management Program
(1010) Personnel 6 100 17 -83 1.0 1.8 0.0 -1.8
(1015) Training and Employee Development 19 15 20 5 0.0 0.0 0.0 0.0
(1020) Contracting and Procurement 0 65 0 -65 1.0 1.0 0.0 -1.0
(1030) Property Management 386 398 499 102 0.0 0.0 0.0 0.0
(1040) Information Technology 123 76 71 -5 0.0 0.0 0.0 0.0
(1050) Financial Services 4 0 0 0 0.0 0.0 0.0 0.0
(1060) Legal Services 0 24 0 -24 0.0 0.5 0.0 -0.5
(1070) Fleet Management 0 5 4 -1 0.0 0.0 0.0 0.0
(1085) Customer Service 0 45 48 3 1.0 1.0 1.0 0.0
(1090) Performance Management 0 0 466 466 0.0 0.0 4.0 4.0
No Activity Assigned 1,514 0 0 0 0.0 0.0 0.0 0.0
Subtotal (1000) Agency Management Program 2,051 726 1,125 399 3.0 4.3 5.0 0.8
(2000) Complaint Resolution
(2010) Investigation 34 1,157 1,084 -73 13.0 14.0 13.8 -0.3
(2020) Adjudication 66 87 164 78 1.0 0.0 1.0 1.0
(2030) Mediation 35 42 16 -26 1.0 0.0 0.0 0.0
Subtotal (2000) Complaint Resolution 135 1,286 1,264 -21 15.0 14.0 14.8 0.8
(3000) Public Relations
(3010) Outreach 6 72 92 20 1.0 1.0 1.0 0.0
Subtotal (3000) Public Relations 6 72 92 20 1.0 1.0 1.0 0.0
(4000) Policy Recommendation
(4010) Policy Recommendation 0 389 147 -243 1.0 3.0 1.5 -1.5
Subtotal (4000) Policy Recommendation 0 389 147 -243 1.0 3.0 1.5 -1.5
Total Proposed Operating Budget 2,191 2,473 2,628 155 20.0 22.3 22.3 0.0
(Change is calculated by whole numbers and numbers may not add up due to rounding)
Note: For further information regarding the proposed funding for the agency’s programs, please refer to Schedule 30-PBB, Program Summary byActivity, in the Operating Appendices volume found on the Office of the Chief Financial Officer’s website.
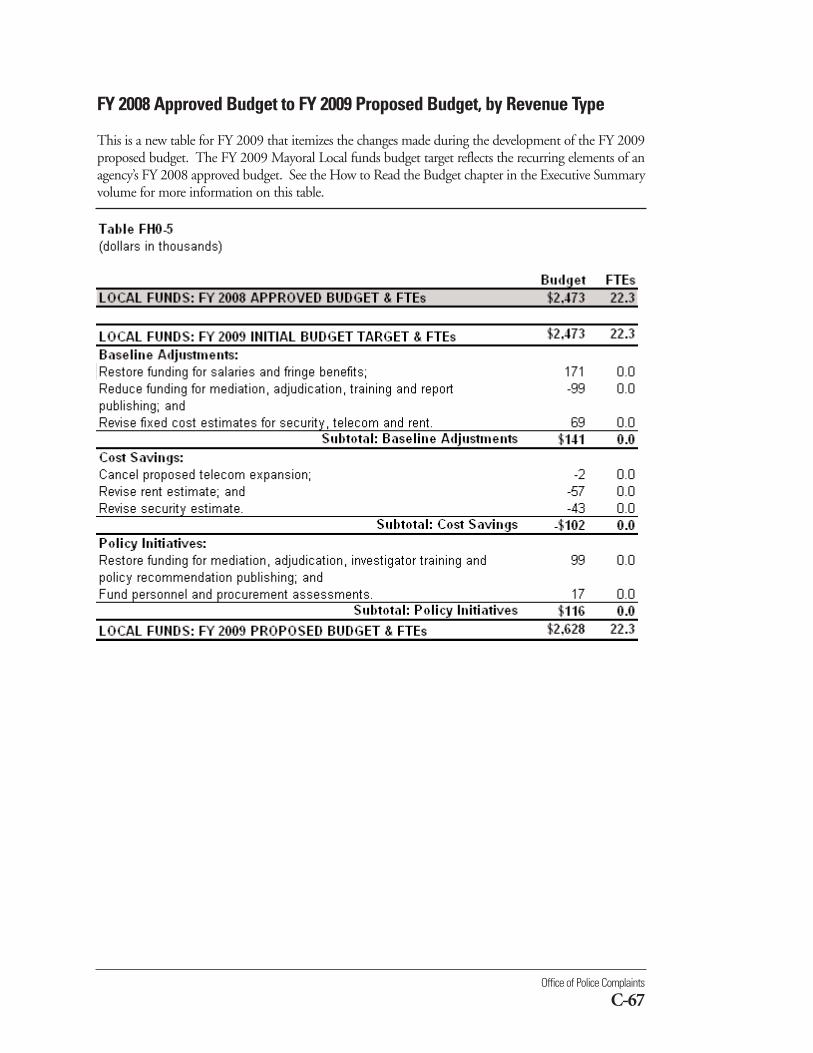
Office of Police Complaints
C-67
FY 2008 Approved Budget to FY 2009 Proposed Budget, by Revenue Type
This is a new table for FY 2009 that itemizes the changes made during the development of the FY 2009proposed budget. The FY 2009 Mayoral Local funds budget target reflects the recurring elements of anagency’s FY 2008 approved budget. See the How to Read the Budget chapter in the Executive Summaryvolume for more information on this table.
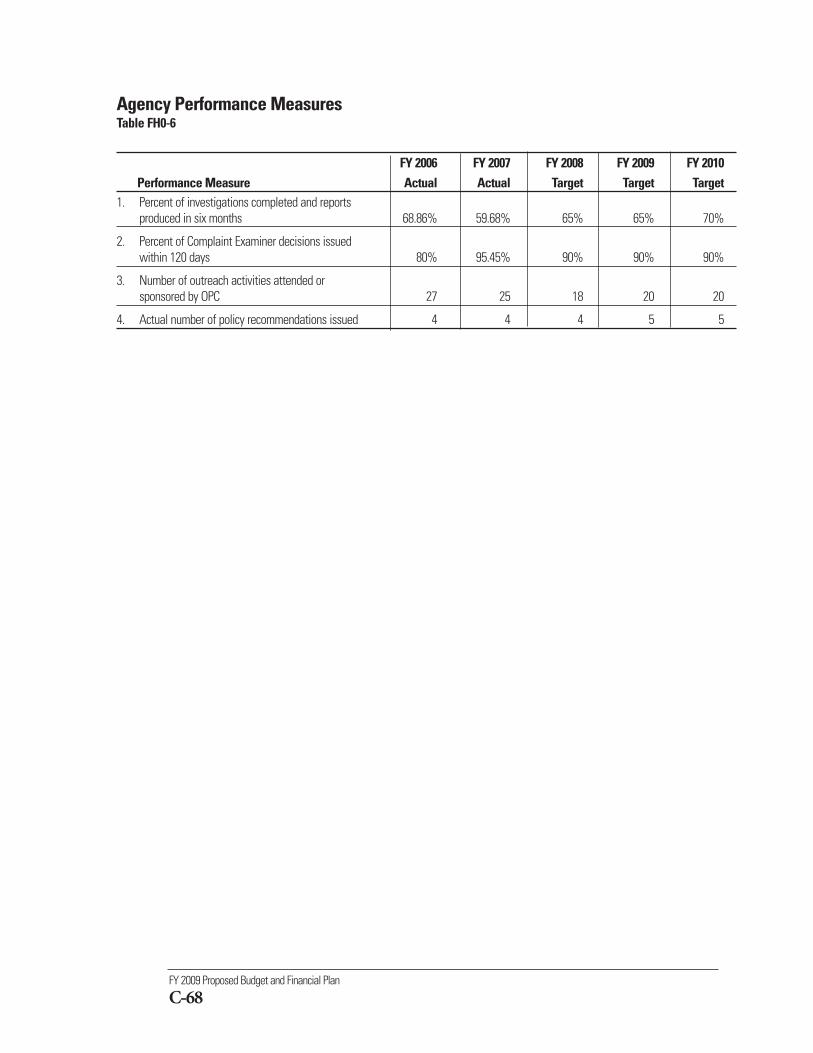
FY 2009 Proposed Budget and Financial Plan
C-68
Agency Performance MeasuresTable FH0-6
FY 2006 FY 2007 FY 2008 FY 2009 FY 2010Performance Measure Actual Actual Target Target Target
1. Percent of investigations completed and reports produced in six months 68.86% 59.68% 65% 65% 70%
2. Percent of Complaint Examiner decisions issued within 120 days 80% 95.45% 90% 90% 90%
3. Number of outreach activities attended or sponsored by OPC 27 25 18 20 20
4. Actual number of policy recommendations issued 4 4 4 5 5
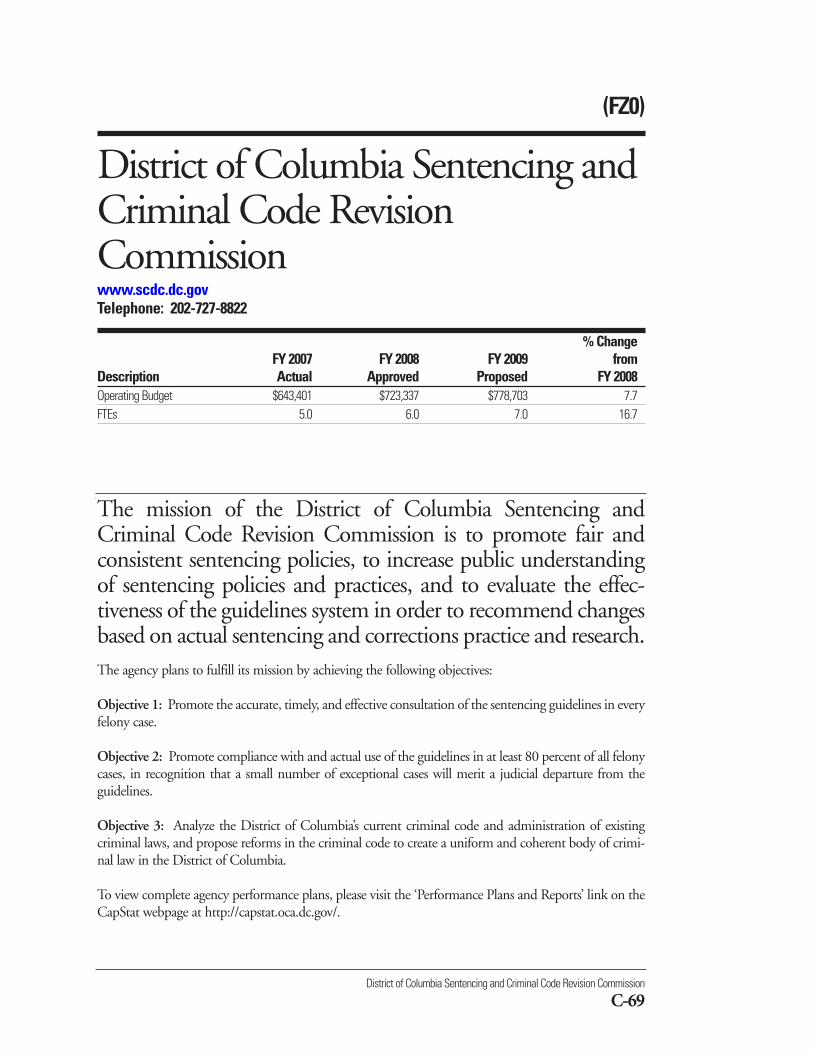
District of Columbia Sentencing and Criminal Code Revision Commission
C-69
The agency plans to fulfill its mission by achieving the following objectives:
Objective 1: Promote the accurate, timely, and effective consultation of the sentencing guidelines in everyfelony case.
Objective 2: Promote compliance with and actual use of the guidelines in at least 80 percent of all felonycases, in recognition that a small number of exceptional cases will merit a judicial departure from theguidelines.
Objective 3: Analyze the District of Columbia’s current criminal code and administration of existingcriminal laws, and propose reforms in the criminal code to create a uniform and coherent body of crimi-nal law in the District of Columbia.
To view complete agency performance plans, please visit the ‘Performance Plans and Reports’ link on theCapStat webpage at http://capstat.oca.dc.gov/.
The mission of the District of Columbia Sentencing andCriminal Code Revision Commission is to promote fair andconsistent sentencing policies, to increase public understandingof sentencing policies and practices, and to evaluate the effec-tiveness of the guidelines system in order to recommend changesbased on actual sentencing and corrections practice and research.
(FZ0)
District of Columbia Sentencing andCriminal Code RevisionCommission www.scdc.dc.govTelephone: 202-727-8822
% ChangeFY 2007 FY 2008 FY 2009 from
Description Actual Approved Proposed FY 2008Operating Budget $643,401 $723,337 $778,703 7.7FTEs 5.0 6.0 7.0 16.7
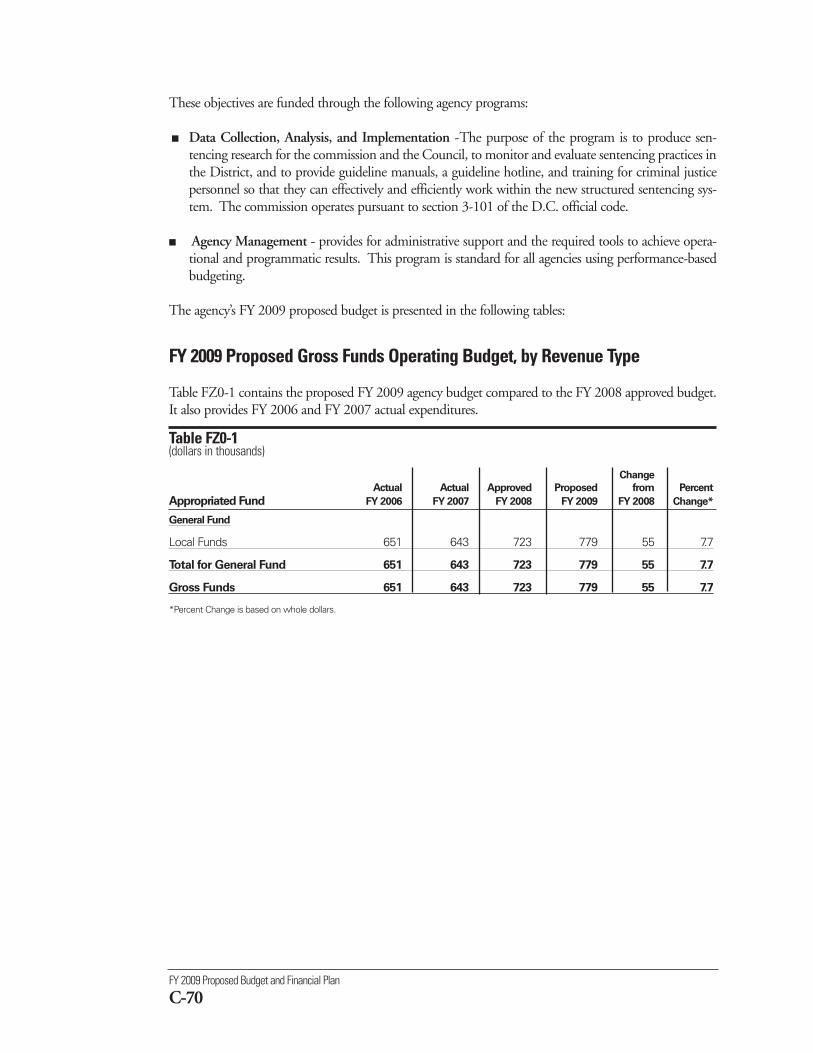
FY 2009 Proposed Budget and Financial Plan
C-70
These objectives are funded through the following agency programs:
■ Data Collection, Analysis, and Implementation -The purpose of the program is to produce sen-tencing research for the commission and the Council, to monitor and evaluate sentencing practices inthe District, and to provide guideline manuals, a guideline hotline, and training for criminal justicepersonnel so that they can effectively and efficiently work within the new structured sentencing sys-tem. The commission operates pursuant to section 3-101 of the D.C. official code.
■ Agency Management - provides for administrative support and the required tools to achieve opera-tional and programmatic results. This program is standard for all agencies using performance-basedbudgeting.
The agency’s FY 2009 proposed budget is presented in the following tables:
FY 2009 Proposed Gross Funds Operating Budget, by Revenue Type
Table FZ0-1 contains the proposed FY 2009 agency budget compared to the FY 2008 approved budget.It also provides FY 2006 and FY 2007 actual expenditures.
Table FZ0-1 (dollars in thousands)
Change
Actual Actual Approved Proposed from Percent
Appropriated Fund FY 2006 FY 2007 FY 2008 FY 2009 FY 2008 Change*
General Fund
Local Funds 651 643 723 779 55 7.7
Total for General Fund 651 643 723 779 55 7.7
Gross Funds 651 643 723 779 55 7.7
*Percent Change is based on whole dollars.
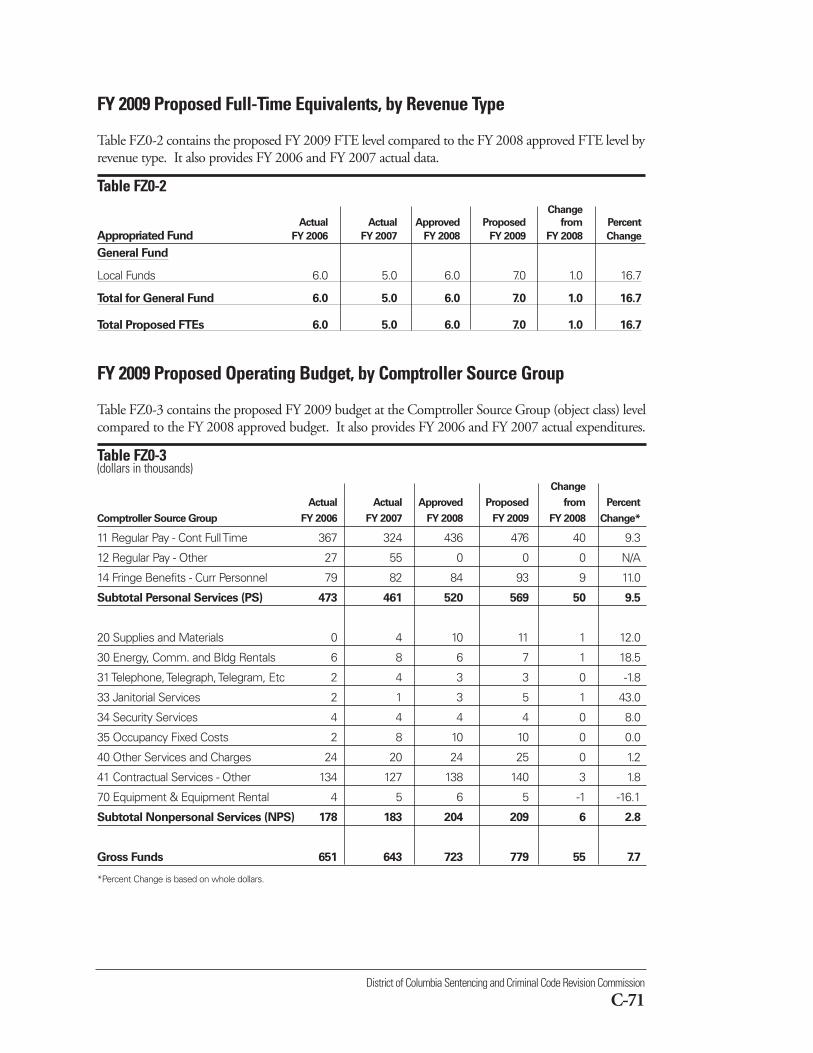
District of Columbia Sentencing and Criminal Code Revision Commission
C-71
FY 2009 Proposed Full-Time Equivalents, by Revenue Type
Table FZ0-2 contains the proposed FY 2009 FTE level compared to the FY 2008 approved FTE level byrevenue type. It also provides FY 2006 and FY 2007 actual data.
Table FZ0-2 Change
Actual Actual Approved Proposed from Percent
Appropriated Fund FY 2006 FY 2007 FY 2008 FY 2009 FY 2008 Change
General Fund
Local Funds 6.0 5.0 6.0 7.0 1.0 16.7
Total for General Fund 6.0 5.0 6.0 7.0 1.0 16.7
Total Proposed FTEs 6.0 5.0 6.0 7.0 1.0 16.7
FY 2009 Proposed Operating Budget, by Comptroller Source Group
Table FZ0-3 contains the proposed FY 2009 budget at the Comptroller Source Group (object class) levelcompared to the FY 2008 approved budget. It also provides FY 2006 and FY 2007 actual expenditures.
Table FZ0-3 (dollars in thousands)
Change
Actual Actual Approved Proposed from Percent
Comptroller Source Group FY 2006 FY 2007 FY 2008 FY 2009 FY 2008 Change*
11 Regular Pay - Cont Full Time 367 324 436 476 40 9.3
12 Regular Pay - Other 27 55 0 0 0 N/A
14 Fringe Benefits - Curr Personnel 79 82 84 93 9 11.0
Subtotal Personal Services (PS) 473 461 520 569 50 9.5
20 Supplies and Materials 0 4 10 11 1 12.0
30 Energy, Comm. and Bldg Rentals 6 8 6 7 1 18.5
31 Telephone, Telegraph, Telegram, Etc 2 4 3 3 0 -1.8
33 Janitorial Services 2 1 3 5 1 43.0
34 Security Services 4 4 4 4 0 8.0
35 Occupancy Fixed Costs 2 8 10 10 0 0.0
40 Other Services and Charges 24 20 24 25 0 1.2
41 Contractual Services - Other 134 127 138 140 3 1.8
70 Equipment & Equipment Rental 4 5 6 5 -1 -16.1
Subtotal Nonpersonal Services (NPS) 178 183 204 209 6 2.8
Gross Funds 651 643 723 779 55 7.7
*Percent Change is based on whole dollars.
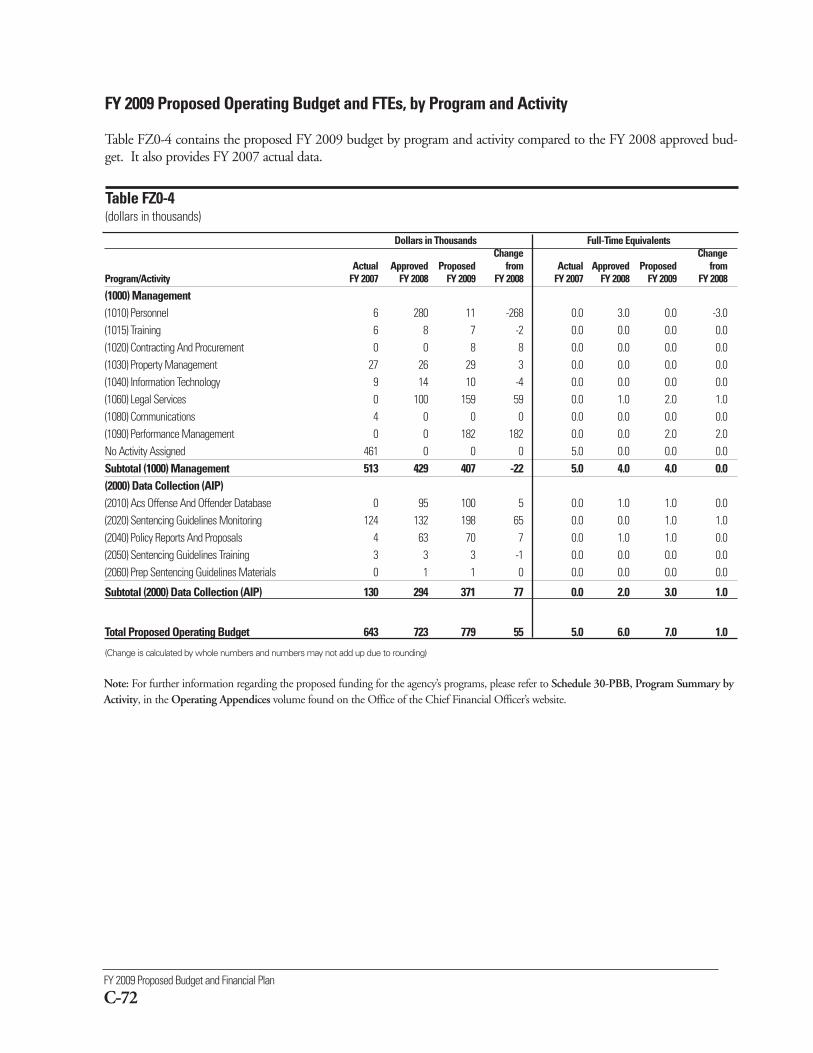
FY 2009 Proposed Budget and Financial Plan
C-72
FY 2009 Proposed Operating Budget and FTEs, by Program and Activity
Table FZ0-4 contains the proposed FY 2009 budget by program and activity compared to the FY 2008 approved bud-get. It also provides FY 2007 actual data.
Table FZ0-4(dollars in thousands)
Dollars in Thousands Full-Time EquivalentsChange Change
Actual Approved Proposed from Actual Approved Proposed from Program/Activity FY 2007 FY 2008 FY 2009 FY 2008 FY 2007 FY 2008 FY 2009 FY 2008
(1000) Management (1010) Personnel 6 280 11 -268 0.0 3.0 0.0 -3.0(1015) Training 6 8 7 -2 0.0 0.0 0.0 0.0(1020) Contracting And Procurement 0 0 8 8 0.0 0.0 0.0 0.0(1030) Property Management 27 26 29 3 0.0 0.0 0.0 0.0(1040) Information Technology 9 14 10 -4 0.0 0.0 0.0 0.0(1060) Legal Services 0 100 159 59 0.0 1.0 2.0 1.0(1080) Communications 4 0 0 0 0.0 0.0 0.0 0.0(1090) Performance Management 0 0 182 182 0.0 0.0 2.0 2.0No Activity Assigned 461 0 0 0 5.0 0.0 0.0 0.0Subtotal (1000) Management 513 429 407 -22 5.0 4.0 4.0 0.0(2000) Data Collection (AIP) (2010) Acs Offense And Offender Database 0 95 100 5 0.0 1.0 1.0 0.0(2020) Sentencing Guidelines Monitoring 124 132 198 65 0.0 0.0 1.0 1.0(2040) Policy Reports And Proposals 4 63 70 7 0.0 1.0 1.0 0.0(2050) Sentencing Guidelines Training 3 3 3 -1 0.0 0.0 0.0 0.0(2060) Prep Sentencing Guidelines Materials 0 1 1 0 0.0 0.0 0.0 0.0
Subtotal (2000) Data Collection (AIP) 130 294 371 77 0.0 2.0 3.0 1.0
Total Proposed Operating Budget 643 723 779 55 5.0 6.0 7.0 1.0
(Change is calculated by whole numbers and numbers may not add up due to rounding)
Note: For further information regarding the proposed funding for the agency’s programs, please refer to Schedule 30-PBB, Program Summary byActivity, in the Operating Appendices volume found on the Office of the Chief Financial Officer’s website.
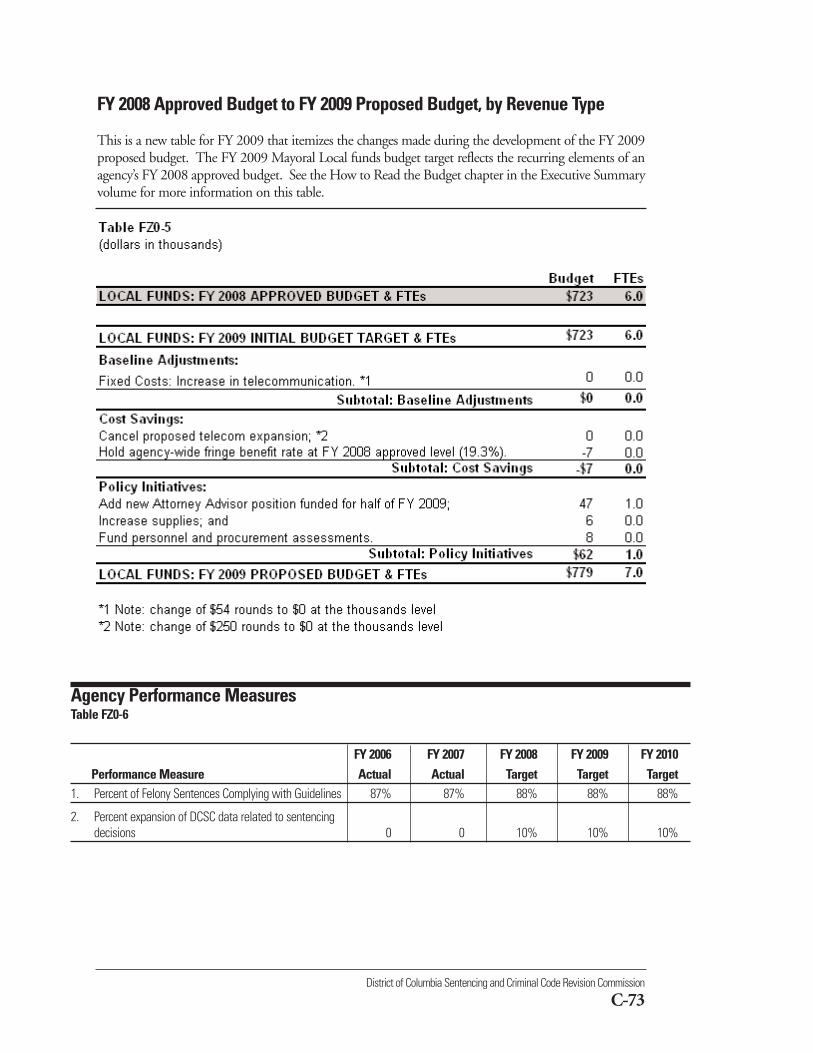
District of Columbia Sentencing and Criminal Code Revision Commission
C-73
FY 2008 Approved Budget to FY 2009 Proposed Budget, by Revenue Type
This is a new table for FY 2009 that itemizes the changes made during the development of the FY 2009proposed budget. The FY 2009 Mayoral Local funds budget target reflects the recurring elements of anagency’s FY 2008 approved budget. See the How to Read the Budget chapter in the Executive Summaryvolume for more information on this table.
Agency Performance MeasuresTable FZ0-6
FY 2006 FY 2007 FY 2008 FY 2009 FY 2010Performance Measure Actual Actual Target Target Target
1. Percent of Felony Sentences Complying with Guidelines 87% 87% 88% 88% 88%
2. Percent expansion of DCSC data related to sentencingdecisions 0 0 10% 10% 10%
(FX0)
Office of the Chief Medical Examinerwww.ocme.dc.govTelephone: 202-698-9000
% ChangeFY 2007 FY 2008 FY 2009 from
Description Actual Approved Proposed FY 2008Operating Budget $8,338,570 $10,632,937 $10,472,666 -1.5FTEs 72.0 94.0 90.0 -4.3
The agency plans to fulfill its mission by achieving the following objectives:
Objective 1: Achieve full facility and fellowship program accreditation in order to raise the national pro-file of the agency.
Objective 2: Educate stakeholders on the mission and services of the agency.
Objective 3: Foster an environment that promotes “health and wellness,” as well as educational and eco-nomic growth opportunities for staff, in order to attract and retain qualified employees.
Objective 4: Achieve readiness to effectively respond to mass fatalities occurring in the District and sur-rounding jurisdictions.
To view complete agency performance plans, please visit the ‘Performance Plans and Reports’ link on theCapStat webpage at http://capstat.oca.dc.gov/.
Office of the Chief Medical Examiner
C-75
The mission of the Office of Chief Medical Examiner (OCME)is to address the needs of grieving families, government agencies,and health care entities and to ensure that justice is servedthrough quality death investigations, certifications, and forensicservices.
FY 2009 Proposed Budget and Financial Plan
C-76
These objectives are funded through the following agency programs:
■ Death Investigations & Certification - supports activities that are part of certifying the cause andmanner of death subsequent to investigation and autopsy/external examination. The agency jurisdic-tion includes investigation of the following types of death: known or suspected homicides, suicides,accidents, drug-related and medically unattended deaths, all deaths in at-risk populations such as chil-dren and intellectually and developmentally challenged individuals, as well as those deaths consideredto be a threat to public health and safety.
■ Fatality Review - operates a series of specialized committees that provide review and analysis servicesto District entities serving defined populations and to the public, so that they can address systemicproblems, provide better services, and be held accountable. Included are the:- Child Fatality Review Committee (CFRC); - Mental Retardation and Developmental Disabilities Fatality Review Committee (MRDDA);
and - Domestic Violence Fatality Review Board (DVFRB).
■ Agency Management - provides for administrative support and the required tools to achieve opera-tional and programmatic results. This program is standard for all agencies using performance-basedbudgeting.
The agency’s FY 2009 proposed budget is presented in the following tables:
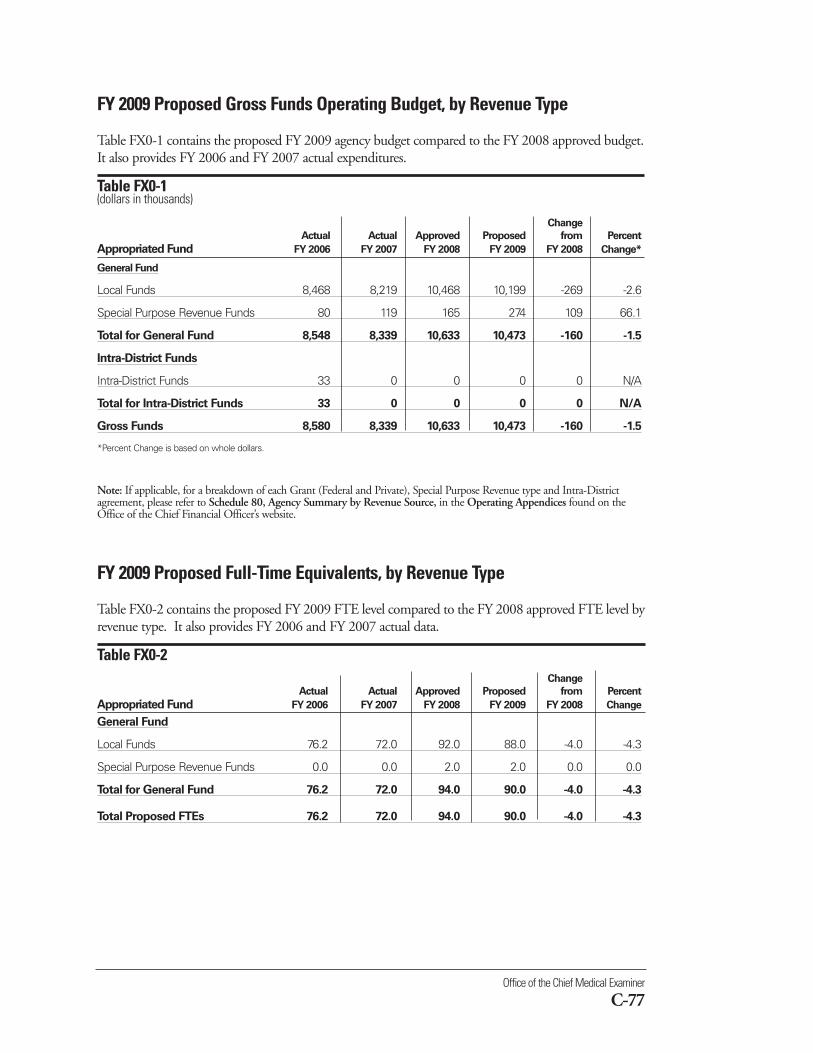
Office of the Chief Medical Examiner
C-77
FY 2009 Proposed Gross Funds Operating Budget, by Revenue Type
Table FX0-1 contains the proposed FY 2009 agency budget compared to the FY 2008 approved budget.It also provides FY 2006 and FY 2007 actual expenditures.
Table FX0-1 (dollars in thousands)
Change
Actual Actual Approved Proposed from Percent
Appropriated Fund FY 2006 FY 2007 FY 2008 FY 2009 FY 2008 Change*
General Fund
Local Funds 8,468 8,219 10,468 10,199 -269 -2.6
Special Purpose Revenue Funds 80 119 165 274 109 66.1
Total for General Fund 8,548 8,339 10,633 10,473 -160 -1.5
Intra-District Funds
Intra-District Funds 33 0 0 0 0 N/A
Total for Intra-District Funds 33 0 0 0 0 N/A
Gross Funds 8,580 8,339 10,633 10,473 -160 -1.5
*Percent Change is based on whole dollars.
Note: If applicable, for a breakdown of each Grant (Federal and Private), Special Purpose Revenue type and Intra-Districtagreement, please refer to Schedule 80, Agency Summary by Revenue Source, in the Operating Appendices found on theOffice of the Chief Financial Officer’s website.
FY 2009 Proposed Full-Time Equivalents, by Revenue Type
Table FX0-2 contains the proposed FY 2009 FTE level compared to the FY 2008 approved FTE level byrevenue type. It also provides FY 2006 and FY 2007 actual data.
Table FX0-2 Change
Actual Actual Approved Proposed from Percent
Appropriated Fund FY 2006 FY 2007 FY 2008 FY 2009 FY 2008 Change
General Fund
Local Funds 76.2 72.0 92.0 88.0 -4.0 -4.3
Special Purpose Revenue Funds 0.0 0.0 2.0 2.0 0.0 0.0
Total for General Fund 76.2 72.0 94.0 90.0 -4.0 -4.3
Total Proposed FTEs 76.2 72.0 94.0 90.0 -4.0 -4.3
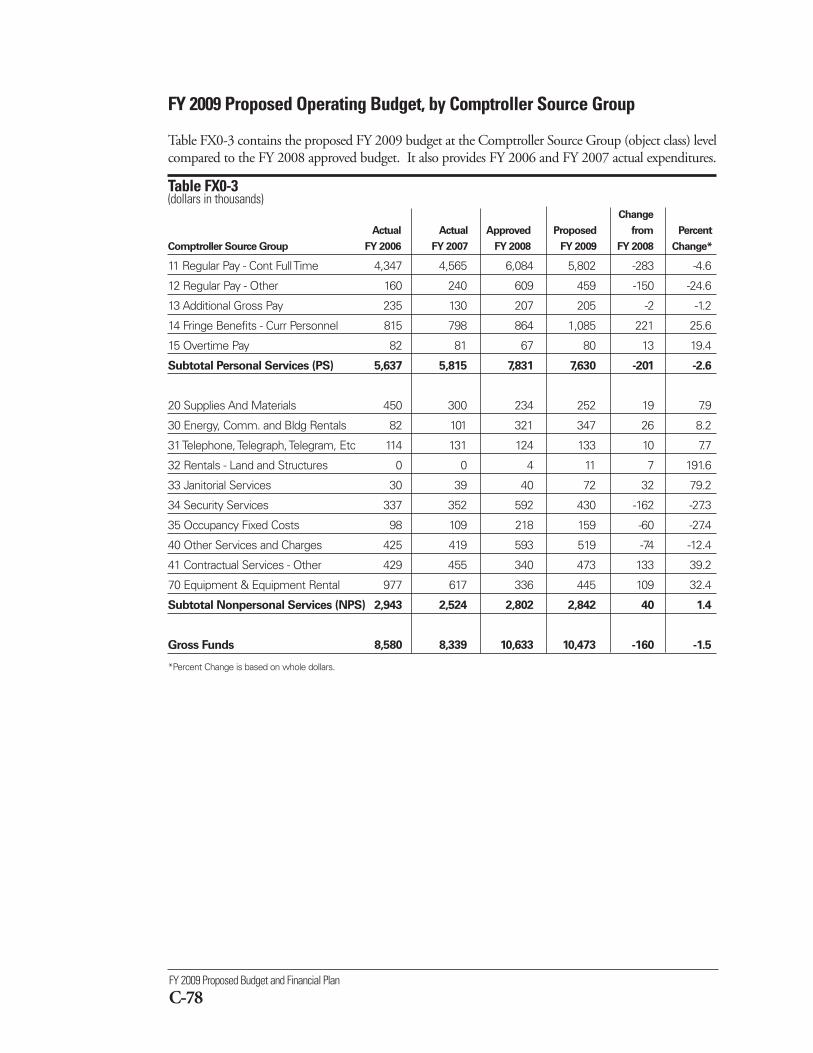
FY 2009 Proposed Budget and Financial Plan
C-78
FY 2009 Proposed Operating Budget, by Comptroller Source Group
Table FX0-3 contains the proposed FY 2009 budget at the Comptroller Source Group (object class) levelcompared to the FY 2008 approved budget. It also provides FY 2006 and FY 2007 actual expenditures.
Table FX0-3(dollars in thousands)
Change
Actual Actual Approved Proposed from Percent
Comptroller Source Group FY 2006 FY 2007 FY 2008 FY 2009 FY 2008 Change*
11 Regular Pay - Cont Full Time 4,347 4,565 6,084 5,802 -283 -4.6
12 Regular Pay - Other 160 240 609 459 -150 -24.6
13 Additional Gross Pay 235 130 207 205 -2 -1.2
14 Fringe Benefits - Curr Personnel 815 798 864 1,085 221 25.6
15 Overtime Pay 82 81 67 80 13 19.4
Subtotal Personal Services (PS) 5,637 5,815 7,831 7,630 -201 -2.6
20 Supplies And Materials 450 300 234 252 19 7.9
30 Energy, Comm. and Bldg Rentals 82 101 321 347 26 8.2
31 Telephone, Telegraph, Telegram, Etc 114 131 124 133 10 7.7
32 Rentals - Land and Structures 0 0 4 11 7 191.6
33 Janitorial Services 30 39 40 72 32 79.2
34 Security Services 337 352 592 430 -162 -27.3
35 Occupancy Fixed Costs 98 109 218 159 -60 -27.4
40 Other Services and Charges 425 419 593 519 -74 -12.4
41 Contractual Services - Other 429 455 340 473 133 39.2
70 Equipment & Equipment Rental 977 617 336 445 109 32.4
Subtotal Nonpersonal Services (NPS) 2,943 2,524 2,802 2,842 40 1.4
Gross Funds 8,580 8,339 10,633 10,473 -160 -1.5
*Percent Change is based on whole dollars.
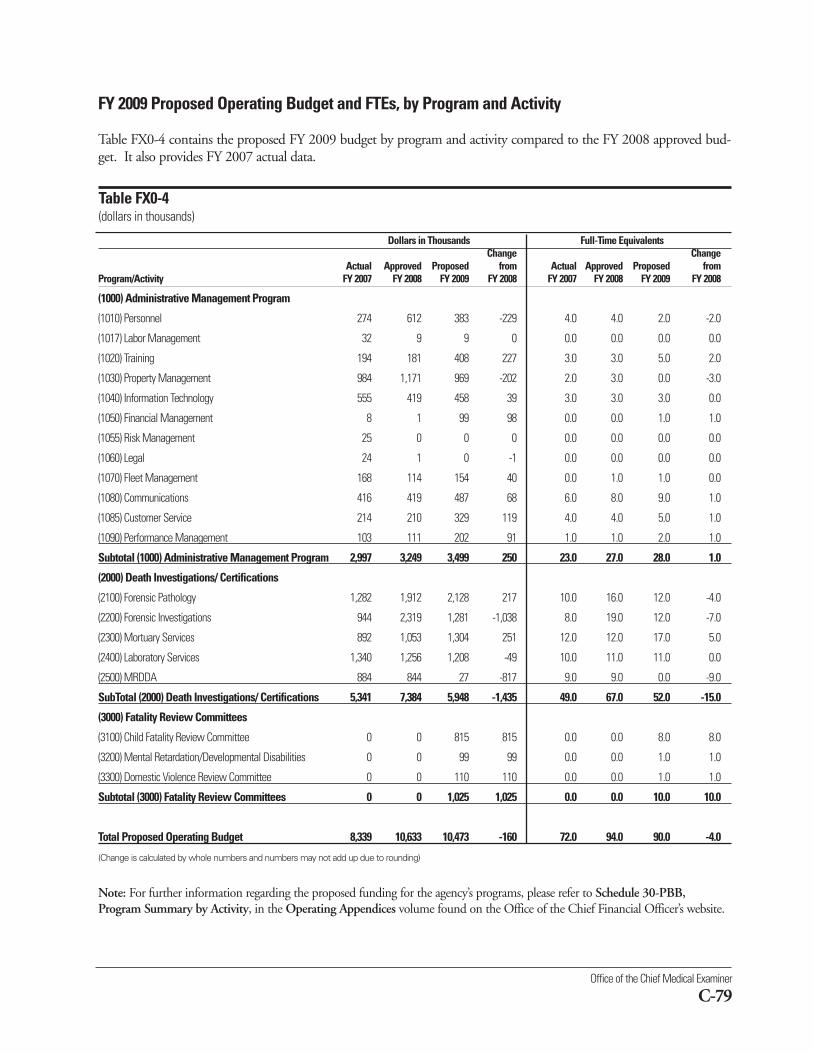
Office of the Chief Medical Examiner
C-79
Dollars in Thousands Full-Time EquivalentsChange Change
Actual Approved Proposed from Actual Approved Proposed from Program/Activity FY 2007 FY 2008 FY 2009 FY 2008 FY 2007 FY 2008 FY 2009 FY 2008
(1000) Administrative Management Program
(1010) Personnel 274 612 383 -229 4.0 4.0 2.0 -2.0
(1017) Labor Management 32 9 9 0 0.0 0.0 0.0 0.0
(1020) Training 194 181 408 227 3.0 3.0 5.0 2.0
(1030) Property Management 984 1,171 969 -202 2.0 3.0 0.0 -3.0
(1040) Information Technology 555 419 458 39 3.0 3.0 3.0 0.0
(1050) Financial Management 8 1 99 98 0.0 0.0 1.0 1.0
(1055) Risk Management 25 0 0 0 0.0 0.0 0.0 0.0
(1060) Legal 24 1 0 -1 0.0 0.0 0.0 0.0
(1070) Fleet Management 168 114 154 40 0.0 1.0 1.0 0.0
(1080) Communications 416 419 487 68 6.0 8.0 9.0 1.0
(1085) Customer Service 214 210 329 119 4.0 4.0 5.0 1.0
(1090) Performance Management 103 111 202 91 1.0 1.0 2.0 1.0
Subtotal (1000) Administrative Management Program 2,997 3,249 3,499 250 23.0 27.0 28.0 1.0
(2000) Death Investigations/ Certifications
(2100) Forensic Pathology 1,282 1,912 2,128 217 10.0 16.0 12.0 -4.0
(2200) Forensic Investigations 944 2,319 1,281 -1,038 8.0 19.0 12.0 -7.0
(2300) Mortuary Services 892 1,053 1,304 251 12.0 12.0 17.0 5.0
(2400) Laboratory Services 1,340 1,256 1,208 -49 10.0 11.0 11.0 0.0
(2500) MRDDA 884 844 27 -817 9.0 9.0 0.0 -9.0
SubTotal (2000) Death Investigations/ Certifications 5,341 7,384 5,948 -1,435 49.0 67.0 52.0 -15.0
(3000) Fatality Review Committees
(3100) Child Fatality Review Committee 0 0 815 815 0.0 0.0 8.0 8.0
(3200) Mental Retardation/Developmental Disabilities 0 0 99 99 0.0 0.0 1.0 1.0
(3300) Domestic Violence Review Committee 0 0 110 110 0.0 0.0 1.0 1.0
Subtotal (3000) Fatality Review Committees 0 0 1,025 1,025 0.0 0.0 10.0 10.0
Total Proposed Operating Budget 8,339 10,633 10,473 -160 72.0 94.0 90.0 -4.0
(Change is calculated by whole numbers and numbers may not add up due to rounding)
Note: For further information regarding the proposed funding for the agency’s programs, please refer to Schedule 30-PBB,Program Summary by Activity, in the Operating Appendices volume found on the Office of the Chief Financial Officer’s website.
FY 2009 Proposed Operating Budget and FTEs, by Program and Activity
Table FX0-4 contains the proposed FY 2009 budget by program and activity compared to the FY 2008 approved bud-get. It also provides FY 2007 actual data.
Table FX0-4(dollars in thousands)
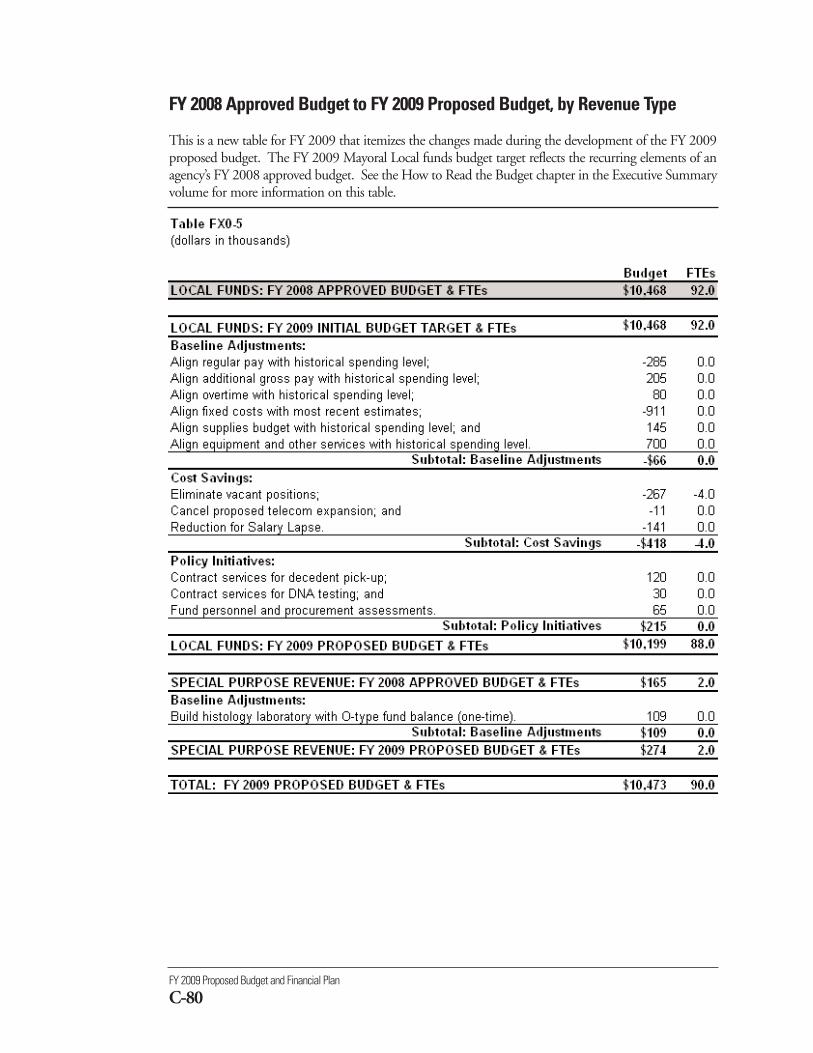
FY 2009 Proposed Budget and Financial Plan
C-80
FY 2008 Approved Budget to FY 2009 Proposed Budget, by Revenue Type
This is a new table for FY 2009 that itemizes the changes made during the development of the FY 2009proposed budget. The FY 2009 Mayoral Local funds budget target reflects the recurring elements of anagency’s FY 2008 approved budget. See the How to Read the Budget chapter in the Executive Summaryvolume for more information on this table.
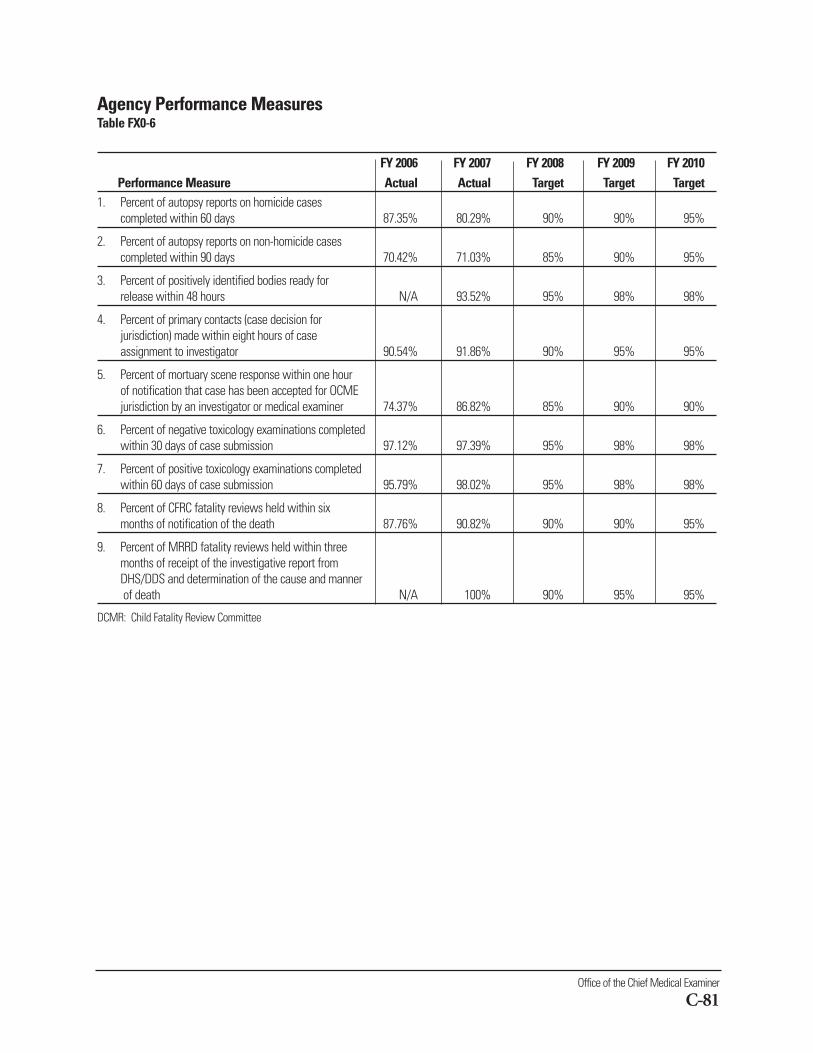
Office of the Chief Medical Examiner
C-81
Agency Performance MeasuresTable FX0-6
FY 2006 FY 2007 FY 2008 FY 2009 FY 2010Performance Measure Actual Actual Target Target Target
1. Percent of autopsy reports on homicide cases completed within 60 days 87.35% 80.29% 90% 90% 95%
2. Percent of autopsy reports on non-homicide cases completed within 90 days 70.42% 71.03% 85% 90% 95%
3. Percent of positively identified bodies ready for release within 48 hours N/A 93.52% 95% 98% 98%
4. Percent of primary contacts (case decision for jurisdiction) made within eight hours of case assignment to investigator 90.54% 91.86% 90% 95% 95%
5. Percent of mortuary scene response within one hour of notification that case has been accepted for OCME jurisdiction by an investigator or medical examiner 74.37% 86.82% 85% 90% 90%
6. Percent of negative toxicology examinations completed within 30 days of case submission 97.12% 97.39% 95% 98% 98%
7. Percent of positive toxicology examinations completed within 60 days of case submission 95.79% 98.02% 95% 98% 98%
8. Percent of CFRC fatality reviews held within six months of notification of the death 87.76% 90.82% 90% 90% 95%
9. Percent of MRRD fatality reviews held within three months of receipt of the investigative report from DHS/DDS and determination of the cause and mannerof death N/A 100% 90% 95% 95%
DCMR: Child Fatality Review Committee
Office of Administrative Hearings
C-83
(FS0)
Office of Administrative Hearingswww.oah.dc.govTelephone: 202-442-9091
% ChangeFY 2007 FY 2008 FY 2009 from
Description Actual Approved Proposed FY 2008Operating Budget $6,081,992 $8,679,580 $8,498,673 -2.1FTEs 61.4 64.1 64.1 -0.1
The mission of the Office of Administrative Hearings (OAH) isto provide the District of Columbia’s citizens and governmentagencies with a fair, efficient, and effective forum to manage andresolve administrative disputes arising under the District’s lawsand regulations.OAH is an independent administrative tribunal established pursuant to §2-1831 of the District ofColumbia Official Code that hears administrative litigation involving over 25 different agencies, boards,and commissions of the District of Columbia.
The agency plans to fulfill its mission by achieving the following objectives:
Objective 1: Reduce the time for reaching final disposition of cases.
Objective 2: Improve customer service.
To view complete agency performance plans, please visit the ‘Performance Plans and Reports’ link on theCapStat webpage at http://capstat.oca.dc.gov/.
These objectives are funded through the following agency programs:
■ Judicial - provides legally appropriate due process while working to improve the quality, efficiency, andefficacy of justice management.
■ Court Counsel - supports the administrative court's judicial function by assisting judges in legal analy-sis, research, and drafting while also providing legal support services to agency management.
■ Clerk of Court - provides day-to-day management of the court's caseload and support to the judicialfunction as the primary customer service interface to parties coming before the court.
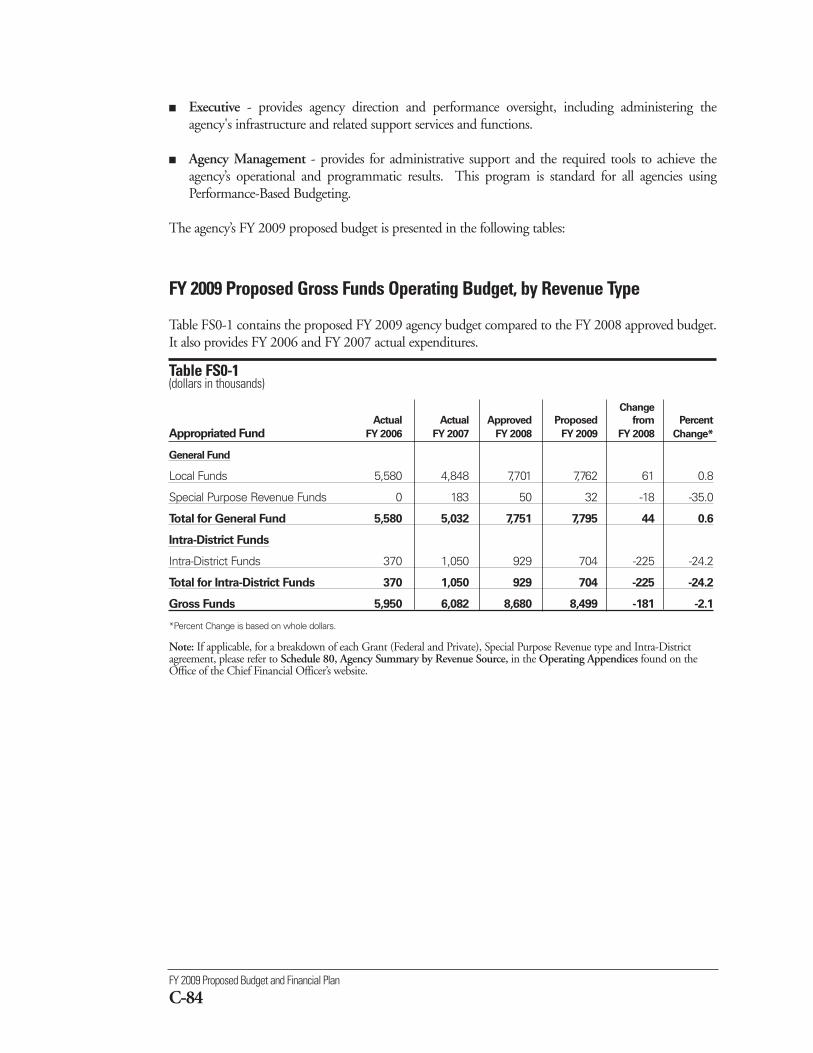
FY 2009 Proposed Budget and Financial Plan
C-84
■ Executive - provides agency direction and performance oversight, including administering theagency's infrastructure and related support services and functions.
■ Agency Management - provides for administrative support and the required tools to achieve theagency’s operational and programmatic results. This program is standard for all agencies usingPerformance-Based Budgeting.
The agency’s FY 2009 proposed budget is presented in the following tables:
FY 2009 Proposed Gross Funds Operating Budget, by Revenue Type
Table FS0-1 contains the proposed FY 2009 agency budget compared to the FY 2008 approved budget.It also provides FY 2006 and FY 2007 actual expenditures.
Table FS0-1 (dollars in thousands)
Change
Actual Actual Approved Proposed from Percent
Appropriated Fund FY 2006 FY 2007 FY 2008 FY 2009 FY 2008 Change*
General Fund
Local Funds 5,580 4,848 7,701 7,762 61 0.8
Special Purpose Revenue Funds 0 183 50 32 -18 -35.0
Total for General Fund 5,580 5,032 7,751 7,795 44 0.6
Intra-District Funds
Intra-District Funds 370 1,050 929 704 -225 -24.2
Total for Intra-District Funds 370 1,050 929 704 -225 -24.2
Gross Funds 5,950 6,082 8,680 8,499 -181 -2.1
*Percent Change is based on whole dollars.
Note: If applicable, for a breakdown of each Grant (Federal and Private), Special Purpose Revenue type and Intra-Districtagreement, please refer to Schedule 80, Agency Summary by Revenue Source, in the Operating Appendices found on theOffice of the Chief Financial Officer’s website.
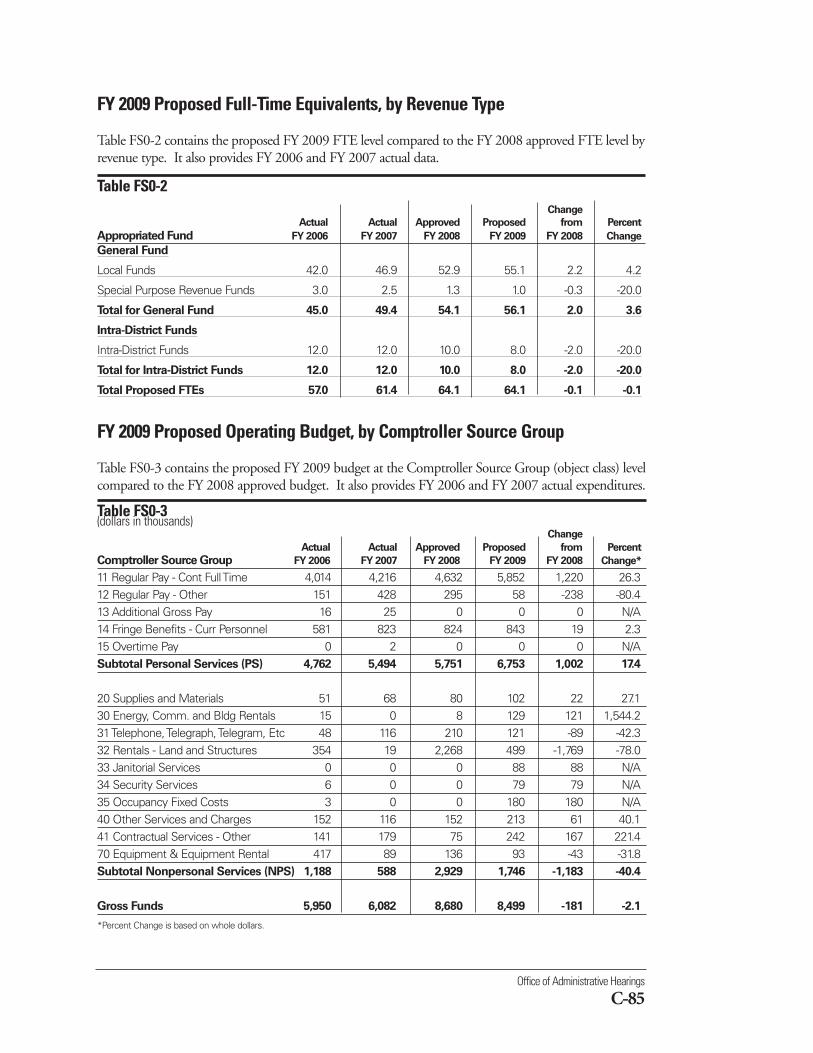
Office of Administrative Hearings
C-85
FY 2009 Proposed Full-Time Equivalents, by Revenue Type
Table FS0-2 contains the proposed FY 2009 FTE level compared to the FY 2008 approved FTE level byrevenue type. It also provides FY 2006 and FY 2007 actual data.
Table FS0-2 Change
Actual Actual Approved Proposed from Percent
Appropriated Fund FY 2006 FY 2007 FY 2008 FY 2009 FY 2008 Change
General Fund
Local Funds 42.0 46.9 52.9 55.1 2.2 4.2
Special Purpose Revenue Funds 3.0 2.5 1.3 1.0 -0.3 -20.0
Total for General Fund 45.0 49.4 54.1 56.1 2.0 3.6
Intra-District Funds
Intra-District Funds 12.0 12.0 10.0 8.0 -2.0 -20.0
Total for Intra-District Funds 12.0 12.0 10.0 8.0 -2.0 -20.0
Total Proposed FTEs 57.0 61.4 64.1 64.1 -0.1 -0.1
FY 2009 Proposed Operating Budget, by Comptroller Source Group
Table FS0-3 contains the proposed FY 2009 budget at the Comptroller Source Group (object class) levelcompared to the FY 2008 approved budget. It also provides FY 2006 and FY 2007 actual expenditures.
Table FS0-3(dollars in thousands)
Change
Actual Actual Approved Proposed from Percent
Comptroller Source Group FY 2006 FY 2007 FY 2008 FY 2009 FY 2008 Change*
11 Regular Pay - Cont Full Time 4,014 4,216 4,632 5,852 1,220 26.312 Regular Pay - Other 151 428 295 58 -238 -80.413 Additional Gross Pay 16 25 0 0 0 N/A14 Fringe Benefits - Curr Personnel 581 823 824 843 19 2.315 Overtime Pay 0 2 0 0 0 N/ASubtotal Personal Services (PS) 4,762 5,494 5,751 6,753 1,002 17.4
20 Supplies and Materials 51 68 80 102 22 27.130 Energy, Comm. and Bldg Rentals 15 0 8 129 121 1,544.231 Telephone, Telegraph, Telegram, Etc 48 116 210 121 -89 -42.332 Rentals - Land and Structures 354 19 2,268 499 -1,769 -78.033 Janitorial Services 0 0 0 88 88 N/A34 Security Services 6 0 0 79 79 N/A35 Occupancy Fixed Costs 3 0 0 180 180 N/A40 Other Services and Charges 152 116 152 213 61 40.141 Contractual Services - Other 141 179 75 242 167 221.470 Equipment & Equipment Rental 417 89 136 93 -43 -31.8Subtotal Nonpersonal Services (NPS) 1,188 588 2,929 1,746 -1,183 -40.4
Gross Funds 5,950 6,082 8,680 8,499 -181 -2.1
*Percent Change is based on whole dollars.
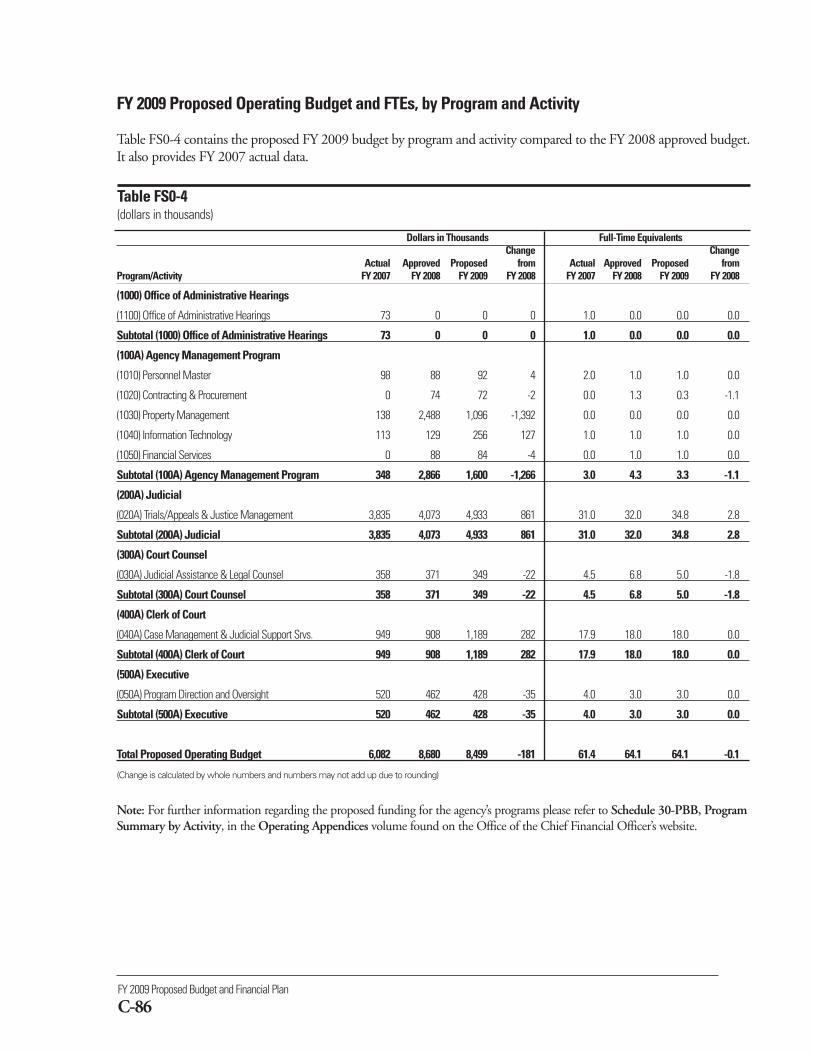
FY 2009 Proposed Budget and Financial Plan
C-86
Dollars in Thousands Full-Time EquivalentsChange Change
Actual Approved Proposed from Actual Approved Proposed from Program/Activity FY 2007 FY 2008 FY 2009 FY 2008 FY 2007 FY 2008 FY 2009 FY 2008
(1000) Office of Administrative Hearings
(1100) Office of Administrative Hearings 73 0 0 0 1.0 0.0 0.0 0.0
Subtotal (1000) Office of Administrative Hearings 73 0 0 0 1.0 0.0 0.0 0.0
(100A) Agency Management Program
(1010) Personnel Master 98 88 92 4 2.0 1.0 1.0 0.0
(1020) Contracting & Procurement 0 74 72 -2 0.0 1.3 0.3 -1.1
(1030) Property Management 138 2,488 1,096 -1,392 0.0 0.0 0.0 0.0
(1040) Information Technology 113 129 256 127 1.0 1.0 1.0 0.0
(1050) Financial Services 0 88 84 -4 0.0 1.0 1.0 0.0
Subtotal (100A) Agency Management Program 348 2,866 1,600 -1,266 3.0 4.3 3.3 -1.1
(200A) Judicial
(020A) Trials/Appeals & Justice Management 3,835 4,073 4,933 861 31.0 32.0 34.8 2.8
Subtotal (200A) Judicial 3,835 4,073 4,933 861 31.0 32.0 34.8 2.8
(300A) Court Counsel
(030A) Judicial Assistance & Legal Counsel 358 371 349 -22 4.5 6.8 5.0 -1.8
Subtotal (300A) Court Counsel 358 371 349 -22 4.5 6.8 5.0 -1.8
(400A) Clerk of Court
(040A) Case Management & Judicial Support Srvs. 949 908 1,189 282 17.9 18.0 18.0 0.0
Subtotal (400A) Clerk of Court 949 908 1,189 282 17.9 18.0 18.0 0.0
(500A) Executive
(050A) Program Direction and Oversight 520 462 428 -35 4.0 3.0 3.0 0.0
Subtotal (500A) Executive 520 462 428 -35 4.0 3.0 3.0 0.0
Total Proposed Operating Budget 6,082 8,680 8,499 -181 61.4 64.1 64.1 -0.1
(Change is calculated by whole numbers and numbers may not add up due to rounding)
Note: For further information regarding the proposed funding for the agency’s programs please refer to Schedule 30-PBB, ProgramSummary by Activity, in the Operating Appendices volume found on the Office of the Chief Financial Officer’s website.
FY 2009 Proposed Operating Budget and FTEs, by Program and Activity
Table FS0-4 contains the proposed FY 2009 budget by program and activity compared to the FY 2008 approved budget.It also provides FY 2007 actual data.
Table FS0-4(dollars in thousands)
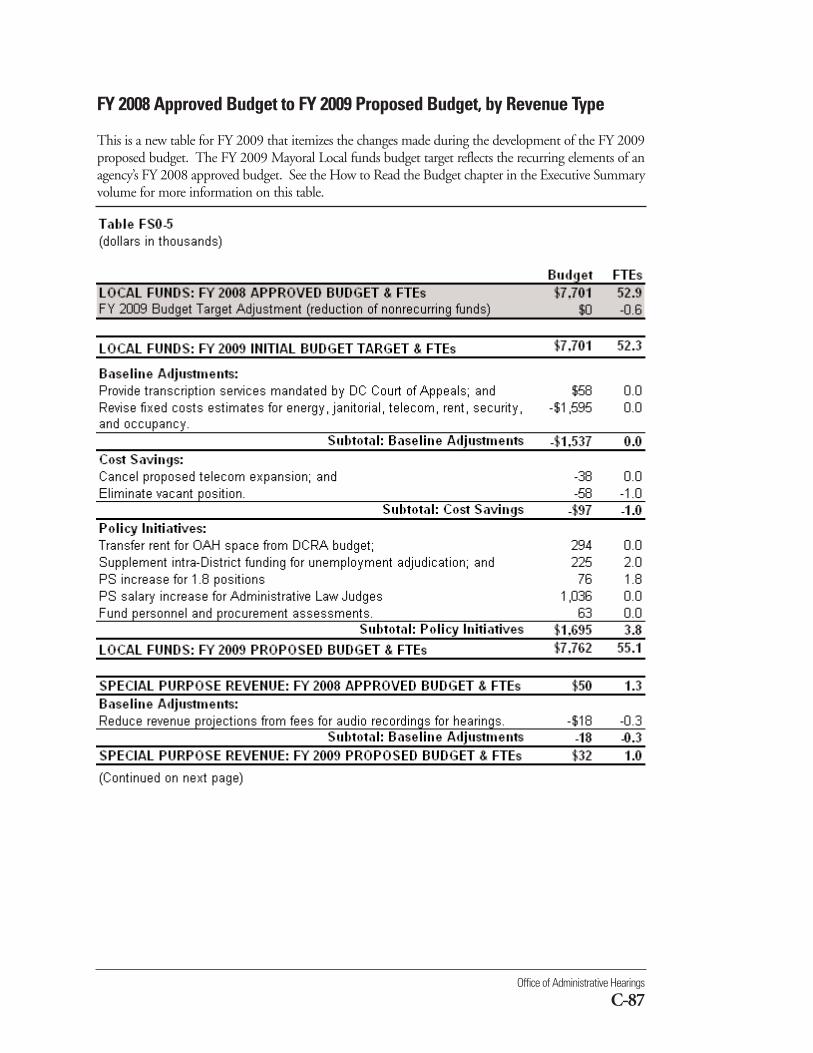
Office of Administrative Hearings
C-87
FY 2008 Approved Budget to FY 2009 Proposed Budget, by Revenue Type
This is a new table for FY 2009 that itemizes the changes made during the development of the FY 2009proposed budget. The FY 2009 Mayoral Local funds budget target reflects the recurring elements of anagency’s FY 2008 approved budget. See the How to Read the Budget chapter in the Executive Summaryvolume for more information on this table.
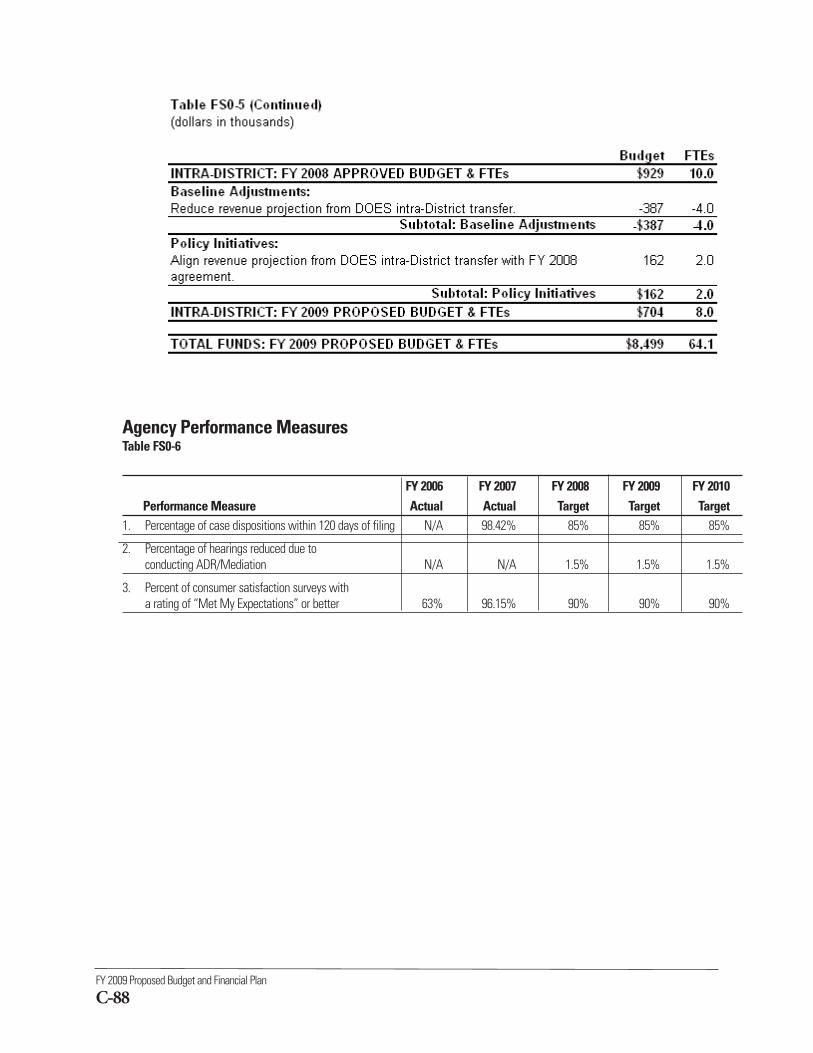
FY 2009 Proposed Budget and Financial Plan
C-88
Agency Performance MeasuresTable FS0-6
FY 2006 FY 2007 FY 2008 FY 2009 FY 2010Performance Measure Actual Actual Target Target Target
1. Percentage of case dispositions within 120 days of filing N/A 98.42% 85% 85% 85%
2. Percentage of hearings reduced due to conducting ADR/Mediation N/A N/A 1.5% 1.5% 1.5%
3. Percent of consumer satisfaction surveys with a rating of “Met My Expectations” or better 63% 96.15% 90% 90% 90%
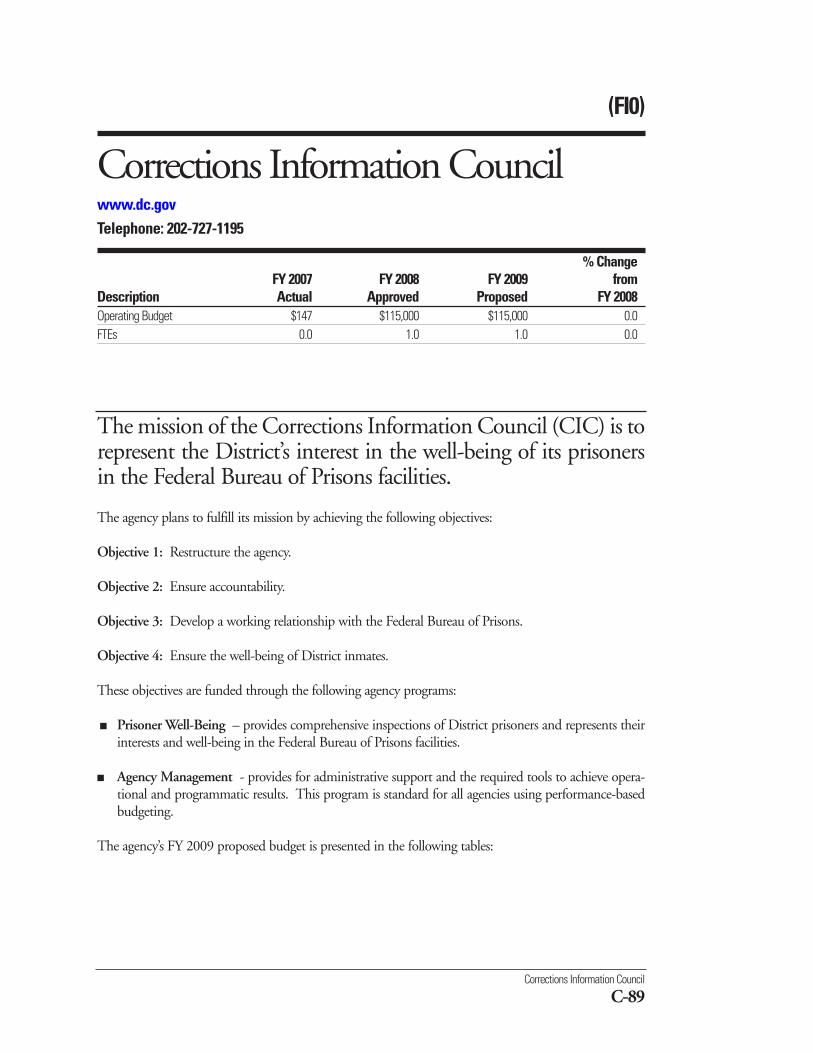
The mission of the Corrections Information Council (CIC) is torepresent the District’s interest in the well-being of its prisonersin the Federal Bureau of Prisons facilities.
Corrections Information Council
C-89
The agency plans to fulfill its mission by achieving the following objectives:
Objective 1: Restructure the agency.
Objective 2: Ensure accountability.
Objective 3: Develop a working relationship with the Federal Bureau of Prisons.
Objective 4: Ensure the well-being of District inmates.
These objectives are funded through the following agency programs:
■ Prisoner Well-Being – provides comprehensive inspections of District prisoners and represents theirinterests and well-being in the Federal Bureau of Prisons facilities.
■ Agency Management - provides for administrative support and the required tools to achieve opera-tional and programmatic results. This program is standard for all agencies using performance-basedbudgeting.
The agency’s FY 2009 proposed budget is presented in the following tables:
(FI0)
Corrections Information Councilwww.dc.govTelephone: 202-727-1195
% ChangeFY 2007 FY 2008 FY 2009 from
Description Actual Approved Proposed FY 2008Operating Budget $147 $115,000 $115,000 0.0FTEs 0.0 1.0 1.0 0.0
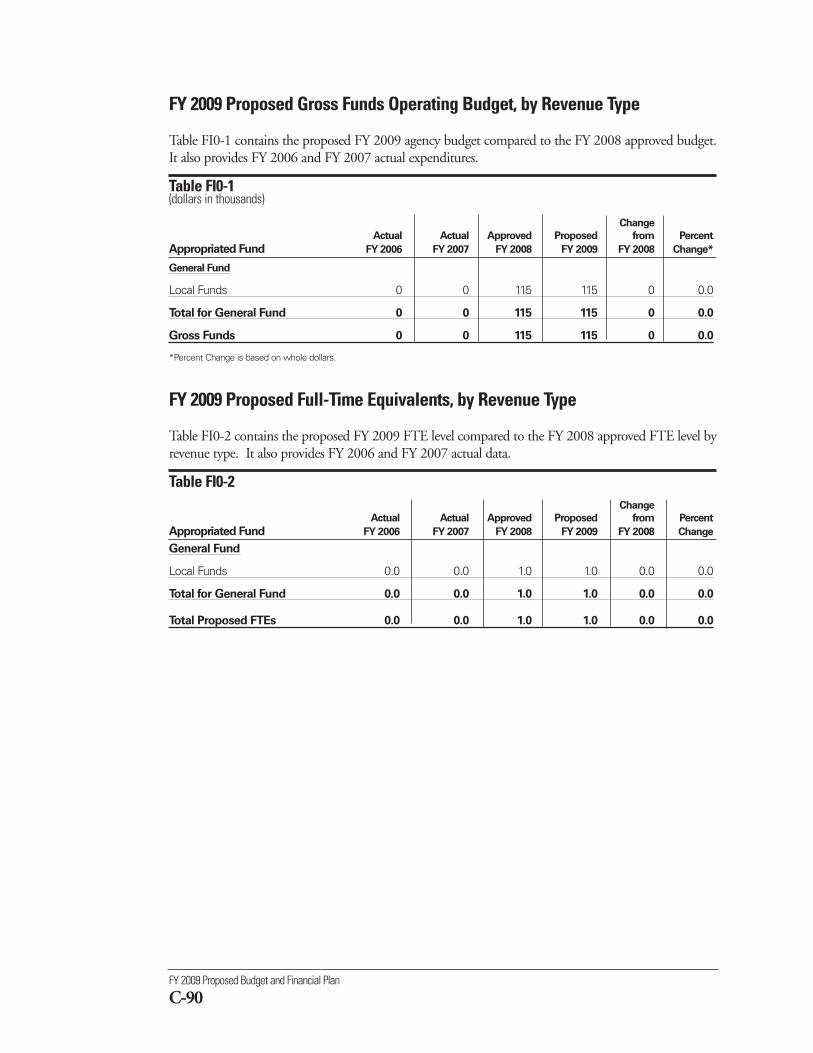
FY 2009 Proposed Budget and Financial Plan
C-90
FY 2009 Proposed Gross Funds Operating Budget, by Revenue Type
Table FI0-1 contains the proposed FY 2009 agency budget compared to the FY 2008 approved budget.It also provides FY 2006 and FY 2007 actual expenditures.
Table FI0-1 (dollars in thousands)
Change
Actual Actual Approved Proposed from Percent
Appropriated Fund FY 2006 FY 2007 FY 2008 FY 2009 FY 2008 Change*
General Fund
Local Funds 0 0 115 115 0 0.0
Total for General Fund 0 0 115 115 0 0.0
Gross Funds 0 0 115 115 0 0.0
*Percent Change is based on whole dollars.
FY 2009 Proposed Full-Time Equivalents, by Revenue Type
Table FI0-2 contains the proposed FY 2009 FTE level compared to the FY 2008 approved FTE level byrevenue type. It also provides FY 2006 and FY 2007 actual data.
Table FI0-2 Change
Actual Actual Approved Proposed from Percent
Appropriated Fund FY 2006 FY 2007 FY 2008 FY 2009 FY 2008 Change
General Fund
Local Funds 0.0 0.0 1.0 1.0 0.0 0.0
Total for General Fund 0.0 0.0 1.0 1.0 0.0 0.0
Total Proposed FTEs 0.0 0.0 1.0 1.0 0.0 0.0
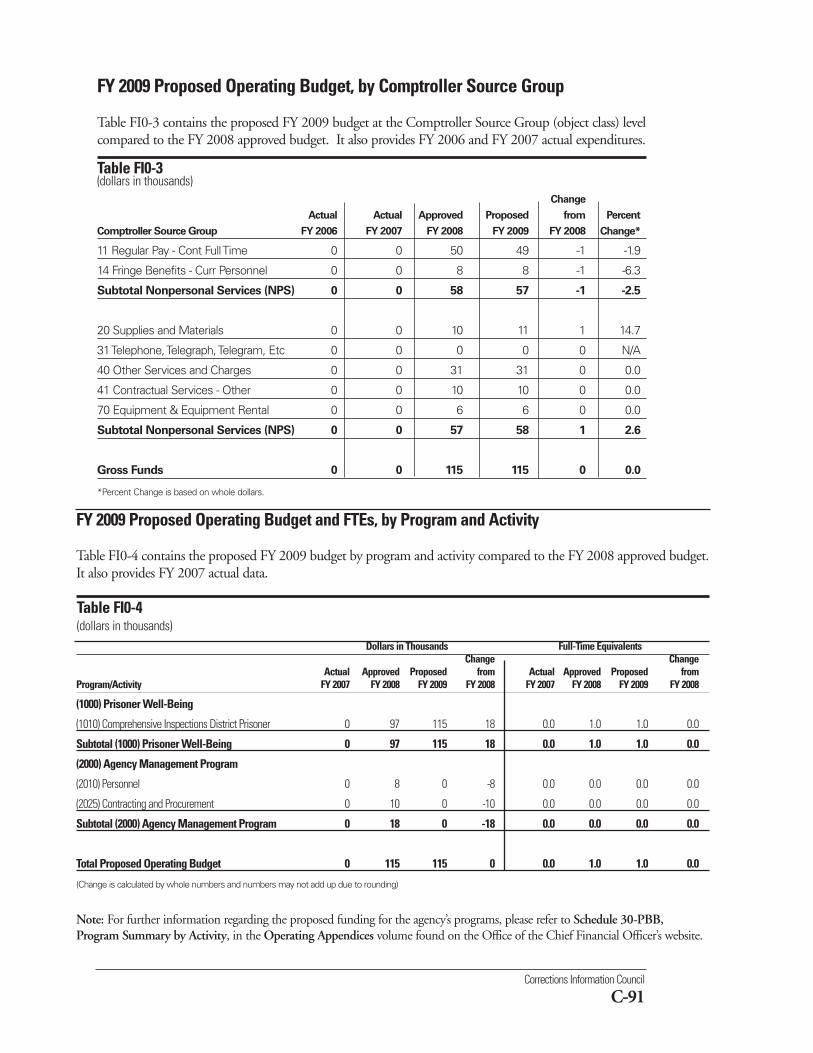
Corrections Information Council
C-91
FY 2009 Proposed Operating Budget, by Comptroller Source Group
Table FI0-3 contains the proposed FY 2009 budget at the Comptroller Source Group (object class) levelcompared to the FY 2008 approved budget. It also provides FY 2006 and FY 2007 actual expenditures.
Table FI0-3 (dollars in thousands)
Change
Actual Actual Approved Proposed from Percent
Comptroller Source Group FY 2006 FY 2007 FY 2008 FY 2009 FY 2008 Change*
11 Regular Pay - Cont Full Time 0 0 50 49 -1 -1.9
14 Fringe Benefits - Curr Personnel 0 0 8 8 -1 -6.3
Subtotal Nonpersonal Services (NPS) 0 0 58 57 -1 -2.5
20 Supplies and Materials 0 0 10 11 1 14.7
31 Telephone, Telegraph, Telegram, Etc 0 0 0 0 0 N/A
40 Other Services and Charges 0 0 31 31 0 0.0
41 Contractual Services - Other 0 0 10 10 0 0.0
70 Equipment & Equipment Rental 0 0 6 6 0 0.0
Subtotal Nonpersonal Services (NPS) 0 0 57 58 1 2.6
Gross Funds 0 0 115 115 0 0.0
*Percent Change is based on whole dollars.
Dollars in Thousands Full-Time EquivalentsChange Change
Actual Approved Proposed from Actual Approved Proposed from Program/Activity FY 2007 FY 2008 FY 2009 FY 2008 FY 2007 FY 2008 FY 2009 FY 2008
(1000) Prisoner Well-Being
(1010) Comprehensive Inspections District Prisoner 0 97 115 18 0.0 1.0 1.0 0.0
Subtotal (1000) Prisoner Well-Being 0 97 115 18 0.0 1.0 1.0 0.0
(2000) Agency Management Program
(2010) Personnel 0 8 0 -8 0.0 0.0 0.0 0.0
(2025) Contracting and Procurement 0 10 0 -10 0.0 0.0 0.0 0.0
Subtotal (2000) Agency Management Program 0 18 0 -18 0.0 0.0 0.0 0.0
Total Proposed Operating Budget 0 115 115 0 0.0 1.0 1.0 0.0
(Change is calculated by whole numbers and numbers may not add up due to rounding)
Note: For further information regarding the proposed funding for the agency’s programs, please refer to Schedule 30-PBB,Program Summary by Activity, in the Operating Appendices volume found on the Office of the Chief Financial Officer’s website.
FY 2009 Proposed Operating Budget and FTEs, by Program and Activity
Table FI0-4 contains the proposed FY 2009 budget by program and activity compared to the FY 2008 approved budget.It also provides FY 2007 actual data.
Table FI0-4(dollars in thousands)
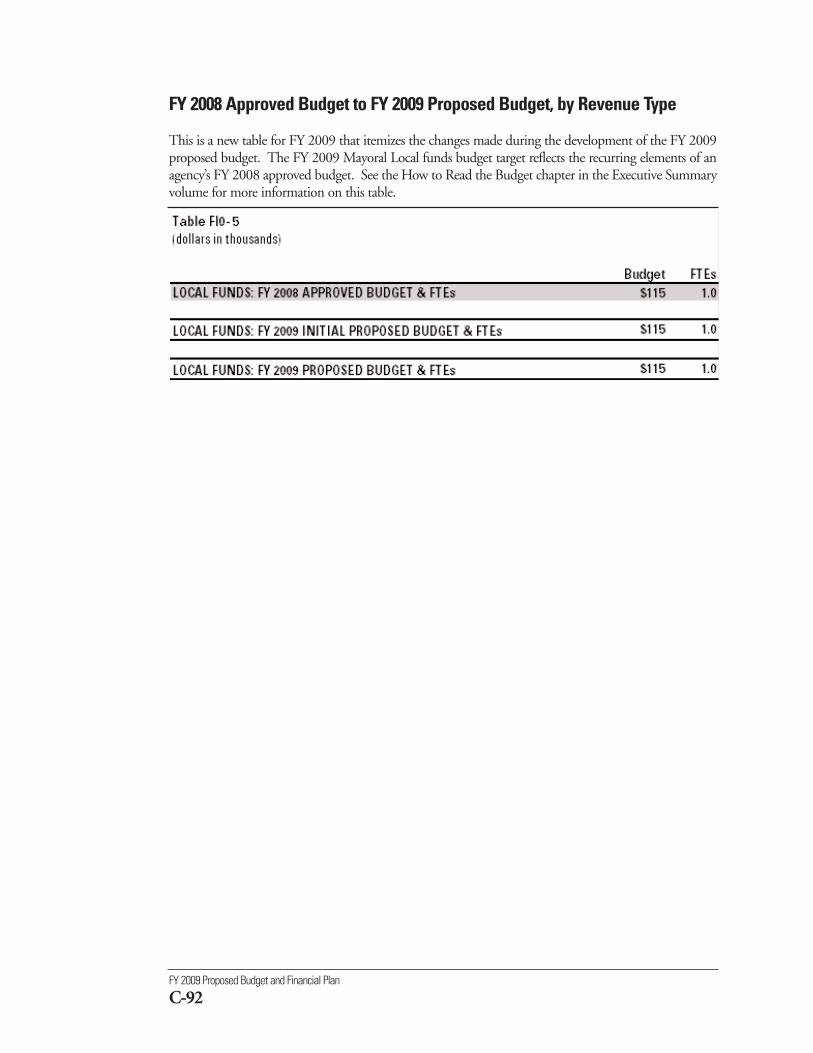
FY 2009 Proposed Budget and Financial Plan
C-92
FY 2008 Approved Budget to FY 2009 Proposed Budget, by Revenue Type
This is a new table for FY 2009 that itemizes the changes made during the development of the FY 2009proposed budget. The FY 2009 Mayoral Local funds budget target reflects the recurring elements of anagency’s FY 2008 approved budget. See the How to Read the Budget chapter in the Executive Summaryvolume for more information on this table.
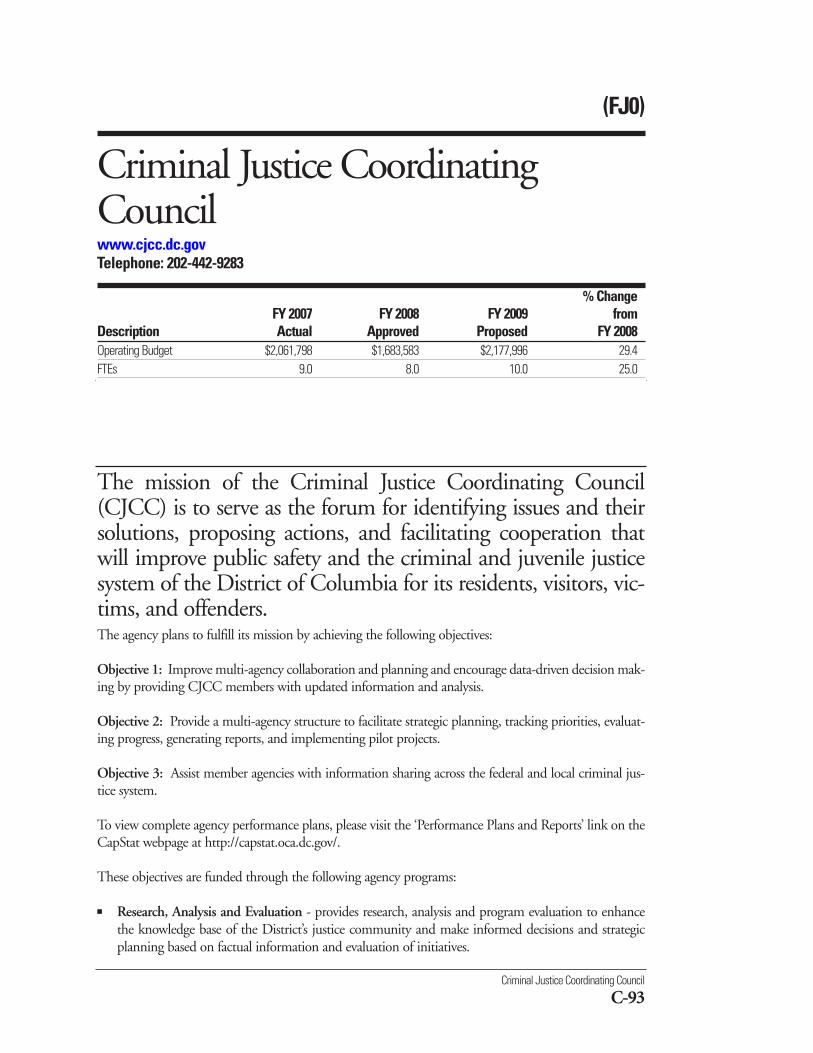
Criminal Justice Coordinating Council
C-93
(FJ0)
Criminal Justice CoordinatingCouncilwww.cjcc.dc.govTelephone: 202-442-9283
% ChangeFY 2007 FY 2008 FY 2009 from
Description Actual Approved Proposed FY 2008Operating Budget $2,061,798 $1,683,583 $2,177,996 29.4FTEs 9.0 8.0 10.0 25.0
The mission of the Criminal Justice Coordinating Council(CJCC) is to serve as the forum for identifying issues and theirsolutions, proposing actions, and facilitating cooperation thatwill improve public safety and the criminal and juvenile justicesystem of the District of Columbia for its residents, visitors, vic-tims, and offenders. The agency plans to fulfill its mission by achieving the following objectives:
Objective 1: Improve multi-agency collaboration and planning and encourage data-driven decision mak-ing by providing CJCC members with updated information and analysis.
Objective 2: Provide a multi-agency structure to facilitate strategic planning, tracking priorities, evaluat-ing progress, generating reports, and implementing pilot projects.
Objective 3: Assist member agencies with information sharing across the federal and local criminal jus-tice system.
To view complete agency performance plans, please visit the ‘Performance Plans and Reports’ link on theCapStat webpage at http://capstat.oca.dc.gov/.
These objectives are funded through the following agency programs:
■ Research, Analysis and Evaluation - provides research, analysis and program evaluation to enhancethe knowledge base of the District’s justice community and make informed decisions and strategicplanning based on factual information and evaluation of initiatives.
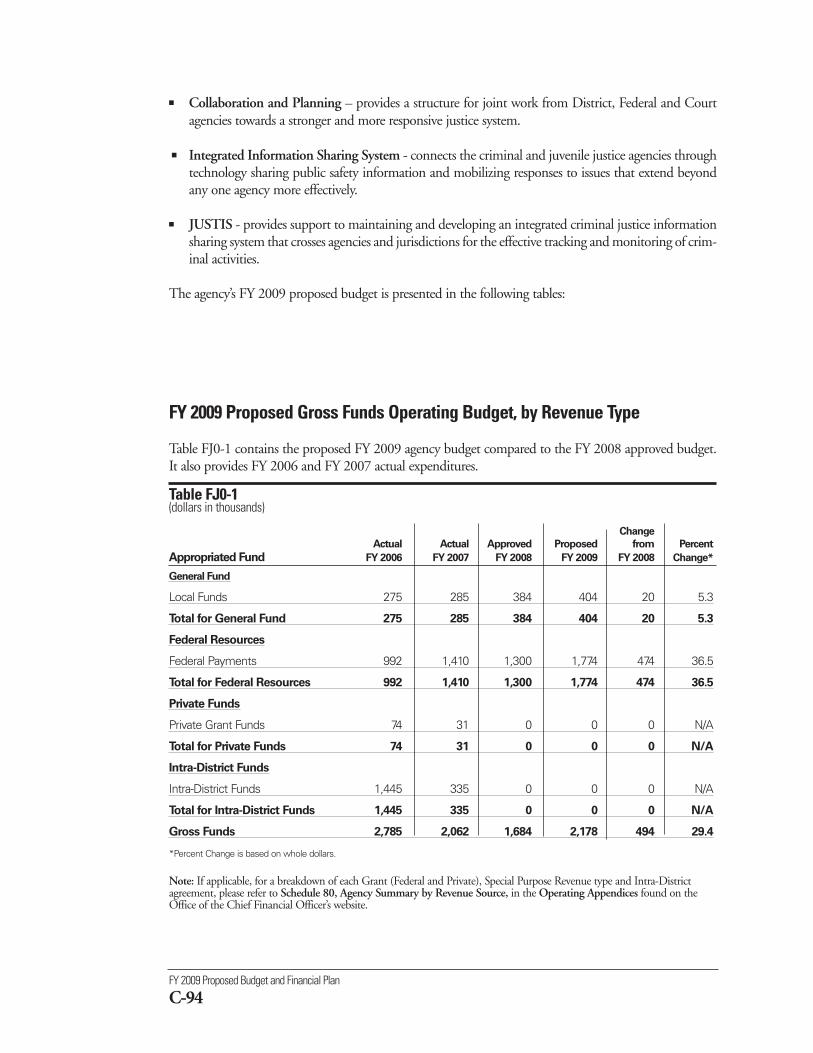
FY 2009 Proposed Budget and Financial Plan
C-94
■ Collaboration and Planning – provides a structure for joint work from District, Federal and Courtagencies towards a stronger and more responsive justice system.
■ Integrated Information Sharing System - connects the criminal and juvenile justice agencies throughtechnology sharing public safety information and mobilizing responses to issues that extend beyondany one agency more effectively.
■ JUSTIS - provides support to maintaining and developing an integrated criminal justice informationsharing system that crosses agencies and jurisdictions for the effective tracking and monitoring of crim-inal activities.
The agency’s FY 2009 proposed budget is presented in the following tables:
FY 2009 Proposed Gross Funds Operating Budget, by Revenue Type
Table FJ0-1 contains the proposed FY 2009 agency budget compared to the FY 2008 approved budget.It also provides FY 2006 and FY 2007 actual expenditures.
Table FJ0-1 (dollars in thousands)
Change
Actual Actual Approved Proposed from Percent
Appropriated Fund FY 2006 FY 2007 FY 2008 FY 2009 FY 2008 Change*
General Fund
Local Funds 275 285 384 404 20 5.3
Total for General Fund 275 285 384 404 20 5.3
Federal Resources
Federal Payments 992 1,410 1,300 1,774 474 36.5
Total for Federal Resources 992 1,410 1,300 1,774 474 36.5
Private Funds
Private Grant Funds 74 31 0 0 0 N/A
Total for Private Funds 74 31 0 0 0 N/A
Intra-District Funds
Intra-District Funds 1,445 335 0 0 0 N/A
Total for Intra-District Funds 1,445 335 0 0 0 N/A
Gross Funds 2,785 2,062 1,684 2,178 494 29.4
*Percent Change is based on whole dollars.
Note: If applicable, for a breakdown of each Grant (Federal and Private), Special Purpose Revenue type and Intra-Districtagreement, please refer to Schedule 80, Agency Summary by Revenue Source, in the Operating Appendices found on theOffice of the Chief Financial Officer’s website.

Criminal Justice Coordinating Council
C-95
FY 2009 Proposed Full-Time Equivalents, by Revenue Type
Table FJ0-2 contains the proposed FY 2009 FTE level compared to the FY 2008 approved FTE level byrevenue type. It also provides FY 2006 and FY 2007 actual data.
Table FJ0-2 Change
Actual Actual Approved Proposed from Percent
Appropriated Fund FY 2006 FY 2007 FY 2008 FY 2009 FY 2008 Change
General Fund
Local Funds 2.0 2.0 2.0 2.0 0.0 0.0
Total for General Fund 2.0 2.0 2.0 2.0 0.0 0.0
Federal Resources
Federal Payments 7.4 6.0 6.0 8.0 2.0 33.3
Total for Federal Resources 7.4 6.0 6.0 8.0 2.0 33.3
Private Funds
Private Grant Funds 0.0 1.0 0.0 0.0 0.0 N/A
Total for Private Funds 0.0 1.0 0.0 0.0 0.0 N/A
Total Proposed FTEs 9.4 9.0 8.0 10.0 2.0 25.0
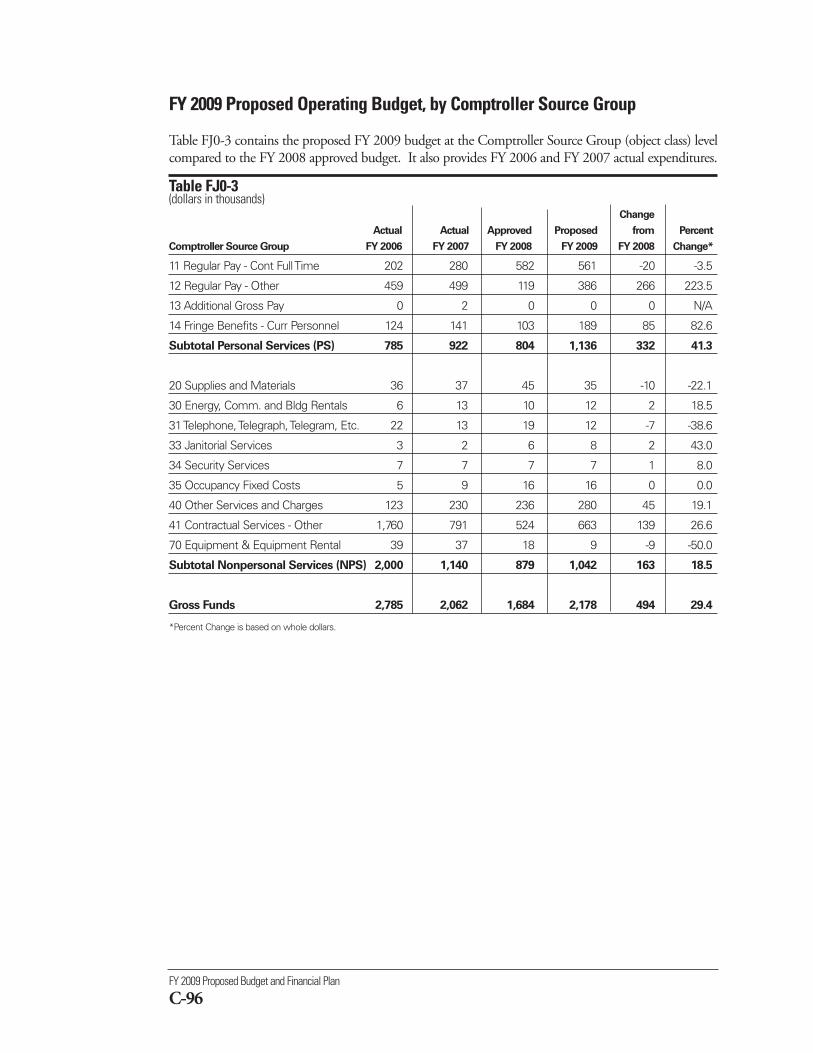
FY 2009 Proposed Budget and Financial Plan
C-96
FY 2009 Proposed Operating Budget, by Comptroller Source Group
Table FJ0-3 contains the proposed FY 2009 budget at the Comptroller Source Group (object class) levelcompared to the FY 2008 approved budget. It also provides FY 2006 and FY 2007 actual expenditures.
Table FJ0-3(dollars in thousands)
Change
Actual Actual Approved Proposed from Percent
Comptroller Source Group FY 2006 FY 2007 FY 2008 FY 2009 FY 2008 Change*
11 Regular Pay - Cont Full Time 202 280 582 561 -20 -3.5
12 Regular Pay - Other 459 499 119 386 266 223.5
13 Additional Gross Pay 0 2 0 0 0 N/A
14 Fringe Benefits - Curr Personnel 124 141 103 189 85 82.6
Subtotal Personal Services (PS) 785 922 804 1,136 332 41.3
20 Supplies and Materials 36 37 45 35 -10 -22.1
30 Energy, Comm. and Bldg Rentals 6 13 10 12 2 18.5
31 Telephone, Telegraph, Telegram, Etc. 22 13 19 12 -7 -38.6
33 Janitorial Services 3 2 6 8 2 43.0
34 Security Services 7 7 7 7 1 8.0
35 Occupancy Fixed Costs 5 9 16 16 0 0.0
40 Other Services and Charges 123 230 236 280 45 19.1
41 Contractual Services - Other 1,760 791 524 663 139 26.6
70 Equipment & Equipment Rental 39 37 18 9 -9 -50.0
Subtotal Nonpersonal Services (NPS) 2,000 1,140 879 1,042 163 18.5
Gross Funds 2,785 2,062 1,684 2,178 494 29.4
*Percent Change is based on whole dollars.
Criminal Justice Coordinating Council
C-97
Dollars in Thousands Full-Time EquivalentsChange Change
Actual Approved Proposed from Actual Approved Proposed from Program/Activity FY 2007 FY 2008 FY 2009 FY 2008 FY 2007 FY 2008 FY 2009 FY 2008
(1000) Research Analysis and Evaluation
(1010) Research and Analysis 3 6 81 76 0.0 0.0 0.0 0.0
(1020) Evaluation 0 0 20 20 0.0 0.0 0.0 0.0
(1080) Jag Evaluation Project 75 0 0 0 0.0 0.0 0.0 0.0
(1095) Jag Justice Info Systems Criminal Record 25 0 0 0 0.0 0.0 0.0 0.0
(1110) Research and Analysis (Federal) 229 0 218 218 0.0 0.0 1.0 1.0
(1120) Evaluation (Federal) 209 5 157 152 0.0 0.0 1.0 1.0
Subtotal (1000) Research Analysis and Evaluation 541 11 476 466 0.0 0.0 2.0 2.0
(2000) Collaboration & Planning Across Agencies
(2010) Operational Infrastructure 240 261 255 -6 2.0 2.0 2.0 0.0
(2040) Technical Assistance and Training 34 6 6 0 1.0 0.0 0.0 0.0
(2110) Operational Infrastructure (Federal) 695 803 126 -677 6.0 6.0 1.0 -5.0
(2120) Topical Work Groups (Federal) 143 210 253 42 0.0 0.0 2.0 2.0
(2130) CJCC Meetings (Federal) 33 18 13 -5 0.0 0.0 0.0 0.0
(2140) Technical Assistance and Training (Federal) 32 50 45 -5 0.0 0.0 0.0 0.0
Subtotal (2000) Collaboration & Planning Across Agencies1,176 1,347 697 -650 9.0 8.0 5.0 -3.0
(3000) Integrated Information System
(3010) JUSTIS 0 75 187 112 0.0 0.0 0.0 0.0
(3020) CJCC Information System (crji) 100 0 0 0 0.0 0.0 0.0 0.0
(3110) JUSTIS (Federal) 196 186 759 573 0.0 0.0 3.0 3.0
Subtotal (3000) Integrated Information System 296 261 946 685 0.0 0.0 3.0 3.0
(4000) ASMP
(4010) Personnel 2 0 0 0 0.0 0.0 0.0 0.0
(4030) Property Management 37 37 42 6 0.0 0.0 0.0 0.0
(4130) Property Management (Federal) 9 28 16 -12 0.0 0.0 0.0 0.0
Subtotal (4000) ASMP 49 65 59 -7 0.0 0.0 0.0 0.0
Total Proposed Operating Budget 2,062 1,684 2,178 494 9.0 8.0 10.0 2.0
(Change is calculated by whole numbers and numbers may not add up due to rounding)
Note: For further information regarding the proposed funding for the agency’s programs, please refer to Schedule 30-PBB,Program Summary by Activity, in the Operating Appendices volume found on the Office of the Chief Financial Officer’s website.
FY 2009 Proposed Operating Budget and FTEs, by Program and Activity
Table FJ0-4 contains the proposed FY 2009 budget by program and activity compared to the FY 2008 approved budget.It also provides FY 2007 actual data.
Table FJ0-4(dollars in thousands)
FY 2009 Proposed Budget and Financial Plan
C-98
FY 2008 Approved Budget to FY 2009 Proposed Budget, by Revenue Type
This is a new table for FY 2009 that itemizes the changes made during the development of the FY 2009proposed budget. The FY 2009 Mayoral Local funds budget target reflects the recurring elements of anagency’s FY 2008 approved budget. See the How to Read the Budget chapter in the Executive Summaryvolume for more information on this table.
Criminal Justice Coordinating Council
C-99
Agency Performance MeasuresTable FJ0-6
FY 2006 FY 2007 FY 2008 FY 2009 FY 2010Performance Measure Actual Actual Target Target Target
1. Issue research reports within the agreed upon timeframe percent N/A N/A 80% 86% 90%
2. Priority committee meetings resulting in policyguidance or reports issued percent N/A N/A 70% 75% 80%
3. Registered agencies using the technology information system number N/A N/A 28 30 32
4. Registered users engaged in technology information sharing system percent N/A N/A 50% 55% 60%
5. Registered users cumulative number N/A N/A 2,500 2,750 3,000
6. New tasks for facilitating data sharing bymember agencies number N/A N/A 3 4 4
7. Registered JUSTIS users responding to survey percent N/A N/A 15% 25% 35%
8. Surveyed users “satisfied” or “very satisfied” with JUSTIS experience percent N/A N/A 98% 98% 98%
9. Surveyed users respond that JUSTIS is easy to navigate, user-friendly “agree” or “strongly agreed” N/A N/A 95% 95% 95%
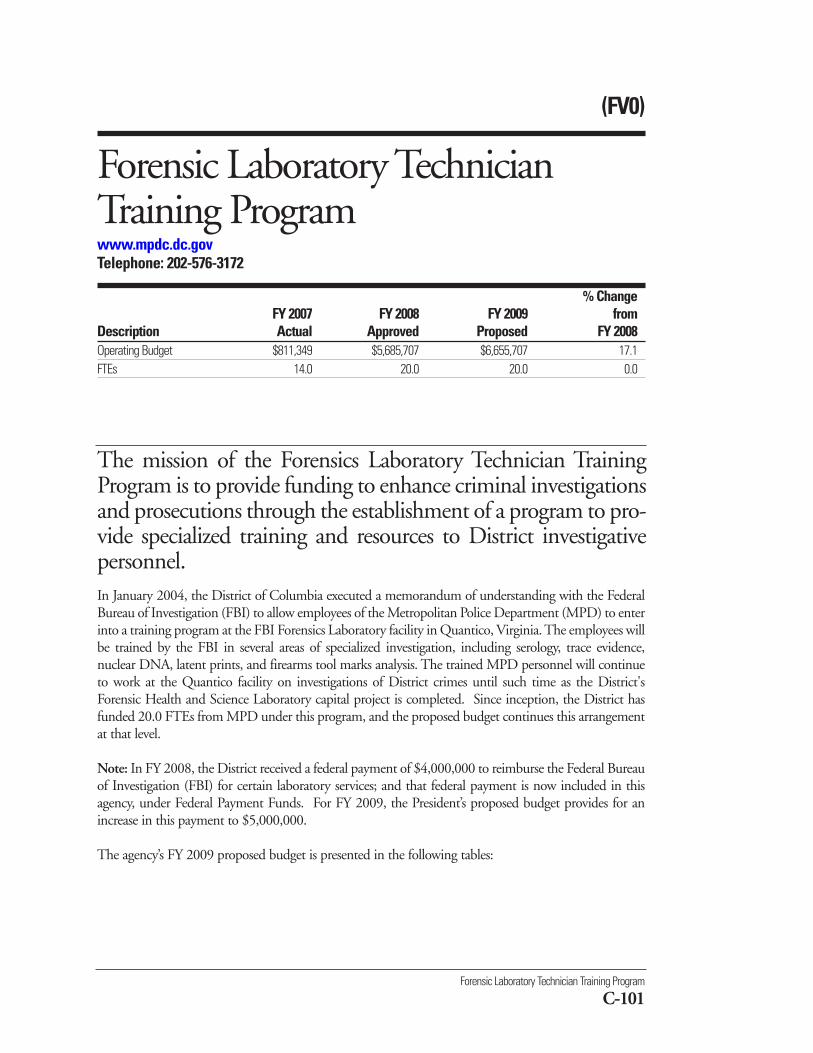
Forensic Laboratory Technician Training Program
C-101
In January 2004, the District of Columbia executed a memorandum of understanding with the FederalBureau of Investigation (FBI) to allow employees of the Metropolitan Police Department (MPD) to enterinto a training program at the FBI Forensics Laboratory facility in Quantico, Virginia. The employees willbe trained by the FBI in several areas of specialized investigation, including serology, trace evidence,nuclear DNA, latent prints, and firearms tool marks analysis. The trained MPD personnel will continueto work at the Quantico facility on investigations of District crimes until such time as the District'sForensic Health and Science Laboratory capital project is completed. Since inception, the District hasfunded 20.0 FTEs from MPD under this program, and the proposed budget continues this arrangementat that level.
Note: In FY 2008, the District received a federal payment of $4,000,000 to reimburse the Federal Bureauof Investigation (FBI) for certain laboratory services; and that federal payment is now included in thisagency, under Federal Payment Funds. For FY 2009, the President’s proposed budget provides for anincrease in this payment to $5,000,000.
The agency’s FY 2009 proposed budget is presented in the following tables:
The mission of the Forensics Laboratory Technician TrainingProgram is to provide funding to enhance criminal investigationsand prosecutions through the establishment of a program to pro-vide specialized training and resources to District investigativepersonnel.
(FV0)
Forensic Laboratory TechnicianTraining Programwww.mpdc.dc.govTelephone: 202-576-3172
% ChangeFY 2007 FY 2008 FY 2009 from
Description Actual Approved Proposed FY 2008Operating Budget $811,349 $5,685,707 $6,655,707 17.1FTEs 14.0 20.0 20.0 0.0
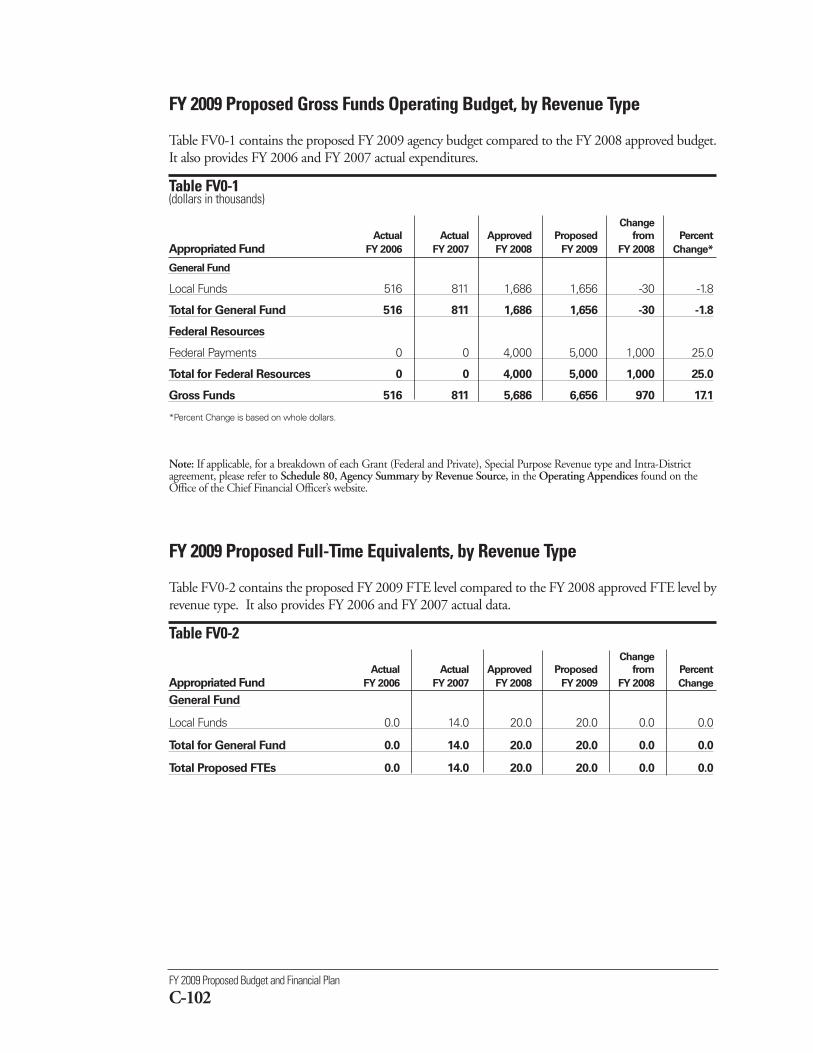
FY 2009 Proposed Budget and Financial Plan
C-102
FY 2009 Proposed Gross Funds Operating Budget, by Revenue Type
Table FV0-1 contains the proposed FY 2009 agency budget compared to the FY 2008 approved budget.It also provides FY 2006 and FY 2007 actual expenditures.
Table FV0-1 (dollars in thousands)
Change
Actual Actual Approved Proposed from Percent
Appropriated Fund FY 2006 FY 2007 FY 2008 FY 2009 FY 2008 Change*
General Fund
Local Funds 516 811 1,686 1,656 -30 -1.8
Total for General Fund 516 811 1,686 1,656 -30 -1.8
Federal Resources
Federal Payments 0 0 4,000 5,000 1,000 25.0
Total for Federal Resources 0 0 4,000 5,000 1,000 25.0
Gross Funds 516 811 5,686 6,656 970 17.1
*Percent Change is based on whole dollars.
Note: If applicable, for a breakdown of each Grant (Federal and Private), Special Purpose Revenue type and Intra-Districtagreement, please refer to Schedule 80, Agency Summary by Revenue Source, in the Operating Appendices found on theOffice of the Chief Financial Officer’s website.
FY 2009 Proposed Full-Time Equivalents, by Revenue Type
Table FV0-2 contains the proposed FY 2009 FTE level compared to the FY 2008 approved FTE level byrevenue type. It also provides FY 2006 and FY 2007 actual data.
Table FV0-2 Change
Actual Actual Approved Proposed from Percent
Appropriated Fund FY 2006 FY 2007 FY 2008 FY 2009 FY 2008 Change
General Fund
Local Funds 0.0 14.0 20.0 20.0 0.0 0.0
Total for General Fund 0.0 14.0 20.0 20.0 0.0 0.0
Total Proposed FTEs 0.0 14.0 20.0 20.0 0.0 0.0
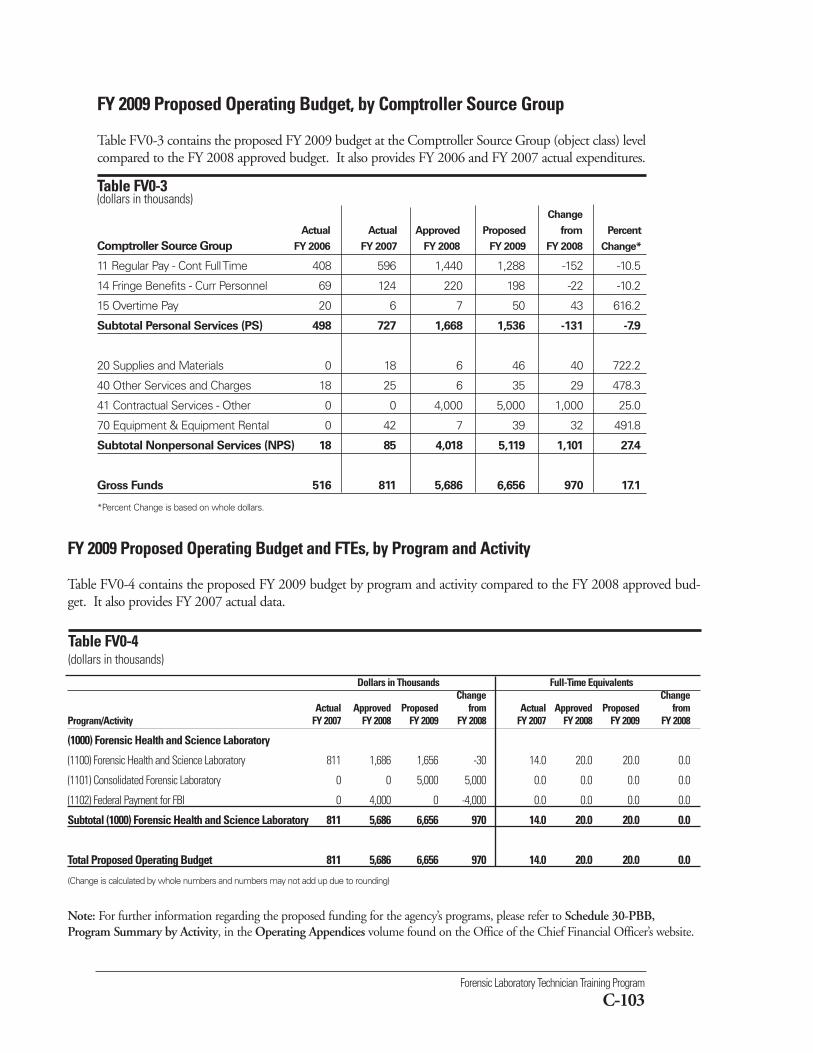
Forensic Laboratory Technician Training Program
C-103
FY 2009 Proposed Operating Budget, by Comptroller Source Group
Table FV0-3 contains the proposed FY 2009 budget at the Comptroller Source Group (object class) levelcompared to the FY 2008 approved budget. It also provides FY 2006 and FY 2007 actual expenditures.
Table FV0-3(dollars in thousands)
Change
Actual Actual Approved Proposed from Percent
Comptroller Source Group FY 2006 FY 2007 FY 2008 FY 2009 FY 2008 Change*
11 Regular Pay - Cont Full Time 408 596 1,440 1,288 -152 -10.5
14 Fringe Benefits - Curr Personnel 69 124 220 198 -22 -10.2
15 Overtime Pay 20 6 7 50 43 616.2
Subtotal Personal Services (PS) 498 727 1,668 1,536 -131 -7.9
20 Supplies and Materials 0 18 6 46 40 722.2
40 Other Services and Charges 18 25 6 35 29 478.3
41 Contractual Services - Other 0 0 4,000 5,000 1,000 25.0
70 Equipment & Equipment Rental 0 42 7 39 32 491.8
Subtotal Nonpersonal Services (NPS) 18 85 4,018 5,119 1,101 27.4
Gross Funds 516 811 5,686 6,656 970 17.1
*Percent Change is based on whole dollars.
Dollars in Thousands Full-Time EquivalentsChange Change
Actual Approved Proposed from Actual Approved Proposed from Program/Activity FY 2007 FY 2008 FY 2009 FY 2008 FY 2007 FY 2008 FY 2009 FY 2008
(1000) Forensic Health and Science Laboratory
(1100) Forensic Health and Science Laboratory 811 1,686 1,656 -30 14.0 20.0 20.0 0.0
(1101) Consolidated Forensic Laboratory 0 0 5,000 5,000 0.0 0.0 0.0 0.0
(1102) Federal Payment for FBI 0 4,000 0 -4,000 0.0 0.0 0.0 0.0
Subtotal (1000) Forensic Health and Science Laboratory 811 5,686 6,656 970 14.0 20.0 20.0 0.0
Total Proposed Operating Budget 811 5,686 6,656 970 14.0 20.0 20.0 0.0
(Change is calculated by whole numbers and numbers may not add up due to rounding)
Note: For further information regarding the proposed funding for the agency’s programs, please refer to Schedule 30-PBB,Program Summary by Activity, in the Operating Appendices volume found on the Office of the Chief Financial Officer’s website.
FY 2009 Proposed Operating Budget and FTEs, by Program and Activity
Table FV0-4 contains the proposed FY 2009 budget by program and activity compared to the FY 2008 approved bud-get. It also provides FY 2007 actual data.
Table FV0-4(dollars in thousands)
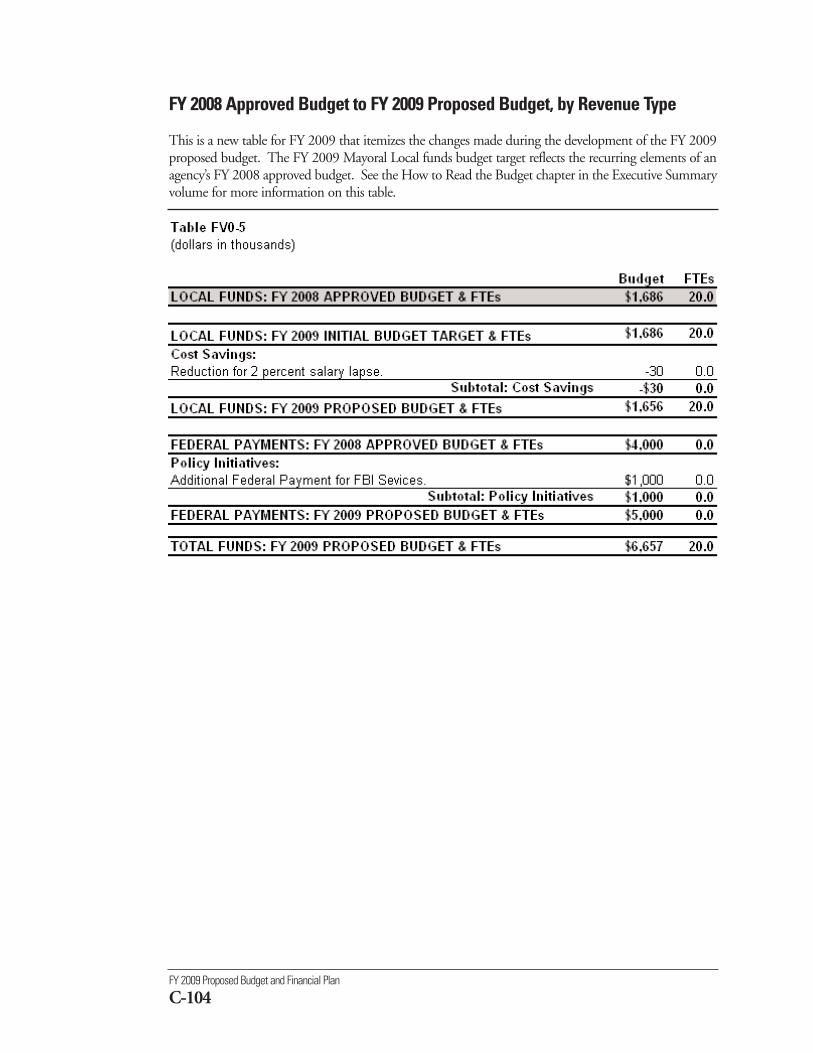
FY 2009 Proposed Budget and Financial Plan
C-104
FY 2008 Approved Budget to FY 2009 Proposed Budget, by Revenue Type
This is a new table for FY 2009 that itemizes the changes made during the development of the FY 2009proposed budget. The FY 2009 Mayoral Local funds budget target reflects the recurring elements of anagency’s FY 2008 approved budget. See the How to Read the Budget chapter in the Executive Summaryvolume for more information on this table.
(UC0)
Office of Unified Communicationswww.ouc.dc.govTelephone: 202-730-0524
% ChangeFY 2007 FY 2008 FY 2009 from
Description Actual Approved Proposed FY 2008Operating Budget $32,063,313 $46,451,345 $50,111,787 7.9FTEs 314.7 398.0 400.0 0.5
The mission of the Office of Unified Communications (OUC)is to deliver world-class customer service to the residents, visitors,and other stakeholders of the District with efficient, profession-al, and cost-effective responses to emergency, non-emergency,and city service requests.
Office of Unified Communications
C-105
The agency plans to fulfill its mission by achieving the following objectives:
Objective 1: Ensure fast and accurate responses to 911 calls.
Objective 2: Establish one non-emergency number for city services and information.
Objective 3: Enhance the District’s communications technology.
To view complete agency performance plans, please visit the ‘Performance Plans and Reports’ link on theCapStat webpage at http://capstat.oca.dc.gov/.
These objectives are funded through the following agency programs:
■ Emergency/Non-Emergency Operations - centralizes the customer service functions and activities ofthe District government’s 911, 311, and 727-1000 systems, and other facilities for emergency, non-emergency, and citizen calls for service. OUC is also responsible for the operation and maintenanceof the District government’s radio technology and call center technology.
■ Customer Operations - centralizes the Department of Motor Vehicles (DMV) call center, CustomerService Operations, and 211 Operations.
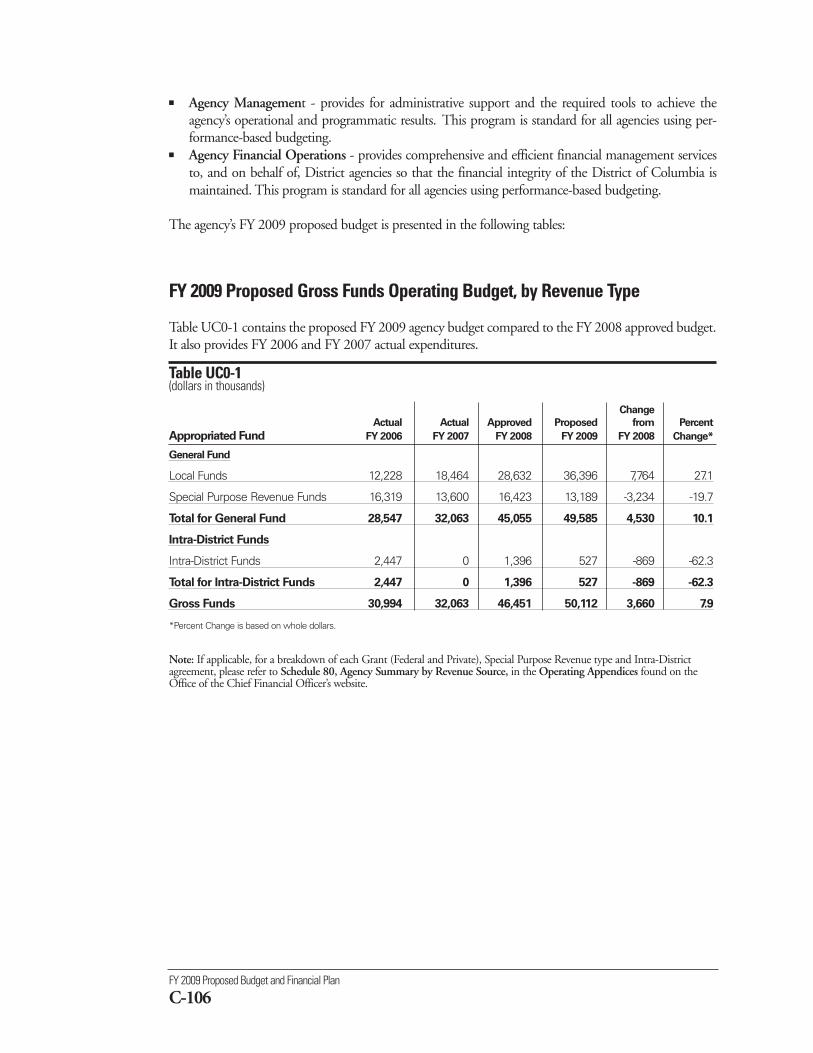
FY 2009 Proposed Budget and Financial Plan
C-106
■ Agency Management - provides for administrative support and the required tools to achieve theagency’s operational and programmatic results. This program is standard for all agencies using per-formance-based budgeting.
■ Agency Financial Operations - provides comprehensive and efficient financial management servicesto, and on behalf of, District agencies so that the financial integrity of the District of Columbia ismaintained. This program is standard for all agencies using performance-based budgeting.
The agency’s FY 2009 proposed budget is presented in the following tables:
FY 2009 Proposed Gross Funds Operating Budget, by Revenue Type
Table UC0-1 contains the proposed FY 2009 agency budget compared to the FY 2008 approved budget.It also provides FY 2006 and FY 2007 actual expenditures.
Table UC0-1 (dollars in thousands)
Change
Actual Actual Approved Proposed from Percent
Appropriated Fund FY 2006 FY 2007 FY 2008 FY 2009 FY 2008 Change*
General Fund
Local Funds 12,228 18,464 28,632 36,396 7,764 27.1
Special Purpose Revenue Funds 16,319 13,600 16,423 13,189 -3,234 -19.7
Total for General Fund 28,547 32,063 45,055 49,585 4,530 10.1
Intra-District Funds
Intra-District Funds 2,447 0 1,396 527 -869 -62.3
Total for Intra-District Funds 2,447 0 1,396 527 -869 -62.3
Gross Funds 30,994 32,063 46,451 50,112 3,660 7.9
*Percent Change is based on whole dollars.
Note: If applicable, for a breakdown of each Grant (Federal and Private), Special Purpose Revenue type and Intra-Districtagreement, please refer to Schedule 80, Agency Summary by Revenue Source, in the Operating Appendices found on theOffice of the Chief Financial Officer’s website.

Office of Unified Communications
C-107
FY 2009 Proposed Full-Time Equivalents, by Revenue Type
Table UC0-2 contains the proposed FY 2009 FTE level compared to the FY 2008 approved FTE levelby revenue type. It also provides FY 2006 and FY 2007 actual data.
Table UC0-2 Change
Actual Actual Approved Proposed from Percent
Appropriated Fund FY 2006 FY 2007 FY 2008 FY 2009 FY 2008 Change
General Fund
Local Funds 135.0 144.0 310.0 397.0 87.0 28.1
Special Purpose Revenue Funds 181.0 170.7 69.0 0.0 -69.0 -100.0
Total for General Fund 316.0 314.7 379.0 397.0 18.0 4.7
Intra-District Funds
Intra-District Funds 1.0 0.0 19.0 3.0 -16.0 -84.2
Total for Intra-District Funds 1.0 0.0 19.0 3.0 -16.0 -84.2
Total Proposed FTEs 317.0 314.7 398.0 400.0 2.0 0.5
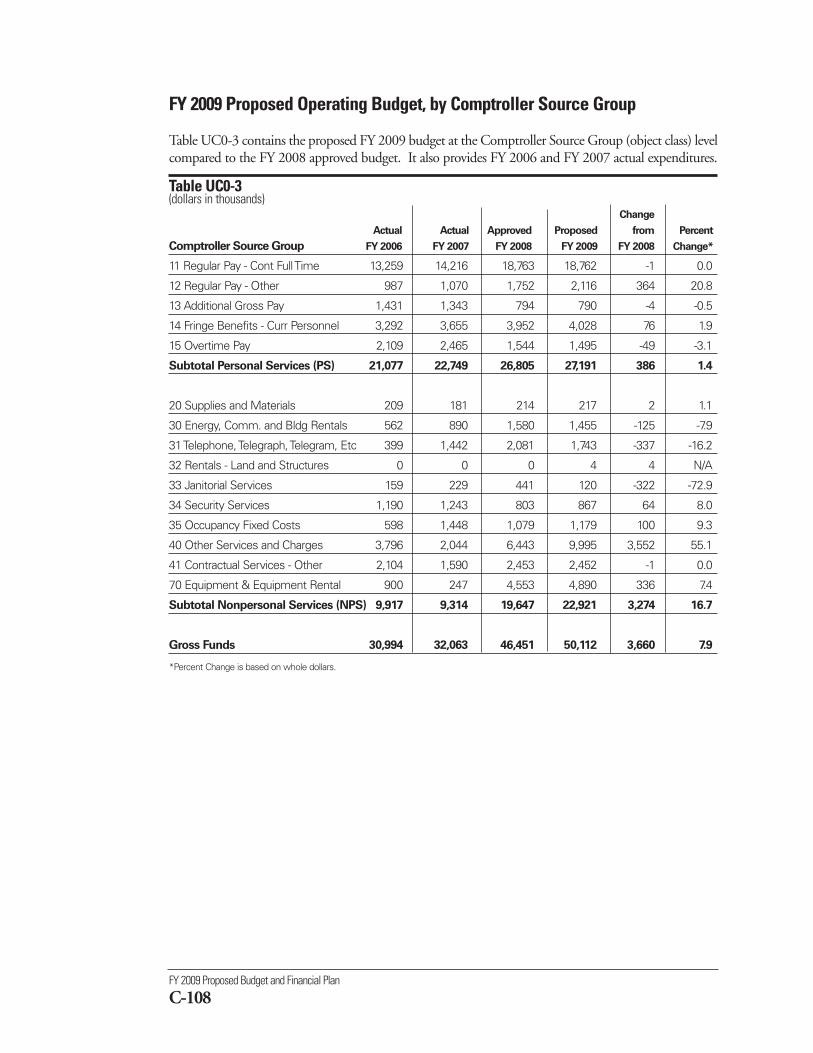
FY 2009 Proposed Budget and Financial Plan
C-108
FY 2009 Proposed Operating Budget, by Comptroller Source Group
Table UC0-3 contains the proposed FY 2009 budget at the Comptroller Source Group (object class) levelcompared to the FY 2008 approved budget. It also provides FY 2006 and FY 2007 actual expenditures.
Table UC0-3(dollars in thousands)
Change
Actual Actual Approved Proposed from Percent
Comptroller Source Group FY 2006 FY 2007 FY 2008 FY 2009 FY 2008 Change*
11 Regular Pay - Cont Full Time 13,259 14,216 18,763 18,762 -1 0.0
12 Regular Pay - Other 987 1,070 1,752 2,116 364 20.8
13 Additional Gross Pay 1,431 1,343 794 790 -4 -0.5
14 Fringe Benefits - Curr Personnel 3,292 3,655 3,952 4,028 76 1.9
15 Overtime Pay 2,109 2,465 1,544 1,495 -49 -3.1
Subtotal Personal Services (PS) 21,077 22,749 26,805 27,191 386 1.4
20 Supplies and Materials 209 181 214 217 2 1.1
30 Energy, Comm. and Bldg Rentals 562 890 1,580 1,455 -125 -7.9
31 Telephone, Telegraph, Telegram, Etc 399 1,442 2,081 1,743 -337 -16.2
32 Rentals - Land and Structures 0 0 0 4 4 N/A
33 Janitorial Services 159 229 441 120 -322 -72.9
34 Security Services 1,190 1,243 803 867 64 8.0
35 Occupancy Fixed Costs 598 1,448 1,079 1,179 100 9.3
40 Other Services and Charges 3,796 2,044 6,443 9,995 3,552 55.1
41 Contractual Services - Other 2,104 1,590 2,453 2,452 -1 0.0
70 Equipment & Equipment Rental 900 247 4,553 4,890 336 7.4
Subtotal Nonpersonal Services (NPS) 9,917 9,314 19,647 22,921 3,274 16.7
Gross Funds 30,994 32,063 46,451 50,112 3,660 7.9
*Percent Change is based on whole dollars.
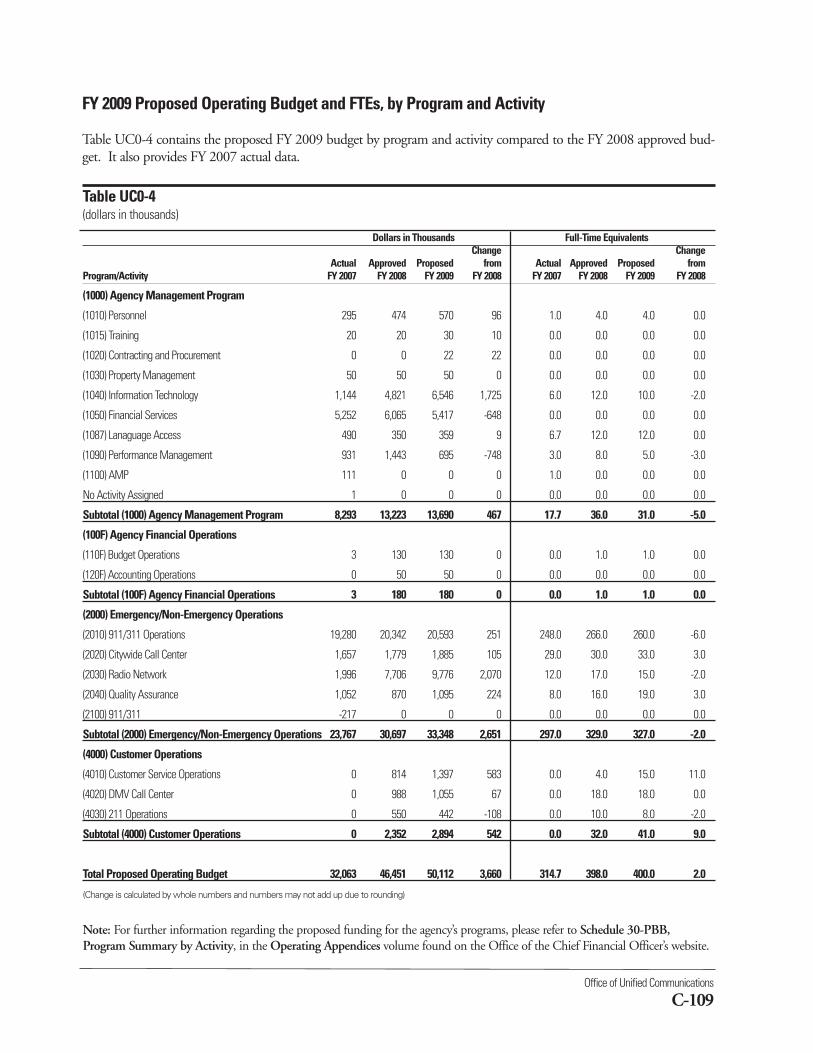
Office of Unified Communications
C-109
Dollars in Thousands Full-Time EquivalentsChange Change
Actual Approved Proposed from Actual Approved Proposed from Program/Activity FY 2007 FY 2008 FY 2009 FY 2008 FY 2007 FY 2008 FY 2009 FY 2008
(1000) Agency Management Program
(1010) Personnel 295 474 570 96 1.0 4.0 4.0 0.0
(1015) Training 20 20 30 10 0.0 0.0 0.0 0.0
(1020) Contracting and Procurement 0 0 22 22 0.0 0.0 0.0 0.0
(1030) Property Management 50 50 50 0 0.0 0.0 0.0 0.0
(1040) Information Technology 1,144 4,821 6,546 1,725 6.0 12.0 10.0 -2.0
(1050) Financial Services 5,252 6,065 5,417 -648 0.0 0.0 0.0 0.0
(1087) Lanaguage Access 490 350 359 9 6.7 12.0 12.0 0.0
(1090) Performance Management 931 1,443 695 -748 3.0 8.0 5.0 -3.0
(1100) AMP 111 0 0 0 1.0 0.0 0.0 0.0
No Activity Assigned 1 0 0 0 0.0 0.0 0.0 0.0
Subtotal (1000) Agency Management Program 8,293 13,223 13,690 467 17.7 36.0 31.0 -5.0
(100F) Agency Financial Operations
(110F) Budget Operations 3 130 130 0 0.0 1.0 1.0 0.0
(120F) Accounting Operations 0 50 50 0 0.0 0.0 0.0 0.0
Subtotal (100F) Agency Financial Operations 3 180 180 0 0.0 1.0 1.0 0.0
(2000) Emergency/Non-Emergency Operations
(2010) 911/311 Operations 19,280 20,342 20,593 251 248.0 266.0 260.0 -6.0
(2020) Citywide Call Center 1,657 1,779 1,885 105 29.0 30.0 33.0 3.0
(2030) Radio Network 1,996 7,706 9,776 2,070 12.0 17.0 15.0 -2.0
(2040) Quality Assurance 1,052 870 1,095 224 8.0 16.0 19.0 3.0
(2100) 911/311 -217 0 0 0 0.0 0.0 0.0 0.0
Subtotal (2000) Emergency/Non-Emergency Operations 23,767 30,697 33,348 2,651 297.0 329.0 327.0 -2.0
(4000) Customer Operations
(4010) Customer Service Operations 0 814 1,397 583 0.0 4.0 15.0 11.0
(4020) DMV Call Center 0 988 1,055 67 0.0 18.0 18.0 0.0
(4030) 211 Operations 0 550 442 -108 0.0 10.0 8.0 -2.0
Subtotal (4000) Customer Operations 0 2,352 2,894 542 0.0 32.0 41.0 9.0
Total Proposed Operating Budget 32,063 46,451 50,112 3,660 314.7 398.0 400.0 2.0
(Change is calculated by whole numbers and numbers may not add up due to rounding)
Note: For further information regarding the proposed funding for the agency’s programs, please refer to Schedule 30-PBB,Program Summary by Activity, in the Operating Appendices volume found on the Office of the Chief Financial Officer’s website.
FY 2009 Proposed Operating Budget and FTEs, by Program and Activity
Table UC0-4 contains the proposed FY 2009 budget by program and activity compared to the FY 2008 approved bud-get. It also provides FY 2007 actual data.
Table UC0-4(dollars in thousands)
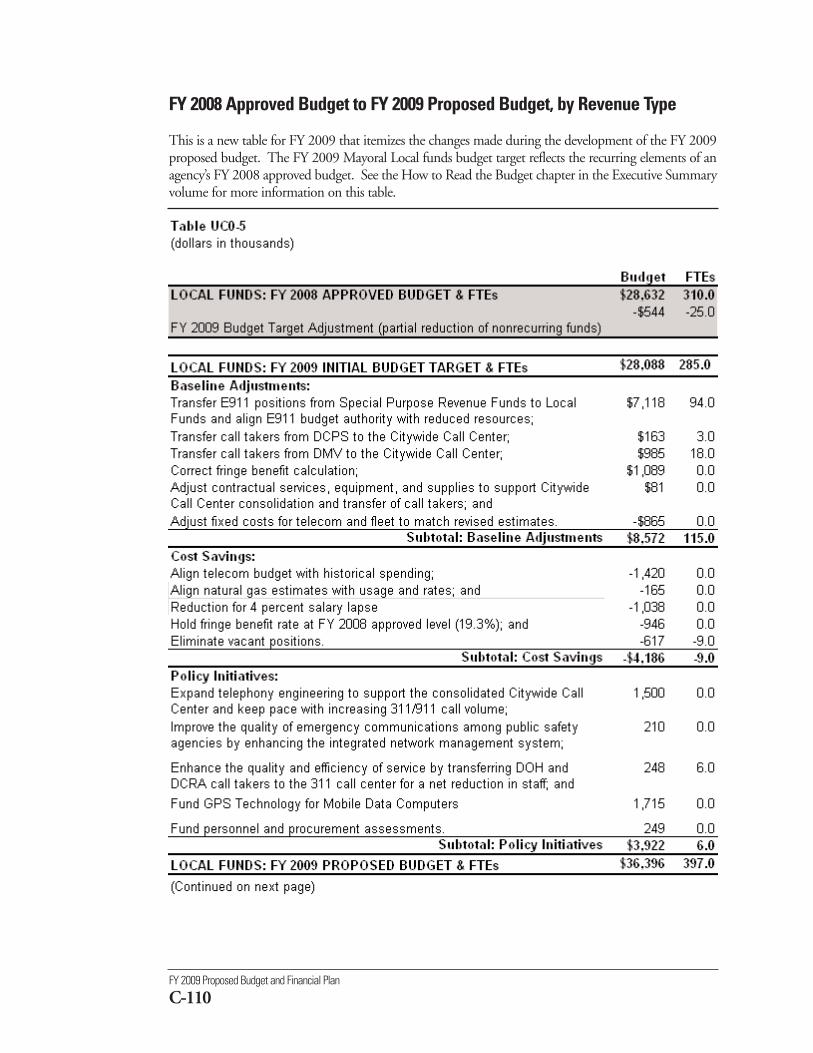
FY 2009 Proposed Budget and Financial Plan
C-110
FY 2008 Approved Budget to FY 2009 Proposed Budget, by Revenue Type
This is a new table for FY 2009 that itemizes the changes made during the development of the FY 2009proposed budget. The FY 2009 Mayoral Local funds budget target reflects the recurring elements of anagency’s FY 2008 approved budget. See the How to Read the Budget chapter in the Executive Summaryvolume for more information on this table.
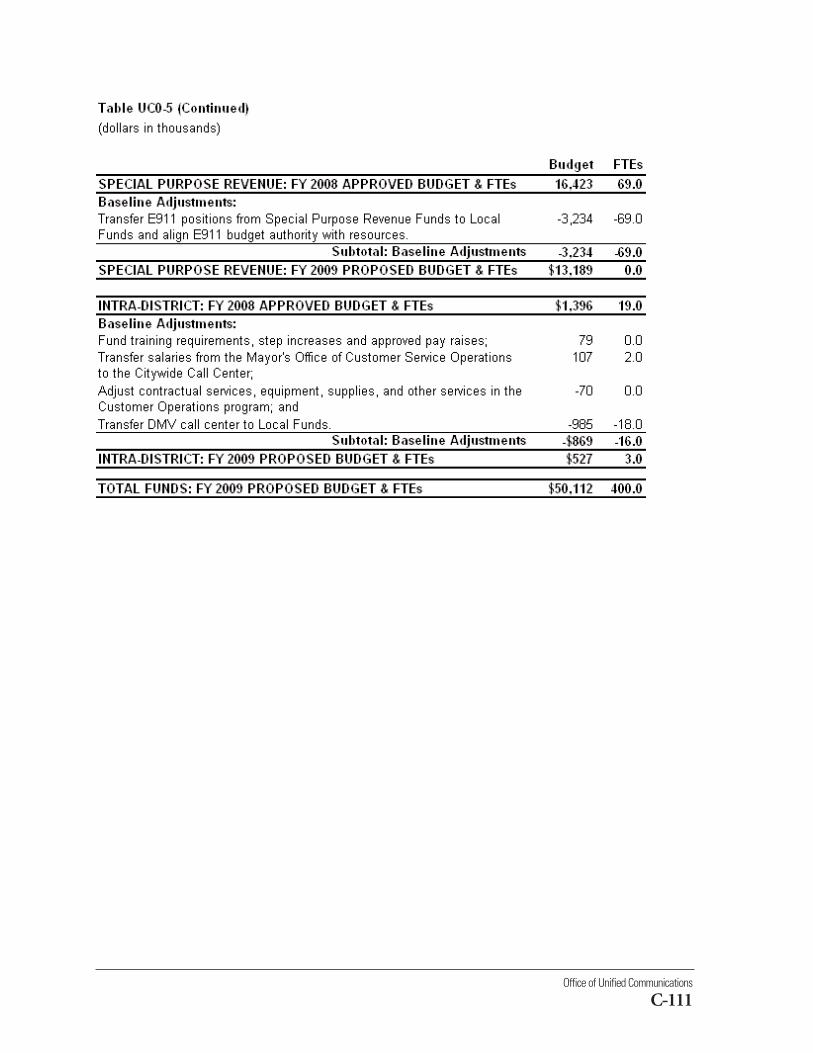
Office of Unified Communications
C-111
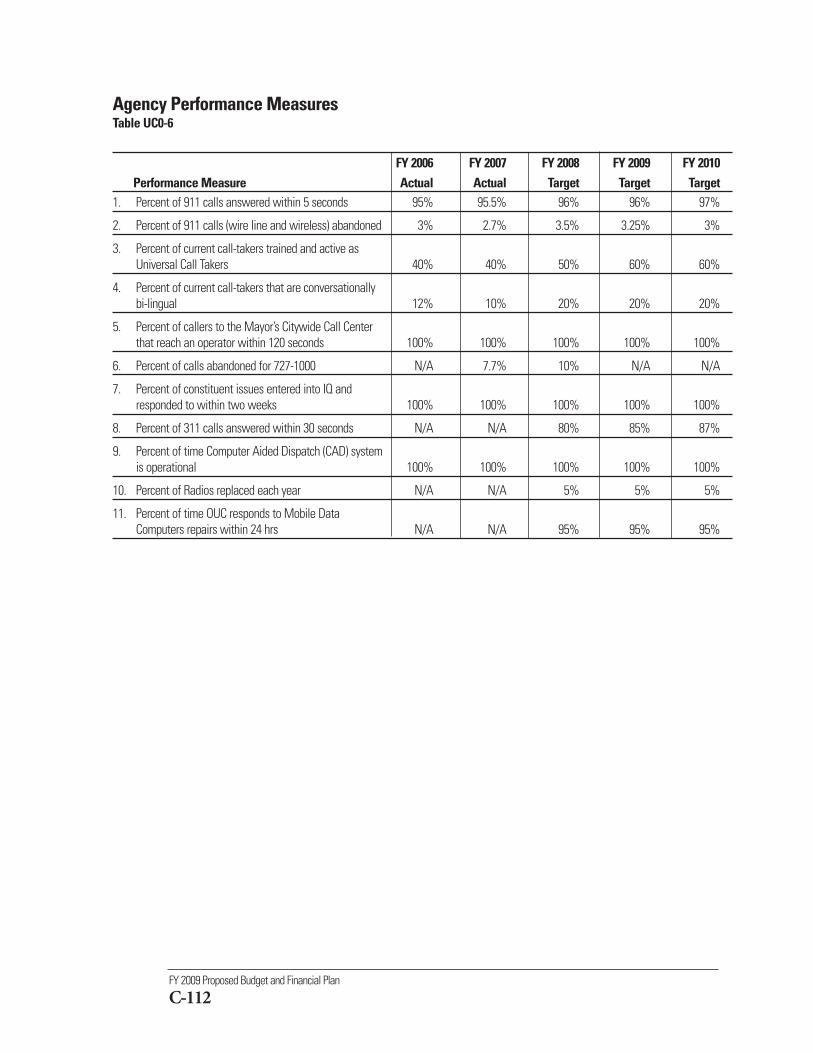
FY 2009 Proposed Budget and Financial Plan
C-112
Agency Performance MeasuresTable UC0-6
FY 2006 FY 2007 FY 2008 FY 2009 FY 2010Performance Measure Actual Actual Target Target Target
1. Percent of 911 calls answered within 5 seconds 95% 95.5% 96% 96% 97%
2. Percent of 911 calls (wire line and wireless) abandoned 3% 2.7% 3.5% 3.25% 3%
3. Percent of current call-takers trained and active asUniversal Call Takers 40% 40% 50% 60% 60%
4. Percent of current call-takers that are conversationallybi-lingual 12% 10% 20% 20% 20%
5. Percent of callers to the Mayor’s Citywide Call Centerthat reach an operator within 120 seconds 100% 100% 100% 100% 100%
6. Percent of calls abandoned for 727-1000 N/A 7.7% 10% N/A N/A
7. Percent of constituent issues entered into IQ andresponded to within two weeks 100% 100% 100% 100% 100%
8. Percent of 311 calls answered within 30 seconds N/A N/A 80% 85% 87%
9. Percent of time Computer Aided Dispatch (CAD) systemis operational 100% 100% 100% 100% 100%
10. Percent of Radios replaced each year N/A N/A 5% 5% 5%
11. Percent of time OUC responds to Mobile DataComputers repairs within 24 hrs N/A N/A 95% 95% 95%
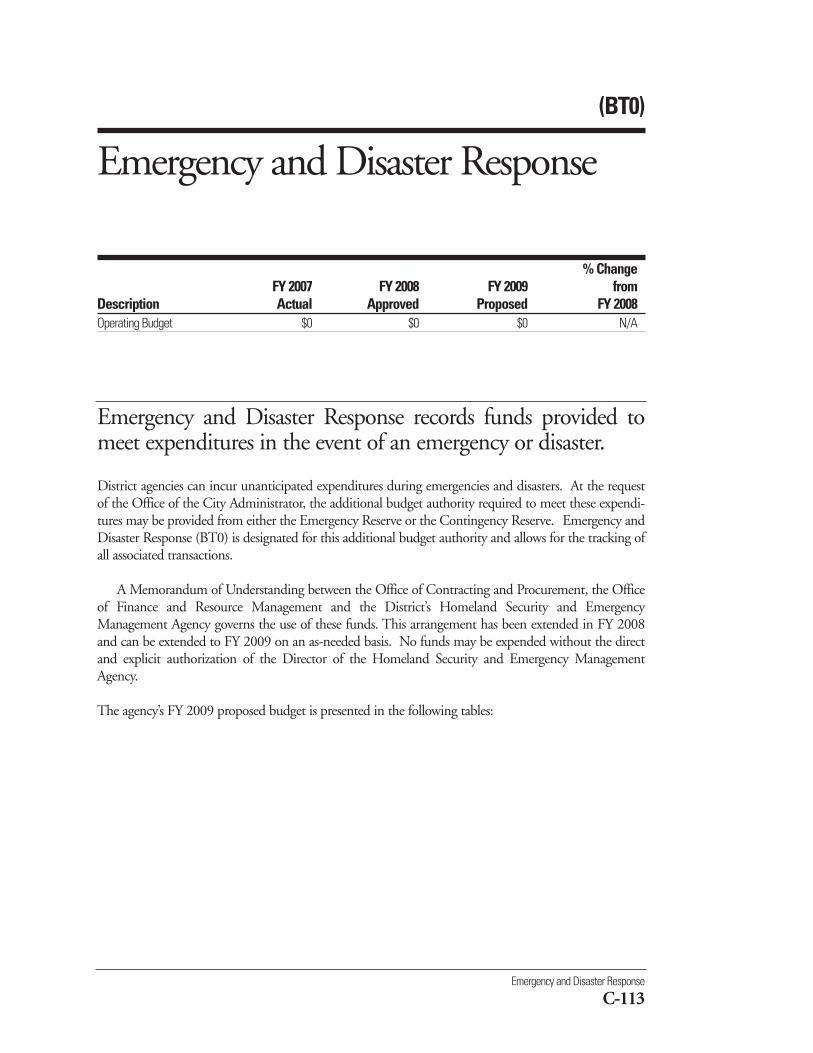
(BT0)
Emergency and Disaster Response
C-113
Emergency and Disaster Response
% ChangeFY 2007 FY 2008 FY 2009 from
Description Actual Approved Proposed FY 2008Operating Budget $0 $0 $0 N/A
Emergency and Disaster Response records funds provided tomeet expenditures in the event of an emergency or disaster.
District agencies can incur unanticipated expenditures during emergencies and disasters. At the requestof the Office of the City Administrator, the additional budget authority required to meet these expendi-tures may be provided from either the Emergency Reserve or the Contingency Reserve. Emergency andDisaster Response (BT0) is designated for this additional budget authority and allows for the tracking ofall associated transactions.
A Memorandum of Understanding between the Office of Contracting and Procurement, the Officeof Finance and Resource Management and the District’s Homeland Security and EmergencyManagement Agency governs the use of these funds. This arrangement has been extended in FY 2008and can be extended to FY 2009 on an as-needed basis. No funds may be expended without the directand explicit authorization of the Director of the Homeland Security and Emergency ManagementAgency.
The agency’s FY 2009 proposed budget is presented in the following tables:
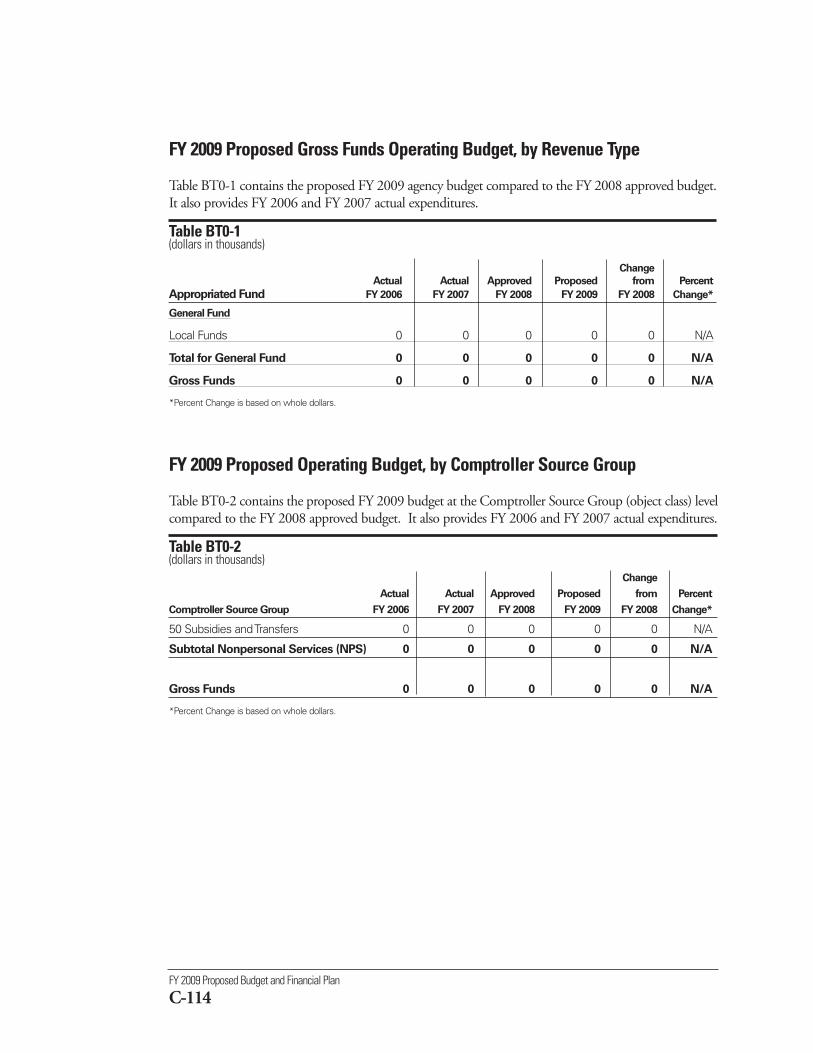
FY 2009 Proposed Budget and Financial Plan
C-114
FY 2009 Proposed Gross Funds Operating Budget, by Revenue Type
Table BT0-1 contains the proposed FY 2009 agency budget compared to the FY 2008 approved budget.It also provides FY 2006 and FY 2007 actual expenditures.
Table BT0-1 (dollars in thousands)
Change
Actual Actual Approved Proposed from Percent
Appropriated Fund FY 2006 FY 2007 FY 2008 FY 2009 FY 2008 Change*
General Fund
Local Funds 0 0 0 0 0 N/A
Total for General Fund 0 0 0 0 0 N/A
Gross Funds 0 0 0 0 0 N/A
*Percent Change is based on whole dollars.
FY 2009 Proposed Operating Budget, by Comptroller Source Group
Table BT0-2 contains the proposed FY 2009 budget at the Comptroller Source Group (object class) levelcompared to the FY 2008 approved budget. It also provides FY 2006 and FY 2007 actual expenditures.
Table BT0-2 (dollars in thousands)
Change
Actual Actual Approved Proposed from Percent
Comptroller Source Group FY 2006 FY 2007 FY 2008 FY 2009 FY 2008 Change*
50 Subsidies and Transfers 0 0 0 0 0 N/A
Subtotal Nonpersonal Services (NPS) 0 0 0 0 0 N/A
Gross Funds 0 0 0 0 0 N/A
*Percent Change is based on whole dollars.
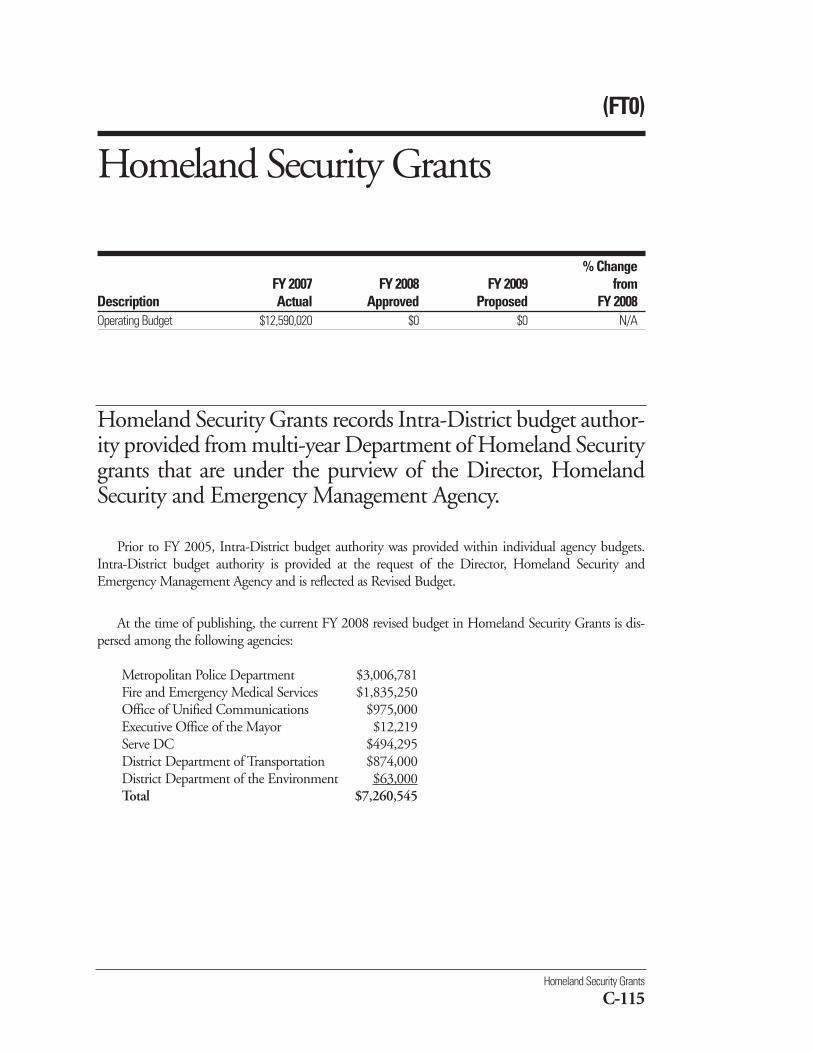
Homeland Security Grants
C-115
(FT0)
Homeland Security Grants
% ChangeFY 2007 FY 2008 FY 2009 from
Description Actual Approved Proposed FY 2008Operating Budget $12,590,020 $0 $0 N/A
Homeland Security Grants records Intra-District budget author-ity provided from multi-year Department of Homeland Securitygrants that are under the purview of the Director, HomelandSecurity and Emergency Management Agency.
Prior to FY 2005, Intra-District budget authority was provided within individual agency budgets.Intra-District budget authority is provided at the request of the Director, Homeland Security andEmergency Management Agency and is reflected as Revised Budget.
At the time of publishing, the current FY 2008 revised budget in Homeland Security Grants is dis-persed among the following agencies:
Metropolitan Police Department $3,006,781Fire and Emergency Medical Services $1,835,250Office of Unified Communications $975,000Executive Office of the Mayor $12,219Serve DC $494,295District Department of Transportation $874,000District Department of the Environment $63,000Total $7,260,545
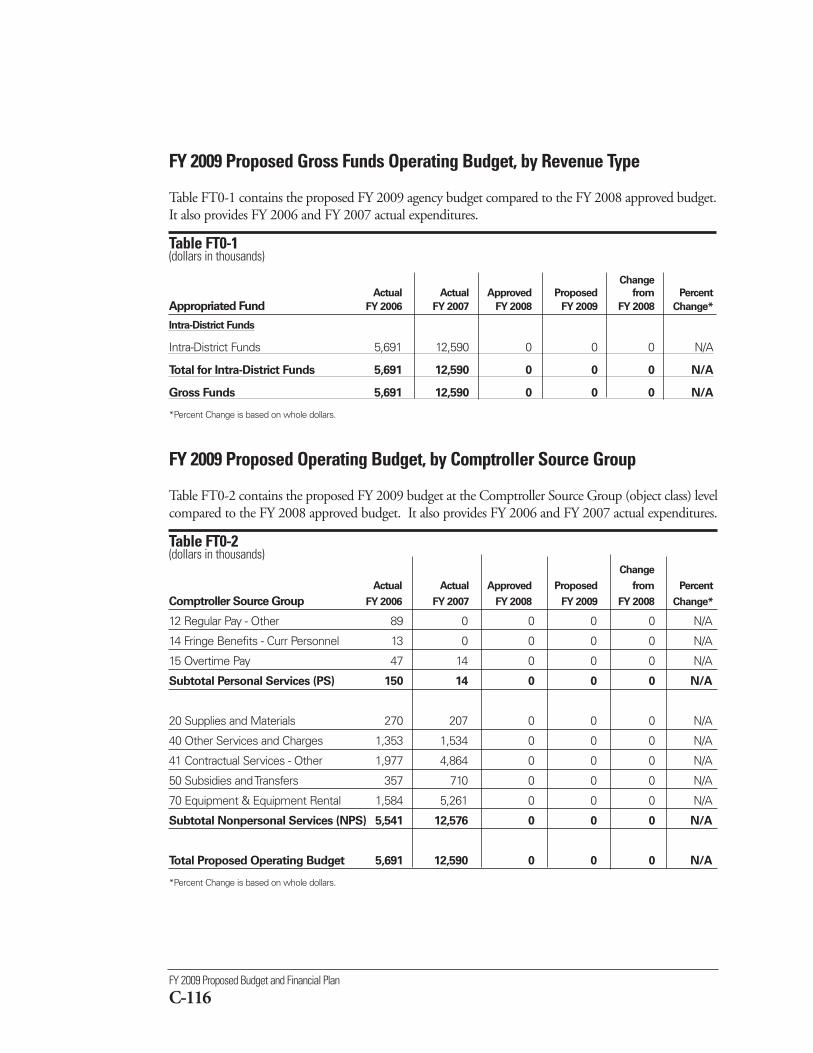
FY 2009 Proposed Budget and Financial Plan
C-116
FY 2009 Proposed Gross Funds Operating Budget, by Revenue Type
Table FT0-1 contains the proposed FY 2009 agency budget compared to the FY 2008 approved budget.It also provides FY 2006 and FY 2007 actual expenditures.
Table FT0-1 (dollars in thousands)
Change
Actual Actual Approved Proposed from Percent
Appropriated Fund FY 2006 FY 2007 FY 2008 FY 2009 FY 2008 Change*
Intra-District Funds
Intra-District Funds 5,691 12,590 0 0 0 N/A
Total for Intra-District Funds 5,691 12,590 0 0 0 N/A
Gross Funds 5,691 12,590 0 0 0 N/A
*Percent Change is based on whole dollars.
FY 2009 Proposed Operating Budget, by Comptroller Source Group
Table FT0-2 contains the proposed FY 2009 budget at the Comptroller Source Group (object class) levelcompared to the FY 2008 approved budget. It also provides FY 2006 and FY 2007 actual expenditures.
Table FT0-2(dollars in thousands)
Change
Actual Actual Approved Proposed from Percent
Comptroller Source Group FY 2006 FY 2007 FY 2008 FY 2009 FY 2008 Change*
12 Regular Pay - Other 89 0 0 0 0 N/A
14 Fringe Benefits - Curr Personnel 13 0 0 0 0 N/A
15 Overtime Pay 47 14 0 0 0 N/A
Subtotal Personal Services (PS) 150 14 0 0 0 N/A
20 Supplies and Materials 270 207 0 0 0 N/A
40 Other Services and Charges 1,353 1,534 0 0 0 N/A
41 Contractual Services - Other 1,977 4,864 0 0 0 N/A
50 Subsidies and Transfers 357 710 0 0 0 N/A
70 Equipment & Equipment Rental 1,584 5,261 0 0 0 N/A
Subtotal Nonpersonal Services (NPS) 5,541 12,576 0 0 0 N/A
Total Proposed Operating Budget 5,691 12,590 0 0 0 N/A
*Percent Change is based on whole dollars.
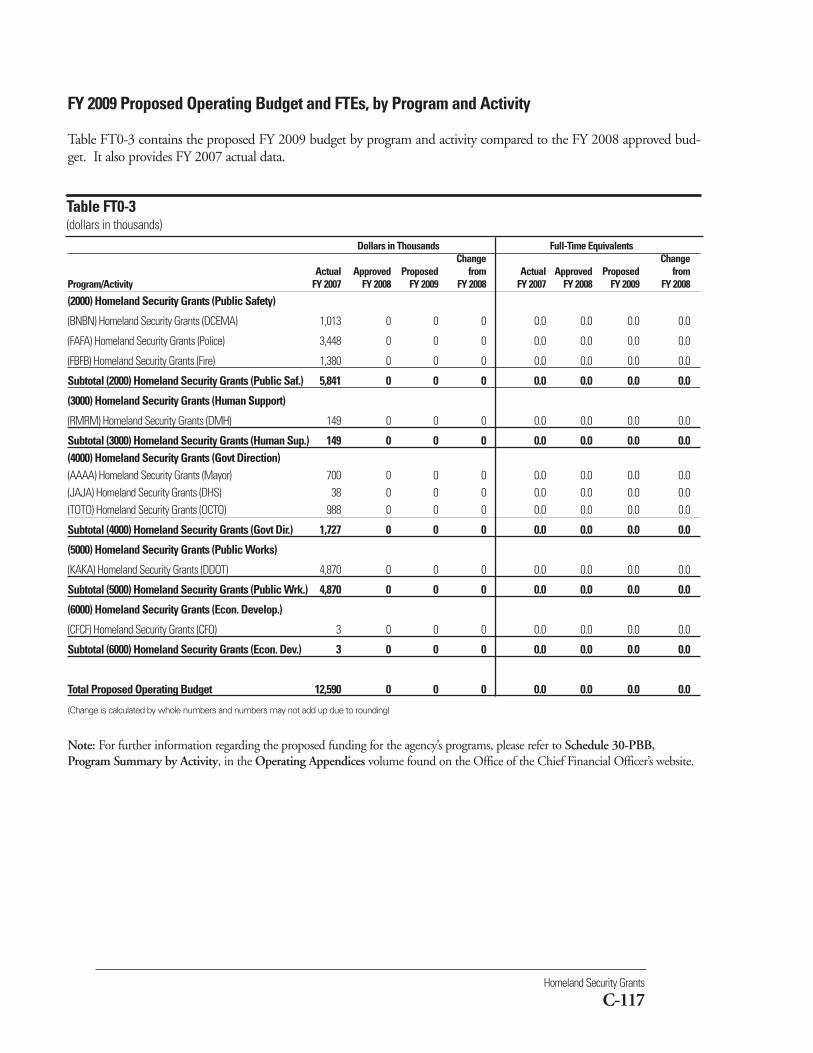
Table FT0-3(dollars in thousands)
Homeland Security Grants
C-117
Dollars in Thousands Full-Time EquivalentsChange Change
Actual Approved Proposed from Actual Approved Proposed from Program/Activity FY 2007 FY 2008 FY 2009 FY 2008 FY 2007 FY 2008 FY 2009 FY 2008
(2000) Homeland Security Grants (Public Safety)
(BNBN) Homeland Security Grants (DCEMA) 1,013 0 0 0 0.0 0.0 0.0 0.0
(FAFA) Homeland Security Grants (Police) 3,448 0 0 0 0.0 0.0 0.0 0.0
(FBFB) Homeland Security Grants (Fire) 1,380 0 0 0 0.0 0.0 0.0 0.0
Subtotal (2000) Homeland Security Grants (Public Saf.) 5,841 0 0 0 0.0 0.0 0.0 0.0
(3000) Homeland Security Grants (Human Support)
(RMRM) Homeland Security Grants (DMH) 149 0 0 0 0.0 0.0 0.0 0.0
Subtotal (3000) Homeland Security Grants (Human Sup.) 149 0 0 0 0.0 0.0 0.0 0.0(4000) Homeland Security Grants (Govt Direction) (AAAA) Homeland Security Grants (Mayor) 700 0 0 0 0.0 0.0 0.0 0.0(JAJA) Homeland Security Grants (DHS) 38 0 0 0 0.0 0.0 0.0 0.0(TOTO) Homeland Security Grants (OCTO) 988 0 0 0 0.0 0.0 0.0 0.0
Subtotal (4000) Homeland Security Grants (Govt Dir.) 1,727 0 0 0 0.0 0.0 0.0 0.0
(5000) Homeland Security Grants (Public Works)
(KAKA) Homeland Security Grants (DDOT) 4,870 0 0 0 0.0 0.0 0.0 0.0
Subtotal (5000) Homeland Security Grants (Public Wrk.) 4,870 0 0 0 0.0 0.0 0.0 0.0
(6000) Homeland Security Grants (Econ. Develop.)
(CFCF) Homeland Security Grants (CFO) 3 0 0 0 0.0 0.0 0.0 0.0
Subtotal (6000) Homeland Security Grants (Econ. Dev.) 3 0 0 0 0.0 0.0 0.0 0.0
Total Proposed Operating Budget 12,590 0 0 0 0.0 0.0 0.0 0.0
(Change is calculated by whole numbers and numbers may not add up due to rounding)
Note: For further information regarding the proposed funding for the agency’s programs, please refer to Schedule 30-PBB,Program Summary by Activity, in the Operating Appendices volume found on the Office of the Chief Financial Officer’s website.
FY 2009 Proposed Operating Budget and FTEs, by Program and Activity
Table FT0-3 contains the proposed FY 2009 budget by program and activity compared to the FY 2008 approved bud-get. It also provides FY 2007 actual data.
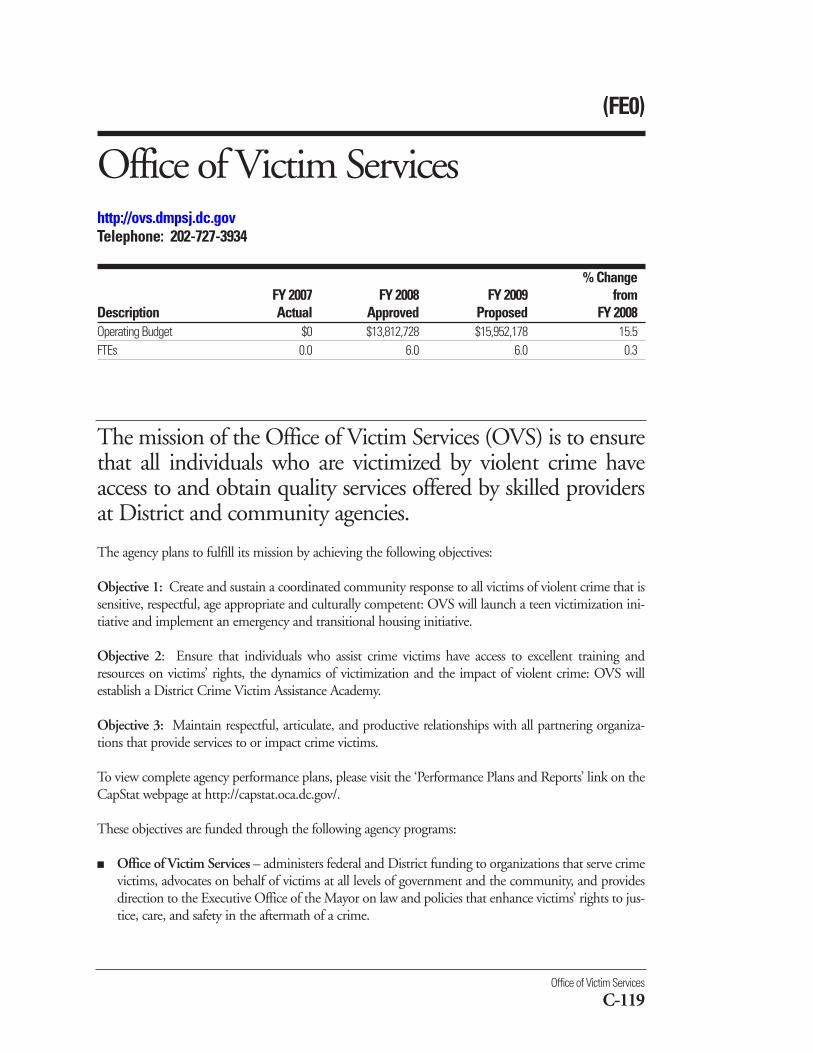
Office of Victim Services
C-119
(FE0)
Office of Victim Serviceshttp://ovs.dmpsj.dc.govTelephone: 202-727-3934
% ChangeFY 2007 FY 2008 FY 2009 from
Description Actual Approved Proposed FY 2008Operating Budget $0 $13,812,728 $15,952,178 15.5FTEs 0.0 6.0 6.0 0.3
The mission of the Office of Victim Services (OVS) is to ensurethat all individuals who are victimized by violent crime haveaccess to and obtain quality services offered by skilled providersat District and community agencies.
The agency plans to fulfill its mission by achieving the following objectives:
Objective 1: Create and sustain a coordinated community response to all victims of violent crime that issensitive, respectful, age appropriate and culturally competent: OVS will launch a teen victimization ini-tiative and implement an emergency and transitional housing initiative.
Objective 2: Ensure that individuals who assist crime victims have access to excellent training andresources on victims’ rights, the dynamics of victimization and the impact of violent crime: OVS willestablish a District Crime Victim Assistance Academy.
Objective 3: Maintain respectful, articulate, and productive relationships with all partnering organiza-tions that provide services to or impact crime victims.
To view complete agency performance plans, please visit the ‘Performance Plans and Reports’ link on theCapStat webpage at http://capstat.oca.dc.gov/.
These objectives are funded through the following agency programs:
■ Office of Victim Services – administers federal and District funding to organizations that serve crimevictims, advocates on behalf of victims at all levels of government and the community, and providesdirection to the Executive Office of the Mayor on law and policies that enhance victims’ rights to jus-tice, care, and safety in the aftermath of a crime.
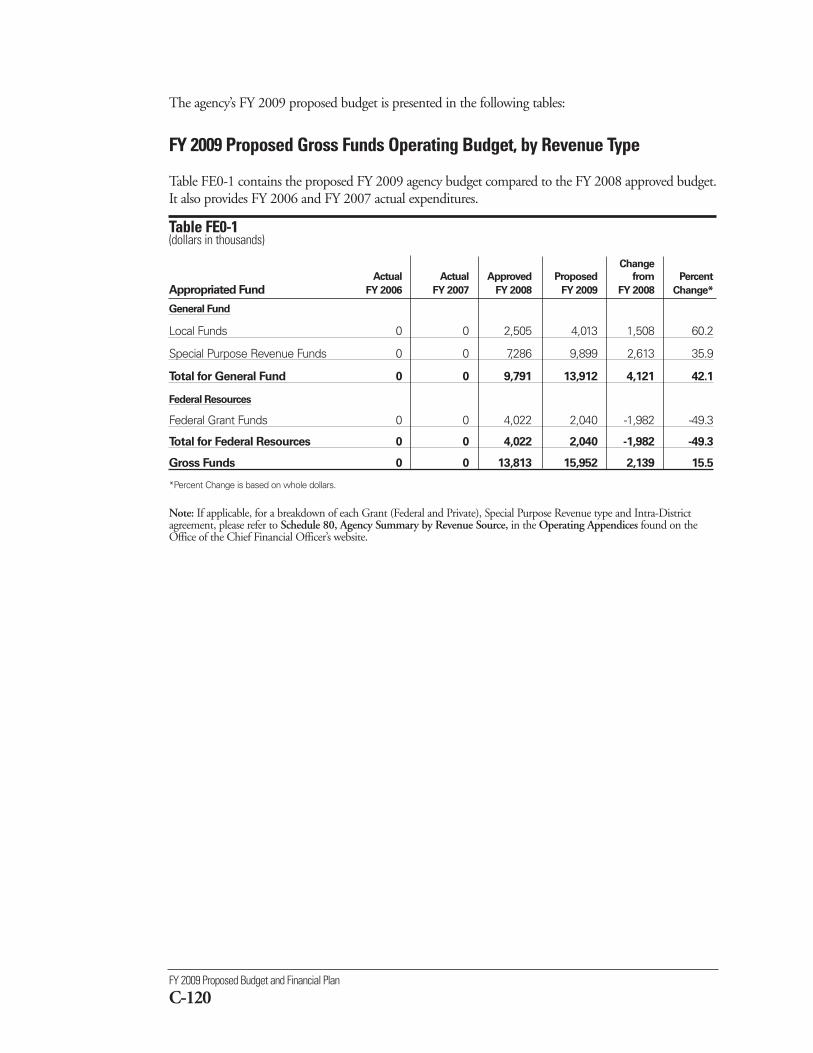
FY 2009 Proposed Budget and Financial Plan
C-120
The agency’s FY 2009 proposed budget is presented in the following tables:
FY 2009 Proposed Gross Funds Operating Budget, by Revenue Type
Table FE0-1 contains the proposed FY 2009 agency budget compared to the FY 2008 approved budget.It also provides FY 2006 and FY 2007 actual expenditures.
Table FE0-1 (dollars in thousands)
Change
Actual Actual Approved Proposed from Percent
Appropriated Fund FY 2006 FY 2007 FY 2008 FY 2009 FY 2008 Change*
General Fund
Local Funds 0 0 2,505 4,013 1,508 60.2
Special Purpose Revenue Funds 0 0 7,286 9,899 2,613 35.9
Total for General Fund 0 0 9,791 13,912 4,121 42.1
Federal Resources
Federal Grant Funds 0 0 4,022 2,040 -1,982 -49.3
Total for Federal Resources 0 0 4,022 2,040 -1,982 -49.3
Gross Funds 0 0 13,813 15,952 2,139 15.5
*Percent Change is based on whole dollars.
Note: If applicable, for a breakdown of each Grant (Federal and Private), Special Purpose Revenue type and Intra-Districtagreement, please refer to Schedule 80, Agency Summary by Revenue Source, in the Operating Appendices found on theOffice of the Chief Financial Officer’s website.
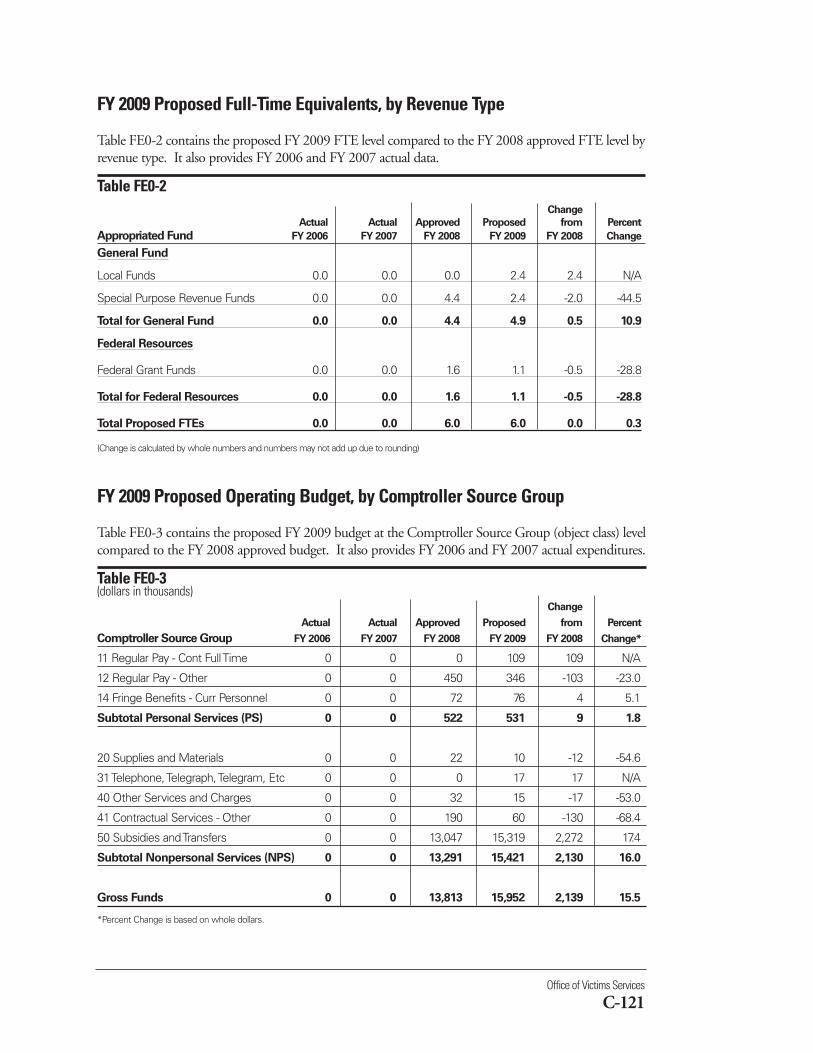
Office of Victims Services
C-121
FY 2009 Proposed Full-Time Equivalents, by Revenue Type
Table FE0-2 contains the proposed FY 2009 FTE level compared to the FY 2008 approved FTE level byrevenue type. It also provides FY 2006 and FY 2007 actual data.
Table FE0-2 Change
Actual Actual Approved Proposed from Percent
Appropriated Fund FY 2006 FY 2007 FY 2008 FY 2009 FY 2008 Change
General Fund
Local Funds 0.0 0.0 0.0 2.4 2.4 N/A
Special Purpose Revenue Funds 0.0 0.0 4.4 2.4 -2.0 -44.5
Total for General Fund 0.0 0.0 4.4 4.9 0.5 10.9
Federal Resources
Federal Grant Funds 0.0 0.0 1.6 1.1 -0.5 -28.8
Total for Federal Resources 0.0 0.0 1.6 1.1 -0.5 -28.8
Total Proposed FTEs 0.0 0.0 6.0 6.0 0.0 0.3
(Change is calculated by whole numbers and numbers may not add up due to rounding)
FY 2009 Proposed Operating Budget, by Comptroller Source Group
Table FE0-3 contains the proposed FY 2009 budget at the Comptroller Source Group (object class) levelcompared to the FY 2008 approved budget. It also provides FY 2006 and FY 2007 actual expenditures.
Table FE0-3(dollars in thousands)
Change
Actual Actual Approved Proposed from Percent
Comptroller Source Group FY 2006 FY 2007 FY 2008 FY 2009 FY 2008 Change*
11 Regular Pay - Cont Full Time 0 0 0 109 109 N/A
12 Regular Pay - Other 0 0 450 346 -103 -23.0
14 Fringe Benefits - Curr Personnel 0 0 72 76 4 5.1
Subtotal Personal Services (PS) 0 0 522 531 9 1.8
20 Supplies and Materials 0 0 22 10 -12 -54.6
31 Telephone, Telegraph, Telegram, Etc 0 0 0 17 17 N/A
40 Other Services and Charges 0 0 32 15 -17 -53.0
41 Contractual Services - Other 0 0 190 60 -130 -68.4
50 Subsidies and Transfers 0 0 13,047 15,319 2,272 17.4
Subtotal Nonpersonal Services (NPS) 0 0 13,291 15,421 2,130 16.0
Gross Funds 0 0 13,813 15,952 2,139 15.5
*Percent Change is based on whole dollars.
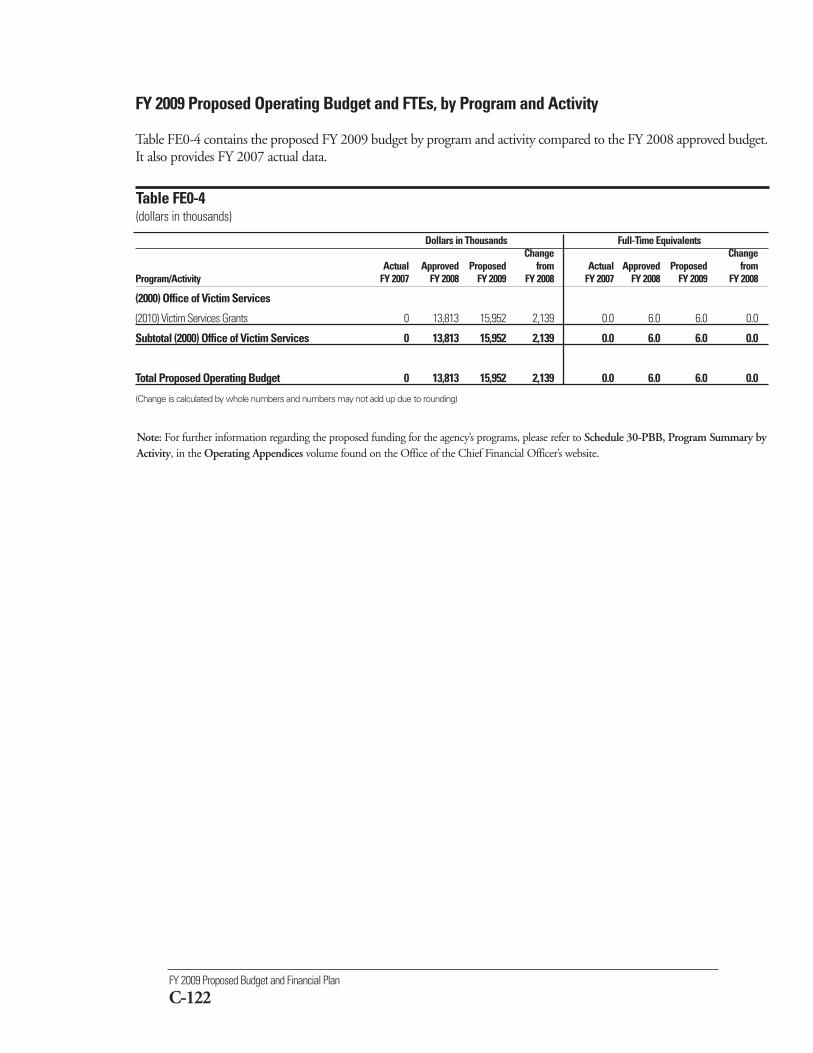
FY 2009 Proposed Budget and Financial Plan
C-122
FY 2009 Proposed Operating Budget and FTEs, by Program and Activity
Table FE0-4 contains the proposed FY 2009 budget by program and activity compared to the FY 2008 approved budget.It also provides FY 2007 actual data.
Table FE0-4(dollars in thousands)
Dollars in Thousands Full-Time EquivalentsChange Change
Actual Approved Proposed from Actual Approved Proposed from Program/Activity FY 2007 FY 2008 FY 2009 FY 2008 FY 2007 FY 2008 FY 2009 FY 2008
(2000) Office of Victim Services
(2010) Victim Services Grants 0 13,813 15,952 2,139 0.0 6.0 6.0 0.0
Subtotal (2000) Office of Victim Services 0 13,813 15,952 2,139 0.0 6.0 6.0 0.0
Total Proposed Operating Budget 0 13,813 15,952 2,139 0.0 6.0 6.0 0.0
(Change is calculated by whole numbers and numbers may not add up due to rounding)
Note: For further information regarding the proposed funding for the agency’s programs, please refer to Schedule 30-PBB, Program Summary byActivity, in the Operating Appendices volume found on the Office of the Chief Financial Officer’s website.
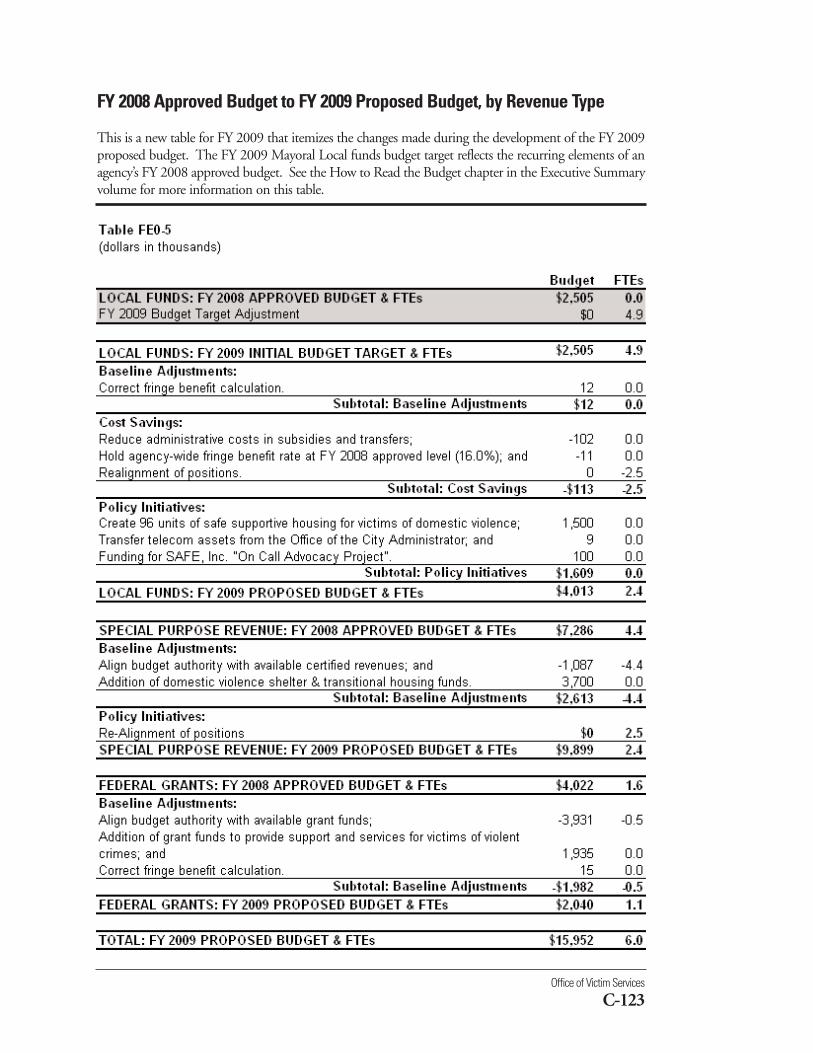
Office of Victim Services
C-123
FY 2008 Approved Budget to FY 2009 Proposed Budget, by Revenue Type
This is a new table for FY 2009 that itemizes the changes made during the development of the FY 2009proposed budget. The FY 2009 Mayoral Local funds budget target reflects the recurring elements of anagency’s FY 2008 approved budget. See the How to Read the Budget chapter in the Executive Summaryvolume for more information on this table.
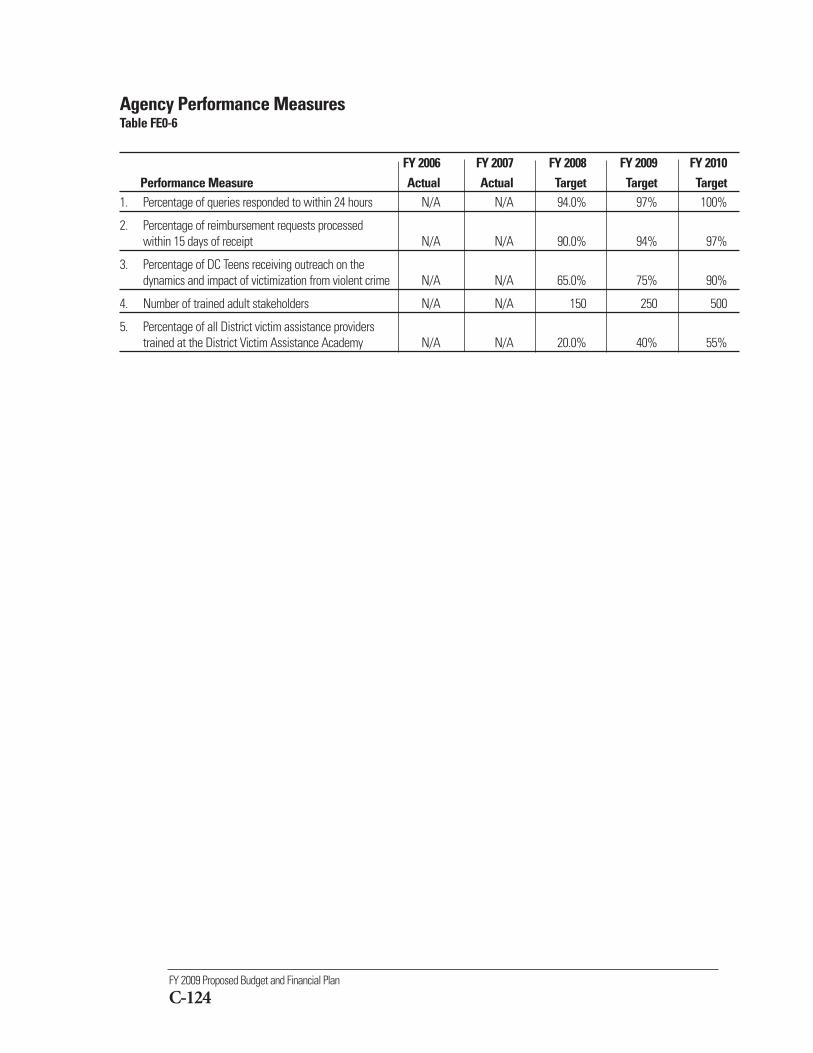
FY 2009 Proposed Budget and Financial Plan
C-124
Agency Performance MeasuresTable FE0-6
FY 2006 FY 2007 FY 2008 FY 2009 FY 2010Performance Measure Actual Actual Target Target Target
1. Percentage of queries responded to within 24 hours N/A N/A 94.0% 97% 100%
2. Percentage of reimbursement requests processedwithin 15 days of receipt N/A N/A 90.0% 94% 97%
3. Percentage of DC Teens receiving outreach on thedynamics and impact of victimization from violent crime N/A N/A 65.0% 75% 90%
4. Number of trained adult stakeholders N/A N/A 150 250 500
5. Percentage of all District victim assistance providerstrained at the District Victim Assistance Academy N/A N/A 20.0% 40% 55%
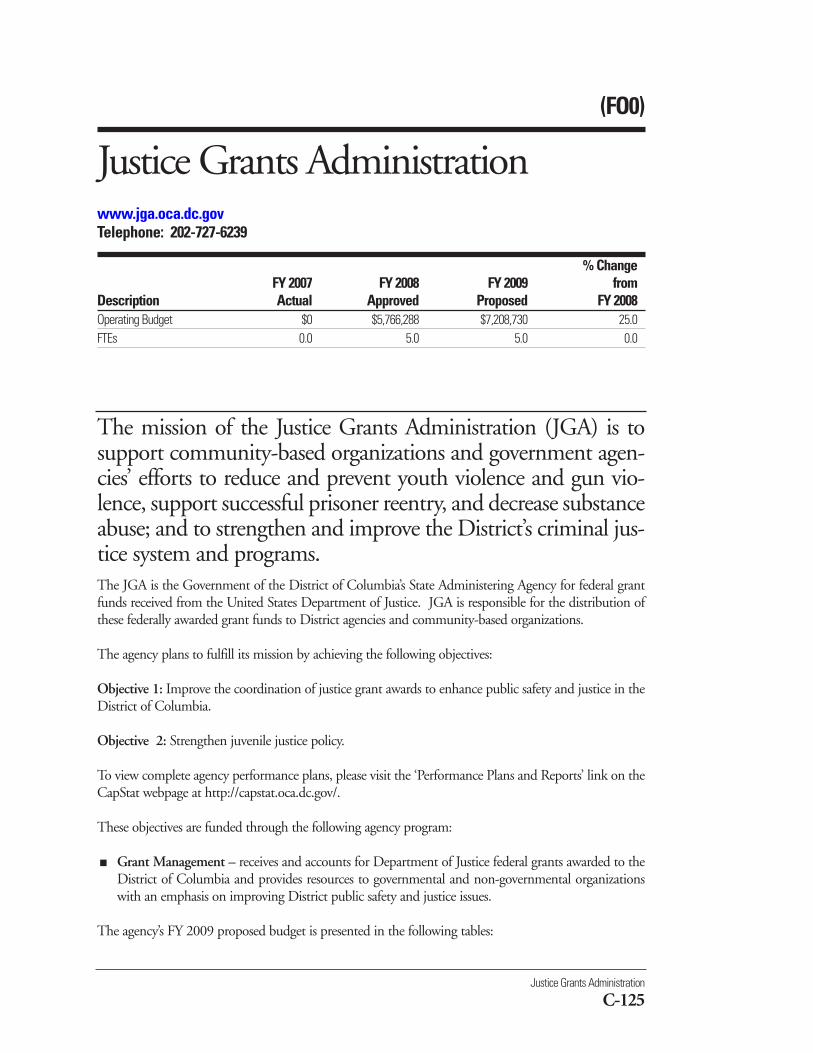
Justice Grants Administration
C-125
The JGA is the Government of the District of Columbia’s State Administering Agency for federal grantfunds received from the United States Department of Justice. JGA is responsible for the distribution ofthese federally awarded grant funds to District agencies and community-based organizations.
The agency plans to fulfill its mission by achieving the following objectives:
Objective 1: Improve the coordination of justice grant awards to enhance public safety and justice in theDistrict of Columbia.
Objective 2: Strengthen juvenile justice policy.
To view complete agency performance plans, please visit the ‘Performance Plans and Reports’ link on theCapStat webpage at http://capstat.oca.dc.gov/.
These objectives are funded through the following agency program:
■ Grant Management – receives and accounts for Department of Justice federal grants awarded to theDistrict of Columbia and provides resources to governmental and non-governmental organizationswith an emphasis on improving District public safety and justice issues.
The agency’s FY 2009 proposed budget is presented in the following tables:
(FO0)
Justice Grants Administrationwww.jga.oca.dc.govTelephone: 202-727-6239
% ChangeFY 2007 FY 2008 FY 2009 from
Description Actual Approved Proposed FY 2008Operating Budget $0 $5,766,288 $7,208,730 25.0FTEs 0.0 5.0 5.0 0.0
The mission of the Justice Grants Administration (JGA) is tosupport community-based organizations and government agen-cies’ efforts to reduce and prevent youth violence and gun vio-lence, support successful prisoner reentry, and decrease substanceabuse; and to strengthen and improve the District’s criminal jus-tice system and programs.
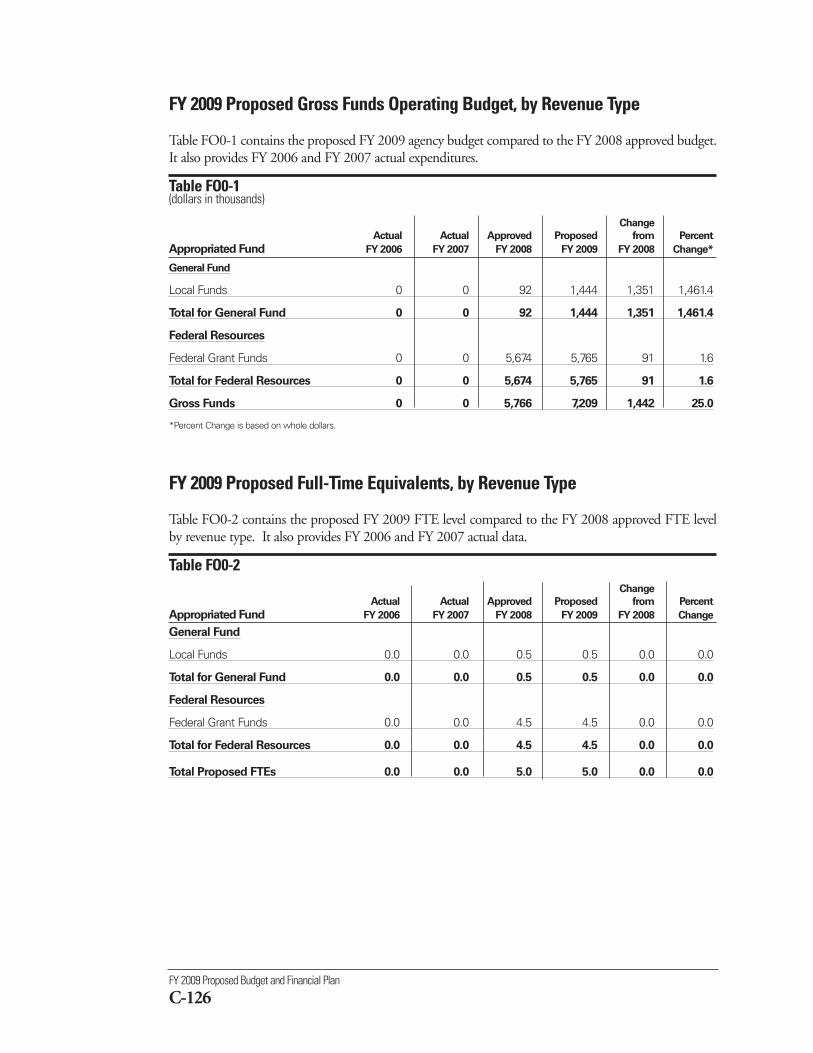
FY 2009 Proposed Budget and Financial Plan
C-126
FY 2009 Proposed Gross Funds Operating Budget, by Revenue Type
Table FO0-1 contains the proposed FY 2009 agency budget compared to the FY 2008 approved budget.It also provides FY 2006 and FY 2007 actual expenditures.
Table FO0-1 (dollars in thousands)
Change
Actual Actual Approved Proposed from Percent
Appropriated Fund FY 2006 FY 2007 FY 2008 FY 2009 FY 2008 Change*
General Fund
Local Funds 0 0 92 1,444 1,351 1,461.4
Total for General Fund 0 0 92 1,444 1,351 1,461.4
Federal Resources
Federal Grant Funds 0 0 5,674 5,765 91 1.6
Total for Federal Resources 0 0 5,674 5,765 91 1.6
Gross Funds 0 0 5,766 7,209 1,442 25.0
*Percent Change is based on whole dollars.
FY 2009 Proposed Full-Time Equivalents, by Revenue Type
Table FO0-2 contains the proposed FY 2009 FTE level compared to the FY 2008 approved FTE levelby revenue type. It also provides FY 2006 and FY 2007 actual data.
Table FO0-2 Change
Actual Actual Approved Proposed from Percent
Appropriated Fund FY 2006 FY 2007 FY 2008 FY 2009 FY 2008 Change
General Fund
Local Funds 0.0 0.0 0.5 0.5 0.0 0.0
Total for General Fund 0.0 0.0 0.5 0.5 0.0 0.0
Federal Resources
Federal Grant Funds 0.0 0.0 4.5 4.5 0.0 0.0
Total for Federal Resources 0.0 0.0 4.5 4.5 0.0 0.0
Total Proposed FTEs 0.0 0.0 5.0 5.0 0.0 0.0
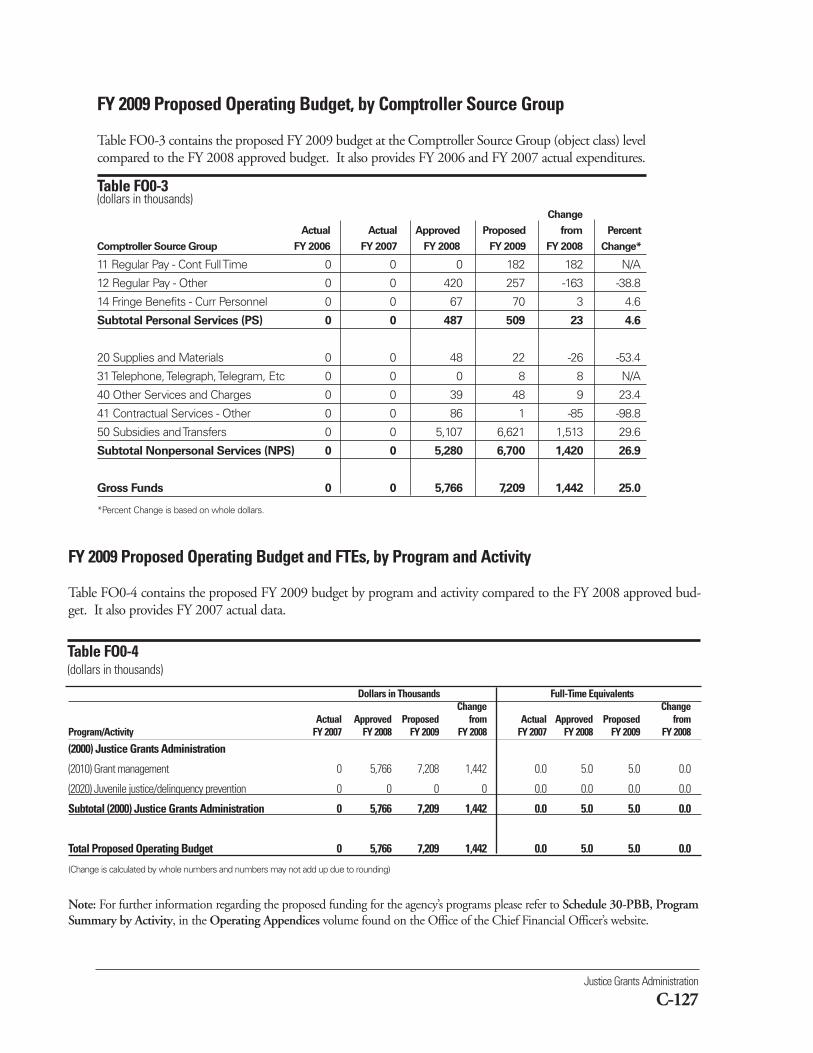
Justice Grants Administration
C-127
FY 2009 Proposed Operating Budget, by Comptroller Source Group
Table FO0-3 contains the proposed FY 2009 budget at the Comptroller Source Group (object class) levelcompared to the FY 2008 approved budget. It also provides FY 2006 and FY 2007 actual expenditures.
Table FO0-3(dollars in thousands)
Change
Actual Actual Approved Proposed from Percent
Comptroller Source Group FY 2006 FY 2007 FY 2008 FY 2009 FY 2008 Change*
11 Regular Pay - Cont Full Time 0 0 0 182 182 N/A
12 Regular Pay - Other 0 0 420 257 -163 -38.8
14 Fringe Benefits - Curr Personnel 0 0 67 70 3 4.6
Subtotal Personal Services (PS) 0 0 487 509 23 4.6
20 Supplies and Materials 0 0 48 22 -26 -53.4
31 Telephone, Telegraph, Telegram, Etc 0 0 0 8 8 N/A
40 Other Services and Charges 0 0 39 48 9 23.4
41 Contractual Services - Other 0 0 86 1 -85 -98.8
50 Subsidies and Transfers 0 0 5,107 6,621 1,513 29.6
Subtotal Nonpersonal Services (NPS) 0 0 5,280 6,700 1,420 26.9
Gross Funds 0 0 5,766 7,209 1,442 25.0
*Percent Change is based on whole dollars.
Dollars in Thousands Full-Time EquivalentsChange Change
Actual Approved Proposed from Actual Approved Proposed from Program/Activity FY 2007 FY 2008 FY 2009 FY 2008 FY 2007 FY 2008 FY 2009 FY 2008
(2000) Justice Grants Administration
(2010) Grant management 0 5,766 7,208 1,442 0.0 5.0 5.0 0.0
(2020) Juvenile justice/delinquency prevention 0 0 0 0 0.0 0.0 0.0 0.0
Subtotal (2000) Justice Grants Administration 0 5,766 7,209 1,442 0.0 5.0 5.0 0.0
Total Proposed Operating Budget 0 5,766 7,209 1,442 0.0 5.0 5.0 0.0
(Change is calculated by whole numbers and numbers may not add up due to rounding)
Note: For further information regarding the proposed funding for the agency’s programs please refer to Schedule 30-PBB, ProgramSummary by Activity, in the Operating Appendices volume found on the Office of the Chief Financial Officer’s website.
FY 2009 Proposed Operating Budget and FTEs, by Program and Activity
Table FO0-4 contains the proposed FY 2009 budget by program and activity compared to the FY 2008 approved bud-get. It also provides FY 2007 actual data.
Table FO0-4(dollars in thousands)
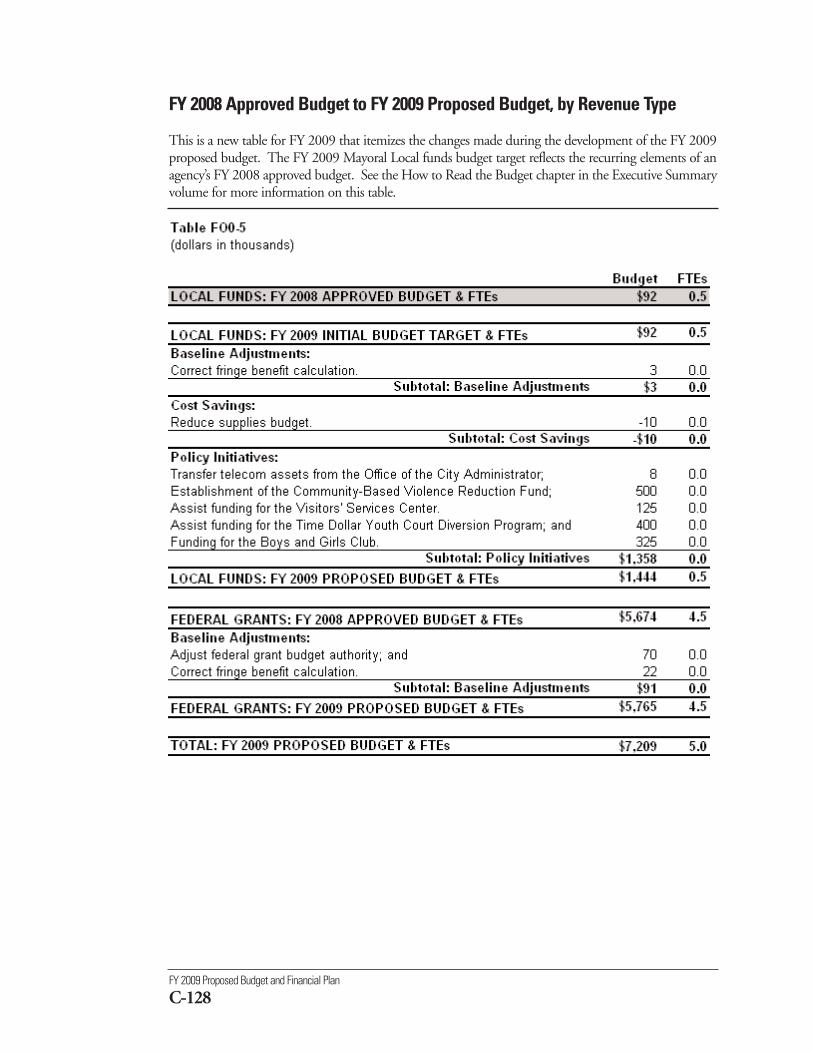
FY 2009 Proposed Budget and Financial Plan
C-128
FY 2008 Approved Budget to FY 2009 Proposed Budget, by Revenue Type
This is a new table for FY 2009 that itemizes the changes made during the development of the FY 2009proposed budget. The FY 2009 Mayoral Local funds budget target reflects the recurring elements of anagency’s FY 2008 approved budget. See the How to Read the Budget chapter in the Executive Summaryvolume for more information on this table.
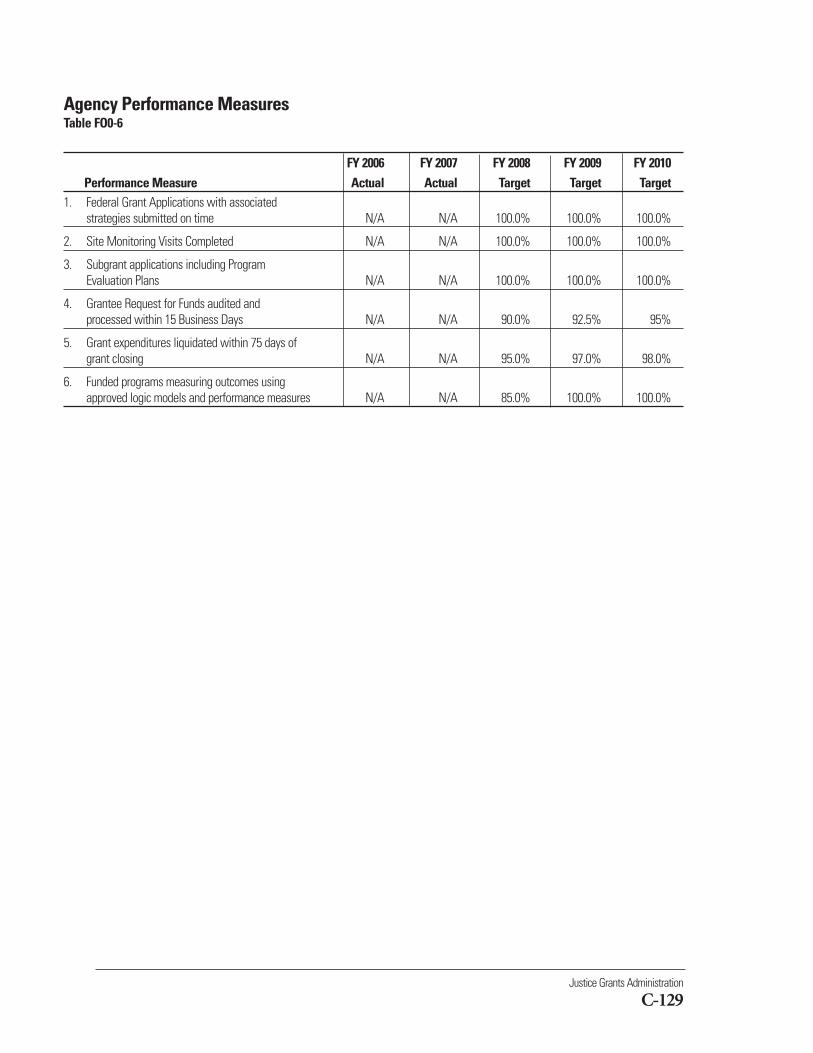
Justice Grants Administration
C-129
Agency Performance MeasuresTable FO0-6
FY 2006 FY 2007 FY 2008 FY 2009 FY 2010Performance Measure Actual Actual Target Target Target
1. Federal Grant Applications with associated strategies submitted on time N/A N/A 100.0% 100.0% 100.0%
2. Site Monitoring Visits Completed N/A N/A 100.0% 100.0% 100.0%
3. Subgrant applications including Program Evaluation Plans N/A N/A 100.0% 100.0% 100.0%
4. Grantee Request for Funds audited and processed within 15 Business Days N/A N/A 90.0% 92.5% 95%
5. Grant expenditures liquidated within 75 days of grant closing N/A N/A 95.0% 97.0% 98.0%
6. Funded programs measuring outcomes using approved logic models and performance measures N/A N/A 85.0% 100.0% 100.0%
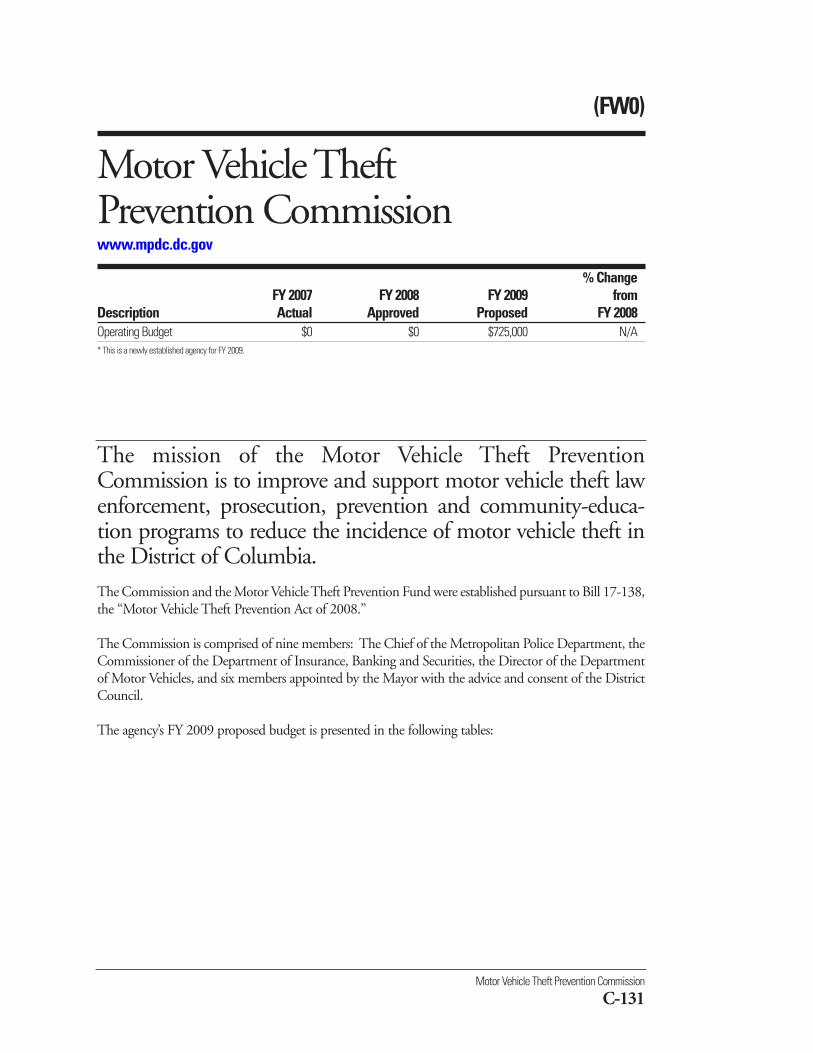
Motor Vehicle Theft Prevention Commission
C-131
The Commission and the Motor Vehicle Theft Prevention Fund were established pursuant to Bill 17-138,the “Motor Vehicle Theft Prevention Act of 2008.”
The Commission is comprised of nine members: The Chief of the Metropolitan Police Department, theCommissioner of the Department of Insurance, Banking and Securities, the Director of the Departmentof Motor Vehicles, and six members appointed by the Mayor with the advice and consent of the DistrictCouncil.
The agency’s FY 2009 proposed budget is presented in the following tables:
The mission of the Motor Vehicle Theft PreventionCommission is to improve and support motor vehicle theft lawenforcement, prosecution, prevention and community-educa-tion programs to reduce the incidence of motor vehicle theft inthe District of Columbia.
(FW0)
Motor Vehicle Theft Prevention Commissionwww.mpdc.dc.gov
% ChangeFY 2007 FY 2008 FY 2009 from
Description Actual Approved Proposed FY 2008Operating Budget $0 $0 $725,000 N/A* This is a newly established agency for FY 2009.
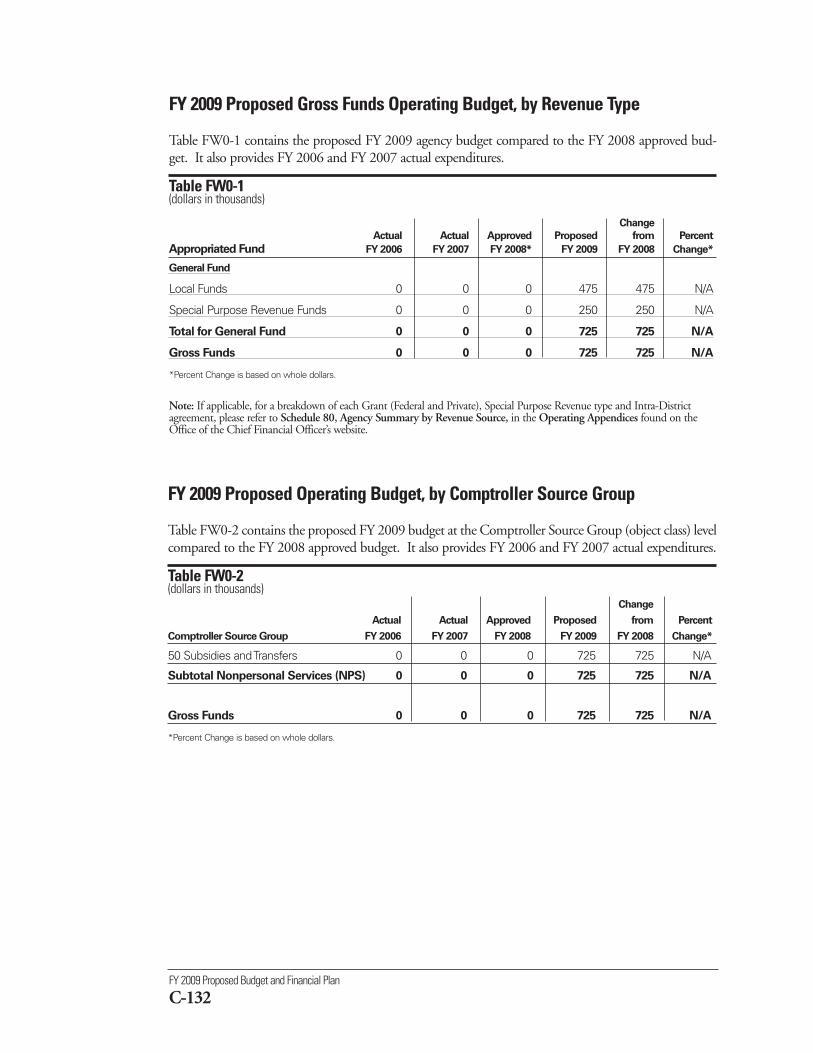
FY 2009 Proposed Budget and Financial Plan
C-132
FY 2009 Proposed Gross Funds Operating Budget, by Revenue Type
Table FW0-1 contains the proposed FY 2009 agency budget compared to the FY 2008 approved bud-get. It also provides FY 2006 and FY 2007 actual expenditures.
Table FW0-1 (dollars in thousands)
Change
Actual Actual Approved Proposed from Percent
Appropriated Fund FY 2006 FY 2007 FY 2008* FY 2009 FY 2008 Change*
General Fund
Local Funds 0 0 0 475 475 N/A
Special Purpose Revenue Funds 0 0 0 250 250 N/A
Total for General Fund 0 0 0 725 725 N/A
Gross Funds 0 0 0 725 725 N/A
*Percent Change is based on whole dollars.
Note: If applicable, for a breakdown of each Grant (Federal and Private), Special Purpose Revenue type and Intra-Districtagreement, please refer to Schedule 80, Agency Summary by Revenue Source, in the Operating Appendices found on theOffice of the Chief Financial Officer’s website.
FY 2009 Proposed Operating Budget, by Comptroller Source Group
Table FW0-2 contains the proposed FY 2009 budget at the Comptroller Source Group (object class) levelcompared to the FY 2008 approved budget. It also provides FY 2006 and FY 2007 actual expenditures.
Table FW0-2(dollars in thousands)
Change
Actual Actual Approved Proposed from Percent
Comptroller Source Group FY 2006 FY 2007 FY 2008 FY 2009 FY 2008 Change*
50 Subsidies and Transfers 0 0 0 725 725 N/A
Subtotal Nonpersonal Services (NPS) 0 0 0 725 725 N/A
Gross Funds 0 0 0 725 725 N/A
*Percent Change is based on whole dollars.
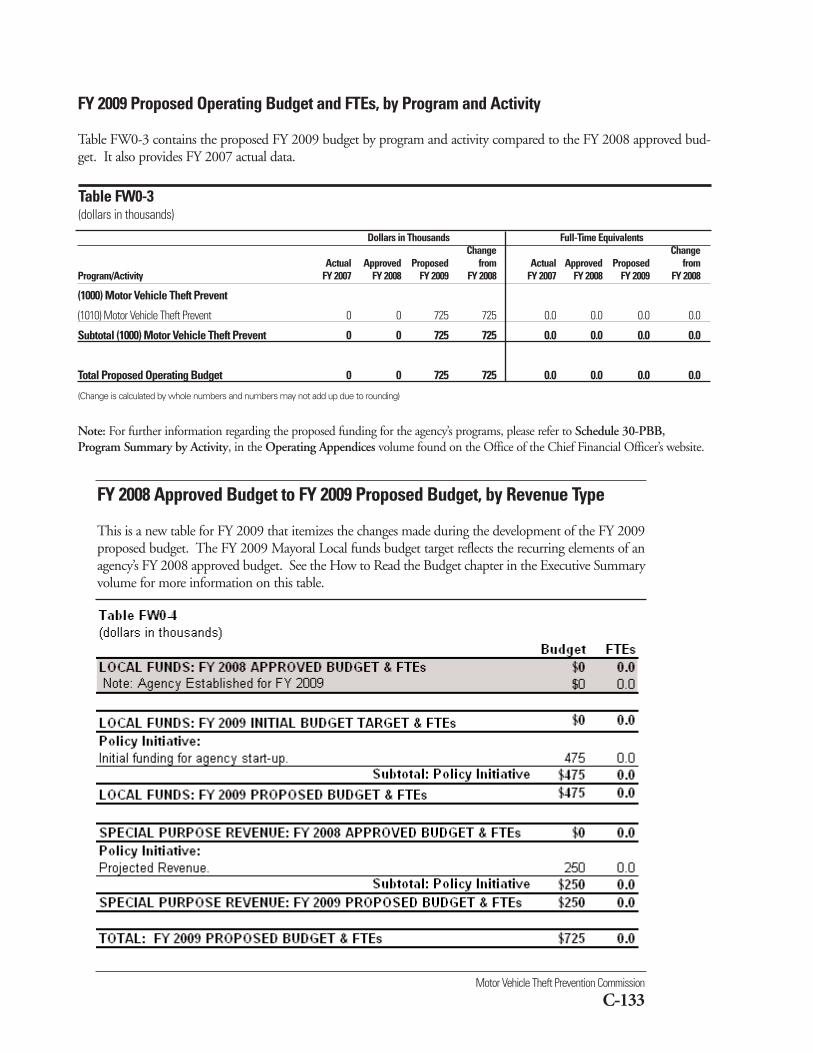
Motor Vehicle Theft Prevention Commission
C-133
Dollars in Thousands Full-Time EquivalentsChange Change
Actual Approved Proposed from Actual Approved Proposed from Program/Activity FY 2007 FY 2008 FY 2009 FY 2008 FY 2007 FY 2008 FY 2009 FY 2008
(1000) Motor Vehicle Theft Prevent
(1010) Motor Vehicle Theft Prevent 0 0 725 725 0.0 0.0 0.0 0.0
Subtotal (1000) Motor Vehicle Theft Prevent 0 0 725 725 0.0 0.0 0.0 0.0
Total Proposed Operating Budget 0 0 725 725 0.0 0.0 0.0 0.0
(Change is calculated by whole numbers and numbers may not add up due to rounding)
Note: For further information regarding the proposed funding for the agency’s programs, please refer to Schedule 30-PBB,Program Summary by Activity, in the Operating Appendices volume found on the Office of the Chief Financial Officer’s website.
FY 2009 Proposed Operating Budget and FTEs, by Program and Activity
Table FW0-3 contains the proposed FY 2009 budget by program and activity compared to the FY 2008 approved bud-get. It also provides FY 2007 actual data.
Table FW0-3(dollars in thousands)
FY 2008 Approved Budget to FY 2009 Proposed Budget, by Revenue Type
This is a new table for FY 2009 that itemizes the changes made during the development of the FY 2009proposed budget. The FY 2009 Mayoral Local funds budget target reflects the recurring elements of anagency’s FY 2008 approved budget. See the How to Read the Budget chapter in the Executive Summaryvolume for more information on this table.