functional differentiation of bundle sheath and mesophyll maize chloroplasts determined by...
TRANSCRIPT
Functional Differentiation of Bundle Sheath and MesophyllMaize Chloroplasts Determined by Comparative Proteomics W
Wojciech Majeran,a Yang Cai,a Qi Sun,b and Klaas J. van Wijka,1
a Department of Plant Biology, Cornell University, Ithaca, New York 14853b Computational Biology Service Unit, Cornell Theory Center, Cornell University, Ithaca, New York 14853
Chloroplasts of maize (Zea mays) leaves differentiate into specific bundle sheath (BS) and mesophyll (M) types to
accommodate C4 photosynthesis. Consequences for other plastid functions are not well understood but are addressed
here through a quantitative comparative proteome analysis of purified M and BS chloroplast stroma. Three independent
techniques were used, including cleavable stable isotope coded affinity tags. Enzymes involved in lipid biosynthesis,
nitrogen import, and tetrapyrrole and isoprenoid biosynthesis are preferentially located in the M chloroplasts. By contrast,
enzymes involved in starch synthesis and sulfur import preferentially accumulate in BS chloroplasts. The different soluble
antioxidative systems, in particular peroxiredoxins, accumulate at higher levels in M chloroplasts. We also observed
differential accumulation of proteins involved in expression of plastid-encoded proteins (e.g., EF-Tu, EF-G, and mRNA
binding proteins) and thylakoid formation (VIPP1), whereas others were equally distributed. Enzymes related to the C4
shuttle, the carboxylation and regeneration phase of the Calvin cycle, and several regulators (e.g., CP12) distributed as
expected. However, enzymes involved in triose phosphate reduction and triose phosphate isomerase are primarily located
in the M chloroplasts, indicating that the M-localized triose phosphate shuttle should be viewed as part of the BS-localized
Calvin cycle, rather than a parallel pathway.
INTRODUCTION
Leaves in C4 plants such as maize (Zea mays) form a classical
Kranz leaf anatomy during their development (Edwards and
Walker, 1983; Nelson and Langdale, 1992). In this Kranz
anatomy, each vein is surrounded by a ring of bundle sheath
(BS) cells, followed by one or more concentric files of mesophyll
(M) cells. BS cells have thick cell walls and contain centrifugally
arranged chloroplasts with large starch granules and unstacked
thylakoid membranes, whereas the M cells contain randomly
arranged chloroplasts with stacked thylakoids and little or no
starch (Edwards and Walker, 1983). Each cell type accumulates
a distinct set of C4 photosynthetic enzymes (reviewed in
Langdale, 1998; Sheen, 1999).
Numerous studies have focused on the analysis of BS and M
cell differentiation and the relationship to formation of the Kranz
anatomy (Edwards et al., 2004). Transcript accumulation studies
in BS andMcells using in situ hybridization have been successful
in determining spatial patterns and developmental gradients for
several specific genes in maize (Furumoto et al., 2000) and in
sorghum (Sorghum bicolor; Wyrich et al., 1998). Signals required
for plastid-specific gene expression of C4 enzymes involve
promoter sequences and other DNA regulatory elements (Sheen,
1999). Collectively, these and other studies show that M cells in
maize leaves develop in a C3 pattern by default and in a C4
pattern through the influence of closely neighboring veins.
Specialization of BS cells seems to be a combination of their
procambial lineage and their vein adjacent position (Smith et al.,
1996; Jankovsky et al., 2001). The golden 2 nuclear transcription
factor seems to play an important role to promote BS chloroplast
development and plastid-specific protein accumulation (Cribb
et al., 2001). Several M/BS differentiation mutants were ana-
lyzed, such as bundle sheath defective1 (bsd1) (Langdale and
Kidner, 1994; Hall et al., 1998) and bsd2 (Roth et al., 1996;
Brutnell et al., 1999).
The fully differentiated BS and M chloroplasts each accumu-
late a distinct set of photosynthetic enzymes and proteins that
enables them to cooperate in carbon fixation (Hatch and
Osmond, 1976; Edwards and Walker, 1983). For instance,
ribulose-1,5-bis-phosphate carboxylase/oxygenase (Rubisco)
(RBCL and RBCS) accumulates exclusively in BS chloroplasts,
whereas pyruvate phosphate dikinase (PPDK) and photosystem
II accumulate inMchloroplasts. Differential protein accumulation
of several other chloroplast proteins has been determined using
chloroplast fractionation techniques, in combination with protein
gel blot analysis, in situ immunolocalization, and green fluores-
cent protein fusions (reviewed in Edwards et al., 2001). In
addition, several BS- and M-specific enzymatic activities were
determined using nonaqueous fractionation techniques and
pulse labeling techniques (Slack et al., 1969). Collectively, these
biochemical studies showed that M cells carry out linear photo-
synthetic electron transport that produces the ATP and NADPH
needed for autotrophic growth, to import pyruvate from the BS
1 To whom correspondence should be addressed. E-mail [email protected]; fax 607-255-3664.The author responsible for distribution of materials integral to thefindings presented in this article in accordance with the policy describedin the Instructions for Authors (www.plantcell.org) is: Klaas J. van Wijk([email protected]).WOnline version contains Web-only data.Article, publication date, and citation information can be found atwww.plantcell.org/cgi/doi/10.1105/tpc.105.035519.
The Plant Cell, Vol. 17, 3111–3140, November 2005, www.plantcell.orgª 2005 American Society of Plant Biologists
cells to generate phosphoenolpyruvate, and to convert the C4
acid oxaloacetate into the C4 acid malate. In complementary
fashion, BS cells import and decarboxylate malate into pyruvate,
using the released NADPH and CO2 to generate reduced
carbohydrates in the Calvin cycle and convert the surplus of
carbohydrates into starch. Additional NADPH is imported from
theM cells via the triosphosphate shuttle. Differentiation of many
other chloroplast functions (reviewed in Neuhaus and Emes,
2000), such as synthesis of fatty acids, nucleotides, hormones,
and amino acids, is largely unknown in C4 plants.
The high mass accuracy, sensitivity, and high-throughput
possibilities of mass spectrometry (MS), together with the
availability of genomes, now allow the rapid identification of
large sets of proteins (Aebersold and Mann, 2003; Ferguson
and Smith, 2003; Lin et al., 2003). Proteomes of different
organelles, membranes, and tissues of Arabidopsis thaliana
and Medicago truncatula have been analyzed to various de-
grees, providing a good starting point formany functional studies
(e.g., Watson et al., 2003; Friso et al., 2004; Heazlewood et al.,
2004; Nuhse et al., 2004; Peltier et al., 2004a; Shimaoka et al.,
2004). The large EST assembly of maize and recent efforts in
sequencing of the maize genome (Gomez et al., 2002; Palmer
et al., 2003) now facilitate meaningful studies on the maize
proteome (Porubleva et al., 2001; Hochholdinger et al., 2004;
Lonosky et al., 2004).
Although cataloguing proteomes is useful, in the context of BS
and M chloroplast differentiation, it is most important to compare
protein accumulation in a quantitative manner. Initially, strategies
based on two-dimensional gel electrophoresis (2-DE) were
the main tool for comparative protein analysis. Examples of com-
parative 2-DE–based analysis in plants are protein expression
profiling during seed filling and germination in Arabidopsis,
M. trunculata, soybean (Glycine max), and pea (Pisum sativum;
Gallardo et al., 2001, 2003; Schiltz et al., 2004; Hajduch et al.,
2005). Very recently, several non-gel-based techniqueshavebeen
developed that are based on differential labeling of proteomes
with stable isotopes, followed by quantification in the mass
spectrometer (Goshe and Smith, 2003; Ong et al., 2003). These
non-gel-based methods allow better quantification and in princi-
ple much higher throughput analysis. In particular, the cleavable
isotope coded affinity tag technique (cICAT) has been success-
fully employed for comparative proteome analysis (Hansen et al.,
2003; Li et al., 2003; Tao and Aebersold, 2003; Conrads et al.,
2004). However, these novel stable isotope techniques have not
yet been applied in the analysis of plant proteomes.
We present here a systematic overview and a quantitative
comparison of the soluble stromal proteomes of BS and M
chloroplasts. The availability of the EST assembly and partial
genome sequence allowed identification of specific members of
protein families in many cases. This is important since different
homologs within a protein family might have different functions
and expression patterns, as will be shown in this study. The
soluble, stromal proteomes of purified BS and M chloroplasts
from young maize leaves were compared by a combination of
2-DE and image analysis, followed by identification of proteins by
MS. To improve dynamic resolution, accuracy, and significance,
we also used two non-gel-based techniques: a differential
labeling with cICAT and a comparative analysis of unlabeled
BS and M stromal proteomes by liquid chromatography electro-
spray mass spectrometry (LC-ESI-MS). In total, ;400 acces-
sions in the EST unigene assembly were identified, providing an
excellent overview of the stromal chloroplast proteomes in
maize. Differential expression was determined for 125 chloro-
plast proteins, providing numerous novel insights in BS and M
functional differentiation. These data are available via our Plastid
Proteome Database (PPDB) at http://ppdb.tc.cornell.edu/ and
linked to homologous plastid proteins in Arabidopsis and rice
(Oryza sativa).
RESULTS
Purification of BS and M Chloroplasts from Leaf Tips
of Young Leaves
The objective of this study was to compare the stromal pro-
teomes of M and BS chloroplasts that had completed their
differentiation process. Therefore, WT-T43 maize plants were
grown for 14 d in the growth chamber until the 4th leaf was
emerging. The top 4-cm sections of the 2nd and 3rd leaves were
harvested ;2 h after the onset of the light period. We used
a mechanical procedure for purification of M and BS chloro-
plasts, following suggestions from A. Barkan and R. Bassi
and protocols adapted from Edwards and Black (1971) and
Kannangara et al. (1977). This procedure is based on the much
higher resistance of the BS cell wall to mechanical grinding as
compared with the M cell wall. After BS and M chloroplast
purification, both chloroplast types were broken by lysis and
the membrane fractions removed by ultracentrifugation. The
purity of M and BS chloroplast fractions was determined from
stained SDS-PAGE gels using the abundant marker proteins
Rubisco (RbcL at 54 kD) and PPDK (at 97 kD) for BS and M
chloroplasts, respectively (Figure 1A). The one-dimensional gel
electrophoresis (1-DE) analysis of BS andM purified stroma also
clearly visualized additional BS/M-specific proteins, such as
fructose biphosphate aldolase (FBA) and RBCS. This showed
that our preparations were of high quality. For the analysis in this
article, nine biologically independent preparations (pairs of BS
and M) were used with cross-contamination levels between 5
and 15% but without any significant nonchloroplast contamina-
tions. The cross-contamination of the BS chloroplasts by the M
fraction was lower than we calculated, since it was shown that
10% of a light-independent PPDK form can accumulate in BS
cells (Aoyagi and Nakamoto, 1985; Sheen and Bogorad, 1987a,
1987b). We deliberately did not use other types of BS/M
preparations involving long enzymatic digestions of cell walls,
likely resulting in unwanted induction of stress proteins.
To verify the contamination from non-chloroplast-localized
proteins in the BS andM preparations, a protein gel blot analysis
was performed using specific antisera against abundant proteins
from the cytosol (phosphoenol pyruvate carboxylase [PEPC];
Figure 1B) and mitochondria (pyruvate dehydrogenase; Figure
1C). Gels were loaded with protein titrations of M stroma, BS
stroma, and total soluble leaf proteome. As is apparent from the
protein gel blot analyses, cross-contaminations of cytosolic and
mitochondrial proteins were undetectable. The protein gel blot
3112 The Plant Cell
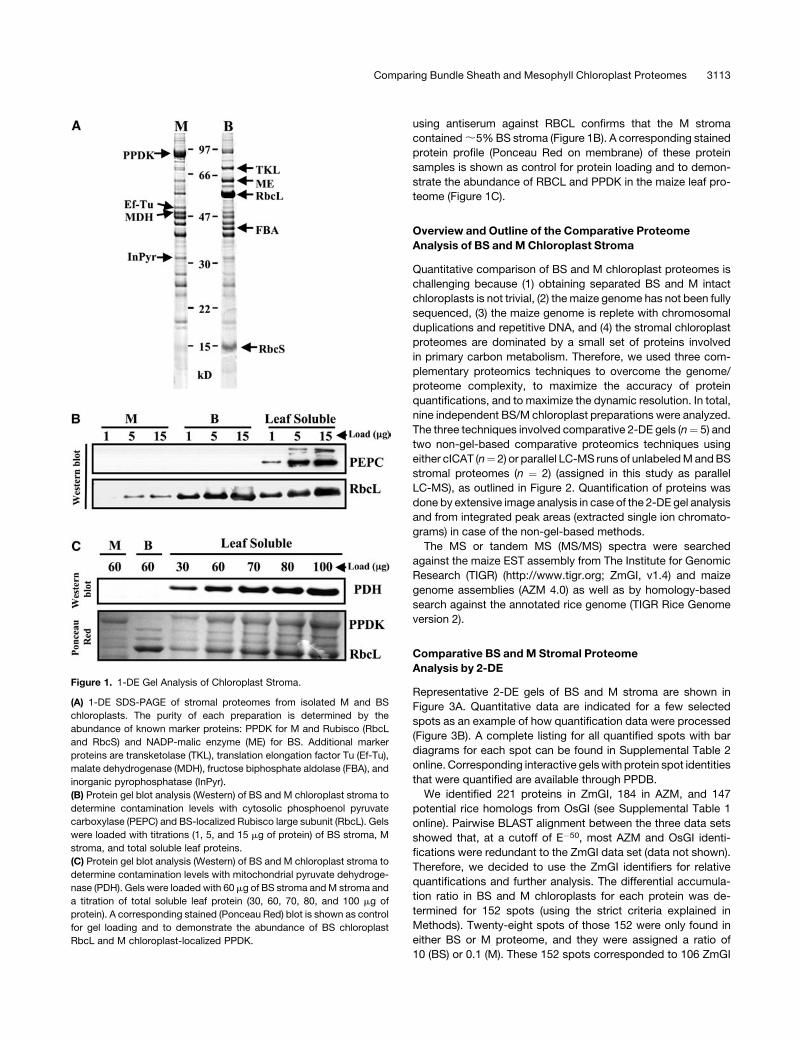
using antiserum against RBCL confirms that the M stroma
contained;5%BS stroma (Figure 1B). A corresponding stained
protein profile (Ponceau Red on membrane) of these protein
samples is shown as control for protein loading and to demon-
strate the abundance of RBCL and PPDK in the maize leaf pro-
teome (Figure 1C).
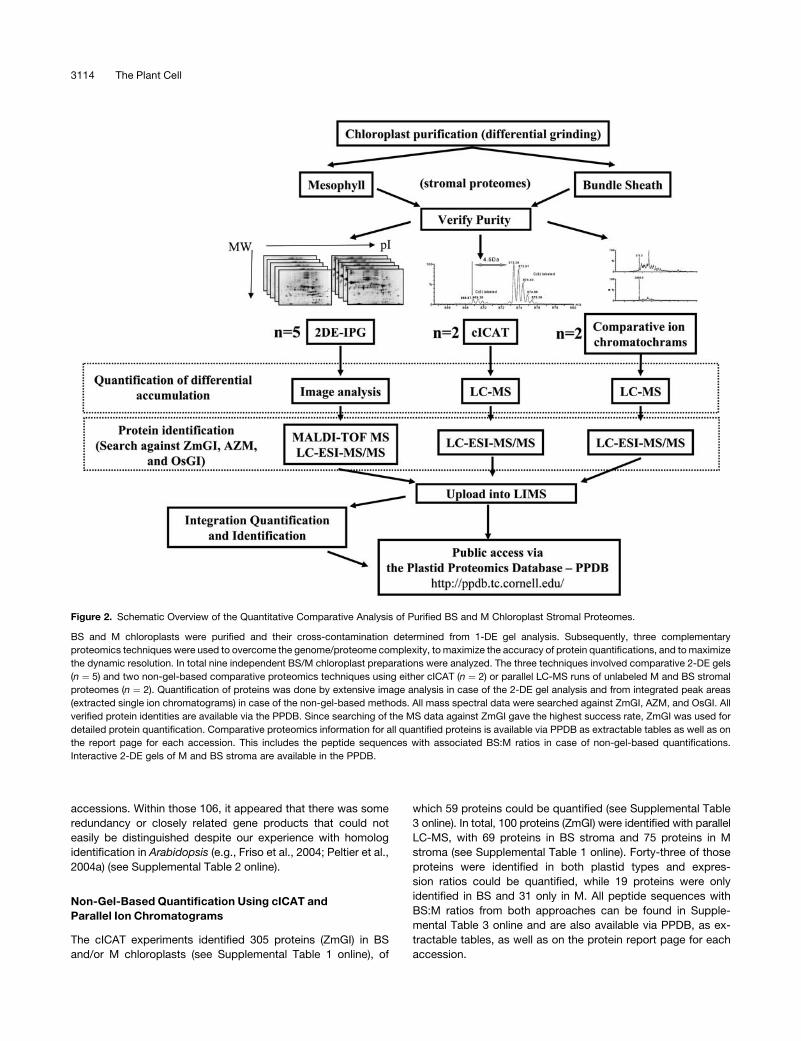
Overview and Outline of the Comparative Proteome
Analysis of BS and M Chloroplast Stroma
Quantitative comparison of BS and M chloroplast proteomes is
challenging because (1) obtaining separated BS and M intact
chloroplasts is not trivial, (2) the maize genome has not been fully
sequenced, (3) the maize genome is replete with chromosomal
duplications and repetitive DNA, and (4) the stromal chloroplast
proteomes are dominated by a small set of proteins involved
in primary carbon metabolism. Therefore, we used three com-
plementary proteomics techniques to overcome the genome/
proteome complexity, to maximize the accuracy of protein
quantifications, and to maximize the dynamic resolution. In total,
nine independent BS/M chloroplast preparations were analyzed.
The three techniques involved comparative 2-DE gels (n¼ 5) and
two non-gel-based comparative proteomics techniques using
either cICAT (n¼ 2) or parallel LC-MS runs of unlabeledMandBS
stromal proteomes (n ¼ 2) (assigned in this study as parallel
LC-MS), as outlined in Figure 2. Quantification of proteins was
done by extensive image analysis in case of the 2-DE gel analysis
and from integrated peak areas (extracted single ion chromato-
grams) in case of the non-gel-based methods.
The MS or tandem MS (MS/MS) spectra were searched
against the maize EST assembly from The Institute for Genomic
Research (TIGR) (http://www.tigr.org; ZmGI, v1.4) and maize
genome assemblies (AZM 4.0) as well as by homology-based
search against the annotated rice genome (TIGR Rice Genome
version 2).
Comparative BS and M Stromal Proteome
Analysis by 2-DE
Representative 2-DE gels of BS and M stroma are shown in
Figure 3A. Quantitative data are indicated for a few selected
spots as an example of how quantification data were processed
(Figure 3B). A complete listing for all quantified spots with bar
diagrams for each spot can be found in Supplemental Table 2
online. Corresponding interactive gelswith protein spot identities
that were quantified are available through PPDB.
We identified 221 proteins in ZmGI, 184 in AZM, and 147
potential rice homologs from OsGI (see Supplemental Table 1
online). Pairwise BLAST alignment between the three data sets
showed that, at a cutoff of E�50, most AZM and OsGI identi-
fications were redundant to the ZmGI data set (data not shown).
Therefore, we decided to use the ZmGI identifiers for relative
quantifications and further analysis. The differential accumula-
tion ratio in BS and M chloroplasts for each protein was de-
termined for 152 spots (using the strict criteria explained in
Methods). Twenty-eight spots of those 152 were only found in
either BS or M proteome, and they were assigned a ratio of
10 (BS) or 0.1 (M). These 152 spots corresponded to 106 ZmGI
Figure 1. 1-DE Gel Analysis of Chloroplast Stroma.
(A) 1-DE SDS-PAGE of stromal proteomes from isolated M and BS
chloroplasts. The purity of each preparation is determined by the
abundance of known marker proteins: PPDK for M and Rubisco (RbcL
and RbcS) and NADP-malic enzyme (ME) for BS. Additional marker
proteins are transketolase (TKL), translation elongation factor Tu (Ef-Tu),
malate dehydrogenase (MDH), fructose biphosphate aldolase (FBA), and
inorganic pyrophosphatase (InPyr).
(B) Protein gel blot analysis (Western) of BS and M chloroplast stroma to
determine contamination levels with cytosolic phosphoenol pyruvate
carboxylase (PEPC) and BS-localized Rubisco large subunit (RbcL). Gels
were loaded with titrations (1, 5, and 15 mg of protein) of BS stroma, M
stroma, and total soluble leaf proteins.
(C) Protein gel blot analysis (Western) of BS and M chloroplast stroma to
determine contamination levels with mitochondrial pyruvate dehydroge-
nase (PDH). Gels were loaded with 60 mg of BS stroma andM stroma and
a titration of total soluble leaf protein (30, 60, 70, 80, and 100 mg of
protein). A corresponding stained (Ponceau Red) blot is shown as control
for gel loading and to demonstrate the abundance of BS chloroplast
RbcL and M chloroplast-localized PPDK.
Comparing Bundle Sheath and Mesophyll Chloroplast Proteomes 3113
accessions. Within those 106, it appeared that there was some
redundancy or closely related gene products that could not
easily be distinguished despite our experience with homolog
identification in Arabidopsis (e.g., Friso et al., 2004; Peltier et al.,
2004a) (see Supplemental Table 2 online).
Non-Gel-Based Quantification Using cICAT and
Parallel Ion Chromatograms
The cICAT experiments identified 305 proteins (ZmGI) in BS
and/or M chloroplasts (see Supplemental Table 1 online), of
which 59 proteins could be quantified (see Supplemental Table
3 online). In total, 100 proteins (ZmGI) were identified with parallel
LC-MS, with 69 proteins in BS stroma and 75 proteins in M
stroma (see Supplemental Table 1 online). Forty-three of those
proteins were identified in both plastid types and expres-
sion ratios could be quantified, while 19 proteins were only
identified in BS and 31 only in M. All peptide sequences with
BS:M ratios from both approaches can be found in Supple-
mental Table 3 online and are also available via PPDB, as ex-
tractable tables, as well as on the protein report page for each
accession.
Figure 2. Schematic Overview of the Quantitative Comparative Analysis of Purified BS and M Chloroplast Stromal Proteomes.
BS and M chloroplasts were purified and their cross-contamination determined from 1-DE gel analysis. Subsequently, three complementary
proteomics techniques were used to overcome the genome/proteome complexity, to maximize the accuracy of protein quantifications, and tomaximize
the dynamic resolution. In total nine independent BS/M chloroplast preparations were analyzed. The three techniques involved comparative 2-DE gels
(n ¼ 5) and two non-gel-based comparative proteomics techniques using either cICAT (n ¼ 2) or parallel LC-MS runs of unlabeled M and BS stromal
proteomes (n ¼ 2). Quantification of proteins was done by extensive image analysis in case of the 2-DE gel analysis and from integrated peak areas
(extracted single ion chromatograms) in case of the non-gel-based methods. All mass spectral data were searched against ZmGI, AZM, and OsGI. All
verified protein identities are available via the PPDB. Since searching of the MS data against ZmGI gave the highest success rate, ZmGI was used for
detailed protein quantification. Comparative proteomics information for all quantified proteins is available via PPDB as extractable tables as well as on
the report page for each accession. This includes the peptide sequences with associated BS:M ratios in case of non-gel-based quantifications.
Interactive 2-DE gels of M and BS stroma are available in the PPDB.
3114 The Plant Cell
Analysis of the Collective Data Set: Identification,
Quantification, and Function
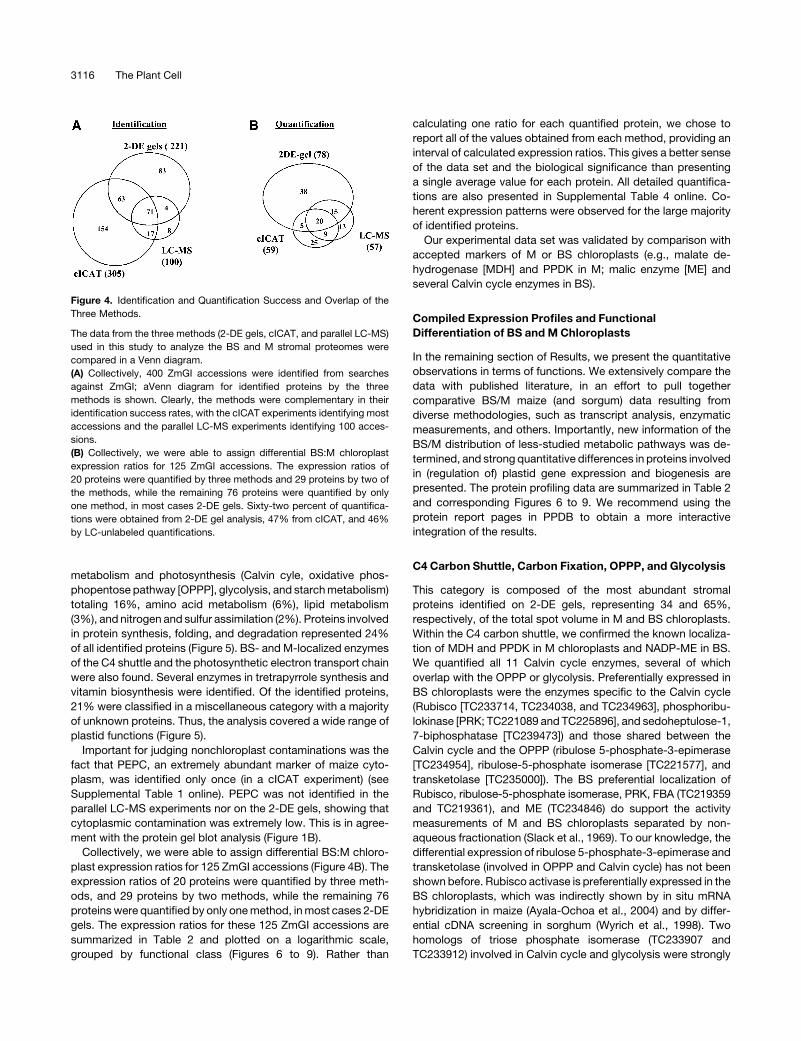
The data from the three methods described above weremerged.
Collectively, 400 ZmGI accessions were identified from searches
against ZmGI, and a Venn Diagram for identified proteins by the
three methods is shown in Figure 4A. Clearly, the methods were
complementary in their identification success rates, with the
cICAT experiments identifying most accessions (Table 1). In
total, 327 proteins were identified by searching against the
maize genome sequences (AZM), and 277 by homology-based
searches against the predicted rice proteome (OsGI) (Table 1). A
complete listing of all identified ZmGI, AZM, and OsGI acces-
sions can be found in Supplemental Table 1 online.
To determine the functions of the identified stromal pro-
teomes, we used in-house BLAST alignments of the identified
ZmGI accessions to the predicted rice and Arabidopsis pro-
teomes. Proteins were then functionally classified using the
nonredundant MapMan functional classification system (see
http://gabi.rzpd.de/projects/MapMan/) developed for Arabidop-
sis (Thimm et al., 2004) as a basis. BLAST alignments of proteins
identified in maize resulted in a set of Arabidopsis homologs,
which we classified into 25 MapManBins covering a wide range
of pathways and functions. This includes primary carbon
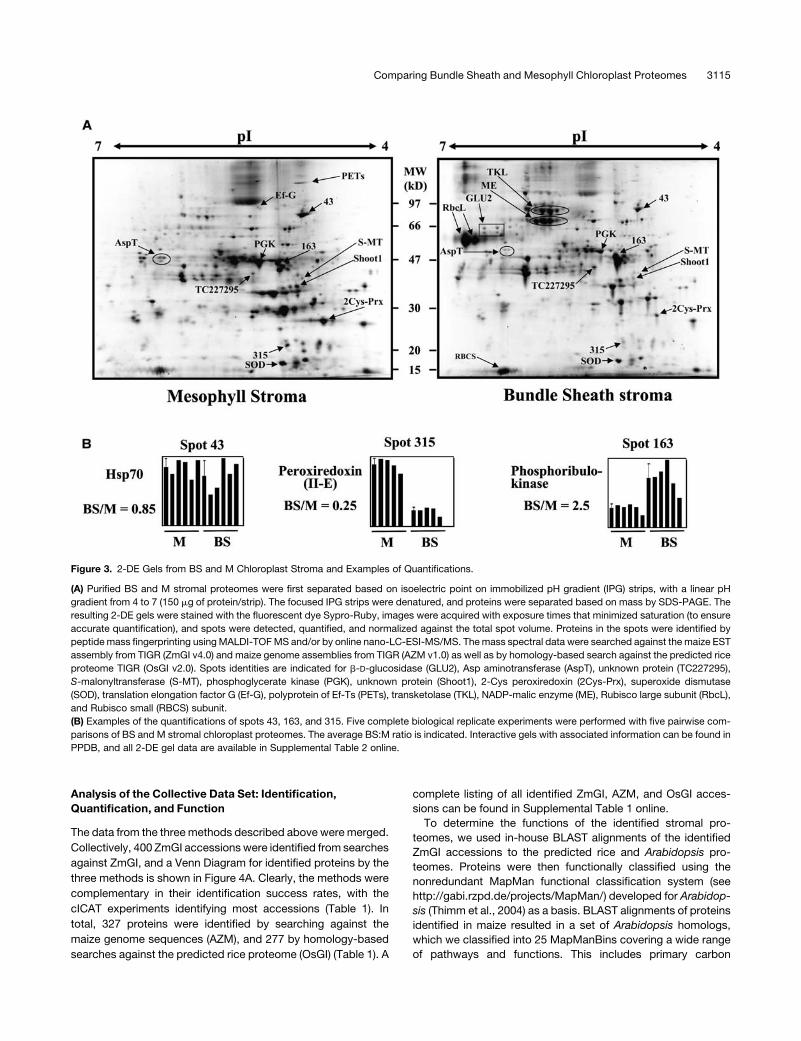
Figure 3. 2-DE Gels from BS and M Chloroplast Stroma and Examples of Quantifications.
(A) Purified BS and M stromal proteomes were first separated based on isoelectric point on immobilized pH gradient (IPG) strips, with a linear pH
gradient from 4 to 7 (150 mg of protein/strip). The focused IPG strips were denatured, and proteins were separated based on mass by SDS-PAGE. The
resulting 2-DE gels were stained with the fluorescent dye Sypro-Ruby, images were acquired with exposure times that minimized saturation (to ensure
accurate quantification), and spots were detected, quantified, and normalized against the total spot volume. Proteins in the spots were identified by
peptidemass fingerprinting usingMALDI-TOFMS and/or by online nano-LC-ESI-MS/MS. Themass spectral data were searched against the maize EST
assembly from TIGR (ZmGI v4.0) and maize genome assemblies from TIGR (AZM v1.0) as well as by homology-based search against the predicted rice
proteome TIGR (OsGI v2.0). Spots identities are indicated for b-D-glucosidase (GLU2), Asp aminotransferase (AspT), unknown protein (TC227295),
S-malonyltransferase (S-MT), phosphoglycerate kinase (PGK), unknown protein (Shoot1), 2-Cys peroxiredoxin (2Cys-Prx), superoxide dismutase
(SOD), translation elongation factor G (Ef-G), polyprotein of Ef-Ts (PETs), transketolase (TKL), NADP-malic enzyme (ME), Rubisco large subunit (RbcL),
and Rubisco small (RBCS) subunit.
(B) Examples of the quantifications of spots 43, 163, and 315. Five complete biological replicate experiments were performed with five pairwise com-
parisons of BS and M stromal chloroplast proteomes. The average BS:M ratio is indicated. Interactive gels with associated information can be found in
PPDB, and all 2-DE gel data are available in Supplemental Table 2 online.
Comparing Bundle Sheath and Mesophyll Chloroplast Proteomes 3115
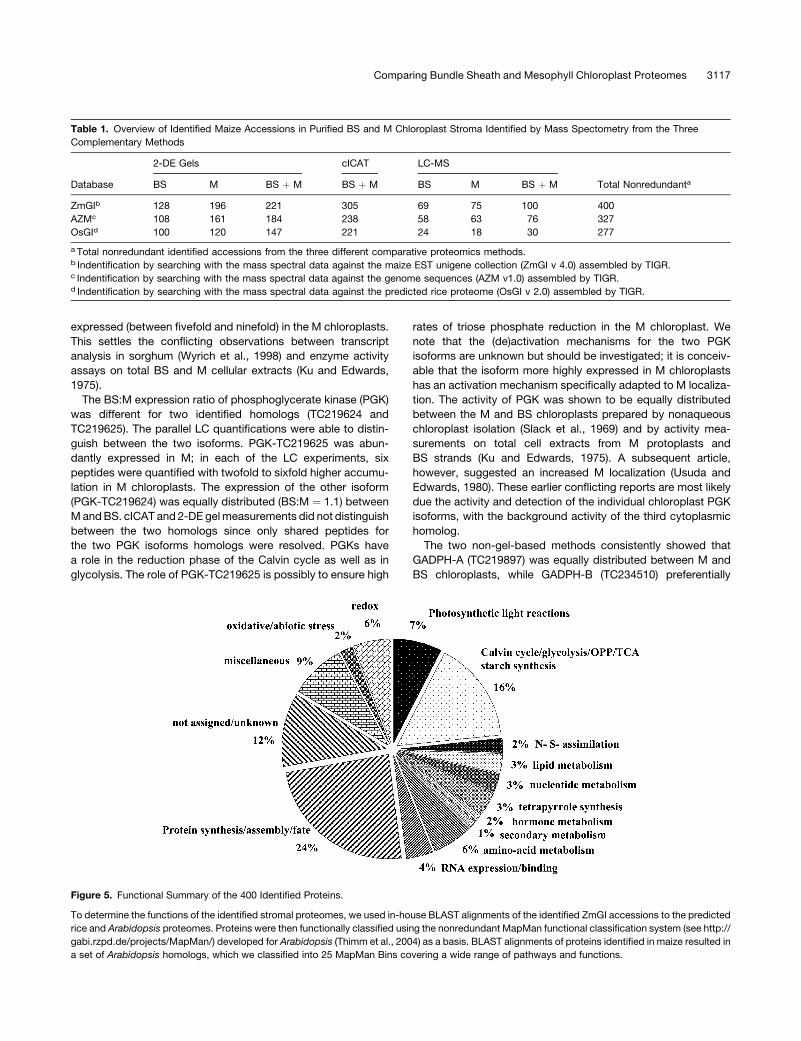
metabolism and photosynthesis (Calvin cyle, oxidative phos-
phopentose pathway [OPPP], glycolysis, and starchmetabolism)
totaling 16%, amino acid metabolism (6%), lipid metabolism
(3%), and nitrogen and sulfur assimilation (2%). Proteins involved
in protein synthesis, folding, and degradation represented 24%
of all identified proteins (Figure 5). BS- andM-localized enzymes
of the C4 shuttle and the photosynthetic electron transport chain
were also found. Several enzymes in tretrapyrrole synthesis and
vitamin biosynthesis were identified. Of the identified proteins,
21% were classified in a miscellaneous category with a majority
of unknown proteins. Thus, the analysis covered a wide range of
plastid functions (Figure 5).
Important for judging nonchloroplast contaminations was the
fact that PEPC, an extremely abundant marker of maize cyto-
plasm, was identified only once (in a cICAT experiment) (see
Supplemental Table 1 online). PEPC was not identified in the
parallel LC-MS experiments nor on the 2-DE gels, showing that
cytoplasmic contamination was extremely low. This is in agree-
ment with the protein gel blot analysis (Figure 1B).
Collectively, we were able to assign differential BS:M chloro-
plast expression ratios for 125 ZmGI accessions (Figure 4B). The
expression ratios of 20 proteins were quantified by three meth-
ods, and 29 proteins by two methods, while the remaining 76
proteins were quantified by only onemethod, inmost cases 2-DE
gels. The expression ratios for these 125 ZmGI accessions are
summarized in Table 2 and plotted on a logarithmic scale,
grouped by functional class (Figures 6 to 9). Rather than
calculating one ratio for each quantified protein, we chose to
report all of the values obtained from each method, providing an
interval of calculated expression ratios. This gives a better sense
of the data set and the biological significance than presenting
a single average value for each protein. All detailed quantifica-
tions are also presented in Supplemental Table 4 online. Co-
herent expression patterns were observed for the large majority
of identified proteins.
Our experimental data set was validated by comparison with
accepted markers of M or BS chloroplasts (e.g., malate de-
hydrogenase [MDH] and PPDK in M; malic enzyme [ME] and
several Calvin cycle enzymes in BS).
Compiled Expression Profiles and Functional
Differentiation of BS and M Chloroplasts
In the remaining section of Results, we present the quantitative
observations in terms of functions. We extensively compare the
data with published literature, in an effort to pull together
comparative BS/M maize (and sorgum) data resulting from
diverse methodologies, such as transcript analysis, enzymatic
measurements, and others. Importantly, new information of the
BS/M distribution of less-studied metabolic pathways was de-
termined, and strong quantitative differences in proteins involved
in (regulation of) plastid gene expression and biogenesis are
presented. The protein profiling data are summarized in Table 2
and corresponding Figures 6 to 9. We recommend using the
protein report pages in PPDB to obtain a more interactive
integration of the results.
C4 Carbon Shuttle, Carbon Fixation, OPPP, and Glycolysis
This category is composed of the most abundant stromal
proteins identified on 2-DE gels, representing 34 and 65%,
respectively, of the total spot volume in M and BS chloroplasts.
Within the C4 carbon shuttle, we confirmed the known localiza-
tion of MDH and PPDK in M chloroplasts and NADP-ME in BS.
We quantified all 11 Calvin cycle enzymes, several of which
overlap with the OPPP or glycolysis. Preferentially expressed in
BS chloroplasts were the enzymes specific to the Calvin cycle
(Rubisco [TC233714, TC234038, and TC234963], phosphoribu-
lokinase [PRK; TC221089 and TC225896], and sedoheptulose-1,
7-biphosphatase [TC239473]) and those shared between the
Calvin cycle and the OPPP (ribulose 5-phosphate-3-epimerase
[TC234954], ribulose-5-phosphate isomerase [TC221577], and
transketolase [TC235000]). The BS preferential localization of
Rubisco, ribulose-5-phosphate isomerase, PRK, FBA (TC219359
and TC219361), and ME (TC234846) do support the activity
measurements of M and BS chloroplasts separated by non-
aqueous fractionation (Slack et al., 1969). To our knowledge, the
differential expression of ribulose 5-phosphate-3-epimerase and
transketolase (involved in OPPP and Calvin cycle) has not been
shown before. Rubisco activase is preferentially expressed in the
BS chloroplasts, which was indirectly shown by in situ mRNA
hybridization in maize (Ayala-Ochoa et al., 2004) and by differ-
ential cDNA screening in sorghum (Wyrich et al., 1998). Two
homologs of triose phosphate isomerase (TC233907 and
TC233912) involved in Calvin cycle and glycolysis were strongly
Figure 4. Identification and Quantification Success and Overlap of the
Three Methods.
The data from the three methods (2-DE gels, cICAT, and parallel LC-MS)
used in this study to analyze the BS and M stromal proteomes were
compared in a Venn diagram.
(A) Collectively, 400 ZmGI accessions were identified from searches
against ZmGI; aVenn diagram for identified proteins by the three
methods is shown. Clearly, the methods were complementary in their
identification success rates, with the cICAT experiments identifying most
accessions and the parallel LC-MS experiments identifying 100 acces-
sions.
(B) Collectively, we were able to assign differential BS:M chloroplast
expression ratios for 125 ZmGI accessions. The expression ratios of
20 proteins were quantified by three methods and 29 proteins by two of
the methods, while the remaining 76 proteins were quantified by only
one method, in most cases 2-DE gels. Sixty-two percent of quantifica-
tions were obtained from 2-DE gel analysis, 47% from cICAT, and 46%
by LC-unlabeled quantifications.
3116 The Plant Cell
expressed (between fivefold and ninefold) in the M chloroplasts.
This settles the conflicting observations between transcript
analysis in sorghum (Wyrich et al., 1998) and enzyme activity
assays on total BS and M cellular extracts (Ku and Edwards,
1975).
The BS:M expression ratio of phosphoglycerate kinase (PGK)
was different for two identified homologs (TC219624 and
TC219625). The parallel LC quantifications were able to distin-
guish between the two isoforms. PGK-TC219625 was abun-
dantly expressed in M; in each of the LC experiments, six
peptides were quantified with twofold to sixfold higher accumu-
lation in M chloroplasts. The expression of the other isoform
(PGK-TC219624) was equally distributed (BS:M ¼ 1.1) between
MandBS. cICAT and 2-DE gelmeasurements did not distinguish
between the two homologs since only shared peptides for
the two PGK isoforms homologs were resolved. PGKs have
a role in the reduction phase of the Calvin cycle as well as in
glycolysis. The role of PGK-TC219625 is possibly to ensure high
rates of triose phosphate reduction in the M chloroplast. We
note that the (de)activation mechanisms for the two PGK
isoforms are unknown but should be investigated; it is conceiv-
able that the isoform more highly expressed in M chloroplasts
has an activation mechanism specifically adapted to M localiza-
tion. The activity of PGK was shown to be equally distributed
between the M and BS chloroplasts prepared by nonaqueous
chloroplast isolation (Slack et al., 1969) and by activity mea-
surements on total cell extracts from M protoplasts and
BS strands (Ku and Edwards, 1975). A subsequent article,
however, suggested an increased M localization (Usuda and
Edwards, 1980). These earlier conflicting reports are most likely
due the activity and detection of the individual chloroplast PGK
isoforms, with the background activity of the third cytoplasmic
homolog.
The two non-gel-based methods consistently showed that
GADPH-A (TC219897) was equally distributed between M and
BS chloroplasts, while GADPH-B (TC234510) preferentially
Figure 5. Functional Summary of the 400 Identified Proteins.
To determine the functions of the identified stromal proteomes, we used in-house BLAST alignments of the identified ZmGI accessions to the predicted
rice and Arabidopsis proteomes. Proteins were then functionally classified using the nonredundant MapMan functional classification system (see http://
gabi.rzpd.de/projects/MapMan/) developed for Arabidopsis (Thimm et al., 2004) as a basis. BLAST alignments of proteins identified in maize resulted in
a set of Arabidopsis homologs, which we classified into 25 MapMan Bins covering a wide range of pathways and functions.
Table 1. Overview of Identified Maize Accessions in Purified BS and M Chloroplast Stroma Identified by Mass Spectometry from the Three
Complementary Methods
2-DE Gels cICAT LC-MS
Database BS M BS þ M BS þ M BS M BS þ M Total Nonredundanta
ZmGIb 128 196 221 305 69 75 100 400
AZMc 108 161 184 238 58 63 76 327
OsGId 100 120 147 221 24 18 30 277
a Total nonredundant identified accessions from the three different comparative proteomics methods.b Indentification by searching with the mass spectral data against the maize EST unigene collection (ZmGI v 4.0) assembled by TIGR.c Indentification by searching with the mass spectral data against the genome sequences (AZM v1.0) assembled by TIGR.d Indentification by searching with the mass spectral data against the predicted rice proteome (OsGI v 2.0) assembled by TIGR.
Comparing Bundle Sheath and Mesophyll Chloroplast Proteomes 3117
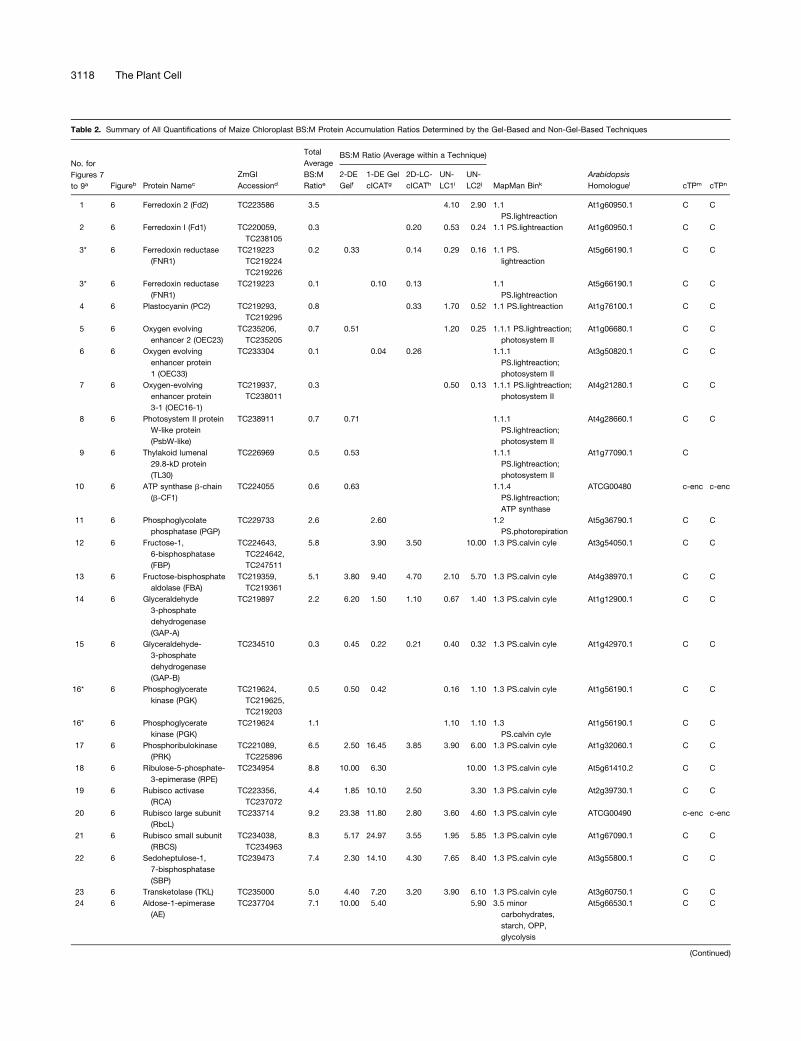
Table 2. Summary of All Quantifications of Maize Chloroplast BS:M Protein Accumulation Ratios Determined by the Gel-Based and Non-Gel-Based Techniques
No. for
Figures 7
to 9a
Total
Average
BS:M
Ratioe
BS:M Ratio (Average within a Technique)
Figureb Protein NamecZmGI
Accessiond2-DE
Gelf1-DE Gel
cICATg2D-LC-
cICAThUN-
LC1iUN-
LC2j MapMan BinkArabidopsis
Homologuel cTPm cTPn
1 6 Ferredoxin 2 (Fd2) TC223586 3.5 4.10 2.90 1.1
PS.lightreaction
At1g60950.1 C C
2 6 Ferredoxin I (Fd1) TC220059,
TC238105
0.3 0.20 0.53 0.24 1.1 PS.lightreaction At1g60950.1 C C
3* 6 Ferredoxin reductase
(FNR1)
TC219223
TC219224
TC219226
0.2 0.33 0.14 0.29 0.16 1.1 PS.
lightreaction
At5g66190.1 C C
3* 6 Ferredoxin reductase
(FNR1)
TC219223 0.1 0.10 0.13 1.1
PS.lightreaction
At5g66190.1 C C
4 6 Plastocyanin (PC2) TC219293,
TC219295
0.8 0.33 1.70 0.52 1.1 PS.lightreaction At1g76100.1 C C
5 6 Oxygen evolving
enhancer 2 (OEC23)
TC235206,
TC235205
0.7 0.51 1.20 0.25 1.1.1 PS.lightreaction;
photosystem II
At1g06680.1 C C
6 6 Oxygen evolving
enhancer protein
1 (OEC33)
TC233304 0.1 0.04 0.26 1.1.1
PS.lightreaction;
photosystem II
At3g50820.1 C C
7 6 Oxygen-evolving
enhancer protein
3-1 (OEC16-1)
TC219937,
TC238011
0.3 0.50 0.13 1.1.1 PS.lightreaction;
photosystem II
At4g21280.1 C C
8 6 Photosystem II protein
W-like protein
(PsbW-like)
TC238911 0.7 0.71 1.1.1
PS.lightreaction;
photosystem II
At4g28660.1 C C
9 6 Thylakoid lumenal
29.8-kD protein
(TL30)
TC226969 0.5 0.53 1.1.1
PS.lightreaction;
photosystem II
At1g77090.1 C
10 6 ATP synthase b-chain
(b-CF1)
TC224055 0.6 0.63 1.1.4
PS.lightreaction;
ATP synthase
ATCG00480 c-enc c-enc
11 6 Phosphoglycolate
phosphatase (PGP)
TC229733 2.6 2.60 1.2
PS.photorepiration
At5g36790.1 C C
12 6 Fructose-1,
6-bisphosphatase
(FBP)
TC224643,
TC224642,
TC247511
5.8 3.90 3.50 10.00 1.3 PS.calvin cyle At3g54050.1 C C
13 6 Fructose-bisphosphate
aldolase (FBA)
TC219359,
TC219361
5.1 3.80 9.40 4.70 2.10 5.70 1.3 PS.calvin cyle At4g38970.1 C C
14 6 Glyceraldehyde
3-phosphate
dehydrogenase
(GAP-A)
TC219897 2.2 6.20 1.50 1.10 0.67 1.40 1.3 PS.calvin cyle At1g12900.1 C C
15 6 Glyceraldehyde-
3-phosphate
dehydrogenase
(GAP-B)
TC234510 0.3 0.45 0.22 0.21 0.40 0.32 1.3 PS.calvin cyle At1g42970.1 C C
16* 6 Phosphoglycerate
kinase (PGK)
TC219624,
TC219625,
TC219203
0.5 0.50 0.42 0.16 1.10 1.3 PS.calvin cyle At1g56190.1 C C
16* 6 Phosphoglycerate
kinase (PGK)
TC219624 1.1 1.10 1.10 1.3
PS.calvin cyle
At1g56190.1 C C
17 6 Phosphoribulokinase
(PRK)
TC221089,
TC225896
6.5 2.50 16.45 3.85 3.90 6.00 1.3 PS.calvin cyle At1g32060.1 C C
18 6 Ribulose-5-phosphate-
3-epimerase (RPE)
TC234954 8.8 10.00 6.30 10.00 1.3 PS.calvin cyle At5g61410.2 C C
19 6 Rubisco activase
(RCA)
TC223356,
TC237072
4.4 1.85 10.10 2.50 3.30 1.3 PS.calvin cyle At2g39730.1 C C
20 6 Rubisco large subunit
(RbcL)
TC233714 9.2 23.38 11.80 2.80 3.60 4.60 1.3 PS.calvin cyle ATCG00490 c-enc c-enc
21 6 Rubisco small subunit
(RBCS)
TC234038,
TC234963
8.3 5.17 24.97 3.55 1.95 5.85 1.3 PS.calvin cyle At1g67090.1 C C
22 6 Sedoheptulose-1,
7-bisphosphatase
(SBP)
TC239473 7.4 2.30 14.10 4.30 7.65 8.40 1.3 PS.calvin cyle At3g55800.1 C C
23 6 Transketolase (TKL) TC235000 5.0 4.40 7.20 3.20 3.90 6.10 1.3 PS.calvin cyle At3g60750.1 C C
24 6 Aldose-1-epimerase
(AE)
TC237704 7.1 10.00 5.40 5.90 3.5 minor
carbohydrates,
starch, OPP,
glycolysis
At5g66530.1 C C
(Continued)
3118 The Plant Cell
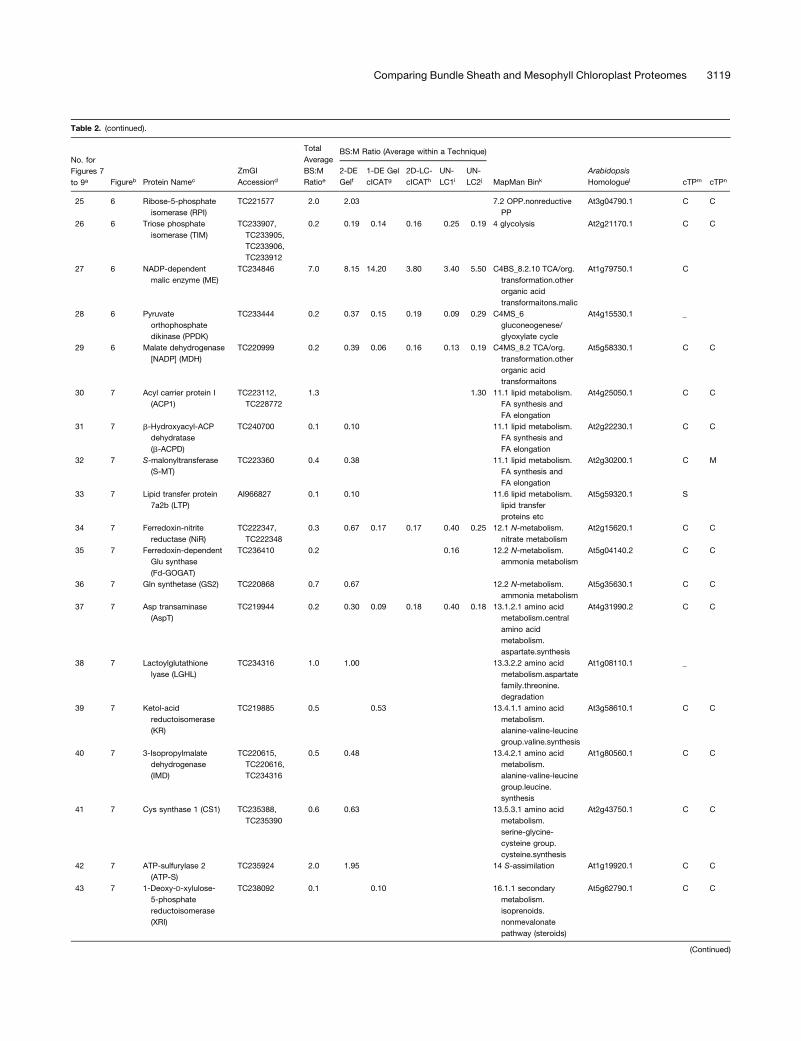
Table 2. (continued).
No. for
Figures 7
to 9a
Total
Average
BS:M
Ratioe
BS:M Ratio (Average within a Technique)
Figureb Protein NamecZmGI
Accessiond2-DE
Gelf1-DE Gel
cICATg2D-LC-
cICAThUN-
LC1iUN-
LC2j MapMan BinkArabidopsis
Homologuel cTPm cTPn
25 6 Ribose-5-phosphate
isomerase (RPI)
TC221577 2.0 2.03 7.2 OPP.nonreductive
PP
At3g04790.1 C C
26 6 Triose phosphate
isomerase (TIM)
TC233907,
TC233905,
TC233906,
TC233912
0.2 0.19 0.14 0.16 0.25 0.19 4 glycolysis At2g21170.1 C C
27 6 NADP-dependent
malic enzyme (ME)
TC234846 7.0 8.15 14.20 3.80 3.40 5.50 C4BS_8.2.10 TCA/org.
transformation.other
organic acid
transformaitons.malic
At1g79750.1 C
28 6 Pyruvate
orthophosphate
dikinase (PPDK)
TC233444 0.2 0.37 0.15 0.19 0.09 0.29 C4MS_6
gluconeogenese/
glyoxylate cycle
At4g15530.1 _
29 6 Malate dehydrogenase
[NADP] (MDH)
TC220999 0.2 0.39 0.06 0.16 0.13 0.19 C4MS_8.2 TCA/org.
transformation.other
organic acid
transformaitons
At5g58330.1 C C
30 7 Acyl carrier protein I
(ACP1)
TC223112,
TC228772
1.3 1.30 11.1 lipid metabolism.
FA synthesis and
FA elongation
At4g25050.1 C C
31 7 b-Hydroxyacyl-ACP
dehydratase
(b-ACPD)
TC240700 0.1 0.10 11.1 lipid metabolism.
FA synthesis and
FA elongation
At2g22230.1 C C
32 7 S-malonyltransferase
(S-MT)
TC223360 0.4 0.38 11.1 lipid metabolism.
FA synthesis and
FA elongation
At2g30200.1 C M
33 7 Lipid transfer protein
7a2b (LTP)
AI966827 0.1 0.10 11.6 lipid metabolism.
lipid transfer
proteins etc
At5g59320.1 S
34 7 Ferredoxin-nitrite
reductase (NiR)
TC222347,
TC222348
0.3 0.67 0.17 0.17 0.40 0.25 12.1 N-metabolism.
nitrate metabolism
At2g15620.1 C C
35 7 Ferredoxin-dependent
Glu synthase
(Fd-GOGAT)
TC236410 0.2 0.16 12.2 N-metabolism.
ammonia metabolism
At5g04140.2 C C
36 7 Gln synthetase (GS2) TC220868 0.7 0.67 12.2 N-metabolism.
ammonia metabolism
At5g35630.1 C C
37 7 Asp transaminase
(AspT)
TC219944 0.2 0.30 0.09 0.18 0.40 0.18 13.1.2.1 amino acid
metabolism.central
amino acid
metabolism.
aspartate.synthesis
At4g31990.2 C C
38 7 Lactoylglutathione
lyase (LGHL)
TC234316 1.0 1.00 13.3.2.2 amino acid
metabolism.aspartate
family.threonine.
degradation
At1g08110.1 _
39 7 Ketol-acid
reductoisomerase
(KR)
TC219885 0.5 0.53 13.4.1.1 amino acid
metabolism.
alanine-valine-leucine
group.valine.synthesis
At3g58610.1 C C
40 7 3-Isopropylmalate
dehydrogenase
(IMD)
TC220615,
TC220616,
TC234316
0.5 0.48 13.4.2.1 amino acid
metabolism.
alanine-valine-leucine
group.leucine.
synthesis
At1g80560.1 C C
41 7 Cys synthase 1 (CS1) TC235388,
TC235390
0.6 0.63 13.5.3.1 amino acid
metabolism.
serine-glycine-
cysteine group.
cysteine.synthesis
At2g43750.1 C C
42 7 ATP-sulfurylase 2
(ATP-S)
TC235924 2.0 1.95 14 S-assimilation At1g19920.1 C C
43 7 1-Deoxy-D-xylulose-
5-phosphate
reductoisomerase
(XRI)
TC238092 0.1 0.10 16.1.1 secondary
metabolism.
isoprenoids.
nonmevalonate
pathway (steroids)
At5g62790.1 C C
(Continued)
Comparing Bundle Sheath and Mesophyll Chloroplast Proteomes 3119
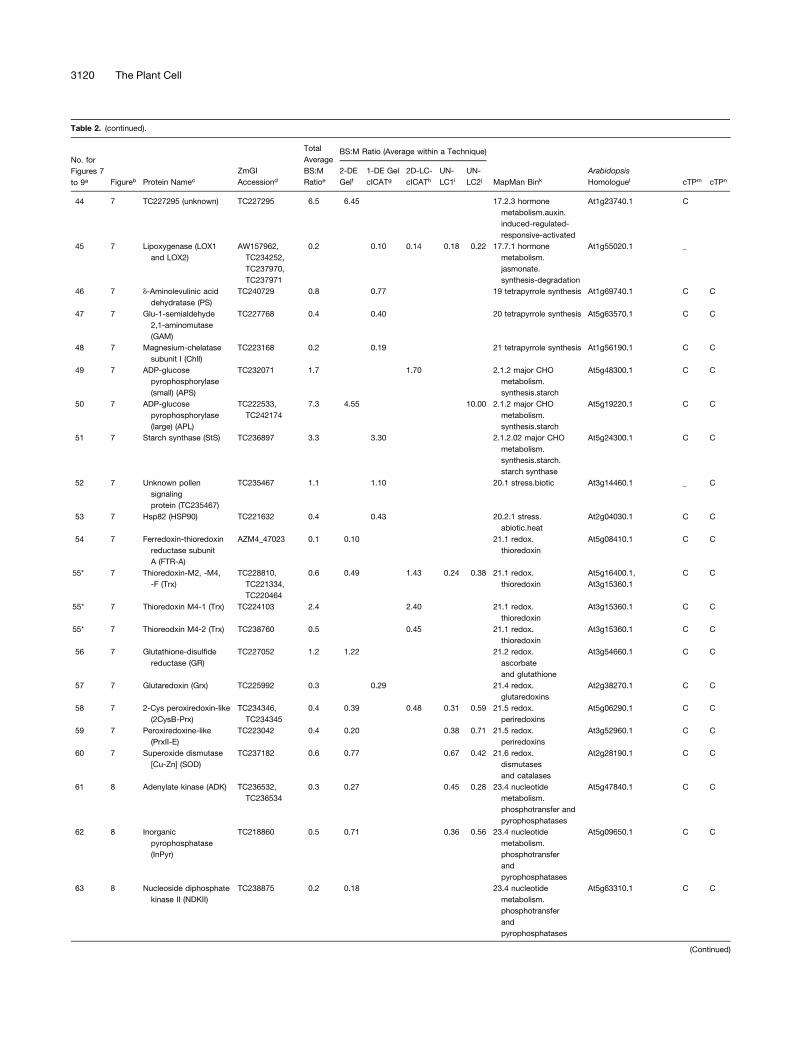
Table 2. (continued).
No. for
Figures 7
to 9a
Total
Average
BS:M
Ratioe
BS:M Ratio (Average within a Technique)
Figureb Protein NamecZmGI
Accessiond2-DE
Gelf1-DE Gel
cICATg2D-LC-
cICAThUN-
LC1iUN-
LC2j MapMan BinkArabidopsis
Homologuel cTPm cTPn
44 7 TC227295 (unknown) TC227295 6.5 6.45 17.2.3 hormone
metabolism.auxin.
induced-regulated-
responsive-activated
At1g23740.1 C
45 7 Lipoxygenase (LOX1
and LOX2)
AW157962,
TC234252,
TC237970,
TC237971
0.2 0.10 0.14 0.18 0.22 17.7.1 hormone
metabolism.
jasmonate.
synthesis-degradation
At1g55020.1 _
46 7 d-Aminolevulinic acid
dehydratase (PS)
TC240729 0.8 0.77 19 tetrapyrrole synthesis At1g69740.1 C C
47 7 Glu-1-semialdehyde
2,1-aminomutase
(GAM)
TC227768 0.4 0.40 20 tetrapyrrole synthesis At5g63570.1 C C
48 7 Magnesium-chelatase
subunit I (ChlI)
TC223168 0.2 0.19 21 tetrapyrrole synthesis At1g56190.1 C C
49 7 ADP-glucose
pyrophosphorylase
(small) (APS)
TC232071 1.7 1.70 2.1.2 major CHO
metabolism.
synthesis.starch
At5g48300.1 C C
50 7 ADP-glucose
pyrophosphorylase
(large) (APL)
TC222533,
TC242174
7.3 4.55 10.00 2.1.2 major CHO
metabolism.
synthesis.starch
At5g19220.1 C C
51 7 Starch synthase (StS) TC236897 3.3 3.30 2.1.2.02 major CHO
metabolism.
synthesis.starch.
starch synthase
At5g24300.1 C C
52 7 Unknown pollen
signaling
protein (TC235467)
TC235467 1.1 1.10 20.1 stress.biotic At3g14460.1 _ C
53 7 Hsp82 (HSP90) TC221632 0.4 0.43 20.2.1 stress.
abiotic.heat
At2g04030.1 C C
54 7 Ferredoxin-thioredoxin
reductase subunit
A (FTR-A)
AZM4_47023 0.1 0.10 21.1 redox.
thioredoxin
At5g08410.1 C C
55* 7 Thioredoxin-M2, -M4,
-F (Trx)
TC228810,
TC221334,
TC220464
0.6 0.49 1.43 0.24 0.38 21.1 redox.
thioredoxin
At5g16400.1,
At3g15360.1
C C
55* 7 Thioredoxin M4-1 (Trx) TC224103 2.4 2.40 21.1 redox.
thioredoxin
At3g15360.1 C C
55* 7 Thioreodxin M4-2 (Trx) TC238760 0.5 0.45 21.1 redox.
thioredoxin
At3g15360.1 C C
56 7 Glutathione-disulfide
reductase (GR)
TC227052 1.2 1.22 21.2 redox.
ascorbate
and glutathione
At3g54660.1 C C
57 7 Glutaredoxin (Grx) TC225992 0.3 0.29 21.4 redox.
glutaredoxins
At2g38270.1 C C
58 7 2-Cys peroxiredoxin-like
(2CysB-Prx)
TC234346,
TC234345
0.4 0.39 0.48 0.31 0.59 21.5 redox.
periredoxins
At5g06290.1 C C
59 7 Peroxiredoxine-like
(PrxII-E)
TC223042 0.4 0.20 0.38 0.71 21.5 redox.
periredoxins
At3g52960.1 C C
60 7 Superoxide dismutase
[Cu-Zn] (SOD)
TC237182 0.6 0.77 0.67 0.42 21.6 redox.
dismutases
and catalases
At2g28190.1 C C
61 8 Adenylate kinase (ADK) TC236532,
TC236534
0.3 0.27 0.45 0.28 23.4 nucleotide
metabolism.
phosphotransfer and
pyrophosphatases
At5g47840.1 C C
62 8 Inorganic
pyrophosphatase
(InPyr)
TC218860 0.5 0.71 0.36 0.56 23.4 nucleotide
metabolism.
phosphotransfer
and
pyrophosphatases
At5g09650.1 C C
63 8 Nucleoside diphosphate
kinase II (NDKII)
TC238875 0.2 0.18 23.4 nucleotide
metabolism.
phosphotransfer
and
pyrophosphatases
At5g63310.1 C C
(Continued)
3120 The Plant Cell
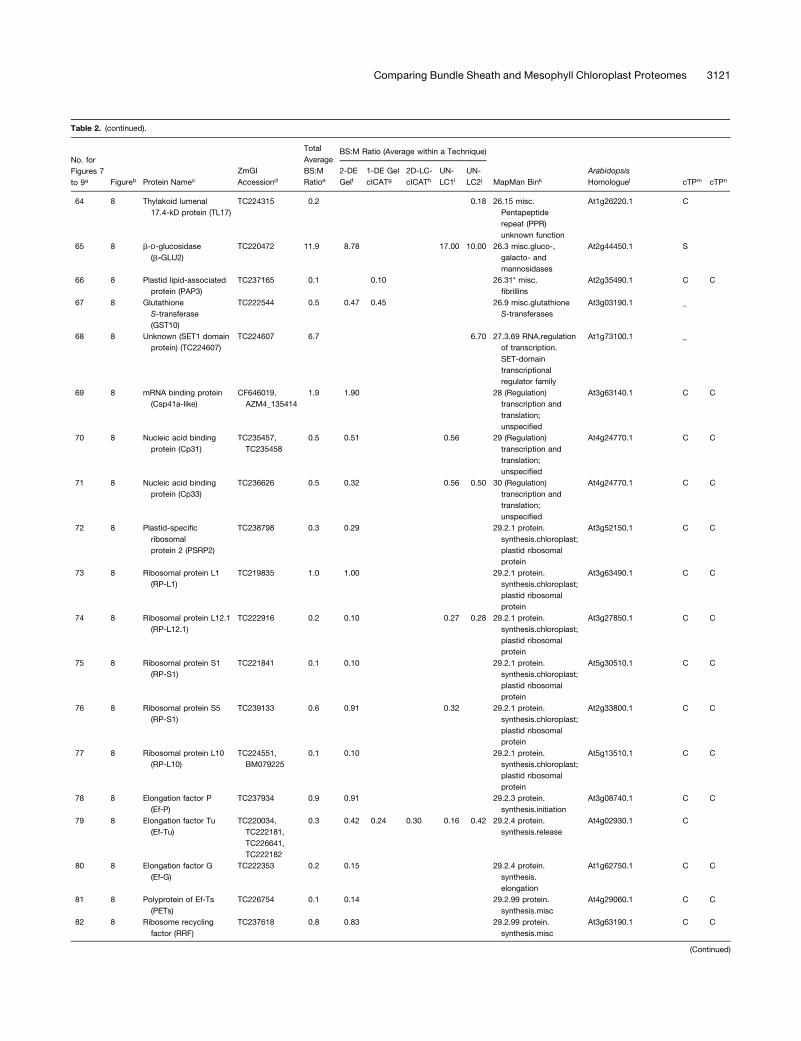
Table 2. (continued).
No. for
Figures 7
to 9a
Total
Average
BS:M
Ratioe
BS:M Ratio (Average within a Technique)
Figureb Protein NamecZmGI
Accessiond2-DE
Gelf1-DE Gel
cICATg2D-LC-
cICAThUN-
LC1iUN-
LC2j MapMan BinkArabidopsis
Homologuel cTPm cTPn
64 8 Thylakoid lumenal
17.4-kD protein (TL17)
TC224315 0.2 0.18 26.15 misc.
Pentapeptide
repeat (PPR)
unknown function
At1g26220.1 C
65 8 b-D-glucosidase
(b-GLU2)
TC220472 11.9 8.78 17.00 10.00 26.3 misc.gluco-,
galacto- and
mannosidases
At2g44450.1 S
66 8 Plastid lipid-associated
protein (PAP3)
TC237165 0.1 0.10 26.31* misc.
fibrillins
At2g35490.1 C C
67 8 Glutathione
S-transferase
(GST10)
TC222544 0.5 0.47 0.45 26.9 misc.glutathione
S-transferases
At3g03190.1 _
68 8 Unknown (SET1 domain
protein) (TC224607)
TC224607 6.7 6.70 27.3.69 RNA.regulation
of transcription.
SET-domain
transcriptional
regulator family
At1g73100.1 _
69 8 mRNA binding protein
(Csp41a-like)
CF646019,
AZM4_135414
1.9 1.90 28 (Regulation)
transcription and
translation;
unspecified
At3g63140.1 C C
70 8 Nucleic acid binding
protein (Cp31)
TC235457,
TC235458
0.5 0.51 0.56 29 (Regulation)
transcription and
translation;
unspecified
At4g24770.1 C C
71 8 Nucleic acid binding
protein (Cp33)
TC236626 0.5 0.32 0.56 0.50 30 (Regulation)
transcription and
translation;
unspecified
At4g24770.1 C C
72 8 Plastid-specific
ribosomal
protein 2 (PSRP2)
TC238798 0.3 0.29 29.2.1 protein.
synthesis.chloroplast;
plastid ribosomal
protein
At3g52150.1 C C
73 8 Ribosomal protein L1
(RP-L1)
TC219835 1.0 1.00 29.2.1 protein.
synthesis.chloroplast;
plastid ribosomal
protein
At3g63490.1 C C
74 8 Ribosomal protein L12.1
(RP-L12.1)
TC222916 0.2 0.10 0.27 0.28 29.2.1 protein.
synthesis.chloroplast;
plastid ribosomal
protein
At3g27850.1 C C
75 8 Ribosomal protein S1
(RP-S1)
TC221841 0.1 0.10 29.2.1 protein.
synthesis.chloroplast;
plastid ribosomal
protein
At5g30510.1 C C
76 8 Ribosomal protein S5
(RP-S1)
TC239133 0.6 0.91 0.32 29.2.1 protein.
synthesis.chloroplast;
plastid ribosomal
protein
At2g33800.1 C C
77 8 Ribosomal protein L10
(RP-L10)
TC224551,
BM079225
0.1 0.10 29.2.1 protein.
synthesis.chloroplast;
plastid ribosomal
protein
At5g13510.1 C C
78 8 Elongation factor P
(Ef-P)
TC237934 0.9 0.91 29.2.3 protein.
synthesis.initiation
At3g08740.1 C C
79 8 Elongation factor Tu
(Ef-Tu)
TC220034,
TC222181,
TC226641,
TC222182
0.3 0.42 0.24 0.30 0.16 0.42 29.2.4 protein.
synthesis.release
At4g02930.1 C
80 8 Elongation factor G
(Ef-G)
TC222353 0.2 0.15 29.2.4 protein.
synthesis.
elongation
At1g62750.1 C C
81 8 Polyprotein of Ef-Ts
(PETs)
TC226754 0.1 0.14 29.2.99 protein.
synthesis.misc
At4g29060.1 C C
82 8 Ribosome recycling
factor (RRF)
TC237618 0.8 0.83 29.2.99 protein.
synthesis.misc
At3g63190.1 C C
(Continued)
Comparing Bundle Sheath and Mesophyll Chloroplast Proteomes 3121
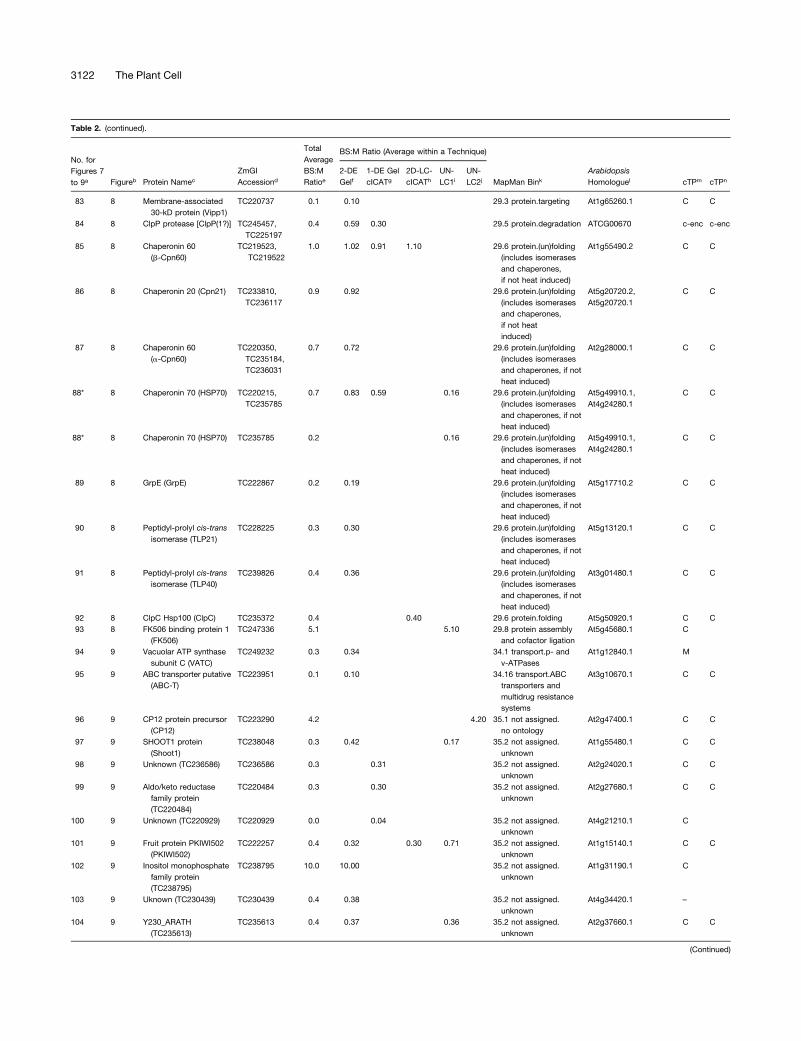
Table 2. (continued).
No. for
Figures 7
to 9a
Total
Average
BS:M
Ratioe
BS:M Ratio (Average within a Technique)
Figureb Protein NamecZmGI
Accessiond2-DE
Gelf1-DE Gel
cICATg2D-LC-
cICAThUN-
LC1iUN-
LC2j MapMan BinkArabidopsis
Homologuel cTPm cTPn
83 8 Membrane-associated
30-kD protein (Vipp1)
TC220737 0.1 0.10 29.3 protein.targeting At1g65260.1 C C
84 8 ClpP protease [ClpP(1?)] TC245457,
TC225197
0.4 0.59 0.30 29.5 protein.degradation ATCG00670 c-enc c-enc
85 8 Chaperonin 60
(b-Cpn60)
TC219523,
TC219522
1.0 1.02 0.91 1.10 29.6 protein.(un)folding
(includes isomerases
and chaperones,
if not heat induced)
At1g55490.2 C C
86 8 Chaperonin 20 (Cpn21) TC233810,
TC236117
0.9 0.92 29.6 protein.(un)folding
(includes isomerases
and chaperones,
if not heat
induced)
At5g20720.2,
At5g20720.1
C C
87 8 Chaperonin 60
(a-Cpn60)
TC220350,
TC235184,
TC236031
0.7 0.72 29.6 protein.(un)folding
(includes isomerases
and chaperones, if not
heat induced)
At2g28000.1 C C
88* 8 Chaperonin 70 (HSP70) TC220215,
TC235785
0.7 0.83 0.59 0.16 29.6 protein.(un)folding
(includes isomerases
and chaperones, if not
heat induced)
At5g49910.1,
At4g24280.1
C C
88* 8 Chaperonin 70 (HSP70) TC235785 0.2 0.16 29.6 protein.(un)folding
(includes isomerases
and chaperones, if not
heat induced)
At5g49910.1,
At4g24280.1
C C
89 8 GrpE (GrpE) TC222867 0.2 0.19 29.6 protein.(un)folding
(includes isomerases
and chaperones, if not
heat induced)
At5g17710.2 C C
90 8 Peptidyl-prolyl cis-trans
isomerase (TLP21)
TC228225 0.3 0.30 29.6 protein.(un)folding
(includes isomerases
and chaperones, if not
heat induced)
At5g13120.1 C C
91 8 Peptidyl-prolyl cis-trans
isomerase (TLP40)
TC239826 0.4 0.36 29.6 protein.(un)folding
(includes isomerases
and chaperones, if not
heat induced)
At3g01480.1 C C
92 8 ClpC Hsp100 (ClpC) TC235372 0.4 0.40 29.6 protein.folding At5g50920.1 C C
93 8 FK506 binding protein 1
(FK506)
TC247336 5.1 5.10 29.8 protein assembly
and cofactor ligation
At5g45680.1 C
94 9 Vacuolar ATP synthase
subunit C (VATC)
TC249232 0.3 0.34 34.1 transport.p- and
v-ATPases
At1g12840.1 M
95 9 ABC transporter putative
(ABC-T)
TC223951 0.1 0.10 34.16 transport.ABC
transporters and
multidrug resistance
systems
At3g10670.1 C C
96 9 CP12 protein precursor
(CP12)
TC223290 4.2 4.20 35.1 not assigned.
no ontology
At2g47400.1 C C
97 9 SHOOT1 protein
(Shoot1)
TC238048 0.3 0.42 0.17 35.2 not assigned.
unknown
At1g55480.1 C C
98 9 Unknown (TC236586) TC236586 0.3 0.31 35.2 not assigned.
unknown
At2g24020.1 C C
99 9 Aldo/keto reductase
family protein
(TC220484)
TC220484 0.3 0.30 35.2 not assigned.
unknown
At2g27680.1 C C
100 9 Unknown (TC220929) TC220929 0.0 0.04 35.2 not assigned.
unknown
At4g21210.1 C
101 9 Fruit protein PKIWI502
(PKIWI502)
TC222257 0.4 0.32 0.30 0.71 35.2 not assigned.
unknown
At1g15140.1 C C
102 9 Inositol monophosphate
family protein
(TC238795)
TC238795 10.0 10.00 35.2 not assigned.
unknown
At1g31190.1 C
103 9 Uknown (TC230439) TC230439 0.4 0.38 35.2 not assigned.
unknown
At4g34420.1 –
104 9 Y230_ARATH
(TC235613)
TC235613 0.4 0.37 0.36 35.2 not assigned.
unknown
At2g37660.1 C C
(Continued)
3122 The Plant Cell
accumulated in the M chloroplast (2.5- to 4.8-fold up). The 2-DE
analysis of the acidic GADPH-B also showed an increased
accumulation in the M chloroplasts. Measurements of total
GADPH activities showed equal distribution between M and
BS chloroplasts (Slack et al., 1969; Ku and Edwards, 1975). In C3
plants, GAPDH-B can form a homotetramer in addition to
formation of a heterotetramer with GAPDH-A1,2 (Baalmann
et al., 1996). It is most likely that GAPDH oligomers in M maize
chloroplasts differ in the GAPDH A/B protein ratio as compared
with GAPDHcomplexes in BS chloroplasts. In C3 plants, GAPDH
oligomers reversibly associate with PRK and a small CP12 linker
protein to help activation of PRK (Baalmann et al., 1996;
reviewed in Graciet et al., 2004). This likely regulates the carbon
flow from the Calvin cycle to the oxidative pentose phosphate
cycle (Tamoi et al., 2005). Interestingly, we quantified the maize
CP12 (TC223290) homolog with a BS:M ratio of 4.2. The pres-
ence of CP12 in the BS fractions strongly suggests that forma-
tion of the GAPDH-CP12-PRK supercomplex takes place in the
BS chloroplast (not in M chloroplast), in agreement with the role
of the BS chloroplast in the Calvin cycle. The CP12 protein was
not earlier detected in maize.
Starch Biosynthesis and Carbohydrate Metabolism
We found a preferential BS localization for several enzymes
involved in starch synthesis in agreement with earlier observa-
tions (Spilatro and Preiss, 1987; Lunn and Furbank, 1997). The
small subunit of ADP-glucose pyrophosphorylase (TC232071),
the first committed step in starch synthesis, was 1.7-fold higher
in BS. Isoforms of the large subunit ADP-glucose pyrophosphor-
ylase glucose-1-phosphate adenyltransferase (TC222533 and
TC242174) were also significantly higher in B chloroplasts,
whereas aldose-1-epimerase (TC237704) and soluble starch
synthase (TC236897) were 5- and 3.3-fold higher, respectively,
in BS chloroplasts. It is important to point out, however, that we
did observe starch accumulation in the M chloroplasts of older
(20 d) maize leaves during chloroplast preparations (W. Majeran,
unpublished data). This suggests that starch synthesis is mostly
limited to BS chloroplasts when the leaf is a sink, but when leaf
tissue becomes a source, M chloroplasts also have significant
rates of starch synthesis.
Nitrogen Assimilation
Two nitrogen assimilation pathways can be distinguished in
leaves. The primary N assimilation involves chloroplast nitrite
reductase (NiR), Gln synthase 2 (GS2), ferredoxin-dependent Glu
synthase (Fd-GOGAT), andAsp transaminase (AspT). Secondary
N assimilation is performed by the enzyme couple Gln synthase
2 and Fd-GOGAT, which allows the reassimilation of ammonium
produced as the last product of the photorespiration, in particular
in C3 species (Weber and Flugge, 2002).
We were able to quantify the accumulation of four chloroplast
enzymes (with one isoform each) implicated in N assimilation.
Three enzymes were predominantly expressed in the M chlo-
roplasts and are NiR (TC222347 and TC222348, 2.5- to 6-fold),
Table 2. (continued).
No. for
Figures 7
to 9a
Total
Average
BS:M
Ratioe
BS:M Ratio (Average within a Technique)
Figureb Protein NamecZmGI
Accessiond2-DE
Gelf1-DE Gel
cICATg2D-LC-
cICAThUN-
LC1iUN-
LC2j MapMan BinkArabidopsis
Homologuel cTPm cTPn
105 9 Uknown (TC220990) TC220990 0.6 0.59 35.2 not assigned.
unknown
At4g15940.1 M M
106 9 Unknown (CF032674) CF032674 1.0 1.00 35.2 not assigned.
unknown
None
a Protein number in Figures 6 to 9.b Corresponding figure.c Assigned protein named based on information from BLAST alignments. Protein for which a differential expression of paralogues (where it was possible to distinguish them) are marked
with an asterisk. Protein name abbreviations are indicated in parentheses (see Supplemental Table 4 online).d ZmGI accession identified by MS.e Average BS:M protein accumulation ratio across all experiments.f Average BS:M ratio for ZmGI accession based on quantification from 2-DE gels.g Quantificaton from cICAT labeling combined with 1-DE gel protein separation.h Quantificaton from cICAT labeling combined with online 2D-LC–based separation.i First BS:M accumulation ratio based on parallel LC-MS–based quantifications of unlabeled peptides.j Second experiments with BS:M accumulation ratio based on parallel LC-MS–based quantifications of unlabeled peptides.k Functional assigment based on the MapMan Bin system developed by Thimm et al. (2004).l Best Arabidopsis homologues as judged by BLAST E-value.m Predicted subcellular localization of Arabidopsis homologues using TargetP. C, chloroplast; M, mitochondria; S, signal peptide.n Predicted subcellular localization of Arabidopsis homologues using Predotar. C, chloroplast; M, mitochondria.
ZmGI accessions were quantified by one or more of the following techniques: 2-DE gels, 1-DE SDS-PAGE followed by cICAT (1-DE gel cICAT), cICAT followed by 2D-LC fractionation (2D-
LC-cICAT), and 2-DE IPG and parallel LC-MS–based quantifications of unlabeled peptides (UN-LC1 and UN-LC2). For the non-gel-based quantifications, each BS:M ratio was often based
on more than one peptide pair. For 2-DE gel-based identification, at least three quantified protein spots on each BS and M contributed to the BS:M ratio. Within each technique, typically
more than one observation per accession number was made. The differences in protein accumulation between the M and BS are represented as BS:M ratio. The average BS:M ratio across
all experiments is listed. The closest Arabidopsis homologues are indicated followed by their annotation in PPDB and predicted subcellular localization. The asterisks indicate very similar
accessions that could not unambiguously be individually quantified were grouped together. In some cases, one of the three quantification methods allowed individual quantification and are
marked with an asterisk.
Comparing Bundle Sheath and Mesophyll Chloroplast Proteomes 3123
Fd-GOGAT-1 (TC236410 or GLU1 in Arabidopsis, 5-fold or
unique in M), and AspT (TC219944, 2- to 11-fold). GS
(TC220868) synthase was identified only on 2-DE gels, and its
BS:M ratio was close to one.
Several groups analyzed the localization of nitrogen assimi-
lation in C4 plants and designated M cells as the compartment
where primary N assimilation takes place (Rathnam and Ed-
wards, 1975, 1976; Harel et al., 1977; Becker et al., 1993).
However, conflicting conclusions were presented for the local-
ization of GS and Fd-GOGAT involved in secondary N assimila-
tion (Rathnam and Edwards, 1976; Harel et al., 1977; Becker
et al., 1993, 2000). This might well have been the result of the
lengthy preparations of M and BC cells using enzymatic di-
gestion at 37C. A preferential localization of AspT activity in theM
was previously described, but the authors associated it with the
cytoplasmic fraction (Hatch and Mau, 1973). AspT catalyzes the
fixation of ammonium on oxaloacetate to yield aspartate. It
constitutes a metabolic link between N assimilation and amino
acid synthesis. The increased accumulation of AspT in M chlo-
roplasts is consistent with the fact that both the N assimilation
(see above) and enzymes of amino acid synthesis pathways
preferentially accumulate in M chloroplasts.
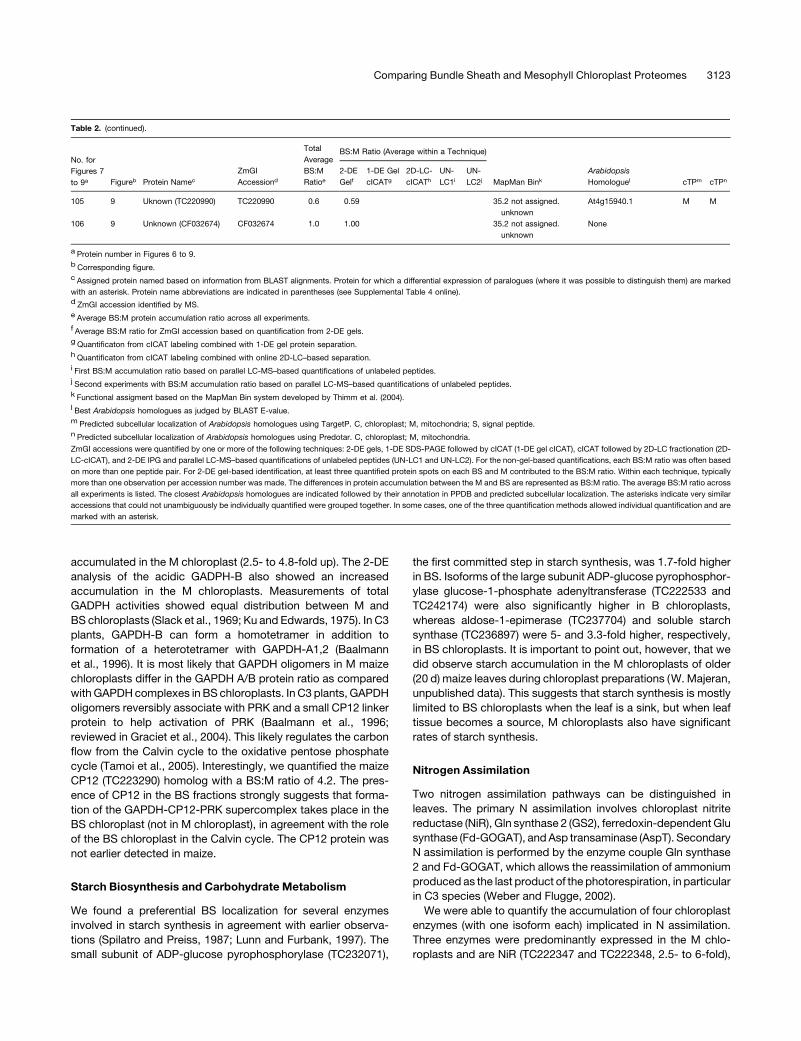
Figure 6. Overview of BS:M Ratio Determinations by the Three Complementary Methods.
The 125 quantified maize proteins (ZmGI accessions) were divided in Figures 6 to 9 and are grouped by function; here, we show the first group. BS:M
protein accumulation ratios obtained for each protein by three different methods (closed squares, 1-DE gel cICAT; circles, 2D-LC-cICAT; open squares,
2-DE gels; closed triangles, unlabeled LC1; open triangles, unlabeled LC2) were plotted on a logarithmic scale. The numbers represent the different
quantified proteins. The actual accession numbers and associated information can be found in Table 2. A number of similar accessions that could not
unambiguously be individually quantified were grouped together. In some cases, one of the three quantification methods allowed individual
quantification and are marked with an asterisk. The protein name abbreviations are indicated as follows: 1, Ferredoxin 2 (Fd2); 2, Ferredoxin I (Fd1); 3,
Ferredoxin reductase (FNR1); 4, plastocyanin (PC2); 5, Oxygen evolving enhancer 2 (OEC23); 6, Oxygen evolving enhancer protein 1 (OEC33); 7,
Oxygen-evolving enhancer protein 3-1 (OEC16-1); 8, photosystem II protein W-like protein (PsbW-like); 9, thylakoid lumenal 29.8-kD protein (TL30); 10,
ATP synthase b-chain (b-CF1); 11, phosphoglycolate phosphatase (PGP); 12, fructose-1,6-bisphosphatase (FBP); 13, fructose-bisphosphate aldolase
(FBA); 14, glyceraldehyde 3-phosphate dehydrogenase (GAP-A); 15, glyceraldehyde-3-phosphate dehydrogenase (GAP-B); 16, phosphoglycerate
kinase (PGK); 17, phosphoribulokinase (PRK); 18, ribulose-5-phosphate-3-epimerase (RPE); 19, Rubisco activase (RCA); 20, Rubisco large subunit
(RbcL); 21, Rubisco small subunit (RBCS); 22, sedoheptulose-1,7-bisphosphatase (SBP); 23, transketolase (TKL); 24, aldose-1-epimerase (AE); 25,
ribose-5-phosphate isomerase (RPI); 26, triose phosphate isomerase (TIM); 27, NADP-dependent malic enzyme (ME); 28, pyruvate orthophosphate
dikinase (PPDK); 29, malate dehydrogenase [NADP] (MDH).
3124 The Plant Cell
S-Assimilation
We identified one enzyme in the sulfur import pathway, the ATP-
sulfurylase (TC235924, similar to Arabidopsis ATP SULFURY-
LASE2), which catalyzes the first step of sulfate import (sulfate
fixation onto an adenyl-sulfate). Its accumulation was increased
in the BS chloroplasts (twofold), which was consistent with
previous localization of primary sulfur assimilation in the BS cells
by activity measurements (Burgener et al., 1998). Cystein was
proposed to be the transport factor for sulfur between M and BS
cells (Burgener et al., 1998). A cystein synthase (TC235388 and
TC235390) was slightly higher in the M chloroplast (1.6-fold),
suggesting that secondary assimilation of H2S takes place in M
chloroplasts.
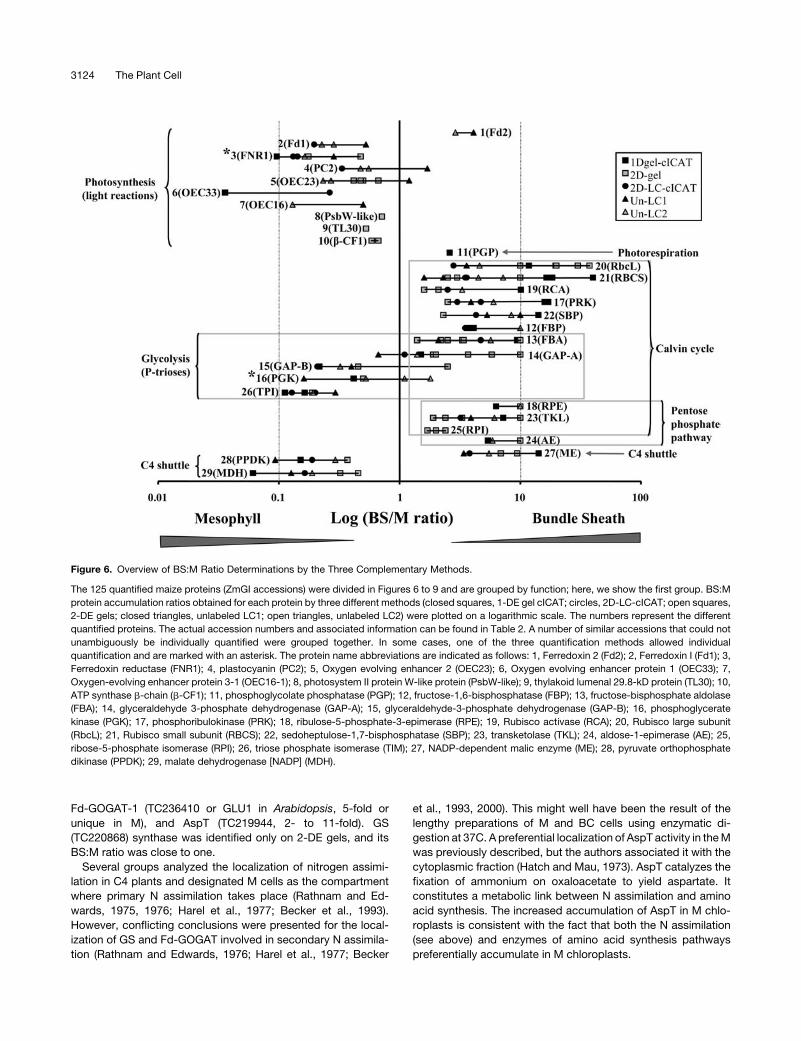
Figure 7. Overview of BS:M Ratio Determinations by the Three Complementary Methods.
The 125 quantified maize proteins (ZmGI accessions) were divided in Figures 6 to 9 and are grouped by function; here, we show the second group.
BS:M protein accumulation ratios obtained for each protein by three different methods (closed squares, 1-DE gel cICAT; circles, 2D-LC-cICAT; open
squares, 2-DE gels; closed triangles, unlabeled LC1; open triangles, unlabeled LC2) were plotted on a logarithmic scale. The numbers represent the
different quantified proteins. The actual accession numbers and associated information can be found in Table 2. A number of similar accessions that
could not unambiguously be individually quantified were grouped together. In some cases, one of the three quantification methods allowed individ-
ual quantification and are marked with an asterisk. The protein name abbreviations are indicated as follows: 30, Acyl carrier protein 1 (ACP1); 31,
b-hydroxyacyl-ACP dehydratase (b-ACPD); 32, S-malonyltransferase (S-MT); 33, lipid transfer protein 7a2b (LPT); 34, ferredoxin-nitrite reductase (NiR);
35, ferredoxin-dependent glutamate synthase (Fd-GOGAT); 36, Gln synthetase (GS2); 37, Asp transaminase (Asp-T); 38, lactoylglutathione lyase
(LGHL); 39, ketol-acid reductoisomerase (KR); 40, 3-isopropylmalate dehydrogenase (IMD); 41, Cys synthase 1 (CS1); 42, ATP-sulfurylase 2 (ATP-S);
43, 1-deoxy-D-xylulose-5-phosphate reductoisomerase (XRI); 44, TC227295 (unknown); 45, Lipoxygenase (LOX1 and LOX2); 46, d-aminolevulinic acid
dehydratase (PS); 47, Glu-1-semialdehyde 2,1-aminomutase (GAM); 48, magnesium-chelatase subunit I (ChlI); 49, ADP-glucose pyrophosphorylase
(small) (APS); 50, ADP-glucose pyrophosphorylase (large) (APL); 51, starch synthase (StS); 52, unknown pollen signaling protein (TC235467); 53, Hsp82
(HSP90); 54, ferredoxin-thioredoxin reductase subunit A (FTR-A); 55, thioredoxin-M2, -M4, and -F (Trx); 56, glutathione-disulfide reductase (GSR); 57,
glutaredoxin (Grx); 58, 2-cys peroxiredoxin-like (2CysB-Prx); 59, peroxiredoxine-like (PrxII-E); 60, superoxide dismutase [Cu-Zn] (SOD).
Comparing Bundle Sheath and Mesophyll Chloroplast Proteomes 3125
Photorespiration
Chloroplast phosphoglycolate phosphatase (TC229733) accu-
mulated preferentially in BS chloroplasts (BS:M ¼ 2.6), in
agreement with phosphoglycolate phosphatase activity mea-
surements (Baldy and Cavalie, 1984). The significance and
capacity of photorespiration in C4 photosynthesis in maize
is, however, a matter of debate and is driven by the O2/CO2
partial pressures in BS cells. Clearly, it is lower in NADP-ME
type C4 plants, such as maize, than in NAD-ME or phospho-
enolpyruvate carboxykinase type C4 plants (Yoshimura et al.,
2004).
Lipid Metabolism and Hormones
We quantified three proteins in lipid biosynthesis: acyl carrier
protein 1 (ACP1; TC223112 and TC228772), b-hydroxyacyl-ACP
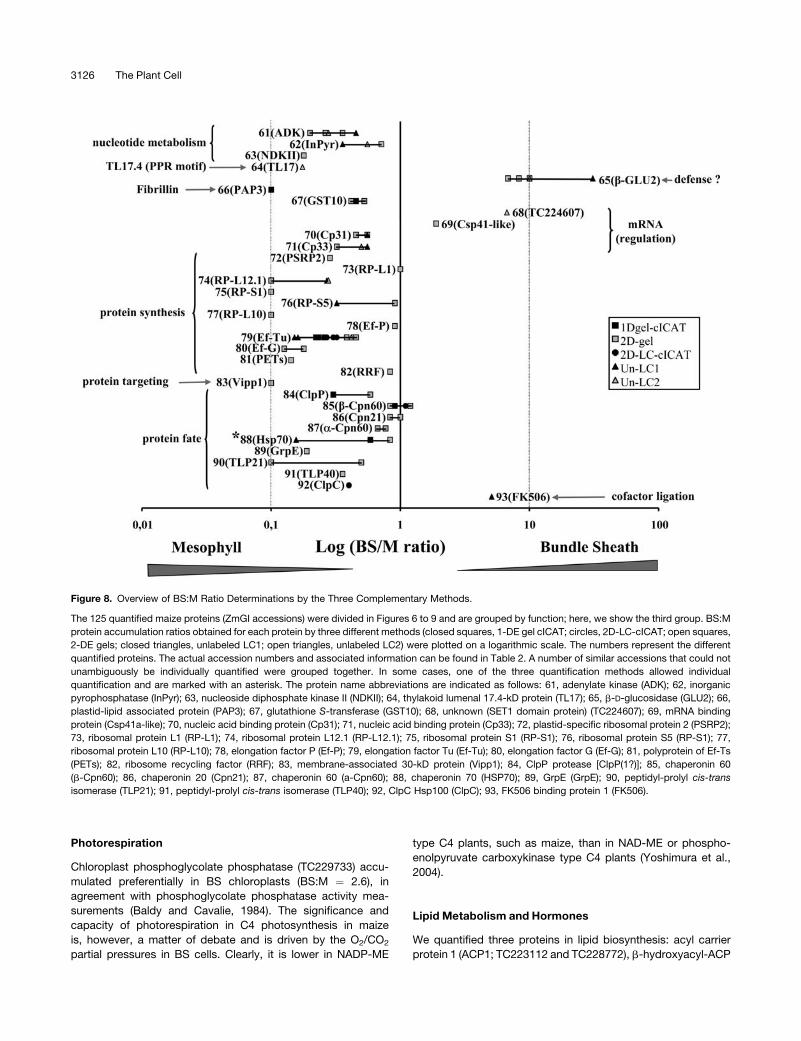
Figure 8. Overview of BS:M Ratio Determinations by the Three Complementary Methods.
The 125 quantified maize proteins (ZmGI accessions) were divided in Figures 6 to 9 and are grouped by function; here, we show the third group. BS:M
protein accumulation ratios obtained for each protein by three different methods (closed squares, 1-DE gel cICAT; circles, 2D-LC-cICAT; open squares,
2-DE gels; closed triangles, unlabeled LC1; open triangles, unlabeled LC2) were plotted on a logarithmic scale. The numbers represent the different
quantified proteins. The actual accession numbers and associated information can be found in Table 2. A number of similar accessions that could not
unambiguously be individually quantified were grouped together. In some cases, one of the three quantification methods allowed individual
quantification and are marked with an asterisk. The protein name abbreviations are indicated as follows: 61, adenylate kinase (ADK); 62, inorganic
pyrophosphatase (InPyr); 63, nucleoside diphosphate kinase II (NDKII); 64, thylakoid lumenal 17.4-kD protein (TL17); 65, b-D-glucosidase (GLU2); 66,
plastid-lipid associated protein (PAP3); 67, glutathione S-transferase (GST10); 68, unknown (SET1 domain protein) (TC224607); 69, mRNA binding
protein (Csp41a-like); 70, nucleic acid binding protein (Cp31); 71, nucleic acid binding protein (Cp33); 72, plastid-specific ribosomal protein 2 (PSRP2);
73, ribosomal protein L1 (RP-L1); 74, ribosomal protein L12.1 (RP-L12.1); 75, ribosomal protein S1 (RP-S1); 76, ribosomal protein S5 (RP-S1); 77,
ribosomal protein L10 (RP-L10); 78, elongation factor P (Ef-P); 79, elongation factor Tu (Ef-Tu); 80, elongation factor G (Ef-G); 81, polyprotein of Ef-Ts
(PETs); 82, ribosome recycling factor (RRF); 83, membrane-associated 30-kD protein (Vipp1); 84, ClpP protease [ClpP(1?)]; 85, chaperonin 60
(b-Cpn60); 86, chaperonin 20 (Cpn21); 87, chaperonin 60 (a-Cpn60); 88, chaperonin 70 (HSP70); 89, GrpE (GrpE); 90, peptidyl-prolyl cis-trans
isomerase (TLP21); 91, peptidyl-prolyl cis-trans isomerase (TLP40); 92, ClpC Hsp100 (ClpC); 93, FK506 binding protein 1 (FK506).
3126 The Plant Cell
dehydratase (TC240700), andS-malonyltransferase (TC223360).
We also found a lipid transfer protein 7a2b (LTP-7a2b;
AI966827). ACP1 showed an equal distribution between M
and BS chloroplasts. The b-hydroxyacyl-ACP dehydratase was
a low abundant spot in the 2-DE gel analysis, at the detection
limit of the analysis. S-malonyltransferase was found to be
preferentially expressed in the M chloroplasts (BS:M ratio
0.38), and the lipid transfer protein 7a2b showed a unique M
localization.
We identified two types of enzymes, lipoxygenase 1 (LOX1)
and LOX2 that are involved in the production of oxylipins,
a diverse group of fatty acid derivatives that includes the
hormone jasmonate and defensive metabolites (Feussner
and Wasternack, 2002). LOX1 (AW157962) and LOX2
(TC234252, TC237970, and TC237971) all showed a high pref-
erence for M accumulation (fourfold up to ninefold). The high
preferential accumulation of lipoxygenases in M chloroplasts
has not been determined earlier and warrants further investiga-
tion.
Nucleotide Metabolism
Adenylate kinase (TC236532 and TC236534) and inorganic
pyrophosphatase (InPyr; TC218860) both accumulated prefer-
entially in the M chloroplast, with BS:M ratios of 0.3 and 0.5,
respectively. Adenylate kinase removes and recycles AMP
produced in the reversible PPDK reaction, while InPyr is also
indirectly needed to activate PPDK through dephosphorylation.
Thus, the relatively high M expression is likely to be dictated by
the large flux through PPDK. InPyr also plays a role (by removal of
pyrophosphate) to drive the forward reaction of plastid-localized
ADP-glucose pyrophosphorylase toward starch biosynthesis.
The observed expression ratios are consistent with their M
localization based on activity assays in maize (Slack et al., 1969).
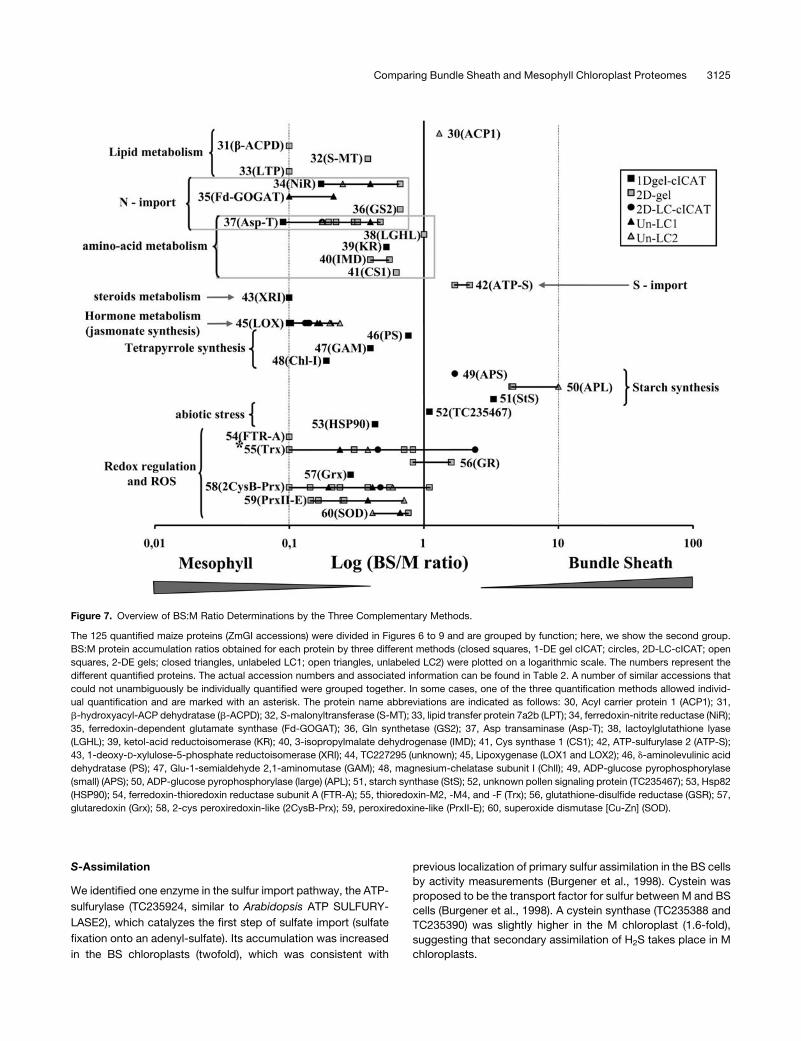
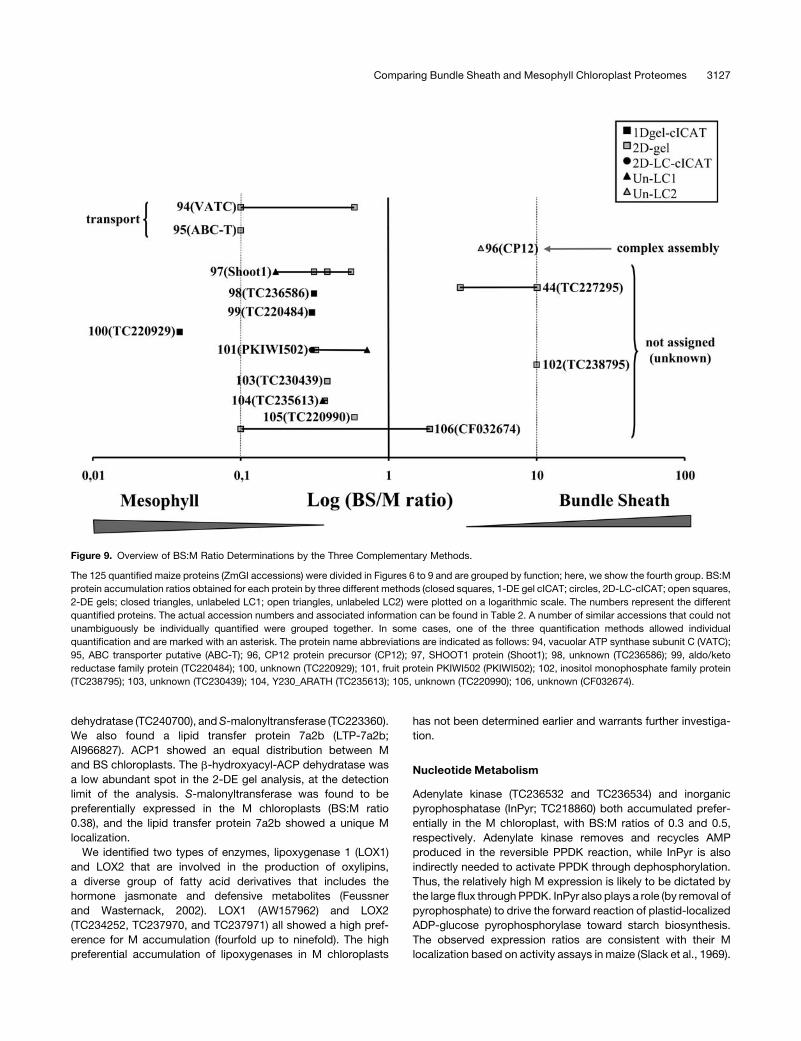
Figure 9. Overview of BS:M Ratio Determinations by the Three Complementary Methods.
The 125 quantified maize proteins (ZmGI accessions) were divided in Figures 6 to 9 and are grouped by function; here, we show the fourth group. BS:M
protein accumulation ratios obtained for each protein by three different methods (closed squares, 1-DE gel cICAT; circles, 2D-LC-cICAT; open squares,
2-DE gels; closed triangles, unlabeled LC1; open triangles, unlabeled LC2) were plotted on a logarithmic scale. The numbers represent the different
quantified proteins. The actual accession numbers and associated information can be found in Table 2. A number of similar accessions that could not
unambiguously be individually quantified were grouped together. In some cases, one of the three quantification methods allowed individual
quantification and are marked with an asterisk. The protein name abbreviations are indicated as follows: 94, vacuolar ATP synthase subunit C (VATC);
95, ABC transporter putative (ABC-T); 96, CP12 protein precursor (CP12); 97, SHOOT1 protein (Shoot1); 98, unknown (TC236586); 99, aldo/keto
reductase family protein (TC220484); 100, unknown (TC220929); 101, fruit protein PKIWI502 (PKIWI502); 102, inositol monophosphate family protein
(TC238795); 103, unknown (TC230439); 104, Y230_ARATH (TC235613); 105, unknown (TC220990); 106, unknown (CF032674).
Comparing Bundle Sheath and Mesophyll Chloroplast Proteomes 3127
Tetrapyrrole Synthesis
We quantified three enzymes in the tetrapyrrole synthesis path-
way implicated in three steps of the chlorophyll/heme biosynthe-
sis pathway: (1) formation of the precursor 5-aminolevulinic acid
(ALA), (2) synthesis of protoporphyrin, and (3) incorporation of
Mg2þ into the porphyrin ring (for reviews, see Beale, 1999;
Eckhardt et al., 2004). The formation of ALA is the limiting step
for the rest of the pathway. We identified Glu-1-semialdehyde 2,
1-aminomutase (TC227768), which catalyzes the rearrangement
of Glu-1-semialdehyde into ALA. This stromal enzyme accumu-
lated preferentially in M (BS:M 0.40). The subsequent enzyme,
d-aminolevulinic acid dehydratase (TC240729), which catalyzes
the asymmetric condensation of two ALA to form porphobilino-
gen, also accumulated at a somewhat higher level in M chloro-
plasts. We identified the Mg-chelatase subunit I (TC223168),
similar to Mg-chelatase I-2 from Arabidopsis (At5g45930.1),
several enzymatic steps further downstream in the chlorophyll
biosynthesis pathway. This enzyme showed a strong preferential
M accumulation (BS:M 0.19), likely reflecting the higher demand
of chlorophylls due to photosystem II (PSII) accumulation.
Defense
Hydroxamic acids (Hx) possess antifungal and insecticidal prop-
erties and are abundantly accumulating in rye (Secale cereale),
wheat (Triticum aestivum), and maize cell walls as a glucoside-
linked precursor (Hx-glc) (Niemeyer, 1988). Upon tissue damage,
theb-D-glucosidases come in contact withHx-glc and release the
Hx that can be converted into a benzoxalolinone. IMBOA (2-O-b-
D-glucopyranosyl-4-hydroxyl-7-methoxy-1,4-benzoxazin-3-one)
is the main Hx-glc in maize and wheat.
Each of the three quantification methods used in this study
showed that b-D-glucosidase (TC220472) accumulates at much
higher levels in BS chloroplasts (BS:M ratio >6.7). This is in
agreement with previous observations showing that b-D-glucosi-
daseswere found inmaize plastids and proplastids of the BS cells
(Nikus and Jonsson, 1999; Nikus et al., 2001). Although the major
role of b-D-glucosidase was attributed to defense, it was also
suggested to play a role in development and growth regulation,
since transient expression of maize b-D-glucosidase in tobacco
(Nicotiana tabacum) protoplasts was able to release cytokinin
from an inactive cytokinin-O-glucoside (Brzobohaty et al., 1993).
Proteins Involved in Redox Regulation
Ferredoxins are not only essential in linking thylakoid-localized
photosynthetic electron transport to NADPH production via Fd-
NADPþ reductases (FNR), but also provide redox equivalents
to the different thioredoxins (Trxf, -m, -x, and -y) via Fd-Trx
reductase. These different Trx regulate several plastid-localized
pathways by changing the redox state of thiol groups
(S-S</2SH) (Buchanan and Balmer, 2005).
We identified and quantified both Fd1 (TC220059 and
TC238105) and Fd2 (TC223586). Fd1 accumulated predomi-
nantly in the M chloroplast (twofold to fivefold), while Fd2
accumulated predominantly in the BS chloroplast (threefold to
fourfold). This is in agreement with transcript analysis of Fd1 and
Fd2 (Matsumura et al., 1999; Furumoto et al., 2000). Preferential
accumulation of Fd2 in BS chloroplasts was shown by immuno-
blots, while Fd1 was found to be equally distributed over both
chloroplast types (Kimata andHase, 1989). It seems that Fd1 and
Fd2 have evolved to interact with different partners. They
possess similar redox potentials but have different Km values
for interaction with FNR, suggesting different cellular functions.
Indeed, expression of maize Fd1 in Fd-deficient strains of
cyanobacteria (Plectonema boryanum) led to a high light sensi-
tive phenotype, while the strain expressing Fd2 showed a nitro-
gen deficiency phenotype (Kimata-Ariga et al., 2000).
We identified and quantified BS and M expression ratios for
three FNR identifiers: TC219223, TC219224, and TC219226. All
three sequences were similar to Arabidopsis FNR-2. All of them
(FNR: TC219223, TC219224, and TC219226) showed a prefer-
ential localization in M chloroplasts (from twofold up to seven-
fold). This is consistent with previous M localization of an FNR
protein by rocket electrophoresis (Broglie et al., 1984).
TheTrx play an important role in redox regulation (activation and
deactivation) of many biosynthetic and other activities in plastids
(Balmer et al., 2004). The distribution of the different Trx between
the M and BS chloroplasts has not been reported earlier, which is
somewhat surprising given the central role of the Trx in regulating
chloroplast function. Based on their closest homologs in Arabi-
dopsis, we identified and quantified Trx-m2, Trx-m4, and Trx-f2.
For Trx-m4 (TC221334) and Trx-m2 (TC228810), only common
peptides were identified showing their preferential accumulation
in theM chloroplast (2.6 to 4). In the 2-DE spot 348 (only present in
M stroma), Trx-f2 (TC220464) was identified; however, its quan-
tification could not be exclusively determined as it comigrated
with Trx-m4 (TC221334). The non-gel-based methods quantified
unique peptides for two other Trx-m4 isoforms (TC238760 and
TC224103), which showed preferential accumulation in M (BS:M
ratio 0.45) and BS (BS:M ratio 2.4), respectively (Table 2; see
Supplemental Table 4 online).
Proteins Involved in Detoxification of Reactive
Oxygen Species
Chloroplasts have an elaborate enzymatic system to detoxify
different reactive oxygen species (ROS), such as superoxide,
hydrogen peroxide, and lipid peroxides. M chloroplasts have high
rates of linear photosynthetic electron transport and high pro-
duction rates of molecular oxygen through the water-splitting
activity of PSII, whereas BS chloroplasts only carry out cyclic
electron flow. It is thus quite likely that there are substantial
differences in the quantity and quality of ROS in these two
chloroplast types. However, differential expression levels of the
BS and M chloroplast ROS defense systems are unknown. We
quantified the BS/M chloroplast expression of Cu-Zn superoxide
dismutase (SOD), glutathione disulfide reductase (GR), and several
peroxiredoxins (Prx). GR (TC227052) and Cu-Zn SOD (TC237182)
each accumulated in M and BS chloroplasts. We observed an
equal distribution of GR over both plastid types. Both gel-based
and non-gel-based analysis suggested that the BS:M expression
ratio of CuZn SOD (TC237182) was between 0.4 and 0.7.
Several studies tried to measure SOD activity in BS and M
maize cells (but not in purified chloroplasts), with inconsistent
3128 The Plant Cell
results between the different studies (Foster and Edwards, 1980;
Doulis et al., 1997). Possibly this is due to the presence of
different SOD homologs and different isolation procedures.
Comparisons between the total maize leaf extracts and rapid
M sap extractions showed that glutathione (Burgener et al.,
1998), dehydroascorbate reductase, and GR were localized in
the M, while ascorbate peroxidase was found in the total
leaf extracts (Doulis et al., 1997). As GR mRNA was distri-
buted in both compartments, a translational regulation mecha-
nism of differential expression was proposed (Pastori et al.,
2000).
Prx are Trx-dependent peroxidases that have a capacity to
scavenge peroxides. They constitute an antioxidant system that
operates in parallel to the ascorbate-glutathione system (re-
viewed in Dietz, 2003). In Arabidopsis, four types of Prx are
targeted to plastids (Prx IIE, PrxQ, 2-Cys PrxA, and 2-Cys
PrxB). We quantified the expression of maize EST products
2-CysPrx-TC234345 and 2-CysPrx-TC234346, which both
showed high degrees of similarity to Arabidopsis 2-Cys PrxB
(At5g06290.1), and TC223042, which was closest to Prx IIE
(At3g52960.1). Both 2-Cys Prx (TC234345 and TC234346) and
Prx IIE (TC223042) accumulated preferentially in M chloroplasts
(1.8- up to 7-fold). The2-CysPrxwere also identifiedon2-DEgels
in a small train of spots (spots 362, 459, and 125), migrating in the
region between 47 and 53 kD at about twice the expected
molecular mass (of 26 kD). These spots represented likely 2-Cys
Prx dimers, despite the denaturing conditions of the 2-DE gel.
The basic oligomeric state of Prx is a dimer that under reducing
conditions can assemble into larger 2-Cys Prx oligomers (Konig
et al., 2002). To our knowledge, the distribution of the different
Prx homologs overM andBS chloroplasts was not determined in
published literature. The preferential accumulation of Prx pro-
teins in the M chloroplasts is consistent with the high linear
electron flow and production of active oxygen species, such as
H2O2 (Doulis et al., 1997) in M chloroplasts. A wide range of
electron donors has been shown to interact with Prx. Some Prx
can accept electrons from both Trx and glutaredoxins (Rouhier
et al., 2001), whereas others can only use Trx as electron donor. It
is interesting to note that the preferential expression of
Prx (TC223042, TC234346, and TC234345) in M is correlated
with the expression in M chloroplasts of two isoforms of Trx
(TC238760 and TC221334) and one glutaredoxin (TC225992,
3.5-fold).
Chloroplast Chaperones, Isomerases, and Proteases
The two major housekeeping chloroplast chaperone families
(Cpn60/20 and Hsp70/GrpE) were relatively abundant on the
2-DE gels. The Cpn60/20 complex is composed of three types of
proteins, namely Cpn60a and Cpn60b (homologs to Escherichia
coliGroEL) and Cpn20 (homolog to E. coliGroES). The identified
Cpn60a homologs (TC220350, TC235184, and TC236031),
Cpn60-b (TC219523 and TC219522), and Cpn20 (TC233810
and TC236117) all showed an equal distribution between M and
BS chloroplasts, with BS:M ratios between 1 and 1.4. This clearly
shows that the Cpn60/20 chaperone system is not exclusively
functioning in Rubisco assembly (since Rubisco is absent in M
chloroplasts).
We identified two highly homologous HSP70 homologs
(TC220215 and TC235785). In the cICAT and 2-DE gel analysess,
we were not able to distinguish the BS:M expression ratio for
each of the HSP70 proteins individually. Collectively, their BS:M
expression ratio ranged between 0.9 and 5.8, depending on the
quantification method and protein spot. However, in the parallel
LC-based quantifications, we were able to determine the BS:M
expression ratios for each of the two homologs. This showed an
equal distribution for HSP70-TC220215 and a strong (sixfold)
preferential expression of HSP70-TC235785 in the M chloro-
plasts. It is noteworthy that one of the interacting partners of
HSP70, the GrpE (TC222867) also showed a fivefold preferential
M expression. This result is consistent with a previous sorghum
cDNA library screening where HSP70 expression ranged from
1 up to 10 inM cells (Wyrich et al., 1998). This result suggests that
besides the expression of chaperones in both plastid types as
housekeeping proteins, HSP70-TC235785 seems to have a spe-
cific function in M chloroplasts.
Proteome analysis of chloroplasts in Arabidopsis showed
accumulation of a relatively large number of protein peptidyl-
prolyl cis-trans isomerases of different categories,many of which
seem localized in the thylakoid lumen (Peltier et al., 2002;
Schubert et al., 2002). Here, we identified and quantified BS:M
expression ratios of three of these lumenal isomerases, appar-
ently released into the chloroplast stroma. Tlp21-TC228225 and
Tlp40-TC239826, homologs to the cyclophylins Tlp21 and Tlp40,
both showed a BS:M expression ratio of 0.5 in the 2-DE gel
experiments. FK506-TC247336, a homolog of Arabidopsis
At5g45680 assigned FKBP13, was preferentially expressed in
the BS chloroplasts (BS:M¼ 5). FKBP13 was found in yeast two-
hybrid experiments as interacting with the cytochrome b6f
complex Rieske subunit (Gupta et al., 2002).
Interestingly, we also quantified the expression ratio of ClpC-
TC235372, a homolog of the HSP100 ClpC chaperone family.
The BS:M expression ratio was 0.4. ClpC1 in Arabidopsis accu-
mulates in the stroma likely delivering substrate to the Ser-type
ClpP/R protease complex, while an envelope-associated form is
involved in protein import. We also quantified two ClpP proteins
(TC245457 and TC225197) with BS:M ratios ranging from 0.3
to 0.59. The alignment of TC245457 and TC225197 with the
members of the ClpP/R family in Arabidopsis did not identify
clear-cut homologs.
Plastid Protein Expression
Both BS and M chloroplasts contain the same plastid genome
(with 104 genes), encoding for four rRNAs and 30 tRNAs and
some 70 proteins involved in plastid gene expression (e.g.,
ribosomal proteins, tRNA synthetases, etc.) as well as photo-
synthesis (RBCL and thylakoid proteins) (Maier et al., 1995).
Expression of these plastid genes likely involves hundreds of
nuclear-encoded proteins, each imported into the chloroplast
(reviewed in Barkan and Goldschmidt-Clermont, 2000).
We quantified BS/M expression for seven plastid ribosomal
proteins. Ribosomal protein L1 (TC219835) was equally ex-
pressed in both compartments, while L12.1 (TC222916), S1
(TC221841), S5 (TC239133), and L10 (TC224551) predominantly
or exclusively accumulated in M chloroplasts. This suggests that
Comparing Bundle Sheath and Mesophyll Chloroplast Proteomes 3129
70S ribosomes in M and BS chloroplasts are different in com-
position, in agreement with differential accumulation of chlo-
roplast L2 in an earlier study (Zhao et al., 1999).
Homologs to Arabidopsis plastid-specific ribosomal proteins
PSRP2 (TC238798) and polyprotein of Ef-Ts (PSRP7-EF-Ts fusion
protein; TC226754) were preferentially expressed in the M chloro-
plasts, with BS:M ratios of 0.29 and 0.14, respectively. It was
proposed that PSRP2 is part of a plastid translational regulatory
module on the 30S ribosomal subunit structure for the possible
mediation of nuclear factors on plastid translation (Yamaguchi
et al., 2000). We identified TC226754 as a 125-kD protein on the
2-DE gels. It is likely a homolog of a polyprotein of Ef-Ts gene
originally described inChlamydomonas reinhardtii asa single-copy
gene containing PSRP-7 and EF-Ts sequences (Beligni et al.,
2004). Translation of this gene resulted in a 110-kD pro-protein,
and the majority of this protein was likely posttranslationally
processed into the 65-kD protein PSRP-7 and a 55-kD EF-Ts.
OurMSdata for this protein coveredboth theN- and theC-terminal
parts containing the PSRP7 and EF-Ts sequences, respectively.
We did not identify the 65- and 55-kD maturation products.
We found an equal BS/M distribution of a ribosome recycling
factor (TC237618). In E. coli, it is implicated in the disassembly
of the post-termination complex (Kaji et al., 1998), and a spinach
(Spinacia oleracea) homolog was identified in chloroplasts
(Rolland et al., 1999). An equal M and BS distribution was also
observed for the elongation factor P (TC237934), which was
shown to be an essential gene in E. coli (Aoki et al., 1997).
Surprisingly, elongation factor G (TC222353) was expressed up
to eightfold higher in the M than in BS chloroplasts. We identified
one or two abundant elongation factors Tu, matching four ESTs
(TC222181, TC226641, TC222182, and TC220034). Expression
was twofold to sixfold higher in the M chloroplasts than in BS
chloroplasts. Its high abundance as judged from the 2-DE gels
suggested a role in addition to translation elongation. Indeed,
elongation factor Tu has been characterized in maize as a heat-
inducedmolecular chaperone, in addition to its role in translation
(Bhadula et al., 2001; Rao et al., 2004).
In addition, searching the MS data against the maize genomic
sequences (in AZM) identified a protein encoded by CF646019
(and AZM4_135414) similar to Arabidopsis CSP41, which was
characterized as an mRNA binding protein in spinach chloro-
plasts with endoribonuclease activity (Yang et al., 1996) and is
a homolog of C. reinhardtii RAP41 ribosome-associated protein
(Yamaguchi et al., 2003). The expression of CSP41 (CF646019,
AZM4_135414) shows a small preference for the BS chloroplasts
(BS:M ratio ¼ 1.8-fold).
We identified two abundant stromal ribonucleoproteins, CP31
(TC235457 and TC235458) and CP33 (TC236626). Their pro-
posed role is to protect mRNAs that are not engaged in trans-
lation (Nakamura et al., 2001). Their accumulation levels were
1.8- to 3-fold higher in M chloroplasts.
Proteins with Unknown Function
We could not assign any obvious function (Table 2) to a dozen
quantified proteins. Here, we just highlight a few of these
proteins. We identified a tetratricopetide repeat (TPR) protein,
TC238048, with an average BS:M accumulation ratio of 0.29. It is
an homolog of the gene called Shoot1 of unknown function in
Glycine max (Karakaya et al., 2002) and was quite abundant on
the 2-DE gels (Figure 3). TPR proteins have been associated with
numerous functions (Das et al., 1998). Characterized TPR
proteins in the chloroplast play a role in stabilization of chloro-
plast mRNA (Vaistij et al., 2000; Felder et al., 2001) or in
photosystem I assembly (Boudreau et al., 2000). TC236586
with a DUF149 motif with unknown function, TC220484 with an
oxidoreductase or aldo/keto reductase domain, and TC222257
with an oxidoreductase NAD binding domain each accumulated
with a BS:M ratio of 0.3. TC220929 with a DUF299 domain was
predominantly expressed in M chloroplasts (BS:M ratio of 0.04)
and is probably unique to M chloroplasts. The expression of
TC238795 with similarity to inositol monophosphatase was five
times higher in BS than in M chloroplasts. TC235613 showed
a preferential (twofold or sevenfold) expression in the M chloro-
plast and was similar to a 3-b-hydroxy-d5-steroid dehydro-
genase, probably associated with steroid metabolism. Its
Arabidopsis homolog (At2g37660) was identified numerous
times in proteome analyses of thylakoids and stroma (see
PPDB). On the BS side, we found in two spots (BS:M ratio ¼2.9 and only found in BS) the unknown protein TC227295
containing the Qor motif (for NADPH quinone reductase and
related Zn-dependent oxidoreductases) similar to At1g23740.
Peripheral and Lumenal Thylakoid Proteins Involved
in Photosynthesis
The BS and M stromal analysis also identified several abundant
members of the oxygen evolving complex of PSII (OEC16
[TC219937 and TC238011], OEC23 [TC235206 and TC235205],
and OEC33 [TC233304]) and plastocyanin (TC219293 and
TC219295) (see Supplemental Table 4 online). They are located
on the lumenal side of the thylakoid membrane and were re-
leased into the stroma during chloroplast lysis. Their preferential
accumulation in the M chloroplasts is consistent with the low but
detectable accumulation levels of PSII in the BS chloroplasts
(Meierhoff andWesthoff, 1993; Bassi et al., 1995). In this context,
it is interesting to mention the identification of TC230967, the
maize homolog of the Arabidopsis HCF136 protein in M chloro-
plasts. HCF136 is specifically involved in PSII assembly (Meurer
et al., 1998), and its identification in M chloroplasts is consistent
with its specialized role.
DISCUSSION
This article presents an extensive quantitative comparative
analysis of cell-specific chloroplast proteome differentiation in
maize, in which new quantitative protein profiling techniques
were implemented and the data integrated with the published
literature using various measures of enzyme activity as well
as transcript accumulation. We provide an overview of the
differential protein accumulation in the stroma of BS and M
chloroplasts and identified some 400 proteins (ZmGI accessions)
with few obvious nonchloroplast contaminants, covering a wide
range of pathways and functions. After a brief comparison of
the three comparative proteomics methods, we will focus this
3130 The Plant Cell
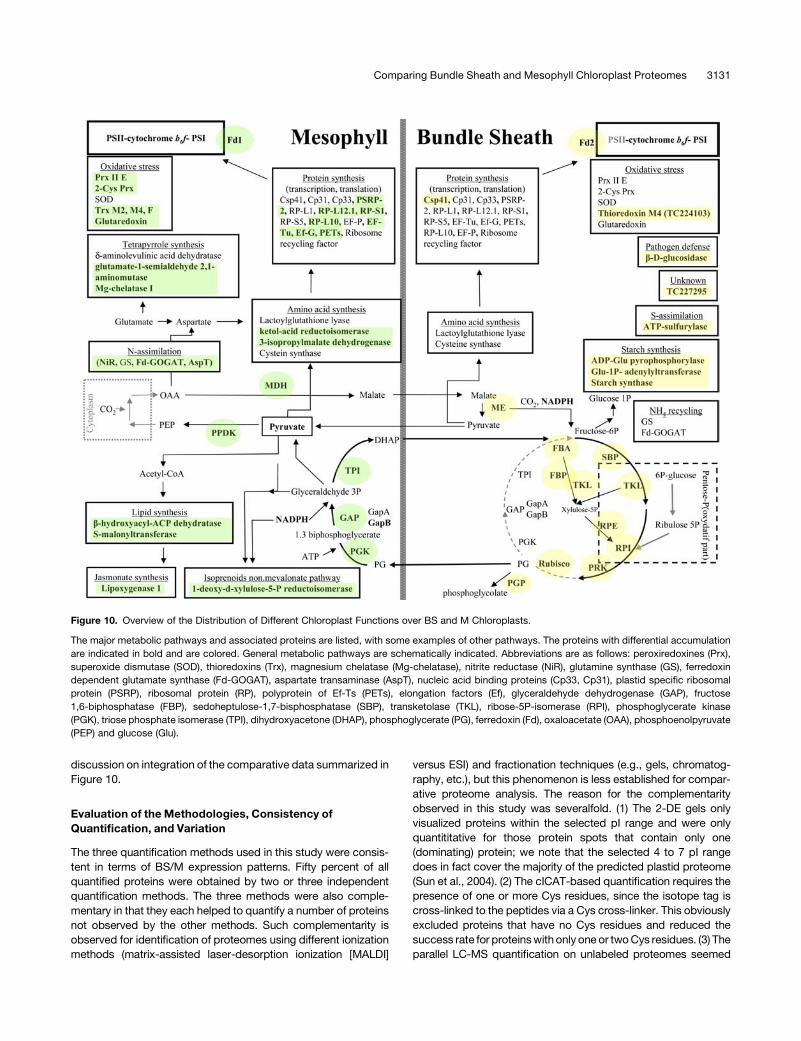
discussion on integration of the comparative data summarized in
Figure 10.
Evaluation of the Methodologies, Consistency of
Quantification, and Variation
The three quantification methods used in this study were consis-
tent in terms of BS/M expression patterns. Fifty percent of all
quantified proteins were obtained by two or three independent
quantification methods. The three methods were also comple-
mentary in that they each helped to quantify a number of proteins
not observed by the other methods. Such complementarity is
observed for identification of proteomes using different ionization
methods (matrix-assisted laser-desorption ionization [MALDI]
versus ESI) and fractionation techniques (e.g., gels, chromatog-
raphy, etc.), but this phenomenon is less established for compar-
ative proteome analysis. The reason for the complementarity
observed in this study was severalfold. (1) The 2-DE gels only
visualized proteins within the selected pI range and were only
quantititative for those protein spots that contain only one
(dominating) protein; we note that the selected 4 to 7 pI range
does in fact cover the majority of the predicted plastid proteome
(Sun et al., 2004). (2) The cICAT-based quantification requires the
presence of one or more Cys residues, since the isotope tag is
cross-linked to the peptides via a Cys cross-linker. This obviously
excluded proteins that have no Cys residues and reduced the
success rate for proteinswithonly one or twoCys residues. (3) The
parallel LC-MS quantification on unlabeled proteomes seemed
Figure 10. Overview of the Distribution of Different Chloroplast Functions over BS and M Chloroplasts.
The major metabolic pathways and associated proteins are listed, with some examples of other pathways. The proteins with differential accumulation
are indicated in bold and are colored. General metabolic pathways are schematically indicated. Abbreviations are as follows: peroxiredoxines (Prx),
superoxide dismutase (SOD), thioredoxins (Trx), magnesium chelatase (Mg-chelatase), nitrite reductase (NiR), glutamine synthase (GS), ferredoxin
dependent glutamate synthase (Fd-GOGAT), aspartate transaminase (AspT), nucleic acid binding proteins (Cp33, Cp31), plastid specific ribosomal
protein (PSRP), ribosomal protein (RP), polyprotein of Ef-Ts (PETs), elongation factors (Ef), glyceraldehyde dehydrogenase (GAP), fructose
1,6-biphosphatase (FBP), sedoheptulose-1,7-bisphosphatase (SBP), transketolase (TKL), ribose-5P-isomerase (RPI), phosphoglycerate kinase
(PGK), triose phosphate isomerase (TPI), dihydroxyacetone (DHAP), phosphoglycerate (PG), ferredoxin (Fd), oxaloacetate (OAA), phosphoenolpyruvate
(PEP) and glucose (Glu).
Comparing Bundle Sheath and Mesophyll Chloroplast Proteomes 3131
limited to the more abundant proteins but does not require any
Cys residues. (4) Lower-abundance proteins with a near exclusive
presence in either BS or M chloroplasts could not easily be
quantified by the non-gel-based methods due to the relative
complexity of the proteomes. By contrast, quantification of such
proteins was possible and accurate on 2-DE gels in less complex
regions of the gels. The MS analysis was sensitive enough to
identify these low abundant proteins because of the strongly
reduced complexity of proteins in gel spots.
In terms of BS:M expression ratios, we observed in a number
of cases that the non-gel-based methods gave more pro-
nounced ratios, indicating a stronger BS/M proteome differen-
tiation than the 2-DE gel analysis. The reason is primarily that we
used the highest quality BS andMpreparation (with;5%cross-
contamination) for the non-gel-based methods. This was done
because these non-gel-based methods required less protein
material (e.g., for parallel LC-MS, only 20 to 40 mg per sample),
and the BS and M preparations of highest purity had the lowest
yield. In a few cases (marked with an asterisk in Table 2 and
Figures 6 to 9), we observed more variation in BS:M ratios,
primarily because two isoforms or homologs could not be
quantified separately in one or all of the quantification methods
used. In case of 2-DE gel-based quantification, we also observed
variation due to differential protein modifications.
We were pleased to find that our differential proteome expres-
sion data were generally consistent with published differential
enzymatic activity data, transcript data, and immunoblots and in
situ immunolocalization. This provided confidence in the signif-
icance and accuracy of our differential protein expression data.
General Conclusions for BS and
M Chloroplast Differentiation
Five general conclusions can be extracted from the comparative
proteomics data. First, many differences in metabolic differen-
tiation can be explained as being driven by the production of
NADPH in the M chloroplasts and a relative shortage of reducing
equivalents in the BS chloroplasts. For instance, proteins in-
volved in lipid biosynthesis and nitrogen import are primarily
located inM chloroplasts, in addition to preferential M location of
Calvin cycle enzymes involved in triose phosphate reduction.
Second, many plastid functions are not exclusively located in
one chloroplast type or the other, with some exceptions, such as
b-D-glucosidase (TC220472) (BS:M >10) and LOX1 (AW157962,
TC234252, TC237970, and TC237971). Third, differential accu-
mulation occurred in a number of cases by differential expression
of homologs within gene families; for instance, Fd1 (TC220059
and TC238105) accumulates mostly in M chloroplasts, while Fd2
(TC223586) accumulates mostly in BS. Fourth, our data set
provides clear evidence for differential regulation of plastid gene
expression, protein biogenesis, and protein fate. This is a rela-
tively understudied area. The differential accumulation of VIPP1
(TC220737; high in M), for example, could help to accelerate our
understanding of plastid protein biogenesis and the specific role
of such proteins. Finally, we found several proteins of unknown
function (e.g., KiwiFruit protein [TC222257] and Shoot1
[TC238048]), for which the relatively high abundance on the
2-DE gels suggested their participation in central functions, while
their differential BS/M expression indicated their specialization.
The role of these proteins in C4 metabolism awaits investigation.
In the remainder of this discussion, we integrate our observa-
tions in three parts, as follows: (1) differentiation of metabolic
functions, (2) differentiation of redox regulation and antioxidative
defense, and (3) differentiation of plastid gene expression and
protein biogenesis/homeostasis. An overview of the observa-
tions and their connections are provided in Figure 10. All data are
integrated in the PPDB and are linked to sequence and proteo-
mics data from Arabidopsis.
Differentiation of Metabolic Chloroplast Functions
The C4 malate-pyruvate shuttle provides the net influx pathway
for carbon from M to BS but only half of the required reducing
equivalents for the Calvin cycle. The other half of the reducing
equivalents needed for the Calvin cycle is provided through the
triose phosphate shuttle. Our proteomics data are in agreement
with earlier established differential localization and/or enzyme
activities of these shuttles. Our study now provides specific
ZmGI and AZM gene identifiers for these enzymes. Surprisingly,
accumulation levels of triose phosphate isomerase (TC233907,
TC233905, TC233906, and TC233912) are consistently (with all
three proteomicsmethods)much higher inM chloroplasts than in
BS chloroplasts. This suggests that theM-localized triose shuttle
should be viewed as part of the BS-localized Calvin cycle rather
than being viewed as an MS-localized shuttle operating in
parallel to an exclusively BS-localized Calvin cycle. Our data
also suggest that at least one GAPDH-B (TC234510) isoform
(homolog) plays a more prominent role in M chloroplasts as part
of the triose phosphate shuttle (or, less likely, in glycolysis).
As expected, the Calvin cycle–specific enzymes (Rubisco,
PRK, and SBP) and CP12 [involved in assembly and (de)activa-
tion of PRK and GAPDH in C3 chloroplasts; Wedel et al., 1997]
and Rubisco activase have high BS:M expression ratios. The
differential accumulation of CP12 is an excellent tool to further
define its role in regulation of carbon metabolism. Starch bio-
synthetic enzymes have higher accumulation levels in BS, which
is a logical consequence of M localization of the Calvin cycle and
is in agreement with earlier observations.
The possibility of an alternative NAD-ME C4 like pathway in
maize (in addition to the established NADPþ-ME C4 pathway)
has been raised (Chapman and Hatch, 1981; Furumoto et al.,
1999; Wingler et al., 1999), in which Asp could serve as the
carbon carrier instead of malate, with AspT converting oxaloac-
etate into Asp (and several other differences). We did observe
a preferential accumulation of AspT (TC219944) in M. It is
conceivable that AspT participates in carbon transport, initiated
not as postulated in the NAD-MEC4 pathway in the cytoplasm of
the M cells (Hatch and Mau, 1973), but in chloroplasts. In this
way, AspT could remove excess OAA from its main flow in
situations where the MDH or the pool of malate was saturated.
Virtual lack of linear photosynthetic electron transport in BS
thylakoids and high rates of linear electron transport in M
thylakoids lead to an imbalance in supply and demand for
NADPH (reducing equivalents) between the two chloroplast
types. Many observed differences in metabolic differentiation
outside of primary carbon metabolism can essentially be
3132 The Plant Cell
explained as being driven by this imbalance of redox equivalents.
For instance, nitrogen import is a highly demanding pathway for
energy (ATP) and reductive power (NADPH). Correspondingly,
we observed NiR (TC222347 and TC222348), GS (TC220868),
and Fd-GOGAT (TC236410) involved in the conversion of nitrite
into Glu preferentially expressed in M chloroplasts. As a possible
consequence of M-localized N-assimilation and availability of
pyruvate as carbon backbone, we quantified several enzymes in
Leu/Val synthesis (using pyruvate as carbon metabolite) and
Asp/Thr (using oxaloacetate and Glu) with preference for M
choroplasts (Figure 7). The preferred nitrogen assimilation into
Glu in M cells also connects well with our observation that the
enzyme Glu-1-semialaldehyde aminotransferase (TC227768) is
preferentially located in the M chloroplasts. The high M accu-
mulation ratio of Mg-chelatase subunit I (TC223168) suggests
that overall chlorophyll synthesis rates are higher in the M
chloroplasts, possibly to accommodate the high number of
chlorophyll molecules in M-specific PSII.
The de novo fatty acid biosynthesis in plants is located in the
chloroplast, whereas lipid biosynthesis is shared between dif-
ferent organelles, including chloroplasts (e.g., Ohlrogge and
Browse, 1995; Ohlrogge and Jaworski, 1997). Reports about
the differential contribution of BS andM cells and chloroplasts in
fatty acid and lipid biosynthesis are scarce. Our finding that at
least a part of the lipid biosynthesis pathway is located prefer-
entially in M is consistent with the energy requirements of fatty
acid biosynthesis. It is inMchloroplasts that reductive power and
the carbon precursors like pyruvate and malate are present in
abundance. The observation for preferential M accumulation of
two lipoxygenases, LOX1 and LOX2 (AW157962, TC234252,
TC237970, and TC237971), is intriguing and warrants further
examination.
Differentiation of Redox Regulators and Antioxidative
Defense Systems
Redox regulation plays a central role in many plastid functions,
and chloroplasts undergo tremendous changes in redox poten-
tial during the day/night cycle and during variation in metabolic
demand for NADPH and ATP. The production of ROS is tightly
intertwined with this redox balance (Baier and Dietz, 2005). A
multilayered anti-ROS detoxification system is in place in chloro-
plasts. These antioxidative systems and redox regulators and
their connectivity have received lots of attention in Arabidopsis
chloroplasts and other C3 species, as also evidenced by recent
reviews on ROS (Noctor and Foyer, 1998; Mittler et al., 2004), Trx
(Buchanan and Balmer, 2005; Gelhaye et al., 2005), and Prx
(Dietz, 2003). The differentiation of maize BS and M chloroplasts
in photosynthetic electron transport and carbon metabolism
adds another level of complexity and dynamism.
We quantified two different Fds (Fd1 and Fd2), several FNRs,
at least four Trx (Trx-f, Trx-m2, and two isoforms/homologs of
Trx-m4), Fd-Trx reductase, components of the gluthatione de-
fense system (gluthatione S-transferase and glutaredoxin), most
known chloroplast Prx (Per II-E, 2-Cys PrxA, and 2-Cys PrxB),
and Cu-Zn SOD. Expression levels for these different compo-
nents were generally higher in M chloroplasts, with the exception
of glutathione reductase and CuZn-SOD, each quite equally
distributed over M and BS chloroplasts and a BS-specific
isoform of Fd (Fd2) and Trx-m4. The novel observation of the
preferential localization of two types of Prx inM raises interesting
questions regarding the role and specificity of Prx.
Future challenges and questions in this area are severalfold.
For instance, has the redox regulatory system adapted to the
different redox states in BS and M chloroplasts? Do different
isoenzymes/homologous proteins in metabolism with different
BS/M expression levels have different redox activation levels?
ROS seems to be emerging as an important signaling molecule
(Apel and Hirt, 2004; Mittler et al., 2004). Does ROS contribute in
BS/M development and/or gene regulation to maintain BS/M
differentiation status? We believe that this comparative pro-
teome analysis provides experimental starting points to address
these questions.
Differentiation of Plastid Gene Expression and Protein
Assembly and Fate
The comparison between protein machineries of BS and M
chloroplast gene expression and chloroplast protein biogenesis/
homeostasis provides a tool to understand many unresolved
questions in this area. In particular it will be important to study (1)
the influence of redox state on plastid gene expression since the
two plastid types have such a different NADPH/NADPþ status
and (2) the biogenesis of PSII and Rubisco, for example, since
they each accumulate only or predominantly in one chloroplast
type. The BS/M differentiation could narrow down the roles of
proteins with unknown function, such as mRNA binding proteins
and VIPP1, and also help to determine if regulators and chap-
erones, for example, are specific to particular complexes, such
as HCF136 (Meurer et al., 1998).
The plastid genome encodes ;50 proteins of the photosyn-
thetic apparatus, of which 14 are PSII subunits, in addition to
ribosomal subunits, four RNA polymerases (phosphoenolpyr-
uvate), a Clp protease, and a few others (Maier et al., 1995).
These 14 PSII subunits are highly abundant in M chloroplasts.
PSII has also been shown (mostly in C3 species) to be particularly
prone to photooxidative damage, requiring high protein synthe-
sis rates for repair of the chloroplast-encoded reaction center
protein D1 (Baena-Gonzalez and Aro, 2002). It is therefore likely
that overall protein synthesis rates are much higher in M than in
BS chloroplasts. Indeed, several ribosomal proteins were only
identified in M chloroplasts and likely escaped identification in
BS chloroplasts, indicative of generally higher accumulation
levels of 70S ribosomes in M chloroplasts. We identified a num-
ber of proteins that preferentially accumulated in M chloroplasts,
such as Ef-G (TC222353) and the PRSP7-Ef-Ts fusion protein
(TC226754), which could fulfill M chloroplast-specific functions
or are simply accommodating these higher translation rates.
In addition to plastid-encoded proteins, chloroplasts accumu-
late a few thousand nuclear-encoded proteins imported from the
cytosol. It appears that the protein folding, assembly, and
degradation machinery in the chloroplast stroma generally
accommodates both chloroplast- and nuclear-encoded pro-
teins. The accumulation pattern of the DnaK/DnaJ system or
HSP70/GrpE was interesting in that one HSP70 homolog
(TC220215) showed an equal distribution between BS and M
Comparing Bundle Sheath and Mesophyll Chloroplast Proteomes 3133
chloroplasts, whereas the other HSP70 (TC235785) homolog
and GrpE (TC222867) were clearly much higher in M chloro-
plasts. Interestingly, in the green alga C. reinhardtii, a HSP70/
GrpE pair has been implicated in protection and repair of PSII, in
particular under light stress conditions (Schroda et al., 1999).
This would be the simplest explanation for their low BS:M ratio in
maize chloroplasts.
The central focus of this article is to obtain a better under-
standing of the functional differentiation of BS and M chloro-
plasts. It is well established that BS and M cells and their
respective chloroplasts each contain complementary sets of
proteins facilitating C4 photosynthesis (for reviews, see Sheen,
1999; Miyao, 2003). However, it is less clear to what extent other
chloroplast functions differentiate. This study brings a quantita-
tive overview of differentiation not only of C4 functions but, most
importantly, provides new insights in differentiation of other
plastid functions. Moroever, the data set is robust, in particular
since nine independent biological (pairwise) samples were
analyzed. These data, including details of peptide sequences
used for identification, are integrated into PPDB, along with
several hundred additional maize chloroplast proteins that were
identified but not quantified.
METHODS
Maize Genotype, Plant Growth, and Purification of BS and
M Chloroplast Stroma
WT-T43 maize (Zea mays) plants were grown for 14 d in the growth
chamber (16 h light/8 h dark, 400 mmol photons�m�2�s�1) until the 4th leaf
was emerging. A new procedure for purification of M and BS chloroplasts
was developedbased on suggestions fromA. Barkan andR. Bassi and on
published protocols (Edwards and Black, 1971; Kannangara et al., 1977).
The top 4-cm sections of the 2nd and 3rd leaves were harvested ;2 h
after the onset of the light period. Several hundreds of leaf tips (;80 g of
fresh tissue) were cut into 5- to 10-mm slices and gently ground by pestle
and mortar in grinding buffer containing (350 mM sorbitol, 50 mMHepes-
KOH, pH 8, 2 mM EDTA, 5 mM ascorbic acid, and 5 mM L-cystein). The
tearing effect applied by the pestle was sufficient to break M cells and
release the M chloroplasts into the grinding buffer solution without
excessively damaging the BS strands. The residual M cells attached to
BS strands were removed by 10min of blending (one-third of themaximal
speed) in a modified Warring blender (WB1) with blunt blades. The purity
of the BS strands was at this step assessed by light microscopy. After
a wash with grinding buffer solution, the BS chloroplasts were released
into the grinding buffer solution by short (2 s) high-speed pulses in
a second modified Warring blender (WB2) in which the original blades
were replaced by razor blades (as described in Kannangara et al., 1977).
Subsequently, chloroplasts were further isolated, and the stromal pro-
teome was released by osmotic shock, followed by removal of thylakoid
and envelope membranes by ultracentrifugation, similarly as described
by Peltier et al. (2004b). The cross-contamination of M and BS chloro-
plasts fractions was assessed from the presence of the M and BS
markers (PPDK and Rubisco, respectively) visualized on Coomassie
Brilliant Blue or silver-stained 1-DESDS-PAGEgels. Chloroplast fractions
showing <15% of cross-contamination were used, with the majority
having a contamination of ;10%. The yield of chloroplast preparations
was inversely proportional to their purity. On average, preparations with
<15% cross-contamination yielded ;300 mg of protein for each M and
BS fraction.
1-DE and 2-DE Gel Electrophoresis and Protein Gel Blotting
For 1-DE SDS-PAGE separation, proteins were equilibrated with SDS
(0.2%), Na2CO3 (100 mM), DTT (100 mM), and sucrose (10%) and
separated on 12% Tricine gels (Schagger and von Jagow, 1987). Gels
were stained with fluorescent Sypro Ruby stain (Molecular Probes) or
silver nitrate (Rabilloud et al., 1994). Protein gel blot analysis with
polyclonal rabbit antisera and monoclonal mouse serum using chemo-
luminescence was essentially performed as described earlier (Friso et al.,
2004).
Comparative BS and M Stromal Proteome Analysis by 2-DE
Purified M and BS stromal proteomes were first separated based on
isoelectric point on IPG strips (150 mg of protein/strip), followed by
a second dimension separation of SDS-PAGE. 2-DE-IPG was performed
on 11-cm Immobiline Dry strips (Amersham Biosciences). Protein con-
centrations were determined by the Bradford method (Bradford, 1976).
The IPG strips were rehydrated overnight with 150 mg of proteins
solubilized in 9 M urea, 4% 3-([3-cholamidopropyl]dimethylammonio)-
1-propane-sulfonate, 2 mM tributylphosphine, 2% pharmalyte, pH 4.0 to
7.0, 0.5% Triton X-100, and a few crystals of bromophenol blue (to
evaluate the uniformity of the rehydration) in a reswelling tray at room
temperature. Isoelectric focusing was conducted at 188C in a Multiphor II
(Amersham Biosciences) following the running conditions as described
(Rouquie et al., 1997) for up to 72 kV/h. The focused strips were
denaturated and reduced in an equilibration buffer (6 M urea, 30%
glycerol, 50 mM Tris-HCl, pH 6.8, and 2% SDS) with addition of 5 mM
tributylphosphine for 20 min and subsequently alkylated in equilibration
buffer with 15 mM iodoacetamide for 20 min (Rabilloud et al., 1997;
Herbert et al., 1998). The equilibrated IPG strips were loaded onto second
dimension 10.5 to 14% Laemmli SDS gels (Criterium; Bio-Rad), and the
protein separation was performed at constant current. Protein pIs on the
resulting 2-DE-IPG gels were internally calibrated by mixing carbamy-
lated standards (Pharmacia Biosciences) with the stromal extracts before
2-DE analysis. Denatured apparent molecular masses were determined
from molecular mass markers loaded onto the second dimension gels.
Gel images were acquired with a Fluoro-S MultImager (Bio-Rad) using
subsaturation exposure times. Five independent M and BS chloroplast
preparations were resolved on five pairs of 2-DE gels. Image analysis was
performed using Phoretix software (Nonlinear Dynamics). Approximately
400 spots per gel were detected, with spot volumes spanning five orders
of magnitude. Spot selection was performed semiautomatically, with
a large time investment in manual spot matching and verification.
Ambiguous matches were resolved by protein identification from MS.
After background removal and normalization of each spot volume to the
total gel spot volume, virtual average M and BS gels were created, where
each spot volume represented the average of volumes of matched spots
in M or BS gels. The majority of spots (65% for M and 54% for BS gels)
were represented at least three times either in M and/or in BS proteomes
(45% for M and 39% for BS spots were represented at least four times).
On average, we included gels only those matched spots that were
present at least three times on M or BS gels. Corresponding interactive
gels with protein spot identities that were quantified are available in the
PPDB.
Sypro Ruby–stained spots were excised from the gel using a robot
(ProPic; Genomic Solutions) or picked manually. The spots were
automatically washed, digested with modified trypsin (Promega)
(Shevchenko et al., 1996), and extracted using the ProGest robot
(Genomic Solutions). The extracted peptides were dried and resus-
pended in 20 mL 5% formic acid. Protein identification was performed
by peptide mass fingerprinting using MALDI time-of-flight (TOF) MS in
reflectron mode (Voyager DE-STR; Perseptive Biosystems) and online
LC-ESI-MS/MS (Q-TOF; Micromass). For MALDI-TOF analysis, 0.3 mL
3134 The Plant Cell
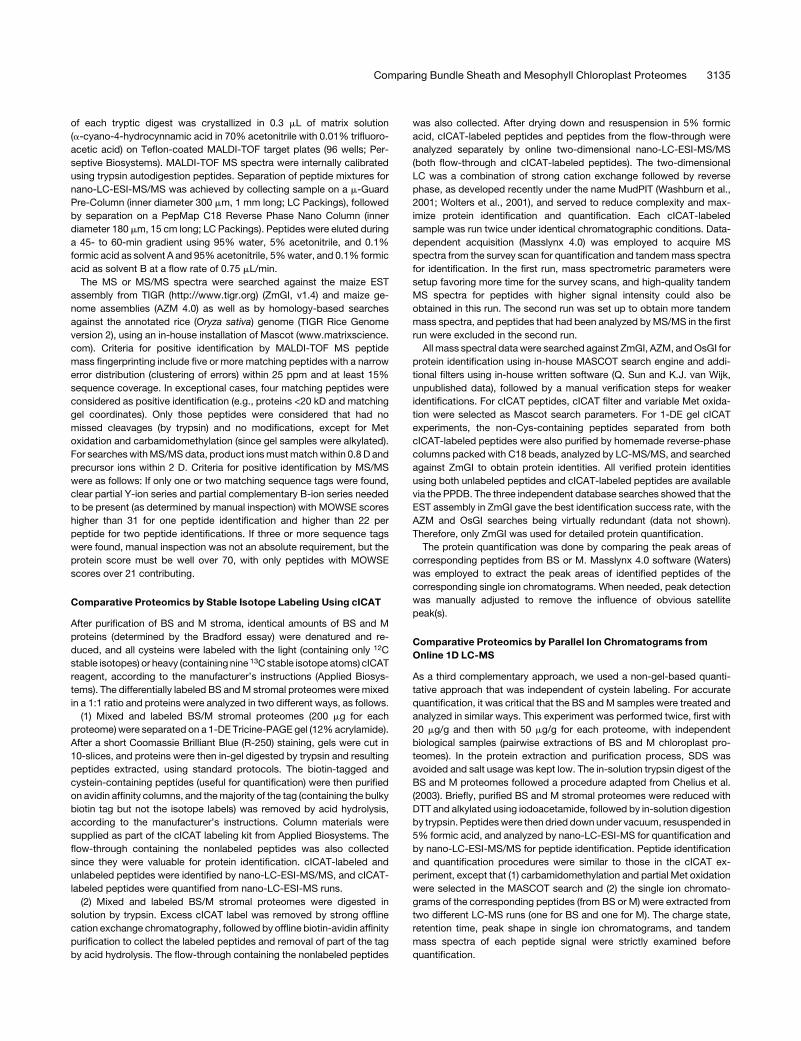
of each tryptic digest was crystallized in 0.3 mL of matrix solution
(a-cyano-4-hydrocynnamic acid in 70% acetonitrile with 0.01% trifluoro-
acetic acid) on Teflon-coated MALDI-TOF target plates (96 wells; Per-
septive Biosystems). MALDI-TOF MS spectra were internally calibrated
using trypsin autodigestion peptides. Separation of peptide mixtures for
nano-LC-ESI-MS/MS was achieved by collecting sample on a m-Guard
Pre-Column (inner diameter 300 mm, 1 mm long; LC Packings), followed
by separation on a PepMap C18 Reverse Phase Nano Column (inner
diameter 180 mm, 15 cm long; LC Packings). Peptides were eluted during
a 45- to 60-min gradient using 95% water, 5% acetonitrile, and 0.1%
formic acid as solvent A and 95%acetonitrile, 5%water, and 0.1% formic
acid as solvent B at a flow rate of 0.75 mL/min.
The MS or MS/MS spectra were searched against the maize EST
assembly from TIGR (http://www.tigr.org) (ZmGI, v1.4) and maize ge-
nome assemblies (AZM 4.0) as well as by homology-based searches
against the annotated rice (Oryza sativa) genome (TIGR Rice Genome
version 2), using an in-house installation of Mascot (www.matrixscience.
com). Criteria for positive identification by MALDI-TOF MS peptide
mass fingerprinting include five or more matching peptides with a narrow
error distribution (clustering of errors) within 25 ppm and at least 15%
sequence coverage. In exceptional cases, four matching peptides were
considered as positive identification (e.g., proteins <20 kD and matching
gel coordinates). Only those peptides were considered that had no
missed cleavages (by trypsin) and no modifications, except for Met
oxidation and carbamidomethylation (since gel samples were alkylated).
For searcheswithMS/MS data, product ionsmustmatchwithin 0.8 D and
precursor ions within 2 D. Criteria for positive identification by MS/MS
were as follows: If only one or two matching sequence tags were found,
clear partial Y-ion series and partial complementary B-ion series needed
to be present (as determined by manual inspection) with MOWSE scores
higher than 31 for one peptide identification and higher than 22 per
peptide for two peptide identifications. If three or more sequence tags
were found, manual inspection was not an absolute requirement, but the
protein score must be well over 70, with only peptides with MOWSE
scores over 21 contributing.
Comparative Proteomics by Stable Isotope Labeling Using cICAT
After purification of BS and M stroma, identical amounts of BS and M
proteins (determined by the Bradford essay) were denatured and re-
duced, and all cysteins were labeled with the light (containing only 12C
stable isotopes) or heavy (containing nine 13C stable isotope atoms) cICAT
reagent, according to the manufacturer’s instructions (Applied Biosys-
tems). The differentially labeled BS andM stromal proteomeswere mixed
in a 1:1 ratio and proteins were analyzed in two different ways, as follows.
(1) Mixed and labeled BS/M stromal proteomes (200 mg for each
proteome) were separated on a 1-DE Tricine-PAGE gel (12%acrylamide).
After a short Coomassie Brilliant Blue (R-250) staining, gels were cut in
10-slices, and proteins were then in-gel digested by trypsin and resulting
peptides extracted, using standard protocols. The biotin-tagged and
cystein-containing peptides (useful for quantification) were then purified
on avidin affinity columns, and themajority of the tag (containing the bulky
biotin tag but not the isotope labels) was removed by acid hydrolysis,
according to the manufacturer’s instructions. Column materials were
supplied as part of the cICAT labeling kit from Applied Biosystems. The
flow-through containing the nonlabeled peptides was also collected
since they were valuable for protein identification. cICAT-labeled and
unlabeled peptides were identified by nano-LC-ESI-MS/MS, and cICAT-
labeled peptides were quantified from nano-LC-ESI-MS runs.
(2) Mixed and labeled BS/M stromal proteomes were digested in
solution by trypsin. Excess cICAT label was removed by strong offline
cation exchange chromatography, followed by offline biotin-avidin affinity
purification to collect the labeled peptides and removal of part of the tag
by acid hydrolysis. The flow-through containing the nonlabeled peptides
was also collected. After drying down and resuspension in 5% formic
acid, cICAT-labeled peptides and peptides from the flow-through were
analyzed separately by online two-dimensional nano-LC-ESI-MS/MS
(both flow-through and cICAT-labeled peptides). The two-dimensional
LC was a combination of strong cation exchange followed by reverse
phase, as developed recently under the name MudPIT (Washburn et al.,
2001; Wolters et al., 2001), and served to reduce complexity and max-
imize protein identification and quantification. Each cICAT-labeled
sample was run twice under identical chromatographic conditions. Data-
dependent acquisition (Masslynx 4.0) was employed to acquire MS
spectra from the survey scan for quantification and tandemmass spectra
for identification. In the first run, mass spectrometric parameters were
setup favoring more time for the survey scans, and high-quality tandem
MS spectra for peptides with higher signal intensity could also be
obtained in this run. The second run was set up to obtain more tandem
mass spectra, and peptides that had been analyzed byMS/MS in the first
run were excluded in the second run.
All mass spectral datawere searched against ZmGI, AZM, andOsGI for
protein identification using in-house MASCOT search engine and addi-
tional filters using in-house written software (Q. Sun and K.J. van Wijk,
unpublished data), followed by a manual verification steps for weaker
identifications. For cICAT peptides, cICAT filter and variable Met oxida-
tion were selected as Mascot search parameters. For 1-DE gel cICAT
experiments, the non-Cys-containing peptides separated from both
cICAT-labeled peptides were also purified by homemade reverse-phase
columns packed with C18 beads, analyzed by LC-MS/MS, and searched
against ZmGI to obtain protein identities. All verified protein identities
using both unlabeled peptides and cICAT-labeled peptides are available
via the PPDB. The three independent database searches showed that the
EST assembly in ZmGI gave the best identification success rate, with the
AZM and OsGI searches being virtually redundant (data not shown).
Therefore, only ZmGI was used for detailed protein quantification.
The protein quantification was done by comparing the peak areas of
corresponding peptides from BS or M. Masslynx 4.0 software (Waters)
was employed to extract the peak areas of identified peptides of the
corresponding single ion chromatograms. When needed, peak detection
was manually adjusted to remove the influence of obvious satellite
peak(s).
Comparative Proteomics by Parallel Ion Chromatograms from
Online 1D LC-MS
As a third complementary approach, we used a non-gel-based quanti-
tative approach that was independent of cystein labeling. For accurate
quantification, it was critical that the BS and M samples were treated and
analyzed in similar ways. This experiment was performed twice, first with
20 mg/g and then with 50 mg/g for each proteome, with independent
biological samples (pairwise extractions of BS and M chloroplast pro-
teomes). In the protein extraction and purification process, SDS was
avoided and salt usage was kept low. The in-solution trypsin digest of the
BS and M proteomes followed a procedure adapted from Chelius et al.
(2003). Briefly, purified BS and M stromal proteomes were reduced with
DTT and alkylated using iodoacetamide, followed by in-solution digestion
by trypsin. Peptideswere then dried down under vacuum, resuspended in
5% formic acid, and analyzed by nano-LC-ESI-MS for quantification and
by nano-LC-ESI-MS/MS for peptide identification. Peptide identification
and quantification procedures were similar to those in the cICAT ex-
periment, except that (1) carbamidomethylation and partial Met oxidation
were selected in the MASCOT search and (2) the single ion chromato-
grams of the corresponding peptides (from BS or M) were extracted from
two different LC-MS runs (one for BS and one for M). The charge state,
retention time, peak shape in single ion chromatograms, and tandem
mass spectra of each peptide signal were strictly examined before
quantification.
Comparing Bundle Sheath and Mesophyll Chloroplast Proteomes 3135
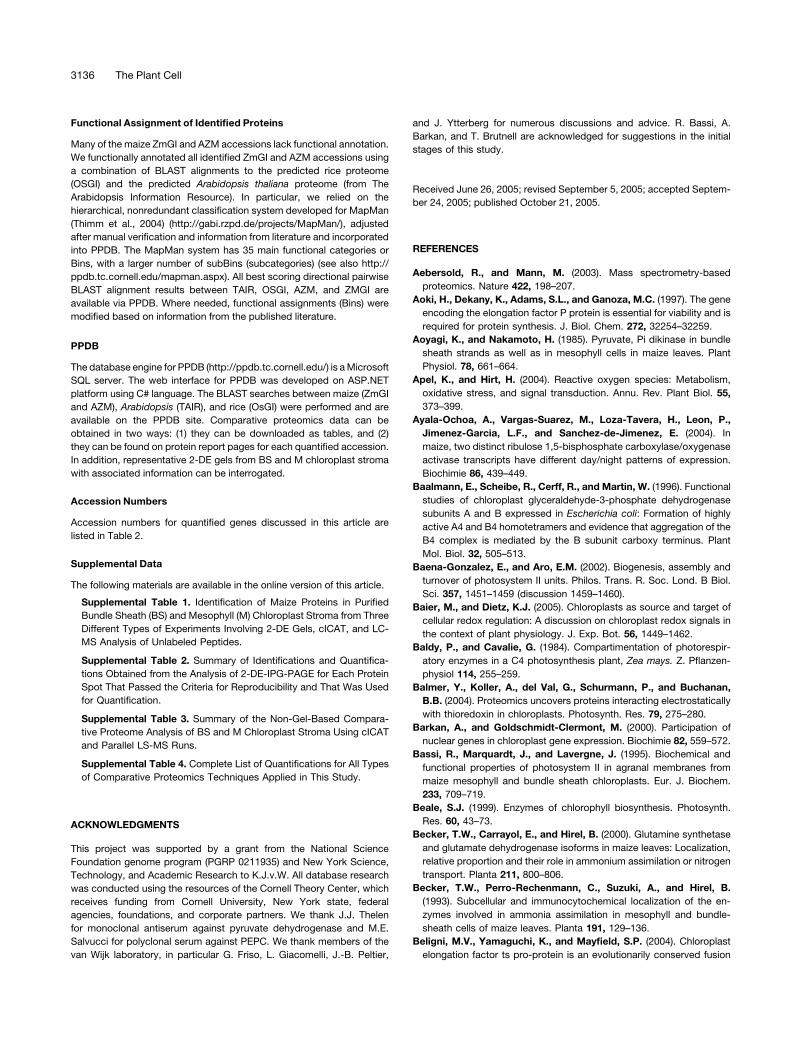
Functional Assignment of Identified Proteins
Many of the maize ZmGI and AZM accessions lack functional annotation.
We functionally annotated all identified ZmGI and AZM accessions using
a combination of BLAST alignments to the predicted rice proteome
(OSGI) and the predicted Arabidopsis thaliana proteome (from The
Arabidopsis Information Resource). In particular, we relied on the
hierarchical, nonredundant classification system developed for MapMan
(Thimm et al., 2004) (http://gabi.rzpd.de/projects/MapMan/), adjusted
after manual verification and information from literature and incorporated
into PPDB. The MapMan system has 35 main functional categories or
Bins, with a larger number of subBins (subcategories) (see also http://
ppdb.tc.cornell.edu/mapman.aspx). All best scoring directional pairwise
BLAST alignment results between TAIR, OSGI, AZM, and ZMGI are
available via PPDB. Where needed, functional assignments (Bins) were
modified based on information from the published literature.
PPDB
The database engine for PPDB (http://ppdb.tc.cornell.edu/) is aMicrosoft
SQL server. The web interface for PPDB was developed on ASP.NET
platform using C# language. The BLAST searches between maize (ZmGI
and AZM), Arabidopsis (TAIR), and rice (OsGI) were performed and are
available on the PPDB site. Comparative proteomics data can be
obtained in two ways: (1) they can be downloaded as tables, and (2)
they can be found on protein report pages for each quantified accession.
In addition, representative 2-DE gels from BS and M chloroplast stroma
with associated information can be interrogated.
Accession Numbers
Accession numbers for quantified genes discussed in this article are
listed in Table 2.
Supplemental Data
The following materials are available in the online version of this article.
Supplemental Table 1. Identification of Maize Proteins in Purified
Bundle Sheath (BS) and Mesophyll (M) Chloroplast Stroma from Three
Different Types of Experiments Involving 2-DE Gels, cICAT, and LC-
MS Analysis of Unlabeled Peptides.
Supplemental Table 2. Summary of Identifications and Quantifica-
tions Obtained from the Analysis of 2-DE-IPG-PAGE for Each Protein
Spot That Passed the Criteria for Reproducibility and That Was Used
for Quantification.
Supplemental Table 3. Summary of the Non-Gel-Based Compara-
tive Proteome Analysis of BS and M Chloroplast Stroma Using cICAT
and Parallel LS-MS Runs.
Supplemental Table 4. Complete List of Quantifications for All Types
of Comparative Proteomics Techniques Applied in This Study.
ACKNOWLEDGMENTS
This project was supported by a grant from the National Science
Foundation genome program (PGRP 0211935) and New York Science,
Technology, and Academic Research to K.J.v.W. All database research
was conducted using the resources of the Cornell Theory Center, which
receives funding from Cornell University, New York state, federal
agencies, foundations, and corporate partners. We thank J.J. Thelen
for monoclonal antiserum against pyruvate dehydrogenase and M.E.
Salvucci for polyclonal serum against PEPC. We thank members of the
van Wijk laboratory, in particular G. Friso, L. Giacomelli, J.-B. Peltier,
and J. Ytterberg for numerous discussions and advice. R. Bassi, A.
Barkan, and T. Brutnell are acknowledged for suggestions in the initial
stages of this study.
Received June 26, 2005; revised September 5, 2005; accepted Septem-
ber 24, 2005; published October 21, 2005.
REFERENCES
Aebersold, R., and Mann, M. (2003). Mass spectrometry-based
proteomics. Nature 422, 198–207.
Aoki, H., Dekany, K., Adams, S.L., and Ganoza, M.C. (1997). The gene
encoding the elongation factor P protein is essential for viability and is
required for protein synthesis. J. Biol. Chem. 272, 32254–32259.
Aoyagi, K., and Nakamoto, H. (1985). Pyruvate, Pi dikinase in bundle
sheath strands as well as in mesophyll cells in maize leaves. Plant
Physiol. 78, 661–664.
Apel, K., and Hirt, H. (2004). Reactive oxygen species: Metabolism,
oxidative stress, and signal transduction. Annu. Rev. Plant Biol. 55,
373–399.
Ayala-Ochoa, A., Vargas-Suarez, M., Loza-Tavera, H., Leon, P.,
Jimenez-Garcia, L.F., and Sanchez-de-Jimenez, E. (2004). In
maize, two distinct ribulose 1,5-bisphosphate carboxylase/oxygenase
activase transcripts have different day/night patterns of expression.
Biochimie 86, 439–449.
Baalmann, E., Scheibe, R., Cerff, R., and Martin, W. (1996). Functional
studies of chloroplast glyceraldehyde-3-phosphate dehydrogenase
subunits A and B expressed in Escherichia coli: Formation of highly
active A4 and B4 homotetramers and evidence that aggregation of the
B4 complex is mediated by the B subunit carboxy terminus. Plant
Mol. Biol. 32, 505–513.
Baena-Gonzalez, E., and Aro, E.M. (2002). Biogenesis, assembly and
turnover of photosystem II units. Philos. Trans. R. Soc. Lond. B Biol.
Sci. 357, 1451–1459 (discussion 1459–1460).
Baier, M., and Dietz, K.J. (2005). Chloroplasts as source and target of
cellular redox regulation: A discussion on chloroplast redox signals in
the context of plant physiology. J. Exp. Bot. 56, 1449–1462.
Baldy, P., and Cavalie, G. (1984). Compartimentation of photorespir-
atory enzymes in a C4 photosynthesis plant, Zea mays. Z. Pflanzen-
physiol 114, 255–259.
Balmer, Y., Koller, A., del Val, G., Schurmann, P., and Buchanan,
B.B. (2004). Proteomics uncovers proteins interacting electrostatically
with thioredoxin in chloroplasts. Photosynth. Res. 79, 275–280.
Barkan, A., and Goldschmidt-Clermont, M. (2000). Participation of
nuclear genes in chloroplast gene expression. Biochimie 82, 559–572.
Bassi, R., Marquardt, J., and Lavergne, J. (1995). Biochemical and
functional properties of photosystem II in agranal membranes from
maize mesophyll and bundle sheath chloroplasts. Eur. J. Biochem.
233, 709–719.
Beale, S.J. (1999). Enzymes of chlorophyll biosynthesis. Photosynth.
Res. 60, 43–73.
Becker, T.W., Carrayol, E., and Hirel, B. (2000). Glutamine synthetase
and glutamate dehydrogenase isoforms in maize leaves: Localization,
relative proportion and their role in ammonium assimilation or nitrogen
transport. Planta 211, 800–806.
Becker, T.W., Perro-Rechenmann, C., Suzuki, A., and Hirel, B.
(1993). Subcellular and immunocytochemical localization of the en-
zymes involved in ammonia assimilation in mesophyll and bundle-
sheath cells of maize leaves. Planta 191, 129–136.
Beligni, M.V., Yamaguchi, K., and Mayfield, S.P. (2004). Chloroplast
elongation factor ts pro-protein is an evolutionarily conserved fusion
3136 The Plant Cell
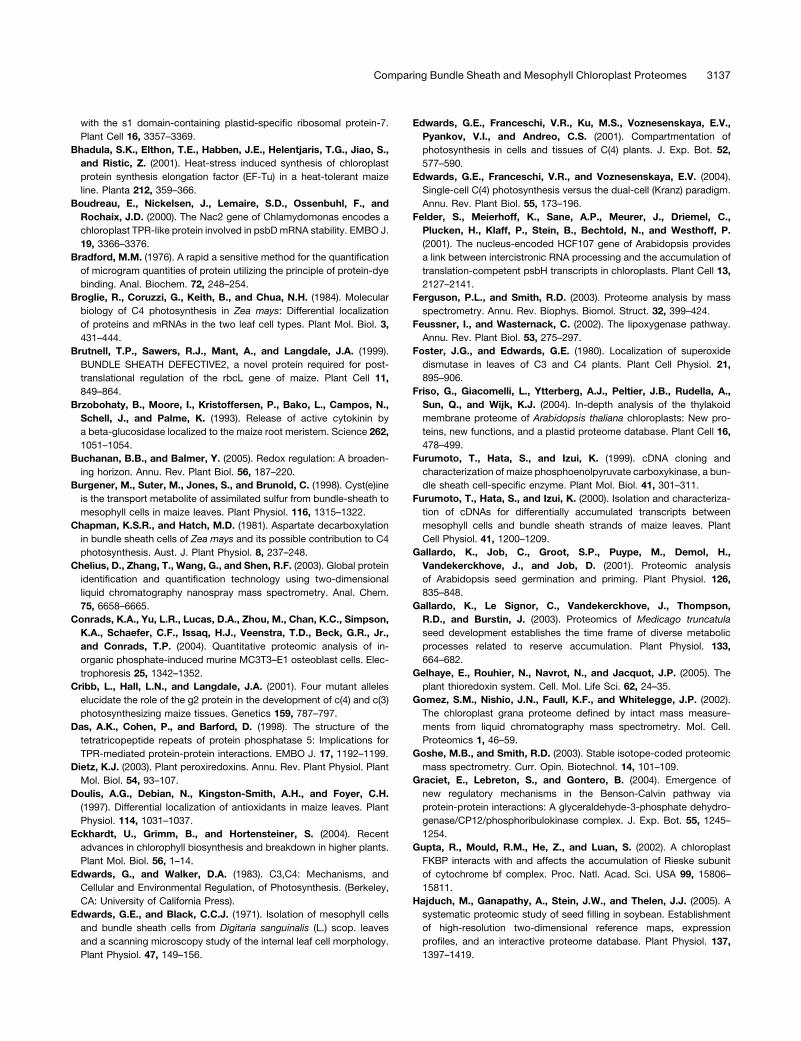
with the s1 domain-containing plastid-specific ribosomal protein-7.
Plant Cell 16, 3357–3369.
Bhadula, S.K., Elthon, T.E., Habben, J.E., Helentjaris, T.G., Jiao, S.,
and Ristic, Z. (2001). Heat-stress induced synthesis of chloroplast
protein synthesis elongation factor (EF-Tu) in a heat-tolerant maize
line. Planta 212, 359–366.
Boudreau, E., Nickelsen, J., Lemaire, S.D., Ossenbuhl, F., and
Rochaix, J.D. (2000). The Nac2 gene of Chlamydomonas encodes a
chloroplast TPR-like protein involved in psbDmRNA stability. EMBO J.
19, 3366–3376.
Bradford, M.M. (1976). A rapid a sensitive method for the quantification
of microgram quantities of protein utilizing the principle of protein-dye
binding. Anal. Biochem. 72, 248–254.
Broglie, R., Coruzzi, G., Keith, B., and Chua, N.H. (1984). Molecular
biology of C4 photosynthesis in Zea mays: Differential localization
of proteins and mRNAs in the two leaf cell types. Plant Mol. Biol. 3,
431–444.
Brutnell, T.P., Sawers, R.J., Mant, A., and Langdale, J.A. (1999).
BUNDLE SHEATH DEFECTIVE2, a novel protein required for post-
translational regulation of the rbcL gene of maize. Plant Cell 11,
849–864.
Brzobohaty, B., Moore, I., Kristoffersen, P., Bako, L., Campos, N.,
Schell, J., and Palme, K. (1993). Release of active cytokinin by
a beta-glucosidase localized to the maize root meristem. Science 262,
1051–1054.
Buchanan, B.B., and Balmer, Y. (2005). Redox regulation: A broaden-
ing horizon. Annu. Rev. Plant Biol. 56, 187–220.
Burgener, M., Suter, M., Jones, S., and Brunold, C. (1998). Cyst(e)ine
is the transport metabolite of assimilated sulfur from bundle-sheath to
mesophyll cells in maize leaves. Plant Physiol. 116, 1315–1322.
Chapman, K.S.R., and Hatch, M.D. (1981). Aspartate decarboxylation
in bundle sheath cells of Zea mays and its possible contribution to C4
photosynthesis. Aust. J. Plant Physiol. 8, 237–248.
Chelius, D., Zhang, T., Wang, G., and Shen, R.F. (2003). Global protein
identification and quantification technology using two-dimensional
liquid chromatography nanospray mass spectrometry. Anal. Chem.
75, 6658–6665.
Conrads, K.A., Yu, L.R., Lucas, D.A., Zhou, M., Chan, K.C., Simpson,
K.A., Schaefer, C.F., Issaq, H.J., Veenstra, T.D., Beck, G.R., Jr.,
and Conrads, T.P. (2004). Quantitative proteomic analysis of in-
organic phosphate-induced murine MC3T3–E1 osteoblast cells. Elec-
trophoresis 25, 1342–1352.
Cribb, L., Hall, L.N., and Langdale, J.A. (2001). Four mutant alleles
elucidate the role of the g2 protein in the development of c(4) and c(3)
photosynthesizing maize tissues. Genetics 159, 787–797.
Das, A.K., Cohen, P., and Barford, D. (1998). The structure of the
tetratricopeptide repeats of protein phosphatase 5: Implications for
TPR-mediated protein-protein interactions. EMBO J. 17, 1192–1199.
Dietz, K.J. (2003). Plant peroxiredoxins. Annu. Rev. Plant Physiol. Plant
Mol. Biol. 54, 93–107.
Doulis, A.G., Debian, N., Kingston-Smith, A.H., and Foyer, C.H.
(1997). Differential localization of antioxidants in maize leaves. Plant
Physiol. 114, 1031–1037.
Eckhardt, U., Grimm, B., and Hortensteiner, S. (2004). Recent
advances in chlorophyll biosynthesis and breakdown in higher plants.
Plant Mol. Biol. 56, 1–14.
Edwards, G., and Walker, D.A. (1983). C3,C4: Mechanisms, and
Cellular and Environmental Regulation, of Photosynthesis. (Berkeley,
CA: University of California Press).
Edwards, G.E., and Black, C.C.J. (1971). Isolation of mesophyll cells
and bundle sheath cells from Digitaria sanguinalis (L.) scop. leaves
and a scanning microscopy study of the internal leaf cell morphology.
Plant Physiol. 47, 149–156.
Edwards, G.E., Franceschi, V.R., Ku, M.S., Voznesenskaya, E.V.,
Pyankov, V.I., and Andreo, C.S. (2001). Compartmentation of
photosynthesis in cells and tissues of C(4) plants. J. Exp. Bot. 52,
577–590.
Edwards, G.E., Franceschi, V.R., and Voznesenskaya, E.V. (2004).
Single-cell C(4) photosynthesis versus the dual-cell (Kranz) paradigm.
Annu. Rev. Plant Biol. 55, 173–196.
Felder, S., Meierhoff, K., Sane, A.P., Meurer, J., Driemel, C.,
Plucken, H., Klaff, P., Stein, B., Bechtold, N., and Westhoff, P.
(2001). The nucleus-encoded HCF107 gene of Arabidopsis provides
a link between intercistronic RNA processing and the accumulation of
translation-competent psbH transcripts in chloroplasts. Plant Cell 13,
2127–2141.
Ferguson, P.L., and Smith, R.D. (2003). Proteome analysis by mass
spectrometry. Annu. Rev. Biophys. Biomol. Struct. 32, 399–424.
Feussner, I., and Wasternack, C. (2002). The lipoxygenase pathway.
Annu. Rev. Plant Biol. 53, 275–297.
Foster, J.G., and Edwards, G.E. (1980). Localization of superoxide
dismutase in leaves of C3 and C4 plants. Plant Cell Physiol. 21,
895–906.
Friso, G., Giacomelli, L., Ytterberg, A.J., Peltier, J.B., Rudella, A.,
Sun, Q., and Wijk, K.J. (2004). In-depth analysis of the thylakoid
membrane proteome of Arabidopsis thaliana chloroplasts: New pro-
teins, new functions, and a plastid proteome database. Plant Cell 16,
478–499.
Furumoto, T., Hata, S., and Izui, K. (1999). cDNA cloning and
characterization of maize phosphoenolpyruvate carboxykinase, a bun-
dle sheath cell-specific enzyme. Plant Mol. Biol. 41, 301–311.
Furumoto, T., Hata, S., and Izui, K. (2000). Isolation and characteriza-
tion of cDNAs for differentially accumulated transcripts between
mesophyll cells and bundle sheath strands of maize leaves. Plant
Cell Physiol. 41, 1200–1209.
Gallardo, K., Job, C., Groot, S.P., Puype, M., Demol, H.,
Vandekerckhove, J., and Job, D. (2001). Proteomic analysis
of Arabidopsis seed germination and priming. Plant Physiol. 126,
835–848.
Gallardo, K., Le Signor, C., Vandekerckhove, J., Thompson,
R.D., and Burstin, J. (2003). Proteomics of Medicago truncatula
seed development establishes the time frame of diverse metabolic
processes related to reserve accumulation. Plant Physiol. 133,
664–682.
Gelhaye, E., Rouhier, N., Navrot, N., and Jacquot, J.P. (2005). The
plant thioredoxin system. Cell. Mol. Life Sci. 62, 24–35.
Gomez, S.M., Nishio, J.N., Faull, K.F., and Whitelegge, J.P. (2002).
The chloroplast grana proteome defined by intact mass measure-
ments from liquid chromatography mass spectrometry. Mol. Cell.
Proteomics 1, 46–59.
Goshe, M.B., and Smith, R.D. (2003). Stable isotope-coded proteomic
mass spectrometry. Curr. Opin. Biotechnol. 14, 101–109.
Graciet, E., Lebreton, S., and Gontero, B. (2004). Emergence of
new regulatory mechanisms in the Benson-Calvin pathway via
protein-protein interactions: A glyceraldehyde-3-phosphate dehydro-
genase/CP12/phosphoribulokinase complex. J. Exp. Bot. 55, 1245–
1254.
Gupta, R., Mould, R.M., He, Z., and Luan, S. (2002). A chloroplast
FKBP interacts with and affects the accumulation of Rieske subunit
of cytochrome bf complex. Proc. Natl. Acad. Sci. USA 99, 15806–
15811.
Hajduch, M., Ganapathy, A., Stein, J.W., and Thelen, J.J. (2005). A
systematic proteomic study of seed filling in soybean. Establishment
of high-resolution two-dimensional reference maps, expression
profiles, and an interactive proteome database. Plant Physiol. 137,
1397–1419.
Comparing Bundle Sheath and Mesophyll Chloroplast Proteomes 3137
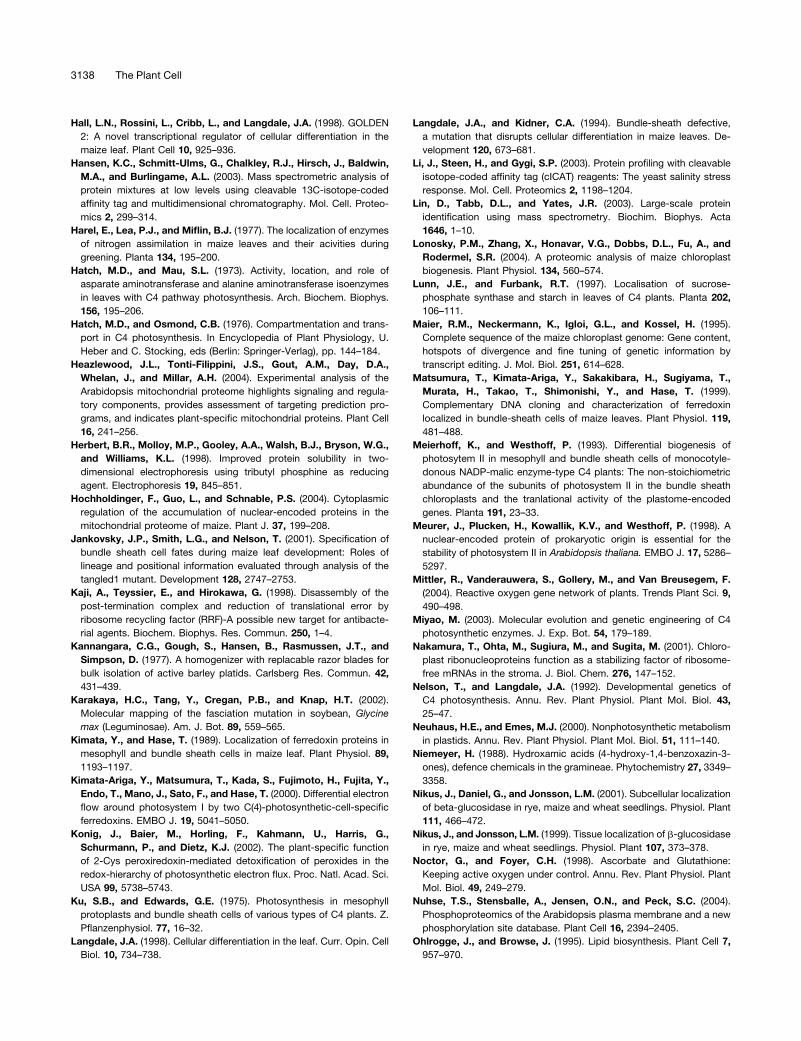
Hall, L.N., Rossini, L., Cribb, L., and Langdale, J.A. (1998). GOLDEN
2: A novel transcriptional regulator of cellular differentiation in the
maize leaf. Plant Cell 10, 925–936.
Hansen, K.C., Schmitt-Ulms, G., Chalkley, R.J., Hirsch, J., Baldwin,
M.A., and Burlingame, A.L. (2003). Mass spectrometric analysis of
protein mixtures at low levels using cleavable 13C-isotope-coded
affinity tag and multidimensional chromatography. Mol. Cell. Proteo-
mics 2, 299–314.
Harel, E., Lea, P.J., and Miflin, B.J. (1977). The localization of enzymes
of nitrogen assimilation in maize leaves and their acivities during
greening. Planta 134, 195–200.
Hatch, M.D., and Mau, S.L. (1973). Activity, location, and role of
asparate aminotransferase and alanine aminotransferase isoenzymes
in leaves with C4 pathway photosynthesis. Arch. Biochem. Biophys.
156, 195–206.
Hatch, M.D., and Osmond, C.B. (1976). Compartmentation and trans-
port in C4 photosynthesis. In Encyclopedia of Plant Physiology, U.
Heber and C. Stocking, eds (Berlin: Springer-Verlag), pp. 144–184.
Heazlewood, J.L., Tonti-Filippini, J.S., Gout, A.M., Day, D.A.,
Whelan, J., and Millar, A.H. (2004). Experimental analysis of the
Arabidopsis mitochondrial proteome highlights signaling and regula-
tory components, provides assessment of targeting prediction pro-
grams, and indicates plant-specific mitochondrial proteins. Plant Cell
16, 241–256.
Herbert, B.R., Molloy, M.P., Gooley, A.A., Walsh, B.J., Bryson, W.G.,
and Williams, K.L. (1998). Improved protein solubility in two-
dimensional electrophoresis using tributyl phosphine as reducing
agent. Electrophoresis 19, 845–851.
Hochholdinger, F., Guo, L., and Schnable, P.S. (2004). Cytoplasmic
regulation of the accumulation of nuclear-encoded proteins in the
mitochondrial proteome of maize. Plant J. 37, 199–208.
Jankovsky, J.P., Smith, L.G., and Nelson, T. (2001). Specification of
bundle sheath cell fates during maize leaf development: Roles of
lineage and positional information evaluated through analysis of the
tangled1 mutant. Development 128, 2747–2753.
Kaji, A., Teyssier, E., and Hirokawa, G. (1998). Disassembly of the
post-termination complex and reduction of translational error by
ribosome recycling factor (RRF)-A possible new target for antibacte-
rial agents. Biochem. Biophys. Res. Commun. 250, 1–4.
Kannangara, C.G., Gough, S., Hansen, B., Rasmussen, J.T., and
Simpson, D. (1977). A homogenizer with replacable razor blades for
bulk isolation of active barley platids. Carlsberg Res. Commun. 42,
431–439.
Karakaya, H.C., Tang, Y., Cregan, P.B., and Knap, H.T. (2002).
Molecular mapping of the fasciation mutation in soybean, Glycine
max (Leguminosae). Am. J. Bot. 89, 559–565.
Kimata, Y., and Hase, T. (1989). Localization of ferredoxin proteins in
mesophyll and bundle sheath cells in maize leaf. Plant Physiol. 89,
1193–1197.
Kimata-Ariga, Y., Matsumura, T., Kada, S., Fujimoto, H., Fujita, Y.,
Endo, T., Mano, J., Sato, F., and Hase, T. (2000). Differential electron
flow around photosystem I by two C(4)-photosynthetic-cell-specific
ferredoxins. EMBO J. 19, 5041–5050.
Konig, J., Baier, M., Horling, F., Kahmann, U., Harris, G.,
Schurmann, P., and Dietz, K.J. (2002). The plant-specific function
of 2-Cys peroxiredoxin-mediated detoxification of peroxides in the
redox-hierarchy of photosynthetic electron flux. Proc. Natl. Acad. Sci.
USA 99, 5738–5743.
Ku, S.B., and Edwards, G.E. (1975). Photosynthesis in mesophyll
protoplasts and bundle sheath cells of various types of C4 plants. Z.
Pflanzenphysiol. 77, 16–32.
Langdale, J.A. (1998). Cellular differentiation in the leaf. Curr. Opin. Cell
Biol. 10, 734–738.
Langdale, J.A., and Kidner, C.A. (1994). Bundle-sheath defective,
a mutation that disrupts cellular differentiation in maize leaves. De-
velopment 120, 673–681.
Li, J., Steen, H., and Gygi, S.P. (2003). Protein profiling with cleavable
isotope-coded affinity tag (cICAT) reagents: The yeast salinity stress
response. Mol. Cell. Proteomics 2, 1198–1204.
Lin, D., Tabb, D.L., and Yates, J.R. (2003). Large-scale protein
identification using mass spectrometry. Biochim. Biophys. Acta
1646, 1–10.
Lonosky, P.M., Zhang, X., Honavar, V.G., Dobbs, D.L., Fu, A., and
Rodermel, S.R. (2004). A proteomic analysis of maize chloroplast
biogenesis. Plant Physiol. 134, 560–574.
Lunn, J.E., and Furbank, R.T. (1997). Localisation of sucrose-
phosphate synthase and starch in leaves of C4 plants. Planta 202,
106–111.
Maier, R.M., Neckermann, K., Igloi, G.L., and Kossel, H. (1995).
Complete sequence of the maize chloroplast genome: Gene content,
hotspots of divergence and fine tuning of genetic information by
transcript editing. J. Mol. Biol. 251, 614–628.
Matsumura, T., Kimata-Ariga, Y., Sakakibara, H., Sugiyama, T.,
Murata, H., Takao, T., Shimonishi, Y., and Hase, T. (1999).
Complementary DNA cloning and characterization of ferredoxin
localized in bundle-sheath cells of maize leaves. Plant Physiol. 119,
481–488.
Meierhoff, K., and Westhoff, P. (1993). Differential biogenesis of
photosytem II in mesophyll and bundle sheath cells of monocotyle-
donous NADP-malic enzyme-type C4 plants: The non-stoichiometric
abundance of the subunits of photosystem II in the bundle sheath
chloroplasts and the tranlational activity of the plastome-encoded
genes. Planta 191, 23–33.
Meurer, J., Plucken, H., Kowallik, K.V., and Westhoff, P. (1998). A
nuclear-encoded protein of prokaryotic origin is essential for the
stability of photosystem II in Arabidopsis thaliana. EMBO J. 17, 5286–
5297.
Mittler, R., Vanderauwera, S., Gollery, M., and Van Breusegem, F.
(2004). Reactive oxygen gene network of plants. Trends Plant Sci. 9,
490–498.
Miyao, M. (2003). Molecular evolution and genetic engineering of C4
photosynthetic enzymes. J. Exp. Bot. 54, 179–189.
Nakamura, T., Ohta, M., Sugiura, M., and Sugita, M. (2001). Chloro-
plast ribonucleoproteins function as a stabilizing factor of ribosome-
free mRNAs in the stroma. J. Biol. Chem. 276, 147–152.
Nelson, T., and Langdale, J.A. (1992). Developmental genetics of
C4 photosynthesis. Annu. Rev. Plant Physiol. Plant Mol. Biol. 43,
25–47.
Neuhaus, H.E., and Emes, M.J. (2000). Nonphotosynthetic metabolism
in plastids. Annu. Rev. Plant Physiol. Plant Mol. Biol. 51, 111–140.
Niemeyer, H. (1988). Hydroxamic acids (4-hydroxy-1,4-benzoxazin-3-
ones), defence chemicals in the gramineae. Phytochemistry 27, 3349–
3358.
Nikus, J., Daniel, G., and Jonsson, L.M. (2001). Subcellular localization
of beta-glucosidase in rye, maize and wheat seedlings. Physiol. Plant
111, 466–472.
Nikus, J., and Jonsson, L.M. (1999). Tissue localization of b-glucosidase
in rye, maize and wheat seedlings. Physiol. Plant 107, 373–378.
Noctor, G., and Foyer, C.H. (1998). Ascorbate and Glutathione:
Keeping active oxygen under control. Annu. Rev. Plant Physiol. Plant
Mol. Biol. 49, 249–279.
Nuhse, T.S., Stensballe, A., Jensen, O.N., and Peck, S.C. (2004).
Phosphoproteomics of the Arabidopsis plasma membrane and a new
phosphorylation site database. Plant Cell 16, 2394–2405.
Ohlrogge, J., and Browse, J. (1995). Lipid biosynthesis. Plant Cell 7,
957–970.
3138 The Plant Cell
Ohlrogge, J.B., and Jaworski, J.G. (1997). Regulation of fatty acid
synthesis. Annu. Rev. Plant Physiol. Plant Mol. Biol. 48, 109–136.
Ong, S.E., Foster, L.J., and Mann, M. (2003). Mass spectrometric-
based approaches in quantitative proteomics. Methods 29, 124–130.
Palmer, L.E., Rabinowicz, P.D., O’Shaughnessy, A.L., Balija, V.S.,
Nascimento, L.U., Dike, S., de la Bastide, M., Martienssen, R.A.,
and McCombie, W.R. (2003). Maize genome sequencing by meth-
ylation filtration. Science 302, 2115–2117.
Pastori, G.M., Mullineaux, P.M., and Foyer, C.H. (2000). Post-
transcriptional regulation prevents accumulation of glutathione re-
ductase protein and activity in the bundle sheath cells of maize. Plant
Physiol. 122, 667–675.
Peltier, J.B., Emanuelsson, O., Kalume, D.E., Ytterberg, J., Friso, G.,
Rudella, A., Liberles, D.A., Soderberg, L., Roepstorff, P., von
Heijne, G., and van Wijk, K.J. (2002). Central functions of the lumenal
and peripheral thylakoid proteome of Arabidopsis determined by
experimentation and genome-wide prediction. Plant Cell 14, 211–236.
Peltier, J.B., Ripoll, D.R., Friso, G., Rudella, A., Cai, Y., Ytterberg, J.,
Giacomelli, L., Pillardy, J., and Van Wijk, K.J. (2004b). Clp protease
complexes from photosynthetic and non-photosynthetic plastids and
mitochondria of plants, their predicted three-dimensional structures,
and functional implications. J. Biol. Chem. 279, 4768–4781.
Peltier, J.B., Ytterberg, A.J., Sun, Q., and van Wijk, K.J. (2004a). New
functions of the thylakoid membrane proteome of Arabidopsis thaliana
revealed by a simple, fast, and versatile fractionation strategy. J. Biol.
Chem. 279, 49367–49383.
Porubleva, L., Vander Velden, K., Kothari, S., Oliver, D.J., and Chitnis,
P.R. (2001). The proteome of maize leaves: Use of gene sequences
and expressed sequence tag data for identification of proteins
with peptide mass fingerprints. Electrophoresis 22, 1724–1738.
Rabilloud, T., Adessi, C., Giraudel, A., and Lunardi, J. (1997).
Improvement of the solubilization of proteins in two-dimensional
electrophoresis with immobilized pH gradients. Electrophoresis 18,
307–316.
Rabilloud, T., Vuillard, L., Gilly, C., and Lawrence, J.J. (1994). Silver-
staining of proteins in polyacrylamide gels: A general overview. Cell.
Mol. Biol. (Noisy-le-grand) 40, 57–75.
Rao, D., Momcilovic, I., Kobayashi, S., Callegari, E., and Ristic, Z.
(2004). Chaperone activity of recombinant maize chloroplast
protein synthesis elongation factor, EF-Tu. Eur. J. Biochem. 271,
3684–3692.
Rathnam, C.K., and Edwards, G.E. (1975). Intracellular localization of
certain photosynthetic enzymes in bundle sheath cells of plants
possessing the C4 pathway of photosynthesis. Arch. Biochem.
Biophys. 171, 214–225.
Rathnam, C.K., and Edwards, G.E. (1976). Distribution of nitrate-
assimilating enzymes between mesophyll protoplasts and bundle
sheath cells in leaves of three groups of C4 plants. Plant Physiol. 57,
881–885.
Rolland, N., Janosi, L., Block, M.A., Shuda, M., Teyssier, E., Miege,
C., Cheniclet, C., Carde, J.P., Kaji, A., and Joyard, J. (1999). Plant
ribosome recycling factor homologue is a chloroplastic protein and is
bactericidal in Escherichia coli carrying temperature-sensitive ribo-
some recycling factor. Proc. Natl. Acad. Sci. USA 96, 5464–5469.
Roth, R., Hall, L.N., Brutnell, T.P., and Langdale, J.A. (1996). bundle
sheath defective2, a mutation that disrupts the coordinated develop-
ment of bundle sheath and mesophyll cells in the maize leaf. Plant Cell
8, 915–927.
Rouhier, N., Gelhaye, E., Sautiere, P.E., Brun, A., Laurent, P., Tagu,
D., Gerard, J., de Fay, E., Meyer, Y., and Jacquot, J.P. (2001).
Isolation and characterization of a new peroxiredoxin from poplar
sieve tubes that uses either glutaredoxin or thioredoxin as a proton
donor. Plant Physiol. 127, 1299–1309.
Rouquie, D., Peltier, J.B., Marquis-Mansion, M., Tournaire, C.,
Doumas, P., and Rossignol, M. (1997). Construction of a directory
of tobacco plasma membrane proteins by combined two-dimensional
gel electrophoresis and protein sequencing. Electrophoresis 18,
654–660.
Schagger, H., and von Jagow, G. (1987). Tricine-sodium dodecyl
sulfate-polyacrylamide gel electrophoresis for the separation of
proteins in the range from 1 to 100 kDa. Anal. Biochem. 166,
368–379.
Schiltz, S., Gallardo, K., Huart, M., Negroni, L., Sommerer, N., and
Burstin, J. (2004). Proteome reference maps of vegetative tissues in
pea. An investigation of nitrogen mobilization from leaves during seed
filling. Plant Physiol. 135, 2241–2260.
Schroda, M., Vallon, O., Wollman, F.A., and Beck, C.F. (1999). A
chloroplast-targeted heat shock protein 70 (HSP70) contributes to the
photoprotection and repair of photosystem II during and after photo-
inhibition. Plant Cell 11, 1165–1178.
Schubert, M., Petersson, U.A., Haas, B.J., Funk, C., Schroder, W.P.,
and Kieselbach, T. (2002). Proteome map of the chloroplast lumen of
Arabidopsis thaliana. J. Biol. Chem. 277, 8354–8365.
Sheen, J. (1999). C-4 gene expression. Annu. Rev. Plant Physiol. Plant
Mol. Biol. 50, 187–217.
Sheen, J.Y., and Bogorad, L. (1987a). Regulation of levels of nuclear
transcripts for C-4 photosynthesis in bundle sheath and mesophyll
cells of maize leaves. Plant Mol. Biol. 8, 227–238.
Sheen, J.Y., and Bogorad, L. (1987b). Differential expression of C-4
pathway genes in mesophyll and bundle sheath cells of greening
maize leaves. J. Biol. Chem. 262, 11726–11730.
Shevchenko, A., Wilm, M., Vorm, O., and Mann, M. (1996). Mass
spectrometric sequencing of proteins silver-stained polyacrylamide
gels. Anal. Chem. 68, 850–858.
Shimaoka, T., Ohnishi, M., Sazuka, T., Mitsuhashi, N., Hara-Nishimura,
I., Shimazaki, K., Maeshima, M., Yokota, A., Tomizawa, K., and
Mimura, T. (2004). Isolation of intact vacuoles and proteomic analysis
of tonoplast from suspension-cultured cells of Arabidopsis thaliana.
Plant Cell Physiol. 45, 672–683.
Slack, C.R., Hatch, M.D., and Goodchild, D.J. (1969). Distribution of
enzymes in mesophyll and parenchyma-sheath chloroplasts of maize
leaves in relation to the C4-dicarboxylic acid pathway of photosyn-
thesis. Biochem. J. 114, 489–498.
Smith, L.G., Hake, S., and Sylvester, A.W. (1996). The tangled-1
mutation alters cell division orientations throughout maize leaf de-
velopment without altering leaf shape. Development 122, 481–489.
Spilatro, S., and Preiss, J. (1987). Regulation of starch synthesis in
the bundle sheath and mesophyll of Zea mays L.: Intercellular com-
partmentalisation of enzymes of starch metabolism and the prop-
erties of the ADPglucose pyrophosphorylases. Plant Physiol. 83,
621–627.
Sun, Q., Emanuelsson, O., and van Wijk, K.J. (2004). Analysis of
curated and predicted plastid subproteomes of Arabidopsis. Sub-
cellular compartmentalization leads to distinctive proteome proper-
ties. Plant Physiol. 135, 723–734.
Tamoi, M., Miyazaki, T., Fukamizo, T., and Shigeoka, S. (2005). The
Calvin cycle in cyanobacteria is regulated by CP12 via the NAD(H)/
NADP(H) ratio under light/dark conditions. Plant J. 42, 504–513.
Tao, W.A., and Aebersold, R. (2003). Advances in quantitative proteo-
mics via stable isotope tagging and mass spectrometry. Curr. Opin.
Biotechnol. 14, 110–118.
Thimm, O., Blasing, O., Gibon, Y., Nagel, A., Meyer, S., Kruger, P.,
Selbig, J., Muller, L.A., Rhee, S.Y., and Stitt, M. (2004). MAPMAN:
A user-driven tool to display genomics data sets onto diagrams
of metabolic pathways and other biological processes. Plant J. 37,
914–939.
Comparing Bundle Sheath and Mesophyll Chloroplast Proteomes 3139
Usuda, H., and Edwards, G.E. (1980). Localization of glycerate kinase
and some enzymes for sucrose synthesis in C3 and C4 plants. Plant
Physiol. 65, 1017–1022.
Vaistij, F.E., Boudreau, E., Lemaire, S.D., Goldschmidt-Clermont,
M., and Rochaix, J.D. (2000). Characterization of Mbb1, a nucleus-
encoded tetratricopeptide-like repeat protein required for expression
of the chloroplast psbB/psbT/psbH gene cluster in Chlamydomonas
reinhardtii. Proc. Natl. Acad. Sci. USA 97, 14813–14818.
Washburn, M.P., Wolters, D., and Yates III, J.R. (2001). Large-scale
analysis of the yeast proteome by multidimensional protein identifi-
cation technology. Nat. Biotechnol. 19, 242–247.
Watson, B.S., Asirvatham, V.S., Wang, L., and Sumner, L.W. (2003).
Mapping the proteome of barrel medic (Medicago truncatula). Plant
Physiol. 131, 1104–1123.
Weber, A., and Flugge, U.I. (2002). Interaction of cytosolic and plastidic
nitrogen metabolism in plants. J. Exp. Bot. 53, 865–874.
Wedel, N., Soll, J., and Paap, B.K. (1997). CP12 provides a new mode
of light regulation of Calvin cycle activity in higher plants. Proc. Natl.
Acad. Sci. USA 94, 10479–10484.
Wingler, A., Walker, R.P., Chen, Z.H., and Leegood, R.C. (1999). Phos-
phoenolpyruvate carboxykinase is involved in the decarboxylation of
aspartate in the bundle sheath of maize. Plant Physiol. 120, 539–546.
Wolters, D.A., Washburn, M.P., and Yates III, J.R. (2001). An auto-
mated multidimensional protein identification technology for shotgun
proteomics. Anal. Chem. 73, 5683–5690.
Wyrich, R., Dressen, U., Brockmann, S., Streubel, M., Chang,
C., Qiang, D., Paterson, A.H., and Westhoff, P. (1998). The
molecular basis of C4 photosynthesis in sorghum: Isolation, charac-
terization and RFLP mapping of mesophyll- and bundle-sheath-
specific cDNAs obtained by differential screening. Plant Mol. Biol.
37, 319–335.
Yamaguchi, K., Beligni, M.V., Prieto, S., Haynes, P.A., McDonald,
W.H., Yates III, J.R., and Mayfield, S.P. (2003). Proteomic charac-
terization of the Chlamydomonas reinhardtii chloroplast ribosome.
Identification of proteins unique to th e70 S ribosome. J. Biol. Chem.
278, 33774–33785.
Yamaguchi, K., von Knoblauch, K., and Subramanian, A.R. (2000).
The plastid ribosomal proteins. Identification of all the proteins in the
30 S subunit of an organelle ribosome (chloroplast). J. Biol. Chem.
275, 28455–28465.
Yang, J., Schuster, G., and Stern, D.B. (1996). CSP41, a sequence-
specific chloroplast mRNA binding protein, is an endoribonuclease.
Plant Cell 8, 1409–1420.
Yoshimura, Y., Kubota, F., and Ueno, O. (2004). Structural and
biochemical bases of photorespiration in C4 plants: Quantification
of organelles and glycine decarboxylase. Planta 220, 307–317.
Zhao, Y.Y., Xu, T., Zucchi, P., and Bogorad, L. (1999). Subpopulations
of chloroplast ribosomes change during photoregulated development
of Zea mays leaves: Ribosomal proteins L2, L21, and L29. Proc. Natl.
Acad. Sci. USA 96, 8997–9002.
3140 The Plant Cell
DOI 10.1105/tpc.105.035519; originally published online October 21, 2005; 2005;17;3111-3140Plant Cell
Wojciech Majeran, Yang Cai, Qi Sun and Klaas J. van WijkComparative Proteomics
Functional Differentiation of Bundle Sheath and Mesophyll Maize Chloroplasts Determined by
This information is current as of August 20, 2015
Supplemental Data http://www.plantcell.org/content/suppl/2005/10/05/tpc.105.035519.DC1.html
References http://www.plantcell.org/content/17/11/3111.full.html#ref-list-1
This article cites 133 articles, 68 of which can be accessed free at:
Permissions https://www.copyright.com/ccc/openurl.do?sid=pd_hw1532298X&issn=1532298X&WT.mc_id=pd_hw1532298X
eTOCs http://www.plantcell.org/cgi/alerts/ctmain
Sign up for eTOCs at:
CiteTrack Alerts http://www.plantcell.org/cgi/alerts/ctmain
Sign up for CiteTrack Alerts at:
Subscription Information http://www.aspb.org/publications/subscriptions.cfm
is available at:Plant Physiology and The Plant CellSubscription Information for
ADVANCING THE SCIENCE OF PLANT BIOLOGY © American Society of Plant Biologists