fuel and chemicals from renewable alcohols part 1+2
TRANSCRIPT

General rights Copyright and moral rights for the publications made accessible in the public portal are retained by the authors and/or other copyright owners and it is a condition of accessing publications that users recognise and abide by the legal requirements associated with these rights.
Users may download and print one copy of any publication from the public portal for the purpose of private study or research.
You may not further distribute the material or use it for any profit-making activity or commercial gain
You may freely distribute the URL identifying the publication in the public portal If you believe that this document breaches copyright please contact us providing details, and we will remove access to the work immediately and investigate your claim.
Downloaded from orbit.dtu.dk on: Jun 27, 2022
Fuel and Chemicals from Renewable AlcoholsPart 1+2
Hansen, Jeppe Rass
Publication date:2008
Document VersionPublisher's PDF, also known as Version of record
Link back to DTU Orbit
Citation (APA):Hansen, J. R. (2008). Fuel and Chemicals from Renewable Alcohols: Part 1+2.
DOI: 10.1002/cssc.200700168
The Renewable Chemicals Industry
Claus Hviid Christensen,* Jeppe Rass-Hansen, Charlotte C. Marsden, Esben Taarning, andKresten Egeblad[a]
Introduction
Currently, there exists an intense focus on the production of
transportation fuels from biomass.[1–4] This focus can be attrib-
uted to a desire to significantly lower the emission of green-
house gases, thereby minimizing global warming, and also to
relinquish our dependence on fossil fuels. Moreover, biomass is
the only accessible non-fossil source of carbon that can be
processed into liquids that are easily incorporated into the ex-
isting transportation fuel infrastructure. In particular, the wide-
spread use of bioethanol and biodiesel as fuel additives is rap-
idly gaining importance in many parts of the world, and signifi-
cant efforts are now being devoted to develop technologies
that are simultaneously more sustainable than current technol-
ogies and allow more efficient use of the available bioresour-
ces.
In some regions, it appears that bioethanol can indeed al-
ready be produced to be cost-competitive with gasoline.[5]
However, it also seems that the extensive use of biomass to
produce biofuels remains controversial from both an economi-
cal and an ecological perspective, and these issues clearly
need to be resolved in a fully transparent manner. It is interest-
ing that despite the ongoing efforts to widely introduce bio-
fuels as fuel additives, all prognoses still predict the demand
for fossil fuels to increase over the next decades.[6] Conse-
quently, it is clear that there is a strong need to consider if
there are other options for substituting fossil resources with
bio ACHTUNGTRENNUNGresources.
Today, about 85% of all crude oil consumed is used for the
production of transportation fuels,[6] and this is undoubtedly
the reason that the production of biofuels attracts most atten-
tion when considering renewable alternatives. However, as
much as 10% of crude oil is currently used for the production
of industrial chemicals.[6, 7] In general terms, these chemicals are
significantly more economically valuable than transportation
fuels and, simultaneously, their production often also involves
the co-production of significant amounts of carbon dioxide.
Taking this into account, it is conspicuous that relatively little
attention has been given to develop the use of biomass as a
raw material for the production of industrial chemicals.[8]
Herein, it is argued that the optimal use of abundant bio-
ACHTUNGTRENNUNGresources could well serve as a renewable feedstock for the
chemical industry.[9] From a chemical perspective, renewable
feedstocks, being highly functionalized molecules, are very dif-
ferent from fossil feedstocks which are generally unfunctional-
ized. Therefore, a huge challenge for chemists today is to pro-
vide the chemical industry with a new set of tools to convert
renewables into useful chemicals in an economically viable
fashion.[10,11] Here, we illustrate examples of two different ap-
proaches or strategies towards potential biomass-derived
chemicals. It is proposed that the required cost-competitive
and environmentally acceptable (sustainable) industrial chemi-
cal processes utilizing renewable starting materials are best
achieved by the close integration of biocatalytic and heteroge-
neous catalytic processes.[12]
Fossil and Renewables Value Chains
Today, fossil resources are widely used to produce electricity,
heat, and transportation fuels as well as the vast majority of
the many chemicals that are required by contemporary society.
During the 20th century, continuous scientific and technologi-
cal developments led to ongoing refinements in these areas
resulting in highly optimized and efficient technologies for uti-
lizing fossil resources. Additionally, during the same period
fossil resources were abundantly available at relatively low
costs, and we can therefore talk of a fossil economy with re-
[a] Prof. C. H. Christensen, J. Rass-Hansen, C. C. Marsden, E. Taarning,
K. Egeblad
Center for Sustainable and Green Chemistry
Department of Chemistry, Technical University of Denmark
Building 206, 2800 Lyngby (Denmark)
Fax: (+45)4588 3136
E-mail : [email protected]
The possibilities for establishing a renewable chemicals industry
featuring renewable resources as the dominant feedstock rather
than fossil resources are discussed in this Concept. Such use of
biomass can potentially be interesting from both an economical
and ecological perspective. Simple and educational tools are in-
troduced to allow initial estimates of which chemical processes
could be viable. Specifically, fossil and renewables value chains
are used to indicate where renewable feedstocks can be optimal-
ly valorized. Additionally, C factors are introduced that specify the
amount of CO2 produced per kilogram of desired product to illus-
trate in which processes the use of renewable resources lead to
the most substantial reduction of CO2 emissions. The steps to-
wards a renewable chemicals industry will most likely involve in-
timate integration of biocatalytic and conventional catalytic pro-
cesses to arrive at cost-competitive and environmentally friendly
processes.
ChemSusChem 2008, 1, 283 – 289 � 2008 Wiley-VCH Verlag GmbH&Co. KGaA, Weinheim www.chemsuschem.org 283
spect to our society today. The aforementioned factors also
mean that typically existing industrial processes are very cost-
competitive when compared with emerging new technologies.
Accordingly, significant efforts are required to develop such
new alternatives into commercially viable solutions.[13]
Herein, we explore the prospects for using renewable re-
sources, namely biomass, as an alternative to fossil resources
as a feedstock for the chemical industry. In order to attempt to
start identifying promising opportunities, it is instructive to es-
tablish a simple value chain that illustrates how the petro-
chemical industry transforms fossil resources into desirable
products by a series of chemical transformations. The value
chain in Figure 1 qualitatively illustrates the value of various
important commodity chemicals relative to that of the fossil
raw materials, that is, coal, natural gas, and crude oil.[14,15]
This is certainly a very simplistic illustration as the value of
the fossil resources varies considerably, not only according to
the geographic origin and quality but also over time for com-
plex socio-economic reasons. Nonetheless, this fossil value
chain for the chemical industry emphasizes that crude oil is
transformed into transportation fuels by relatively simple, effi-
cient, and inexpensive operations. Thus, transportation fuels
are among the least expensive chemicals available.
In the petrochemical industry, fossil resources are used to
produce important major chemicals ; currently, the building
blocks for about 95% of all the carbon-containing chemicals
that are required to sustain our everyday lives. The majority of
this wide range of specialized chemicals can be traced back to
just seven basic building blocks. These building blocks—meth-
anol, ethene, propene, butadiene, benzene, toluene, and
xylene—can be considered as the backbone of the chemical
industry.[16] The entire chemical industry is essentially construct-
ed from these building blocks, a few of which are included in
Figure 1. The fossil value chain illustrates that these building
blocks are, typically, somewhat more valuable than transporta-
tion fuels and that the commodity chemicals produced from
them can often be appreciably more so. The value of these
bulk chemicals is essentially governed by the cost of the feed-
stocks and processing costs.
If we now envisage that the most important fuels and chem-
icals should instead be produced from biomass, then another
value chain might materialize, as also depicted in Figure 1.[14]
This value chain could be termed a renewables value chain for
the chemical industry. As with the fossil resources chain, this is
again only a qualitative evaluation for two main reasons: First,
the cost and composition of the biomass feedstock will vary
significantly from region to region; likewise, it will depend
upon the source of biomass feedstock (e.g. , food crops or
waste products). In this respect, the situation differs not so
greatly from that of fossil raw materials. Second, most of the
chemical transformations required to establish a renewable
chemicals industry are not yet developed to any major extent.
In actuality, in many cases they still remain to be discovered.
Thus, establishment of the renewables value chain is, to some
extent, based on estimates. However, in some cases the rele-
vant processes in this value chain can be identical to those in
the fossil value chain.
In Figure 1, the fossil value chain and the renewables value
chain are shown independently of one another, hence they
cannot be directly compared. To directly compare the two
value chains more quantitatively, it is necessary to know solely
the cost of the compounds in the fossil and renewable feed-
stocks, assuming that the uncertainties related to the individu-
al value chains are first handled properly as discussed. Figure 2
illustrates how the price of one specific fossil resource (crude
oil) has varied relative to one specific renewable resource
(corn) over time. Of special interest, during the last 80 years
the corn/crude oil ratio has changed significantly but today it
is at a historic low level. It is clear that if the cost of biomass
feedstocks continues to decline relative to that of fossil resour-
ces, an increasing number of chemicals could be produced
competitively from renewable resources.
However, it is important to be aware that the feedstock cost
ratio will not change which products are the most attractive to
produce from biomass; this depends exclusively on the relative
values of the relevant compounds in the two different value
chains. To develop an industry based on biomass is then
simply a matter of developing the technologies that are best
Figure 1. The fossil and renewables value chains indicate the value of differ-
ent commodity chemicals relative to the feedstocks. A direct comparison be-
tween the two different value chains depends on the actual cost of the
feedstocks.
Figure 2. The plot of corn/oil price ratio during the last 80 years shows how
biomass (corn) has become relatively cheaper and by that economically
more interesting as an alternative to oil for the chemical industry.[14]
284 www.chemsuschem.org � 2008 Wiley-VCH Verlag GmbH&Co. KGaA, Weinheim ChemSusChem 2008, 1, 283 – 289
C. H. Christensen et al.
able to compete with their fossil equivalents. Thus, from the
value chains, it is possible to identify interesting first target
chemicals that utilize the abundant biomass resources most ef-
ficiently, when establishing the foundation of a renewable
chemicals industry. However, cost is not the only important pa-
rameter, as in many cases the potential to decrease CO2 emis-
sions on going from a fossil resource to a renewable resource
will also hold significant importance. This is discussed briefly
later, but here it is noted that this will vary significantly from
one chemical on the two value chains to another. Accordingly,
it would be fitting to also establish the exact amount of CO2
produced, for instance, per kilogram of desired product (this
could be termed a climate factor, or C factor, to remain consis-
tent with the E factor introduced to indicate the overall
amount of waste produced by chemical processes[17–18]). This
C factor would help evaluate which renewable chemical pro-
cesses are most desirable to develop under given boundary
conditions.
From another perspective, the use of biomass as a sustaina-
ble resource for the production of fuels and chemicals should
offer improved security in supply as biomass can be grown in
most parts of the world. Conversely, oil resources are limited
by being located only in a few, and in some cases, unstable
areas of the world.[19] In conclusion, it appears very attractive
to attempt to convert biomass into high value-added products
rather than into relatively low-value fuels, in particular if this
can be done in only a few and highly efficient process steps.
Prior to fossil resources becoming widely and inexpensively
available, much of the chemical industry was based mostly on
renewable raw materials. However, as these processes have
not been continuously improved (as a result of unfavorable
feedstock costs), they are generally not competitive with
modern processes that rely on fossil resources. Nevertheless, in
some case it has proven beneficial to explore biomass resour-
ces as raw materials and it could be even more attractive in
the future.[20] This is typically the case in the production of key
chemicals that have structures and functionalities which are
very similar to those of the biomass feedstock.[21,22]
An economic evaluation of ethylene produced from steam-
cracking of petroleum fractions and from the dehydration of
bioethanol showed that the bio route was about 10–40%
more expensive than the petroleum route to ethylene.[23] This
study was carried out in 1988, with an oil price of about
US$30/bbl (bbl=barrel ; inflation adjusted) and a very well-es-
tablished steam-cracking process. On the other hand, the pro-
duction of bioethanol by fermentation of carbohydrates was
not as developed as it is today. So, with today’s oil prices
around US$65–100/bbl and improved technology in the fer-
mentation of biomass to ethanol, the route to bio-ethylene is
becoming increasingly economically viable as compared to the
route to petro-ethylene, and will continue to do so.
Today, all ethylene is still produced from fossil resources
with the steam-cracking of naphtha as the main route. Ethyl-
ene has a price of more than US$1000/t[15] (metric ton=
1000 kg) and the price can only increase with the depletion of
crude oil and increasing ethylene demands, in particular in
China and India. Fuel-grade bioethanol has a price of less than
US$600/t, clearly indicating that a relatively cheap dehydration
process for ethanol to ethylene has good economic potential.
Moreover, anhydrous ethanol is not necessary for the dehydra-
tion reaction,[23] thus the price for the bioethanol feedstock
could be even lower as the expensive distillation to fuel-grade
ethanol can be avoided.
A process that perhaps could be even more economically in-
teresting is the oxidation of bioethanol to acetic acid. Acetic
acid has today a value of around US$1400/t, which means that
it is three times as expensive as fuel-grade ethanol on a molar
basis. Again, it is not necessary to use anhydrous ethanol to
produce acetic acid,[37] thus additionally favoring the biopro-
cess. These considerations lie behind the actual positions of
ethylene and acetic acid in the renewables value chain
(Figure 1) which we believe might be produced cheaper from
renewable resources than from fossil resources.
Routes to a Renewable Chemicals Industry
In principle, it is possible to categorize the possible routes to
establish a renewable chemicals industry into two distinctly
different approaches, which should be pursued simultaneously.
This categorization is presented in more detail here, and select-
ed recent examples of both approaches are highlighted. It is
shown how this categorization can be linked to the previously
introduced value chains, and the barriers impeding the imple-
mentation of promising examples are discussed for the two
different methods. In all likelihood, the future chemical indus-
try will rely upon renewable chemicals fashioned from both
approaches. In the first approach, biomass feedstocks are used
to supply a proportion of the chemical building blocks that are
currently produced from fossil resources, that is, the chemicals
generically termed petrochemicals owing to their origin. The
second approach is to target new chemicals, which have prop-
erties that make them potential substitutes for current petro-
chemicals.
Biomass Chemicals Identical to Current Petrochemicals
Figure 3 illustrates the current primary building blocks in the
chemical industry derived from fossil resources (coal, natural
gas and oil) and consequently used as building blocks for a
range of significant large-scale commodity chemicals (shaded
in dark gray). Syngas is produced from natural gas, along with
ethylene and propylene, and is used to produce methanol on
a large scale. In turn, methanol is used to produce commodity
chemicals such as acetic acid and formaldehyde. Ethylene,
along with other liquefied refinery gases such as propanes
(propane and propylene), butanes (isobutylene and butadiene),
and pentanes, is typically obtained by steam-cracking of naph-
tha, one of the largest industrial chemical processes today. As
steam-cracking is endothermic and conducted at a very high
temperature of around 750–875 8C, large amounts of fossil re-
sources are required to heat the reaction mixture and to
supply the heat of reaction. In fact, a mere 20% of the heat
input to the steam-cracking process is used in the chemical
conversion to olefin products ; hence, there is a significant co-
ChemSusChem 2008, 1, 283 – 289 � 2008 Wiley-VCH Verlag GmbH&Co. KGaA, Weinheim www.chemsuschem.org 285
The Renewable Chemicals Industry
production of carbon dioxide. Accordingly, the C factor for the
production of ethylene and propylene by steam-cracking is
0.65.[24] Ethylene is used to produce a wide range of chemicals,
including ethylene glycol and styrene (with benzene via ethyl-
benzene), and it is also used directly as a monomer in poly-
mers such as polyethylene and poly(ethylene terephthalate)
(PET). Propylene is used to produce propylene glycol (1,2-pro-
panediol), acrolein, acrylic acid, and acrylonitrile, and it is also
used in the production of polymers. Benzene, toluene, and xy-
lenes are derived from crude oil. Benzene is used to prepare
commodity chemicals such as styrene, hydroquinone, phenol
and acetone (both produced via cumene), and adipic acid and
caprolactam (both produced via cyclohexane). The main outlet
for xylene is in the production of terephthalic acid, which is
used on a large scale for PET plastics.
Importantly, as is also illustrated in Figure 3, the primary
building blocks described above can in principle also be pro-
duced from bioresources, and therefore, the commodity petro-
chemicals available today will also be available in the renewa-
ble chemicals industry. However, the production of these pri-
mary building blocks from bioresources will in some cases re-
quire more transformation steps as the natural primary renew-
able building blocks are newcomers to the commodity
chemicals market. Nevertheless, biomass-derived syngas is an
example of a primary fossil building block that is readily avail-
able from renewable resources by either gasification of bio-
mass[25–27] or by aqueous-phase reforming of carbohydrate re-
sources. However, instead of steam-reforming carbohydrates
into syngas, they can also be
transformed into simple sugars
and fermented into building
blocks such as ethanol and glyc-
erol. Ethanol can be used to pro-
duce ethylene and butadiene
(see below), and benzene, tolu-
ene, and xylenes can in turn be
produced from ethylene by acid-
catalyzed oligomerization.
Note that only selected chemi-
cals are included in Figure 3, so
as to focus on the synthesis
strategy rather than on the ex-
haustive number of compounds
that are produced in today’s
chemical industry or on the
overwhelming number of possi-
ble routes to obtain these chem-
icals from bioresources. To out-
line the approach in more detail
and to illustrate some recent ex-
amples of research efforts to de-
velop new efficient routes to
biomass-derived chemicals, a
few selected synthesis pathways
to major chemicals are highlight-
ed with arrows. In the left part
of Figure 3, the arrows connect-
ing the fossil resources with various compounds illustrate how
a given chemical is produced industrially today. On going from
the top-right section of the diagram to the bottom left, the
arrows indicate how it can be envisaged that the same com-
pounds could instead be produced from renewable resources.
By way of an example, the acrylic acid family is explored in
which acrolein is the key petrochemical intermediate. Acrylic
acid is produced by the oxidation of propene in heterogene-
ously catalyzed processes, either directly or via acrolein in a
two-step process. In terms of its usage, more than 90% of the
acrylic acid is consumed as intermediates in the production of
acrylate esters, which find widespread use as polymers, includ-
ing superabsorbent polymers, detergents, adhesives, and coat-
ings. Recently, the manufacture of acrolein from glycerol has
received significant attention.[28] This is attributed to the fact
that glycerol could become widely and inexpensively available
as a by-product (or eventually even a waste product) from the
production of biodiesel by transesterification. Indeed, it has
been estimated that if the production of biodiesel grows as
projected, the amount of glycerol available will rapidly be
more than ten times higher than the current demand.[29] Alter-
natively, glycerol can be produced, for example, by the fermen-
tation of glucose,[30] which could also develop into a cost-com-
petitive process provided that the biodiesel market does not
develop as quickly as projected. It is well known that by dehy-
drating glycerol, for example, with finely powdered KHSO4 and
K2SO4, it is possible to obtain acrolein in reasonable yields.[31]
Through further developments, recently, several research
Figure 3. Strategies for producing commodity chemicals from biomass. The part set on a gray background shows
some of the currently most important commodity chemicals produced from fossil resources. By strategy 1, these
same chemicals are produced from renewable building blocks. Strategy 2 covers the idea of producing alternative
chemicals, which potentially can substitute some of the “old” chemicals. Together strategies 1 and 2 cover the
parts shown on the green background.
286 www.chemsuschem.org � 2008 Wiley-VCH Verlag GmbH&Co. KGaA, Weinheim ChemSusChem 2008, 1, 283 – 289
C. H. Christensen et al.
groups have reported that glycerol can be effectively dehydrat-
ed over solid acid catalysts to furnish acrolein in continuous
processes with high yields,[32,33] and that acrolein can be oxi-
dized to methyl acrylate in good yields even at ambient condi-
tions.[34] Thus, the production of acrolein, and therefore also
derivatives such as methyl acrylate, from glycerol obtained by
fermentation will entail both biochemical as well as chemical
process steps. In summary, acrolein could also be a key inter-
mediate in the renewable chemicals industry.
Another example of integrated biochemical and chemical
processes is the production of hydroquinone. Its production is
currently mainly based on the oxidation of para-diisopropyl-
benzene (p-DIPB), which is available from Friedel–Crafts alkyla-
tion of benzene with propylene. p-DIPB is oxidized to the dihy-
droxyperoxide, which is cleaved to yield hydroquinone and
acetone by an acid-catalyzed Hock rearrangement. Currently,
the annual world production of hydroquinone is around
43000 t. It has been reported that a benzene-free synthesis of
hydroquinone is possible through biological pathways from
glucose. The first approach proceeds by the shikimate path-
way,[35] which requires 18 enzyme-catalyzed steps and one
chemical step. However, a new approach to produce hydroqui-
none from glucose could be achieved in two enzyme-catalyzed
steps and two chemical steps via 2-deoxy-scyllo-inosose syn-
thase, thereby increasing the potential of the biosynthetic pro-
duction of aromatic chemicals from glucose.[36]
A final example relates to the possibilities for using bioetha-
nol as a feedstock for the chemical industry rather than, or as
an alternative to, using it as a fuel additive. Ethanol can be
thought of as a raw material for numerous industrially impor-
tant chemicals, including ethylene, acetic acid, butadiene, and
hydrogen.[14,37] As several of these transformations will be
chemical processes, many of the chemicals produced from eth-
anol in the future will rely on integrated chemical and bio-
chemical processes.
Originally, ethylene was manufactured primarily by the dehy-
dration of ethanol[38] and similarly butadiene was produced
from ethanol.[39,40] Today, acetic acid is still manufactured from
ethanol. However, the major industrial process for the produc-
tion of acetic acid is the carbonylation of methanol. Both
methanol and carbon monoxide are typically produced by the
steam-reforming of methane, which is a significantly endother-
mic reaction that takes place at temperatures above 600 8C.
Approximately one quarter of the methane is directly combust-
ed to heat the reactants and supply the heat of the reaction.
Accordingly, about 0.6 kg CO2 is produced for each kilogram of
acetic acid, and the manufacture of acetic acid by this ap-
proach can therefore be said to have a C factor of about 0.6.
Alternatively, it can be conceived that acetic acid could be
produced by the catalytic oxidation of ethanol. From the fossil
and renewables value chains, it is observed that acetic acid is a
relatively high-value commodity chemical, which is, say, twice
as expensive as gasoline. In recent studies, acetic acid has
been furnished in very high yields from the aerobic oxidation
of ethanol in either liquid-phase[37] or gas-phase[41] processes
using heterogeneous catalysts. In such new processes, it will
be necessary to achieve optimal process integration so that
energy-efficient handling of the large amount of water re-
quired in the fermentation is properly handled. With bioetha-
nol available at lower prices than gasoline, a viable alternative
technology for supplying acetic acid is available and could be
cost-competitive and also lead to substantially lower CO2 emis-
sions than those reached when using bioethanol as a fuel ad-
ditive.
In the manufacture of the chemicals described above, the
chemical identity of the major building blocks remains unal-
tered when the feedstock is shifted from fossil to renewable,
therefore resulting in only a modest impact on the rest of the
chemical industry. As a result, the barriers presented for intro-
ducing such biomass-derived chemicals are expected to be rel-
atively low. The focus in this approach will be on supplying
the desired major chemicals at the lowest possible cost—and
with the least possible environmental impact. This will require
further development of efficient routes to transform biomass
into useful starting materials, and here the technological devel-
opments driven by the demand for biofuels will be of appreci-
able importance. It appears that intimate integration of the in-
volved biological and chemical processes is required to maxi-
mize energy efficiency, and thus this integration will be at least
as important as it is in today’s chemical industry.
Alternative Biomass Chemicals as Substitutes for Current
Petrochemicals
The second approach towards realizing a renewable chemical
industry is to produce chemicals from biomass that might po-
tentially replace current petrochemicals. In its nature, this strat-
egy is more visionary and will be harder to implement than
the approach described above owing to the fact that such po-
tentially new commodity chemicals are not already part of the
existing markets. Therefore, cost will also become an important
factor here in order for the new biomass-derived chemicals to
compete with current petrochemicals and thus find an initial
niche in the market. Likewise, environmental considerations
need to be factored in—the new chemical should be manufac-
turable in a sustainable manner without the CO2 emission
problems currently encountered in the production of petro-
chemicals, otherwise the concept of introducing biomass as a
sustainable replacement for fossil resources has little sense.
However, the concept of redesigning our chemical industry
with replacement chemical commodities, designed in both
process and final structure from today’s know-how and tech-
nologies, is indeed an exciting one. The possibility to find bio-
mass substitutes that are not only furnished from renewable
feedstocks but involve a more efficient manufacturing process,
and are maybe even more sustainable, stands as high. Exam-
ples of this approach include chemicals such as 2,5-furandicar-
boxylic acid (FDCA), lactic acid, and 1,2- and 1,3-propanediols,
all of which are discussed here in some detail. In Figure 3, on
going from the top right to the bottom right of the diagram, a
pathway can be followed from renewable resources and pri-
mary building blocks to some of these potential replacement
chemicals originating from biomass. Again, only a selection
has been included for clarity.
ChemSusChem 2008, 1, 283 – 289 � 2008 Wiley-VCH Verlag GmbH&Co. KGaA, Weinheim www.chemsuschem.org 287
The Renewable Chemicals Industry

Lactic acid and its polymer, poly(lactic acid) (PLA), are taken
as first examples to further illustrate this approach as it is an
example of a biomass chemical that has already entered the
market as an alternative to fossil-derived polymers such as PET
and polystyrene. The monomer, lactic acid, is produced by bac-
terial fermentation from cornstarch or sugar, and PLA is mostly
manufactured by polymerization of its cyclic dimer lactide. The
current production capacity for PLA is 450000 tons per annum,
however, this is projected to increase significantly in the
coming years. PLA polymers are now used as biodegradable al-
ternatives for packaging purposes and as fiber materials and
could very well become economically competitive alternatives
on a larger scale in the future. The major advantage of PLA
polymers is the fact that they are fully biodegradable and com-
postable, and the degradation products, lactic acid and CO2,
are of course easily assimilated into biological systems. In fact,
owing to the ease of absorbability, PLA polymers have been
used for decades in the medical industry as, for example, re-
sorbable implants and sutures.
FDCA is another example of a biomass chemical that could
find use as a replacement monomer for making PET-type plas-
tics. It can be produced from carbohydrates such as glucose
and fructose that can undergo dehydration in the presence of
acidic catalysts to form 5-hydroxymethylfurfural (HMF),[42,43]
which under mild conditions can be oxidized to FDCA. This
has been achieved using various strategies : notably, it has
been shown that a silica-supported cobalt catalyst performs
the dual task of dehydration to form HMF in situ and aerobic
oxidation of HMF to furnish FDCA directly from fructose.[44] An
alumina-supported platinum catalyst[45,46] as well as a titania-
supported gold catalyst[47] have also been reported as effective
catalysts for the oxidation reaction, although in the latter case
the dimethyl ester is produced instead of the dicarboxylic acid.
However, there are several obstacles to overcome for FDCA to
become a viable alternative monomer in the production of
PET-type plastics, namely that it remains to be demonstrated
that polymers with the desired properties can indeed be made
from FDCA on a large scale. Another limiting factor to the use
of FDCA is the current high cost of dehydrating carbohydrates
and purifying HMF.
Both isomers of propanediol are also examples of biomass
chemicals that are expected to find increasing application in
the future. They can both be produced from glycerol, which,
as discussed above, might become an increasingly important
renewable chemical in the future.[30] Although 1,2-propanediol
is a petrochemical, which is typically produced in quantities ex-
ceeding 500000 tons per annum by hydration of propylene
oxide, its use for several applications is impeded by its current
cost relative to ethylene glycol. However, as 1,2-propanediol
can be produced in high yield by hydrogenation of glycerol,[48]
it could become competitive to ethylene glycol in the future
for selected applications, for example, as an antifreeze agent.
Contrarily, 1,3-propanediol is not readily available from petro-
chemical feedstocks. However, in recent years, fermentation
routes to 1,3-propanediol have been developed either from
glycerol[49] or from glucose,[50] making this biomass chemical
available at competitive cost. It has now found application as
one of the monomers of poly(trimethylene terephthalate), a
high-performance polyester material, under trade names such
as Sorona 3GT (DuPont) and Corterra (Shell).
In the future, more examples of this approach will appear.
Even though it can be more difficult with this approach to
penetrate markets, it might be the strategy that ultimately
leads to the most sustainable use of our limited bioresources.
Conclusions
Establishment of a renewable chemicals industry in which bio-
mass is transformed into high-value-added chemicals might be
the most advantageous way to secure optimal use of our
abundant, but limited, bioresources from both an economical
and ecological perspective. To evaluate the economical poten-
tial of new processes that transform biomass into desirable
chemicals, we propose that the fossil and renewables value
chains can be useful tools. Another important factor to consid-
er in targeting the production of chemicals from renewable re-
sources is the reduction in CO2 emissions that might be ach-
ieved by the new technology. We put forward that the use of
C factors could be a simple, convenient, and instructive
method to facilitate such comparisons. Finally, it is noted that
the establishment of a renewable chemicals industry appears
to require an intimate integration of biocatalytic and heteroge-
neous catalytic processes to ensure that profuse bioresources
are transformed into useful chemicals in a cost-competitive
way, coupled with having minimum impact on the environ-
ment. Undoubtedly, the transition from a fossil chemical indus-
try to a renewable chemicals industry will occur in many small
steps. The rate at which these steps are taken evidently de-
pends on the relative costs of renewable and fossil feedstocks,
but also on requirements for introducing CO2-reducing tech-
nologies. However, progress will likewise depend on our ability
to focus research and development efforts on the most prom-
ising alternatives. In this aim, we hope that the present discus-
sion might contribute to identifying suitable first targets in a
more lucid manner.
Acknowledgements
The Center for Sustainable and Green Chemistry is sponsored by
the Danish National Research Foundation.
Keywords: industrial chemistry · renewable resources ·
sustainable chemistry
[1] A. J. Ragauskas, C. K. Williams, B. H. Davison, G. Britovsek, J. Cairney,
C. A. Eckert, W. J. Frederick Jr. , J. P. Hallett, D. J. Leak, C. L. Liotta, J. R.
Mielenz, R. Murphy, R. Templer, T. Tschaplinski, Science 2006, 311, 484.
[2] G. W. Huber, A. Corma, Angew. Chem. 2007, 119, 7320; Angew. Chem.
Int. Ed. 2007, 46, 7184.
[3] J. N. Chheda, G. W. Huber, J. A. Dumesic, Angew. Chem. 2007, 119, 7298;
Angew. Chem. Int. Ed. 2007, 46, 7164.
[4] G. W. Huber, S. Iborra, A. Corma, Chem. Rev. 2006, 106, 4044.
[5] J. Goldemberg, Science 2007, 315, 808.
[6] http://www.eia.doe.gov.
[7] D. R. Dodds, R. A. Gross, Science 2007, 318, 1250.
288 www.chemsuschem.org � 2008 Wiley-VCH Verlag GmbH&Co. KGaA, Weinheim ChemSusChem 2008, 1, 283 – 289
C. H. Christensen et al.
[8] D. L. Klass, Biomass for Renewable Energy, Fuels, and Chemicals, Academ-
ic Press, California, 1998, pp. 495–543.
[9] B. O. Palsson, S. Fathi-Afshar, F. F. Rudd, E. N. Lightfoot, Science 1981,
213, 513.
[10] B. Kamm, Angew. Chem. 2007, 119, 5146; Angew. Chem. Int. Ed. 2007,
46, 5056.
[11] F. W. Lichtenthaler in Biorefineries—Industrial Processes and Products
(Eds. : B. Kamm, P. R. Gruber, M. Kamm), Wiley-VCH, Weinheim, 2006,
pp. 3–51.
[12] Y. Romµn-Leshkov, C. J. Barret, Z. Y. Liu, J. A. Dumesic, Nature 2007, 447,
982.
[13] M. Eissen, J. O. Metzger, E. Schmidt, U. Schneidewind, Angew. Chem.
2002, 114, 402; Angew. Chem. Int. Ed. 2002, 41, 414.
[14] J. Rass-Hansen, H. Falsig, B. Jørgensen, C. H. Christensen, J. Chem. Tech-
nol Biotechnol. 2007, 82, 329.
[15] http://www.icispricing.com.
[16] E. S. Lipinsky, Science 1981, 212, 1465.
[17] R. A. Sheldon, Chem. Ind. 1992, 903.
[18] R. A. Sheldon, Green Chem. 2007, 9, 1273.
[19] E. S. Lipinsky, Science 1978, 199, 644.
[20] Top Value-Added Chemicals From Biomass, Volume 1—Results of Screen-
ing for Potential Candidates from Sugars and Synthesis Gas (Eds. : T.
Werpy, G. Petersen), US Department of Energy, Oak Ridge, TN, August
2004 ; available at http://www.eere.energy.gov/biomass/pdfs/35523.pdf.
[21] The Key Sugars of Biomass : F. W. Lichthenthaler in Biorefineries—Industri-
al Processes and Products (Eds. : B. Kamm, P. R. Gruber, M. Kamm), Wiley-
VCH, Weinheim, 2006.
[22] Biomass Chemicals : B. A. Tokay in Ullmann’s Encyclopedia of Industrial
Chemistry, Wiley-VCH, Weinheim, 2005.
[23] R. Le Van Mao, T. M. Nguyen, G. P. McLaughlin, Appl. Catal. 1989, 48,
265.
[24] J. R. Nielson, NATO ASI Sustainable Strategies for the Upgrading of Natu-
ral Gas: Fundamentals, Challenges, and Opportunities, Vilamoura, July 6–
18, 2003.
[25] T. A. Milne, R. J. Evans, N. Abatzoglou, Biomass Gasifier “Tars”: Their
Nature, Formation and Conversion, NREL Technical Report (NREL/TP-570–
25357), November 1998.
[26] D. Dayton, A Review of the Literature on Catalytic Biomass Tar Destruc-
tion, NREL Technical Report (NREL/TP-510–32815), December 2002.
[27] D. Sutton, B. Kelleher, J. R. H. Ross, Fuel Process. Technol. 2001, 73, 155.
[28] A. Behr, J. Eilting, K. Irawadi, J. Leschinski, F. Lindner, Green Chem. 2008,
10, 13.
[29] Glycerol : Ullmann’s Encyclopedia of Industrial Chemistry, Wiley-VCH,
Weinheim, 2005.
[30] M. Pagliaro, R. Ciriminna, H. Kimura, M. Rossi, C. D. Pina, Angew. Chem.
2007, 119, 4516; Angew. Chem. Int. Ed. 2007, 46, 4434.
[31] Organic Syntheses, Coll. Vol. 1, 1941, p. 15.
[32] A. Neher, T. Haas, D. Arntz, H. Klenk, W. Gierke, US Patent 5,387,720,
1995.
[33] J. Dubois, C. Duquenne, W. Holderich, FR2882052, 2006.
[34] C. Marsden, E. Taarning, D. Hansen, L. Johansen, S. K. Klitgaard, K. Ege-
blad, C. H. Christensen, Green Chem. 2008, 10, 168.
[35] N. Ran, D. R. Knop, K. M. Draths, J. W. Frost, J. Am. Chem. Soc. 2001, 123,
10927.
[36] C. A. Hansen, J. W. Frost, J. Am. Chem. Soc. 2002, 124, 5927.
[37] C. H. Christensen, B. Jørgensen, J. Rass-Hansen, K. Egeblad, R. Madsen,
S. K. Klitgaard, M. R. Hansen, H. C. Andersen, A. Riisager, Angew. Chem.
2006, 118, 4764; Angew. Chem. Int. Ed. 2006, 45, 4648.
[38] Y. C. Hu, Hydrocarbon Process. 1983 (April issue), 113.
[39] G. S. Whitby, Synthetic Rubber, J. Wiley & Sons, New York, 1954, p. 86.
[40] A. Talalay, M. Magat: Synthetic Rubber from Alcohol, Interscience, New
York, 1945.
[41] X. Li, E. Iglesia, Chem. Eur. J. 2007, 13, 9324.
[42] J. N. Chheda, Y. Romµn-Leshkov, J. A. Dumesic, Green Chem. 2007, 9,
342.
[43] H. Zhao, J. E. Holladay, H. Brown, C. Zhang, Science 2007, 316, 1597.
[44] M. L. Ribeiro, U. Schuhardt, Catal. Commun. 2003, 4, 83.
[45] P. Vinke, H. E. van Dam, H. van Bekkum, Stud. Surf. Sci. Catal. 1990, 55,
147.
[46] W. Partenheimer, V. V. Grushin, Adv. Synth. Catal. 2001, 343, 102.
[47] E. Taarning, I. S. Nielsen, K. Egeblad, R. Madsen, C. H. Christensen, Chem-
SusChem 2008, 1, 75.
[48] M. Dasari, P. Kiatsimkul, W. Sutterlin, G. J. Suppes, Appl. Catal. A 2005,
281, 225.
[49] M. M. Zhu, P. D. Lawman, D. C. Cameron, Biotechnol. Prog. 2002, 18, 694.
[50] A. N. Zeng, H. Biebl, Adv. Biochem. Eng./Biotechnol. 2002, 74, 239.
Received: December 21, 2007
Published online on March 25, 2008
ChemSusChem 2008, 1, 283 – 289 � 2008 Wiley-VCH Verlag GmbH&Co. KGaA, Weinheim www.chemsuschem.org 289
The Renewable Chemicals Industry
1
Heterogeneous Catalysis for Production of Value-added
Chemicals from Biomass
Kresten Egeblad, Jeppe Rass-Hansen, Charlotte C. Marsden, Esben Taarning, and
Claus Hviid Christensen*
Center for Sustainable and Green Chemistry, Department of Chemistry, Technical
University of Denmark, Building 206, DK-2800 Lyngby, Denmark. Email:
1. Introduction
Almost everything around us is in some way a product of controlled chemical
processes. That is either chemical processes conducted in Nature or chemical processes
conducted in the chemical industry. In the most developed parts of the World, it is in
fact products from the chemical industry that completely dominate our everyday lives.
These products range from fuels and fertilizers to plastics and pharmaceuticals [1]. To
make these products widely available, a huge amount of resources have been invested
during the last century to develop the chemical industry to its current level where it is
the largest industry worldwide, a cornerstone of contemporary society, and also a
platform for further global economic growth [2,3]. It can be argued that the enormous
success of the chemical industry can be attributed to the almost unlimited availability of
inexpensive fossil resources, and to a continuously increasing number of catalysts and
catalytic processes that make it possible to efficiently transform the fossil resources into
all the required compounds and materials. Accordingly, more than 95 % of the fuels and
chemicals produced worldwide are derived from fossil resources, and more than 60 %
of the processes and 90 % of the products in chemical industry somehow rely on
catalysis. It has been estimated that 20-30% of the production in the industrialized
world is directly dependent on catalytic technology [4]. Therefore, it is not surprising
2
that we are continuously expanding our already vast empirical knowledge about
catalysis to further improve the efficiency of existing catalysts and processes, to
discover entirely new ways of valorizing available resources, and to lower the
environmental impact of human activities [5]. Due to the overwhelming importance of
fossil resources during the 20th century, most catalysis research efforts have, so far,
concerned the conversion of these resources into value-added fuels and chemicals.
There are, however, indications that the era of easy access to inexpensive fossil
resources, especially crude oil, is coming to an end. The resources are certainly limited
and the demand from everywhere in the world is growing rapidly. At the same time, it is
becoming increasingly clear that the emission of CO2 that follows the use of fossil
resources is threatening the climate of the Earth. Together this makes the development
of a chemical industry based on renewable resources one of the most important
challenges of the 21th century.
This challenge has two different facets. One is the discovery and development of
methods to use renewable resources to supply suitable energy currencies, i.e. fuels, in
sufficient quantities at acceptable costs, and with minimal impact on the environment.
The other is the discovery and development of new ways to provide all the chemicals
needed to sustain a modern society. Whereas there are several possible energy scenarios
that do not involve carbon-containing energy currencies, it is in fact impossible to
envisage how it should be possible to provide the required chemicals and materials
without relying extensively on carbon-containing compounds. Thus, to develop a
chemical industry that does not depend on fossil resources, there are only two
alternative carbon sources and that is CO2 and biomass. Since transformation of CO2
into useful chemicals always requires a significant energy input and since it is usually
only available in minute concentrations, it appears attractive to instead utilize biomass
as the dominant feedstock for chemical industry. In this way, it is possible to harvest the
energy input from the Sun that is stored by photosynthesis in the C-C, C-H, C-O, and O-
H bonds of the biomass. Clearly, a shift from fossil resources to renewable resources as
the preferred feedstock in chemical industry is a formidable challenge. However, it is
worth pointing out that during the early part of the 20th century, before fossil resources
became widely available, biomass was the preferred feedstock for the emerging
chemical industry, and today, biomass still finds use as a feedstock for a range of very

3
important chemicals [6]. Interestingly, these processes often rely mostly on the
availability of biological catalysts whereas the processes for conversion of hydrocarbons
use mostly heterogeneous catalysts. However, to explore the full potential of biomass as
a feedstock in chemical industry, it appears necessary to integrate processes that rely on
biological catalysts with processes that use heterogeneous or homogeneous catalysts to
develop new, cost-competitive and environmentally friendly technologies [7]. Here, we
will survey the possibilities for producing value-added chemicals from biomass using
heterogeneous catalytic processes.
4
2. Setting a New Scene
Currently, there is an intense focus on the production of transportation fuels from
biomass [8,9]. Clearly, this can be attributed to a desire to relinquish our dependence on
fossil fuels, in particular crude oil, and also to significantly lower the emission of
greenhouse gasses to minimize global warming. In some regions, it appears that
production of bio-ethanol is indeed already cost-competitive with gasoline [8] and this
emphasizes the potential of biomass as a renewable raw material. However, it is also
clear that the extensive use of biomass to produce biofuels remains controversial from
both an economical and an ecological perspective, and these issues must, of course, be
resolved soon in a fully transparent way. However, it is undisputable that we will
eventually need alternatives to the fossil resources for producing chemicals and
materials [9,10,11]. It can be argued that if the amount of biomass available is too
limited to substitute fossil resources in all its applications and if sufficiently efficient
methods for transforming biomass into value-added chemical can be developed, this
will represent the optimal use of biomass [7]. There are two reasons for this. First of all,
most chemicals, even most of the simple petrochemical building blocks, are
significantly more valuable than transportation fuels. This can be illustrated in a semi-
quantitative way by comparing the value chains in a chemical industry based on fossil
and renewable resources, respectively [7]. In this context, it is instructive to compare the
cost of renewable resources to fossil resources over time. It is noteworthy that today, the
cost of glucose is comparable to the cost of crude oil (on a mass-to-mass basis).
Secondly, it is clear that by use of renewable resources as a feedstock for the chemical
industry, significantly higher reductions in the emissions of green-house gases can be
achieved than what is possible by production of biofuels. This can be attributed to the
fact that production of many large-scale commodity chemicals from fossil resources is
associated with a substantial co-production of CO2 as expressed e.g., by the C-factor (kg
CO2 produced by kg of desirable product) [7]. This can often be attributed to the high
temperature required to transform hydrocarbons. To illustrate this, the C-factor for
industrial production of hydrogen from natural gas is about 9 and for ethylene from
naptha it is 0.65. If hydrogen or ethylene was produced efficiently from biomass, the C-
factor would approximately express the amount of CO2 emission that would be saved
compared to what would be possible by production of biofuels instead. Since ethylene
5
alone is currently produced in an annual amount close to 100 mill. ton, it is obvious that
this would have a substantial impact on the total emission of green-house gases.
Fig. 1
There are many ways in which biomass can be envisaged to become an increasingly
important feedstock for the chemical industry, and this has already been the topic of
numerous studies [10-22]. The most comprehensive study was published recently by
Corma et al. [10] and it contains a very detailed review of possible routes to produce
chemicals from biomass. In Figure 1, we illustrate schematically how selected
commodity chemicals could be produced using abundant bio-resources, i.e.,
carbohydrates (starch, cellulose, hemi-cellulose, sucrose), lipids and oils (rapeseed oil,
soy oil, etc), and lignin as the sole raw materials. From these bio-resources, it is possible
to directly obtain all the compounds classified in Figure 1 as primary renewable
building blocks (of which only selected examples are given) with only one purification
step. For example, ethanol can be obtained by fermentation of sucrose, glucose by
hydrolysis of starch, glycerol by transesterification of triglycerides (or by fermentation
of glucose), xylose by hydrolysis of hemi-cellulose, fructose by hydrolysis of sucrose
(and by isomerization of glucose), and finally synthesis gas can be obtained directly by
gasification of most bio-resources or by steam-reforming of the other primary
renewable building blocks. From the primary renewable building blocks a wide range of
possible commodity chemicals can be produced in a single step, and again examples of
selected transformations are shown in Figure 1. For instance, acetic acid can be
produced by fermentation of glucose or by selective oxidation of ethanol. Lactic acid is
available by fermentation of glucose, and 5-hydroxymethyl furfural can be obtained by
dehydration of fructose. These compounds can again be starting materials for other
desirable products and so forth. Some of the commodity chemicals shown are already
produced on a large scale from fossil resources, e.g., ethylene, acetic acid, acrolein and
butadiene. Others are envisaged to become important large-scale commodity chemicals
in the future when biomass gradually becomes a more important feedstock [14]. The
different commodity chemicals are labeled using different colors to categorize them
according to their number of carbon atoms. It is seen that a wide range of C1 to C6
6
compounds can be made available by quite simple means. Moreover, the chemical
transformations in Figure 1 are labeled with colored arrows to illustrate specific ways to
convert one building block into another. As it is apparent, the reactions all require a
suitable catalyst, and this can be either a biological catalyst or a
heterogeneous/homogeneous catalyst. Most of the primary renewable building blocks
are produced today from bio-resources using mainly biocatalytic processes, and
similarly several of the proposed commodity chemicals can also be produced from the
primary renewable building blocks using biological catalysts. On the other hand, it is
also clear that a very substantial number of the desirable transformations rely on the
availability of suitable heterogeneous or homogeneous catalysts. Thus, it appears likely
that a chemical industry based on renewable resources as the dominant feedstock will
feature biological and chemical processes intimately integrated to efficiently produce all
the desired chemicals and materials. Often, it appears that the possible role of
heterogeneous catalysis in this scenario is not receiving sufficient attention in
comparison with that of the biocatalytic methods. Therefore, in the present chapter we
will highlight some of the existing possibilities for converting bio-resources, primary
renewable building blocks, and commodity chemicals derived from these into value-
added chemicals. We will focus on production of chemicals that can prove useful on a
larger scale since they will contribute most to the valorization of significant quantities
of biomass, and thereby contribute most to relinquishing the dependence on fossil fuels
and to lowering the emission of green-house gases. Hopefully, this will be useful as a
starting point for others to discover and develop new reactions and catalysts that can
become useful in the efforts to make biomass a more useful resource for chemical
industry. Our emphasis here is the catalytic reactions and the corresponding catalysts.
Therefore, we have organized the literature covered in separate chapters according to
five important reaction types, specifically, C-C bond breaking, hydrolysis, dehydration,
oxidation, and hydrogenation. We envisage that these reaction types will be the most
important for producing value-added chemicals from biomass since they can be
conducted on large scale and they do not involve expensive reagents that will make
them prohibitively expensive for industrial applications. Clearly, other reactions will
also be important but several of those will be analogues to current methods in chemical
industry. In each chapter, the presentation is organized hierarchically to first discuss the

7
catalytic conversion of compounds that are most closely related to the bio-resources
(carbohydrates, lipids and oils, and lignin) and then successively those derived from
these renewable raw materials.
8
3. Catalytic C-C Bond Breaking
3.1 Introduction
This section concerns catalytic processes that transform chemicals from renewables by
C-C bond breaking. Among these are thermochemical processes, such as pyrolysis and
also gasification, catalytic reactions, such as catalytic cracking and different reforming
reactions, and decarbonylation and decarboxylation reactions. Many of these reactions
occur simultaneously, particularly in the thermochemical processes. Another technically
important class of C-C bond breaking reactions is the fermentation processes, however,
they will not be considered in this section since they do not involve heterogeneous
catalysis.
3.2 C-C Bond Breaking Reactions involving Bio-resources
3.2.1. Crude Biomass
Next to combustion, gasification is probably the easiest and most primitive method for
degradation of biomass. In the simplest form, gasification involves heating of biomass
(or any other carbonaceous material) to temperatures around 800-900 ºC, in an
atmosphere with only little oxygen, until it thermally decomposes into smaller
fragments. This partial oxidation process obviously requires a significant energy input
and is not particularly selective; on the other hand, it is reasonably flexible since
essentially all types of biomass can be gasified. Gasification, in particular of coal, has
been known for long and was previously used to produce town gas. However, the gas
resulting from gasification has a relatively low heating value of only 10-50% of that of
natural gas [23-25], and this was a major reason for replacing town gas with natural gas.
During World War II, biomass gasification advanced in Europe, but it was not until the
oil crisis in the 1970s that new developments in the area truly took place [24]. Today,
the main purpose of biomass gasification is to produce synthesis gas, with a H2:CO ratio
close to two, which is suitable for methanol synthesis or Fischer-Tropsch fuels.
There exist many different types of gasification furnaces but they generally work by
having several different cracking and reforming zones. These zones are typically a
pyrolysis zone, an oxidation zone and a reduction zone. Biomass is broken down either
by pyrolysis (without oxygen) or by partial oxidation (with oxygen or air as oxidant) to
9
a mixture of CO, CO2, H2O, H2, CH4, other light hydrocarbons, some tar, char and ash,
as well as some nitrogen and sulfur containing gasses such as HCN, NH3, HCl, H2S etc.
[25]. The hydrocarbons and the char are further partially oxidized to mainly CO and
H2O (1-4) and steam reformed (5-6) or dry reformed (7-9) to CO and H2. The heat from
the exothermic oxidation reactions is used to supply the heat for the endothermic
cracking reactions. Finally, the H2:CO ratio can be adjusted by the water gas shift
reaction (10). [23-26]
(1) CH4 + ½O2 = CO + 2H2
(2) H2 + ½O2 = H2O
(3) CnHm + (n/2+m/4)O2 = nCO + (m/2)H2O
(4) C + ½O2 = CO
(5) CnHm + nH2O = nCO + (n+m/2)H2
(6) C + H2O = CO + H2
(7) CnHm + nCO2 = 2nCO + (m/2)H2
(8) C + CO2 = 2CO
(9) CH4 + CO2 = 2CO + 2H2
(10) CO + H2O = CO2 + H2
The major challenge in gasification is to avoid the formation of tars, which have a
tendency to clog filters and condense in end-pipelines. Tars are considered as the
condensable fraction of the organic gasification products, and consist mainly of
different aromatic hydrocarbons with benzene as the main species. For removal of tars
three types of catalysts have been widely investigated; alkali metal salts, alkaline earth
metal oxides and supported metallic oxides [24-26].
Alkali metal salts can be mixed directly with the biomass before entering the
gasification furnace. They enhance the gasification reactions and lower the tar content,
but recovery of the catalyst is difficult and costly making the alkali metals unattractive
as catalysts for industrial use [25-26]. Another family of catalysts, which can be used
effectively for gasification, is the alkaline earth metal oxides and carbonates. Of these,
mainly the naturally occurring mineral dolomite (MgCO3·CaCO3) has been used [25]. It
enhances the degradation of especially the tars and hydrocarbons into light gasses,
though it is not active for methane reforming. When dolomite is calcined at 800 ºC, CO2
is eliminated, yielding a far more active catalyst. These catalysts are deactivated by
10
carbon formation and attrition but they are inexpensive and disposable, and therefore
easily replaceable. The third type of catalysts used are metals on a support, typically
nickel on various oxide supports. Nickel catalysts are highly effective in tar destruction,
the reforming of hydrocarbons and in adjusting the composition of the synthesis gas by
the water gas shift reaction (10). They are operated as secondary catalysts in a
downstream reactor, which can be operated at conditions different from those in the
gasifier. Nickel catalysts primarily deactivate due to carbon formation and nickel
particle sintering. Therefore, dolomite is often used in guard beds upstream of the nickel
catalyst bed to remove most of the higher hydrocarbons [24-26].
Instead of gasifying biomass, it can be subjected to liquefaction in a pyrolysis process.
Pyrolysis is actually one of the main processes occurring during gasification, however,
in a dedicated pyrolysis plant, the desired products are liquid hydrocarbons rather than
synthesis gas. In the current development of pyrolysis reactors, this is achieved by a fast
pyrolysis process. Here, the biomass is heated rapidly to temperatures of around 500-
600 ºC, which leads to formation of a dark brown liquid known as bio-oil along with
some gasses and chars. Other types of liquefaction processes are high pressure pyrolysis
(350 ºC, 20 MPa) and non-pyrolytic liquefaction (aqueous/non-aqueous) (250-425 ºC,
10-35 MPa) [27]. The liquid products from these processes are of relatively pure quality
with a heating value of around half that of conventional oil. Alternatively to being used
as heating oil they can be upgraded to transportation fuels or chemical feedstocks by
hydrotreatment and catalytic cracking.
A possibly more sophisticated method for utilizing biomass to produce synthesis gas is
by aqueous phase reforming (APR), a processing method that was developed for
carbohydrates and other more readily accessible biomass oxygenates by Dumesic et al.
[28-32]. Valenzuela et al. [33], however, were the first to report APR of real woody
biomass. They used sawdust from pine, which was milled to an average diameter of 375
µm. The biomass was mixed with water, sulfuric acid (5%) and a catalyst (Pt/Al2O3) in
a batch reactor. The acid catalyzed the hydrolysis of the biomass to decompose it into
smaller soluble molecules, which were reformed over the platinum catalyst to yield
mostly hydrogen and carbon dioxide. The process was operated at 225 ºC, with
hydrogen accounting for 33% of the non-condensable product gasses.
11
3.2.2. Bio-oils
In the 1970s, it was shown that bio-oils from plant extracts such as rubber latex, corn
oil, and peanut oil can be converted into a mixture of mainly gasoline and liquid
petroleum gas over a ZSM-5 catalyst, at temperatures between 400-500 ºC [34]. These
bio-oils were investigated as feedstocks for the reaction because they have high
hydrogen to carbon ratios and low oxygen contents and therefore a hydrocarbon-like
structure. It was suggested that such renewable plant resources, due to their siginifant
content of highly reduced photosynthetic products, would be suitable for producing
fuels or chemical raw materials [35]. The high hydrogen-to-carbon ratios in the biomass
feed is desirable because oxygen usually must be removed and/or hydrogen must be
added to achieve useful products.
Recently, several groups have investigated the catalytic conversion of bio-oils or model
bio-oils over HZSM-5 catalysts [36-38], and recently a review was published describing
how biomass could be converted into fuels or chemicals in a conventional
petrochemical refinery in FCC or hydrotreating refinery units [39].
3.2.3. Carbohydrate Resources
Carbohydrate resources, such as hydrolyzed starch and sucrose as well as xylose and
glucose, can be processed into hydrocarbons in a process similar to the one performed
with bio-oils as described above (Section 3.2.2.), i.e. by using a HZSM-5 catalyst
operated at around 510 ºC and ambient pressure [40]. This process is perhaps a little
surprising since carbohydrates do not resemble the desired hydrocarbon product as
much as the bio-oils do. However, formation of hydrocarbon compounds was found to
occur as a result of oxygen removal from the carbohydrate by decarbonylation and
decarboxylation reactions [40]. This process is probably one of the first attempts to
conduct catalytic cracking of biomass.
Carbohydrate resources have also been processed under hydrotreating conditions, i.e.
high hydrogen pressures (35-300 bar) and high temperatures (300-600 ºC) in the
presence of Co-Mo or Ni-Mo-based catalysts; although other precious metals like Ru
and Pt can also be used [39]. The main reaction involved under these conditions is
hydrodeoxygenation (HDO), as, for example, described by Elliot et al. [41]. The
important advantage of this technology is that excellent fuels and useful chemicals can
12
be produced in good yields, but the process is expensive and requires high hydrogen
pressures.
3.3. C-C Bond Breaking Reactions involving Primary Renewable Building Blocks
3.3.1. Aqueous-phase Reforming (APR)
Aqueous phase reforming of glucose, glycerol and other biomass oxygenates, such as
methanol, ethylene glycol and sorbitol, was carefully investigated by the group of
Dumesic [28-32]. They showed how various biomass oxygenates can be converted into
H2, CO2 and some light alkanes with good conversions and high selectivities over a
Pt/Al2O3 catalyst operated at 225-265 ºC and 29-56 bar [28], as well as over a specially
designed non-precious metal catalysts (Raney Ni-Sn) [29]. It was shown that this
reaction could be used to supply hydrogen that could simultaneously be used for
reduction of sorbitol to hexane [30]. This was achieved using a bifunctional catalyst that
caused sorbitol to be partly cleaved over a metal catalyst (Pt, Pd) to form H2 and CO2
and at the same time sorbitol was also dehydrated over a solid acid catalyst. By
carefully balancing these reaction steps, the hydrogen produced could be used directly
for hydrogenation of the dehydrated sorbitol to eventually yield alkanes [30].
Alternatively, hydrogen could be co-fed, whereby the production of CO2 was avoided
and the conversion to alkanes (especially hexane) is improved [30].
3.3.2. Steam Reforming of Ethanol
Steam reforming (SR) is probably the most investigated process for breaking C-C bonds
in chemicals available from biomass. Particularly, ethanol SR for production of
hydrogen has been extensively examined [42-44], but also other primary renewable
building blocks have received attention, such as SR of glycerol [45-46] or SR of bio-oils
[47-48].
SR of methane/natural gas is one of the largest catalytic processes in the world and is by
far the most important method for producing industrial hydrogen today. The process is
well described in literature and it is typically carried out at 800-950 ºC over nickel-
based catalysts [49]. The main reactions are methane SR (11) and water-gas-shift
(WGS) (12).
(11) CH4 + H2O = CO + 3H2
13
(12) CO + H2O = CO2 + H2
SR of ethanol has mainly been conducted under similar conditions as methane SR,
which means relatively high temperatures, ambient pressure, and primarily with Ni- or
Rh-based catalysts [42-44]. Ideally, one mole of ethanol is converted into 6 moles of
hydrogen (13). During SR, ethanol decomposes mainly through two different routes;
either by dehydrogenation to acetaldehyde (14) or dehydration to ethylene (15). These
two intermediates can be further catalytically reformed to a thermodynamically
equilibrated reaction mixture of H2, CO, CO2, CH4 and H2O (12, 16-18) [50].
(13) CH3CH2OH + 3H2O = 2CO2 + 6H2
(14) CH3CH2OH = CH3CHO + H2
(15) CH3CH2OH = CH2CH2 + H2O
(16) CH3CHO = CH4 + CO
(17) CH3CHO + H2O = 3H2 + 2CO
(18) CH2CH2 + 2H2O = 4H2 + 2CO
A substantial difficulty in ethanol SR is a too rapid catalyst deactivation due to coking.
This can occur by several reactions, such as methane decomposition (19) or the
Boudouard reaction (20), but primarily the polymerization of ethylene is thought to
cause the problems (21). Unlike the situation for methane SR, it appears that for ethanol
SR the deactivation by coke formation is lower at high temperatures.
(19) CH4 = 2H2 + C
(20) 2CO = CO2 + C
(21) CH2CH2 = polymeric deposits (coke)
SR of ethanol is an endothermic reaction and relatively high temperatures are required
to convert ethanol into hydrogen and carbon monoxide and eventually carbon dioxide
after equilibration by the WGS reaction (12). Thus, the drawback of this process is the
energy requirements, which perhaps are not so disadvantageous. If the hydrogen is used
in a high efficiency fuel cell, compared to combusting the ethanol in a motor engine
with a relatively low efficiency, the overall energy output could be significantly
improved [50]. Alternatively, the steam reforming reaction can be performed as a partial
oxidation (22) [51]. Less hydrogen is formed in this way, but instead the reaction is
14
slightly exothermic, thus making hydrogen from renewable resources without the need
of adding extra energy in terms of heat.
(22) CH3CH2OH + 2H2O + ½O2 = 2CO2 + 5H2
3.3.3 Decarbonylation
Furfural is easily obtained from biomass waste such as oat and rice hulls that are rich in
pentosans. Further valorisation of furfural can be done by decarbonylation to produce
furan, which can be further converted into tetrahydrofuran by catalytic hydrogenation.
Pure decarbonylation typically employs noble metal catalysts. Carbon supported
palladium, in particular, is highly effective for furan and CO formation [52]. Typically,
alkali carbonates are added as promoters for the palladium catalyst [52-53]. The
decarbonylation reaction can be carried out at reflux conditions in pure furfural (165
°C), which achieves continuous removal of CO and furan from the reactor. However, a
continuous flow system at 159-162 °C gave the highest activity of 36 kg furan per gram
of palladium with potassium carbonate added as promoter [54]. In oxidative
decarbonylation, gaseous furfural and steam is passed over a catalyst at high
temperatures (300-400 °C). Typical catalysts are zinc-iron chromite or zinc-manganese
chromite catalyst and furfural can be obtained in yields of around 90% at full
conversion [53]. Again, addition of alkali metal carbonates promotes the reaction.
3.3.4 Deformylation
Levulinic acid is used as a starting material for the preparation of organic chemicals,
dyes, polymers, pharmaceutically active compounds and flavoring agents. Acidic
catalysts are required to procure levulinic acid from sugars, and/or 5-HMF. Acidic ion-
exchange resins have been tested for dehydration of sucrose in pure water at 100 °C
[55]. And levulinic acid could be achieved with up to 83% selectivity using all four
tested ion-exchange resins (Dowex MSC-1H, Amberlyst 15, Amberlyst XN-1010 and
Amberlyst XN-1005) although the overall yields were quite low (9-24%) even after 24
h reaction times [55]. Better results were achieved using zeolites as catalysts. Zeolite
LZY was tested for fructose dehydration in pure water at various temperatures with the
main product being levulinic acid formed in ca. 66% yield after 15 h at 140 °C [56].
Levulinic acid was also observed as one of the main products from aqueous phase
dehydration of glucose using zeolite H-Y (with a SiO2/Al 2O3 ratio of 6.5) as well as
15
with acidic montmorillonite clays as catalysts [57-58], but significantly lower yields
were reported. With the possibilities of levulinic acid as a renewable chemical building
block, it seems interesting to develop the zeolite-catalyzed process from cellulosic
feedstocks.
3.3.5 Hydrogenolysis
C-C and C-O bond breaking by hydrogenolysis of different polyols (glycerol, xylitol,
erythritol and sorbitol) has been investigated by Montassier et al. [59-60].
Predominantly ruthenium and copper-based charcoal catalysts were studied at 210-260
°C and 1-6 MPa hydrogen pressures. The main products from the aqueous glycerol
conversions were propylene glycol using copper catalysts and ethylene glycol along
with methane using ruthenium catalysts. The hydrogenolysis of glycerol to ethylene
glycol and propylene glycol using ruthenium on a range of different supports at 180 °C
and 5 MPa hydrogen pressure showed the highest conversion on a TiO2 support [61].
Blanc et al. reported the treatment of aqueous sorbitol solutions on CuO-ZnO catalysts
at 180 °C 130 bar hydrogen pressure [62]. The purpose of the analysis was to achieve a
high C4+ selectivity suitable in the synthesis of alkyd polymers, and the CuO-ZnO
catalyst was superior in achieving a high C4+ selectivity (73 % yield) compared to Ru
and Ni catalysts which mainly yielded C1- C3 products.
A commercial example of a hydrotreating technology is examined below. The IPCI
(International Polyol Chemicals, Inc.) hydrogenolysis process is carried out at 100-300
ºC and at hydrogen pressures of 70-300 bar [63]. The hydrogenolysis process is used to
cleave carbohydrates to smaller polyol fragments. Specifically, sorbitol and mannitol
are reformed to propylene glycol and ethylene glycol as the main products, and to
different butanediols in smaller quantities [64]. The primary product, propylene glycol,
is formed by hydrocracking either of sorbitol directly (23) or, more likely, through
glycerol (24,25).
(23) C6H14O6 + 3H2 = 2C3H8O2 + 2H2O
(24) C6H14O6 + H2 = 2C3H8O3
(25) C3H8O3 + H2 = C3H8O2 + H2O
The composition of the hydrogenolysis products is very dependent on the actual process
conditions and on the catalysts used in the reaction. So far, mostly supported nickel

16
catalysts are being applied. IPCI has constructed a 10 000 MT/y pilot plant in China in
2005, and in 2007, a commercial 200 000 MT/y plant was commissioned, also in China
[63].
17
4. Catalytic Hydrolysis
4.1 Introduction
Hydrolysis is the process by which a compound is broken down by reaction with water,
thus it can be thought of as the opposite reaction of dehydration, where water is of
course removed. Hydrolysis is a key reaction type in biomass chemistry, for it is central
in the depolymerisation of polysaccharides to simpler monosaccharide building blocks,
such as fructose, glucose, and xylose.
4.2. Hydrolysis Reactions involving Renewable Resources
4.2.1 Sucrose, Maltose and Cellubiose
Sucrose can be hydrolyzed to give inverted sugars, i.e. a mixture of fructose and glucose
(Scheme 1). For the transformation of biomass into value-added chemicals, this is a key
reaction since it provides major building blocks for further chemical synthesis, fructose
and glucose, from widely occurring sucrose. In the past, and on an industrial level, this
reaction has been performed with the use of enzymes as the catalyst. However, due to
the production of waste, low thermal stability, problems with separation of products and
enzymes, and recovery, and low rate due to glucose and fructose inhibiting the reaction,
a different path has been sought for.
Scheme 1
It has been established early that acids catalyze this hydrolysis reaction, thus liquid
sulfuric acid has been used. Heterogeneous catalysis can potentially provide simpler and
environmentally more benign processes, however, via ease of separation and recovery.
Thus, solid acids, such as acidic ion-exchange resins [65-66], zeolites and
heteropolyacids, can replace the homogeneous acids. Hydrolysis of sucrose is in fact
already established on an industrial scale using acid ion-exchangers [67], but the main
route is still via enzyme catalysis. Transfer to the heterogeneous system shows problems
regarding the microenvironment of the swollen polymer, i.e. limitation of diffusion and
restricted accessibility, as well as the production of many by-products [68].
18
In an effort to make this switch to heterogeneous catalysts viable, various acidic
exchange resins have been tested, including those prepared by radiation-induced
grafting to produce graft copolymers capable of hosting sulfonic groups [69-71]. A
common problem with solid acids, including ion-exchange resins, is that they are
subject to poisoning by water. Thus, sulfonated mesoporous silicas were investigated as
a new class of solid acids, giving glucose and fructose in 90% yield after four hours at
80 °C [72]. Zeolites are also acid ion-exchangers. A conversion of sucrose of up to 90%
with close to 90% selectivity and very few by-products formed was achieved using
highly dealuminated zeolite Y at 70 °C [73]. Similarly, the activity of various
dealuminated zeolites was compared, again showing high selectivities and few by-
products, regardless of the conversion [74]. Similarly, the hydrolysis of maltose was
studied by comparing the performance of acid zeolites, ion-exchange resins, amorphous
silic-aluminas and also the ordered mesoporous material, MCM-41 [75]. The best
results were achieved with zeolite beta (Si/Al=50) at 130 °C and 10 bar where a
conversion of 85% and a selectivity of 94% was reported. Most recently, the use of
organic-inorganic hybrid mesoporous silica catalysts was reported for the hydrolysis of
cellubiose to yield glucose. Cellubiose was used as a model for oligosaccharides, and it
was possible to achieve 100% conversion at 175 °C but significant glucose degradation
was observed simultaneously [76].
It can be seen then that heterogeneous catalysis may find an opportunity for replacing
the enzymatic catalysis of disaccharides to its monosaccharides, and thereby provide
industry with a more efficient and benign route. However, it is also clear that more
selective catalysts are required.
4.2.2 Triglycerides
Triglycerides can be hydrolyzed to give fatty acids and glycerol (Scheme 2). The fatty
acids obtained have many industrial uses, mostly for the manufacture of soap. Glycerol
is currently viewed as a by-product from this reaction, but maybe in the future it will be
considered a commodity due to the current drive to develop it as a feedstock.
Technologies in this area have often featured high temperatures and pressures because
of low reaction rates. In an attempt to develop low temperature and pressure processes,
19
as well as methods that are easy to implement, heterogeneous catalysis has been
pursued as an alternative.
Scheme 2
Similarly to the hydrolysis of sucrose, acid exchanged resins can be utilized, in one case
to give 75% hydrolysis of triglycerides after six hours at 155 °C. It was shown that the
Brøndsted acid sites catalyze the hydrolysis reaction, which was performed in the liquid
phase with continuous steam injection [77]. The same authors reported that polystyrene
sulfonic cation-exchange resin, loaded with 13 % of the superacid H3Mo, gave 74.5%
hydrolysis of palm oil at 155 °C in a batch reactor also operated with steam injection
[78].
4.2.3 Polysaccharides
Before the introduction of enzymes (α-amylase and glycoamylase) to facilitate the
hydrolysis of polysaccharides, this transformation was typically achieved using strong
mineral acids. There have also been studies of the use of ion-exchange resins and of the
zeolite mordenite to catalyze the hydrolysis of amylose and starch at 130 °C and 10 atm.
With the ion-exchange resin, it was seen that the selectivity towards glucose was not
lowered by lengthening the reaction time. However, this was not the case for mordenite
where substantial degradation of the glucose was observed [75]. With the ion-exchange
resin, it was possible to obtain 35% glucose after 24 hours reaction time. Similarly, the
performance of an ion-exchange resin (Amberlyst 15), nafion-silica and sulfonated
mesoporous silicas were compared for starch hydrolysis. The best yields reported were
39 % glucose and 18 % maltose obtained at 130 °C [79].
20
5. Catalytic Dehydrations
5.1. Introduction
There are several examples of dehydrations of chemicals derived by renewable
resources by use of heteregeneous catalytic approaches in the literature. These can be
categorized into three types of reactions: (a) reactions in which one (or more)
molecule(s) of water is eliminated from a single substrate molecule, (b) reactions in
which one (or more) molecule(s) of water is generated as the result of an esterification
reaction between an alcohol and a carboxylic acid or carboxylic acid derivative and (c)
reactions in which one (or more) molecule(s) of water is generated due to an
etherification reaction between two alcohol functionalities.
5.2. Dehydration Reactions involving Bio-resources and Primary Renewable
Building Blocks
5.2.1. Bio-oils
Transesterification of vegetable oils to produce fatty acid methyl esters (FAME) which
can be used as biodiesel has been studied intensely in recent years. Mainly solid bases
such as MgO and hydrotalcites are used as catalysts [80-81], however, solid acids are
also studied for these reactions [81]. In a study with soybean oil as the source of fatty
acids, MgO catalysts prepared in different ways, as well as a hydrotalcite catalyst, were
all reported to be effective catalysts for the transesterification reactions yielding
between 75 and 95% FAME after 1 h at 180 °C, whereas application of alumina
resulted in less than 5% FAME [80]. At 200 °C, all the tested base catalysts (except one
of the four MgO ones) resulted in a yield of FAME of 95-100%. In a similar study,
experiments carried out at 180 °C showed a difference in the yields obtained using
hydrotalcite and MgO catalysts [81]. Using hydrotalcite, 92% yield was obtained,
whereas the yield using MgO was 75%. However, the yield obtained using these
catalysts were similar (75-80%) when the reaction mixture also contained some free
fatty acid. In this study, pure and metal-substituted vanadyl phosphates (MeVPO) as
well as titanated silica (tetraisopropoxide titanium grafted onto silica) were also tested
for the reaction [81]. The best results were obtained with GaVPO with which a yield of
82% FAME yield was obtained. The transesterification reactions have also been studied
21
using alumina-supported solid base catalysts at methanol reflux temperatures, e.g. using
catalysts made by calcining KNO3 adsorbed on Al2O3 [82]. The study showed that 35
wt% KNO3/Al 2O3 calcined at 500 °C was the optimum catalyst for the reaction, and this
catalyst gave 87% yield after a reaction time of 7 h. Recently, KF/Al2O3 has also been
reported as catalyst for transesterification at about 65 °C in a study using cottonseed oil
as the fatty acid source [83], and even poultry fat has been transesterified recently using
hydrotalcite as the catalyst [84].
5.2.2. Syngas and Methanol
Methanol is one of the top industrial chemicals today. It is produced on a very large
scale from fossil-derived syngas by use of a Cu-Zn-Al-oxide catalyst, however, it can of
course also be produced in a similar manner from bio-derived syngas. Methanol (and
also syngas) can be used as a feedstock to produce dimethyl ether via catalytic
dehydration. However, the chemistry involved in these processes is well-known, and
will not be considered here, since it has been extensively dealt with in detail elsewhere
[85-87].
5.2.3. Ethanol
Ethanol is the most important chemical produced by fermentation, and it has the
potential to become a major feedstock for the chemical industry since many other large-
scale chemicals can be produced from ethanol. In fact, ethanol can in many respects be
considered a renewable alternative to ethylene, which is the largest volume carbon-
containing chemical produced from fossil resources today. Via catalytic dehydration,
ethanol can easily be converted into ethylene and diethyl ether, both of which are well-
known acid catalyzed processes. Almost all available solid dehydration catalysts have
been tested for these reactions, and a comprehensive review of this field is beyond the
scope of this review. The reader is referred elsewhere for reviews on these topics [88-
91].
5.2.4. Glycerol
It has long been known that glycerol can be dehydrated to produce acrolein by heating
aqueous glycerol with a mixture of finely powdered KHSO4 and K2SO4 (Scheme 3)
22
[92]. Recently, the reaction has received attention again, as several acidic solid oxide
catalysts were tested as catalysts for the reaction [93-95]. The best results were obtained
with silica-supported heteropolyacids such as silicotungstic acid with which 86%
selectivity towards acrolein was obtained at 98% conversion of glycerol at 275 °C [93].
Also tungstated zirconia has been reported to be a selective catalyst for acrolein
formation in a comparative study of many different catalysts; using 15 wt% WO3/ZrO2,
65% selectivity towards acrolein was achieved at 100% conversion at 325 °C [95].
Scheme 3
Another dehydration product from glycerol is hydroxyacetone, or acetol (Scheme 4). In
one study, several catalysts were tested for this reaction [96]. Of the tested catalysts,
however, only copper-chromite appeared to be effective for this transformation. Using
this catalyst, 80% selectivity towards hydroxyacetone was achieved at 86% conversion
in a reactive distillation experiment carried out under a slight vacuum (98 kPa) at 240
°C [96].
Scheme 4
5.2.5. Xylose
Catalytic dehydration of xylose, which is the most abundantly available pentose
monomer in hemicellulose, has been known for a long time (Scheme 5). In fact, as early
as 1922, an industrial process involving sulfuric acid catalyzed dehydration of xylose to
produce furfural was developed by the Quaker Oats Co.
Scheme 5
Recently, several reports concerning this reaction have appeared in literature describing
the use of zeolites [97], ion-exchange resins [98], sulfonic acid functionalized MCM-41
[98], immobilized heteropolyacids [99-101], niobium silicates [102] and exfoliated
titanate and niobate nanosheet structures [103] as solid acid catalysts. In 1998, Moreau
et al. compared zeolites H-Y and H-Mordenite in batch experiments at 170 °C with 1:3
23
water/toluene or water/methyl isobutylketone mixtures as the reaction media. It was
found that H-Y was generally the most active catalyst whereas H-mordenite was the
most selective towards furfural formation; up to 96% selectivity at 27% conversion after
30 min. using water/toluene as the reaction media [97]. Using sulfonic acid-
functionalized MCM-41, 82% selectivity at 91% conversion was achieved after 24 h at
140 °C using either DMSO or toluene/water as the extraction phase [98]. Under the
same conditions, application of Amberlyst-15 resulted in only 70% selectivity towards
furfural at 90% conversion. Catalysts made by functionalizing MCM-41 with
heteropolyacids have also been tested for the reaction. In general, however, the
performances of these catalysts are not particularly good, as the highest selectivity
achieved in a study of several heteropolyacids using different extraction phases were
67% at 94% conversion after 4 h at 140 °C [99]. Moreover, microporous AM-11
niobium silicate and ordered mesoporous niobium silicates have been reported as
catalysts for dehydration of xylose, however, at 160 °C no more than 56% selectivity at
89% conversion was obtained using microporous AM-11 [102]. However, the study
also showed that the reaction temperature could be raised to 180 °C whereby the
furfural yield increased from ca. 20% after 1 h at 160 °C to ca. 45%. Very recently,
exfoliated and acidified layered titanates, niobates and titanoniobates prepared by
heating mixtures of TiO2 or Nb2O5 with alkali carbonates followed by immersion in
aqueous HCl or HNO3 and finally exfoliating the sheets with tetrabutylammonium
hydroxide [103]. Using these catalysts, furfural yields up to 55% could be obtained at
92% conversion after 4 h at 160 °C.
5.2.6. Glucose and Fructose
Sucrose is one of the largest chemicals readily available from biomass. It is produced
from sugar cane or sugar beats and can be easily hydrolyzed into its constituent
monomers, glucose and fructose. In general, dehydration of these carbohydrates will
lead to the formation of many different products, however, some control of the
dehydration products obtained can be achieved using different acid catalysts. The target
chemical in most reports concerning solid acid catalyzed dehydration of hexoses is 5-
hydroxymethyl furfural (Scheme 6), and to a lesser extent levulinic acid, which is
formed along with formic acid from HMF by a rehydration-decomposition reaction.

24
HMF is sometimes referred to as a "sleeping giant" due to its enormous potential
importance as a key chemical intermediate [104], and several reviews are available
concerning the production as well as chemistry of HMF [105-106]. Very recently,
significant achievements were made in the production of HMF by homogeneous
catalytic approaches [107]. Typically, the starting material for HMF synthesis is
fructose, however, there exists, of course, great interest in establishing a commercially
viable process directly from glucose, since glucose is less expensive than fructose.
Several types of catalysts have been applied for dehydration of fructose to produce
HMF. These were categorized into five classes of catalysts (organic acids, inorganic
acids, salts, Lewis acids and other) by Cottier et al. who also categorized the different
methods by which the dehydration reaction was carried out into five different types
(aqueous media below 100 °C, aqueous media above 100 °C, non-aqueous media,
mixed-solvent systems and solvent-free/microwave processes) [105]. Most of the solid
acids applied in the synthesis of HMF from fructose, zeolites, ion-exchange resins, solid
inorganic phosphates, belong to the group of "other catalysts" according to the
categorization of Cottier et al. Although levulinic acid can be an interesting target in
itself, it is nonetheless an undesirable byproduct in processes targeting HMF,
particularly, when water is used as the reaction media. Therefore, the most successful
approaches to circumvent levulinic acid formation by HMF rehydration-decomposition
is to carry out the reaction in a mixed water-organic solvent system, so that HMF is
removed from the aqueous phase as it forms. Literature covering the synthesis of
levulinic acid can be found in Section 5.3.
Scheme 6
With zeolites as the solid acid catalyst, the best results for HMF synthesis were obtained
by Moreau et al. who tested acidic mordenites with different Si/Al ratios in batch
experiments and reported that dealuminated H-Mordenite with Si/Al ratio of 11
exhibited the highest selectivity and even so at reasonably high fructose conversion
(91% selectivity at 76% conversion after 60 min. at 165 °C using water/methyl isobutyl
ketone as the reaction media) [108]. Other zeolites, H-Y, H-Beta and H-ZSM-5 were
25
also tested for the reaction, however, none of these catalysts were as selective as H-
mordenite [109].
Also acidic ion-exchange resins were tested as catalysts for fructose dehydration. Using
PK-216, a solution of water-DMSO-polyvinylpyrrolidone containing 10 wt% fructose
was dehydrated to HMF after 8-16 h at 90 °C with 71% selectivity at 80% conversion
using MIBK as the extraction phase [107]. Using a more concentrated fructose solution
(30 wt%), 65% selectivity was achieved at 83% conversion. Working in more dilute
solution (0.5 M in DMSO), also with PK-216 as the catalyst, an HMF yield of 90% was
obtained after 5 h at 80 °C [110]. Even more remarkable perhaps was the observation
that the reaction could be carried out in a continuous process with no signs of
deactivation even after 900 h, in this case using Amberlite IR-118 as the catalyst.
Recently, Amberlyst 15 was also reported as catalyst for fructose dehydration to
produce HMF at 80 °C using a solvent system comprising DMSO and either a
hydrophilic (BMIM-BF4) or hydrophobic (BMIM-PF6) ionic liquid [111]. In both cases,
HMF yields of ca. 80% were achieved after 24 h, however, when the reaction was
carried out without DMSO as co-solvent, a maximum yield of only ca. 50% yield could
be achieved (after 3 h) using BMIM-BF4. Very recently, ionic liquids immobilized on
silica (ILIS) were used as catalysts for dehydration of fructose to HMF [112]. In the
study, it was shown that both Lewis and Brøndsted acidic ILIS were effective for the
transformation. 70% yield was obtained at 100% conversion after 4 min. of 200 W
microwave irradiation in DMSO using Brøndsted acidic 3-allyl-1-(4-
sulfobutyl)imidazolium trifluormethanesulfonate [ASBI][Tf], whereas a yield of 67%
was achieved using Lewis acidic 3-allyl-1-(4-sulfurylchloride butyl)imidazolium
trifluormethanesulfonate [ASCBI][Tf].
A third class of solids, which were tested as catalysts for carbohydrate dehydrations are
inorganic phosphates. In a comparative study including vanadyl phosphate
(VOPO4·2H2O) and partially metal-substituted vanadyl phosphates (MxVO1−xPO4·2H2O,
M being Cr, Mn, Fe, Al and Ga), it was shown that vanadyl phosphate, which contains
both Brøndsted and Lewis acid sites, is very selective towards HMF formation (80%
selectivity at 50% conversion after 1 h) under mild conditions (80 °C) and in pure water
26
[113]. Moreover, it was shown that partial Fe-doping increased the performance quite
significantly, so that even at very high fructose concentrations, a reasonable yield of
HMF could be achieved (84% selectivity at 71% conversion using 30 wt% fructose as
the reaction media). The study also showed that the catalyst performances are very
similar when inulin is used as the carbohydrate source in stead of fructose, perhaps
opening up the possibility of producing HMF from an even more inexpensive source
than fructose. Overall, the performance of the vanadyl phosphate catalysts at 80 °C was
quite similar to the performance of zirconium and titanium phosphate and
pyrophosphate catalysts operated at 100 °C. Of the latter two types of catalysts, the best
performance was achieved with cubic zirconium pyrophosphate and γ-titanium
phosphate, that gave selectivities of up to 99.8% and 98.3% after 30 min., respectively
[114]. Also selectivities up to ca. 100% were reported for niobium phosphate systems at
100 °C, although at low conversions of fructose [115-116]. Very recently, niobic acid
and niobium phosphate catalysts were also studied under continuous flow conditions in
aqueous medium. It was shown that the niobium phosphate catalyst was more active
than the niobic acid catalyst due to it having a more acidic surface [117]. The use of
zirconium phosphates under subcritical water conditions was also reported recently. In
the study, it was shown that HMF yield of 61% at 80% fructose conversion could be
achieved after only 2 min. at 240 °C [118]. Using glucose as the reactant under
otherwise similar conditions, only 39% selectivity was achieved.
Dehydration of glucose and fructose was also reported using solid oxide catalysts. With
anatase-TiO2 (a-TiO2) and a mixture of monoclinic and tetragonal ZrO2 (m/c-ZrO2) it
was reported that fructose could be relatively selectively dehydrated to HMF after only
5 min. at 200 °C, although in quite low yields (ca. 25%) [119-120]. With the same
catalysts but with glucose as the starting material, a-TiO2 was much more selective
towards HMF than m/c-ZrO2, which gave more or less the equilibrium mixture of 1,6-
anhydroglucose and HMF, which was also obtained in the absence of a catalyst.
However, it should be noted that m/c-ZrO2 presumably catalyzes the isomerization of
glucose into fructose since more than 60 mol% fructose was present in the reaction
mixture after experiments starting from aqueous glucose.
27
In 2000, Kröger et al. reported that 2,5-furan-dicarboxylic acid (FDCA) could be
produced in a combined one pot dehydration-oxidation reaction starting from fructose,
however, only in 25% yield [121]. Very recently, this was improved significantly, when
Ribeiro and Schuchardt reported that also SiO2-gel containing Co(acac)3 could be used
as catalyst for the combined dehydration-oxidation reaction of fructose to yield FDCA
[122]. With pure SiO2-gel, ca. 100% HMF selectivity could be achieved at ca. 50%
conversion after 65 min. at 160 °C. However, with Co(acac)3 encapsulated in SiO2-gel,
a 70% one-pot yield of 2,5-furan-dicarboxylic acid was achieved. This proves an
important point, namely that an alternative strategy to improving the HMF yield by
adding an extraction phase is simply to react it further in-situ to desired end-products.
5.3. Dehydration Reactions involving Commodity Chemicals
5.3.1. 1,2- and 1,3-Propanediols
Dehydration of 1,2- and 1,3-propanediols to produce allyl alcohol was studied using
CeO2 as the catalyst [123-124]. With 1,3-propanediol, the reaction is very specific
towards allyl alcohol which is formed with 99% selectivity at 51% conversion at 325 °C
[123]. At the same temperature and with 1,2-propanediol as the substrate, only 44%
selectivity was achieved and at very low conversion. At elevated temperatures, higher
conversion of 1,3-propanediol can be achieved, however, at a substantial drop in
selectivity. At 425 °C, the selectivity towards allyl alcohol was 54% at 78% conversion
of 1,3-propanediol.
5.3.2. Succinic Acid
Succinic acid is also available via fermentation of glucose, and has the potential to
become a large-scale industrial chemical in the future. However, there are only a few
reports on dehydration reactions involving succinic acids in the literature, and most of
these are concerned with esterification to produce dialkyl esters. The synthesis of
various dialkyl esters was reported using metal exchanged montmorillonite clays (Na+,
Mn2+, Zn2+, Ni2+, Cr3+, Fe3+ and Al3+) as the catalysts [125-127]. For dimethyl
succinate, 70% isolated yield was achieved using Fe3+-exchanged montmorillonite after
4.5 h at methanol reflux temperature [127]. For dibutyl succinate, the best results were
obtained with Al-montmorillonite (94% yield after 8 h, also at reflux temperature),
28
which also proved to be a good catalyst for other esterification reactions, e.g. for
diesterification with isobutyl alcohol to produce di-(isobutyl) succinate in 98% yield
[126]. Very recently, a new family of materials known as Starbons was also applied for
esterification of succinic acid with ethanol in aqueous ethanol solution [128-129]. Using
sulfonated Starbon-400-SO3H as the catalyst, diethyl succinate was obtained in >99%
after ca. 9 h at 80 °C [128].
5.3.3. Levulinic acid and itaconic acid
Levulinic acid could also become an important intermediate chemical in the future since
it can be produced by acid catalyzed dehydration-decomposition of fructose. The
synthesis of diethyl levulinate was recently reported using sulfonated Starbon-400-
SO3H. The selectivity towards the diester was >99% at 85% conversion after 6 h at 80
°C [128]. In the paper esterification of itaconic acid was also reported. However, this
reaction is much slower and less selective, as ethyl itaconate was achieved with 75%
selectivity at 81% conversion after 24 h [128].
5.3.4. Sorbitol
Sorbitol is the sugar alcohol obtained by reduction of glucose and it can be dehydrated
to either isosorbide or to 1,4- and 2,5-sorbitan in acid or base catalyzed processes,
respectively. Using sulfonic acid functionalized MCM-41 type materials lauric acid
esters of isosorbide can be achieved quite selectively starting from sorbitol (>95%
selectivity towards isosorbide dilaurate at 33% lauric acid conversion) in a dehydration-
esterification reaction [130].
29
6. Catalytic Oxidations
6.1. Introduction
Oxidation as a process to transform biomass into value-added chemicals is a key one.
Here, we focus on oxidations using molecular oxygen as the oxidant, with the aim of
illustrating selected interesting reactions that could be important in the efforts to
develop sustainable chemistry since they only require abundant bio-resources as
reactants and have water as the only, or at least the main, byproduct.
6.2. Oxidation Reactions involving Primary Renewable Building Blocks
6.2.1. Ethanol
Acetic acid, an important chemical reagent and industrial chemical with a global
demand of around 10 million tonnes per year, can be produced from the oxidation of
bioethanol. It has a very large number of industrial applications e.g., in the production
of cellulose acetate for photographic films and in polyvinyl acetate for wood glue.
Moreover, it also finds use in the food industry as an acidity regulator, as the additive
E260.
The oxidation of ethanol to acetic acid was among the first heterogeneous catalyzed
reactions to be reported, but it has not attracted continued interest. During the 1990ies,
however, 100% conversion of ethanol coupled with 100% selectivity to acetic acid was
reported in a gas-phase reaction using molybdenum oxide catalytic systems on various
supports, at temperatures below 250 °C [131]. Similarly, a tin oxide and molybdenum
oxide catalyst was used with a feed consisting of 80% aqueous ethanol to produce acetic
acid at 320 °C [132]. Recently, it was reported that a mixed Mo-V-Nb oxide also
catalyzes the selective oxidation of ethanol to acetic acid with oxygen in a gas phase
reaction at about 235 °C with 95 % selectivity at full conversion at about 235 °C [133].
At even milder conditions, gold nanoparticles were found to be effective heterogeneous
catalysts for this reaction in aqueous phase. A yield of acetic acid of 92% after eight
hours and at the considerably lower temperature of 180 °C and 3.5 MPa air pressure
was achieved, employing Au/MgAl2O4 as the catalyst, and starting from ethanol
concentrations comparable to those obtained by fermentation (ca. 5 wt% aqueous
30
ethanol). Platinum and palladium, as traditional catalysts in this area, were compared to
gold to show that a superior selectivity and conversion can be achieved using gold
catalysis. At 180 °C, 3 MPa air pressure and after four hours, gold yielded 83% acetic
acid, platinum 16% and palladium 60%. Moreover, gold catalysts exhibited a selectivity
of 97%, whereas platinum and palladium gave only 82% and 93% respectively [134].
At higher ethanol concentrations (above 60%), the same catalytic reaction leads
primarily to formation of ethyl acetate [135] and the reaction was shown to proceed via
acetalaldehyde as intermediate.
6.2.2. Glycerol
Recently, the possibilities for oxidizing glycerol into valuable chemicals have received
significant attention, and there are several recent reviews with entire sections devoted to
this particular topic [136-138]. The market for glycerol oxidation products is not yet
developed due to the current catalytic routes providing too low selectivities and yields.
However, since many expect that glycerol will be widely (and inexpensively) available
as a result of glycerol being a major waste product in the production of biodiesel by
transesterification [136], there is a significant drive to develop new catalytic
technologies. Glycerol possesses two (identical) primary alcohol functionalities and one
secondary. Consequently, there exist a multitude of possible products from the
oxidation reaction. Catalytic selectivity is therefore a central factor to consider in
developing this chemistry. In fact, the nature of the metal, as well as the pH, largely
controls the selectivity for converting either type of alcohol. The main products possible
from glycerol oxidation are glyceric acid or glycerate depending on pH,
dihydroxyacetone (DHA), and glyceraldehyde. Under acidic conditions, oxidation of
glycerol usually leads to the formation of DHA (Scheme 7). In initial experiments
performed at pH of 2-4, platinum on charcoal showed low catalytic activity for
oxidation of the secondary hydroxy group of glycerol with a dihydroxyacetone yield of
only 4% at a glycerol conversion of 37%. Several promoters were tried, including
bismuth, tellurium, lead, tin, and selenium. On addition of bismuth (mass ratio of
bismuth/platinum = 0.2), a drastic increase was seen in the DHA selectivity, which
increased from 10% to 80% [139]. The bismuth addition decreases the conversion
slightly, but the yield still increased from 4% to 20%.
31
Scheme 7
The selective oxidation of a 50% aqueous solution of glycerol was performed at 50 °C
with an oxygen/glycerol ratio of 2, in a continuous fixed bed process using a Pt-Bi
catalyst supported on charcoal. Here, a DHA selectivity of 80% at a conversion of 80%
was obtained [140].
Under basic conditions, oxidation of glycerol mainly leads to the formation of glycerate
(Scheme 8). By employing a 5 wt% Pd/C catalyst, the selectivity to glycerate can be as
high as 70% at 100% conversion at pH=11 [141-142].
Scheme 8
During the last few years, significant attention has been devoted to the aerobic oxidation
of glycerol using heterogeneous gold catalysts. Glycerol was oxidized to glycerate in
the presence of NaOH with 100 % selectivity at 60 °C using water as the solvent, and at
an oxygen pressure of 0.3 MPa. The catalysts used were either 1% Au/charcoal or 1%
Au/graphite both giving around 55 % conversion [143]. A range of different supports
for the gold nanoparticles catalysts were investigated, TiO2, MgO, and Al2O3, but all
showed low activity compared to Au/C. Depending on the base concentration and the
reaction time, the selectivity of the Au/C catalyzed liquid phase glycerol oxidation
could be controlled [144]. Most recently, it was shown that hydrogen peroxide is
formed during oxidation of glycerol using gold catalysts [145] and that this leads to C-C
bond breakage and a resulting loss of selectivity. This was independently supported by
the fact the Au-Pd catalysts showed higher selectivity to glycerate than the
monometallic Au catalyst, which was shown to be related to the higher efficiency of Pd
to catalytically decompose the produced hydrogen peroxide in situ [146]. By employing
a reaction temperature of 100 °C and an air pressure of 21 bar with methanol as the
solvent, it is possible to obtain dimethyl mesoxalate in yields as high as 89% [147] and
this clearly illustrates the effect of temperature on the degree of oxidation of the
glycerol feedstock.
6.2.3. Glucose
32
Glucose can be selectively oxidized to a number of products. Currently, gluconic acid,
glucuronic acid, glucaric acid and 2-keto-gluconic acid can be formed from such
catalytic transformations. All these oxidations can be performed with air or oxygen, in
an aqueous medium, under mild conditions and using a supported noble metal catalyst.
Owing to the multifunctionality of glucose, the possibility of controlling the catalytic
selectivity is again highly important. By use of Pt/C as the catalyst, the anomeric carbon
atom of glucose is oxidized most readily, followed by the terminal primary alcohol
moiety. The least oxidizable group is found to be the equatorial alcohol moieties [148-
150]. A plausible mechanism of the reaction is that a dehydrogenation of glucose takes
place to form gluconic acid and adsorbed hydrogen on the platinum surface. The
hydrogen is then subsequently oxidized by oxygen to form water. This mechanism is
supported by the observation that gluconic acid is formed even in the absence of oxygen
in strongly basic solution and in the presence of the Pt catalyst [148-149]. The main
product from the reaction of glucose is gluconic acid (Scheme 9). This represents one of
the first examples where oxidation occurs solely by dehydrogenation, and thus it is
clearly an attractive option with the only reagents required being simply water and
hydroxide ions [151-152].
Scheme 9
Gluconic acid is found naturally in many fruits, in tea and in wine. Gluconic acid is also
used as an additive, to regulate pH in food (E574). Currently, gluconic acid is produced
industrially from glucose, using glucose oxidase enzymes. The market of gluconic acid
is in the range of 60.000 t/year [153]. However, heterogeneous catalytic oxidation is
also a viable method, and one under currently intense investigation. It has been debated
whether the currently best heterogeneously catalyzed process is possibly better than the
industrial biocatalytic process [154].
Oxidation is usually selective for the anomeric position, as mentioned previously. Thus
when glucose is oxidized in the presence of supported metal catalysts, specifically Pd
and Pt, gluconic acid is achieved in high yields, for example with 5% Pt/C, a 70% yield
is obtained [155], or, also reported, complete conversion is seen with Pd/C after six
hours [156]. However, when using palladium catalysts deactivation is observed at high
33
conversions. This problem can be alleviated using a modified palladium catalyst. Thus,
a Pd-Bi/C catalyst was found to be capable of oxidizing glucose to gluconic acid with
excellent selectivity (95-100%) at rates up to 20 times greater than that of the Pd/C
catalyst [157-158]. An oxidative dehydrogenation mechanism is also proposed here
[159].
The use of gold as a catalyst in the oxidation of glucose to gluconic acid has also been
reported, on supports such as activated carbon, CeO2, TiO2, Fe2O3. Gold exhibits
somewhat lower selectivity than the Pd-Bi/C catalyst, though. However, the activity of
gold is strongly dependent on particle size, and it is less sensitive to low pH, being
active even under acidic conditions [160-164]. In the aerobic oxidation of glucose over
gold catalysts, hydrogen peroxide has been observed to be a reaction product, just as it
was the case in the oxidation of glycerol [165]. Most recently, it has proved possible to
achieve long-term stability (recycled 17 times without noticeable loss of activity) of an
Au/TiO2 catalyst in the oxidation of glucose at pH=9, and at temperature between 40
and 60 °C [166].
6.3. Oxidation Reactions involving Commodity Chemicals
6.3.1. 1,2-Propanediol and 1,3-Propanediol
1,2-propanediol and 1,3-propanediol can be obtained as hydrogenation products of
glycerol. The first example of gold catalysts being able conduct aerobic oxidations of
alcohols was provided by Prati and Rossi, who showed that 1,2-propanediol can be
oxidized at about 80 °C in alkaline aqueous solution to yield lactate with a selectivity of
90-100% at 80-94% conversion using an Au/C catalyst [167]. Later, it was shown that
similar results can be achieved using Au nanosols stabilized with poly(vinylalcohol)
[168]. If the reaction is instead performed in methanol, it is only necessary to add a
catalytic amount of base, and under these conditions 1,2-propanediol and 1,3-
propanediol are oxidized to yield methyl lactate and methyl-3-hydroxypropionate,
respectively. Methyl lactate can be formed with 71% selectivity at 99% conversion in
the presence of 2 wt% Au/TiO2. The reaction requires about 20 hours at 100 °C and
with 2.5 MPa air pressure [147]. Similarly, methyl 3-hydroxypropionate can be
produced with a somewhat higher selectivity of 85% at 99% conversion [147].
34
6.3.2 Acrolein
Acrylic acid and acrylate esters constitute an important group of chemicals in today’s
chemical indstry, for example, they are used to make water-based paints, solvent-based
coatings and acrylic coatings. Typically, acrolein is obtained by catalytic oxidation of
propene. However, acrolein can also be obtained from glycerol, and in this way it can be
thought considered a renewable feedstock. Industrially, acrolein is oxidized to acrylic
acid in a gas-phase process operated at temperatures above 350 °C employing mixed
oxide catalysts [169]. Therefore, it is noteworthy that methyl acrylate can be produced
from acrolein with 87% selectivity at 97% conversion in the presence of catalytic
amounts of Au/ZnO, suspended in methanol, at room temperature and ambient pressure
[170].
6.3.3. Glyceric Acid
The selectivity for the catalytic oxidation of glyceric acid, and the calcium salt, can be
controlled by the nature of the catalyst, and the pH, in a similar way to that of glycerol
as discussed above. In this way, it is possible to obtain products corresponding to the
oxidation of the primary and secondary alcohol moieties, i.e., tartronic acid and
hydroxypyruvic acid, respectively. As reported by Fordham et al., oxidation of glyceric
acid under basic conditions leads to the formation of tartronic acid whereas
hydroxypuric is afforded under acidic conditions [171]. The catalyst was suspended in
glyceric acid, a calcium salt added, and oxygen gas bubbled through. NaOH was added
to keep the pH constant. Two catalytic systems were tested; 5 wt% Pt/C at pH 10-11
yields tartronic acid with a selectivity of 60% at a conversion of 94%; when 2% of
bismuth is added, the same product is obtained but with a selectivity of 83% at 90%
conversion [171]. Hydroxypyruvic acid was obtained by aerobic oxidation of glyceric
acid using a bismuth-promoted platinum catalyst under acidic conditions (pH 3–4) to
give a 64% yield at 75% conversion [171]. After prolonged contact with the catalyst,
tartronic acid was oxidized to oxalate whereas hydroxypyruvic acid was oxidised even
more rapidly to glycolic acid.
6.3.3. Lactic Acid

35
Pyruvic acid and its derivatives are in increasing demand due to their use as precursors
in the synthesis of drugs and agrochemicals [10]. It has proved difficult to obtain
pyruvic acid directly from lactic acid via heterogeneous catalysis, because the major
part of lactic acid is converted to form acetaldehyde and CO2 by the oxidative C-C bond
cleavage over most catalysts, e.g. V2O5- or MoO3- based mixed oxide catalysts [172].
The vapor-phase oxidation of lactic acid with air was executed using an iron phosphate
catalyst with a P/Fe atomic ratio of 1.2. It was found that lactic acid is selectively
converted to form pyruvic acid by oxidative dehydrogenation. The one-pass yield
reached 50 mol%; however, acetaldehyde, acetic acid, and CO2 was still formed, and
the pyruvic acid produced decomposes over time to give acetic acid and CO2 [173].
Oxidation has also been tried over iron phosphates with a P/Fe atomic ratios of 1.2,
including FePO4, Fe2P2O7 and Fe3(P2O7)2, at 230 °C. The catalysts containing both Fe2+
and Fe3+ performed better than those with just one oxidation state present. The best
results were 62% selectivity at 60% conversion [174].
6.3.4. Furfural
Furfural is a commodity chemical that is readily available from dehydration of pentoses,
and it can be produced in a very large scale if necessary. Furfural finds limited use
today, though, which is reflected in its pricing being similar to the cheapest fossil bulk
chemicals such as benzene and toluene [10]. In this way then, it can be seen that furfural
could become a key feedstock in the future, especially given the new turn towards using
bio-resources as a feedstock for chemicals when oil supplies become more and more
insecure and/or expensive. Furoic acid is used as a feedstock in organic syntheses, and
as an intermediate in the synthesis of perfumes and medicines. The oxidation of furfural
to furoic acid is mainly described in patents, which discloses the use of various different
catalysts including Ag2O and Ag2O/CuO mixtures. However, during the 1990s, the use
of PbPt/C catalysts was also investigated [175]. Very recently, methyl furoate was
synthesized using gold catalysis. Au/TiO2 was suspended in a solution of furfural in
methanol, a catalytic amount of sodium methoxide was added, and methyl furoate could
be produced with 90% selectivity at more than 90% conversion [176].
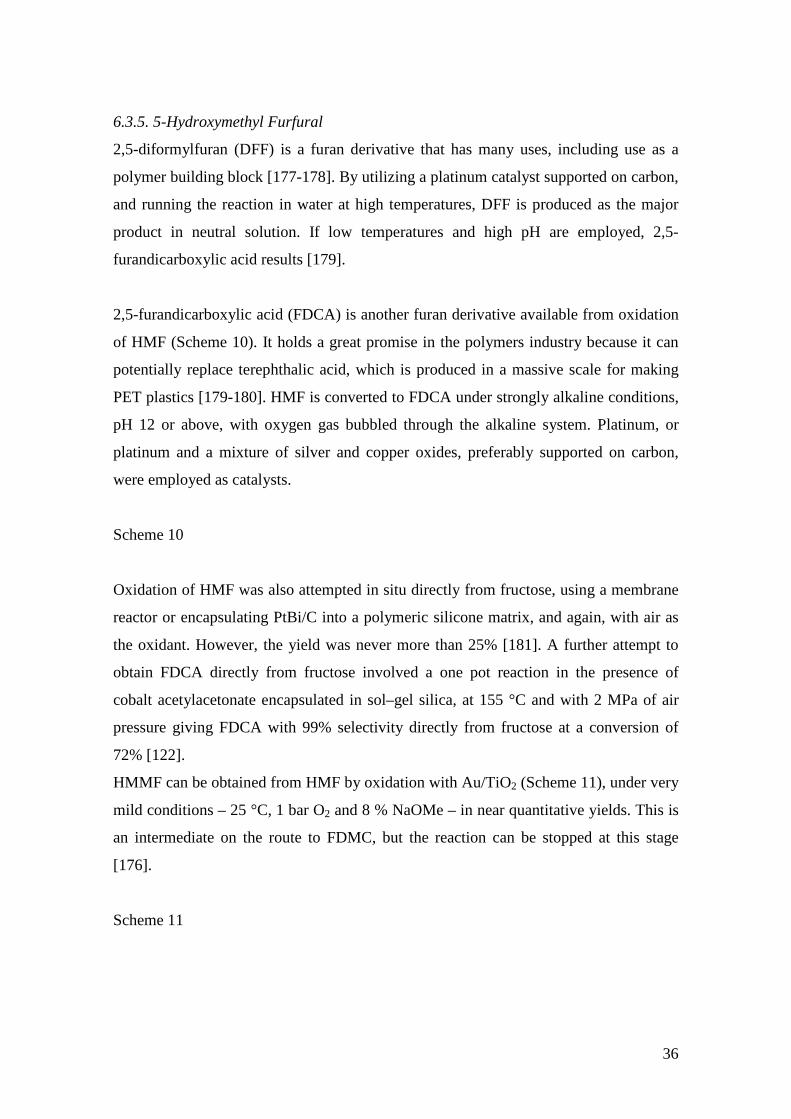
36
6.3.5. 5-Hydroxymethyl Furfural
2,5-diformylfuran (DFF) is a furan derivative that has many uses, including use as a
polymer building block [177-178]. By utilizing a platinum catalyst supported on carbon,
and running the reaction in water at high temperatures, DFF is produced as the major
product in neutral solution. If low temperatures and high pH are employed, 2,5-
furandicarboxylic acid results [179].
2,5-furandicarboxylic acid (FDCA) is another furan derivative available from oxidation
of HMF (Scheme 10). It holds a great promise in the polymers industry because it can
potentially replace terephthalic acid, which is produced in a massive scale for making
PET plastics [179-180]. HMF is converted to FDCA under strongly alkaline conditions,
pH 12 or above, with oxygen gas bubbled through the alkaline system. Platinum, or
platinum and a mixture of silver and copper oxides, preferably supported on carbon,
were employed as catalysts.
Scheme 10
Oxidation of HMF was also attempted in situ directly from fructose, using a membrane
reactor or encapsulating PtBi/C into a polymeric silicone matrix, and again, with air as
the oxidant. However, the yield was never more than 25% [181]. A further attempt to
obtain FDCA directly from fructose involved a one pot reaction in the presence of
cobalt acetylacetonate encapsulated in sol–gel silica, at 155 °C and with 2 MPa of air
pressure giving FDCA with 99% selectivity directly from fructose at a conversion of
72% [122].
HMMF can be obtained from HMF by oxidation with Au/TiO2 (Scheme 11), under very
mild conditions – 25 °C, 1 bar O2 and 8 % NaOMe – in near quantitative yields. This is
an intermediate on the route to FDMC, but the reaction can be stopped at this stage
[176].
Scheme 11
37
Similarly to above, but at a higher temperature and pressure – 130 °C and 4 bar O2 –
2,5-furan dimethyl furoate (FDMC), a direct analogue of FDMA, can be obtained in
near quantitative yields from HMF [176]. It is possible that the formation of a diester
directly, rather than a diacid, could save a further synthesis step on the route to
polymerization.
6.3.6. Gluconic Acid
Glucaric acid can be furnished by the selective oxidation of the primary alcohol of
gluconic acid with Pt-based catalysts [182]. Platinum is preferred over palladium due its
greater selectivity for the oxidation of primary alcohols [183]. Low rates of oxidation of
primary the alcohols is usually a complication, since products and byproducts bind more
strongly to the platinum surface than the primary alcohol moiety and in effect poison
the catalyst. Oxidation of secondary alcohols can also occur, leading to the formation of
highly oxidized species such as oxalic acid, resulting in a poor selectivity towards
gluraric acid. Gluconic acid was oxidized to glucaric acid with 55% selecticity at 97.2
% conversion, using a Pt/C catalyst [182,184].
When modifying the Pt catalyst by addition of bismuth or lead, a significant change in
selectivity occurs. Oxidation of the primary terminal alcohol moiety in gluconic acid is
no longer the dominating reaction. Instead oxidation of the α-hydroxy group, next to the
carboxylic acid takes place, resulting in the formation of 2-keto gluconic acid with a
98% selectivity under slightly acidic conditions [184-185]. It has been proposed that the
carboxylic acid coordinates to the promoter, as does the α-alcohol group, thus
promoting the oxidation of the α-alcohol group [184]. This is supported by the reaction
proceeding in a weakly acidic medium; when run in a basic medium, other products
form and this is thought to be due to further coordination with the remaining alcohol
groups [186].
38
7. Catalytic Hydrogenations
7.1. Introduction
Catalytic hydrogenation represents a set of reactions that will be extremely important in
the production of value-added chemicals from biomass. Already now, they play a
significant role in today’s industry, and holds great promise for further developments.
Here, selected examples of heterogeneously catalyzed hydrogenations of chemicals
available from renewables resources are presented.
7.2. Hydrogenation Reactions involving Bio-resources and Primary Renewable
Building Blocks
7.2.1. Cellulose
The hydrolysis of polysaccharides, e.g. starch, inulin, can also be combined with
hydrogenation processes to yield polyols directly, in a one step process. A one-pot
process was previously reported using a homogenous catalyst based on Ru(TPPTS)3
[187], however, heterogeneous catalysis would be preferential in terms of the ease of
recovery and re-use of the catalyst. In this way, a heterogeneous system was developed
whereby ruthenium is supported on carbon, which is made acidic by treatment with
different oxidizing agents, thereby catalyzing the hydrolysis part of the reaction.
Selectivities to mannitol of 37-40% were achieved, which is in line with the yields from
the non-coupled hydrolysis reaction, i.e. simply the hydrogenation reaction, from
fructose to mannitol [188]. Cellulose, making up around 40-50% of biomass by weight
makes it the largest component of biomass. Cellulose is a linear polysaccharide
consisting of many thousands of glucose subunits. The glucose monomers are adjoined
by 1-4-β glycosidic bonds, which can be hydrolysed by strong acids at high
temperature. Direct hydrogenation of cellulose to sorbitol would be a highly desirable
way to valorize biomass. The major complication in this strategy is the insolubility of
cellulose in water. However, hydrogenation of cellulose to sorbitol has been achieved in
superheated water (190 °C) using platinum and ruthenium on acidic supports [189]. The
highest activity can be achieved using a 2.5% Pt/γ-Al 2O3 catalyst which affords sorbitol
in 25% yield and mannitol, resulting from epimerisation, is formed in 6% yield. The
catalyst is reported to remain active after several runs. However, the maximum overall
39
yield is limited to 31%, which is attributed to the complex structure of cellulose that
does not allow it to undergo complete hydrolysis under these conditions.
In a different study, the 1-4-β glucose dimer cellubiose was used as a model substrate
for cellulose. Using a polymer supported ruthenium nanocluster catalyst; cellubiose was
converted to sorbitol in a one-pot hydrolysis-hydrogenation reaction in 100% yield
under acidic conditions using an ionic liquid solvent [190]. This procedure was found to
result in a complicated separation of the sorbitol from the ionic liquid and catalyst. A
modification to the procedure was reported recently, in which cellulose is hydrolyzed in
superheated water (200-250 °C) and reduced using a carbon-supported ruthenium
catalyst [191]. Cellulose conversion of 85% and 39% selectivity towards hexitols
(sorbitol and mannitol) was achieved with a hydrogen pressure of 60 bar using this
procedure.
7.2.2. Glycerol
Hydrogenation of glycerol to 1,2-propanediol or 1,3-propanediol has been reported
using different metal catalysts including nickel, copper, copper-chromite, ruthenium,
rhodium palladium and platinum [192-195]. For these reactions, the difficulties lie in
achieving either diol with high selectivity. One method that has proven useful for
producing 1,2-propanediol selectively is to carry out the hydrogenation reaction in the
presence of an ion-exchange resin in addition to a hydrogenation catalyst containing Ru
[193-196]. In this approach, the ion-exchange resins functions as a dehydration catalyst
which presumably facilitates the dehydration of glycerol to hydroxyacetone, that is
subsequently hydrogenated into 1,2-propanediol.
7.2.3. Glucose
Catalytic hydrogenation of glucose leads to the formation of sorbitol (Scheme 12).
Typically, Raney nickel is used to catalyze the reaction [197], however, several other
catalysts including platinum and ruthenium have been reported to be active for the
reaction, and in many cases these catalysts are more effective than standard Raney
nickel, which can be problematic due to leaching of nickel [197-200]. Very recently, an
impressive yield of more than 99.5% sorbitol was obtained using Pt supported on

40
microporous activated carbon cloth [198]. The experiments were conducted at 100 °C
using a 40 wt% aqueous solution of glucose in a 300 ml stirred autoclave pressurized to
a hydrogen pressure of 80 bar. The high selectivity towards sorbitol exhibited by the
catalyst was attributed to fast desorption of sorbitol from the catalyst surface, which
effectively lowers sorbitol epimerization and thus suppresses the formation of mannitol.
Scheme 12
7.2.4. Xylose and Fructose
Xylose can be hydrogenated into xylitol (Scheme 13). This reaction was reported using
hydrogenation catalysts such as Raney nickel as well as platinum group metal catalysts
[201-202].
Scheme 13
Raney nickel, copper and platinum group metal catalysts have also been used as
catalysts for transforming fructose into mannitol via catalytic hydrogenation (Scheme
14) [197-199,203-204]. Ruthenium supported on carbon is among the most studied
catalysts for this reaction [205], and it is, in fact, also effective for the combined
hydrolysis-hydrogenation of inulin to mannitol when the carbon support has been made
acidic prior to the catalytic experiments [188]. The bifunctional catalyst applied in the
study was made by pre-oxidizing activated carbon (SX1G) with various oxidants such
as nitric acid and ammonium persulfate and then introducing Ru onto this support by
incipient wetness impregnation followed by reduction with NaBH4. The oxidized
carbon catalyzes the hydrolysis of inulin to a mixture of glucose and fructose which is
subsequently hydrogenated to a mixture of glucitol and mannitol. Increasing the
hydrogen pressure (up to 100 bar) apparently also increases the rate of hydrolysis
dramatically.
Scheme 14
7.3. Hydrogenation Reactions involving Commodity Chemicals
41
7.3.1 3-Hydroxypropanal
3-Hydroxypropanal can be formed by fermentation of glucose and is thus an attractive
starting material for production of 1,3-propanediol, which can be polymerized with tere-
phthalic acid to produce polytrimethylene terephthalate (PTT). PTT is used in the fibers
industry in the production of stain resistant carpets etc.
Aqueous solutions of 3-hydroxypropanal were reduced using TiO2 supported ruthenium
catalysts at 40-60 °C using 40 bar of hydrogen [206]. The most stable catalysts were
found to be ruthenium catalysts supported on low surface area macroporous rutile.
7.3.2 Lactic acid
Propylene glycol (1,2-propanediol) can be employed as a de-icing agent replacing
ethylene glycol, which is currently produced from fossil resources. Furthermore,
propylene glycol is a safe alternative to ethylene glycol, which is toxic to humans due to
its metabolism to oxalic acid.
Hydrogenation of lactic acid represents a simple route from a biomass chemical to
propylene glycol. Lactic acid has been hydrogenated in the vapor phase using a Cu/SiO2
catalyst at 140-220 °C with a hydrogen pressure of 0.1-0.72 MPa. The selectivity of 1,2-
propanediol was 88% at full conversion, with 2-hydroxypropionaldehyde and propionic
acid formed as the major by-products [207]. In a different study, aqueous phase
hydrogenation of lactic acid was achieved using a carbon supported ruthenium catalyst.
The hydrogenation is operated at temperatures from 100-170 °C with a hydrogen
pressure of 7-14 MPa resulting in the formation of 1,2-propanediol in 90% selectivity at
95% conversion [208]. Disappointingly though, hydrogenation of salts of lactic acid did
not result in the formation of 1,2-propandiol. Hydrogenation has also been carried out
using a magnesia supported poly-γ-aminopropysiloxane-ruthenium complex in aqueous
solution at 240 °C and 5 MPa hydrogen pressure for 18 hours, giving 100% yield of 1,2-
propandiol, with no apparent deactivation of the catalyst [209].
7.3.3. Furfural
Furfural is readily obtainable from dehydration of pentoses. Reduction of furfural can
lead to a variety of products that are more volatile, more stable and possibly also more
useful than furfural itself. Selective reduction of the aldehyde moiety leads to furfuryl
42
alcohol (Scheme 15), whereas further reduction of the furan core will lead to
tetrahydrofurfuryl alcohol. Reductive deoxygenation can result in the formation of
either 2-methylfuran or 2-methyltetrahydrofuran, which can be used as liquid fuels or
solvents.
Scheme 15
Furfuryl alcohol has traditionally been obtained from furfural by hydrogenation with
copper containing catalysts, e.g. copper-barium-chromium oxide, copper oxide
supported on silica or alumina, copper-chromium oxide and copper-cobalt oxide on
silica yields furfuryl alcohol as the major product [210]. Due to its toxicity, attempts
have been made to eliminate chromium from such catalytic systems, especially due to
new restrictions that prevent used copper chromite catalysts from being deposited in
landfill sites [211]. In recent years, several new catalytic systems have been
demonstrated to successfully catalyze the hydrogenation of furfural to furfuryl alcohol.
Copper has been investigated as a catalyst for this reaction on its own. Furfural
hydrogenation over copper dispersed on three forms of carbon – activated carbon,
diamond and graphitized fibers – was studied. Similar to other copper-containing
catalysts, only products corresponding to hydrogenation of the carbonyl bond were
detected, and the selectivity to furfuryl alcohol was comparable to that obtained with
commercial copper chromite catalysts [212]. Copper supported on magnesium oxide has
also been prepared, via the coprecipitation method, giving a 98% selectivity of furfuryl
alcohol at 98% conversion of furfural. This is attributed to the higher number of surface
copper sites and the defective sites at the copper and magnesium oxide interfacial
region. Similarly, Cu-Ca/SiO2 catalysts revealed a selectivity of 98% in the gas phase
hydrogenation of furfural to furfuryl alcohol at a conversion of 98% and a temperature
of 130 °C [213]. Various other catalytic systems have recently been used to promote
hydrogenation, including a molybdenum doped cobalt-boron amorphous catalyst
exhibiting excellent activity and nearly 100% selectivity to furfuryl alcohol during
liquid phase hydrogenation of furfural, at 100 °C and 1 MPa hydrogen pressure [214].
Reduction of the alcohol group to produce 2-methyl furan can be achieved using a
commercial Cu/Zn/Al/Ca/Na catalyst with the atomic ratio 59:33:6:1:1. This catalyst
43
was found to achieve 99.7% conversion with 87.0% selectivity to 2-methyl fural at 250
°C. Hydrogenation from furfuryl alcohol yields a slightly higher selectivity of 92.7% at
98.1% conversion under similar conditions [215].
7.3.5. Levulinic acid
Hydrogenation of levulinic acid resulting in the reduction of the ketone moiety leads to
4-hydroxy pentanoic acid. This acid can cyclize to form γ-valerolactone (GVL) which is
a useful industrial solvent. A 94% yield of GVL was obtained with a Raney nickel
catalyst, and a hydrogen pressure of 5 MPa at a temperature of 100-150 °C [216].
1,4-Pentanediol (PDO) holds promise for being used in the synthesis of polyesters. It
has been synthesized from GVL in the presence of a copper chromite catalyst. At 150
°C and 20.3–30.4 MPa hydrogen pressure, 78.5% PDO was produced together with
8.1% 1-pentanol [217].
7.3.6. 5-Hydroxymethylfurfural
2,5-di(hydroxymethyl)furan can be synthesized from 5-HMF via hydrogenation
(Scheme 16). Under a hydrogen pressure of 7 MPa at 140 °C in the presence of
platinum or copper catalysts, practically quantitative yields of 2,5-
di(hydroxymethyl)furan can be obtained [218]. However, under similar conditions but
with palladium or nickel as catalyst, hydrogenation of the ring system occurs so that
2,5-di(hydroxymethyl)-tetrahydrofuran is obtained as the predominant product.
Scheme 16
44
8. Summary and Outlook
From a chemical perspective, renewable feedstocks being highly functionalized
molecules are very different from fossil feedstocks that are generally unfunctionalized.
Therefore, the challenge in converting fossil resources, in particular crude oil, into
useful products has been to develop methods that allow controlled addition of desirable
chemical functionality to the hydrocarbon feedstock. Due to the quite low reactivity of
the hydrocarbons; it has been possible to develop efficient catalytic processes that
operate satisfactorily at relatively high temperatures and pressures. Here, heterogeneous
catalysis has proven most successful and therefore played a dominant role in chemical
industry. The challenge of converting renewable feedstocks into useful chemicals is
very different. Still the desirable transformations are entirely dependent on catalysis, but
now it is often a question of controlled removal of superfluous chemical functionality
under sufficiently mild conditions to prevent uncontrolled degradation of the renewable
feedstock. So far, most emphasis has been on using biocatalytic processes to facilitate
these transformations but it appears likely that heterogeneous catalysis could also play a
significant role in the future valorization of renewables. Since the conversion of bio-
resources into the primary renewable building blocks is typically achieved using
biocatalytic processes operating in water as the natural solvent, it seems likely that there
will be a significant drive to develop heterogeneous catalysts that also operate in water,
and preferably at low temperatures. In this way, it will be possible to achieve maximum
process integration between the biocatalytic processes and the heterogeneously
catalyzed processes. This integration will lead to lower costs of the resulting products
since the need for expensive unit operations, especially separations, will be minimized.
Clearly, it represents a significant challenge to discover and develop heterogeneous
catalysts that exhibit sufficient activity and selectivity under these conditions but it
seems likely that this will be one of the new directions that heterogeneous catalysis will
take during the next decade. The progress made in this endeavor will obviously
determine how large a role heterogeneous catalysis will eventually play in the
production of value-added chemicals from biomass. Here, we have shown that there are
several reaction types where heterogeneous catalysis already offers some very
promising opportunities but that there clearly exists a great need for further discoveries
and developments in this emerging field.
45
References
[1] C. H. Christensen, J. K., Nørskov, J. Chem. Phys. 2008, in press
[2] S. Shaik, Angew. Chem. Int. Ed. 2003, 42, 3208
[3] S. Senkan, Angew. Chem. Int. Ed. 2001, 40, 312
[4] I. Maxwell, Stud. Surf. Sci. Catal. 1996, 101, 1
[5] Handbook of Heterogeneous Catalysis (Eds. G. Ertl, H. Knözinger, F. Schüth, J.
Weitkamp), Wiley-VCH, Weinheim, 2008.
[6] B. A. Tokay, Biomass Chemicals, in Ullmann’s Encyclopedia of Industrial
Chemistry, Wiley-VCH, Weinheim, 2005.
[7] C. H. Christensen, J. Rass-Hansen, C. C. Marsden, E. Taarning, K. Egeblad,
ChemSusChem. 2008, in press.
[8] J. Goldemberg, Science 2007, 315, 808
[9] G. W. Huber, S. Iborra, A. Corma, Chem. Rev. 2006, 106, 4044
[10] A. Corma, S. Iborra, A. Velty, Chem. Rev. 2007, 107, 2411
[11] A. J. Ragauskas, C. K. Williams, B. H. Davison, G. Britovsek, J. Cairney, C. A.
Eckert, W. J. Frederick Jr., J. P. Hallett, D. J. Leak, C. L. Liotta, J. R. Mielenz,
R. Murphy, R. Templer, T. Tschaplinski, Science 2006, 311, 484
[12] D. R. Dodds, R. A. Gross, Science 2007, 318, 1250.
[13] P. Mäki-Arbela, B. Holmbom, T. Salmi, D. Y. Murzin, Catal. Rev. Sci. Eng.
2007, 49, 197.
[14] T. Werpy, G. Petersen, Eds., Top Value Added Chemicals From Biomass,
Volume 1—Results of Screening for Potential Candidates from Sugars and
Synthesis Gas (U.S. Department of Energy, Oak Ridge, TN, August 2004;
available at www.eere.energy.gov/biomass/pdfs/35523.pdf).
[15] Biorefineries – Industrial Processes and Products (Eds. B. Kamm, P. R. Gruber,
M. Kamm), Wiley-VCH, Weinheim, 2005.
[16] B. O. Palsson, S. Fathi-Afshar, F. F. Rudd, E. N. Lightfoot, Science 1980, 213,
513.
[17] E. S. Lipinsky, Science 1981, 212, 1465.
[18] B. Kamm, Angew. Chem. Int. Ed. 2007, 46, 5056.
[19] J. Rass-Hansen, H. Falsig, B. Jørgensen, C.H. Christensen, J. Chem. Technol.
Biotechnol. 2007, 82, 329.
46
[20] F. W. Lichtenhaler, S. Peters, C. R. Chimia 2004, 7, 65.
[21] P. Gallezot, Catal. Today 2007, 121, 76
[22] P. Gallezot, Green Chem. 2007, 9, 295
[23] M. A. Paisley, Biomass Energy, in Kirk-Othmer Encyclopedia of Chemical
Technology, Wiley VCH, Weinheim, 2003
[24] Milne et al 1998 _ NREL/TP-570-25357
[25] Dayton 2002_Nrel/TP-510-32815
[26] D. Sutton, B. Kelleher, J.R.H. Ross, Fuel Process. Technol. 2001, 73, 155
[27] D. L. Klass, Biomass for Renewable Energy, Fuels, and Chemicals, Academic
Press. San Diego, 1998
[28] R. D. Cortright, R. R. Davda, J. A. Dumesic, Nature 2002, 418, 964
[29] G. W. Huber, J. W. Shabaker, J. A. Dumesic, Science 2003, 300, 2075
[30] G. W. Huber, R. D. Cortright, J. A. Dumesic, Angew. Chem. Int. Ed. 2004, 43,
1549
[31] R. R. Davda, J. W. Shabaker, G. W. Huber, R. D. Cortright, J.A. Dumesic, Appl.
Catal. B, 2005, 56, 171
[32] G. W. Huber, J. N. Chheda, C. J. Barrett, J. A. Dumesic, Science 2005, 308,
1446
[33] M. B. Valenzuela, C. W. Jones, P. K. Agrawal, Energy Fuels 2006, 20, 1744
[34] P. B. Weisz, W. O. Haag, P. G. Rodewald, Science 1979, 206, 57
[35] P. E. Nielsen, H. Nishimura, J. W. Otvos, M. Calvin, Science 1977, 198, 942
[36] R. K. Sharma, N. N. Bakhshi, Biomass Bioenergy 1993, 5(6), 445
[37] A. G. Gayubo, A. T. Aguayo, A. Atutxa, R. Aguado, J. Bilbao, Ind. Eng. Chem.
Res., 2004, 43, 2610
[38] A. Corma, G. W. Huber, L. Sauvanaud, P. O’Connor, J. Catal., 2007, 247, 307
[39] G. W. Huber, A. Corma, Angew. Chem. Int. Ed., 2007, 46, 7184
[40] N.Y. Chen, T.F. Degnan Jr., L.R. Koenig. Chemtech 1986, August, 506
[41] D. C. Elliott, D. Beckman, A. V. Bridgwater, J. P. Diebold, S. B. Gevert, Y.
Solantausta, Energy Fuels 1991, 5, 399
[42] A. Haryanto, S. Fernando, N. Murali, S. Adhikari, Energy Fuels 2005, 19, 2098
[43] P. D. Vaidya, A. E. Rodrigues, Chem. Eng. J. 2006, 117, 39
[44] M. Ni, D. Y. C. Leung, M. K. H. Leung, Int. J. Hydrogen Energy 2007, 32, 3238
47
[45] A. Behr, J. Eilting, K. Irawadi, J. Leschinski, F. Lindner, Green Chem. 2008, 10,
13
[46] S. Adhikari, S. Fernando, A. Haryanto, Energy Fuels 2007, 21, 2306
[47] D. Wang, S. Czernik, D. Montané, M. Mann, E. Chornet, Ind. Eng. Chem. Res.
1997, 36, 1507
[48] S. Czernik, R. Evans, R. French, Catal. Today 2007, 129, 265
[49] J. R. Rostrup-Nielsen, J. Sehested, J. K. Nørskov, Adv. Catal. 2002, 47, 65
[50] J. Rass-Hansen, C. H. Christensen, J. Sehested, S. Helveg, J. R. Rostrup-
Nielsen, S. Dahl, Green Chem. 2007, 9, 1016
[51] G. A. Deluga, J. R. Salge, L. D. Schmidt, X. E. Verykios, Science 2004, 303,
993
[52] P. Lejemble, A. Gaset, P. Kalck, Biomass 1984, 4, 263
[53] H. E. Hoydonckx, W. M. Van Rhijn, W. Van Rihjn, D. E. De Vos, P. A. Jacobs,
Furfural and Derivatives, in Ullmann’s Encyclopedia of Industrial Chemistry,
Wiley-VCH, Weinheim, 2007.
[54] K. J. Jung, A. Gaset, Biomass 1988, 16, 89
[55] R. A.. Schraufnagel, H. F. Rase, Ind. Eng. Chem. Prod. Res. Dev. 1975, 14, 40
[56] J. Jow, G. L. Rorrer, M. C. Hawley, D. T. A. Lamport, Biomass 1987, 14, 185.
[57] K. Lourvanij, G. L. Rorrer, Ind. Eng. Chem. Res. 1993, 32, 11.
[58] K. Lourvanij, G. L. Rorrer, Appl. Catal. A 1994, 109, 147.
[59] C. Montassier, J. C. Ménézo, L. C. Hoang, C. Renaud, J. Barbier, J. Mol. Catal.,
1991, 70, 99
[60] C. Montassier, J. M. Dumas, P. Granger, J. Barbier, Appl. Catal. A 1995, 121,
231
[61] J. Feng, H. Fu, J. Wang, R. Li, H. Chen, X. Li, Catal. Comm. 2008, 9, 1458
[62] B. Blanc, A. Bourrel, P. Gallezot, T. Haas, P. Taylor, Green Chem. 2000, 2, 89
[63] www.polyolchem.com
[64] T. Brix, BBI Conference, Portland, 9-11 October, 2007
[65] B. Satyanarayana, Y. B. G. Varma, Indian J. Technol. 1970, 8, 58
[66] A. Masroua, A. Revillon, J. C. Martin, A. Guyot, G. Descotes, Bull. Soc. Chim.
1988, 561
[67] G. Siegers, F. Martinola, Int. Sugar. J. 1985, 87, 23
48
[68] C. Buttersack, React. Polymers 1989, 10, 143
[69] T. Mizota, S. Tsuneda, K. Saito, T. Sugo, Ind. Eng. Chem. Res. 1994, 33, 2215
[70] T. Yoshioka, M. Shimamura, Bull. Chem. Soc. Jpn. 1984, 57, 334
[71] M. M. Nasef, H. Saidi, M. M. Senna, Chem. Eng. J., 2005, 108, 13
[72] P. L. Dhepe, M. Ohashi, S. Inagaki, M. Ichikawa, A. Fukuoka, Catal. Lett. 2005,
102, 163
[73] C. Buttersack, D. Laketic, J. Mol. Catal. 1994, L283
[74] C. Moreau, R. Durand, F. Aliès, M. Cotillon, T. Frutz, M. Théoleyre, Ind. Crops
Prod. 2000, 11, 237
[75] A. Abbadi, K. F. Gotlieb, H. van Bekkum, Starch/Stärke 1998, 50, 23
[76] J. A. Bootsma, B. H. Shanks, Appl. Catal. A 2007, 327, 44
[77] C. J. Yow, K. Y. Liew, J. Am. Oil Chem. Soc. 1999, 76, 529
[78] C. J. Yow, K. Y. Liew, J. Am. Oil Chem. Soc. 2002, 79, 357
[79] P. L. Dhepe, M. Ohashi, S. Inagaki, M. Ichikawa, A. Fukuoka, Catal. Lett. 2005,
102, 163
[80] M. D. Serio, M. Ledda, M. Cozzolino, G. Minutillo, R. Tesser, E. Santacesaria,
Ind. Eng. Chem. Res. 2006, 45, 3009
[81] M. D. Serio, M. Cozzolino, M. Giodano, R. Tesser, P. Patrono, E. Santacesaria,
Ind. Eng. Chem. Res. 2007 46, 6379
[82] W. Xe, H. Pong, L. Chen, Appl. Catal. A 2006, 300, 67
[83] C. Lingfeng, X. Guomin, X. Bo, T. Guangyuan, Energy Fuels 2007, 21, 3740
[84] Y. Liu, E. Lotero, J. G. Goodwin Jr., X. Mo, Appl. Catal. A 2007, 331, 138
[85] S. Lee, A. Sardesai. Top. Catal. 2005, 32, 197.
[86] J. Rostrup-Nielsen, Proceedings of the World Petroleum Congress 1998, 2, 767.
[87] J. J. Spivey, Chem. Eng. Commun. 1991, 110, 123.
[88] Y.C. Hu, Hydrocarbon Processing 1983, april issue, 113.
[89] Y.C. Hu, Hydrocarbon Processing 1983, may issue, 88.
[90] J. Schulz, F. Bandermann. Chem. Eng. Technol. 1994, 17, 179.
[91] W.J. Toussaint, J.T. Dunn, D.R. Jackson, Ind. Eng. Chem. 1947, february issue,
121.
[92] Organic Syntheses 1941, Coll. Vol. 1, p.15
[93] E. Tsukuda, S. Sato, R. Takahashi, T. Sodesawa, Catal. Comm. 2007, 8, 1349
49
[94] S.-H. Chai, H.-P. Wang, Y. Liang, B.-Q. Xu, J. Catal. 2007, 250, 342
[95] S.-H. Chai, H.-P. Wang, Y. Liang, B.-Q. Xu, Green Chem. 2007, 9, 1130
[96] C.-W. Chiu, M. A. Dasari, G. J. Suppes, AIChE Journal 2006, 52, 3543
[97] C. Moreau, R. Durand, D. Peyron, J. Duhamet, P. Rivalier, Ind. Crops Prod.
1998, 7, 95
[98] A. S. Dias, M. Pillinger, A. A. Valente, J. Catal. 2005, 229, 414
[99] A. S. Dias, M. Pillinger, A. A. Valente, Appl. Catal. A 2005, 285, 126
[100] A. S. Dias, S. Lima, M. Pillinger, A. A. Valente, Carbohydrate Res. 2006, 341,
2946
[101] A. S. Dias, M. Pillinger, A. A. Valente, Micropor. Mesopor. Mater. 2006, 94,
214
[102] A. S. Dias, S. Lima, P. Brandao, M. Pillinger, J. Rocha, A. A. Valente, Catal.
Lett. 2006, 108, 179.
[103] A. S. Dias, S. Lima, D. Carriazo, V. Rives, M. Pillinger, J. Catal. 2006, 244,
230
[104] M. Bicker, J. Hirth, H. Vogel, Green Chem. 2003, 5, 280.
[105] L. Cottier, G. Descotes, Trends Heterocycl. Chem 1991, 2, 233.
[106] J. Lewkowski, Arkivoc 2001, i, 17.
[107] Y. Román-Leshkov, J. N. Chheda, J. A. Dumesic, Science 2006, 312, 1933.
[108] C. Moreau, R. Durand, S. Razigade, J. Duhamet, P. Faugeras, P. Rivalier, P.
Ros, G. Avignon, Appl. Catal. A-General 1996, 145, 211
[109] P. Rivalier, J. Duhamet, C. Moreau, R. Durand, Catal. Today 1995, 24, 165.
[110] Y. Nakamura, S. Morikawa, Bull. Chem. Soc. Jpn. 1980, 53, 3705.
[111] C. Lansalot-Matras, C. Moreau, Catal. Commun. 2003, 4, 517.
[112] Q. Bao, K. Qiao, D. Tomida, C. Yokoyama, Catal. Comm. 2008, 9, 1383
[113] C. Carlini, P. Patrono, P. Raspolli, A. M. Galletti, G. Sbrana, Appl. Catal. A
2004, 275, 111
[114] F. Benvenuti, C. Carlini, P. Patrono, P. Raspolli, A. M. Galletti, G. Sbrana, M.
A. Massucci, P. Galli, Appl. Catal. A 2000, 193, 147
[115] C. Carlini, M. Giuttari, A. M. R. Galletti, G. Sbrana, T. Armaroli, G. Busca,
Appl. Catal. A-General 1999, 183, 295.
50
[116] T. Armaroli, G. Busca, C. Carlini, M Giuttari, A. M. R. Galletti, G. Sbrana, J.
Mol. Catal. A 2000, 151, 233
[117] P. Carniti, A. Gervasini, S. Biella, A. Auroux, Catal. Today 2006, 118, 373
[118] F. S. Ashgari, H. Yoshida, Carbohydrate Res. 2006, 341, 2379
[119] M. Watanabe, Y. Aizawa, T. Iida, R. Nishimura, H. Inomata, Appl. Catal. A
2005, 295, 150.
[120] M. Watanabe, Y. Aizawa, T. Iida, T.M. Aida, C. Levy, K. Sue, H. Inomata,
Carbohydrate Research 2005, 340, 1925
[121] M. Kröger, U. Prüsse, K.-D. Vorlop, Top. Catal. 2000, 13, 237
[122] M. L. Ribeiro, U. Schuchardt, Catal. Commun. 2003, 4, 83
[123] S. Sato, R. Takahashi, T. Sodesawa, N. Honda, H. Shimizu, Catal. Comm. 2003,
4, 77
[124] S. Sato, R. Takahashi, T. Sodesawa, N. Honda, J. Mol. Catal. A 2004, 221, 177
[125] C. R. Reddy, P. Iyengar, G. Nagendrappa, B. S. J. Prakasha, J. Mol. Catal. A
2005, 229, 31
[126] C. R. Reddy, P. Iyengar, G. Nagendrappa, B. S. J. Prakash, Catal. Lett. 2005,
101, 87.
[127] M. L. Kantam, V. Bhaskar, B. M. Choudary, Catal. Lett. 2002, 78, 185.
[128] V. L. Budarin, J. H. Clark, R. Luque, D. J. Macquarrie, Chem. Commun. 2007,
634
[129] V. Budarin, R. Luque, D. J. Macquarrie, J. H. Clark, Chem. Eur. J. 2007, 13,
6914
[130] W. M. Van Rhijn, D.E. De Vos, B.F. Sels, W.D. Bossaert, P.A. Jacobs, Chem.
Commun. 1998, 317.
[131] E. C. Alyea, K. F. Brown, L. Durham, I. Svazic, Stud. Surf. Sci. Catal. 1992, 73,
309
[132] P. A. Awasarkar, A. Y. Sonsale, A. K. Chatterjee, React. Kinet. Catal. Lett.
1988, 36, 301
[133] X. Li, E. Iglesia, Chem. Eur. J. 2007, 13, 9324
[134] C. H. Christensen, B. Jørgensen, J. Rass-Hansen, K. Egeblad, Kresten, R.
Madsen, S. K. Klitgaard, S. M. Hansen, M. R. Hansen, H. C. Andersen, A.
Riisager, Angew. Chem. Int. Ed. 2006, 45, 4648
51
[135] B. Jørgensen, S. E. Christiansen, M. L. D. Thomsen, C. H. Christensen, J. Catal.
2007, 251, 332
[136] C.-H. Zhou, J. N. Beltramini, Y.-X. Fan, G. Q. Lu, Chem. Soc. Rev. 2008, 37,
527
[137] D. T. Johnson, K. A. Taconi, Environmental Progress 2007, 26, 338
[138] M. Pagliaro, R. Ciriminna, H. Kimura, M. Rossi, C. D. Pina, Angew. Chem. Int.
Ed. 2007, 46, 4434
[139] H. Kimura, K. Tsuto, T. Wakisaka, Y. Kazumi, Y. Inaya, Appl. Catal. A 1993,
96, 217
[140] H. Kimura, Appl. Catal. A 1993, 105, 147
[141] R. Garcia,M. Besson, P. Gallezot, Appl. Catal. A 1995, 127, 165
[142] N. Dimitratos, J. A. Lopez-Sanchez, D. Lennon, F. Porta, L. Prati, A. Villa,
Catal. Lett. 2006, 108, 147
[143] S. Carrettin, P. McMorn, P. Johnston, K. Griffin, G. J. Hutchings, G. J. Chem.
Commun. 2002, 696
[144] S. Demirel-Guelen, M. Lucas, P. Claus, Catal. Today 2005, 102, 166
[145] W. C. Ketchie, M. Murayama, R. J. Davis, Top. Catal. 2007, 44, 307
[146] W. C. Ketchie, M. Murayama, R. J. Davis, J. Catal. 2007, 250, 264
[147] E. Taarning, R. Madsen, J. M. Marchetti, K. Egeblad, C. H. Christensen, Green
Chem. 2008, 10, 408
[148] K. Heyns, H. Paulsen, Angew. Chem. 1957, 69, 600
[149] K. Heyns, H. Paulsen, Adv. Carbohydr. Chem. 1962, 17, 169
[150] K. Heyns, W. D. Soldat, P. Koll, Chem. Ber. 1975, 108, 3619
[151] G. Dewit, J. J. Devlieger, A. C. Kockvandalen, R. Heus, R. Laroy, A. J.
Vanhengstum, A. P. G. Kieboom, H. Van Bekkum, Carbohydr. Res. 1981, 91,
125
[152] G. D. Wit, J. J. D. Vlieger, A. C. Kockvandalen, A. P. G. Kieboom, H. Van
Bekkum, Tetrahedron Lett. 1978, 1327
[153] F. W. Lichtenthaler, Acc. Chem. Res. 2002, 35, 728
[154] M. Comotti, C. D. Pina, E. Falletta, M. Rossi, J. Catal. 2006, 244, 122
[155] P. Gallezot, Catal. Today 1997, 37, 405

52
[156] M. Besson, P. Gallezot, F. Lahmer, G. Fleche, P. Fuertes, In Catalysis of
Organic Reactions; Kosak, J. R., Johnson, T. A., Eds.; Marcel Dekker: New
York, 1993; Vol. 53, pp 169-180
[157] A. Abbadi, H. Van Bekkum, J. Mol. Catal. A 1995, 97, 111
[158] S. Karski, I. Witonska, J. Goluchowska, J. Mol. Catal. A 2005, 245, 225
[159] M. Besson, F. Lahmer, P. Gallezot, P. Fuertes, G. Fleche, J. Catal. 1995, 152,
116
[160] A. Abbadi, M. Makkee, W. Visscher, J. A. R. Vanveen, H. Van Bekkum, J.
Carbohydr. Chem. 1993, 12, 573
[161] A. Abad, P. Concepcion, A. Corma, H. Garcia, Angew. Chem. Int. Ed. 2005, 44,
4066
[162] A. Corma, P. Serna, Science 2006, 313, 332
[163] A. Mirescu, U. Prusse, Catal. Commun. 2006, 7, 11
[164] S. Biella, L. Prati and M. Rossi, J. Catal., 2002, 206, 242
[165] M. Comotti, C. D. Pina, E. Falletta, M. Rossi, Adv. Synth. Catal. 2006, 348, 313
[166] A. Mirescu, H. Berndt, A. Martin, U. Prüsse, Appl. Catal. A 2007, 317, 204
[167] L. Prati, M. Rossi, J. Catal. 1998, 176, 552
[168] P. G. N. Mertens, M. Bulut, L. E. M. Gevers, I. F. J. Vankelecom, P. A. Jacobs,
D. E. De Vos, Catal. Lett. 2005, 102, 57
[169] T. V. Andrushkevich, Catal. Rev. Sci. Eng. 1993, 35, 213
[170] C. Marsden, E. Taarning, D. Hansen, L. Johansen, S. K. Klitgaard, K. Egeblad,
C. H. Christensen, Green Chem., 2008, 10, 168.
[171] P. Fordham, M. Besson, P. Gallezot, Appl. Catal. A 1995, 133, L179
[172] S. Sugiyama, N. Shigemoto, N. Masaoka, S. Suetoh, H. Kawami, K. Miyaura
and H. Hayashi, Bull. Chem. Soc. Jpn., 1993, 66, 1542
[173] M. Ai, K. Ohdan, Appl. Catal. A 1997, 150, 13
[174] M. Ai, K. Ohdan, Appl. Catal. 1997, 165, 461
[175] P. Verdegeur, N. Merat, A. Gaset, Appl. Catal. A 1994, 112, 1
[176] E. Taarning, I. Nielsen, K. Egeblad, R. Madsen, C. H. Christensen,
ChemSusChem 2008, 1, 75
[177] A. Gandini, M. N. Belgacem, Prog. Polym. Sci. 1997, 22, 1203
[178] F. W. Lichtenthaler, S. Nishiyama, T. Weiner, Liebigs Ann. 1989, 1163
53
[179] F. W. Lichtenthaler, U. Kraska, Carbohydr. Res. 1977, 58, 363
[180] C. Moreau, M. N. Belgacem, A. Gandini, Top. Catal. 2004, 27, 11
[181] M. Kroger, U. Prusse,K. D. Vorlop, Top. Catal. 2000, 13, 237
[182] M. Besson, G. Fleche, P. Fuertes, P. Gallezot, F. Lahmer, Recl. Trav. Chim.
Pays-Bas 1996, 115, 217
[183] A. W. Heinen, J. A. Peters, H. Van Bekkum, Carbohydr. Res. 1997, 304, 155
[184] P. C. C. Smits, B. F. M. Kuster, K. Van der Wiele, H. Van der Baan, H. S. Appl.
Catal. 1987, 33, 83
[185] P. C. C. Smits, B. F. M. Kuster, K. Van der Wiele, H. S. Van der Baan,
Carbohydr. Res. 1986, 153, 227
[186] A. Abbadi, H. Van Bekkum, Appl. Catal. A 1995, 124, 409
[187] A. W. Heinen, G. Papadogianakis, R. A. Sheldon, J. A. Peters, H. van Bekkum,
J. Mol. Catal. A 1999, 142, 17.
[188] A. W. Heinen, J. A. Peters, H. van Bekkum, Carbohydrate Res. 2001, 330, 381
[189] A. Fukuoka, L. Dhepe, Angew. Chem. Int. Ed. 2006, 45, 5161
[190] N. Yan, C. Zhao, C. Luo, P.J. Dyson, H. Liu, Y. Kou, J. Am. Chem. Soc. 2006,
128, 8714-8715.
[191] C. Luo, S. Wang, H. Liu, Angew. Chem. Int. Ed., 2007, 46, 7637
[192] M. A. Dasari, P. P. Kiatsimkul, W. R. Sutterlin, G. J. Suppes, Appl. Catal. A
2005, 281, 225
[193] D. G. Lahr, B. Shanks, J. Catal. 2005, 232, 386
[194] T. Miyazawa, Y. Kusunoki, K. Kunimori, K. Tomishige, J. Catal. 2006, 240,
213
[195] J. Chaminand, L. Djakovitch, P. Gallezot, P. Marion, C. Pinel, C. Rosier, Green
Chem. 2004, 6, 359
[196] T. Miyazawa, S. Koso, K. Kunimori, K. Tomishige, Appl. Catal. A 2007, 329,
30.
[197] B.W. Hoffer, E. Crezee, P.R.M. Mooijman, A.D. van Langeveld, F. Kapteijn,
J.A. Moulijn, Catal. Today, 2003, 79-80, 35-41.
[198] A. Perrard, P. Gallezot, J.-P. Joly, R. Durand, C. Baljou, B. Coq, P. Trens, Appl.
Catal. A 2007, 331, 100
54
[199] H. C. M. Pijnenburg, B. F. M. Kuster, H. S. Van der Baan, Staerke 1978, 30,
352
[200] J. Wisniak, R. Simon, Ind. Eng. Chem. Prod. Res. Dev. 1979, 18, 50
[201] J. Wisniak, M. Hershkowitz, S. Stein, Ind. Eng. Chem. Prod. Res. Dev. 1974,
13, 232.
[202] J. Wisniak, M. Hershkowitz, R. Leibowitz, S. Stein, Ind. Eng. Chem. Prod. Res.
Dev. 1974, 13, 75.
[203] M. Makkee, A. P. G. Kieboom, H. Van Bekkum, Carbohydrate Res. 1985, 138,
225
[204] J. Wisniak, R. Simon, Ind. Eng. Chem. Prod. Res. Dev. 1979, 18, 50
[205] A. W. Heinen, J. A. Peters, H. van Bekkum, Carbohydrate Res. 2000, 328, 449
[206] M. Besson, P. Gallezot, A. Pigamo, S. Reifsnyder, Appl. Catal. A 2003, 117-
124.
[207] R.D. Cortright, M. Sanchez-Castillo, J.A. Dumesic, Appl. Catal. B 2002, 39,
353-359.
[208] Z. Zhang, J.E. Jackson, D.J. Miller, Appl. Catal. A 2001, 219, 89-98.
[209] B. W. Mao, Z. Z. Cai, M. Y. Huang, Y. Y. Jiang, Polym. Adv. Technol. 2003,
14, 278
[210] G. Seo, H. Chon, J. Catal. 1981, 67, 424
[211] R. Rao, R. Dandekar, R. T. K. Baker, Vannice, M. A. J. Catal., 1997, 171, 406
[212] R. S. Rao, R. T. Baker, M. A. Vannice, Catal. Lett. 1999, 60, 51
[213] J. Wu, Y. Shen, C. Liu, H. Wang, C. Geng, Z. Zhang, Catal. Commun. 2005, 6,
633
[214] X. Chen, H. Li, H. Luo, M. Qiao, Appl. Catal. A 2002, 233, 13
[215] H. Y. Zheng, Y. L. Zhua, B. T. Teng, Z. Q. Bai, C. H. Zhang, H. W. Xiang, Y.
W. Li, J. Mol. Catal. A 2006, 246, 18
[216] R. V. Christian, H. D. Brown, R. M. Hixon, J. Am. Chem. Soc. 1947, 69, 1961
[217] K. Folkers, H. Adkins, J. Am. Chem. Soc. 1932, 54, 1145
[218] V. Schiavo, G. Descotes, J. Mentech, Bull. Soc. Chim. Fr. 1991, 704

55
Fig. 1. Overview of how selected commodity chemicals could be produced from
primary renewable building blocks.
56
Scheme 1. Sucrose is hydrolyzed into a mixture of glucose and fructose when exposed
to an acid catalyst. Sulfuric acid has been used for this, but also heterogeneous solid
acid catalysts have found use, especially acidic ion exchange resins.
OOH
HOOH
O O
OHOH
OH
HOOH
O
HO OH
OH
HO
OH
O OH
OH
HO
HO
OH+
sucrose glucose fructose
acid catalyst+ H2O
Scheme 2. Triglycerides can be hydrolyzed to give fatty acids and glycerol. This can be
catalyzed by solid acid catalysts like zeolites or acid exchanged resins.
O OO
O
R
O
R
O
R
OHOHHO R
O
OH+ 3
triglyceride glycerol fatty acid
acid catalyst+ 3 H2O
Scheme 3. Acrolein can be obtained by dehydration of glycerol. The reaction was
reported many years ago using powdered KHSO4/K2SO4 as catalyst. Recently, the use
of silica-supported heteropolyacids has also been described, notably with silicotungstic
acid as catalyst.
OHHOOH
O
Glycerol Acrolein
silicotungst ic acid
275 ºC+ 2 H2O
Scheme 4. Hydroxyacetone can be obtained from glycerol by dehydration. The reaction
has been reported using copper-chromite as catalyst.
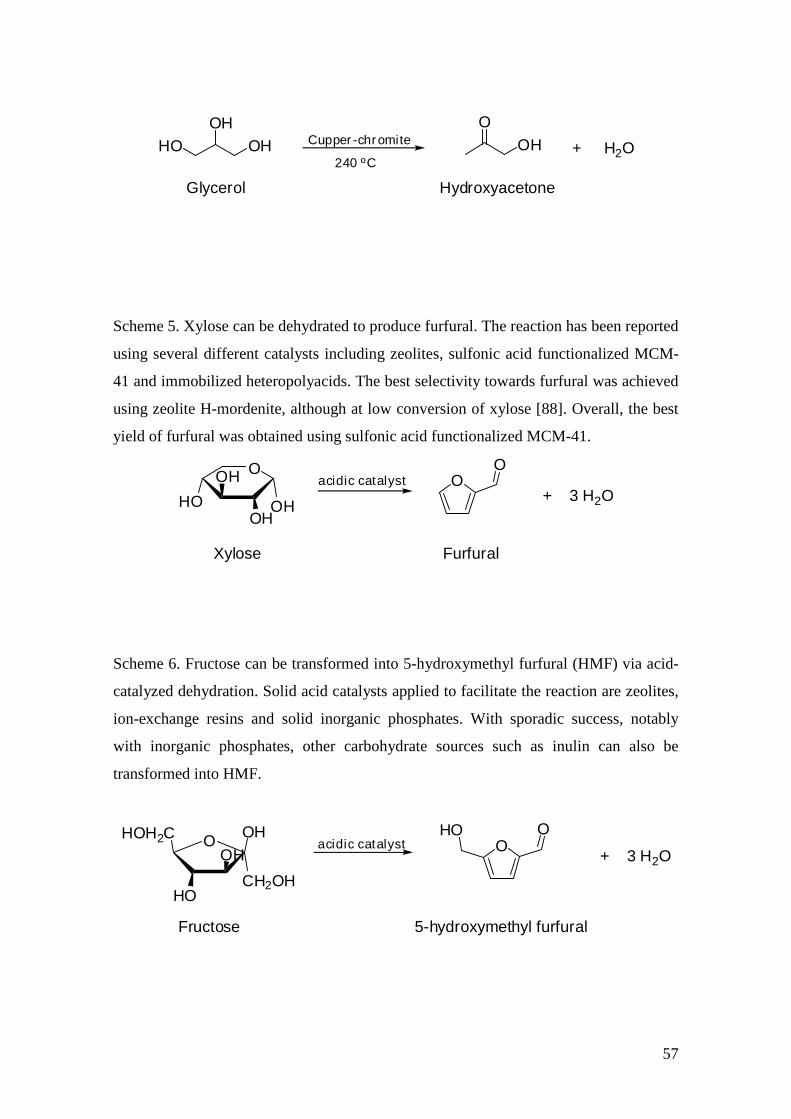
57
OHHOOH
OH
Glycerol Hydroxyacetone
O
240 ºC
Cupper -chromite + H2O
Scheme 5. Xylose can be dehydrated to produce furfural. The reaction has been reported
using several different catalysts including zeolites, sulfonic acid functionalized MCM-
41 and immobilized heteropolyacids. The best selectivity towards furfural was achieved
using zeolite H-mordenite, although at low conversion of xylose [88]. Overall, the best
yield of furfural was obtained using sulfonic acid functionalized MCM-41.
+ 3 H2OO
O
OHHOOH
OH O
Xylose Furfural
acidic catalyst
Scheme 6. Fructose can be transformed into 5-hydroxymethyl furfural (HMF) via acid-
catalyzed dehydration. Solid acid catalysts applied to facilitate the reaction are zeolites,
ion-exchange resins and solid inorganic phosphates. With sporadic success, notably
with inorganic phosphates, other carbohydrate sources such as inulin can also be
transformed into HMF.
+ 3 H2OO
OHO
CH2OH
OHHOH2C
HO
OHO
Fructose 5-hydroxymethyl furfural
acidic catalyst
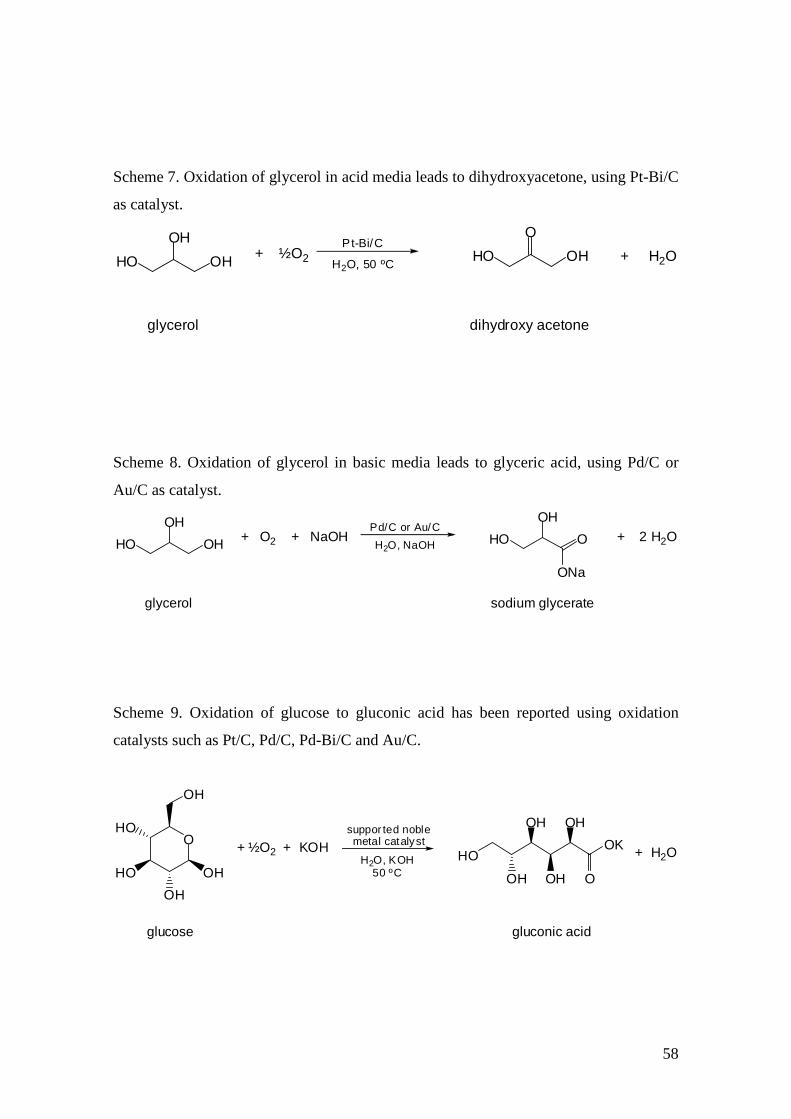
58
Scheme 7. Oxidation of glycerol in acid media leads to dihydroxyacetone, using Pt-Bi/C
as catalyst.
HO
OH
OH HO
O
OH
glycerol dihydroxy acetone
Pt-Bi/C
H2O, 50 ºC+ H2O+ ½O2
Scheme 8. Oxidation of glycerol in basic media leads to glyceric acid, using Pd/C or
Au/C as catalyst.
+ 2 H2OHO
OH
OH HO
OH
O
ONa
glycerol sodium glycerate
+ O2 + NaOHPd/C or Au/C
H2O, NaOH
Scheme 9. Oxidation of glucose to gluconic acid has been reported using oxidation
catalysts such as Pt/C, Pd/C, Pd-Bi/C and Au/C.
+ H2O+ ½O2 + KOHO
HO OH
OH
HO
OH
glucose
HOOK
OOH
OH
OH
OH
gluconic acid
suppor ted noblemetal catalyst
H2O, KOH50 ºC
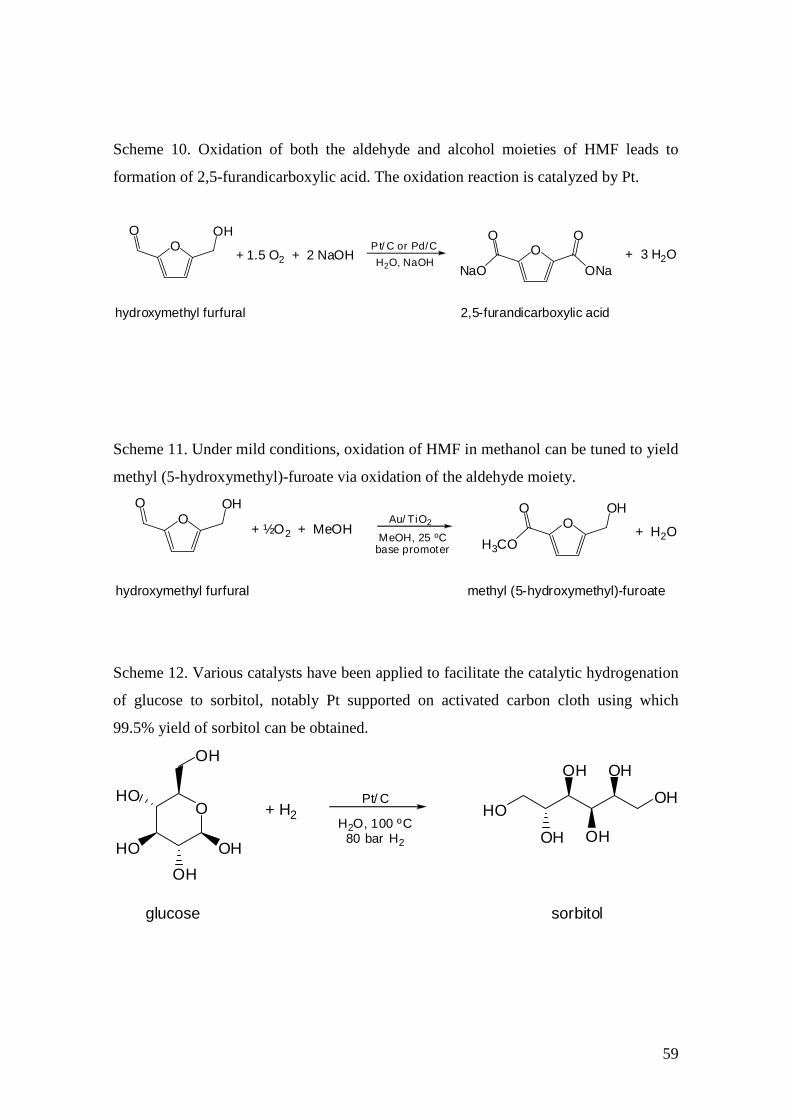
59
Scheme 10. Oxidation of both the aldehyde and alcohol moieties of HMF leads to
formation of 2,5-furandicarboxylic acid. The oxidation reaction is catalyzed by Pt.
+ 3 H2OO
O OHO
O O
hydroxymethyl furfural 2,5-furandicarboxylic acid
ONaNaO
Pt/ C or Pd/C
H2O, NaOH+ 1.5 O2 + 2 NaOH
Scheme 11. Under mild conditions, oxidation of HMF in methanol can be tuned to yield
methyl (5-hydroxymethyl)-furoate via oxidation of the aldehyde moiety.
OO OH
OO OH
hydroxymethyl furfural methyl (5-hydroxymethyl)-furoate
H3CO+ H2O+ ½O2 + MeOH
Au/ TiO2
MeOH, 25 ºCbase promoter
Scheme 12. Various catalysts have been applied to facilitate the catalytic hydrogenation
of glucose to sorbitol, notably Pt supported on activated carbon cloth using which
99.5% yield of sorbitol can be obtained.
H2O, 100 ºC80 bar H2
sorbitol
HOOH
OH
OH
OH
OH
O
HO OH
OH
HO
OH
glucose
Pt/ C+ H2
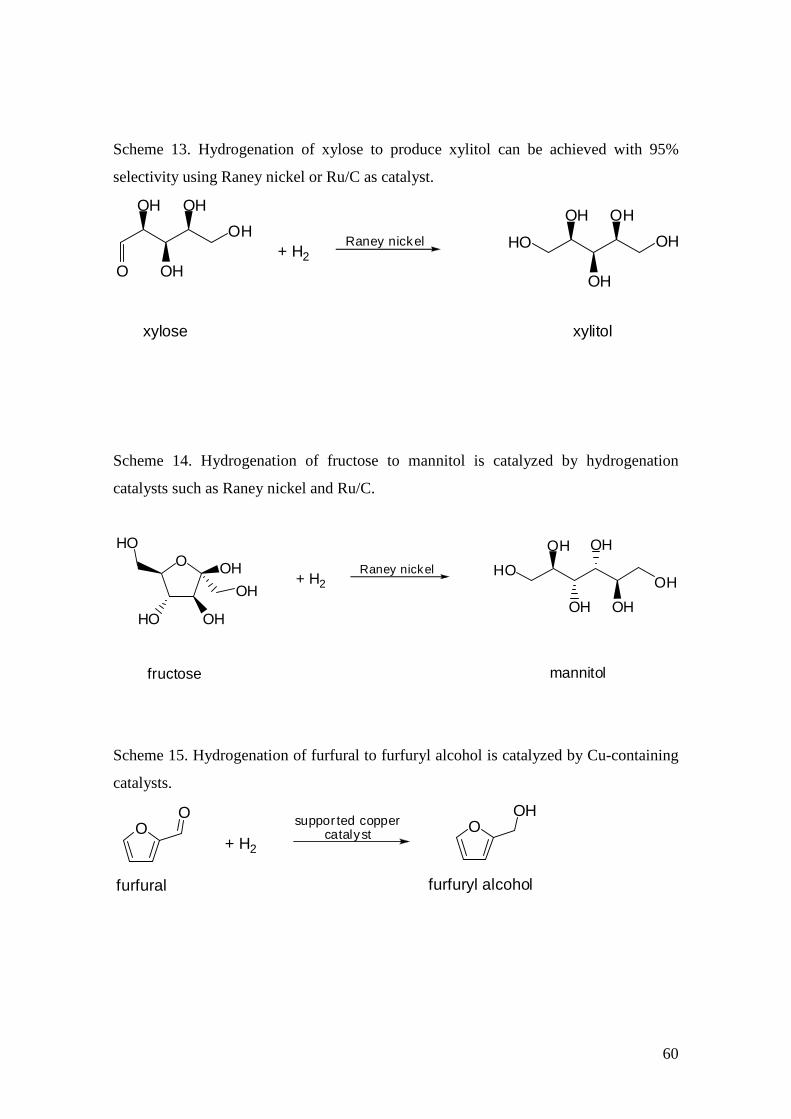
60
Scheme 13. Hydrogenation of xylose to produce xylitol can be achieved with 95%
selectivity using Raney nickel or Ru/C as catalyst.
+ H2O
OH
OH
OH
OH
xylose
OH
OH
OH
OHHO
xylitol
Raney nickel
Scheme 14. Hydrogenation of fructose to mannitol is catalyzed by hydrogenation
catalysts such as Raney nickel and Ru/C.
O OH
OH
HO
HO
OHHO
OH
OH
OH
OH
OH
fructose mannitol
+ H2Raney nickel
Scheme 15. Hydrogenation of furfural to furfuryl alcohol is catalyzed by Cu-containing
catalysts.
OO
furfural
O
furfuryl alcohol
OH
+ H2
suppor ted coppercatalyst
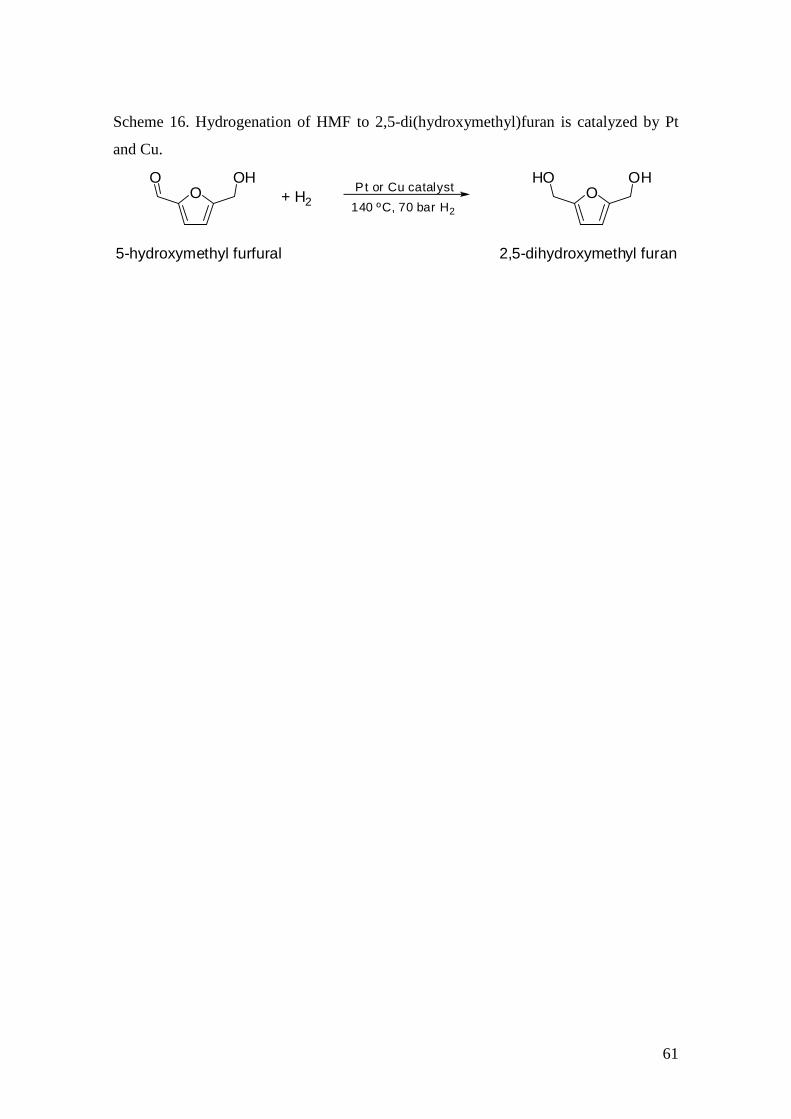
61
Scheme 16. Hydrogenation of HMF to 2,5-di(hydroxymethyl)furan is catalyzed by Pt
and Cu.
+ H2O
O OHO
HO OH
5-hydroxymethyl furfural 2,5-dihydroxymethyl furan
Pt or Cu catalyst
140 ºC, 70 bar H2
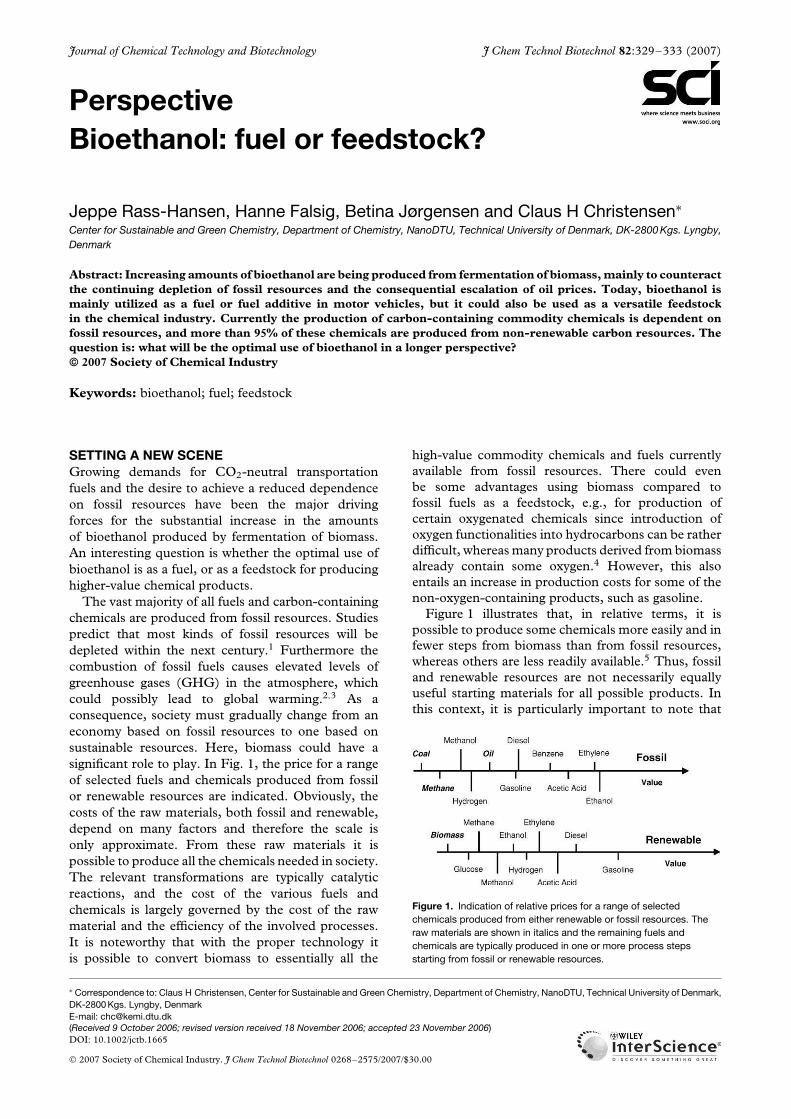
Journal of Chemical Technology and Biotechnology J Chem Technol Biotechnol 82:329–333 (2007)
Perspective
Bioethanol: fuel or feedstock?
Jeppe Rass-Hansen, Hanne Falsig, Betina Jørgensen and Claus H Christensen∗
Center for Sustainable and Green Chemistry, Department of Chemistry, NanoDTU, Technical University of Denmark, DK-2800 Kgs. Lyngby,
Denmark
Abstract: Increasing amounts of bioethanol are being produced from fermentation of biomass, mainly to counteract
the continuing depletion of fossil resources and the consequential escalation of oil prices. Today, bioethanol is
mainly utilized as a fuel or fuel additive in motor vehicles, but it could also be used as a versatile feedstock
in the chemical industry. Currently the production of carbon-containing commodity chemicals is dependent on
fossil resources, and more than 95% of these chemicals are produced from non-renewable carbon resources. The
question is: what will be the optimal use of bioethanol in a longer perspective?
2007 Society of Chemical Industry
Keywords: bioethanol; fuel; feedstock
SETTING A NEW SCENE
Growing demands for CO2-neutral transportation
fuels and the desire to achieve a reduced dependence
on fossil resources have been the major driving
forces for the substantial increase in the amounts
of bioethanol produced by fermentation of biomass.
An interesting question is whether the optimal use of
bioethanol is as a fuel, or as a feedstock for producing
higher-value chemical products.
The vast majority of all fuels and carbon-containing
chemicals are produced from fossil resources. Studies
predict that most kinds of fossil resources will be
depleted within the next century.1 Furthermore the
combustion of fossil fuels causes elevated levels of
greenhouse gases (GHG) in the atmosphere, which
could possibly lead to global warming.2,3 As a
consequence, society must gradually change from an
economy based on fossil resources to one based on
sustainable resources. Here, biomass could have a
significant role to play. In Fig. 1, the price for a range
of selected fuels and chemicals produced from fossil
or renewable resources are indicated. Obviously, the
costs of the raw materials, both fossil and renewable,
depend on many factors and therefore the scale is
only approximate. From these raw materials it is
possible to produce all the chemicals needed in society.
The relevant transformations are typically catalytic
reactions, and the cost of the various fuels and
chemicals is largely governed by the cost of the raw
material and the efficiency of the involved processes.
It is noteworthy that with the proper technology it
is possible to convert biomass to essentially all the
high-value commodity chemicals and fuels currently
available from fossil resources. There could even
be some advantages using biomass compared to
fossil fuels as a feedstock, e.g., for production of
certain oxygenated chemicals since introduction of
oxygen functionalities into hydrocarbons can be rather
difficult, whereas many products derived from biomass
already contain some oxygen.4 However, this also
entails an increase in production costs for some of the
non-oxygen-containing products, such as gasoline.
Figure 1 illustrates that, in relative terms, it is
possible to produce some chemicals more easily and in
fewer steps from biomass than from fossil resources,
whereas others are less readily available.5 Thus, fossil
and renewable resources are not necessarily equally
useful starting materials for all possible products. In
this context, it is particularly important to note that
Figure 1. Indication of relative prices for a range of selected
chemicals produced from either renewable or fossil resources. The
raw materials are shown in italics and the remaining fuels and
chemicals are typically produced in one or more process steps
starting from fossil or renewable resources.
∗ Correspondence to: Claus H Christensen, Center for Sustainable and Green Chemistry, Department of Chemistry, NanoDTU, Technical University of Denmark,
DK-2800 Kgs. Lyngby, Denmark
E-mail: [email protected]
(Received 9 October 2006; revised version received 18 November 2006; accepted 23 November 2006)
DOI: 10.1002/jctb.1665
2007 Society of Chemical Industry. J Chem Technol Biotechnol 0268–2575/2007/$30.00
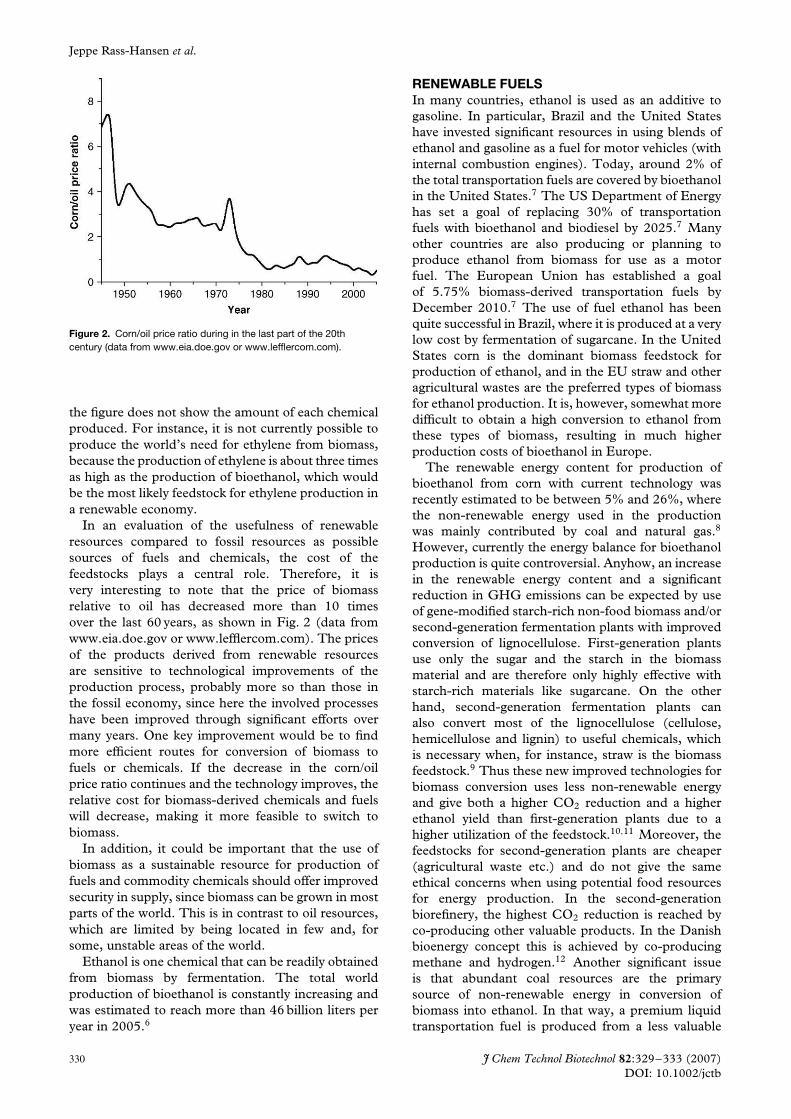
Jeppe Rass-Hansen et al.
Figure 2. Corn/oil price ratio during in the last part of the 20th
century (data from www.eia.doe.gov or www.lefflercom.com).
the figure does not show the amount of each chemical
produced. For instance, it is not currently possible to
produce the world’s need for ethylene from biomass,
because the production of ethylene is about three times
as high as the production of bioethanol, which would
be the most likely feedstock for ethylene production in
a renewable economy.
In an evaluation of the usefulness of renewable
resources compared to fossil resources as possible
sources of fuels and chemicals, the cost of the
feedstocks plays a central role. Therefore, it is
very interesting to note that the price of biomass
relative to oil has decreased more than 10 times
over the last 60 years, as shown in Fig. 2 (data from
www.eia.doe.gov or www.lefflercom.com). The prices
of the products derived from renewable resources
are sensitive to technological improvements of the
production process, probably more so than those in
the fossil economy, since here the involved processes
have been improved through significant efforts over
many years. One key improvement would be to find
more efficient routes for conversion of biomass to
fuels or chemicals. If the decrease in the corn/oil
price ratio continues and the technology improves, the
relative cost for biomass-derived chemicals and fuels
will decrease, making it more feasible to switch to
biomass.
In addition, it could be important that the use of
biomass as a sustainable resource for production of
fuels and commodity chemicals should offer improved
security in supply, since biomass can be grown in most
parts of the world. This is in contrast to oil resources,
which are limited by being located in few and, for
some, unstable areas of the world.
Ethanol is one chemical that can be readily obtained
from biomass by fermentation. The total world
production of bioethanol is constantly increasing and
was estimated to reach more than 46 billion liters per
year in 2005.6
RENEWABLE FUELS
In many countries, ethanol is used as an additive to
gasoline. In particular, Brazil and the United States
have invested significant resources in using blends of
ethanol and gasoline as a fuel for motor vehicles (with
internal combustion engines). Today, around 2% of
the total transportation fuels are covered by bioethanol
in the United States.7 The US Department of Energy
has set a goal of replacing 30% of transportation
fuels with bioethanol and biodiesel by 2025.7 Many
other countries are also producing or planning to
produce ethanol from biomass for use as a motor
fuel. The European Union has established a goal
of 5.75% biomass-derived transportation fuels by
December 2010.7 The use of fuel ethanol has been
quite successful in Brazil, where it is produced at a very
low cost by fermentation of sugarcane. In the United
States corn is the dominant biomass feedstock for
production of ethanol, and in the EU straw and other
agricultural wastes are the preferred types of biomass
for ethanol production. It is, however, somewhat more
difficult to obtain a high conversion to ethanol from
these types of biomass, resulting in much higher
production costs of bioethanol in Europe.
The renewable energy content for production of
bioethanol from corn with current technology was
recently estimated to be between 5% and 26%, where
the non-renewable energy used in the production
was mainly contributed by coal and natural gas.8
However, currently the energy balance for bioethanol
production is quite controversial. Anyhow, an increase
in the renewable energy content and a significant
reduction in GHG emissions can be expected by use
of gene-modified starch-rich non-food biomass and/or
second-generation fermentation plants with improved
conversion of lignocellulose. First-generation plants
use only the sugar and the starch in the biomass
material and are therefore only highly effective with
starch-rich materials like sugarcane. On the other
hand, second-generation fermentation plants can
also convert most of the lignocellulose (cellulose,
hemicellulose and lignin) to useful chemicals, which
is necessary when, for instance, straw is the biomass
feedstock.9 Thus these new improved technologies for
biomass conversion uses less non-renewable energy
and give both a higher CO2 reduction and a higher
ethanol yield than first-generation plants due to a
higher utilization of the feedstock.10,11 Moreover, the
feedstocks for second-generation plants are cheaper
(agricultural waste etc.) and do not give the same
ethical concerns when using potential food resources
for energy production. In the second-generation
biorefinery, the highest CO2 reduction is reached by
co-producing other valuable products. In the Danish
bioenergy concept this is achieved by co-producing
methane and hydrogen.12 Another significant issue
is that abundant coal resources are the primary
source of non-renewable energy in conversion of
biomass into ethanol. In that way, a premium liquid
transportation fuel is produced from a less valuable
330 J Chem Technol Biotechnol 82:329–333 (2007)
DOI: 10.1002/jctb
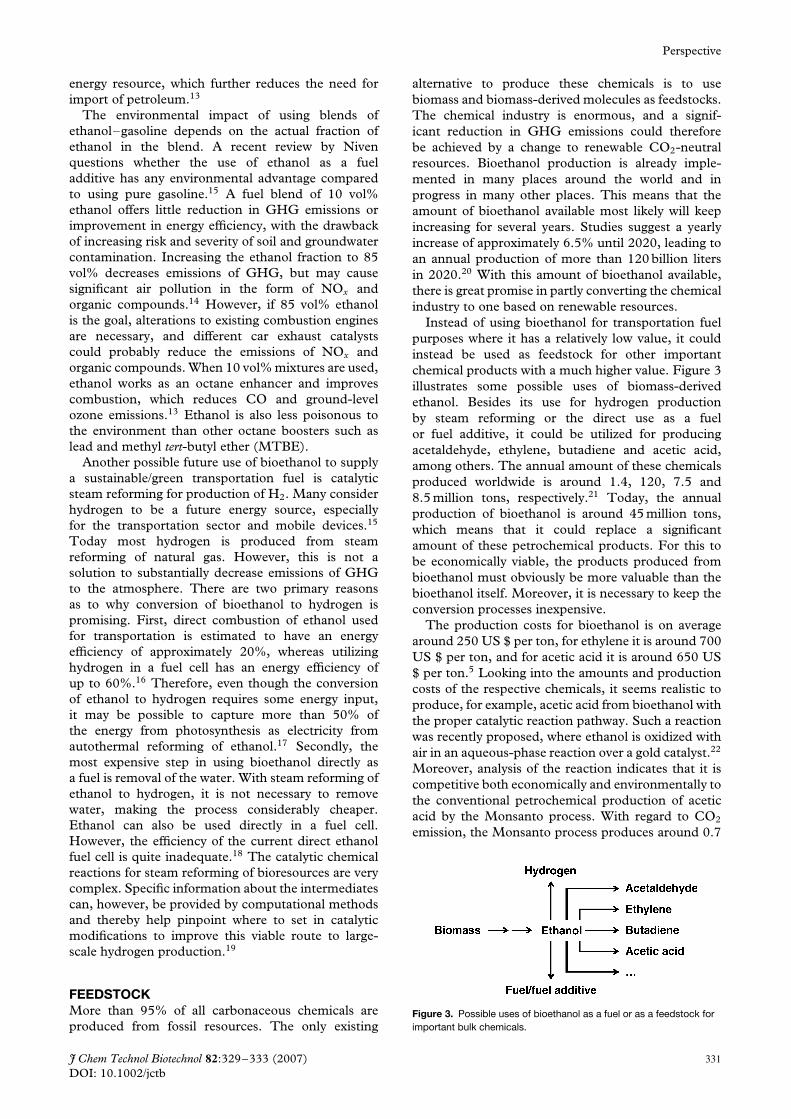
Perspective
energy resource, which further reduces the need for
import of petroleum.13
The environmental impact of using blends of
ethanol–gasoline depends on the actual fraction of
ethanol in the blend. A recent review by Niven
questions whether the use of ethanol as a fuel
additive has any environmental advantage compared
to using pure gasoline.15 A fuel blend of 10 vol%
ethanol offers little reduction in GHG emissions or
improvement in energy efficiency, with the drawback
of increasing risk and severity of soil and groundwater
contamination. Increasing the ethanol fraction to 85
vol% decreases emissions of GHG, but may cause
significant air pollution in the form of NOx and
organic compounds.14 However, if 85 vol% ethanol
is the goal, alterations to existing combustion engines
are necessary, and different car exhaust catalysts
could probably reduce the emissions of NOx and
organic compounds. When 10 vol% mixtures are used,
ethanol works as an octane enhancer and improves
combustion, which reduces CO and ground-level
ozone emissions.13 Ethanol is also less poisonous to
the environment than other octane boosters such as
lead and methyl tert-butyl ether (MTBE).
Another possible future use of bioethanol to supply
a sustainable/green transportation fuel is catalytic
steam reforming for production of H2. Many consider
hydrogen to be a future energy source, especially
for the transportation sector and mobile devices.15
Today most hydrogen is produced from steam
reforming of natural gas. However, this is not a
solution to substantially decrease emissions of GHG
to the atmosphere. There are two primary reasons
as to why conversion of bioethanol to hydrogen is
promising. First, direct combustion of ethanol used
for transportation is estimated to have an energy
efficiency of approximately 20%, whereas utilizing
hydrogen in a fuel cell has an energy efficiency of
up to 60%.16 Therefore, even though the conversion
of ethanol to hydrogen requires some energy input,
it may be possible to capture more than 50% of
the energy from photosynthesis as electricity from
autothermal reforming of ethanol.17 Secondly, the
most expensive step in using bioethanol directly as
a fuel is removal of the water. With steam reforming of
ethanol to hydrogen, it is not necessary to remove
water, making the process considerably cheaper.
Ethanol can also be used directly in a fuel cell.
However, the efficiency of the current direct ethanol
fuel cell is quite inadequate.18 The catalytic chemical
reactions for steam reforming of bioresources are very
complex. Specific information about the intermediates
can, however, be provided by computational methods
and thereby help pinpoint where to set in catalytic
modifications to improve this viable route to large-
scale hydrogen production.19
FEEDSTOCK
More than 95% of all carbonaceous chemicals are
produced from fossil resources. The only existing
alternative to produce these chemicals is to use
biomass and biomass-derived molecules as feedstocks.
The chemical industry is enormous, and a signif-
icant reduction in GHG emissions could therefore
be achieved by a change to renewable CO2-neutral
resources. Bioethanol production is already imple-
mented in many places around the world and in
progress in many other places. This means that the
amount of bioethanol available most likely will keep
increasing for several years. Studies suggest a yearly
increase of approximately 6.5% until 2020, leading to
an annual production of more than 120 billion liters
in 2020.20 With this amount of bioethanol available,
there is great promise in partly converting the chemical
industry to one based on renewable resources.
Instead of using bioethanol for transportation fuel
purposes where it has a relatively low value, it could
instead be used as feedstock for other important
chemical products with a much higher value. Figure 3
illustrates some possible uses of biomass-derived
ethanol. Besides its use for hydrogen production
by steam reforming or the direct use as a fuel
or fuel additive, it could be utilized for producing
acetaldehyde, ethylene, butadiene and acetic acid,
among others. The annual amount of these chemicals
produced worldwide is around 1.4, 120, 7.5 and
8.5 million tons, respectively.21 Today, the annual
production of bioethanol is around 45 million tons,
which means that it could replace a significant
amount of these petrochemical products. For this to
be economically viable, the products produced from
bioethanol must obviously be more valuable than the
bioethanol itself. Moreover, it is necessary to keep the
conversion processes inexpensive.
The production costs for bioethanol is on average
around 250 US $ per ton, for ethylene it is around 700
US $ per ton, and for acetic acid it is around 650 US
$ per ton.5 Looking into the amounts and production
costs of the respective chemicals, it seems realistic to
produce, for example, acetic acid from bioethanol with
the proper catalytic reaction pathway. Such a reaction
was recently proposed, where ethanol is oxidized with
air in an aqueous-phase reaction over a gold catalyst.22
Moreover, analysis of the reaction indicates that it is
competitive both economically and environmentally to
the conventional petrochemical production of acetic
acid by the Monsanto process. With regard to CO2
emission, the Monsanto process produces around 0.7
Figure 3. Possible uses of bioethanol as a fuel or as a feedstock for
important bulk chemicals.
J Chem Technol Biotechnol 82:329–333 (2007) 331
DOI: 10.1002/jctb
Jeppe Rass-Hansen et al.
tons of CO2 for every ton of acetic acid, whereas
production from bioethanol is almost CO2 neutral.
Thus, production of chemicals from bioethanol can
actually lead to higher CO2 savings than by using
it as a fuel. At the moment, it is not possible to
produce all the required ethylene from bioethanol,
because ethylene is produced in much greater amounts
than bioethanol. This, though, is likely to change
in the future with increasing production capacity of
bioethanol and eventually with increasing oil prices.
However, in the foreseeable future, the production
of bioethanol will most likely be smaller than the
production of the most important carbon-containing
commodity chemicals, and therefore it could easily be
an important feedstock for several of these.
THE FUTURE
During the previous century, petroleum became an
essential source for energy and commodity chemicals.
One future goal is to convert biomass into products
that can compete with corresponding products derived
from fossil resources with a focus on sustainability,
resource availability and supply reliability. The aim
for the US Department of Energy is to replace
25% of carbonaceous chemicals with biomass-derived
chemicals by 2025.7 To achieve this goal, there is
a need for some manageable oxygenated molecules.
With its large-scale production ethanol is an obvious
choice for such a molecule, but other easily available
molecules from biomass, like glucose and fructose,
could also be very important for attaining this and
further ambitions.
The most energy-efficient utilization of dry biomass
is to use it in a combined heat and power plant, where
it directly substitutes fossil fuels on a 1:1 basis, and
yields energy efficiencies above 90%. Furthermore,
a 50% increased CO2 reduction can be achieved
if biomass is used for combined heat and power
production instead of production of bioethanol using
first-generation technologies.23
Recently, it was estimated for the European Union
that around 20% of the total energy consumption in
the future could be covered from the use of biomass,
without compromising the need for food. Thus,
biomass cannot alone cover the energy demands.24
The main motivation for producing ethanol has
so far been the need for transportation fuels. The
consumption of transportation fuels alone in the
United States is over 530 billion liters per year, whereas
US bioethanol production was only about 15 billion
liters in 2005.25 Bioethanol will most certainly have
some positive influence on CO2 emissions from the
transportation sector, but it might prove possible to
achieve an even better environmental effect by using
it as a feedstock for the chemical industry. Finding
effective catalytic reaction pathways for producing
commodity or specialty chemicals from bioethanol
rather than using it to substitute the least expensive
fossil products, such as the fuels, will most likely hold
the greatest economic promise. Thus, the optimal use
of bioethanol, in terms of efficiency, could well be
to incorporate it into high-value materials otherwise
produced from fossil resources and eventually burn
the resulting waste in a thermal power station for heat
generation.
The central point is that all available resources, both
fossil and renewable, are limited and it is essential that
we carefully consider how each is best used. This
is a future key challenge for chemical research and
development.
REFERENCES1 BP Statistical Review of World Energy, June 2005
(www.bp.com).
2 Huybrechts P, Kuhn M, Lambeck K, Nhuan MT, Qin D,
Woodworth PL, Changes in sea level, in Climate Change
2001: The Scientific Basis, ed. by Douglas BC and Ramirez A.
Cambridge University Press, Cambridge, UK, pp. 639–693
(2001).
3 Wigley TML, The climate change commitment. Science
307:1766–1769 (2005).
4 Dale BE, ‘Greening’ the chemical industry: research and
development priorities for biobased industrial products.
J Chem Technol Biotechnol 78:1093–1103 (2003).
5 Kosaric N, Duvnjak Z, Farkas A, Sahm H, Bringer-Meyer S,
Goebel O, et al., Ethanol in Ullmann’s Encyclopedia of
Industrial Chemistry (7th edn). Wiley, Chichester (2006.).
Additional data from www.icispricing.com, www.eia.doe.gov
and www.dft.gov.uk.
6 Biofuels Strategy: Key Facts and Figures. MEMO/06/05 European
Commission, Brussels (2005).
7 Ragauskas AJ, Williams CK, Davison BH, Britovsek G, Cair-
ney J, Eckert CA, et al., The path forward for biofuels and
biomaterials. Science 311:484–489 (2006).
8 Farrell AE, Plevin RJ, Turner BT, Jones AD, O’Hare M and
Kammen DM, Ethanol can contribute to energy and
environmental goals. Science 311:506–508 (2006).
9 Haagesen F, Torry-Smith M and Ahring BK, Fermentation of
biomass to alcohols, in Biofuels for Fuel Cells: Renewable Energy
from Biomass Fermentation, ed. by Lens P, Westermann P,
Haberbauer M and Moreno A. IWA Publishing, London,
pp. 169–190 (2005).
10 Biofuels for Transport: An International Perspective. International
Energy Agency, Paris (2004). (www.iea.org).
11 Hammerschlag R, Ethanol’s energy return on investment: a
survey of the literature 1990–present. Environ Sci Technol
40:1744–1750 (2006).
12 Westermann P and Ahring B, The biorefinery for production of
multiple biofuels, in Biofuels for Fuel Cells: Renewable Energy
from Biomass Fermentation, ed. by Lens P, Westermann P,
Haberbauer M and Moreno A. IWA Publishing, London,
pp. 194–205 (2005).
13 Shapouri H, Duffield JA and Wang M, The energy balance of
corn ethanol revisited. Trans ASAE 46:959–968 (2003).
14 Niven RK, Ethanol in gasoline: environmental impacts and
sustainability review article. Renew Sust Energ Rev 9:535–555
(2005).
15 Jacobson MZ, Colella WG and Golden DM, Cleaning the air
and improving health with hydrogen fuel-cell vehicles. Science
308:1901–1905 (2005).
16 Larminie J and Dicks A, Fuel Cell Systems Explained (2nd edn).
Wiley, Chichester (2005).
17 Deluga GA, Salge JR, Schmidt LD and Verykios XE, Renew-
able hydrogen from ethanol by autothermal reforming. Science
303:993–997 (2004).
18 Lamy C, Belgsir EM and Leger J-M, Electrocatalytic oxidation
of aliphatic alcohols: application to the direct alcohol fuel cell
(DAFC). J Appl Electrochem 31:799–809 (2001).
332 J Chem Technol Biotechnol 82:329–333 (2007)
DOI: 10.1002/jctb

Perspective
19 Nørskov JK and Christensen CH, Toward efficient hydrogen
production at surfaces. Science 312:1322–1323 (2006).
20 Biofuel Market Worldwide (2006), RNCOS, 1 July (2006).
(www.rncos.com).
21 Weissermel K and Arpe H-J, Industrial Organic Chemistry (4th
edn). Wiley-VCH, Weinheim (2003).
22 Christensen CH, Jørgensen B, Rass-Hansen J, Egeblad K,
Madsen R, Klitgaard SK, et al, Formation of acetic acid by
aqueous-phase oxidation of ethanol with air in the pres-
ence of a heterogeneous gold catalyst. Angew Chem Int Ed
45:4648–4651 (2006).
23 Nielsen PH and Wenzel H, Environmental assessment of
ethanol produced from corn starch and used as an alterna-
tive to conventional gasoline for car driving. IPU Pruduktion
(2005). (http://www.ipu.dk/IPU-Produktion/Publikationer/bio-
ethanol-report,-d-,pdf.aspx.).
24 Ericsson K and Nilsson LJ, Assessment of the potential biomass
supply in Europe using a resource-focused approach. Biomass
Bioenerg 30:1–15 (2006).
25 Editorial, Bioethanol needs biotech now. Nature Biotechnol
24:725 (2006).
J Chem Technol Biotechnol 82:329–333 (2007) 333
DOI: 10.1002/jctb
Renewable hydrogen: carbon formation on Ni and Ru catalysts duringethanol steam-reforming
Jeppe Rass-Hansen,a Claus Hviid Christensen,*a Jens Sehested,b Stig Helveg,b Jens R. Rostrup-Nielsenb and
Søren Dahl*b
Received 26th February 2007, Accepted 3rd May 2007
First published as an Advance Article on the web 29th May 2007
DOI: 10.1039/b702890c
Biomass is probably the only realistic green and sustainable carbonaceous alternative to fossil
fuels. By degradation and fermentation, it can be converted into bioethanol, which is a chemical
with a range of possible applications. In this study, the catalytic steam-reforming of ethanol for
the production of hydrogen is investigated, along with quantitative and qualitative determinations
of carbon formation on the catalysts by TPO and TEM experiments. A Ru/MgAl2O4 catalyst, a
Ni/MgAl2O4 catalyst as well as Ag- and K-promoted Ni/MgAl2O4 catalysts were studied. The
operating temperature was between 673 and 873 K, and a 25 vol% ethanol–water mixture was
employed. Deactivation of the catalysts by carbon formation is the main obstacle for industrial use
of this process. Carbon formation was found to be highly affected by the operating temperature and
the choice of catalyst. The effect of Ag addition was a rapid deactivation of the catalyst due to an
enhanced gum carbon formation on the Ni crystals. Contrary to this, the effect of K addition was a
prolonged resistance against carbon formation and therefore against deactivation. The Ru catalyst
operates better than all the Ni catalysts, especially at lower temperatures.
Introduction
The continuously increasing oil prices and the need for a CO2-
neutral energy production have in recent years increased the
interest in different bio-fuels. Lately, bioethanol in particular
has achieved significant attention for several reasons. First of
all, it can be produced in large amounts from biomass by a
relatively simple fermentation, it is considered CO2-neutral, it
is easy to handle, and it is non-toxic.1,2
Here, the catalytic steam-reforming (SR) of ethanol for
hydrogen production is investigated. In particular, the objec-
tives of this paper are to quantitatively determine the effect
of temperature and the role of the catalytic metal on the
formation rate for coke on the technical catalysts during the
SR. This is important to eventually implement ethanol SR in
stationary and/or mobile units.
It is well known3 that highly pure ethanol in small quantities
can be mixed with gasoline to increase the octane number.
Additionally, it is possible to run cars on any mixture of
ethanol and gasoline with an engine adjustment. These cars are
called flexible fuel vehicles (FFVs). The production of highly
pure ethanol is, however, still quite expensive and generally
not cost-competitive with gasoline.3,4 But the world ethanol
production has more than doubled from 2000 to 2005 and is
expected to increase significantly.5 Together with technological
improvements and lack of oil this will continue to favor
ethanol prices compared to gasoline prices.
When ethanol is burned in a combustion engine, the energy
efficiency of the fuel is limited by the Carnot efficiency and can
reach only about 25%.6 This fuel efficiency can be significantly
increased when ethanol is first converted to hydrogen and then
used in a fuel cell with an efficiency of more than 50%.6–8
Besides that, it will not be necessary to first produce the highly
pure ethanol required for fuel in combustion engines by
expensive distillation since the reaction of ethanol SR [eqn (1)]
requires at least three moles of water for every mole of ethanol:
CH3CH2OH + 3H2O A 2CO2 + 6H2 (1)
The use of agricultural feedstocks for a form of CO2-neutral
energy production relies on the photosynthesis of carbo-
hydrates with high energy contents. These can, by degradation
and fermentation, be converted into ethanol and CO2.
Especially in Brazil and the USA this is done on large scales
(around 16 billion L in each country)9 by fermentation of
sugar-cane and corn, respectively. Further catalytic conversion
of ethanol into hydrogen requires energy, but the higher
efficiency from using hydrogen in fuel cells, probably, makes
the effort worthwhile. Fig. 1 shows in an energy level diagram
the idea and potential of using biohydrogen versus bioethanol
for energy applications. Theoretically, the total efficiency
could be raised by about 70% with the given energy effici-
encies, or even higher when considering distillation issues and
the efficient use of waste heat.
The catalytic SR of ethanol has recently been reviewed by
Haryanto et al.10 The conversion of ethanol to hydrogen and
CO2 is possible with many different catalysts, but in particular
Rh and Ni catalysts have shown promising results.10–14 One
major problem is, however, the formation of coke on the less
noble catalysts and the resulting deactivation.10
aCenter for Sustainable and Green Chemistry, Department of Chemistry,Technical University of Denmark, DK-2800 Kgs. Lyngby, Denmark.E-mail: [email protected]; Tel: +45 45252402bHaldor Topsøe A/S, Nymøllevej 55, DK-2800 Kgs. Lyngby, Denmark.E-mail: [email protected]; Tel: +45 45272487
PAPER www.rsc.org/greenchem | Green Chemistry
1016 | Green Chem., 2007, 9, 1016–1021 This journal is ß The Royal Society of Chemistry 2007
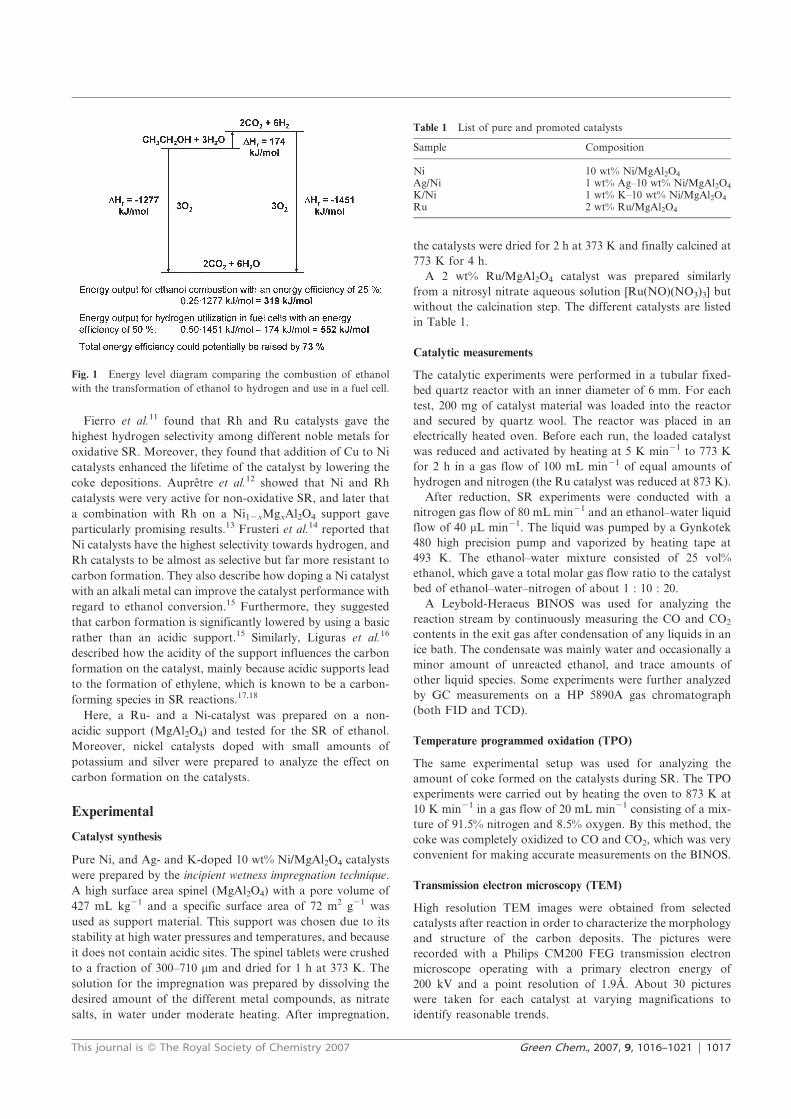
Fierro et al.11 found that Rh and Ru catalysts gave the
highest hydrogen selectivity among different noble metals for
oxidative SR. Moreover, they found that addition of Cu to Ni
catalysts enhanced the lifetime of the catalyst by lowering the
coke depositions. Aupretre et al.12 showed that Ni and Rh
catalysts were very active for non-oxidative SR, and later that
a combination with Rh on a Ni12xMgxAl2O4 support gave
particularly promising results.13 Frusteri et al.14 reported that
Ni catalysts have the highest selectivity towards hydrogen, and
Rh catalysts to be almost as selective but far more resistant to
carbon formation. They also describe how doping a Ni catalyst
with an alkali metal can improve the catalyst performance with
regard to ethanol conversion.15 Furthermore, they suggested
that carbon formation is significantly lowered by using a basic
rather than an acidic support.15 Similarly, Liguras et al.16
described how the acidity of the support influences the carbon
formation on the catalyst, mainly because acidic supports lead
to the formation of ethylene, which is known to be a carbon-
forming species in SR reactions.17,18
Here, a Ru- and a Ni-catalyst was prepared on a non-
acidic support (MgAl2O4) and tested for the SR of ethanol.
Moreover, nickel catalysts doped with small amounts of
potassium and silver were prepared to analyze the effect on
carbon formation on the catalysts.
Experimental
Catalyst synthesis
Pure Ni, and Ag- and K-doped 10 wt% Ni/MgAl2O4 catalysts
were prepared by the incipient wetness impregnation technique.
A high surface area spinel (MgAl2O4) with a pore volume of
427 mL kg21 and a specific surface area of 72 m2 g21 was
used as support material. This support was chosen due to its
stability at high water pressures and temperatures, and because
it does not contain acidic sites. The spinel tablets were crushed
to a fraction of 300–710 mm and dried for 1 h at 373 K. The
solution for the impregnation was prepared by dissolving the
desired amount of the different metal compounds, as nitrate
salts, in water under moderate heating. After impregnation,
the catalysts were dried for 2 h at 373 K and finally calcined at
773 K for 4 h.
A 2 wt% Ru/MgAl2O4 catalyst was prepared similarly
from a nitrosyl nitrate aqueous solution [Ru(NO)(NO3)3] but
without the calcination step. The different catalysts are listed
in Table 1.
Catalytic measurements
The catalytic experiments were performed in a tubular fixed-
bed quartz reactor with an inner diameter of 6 mm. For each
test, 200 mg of catalyst material was loaded into the reactor
and secured by quartz wool. The reactor was placed in an
electrically heated oven. Before each run, the loaded catalyst
was reduced and activated by heating at 5 K min21 to 773 K
for 2 h in a gas flow of 100 mL min21 of equal amounts of
hydrogen and nitrogen (the Ru catalyst was reduced at 873 K).
After reduction, SR experiments were conducted with a
nitrogen gas flow of 80 mL min21 and an ethanol–water liquid
flow of 40 mL min21. The liquid was pumped by a Gynkotek
480 high precision pump and vaporized by heating tape at
493 K. The ethanol–water mixture consisted of 25 vol%
ethanol, which gave a total molar gas flow ratio to the catalyst
bed of ethanol–water–nitrogen of about 1 : 10 : 20.
A Leybold-Heraeus BINOS was used for analyzing the
reaction stream by continuously measuring the CO and CO2
contents in the exit gas after condensation of any liquids in an
ice bath. The condensate was mainly water and occasionally a
minor amount of unreacted ethanol, and trace amounts of
other liquid species. Some experiments were further analyzed
by GC measurements on a HP 5890A gas chromatograph
(both FID and TCD).
Temperature programmed oxidation (TPO)
The same experimental setup was used for analyzing the
amount of coke formed on the catalysts during SR. The TPO
experiments were carried out by heating the oven to 873 K at
10 K min21 in a gas flow of 20 mL min21 consisting of a mix-
ture of 91.5% nitrogen and 8.5% oxygen. By this method, the
coke was completely oxidized to CO and CO2, which was very
convenient for making accurate measurements on the BINOS.
Transmission electron microscopy (TEM)
High resolution TEM images were obtained from selected
catalysts after reaction in order to characterize the morphology
and structure of the carbon deposits. The pictures were
recorded with a Philips CM200 FEG transmission electron
microscope operating with a primary electron energy of
200 kV and a point resolution of 1.9A. About 30 pictures
were taken for each catalyst at varying magnifications to
identify reasonable trends.
Fig. 1 Energy level diagram comparing the combustion of ethanol
with the transformation of ethanol to hydrogen and use in a fuel cell.
Table 1 List of pure and promoted catalysts
Sample Composition
Ni 10 wt% Ni/MgAl2O4
Ag/Ni 1 wt% Ag–10 wt% Ni/MgAl2O4
K/Ni 1 wt% K–10 wt% Ni/MgAl2O4
Ru 2 wt% Ru/MgAl2O4
This journal is ß The Royal Society of Chemistry 2007 Green Chem., 2007, 9, 1016–1021 | 1017
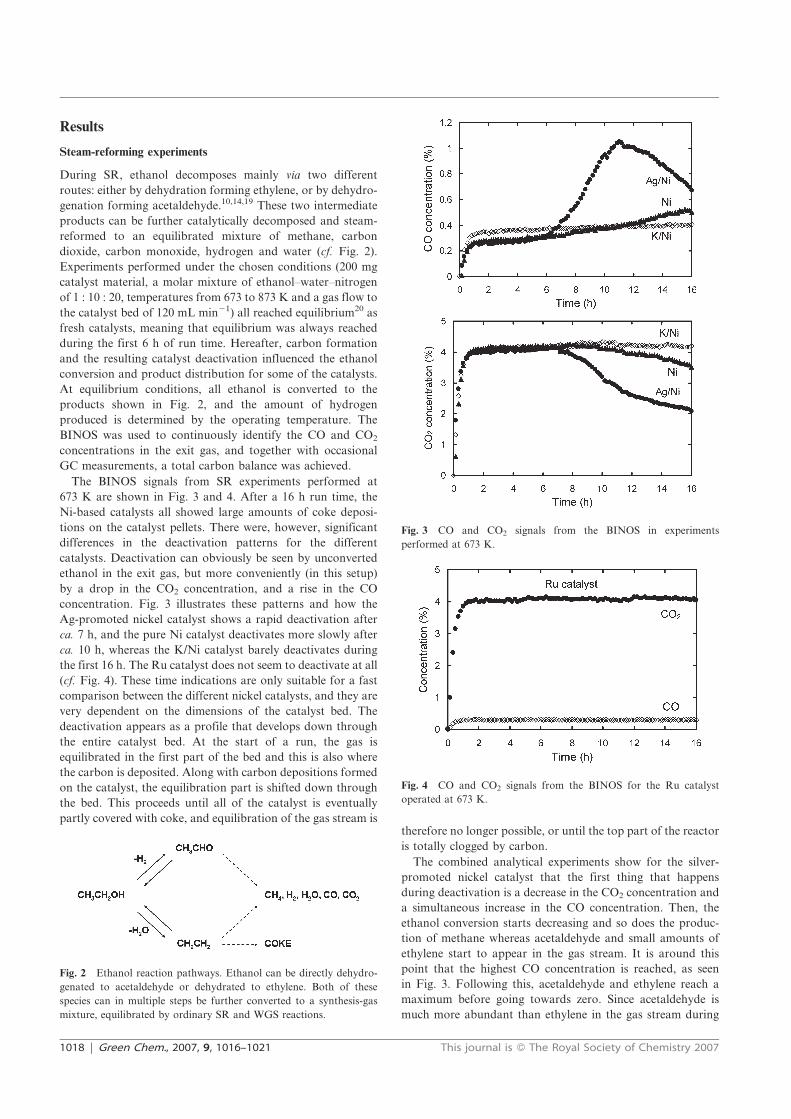
Results
Steam-reforming experiments
During SR, ethanol decomposes mainly via two different
routes: either by dehydration forming ethylene, or by dehydro-
genation forming acetaldehyde.10,14,19 These two intermediate
products can be further catalytically decomposed and steam-
reformed to an equilibrated mixture of methane, carbon
dioxide, carbon monoxide, hydrogen and water (cf. Fig. 2).
Experiments performed under the chosen conditions (200 mg
catalyst material, a molar mixture of ethanol–water–nitrogen
of 1 : 10 : 20, temperatures from 673 to 873 K and a gas flow to
the catalyst bed of 120 mL min21) all reached equilibrium20 as
fresh catalysts, meaning that equilibrium was always reached
during the first 6 h of run time. Hereafter, carbon formation
and the resulting catalyst deactivation influenced the ethanol
conversion and product distribution for some of the catalysts.
At equilibrium conditions, all ethanol is converted to the
products shown in Fig. 2, and the amount of hydrogen
produced is determined by the operating temperature. The
BINOS was used to continuously identify the CO and CO2
concentrations in the exit gas, and together with occasional
GC measurements, a total carbon balance was achieved.
The BINOS signals from SR experiments performed at
673 K are shown in Fig. 3 and 4. After a 16 h run time, the
Ni-based catalysts all showed large amounts of coke deposi-
tions on the catalyst pellets. There were, however, significant
differences in the deactivation patterns for the different
catalysts. Deactivation can obviously be seen by unconverted
ethanol in the exit gas, but more conveniently (in this setup)
by a drop in the CO2 concentration, and a rise in the CO
concentration. Fig. 3 illustrates these patterns and how the
Ag-promoted nickel catalyst shows a rapid deactivation after
ca. 7 h, and the pure Ni catalyst deactivates more slowly after
ca. 10 h, whereas the K/Ni catalyst barely deactivates during
the first 16 h. The Ru catalyst does not seem to deactivate at all
(cf. Fig. 4). These time indications are only suitable for a fast
comparison between the different nickel catalysts, and they are
very dependent on the dimensions of the catalyst bed. The
deactivation appears as a profile that develops down through
the entire catalyst bed. At the start of a run, the gas is
equilibrated in the first part of the bed and this is also where
the carbon is deposited. Along with carbon depositions formed
on the catalyst, the equilibration part is shifted down through
the bed. This proceeds until all of the catalyst is eventually
partly covered with coke, and equilibration of the gas stream istherefore no longer possible, or until the top part of the reactor
is totally clogged by carbon.
The combined analytical experiments show for the silver-
promoted nickel catalyst that the first thing that happens
during deactivation is a decrease in the CO2 concentration and
a simultaneous increase in the CO concentration. Then, the
ethanol conversion starts decreasing and so does the produc-
tion of methane whereas acetaldehyde and small amounts of
ethylene start to appear in the gas stream. It is around this
point that the highest CO concentration is reached, as seen
in Fig. 3. Following this, acetaldehyde and ethylene reach a
maximum before going towards zero. Since acetaldehyde is
much more abundant than ethylene in the gas stream during
Fig. 2 Ethanol reaction pathways. Ethanol can be directly dehydro-
genated to acetaldehyde or dehydrated to ethylene. Both of these
species can in multiple steps be further converted to a synthesis-gas
mixture, equilibrated by ordinary SR and WGS reactions.
Fig. 3 CO and CO2 signals from the BINOS in experiments
performed at 673 K.
Fig. 4 CO and CO2 signals from the BINOS for the Ru catalyst
operated at 673 K.
1018 | Green Chem., 2007, 9, 1016–1021 This journal is ß The Royal Society of Chemistry 2007
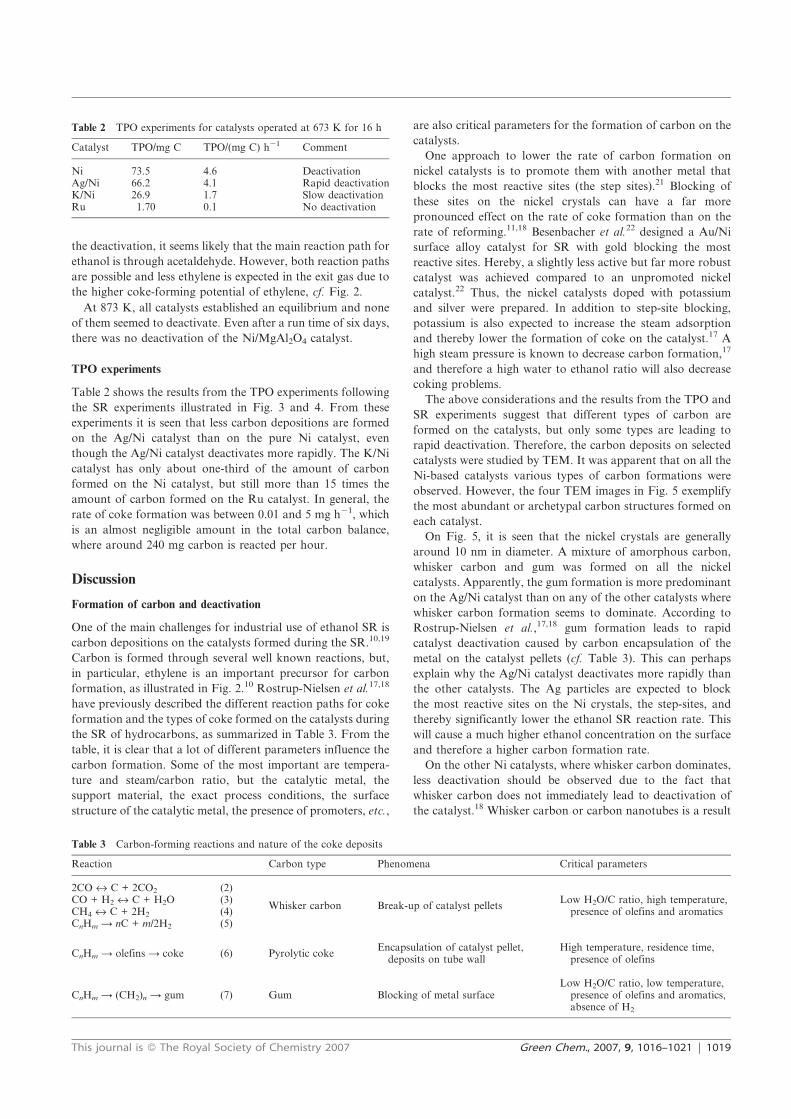
the deactivation, it seems likely that the main reaction path for
ethanol is through acetaldehyde. However, both reaction paths
are possible and less ethylene is expected in the exit gas due to
the higher coke-forming potential of ethylene, cf. Fig. 2.
At 873 K, all catalysts established an equilibrium and none
of them seemed to deactivate. Even after a run time of six days,
there was no deactivation of the Ni/MgAl2O4 catalyst.
TPO experiments
Table 2 shows the results from the TPO experiments following
the SR experiments illustrated in Fig. 3 and 4. From these
experiments it is seen that less carbon depositions are formed
on the Ag/Ni catalyst than on the pure Ni catalyst, even
though the Ag/Ni catalyst deactivates more rapidly. The K/Ni
catalyst has only about one-third of the amount of carbon
formed on the Ni catalyst, but still more than 15 times the
amount of carbon formed on the Ru catalyst. In general, the
rate of coke formation was between 0.01 and 5 mg h21, which
is an almost negligible amount in the total carbon balance,
where around 240 mg carbon is reacted per hour.
Discussion
Formation of carbon and deactivation
One of the main challenges for industrial use of ethanol SR is
carbon depositions on the catalysts formed during the SR.10,19
Carbon is formed through several well known reactions, but,
in particular, ethylene is an important precursor for carbon
formation, as illustrated in Fig. 2.10 Rostrup-Nielsen et al.17,18
have previously described the different reaction paths for coke
formation and the types of coke formed on the catalysts during
the SR of hydrocarbons, as summarized in Table 3. From the
table, it is clear that a lot of different parameters influence the
carbon formation. Some of the most important are tempera-
ture and steam/carbon ratio, but the catalytic metal, the
support material, the exact process conditions, the surface
structure of the catalytic metal, the presence of promoters, etc.,
are also critical parameters for the formation of carbon on the
catalysts.
One approach to lower the rate of carbon formation on
nickel catalysts is to promote them with another metal that
blocks the most reactive sites (the step sites).21 Blocking of
these sites on the nickel crystals can have a far more
pronounced effect on the rate of coke formation than on the
rate of reforming.11,18 Besenbacher et al.22 designed a Au/Ni
surface alloy catalyst for SR with gold blocking the most
reactive sites. Hereby, a slightly less active but far more robust
catalyst was achieved compared to an unpromoted nickel
catalyst.22 Thus, the nickel catalysts doped with potassium
and silver were prepared. In addition to step-site blocking,
potassium is also expected to increase the steam adsorption
and thereby lower the formation of coke on the catalyst.17 A
high steam pressure is known to decrease carbon formation,17
and therefore a high water to ethanol ratio will also decrease
coking problems.
The above considerations and the results from the TPO and
SR experiments suggest that different types of carbon are
formed on the catalysts, but only some types are leading to
rapid deactivation. Therefore, the carbon deposits on selected
catalysts were studied by TEM. It was apparent that on all the
Ni-based catalysts various types of carbon formations were
observed. However, the four TEM images in Fig. 5 exemplify
the most abundant or archetypal carbon structures formed on
each catalyst.
On Fig. 5, it is seen that the nickel crystals are generally
around 10 nm in diameter. A mixture of amorphous carbon,
whisker carbon and gum was formed on all the nickel
catalysts. Apparently, the gum formation is more predominant
on the Ag/Ni catalyst than on any of the other catalysts where
whisker carbon formation seems to dominate. According to
Rostrup-Nielsen et al.,17,18 gum formation leads to rapid
catalyst deactivation caused by carbon encapsulation of the
metal on the catalyst pellets (cf. Table 3). This can perhaps
explain why the Ag/Ni catalyst deactivates more rapidly than
the other catalysts. The Ag particles are expected to block
the most reactive sites on the Ni crystals, the step-sites, and
thereby significantly lower the ethanol SR reaction rate. This
will cause a much higher ethanol concentration on the surface
and therefore a higher carbon formation rate.
On the other Ni catalysts, where whisker carbon dominates,
less deactivation should be observed due to the fact that
whisker carbon does not immediately lead to deactivation of
the catalyst.18 Whisker carbon or carbon nanotubes is a result
Table 2 TPO experiments for catalysts operated at 673 K for 16 h
Catalyst TPO/mg C TPO/(mg C) h21 Comment
Ni 73.5 4.6 DeactivationAg/Ni 66.2 4.1 Rapid deactivationK/Ni 26.9 1.7 Slow deactivationRu 1.70 0.1 No deactivation
Table 3 Carbon-forming reactions and nature of the coke deposits
Reaction Carbon type Phenomena Critical parameters
2CO « C + 2CO2 (2)
Whisker carbon Break-up of catalyst pelletsLow H2O/C ratio, high temperature,
presence of olefins and aromaticsCO + H2 « C + H2O (3)CH4 « C + 2H2 (4)CnHm A nC + m/2H2 (5)
CnHm A olefins A coke (6) Pyrolytic cokeEncapsulation of catalyst pellet,deposits on tube wall
High temperature, residence time,presence of olefins
CnHm A (CH2)n A gum (7) Gum Blocking of metal surfaceLow H2O/C ratio, low temperature,
presence of olefins and aromatics,absence of H2
This journal is ß The Royal Society of Chemistry 2007 Green Chem., 2007, 9, 1016–1021 | 1019
of adsorbed carbon atoms, which forms on a Ni particle,
diffuses and nucleates into a carbon fiber. In this process, most
of the nickel crystal remains open for catalysis and only part of
it is blocked by the growing carbon fiber. However, eventually
the catalyst particle will be completely destroyed as described
in Table 3.18
The K/Ni catalyst was very special in the way that among
the small Ni crystals several relatively large particles (around
100 nm) were also present resulting in carbon formed in the so-
called ‘octopus’ structure, where several fibers are growing
from one nickel crystal (cf. Fig. 5).23 These large particles
create a kind of whisker carbon formation, which perhaps
partly can explain the almost complete lack of deactivation
observed with the K-promoted catalyst. Another important
observation is, of course, that far less carbon is formed on the
K/Ni catalyst, which could also be the reason for the very
slow deactivation. The reason why less carbon is formed on
the K/Ni catalyst can probably be ascribed to a better steam
adsorption as discussed.17
Essentially no carbon was observed on the ruthenium
catalyst, which is in agreement with earlier published work
on methane SR.24 As seen in Fig. 5, the Ru particles are
distributed quite uniformly on the spinel with a crystal size
of ca. 1–2 nm.
Fig. 6 clearly illustrates the effect of temperature on the
amount of carbon formed on the catalysts. Experiments
performed at high temperatures e.g. 873 K show no catalyst
deactivation and almost no carbon formations on any of
the catalysts, even after running for a week. These results
are somewhat surprising since methane decomposition on
supported nickel catalysts usually leads to increasing carbon
formation with increasing temperature.18 This might be
explained by diffusion limitations at high temperatures
resulting in a very low ethanol concentration at the catalyst
surface and therefore in a very low rate of carbon formation. It
is clear that promotion by potassium has a positive effect on
the nickel catalyst because it significantly lowers the coking
rate. The silver-promoted catalyst is not included in this
diagram because the rapid deactivation gives incomparable
results regarding the hourly normalized carbon formation. The
Ru catalyst is by far the best of the tested catalysts, especially
at lower temperatures around 673 K.
Applications
Ethanol SR can be implemented either in mobile or stationary
units. For ‘on-board’ SR in vehicles, relatively low tempera-
tures should be applied in order to meet the requirements of
the polymer electrolyte membrane fuel cell (PEMFC). This
type of FC is probably the most convenient to use in cars,
because of its high power density and its ability to vary the
output very fast, which, for example, is required to reach the
power demands for a quick start-up. To run the SR ‘on-board’
it will be necessary to burn some of the ethanol to make the
required heat for the endothermic SR reaction. Cavallaro
et al.14,25 suggest instead to use a molten carbonate FC
(MCFC). MCFCs, as well as solid oxide FCs (SOFCs), are
convenient when running due to their operating temperature of
around 900–1200 K, which provides the system with the
necessary heat for the SR reaction, improves the hydrogen
production and lowers the coking rate. Moreover, the
MCFC and SOFC can use a less clean hydrogen fuel than
the PEMFC. However, the high temperatures needed for the
MCFC or SOFC are also the main disadvantage of the system
for use in vehicles where they cannot meet the flexibility
requirements.26 They are more likely to be used in a stationary
system. The optimal hydrogen production is, however,
according to equilibrium calculations20 at high temperatures.
Therefore a better alternative might be to integrate a SR and
water gas shift (WGS) reactor in extension to the bio-refinery
producing the ethanol. Westermann and Ahring27 describe
a new type of bio-refinery in which bio-material rich in
lignocelluloses (e.g. straw) can be used in combination with
Fig. 5 TEM images of typical carbon formations on the different
catalysts: (a) Ru catalyst, the image shows an ensemble of supported
Ru particles without carbon deposits; (b) Ag/Ni catalyst, the image
shows a Ni particle encapsulated by gum (graphitic layers); (c) K/Ni
catalyst, the image shows an ‘octopus’ carbon nanofiber formed
around a Ni particle; (d) Ni catalyst, the image shows numerous
carbon nanofibers with Ni particles located at their tip apexes.
Fig. 6 Carbon formation as a function of temperature.
1020 | Green Chem., 2007, 9, 1016–1021 This journal is ß The Royal Society of Chemistry 2007
manure for a combined ethanol and methane production. In
this bio-refinery the methane produced could be used directly
as a fuel for the endothermic SR process. Another possibility
is to add a SOFC or a MCFC to the system to produce
electricity, and then use the generated heat at 900–1200 K to
run the endothermic SR reaction.
Moreover, for implementation of ‘on-board’ ethanol SR in
vehicles, no carbon formations are allowed on the catalyst
during the lifetime of the vehicle. It will be far too inconvenient
if the catalyst is something that has to be replaced over time.
For stationary applications the requirements for the catalyst
could perhaps be a little less strict concerning the carbon
formations. It might be acceptable, after a certain period of
time, that the catalyst should be replaced, or at least oxidized
to get rid of possible carbon depositions. Nevertheless, carbon
depositions should by all means be minimized.
An alternative to lower the coke depositions and the costs
for the endothermic SR, which has gained a lot of interest,11,28
is to do oxidative SR [eqn (8)]. For this exothermic reaction no
external heat is necessary to do the SR. Moreover, the oxygen
decreases the coke depositions by oxidizing the solid carbon to
CO and CO2. However, the total amount of hydrogen
produced by oxidative SR is significantly less than from non-
oxidative SR.
CH3CH2OH + 2H2O + KO2 A 2CO2 + 5H2 (8)
Conclusions
Bioethanol is a fast growing industrial chemical, whose main
use is as an additive to gasoline for fueling automobiles.
However, simple calculations indicate that this is an inefficient
use of the chemical. Instead, bioethanol could be converted to
hydrogen and used in fuel cells, which have much higher
energy efficiencies.
Catalytic conversion of bioethanol by SR has turned out to
be a very promising route to hydrogen. But severe difficulties
with catalyst deactivation caused by coke depositions exist.
In this paper it is clarified how important the temperature is
on the rate of carbon formation on the catalysts. It is shown
that at 873 K both Ru- and Ni-based catalysts perform
without any deactivation under the chosen conditions. Below
773 K, however, a noble metal like Ru is needed to avoid coke
depositions.
It is illustrated how the addition of other metals to the
Ni/MgAl2O4 catalyst influence the type of carbon deposition
formed on the catalysts. Doping with K prolonged the lifetime
of the catalyst by lowering the rate of carbon formation,
whereas Ag promotion lowered the lifetime of the catalyst
probably, due to a more pronounced gum carbon formation.
Both the Ru/MgAl2O4 catalyst and the Ni/MgAl2O4-based
catalysts had high selectivity towards hydrogen since the
reaction mixture was equilibrated. This also meant the total
conversion of ethanol.
The K–Ni/MgAl2O4 catalyst is very cheap and a promising
candidate for high temperature SR in stationary systems.
However, low temperature SR could be even more interesting
regarding its use in mobile units, and here the Ru/MgAl2O4
catalyst shows great potential. The challenges for the
implementation in mobile units are, on the other hand,
probably much more difficult than in stationary systems.
Acknowledgements
The Center for Sustainable and Green Chemistry is sponsored
by the National Danish Research Foundation.
References
1 E. C. Wanat, K. Venkataraman and L. D. Smith, Appl. Catal., A,2004, 276, 155–162.
2 L. F. Brown, Int. J. Hydrogen Energy, 2001, 26, 381–397.3 H. Bayraktar, Renewable Energy, 2005, 30, 1733–1747.4 Bio-methane & Bio-hydrogen: status and perspectives of biological
methane and hydrogen production, ed. J. H. Reith, R. H. Wijffelsand H. Barten, Dutch Biological Hydrogen Foundation, ZGPetten, Netherlands, 2003.
5 RNCOS, Biofuel Market Worldwide (2006), July 1, 2006, 85 pp.,pub. ID: CICQ1316286, http://www.rncos.com.
6 L. Schlapbach and A. Zuttel, Nature, 2001, 414, 353–358.7 I. Chorkendorf and J. W. Niemantsverdriet, in Concepts of Modern
Catalysis and Kinetics, Wiley-VCH, Weinheim, 2003.8 J. R. Rostrup-Nielsen, Phys. Chem. Chem. Phys., 2001, 3, 283–288.9 F. O. Licht, World Ethanol and Biofuels Report, vol. 4, no. 17
(9 May 2006), Table: ‘Ethanol: World Production, by Country’,p. 395.
10 A. Haryanto, S. Fernando, N. Murali and S. Adhikari, EnergyFuels, 2005, 19, 2098–2106.
11 V. Fierro, O. Akdim and C. Mirodatos, Green Chem., 2003, 5,20–24.
12 F. Aupretre, C. Descorme and D. Duprez, Catal. Commun., 2002,3, 263–267.
13 F. Aupretre, C. Descorme, D. Duprez, D. Casanave and D. Uzio,J. Catal., 2005, 233, 464–477.
14 F. Frusteri, S. Freni, L. Spadaro, V. Chiodo, G. Bonura, S. Donatoand S. Cavallaro, Catal. Commun., 2004, 5, 611–615.
15 F. Frusteri, S. Freni, V. Chiodo, L. Spadaro, O. Di Blasi,G. Bonura and S. Cavallaro, Appl. Catal., A, 2004, 270, 1–7.
16 D. K. Liguras, D. I. Kondarides and X. E. Verykios, Appl. Catal.,B, 2003, 43, 345–354.
17 J. R. Rostrup-Nielsen, Steam Reforming Catalysts, TekniskForlag, Copenhagen, 1975.
18 J. R. Rostrup-Nielsen, J. Sehested and J. K. Nørskov, Adv. Catal.,2002, 47, 65–139.
19 P. D. Vaidya and A. E. Rodrigues, Chem. Eng. J., 2006, 117,39–49.
20 Equilibrium calculations are performed with the programOutokumpu HSC Chemistry 5.1.
21 R. T. Vang, K. Honkala, S. Dahl, E. K. Vestergaard, J. Schnadt,E. Lægsgaard, B. S. Clausen, J. K. Nørskov and F. Besenbacher,Nat. Mater., 2005, 4, 160–162.
22 F. Besenbacher, I. Chorkendorff, B. S. Clausen, B. Hammer,A. M. Molenbroek, J. K. Nørskov and I. Stensgaard, Science,1998, 279, 1913–1915.
23 C. A. Bernardo, I. Alstrup and J. R. Rostrup-Nielsen, J. Catal.,1985, 96, 517–534.
24 J. R. Rostrup-Nielsen and J.-H. B. Hansen, J. Catal., 1992, 144,38–49.
25 S. Cavallaro, Energy Fuels, 2000, 14, 1195–1199.26 N. M. Sammes, Y. Du and R. Bove, in Biofuels for Fuel Cells, ed.
P. Lens, P. Westermann, M. Haberbauer and A. Moreno, IWA,London, UK, 2005, ch. 14, pp. 235–247.
27 P. Westermann and B. Ahring, in Biofuels for Fuel Cells, ed.P. Lens, P. Westermann, M. Haberbauer and A. Moreno, IWA,London, UK, 2005, ch. 11, pp. 194–205.
28 G. A. Deluga, J. R. Salge, L. D. Schmidt and X. E. Verykios,Science, 2004, 303, 993–997.
This journal is ß The Royal Society of Chemistry 2007 Green Chem., 2007, 9, 1016–1021 | 1021
Steam reforming of technical bioethanol
for hydrogen production
Jeppe Rass-Hansena, Roger Johanssona, Martin Møllerb, Claus Hviid Christensena,*aCenter for Sustainable and Green Chemistry, Department of Chemistry, Technical University of Denmark, Building 206, DK-2800 Kgs.
Lyngby, DenmarkbDONG Energy, DK-7000 Fredericia, Denmark
a r t i c l e i n f o
Article history:
Received 8 May 2008
Received in revised form
13 June 2008
Accepted 14 June 2008
Available online 19 August 2008
Keywords:
Bioethanol
Steam reforming
Carbon depositions
Hydrogen production
a b s t r a c t
Essentially all work on ethanol steam reforming so far has been carried out using simu-
lated bioethanol feedstocks, which means pure ethanol mixed with water. However, tech-
nical bioethanol consists of a lot of different components including sugars, which cannot
be easily vaporized and steam reformed. For ethanol steam reforming to be of practical
interest, it is important to avoid the energy-intensive purification steps to fuel grade
ethanol. Therefore, it is imperative to analyze how technical bioethanol, with the relevant
impurities, reacts during the steam reforming process. We show how three different distil-
lation fractions of technical 2nd generation bioethanol, produced in a pilot plant, influence
the performance of nickel- and ruthenium-based catalysts during steam reforming, and we
discuss what is required to obtain high activity and long catalyst lifetime. We conclude that
the use of technical bioethanol will result in a faster catalyst deactivation than what is
observed when using pure ethanol–water mixtures because of contaminants remaining
in the feed. However, the initial activity of the catalysts are not affected by this, hence it
is important to not only focus on catalyst activity but rather on the lifetime of the catalyst.
ª 2008 International Association for Hydrogen Energy. Published by Elsevier Ltd. All rights
reserved.
1. Introduction
Recent reviews [1–3] show how steam reforming (SR) of
ethanol has received significant attention in the literature as
a promising way to produce hydrogen from renewable
resources. However, so far essentially all reported investiga-
tions have been performedwith pure ethanol/water mixtures,
i.e. by mixing distilled ethanol and water. Here, we present
results on catalytic steam reforming of technical 2nd genera-
tion bioethanol produced from straw. To our knowledge, this
is the first investigation using 2nd generation bioethanol feed-
stock although there do exist a few previous papers on the
topic using 1st generation bioethanol [4–6]. The difference
between 1st and 2nd generation bioethanol is the source of
feedstock. 1st generation feedstocks are for instance corn,
sugarcane and crops, whereas 2nd generation feedstocks
could be agricultural waste, wood or household waste. Typi-
cally, 1st generation feedstocks are based on sucrose or starch
whereas 2nd generation feedstocks are based on lignocellu-
lose. Ethanol is produced by fermentation of glucose, which
is readily achieved from the first group of feedstocks through
simple hydrolysis. 2nd generation feedstocks typically consist
of cellulose, hemicelluloses and lignin with the glucose bound
in complex structures and more energy is required to release
the glucose for fermentation [7]. It is important to realize
that the 1st generation feedstocks are also used as food for
humans and animals, which is usually not the case for the
2nd generation feedstocks. The use of 1st generation
* Corresponding author.E-mail address: [email protected] (C.H. Christensen).
Avai lab le a t www.sc iencedi rec t .com
journa l homepage : www.e lsev ier . com/ loca te /he
0360-3199/$ – see front matter ª 2008 International Association for Hydrogen Energy. Published by Elsevier Ltd. All rights reserved.doi:10.1016/j.ijhydene.2008.06.020
i n t e r n a t i o n a l j o u rn a l o f h y d r o g e n en e r g y 3 3 ( 2 0 0 8 ) 4 5 4 7 – 4 5 5 4
bioethanol has led to a vehement debate about the ethical
issues of using food for fuels, see for example reference [8].
Contrary to 1st generation bioethanol, 2nd generation bioe-
thanol significantly reduce greenhouse gas emissions from
fuels [9], thus the use of 2nd generation plants are expected
to increase at the expense of 1st generation bioethanol plants.
Also, the use of diverse feedstocks for the production of
ethanol can pose different challenges in a subsequent steam
reforming process, due to the variety of contaminants, and
hence it is vital to have good experimental data with different
feeds. We have analyzed three different distillation fractions
of a technical 2nd generation bioethanol produced from
wheat straw and we will give a discussion about the hurdles
in using technical bioethanol in steam reforming.
The two largest producers of bioethanol in the world are
Brazil and the USA, each producing approximately 13 million
tons annually (2005) [10] from sugarcane and corn, respec-
tively. With regard to the Brazilian situation, the price of
ethanol is comparable to, if not lower than, the equivalent
amount of fossil fuel, and the amount of sugarcane available
exceeds the need as an edible resource, leading to a situation
that might be sustainable [11]. In the US, bioethanol is mainly
produced by fermentation of corn. With a corn/oil price ratio
that has decreased more than 10 times in the last 60 years
[12], bioethanol is continuously gaining importance as a fuel
for combustionengines invehicles.Theefficiencyofa combus-
tion engine is, however, relatively low and only 20–25% [13] of
the energy in the fuel is converted into useful power. Fuel cells,
on the other hand, potentially have energy efficiencies of 50–
60% [13–15] when operating on pure hydrogen. Fuel cells con-
nected to an onboard ethanol reformer could potentially be
used in the automotive sector or to produce heat and power
in household micro combined heat and power plants (CHP’s).
Therefore, a processallowing inexpensiveandenergy-efficient
conversion of bioethanol to hydrogen could increase the value
of the fuel considerably [16].
Important factors to consider when evaluating the use of
bioethanol as fuel or feedstock is the overall economy of the
processes involved as well as the energy-efficiency from
biomass to wheel. Fuel grade bioethanol needs to be water-
free, thus the production requires distillation beyond the
azeotrope point, and this is one of the major production costs
of fuel-ethanol [17–19]. On the other hand, the ethanol SR
process requires a significant amount of water (Eq. (1)), which
makes the expensive distillation superfluous. Only a simple
flash distillation to some 50–70% is necessary thereby consid-
erably lowering the production costs of bioethanol.
CH3CH2OH þ 3H2O/2CO2 þ 6H2 (1)
The use of 1st generation bioethanol, like that obtained in
Brazil and in the US from sugarcane and corn is, as mentioned
above, continuously questioned due to the use of food for
fuels [20]; and there have also been concerns over the amount
of fossil fuels used in the production of the bioethanol [18] but
the topic is still controversial [8,21]. In most places of the
world, it will only be reasonable to produce bioethanol from
non-food resources like household waste, straw, cornstower
and wood. These resources are often considered to be waste
materials and are thus significantly less valuable than edible
ones; not only will the use of these resources not interfere
with food production it will also greatly reduce the green-
house gas emissions and feedstock costs from the ethanol
production [9]. Therefore, there is globally an intense research
on developing so-called 2nd generation bioethanol, however
only a few companies have reached the point of demon-
strating the process in a pilot plant. The Danish company Inbi-
con, a subsidiary of DONG Energy A/S, has for the last 4 years
operated a pilot plant, able to convert straw into ethanol using
the so-called IBUS process. The demonstration plant is located
in Skærbæk, Denmark, and has a capacity up to 1000 kg of
straw per hour. The bioethanol examined in this paper was
received from this pilot plant.
2. Experimental
2.1. Production and characterization of technical
bioethanol
The bioethanol received from Inbicon, was delivered in three
different purities. The produced fractions were based on
a run of 50 kg/hr of Danishwheat straw. The strawwas heated
with steam for 5–15 min between 180 and 220 �C. The dry-
matter concentration of the pretreated straw was approxi-
mately 26%. To the pretreated straw was added yeast and
enzymes supplied by Novozymes AS, no other chemicals are
added in the process. The mixture of heated straw, enzymes
and yeast were fermented for 5 days in an 11 m3 fermenter,
which resulted in an ethanol concentration of around 5–6%.
This fibre beer was distilled in a traditional distillation
column, with modified trays in the stripper section. The
column has a capacity of 1000 kg fibre beer per hour, and is
operated under vacuumat around 0.1 bar. The Inbicon Process
is well described in a recent paper [22].
The first fraction was the ‘‘fibre beer’’, which is 5–6%
ethanol in amixture of water and biomass residues. The other
two fractions where taken from different parts of the distilla-
tion process. Fractions 2 and 3, with greatly reduced amounts
of impurities, had an ethanol concentration of 42 and 72 vol%,
respectively. All fractions have been analyzed by GC-MS (Agi-
lent 6850 GC equipped with a capillary HP-5MS column an FID
detector and Agilent 5975C MSD) and GC (Agilent 6890 N
equipped with a capillary HP-5 column and FID detector),
the beer was also analyzed by HPLC (Dionex Ultimate 3000
HPLC equipped with a Phenomenex Rezex RHM-Monosaccha-
ride Hþ 8% Column) to determine the composition of each.
2.2. Catalyst synthesis
A 10 wt% Ni/MgAl2O4 and a 1 wt% K doped 10 wt% Ni/MgAl2O4
catalyst were prepared by the incipient wetness impregnation
technique. An industrial high surface area spinel (MgAl2O4)
with a pore volume of 427 mL kgÿ1 and a specific surface
area of 72 m2 gÿ1 received from Haldor Topsøe A/S was used
as support material. The spinel tablets were crushed to
a size fraction of 300–710 mm and dried for 1 h at 100 �C. The
solution for the impregnation was prepared by dissolving
the desired amount of the different metal compounds, as
nitrate salts, in water under moderate heating. After impreg-
nation, the catalysts were dried at 100 �C for 2 h and finally
i n t e r n a t i o n a l j o u r n a l o f h y d r o g e n en e r g y 3 3 ( 2 0 0 8 ) 4 5 4 7 – 4 5 5 44548
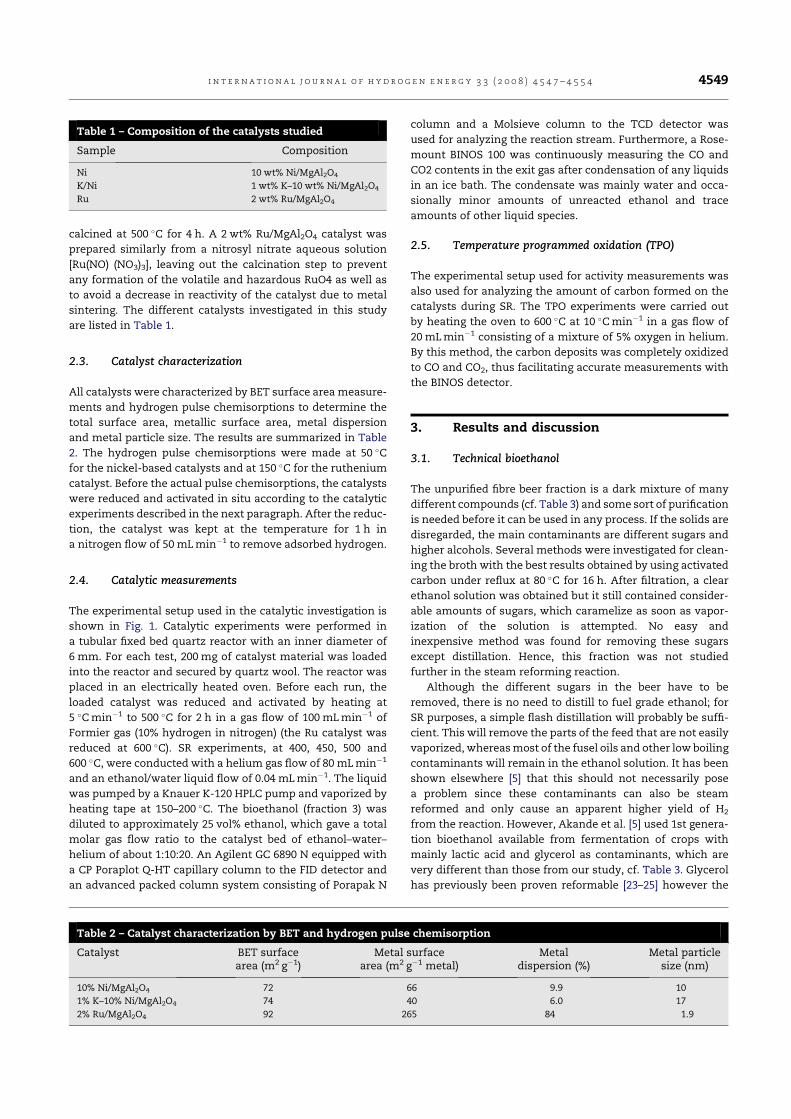
calcined at 500 �C for 4 h. A 2 wt% Ru/MgAl2O4 catalyst was
prepared similarly from a nitrosyl nitrate aqueous solution
[Ru(NO) (NO3)3], leaving out the calcination step to prevent
any formation of the volatile and hazardous RuO4 as well as
to avoid a decrease in reactivity of the catalyst due to metal
sintering. The different catalysts investigated in this study
are listed in Table 1.
2.3. Catalyst characterization
All catalysts were characterized by BET surface area measure-
ments and hydrogen pulse chemisorptions to determine the
total surface area, metallic surface area, metal dispersion
and metal particle size. The results are summarized in Table
2. The hydrogen pulse chemisorptions were made at 50 �C
for the nickel-based catalysts and at 150 �C for the ruthenium
catalyst. Before the actual pulse chemisorptions, the catalysts
were reduced and activated in situ according to the catalytic
experiments described in the next paragraph. After the reduc-
tion, the catalyst was kept at the temperature for 1 h in
a nitrogen flow of 50 mLminÿ1 to remove adsorbed hydrogen.
2.4. Catalytic measurements
The experimental setup used in the catalytic investigation is
shown in Fig. 1. Catalytic experiments were performed in
a tubular fixed bed quartz reactor with an inner diameter of
6 mm. For each test, 200 mg of catalyst material was loaded
into the reactor and secured by quartz wool. The reactor was
placed in an electrically heated oven. Before each run, the
loaded catalyst was reduced and activated by heating at
5 �Cminÿ1 to 500 �C for 2 h in a gas flow of 100 mLminÿ1 of
Formier gas (10% hydrogen in nitrogen) (the Ru catalyst was
reduced at 600 �C). SR experiments, at 400, 450, 500 and
600 �C, were conducted with a helium gas flow of 80 mLminÿ1
and an ethanol/water liquid flow of 0.04 mLminÿ1. The liquid
was pumped by a Knauer K-120 HPLC pump and vaporized by
heating tape at 150–200 �C. The bioethanol (fraction 3) was
diluted to approximately 25 vol% ethanol, which gave a total
molar gas flow ratio to the catalyst bed of ethanol–water–
helium of about 1:10:20. An Agilent GC 6890 N equipped with
a CP Poraplot Q-HT capillary column to the FID detector and
an advanced packed column system consisting of Porapak N
column and a Molsieve column to the TCD detector was
used for analyzing the reaction stream. Furthermore, a Rose-
mount BINOS 100 was continuously measuring the CO and
CO2 contents in the exit gas after condensation of any liquids
in an ice bath. The condensate was mainly water and occa-
sionally minor amounts of unreacted ethanol and trace
amounts of other liquid species.
2.5. Temperature programmed oxidation (TPO)
The experimental setup used for activity measurements was
also used for analyzing the amount of carbon formed on the
catalysts during SR. The TPO experiments were carried out
by heating the oven to 600 �C at 10 �Cminÿ1 in a gas flow of
20 mLminÿ1 consisting of a mixture of 5% oxygen in helium.
By this method, the carbon deposits was completely oxidized
to CO and CO2, thus facilitating accurate measurements with
the BINOS detector.
3. Results and discussion
3.1. Technical bioethanol
The unpurified fibre beer fraction is a dark mixture of many
different compounds (cf. Table 3) and some sort of purification
is needed before it can be used in any process. If the solids are
disregarded, the main contaminants are different sugars and
higher alcohols. Several methods were investigated for clean-
ing the broth with the best results obtained by using activated
carbon under reflux at 80 �C for 16 h. After filtration, a clear
ethanol solution was obtained but it still contained consider-
able amounts of sugars, which caramelize as soon as vapor-
ization of the solution is attempted. No easy and
inexpensive method was found for removing these sugars
except distillation. Hence, this fraction was not studied
further in the steam reforming reaction.
Although the different sugars in the beer have to be
removed, there is no need to distill to fuel grade ethanol; for
SR purposes, a simple flash distillation will probably be suffi-
cient. This will remove the parts of the feed that are not easily
vaporized, whereasmost of the fusel oils and other low boiling
contaminants will remain in the ethanol solution. It has been
shown elsewhere [5] that this should not necessarily pose
a problem since these contaminants can also be steam
reformed and only cause an apparent higher yield of H2
from the reaction. However, Akande et al. [5] used 1st genera-
tion bioethanol available from fermentation of crops with
mainly lactic acid and glycerol as contaminants, which are
very different than those from our study, cf. Table 3. Glycerol
has previously been proven reformable [23–25] however the
Table 1 – Composition of the catalysts studied
Sample Composition
Ni 10 wt% Ni/MgAl2O4
K/Ni 1 wt% K–10 wt% Ni/MgAl2O4
Ru 2 wt% Ru/MgAl2O4
Table 2 – Catalyst characterization by BET and hydrogen pulse chemisorption
Catalyst BET surfacearea (m2 gÿ1)
Metal surfacearea (m2 gÿ1 metal)
Metaldispersion (%)
Metal particlesize (nm)
10% Ni/MgAl2O4 72 66 9.9 10
1% K–10% Ni/MgAl2O4 74 40 6.0 17
2% Ru/MgAl2O4 92 265 84 1.9
i n t e r n a t i o n a l j o u rn a l o f h y d r o g e n en e r g y 3 3 ( 2 0 0 8 ) 4 5 4 7 – 4 5 5 4 4549
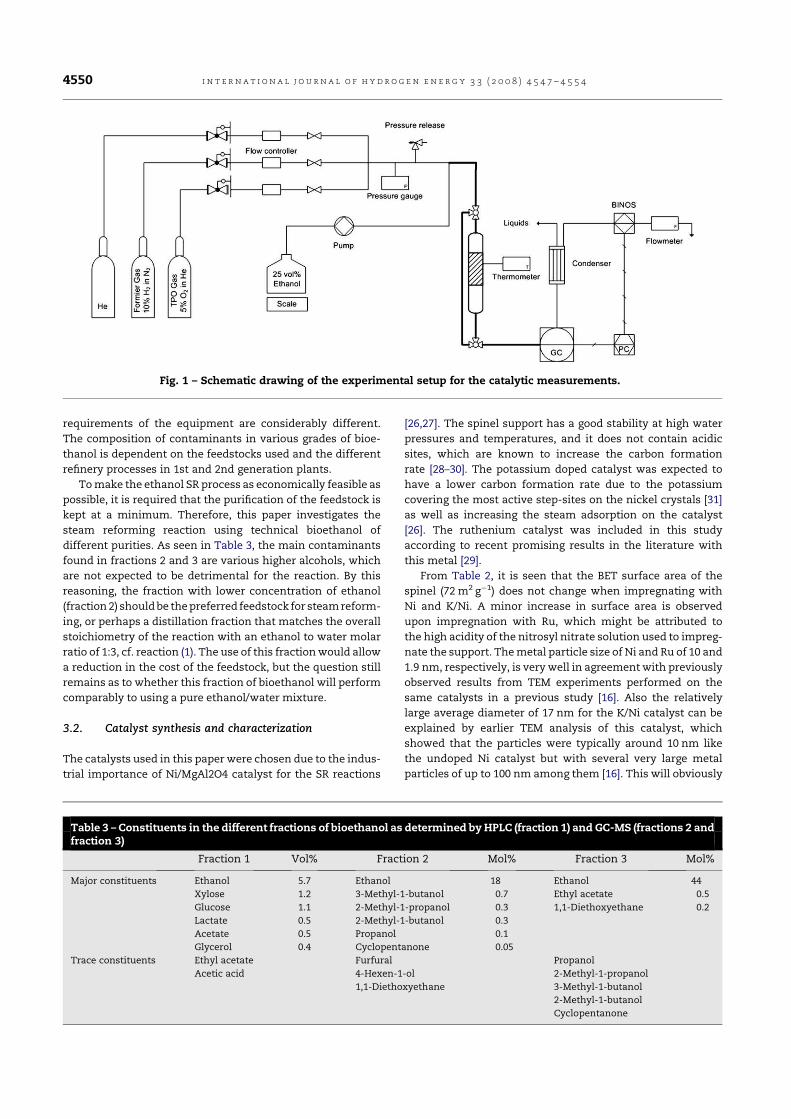
requirements of the equipment are considerably different.
The composition of contaminants in various grades of bioe-
thanol is dependent on the feedstocks used and the different
refinery processes in 1st and 2nd generation plants.
Tomake the ethanol SR process as economically feasible as
possible, it is required that the purification of the feedstock is
kept at a minimum. Therefore, this paper investigates the
steam reforming reaction using technical bioethanol of
different purities. As seen in Table 3, the main contaminants
found in fractions 2 and 3 are various higher alcohols, which
are not expected to be detrimental for the reaction. By this
reasoning, the fraction with lower concentration of ethanol
(fraction2) shouldbe thepreferred feedstock for steamreform-
ing, or perhaps a distillation fraction that matches the overall
stoichiometry of the reaction with an ethanol to water molar
ratio of 1:3, cf. reaction (1). The use of this fractionwould allow
a reduction in the cost of the feedstock, but the question still
remains as to whether this fraction of bioethanol will perform
comparably to using a pure ethanol/water mixture.
3.2. Catalyst synthesis and characterization
The catalysts used in this paper were chosen due to the indus-
trial importance of Ni/MgAl2O4 catalyst for the SR reactions
[26,27]. The spinel support has a good stability at high water
pressures and temperatures, and it does not contain acidic
sites, which are known to increase the carbon formation
rate [28–30]. The potassium doped catalyst was expected to
have a lower carbon formation rate due to the potassium
covering the most active step-sites on the nickel crystals [31]
as well as increasing the steam adsorption on the catalyst
[26]. The ruthenium catalyst was included in this study
according to recent promising results in the literature with
this metal [29].
From Table 2, it is seen that the BET surface area of the
spinel (72 m2 gÿ1) does not change when impregnating with
Ni and K/Ni. A minor increase in surface area is observed
upon impregnation with Ru, which might be attributed to
the high acidity of the nitrosyl nitrate solution used to impreg-
nate the support. Themetal particle size of Ni and Ru of 10 and
1.9 nm, respectively, is very well in agreementwith previously
observed results from TEM experiments performed on the
same catalysts in a previous study [16]. Also the relatively
large average diameter of 17 nm for the K/Ni catalyst can be
explained by earlier TEM analysis of this catalyst, which
showed that the particles were typically around 10 nm like
the undoped Ni catalyst but with several very large metal
particles of up to 100 nm among them [16]. This will obviously
Fig. 1 – Schematic drawing of the experimental setup for the catalytic measurements.
Table 3 – Constituents in the different fractions of bioethanol as determined byHPLC (fraction 1) and GC-MS (fractions 2 andfraction 3)
Fraction 1 Vol% Fraction 2 Mol% Fraction 3 Mol%
Major constituents Ethanol 5.7 Ethanol 18 Ethanol 44
Xylose 1.2 3-Methyl-1-butanol 0.7 Ethyl acetate 0.5
Glucose 1.1 2-Methyl-1-propanol 0.3 1,1-Diethoxyethane 0.2
Lactate 0.5 2-Methyl-1-butanol 0.3
Acetate 0.5 Propanol 0.1
Glycerol 0.4 Cyclopentanone 0.05
Trace constituents Ethyl acetate
Acetic acid
Furfural
4-Hexen-1-ol
1,1-Diethoxyethane
Propanol
2-Methyl-1-propanol
3-Methyl-1-butanol
2-Methyl-1-butanol
Cyclopentanone
i n t e r n a t i o n a l j o u r n a l o f h y d r o g e n en e r g y 3 3 ( 2 0 0 8 ) 4 5 4 7 – 4 5 5 44550
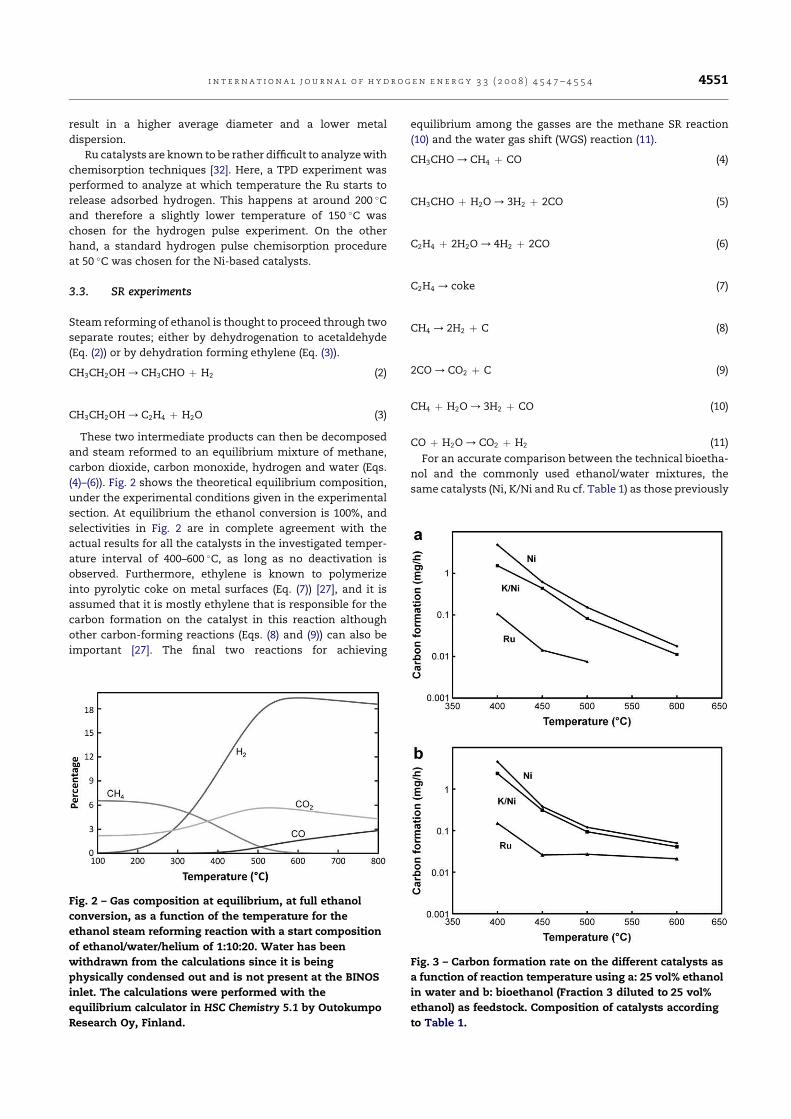
result in a higher average diameter and a lower metal
dispersion.
Ru catalysts are known to be rather difficult to analyzewith
chemisorption techniques [32]. Here, a TPD experiment was
performed to analyze at which temperature the Ru starts to
release adsorbed hydrogen. This happens at around 200 �C
and therefore a slightly lower temperature of 150 �C was
chosen for the hydrogen pulse experiment. On the other
hand, a standard hydrogen pulse chemisorption procedure
at 50 �C was chosen for the Ni-based catalysts.
3.3. SR experiments
Steam reforming of ethanol is thought to proceed through two
separate routes; either by dehydrogenation to acetaldehyde
(Eq. (2)) or by dehydration forming ethylene (Eq. (3)).
CH3CH2OH/CH3CHO þ H2 (2)
CH3CH2OH/C2H4 þ H2O (3)
These two intermediate products can then be decomposed
and steam reformed to an equilibrium mixture of methane,
carbon dioxide, carbon monoxide, hydrogen and water (Eqs.
(4)–(6)). Fig. 2 shows the theoretical equilibrium composition,
under the experimental conditions given in the experimental
section. At equilibrium the ethanol conversion is 100%, and
selectivities in Fig. 2 are in complete agreement with the
actual results for all the catalysts in the investigated temper-
ature interval of 400–600 �C, as long as no deactivation is
observed. Furthermore, ethylene is known to polymerize
into pyrolytic coke on metal surfaces (Eq. (7)) [27], and it is
assumed that it is mostly ethylene that is responsible for the
carbon formation on the catalyst in this reaction although
other carbon-forming reactions (Eqs. (8) and (9)) can also be
important [27]. The final two reactions for achieving
equilibrium among the gasses are the methane SR reaction
(10) and the water gas shift (WGS) reaction (11).
CH3CHO/CH4 þ CO (4)
CH3CHO þ H2O/3H2 þ 2CO (5)
C2H4 þ 2H2O/4H2 þ 2CO (6)
C2H4 / coke (7)
CH4 /2H2 þ C (8)
2CO/CO2 þ C (9)
CH4 þ H2O/3H2 þ CO (10)
CO þ H2O/CO2 þ H2 (11)
For an accurate comparison between the technical bioetha-
nol and the commonly used ethanol/water mixtures, the
same catalysts (Ni, K/Ni and Ru cf. Table 1) as those previously
Fig. 2 – Gas composition at equilibrium, at full ethanol
conversion, as a function of the temperature for the
ethanol steam reforming reaction with a start composition
of ethanol/water/helium of 1:10:20. Water has been
withdrawn from the calculations since it is being
physically condensed out and is not present at the BINOS
inlet. The calculations were performed with the
equilibrium calculator in HSC Chemistry 5.1 by Outokumpo
Research Oy, Finland.
Fig. 3 – Carbon formation rate on the different catalysts as
a function of reaction temperature using a: 25 vol% ethanol
in water and b: bioethanol (Fraction 3 diluted to 25 vol%
ethanol) as feedstock. Composition of catalysts according
to Table 1.
i n t e r n a t i o n a l j o u rn a l o f h y d r o g e n en e r g y 3 3 ( 2 0 0 8 ) 4 5 4 7 – 4 5 5 4 4551
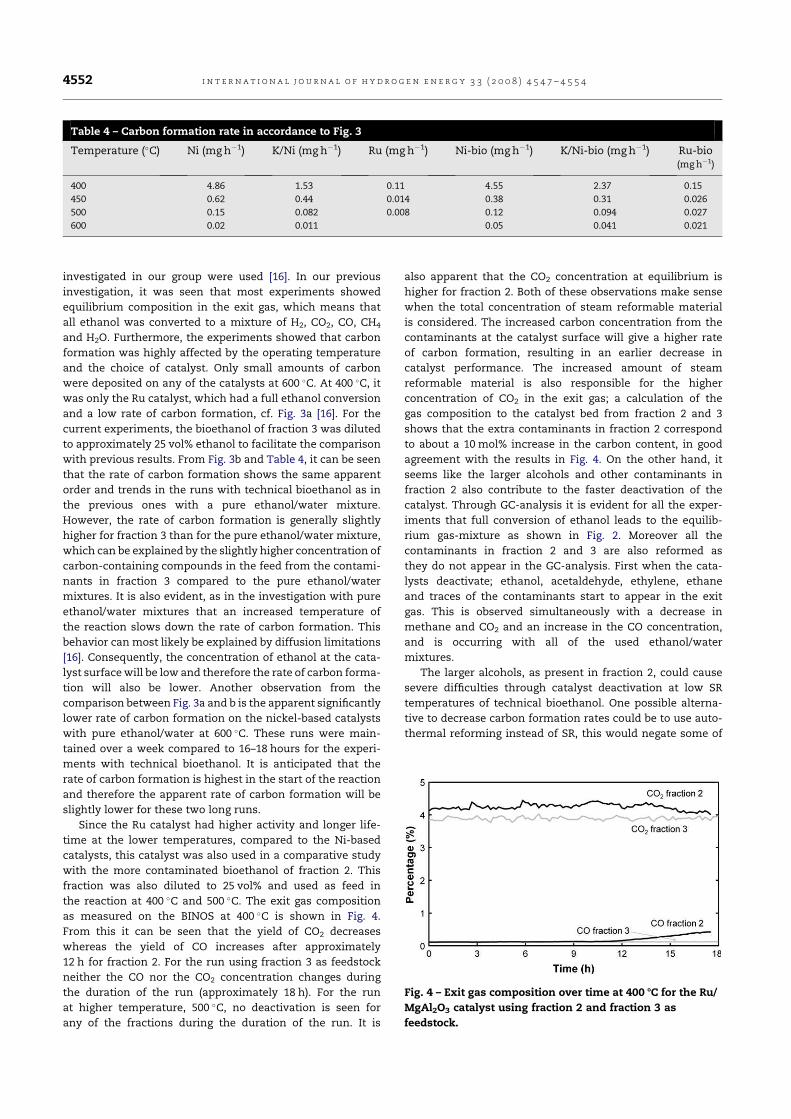
investigated in our group were used [16]. In our previous
investigation, it was seen that most experiments showed
equilibrium composition in the exit gas, which means that
all ethanol was converted to a mixture of H2, CO2, CO, CH4
and H2O. Furthermore, the experiments showed that carbon
formation was highly affected by the operating temperature
and the choice of catalyst. Only small amounts of carbon
were deposited on any of the catalysts at 600 �C. At 400 �C, it
was only the Ru catalyst, which had a full ethanol conversion
and a low rate of carbon formation, cf. Fig. 3a [16]. For the
current experiments, the bioethanol of fraction 3 was diluted
to approximately 25 vol% ethanol to facilitate the comparison
with previous results. From Fig. 3b and Table 4, it can be seen
that the rate of carbon formation shows the same apparent
order and trends in the runs with technical bioethanol as in
the previous ones with a pure ethanol/water mixture.
However, the rate of carbon formation is generally slightly
higher for fraction 3 than for the pure ethanol/water mixture,
which can be explained by the slightly higher concentration of
carbon-containing compounds in the feed from the contami-
nants in fraction 3 compared to the pure ethanol/water
mixtures. It is also evident, as in the investigation with pure
ethanol/water mixtures that an increased temperature of
the reaction slows down the rate of carbon formation. This
behavior can most likely be explained by diffusion limitations
[16]. Consequently, the concentration of ethanol at the cata-
lyst surfacewill be low and therefore the rate of carbon forma-
tion will also be lower. Another observation from the
comparison between Fig. 3a and b is the apparent significantly
lower rate of carbon formation on the nickel-based catalysts
with pure ethanol/water at 600 �C. These runs were main-
tained over a week compared to 16–18 hours for the experi-
ments with technical bioethanol. It is anticipated that the
rate of carbon formation is highest in the start of the reaction
and therefore the apparent rate of carbon formation will be
slightly lower for these two long runs.
Since the Ru catalyst had higher activity and longer life-
time at the lower temperatures, compared to the Ni-based
catalysts, this catalyst was also used in a comparative study
with the more contaminated bioethanol of fraction 2. This
fraction was also diluted to 25 vol% and used as feed in
the reaction at 400 �C and 500 �C. The exit gas composition
as measured on the BINOS at 400 �C is shown in Fig. 4.
From this it can be seen that the yield of CO2 decreases
whereas the yield of CO increases after approximately
12 h for fraction 2. For the run using fraction 3 as feedstock
neither the CO nor the CO2 concentration changes during
the duration of the run (approximately 18 h). For the run
at higher temperature, 500 �C, no deactivation is seen for
any of the fractions during the duration of the run. It is
also apparent that the CO2 concentration at equilibrium is
higher for fraction 2. Both of these observations make sense
when the total concentration of steam reformable material
is considered. The increased carbon concentration from the
contaminants at the catalyst surface will give a higher rate
of carbon formation, resulting in an earlier decrease in
catalyst performance. The increased amount of steam
reformable material is also responsible for the higher
concentration of CO2 in the exit gas; a calculation of the
gas composition to the catalyst bed from fraction 2 and 3
shows that the extra contaminants in fraction 2 correspond
to about a 10 mol% increase in the carbon content, in good
agreement with the results in Fig. 4. On the other hand, it
seems like the larger alcohols and other contaminants in
fraction 2 also contribute to the faster deactivation of the
catalyst. Through GC-analysis it is evident for all the exper-
iments that full conversion of ethanol leads to the equilib-
rium gas-mixture as shown in Fig. 2. Moreover all the
contaminants in fraction 2 and 3 are also reformed as
they do not appear in the GC-analysis. First when the cata-
lysts deactivate; ethanol, acetaldehyde, ethylene, ethane
and traces of the contaminants start to appear in the exit
gas. This is observed simultaneously with a decrease in
methane and CO2 and an increase in the CO concentration,
and is occurring with all of the used ethanol/water
mixtures.
The larger alcohols, as present in fraction 2, could cause
severe difficulties through catalyst deactivation at low SR
temperatures of technical bioethanol. One possible alterna-
tive to decrease carbon formation rates could be to use auto-
thermal reforming instead of SR, this would negate some of
Table 4 – Carbon formation rate in accordance to Fig. 3
Temperature (�C) Ni (mghÿ1) K/Ni (mg hÿ1) Ru (mg hÿ1) Ni-bio (mg hÿ1) K/Ni-bio (mghÿ1) Ru-bio(mg hÿ1)
400 4.86 1.53 0.11 4.55 2.37 0.15
450 0.62 0.44 0.014 0.38 0.31 0.026
500 0.15 0.082 0.008 0.12 0.094 0.027
600 0.02 0.011 0.05 0.041 0.021
Fig. 4 – Exit gas composition over time at 400 8C for the Ru/
MgAl2O3 catalyst using fraction 2 and fraction 3 as
feedstock.
i n t e r n a t i o n a l j o u r n a l o f h y d r o g e n en e r g y 3 3 ( 2 0 0 8 ) 4 5 4 7 – 4 5 5 44552
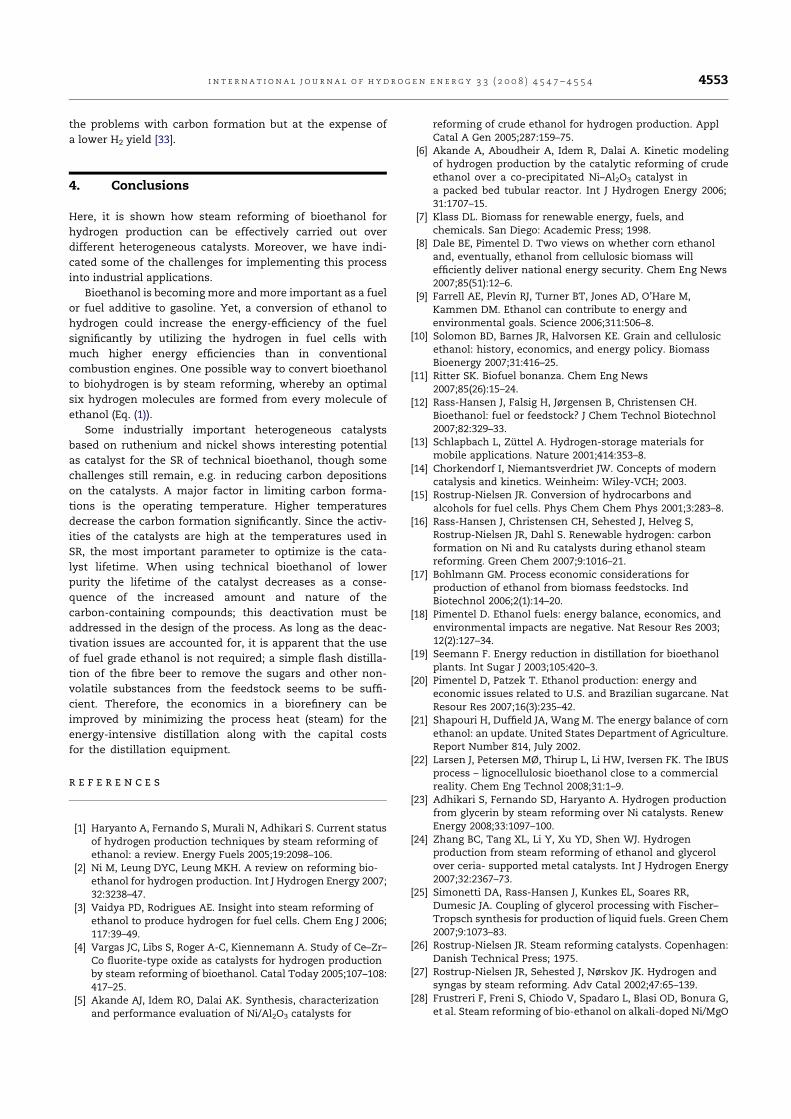
the problems with carbon formation but at the expense of
a lower H2 yield [33].
4. Conclusions
Here, it is shown how steam reforming of bioethanol for
hydrogen production can be effectively carried out over
different heterogeneous catalysts. Moreover, we have indi-
cated some of the challenges for implementing this process
into industrial applications.
Bioethanol is becomingmore andmore important as a fuel
or fuel additive to gasoline. Yet, a conversion of ethanol to
hydrogen could increase the energy-efficiency of the fuel
significantly by utilizing the hydrogen in fuel cells with
much higher energy efficiencies than in conventional
combustion engines. One possible way to convert bioethanol
to biohydrogen is by steam reforming, whereby an optimal
six hydrogen molecules are formed from every molecule of
ethanol (Eq. (1)).
Some industrially important heterogeneous catalysts
based on ruthenium and nickel shows interesting potential
as catalyst for the SR of technical bioethanol, though some
challenges still remain, e.g. in reducing carbon depositions
on the catalysts. A major factor in limiting carbon forma-
tions is the operating temperature. Higher temperatures
decrease the carbon formation significantly. Since the activ-
ities of the catalysts are high at the temperatures used in
SR, the most important parameter to optimize is the cata-
lyst lifetime. When using technical bioethanol of lower
purity the lifetime of the catalyst decreases as a conse-
quence of the increased amount and nature of the
carbon-containing compounds; this deactivation must be
addressed in the design of the process. As long as the deac-
tivation issues are accounted for, it is apparent that the use
of fuel grade ethanol is not required; a simple flash distilla-
tion of the fibre beer to remove the sugars and other non-
volatile substances from the feedstock seems to be suffi-
cient. Therefore, the economics in a biorefinery can be
improved by minimizing the process heat (steam) for the
energy-intensive distillation along with the capital costs
for the distillation equipment.
r e f e r e n c e s
[1] Haryanto A, Fernando S, Murali N, Adhikari S. Current statusof hydrogen production techniques by steam reforming ofethanol: a review. Energy Fuels 2005;19:2098–106.
[2] Ni M, Leung DYC, Leung MKH. A review on reforming bio-ethanol for hydrogen production. Int J Hydrogen Energy 2007;32:3238–47.
[3] Vaidya PD, Rodrigues AE. Insight into steam reforming ofethanol to produce hydrogen for fuel cells. Chem Eng J 2006;117:39–49.
[4] Vargas JC, Libs S, Roger A-C, Kiennemann A. Study of Ce–Zr–Co fluorite-type oxide as catalysts for hydrogen productionby steam reforming of bioethanol. Catal Today 2005;107–108:417–25.
[5] Akande AJ, Idem RO, Dalai AK. Synthesis, characterizationand performance evaluation of Ni/Al2O3 catalysts for
reforming of crude ethanol for hydrogen production. ApplCatal A Gen 2005;287:159–75.
[6] Akande A, Aboudheir A, Idem R, Dalai A. Kinetic modelingof hydrogen production by the catalytic reforming of crudeethanol over a co-precipitated Ni–Al2O3 catalyst ina packed bed tubular reactor. Int J Hydrogen Energy 2006;31:1707–15.
[7] Klass DL. Biomass for renewable energy, fuels, andchemicals. San Diego: Academic Press; 1998.
[8] Dale BE, Pimentel D. Two views on whether corn ethanoland, eventually, ethanol from cellulosic biomass willefficiently deliver national energy security. Chem Eng News2007;85(51):12–6.
[9] Farrell AE, Plevin RJ, Turner BT, Jones AD, O’Hare M,Kammen DM. Ethanol can contribute to energy andenvironmental goals. Science 2006;311:506–8.
[10] Solomon BD, Barnes JR, Halvorsen KE. Grain and cellulosicethanol: history, economics, and energy policy. BiomassBioenergy 2007;31:416–25.
[11] Ritter SK. Biofuel bonanza. Chem Eng News2007;85(26):15–24.
[12] Rass-Hansen J, Falsig H, Jørgensen B, Christensen CH.Bioethanol: fuel or feedstock? J Chem Technol Biotechnol2007;82:329–33.
[13] Schlapbach L, Zuttel A. Hydrogen-storage materials formobile applications. Nature 2001;414:353–8.
[14] Chorkendorf I, Niemantsverdriet JW. Concepts of moderncatalysis and kinetics. Weinheim: Wiley-VCH; 2003.
[15] Rostrup-Nielsen JR. Conversion of hydrocarbons andalcohols for fuel cells. Phys Chem Chem Phys 2001;3:283–8.
[16] Rass-Hansen J, Christensen CH, Sehested J, Helveg S,Rostrup-Nielsen JR, Dahl S. Renewable hydrogen: carbonformation on Ni and Ru catalysts during ethanol steamreforming. Green Chem 2007;9:1016–21.
[17] Bohlmann GM. Process economic considerations forproduction of ethanol from biomass feedstocks. IndBiotechnol 2006;2(1):14–20.
[18] Pimentel D. Ethanol fuels: energy balance, economics, andenvironmental impacts are negative. Nat Resour Res 2003;12(2):127–34.
[19] Seemann F. Energy reduction in distillation for bioethanolplants. Int Sugar J 2003;105:420–3.
[20] Pimentel D, Patzek T. Ethanol production: energy andeconomic issues related to U.S. and Brazilian sugarcane. NatResour Res 2007;16(3):235–42.
[21] Shapouri H, Duffield JA, Wang M. The energy balance of cornethanol: an update. United States Department of Agriculture.Report Number 814, July 2002.
[22] Larsen J, Petersen MØ, Thirup L, Li HW, Iversen FK. The IBUSprocess – lignocellulosic bioethanol close to a commercialreality. Chem Eng Technol 2008;31:1–9.
[23] Adhikari S, Fernando SD, Haryanto A. Hydrogen productionfrom glycerin by steam reforming over Ni catalysts. RenewEnergy 2008;33:1097–100.
[24] Zhang BC, Tang XL, Li Y, Xu YD, Shen WJ. Hydrogenproduction from steam reforming of ethanol and glycerolover ceria- supported metal catalysts. Int J Hydrogen Energy2007;32:2367–73.
[25] Simonetti DA, Rass-Hansen J, Kunkes EL, Soares RR,Dumesic JA. Coupling of glycerol processing with Fischer–Tropsch synthesis for production of liquid fuels. Green Chem2007;9:1073–83.
[26] Rostrup-Nielsen JR. Steam reforming catalysts. Copenhagen:Danish Technical Press; 1975.
[27] Rostrup-Nielsen JR, Sehested J, Nørskov JK. Hydrogen andsyngas by steam reforming. Adv Catal 2002;47:65–139.
[28] Frustreri F, Freni S, Chiodo V, Spadaro L, Blasi OD, Bonura G,et al. Steam reforming of bio-ethanol on alkali-doped Ni/MgO
i n t e r n a t i o n a l j o u rn a l o f h y d r o g e n en e r g y 3 3 ( 2 0 0 8 ) 4 5 4 7 – 4 5 5 4 4553

catalysts: hydrogen production for MC fuel cell. Appl Catal AGen 2004;270:1–7.
[29] Liguras DK, Kondarides DI, Verykios XE. Production ofhydrogen for fuel cells by steam reforming of ethanol oversupported noble metal catalysts. Appl Catal, B2003;43:345–54.
[30] Vizcaino AJ, Carriero A, Calles JA. Hydrogen production byethanol steam reforming over Cu–Ni supported catalysts. IntJ Hydrogen Energy 2007;32:1451–61.
[31] Bengaard HS, Nørskov JK, Sehested J, Clausen BS,Nielsen LP, Molenbroeck AM, et al. Steam reformingand graphite formation on Ni catalysts. J Catal 2002;209:365–84.
[32] Fastrup B. On the interaction of N2 and H2 with Ru catalystsurfaces. Catal Lett 1997;48:111–9.
[33] Deluga GA, Salge JR, Schmidt LD, Verykios XE. Renewablehydrogen from ethanol by autothermal reforming. Science2004;303:993–7.
i n t e r n a t i o n a l j o u r n a l o f h y d r o g e n en e r g y 3 3 ( 2 0 0 8 ) 4 5 4 7 – 4 5 5 44554

www.rsc.org/greenchem Volume 9 | Number 10 | October 2007 | Pages 1029–1144
ISSN 1463-9262
Cutting-edge research for a greener sustainable future
Chen et al. E!cient and controlled polymerization of lactide
Simonetti et al. Coupling of glycerol processing with Fischer–Tropsch synthesis 1463-9262(2007)9:10;1-T
Mack et al. Solvent-free method for the reduction of esters
Sheldrake and Schleck
Dicationic molten salts as re-usable media for pyrolysis of cellulose
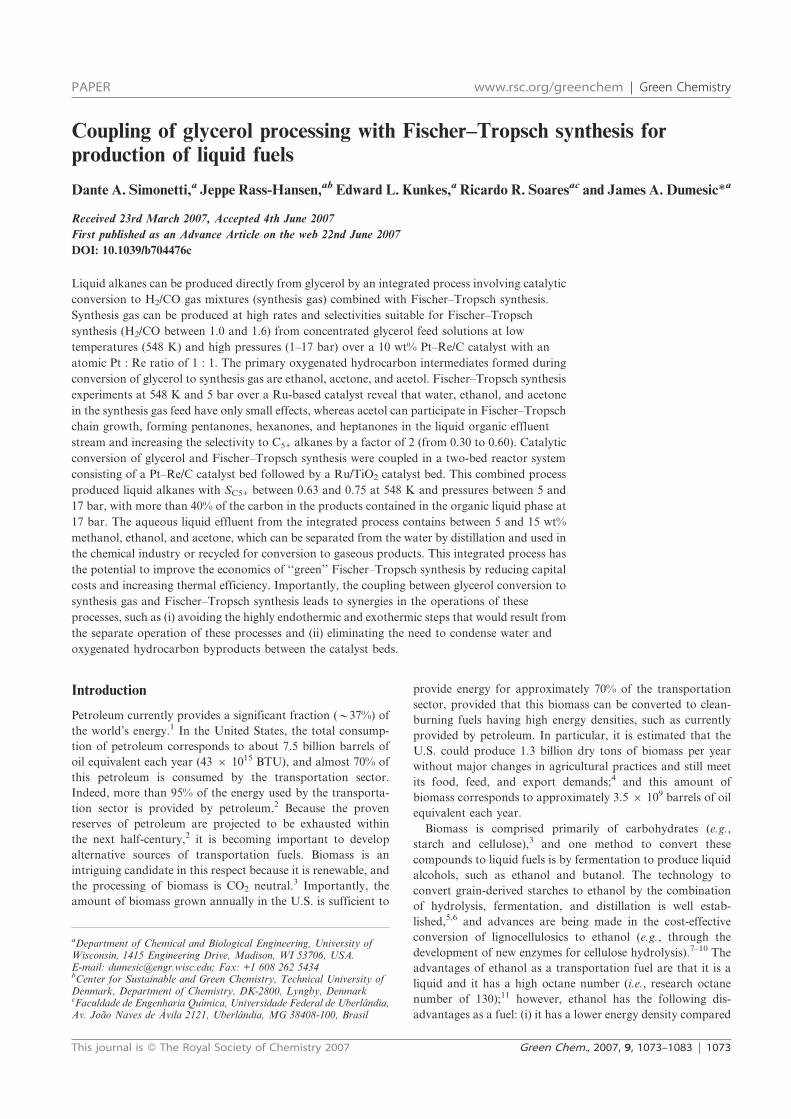
Coupling of glycerol processing with Fischer–Tropsch synthesis forproduction of liquid fuels
Dante A. Simonetti,a Jeppe Rass-Hansen,ab Edward L. Kunkes,aRicardo R. Soaresac and James A. Dumesic*a
Received 23rd March 2007, Accepted 4th June 2007
First published as an Advance Article on the web 22nd June 2007
DOI: 10.1039/b704476c
Liquid alkanes can be produced directly from glycerol by an integrated process involving catalytic
conversion to H2/CO gas mixtures (synthesis gas) combined with Fischer–Tropsch synthesis.
Synthesis gas can be produced at high rates and selectivities suitable for Fischer–Tropsch
synthesis (H2/CO between 1.0 and 1.6) from concentrated glycerol feed solutions at low
temperatures (548 K) and high pressures (1–17 bar) over a 10 wt% Pt–Re/C catalyst with an
atomic Pt : Re ratio of 1 : 1. The primary oxygenated hydrocarbon intermediates formed during
conversion of glycerol to synthesis gas are ethanol, acetone, and acetol. Fischer–Tropsch synthesis
experiments at 548 K and 5 bar over a Ru-based catalyst reveal that water, ethanol, and acetone
in the synthesis gas feed have only small effects, whereas acetol can participate in Fischer–Tropsch
chain growth, forming pentanones, hexanones, and heptanones in the liquid organic effluent
stream and increasing the selectivity to C5+ alkanes by a factor of 2 (from 0.30 to 0.60). Catalytic
conversion of glycerol and Fischer–Tropsch synthesis were coupled in a two-bed reactor system
consisting of a Pt–Re/C catalyst bed followed by a Ru/TiO2 catalyst bed. This combined process
produced liquid alkanes with SC5+ between 0.63 and 0.75 at 548 K and pressures between 5 and
17 bar, with more than 40% of the carbon in the products contained in the organic liquid phase at
17 bar. The aqueous liquid effluent from the integrated process contains between 5 and 15 wt%
methanol, ethanol, and acetone, which can be separated from the water by distillation and used in
the chemical industry or recycled for conversion to gaseous products. This integrated process has
the potential to improve the economics of ‘‘green’’ Fischer–Tropsch synthesis by reducing capital
costs and increasing thermal efficiency. Importantly, the coupling between glycerol conversion to
synthesis gas and Fischer–Tropsch synthesis leads to synergies in the operations of these
processes, such as (i) avoiding the highly endothermic and exothermic steps that would result from
the separate operation of these processes and (ii) eliminating the need to condense water and
oxygenated hydrocarbon byproducts between the catalyst beds.
Introduction
Petroleum currently provides a significant fraction (y37%) of
the world’s energy.1 In the United States, the total consump-
tion of petroleum corresponds to about 7.5 billion barrels of
oil equivalent each year (43 6 1015 BTU), and almost 70% of
this petroleum is consumed by the transportation sector.
Indeed, more than 95% of the energy used by the transporta-
tion sector is provided by petroleum.2 Because the proven
reserves of petroleum are projected to be exhausted within
the next half-century,2 it is becoming important to develop
alternative sources of transportation fuels. Biomass is an
intriguing candidate in this respect because it is renewable, and
the processing of biomass is CO2 neutral.3 Importantly, the
amount of biomass grown annually in the U.S. is sufficient to
provide energy for approximately 70% of the transportation
sector, provided that this biomass can be converted to clean-
burning fuels having high energy densities, such as currently
provided by petroleum. In particular, it is estimated that the
U.S. could produce 1.3 billion dry tons of biomass per year
without major changes in agricultural practices and still meet
its food, feed, and export demands;4 and this amount of
biomass corresponds to approximately 3.56 109 barrels of oil
equivalent each year.
Biomass is comprised primarily of carbohydrates (e.g.,
starch and cellulose),3 and one method to convert these
compounds to liquid fuels is by fermentation to produce liquid
alcohols, such as ethanol and butanol. The technology to
convert grain-derived starches to ethanol by the combination
of hydrolysis, fermentation, and distillation is well estab-
lished,5,6 and advances are being made in the cost-effective
conversion of lignocellulosics to ethanol (e.g., through the
development of new enzymes for cellulose hydrolysis).7–10 The
advantages of ethanol as a transportation fuel are that it is a
liquid and it has a high octane number (i.e., research octane
number of 130);11 however, ethanol has the following dis-
advantages as a fuel: (i) it has a lower energy density compared
aDepartment of Chemical and Biological Engineering, University ofWisconsin, 1415 Engineering Drive, Madison, WI 53706, USA.E-mail: [email protected]; Fax: +1 608 262 5434bCenter for Sustainable and Green Chemistry, Technical University ofDenmark, Department of Chemistry, DK-2800, Lyngby, DenmarkcFaculdade de Engenharia Quımica, Universidade Federal de Uberlandia,Av. Joao Naves de Avila 2121, Uberlandia, MG 38408-100, Brasil
PAPER www.rsc.org/greenchem | Green Chemistry
This journal is ß The Royal Society of Chemistry 2007 Green Chem., 2007, 9, 1073–1083 | 1073
to petroleum (i.e., approximately 20 6 103 BTU l21 for
ethanol versus 30 6 103 BTU l21 for petroleum),12 (ii) it is
completely miscible with water, leading to significant absorp-
tion of water into the fuel, and (iii) it has a relatively low
boiling point (346 K), leading to excessive evaporation at
elevated temperatures. Importantly, the fermentation process
used to produce bio-ethanol from carbohydrates leads to an
aqueous solution containing only 5–10 wt% ethanol, and
significant expenditure of energy is required to produce fuel-
grade ethanol by distillation of this rather dilute aqueous
solution.6,13 Indeed, the overall energy balance for production
of bio-ethanol is not very favorable, and it has been estimated
that the amount of energy required to produce bio-ethanol is
approximately equal to (or greater than) the energy-content of
the ethanol produced.5,6,14,15
Long-chain alkanes comprise the vast majority of compo-
nents in transportation fuels from petroleum (branched for
gasoline and linear for diesel), and the conversion of renewable
biomass resources to liquid alkanes thus represents an attrac-
tive processing option. For example, the liquid alkanes from
such a conversion (i) can be distributed using infrastructure
already employed for petroleum products, (ii) can be added to
the existing petroleum pool for further processing, and (iii) can
be combusted without alterations in existing engines. The
production of liquid alkanes from biomass typically occurs by
gasification of biomass to produce synthesis gas (H2/CO)
followed by Fischer–Tropsch synthesis.16,17 However, both
conventional Fischer–Tropsch synthesis (i.e., using coal or
natural gas) and ‘‘green’’ Fischer–Tropsch synthesis (using
biomass) have similar economic disadvantages, specifically,
high capital and operating costs, of which greater than 50%
stems from synthesis gas generation.18,19 Also, Fischer–Tropsch
synthesis processes suffer from low thermal efficiency.18,19
Because of these limitations, liquid alkane production by
Fischer–Tropsch synthesis becomes economically viable only
at large scales.16–19 Indeed, improvements in synthesis gas
generation and thermal efficiency are necessary to improve
the economics of Fischer–Tropsch synthesis processes.16,17,19
We have recently reported that glycerol can be converted to
synthesis gas at high rates and selectivities at temperatures
from 498 to 620 K according to eqn (1).20
C3O3H8 A 3CO + 4H2 (1)
This glycerol can be derived from fermentation of glucose,21
from hydrogenolysis of sorbitol,22 or as a waste product
from the transesterification of plant oils and animal fats.23
Operation at low temperatures provides the opportunity to
couple this endothermic glycerol conversion with exothermic
Fischer–Tropsch synthesis to produce liquid transportation
fuels via the following integrated process:20
C3O3H8?7
25C8H18z
19
25CO2z
37
25H2O (2)
This integrated process can potentially improve the
economics of ‘‘green’’ Fischer–Tropsch synthesis by reducing
costs associated with synthesis gas production, for example, by
eliminating the need for an O2-blown auto-thermal reformer
or biomass gasifier.16–20 Also, our process presents the
opportunity for reducing the size of the Fischer–Tropsch
synthesis reactor by producing an undiluted synthesis gas
stream and for eliminating subsequent cleaning steps required
for synthesis gas produced from biomass gasification.16–18,20 A
reduction in capital costs may result in reduced operation
and maintenance costs as well.17 Accordingly, our integrated
process potentially allows for smaller scale Fischer–Tropsch
synthesis plants to produce liquid fuels from biomass, which is
an advantage for distributed biomass resources. In addition,
the low temperature of our glycerol conversion process allows
for potential thermal coupling with the Fischer–Tropsch
synthesis reaction, thereby increasing thermal efficiency.20
Furthermore, the coupling between these processes may lead
to chemical synergies related to the presence of chemical
species from both reactions in the same reactor. For example,
the intermediates produced from glycerol conversion (e.g.,
acetol) can enter the growing hydrocarbon chain on the
Fischer–Tropsch catalyst sites. Fig. 1 shows a process
schematic which illustrates this integrated process as well as
potential end-uses for each of the three product phases. The
gaseous product stream consisting of light alkanes can be
combusted to produce heat and electricity while the oxyge-
nated hydrocarbons in the aqueous phase effluent can be
separated by distillation for use in the chemical industry.
Importantly, the oil phase containing liquid alkanes can be
upgraded to gasoline and diesel fuel.
In this study, we demonstrate the formation of liquid fuels
by the integration of glycerol conversion with Fischer–Tropsch
synthesis. We conduct reaction kinetics studies at different
pressures and glycerol feed concentrations to demonstrate that
glycerol conversion produces synthesis gas suitable for Fischer–
Tropsch synthesis at moderate pressures (e.g., 17 bar) and
using concentrated glycerol feeds (e.g., 80 wt%). Furthermore,
we conduct Fischer–Tropsch synthesis studies to investigate
the effects of water and oxygenated hydrocarbons on the
selectivity and activity of an Ru-based Fischer–Tropsch
synthesis catalyst. Finally, we show that liquid alkanes can
be produced directly from glycerol by conversion to synthesis
gas combined with Fischer–Tropsch synthesis in a two-bed
reactor system.
Experimental
Catalyst preparation and characterization
Glycerol conversion studies were carried out using a Pt–Re/C
catalyst that was prepared by incipient wetness impregnation
of carbon black (Vulcan XC-72) with an aqueous solution of
H2PtCl6?6H2O (Sigma–Aldrich) and HReO4 (Strem Chemicals)
to yield a catalyst with loadings of 5.1 wt% Pt and 4.9 wt%
Re (atomic Pt : Re ratio of 1 : 1). The support was dried in air for
12 h at 373 K prior to impregnation, and 1.7 g of solution was
used per gram of support. The catalyst was dried at 403 K for
12 h in air prior to activation. Several Ru/TiO2 catalysts
(1.0 wt% and 2.9 wt%) were prepared for Fischer–Tropsch
synthesis according to the methods described by Iglesia et al.24
Prior to reaction kinetics studies or gas adsorption
measurements (i.e., CO and O2 chemisorption), the Pt–Re/C
catalyst was reduced at 723 K (ramp rate of 0.5 K min21)
for 2 h in flowing H2 (140 cm3(NTP) min21). The Ru/TiO2
1074 | Green Chem., 2007, 9, 1073–1083 This journal is ß The Royal Society of Chemistry 2007
catalysts were reduced in-situ before reaction kinetics studies
and gas adsorption measurements. The gas hourly space
velocity (GHSV) was calculated for Fischer–Tropsch synthesis
experiments using the total volumetric flowrate of gas (at
standard conditions) to the reactor and a bed density of
0.175 g cm23 (g catalyst per total bed volume) for Ru/TiO2
catalyst diluted with an equal volume of crushed SiO2
granules. The weight hourly space velocity (WHSV) was
calculated for glycerol conversion experiments using the mass
flowrate of glycerol into the reactor and the total mass of
catalyst. The irreversible CO uptake of Pt–Re/C at 300 K was
taken to be the number of catalytic sites (150 mmol g21) and
was measured using a standard gas adsorption apparatus
described elsewhere.25 This number of sites corresponds to
a dispersion (molar CO : total metal ratio) of 29%. The
dispersions of the Ru/TiO2 catalysts were determined by
chemisorption of O2 at 195 K in a static chemisorption
system.26 Table 1 shows the properties of the Ru/TiO2
catalysts, and these results are in agreement with similar
catalysts studied by Iglesia et al.27
Reaction kinetics measurements
The apparatus used to conduct reaction kinetics measurements
for Pt–Re/C is described elsewhere.20 Fresh catalyst was
loaded into a 12.7 mm (0.5 inch) outer diameter tubular
stainless steel reactor with a wall thickness of 0.71 mm
(0.028 inch). The catalyst bed was contained between an end
plug of quartz wool (Alltech) and fused SiO2 granules (24 +
16 mesh; Sigma–Aldrich) which aid in vaporization of the
liquid feed. The Pt–Re/C catalyst powder was mixed with an
equal volume of SiO2 granules to decrease the pressure drop
across the catalyst bed. For experiments that combined
glycerol conversion with Fischer–Tropsch synthesis, a bed of
1.0 wt% Ru/TiO2 was mixed with an equal volume of crushed
SiO2 granules, and this bed was loaded downstream of the
Pt–Re/C bed. The reactor was heated with a furnace consisting
of a close fitting aluminum block heated externally by a well-
insulated furnace (1450 W/115 V, Applied Test Systems series
3210). Type-K thermocouples (Omega) were attached to the
outside of the reactor to measure reactor temperature, which
was controlled with a series 16A type temperature controller
(Dwyer Instruments). Fresh catalyst was reduced in flowing
H2, as described previously. Mass-flow controllers (5850
Brooks Instruments) were used to control the flowrate of H2.
An HPLC pump (Model 301, Alltech) was used to introduce
the aqueous feed solution into a 6 inch needle with a point
5 style tip (Hamilton) soldered into a section of 3.2 mm
(0.125 inch) outer diameter, stainless steel tubing, and this
Fig. 1 Process pathway for production of liquid fuels from biomass by integrated glycerol conversion to synthesis gas and Fischer–Tropsch
synthesis.
Table 1 Properties of Fischer–Tropsch catalysts
Ru loading(wt%)
BET surfacearea/m2 g21
Dispersion(O : Ru ratio)
Ru sitedensity/1016 m22
Average pelletradius/1024 m
Average poreradiusa /10210 m x/1016 m21b
1.0 15 0.55 217 0.63 210 402.9 30 0.36 208 0.63 165 50a Estimated from BET surface area measurement and values for similar catalysts studied by Iglesia, et al.27 b Calculated as in ref. 27.
This journal is ß The Royal Society of Chemistry 2007 Green Chem., 2007, 9, 1073–1083 | 1075
needle was positioned upstream of the Pt–Re/C catalyst bed.
The liquid effluent was condensed in a gas-liquid separator
and drained periodically for gas-chromatograph (GC) analysis
(Agilent 6890 with a flame ionization detector (FID) and
HP-Innowax column or Shimadzu GC-2010 with an FID
detector and Rtx-5 column) and total organic carbon analysis
(Shimadzu TOC-V CSH). Each effluent was tested for the
presence of glycerol and other liquid byproducts. For runs that
combined glycerol conversion with Fischer–Tropsch synthesis,
the downstream system lines were heated to 373 K.
The effluent gas stream passed through a back-pressure
regulator (GO Regulator, Model BP-60) which controlled
the system pressure. The effluent gas was analyzed by gas
chromatography: H2 with a Carle GC (series 8700) using a
thermal conductivity detector (TCD), CO and CH4 using an
HP 5890 GC with TCD and washed molecular sieve 5A 80/100
column (Alltech), and CO2 and light alkanes (C2–C3) using an
HP 5890 GC with TCD and a Porapak QS 100/120 column
(Alltech). All feed solutions were prepared by mixing glycerol
(99.5%, ACS reagent, Sigma-Aldrich) with deionized water.
The apparatus used to conduct Fischer–Tropsch synthesis
experiments is similar to the system used for reaction kinetics
measurements of glycerol conversion over Pt–Re/C, except
that the downstream lines from the reactor were heated to
373 K. The 2.9 wt% Ru/TiO2 catalyst was mixed with an equal
volume of crushed SiO2 granules to help dissipate the heat
generated by the exothermic Fischer–Tropsch reaction and
loaded into a 12.7 mm (0.5 inch) outer diameter, stainless steel
tubular reactor. The liquid phase products were collected in a
gas-liquid separator and analyzed by GC (Shimadzu GC-2010
with an FID detector and Rtx-5 column). The effluent gas
stream was analyzed for C1–C10 hydrocarbons with a Varian
GC-MS (Saturn 3) using an FID detector and GS-Q capillary
column. H2, CO, and CO2 were analyzed using an HP 5890
GC with TCD and a Porapak QS 100/120 column (Alltech).
Ultra-high purity CO and H2 (Linde) gases were mixed to give
a synthesis gas feed with H2 : CO # 2, and aqueous solutions
of acetone, acetol, and ethanol were introduced into the
reactor in a similar way as described above for glycerol
conversion experiments.
Results and discussion
Glycerol conversion to synthesis gas
Fischer–Tropsch synthesis is typically operated at pressures
between 5 and 20 bar,18 and it is advantageous to carry out the
conversion of glycerol to synthesis gas at these higher pressures
to reduce compression costs. Accordingly, while our previous
work investigated the performance of Pt–Re/C at atmospheric
pressure,20 in the present work we studied the production of
synthesis gas at a pressure of 8.3 bar at 548 K over 10 wt%
Pt–Re (atomic ratio 1 : 1)/C using a feed solution containing
30 wt% glycerol in water. Fig. 2 shows the conversion to gas
phase products and the CO/CO2 and H2/CO molar ratios for
glycerol conditions at this elevated pressure. The total inlet
flowrate of carbon (as glycerol) for this experiment was
833 mmol min21 (feed flowrate of 0.08 cm3 min21), and the
total conversion of glycerol was 90% (57% to gas phase
products and 33% to liquid phase products). After a period of
60 h, during which the conversion of glycerol to gas-phase
products decreased from 68% to 57%, the catalyst showed
excellent stability for an additional 60 h time on stream. The
gas-phase effluent is comprised of synthesis gas with a H2 : CO
ratio equal to 1.6, which can be adjusted, if necessary, via the
water-gas shift reaction to reach the stoichiometric 2 : 1 ratio
appropriate for Fischer–Tropsch synthesis.20 The balance of
the gaseous products consists of CO2 (CO/CO2 molar ratio
of 6) and light alkanes (C1–C3, with a CO/alkanes carbon ratio
of 10). At 548 K and 5 bar, the gas-phase product distribution
and catalytic stability were similar, and the conversion to
gas-phase products was 80%. The aqueous liquid effluent
contained 15 wt% of oxygenated hydrocarbons (methanol,
ethanol, n-propanol, ethylene glycol, 1,2 propanediol, acetone,
and acetol), and the carbon balance closed to within 10% for
this experiment.
To couple the conversion of glycerol to synthesis gas with
Fischer–Tropsch synthesis in a two-bed reactor system, it is
necessary to expose the down-stream Fischer–Tropsch catalyst
to water vapor from the aqueous glycerol feed. Iglesia et al.
report that small amounts of water can, in fact, improve
the performance of Co-based Fischer–Tropsch catalysts.28
However, the highest water partial pressure in their study
(PH2O/PCO = 3) was lower than that which results from
conversion of a 30 wt% glycerol feed (PH2O/PCO = 8). Also, the
studies by Iglesia et al. were conducted at higher total pressure
(20 bar).28 Therefore, it is advantageous to decrease the
concentration of water in our system. Thus, we tested the
Pt–Re/C catalyst for conversion of 50 wt% and 80 wt%
glycerol solutions at pressures between 1 and 11 bar, and
Table 2 shows the conversion to gas phase products as well as
the H2/CO and CO/CO2 molar ratios for these experiments.
The conversion to gas phase products increases with decreas-
ing concentration of glycerol in the feed at constant pressure
and decreases with increasing pressure at constant feed
Fig. 2 Conversion to gas phase products (r), CO/CO2 molar ratio
($), and H2/CO molar ratio (&) for gas-phase processing of 30 wt%
aqueous-glycerol feed at 548 K and 8.3 bar. Conversion to gas phase is
calculated as (carbon atoms in gas phase product stream/total carbon
into reactor as feed)6 100. Reaction carried out using 0.08 cm3 min21
of feed solution over 520 mg of catalyst (WHSV = 3.0 h21).
1076 | Green Chem., 2007, 9, 1073–1083 This journal is ß The Royal Society of Chemistry 2007
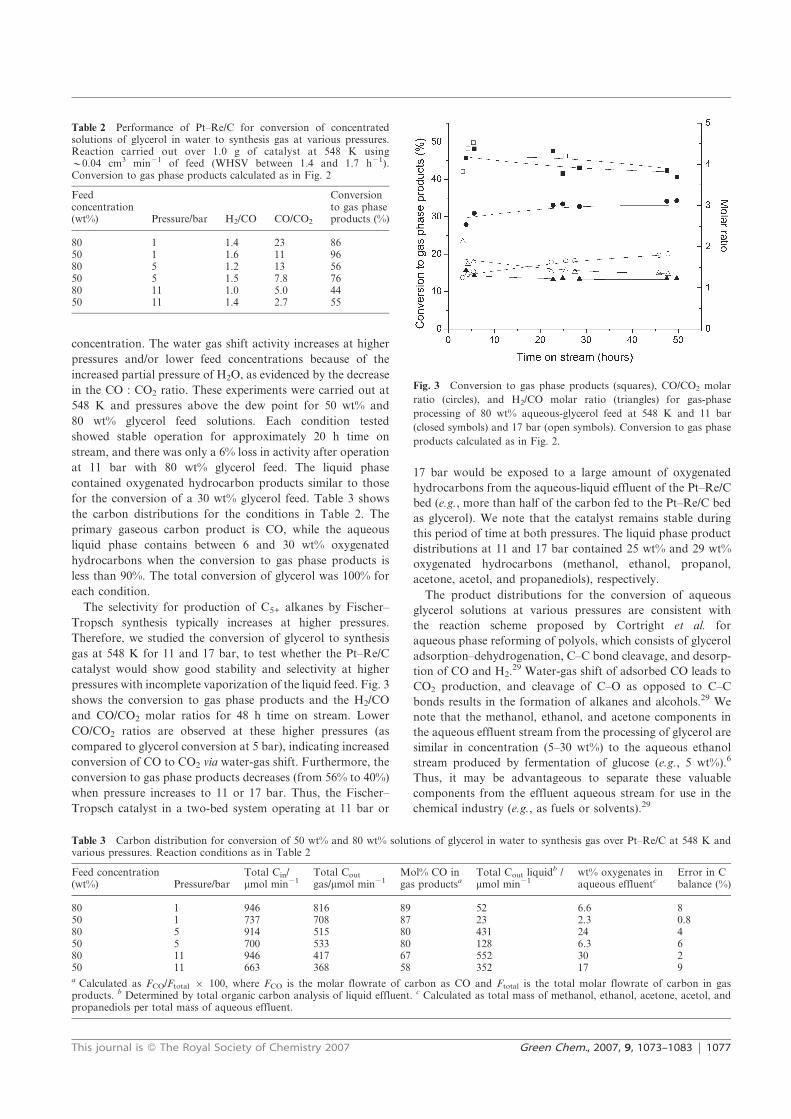
concentration. The water gas shift activity increases at higher
pressures and/or lower feed concentrations because of the
increased partial pressure of H2O, as evidenced by the decrease
in the CO : CO2 ratio. These experiments were carried out at
548 K and pressures above the dew point for 50 wt% and
80 wt% glycerol feed solutions. Each condition tested
showed stable operation for approximately 20 h time on
stream, and there was only a 6% loss in activity after operation
at 11 bar with 80 wt% glycerol feed. The liquid phase
contained oxygenated hydrocarbon products similar to those
for the conversion of a 30 wt% glycerol feed. Table 3 shows
the carbon distributions for the conditions in Table 2. The
primary gaseous carbon product is CO, while the aqueous
liquid phase contains between 6 and 30 wt% oxygenated
hydrocarbons when the conversion to gas phase products is
less than 90%. The total conversion of glycerol was 100% for
each condition.
The selectivity for production of C5+ alkanes by Fischer–
Tropsch synthesis typically increases at higher pressures.
Therefore, we studied the conversion of glycerol to synthesis
gas at 548 K for 11 and 17 bar, to test whether the Pt–Re/C
catalyst would show good stability and selectivity at higher
pressures with incomplete vaporization of the liquid feed. Fig. 3
shows the conversion to gas phase products and the H2/CO
and CO/CO2 molar ratios for 48 h time on stream. Lower
CO/CO2 ratios are observed at these higher pressures (as
compared to glycerol conversion at 5 bar), indicating increased
conversion of CO to CO2 via water-gas shift. Furthermore, the
conversion to gas phase products decreases (from 56% to 40%)
when pressure increases to 11 or 17 bar. Thus, the Fischer–
Tropsch catalyst in a two-bed system operating at 11 bar or
17 bar would be exposed to a large amount of oxygenated
hydrocarbons from the aqueous-liquid effluent of the Pt–Re/C
bed (e.g., more than half of the carbon fed to the Pt–Re/C bed
as glycerol). We note that the catalyst remains stable during
this period of time at both pressures. The liquid phase product
distributions at 11 and 17 bar contained 25 wt% and 29 wt%
oxygenated hydrocarbons (methanol, ethanol, propanol,
acetone, acetol, and propanediols), respectively.
The product distributions for the conversion of aqueous
glycerol solutions at various pressures are consistent with
the reaction scheme proposed by Cortright et al. for
aqueous phase reforming of polyols, which consists of glycerol
adsorption–dehydrogenation, C–C bond cleavage, and desorp-
tion of CO and H2.29 Water-gas shift of adsorbed CO leads to
CO2 production, and cleavage of C–O as opposed to C–C
bonds results in the formation of alkanes and alcohols.29 We
note that the methanol, ethanol, and acetone components in
the aqueous effluent stream from the processing of glycerol are
similar in concentration (5–30 wt%) to the aqueous ethanol
stream produced by fermentation of glucose (e.g., 5 wt%).6
Thus, it may be advantageous to separate these valuable
components from the effluent aqueous stream for use in the
chemical industry (e.g., as fuels or solvents).29
Table 2 Performance of Pt–Re/C for conversion of concentratedsolutions of glycerol in water to synthesis gas at various pressures.Reaction carried out over 1.0 g of catalyst at 548 K usingy0.04 cm3 min21 of feed (WHSV between 1.4 and 1.7 h21).Conversion to gas phase products calculated as in Fig. 2
Feedconcentration(wt%) Pressure/bar H2/CO CO/CO2
Conversionto gas phaseproducts (%)
80 1 1.4 23 8650 1 1.6 11 9680 5 1.2 13 5650 5 1.5 7.8 7680 11 1.0 5.0 4450 11 1.4 2.7 55
Table 3 Carbon distribution for conversion of 50 wt% and 80 wt% solutions of glycerol in water to synthesis gas over Pt–Re/C at 548 K andvarious pressures. Reaction conditions as in Table 2
Feed concentration(wt%) Pressure/bar
Total Cin/mmol min21
Total Cout
gas/mmol min21Mol% CO ingas productsa
Total Cout liquidb /
mmol min21wt% oxygenates inaqueous effluentc
Error in Cbalance (%)
80 1 946 816 89 52 6.6 850 1 737 708 87 23 2.3 0.880 5 914 515 80 431 24 450 5 700 533 80 128 6.3 680 11 946 417 67 552 30 250 11 663 368 58 352 17 9a Calculated as FCO/Ftotal 6 100, where FCO is the molar flowrate of carbon as CO and Ftotal is the total molar flowrate of carbon in gasproducts. b Determined by total organic carbon analysis of liquid effluent. c Calculated as total mass of methanol, ethanol, acetone, acetol, andpropanediols per total mass of aqueous effluent.
Fig. 3 Conversion to gas phase products (squares), CO/CO2 molar
ratio (circles), and H2/CO molar ratio (triangles) for gas-phase
processing of 80 wt% aqueous-glycerol feed at 548 K and 11 bar
(closed symbols) and 17 bar (open symbols). Conversion to gas phase
products calculated as in Fig. 2.
This journal is ß The Royal Society of Chemistry 2007 Green Chem., 2007, 9, 1073–1083 | 1077
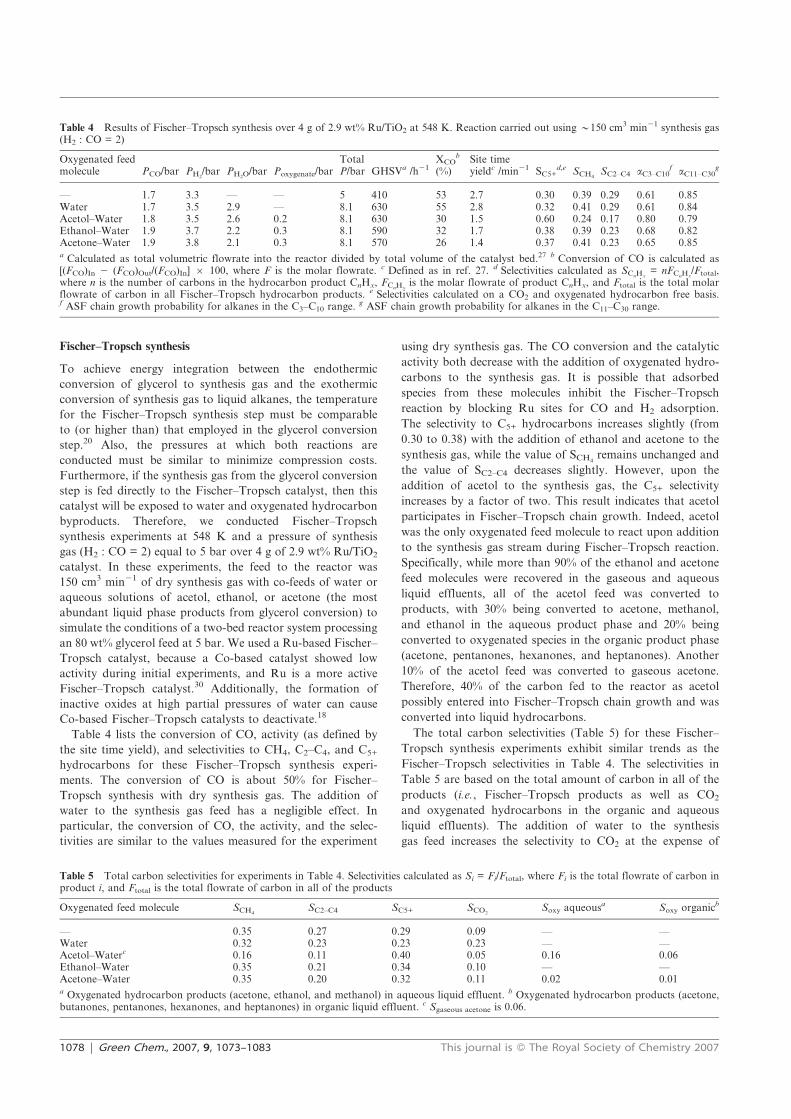
Fischer–Tropsch synthesis
To achieve energy integration between the endothermic
conversion of glycerol to synthesis gas and the exothermic
conversion of synthesis gas to liquid alkanes, the temperature
for the Fischer–Tropsch synthesis step must be comparable
to (or higher than) that employed in the glycerol conversion
step.20 Also, the pressures at which both reactions are
conducted must be similar to minimize compression costs.
Furthermore, if the synthesis gas from the glycerol conversion
step is fed directly to the Fischer–Tropsch catalyst, then this
catalyst will be exposed to water and oxygenated hydrocarbon
byproducts. Therefore, we conducted Fischer–Tropsch
synthesis experiments at 548 K and a pressure of synthesis
gas (H2 : CO = 2) equal to 5 bar over 4 g of 2.9 wt% Ru/TiO2
catalyst. In these experiments, the feed to the reactor was
150 cm3 min21 of dry synthesis gas with co-feeds of water or
aqueous solutions of acetol, ethanol, or acetone (the most
abundant liquid phase products from glycerol conversion) to
simulate the conditions of a two-bed reactor system processing
an 80 wt% glycerol feed at 5 bar. We used a Ru-based Fischer–
Tropsch catalyst, because a Co-based catalyst showed low
activity during initial experiments, and Ru is a more active
Fischer–Tropsch catalyst.30 Additionally, the formation of
inactive oxides at high partial pressures of water can cause
Co-based Fischer–Tropsch catalysts to deactivate.18
Table 4 lists the conversion of CO, activity (as defined by
the site time yield), and selectivities to CH4, C2–C4, and C5+
hydrocarbons for these Fischer–Tropsch synthesis experi-
ments. The conversion of CO is about 50% for Fischer–
Tropsch synthesis with dry synthesis gas. The addition of
water to the synthesis gas feed has a negligible effect. In
particular, the conversion of CO, the activity, and the selec-
tivities are similar to the values measured for the experiment
using dry synthesis gas. The CO conversion and the catalytic
activity both decrease with the addition of oxygenated hydro-
carbons to the synthesis gas. It is possible that adsorbed
species from these molecules inhibit the Fischer–Tropsch
reaction by blocking Ru sites for CO and H2 adsorption.
The selectivity to C5+ hydrocarbons increases slightly (from
0.30 to 0.38) with the addition of ethanol and acetone to the
synthesis gas, while the value of SCH4remains unchanged and
the value of SC2–C4 decreases slightly. However, upon the
addition of acetol to the synthesis gas, the C5+ selectivity
increases by a factor of two. This result indicates that acetol
participates in Fischer–Tropsch chain growth. Indeed, acetol
was the only oxygenated feed molecule to react upon addition
to the synthesis gas stream during Fischer–Tropsch reaction.
Specifically, while more than 90% of the ethanol and acetone
feed molecules were recovered in the gaseous and aqueous
liquid effluents, all of the acetol feed was converted to
products, with 30% being converted to acetone, methanol,
and ethanol in the aqueous product phase and 20% being
converted to oxygenated species in the organic product phase
(acetone, pentanones, hexanones, and heptanones). Another
10% of the acetol feed was converted to gaseous acetone.
Therefore, 40% of the carbon fed to the reactor as acetol
possibly entered into Fischer–Tropsch chain growth and was
converted into liquid hydrocarbons.
The total carbon selectivities (Table 5) for these Fischer–
Tropsch synthesis experiments exhibit similar trends as the
Fischer–Tropsch selectivities in Table 4. The selectivities in
Table 5 are based on the total amount of carbon in all of the
products (i.e., Fischer–Tropsch products as well as CO2
and oxygenated hydrocarbons in the organic and aqueous
liquid effluents). The addition of water to the synthesis
gas feed increases the selectivity to CO2 at the expense of
Table 4 Results of Fischer–Tropsch synthesis over 4 g of 2.9 wt% Ru/TiO2 at 548 K. Reaction carried out using y150 cm3 min21 synthesis gas(H2 : CO = 2)
Oxygenated feedmolecule PCO/bar PH2
/bar PH2O/bar Poxygenate/bar
TotalP/bar GHSVa /h21
XCOb
(%)Site timeyieldc /min21 SC5+
d,e SCH4SC2–C4 aC3–C10
faC11–C30
g
— 1.7 3.3 — — 5 410 53 2.7 0.30 0.39 0.29 0.61 0.85Water 1.7 3.5 2.9 — 8.1 630 55 2.8 0.32 0.41 0.29 0.61 0.84Acetol–Water 1.8 3.5 2.6 0.2 8.1 630 30 1.5 0.60 0.24 0.17 0.80 0.79Ethanol–Water 1.9 3.7 2.2 0.3 8.1 590 32 1.7 0.38 0.39 0.23 0.68 0.82Acetone–Water 1.9 3.8 2.1 0.3 8.1 570 26 1.4 0.37 0.41 0.23 0.65 0.85a Calculated as total volumetric flowrate into the reactor divided by total volume of the catalyst bed.27 b Conversion of CO is calculated as[(FCO)In 2 (FCO)Out/(FCO)In] 6 100, where F is the molar flowrate. c Defined as in ref. 27. d Selectivities calculated as SCnHx
= nFCnHx/Ftotal,
where n is the number of carbons in the hydrocarbon product CnHx, FCnHxis the molar flowrate of product CnHx, and Ftotal is the total molar
flowrate of carbon in all Fischer–Tropsch hydrocarbon products. e Selectivities calculated on a CO2 and oxygenated hydrocarbon free basis.f ASF chain growth probability for alkanes in the C3–C10 range.
g ASF chain growth probability for alkanes in the C11–C30 range.
Table 5 Total carbon selectivities for experiments in Table 4. Selectivities calculated as Si = Fi/Ftotal, where Fi is the total flowrate of carbon inproduct i, and Ftotal is the total flowrate of carbon in all of the products
Oxygenated feed molecule SCH4SC2–C4 SC5+ SCO2
Soxy aqueousa Soxy organic
b
— 0.35 0.27 0.29 0.09 — —Water 0.32 0.23 0.23 0.23 — —Acetol–Waterc 0.16 0.11 0.40 0.05 0.16 0.06Ethanol–Water 0.35 0.21 0.34 0.10 — —Acetone–Water 0.35 0.20 0.32 0.11 0.02 0.01a Oxygenated hydrocarbon products (acetone, ethanol, and methanol) in aqueous liquid effluent. b Oxygenated hydrocarbon products (acetone,butanones, pentanones, hexanones, and heptanones) in organic liquid effluent. c Sgaseous acetone is 0.06.
1078 | Green Chem., 2007, 9, 1073–1083 This journal is ß The Royal Society of Chemistry 2007
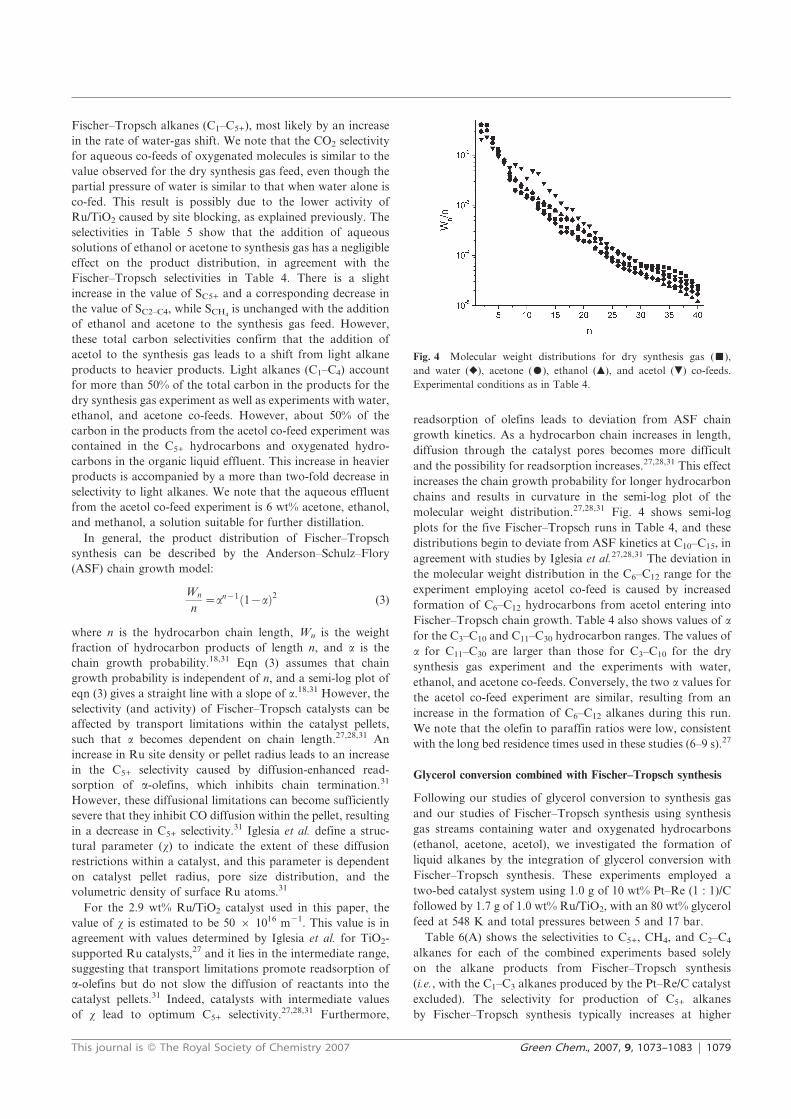
Fischer–Tropsch alkanes (C1–C5+), most likely by an increase
in the rate of water-gas shift. We note that the CO2 selectivity
for aqueous co-feeds of oxygenated molecules is similar to the
value observed for the dry synthesis gas feed, even though the
partial pressure of water is similar to that when water alone is
co-fed. This result is possibly due to the lower activity of
Ru/TiO2 caused by site blocking, as explained previously. The
selectivities in Table 5 show that the addition of aqueous
solutions of ethanol or acetone to synthesis gas has a negligible
effect on the product distribution, in agreement with the
Fischer–Tropsch selectivities in Table 4. There is a slight
increase in the value of SC5+ and a corresponding decrease in
the value of SC2–C4, while SCH4is unchanged with the addition
of ethanol and acetone to the synthesis gas feed. However,
these total carbon selectivities confirm that the addition of
acetol to the synthesis gas leads to a shift from light alkane
products to heavier products. Light alkanes (C1–C4) account
for more than 50% of the total carbon in the products for the
dry synthesis gas experiment as well as experiments with water,
ethanol, and acetone co-feeds. However, about 50% of the
carbon in the products from the acetol co-feed experiment was
contained in the C5+ hydrocarbons and oxygenated hydro-
carbons in the organic liquid effluent. This increase in heavier
products is accompanied by a more than two-fold decrease in
selectivity to light alkanes. We note that the aqueous effluent
from the acetol co-feed experiment is 6 wt% acetone, ethanol,
and methanol, a solution suitable for further distillation.
In general, the product distribution of Fischer–Tropsch
synthesis can be described by the Anderson–Schulz–Flory
(ASF) chain growth model:
Wn
n~a
n{1 1{að Þ2 (3)
where n is the hydrocarbon chain length, Wn is the weight
fraction of hydrocarbon products of length n, and a is the
chain growth probability.18,31 Eqn (3) assumes that chain
growth probability is independent of n, and a semi-log plot of
eqn (3) gives a straight line with a slope of a.18,31 However, the
selectivity (and activity) of Fischer–Tropsch catalysts can be
affected by transport limitations within the catalyst pellets,
such that a becomes dependent on chain length.27,28,31 An
increase in Ru site density or pellet radius leads to an increase
in the C5+ selectivity caused by diffusion-enhanced read-
sorption of a-olefins, which inhibits chain termination.31
However, these diffusional limitations can become sufficiently
severe that they inhibit CO diffusion within the pellet, resulting
in a decrease in C5+ selectivity.31 Iglesia et al. define a struc-
tural parameter (x) to indicate the extent of these diffusion
restrictions within a catalyst, and this parameter is dependent
on catalyst pellet radius, pore size distribution, and the
volumetric density of surface Ru atoms.31
For the 2.9 wt% Ru/TiO2 catalyst used in this paper, the
value of x is estimated to be 50 6 1016 m21. This value is in
agreement with values determined by Iglesia et al. for TiO2-
supported Ru catalysts,27 and it lies in the intermediate range,
suggesting that transport limitations promote readsorption of
a-olefins but do not slow the diffusion of reactants into the
catalyst pellets.31 Indeed, catalysts with intermediate values
of x lead to optimum C5+ selectivity.27,28,31 Furthermore,
readsorption of olefins leads to deviation from ASF chain
growth kinetics. As a hydrocarbon chain increases in length,
diffusion through the catalyst pores becomes more difficult
and the possibility for readsorption increases.27,28,31 This effect
increases the chain growth probability for longer hydrocarbon
chains and results in curvature in the semi-log plot of the
molecular weight distribution.27,28,31 Fig. 4 shows semi-log
plots for the five Fischer–Tropsch runs in Table 4, and these
distributions begin to deviate from ASF kinetics at C10–C15, in
agreement with studies by Iglesia et al.27,28,31 The deviation in
the molecular weight distribution in the C6–C12 range for the
experiment employing acetol co-feed is caused by increased
formation of C6–C12 hydrocarbons from acetol entering into
Fischer–Tropsch chain growth. Table 4 also shows values of a
for the C3–C10 and C11–C30 hydrocarbon ranges. The values of
a for C11–C30 are larger than those for C3–C10 for the dry
synthesis gas experiment and the experiments with water,
ethanol, and acetone co-feeds. Conversely, the two a values for
the acetol co-feed experiment are similar, resulting from an
increase in the formation of C6–C12 alkanes during this run.
We note that the olefin to paraffin ratios were low, consistent
with the long bed residence times used in these studies (6–9 s).27
Glycerol conversion combined with Fischer–Tropsch synthesis
Following our studies of glycerol conversion to synthesis gas
and our studies of Fischer–Tropsch synthesis using synthesis
gas streams containing water and oxygenated hydrocarbons
(ethanol, acetone, acetol), we investigated the formation of
liquid alkanes by the integration of glycerol conversion with
Fischer–Tropsch synthesis. These experiments employed a
two-bed catalyst system using 1.0 g of 10 wt% Pt–Re (1 : 1)/C
followed by 1.7 g of 1.0 wt% Ru/TiO2, with an 80 wt% glycerol
feed at 548 K and total pressures between 5 and 17 bar.
Table 6(A) shows the selectivities to C5+, CH4, and C2–C4
alkanes for each of the combined experiments based solely
on the alkane products from Fischer–Tropsch synthesis
(i.e., with the C1–C3 alkanes produced by the Pt–Re/C catalyst
excluded). The selectivity for production of C5+ alkanes
by Fischer–Tropsch synthesis typically increases at higher
Fig. 4 Molecular weight distributions for dry synthesis gas (&),
and water (r), acetone ($), ethanol (m), and acetol (.) co-feeds.
Experimental conditions as in Table 4.
This journal is ß The Royal Society of Chemistry 2007 Green Chem., 2007, 9, 1073–1083 | 1079
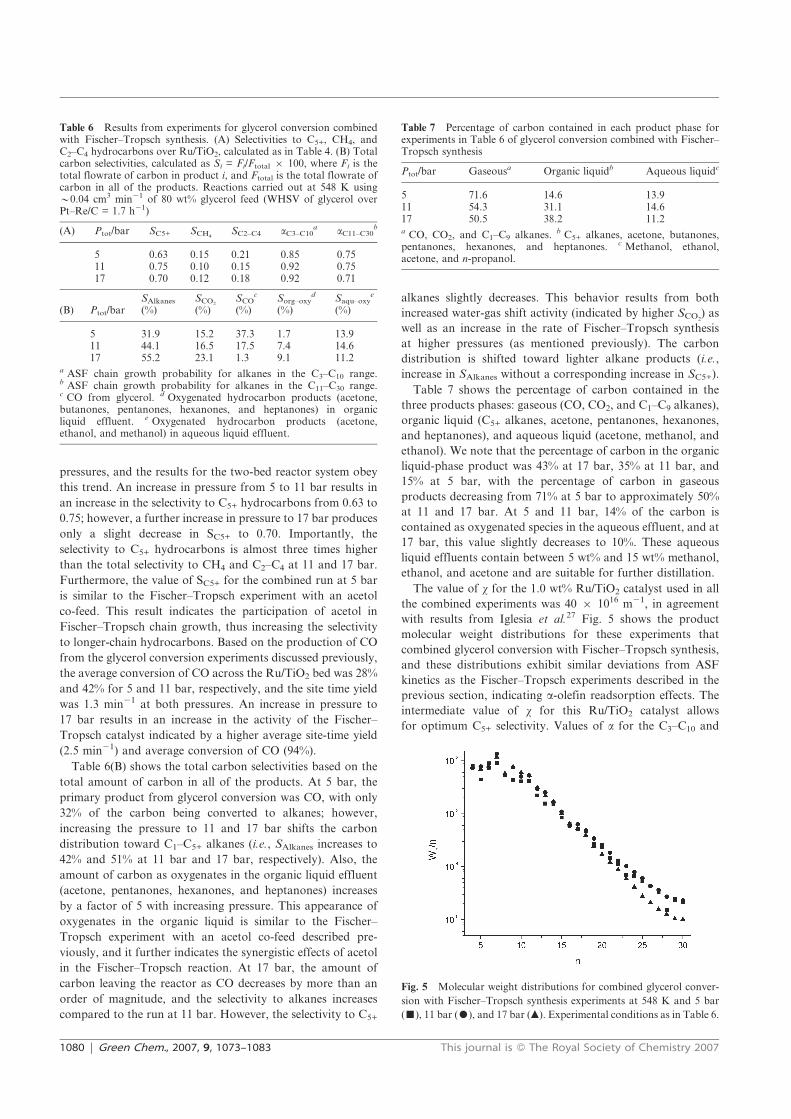
pressures, and the results for the two-bed reactor system obey
this trend. An increase in pressure from 5 to 11 bar results in
an increase in the selectivity to C5+ hydrocarbons from 0.63 to
0.75; however, a further increase in pressure to 17 bar produces
only a slight decrease in SC5+ to 0.70. Importantly, the
selectivity to C5+ hydrocarbons is almost three times higher
than the total selectivity to CH4 and C2–C4 at 11 and 17 bar.
Furthermore, the value of SC5+ for the combined run at 5 bar
is similar to the Fischer–Tropsch experiment with an acetol
co-feed. This result indicates the participation of acetol in
Fischer–Tropsch chain growth, thus increasing the selectivity
to longer-chain hydrocarbons. Based on the production of CO
from the glycerol conversion experiments discussed previously,
the average conversion of CO across the Ru/TiO2 bed was 28%
and 42% for 5 and 11 bar, respectively, and the site time yield
was 1.3 min21 at both pressures. An increase in pressure to
17 bar results in an increase in the activity of the Fischer–
Tropsch catalyst indicated by a higher average site-time yield
(2.5 min21) and average conversion of CO (94%).
Table 6(B) shows the total carbon selectivities based on the
total amount of carbon in all of the products. At 5 bar, the
primary product from glycerol conversion was CO, with only
32% of the carbon being converted to alkanes; however,
increasing the pressure to 11 and 17 bar shifts the carbon
distribution toward C1–C5+ alkanes (i.e., SAlkanes increases to
42% and 51% at 11 bar and 17 bar, respectively). Also, the
amount of carbon as oxygenates in the organic liquid effluent
(acetone, pentanones, hexanones, and heptanones) increases
by a factor of 5 with increasing pressure. This appearance of
oxygenates in the organic liquid is similar to the Fischer–
Tropsch experiment with an acetol co-feed described pre-
viously, and it further indicates the synergistic effects of acetol
in the Fischer–Tropsch reaction. At 17 bar, the amount of
carbon leaving the reactor as CO decreases by more than an
order of magnitude, and the selectivity to alkanes increases
compared to the run at 11 bar. However, the selectivity to C5+
alkanes slightly decreases. This behavior results from both
increased water-gas shift activity (indicated by higher SCO2) as
well as an increase in the rate of Fischer–Tropsch synthesis
at higher pressures (as mentioned previously). The carbon
distribution is shifted toward lighter alkane products (i.e.,
increase in SAlkanes without a corresponding increase in SC5+).
Table 7 shows the percentage of carbon contained in the
three products phases: gaseous (CO, CO2, and C1–C9 alkanes),
organic liquid (C5+ alkanes, acetone, pentanones, hexanones,
and heptanones), and aqueous liquid (acetone, methanol, and
ethanol). We note that the percentage of carbon in the organic
liquid-phase product was 43% at 17 bar, 35% at 11 bar, and
15% at 5 bar, with the percentage of carbon in gaseous
products decreasing from 71% at 5 bar to approximately 50%
at 11 and 17 bar. At 5 and 11 bar, 14% of the carbon is
contained as oxygenated species in the aqueous effluent, and at
17 bar, this value slightly decreases to 10%. These aqueous
liquid effluents contain between 5 wt% and 15 wt% methanol,
ethanol, and acetone and are suitable for further distillation.
The value of x for the 1.0 wt% Ru/TiO2 catalyst used in all
the combined experiments was 40 6 1016 m21, in agreement
with results from Iglesia et al.27 Fig. 5 shows the product
molecular weight distributions for these experiments that
combined glycerol conversion with Fischer–Tropsch synthesis,
and these distributions exhibit similar deviations from ASF
kinetics as the Fischer–Tropsch experiments described in the
previous section, indicating a-olefin readsorption effects. The
intermediate value of x for this Ru/TiO2 catalyst allows
for optimum C5+ selectivity. Values of a for the C3–C10 and
Table 6 Results from experiments for glycerol conversion combinedwith Fischer–Tropsch synthesis. (A) Selectivities to C5+, CH4, andC2–C4 hydrocarbons over Ru/TiO2, calculated as in Table 4. (B) Totalcarbon selectivities, calculated as Si = Fi/Ftotal 6 100, where Fi is thetotal flowrate of carbon in product i, and Ftotal is the total flowrate ofcarbon in all of the products. Reactions carried out at 548 K usingy0.04 cm3 min21 of 80 wt% glycerol feed (WHSV of glycerol overPt–Re/C = 1.7 h21)
(A) Ptot/bar SC5+ SCH4SC2–C4 aC3–C10
aaC11–C30
b
5 0.63 0.15 0.21 0.85 0.7511 0.75 0.10 0.15 0.92 0.7517 0.70 0.12 0.18 0.92 0.71
(B) Ptot/barSAlkanes
(%)SCO2
(%)SCO
c
(%)Sorg–oxy
d
(%)Saqu–oxy
e
(%)
5 31.9 15.2 37.3 1.7 13.911 44.1 16.5 17.5 7.4 14.617 55.2 23.1 1.3 9.1 11.2
a ASF chain growth probability for alkanes in the C3–C10 range.b ASF chain growth probability for alkanes in the C11–C30 range.c CO from glycerol. d Oxygenated hydrocarbon products (acetone,butanones, pentanones, hexanones, and heptanones) in organicliquid effluent. e Oxygenated hydrocarbon products (acetone,ethanol, and methanol) in aqueous liquid effluent.
Table 7 Percentage of carbon contained in each product phase forexperiments in Table 6 of glycerol conversion combined with Fischer–Tropsch synthesis
Ptot/bar Gaseousa Organic liquidb Aqueous liquidc
5 71.6 14.6 13.911 54.3 31.1 14.617 50.5 38.2 11.2a CO, CO2, and C1–C9 alkanes. b C5+ alkanes, acetone, butanones,pentanones, hexanones, and heptanones. c Methanol, ethanol,acetone, and n-propanol.
Fig. 5 Molecular weight distributions for combined glycerol conver-
sion with Fischer–Tropsch synthesis experiments at 548 K and 5 bar
(&), 11 bar ($), and 17 bar (m). Experimental conditions as in Table 6.
1080 | Green Chem., 2007, 9, 1073–1083 This journal is ß The Royal Society of Chemistry 2007
C11–C30 hydrocarbon ranges are also shown in Table 6A. The
values in the C3–C10 range are high, most likely caused by
the participation of oxygenates (acetol) in Fischer–Tropsch
chain growth, increasing the production of C6–C12 species.
This result is similar to the acetol co-feed experiment in
Table 4.
The C5+ selectivity, selectivity to pentanones, hexanones,
and heptanones in the organic liquid, and the conversion of
CO for combined glycerol conversion with Fischer–Tropsch
synthesis at 11 and 17 bar are all higher than those at 5 bar,
despite the fact that synthesis gas production from glycerol is
decreased at these elevated pressures. These results indicate
that the more favorable Fischer–Tropsch conditions (i.e.,
higher pressure) are more important to the integrated process
than the synthesis gas production rate. Also, the H2/CO ratio
varies between 1.0 and 1.5 for the conversion of glycerol to
synthesis gas at pressures between 5 and 17 bar. However, the
integrated runs at these pressures show good selectivities to
C5+ hydrocarbons. These results show that synthesis gas with a
stoichiometric H2/CO ratio of 2 : 1 is not essential to the
production of liquid alkanes via our integrated process.
Furthermore, the Ru/TiO2 catalyst is exposed to increasing
amounts of oxygenated hydrocarbon byproducts at 11 and
17 bar; however, the selectivity to oxygenates in the aqueous
liquid effluent at these pressures is similar to or lower than that
of the aqueous effluent at 5 bar. This result indicates that the
oxygenated hydrocarbon byproducts from glycerol react over
the Ru/TiO2 bed, most likely by entering into Fischer–Tropsch
chain growth. Because the aqueous product distribution
contains a wide array of oxygenated species, it is likely that
other byproducts with similar functionality as acetol (e.g.,
polyols, secondary alcohols, and hydroxyl-ketones) have a
similar synergistic effect on Fischer–Tropsch synthesis.
Importantly, these experiments demonstrate that liquid
alkanes can be produced directly from glycerol in a two-bed
reactor system using an integrated process.
Potential industrial application
The integrated process presented in this paper has the potential
to improve the economics of ‘‘green’’ Fischer–Tropsch
synthesis. For example, previous studies investigating the
optimum design of large scale ‘‘green’’ Fischer–Tropsch
plants conclude that synthesis gas production and cleanup
are critical steps in the entire process and have significant
effects on the economics of producing liquid alkanes from
biomass.16,17 Studies by Hamelinck et al. and Tijmensen et al.
show that capital costs account for more than 50% of the
total costs of producing liquid alkanes from ‘‘green’’
Fischer–Tropsch synthesis, and of these capital costs
nearly 50% result from biomass gasification (18–25%), oxygen
production (12–15%) and synthesis gas processing and
cleaning (10–18%).16,17
Typical gasifiers suitable for conventional ‘‘green’’ Fischer-
Trospch processes are circulated fluidized bed designs that can
operate over a wide range of conditions.16,17 For example,
these gasifiers operate from atmospheric pressure to 30 bar
using air or O2 with exit temperatures of 1100–1240 K.17 The
major disadvantage of an air-blown gasifier operating at
atmospheric pressure is the increased cost for larger down-
stream equipment necessary to handle the synthesis gas diluted
with N2.16,17 Furthermore, dilution of synthesis gas with N2
has negative effects on the C5+ selectivity.17 Pressurized
gasifiers are more costly at small scale and are more difficult
to maintain,17 and the air separation plant required for
O2-blown gasifiers is expensive, especially at small scales.16,17
Another disadvantage of conventional biomass gasifiers is that
the synthesis gas stream often contains contaminants (e.g.,
HCN, NH3, H2S, COS, and HCl among others)17 that must be
removed to concentrations lower than 10–20 ppb each, with
some requiring complete removal.17 Typically, gas cleaning
trains are comprised of five to seven different cleaning steps
(e.g., tar cracker, cyclone separator, bag filters, wet and/or dry
scrubbers, and ZnO guard beds).16,17 The integrated process
presented in the present paper is advantageous over these
conventional synthesis gas production methods in that our
process produces an undiluted synthesis stream at the tempera-
ture, pressure, and purity appropriate for Fischer–Tropsch
synthesis. In addition, our integrated process is advantageous
over conventional gasifiers in that our process can produce
synthesis gas with varying H2/CO compositions, thus eliminat-
ing the need for a water-gas shift reactor and allowing for
the use of Fischer–Trospch catalysts that operate at different
H2/CO ratios.32–34 Thus, capital costs and operating expenses
can be reduced (by close to 50%) by eliminating the need for a
biomass gasifier, large downstream equipment, and synthesis
gas cleaning steps.
In addition to potential economic improvements, the
different product streams of our integrated process each have
potential end-uses, as illustrated in Fig. 1. In an industrial
application, the gaseous product stream would contain
primarily gaseous alkanes in the C1–C2 range; however, some
process studies show that recovering the C3–C4 fractions from
the gas stream is energy consuming and not economical.16
Also, the gaseous products would contain unconverted H2 and
CO with some CO2. The most likely use for the gas alkanes in
our process would be combustion to produce process heat and
electricity (Fig. 1) with some of the unconverted H2 and CO
being recycled to the Fischer–Tropsch bed. However, these
gaseous alkanes could be reformed to synthesis gas and
recycled to the Fischer–Tropsch bed as well.16 The organic
liquid phase product contains primarily liquid hydrocarbons
with a small amount of oxygenates (acetone, butanone,
pentanone, hexanone, and heptanone). In some applications,
the oxygenates could be hydrogenated to alcohols, which are
excellent fuel additives. Alternatively, the oxygenates in the
organic liquid could undergo hydrodeoxygenation to remove
the oxygen and form saturated hydrocarbons.35 If diesel fuel is
the desired product, the C5–C9 fraction would be separated,
and the waxy C10+ fraction would be hydrocracked to naptha,
kerosene, and diesel.16,17 The aqueous liquid product stream
contains oxygenated hydrocarbons (e.g., ethanol, methanol,
and acetone) at concentrations between 5–15 wt%. This
aqueous solution is suitable for distillation with the oxyge-
nated hydrocarbons either being recycled for further conver-
sion to synthesis gas or being used as intermediates or
solvents in the chemical industry. However, this aqueous
solution could be converted to H2 by aqueous phase
This journal is ß The Royal Society of Chemistry 2007 Green Chem., 2007, 9, 1073–1083 | 1081
reforming29 or upgraded to transportation fuels via selective
dehydration/hydrogenation.36,37
Conclusions
The production of synthesis gas from glycerol coupled with the
conversion of synthesis gas to produce liquid fuels by Fischer–
Tropsch synthesis is a net exothermic process with a heat of
reaction that is 4% of the lower heating value of glycerol.20
We show that conversion of glycerol over a Pt–Re/C catalyst
produces a synthesis gas stream that is suitable for Fischer–
Tropsch synthesis over a wide range of glycerol feed
concentrations and at pressures up to 17 bar where incomplete
vaporization of the glycerol feed occurs. Also, we have
demonstrated that the oxygenated hydrocarbon byproducts
in the synthesis gas stream from glycerol conversion (e.g.,
ethanol, acetone, acetol) have positive effects on the Fischer–
Tropsch synthesis step. In particular, water, ethanol and
acetone have slightly positive effects, such as slightly increasing
the selectivity to C5+ hydrocarbons (SC5+); and, acetol can
participate in Fischer–Tropsch chain growth, forming penta-
nones, hexanones, and heptanones in the liquid organic
effluent stream. This synergistic participation of acetol (and,
possibly, other oxygenates) in Fischer–Tropsch chain growth
has beneficial effects with respect to integration of glycerol
conversion with Fischer–Tropsch synthesis in a two-bed
system, such as (i) eliminating the need to condense water
and oxygenated hydrocarbon byproducts between the catalyst
beds, (ii) allowing for operation at higher pressures (i.e., 17 bar)
where synthesis gas production over Pt–Re/C is decreased and
the production of liquid byproducts is increased, and (iii)
causing an increase in the selectivity to C5+ hydrocarbons.
Accordingly, glycerol conversion and Fischer–Tropsch syn-
thesis can be carried out effectively (and perhaps synergisti-
cally) at the same conditions and in a two-bed reactor system,
allowing the coupling between glycerol conversion and
Fischer–Tropsch synthesis to be used for the production of
liquid fuels from aqueous-glycerol solutions.
The integrated process presented in this paper is a simple,
two step catalytic process that can be carried out at low
temperature and moderate pressure and can effectively harness
the energy from a renewable resource. Importantly, our
process minimizes the amount of waste byproducts since
each product phase is useful (Fig. 1). Therefore, this ‘‘green’’
process represents an energy efficient alternative for producing
liquid transportation fuels from petroleum. Furthermore, it
presents the opportunity for improving the economic viability
of ‘‘green’’ Fischer–Tropsch synthesis by reducing costs
associated with synthesis gas production and by improving
the thermal efficiency of Fischer–Tropsch processes.
Acknowledgements
This work was supported by the U.S. Department of Energy
(DOE), Office of Basic Energy Sciences. R. R. Soares acknowl-
edges a post-doctoral grant from CAPES. We thank Randy
Cortright and Manos Mavrikakis for valuable discussions
and collaborations throughout this project. We also thank
Jennifer Ross for assistance in collecting reaction kinetics data.
References
1 G. Alexander and G. Boyle, Introducing Renewable Energy, inRenewable Energy, ed. G. Boyle, Oxford University Press,New York, 2004.
2 Energy Information Administration, U. S. Department of Energy,http://www.eia.doe.gov/.
3 D. L. Klass, Biomass for Renewable Energy, Fuels, and Chemicals,Academic Press, San Diego, 1998.
4 R. D. Perlack, L. L. Wright, A. F. Turhollow, R. L. Graham, B. J.Stokes and D. C. Erbach, Biomass as Feedstock for a Bioenergy andBioproducts Industry: The Technical Feasibility of a Billion-TonAnnual Supply, United States Department of Energy, Oak RidgeNational Laboratory, DOE/GO-102005-2135, 2005, 1–78.
5 A. E. Farrell, R. J. Plevin, B. T. Turner, A. D. Jones, M. O’Hareand D. M. Kammen, Ethanol can contribute to energy andenvironmental goals, Science, 2006, 311, 506–508.
6 H. Shapouri, J. A. Duffield and M. Wang, The Energy Balance ofCorn Ethanol: An Update, United States Department ofAgriculture, Agricultural Economic Report No. 814, 2002, 1–15.
7 K. L. Kadam and J. D. McMillan, Availability of corn stover as asustainable feedstock for bioethanol production, Bioresour.Technol., 2003, 88, 17–25.
8 J. D. McMillan, Bioethanol Production: Status and Prospects,Renew. Energ., 1997, 10, 295–302.
9 V. Senthilkumar and P. Gunasekaran, Bioethanol production fromcellulosic substrates: engineered bacteria and process integrationchallenges, J. Sci. Ind. Res. India, 2005, 64, 845–853.
10 P. O. Ward and A. Singh, Microbial technology for bioethanolproduction from agricultural and forestry wastes, in MicrobialBiotechnology in Agriculture and Aquaculture, ed. R. C. Ramesh,Science Publishers, Inc., Enfield, NH, USA, 2005.
11 The European Fuel Oxygenates Association, http://www.efoa.org/oxygen.html.
12 Energy Efficiency and Renewable Energy, U.S. Department ofEnergy, http://www.eere.energy.gov/.
13 T. W. Patzek, Thermodynamics of the Corn-Ethanol BiofuelCycle, Crit. Rev. Plant Sci., 2004, 23, 519–567.
14 T. Patzek and D. Pimentel, Thermodynamics of EnergyProduction from Biomass, Crit. Rev. Plant Sci., 2005, 24, 327–364.
15 D. Pimentel and T. W. Patzek, Ethanol Production Using Corn,Switchgrass, and Wood; Biodiesel Production Using Soybean andSunflower, Nat. Resour. Res., 2005, 14, 65–76.
16 C. N. Hamelinck, A. P. C. Faaij, H. den Uil and H. Boerrigter,Production of FT transportation fuels from biomass; technicaloptions, process analysis and optimisation, and developmentpotential, Energy, 2004, 29, 1743–1771.
17 M. J. A. Tijmensen, A. P. C. Faaij, C. N. Hamelinck andM. R. M. van Hardeveld, Exploration of the possibilities forproduction of Fischer Tropsch liquids and power via biomassgasification, Biomass Bioenerg., 2002, 23, 129–152.
18 C. H. Bartholomew and R. J. Farrauto, Fundamentals of IndustrialCatalytic Processes, Wiley, Hoboken, NJ, USA, 2006.
19 P. L. Spath and D. C. Dayton, Preliminary Screening–Technicaland Economic Assessment of Synthesis Gas to Fuels and Chemicalswith Emphasis on the Potential for Biomass-Derived Syngas,United States Department of Energy, National RenewableEnergy Laboratory, NREL/TP-510-34929, 2003, 1–142.
20 R. R. Soares, D. A. Simonetti and J. A. Dumesic, Glycerol as aSource for Fuels and Chemicals by Low-Temperature CatalyticProcessing, Angew. Chem., Int. Ed., 2006, 45, 3982–3985.
21 C. S. Gong, J. X. Du, N. J. Cao and G. T. Tsao, Co-production ofethanol and glycerol, Appl. Biochem. Biotechnol., 2000, 84–86,543–559.
22 T. A. Werpy, J. G. Frye, A. H. Zacher and D. J. Miller, PCT,Hydrogenolysis of 6-carbon sugars and other organic compounds,World Pat. WO 03/035582 A1, 2003.
23 J. Van Gerpen, Biodiesel processing and production, Fuel Process.Technol., 2006, 86, 1097–1107.
24 E. Iglesia, S. L. Soled and R. A. Fiato, Fischer–Tropsch Synthesison Cobalt and Ruthenium – Metal Dispersion and Support Effectson Reaction-Rate and Selectivity, J. Catal., 1992, 137, 212–224.
25 B. E. Spiewak, J. Shen and J. A. Dumesic, MicrocalorimetricStudies of CO and H2 Adsorption on Nickel Powders Promotedwith Potassium and Cesium, J. Phys. Chem., 1995, 99, 17640.
1082 | Green Chem., 2007, 9, 1073–1083 This journal is ß The Royal Society of Chemistry 2007
26 K. C. Taylor, Determination of Ruthenium Surface-Areas byHydrogen and Oxygen Chemisorption, J. Catal., 1975, 38, 299–306.
27 E. Iglesia, S. C. Reyes and R. J. Madon, Transport-EnhancedAlpha-Olefin Readsorption Pathways in Ru-CatalyzedHydrocarbon Synthesis, J. Catal., 1991, 129, 238–256.
28 E. Iglesia, Design, synthesis, and use of cobalt-based Fischer–Tropsch synthesis catalysts, Appl. Catal. A, 1997, 161, 59–78.
29 R. D. Cortright, R. R. Davda and J. A. Dumesic, Hydrogen fromcatalytic reforming of biomass-derived hydrocarbons in liquidwater, Nature, 2002, 418, 964–967.
30 M. A. Vannice, The catalytic synthesis of hydrocarbons fromH2/CO mixtures over the group VIII metals: I. The specificactivities and product distributions of supported metals, J. Catal.,1975, 37, 449–461.
31 E. Iglesia, S. C. Reyes, R. J. Madon and S. L. Soled,Selectivity Control and Catalyst Design in the Fischer–Tropsch
Synthesis – Sites, Pellets, and Reactors, Adv. Catal., 1993, 39,221–302.
32 M. E. Dry, Chemical concepts used for engineering purposes, Stud.Surf. Sci. Catal., 2004, 152, 196–257.
33 M. E. Dry, FT catalysts, Stud. Surf. Sci. Catal., 2004, 152,533–600.
34 M. E. Dry and A. P. Steynberg, Commercial FT processapplications, Stud. Surf. Sci. Catal., 2004, 152, 406–481.
35 G. W. Huber, S. Iborra and A. Corma, Synthesis of transportationfuels from biomass: chemistry, catalysts, and engineering, Chem.Rev., 2006, 106, 4044–4098.
36 C. D. Chang, Hydrocarbons from methanol, Catal. Rev. Sci. Eng.,1983, 25, 1–118.
37 R. J. J. Nel and A. de Klerk, Fischer-Tropsch aqueous phaserefining by catalytic alcohol dehydration, Ind. Eng. Chem. Res.,2007, 46, 3558–3565.
This journal is ß The Royal Society of Chemistry 2007 Green Chem., 2007, 9, 1073–1083 | 1083
Sustainable Chemistry
DOI: 10.1002/anie.200601180
Formation of Acetic Acid by Aqueous-PhaseOxidation of Ethanol with Air in the Presence of aHeterogeneous Gold Catalyst**
Claus H. Christensen,* Betina Jørgensen, Jeppe Rass-Hansen, Kresten Egeblad, Robert Madsen,Søren K. Klitgaard, Stine M. Hansen, Mike R. Hansen,Hans C. Andersen, and Anders Riisager
Bioethanol is produced by fermentation of biomass in
increasing amounts to meet the growing demands for CO2-
neutral transportation fuels and to eventually remove the
dependence on fossil fuels. However, bioethanol could also
find use as a versatile, sustainable chemical feedstock. Herein,
it is shown that it is possible to selectively oxidize ethanol into
acetic acid in aqueous solution using air as the oxidant with a
heterogeneous gold catalyst at temperatures of about 423 K
and O2 pressures of 0.6 MPa. This reaction proceeds readily in
aqueous acidic media and yields of up to 90% are achieved,
with CO2 as the only major by-product. Thus, it constitutes a
very simple, green route to acetic acid.
The oxidation of ethanol by air into acetic acid over
platinum was among the first heterogeneously catalyzed
reactions to be reported. The initial discovery was made by
Döbereiner about two centuries ago, even before the term
catalysis was coined.[1] So far, the reaction has not been used
for large-scale production of acetic acid. Instead, three other
routes to acetic acid have found industrial application:
fermentation (vinegar), catalytic liquid-phase oxidation of
butane, naphtha, or acetaldehyde, and the carbonylation of
methanol, which has recently become the most important.[2]
In the most widely used industrial processes today, the
feedstock is almost exclusively derived from fossil fuels. Thus,
the production of acetic acid consumes fossil fuels and
therefore contributes slightly to increasing CO2 levels in the
atmosphere, and, more importantly, the cost of acetic acid is
strongly dependent on the price of the fossil fuels. Therefore,
it is interesting that the cost of renewable feedstocks has
decreased dramatically relative to fossil fuel feedstocks over
the last four decades. Specifically, the cost of corn relative to
oil has decreased fivefold from 1950 to 2005. Today, bio-
ethanol is mostly produced by fermentation of starch-
containing crops, such as corn or sugar cane, but it seems
likely that cellulose-rich agricultural waste will gain impor-
tance as a feedstock in the future.[3] Therefore, and also
because of the continuing technological improvements of the
production process, the cost of bioethanol is expected to
decrease.[4] Thus, with increasing fossil fuel prices, the
production of acetic acid from bioethanol will become
increasingly favorable compared to current fossil fuel-based
methods. Clearly, this development requires that an active
and selective catalyst for oxidation of ethanol with dioxygen
to form acetic acid [Eq. (1)] is available.
CH3CH2OHþO2 ! CH3COOHþH2O ð1Þ
So far, primarily palladium and platinum catalysts have
received attention as catalysts for ethanol oxidation.[5] How-
ever, with these catalysts it has proven difficult to reach
sufficient selectivities at high conversions.
Here, it is reported for the first time that gold catalysts are
both very active and selective catalysts for aqueous-phase
oxidation of ethanol with air into acetic acid at 373–473 K
with O2 pressures of 0.5–1 MPa. Interestingly, metallic gold
was for many years considered too unreactive to be useful as a
catalyst.[6] However, this view was challenged in the seminal
studies of Haruta and co-workers,[7,8] who showed that gold
very efficiently catalyzed the room-temperature oxidation of
CO with O2 to form CO2, and by Hutchings, who studied
acetylene hydrochlorination with gold catalysts.[9] Since then,
numerous reports of different gold-catalyzed reactions have
appeared and the field has recently been reviewed and
highlighted.[10–12]
[*] Prof. C. H. Christensen, B. Jørgensen, J. Rass-Hansen, K. Egeblad,
Prof. R. Madsen, S. K. Klitgaard, S. M. Hansen, M. R. Hansen,
H. C. Andersen, Prof. A. Riisager
Center for Sustainable and Green Chemistry
Department of Chemistry
Technical University of Denmark
Kemitorvet building 207, 2800 Kgs. Lyngby (Denmark)
Fax: (+45)4525-2235
E-mail: [email protected]
[**] The Center for Sustainable and Green Chemistry is sponsored by the
Danish National Research Foundation. Financial support from the
Danish Research Agency (grant 2104-04-0003) is acknowledged.
Communications
4648 � 2006 Wiley-VCH Verlag GmbH & Co. KGaA, Weinheim Angew. Chem. Int. Ed. 2006, 45, 4648 –4651
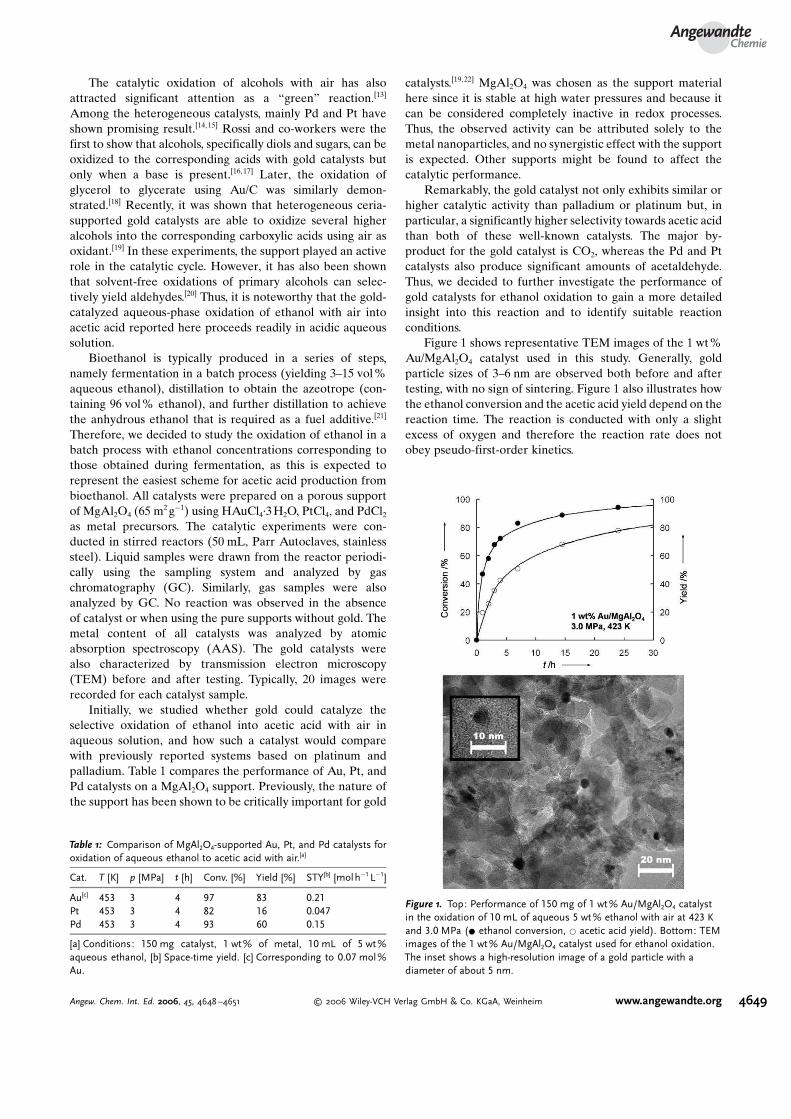
The catalytic oxidation of alcohols with air has also
attracted significant attention as a “green” reaction.[13]
Among the heterogeneous catalysts, mainly Pd and Pt have
shown promising result.[14,15] Rossi and co-workers were the
first to show that alcohols, specifically diols and sugars, can be
oxidized to the corresponding acids with gold catalysts but
only when a base is present.[16,17] Later, the oxidation of
glycerol to glycerate using Au/C was similarly demon-
strated.[18] Recently, it was shown that heterogeneous ceria-
supported gold catalysts are able to oxidize several higher
alcohols into the corresponding carboxylic acids using air as
oxidant.[19] In these experiments, the support played an active
role in the catalytic cycle. However, it has also been shown
that solvent-free oxidations of primary alcohols can selec-
tively yield aldehydes.[20] Thus, it is noteworthy that the gold-
catalyzed aqueous-phase oxidation of ethanol with air into
acetic acid reported here proceeds readily in acidic aqueous
solution.
Bioethanol is typically produced in a series of steps,
namely fermentation in a batch process (yielding 3–15 vol%
aqueous ethanol), distillation to obtain the azeotrope (con-
taining 96 vol% ethanol), and further distillation to achieve
the anhydrous ethanol that is required as a fuel additive.[21]
Therefore, we decided to study the oxidation of ethanol in a
batch process with ethanol concentrations corresponding to
those obtained during fermentation, as this is expected to
represent the easiest scheme for acetic acid production from
bioethanol. All catalysts were prepared on a porous support
of MgAl2O4 (65 m2gÿ1) using HAuCl4·3H2O, PtCl4, and PdCl2
as metal precursors. The catalytic experiments were con-
ducted in stirred reactors (50 mL, Parr Autoclaves, stainless
steel). Liquid samples were drawn from the reactor periodi-
cally using the sampling system and analyzed by gas
chromatography (GC). Similarly, gas samples were also
analyzed by GC. No reaction was observed in the absence
of catalyst or when using the pure supports without gold. The
metal content of all catalysts was analyzed by atomic
absorption spectroscopy (AAS). The gold catalysts were
also characterized by transmission electron microscopy
(TEM) before and after testing. Typically, 20 images were
recorded for each catalyst sample.
Initially, we studied whether gold could catalyze the
selective oxidation of ethanol into acetic acid with air in
aqueous solution, and how such a catalyst would compare
with previously reported systems based on platinum and
palladium. Table 1 compares the performance of Au, Pt, and
Pd catalysts on a MgAl2O4 support. Previously, the nature of
the support has been shown to be critically important for gold
catalysts.[19,22] MgAl2O4 was chosen as the support material
here since it is stable at high water pressures and because it
can be considered completely inactive in redox processes.
Thus, the observed activity can be attributed solely to the
metal nanoparticles, and no synergistic effect with the support
is expected. Other supports might be found to affect the
catalytic performance.
Remarkably, the gold catalyst not only exhibits similar or
higher catalytic activity than palladium or platinum but, in
particular, a significantly higher selectivity towards acetic acid
than both of these well-known catalysts. The major by-
product for the gold catalyst is CO2, whereas the Pd and Pt
catalysts also produce significant amounts of acetaldehyde.
Thus, we decided to further investigate the performance of
gold catalysts for ethanol oxidation to gain a more detailed
insight into this reaction and to identify suitable reaction
conditions.
Figure 1 shows representative TEM images of the 1 wt%
Au/MgAl2O4 catalyst used in this study. Generally, gold
particle sizes of 3–6 nm are observed both before and after
testing, with no sign of sintering. Figure 1 also illustrates how
the ethanol conversion and the acetic acid yield depend on the
reaction time. The reaction is conducted with only a slight
excess of oxygen and therefore the reaction rate does not
obey pseudo-first-order kinetics.
Table 1: Comparison of MgAl2O4-supported Au, Pt, and Pd catalysts for
oxidation of aqueous ethanol to acetic acid with air.[a]
Cat. T [K] p [MPa] t [h] Conv. [%] Yield [%] STY[b] [molhÿ1Lÿ1]
Au[c] 453 3 4 97 83 0.21
Pt 453 3 4 82 16 0.047
Pd 453 3 4 93 60 0.15
[a] Conditions: 150 mg catalyst, 1 wt% of metal, 10 mL of 5 wt%
aqueous ethanol, [b] Space-time yield. [c] Corresponding to 0.07 mol%
Au.
Figure 1. Top: Performance of 150 mg of 1 wt% Au/MgAl2O4 catalyst
in the oxidation of 10 mL of aqueous 5 wt% ethanol with air at 423 K
and 3.0 MPa (* ethanol conversion, * acetic acid yield). Bottom: TEM
images of the 1 wt% Au/MgAl2O4 catalyst used for ethanol oxidation.
The inset shows a high-resolution image of a gold particle with a
diameter of about 5 nm.
AngewandteChemie
4649Angew. Chem. Int. Ed. 2006, 45, 4648 –4651 � 2006 Wiley-VCH Verlag GmbH & Co. KGaA, Weinheim www.angewandte.org
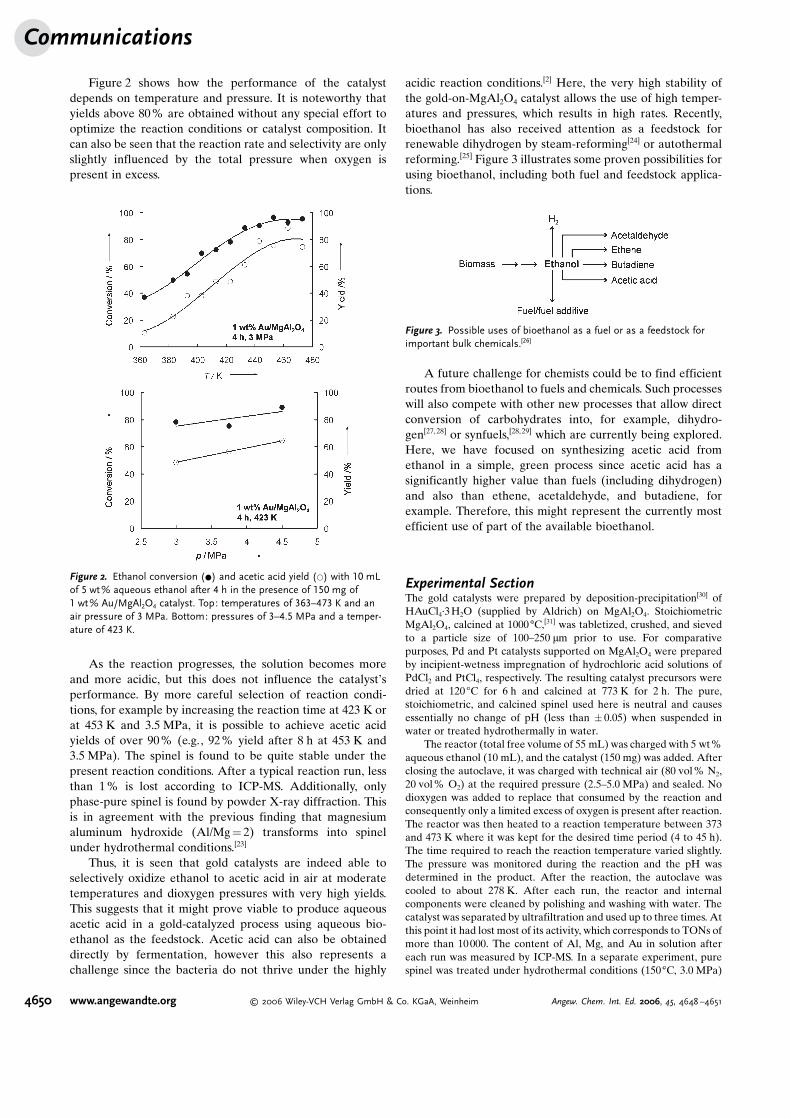
Figure 2 shows how the performance of the catalyst
depends on temperature and pressure. It is noteworthy that
yields above 80% are obtained without any special effort to
optimize the reaction conditions or catalyst composition. It
can also be seen that the reaction rate and selectivity are only
slightly influenced by the total pressure when oxygen is
present in excess.
As the reaction progresses, the solution becomes more
and more acidic, but this does not influence the catalyst�s
performance. By more careful selection of reaction condi-
tions, for example by increasing the reaction time at 423 K or
at 453 K and 3.5 MPa, it is possible to achieve acetic acid
yields of over 90% (e.g., 92% yield after 8 h at 453 K and
3.5 MPa). The spinel is found to be quite stable under the
present reaction conditions. After a typical reaction run, less
than 1% is lost according to ICP-MS. Additionally, only
phase-pure spinel is found by powder X-ray diffraction. This
is in agreement with the previous finding that magnesium
aluminum hydroxide (Al/Mg= 2) transforms into spinel
under hydrothermal conditions.[23]
Thus, it is seen that gold catalysts are indeed able to
selectively oxidize ethanol to acetic acid in air at moderate
temperatures and dioxygen pressures with very high yields.
This suggests that it might prove viable to produce aqueous
acetic acid in a gold-catalyzed process using aqueous bio-
ethanol as the feedstock. Acetic acid can also be obtained
directly by fermentation, however this also represents a
challenge since the bacteria do not thrive under the highly
acidic reaction conditions.[2] Here, the very high stability of
the gold-on-MgAl2O4 catalyst allows the use of high temper-
atures and pressures, which results in high rates. Recently,
bioethanol has also received attention as a feedstock for
renewable dihydrogen by steam-reforming[24] or autothermal
reforming.[25] Figure 3 illustrates some proven possibilities for
using bioethanol, including both fuel and feedstock applica-
tions.
A future challenge for chemists could be to find efficient
routes from bioethanol to fuels and chemicals. Such processes
will also compete with other new processes that allow direct
conversion of carbohydrates into, for example, dihydro-
gen[27, 28] or synfuels,[28,29] which are currently being explored.
Here, we have focused on synthesizing acetic acid from
ethanol in a simple, green process since acetic acid has a
significantly higher value than fuels (including dihydrogen)
and also than ethene, acetaldehyde, and butadiene, for
example. Therefore, this might represent the currently most
efficient use of part of the available bioethanol.
Experimental SectionThe gold catalysts were prepared by deposition-precipitation[30] of
HAuCl4·3H2O (supplied by Aldrich) on MgAl2O4. Stoichiometric
MgAl2O4, calcined at 1000 8C,[31] was tabletized, crushed, and sieved
to a particle size of 100–250 mm prior to use. For comparative
purposes, Pd and Pt catalysts supported on MgAl2O4 were prepared
by incipient-wetness impregnation of hydrochloric acid solutions of
PdCl2 and PtCl4, respectively. The resulting catalyst precursors were
dried at 120 8C for 6 h and calcined at 773 K for 2 h. The pure,
stoichiometric, and calcined spinel used here is neutral and causes
essentially no change of pH (less than � 0.05) when suspended in
water or treated hydrothermally in water.
The reactor (total free volume of 55 mL) was charged with 5 wt%
aqueous ethanol (10 mL), and the catalyst (150 mg) was added. After
closing the autoclave, it was charged with technical air (80 vol% N2,
20 vol% O2) at the required pressure (2.5–5.0 MPa) and sealed. No
dioxygen was added to replace that consumed by the reaction and
consequently only a limited excess of oxygen is present after reaction.
The reactor was then heated to a reaction temperature between 373
and 473 K where it was kept for the desired time period (4 to 45 h).
The time required to reach the reaction temperature varied slightly.
The pressure was monitored during the reaction and the pH was
determined in the product. After the reaction, the autoclave was
cooled to about 278 K. After each run, the reactor and internal
components were cleaned by polishing and washing with water. The
catalyst was separated by ultrafiltration and used up to three times. At
this point it had lost most of its activity, which corresponds to TONs of
more than 10000. The content of Al, Mg, and Au in solution after
each run was measured by ICP-MS. In a separate experiment, pure
spinel was treated under hydrothermal conditions (150 8C, 3.0 MPa)
Figure 2. Ethanol conversion (*) and acetic acid yield (*) with 10 mL
of 5 wt% aqueous ethanol after 4 h in the presence of 150 mg of
1 wt% Au/MgAl2O4 catalyst. Top: temperatures of 363–473 K and an
air pressure of 3 MPa. Bottom: pressures of 3–4.5 MPa and a temper-
ature of 423 K.
Figure 3. Possible uses of bioethanol as a fuel or as a feedstock for
important bulk chemicals.[26]
Communications
4650 www.angewandte.org � 2006 Wiley-VCH Verlag GmbH & Co. KGaA, Weinheim Angew. Chem. Int. Ed. 2006, 45, 4648 –4651
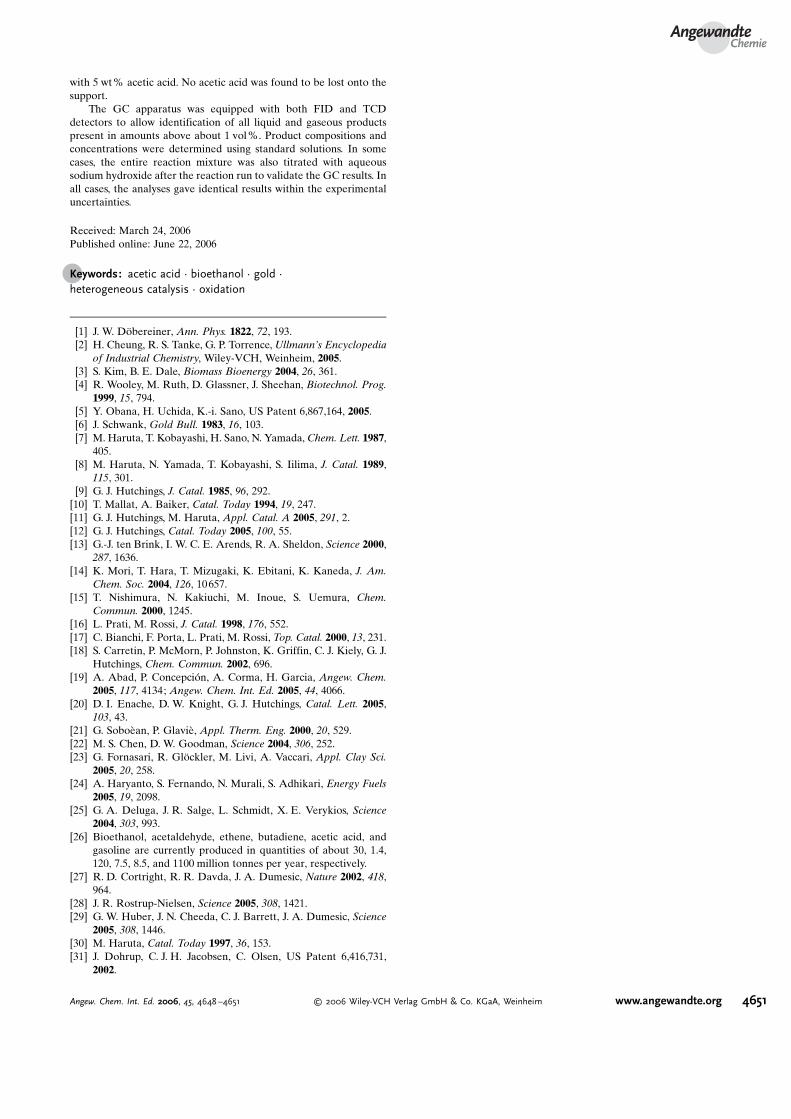
with 5 wt% acetic acid. No acetic acid was found to be lost onto the
support.
The GC apparatus was equipped with both FID and TCD
detectors to allow identification of all liquid and gaseous products
present in amounts above about 1 vol%. Product compositions and
concentrations were determined using standard solutions. In some
cases, the entire reaction mixture was also titrated with aqueous
sodium hydroxide after the reaction run to validate the GC results. In
all cases, the analyses gave identical results within the experimental
uncertainties.
Received: March 24, 2006
Published online: June 22, 2006
.Keywords: acetic acid · bioethanol · gold ·
heterogeneous catalysis · oxidation
[1] J. W. Döbereiner, Ann. Phys. 1822, 72, 193.
[2] H. Cheung, R. S. Tanke, G. P. Torrence, Ullmann�s Encyclopedia
of Industrial Chemistry, Wiley-VCH, Weinheim, 2005.
[3] S. Kim, B. E. Dale, Biomass Bioenergy 2004, 26, 361.
[4] R. Wooley, M. Ruth, D. Glassner, J. Sheehan, Biotechnol. Prog.
1999, 15, 794.
[5] Y. Obana, H. Uchida, K.-i. Sano, US Patent 6,867,164, 2005.
[6] J. Schwank, Gold Bull. 1983, 16, 103.
[7] M. Haruta, T. Kobayashi, H. Sano, N. Yamada, Chem. Lett. 1987,
405.
[8] M. Haruta, N. Yamada, T. Kobayashi, S. Iilima, J. Catal. 1989,
115, 301.
[9] G. J. Hutchings, J. Catal. 1985, 96, 292.
[10] T. Mallat, A. Baiker, Catal. Today 1994, 19, 247.
[11] G. J. Hutchings, M. Haruta, Appl. Catal. A 2005, 291, 2.
[12] G. J. Hutchings, Catal. Today 2005, 100, 55.
[13] G.-J. ten Brink, I. W. C. E. Arends, R. A. Sheldon, Science 2000,
287, 1636.
[14] K. Mori, T. Hara, T. Mizugaki, K. Ebitani, K. Kaneda, J. Am.
Chem. Soc. 2004, 126, 10657.
[15] T. Nishimura, N. Kakiuchi, M. Inoue, S. Uemura, Chem.
Commun. 2000, 1245.
[16] L. Prati, M. Rossi, J. Catal. 1998, 176, 552.
[17] C. Bianchi, F. Porta, L. Prati, M. Rossi, Top. Catal. 2000, 13, 231.
[18] S. Carretin, P. McMorn, P. Johnston, K. Griffin, C. J. Kiely, G. J.
Hutchings, Chem. Commun. 2002, 696.
[19] A. Abad, P. Concepción, A. Corma, H. Garcia, Angew. Chem.
2005, 117, 4134; Angew. Chem. Int. Ed. 2005, 44, 4066.
[20] D. I. Enache, D. W. Knight, G. J. Hutchings, Catal. Lett. 2005,
103, 43.
[21] G. Sobo�an, P. Glavi�, Appl. Therm. Eng. 2000, 20, 529.
[22] M. S. Chen, D. W. Goodman, Science 2004, 306, 252.
[23] G. Fornasari, R. Glöckler, M. Livi, A. Vaccari, Appl. Clay Sci.
2005, 20, 258.
[24] A. Haryanto, S. Fernando, N. Murali, S. Adhikari, Energy Fuels
2005, 19, 2098.
[25] G. A. Deluga, J. R. Salge, L. Schmidt, X. E. Verykios, Science
2004, 303, 993.
[26] Bioethanol, acetaldehyde, ethene, butadiene, acetic acid, and
gasoline are currently produced in quantities of about 30, 1.4,
120, 7.5, 8.5, and 1100 million tonnes per year, respectively.
[27] R. D. Cortright, R. R. Davda, J. A. Dumesic, Nature 2002, 418,
964.
[28] J. R. Rostrup-Nielsen, Science 2005, 308, 1421.
[29] G. W. Huber, J. N. Cheeda, C. J. Barrett, J. A. Dumesic, Science
2005, 308, 1446.
[30] M. Haruta, Catal. Today 1997, 36, 153.
[31] J. Dohrup, C. J. H. Jacobsen, C. Olsen, US Patent 6,416,731,
2002.
AngewandteChemie
4651Angew. Chem. Int. Ed. 2006, 45, 4648 –4651 � 2006 Wiley-VCH Verlag GmbH & Co. KGaA, Weinheim www.angewandte.org
For P
eer Review
The Hydrocarbon Pool in Ethanol-to-Gasoline over HZSM-5 Catalysts.
Journal: Catalysis Letters
Manuscript ID: draft
Manuscript Type: Original Manuscript
Date Submitted by the Author:
n/a
Complete List of Authors: Johansson, Roger; Technical University of Denmark, Center for Sustainable and Green Chemistry Hruby, Sarah; Iowa State University, Department of Chemical and Biological Engineering
Rass-Hansen, Jeppe; Technical University of Denmark, Center for Sustainable and Green Chemistry Christensen, Claus; Haldor Topsøe A/S; Technical University of Denmark, Center for Sustainable and Green Chemistry
Keywords: ethanol-to-gasoline, hydrocarbon pool, H-ZSM-5
Catalysis Letters
Catalysis Letters
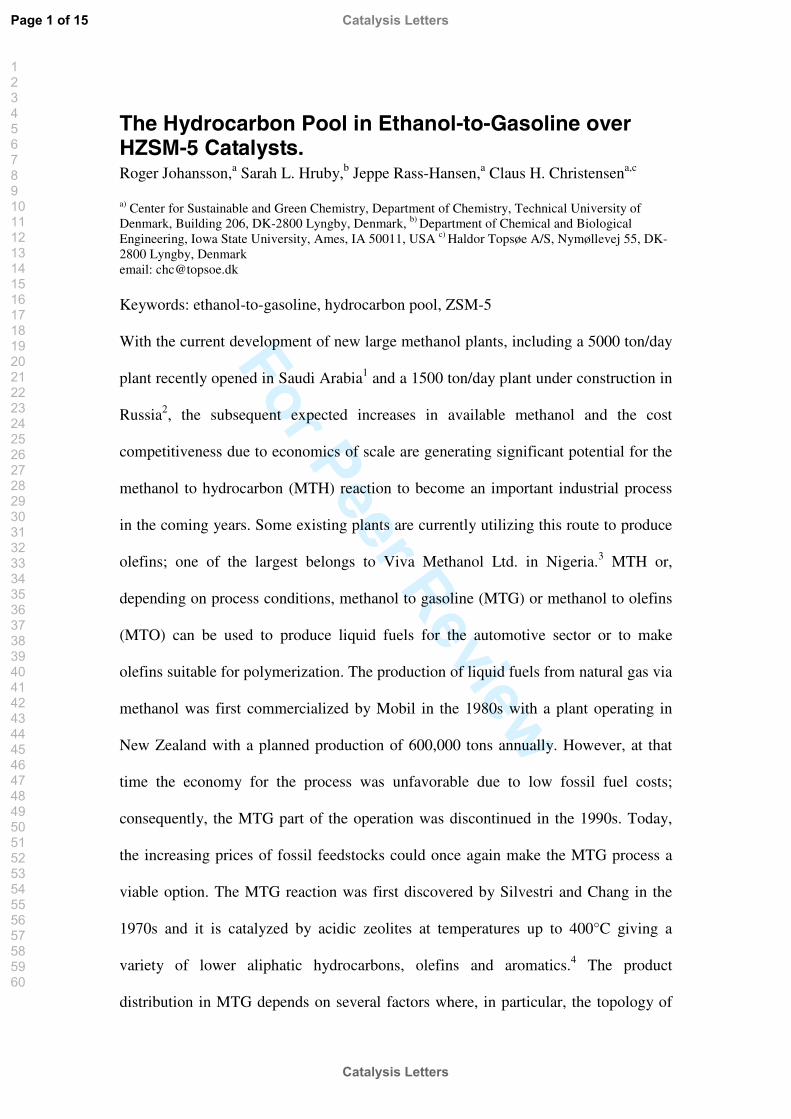
For P
eer Review
The Hydrocarbon Pool in Ethanol-to-Gasoline over HZSM-5 Catalysts.Roger Johansson,a Sarah L. Hruby,b Jeppe Rass-Hansen,a Claus H. Christensena,c
a) Center for Sustainable and Green Chemistry, Department of Chemistry, Technical University of Denmark, Building 206, DK-2800 Lyngby, Denmark, b) Department of Chemical and Biological Engineering, Iowa State University, Ames, IA 50011, USA c) Haldor Topsøe A/S, Nymøllevej 55, DK-2800 Lyngby, Denmarkemail: [email protected]
Keywords: ethanol-to-gasoline, hydrocarbon pool, ZSM-5 With the current development of new large methanol plants, including a 5000 ton/day
plant recently opened in Saudi Arabia1 and a 1500 ton/day plant under construction in
Russia2, the subsequent expected increases in available methanol and the cost
competitiveness due to economics of scale are generating significant potential for the
methanol to hydrocarbon (MTH) reaction to become an important industrial process
in the coming years. Some existing plants are currently utilizing this route to produce
olefins; one of the largest belongs to Viva Methanol Ltd. in Nigeria.3 MTH or,
depending on process conditions, methanol to gasoline (MTG) or methanol to olefins
(MTO) can be used to produce liquid fuels for the automotive sector or to make
olefins suitable for polymerization. The production of liquid fuels from natural gas via
methanol was first commercialized by Mobil in the 1980s with a plant operating in
New Zealand with a planned production of 600,000 tons annually. However, at that
time the economy for the process was unfavorable due to low fossil fuel costs;
consequently, the MTG part of the operation was discontinued in the 1990s. Today,
the increasing prices of fossil feedstocks could once again make the MTG process a
viable option. The MTG reaction was first discovered by Silvestri and Chang in the
1970s and it is catalyzed by acidic zeolites at temperatures up to 400°C giving a
variety of lower aliphatic hydrocarbons, olefins and aromatics.4 The product
distribution in MTG depends on several factors where, in particular, the topology of
Page 1 of 15
Catalysis Letters
Catalysis Letters
1
2
3
4
5
6
7
8
9
10
11
12
13
14
15
16
17
18
19
20
21
22
23
24
25
26
27
28
29
30
31
32
33
34
35
36
37
38
39
40
41
42
43
44
45
46
47
48
49
50
51
52
53
54
55
56
57
58
59
60
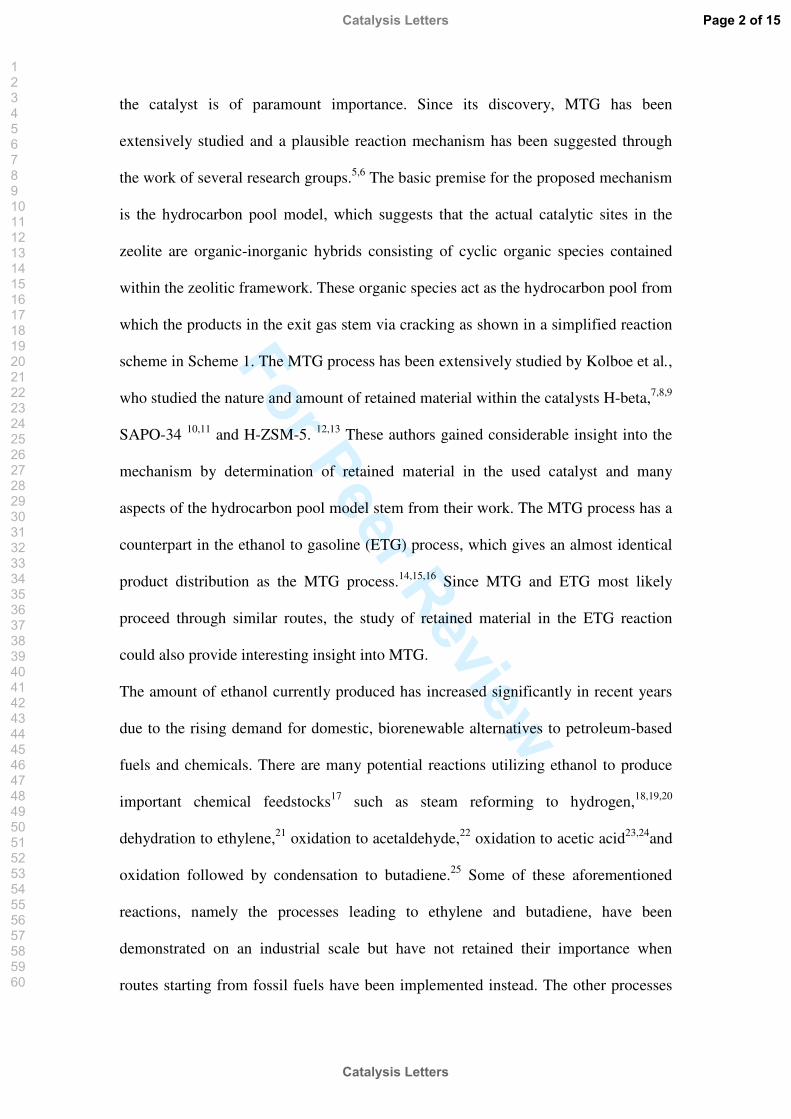
For P
eer Review
the catalyst is of paramount importance. Since its discovery, MTG has been
extensively studied and a plausible reaction mechanism has been suggested through
the work of several research groups.5,6 The basic premise for the proposed mechanism
is the hydrocarbon pool model, which suggests that the actual catalytic sites in the
zeolite are organic-inorganic hybrids consisting of cyclic organic species contained
within the zeolitic framework. These organic species act as the hydrocarbon pool from
which the products in the exit gas stem via cracking as shown in a simplified reaction
scheme in Scheme 1. The MTG process has been extensively studied by Kolboe et al.,
who studied the nature and amount of retained material within the catalysts H-beta,7,8,9
SAPO-34 10,11 and H-ZSM-5. 12,13 These authors gained considerable insight into the
mechanism by determination of retained material in the used catalyst and many
aspects of the hydrocarbon pool model stem from their work. The MTG process has a
counterpart in the ethanol to gasoline (ETG) process, which gives an almost identical
product distribution as the MTG process.14,15,16 Since MTG and ETG most likely
proceed through similar routes, the study of retained material in the ETG reaction
could also provide interesting insight into MTG.
The amount of ethanol currently produced has increased significantly in recent years
due to the rising demand for domestic, biorenewable alternatives to petroleum-based
fuels and chemicals. There are many potential reactions utilizing ethanol to produce
important chemical feedstocks17 such as steam reforming to hydrogen,18,19,20
dehydration to ethylene,21 oxidation to acetaldehyde,22 oxidation to acetic acid23,24and
oxidation followed by condensation to butadiene.25 Some of these aforementioned
reactions, namely the processes leading to ethylene and butadiene, have been
demonstrated on an industrial scale but have not retained their importance when
routes starting from fossil fuels have been implemented instead. The other processes
Page 2 of 15
Catalysis Letters
Catalysis Letters
1
2
3
4
5
6
7
8
9
10
11
12
13
14
15
16
17
18
19
20
21
22
23
24
25
26
27
28
29
30
31
32
33
34
35
36
37
38
39
40
41
42
43
44
45
46
47
48
49
50
51
52
53
54
55
56
57
58
59
60
For P
eer Review
mentioned above have mostly received attention in the last decade but have not found
industrial applications yet. One of the important drawbacks of the production of
ethanol from biomass is the energy input required for distillation, which usually
comes from fossil fuels. Consequently, when developing new reactions aqueous
ethanol would be the preferred feedstock to achieve a more favorable energy balance
by reducing the required extent of distillation. As a result, processes that do not
require fuel-grade ethanol such as the dehydration of ethanol to ethylene and steam
reforming to hydrogen are attracting interest.26,18 Other researchers have investigated
the use of the ethanol to gasoline reaction as an alternative to fuel grade distillation of
ethanol.27 One challenge with the ETG process that can be envisioned when using
ethanol as feed is a more rapid catalyst deactivation due to the formation of ethylene,
which is a known coke precursor on H-ZSM-5.28 This deactivation could perhaps be
inhibited by addition of water to the feed,28,29 Using lightly distilled bio-ethanol as the
feed would add additional water to the reaction and slow down deactivation and
lower the ethanol feed concentration. Our first effort towards this is to study the
mechanism behind ETG through the analysis of retained material in the catalyst after
the ethanol to gasoline reaction. This has been done previously for the MTG reaction
but to our knowledge no such information exists for the ETG reaction. We are also
comparing the ETG and MTG reaction with the same process parameters to further
our understanding of these reactions.
The catalyst used in this study was H-ZSM-5 (Si/Al = 11.5), supplied by Zeolyst
International. The experiments for determining retained material were performed in a
continuous flow fixed bed quartz tubular reactor with an inner diameter of 6 mm; the
catalyst bed was heated in an oven, the temperature monitored with a thermocouple
Page 3 of 15
Catalysis Letters
Catalysis Letters
1
2
3
4
5
6
7
8
9
10
11
12
13
14
15
16
17
18
19
20
21
22
23
24
25
26
27
28
29
30
31
32
33
34
35
36
37
38
39
40
41
42
43
44
45
46
47
48
49
50
51
52
53
54
55
56
57
58
59
60
For P
eer Review
situated immediately below the catalyst bed. The ethanol was added through a HPLC
pump and then evaporated by heating tapes and carried through the catalyst bed with a
flow of helium. The stream was then brought to an Agilent 6890 GC equipped with a
Varian PoraPlot Q-HT column and a FID where the product distribution was
analyzed. The experiments comparing ETG with MTG were performed on a similar
setup but using a stainless steel reactor fitted with a condenser to separate gaseous
products from condensable products before analysis on a Agilent 6890 GC equipped
with a J&W Scientific GS-Gaspro column and a FID where the gaseous products were
analyzed.
Experiments were carried out at 450 °C or 400 ˚C with a WHSV of 9 h-1 or 6 h-1
respectively. For the retained material study the reactor was heated to 450 ˚C and after
15, 60 or 120 minutes, the reactor was immediately moved to another oven where the
catalyst was flushed with helium for 5 minutes at 55 °C to remove small molecules
not trapped inside the zeolite pores.
For determining the retained material in the methanol to olefin process we have
replicated the method employed by Guisnet et al.30 in order to gain insight into the
ethanol to gasoline reaction. In a closed Teflon vial 100 mg of spent catalyst was
dissolved in 3 ml of 20 % wt. hydrofluoric acid. The mixture was shaken and allowed
to stand overnight. When the zeolite was completely dissolved, the retained material
was extracted with 1 ml of dichloromethane with added chlorobenzene as an internal
standard. The organic phase was filtered and most of the dichloromethane was
allowed to evaporate; Arstad et al.10 have shown that this should not have an effect on
the product distribution in the sample. The concentrated samples were then analyzed
on an Agilent 6850 GC fitted with a quadruple mass spectrometer detector 5975C.
Page 4 of 15
Catalysis Letters
Catalysis Letters
1
2
3
4
5
6
7
8
9
10
11
12
13
14
15
16
17
18
19
20
21
22
23
24
25
26
27
28
29
30
31
32
33
34
35
36
37
38
39
40
41
42
43
44
45
46
47
48
49
50
51
52
53
54
55
56
57
58
59
60
For P
eer Review
As it was stated previously, the products achieved from the MTG and the ETG
processes are very similar; specifically the gaseous products are the same in both
processes as can be seen in Figure 1. Additionally the condensable products are
similar although there are subtle differences between the two processes; Figure 2
gives spectra showing the main liquid products in the ETG and MTG respectively. In
the MTG there are small amounts of trimethyl benzene and tetramethyl benzene that
are not seen in ETG, in ETG there are instead small amounts of ethyl methyl benzene
that is not found in MTG. These differences are not discernible using FID but can be
seen when analyzing the samples with mass spectrometry. The similar product
distribution for both processes suggests that the same mechanism is in operation in
both of these processes. If the same mechanism is in operation it would also be likely
that the same material is retained within the catalyst. Figure 3 shows the most
abundant retained material found in HZSM-5 for MTG and ETG respectively. When
comparing the material released from the dissolved zeolite from the ETG reaction
with the products in the reactor effluent it is apparent that the true retained material
consists of tetraethyl benzene, triethyl methyl benzene, triethyl benzene, diethyl
dimethyl benzene and diethyl methyl benzene, see Figure 3, since these compounds
are not present in the reactor effluent. Many of the smaller methyl benzenes such as
the xylenes are present in both reactions and are expected to lead to the same
products. In the catalyst from the ETG reaction there are several mixed methyl ethyl
benzenes that are similar to the methyl benzenes found in MTG but it is surprising
that these mixed benzenes give the same product distribution as the hydrocarbon pool
containing only methyl benzenes. A more thorough examination of the results from
experiments with different reaction times revealed that the amounts of tetraethyl
benzene, triethyl methyl benzene and triethyl benzene were increasing over time
Page 5 of 15
Catalysis Letters
Catalysis Letters
1
2
3
4
5
6
7
8
9
10
11
12
13
14
15
16
17
18
19
20
21
22
23
24
25
26
27
28
29
30
31
32
33
34
35
36
37
38
39
40
41
42
43
44
45
46
47
48
49
50
51
52
53
54
55
56
57
58
59
60
For P
eer Review
whereas the amount of methyl benzenes were approximately the same throughout, as
seen in Figure 4. This implies that the methyl benzenes that are common for both
reactions are reacting faster than the ethyl benzenes present in the ETG reaction.
Considering that the most reactive species of the hydrocarbon pool are shared
between the two processes it is not so surprising that the product distribution is almost
the same in both processes, the differences in product distribution should therefore
come from those species that are not shared between ETG and MTG. Special attention
should be given to the peaks corresponding to triethyl methyl benzene and tetraethyl
benzene; these appear to be increasing more than any of the other peaks over time and
it is reasonable to believe that these do not participate significantly in the reaction and
could be considered as “dead ends” in the reaction network, similar to what Bjørgen et
al. found for hexamethyl benzene in HZSM-5 for the MTG reaction.12 If the triethyl
methyl benzene and the tetraethyl benzene are true dead ends, as the time study
suggests, they would be left unchanged by a flushing experiment at the reaction
temperature, in this paper 450 ˚C. When flushing the catalyst at 450 ˚C a substantial
decrease in the amount of tetraethyl benzene and triethyl methyl benzene is apparent,
but at this time it is not clear why these species are decreasing. This behavior could
mean that these species are indeed part of the reaction network, although at a slower
rate than the smaller species in the hydrocarbon pool or they could be transformed
into coke. When examining the catalysts used in reactions for longer times there are
visible traces of the early stages of coke formation, which could be a logical
progression from tetraethyl benzene and triethyl benzene. Whether these two species
are reacting slowly or are coke precursors is inconsequential to the overall reactivity –
either way the product distribution will not depend much on the larger species in the
hydrocarbon pool.
Page 6 of 15
Catalysis Letters
Catalysis Letters
1
2
3
4
5
6
7
8
9
10
11
12
13
14
15
16
17
18
19
20
21
22
23
24
25
26
27
28
29
30
31
32
33
34
35
36
37
38
39
40
41
42
43
44
45
46
47
48
49
50
51
52
53
54
55
56
57
58
59
60
For P
eer Review
The catalyst appears to deactivate faster with the formation of these compounds that
potentially block the acidic sites within the zeolitic framework, thereby opening a
second route towards deactivation apart from the coke formation on the surface of the
zeolite crystals as has been seen by others in reactions with ZSM-5 catalysts.31,32
When performing deactivation runs using either ethanol or methanol as the feed it was
seen that the ethanol feed gives a faster deactivation than the methanol feed. The
deactivation in MTG is seen as a decrease of all products and formation of dimethyl
ether, for the ETG reaction the deactivation manifests itself as an increase in the
amount of ethylene forming from dehydration of ethanol whereas the other products
are decreasing. The faster deactivation could be a consequence of the formation of the
larger species found in the retained material in addition to the coke formation due to
ethylene that was mentioned previously. In conclusion it is reasonable that MTG and
ETG give similar product distributions since the products mostly stem from the same
retained material via the hydrocarbon pool model, the difference in product
distribution seen for the liquid products can be explained by the presence of larger
hydrocarbon species found in the zeolite but which are not completely retained. In
essence the formation of ethyl benzenes have small effects on the products formed but
it could have serious implications for catalyst activity and deactivation.
[1] Focus on Catalysts Volume 2006, Issue 11, November 2006, Page 5
[2] Chemical Week; 9/5/2007, Vol. 169 Issue 29, p22
[3] Focus on Catalysts Volume 2008, Issue 3, March 2008, Page 5
[4] C. D. Chang, A. J. Silvestri, J. Catal. 47 (1977) 249
[5] J. F. Haw, W. Song, D. M. Marcus, J. B. Nicholas Acc. Chem. Res. 36 (2003) 317
Page 7 of 15
Catalysis Letters
Catalysis Letters
1
2
3
4
5
6
7
8
9
10
11
12
13
14
15
16
17
18
19
20
21
22
23
24
25
26
27
28
29
30
31
32
33
34
35
36
37
38
39
40
41
42
43
44
45
46
47
48
49
50
51
52
53
54
55
56
57
58
59
60
For P
eer Review
[6] U. Olsbye, M. Bjørgen, S. Svelle, KP. Lillerud, S. Kolboe Catalysis Today 106
(2005) 108
[7] M. Bjørgen, S. Kolboe Applied Catalysis A- General 225 (2002) 285
[8] Ø. Mikkelsen, S. Kolboe, Microporous And Mesoporous Materials 29 (1999) 173
[9] M. Bjørgen, U. Olsbye, D. Petersen, S. Kolboe, J. Catal. 221 (2004) 1
[10] B. Arstad, S. Kolboe, Catalysis Letters 71 (2001) 209
[11] B. Arstad, S. Kolboe, J. Am. Chem. Soc. 123 (2001) 8137
[12] M. Bjørgen, S. Svelle, F. Joensen, J. Nerlov, S. Kolboe, F. Bonino, L. Palumbo,
S. Bordiga, U. Olsbye, J. Catal. 249 (2007) 195
[13] S. Svelle, F. Joensen, J. Nerlov, U. Olsbye, KP. Lillerud, S. Kolboe, M. Bjørgen,
J. Am. Chem. Soc. 128 (2006) 14770
[14] E. Costa, A. Uguina, J. Aguado, P. J. Hernandez, Ind. Eng. Chem. Process Des.
Dev. 24 (1985) 239
[15] A. K. Talukdar, K. G. Bhattacharyya, S. Sivasanker, Applied Catalysis A:
General 148 (1997) 357
[16] J. Schulz, F. Bandermann, Chem. Eng. Technol. 17 (1994) 179
[17] J. Rass-Hansen, H. Falsig, B. Jorgensen, C.H. Christensen, J. Chem. Tech.
BioTech. 82 (2007) 329
[18] A. Haryanto, S. Fernando, N. Murali, S. Adhikari, Energy Fuels 19 (2005) 2098
[19] M. Ni, DYC. Leung, MKH. Leung, Int. J. Hydrogen Energy 32 (2007) 3238
[20] J. Rass-Hansen, C.H. Christensen, J. Sehested, S. Helveg, J. R. Rostrup-Nielsen,
S. Dahl, Green Chem. 9 (2007) 1016
[21] Y. C. Hu, Hydrocarbon Process. 62 (1983) 113
[22] B. Jorgensen, R. Fehrmann, C. H. Christensen, A. Riisager, Top. Catal. (2008)
submitted.
Page 8 of 15
Catalysis Letters
Catalysis Letters
1
2
3
4
5
6
7
8
9
10
11
12
13
14
15
16
17
18
19
20
21
22
23
24
25
26
27
28
29
30
31
32
33
34
35
36
37
38
39
40
41
42
43
44
45
46
47
48
49
50
51
52
53
54
55
56
57
58
59
60
For P
eer Review
[23] C.H. Christensen, B. Jorgensen, J. Rass-Hansen, K. Egeblad, R. Madsen, S.K.
Klitgaard, S.M. Hansen, M.R. Hansen, H.C. Andersen, A. Riisager, Angew. Chem.
International Ed. 45 (2006) 4648
[24] X. Li, E. Iglesia, Chem. Eur. J. 13 (2007) 9324
[25] W.J. Toussaint, J. T. Dunn, D.R. Jackson, Ind. Eng. Chem. 39 (1947) 120
[26] R. Le Van Mao, T. My Nguyen, G. P. Mclaughlin, Applied Catal. 48 (1989) 265
[27] D. R. Whitcraft, X. E. Verykios, R. Mutharasan. Ind. Eng. Chem. Process Des.
Dev. 22 (1983) 452
[28] A.T. Aguayo, A.G. Gayubo, A. Atutxa, M. Olazar, J. Bilbao, Ind. Eng. Chem.
Res. 41 (2002) 4216
[29] GZ. Qi, ZK. Xie, WM. Yang, SQ. Zhong, HX. Liu, CF. Zhang, QL. Chen, Fuel
Processing Technology 88 (2007) 437
[30] P. Magnoux, P. Roger, C. Canaff, V. Fouche, N.S. Gnep, M. Guisnet, Stud. Surf.
Sci. Catal. 34 (1987) 317
[31] P. Gallezot, C. Leclercq, M. Guisnet, P. Magnoux, J. Catal. 114 (1987) 100
[32] T. Behrsing, H. Jaeger, J. V. Sanders, Appl. Catal. 54 (1988) 289
Page 9 of 15
Catalysis Letters
Catalysis Letters
1
2
3
4
5
6
7
8
9
10
11
12
13
14
15
16
17
18
19
20
21
22
23
24
25
26
27
28
29
30
31
32
33
34
35
36
37
38
39
40
41
42
43
44
45
46
47
48
49
50
51
52
53
54
55
56
57
58
59
60
For P
eer Review
Scheme 1. A simplified scheme showing the principle behind the hydrocarbon pool model in the methanol-to-gasoline reaction. Methanol reacts with hydrocarbons trapped inside the zeolite giving a charged organic-inorganic hybrid that then loses a smaller fragment giving back the same or a similar hydrocarbon.
Figure 1. Comparison of FID spectra of the gaseous products found in ethanol-to-gasoline reaction and methanol-to-gasoline run at 400 ˚C with a WHSV= 6 h-1. Spectra obtained after 2 h on stream.
Figure 2. FID spectra showing the major condensable products in the ethanol-to-gasoline and the methanol-to- gasoline reactions at 400 ˚C with WHSV=6 h-1. Spectra is showing the organic phase collected over the first 2 hours of reaction.
Figure 3. The major compounds of retained material found within H-ZSM-5 after reaction with either methanol (a) or ethanol (b). Reactions run at 450 ˚C with WHSV = 9 h-1. The truly retained compounds are depicted in the last row in the MTG and in the lower two rows in ETG.
Figure 4. Total ion chromatogram for the retained material in HZSM-5 after addition of ethanol at 450 ˚C with a WHSV of 9 h-1 for (a) 15 minutes, (b) 60 minutes and (c) 120 minutes. *) oxidized form of tetraethyl benzene due to the treatment with hydrofluoric acid.
Page 10 of 15
Catalysis Letters
Catalysis Letters
1
2
3
4
5
6
7
8
9
10
11
12
13
14
15
16
17
18
19
20
21
22
23
24
25
26
27
28
29
30
31
32
33
34
35
36
37
38
39
40
41
42
43
44
45
46
47
48
49
50
51
52
53
54
55
56
57
58
59
60
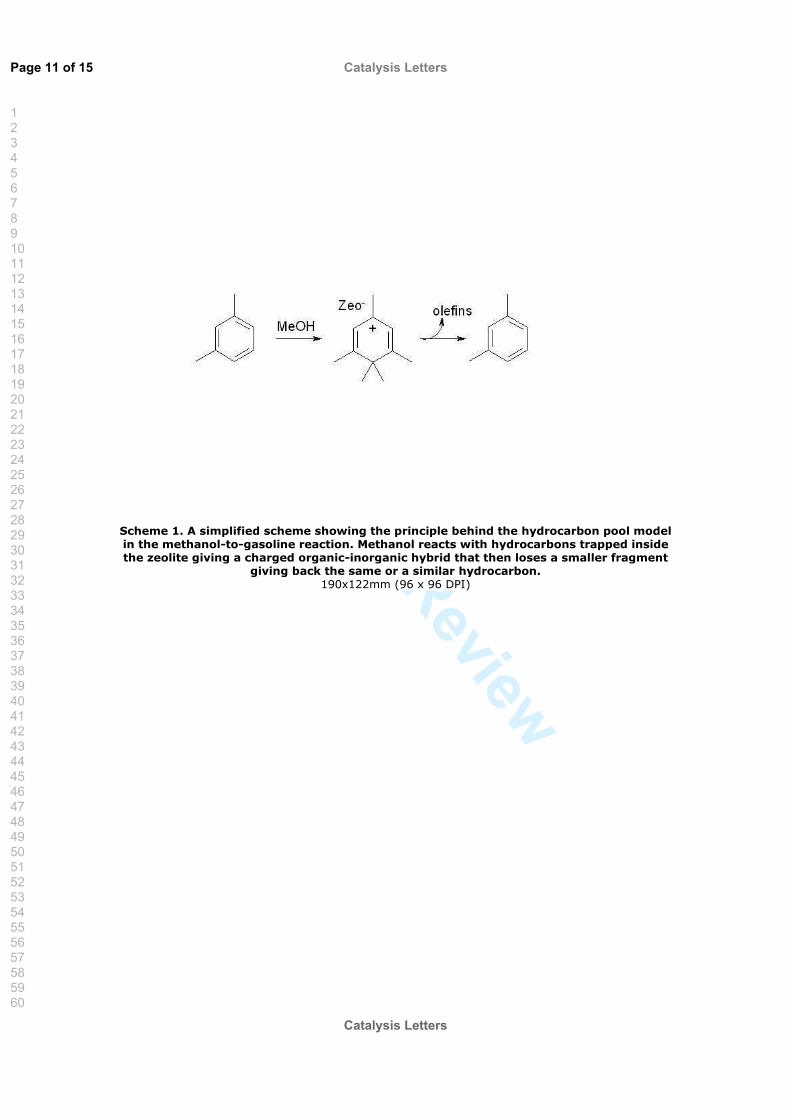
For P
eer Review
Scheme 1. A simplified scheme showing the principle behind the hydrocarbon pool model in the methanol-to-gasoline reaction. Methanol reacts with hydrocarbons trapped inside the zeolite giving a charged organic-inorganic hybrid that then loses a smaller fragment
giving back the same or a similar hydrocarbon. 190x122mm (96 x 96 DPI)
Page 11 of 15
Catalysis Letters
Catalysis Letters
1
2
3
4
5
6
7
8
9
10
11
12
13
14
15
16
17
18
19
20
21
22
23
24
25
26
27
28
29
30
31
32
33
34
35
36
37
38
39
40
41
42
43
44
45
46
47
48
49
50
51
52
53
54
55
56
57
58
59
60
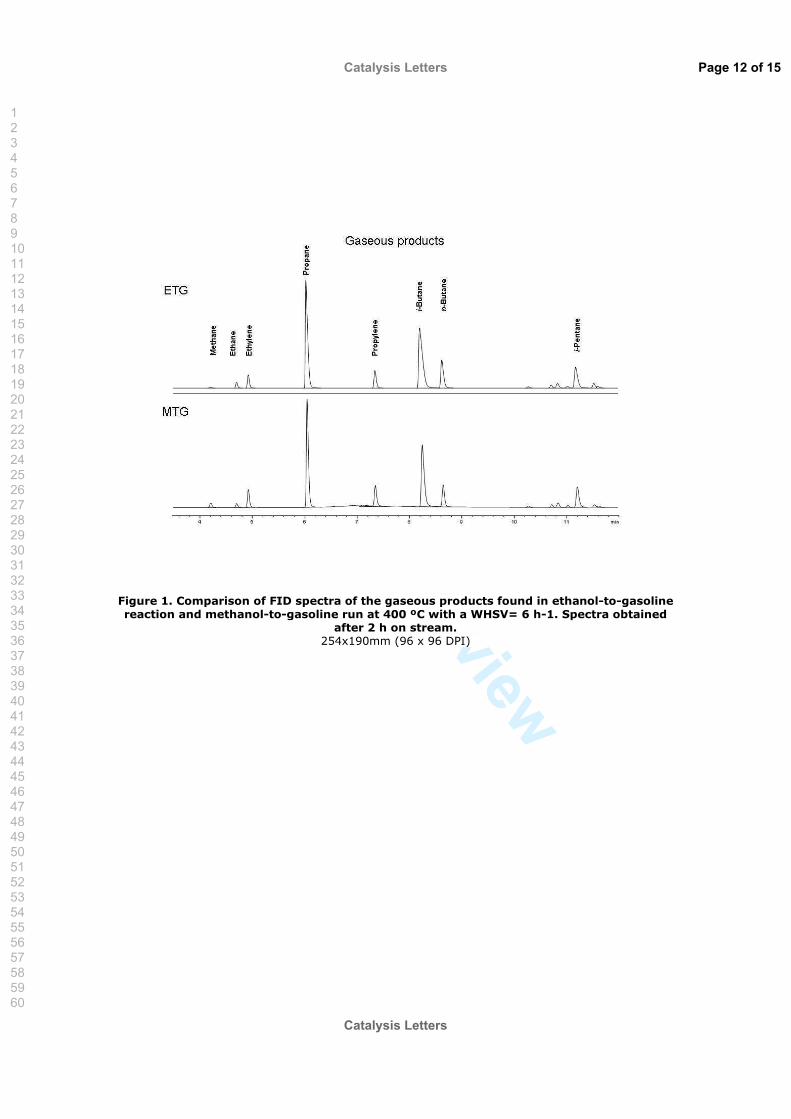
For P
eer Review
Figure 1. Comparison of FID spectra of the gaseous products found in ethanol-to-gasoline reaction and methanol-to-gasoline run at 400 ºC with a WHSV= 6 h-1. Spectra obtained
after 2 h on stream. 254x190mm (96 x 96 DPI)
Page 12 of 15
Catalysis Letters
Catalysis Letters
1
2
3
4
5
6
7
8
9
10
11
12
13
14
15
16
17
18
19
20
21
22
23
24
25
26
27
28
29
30
31
32
33
34
35
36
37
38
39
40
41
42
43
44
45
46
47
48
49
50
51
52
53
54
55
56
57
58
59
60
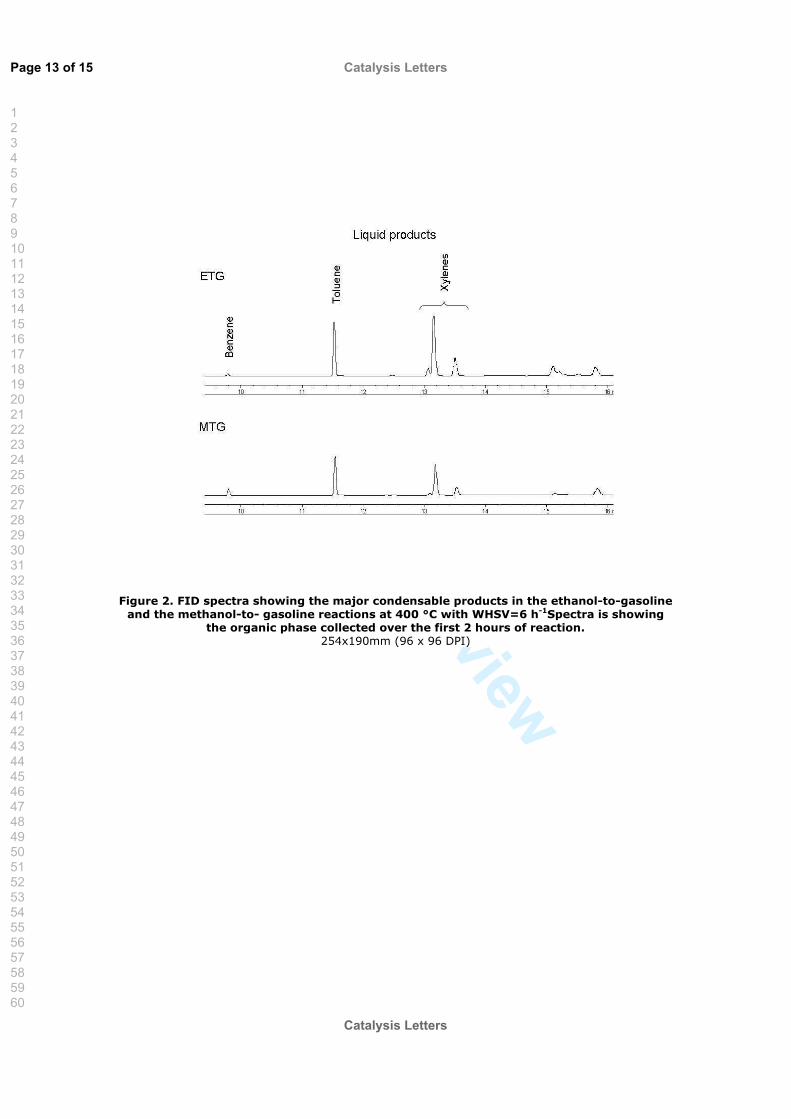
For P
eer Review
Figure 2. FID spectra showing the major condensable products in the ethanol-to-gasoline and the methanol-to- gasoline reactions at 400 °C with WHSV=6 h-1Spectra is showing
the organic phase collected over the first 2 hours of reaction. 254x190mm (96 x 96 DPI)
Page 13 of 15
Catalysis Letters
Catalysis Letters
1
2
3
4
5
6
7
8
9
10
11
12
13
14
15
16
17
18
19
20
21
22
23
24
25
26
27
28
29
30
31
32
33
34
35
36
37
38
39
40
41
42
43
44
45
46
47
48
49
50
51
52
53
54
55
56
57
58
59
60
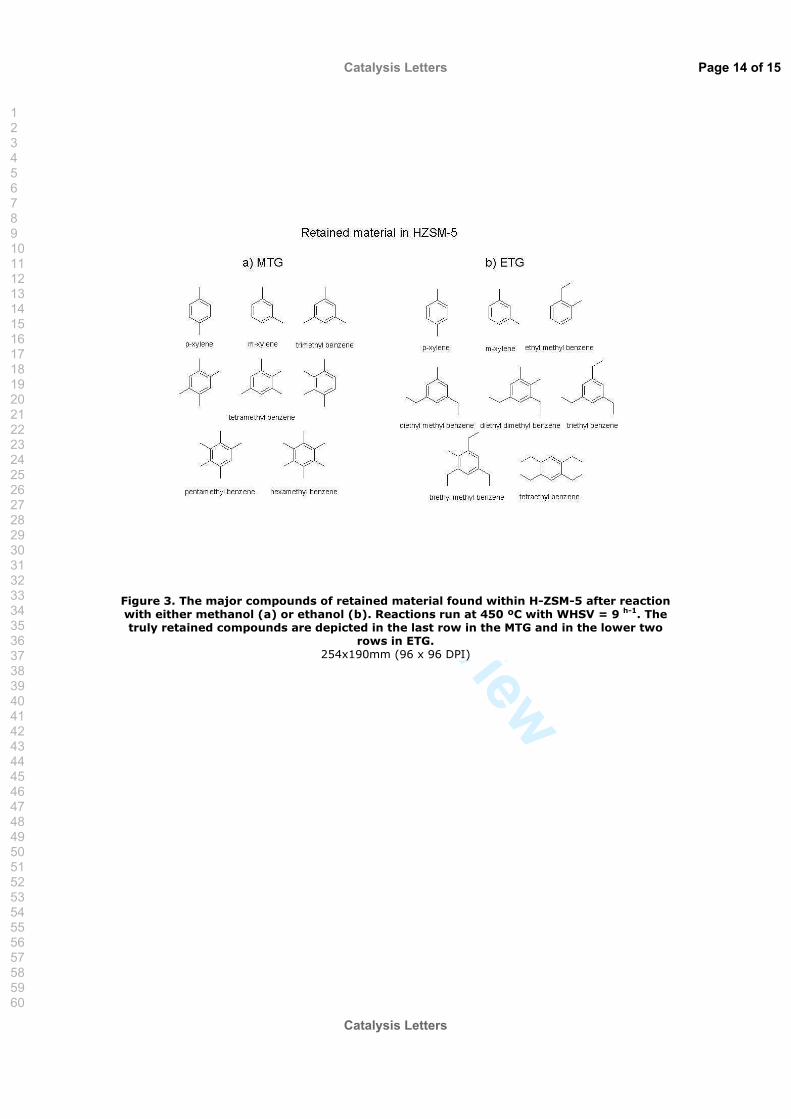
For P
eer Review
Figure 3. The major compounds of retained material found within H-ZSM-5 after reaction with either methanol (a) or ethanol (b). Reactions run at 450 ºC with WHSV = 9 h-1. The truly retained compounds are depicted in the last row in the MTG and in the lower two
rows in ETG. 254x190mm (96 x 96 DPI)
Page 14 of 15
Catalysis Letters
Catalysis Letters
1
2
3
4
5
6
7
8
9
10
11
12
13
14
15
16
17
18
19
20
21
22
23
24
25
26
27
28
29
30
31
32
33
34
35
36
37
38
39
40
41
42
43
44
45
46
47
48
49
50
51
52
53
54
55
56
57
58
59
60
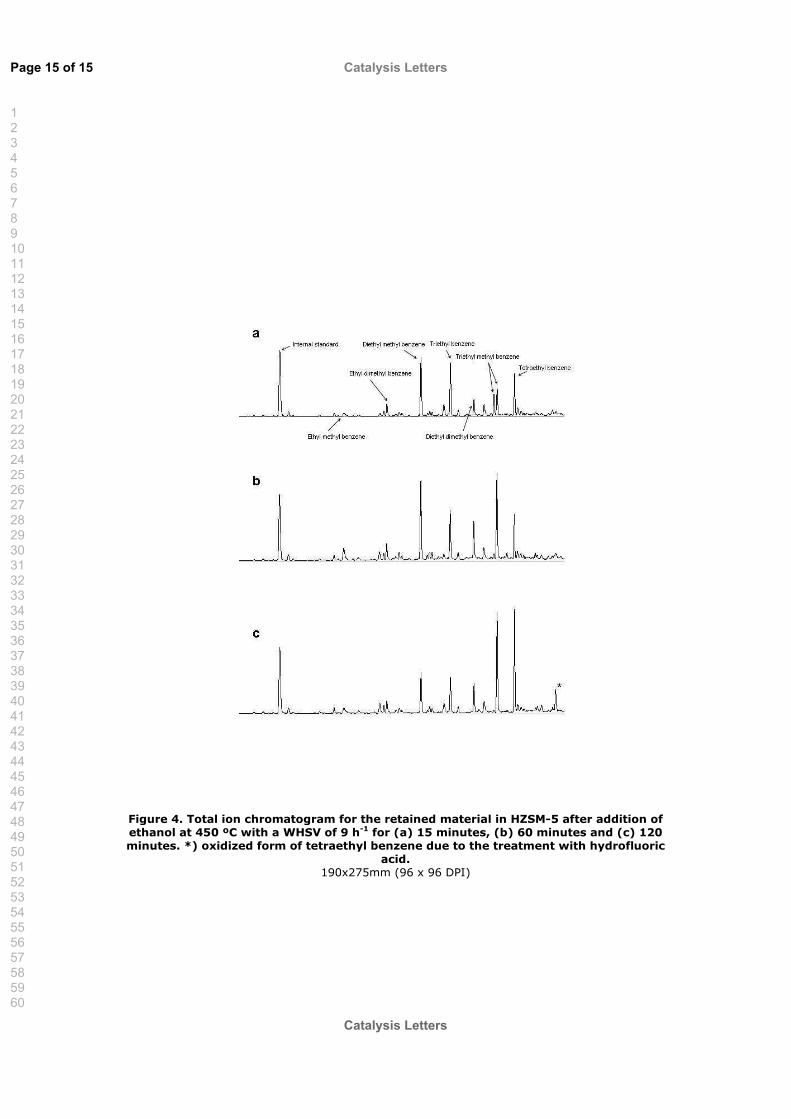
For P
eer Review
Figure 4. Total ion chromatogram for the retained material in HZSM-5 after addition of ethanol at 450 ºC with a WHSV of 9 h-1 for (a) 15 minutes, (b) 60 minutes and (c) 120 minutes. *) oxidized form of tetraethyl benzene due to the treatment with hydrofluoric
acid. 190x275mm (96 x 96 DPI)
Page 15 of 15
Catalysis Letters
Catalysis Letters
1
2
3
4
5
6
7
8
9
10
11
12
13
14
15
16
17
18
19
20
21
22
23
24
25
26
27
28
29
30
31
32
33
34
35
36
37
38
39
40
41
42
43
44
45
46
47
48
49
50
51
52
53
54
55
56
57
58
59
60