frontal callosal fiber integrity selectively predicts coordinated psychomotor performance in chronic...
TRANSCRIPT
Frontal Callosal Fiber Integrity Selectively Predicts CoordinatedPsychomotor Performance in Chronic Alcoholism
Margaret J. Rosenbloom,Neuroscience Program, SRI International, Menlo Park, CA, USA
Department of Psychiatry and Behavioral Sciences, Stanford University School of Medicine, 401Quarry Road, Stanford, CA 94305-5723, USA
Stephanie A. Sassoon,Neuroscience Program, SRI International, Menlo Park, CA, USA
Rosemary Fama,Neuroscience Program, SRI International, Menlo Park, CA, USA
Edith V. Sullivan, andDepartment of Psychiatry and Behavioral Sciences, Stanford University School of Medicine, 401Quarry Road, Stanford, CA 94305-5723, USA
Adolf PfefferbaumNeuroscience Program, SRI International, Menlo Park, CA, USA
Department of Psychiatry and Behavioral Sciences, Stanford University School of Medicine, 401Quarry Road, Stanford, CA 94305-5723, USAMargaret J. Rosenbloom: ; Stephanie A. Sassoon: ; Rosemary Fama: ; Edith V. Sullivan: [email protected]; AdolfPfefferbaum:
AbstractIntroduction—Quantitative fiber tracking with diffusion tensor imaging (DTI) provides a newapproach for assessing deficits in the microstructural integrity of white matter circuits that mayunderlie cognitive deficits associated with conditions affecting white matter, including chronicalcoholism.
Methods—Alcoholic men and women (n=87) and healthy controls (n=88) performed the DigitSymbol (DS) test and underwent structural and diffusion tensor imaging. Measures of fractionalanisotropy (FA) of fibers passing through genu and splenium were computed, as were size of genuand splenium fiber target regions of interest (ROI).
Results—Alcoholics scored lower than controls on the DS and had even greater deficits in genuthan splenium fiber FA. In alcoholics, fiber FA of the genu selectively predicted DS scores afteraccounting for splenium FA. Neither fiber FA measure predicted incidental recall of the symbolsused in the task. Size of genu and splenium ROI, although reduced in alcoholics, did not predict DSscore or incidental recall.
Conclusions—Quantitative tractography of frontal fibers connecting left and right hemispheresselectively predicted performance by alcoholics on a coordinated psychomotor task and provide
© Springer Science + Business Media, LLC 2007Correspondence to: Edith V. Sullivan, [email protected].
NIH Public AccessAuthor ManuscriptBrain Imaging Behav. Author manuscript; available in PMC 2009 July 14.
Published in final edited form as:Brain Imaging Behav. 2008 ; 2(2): 74–83. doi:10.1007/s11682-007-9017-9.
NIH
-PA Author Manuscript
NIH
-PA Author Manuscript
NIH
-PA Author Manuscript
support for frontally based systems in Digit Symbol performance, both of which are compromisedin recovering alcoholics.
KeywordsFiber tractography; Diffusion tensor imaging; Corpus callosum; Alcoholism; Digit Symbol test;Genu; Splenium
IntroductionDemonstration of in vivo selective brain-behavior relationships, particularly in patients whohave diffuse or partial rather than focal or complete brain lesions, is often elusive. Such acondition is alcoholism, in which the characteristic deficits in component processes ofexecutive function, visuospatial function, and balance (Fein et al. 1990; Oscar-Berman 2000;Parsons et al. 1987; Sullivan et al. 2000; Tarter and Alterman 1984) are probably related todisruption of circuits that link fronto-cerebellar neural nodes (Sullivan 2003; Sullivan andPfefferbaum 2005) and provide interhemispheric integration (Schulte et al. 2004) rather thanto focal deficits in specific regions.
Diffusion tensor imaging (DTI) with quantitative tractography provides a powerful tool forassessing the integrity of specific white matter tracks and may be more useful than eitherquantitative measures of regional brain macrostructure or DTI measures of regionalmicrostructural integrity for demonstrating selective brain-behavior relationships. DTI may beparticularly sensitive in the identification of brain substrates of cognitive and motor tasksinvolving interhemispheric integration in alcoholism and other conditions characterized bypartial lesions. A primary measure in DTI is fractional anisotropy (FA), which reflects theextent to which water molecules move in a common restricted orientation in white matter tracts,with higher values representing more consistency, and by implication greater integrity of itsmicrostructural components, such as myelin. Quantitative tractography is a method that extendsthe use of FA, on an intervoxel basis, to visualize and quantify white matter connectivity, i.e.,neural tracts, in the brain.
The corpus callosum, a complex band of white matter fibers linking homologous regions ofleft and right hemispheres (Gazzaniga 2005), is a key structure for integrating functionsbetween the hemispheres. Interhemispheric connections have been demonstrated postmortemin humans (Aboitiz et al. 1992; Gross et al. 1977; Seltzer and Sherwin 1983) and in non-humanprimates (Pandya and Seltzer 1986). Recent in vivo studies using DTI and white matter FAorientational color maps and fiber tractography (Abe et al. 2004; Hofer and Frahm 2006; Huanget al. 2005; Park et al. 2007; Sullivan et al. 2006) are consistent with postmortem studies insuggesting that fibers of the genu, the anterior portion of the corpus callosum, connect left andright ventral prefrontal cortex and parts of the dorsal prefrontal cortex, whereas fibers of thesplenium, the posterior portion of the corpus callosum, connect bilaterally distributed sites ofthe temporal, parietal, and occipital cortices (Pandya and Seltzer 1986). Thus, complete orpartial lesions at the anterior extent of the corpus callosum could affect the execution ofbilaterally distributed executive functions, whereas posterior callosal lesions could affect thetransfer of visuospatial information between hemispheres.
Patients with alcoholism have compromised callosal morphology variously described in vivoand postmortem as “thinning” or reduced area or volume compared with age-matched controls(Cardenas et al. 2007; Estruch et al. 1997; Harper and Kril 1990; Hommer et al. 1996; Lee etal. 2005; Oishi et al. 1999; Pfefferbaum et al. 1996, 2006a). Recent studies quantifying themicrostructural integrity of callosal white matter have found DTI to be more sensitive thanconventional MRI in detecting callosal compromise in alcoholic women (Pfefferbaum and
Rosenbloom et al. Page 2
Brain Imaging Behav. Author manuscript; available in PMC 2009 July 14.
NIH
-PA Author Manuscript
NIH
-PA Author Manuscript
NIH
-PA Author Manuscript
Sullivan 2002). Other DTI studies of patients with a history of chronic heavy alcohol use havenoted a greater predilection for compromised integrity in frontal than posterior callosal regions(Pfefferbaum and Sullivan 2002; Pfefferbaum et al. 2000). Furthermore, a twin study showedthat while genetic influences on regional morphology are similar from anterior to posteriorextent, white matter integrity is more susceptible to environmental than genetic influences inthe anterior portion than in the posterior portion (Pfefferbaum et al. 2001). DTI thus enhancesthe ability to differentiate regional sensitivity of the corpus callosum to the environmental toxinof heavy alcohol consumption.
Both macrostructural size and microstructural DTI measures of the anterior genu of the corpuscallosum based on a region-of-interest approach have been associated with age or alcoholrelated impaired performance on several frontally mediated executive tasks, including TrailMaking and Symbol Digit tests (Jokinen et al. 2007), episodic memory retrieval time (Bucuret al. 2007), and interhemispheric transfer performance (Schulte et al. 2005). These findingssupport the functional significance of the topographic organization of the corpus callosum.Few studies (Pfefferbaum et al. 2007; Sullivan et al. 2006), however, have used quantitativefiber tracking to test for associations and dissociations of selective brain-behavioral relationsthat reflect interhemispheric integration.
The Digit Symbol (DS) subtest of the WAIS-R (Wechsler 1981) has been widely used as a testof psychomotor performance and visual perception in neuropsychological research and clinicalsettings because of its sensitivity to brain insult from trauma, neuropsychiatric disease, andenvironmental toxins including alcohol (Lezak 1995). Patients with alcoholism are commonlyimpaired on the DS (Beatty et al. 2000; Davies et al. 2005; Harris et al. 2003; Hochla et al.1982; Sullivan et al. 2002a; Sullivan et al. 2000), as are many patients with any braindysfunction. Although DS was not designed as an interhemispheric transfer task, coordinationof the executive, visuospatial, motor, and mnemonic processes is required to perform the DStest successfully (Glosser et al. 1977; Joy et al. 2000, 2003a, b; Kaplan et al. 1991) and likelyinvokes frontally-based systems and interhemispheric communication. In support of thispossibility, we recently reported that executive abilities contributed over and above thecontribution of visuospatial, motor, and mnemonic function to prediction of DS scores inpatients with alcoholism (Sassoon et al. 2007).
In the present study, we analyzed the contribution of fiber tractography FA of fiber bundlespassing through the genu and splenium into their left and right hemisphere cortical targets toperformance on the standard DS test. For comparison, we also examined the contribution ofthese brain measures to performance on an incidental recall test of the symbols. Thiscomparison task was used because it permits examination of a non-frontally based functionusing the same material as used for the target coordinated psychomotor test. Based on ourearlier analysis of factors contributing to DS performance (Sassoon et al. 2007), we tested thehypothesis that integrity of fibers crossing at the genu would contribute more to DSperformance than integrity of fibers crossing at the splenium. By contrast, we hypothesizedthat neither genu nor splenium fiber integrity would contribute selectively to incidental recall.
Material and methodsParticipants
We combined data from alcoholic and control participants from two studies in our laboratoryon the effects of chronic alcoholism on brain structure and cognitive and motor abilities. Thefirst study involved only alcoholics and controls (46 alcoholics, 50 controls). The second studyprovided an additional 41 patients with alcoholism and 38 controls. Neuroimaging data fromthe first study (Pfefferbaum et al. 2006a, b; Schulte et al. 2005) and a sample combining subjectsfrom both studies (Pfefferbaum et al. 2006c, 2007; Schulte et al. 2007) have appeared in other
Rosenbloom et al. Page 3
Brain Imaging Behav. Author manuscript; available in PMC 2009 July 14.
NIH
-PA Author Manuscript
NIH
-PA Author Manuscript
NIH
-PA Author Manuscript
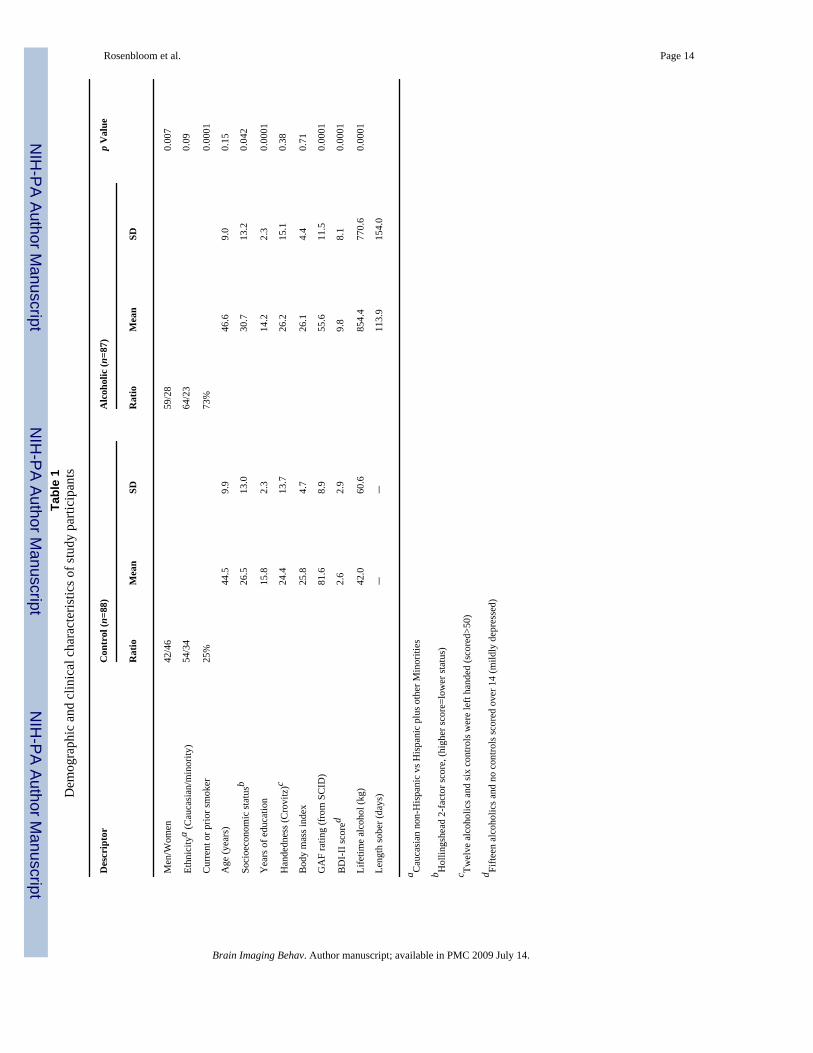
reports. Extensive clinical and demographic descriptions and analysis of the first (Rosenbloomet al. 2005) and second (Rosenbloom et al. 2007) cohorts are also provided elsewhere. Asummary of the demographic characteristics of the 175 men and women in the current analysisappears in Table 1.
Men and women with alcoholism were recruited by referral from several San Francisco BayArea outpatient substance abuse treatment centers. Control subjects were recruited by referralfrom patient participants, by Internet posting, newspaper advertisements, flyers and word ofmouth. Referrals and inquiries were followed up with a brief screening interview designed toidentify subjects who would be ineligible for the study by virtue of a diagnosis of schizophrenia,bipolar disorder, neurological disease not related to alcohol use, or inability to undergo MRI.Those who met initial criteria were invited for a more detailed assessment at our laboratory(Cohort 1) or the AIDS Community Research Consortium (ACRC; Cohort 2), where a trainednurse informed them about the full scope of the study and obtained informed consent.
Clinical evaluationAll alcoholic patients and controls underwent a series of structured interviews designed tocharacterize alcohol history and other pertinent medical and psychiatric information.Admission to or exclusion from the study was based on the Structured Clinical Interview forDSM-IV (SCID) (First et al. 1998), administered by clinicians. Any prospective subject whomet lifetime criteria for schizophrenia or bipolar disorder or for nonalcohol substancedependence or abuse within the prior 3 months was excluded, as were prospective controls thatmet DSM-IV criteria for any other Axis I disorder. All subjects classified as alcoholics metDSM-IV criteria for alcohol dependence. The SCID was also used to rate functioning usingthe Global Assessment of Functioning (GAF) scale (Endicott et al. 1976). All subjects wereHIV negative either by self-reported medical history (Cohort 1) or by blood test (cohort 2). Ahistory of alcohol consumption (Pfefferbaum et al. 1992; Skinner 1982; Skinner and Sheu1982) yielded quantitative lifetime consumption of alcohol and time since last drink. Interviewsand questionnaires assessed current depression symptoms using the Beck Depression Inventory—II (Beck et al. 1996); socioeconomic status (SES) using a two-factor scale based on educationand occupation (Hollingshead and Redlich 1958); handedness (Crovitz and Zener 1962);history of smoking (current, past or never), and body mass index (height, cm/weight kg2), anindex of nutritional status. Statistics of these and other demographic values are presented inTable 1.
MRI acquisition and processingMagnetic resonance imaging (MRI) and diffusion tensor imaging (DTI) protocols were usedto acquire brain data on a General Electric 1.5T system. Methods of acquisition and analysiswere described in detail in our previous report (Pfefferbaum et al. 2007), and are summarizedbriefly here. MRI data were acquired in the coronal plane and included: (1) a dual-echo fastspin echo (FSE) sequence (47 contiguous, 4 mm thick slices; TR/TE1/TE2=7,500/14/98 ms;matrix=256 × 192); and (2) a SPoiled Gradient Recalled Echo (SPGR) sequence (94 2 mmthick slices; TR/TE=25/5 ms, flip angle=30°, matrix=256 × 192) to provide neuroanatomicalcontext for the DTI data. DTI was also acquired in the coronal plane with the same slice locationparameters as the dual-echo FSE, using a single shot spin-echo echo-planar imaging techniquewith a 24 cm field of view (47 contiguous, 4 mm thick slices, TR/TE=10,000/103 ms,matrix=128 × 128, in-plane resolution=1.875 mm2). Diffusion was measured along sixnoncollinear directions with alternating signs to minimize the need to account for cross termsbetween imaging and diffusion gradients. Six images were acquired and averaged for eachgradient direction. The coronal MRI and DTI acquisitions produced either 2 or 4 mm thickslices and were prescribed for consistent slice locations so that each 4-mm slice encompasseda pair of 2 mm thick slices. To align the structural and DTI images, the dual-echo FSE images
Rosenbloom et al. Page 4
Brain Imaging Behav. Author manuscript; available in PMC 2009 July 14.
NIH
-PA Author Manuscript
NIH
-PA Author Manuscript
NIH
-PA Author Manuscript
were passed through the FSL Brain Extraction Tool (BET; Smith 2002) to extract the brainand exclude dura, skull, scalp and other non-brain tissue. Eddy-current correction precededalignment of DTI data with FSE data using a non-linear 3D warp (Woods et al. 1998).
On DTI images, the apparent diffusion coefficient was mapped, and the general diffusion tensorwas then diagonalized, yielding eigenvalues λ1, λ2, λ3 as well as eigenvectors that define thepredominant diffusion orientations. Based on these eigenvalues, fractional anisotropy (FA)was calculated on a voxel-by-voxel basis yielding new images for analysis after alignment withthe anatomical images.
Identification of the corpus callosum and its sectorsAlignment enabled anatomical identification of the corpus callosum in a common space foreach subject from FA images. The corpus callosum was identified on the midsagittal sliceextracted from the FA data with a semi-automated edge identification procedure with highinterrater reliability (r=0.99; Schulte et al. 2004; Sullivan et al. 2002b). Genu and spleniumregions of interest (ROI) were defined geometrically by projecting radii at +15° (genu +rostrum) and +160° (splenium) from the midpoint of a plane connecting the anterior extremeof the genu and the posterior extreme of the splenium and computing the area of these regions.
Quantitative fiber tracking of the genu and spleniumThe genu and splenium ROIs served as targets for fiber tracking. The fiber sources were parallelplanes perpendicular to the midsagittal plane and located 10 mm anterior to the genu targetand 10 mm posterior to the splenium target on the aligned FA data. Targets and sources werethen transformed back to each subject’s coordinates on the native unwarped DTI image andfiber tracking performed for each callosal region of interest separately, using softwaredistributed by Gerig and colleagues (Gerig et al. 2005) based on the method of Mori andcolleagues (Mori and van Zijl 2002; Xu et al. 2002; Xue et al. 1999). This process identifiedindividual fibers for which the FA of each voxel was determined. Quantification yielded thenumber and mean length of fibers coursing through either genu or splenium and mean FA foreach “fiber system.” After fiber detection the fiber locations were transformed back to commoncoordinates for display (Fig. 1).
Behavioral testingDigit Symbol (DS) subtest of the WAIS-R (Wechsler 1981)—Participants werepresented with 93 randomly assigned digits from one to nine, each in a box with a blank boxbelow and were required to fill in the blank box by pairing each digit with a symbol from akey displayed above the grid. The score was the number of boxes correctly completed in 90 s.As previously reported (Sassoon et al. 2007), subjects also completed the entire grid andfollowing a 30 s delay, they were given a sheet containing the nine digits and instructed to fillin the matching symbol for each number from memory.
Statistical analysisGroup differences for brain and behavioral data were assessed with repeated measures analysisof variance (ANOVA) and t-tests. Relations between variables were tested with Pearsonproduct-moment correlations (r). When the association between measures of either genu orsplenium and a behavioral measure was significant, multiple regression analyses were used to
Rosenbloom et al. Page 5
Brain Imaging Behav. Author manuscript; available in PMC 2009 July 14.
NIH
-PA Author Manuscript
NIH
-PA Author Manuscript
NIH
-PA Author Manuscript
examine the relative contribution of genu and splenium measures to predict these cognitivescores. For group comparisons α=.05.
To control for the normal effects of age on white matter fiber integrity (Sullivan et al. 2006),fiber FA measures were converted to age-corrected Z scores, using age effects detected in thelarger control sample (n=120), as described in an earlier report (Pfefferbaum et al. 2007). Genuand splenium areas were converted to both age and brain size corrected Z scores, while DS andincidental recall scores were converted to age- and education-corrected Z scores based on theperformance of the normal control sample.
ResultsGroup differences in number and length of fibers, fiber FA, and region size
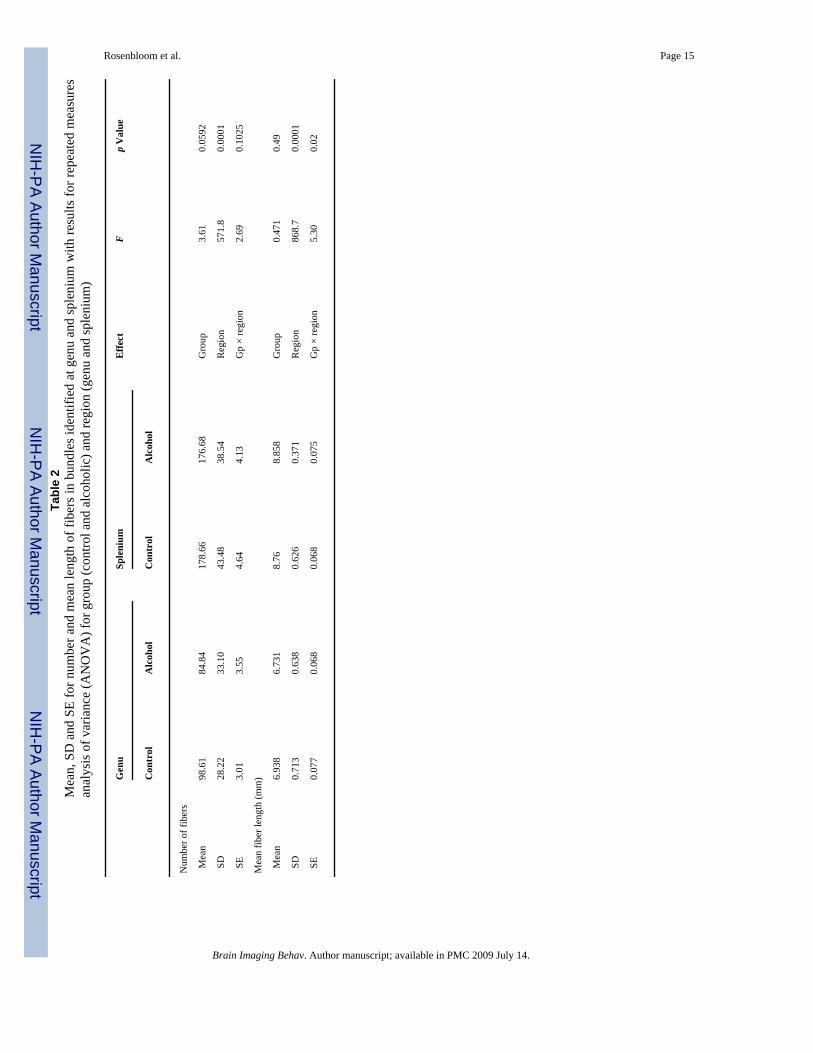
Raw scores for number and mean length of fibers are summarized in Table 2. Significantlymore fibers were identified in the splenium than the genu bundle, with alcoholics showing atrend for fewer fibers than controls. There was no group by region interaction. On average,fibers in the splenium bundle were longer than those in the genu bundle. Groups did not differin fiber length, but alcoholics had longer fibers in the splenium whereas controls had longerfibers in the genu.
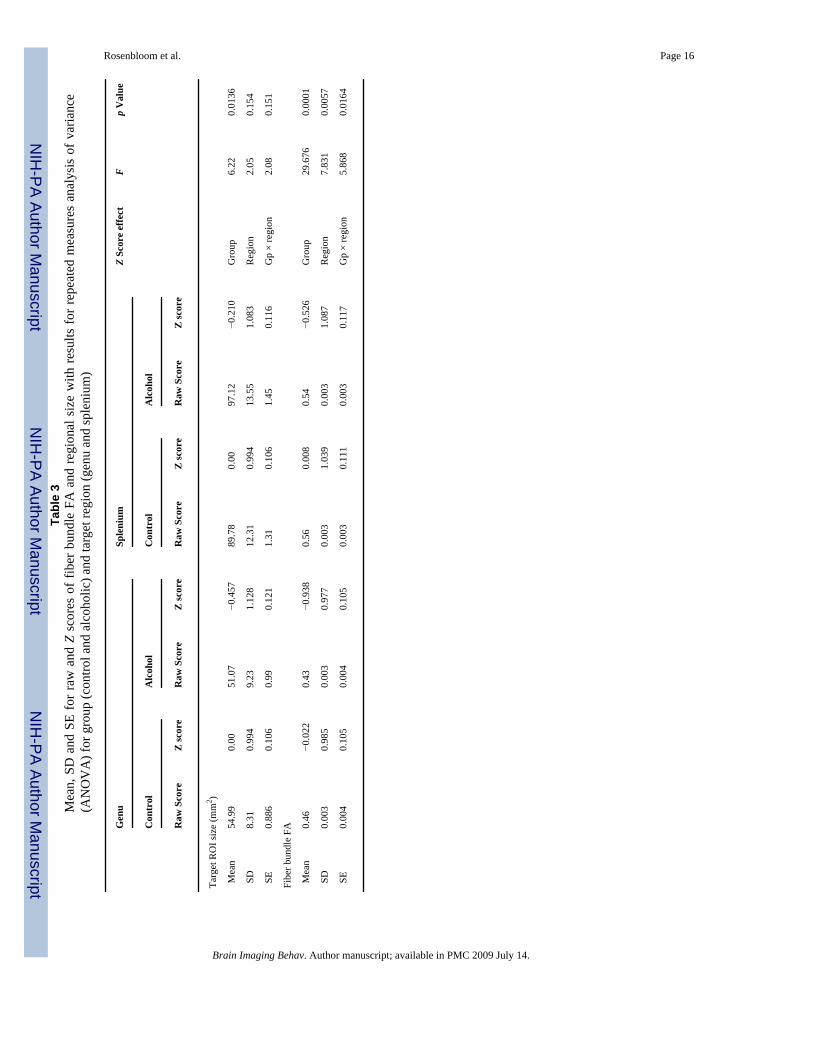
Both raw and age-corrected Z scores for fiber FA and age and intracranial volume correctedsize of the target ROIs are summarized in Table 3. Statistics were performed on the Z scores.Fiber FA was significantly lower in the alcohol group than controls, and the deficit wasdisproportionately greater in the genu than the splenium. Genu and splenium size were bothreduced in alcoholics relative to the controls, with greater deficits at the genu (−0.46 SD) thanthe splenium (−0.21 SD) but the group-by-region interaction was not significant. ANOVAsfor group and sex for fiber FA or size of each region revealed no significant effects for sex orgroup-by-sex interactions.
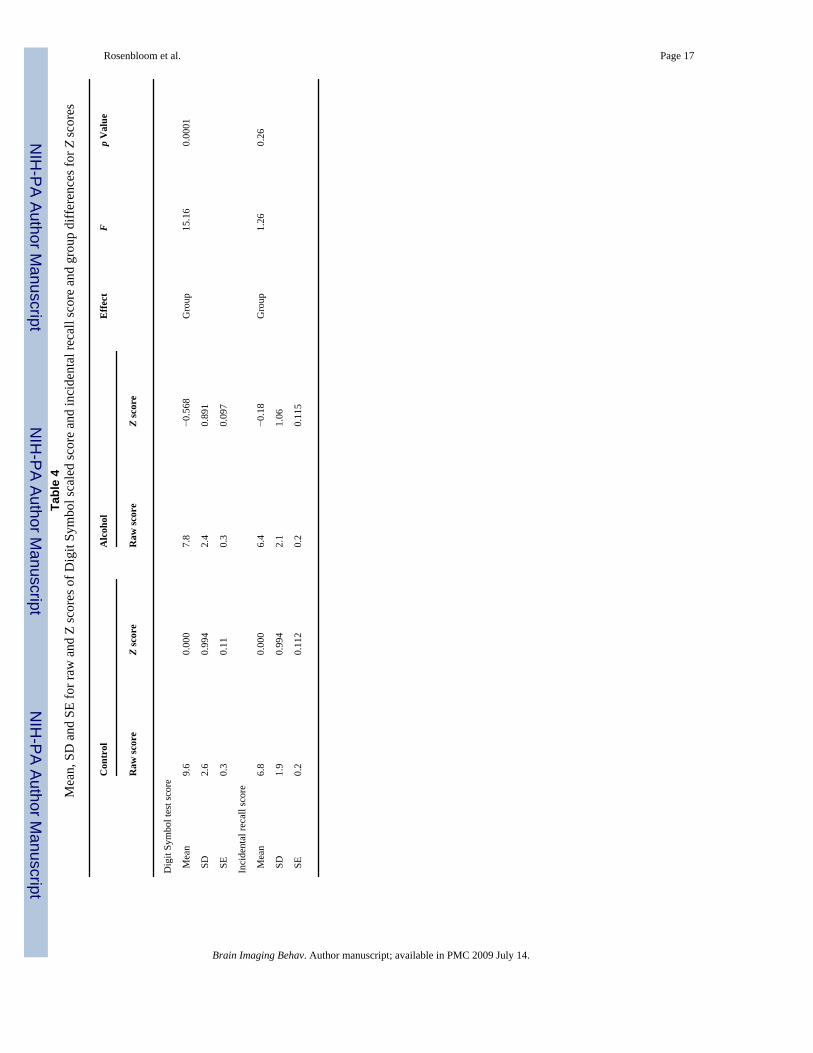
Group differences in DS and incidental recall performanceAlcoholics performed more poorly than controls on the DS test but did not show deficits inincidental recall of the symbols (see Table 4). ANOVAs for group and sex revealed that womenas a whole performed better than men on the DS test (F(1,163)=24.39, p<0.0001), but therewas no sex by diagnosis interaction.
Other contributing factors to callosal fiber or DS measuresGreater lifetime alcohol consumption among the alcoholics modestly correlated with lower DSscore (r=−0.297, p<0.006) but not with fiber FA of the genu or splenium. Length of sobrietybefore testing was not associated with DS, incidental recall, or fiber FA of genu or splenium.Alcoholic patients were significantly more likely (73%) to have ever been a cigarette smokerthan controls (25%; see Table 1). However, among alcoholics, ANOVA for the factor ofnicotine use (never, past, current) did not show a significant effect on fiber FA at eithersplenium (F(2,83)=0.61, p=0.54) or genu (F(2,83)=0.89, p=0.41). Smoking also had no effecton DS performance among the alcoholics (F(2,83)=0.42, p=0.65) and did not account for groupdifferences in DS performance; ANOVA for diagnosis and nicotine use revealed no effect fornicotine use or a diagnosis-by-nicotine use interaction. Half of the alcoholic sample reportedremote (median=3 years) prior abuse or dependence on other substances. However, former-users of other substances were not significantly different from never-users on DS performanceor fiber FA at genu or splenium.
Rosenbloom et al. Page 6
Brain Imaging Behav. Author manuscript; available in PMC 2009 July 14.
NIH
-PA Author Manuscript
NIH
-PA Author Manuscript
NIH
-PA Author Manuscript
Fiber tractography and ROI size predictors of performanceSimple regressions analyzed genu and splenium measures separately as associates ofperformance. Where significant associations were found, both brain measures were enteredinto multiple regressions to see if one measure persisted as a predictor of behavior afteraccounting for the contribution of the other. This analysis does not necessarily imply causalityor a longitudinal process.
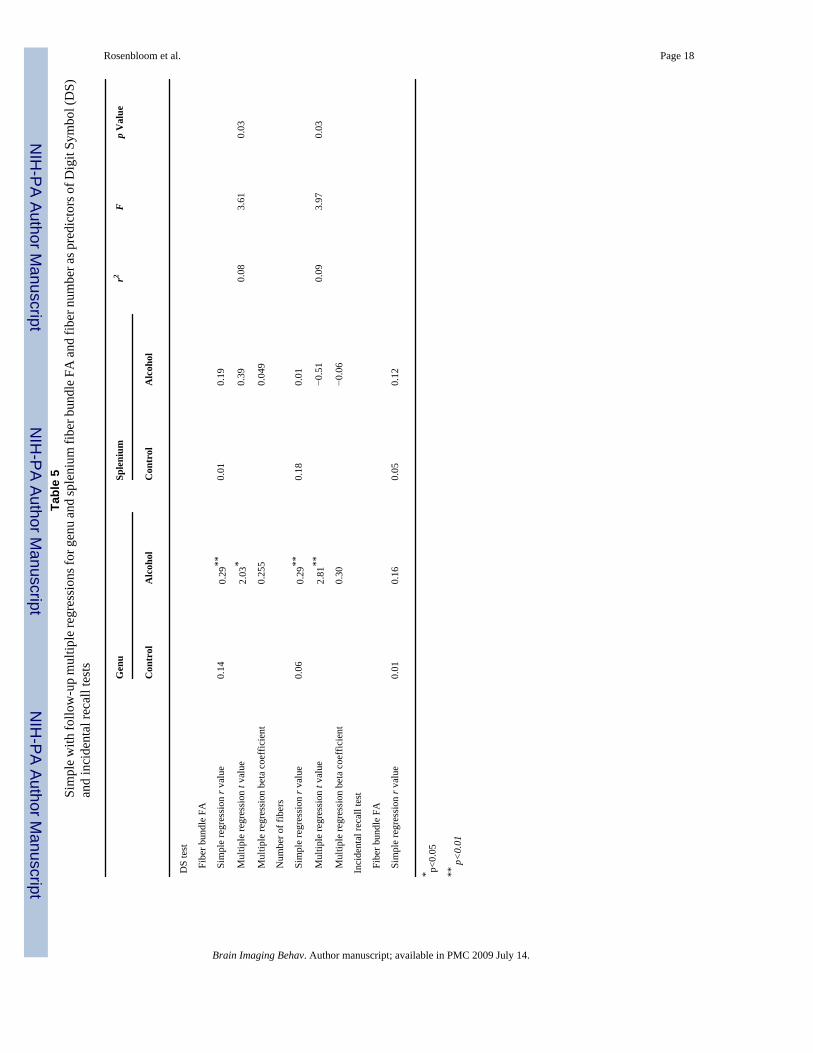
Among the alcoholics, Pearson product-moment correlations showed that higher DS scoreswere significantly associated with higher fiber FA in the genu but not the splenium. A similarpattern of results was found for the absolute number of fibers in the genu and splenial bundles(Table 5 and Fig. 1). By contrast neither genu nor splenium size was associated with DS scorein the control group. Simple and multiple regression results for fiber FA are presented in Table5 and indicated that FA in both these fiber bundles together accounted for 8% of the variancein performance and the contribution of the genu persisted after accounting for that of thesplenium. This genu effect was also seen in alcoholic men (n=59) and women (n=28) examinedalone but was significant only in the larger sample of men.
Neither fiber FA nor size of the genu or splenium ROIs was significantly associated withincidental recall of DS symbols in simple regressions in either alcoholics or controls.
DiscussionThis study provides evidence for a selective relation between DS performance and fiber tractintegrity of the genu of the corpus callosum—specifically, FA of fiber tracking targeted at thegenu predicted coordinated psychomotor performance in chronic alcoholics after accountingfor the contribution from FA of fiber bundles coursing through the splenium. This selectiverelationship demonstrates a predominantly frontal contribution to the DS test, a visually basedpsychomotor task, requiring speeded eye-hand coordinated actions. By contrast, although genuand splenium of the corpus callosum are reduced in size (based on the size of the target ROIs)in patients with alcoholism, neither region size was associated with performance on the DStest.
Higher FA represents more consistency in water molecule diffusion, and by implication greaterintegrity of local white matter. The resolution at which these DTI data were acquired, however,precludes direct axonal measurement. Nonetheless, the fibers identified by the tractographysoftware as passing through the genu putatively link the left and right ventral prefrontal cortexand parts of the dorsal prefrontal cortex, whereas fibers passing through the splenium putativelylink regions of left and right parietal, temporal and occipital cortices. Thus, a positiveassociation of FA in the genu bundle, reflecting the microstructural integrity of those whitematter fibers, with DS performance in alcoholics is consistent with behavioral evidence for astrong executive component to successful DS task performance (Sassoon et al. 2007). Eventhough FA in splenium fibers showed some association with DS task performance in alcoholics,consistent with the visual scanning and associative learning skills required for this task, it didnot contribute independently. Although the DS certainly requires simple psychomotor skills—tracking and filling in the boxes—our analysis suggests that performance also benefits fromhigher order skills, such as directed attention. Performance on the incidental recall task wasnot impaired in the alcoholic patients and, as predicted, was not associated with either genu orsplenium fiber bundle FA. The contrast between fiber tractography and regional size measuresas predictors of behavior suggests the possibility that integrity and number of fibers reachingout into the cortical areas from the corpus callosum, rather than size of the section of corpuscallosum from which they originate better predict performance.
Rosenbloom et al. Page 7
Brain Imaging Behav. Author manuscript; available in PMC 2009 July 14.
NIH
-PA Author Manuscript
NIH
-PA Author Manuscript
NIH
-PA Author Manuscript
A limitation of this study is that the DS task was the only behavioral task available across thisentire subject sample with which to assess the functional ramifications of impaired white matterfiber integrity in genu and splenium of the corpus callosum. The two measures yielded by thistask—number of boxes completed in 90 s and score on incidental recall of the symbols—were,nonetheless, successful in showing differential associations with genu and splenium.
As expected, and regardless of diagnosis, women as a group performed the DS test better thanmen (Snow and Weinstock 1990), but there was no evidence to suggest that group differencesin performance were an artifact of the fact that there were a larger proportion of women in thecontrol sample than in the alcoholic sample. Furthermore, among the alcoholics, similarpatterns of association between DS performance and genu fiber FA were observed in both menand women, albeit with a stronger effect in the larger sample of men.
Functional ramifications of the topographic organization of the corpus callosum in humanshave been studied by administering cognitive tests to patients with callosal lesions resultingfrom relatively discrete trauma (e.g., Peru et al. 2003) to more extensive surgically inducedlesions (e.g., Funnell et al. 2000; Gazzaniga 2005). Such studies have illuminated complexpatterns of interhemispheric communication as well as compensatory mechanisms that developwhen the normal functional connections either fail to develop or are damaged. Recent brainimaging studies using DTI are revealing not only the integrity of the corpus callosum and itsclassically defined subsections, but are redefining those sections in terms of the source andtarget of white matter fiber tracts that course through them (Hofer and Frahm 2006). Theapplication of quantitative tractography also permits the investigation of incomplete lesions inthe corpus callosum, such as those associated with chronic alcohol use, and provides evidencethat impaired integrity of white matter tracks coursing through the genu, the anterior portionof the corpus callosum, contributes to impaired performance on tasks such as the DS that relyon interhemispheric coordination of frontal lobe processes. As new analysis approaches permitgreater specificity in identifying and quantifying the integrity of white matter circuits linkingnot only left and right hemispheres but also cortical-subcortical and anterior-posterior circuitsthey will allow further investigations of the neural underpinnings of a wide range of cognitiveprocessing.
AcknowledgmentThis study was supported by the National Institute on Alcohol Abuse and Alcoholism (AA10723, AA12388,AA05965).
ReferencesAbe O, Masutani Y, Aoki S, Yamasue H, Yamada H, Kasai K, et al. Topography of the human corpus
callosum using diffusion tensor tractography. Journal of Computer Assisted Tomography2004;28:533–539. [PubMed: 15232387]
Aboitiz F, Scheibel A, Fisher R, Zaidel E. Fiber composition of the human corpus callosum. BrainResearch 1992;598:143–153. [PubMed: 1486477]
Beatty W, Tivis R, Stott H, Nixon S, Parsons O. Neuropsychological deficits in sober alcoholics:Influences of chronicity and recent alcohol consumption. Alcoholism: Clinical and ExperimentalResearch 2000;24:149–154.
Beck, AT.; Steer, RA.; Brown, GK. Manual for the Beck Depression Inventory—II. San Antonio, TX:Psychological Corporation; 1996.
Bucur B, Madden DJ, Spaniol J, Provenzale JM, Cabeza R, White LE, et al. Age-related slowing ofmemory retrieval: Contributions of perceptual speed and cerebral white matter integrity. Neurobiologyof Aging. 2007(in press)
Rosenbloom et al. Page 8
Brain Imaging Behav. Author manuscript; available in PMC 2009 July 14.
NIH
-PA Author Manuscript
NIH
-PA Author Manuscript
NIH
-PA Author Manuscript

Cardenas VA, Studholme C, Gazdzinski S, Durazzo TC, Meyerhoff DJ. Deformation-basedmorphometry of brain changes in alcohol dependence and abstinence. NeuroImage 2007;34:879–887.[PubMed: 17127079]
Crovitz HF, Zener KA. Group test for assessing hand and eye dominance. American Journal ofPsychology 1962;75:271–276. [PubMed: 13882420]
Davies SJ, Pandit SA, Feeney A, Stevenson BJ, Kerwin RW, Nutt DJ, et al. Is there cognitive impairmentin clinically ‘healthy’ abstinent alcohol dependence? Alcohol and Alcoholism 2005;40:498–503.[PubMed: 16186142]
Endicott J, Spitzer RL, Fleiss JL, Cohen J. The global assessment scale. A procedure for measuring overallseverity of psychiatric disturbance. Archives of General Psychiatry 1976;33:766–771. [PubMed:938196]
Estruch R, Nicolas JM, Salamero M, Aragon C, Sacanella E, Fernandez-Sola J, et al. Atrophy of thecorpus callosum in chronic alcoholism. Journal of the Neurological Sciences 1997;146:145–151.[PubMed: 9077511]
Fein G, Bachman L, Fisher S, Davenport L. Cognitive impairments in abstinent alcoholics. WesternJournal of Medicine 1990;152:531–537. [PubMed: 2190421]
First, MB.; Spitzer, RL.; Gibbon, M.; Williams, JBW. Structured clinical interview for DSM-IV Axis Idisorders (SCID) version 2.0. New York, NY: Biometrics Research Department, New York StatePsychiatric Institute; 1998.
Funnell MG, Corballis PM, Gazzaniga MS. Insights into the functional specificity of the human corpuscallosum. Brain 2000;123(Pt 5):920–926. [PubMed: 10775537]
Gazzaniga MS. Forty-five years of split-brain research and still going strong. Nature ReviewsNeuroscience 2005;6:653–659.
Gerig, G.; Corouge, I.; Vachet, C.; Krishnan, KR.; MacFall, JR. Quantitative analysis of diffusionproperties of white matter fiber tracts: A validation study; Paper presented at the 13th Proceedingsof the International Society for Magnetic Resonance in Medicine; Miami, FL. 2005.
Glosser G, Butters N, Kaplan E. Visuoperceptual processes in brain damaged patients on the digit symbolsubstitution test. International Journal of Neuroscience 1977;7:59–66. [PubMed: 893004]
Gross CG, Bender DB, Mishkin M. Contributions of the corpus callosum and the anterior commissureto visual activation of inferior temporal neurons. Brain Research 1977;131:227–239. [PubMed:407973]
Harper CG, Kril JJ. Neuropathology of alcoholism. Alcohol and Alcoholism 1990;25:207–216. [PubMed:2198036]
Harris CR, Albaugh B, Goldman D, Enoch MA. Neurocognitive impairment due to chronic alcoholconsumption in an American Indian community. Journal of Studies on Alcohol 2003;64:458–466.[PubMed: 12921187]
Hochla NA, Fabian MS, Parsons OA. Brain-age quotients in recently detoxified alcoholic, recoveredalcoholic and nonalcoholic women. Journal of Clinical Psychology 1982;38:207–212. [PubMed:7056868]
Hofer S, Frahm J. Topography of the human corpus callosum revisited—comprehensive fibertractography using diffusion tensor magnetic resonance imaging. NeuroImage 2006;32:989–994.[PubMed: 16854598]
Hollingshead, A.; Redlich, F. Social class and mental illness. New York: Wiley; 1958.Hommer D, Momenan R, Rawlings R, Ragan P, Williams W, Rio D, et al. Decreased corpus callosum
size among alcoholic women. Archives of Neurology 1996;53:359–363. [PubMed: 8929159]Huang H, Zhang J, Jiang H, Wakana S, Poetscher L, Miller MI, et al. DTI tractography based parcellation
of white matter: Application to the mid-sagittal morphology of corpus callosum. NeuroImage2005;26:195–205. [PubMed: 15862219]
Jokinen H, Ryberg C, Kalska H, Ylikoski R, Rostrup E, Stegmann MB, et al. Corpus callosum atrophyis associated with mental slowing and executive deficits in subjects with age-related white matterhyperintensities: the LADIS Study. Journal of Neurology, Neurosurgery, and Psychiatry2007;78:491–496.
Joy S, Fein D, Kaplan E. Decoding digit symbol: speed, memory, and visual scanning. Assessment 2003a;10:56–65. [PubMed: 12675384]
Rosenbloom et al. Page 9
Brain Imaging Behav. Author manuscript; available in PMC 2009 July 14.
NIH
-PA Author Manuscript
NIH
-PA Author Manuscript
NIH
-PA Author Manuscript
Joy S, Fein D, Kaplan E, Freedman M. Speed and memory in WAIS-R-III digit symbol performanceamong healthy older adults. Journal of the International Neuropsychological Society 2000;6:770–780. [PubMed: 11105467]
Joy S, Kaplan E, Fein D. Digit symbol–incidental learning in the WAIS-III: Construct validity and clinicalsignificance. Clinical Neuropsychology 2003b;17:182–194.
Kaplan, E.; Fein, D.; Morris, R.; Delis, DC. WAIS-R as a neuropsychological instrument. New York:The Psychological Corporation; 1991.
Lee ST, Jung YM, Na DL, Park SH, Kim M. Corpus callosum atrophy in Wernicke's encephalopathy.Journal of Neuroimaging 2005;15:367–372. [PubMed: 16254403]
Lezak, MD. Neuropsychological assessment. Vol. 3rd ed.. New York: Oxford University Press; 1995.Mori S, van Zijl PC. Fiber tracking: Principles and strategies—A technical review. NMR in Biomedicine
2002;15:468–480. [PubMed: 12489096]Oishi M, Mochizuki Y, Shikata E. Corpus callosum atrophy and cerebral blood flow in chronic alcoholics.
Journal of Neurological Sciences 1999;162:51–55.Oscar-Berman, M. Neuropsychological vulnerabilities in chronic alcoholism. In: Noronha, A.; Eckardt,
M.; Warren, K., editors. Review of NIAAA’s neuroscience and behavioral research portfolio,NIAAA research monograph no. 34. Bethesda, MD: National Institutes of Health; 2000. p. 437-472.
Pandya, DN.; Seltzer, B. The topography of commissural fibers. In: Lepore, F.; Ptito, M.; Jasper, HH.,editors. Two hemispheres—one brain: Functions of the corpus callosum. New York: Alan R. Liss,Inc.; 1986. p. 47-74.
Park H-J, Kim JJ, Lee S-K, Seok JH, Chun J, Kim DI, et al. Corpus callosal connection mapping usingcortical gray matter parcellation and DT-MRI. Human Brain Mapping. 2007(in press)
Parsons, OA.; Butters, N.; Nathan, PE., editors. Neuropsychology of alcoholism: Implications fordiagnosis and treatment. New York: Guilford; 1987.
Peru A, Beltramello A, Moro V, Sattibaldi L, Berlucchi G. Temporary and permanent signs ofinterhemispheric disconnection after traumatic brain injury. Neuropsychologia 2003;41:634–643.[PubMed: 12559156]
Pfefferbaum A, Adalsteinsson E, Sullivan EV. Dysmorphology and micro structural degradation of thecorpus callosum: Interaction of age and alcoholism. Neurobiology of Aging 2006a;27:994–1009.[PubMed: 15964101]
Pfefferbaum A, Adalsteinsson E, Sullivan EV. Supratentorial profile of white matter microstructuralintegrity in recovering alcoholic men and women. Biological Psychiatry 2006b;59:364–372.[PubMed: 16125148]
Pfefferbaum A, Lim KO, Desmond JE, Sullivan EV. Thinning of the corpus callosum in older alcoholicmen: A magnetic resonance imaging study. Alcoholism: Clinical and Experimental Research1996;20:752–757.
Pfefferbaum A, Lim KO, Zipursky RB, Mathalon DH, Rosenbloom MJ, Lane B, et al. Brain gray andwhite matter volume loss accelerates with aging in chronic alcoholics: A quantitative MRI study.Alcoholism: Clinical and Experimental Research 1992;16:1078–1089.
Pfefferbaum A, Rosenbloom MJ, Adalsteinsson E, Sullivan EV. Diffusion tensor imaging withquantitative fiber tracking in HIV infection and alcoholism comorbidity: Synergistic white matterdamage. Brain 2007;130:48–64. [PubMed: 16959813]
Pfefferbaum A, Rosenbloom MJ, Rohlfing T, Adalsteinsson E, Kemper CA, Deresinski S, et al.Contribution of alcoholism to brain dysmorphology in HIV infection: Effects on the ventricles andcorpus callosum. NeuroImage 2006c;33:239–251. [PubMed: 16877010]
Pfefferbaum A, Sullivan EV. Microstructural but not macro structural disruption of white matter inwomen with chronic alcoholism. NeuroImage 2002;15:708–718. [PubMed: 11848714]
Pfefferbaum A, Sullivan EV, Carmelli D. Genetic regulation of regional micro structure of the corpuscallosum in late life. Neuroreport 2001;12:1677–1681. [PubMed: 11409738]
Pfefferbaum A, Sullivan EV, Hedehus M, Adalsteinsson E, Lim KO, Moseley M. In vivo detection andfunctional correlates of white matter microstructural disruption in chronic alcoholism. Alcoholism:Clinical and Experimental Research 2000;24:1214–1221.
Rosenbloom et al. Page 10
Brain Imaging Behav. Author manuscript; available in PMC 2009 July 14.
NIH
-PA Author Manuscript
NIH
-PA Author Manuscript
NIH
-PA Author Manuscript
Rosenbloom MJ, O’Reilly A, Sassoon SA, Sullivan EV, Pfefferbaum A. Persistent cognitive deficits incommunity-treated alcoholic men and women volunteering for research: Limited contribution frompsychiatric comorbidity. Journal of Studies on Alcohol 2005;66:254–265. [PubMed: 15957677]
Rosenbloom MJ, Sullivan EV, Sassoon SA, O’Reilly A, Fama R, Kemper CA, et al. Alcoholism, HIVinfection and their comorbidity: Factors affecting self-rated health-related quality of life. Journal ofStudies on Alcohol and Drugs 2007;68:115–125. [PubMed: 17149525]
Sassoon SA, Fama R, Rosenbloom MJ, O'Reilly A, Pfefferbaum A, Sullivan EV. Component cognitiveand motor processes of the digit symbol test: Differential deficits in alcoholism, HIV infection andtheir comorbidity. Alcoholism: Clinical and Experimental Research 2007;31:1315–1324.
Schulte T, Müller-Oehring EM, Pfefferbaum A, Sullivan EV. Callosal compromise differentially affectsconflict processing and attentional allocation in alcoholism, HIV infection, and their comorbidity.Brain Imaging and Behavior. 2007(in press)
Schulte T, Pfefferbaum A, Sullivan EV. Parallel interhemispheric processing in aging and alcoholism:Relation to corpus callosum size. Neuropsychologia 2004;42:257–271. [PubMed: 14644111]
Schulte T, Sullivan EV, Müller-Oehring EM, Adalsteinsson E, Pfefferbaum A. Corpus callosalmicrostructural integrity influences interhemispheric processing: a diffusion tensor imaging study.Cerebral Cortex 2005;15:1384–1392. [PubMed: 15635059]
Seltzer B, Sherwin I. A comparison of clinical features in early and late-onset primary degenerativedementia: One entity or two. Archives of Neurology 1983;40:143–146. [PubMed: 6830452]
Skinner, HA. Development and validation of a lifetime alcohol consumption assessment procedure.Toronto, Canada: Addiction Research Foundation; 1982.
Skinner HA, Sheu WJ. Reliability of alcohol use indices: The lifetime drinking history and the MAST.Journal of Studies on Alcohol 1982;43:1157–1170. [PubMed: 7182675]
Smith S. Fast robust automated brain extraction. Human Brain Mapping 2002;17:143–155. [PubMed:12391568]
Snow WG, Weinstock J. Sex differences among nonbrain-damaged adults on the Wechsler AdultIntelligence Scales: A review of the literature. Journal of Clinical and Experimental Neuropsychology1990;12:873–886. [PubMed: 2286652]
Sullivan EV. Compromised pontocerebellar and cerebellothalamocortical systems: speculations on theircontributions to cognitive and motor impairment in nonamnesic alcoholism. Alcoholism: Clinicaland Experimental Research 2003;27:1409–1419.
Sullivan EV, Adalsteinsson E, Pfefferbaum A. Selective age-related degradation of anterior callosal fiberbundles quantified in vivo with fiber tracking. Cerebral Cortex 2006;16:1030–1039. [PubMed:16207932]
Sullivan EV, Fama R, Rosenbloom MJ, Pfefferbaum A. A profile of neuropsychological deficits inalcoholic women. Neuropsychology 2002a;16:74–83. [PubMed: 11853359]
Sullivan EV, Pfefferbaum A. Neurocircuitry in alcoholism: A substrate of disruption and repair.Psychopharmacology 2005;180:583–594. [PubMed: 15834536]
Sullivan EV, Pfefferbaum A, Adalsteinsson E, Swan GE, Carmelli D. Differential rates of regional changein callosal and ventricular size: A 4-year longitudinal MRI study of elderly men. Cerebral Cortex2002b;12:438–445. [PubMed: 11884358]
Sullivan EV, Rosenbloom MJ, Pfefferbaum A. Pattern of motor and cognitive deficits in detoxifiedalcoholic men. Alcoholism: Clinical and Experimental Research 2000;24:611–621.
Tarter RE, Alterman AI. Neuropsychological deficits in alcoholics: Etiological considerations. Journalof Studies on Alcohol 1984;45:1–9. [PubMed: 6366376]
Wechsler, D. Wechsler Adult Intelligence Scale—Revised. San Antonio, TX: The PsychologicalCorporation; 1981.
Woods RP, Grafton ST, Holmes CJ, Cherry SR, Mazziotta JC. Automated image registration: I. Generalmethods and intrasubject, intramodality validation. Journal of Computer Assisted Tomography1998;22:139–152. [PubMed: 9448779]
Xu D, Mori S, Solaiyappan M, van Zijl PC, Davatzikos C. A framework for callosal fiber distributionanalysis. NeuroImage 2002;17:1131–1143. [PubMed: 12414255]
Rosenbloom et al. Page 11
Brain Imaging Behav. Author manuscript; available in PMC 2009 July 14.
NIH
-PA Author Manuscript
NIH
-PA Author Manuscript
NIH
-PA Author Manuscript

Xue R, van Zijl PC, Crain BL, Solaiyappan M, Mori S. In vivo three-dimensional reconstruction of ratbrain axonal projections by diffusion tensor imaging. Magnetic Resonance in Medicine1999;42:1123–1127. [PubMed: 10571934]
Rosenbloom et al. Page 12
Brain Imaging Behav. Author manuscript; available in PMC 2009 July 14.
NIH
-PA Author Manuscript
NIH
-PA Author Manuscript
NIH
-PA Author Manuscript
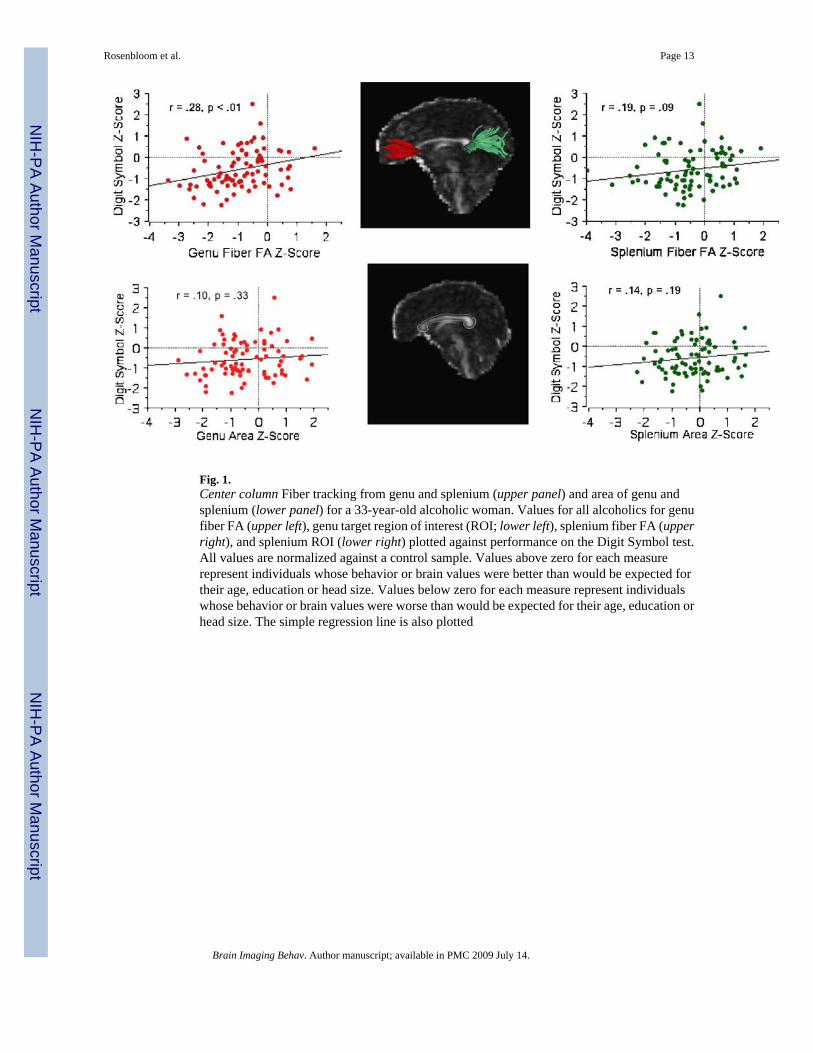
Fig. 1.Center column Fiber tracking from genu and splenium (upper panel) and area of genu andsplenium (lower panel) for a 33-year-old alcoholic woman. Values for all alcoholics for genufiber FA (upper left), genu target region of interest (ROI; lower left), splenium fiber FA (upperright), and splenium ROI (lower right) plotted against performance on the Digit Symbol test.All values are normalized against a control sample. Values above zero for each measurerepresent individuals whose behavior or brain values were better than would be expected fortheir age, education or head size. Values below zero for each measure represent individualswhose behavior or brain values were worse than would be expected for their age, education orhead size. The simple regression line is also plotted
Rosenbloom et al. Page 13
Brain Imaging Behav. Author manuscript; available in PMC 2009 July 14.
NIH
-PA Author Manuscript
NIH
-PA Author Manuscript
NIH
-PA Author Manuscript
NIH
-PA Author Manuscript
NIH
-PA Author Manuscript
NIH
-PA Author Manuscript
Rosenbloom et al. Page 14Ta
ble
1D
emog
raph
ic a
nd c
linic
al c
hara
cter
istic
s of s
tudy
par
ticip
ants
Des
crip
tor
Con
trol
(n=8
8)A
lcoh
olic
(n=8
7)p
Val
ue
Rat
ioM
ean
SDR
atio
Mea
nSD
Men
/Wom
en42
/46
59/2
80.
007
Ethn
icity
a (Cau
casi
an/m
inor
ity)
54/3
464
/23
0.09
Cur
rent
or p
rior s
mok
er25
%73
%0.
0001
Age
(yea
rs)
44.5
9.9
46.6
9.0
0.15
Soci
oeco
nom
ic st
atus
b26
.513
.030
.713
.20.
042
Yea
rs o
f edu
catio
n15
.82.
314
.22.
30.
0001
Han
dedn
ess (
Cro
vitz
)c24
.413
.726
.215
.10.
38
Bod
y m
ass i
ndex
25.8
4.7
26.1
4.4
0.71
GA
F ra
ting
(fro
m S
CID
)81
.68.
955
.611
.50.
0001
BD
I-II
scor
ed2.
62.
99.
88.
10.
0001
Life
time
alco
hol (
kg)
42.0
60.6
854.
477
0.6
0.00
01
Leng
th so
ber (
days
)–
–11
3.9
154.
0
a Cau
casi
an n
on-H
ispa
nic
vs H
ispa
nic
plus
oth
er M
inor
ities
b Hol
lings
head
2-f
acto
r sco
re, (
high
er sc
ore=
low
er st
atus
)
c Twel
ve a
lcoh
olic
s and
six
cont
rols
wer
e le
ft ha
nded
(sco
red>
50)
d Fifte
en a
lcoh
olic
s and
no
cont
rols
scor
ed o
ver 1
4 (m
ildly
dep
ress
ed)
Brain Imaging Behav. Author manuscript; available in PMC 2009 July 14.
NIH
-PA Author Manuscript
NIH
-PA Author Manuscript
NIH
-PA Author Manuscript
Rosenbloom et al. Page 15Ta
ble
2M
ean,
SD
and
SE
for n
umbe
r and
mea
n le
ngth
of f
iber
s in
bun
dles
iden
tifie
d at
gen
u an
d sp
leni
um w
ith re
sults
for r
epea
ted
mea
sure
san
alys
is o
f var
ianc
e (A
NO
VA
) for
gro
up (c
ontro
l and
alc
ohol
ic) a
nd re
gion
(gen
u an
d sp
leni
um)
Gen
uSp
leni
umE
ffect
Fp
Val
ue
Con
trol
Alc
ohol
Con
trol
Alc
ohol
Num
ber o
f fib
ers
Mea
n98
.61
84.8
417
8.66
176.
68G
roup
3.61
0.05
92
SD
28.2
233
.10
43.4
838
.54
Reg
ion
571.
80.
0001
SE
3.01
3.55
4.64
4.13
Gp
× re
gion
2.69
0.10
25
Mea
n fib
er le
ngth
(mm
)
Mea
n6.
938
6.73
18.
768.
858
Gro
up0.
471
0.49
SD
0.71
30.
638
0.62
60.
371
Reg
ion
868.
70.
0001
SE
0.07
70.
068
0.06
80.
075
Gp
× re
gion
5.30
0.02
Brain Imaging Behav. Author manuscript; available in PMC 2009 July 14.
NIH
-PA Author Manuscript
NIH
-PA Author Manuscript
NIH
-PA Author Manuscript
Rosenbloom et al. Page 16Ta
ble
3M
ean,
SD
and
SE
for r
aw a
nd Z
sco
res
of fi
ber b
undl
e FA
and
regi
onal
siz
e w
ith re
sults
for r
epea
ted
mea
sure
s an
alys
is o
f var
ianc
e(A
NO
VA
) for
gro
up (c
ontro
l and
alc
ohol
ic) a
nd ta
rget
regi
on (g
enu
and
sple
nium
)
Gen
uSp
leni
umZ
Scor
e ef
fect
Fp
Val
ue
Con
trol
Alc
ohol
Con
trol
Alc
ohol
Raw
Sco
reZ
scor
eR
aw S
core
Z sc
ore
Raw
Sco
reZ
scor
eR
aw S
core
Z sc
ore
Targ
et R
OI s
ize
(mm
2 )
Mea
n54
.99
0.00
51.0
7−0
.457
89.7
80.
0097
.12
−0.2
10G
roup
6.22
0.01
36
SD
8.31
0.99
49.
231.
128
12.3
10.
994
13.5
51.
083
Reg
ion
2.05
0.15
4
SE
0.88
60.
106
0.99
0.12
11.
310.
106
1.45
0.11
6G
p ×
regi
on2.
080.
151
Fibe
r bun
dle
FA
Mea
n0.
46−0
.022
0.43
−0.9
380.
560.
008
0.54
−0.5
26G
roup
29.6
760.
0001
SD
0.00
30.
985
0.00
30.
977
0.00
31.
039
0.00
31.
087
Reg
ion
7.83
10.
0057
SE
0.00
40.
105
0.00
40.
105
0.00
30.
111
0.00
30.
117
Gp
× re
gion
5.86
80.
0164
Brain Imaging Behav. Author manuscript; available in PMC 2009 July 14.
NIH
-PA Author Manuscript
NIH
-PA Author Manuscript
NIH
-PA Author Manuscript
Rosenbloom et al. Page 17Ta
ble
4M
ean,
SD
and
SE
for r
aw a
nd Z
scor
es o
f Dig
it Sy
mbo
l sca
led
scor
e an
d in
cide
ntal
reca
ll sc
ore
and
grou
p di
ffer
ence
s for
Z sc
ores
Con
trol
Alc
ohol
Effe
ctF
p V
alue
Raw
scor
eZ
scor
eR
aw sc
ore
Z sc
ore
Dig
it Sy
mbo
l tes
t sco
re
Mea
n9.
60.
000
7.8
−0.5
68G
roup
15.1
60.
0001
SD
2.6
0.99
42.
40.
891
SE
0.3
0.11
0.3
0.09
7
Inci
dent
al re
call
scor
e
Mea
n6.
80.
000
6.4
−0.1
8G
roup
1.26
0.26
SD
1.9
0.99
42.
11.
06
SE
0.2
0.11
20.
20.
115
Brain Imaging Behav. Author manuscript; available in PMC 2009 July 14.
NIH
-PA Author Manuscript
NIH
-PA Author Manuscript
NIH
-PA Author Manuscript
Rosenbloom et al. Page 18Ta
ble
5Si
mpl
e w
ith fo
llow
-up
mul
tiple
regr
essi
ons f
or g
enu
and
sple
nium
fibe
r bun
dle
FA a
nd fi
ber n
umbe
r as p
redi
ctor
s of D
igit
Sym
bol (
DS)
and
inci
dent
al re
call
test
s
Gen
uSp
leni
umr2
Fp
Val
ue
Con
trol
Alc
ohol
Con
trol
Alc
ohol
DS
test
Fib
er b
undl
e FA
Sim
ple
regr
essi
on r
valu
e0.
140.
29**
0.01
0.19
Mul
tiple
regr
essi
on t
valu
e2.
03*
0.39
0.08
3.61
0.03
Mul
tiple
regr
essi
on b
eta
coef
ficie
nt0.
255
0.04
9
Num
ber o
f fib
ers
Sim
ple
regr
essi
on r
valu
e0.
060.
29**
0.18
0.01
Mul
tiple
regr
essi
on t
valu
e2.
81**
−0.5
10.
093.
970.
03
Mul
tiple
regr
essi
on b
eta
coef
ficie
nt0.
30−0
.06
Inci
dent
al re
call
test
Fib
er b
undl
e FA
Sim
ple
regr
essi
on r
valu
e0.
010.
160.
050.
12
* p<0.
05
** p
<0.
01
Brain Imaging Behav. Author manuscript; available in PMC 2009 July 14.