fripp inlet, south carolina timothy w. kana p
TRANSCRIPT
1
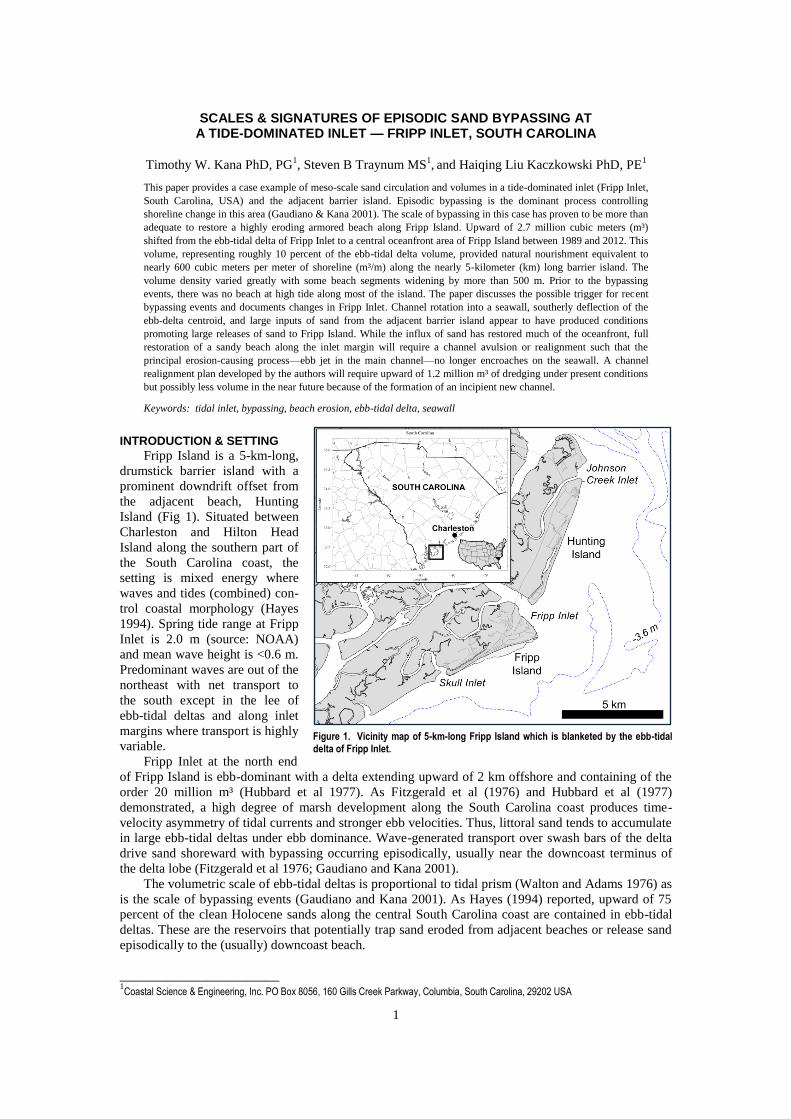
Figure 1. Vicinity map of 5-km-long Fripp Island which is blanketed by the ebb-tidal delta of Fripp Inlet.
SCALES & SIGNATURES OF EPISODIC SAND BYPASSING AT A TIDE-DOMINATED INLET — FRIPP INLET, SOUTH CAROLINA
Timothy W. Kana PhD, PG1, Steven B Traynum MS
1, and Haiqing Liu Kaczkowski PhD, PE
1
This paper provides a case example of meso-scale sand circulation and volumes in a tide-dominated inlet (Fripp Inlet,
South Carolina, USA) and the adjacent barrier island. Episodic bypassing is the dominant process controlling
shoreline change in this area (Gaudiano & Kana 2001). The scale of bypassing in this case has proven to be more than
adequate to restore a highly eroding armored beach along Fripp Island. Upward of 2.7 million cubic meters (m³)
shifted from the ebb-tidal delta of Fripp Inlet to a central oceanfront area of Fripp Island between 1989 and 2012. This
volume, representing roughly 10 percent of the ebb-tidal delta volume, provided natural nourishment equivalent to
nearly 600 cubic meters per meter of shoreline (m³/m) along the nearly 5-kilometer (km) long barrier island. The
volume density varied greatly with some beach segments widening by more than 500 m. Prior to the bypassing
events, there was no beach at high tide along most of the island. The paper discusses the possible trigger for recent
bypassing events and documents changes in Fripp Inlet. Channel rotation into a seawall, southerly deflection of the
ebb-delta centroid, and large inputs of sand from the adjacent barrier island appear to have produced conditions
promoting large releases of sand to Fripp Island. While the influx of sand has restored much of the oceanfront, full
restoration of a sandy beach along the inlet margin will require a channel avulsion or realignment such that the
principal erosion-causing process—ebb jet in the main channel—no longer encroaches on the seawall. A channel
realignment plan developed by the authors will require upward of 1.2 million m³ of dredging under present conditions
but possibly less volume in the near future because of the formation of an incipient new channel.
Keywords: tidal inlet, bypassing, beach erosion, ebb-tidal delta, seawall
INTRODUCTION & SETTING
Fripp Island is a 5-km-long,
drumstick barrier island with a
prominent downdrift offset from
the adjacent beach, Hunting
Island (Fig 1). Situated between
Charleston and Hilton Head
Island along the southern part of
the South Carolina coast, the
setting is mixed energy where
waves and tides (combined) con-
trol coastal morphology (Hayes
1994). Spring tide range at Fripp
Inlet is 2.0 m (source: NOAA)
and mean wave height is <0.6 m.
Predominant waves are out of the
northeast with net transport to
the south except in the lee of
ebb-tidal deltas and along inlet
margins where transport is highly
variable.
Fripp Inlet at the north end
of Fripp Island is ebb-dominant with a delta extending upward of 2 km offshore and containing of the
order 20 million m³ (Hubbard et al 1977). As Fitzgerald et al (1976) and Hubbard et al (1977)
demonstrated, a high degree of marsh development along the South Carolina coast produces time-
velocity asymmetry of tidal currents and stronger ebb velocities. Thus, littoral sand tends to accumulate
in large ebb-tidal deltas under ebb dominance. Wave-generated transport over swash bars of the delta
drive sand shoreward with bypassing occurring episodically, usually near the downcoast terminus of
the delta lobe (Fitzgerald et al 1976; Gaudiano and Kana 2001).
The volumetric scale of ebb-tidal deltas is proportional to tidal prism (Walton and Adams 1976) as
is the scale of bypassing events (Gaudiano and Kana 2001). As Hayes (1994) reported, upward of 75
percent of the clean Holocene sands along the central South Carolina coast are contained in ebb-tidal
deltas. These are the reservoirs that potentially trap sand eroded from adjacent beaches or release sand
episodically to the (usually) downcoast beach.
________________________ 1Coastal Science & Engineering, Inc. PO Box 8056, 160 Gills Creek Parkway, Columbia, South Carolina, 29202 USA
COASTAL ENGINEERING 2014 2
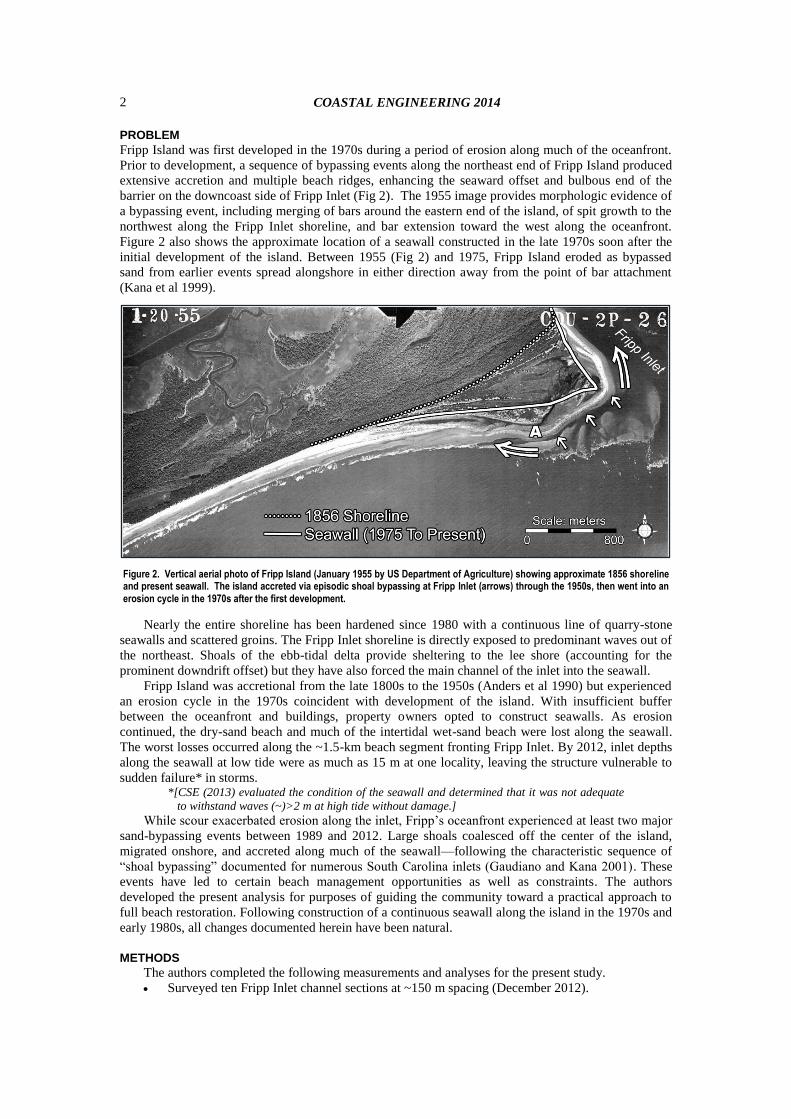
Figure 2. Vertical aerial photo of Fripp Island (January 1955 by US Department of Agriculture) showing approximate 1856 shoreline and present seawall. The island accreted via episodic shoal bypassing at Fripp Inlet (arrows) through the 1950s, then went into an erosion cycle in the 1970s after the first development.
PROBLEM
Fripp Island was first developed in the 1970s during a period of erosion along much of the oceanfront.
Prior to development, a sequence of bypassing events along the northeast end of Fripp Island produced
extensive accretion and multiple beach ridges, enhancing the seaward offset and bulbous end of the
barrier on the downcoast side of Fripp Inlet (Fig 2). The 1955 image provides morphologic evidence of
a bypassing event, including merging of bars around the eastern end of the island, of spit growth to the
northwest along the Fripp Inlet shoreline, and bar extension toward the west along the oceanfront.
Figure 2 also shows the approximate location of a seawall constructed in the late 1970s soon after the
initial development of the island. Between 1955 (Fig 2) and 1975, Fripp Island eroded as bypassed
sand from earlier events spread alongshore in either direction away from the point of bar attachment
(Kana et al 1999).
Nearly the entire shoreline has been hardened since 1980 with a continuous line of quarry-stone
seawalls and scattered groins. The Fripp Inlet shoreline is directly exposed to predominant waves out of
the northeast. Shoals of the ebb-tidal delta provide sheltering to the lee shore (accounting for the
prominent downdrift offset) but they have also forced the main channel of the inlet into the seawall.
Fripp Island was accretional from the late 1800s to the 1950s (Anders et al 1990) but experienced
an erosion cycle in the 1970s coincident with development of the island. With insufficient buffer
between the oceanfront and buildings, property owners opted to construct seawalls. As erosion
continued, the dry-sand beach and much of the intertidal wet-sand beach were lost along the seawall.
The worst losses occurred along the ~1.5-km beach segment fronting Fripp Inlet. By 2012, inlet depths
along the seawall at low tide were as much as 15 m at one locality, leaving the structure vulnerable to
sudden failure* in storms. *[CSE (2013) evaluated the condition of the seawall and determined that it was not adequate
to withstand waves (~)>2 m at high tide without damage.]
While scour exacerbated erosion along the inlet, Fripp’s oceanfront experienced at least two major
sand-bypassing events between 1989 and 2012. Large shoals coalesced off the center of the island,
migrated onshore, and accreted along much of the seawall—following the characteristic sequence of
“shoal bypassing” documented for numerous South Carolina inlets (Gaudiano and Kana 2001). These
events have led to certain beach management opportunities as well as constraints. The authors
developed the present analysis for purposes of guiding the community toward a practical approach to
full beach restoration. Following construction of a continuous seawall along the island in the 1970s and
early 1980s, all changes documented herein have been natural.
METHODS
The authors completed the following measurements and analyses for the present study.
Surveyed ten Fripp Inlet channel sections at ~150 m spacing (December 2012).
COASTAL ENGINEERING 2014
3
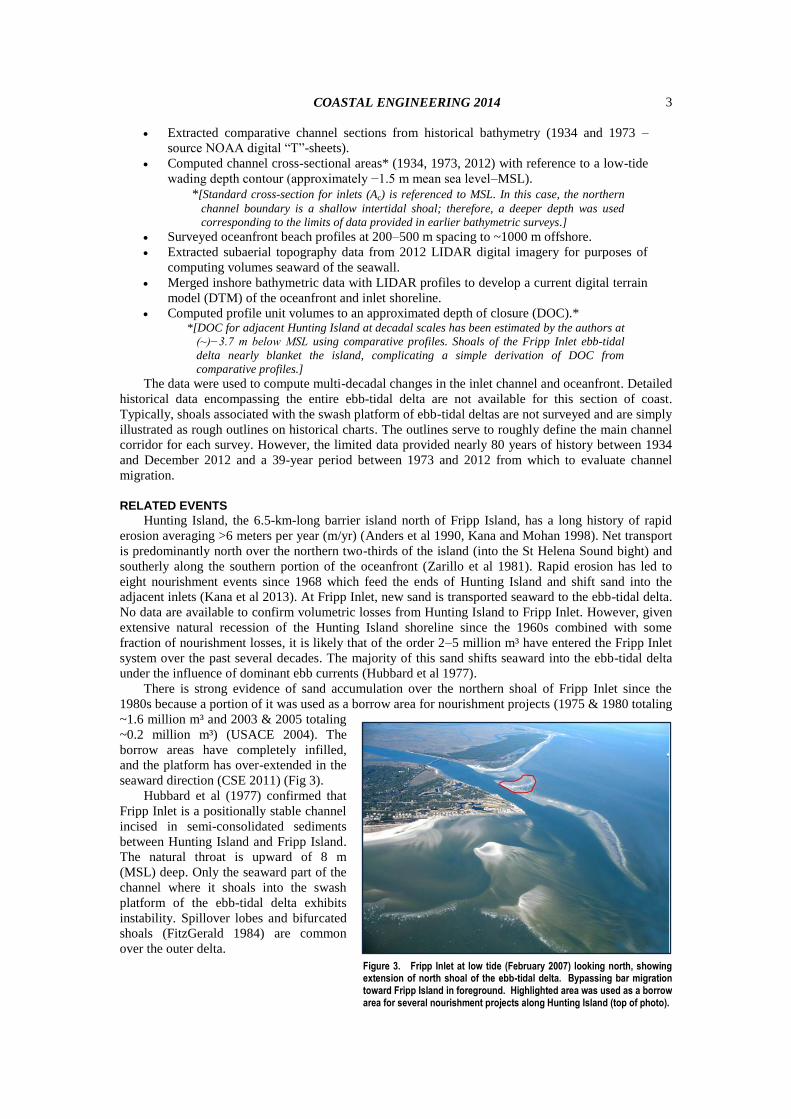
Figure 3. Fripp Inlet at low tide (February 2007) looking north, showing extension of north shoal of the ebb-tidal delta. Bypassing bar migration toward Fripp Island in foreground. Highlighted area was used as a borrow area for several nourishment projects along Hunting Island (top of photo).
Extracted comparative channel sections from historical bathymetry (1934 and 1973 –
source NOAA digital “T”-sheets).
Computed channel cross-sectional areas* (1934, 1973, 2012) with reference to a low-tide
wading depth contour (approximately −1.5 m mean sea level–MSL).
*[Standard cross-section for inlets (Ac) is referenced to MSL. In this case, the northern
channel boundary is a shallow intertidal shoal; therefore, a deeper depth was used
corresponding to the limits of data provided in earlier bathymetric surveys.] Surveyed oceanfront beach profiles at 200–500 m spacing to ~1000 m offshore.
Extracted subaerial topography data from 2012 LIDAR digital imagery for purposes of
computing volumes seaward of the seawall.
Merged inshore bathymetric data with LIDAR profiles to develop a current digital terrain
model (DTM) of the oceanfront and inlet shoreline.
Computed profile unit volumes to an approximated depth of closure (DOC).* *[DOC for adjacent Hunting Island at decadal scales has been estimated by the authors at
(~)−3.7 m below MSL using comparative profiles. Shoals of the Fripp Inlet ebb-tidal
delta nearly blanket the island, complicating a simple derivation of DOC from
comparative profiles.]
The data were used to compute multi-decadal changes in the inlet channel and oceanfront. Detailed
historical data encompassing the entire ebb-tidal delta are not available for this section of coast.
Typically, shoals associated with the swash platform of ebb-tidal deltas are not surveyed and are simply
illustrated as rough outlines on historical charts. The outlines serve to roughly define the main channel
corridor for each survey. However, the limited data provided nearly 80 years of history between 1934
and December 2012 and a 39-year period between 1973 and 2012 from which to evaluate channel
migration.
RELATED EVENTS
Hunting Island, the 6.5-km-long barrier island north of Fripp Island, has a long history of rapid
erosion averaging >6 meters per year (m/yr) (Anders et al 1990, Kana and Mohan 1998). Net transport
is predominantly north over the northern two-thirds of the island (into the St Helena Sound bight) and
southerly along the southern portion of the oceanfront (Zarillo et al 1981). Rapid erosion has led to
eight nourishment events since 1968 which feed the ends of Hunting Island and shift sand into the
adjacent inlets (Kana et al 2013). At Fripp Inlet, new sand is transported seaward to the ebb-tidal delta.
No data are available to confirm volumetric losses from Hunting Island to Fripp Inlet. However, given
extensive natural recession of the Hunting Island shoreline since the 1960s combined with some
fraction of nourishment losses, it is likely that of the order 2–5 million m³ have entered the Fripp Inlet
system over the past several decades. The majority of this sand shifts seaward into the ebb-tidal delta
under the influence of dominant ebb currents (Hubbard et al 1977).
There is strong evidence of sand accumulation over the northern shoal of Fripp Inlet since the
1980s because a portion of it was used as a borrow area for nourishment projects (1975 & 1980 totaling
~1.6 million m³ and 2003 & 2005 totaling
~0.2 million m³) (USACE 2004). The
borrow areas have completely infilled,
and the platform has over-extended in the
seaward direction (CSE 2011) (Fig 3).
Hubbard et al (1977) confirmed that
Fripp Inlet is a positionally stable channel
incised in semi-consolidated sediments
between Hunting Island and Fripp Island.
The natural throat is upward of 8 m
(MSL) deep. Only the seaward part of the
channel where it shoals into the swash
platform of the ebb-tidal delta exhibits
instability. Spillover lobes and bifurcated
shoals (FitzGerald 1984) are common
over the outer delta.
COASTAL ENGINEERING 2014 4
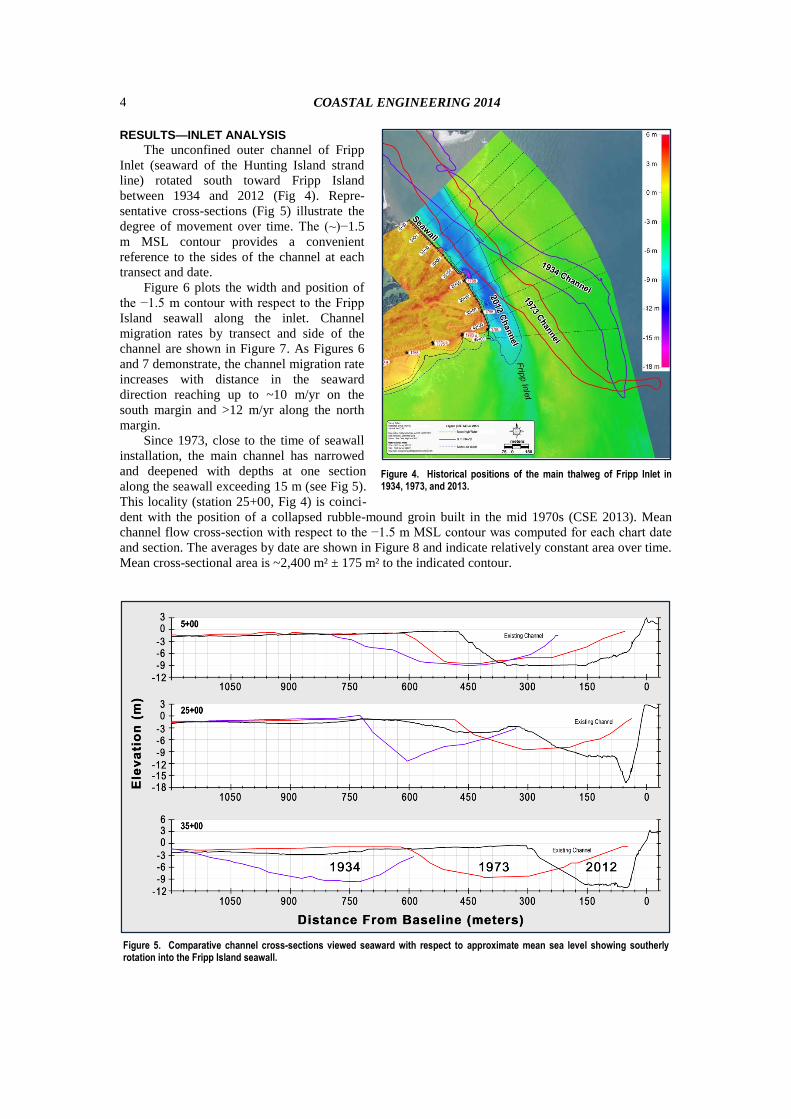
Figure 4. Historical positions of the main thalweg of Fripp Inlet in 1934, 1973, and 2013.
Figure 5. Comparative channel cross-sections viewed seaward with respect to approximate mean sea level showing southerly rotation into the Fripp Island seawall.
RESULTS—INLET ANALYSIS
The unconfined outer channel of Fripp
Inlet (seaward of the Hunting Island strand
line) rotated south toward Fripp Island
between 1934 and 2012 (Fig 4). Repre-
sentative cross-sections (Fig 5) illustrate the
degree of movement over time. The (~)−1.5
m MSL contour provides a convenient
reference to the sides of the channel at each
transect and date.
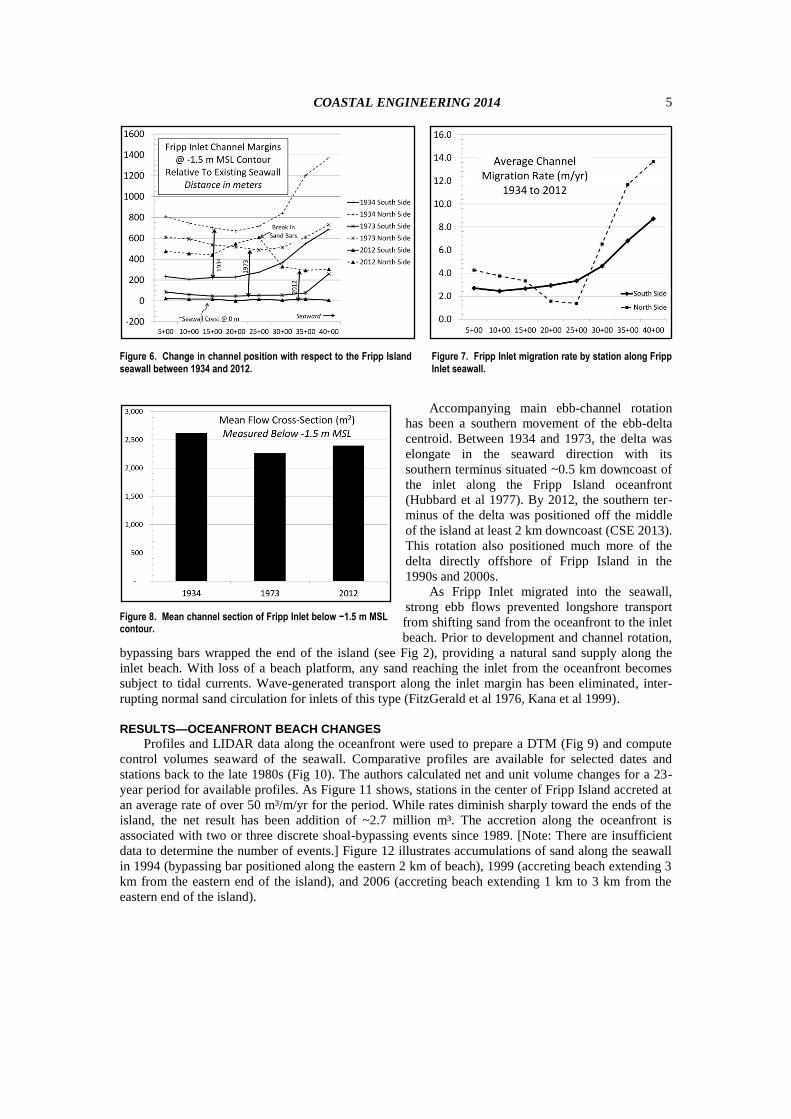
Figure 6 plots the width and position of
the −1.5 m contour with respect to the Fripp
Island seawall along the inlet. Channel
migration rates by transect and side of the
channel are shown in Figure 7. As Figures 6
and 7 demonstrate, the channel migration rate
increases with distance in the seaward
direction reaching up to ~10 m/yr on the
south margin and >12 m/yr along the north
margin.
Since 1973, close to the time of seawall
installation, the main channel has narrowed
and deepened with depths at one section
along the seawall exceeding 15 m (see Fig 5).
This locality (station 25+00, Fig 4) is coinci-
dent with the position of a collapsed rubble-mound groin built in the mid 1970s (CSE 2013). Mean
channel flow cross-section with respect to the −1.5 m MSL contour was computed for each chart date
and section. The averages by date are shown in Figure 8 and indicate relatively constant area over time.
Mean cross-sectional area is ~2,400 m² ± 175 m² to the indicated contour.
COASTAL ENGINEERING 2014
5
Figure 6. Change in channel position with respect to the Fripp Island seawall between 1934 and 2012.
Figure 7. Fripp Inlet migration rate by station along Fripp Inlet seawall.
Figure 8. Mean channel section of Fripp Inlet below −1.5 m MSL contour.
Accompanying main ebb-channel rotation
has been a southern movement of the ebb-delta
centroid. Between 1934 and 1973, the delta was
elongate in the seaward direction with its
southern terminus situated ~0.5 km downcoast of
the inlet along the Fripp Island oceanfront
(Hubbard et al 1977). By 2012, the southern ter-
minus of the delta was positioned off the middle
of the island at least 2 km downcoast (CSE 2013).
This rotation also positioned much more of the
delta directly offshore of Fripp Island in the
1990s and 2000s.
As Fripp Inlet migrated into the seawall,
strong ebb flows prevented longshore transport
from shifting sand from the oceanfront to the inlet
beach. Prior to development and channel rotation,
bypassing bars wrapped the end of the island (see Fig 2), providing a natural sand supply along the
inlet beach. With loss of a beach platform, any sand reaching the inlet from the oceanfront becomes
subject to tidal currents. Wave-generated transport along the inlet margin has been eliminated, inter-
rupting normal sand circulation for inlets of this type (FitzGerald et al 1976, Kana et al 1999).
RESULTS—OCEANFRONT BEACH CHANGES
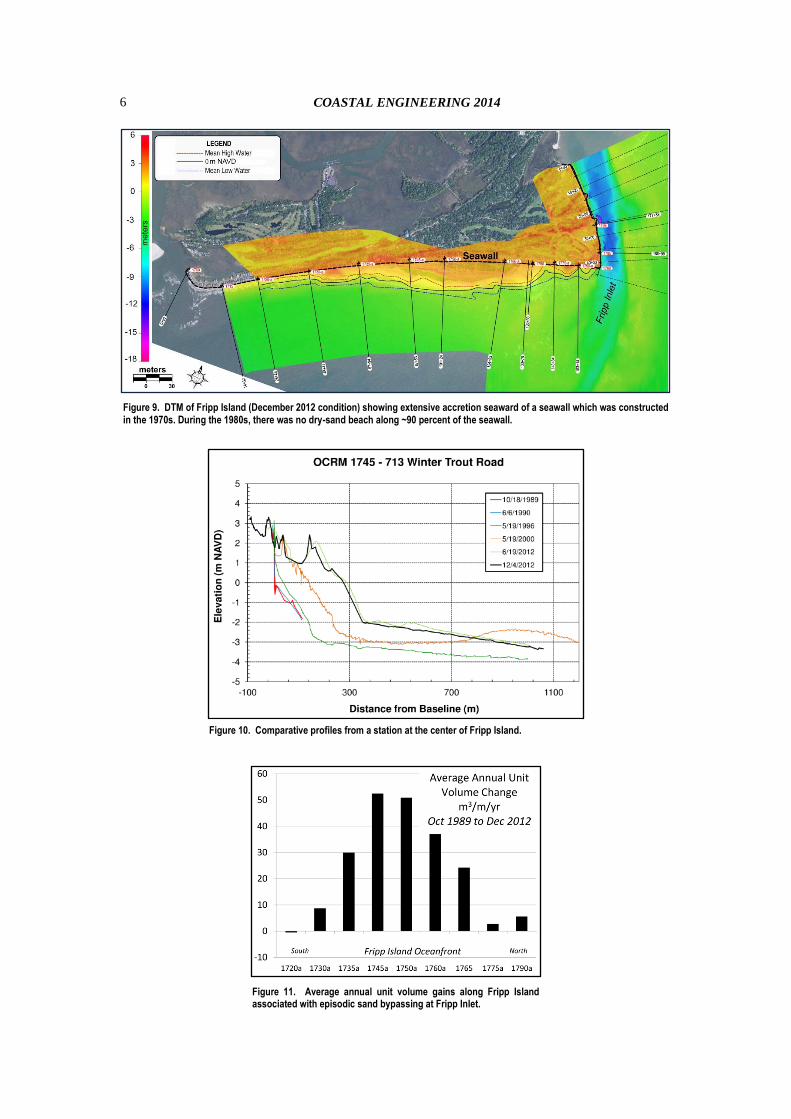
Profiles and LIDAR data along the oceanfront were used to prepare a DTM (Fig 9) and compute
control volumes seaward of the seawall. Comparative profiles are available for selected dates and
stations back to the late 1980s (Fig 10). The authors calculated net and unit volume changes for a 23-
year period for available profiles. As Figure 11 shows, stations in the center of Fripp Island accreted at
an average rate of over 50 m³/m/yr for the period. While rates diminish sharply toward the ends of the
island, the net result has been addition of ~2.7 million m³. The accretion along the oceanfront is
associated with two or three discrete shoal-bypassing events since 1989. [Note: There are insufficient
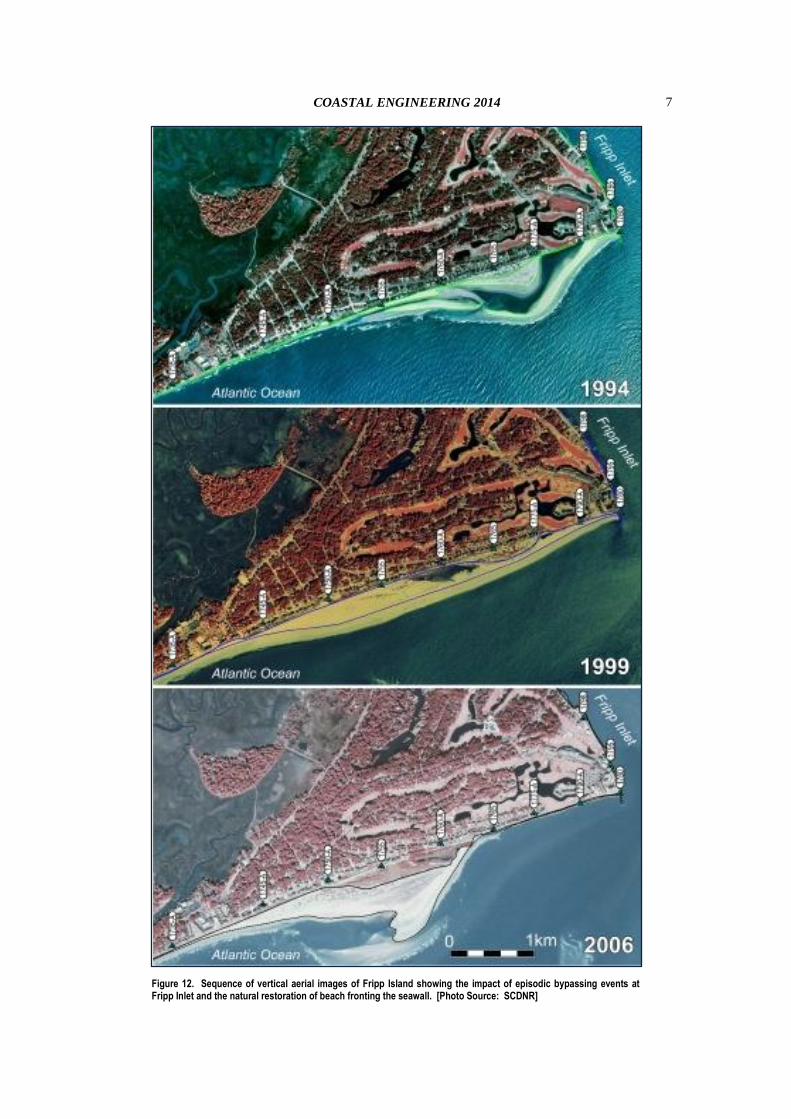
data to determine the number of events.] Figure 12 illustrates accumulations of sand along the seawall
in 1994 (bypassing bar positioned along the eastern 2 km of beach), 1999 (accreting beach extending 3
km from the eastern end of the island), and 2006 (accreting beach extending 1 km to 3 km from the
eastern end of the island).
COASTAL ENGINEERING 2014 6
Figure 9. DTM of Fripp Island (December 2012 condition) showing extensive accretion seaward of a seawall which was constructed in the 1970s. During the 1980s, there was no dry-sand beach along ~90 percent of the seawall.
Figure 10. Comparative profiles from a station at the center of Fripp Island.
Figure 11. Average annual unit volume gains along Fripp Island associated with episodic sand bypassing at Fripp Inlet.
COASTAL ENGINEERING 2014
7
Figure 12. Sequence of vertical aerial images of Fripp Island showing the impact of episodic bypassing events at Fripp Inlet and the natural restoration of beach fronting the seawall. [Photo Source: SCDNR]
COASTAL ENGINEERING 2014 8
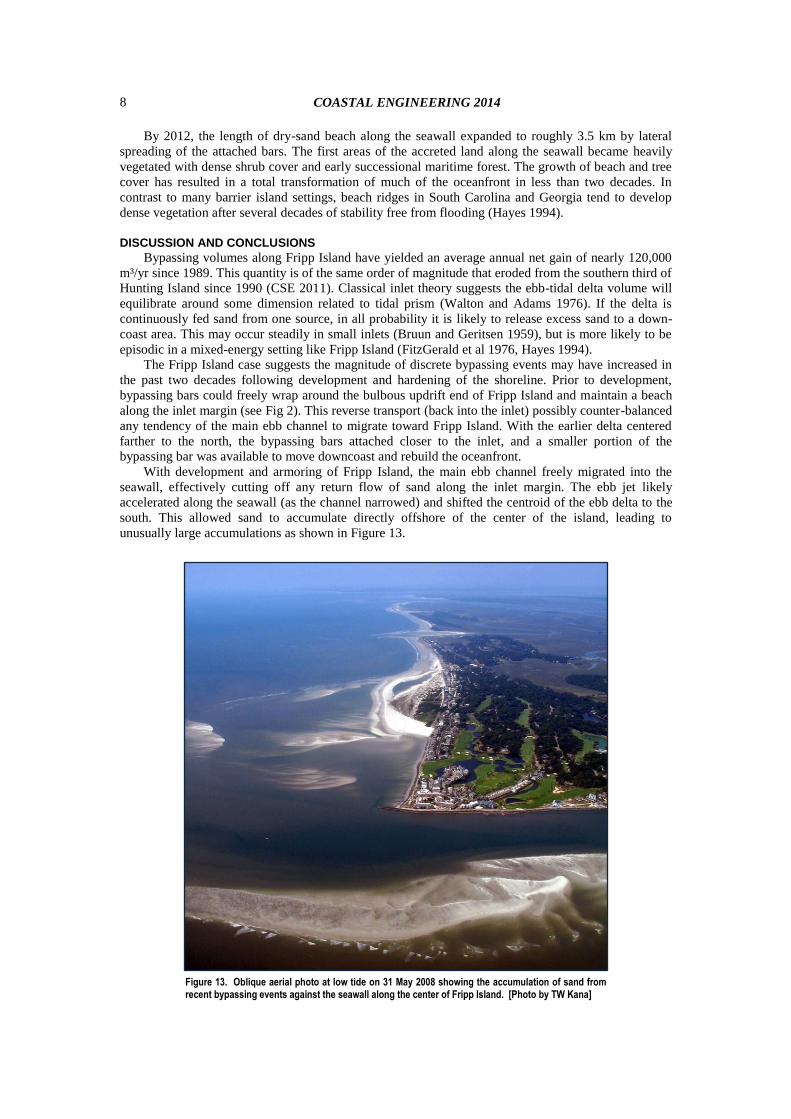
Figure 13. Oblique aerial photo at low tide on 31 May 2008 showing the accumulation of sand from recent bypassing events against the seawall along the center of Fripp Island. [Photo by TW Kana]
By 2012, the length of dry-sand beach along the seawall expanded to roughly 3.5 km by lateral
spreading of the attached bars. The first areas of the accreted land along the seawall became heavily
vegetated with dense shrub cover and early successional maritime forest. The growth of beach and tree
cover has resulted in a total transformation of much of the oceanfront in less than two decades. In
contrast to many barrier island settings, beach ridges in South Carolina and Georgia tend to develop
dense vegetation after several decades of stability free from flooding (Hayes 1994).
DISCUSSION AND CONCLUSIONS
Bypassing volumes along Fripp Island have yielded an average annual net gain of nearly 120,000
m³/yr since 1989. This quantity is of the same order of magnitude that eroded from the southern third of
Hunting Island since 1990 (CSE 2011). Classical inlet theory suggests the ebb-tidal delta volume will
equilibrate around some dimension related to tidal prism (Walton and Adams 1976). If the delta is
continuously fed sand from one source, in all probability it is likely to release excess sand to a down-
coast area. This may occur steadily in small inlets (Bruun and Geritsen 1959), but is more likely to be
episodic in a mixed-energy setting like Fripp Island (FitzGerald et al 1976, Hayes 1994).
The Fripp Island case suggests the magnitude of discrete bypassing events may have increased in
the past two decades following development and hardening of the shoreline. Prior to development,
bypassing bars could freely wrap around the bulbous updrift end of Fripp Island and maintain a beach
along the inlet margin (see Fig 2). This reverse transport (back into the inlet) possibly counter-balanced
any tendency of the main ebb channel to migrate toward Fripp Island. With the earlier delta centered
farther to the north, the bypassing bars attached closer to the inlet, and a smaller portion of the
bypassing bar was available to move downcoast and rebuild the oceanfront.
With development and armoring of Fripp Island, the main ebb channel freely migrated into the
seawall, effectively cutting off any return flow of sand along the inlet margin. The ebb jet likely
accelerated along the seawall (as the channel narrowed) and shifted the centroid of the ebb delta to the
south. This allowed sand to accumulate directly offshore of the center of the island, leading to
unusually large accumulations as shown in Figure 13.
COASTAL ENGINEERING 2014
9
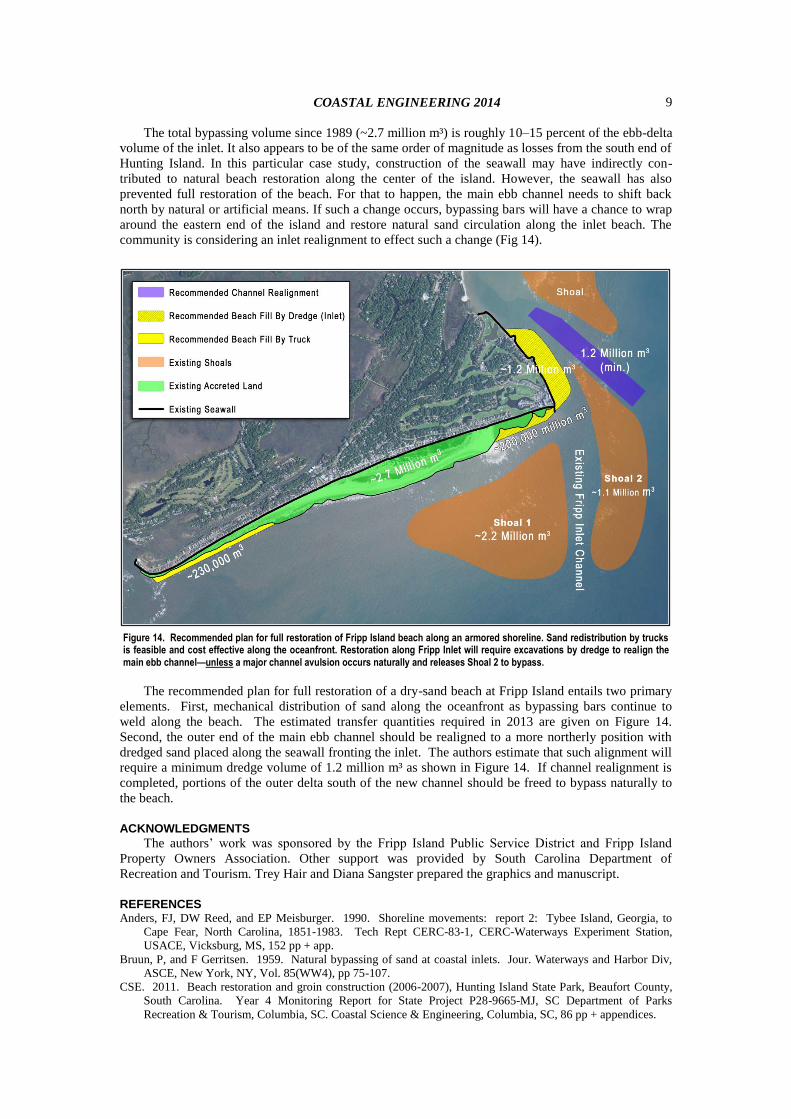
Figure 14. Recommended plan for full restoration of Fripp Island beach along an armored shoreline. Sand redistribution by trucks is feasible and cost effective along the oceanfront. Restoration along Fripp Inlet will require excavations by dredge to realign the main ebb channel—unless a major channel avulsion occurs naturally and releases Shoal 2 to bypass.
The total bypassing volume since 1989 (~2.7 million m³) is roughly 10–15 percent of the ebb-delta
volume of the inlet. It also appears to be of the same order of magnitude as losses from the south end of
Hunting Island. In this particular case study, construction of the seawall may have indirectly con-
tributed to natural beach restoration along the center of the island. However, the seawall has also
prevented full restoration of the beach. For that to happen, the main ebb channel needs to shift back
north by natural or artificial means. If such a change occurs, bypassing bars will have a chance to wrap
around the eastern end of the island and restore natural sand circulation along the inlet beach. The
community is considering an inlet realignment to effect such a change (Fig 14).
The recommended plan for full restoration of a dry-sand beach at Fripp Island entails two primary
elements. First, mechanical distribution of sand along the oceanfront as bypassing bars continue to
weld along the beach. The estimated transfer quantities required in 2013 are given on Figure 14.
Second, the outer end of the main ebb channel should be realigned to a more northerly position with
dredged sand placed along the seawall fronting the inlet. The authors estimate that such alignment will
require a minimum dredge volume of 1.2 million m³ as shown in Figure 14. If channel realignment is
completed, portions of the outer delta south of the new channel should be freed to bypass naturally to
the beach.
ACKNOWLEDGMENTS
The authors’ work was sponsored by the Fripp Island Public Service District and Fripp Island
Property Owners Association. Other support was provided by South Carolina Department of
Recreation and Tourism. Trey Hair and Diana Sangster prepared the graphics and manuscript.
REFERENCES Anders, FJ, DW Reed, and EP Meisburger. 1990. Shoreline movements: report 2: Tybee Island, Georgia, to
Cape Fear, North Carolina, 1851-1983. Tech Rept CERC-83-1, CERC-Waterways Experiment Station,
USACE, Vicksburg, MS, 152 pp + app.
Bruun, P, and F Gerritsen. 1959. Natural bypassing of sand at coastal inlets. Jour. Waterways and Harbor Div,
ASCE, New York, NY, Vol. 85(WW4), pp 75-107.
CSE. 2011. Beach restoration and groin construction (2006-2007), Hunting Island State Park, Beaufort County,
South Carolina. Year 4 Monitoring Report for State Project P28-9665-MJ, SC Department of Parks
Recreation & Tourism, Columbia, SC. Coastal Science & Engineering, Columbia, SC, 86 pp + appendices.
COASTAL ENGINEERING 2014 10
CSE. 2013 (April). Assessment of potential realignment of Fripp Inlet and alternatives for oceanfront
improvement, Fripp Island, South Carolina — Tasks 2 & 3. Technical Report for Fripp Island Public Service
District and Fripp Island Property Owners Association. CSE, Columbia, SC, 57 pp.
FitzGerald, DM. 1984. Interactions between the ebb-tidal delta and landward shoreline: Price Inlet, South
Carolina. Jour. Sed. Petrology, Vol. 54(4), pp 1303-1318.
FitzGerald, DM, D Nummedal, and TW Kana. 1976. Sand circulation patterns of Price Inlet, South Carolina. In
Proc 15th Coastal Engineering Conf, ASCE, New York, pp 1868-1880.
Gaudiano, DJ, and TW Kana. 2001. Shoal bypassing in South Carolina tidal inlets: geomorphic variables and
empirical predictions for nine mesotidal inlets. Jour Coastal Research, Vol 17, pp 280-291.
Hayes, MO. 1994. Georgia Bight. Chapter 7 in RA Davis, Jr (ed), Geology of the Holocene Barrier Island
System, Springer-Verlag, Berlin, pp 233-304.
Hubbard, DK, JH Barwis, and D Nummedal. 1977. Sediment transport in four South Carolina inlets. In Proc
Coastal Sediments ‘77, pp 582-601.
Kana, TW, and R.K. Mohan. 1998. Analysis of nourished profile stability following the fifth Hunting Island (SC)
beach nourishment project. Jour. Coastal Engineering, Vol. 33, pp 117-136.
Kana, TW, EJ Hayter, and PA Work. 1999. Mesoscale sediment transport at southeastern U.S. tidal inlets:
conceptual model applicable to mixed energy settings. Jour. Coastal Research, Vol 15(2), pp 303-313.
Kana, TW, SB Traynum, D Gaudiano, HL Kaczkowski, and T Hair. 2013. The physical condition of South
Carolina beaches 1980–2010. Jour Coastal Research, Special Issue 69, pp 61-82.
USACE. 2004. Environmental assessment (EA), Hunting Island ecosystem restoration study, Beaufort County,
South Carolina. USACE, Charleston District, South Carolina, 29 pp + appendices A–J.
Walton, TL, and WD Adams. 1976. Capacity of inlet outer bars to store sand. 15th Coastal Engineering Conf,
ASCE, New York, NY, Vol. 2, pp 1919-1937.
Zarillo, GA, WE Jones, and CM McCreesh. 1981. Beach erosion and shoreline processes: Hunting Island, South
Carolina. Dept. Geol, Univ. South Carolina, Columbia, 88 pp.