freshwater swamp forest ecosystem in the niger delta - core
TRANSCRIPT
Freshwater Swamp Forest
Ecosystem in the Niger Delta:
Ecology, Disturbance and Ecosystem
Services
Nwabueze Ikenna Igu
PhD
University of York
Environment
February 2016

2
This thesis is dedicated to my wife and son (Chimdiebube), who was born on the day of my
Ph.D. viva
3
Thesis Abstract
Freshwater swamp forests are wetland ecosystems of global importance, especially because
they provide very valuable ecosystem services such as regulation of flood and maintenance of
water quality, and provide suitable habitat for the conservation of wetland ecosystems (flora
and fauna). Though they are hosts to important biodiversity as in other tropical ecosystems,
their ecology, function and contribution to ecosystem services are poorly understood. With
poor baseline data on this threatened ecosystem across the Niger Delta region and the entire
West African region, this thesis explores its ecology, biogeography and the capacity to which
this ecosystem sequester carbon, in a bid to better prioritize and inform effective conservation
and management.
Floristic compositions of the ecosystem were varied in density, diversity and rarity across
undisturbed, disturbed and transition (mangrove-freshwater) zones. A total of 138 species
within 100 genera and 41 families of taxa were identified across the 24 one hectare forest
plots; with variations in dominance according to each of the zones. With a stem density which
ranged from 94 – 506 stems ha-1, the ecosystem was seen to be comparable with other tropical
forest ecosystems, but were poorer in species richness as a result of the environmental
constraints associated with the swamp. Though disturbance (local factors) influenced the
pattern of species distribution to a great extent, environmental (regional factors) equally
contributed to this variation.
Above ground carbon estimates (AGC) were also similar to other African forest ecosystems,
with the estimates varying at the plot level mainly due to disturbance gradients. Other
variables that contributed to AGC variations included the floristic composition (which were
found to be more carbon dense towards the transition zones), tree structure and climatic
variables. Other ecosystem services derived from the ecosystem (timber and non-timber forest
products) were found to be a major source of sustenance and income generation at varying
levels. Household usage and dependence on the forests were mainly influenced by the degrees
of remoteness of each community, and whether each of the households had other alternative
sources of livelihood. With a poor perception of decline in ecosystem services with usage, the
forests has steadily shrunk and degraded.

4
The future of this disturbance-prone and disturbance-determined ecosystem to continually
remain viable and provide a wide range of ecosystem services at the global, regional and local
scales are dependent on the conservation and management measures adopted by its people
and government. Forest friendly and effective management policies (such as joint forest
management strategies) and alternative sources of livelihood are advocated across the tropics,
in a bid to forestall efficient conservation of the biodiversity and the services derived from such
forest ecosystems.
5
Contents
Thesis Abstract 3
Contents 5
List of Tables 12
List of Figures 13
Acknowledgements 15
Author’s Declaration 16
1. Introduction to thesis 18
1.1 Overview 19
1.2 Forest classification and delimitation 20
1.2.1 Environmental approaches to forest classification 20
1.2.2 Physiognomic approaches to forest classification 22
1.2.3 Floristic approaches to forest classification 23
1.3 Tropical forest ecosystem, distribution and ecology 24
1.4 Swamp forest ecosystem, characteristics and types 25
1.5 Freshwater swamp forest ecosystem, distribution and features 25
1.6 Forest disturbance, loss and degradation 27
1.7 Agents of freshwater swamp forest decline 30
1.7.1 Urbanization, industrialization and wetland reclamation 30
1.7.2 Population growth and pressure 31
1.7.3 Agriculture 32
6
1.7.4 Oil exploration and gas flaring 32
1.8 Ecosystem services 34
1.9 Study region 39
1.10 Thesis overall aims 44
1.11 Outline of chapters 45
1.12 References 47
2. Floristic composition and diversity of freshwater swamp forests 59
2.1 Abstract 60
2.2 Introduction 61
2.3 Materials and methods 62
2.3.1 Study area 62
2.3.2 Vegetation data collection 63
2.3.3 Data analysis 64
2.4 Results 66
2.4.1 Species composition and dominance across the forest sites 66
2.4.2 Biodiversity indices, tree abundance and stem sizes 70
2.5 Discussion 73
2.6 Conclusion 76
2.7 References 78
3. Determinants of freshwater swamp forests distribution 82
7
3.1 Abstract 83
3.2 Introduction 84
3.3 Materials and methods 85
3.3.1 Study area 85
3.3.2 Data collection 87
3.3.3 Data analysis 87
3.4 Results 89
3.4.1 Overview 89
3.4.2 Patterns and cluster of forest species 89
3.4.3 Indicator species analysis 91
3.4.4 Determinants of variation in floristic composition 92
3.5 Discussion 92
3.5.1 Patterns of community variation 92
3.5.2 Ecological characteristics and determinants of indicator species 94
3.6 Conclusion 95
3.7 References 96
4. Above ground carbon storage and drivers in freshwater swamp forests 101
4.1 Abstract 102
4.2 Introduction 103
4.3 Materials and methods 104
4.3.1 Study area 104
8
4.3.2 Data collection 106
4.3.3 Quantifying above ground carbon 107
4.3.4 Determinants of variation in AGC estimates 107
4.4 Results 108
4.4.1 Above ground carbon estimates 108
4.4.2 Determinants of AGC across the ecosystem 109
4.4.3 Floristic contributions to the total AGC of the forest categories 112
4.5 Discussion 114
4.5.1 AGC and its determinants 114
4.5.2 Climatic influences on AGC 115
4.5.3 Floristic composition and structural influences on AGC 116
4.5.4 Implications for carbon budget, forest conservation & climate change 117
4.6 Conclusion 118
4.7 References 119
5. Patterns of freshwater swamp forest use and degradation 125
5.1 Abstract 126
5.2 Introduction 127
5.3 Materials and methods 128
5.3.1 Study area 128
5.3.1.1 Niger Delta environment and people 128
5.3.1.2 Freshwater forest ecosystem and resources 129
9
5.3.2 Questionnaire design and data collection 132
5.3.3 Data analysis 133
5.4 Results 133
5.4.1 Forest use dynamics 133
5.4.2 Forest products/services loss and responses 136
5.4.3 Determinants/patterns of forest use 136
5.5 Discussion 137
5.5.1 Forest utilization 137
5.5.2 Patterns and determinants of forest use 137
5.5.3 Forest ecosystem services reduction and responses 139
5.6 Conclusion 140
5.7 References 141
6. Ecosystem services at the cross-roads 145
6.1 Abstract 146
6.2 Introduction 147
6.3 Materials and methods 148
6.3.1 Study area 148
6.3.2 Data collection 149
6.3.3 Data analysis 152
6.4 Results 153
6.4.1 AGC estimates and influences 153
10
6.4.2 Forest management and use 157
6.4.3 Relationship between forest use/management and AGC 159
6.5 Discussion 160
6.6 Conclusion 162
6.7 References 164
7. Summary Discussion 169
7.1 Biodiversity patterns and indicators of the ecosystem 170
7.2 Freshwater swamp forest determinants and regimes 171
7.3 Forest dependence and degradation 172
7.4 Ecosystem services 173
7.5 Forest use and ownership 174
7.6 Forest management and conservation 175
7.6.1 Enhancing the implementation of agroforestry in agricultural landscapes 177
7.6.2 Protection and establishment of forest pools or patches 177
7.6.3 Forest restoration 178
7.6.4 Forest friendly and sustainable agricultural practices 178
7.6.5 Sustainable and alternative sources of energy 179
7.6.6 Alternative sources of livelihood and sustenance 179
7.7 Further work 180
7.7.1 Increased taxonomic inventories 180
7.7.2 Data improvements and generation 180
11
7.7.3 Additional baselines 181
7.7.4 Ecosystem dynamics and management 182
7.8 References 183
Appendix 1 List of taxa identified 187
Appendix 2 Species importance values for all the forest sites 192
Appendix 3 Family importance values of the forest sites 196
Appendix 4 Biodiversity indices of the different forest sites 198
Appendix 5 Indicator species across the ecosystem 199
Appendix 6 Questionnaire 202
Appendix 7 Additional data used in the work 207
12
List of Tables
Table 1.1 States of the Niger Delta region, land area and population 31
Table 1.2 Categories of ecosystem services and examples 35
Table 1.3 Some selected plant species and their uses in the Niger Delta 38
Table 2.1 Species rich families (with occurrence ≥ 4 species) 71
Table 2.2 Mean values of basal area, diversity and stem density 71
Table 6.1 Questions used to assess forest ownership, use and management 152
Table 6.2 Results of forest use and management in the different locations 158
13
List of Figures
Figure 1.1 Photographs of freshwater swamp forests in the Niger Delta 27
Figure 1.2 Map of the study region 40
Figure 2.1 Map showing the four study locations 64
Figure 2.2 Species abundance across site 1 67
Figure 2.3 Species abundance across site 2 68
Figure 2.4 Species abundance across site 3 69
Figure 2.5 Species abundance across site 4 70
Figure 2.6 Mean basal area of the forest locations 72
Figure 2.7 Mean diversity of each of the forest locations 72
Figure 2.8 Mean values of the stem density of the forest locations 73
Figure 3.1 Map of the study locations 86
Figure 3.2 Ward’s cluster analysis of 24 forest tree plots 90
Figure 4.1 Map of the study sites 105
Figure 4.2 Mean ± 95% CI bootstrapped AGC of the forest categories 108
Figure 4.3 Diversity variations of the forest categories 110
Figure 4.4 Variation in stem size contributions to total AGC 111
Figure 4.5 Contributions of the stem size categories to the AGC of the ecosystem 112
Figure 4.6 Ten species with the highest AGC in disturbed forests 113
Figure 4.7 Ten species with the highest AGC in transition forests 113
Figure 4.8 Ten species with the highest AGC in intact forests 114
Figure 5.1 Map of the Niger Delta region showing the study locations 131
14
Figure 5.2 Frequency of forest use 134
Figure 5.3 Varying forest uses across the communities 135
Figure 5.4 Patterns of past forest use 135
Figure 5.5 Reasons for forest product reduction 136
Figure 6.1 Map of the study locations 151
Figure 6.2 Estimates of the above ground carbon of the forest sites 154
Figure 6.3 AGC estimates of each forest site 155
Figure 6.4 Relationship between AGC and forest modification 156
Figure 6.5 Number of palm occurrence across the modified locations 157
Figure 6.6 Variation in AGC with levels of human use 159
Figure 7.1 Relationship between forest ownership, ecology and ecosystem functions 175
15
Acknowledgements
This study was funded by the Nigerian Government through the Tertiary Education Trust Fund
(TETFUND) scheme. I am very grateful to my supervisor Dr Rob Marchant for his very
supportive and consistent help and guidance throughout the development and writing of this
thesis. I am grateful to Dr Andrew Marshall and Dr Colin McClean who were members of my
thesis advisory panel and who provided useful insights that helped shape the work. Thanks also
to Dr Phil Platts for advice and insights with GIS and data extractions, and staff of the
Environment Department who helped to shape my understanding of the field in varied ways. I
am very grateful also to Prof. Shadrach, O. Akindele and Dr. Akintunde, A. Alo whom
irrespective of not being familiar with me, were willing to share their knowledge and insights
on forest sampling and management during my fieldwork in Nigeria.
Thanks also to the staff and directors of the various state Forestry Departments in Nigeria who
helped with logistics and guidance during my fieldwork. I am also grateful to all my research
and field assistants especially, Michael Oladeji, Peter Ige, Cyril Mama, Ifeanyi Iwegbue and
other assistants from the forest communities, who contributed in various ways to make this
work a success. Many thanks also to the families and individuals who helped with
accommodation and assistance in varied ways. Among these, I am really grateful to Emmanuel
and Ifeanyi Iwegbue, Grace Fyneface, Ikenna Alumonah and Dr. Niyi Adefegha.
I am indebted to my late father Godfrey and mother Esther for the training, support and
encouragements to scale greater heights, and grateful to my siblings for all their
encouragements. Most special thanks go to my wife, Ogochukwu for all the love, unflinching
support and understanding. Many thanks also to all my colleagues and friends in York, as well
as members of Environment Department, for all their encouragement and friendship. Above
all, am very grateful to God for the life, support and favor to start and finish this program.

16
Author’s Declaration
I hereby declare that this thesis represents my work and has not been submitted at any time
for any degree, diploma or other qualification in this University or any other institution. I
carried out the study design, data analysis, interpretation and writing of the thesis.

17
“Ultimately, the future of a natural ecosystem depends not on protection from humans
but on its relationship with the people who inhabit it or share the landscape with it”
William R. Jordan III

Chapter 1 – Introduction
19
1.1 Overview of thesis
Freshwater swamp forests belong to a broad delimitation of forested wetlands which occupy
more than 330 Mha globally (Matthews and Fung, 1987) and like other forms of the tropical
forest ecosystem, are epicentres of biodiversity (Lewis, 2006). These forests are periodically
inundated with mineral rich water from streams (Whitmore, 1984) and are very useful in the
regulation of flood and maintenance of water quality (Asthana and Asthana, 2003). This
ecosystem is delimited according to their hydrological factors, nutritional factors and
geomorphology (Lugo et al. 1988). The hydrological factors include the kinetic flow of energy,
the predominant direction of water flows and the hydro-period. Nutritional factors defining the
freshwater swamp forests include the nutritional quality of the sediments and water. Their
geomorphological delimitation includes the riverine, basin and fringe types. Even though their
ecology, function and mechanism are distinct, they have not received much attention as other
tropical forest ecosystems (Lugo, 1984).
Nigeria’s freshwater swamp forest is an extensive biome that covers some 12,000km2 (NDES,
1997) and found between the lowland forest and mangrove forest ecosystems. The ecosystem
is found in the Niger Delta, which is a region that has been of global importance (through the
slave trade, palm oil trade and fossil fuels more recently) since 1600, but has not been closely
investigated biologically (Blench and Dendo, 2007). The limited surveys have revealed many
species which were not known to occur in the delta notably the Niger Delta red colobus
(Procolobus badius epieni) which was new to science (Blench and Dendo, 2007). The almost
extinct abura (Hallea ledermannii), considered to be Nigeria’s second most important timber
tree, since the late 1950’s, more broadly attests to the threats facing the biodiversity of the
ecosystem. The demise of the abura tree coincided with the discovery of crude oil in the delta
in the 1950’s.
Since many of the locations in the delta were made accessible through the construction of
various transportation networks (for crude oil exploration), it aided in a further decline of the
biodiversity of the ecosystem. Oil activities which grew in proportion over the years have also
been instrumental to massive forest loss and degradation of the ecosystem through oil spills,
gas flares and forested land conversion to other uses for the advancement of crude oil
exploration. Agricultural activities, especially oil palm production, root and tree crops, led to
the conversion of the forest lands into plantations since the colonial days. Furthermore,
20
increasing population growth in the region has contributed to a serious decline in the
ecosystem. All these are points of concern especially because the conservation of the
freshwater swamp forest ecosystem depends on forest reserves, community and/or private
forest management in host communities.
This chapter provides a general introduction to the thesis, exploring the ecology, composition,
determinants and dynamics of the freshwater swamp forests in Nigeria and further quantifies
the use and ecosystem services, including carbon storage.
1.2 Forest classification
According to Kimmins (1997), “vegetation classification attempts to identify discrete,
repeatable classes of relatively homogenous vegetation communities or associations about
which reliable statements can be made. It assumes either that natural vegetation groupings
(communities) do occur or that it is reasonable to separate a continuum of variation in
vegetation composition and/or structure into a series of arbitrary classes”. Achieving this
categorization for forest ecosystems is beneficial as it provides a foundation for forest
management and conservation planning. The different approaches of forest classification can
be summarized as environmental, physiognomic and floristic approaches accordingly.
1.2.1 Environmental approaches to forest classification
Environmental factors are responsible for the growth form, physiology, metabolic and resource
availability of different plants and forest cover. They provide insights about the tolerance limits
of plants and are responsible for the variations in the composition, structure and features of
forest ecosystems. They are thus distinguished as climatic and topographic or physiographic
(edaphic) variables as follows:
21
1.2.1.1 Climatic influences and approaches to forest classification
Climate is a major factor influencing the distribution of vegetation and is primarily defined in
terms of temperature and precipitation. It influences the distribution of plant species by
imposing physiological constraints which in turn affects their growth and reproduction directly
and then indirectly by mediating competitive interactions (Gavin and Hu, 2006). Climatic
variables affect the production of pollen, flowers and nectar (Scaven and Rafferty, 2013), size of
flowers (Hoover et al. 2012), plant height (Liu et al. 2012) and also plant-pollinator interactions
(Scaven and Rafferty, 2013). As climatic variables affect the photosynthesis, growth and
reproduction of plants, they influence the population dynamics and distribution at local and
global scales, and delineate the world into different biomes. Starting from the early bioclimatic
classification by Koppen since 1900, and the modifications that followed, other notable works
have been done, such as that of Thornthwaite (1933) and Holdridge (1967), who further
contributed to the understanding of the influence of climatic variables in forest classification.
Climatic variables have indeed been one of the oldest methods used in empirical classification
and prediction of broad physiognomic vegetation (Prentice et al. 1992). While Koppen’s work
classified climatic patterns, the boundary lines coincided approximately with vegetation
boundaries and were used to determine climatic variables that were relevant to plants, among
which, seasonality was the strongest. Holdridge’s Life Zone Classification is the most commonly
used bioclimatic classification and again related potential natural vegetation to climate. The
boundaries in his work were defined by annual precipitation and growing season temperatures.
Both works were developed by others over the years, and applied in understanding the impact
of climate change on natural vegetation at a global scale (Prentice et al. 1992; Solomon and
Kirilenko, 1996; Steffen et al. 1996; Yates, 2000). More recently, Blasco et al. (2000) have
contributed to this classification by using annual rainfall, seasonality and mean temperature of
the coldest month in the bioclimatic classification of the global forest ecosystems. These works
have been useful in understanding forest classification at a global scale, however, classifications
are still lacking at the local scales for most regions, where it is needed for effective
conservation and management.
22
1.2.1.2 Landform or Edaphic influences and approaches to forest classification
Landform or edaphic influences have been used to delimit agro-ecological zones and
vegetation boundaries, for example, differentiating between Sahel and Sudan zones in Mali
using boundaries that cross major geomorphologic and geologic zones (ITC, 1977). This method
of classification is normally used in vegetation classification at the regional scale, mainly
because data at global scales are often lacking as is also often the case at regional scales. It was
applied in the Interim Biogeographic Regionalization of Australia (Thackway and Cresswell,
1995), which used climatic, substrate and soil variables. Edaphic variables unlike climatic
factors normally influence vegetation patterns with the association of other environmental
factors. This could be seen from the example of Nigeria, where the major soil types are related
to factors such as: climate, vegetation, lithology and topography (Areola, 1982). Since the
distribution of soils is mainly due to variations in parent rock (which influences soil depth,
texture, stoniness, moisture condition, nutrients and minerals) (Areola, 1982), the vegetation
covers that they support equally varies across these scales. Hence, with the soils of Nigeria
broadly distinguished as ferruginous tropical soils, ferralitic soils, ferrisols, weakly-developed
soils and hydromorphic soils (Areola, 1982), the vegetation is equally varied due to differences
in parent rocks, chemical compositions, soil horizon differentiations, nutrient status, texture,
structure, organic contents and drainage. Among these soils, the hydromorphic soils are
characterized by seasonal and permanent waterlogging due to their location around marine
and riverine valleys and flood plains, and consequently, these dominate the Niger Delta region
where swamp forests, freshwater and mangrove ecosystems are concentrated.
1.2.2 Physiognomic approaches to forest classification
The physiognomic approach to classification is mainly based on the growth form of dominant
plants and their general external appearance. Most physiognomic classification is based on a
‘community type defined by dominance of a given growth form in the uppermost stratum of
the community, or by a combination of dominant growth forms’ (Whittaker, 1962). Application
of the physiognomic approach has mostly been on continental or global levels for mapping of
vegetation. A good example is the widely recognized global vegetation classification by
UNESCO (1973), which produced the world’s vegetation maps at a scale of 1:1 million or
23
smaller. They have equally been applied in natural resource inventory, management and
planning; based on assessments of vegetation attributes that may change during stand
development and disturbance (Jennings et al. 2003). Other applications include the
classification of redwood ecosystems based primarily on their variable physiognomy and
canopy (Eyre, 1980; Fox, 1989).
1.2.3 Floristic approaches to forest classification
Floristic approaches of vegetation classification use the composition of taxa to describe
vegetation types. They normally achieve this by describing the dominant (taxa) or the total
floristic composition. Using dominance involves assessing the most common taxonomic
entities, for example, the biomass, density, height, or canopy cover of forest ecosystems
(Kimmins, 1997). Floristic classification has been used in aerial photo mapping and inventory
because of its ease of interpretation, as well as the use of space borne and airborne remote
sensing over large areas (Jennings et al. 2003). Its limitations notwithstanding, is been used
mainly because it provides a simple, efficient approach for inventory and mapping (Jennings et
al. 2003).
Total floristic composition on the other hand is used in community classification applications.
This approach has found its main application through the works of Braun-Blanquet (1928) and
Daubenmire (1952). Both dominance and total floristic approaches are based on the concept of
‘association’ which was defined by Flahault and Schröter (1910) as “a plant community type of
definite floristic composition, uniform habitat conditions, and uniform physiognomy” (Jennings
et al. 2003). While Braun-Blanquet (1928) based his work on the definition of association as ‘a
plant community characterized by definite floristic and sociological (organizational) features’,
Daubenmire (1952) focused on least disturbed and oldest plant communities (near climax); and
hence based his premise on the view that a classification ‘based upon climax types of
vegetation best expresses the potential biotic productivity of a given combination of
environmental factors’. Though both schools of thought had some distinctness and differences,
they still have underlying similarities; and have been applied in vegetation classification ever
since. Notable works include: the use of leaf retention and leaf size in defining high hierarchical
orders in northern hemisphere (Dansereau, 1951) and the dominant plant species life forms-
24
which has gained mass usage in vegetation categorization throughout the world (Raunkiaer,
1934).
These approaches represent direct methods of forest classification which have been developed
from antiquity and modified over the years in a bid to categorize vast forest ecosystems into
relatively homogenous units for better conservation, management and understanding of the
processes. Other indirect methods of achieving the same objective have involved the use of
remote sensing techniques in mapping the forest ecosystems.
1.3 Tropical forest ecosystem, distribution and ecology
Tropical forests are rich biodiverse forests that occur near the equator (within the area
bounded by latitudes 23.5oN and 23.5oS), characterized by distinct wet and dry seasons. Even
though they cover only ca. 10% of the earth’s land surface, they are global epicentres of
biodiversity, regulators of global biogeochemical cycles, modulators of climate change, and
storehouses of large quantities of carbon (Lewis et al. 2013; Lewis, 2006; Myers et al. 2000;
Houghton, 2005; Malhi et al. 2014). Tropical forests are found on different soil types, but are
predominated by infertile soils from an agricultural perspective (Vitousek and Sandford, 1986;
Malhi et al. 2004; Lewis, 2006). That notwithstanding, they are highly productive ecosystem
that supports a large concentration of flora and fauna (Jermy and Chapman, 2002; Malhi et al.
2004).
Tropical forests are a diverse array of forests which includes both the moist forests and dry
forests and also wooded savanna systems (Lewis, 2006). Tropical forest ecosystems are found
in various locations: 49% in tropical America, 34% in tropical Africa and 16% in tropical Asia
(FAO, 2001). They are the most species rich ecosystem on earth (Gentry, 1992), host at least
two-thirds of the earth’s terrestrial biodiversity (Gardner et al. 2009) and constitute 17 out of
the 25 areas identified as global biodiversity hotspots (Myers et al. 2000).
Africa’s tropical forests represent 13% of the world’s forest area and include rainforest:
evergreen forests and semi-evergreen forests dry forests, mountain forests and dry forests,
mangrove swamp forest and freshwater swamp forest. (Whitmore, 1984; Grainger, 1993;
Jermy and Chapman, 2002). While mangrove swamp forests are characterized by saline water
25
and comprise trees with buttresses, stilt-roots and pneumatophores, freshwater swamp forests
are fed with fresh water from streams, and periodically inundated with mineral rich water from
streams (Whitmore, 1984).
1.4 Swamp forest ecosystem, characteristics and types
Swamp forests are found in different climatic regions across the globe and exist as coniferous
swamp forest, boreal swamp forest, peat swamp forest, mangrove swamp forests, and
freshwater swamp forest. In tropical or sub-tropical areas, swamp forests are classified as
mangrove forests, peat swamp forests and freshwater swamp forests. Mangrove forests are
found in brackish or salt water environments, with > 30% canopy cover, low floristic diversity
and specialized roots that are inundated with saline water (FAO, 1998). Peat swamp forests and
freshwater swamps are both typically flanked by lowland rainforests farther inland and
mangrove forests near the coast. Peat swamp forests are found in parts of Sumatra, Borneo,
Indonesia, New Guinea and Malaysia. They grow on deposits of thick peat (which may be up to
13m thick) and are significant carbon sinks (FAO, 1998). Freshwater swamp forests are found in
the tropics on fertile alluvial, predominantly waterlogged soils with an average soil pH of ≥ 6.0
(Whitmore, 1990).
1.5 Freshwater swamp forest ecosystem, global and regional distribution
Freshwater swamp forests cover about 2.1% of the earth’s surface (Raven and Johnson, 2002).
Swamp or flooded forests, inundated with freshwater, either permanently or seasonally, occur
along the lower reaches of rivers and around freshwater lakes. Freshwater swamp forests are
usually associated with rivers or streams that flow into the sea (Keay, 1989), as well as a very
irregular ground with frequent patches of open water in the dry season. The frequent
inundation of the ecosystem by river water results in high soil nutrients which come from the
transportation and deposition of mineral rich sediments and debris. Though this flood activitiy
is responsible for the natural disturbance of the ecosystem, they on the other hand help to
replenish the soil and enhance rapid tree growth (Thomas and Baltzer, 2002). Mounds and
ridges in freshwater forests form numerous intricate narrow channels which provide a drainage
26
network from the forest to surrounding rivers and streams, thus regulating coastal water flow
and eliminating silt, sediment and pollutants from moving water (Asthana and Asthana, 2003).
In Nigeria, freshwater swamp forests are found inland beyond the reach of tidal waters on
generally low-lying areas. They occur in an intricate network of creeks and lagoons which
dominate the area and form dense forest vegetation in the region. The annual floods inundate
the forest areas and result in siltation and soil fertility augmentation of the ecosystem during
the rainy and flooding months. Raffia palm dominates the swampy parts of the ecosystem,
while the better drained areas support Elaeis guineensis (oil palm trees) and trees like Milicia
excelsa (Iroko). The main canopy of the forest is rather open and in gaps and has an almost
impenetrable undergrowth (Keay, 1959). Fauna like Hartlaub’s duck (Pteronetta hartlaubi), as
well as families like heron (Ardeidae), ibis (Threskiornithidae), pelican (Pelecanidae), kingfisher
(Alcedinidae) and the near threatened raptor-fish eagle (Heliaetus vocifer) also breed and hunt
for food in the ecosystem (Isikhuemen, 2012). Seasonally flooded swamp forests (chiefly
inundated during the wet season) are dominated by Anthocleista vogelii, Carapa procera,
Chrysobalanus orbicularis, Grewia coriacea, Garcinia spp., whereas permanently flooded
swamp forests (usually inundated throughout the year), are characterized by species such as
Alstonia spp. Hallea ledermannii and Raphia spp. (Hughes and Hughes, 1992) (Fig 1.1). Since
the ecosystem traverses large spatial scales, the species composition is expected to vary
markedly in relation to environmental conditions.
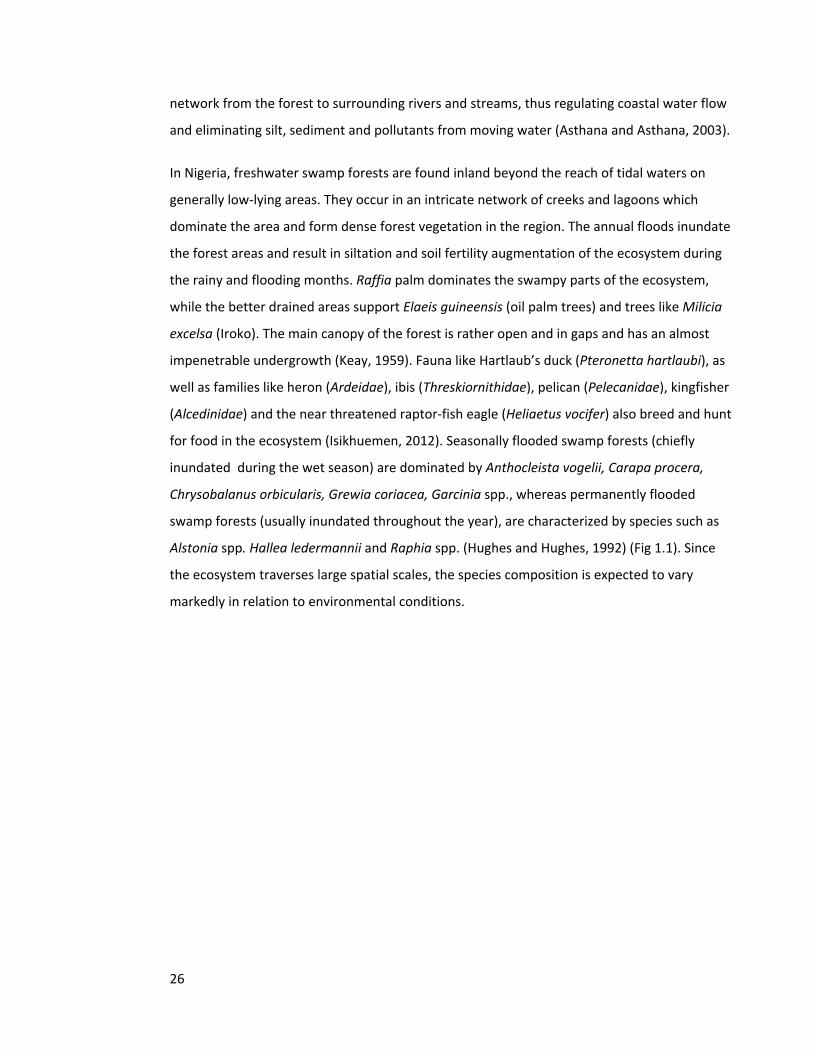
27
Figure 1.1 Photographs of freshwater swamp forest in the Niger Delta showing (a) seasonally
flooded forest which was dry during the field-work, (b) permanently flooded forest, for which
the water was at its lowest annual level during the field-work (being at the peak of dry season
experienced in the month of February).
The freshwater swamp forest in Nigeria was initially protected from deforestation because of
its relative inaccessibility, but is now being destroyed (Omokhua and Koyejo, 2008). The
Nigerian freshwater swamp forest is concentrated in the Niger Delta where over 30 million
people including 40 ethnic groups live (NPC, 2006; Spalding et al. 2010).
1.6 Forest disturbance, loss and degradation
Forest disturbance is a major feature of forest ecosystems and a fundamental reason for the
variations in species composition across forest landscapes. This “relatively discrete event in
time” is responsible for the disruption of the community or population structure of forest
ecosystems (Pickett and White, 1985), and important for the renewal and maintenance of
forest ecosystems. Disturbance occurs over a varied range of spatial scales, viz, individual tree
level, stand level and landscape levels (Gong and Xu, 2003; Coops et al. 2009), duration and
28
intensities. Hence, while some of these disturbance events occur slowly such as infestation,
others are more rapid in occurrence (such as deforestation) and are more easily detected.
Natural disturbances are characterized by endogenous and exogenous causal factors that lead
to tree mortality and operate over wide ranges of frequency, intensity, size, predictability and
timing; and are mainly as a result of insect outbreaks, wildfire or strong winds (Attiwill, 1994;
Seidl et al. 2014). These occurrence or disturbance regimes inherent in tropical forests termed
“gap-phase dynamics” (Brokaw, 1985), are responsible for the cycle of tree mortality and
replacement found in forest ecosystems. Gap dynamics is based on the assumption that with
sufficient time periods, forest canopies are disturbed or open up in closed forest ecosystems.
As these gaps are created, light tolerant species takes advantage of the micro-environmental
conditions (light, moisture and temperature) to establish in the forest floor (spaces provided by
such gaps). These pioneer species are sooner or later substituted with other slower growing
tree species which may live for longer periods (say decades or centuries) before falling and
creating gaps for subsequent replacements (Watt, 1947; Whitmore, 1978; Asner, 2013).
With this cycle and successional processes ongoing in the forests, the species diversity and
adaptive capacity of the ecosystems are enhanced (Gutschick and BassiriRad, 2003). Besides
the endogenous gap-phase dynamics found across tropical forests, the freshwater swamp
forests are on other occasions faced with other natural exogenous disturbance incidents that
are very destructive in patterns like long lasting flooding events. Such cycles or trends of
disturbance (especially with only short intervals between the disturbance cycles) however
affect the health of the ecosystem and its ability to both replace pioneer species and facilitate
the establishment of a climax community.
Anthropogenic factors have on the other hand contributed mostly to large disturbances and
consequential forest cover losses and degradation in freshwater swamp forests. Even though
some of the forest areas could recover and eventually become forested landscapes, most of
such anthropogenic alterations have led to a steady decline, degradation of forest ecosystems
and a modification of such landscapes to other land uses. Forest loss has been attributed to
factors like population increases, dependence on the forests for subsistence, food, fuel and
forest products and quest for other land uses (Geist and Lambin, 2002; Diaz et al. 2006;
Ferretti-Gallon and Busch, 2014). Forest ecosystems loss has been estimated to be as much as
29
1.8 billion hectares over the past 5,000 years (Williams, 2002) and have varied across the
different ecosystems- temperate, boreal and tropical forests. With much of the tropical forest
loss occurring from the beginning of the twentieth century (Morris, 2010), its capacity as an
epicenter of biodiversity and carbon sink are steadily lost. More recent estimates puts the rate
of loss in the ecosystem far ahead of other climatic domains (subtropical, temperate, boreal);
2101 km2 per year, > 50% of tree cover loss (2000 – 2012; Hansen et al. 2013). These losses
have not only reduced the forest extent, but has led to fragmentation of the ecosystem; which
leaves some of the forested areas too small for species persistence, too far apart for migration
of species and the introduction of edge effects (Fahrig, 2003; Ewers and Didham, 2006; Martin
and Blackburn, 2010; Morris, 2010).
Forest loss could be caused by direct factors (which could be natural or anthropogenic), or
indirect factors like market failures, weakness in governance, political and socioeconomic
factors and poor policy (Contreras-Hermosilla, 2000). The dominant feature(s) that leads to loss
in forest cover is a combination of both direct and indirect factors. Geist and Lambin (2002)
succinctly categorized them as proximate factors: agricultural expansion, wood extraction,
infrastructure extension and other factors like predisposing environmental factors, biophysical
drivers, social trigger events; and underlying causes: demographic, economic, technological,
policy and institutional, and cultural factors. The forest ecosystem in the Niger Delta region of
Nigeria is threatened by deforestation and degradation; that have turned most of the forest
landscapes into forest mosaics across the entire region. Annual forests loss across the region is
at the rate of 0.95% (through deforestation); while its annual rate of change in forest cover
showed a decline of – 0.13% (1986 – 2007; Onojeghuo and Blackburn, 2011). As there are no
established guidelines on management of these forests at the community level, poor
management of the forest reserves at the state levels and an ever increasing quest for available
(forest) land space; forest losses are expected to continue across the region. As a lot of
transformations (such as loss of biodiversity, fragmentation, extinction and degradation) are
experienced in the ecosystem, there is a critical need to understand the patterns of these
anomalies and threats through a comprehensive, up-to-date assessment and monitoring of the
ecosystem.
30
1.7 Agents of freshwater swamp forest decline
Freshwater swamp forests in Nigeria are reducing as a result of the following factors:
1.7.1 Urbanization, industrialization and wetland reclamation
Urbanization may affect freshwater swamps through loss of extensive areas, through drainage
modification and ecosystem fragmentation (Weller, 1998). The discovery of the crude oil in the
Niger Delta affected the urban morphology of the entire landscape. Most of the towns and
cities across the region suddenly rose to prominence by becoming the ‘centers of oil
production or associated industrial activities’, and were equally accompanied by rapid and
uncontrolled urbanization across the region (UNDP, 2006). Furthermore, the demand for land,
wood and building materials like sand and the allure for fast money-making (which influenced
many of the people to sell their forest lands), have ever since then impacted the environment
and the forest ecosystem. As roads, waterways and rail lines were constructed across the
landscape, it altered the topography and hydrology of the ecosystem, fragmented most of the
forests, provided inlets of sea water into the freshwater ecosystem and consequently,
impacted the local freshwater forest species.
Construction of oil and gas refineries as well as other industries has led to loss of forested
lands. Reclamation of marginal swampy lands in addition to few dry portions leads to more
forest and biodiversity losses and fragmentation across the ecosystem. The construction of the
Nigerian Liquefied Natural Gas (NLNG) Plant in 1999 required the reclaiming of approximately
2.27 km2 of this forest in Finima, Bonny Island (Rivers state, Nigeria); and provides a suitable
example to the extent of loss ongoing in the freshwater swamp forest. Since the Delta has
become a focal hub, multinational companies and the government have barely given thought
to the ecological imbalance such activities result in, and as a result, the freshwater forest
ecosystem has steadily been lost, degraded and modified over the years. While there is no
doubt that the aforementioned anthropogenic activities contributes to the wealth of the
Nigerian state and a suitable place for accommodating a growing population, forest friendly
and ecosystem resilient strategies that would ensure a continuity in ecosystem function and
existence should be equally be adopted.
31
1.7.2. Population growth and pressure
In most of West Africa, rapid and uncontrolled population growth has caused social, economic
as well as environmental problems, in the face of the rapidly diminishing forest and related
natural resources (Dykstra et al. 1996). The increase in the population of the Niger Delta could
be attributed primarily to the migration into the region following the ‘oil boom’. While the
majority of the people that thronged the region were concentrated in the cities, the rural
fringes supported farmers, laborers, traders, fishermen and job seekers.
The population of the Niger Delta increased from 11.3 million to 19.3 million to 31.2 million in
1963, 1991 and 2006 respectively (NPC, 2006; Onojeghuo and Blackburn, 2011) and predicted
to rise to 45.7 million by 2020 (UNDP, 2006). The region constitutes 25% of Nigeria’s population
and its average population density is 265 persons per square kilometre (NPC, 2006; UNDP,
2006). About 62% of the entire population is below the age of 30 (Francis et al. 2011). With
increased demand for food, housing and infrastructure following such increased population,
the forest ecosystem continues to decline (Geist and Lambin, 2002; Pan et al. 2007; Gardner et
al. 2009) due to overharvesting, degradation and land use modifications.
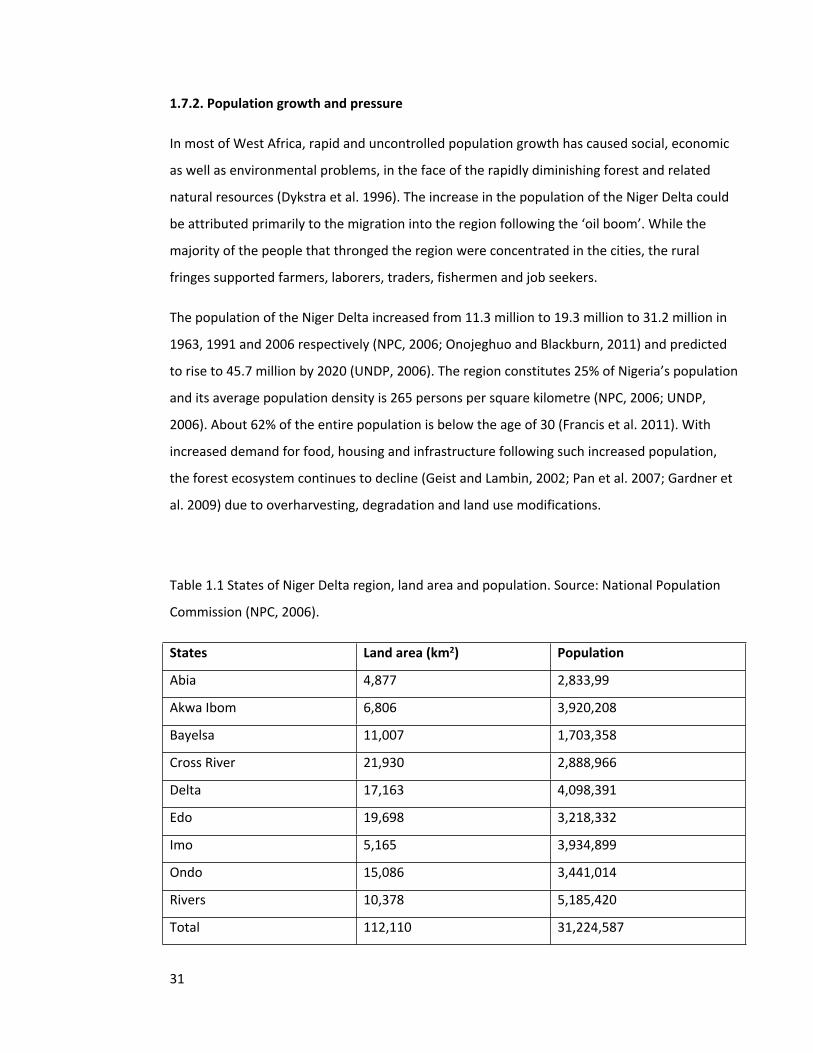
Table 1.1 States of Niger Delta region, land area and population. Source: National Population
Commission (NPC, 2006).
States Land area (km2) Population
Abia 4,877 2,833,99
Akwa Ibom 6,806 3,920,208
Bayelsa 11,007 1,703,358
Cross River 21,930 2,888,966
Delta 17,163 4,098,391
Edo 19,698 3,218,332
Imo 5,165 3,934,899
Ondo 15,086 3,441,014
Rivers 10,378 5,185,420
Total 112,110 31,224,587
32
1.7.3. Agriculture
As the population of the region continues to grow, more pressure is put on the ecosystem
through an increase in aquaculture, plantation agriculture, commercial agriculture and
subsistence agriculture; in order to meet the increasing demands for sustenance and livelihood.
With the support of rich alluvial soils across the freshwater swamp ecosystem, agricultural
activities were not only practiced by individuals and households, but also the government, who
utilized it as a source of income for the regional and national economy. Since the soils of the
ecosystem supported the cultivation of crops like plantain, banana, rubber and oil palm,
individuals and government alike have used its cultivation as their economic mainstay long
before the advent of crude oil in the region.
The contribution of a crop like oil palm was quite significant that “between 1865 and 1910, the
export of palm produce doubled from West Africa as Nigeria took the lead; and by 1900, palm
produce constituted 89% of Nigeria’s total export” (Stillard, 1938; Helleiner, 1996; Aghalino,
2000). While its prominence has declined as a major source of government revenue for the
Niger Delta region and the Nigerian state (following crude oil exploration), it has however
remained a major source of income (together with other crops) for the rural population who
mostly depend on it as sources of livelihood. Agriculture has equally thrived across the region
with the cultivation of root crops like cassava and vegetables; and these have all contributed to
forest degradation in various ways. These agricultural practices are carried out on dry lands and
in marshy portions (that are first of all drained) and are responsible for a significant forest
cover change across the entire region (Momodu et al. 2011; Enaruvbe and Atafo, 2014).
1.7.4. Oil exploration and gas flaring
The Niger Delta is home to most of Nigeria’s vast reserve of oil and gas, and hub to her
government revenue and national wealth. However, as this resource has been associated with
spills and flares for decades, it has brought mixed blessings of wealth to the nation and
degradation to the fragile environment. As these spills have repeatedly occurred over the
years, a large part of the land, vegetation and wetlands are already affected, and groundwater
contamination has equally occurred due to its penetration to the soils (Linden and Palsson,
2013). Statistics from the Department of Petroleum Resources, Shell, Nigerian National
33
Petroleum Corporation (NNPC) and the World Bank, on the extent and volume of spills from
the inception till date are quite huge (Moffat and Linden, 1995; NDES, 1997; UNDP, 2006;
Steiner, 2010) and depict the level of contamination such events introduce into the ecosystem.
A suitable example of the extent and impact of such spills on the environment, could be seen
from the Ogada-Brass pipeline oil spillage (near Etiama, Nembe, Bayelsa state) that occurred in
February 1995; and spilled approximately 24,000 barrels of oil that spread over the freshwater
swamp forest and into the brackish swamp (Kadafa, 2012); causing an unquantifiable damage
to the ecosystem. Spills of such great magnitudes, which are estimated to be between 9 million
and 13 million barrels (1.5 million tons), have continued over the past 50 years across the
region (Obot et al. 2006), and have adversely affected and destroyed an undocumented array
of plant and forest landscapes.
Oil spills impact the biodiversity of forest ecosystems- flora and fauna alike; reduces mobility of
biodiversity; directly impact them through toxicity; damage cell membranes in roots and
eventually lead to their death. More worryingly is the fact that cleaning up wetlands that are
already contaminated are not only difficult but may not be done without additional harm to
such habitats (NRC, 2003; Chan and Baba, 2009; Linden and Palsson, 2013). As the surface of
the delta is dissected by a dense network of rivers and creeks, which creates a condition of
delta-wide hydrological continuity, disasters such as oil spills in one part of the delta can readily
be felt in other parts. This has grave implications for the ecosystem, as environmental problems
like this can hardly be limited in an ecological boundary (Abam, 2009).
Gas flaring has been part of the oil industry in the Niger Delta from its inception. With as much
as 70.8 million cubic metres of gas associated with crude oil flared everyday across the Delta
(Environmental Rights Action, 2005), Nigeria is not only a major contributor to the global
estimate of 150 billion cubic metres of gas flares each year (Farina, 2011), but also key to the
challenging energy and environmental problems ravaging the globe. These activities releases
large amounts of toxic components such as methane, benzene and carbon dioxide to the
atmosphere and contribute to climate change and global warming across the region. They also
affect the local and regional microclimate, cause greenhouse effects, acidification, retardation
and destruction of plants (Isichei and Sanford, 1976; Odjugo and Osemwenkhae, 2009; Julius,
2011; Ite and Ibok, 2013). Since the gas flares generate high heat intensities, they directly burn
up or destroy vegetation cover that they have contact with and destroy other biodiversity in
34
the ecosystem. Channeling such (wasted or flared) resources for domestic and industrial use
will not only benefit the Nigerian state, but also help to preserve the biodiversity of the
(freshwater swamp forest) forest ecosystems in the region.
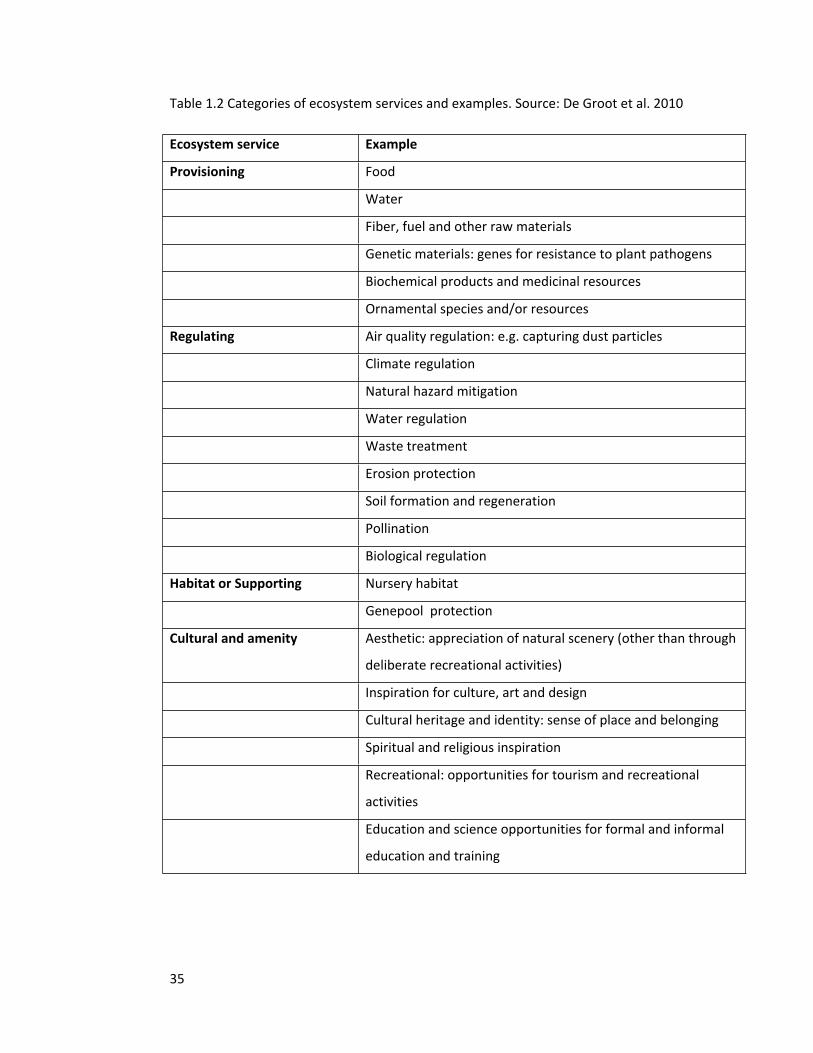
1.8 Ecosystem services
Ecosystem services have been a subject of discussion for a long time (Whitford, 1923; Pearson,
1937), although the last decade has witnessed a large amount of inquiry into this concept from
stakeholders across different disciplines: scientists, policy makers, economists, environmental
educators and managers (Fisher et al. 2009), who have all broadened society’s understanding
on the issue. Very significant among these is the work by more than 1300 scientists into the
Millennium Ecosystem Assessment that provided insights on the varied categories of
ecosystem services (Table 1.2), and highlighted the need for additional research on their
measurements, mapping and assessments, especially as a majority of the services were found
to be diminishing across the globe (MA, 2005). The ability of forests to continually deliver
ecosystem services such as climate regulation, carbon sequestration, water supply and
biodiversity richness, are greatly impaired due to the changes in the forest cover being
experienced at different scales globally (Foley et al. 2005; Hansen et al. 2013).
35
Table 1.2 Categories of ecosystem services and examples. Source: De Groot et al. 2010
Ecosystem service Example
Provisioning Food
Water
Fiber, fuel and other raw materials
Genetic materials: genes for resistance to plant pathogens
Biochemical products and medicinal resources
Ornamental species and/or resources
Regulating Air quality regulation: e.g. capturing dust particles
Climate regulation
Natural hazard mitigation
Water regulation
Waste treatment
Erosion protection
Soil formation and regeneration
Pollination
Biological regulation
Habitat or Supporting Nursery habitat
Genepool protection
Cultural and amenity Aesthetic: appreciation of natural scenery (other than through
deliberate recreational activities)
Inspiration for culture, art and design
Cultural heritage and identity: sense of place and belonging
Spiritual and religious inspiration
Recreational: opportunities for tourism and recreational
activities
Education and science opportunities for formal and informal
education and training
36
As tropical forests are continually altered and lost, its central role in furnishing the world with
ecosystem services and functions at landscape, regional and global scales are reduced and
eventually lost. Such losses have interconnected impacts on the ecosystem, since the use of
one ecosystem function may influence the availability of other functions, and the good and
services they provide (Limburg et al. 2002). Harvesting forest resources on the other hand, is an
inherent societal trade-off which is not totally bad or evil, as it offers some positive outcomes
like: the provision of forest resources (such as timber and food), employment, as well as other
economic and social benefits. However, since it has the capacity to degrade other ecosystem
services especially those ones that have strong ties to the functioning of the ecosystem (Foley
et al. 2007; DeFries et al. 2004), it should be practiced sustainably by ensuring that there is a
balance between the societal benefits (which are short termed) and long term existence and
ecological functioning of the ecosystem.
Ecosystem services have been utilized in varied ways in ensuring human well-being long before
and after the concept attracted scientific inquiry. More recently, its role in carbon
sequestration and regulation of the global climate processes has not only been widely
recognized and acknowledged, but has also been at the center of international debates and
forums (Houghton, 2005; Grainger et al. 2009; Gardner et al. 2012). This has led to the
assessment of forest carbon at the global, regional and local scales, and to the formulation of
organizations and policies that addresses such concerns; notable among which is the recent
REDD and REDD+ initiatives (Houghton, 2005; Gorte, 2009; Pan et al. 2011; Saatchi et al. 2011).
While tropical forests are acknowledged to contain the highest concentration of carbon in its
biomass (Pan et al. 2011), the assessment of this ecosystem service has received greater
inquiry in south America and Asia, compared to the amount of inquiry in Africa (Lewis et al.
2013). Existing estimates for Nigeria are derived from global carbon assessments (Baccini et al.
2008; Ruesch and Gibbs, 2008; Scharlemann et al. 2011), which neither gives the estimates for
specific forest ecosystems nor provide baselines for understanding the variations across the
ecosystems and disturbance gradients. With varied floristic composition and disturbance
regimes evident between the freshwater swamp forests and other forest ecosystems in the
Niger Delta, there is need to establish baselines for the ecosystem, as this could be used for the
calibration and validation of the estimates from satellite remote sensors and for comparison
with other ecosystems as well.
37
Forest ecosystems are very vital for the sustenance and livelihood of people across different
forest landscapes. Besides its role in carbon sequestration, it provides economic goods, raw
materials, food and shelter for humanity at local, regional and global scales (Lewis, 2006;
Gardner et al. 2009). In sub-Saharan African communities, it is known to supply over 50% of the
cash income of most farmers, provides over 80% of the health needs of the entire population
and as much as 80% of domestic energy needs (FAO, 2004; Babalola, 2009; Tutu and Akol,
2009). In the Niger Delta, the utilization of forest resources pre-dated the pre-colonial and
colonial eras and has characterized the general livelihood pattern of the region. Before the
advent of crude oil, the region has been known as a resource rich zone that produced products
ranging from fishes and other sea foods like periwinkles, oysters, crabs, prawn, crayfish; honey,
salt, mushroom, snails, wild fruits, nuts, biochemicals and bushmeat. Some of the resources in
the locality had regional importance so much so that they were exchanged for slaves and
livestock with people from the hinterlands (Irikana, 2011); and were sold in other parts of
Nigeria and as far as Tripoli in North Africa (Enemugwem, 2001). It has indeed been a source of
sustainability for many households and to a great extent maintained the local economy of the
region till date. While the trees are used as timber for varied purposes, they are also used for
other non-timber purposes across the region (Table 1.3).
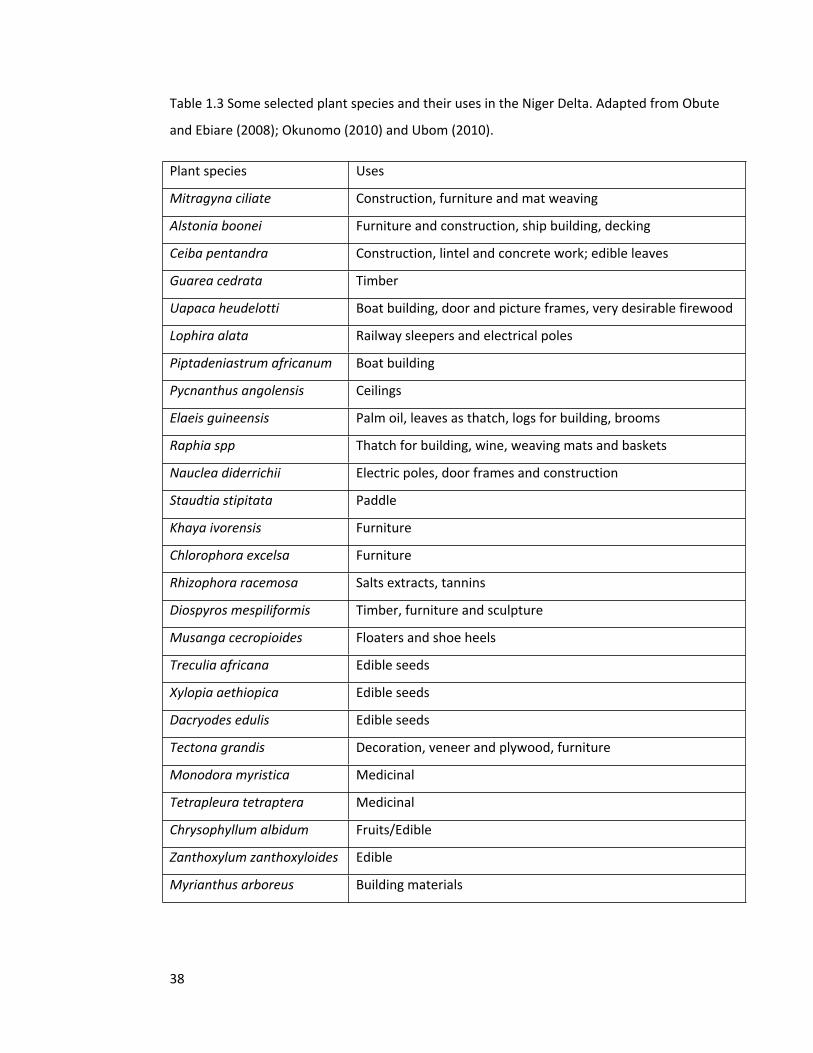
38
Table 1.3 Some selected plant species and their uses in the Niger Delta. Adapted from Obute
and Ebiare (2008); Okunomo (2010) and Ubom (2010).
Plant species Uses
Mitragyna ciliate Construction, furniture and mat weaving
Alstonia boonei Furniture and construction, ship building, decking
Ceiba pentandra Construction, lintel and concrete work; edible leaves
Guarea cedrata Timber
Uapaca heudelotti Boat building, door and picture frames, very desirable firewood
Lophira alata Railway sleepers and electrical poles
Piptadeniastrum africanum Boat building
Pycnanthus angolensis Ceilings
Elaeis guineensis Palm oil, leaves as thatch, logs for building, brooms
Raphia spp Thatch for building, wine, weaving mats and baskets
Nauclea diderrichii Electric poles, door frames and construction
Staudtia stipitata Paddle
Khaya ivorensis Furniture
Chlorophora excelsa Furniture
Rhizophora racemosa Salts extracts, tannins
Diospyros mespiliformis Timber, furniture and sculpture
Musanga cecropioides Floaters and shoe heels
Treculia africana Edible seeds
Xylopia aethiopica Edible seeds
Dacryodes edulis Edible seeds
Tectona grandis Decoration, veneer and plywood, furniture
Monodora myristica Medicinal
Tetrapleura tetraptera Medicinal
Chrysophyllum albidum Fruits/Edible
Zanthoxylum zanthoxyloides Edible
Myrianthus arboreus Building materials
39
1.9 Study region- The Niger Delta
1.9.1 Setting and Ethnography
Situated on the coast of West Africa, it is Africa’s largest delta. It is a vast sedimentary basin
covering about 75,000km2. The region is a flat area criss-crossed by a large number of
meandering streams, rivers, creeks that drain the river Niger into the Atlantic Ocean at the
Bight of Biafra. Based on the hydrology and human geography of the region, the Niger Delta
was initially made up of the three states namely, Delta, Rivers and Bayelsa states (Fig 1.2).
However, for more administrative and political benefits and governance, it currently covers all
the nine oil producing states: Abia, Akwa Ibom, Bayelsa, Cross River, Delta, Edo, Imo, Ondo and
Rivers states. It is a region of vast hydrocarbon stores, economic and ecological importance,
and is ethnically and multi-culturally diverse. The territory is home to Nigeria’s economic hub,
and is made up of more than 40 ethnic groups that speak more than 250 dialects and has a rich
cultural heritage (Jike, 2004). They can be broadly classified into five major linguistic categories:
the Ijoid, Yoruboid, Edoid, Igboid and Delta Cross and each of these categories embraces an
enormous mix of ethno-linguistic communities (Watts, 2004).
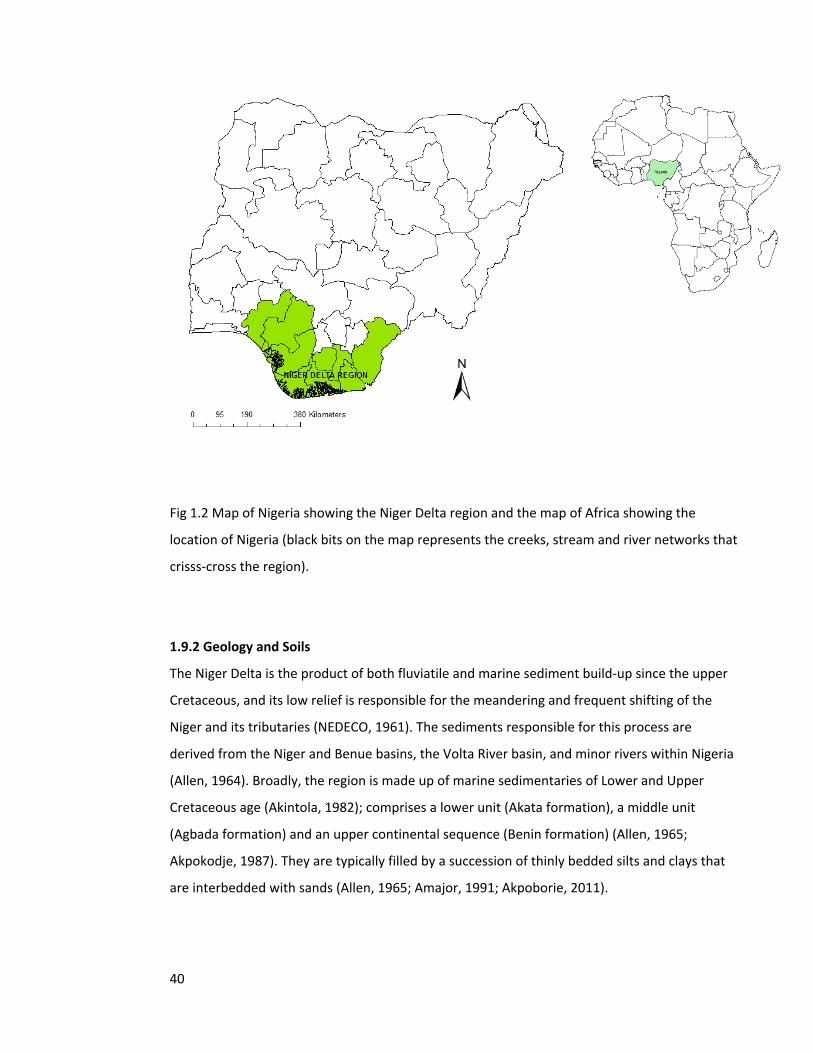
40
Fig 1.2 Map of Nigeria showing the Niger Delta region and the map of Africa showing the
location of Nigeria (black bits on the map represents the creeks, stream and river networks that
crisss-cross the region).
1.9.2 Geology and Soils
The Niger Delta is the product of both fluviatile and marine sediment build-up since the upper
Cretaceous, and its low relief is responsible for the meandering and frequent shifting of the
Niger and its tributaries (NEDECO, 1961). The sediments responsible for this process are
derived from the Niger and Benue basins, the Volta River basin, and minor rivers within Nigeria
(Allen, 1964). Broadly, the region is made up of marine sedimentaries of Lower and Upper
Cretaceous age (Akintola, 1982); comprises a lower unit (Akata formation), a middle unit
(Agbada formation) and an upper continental sequence (Benin formation) (Allen, 1965;
Akpokodje, 1987). They are typically filled by a succession of thinly bedded silts and clays that
are interbedded with sands (Allen, 1965; Amajor, 1991; Akpoborie, 2011).
41
The soils of this ecoregion are all of fluvial origin, except for the Coastal Barrier islands that
consist of marine sand overlain with an organic surface area; characterized by a mosaic of soil
types (WWF, 2008). Areola (1982) broadly categorized it as hydromorphic soils which are
described as seasonally or permanently waterlogged soils; and are whitish or greyish in colour
due to the reduction of oxides in the soils (an influence of their poor drainage). The
permanently waterlogged soils show little horizon differentiation, the profile being largely
uniformly coloured; while the extent of profile development for the seasonally waterlogged
ones are limited by the depth of the permanent water table.
1.9.3 Climate and Hydrology
The climate of the region like any other part of West Africa is controlled principally by the
seasonal movement of two air masses (Ojo, 1977). From September to February, the Tropical
Continental Air Mass spreads southwards from the Sahara to about latititude 5oN,
accompanied by the hot, dry and dusty north-easterly wind known as the Harmattan. From
March to August, the Tropical Maritime Air Mass, associated with rain-bearing south-westerly
winds, moves northwards to about latitude 21oN. The two air masses are separated by the
Inter-Tropical Convergence Zone (ITCZ). Movement of the ITCZ northwards is thus associated
with the rainy season while its southward movement brings the dry season.
The region has a tropical climate with long rainy season mainly from March/April to October.
Precipitation increases from the north of the delta (with an average of 2,500 mm y-1) to the
coastal area where mean annual rainfall averages around 4,000 mm y-1, making it one of the
wettest areas in Africa. The wet season lasts nearly throughout the year, but more pronounced
between eight and eleven months across space and time. The wet season peaks in July and the
dry months are mainly between Decembers to February (with an average monthly rainfall of
150 mm) (Hughes and Hughes, 1992). Relative humidity rarely dips below 60% and fluctuates
between 90% and 100% for most of the year, with average monthly maximum and minimum
temperatures varying between 28oC to 33oC and 21oC to 23oC respectively (NDES, 1997; James,
2008).
42
The hydrological regime of the region comes from the Atlantic Ocean’s tidal movements and
the Niger River flood. The flood begins toward the end of the rainy season in August, peaks in
October, and tapers off in December. Some fluctuations in flow is determined by the yearly
variation in rainfall, but after the completion of the Kainji dam on the Niger at Bussa in 1968,
the timing and level of flooding is also determined by the opening and closing of the dam’s
sluices (WWF, 2008). As the region’s diversity is mainly varied due to its hydrology, three zones
are evident: the flood forest (with seasonal variations); the second zone flanks the delta in the
east and declines westwards; and the third is a relatively stable delta fringes and associated
creeks barring the flood and tidal influences (NEDECO, 1996; Powell, 1997; Were, 2000).
1.9.4 Forest ecosystems across the Niger Delta
The forest ecosystem in the Niger Delta differs from each other on the basis of varied floristic
composition, hydrology, soil and topography. These forest ecosystems are mainly classified as
lowland rain forest, freshwater swamp forest and mangrove swamp forest. The lowland
rainforest belt is the least swampy and highest in elevation among all the other ecosystems in
the region. It shares or has boundaries with the freshwater swamp forest and is found in the
northern part of the freshwater ecosystem. The freshwater swamp forest ecosystem is a
flooded forest located in the landward side of the mangrove ecosystem. Varied by its
hydrology, three zones are found in the ecosystem: the flood forest- which has large sand river
channels and creeks- both permanent and seasonal; the marsh forest- which flanks the delta in
the east and declines westwards, permanently swampy and under the influence of ‘black flood’
from the rains; and the relatively stable delta fringes which is associated with creeks that bar
the flood and tidal influences (Powell, 1997; NEDECO, 1996; Were, 2000; James, 2008).
The ecosystem is located between the lowland rain forest to the north and the mangrove
swamp forest to the south; providing a transition zone between the two ecosystems and a
corridor for the migration of flora and fauna. The mangrove swamp forest ecosystem is the
swampiest of all the other forest ecosystems and has the lowest elevation (less than one
meter). The freshwater system meets the tidal salt water intrusion from the Atlantic Ocean in
this zone- hence the brackish characteristics of the zone (James, 2008). Characterized by saline
water and an understory of salt-tolerant plant species and flora with buttresses, stilt-roots and
43
pneumatophores; it has a transition zone with the freshwater swamp forest which is located in
its northern part.
1.9.5 Forest resources, use and management
The region has a long history of human existence (Nzewunwa, 1985) and an old account of
forest resources use and exploitation. Notable among such is the use of tree species in the
freshwater swamp forest for the production of plywood and other timber products. Since the
region had a lot of trees, it led to the establishment of sawmills in the region with the largest in
Sapele, established in 1936. The town Sapele which is a confluence location of three rivers- the
Benin, Jameson and Ethiope became almost synonymous with timber production; and has ever
since been a timber port due to its access (through a network of waterways) to the major
forests in the country (Buckle, 1959). Mangrove species are equally dominant across the forests
in the region- at the transition zones between freshwater swamp forests and in mangrove
swamp forests as well. These tree species have been used for a variety of purposes: fuel wood,
construction materials, dyes, tannins for fishing, medicines and timber. They equally provide
habitats, spawning grounds, nutrients, nurseries and a crucial role in marine food chain (FAO,
2007). With the raffia and oil palms found across most of the forests in the region, the region is
known for tapping of the sap from the palms; which are eventually used for local wine and gin.
Other forest uses include: sources of fresh water supply for both domestic and industrial
purposes, fishing ground, brooding grounds and nesting sites for a host of birds and other
fauna. As both the black and whitewater rivers flow into the highly productive Niger Delta, it
supports an extremely rich freshwater fauna and includes the highest concentration of
monotypic fish families in the world (WWF, 2008). Classified as a hot spot (Myers et al. 2000), it
is home to a lot of endemic, rare and threatened plant and animal species: white throated
guenon (Cercopithecus erithrogaster), Chimpazee (Pan troglodytes), Manatee (Trichecus
senegalensis), spotted-necked otter (Lutra maculicollis), Crested genet (Genetta cristata) and
Sclater’s guenon (Cercopithecus sclateri) (Happold, 1987; Sayer et al. 1992; Hilton-Taylor,
2000).
Forest ecosystems across the region, like in other parts of Nigeria, are managed at the state
levels, community levels and family or private levels. The state ministry of forestry in each of
44
the Niger Delta states is laden with the responsibility of managing government forest units
(mostly in forest reserves). At the community level, the forest units found on communal lands
are managed by the host community of such forests; mostly with the paramount rulers in
charge, while community leaders and youth groups support them. Family units and individuals
equally own and manage most of the remaining forest lands in the region and transfer the
ownership of such forest lands to either their offspring or non-relatives by inheritance or sale.
Other forest units found in sacred groves, burial grounds and shrines are managed by their
respective owners (either a community or family).
1.10 Thesis overall aims
Freshwater swamp forest is a poorly understood ecosystem found within the Niger Delta. Its
ecology and floristic composition (chapters 2 to 6) are sufficient to distinguish it from other
ecosystems, mainly mangroves. With the high rate of losses and degradation of forest
ecosystems across the Nigerian state and the African continent, the study will provide a
baseline for the ecosystem, but furthermore contribute to understanding the processes,
functional dynamics and resource utilization of the ecosystem. This thesis is aimed at
documenting the varied floristic composition of the ecosystem, its biodiversity index patterns
and the varied ecosystem service values and utilization. These will be achieved through the
following objectives:
1. Document and update the floristic composition of the freshwater swamp forest
2. Determine the environmental variables that are responsible for the distribution of the
flora
3. Measure the carbon storage of the swamp forests
4. Determine the drivers of forest loss and degradation across the ecosystem
5. Determine the swamp forest human use and dependence across the Niger Delta region
45
1.11 Outline of chapters
This thesis is structured as scientific publications (from chapter 2 to 6) and then a summary of
the findings and further discussions provided in chapter 7. With this style of presentation some
of the chapters will overlap each other.
Chapter 2- Floristic composition and diversity of freshwater swamp forests in the Niger Delta
With poor baselines on the ecosystem across the Niger Delta, the study sought to document
and updates the floristic composition of the ecosystem. It sought to elucidate how species rich
or diverse the ecosystem is and compare the findings with the more studied swamp forests in
other parts of the world. Furthermore, the patterns of abundance of the different taxa were
elucidated for each of the forest zones. These data can better inform the conservation and
management of this threatened ecosystem.
Chapter 3- Determinants and patterns of freshwater swamp forests
The study sought to explain the variables responsible for the variations in the species
composition of the ecosystem. Indicator species analysis was used to characterize the
ecosystem, while each of the taxa was grouped according to their associations. This aimed at
providing more detail for biogeographic classification and in elucidating the extent
environmental factors and disturbances shaped the ecosystem. Furthermore, the study was
used to ascertain the validity of the intermediate disturbance hypothesis to swamp forests and
highlight the extent to which the ecosystem could be impacted by changes in the environment.
Chapter 4- Above ground carbon storage in freshwater swamp forest ecosystems
Tropical forests are known as storehouses of carbon and important for modulating the climatic
influences across the globe. With little or no baselines for the freshwater swamp forests across
Nigeria and the West African region, this chapter highlights the estimates of the ecosystem in
providing this ecosystem service. Utilizing the varied flora across the ecosystem, the study
examined the extent to which the above ground carbon for each forest zone was determined
by its composition. Furthermore, since the ecosystem is rife with disturbance, it provided a
basis for estimating the relative carbon store of disturbed forests versus intact forests, in order
to effectively assess its conservation value.
46
Chapter 5- Patterns of freshwater swamp use and degradation
Tropical forest ecosystems in Africa are vital for household sustenance and income generation;
however, the extent to which this is harnessed in freshwater swamp forests across West Africa
is largely unknown. This study assessed the use of this ecosystem across the Niger Delta and
the extent livelihoods depended on the ecosystem. How the people used the forest was
highlighted since it served as a good basis for understanding the underlying issues of utilization
in the ecosystem, and could provide insights on effective management and conservation
guidelines suitable for the ecosystem. These issues are vital for ensuring a sustainable
livelihood for the rural poor across the region and continual existence of the ecosystem.
Chapter 6- Ecosystem services at the cross-roads
Forest use affects the viability, composition and ultimately, the extent to which forest
ecosystems could provide vital services. With variations in the ownership and management of
the ecosystem differing across the forest communities as in most African landscapes, this
chapter focuses on assessing how these patterns influences the carbon potentials of the
ecosystem. Since most of the forest landscapes across the region are being modified and its
capacities as potential carbon stores dwindling, deciphering effective and realistic forest
management policies for the privately owned and community owned forest units (that
dominate the landscape) has become more crucial than ever. This will not only help to ensure
that the carbon sequestration in the ecosystem is maintained, but also help to preserve its
unique biodiversity.
Chapter 7- Summary discussion
This chapter summarizes the findings and discussions of the study, provides insights on
effective management structures and presents the need for further work. Furthermore, it
highlights the importance of additional baselines, data improvements and updating. These are
viewed as essential steps to achieving more applied ecological studies in the future.
47
1.12 References
Abam, T.K.S. (2009). Regional hydrological research perspectives in the Niger Delta.
Hydrological Science Journal 46 (1): 13-25.
Aghalino, S.O. (2000). British colonial policies and the oil palm industry in the Niger Delta region
of Nigeria, 1900- 1960. African study Monographs 21(1):19-33.
Akintola, F. (1982). Geology and Geomorphology. In: Barbour, K.M., Oguntoyinbo, J.S.,
Onyemelukwe, J.O.C., and Nwafor, J.C. (Eds.). Nigeria in Maps. Africana Publishing
Company, U.S.A.
Akpoborie, I.A. (2011). Aspects of the hydrology of the western Niger Delta wetlands:
groundwater conditions in the Neogene (recent) deposits of the Ndokwa area.
Proceedings of the Environmental management conference: managing coastal and
wetland areas of Nigeria, Sept. 12-14, Abeokuta.
Akpokodje, E.G. (1987). The engineering geological characteristics and classification of the
major superficial soils of the Niger Delta, Engineering geology, 23: 193-211.
Allen, J.R. (1964). Coastal geomorphology of eastern Nigeria: beach ridge barrier islands and
vegetated tidal flats. Geologie en Mynbouw 44: 1-21.
Allen, J.R. (1965). Late quaternary of the Niger Delta and adjacent areas: sedimentary
environments and lithofacies, AAPG BULL, 49.
Amajor, L.C. (1991). Acquifers in the Benin formation (Miocene Recent), Eastern Niger Delta.
Environ. Geol Water Sci. 17 (2): 85-101 E.
Areola, O. (1982). Soils. In: Barbour, K.M., Oguntoyinbo, J.S., Onyemelukwe, J.O.C., and Nwafor,
J.C. (Eds.). Nigeria and Maps. Africana Publishing Company, U.S.A.
Asner, G. P. (2013). Geography of forest disturbance. PNAS 110 (10): 3711-3712.
Asthana, D.K. and Asthana, M. (2003). Environmental problems and solutions. S. Chand and
Company Ltd. New Delhi.
Attiwill, P. M. (1994). The disturbance of forest ecosystems: the ecological basis for
conservative management. Forest Ecology and Management 63: 247-300.
Babalola, F. D. (2009). Prospects and challenges of production and marketing of non-timber
forest products (NTFPs) by rural farmers in southwest Nigeria. Academic Journal of Plant
Sciences 2 (4): 222-230.
48
Baccini, A., Laporte, N., Goetz, S. J., Sun, M. and Dong, H. (2008). A first map of tropical Africa’s
above-ground biomass derived from satellite imagery. Environ. Res. Lett. 3, 045011.
Barbour, K.M., Oguntoyinbo, J.S., Onyemelukwe, J.O.C, and Nwafor. J.C. (1982). Nigeria in
Maps. Africana Publishing Company, U.S.A.
Blasco, F., Whitmore, T. C. and Gers, C. (2000). A framework for the worldwide comparison of
tropical woody vegetation types. Biological Conservation 97 (2): 175-189.
Blench, R. and Dendo, M. (2007). Mammals of the Niger Delta, Nigeria.
http://www.rogerblench.info/Ethnoscience.
Braun-Blanquet, J. (1928). Pflanzensoziologie. Gründzuge der Vegetationskunde. Springer-
Verlag, Berlin, Germany, 631p.
Brokaw, N. V. L. (1985). Gap-phase regeneration in a tropical forest. Ecology 66 (3): 682-687.
Buckle, D. H. (1959). Timber operations in West Africa. Unasylva Vol. 13, No. 1.
http://www.fao.org/docrep/x5390e/x5390e00.htm.
Chan, H. T. and Baba, S. (2009). Manual on guidelines for rehabilitation of coastal forests
damaged by natural hazards in the Asia-Pacific region. ISME and ITTO.
Contreras-Hermosilla, A. (2000). The underlying causes of forest decline. Centre for
International Forestry Research (CIFOR), Occasional paper no. 30.
Coops, N. C., Wulder, M. A. and Iwanicka, D. (2009). Large area monitoring with a MODIS-based
Disturbance Index (DI) sensitive to annual and seasonal variations. Remote Sensing of
Environment 113: 1250-1261.
Dansereau, P. (1951). Description and recording of vegetation upon a structural basis. Ecology
32: 172-229.
Daubenmire, R. F. (1952). Forest vegetation of northern Idaho and adjacent Washington, and
its bearing on concepts of vegetation classification. Ecological Monographs 22: 301-330.
De Groot, R. S., Alkemade, R., Braat, L., Hein, L. and Willemen, L. (2010). Challenges in
integrating the concept of ecosystem services and values in landscape planning,
management and decision making. Ecological Complexity 7: 260-272.
DeFries, R. S., Foley, J. A. and Asner, G. P. (2004). Land-use choices: balancing human needs and
ecosystem function. Front. Ecol. Environ. 2: 249-257.
Diaz, S., Fargione, J., Chapin, F. S. and Tilman, D. (2006). Biodiversity loss threatens human well-
being. PLoS Biology 4 (8): 1300-1305.
49
Dykstra, D.P., Kowero, G.S., Ofosu-Asiedu, A., and Kio, P. (Eds.). (1996). Promoting stewardship
of forests in the humid forest zone of Anglophone west and central Africa. Final report of
a collaborative research project undertaken by the United Nations environment
programme and the Center for international forestry research, CIFOR, Indonesia.
Enaruvbe, G. O. and Atafo, O. P. (2014). Analysis of deforestation pattern in the Niger Delta
region of Nigeria. Journal of Land Use Science, doi: 10.1080/1747423X.2014.965279.
Enemugwem, J. H. (2001). The significance of the Niger Delta in the political and economic
development of Nigeria. PhD thesis, University of Port Harcourt.
Environmental Rights Action/Friends of the Earth Nigeria (2005). Gas flaring in Nigeria: A
human rights, environmental and economic monstrosity, Amsterdam, Netherlands.
Ewers, R. M. and Didham, R. K. (2006). Confounding factors in the detection of species
responses to habitat fragmentation. Biological Review 81: 117-142.
Eyre, F. H. (Ed.) (1980). Forest cover types of the United States and Canada. Washington DC:
Society of American Foresters, 148pp.
Fahrig, L. (2003). Effects of habitat fragmentation on biodiversity. Ann. Rev. Ecol. Evol. Syst. 34:
487-515.
FAO (1998). Integrated coastal area management and agriculture, forestry and fisheries.
http://www.fao.org/docrep/W8440E/W8440E00.
FAO (2001). Forest Resources Assessment 2000. FAO Forestry papers 140, Rome.
FAO (2004). Do sustainable livelihoods approaches have a positive impact on the rural poor? A
look at twelve case studies. Food and Agricultural Organisation, Rome.
FAO (2007). The world’s mangroves. FAO forestry paper, Rome.
Farina, M.F. (2011). Flare gas reduction. Recent global trends and policy. Global strategy and
planning.
Ferretti-Gallon, K. and Busch, J. (2014). What drives deforestation and what stops it? A meta-
analysis of spatially explicit econometric studies. Center for Global development
www.cgdev.org. Working paper 361 (2).
Fisher, B., Turner, R. K. and Morling, P. (2009). Defining and classifying ecosystem services for
decision making. Ecological Economics 68: 643-653.
Flahault, C. and C. Schroter. 1910. Rapport sur la nomenclature phytogeographique.
Proceedings of the 3rd International Botanical Congress, Brussels, 1910, 1:131–164.
50
Foley, J. A., Asner, G. P., Costa, M. H., Coe, M. T., DeFries, R., Gibbs, H. K., Howard, E. A., Olson,
S., Patz, J., Ramankutty, N. and Snyder, P. (2007). Amazonia revealed: forest degradation
and loss of ecosystem goods and services in the Amazon Basin. Front. Ecol. Environ. 5 (1):
25-32.
Foley, J. A., DeFries, R., Asner, G. P., Barford, C., Bonan, G., Carpenter, S. R., Chapin, F. S., Coe,
M. T., Daily, G. C., Gibbs, H. K., Helkowski, J. H., Holloway, T., Howard, E. A., Kucharik, C.
J., Monfreda, C., Patz, J. A., Prentice, I. C., Ramankutty, N. and Snyder, P. K. (2005). Global
consequences of land use. Science 309: 570-574.
FORMECU (1999). Forest resources study. Revised forest management plan. Edo state. Report
by Beak consultants limited, Geomatic international and Geomatics Nigeria limited.
Fox, L. (1989). A classification, map and volume estimate for the coast redwood forest in
California: The forest and rangeland resources assessment program. California
Department of Forestry and Fire Protection, 37pp.
Francis, P., Lapin, D. and Rossiasco, P. (2011). Securing development and peace in the Niger
Delta. A social and conflict analysis for change. Woodrow Wilson International center for
scholars, U.S.A.
Gardner, T. A., Burgess, N. D., Aguilar-Amuchastegui, N., Barlow, J., Berenguer, E., Clements, T.,
Danielsen, F., Ferreira, J., Foden, W., Kapos, V., Khan, S. M., Lees, A. C., Parry, L., Roman-
Cuesta, R. M., Schmitt, C. B., Strange, N., Theilade, I., Vieira, I. C. G. (2012). A framework
for integrating biodiversity concerns into national REDD+ programmes. Biological
Conservation 154: 61-71.
Gardner, T.A., Barlow, J., Chazdon, R., Ewers, R.M., Harvey, C.A., Peres, C.A. and Sodhi, N.S.
(2009). Prospects for tropical forest biodiversity in a human-modified world. Ecology
Letters 12: 561-582.
Gavin, D. G. and Hu, F. S. (2006). Spatial variations of climate and non-controls on species
distribution: the range limit of Tsuga heterophylla. Journal of Biogeography 33: 1384-
1396.
Geist, H.J and Lambin, E.F. (2002). Proximate causes and underlying driving forces of tropical
deforestation. Bioscience 52 (2): 143- 150.
Gentry, A.H. (1992). Tropical forest biodiversity: distributional patterns and their conservational
significance. Oikos 63: 19-28.
51
Gong, P. and Xu, B. (2003). Remote sensing of forests over time: Change types, methods and
opportunities. In Wulder, M. A. and Franklin, S. E. (Eds.), Remote sensing of forest
environments: concepts and case studies, pp. 301-333. Massachusetts: Kluwer Academic
Publishers.
Gorte, R. W. (2009). Carbon sequestration in forests. http://www.crs.gov.
Grainger, A. (1993). Controlling tropical deforestation. Earthscan Publications, London.
Grainger, A., Boucher, D. H., Frumhoff, P. C., Laurance, W. F., Lovejoy, T., McNeely, J., Niekisch,
M., Raven, P., Sodhi, N. S., Venter, O. and Pimm, S. L. (2009). Biodiversity and REDD at
Copenhagen. Current Biology 19 (21): 1-3.
Gutschick, V. P. and BassiriRad, H. (2003). Extreme events as shaping physiology, ecology, and
evolution of plants: toward a unified definition and evaluation of their consequences.
New Phytologist 160 (1): 21-42.
Hansen, M. C., Potapov, P. V., Moore, R., Hancher, M., Turubanova, S. A., Tyukavina, A., Thau,
D., Stehman, S. V., Goetz, S. J., Loveland, T. R., Kommareddy, A., Egorov, A., Chini, L.,
Justice, C. O., Townshend, J. R. G. (2013). High-resolution global maps of 21st century
forest cover change. Science 342: 850-853.
Happold, D. C. (1987). The mammals of Nigeria. Clarendon press, Oxford, UK.
Helleiner, G. K. (1996). Peasant agriculture, government and economic growth in Nigeria.
Illinois 97.
Hilton-Taylor (2000). IUCN Red List of threatened species. IUCN, Gland, Switzerland and
Cambridge, UK.
Holdridge, L. R. (1947). Determination of world plant formations from simple climatic data.
Science 105 (2727): 367-368.
Holdridge, L. R. (1967). Life zone ecology. Tropical science center, San Jose, Costa Rica.
Hoover, S. E. R., Ladley, J. J., Shchepetkina, A. A., Tisch, M., Gieseg, S. P. and Tylianakis, J. M.
(2012). Warming, CO2, and nitrogen deposition interactively affect a plant-pollinator
mutualism. Ecology Letters 15: 227-234.
Houghton, R. A. (2005). Tropical deforestation as a source of greenhouse gas emissions. In
Moutinho, P. and Schwartzman, S. (Eds). Tropical deforestation and climate change.
Amazon Institute for Environmental Research.
Hughes, R.H. and Hughes, J.S. (1992). A directory of African wetlands. Gland, Switzerland,
Nairobi, Kenya, and Cambridge, UK: IUCN, UNEP, and WCMC.
52
Irikana, G. J. (2011). Mangrove resources utilization in Nigeria: an analysis of the Andoni
mangrove resources crisis. Sache Journal of Environmental studies 1 (1): 49-63.
Isichei, A. O. and Sanford, W. W. (1976). The effects of waste gas flares on the surrounding
vegetation in South-Eastern Nigeria. Journal of Applied Ecology 13 (1): 177-187.
Isikhuemen, E.M. (2012). Status, threats and priority for conservation of freshwater swamp
forest in protected areas of Edo state, Nigeria. Nigerian Journal of Agriculture, Food and
Environment 8 (1): 38-46.
ITC (1977). Project de développement rural integer de la Région Kaarta, Rep du Mali. Phase de
reconnaissance du Volet VIII, Cartographie. ITC, Enschede.
Ite, A. E. and Ibok, U. J. (2013). Gas flaring and venting associated with petroleum exploration
and production in the Nigeria’s Niger Delta. American Journal of Environmental
Protection 1 (4): 70-77.
James, G. K. (2008). Assessment of environmental change and its socio-economic impacts in the
mangrove ecological zone of the Niger Delta, Nigeria. Ph.D thesis, University of Missouri-
Kansas city.
Jennings, M., Loucks, O., Peet, R., Faber-Langendoen, D., Glenn-Lewin, D., Grossman, D.,
Damman, A., Barbour, M., Pfister, R., Walker, M., Talbot, S., Walker, J., Hartshorn, G.,
Waggoner, G., Abrams, M., Hill, A., Roberts, D., Tart, D. and Rejmanek, M. (2003).
Guidelines for Describing Associations and Alliances of the U.S National Vegetation
Classification. The Ecological Society of America Vegetation Classification Panel,
Washington DC.
Jermy, C. and Chapman, R. (2002). Tropical forest expeditions. RGS-IBG Expedition advisory
centre. Royal Geographical Society.
Jike, T. V. (2004). Environmental degradation, social disequilibrium and the dilemma of
sustainable development in the Niger Delta of Nigeria. J. Black Stud., 34 (5): 686-701.
Julius, O. O. (2011). Environmental impact of gas flaring within Umutu-Ebedei gas plant in Delta
state, Nigeria. Archives of Applied Science Research 3 (6): 272-279.
Kadafa, A. A. (2012). Oil exploration and spillage in the Niger Delta of Nigeria. Civil and
Environmental Research 2: 38-51.
Keay, R.W. (1959). An outline of the Nigerian vegetation. Federal Department of Forest
Research. Federal Ministry of Information, Lagos.
53
Keay, R.W.J. (1989). Trees in Nigeria. Oxford science publications. Clarendon press Oxford.
476pp.
Kimmins, J.P. (1997). Forest ecology: a foundation for sustainable management. (Second
edition). Prentice Hall, New Jersey, USA. 596pp.
Köppen, W. (1936). Das geographische System der Klimate. In: Köppen, W. and Geiger, R.
(Eds.), Handbuch der Klimatologie. Gebrüder Borntraeger, Berlin, pp. 1-44.
Lewis, S. L. et al. (2013). Aboveground biomass and structure of 260 African tropical forests.
Phil Trans R Soc B 368: 20120295. http://dx.doi.org/10.1098/rstb.2012.0295.
Lewis, S.L (2006). Tropical forests and the changing earth system. Phil. Trans. R. Soc. B 361, 195-
210.
Limburg, K. E., O’Neil, R. V., Costanza, R. and Farber, S. (2002). Complex systems and valuation.
Ecological Economics 41: 409-420.
Linden, O. and Palsson, J. (2013). Oil contamination in Ogoniland, Niger Delta. Ambio 42: 685-
701.
Liu, Y., Mu, J., Niklas, K. J., Li, G. and Sun. S. (2012). Global warming reduces plant reproductive
output for temperate multi-inflorescence species on the Tibetan plateau. New Phytol.
195 (2): 427-436.
Lugo, A. E. (1984). A review of early literature on forested wetlands in the United States. In
Ewel, K. C and H. T. Odum (Eds.), Cypress swamps. University of Florida.
Lugo, A.E, Brown, S., and Brinson, M.M. (1988). Forested wetlands in freshwater and salt-water
environments. Limnology and Oceanography 33: 894-909.
MA (2005). Millennium Ecosystem Assessment, General Synthesis Report, Island Press,
Washington D.C.
Malhi, Y., Amezquita, F. F., Doughty, C. E., Silva-Espejo., J. E., Girardin, C. A. J., Metcalfe, D. B.,
Aragao, L. E. O. C. et.al. (2014). The productivity, metabolism and carbon cycle of two
lowland tropical forest plots in south-western Amazonia, Peru. Plant Ecology and
Diversity 7 (1-2): 85-105.
Malhi, Y., Baker, T. R., Phillips, O. L., Almeida, S., Alvarez, E., Arroyo, L., Chave, J., Czimczik, C. I.,
Di Fiore, A., Higuchi, N., Killeen, T. J., Laurance, S. G., Laurance, W. F., Lewis, S. L.,
Montoya. L. M. M., Monteagudo, A., Neill, D. A., Vargas, P. N., Patino, S., Pitman, N. C. A.,
Quesada, C. A., Salomao, R., Silva, M. J. N., Lezama, A. T., Martinez, R. V., Terborgh, J.,
54
Vinceti, B. and Lloyd, J. (2004). The above-ground coarse wood productivity of 104
Neotropical forest plots. Global change Biology 10: 563-591.
Martin, T. E. and Blackburn, G. A. (2010). Impacts of tropical forest disturbance upon avifauna
on a small island with high endemism: implications for conservation. Conservation and
Society 8: 127-139.
Mathews, E. and Fung, I. (1987). Methane emission from natural wetlands: Global distribution
area and environmental characteristics of sources. Global Biogeochemical Cycles 1 (1):
61-86.
Moffat, D. and Linden, O. (1995). Perception and reality: Assessing priorities for sustainable
development in the Niger Delta. Ambio, 24: 7-8. Stockholm.
Momodu, A.S., Siyanbola, W.O., Pelemo, D. A., Obioh, I. B. and Adesina, F. A. (2011). Carbon
flow pattern in the forest zones of Nigeria as influenced by land use change. African
Journal of Environmental Science and Technology 5 (9): 700-709.
Morris, R. J. (2010). Anthropogenic impacts on tropical forest biodiversity: a network structure
and ecosystem functioning perspective. Phil. Trans. R. Soc. B. 365: 3709-3718.
Myers, N., Mittermeier, R.A., Mittermeier, C.G., da Fonseca, G.A.B. and Kent, J. (2000).
Biodiversity hotspots for conservation priorities. Nature 403: 853-858.
NDES (1997). The Niger Delta Environmental Survey. Environmental and socio-economic
characteristics. Lagos-Nigeria: Environmental Resources Managers limited.
NEDECO (1961). The Niger Delta: Report on an Investigation. Netherlands Engineering
Consultants: The Hague.
NEDECO (1996). The soils of the Niger delta. Netherlands Engineering Consultants. The Hague.
NPC (2006). Population and Housing Census of the Federal Republic of Nigeria 2006 Census.
National Population Commission, Abuja, Nigeria.
NRC. (2003). Oil in the sea III: Inputs, fates and effects. National Academy Press, Washington
DC.
Nzewunwa, N. (1985). Man’s early interest in, and use of, the mangrove ecosystem: the
archaeological perspective. In B.H.R. Wilcox and C.P. Powell, Eds. The mangrove
ecosystem of the Niger Delta: proceedings of a workshop. University of Port Harcourt,
Port Harcourt.
Obot, E., Antonio, Q. B., Braide, S., Dore, M., Wicks, C. and Steiner, R. (2006). Niger Delta
natural resource damage assessment and restoration project. Phase 1 scoping report.
55
https://cmsdata.iucn.org/niger_delta_natural_resource_damage_assessment_and_resto
ration_project_recommendation.doc [Accessed 6 August, 2015.].
Obute, G. C. and Ebiare, E. (2008). Ethnobotanical applications of some flora species in Bayelsa
state, Nigeria. Ethnobotanical leaflets 12: 713-718.
Odjugo, P. A. O. and Osemwenkhae, E. J. (2009). Natural gas flaring affects microclimate and
reduces maize (Zea mays) yield. International Journal of Agriculture and Biology 11 (4):
408-412.
Oil spill intelligence report (1997). White paper series, 1(7). Arlington, Massachusetts.
Ojo, O. (1977). The climate of West Africa. Heineman: London.
Okunomo, K. (2010). Utilization of forest products in Nigeria. African Journal of General
Agriculture 6 (3).
Omokhua, G.E, and Koyejo, A.O. (2008). Impact of deforestation on ecosystem: a case study of
the freshwater swamp forest in Onne, Niger delta region, Nigeria. Journal of Agriculture
and Social Research (JASR) 8 (2).
Onojeghuo, A. O. and Blackburn, G. A. (2011). Forest transition in an ecologically important
region: patterns and causes for landscape dynamics in the Niger Delta. Ecological
Indicators 11: 1437-1446.
Pan, W., Carr, D., Barbierri, A., Bilsborrow, R., and Suchindran, C. (2007). Forest clearing in the
Ecuadorian Amazon: a study of patterns over space and time. Population research and
policy review, 26: 635-659.
Pan, Y., Birdsey, R .A., Fang, J., Houghton, R., Kauppi, P. E., Kurz, W. A., Phillips, O. L., Shvidenko,
A., Lewis. S. L., Canadell, J. G., Ciais, P., Jackson, R. B., Pacala. S. W., McGuire, D., Piao, S.,
Rautiainen, A., Sitch, S. and Hayes, D. (2011). A large and persistent carbon sink in the
world’s forests. Science 333: 988-993.
Pearson, G. A. (1937). Conservation and use of forests in the Southwest. Scientific Monthly 45:
150-157.
Pickett, M. G. and White, P. S. (1985). The ecology of natural disturbance and patch dynamics.
Academic Press, Inc. Orlando, Florida.
Powell, C.B. (1997). Discoveries and priorities of mammals in the freshwater forests of Niger
Delta. Oryx 31: 83-85.
56
Prentice, I. C., Cramer, W., Harrison, S. P., Leemans, R., Monserud, R. A. and Solomon, A. M.
(1992). A global biome model based on plant physiology and dominance, soil properties
and climate. Journal of Biogeography 19: 117-134.
Raunkiaer, C. (1934). The life forms of plants and statistical plant geography. Clarendon press,
Oxford.
Raven P.H. and Johnson, G.B. (2002). Biology. 6th Edition. McGraw-Hill, New York.
Ruesch, A. and Gibbs, H. K. (2008). New IPCC Tier-1 Global Biomass Carbon Map for the year
2000. http://cdiac.ornl.gov
Saatchi, S. S., Harris, N. L., Brown, S., Lefsky, M., Mitchard, E. T. A., Salas, W., Zutta, B. R.,
Buermann, W., Lewis, S. L., Hagen, S., Petrova, S., White, L., Silman, M., and Morel, A.
(2011). Benchmark map of forest carbon stocks in tropical regions across three
continents. www.pnas.org/cgi/doi/10.1073/pnas.1019576108.
Sayer, J. A., Harcourt, C. S., and Collins, N. N. (1992). The Conservation Atlas of Tropical Forest,
Africa. IUCN Gland, Switzerland.
Scaven, V. L. and Rafferty, N. E. (2013). Physiological effects of climate warming on flowering
plants and insect pollinators and potential consequences for their interactions. Curr Zool.
59 (3): 418- 426.
Scharlemann, J. P. W., Hiederer, R., Kapos, V. and Ravilious, C. (2011). UNEP WCMC Updated
Global Carbon Map. United Nations Environment Programme- World Conservation
Monitoring Centre.
Seidl, R., Schelhaas, M., Rammer, W. and Verkerk, P. J. (2014). Increasing forest disturbances in
Europe and their impact on carbon storage. Letters, Nature Climate Change 4: 806-810.
Solomon, A. M. and Kirilenko, A. P. (1996). Climate change and terrestrial biomass: what if trees
do not migrate? Global Ecol. Biogeogr. Lett. 6: 139-148.
Spalding, M., Kainamu, M. and Collins, L. (2010). World Atlas of mangroves. Earthscan. 319p.
Steffen, W. L., Cramer, W., Plochl, M. and Bugmann, H. (1996). Global vegetation models:
incorporating transient changes to structure and composition. J. Veget. Sci. 7: 321-328.
Steiner, R. (2010). Double standard. Shell practices in Nigeria compared with international
standards to prevent and control pipeline oil spills and the deepwater horizon oil spill.
Friends of the earth, Netherlands.
Stillard, N. H. (1938). The rise and development of legitimate trade in palm oil with West Africa.
Unpublished M. A. Thesis, University of Birmingham.
57
Swaine, M.D. (1996). Rainfall and soil fertility as factors limiting forest species distributions in
Ghana. Journal of Ecology 84: 419-428.
Thackway, R. and Cresswell, I. D. (Eds.) (1995). An interim biogeographic regionalisation for
Australia. Version 6.0. Australian Nature Conservation Agency, Canberra.
Thomas, S.C. and Baltzer, J.L. (2002). Tropical forests. Encyclopedia of life sciences. Macmillan
publishers’ Ltd, Nature publishing group.
Thornthwaite, C. W. (1933). The climates of the Earth. Geographical Review, pp. 433-440.
Tutu, K. and Akol, C. (2009). Reversing Africa’s deforestation for sustainable development.
Springer Netherlands pp. 25-34.
Ubom, R. M. (2010). Ethnobotany and biodiversity conservation in the Niger Delta, Nigeria.
International Journal of Botany 6 (3): 310-322.
UNDP (2006). Niger Delta human development report. United Nations Development
Programme, UN House, Abuja, Nigeria.
UNESCO (1973). International classification and mapping of vegetation. United Nations
Educational Scientific and Cultural Organisation, Switzerland.
Vitousek, P. M. and Sandford Jr. R. L. (1986). Nutrient cycling in moist tropical forest. Annu.
Rev. Ecol. Syst. 17: 137-167.
Watt, A. S. (1947). Pattern and process in the plant community. J. Ecol. 35: 1-22.
Watts, M. (2004). Resource curse? Governmentality, oil and power in the Niger Delta, Nigeria.
Geopolitics (special issue) 9 (1): 50-80.
Weller, M.W. (1998). Issues and approaches in assessing cumulative impacts on waterbird
habitats in wetlands. Environmental management 12 (5): 695- 701.
Were, J.L.R. (2000). Ecology and behavior in the Niger delta Red Colobus (Pro colobus badius
epeieni). PhD thesis, University of New York, New York, USA.
Whitford, H. N. (1923). The use of tropical land and tropical forests. Scientific Monthly 17: 135-
145.
Whitmore, T. C. (1978). Gaps in the forest canopy. In tropical trees as living systems,
Tomlinson, P. B. and Zimmermann, M. H. (Eds.), 675pp. Cambridge University Press, New
York, 639-655.
Whitmore, T. C. (1990). An introduction to tropical rain forests. Clarendon press, Oxford.
Whitmore, T.C. (1984). Tropical rain forests of the Far East (2nd edition). Clarendon, Oxford.
Whittaker, R. H. (1962). Classification of natural communities. Botanical Review 28: 1-239.
58
Williams (2002). Deforesting the earth: from prehistory to global crises. University of Chicago
press, USA.
World Wildlife Fund (2008). Niger Delta swamp forest. In: Encyclopedia of Earth. Available at
http://www.eoearth.org/article/Niger_Delta_swamp_forest. [Accessed 5 March, 2013].
WRI (1990). World Resources 1990-1991. World Resources Institute/Oxford University Press,
Oxford.
Yates, D. N., Kittel, T. G. F., Cannon, R. F. (2000). Comparing the correlative Holdridge model to
mechanistic biogeographical models for assessing vegetation distribution response to
climate change. Climatic Change 44: 59-87, Kluwer Academic Publishers, Netherlands.
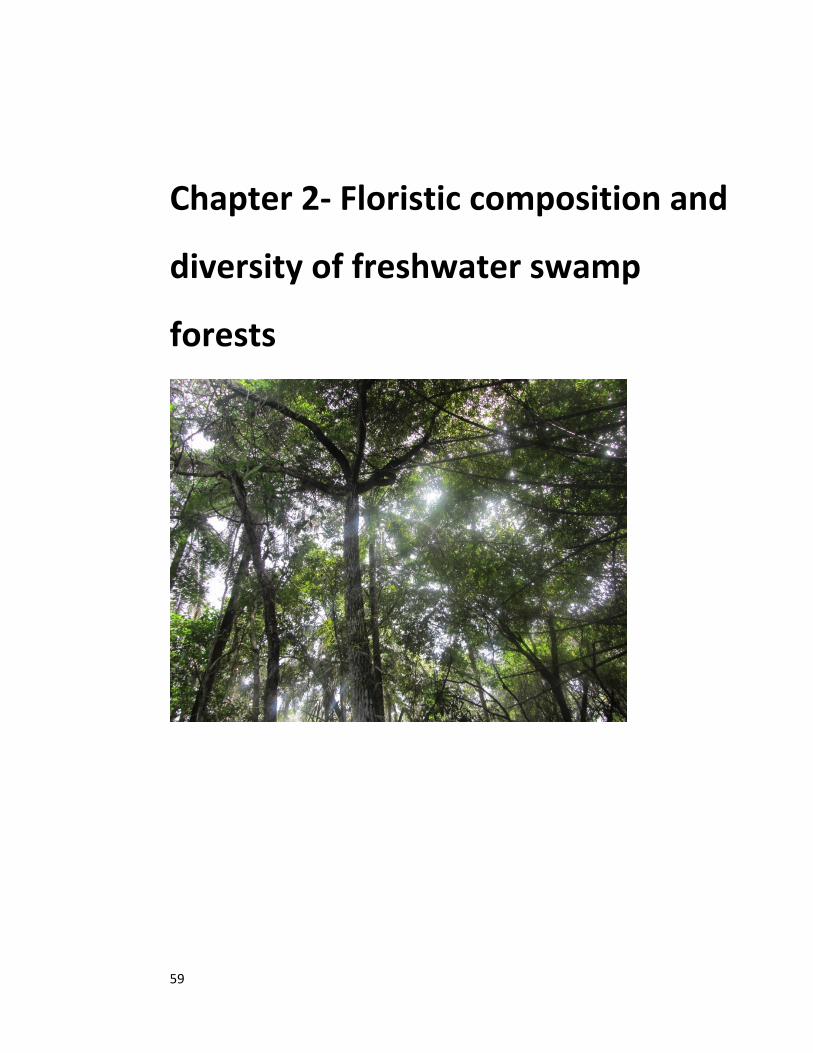
59
Chapter 2- Floristic composition and
diversity of freshwater swamp
forests
60
2.0 Floristic composition and diversity of freshwater swamp forests in the Niger Delta
Nwabueze, I. Igu1 and Rob Marchant1
1York Institute for Tropical Ecosystem Dynamics (KITE), Environment Department, University of
York, YO10 5NG, UK.
2.1 Abstract
Freshwater swamp forests are very valuable ecosystems with poorly understood ecology. With
increasing degradation and loss of the ecosystem in the Niger Delta region of Nigeria, there is
need to improve the understanding of the ecosystem and provide ecological and
environmental baselines. This study assessed the floristic composition and diversity across 24
one hectare forest plots comprising 138 species within 100 genera and 41 families. Species and
family importance values were used to summarize the floristic composition and patterns of
abundance for each of the sites. Analysis of variance (ANOVA) using Tukey’s post-hoc test was
used to see how the sites varied in diversity, stem density and basal area. The number of
species found in each of the disturbed sites was generally higher than in the intact forest sites,
which was not diverse but comprised many trees with higher basal area. While the stem
density of 94 – 506 stems ha-1 was comparable with that of other tropical forest, species
richness was low, but consistent with other freshwater swamp forests across the globe.
Diversity was higher in the disturbed sites than in the intact location and the number of species
with single occurrence was equally more in the disturbed forest plots/sites. This emphasizes
the huge importance of disturbed swamp forests for conservation.
Keywords: biodiversity indices, forest disturbance, species rarity, stem density, transition
forests
61
2.2 Introduction
Tropical forest ecosystems are host to a rich assemblage of biodiversity which are varied in
composition across spatial scales. While several attempts have been made to document this
array of flora across the tropics (Keay, 1949; White, 1983; Gentry, 1988) , a lot still remain to be
explored especially with reference to their patterns of abundance at the landscape level (Boubli
et al. 2004). Such understanding and inventory are not only vital for providing an updated
database for such ecosystems, but furthermore, help to provide veritable insights on the
varying mechanisms inherent in such ecosystems. On the other hand, such in-depth
understanding of the biodiversity of tropical forest ecosystems is needed for an adequate
conservation of the ecosystem (van Andel, 2003). Among the different vegetation types that
make up the tropical forest ecosystem, the freshwater swamp forests have received little
inquiry and are poorly known even though that it constitutes about 2.1% of the earth surface
(Raven and Johnson, 2002). These forests (freshwater swamp forests) are wetland ecosystems
associated with low-lying areas along the lower reaches of rivers and around freshwater lakes.
Being periodically inundated by river water, their soils are high in nutrients and its trees grow
rapidly, particularly where flooding results in physical disturbance of the forest (Thomas and
Baltzer, 2002).
Although ample work have been conducted on the floristic composition of freshwater swamp
forests (Ivanauskas et al. 1997; Scarano et al. 1997; Marques et al. 2003; Scarano, 2006;
Teixeira, 2008; Teixeira et al. 2008; Teixeira and Assis, 2011; Kurtz et al. 2013), it has been
dominated by studies from the Neotropics. The studies on the ecosystem in the neotropics
have focused mainly on understanding the diversity, phytosociological structure of the tree
layer of the ecosystem, general floristic patterns and the floristic similarities the ecosystem
shared with other surrounding ecosystems. Generally, the species richness and diversity of the
ecosystem were reported to be low, their species mostly had high local densities and were
monodominant (Koponen et al. 2004; Teixeira and Assis, 2011; Kurtz et al. 2013). Their studies
revealed that the ecosystem was mostly restricted to hydromorphic soils and characterized by
natural fragmentation and exposed borders (Ivanauskas et al. 1997; Teixeira and Assis, 2011).
As a result, species found in other surrounding ecosystems were noted to occur in the
ecosystem (Teixeira and Assis, 2011; Kurtz et al. 2013).
62
There is need to understand the ecosystem better in other parts of the tropics, document its
varied floristic composition and fill the gaps that may be existing as well. This lack of
information about the ecosystem is more pronounced in Africa and Nigeria as a whole, with no
baseline information and understanding since the initial rapid assessment on the composition
and control of the ecosystem by Keay (1959). Documenting the biodiversity of this ecosystem
through forest surveys and taxonomic inventories have become more necessary than ever,
particularly in the Niger Delta region of Nigeria where the ecosystem has a vast extent and
covers up to half of the delta (NDES, 1997). Though this ecosystem has been a source of timber
for most other parts of the Niger Delta for a long time (UNDP, 2006), its relative inaccessibility
has on the other hand not permitted over exploitation of its varied tree populations. However,
with the development of the region and opening of its forest interiors mainly through crude oil
exploration and prospecting, more of the ecosystem’s flora was lost at astronomical scales,
without being captured in the taxonomic database for the region/ecosystem. Such continual
degradation of the ecosystem affects not only the species composition of the ecosystem, but
also reduces the capacity to which it could inform conservation prioritization.
This study is hence aimed at improving the baselines of the freshwater swamp forests at the
landscape level across the Niger Delta. To achieve this, the objectives are to: 1) document the
existing composition of the ecosystem and show their varied abundance at the species and
family levels; 2) show the variations in species richness, diversity and density of the ecosystem;
3) to determine the variations that exist in the biodiversity indices within and across the sites
and 4) to compare the findings with other studies conducted elsewhere and determine the
global importance of the region and priorities for conservation management.
2.3 Materials and methods
2.3.1 Study area
The study was conducted in the Niger Delta region of Nigeria, which is a vast low lying
sedimentary basin crisscrossed by a large number of meandering streams, rivers, creeks that
drain the river Niger into the Atlantic Ocean at the Bight of Biafra. Areola (1982) broadly
categorized the soils of this region as hydromorphic. These soils are seasonally or permanently
waterlogged and are whitish or greyish in colour due to the reduction of oxides. The region has
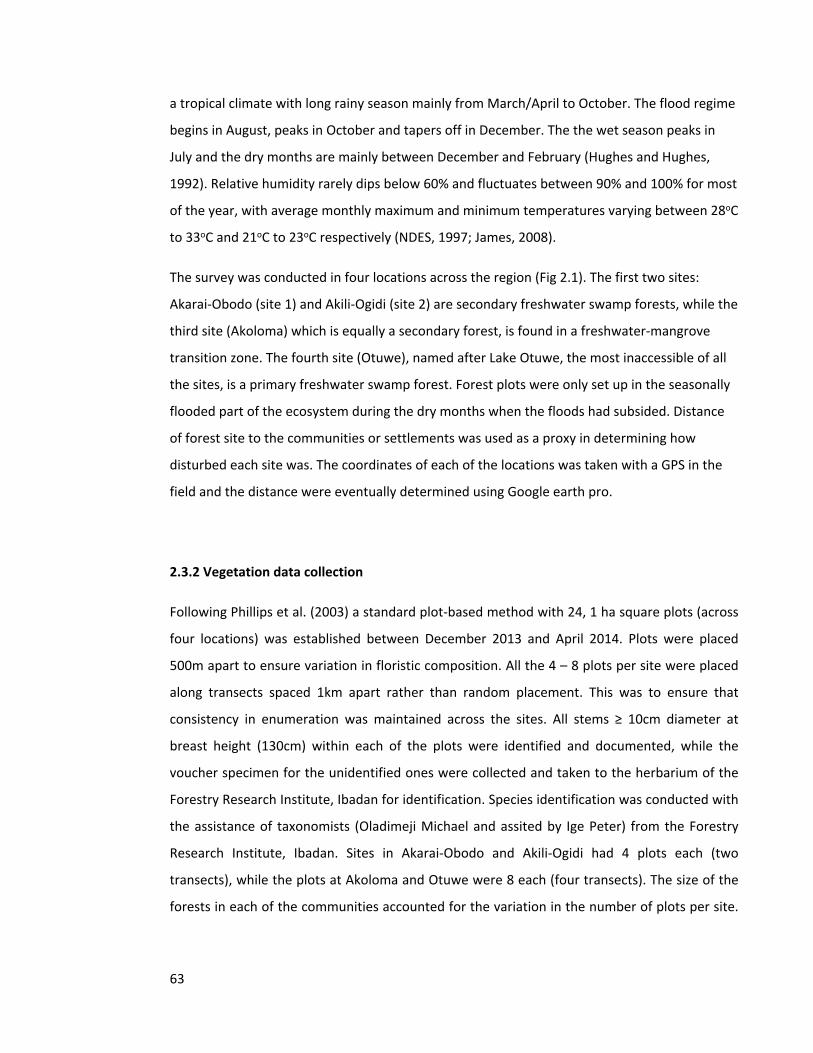
63
a tropical climate with long rainy season mainly from March/April to October. The flood regime
begins in August, peaks in October and tapers off in December. The the wet season peaks in
July and the dry months are mainly between December and February (Hughes and Hughes,
1992). Relative humidity rarely dips below 60% and fluctuates between 90% and 100% for most
of the year, with average monthly maximum and minimum temperatures varying between 28oC
to 33oC and 21oC to 23oC respectively (NDES, 1997; James, 2008).
The survey was conducted in four locations across the region (Fig 2.1). The first two sites:
Akarai-Obodo (site 1) and Akili-Ogidi (site 2) are secondary freshwater swamp forests, while the
third site (Akoloma) which is equally a secondary forest, is found in a freshwater-mangrove
transition zone. The fourth site (Otuwe), named after Lake Otuwe, the most inaccessible of all
the sites, is a primary freshwater swamp forest. Forest plots were only set up in the seasonally
flooded part of the ecosystem during the dry months when the floods had subsided. Distance
of forest site to the communities or settlements was used as a proxy in determining how
disturbed each site was. The coordinates of each of the locations was taken with a GPS in the
field and the distance were eventually determined using Google earth pro.
2.3.2 Vegetation data collection
Following Phillips et al. (2003) a standard plot-based method with 24, 1 ha square plots (across
four locations) was established between December 2013 and April 2014. Plots were placed
500m apart to ensure variation in floristic composition. All the 4 – 8 plots per site were placed
along transects spaced 1km apart rather than random placement. This was to ensure that
consistency in enumeration was maintained across the sites. All stems ≥ 10cm diameter at
breast height (130cm) within each of the plots were identified and documented, while the
voucher specimen for the unidentified ones were collected and taken to the herbarium of the
Forestry Research Institute, Ibadan for identification. Species identification was conducted with
the assistance of taxonomists (Oladimeji Michael and assited by Ige Peter) from the Forestry
Research Institute, Ibadan. Sites in Akarai-Obodo and Akili-Ogidi had 4 plots each (two
transects), while the plots at Akoloma and Otuwe were 8 each (four transects). The size of the
forests in each of the communities accounted for the variation in the number of plots per site.
64
Tree measurements and setting of the plots were conducted by Nwabueze Igu, with the
assistance of Cyril Mama and Ifeanyi Iwegbue.
Fig 2.1 Map showing the four study locations
2.3.3 Data analysis
Stem frequency, density, basal area and species dominance were calculated. Species and family
importance values (SIV and FIV) and biodiversity indices were also calculated to characterize
the forest sites and summarize variation across different forest locations (Equations 1-5). The
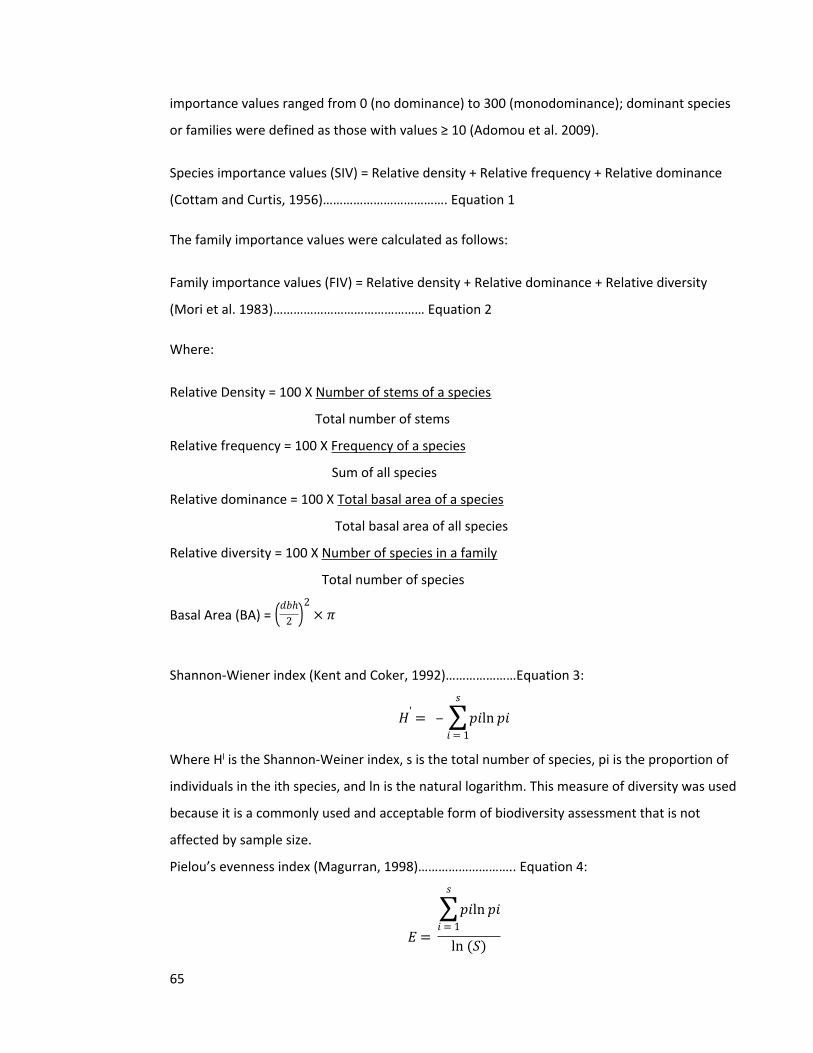
65
importance values ranged from 0 (no dominance) to 300 (monodominance); dominant species
or families were defined as those with values ≥ 10 (Adomou et al. 2009).
Species importance values (SIV) = Relative density + Relative frequency + Relative dominance
(Cottam and Curtis, 1956)………………………………. Equation 1
The family importance values were calculated as follows:
Family importance values (FIV) = Relative density + Relative dominance + Relative diversity
(Mori et al. 1983)……………………………………… Equation 2
Where:
Relative Density = 100 X Number of stems of a species
Total number of stems
Relative frequency = 100 X Frequency of a species
Sum of all species
Relative dominance = 100 X Total basal area of a species
Total basal area of all species
Relative diversity = 100 X Number of species in a family
Total number of species
Basal Area (BA) = (𝑑𝑏ℎ2 )2
× 𝜋
Shannon-Wiener index (Kent and Coker, 1992)…………………Equation 3:
𝐻' = ‒𝑠
∑𝑖 = 1
𝑝𝑖ln 𝑝𝑖
Where Hl is the Shannon-Weiner index, s is the total number of species, pi is the proportion of
individuals in the ith species, and ln is the natural logarithm. This measure of diversity was used
because it is a commonly used and acceptable form of biodiversity assessment that is not
affected by sample size.
Pielou’s evenness index (Magurran, 1998)……………………….. Equation 4:
𝐸 =
𝑠
∑𝑖 = 1
𝑝𝑖ln 𝑝𝑖
ln (𝑆)
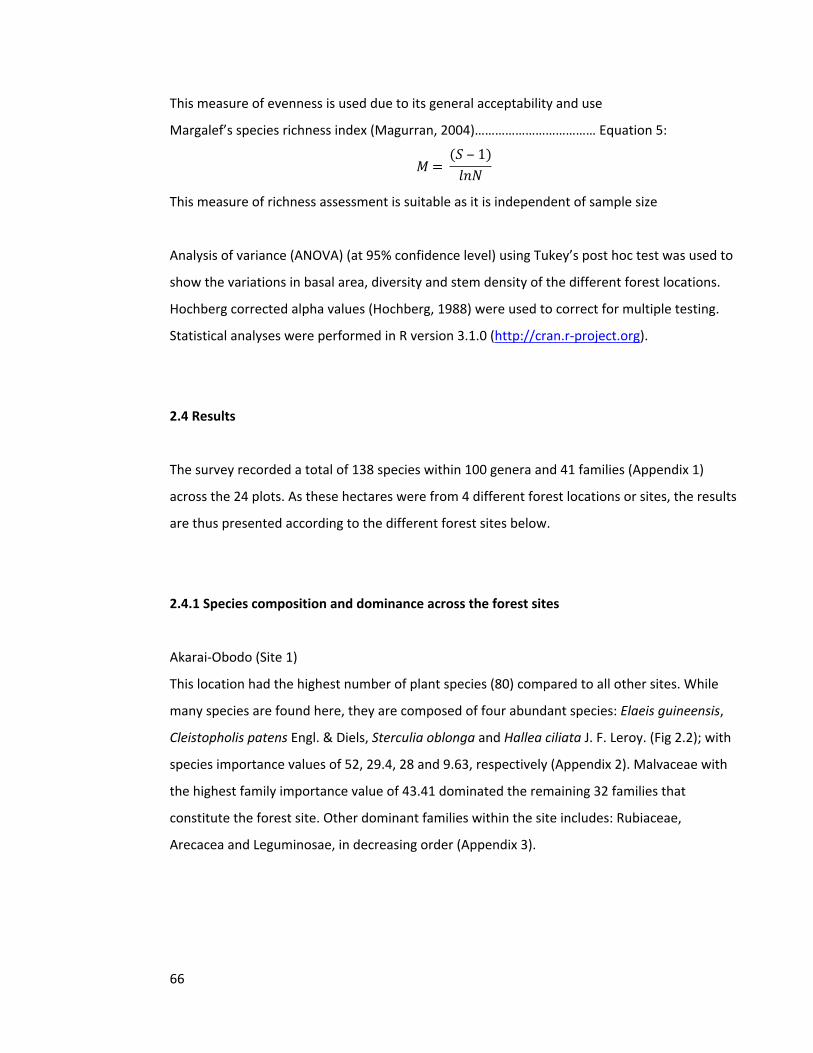
66
This measure of evenness is used due to its general acceptability and use
Margalef’s species richness index (Magurran, 2004)……………………………… Equation 5:
𝑀 = (𝑆 ‒ 1)
𝑙𝑛𝑁
This measure of richness assessment is suitable as it is independent of sample size
Analysis of variance (ANOVA) (at 95% confidence level) using Tukey’s post hoc test was used to
show the variations in basal area, diversity and stem density of the different forest locations.
Hochberg corrected alpha values (Hochberg, 1988) were used to correct for multiple testing.
Statistical analyses were performed in R version 3.1.0 (http://cran.r-project.org).
2.4 Results
The survey recorded a total of 138 species within 100 genera and 41 families (Appendix 1)
across the 24 plots. As these hectares were from 4 different forest locations or sites, the results
are thus presented according to the different forest sites below.
2.4.1 Species composition and dominance across the forest sites
Akarai-Obodo (Site 1)
This location had the highest number of plant species (80) compared to all other sites. While
many species are found here, they are composed of four abundant species: Elaeis guineensis,
Cleistopholis patens Engl. & Diels, Sterculia oblonga and Hallea ciliata J. F. Leroy. (Fig 2.2); with
species importance values of 52, 29.4, 28 and 9.63, respectively (Appendix 2). Malvaceae with
the highest family importance value of 43.41 dominated the remaining 32 families that
constitute the forest site. Other dominant families within the site includes: Rubiaceae,
Arecacea and Leguminosae, in decreasing order (Appendix 3).
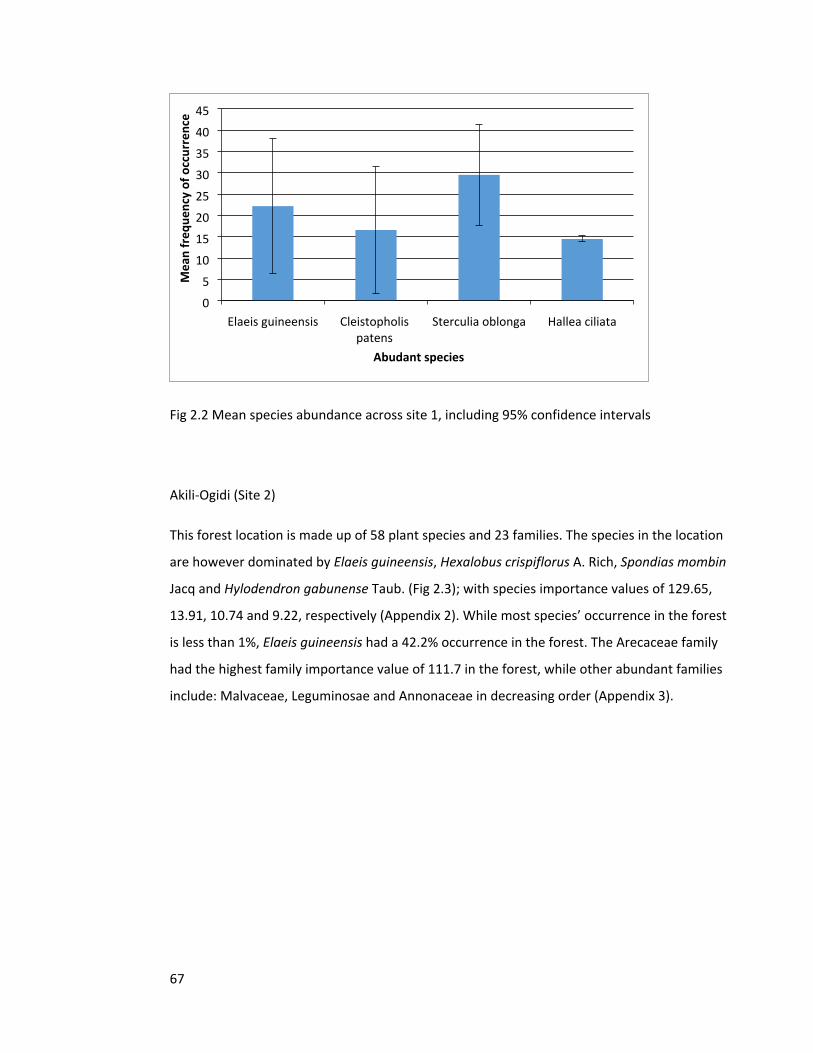
67
Elaeis guineensis Cleistopholis patens
Sterculia oblonga Hallea ciliata0
5
10
15
20
25
30
35
40
45
Abudant species
Mea
n fr
eque
ncy
of o
ccur
renc
e
Fig 2.2 Mean species abundance across site 1, including 95% confidence intervals
Akili-Ogidi (Site 2)
This forest location is made up of 58 plant species and 23 families. The species in the location
are however dominated by Elaeis guineensis, Hexalobus crispiflorus A. Rich, Spondias mombin
Jacq and Hylodendron gabunense Taub. (Fig 2.3); with species importance values of 129.65,
13.91, 10.74 and 9.22, respectively (Appendix 2). While most species’ occurrence in the forest
is less than 1%, Elaeis guineensis had a 42.2% occurrence in the forest. The Arecaceae family
had the highest family importance value of 111.7 in the forest, while other abundant families
include: Malvaceae, Leguminosae and Annonaceae in decreasing order (Appendix 3).
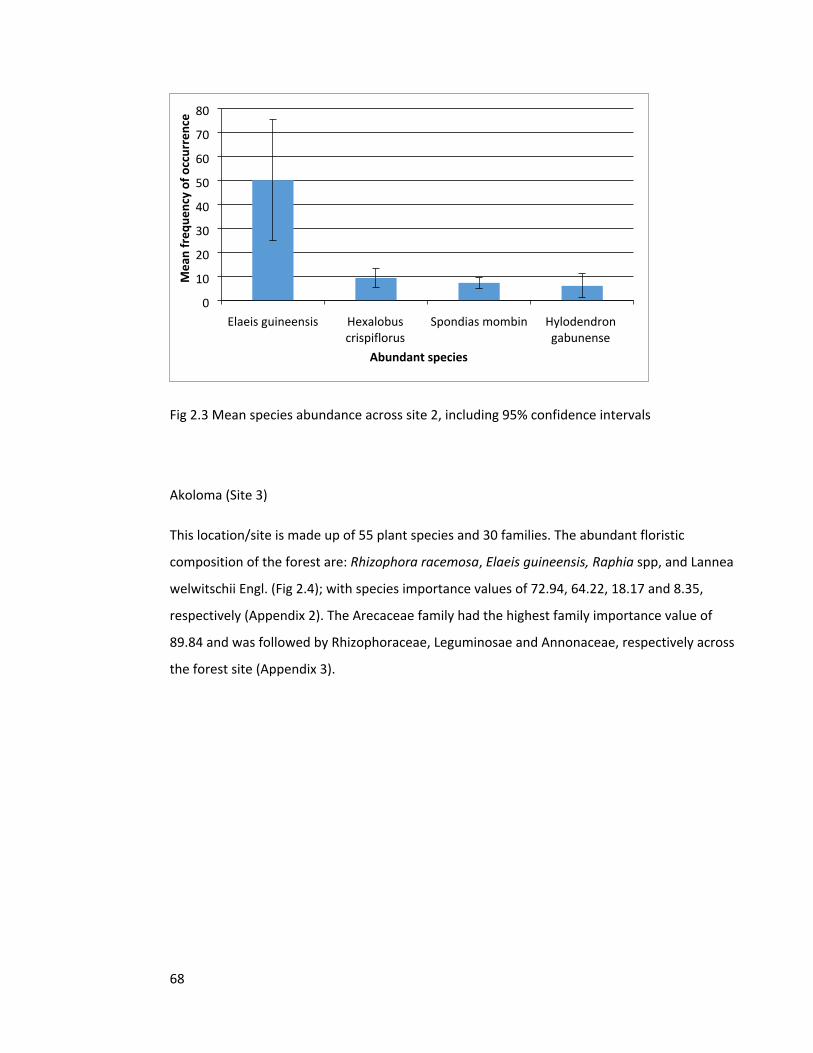
68
Elaeis guineensis Hexalobus crispiflorus
Spondias mombin Hylodendron gabunense
0
10
20
30
40
50
60
70
80
Abundant species
Mea
n fr
eque
ncy
of o
ccur
renc
e
Fig 2.3 Mean species abundance across site 2, including 95% confidence intervals
Akoloma (Site 3)
This location/site is made up of 55 plant species and 30 families. The abundant floristic
composition of the forest are: Rhizophora racemosa, Elaeis guineensis, Raphia spp, and Lannea
welwitschii Engl. (Fig 2.4); with species importance values of 72.94, 64.22, 18.17 and 8.35,
respectively (Appendix 2). The Arecaceae family had the highest family importance value of
89.84 and was followed by Rhizophoraceae, Leguminosae and Annonaceae, respectively across
the forest site (Appendix 3).
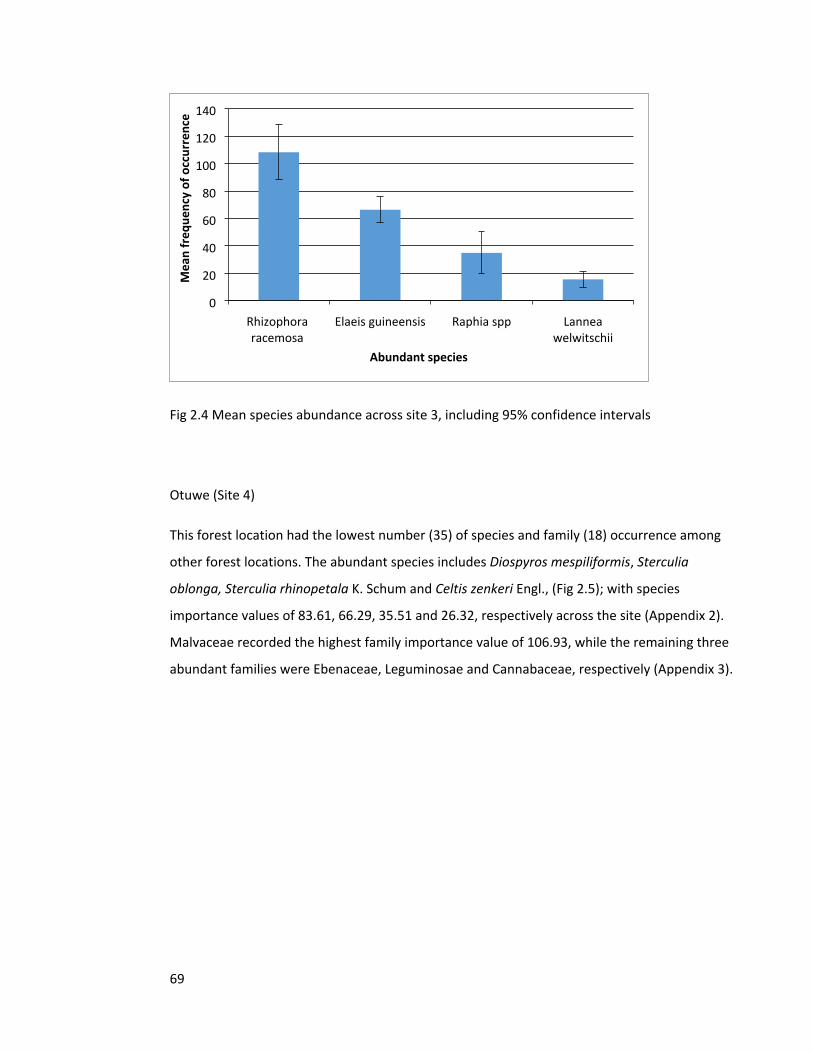
69
Rhizophora racemosa
Elaeis guineensis Raphia spp Lannea welwitschii
0
20
40
60
80
100
120
140
Abundant species
Mea
n fr
eque
ncy
of o
ccur
renc
e
Fig 2.4 Mean species abundance across site 3, including 95% confidence intervals
Otuwe (Site 4)
This forest location had the lowest number (35) of species and family (18) occurrence among
other forest locations. The abundant species includes Diospyros mespiliformis, Sterculia
oblonga, Sterculia rhinopetala K. Schum and Celtis zenkeri Engl., (Fig 2.5); with species
importance values of 83.61, 66.29, 35.51 and 26.32, respectively across the site (Appendix 2).
Malvaceae recorded the highest family importance value of 106.93, while the remaining three
abundant families were Ebenaceae, Leguminosae and Cannabaceae, respectively (Appendix 3).
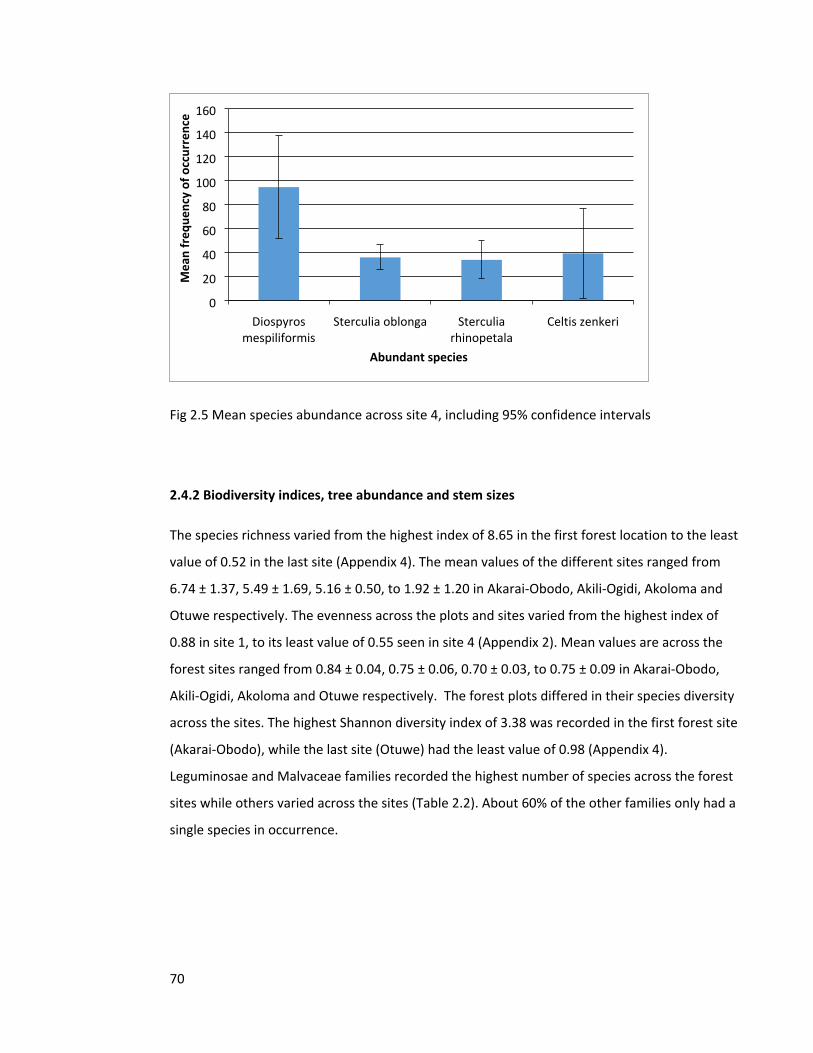
70
Diospyros mespiliformis
Sterculia oblonga Sterculia rhinopetala
Celtis zenkeri0
20
40
60
80
100
120
140
160
Abundant species
Mea
n fr
eque
ncy
of o
ccur
renc
e
Fig 2.5 Mean species abundance across site 4, including 95% confidence intervals
2.4.2 Biodiversity indices, tree abundance and stem sizes
The species richness varied from the highest index of 8.65 in the first forest location to the least
value of 0.52 in the last site (Appendix 4). The mean values of the different sites ranged from
6.74 ± 1.37, 5.49 ± 1.69, 5.16 ± 0.50, to 1.92 ± 1.20 in Akarai-Obodo, Akili-Ogidi, Akoloma and
Otuwe respectively. The evenness across the plots and sites varied from the highest index of
0.88 in site 1, to its least value of 0.55 seen in site 4 (Appendix 2). Mean values are across the
forest sites ranged from 0.84 ± 0.04, 0.75 ± 0.06, 0.70 ± 0.03, to 0.75 ± 0.09 in Akarai-Obodo,
Akili-Ogidi, Akoloma and Otuwe respectively. The forest plots differed in their species diversity
across the sites. The highest Shannon diversity index of 3.38 was recorded in the first forest site
(Akarai-Obodo), while the last site (Otuwe) had the least value of 0.98 (Appendix 4).
Leguminosae and Malvaceae families recorded the highest number of species across the forest
sites while others varied across the sites (Table 2.2). About 60% of the other families only had a
single species in occurrence.
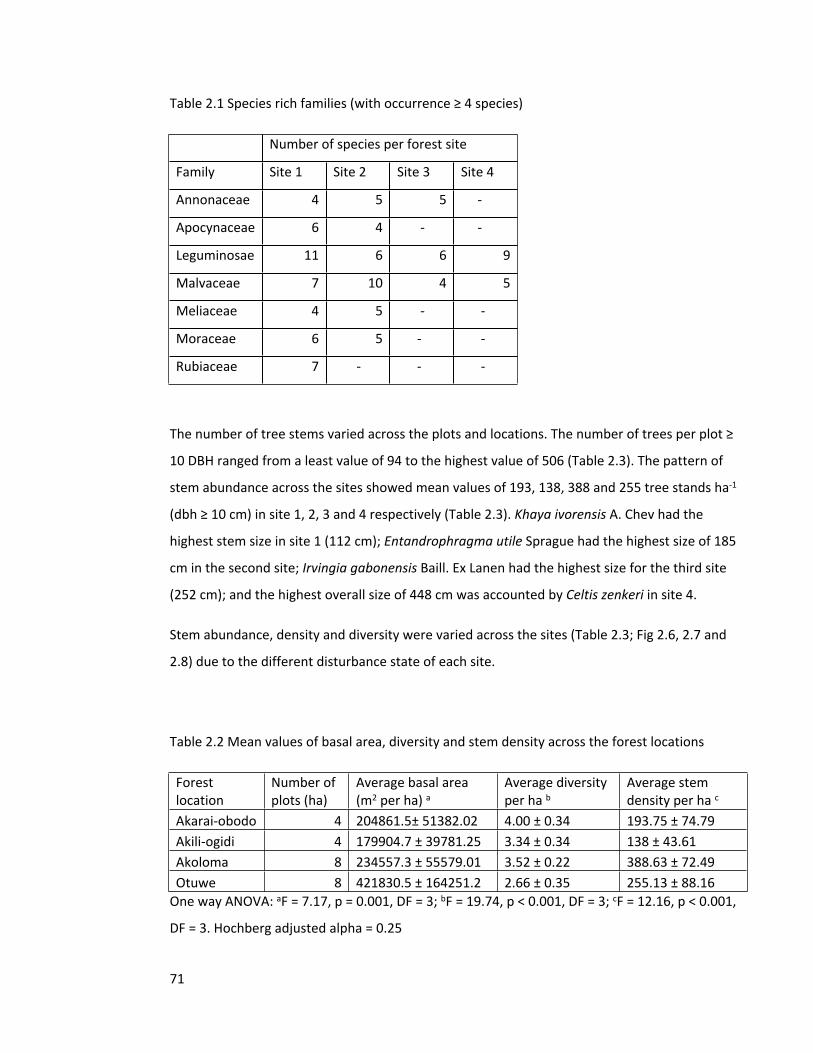
71
Table 2.1 Species rich families (with occurrence ≥ 4 species)
Number of species per forest site
Family Site 1 Site 2 Site 3 Site 4
Annonaceae 4 5 5 -
Apocynaceae 6 4 - -
Leguminosae 11 6 6 9
Malvaceae 7 10 4 5
Meliaceae 4 5 - -
Moraceae 6 5 - -
Rubiaceae 7 - - -
The number of tree stems varied across the plots and locations. The number of trees per plot ≥
10 DBH ranged from a least value of 94 to the highest value of 506 (Table 2.3). The pattern of
stem abundance across the sites showed mean values of 193, 138, 388 and 255 tree stands ha-1
(dbh ≥ 10 cm) in site 1, 2, 3 and 4 respectively (Table 2.3). Khaya ivorensis A. Chev had the
highest stem size in site 1 (112 cm); Entandrophragma utile Sprague had the highest size of 185
cm in the second site; Irvingia gabonensis Baill. Ex Lanen had the highest size for the third site
(252 cm); and the highest overall size of 448 cm was accounted by Celtis zenkeri in site 4.
Stem abundance, density and diversity were varied across the sites (Table 2.3; Fig 2.6, 2.7 and
2.8) due to the different disturbance state of each site.
Table 2.2 Mean values of basal area, diversity and stem density across the forest locations
Forest location
Number of plots (ha)
Average basal area (m2 per ha) a
Average diversity per ha b
Average stem density per ha c
Akarai-obodo 4 204861.5± 51382.02 4.00 ± 0.34 193.75 ± 74.79Akili-ogidi 4 179904.7 ± 39781.25 3.34 ± 0.34 138 ± 43.61Akoloma 8 234557.3 ± 55579.01 3.52 ± 0.22 388.63 ± 72.49Otuwe 8 421830.5 ± 164251.2 2.66 ± 0.35 255.13 ± 88.16
One way ANOVA: aF = 7.17, p = 0.001, DF = 3; bF = 19.74, p < 0.001, DF = 3; cF = 12.16, p < 0.001,
DF = 3. Hochberg adjusted alpha = 0.25
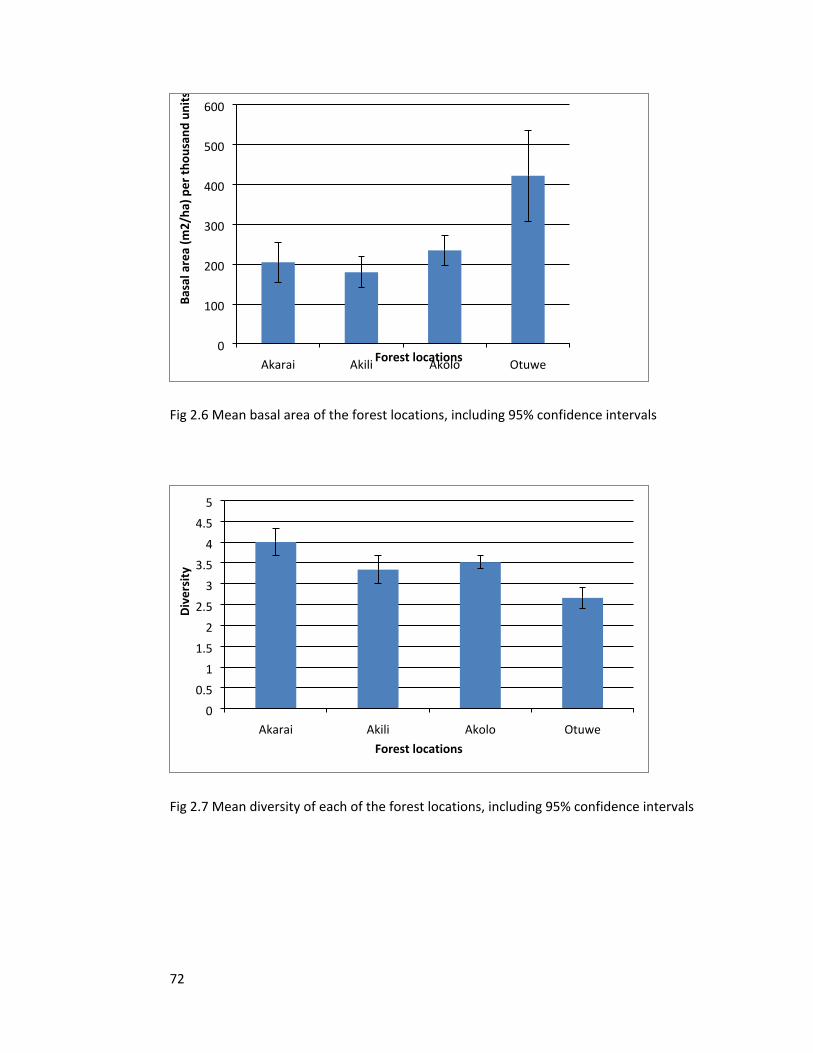
72
Akarai Akili Akolo Otuwe0
100
200
300
400
500
600
Forest locations
Basa
l are
a (m
2/ha
) per
thou
sand
uni
ts
Fig 2.6 Mean basal area of the forest locations, including 95% confidence intervals
Akarai Akili Akolo Otuwe0
0.51
1.52
2.53
3.54
4.55
Forest locations
Dive
rsity
Fig 2.7 Mean diversity of each of the forest locations, including 95% confidence intervals
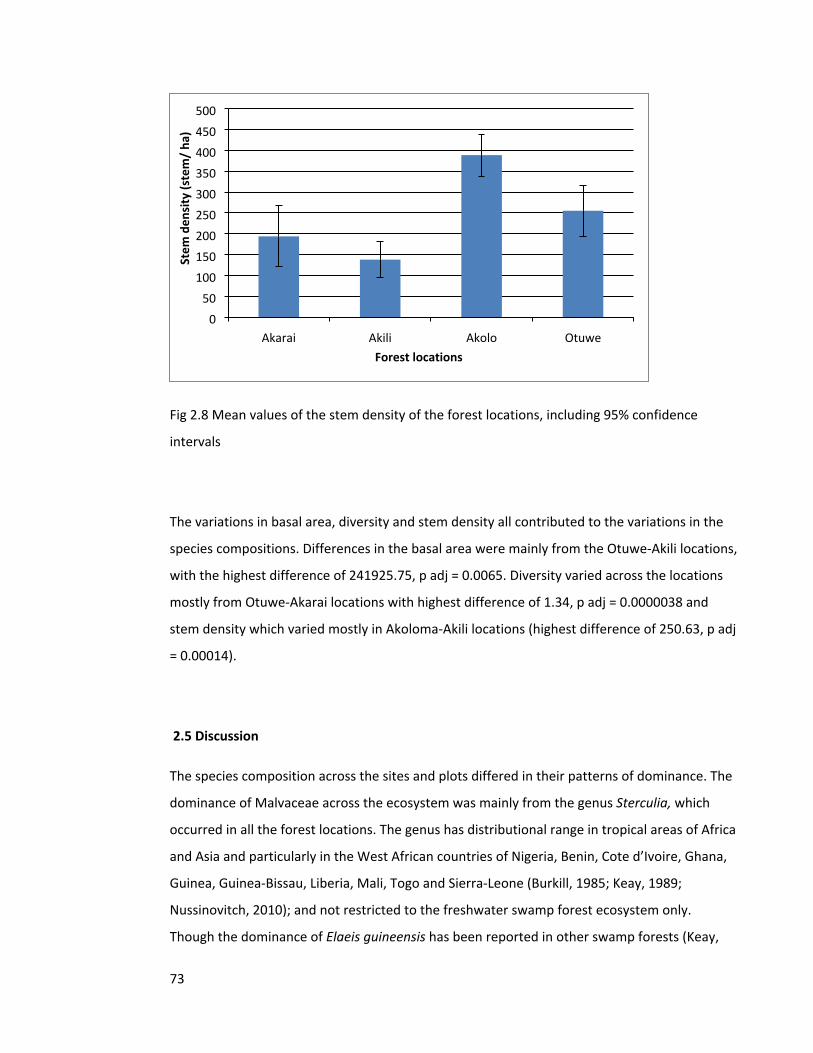
73
Akarai Akili Akolo Otuwe0
50100150200250300350400450500
Forest locations
Stem
den
sity
(ste
m/
ha)
Fig 2.8 Mean values of the stem density of the forest locations, including 95% confidence
intervals
The variations in basal area, diversity and stem density all contributed to the variations in the
species compositions. Differences in the basal area were mainly from the Otuwe-Akili locations,
with the highest difference of 241925.75, p adj = 0.0065. Diversity varied across the locations
mostly from Otuwe-Akarai locations with highest difference of 1.34, p adj = 0.0000038 and
stem density which varied mostly in Akoloma-Akili locations (highest difference of 250.63, p adj
= 0.00014).
2.5 Discussion
The species composition across the sites and plots differed in their patterns of dominance. The
dominance of Malvaceae across the ecosystem was mainly from the genus Sterculia, which
occurred in all the forest locations. The genus has distributional range in tropical areas of Africa
and Asia and particularly in the West African countries of Nigeria, Benin, Cote d’Ivoire, Ghana,
Guinea, Guinea-Bissau, Liberia, Mali, Togo and Sierra-Leone (Burkill, 1985; Keay, 1989;
Nussinovitch, 2010); and not restricted to the freshwater swamp forest ecosystem only.
Though the dominance of Elaeis guineensis has been reported in other swamp forests (Keay,
74
1959; Ubom et al. 2012), it is however a reflection of the extent of the degradation, mainly
from anthropogenic factors ongoing in the ecosystem. Being a secondary forest species which
requires an open canopy to thrive, it dominates the freshwater swamp ecosystems that have
undergone series of anthropogenic and natural disturbances. As such, it is a main flora of the
first three sites which are more degraded than the fourth site where it only had a single
stem/tree occurrence out of 2,041 stems ≥ 10 DBH.
The Leguminosae family being another notable dominant family in the ecosystem recorded the
highest number of species among all the families in the ecosystem. Being a major feature of the
tropical (or Neotropical) rainforest ecosystem (Gentry, 1995; 1988; Duran et al. 2006; Romero-
Duque et al. 2007; Fonty et al. 2011), it maintains its dominance through its multiple species
presence. As such, the constraint associated with the ecosystem which limits the number of
plant presence does not affect it in the same proportion with the other families with poorer
species diversity. The Rhizophoraceae (mainly from Rhizophora racemosa) is a main feature of
the ecosystem especially where the ecosystem has transition with the mangrove ecosystem
(site 3). The genus Rhizophora was also found in plots (especially, in site 1 and site 4) associated
with creeks and rivulets where disturbances have opened up spaces for them to thrive and
where the degree of salinity (associated with the creeks) permits or is suitable for them to
coexist with other freshwater swamp flora. It was not found in site 2 which even though was
similar in terms of wetness but does not have the tiny creeks and inlets like other locations that
permits the transportation of both their seeds and saline water for the facilitation of their
propagation and coexistence. However, the Rhizophoraceae are floristic features of the
freshwater swamp ecosystem but the patterns of their coexistence and dominance are varied
from site to site.
The freshwater swamp ecosystem is a floristically variable forest whose dominance is varied
across different geographical scales. As such, the main feature that is found or dominates one
location is not consistently the same across a landscape or region. In the Indo Malayan region
for example, dominant species like: Melaleuca leucadendron, Ficus sp., Erythrina sp,
Memecylon sp. have been reported (Wikramanayake et al. 2002); in the neotropics, dominant
species like Tabebuia cassinoides, Tovomitopsis paniculata, Symphonia globulifera, Pterocarpus
officinalis and families like: Clusiaceae, Bignoniaceae, Burseraceae, Arecaceae and Annonaceae
were reported (Scarano et al. 1997; van Andel, 2003; Fickert and Grüninger, 2010; Teixeira et
75
al. 2011). This pattern is unlike other ecosystem like the lowland forests in the tropical and
neotropical regions which are dominated by the Leguminosae family (Gentry, 1995; 1988;
Duran et al. 2006) and the lowland (rainforest) forests of southwestern Nigeria which is
dominated by Moraceae family (Adekunle et al. 2013). The freshwater swamp forests in the
Niger Delta are made up of floristic composition which occurs in other ecosystems; however its
pattern of dominance and coexistence are varied and site specific.
Species diversity varied from site to site and from forest to forest, with some forest or sites
being composed of large trees and diverse composition, while others have less (Table 2.3; Fig
2.7) . The variation in the species diversity of the forest sites is mainly a function of disturbance,
which was equally varied across the sites. This come out clearly in the Tukey’s test, which
showed the highest difference in diversity between the intact forest site and the most
disturbed site, which incidentally had the highest diversity as well. While the extent of
disturbance, as well as land use and biogeochemical factors are undoubtedly responsible for
the variations seen in forest landscapes, understanding they apply to the local environment
and particular ecosystem like the freshwater swamp forest is very vital. This variation in the
number of species found across the forest sites especially among the disturbed sites shows that
the freshwater swamp forest ecosystem does not have uniform or consistent flora across large
geographical scales, but are site specific and very variable. Even though the diversity of the
forest sites increased with disturbance and the species richness improved with disturbance as
well, such landscape’s resilience reduces on the other hand since functional attributes such as
invasion resistance tends to become more endangered (MacDougall et al. 2013).
The results of the patterns of stem abundance across the sites (Table 2.3) could be compared
with the results from other tropical forests. Studies from tropical forests in Asia have shown
tree densities of 349-627 stems ha-1 and 9-14 species in a dry tropical forest of Mirzapur
district, Uttar Pradesh, India (Singh and Singh, 1991); 217-292 stems ha-1 in a dry tropical forest
sanctuary in Raipur district, Chhattisgarh (Bijalwan, 2010); 428 stems ha-1 in 95 species in a
rainforest of Xishuangbana, China (Lu et al. 2010). African tropical forests have shown densities
of 434 stems (≥ 10 cm dbh) in mixed tropical forest, and 340 stems in a monodominant forest
in Cameroun (Lewis et al. 2013); 387 stems in 94 species in a strict nature reserve in southwest
Nigeria (Adekunle et al. 2013). The stem densities are indeed similar and comparable with that
of other tropical forests across the globe. These densities vary across the sites mainly due to
76
the variations in disturbance regimes and capacities of each landscape to regrow after
disturbance cycles. This on the other hand is responsible for the variations in basal area of the
stems in each site.
Species richness of the ecosystem though varied, were generally low. However, this is not
strange with the freshwater swamp forests which are characterized by low species richness
(Lugo et al. 1988; Scarano et al. 1997; Teixeira et al. 2011; Kurtz et al. 2013) due to
environmental constraints which the ecosystem responds to sensitively. The flooding regime
that is associated with the ecosystem which inundates the soil exerts selective pressure on the
composition and the structure of the ecosystem (Kurtz et al. 2013). As trees require flood free
environments to facilitate reproduction and shallow water to prevent water-logging of
seedlings or gas exchange (Lugo et al. 1998) which are not guaranteed for the ecosystem
regularly, species with higher tendencies of adaptation to such conditions are found more in
the ecosystem; hence making the ecosystem to display tendencies of monodominance. Similar
studies (Kurtz et al. 2013) reported lower species richness of the forests compared to the drier
adjacent soil or forest locations; as was seen in the study. This further explains why the
permanently flooded sites (were observed) have lower species richness and stem density than
the seasonally flooded sites and then the adjacent lowland rain forests (which has transition
zones with the freshwater swamp forests) in the region.
As the ecosystem continues to undergo regimes of natural and anthropogenic disturbances,
they provide gaps in the canopies of the forests and provide basis for regeneration and species
diversity across the landscape. Such events go on to create opportunities for the addition of
new species to the ecosystem and in turn facilitate the reinforcement and maintenance of the
tree diversity in the ecosystem (Nakagawa et al. 2013).
2.6 Conclusion
The study documented an array of composition found across the ecosystem according to their
respective abundance in the ecosystem. Their stem densities were similar with that of other
tropical forest ecosystems, while their diversity increased with disturbance across the
ecosystem. The ecosystem is characterized by general low species richness, as in other
freshwater swamp forests in the Neotropics. This implies that the loss of any single species in

77
the ecosystem poses a great threat to the ecosystem as there are not many species for which
the ecosystem is known for and puts the ecosystem at the risk of ecosystem collapse.
Furthermore, as the species diversity and rarity of the ecosystem are more associated with
disturbed locations more than the intact zones, effective conservation of the ecosystem should
not only be focused on the intact forest locations with higher basal area per hectare, but also
the disturbed locations whose higher species value are vital for the stability of the ecosystem.
78
2.7 References
Adekunle, V. A. J., Olagoke, A. O. and Akindele, S. O. (2013). Tree species diversity and structure
of a Nigerian strict nature reserve. Tropical Ecology 54 (3): 275-289.
Adomou, A. C., Akoegninou, A., Sinsin, B., De Foucault, B. and Van Der Maesen, L. J. G. (2009).
Semi-deciduous forest remnants in Benin: patterns and floristic characterization. Acta
Botanica Gallica: Botany Letters 156 (2): 159-171.
Areola, O. (1982). Soils. In: Barbour, K.M., Oguntoyinbo, J.S., Onyemelukwe, J.O.C., and Nwafor,
J.C. (Eds.). Nigeria in Maps. Africana Publishing Company, U.S.A.
Asthana, D.K. and Asthana, M. (2003). Environmental problems and solutions. Schannel and
company Ltd. Ram Magar, New Delhi.
Bijalwan, A. (2010). Structure, composition and diversity of degraded dry tropical forest in
Balamdi watershed of Chhattisgarh plain, India. J. Biodiversity 1 (2): 119-124.
Burkill, H. M. (1985). The useful plants of West tropical Africa, Vol. 5. Royal Botanic Gardens,
Kew.
Cottam, G. and Curtis, J. T. (1956). The use of distance measurements in phytosociological
sampling. Ecology 37: 451-460.
Duran, E., Meave, J.A., Lott, E.J. and Segura, G. (2006). Structure and tree diversity patterns at
the landscape level in a Mexican tropical deciduous forest. Bol. Soc. Bot. Mex. 79: 43-60.
Fickert, T. and Grüninger, F. (2010). Floristic zonation, vegetation structure, and plant diversity
patterns within a Caribbean mangrove and swamp forest on the bay island of Utila
(Honduras). Ecotropica 16 (2): 73-92.
Fonty, E., Molino, J., Prevost, M. and Sabatier, D. (2011). A new case of Neotropical
monodominant forest: Spirotropis longifolia (Legumiosae-papilionoideae) in French
Guiana. Journal of Tropical Ecology 27: 641-644. Cambridge University Press.
Gentry, A.H. (1988). Changes in plant community diversity and floristic composition on
environmental and geographical gradients. Annals of the Missouri Botanical Garden 75:
1-34.
Gentry, A.H. (1995). Diversity and floristic composition of Neotropical dry forest. In Bullock,
S.H., Mooney, H.A. and Medina, E. (Eds.). seasonally dry tropical forests, pp. 146-194.
Cambridge University Press, Cambridge.
Hochberg, Y. (1988). A sharper Bonferroni procedure for multiple tests of significance.
Biometrika 75: 800-802.
79
Hughes, R.H. and Hughes, J.S. (1992). A directory of African wetlands. Gland, Switzerland,
Nairobi, Kenya, and Cambridge, UK: IUCN, UNEP, and WCMC.
James, G. K. (2008). Assessment of environmental change and its socio-economic impacts in the
mangrove ecological zone of the Niger Delta, Nigeria. Ph.D thesis, University of Missouri-
Kansas city.
Keay, R.W. (1959). An outline of the Nigerian vegetation. Federal Department of Forest
Research. Federal Ministry of Information, Lagos.
Keay. R. W. J. (1989). Trees of Nigeria. Clarendon Press, Oxford, UK.
Kent, M. and Coker, P. (1992). Vegetation description analysis. Wiley, Chichester.
Koponen, P., Nygren, P., Sabatier, D., Rousteau, A. and Saur, E. (2004). Tree species diversity
and forest structure in relation to microtopography in a tropical freshwater swamp forest
in French Guiana. Plant Ecology 173: 17-32.
Kurtz, B. C., Gomes, J. C. and Scarano, F. B. (2013). Structure and phytogeographic relationships
of swamp forests of Southeast Brazil. Acta Botanica Brasilica 27 (4): 647-660.
Lewis, S. L., Sonké, B., Sunderland, T., Begne, S. K., López-González, G., van der Heijden, G. M.
F., Phillips, O. L., Affum-Baffoe, K., Baker, T. R., Banin, L., Bastin, J., Beeckman, H., Boeckx,
P., Bogaert, J., De Cannière, C., Chezeaux, E., Clark, C. J., Collins, M., Djagbletey, G.,
Djuikouo, M. N. K., Droissart, V., Doucet, J., Ewango, C. E. N., Fauset, S., Feldpausch, T. R.,
Foli, E. G., Gillet, J., Hamilton, A. C., Harris, D. J., Hart, T. B., de Haulleville, T., Hladik, A.,
Hufkens, K., Huygens, D., Jeanmart, P., Jeffery, K. J., Kearsley, E., Leal, M. E., Lloyd, J.,
Lovett, J. C., Makana, J., Malhi, Y., Marshall, A. R., Ojo, L., Peh, K. S., Pickavance, G.,
Poulsen, J. R., Reitsma, J., Sheil, D., Simo, M., Steppe, K., Taedoumg, H. E., Talbot, J.,
Taplin, J. R. D., Taylor, D., Thomas, S. C., Toirambe, B., Verbeeck, H., Vleminckx, J., White,
L. J. T., Willcock, S., Woell, H., Zemagho. L. (2013). Aboveground biomass and structure of
260 African tropical forests. Philos. T. Roy. Soc. B 368: 20120295.
Lü, X. T., Yin, J. X. and Tang, J. W. (2010). Structure, tree species diversity and composition of
tropical seasonal rainforests in Xishuangbanna, south-west China. Journal of Tropical
Forest Science 22: 260-270.
Lugo, A. E., Brown, S. and Brinson, M. M. (1998). Forested wetlands in freshwater and salt-
water environments. Limnol. Oceanogr. 33 (4, part 2): 894-909.
80
MacDougall, A. S., Mccann, K. S., Gellner, G. and Turkington, R. (2013). Diversity loss with
persistent human disturbance increases vulnerability to ecosystem collapse. Nature 494:
86-89. Macmillan publishers limited.
Magurran, A. E. (1998). Ecological diversity and its measurement. Princeton, NJ: Princeton
University Press.
Magurran, A. E. (2004). Measuring biological diversity. Blackwell, Oxford.
Mori, S. A., Boom, B. M., De Carvalino, A. M. and Dos Santos, T. S. (1983). Southern Bahian
moist forest. Bot. Review 49: 155-232.
Nakagawa, M., Momose, K., Kishimoto-Yamada, K., et al. (2013). Tree community structure,
dynamics, and diversity partitioning in a Bornean tropical forested landscape.
Biodiversity Conservation 22: 127-140. Doi 10.1007/s10531-012-0405-0.
NDES. (1997). The Niger Delta Environmental Survey. Environmental and socio-economic
characteristics. Lagos-Nigeria: Environmental Resources Managers limited.
Nussinovitch, A. (2010). Plant gum exudates of the world: sources, distribution, properties and
applications. Taylor and Francis.
Phillips, O. L., Nunez-Vargas, P., Monteagudo, A. L., Pena-Cruz, A., Chuspe-Zans, M. E., Galiano-
Sánchez, W., Yli-Halla, M. & Rose, S. (2003). Habitat association among Amazonian tree
species: A landscape scale approach. J. Ecol. 91: 757-775.
Romero-Duque, L.P., Jaramillo, V.J. and Perez-Jimenez, A. (2007). Structure and diversity of
secondary tropical dry forests in Mexico, differing in their prior land-use history. Forest
Ecology and Management 253: 38-47.
Scarano , F. R., Ribeiro, K. T., De Moraes, L. F. D. and De Lima, H. C. (1997). Plant establishment
on flooded and unflooded patches of a freshwater swamp forest in southeastern Brazil.
Journal of Tropical Ecology 14: 793-803. Cambridge University Press.
Singh, L. and Singh, J. S. (1991). Species structure, dry matter dynamics and carbon flux of a dry
tropical forest in India. Annals of Botany 68: 263-273.
Spalding, M., Kainamu, M. and Collins, L. (2010). World Atlas of Mangroves. Earthscan.
Teixeira, A., Assis, M. A. and Luize, B. G. (2011). Vegetation and environmental heterogeneity
relationships in a Neotropical swamp forest in southeastern Brazil (Itirapina, SP). Aquatic
Botany 94: 17-23. Science Direct.
Thomas, S.C. and Baltzer, J.L. (2002). Tropical forests. Encyclopedia of life sciences. Macmillan
publishers’ Ltd, Nature publishing group.
81
Ubom, R. M., Ogbemudia, F. O. and Benson, K. O. (2012). Soil-vegetation relationship in fresh
water swamp forest. Scientific Journal of Biological Sciences 1 (2): 43-51.
Van Andel, T. R. (2003). Floristic composition and diversity of three swamp forests in northwest
Guyana. Plant Ecology 167: 293-317. Kluwer Academic Publishers, Netherlands.
Wikramanayake, E., Dinerstein, E., Loucks, C. J. et al. (2002). Terrestrial ecoregions of the Indo-
Pacific: A conservation assessment. Island press, Washington DC.
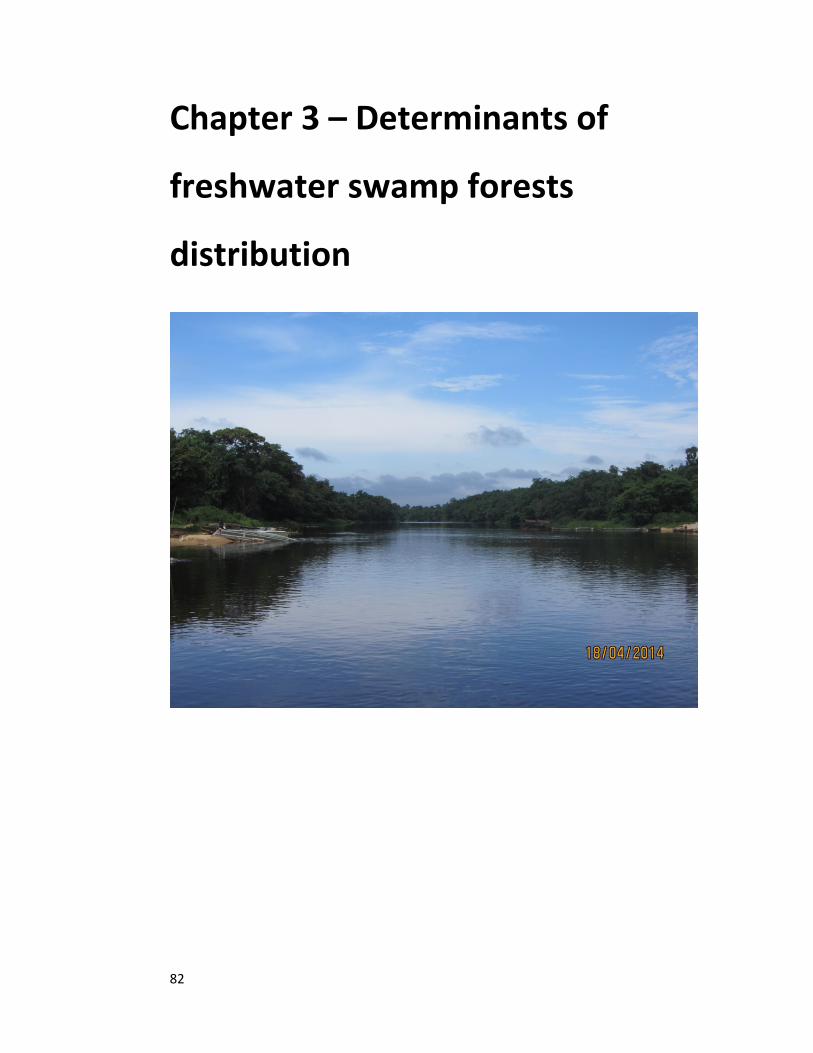
82
Chapter 3 – Determinants of
freshwater swamp forests
distribution
83
3.0 Determinants of freshwater swamp forests distribution in the Niger Delta
Nwabueze, I. Igu1 and Rob Marchant1
1York Institute for Tropical Ecosystem Dynamics (KITE), Environment Department, University of
York, YO10 5NG, UK.
3.1 Abstract
Global understanding of the biogeography of freshwater swamp forests are shaped and
dominated by studies from the neotropics, with little or no baselines from (west) Africa to
compare with. This study seeks to provide insights about these factors as well as the species
therein across the Niger Delta and West African region. To understand the determinants of
species distribution in the Niger Delta, forest plots were set up in four locations and were used
to assess the tree species (DBH ≥ 10 cm). In total, 138 species within 100 genera and 41 families
were the taxa identified across the forest plots. Cluster analysis (Ward’s agglomerative cluster)
was used to classify the forest plots distributed across the four forest locations into three
zones: intact, transition and disturbed. Indicator species analysis was used to decipher the key
taxa (indicator species) that represented each of the forest classes. Among the 47 species
identified as indicator species, 40 of them occurred (had single associations) only once across
the zones, while the remaining 7 coexisted in disturbed freshwater and transition zones. The
mangrove-freshwater zone had the highest occurrence of indicator species (25) and was
followed by disturbed freshwater zone and intact zone with ten and five species occurrences
respectively. The variation in the distribution of the species was found to be mainly as a result
of disturbance (local factors) and the varied climate of the locations. Indicator species
identified for each of the forest zones both serve as indicators for deciphering the state
(disturbed or intact) of the forest and for assessing forest restoration. Employing such insights
(indicator species) will not only help to understand the biogeography of tropical forest
ecosystems, but furthermore inform better restoration capacities for its degraded landscapes.
Keywords: ecological niche, ecosystem resilience, environmental gradients, floristic
composition, forest transitions
84
3.2 Introduction
The floristic composition and species distribution of plants within a region or geographical
delimitation are structured according to environmental (Tuomisto et al. 2003; Gole et al. 2008;
Costa et al. 2009; Homeier et al. 2010), ecological (Holt, 2003; Clarke et al. 2007; Chave, 2008)
and historical factors (Von Holle and Motzkin, 2007; Blach-Overgaard et al. 2010; Eiserhardt et
al. 2011); and constrain or permit plant species to occur and coexist with others in different
environments. While these patterns and processes have varied spatial scales (Eiserhardt et al.
2011), their role in determining the floristic composition have mainly been attributed to
climatic factors (Pyke et al. 2001; Parmentier et al. 2007); soil and topography (Phillips et al.
2003; Chain-Guadarrama et al. 2012; Bueno et al. 2013; Mwakalukwa et al. 2014); and natural
and anthropogenic disturbances (Lugo and Scatena, 1996; Motzkin et al. 2002). Even though
the role of climatic and edaphic factors has been established in defining the gradients of the
tropical forests, their patterns have however varied across the tropics. While studies from
South America have emphasized soil gradients (soil fertility) as the main determinant for
defining species composition, West African forests’ composition have been correlated mostly
with climatic gradients (rainfall) (Toledo et al. 2011).
As the biodiversity of tropical forests are products of their biogeography, habitat and
disturbance regime (Whitmore, 1998), understanding the role of disturbance in shaping
tropical ecosystems, alongside other factors, have been understudied in the west African
region, particularly the freshwater swamp forest which is characterized by different
disturbance regimes. Studies in West Africa have attempted to use the environmental variables
of climate and soil in the zonation of the forest ecosystem into phytogeographical units: Hall
and Swaine (1981) in Ghana; Ern (1979) in Togo; Adomou et al. (2006) in Benin and Keay (1949)
in Nigeria. While these studies provide background for understanding the patterns of the forest
ecosystem, they are focused on categorizing the whole forest ecosystem and not specifically
aimed at understanding how these affect the individual ecosystems. As plants are more
consistent indicators than other taxa, (Toledo et al. 2011; Bakker, 2008) they could be used as
bioindicators of their environment especially when their frequencies within a particular habitat
is high (Dufrêne and Legendre, 1997). This study aims to determine the variables that are
responsible for the floristic distribution across the ecosystem. Specific objectives include: 1) to
85
determine the species that are indicators of each of the forest groups; 2) to examine how
variations in disturbance and environmental variables contributed to the distribution of the
floristic composition across the ecosystem and 3) relate the insights to that of other
ecosystems and provide biogeographic insights for the ecosystem.
3.3 Materials and methods
3.3.1 Study area
The study was carried out in the Niger Delta region; a vast sedimentary area characterized by
low relief and crisscrossed by a network of rivers, streams and creeks (Fig 3.1). Forest sites used
for the study were communally owned forests located in Akarai-Obodo, Akili-Ogidi and Otuwe
and Akoloma (Fig 3.1). The two sites in Akarai-Obodo and Akili-Ogidi are disturbed freshwater
swamp forests that are only accessible during the dry season months due to poor terrain and
flooding. Both forests are secondary forests regrowing from anthropogenic disturbances and
owned by nearby villages that are composed mainly of local farmers, artisanal fishermen and
few civil servants; who all depend on the environment for their sustenance. The site at Otuwe
is an intact freshwater swamp forest with a nearby lake where fishing camps are established
and used seasonally by the surrounding communities. With no form of accessibility, it is the
most intact of all the forest sites with no signs of anthropogenic disturbances (stumps and cut
stems) and characterized by large stems and tall trees. The site in Akoloma is a freshwater-
mangrove transition forest zone not too far from a creek (Kolo creek); which has tiny rivulets
into the forests and owned by a neighbouring hamlet. It is a secondary forest with dense
undergrowth and tree species that have buttresses and close to each other. Seismic activities
and logging contributed to the disturbance in the past; while being encroached currently by
plantain farms. With no access road linking it to other communities, it is made up of few
household units that engage in farming, oil palm processing, artisanal fishing and hunting.
The soils of the region are of fluvial origin which is characterized by a succession of thinly
bedded silts and clays interbedded with sands. Soils are classified as hydromorphic soils which
are either temporarily or permanently flooded (Areola, 1982). The hydrological regime comes
from the Atlantic Ocean’s tidal movements and the Niger River flood. It’s flooding starts toward
the end of August, peaks in October, and tapers off in December. It is characterized by a long
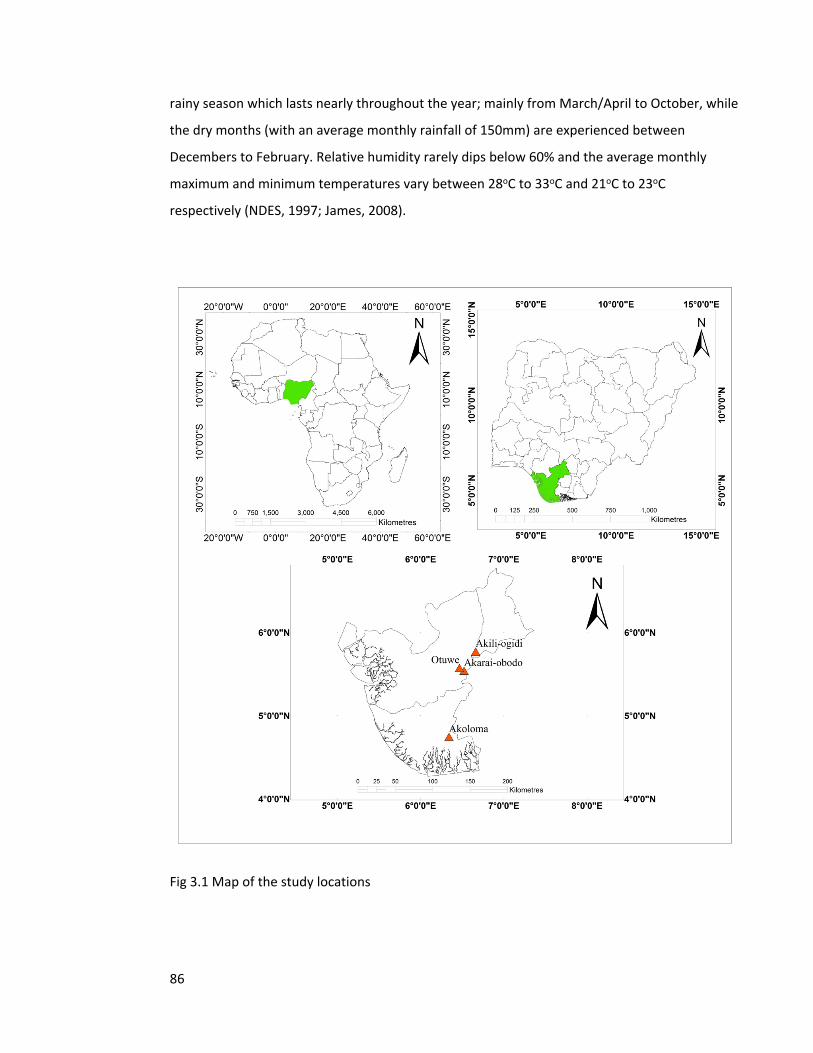
86
rainy season which lasts nearly throughout the year; mainly from March/April to October, while
the dry months (with an average monthly rainfall of 150mm) are experienced between
Decembers to February. Relative humidity rarely dips below 60% and the average monthly
maximum and minimum temperatures vary between 28oC to 33oC and 21oC to 23oC
respectively (NDES, 1997; James, 2008).
Fig 3.1 Map of the study locations
87
3.3.2 Data collection
The forest survey employed a standard 1 hectare (ha) square plot method established along
transects (Phillips et al. 2003) between December 2013 and April 2014. Plots were placed 500m
apart to ensure variation in floristic composition. All the 4 – 8 plots per site were placed along
transects spaced 1km apart rather than random placement. This helped to ensure that
consistency in enumeration was maintained across the plots. Sites in Akarai-Obodo and Akili-
Ogidi had 4 plots each (two transects), while the plots at Akoloma and Otuwe were 8 each (four
transects). Each of the forest plots were used for the enumeration and identification of all tree
stems ≥ 10cm in diameter. Tree species were identified in the field with the assistance of
botanists from the Forestry Research Institute of Nigeria, Ibadan; while voucher specimen for
species that could not be identified in the field was taken to the herbarium of the Forestry
Research Institute for identification. The forest plots were only set up in the seasonally flooded
part of the freshwater swamp forests during the dry months when the water had subsided.
Species identification was conducted by Michael Oladimeji, a taxonomist from the research
institute and assisted by Peter Ige. Tree measurements and setting of the plots were conducted
by Nwabueze Igu, with the assistance of Cyril Mama and Ifeanyi Iwegbue. The climatic data
used for the work were highest resolution (30ll minute) WorldClim data (Hijmans et al. 2005).
Elevation was measured in the field with a GPS. Distance of the forest to the nearest
settlement was used as a proxy for determining disturbance across the sites. A GPS was used to
collect the coordinates of the locations and was converted to distance in kilometres in Google
earth pro.
3.3.3 Data analysis
To understand how the species composition compared among the plots, quantitative
(abundance data) and qualitative (presence/absence data) matrices were generated using Non-
metric Multidimensional Scaling Ordination (NMDS) in Community Analysis Package (CAP)
version 4.0 (Pisces Conservation Limited, 2007); with default setting of PCA rotations and Bray-
Curtis distance similarity measure (McCune and Grace, 2002). This method of ordination is
suitable as it summarizes the data into two axes dimensions unlike other indirect ordination
methods. To understand the plot resemblance based on their community composition, a
88
cluster analysis based on Ward’s agglomerative cluster using Bray-Curtis dissimilarity
coefficient (Clarke and Warwick, 2001) was performed in Community Analysis Package (CAP)
version 4.0. (Pisces Conservation Limited, 2007).
Indicator species analysis (ISA) was used to understand the species associations or preferences
of certain key taxa across the study region. This method characterizes the environmental
preferences of target species (De Cáceres et al. 2010) by combining the abundance of specific
group and the occurrence of species in a specific group (McCune and Grace, 2002). This
method of analysis is preferred to TWINSPAN in identifying indicator species, as it treats each
species separately, unlike TWINSPAN where the value of one species depends on the
abundance of other species in a data set (Dufrêne and Legendre, 1997; McGeoch and Chown,
1998). The indicator species analysis combines species mean abundance and frequency of
occurrence in each group. The resulting indicator values ranges from 0 to 1. A high indicator
value occurs when a species is both abundant (“specificity”) and occurs in most sites
(“fidelity”), with the IndVal value of 1 seen as a perfect indicator species with reference to
specificity and fidelity.
The summarized axes dimension in NMDS was used in the multivariate analyses of variance
(MANOVA) to show how the species compositions were varied across the forest locations.
Multiple-response permutation procedures (MRPP), a nonparametric procedure for testing
difference between groups of entities (Mielke and Berry, 2001), was used to verify if clusters of
vegetation type identified by the NMDS were statistically different. To show how varied
disturbance and climatic variables were in contributing to the distribution of the composition, a
one way ANOVA with Tukey’s HSD post hoc test (95% confidence level) was conducted.
Hochberg corrected alpha values (Hochberg, 1988) was used for the adjustment due to
multiple testing. All analyses were performed using R statistical software version 3.1.0
(http://cran.r-project.org).
89
3.4 Results
3.4.1 Overview
The ecosystem is composed of 138 species within 100 genera and 41 families distributed across
24 hectares. Elaeis guineensis Jacq, Sterculia oblonga Mast, Diospyros mespiliformis Hochst and
Rhizophora racemosa G. Mey recorded the highest number of stems across the forest region.
Malvaceae and Leguminosae families had the highest number of species (13 each), while 60%
of other families has single species in occurrence across the ecosystem. The stem density
ranged from 94 – 506 stems ha-1.
3.4.2 Patterns and cluster of forest species
The results of the cluster analysis divided the forest into three main clusters: plots 1-8, which
are termed disturbed freshwater swamp forests; plots 9-16, termed, the freshwater-mangrove
transition zone; and then plots 17-24, which are the intact freshwater swamp forest zone (Fig
3.2).
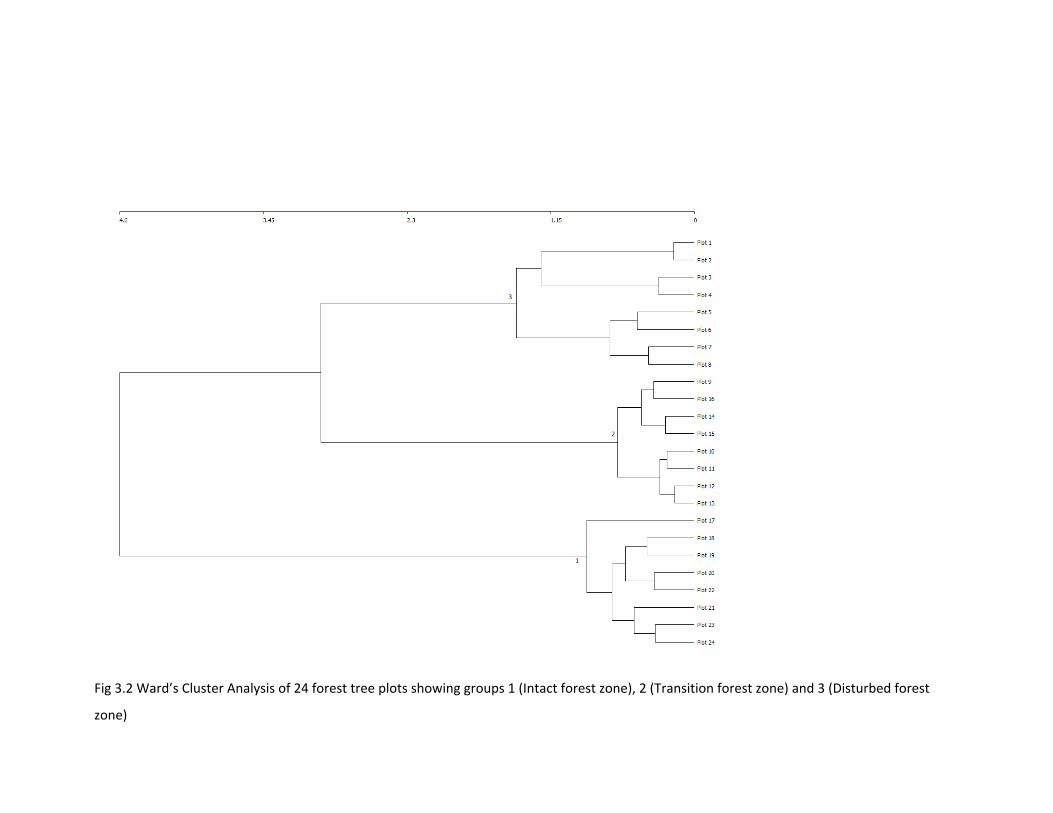
Fig 3.2 Ward’s Cluster Analysis of 24 forest tree plots showing groups 1 (Intact forest zone), 2 (Transition forest zone) and 3 (Disturbed forest
zone)
3.4.3 Indicator species analysis
The results of the analysis showed that out the 138 species, 47 were selected and presented in
two groups: the number of species associated to group 1 was 40 (and made up of species with
single occurrence across the groups), while the species associated to group 2 were 7 (being
composed of species that coexisted in more than one group). Further details are given below:
A total of 10 species were found in group 1 (disturbed forest locations) with different
significance (with 1 as the highest value) and p values. Among them, Treculia africana Decne.
ex Trécul had the highest statistical significance of 1.000, with 0.001 p values; followed by
Spondias mombin L. and Ceiba pentandra Gaertn with 0.935 and 0.897 statistical significance
(Appendix 5).
Group 2 (transition forest zone) was characterised by 25 species: Abarema floribunda Benth,
Erythrina indet., Lannea welwitschii (Hiern) Engl , Raphia indet and Staudtia stipitata Warb,
which recorded the highest statistical significance of 1.000, with p values of 0.001. These were
followed by Rhizophora racemosa G. Mey and Monodora myristica Dunal with 0.984 and 0.959
values respectively and p values of 0.001 (Appendix 5).
Group 3 (intact forest zone) had a total of 5 species that were associated with the cluster.
Among the significant species: Diospyros mespiliformis Hochst. ex A. DC had the highest
statistical significance of 0.987, and was followed by Sterculia rhinopetala K. Schum, Sterculia
oblonga Mast and Celtis zenkeri Engl with 0.975, 0.912 and 0.861 values respectively, with
0.001 p values (Appendix 5).
Among the combination groups (1+2 groups), Elaeis guineensis Jacq had the highest
significance of 0.968 and was followed by Hylodendron gabunense Taub (0.901) with 0.001 p
values (Appendix 5).
The results of the Multiple Response Permutation Procedure (MRPP) test showed that the a
priori groups were different as regards their species composition (MRPP: A = 0.3659, p = 0.001).
92
3.4.4 Determinants of variation in floristic composition
The results of the multivariate analysis of variance (MANOVA) showed how varied the
composition was across the forest locations: F = 35.25, DF = 3, p adj < 0.001 (95% family-wise
confidence levels). These variations in composition were contributed by the variation in
disturbance: F = 1.743 × 1031, DF = 3, p adj < 0.001 (95% family-wise confidence levels) which
was mostly between Otuwe and Akoloma sites (difference = 13.66); mean annual temperature:
F = 2.84 × 1028, DF = 3, p adj < 0.001 (95% family-wise confidence levels), mostly between
Akoloma and Akarai-Obodo sites (difference = 11) and annual precipitation: F = 2.203 × 1029, DF
= 3, p adj < 0.001 (95% family-wise confidence levels), mostly between Akoloma and Akili-Ogidi
(difference = 352).
3.5 Discussion
3.5.1 Patterns of community variation
Tree species composition of tropical forest ecosystems are not only biodiverse, but differ
widely within the same forest ecosystem and across the different forest types within the
tropics. As its concerns the freshwater swamp forests, the nature of this variation in flora
followed three main distinct community patterns. While most of the species (85.1%) were seen
in only one group out of the three clusters, others were captured in two clusters (14.9%).
Malvaceae and Leguminosae were the most dominant families, recording six species each
across the community clusters. As their species were found in all the forest clusters, disturbed
freshwater swamp forests, intact freshwater swamp forests and mangrove-freshwater
transition zone, it shows that they are widespread and are dominant features or flora of
tropical forests (Gentry, 1988). The Malvaceae family, which has not received wide
documentation as a main feature of tropical forests, was seen occur across the forest locations
and share a good coexistence with the mangrove swamps following its representativeness in
the transition zone community.
Since plant species respond differently to ecological niches (Chase and Myers, 2011; Wiens,
2011; Heino, 2005), the pattern of distribution of the species expectedly varied across the
forest clusters. The disturbed forest groups (both the disturbed freshwater and transition
93
zones) were seen to have higher indicator species frequencies as a result of their great number
of ecological niches, compared to the intact forest group with a lower ecological diversity and
consequently, fewer species occurrence. However, with reference to the two disturbed groups,
more species were found to coexist in the transition zones than in the disturbed freshwater
zone. This ongoing community facilitation in the transition zone enables the realized niches of
the species to be larger than the fundamental ecological niches within the disturbed freshwater
zone (Bruno et al. 2003; He and Bertness, 2014; He and Cui, 2015). Conversely, since the
populations in the regional pool of the intact zone are few and it’s rare species (low relative
abundance) are limited in their recruitment due to limited dispersal or fecundity (Chase and
Myers, 2011); its homogeneity will remain low. This is however not so for the other groups (1
and 2) which are more disturbed and have limited physical barriers to dispersal, and as such
their community composition will not be structured by such stochastic factors like colonization
history (Chase and Myers, 2011).
The distribution of the indicator species across three groups (Appendix 5) shows the different
environmental preferences of the species across the ecosystem. Hence, they (indicator species)
could be used to understand the environmental (due to the existing species-environment
relationships) conditions of the ecosystem (Diekmann, 2003; Toledo et al. 2011) and will be
suitable for informing more precise classification and sustainable management of the
ecosystem. A greater part of these indicator species (85.1%) had single species distribution
across the forest sites and are suitable for understanding the habitat conditions of the forest
categories they represent (Baker, 2008). While this is equally similar for the remaining smaller
fraction (14.9%) which occurred in more than one group or cluster (both group 1 and 2), they
are however species that could indicate disturbed freshwater and mangrove-freshwater
ecosystems. Though the results of the multiple response permutation procedure (MRPP)
showed that there was a difference in the different forest categories, the significant value was
weak. This is mainly due to the weak environmental gradients within and between the
communities (same geology and ecological zonation shared by the sites) and the close
proximity of the plots.
94
3.5.2 Ecological characteristics and determinants of indicator species
The freshwater ecosystems in the Niger Delta are generally found in low-lying areas and
composed of alluvial soils whose fertility are replenished on regular basis through the
deposition of silt and soil nutrients following the annual inundation (flooding) of the forest
floor. Unlike other West African forests which are generally poor in their soil fertility (Hall and
Swaine, 1976; Swaine et al. 1996; Toledo et al. 2011), the freshwater swamp forests in the
Niger Delta are characterized by rapid tree growth and dense vegetation. With similar
geological history, geomorphology and relief across the region, edaphic factors were not seen
to be responsible for the variations in the composition of the different locations. Though the
forest floor across the region is characterized by ridges, mounds and some pockets of
depressions (with marshes or pools of stagnant water that generally limits tree growth and
shapes the ecosystem at the landscape scale), it however contributes to the gap dynamics of
the ecosystem. Such features are not only responsible for the gaps found in the forest structure
of freshwater swamp ecosystems, but furthermore presents the ecosystem as mosaics of forest
patches even when anthropogenic disturbances may not be ongoing.
Climatic factors contributed to the variations in distribution of the ecosystem’s composition.
Both the mean annual rainfall and temperature were needed to sustain the humid, warm and
swampy environment suitable for the ecosystem’s flora. Their variations contributed to the
differences in the duration of waterlogging of the soil (and micro climate of the forest clusters),
their ecological processes (distribution, productivity and reproductive biology) and their
floristic/vegetative formations of the ecosystem (Megonigal et al. 1997; Ferreira et al. 2014).
These climatic factors impose habitat selection on the ecosystem, contribute to the variation in
the stem and species abundance across the forest clusters and create different climatic niches
(gradients) and stand structure within the ecosystem. While both the mean annual rainfall and
temperature are vital in ensuring that the climatic conditions necessary for the swamp
environment is maintained, other climatic variables also contribute in determining the patterns
of their heights and their general life history traits (Moles et al. 2009).
The pattern of disturbance across the forest clusters are varied and are significant indices in the
biogeography of the ecosystem. Being a dynamic determinant for species richness of different
landscapes (Wohlgemuth et al. 2002); it (disturbance) is responsible for the variations seen in
the species abundance as well as the structure of forest clusters. Disturbed forest clusters are
95
characterised by more species than the intact clusters (Appendix 5): a character found in other
forest ecosystems and best explained by the intermediate disturbance hypothesis (Connell,
1978). Although disturbances may have destroyed certain tree species, it equally creates
opportunities for propagules to arrive in the open spaces and colonize the ecosystem, thereby
increasing the diversity of the disturbed area. As the time between disturbances increases,
their diversity will also increase as more species invade the area, while the slower growing
species and those with low dispersal capabilities will then have the capacity and opportunity to
reach maturity.
3.6 Conclusion
Variation in disturbance and climate were both responsible for the varied distribution of their
flora. With differences existing in the ecological niches of the species in the ecosystem, their
indicator species were equally seen to occur at different frequencies. Even though the relative
abundance of species is higher in disturbed locations due to their higher fecundity, ensuring
that their rate of disturbance is managed will help to ensure that their ecological thresholds are
not exceeded. To achieve this, efforts that encourage community forest conservation should
not only focus on preserving the biodiversity of the freshwater ecosystems, but also the
environmental conditions of the region and in turn, the viability of the ecosystem.
96
3.7 References
Adomou, A. C., Sinsin, B. and van der Maesen, L. J. G. (2006). Phytosocilogical and chorological
approaches to phytogeography: A meso-scale study in Benin. Systematics and Geography
of plants 76 (2): 155-178.
Areola, O. (1982). Soils. In: Barbour, K.M., Oguntoyinbo, J.S., Onyemelukwe, J.O.C., and Nwafor,
J.C. (Eds.). Nigeria in Maps, pp. 22-23. Africana Publishing Company, U.S.A.
Bakker, J. D. (2008). Increasing the utility of indicator species analysis. J. Appl. Ecol. 45: 1829-
1835
Blach-Overgaard, A., Svenning, J. C., Dransfield, J., Greve, M. and Balslev, H. (2010).
Determinants of palm species distributions across Africa: the relative roles of climate,
non-climatic environmental factors and spatial constraints. Ecography 33: 380-391.
Bruno, J. F., Stachowicz, J. J. and Bertness, M. D. (2003). Inclusion of facilitation into ecological
theory. Trends Ecol. Evol. 18: 119-125.
Bueno, M. L., Neves, D. R. M., Souza. A. F., Junior, G. A. D., Junior, E. O., Pontara, V., Laura, V. A.
and Ratter, J. M. (2013). Influence of edaphic factors on the floristic composition of an
area of cerradāo in the Brazilian central-west. Acta Botanica Brasilica 27 (2): 445-455.
Chain-Guadarrama, A., Finegan, B., Vilchez, S. and Casanoves, F. (2012). Determinants of rain-
forest floristic variation on an altitudinal gradient in southern Costa Rica. Journal of
Tropical Ecology 28: 463-481.
Chase, J. M. (2010). Stochastic community assembly causes higher biodiversity in more
productive environments. Science 328: 1388-1391.
Chase, M. and Myers, J. A. (2011). Disentangling the importance of ecological niches from
stochastic processes across scales. Phil. Trans. R. Soc. B, 366: 2351-2363.
Chave, J. (2008). Spatial variation in tree species composition across tropical forests: Patterns
and process. In Carson, W. P. and Schitzer (Eds.). Tropical forest community ecology, pp.
11-30. John Wiley and sons Ltd, Chichester, U.K.
Clark, J. S., Dietze, M., Chakraborty, S., Agarwal, P. L., Ibanez, I., LaDeau, S. and Wolosin, M.
(2007). Resolving the biodiversity paradox. Ecol Lett. 10: 647-659.
Connell, J. H. (1978). Diversity in tropical rain forests and coral reefs. Science, New series 199
(4335): 1302-1310.
97
Costa, F. R. C., Guillaumet, J. L., Lima, A. P. and Pereira, O. (2009). Gradients within gradients:
the mesoscale distribution patterns of palms in a central Amazonian forest. Journal of
Vegetation Science 20: 69-78.
De Cáceres, M., Legendre, P. and Moretti, M. (2010). Improving indicator species analysis by
combining groups of sites. Oikos 119: 1674-1684.
Diekmann, M. (2003). Species indicator values as important tool in applied plant ecology – a
review. Basic Appl. Ecol. 4: 493-506.
Dufrêne, M. and Legendre, P. (1997). Species assemblages and indicator species: the need for a
flexible asymmetrical approach. Ecological Monographs 67 (3): 345-366.
Dufrêne, M. and Legendre, P. (1997). Species assemblages and indicator species: the need for a
flexible assymetrical approach. Ecol. Monogr. 67: 345-366.
Eiserhardt, W. L., Svenning, J. C., Kissling, W. D. and Balslev, H. (2011). Geographical ecology of
the palms (Arecaceae): determinants of diversity and distributions across spatial scales.
Annals of Botany 108: 1391-1416. Oxford University Press.
Ern, H. (1979). Die vegetation Togos. Gliederung, Gefährdung, Erhaltung. Willdenowia 9: 295-
312.
Ferreira, V. B. R., Nascimento, M. T. and de Menezes, L. F. T. (2014). Floristic and
phytogeographic pattern of native field in southeastern Brazil. Acta Botanica Brasilica 28
(3): 465-475.
Gentry, A. H. 1988. Changes in plant community diversity and floristic composition on
environmental and geographical gradients. Annals of the Missouri Botanical Garden 75:
1-34.
Gole, T. W., Borsch, T., Denich, M. and Teketay, D. (2008). Floristic composition and
environmental factors characterizing coffee forests in southwest Ethiopia. Forest Ecology
and Management 255: 2138-2150.
Hall, J. B. and Swaine, M. D. (1981). Distribution and ecology of vascular plants in a tropical rain
forest: forest vegetation in Ghana. Geobotany 1: 1-383.
He, Q. and Bertness, M. D. (2014). Extreme stresses, niches and positive species interactions
along stress gradients. Ecology 95: 1437-1443.
He, Q. and Cui, B. (2015). Multiple mechanisms sustain a plant-animal facilitation on a coastal
ecotone. Scientific reports 5: 8612. Doi:10.1038/srep08612.
98
Heino, J. (2005). Positive relationship between regional distribution and local abundance in
stream insects: a consequence of niche breadth or niche position? Ecography 28: 345-
354.
Hijmans, R. J., Cameron, S. E., Parra, J. L., Jones, P. G. and Jarvis, A. (2005). Very high resolution
interpolated climate surfaces for global land areas. International Journal of Climatology
25: 1965-1978.
Hochberg, Y. (1988). A sharper Bonferroni procedure for multiple tests of significance.
Biometrika 75: 800-802.
Holt, R. D. (2003). On the evolutionary ecology of species’ ranges. Evolutionary Ecology
Research 5: 159-178.
Homeier, J., Breckle, S. W., Günter, S., Rollenbeck, R. T. and Leuschner, C. (2010). Tree diversity,
forest structure and productivity along altitudinal and topographical gradients in species-
rich Ecuadorian montane rainforest. Biotropica 42: 140-148.
Hutchinson, G. E. (1959). Homage to Santa Rosalia or why are there so many kinds of animals?
American Naturalist 93: 145-159.
James, G. K. (2008). Assessment of environmental change and its socio-economic impacts in the
mangrove ecological zone of the Niger Delta, Nigeria. Ph.D thesis, University of Missouri-
Kansas city.
Keay, R. W. J. (1949). An outline of Nigerian vegetation: 52pp. Government printer, Lagos.
Lugo, A. E. and Scatena, F. N. (1996). Background and catastropic tree mortality in tropical
moist, wet, and rain forests. Biotropica 28: 585-599.
McCune, B. and Grace, J. B. (2002). Analysis of ecological communities. MjM Software Design,
Gleneden Beach, Oregon, USA.
McGeoch, M. A. and Chown, S. L. (1998). Scaling up the value of bioindicators. Trends in
Ecology and Evolution 13: 46-47.
Megonigal, J. P., Conner, W. H., Kroeger, S. and Sharitz, R. R. (1997). Aboveground production
in southeastern floodplain forests: a test of the subsidy-stress hypothesis. Ecology 78:
370-384.
Mielke, P. W. and Berry, K. J. (2001). Permutation methods: A distance function approach. New
York, Springer-Verlag.
99
Moles, A. T., Warton, D. I., Warman, L., Swenson, N. G., Laffan, S. W., Zanne, A. E., Pitman, A.,
Hemmings, F. A. and Leishman, M. R. (2009). Global patterns in plant height. British
Ecological Society, Journal of Ecology 97 (5): 923-932.
Motzkin, G., Eberhardt, R., Hall, B., Foster, D. R., Harrod, J. and MacDonald, D. (2002).
Vegetation variation across Cape Cod, Massachusetts: environmental and historical
determinants. Journal of Biogeography 29: 1439-1454.
Mwakalukwa, E. E., Meilby, H. and Treue, T. (2014). Floristic composition, structure, and
species associations of dry Miombo woodland in Tanzania. ISRN Biodiversity 2014:
153278, 15pp. Doi:10.1155/2014/153278.
NDES. 1997. The Niger Delta Environmental Survey. Environmental and socio-economic
characteristics. Lagos-Nigeria: Environmental Resources Managers limited.
Parmentier, I., Malhi, Y., Senterre, B., Whittaker, J. et al. (2007). The odd man out? Might
climate explain the lower tree α-diversity of African rain forests relative to Amazonian
rain forests? J. Ecol. 95: 1058-1071.
Phillips, O. L., Nunez-Vargas, P., Monteagudo, A. L., Pena-Cruz, A., Chuspe-Zans, M. E., Galiano-
Sánchez, W., Yli-Halla, M. and Rose, S. (2003). Habitat association among Amazonian tree
species: A landscape scale approach. J. Ecol. 91: 757-775.
Pyke, C. R., Condit, R., Aguilar, S. and Lao, S. (2001). Floristic composition across a climatic
gradient in a Neotropical lowland forest. J. Veg. Sci. 12: 553-556.
Swaine, M. D. (1996). Rainfall and soil fertility as factors limiting forest species distribution in
Ghana. Journal of Ecology 84: 419-428.
Toledo, M., Poorter, L., Pena-Claros, M., Alarcόn, A., Balcázar, J., Chuvina, J., Leano, C., Licona,
J. C., ter Steege, H. and Bongers, F. (2011). Patterns and determinants of floristic
variation across lowland forests of Bolivia. Biotropica 43 (4): 405-413.
Tuomisto, H., Ruokolainen, K., and Yli-Halla, M. (2003). Dispersal, environment and floristic
variation of western Amazonian forests. Science 299: 241-244.
Von Holle, B. and Motzkin, G. (2007). Historical land use and environmental determinants of
nonnative plant distribution in coastal southern New England. Biological Conservation
136: 33-43.
Whitmore, T. C. (1998). An introduction to tropical rain forests (Second Edition) 296pp. Oxford
University Press, New York.

100
Wiens, J. J. (2011). The niche, biogeography and species interactions. Phil. Trans. R. Soc. B, 366:
2336-2350.
Wohlgemuth, T., Bürgi, M., Scheidegger, C. and Schütz, M. (2002). Dominance reduction of
species through disturbance- a proposed management principle for central European
forests. Forest Ecology and Management 166: 1-15.
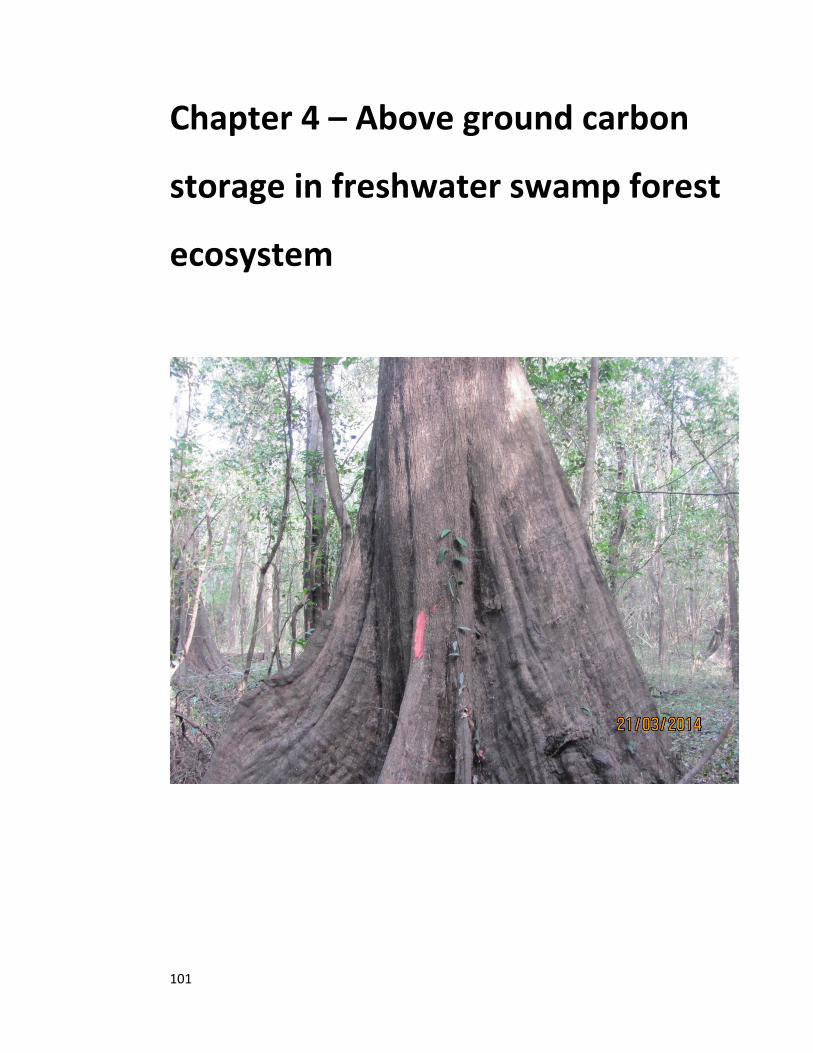
101
Chapter 4 – Above ground carbon
storage in freshwater swamp forest
ecosystem
102
4.0 Above ground carbon storage in freshwater swamp forest ecosystem in the Niger Delta
Nwabueze, I. Igu1 and Rob Marchant1
1York Institute for Tropical Ecosystem Dynamics (KITE), Environment Department, University of
York, YO10 5NG, UK.
4.1 Abstract
Tropical forests are important stores of carbon but the contribution of freshwater swamp
forests to this store is largely unquantified. This study quantifies the above ground carbon
(AGC) store of Freshwater swamp forests and the transition zones into mangrove forests in the
Niger Delta and the results used to explore the role of forest structure, floristic composition
and climatic variables to this store. Taxonomic data were derived from tree stems ≥ 10 cm
diameter at breast height (DBH) in 24 one hectare plots established across different
disturbance gradients and transition zone to mangrove and terrestrial forest. An allometric
equation was used to estimate the AGC of forest disturbance categories and multiple
regressions used to verify the determinants of the carbon stores, including climatic influences.
Future climate projections were also used to model expected change. AGC was typical of other
African forests, and ranged from a mean of 228 t ha-1 (bootstrapped 95% CI: 168 - 288) in intact
forests, to 104 t ha-1 (64 - 144) in disturbed forests and 100 t ha-1 (60 - 141) in disturbed
freshwater-mangrove transition. Basal area was seen as the most important variable, hence
showing the role of disturbance in distinguishing areas of higher carbon stores from lower
zones. Though the disturbed forests contained less carbon, conserving them alongside the
intact forests was seen to not only contribute to increasing the long-term carbon budget of the
region, but also its biodiversity and other ecosystem services. Variations in temperature and
precipitation across the sites contributed to their varied AGC. Expected temperature rise
(following the climate change scenarios) are equally expected to contribute to the AGC of the
different forests. Our study suggests that the variation in AGC of the swamp forests is largely
related to historical use and current management of the forest resources. Efforts to ensure that
forest degradation is reduced are advocated in order to enhance carbon storage by 228 t ha-1
or more for the whole Niger Delta freshwater swamp ecosystem.
Keywords: biomass, carbon budget, climate change, forest structure, Nigeria
103
4.2 Introduction
Tropical forests are store houses for vast quantities of carbon and modulators of climate
change (Houghton, 2005; Lewis, 2013). Containing as much as 30% of global carbon stocks
(Keith et al. 2009), tropical forests are estimated to store a greater proportion of carbon in its
above ground biomass (70-90%) depending on its climate, soil, disturbance and topography
(Saatchi et al. 2011), as well as threats from deforestation and forest degradation. Since forests
have a significant role to play in carbon mitigation, understanding the drivers that determine
the carbon potentials of the ecosystem are vital for effective management and will in turn help
to optimize and potentially increase carbon stocks for sustained mitigation benefit.
Estimating the quantity of carbon stored in the biomass of tropical forests, with high-resolution
remote sensors like light detection and ranging (LiDar) and radio detection and ranging (radar)
have been produced (Saatchi et al. 2011). However, despite the importance for climate change
mitigation, baseline information from field studies on estimates of the forest carbon are still
lacking in many parts of the tropics and for whole ecosystem types. This ‘basic’ foundation
information is vital as it is used for calibration and validation of remote sensing methods and
models used to produce carbon estimates that policies such as Reducing Emissions from
Deforestation and Degradation (REDD+) are based upon. While most of the studies on forest
carbon have been concentrated in the Americas, the (West) African forests (especially Nigeria)
have been relatively poorly studied. Furthermore, with varied determinants and patterns of
distribution of forests across the region, establishing carbon baselines for the different forest
ecosystems in the region is the first step towards understanding how the varied ecosystems,
and the associated carbon store, could respond to changes in the environment.
Freshwater swamp forests are ecosystems whose biogeography and biogeochemical processes
differ from other tropical forest ecosystems, notably with adjacent lowland rainforest and
mangrove swamp forest ecosystems. With such inter-ecosystem variation in biodiversity
indices, environmental determinants and disturbance regimes, understanding the carbon
storage or capacity of the freshwater ecosystem will furthermore enhance a better
appreciation of the importance of swamp forests. The Nigerian freshwater forest ecosystem
which is concentrated in the Niger Delta (Fig 4.1) and covers some 12,000 km2 (NDES, 1997), is
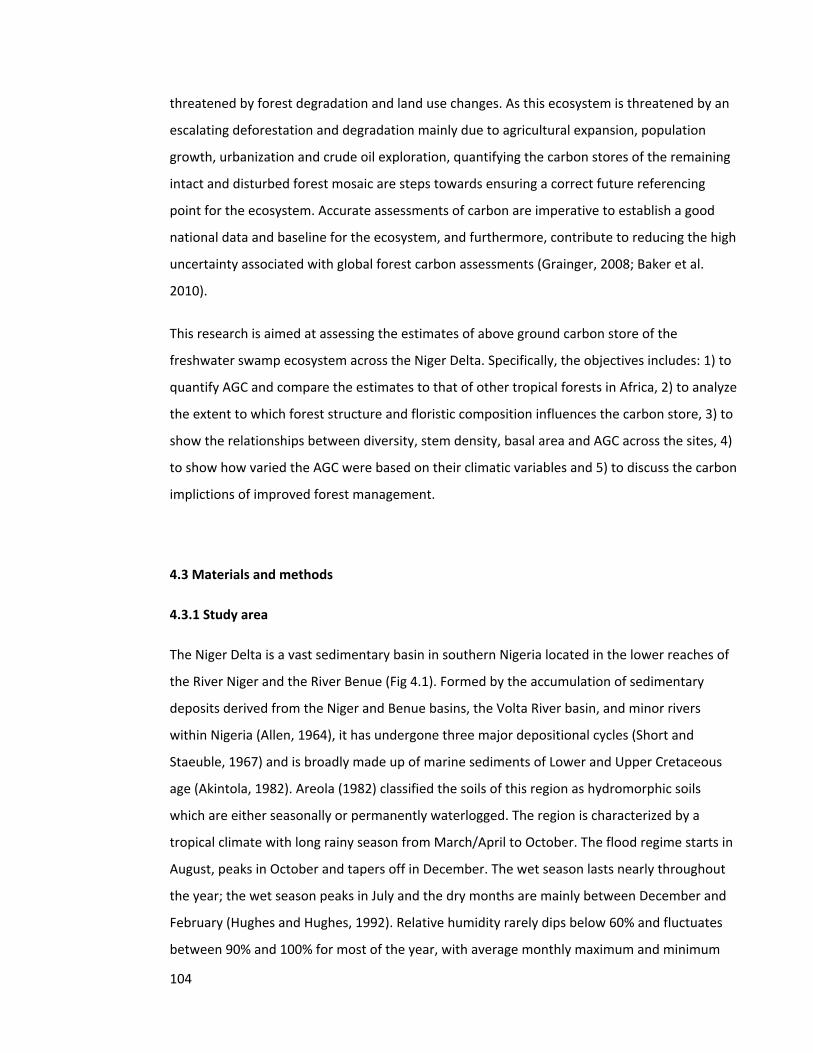
104
threatened by forest degradation and land use changes. As this ecosystem is threatened by an
escalating deforestation and degradation mainly due to agricultural expansion, population
growth, urbanization and crude oil exploration, quantifying the carbon stores of the remaining
intact and disturbed forest mosaic are steps towards ensuring a correct future referencing
point for the ecosystem. Accurate assessments of carbon are imperative to establish a good
national data and baseline for the ecosystem, and furthermore, contribute to reducing the high
uncertainty associated with global forest carbon assessments (Grainger, 2008; Baker et al.
2010).
This research is aimed at assessing the estimates of above ground carbon store of the
freshwater swamp ecosystem across the Niger Delta. Specifically, the objectives includes: 1) to
quantify AGC and compare the estimates to that of other tropical forests in Africa, 2) to analyze
the extent to which forest structure and floristic composition influences the carbon store, 3) to
show the relationships between diversity, stem density, basal area and AGC across the sites, 4)
to show how varied the AGC were based on their climatic variables and 5) to discuss the carbon
implictions of improved forest management.
4.3 Materials and methods
4.3.1 Study area
The Niger Delta is a vast sedimentary basin in southern Nigeria located in the lower reaches of
the River Niger and the River Benue (Fig 4.1). Formed by the accumulation of sedimentary
deposits derived from the Niger and Benue basins, the Volta River basin, and minor rivers
within Nigeria (Allen, 1964), it has undergone three major depositional cycles (Short and
Staeuble, 1967) and is broadly made up of marine sediments of Lower and Upper Cretaceous
age (Akintola, 1982). Areola (1982) classified the soils of this region as hydromorphic soils
which are either seasonally or permanently waterlogged. The region is characterized by a
tropical climate with long rainy season from March/April to October. The flood regime starts in
August, peaks in October and tapers off in December. The wet season lasts nearly throughout
the year; the wet season peaks in July and the dry months are mainly between December and
February (Hughes and Hughes, 1992). Relative humidity rarely dips below 60% and fluctuates
between 90% and 100% for most of the year, with average monthly maximum and minimum
105
temperatures varying between 28oC to 33oC and 21oC to 23oC respectively (James, 2008; NDES,
1997). The Niger Delta is the third largest wetland in the world (Uluocha and Okeke, 2004), has
the most extensive mangrove and freshwater ecosystems in Africa (Ajonina et al. 2008) and is
the most biodiverse area in Nigeria (Ebeku, 2004).
Fig 4.1 Map of the study sites
106
4.3.2 Data collection
The vegetation survey was conducted in four locations across the region (Fig 4.1). The first two
sites: Akarai-Obodo (site 1) and Akili-Ogidi (site 2) are disturbed freshwater swamp forests, the
third site (Akoloma) is a (secondary forest) freshwater-mangrove transition forest and the
fourth site (Otuwe) is an intact freshwater swamp forest. Distance of the forest sites to the
communities were used as a proxy for assessing the degree of disturbance for each of the study
sites. A GPS was used to get the coordinates of the forest locations and that of the
communities and was converted to distance in kilometres with Google earth pro. Palms were
included in the survey as taxa since they occupied a great amount of space in forest locations
and by implication, stored carbon in their biomass.
Twenty four, one hectare forest plots used for the survey were set up in the seasonally flooded
part of the ecosystem between December 2013 and April 2014, when the flood water had
subsided. Plots were placed 500m apart to ensure variation in floristic composition. All the 24
plots (4 – 8 plots) per site were placed along transects spaced 1km apart rather than random
placement. This helped to ensure that consistency in enumeration was maintained across the
plots. Sites in Akarai-Obodo and Akili-Ogidi had 4 plots each (two transects), while the plots at
Akoloma and Otuwe were 8 each (four transects). The forest plots were then used for species
identification and measurements across the ecosystem. All stems ≥ 10 cm diameter at breast
height (DBH) were enumerated and identified to species level in the field with the assistance of
taxonomists from the Forestry Research Institute Ibadan, Nigeria. Voucher specimens were
collected for unidentified species and verified at the Forestry Research Institute Ibadan
(Nigeria). Smaller tree stems were omitted in the inventory as they contained approximately
5% of above ground carbon (Lewis et al. 2009). Tree diameters were measured at DBH or above
the buttresses if present. Stem heights were measured from the base of each tree to its highest
point with a laser rangefinder and with a graduated pole where the tree was less than 10m, for
which the rangefinder could not measure. Species identification was conducted by Michael
Oladimeji, a taxonomist from the research institute and assisted by Peter Ige. Tree
measurements and setting of the plots were conducted by Nwabueze Igu, with the assistance
of Cyril Mama and Ifeanyi Iwegbue. The climatic data used were derived from WorldClim at the
highest available resolution of 30ll minute (Hijmans et al. 2005), while the data for future
climatic scenarios were from AFRICLIM (Platts et al. 2015).
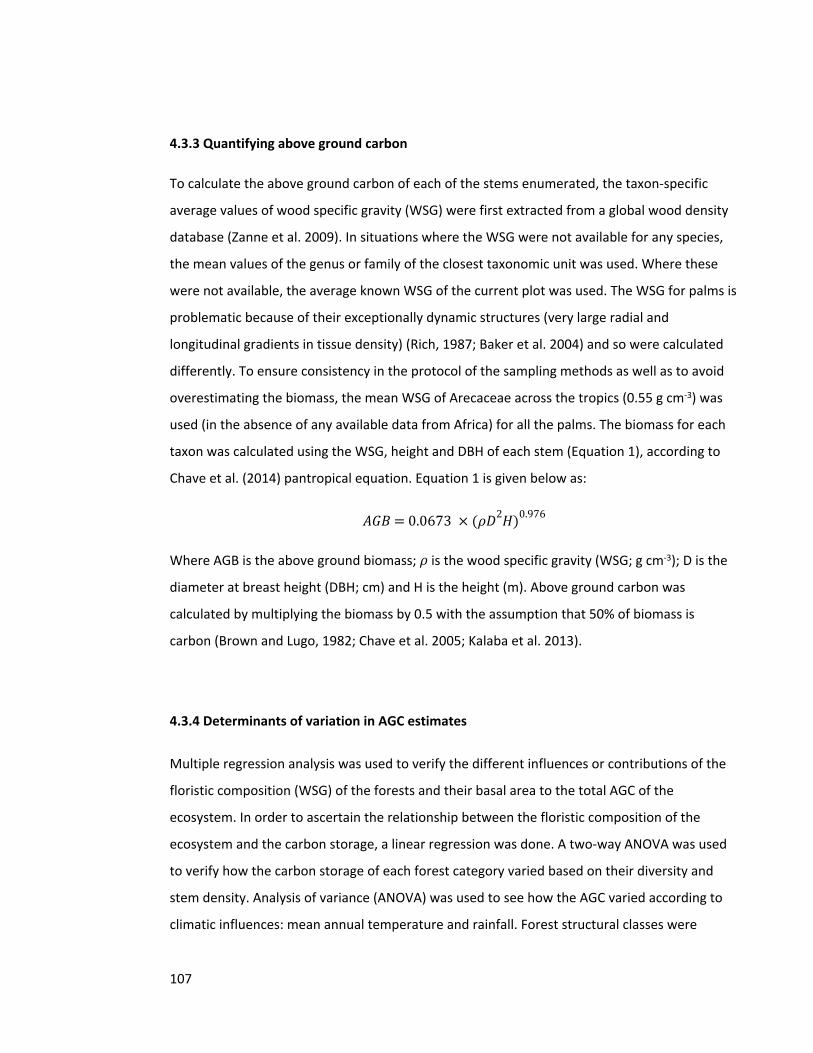
107
4.3.3 Quantifying above ground carbon
To calculate the above ground carbon of each of the stems enumerated, the taxon-specific
average values of wood specific gravity (WSG) were first extracted from a global wood density
database (Zanne et al. 2009). In situations where the WSG were not available for any species,
the mean values of the genus or family of the closest taxonomic unit was used. Where these
were not available, the average known WSG of the current plot was used. The WSG for palms is
problematic because of their exceptionally dynamic structures (very large radial and
longitudinal gradients in tissue density) (Rich, 1987; Baker et al. 2004) and so were calculated
differently. To ensure consistency in the protocol of the sampling methods as well as to avoid
overestimating the biomass, the mean WSG of Arecaceae across the tropics (0.55 g cm-3) was
used (in the absence of any available data from Africa) for all the palms. The biomass for each
taxon was calculated using the WSG, height and DBH of each stem (Equation 1), according to
Chave et al. (2014) pantropical equation. Equation 1 is given below as:
𝐴𝐺𝐵 = 0.0673 × (𝜌𝐷2𝐻)0.976
Where AGB is the above ground biomass; is the wood specific gravity (WSG; g cm-3); D is the 𝜌
diameter at breast height (DBH; cm) and H is the height (m). Above ground carbon was
calculated by multiplying the biomass by 0.5 with the assumption that 50% of biomass is
carbon (Brown and Lugo, 1982; Chave et al. 2005; Kalaba et al. 2013).
4.3.4 Determinants of variation in AGC estimates
Multiple regression analysis was used to verify the different influences or contributions of the
floristic composition (WSG) of the forests and their basal area to the total AGC of the
ecosystem. In order to ascertain the relationship between the floristic composition of the
ecosystem and the carbon storage, a linear regression was done. A two-way ANOVA was used
to verify how the carbon storage of each forest category varied based on their diversity and
stem density. Analysis of variance (ANOVA) was used to see how the AGC varied according to
climatic influences: mean annual temperature and rainfall. Forest structural classes were
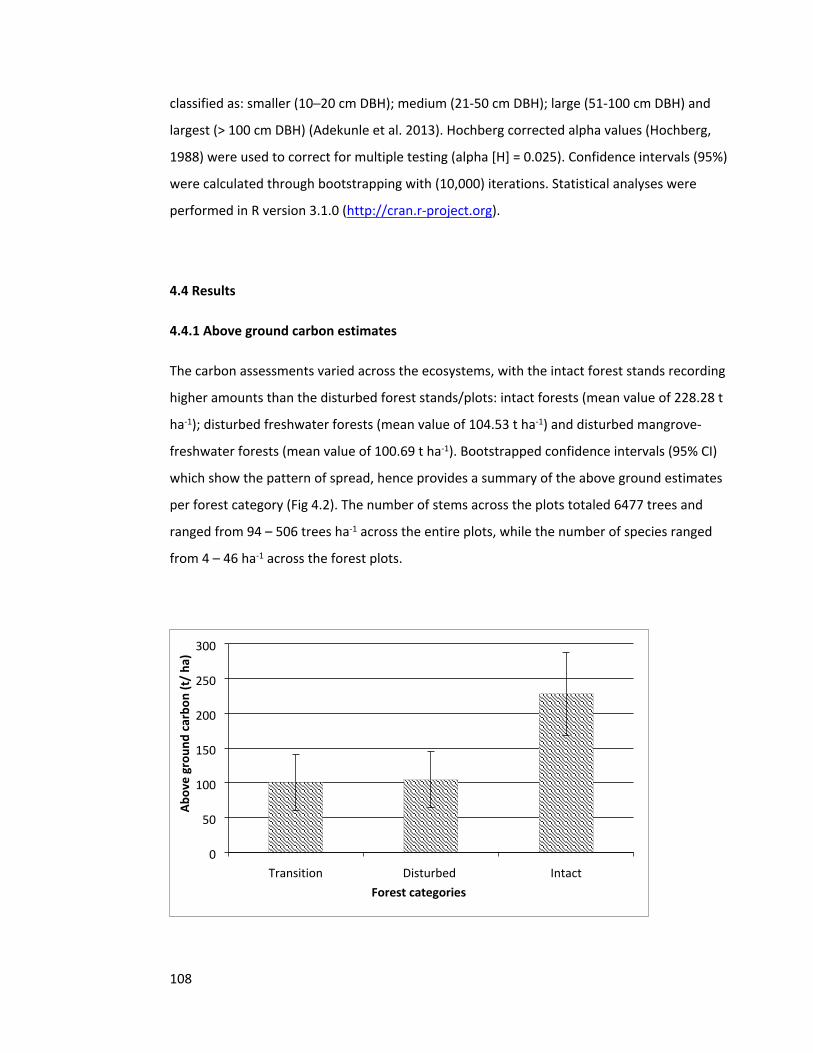
108
classified as: smaller (10─20 cm DBH); medium (21-50 cm DBH); large (51-100 cm DBH) and
largest (> 100 cm DBH) (Adekunle et al. 2013). Hochberg corrected alpha values (Hochberg,
1988) were used to correct for multiple testing (alpha [H] = 0.025). Confidence intervals (95%)
were calculated through bootstrapping with (10,000) iterations. Statistical analyses were
performed in R version 3.1.0 (http://cran.r-project.org).
4.4 Results
4.4.1 Above ground carbon estimates
The carbon assessments varied across the ecosystems, with the intact forest stands recording
higher amounts than the disturbed forest stands/plots: intact forests (mean value of 228.28 t
ha-1); disturbed freshwater forests (mean value of 104.53 t ha-1) and disturbed mangrove-
freshwater forests (mean value of 100.69 t ha-1). Bootstrapped confidence intervals (95% CI)
which show the pattern of spread, hence provides a summary of the above ground estimates
per forest category (Fig 4.2). The number of stems across the plots totaled 6477 trees and
ranged from 94 – 506 trees ha-1 across the entire plots, while the number of species ranged
from 4 – 46 ha-1 across the forest plots.
Transition Disturbed Intact0
50
100
150
200
250
300
Forest categories
Abov
e gr
ound
car
bon
(t/
ha)
109
Fig 4.2 Mean ± 95% CI bootstrapped AGC of transition, disturbed and undisturbed (intact)
forest categories
4.4.2 Determinants of AGC across the ecosystem
Estimates of AGC were different across the plots and forest categories as a result of the
variations in the biodiversity, forest structure and climatic variables. Basal area of the stems
and floristic composition were the main deteminants of the total AGC across the ecosystems: (F
= 77.04 (2, 21), p adj < 0.001, Adj R2 = 0.87). Though the floristic composition (t = 0.00989) of
each forest group contributed to its total AGC, it was not as significant as that of the basal area
(t = 4.32 x 10⁻¹¹). On the other hand, since the disturbance state of the forests (seen through
their variations in basal area or stem size) had stronger influence, their composition were not
seen to directly determine their carbon storage (F = 0.22 (1, 22), p = 0.65, Adj R2 = -0.04, t =
0.47). The carbon storage of each forest category was varied due to their diversity (F = 20.86, p
adj < 0.001; Fig 4.3) rather than according to their stem density (F = 0.58, p = 0.45). Climatic
variables varied across the forest sites (F = 20.9, p adj < 0.001; 95% family-wise confidence
levels): mean annual temperature range and mean annual rainfall range were 257- 268 oC and
2096 - 2448 mm, respectively. This was mainly from the mean annual temperature (F = 10.57, p
= 0.004) rather than from the mean annual rainfall (F = 0.57, p = 0.46). Expectedly, the
different forest categories varied in their AGC contributions (Fig 4.2), due to the varied basal
area of the forest locations (F = 11.17, p adj < 0.001; 95% family-wise confidence levels) as well
as their different structural class contributions (Fig 4.4). This variation in structural class
contributions to AGC was most pronounced between the large and small stem intervals, being
the highest and least contributors, respectively (Fig 4.5).
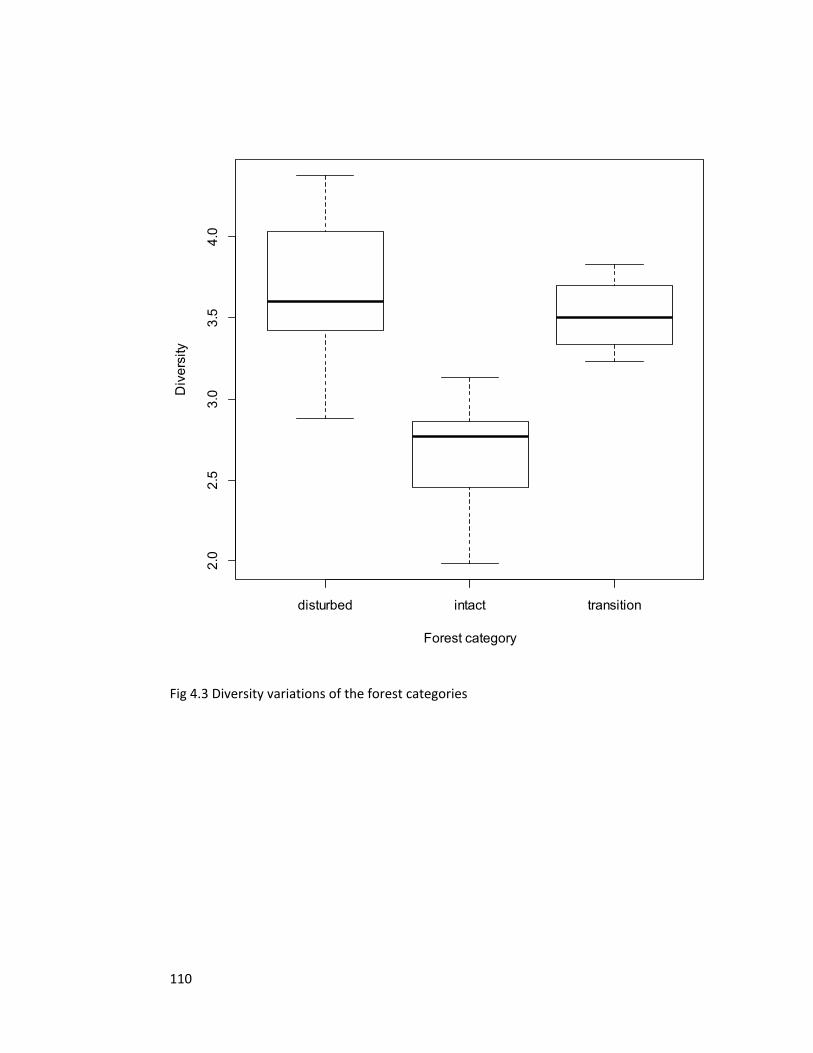
110
disturbed intact transition
2.0
2.5
3.0
3.5
4.0
Forest category
Div
ersi
ty
Fig 4.3 Diversity variations of the forest categories
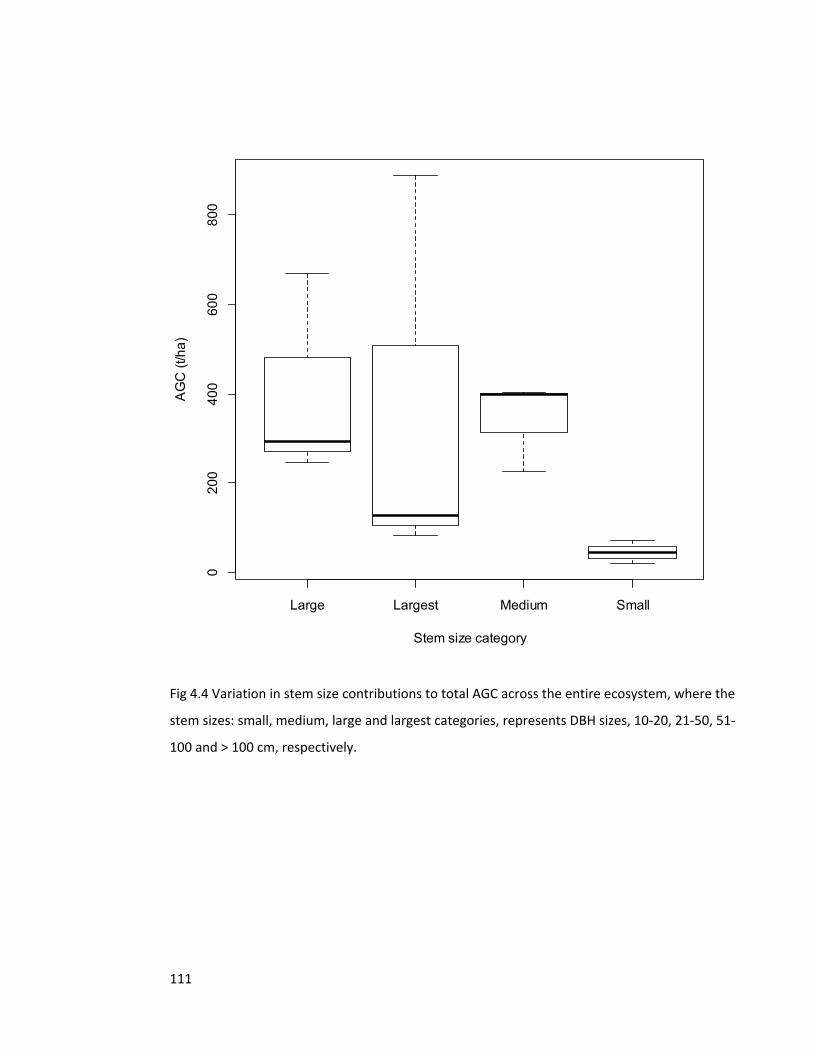
111
Large Largest Medium Small
020
040
060
080
0
Stem size category
AG
C (t
/ha)
Fig 4.4 Variation in stem size contributions to total AGC across the entire ecosystem, where the
stem sizes: small, medium, large and largest categories, represents DBH sizes, 10-20, 21-50, 51-
100 and > 100 cm, respectively.
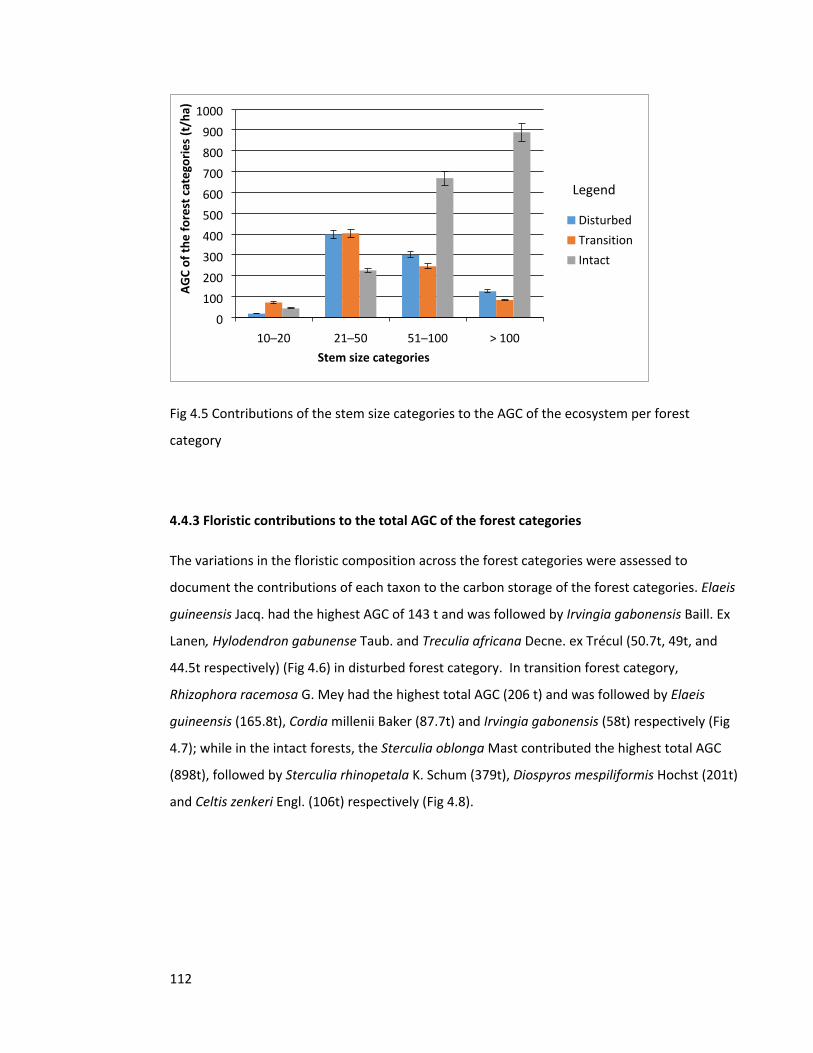
112
10─20 21─50 51─100 > 1000
100200300400500600700800900
1000
DisturbedTransitionIntact
Stem size categories
AGC
of th
e fo
rest
cat
egor
ies (
t/ha
) Legend
Fig 4.5 Contributions of the stem size categories to the AGC of the ecosystem per forest
category
4.4.3 Floristic contributions to the total AGC of the forest categories
The variations in the floristic composition across the forest categories were assessed to
document the contributions of each taxon to the carbon storage of the forest categories. Elaeis
guineensis Jacq. had the highest AGC of 143 t and was followed by Irvingia gabonensis Baill. Ex
Lanen, Hylodendron gabunense Taub. and Treculia africana Decne. ex Trécul (50.7t, 49t, and
44.5t respectively) (Fig 4.6) in disturbed forest category. In transition forest category,
Rhizophora racemosa G. Mey had the highest total AGC (206 t) and was followed by Elaeis
guineensis (165.8t), Cordia millenii Baker (87.7t) and Irvingia gabonensis (58t) respectively (Fig
4.7); while in the intact forests, the Sterculia oblonga Mast contributed the highest total AGC
(898t), followed by Sterculia rhinopetala K. Schum (379t), Diospyros mespiliformis Hochst (201t)
and Celtis zenkeri Engl. (106t) respectively (Fig 4.8).
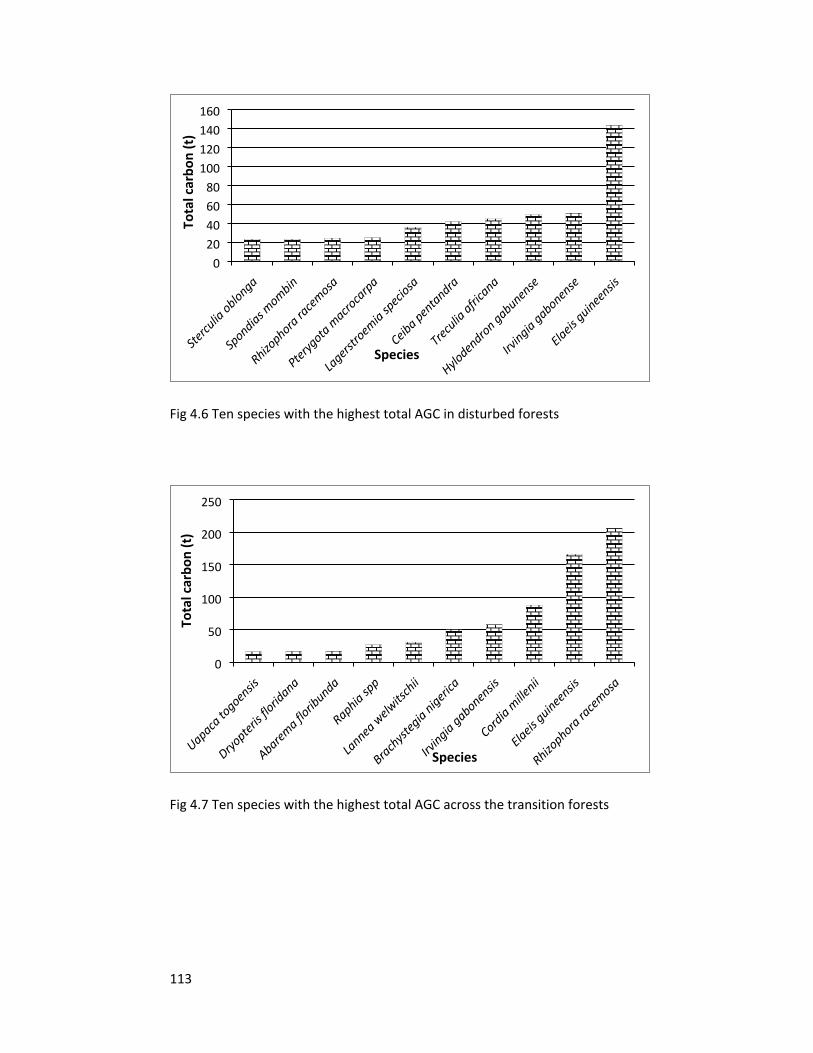
113
Stercu
lia oblonga
Spondias m
ombin
Rhizophora ra
cemosa
Pteryg
ota macro
carpa
Lagers
troem
ia speci
osa
Ceiba pen
tandra
Treculia
africana
Hyloden
dron gabunense
Irvingia gabonen
se
Elaeis guinee
nsis0
20406080
100120140160
Tota
l car
bon
(t)
Species
Fig 4.6 Ten species with the highest total AGC in disturbed forests
Uapaca to
goensis
Dryopter
is florid
ana
Abarema flo
ribunda
Raphia spp
Lannea
welw
itsch
ii
Brachyst
egia nigeri
ca
Irvingia gabonen
sis
Cordia mille
nii
Elaeis guinee
nsis
Rhizophora ra
cemosa
0
50
100
150
200
250
Tota
l car
bon
(t)
Species
Fig 4.7 Ten species with the highest total AGC across the transition forests
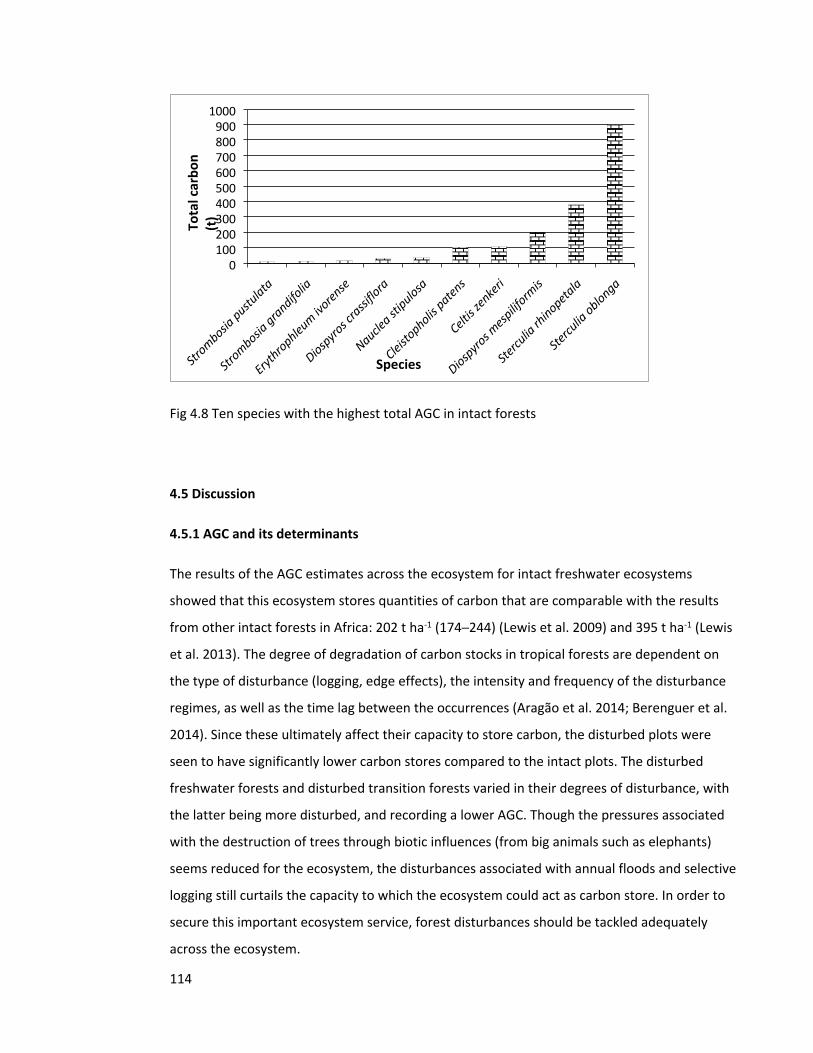
114
Strombosia
pustulata
Strombosia
grandifolia
Erythrophleu
m ivoren
se
Diospyro
s crassi
flora
Nauclea st
ipulosa
Cleisto
pholis paten
s
Celtis z
enke
ri
Diospyro
s mesp
iliform
is
Stercu
lia rh
inopetala
Stercu
lia oblonga
0100200300400500600700800900
1000
Tota
l car
bon
(t)
Species
Fig 4.8 Ten species with the highest total AGC in intact forests
4.5 Discussion
4.5.1 AGC and its determinants
The results of the AGC estimates across the ecosystem for intact freshwater ecosystems
showed that this ecosystem stores quantities of carbon that are comparable with the results
from other intact forests in Africa: 202 t ha-1 (174─244) (Lewis et al. 2009) and 395 t ha-1 (Lewis
et al. 2013). The degree of degradation of carbon stocks in tropical forests are dependent on
the type of disturbance (logging, edge effects), the intensity and frequency of the disturbance
regimes, as well as the time lag between the occurrences (Aragão et al. 2014; Berenguer et al.
2014). Since these ultimately affect their capacity to store carbon, the disturbed plots were
seen to have significantly lower carbon stores compared to the intact plots. The disturbed
freshwater forests and disturbed transition forests varied in their degrees of disturbance, with
the latter being more disturbed, and recording a lower AGC. Though the pressures associated
with the destruction of trees through biotic influences (from big animals such as elephants)
seems reduced for the ecosystem, the disturbances associated with annual floods and selective
logging still curtails the capacity to which the ecosystem could act as carbon store. In order to
secure this important ecosystem service, forest disturbances should be tackled adequately
across the ecosystem.
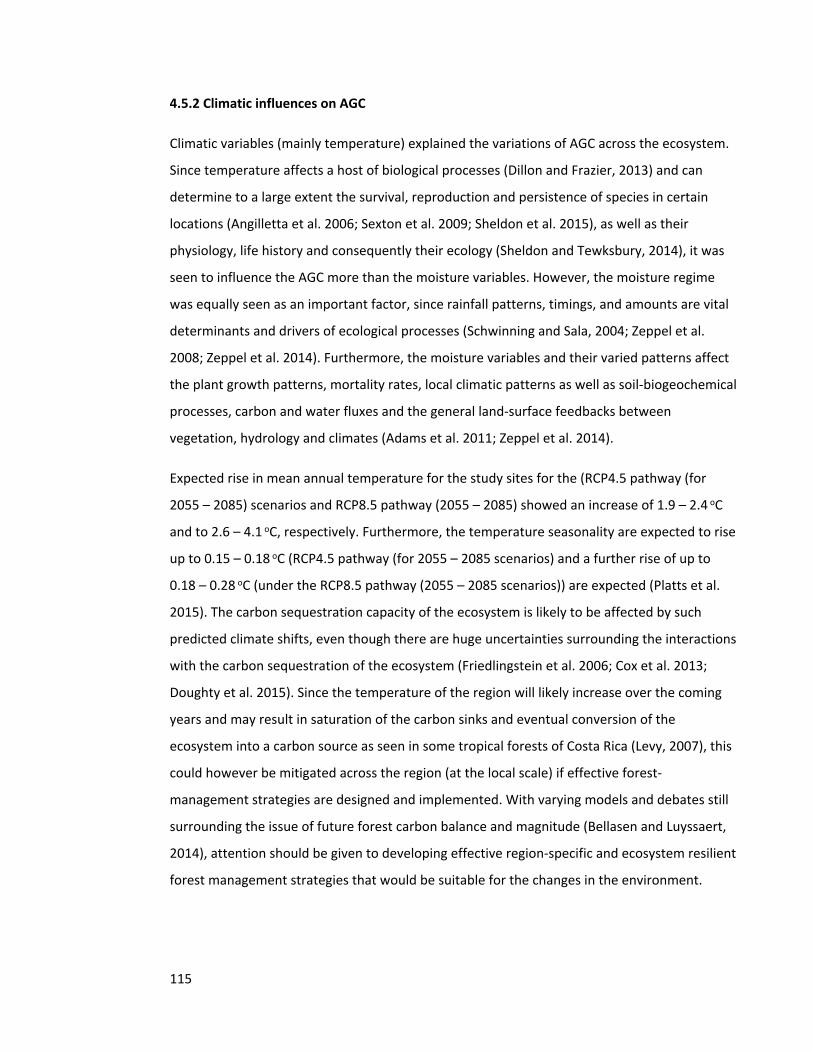
115
4.5.2 Climatic influences on AGC
Climatic variables (mainly temperature) explained the variations of AGC across the ecosystem.
Since temperature affects a host of biological processes (Dillon and Frazier, 2013) and can
determine to a large extent the survival, reproduction and persistence of species in certain
locations (Angilletta et al. 2006; Sexton et al. 2009; Sheldon et al. 2015), as well as their
physiology, life history and consequently their ecology (Sheldon and Tewksbury, 2014), it was
seen to influence the AGC more than the moisture variables. However, the moisture regime
was equally seen as an important factor, since rainfall patterns, timings, and amounts are vital
determinants and drivers of ecological processes (Schwinning and Sala, 2004; Zeppel et al.
2008; Zeppel et al. 2014). Furthermore, the moisture variables and their varied patterns affect
the plant growth patterns, mortality rates, local climatic patterns as well as soil-biogeochemical
processes, carbon and water fluxes and the general land-surface feedbacks between
vegetation, hydrology and climates (Adams et al. 2011; Zeppel et al. 2014).
Expected rise in mean annual temperature for the study sites for the (RCP4.5 pathway (for
2055 – 2085) scenarios and RCP8.5 pathway (2055 – 2085) showed an increase of 1.9 – 2.4 oC
and to 2.6 – 4.1 oC, respectively. Furthermore, the temperature seasonality are expected to rise
up to 0.15 – 0.18 oC (RCP4.5 pathway (for 2055 – 2085 scenarios) and a further rise of up to
0.18 – 0.28 oC (under the RCP8.5 pathway (2055 – 2085 scenarios)) are expected (Platts et al.
2015). The carbon sequestration capacity of the ecosystem is likely to be affected by such
predicted climate shifts, even though there are huge uncertainties surrounding the interactions
with the carbon sequestration of the ecosystem (Friedlingstein et al. 2006; Cox et al. 2013;
Doughty et al. 2015). Since the temperature of the region will likely increase over the coming
years and may result in saturation of the carbon sinks and eventual conversion of the
ecosystem into a carbon source as seen in some tropical forests of Costa Rica (Levy, 2007), this
could however be mitigated across the region (at the local scale) if effective forest-
management strategies are designed and implemented. With varying models and debates still
surrounding the issue of future forest carbon balance and magnitude (Bellasen and Luyssaert,
2014), attention should be given to developing effective region-specific and ecosystem resilient
forest management strategies that would be suitable for the changes in the environment.
116
4.5.3 Floristic composition and structural influences on AGC
The forest locations were varied in their diversity (Fig 4.3) and their floristic composition at the
plot and regional levels. However, this did not determine the capacities to which they stored
carbon in their biomass. This further explained why plots and forest categories that had trees
with higher WSG (example, the genus Rhizophora; mean WSG = mean 0.93 g cm-3) did not
necessarily have higher AGC t ha-1 stores. Since this was the case, the transition forest category
which was dominated by such taxa did not have the higher carbon storage. It instead recorded
the least AGC t ha-1 compared to the mean values found in intact forest locations and disturbed
freshwater forest locations, which were dominated by the genus Sterculia (mean WSG = 0.60 g
cm-3) and Elaeis guineensis (mean WSG = 0.56 g cm-3) respectively. The variation in the basal
area across the forest sites and regions were the main reason for the varied mean AGC of the
different forest categories instead of the WSG of the sites. The basal area of the forest plots
differed among and between each of the forest categories due to the varied disturbance
gradients of each of the sites. While edge effects and natural disturbances from the annual
flooding of the ecosystem were responsible for the variations in basal area of the intact forest
sites and in effect the total AGC ha-1, selective logging and land use changes were the main
issues for lower basal areas (AGC) of the disturbed forests.
Forest structure determines the net primary productivity and turnover of ecosystems (Marvin
et al. 2014) and was found to be a major determinant of the AGC across the swamp forest
ecosystem. Evidence from the study showed that the frequency of species occurrence were not
the main determinants of total AGC of the forests, but their structural configurations. As a
result, though the number of species of the smaller structural classes outnumbered those with
larger structures as would be seen in most tropical forests, yet the fewer bigger structured
trees contributed mostly to the AGC of each of the forest categories. This pattern whereby
larger stems contribute mostly to the estimates of AGC across most of the forest ecosystems
have been reported in other studies (Rutishauser et al. 2010; Baraloto et al. 2011; Marshall et
al. 2012) and may explain the underlying focus of carbon estimation and conservation in intact
forests.
117
4.5.4 Implications for carbon budget, forest conservation and climate change
Tropical forests are affected by a wide range of environmental and anthropogenic factors
which directly and indirectly influence their carbon budget and potential as a global carbon
store. While these influences affect the above ground carbon in inter-related ways and spatial
scales, it has increasingly affected the carbon sinks due to human modifications which have
degraded the ecosystem. As the rate of forest degradation through selective logging increases
throughout the tropics (Asner et al. 2005) with a consequential loss in the biodiversity, it has
become imperative to understand the carbon budget of different regions and ecosystem types.
With the apparent decline of the forest cover and land use changes in the tropics,
concentrating conservation and management efforts only on the intact forests which no doubt
have larger biomass and carbon budgets seems elusive, as tangible alternative sources of
livelihood are not yet at sight for the vast majority of the forest-poor dependent populace.
Even though the capacity of forests to store large quantities of carbon are higher when
undisturbed, and losses much greater carbon when the forests become disturbed (Luyssaert et
al. 2008), the potential for such disturbed ecosystems to still act as carbon sinks and stores of
biodiversity are substantial. This potential could be further realised through reforestation and
forest restoration (Silver et al. 2000; Sasaki et al. 2011) of such disturbed ecosystems. Although
the effectiveness of such strategies depends to a large extent on the management of such
forest lands, supporting such techniques with alternative sources of livelihood and fuel will
enable greater carbon biomass accumulation for such landscapes to become a reality. Efforts
towards effective forest conservation and stronger management regime have become
imperative, particularly as most of the remaining intact forests in the Niger Delta are owned
and managed by individuals. Such measures will help to ensure that the rate at which such
forest landscapes are exposed to edge effects, fragmentation, degradation from adjacent
agricultural activities, land tenure and population pressure becomes reduced.
With the total net carbon emission from tropical deforestation and land use at 1.0 Pg C yr-1
(2000─2010; Baccini et al. 2012) and an ever increasing degradation of tropical forests (Asner et
al. 2005; 2009), efforts towards increasing the carbon sink of tropical forests should not be
targeted only on primary forests. Since secondary and degraded forests equally contribute to
the overall carbon budget, their potentials should be harnessed as well. The analyses
demonstrates the wide margin (more than 50%) between the amount of carbon from intact
118
forests and that from disturbed forest tracts. With this in mind, there is then every need to
conserve the remaining intact forests not just in the Niger Delta, but generally across the
tropics, since forest degradation not only affects the carbon budget of the tropical forest
ecosystem, but also other important ecosystem services (Seidl et al. 2014; Lewis et al. 2006),
the local climate (Chagnon et al. 2004) and the biodiversity (Reid et al. 2005) of the ecosystem.
4.6 Conclusion
Freshwater swamp forests are important carbon stores comparable to other tropical forest
ecosystems. Their capacity to provide this increasingly vital ecosystem service is dependent on
the disturbance regime of the forest in its intact, disturbed and transition zones. With
variations in basal area as well as the floristic composition of the different zones, their
capacities to store carbon were seen to vary. Climatic influences varied across the ecosystem
and were responsible for the variations in the carbon store. With an expected change in the
climate of the region, the capacity of the ecosystem to act as a carbon sink remains uncertain.
Efforts that will promote effective forest management for the ecosystem are advocated, in a
bid to both promote biodiversity conservation for the ecosystem as well as its carbon stores.
119
4.7 References
Adams, H. D., Luce, C. H., Breshears, D. D., Allen, C. D., Weiler, M., Hale, V. C., Smith, A. M. S.
and Huxman, T. E. (2011). Ecohydrological consequences of drought-and infestation-
triggered tree die-off: insights and hypotheses. Ecohydrology 5: 145─159.
Adekunle, V. A. J., Olagoke, A. O. and Akindele, S. O. (2013). Tree species diversity and structure
of a Nigerian strict nature reserve. Tropical Ecology 54 (3): 275-289.
Ajonina, G., Diame, A. and Kairo, J. (2008). Current status and conservation of mangroves in
Africa: an overview. World Rainforest Movement Bull. 133.
Akintola, F. (1982). Geology and Geomorphology. In: Barbour, K.M., Oguntoyinbo, J.S.,
Onyemelukwe, J.O.C., and Nwafor, J.C. (Eds.). Nigeria in Maps. Africana Publishing
Company, U.S.A.
Allen, J.R.L. (1964). Coastal geomorphology of eastern Nigeria: beach ridge barrier islands and
vegetated tidal flats. Geologie en Mynbouw 44: 1-21.
Angilletta, M. J., Oufiero, C. E. and Leaché, A. D. (2006). Direct and indirect effects of
environmental temperature on the evolution of reproductive strategies: an
information-theoretic approach. The American Naturalist 168: E123─E135.
Aragão, L.E.O.C., Poulter, B. and Barlow, J. B., Anderson, L. O., Malhi, Y., Saatchi, S., Phillips, O.
L. and Gloor, E. (2014). Environmental change and the carbon balance of Amazonian
forests. Biological Reviews, doi: 10.1111/brv.12088.
Areola, O. (1982). Soils. In: Barbour, K.M., Oguntoyinbo, J.S., Onyemelukwe, J.O.C., and Nwafor,
J.C. (Eds.). Nigeria in Maps. Africana Publishing Company, U.S.A.
Asner, G. P., Knapp, D. E., Broadbent, E. N., Oliveira, P. J., Keller, M. and Silva, J. N. (2005).
Selective logging in the Brazilian Amazon. Science 301 (5747): 480-482.
Asner, G. P., Rudel, T. K., Aide, M., Defries, R. and Emerson, R. (2009). A contemporary
assessment of change in humid tropical forests. Conserv. Biol. 23: 1386-1395.
Baccini, A., Goetz, S. J., Walker, W. S., Laporte, N. T., Sun, M., Sulla-Menashe, D., Hackler, J.,
Beck, P. S. A., Dubayah, R., Friedl, M. A., Samanta, S. and Houghton, R. A. (2012).
Estimated carbon dioxide emissions from tropical deforestation improved by carbon-
density maps. Letters, Nature Climate Change 2, doi: 10.1038/NCLIMATE1354.
Baker, D. J., Richards, G., Grainger, A., Gonzalez, P., Brown, S., Defries, R., Held, A., Kellndorfer,
J., Ndunda, P., Ojima, D., Skrovseth, P., Souza, C. and Stolle, F. (2010). Achieving forest
120
carbon information with higher certainty: A five-part plan. Environmental Science and
Policy 13: 249-260.
Baker, T. R., Phillips, O. L., Malhi, Y., Almeida, S., Arroyo, L., Di Fiore, A., Erwin, T., Killeen, T. J.,
Laurance, S. G., Laurance, W. F., Lewis, S. L., Lloyd, J., Monteagudo, A., Neill, D. A.,
Patińo, S., Pitman, N. C. A., Silva, J. N. M. and Martínez, R. V. (2004). Variation in wood
density determines spatial patterns in Amazonian forest biomass. Global Change
Biology 10: 545-562.
Baraloto, C., Rabaud, S., Molto, Q., Blanc, L., Fortunel, C., Hérault, B., Dávila, N., Mesones, I.,
Rios, M., Valderrama, E. and Fine, P. V. A. (2011). Disentangling stand and
environmental correlates of aboveground biomass in Amazonian forests. Global
Change Biology 17: 2677─2688.
Bellassen, V. and Luyssaert, S. (2014). Managing forests in uncertain times. Nature 506: 153-
155.
Berenguer, E., Ferreira, J., Gardner, T. A., Aragão, L. E. O. C., De Camargo, P. B., Cerri, C. E.,
Durigan, M., Junior, R. C., Vieira, I. C. G. and Barlow, J. (2014). A large-scale field
assessment of carbon stocks in human-modified tropical forests. Global Change
Biology, 20: 3713-3726, doi:10.1111/gcb.12627.
Brown, S. and Lugo, A. E. (1982). The storage and production of organic matter in tropical
forests and their role in global carbon cycle. Biotropica 14: 161-167.
Chagnon, F. J. F., Bras, R. L. and Wang, J. (2004). Climatic shift in patterns of shallow clouds over
the Amazon. Geophysical Research Letters 31, L24212, doi:10.1029/2004GL021188.
Chave, J., Andalo, C., Brown, S., Cairns, M. A., Chambers, J. Q., Eamus, D., Folster, H., Fromard,
F., Higuchi, N., Kira, T., Lescure, J. P., Nelson, B. W., Ogawa, H., Puig, H., Riera, B.,
Yamakura, T. (2005). Tree allometry and improved estimation of carbon stocks and
balance in tropical forests. Oecologia 145: 87-99.
Chave, J., Condit, R., Aguilar, S., Hernandez, A., Laos, S. and Perez, R. (2004). Error propagation
and scaling for tropical forest biomass estimates. Phil Trans R Soc B 359: 409-420.
Chave, J., Réjou-Méchain, M., Burquez, A., Chidumayo, E., Colgan, M. S., Delitti, W. B. C.,
Duque, A., Eid, T., Fearnside, P. M., Goodman, R. C., Henry, M., Martínez-Yrízar, A.,
Mugasha, W. A., Muller-Landau, H. C., Mencuccini, M., Nelson, B. W., Ngomanda, A.,
Nogueira, E. M., Ortiz-Malavassi, E., Pélissier, R., Ploton, P., Ryan, C. M., Saldarriaga, J. G.
121
and Vieilledent, G. (2015). Improved allometric models to estimate the aboveground
biomass of tropical trees. Global Change Biology 20: 3177-3190, doi:10.1111/gcb.12629.
Cox, P. M., Pearson, D., Booth, B. B., Friedlingstein, P., Huntingford, C., Jones, C. D. and Luke, C.
M. (2013). Sensitivity of tropical carbon to climate change constrained by carbon
dioxide variability. Nature 494: 341-344.
Dillon, M. E. and Frazier, M. R. (2013). Thermodynamics constrains allometric scaling of optimal
development time in insects. PLoS ONE 8 (12): e84308,
doi:10.1371/journal.pone.0084308.
Doughty, C. E., Metcalfe, D. B., Girardin, A. J., Amezquita, F. F., Durand, L., Huasco, W. H., Silva-
Espejo, J. E., Araujo-Murakami, A., da Costa, M. C., da Costa, A. C. L., Rocha, W., Meir,
P., Galbraith, D. and Malhi, Y. (2015). Source and sink carbon dynamics and carbon
allocation in the Amazon basin. Global Biogeochemical Cycles 29 (5): 645-655.
Ebeku, K. S. A. (2004). Biodiversity conservation in Nigeria: an appraisal of the legal regime in
relation to the Niger Delta area of the country. J Environmental Law 16 (3): 361-375.
Friedlingstein, P., Cox, P., Betts, R., Bopp, L., von Bloh, W., Brovkin, V., Cadule, P., Doney, S.,
Eby, M., Fung, I., Bala, G., John, J., Jones, C., Joos, F., Kato, T., Kawamiya, M., Knorr, W.,
Lindsay, K., Matthews, H. D., Raddatz, T., Rayner, P., Reick, C., Roeckner, E., Schnitzler,
K. G., Schnur, R., Strassmann, K., Weaver, A. J., Yoshikawa, C. and Zeng, N. (2006).
Climate-carbon cycle feedback analysis: Results from the C4MIP Model
intercomparison. J. Climate 19 (14): 3337-3353.
Grainger, A. (2008). Difficulties in tracking the long-term global trend in tropical forest area.
Proceedings of the National Academy of Sciences of the United States of America 105:
818-823.
Hijmans, R. J., Cameron, S. E., Parra, J. L., Jones, P. G. and Jarvis, A. (2005). Very high resolution
interpolated climate surfaces for global land areas. International Journal of Climatology
25: 1965-1978.
Hochberg, Y. (1988). A sharper Bonferroni procedure for multiple tests of significance.
Biometrika 75: 800-802.
Houghton, R. A. (2005). Tropical deforestation as a source of greenhouse gas emissions. In
Moutinho, P. and Schwartzman, S. (Eds). Tropical deforestation and climate change.
Amazon Institute for Environmental Research.
122
Hughes, R. H. and Hughes, J.S. (1992). A directory of African wetlands. Gland, Switzerland,
Nairobi, Kenya, and Cambridge, UK: IUCN, UNEP, and WCMC.
James, G. K. (2008). Assessment of environmental change and its socio-economic impacts in the
mangrove ecological zone of the Niger Delta, Nigeria. Ph.D thesis, University of Missouri-
Kansas city.
Kalaba, F. K., Quinn, C. H., Dougill, A. J. and Vinya, R. (2013). Floristic composition, species
diversity and carbon storage in charcoal and agriculture fallows and management
implications in Miombo woodlands of Zambia. Forest Ecology and Management 304: 99-
109.
Keith, H., Mackey, B. G and Lindenmayer, D. B. (2009). Re-evaluation of forest biomass carbon
stocks and lessons from the world’s most carbon dense forests. Proc. Natl Acad. Sci. USA
106: 11625-11640. Doi:10.1073/pnas.0901970106.
Levy, S. (2007). Running hot and cold: are rainforests sinks or taps for carbon? BioScience 57
(7): 552-557.
Lewis, S. L. (2006). Tropical forests and the changing earth system. Phil. Trans. R. Soc. B. 361:
195-210, doi: 10.1098/rstb.2005.1711.
Lewis, S. L. et al. (2013). Aboveground biomass and structure of 260 African tropical forests.
Phil Trans R Soc B 368: 20120295.
Lewis, S. L., Lopez-Gonzalez, G., Sonke, B., Affum-Baffoe, K., Baker, T. R., Ojo, L. O., Phillips, O.
L., Reitsma, J. M., White, L., Comiskey, J. A., Djuikouo, M. N., Ewango, C. E. N.,
Feldpausch, T. R., Hamilton, A. C., Gloor, M., Hart, T., Hladik, A., Lloyd, J., Lovett, J. C.,
Makana, J. R., Malhi, Y., Mbago, F. M., Ndangalasi, H. J., Peacock, J., Peh, K. S. H., Sheil,
D., Sheil, D., Sunderland, T., Swaine, M. D., Taplin, J., Taylor, D., Thomas, S. C., Votere, R.
and Woll, H. (2009). Increasing carbon storage in intact African tropical forests. Nature
457: 1003-1006.
Luyssaert, S., Schulze, D., Börner, A., Knohl, A., Hessenmöller, D., Law, B. E., Ciais, P. and Grace,
J. (2008). Old-growth forests as global carbon sinks. Letters 455: 213-215.
Marshall, A. R., Willcock, S., Platts, P. J., Lovett, J. C., Balmford, A., Burgess, N. D., Latham, J. E.,
Munishi, P. K. T., Slater, R., Shirima, D. D. and Lewis, S. L. (2012). Measuring and
modeling above-ground carbon and tree allometry along a tropical gradient. Biological
Conservation 154: 20-33.
123
Marthews, T. R., Riutta, T., Oliveras Menor I., Urrutia R., Moore S., Metcalfe D., Malhi Y., Phillips
O., Huaraca Huasco W., Ruiz Jaén M., Girardin C., Butt N., Cain R and colleagues from the
RAINFOR and GEM networks (2014). Measuring Tropical Forest Carbon Allocation and
Cycling: A RAINFOR-GEM Field Manual for Intensive Census Plots (v3.0). Manual, Global
Ecosystems Monitoring network. http://gem.tropicalforests.ox.ac.uk/.
Marvin, D. C., Asner, G. P., Knapp, D. E., Anderson, C. B., Martin, R. E., Sinca, F. and Tupayachi,
R. (2014). Amazonian landscapes and the bias in field studies of forest structure and
biomass. PNAS: E5224─E5232, doi: 10.1073/pnas.1412999111.
NDES (1997). The Niger Delta Environmental Survey. Environmental and socio-economic
characteristics. Lagos-Nigeria: Environmental Resources Managers limited.
Platts, P. J., Omeny, P. A. and Marchant, R. (2015). AFRICLIM: high-resolution climate
projections for ecological applications in Africa. African Journal of Ecology 53: 103-108.
Reid, W. V. et al. (2005). Millennium Ecosystem Assessment Synthesis Report. United Nations
Environment Programme. www.millenniumassessment.org.
Rich, P. M. (1987). Mechanical structure of the stem of arborescent palms. Botanical gazette
148 (1): 42-50. University of Chicago press.
Rutishauser, E., Wagner, F., Herault, B., Nicolini, E. and Blanc, L. (2010). Contrasting above-
ground biomass balance in a Neotropical rain forest. Journal of Vegetation Science 21:
672-682, doi: 10.1111/j.1654-1103.2010.01175.x
Saatchi, S. S., Harris, N. L., Brown, S., Lefsky, M., Mitchard, E. T. A., Salas, W., Zutta, B. R.,
Buermann, W., Lewis, S. L., Hagen, S., Petrova, S., White, L., Silman, M and Morel, A.
(2011). Benchmark map of forest carbon stocks in tropical regions across three
continents. PNAS Early Edition. www.pnas.org/cgi/doi/10.1073/pnas.1019576108.
Sasaki, N., Asner, G. P., Knorr, W., Durst, P. B., Priyadi, H. R. and Putz, F. E. (2011). Approaches
to classifying and restoring degraded tropical forests for the anticipated REDD+ climate
change mitigation mechanism. iForest 4: 1-6.
Schwinning, S. and Sala, O. E. (2004). Hierarchy of responses to resource pulses in arid and
semi-arid ecosystems. Oecologia 141: 211-220.
Seidl, R., Schelhaas, M., Rammer, W. and Verkerk, P. J. (2014). Increasing forest disturbances in
Europe and their impact on carbon storage. Letters, Nature Climate Change 4: 806-810.
Sexton, J. P., McIntyre, P. J., Angert, A. L. and Rice, K. L. (2009). Evolution and ecology of species
range limits. Annual Review of Ecology, Evolution and Systematics 40: 415-436.
124
Sheldon, K. S. and Tewksbury, J. J. (2014). The impact of seasonality in temperature on thermal
tolerance and elevational range size. Ecology 95 (8): 2134-2143.
Sheldon, K. S., Leaché, A. D. and Cruz, F. B. (2015). The influence of temperature seasonality on
elevational range size across latitude: a test using Liolaemus lizards. Global Ecology and
Biogeography 24: 632-641.
Short, K. C. and Staeuble, A. J. (1967). Outline of geology of Niger Delta. AAPG Bull. 51 (5): 761-
799.
Silver, W. L., Ostertag, R. and Lugo, A. E. (2000). The potential for carbon sequestration through
reforestation of abandoned tropical agricultural and pasture lands. Restoration Ecology
8 (4): 394─407.
Uluocha, N. and Okeke, I. (2004). Implications of wetlands degradation for water resources
management: lessons from Nigeria. GeoJournal 61: 151-154.
Zanne, A. E., Lopez-Gonzalez, G., Coomes, D. A., Ilic, J., Jansen, S., Lewis, S. L., Miller, R. B.,
Swenson, N. G., Wiemann, M. C. and Chave, J. (2009). Global wood density database.
Dryad identifier. http://hdl.handle.net/10255/dryad.235.
Zeppel, M. J. B., Macinnis-Ng, C. M. O., Ford, C. R. and Eamus, D. (2008). The response of sap
flow to pulses of rain in a temperate Australian woodland. Plant and Soil 305: 121-130.
Zeppel, M. J. B., Wilks, J. V. and Lewis, J. D. (2014). Impacts of extreme precipitation and
seasonal changes in precipitation on plants. Biogeosciences 11: 3083-3093.
Zuur, A. F., Leno, E. N. and Elphick, C. S. (2010). A protocol for data exploration to avoid
common statistical problems. Methods in Ecology and Evolution 1: 3-14.
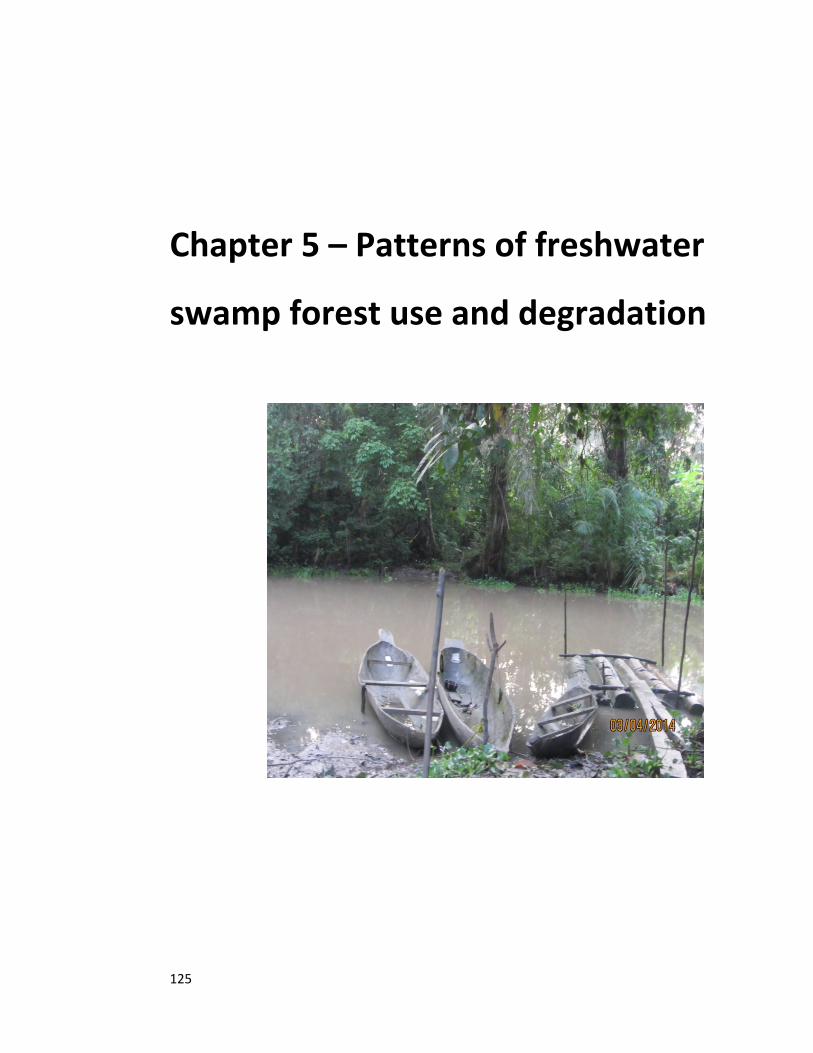
125
Chapter 5 – Patterns of freshwater
swamp forest use and degradation
126
5.0 Patterns of freshwater swamp forest use and degradation in the Niger Delta
Nwabueze, I. Igu1 and Rob Marchant1
1York Institute for Tropical Ecosystem Dynamics (KITE), Environment Department, University of
York, YO10 5NG, UK.
5.1 Abstract
Forest ecosystems are increasingly seen as vital resources and elements for the sustenance of
households across rural landscapes in tropical regions. However, the dynamics surrounding the
forest use and consequent degradation are poorly understood. In West Africa, these
relationships are a serious challenge to the management and sustainable use of freshwater
swamp forest. This study presents a detailed examination of the determinants and socio-
ecological processes of forest use from 243 household surveys within 12 communities across
the Niger Delta region. A socio-economic model of the levels of importance and dependence on
the ecosystem for different provisioning services was produced. I also assessed variation in
current and past use of the ecosystem and furthermore analyzed the influences of spatial
distance (from household to forests) on their level of use. The results showed that the
communities derived a major part of their sustenance from the forests and frequently used the
forests for varied purposes. However, since some households had other non-forest related
sources of livelihood (such as civil service), forest distance only mattered to those whose
livelihood depends totally on it and who were found to defy the constraints associated with the
swamp terrain to source their livelihood and income. The socio-economic status of each
household influenced their degree of dependence and the importance they attached to each of
the forest resources. Since the communities varied in their levels of remoteness, availability of
alternative sources of livelihood and resources (crude oil presence), their use of the forests
equally differed. With little or no understanding that the forests serve other ecosystem
functions, they are being exploited mainly for sustenance (provisioning service) across the
region, as in most other tropical regions. This explains why most tropical forest ecosystems are
undergoing different scales of degradation, without user consideration of resilience, livelihood
implications of resource depletion or sustainable forest use.
Keywords: ecosystem services, environmental income, livelihood, sustainability
127
5.2 Introduction
Tropical forest ecosystems are host to a rich assemblage of species and provide a wide range of
ecosystem services such as food, medicines, building materials, shelter (Lawrence et al. 2005;
Reid et al. 2005) and store houses for carbon (Houghton, 2005; Pan et al. 2011; Lewis, 2013).
These enormous resources provide a wide range of benefits to the African populace whose
subsistence and livelihood are to a large extent dependent on the forests (CIFOR, 2005; Norris
et al. 2010; Bromhead, 2012). As these forest resources continually sustain the rural poor
communities by providing an important “safety net” of food (Bromhead, 2012), they equally
contribute to the economy by providing employment in the forest sector and so provide a basis
for diversification in forest-based enterprises at different scales. Although rural households
generate quite a lot of “environmental income” (either as cash or subsistence) from the forests,
its benefits are not only used to meet their immediate needs, but helps them not to slack into
(deeper) poverty (during bad harvests or between agricultural harvests (by filling the seasonal
gaps) and also to step out of poverty (Angelsen and Wunder, 2003; McSweeney, 2004; Wunder
et al. 2014). Hence, these forest resources have not only supported households that are mostly
engaged in farming activities (as seen in most rural African setting), but also, provided
platforms for continual co-existence and subsistence. Even though the African forest ecosystem
is known to achieve the afore-mentioned for many households, little is known about the
existing relationships between freshwater swamp forest use and degradation across the West
African region.
Indeed the freshwater swamp forest ecosystems are not only poorly understood, estimated
and studied, but are largely unexplored as regards their use, potentials and ecological
processes. Though this fragile but beautiful landscape supports the livelihood and economy of
the forest dependent communities with its high value timber, other forest products, fertile soils
and vast potentials, it has largely remained unexplored and documented. With the tightly
socio-ecological system and processes of forest ecosystems across the region (Norris et al.
2010), it has become imperative that how these relate to and affect the freshwater swamp
forest ecosystem is explored and elucidated. As this ecosystem remains both a centre-piece
and pivotal resource base for the sustenance of households across the Niger Delta region,
exploring its use dynamics are both important in achieving sustainability of the ecosystem to
128
the people and maximizing its potential in climatic regulation and ecosystem stability of the
West African region. This study aims to explore the dynamics of forest use across the
freshwater swamp forest ecosystem. Specific objectives include: 1) to elucidate the
determinants of forest utilization across the forest region, 2) to determine the extent to which
the populace depends on the ecosystem, and 3) to highlight the constraints surrounding the
use of the ecosystem and how it affects their livelihoods and 4) to relate the findings to that of
other (tropical) forested landscapes and provide insights on effective management strategies.
5.3 Materials and methods
5.3.1 Study area
5.3.1.1 Niger Delta environment and people
The Niger Delta is a generally flat, low-lying sedimentary basin located in southern Nigeria,
drained by the Niger River and criss-crossed by a network of rivers, streams and creeks which
drains into the Atlantic Ocean at the Bight of Biafra (Fig 5.1). Broadly made up of marine
sedimentaries of Lower and Upper Cretaceous age (Akintola, 1982), it is a swampy region with
mainly medium to coarse unconsolidated sands, silt, clay, shale and peat. The region is
characterized by a tropical climate with long rainy season mainly from March/April to October.
The flood regime starts in August, peaks in October and tapers off in December. The wet
season lasts nearly throughout the year; the wet season peaks in July and the dry months are
mainly between Decembers to February (Hughes and Hughes, 1992). Relative humidity rarely
dips below 60% and fluctuates between 90% and 100% for most of the year, with average
monthly maximum and minimum temperatures varying between 28oC to 33oC and 21oC to 23oC
respectively (NDES, 1997; James, 2008).
The region represents about 12% of Nigeria’s total land surface area and supports 31.2 million
people who account for 25% of Nigeria’s population (NPC, 2006; UNDP, 2006). It is made up of
more than 40 ethnic groups that speak more than 250 dialects and has a rich cultural heritage
(Jike, 2004). These ethnic groups are broadly classified into five major linguistic categories: the
Ijoid, Yoruboid, Edoid, Igboid and Delta Cross; with each of them embracing an enormous mix
of ethno-linguistic settlements (Watts, 2004). The settlement of the region is made up of
129
predominantly rural populations who live in dispersed settlements and have cultural
attachments to the environment. With the availability of dry land determining the settlement
pattern across the region, many of the larger settlements are found in the better drained and
accessible interior parts, while the low relief and poorly drained locations supports the vast
majority of small and scattered rural settlements (UNDP, 2006).
5.3.1.2 Freshwater forest ecosystem and resources
The forest ecosystems in the Niger Delta differ from each other on the basis of varied floristic
composition, hydrology, soil and topography and are mainly grouped into mangrove and
coastal vegetation (brackish water swamps), lowland rain forest and freshwater swamp forest.
Covering about 17,000 km2 or about half of the delta region (UNDP, 2006), the freshwater
swamp ecosystem of the Niger Delta are unique and represent an important biodiversity area
(Happold, 1987; Hilton-Taylor, 2000; UNDP, 2006) not only for the local environment and the
Nigerian state but also for the west African region. This important ecosystem which is
concentrated in the Delta region is a flooded forest with varied ecology, biodiversity and
potentials. Driven by hydrology, three zones are found in the ecosystem: the flood forest-
which has large sand river channels and creeks- both permanent and seasonal; the marsh
forest- which flanks the delta in the east and declines westwards, permanently swampy and
under the influence of ‘black flood’ from the rains; and the relatively stable delta fringes which
is associated with creeks that bar the flood and tidal influences (NEDECO, 1996; Powell, 1997;
Were, 2000; James, 2008).
The freshwater swamp ecosystem is located between the lowland rain forest to the north and
the mangrove swamp forest to the south; providing a transition zone between the two
ecosystems and a corridor for the migration of flora and fauna. It is the region’s main source of
timber and forest products, and habitat for endangered and rare wildlife (UNDP, 2006). It has
vast potentials for fishery across the region, a seasonal nursery for fishes especially during the
floods and a major habitat for crayfish, prawn, crabs and crocodile. The fertile silt soils which
are enriched from annual floods, have great agricultural potentials both for the region and the
Nigerian state and have been a major attraction for migrant farmers long before the advent of

130
crude oil in the zone. The region is notable for its vast quantities of oil and gas reserves of
reputable quality; which has been the economic mainstay of the Nigerian state.
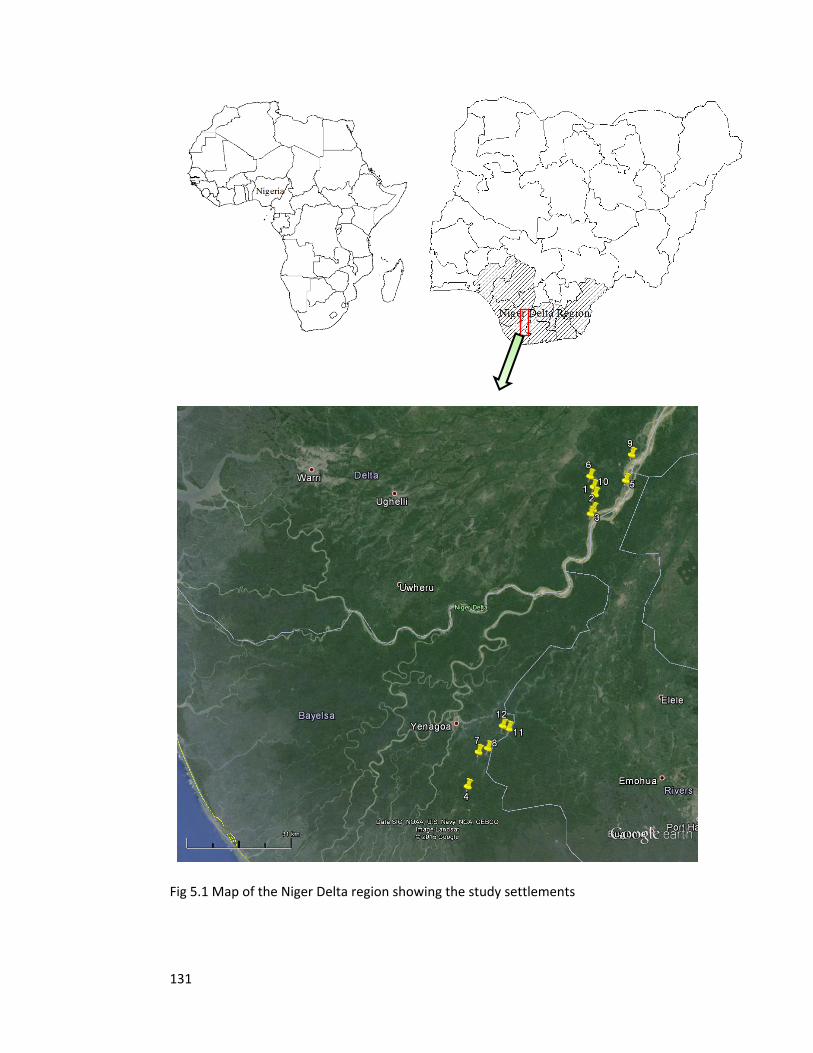
131
Fig 5.1 Map of the Niger Delta region showing the study settlements
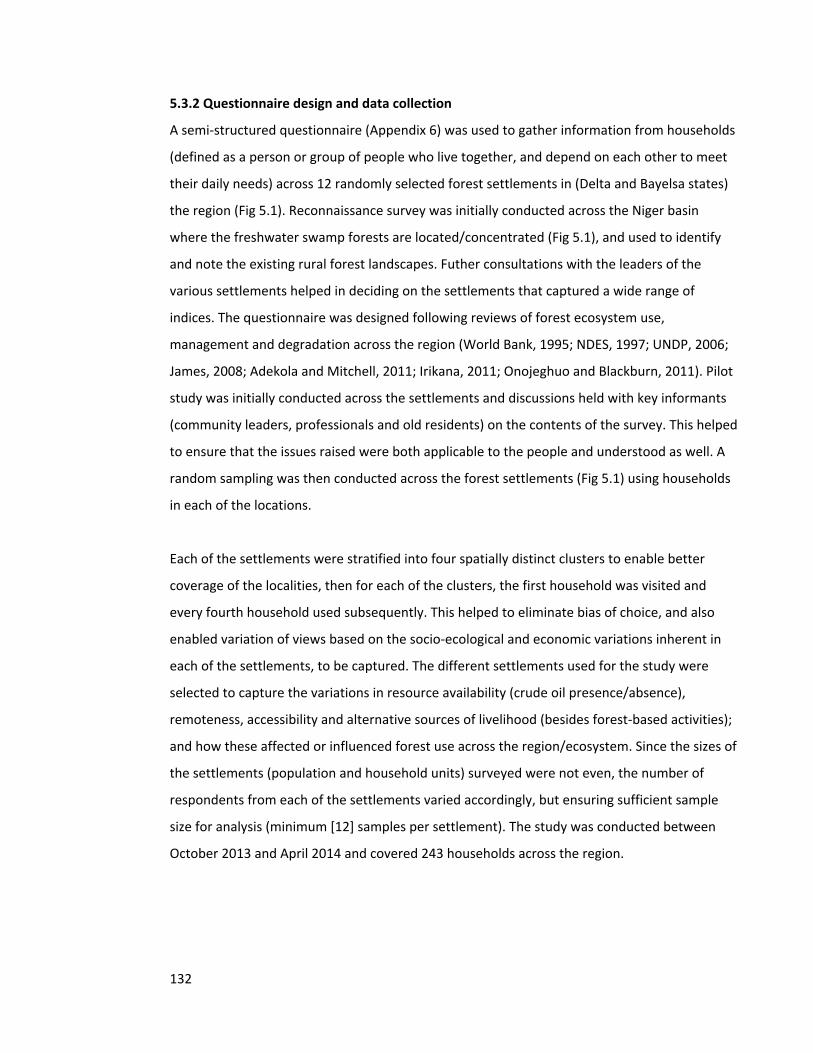
132
5.3.2 Questionnaire design and data collection
A semi-structured questionnaire (Appendix 6) was used to gather information from households
(defined as a person or group of people who live together, and depend on each other to meet
their daily needs) across 12 randomly selected forest settlements in (Delta and Bayelsa states)
the region (Fig 5.1). Reconnaissance survey was initially conducted across the Niger basin
where the freshwater swamp forests are located/concentrated (Fig 5.1), and used to identify
and note the existing rural forest landscapes. Futher consultations with the leaders of the
various settlements helped in deciding on the settlements that captured a wide range of
indices. The questionnaire was designed following reviews of forest ecosystem use,
management and degradation across the region (World Bank, 1995; NDES, 1997; UNDP, 2006;
James, 2008; Adekola and Mitchell, 2011; Irikana, 2011; Onojeghuo and Blackburn, 2011). Pilot
study was initially conducted across the settlements and discussions held with key informants
(community leaders, professionals and old residents) on the contents of the survey. This helped
to ensure that the issues raised were both applicable to the people and understood as well. A
random sampling was then conducted across the forest settlements (Fig 5.1) using households
in each of the locations.
Each of the settlements were stratified into four spatially distinct clusters to enable better
coverage of the localities, then for each of the clusters, the first household was visited and
every fourth household used subsequently. This helped to eliminate bias of choice, and also
enabled variation of views based on the socio-ecological and economic variations inherent in
each of the settlements, to be captured. The different settlements used for the study were
selected to capture the variations in resource availability (crude oil presence/absence),
remoteness, accessibility and alternative sources of livelihood (besides forest-based activities);
and how these affected or influenced forest use across the region/ecosystem. Since the sizes of
the settlements (population and household units) surveyed were not even, the number of
respondents from each of the settlements varied accordingly, but ensuring sufficient sample
size for analysis (minimum [12] samples per settlement). The study was conducted between
October 2013 and April 2014 and covered 243 households across the region.
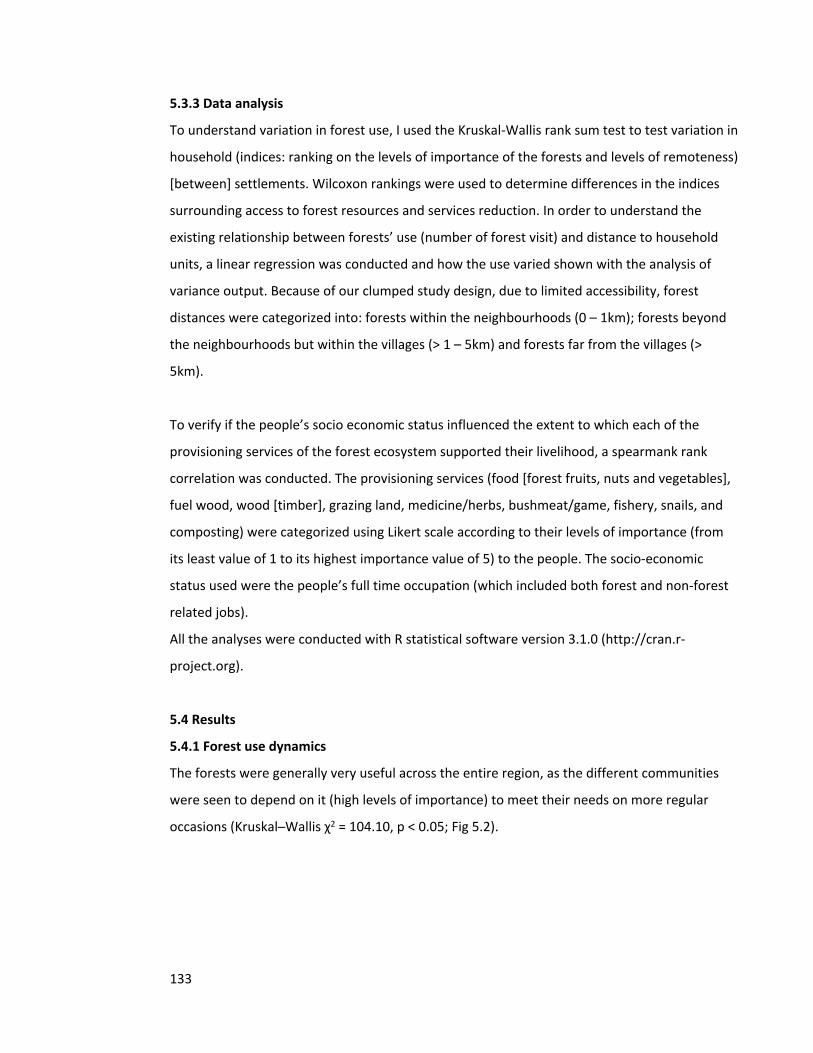
133
5.3.3 Data analysis
To understand variation in forest use, I used the Kruskal-Wallis rank sum test to test variation in
household (indices: ranking on the levels of importance of the forests and levels of remoteness)
[between] settlements. Wilcoxon rankings were used to determine differences in the indices
surrounding access to forest resources and services reduction. In order to understand the
existing relationship between forests’ use (number of forest visit) and distance to household
units, a linear regression was conducted and how the use varied shown with the analysis of
variance output. Because of our clumped study design, due to limited accessibility, forest
distances were categorized into: forests within the neighbourhoods (0 – 1km); forests beyond
the neighbourhoods but within the villages (> 1 – 5km) and forests far from the villages (>
5km).
To verify if the people’s socio economic status influenced the extent to which each of the
provisioning services of the forest ecosystem supported their livelihood, a spearmank rank
correlation was conducted. The provisioning services (food [forest fruits, nuts and vegetables],
fuel wood, wood [timber], grazing land, medicine/herbs, bushmeat/game, fishery, snails, and
composting) were categorized using Likert scale according to their levels of importance (from
its least value of 1 to its highest importance value of 5) to the people. The socio-economic
status used were the people’s full time occupation (which included both forest and non-forest
related jobs).
All the analyses were conducted with R statistical software version 3.1.0 (http://cran.r-
project.org).
5.4 Results
5.4.1 Forest use dynamics
The forests were generally very useful across the entire region, as the different communities
were seen to depend on it (high levels of importance) to meet their needs on more regular
occasions (Kruskal─Wallis χ2 = 104.10, p < 0.05; Fig 5.2).
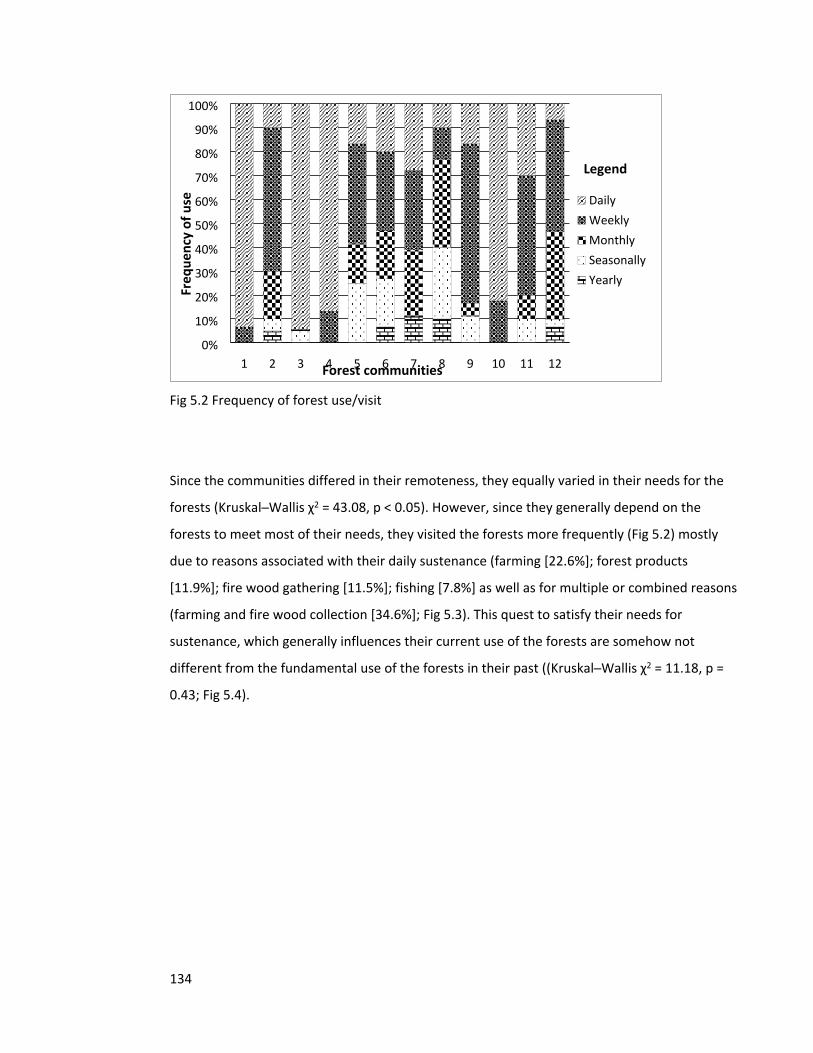
134
1 2 3 4 5 6 7 8 9 10 11 120%
10%
20%
30%
40%
50%
60%
70%
80%
90%
100%
DailyWeeklyMonthlySeasonallyYearly
Freq
uenc
y of
use
Forest communities
Legend
Fig 5.2 Frequency of forest use/visit
Since the communities differed in their remoteness, they equally varied in their needs for the
forests (Kruskal─Wallis χ2 = 43.08, p < 0.05). However, since they generally depend on the
forests to meet most of their needs, they visited the forests more frequently (Fig 5.2) mostly
due to reasons associated with their daily sustenance (farming [22.6%]; forest products
[11.9%]; fire wood gathering [11.5%]; fishing [7.8%] as well as for multiple or combined reasons
(farming and fire wood collection [34.6%]; Fig 5.3). This quest to satisfy their needs for
sustenance, which generally influences their current use of the forests are somehow not
different from the fundamental use of the forests in their past ((Kruskal─Wallis χ2 = 11.18, p =
0.43; Fig 5.4).
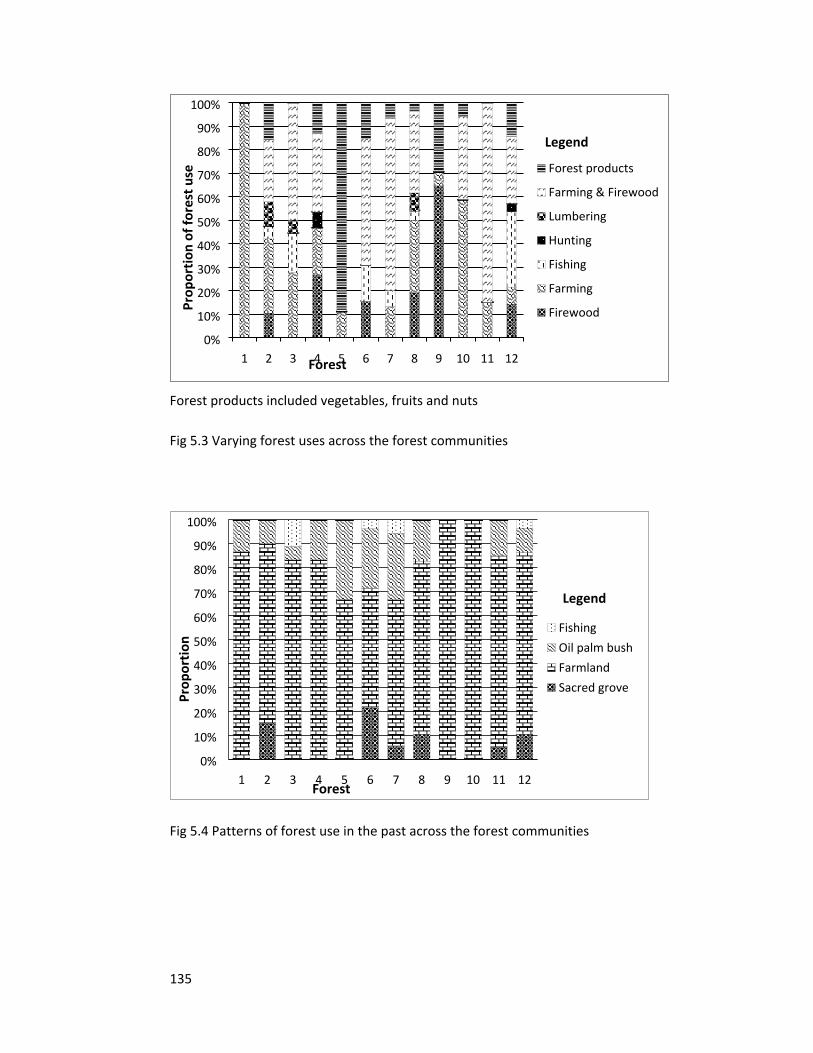
135
1 2 3 4 5 6 7 8 9 10 11 120%
10%
20%
30%
40%
50%
60%
70%
80%
90%
100%
Forest products
Farming & Firewood
Lumbering
Hunting
Fishing
Farming
FirewoodProp
ortio
n of
fore
st u
se
Forest
Legend
Forest products included vegetables, fruits and nuts
Fig 5.3 Varying forest uses across the forest communities
1 2 3 4 5 6 7 8 9 10 11 120%
10%
20%
30%
40%
50%
60%
70%
80%
90%
100%
FishingOil palm bushFarmlandSacred grove
Prop
ortio
n
Forest
Legend
Fig 5.4 Patterns of forest use in the past across the forest communities
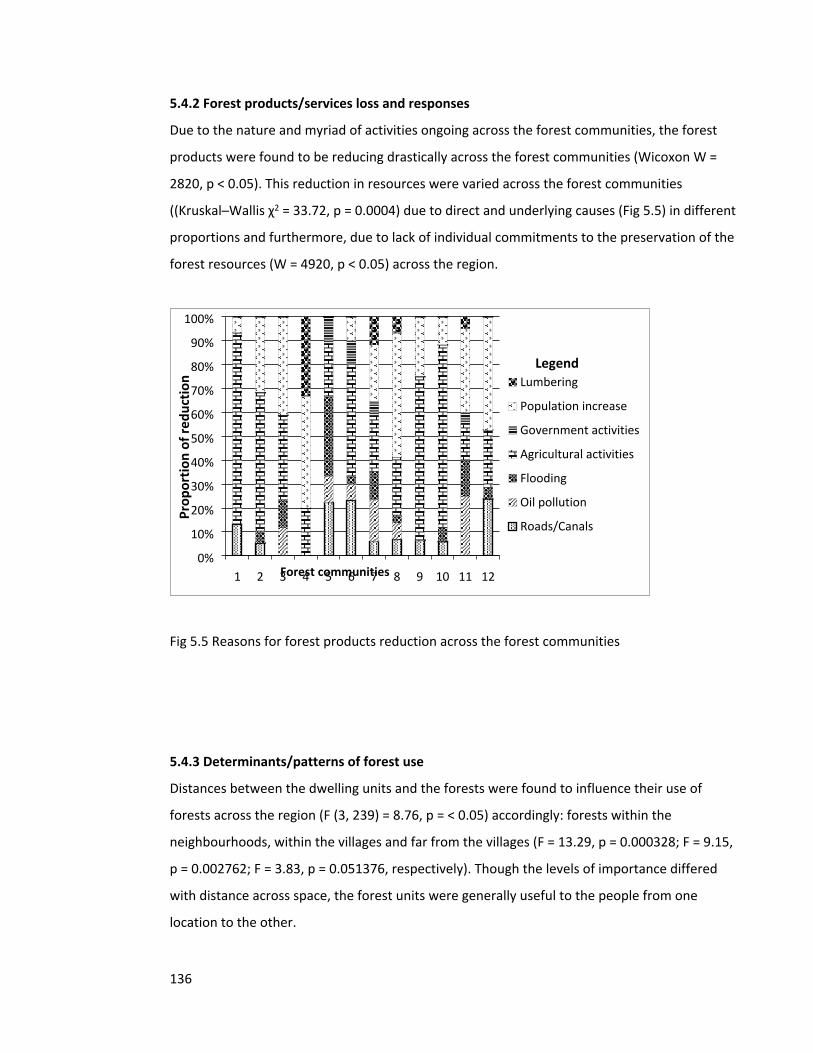
136
5.4.2 Forest products/services loss and responses
Due to the nature and myriad of activities ongoing across the forest communities, the forest
products were found to be reducing drastically across the forest communities (Wicoxon W =
2820, p < 0.05). This reduction in resources were varied across the forest communities
((Kruskal─Wallis χ2 = 33.72, p = 0.0004) due to direct and underlying causes (Fig 5.5) in different
proportions and furthermore, due to lack of individual commitments to the preservation of the
forest resources (W = 4920, p < 0.05) across the region.
1 2 3 4 5 6 7 8 9 10 11 120%
10%
20%
30%
40%
50%
60%
70%
80%
90%
100%
Lumbering
Population increase
Government activities
Agricultural activities
Flooding
Oil pollution
Roads/Canals
Forest communities
Prop
ortio
n of
redu
ctio
n
Legend
Fig 5.5 Reasons for forest products reduction across the forest communities
5.4.3 Determinants/patterns of forest use
Distances between the dwelling units and the forests were found to influence their use of
forests across the region (F (3, 239) = 8.76, p = < 0.05) accordingly: forests within the
neighbourhoods, within the villages and far from the villages (F = 13.29, p = 0.000328; F = 9.15,
p = 0.002762; F = 3.83, p = 0.051376, respectively). Though the levels of importance differed
with distance across space, the forest units were generally useful to the people from one
location to the other.
137
Generally, the different forest resources were important to the people, as the people were
found to utilize or depend on them to sustain their livlihoods. Socio economic status only partly
influenced their dependence on fishery (rho = -0.19, p = 0.0029), as against other provisioning
services that were not significant.
5.5 Discussion
5.5.1 Forest utilization
The Niger Delta ecosystem provided forest products (such as food, medicines, protein sources –
fishes and game and building materials) as seen in most other forest-community landscapes
(Lawrence et al. 2005; Lewis, 2006; Shackleton et al. 2007; World Bank, 2008). Hence, the
forests were used frequently by the people for sustenance and sources of livelihood (Fig 5.2).
However, with varied communal-individual preferences and needs, the uses of the forests for
different purposes varied across the communities. While some of the people across the forest
communities utilized the forest resources by harvesting what they needed, others were
constrained to buy them from the markets due to the scarcity of the forest products or lack of
time to harness them. Similarly, forest products were used as avenues for sustenance and
sources of livelihood for some fraction of the populace who used proceeds from its sale in the
market to meet other needs.
This quest for sustenance has remained the central focus of forest use across the region over
the years and may likely remain the same since neither their lifestyle nor their economic well-
being has changed. Hence, logging of forests to facilitate agricultural activities, oil palm
production and fishing (Fig 5.4) were seen to dominate the forest use. With the variation in
perception and dependence on the forest in absolute terms for the provision of vital services,
the ecosystem’s forest and rural landscapes are expected to experience degradation at
different spatial scales.
5.5.2 Patterns and determinants of forest use
The freshwater swamp forests were important for the existence of the forest communities and
were the mainstay of their sustenance and livelihood. This may be partly because there are no
138
wide gaps between the wealth of the people, as those that had higher degrees and were
engaged in non-forestry related jobs like civil service, still depended on the forests to meet
some of their needs. Such individuals maximize the use of the forests for the provision of
nutrition (fruits, vegetables and nuts), fuel and forest land for subsistence agriculture. This
enables them to channel their income to meeting other needs like clothing and family
maintenance and in effect augment or make up for their low earnings. Since most of the people
are indigenes of the communities, they had access to family lands and either lived in their own
houses or family houses. Such dwelling units equally afforded them the convenience and
opportunity to process harvested forest products and to use fuel wood in cooking.
Though there are no supposed restrictions on forest use across most of the communities, non-
indigenes tends to be be free and able to utilize it the longer they spend and become
integrated into the society. These few migrant populations are mostly in the communities as
civil servants or teachers, traders and short term contract workers (which are mostly better
socio-economically than the indigenous people). Such fraction constitute the bulk of the people
whose household income could afford them other sources of protein (such as meat and dairy
products) apart from fishes sourced in their environment and options of buying forest products
(including fishes) from the market as well. Higher levels of education are supposed to generally
reduce forest dependency (Mamo et al. 2007) (by opening up other opportunities) as well as
the use of fuel wood (as the time spent collecting them are both unprofitable and higher in
opportunity costs) (Adhikari et al. 2004; Coulibaly-Lingani et al. 2009). However, as most of the
people do not have the (better) employment which their educational status are supposed to
offer them due to the high unemployment rates in the region (UNDP, 2006), it becomes
difficult to absolutely depend on it as an index for socio-economic status across the region.
Households and individuals with full time occupations equally utilized the forests as sources of
some of their needs, though not at the same scale with the general populace. While such
households with other alternative sources of livelihood tended to use the forests at a lesser
proportion, other indices such as household size and family needs also shaped their ultimate
dependence pattern. Hence, as it is common to find families with so many children to feed or
extended families (living with them) to take care of across the region, people that had jobs that
could take care of their needs still relied on the forests to provide for their households. These
139
additional burdens affect both the indigenous and migrant households, and have contributed
to the degradation of the resources.
Forests found within their neighbourhoods were considered to be more important and useful
compared to those more distant to their neighbourhoods. While this (distance to forests) may
be considered a common phenomenon of forest use (Mamo et al. 2007; Brown et al. 2011), its
application to the swamp forests are both contextual and specific. This is so because, the very
rainy and swampy nature of the communities were found to constrain forest resource use
among the people. Such scenarios lead to loss of forest resources, as the inability to harvest the
vital forest products (due to longer rains and flood) leads to their rot and decay for greater
times of the year. As a result, only forests locations that are easily accessible are utilized for a
greater part of the year. This model of forest use is however not adhered to strictly by some of
the people that depend on certain forest products to generate income and sources of
livelihood for their families. As most of these resources are scarce in nearby forests, these
fewer group of people for whom forest distance is not an issue, utilize short breaks in rain to
access the distant forests and so act as agents of degradation in the distant (more undisturbed)
forests long before the general populace.
5.5.3 Forest ecosystem services reduction and responses
The causes of loss and reduction of ecosystem services are varied at different spatial scales
across the communities (Fig 5.5), mainly due to underlying factors such as agricultural activities
and population increase. As the population of the region grows, efforts to harness forest
resources are intensified and as a result, most of the forest products are overexploited at non-
resilient scales. While this pressure and consequent depletion of forest resources are mainly as
a result of varied and increased demands from a growing population (Dubey et al. 2009; Misra
et al. 2014), it is equally as a result of the shallow understanding and perception of forest use
and service across the region as in most African communities. As the communities know so
much about what they could get from the forest ecosystem in terms of provisioning services
and little or nothing about the capacities of the forests to provide regulatory and supportive
services, it affects both the way they relate with and use the swamp forests. Hence, the
capacity of the swamp forests to continually sequester carbon and regulate the climate of the
140
region is continually impeded by the people who have been focused on short term and
immediate benefits from the ecosystem.
On the other hand, as agricultural activities are continually seen as a better (income yielding)
alternative to the forests, it has remained the major threat to harnessing the full potential of
the freshwater swamp ecosystem. Such agricultural activities (which have mainly been in the
form of plantain and oil palm plantations) have no doubt sustained the different households.
However, it has promoted reductions in the biodiversity, led to large-scale environmental
degradation, resulted in a net loss of carbon emissions and reduced the carbon storage in the
ecosystem (Koh and Wilcove, 2008; van der Werf et al. 2009; Morel et al. 2011; Koh et al.
2011).
As the forest ecosystem continually becomes degraded, the associated consequences are not
only seen in the loss of ecological services (such as the biodiversity and watershed protection),
but equally affects the forest-dwelling people who continually lose their means of existence
(Lamb et al. 2005). Since these reductions are likely to impact the livelihoods of the rural poor
mostly, alternative sources of livelihood and proactive steps towards sustaining the ecosystem
are advocated.
5.6 Conclusion
Swamp forest ecosystems are important in meeting the needs of people who depend on them
to sustain their needs and household livelihoods. The extent to which the populace depended
on the ecosystem to provide vital resources and income were shaped by the socioeconomic
well-being. Since the people’s needs, household size, occupation and levels of education
differed, so did their utilization of the forests. Constraints associated with the swampy terrain
and distance to the forest locations only deterred those whose livelihoods were not absolutely
dependent on the forests from harnessing the resources. With the intensity and trend of
anthropogenic activities ongoing in the Niger Delta, the freshwater swamp forests, as well most
other tropical forest ecosystems are threatened with extinctions and potential collapse.
Achieving forest conservation and sustainability across most tropical regions has not been
effective due to the absence of all-inclusive forest conservation strategies that considers the
people’s social interests. Implementing such efficient steps will help promote forest resource
management and use across the ecosystem.
141
5.7 References
Adekola, O. and Mitchell, G. (2011). The Niger Delta wetlands: threats to ecosystem services,
their importance to dependent communities and possible management measures.
International Journal of Biodiversity Science, Ecosystem Services and Management 7 (1):
50-68.
Adhikari, B., Di Falco, S. and Lovett, J. C. (2004). Household characteristics and forest
dependency: evidence from common property forest management in Nepal. Ecological
Economics 48: 245-257.
Akintola, F. (1982). Geology and Geomorphology. In: Barbour, K.M., Oguntoyinbo, J.S.,
Onyemelukwe, J.O.C., and Nwafor, J.C. (Eds.). Nigeria in Maps. Africana Publishing
Company, U.S.A.
Angelsen, A. and Wunder, S. (2003). Exploring the forest-poverty link: Key concepts, issues and
research implications. Occasional Paper No. 40. Bogor, Indonesia: Center for
International Forestry Research.
Bromhead, M. (2012). Forest, trees and woodlands in Africa: An action plan for World Bank
Engagement. Washington D.C. World Bank.
Brown, K. A., Flynn, D. F. B., Abram, N. K., Ingram, J. C., Johnson, S. E. and Wright, P. (2011).
Assessing natural resource use by forest-reliant communities in Madagascar using
functional diversity and functional redundancy metrics. PLoS ONE 6 (9): 1-11.
CIFOR. (2005). Contributing to Africa’s development through forests strategy for engagement in
sub-Saharan Africa. Centre for International Forestry Research, Bogor, Indonesia. 35pp.
Coulibaly-Lingani, P., Tigabu, M., Savadogo, P., Oden, P. and Ouadba, J. (2009). Determinants of
access to forest products in southern Burkina Faso. Forest Policy and Economics 11: 516-
524.
Dubey, B., Sharma, S., Sinha, P. and Shukla, J. B. (2009). Modelling the depletion of forestry
resources by population and population pressure augmented industrialization. Applied
Mathematical Modelling 33 (7): 3002-3014.
Happold, D. C. (1987). The mammals of Nigeria. Clarendon press, Oxford, UK.
Hilton-Taylor, C. (2000). IUCN Red list of threatened species. IUCN, Gland, Switzerland and
Cambridge, UK.
142
Houghton, R. A. (2005). Tropical deforestation as a source of greenhouse gas emissions. In
Moutinho, P. and Schwartzman, S. (Eds). Tropical deforestation and climate change.
Amazon Institute for Environmental Research.
Hughes, R. H. and Hughes, J.S. (1992). A directory of African wetlands. Gland, Switzerland,
Nairobi, Kenya, and Cambridge, UK: IUCN, UNEP, and WCMC.
Irikana, G. J. (2011). Mangrove resources utilization in Nigeria: An analysis of the Andoni
mangrove resources crisis. Sacha Journal of Environmental Studies 1 (1): 49-63.
James, G. K. (2008). Assessment of environmental change and its socio-economic impacts in the
mangrove ecological zone of the Niger Delta, Nigeria. Ph.D thesis, University of Missouri-
Kansas city.
Jike, T. V. (2004). Environmental degradation, social disequilibrium and the dilemma of
sustainable development in the Niger Delta of Nigeria. J. Black Stud. 34 (5): 686-701.
Koh, L. P. and Wilcove, D. S. (2008). Is oil palm agriculture really destroying tropical
biodiversity? Conservation Letters 1 (2): 60-64.
Koh, L. P., Miettinen, J., Liew, S. C. and Ghazoul, J. (2011). Remotely sensed evidence of tropical
peatland conversion to oil palm. Proceedings of the National Academy of Sciences 108
(12): 5127-5132.
Lamb, D., Erskine, P. D. and Parrotta, J. A. (2005). Restoration of degraded tropical forest
landscapes. Science 310: 1628-1632.
Lawrence, A., Phillips, O. L., Ismodes, A. R., Lopez, M., Rose, S., Wood, D. and Farfan, A. J.
(2005). Local values for harvested forest plants in Madre de Dios, Peru: towards a more
contextualized interpretation of quantitative ethnobotanical data. Biodivers. Conserv.
14: 45-79.
Lewis, S. L. (2006). Tropical forests and the changing earth system. Phil. Trans. R. Soc. B. 361:
195-210.
Lewis, S. L. et al. (2013). Aboveground biomass and structure of 260 African tropical forests.
Phil Trans R Soc B 368: 20120295.
Mamo, G., Sjaastad, E. and Vedeld, P. (2007). Economic dependence on forest resources: a case
from Dendi District Ethiopia. Forest Policy and Economics 9: 916-927.
McSweeney, K. (2004). Forest product sale as natural insurance: The effects of household
characteristics and the nature of shock in eastern Honduras. Society and Natural
Resources 17 (1): 39-56.
143
Misra, A. K., Lata, K. and Shukla, J. B. (2014). Effects of population and population pressure on
forest resources and their conservation: a modelling study. Environ Dev Sustain 16: 361-
374.
Morel, A. C., Saatchi, S. S., Malhi, Y., Berry, N. J., Banin, L., Burslem, D., Nilus, R. and Ong, R. C.
(2011). Estimating aboveground biomass in forest and oil palm plantation in Sabah,
Malaysia Borneo using ALOS PALSAR data. Forest Ecology and Management 262: 1786-
1798.
NDES (1997). The Niger Delta Environmental Survey. Environmental and socio-economic
characteristics. Lagos-Nigeria: Environmental Resources Managers limited.
NEDECO. (1996). The Niger Delta: Report on an investigation. Netherlands Engineering
Consultants: The Hague.
Norris, K., Asase, A., Collen, B., Gockowksi, J., Mason, J., Phalan, B. and Wade, A. (2010).
Biodiversity in a forest-agriculture mosaic – The changing face of West African
rainforests. Biological Conservation 143 (10): 2341-2350.
NPC (2006). Population and Housing Census of the Federal Republic of Nigeria 2006 Census.
National Population Commission, Abuja, Nigeria.
Onojeghuo, A. O. and Blackburn, G. A. (2011). Forest transition in an ecologically important
region: Patterns and causes for landscape dynamics in the Niger Delta. Ecological
indicators 11: 1437-1446.
Pan, Y., Birdsey, R .A., Fang, J., Houghton, R., Kauppi, P. E., Kurz, W. A., Phillips, O. L., Shvidenko,
A., Lewis. S. L., Canadell, J. G., Ciais, P., Jackson, R. B., Pacala. S. W., McGuire, D., Piao, S.,
Rautiainen, A., Sitch, S. and Hayes, D. (2011). A large and persistent carbon sink in the
world’s forests. Science 333: 988-993.
Powell, C. B. (1997). Discoveries and priorities of mammals in the freshwater forests of Niger
Delta. Oryx 31: 83-85.
Reid, W. V. et al. (2005). Millennium Ecosystem Assessment Synthesis Report. United Nations
Environment Programme. www.millenniumassessment.org.
Shackleton, C. M., Shackleton, S. E., Buiten, E. and Bird, N. (2007). The importance of dry
woodlands and forests in rural livelihoods and poverty alleviation in South Africa.
Forest Policy and Economics 9: 558─577.
UNDP (2006). Niger Delta human development report. United Nations Development Program.
Lagos.
144
Van der Werf, G. R., Morton, D. C., Defries, R., Olivier, J. G. J., Kasibhatla, P. S., Jackson, R. B.,
Collatz, G. J. and Randerson, J. T. (2009). CO2 emissions from forest loss. Nature Geosci.
2 (11): 737-738.
Watts, M. (2004). Resource curse? Governmentality, oil and power in the Niger Delta, Nigeria.
Geopolitics (special issue) 9 (1): 50-80.
Were, J. L. R. (2000). Ecology and behavior in the Niger Delta Red Colobus. PhD thesis,
University of New York, New York, USA.
World Bank (1995). Defining an Environmental Strategy for the Niger Delta. Washington DC:
World Bank.
World Bank (2008). Forests Sourcebook: Practical guidance for sustaining forests in
development cooperation. The World Bank.
Wunder, S., Angelsen, A. and Belcher, B. (2014). Forests, livelihoods, and conservation:
broadening the empirical base. World Development 64: S1-S11.
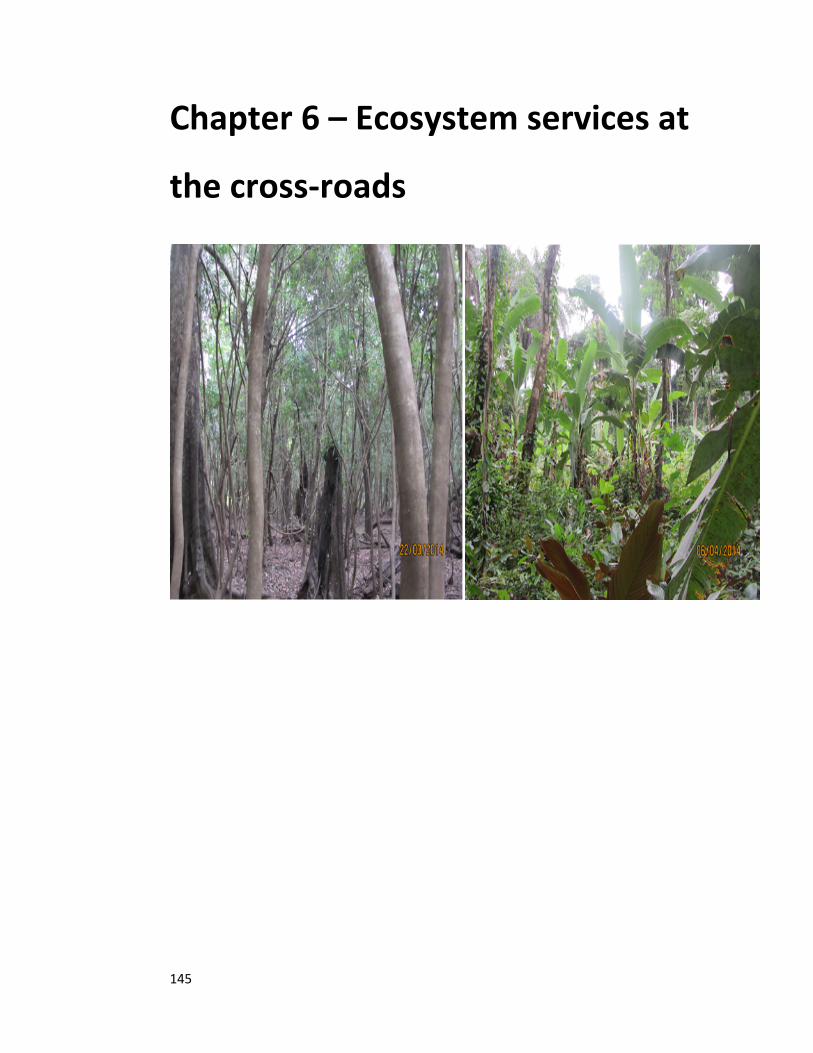
145
Chapter 6 – Ecosystem services at
the cross-roads
146
6.0 Ecosystem services at the cross-roads: the carbon potential of freshwater swamp forests
in the Niger Delta and its associated determinants
Nwabueze, I. Igu1 and Rob Marchant1
1York Institute for Tropical Ecosystem Dynamics (KITE), Environment Department, University of
York, YO10 5NG, UK.
6.1 Abstract
Carbon storage in terrestrial ecosystems, mostly tropical forest ecosytems are important for
global biogeochemical cycles and climate change modulation. Even though tropical forests are
carbon dense and its storage capacity is critical, the extent to which this is influenced by human
forest use and management (especially for the freshwater swamp forests) is poorly quantified.
This study utilized the results of a taxanomic inventory from 16, one hectare forest plots
divided evenly across four forest sites in the Niger Delta to estimate their above ground carbon
(AGC). The results were compared with results from interviews (targeted at the community
leaders, aged individuals and other key informants) on forest management, use and ownership,
in order to assess the linkages between AGC and forest management. The capacity to which
each of the plots stored carbon in its biomass varied (and decreased) from plots found in
locations with least frequency of forest use and dependence to the ones that were used more
frequently (mostly on daily and weekly basis) as sources of livelihood and sustenance. Forest
units under communal management had restrictions to forest use and presents possibilities of
regulated resource exploitation and AGC. The forests were used across the locations for
different purposes such as farming, sources of timber and non-timber forest products, hunting
and fishing. While these vital needs are important components for the livelihood support of
such rural landscapes, they were however exploited by its owners at the expense of other long
term benefits (as potential carbon stores). Ensuring that tropical forest landscapes are jointly
managed and conserved will not only assist in preserving its biodiversity, but also promote and
facilitate greater carbon storage across tropical forest ecosystems.
Keywords: forest carbon, forest resources, mangrove transition, modified ecosystems
147
6.2 Introduction
Tropical forest ecosystems are hosts to rich biological diversity and critical for global carbon
storage and climatic processes. While tropical forests are known to store as much as 40-50%
carbon in its terrestrial vegetation, the contribution of the African forests to this trajectory only
started receiving attention more recently (Lewis et al. 2009). Such insights will become more
beneficial with more improved and specific assessment of the different forest types within the
tropics, especially those ones (such as the freshwater swamp forests) for which much is not
known. Freshwater swamp forests supports high levels of important biodiversity for which the
Niger Delta is renowned. Located between the mangrove swamp forest and the lowland forest
ecosystems in the region, freshwater swamp forests provides a corridor for the migration of
flora and fauna between the ecosystems and is floristically varied from the other ecosystems.
Swamp forests contributes to the provision of ecosystem services across the Nigerian state and
like other tropical forests, are potential stores of carbon and important for climate regulation
and biogeochemical cycling (Lewis, 2006; Keith et al. 2009; Lewis, 2013; Cavaleri et al. 2015).
Supporting the majority of households across the region that depend on it for subsistence and
livelihood (UNDP, 2006), swamp forest has provided a resource base over the last 400 years
(Fund, 2014). However, this ecosystem has been steadily exploited, its extent has reduced,
been degraded and is now confined to small pockets across the Niger Delta. As a result, its
species like in most other old growth forests across the tropics, are not only threatened and
fragmented, but the ecosystem services they provide are reduced (Laurance and Peres, 2006;
Sodhi and Ehrlich, 2010; Laurance et al. 2011; Kessler et al. 2012; Hansen et al. 2013). These
changes have impacted the forest landscape adversely and reduced the former extensive
ecosystem into mosaics of forest islands.
Disturbance and degradation associated with the use of the forests are responsible for
modifying the composition, their biodiversity and conservation prospects (Harvey et al. 2008;
Chazdon et al. 2009; van Breugel et al. 2013). Hence, with variations in frequency and patterns
of use of the freshwater swamp forests across the Niger Delta, some of the native species (such
as the “abura” taxa (Hallea ledermannii)) have almost become extinct in many locations across
the ecosystem; while some other economic trees (such as “Iroko” tree (Milicia excelsa)) have
become very rare at the landscape levels across the region. With most of the ‘target species’ in
148
the ecosystem continually facing harvesting pressure, maintaining stable climax species
composition across most of the forest landscapes in the region has remained difficult (Joseph
et al. 2009; Bisong and Buckley, 2014). As these trees are either selectively logged or cleared,
they are on the other hand replaced by other (heliophilous) species such as the palms
(Arecaceae family), which eventually dominate the ecosystem and in turn affect the ecosystem
services derived from the forest. Since the use of the ecosystem are dependent on the
management and ownership statuses of the forest lands, understanding the linkages between
the management of the ecosystem and the services they provide is crucial to maximize
ecosystem service potentials.
The study aims to show the extent to which forest use and management influences the AGC of
the freshwater swamp forest ecosystem in the Niger Delta. Specific objectives include: to 1)
estimate the AGC of the different sites, 2) show the different uses of the forests across the
communities and how they were managed, 3) show the relationship between forest use,
management and AGC across the sites and 4) provide insights on effective measures that will
enhance adequate management of tropical forest landscapes.
6.3 Materials and methods
6.3.1 Study area
The Niger Delta is the largest river Delta in Africa (Dupont et al. 2000). With thousands of
creeks dotted across the region, this unique delta supports rich floral and faunal biodiversity
that is of regional and international importance (Happold, 1987; Hilton-Taylor, 2000; Abam,
2001; Ikelegbe, 2006). The region is a vast sedimentary basin found in the lower reaches of the
River Niger and River Benue (Fig 6.1). They were formed from the accumulated sediments
derived from the Niger and Benue basins, the Volta River basin, and minor rivers within Nigeria
(Allen, 1964). Soils of the region are classified as hydromorphic soils that are either seasonally
or permanently waterlogged (Areola, 1982). The region is characterized by a long rainy season
that lasts nearly throughout the year (mainly between March and October) and a short dry
season (with an average monthly rainfall of 150 mm).
149
Situated at the apex of the Gulf of Guinea and in the southern part of Nigeria (Fig 6.1), the
region covers all the oil producing states of Nigeria, from which the bulk of Nigeria’s oil and gas
reserves, wealth and foreign exchange are sourced (Haack et al. 2000; Ite et al. 2013). The
region has a rich cultural heritage and is ethnically varied; with ethnic groups such as Ijo, Efik,
Ibibio, Bini, Isoko/Ukwani, Urhobo and Itsekiri found across the entire region. Settlements
across the region are predominantly rural and composed of people that are culturally attached
to the environment. Most of the people living in the region are quite poor and the
unemployment and underemployment rates (8.8% and 26.2% respectively) across the region
are higher than that of other regions in the country (Ukiwo, 2009).
6.3.2 Data collection
A standard plot based method (Phillips et al. 2003) was used to conduct a vegetation survey by
establishing sixteen 1 ha plots across the ecosystem in four locations: Akarai-Obodo, Akili-
Ogidi, Otuwe and Akoloma (Fig 6.1) between December 2013 and April 2014. Plots were placed
500m apart to ensure variation in floristic composition. All the 16 plots (4 plots) per site were
placed along transects (two transects per site) spaced 1km apart rather than random
placement. This helped to ensure that consistency in enumeration was maintained across the
plots. The forest plots were then used for species identification and measurements across the
ecosystem. The plot size and arrangement for the carbon assessment followed the RAINFOR
protocol (Marthews et al. 2014). All tree species that were ≥ 10 cm diameter at breast height
(DBH) were identified and measured. While each of these species were enumerated and
identified to species level in the field, voucher specimens were collected for unidentified
species that were verified at the Forestry Research Institute Ibadan (Nigeria).
Smaller tree stems were omitted as they contain approximately 5% of above ground carbon
(Lewis et al. 2009). Tree heights were determined using a laser rangefinder, and where the tree
height was less than 10 metres, graduated poles was used to measure the height. Species
identification was conducted by Michael Oladimeji, a taxonomist from the research institute
and assisted by Peter Ige. Tree measurements and setting of the plots were conducted by
Nwabueze Igu, with the assistance of Cyril Mama and Ifeanyi Iwegbue. The forest sites were
selected to capture variation in species composition, carbon storage potentials, as well as use
150
and management dynamics. While Akarai-Obodo, Akili-Ogidi and Otuwe are freshwater swamp
forests, Akoloma is a mangrove-freshwater transition forest (Fig 6.1). Akili-Ogidi, Akarai-Obodo
and Akoloma are secondary forests that are managed by people from the nearby communities;
whereas Otuwe is an undisturbed forest that is very remote and inaccessible either during the
rainy or dry season. Plots were only set up in the seasonally flooded part of the ecosystem,
when the water had subsided.
Information on forest use, management and ownership (Table 6.1) was collected from the
forest communities using interviews and informal discussions. This was targeted at the
community leaders, aged individuals and other key informants (such as youth leaders and
school teachers) where possible. Each of the respondents was interviewed individually so they
could comfortably express their views. This method of collecting information enabled in depth
views to be garnered from respondents and also gave opportunity for follow-up questions
where necessary.
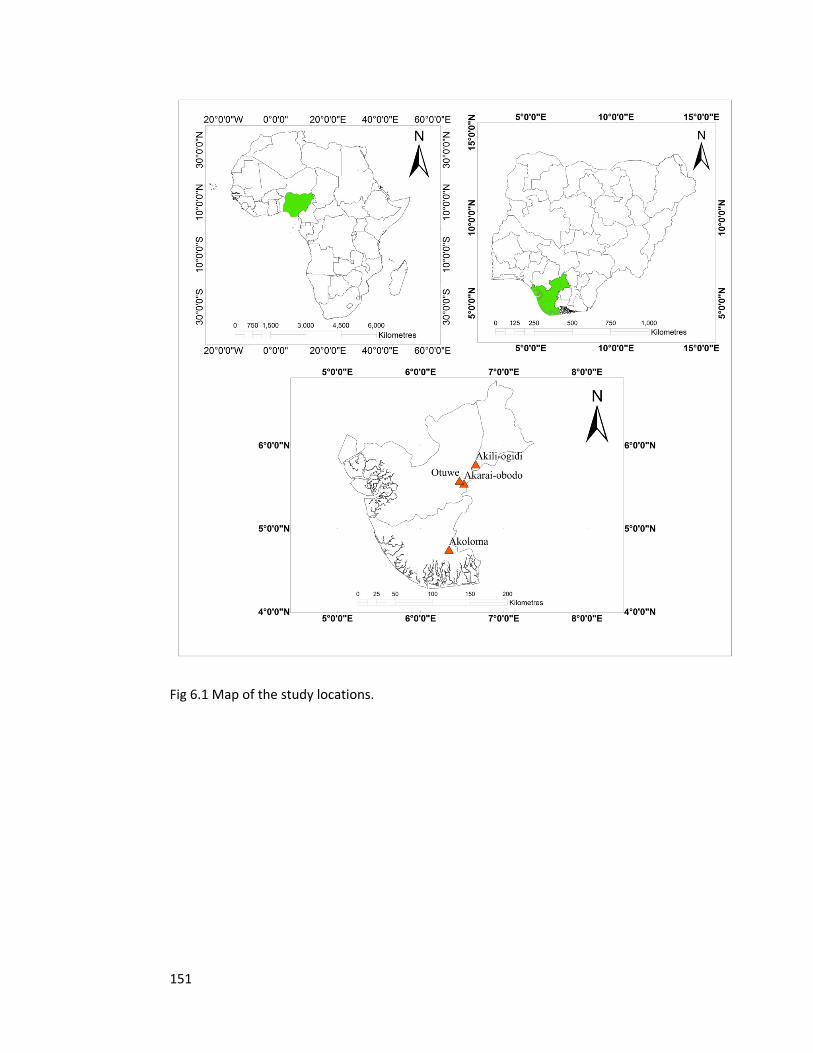
151
Fig 6.1 Map of the study locations.
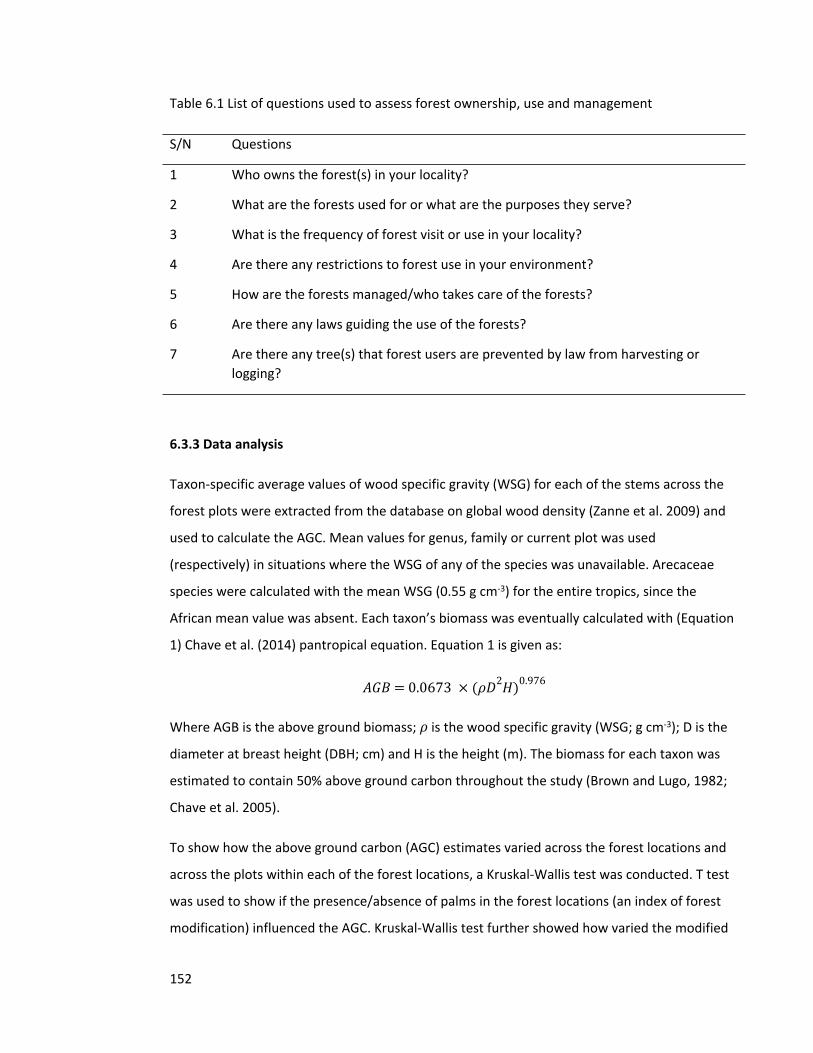
152
Table 6.1 List of questions used to assess forest ownership, use and management
S/N Questions
1 Who owns the forest(s) in your locality?
2 What are the forests used for or what are the purposes they serve?
3 What is the frequency of forest visit or use in your locality?
4 Are there any restrictions to forest use in your environment?
5 How are the forests managed/who takes care of the forests?
6 Are there any laws guiding the use of the forests?
7 Are there any tree(s) that forest users are prevented by law from harvesting or logging?
6.3.3 Data analysis
Taxon-specific average values of wood specific gravity (WSG) for each of the stems across the
forest plots were extracted from the database on global wood density (Zanne et al. 2009) and
used to calculate the AGC. Mean values for genus, family or current plot was used
(respectively) in situations where the WSG of any of the species was unavailable. Arecaceae
species were calculated with the mean WSG (0.55 g cm-3) for the entire tropics, since the
African mean value was absent. Each taxon’s biomass was eventually calculated with (Equation
1) Chave et al. (2014) pantropical equation. Equation 1 is given as:
𝐴𝐺𝐵 = 0.0673 × (𝜌𝐷2𝐻)0.976
Where AGB is the above ground biomass; is the wood specific gravity (WSG; g cm-3); D is the 𝜌
diameter at breast height (DBH; cm) and H is the height (m). The biomass for each taxon was
estimated to contain 50% above ground carbon throughout the study (Brown and Lugo, 1982;
Chave et al. 2005).
To show how the above ground carbon (AGC) estimates varied across the forest locations and
across the plots within each of the forest locations, a Kruskal-Wallis test was conducted. T test
was used to show if the presence/absence of palms in the forest locations (an index of forest
modification) influenced the AGC. Kruskal-Wallis test further showed how varied the modified
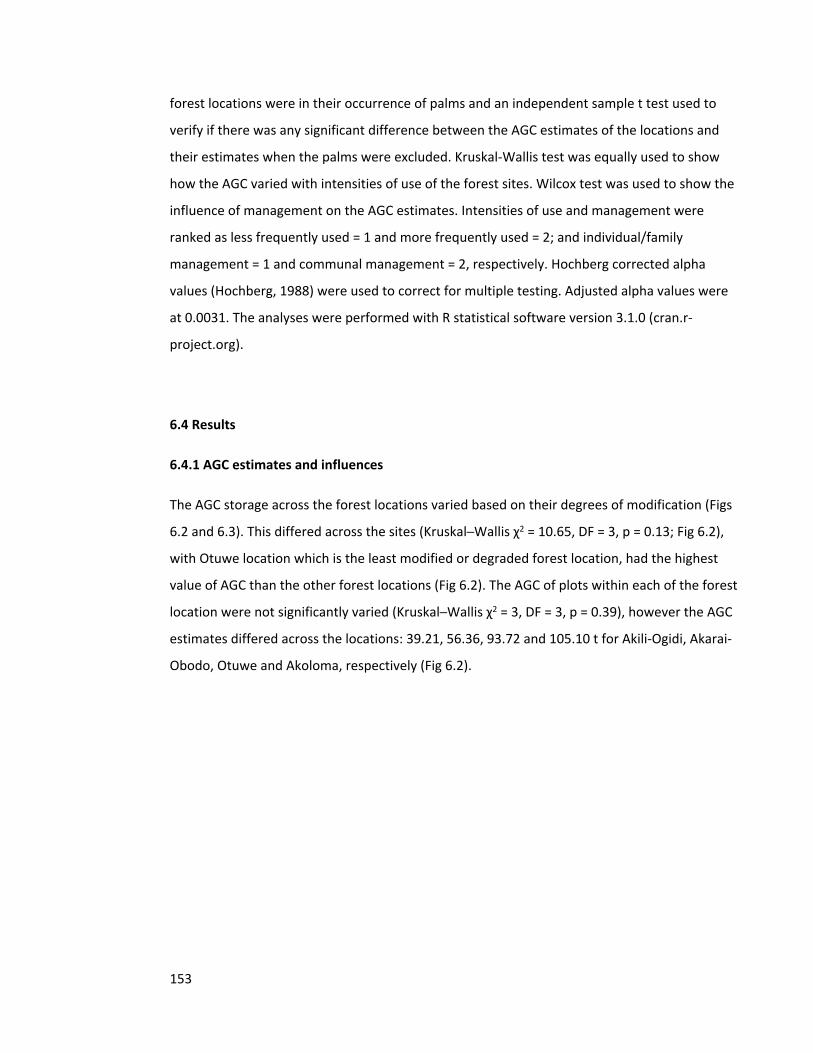
153
forest locations were in their occurrence of palms and an independent sample t test used to
verify if there was any significant difference between the AGC estimates of the locations and
their estimates when the palms were excluded. Kruskal-Wallis test was equally used to show
how the AGC varied with intensities of use of the forest sites. Wilcox test was used to show the
influence of management on the AGC estimates. Intensities of use and management were
ranked as less frequently used = 1 and more frequently used = 2; and individual/family
management = 1 and communal management = 2, respectively. Hochberg corrected alpha
values (Hochberg, 1988) were used to correct for multiple testing. Adjusted alpha values were
at 0.0031. The analyses were performed with R statistical software version 3.1.0 (cran.r-
project.org).
6.4 Results
6.4.1 AGC estimates and influences
The AGC storage across the forest locations varied based on their degrees of modification (Figs
6.2 and 6.3). This differed across the sites (Kruskal─Wallis χ2 = 10.65, DF = 3, p = 0.13; Fig 6.2),
with Otuwe location which is the least modified or degraded forest location, had the highest
value of AGC than the other forest locations (Fig 6.2). The AGC of plots within each of the forest
location were not significantly varied (Kruskal─Wallis χ2 = 3, DF = 3, p = 0.39), however the AGC
estimates differed across the locations: 39.21, 56.36, 93.72 and 105.10 t for Akili-Ogidi, Akarai-
Obodo, Otuwe and Akoloma, respectively (Fig 6.2).
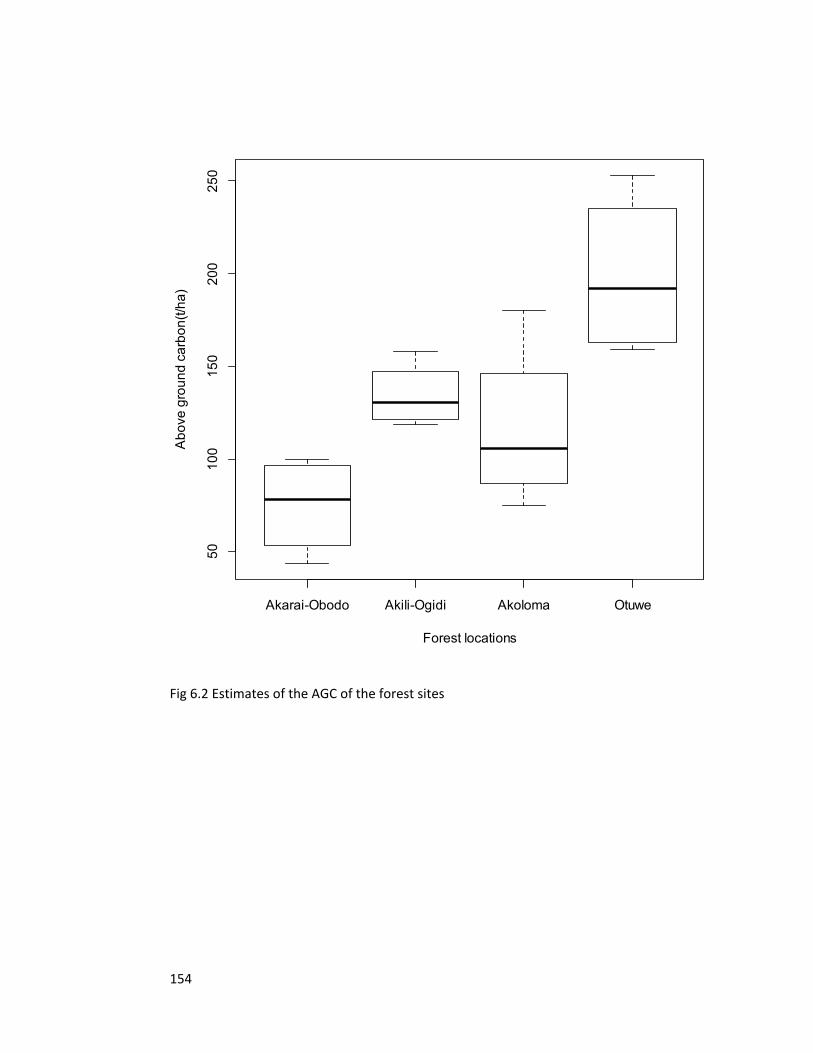
154
Akarai-Obodo Akili-Ogidi Akoloma Otuwe
5010
015
020
025
0
Forest locations
Abo
ve g
roun
d ca
rbon
(t/ha
)
Fig 6.2 Estimates of the AGC of the forest sites
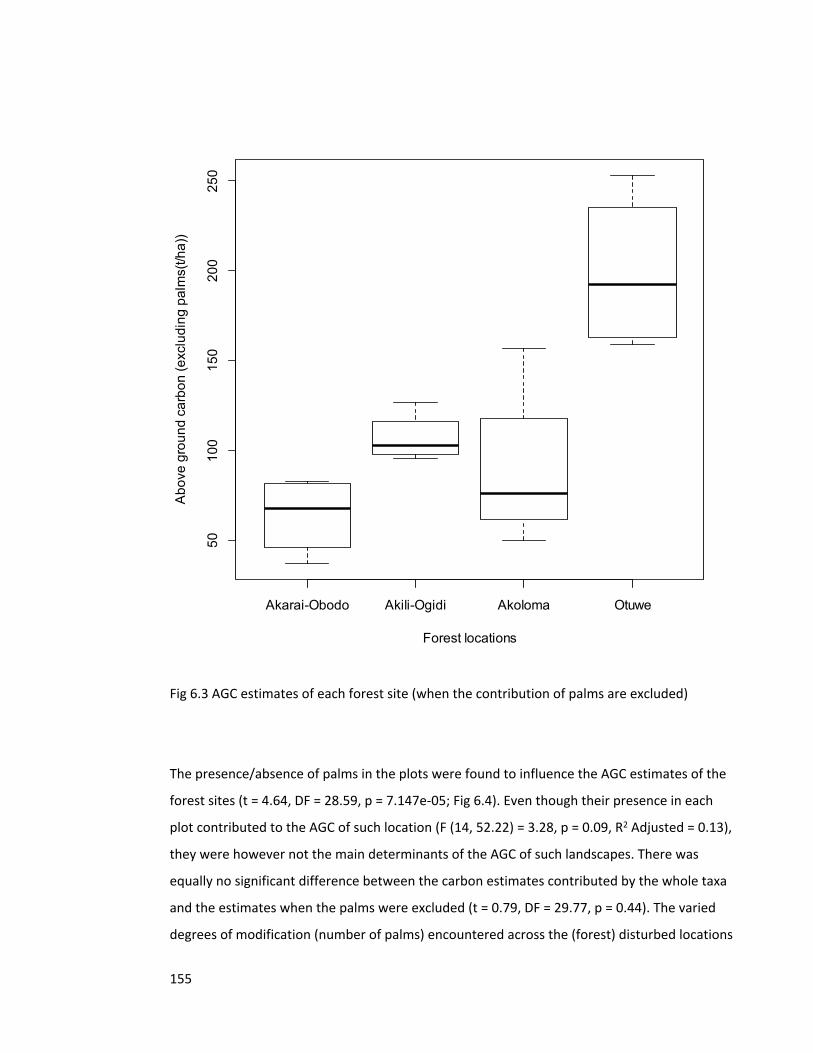
155
Akarai-Obodo Akili-Ogidi Akoloma Otuwe
5010
015
020
025
0
Forest locations
Abo
ve g
roun
d ca
rbon
(exc
ludi
ng p
alm
s(t/h
a))
Fig 6.3 AGC estimates of each forest site (when the contribution of palms are excluded)
The presence/absence of palms in the plots were found to influence the AGC estimates of the
forest sites (t = 4.64, DF = 28.59, p = 7.147e-05; Fig 6.4). Even though their presence in each
plot contributed to the AGC of such location (F (14, 52.22) = 3.28, p = 0.09, R2 Adjusted = 0.13),
they were however not the main determinants of the AGC of such landscapes. There was
equally no significant difference between the carbon estimates contributed by the whole taxa
and the estimates when the palms were excluded (t = 0.79, DF = 29.77, p = 0.44). The varied
degrees of modification (number of palms) encountered across the (forest) disturbed locations
156
(Akarai-Obodo, Akili-Ogidi and Akoloma) (Kruskal─Wallis χ2 = 7.27, DF = 2, p = 0.026; Fig 6.5),
explains the wide variations of AGC across the forest locations (Fig 6.2).
Palms/ha
Abo
ve g
roun
d ca
rbon
t/ha
50
100
150
200
250
0 50 100
Akarai-ObodoAkili-Ogidi
AkolomaOtuwe
Fig 6.4 Relationship between AGC and forest modification (presence/absence of palms)
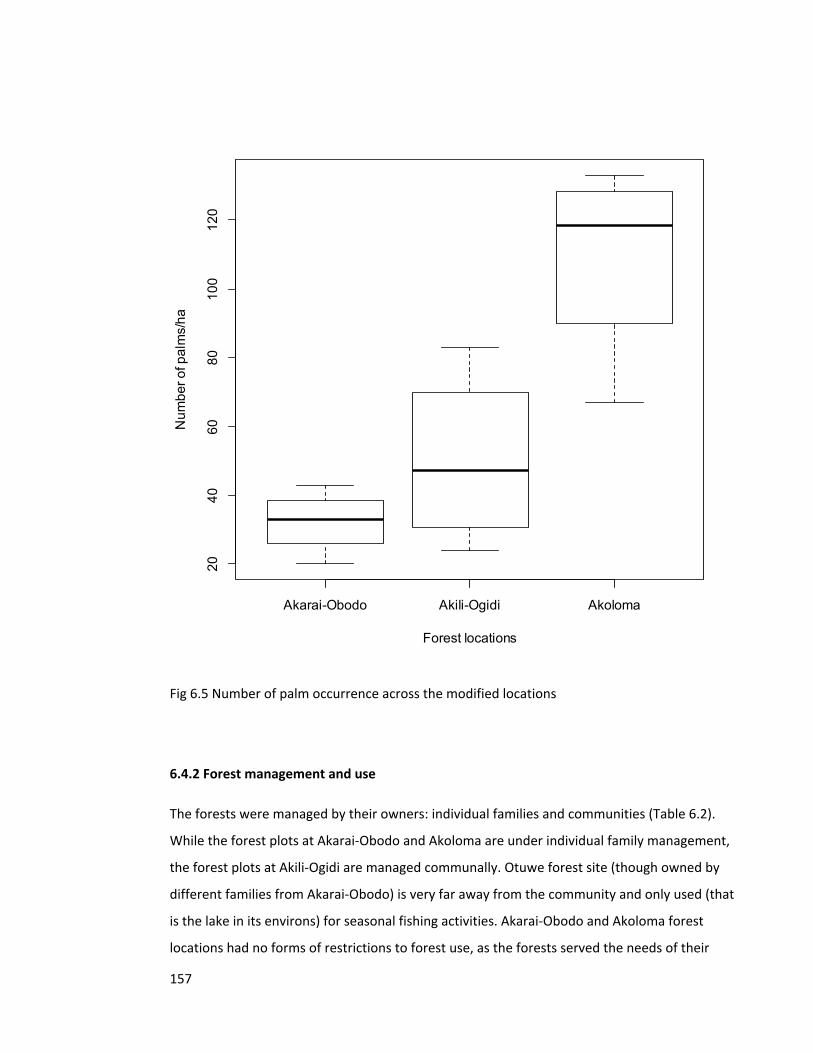
157
Akarai-Obodo Akili-Ogidi Akoloma
2040
6080
100
120
Forest locations
Num
ber o
f pal
ms/
ha
Fig 6.5 Number of palm occurrence across the modified locations
6.4.2 Forest management and use
The forests were managed by their owners: individual families and communities (Table 6.2).
While the forest plots at Akarai-Obodo and Akoloma are under individual family management,
the forest plots at Akili-Ogidi are managed communally. Otuwe forest site (though owned by
different families from Akarai-Obodo) is very far away from the community and only used (that
is the lake in its environs) for seasonal fishing activities. Akarai-Obodo and Akoloma forest
locations had no forms of restrictions to forest use, as the forests served the needs of their
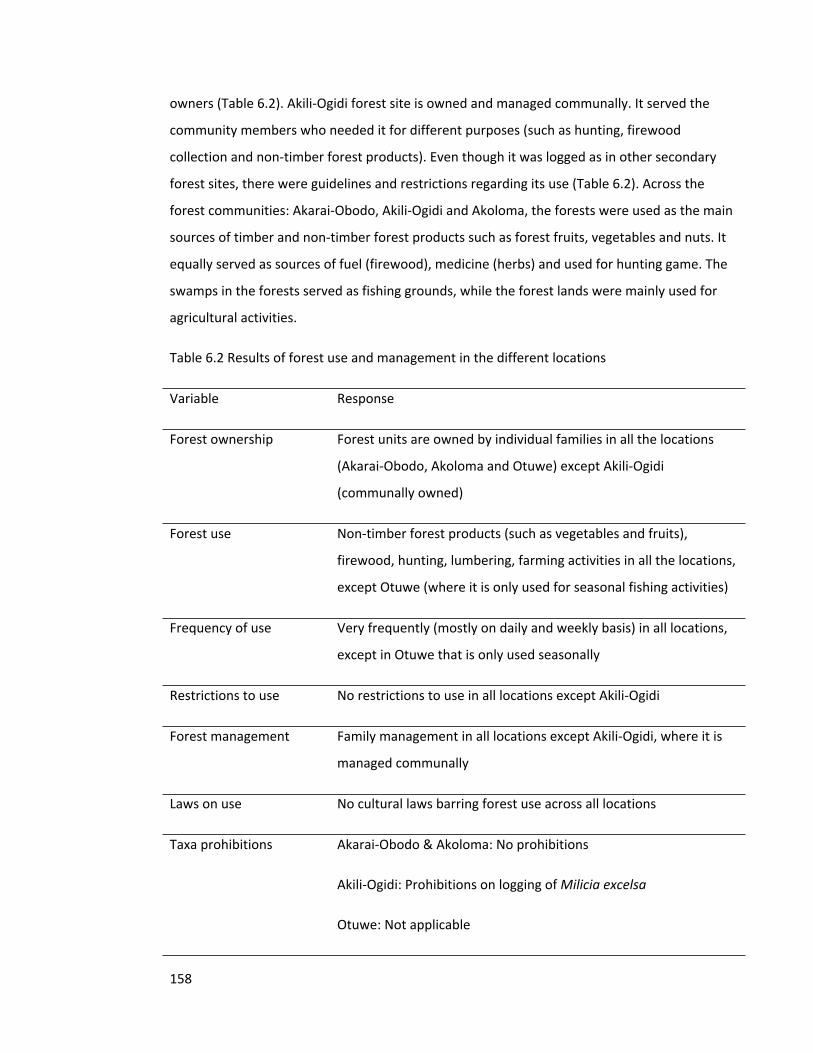
158
owners (Table 6.2). Akili-Ogidi forest site is owned and managed communally. It served the
community members who needed it for different purposes (such as hunting, firewood
collection and non-timber forest products). Even though it was logged as in other secondary
forest sites, there were guidelines and restrictions regarding its use (Table 6.2). Across the
forest communities: Akarai-Obodo, Akili-Ogidi and Akoloma, the forests were used as the main
sources of timber and non-timber forest products such as forest fruits, vegetables and nuts. It
equally served as sources of fuel (firewood), medicine (herbs) and used for hunting game. The
swamps in the forests served as fishing grounds, while the forest lands were mainly used for
agricultural activities.
Table 6.2 Results of forest use and management in the different locations
Variable Response
Forest ownership Forest units are owned by individual families in all the locations
(Akarai-Obodo, Akoloma and Otuwe) except Akili-Ogidi
(communally owned)
Forest use Non-timber forest products (such as vegetables and fruits),
firewood, hunting, lumbering, farming activities in all the locations,
except Otuwe (where it is only used for seasonal fishing activities)
Frequency of use Very frequently (mostly on daily and weekly basis) in all locations,
except in Otuwe that is only used seasonally
Restrictions to use No restrictions to use in all locations except Akili-Ogidi
Forest management Family management in all locations except Akili-Ogidi, where it is
managed communally
Laws on use No cultural laws barring forest use across all locations
Taxa prohibitions Akarai-Obodo & Akoloma: No prohibitions
Akili-Ogidi: Prohibitions on logging of Milicia excelsa
Otuwe: Not applicable
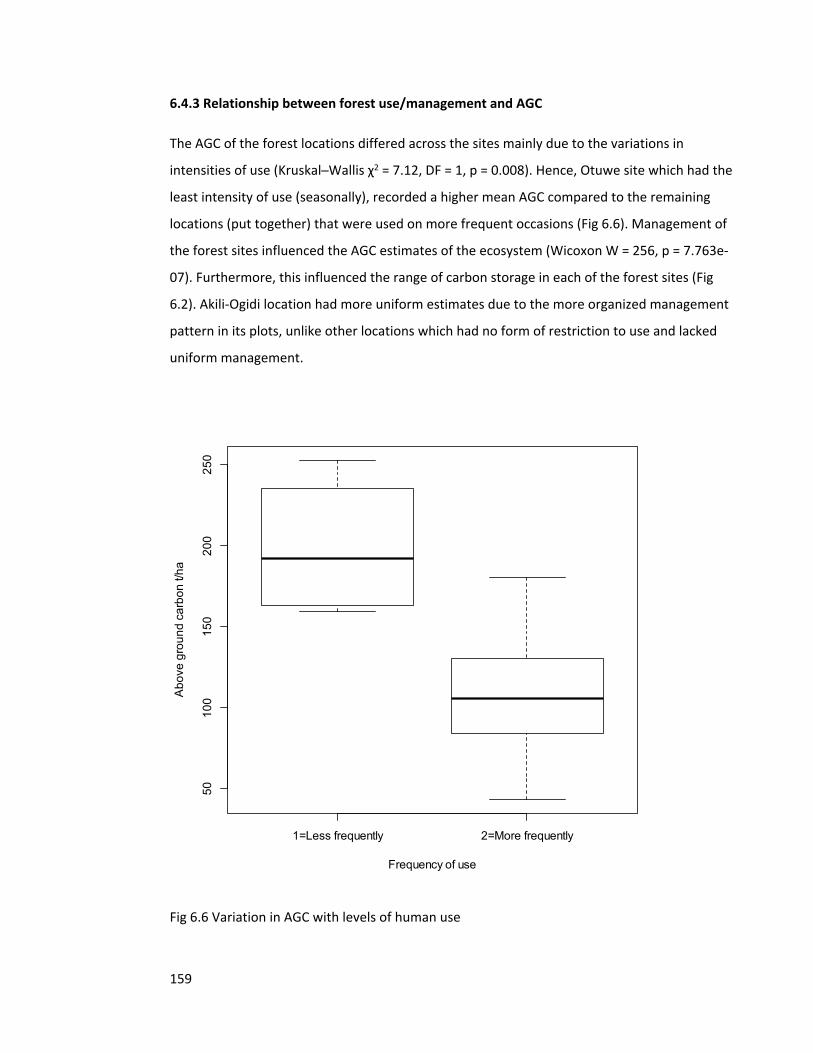
159
6.4.3 Relationship between forest use/management and AGC
The AGC of the forest locations differed across the sites mainly due to the variations in
intensities of use (Kruskal─Wallis χ2 = 7.12, DF = 1, p = 0.008). Hence, Otuwe site which had the
least intensity of use (seasonally), recorded a higher mean AGC compared to the remaining
locations (put together) that were used on more frequent occasions (Fig 6.6). Management of
the forest sites influenced the AGC estimates of the ecosystem (Wicoxon W = 256, p = 7.763e-
07). Furthermore, this influenced the range of carbon storage in each of the forest sites (Fig
6.2). Akili-Ogidi location had more uniform estimates due to the more organized management
pattern in its plots, unlike other locations which had no form of restriction to use and lacked
uniform management.
1=Less frequently 2=More frequently
5010
015
020
025
0
Frequency of use
Abo
ve g
roun
d ca
rbon
t/ha
Fig 6.6 Variation in AGC with levels of human use
160
6.5 Discussion
Freshwater swamp forests are good stores of carbon and important for climate change
mitigation across the Niger Delta region, however, the rate at which this could be realised is
dependent on the state of the forest, its extent and disturbance dynamics. While the intactness
of the forest ecosystem is a major feature that determines its ability to store more carbon (Fig
6.2) as seen in other forest ecosystems across the African continent (Lewis et al. 2013), the
floristic composition or taxa (which has varied wood specific gravities) in each forest site
determines also the potential carbon estimate of each site. This was more evident across the
modified forest landscapes in the region: Akarai-Obodo, Akili-Ogidi and Akoloma, where human
impacts on the ecosystem are responsible for the dominance and growth of monocots like the
palms (Arecaceae family) in the ecosystem.
Even though palms could grow naturally in both pioneer and secondary forests and in swamps
(Runge, 2008), they tend to grow more and dominate such forests, when their surrounding
environment become hotter and drier (Luskin and Potts, 2011). Such environments are created
through disturbances (mainly from anthropogenic influences) associated with forest use and
land use changes across the freshwater ecosystem. This opens up the forest canopies and
vegetation structure and alters the microclimate; hence, creating suitable microclimatic
conditions that will promote the growth and spread of palms across the ecosystem. Such
modifications in the ecosystem alters its composition, threatens forest-dependent species in
the landscape, and will also act as microclimatic barriers to the growth of native species that
are adapted to the moist freshwater swamp terrain (Fitzherbert et al. 2008; Luskin and Potts,
2011).
On the other hand, since the proceeds from the palms have remained the main source of
livelihood for the people of the region for centuries (Aghalino, 2000), the people not only
became attached to the tree and encouraged its growth, but rarely log it in the forests. With
this, the composition of the freshwater swamp forests have steadily changed across disturbed
forest sites in the ecosystem (Fig 6.5). While there is no doubt that such forest-agricultural
landscapes have the capacity to store carbon in the above ground biomass of its taxa (like the
Arecaceae), they cannot be compared with the capacities found in dominant and pioneer
species in the ecosystem. Examples of such taxa includes Sterculia oblonga and Rhizophora
racemosa, whose capacities to store carbon (mean genus WSG = 0.832 and mean 0.93 g cm-3,
161
respectively) are higher than that found in the Arecaceae (mean WSG = 0.55 g cm-3). Ensuring
that the forest ecosystem as well as their taxa is not being replaced by other land uses or less
carbon dense taxa (in instances where the forests become degraded) are vital steps to ensuring
a higher potential carbon sequestration for the ecosystem.
Forest use has both shaped and contributed to the biodiversity modifications of freshwater
swamps and its composition at landscape levels across the region. This is mostly due to the
pattern of forest harvesting as well as the purpose for such activities. Continual and
unregulated harvesting of trees in the ecosystem have steadily altered the composition of the
forests and equally caused species with small ranges to become scarce (Pimm and Raven,
2000). Furthermore, as such patterns of forest use have continually contributed to a reduction
in the viability of the ecosystem (Vos et al. 2008; Pütz et al. 2011; Laurance et al. 2011), the
extent and capacity to which such disturbed forests could store carbon in its biomass at plot
levels and landscape scales have continually widened (Fig 6.2). On the other hand, as the
intensity of forest use and land use changes (mainly for agricultural purposes) increases across
the landscape, the services such forest landscapes initially provided will continue to be on the
decline (Fig 6.6). This pressure from agricultural activities at subsistence and commercial levels
are not only the main underlying causes of forest loss in a majority of the forest communities
in the region (Geist and Lambin, 2002; Enaruvbe and Atafo, 2014), but a threat to long term
ecosystem service provision and forest conservation. Since the rural landscapes across the
region mostly engage in agro-based economies, land use changes and conversions are likely to
continue its debilitating effects on ecosystem services unless alternative sources of livelihood
and forest friendly initiatives are adopted.
Forest ecosystems in most forest communities in the Niger Delta region are mainly under
private (family) and community ownership holdings. These management levels are responsible
for the use and preservation of the forest landscapes and directly influence the composition,
service provision and viability of the ecosystem. Community ownership and management of
the forest lands offers viable management and use of forests through its ability to provide
sutiable guidelines and enforce restrictions on forest. Hence, with the restrictions on the
logging of Milicia excelsa in Akili-Ogidi, such high-market valued and sought after economic
tree (which are very rare in forest ecosystems in the region), are preserved. Such communal
162
management structures may be potentially useful in preserving the native species in the
freshwater swamp forests in the region as well as their carbon storage capacities.
Conversely, the ownership and management of forest units under private holdings are mainly
influenced by the needs and socio-economic status of the individuals or families that own
them. Such ownership structures have had to grapple more with intense pressures from
commercial timber operators who desire to log the high value timber trees in their forest lands.
These family ownership structures span from single nuclear family ownerships to the kindred
levels, depending on how united the families are and the size of forest lands to be inherited. As
most family units are characterized by individuals with different socio-economic levels and
interests, their forest lands have mostly been parcelized (in a bid to either ensure that each one
gets his inheritance or to settle conflicting interests on forest use) over the years. Managing
such extensive forest units that are owned by different individuals with varied needs have not
only been complicated, but has continually made conservation prioritization of such landscapes
very elusive.
In a bid to properly manage such forest ecosystems and sites (under private ownership), a
more decentralized system of ownership, management and decision-making have been
advocated across most African nations (Lund and Treue, 2008; Robinson et al. 2013) which are
equally dominated by private ownership of forest lands. While this seems to be a likely strategy
to enforce forest management and guided use of the ecosystem services across the region, the
feasibility of achieving it in a region with deeply entrenched land tenure system and a family
land (forest) inheritance norm seems elusive. With the bulk of forest lands and majority of the
undisturbed forests under private ownership and management across the region, the future of
ecosystem service provision across the region depends to a large extent on how the people use
the ecosystem.
6.6 Conclusion
Forest ownership, use and management can affect forest productivity, composition and its
capacity to provide vital ecosystem services. The AGC of the different sites were found to vary
based on the intensities of use, management and ownership of the sites. The forest was found
to be of much importance to its owners, for whom it provided vital ecosystem services such as

163
game, firewood and timber. Forest sites were privately and publicly owned and managed, with
each reflecting differences in restrictions of use and management and in turn, the capacity to
which it was beneficial to the people. Awareness of forest management techniques that are
harvesting friendly and sustainable are advocated across tropical forest landscapes and
ecosystems, so that the services such landscapes provide could be assured.
164
6.7 References
Abam, T. K. S. (2001). Regional hydrological research perspectives in the Niger Delta. Hydrol.
Sci. 46: 13-25.
Aghalino, S. O. (2000). British colonial policies and the oil palm industry in the Niger Delta
region of Nigeria, 1900-1960. African Study Monographs 21 (1): 19-33.
Allen, J.R.L. (1964). Coastal geomorphology of eastern Nigeria: beach ridge barrier islands and
vegetated tidal flats. Geologie en Mynbouw 44: 1-21.
Areola, O. (1982). Soils. In: Barbour, K.M., Oguntoyinbo, J.S., Onyemelukwe, J.O.C., and Nwafor,
J.C. (Eds.). Nigeria in Maps. Africana Publishing Company, U.S.A.
Bisong, F. E. and Buckley, P. (2014). Threat status of commercially exploited trees in the
Nigerian rainforest. Open Journal of Forestry 4: 536-546.
Brown, S. and Lugo, A. E. (1982). The storage and production of organic matter in tropical
forests and their role in global carbon cycle. Biotropica 14: 161-167.
Cavaleri, M. A., Reed, S. C., Smith, W. K. and Wood, T. E. (2015). Urgent need for warming
experiments in tropical forests. Global Change Biology 21: 2111-2121.
Chave, J., Andalo, C., Brown, S., Cairns, M. A., Chambers, J. Q., Eamus, D., Folster, H., Fromard,
F., Higuchi, N., Kira, T., Lescure, J. P., Nelson, B. W., Ogawa, H., Puig, H., Riera, B.,
Yamakura, T. (2005). Tree allometry and improved estimation of carbon stocks and
balance in tropical forests. Oecologia 145: 87-99.
Chave, J., Réjou-Méchain, M., Burquez, A., Chidumayo, E., Colgan, M. S., Delitti, W. B. C.,
Duque, A., Eid, T., Fearnside, P. M., Goodman, R. C., Henry, M., Martínez-Yrízar, A.,
Mugasha, W. A., Muller-Landau, H. C., Mencuccini, M., Nelson, B. W., Ngomanda, A.,
Nogueira, E. M., Ortiz-Malavassi, E., Pélissier, R., Ploton, P., Ryan, C. M., Saldarriaga, J. G.
and Vieilledent, G. (2015). Improved allometric models to estimate the aboveground
biomass of tropical trees. Global Change Biology 20: 3177-3190, doi:10.1111/gcb.12629.
Chazdon, R. L., Peres, C. A., Dent, D., Sheil, D., Lugo, A. E., Lamb, D., Stork, N. E. and Miller, S. E.
(2009). The potential for species conservation in tropical secondary forests. Conservation
Biology 23 (6): 1406-1417.
165
Dupont, L. M., Jahns, S., Marret, F. and Ning, S. (2000). Vegetation change in equatorial West
Africa: time-slices for the last 150 ka. Palaeogeogr. Palaeoclimatol. Palaeoecol. 155: 95-
122.
Enaruvbe, G. O. and Atafo, O. P. (2014). Analysis of deforestation pattern in the Niger Delta
region of Nigeria. Journal of Land Use Science, doi: 10.1080/1747423X.2014.965279.
Fitzherbert, E. B., Struebig, M. J., Morel, A., Danielsen, F., Brulh, C. A., Donald, P. A., Phalan, B.
(2008). How will oil palm expansion affect biodiversity? Trend in Ecology and Evolution
23: 538-545.
Fund, W. (2014). Niger Delta swamp forests. Retrieved from
http://www.eoearth.org/view/article/154853. [Accessed 4 November, 2015].
Geist, H. J. and Lambin, E. F. (2002). Proximate causes and underlying driving forces of tropical
deforestation. BioScience 52: 143-150.
Haack, R. C., Sundararaman, P., Diedjomahor, J. O., Xiao, H., Gant, N. J., May, E. D. and Kelsch,
K. (2000). Niger Delta petroleum systems, Nigeria. In Mello, M. R. and Katz, B. J. (Eds.).
Petroleum systems of south Atlantic margins. American Association of Petroleum
Geologists (AAPG) Memoir 73: 213-231.
Hansen, M. C. et al. (2013). High-resolution global maps of 21st-century forest cover change.
Science 324: 850-853.
Happold, D. C. (1987). The mammals of Nigeria. Clarendon press, Oxford, UK.
Harvey, C. A., Komar, O., Chazdon, R., Ferguson, B. G., Finegan, B., Griffith, D. M., Martínez-
Ramos, M., Morales, H., Nigh, R., Soto-Pinto, L., Van Breugel, M. and Wishnie, M. (2008).
Integrating agricultural landscapes with biodiversity conservation in the Mesoamerican
hotspot. Conservation Biology 22 (1): 8-15.
Hilton-Taylor, C. (2000). IUCN Red list of threatened species. IUCN, Gland, Switzerland and
Cambridge, UK.
Hochberg, Y. (1988). A sharper Bonferroni procedure for multiple tests of significance.
Biometrika 75: 800-802.
Ikelegbe, A. (2006). The economy of conflict in the oil rich Niger Delta region of Nigeria. Afr.
Asian Studies 5: 23-56.
Ite, A. E., Ibok, U. J., Ite, M. U. and Petters, S. W. (2013). Petroleum exploration and production:
past and present environmental issues in the Nigeria’s Niger Delta. American Journal of
Environmental Protection 1 (4): 78-90.
166
Joseph, L. N., Maloney, R. F. and Possingham, H. P. (2009). Optimal allocation of resources
among threatened species: a project prioritization protocol. Conservation Biology 23 (2):
328-338.
Keith, H., Mackey, B. G and Lindenmayer, D. B. (2009). Re-evaluation of forest biomass carbon
stocks and lessons from the world’s most carbon dense forests. Proc. Natl Acad. Sci. USA
106: 11625-11640.
Kessler, M., Hertel, D., Jungkunst, H. F., Kluge, J., Abrahamczyk, S., Bos, M., Buchori, D., Gerold,
G., Gradstein, S. R., Köhler, S., Leuschner, C., Moser, G., Pitopang, R., Saleh, S., Schulze, C.
H., Sporn, S. G., Steffan-Dewenter, I., Tjitrosoedirdjo, S. S. and Tscharntke, T. (2012). Can
joint carbon and biodiversity management in tropical agroforestry landscape be
optimized? PLOS ONE 7 (10): e47192.
Laurance, W. F. and Peres, C. A. (Eds.) (2006). Emerging threats to tropical forests. University of
Chicago Press, Chicago.
Laurance, W. F., Camargo, J. L. C., Luizão, R. C. C., Laurance, S. G., Pimm, S. L., Bruna, E. M.,
Stouffer, P. C., Williamson, G. B., Benítez-Malvido, J., Vasconcelos, H. L., Houtan, K. S. V.,
Zartman, C. E., Boyle, S. A., Didham, R. K., Andrade, A. and Lovejoy, T. E. (2011). The fate
of Amazonian forest fragments: A 32-year investigation. Biological Conservation 144: 56-
67.
Lewis, S. L. (2006). Tropical forests and the changing earth system. Phil. Trans. R. Soc. B. 361:
195-210.
Lewis, S. L. et al. (2013). Aboveground biomass and structure of 260 African tropical forests.
Phil Trans R Soc B 368: 20120295.
Lewis, S. L., Lopez-Gonzalez, G., Sonke, B., Affum-Baffoe, K., Baker, T. R., Ojo, L. O., Phillips, O.
L., Reitsma, J. M., White, L., Comiskey, J. A., Djuikouo, M. N., Ewango, C. E. N.,
Feldpausch, T. R., Hamilton, A. C., Gloor, M., Hart, T., Hladik, A., Lloyd, J., Lovett, J. C.,
Makana, J. R., Malhi, Y., Mbago, F. M., Ndangalasi, H. J., Peacock, J., Peh, K. S. H., Sheil,
D., Sheil, D., Sunderland, T., Swaine, M. D., Taplin, J., Taylor, D., Thomas, S. C., Votere, R.
and Woll, H. (2009). Increasing carbon storage in intact African tropical forests. Nature
457: 1003-1006.
Lund, J. F. and Treue, T. (2008). Are we getting there? Evidence of decentralized forest
management from the Tanzanian Miombo woodlands. World Development 36 (12):
2780-2800.
167
Luskin, M. S. and Potts, M. D. (2011). Microclimate and habitat heterogeneity through the oil
palm lifecycle. Basic and Applied Ecology 12 (6): 540-551.
Marshall, A. R., Willcock, S., Platts, P. J., Lovett, J. C., Balmford, A., Burgess, N. D., Latham, J. E.,
Munishi, P. K. T., Slater, R., Shirima, D. D. and Lewis, S. L. (2012). Measuring and
modeling above-ground carbon and tree allometry along a tropical gradient. Biological
Conservation 154: 20-33.
Marthews, T. R., Riutta, T., Oliveras Menor I., Urrutia R., Moore S., Metcalfe D., Malhi Y., Phillips
O., Huaraca Huasco W., Ruiz Jaén M., Girardin C., Butt N., Cain R and colleagues from the
RAINFOR and GEM networks (2014). Measuring Tropical Forest Carbon Allocation and
Cycling: A RAINFOR-GEM Field Manual for Intensive Census Plots (v3.0). Manual, Global
Ecosystems Monitoring network. http://gem.tropicalforests.ox.ac.uk/.
Phillips, O. L., Nunez-Vargas, P., Monteagudo, A. L., Pena-Cruz, A., Chuspe-Zans, M. E., Galiano-
Sánchez, W., Yli-Halla, M. and Rose, S. (2003). Habitat association among Amazonian tree
species: A landscape scale approach. J. Ecol. 91: 757-775.
Pimm, S. L. and Raven, P. (2000). Biodiversity: Extinction by numbers. Nature 403: 843-845.
Pütz, S., Groeneveld, J., Alves, L. F., Metzger, J. P., Huth, A. (2011). Fragmentation drives
tropical forest fragments to early successional states: A modelling study for Brazilian
Atlantic forests. Ecological Modelling 222: 1986-1997.
Robinson, E. J. Z., Albers, H. J., Meshack, C. and Lokina, R. B. (2013). Implementing REDD
through community-based forest management: Lessons from Tanzania. Natural
Resources Forum 37: 141-152.
Runge, J. (2008). Dynamics of forest ecosystems in Central Africa during the Holocene, past-
present-future. Taylor and Francis.
Sodhi, N. S. and Ehrlich, P. R. (2010). Conservation Biology for all. Oxford University Press,
Oxford.
Ukiwo, U. (2009). Causes and cures of oil-related Niger Delta conflicts. Policy notes 1. Nordiska
Afrikainstitutet. The Nordic Africa Institute.
UNDP (2006). Niger Delta human development report. United Nations Development Program.
Lagos.
Van Breugel, M., Hall, J. S., Craven, D., Bailon, M., Hernandez, A., Abbene, M. and Van Breugel,
P. (2013). Succession of ephemeral secondary forests and their limited role for the
168
conservation of floristic diversity in a human-modified tropical landscape. PLOS ONE 8
(12): e82433.
Vos, C. C., Berry, P., Opdam, P., Baveco, H., Nijhof, B., O’Hanley, J., Bell, C. and Kuipers, H.
(2008). Adapting landscapes to climate change: examples of climate-proof ecosystem
networks and priority adaptation zones. Journal of Applied Ecology 45: 1722-1731.
Zanne, A. E., Lopez-Gonzalez, G., Coomes, D. A., Ilic, J., Jansen, S., Lewis, S. L., Miller, R. B.,
Swenson, N. G., Wiemann, M. C. and Chave, J. (2009). Global wood density database.
Dryad identifier. http://hdl.handle.net/10255/dryad.235.

169
Chapter 7 – Summary Discussion
170
This thesis focused on investigating the ecology, biodiversity, potentials and threats of the
poorly understood freshwater swamp forest ecosystem of the Niger Delta. The second and
third chapters showed the floristic composition of the ecosystem and shed light on the
variability in species dominance, diversity and richness of the ecosystem, as well as its varied
indicator species. Chapter four looked at the carbon storage capacities of the ecosystem; while
chapter five identified the pattern of forest use and consequent degradation ongoing in the
ecosystem. Chapter six provided insights on the linkages between forest management and
carbon storage in the ecosystem. The following discussion provides a summary of the findings;
posits the need and guidelines for effective forest management and conservation across the
ecosystem and presents issues for further work.
7.1 Biodiversity patterns and indicators of the ecosystem
The freshwater swamp forest ecosystem is unique and distinct from other tropical forest
ecosystems. While the tree densities and stem abundance are similar with other tropical forest
ecosystems, its species richness is lower, mainly due to the environmental constraints
associated with the ecosystem (Teixeira et al. 2011; Scarano et al. 1997; Kurtz et al. 2013; Lugo
et al. 1988). With variations in the dominance and the environmental features of the different
forest locations or plots (Gole et al. 2008; Toledo et al. 2011), the species in the ecosystem
were either constrained in some distinct locations or permitted to coexist with other species in
other locations. Gaining insight into these variations were seen to be necessary for
understanding the plant-environment relationships inherent in the ecosystem (Bakker, 2008;
Toledo et al. 2011); explore the appropriate biogeographic categorization and provide insights
on how the species may respond to changes in the environment. Furthermore, with increasing
forest disturbances and degradation ongoing across the ecosystem, offsetting biodiversity
losses could be achieved through forest restoration (Montoya et al. 2012; Audino et al. 2014)
using the indicator species of the different forest zones. These (indicator) species could be used
as consistent indicators of ongoing environmental-ecological relationships and in ascertaining
the health of the ecosystem. With the knowledge of which species to expect in each of the
171
forest categories (disturbed, undisturbed and transition zones), better and more accurate
assessments of the ecosystem will result in more effective forest regeneration.
7.2 Freshwater swamp forest determinants and regimes
Forest ecosystems are all subject to different regimes of disturbance which shape and maintain
their structures and ecological processes through varied and inter-related ways. Freshwater
swamp forest ecosystems are to a large extent designed by the environmental factors and
processes in its surrounding region; however the extent to which this influences the floristic
composition of the ecosystem is dependent on the disturbance regime. While (disturbance)
this “relatively discreet event in time” is responsible for the disruption of the community or
population structure of the ecosystem (Pickett and White, 1985), it has on the other hand
enabled patch or gap dynamics (Brokaw, 1985; Torimaru et al. 2012; Boyd et al. 2013) in the
ecosystem and facilitated forest succession. Such successional processes not only enables new
species to be introduced into the ecosystem, but has to a great extent influenced (improved)
the diversity, species richness and adaptive capacity of the ecosystem (Gutschick and
BassiriRad, 2003; Seidl et al. 2014).
As the ecosystem has the resilience to cope with the anomalies associated with the natural
disturbance regime (mainly from the annual or seasonal flood), the forests have maintained
their dense vegetations and luxuriant growth over the years. However, with the recent
anthropogenic activities ongoing in the ecosystem, forest degradation is exacerbated at local
and regional scales and the resilience capacity of the ecosystem reduced over the years.
Consequently, there has been a reduction in the capacity of the ecosystem to sequester carbon
and also to provide other vital ecosystem services for its forest-dependent communities.
Hence, while this process (disturbance) is meant to bring about the renewal and continual
growth of the ecosystem, it has been complicated by a variety of exogenous anthropogenic
disturbances that has not permitted the establishment of climax communities across most of
the forest locations. As a result, such forests have barely been restored, but have instead
remained as shrub-lands and serve as grazing fields or open spaces (which may be used
eventually as farmlands).
On the other hand, environmental variables were found to influence the floristic composition
and pattern of cluster of the indicator species across the ecosystem. Such environmental
172
variables (notably, the mean annual rainfall and temperature) not only impose habitat
selection on the ecosystem, but also influence their stem and species abundance. Furthermore,
they help to ensure that the climatic conditions necessary to maintain the ecological processes
and species differentiation across the ecosystem is assured (Slik et al. 2003; Ferreira et al.
2014). With alterations in the forest structure (through disturbances regimes and events), the
microclimate of the forests become modified and eventually necessitate variations in
composition across the forest ecosystem, depending on the varied ecological niches, species
pool, dispersal capacities, relative abundance of the species and the degree of physical barriers
in each of the forest locations (Chase and Myers, 2011; Wiens, 2011).
7.3 Forest dependence and degradation
The rate of tropical forest loss is so enormous that the future of its species has never been
more uncertain (Gardner et al. 2009). With only very few area across the whole tropics
escaping human impacts (Kareiva et al. 2007), forest modifications, biodiversity losses and
extinctions are fast becoming a norm. These have been attributed to varied proximate and
underlying (Geist and Lambin, 2002) causes which have not only reduced the extent of the
forests, but has led to the degradation of vital forest resources across the study region. With
increase in the population of the region, much demand and pressures have been placed on the
forests’ resources beyond their resilient capacities. As a result, most of the forest resources are
not only scarce, but are threatened with extinction at the landscape scale and across the
region. On the other hand, agriculture has been intensified by households in a bid to meet the
demands of the growing family sizes across the freshwater swamp communities. Indeed,
agricultural expansion has not only been the major indicator of human footprint on the entire
biosphere (Gardner et al. 2013), but has indirectly (through biodiversity losses and forest
fragmentation) affected the capacity to which forest ecosystems could provide other functions
such as carbon sequestration (Sasaki et al. 2011; Berenguer et al. 2014).
With the high unemployment and underemployment across the region (Ukiwo, 2009), the
intensity of use of the forest ecosystem to meet the needs for sustenance and livelihood has
steadily increased in the freshwater swamp ecosystem. As a result, forest degradation has not
only affected forest units that are closer to community dwelling units, but has been introduced
173
in distant forests mostly by the people whose livelihood are dependent on the forest resources,
and who have defied the constraints associated with the swampy terrain to harness the forest
resources.
7.4 Ecosystem services
Freshwater swamp forests are very productive ecosystems that provide a wide array of services
and functions across the Niger Delta region and globally. Its potential to sequester carbon in its
carbon-dense ecosystem was found to be high and comparable to other tropical forest
ecosystems, but, decreasing with disturbance and poor management across the forest
landscapes. Since the ecosystem is composed of different flora (with varied carbon densities),
the capacities of each of the forest categories to store carbon in its biomass varied at different
spatial scales. Basal area and height of each tree were found to determine to a large extent the
carbon storage of each forest, as is common in forest ecosystems. As a result, though the intact
forest group was not composed of carbon dense flora as in the other groups (which had more
carbon dense flora like the genus Rhizophora); they were found to contain ample and higher
stores of carbon across the ecosystem. The inability of other forest categories (disturbed
freshwater forests and transition forests) to measure up with the intact category despite their
carbon dense composition were strictly because of their disturbed state (lower basal area and
heights). Thus, as the households across the forest ecosystem intensify their use of the
ecosystem services for sustenance and livelihood, it not only leads to degradation of the forest
trees but also other services they provide (such as carbon storage) (Berenguer et al. 2014).
Other ecosystem services derived from the ecosystem were seen to be the basis for the
sustenance of many households across the region as in most other African communities
(CIFOR, 2005; Shackleton et al. 2007; Bromhead, 2012). While a lot of households depend on
the swamp forest ecosystem to meet varied needs and so have continually used the forests on
regular basis, they have mostly not considered other vital aspects of ecosystem service such as
regulatory and supportive functions. Since forest ecosystem and its resources have mostly been
used to meet immediate needs (with little or no thought given to long term uses), the
ecosystem’s capacity as carbon stores are on the decline. While there are possibilities of
regulating the use of the ecosystem to achieve targeted potential stores of carbon (through
174
community forest management) for the ecosystem, the poor management structure associated
with the privately owned forest units (which dominate the landscape) still poses a challenge to
realizing such targets.
7.5 Forest use and ownership
Freshwater swamp forest across the Niger Delta region are beneficial to the people in various
ways as sources of livelihood, sustenance and nutrition; hence, are used for lumbering, fishing,
farming, hunting and gathering of fuelwood and other non-timber forest products. While the
ecosystem serves diverse functions, the extent to which they could be utilized are however
constrained by the ownership status of the forest units and the environment (swampy and
inaccessible terrain and/or dry accessible parts). Ownership of the different forest units
determines to a great extent, the activities in terms of what the forests are used for, the values
and attitudes the people have towards the forest units (Ritter and Dauksta, 2011) and the
pattern of loss or degradation in such landscapes.
The variations in the ownership of forest units across the region: government (forest reserves),
community forest lands and individual/family land units; determines the pattern of forest use
(through restriction or access to forest units), shapes the ecosystem composition and
distribution (ecology) and consequently, dictates its capacity to provide other vital functions
(biophysical attributes) (Figure 7.1). With this trend, communities that are dominated by
private forest ownership across the Niger Delta, which are more prone to forest modifications
and fragmentation (due to unrestricted forest use), are expected to experience more intensive
forest use and higher rate of degradation, unlike those that are jointly owned by more
people(s) or communities. While forest units that are owned by a higher number of person(s)
(such as a large extended family or community forest holdings) may not allow the weak,
individualistic and unregulated use of the forest (as in private forest holdings), it may still not
be effective in enhancing a better use of such forest landscapes (due to conflicts of interests
that may arise) except suitable people-oriented guidelines and mutual understanding are in
place.
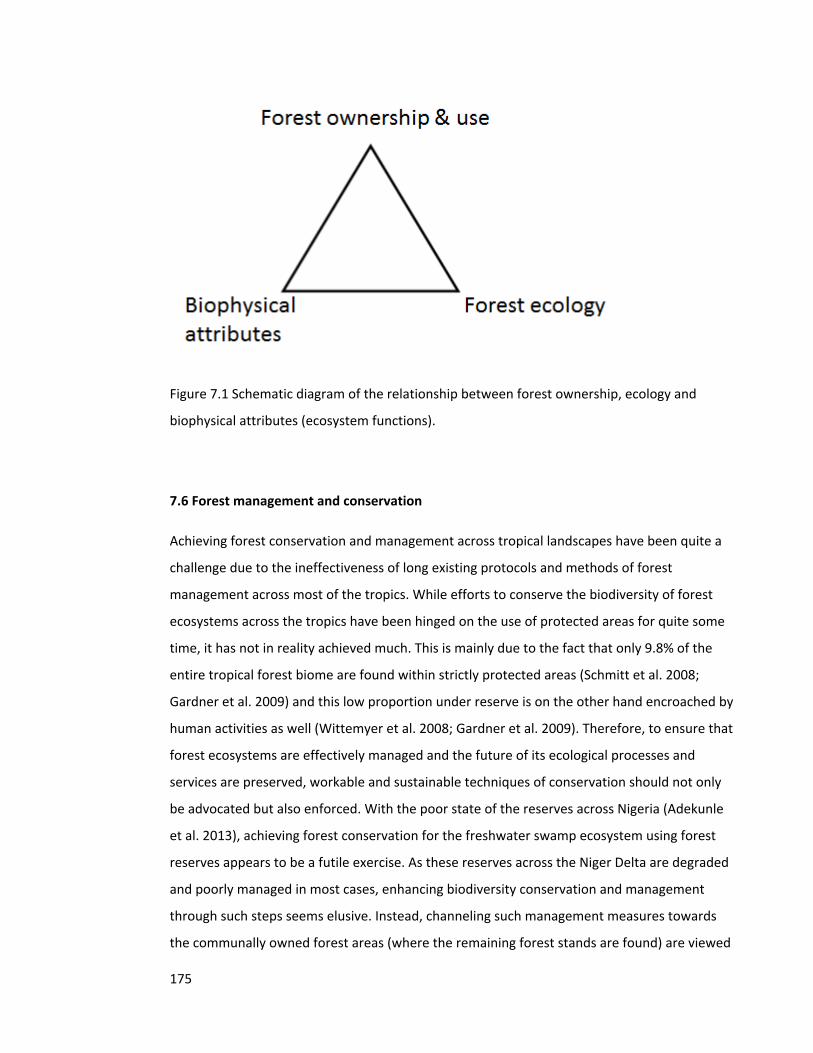
175
Figure 7.1 Schematic diagram of the relationship between forest ownership, ecology and
biophysical attributes (ecosystem functions).
7.6 Forest management and conservation
Achieving forest conservation and management across tropical landscapes have been quite a
challenge due to the ineffectiveness of long existing protocols and methods of forest
management across most of the tropics. While efforts to conserve the biodiversity of forest
ecosystems across the tropics have been hinged on the use of protected areas for quite some
time, it has not in reality achieved much. This is mainly due to the fact that only 9.8% of the
entire tropical forest biome are found within strictly protected areas (Schmitt et al. 2008;
Gardner et al. 2009) and this low proportion under reserve is on the other hand encroached by
human activities as well (Wittemyer et al. 2008; Gardner et al. 2009). Therefore, to ensure that
forest ecosystems are effectively managed and the future of its ecological processes and
services are preserved, workable and sustainable techniques of conservation should not only
be advocated but also enforced. With the poor state of the reserves across Nigeria (Adekunle
et al. 2013), achieving forest conservation for the freshwater swamp ecosystem using forest
reserves appears to be a futile exercise. As these reserves across the Niger Delta are degraded
and poorly managed in most cases, enhancing biodiversity conservation and management
through such steps seems elusive. Instead, channeling such management measures towards
the communally owned forest areas (where the remaining forest stands are found) are viewed
176
as more likely steps to achieving the set goal. While it would be ideal to harness the forest
resource potentials in non-government forest holdings, efforts towards reforesting the
degraded forest reserves should be promoted, where possible. To maximize such strategies,
plant species that are adapted to the environment should be considered, such as the ones
identified as indicators of the ecosystem.
Effective and sustainable community forest management practices on the other hand should
be promoted across the region. While it may not be appropriate to confiscate individual/family
(forest) lands, however, in instances where such lands and those on communal holdings are
procured with appropriate agreement and compensation, they should be used as reserves.
Where such reserves are gazetted, they should be under the management of the donor
communities, as they are more likely to ensure its sustainability. Conversely, since most of the
communities in the region are characterized with land scarcity on the large scale (since most of
their terrestrial spaces are swamps), establishing isolated forest reserves may not be that easy
and feasible.
As such, the conservation techniques that would be suitable across most of the region are such
that would take into consideration other important land uses especially agriculture. Though
agriculture is viewed as a defining feature of biodiversity loss (Perfecto and Vandermeer, 2008),
they are a vital necessity for the sustenance of such forest-landscapes and so should be
properly managed. This reality about how modified the forest ecosystem (as a result of human
actions and influences) are already, have however been accommodated by the ecological and
conservation paradigms, which is moving away from the strict protection of forests in isolated
reserves, to an acceptance of the coupled social-ecological dynamics inherent in modified
forest lands (Liu et al. 2007; Gardner et al. 2009). Implementing such strategies for the
freshwater forest ecosystem seems appropriate since in advocating for the conservation of the
ecosystem, it does not on the other hand dismiss the idea that the sources of livelihood of the
people across the region should be eliminated. To achieve this, the following should be
considered:
177
7.6.1 Enhancing the implementation of agroforestry in agricultural landscapes across
the region
Forest conservation could be enhanced in regions with degraded native forests and associated
agricultural intensification (Perfecto and Vandermeer, 2008). This has been demonstrated in
planned biodiversity environments, where trees, crops (both annual and perennials) and
livestock are raised together, with up to 80 – 334 species being reported (Montagnini, 2006;
Perfecto and Vandermeer, 2008). Even though similar coexistence of trees and shrubs are
common features in home gardens across the forest landscapes in the Niger Delta region, it has
mainly been characterized by very few trees and shrubs which are mostly edible. Since such
disturbed landscapes have the potentials of experiencing an enormous number of different
tree species sprouting in its landscapes, selective thinning of the trees or shrubs (with due
consideration to the total surface area, and structural attributes of the plants) rather than a
complete removal, should be encouraged. Furthermore, selective cultivation of tree species is
advocated across the agricultural ecosystems that span the region, as they equally contribute
to the biodiversity and better symbiotic interactions across the landscapes.
7.6.2 Protection and establishments of forest pools or patches across disturbed
landscapes
Disturbed forest ecosystems are characterized by patches of forest trees and shrubs in
different proportions. Encouraging the growth of such tree species across the region is
important as they could contribute to improving the ecosystem’s species pool, as well as
preserving its native biodiversity. Managing such forest islands on the other hand are equally
vital, in order to facilitate continual corridors for the migration of important species across the
ecosystem and in turn, contribute to the ecosystem’s functional biodiversity. Across the region,
these forest islands are normally found on abandoned farmlands, along the creeks (in small
pockets) and in locations designated as groves or shrines. Sustainable use and preservation of
such small pockets by individuals and communities are essential and potential forest
conservation steps that could grow from such micro scales to larger forest management
commitments across the region.
178
7.6.3 Forest restoration
Even though restored forest ecosystems are not comparable to the natural forest ecosystems
in terms of species composition and structure, they still have potentials to improve the
ecosystem services and biodiversity conservation of such landscapes (Chazdon, 2008). This
initiative is responsible for the increases in forest cover despite ongoing forest losses
experienced the world over; though, it has not been much practiced in the study region. As the
region’s forest ecosystem has been lost at astronomical rates through deforestation and
degradation, employing it in areas with sparse tree stands to no tree stands due to logging and
pollution (mainly through crude oil spills) could be steps to enhancing the productivity of
freshwater forests across the region and potentially, reclaiming oil-devastated derelict lands.
On the other hand, this equally has the ability to increase the carbon sequestration capacity of
the ecosystem, sustain the nearly extinct species of the region (both fauna and flora) and
stimulate the return and restoration of important animals that were displaced by degradation.
However, it is expedient to balance ambition with reality if such projects are to be fruitful and
sustained. To achieve this, long-term processes and goals should not be replaced with short-
term attractive solutions, example, fast-growing and short-lived species which are low in wood
density (and carbon offset) should not be favored for the long-lived, slow-growing trees with
dense wood and slow turnover of woody species in carbon sequestration initiatives (Chazdon,
2008). Since forest restoration projects are not always guaranteed of success (leading to huge
financial losses), efforts that will help to ensure that a positive result is achieved is hereby
advocated. Such initiatives should consider very important steps such as: planting the right tree
species, right timing for planting, ideal site preparation, ensuring that individuals and
communities participate and are committed to the project (rather than being seen as a
“government thing”).
7.6.4 Forest friendly and sustainable agricultural practices
Despite the fact that agriculture is a major threat to continuous forest existence across the
region, it is however, essential for human sustenance and regional coexistence. However, to
179
ensure that the ecosystem is not completely overtaken by agricultural activities, farming
practices that will reduce the pressure on forest lands needs to be adopted across the region.
Techniques such as mixed cropping are advocated across the region, since it encourages
multiple crops planting and in effect could reduce the portions of forest lands that are cleared
for agricultural purposes. On the other hand, farmers should be made to maximize the use of
agricultural extension personnel in their locality, as this will afford them the privilege of
optimizing their time, resources, output and the forest lands as well. Government support and
the awareness on the use of organic or inorganic fertilizers to enrich the soils are equally
advocated. Such initiatives are important steps that could discourage forest loss that are as a
result of a quest to farm on fertile or virgin soils.
7.6.5 Sustainable and alternative sources of energy
Fuel wood generation across the region is both a norm and a major cause of forest
degradation; especially as its gathering prevents disturbed forests from achieving its climax
succession. Advocating for sustainable use of wood for energy generation is necessary for
continued forest existence across the ecosystem. This could be achieved by: encouraging the
people to use energy saving stoves (as it only requires few logs of wood to generate energy);
use of saw dust and wood chippings; harvesting of snags (dead wood) either from live trees or
from fallen dead trees instead of cutting down of live shrubs (as is mostly practiced by the
people). Conversely, other alternative sources of energy such as kerosene, gas and electricity
should not only be advocated, but provided for the people at subsidized rates as well.
Furthermore, the uses of other viable alternative sources of energy such as sawmill wastes and
agricultural wastes in form of briquettes could also provide affordable options for the
populace.
7.6.6 Alternative sources of livelihood and sustenance
Since a vast majority of households across the region are mostly made up of individuals that
depend on the forests for their sources of livelihood, the provision of other sources of
livelihood are advocated, in a bid to reduce the pressure and demand being put on the forest
180
ecosystem. On the other hand, the populace should be encouraged to domesticate plants and
animals and in effect reduce their dependence on the wild for the supply of nutrients
(vegetables, fruits, spices and meat) and fuel. Such steps will not only reduce the rate of forest
degradation across the region, but also ensure that the biodiversity of the ecosystem is
preserved.
7.7 Further work
While the freshwater swamp forest ecosystem is poorly understood, this study has no doubt
contributed to elucidating the various dynamics surrounding the ecosystem in the Niger Delta.
Nevertheless, there is need to still build on what has already been done and further address
other issues that have not been covered by the study. This will be briefly discussed in the
subsequent sections.
7.7.1 Increased taxonomic inventories
The ecosystem’s understanding will be improved with every additional inventory and survey
that is conducted across the ecosystem. As such, more fieldwork are advocated in other
locations (distant geographically) from the ones already studied, so as to be furnished with
more updated floristic components of the ecosystem. This will not only be useful for
elucidating the phytogeography of the ecosystem, but furthermore provide baselines that will
shed more light on the carbon sequestration of the ecosystem and better inform conservation
prioritization. As more data on the ecosystem become available, the long term dynamics would
be better understood and more precise management strategies developed as well.
7.7.2 Data improvements and generation
Generally, the study was conducted based on what was available in terms of data, and what
could be generated. Nonetheless, improvements in the baseline data of the region are vital in
order to achieve more precision and accuracy. To better understand how the climate of the
region would affect the ecosystem and its processes, ground-truthed data collected at the plot
181
levels could be used to validate the available remote sensed climatic data. While such a data
may not be easy to come by for a study as this due to the enormous resources involved, further
climatic studies in the region are advocated as they could be relied on to provide these
information at shorter intervals. Additionally, if more meteorological stations are established
by the government at shorter distances, they could be relied on to provide more precise
information. The need to provide more refined socio-economic and demographic data for the
region is of utmost importance to help improve the scope of research at local and regional
scales. While these data are not readily available for the region, the few ones that exist (from
sources such as the World Bank and United Nations) are not available in GIS formats and so are
limited in importance for studies like this. Initiatives and projects that would promote and
improve the aforementioned baseline information and data for the region are necessary and
timely, so that future ecological studies in the zone could be more applied.
7.7.3 Additional baselines
Understanding the carbon pathways and baselines for the freshwater swamp forests is a
necessary step to effective climate change mitigation and adaptation. While more data on the
above ground carbon estimates in other parts of the region not covered in the study will be
steps to increasing the baselines for the ecosystem, understanding the below ground carbon of
the ecosystem is very vital but remains largely unexplored. Since the carbon stored in soils is
three times more than the ones in the atmosphere, and four times more than the ones in the
vegetation (Jobbagy and Jackson, 2000), they remain an important and integral part of the
carbon cycle that should be researched alongside. Other aspects of the below ground carbon
such as the below ground biomass for the flora in the ecosystem are equally needed as they
would contribute to a more wholistic understanding of the carbon potentials of the ecosystem.
In addition, inquiries into the canopy features (openness, closure, cover and Leaf area index) of
the ecosystem with the use of hemispherical photographs are equally advocated. These
baselines and others are very vital areas that will equally contribute to undertaking a species
modelling for the ecosystem, which at the moment are lacking for the ecosystem.
182
7.7.4 Ecosystem dynamics and management
Present vegetation patterns of forest ecosystems are products of past events and regimes, as
well as its current and evolving processes. Exploring the spatio-temporal changes in the
ecosystem over a considerable historical time is needed in order to ascertain the trajectories of
change in the ecosystem. This will not only help to better understand the present vegetation
patterns, but will also be beneficial in providing insights to future vegetation trends.
Furthermore, studies that will promote the understanding of the species-environment
relationships in the ecosystem are equally needed at different scales across the ecosystem. On
the other hand, there is also the need to conduct research on the climate change of the region
and decipher its associated impacts on the ecosystem composition and ecological processes.
Providing insights into this area of lack will help to provide the necessary information suitable
for targeted decision making.
Management techniques adopted for the ecosystem not only determine the ecology of the
ecosystem, but also future existence; yet adequate policies that may be most suitable for the
ecosystem/region are still lacking. While this study has highlighted some aspects of
management for the ecosystem/region, studies that would explore in detail suitable ecosystem
and region specific management guidelines are of utmost importance. Such studies should seek
to understand the suitable management techniques that would be ideal in promoting more
carbon storage for the ecosystem under expected future rising temperatures, community
forest management and participation effectiveness, and adequate policy for restoring and
keeping the forest reserves viable; as well as other aspects of ecosystem management.
183
7.8 References
Adekunle, V. A. J., Olagoke, A. O. and Akindele, S. O. (2013). Tree species diversity and structure
of a Nigerian strict nature reserve. Tropical Ecology 54 (3): 275-289.
Audino, L. D., Louzada, J. and Comita, L. (2014). Dung beetles as indicators of tropical forest
restoration success: Is it possible to recover species and functional diversity? Biological
Conservation 169: 248-257.
Bakker, J. D. (2008). Increasing the utility of indicator species analysis. J. Appl. Ecol. 45: 1829-
1835.
Berenguer, E., Ferreira, J., Gardner, T. A., Aragão, L. E. O. C., De Camargo, P. B., Cerri, C. E.,
Durigan, M., Junior, R. C., Vieira, I. C. G. and Barlow, J. (2014). A large-scale field
assessment of carbon stocks in human-modified tropical forests. Global Change
Biology, 20: 3713-3726, doi:10.1111/gcb.12627.
Boyd, D. S., Hill, R. A., Hopkinson, C. and Baker, T. R. (2013). Landscape-scale forest disturbance
regimes in southern Peruvian Amazonia. Ecological Applications 23 (7): 1588-1602.
Brokaw, N. V. L. (1985). Gap-phase regeneration in a tropical forest. Ecology 66 (3): 682-687.
Bromhead, M. (2012). Forest, trees and woodlands in Africa: An action plan for World Bank
Engagement. Washington D.C. World Bank.
Chase, M. and Myers, J. A. (2011). Disentangling the importance of ecological niches from
stochastic processes across scales. Phil. Trans. R. Soc. B, 366: 2351-2363.
Chazdon, R. L. (2008). Beyond deforestation: restoring forests and ecosystem services on
degraded lands. Science 320: 1458-1460.
CIFOR. (2005). Contributing to Africa’s development through forests strategy for engagement in
sub-Saharan Africa. Centre for International Forestry Research, Bogor, Indonesia. 35pp.
Ferreira, V. B. R., Nascimento, M. T. & de Menezes, L. F. T. (2014). Floristic and phytogeographic
pattern of native field in southeastern Brazil. Acta Botanica Brasilica 28 (3): 465-475.
Gardner, T. A., Barlow, J., Chazdon, R., Ewers, R. M., Harvey, C. A., Peres, C. A. and Sodhi, N. S.
(2009). Prospects for tropical forest biodiversity in a human-modified world. Ecology
Letters 12: 561-582.
Gardner, T. A., Ferreira, J., Barlow, J., Lees, A. C., Parry, L., Vieira, I. C. G. and Berenguer, E. et al.
(2013). A social and ecological assessment of tropical land uses at multiple scales: the
Sustainable Amazon Network. Phil Trans R Soc B 368: 20120166.
184
Geist, H. J. and Lambin, E. F. (2002). Proximate causes and underlying driving forces of tropical
deforestation. BioScience 52: 143-150.
Gole, T. W., Borsch, T., Denich, M. & Teketay, D. (2008). Floristic composition and
environmental factors characterizing coffee forests in southwest Ethiopia. Forest Ecology
and Management 255: 2138-2150.
Gutschick, V. P. and BassiriRad, H. (2003). Extreme events as shaping physiology, ecology, and
evolution of plants: toward a unified definition and evaluation of their consequences.
New Phytologist 160 (1): 21-42.
Jobbagy, E. G. and Jackson, R. B. (2000). The vertical distribution of soil organic carbon and its
relation to climate and vegetation. Ecological Applications 10: 423-436.
Kareiva, P., Watts, S., McDonald, R. and Boucher, T. (2007). Domesticated nature: shaping
landscapes and ecosystems for human welfare. Science 316: 1866-1869.
Kurtz, B. C., Gomes, J. C. and Scarano, F. B. (2013). Structure and phytogeographic relationships
of swamp forests of Southeast Brazil. Acta Botanica Brasilica 27 (4): 647-660.
Liu, J., Dietz, T., Carpenter, S. R., Alberti, M., Folke, C., Moran, E., Pell, A. N., Deadman, P., Kratz,
T., Lubchenco, J., Ostrom, E., Ouyang, Z., Provencher, W., Redman, C. L., Schneider, S.
H. and Taylor, W. W. (2007). Complexity of coupled human and natural systems.
Science 317: 1513-1516.
Lugo, A. E., Brown, S. and Brinson, M. M. (1998). Forested wetlands in freshwater and salt-
water environments. Limnol. Oceanogr. 33 (4, part 2): 894-909.
Montagnini, F. (2006). Homegardens of Mesoamerica: biodiversity, food security and nutrient
management. In tropical homegardens: A time-tested example of sustainable
agroforestry, Kumar, B. M. and Nair, P. K. R. (Eds), Springer Netherlands: pp. 61-84.
Montoya, D., Rogers, L. and Memmott, J. (2012). Emerging perspectives in the restoration of
biodiversity-based ecosystem services. Trends in Ecology and Evolution 27 (12):666-672.
Perfecto, I. and Vandermeer, J. (2008). Biodiversity conservation in tropical agroecosystems.
Annals of the New York Academy of Sciences 1134 (1): 173-200.
Pickett, M. G. and White, P. S. (1985). The ecology of natural disturbance and patch dynamics.
Academic Press, Inc. Orlando, Florida.
Ritter, E. and Dauksta, D. (Eds.) (2011). New perspectives on people and forests. World Forests
IX, Springer, London.
185
Sasaki, N., Asner, G. P., Knorr, W., Durst, P. B., Priyadi, H. R. and Putz, F. E. (2011). Approaches
to classifying and restoring degraded tropical forests for the anticipated REDD+ climate
change mitigation mechanism. iForest 4: 1-6.
Scarano , F. R., Ribeiro, K. T., De Moraes, L. F. D. and De Lima, H. C. (1997). Plant establishment
on flooded and unflooded patches of a freshwater swamp forest in southeastern Brazil.
Journal of Tropical Ecology 14: 793-803. Cambridge University Press.
Schmitt, C.B., Belokurov, A., Besanҫon, C., Boisrobert, L., Burgess, N.D., Campbell, A., Coad, L.,
Fish, L., Gliddon, D., Humphries, K., Kapos, V., Loucks, C., Lysenko, I., Miles, L., Mills, C.,
Minnemeyer, S., Pistorius, T., Ravilious, C., Steininger, M. and Winkel, G. (2008). Global
Ecological Forest Classification and Forest Protected Area Gap Analysis. Analyses and
recommendations in view of the 10% target for forest protection under the Convention
on Biological Diversity (CBD). In. University of Freiburg, Freiburg.
Seidl, R., Schelhaas, M., Rammer, W. and Verkerk, P. J. (2014). Increasing forest disturbances in
Europe and their impact on carbon storage. Nature Climate change 4: 806-810.
Shackleton, C. M., Shackleton, S. E., Buiten, E. and Bird, N. (2007). The importance of dry
woodlands and forests in rural livelihoods and poverty alleviation in South Africa.
Forest Policy and Economics 9: 558-577.
Slik, J. W. F., Poulsen, A. D., Ashton, P. S., Cannon, C. H., Eichhorn, K. A. O., Kartawinata, K.,
Lanniari, I., Nagamasu, H., Nakagawa, M., van Nieuwstadt, M. G. L. Payne, J.,
Purwaningsih, Saridan, A., Sidiyasa, K., Verburg, R. W., Webb, C. O. & Wilkie, P. (2003). A
floristic analysis of the lowland dipterocarp forests of Borneo. Journal of Biogeography
30: 1517-1531.
Teixeira, A., Assis, M. A. and Luize, B. G. (2011). Vegetation and environmental heterogeneity
relationships in a Neotropical swamp forest in southeastern Brazil (Itirapina, SP). Aquatic
Botany 94: 17-23.
Toledo, M., Poorter, L., Pena-Claros, M., Alarcόn, A., Balcázar, J., Chuvina, J., Leano, C., Licona,
J. C., ter Steege, H. & Bongers, F. (2011). Patterns and determinants of floristic variation
across lowland forests of Bolivia. Biotropica 43 (4): 405-413.
Torimaru, T., Itaya, A. and Yamamoto, S. (2012). Quantification of repeated gap formation
events and their spatial patterns in three types of old-growth forests: analysis of long-
term canopy dynamics using aerial photographs and digital surface models. Forest
Ecology and Management 284: 1-11.
186
Ukiwo, U. (2009). Causes and cures of oil-related Niger Delta conflicts. Policy notes 1. Nordiska
Afrikainstitutet. The Nordic Africa Institute.
UNDP (2006). Niger Delta human development report. United Nations Development Program.
Lagos.
Wiens, J. J. (2011). The niche, biogeography and species interactions. Phil. Trans. R. Soc. B, 366:
2336-2350.
Wittemyer, G., Elsen, P., Bean, W.T., Burton, C.O. and Brashares, J.S. (2008). Accelerated
human population growth at protected area edges. Science 321: 123-126.
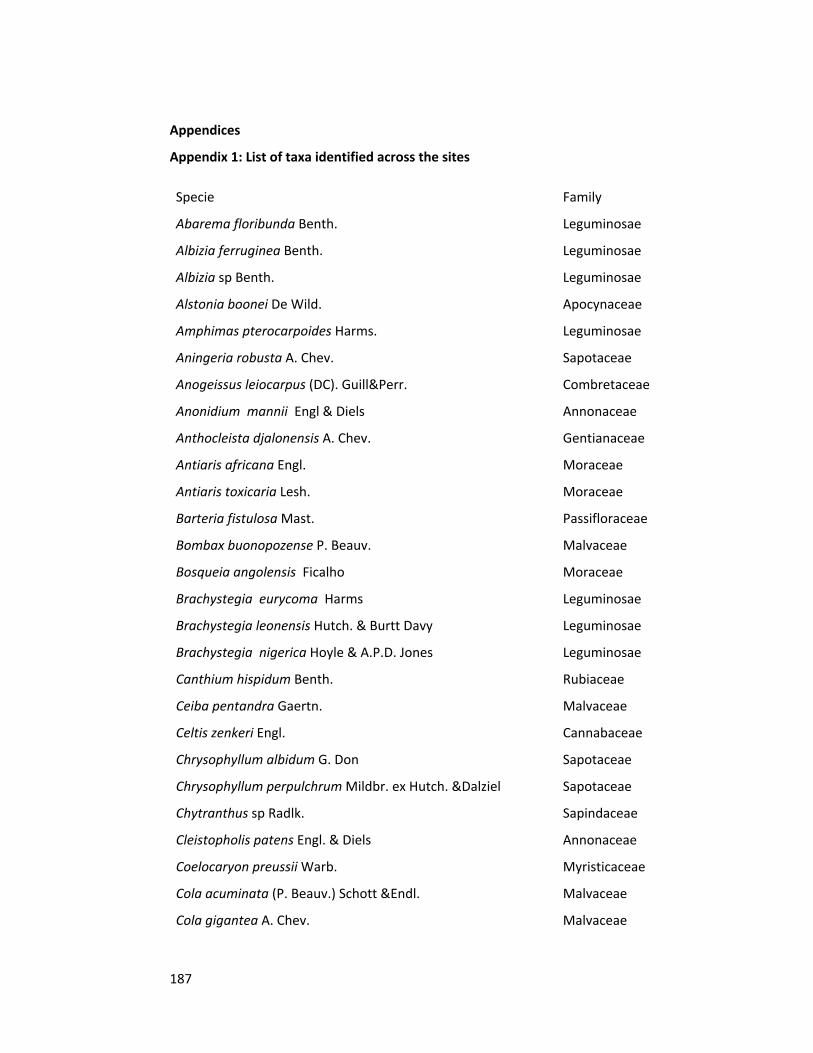
187
Appendices
Appendix 1: List of taxa identified across the sites
Specie Family
Abarema floribunda Benth. Leguminosae
Albizia ferruginea Benth. Leguminosae
Albizia sp Benth. Leguminosae
Alstonia boonei De Wild. Apocynaceae
Amphimas pterocarpoides Harms. Leguminosae
Aningeria robusta A. Chev. Sapotaceae
Anogeissus leiocarpus (DC). Guill&Perr. Combretaceae
Anonidium mannii Engl & Diels Annonaceae
Anthocleista djalonensis A. Chev. Gentianaceae
Antiaris africana Engl. Moraceae
Antiaris toxicaria Lesh. Moraceae
Barteria fistulosa Mast. Passifloraceae
Bombax buonopozense P. Beauv. Malvaceae
Bosqueia angolensis Ficalho Moraceae
Brachystegia eurycoma Harms Leguminosae
Brachystegia leonensis Hutch. & Burtt Davy Leguminosae
Brachystegia nigerica Hoyle & A.P.D. Jones Leguminosae
Canthium hispidum Benth. Rubiaceae
Ceiba pentandra Gaertn. Malvaceae
Celtis zenkeri Engl. Cannabaceae
Chrysophyllum albidum G. Don Sapotaceae
Chrysophyllum perpulchrum Mildbr. ex Hutch. &Dalziel Sapotaceae
Chytranthus sp Radlk. Sapindaceae
Cleistopholis patens Engl. & Diels Annonaceae
Coelocaryon preussii Warb. Myristicaceae
Cola acuminata (P. Beauv.) Schott &Endl. Malvaceae
Cola gigantea A. Chev. Malvaceae
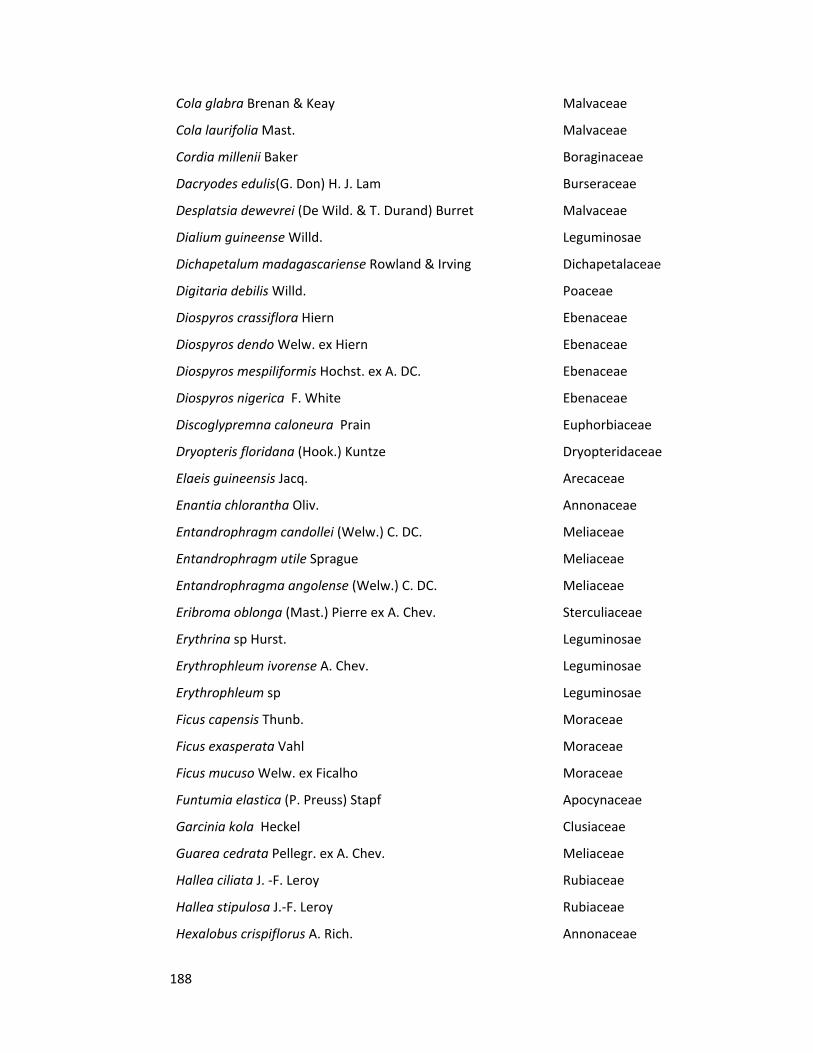
188
Cola glabra Brenan & Keay Malvaceae
Cola laurifolia Mast. Malvaceae
Cordia millenii Baker Boraginaceae
Dacryodes edulis(G. Don) H. J. Lam Burseraceae
Desplatsia dewevrei (De Wild. & T. Durand) Burret Malvaceae
Dialium guineense Willd. Leguminosae
Dichapetalum madagascariense Rowland & Irving Dichapetalaceae
Digitaria debilis Willd. Poaceae
Diospyros crassiflora Hiern Ebenaceae
Diospyros dendo Welw. ex Hiern Ebenaceae
Diospyros mespiliformis Hochst. ex A. DC. Ebenaceae
Diospyros nigerica F. White Ebenaceae
Discoglypremna caloneura Prain Euphorbiaceae
Dryopteris floridana (Hook.) Kuntze Dryopteridaceae
Elaeis guineensis Jacq. Arecaceae
Enantia chlorantha Oliv. Annonaceae
Entandrophragm candollei (Welw.) C. DC. Meliaceae
Entandrophragm utile Sprague Meliaceae
Entandrophragma angolense (Welw.) C. DC. Meliaceae
Eribroma oblonga (Mast.) Pierre ex A. Chev. Sterculiaceae
Erythrina sp Hurst. Leguminosae
Erythrophleum ivorense A. Chev. Leguminosae
Erythrophleum sp Leguminosae
Ficus capensis Thunb. Moraceae
Ficus exasperata Vahl Moraceae
Ficus mucuso Welw. ex Ficalho Moraceae
Funtumia elastica (P. Preuss) Stapf Apocynaceae
Garcinia kola Heckel Clusiaceae
Guarea cedrata Pellegr. ex A. Chev. Meliaceae
Hallea ciliata J. -F. Leroy Rubiaceae
Hallea stipulosa J.-F. Leroy Rubiaceae
Hexalobus crispiflorus A. Rich. Annonaceae
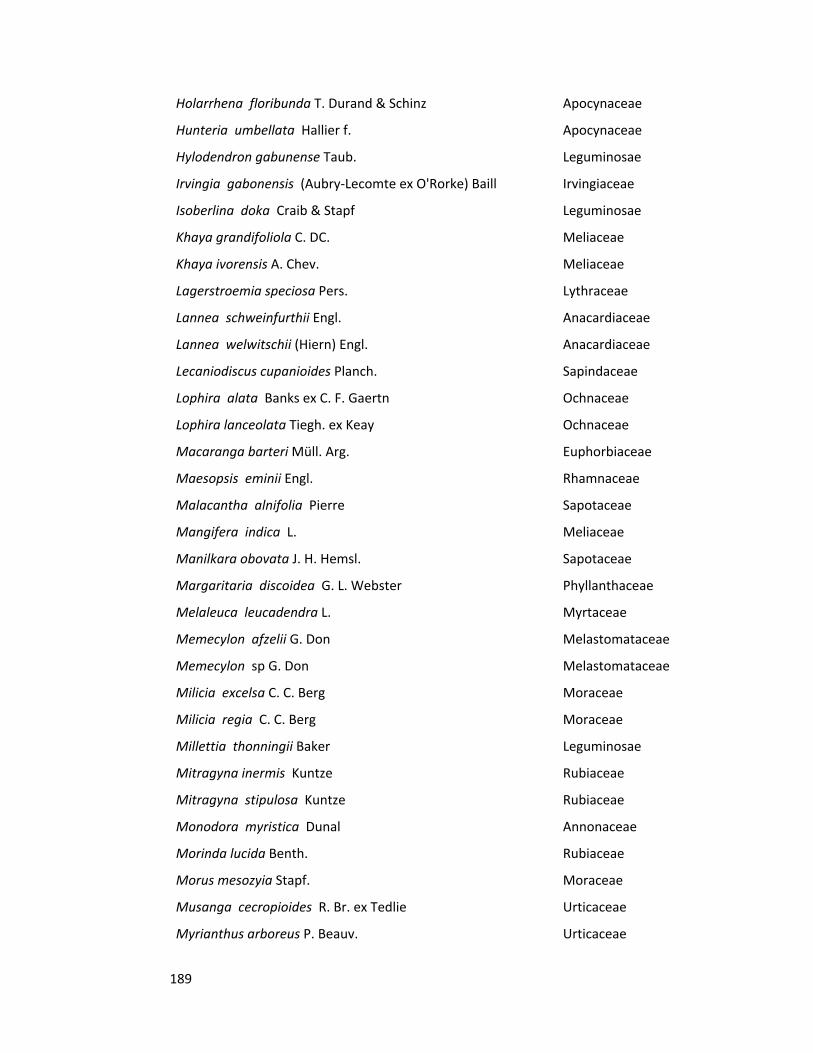
189
Holarrhena floribunda T. Durand & Schinz Apocynaceae
Hunteria umbellata Hallier f. Apocynaceae
Hylodendron gabunense Taub. Leguminosae
Irvingia gabonensis (Aubry-Lecomte ex O'Rorke) Baill Irvingiaceae
Isoberlina doka Craib & Stapf Leguminosae
Khaya grandifoliola C. DC. Meliaceae
Khaya ivorensis A. Chev. Meliaceae
Lagerstroemia speciosa Pers. Lythraceae
Lannea schweinfurthii Engl. Anacardiaceae
Lannea welwitschii (Hiern) Engl. Anacardiaceae
Lecaniodiscus cupanioides Planch. Sapindaceae
Lophira alata Banks ex C. F. Gaertn Ochnaceae
Lophira lanceolata Tiegh. ex Keay Ochnaceae
Macaranga barteri Müll. Arg. Euphorbiaceae
Maesopsis eminii Engl. Rhamnaceae
Malacantha alnifolia Pierre Sapotaceae
Mangifera indica L. Meliaceae
Manilkara obovata J. H. Hemsl. Sapotaceae
Margaritaria discoidea G. L. Webster Phyllanthaceae
Melaleuca leucadendra L. Myrtaceae
Memecylon afzelii G. Don Melastomataceae
Memecylon sp G. Don Melastomataceae
Milicia excelsa C. C. Berg Moraceae
Milicia regia C. C. Berg Moraceae
Millettia thonningii Baker Leguminosae
Mitragyna inermis Kuntze Rubiaceae
Mitragyna stipulosa Kuntze Rubiaceae
Monodora myristica Dunal Annonaceae
Morinda lucida Benth. Rubiaceae
Morus mesozyia Stapf. Moraceae
Musanga cecropioides R. Br. ex Tedlie Urticaceae
Myrianthus arboreus P. Beauv. Urticaceae
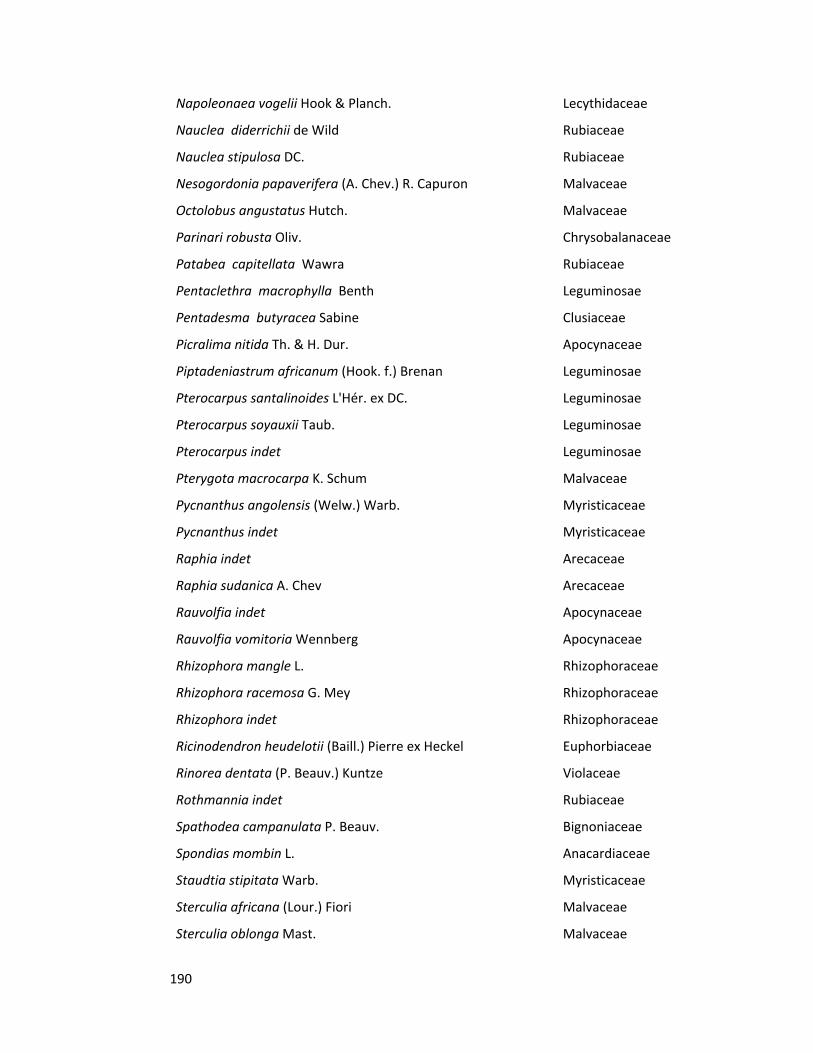
190
Napoleonaea vogelii Hook & Planch. Lecythidaceae
Nauclea diderrichii de Wild Rubiaceae
Nauclea stipulosa DC. Rubiaceae
Nesogordonia papaverifera (A. Chev.) R. Capuron Malvaceae
Octolobus angustatus Hutch. Malvaceae
Parinari robusta Oliv. Chrysobalanaceae
Patabea capitellata Wawra Rubiaceae
Pentaclethra macrophylla Benth Leguminosae
Pentadesma butyracea Sabine Clusiaceae
Picralima nitida Th. & H. Dur. Apocynaceae
Piptadeniastrum africanum (Hook. f.) Brenan Leguminosae
Pterocarpus santalinoides L'Hér. ex DC. Leguminosae
Pterocarpus soyauxii Taub. Leguminosae
Pterocarpus indet Leguminosae
Pterygota macrocarpa K. Schum Malvaceae
Pycnanthus angolensis (Welw.) Warb. Myristicaceae
Pycnanthus indet Myristicaceae
Raphia indet Arecaceae
Raphia sudanica A. Chev Arecaceae
Rauvolfia indet Apocynaceae
Rauvolfia vomitoria Wennberg Apocynaceae
Rhizophora mangle L. Rhizophoraceae
Rhizophora racemosa G. Mey Rhizophoraceae
Rhizophora indet Rhizophoraceae
Ricinodendron heudelotii (Baill.) Pierre ex Heckel Euphorbiaceae
Rinorea dentata (P. Beauv.) Kuntze Violaceae
Rothmannia indet Rubiaceae
Spathodea campanulata P. Beauv. Bignoniaceae
Spondias mombin L. Anacardiaceae
Staudtia stipitata Warb. Myristicaceae
Sterculia africana (Lour.) Fiori Malvaceae
Sterculia oblonga Mast. Malvaceae
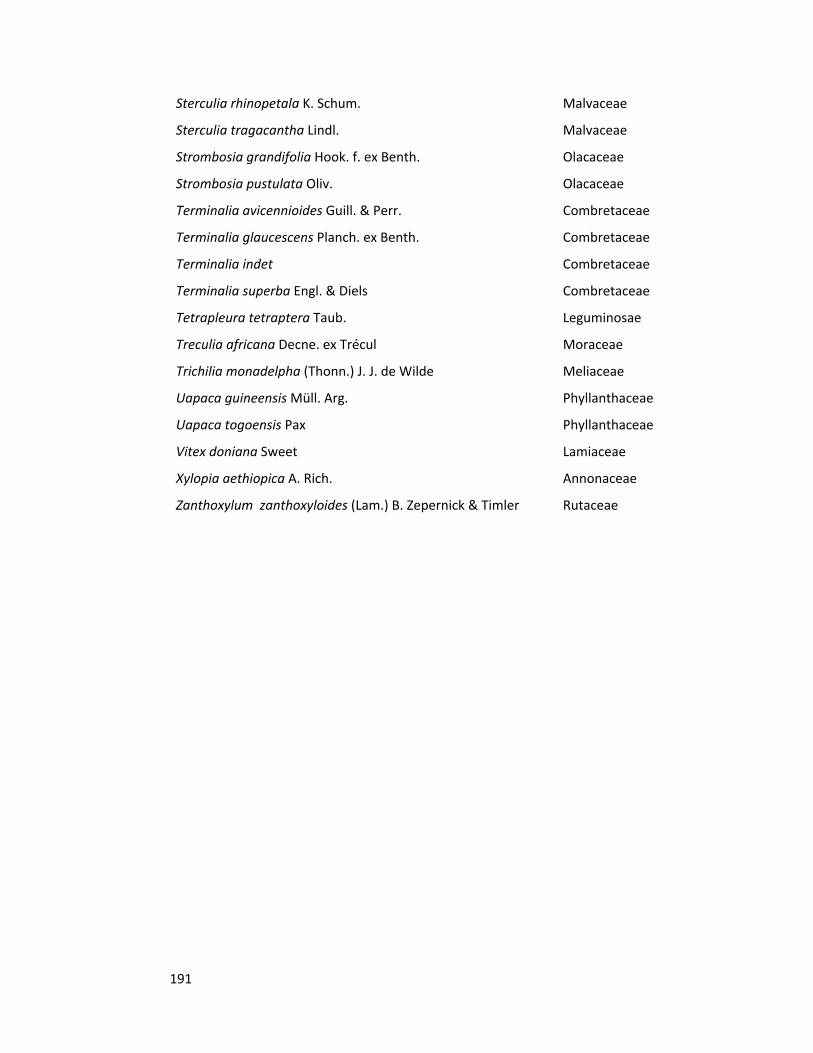
191
Sterculia rhinopetala K. Schum. Malvaceae
Sterculia tragacantha Lindl. Malvaceae
Strombosia grandifolia Hook. f. ex Benth. Olacaceae
Strombosia pustulata Oliv. Olacaceae
Terminalia avicennioides Guill. & Perr. Combretaceae
Terminalia glaucescens Planch. ex Benth. Combretaceae
Terminalia indet Combretaceae
Terminalia superba Engl. & Diels Combretaceae
Tetrapleura tetraptera Taub. Leguminosae
Treculia africana Decne. ex Trécul Moraceae
Trichilia monadelpha (Thonn.) J. J. de Wilde Meliaceae
Uapaca guineensis Müll. Arg. Phyllanthaceae
Uapaca togoensis Pax Phyllanthaceae
Vitex doniana Sweet Lamiaceae
Xylopia aethiopica A. Rich. Annonaceae
Zanthoxylum zanthoxyloides (Lam.) B. Zepernick & Timler Rutaceae
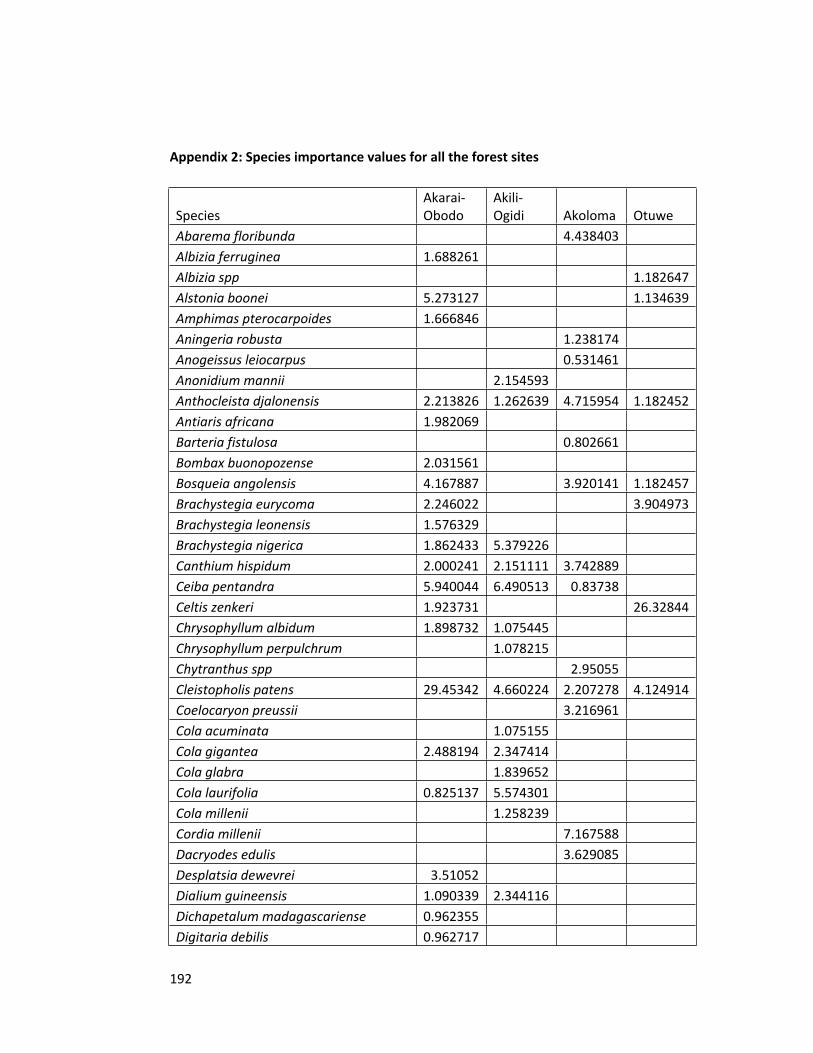
192
Appendix 2: Species importance values for all the forest sites
SpeciesAkarai-Obodo
Akili-Ogidi Akoloma Otuwe
Abarema floribunda 4.438403Albizia ferruginea 1.688261Albizia spp 1.182647Alstonia boonei 5.273127 1.134639Amphimas pterocarpoides 1.666846Aningeria robusta 1.238174Anogeissus leiocarpus 0.531461Anonidium mannii 2.154593Anthocleista djalonensis 2.213826 1.262639 4.715954 1.182452Antiaris africana 1.982069Barteria fistulosa 0.802661Bombax buonopozense 2.031561Bosqueia angolensis 4.167887 3.920141 1.182457Brachystegia eurycoma 2.246022 3.904973Brachystegia leonensis 1.576329Brachystegia nigerica 1.862433 5.379226Canthium hispidum 2.000241 2.151111 3.742889Ceiba pentandra 5.940044 6.490513 0.83738Celtis zenkeri 1.923731 26.32844Chrysophyllum albidum 1.898732 1.075445Chrysophyllum perpulchrum 1.078215Chytranthus spp 2.95055Cleistopholis patens 29.45342 4.660224 2.207278 4.124914Coelocaryon preussii 3.216961Cola acuminata 1.075155Cola gigantea 2.488194 2.347414Cola glabra 1.839652Cola laurifolia 0.825137 5.574301Cola millenii 1.258239Cordia millenii 7.167588Dacryodes edulis 3.629085Desplatsia dewevrei 3.51052Dialium guineensis 1.090339 2.344116Dichapetalum madagascariense 0.962355Digitaria debilis 0.962717
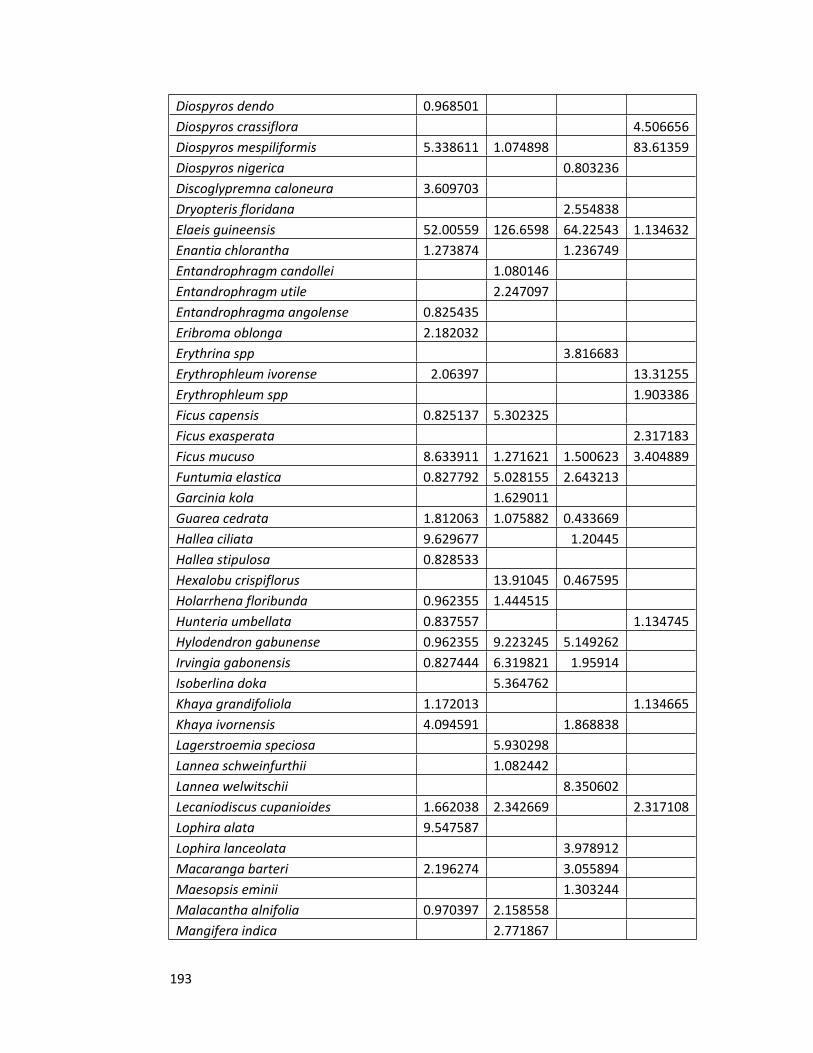
193
Diospyros dendo 0.968501Diospyros crassiflora 4.506656Diospyros mespiliformis 5.338611 1.074898 83.61359Diospyros nigerica 0.803236Discoglypremna caloneura 3.609703Dryopteris floridana 2.554838Elaeis guineensis 52.00559 126.6598 64.22543 1.134632Enantia chlorantha 1.273874 1.236749Entandrophragm candollei 1.080146Entandrophragm utile 2.247097Entandrophragma angolense 0.825435Eribroma oblonga 2.182032Erythrina spp 3.816683Erythrophleum ivorense 2.06397 13.31255Erythrophleum spp 1.903386Ficus capensis 0.825137 5.302325Ficus exasperata 2.317183Ficus mucuso 8.633911 1.271621 1.500623 3.404889Funtumia elastica 0.827792 5.028155 2.643213Garcinia kola 1.629011Guarea cedrata 1.812063 1.075882 0.433669Hallea ciliata 9.629677 1.20445Hallea stipulosa 0.828533Hexalobu crispiflorus 13.91045 0.467595Holarrhena floribunda 0.962355 1.444515Hunteria umbellata 0.837557 1.134745Hylodendron gabunense 0.962355 9.223245 5.149262Irvingia gabonensis 0.827444 6.319821 1.95914Isoberlina doka 5.364762Khaya grandifoliola 1.172013 1.134665Khaya ivornensis 4.094591 1.868838Lagerstroemia speciosa 5.930298Lannea schweinfurthii 1.082442Lannea welwitschii 8.350602Lecaniodiscus cupanioides 1.662038 2.342669 2.317108Lophira alata 9.547587Lophira lanceolata 3.978912Macaranga barteri 2.196274 3.055894Maesopsis eminii 1.303244Malacantha alnifolia 0.970397 2.158558Mangifera indica 2.771867
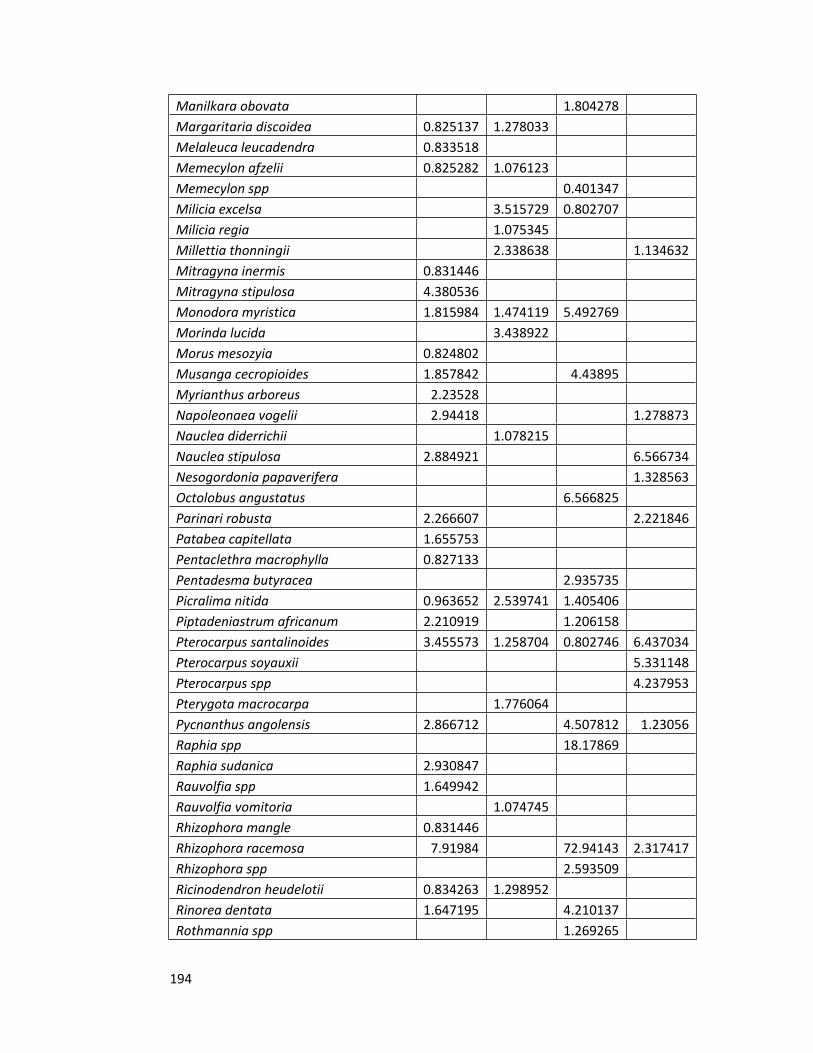
194
Manilkara obovata 1.804278Margaritaria discoidea 0.825137 1.278033Melaleuca leucadendra 0.833518Memecylon afzelii 0.825282 1.076123Memecylon spp 0.401347Milicia excelsa 3.515729 0.802707Milicia regia 1.075345Millettia thonningii 2.338638 1.134632Mitragyna inermis 0.831446Mitragyna stipulosa 4.380536Monodora myristica 1.815984 1.474119 5.492769Morinda lucida 3.438922Morus mesozyia 0.824802Musanga cecropioides 1.857842 4.43895Myrianthus arboreus 2.23528Napoleonaea vogelii 2.94418 1.278873Nauclea diderrichii 1.078215Nauclea stipulosa 2.884921 6.566734Nesogordonia papaverifera 1.328563Octolobus angustatus 6.566825Parinari robusta 2.266607 2.221846Patabea capitellata 1.655753Pentaclethra macrophylla 0.827133Pentadesma butyracea 2.935735Picralima nitida 0.963652 2.539741 1.405406Piptadeniastrum africanum 2.210919 1.206158Pterocarpus santalinoides 3.455573 1.258704 0.802746 6.437034Pterocarpus soyauxii 5.331148Pterocarpus spp 4.237953Pterygota macrocarpa 1.776064Pycnanthus angolensis 2.866712 4.507812 1.23056Raphia spp 18.17869Raphia sudanica 2.930847Rauvolfia spp 1.649942Rauvolfia vomitoria 1.074745Rhizophora mangle 0.831446Rhizophora racemosa 7.91984 72.94143 2.317417Rhizophora spp 2.593509Ricinodendron heudelotii 0.834263 1.298952Rinorea dentata 1.647195 4.210137Rothmannia spp 1.269265
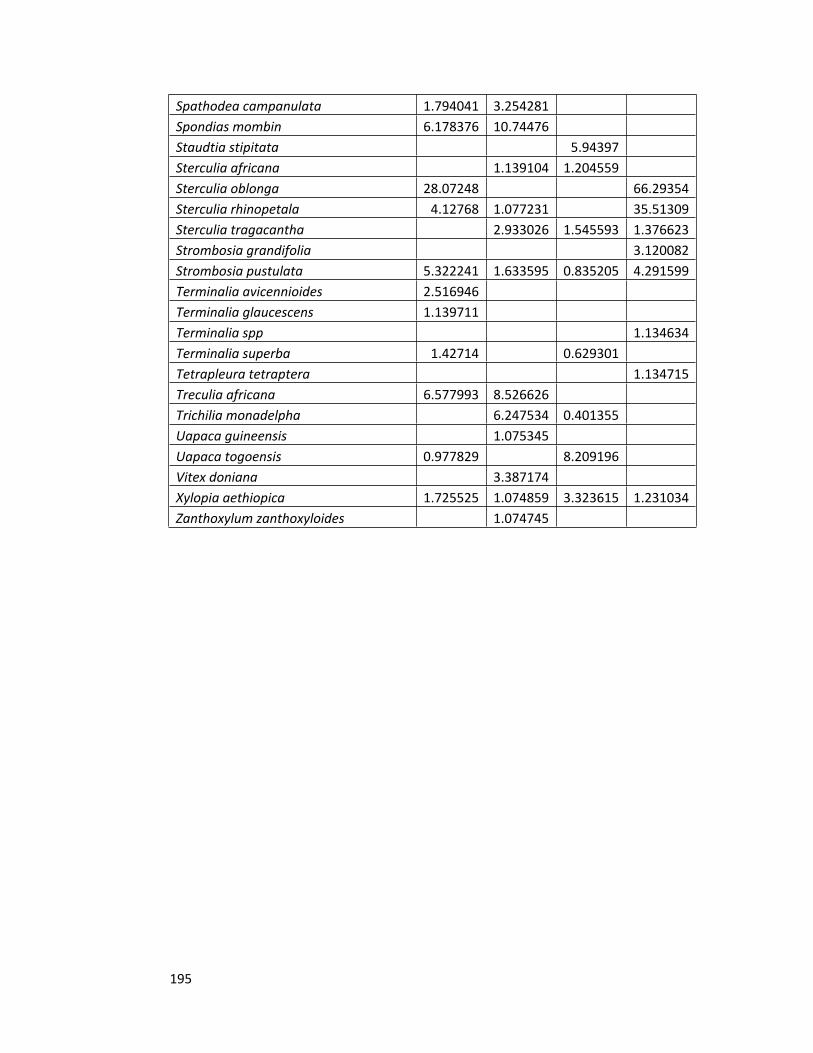
195
Spathodea campanulata 1.794041 3.254281Spondias mombin 6.178376 10.74476Staudtia stipitata 5.94397Sterculia africana 1.139104 1.204559Sterculia oblonga 28.07248 66.29354Sterculia rhinopetala 4.12768 1.077231 35.51309Sterculia tragacantha 2.933026 1.545593 1.376623Strombosia grandifolia 3.120082Strombosia pustulata 5.322241 1.633595 0.835205 4.291599Terminalia avicennioides 2.516946Terminalia glaucescens 1.139711Terminalia spp 1.134634Terminalia superba 1.42714 0.629301Tetrapleura tetraptera 1.134715Treculia africana 6.577993 8.526626Trichilia monadelpha 6.247534 0.401355Uapaca guineensis 1.075345Uapaca togoensis 0.977829 8.209196Vitex doniana 3.387174Xylopia aethiopica 1.725525 1.074859 3.323615 1.231034Zanthoxylum zanthoxyloides 1.074745
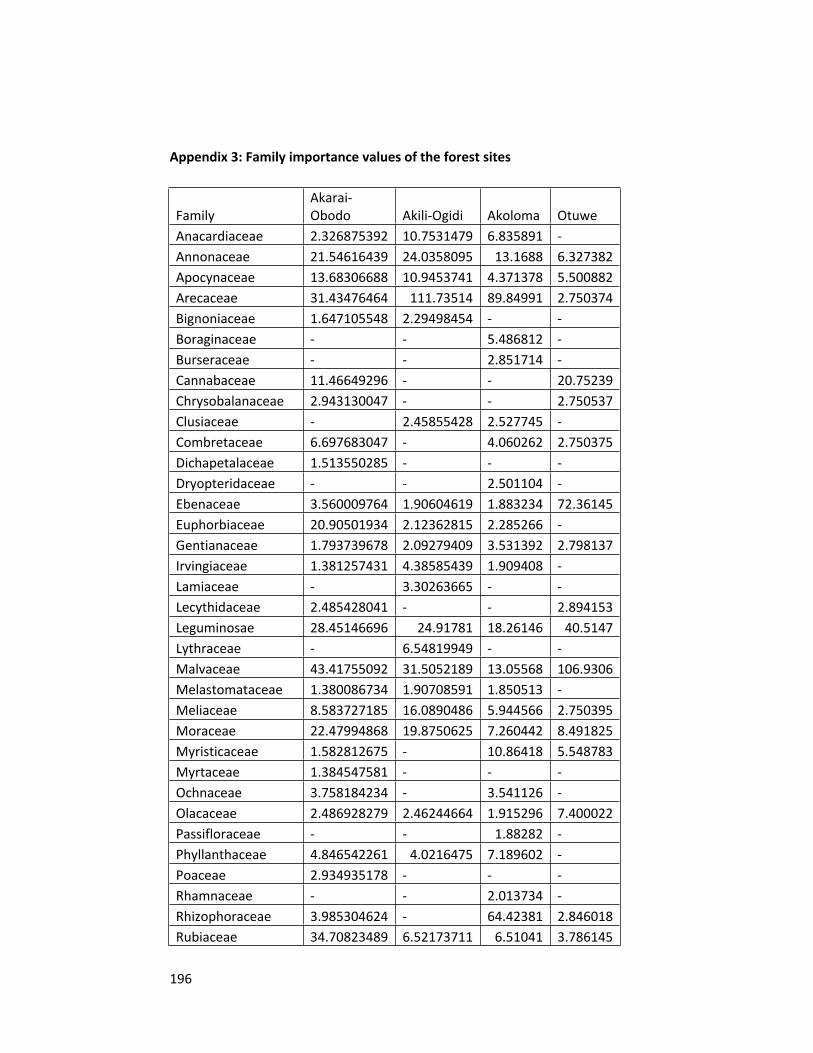
196
Appendix 3: Family importance values of the forest sites
FamilyAkarai-Obodo Akili-Ogidi Akoloma Otuwe
Anacardiaceae 2.326875392 10.7531479 6.835891 -Annonaceae 21.54616439 24.0358095 13.1688 6.327382Apocynaceae 13.68306688 10.9453741 4.371378 5.500882Arecaceae 31.43476464 111.73514 89.84991 2.750374Bignoniaceae 1.647105548 2.29498454 - -Boraginaceae - - 5.486812 -Burseraceae - - 2.851714 -Cannabaceae 11.46649296 - - 20.75239Chrysobalanaceae 2.943130047 - - 2.750537Clusiaceae - 2.45855428 2.527745 -Combretaceae 6.697683047 - 4.060262 2.750375Dichapetalaceae 1.513550285 - - -Dryopteridaceae - - 2.501104 -Ebenaceae 3.560009764 1.90604619 1.883234 72.36145Euphorbiaceae 20.90501934 2.12362815 2.285266 -Gentianaceae 1.793739678 2.09279409 3.531392 2.798137Irvingiaceae 1.381257431 4.38585439 1.909408 -Lamiaceae - 3.30263665 - -Lecythidaceae 2.485428041 - - 2.894153Leguminosae 28.45146696 24.91781 18.26146 40.5147Lythraceae - 6.54819949 - -Malvaceae 43.41755092 31.5052189 13.05568 106.9306Melastomataceae 1.380086734 1.90708591 1.850513 -Meliaceae 8.583727185 16.0890486 5.944566 2.750395Moraceae 22.47994868 19.8750625 7.260442 8.491825Myristicaceae 1.582812675 - 10.86418 5.548783Myrtaceae 1.384547581 - - -Ochnaceae 3.758184234 - 3.541126 -Olacaceae 2.486928279 2.46244664 1.915296 7.400022Passifloraceae - - 1.88282 -Phyllanthaceae 4.846542261 4.0216475 7.189602 -Poaceae 2.934935178 - - -Rhamnaceae - - 2.013734 -Rhizophoraceae 3.985304624 - 64.42381 2.846018Rubiaceae 34.70823489 6.52173711 6.51041 3.786145

197
Rutaceae - 1.90591623 - -Sapindaceae 4.100367167 2.27905925 2.547453 2.845823Sapotaceae 3.91789855 5.93279789 4.098398 -Sterculiaceae 1.942724369 - - -Urticaceae 5.119861064 - 3.944741 -Violaceae 1.534591196 - 3.432862 -
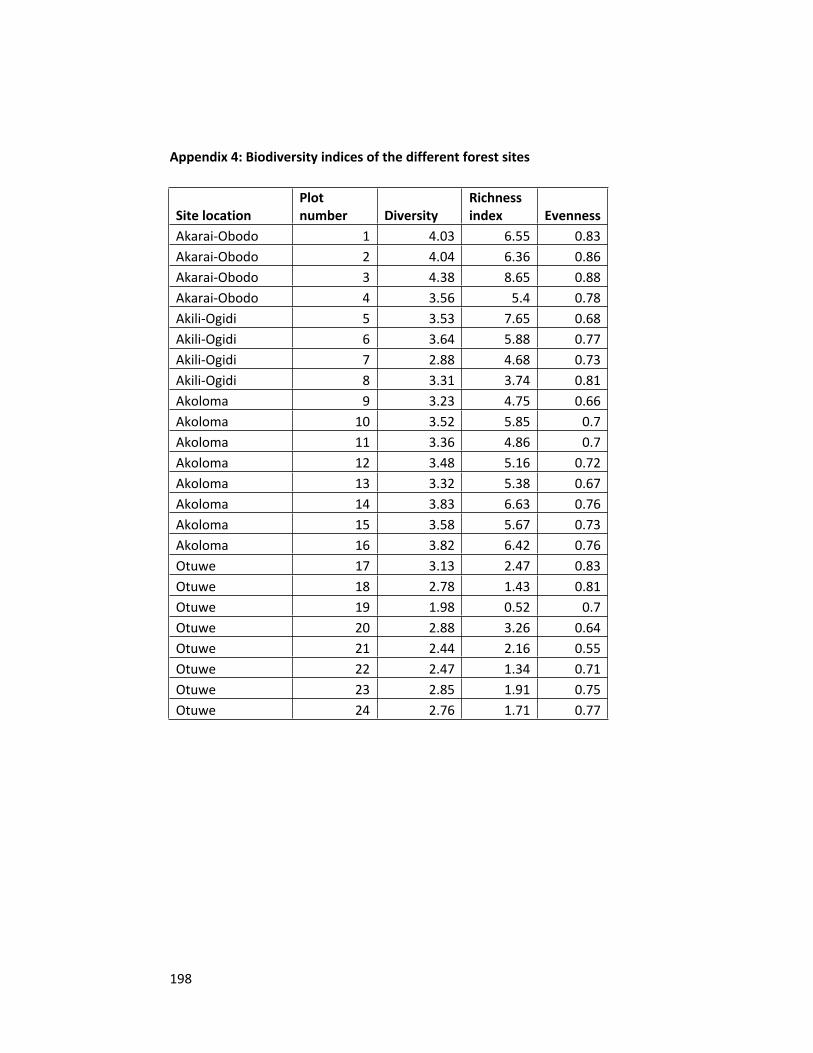
198
Appendix 4: Biodiversity indices of the different forest sites
Site locationPlot number Diversity
Richness index Evenness
Akarai-Obodo 1 4.03 6.55 0.83Akarai-Obodo 2 4.04 6.36 0.86Akarai-Obodo 3 4.38 8.65 0.88Akarai-Obodo 4 3.56 5.4 0.78Akili-Ogidi 5 3.53 7.65 0.68Akili-Ogidi 6 3.64 5.88 0.77Akili-Ogidi 7 2.88 4.68 0.73Akili-Ogidi 8 3.31 3.74 0.81Akoloma 9 3.23 4.75 0.66Akoloma 10 3.52 5.85 0.7Akoloma 11 3.36 4.86 0.7Akoloma 12 3.48 5.16 0.72Akoloma 13 3.32 5.38 0.67Akoloma 14 3.83 6.63 0.76Akoloma 15 3.58 5.67 0.73Akoloma 16 3.82 6.42 0.76Otuwe 17 3.13 2.47 0.83Otuwe 18 2.78 1.43 0.81Otuwe 19 1.98 0.52 0.7Otuwe 20 2.88 3.26 0.64Otuwe 21 2.44 2.16 0.55Otuwe 22 2.47 1.34 0.71Otuwe 23 2.85 1.91 0.75Otuwe 24 2.76 1.71 0.77
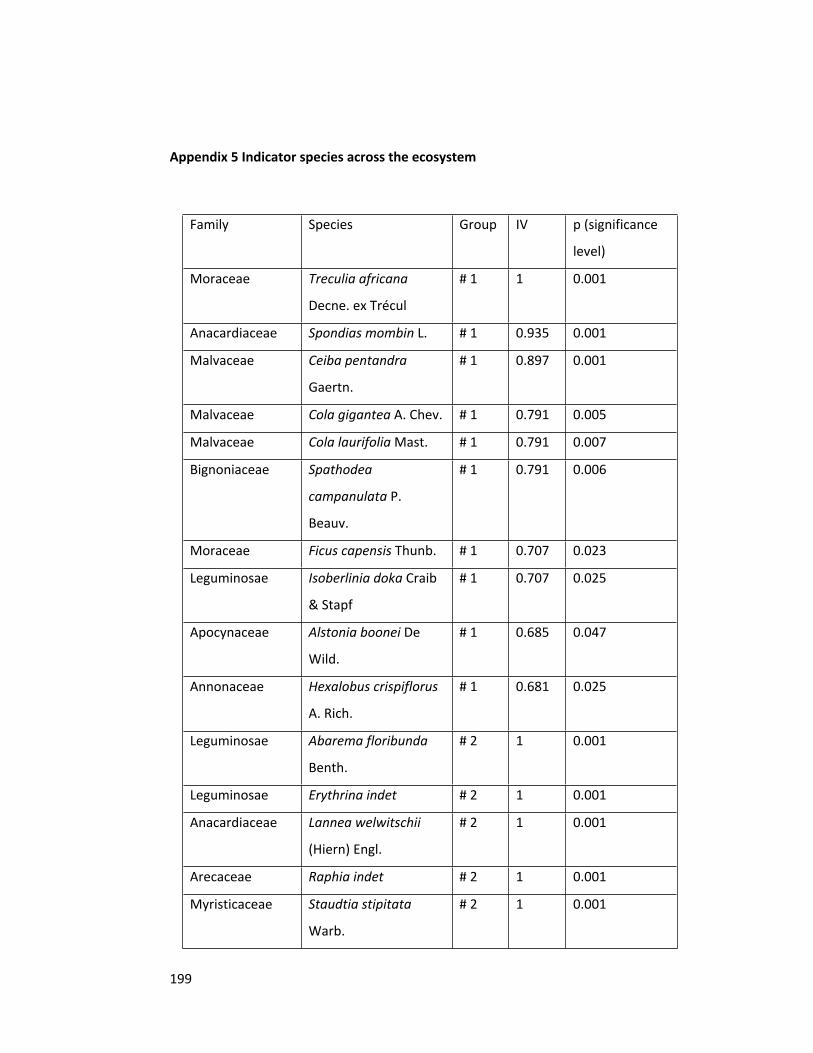
199
Appendix 5 Indicator species across the ecosystem
Family Species Group IV p (significance
level)
Moraceae Treculia africana
Decne. ex Trécul
# 1 1 0.001
Anacardiaceae Spondias mombin L. # 1 0.935 0.001
Malvaceae Ceiba pentandra
Gaertn.
# 1 0.897 0.001
Malvaceae Cola gigantea A. Chev. # 1 0.791 0.005
Malvaceae Cola laurifolia Mast. # 1 0.791 0.007
Bignoniaceae Spathodea
campanulata P.
Beauv.
# 1 0.791 0.006
Moraceae Ficus capensis Thunb. # 1 0.707 0.023
Leguminosae Isoberlinia doka Craib
& Stapf
# 1 0.707 0.025
Apocynaceae Alstonia boonei De
Wild.
# 1 0.685 0.047
Annonaceae Hexalobus crispiflorus
A. Rich.
# 1 0.681 0.025
Leguminosae Abarema floribunda
Benth.
# 2 1 0.001
Leguminosae Erythrina indet # 2 1 0.001
Anacardiaceae Lannea welwitschii
(Hiern) Engl.
# 2 1 0.001
Arecaceae Raphia indet # 2 1 0.001
Myristicaceae Staudtia stipitata
Warb.
# 2 1 0.001
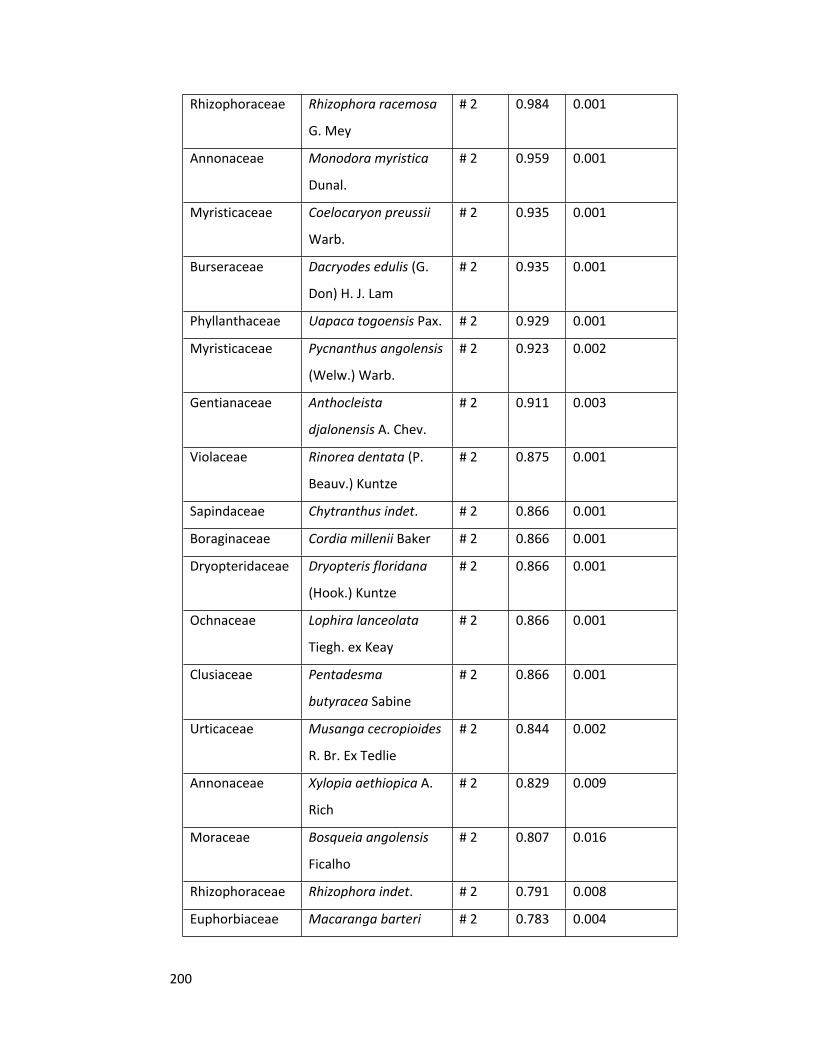
200
Rhizophoraceae Rhizophora racemosa
G. Mey
# 2 0.984 0.001
Annonaceae Monodora myristica
Dunal.
# 2 0.959 0.001
Myristicaceae Coelocaryon preussii
Warb.
# 2 0.935 0.001
Burseraceae Dacryodes edulis (G.
Don) H. J. Lam
# 2 0.935 0.001
Phyllanthaceae Uapaca togoensis Pax. # 2 0.929 0.001
Myristicaceae Pycnanthus angolensis
(Welw.) Warb.
# 2 0.923 0.002
Gentianaceae Anthocleista
djalonensis A. Chev.
# 2 0.911 0.003
Violaceae Rinorea dentata (P.
Beauv.) Kuntze
# 2 0.875 0.001
Sapindaceae Chytranthus indet. # 2 0.866 0.001
Boraginaceae Cordia millenii Baker # 2 0.866 0.001
Dryopteridaceae Dryopteris floridana
(Hook.) Kuntze
# 2 0.866 0.001
Ochnaceae Lophira lanceolata
Tiegh. ex Keay
# 2 0.866 0.001
Clusiaceae Pentadesma
butyracea Sabine
# 2 0.866 0.001
Urticaceae Musanga cecropioides
R. Br. Ex Tedlie
# 2 0.844 0.002
Annonaceae Xylopia aethiopica A.
Rich
# 2 0.829 0.009
Moraceae Bosqueia angolensis
Ficalho
# 2 0.807 0.016
Rhizophoraceae Rhizophora indet. # 2 0.791 0.008
Euphorbiaceae Macaranga barteri # 2 0.783 0.004
201
Müll. Arg.
Sapotaceae Manilkara obovata J.
H. Hemsl.
# 2 0.707 0.022
Malvaceae Octolobus angustatus
Hutch.
# 2 0.707 0.027
Ebenaceae Diospyros
mesipiliformis Hochst.
ex A. DC.
# 3 0.987 0.001
Malvaceae Sterculia rhinopetala
K. Schum.
# 3 0.975 0.001
Malvaceae Sterculia oblonga
Mast.
# 3 0.912 0.001
Cannabaceae Celtis zenkeri Engl. # 3 0.861 0.001
Leguminosae Erythrophleum
ivorense A. Chev.
# 3 0.853 0.004
Arecaceae Elaeis guineensis Jacq. # 1 & 2 0.968 0.001
Leguminosae Hylodendron
gabunense Taub.
# 1 & 2 0.901 0.001
Leguminosae Brachystegia nigerica
Hoyle & A.P.D. Jones
# 1 & 2 0.866 0.002
Rubiaceae Canthium hispidum
Benth.
# 1 & 2 0.829 0.008
Apocynaceae Funtumia elastica
(Preuss) Stapf
# 1 & 2 0.791 0.009
Irvingiaceae Irvingia gabonensis
(Aubry-Lecomte ex
O’Rorke) Baill.
# 1 & 2 0.791 0.007
Meliaceae Khaya ivorensis A.
Chev.
# 1 & 2 0.75 0.032

202
Appendix 6: Questionnaire
HOUSEHOLD SURVEY FOR ASSESSING FOREST USE AND DEGRADATION IN THE NIGER
DELTA
Date ………………….. Village ……………………………..
Local Government Area ……………………………………….. State ………………………..
SECTION A
FOREST ECOSYSTEM, VISIT AND PURPOSE
A1. Have you ever visited the forest in your community?
1. Yes ………. 2. No …………..
A4. What is your frequency of forest visit?
1. Yearly ………. 2. Monthly …………….. 3. Weekly …………………
4. Daily …………… 5. Others (specify) ………………………………………………….
A5. Why do you visit the forests? (Can provide as many reasons as possible)
…………………………………………………………………………………………………………………………………………
…………………………………………………………………………………………………………………………………………
……………………………………
SECTION B
FOREST EXTENT, DISTURBANCE AND CONSERVATION

203
B1. Do you know what the forest was used for about 50 years ago?
1. Evil forest ……………………………. 2. Sacred grove …………………… 3. Farmland
…………………
4. Communal Oil palm bush ………….... 5. Others (specify)
……………………………………………………….
B2. What is your view about the extent of the forest for the past 10 – 40 years?
1. Decreased …………… 2. Increased ……………… 3. Same …………………………
B3. What are the causes of forest loss in your community?
…………………………………………………………………………………………………………………………………………
…………………………………………………………………………………………………………………………………………
……………………………………
B4. Suggest how the forests could be effectively conserved.
…………………………………………………………………………………………………………………………………………
…………………………………………………………………………………………………………………………………………
…………………………………...
SECTION C
FOREST MANAGEMENT
C1. Who owns the forest in your community?
1. Government ………………. 2. Community ……………….. 3. Households/families
………………
4. Others (specify) ………………………….
C2. Do you do anything in particular to care for or preserve the forest?

204
1. Yes ………………… 2. No …………………………….
C3. Are there any restrictions to forest use in your community?
…………………………………………………………………………………………………………………………………………
…………………………………………………………………………………………………………………………………………
…………………………………...
SECTION D
ECOSYSTEM SERVICES AND LIVELIHOOD ASSESSMENT
D1. Rank (√) the following Provisioning services in their order of importance to you and
your family.
S/N Provisioning
Function
Highly
important
Important Neutral Not
important
Not at all
important
1 Food (Edibles like
fruits, vegetables,
nuts, etc)
2 Fuel wood
(Firewood)
3 Wood (Timber,
logs)
4 Grazing/Pasture
land
5 Medicines/Herbs
6 Bush meat (Game)
7 Fishery

205
8 Snails
9 Composting
D2. Do you think that the forest products and services are reducing?
Yes ………………… 2. No …………………………..
D3. What do you think is the cause of the loss or reduction of forest products/resources?
1. Road/Canal construction …………… 2. Oil pollution …………… 3. Natural
causes …………..
4. Agricultural activities …….. 5. Government (Policies and activities) ………………..
6. Population increase …………….
7. Others (specify) ……………………………………………………………..
D4. How important are the forests at different distances from your house to your
livelihood?
S/
N
Distance to
forest
Highly
importan
t
Importan
t
Neither
important
or
unimportan
t
Not
importan
t
Not at all
importan
t
1 Forests found
within your
neighbourhoo
d
2 Forests located
some distances
away from

206
your house but
within your
village
3 Forests found
far away from
your village
D5. What response (with reference to your livelihood) have you adopted (or will adopt)
to the reduction in forest resources/products in your area?
…………………………………………………………………………………………………………
…………………………………………………………………………………………………………………………………………
…………………
SECTION E
SOCIO DEMOGRAPHIC VARIABLES
E1. What is your highest level of education?
1. No formal education ……….. 2. Primary ………… 3. Secondary ………… 4.
Diploma/NCE …………… 5. Bachelor’s degree ……………. 6. Master’s degree …………
7. Others (specify) ……………………
E2. What is your age group?
1. Less than 20 (16 – 20) …………… 2. 21 – 30 ……………. 3. 31 – 40 ……………
4. 41 – 50 ……………. 5. 51 – 60 …………….. 6. Above 60 …………………
E3. Which of the following best describes your full time occupation? (Tick (√) only one
option)
1. Farming [ ] 2. Government employee [ ] 3. Teaching [ ] 4. Fishing [
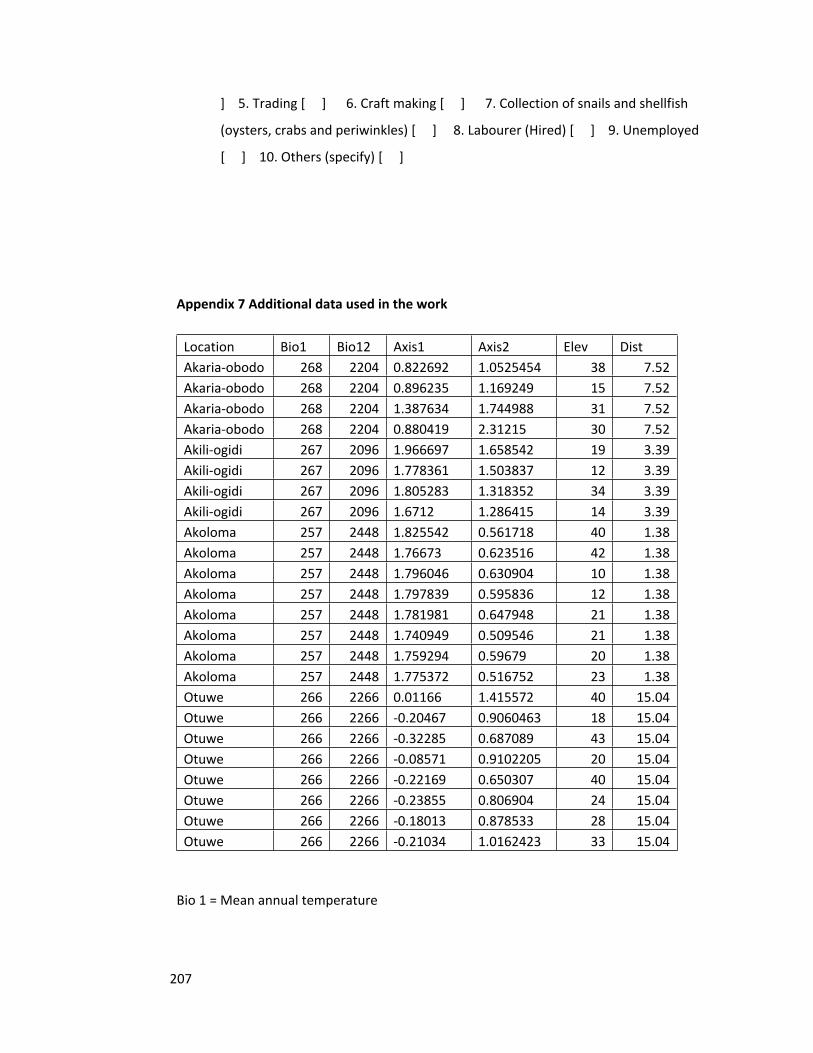
207
] 5. Trading [ ] 6. Craft making [ ] 7. Collection of snails and shellfish
(oysters, crabs and periwinkles) [ ] 8. Labourer (Hired) [ ] 9. Unemployed
[ ] 10. Others (specify) [ ]
Appendix 7 Additional data used in the work
Location Bio1 Bio12 Axis1 Axis2 Elev DistAkaria-obodo 268 2204 0.822692 1.0525454 38 7.52Akaria-obodo 268 2204 0.896235 1.169249 15 7.52Akaria-obodo 268 2204 1.387634 1.744988 31 7.52Akaria-obodo 268 2204 0.880419 2.31215 30 7.52Akili-ogidi 267 2096 1.966697 1.658542 19 3.39Akili-ogidi 267 2096 1.778361 1.503837 12 3.39Akili-ogidi 267 2096 1.805283 1.318352 34 3.39Akili-ogidi 267 2096 1.6712 1.286415 14 3.39Akoloma 257 2448 1.825542 0.561718 40 1.38Akoloma 257 2448 1.76673 0.623516 42 1.38Akoloma 257 2448 1.796046 0.630904 10 1.38Akoloma 257 2448 1.797839 0.595836 12 1.38Akoloma 257 2448 1.781981 0.647948 21 1.38Akoloma 257 2448 1.740949 0.509546 21 1.38Akoloma 257 2448 1.759294 0.59679 20 1.38Akoloma 257 2448 1.775372 0.516752 23 1.38Otuwe 266 2266 0.01166 1.415572 40 15.04Otuwe 266 2266 -0.20467 0.9060463 18 15.04Otuwe 266 2266 -0.32285 0.687089 43 15.04Otuwe 266 2266 -0.08571 0.9102205 20 15.04Otuwe 266 2266 -0.22169 0.650307 40 15.04Otuwe 266 2266 -0.23855 0.806904 24 15.04Otuwe 266 2266 -0.18013 0.878533 28 15.04Otuwe 266 2266 -0.21034 1.0162423 33 15.04
Bio 1 = Mean annual temperature

208
Bio 12 = Mean annual rainfall
Elev = Elevation
Dist = Disturbance