frequency-dependent attenuation of s and coda waves in erzincan region (turkey)
TRANSCRIPT
k . . . . , . .
I ELSEVIER Physics of the Earth and Planetary Interiors 97 (1996) 109-119
PHYSICS OFTHE EARTH
AND PLANETARY INTERIORS
Frequency-dependent attenuation of S and coda waves in Erzincan region (Turkey)
Aybige Akinci a,*, Haluk Eyido~an b a Dokuz Eyl~l l)niversitesi, M~hendislik Fakfdtesi, Jeofizik Mf~hendisli~i Bbli~m~, 35100 Bornova-lzmir, Turkey b lstanbul Teknik l~lniversitesi, Maden Fak~ltesi, Jeofizik M~hendisli~,i Bfil~m~, 80626, Maslak-lstanbul. Turkey
Received 2 November 1995; accepted 2 February 1996
Abstract
The attenuation structure of the Erzincan region is studied using the single scattering model of the coda wave generation and coda normalization method for S waves. We have determined the seismic quality factors Qs(f) (for S waves) and Qc(f) (for coda waves) as a function of frequency for the frequency range 1.5-24 Hz. The quality factors were derived for 161 seismograms that were registered in a 7-day period after the 13 March 1992 Erzincan earthquake (M s = 6.8). Digital recordings from six stations at epicentral distances ranging from 5 to 40 km were used. Frequency-dependent attenuation of S waves according to Q s ( f ) = Qofn in the crust beneath Erzincan was obtained as Q s ( f ) = 35f 0'83 by analysing seismograms of 161 local earthquakes which were selected on the basis of good signal to noise ratios. Coda Q values were calculated from the amplitude decay rate of the S-wave coda in seven frequency bands from 1.5 to 24 Hz. In order to investigate a possible lapse time dependence of the estimated coda Q, we have carried out the analysis of each seismogram using four coda lengths which correspond to four different lapse times 20, 30, 40, 50 s measured from the origin time of the earthquake. Qc averages about 46 and 766 at 1.5 Hz and 24 Hz, respectively, at 20 s lapse time and has a frequency dependence of the form Qc = 29f L°3- For large lapse time data, t c = 50 s, Qc(f) was found to vary from 84 at 1.5 Hz to 783 at 24 Hz with the degree of the frequency dependence, n = 0.81.
1. Introduct ion
Erzincan city in eastern Turkey is seismically very active and has experienced several large earth- quakes in this century. The region is located on the North Anatolian Fault zone which is one of the most prominent tectonic features in Turkey (Fig. 1). The last Erzincan earthquake of March 13, 1992 ( M s = 6.8) was a major event and occurred near the eastern end of the North Anatolian Fault (NAF) zone. Severe
• Corresponding author.
damage occurred in Erzincan city and its surround- ing towns and villages. Several studies reported the focal depth of the main shock to be located in the upper crust as shallow as 10 km (Barka and Eyido~an, 1993; Fuenzalida et al., 1996) while the National Earthquake Information Service (NEIS) and De- schamps and Dufimier (1992) reported it as deep as 25 km. The main shock took place at a right-lateral strike-slip fault striking 122 SE and dipping 65 SW based on the modell ing of the broad-band P and SH waveforms (Fuenzal ida et al., 1996). Even though the major damage occurred in Erzincan city, the exact instrumental epicentre of the main shock is not
0031-9201/96/$15.00 Copyright © 1996 Elsevier Science B.V. All rights reserved. PII S0031-9201(96)03155-X

110 A. Akinci, H. Eyido~,an / Physics o f the Earth and Planetary Interiors 97 I 1996) 109- l 19
known since error of location is greater than + 5 km due to the lack of local seismic stations. Aftershock studies, which were carried out by several institu- tions, began 7-13 days after the main shock (Cisternas et al., 1992; Ergintav et al., 1992; Gtirb~z et al., 1993). Aftershock activity was clearly ob- served along the NAF on the northern border of the basin, but most of the aftershocks took place out of the basin at the intersection of the NAF and OVF (Ovacik Fault), and to the southeast of this area where a second large shock (M s = 5.8) occurred on 15 March 1992.
Now, there are well-registered three-component digital records of aftershocks which are the outcome of the first field expedition on the NAF after a major shock. However, it is obvious that some character- istics of the region have to be examined. So far, Giirbi~z et al. (1993) and Kaypak (1995) analysed the source spectra of the aftershocks of the 13 March 1992 Erzincan earthquake and found that the decay rate of the spectra beyond the corner frequency highly exceeded the values 2 and 3 which were predicted for Brune (1970) and Aki (1967) source models in an attenuation-free medium, respectively. High decay rate is most likely controlled by strong attenuation in the earthquake area if the sources of Erzincan aftershocks do not obey source laws differ- ent from Brune and Aki's.
As is well known, one of the most important problems in seismology is to discriminate which features of the observed signals are due to source and which to the propagation through the litho- sphere. The rate of attenuation of seismic waves, as measured by the reciprocal of the quality factor Q (Knopoff, 1964), provides important information about the source mechanism (Lindley and Archuleta, 1992), earthquake magnitude and range of detectabil- ity of seismic signals and can be strongly affected by variations in the physical state and temperature field of the Earth's interior (Cormier, 1982). Research has shown that studies of the loss mechanism provide additional information about the physical state of the Earth and are important in inversion of seismic data in terms of a real crust model.
The aim of this paper is to present results on Q measurements in a tectonically active region, Erzin- can and its vicinity. There are also several reasons to examine the attenuation characteristics of the Erzin-
can region. First, there are well-recorded three-com- ponent digital records of aftershocks. Second, Erzm- can and vicinity represent many other active areas along the NAF zone which, in several studies, is proposed to have similarities with the San Andreas Fault (Allen, 1969) and it will be interesting to compare the attenuation characteristics of these two similar fault zones. Third, modern assessment of seismic hazards and information on earthquake source parameters in a given region requires good know- ledge of both attenuation and crustal properties of the medium.
The method used in the present paper is based on the estimates of coda waves Q, Qc, and of direct S-wave Q, Qs, for the same set of data. First, we used the coda normalization method to obtain Q~ values for the frequency range 1.5 < f < 24 Hz. Aki (1980) proposed this method to determine Q~ by comparing S and coda amplitudes of events at differ- ent distances from the observer. Recently, Frankel et al. (1990), Takemura et al. (1991) and Yoshimoto et al. (1993) applied this method to a data set of different tectonically active and stable areas. Second, the single scattering model (Aki and Chouet, 1975) was used to calculate Qc values as a function of lapse time in order to investigate the possibility of a real depth dependence of seismic attenuation in the Erzincan region. Although, the physical meaning of Qc is not well established, single scattering and single isotropic scattering models have been used extensively for crustal attenuation studies, because they are simple to apply. Also, Qc values are widely used to compare different tectonically active and stable areas or for monitoring the changes in the attenuation properties of a given area for earthquake prediction purposes.
2. Tectonic setting and data
The Erzincan basin is located between three con- jugate fault segments of right lateral strike-slip NAF, left lateral strike-slip Ovacik Fault and Northeast Anatolian Fault (Fig. 1). The NW-SE trend of Erz- incan basin is parallel to the trend of the NAF which forms the entire northern boundary of the basin. Northeast Anatolian and the Anatolian blocks escape sideways along these faults from the N - S conver-

A. A kinci, H. Eyido~an / Physics of the Earth and Planetary Interiors 97 (1996) 109-I 19 111
43ON
"~7':--. / / , , ~ r : g r ~ ~ . / ~ . / " ~ ' P ' . , , - / Z A A ~ . . . . . . . .
~eG ~, . . . . . . . . . . . . . . . ' \ ' " - : : , - - - - . ~ ~ ~ : : i : : . ' : " : :
• o ~ . . . . . . . . . . ~o e e e . . . . . . . . . . . . . . . . . .
~ Ovo~k East A,'xatolian f~uR ~' • Eurasia "
r . . - - .
1 Late miocene
2 ~ Erzincan basic
Oph;oli t ;c melanges 3 33ON
20OE 28OE 41OE
Fig. 1. Main geologic units of the Erzincan region (reproduced with permission of Barka and Giilen, 1989). 1, late Miocene basins; 2, Plio-Quaternary age Erzincan basin; 3, ophiolitic melanges. S~, S~ and S 3 are the major segments of the North Anatolian Fault, respectively.
39.85 - - - . . . . . . . . . . . . . . . . . . . . . . , . . . . . . . . . . . . . . . . . . . . . . . ; . . . . . . . . . . . . . . . . . . . . . . . , . . . . . . . . . . . . . . . . . . . . . . . .
ie ! 3'0 km
Oi,, Erzlncan • UzQmlu
13"03-1992 -e-.. •;
: o ; • AR A ; BAR A
' ~ J ! ~ i ~ / • . P i i l f lm0r
oj : / - :
39.35
39,25 39.50 39.75 40.00 40.25
LONGITUDE (E)
Fig. 2. Map of the Erzincan region showing the locations of the GEOSTRAS stations (triangles) used in this study and the aftershocks analysed (circles). The stars show the epicentres of the 13 March 1992 main shock and the 15 March 1992 aftershock, respectively.

112 A. A kinci, H. Eyido~,an / Physics of the Earth and Planetary Interiors 97 (1996) 109-1 l 9
gent zone in eastern Turkey caused by the collision of the Arabian and the Eurasian plates (~eng~Sr et al., 1985; Barka and Gfilen, 1989). The NAF consists of three major segments (S t, S 2, S 3) in the vicinity of the Erzincan basin (Fig. 1). The Erzincan basin is a complex full-apart basin and it opens as a result of interactions between segments of the NAF zone and the NE-SW trending OVF (Barka and Giilen, 1989). Fuenzalida et al. (1996) pointed out that the Erzincan basin is wider and more complex than what would be expected from a simple pull-apart basin, based on evidence obtained from satelite images and field observations. These are the extensional features to the NE and SW of the basin, including compres- sional structures to the NW and particularly to the SE and high topography around the basin ( = 3500m).
A seismic network of 25 portable stations was arrayed around the source region by the Turkish and French team 13 days after the main shock (Cisternas et al., 1992). The network consisted of eight MEQ- 800 analog recorders (Sprengnether), eight GEOSTRAS digital three-component autonomous recorders with L4-3D Mark Products seismometers recording on magnetic tape, and a portable digital telemetric network. The seismic network recorded more than 2500 aftershocks. In this study we used aftershocks recorded by GEOSTRAS seismographs and the data corresponding to the period of 4-8 April 1992. The recorder has a flat velocity spectrum between 0.2 Hz and 30 Hz and 70 db dynamic range. The signals are digitized at 150 samples s -~ .
The location of seismic stations and selected events are shown in Fig. 2. Hypocentral distances of studied events range between 5 and 40 km. The earthquakes, which are selected to be processed to find attenuation characteristics of the region, have location accuracies less than 1 km and were recorded
Table 1 The characteristics of GEOSTRAS stations used in this study. All stations are installed on the Miocene rock outcrops
Station code Latitude N Longitude E Elevation (m)
KAR 39035.92 39041.07 1263 MER 39*28.42 39056.03 1550 GUN 39044.37 39o38.06 1430 SAN 39033.34 40004.10 1477 YAR 39°34.10 39°56.71 1460 BAR 39033.96 40°11.18 1451
by at least three stations. Most of the aftershocks have a relatively shallow depth (h < 10 km). Since a good signal-noise ratio is required to record micro- aftershocks, the seismographs are operated at rocky sites exposed around the basin. The characteristics of the station sites are given in Table 1.
3. Method and data analysis
3.1. The coda normalization method
Aki (1980) proposed a technique to determine Q~ by comparing S and coda amplitudes of events at different distances from the observer. This technique which is called the coda normalization method is based on the division of direct S-wave amplitude by the coda amplitude measured at a fixed time, t c, and elimination of the source power, site effect, instru- ment response from the observed spectra of the direct S waves. The technique of the coda normaliza- tion method (Aki, 1980) was also applied by differ- ent authors (e.g. Frankel et al., 1990; Fehler et al., 1992; Mayeda et al., 1992; Hoshiba, 1993; Yoshi- moto et al., 1993) in several different regions.
For the direct S-wave amplitude spectra, As(tO,r) can be written as
As( to ,r ) = R6o I( to)S( to)G(o9) r-:~ e -~''/2Qv.
(1)
Here r is hypocentral distance, G(to) is the site amplification, S(to) source function, I(tO) is the instrumental response characteristic, R~, 0 is the radi- ation pattern and ~o, V, ~, are angular frequency, average S-wave velocity and coefficient of geometri- cal spreading, respectively.
The spectral amplitude of coda waves, Ac(tO,r) can be parametrized as
ac(og,tc) =I ( tO)S( tO)G( tO)P( tO, t c ) (2)
where P(tO,t c) is a coda decay function that repre- sents the coda spectral amplitude with lapse time on the seismogram, G(tO), S(to), l(to) are the same as for the direct S wave.
Then attenuation of direct S waves can be calcu- lated after the division, according to;
<In( As(to,r) r- Y/R6o Ac( tO,t c) )>r+ Ar
= s - ( tO/2QsV)r (3)

A. Akinci, H. Eyido~an / Physics of the Earth and Planetary Interiors 97 (1996) 109-119 t 13
where As(to,r) is the S body wave spectral ampli- tude, Ac(to,t c) is the coda wave spectral amplitude obtained at time tc measured from the occurrence of the event, and r is the hypocentral distance, R+0 is the radiation pattern, ~, is a geometrical coefficient and s is a function of the source of S and coda waves, site effect at the receiver. Here Qs is deter- mined by a least-squares fit of Eq. (3).
Unfortunately, one major assumption in the derivation of Eq. (3) is that averaging over a number of S waves from events at different azimuths in a particular distance range diminishes the effect of the radiation pattern (Aki, 1980). Scatter in the plot of coda normalized amplitudes may be due to the effect of the source radiation pattern. Besides, the division by the coda amplitude should remove the effects of site amplification so that amplitudes from different stations can be compared.
In this part of the study, 161 digital seismograms, which were registered at six stations, were analysed with a very good signal to noise ratio. In order to minimize site effects and to increase the signal to noise ratio, all the stations were deployed on the outcrops of Miocene ophiolitic rocks in the Erzincan region. Of all the events recorded, those that were selected occurred within a radius of 40 km around each station. We determined the normalized shear wave amplitudes for six frequency bands ranging from 1-2, 2-4, 4-8, 8-16, 12-24 and 16-32 Hz. The envelopes of the band-pass filtered waveforms are used to measure As(to,r) and Ac(o~,t~). The value of As(to,r) was taken as a maximum ampli- tude of the S-wave envelope. To normalize the shear wave amplitude, we selected A~(to,t¢) from the en- velope of coda waves at a fixed lapse time, t c = 20 s. t c was chosen to be at least longer than 1.5 or 2 times that of S-wave travel time. The average veloc- ity for direct S wave, V, is taken to be 3.0 km s-
3.2. The coda wave method
A number of attenuation studies in the lithosphere have been made using the coda wave theory of Aki and Chouet (1975) and Aki (1980). According to Aki and Chouet (1975), coda amplitude, A(to,tc), at an- gular frequency, ~o, and lapse time, t~, is given as
A( to,t c ) = C(to) tc ' e- o~ ,c/Qc (4)
where t~ -I represents the effect of geometrical spreading for the body waves and Q¢ the attenuation of the coda waves. Taking the logarithm leads to
log,0 A(to,to) + logt0(tc) = log,0C (to)
- (log j0 e) totc/Qc. (5)
Hence Q¢ can be determined from the slope of the log ~o( A( to, t~ ).t~ l ) versus time distribution.
The assumption in the model of Aki and Chouet (1975), that the source and the receiver are located at the same point, is acceptable for coda waves recorded long after the primary waves. Rautian and Khalturin (1978) showed that Eq. (4) is valid only for lapse times greater than twice the S-wave travel time. Sato (1977) extended the single scattering model to incor- porate source-receiver offset, thus coda analysis be- gins immediately after the shear wave arrival and state as
A(r , to , tc) = C ( t o ) K ( r , a ) e ~-'°''/20~ (6)
where a = t / t S, t~ is the S-wave lapse time, r is the source-receiver distance, K(r ,a) = (l / r ) { ( 1 / a ) ln[(a + 1 ) / ( a - 1)]} °5.
In this work, we selected 161 seismograms with the criteria of a good signal-to-noise ratio at the end of the coda. Each seismogram time series was first bandpass filtered over seven frequency bands centred at 1.5, 3, 6, 9, 12, 18 and 24 Hz, with bandwidths of 1, 2, 4, 6, 8, 12 and 16 Hz, respectively, using four-pole, phase free Butterworth filter. Starting at the origin time, root-mean-square (rms) amplitudes in each window were determined for the data in each frequency band, with the window sliding across the time series at 1-s intervals. Time-window lengths for the rms averaging 2 s were chosen. The left-hand side of Eq. (5) was then evaluated and plotted against lapse time. The beginning of the coda was fixed at a time point 2.t s after the origin time. The end of the coda was selected at a point in which the envelope begins to increase.
In order to avoid variations in coda Q with lapse time and to measure the Q over the same volume of the Earth, we divided the set of data into five groups, having coda lengths not greater than 20, 30, 40, 50 s, respectively. From the plot, a straight line fit to it by least-squares and from the slope of the line, Q~ was

114 A. Akinci, H. Eyido~,an / Physics of the Earth and Planetary Interiors 97 (1996) 109-I 19
calculated. Only Q~ values obtained from least- squares fits with correlation coefficients greater than or equal to 0.80 were retained.
4. Results
Eq. (3) was applied to our data set and ln(A~r-t/A¢) versus distance was plotted for the frequencies 1.5, 3, 6, 12, 18 and 24 Hz (Fig. 3). The S-wave amplitudes are normalized to the coda ampli- tude at 20 s after the origin time. The open circles plotted in Fig. 3 indicate that the coda normalization method is an effective scheme for combining ampli- tudes from different earthquakes and stations on the same plot. We generally observed that the variation
8.0 . . . . . . . . . . . . . . . . . . . . . .
','~ 6.0
~ 4 . 0 0 ~4
2.0
12 llz
800 o
277.34 ± 11.0
5.0 10[0 I . . . . ~'" - - - -1 " - I ~5.0 20.0 zsI.o 30.0 3,~0 400 D i s t a n c e (krn)
8.0
0.0
~ 4 . 0 0
2.11 5.0 101.0 151.0
o ~ o ~ 18 Hz
- ~ ~ o o o o °0oo o~ o o o
20!0 25[0 30[0 D i s t a n c e ( k m )
3 4 9 . 8 5 ± 17.4
351.0 40.0
8.0
6.O
~ 4 . 0
2.0 5.0 I0!0 15!0
1.5 HZ
O °
~O~aQo8 80°°8 8 o o
48,42 + 1.4
20[0 25t0 30'.0 a5to 40.0 Distance (km)
8 . 0
"~ 6.0
~ 4 . 0 o
2.0 5.0 tO[O
3 Hz
O 08 O
~ 0 c ~ o _ 0
8 9 . 0 4 ± 3 . 4
I I 15.0 201.0 251.0 301,0 35.0 40,0
D i s t a n c e ( k i n )
0.0
8 8.o
< ~a0 4.0
2.0
6 Hz
O ~ A O 0 0 £ 0
~ o 0 o o
147.27 :[-6.0
5.0 I01.0 151.0 201.0 25[0 301.0 351.0 40.0 Distance (km)
Fig. 3. Coda.normalized direct S-wave amplitudes at 1.5, 3, 6, 12, 18 and 24 Hz for Erzincan region. Lines indicate least-squares fits for the whole earthquakes. The values of Qs for these least-squares fits are shown in each frame. Geometrical spreading exponent is taken as unity.
0.0 . . . . . . . . . . . . . .
.~ 6.0
~ 4 . 0
2.0 5.0
n O 24 Hz
o o o o
o o o o o 546 .47 _+ 22 .4
I I I - ] - - - - - I ] - - 10.0 15.0 20.0 25.0 30.0 35.0 40.0
D i s t a n c e ( k m )
Fig. 3 (continued).
in the coda normalized amplitudes decreases with increasing hypocentral distance. Scatter of data in Fig. (3) which may be caused by radiation pattem is slightly larger at low frequency than at high fre- quency. We proceed to fit a straight line to the relation and determine the Qs from Eq. (3) by the least-squares method. By assuming that geometrical spreading is proportional to r -I , the frequency de- pendence of Qs(f) is found to be of the form Q~(f) = 35f °.83.
The spectral amplitude of the shear waves ob- served at a station is also changed by the geometrical spreading exponent as well as the attenuation. In an Earth medium with constant velocity, the geometri- cal spreading function for body waves is given as r -~ and r -°5 for surface waves. However, the amplitude decay with distance is sensitive to the presence of velocity gradients and low-velocity zones in the crust. Moho or Conrad discontinuity may

A. A kinci, H. Eyido~,an / Physics of the Earth arul Planetary Interiors 97 (1996) 109-119 1 l 5
Table 2 Comparison of Qs values for different geometrical spreading exponents
Frequency (Hz) Qs for ~/= 0,75 Qs for - / = 1 Qs for ~/= 1.25
I -2 34.16+ 1.4 48.42+___4.6 83.15__ 8.5 2 -4 64.34+3.4 89.04+__5.1 144.55+_ 14.2 4 -8 111.77+_3.5 147.27+_6.0 215.80+_12.8
8-16 220.17+_7.4 277.34+_ 11.0 419.20+_20.0 16-24 295.74+_8.8 349.85__+ 17.4 514.49+-26.3 16-32 422.11+_13.4 546.47+_22.4 774.71+_44.2
change the value of ",/ from unity. In the first step of the Q~ calculation process, we took the "y value as unity and then different values of exponent 3' = 0.75 and 1.25 were used to see how the Q~ changes.
The Q~(f) results and its standard error are repre- sented in Table 2 and Fig. 4 for different geometrical spreading values. It is clearly seen that 1/Q~(f) values in each frequency band and the degree of frequency dependence become smaller for the large ~. The estimates of Q~(f) are approximately fitted by Q~(f) = 6 0 f 077 for the 1.25 geometrical spread- ing exponent and fitted by Q~(f) = 24 f °88 for the 0.75 geometrical spreading exponent in the fre- quency range between 1.5 and 24 Hz.
Qc was obtained using a single scattering model of S waves for different lapse times of the coda in the Erzincan region. So far, several researchers have reported that the fit of the coda envelope by a single curve is not a good way and noted that Q~ increases with the lapse time. Therefore, attenuation measure- ment of coda waves was done at the different lapse times. An increase was also found in this area. The value of the coda quality factor and its standard error
800 -
6 0 0 /
(~r 400 / •
"'I" ~ / /
Z J. j / = 0"75~"
200
2r Qa=a,sru, Q.=sl¢."
o . . . . l l F . . . . . . . . I
o o 5.0 ,0.0 1~.0 200 z5.o F r e q u e n c y (Hz)
Fig. 4. Comparison of S-wave attenuation of the Erzincan region for different geometrical spreading exponents as a function of frequency.
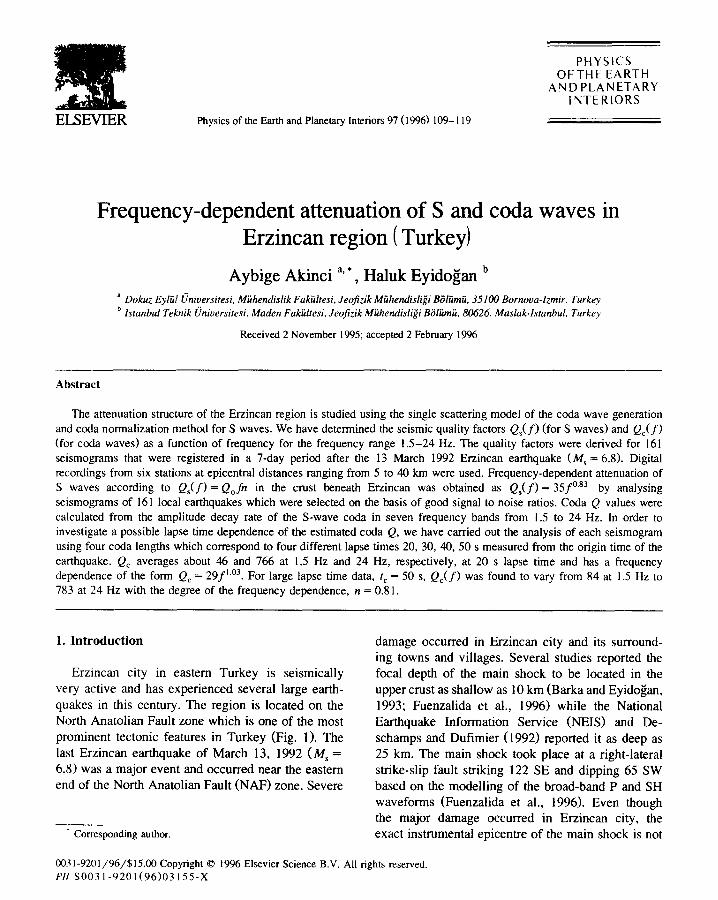
at each frequency and each 10-s lapse time are reported in Table 3. Qc values indicate apparently large attenuation in the Erzincan region. Fig. 5 shows the distribution of Qc for different frequencies and lapse times. As frequency increases, the increase of Qc with lapse time is larger.
For different lapse times a dependence of Qc(f) = Qof" has been found to fit the experimental data well at each lapse time interval. The exponent n was found to vary over a very short range while Qo increases quite regularly with coda duration interval. If we fit the Qc data in Fig. 5 to a power of the form Qc(f) = Qof", we obtain the equations for lapse
Table 3 Average Coda Q for each frequency band and each 10-s lapse time for the Ersincan region
Frequency (Hz) Qc (20 s) Qc (30 s) Qc (40 s) Qc (50 s)
1-2 46.13 -t- 7.3 63.96 + 9.2 74.86 + 8.0 78.02 + 6.4 2 -4 84.87 + 15.5 117.55 +_ 14.4 127.61 4- 9.1 138.89 2:7.2 4 -8 163.49 +_ 35.2 216.00 +- 25.8 232.98 + 12.8 247.24 ± 11.2
6-12 265.66 +- 63.0 308.41 ___ 29.6 330.55 + 16.7 346.43 ± 13.6 8-16 375.19 -1- 73.5 397.03 + 31.2 418.32 + 19.6 440.12 ! 27.0
16-24 557.56 + 86.5 566.80 _+ 32.6 604.52 + 29,8 616.71 _+ 34.8 16-32 766.37 + 104 729.66 +- 47.0 828.87 + 43,4 783.48 +_ 51.8
116 A. Akinci, H. Eyido~an / Physics of the Earth and Planetary Interiors 97 (1996) 109-/I9
800 - -
600, ~ 4 0 0
200
800
~ 4
Frequency ( H z )
600 &4oo
200
1000
lapse Ume 30s
I I I I I I I I I I .i ~, lz 18 2o 24 Frequency (ltz)
0 O"
800
600
400
200
J /
I*Izle thne 40s
Qe=5ot" ' ~ ' ~ ' , ' ' , ~ ' 8'0 ' 2 ~,
Frequency ( H z )
8OO
600 ~t400
200 lapse time 50s
Q e = s a ~ "
' ~ ' ~ ' 1 / , t / , 21o ' 2 / F r e q u e n c y (Hz)
Fig . 5. Q¢ v a l u e s f o r s e l e c t e d s e v e n f r e q u e n c y b a n d s ( 1 . 5 - 2 4 H z )
with increasing lapse time (20-50 s).
time 20 s, Q¢(f)= J03 29f " , and for lapse time 50 s, Q¢(f) = 59 f 0.81
5. D i s c u s s i o n a n d c o n c l u s i o n s
5.1. Frequency and lapse time dependence of Qc
Coda Q has been measured for the Erzincan region of eastern Turkey using a single scattering model of coda generation. Coda Q was obtained
using different lapse times between 20 to 50 s, in steps of 10 s. We see that coda Q increases with increasing lapse time and frequency. Although, the increasing coda Q with lapse time is not apparent, reasons may be connected to increase of coda Q with depth (Rautian and Khalturin, 1978; Roecker et al., 1982; Pulli, 1984; I b ~ez et al., 1990; Akinci et al., 1994). The Qc measurements in the studied area also exhibit a much stronger frequency dependence at short lapse time than at longer ones. This may indicate that the structure of the upper part of the crust is much more heterogeneous than that in the deeper part of the crust.
Correlations between the degree of frequency de- pendence of Qc and the level of tectonic activity in the area of measurement have also been made in compilations of Qc measurements by several work- ers (Aki, 1980; Pulli and Aki, 1981; Roecker et al., 1982; Van Erk, 1988). In general, tectonically stable regions were found to exhibit almost no frequency dependence while active areas, in which processes such as faulting or subduction are likely to introduce strong heterogeneity, show significant frequency de- pendence of Qc. Qc values found for the Erzincan area show a strong frequency dependence (n = 1.03 at 20 s lapse time), which if we assume the validity of the above correlation would not be surprising because of the presence of a complex faulting zone. Gi~rbfiz et al. (1993) analysed the lapse time inde- pendent coda Q, using one digital seismograph lo- cated west of the aftershock clustering area. They also found strong seismic absorption and determined Qo = 82 -I- 22 and frequency dependence coefficient n = 0.87 __+ 0.12 based on the Sato (1977) model.
By using the single scattering model of Aki and Chouet (1975), our interpretation of the results are ultimately constrained by the assumptions and limita- tions of this model. Several studies have questioned the validity of the single scattering approach in the coda studies. According to Gao et al. (1983a,b), the neglect of multiple scattering leads to an overestima- tion of Qc by a factor of 1.4. Qc as originally formulated by Aki (1969) was thought to reflect a predominantly scattering contribution. However, Frankel and Wennerberg (1987), using the energy flux model, suggest that Qc is a measure of intrinsic attenuation rather than scattering attenuation. Re- cently, Hoshiba (1993), using the multiple lapse

A. Akinci, H. Eyido~,an / Physics of the Earth and Planetary Interiors 97 (1996) 109-119 117
time-window analysis, also observed that coda Q is closer to intrinsic Q. If the scattering and intrinsic attenuation can be separately estimated, important properties of the Earth crust, for instance scatterer size or the wave number spectrum of the velocity variations, can be determined by the frequency de- pendence of scattering attenuation.
5.2. Geometrical spreading
Different values of the geometrical spreading ex- ponent, ",/. are taken to see how the Q~(f) value changes. Results show that the Q~(f) determinations are sensitive to small changes in the geometrical spreading exponent. Qs values increase 1.7% with increasing "y and decrease 1.4% with decreasing ~. In this study, we also see that the frequency depen- dence of Qs increases with increase of 2~. Degree of the frequency dependence, n, is 0.77 for ~/= 1.25 and 0.88 for ~/= 0.75.
In fact, recently, many studies show that effective geometrical spreading of S waves can be steeper than r-~ for reasonable models of the crustal veloc- ity structure. Frankel et al. (1990) reported that geometrical spreading changes from 1.27 in New York to 1.95 in Southern California and is generally higher than unity in the tectonically active region. Ib(tfiez et al. (1993) showed a 2~ that is greater than 1 and slightly frequency dependent in Southern Spain. Akinci et ai. (1995) indicated that the geometrical spreading exponent differed by 0.5 for surface waves in Western Anatolia (Turkey).
same as the frequency dependence of the direct S wave Q. Frankel (1991) attempted to separate scat- tering and intrinsic attenuation based on the energy flux model. The question was whether the decay with lapse time of high frequency energy in the coda is equivalent to the decay of high frequency energy with travel time of the direct S wave, when com- pared to the decay of low frequency energy. Accord- ing to the energy flux model, the similarity between the coda and S-wave decay at one frequency implies that intrinsic attenuation is the dominant cause of attenuation at that frequency. If scattering attenuation was important, it would cause the S waves to decay faster than the coda waves.
The results of our study indicate that at short lapse times, 20-40 s, 1.5 and 3 Hz coda decay is comparable to the amplitude decay of S waves with distance. However, for high frequencies, the coda decay is not equivalent to the attenuation of S waves with distance. For instance, the coda Q tends to be higher by about a factor of 1.3 than the S-wave Q at 24 Hz. A significant difference between the coda and S-wave decays at 24 Hz indicates that scattering attenuation is important, according to the energy flux model, in the Erzincan region.
In any case, to better understand the relation between the S and coda waves decay at low and high frequencies, model studies which have depth depen- dent parameters are necessary. Also, more complex models that take into account multiple scattering phenomena by introducing non-isotropic scattering or non-uniformity should be used.
5.3. Relation between Q,~ and Qc
Using the coda normalization and single scatter- ing methods, frequency dependent Q for S waves and coda waves were obtained as a form of Qs(f) = 35f °83 for ~/= 1 and Qs(f) = 47f °86 for 30 s lapse time in a tectonically active Erzincan area. Assuming that the coda waves consist of back-scattered S waves from many randomly distributed hetero- geneities and fractures in the Earth's lithosphere, Aki (1980) interpreted that the coda Q is almost equiva- lent to the Q of direct waves. When we compared Q~ for 2~ = 1 with Qc values at 20-40 s lapse time, we obtained a good agreement between Qc and Qs. The frequency dependence of the coda Q is almost the
Acknowledgements
The authors are grateful to Keiiti Aki and an anonymous reviewer for useful comments and sug- gestions. We thank A. Cisternas of IPGS (Institut de Physique du Globe de Strasbourg) for permitting the use of data and making available to us the list of hypocentre parameters. We also thank Aykut Barka for providing us with the tectonical and geological map of the Erzincan region. This work has been partially supported by ITU (Istanbul Technical Uni- versity) research fund, TUBITAK and DEU (Dokuz Eyli]l University) 922.94.01.01 research project.
118 A. Akinci. H. Eyido,~an / Physics of the Earth and Planetary Interiors 97 (1996) 109-/19
References
Aki, K., 1967. Scaling law of seismic spectrum. J. Geophys. Res., 72: 1217-1231.
Aki, K., 1969. Analysis of the seismic coda of local earthquakes as scattered waves. J. Geophys. Res., 74: 615-631.
Aki, K., 1980. Attenuation of shear waves in the lithosphere for frequencies from 0.05 to 25 Hz. Phys. Earth Planet. Inter., 21: 50-60.
Aki, K. and Chouet, B., 1975. Origin of coda waves; source, attenuation and scattering effects. J. Geophys. Res., 80: 3322- 3342.
Akinci, A., Taktak, G. and Ergintav, S., 1994. Attenuation of coda waves in the Western Anatolia. Phys. Earth Planet. Inter., 87: 155-165.
Akinci, A., Ib~ez, J.M., Del Pezzo, E. and Morales., J., 1995. Geometrical spreading and attenuation of Lg waves: a compar- ison between Western Anatolia and Southern Spain. Teetono- physics, 250: 47-60.
Allen, C.R., 1969. Active faulting in northern Turkey. Contr. No. 1577, Div. Geol. Sci. Calif. Inst. Tech., 32 pp.
Barka, A. and Eyido~an, H., 1993. The Erzincan earthquake of 13 March 1992 in eastern Turkey. Terra Nova, 5: 190-194.
Barka, A. and Giilen, L., 1989. Complex evolution of the Erzincan Basin (eastern Turkey). J. Strnct. Geol., 1 I: 275-283.
Brune, J.N., 1970. Tectonic stress and the spectra of seismic waves from earthquakes. J. Geophys. Res., 75: 4997-5009.
Cisternas, A., Philip, A., Dorbath, L., Eyido~,an, H. and Barka, A., 1992. The Erzincan earthquake of March 13, 1992. Was the North Anatolian Fault the only active one'? In: Programme and Abstracts, XXlll General Assembly of the European Seismo- logical Commission, 7-12 September 1992, Prague.
Cormier, V.F., 1982. The effect of attenuation on seismic body waves. Bull. Seismol. Soc. Am., 72: S169-$200.
Desehamps, A. and Dufimier, H., 1992. Turkish events of March 1992: rupture process from body-waves broad-band modelling. In: Programme and Abstracts, XXIII General Assembly of the European Seismological Commission, 7-12 September 1992, Prague.
Ergintav, S., Bkjmen, F., Ybriik, A., Kaplan, H., Aktar, M. and Yakjm, M.N., 1992. 13 Mart 1992 Erzincan depremi sonrasi deprem etkinli~,i. Erzincan depremi diinii, bugfinii, yanm ve T'tirkiye deprem sorunu sempozyumu, 15 Arahk 1992, pp. 52-55.
Fehler, M., Hoshiba, M., Sato, H. and Obara, K., 1992 Separation of scattering and intrinsic attenuation for the Kanto-Tokai region, Japan, using measurements of S-wave energy vs hypocentral distance. Geophys. J. Int., 108: 787-800.
Frankel, A.A., 1991. Mecahnisms of seismic attenuation in the crust: scattering and anelasticity in New York State, South Africa, and Southern California. J. Geophys. Res., 96: 6269- 6289.
Frankel, A.D. and Wennerberg, L., 1987 Energy-flux model of seismic coda: separation of scattering and intrinsic attenuation. Bull. Seismol. Soc. Am., 77: 1223-1251.
Frankel, A., McGarr, A., Bicknell, J., Mori, J., Seeber, L. and Cranswick, E., 1990. Attenuation of high-frequency shear
waves in the crust: measurements from New York State. South Africa, and Southern California. J. Geophys. Res.. 95:17441 - 17 457.
Fuenzalida, H., Dorbath, L., Cisteruas, A., Rivera, L., Haessler, H., Philip, H., Eyido~an, H. and Barka, A., 1996. Source mechanism of the 1992 Erzincan earthquake, from detailed aftershock analysis and broad-band body wave inversion: tec- tonics of the Erzincan basin and evidences of fault decoupling on the North Anatolian Fault. Geophys. Int. J., submitted.
Gao, L.S., Lee, L.G., Biswas, N.N. and Aki, K., 1983a. Effects of multiple scattering on coda waves in three dimensional medium. Pure Appl. Geophys., 121 : 3-15.
Gao, L.S., Lee, L.G., Biswas, N.N. and Aki, K., 1983b. Compari- son of the effects between single and multiple scattering on coda waves for local earthquakes. Bull. Seismol. Soc. Am., 73: 377-389.
Giirbiiz, C., Pmar, A., Ban~, 5. and I~lkara, A.M., 1993. Erzincan earthquake of 13 March 1992 and its aftershocks. In: A. Ansal (Editor), Proceeding of Second National Meeting on Earth- quake Engineering, 10-13 March 1993, Istanbul. pp. 300-309.
Hoshiba, M., 1993. Separation of scattering attenuation and intrin- sic absorption in Japan using the Multiple Lapse Time Win- dow analysis of full seismogram envelope. J. Geophys. Res., 98: 15.809-15.824.
IbSaSez, J.M., Del Pezzo, E., De Miguel, F., Herraiz, M., Alguacil, G. and Morales., J., 1990. Depth dependent seismic attenua- tion in the Granada zone (Southern Spain). Bull. Seismol. Soc. Am., 80: 1222-1234.
Ib~fiez, J.M., Del Pezzo, E., Alguacil, G., De Miguel, F., Morales, J., De Martino, S., Sabbarese, C. and Posadas, A.M., 1993. Geometrical spreading function for short period S and coda waves recorded in Southern Spain. Phys. Earth Planet. lnter., 80: 25-36.
Kaypak, B., 1995. Aftershock source parameters of Erzincan earthquake of 13 March 1992. M.Sc. Thesis, Istanbul Techni- cal University, Turkey, 126 pp. (in Turkish).
Knopoff, L., 1964, Q. Rev. Geophys., 2: 625-660. Lindley, T.G. and Archuleta, J.R., 1992. Earthquake source pa-
rameters and frequency dependence of attenuation at Coalinga, Mammoth Lakes, and the Santa Cruz Mountains, California. J. Geophys. Res., 97:14137-14 154.
Mayeda, K., Koyanagi, S., Hoshiba, M., Aki, K. and Zeng, Y., 1992. A comparative study of scattering, intrinsic and coda Q- ~ for Hawaii, Long Valley, and Central California between 1.5 and 15 Hz. J. Geophys. Res., 97: 6661-6674.
Pulli, J.J., 1984. Attenuation of coda waves in New England. Bull. Seismol. Soc. Am., 74:1149- t 166.
Pulli, J.J. and Aki, K., 1981. Attenuation of seismic waves in the lithosphere: comparison of active and stable areas. In: J.E. Beavers (Editor), Earthquakes and Earthquake Engineering: The Eastern US. Ann Arbor Science Publishers Inc., Ann Arbor, MI, pp. 129-141.
Rautian, T.G. and Khalturin, V.I., 1978. The use of the coda for determination of the earthquake source spectrum. Bull. Seis- mol. Soc. Am., 68: 923-948.
Roecker, S.W., Tucker, B., King, J. and Hatzfeld, D., 1982. Estimates of Q in central Asia as a function of frequency and
A. Akinci. H. Eyido~an / Physics of the Earth and Planetary Interiors 97 (1996) 109-119 119
depth using the coda of locally recorded earthquakes. Bull. Seismol. Soc. Am., 72: 129-149.
Sato, H., 1977. Energy propagation including scattering effects single isotropic scattering approximation. J. Phys. Earth, 25: 27-41.
~eng~r, A.M.C., G~riir, N. and ~aro~tu, F., 1985. Strike-slip faulting and related basin formation in zones of tectonic escape: Turkey as a case study. In: K.T. Biddke and N. Christie-Blick (Editors), Strike-Slip Deformation, Basin For- mation and Sedimentation. Soc. Econ. Paleontol. Mineral., Spec. Publ., 37: 227-264.
Takemura, M., Kato, K., Ikeura, T. and Shima, E., 1991. Site amplification of S waves from strong motion records in spe- cial relation to surface geology. J. Phys. Earth, 39: 537-552.
Van Erk, T., 1988. Attenuation of coda waves in the Dead Sea region. Bull. Seismol. Soc. Am., 2: 770-779.
Yoshimoto, K., Sato, H. and Ohteka, M., 1993. Frequency-depen- dent attenuation of P and S waves in the Kanto area, Japan, based on the coda-normalization method. Geophys. J. Int.. 114: 165-174.