fluvial landscapes of the harappan civilization
TRANSCRIPT
Fluvial landscapes of the Harappan civilizationLiviu Giosana,1, Peter D. Cliftb,2, Mark G. Macklinc, Dorian Q. Fullerd, Stefan Constantinescue, Julie A. Durcanc,Thomas Stevensf, Geoff A. T. Dullerc, Ali R. Tabrezg, Kavita Gangalh, Ronojoy Adhikarii, Anwar Alizaib,Florin Filipe, Sam VanLaninghamj, and James P. M. Syvitskik
aGeology and Geophysics, Woods Hole Oceanographic Institution, Woods Hole, MA 02543; bSchool of Geosciences, University of Aberdeen, AberdeenAB24 3UE, United Kingdom; cInstitute of Geography and Earth Sciences, Aberystwyth University, Aberystwyth SY23 3DB, United Kingdom; dInstitute ofArchaeology, University College London, London WC1H 0PY, United Kingdom; eDepartment of Geography, University of Bucharest, Bucharest, 70709,Romania; fDepartment of Geography, Royal Holloway, University of London, Egham, Surrey TW20 0EX, United Kingdom; gNational Institute ofOceanography, Karachi, 75600, Pakistan; hSchool of Mathematics and Statistics, Newcastle University, Newcastle upon Tyne NE1 7RU, United Kingdom;iThe Institute of Mathematical Sciences, Chennai 600 113, India; jSchool of Fisheries and Ocean Sciences, University of Alaska, Fairbanks, AK 99775-7220;and kCommunity Surface Dynamics Modeling System (CSDMS) Integration Facility, Institute of Arctic and Alpine Research (INSTAAR), University ofColorado, Boulder, CO 80309-0545
Edited by Charles S. Spencer, American Museum of Natural History, New York, NY, and approved March 20, 2012 (received for review August 5, 2011)
The collapse of the Bronze Age Harappan, one of the earliest urbancivilizations, remains an enigma. Urbanism flourished in the wes-tern region of the Indo-Gangetic Plain for approximately 600 y, butsince approximately 3,900 y ago, the total settled area and settle-ment sizes declined, many sites were abandoned, and a significantshift in site numbers and density towards the east is recorded. Wereport morphologic and chronologic evidence indicating that flu-vial landscapes in Harappan territory became remarkably stableduring the late Holocene as aridification intensified in the regionafter approximately 5,000 BP. Upstream on the alluvial plain, thelarge Himalayan rivers in Punjab stopped incising, while down-stream, sedimentation slowed on the distinctive mega-fluvial ridge,which the Indus built in Sindh. This fluvial quiescence suggests a gra-dual decrease in flood intensity that probably stimulated intensiveagriculture initially and encouraged urbanization around 4,500 BP.However, further decline in monsoon precipitation led to conditionsadverse to both inundation- and rain-based farming. Contrary toearlier assumptions that a large glacier-fed Himalayan river, identi-fied by some with the mythical Sarasvati, watered the Harappanheartland on the interfluve between the Indus and Ganges basins,we show that only monsoonal-fed rivers were active there duringthe Holocene. As the monsoon weakened, monsoonal rivers gradu-ally dried or became seasonal, affecting habitability along theircourses. Hydroclimatic stress increased the vulnerability of agricul-tural production supporting Harappan urbanism, leading to settle-ment downsizing, diversification of crops, and a drastic increase insettlements in the moister monsoon regions of the upper Punjab,Haryana, and Uttar Pradesh.
Indus Valley ∣ floods ∣ droughts ∣ climate change ∣ archaeology
The Harappan or Indus Civilization (1–8) developed at the aridouter edge of the monsoonal rain belt (9, Fig. 1) and largely
depended on river water for agriculture (10). The Harappanssettled the Indus plain over a territory larger than the contempor-ary extent of Egypt and Mesopotamia combined (Figs. 2 and 3).Between the Indus and Ganges watersheds, a now largely defunctsmaller drainage system, the Ghaggar-Hakra, was also heavilypopulated during Harappan times (4, 5). Controlled by the Indianmonsoon and the melting of Himalayan snow and glaciers (2, 11,12), the highly variable hydrologic regime, with recurring droughtsand floods, must have been a critical concern for Harappans, as it istoday for almost a billion people living on the Indo-Gangetic Plainin Pakistan, northern India, and Bangladesh. In such challengingenvironmental conditions, both the development and the declineof the Harappan remain equally puzzling (13). We investigate howclimate change affected this civilization by focusing on fluvialmorphodynamics, which constitutes a critical gap in our currentunderstanding of the Harappan in the way it affects habitabilityand human settlement patterns near rivers in arid regions.
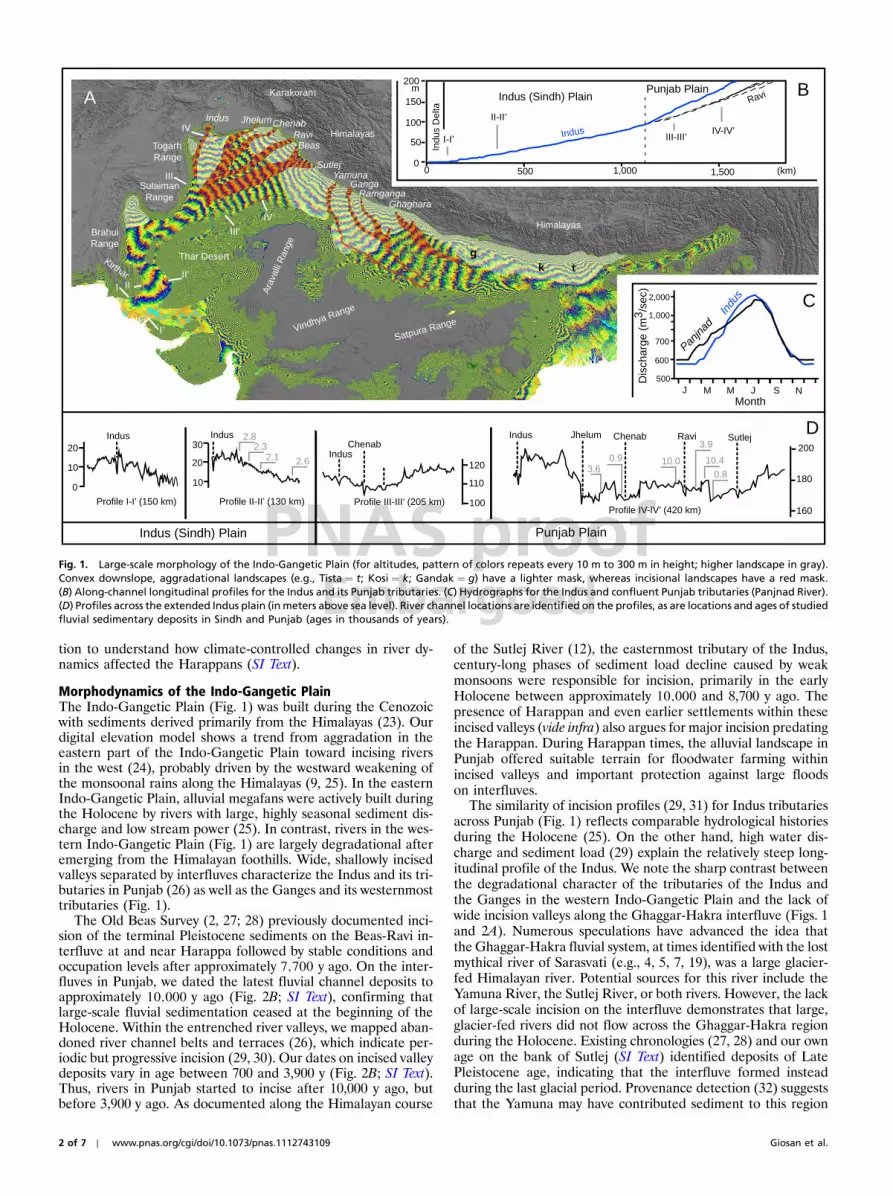
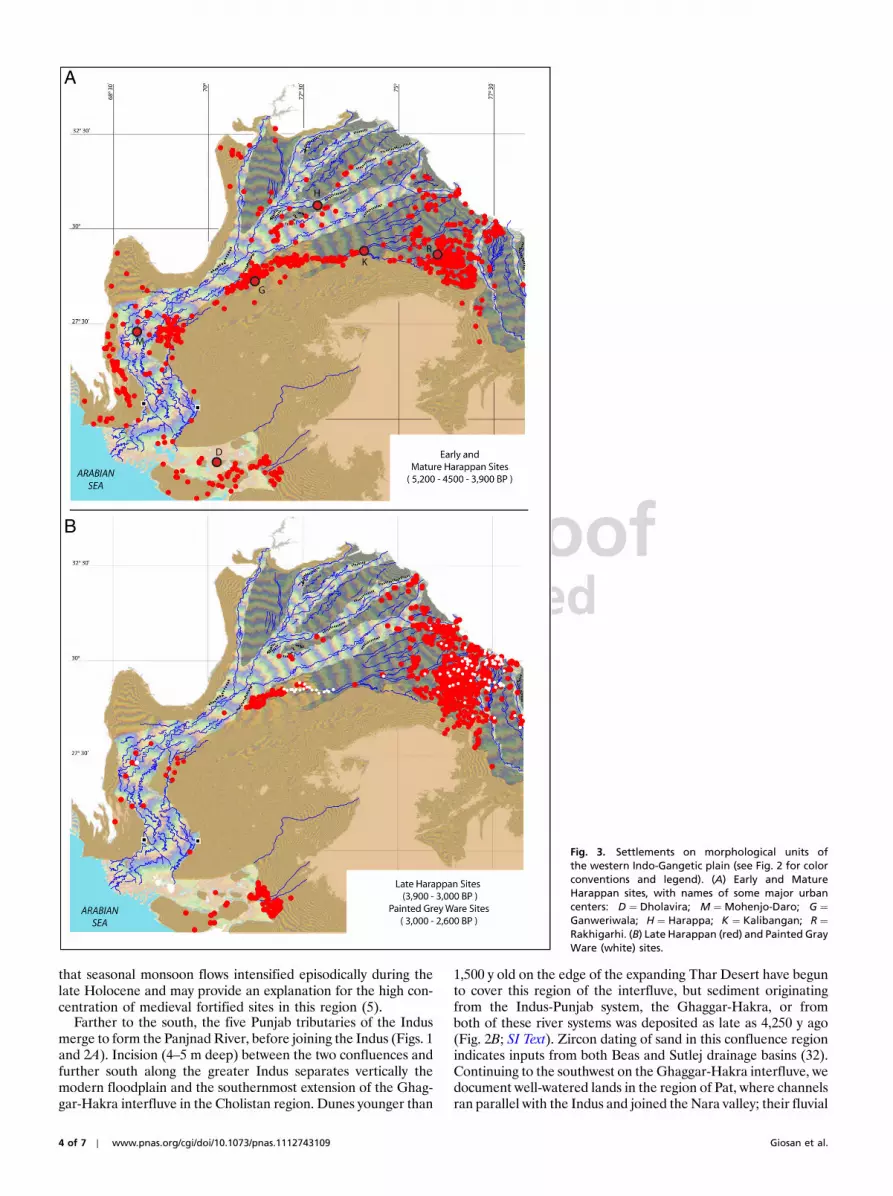
Brief Harappan HistoryThe Harappan cultural tradition (2–4) evolved during an EarlyPhase (5,200–4,500 y ago) from antecedent agricultural commu-nities of the hills bordering the Indus alluvial plain to the west andreached its urban peak (Mature Phase) between approximately4;500 and 3,900 y ago. The Harappans were agrarian but devel-oped large, architecturally complex urban centers and a sophis-ticated material culture coupled with a robust trade system. Incontrast to the neighboring hydraulic civilization of Mesopotamia(14) and to Egypt (15), Harappans did not attempt to controlwater resources by large-scale canal irrigation (16). Deurbaniza-tion ensued after approximately 3;900 y ago and was character-ized by the development of increasingly regional artefact stylesand trading networks as well as the disappearance of the distinc-tive Harappan script (2–4; 17). While this is often referred to as“collapse,” archaeological evidence indicates a protracted andregionally varied process (2, 4, 17). Many settlements exhibitcontinuity, albeit with reduced size, whereas many other riverinesites are abandoned, especially along the lower Indus and theGhaggar-Hakra course (3–5; SI Text). Between 3,900 and 3,000 yago, there was a proliferation of smaller, village-type settlements(2–4, 6, 18), especially in the Himalayan foothills and the westernpart of the Ganges basin along the Yamuna River and on theYamuna-Ganga interfluve (Fig. 3B).
Socio-economic theories have been invoked to address thecollapse of urban Harappan society, including foreign invasions,social instabilities, and decline in trade (4). Alternatively, envir-onmental factors were suggested to play a decisive role in thedecline (1, 2, 8); among these, regional aridification, hydrologicalchanges such as the drying or capture of the Ghaggar-Hakrasystem (3, 4, 7, 19, 20), as well as human-induced environmentaldegradation (21) have been advanced. Despite almost a centuryof research, a clear perspective on the role played by fluvialdynamics in influencing the fate of the Harappan civilization hasbeen hampered by a lack of high-resolution topographic data andsedimentary chronologies. Shuttle Radar Topography Mission(SRTM) data (22) combined with field surveys and radiocarbonand optically stimulated luminescence dating offer us a way toanalyze fluvial landforms and date deposits of the Indo-GangeticPlain. In this context, we reexamine archaeological site distribu-
Author contributions: L.G., P.D.C., M.G.M., and D.Q.F. designed research; L.G., P.D.C., M.G.M.,D.Q.F., S.C., J.A.D., T.S., G.A.T.D., A.R.T., K.G., R.A., A.A., F.F., S.V., and J.P.M.S. performedresearch; L.G., P.D.C., M.G.M., D.Q.F., S.C., J.A.D., T.S., G.A.T.D., A.R.T., K.G., R.A., and J.P.M.S.analyzed data; and L.G. and D.Q.F. wrote the paper.
The authors declare no conflict of interest.
This article is a PNAS Direct Submission.1 Q:3To whom correspondence should be addressed. E-mail: [email protected] address: Department of Geology and Geophysics, Louisiana State University,Baton Rouge, LA 70803.
This article contains supporting information online at www.pnas.org/lookup/suppl/doi:10.1073/pnas.1112743109/-/DCSupplemental.
www.pnas.org/cgi/doi/10.1073/pnas.1112743109 PNAS Early Edition ∣ 1 of 7
ENVIRONMEN
TALSC
IENCE
SEA
RTH,A
TMOSP
HER
IC,
AND
PLANETARY
SCIENCE
SPN
ASPL
US
tion to understand how climate-controlled changes in river dy-namics affected the Harappans (SI Text).
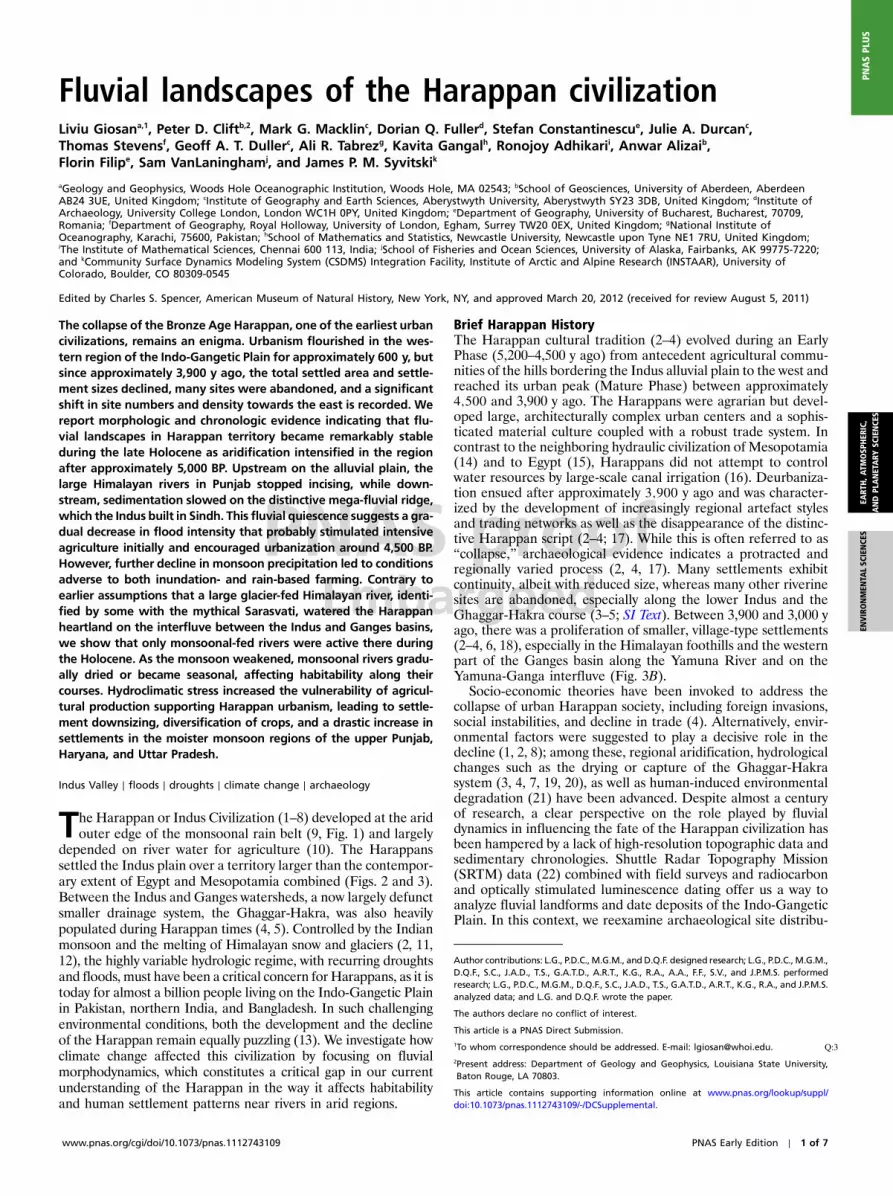
Morphodynamics of the Indo-Gangetic PlainThe Indo-Gangetic Plain (Fig. 1) was built during the Cenozoicwith sediments derived primarily from the Himalayas (23). Ourdigital elevation model shows a trend from aggradation in theeastern part of the Indo-Gangetic Plain toward incising riversin the west (24), probably driven by the westward weakening ofthe monsoonal rains along the Himalayas (9, 25). In the easternIndo-Gangetic Plain, alluvial megafans were actively built duringthe Holocene by rivers with large, highly seasonal sediment dis-charge and low stream power (25). In contrast, rivers in the wes-tern Indo-Gangetic Plain (Fig. 1) are largely degradational afteremerging from the Himalayan foothills. Wide, shallowly incisedvalleys separated by interfluves characterize the Indus and its tri-butaries in Punjab (26) as well as the Ganges and its westernmosttributaries (Fig. 1).
The Old Beas Survey (2, 27; 28) previously documented inci-sion of the terminal Pleistocene sediments on the Beas-Ravi in-terfluve at and near Harappa followed by stable conditions andoccupation levels after approximately 7;700 y ago. On the inter-fluves in Punjab, we dated the latest fluvial channel deposits toapproximately 10;000 y ago (Fig. 2B; SI Text), confirming thatlarge-scale fluvial sedimentation ceased at the beginning of theHolocene. Within the entrenched river valleys, we mapped aban-doned river channel belts and terraces (26), which indicate per-iodic but progressive incision (29, 30). Our dates on incised valleydeposits vary in age between 700 and 3,900 y (Fig. 2B; SI Text).Thus, rivers in Punjab started to incise after 10,000 y ago, butbefore 3,900 y ago. As documented along the Himalayan course
of the Sutlej River (12), the easternmost tributary of the Indus,century-long phases of sediment load decline caused by weakmonsoons were responsible for incision, primarily in the earlyHolocene between approximately 10;000 and 8,700 y ago. Thepresence of Harappan and even earlier settlements within theseincised valleys (vide infra) also argues for major incision predatingthe Harappan. During Harappan times, the alluvial landscape inPunjab offered suitable terrain for floodwater farming withinincised valleys and important protection against large floodson interfluves.
The similarity of incision profiles (29, 31) for Indus tributariesacross Punjab (Fig. 1) reflects comparable hydrological historiesduring the Holocene (25). On the other hand, high water dis-charge and sediment load (29) explain the relatively steep long-itudinal profile of the Indus. We note the sharp contrast betweenthe degradational character of the tributaries of the Indus andthe Ganges in the western Indo-Gangetic Plain and the lack ofwide incision valleys along the Ghaggar-Hakra interfluve (Figs. 1and 2A). Numerous speculations have advanced the idea thatthe Ghaggar-Hakra fluvial system, at times identified with the lostmythical river of Sarasvati (e.g., 4, 5, 7, 19), was a large glacier-fed Himalayan river. Potential sources for this river include theYamuna River, the Sutlej River, or both rivers. However, the lackof large-scale incision on the interfluve demonstrates that large,glacier-fed rivers did not flow across the Ghaggar-Hakra regionduring the Holocene. Existing chronologies (27, 28) and our ownage on the bank of Sutlej (SI Text) identified deposits of LatePleistocene age, indicating that the interfluve formed insteadduring the last glacial period. Provenance detection (32) suggeststhat the Yamuna may have contributed sediment to this region
Indus20
10
0
Profile I-I’ (150 km)
I
I’
Indus30
20
10
2.32.1 2.6
Profile II-II’ (130 km)
IIII’
Indus (Sindh) Plain
IndusChenab
Profile III-III’ (205 km)
120
110
100
Punjab Plain
Indus
III
III’
IV
IV’
Chenab SutlejJhelum
3.60.9 10.0
Ravi
0.8
10.4
3.9 200
180
160Profile IV-IV’ (420 km)
IV-IV’III-III’
II-II’
I-I’
0 500 1,000 1,500
Indus (Sindh) PlainPunjab Plain
Indu
s D
elta
0
50
100
200m
150
(km)
Thar Desert
SulaimanRange
Kirthar
BrahuiRange
TogarhRange
Himalayas
Himalayas
Karakoram
Ara
valli
Ran
ge
Vindhya Range
Satpura Range
Indus JhelumChenabRaviBeas
SutlejYamuna
GangaRamganga
Ghaghara
tkg
500
1,000
2,000
J JM M S N
700
600
Dis
char
ge (
m3 /
sec)
Indus
Ravi
Indu
s
Panjna
d
Month
2.8
A B
C
D
Fig. 1. Large-scale morphology of the Indo-Gangetic Plain (for altitudes, pattern of colors repeats every 10 m to 300 m in height; higher landscape in gray).Convex downslope, aggradational landscapes (e.g., Tista ¼ t; Kosi ¼ k; Gandak ¼ g) have a lighter mask, whereas incisional landscapes have a red mask.(B) Along-channel longitudinal profiles for the Indus and its Punjab tributaries. (C) Hydrographs for the Indus and confluent Punjab tributaries (Panjnad River).(D) Profiles across the extended Indus plain (inmeters above sea level). River channel locations are identified on the profiles, as are locations and ages of studiedfluvial sedimentary deposits in Sindh and Punjab (ages in thousands of years).
2 of 7 ∣ www.pnas.org/cgi/doi/10.1073/pnas.1112743109 Giosan et al.

during the last glacial period, but switched to the Ganges basinbefore Harappan times.
The present Ghaggar-Hakra valley and its tributary rivers arecurrently dry or have seasonal flows. Yet rivers were undoubtedlyactive in this region during the Urban Harappan Phase. We re-covered sandy fluvial deposits approximately 5;400 y old at FortAbbas in Pakistan (SI Text), and recent work (33) on the upperGhaggar-Hakra interfluve in India also documented Holocenechannel sands that are approximately 4;300 y old. On the upperinterfluve, fine-grained floodplain deposition continued until
the end of the Late Harappan Phase, as recent as 2,900 y ago(33) (Fig. 2B). This widespread fluvial redistribution of sedimentsuggests that reliable monsoon rains were able to sustainperennial rivers earlier during the Holocene and explains whyHarappan settlements flourished along the entire Ghaggar-Hakra system without access to a glacier-fed river (5, Fig. 3A).Similar, strictly monsoonal rivers maintaining a groundwater-fed base flow are now active only on the more humid Ganga basin(34). We also document renewed fluvial deposition on the lowerGhaggar-Hakra system approximately 700 y ago, which indicates
Fig. 2. (A) Morphology of the western Indo-Gange-tic plain with interfluves (in gray mask), incisedvalleys (no mask), terrace edges (as dashed blacklines), and active and fossilized river channels (inblue). Legend further indicates sampling locationsand types. (B) Pre-Harappan sites with modernregion names, chronological information (youngestfluvial deposits at all sites), and selected town names.
Giosan et al. PNAS Early Edition ∣ 3 of 7
ENVIRONMEN
TALSC
IENCE
SEA
RTH,A
TMOSP
HER
IC,
AND
PLANETARY
SCIENCE
SPN
ASPL
US
that seasonal monsoon flows intensified episodically during thelate Holocene and may provide an explanation for the high con-centration of medieval fortified sites in this region (5).
Farther to the south, the five Punjab tributaries of the Indusmerge to form the Panjnad River, before joining the Indus (Figs. 1and 2A). Incision (4–5 m deep) between the two confluences andfurther south along the greater Indus separates vertically themodern floodplain and the southernmost extension of the Ghag-gar-Hakra interfluve in the Cholistan region. Dunes younger than
1,500 y old on the edge of the expanding Thar Desert have begunto cover this region of the interfluve, but sediment originatingfrom the Indus-Punjab system, the Ghaggar-Hakra, or fromboth of these river systems was deposited as late as 4,250 y ago(Fig. 2B; SI Text). Zircon dating of sand in this confluence regionindicates inputs from both Beas and Sutlej drainage basins (32).Continuing to the southwest on the Ghaggar-Hakra interfluve, wedocument well-watered lands in the region of Pat, where channelsran parallel with the Indus and joined the Nara valley; their fluvial
Fig. 3. Settlements on morphological units ofthe western Indo-Gangetic plain (see Fig. 2 for colorconventions and legend). (A) Early and MatureHarappan sites, with names of some major urbancenters: D ¼ Dholavira; M ¼ Mohenjo-Daro; G ¼Ganweriwala; H ¼ Harappa; K ¼ Kalibangan; R ¼Rakhigarhi. (B) Late Harappan (red) and Painted GrayWare (white) sites.
4 of 7 ∣ www.pnas.org/cgi/doi/10.1073/pnas.1112743109 Giosan et al.

deposits at Fakirabad, among the dunes of the expanding desert,are even younger at approximately 3;350 y old. Further south,the Nara valley, which would be currently dry if not for modernirrigation, also had active fluvial sedimentation approximately2;900 y ago (Fig. 2B; SI Text).
Downstream in the province of Sindh, the Indus River builta unique distributive-type fluvial system that we term the Indusfluvial mega-ridge (Fig. 1). The alluvial plain here is convex up(35–37), showing maximum aggradation near the modern chan-nel belt and tapering out toward the plain edges (SI Text). Thecross-sectional relief of the ridge is very subdued (over 100 kmwide and 10–15 m high; Fig. 1) and the river is stable on its apexbecause the thalweg is incised as deep as the ridge. Fossil channelbelts and associated crevasse splays occur on both sides of themodern Indus course (Fig. 2A; SI Text). Radiocarbon-datedfluvial deposits of old channel belts in lower Sindh indicate thataggradation was minimal during the late Holocene (between2.4 m∕kyr near the mega-ridge top down to less than 1 m∕kyrnear its edge; Fig. 2B; SI Text). This relative stability of the lateHolocene landscape suggests that large avulsions of the Induswere rare and distributary channels acted mainly as overspills,as documented for the historical period (38, 39). In contrast,at our Matli floodplain drill site on top of the Indus mega-ridge(Fig. 2B; SI Text), sedimentation rates were at least three timeshigher between approximately 7;200 and 2,700 y ago compared tothe last approximately 2;700.
We speculate that the development of the Indus fluvial mega-ridge was also the direct consequence of late Holocene aridity(12, 40–42). Hydroclimate in the western Indo-Gangetic Plainis influenced by both the Indian summer monsoon system andwesterly winter disturbances bringing humidity from the Mediter-ranean, Black, and Caspian Seas (9, 11). Most sediment is deliv-ered to the Indus by floods after high-intensity monsoon storms(43), but the bulk of Indus water discharge is dependent on snowmelt (11). The weakening of the monsoon after approximately5;000 y ago compared to the slower decline in winter precipita-tion originating in western Asia (40, 42, 44, Fig. 4) must haveresulted in a reduction in sediment load compared to water dis-charge, causing channel incision and stabilization (12; SI Text)and leading to longer intervals of decoupling between channelsand the alluvial plain. The subdued relief of the fluvial ridge,resulting from less frequent breaches and overspills as well ascohesive banks (35), which are typical for arid regions, are notfavorable to avulsions. Rarity of large scale avulsions reinforcesdeposition close to existing channel belts and allows for the slowgrowth of the mega-ridge. Within the deep active channels on topof the ridge, effective conveyance of sediments toward the coastfor the build-up of a new deltaic depocenter in western lowerSindh (45, 46) must have diverted most of the sediment awayfrom the Indus alluvial plain in the late Holocene.
Our analysis reveals a palimpsest of fluvial forms and depositsin the western region of the Indo-Gangetic Plain; however, oneconstant trait that is evident across the entire Harappan land-scape is the change from a more energetic fluvial regime earlierin the Holocene (before approximately 5;000 y ago; Fig. 4) toincreased stability of alluvial forms by Early Harappan times, andeven drying up of some river channels during and after Harap-pan times.
Settlement Dynamics in the Harappan DomainThe distribution of Harappan sites within the incised valleys ofPunjab (Fig. 3A) provides clear evidence that rivers were alreadyentrenched by 5,200 y ago or earlier (Fig. 2B). Numerous sitesare present in the incised valley at the confluence zone of theIndus with the Punjab rivers. In this region of confluences, re-gardless of their past geometries, backwater flooding would havebeen common because the Indus and its tributaries in Punjabreach their flood stages asynchronously (Fig. 1). Settlements on
the Punjab interfluves, including Harappa, also tend to be locatednear their edges, close to the fertile, annually flooded areas in theincised valleys (Fig. 3A; 28). Farther to the east, Harappan siteshave been reported along a network of smaller monsoon-fed riversin the upper region of the Ghaggar-Hakra domain (i.e., Haryanaand upper Punjab; 19, 47, 48) as well as along and within theincised valley of the Yamuna and the Yamuna-Ganga interfluve(49, 50). As the climate continued to become drier during late Har-appan times (Fig. 4), the number of sites increased in the upperPunjab and Haryana, especially on interfluves near the Himalayanpiedmont where monsoonal rains are more consistent (Fig. 3B).
The largest agglomeration of mature Harappan sites, includingthe urban Ganweriwala, occurs on the lowermost Ghaggar-Hakrainterfluve (5, 49) in modern Cholistan. The proximity to both theGhaggar-Hakra valley and the well-watered Indus-Punjab riverconfluence region provides the best explanation for the unusualcontinuity and high-density occupation of the lower Ghaggar-Hakra interfluve (Figs. 2 and 3). Recent Harappan discoveriesin the Thar Desert adjacent and along the Nara valley (51) sup-port our reconstructions of a better-watered past for this dryregion as well. As channels of the Ghaggar-Hakra dried throughthe Late Harappan Phase, fewer sites occur on the lower part ofthe Sutlej-Yamuna interfluve (4, 5), with the notable exception ofsites closest to the Indus where access to water remained some-what reliable (Fig. 3B). In contrast, the number of sites in theupper region of the interfluve increased as they did beyond theYamuna to the east (4, 18, 50; SI Text, Fig. 3B). Later, PaintedGray Ware sites were reestablished along the middle Ghaggar-Hakra course (Fig. 3B), suggesting a possible reinvigoration ofseasonal river flows during the Iron Age (5). The lack of PaintedGrayWare sites at the distal end of the Ghaggar-Hakra system (4,5), however, supports our chronostratigraphic evidence that riverflow had become ephemeral and did not reach as far as the Indus.
In Sindh, in the southern part of the Harappan domain,many archaeological sites are found on landforms that were notaffected by fluvial erosion or deposition, such as the westernPakistan ranges and bedrock inselbergs raised above the alluvialplain. However, in upper Sindh, good preservation of early andmature Harappan sites on the alluvial plain (45), includingMohenjo-Daro, suggests that the Indus mega-ridge has beenrelatively stable in that region since Harappan times. In contrast,in lower Sindh, just a few Harappan sites have been discoveredon the eastern delta plain (52), supporting the idea of a switch ofthe fluvio-deltaic depocenter to the west (45, Figs. 2 and 3). Anysettlement on the alluvial plain that may have existed in thesouthwestern part of Sindh is probably buried under later fluvialsediments. Sites in Kutch, a coastal region that was never depen-dent on flood agriculture but instead relied on trade, remainedactive into late Harappan times (4, Fig. 3B), when settlementswere far fewer on the Indus plain.
Although erosion or burial of archaeological sites is an impor-tant process in fluvial environments, preservation of Harappanarchaeological sites in potentially dynamic contexts such asentrenched valleys, river confluences, and accretionary distribu-tive fluvial forms indicates relatively low fluvial activity across thewider alluvial plain since the time settlements were established.In this context, however, the preferential occurrence of Harappanurban sites on interfluves, but in close proximity to floodable,agriculturally viable land (20, 24), suggests awareness of devastat-ing floods that can occur on Himalayan rivers. Settling of theGhaggar-Hakra river system is the best example of an adaptationstrategy that takes advantage of smaller floods along monsoonalrivers, where monsoon rains are not augmented by meltwater.However, most floods, whether in entrenched valleys in Punjab,along overspills in Sindh, or along the smaller rivers of theGhaggar-Hakra system, must have been predominantly benignin character to be able to foster intensive agriculture and also reg-ular enough not to require canal irrigation.
Giosan et al. PNAS Early Edition ∣ 5 of 7
ENVIRONMEN
TALSC
IENCE
SEA
RTH,A
TMOSP
HER
IC,
AND
PLANETARY
SCIENCE
SPN
ASPL
US
Diminished monsoon rains and less reliable flooding during lateHarappan times could explain the expansion of settlements nearthe headwaters of the Ghaggar-Hakra system, where small-scalefloods probably remained more dependable and where rainsallowed summer-cropping on interfluves. Agriculture, land devel-opment, and continuous habitation can skew the distribution ofarchaeological sites, but such biases should be minimal in desertareas like Cholistan. In upper Punjab, Haryana, andUttar Pradesh,where historical and modern destruction of sites has been inten-sive, the increase in the number of sites during the late Harappanshows an unambiguous trend. In contrast, in lower Punjab andSindh, regions of similarly intense history of human activities,the number of sites decreased over the same interval.
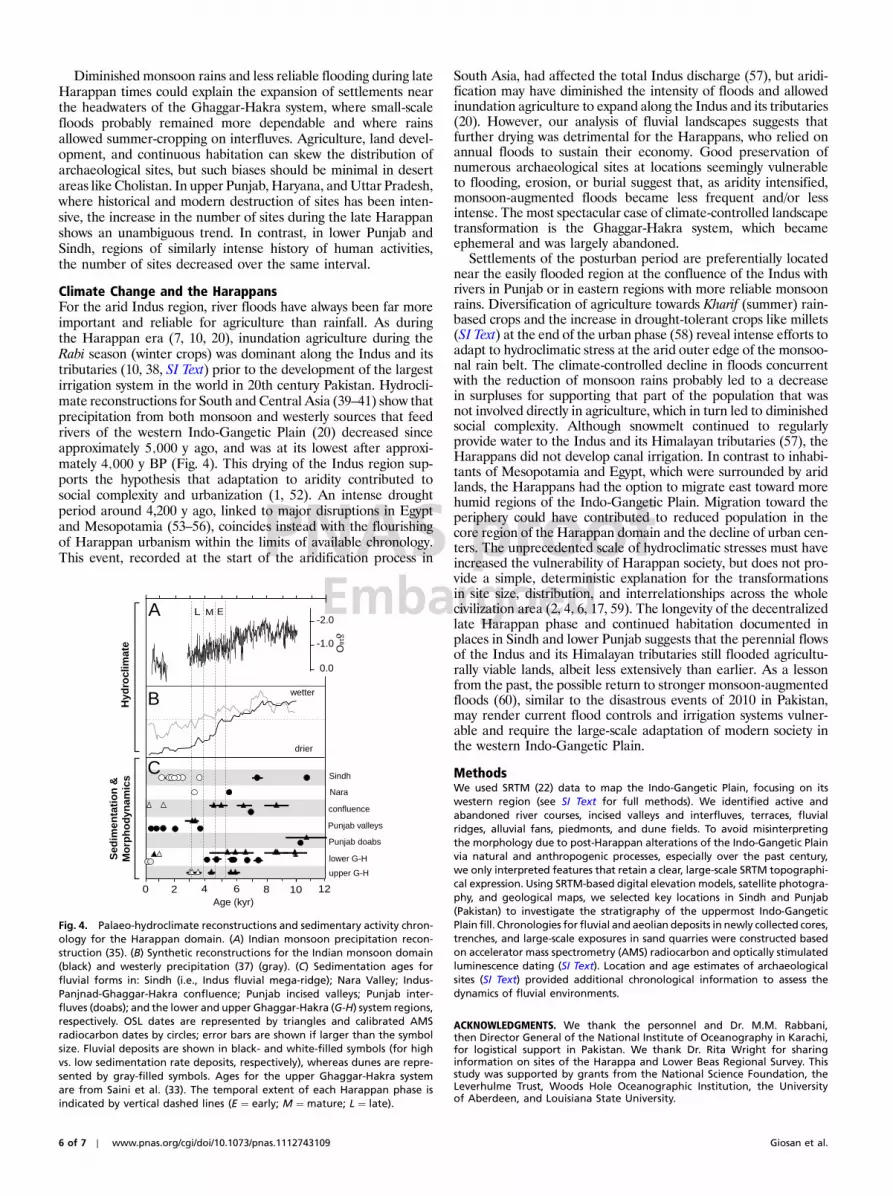
Climate Change and the HarappansFor the arid Indus region, river floods have always been far moreimportant and reliable for agriculture than rainfall. As duringthe Harappan era (7, 10, 20), inundation agriculture during theRabi season (winter crops) was dominant along the Indus and itstributaries (10, 38, SI Text) prior to the development of the largestirrigation system in the world in 20th century Pakistan. Hydrocli-mate reconstructions for South and Central Asia (39–41) show thatprecipitation from both monsoon and westerly sources that feedrivers of the western Indo-Gangetic Plain (20) decreased sinceapproximately 5;000 y ago, and was at its lowest after approxi-mately 4;000 y BP (Fig. 4). This drying of the Indus region sup-ports the hypothesis that adaptation to aridity contributed tosocial complexity and urbanization (1, 52). An intense droughtperiod around 4,200 y ago, linked to major disruptions in Egyptand Mesopotamia (53–56), coincides instead with the flourishingof Harappan urbanism within the limits of available chronology.This event, recorded at the start of the aridification process in
South Asia, had affected the total Indus discharge (57), but aridi-fication may have diminished the intensity of floods and allowedinundation agriculture to expand along the Indus and its tributaries(20). However, our analysis of fluvial landscapes suggests thatfurther drying was detrimental for the Harappans, who relied onannual floods to sustain their economy. Good preservation ofnumerous archaeological sites at locations seemingly vulnerableto flooding, erosion, or burial suggest that, as aridity intensified,monsoon-augmented floods became less frequent and/or lessintense. The most spectacular case of climate-controlled landscapetransformation is the Ghaggar-Hakra system, which becameephemeral and was largely abandoned.
Settlements of the posturban period are preferentially locatednear the easily flooded region at the confluence of the Indus withrivers in Punjab or in eastern regions with more reliable monsoonrains. Diversification of agriculture towards Kharif (summer) rain-based crops and the increase in drought-tolerant crops like millets(SI Text) at the end of the urban phase (58) reveal intense efforts toadapt to hydroclimatic stress at the arid outer edge of the monsoo-nal rain belt. The climate-controlled decline in floods concurrentwith the reduction of monsoon rains probably led to a decreasein surpluses for supporting that part of the population that wasnot involved directly in agriculture, which in turn led to diminishedsocial complexity. Although snowmelt continued to regularlyprovide water to the Indus and its Himalayan tributaries (57), theHarappans did not develop canal irrigation. In contrast to inhabi-tants of Mesopotamia and Egypt, which were surrounded by aridlands, the Harappans had the option to migrate east toward morehumid regions of the Indo-Gangetic Plain. Migration toward theperiphery could have contributed to reduced population in thecore region of the Harappan domain and the decline of urban cen-ters. The unprecedented scale of hydroclimatic stresses must haveincreased the vulnerability of Harappan society, but does not pro-vide a simple, deterministic explanation for the transformationsin site size, distribution, and interrelationships across the wholecivilization area (2, 4, 6, 17, 59). The longevity of the decentralizedlate Harappan phase and continued habitation documented inplaces in Sindh and lower Punjab suggests that the perennial flowsof the Indus and its Himalayan tributaries still flooded agricultu-rally viable lands, albeit less extensively than earlier. As a lessonfrom the past, the possible return to stronger monsoon-augmentedfloods (60), similar to the disastrous events of 2010 in Pakistan,may render current flood controls and irrigation systems vulner-able and require the large-scale adaptation of modern society inthe western Indo-Gangetic Plain.
MethodsWe used SRTM (22) data to map the Indo-Gangetic Plain, focusing on itswestern region (see SI Text for full methods). We identified active andabandoned river courses, incised valleys and interfluves, terraces, fluvialridges, alluvial fans, piedmonts, and dune fields. To avoid misinterpretingthe morphology due to post-Harappan alterations of the Indo-Gangetic Plainvia natural and anthropogenic processes, especially over the past century,we only interpreted features that retain a clear, large-scale SRTM topographi-cal expression. Using SRTM-based digital elevation models, satellite photogra-phy, and geological maps, we selected key locations in Sindh and Punjab(Pakistan) to investigate the stratigraphy of the uppermost Indo-GangeticPlain fill. Chronologies for fluvial and aeolian deposits in newly collected cores,trenches, and large-scale exposures in sand quarries were constructed basedon accelerator mass spectrometry (AMS) radiocarbon and optically stimulatedluminescence dating (SI Text). Location and age estimates of archaeologicalsites (SI Text) provided additional chronological information to assess thedynamics of fluvial environments.
ACKNOWLEDGMENTS. We thank the personnel and Dr. M.M. Rabbani,then Director General of the National Institute of Oceanography in Karachi,for logistical support in Pakistan. We thank Dr. Rita Wright for sharinginformation on sites of the Harappa and Lower Beas Regional Survey. Thisstudy was supported by grants from the National Science Foundation, theLeverhulme Trust, Woods Hole Oceanographic Institution, the Universityof Aberdeen, and Louisiana State University.
drier
wetter
Age (kyr)
-2.0
-1.0
0.0
δ18O
1086420
M EL
upper G-H
Punjab valleys
Punjab doabs
12
Nara
Sindh
confluence
C
B
A
lower G-H
Hyd
rocl
imat
eS
edim
enta
tio
n &
Mo
rph
od
ynam
ics
Fig. 4. Palaeo-hydroclimate reconstructions and sedimentary activity chron-ology for the Harappan domain. (A) Indian monsoon precipitation recon-struction (35). (B) Synthetic reconstructions for the Indian monsoon domain(black) and westerly precipitation (37) (gray). (C) Sedimentation ages forfluvial forms in: Sindh (i.e., Indus fluvial mega-ridge); Nara Valley; Indus-Panjnad-Ghaggar-Hakra confluence; Punjab incised valleys; Punjab inter-fluves (doabs); and the lower and upper Ghaggar-Hakra (G-H) system regions,respectively. OSL dates are represented by triangles and calibrated AMSradiocarbon dates by circles; error bars are shown if larger than the symbolsize. Fluvial deposits are shown in black- and white-filled symbols (for highvs. low sedimentation rate deposits, respectively), whereas dunes are repre-sented by gray-filled symbols. Ages for the upper Ghaggar-Hakra systemare from Saini et al. (33). The temporal extent of each Harappan phase isindicated by vertical dashed lines (E ¼ early; M ¼ mature; L ¼ late).
6 of 7 ∣ www.pnas.org/cgi/doi/10.1073/pnas.1112743109 Giosan et al.

1. Madella M, Fuller DQ (2006) Palaeoecology and the Harappan Civilisation of SouthAsia: a reconsideration. Quaternary Sci Rev 25:1283–1301.
2. Wright RP (2010) The Ancient Indus: Urbanism, Economy and Society (Cambridge,Cambridge University Press).
3. Kenoyer JM (1998) Ancient Cities of the Indus Valley Civilization (Oxford UniversityPress, Oxford).
4. Possehl GL (2002) The Indus Civilization: A Contemporary Perspective (Altamira Press,Lanham, MD).
5. Mughal MR (1997) Ancient Cholistan: Archaeology and Architecture (Ferozsons,Lahore).
6. Gangal K, Vahia M, Adhikari R (2010) Spatio-temporal analysis of the Indus urbaniza-tion. Current Sci India 98:846–852.
7. Fuller DQ, Madella M (2002) Indian Archaeology in Retrospect. Protohistory, edsS Settar and R Korisettar (Manohar Publishers, New Delhi), vol. II, pp 317–390.
8. MacDonald G (2011) Potential influence of the Pacific Ocean on the Indian summermonsoon and Harappan decline. Quatern Int 299:140–148.
9. Bookhagen B, Burbank DW (2010) Towards a complete Himalayan hydrologicalbudget: the spatiotemporal distribution of snow melt and rainfall and their impacton river discharge. J Geophys Res 115:F03019.
10. Miller M-LH (2006) Agriculture and Irrigation in Archaeology, eds C Stanish andJ Marcus (Cotsen Institute of Archaeology Press, Los Angeles), pp 92–128.
11. Karim A, Veizer J (2002) Water balance of the Indus river basin and moisture sourcein the Karakoram and western Himalayas: implications from hydrogen and oxygenisotopes river water. J Geophys Res 107:4362, doi: 10.1029/2000JD000253.
12. Bookhagen B, Fleitmann D, Nishiizumi K, Strecker MR, Thiede RC (2006) Holocenemonsoonal dynamics and fluvial terrace formation in the northwest Himalaya, India.Geology 34:601–604.
13. Lawler A (2008) Unmasking the Indus. Science 320:1276–1285.14. Adams RM (1981) Heartland of Cities: Surveys of Ancient Settlement and Land Use on
the Central Floodplain of the Euphrates (University of Chicago Press, Chicago).15. Butzer KW (1976) Early Hydraulic Civilization in Egypt: A Study in Cultural Ecology
(University of Chicago Press, Chicago).16. Schumm SA (2007) River Variability and Complexity (Cambridge University Press,
Cambridge).17. Kenoyer JM (2006)Historical Roots in theMaking of ‘the Aryan’, ed R Thapar (National
Book Trust, New Delhi), pp 41–97.18. Kumar M (2009) Linguistics, Archaeology and the Human Past, Occasional Paper 7, eds
T Osada and A Uesugi (Research Institute for Humanity and Nature, Nakanishi PrintingCo. Ltd, Kyoto), pp 1–75.
19. Radhakrishna BP, Merh SS (1999) Vedic Saraswati, Memoir, (Geological Society ofIndia, India), Vol. 42.
20. Wright RP, Bryson R, Schuldenrein J (2008) Water supply and history: Harappa and theBeas regional survey. Antiquity 82:37–48.
21. Fairservis WA (1967) The origins, character and decline of an early civilization.AmMusNovit 2302:1–48.
22. Farr TG, et al. (2007) The Shuttle Radar Topography Mission. Rev Geophys 45:RG2004.23. Burbank DW, Beck RA, Mulder T (1996) Asian Tectonics, eds Y An and M Harrison
(Cambridge University Press, Cambridge), pp 149–188.24. Geddes A (1960) The alluvial morphology of the Indo-Gangetic Plains: its mapping and
geographical significance. T I Brit Geogr 28:253–277.25. Sinha R, Sarkar S (2009) Climate-induced variability in the Late Pleistocene-Holocene
fluvial and fluvio-deltaic successions in the Ganga plains, India. Geomorphology113:173–188.
26. Geological Survey of Pakistan (Government of Pakistan, Ministry of Industries andNatural Resources, Pakistan) Geological Map of Pakistan.
27. Schuldenrein J, Wright RP, Mughal R, Khan MA (2004) Landscapes, soils, and moundhistories of the Upper Indus Valley, Pakistan: new insights on the Holocene environ-ments near ancient Harappa. J Archaeol Sci 31:777–797.
28. Wright RP, Schuldenrein J, Mughal MR (2005) South Asian Archaeology 2001, edsC Jarrige and V Lefèvre (CNRS, Paris), pp 327–336.
29. Whipple KX, Parker G, Paola C (1998) Channel dynamics, sediment transport, and theslope of alluvial fans: experimental study. J Geol 106:677–693.
30. Leeder MR, Mack GH (2001) Lateral erosion (‘toe-cutting’) of alluvial fans by axial riv-ers: implications for basin analysis and architecture. J Geol Soc London 158:885–893.
31. Wobus CW, Tucker GE, Anderson RS (2010) Does climate change create distinctivepatterns of landscape incision? J Geophys Res 115:F04008.
32. Clift PD, et al. (2012) U-Pb zircon dating evidence for a Pleistocene Sarasvati River andCapture of the Yamuna River. Geology 40:211–214.
33. Saini HS, Tandon SK, Mujtaba SAI, Pant NC, Khorana RK (2009) Reconstruction of bur-ied channel-floodplain systems of the northwestern Haryana Plains and their relationto the ‘Vedic’ Saraswati. Current Sci India 97:1634–1643.
34. Gibling MR, Tandon SK, Sinha R, Jain M (2005) Discontinuity-bounded alluvialsequences of the southern Gangetic plains, India: aggradation and degradation inresponse to monsoonal strength. J Sed Res 75:369–385.
35. Makaske B (2001) Anastomosing rivers: a review of their classification, origin andsedimentary products. Earth-Sci Rev 53:149–196.
36. Lambrick HT (1964) Sind: A General Introduction, (Sindhi Adabi Board, Pakistan), 1.37. Harbor DJ, Schumm SA, Harvey MD (1994) The Variability of Large Alluvial Rivers, eds
SA Schumm and B Winkley (American Society of Civil Engineers), 161–176.38. Tremenheere CW (1867) On the lower portion of the River Indus. J Roy Geog Soc
37:68–91.39. Holmes DA (1968) The recent history of the Indus. Geogr J 134:367–382.40. Fleitmann D, et al. (2003) Holocene forcing of the Indian monsoon recorded in a
stalagmite from southern Oman. Science 300:1737–1739.41. Gupta AK, Anderson DM, Overpeck JT (2003) Abrupt changes in the Asian southwest
monsoon during the Holocene and their links to the North Atlantic Ocean. Nature421:354–356.
42. Herzschuh U (2006) Palaeo-moisture evolution in monsoonal Central Asia during thelast 50,000 years. Quaternary Sci Rev 25:163–178.
43. Wulf H, Bookhagen B, Scherler D (2010) Seasonal precipitation gradients and theirimpact on erosion in the Northwest Himalaya. Geomorphology 118:13–21.
44. Chen F, et al. (2008) Holocene moisture evolution in arid central Asia and its out-of-phase relationship with Asian monsoon history. Quaternary Sci Rev 27:351–364.
45. Giosan L, et al. (2006) Recent morphodynamics of the Indus delta shore and shelf. ContShelf Res 26:1668–1684.
46. Clift P, et al. (2008) Holocene erosion of the Lesser Himalaya triggered by intensifiedsummer monsoon. Geology 36:79–82.
47. Singh RN, et al. (2008) Settlements in context: reconnaissance in Western UttarPradesh and Haryana. Man Environ XXXIII:71–87.
48. Petrie CA, et al. (2009) Investigating changing settlement dynamics on the plains:the 2009 survey and excavations at Masudpur (Hissar District, Haryana). Puratattva39:38–49.
49. Stein MA (1942) A survey of ancient sites along the ‘Lost’ Saraswati river. Geogr J99:173–182.
50. Joshi RD, Madhu B, Jassu R (1984) Frontiers of the Indus Civilization, eds BB Lal andSP Gupta (Indian Archaeological Society jointly with Indian History & Culture Society,London).
51. Mallah Q (2008) Linguistics, Archaeology and the Human Past, Occasional Paper 3, edsT Osada and A Uesugi (Research Institute for Humanity and Nature, Nakanishi PrintingCo Ltd, Kyoto), pp 27–76.
52. Flam L (1981) The paleogeography and prehistoric settlement patterns in Sind,Pakistan (∼4000–2000 B. C.). Ph.D. thesis (Univ of Pennsylvania).
53. Enzel Y, et al. (1999) High-resolution Holocene environmental changes in the TharDesert, northwestern India. Science 284:125–128.
54. Weiss H, et al. (1993) The genesis and collapse of third millennium North Mesopota-mian civilization. Science 261:995–1004.
55. Hassan F (1997) Third Millennium B.C. Climate Change and Old World Collapse, edsHN Dalfes et al. (Springer, Berlin-Heidelberg-New York), pp 1–23.
56. Cullen HM, et al. (2000) Climate change and the collapse of the Akkadian empire:evidence from the deep sea. Geology 28:379–382.
57. Staubwasser M, Sirocko F, Grootes PM, Segl M (2003) Climate change the 4.2 ka BPtermination of the Indus valley civilization and Holocene south Asian monsoon varia-bility. Geophys Res Lett 30:1425, doi: 10.1029/2002GL016822.
58. Weber SA, Belcher WR (2003) Indus Ethnobiology: New Perspectives from the Field(Lexington Books, Lanham, MD).
59. Law RW (2008) Occasional Paper 11: Linguistics, Archaeology and the Human Past(Research Institute for Humanity and Nature, Nakanishi Printing Co. Ltd, Kyoto).
60. Goswami BN, Venugopal V, Sengupta D, Madhusoodanan MS, Xavier PK (2006)Increasing trend of extreme rain events over India in a warming environment. Science314:1442–1445.
Giosan et al. PNAS Early Edition ∣ 7 of 7
ENVIRONMEN
TALSC
IENCE
SEA
RTH,A
TMOSP
HER
IC,
AND
PLANETARY
SCIENCE
SPN
ASPL
US

Supporting InformationGiosan et al. 10.1073/pnas.1112743109SI TextGeomorphic Mapping.The morphology of the Indo-Gangetic Plainwas analyzed using high-resolution (90-m) digital elevation dataderived fromNASA’s Shuttle Radar TopographyMission (SRTM;1). Digital elevations models (DEMs) were constructed for theentire Indo-Gangetic Plain at 300 m resolution and at 200 and100 m resolution for the Indus region. The DEMs were usedin combination with Advanced Spaceborne Thermal Emissionand Reflection Radiometer (ASTER) and Google Earth to iden-tify geomorphic patterns that provide insight into fluvial morpho-dynamics. Large-scale (tens to hundreds of kilometers long)regional linear features with vertical morphological expressioncutting across elevation contours were visually identified andinterpreted with the aid of DEM cross-profiles and 3D navigationto map the extent and location of fluvial channels, ridges, ter-races, and incised valleys. Locations of dried channels were ver-ified using published morphological and geological data (2–6) aswell as through our own field survey, trenching, and drilling inPakistan.
Lithostratigraphy. The selection of sampling locations for sedi-mentary deposits (organized on transects in Figs. S1–S3; Fig. 2)was based on our geomorphic mapping as well as on publishedliterature on the morphology (4–6) and geology (2, 3) of the wes-tern Indo-Gangetic Plain. Shallow sampling techniques includedvibro- and percussion coringas well as manual and digger-aidedtrenching. Rotary drilling was employed at Matli and Nara inSindh as well as Tilwalla and Marot in Cholistan (Punjab). Atseveral locations in Punjab, Pakistan (Dipalpur, Karan Shah,Kalokay, and Doda) sampling was performed directly in large-scale exposures (i.e., hundreds to thousands of meters outcroplength) in sand quarries. Based on lithofacies characteristics(i.e., lithology, textures, structures, and bedding), we identifiedand logged aeolian sands, fluvial deposits, soils, and anthropo-genic overburden. Older and thicker soils were encountered pre-ferentially in Punjab and Sindh. Anthropogenic overburden (roadfill) was present at Okara in Punjab. Logs are presented in Fig. S4.Aeolian deposits were sampled at several locations along theNara-Hakra-Ghaggar transect in the Pat and Cholistan regionsof Pakistan (Figs. S2 and S4), including Fakirabad, Yazman,and in dedicated dune trenches at locations MGJ-3 and MGJ-5. The aeolian lithofacies was characterized by clean siliciclastic,massive to cross-stratified aeolian deposits composed of moder-ate- to well-sorted fine to medium sands.
Fluvial deposits were sampled at all sites (except at dune loca-tions) directly from the surface or below soils, aeolian sands, oranthopogenic fill. On the Sindh transect (Figs. S1 and S4), we tar-geted channel deposits along dried Indus distributary courses atShah Dipalli as well as floodplain deposits immediately adjacentto Indus distributary channels at Mirwah, Matli, and Merkan.Channel deposits were composed dominantly of poorly sorted,fine to coarse siliciclastic sands, with massive to faint parallel bed-ding/lamination. Floodplain deposits are predominantly finer,with over bank interstratified muds (clays, silts) and poorly sortedfine to medium sands. Carbonate nodules are small and rare,indicating a slow pedogenesis in this region. Below floodplain de-posits, at Mirwah we encountered ca. 3 m of massive poorly sortedfine to medium channel sands. The borehole at Matli penetratedsimilar floodplain (and possibly crevasse splay) and channel de-posits down to 45 m, where it encountered thin limestone gravelsover Eocene limestone. At all Sindh sites, biogenic remains were
rare, consisting primarily of freshwater bivalves and subordinatelygastropods.
Along the Nara-Hakra-Ghaggar transect (Fig. S2), fluvial sili-ciclastic deposits consisting of overbank interstratified muds andsands and channel deposits were generally finer than in Sindh(Fig. S4), suggesting lower energy flows (except for specificallytargeted higher energy depositional environments, such as thebar deposits at Nara Chenab and Fort Abbas). Carbonate nodulesare common in the Cholistan (Bahawalpur) region, indicating amore intense paleo-pedogenesis. At Fort Abbas, channel and san-dy islands/bars deposits were both sampled; their lithofacies aresuggestive of alterations in flow frequency and magnitude. Chan-nel deposits are characterized by alternating flat bedded sandunits with thin discontinuous silts, some of which had been desic-cated, broken up, and then incorporated in the overlying sandunit, with thicker silt units at top and base. Dominantly fine over-bank mud sequences, sometimes overlying coarser channel de-posits, were sampled at Fort Derawar, Yazman, Alkasur CottonJinner, Marot (S-1), and Fort Abbas (S-3), and from the Sutlejbank at SUT-2. Deposits recovered from boreholes at Nara,Tilwalla, and Marot consist of similar alternating sequences ofoverbank deposits and coarser channels deposits. At all drill siteson this transect, a coarsening downward trend into the Pleisto-cene deposits is evident. Biogenic remains at sites along the Nara-Hakra-Ghaggar transect were again rare, consisting primarily ofplant/wood and gastropods remains.
In Punjab (Figs. S3 and S4), large-scale exposures in sand quar-ries allowed us to examine channel deposits in extensive outcrops.Deposits are systematically coarser than in Sindh or Cholistan,consisting primarily of braided channel deposits and scour fills;overbank deposits at the top were generally thinner than 2 m,consisted of undifferentiated muds, and were strongly modifiedby human activity and root bioturbation. Braided channel depos-its are composed of fine to coarse sands with thin (decimeterscale) levels of matrix-supported to imbricated pebbles. Beddingis tabular to lenticular and laterally continuous over a 10 s to 100 smeters, and decimeters to a few m thick. Sedimentary structuresinclude large (submeter thick) cross stratification, parallel orcross lamination in fine sands, channel scours (of meter sizedepth), and pebble imbrications indicative of channel lag depos-its. Channel or bar deposits were also sampled in trenches atOkara (below overburden) and Jahanabad (below well-developedsoil). Carbonate nodules were present at the top of all sites,indicating postdepositional pedogenesis. Biogenic remains atsites along the Punjab transect were rare and consisted primarilyof charcoal and freshwater bivalves.
Chronology. Optically stimulated luminescence. At the AberystwythLuminescence Research Laboratory, all samples were preparedin subdued red light conditions. The 90–125 μm grain-size frac-tion was used for dating, after treatment with hydrochloric acidand hydrogen peroxide to remove carbonates and organic mat-ter, respectively. Heavy liquid density separation (2.62 < ρ <2.70 g∕cm3) was carried out to isolate the quartz grains, andthe resulting material was etched using hydrofluoric acid to re-move the alpha-irradiated outer surface of the quartz grainsand remove any nonquartz minerals still present. Optically stimu-lated luminescence (OSL) measurements were made using a RisøTL/OSL luminescence reader, and OSL was stimulated usingblue light-emitting diodes (470� 20 nm). The resulting signalwas measured through a bialkali photo multiplier tube fitted with7.5 mm U340 filters. Equivalent dose (De) measurements were
Giosan et al. www.pnas.org/cgi/doi/10.1073/pnas.1112743109 1 of 12

made following the single-aliquot regenerative dose (SAR) pro-tocol (7) on small aliquots [2 mm in diameter (8)] of sample, witha preheat of 220 °C for 10 s and a cut-heat of 160 °C for 0 s usedduring the measurement cycles. A standard set of rejection cri-teria (9) was applied, including the OSL IR depletion ratio ofDuller (10) to check for signal contamination by feldspar. Theprotocol of Rodnight, et al. (11) was followed to decide whetherto use the central age model or the finite mixture model (FMM)to calculate aDe for age calculation (Table S1). The environmen-tal dose rate to grains was calculated using a combination of thicksource alpha and beta counting, to assess the impact of radioac-tivity resulting from the decay of uranium, thorium, and potas-sium. The environmental dose due to cosmic rays wascalculated using the equations of Prescott and Hutton (12).
At the Royal Holloway, University of London LuminescenceLaboratory, all samples were prepared in subdued red and amberlight conditions. All grain-size fractions used for dating (chosenbased on dominant grain-size in the sample; Table S2) were trea-ted with hydrochloric acid and hydrogen peroxide to remove car-bonates and organic matter, respectively. Heavy liquid densityseparation at 2.70 g cm−3 was carried out remove heavy minerals.The 125–180 and 180–250 μm grain-size fractions were etchedusing hydrofluoric acid to remove the alpha-irradiated outer sur-face of the quartz grains and remove nonquartz minerals, whilethe 40–70 μm grain-size fraction of Okara was immersed in fluor-osilicic acid for 2 weeks to remove nonquartz material. Multigrain(medium-size aliquots, ca. 5 mm) OSL measurements were madeusing a Risø TL-DATL/OSL luminescence reader and OSL wasstimulated using blue light-emitting diodes (470� 20 nm). Theresulting signal was measured through 9235QA photo multipliertube fitted with 6 mm of Hoya U340 filters. De measurementswere made following the single-aliquot regenerative dose (SAR)protocol (7), with an initial preheat of 240 °C for 10 s and secondpreheat, following application of a test dose, of 200 °C for 10 sused during the measurement cycles. These values were selectedafter a preheat plateau dose recovery test was applied to KaranShah and after testing on Okara and Jahanabad using a doserecovery test (13). A standard set of rejection criteria (9) wereapplied, including the OSL IR depletion ratio of Duller (10),to check for signal contamination by feldspar. The signal wasintegrated from the first 0.8 s of OSL decay minus a backgroundbetween 3.2 and 6.4 s. The De used for age calculation wasobtained from the weighted mean (Table S2). For Okara, analpha efficiency value of 0.04� 0.02 was assumed (14).
Single-grain OSL measurements were conducted on sampleswhere the grainsize used was 180–250 μm using a Risø TL-DATL/OSL luminescence reader. OSL was induced using a green(532 nm) 10 mW Nd : YVO4 laser focused on aluminum diskswith 100 chambers with 300 μm by 300 μm dimensions. Theresulting signal was measured through 9235QA photo multipliertube fitted with 6 mm of Hoya U340 filters. De measurementswere made following the SAR protocol (7), with an initial preheatof 240 °C for 10 s and a second preheat, following application ofat test dose, of 200 °C for 10 s used during the measurementcycles. In addition to applying a standard set of rejection criteria(9) and OSL IR depletion ratio of Duller (10), grains were re-jected if the uncertainty on the test dose was >20%. The signalwas integrated from the 0.08–0.16 s of OSL stimulation, whilebackground was subtracted from the last 0.17 s. In both casesthe De used for age calculation was obtained from the centralage model (CAM, 15). The CAMwas chosen due to the relativelynormal shape of the distribution of grain equivalent doses [theskewness parameter, c, was less than 2σc‚the significance ofthe skew value multiplied by 2 (16)].
Dose rates were calculated from uranium, thorium, and potas-sium contents measured using Inductively Coupled Plasma MassSpectrometry (ICP-MS) and Atomic Emission Spectrometry(-AES). ICP samples were taken from the light-exposed ends
of sample tubes, with sediment being homogenized and sub-sampled for ICP analysis. Samples were prepared by lithiummetaborate or sodium peroxide fusion. Given the arid climateof the region and the well-drained nature of the deposits, watercontents during burial were assumed to be ca. 20% of the mea-sured saturation value (Table S2). Alpha and beta attenuationwas obtained using calculations in Bell (17) and Mejdahl (18),respectively, and dose-rate conversion factors were taken fromAdamiec and Aitken (19). Uncertainties are based on the propa-gation, in quadrature, of individual errors for all measured quan-tities, which if unknown are taken as 10%. In addition touncertainties calculated from counting statistics, errors due to(i) beta source calibration (3%; 20), (ii) radioisotope concentra-tion (10%), (iii) dose-rate conversion factors (3%), and (iv)attenuation factors (3%) have been included (21). The cosmicdose was calculated using present-day burial depth (12).
Radiocarbon.Plant, wood, and charcoal remains as well as molluskshell samples for 14C dating were collected from fluvial and aeo-lian deposits where available (Fig. S4). The depth of each samplewas recorded relative to the local surface. All samples werecleaned ultrasonically and, for inorganic carbon samples, weremoved the outer part of the shell via standard acid etching. ac-celerator mass spectrometry (AMS) radiocarbon dating was per-formed at the National Ocean Sciences Accelerator MassSpectrometry Facility (NOSAMS) at the Woods Hole Oceano-graphic Institution. The methodology for AMS radiocarbon dat-ing is presented on the NOSAMS site (http://nosams.whoi.edu)and discussed in McNichol, et al. (22). All dates have been con-verted to calendar ages (2 sigma range) relative to 2010 usingCalib 5.0.1 software (23) and the IntCal04 calibration dataset(24) and a 60-year positive correction. All radiocarbon datesand their calibrated equivalents together with the location infor-mation in core for the dated samples and their geographical loca-tion are presented in Table S3.
Archaeological Sites Distribution, Ages, and Patterns of the HarappanCollapse. The sources for archaeological site locations and theirradiocarbon and/or archaeological ages are published gazetteers(25–30). Most of the sites were already consolidated in Gangal, etal. (31). To this database we added sites from gazetteers of Punjab(26, 27), Haryana (28), and Sindh (29) in Pakistan and severalsites studied during the Harappa and Beas regional survey (32).
Site distribution provides an important line of evidence forsocial changes in the Late Harappan period and for characteriz-ing urban collapse in this region. Compilations of site counts, andestimated site sizes, by period [e.g., Possehl (33)] indicates thatthe total settled area declines from approximately 7;358 toapproximately 4;484 hectares [ha] during the transition to Post-Urban Harappan times. This area is calculated from the averagesite area, based on the estimates by Possehl, multiplied by thetotal number of sites. The average site size drops from 7.2 to3.2 ha; the latter reflects the reduction of large cities like Harappaand Mohenjodaro to smaller occupied areas. Nevertheless, thetotal number of archaeological sites increased, from 1,022 to1,281, which indicates that on average there were many moresmaller sites. As discussed in our main text, there is also a signifi-cant shift in site numbers and density towards the east. Looking atparticular regions, there is a particularly precipitous decrease insites in Sindh, from around 90 sites to 19 (30, 33, 34). Meanwhile,in the Ghaggar-Hakra, differences are seen between the Choli-stan (western) area and upper Ghaggar-Hakra (eastern) area (seeFig. 5 in ref. 31). The western area sees a decrease from 174 sitesto 41 and an estimated settled area of 974 to 209 ha, while in theeastern area sites numbers increase from 218 to 853; despitethis massive increase, however, estimated settled area only risesfrom 2,943 to 2,985 ha (34, 35). The latter estimates indicateclearly the fall in average site size. Decrease in the number of
Giosan et al. www.pnas.org/cgi/doi/10.1073/pnas.1112743109 2 of 12

sites occurred also in areas outside the core Harappan region onthe Indo-Gangetic plain, such as Baluchistan and Gujarat (Fig. S5and ref. 31). While more recent archaeological field surveys (28,30, 32, 36, 37) will have added some site numbers, these do notaffect the general patterns that have been evidenced for over adecade. These numbers can therefore be taken as indicative ofthe shifts that constitute urban collapse at the end of the Harap-pan civilization in terms of the distribution of human population.The changes in settlement size and the distribution of sites inrelation to climate and landscape imply that adjustments mighthave been made to the agricultural subsistence base. To furtherillustrate these points graphically (Fig. S5),we use the Gangal, etal. database (31), updated as described above.
Harappan Crop Compilation. Changes in the commonness ofHarappan crops over time were compiled by Fuller (38), basedon 53 archaeological sites and/or cultural phases with publishedarchaeobotanical evidence and excluding crops occurring in lessthan 15% of all sites or with uncertain specific identification(Fig. S6). These data included Harappan-era sites, with archae-obotanical evidence, from the Saurashtra peninsula. This evi-dence indicates a strategic shift in agricultural practices, withmore sites practicing two seasons of cultivation. An increasingproportion of sites farmed summer crops, mainly reliant on mon-soon rains, in the Post-Urban Harappan period. During the Earlyand Mature Harappan period, most of those sites with evidencefor summer cereals (millets) are located in the eastern areas ofthe Harappan civilization.
1. Farr TG, et al. (2007) The Shuttle Radar Topography Mission. Rev Geophys 45: 10.1029/2005RG000183.
2. Geological Survey of Pakistan (1964) Geological Map of Pakistan (Government ofPakistan, Ministry of Industries and Natural Resources).
3. Kazmi AH (1984) Marine Geology and Oceanography of Arabian Sea and CoastalPakistan, eds Haq BU, Milliman JD (Van Nostrand Reinhold, NY), pp 65–70.
4. Holmes DA, Western S (1969) Soil texture patterns in the alluvium of the lower Indusplains. J Soil Sc 20:23–37.
5. West Pakistan Water and Power Development Authority (1966) Lower Indus Report:Hunting Technical Service (M. MacDonald & Partners, Lahore).
6. Holmes DA (1968) The recent history of the Indus. Geograph J 134:367–382.7. Murray AS,Wintle AG (2000) Luminescence dating of quartz using an improved single-
aliquot regenerative-dose protocol. Rad Measur 32:57–72.8. Duller GAT (2008) Single-grain optical dating of Quaternary sediments: why aliquot
size matters in luminescence dating. Boreas 37:589–612.9. Jacobs Z, Duller GAT, Wintle AG (2006) Interpretation of single grain De distributions
and calculation of De. Rad Measur 41:264–277.10. Duller GAT (2003) Distinguishing quartz and feldspar in single grain luminescence
measurements. Rad Measur 37:161–165.11. Rodnight H, Duller GAT, Wintle AG, Tooth S (2006) Assessing the reproducibility and
accuracy of optical dating of fluvial deposits. Quat Geochron 1:109–120.12. Prescott JR, Hutton JT (1994) Cosmic ray contributions to dose rates for luminescence
and ESR dating: large depths and long-term time variations. Rad Measur 23:497–500.13. Murray AS, Wintle AG (2003) The single-aliquot regenerative dose protocol: potential
improvements in reliability. Rad Measur 37:377–381.14. Rees-Jones J (1995) Optical dating of young sediments using fine-grain quartz.Ancient
TL 13:9–13.15. Galbraith RF, Roberts RG, Laslett GM, Yoshida H, Olley JM (1999) Optical dating of
single and multiple grains of quartz from Jinmium rock shelter, northern Australia:Part I, Experimental design and statistical models. Archaeometry 41:339–364.
16. Bailey RM, Arnold LJ (2006) Statistical modelling of single-grain quartz De distribu-tions and an assessment of procedures for estimating burial dose. Quat Sci Rev25:2475–2502.
17. Bell WT (1980) Alpha dose attenuation in quartz grains for thermoluminescencedating. Ancient TL 12:4–8.
18. Mejdahl V (1979) Thermoluminescence dating: beta-dose attenuation in quartz grains.Archaeometry 21:61–72.
19. Adamiec G, Aitken MJ (1998) Dose rate conversion factors: update. Ancient TL16:37–50.
20. Armitage SJ, Bailey RM (2005) The measured dependence of laboratory beta doserates on sample grain size. Rad Measur 39:123–127.
21. Murray AS, Olley JM (2002) Precision and accuracy in the optically stimulated lumines-cence dating of sedimentary quartz: a status review. Geochronometria 21:1–16.
22. McNichol AP, et al. (1995) Improvements in procedural blanks at NOSAMS: Reflectionsof improvements in sample preparation and accelerator operation. Radiocarbon37:683–691.
23. Stuiver M, et al. (1998) INTCAL98 Radiocarbon age calibration. Radiocarbon40:1041–1083.
24. Reimer PJ, et al. (2004) IntCal04 terrestrial radiocarbon age calibration, 0–26 cal kyr BP.Radiocarbon 46:1029–1058.
25. Joshi RD, Madhu B, Jassu R (1984) Frontiers of the Indus Civilization, ed Lal BB (Books &Books, India).
26. Mughal MR (1996) Pakistan Archaeology Vol. 29, eds Iqbal F, Khan MA, Hassan M(Department of Archaeology and Museums, Pakistan; Karachi).
27. Mughal MR (1997) Ancient Cholistan: Archaeology and Architecture (Ferozsons Press,Karachi, Pakistan).
28. Kumar M (2009) Linguistics, Archaeology and the Human Past, Occasional Paper 7, edsOsada T, Uesugi A (Research Institute for Humanity and Nature, Nakanishi Printing Co.Ltd., Kyoto), pp. 1–75.
29. Possehl GL (1999) Indus Age. The Beginnings (University of Pennsylvania Press, Phila-delphia).
30. Mallah QH (2010) Current Studies on the Indus Civilization Rohn-Manohar IndusProject Series, eds Osada T,UesugiA (Manohar Publishers, India), pp 27–76.
31. Gangal K, Vahia M, Adhikari R (2010) Spatio-temporal analysis of the Indus urbaniza-tion. Current Sci 98:846–852.
32. Wright RP, Schuldenrein J, Mughal MR (2005) South Asian Archaeology 2001, edsJarrige C, LefŁvre V (CNRS, Paris), pp. 327–36.
33. Possehl GL (1997) The transformation of the Indus Civilization. Journal of WorldPrehistory 11:425–472.
34. Possehl GL (1999) Prehistoric population and settlement in Sindh in The Indus River:Biodiversity, Resources, Humankind, eds. Meadows A, Meadows PS (Oxford UniversityPress, Pakistan).
35. Possehl GL (2000) in The drying up of the Sarasvati: environmental disruption in SouthAsian prehistory. Environmental Disaster and the Archaeology of Human Response,eds Bawden G, Reycraft M. (Maxwell Museum of Anthropology, University of NewMexico, Albuquerque, NM) Papers no. 7.
36. Singh RN, et al. (2008) Settlements in context: reconnaissance in Western UttarPradesh and Haryana. Man Environ XXXIII:71–87.
37. Petrie CA, et al. (2009) Investigating changing settlement dynamics on the Plains: the2009 survey and excavations at Masudpur (Hissar District, Haryana). Puratattva39:38–49.
38. Fuller DQ (2011) Finding plant domestication in the Indian subcontinent. Curr Anthro-pol 52:S347–S362.
Giosan et al. www.pnas.org/cgi/doi/10.1073/pnas.1112743109 3 of 12

Fig. S1. Upper: Location of sampling sites in lower Sindh on a Google Earth image of the Indus alluvial plain and delta: 1 ¼ Matli; 2 ¼ Mirwah;3 ¼ ShahDipalli; 4 ¼ Merkan); the modern city of Hyderabad and towns of Thatta and Umarkot are also identified. The white box shows the extent ofthe region shown in lower box. Lower: SRTM-derived DEM with interpreted distributary channel courses, locations of sampling sites, and localities identifiedin upper box. Drill sites are represented by white circles, and shallow sampling sites are depicted by black circles. For altitudes, pattern of colors repeats every10 m. Nonalluvial or desert regions are covered by a transparent brown mask.
Giosan et al. www.pnas.org/cgi/doi/10.1073/pnas.1112743109 4 of 12
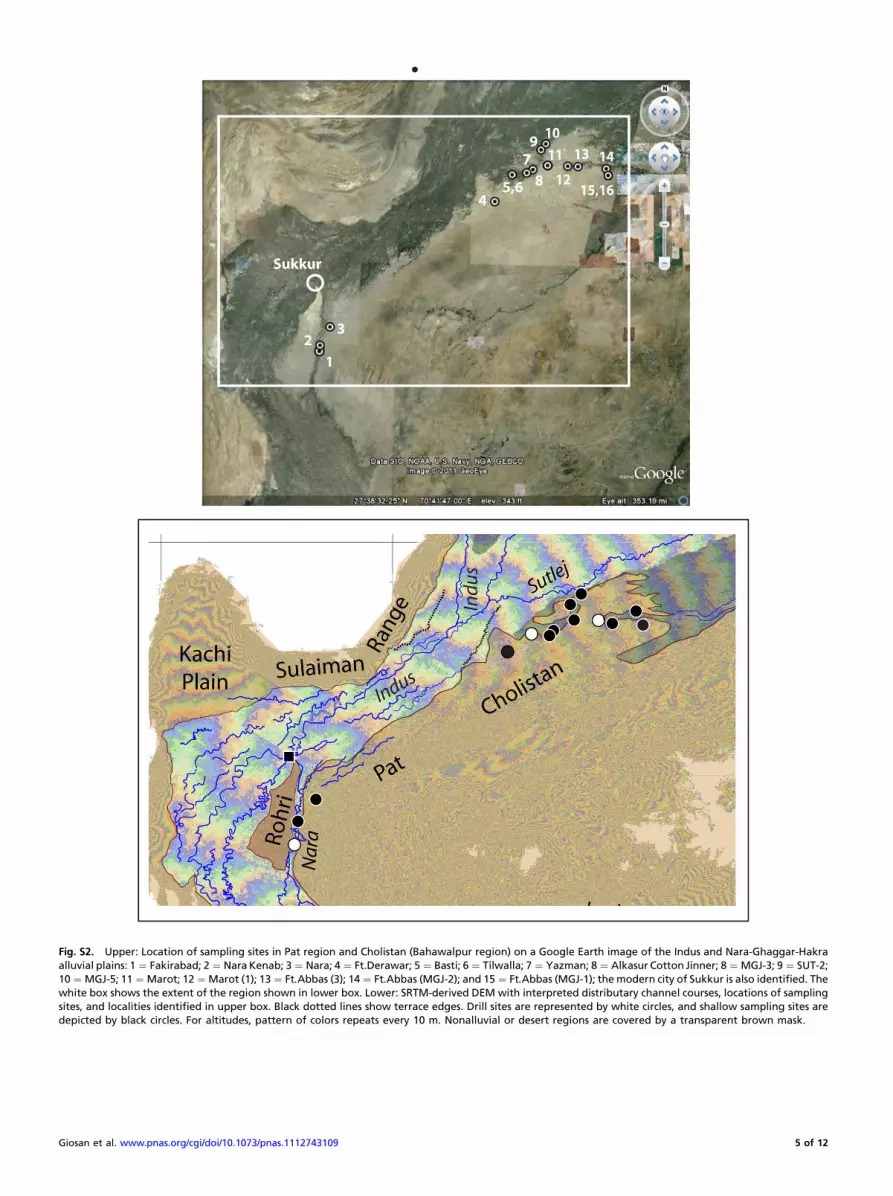
Fig. S2. Upper: Location of sampling sites in Pat region and Cholistan (Bahawalpur region) on a Google Earth image of the Indus and Nara-Ghaggar-Hakraalluvial plains: 1 ¼ Fakirabad; 2 ¼ NaraKenab; 3 ¼ Nara; 4 ¼ Ft.Derawar; 5 ¼ Basti; 6 ¼ Tilwalla; 7 ¼ Yazman; 8 ¼ Alkasur Cotton Jinner; 8 ¼ MGJ-3; 9 ¼ SUT-2;10 ¼ MGJ-5; 11 ¼ Marot; 12 ¼ Marot (1); 13 ¼ Ft:Abbas (3); 14 ¼ Ft:Abbas (MGJ-2); and 15 ¼ Ft:Abbas (MGJ-1); the modern city of Sukkur is also identified. Thewhite box shows the extent of the region shown in lower box. Lower: SRTM-derived DEM with interpreted distributary channel courses, locations of samplingsites, and localities identified in upper box. Black dotted lines show terrace edges. Drill sites are represented by white circles, and shallow sampling sites aredepicted by black circles. For altitudes, pattern of colors repeats every 10 m. Nonalluvial or desert regions are covered by a transparent brown mask.
Giosan et al. www.pnas.org/cgi/doi/10.1073/pnas.1112743109 5 of 12

Fig. S3. Upper: Location of sampling sites in Punjab, Pakistan on a Google Earth image of the combined alluvial plain of the Indus and Punjab rivers:1 ¼ Dipalpur; 2 ¼ Okara; 3 ¼ Karan Shah; 4 ¼ Kalokay; 5 ¼ Doda; 6 ¼ Jahanabad; the modern city of Lahore is also identified. The white box shows the extentof the region shown in lower box. Lower: SRTM-derived DEM with interpreted distributary channel courses, locations of sampling sites (black circles), andlocalities identified in upper box. For altitudes, pattern of colors repeats every 10 m. A gray mask identifies interfluves. Nonalluvial or desert regions arecovered by a transparent brown mask.
Giosan et al. www.pnas.org/cgi/doi/10.1073/pnas.1112743109 6 of 12

Fig. S4. Core logs and their OSL and radiocarbon chronology for sites examined in the Indo-Gangetic Plain along three transects in Pakistan. Geographicallocation of numbered sites on each transect are identified visually in Figs. S1–S3 and numerically in Tables S1–S3.
Giosan et al. www.pnas.org/cgi/doi/10.1073/pnas.1112743109 7 of 12

Fig. S5. Distribution of archaeological sites in the Indus domain approximately 4;500, 3,900, 3,500, and 3,000 y ago (updatedwith data from ref. 31, 26–29, 32).
Giosan et al. www.pnas.org/cgi/doi/10.1073/pnas.1112743109 8 of 12

0%10%20%30%40%50%60%70%80%90%
100%
wheat
barle
ylen
tilpe
a
chick
pea
flax
rice
little
mille
t
mun
g-bea
n
horse
gram
sesa
me
cotto
n
sorg
hum
Early Harappan
Mature Harappan
Post-Urban Harappan
summer/ kharif
winter/ rabi
Fig. S6. Changes in the commonness of crops in the Harappan civilization over time, comparing winter/spring grown (Rabi) crops (dependent largely onriverine water sources) and summer grown (Kharif) crops (dependent largely on monsoon rains). Note the general increase from Early, Mature, to Post-Urbanfor summer crops, while winter crops became less common in the Post-Urban period.
Giosan et al. www.pnas.org/cgi/doi/10.1073/pnas.1112743109 9 of 12
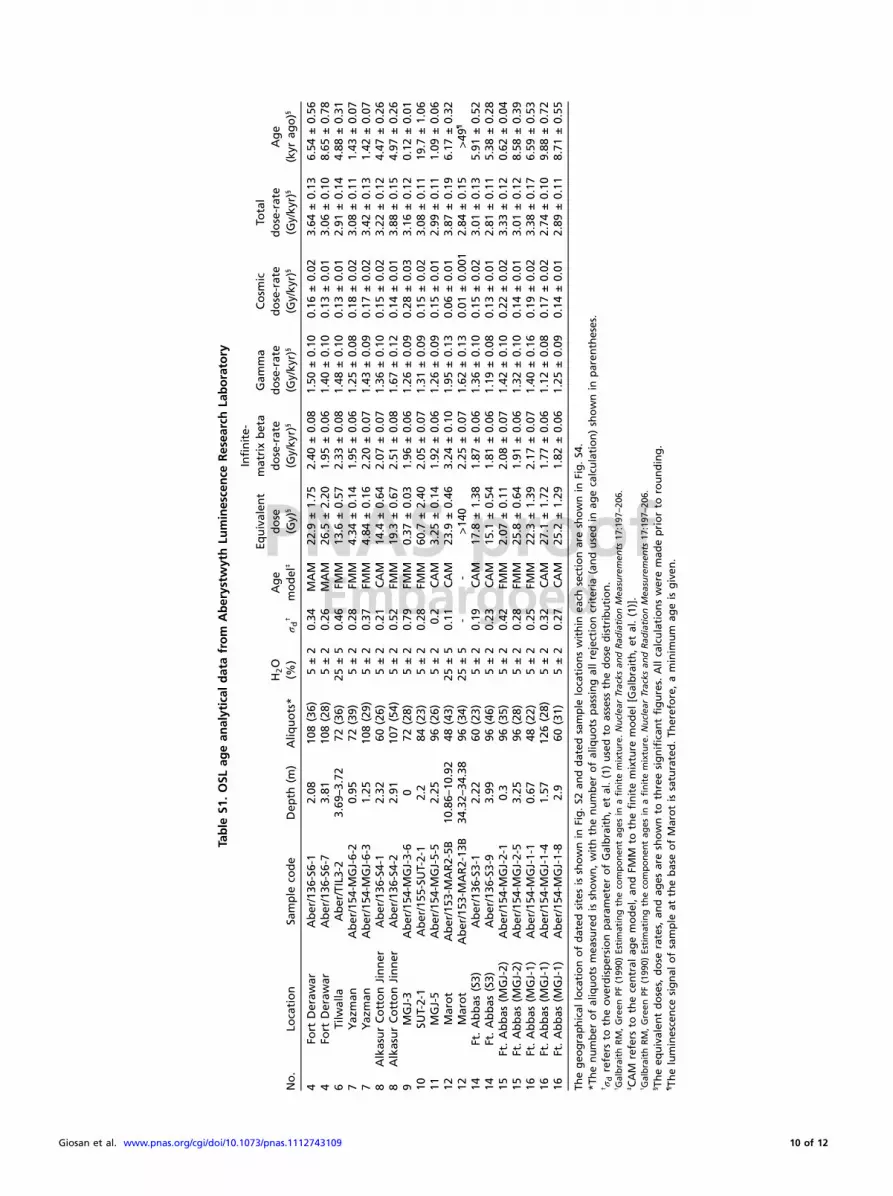
Table
S1.OSL
agean
alytical
datafrom
Aberystw
ythLu
minescence
Resea
rchLa
boratory
No.
Location
Sample
code
Dep
th(m
)Aliq
uots*
H2O
(%)
σd†
Age
model
‡
Equivalen
tdose
(Gy)
§
Infinite-
matrixbeta
dose-rate
(Gy/ky
r)§
Gam
ma
dose-rate
(Gy/ky
r)§
Cosm
icdose-rate
(Gy/ky
r)§
Total
dose-rate
(Gy/ky
r)§
Age
(kyr
ago)§
4Fo
rtDeraw
arAber/136
-S6-1
2.08
108(36)
5±2
0.34
MAM
22.9
±1.75
2.40
±0.08
1.50
±0.10
0.16
±0.02
3.64
±0.13
6.54
±0.56
4Fo
rtDeraw
arAber/136
-S6-7
3.81
108(28)
5±2
0.26
MAM
26.5
±2.20
1.95
±0.06
1.40
±0.10
0.13
±0.01
3.06
±0.10
8.65
±0.78
6Tilw
alla
Aber/TIL3-2
3.69
–3.72
72(36)
25±5
0.46
FMM
13.6
±0.57
2.33
±0.08
1.48
±0.10
0.13
±0.01
2.91
±0.14
4.88
±0.31
7Yaz
man
Aber/154
-MGJ-6-2
0.95
72(39)
5±2
0.28
FMM
4.34
±0.14
1.95
±0.06
1.25
±0.08
0.18
±0.02
3.08
±0.11
1.43
±0.07
7Yaz
man
Aber/154
-MGJ-6-3
1.25
108(29)
5±2
0.37
FMM
4.84
±0.16
2.20
±0.07
1.43
±0.09
0.17
±0.02
3.42
±0.13
1.42
±0.07
8AlkasurCottonJinner
Aber/136
-S4-1
2.32
60(26)
5±2
0.21
CAM
14.4
±0.64
2.07
±0.07
1.36
±0.10
0.15
±0.02
3.22
±0.12
4.47
±0.26
8AlkasurCottonJinner
Aber/136
-S4-2
2.91
107(54)
5±2
0.52
FMM
19.3
±0.67
2.51
±0.08
1.67
±0.12
0.14
±0.01
3.88
±0.15
4.97
±0.26
9MGJ-3
Aber/154
-MGJ-3-6
072
(28)
5±2
0.79
FMM
0.37
±0.03
1.96
±0.06
1.26
±0.09
0.28
±0.03
3.16
±0.12
0.12
±0.01
10SU
T-2-1
Aber/155
-SUT-2-1
2.2
84(23)
5±2
0.28
FMM
60.7
±2.40
2.05
±0.07
1.31
±0.09
0.15
±0.02
3.08
±0.11
19.7
±1.06
11MGJ-5
Aber/154
-MGJ-5-5
2.25
96(26)
5±2
0.2
CAM
3.25
±0.14
1.92
±0.06
1.26
±0.09
0.15
±0.01
2.99
±0.11
1.09
±0.06
12Marot
Aber/153
-MAR2-5B
10.86–
10.92
48(43)
25±5
0.11
CAM
23.9
±0.46
3.24
±0.10
1.95
±0.13
0.06
±0.01
3.87
±0.19
6.17
±0.32
12Marot
Aber/153
-MAR2-13
B34
.32–
34.38
96(34)
25±5
--
>140
2.25
±0.07
1.62
±0.13
0.01
±0.00
12.84
±0.15
>49¶
14Ft.Abbas
(S3)
Aber/136
-S3-1
2.22
60(23)
5±2
0.19
CAM
17.8
±1.38
1.87
±0.06
1.36
±0.10
0.15
±0.02
3.01
±0.13
5.91
±0.52
14Ft.Abbas
(S3)
Aber/136
-S3-9
3.99
96(46)
5±2
0.23
CAM
15.1
±0.54
1.81
±0.06
1.19
±0.08
0.13
±0.01
2.81
±0.11
5.38
±0.28
15Ft.Abbas
(MGJ-2)
Aber/154
-MGJ-2-1
0.3
96(35)
5±2
0.42
FMM
2.07
±0.11
2.08
±0.07
1.42
±0.10
0.22
±0.02
3.33
±0.12
0.62
±0.04
15Ft.Abbas
(MGJ-2)
Aber/154
-MGJ-2-5
3.25
96(28)
5±2
0.28
FMM
25.8
±0.64
1.91
±0.06
1.32
±0.10
0.14
±0.01
3.01
±0.12
8.58
±0.39
16Ft.Abbas
(MGJ-1)
Aber/154
-MGJ-1-1
0.67
48(22)
5±2
0.25
FMM
22.3
±1.39
2.17
±0.07
1.40
±0.16
0.19
±0.02
3.38
±0.17
6.59
±0.53
16Ft.Abbas
(MGJ-1)
Aber/154
-MGJ-1-4
1.57
126(28)
5±2
0.32
CAM
27.1
±1.72
1.77
±0.06
1.12
±0.08
0.17
±0.02
2.74
±0.10
9.88
±0.72
16Ft.Abbas
(MGJ-1)
Aber/154
-MGJ-1-8
2.9
60(31)
5±2
0.27
CAM
25.2
±1.29
1.82
±0.06
1.25
±0.09
0.14
±0.01
2.89
±0.11
8.71
±0.55
Thegeo
graphical
locationofdated
sitesis
shownin
Fig.S2
anddated
sample
locationswithin
each
sectionareshownin
Fig.S4
.*T
henumber
ofaliquots
mea
suredis
shown,withthenumber
ofaliquots
passingallrejectioncriteria
(andusedin
agecalculation)shownin
paren
theses.
†σdrefers
totheove
rdispersionparam
eter
ofGalbraith,et
al.(1)usedto
assess
thedose
distribution.
1 GalbraithRM,Green
PF(199
0)Estimatingtheco
mponen
tag
esin
afinitemixture.Nuclea
rTracks
andRad
iationMea
suremen
ts17
:197
–206
.‡CAM
refers
tothecentral
agemodel,an
dFM
Mto
thefinitemixture
model
[Galbraith,et
al.(1)].
1 GalbraithRM,Green
PF(199
0)Estimatingtheco
mponen
tag
esin
afinitemixture.Nuclea
rTracks
andRad
iationMea
suremen
ts17
:197
–206
.§ Theeq
uivalen
tdoses,
dose
rates,
andag
esareshownto
threesignifican
tfigures.
Allcalculationsweremad
epriorto
rounding.
¶Th
eluminescence
signal
ofsample
atthebaseofMarotis
saturated.Th
erefore,aminim
um
ageis
given
.
Giosan et al. www.pnas.org/cgi/doi/10.1073/pnas.1112743109 10 of 12

Table
S2.OSL
agean
alytical
datafrom
Roya
lHollo
way
Luminescence
Lab
Location
Dep
th(m
)
Grain-
size
(μm)
H2O
content
(%)*
σd†
SGCAM
equivalen
tdose
(Gy)
‡
MG
equivalen
tdose
(Gy)
‡
Alpha
dose-rate
(Gyky
r−1)§
Infinite-
matrixbeta
dose-rate
(Gyky
r−1)§
Gam
ma
dose-rate
(Gyky
r−1)§
Cosm
icdose-rate
(Gyky
r−1)§
Total
dose-rate
(Gyky
r−1)§
SGCAM
Age(ka)
¶
MG
Age
(ka)
¶
Oka
ra2.6
40–7
37.5±1
n/a
n/a
76.7
±3.37
(15)
0.30
±0.12
1.26
±0.08
1.17
±0.08
0.14
±0.01
2.88
±0.16
n/a
26.6
±1.91
Karan
Shah
3.5
180–
250
6.6±1
0.3
9.21
±0.66
(46)
9.20
±0.65
(15)
n/a
1.38
±0.11
1.08
±0.07
0.13
±0.01
2.60
±0.13
3.55
±0.31
3.54
±0.31
Kaloka
y3.1
180–
250
5.1±1
0.7
26.5
±3.26
(39)
30.4
±2.98
(10)
n/a
1.41
±0.11
1.10
±0.07
0.14
±0.01
2.65
±0.13
10.0
±1.33
11.5
±1.26
Jahan
abad
1.0
125–
180
5.9±1
n/a
n/a
10.1
±0.86
(15)
n/a
1.47
±0.11
1.16
±0.06
0.18
±0.02
2.81
±0.14
n/a
3.58
±0.35
Thegeo
graphical
locationofdated
sitesis
shownin
Fig.S3
,an
ddated
sample
locationswithin
each
sectionareshownin
Fig.S4
.*W
ater
contents
take
nas
20%
ofsaturationva
lue�1
0%
.†σdrefers
totheove
rdispersionparam
eter
ofGalbraith,et
al.(2)usedto
assess
thedose
distribution.
2 GalbraithRM,Green
PF(199
0)Estimatingtheco
mponen
tag
esin
afinitemixture.Nuclea
rTracks
andRad
iationMea
suremen
ts17
:197
–206
.‡Th
eeq
uivalen
tdose
areshownto
threesignifican
tfigureswithnumber
ofaliquots
usedin
paren
theses.A
llcalculationsweremad
epriorto
rounding.S
GCAM
=single
grain
usingcentral
agemodel;M
G=
multigrain
(med
ium-sizealiquots,ap
proximately5mm).
§ Dose
ratesareshownto
threesignifican
tfigures.
Allcalculationsweremad
epriorto
rounding.
¶Ages
areshownto
threesignifican
tfigures.Allcalculationsweremad
epriorto
rounding.SG
CAM
=single
grain
usingcentral
agemodel;MG
=multigrain
(med
ium-sizealiquots,ap
proximately5mm).
Giosan et al. www.pnas.org/cgi/doi/10.1073/pnas.1112743109 11 of 12

Table S3. Results of AMS 14C dating of organic materials recovered from locations shown in Figs. S1–S3
LocationDepth(m)
Latitude(deg min)
Longitude(deg min) Type
14C Age(yr BP)
Error(yr)
Cal. age(yrs)*
Cal. age(yrs)*
Error(yrs)
Sedimentationrates (m/kyr) Number‡
Punjab transectDipalpur 3.50 30 43.962 73 35.351 charcoal 760 30 667–730 759 32 1Okara 5.00 30 47.226 73 27.099 bivalve 9,150 35 10,233–10,407 10,380 87 2Karan Shah 3.30 31 39.636 74 12.169 bivalve 3,520 30 3,701–3,875 3,848 87 3Doda 2.50 32 00.573 73 02.415 gastropod 860 35 690–904 875 125 5Doda 2.60 32 00.573 73 02.415 charcoal 1,280 30 1,149–1,288 1,279 70 5
Nara—Hakra—Ghaggar transectNara
Kenab0.80 26 54.371 68 59.119 bivalve 2,670 25 2,747–2,844 2,856 49 1
Nara 6.00 26 58.561 68 59.474 bivalve 4,830 25 5,481–5,607 5,604 63 2Fakirabad 1.85 27 12.224 69 07.174 gastropod 3,080 35 3,215:3,373BP 3,354 79 3Basti 0.75 29 11.236 72 15.028 gastropod 5,050 20 5,740–5,893 5,877 77 5Basti 2.65 29 11.236 72 15.028 gastropod 5,880 20 6,659–6,743 6,761 42 5Tilwalla 43.7 29 05.740 71 34.084 plant/wood 45,100 670 6Yazman 2.70 29 07.386 71 46.168 gastropod 3,810 20 4,097–4,283 4,250 93 7Yazman 3.55 29 07.386 71 46.168 gastropod 4,130 20 4,540–4,815 4,738 138 7Alkasur
CottonJinner
3.81 29 09.907 71 51.325 gastropod 6,010 50 6,787–6,928 6,918 71 8
MGJ-5 1.10 29 10.082 72 01.148 plant/wood 145 25 modern–282 201 141 11MGJ-5 1.40 29 10.082 72 01.148 plant/wood 315 30 303–464 444 81 11Marot (S1) 2.40 29 12.816 72 20.475 gastropod 6,500 50 7,308–7,552 7,490 122 13Ft. Abbas
(S3)3.45 29 11.409 72 52.909 gastropod 5,050 35 5,668–5,906 5,847 119 14
Ft. Abbas(MGJ-1)
2.59 29 06.450 72 54.542 gastropod 11,900 50 13,708–13,961 13,835 127 † 16
Ft. Abbas(MGJ-1)
2.96 29 06.450 72 54.542 gastropod 12,000 70 13,785–14,077 13,931 146 † 16
Sindh transectMatli 6.7 25 02.670 68 39.309 bivalve 2,610 30 2,624–2,776 2,760 76 2.4 1Matli 40.2 25 02.670 68 39.309 plant/wood 6,520 180 7,000–7,716 7,418 358 7.2 1Mirwah 0.5 25 19.589 69 02.512 bivalve 2,250 25 2,158–2,340 2,309 91 0.2 2Shah
Dipalli2.3 25 29.336 69 12.215 bivalve 2,070 35 1,947–2,133 2,100 93 1.1 3
Merkan 1.35 25 24.514 69 35.425 bivalve 2,430 30 2,353–2,698 2,586 173 0.5 4
Sample locations within each section are shown in Fig. S4.*Calendar ages are relative to year 2010.†Ages on mollusk fragments; probably reworked; not used in age models.‡Number refers to lithostratigraphic log for sample in Fig. S4.
Giosan et al. www.pnas.org/cgi/doi/10.1073/pnas.1112743109 12 of 12

AUTHOR QUERIES
AUTHOR PLEASE ANSWER ALL QUERIES 1
Q: 3_The email should be active. Please confirm that it is active.