fluorescence tracing of diffuse landfill leachate contamination in rivers
TRANSCRIPT

FLUORESCENCE TRACING OF DIFFUSE LANDFILL LEACHATECONTAMINATION IN RIVERS
ANDY BAKERSchool of Geography, Earth and Environmental Sciences, The University of Birmingham,
Edgbaston, Birmingham, B15 2TT, U.K.(e-mail: [email protected], Tel. +44-121-4158133, Fax: +44-121-4145528)
(Received 20 July 2004; accepted 21 December 2004)
Abstract. Landfill leachates are composed of a complex mixture of degradation products whichinclude a wide range of potentially fluorescent organic molecules and compounds. Here we investigatethe use of fluorescence excitation–emission matrix (EEM) analysis in detecting diffuse landfill leachatecontamination in rivers. Landfill leachates from three unlined landfill sites adjacent to our studyriver are characterised by intense fluorescence at excitation wavelength 220–230 nm, and emissionwavelength 340–370 nm, which derives from fluorescent components of the xenobiotic organic matterfraction. Seven surface water sample sites on an adjacent polluted river system were analysed forfluorescence and water quality properties. The 220–230 nm excitation wavelength, 340–370 nmemission wavelength fluorescent centre was also detected in this river system at the sample locationsdownstream of the landfills, but not at upstream control sites, demonstrating its use as a tracer oflandfill leachate contamination. Negative correlations are observed between this fluorescence centreand dissolved oxygen in the river water samples, demonstrating the water quality implications ofleachate contamination at this study site. The fluorescence intensity at the 220–230 nm excitationwavelength, 340–370 nm emission wavelength fluorescent centre in landfill leachates is such that itremains detectable at dilutions of 102–103, and the fluorescence EEM technique is rapid and cost-effective for use by river managers and water quality regulators.
Keywords: excitation–emission matrix, fluorescence, landfill leachate, river pollution
Introduction
Landfill leachate is formed by excess rainfall percolating through waste layers ina landfill site. Leachate characteristics are a function of the quality of the landfillinput, which determines the relative importance of dissolved organic matter (DOM),xenobiotic organic matter (XOM), inorganic macrocomponents, and heavy metals,as well as the landfilling technology used and the age of the leachate (Christensenet al., 2001). Within the organic matter fraction, Kang et al. (2002) demonstratean increase in leachate humification with age and Calace et al. (2001) demonstratethat old leachate has a wider range of molecular weight and with a high molecularweight fraction being present. Schwarzbauer et al. (2002) identified plant materialderived compounds, degradation products of peptides, carbohydrates and lignin,and numerous XOMs from pharmaceuticals, plasticisers, pesticides and chlorinatedaromatics in contained and leaked leachate.
Water, Air, and Soil Pollution (2005) 163: 229–244 C© Springer 2005

230 ANDY BAKER
Landfill leachate can be a significant environmental contaminant if it leaves thelandfill site, which can occur if the site is designed as a ‘dilute and disperse’ site, ifthe landfill is unlined (for example, at landfills in relatively impermeable clay soils,or in developing countries where unlined landfilling is still regular practice) or ifthe landfill is lined but the lining fails. Typically, leachate that leaves a landfill sitewill enter the ground water as a contaminant plume, where it is then diluted and alsotransformed by a variety of processes such as sorption, chemical precipitation andmicrobial degradation. Rivers may also be impacted by landfill leachate; this mayoccur due to runoff directly from uncovered landfills (Zafar and Alappat, 2004),due to contaminated groundwater inputs into the river banks or bed (Atekwana andKrishnamurthy, in press), or erosion of bankside landfills (Kao et al., 2003). Thepollution impacts of landfill leachate are varied, depending on the nature of the fillmaterial, the age of the landfill (if in a plume then) the extent of any attenuationprocesses, and the concentration of leachate. Many researchers have suggested thatthe most significant long-term pollutant from landfills is ammonia (Christensenet al., 2001; Barlez et al., 2002), which can lead to toxicity in surface water atconcentrations 102–105 lower than in landfill leachate. Eutrophication from phos-phorus rich run-off from exposed landfill surfaces has also been suggested to bea surface water quality issue (Hodgkiss and Lu, 2004). The XOM fraction in theleachate may also reach toxic levels, with BTEX compounds, PAHs, and pesticidescommonly reported in leachates (Baun et al., 2003; Schwarzbauer et al., 2002) aswell as compounds with xeno-estrogenic properties (Wintgens et al., 2003; Coorset al., 2003), although the toxicity of XOM in leachate has received little atten-tion (Christensen et al., 2001). Landfill leachate induced toxicity has recently beenreported in mice (Bakare et al., 2003).
Given the potential water quality issues arising from landfill leachate contami-nation, the identification of a suitable tracer for leaked landfill leachate has been thefocus of many research studies. These studies have in general focused on groundwater contaminant plumes. For example, using GC/MS Schwarzbauer et al. (2002)identified 184 organic compounds (both natural and xenobiotic) from two landfillleachates in landfills, but only 92 organic compounds in leakage water. Of the lat-ter, several XOMs appeared both persistent and specific to the landfill leachates (e.g. N,N-diethyloluamide (DEET), N-butylbenzenesulfonamide (NBBS) and propy-phenazone) and therefore could be used as tracers of landfill leachate using GC/MS.Van Breukelen et al. (2003) used a combination of biogeochemical and isotope trac-ers to both identify the ground water leachate plume extent as well as interpret theredox conditions within it. Vilomet et al. (2001, 2003) demonstrated that leachatecontaminant plumes can be detected through both stable lead (206Pb/207Pb) andstrontium (87Sr/86Sr) isotope ratios. In river systems, Atekwana and Kirshnamurthy(in press) investigated the use of 13C isotopes as a tracer of leachate contaminatedgroundwater seeping into a headwater stream, but although leachate 13C was el-evated (δ13C of −2.3 to +5.7 per mil in seepage groundwaters) with respect tonatural 13C (δ13C of −16.9 to −10.0 per mil in upstream river samples), grab

FLUORESCENCE TRACING OF DIFFUSE LANDFILL LEACHATE CONTAMINATION 231
samples failed to detect the presence of leachate pollution in the stream itself due todilution effects. Ammonia might also be considered to be a useful tracer of landfillleachate in surface waters, with typical quoted leachate concentrations (50–2200mg/L; Christensen et al., 2001) more likely to be detectable after dilution, but ox-idation and the presence of multiple ammonia contaminant sources in many riverenvironments limits its use as a unique fingerprint.
Most recently, fluorescence has been used to fingerprint landfill leachates withinthree landfill sites (Baker and Curry, 2004). Rapid fluorescence analysis is now pos-sible using fluorescence spectrophotometers such that an excitation–emission ma-trix (or EEM) can be generated in approximately 1 min, with analysis possible in situwith portable spectrometers (Baker et al., 2004). The technique is now widely usedin wastewater characterisation within the wastewater treatment process (Reynoldsand Ahmad, 1997; Westerhoff et al., 2001; Vasel and Praet, 2002), for DOM char-acterisation in marine and estuarine waters (Coble et al., 1990; Mopper and Schultz,1993; Mayer et al., 1999; Parlanti et al., 2001; Stedmon et al., 2003), and riverineDOM fingerprinting (Baker, 2001, 2002a,b,c; Baker et al., 2003; McKnight et al.,2001, 2003; Thoss et al. 2000; Newson et al. 2001; Yan et al. 2000, Stedmonet al. 2003). Baker and Curry (2004) demonstrated that landfill fluorescence prop-erties are all characterized by intense fluorescence at λex = 220–230 nm, andλem = 340–370 nm that was suggested to derive from fluorescent components ofthe XOM fraction such as naphthalene (the “XOM peak”). A second fluorescencecentre, at λex = 320–360 nm, and λem = 400–470 nm, derives from a highermolecular weight fulvic-like fraction, and a third centre at λex = 270–280 nm,and λem = 340–360 nm to tryptophan-like fluorescence. Baker and Curry (2004)demonstrated that leachates from different landfill sites could be statistically dis-criminated using a combination of fluorescence and basic geochemical parameters.For the XOM fluorescence peak, fluorescence could be detected at ∼103 dilution,suggesting that this technique could be appropriate for leachate detection in riversystems.
Previous research therefore suggests that fluorescence EEM spectrophotometryis able to fingerprint landfill leachate contamination in surface waters. However,to date no investigations have been undertaken to test this hypothesis on riversthat suffer from landfill leachate contamination. Therefore, results are presented ofthe analysis of fluorescence EEM spectrophotometric analysis of landfill leachatesamples from potentially polluting landfill sites, as well as river water samples froman adjacent contaminated river in NE England.
Materials and Methods
A site was investigated where it was thought that landfill leachate contaminationwas having an impact on a local watercourse. Therefore both the potential sourcematerial (the fluorescence properties of landfill leachates) as well as river water

232 ANDY BAKER
adjacent to the landfills was sampled. The site, including sampling locations forboth leachate samples and river waters is presented in Figure 1.
Three unlined landfills are situated in former clay pits adjacent to the RowletchBurn, a tributary of the River Team, part of the Tyne catchment in NE England(lat: 54◦53′37′N, long: 1◦35′18′W). The burn is a small ungauged stream of ∼4 kmlength, heavily channelised and in places culverted, of channel width 1–2 m, whichdrains a mixed land use of agriculture, industry and housing. Water quality of theRowletch Burn monitored monthly over the period 1990–2002 at site 5 (Figure1) by the England and Wales water quality regulator the Environment Agencydemonstrates that the quality is poor, with biochemical oxygen demand averaging12.3 ± 18.7 mg/L, ammonia 7.4 ± 8.6 mg/L and dissolved oxygen 47 ± 15%saturation (1 S.D.; n = 132). Given the high ammonia concentrations observed inthe burn, the adjacent landfills had been identified as probable sources of the poorwater quality, but Environment Agency surveys failed to detect point pollutionsources to the river. Diffuse source contamination through the stream banks or bedwas therefore assumed to be occurring, but it was not known which of the threelandfill sites was the possible source.
The Rowletch Burn passes over a geology that comprises thick laminated glacialclays that were deposited in a buried valley cut into the underlying Coal Measures.The laminated clays are overlain locally by more variable silty clays, which containsands in places, as well as areas of made ground. The laminated clays, which areextensive both laterally and vertically, are of low permeability and were viewedto form a non-aquifer and therefore suitable for landfilling. Two landfills, OustonQuarry and North Quarry (Figure 2), are disused and details about their history aresparse. Single boreholes are present in each landfill, permitting leachate samplingalthough not a spatial coverage of leachate quality variations within the formerlandfills. Four leachate samples were collected from each borehole over the sam-pling period. A third landfill, St Bede’s, had just ceased operation, and sampleswere collected just prior to closure. Due to its commencement age and its locationin thick clay deposits, the site is also unlined. The landfill had an initial void spaceof 2 223 607 m3; between 1970 and 1975 the northern half of the landfill was filledwith a high proportion of incinerator residues together with some domestic andindustrial wastes. The southern half of the void has been landfilled with domestic,commercial and industrial waste, incorporating a proportion of special wastes be-tween 1993 and 2003. The northern area has also received additional waste overthe older landfill to produce a domed restoration landform. Landfilling operationsceased during March 2003 and leachate from the site is discharged to sewer. Ninesamples covering both old and active sectors of the landfill were sampled once inSeptember 2002.
River water samples were collected on the Rowletch Burn at seven sampling lo-cations, with sample locations limited by public access points (Figure 1). Samplingoccurred in May and June 2002; initial weekly sampling (May) was followed bybiweekly sampling (June). Six samples at each site were collected over the study

FLUORESCENCE TRACING OF DIFFUSE LANDFILL LEACHATE CONTAMINATION 233
Figure 1. Location map. The three landfills are shown, together with locations of leachate and riverwater samples. The Rowletch Burn flows from S to N into the River Team.

234 ANDY BAKER
Figure 2. Typical fluorescence EEMs observed in this study. (A) Leachate from treatment worksoutlet to sewer at St Bede’s (b) Leachate from borehole in Ouston Quarry. (c) River water samplefrom downstream site 3 (4) River water sample from upstream site 6. All EEMs are scaled from 0 to750 intensity units with 10 equally spaced contours; note the different dilutions applied. See text forpeak identification.
period. Sites 1 and 6 are of tributaries to the Rowletch Burn that are upstream of anylandfill sites. Sites 2, 3, 4, 5 and 7 are progressively downstream on the RowletchBurn. Site 2 is at the upstream corner of Ouston Quarry, site 3 adjacent the midpoint of Ouston Quarry, and site 4 downstream of Ouston Quarry and upstream ofSt Bede’s. Site 5 is downstream of St Bede’s and upstream of North Quarry and site7 is downstream of North Quarry. Over the length of the river sampled, no othertributary inputs were present, although several surface-water drains are present aswell as combined sewage overflows.
Water samples were collected in 50 mL plastic containers that had been previ-ously cleaned by soaking in 10% HCl for 24 h and then triple rinsed in distilled,deionised water. Samples were returned to laboratory and analysed within 24 hfor spectrophotometric and geochemical properties. Samples were filtered usingWhatman GF/C glass microfibre filter papers that had been previously heated to450 ◦C to remove any possible organic contamination. Fluorescence EEMs weregenerated using a Perkin Elmer LS50B Luminescence Spectrophotometer as de-scribed elsewhere (Baker, 2001). The only modification was to scan a wider rangeof wavelengths with excitation from 200 to 370 nm and emission detected from

FLUORESCENCE TRACING OF DIFFUSE LANDFILL LEACHATE CONTAMINATION 235
250 to 500 nm. The majority of samples were analysed at least ×10 dilution dueto their high fluorescence intensity. The Raman peak intensity of water at 348 nmover the analysis period averaged 23.6±0.9 arbitrary units (n = 30); this value canbe used to permit inter-laboratory comparison. Absorbance was measured usinga WPA Lightwave UV/VIS spectrophotometer; absorbance was measured at 254,340 and 410 nm. As well as providing water quality information, the measurementof absorbance permits the inner-filtering correction of fluorescence intensities, al-though this was not required as our diluted samples all fell below the necessaryabsorbance (Ohno, 2002). Ammonia was measured using a Hanna Instruments Col-orimeter and chloride concentration by silver nitrate titration. Total organic carbonwas measured using a Shimadzu TOC analyser; measurements were made in trip-licate and the mean value recorded. pH, dissolved oxygen and oxidation-reductionpotential were measured in the field.
1. Results and Discussion
Results are presented in Table I for both river water and leachate samples, andtypical fluorescence EEMs are presented in Figure 2. Table I demonstrates thatlandfill leachates are characterised by high absorbance, high ammonia concentra-tion, high total organic carbon concentrations, low dissolved oxygen and highlyreduced condition as would be expected from such samples and described else-where (Christensen et al., 2001). River water samples downstream of the landfillsalso show high ammonia and low dissolved oxygen, indicative of poor water quality.In contrast, upstream sites 1 and 6 have low ammonia and high dissolved oxygenand are of good water quality. Other geochemical (pH, chloride, organic carbon) andabsorbance data at the river sample sites show no significant differences betweenupstream and downstream sites.
Typical fluorescence EEM results for leachate samples (Figures 2a and 2b)demonstrate the distinctive and intense fluorescence peak at λex = 220–230 nm,and λem = 340–370 nm, which we will call here the XOM peak, which is identical inlocation to that observed previously by Baker and Curry (2004). Other peaks clearlypresent include one at λex = 230–250 nm and λem = 400–440 nm that is attributedto humic material (Coble, 1996; Yan et al., 2000), and at λex = 320–340 nm andλem = 400–440 nm, a peak that is attributed to aromatic and aliphatic groups in thefulvic-like fraction. A final fluorescence centre that is weakly visible as a shoulderin the other fluoresce peaks and with variable intensity is at λex = 275–280 nmand λem = 350–360 nm, attributed to the protein tryptophan, and widely observedin polluted river waters (Baker, 2001, 2002b). At the sites where replicate sampleswere taken (Ouston and North Quarries), the fluorescence EEMs at each site aresimilar in terms of the presence and intensity of the fluorescence centres present(including the presence of the XOM peak; Table I). At St Bede’s landfill, wherespatial sampling was possible, a wider range of variability of fluorescence properties

236 ANDY BAKERTA
BL
EI
Geo
chem
ical
and
fluor
esce
nce
data
for
leac
hate
and
rive
rw
ater
sam
ples
Fulv
ic-l
ike
Abs
orba
nce
fluor
esce
nce
Dis
solv
edO
xida
tion
Tota
lX
OM
Site
Am
mon
iaox
ygen
Chl
orid
ere
duct
ion
orga
nic
254
nm34
0nm
410
nmT
rypt
opha
nex
emin
tpe
ak(b
ottle
ID)
pH(m
gL
−1)
(%)
(mm
olL
−1)
pote
ntia
lC
(mg
L−1
)(c
m−1
)(c
m−1
)(c
m−1
)in
t(U
)(n
m)
(nm
)(U
)in
t(U
)
1M
ean
8.10
0.04
93.0
1.15
48.6
05.
250.
090.
020.
0178
325.
841
2.9
127
<25
0
S.D
.0.
350.
064.
80.
4239
.85
1.41
0.01
0.00
0.00
198.
63.
021
2M
ean
7.53
0.26
81.5
2.23
22.6
06.
050.
070.
020.
0010
932
4.2
414.
398
600
S.D
.0.
300.
145.
50.
7740
.78
2.07
0.02
0.00
0.00
568.
64.
623
311
3M
ean
7.28
5.92
68.7
2.30
66.6
07.
140.
090.
020.
0125
631
9.2
412.
215
714
01
S.D
.0.
292.
538.
20.
8944
.41
2.29
0.01
0.00
0.00
121
5.8
3.8
3155
5
4M
ean
7.28
3.60
47.1
2.62
59.2
012
.24
0.11
0.02
0.01
432
320.
841
7.9
189
3420
S.D
.0.
271.
8715
.70.
6722
.74
8.12
0.02
0.01
0.00
9512
.46.
724
613
5M
ean
7.31
3.78
28.8
2.12
37.0
09.
200.
130.
030.
0147
631
7.0
414.
720
336
70
S.D
.0.
302.
016.
50.
5227
.94
2.33
0.02
0.01
0.01
129
5.7
4.0
3043
8
6M
ean
7.75
0.41
92.7
1.88
33.6
06.
350.
130.
030.
0193
322.
041
4.6
159
<25
0
S.D
.0.
210.
6710
.30.
7025
.23
1.34
0.01
0.00
0.00
1311
.53.
822
7M
ean
7.39
3.18
55.4
2.32
51.5
09.
300.
130.
030.
0142
331
5.0
415.
320
732
40
S.D
.0.
172.
005.
40.
416.
563.
740.
020.
010.
0012
16.
11.
435
232
Ous
ton
Mea
n6.
9616
3.45
5.9
5.70
−210
.33
20.4
80.
500.
140.
0411
7332
5.0
408.
513
7745
21
S.D
.0.
2510
.85
1.0
1.16
4.62
6.74
0.01
0.01
0.01
135
0.0
2.9
165
685
Nor
thQ
uary
Mea
n7.
2245
.43
5.4
11.2
55.
3351
.83
0.92
0.19
0.05
1513
317.
540
4.5
1455
5878
S.D
.0.
4516
.90
1.2
1.91
50.8
13.
500.
050.
030.
0229
95.
03.
312
212
72
StB
ede’
sM
ean
6.99
115.
47nd
480.
00nd
110.
330.
570.
150.
0610
5532
4.4
416.
112
1239
27
S.D
.0.
2310
8.29
nd58
8.05
nd88
.18
0.41
0.08
0.06
897
8.1
11.1
1031
3196
For
sam
ple
loca
tions
,see
Figu
re1.
Lea
chat
esa
mpl
esar
efr
omm
ultip
lesa
mpl
esfr
omsi
ngle
bore
hole
s(O
usto
n,N
orth
)an
dfr
omsi
ngle
sam
ples
from
nine
diff
eren
tbor
ehol
es(S
tBed
e’s)
.

FLUORESCENCE TRACING OF DIFFUSE LANDFILL LEACHATE CONTAMINATION 237
is visible, suggesting that a similar variability might be expected at Ouston andNorth Quarry landfills had sampling of spatial variability within each landfill beenpossible. Differences also occur in the relative intensity of the fluorescence centresbetween the sites, probably relating to differences in leachate age and quality asdemonstrated by Baker and Curry (2004).
Figures 2c and 2d presents the typical fluorescence EEMs of the diluted riverwater samples, both upstream and downstream of the landfill sites. The down-stream sample (Figure 2c) is dominated by the XOM peak, although at a lowerconcentration than in the leachates. The upstream sample (Figure 2d) is similar tofluorescence EEMs of clean river waters, with only the presence of fluorescencecentres at λex = 230–250 nm and λem = 400–440 nm, and at λex = 340 nm andλem = 400–440 nm, indicative of natural dissolved organic matter. Total organiccarbon data (Table I) demonstrates no difference between TOC in upstream anddownstream river water samples, irrespective of the presence of fluorescence XOMpeak downstream sites, confirming that this fluorescence centre derives from a lowconcentration, high fluorescence efficiency source.
Visual inspection of Table I reveals differences between sample sites upstreamand downstream of the landfills. Correlations between the fluorescence and geo-chemical results for all the river water samples (n = 40–42) are presented inTable II. Strong correlations exists between the intensity of all the fluorescence cen-tres (0.65 < r < 0.90), with the strongest correlations between the fluorescenceXOM peak and tryptophan-like fluorescence intensity (r = 0.90), suggesting alandfill leachate source for both centres. The strongest correlations between waterquality and fluorescence variables are between dissolved oxygen and both the XOMpeak intensity (r = −0.87) and tryptophan-like fluorescence intensity (r = −0.85),suggesting a causal link between landfill leachate (the presence of the XOM peak)and low dissolved oxygen concentrations in the river. Ammonia also exhibitedstatistically significant correlations with both XOM peak intensity (r = 0.65) andtryptophan-like intensity (r = 0.60) but at weaker levels. Weakest correlations werebetween absorbance, chlorine, and fulvic-like excitation and emission wavelengths.
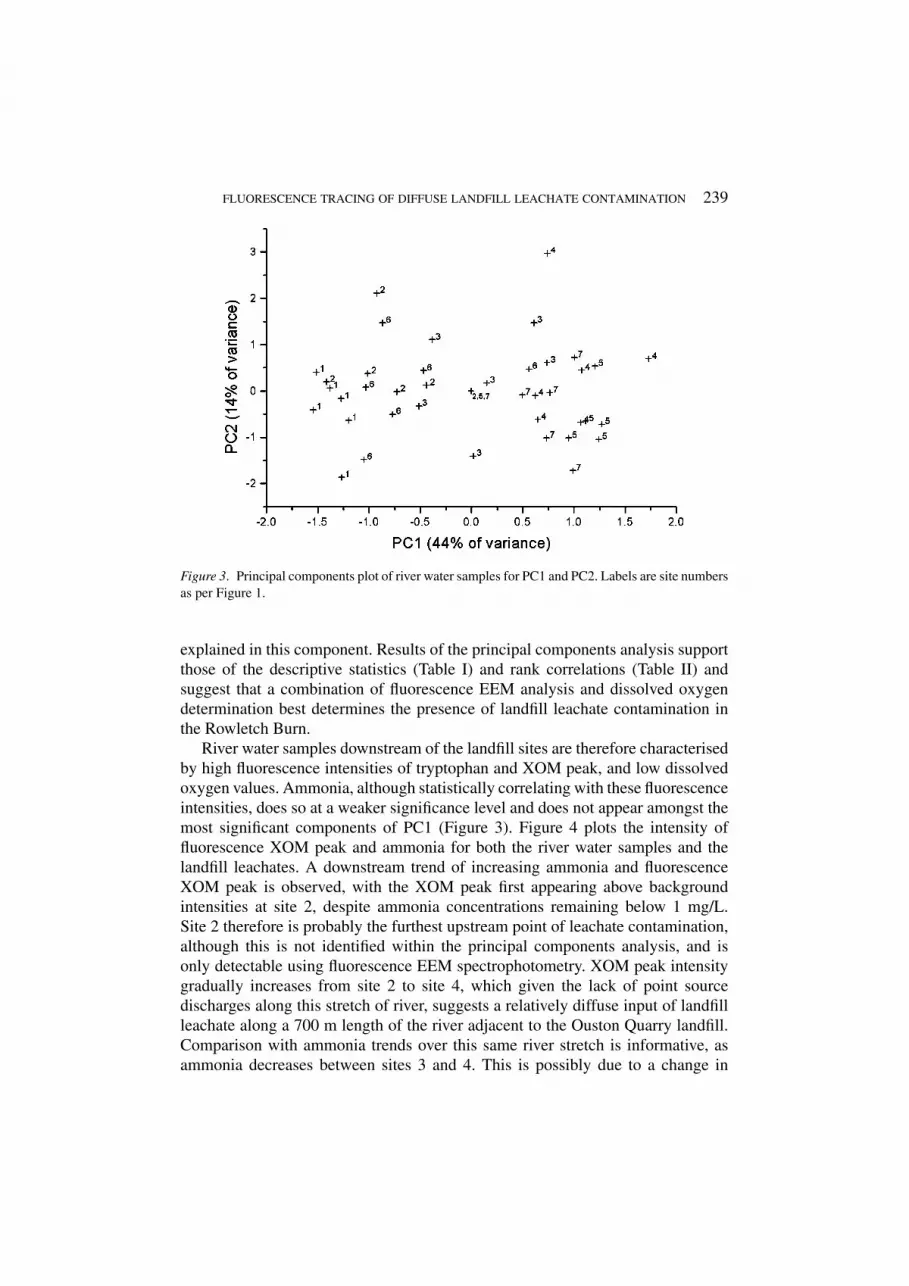
An alternative method of exploring the relationships between the geochemicaland spectrophotometric results is to use principal components analysis, the resultsof which are shown in Figure 3. This shows that the first principal componentexplains 44% of the total variance; the variables with the greatest correlation withinthis component are the fluorescence intensity of XOM peak (r = 0.89), tryptophanfluorescence intensity (r = 0.89) and dissolved oxygen (r = −0.91). Each ofthese three parameters are typical of the leachate samples (Table I), suggestingthat river water samples with a positive score are those contaminated by landfillleachate (sites 3, 4, 5 and 7), whereas those with a negative score are uncontaminated(sites 1, 2 and 6). Principal component 2 explains a further 14% and comprisesfulvic-like fluorescence excitation wavelength (r = 0.62) and emission wavelength(r = 0.53). In this case there seems to be little correlation between component scoreand sampling site location, which is probably a reflection of the low total variance

238 ANDY BAKER
TAB
LE
II
Spea
rman
’sra
nkco
rrel
atio
nsbe
twee
nw
ater
qual
ityva
riab
les
mea
sure
dat
the
seve
nR
owle
tch
Bur
nsa
mpl
esi
tes
Fluo
resc
ence
Dis
solv
edTo
tal
Abs
orba
nce
XO
Mpe
akT
ryp
peak
Fulv
ic-l
ike
Fulv
ic-l
ike
Fulv
ic-l
ike
Am
mon
iaox
ygen
CI
orga
nic
C41
0nm
inte
nsity
inte
nsity
exci
tatio
nem
issi
onin
tens
ity
pH−0
.64
0.54
−0.5
4−0
.46
−0.1
2−0
.45
−0.5
00.
15−0
.23
−0.2
4
Am
mon
ia–
−0.7
30.
570.
560.
240.
650.
60−0
.02
0.26
0.47
Dis
solv
edox
ygen
–−0
.40
−0.6
2−0
.32
−0.8
7−0
.85
0.23
−0.1
8−0
.69
CI
–0.
300.
120.
530.
420.
010.
040.
26
Tota
lorg
anic
C–
0.54
0.59
0.68
0.13
0.57
0.66
Abs
orba
nce
410
nm–
0.25
0.46
0.01
0.22
0.58
Fluo
resc
ence
–0.
90−0
.23
0.26
0.65
inte
nsity
XO
Mpe
ak
Fluo
resc
ence
–−0
.28
0.24
0.81
inte
nsity
Try
ppe
ak
Exc
itatio
n–
0.19
−0.2
4w
avel
engt
hFu
lvic
-lik
e
Em
issi
on–
0.22
wav
elen
gth
Fulv
ic-l
ike
Cor
rela
tions
that
are
sign
ifica
ntat
the
99%
confi
denc
ele
vela
resh
own
inbo
ld.
FLUORESCENCE TRACING OF DIFFUSE LANDFILL LEACHATE CONTAMINATION 239
Figure 3. Principal components plot of river water samples for PC1 and PC2. Labels are site numbersas per Figure 1.
explained in this component. Results of the principal components analysis supportthose of the descriptive statistics (Table I) and rank correlations (Table II) andsuggest that a combination of fluorescence EEM analysis and dissolved oxygendetermination best determines the presence of landfill leachate contamination inthe Rowletch Burn.
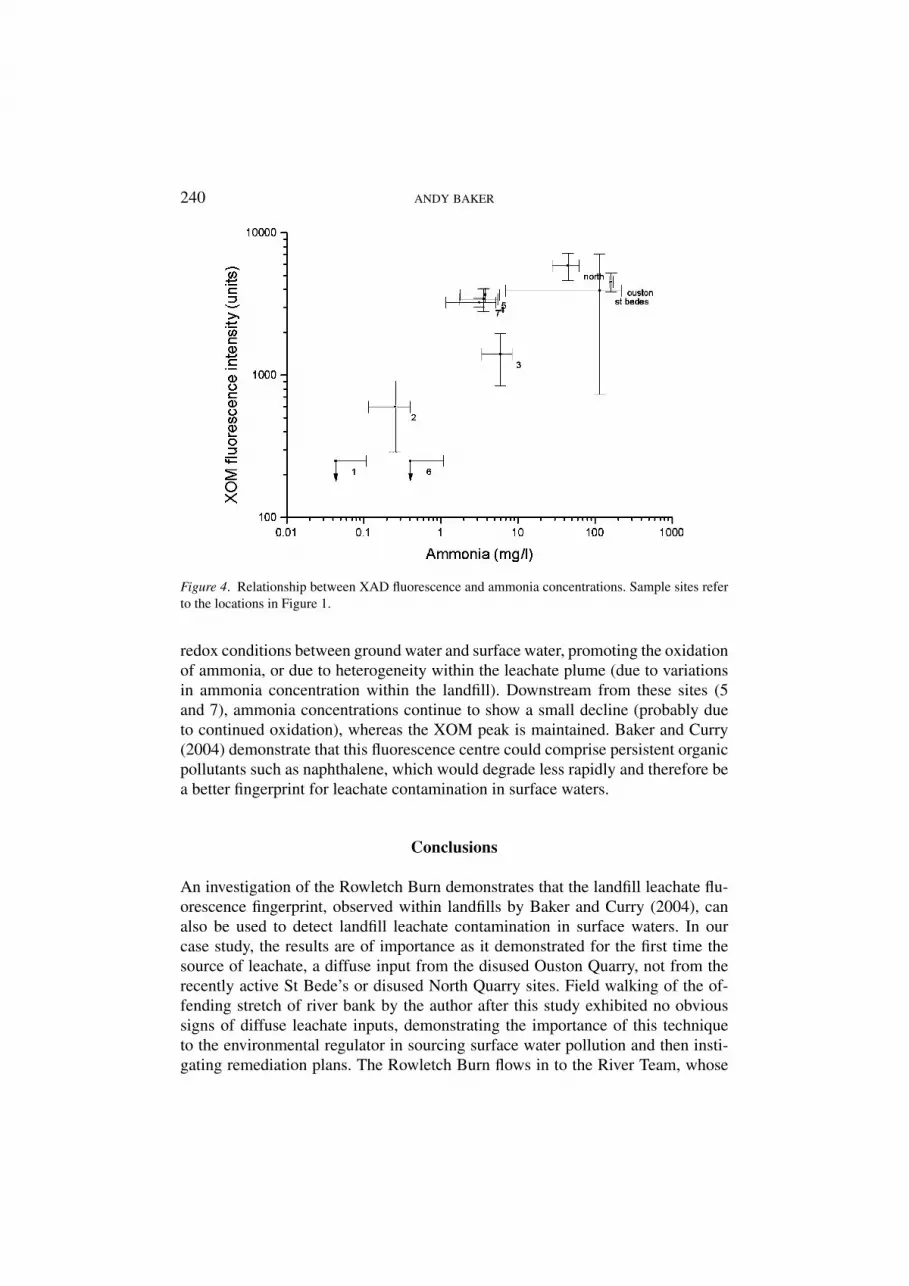
River water samples downstream of the landfill sites are therefore characterisedby high fluorescence intensities of tryptophan and XOM peak, and low dissolvedoxygen values. Ammonia, although statistically correlating with these fluorescenceintensities, does so at a weaker significance level and does not appear amongst themost significant components of PC1 (Figure 3). Figure 4 plots the intensity offluorescence XOM peak and ammonia for both the river water samples and thelandfill leachates. A downstream trend of increasing ammonia and fluorescenceXOM peak is observed, with the XOM peak first appearing above backgroundintensities at site 2, despite ammonia concentrations remaining below 1 mg/L.Site 2 therefore is probably the furthest upstream point of leachate contamination,although this is not identified within the principal components analysis, and isonly detectable using fluorescence EEM spectrophotometry. XOM peak intensitygradually increases from site 2 to site 4, which given the lack of point sourcedischarges along this stretch of river, suggests a relatively diffuse input of landfillleachate along a 700 m length of the river adjacent to the Ouston Quarry landfill.Comparison with ammonia trends over this same river stretch is informative, asammonia decreases between sites 3 and 4. This is possibly due to a change in
240 ANDY BAKER
Figure 4. Relationship between XAD fluorescence and ammonia concentrations. Sample sites referto the locations in Figure 1.
redox conditions between ground water and surface water, promoting the oxidationof ammonia, or due to heterogeneity within the leachate plume (due to variationsin ammonia concentration within the landfill). Downstream from these sites (5and 7), ammonia concentrations continue to show a small decline (probably dueto continued oxidation), whereas the XOM peak is maintained. Baker and Curry(2004) demonstrate that this fluorescence centre could comprise persistent organicpollutants such as naphthalene, which would degrade less rapidly and therefore bea better fingerprint for leachate contamination in surface waters.
Conclusions
An investigation of the Rowletch Burn demonstrates that the landfill leachate flu-orescence fingerprint, observed within landfills by Baker and Curry (2004), canalso be used to detect landfill leachate contamination in surface waters. In ourcase study, the results are of importance as it demonstrated for the first time thesource of leachate, a diffuse input from the disused Ouston Quarry, not from therecently active St Bede’s or disused North Quarry sites. Field walking of the of-fending stretch of river bank by the author after this study exhibited no obvioussigns of diffuse leachate inputs, demonstrating the importance of this techniqueto the environmental regulator in sourcing surface water pollution and then insti-gating remediation plans. The Rowletch Burn flows in to the River Team, whose
FLUORESCENCE TRACING OF DIFFUSE LANDFILL LEACHATE CONTAMINATION 241
downstream water quality is poor due to the impacts of both the Burn, as well asmine water discharges and treated sewage effluent, which in total often comprise>50% of the total river flow. Understanding the causes of water quality issues onthe downstream river Team, and their remediation, is of regional importance as theTeam and its tributaries are the focus of the River Team Revival Project, a part-nership between local communities, local authorities and the England and WalesEnvironment Agency to develop sustainable river management systems. Our resultswill help in the remediation strategy for the Rowletch Burn.
The observed negative correlations between the tryptophan-like and XOM peaksand dissolved oxygen in the river water samples demonstrate the water quality im-plications of leachate contamination. Visual inspection of the total organic carbonconcentration data suggests no downstream trends between water sample sites (Ta-ble I), suggesting that the landfill leachate does not make up a significant fractionof the TOC load. This is confirmed by stepwise multiple regression, which demon-strates that TOC is primarily correlated with tryptophan-like fluorescence, but thatthe fit to the data (r = 0.45, n = 37) is such that only ∼20% of variability isexplained. This result suggests that there are multiple organic carbon source in theburn, and that landfill leachate is not a dominant source. The significant negativecorrelation of the XOM fluorescence peak with dissolved oxygen does suggest thatthe (relatively low concentrations of) landfill leachate impacting the river is alsohighly bioavailable.
Further studies now required in particular are as follows:
1. It is informative to know the extent to which the XOM fluorescence peak isobserved in surface waters. In a study of 62 sample sites on the River Tynecatchment, NE England, sampled six times over the course of one year, onlyone site exhibited this peak (Baker and Inverarity, 2004), and that site was onthe River Team downstream of the Rowletch Burn confluence. Within the Tynecatchment, no other tributaries are known to be impacted from landfill leachatepollution (Inverarity, personal communication), demonstrating the uniquenessof XOM fluorescence peak in detecting landfill leachate contamination. Furtherresearch is required from other rivers with known landfill leachate impacts todetermine the wider applicability of fluorescence EEM spectrophotometry.
2. To date, no other fluorescent pollutants have been demonstrated to fluoresceat the wavelengths of the XOM peak, although the future detection of suchcompounds must not be ruled out. Further research, especially into naphthaleneand other PAH rich contaminants such as contaminated land sites, is necessary.The analysis of further landfill leachates is also required to develop a databaseof source fluorescence properties.
3. A major advantage of fluorescence spectrophotometry is its rapid analysis time(<1 min) using small samples (<5 mL) and its non invasive nature. Our studyinvolved the return of samples to the laboratory for analysis, but the developmentof portable spectrophotometers (for example Baker et al., 2004) will eventually

242 ANDY BAKER
permit the in-situ field analysis of river water fluorescence. Currently, portabledevices are limited to ∼270 nm excitation wavelength, preventing the detectionof the XOM peak, but permitting the detection of tryptophan-like fluorescence.Unfortunately, the latter peak is also indicative of organic pollution from indus-trial, farm and sewage effluents (Baker, 2001, 2002a, b) and so would not providea unique fingerprint of landfill leachate. However, a twofold sampling strategy ofinitial laboratory EEM spectrophotometry to identify landfill leachate impacts,followed by field based high spatial resolution studies within the impacted reach,would be successful.
Acknowledgments
Nick Diggle and Roger Inverarity at the Environment Agency, Northumbria Office,first alerted me to the presence of the water quality issues on the Rowletch Burn andprovided borehole sampling locations. Ian MacDonald at Norsk Hydro Aluminium,Birtley, is thanked for providing site access. Andrew Cowan provided field supportwhen accessing St Bede’s landfill; Pat Johnston in the School of Civil Engineeringand Geosciences at the University of Newcastle kindly provided access to TOCanalysis. Ann Rooke is thanked for drawing Figure 1.
References
Atekwana, E. A. and Krishnamumurthy, R. V.: in press, ‘Investigating landfill-impacted groundwaterseepage into headwater streams using stable carbon isotopes’, Hydrol. Process. 18, 1915–1926.
Bakare, A. A., Mosuro, A. A. and Osibanjo, O.: 2003, ‘Landfill leachate-induced toxicity in mice’,J. Environ. Biol. 24, 429–435.
Baker, A.: 2001, ‘Fluorescence excitation-emission matrix characterisation of some sewage impactedrivers’, Environ. Sci. Technol. 35, 948–953.
Baker, A.: 2002a, ‘Fluorescence properties of some farm wastes: Implications for water qualitymonitoring’, Water Res. 36, 189–194.
Baker, A.: 2002b, ‘Spectrophotometric discrimination of river organic matter’, Hydrol. Process. 16,3202–3213.
Baker, A.: 2002c, ‘Fluorescence excitation-emission matrix characterisation of river waters impactedby a tissue mill effluent’, Environ. Sci. Technol. 36, 1377–1382.
Baker, A. and Inverarity, R.: 2004, ‘Protein-like fluorescence intensity as a possible tool for deter-mining river water quality’, Hydrol. Process. 18, 2927–2945.
Baker, A., Inverarity, R., Charlton, M. E. and Richmond, S.: 2003, ‘Detecting river pollution usingfluorescence spectrophotometry: Case studies from the Ouseburn, NE England’, Environ. Pollut.124, 57–70.
Baker, A., Ward, D., Lieten, S. H., Periera, R., Simpson, E. C. and Slater, M.: 2004, ‘Measurementof protein-like fluorescence in river and waste water using a handheld spectrophotometer’, WaterRes. 38, 2934–2938.
Barlez, M. A., Rooker, A. P., Kjeldsen, P., Gabr, M. A. and Borden, R. C.: 2002, ‘Critical evaluation offactors required to terminate the post-closure monitoring period at solid waste landfills’, Environ.Sci. Technol. 36, 3457–3464.

FLUORESCENCE TRACING OF DIFFUSE LANDFILL LEACHATE CONTAMINATION 243
Baun, A., Reitzel, L. A., Ledin, A., Christensen, T. H. and Bjerg, P. L.: 2003, ‘Natural attenuation ofxenobiotic organic compounds in a landfill leachate plume (Vejen, Denmark)’, J. Contam. Hydrol.65, 269–291.
Calace, N., Liberatori, A., Petronio, B. M. and Pietroletti, M.: 2001, ‘Charateristics of differentmolecular weight fractions of organic matter in landfill leachate and their role in soil sorption ofheavy metals’, Environ. Pollut. 113, 331–339.
Christensen, T. H., Kjeldsen, P., Bjerg, P. L., Jensen, D. L., Christensen, J. B., Baun, A., Albrechtsen,H. J. and Heron, G.: 2001, ‘Biogeochemistry of landfill leachate plumes’, Appl. Geochem. 16,659–718.
Coble, P. G., Green, S. A., Blough, N. V. and Gagosian, R. B.: 1990, ‘Characterisation of dissolvedorganic matter in the Black Sea by fluorescence spectroscopy’, Nature 348, 432–435.
Coors, A., Jones, P. D., Giesy, J. P. and Ratte, H. T.: 2003, ‘Removal of estrogenic activity frommunicipal waste landfill leachate assessed with bioassay based on reporter gene expression’,Environ. Sci. Technol. 37, 3430–3434.
Hodgkiss, I. J. and Lu, S.: 2004, ‘The effects of nutrients and their ratios on phytoplankton abundancein Junk Bay Hong Kong’, Hydrobiologia 512, 215–229.
Kang, K.-H., Shin, H. S. and Park, H.: 2002, ‘Characterization of humic substances present in landfillleachates with different ages and its implications’, Water Res. 36, 4023–4032.
Kao, C. M., Chen, K. F., Liao, Y. L. and Chen, C. W.: 2003, ‘Water quality management in the KaopingRiver watershed, Taiwan’, Water Sci. Technol. 47, 209–216.
Mayer, L. M., Schick, L. L. and Loder, T. C. III.: 1999, ‘Dissolved protein fluorescence in two Maineestuaries’, Mar. Chem. 64, 171–179.
McKnight, D. M., Boyer, E. W., Westerhoff, P. K., Doran, P. T., Kulbe, T. and Andersen, D. T.: 2001,‘Spectrofluorometric characterization of aquatic fulvic acid for determination of precursor organicmaterial and general structural properties’, Limnol. Oceanogr. 46, 38–48.
McKnight, D. M., Hood, E. and Klapper, L.: 2003, ‘Trace organic moieties of dissolved organicmaterial in natural waters’, in S. E. G. Findlay and R. L. Sinsaburgh (eds), Aquatic Ecosystems:Interactivity of Dissolved Organic Matter, Academic Press, San Diego, pp. 71–93.
Mopper, K. and Schultz, C. A.: 1993 ‘Fluorescence as a possible tool for studying the nature andwater column distribution of DOC components’, Mar. Chem. 41, 229–238.
Newson, M. D., Baker, A., and Mounsey, S.: 2001, ‘The potential role of freshwater luminescencemeasurements in exploring runoff pathways in upland catchments’, Hydrol. Process. 15, 989–1002.
Ohno, T.: 2002, ‘Fluorescence inner-filtering correction for determining the humification index ofdissolved organic matter’, Environ. Sci. Technol. 36, 742–746.
Parlanti, E., Worz, K., Geoffroy, L. and Lamotte, M.: 2001, ‘Dissolved organic matter fluorescencespectroscopy as a tool to estimate biological activity in a coastal zone submitted to anthropogenicinputs’, Org. Geochem. 31, 1765–1781.
Reynolds, D. M. and Ahmad, S. R.: 1997, ‘Rapid and direct determination of wastewater BOD valuesusing a fluorescence technique’, Water Res. 31, 2012–2018.
Schwarzbauer, J., Heim, S., Brinker, S. and Littke, R.: 2002, ‘Occurrence and alteration of organiccontaminants in seepage and leakage water from a waste deposit landfill’, Water Res. 36, 2275–2287.
Stedmon, C. A., Markager, S., and Bro, R.: 2003, ‘Tracing dissolved organic matter in aquatic envi-ronments using a new approach to fluorescence spectroscopy’, Mar. Chem. 82, 239–254.
Thoss, V., Baird, M. S. and Lock, M. A.: 2000, ‘The development of a chemical “fingerprint” tocharacterise dissolved organic matter in natural waters’, J. Environ. Monit. 2, 398–403.
Van Breukelen, B. M., Roling, W. F. M., Groen, J., Griffioen, J. and van Verseveld, H. W.: 2003,‘Biogeochemistry and isotope geochemistry of a landfill leachate plume’, J. Contam. Hydrol. 65,245–268.
244 ANDY BAKER
Vasel, J. L. and Praet, E.: 2002, ‘On the use of fluorescence measurements to characterise wastewater’,Water Sci. Technol. 45, 109–116.
Vilomet, J. D., Angeletti, B., Moustier, S., Ambrosi, J. P., Wiesner, M., Bottero, J. Y. and Chatelet-Snidaro, L.: 2001, ‘Application of strontium isotopes for tracing landfill leachate plumes’, Environ.Sci. Technol. 35, 4675–4679.
Vilomet, J. D., Veron, A., Ambrosi, J. P., Moustier, S., Bottero, J. Y. and Chatelet-Snidaro, L.: 2003,‘Isotopic tracing of landfill leachates and pollutant lead mobility in soil and groundwater’, Environ.Sci. Technol. 37, 4586–4591.
Westerhoff, P., Chen, W. and Esparza, M.: 2001, ‘Fluorescence analysis of a standard fulvic acid andtertiary treated wastewater’, J. Environ. Qual. 30, 2037–2046.
Wintgens, T., Gallenkemper, M. and Melin, T.: 2003, ‘Occurrence and removal of endocrine disruptersin landfill leachate treatment plants’, Water Sci. Technol. 48, 127–134.
Yan, Y., Li, H. and Myrick, M. L.: 2000, ‘Fluorescence fingerprint of waters: excitation emissionmatrix spectroscopy as a tracking tool’, Appl. Spectrosc. 54, 1539–1542.
Zafar, M. and Alappat, B. J.: 2004, ‘Landfill surface runoff and its effect on surface water qualityon the River Yamuna’, J. Environ. Sci. Health Part A – Toxic/Hazard. Subst. Environ. Eng. 39,375–384.