an anaerobic field injection experiment in a landfill leachate plume, grindsted, denmark: 2....
TRANSCRIPT
WATER RESOURCES RESEARCH, VOL. 35, NO. 4, PAGES 1231-1246, APRIL 1999
An anaerobic field injection experiment in a landfill leachate plume, Grindsted, Denmark 1. Experimental setup, tracer movement, and fate of aromatic and chlorinated compounds
Kirsten Rfigge, • Poul L. Bjerg, • JOrn K. Pedersen, 2 Hans Mosb•ek, • and Thomas H. Christensen •
Abstract. A continuous, natural-gradient field injection experiment, involving 18 xenobiotic compounds and bromide as tracers, was performed in the anaerobic region of a leachate plume downgradient from the Grindsted Landfill, Denmark. The injection lasted for 195 days, and within this period a continuous cloud was established. Over a period of 924 days the cloud movement was monitored in approximately 70 discrete sampling points in the central part of the cloud, and the spatial distribution was described by seven cloud snapshots involving 400-700 sampling points. The bromide cloud movement closely followed the varying flow direction predicted by the water table measurements. Moment analysis showed decreasing tracer flow velocities and reduced capture of bromide mass with time, which may be explained by varying flow conditions (direction, hydraulic gradient) and the heterogeneous geological conditions in the sandy aquifer. Naphthalene, having the highest log Kow value, was the most retarded compound, with a retardation of less than 10%. Therefore sorption was not considered to be a significant attenuation process for any of the compounds studied. Transformation under iron-reducing conditions was observed for toluene, o-xylene, TeCM, 1,1,1-TCA, PCE, and TCE, while transformation of benzene and napthalene was not detected in the aquifer within the time frame of this study. First-order transformation rates were in the range of 0.028-0.039 d -• and 0.0014-0.0028 d -• for the aromatic compounds toluene and o-xylene, respectively. The rates for the chlorinated aliphatic compounds, tetrachloromethane, 1,1,1- trichloroethane, tetrachloroethylene, and trichloroethylene, were >0.7 d -•, 0.0044-0.0054 d -•, 0.0012-0.0038 d -•, and 0.0003-0.001 d -•, respectively. Long lag periods and slow transformation rates were observed for some of the compounds, suggesting that lack of transformation reported in the literature may be attributable to short experimental periods in those studies.
1. Introduction
Groundwater contamination by xenobiotic compounds.has become a matter of concern in recent years. In the context of landfills and chemical waste disposal sites much focus has been placed on the issues of engineered remediation, with less focus on natural attenuation. Considering the costs of remediating the millions of waste disposal sites in existence, remediation by the natural attenuation should also be of great interest.
Degradation of various xenobiotic compounds under strongly anaerobic conditions has been proposed on the basis of landfill leachate plume observations by estimation of mass removal using tracers (chloride) or recalcitrant organic com- pounds (ethylbenzene) or in a few cases degradation products
•Department of Environmental Science and Engineering, Ground- water Research Centre, Technical University of Denmark, Lyngby, Denmark.
2Department of Hydrodynamics and Water Resources, Ground- water Research Centre, Technical University of Denmark, Lyngby, Denmark.
Copyright 1999 by the American Geophysical Union.
Paper number 1998WR900101. 0043-1397/99/1998WR900101 $09.00
[e.g., Reinhard et at., 1984; Barker et at., 1986; Lyngkilde and Christensen, 1992b; Rtigge et al., 1995]. Most research concern- ing degradation and transport of xenobiotic compounds under anaerobic conditions has been based on laboratory experi- ments which may not relate directly to field conditions. A few strictly anaerobic field experiments involving xenobiotic com- pounds exist [e.g.,Acton and Barker, 1992; Thierrin et al., 1995; Reinhard et al., 1997]. However, most of the field experiments concerning the fate of xenobiotic compounds have been con- ducted in more oxidized aquifer environments representing aerobic or nitrate reducing conditions [e.g., Barbaro et al., 1992; Maclntyre et al., 1993; Sutton and Barker, 1985].
The leachate plume downgradient from the Grindsted Land- fill, Denmark, has been investigated in details with respect to hydrogeology, redox conditions, and distribution of xenobiotic compounds [Bjerg et al., 1995; Heron et al., 1998; Rtigge et al., 1995]. Most of the xenobiotic organic compounds were no longer detectable approximately 60 m from the edge of the landfill site. Since dilution and sorption could not account for the disappearance of the xenobiotic compounds, it was pro- posed that the majority of the xenobiotic compounds in the leachate was transformed under methanogenic/sulfate- reducing or iron-reducing conditions in the aquifer.
On the basis of these investigations a natural-gradient, field
1231

1232 Rf)GGE ET AL.: ANAEROBIC FIELD INJECTION, 1
• Landfill
-:'-" i•i•mt•!!ia I area -• Overall flow direction I I I I I I
0 500 rn
Figure 1. Map of the Grindsted Landfill, contour map of isopotential curves (September 1994), and location of the experimental area.
injection experiment was established to provide field data con- cerning natural attenuation, including sorption/distribution, degradation, and degradation rate data for selected xenobiotic compounds under anaerobic conditions. Trace concentrations of xenobiotic compounds were injected into the strongly re- ducing region of the leachate plume, which was characterized with respect to flow field and redox conditions. The movement of these compounds was monitored in three dimensions for 3 years to allow the estimation of transformation rates.
This article describes the experimental setup, the tracer movement, and the fate of xenobiotic organic compounds. A companion article [Albrechtsen et al., this issue] describes the geochemistry and redox conditions in the anaerobic field in- jection experiment.
2. Field Site
The Grindsted Landfill covers approximately 10 ha and has an average depth of 5 m (Figure 1). The landfill was placed on the ground surface of a glacial outwash plain. In total, approx- imately 500,000 m 3 of waste, consisting of municipal, demoli- tion, and some chemical waste, have been landfilled in the period from 1930 to 1977 [Kjeldsen et al., 1998].
The aquifer downgradient from the landfill is a 10-12 m deep sandy aquifer [Heron et al., 1998]. The aquifer was orig- inally aerobic, but because of the leaching of primarily organic matter from the landfill, a sequence of redox zones has devel- oped With a methanogenic/sulfate-reducing zone dosest to the landfill followed by iron-reducing, manganese-reducing, ni- trate-reducing, and finally aerobic zones downgradient of the landfill. This sequence was mapped on the basis of measure- ments of redox sensitive groundwater constituents [Bjerg et al., 1995]. The injection experiment was performed within the first 65 m downgradient of the landfill (Figure 1) cons!sting of the methanogenic/sulfate-reducing and the iron-reducing zones.
The polluted groundwater is rich in organic matter (50-100 mg C/L) and has a high concentration of methane (15-25 mg/L) and iron(II) (130-200 mg/L). Only low concentrations of sul- fate are present (1-5 mg/L), and neither nitrate nor oxygen are present [Bjerg et al., 1995]. More than 15 different organic compounds were identified close to the landfill, with the BTEX compounds dominating: concentrations of 0-222 /xg• were observed close to the landfill, with single observations of o- xylene concentrations up to 1550 /xg•. No chlorinated ali- phatic compounds were present in this part of the pollution plume [Riigge et al., 1995].
3. Materials and Methods
3.1. Xenobiotic Compounds Studied
The injection involved a total of 18 different organic com- pounds (Table 1): seven aromatic hydrocarbons (benzene, tol- uene, ethylbenzene, o-, m-, and p-xylene, and naphthalene), five nitroaromatic hydrocarbons (nitrobenzene, 2-CH 3- nitrobenzene, 4-CH3-nitrobenzene, 1,2-dinitrobenzene, and 1,3-dinitrobenzene), four chlorinated aliphatic hydrocarbons (tctrachloro-methane (TeCM), 1,1,l-trichloroethane (I,I,I- TCA), tetrachloroethylene (PCE), and trichloroethylene (TCE) and two pesticides (mecoprop and atrazine). The nitro- benzenes and the pesticides will not be discussed further in this paper. These compounds were selected as they are represen- tative of varying degrees of degradability and of chemicals typically found at landfill sites. Because benzene degradation under strongly anaerobic conditions is highly disputed, •4C- labeled benzene was injected along with the unlabeled ben- zene, so that analysis of 14CO2 could be used to demonstrate benzene mineralization.
The chlorinated aliphatic compounds are especially volatile with dimensionless Henry's law constants of up to 0.64 (10øC)

RfdJGGE ET AL.: ANAEROBIC FIELD INJECTION, 1 1233
Table 1. Physical/Chemical Properties of the Compounds Studied
Octanol-Water
Coefficient, Henry's Law Aimed Solubility, Log Kow Constant at 10øC Concentration, a
mg/L (-) (-) txg/L
Injected Mass,
g
Bromide 2,500 b (LiBr) NA NA Benzene 1780 c 2.13 c 0.14 d Toluene 515 c 2.69 c 0.16 d Ethylbenzene 152 c 3.14 c 0.14d o-xylene 220 c 3.15 c 0.12 d m-xylene 160 c 3.20 c 0.18 d p-xylene 215 c 3.18 c 0.18 d Naphthalene 31 e 3.37 e 0.02 e Tetrachloroethylene, PCE 240 f (23-24øC) 2.88 g 0.36 d Trichloroethylene, TCE 1400 f (23-24øC) 2.29 g 0.23 d 1,1,1-trichloroethane, 1,1,1-TCA 1250 f (23-24øC) 2.49 g 0.42 d Tetrachloromethane, TeCM 8600 f (23-24øC) 2.64 g 0.64 d Mecoprop 734 h 1.26 h NA Atrazin 33 h 2.50 h NA Nitrobenzene 1900 i (20øC) 1.85-2.93 i 1.02 X 10 -3b
(20øC) 1,2-dinitrobenzene 100 i 1.58 i NA 1,3-dinitrobenzene 469 i (15øC) 1.49 i NA 2-methylnitrobenzene 652 i (30øC) 2.3 i 2.38 X 10 -3b
(20oc) 4-methylnitrobenzene 442 i (30øC) 2.37-2.42 i 2.13 X 10 -3b
(20oc)
100 mg/L 150
150
150
150
75
75
150
150
150
150
150 150
150
246
336
336 274
274
1.2 kg 1.3
1.2
1.3 1.5
0.7 0.7
1.4
1.2
1.3 1.3
1.3 1.9
,
1.4
3.1
3.2
3.8
3.4
3.3
NA, no data available. aThe concentration in the stock solution was approximately 20 times the aimed concentration for each compound. briandbook of Chemistry and Physics [CRC Press, 1992]. CMackay et al. [1992]. dAsworth et al. [1988]. eMackay et al. [ 1992b]. fBroholm and Feenstra [1995]. gMackay et al. [1992c]. hpesticide Manual [BCPC Publications, 1994]. iVerschueren [1996].
[Asworth, 1988 ] for tetrachloromethane. The BTEX com- pounds are also volatile, while the remaining compounds have Henry's law constants of less than 0.02 (Table 1). All com- pounds are moderately water soluble, with a solubility of at least 31 mg/L (for naphthalene). The hydrophobicity of the compounds ranges from a log Kow of 1.5-3.4.
All compounds were injected continuously for 195 days to- gether with bromide as a tracer. A tracer concentration of approximately 100 mg/L immediately downgradient of the in- jection wells was the target concentration so that the tracer cloud could be detected after as much as a 100-fold dilution by mixing with the ambient leachate plume. The intended con- centrations of the xenobiotic compounds immediately down- gradient of the injection wells were 150-350/xg/L, which is a relevant concentration level in the groundwater according to the earlier findings [Rtigge et al., 1995]. A stock solution was prepared using distilled, anaerobic water (1.5-7 mg/L of each of the organic compounds and 2 g/L of bromide). The volume of stock solution injected during the natural gradient experi- ment was only approximately 5% (a dilution factor of 20) of the groundwater passing naturally through the injection wells (see next paragraph).
3.2. Injection Wells
The compounds were injected into six injection wells in- stalled approximately 15 m downgradient from the edge of the landfill. Each injection well consisted of a PVC pipe (OD, 125 mm; ID, 117.5 mm) screened from 4.5 to 5.5 m below ground surface (approximately 3-4 m below the groundwater
table) and wrapped with a stainless steel mesh. The six injec- tion wells were located 250 mm (center to center) apart on a line perpendicular to the groundwater flow direction, thus pro- ducing an injected cloud with an initial width of 1.5 m. Ground- water passed through the well screens by the natural gradient controlling the cloud movement. Three vertical sampling points were placed on each well to monitor the homogeneity of the injected cloud (Figure 2). The wells were installed using a sediment bailer and a steel casing. The injection wells were installed in April 1994, 3 months prior to the start of the experiment.
Each PVC pipe was fitted with a second PVC pipe (OD, 63 mm; ID, 57 mm) which housed a stainless steel pipe (OD, 4 mm; ID, 2 mm) supplying the stock solution as well as a mixing pump. The latter ensured complete mixing of the injected stock solution with groundwater. Precautions were taken to ensure that no oxygen could diffuse into the aquifer via the injection wells. The PVC pipe was screened for 10 cm above the screened injection area, thus allowing anaerobic leachate- contaminated groundwater to pass through the pipe and con- sume any oxygen. In addition, a flange between the inner and the outer PVC pipes hindered the access of more-oxidized water from the upper aquifer to enter the screened interval of the injection wells (Figure 2). Furthermore, the wells were filled with argon, which is a gas more dense than air.
3.3. Injection System
A system, similar to that developed by Larsen et al. [1992b], consisting of three stainless steel containers, was used to en-

1234 ROGGE ET AL.: ANAEROBIC FIELD INJECTION, 1
Head space equilibrium containers
PC
Stock solution
GWL
Screened! i
area,
Flange! , i i
i i
I
Injection wells
Flow
Figure 2.
points
Mixing pump
i i i
i i i i
i :•i,• i i i i i i i i .. i I i i i I I i
Screened I '7r1•1\ ' '' area ,, ,,
I i I i I i i i
I i I i i i
I I I I i i I i
i i I i i i i i i i
i i
i' i
I ' i
Injection system and injection wells.
sure a stable stock solution concentration during the injection period (Figure 2). The liquid level of the stock solution in the third container gradually sank, as the solution was pumped into the injection wells. In order to compensate for the loss of volume (and increase of headspace), this third container re- ceived gas from the first two containers, each of which held the same stock solution. Consequently, no compounds in the stock solution were lost to the increasing headspace, as the gas en- tering the third stock solution container had already equili- brated with a solution of the same composition. Each container was placed on a magnetic stirrer to ensure complete mixing and equilibrium between the liquid phase and headspace. The
containers were kept at iøC and changed once a week to ensure that no substantial loss of compounds by microbial or chemical transformation occurred. Each week samples were taken from the 1-week-old solution and from the fresh solu-
tion. The average concentration in the 1-week-old containers of the most volatile compound, tetrachloromethane, was 98.7% of the average concentration in the fresh containers, indicating that the loss during 1 week was insignificant. No transformation could be observed for any of the compounds in the stock solution.
The injection system sequentially injected 23.6 mL of the stock solution over 60 s once each hour in each of the six

ROGGE ET AL.' ANAEROBIC FIELD INJECTION, 1 1235
injection wells. The mixer started simultaneously and o•)erated for 90 s to ensure complete mixing in each well. Samples collected several times during the course of the injection from the three sampling ports on each injection well showed com- plete mixing over depth. The injection was performed with a computer-controlled system set up for remote access and con- trol.
3.4. Multilevel Samplers
A dense network of multilevel samplers (MLSs) was in- stalled downgradient from the six injection wells (Figure 3). Three background MLSs were placed 3 m upgradient from the injection wells. The MLSs consisted of a solid PVC rod (D, 10 mm) with 7 or 9 Teflon sampling tubes (OD, 4 mm; ID, 2 mm) attached on the outside with a vertical spacing of 0.25 m. Each Teflon tube was screened over 5 cm. The MLSs were installed
in a fence formation, in lines perpendicular to the groundwater flow, with 1 to 5 m of spacing between each fence. The hori- zontal spacing of the MLSs within each fence was of 0.5-1.5 m; the horizontal spacing increased gradually as the cloud spread. The sampling network consisted of a total of 140 MLSs ar- ranged in 22 fences (a total of 1030 sampling points) and covered a trapezoidal area 1-14 m wide by 53 m long. The first four fences were installed prior to the start of the injection. The current location of the tracer cloud and the direction of
the groundwater flow as inferred from the water table map were used after each sampling campaign to predict the migra- tion of the cloud. Additional MLSs were then installed ahead
of the cloud.
The MLSs were installed by driving a galvanized iron pipe equipped with a stainless steel tip to a depth 15 cm deeper than the desired depth of lowest sampling point on the MLS. The iron pipe was filled with anaerobic leachate-contaminated groundwater to prevent an influx of sand, and the tip was knocked out and left in the ground. The MLSs were then lowered inside the iron pipe and leveled. The iron pipe was pulled out and the sediment was allowed to collapse around the MLSs. The annular space between the MLSs and the out- side of the iron pipe was less than 10 mm and was assumed to collapse completely, as a test showed no indication of cross contamination.
3.5. Sampling
Continuous injection of the xenobiotic compounds and the tracer started on July 21, 1994, and lasted for a total of 195 days. During this period, approximately 40 discrete sampling points in the central part of the cloud were sampled weekly, in order to determine breakthrough curves. Later, the sampling frequency was gradually reduced to once a month in discrete sampling points. The data set consisted of breakthrough curves (BTCs) at discrete sampling points in the central part of the cloud. At each 5 m distance downgradient from the injection wells (5 m, 10 m, 15 m, etc.), 4-12 monitoring points were sampled. In total, BTCs from approximately 70 discrete points were obtained over a period of 924 days. After injection had ceased, the focus of the sampling strategy was changed so that the three-dimensional distribution of the compounds could be mapped via "snapshots." Snapshot sampling involved taking samples from a large number of points within a 2-3 day frame. Snapshots were obtained every 2-4 months. Seven cloud snap- shots were collected at days 215, 343, 440, 503, 573, 649, and 761 (400-700 monitoring points were sampled during each snapshot). Sampling in discrete sampling points continued for
16 i 14
•'•2- =10- • 8- g: 6-
4
2-
0 -5 • ' • ' 1'0 ' 1'5 ' 2'0 ' 2'5 ' 3'0 ' 3'5 '
. ß . (•)
4'0 ' 4'5 ' 5'0 ' 55 Distance from injection wells (m)
Injection Wells [] Data Logger
Multilevel Samplers • Overall flow direction
m Tertiary ..........
E33 ......... • -5 ' •) ' • ' 1'0 ' 1'5 ' 2'0 ' 2'5 ' 3'0 ' 3'5 4'0 4'5 5'0 '
Distance from injection wells (m)
Sampling points Overall flow direction
55
Figure 3. (a) Horizontal plane view of the injection site showing the injection wells, multilevel samplers and the data logger. (b) Vertical cross section along the approximate center line showing the multilevel samplers and injection wells.
another 163 days. In total, approximately 6000 samples were collected.
All samples for xenobiotic compounds were collected with a gas-tight glass syringe using a vacuum of no more than 40% to avoid stripping the volatile compounds (e.g., the chlorinated aliphatic compounds). The first 30 mL sampled from each tube, which corresponds to a minimum of twice the tube vol- ume, was discarded to ensure that no stagnant water was sam- pled. Thereafter samples for the xenobiotic compounds and the tracer composing a total of 35 mL were collected.
Sediment samples were collected at four distances from the landfill along the transect of the cloud 800 days after start of the injection as described by Albrechtsen et al. [this issue]. The subsamples were geologically described, and the total porosity was calculated from measurements of the dry density and the bulk density of the sediment determined on minimally dis- turbed sediment samples.
3.6. Analytical Methods
Bromide were analysed by a Dionex ion chromatography system. All samples were kept at 10øC until analyzed. The aromatic and chlorinated aliphatic compounds were analyzed using the following method. A 10 mL groundwater sample was taken, to which 100/xL of 10 M NaOH was added. The com- pounds were extracted in the field with 100/xL pentane con- taining internal standards. The samples were kept at 10øC until analyzed in the laboratory. Here the pentane extract was ana- lysed on a gas chromatograph equipped with FID and ECD detectors as described by Nielsen and Christensen [1994]; m- and p-xylene were quantified as the sum of m- + p-xylene.
The •4C-benzene/•4CO2 samples consisted of 10 mL of groundwater, preserved by adding 100/xL of 10 M NaOH and extracted by 1000/xL dodecane in the field. Samples for ben-

1236 ROGGE ET AL.' ANAEROBIC FIELD INJECTION, 1
zene counting were prepared by mixing 500/xL of the dode- cane phase with 5 mL of the scintillation cocktail Optiphase "HighSafe" 3. Samples for 14CO2 counting were prepared by adding 5 mL of the water phase to a vial containing 1 mL of 1 M HC1. The vial was placed in an outer vial containing 1 mL of 1.25 M NaOH to trap the expelled CO2. The system was immediately closed, and after 24 hours the contents of the outer vial was mixed with 5 mL of the scintillation cocktail
Optiphase "HighSafe" 3. Samples for total •4C activity includ- ing benzene, CO2, and possible intermediates were obtained by completely filling (no headspace) a 8 mL glass vial with groundwater in the field. Five milliliters of the groundwater sample was mixed with 5 mL of the scintillation cocktail Op- tiphase "HighSafe" 3, and all samples were thereafter quanti- fied by liquid scintillation counting.
3.7. Water Level Measurements
Variations in the groundwater table were measured in 17 piezometers placed closest to the injection field with the same frequency as sampling of the xenobiotic compounds and the tracer was conducted. Also a data logger for measuring groundwater levels was installed just upgradient of the injec- tion wells at 5 m depth (Figure 3). The general groundwater flow direction and gradient was monitored every 6-8 weeks by groundwater table measurements in 80 piezometers distrib- uted over a larger area.
3.8. Mass Calculations
Moment analysis of the snapshot data provided an evalua- tion of the loss of solute mass in the system and the migration pattern of the cloud in the aquifer. The program used for spatial integration of the mass was identical to the program used at Cape Cod, Massachusetts, by Garabedian et al. [1991]. The calculated mass for each sampling campaign (the zeroth moment) and the position of the center of mass (the first moment) were obtained by spatially integrating the point val- ues of the compounds over the volume of the cloud as de- scribed by Garabedian et al. [1991]. At some locations the MLS coverage did not completely capture the cloud, that is, concen- trations above background levels were measured, and thus fictitious zero points were added to the sampling network. In the vertical direction the zero values were always added at a distance of 50 cm (equivalent to two times the distance be- tween two sampling points) in the top and/or the bottom of the MLS. In the horizontal direction, zero values were added where the outermost MLSs showed concentrations above
background levels. Here the zero values were added at a dis- tance equivalent to the distance between the two outermost MLSs (50-150 cm depending on the location in the field).
3.9. Interpretation of Data for Organic Compounds
Moment analysis was performed for all snapshots. The total mass of each xenobiotic compound was determined from the zeroth moment. The masses of the xenobiotic compounds de- creased with time due to incomplete capture of the cloud by the MLSs over depth (see below). The masses were therefore normalized to the bromide mass in order to account for this
mass loss. Thereafter any decrease in mass compared to the mass of bromide was evaluated by plotting M½/M½o normal- ized to bromide, where Me is the total mass determined by moment analysis, and M½o is the total mass of the xenobiotic compound injected. From this plot the percent transformation could be determined. A compound was defined as transform-
able when a significant decrease of the normalized mass (on a 95% significance level, linear regression, trend analysis) was observed over the experimental period and when BTC analysis showed a significant decrease in concentration at discrete sam- pling points.
The first moment gave us the position of the center of mass for each compound. In order to evaluate retardation, the po- sition of the xenobiotic compound's centers of mass were plot- ted as a function of the position of the bromide center of mass for the seven snapshots. The slope of the line estimates the retardation factor, R, according to
gBr ( A XBr / h t) AXBr = = (ax/at) =
where VBr is the pore flow velocity determined from the bro- mide velocity, V½ is the velocity of the xenobiotic compound, •YBr is the travel distance of the bromide center of mass, is the travel distance of the xenobiotic compound center of mass, and At is the time interval considered. The retardation of a compound's center of mass, however, could be due to trans- formation and/or sorption. In such cases, retardation by sorp- tion was also identified from the BTCs by comparing the ar- rival of 50% of the compound with the arrival of 50% of the bromide (on a concentration basis).
The data were initially evaluated in terms of zeroth- and first-order degradation models, and both models appeared to fit the data. A first-order degradation model was chosen to describe the data, since such a model is considered to provide the best fit to xenobiotic compound data at trace concentra- tions [Alexander, 1985] as measured in this study. This is a fairly simple way of quantifying degradation rates; however, more advanced methods do not seem appropriate in a multicom- pound system [Bjerg et al., 1996]. However, the first-order rates are most likely site specific and should be considered only as a relative parameter. Either of the following equations was used:
Mc
Moo
lB
- exp ( - kt)
Mc
Moo
(2)
where k is the first order rate constant and t is time.
Rate constants for overall and maximum first-order degra- dation were obtained from a subjective evaluation of the slope of a semilogarithmic plot of M½/M½o (normalized to bromide) versus time, according to (2). Overall rates may be slightly overestimated, since the mass loss, when determined from day 0, includes both sorption and degradation. It should be noted that the rates determined by the integrated masses obtained by moment analysis are average rates for the whole cloud, and specific areas with faster or slower transformation rates may exist within the cloud.
4. Results and Discussion
4.1. Geology and Hydrogeology
The experimental site (20 m x 60 m) is located in the anaerobic region of the Grindsted Landfill leachate plume (Figure 1). The geology of the area is characterized by an upper Quaternary layer of glacial meltwater sand and a Ter- tiary layer of fine-grained and weakly silty micaceous sand (Figure 3). The interface between these two layers is situated

ROGGE ET AL.' ANAEROBIC FIELD INJECTION, 1 1237
at level 33.7 m at the injection wells, but rises 0.5 m within 10-15 m downgradient from the injection wells. Polished grav- els have been observed at the interface between the Quarter-
nary and the Tertiary deposits. In the parallel transect inves- tigated by Heron et al. [1998] silt and clay lenses were abundant in this depth (level 33.5-35.0 m). Gamma logs performed close to the injection wells also indicated such lenses; however, the horizontal extent of these lenses is uncertain in the region of the aquifer investigated.
The variation in the geological layers indicated variation in the hydraulic conductivities within the experimental site. The hydraulic conductivities were expected to be highest above level 35 m. Below this level the hydraulic conductivities prob- ably are comparable to the values obtained by Bjerg et al. [1995] for the Tertiary layer (typically 0.9 10 -4 m/s). No direct mea- surements of the hydraulic conductivity were obtained during the experimental period in order to avoid disturbance of the cloud movement.
Porosities were in the range of 0.33-0.40. The variation was limited, although slightly higher porosities were observed in the Tertiary deposits. These values are comparable to values obtained for the Borden aquifer (0.33 [Mackay et al., 1986]), Cape Cod aquifer (0.39 [Garabedian et al., 1991]), and the Columbus aquifer (0.35 [Adams and Gelhat, 1992]). A mean value of 0.37 was selected as representative for the aquifer. This porosity value was used in the spatial moment analysis calculations (see below).
The water table rose significantly and thereafter decreased gradually during the experimental period (Figure 4a). Winter 1995 and spring 1996 were extremely dry, and the normally observed rise in the groundwater table elevation did not occur. The low groundwater table resulted in a decrease in the gra- dient from 3.6%o to 1.2%o, over the experimental period of 924 days (Figures 4a and 4b), and thus also in lower ground- water flow velocities. The groundwater flow direction varied within an approximate angle of +_ 10 ø to 15 ø compared to the center line of the injection over the experimental period. The flow direction strongly influenced the cloud movement, which is discussed in a later section.
4.2. Tracer Movement
The movement of the tracer cloud was tracked during the experiment by preparing BTCs, maps, and cross sections of the concentration data. The reactivity of bromide was investigated prior to the injection experiment by means of column experi- ments involving sediment and groundwater from the study aquifer (data not shown). Tritiated water (3H20) and bromide showed similar transport velocities, and it was concluded that bromide acted as a conservative tracer in the aquifer material.
Breakthrough curves for bromide at selected sampling points at 1, 5, 20, and 35 m downgradient from the injection wells are shown in Figure 5. The concentrations of bromide were stable after the breakthrough and until stop of the injec- tion. Between 1 and 5 m distance the concentration level of
bromide remained almost stable, indicating no significant di- lution. It was possible to establish reliable BTCs up to a dis- tance of 40 m; thereafter the tracer concentration was too low because of longitudinal and transversal dispersion. Further- more, the shifting direction of the groundwater flow compli- cated the interpretation of the breakthrough curves as shown in Figure 5b. The accumulated travel distance of the bromide center of mass (calculated from the first moment) is shown in Table 2. In the beginning of the experiment the flow velocity
rn above sea level (•)
40.0 1 39.5 I-I Piezometer
39.0 -• • [• A Piezometer -- ta logger
38.5
38.0
37.5 , ' , , ' ' ' ' ' 0 200 400 600 800 1000
Days after start of injection
August 25, 1994. Day 35. 18
16- I I I I / \ • ' 14 • co •o •- co • .... ß -c r•
•o . ' • • 8 • ..
4
2
0 ' ' ' • • ' • ' • ' ' • '
18
16
14
'•'12 ,._10 -• 8 ._
• 6 4
2
0
February 2, 1995. Day 196.
July 27, 1995. Day 371 18
14- r-. r-. t-. •. • •.
4
2
0 , • , , • , , , , , i -5 0 5 10 15 20 25 30 35 40 45 50 55
Distance from injection wells (m)
O Injection Wells ß Multilevel Samplers • Groundwater I•vel (m)
Figure 4. (a) Water level measurements with time in 2 of the 17 piezometers surrounding the injection field and in the data logger situated beside the injection wells. (b) Isopotential curves inferred from measurement taken from 80 piezometers at days 35, 196, and 371, respectively.
was 24-27 m/y. The velocity decreased from day 343 to day 573, finally reaching a velocity of approximately 7-10 m/y. Two factors contributed to the decreasing velocity: the general de- crease in the hydraulic gradient from 3.4%o to 1.2%o (Figure 4b) and the local geological conditions. The center of mass sank vertically 1.2 m within a travel distance of 31 m. Because of the general sinking of the cloud and the rising interface between the Tertiary and Quaternary deposits (between the injection wells and 10-15 m), an increasing part of the cloud was transported in the lower layers having fine texture (Figure 3b).
The spatial distribution of the bromide cloud for one Of the seven snapshots is shown in Figure 6a. At the start of the injection the flow direction was approximately perpendicular

1238 ROGGE ET AL.: ANAEROBIC FIELD INJECTION, 1
Conc. mg/L 200 -
150 -
100 -
50-
o• o
©
•:•'L• -•- 20 m
i i
200 400 600 800 1000
Days after stad of injection
Conc. mg/L
120 (• 100
80
60 • 40
2O
0 200 400 600 800
Days after stad of injection
i
1000
Figure 5. (a) Examples of breakthrough curves for bromide at 1, 5, 20, and 35 m from the injection wells. The sampling points were situated along an approximate center line of the cloud. (b) Examples of breakthrough curves affected by the shifting flow directions 10 m from the injection wells.
to the line of injection wells (Figure 4b). Later the flow direc- tion gradually changed towards southwest. Approximately a year after the start of the injection, the flow resumed its pre- vious direction, and the cloud again moved approximately par- allel to the center line of the injection field.
The vertical-transverse distribution of the cloud was homo-
geneous close to the injection wells; that is, the cloud did not spread out in different vertical layers but stayed as a continu- ous cloud. However, the MLS network did not fully penetrate the cloud in this area (5-15 m downgradient from the injection wells). MLSs were thereafter installed to a greater depth, which enabled more efficient capture of the deepest part of the cloud in later sampling campaigns. Further downgradient the
18
16-
14-
•2-
'• 8- _
• 6- 4-
2-
0
18
Bromide
;' ß .
i , i , i , • , i ,
16-
14-
•2- .r:10 ' '• 8•
-- ,
• 6 4-• 2-'
18
16-
14-
•'•o
4
2
Naphthalene ß ß . ß o
ß
e:.:.......•.,...•' * ß ß ß ..' [ . ;. . ß
-5 • • 1'0 1'5 2'0 2'5 3'0 3'5 4'0 4'5 5'0 55 Distance from injection wells (m)
[•] > 2 :::• > 10 • Overall flow direction
0 Injection Wells ß Multilevel Samplers
Figure 6. Observed clouds of bromide, o-xylene, and naph- thalene after 649 days (snapshot 6). Bromide in grams per square meter; xenobiotics in milligrams per square meter.
cloud started to spread vertically into different layers. Espe- cially the upwards spreading of the cloud was unexpected; however, subsequent geological profiling clearly indicated the existence of a higher-permeability zone in this area (data not shown). As a result of this spreading the MLSs did not fully capture the cloud, neither in the topmost nor in the bottom- most sampling points.
The calculated mass of the tracer (the zeroth moment) in the first snapshot, sampled 210 days after start of the injection, was 73% of the total mass injected (Table 2). This initial reduction of mass recovery was due to sinking of the cloud within the first 10 m from the injection wells. This sinking was not attributed to density contrasts between the cloud and the ambient water, as observed at Cape Cod [Le Blanc et al., 1991] and at Borden [Mackay et al., 1986], since no density difference could be measured between background samples unaffected by injec-
Table 2. Summary of Snapshots Based on Bromide Tracer Data
Mass
Number of Recovery, Snapshot Days Samples %
Position of Center of Mass, First Moment, m
x y z
Travel
Velocity,* m/yr
*Calculated between the individual snapshots as (dx 2 + dy 2 + dz2)•/2/365.
1 215 367 73 7.7 4.56 34.8 24.1 2 343 392 52 17.2 6.41 34.7 27.4
3 440 530 73 22.2 7.37 34.5 19.2 4 503 611 61 25.1 7.67 34.4 17.0 5 573 712 59 26.6 8.01 34.2 8.0 6 649 752 43 28.8 8.16 34.2 10.5
7 761 702 32 31.0 8.17 33.9 7.4

ROGGE ET AL.: ANAEROBIC FIELD INJECTION, 1 1239
tion and samples from the injection wells (where the stock solution was mixed with the leachate-contaminated groundwa- ter in approximately a 5:95 ratio) (data not shown). Sinking was due rather to the heterogeneities in the aquifer. A part of the cloud was distributed in the Tertiary layer, where the MLSs did not fully capture the cloud. The modest mass recoveries in the last snapshots were due to the distribution of the cloud into the upper and lower layer. The distribution of the xenobiotic organic compounds can be interpreted despite the partial loss of mass, since their centers of mass and spatial distribution followed the bromide center of mass (section 4.3).
250 -
200 -
6150 o
o 100
5o
lm
4.3. Transport and Sorption of Organic Compounds
The organic compounds followed in general the flow path of the bromide cloud but may also have been subjected to sorp- tion and transformation. Both the aromatic hydrocarbons and the chlorinated aliphatic hydrocarbons discussed in this paper are nonpolar hydrophobic compounds. The octanol-water par- tition coefficients (log Kow) range from 2.13 for benzene to 3.37 for naphthalene (Table 1). The organic carbon content in the part of the aquifer investigated is 0.008-0.034% [Albrecht- sen et al., this issue]. For such low organic carbon contents the sorption capacity may not be described by the general relation- ships between the fraction of solid organic carbon and log Kow [Ball and Roberts, 1991; Larsen et al., 1992a, b]. However, it was anticipated that the effect of sorption would be relatively small.
Naphthalene was expected to be the most retarded com- pound in the aquifer, followed by the xylenes. The average velocity of the naphthalene center of mass (the first moment) was 90% relative to bromide, as shown in Figure 7. This cor- responds very well to estimates made from the BTC analysis (Figure 8). The spatial distribution of the naphthalene cloud along with the bromide cloud for snapshot 6 (649 days after start of injection) is shown in Figure 6, which illustrates the naphthalene retardation in the aquifer relative to the bromide migration.
The normalized mass of o-xylene showed only a limited decrease over time for the first three snapshots (until day 440; see Figure 9), and relative to bromide, the o-xylene center of mass moved with a flow velocity of 93% in this period (Figure 7). Thereafter a significant decrease in the normalized mass of
Travel distance of Br (m) 30-
25-
_ y = 0.93.x 20 R 2 = 0.97 15 - 'X•,•'• •' '•y = 0.90. x 10 - R 2= 1.0
5-
O• 'r I • 0 5 10 15 20 25 30
Travel distance of xenobiotic compounds (m
o-Xylene Naphthalene
o-Xylene (linear) - - Naphthalene (linear)
Figure 7. Travel distance of naphthalene and o-xylene ver- sus travel distance of bromide based on the first moments.
200 -
d 150 - o
o lOO -
50
0
51TI
' I I
150 -
125 -
100 -
75-
50-
25-
50-
40-
30-
20-
10-
35m (•)
0 2(•0 400 600 800 1000 Days after start of injection
1*8,omide IZIToluene &o-Xylene ONaphthalene I Figure 8. Examples of breakthrough curves for bromide, tol- uene, o-xylene, and naphthalene at 1, 5, 20, and 35 m from the injection wells. Bromide in milligrams per liter; xenobiotics in micrograms per liter.
o-xylene was observed, which also affected the relative travel velocity. This pattern was confirmed by the BTCs at 1, 5, and 20 m, where no significant retardation of o-xylene compared to bromide could be observed (Figure 8).
In conclusion, sorption to aquifer sediments was considered to be of minor importance for all the xenobiotic compounds studied. The maximum decrease in compound masses due to

1240 ROGGE ET AL.: ANAEROBIC FIELD INJECTION, 1
M/M o 1.2
[] 1.0 •*•*--*--*--*--*•*
0.8 0
0.6-
0.4- •a, 0.2-
i i i 0 200 400 600 800
Days after start of injection
Conc. Bq/L _
400 -
_
300 - _
200 - _
100 - _
0 ,
10'00 0 200
Bromide I-IToluene & o-Xylene O Naphthalene Figure 9. Mass of bromide, toluene, o-xylene, and naphtha- lene normalized to the injected mass for each compound. The masses of the compounds are normalized to the bromide mass in order to account for the truncation of the cloud.
4OO 6OO 8OO
Days after start of injection
Conc. mg/L -
- 40
- 30 _
- 20 _
o lOOO
Bromide I-I 14C-tot & 14C-Benzene O 14OO 2 ! Figure 10. Examples of breakthrough curves for bromide, 14 14 14
C-total activity, C-benzene, and CO2 at 25 m distance from the injection wells. Bromide in milligrams per liter; all other parameters in becquerels per liter.
sorption would be less than 10% and supposedly much less for benzene, toluene, PCE, TCE, TeCM, and TCA, which all have log Kow values below 2.88 (Table 1). This was also confirmed by the insignificant retardation, which could be observed on the BTCs for these compounds.
4.4. Transformation of Aromatic Compounds
An overview of the transformation results and the anaerobic
first-order transformation rates observed in the injection ex- periment for the aromatic and aliphatic compounds are given in Table 3. We have compared our results on transformation and transformation field rates to literature data obtained in
unamended laboratory and field systems. 4.4.1. Benzene. The interpretation of the fate of benzene
was complicated by high background levels and periodic slugs of benzene coming from the landfill, which resulted in highly varying concentrations that occasionally exceeded the injected concentrations. This resulted in BTCs with significant scatter and above-zero concentrations before and after the cloud had
passed a specific point. Also an increasing mass over time (the zeroth moment) compared to the bromide mass was observed in the seven cloud snapshots (data not shown). However, the
fate of benzene could be revealed by interpreting the 14C- counting data by means of BTC analyses at discrete sampling points. The BTCs for •4C-benzene, 14002, and total •40 activ- ity are shown, along with bromide, for a sampling point at 20 m distance from the injection wells in Figure 10. This sampling point is representative of the pattern seen at all the discrete points evaluated. No decrease in the •4C-benzene activity com- pared to the bromide concentration was observed. The total •40 activity was equivalent to the •4C-benzene activity at all discrete points studied, indicating that no benzene transforma- tion occurred. The counting for 14002 resulted in an activity less than 0.1% of the maximum benzene activity and was con- sidered to be insignificant. Thus there was no indication of intermediates or 14002 observed. On the basis of these results, benzene was found to be recalcitrant during the experiment, which lasted 924 days and was conducted in an redox environ- ment dominated by iron reduction [Albrechtsen et al., this is- sue]. A lack of benzene transformation has also been observed previously in anaerobic field and laboratory studies with natu- ral sediment and groundwater by, for example, Acton and Barker [1992], Beller et al. [1995], Johnston et al. [1996], and Nielsen et al. [1995]. Limited transformation was demonstrated
Table 3. Summary of Transformation Results for the Aromatic and Chlorinated Aliphatic Compounds Studied in the Field Injection Experiment, Grindsted, Denmark
First-Order Rate, d -• Half Life, Lag Period, t•/2,
Transformation days Overall Maximum days
Benzene ND ND ND ND ND Toluene CT > 150 0.028 0.039 18-25
Ethylbenzene NP NP NP NP NP m/p-xylene NP NP NP NP NP o-xylene PT > 165 0.0014 0.0028 248-495 Naphthalene ND ND ND ND ND TeCM CT none >0.7 >0.7 <1
1,1,1-TCA CT none 0.0044 0.0054 128-158 PCE PT none 0.0012 0.0038 182-578 TCE PT none 0.0003 0.0013 533-2310
ND, not degradable within the experimental period of 924 days; CT, completely transformed within the experimental period of 924 days; NP, not possible to determine due to highly varying background conditions; PT, partly transformed within the experimental period of 924 days.

ROGGE ET AL.: ANAEROBIC FIELD INJECTION, 1 1241
by Wilson et al. [1986] in laboratory studies after 40 weeks. Kazumi et al. [1997] conducted laboratory experiments with sediment and groundwater from five different sites. They ob- served benzene degradation (complete mineralization) in four of the experiments, while benzene was recalcitrant in the fifth experiment involving landfill contaminated sediment (Norman Landfill, Oklahoma). Therefore the lack of benzene transfor- mation observed in our experiment may be due to either the strictly anaerobic conditions prevailing in the aquifer or the complex chemical matrix of leachate-contaminated groundwa- ter, in which benzene as a component could not be trans- formed.
4.4.2. Toluene. No toluene transformation was observed
by BTC analyses until day 250, after which a minor decrease in the concentration could be observed as manifested by a faster drop in concentration relative to bromide at the 5 rn fence (Figure 8). At the 20 rn fence the toluene concentration de- creased to approximately the detection limit (1-3 /•g/L) be- tween day 430 and day 460. At the 35 rn fence toluene was not found in significant concentrations (Figure 8).
A significant decrease in mass, compared to the bromide mass, was observed after 343 days, and within a period of approximately 150 days the total mass disappeared completely (Figure 9). The first moment showed that the toluene center of mass moved along with the tracer, indicating that transforma- tion occurred throughout the entire cloud and not at a specific distance from the injection wells.
Toluene transformation under methanogenic conditions in both field and laboratory experiments has been reported by several authors [Acton and Barker, 1992; Grbi•-Gali•, 1990; Wilson et al., 1986]. Beller et al. [1995] observed toluene trans- formation in an injection experiment under presumably sul- fate-reducing conditions. Lovely and Lonergan [1990] con- ducted laboratory experiments where a specific iron-reducing microorganism was shown to degrade toluene. Nielsen et al. [1995] observed toluene transformation after a lag phase of approximately 3 months in one out of three in situ microcosm experiments performed in the iron-reducing zone downgradi- ent from the Vejen Landfill, Denmark. Our findings of toluene transformation in a field experiment dominated by iron- reducing conditions thus seem consistent with previous find- ings reported in the literature.
The initial lack of toluene transformation followed by a rapid decrease in concentration (BTC analyses) and mass (mo- ment analyses) was interpreted as an initial lag period of more than 150 days followed by biotic transformation of toluene. In the previous study involving mapping of the distribution of organic compounds in the leachate, toluene was found at very low concentrations close to the landfill and was below the
detection limit of 1/•g• at a distance of 30 rn from the border of the landfill [Rtigge et al., 1995]. This indicated potential for toluene biotransformation in the aquifer, even close to the landfill, and consequently the redox conditions were not con- sidered to be the determining factor for toluene transforma- tion in the injection experiment. Lack of transformation close to the injection wells may be due to the presence of inhibitory compounds in the leachate plume, either in the injected solu- tion or in the leachate-contaminated groundwater, or to se- quential degradation.
On the basis of the total mass disappearance, an overall first-order transformation rate was estimated to be 0.028 d -•
(R 2 = 0.93) between day 343 and day 503 with a maximum rate of 0.039 d -• (R 2 = 1) between day 440 and day 503
(Figure 9). The toluene rates determined in the present exper- iment compare fairly well with the rates reported by Thierrin et al. [1995] (our rate is approximately a factor of 3-6 higher).
4.4.3. Ethylbenzene and m/p.xylene. As with benzene, high background levels and periodic slugs coming from the landfill complicated the data interpretation since highly vary- ing background concentrations exceeding the injected concen- trations were observed for both compounds throughout the aquifer. Consequently, increasing masses compared to the bro- mide mass over time were observed (data not shown), and it was not possible to determine whether transformation actually occurred.
On the basis of the earlier observations [Rtigge et al., 1995], background ethylbenzene concentrations of up to a maximum of 10/•g/L close to the injection wells were expected, as well as a potential for ethylbenzene transformation in the aquifer. Background ethylbenzene concentrations of 2-150/•g• at the 50 rn fence were measured in the present study. Because of these high and random ethylbenzene concentrations, it was not possible to determine whether limited transformation actually took place.
On the basis of the previous observations, it was also ex- pected that rn/p-xylene concentrations of up to a maximum of 25 /•g• close to the injection wells would be measured and additionally that there would be potential for m/p-xylene transformation in the aquifer. As with ethylbenzene, no indi- cations of m/p-xylene transformation were observed, since high and varying background concentrations of m/p-xylene were measured (2-50/•g/L at 50 rn distance from the injection wells). Potential for ethylbenzene and for rn/p-xylene transfor- mation in the aquifer was expected on the basis of the previous field observation study [Rtigge et al., 1995]. However, it was not possible in the present study to determine whether transfor- mation actually took place.
Both transformation [Acton and Barker, 1992; Wilson et al., 1986] and lack of transformation [Beller et al., 1995; Johnston et al., 1996; Nielsen et al., 1995] of ethylbenzene have been re- ported in the literature. In the present study both m- and p-xylene were injected in order to mimic the typical leachate from a landfill, although the analytical procedure used was unable to separate these two compounds. Transformation of m- andp-xylene under anaerobic conditions has been reported [Acton and Barker, 1992; Beller et al., 1995; Edwards et al., 1992; Thierrin et al., 1995].
4.4.4. o-Xylene. No decrease in o-xylene concentrations could be observed in BTCs until the 30 rn fence, while a complete disappearance of o-xylene was observed after 649 days at the 35 rn fence (Figures 8a-8d). A minor decrease in the normalized o-xylene mass could be observed before day 440, after which a more rapid decrease took place (Figure 9). Apparently, the main loss of mass occurred at the front of the cloud, as shown in snapshot 6 (649 days after start of injection) (Figure 6), indicating that significant transformation took place under slightly less-reduced redox conditions (solely iron- reducing) [Albrechtsen et al., this issue]. A comparison of the total mass (zeroth moment) and the position of the center of mass (first moment) showed that the increasing retardation after 440 days correlated with a decrease in mass. This con- firmed that o-xylene was most significantly transformed at the front of the cloud.
The significant mass loss of o-xylene after 440 days was interpreted as biotic transformation under iron-reducing con- ditions. The explanation for the observed lack of transforma-
1242 ROGGE ET AL.: ANAEROBIC FIELD INJECTION, 1
250 -
200 -
d 150 - o
100 -
50-
0 4
250 -
2øø i d150 o
100 -
50-
_
50
40
30-
20-
1ø 1 50-
40-
d 3O o
o 20
10-
lm
i i i i
10m
25 m
35m
. /."
0 , • "•' ' •'•A'N"A-I'-'FA'N'A-•A.'N"A'N"A-I•I"A• i
0 200 400 600 800 10'00 Days after start of injection
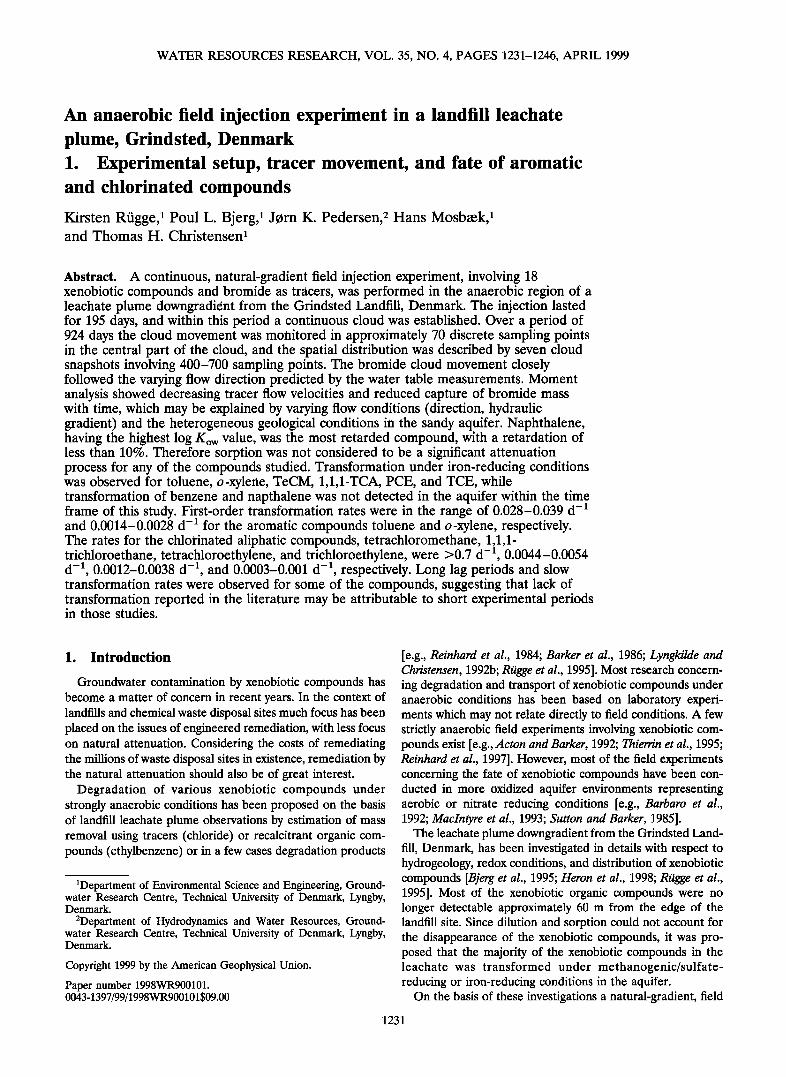
I'Bromide ,TeOM I-I1,1,1-TOA OPOE .TOE ! Figure 11. Examples of breakthrough curves for bromide, TeCM, 1,1,1-TCA, PCE, and TCE at 1, 10, 25, and 35 m distance from the injection wells. Bromide in milligrams per liter; xenobiotics in micrograms per liter.
tion between 0 and 35 m could not be deduced from the field
experiment but may be due to one or a combination of the following factors: (1) a biological lag phase, (2) a sequential transformation (e.g., toluene was almost completely trans- formed before the onset of o-xylene transformation (Figure 9), or (3) the slightly more reduced redox conditions in the aquifer closer to the injection wells.
Contradictory results are reported in the literature regarding o-xylene transformation. Acton and Barker [1992] observed transformation in methanogenic in situ microcosm experi- ments. Beller et al. [1995] observed o-xylene transformation under presumably sulfate-reducing conditions, while Johnston et al. [1996] found o-xylene to be resistant under methanogenic conditions in laboratory experiments, and Nielsen et al. [1995] found o-xylene to be resistant under both methanogenic and iron-reducing conditions in in situ microcosm experiments at the Vejen Landfill.
An overall first-order transformation rate was estimated to
be 0.0014 d -• (R 2 = 0.77) between day 0 and day 769 with a maximum rate of 0.0028 d -• (R 2 = 0.96) between day 440 and day 769 (Figure 9). No literature data on first-order trans- formation rates in similar systems have been identified.
4.4.5. Naphthalene. A decrease in the normalized naph- thalene mass of up to 37% was observed (Figure 9); however, the majority of the decrease took place between day 0 and day 215. From day 215 to day 761 an insignificant decrease in the normalized mass of naphthalene was observed. We cannot explain the initial drop in naphthalene, which was significantly more than could be explained by sorption, since a maximum mass loss of 10% (1/R = 90%) was expected (Figure 6), assuming that the retardation of the center of mass was due only to sorption. Two possible explanations exist: (1) The es- timation of initial mass may be erroneous or (2) there was transformation of naphthalene in the initial phase. However, transformation is not clearly supported by the BTCs, which showed only a slight decrease on some of the breakthrough curves at discrete sampling points (examples in Figures 7a-7d). In conclusion, naphthalene seems to be recalcitrant in this study or is only being transformed to a degree less than the uncertainties of our mass estimates.
Few authors have studied naphthalene transformation under natural anaerobic conditions in aquifers. Thierrin et al. [1995] found naphthalene to be easily degradable under sulfate- reducing conditions in an injection experiment conducted in a gasoline-contaminated aquifer. Langenhof et al. [1996] ob- served a significant biotic transformation under sulfate- reducing conditions in aquifer columns, while Nielsen et al. [1995] reported no naphthalene transformation under either methanogenic conditions or under iron-reducing conditions in in situ microcosm studies at the Vejen Landfill.
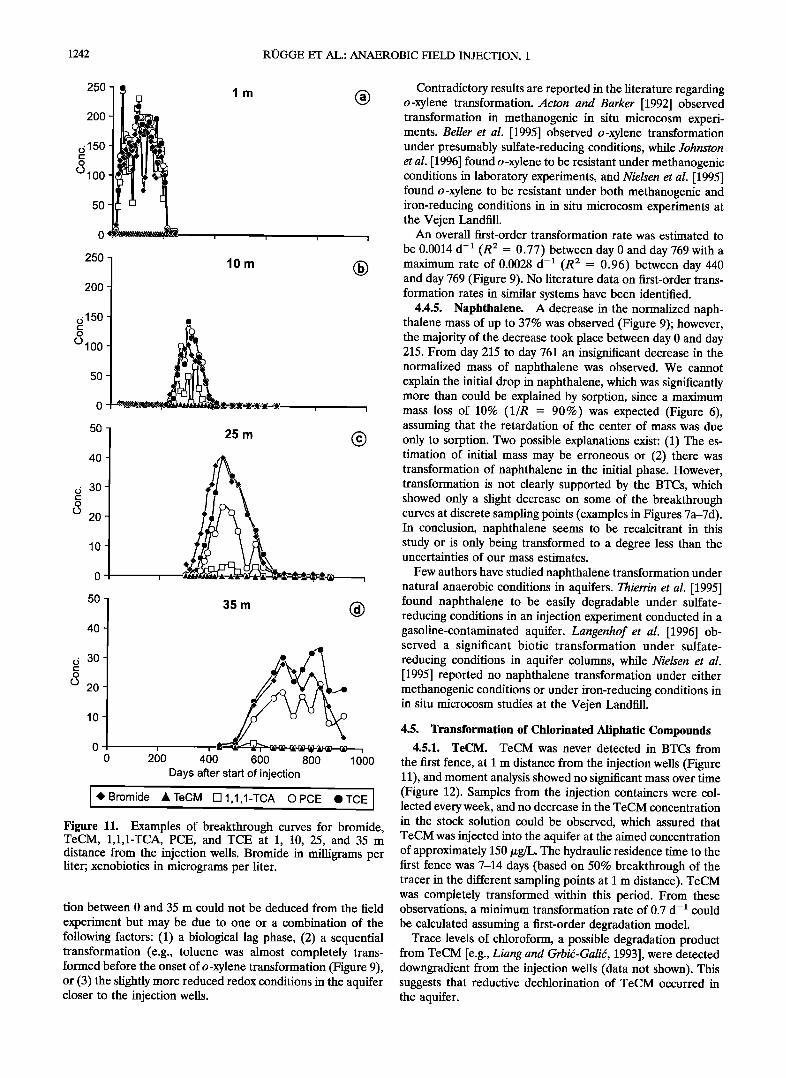
4.5. Transformation of Chlorinated Aliphatic Compounds 4.5.1. TeCM. TeCM was never detected in BTCs from
the first fence, at 1 m distance from the injection wells (Figure 11), and moment analysis showed no significant mass over time (Figure 12). Samples from the injection containers were col- lected every week, and no decrease in the TeCM concentration in the stock solution could be observed, which assured that TcCM was injected into the aquifer at the aimed concentration of approximately 150 •g/L. The hydraulic residence time to the first fence was 7-14 days (based on 50% breakthrough of the tracer in the different sampling points at 1 m distance). TeCM was completely transformed within this period. From these observations, a minimum transformation rate of 0.7 d -• could be calculated assuming a first-order degradation model.
Trace levels of chloroform, a possible degradation product from TeCM [e.g., Liang and Grbi&Gali•, 1993], were detected downgradient from the injection well s (data not shown). This suggests that reductive dechlorination of TeCM occurred in the aquifer.

ROGGE ET AL.: ANAEROBIC FIELD INJECTION, 1 1243
The aquifer is rich in aqueous and solid Fe(II) [Albrechtsen et at., this issue], which are generally considered to be highly reactive species for reducible organic pollutants. Thus it is proposed that this rapid transformation was due to abiotic transformation with iron (II) under strictly anaerobic condi- tions. Abiotic transformation has previously been demon- strated in a system of Fe(II)/iron oxides [Pecher et at., 1997] and in a pyrite system [Kriegrnan-King and Reinhard, 1994]. A rapid reduction of nitroaromatic compounds paralleling the reduction of TeCM was found in the present experiment, which was attributed to the high concentrations of soluble Fe(II) and Fe(II) associated with Fe(III)-rich minerals [R•igge et at., 1998].
4.5.2. 1,1,1-TCA. After the 1 m fence the 1,1,1-TCA con- centration continued to decrease compared to bromide, and after 600 days 1,1,1-TCA was below the detection limit of 1-5 txg• at the 35 m fence (Figures 11a-lld). Four samples, two from 35 m and two from 45 m, were analyzed for lower chlo- rinated compounds by a commercial laboratory. The com- pound 1,1-DCA, which is a possible product from the biotic transformation of 1,1,1-TCA [Klecka et al., 1990; Vogel and McCarty, 1987], was detected in concentrations of 6 txg•. This concentration level corresponds to the concentration level of bromide determined from BTCs in the two sampling points, and thus this concentration is significant.
A rapid decrease in the normalized 1,1,1-TCA mass oc- curred before day 343, where only 20% of the injected mass was left. Thereafter the mass remained stable until day 573, which was followed by a rapid mass loss (Figure 12). The loss of 1,1,1-TCA was attributed to transformation, which was most significant within the first 0-15 m downgradient from the in- jection wells, where iron reduction, sulfate reduction, and methanogenesis were occurring [Albrechtsen et al., this issue].
At snapshot 6, 649 days after start of the injection, the 1,1,1-TCA cloud had almost disappeared compared to the clouds of bromide and other aliphatic compounds (Figure 13). The 1,1,1-TCA center of mass was slightly retarded compared to the bromide center of mass; however, this retardation was not significantly influenced by sorption but mainly a result of the decreasing mass.
M/M o
1.2 1 1.0
0.8
0.6 o
o
0.4
0.2
.
0 200 400 600 800 1000 Days after start of injection
Bromide A TeCM Ull,I,I-TCA OPCE ß TCE 1 Figure 12. Mass of bromide, TeCM, 1,1,1-TCA, PCE, and TCE normalized to the injected mass for each compound. The masses of the chlorinated aliphatic compounds are normalized to the bromide mass in order to account for the truncation of the cloud.
18
16
14
'•' '•2 ,-10 • 8 • 6
4
2
0
Bromide
18
16
14
'•'12 •..10 • 8 • 6
4
2
0
18
16 TCE ß ß . 14 ' :•..o ß
•'12 i•' *•/•. "••: '. ß 4 i ß : ß . ß 2 ' ' • 0 ............
Distance from injection wells (m)
i:i**.• > 2 • .... > 10 • Overall flow direction
O Injection Wells ß Multilevel Samplers
Figure 13. Obse•ed clouds of bromide, 1,1,1-TCA, PCE, and TCE after 649 days (snapshot 6). Bromide in grams per square meter; xenobiotics in milligrams per square meter.
Varying results of 1,1,1-TCA transformation under various anaerobic conditions have been presented in the literature. Nielsen et al. [1995] observed transformation (presumably bi- otic) under methanogenic conditions after long lag periods of 1-3 months downgradient from the Vejen Landfill, whereas no transformation under iron-reducing conditions could be docu- mented. Schreier and Reinhard [1994] performed laboratory experiments with anaerobic leachate from two landfills and observed biotic transformation of 1,1,1-TCA in only one of the leachates. Klecka et al. [1990] reported both biotic and abiotic transformation of 1,1,1-TCA in laboratory experiments with landfill-contaminated groundwater from Norman Landfill, Oklahoma. This indicates that simultaneous biotic and abiotic
transformation of 1,1,1-TCA may take place under anaerobic conditions. It was not possible in the present experiment to conclude whether the transformation was due to biotic or abi-
otic transformations or a combination thereof. The presence of 1,1-DCA, however, indicated that biotic transformation con- tributed to the transformation, since abiotic transformation would result in the formation of 1,1-DCE (elimination) and/or acetic acid (hydrolysis) but not 1,1-DCA [Klecka et al., 1990; Schwarzenbach et al., 1993; Vogel and McCarty, 1987].
An overall first-order transformation rate was estimated as
0.0044 d -• (R 2 = 0.97) between day 0 and day 404 with a

1244 ROGGE ET AL.: ANAEROBIC FIELD INJECTION, 1
maximum rate of 0.0054 (R 2 -- 0.97) between day 215 and day 404 (Figure 12). Klecka et al. [1990] studied 1,1,1-TCA transformation in laboratory experiments with sediment and groundwater sampled from methanogenic and sulfate-reducing zones downgradient from the Norman Landfill, Oklahoma. They found biological transformation rates of 0.0034-0.015 d- • and abiotic rates of 0.0006 d-•. The rate determined in the
present experiment corresponds well to the values reported for biotic transformation of 1,1,1-TCA, although this does not prove that the transformation was microbially mediated.
4.5.3. PCE and TCE. BTCs at discrete sampling points revealed a significant decrease in PCE concentrations at the 25 m fence, and this trend continued throughout the aquifer (Figures 1 la-1 ld). Throughout the first six snapshots the nor- malized mass decreased, and after 649 days (snapshot 6) the total mass was reduced to approximately 40% of the injected mass (Figure 12). In snapshot 7 approximately 30% of the samples were accidentally contaminated with PCE, providing a nonquantifiable increase in the PCE mass in this last snapshot (which is excluded from Figure 12). It was anticipated that transformation would occur close to the injection wells, in the most reduced part of the aquifer; however, transformation continued (with a slightly lower rate but still significant on a 95% probability level) after PCE entered the less-reduced zone where sulfate reduction and methanogenesis no longer were detected but where only iron reduction was occurring [Albrechtsen et al., this issue].
The spatial distribution of the PCE cloud for snapshot 6, 649 days after start of injection, showed a decreased size compared to the bromide cloud (Figure 13). The center of mass followed the bromide center of mass (data not shown), which indicated that the transformation occurred throughout the entire cloud. An overall first-order transformation rate was estimated to be
0.0012 d -• (R 2 = 0.83) between day 0 and day 649 with a maximum rate of 0.0038 (R 2 = 0.96) between day 440 and day 649.
A minor decrease in the TCE concentration compared to bromide was observed from BTC analyses at the 25 m fence. This ratio decrease was maintained at the 35 m fence (Figures 11a-lld). Moment analysis revealed a fairly stable TCE mass of approximately 90% of the injected mass relative to the bromide mass until day 573, whereafter a slight decrease could be observed (Figure 12). The mass decreased to approximately 75% of the injected mass relative to bromide from day 573 and to the last snapshot, sampled after 761 days (Figure 12). It was anticipated that like PCE, TCE transformation would occur in the most reduced part of the aquifer, close to the injection wells; however, transformation appeared to continue in the less-reduced part of the iron-reducing aquifer. The observed pattern of the TCE mass over time could indicate that little or no transformation of TCE occurred within the first 573 days. However, as PCE is known to reductively dechlorinate to TCE, the stable mass could also indicate that TCE was transformed
at a rate equivalent to the production rate of TCE from PCE. The more rapid TCE transformation after 573 days could be the result of the decreasing PCE concentrations. Our experi- ment indicated that TCE could be transformed simultaneously with PCE but at a slow rate; however, this rate increased with decreasing PCE concentrations. An overall first-order trans- formation rate was estimated to be 0.0003 d -• (R 2 -- 0.57) between day 0 and day 649 with a maximum rate of 0.0010 (R 2 = 0.75) between day 440 and day 649. These rates are abso- lute minimum rates since they are based only on the observed
decrease in the TCE mass. If a stochiometric production of TCE from PCE was assumed, and included in the calculation, a transformation rate on the order of 0.0013 d -• could roughly be estimated.
PCE and TCE were transformed simultaneously throughout the aquifer. This was deduced to be biotic transformation, since it has been suggested in the literature [Freedman and Gosset, 1989; Gibson and Sewell, 1992; Vogel and McCarty, 1985] that reductive dechlorination of PCE to TCE is linked to biotic processes. Nielsen et al. [1995] observed PCE transfor- mation under methanogenic conditions but not under iron- reducing conditions downgradient from the Vejen Landfill. TCE was not transformed under either methanogenic or iron- reducing conditions [Nielsen et al., 1995]. Schreier and Reinhard [1994] observed biotic transformation of PCE in untreated, anaerobic leachate, and Johnston et al. [1996] reported biotic transformation of TCE under methanogenic conditions down- gradient from the Wilders Grove Landfill. Gibson and Sewell [1992] also observed transformation of PCE and TCE in lab- oratory experiments with leachate-contaminated groundwater from the Norman Landfill, Oklahoma. This indicates that transformation of PCE and TCE under methanogenic condi- tions can occur in leachate-contaminated aquifers. The current experiment showed that the transformation can also occur under iron-reducing conditions in a natural flow system.
4.6. Perspectives
This investigation has demonstrated that anaerobic transfor- mation of xenobiotic compounds may occur after lag periods of more than 150 days. Thus lack of transformation of some compounds reported in the literature may be due to inade- quate experimental periods in some cases. The results obtained emphasize that transformation and transformation rates are dependent on the actual aquifer, the, source of pollution, and maybe the actual experimental conditions. In addition, the actual redox conditions and the chemical composition of the plume may influence the potential for biotic and abiotic trans- formation. The redox conditions were described in detail in the
present experiment, but often this information is neglected in other experiments, making comparison between different in- vestigations difficult.
The number of investigations to which the present study's first-order transformation rates may be compared is limited, but in general the rates obtained in other experiments corre- spond within a factor of 5-100 to the rates determined in the present field experiment. The discrepancy between first-order transformation rates is likely to be due to the many biotic and abiotic reactions which may occur simultaneously within the same microenvironment (down to pore scale) in landfill leachate plumes and other contaminated aquifer environ- ments. In general, the observed rates may therefore be a com- bination of the dominant processes's rates at a particular time and location in a particular aquifer. In addition, there may be a larger degree of competition between different xenobiotic compounds for available electron donors/acceptors in leachate-contaminated aquifers that may limit the rate of transformation. Finally, the temperature dependency may be important. All data in this experiment was obtained at the actual groundwater temperature, 10øC, which is low compared to some laboratory experiments and to groundwater tempera- tures in other parts of the world. In conclusion, field rates are site specific and provide a rough estimate, which should be used only for relative comparisons.

ROGGE ET AL.: ANAEROBIC FIELD INJECTION, 1 1245
The retention times in landfill leachate plumes will most likely be several months to years, and precise estimates of the transformation rates are thus not really needed. The most rapidly transformed compounds will degrade within a few meters of travel. However, the slower compounds may travel from one redox environment to another and hence enter a
zone where the rates will alter. For compounds such as PCE and TCE, which are known to degrade only under strongly anaerobic conditions, the result could be that they may travel from the anaerobic zone without being completely trans- formed and into more oxidized zones, where transformation no longer will take place. For a compound such as naphtha- lene, downgradient transport may favor transformation, since naphthalene is expected to be transformed at a higher rate under less-reduced conditions.
for the other degradable aromatic and chlorinated aliphatic compounds.
The present experiment demonstrated that many xenobiotic compounds may be transformed under strongly reducing con- ditions in a leachate plume. This is a promising result for the application of natural attenuation at landfill sites.
Acknowledgments. Bent Skov, Anja Foverskov, Jens S. S0rensen, and Mette L. Andersen took active part in the field and/or laboratory work. Kathrin M. Hess, USGS, supplied us with the program "Mom- gen" for generating spatial moments. Gorm Heron commented on the manuscript. Birte Brejl and Torben Dolin drew the illustrations, while Grete Hansen assembled the references. All these contributions are
gratefully acknowledged. This study was funded by the Danish Envi- ronmental Research Programme and the Danish Research Council and is a part of a major research program focusing on the effects of waste disposal on groundwater.
5. Summary A natural gradient injection experiment was successfully
conducted in the anaerobic contaminant plume downgradient from the Grindsted Landfill. Over a period of 195 days trace concentrations of xenobiotic compounds along with the con- servative tracer bromide were injected into the strongly anaer- obic region of the leachate plume, and a continuous cloud was created. The movement of the xenobiotic compounds and the tracer was monitored in three dimensions within the contam-
inant plume in a dense sampling network installed downgradi- ent from the injection wells. A total of 140 MLSs (1030 sam- pling points) covered an area 1 to 20 m wide and 60 m long. Over a period of 924 days BTCs were established at approxi- mately 70 discrete sampling points, and seven cloud snapshots, covering 400-700 sampling points each time, were collected.
Over the 924 day experimental period, the hydraulic gradi- ent decreased from 3.6%0 to 1.2%o, which lowered the average groundwater flow velocity from 27 m/y to 7 m/y. The spatial distribution of the cloud was determined; however, some trun- cation of the cloud was observed. Interpretation of the exper- iment was based on BTC analysis at the discrete sampling points and on moment analysis of the seven snapshots. Mass recoveries of up to 73% were observed for the bromide tracer.
Of the seven aromatic and four chlorinated aliphatic com- pounds studied, transformation was observed for toluene, o- xylene, TeCM, 1,1,1-TCA, PCE, and TCE; however, the trans- formation of PCE and TCE was only partial. Transformation of benzene and naphthalene was not detected under the strictly anaerobic conditions. It was not possible, because of the ex- perimental conditions, to determine whether transformation of ethylbenzene or of m- and p-xylene occurred. The transforma- tion of these seven compounds under natural field conditions is fairly consistent with the literature concerning anaerobic trans- formation experiments. The present field injection experiment indicated that only few compounds are easily degradable under strongly anaerobic conditions. These results emphasize that the factors determining whether an organic compound is de- gradable under given anaerobic conditions should not be over- simplified.
Field transformation rates in the plume were assessed in terms of first-order rates for the degradable compounds. These rates suggested that the transformation of xenobiotic com- pounds may be highly variable in such strongly anaerobic en- vironments. The chlorinated aliphatic compound, TeCM, un- derwent reductive dehalogenation with a minimum first-order rate greater than 0.7 d-•. The transformation was much slower
References
Acton, D. W., and J. F. Barker, In situ biodegradation potential of aromatic hydrocarbons in anaerobic groundwaters, J. Contam. Hy- drol., 9, 325-352, 1992.
Albrechtsen, H.-J., P. L. Bjerg, L. Ludvigsen, K. Rtigge, and T. H. Christensen, An anaerobic field injection experiment in a landfill leachate plume, Grindsted, Denmark, 2, Deduction of anaerobic (methanogenic, sulfate-, and Fe(III)-reducing) redox conditions, Water Resour. Res., this issue.
Alexander, M., Biodegradation of organic chemicals, Environ. Sci. Technol., 18(2), 106-111, 1985.
Adams, E. E., and L. W. Gelhar, Field study in a heterogeneous aquifer, 2, Spatial moments analysis, Water Resour. Res., 28(12), 3293-3307, 1992.
Asworth, R. A., G. B. Howe, M. E. Mullins, and T. N. Rogers, Air- water partitioning coefficients of organics in dilute aqueous solu- tions, J. Hazard. Mater., 18, 25-36, 1988.
B011, W. P., and P. V. Roberts, Long-term sorption of halogenated organic chemicals by aquifer material, 1, Equilibrium, Environ. Sci. Technol., 25(7), 1223-1237, 1991.
Barbaro, J. R., J. F. Barker, L. A. Lemon, and C. I. Mayfield, Bio- transformation of BTEX under anaerobic denitrifying conditions: Field and laboratory observations, J. Contam. Hydrol., 11,245-272, 1992.
Barker, J. F., J. S. Tessmann, P. E. Plotz, and M. Reinhard, The organic geochemistry of a sanitary landfill leachate plume, J. Con- tam. Hydrol., 1, 171-189, 1986.
BCPC Publications, The Pesticide Manual, 10th ed., Bracknell, Berks, U. K., 1994.
Beller, H. R., W.-H. Ding, and M. Reinhard, Byproducts of anaerobic alkylbenzene metabolism useful as indicators of in situ bioremedia- tion, Environ. Sci. Technol., 29(11), 2864-2870, 1995.
Bjerg, P. L., K. Rtigge, J. K. Pedersen, and T. H. Christensen, Distri- bution of redox sensitive groundwater quality parameters downgra- dient of a landfill (Grindsted Denmark), Environ. Sci. Technol., 29, 1387-1394, 1995.
Bjerg, P. L., A. Brun, P. H. Nielsen, and T. H. Christensen, Application of a model accounting for kinetic sorption and degradation to in situ microcosm observations on the fate of aromatic hydrocarbons in an aerobic aquifer, Water Resour. Res., 32(6), 1831-1841, 1996.
Broholm, K., and S. Feenstra, Laboratory measurements of the aque- ous solubility of mixtures of chlorinated solvents, Environ. Toxicol. Chem., 14(1), 9-15,-1995.
Christensen, T. H., P. Kjeldsen, H.-J. Albrechtsen, G. Heron, P. H. Nielsen, P. L. Bjerg, and P. E. Holm, Attenuation of landfill leachate pollutants in aquifers, Crit. Rev. Environ. Sci. Technol., 24(2), 119- 2O2, 1994.
CRC Press, Handbook of Chemistry and Physics, 73rd ed., edited by D. R. Lide, Boca Raton, Fla., 1992.
Edwards, E. A., L. E. Wills, M. Reinhard, and D. Grbi•-Gali•, Anaer- obic degradation of toluene and xylene by aquifer microorganisms' under sulfate-reducing conditions, Appl. Environ. Microbiol., 58(3), 794-800, 1992.
Freedman, D. L., and J. Gosset, Biological reductive dechlorination of tetrachloroethylene and trichloroethylene to ethylene under metha-

1246 ROGGE ET AL.: ANAEROBIC FIELD INJECTION, 1
nogenic conditions, Appl. Environ. Microbiol., 55(9), 2144-2451, 1989.
Garabedian, S. P., D. R. LeBlanc, L. W. Gelhar, and M. A. Celia, Large-scale natural gradient tracer test in sand and gravel, Cape Cod, Massachusetts, 2, Analysis of spatial moments for nonreactive tracer, Water Resour. Res., 27(5), 911-924, 1991.
Gibson, S. A., and G. W. Sewell, Effects of electron donors, electron acceptors, and chloroethene ratios on adaptation of dechlorinating bacterial populations in subsurface microcosms, in Subsurface Res- toration Conference, Third International Conference on Ground Water Quality Research, Dallas, Texas, June 1992, pp. 105-107, Natl. Cent. for Ground Water Res., Houston, Tex., 1992.
Grbi6-Gali6, D., Methanogenic transformation of aromatic hydrocar- bons and phenols in groundwater aquifers, Geomicrobiol. J., 8, 167- 200, 1990.
Heron, G., P. L. Bjerg, P. Gravesen, L. Ludvigsen, and T. H. Chris- tensen, Geology and sediment geochemistry of a landfill leachate contaminated aquifer (Grindsted, Denmark), J. Contam. Hydrol., 29, 301-317, 1998.
Johnston, J. J., R. C. Borden, and M. A. Barlaz, Anaerobic biodegra- dation of alkylbenzenes and trichloroethylene in aquifer sediment down gradient of a sanitary landfill, J. Contam. Hydrol., 23, 263-283, 1996.
Kazumi, J., M. E. Caldwell, J. M. Suflita, D. R. Lovely, and L. Y. Young, Anaerobic degradation of benzene in diverse anoxic envi- ronments, Environ. Sci. Technol., 31,813-818, 1997.
Kjeldsen, P., P. L. Bjerg, J. K. Pedersen, K. Rfigge, and T. H. Chris- tensen, Characterization of an old municipal landfill (Grindsted, Denmark) as a groundwater pollution source: Landfill hydrology and leachate migration, Waste Manage. Res., 16, 14-22, 1998.
Klecka, G. M., S. J. Gonsior, and D. A. Markham, Biological trans- formation of 1,1,1-trichloroethane in subsurface soils and ground- water, Environ. Toxicol. Chem., 9, 1437-1451, 1990.
Kriegman-King, M. R., and M. Reinhard, Transformation of carbon tetrachloride by pyrite in aqueous solution, Environ. Sci. Technol., 28, 692-700, 1994.
Langenhoff, A. A.M., A. J. B. Zehnder, and G. Schraa, Behaviour of toluene, benzene and naphthalene under anaerobic conditions in sediment columns, Biodegradation, 7, 267-274, 1996.
Larsen, T., P. Kjeldsen, and T. H. Christensen, Correlation of benzene, 1,1,1-trichloroethane, and naphthalene distribution coefficients to the characteristics of aquifer materials with low organic carbon con- tent, Chemosphere, 24, 979-991, 1992a.
Larsen, T., P. Kjeldsen, and T. H. Christensen, Sorption of hydropho- bic hydrocarbons on three aquifer materials in a flow through sys- tem, Chemosphere, 24, 439-451, 1992b.
LeBlanc, D. R., S. P. Garabedian, K. M. Hess, L. W. Gelhar, R. D. Quadri, K. G. Stollenwerk, and W. W. Wood, Large-scale natural gradient tracer test in sand and gravel, Cape Cod, Massachusetts, 1, Experimental design and observed tracer movement, Water Resour. Res., 27(5), 895-910, 1991.
Liang, L.-N., and D. Grbi6-Gali6, Biotransformation of chlorinated aliphatic solvents in the presence of aromatic compounds under methanogenic conditions, Environ. Toxicol. Chem., 12, 1377-1393, 1993.
Lovely, D. R., and D. J. Lonergan, Anaerobic oxidation of toluene, phenol, and p-cresol by the dissimilatory iron-reducing organism, GS-15, Appl. Environ. Microbiol., 56(6), 1858-1864, 1990.
Lyngkilde, J., and T. H. Christensen, Fate of organic contaminants in the redox zones of a landfill leachate pollution plume (Vejen, Den- mark), J. Contam. Hydrol., 10, 291-307, 1992b.
Maclntyre, W. G., M. Boggs, C. P. Antworth, and T. B. Stauffer, Degradation kinetics of aromatic organic solutes introduced into a heterogeneous aquifer, Water Resour. Res., 29(12), 4045-4051, 1993.
Mackay, D. M., D. L. Freyberg, P. V. Roberts, and J. A. Cherry, A natural gradient experiment on solute transport in a sand aquifer, 1, Approach and overview of plume movement, Water Resour. Res., 22(13), 2017-2029, 1986.
Mackay, D., W. Y. Shiu, and K. C. Ma, Illustrated I•andbook of Phys- ical-Chemical Properties and Environmental Fate for Organic Chem-
icals, vol. 1; Monoaromatic Hydrocarbons, Chlorobenzenes, and PCBs, Lewis, Chelsea, Mich., 1992a.
Mackay, D., W. Y. Shiu, and K. C. Ma, Illustrated Handbook of Phys- ical-Chemical Properties and Environmental Fate for Organic Chem- icals, vol. 2, Polynuclear Aromatic Hydrocarbons, Polychlorinated Di- oxins and Dibenzofurans, Lewis, Chelsea, Mich., 1992b.
Mackay, D., W. Y. Shiu, and K. C. Ma, Illustrated Handbook of Phys- ical-Chemical Properties and Environmental Fate for Organic Chem- icals, vol. 3, Volatile Organic, Lewis, Chelsea, Mich., 1992c.
Nielsen, P. H., and T. H. Christensen, Variability of biological degra- dation of aromatic hydrocarbons in an aerobic aquifer determined by laboratory batch experiments, J. Contain. Hydrol., 15, 305-320, 1994.
Nielsen, P. H., H. Bjarnadottir, P. L. Winter, and T. H. Christensen, In situ and laboratory studies on the fate of specific organic compounds in an anaerobic landfill leachate plume, II, Fate of aromatic and chlorinated aliphatic compounds, J. Contain, Hydrol., 20, 51-66, 1995.
Pecher, K., S. B. Haderlein, and R. P. Schwarzenbach, Transformation of polyhalogenated alkanes in suspensions of ferrous iron and iron oxides, in 213th ASC National Meeting, San Francisco, April 13-17, 1997, pp. 185-187, Am. Chem. Soc., Div. of Environ. Chem., Wash- ington, D.C., 1997.
Reinhard, M., N. L. Goodman, and J. F. Barker, Occurrence and distribution of organic chemicals in two landfill leachate plumes, Environ. Sci. Technol., 18, 953-961, 1984.
Reinhard, M., S. Shang, P. K. Kitadinis, E. Orwin, G. F. Hopkins, and C. A. A. Lebron, In situ BTEX biotransformation under enhanced nitrate and sulfate-reducing, Environ. Sci. Technol., 31, 28-36, 1997.
Rfigge, K., P. L. Bjerg, and T. H. Christensen, Distribution of organic compounds from municipal solid waste in the groundwater down- gradient of a landfill (Grindsted, Denmark), Environ. Sci. Technol., 29, 1395-1400, 1995.
Rfigge, K., T. B. Hofstetter, S. B. Haderlein, P. L. Bjerg, S. Knudsen, C. Zraunig, H. Mosbaek, and T. H. Christensen, Characterization of active reductants in an anaerobic leachate-affected aquifer using a set of nitroaromatic probe compounds, Environ. Sci. Technol., 32, 23-31, 1998.
Schreier, C. G., and M. Reinhard, Transformation of chlorinated or- ganic compounds by iron and manganese powders in buffered water and landfill leachate, Chemosphere, 29(8), 1743-1753, 1994.
Schwarzenbach, R. P., P.M. Gschwend, and D. M. Imboden, Environ- mental Organic Chemistry, John Wiley, New York, 1993.
Sutton, P. A., and J. F. Barker, Migration and attenuation of selected organics in a sandy aquifer--a natural gradient experiment, Ground Water, 23,. 199 -204, 1985.
Thierrin, J., G. B. Davis, and C. Barber, A ground-water tracer test with deuterated compounds for monitoring in situ biodegradation and retardation of aromatic hydrocarbons, Ground Water, 33(3), 469-475, 1995.
Verschueren, K., Handbook of Environmental Data on Organic Chem- icals, 3rd ed., Van Nostrand Reinhold, New York, 1996.
Vogel, T. M., and P. L. McCarty, Rate of abiotic formation of 1,1- dichloroethylene from 1,1,1-trichloroethane in groundwater, J. Con- tam. Hydrol., 1,299-308, 1987.
Wilson, B. H., G. B. Smith, and J. F. Rees, Biotransformation of selected alkylbenzenes and halogenated aliphatic hydrocarbons in methanogenic aquifer material: A microcosm study, Environ. Sci. Technol., 20(10), 997-1002, 1986.
P. L. Bjerg, T. H. Christensen, H. Mosbaek, and K. Rfigge, Depart- ment of Environmental Science and Engineering, Technical University of Denmark, Building 115, DK-2800 Lyngby, Denmark. ([email protected])
J. K. Pedersen, Department of Hydrodynamics and Water Re- sources, Technical University of Denmark, Building 115, DK-2800, Lyngby, Denmark.
(Received September 10, 1998; revised November 19, 1998; accepted November 20, 1998.)