fiscal management in adjustment lending
TRANSCRIPT
________ -m" Ai'~~4 -,4
~~~ -~~~~~~-7
4:
A WorldBank Oera"IT
Pub
lic D
iscl
osur
e A
utho
rized
Pub
lic D
iscl
osur
e A
utho
rized
Pub
lic D
iscl
osur
e A
utho
rized
Pub
lic D
iscl
osur
e A
utho
rized

Fiscal Managementin Adjustment Lending
Other Titles in the SeriesPREPARED BY THE WORLD BANK OPERATIONS EVALUATION DEPARTMENT
Reforming Agriculture: The World Bank Goes to Market(1997)*
Paddy Irrigation and Water Management in Southeast Asia(1997)*
1995 Evaluation Results(1997)*
Zambia Country Assistance Review: Turning an Economy Around(1997)*
Aga Khan Rural Support Program: A Third Evaluation(1996)*
Lending for Electric Power in Sub-Saharan Africa(1996)*
Industrial Restructuring: World Bank Experience, Future Challenges(1996)*
Social Dimensions of Adjustment: World Bank Experience, 1980-93(1996)*
1994 Evaluation Results(1996)*
Ghana Country Assistance Review: A Study in DevelopmentEffectiveness(1995)*
Evaluation and Development: Proceedings of the 1994 WorldBank Conference(1995)
Developing Industrial Technology: Lessons for Policy and Practice(1995)*
The World Bank and Irrigation(1995)*
1993 Evaluation Results(1995)*

Structural and Sectoral Adjustment: World Bank Experience, 1980-92(1995)*
Gender Issues in World Bank Lending(1995)*
The World Bank's Role in Human Resource Development in Sub-Saharan Africa: Education, Training, and Technical Assistance(1994)*
1992 Evaluation Results(1994)*
New Lessons from Old Projects: The Workings of Rural Developmentin Northeast Brazil(1993; contains summaries in French, Portuguese, and Spanish)
World Bank Approaches to the Environment in Brazil(1993; contains summaries in French, Portuguese, and Spanish)
Trade Policy Reforms under Adjustment Programs(1992)*
World Bank Support for Industrialization in Korea, India,and Indonesia(1992)*
Population and the World Bank: Implications from Eight Case Studies(1992)*
The Aga Khan Rural Support Program in Pakistan:Second Interim Evaluation(1990)*
*Contains summaries in French and Spanish.


Fiscal Managementin Adjustment Lending
Jayati Datta-Mitra
THE WORLD BANK
WASHINGTON, D.C.
Copyright C 1997The Intemational Bank for Reconstructionand Development/THE WORLD BANK1818 H Street, N.W.Washington, D.C. 20433, U.S.A.
All rights reservedManufactured in the United States of AmericaFirst printing June 1997
The opinions expressed in this report do not necessarily represent the views of the World Bank orits member governments. The World Bank does not guarantee the accuracy of the data included inthis publication and accepts no responsibility whatsoever for any consequence of their use. Theboundaries, colors, denominations, and other information shown on any map in this volume donot imply on the part of the World Bank Group any judgment on the legal status of any territory orthe endorsement or acceptance of such boundaries.
The material in this publication is copyrighted. Requests for permission to reproduce portions of itshould be sent to the Office of the Publisher at the address shown in the copyright notice above.The World Bank encourages dissemination of its work and will normally give permission prompt-ly and, when the reproduction is for noncommercial purposes, without asking a fee. Permission tocopy portions for classroom use is granted through the Copyright Clearance Center, Inc., Suite 910,222 Rosewood Drive, Danvers, Massachusetts 01923, U.S.A.
Cover photo by Angie Gentile-Blackwell.
Library of Congress Cataloging-in-Publication Data
Datta-Mitra, Jayati.Fiscal management in adjustment lending / Jayati Datta-Mitra.
p. cm. - (A World Bank operations evaluation study, ISSN1011-0984)
Includes bibliographical references.ISBN 0-8213-3965-61. Fiscal policy-Developing countries. 2. Loans, Foreign-
Developing countries. 3. World Bank. 4. Budget deficits-Developing countries. 5. Structural adjustment (Economic policy)-Developing countries. I. World Bank. II. Title. III. Series.HJ1620.D377 1997332.1'532-dc2l 97-19151
CIP
Contents
Foreword xiPr6logo xiiiAvant-propos xvAcknowledgments xviiAbbreviations and acronyms xviii
Summary 1Resumen 8Resume 16
1. Setting the stage 25
The typical crisis profile 25The centrality of fiscal reform 27Coverage of the report 27
2. Fiscal management in SALs/SECALs: a close-up view 30
What was the quality of fiscal diagnosis? 31Was the quality of conditionality adequate? 39Was implementation adequate? 43Conclusions 45Lessons 47
3. Tax reform 51
What the study found 51Principles of tax reform 52Precision and content of tax conditionality 54How successfully were tax conditionalities implemented? 61How effective was tax reform? 61Lessons and directions for the future 66
4. Tax administration reform 71
What the study found 71The ends and means of tax administration reform 71Bank involvement in tax administration reform 75Tracking implementation of reforms 79Measuring outcomes 80Lessons 81
5. Public expenditure reform 83
What the study found 83A framework for evaluating public sector reforms 85Expenditure patterns before adjustment lending 87
vii

viii
Bank conditionalities 88Implementation of conditionalities 94How effective were expenditure reform conditions? 96Lessons 104
6. Fiscal adjustment under SALs and SECALs: an aggregateview and conclusions 106
Were fiscal deficits reduced? 106How did external factors affect fiscal outcomes? 109How was fiscal adjustment achieved? 111Recommendations 113
Annexes 121
Bibliography 167
Supplement 173
Introductory note 174Management response 175Summary of Committee on Development Effectiveness findings 179
Boxes
2.1 Basic elements of diagnosis 312.2 Examples of quasi-fiscal activities of financial systems 342.3 Evaluating conditionality 403.1 Fiscal reform needs to precede tariff reform 676.1 Determining the solvency of the public sector 113
Figures
1.1 Macroeconomic indicators during the preloan periodpresaged the onset of crisis 26
1.2 Private investment and interest on external debt werelow during the preloan period 26
1.3 Fiscal years 1979-94: AFR and LAC account for largest number ofadjustment loans and greatest share in total adjustment lending 28
2.1 Coverage of fiscal accounts was specified in only halfof the 129 SALs/SECALs 32
2.2 Proportion of SALs/SECALs with budget deficit conditions 416.1 Change in fiscal deficits by region and country group 108
Tables
2.1 Quantitative fiscal targets in SALs/SECALs 423.1 Content of tax conditionality in Africa, Latin America and
the Caribbean, and all regions 553.2 Trade tax conditionality by type and region 593.3 Types of trade tax conditionality by region and country 603.4 Tax structure before and after adjustment 623.5 Diagnosis of need for revenue reform and performance 653.6 Successful and less successful trade adjusters 664.1 Sample SALs/SECALs incorporating tax administration
reforms by region and period 754.2 Specificity of tax administration reform conditionalities by region 77
ix
4.3 Sample conditionalities by level of precision 774.4 Specific tax administration reform conditionalities by region 775.1 Composition of central government expenditures, regional
averages, 1970-79 875.2 Public current expenditures per pupil by level of education 885.3 Loan conditions by expenditure reform objective, 1980-94 895.4 Countries facing civil service conditions 905.5 Loan conditions by equity objective, 1980-94 935.6 Implementation of Bank conditions on public expenditures 955.7 Diagnosis of need for total expenditure reform and performance 955.8 Diagnosis of need for capital expenditure reform and performance 975.9 Diagnosis of need for current expenditure reform and performance 985.10 Changes in wage expenditure shares, before and after adjustment 995.11 Changes in central government expenditures on education,
before and after adjustment 1015.12 Changes in central government expenditures on health 1015.13 Expenditure inflexibility 1025.14 Primary enrollment ratios in countries with education conditions 1035.15 Enrollment ratios and the gender gap in primary education 1036.1 Average fiscal deficits by country group and region 107

Foreword
Fiscal balance is central to the success of adjustment. This study, preparedby the World Bank's Operations Evaluation Department, analyzes theBank's experience with fiscal management in 250 adjustment operationsin 86 countries. It examines the fiscal record in a sample of 26 countries(134 operations) grouped by region, portfolio characteristics, and economictraits. The study confirms that fiscal deficit reduction is associated with im-proved external balances and economic growth and that it takes sustained,long-term effort, and continual vigilance against reversals. Contrary to theview prevailing in the early years of adjustment operations, the study sug-gests that fiscal mismanagement, not exogenous shocks, was the principalcause of persistent budget deficits.
Budget deficits-accompanied by rising external debt and a growing ratioof debt to GDP-remain high, and there have been some reversals, particu-larly in Africa and among low-income and severely indebted adjusters andprimary exporters. Fiscal success was limited in part because reform pro-grams (1) failed to address the role of the state, a critical factor determiningthe level of public finances; (2) treated fiscal issues separately from othermacroeconomic reforms and ignored fiscal sustainability and solvency;(3) paid scant attention to fiscal deficit coverage, measurement, and data;and (4) were couched in conditionality that was too soft, ambiguous, orinconsistent.
Countries reduced deficits by increasing revenue and to a lesser extent bylowering capital spending; targeted cuts in current expenditures provedmore elusive. Revenues increased, not by imposing higher tax rates, butby broadening and simplifying the tax base. Tax conditionality (affectingpolicy as well as administration) was imprecise and did not build in perfor-mance monitoring indicators. And expenditure conditions focused on shiftsin expenditure, not outcomes.
The study offers a number of recommendations for the Bank and its borrowers:
* Estimate the level of the sustainable deficit and provide guidelinesfor achieving it in Bank economic and sector work and adjustmentlending.
* Improve sequencing of tax reform, for example, by ensuring that non-tax trade reform precedes trade tax reform and that tax administrationreform precedes or accompanies tax policy reform.
* Consider explicitly the role of the state and the appropriate mix ofpublic/private provision of services in recommending public expendi-ture reform.
* Include poverty alleviation and equity objectives in public expendi-ture reform.
xi
xii
* Build adequate monitoring and performance indicators for both tax andexpenditure reforms.
* Enhance Bank-Fund coordination, in support of the Fund's lead role ingiving fiscal advice, by strengthening the Bank's ability to analyze taxesand expenditures.
Robert PicciottoDirector GeneralOperations Evaluation
Prologo
El equilibrio fiscal es esencial para la eficacia del ajuste. En este estudio,preparado por el Departamento de Evaluaci6n de Operaciones del BancoMundial, se analiza la experiencia del Banco en materia de gesti6n fiscal en250 operaciones de ajuste realizadas en 86 paises. Se examina el historial fis-cal de una muestra de 26 paises (134 operaciones) agrupados por regiones,caracteristicas econ6micas y de la cartera. El estudio confirma que la reduc-ci6n del deficit fiscal se vincula con la mejora de la balanza de pagos y elaumento del crecimiento econ6mico, y que para lograrla se necesita unesfuerzo sostenido a largo plazo y la vigilancia constante para que no seproduzcan retrocesos. A diferencia de la opini6n predominante en los pri-meros anios de las operaciones de ajuste, el estudio revela que la principalcausa de la persistencia de los deficit presupuestarios era la mala gesti6nfiscal y no las conmociones externas.
El nivel de los deficit presupuestarios -unidos a una deuda externa yuna relaci6n deuda-PIB crecientes- sigue siendo alto, y se han observadoalgunos retrocesos, sobre todo en los paises de Africa y las naciones deingreso bajo y gravemente endeudadas en proceso de ajuste y exportadorasde productos primarios. El exito fiscal se vio en parte limitado porque losprogramas de reforma: (1) no abordaron el papel que cabe al estado, unfactor crucial para determinar el nivel de las finanzas publicas; (2) trataronlos problemas fiscales en forma independiente de otras reformas macro-econ6micas e ignoraron la sostenibilidad fiscal y la solvencia; (3) presta-ron escasa atenci6n a la cobertura del d6ficit fiscal, su medici6n y datosconexos, y (4) contenfan condicionalidades demasiado blandas, ambiguaso incongruentes.
Los pafses redujeron los deficit aumentando los ingresos y, en menor medi-da, reduciendo el gasto de capital; result6 mas dificil aplicar reduccionesespecificas de los gastos corrientes. Los ingresos aumentaron gracias a laampliaci6n y simplificaci6n de la base imponible, y no mediante la aplica-ci6n de tasas impositivas mas altas. La condicionalidad de orden tributario(que afectaba a las politicas y la administraci6n) era imprecisa y no incor-poraba indicadores de seguimiento de los resultados. Ademas, las condicionesdel gasto se centraron en el desplazamiento de estos y no en los resultados.
El estudio contiene varias recomendaciones para el Banco y sus prestata-rios, a saber:
* Estimar el nivel de deficit sostenible y establecer directrices paraalcanzarlo en los estudios econ6micos y sectoriales del Banco y en elfinanciamiento para fines de ajuste.
* Mejorar la secuencia de la reforma tributaria, por ejemplo, asegurandoque esta se vea precedida por la reforma comercial no tributaria, y quela reforma de la administraci6n tributaria se introduzca antes que lareforma de la politica impositiva o en forma simultanea.
xiii
xiv
* Al recomendarse la reforma del gasto piublico, considerar expresamenteel papel que cabe al estado y la combinaci6n adecuada de prestaci6n deservicios por los sectores piiblico y privado.
* Incluir objetivos de equidad y reducci6n de la pobreza en la reforma delgasto publico.
* Formular indicadores adecuados de seguimiento y los resultados de lareforma impositiva y del gasto.
* Mejorar la coordinaci6n entre el Banco y el Fondo, respaldando lafunci6n rectora que cabe al Fondo en materia de asesoramiento fiscalmediante el fortalecimiento de la capacidad del Banco para el analisisde los impuestos y el gasto.
Robert PicciottoDirector GeneralEvaluaci6n de Operaciones
Avant-propos
L'equilibre budgetaire est a la base de la reussite de l'ajustement. La pre-sente etude, preparee par le Departement de l'evaluation des operationsde la Banque mondiale, analyse l'experience de la Banque en matiere degestion budgetaire dans le cadre de 250 operations d'ajustement meneesdans 86 pays. Elle examine les resultats budgetaires d'un echantillon de 26pays (134 operations) regroupes par region, caracteristiques du portefeuilleet particularites 6conomiques. L'etude confirme que la reduction du deficitbudgetaire est liMe a l'amelioration des comptes exterieurs et a la croissanceeconomique, et qu'il faut consentir un effort soutenu et de longue haleine etfaire preuve d'une vigilance de tous les instants si l'on veut eviter un retouren arriere. Contrairement aux theses qui avaient cours durant les premieresann6es des operations d'ajustement, l'etude laisse entendre que c'est lamauvaise gestion budgetaire, et non les chocs exogenes, qui sont la causeprincipale de d6ficits budgetaires persistants.
Les deficits budg6taires - qui vont de pair avec l'alourdissement de la detteext6rieure et l'augmentation du ratio d'endettement par rapport au PIB -restent eleves et l'on a assist6 a un certain nombre de revirements, en par-ticulier en Afrique et parmi les pays a faible revenu et lourdement endettes,engag6s dans la voie de l'ajustement et exportateurs de produits primaires.Le caractere limite de la r6ussite budgetaire tient en partie au fait que lesprogrammes de reforme: (1) n'ont pas su apprehender la question du r6lede l1'tat, determinant fondamental du niveau des finances publiques; (2) onttraite separement les problemes budgetaires d'une part et les autres reformesmacro6conomiques d'autre part, sans tenir compte des aspects de soutena-bilite ou de solvabilite budgetaires; (3) n'ont guere prete attention aux mo-yens a mettre en oeuvre pour prendre veritablement en compte le d6ficitbudgetaire, le mesurer et rassembler des donnees statistiques; et (4) etaientfondes sur des conditions trop laxistes, ambigues ou incoherentes.
Les pays ont reduit leur deficit en augmentant leurs recettes et, dans unemoindre mesure, en diminuant leurs depenses d'6quipement, mais les objec-tifs de compression des depenses courantes se sont r6veles plus difficiles aatteindre. Les recettes ont augmente non pas par suite d'un relevement destaux d'imposition, mais du fait de l'6largissement et de la simplification del'assiette fiscale. Les conditions d'ordre fiscal (influant sur les politiquesautres que commerciale ainsi que sur l'administration fiscale) etaient im-precises et n'incorporaient pas d'indicateurs de suivi des performances.De plus, les conditions relatives aux d6penses ne portaient plus sur lesresultats, mais sur les r6orientations des d6penses.
L'6tude offre un certain nombre de recommandations a la Banque et ases emprunteurs:
* Estimer le niveau de deficit soutenable et fournir, dans les etudes eco-nomiques et sectorielles et les prets d'ajustement de la Banque, deslignes directrices pour y parvenir.
xv
xvi
* Am6liorer 1'echelonnement des mesures de reforme fiscale, par exempleen veillant a ce que les mesures de reforme commerciale non fiscales pre-cedent les mesures fiscales et que la reforme de l'administration fiscaleprec&de ou accompagne la reforme de la politique fiscale.
* Examiner explicitement, lors -de la formulation de recommandationsconcernant la r6forme des depenses publiques, le role de l'etat et larepartition appropri&e des services a assurer respectivement par lessecteurs public et prive.
* Prendre en compte, dans la reforme des d6penses publiques, les objec-tifs de reduction de la pauvrete et d'equite.
* Ptablir des indicateurs adequats de suivi et de performance pour lareforme de la fiscalite comme pour celle des depenses.
* Renforcer la coordination entre la Banque et le Fonds pour aider le Fondsa jouer le r6le pilote qui est le sien en matiere de conseils fiscaux en ren-dant la Banque mieux a meme d'analyser les impots et les depenses.
Robert PicciottoDirecteur g6neralEvaluation des operations

Acknowledgments
The report was prepared by Jayati Datta-Mitra (Principal Evaluation Officer).Members of the team included Amaresh Bagchi ("Tax administration re-form"); Vandana Chandra and Salman Anees ("Fiscal management underSALs/SECALs: an aggregate view and conclusions"); Poonam Gupta ("Fis-cal management in SALs/SECALs: a close-up view"); Anwar Shah (PrincipalEvaluation Officer), Jeff Huther, Sandra Roberts, and Ylbin Xiang ("Public ex-penditure reform"); Wayne Thirsk and Harry Watson ("Tax reform"). JohnDiamond, Mohammad Emran, and Monica Rubio provided initial researchsupport. Meta de Coquereaumont, Barbara Kami, and Alison Strong editedthe grey cover version of this report. Angie Gentile-Blackwell copyeditedand produced the published version. Jasmine Mason-Anderson, NormaNamisato, and Geri Wise provided administrative assistance. The reportwas issued by the Country Policy, Industry, and Finance Division (ManuelPefialver, Division Chief) of the Operations Evaluation Department (Fran-cisco Aguirre-Sacasa, Director) under the Director-General, OperationsEvaluation, Robert Picciotto.
xvii

Abbreviations and acronyms
AFR Africa Regional OfficeALCID Adjustment Lending Conditionality and
Implementation DatabaseEAP East Asia and Pacific Regional OfficeECA Europe and Central Asia Regional OfficeESW Economic and sector workGDP Gross domestic productGNP Gross national productICR Implementation completion reportIBRD International Bank for Reconstruction and DevelopmentIDA International Development AssociationIMF International Monetary FundLAC Latin America and Caribbean Regional OfficeMNA Middle East and North Africa Regional OfficeOED Operations Evaluation DepartmentO&M Operations and maintenancePAR Performance audit reportPCR Project completion reportPR President's reportQR Quantitative restrictionRMSM Revised Minimum Standard ModelSAL Structural adjustment loanSAS South Asia Regional OfficeSECAL Sectoral adjustment loanTAR Tax administration reformTFSAL Trade and financial sector adjustment loanTIN Tax identification numberVAT Value added tax
xviii
FISCAL MANAGEMENT INADJUSTMENT LENDING
Summary
The World Bank initiated structural adjustment lending in the early 1980sto help developing countries out of the economic crises into which externalshocks and macroeconomic mismanagement had plunged them. By the early1990s about two-thirds of the Bank's clients had initiated policy reforms sup-ported by structural or sectoral adjustment loans (SALs/SECALs). A largenumber of these loans-about 250 SALs/SECALs to 86 countries between fis-cal years 1979 and 1994-had fiscal reform components. This study assesseshow well Bank-supported fiscal adjustment worked and reflects on how loanperformance can be improved in future operations.
What the study found
The principal findings of the study are that (a) successful fiscal management Fi scalrequires sustained, long-term effort, (b) lower fiscal deficits are associatedwith faster economic growth, (c) sustained deficit reductions were achieved adjustment isprimarily through revenue enhancement, while expenditure reduction tar- a long-termgets were more elusive, and (d) the fiscal reform component of Bank-sup-ported adjustment lending had only limited success because of the frag- processmented treatment of fiscal issues and the vague conditionality of loans.
General findings
Management of fiscal deficits requires sustained, long-term adjustment effort. Defi-cits of SAL/SECAL countries rose in the medium term; only in the long term(five to eight years following the first loan) were there substantive signs ofbudgetary improvements. Though deficits were lower in the most recenttwo years (relative to the four-year preloan period) in SAL/SECAL coun-tries as a whole, deficits continued at well above 3 percent of GDP, and therewere significant reversals in deficit reduction in Africa among low-income andseverely indebted adjusters and primary exporters. The low-income and pri-mary exporter groups showed no improvement relative to the preloan period.
The principal source of large fiscal deficits was fiscal mismanagement, notexogenous shocks. Though the foreign interest burden did not constrain ad-justment in several SAL/SECAL countries, the growing ratio of external debtto gross domestic product (GDP) across most regions indicates that the im-provements in fiscal management were not strong enough to sustain sol-vency in many of the client countries.
Deficit reduction leads to improved external balances and stimulates growth. Be-cause fiscal deficits can contribute to many economic ills (inflation, creditshortages, distorted interest and exchange rates, current account imbalances),they can crowd out private investment and hurt economic growth. Although
1
2
growth performance was uneven across regions, the data confirm that whileother conditions are also necessary for growth, good fiscal managementhelps. The data also indicate a strong association between improvements infiscal deficits and in current account deficits.
Sustained deficit reductions were achieved primarily through revenue enhancementsand to a lesser extent through reductions in capital spending. Targeted reductions incurrent expenditures proved to be more elusive. Fiscal adjustments were not sus-
Sustained def cit tained in countries that reduced their deficits through short-term shifts in rev-enue or expenditure. Most countries that made fiscal improvements over the
reduction is longer term did so by increasing revenue (not by increasing tax rates but by
achieved broadening tax bases and simplifying tax systems). Countries with worseningfiscal deficits generally increased current expenditures without increasing
primarily revenues. Current and capital expenditure strategies were consistent acrossthrough revenue country groups and regions and over time: all regions and country groups
except the Middle East and North Africa (MNA) and the middle-income ad-enhancements justers increased current expenditures, and all groups except East Asia and
Pacific (EAP) pruned capital expenditures relative to the preloan period. Re-ductions in current expenditures, while considered necessary in many cases,were only achieved in a small number of countries.
The record of borrower compliance with Bank conditions was excellent, yetBank-supported adjustment lending had only limited fiscal success becausefiscal issues were treated in a fragmented manner and conditionality wasvague. The poor quality of fiscal data undoubtedly contributed to the diffi-culties of identifying the components of fiscal accounts and the budgetaryimplications of changes in fiscal and other macroeconomic policies. Mostoperations paid little attention to coverage, measurement, or sustainability ofthe deficit or to the role of the public sector (a critical factor determining thelevel of the public finances). Though fiscal policy is only one aspect of a largeradjustment program of interdependent policy reforms, few operations dis-cussed the relationship between fiscal deficits (and the instruments for reduc-ing them) and the other macroeconomic variables and structural reform mea-sures underway or planned. The complex issues connected with budgetaryreform (budgetary discipline, identification of strategic priorities, technicalefficacy, accountability, information systems). Conditionality on the budgetdeficit or public savings was too general, inconsistent between loans for thesame country, or subject to different interpretations. The vagueness of fiscalconditions made implementation and monitoring difficult or impossible (in68 percent of operations covered by project completion and performance au-dit reports-PCRs and PARs). Conditions were "soft," calling for legislationto be drafted rather than implemented (47 percent) and stressing studiesrather than implementation (16 percent). Conditionality was occasionallypoorly timed (32 percent).
Specific findings on aspects offiscal reform
Revenue reform. The Bank's advice on tax reform has generally been consistentwith best practice as set out in the Bank's Lessons of Tax Reform (1991). Taxadministration reforms have generally been consistent with state-of-the-artrecommendations for improving taxpayer compliance and operation of taxdepartments. But some problems remain. Revenues rose in only 17 of the 26countries where tax measures (base broadening, simplification, or rationaliza-tion) had been identified as necessary and as likely to boost revenue. Weak-nesses in tax administration appear to at least partly explain why revenue fellshort of expectations in several countries (Bulgaria, C6te d'Lvoire, Hungary,Senegal, Venezuela) and why revenue increases, where they occurred, failed
3
to have the desired fiscal impact (Bangladesh, Pakistan, Uganda). Tax admin-istration was also neglected in some early SALs (Bangladesh, C6te d'Ivoire,Hungary, Pakistan, Uganda).
In general, conditions on nontrade tax reforms have constituted only a smallcomponent of SALs/SECALs and have been selective rather than comprehen-sive. In 92 SALs/SECALs covering 53 countries with nontrade tax conditions,conditionality sought largely to broaden direct and indirect tax bases and tolower marginal income tax rates in order to make tax systems simpler, moreefficient, and easier to administer. Typically, conditionality supported govern-ment reform initiatives or piggybacked on other institutional initiatives. TheBank generally deferred to the International Monetary Fund's (IMF or Fund)lead in nontrade tax reform in countries where the Fund was involved in thetax area.
About 40 percent of conditionality was quantitative and easily monitorable:meeting certain quantitative criteria or making specific changes in tax basesor rate structures. However, about 48 percent of conditions stipulated specificstatutory changes but did not provide quantitative measures of performance;these conditions generally specified the direction of change in the tax codewithout mentioning the magnitude of change expected. About 12 percent of Nontrade taxconditions lacked both quantitative and qualitative criteria. Thus about 60 riform supportedpercent of conditions left open the possibility of poor outcomes: some could ' t Bbe satisfied de jure by minor alterations in the tax code; others simply could by the Banknot be adequately monitored or evaluated. was generally
None of the SALs/SECALs specified pre-reform benchmarks such as mar- selective andginal effective tax rates. Partly as a result, none of the PCRs/PARs could difficult toevaluate implementation and outcomes in terms of changes in these rates,and very few verified compliance by comparing the record before and after monitor andreform. Thus the effectiveness of tax conditionality was generally evaluated evaluate; thein terms of statutory compliance (fulfillment of conditions stipulating chan-ges in tax statutes) or increases in tax ratios even though such ratios are af- record on tradefected by many other factors. Although few conditions called specifically for tax reforms wasincreases in tax rates, tax ratios did increase (through increases in tax bases)in a large number of countries. The shifts in tax structure that followed tax betterreform were generally consistent with Lessons of Tax Reform (World Bank1991a)-in the direction of less reliance on trade taxes and greater relianceon domestic indirect taxes.
The record for trade taxes was much better. In a sample of 83 operationscovering 23 countries with trade tax conditions (out of a total of 171 opera-tions in 75 countries), conditionality was specific, and reform objectives werespelled out as clear-cut, quantified policy targets to be reached before a speci-fied deadline. Such precision makes compliance relatively easy to monitor.Though compliance was good, the pace of reform varied, often depending onhow well trade reform was synchronized with other reforms. Revenue pres-sures often held up trade reform. So did insufficient progress on stabilization.Little effort was made to quantify the revenue effects of trade reforms; inad-equate attention went to harmonizing sales and excise taxes for imports anddomestic goods.
Though the Bank's involvement in tax administration reform has increasedsignificantly since 1987, the record suggests piecemeal reform rather thana comprehensive reform strategy. Only 40 percent of conditionality wascouched in precise terms. PCRs/PARs that tracked implementation of con-ditionality pronounced compliance to be high, but without monitorable per-

4
formance indicators such findings are not very persuasive. The most com-mon yardstick was the ratio of taxes to GDP, even though tax collections areaffected by many factors other than administration. As with nontrade tax re-form, imprecision and a paucity of monitorable indicators impaired the qual-ity of tax administration conditionality.
Expenditure reform. The Bank has frequently helped countries define expendi-ture reform; expenditure conditions were incorporated in 219 operations in83 countries during FY79-94. In general, expenditure reform efforts havebeen broadly consistent with the directions discussed in Bank reports on ad-justment lending (World Bank 1988a, 1990a, 1992a, b; Jayarajah and Branson1995). Conditions have focused on reducing and restructuring capital expen-ditures, reducing subsidies, reforming public employment and cutting thepublic wage bill, emphasizing operations and maintenance (O&M) of exist-ing facilities, and increasing social sector spending (though attention to pov-erty reduction has been weak).
Countries with Countries with expenditure conditions did only marginally better than coun-tries without them in improving expenditure patterns. Countries with condi-
expenditure tions had greater success in increasing social spending and cutting subsidies
conditions did and defense spending, and they ended the period with lower wage expendi-tures than countries without conditions. Although both groups started out
only marginally with roughly equal ratios of total expenditure to GDP, countries with condi-
better than tions had less success in cutting total expenditure. Success has been limitedin restructuring current expenditures away from wages and subsidies and to-
countries without ward nonwage O&M, and attempts to cut public employment have generally
in improving been short-lived or modest. Countries with capital expenditure conditionsended the period with very low levels of capital expenditures, reflecting re-
expenditure latively large cuts in infrastructure spending. One reason for the relativelypnatterns modest performance on the expenditure front may be the inflexibility that af-
flicts budgets in many countries; Bank adjustment lending made little head-way in this area.
In countries with education and health conditions, both sectors increasedtheir shares in total spending. Yet education and health expenditure ratioswere only marginally better in countries with such conditions than in coun-tries without. For both groups of countries illiteracy rates declined, particu-larly for girls and women, as did infant mortality rates. Cost-recovery effortsin the social sectors were limited. One reason that Bank conditions may havehad little additional impact on social sectors is that the Bank emphasized themeans rather than the ends of expenditure reform. Conditions focused onchanging expenditures in specific functional categories or sectors rather thanon the relation between inputs (such as level of expenditures), outputs (en-rollment rates, graduation rates), and final outcomes (rates of literacy; mor-tality; access to basic services, particularly by the poor and needy).
What can be done?
Suggested priorities for Bank work
On Bank-Fund coordination. The centrality of fiscal reform to macroeconomicstability and growth has been well recognized by the Bank and the Fund, andthe two institutions have worked out a division of labor in recent years. TheFund takes a lead in issues relating to taxes and the aggregate level of spend-ing, whereas the Bank leads on sectoral spending issues. Although this divi-sion of labor works well for the most part, it cannot be viewed inflexibly.
5
Thus while respecting the Fund's lead role in giving fiscal advice, the Bankneeds to take a more hands-on approach to the design of fiscal reforms inadjustment lending, particularly where the Fund may not be directly in-volved. For example, the Bank needs to consider the relationships betweentax policy reforms undertaken in adjustment programs and other structuralreforms (as in private sector development, financial and capital market re-forms); between the size and role of the government and the level of thepublic finances; between the financing of the budget and the level and com-position of public expenditures; and between tax and expenditure decisionsand poverty programs. The Bank needs to build up analytical capacity toadvise staff on fiscal and adjustment issues, to identify best practice, and toanalyze new fiscal policy issues that are likely to assume importance in thefuture (financial sector taxation, environmental taxes). In this respect, theBank's Policy Research Department, which withdrew from tax analysis in Oc-tober 1994 to concentrate on expenditure issues, needs to correct the balance.Such a capability will enhance Bank-Fund coordination and strengthen dia-logue on fiscal issues. The Bank and Fund are exploring new and existing chan-nels for improving coordination in the preparation of country macroeconomicframeworks (policy framework papers, public expenditure reviews, Bank coun-try assistance strategy papers, Fund country assistance briefs). The Bank andFund also need to collaborate in improving their own fiscal databases and clientfiscal data systems. A lot can be
On loan conditions. Fiscal conditionality in adjustment operations needs to done to improvebe more specific and precise, supported by specific and monitorable per- the qualityformance indicators, and focused on fiscal (and related macroeconomic)outcomes in addition to the means of reform. Conditionality should stress of fiscalimplementation of new laws as much as enactment and implementation of di Istudy recommendations more than the preparation of studies. condionalty
Onfiscal deficits. The Bank needs to ensure greater precision on several fronts:
* The coverage of fiscal accounts needs to be expanded and the transpar-ency of accounts improved. This implies a need to incorporate state, lo-cal, and municipal accounts into the fiscal accounts, track quasi-fiscaldeficits, and work out the implications of implicit taxes, subsidies, andgovernment guarantees.
* The appropriate measure of the deficit for tackling the problem at handneeds to be identified. In most countries, the overall deficit may be ap-propriate; in some, it may be the operational or the structural deficit; inothers, public savings may need to be the focus; in yet others, primarydeficits may need monitoring.
* Fiscal accounts must be better integrated into the macroeconomicframework of analysis to enable more dynamic analysis of fiscal andother macroeconomic adjustments. This is essential for estimating thesustainable deficit; identifying tradeoffs among acceptable levels of bor-rowing, inflation, interest rates, and other macroeconomic variables;and setting quantitative targets for achieving a sustainable deficit andmonitoring macroeconomic outcomes.
On tax reform. The main areas of Bank attention should be:
* Simplification and base broadening. Bank work in tax reform should con-tinue to stress broadening and simplifying tax bases for easier adminis-tration and better compliance.
6
* Sequencing of tax reform. The Bank needs to emphasize the proper se-quencing of tax reform. If trade taxes contribute significantly to revenue,nontrade tax reforms to enhance revenue may need to precede trade taxreform. Reforms in tax administration should precede or accompany taxstructure reform.
* Environment, equity, and private sector development concerns. Bank work ontax reform should involve considerations of environmental concerns; thetax system should also not adversely affect equity/poverty reduction orthe intemational competitiveness of the economy
* Tax administration. Tax administration reform should focus on a condu-cive legal environment, taxpayer education, information systems (usedby tax departments), audits, withholding and presumptive taxation, andimprovements in value-added tax (VAT) administration.
* Monitoring progress. Building better performance indicators into tax andtax administration reform programs would benefit design, implementa-tion, and evaluation and focus attention on the goals of reform. Perfor-mance indicators should cover effective tax rates and, for tax administra-tion, cost and output measures.
On public expenditure reform. The Bank should focus on:
* Establishing the basisfor the recommendations. Recommendations on publicexpenditure reform should be derived from considerations of the appro-priate role of government. Govemments need to be persuaded to moveaway from a command and control culture toward a service deliveryoutlook. They also need to be encouraged to invite local governments,potential beneficiaries, and other stakeholders to participate in discus-sions on development and spending priorities, particularly in social sec-tors. This would entail reform of budgetary processes and institutions.
* Clarifying the goals of reform. Focusing on the ultimate goals of expendi-ture reform right from the start is important both for the proper selectionof expenditure (or other) instruments and for better implementation. TheBank needs to promote the development of appropriate performancemonitoring indicators that include intermediate (short-run) outputs andfinal (long-run) outcomes as well as measures of the level and composi-tion of expenditure.
* Increasing attention to expenditure composition. When deficit reduction is amajor objective, both current and capital expenditures need to be exam-ined, with special attention to inflexible and unproductive expenditures(such as defense and subsidies not oriented to the poor). Although theBank's emphasis on capital spending cuts was warranted in countrieswhere large capital projects did not meet the basic needs of the popula-tion, in some countries capital spending shares (of total spending orGDP) have fallen to levels that may be retarding growth. In these coun-tries and in others where much of the population lacks access to basicservices, basic investments may need a boost.
* Emphasizing poverty alleviation. Expenditure programs have greater po-tential than revenue reforms as instruments for reducing poverty. Thusthe Bank needs to pursue expenditure solutions for better targeting ofsubsidy programs and better access by the poor to basic services. TheBank might also seek innovative solutions to the problems of poverty,

7
such as using education programs to teach poor households about safewater and sanitation practices. The Bank also needs to encourage clientsto direct resources to rural areas, where most of the poor live.
* Promoting equity. Basic education and health services should be almostfree to ensure universal coverage, while innovative cost-recovery solu-tions that also promote equity are needed for tertiary education andhealth services.

FISCAL MANAGEMENT INADJUSTMENT LENDING
Resumen
El Banco Mundial comenz6 a efectuar prestamos para fines de ajuste estruc-tural a principios de los afios ochenta con objeto de ayudar a los paises endesarrollo a superar la crisis econ6mica que sufrian como consecuencia delas conmociones externas y la mala gesti6n macroecon6mica. Al inicio deldecenio de 1990 unos dos tercios de los clientes del Banco habian empren-dido el proceso de reforma de sus politicas con el apoyo de prestamos paraajuste estructural o para ajuste sectorial. Muchos de estos pr6stamos -
alrededor de 250 otorgados a 86 paises entre los ejercicios de 1979 y 1994-tenian componentes de reforma fiscal. En este estudio se analiza la eficaciadel apoyo brindado por el Banco para el ajuste fiscal y se consideran mediosde mejorar el desempefno de los prestamos futuros para ese fin.
Resultados del estudio
Las principales conclusiones del estudio son las siguientes: (a) una gesti6nfiscal eficaz requiere esfuerzos sostenidos a largo plazo; (b) un nivel mas ba-jo de d6ficit fiscales esta relacionado con un crecimiento econ6mico mas ra-pido; (c) las reducciones sostenidas de los deficit se lograron principalmentea traves del incremento de los ingresos, pero los resultados fueron menossatisfactorios en lo que respecta a la rebaja de los gastos, y (d) el exito delcomponente de reforma fiscal de los prestamos para fines de ajuste del Bancos6lo ha sido limitado debido al enfoque fragmentario de las cuestiones fis-cales y a la imprecisi6n de la condicionalidad de esas operaciones.
Conclusiones generales
La gesti6n de los deficitfiscales exige esfuerzos sostenidos de ajuste a largo plazo.Los deficit de los paises receptores de prestamos para ajuste estructural ypara ajuste sectorial aumentaron a plazo mediano; s6lo a largo plazo (entrecinco y ocho afios despues del primer prestamo) hubo indicios importantesde mejoras presupuestarias. Si bien en los dos afios mas recientes los deficithan sido menores en el conjunto de paises receptores de esos prestamos (enrelaci6n con el cuatrienio anterior a su aprobaci6n), en Africa y en los paisesde ingreso bajo y gravemente endeudados en proceso de ajuste y en los ex-portadores de productos primarios se registraron fuertes reveses. En estosdos ultimos grupos no hubo mejoras en relaci6n con el periodo anterior alos prestamos.
La causa principal de los cuantiosos deficit fiscales fue la mala administra-ci6n fiscal, y no las conmociones ex6genas. Si bien la carga de los interesesexternos no limit6 el ajuste en varios de los paises receptores de prestamospara ajuste estructural y para ajuste sectorial, la creciente relaci6n deudaexterna-producto intemo bruto (PIB) en la mayoria de las regiones indica
8
9
que las mejoras en la gesti6n fiscal no fueron suficientemente profundas paramantener la solvencia en muchos de los paises clientes.
La rebaja de los deficit resulta en saldos externos mas satisfactorios y estimula elcrecimiento. Puesto que los d6ficit fiscales pueden contribuir a muchos malesecon6micos (inflaci6n, escasez de credito, distorsi6n de las tasas de interesy los tipos de cambio, desequilibrios en la cuenta corriente), es posible quedesplacen a la inversi6n privada y perjudiquen el proceso de crecimientoecon6mico. El desempeno en materia de crecimiento vari6 de una regi6n aotra, pero los datos confirman que, a pesar de que otras condiciones tambienson necesarias en ese sentido, una buena gesti6n fiscal contribuye al creci-miento. Los datos apuntan tambi6n a la existencia de un s6lido nexo entrelas mejoras de los deficit fiscales y de los deficit en cuenta corriente.
Las reducciones sostenidas de los deficit fiscales se alcanzaron principalmentegracias a incrementos de los ingresos y, en menor medida, a la disminuci6n de losgastos de capital. Los resultadosfueron menos satisfactorios en lo referente a lasmetas relacionadas con el recorte de los gastos corrientes. La mayoria de los pai-ses que mejoraron su situaci6n fiscal lograron ese objetivo mediante incre-mentos de los ingresos. Los pafses cuyos deficit fiscales se agravaron en gen-eral incrementaron sus gastos corrientes sin al mismo tiempo elevar sus in-gresos. Las estrategias en materia de gastos corrientes y de capital fueronsemejantes en los diversos grupos de paises y regiones y a traves del tiem-po: todas las regiones y grupos de paises, con excepci6n de Oriente Medioy Norte de Africa y los paises de ingreso mediano abocados al proceso deajuste, elevaron sus gastos corrientes, y todos los grupos, salvo Asia orientaly el Pacifico, recortaron sus gastos de capital en comparaci6n con el periodoanterior a los prestamos. La reducci6n de los gastos corrientes, aunque enmuchos casos se consideraba necesaria, iinicamente se alcanz6 en un peque-iio numero de paises.
El historial de cumplimiento por los prestatarios de las condiciones esta-blecidas por el Banco fue excelente, pero en el plano fiscal el exito de losprestamos para fines de ajuste respaldados por la instituci6n s6lo fue limi-tado debido al enfoque fragmentario de las cuestiones fiscales y a la impre-cisi6n de la condicionalidad. La calidad deficiente de los datos fiscales indu-dablemente increment6 la dificultad de identificar los componentes de lascuentas fiscales y las repercusiones presupuestarias de los cambios en lapolitica fiscal y otras politicas macroecon6micas. En la mayor parte de lasoperaciones se prest6 poca atenci6n a la cobertura, medici6n o sostenibilidadde los deficit y a la funci6n del sector publico (factor de importancia criticapara determinar el nivel de las finanzas piiblicas). Aunque la politica fiscal ess6lo uno de los aspectos de un programa mas amplio de ajuste que involucrela reforma de politicas relacionadas entre si, en pocas operaciones se abord6la relaci6n entre los d6ficit fiscales y los instrumentos para reducirlos y otrasvariables macroecon6micas y medidas de reforma estructural. Tampoco seadopt6 un enfoque integral de las complejas cuestiones que entrafia la refor-ma presupuestaria (disciplina presupuestaria, participaci6n de los beneficia-rios locales en las decisiones en materia de gastos, eficacia tecnica, responsa-bilidad, sistemas de informaci6n). En lo que respecta al deficit presupues-tario o al ahorro piublico, la condicionalidad fue demasiado general, no fuecoherente en los diversos prestamos a un mismo pais o estuvo abierta ainterpretaciones diferentes. La imprecisi6n de las condiciones fiscales hizoque su aplicaci6n y seguimiento resultaran dificiles o imposibles (el 68 porciento de las operaciones sobre las que se han preparado informes de termi-naci6n y de evaluaci6n ex post). Las condiciones fueron "blandas", puesrequerian la formulaci6n de legislaci6n mas bien que su aplicaci6n (47 por
10
ciento), y hacian hincapie en la elaboraci6n de estudios y no en la ejecuci6n(16 por ciento). La condicionalidad en ocasiones tambi6n adoleci6 de defi-ciencias en lo que respecta a su oportunidad (32 por ciento).
Resultados especfficos en determinados aspectos de la reforma fiscal
Reforma en el drea de los ingresos. La asesoria brindada por el Banco acerca dela reforma tributaria en general se ha ajustado a las practicas 6ptimas deli-neadas en su publicaci6n Lessons of Tax Reform (Lecciones de la reforma tri-butaria) (1991a). En la esfera de la administraci6n tributaria, las reformas engeneral han estado en consonancia con las recomendaciones mas avanzadaspara mejorar el cumplimiento por los contribuyentes y el funcionamientode los departamentos de impuestos. Pero persisten algunos problemas. Losingresos s6lo se elevaron en 17 de los 26 paises en los que se habia deter-minado que era necesario adoptar medidas impositivas (ampliaci6n de labase, simplificaci6n o racionalizaci6n) y que estas medidas probablementeincrementarian los ingresos. Las deficiencias de la administraci6n tributariaparecen explicar, por lo menos parcialnente, por qu6 en varios paises (Bul-garia, C6te d'Ivoire, Hungria, Senegal, Venezuela) los ingresos no estuvierona la altura de las expectativas y por qu6 en los casos en que si se registraronaumentos estos no tuvieron el efecto fiscal deseado (Bangladesh, PakistAn,Uganda). En algunos de los primeros prestamos para ajuste estructural(Bangladesh, C6te d'Ivoire, Hungria, Pakistan, Uganda), tampoco se prest6la atenci6n debida a la administraci6n tributaria.
En general, las condiciones vinculadas con las reformas tributarias no rela-cionadas con el comercio s6lo han constituido un pequeino componente delos prestamos para ajuste estructural y para ajuste sectorial, y han sido decaracter selectivo mas bien que integral. En 92 de estos prestamos que in-cluian condiciones tributarias no relacionadas con el comercio, correspon-dientes a 53 paises, en gran medida la condicionalidad se orientaba a am-pliar las bases de los impuestos directos e indirectos y rebajar las tasasmarginales del impuesto sobre la renta con objeto de lograr que el sistemaimpositivo fuera mas sencillo, mas eficiente y mas facil de administrar.Tipicamente, la condicionalidad respaldaba iniciativas de reforma guber-namentales o acompafiaba a otras iniciativas institucionales. En generalel Banco sigui6 la orientaci6n del Fondo Monetario Internacional (FMI oFondo) en lo relativo a las reformas tributarias no relacionadas con el co-mercio en los paises en que el Fondo actuaba en la esfera de los impuestos.
Alrededor del 40 por ciento de la condicionalidad era de indole cuantitativay susceptible de facil seguimiento: consistia en el cumplimiento de deter-minados criterios cuantitativos o la implantaci6n de cambios especificos enla base tributaria o en la estructura de las tasas. Sin embargo, alrededor del48 por ciento de las condiciones requerian la introducci6n de cambios legis-lativos especificos, pero no comprendian indices cuantitativos del desem-pefno; estas condiciones en general especificaban la orientaci6n de la modi-ficaci6n del c6digo tributario sin mencionar la magnitud prevista de esamodificaci6n. Aproximadamente el 12 por ciento de las condiciones careciande criterios tanto cuantitativos como cualitativos. De modo que alrededordel 60 por ciento de las condiciones dejaban abierta la posibilidad de que losresultados fueran deficientes: algunas podian cumplirse de jure implantandopequefios cambios en el c6digo tributario; en el caso de otras sencillamenteno era posible un seguimiento o evaluaci6n retrospectiva adecuados.
En ninguno de los prestamos para ajuste estructural o para ajuste sectorial sesefnalaban puntos de referencia especificos anteriores a la reforma, como las
11
tasas impositivas marginales efectivas. En parte como consecuencia de ello,ninguno de los informes de terminaci6n y evaluaci6n ex post pudo analizarla ejecuci6n y los resultados desde la perspectiva de los cambios en esastasas, y muy pocos verificaron el cumplimiento comparando la situaci6n an-tes y despues de la reforma. En consecuencia, la efectividad de la condicio-nalidad en el plano tributario en general se evalu6 en funci6n del cumpli-miento en el terreno legislativo (cumplimiento de las condiciones que reque-rian la implantaci6n de cambios en las leyes tributarias) o de aumentos delos coeficientes tributarios, a pesar de que estos ultimos se ven afectados pormuchos otros factores. Si bien pocas condiciones exigian especificamente elincremento de las tasas impositivas, los coeficientes tributarios si se elevaronen un gran numero de paises (como resultado de aumentos de la base tribu-taria). Los cambios en la estructura impositiva a raiz de la reforma tributariaen general estaban en consonancia con lo establecido en la publicaci6n Les-sons of Tax Reform (Banco Mundial 1991a), o sea, menor dependencia de losimpuestos al comercio y mayor apoyo en los impuestos internos indirectos.
El historial es mucho mas satisfactorio en lo que respecta a los impuestos alcomercio. En una muestra de 83 operaciones correspondientes a 23 paises enlas que habia condiciones relativas a los impuestos al comercio (de un totalde 171 operaciones en 75 paises), la condicionalidad era especifica, y losobjetivos de la reforma estaban formulados en forma de metas de politicacuantitativas concretas que debian alcanzarse dentro del plazo especificadoa ese efecto. Con ese grado de precisi6n el seguimiento del cumplimientoresulta relativamente facil. Aunque el historial de cumplimiento fue bueno,el ritmo de la reforma vari6 de un caso a otro, y en muchas ocasiones depen-di6 del grado de sincronizaci6n de la reforma comercial con la reforma enotras areas. En muchos casos las presiones en materia de ingresos retrasaronla reforma comercial. Lo mismo puede decirse del progreso insuficiente enlo que respecta a la estabilizaci6n. Se hicieron pocos esfuerzos por cuanti-ficar los efectos de la reforma comercial en los ingresos, y no se prest6 ladebida atenci6n a la armonizaci6n de los impuestos a las ventas y los im-puestos al consumo en lo que atafie a las importaciones y a los bienes deproducci6n nacional.
La reforma de la administraci6n tributaria en general ha adolecido de impre-cisi6n y no ha sido susceptible de seguimiento. A pesar de que la participa-ci6n del Banco en la reforma de la administraci6n tributaria se ha intensifi-cado considerablemente desde 1987, todo sugiere que el proceso de reformaha sido fragmentario y que no se ha seguido una estrategia integral. S61o enun 40 por ciento de los casos la condicionalidad estaba formulada en termi-nos concretos. Los informes de terminaci6n y de evaluaci6n ex post que anali-zaron esa cuesti6n encontraron que el cumplimiento de la condicionalidadfue alto, pero dada la inexistencia de indicadores del desempenlo suscepti-bles de seguimiento esa conclusi6n no es muy significativa. El indice usadomas frecuentemente fue la relaci6n impuestos-producto interno bruto, apesar de que la recaudaci6n de impuestos se ve afectada por muchos otrosfactores ademas de la administraci6n. Al igual que en el caso de la reformatributaria no relacionada con el comercio, la imprecisi6n y la escasez de indi-cadores susceptibles de seguimiento repercutieron negativamente en la cali-dad de la condicionalidad en el area de la administraci6n tributaria.
Reforma en el drea de los gastos. Con frecuencia el Banco ha ayudado a lospaises a definir los parametros de la reforma en esta esfera: en los ejerciciosde 1979-94 se incluyeron condiciones relativas a los gastos en 219 operacio-nes correspondientes a 83 paises. En general, los esfuerzos de reforma de losgastos han estado en consonancia con los lineamientos formulados en los
12
informes del Banco sobre los prestamos para fines de ajuste (Banco Mundial1988a, 1990a, 1992a, b; Jayarajah y Branson 1995). Las condiciones se hancentrado en la disminuci6n y reestructuraci6n de los gastos de capital, la rebajade los subsidios, la reforma del empleo en el sector puiblico y la reducci6n de losgastos salariales en ese sector, el enfasis en el funcionamiento y manteninijentode las instalaciones existentes y el incremento de los gastos en el sector social(aunque no se prest6 la debida atenci6n a la meta de aliviar la pobreza).
El desempefio de los paises para los que se establecieron condiciones relati-vas a los gastos fue s6lo marginalmente mas satisfactorio que el de los de-mas paises en cuanto al mejoramiento de las pautas del gasto. Esos paisestuvieron mas exito en lo que respecta al aumento de los gastos para finessociales y la reducci6n de los subsidios y los gastos de defensa, y terminaronel periodo con un nivel mas bajo de gastos salariales que los paises a los queno se aplicaron tales condiciones. Aunque inicialmente ambos grupos de pai-ses tenian relaciones gastos totales-PIB aproximadamente iguales, los paisescon condiciones tuvieron menos exito en la reducci6n de los gastos totales.Su exito fue limitado en lo que atafie a la reestructuraci6n de los gastos co-rrientes, en el sentido de reducir los correspondientes a salarios y subsidios eincrementar los orientados a actividades de funcionamiento y mantenimien-to no salariales; las tentativas de reducir el empleo en el sector publico engeneral han sido de corta duraci6n o de poca envergadura. Los paises concondiciones relativas a los gastos de capital terminaron el periodo con nive-les muy bajos de gastos de ese tipo, lo que indica la existencia de reduccionesrelativamente grandes de los gastos por concepto de infraestructura. Unaraz6n de este desempefio mas bien modesto en el area de los gastos puederadicar en la falta de flexibilidad de que adolecen los presupuestos de mu-chos paises; los prestamos para fines de ajuste del Banco hicieron pocasaportaciones en esta esfera.
En los paises para los que se establecieron condiciones relacionadas con lossectores de educaci6n y salud, aument6 la participaci6n de ambos sectoresen el gasto total. Sin embargo, los coeficientes de gastos en educaci6n y saluds6Lo fueron marginalmente mas satisfactorios en los paises con tales condi-ciones que en los demas. Las tasas de analfabetismo, particularmente deninias y mujeres, y las tasas de mortalidad infantil bajaron en ambos gruposde paises. Los esfuerzos de recuperaci6n de costos en los sectores socialesfueron limitados. Una raz6n que explica por que es posible que las condicio-nes establecidas por el Banco hayan tenido poco efecto adicional en los sec-tores sociales es que la instituci6n hizo hincapie en los medios mas bien queen la finalidad de la reforma de los gastos. Las condiciones se centraron en lamodificaci6n de los gastos en determinadas categorfas funcionales o sectoresmAs bien que en la relaci6n entre insumos (como el nivel de los gastos), pro-ductos (tasas de matricula y de graduaci6n) y resultados finales (tasas dealfabetizaci6n; mortalidad; acceso a los servicios basicos, particularmentepor parte de los pobres y necesitados).
iQue puede hacerse?
Prioridades sugeridas para las actividades del Banco
En el area de la coordinaci6n Banco-Fondo. Tanto el Banco como el Fondo reco-nocen debidamente la importancia fundamental de la reforma fiscal parala estabilidad macroecon6mica y el crecimiento, y en los iiltimos afios hanconvenido en una divisi6n de sus actividades en esa esfera. El Fondo toma lainiciativa en las cuestiones relacionadas con los impuestos y el nivel global

13
del gasto, mientras que el Banco lo hace en las cuestiones relacionadas con losgastos sectoriales. Aunque en general esta divisi6n de las actividades funcionaen forma satisfactoria, no puede considerarse como una norma inflexible. Demodo que el Banco, al mismo tiempo que respeta el papel principal del Fondoen el suministro de asesoria fiscal, necesita participar mas activamente en laformulaci6n de las reformas fiscales en el marco de los prestamos para finesde ajuste, sobre todo en los casos en que es posible que el Fondo no tenga unaparticipaci6n directa. Por ejemplo, el Banco tiene que tomar en cuenta la rela-ci6n entre las reformas de la politica tributaria emprendidas en virtud de pro-gramas de ajuste y otras reformas estructurales (como las reformas relaciona-das con la promoci6n del sector privado y los mercados financieros y de capi-tal); entre las dimensiones y el papel del gobierno y el nivel de las finanzaspiIblicas; entre la financiaci6n del presupuesto y el nivel y composici6n de losgastos publicos, y entre las decisiones en materia de impuestos y gastos y losprogramas de lucha contra la pobreza. Es necesario que el Banco establezcala capacidad analitica requerida para asesorar a los funcionarios acerca delas cuestiones fiscales y de ajuste, para identificar las practicas 6ptimas ypara analizar los problemas emergentes de poliftica fiscal que probablementerevestiran importancia en el futuro (tributaci6n del sector financiero, impues-tos ambientales). En este sentido, es preciso que el Departamento de Investi-gaciones sobre Politicas de Desarrollo del Banco, que en octubre de 1994 dej6de realizar analisis impositivos para concentrarse en las cuestiones relacio-nadas con los gastos, tome medidas para modificar esa situaci6n. Su capaci-dad en esta esfera estrecharia la coordinaci6n Banco-Fondo y fortaleceria eldidalogo sobre cuestiones fiscales. El Banco y el Fondo estan explorando caucesnuevos y ya existentes para mejorar la coordinaci6n respecto de la preparaci6nde documentos generales de politica macroecon6mica (documentos sobre para-metros de politica econ6mica, analisis de los gastos publicos, documentos delBanco sobre estrategias de asistencia a los paises, documentos del Fondo deorientaci6n sobre la estrategia para los pafses). El Banco y el Fondo tambientienen que colaborar en la tarea de mejorar sus propias bases de datos fiscalesy los sistemas de datos fiscales de los clientes.
En el drea de las condiciones de los prestamos. En las operaciones de ajuste lacondicionalidad fiscal necesita ser mas especifica y precisa, estar respaldadapor indicadores del desempefio concretos y susceptibles de seguimiento yprestar especial atenci6n, ademas de a los medios de alcanzar la reforma, alos resultados fiscales (y otros macroecon6micos conexos). La condiciona-lidad deberia otorgar tanta importancia a la aplicaci6n de nuevas leyes comoa su promulgaci6n, y deberia hacer mas hincapie en la puesta en practica delas recomendaciones de los estudios que en su preparaci6n.
En el drea de los deficit fiscales. El Banco necesita asegurar la existencia de mayorprecisi6n en varios frentes:
* Es preciso ampliar la cobertura de las cuentas fiscales y mejorar sutransparencia. Esto entrafia la incorporaci6n de las cuentas provinciales,locales y municipales en las cuentas fiscales; el seguimiento de los d6ficitcuasifiscales, y la determinaci6n de las repercusiones de los impuestosimplicitos, los subsidios y las garantias gubernamentales.
* Tiene que identificarse el indice apropiado del deficit para abordar elproblema en cuesti6n. El deficit global puede ser el indice apropiado enla mayoria de los paises, pero en algunos puede serlo el deficit operacio-nal o estructural; en ciertos paises la atenci6n quizas deba centrarse en elahorro publico, y en otro grupo puede requerirse el seguimiento de losdeficit primarios.
14
* Las cuentas fiscales deben integrarse mejor en el marco macroecon6micode analisis para poder estudiar en forma mas dinamica los ajustes fisca-les y otros ajustes macroecon6micos. Esto es esencial para estimar el de-ficit sostenible; para identificar las ventajas y desventajas de diversosniveles aceptables de endeudamiento, inflaci6n, tasas de interes y otrasvariables macroecon6micas, y para establecer metas cuantitativas parael logro de niveles sostenibles de d6ficit y el seguimiento de los resul-tados macroecon6micos.
En el area de la reforma tributaria. Las cuestiones principales en las que elBanco deberia centrarse son las siguientes:
* Simplificacion y ampliaci6n de la base tributaria. Las actividades del Bancoen materia de reforma tributaria deberian seguir haciendo hincapie enla ampliaci6n y simplificaci6n de la base tributaria a fin de facilitar laadministraci6n e incrementar el cumplimiento.
* Secuencia apropiada de las medidas de reforma tributaria. El Banco tiene queprestar especial atenci6n a la secuencia apropiada de las medidas dereforma tributaria. En los casos en que los impuestos al comercio contri-buyen en forma significativa a los ingresos, las reformas tributarias norelacionadas con el comercio cuyo objetivo es elevar los ingresos tal veztengan que preceder a las relacionadas con el comercio, que por lo gen-eral resultan en niveles de ingreso mas bajos. Las reformas de la admi-nistraci6n tributaria deben preceder o acompafiar a la reforma de laestructura impositiva.
* Consideraciones relacionadas con el medio ambiente, la equidad y la promo-ci6n del sector privado. Las actividades del Banco en la esfera de la refor-ma tributaria deben tener en cuenta las consideraciones pertinentes decaracter ambiental; ademas, el sistema tributario no debe repercutirnegativamente en la equidad y la lucha contra la pobreza ni en lacompetitividad intemacional de la economia.
* Administraci6n tributaria. La reforma de la administraci6n tributariadeberia centrarse en el establecimiento de un marco legal propicio, laformaci6n de los contribuyentes, los sistemas de informaci6n (emplea-dos por los departamentos de impuestos), las auditorias, los impuestosretenidos en la fuente y los impuestos sobre la renta presuntiva, y elperfeccionamiento de la administraci6n de los impuestos al valoragregado (IVA).
* Seguimiento de los progresos. La incorporaci6n de indicadores mas efica-ces del desempefio en los programas de reforma de los impuestos y suadministraci6n redundaria en mejoras en el disenlo, ejecuci6n y evalua-ci6n retrospectiva, y atraeria la atenci6n a las metas de la reforma. Estosindicadores deberian abarcar las tasas impositivas efectivas y, en el casode la administraci6n tributaria, los indices de los costos y resultados.
En el area de la reforma de los gastos. El Banco deberia centrarse en:
* El establecimiento de la base para las recomendaciones. Las recomendacionespara la reforma del gasto publico deben fundamentarse en considera-ciones relativas a la funci6n gubemamental apropiada. Es necesariopersuadir a los gobiemos de que pasen de una cultura de direcci6n ycontrol a una de suministro de servicios. Asimismo es preciso alentar-los a que inviten a las administraciones locales, los posibles beneficia-

15
rios y otros interesados a participar en conversaciones sobre prioridadesen materia de desarrollo y gasto, particularmente en los sectores so-ciales. Esto entrafiaria la reforma de los procesos presupuestarios ylas instituciones.
* La aclaraci6n de las metas de la reforma. A fin de seleccionar los instrumen-tos adecuados en materia de gastos (o de otros rubros) y de propiciaruna mayor eficiencia en la ejecuci6n, es importante centrar la atenci6ndesde el principio en las metas finales de la reforma de los gastos. ElBanco necesita fomentar el desarrollo de indicadores apropiados deldesempefno que comprendan resultados intermedios (a corto plazo) yresultados finales (a largo plazo) y tambien indices del nivel y compo-sici6n de los gastos.
* Una mayor atenci6n a la composici6n de los gastos. En los casos en que lareducci6n de los deficit es un objetivo importante, es necesario analizarlos gastos tanto corrientes como de capital, y prestar especial atenci6n alos gastos inflexibles e improductivos (como los de defensa y los subsi-dios no orientados a la poblaci6n pobre). Si bien el enfasis del Banco enla rebaja de los gastos de capital ha estado justificado en los paises enque los proyectos grandes de capital no se orientaban a la atenci6n de lasnecesidades basicas de la poblaci6n, en algunos paises esos gastos (comoproporci6n de los gastos totales o del PIB) han caido a niveles que pue-den estar retrasando el crecimiento. En estos paises y en otros en quegran parte de la poblaci6n carece de acceso a los servicios fundamen-tales, puede ser necesario incrementar las inversiones basicas.
* El enfasis en el alivio de la pobreza. El potencial de los programas de gastoses mayor que el de las reformas de los ingresos en lo que se refiere a lareducci6n de la pobreza. Es preciso, por lo tanto, que el Banco busque enel ambito de los gastos los medios de lograr una mejor focalizaci6n delos programas de subsidios y un mayor acceso de la poblaci6n pobre alos servicios basicos. El Banco tambien podria tratar de encontrar solu-ciones innovadoras a los problemas de la pobreza, como programas paraimpartir informaci6n sobre la potabilidad del agua a los hogares pobresy enseniarles buenas practicas sanitarias. Asimismo, el Banco necesitaalentar a los clientes a que encaucen recursos hacia las zonas rurales,pues es en ellas que vive la mayoria de la poblaci6n pobre.
* La promoci6n de la equidad. Los servicios bAsicos de educaci6n y saluddeben ser casi gratuitos para asegurar una cobertura universal, mientrasque en el caso del nivel terciario de esos servicios deben aplicarse solu-ciones innovadoras de recuperaci6n de costos que tambien fomentenla equidad.

FISCAL MANAGEMENT INADJUSTMENT LENDING
Resume
La Banque mondiale a lance son programme de pret a l'ajustement structu-rel au debut des ann6es 80 pour aider les pays en developpement a sortirde la crise economique dans laquelle les chocs exterieurs et leur mauvaisegestion macroeconomique les avaient plonges. Au debut des annees 90, presde deux tiers des clients de la Banque avaient entrepris des reformes appu-yees par des prets a l'ajustement structurel ou sectoriel (PAS/PASEC). Ungrand nombre de ces prets (environ 250 PAS/PASEC ont et6 consentis a 86pays entre les exercices 79 et 94) comprenaient une composante << reformedes finances publiques »>. Les auteurs de la presente etude evaluent lesprogres realises grace aux ajustements que la Banque a appuy6s dans cedomaine et cherchent a voir comment les prets pourraient devenir plusperformants a l'avenir.
Conclusions de l1'tude
L'etude a abouti aux quatre grandes conclusions suivantes: (a) une sainegestion des finances publiques passe par une action soutenue sur une longueduree; (b) la reduction du d6ficit budgetaire et l'acc6leration de la croissanceeconomique vont de pair; (c) les reductions durables du d6ficit sont davan-tage le resultat d'une augmentation des recettes que d'une compression desd6penses; et (d) le succes limite des composantes "< reforme des financespubliques >> appuyees par la Banque tient au fait que les questions budg&-taires n'ont pas ete traitees de facon suffisamment globale et que les clausesde conditionnalite des prets etaient peu explicites.
Constatations d'ordre general
La gestion du deficit budgetaire passe par une action soutenue sur une longue du-ree. Le deficit des pays beneficiaires de PAS et de PASEC a augmente a mo-yen terme; l'amelioration de la situation budgetaire ne s'est vraiment faitsentir qu'a long terme (de cinq a huit ans apres l'octroi du premier pret).Bien que le deficit ait baisse au cours des deux dernieres annees (par rap-port a la periode de quatre ans ayant precede l'octroi des prets) dans lespays ben6ficiaires de PAS/PASEC, pris dans leur ensemble, on a constated'importants retoumements de situation dans les pays d'Afrique, ainsi quechez les exportateurs de produits primaires et parmi les pays a faible reve-nu et gravement endettes qui avaient pris des mesures d'ajustement. Legroupe des pays a faible revenu et celui des exportateurs de produits pri-maires n'ont enregistre aucun progres sur ce plan par rapport a la periodeavant l'octroi des prets.
Les deficits budgetaires importants ont avant tout ete dus a une mauvaisegestion des finances publiques, et non a des chocs exogenes. Bien que la
16
17
charge des int6rets en devises etrangeres n'ait pas entrave I'ajustement deplusieurs pays beneficiaires de PAS/PASEC, I'accroissement du ratio detteexterieure-produit int6rieur brut (PIB) dans la plupart des regions du mondemontre que l'assainissement des finances publiques n'a pas et suffisantpour assurer la solvabilite de nombreux pays clients.
La reduction du deficit conduit a une amelioration de la balance exterieure et sti-mule la croissance. Le deficit budgetaire pouvant etre l'une des causes denombreux maux economiques (inflation, rarete du credit, distorsion destaux d'int&r&t et de change), il peut faire fuir l'investissement prive et pena-liser la croissance economique. Bien que celle-ci ait ete inegale d'une regiona l'autre, les donnees montrent qu'une saine gestion des finances publiquesaide a obtenir de bons resultats, meme si d'autres conditions doivent aussietre reunies. Les chiffres montrent aussi que la reduction du deficit budge-taire et l'amelioration du deficit des comptes courants sont etroitement liees.
La reduction durable du deficit a surtout et lefait d'un accroissement des recetteset, dans une moindre mesure, d'une compression des depenses d'equipement. Lareduction ciblee de certaines depenses defonctionnement ne s'est pas traduite pardes resultats aussi nets. La plupart des pays ayant ameliore leur situationbudgetaire y sont parvenus en augmentant les recettes. En regle g6nerale,les pays dont le deficit budgetaire s'est creuse avaient accru leurs depensesde fonctionnement sans augmenter leurs recettes. En matiere de depensesde fonctionnement et d'equipement, les strategies ont ete appliquees defacon uniforme dans le temps, d'un groupe de pays a l'autre et d'une regiona l'autre. En effet, a l'exception du Moyen-Orient et de l'Afrique du Nord(MNA) et des pays a revenu intermediaire ayant applique un programmed'ajustement, l'ensemble des r6gions et des groupes de pays ont accru leursdepenses de fonctionnement et, a l'exception de l'Asie de l'Est et du Pacifi-que (EAP), tous les groupes ont tailk dans leurs depenses d'equipement parrapport a la periode avant l'octroi des prets. Bien que jugee necessaire dansde nombreux cas, une compression des d6penses de fonctionnement n'estintervenue que dans un petit nombre de pays.
On peut dresser un bilan tres positif du respect des conditions de la Banquepar les emprunteurs, meme si les operations de pret a l'ajustement n'ont euqu'un succes limite sur le plan budgetaire. En effet, les aspects budg6tairesn'ont pas et6 traites de facon suffisamment globale et les clauses de condi-tionnalite etaient trop vagues. La mauvaise qualite des donnees sur les fi-nances publiques a incontestablement contribue aux problemes rencontrespour faire ressortir les differentes composantes des comptes publics et mettreen evidence les incidences sur le budget de la reorientation de la politiquebudgetaire et des autres mesures macroeconomiques. La couverture du defi-cit, sa mesure et son caractere soutenable, ou encore le r6le du secteur public(un facteur qui determine tres largement le niveau des finances publiques),sont des questions auxquelles on n'a guere prete attention dans la plupartdes op6rations. Bien que la politique budgetaire ne soit que l'un des aspectsd'un programme plus large d'ajustement comportant des reformes inter-dependantes, peu d'operations ont et l'occasion d'examiner la relation en-tre le deficit budgetaire et les instruments pour le faire reculer, ou entre lesautres variables economiques et les mesures de reforme structurelle. Lesquestions complexes li6es a la reforme budgetaire (discipline budgetaire,participation des beneficiaires locaux aux choix de depenses a engager, effi-cacite sur le plan technique, gestion responsable, systemes informatiques,etc.) n'ont pas non plus ete abordces de facon globale. Les clauses de con-ditionnalite applicables au d6ficit budgetaire ou a l'epargne publique etaienttrop generales, variaient d'un pret a l'autre dans le meme pays ou faisaient
18
l'objet d'interpr6tations diff6rentes. Le manque de pr6cision des conditionsli6es aux aspects budg6taires a fait que l'ex6cution et le suivi ont 6t6 diffi-ciles ou impossibles a realiser (dans 68 pour cent des operations couvertespar des rapports de fin d'ex6cution et d'evaluation r6trospective - RFE etRER). Les conditions etaient peu contraignantes, portant davantage sur lar6daction que sur l'application de textes l6gislatifs et reglementaires (47pour cent) et mettant plus l'accent sur la r6alisation d'6tudes que sur leurexecution (16 pour cent). Dans certains cas, les conditions pr6vues devaient&re appliqu6es a un moment peu opportun (32 pour cent).
Constatations sur des aspects precis de la reforme des finances publiques
Recettes. Lors des conseils qu'elle donne sur la r6forme fiscale, la Banquene s'6carte generalement pas des pratiques optimales d6crites dans le docu-ment qu'elle a publie sous le titre Lessons of Tax Reform (1991a). Les reformesde l'administration de l'imp6t correspondent habituellement aux recomman-dations les plus r6centes pour am6liorer le civisme fiscal et le fonctionne-ment des services du fisc. Mais certains problemes restent entiers. Les re-cettes n'ont augment6 que dans 17 des 26 pays pour lesquels des mesuresfiscales (6largissement, simplification ou rationalisation de la base d'impo-sition) avaient 6t6 jug6es necessaires et susceptibles de faire progresser lesrecettes. Les lacunes dans l'administration fiscale semblent expliquer, aumoins partiellement, pourquoi les recettes sont rest6es en deca des pre-visions dans plusieurs pays (Bulgarie, COte d'Ivoire, Hongrie, S6n6gal,Venezuela) et pourquoi leur augmentation, lorsqu'elle s'est produite, n'apas eu l'impact budgetaire souhaite (Bangladesh, Ouganda, Pakistan).L'administration fiscale est egalement un aspect qui a 6t6 laiss6 de c6t6dans certains des premiers PAS (Bangladesh, C6te d'Ivoire, Hongrie,Ouganda, Pakistan).
En regle g6n6rale, les PAS/PASEC comprenaient peu de conditions applica-bles a la r6forme de l'imp6t hors commerce ext6rieur et celles-ci 6taient plusponctuelles que syst6matiques. Dans 92 PAS/PASEC interessant 53 pays etcomportant des conditions de cette nature, la conditionnalite visait surtout aelargir l'assiette des contributions directes et indirectes, et a abaisser le tauxmarginal de l'imp6t sur le revenu de faqon a simplifier le regime fiscal, lerendre plus efficace et plus facile a administrer. Le plus souvent, les clausesde conditionnalit6 allaient dans le sens de l'action entreprise par le gouver-nement ou s'articulaient sur d'autres initiatives institutionnelles. La Banques'est gen6ralement tournee vers le Fonds monetaire international (FMI ouFonds) pour les r6formes de l'imp6t hors commerce exterieur dans les paysout le Fonds etait d6ja pr6sent sur le terrain fiscal.
Pres de 40 pour cent des clauses de conditionnalit6 6taient quantitatives etfacilement contrOlables. I1 s'agissait de r6pondre a certains criteres quantita-tifs ou d'apporter des changements pr6cis a l'assiette fiscale ou au baremede l'imp6t. Toutefois, environ 48 pour cent des conditions portaient sur unemodification des dispositions l6gales mais ne pr6voyaient aucune mesurequantitative des r6sultats obtenus. I1 s'agissait g6n6ralement de conditionsqui indiquaient dans quel sens le code des imp6ts devait etre modifi6, sanstoutefois pr6ciser la portee des changements attendus. Pres de 12 pour centdes conditions n'etaient assorties de criteres ni quantitatifs ni qualitatifs.Aussi quelque 60 pour cent de ces clauses ne permettaient-elles pas de gara-ntir de bons r6sultats. L'application de certaines d'entre elles pouvait &reassur6e de jure en apportant des modifications mineures au code des impots,alors que, dans d'autres cas, elles ne pouvaient tout simplement pas etreconvenablement contr6l6es ou 6valu6es.
19
Aucun des PAS/PASEC n'ayant de point de ref6rence avant la r6forme (tauxeffectif d'imposition marginale, par exemple), aucun des RFE/RER n'a puevaluer l'execution des operations ni les resultats obtenus du point de vuede l'6volution de ce taux. En outre, tres rares sont les cas oil on a verifie queles conditions avaient et6 respectees en comparant les resultats avant etapres la reforme. Aussi l'application des clauses de conditionnalite sur leplan fiscal a-t-elle ete generalement evaluee du point de vue de la conformitedes textes (bonne application des conditions visant une modification de lalegislation fiscale) ou de l'augmentation de coefficients de pression fiscale,bien que beaucoup d'autres facteurs influent sur les coefficients en question.Peu de conditions portaient expressement sur une augmentation du tauxd'imposition. Malgre cela, le coefficient de pression fiscale s'est bel et bienaccru (par une augmentation de la base d'imposition) dans un grand nombrede pays. Le r6amenagement de la structure de l'imp6t qui a suivi la reformefiscale allait generalement dans le sens des Lessons of Tax Reform (Banquemondiale 1991a), c'est-a-dire vers une moindre dependance vis-a-vis desimp6ts sur le commerce exterieur et d'un plus large recours a la fiscaliteinterieure indirecte.
Les resultats pour les imp6ts sur le commerce ext6rieur ont ete bien meilleurs.Sur un echantillon de 83 operations interessant 23 pays et comportant desconditions applicables aux imp6ts sur le commerce exterieur (sur un totalde 171 op6rations dans 75 pays), les clauses conditionnelles etaient preciseset le but des reformes etait 6nonce sous forme d'objectifs d'action chiffr6s,bien delimites et a atteindre dans un delai donne. Avec une telle precision, ilest relativement facile de voir si les conditions sont respectees. Bien qu'ellesl'aient et, le rythme des reformes a varie, souvent selon que la reforme com-merciale 6tait plus ou moins bien synchronisee avec celles dans les autressecteurs. La pression des recettes a souvent ralenti la reforme commerciale.Le manque de progres dans le domaine de la stabilisation a eu des effetssimilaires. On s'est peu employe a quantifier les effets de la reforme com-merciale sur les recettes, et on n'a pas suffisamment cherche a harmoniserles imp6ts sur les ventes et les droits d'accise pour les biens importes etceux produits localement.
La reforme de l'administration fiscale a souvent et imprecise et incontro-lable. Bien que ce soit la un domaine auquel la Banque s'interesse beaucoupplus aujourd'hui qu'en 1987, les resultats obtenus montrent que cette refor-me a davantage et l'objet d'une action au coup par coup que d'une strategied'ensemble. Seuls 40 pour cent des clauses de conditionnalit6 etaient formu-lees avec precision. Les RFE et RER qui ont cherche a determiner si ces clausesavaient ete respectees ont conclu que le taux d'application etait eleve mais,sans indicateurs de performance verifiables, ces constatations sont peu con-vaincantes. Le coefficient de pression fiscale a et le critere le plus souventretenu, meme si l'administration n'est que l'un des nombreux facteurs qui in-fluent sur le recouvrement de l'imp6t. A l'instar de la reforme de l'imp6thors commerce exterieur, l'imprecision et le manque d'indicateurs contr6la-bles ont nui a la qualit6 des clauses de conditionnalite dans le domaine del'administration fiscale.
Depenses. La Banque aide souvent les pays a definir des reformes dans cesecteur. Pendant les exercices 79-94, 219 operations dans 83 pays ont etassorties de conditions applicables aux depenses. En regle gen6rale, l'actionmen6e va largement dans le sens des orientations exposees dans les rapportsde la Banque sur les operations d'ajustement (Banque mondiale 1988a, 1990a,1992a, b; Jayarajah et Branson 1995). Les conditions visaient essentiellementa permettre une reduction et une restructuration des depenses d'6quipement,

20
une diminution des subventions, une reforme de l'emploi et une compres-sion de la masse salariale dans le secteur public, un effort particulier enfaveur de l'exploitation et de l'entretien des installations existantes, et unaccroissement des depenses sociales (bien qu'on se soit peu preoccupe de lalutte contre la pauvrete).
Les pays dans lesquels des conditions etaient applicables aux depenses ontobtenu dans ce domaine des resultats a peine meilleurs que les autres. Lespremiers sont mieux parvenus a accroitre leurs depenses sociales et a reduireles subventions et les depenses militaires, et leurs couats salariauk etaientmoindres en fin de periode. Bien que le rapport des depenses totales au PIBait ete presque le meme au d6part dans les deux groupes, les pays auxquelsdes conditions etaient applicables ont moins bien reussi a comprimer cesdepenses que les autres. Les initiatives visant a restructurer les depenses defonctionnement en reduisant la part des salaires et subventions au profit descharges non salariales d'exploitation et d'entretien ont eu des resultats peuconcluants. Quant aux efforts tendant a supprimer des emplois dans le sec-teur public, ils ont generalement 6te eph6meres ou limites. A la fin de laperiode couverte par la presente etude, le niveau des depenses d'equipe-ment etait tres bas dans les pays ayant da respecter des conditions dansce domaine. Cette situation tient a des coupes assez importantes dans lesdepenses d'infrastructure. Cette performance relativement modeste sur lefront des depenses pourrait etre en partie due a la rigidite du budget dansbeaucoup de pays. Les operations de pret a l'ajustement de la Banque ontpeu fait progresser les choses a cet egard.
Dans les pays oii les clauses de conditionnalit6 portaient sur l'education etla sant6, la part de ces deux secteurs dans les depenses totales a augmente.Toutefois, cette part etait seulement a peine plus elevee que dans les paysnon soumis a ces clauses. Dans les deux groupes, le taux d'analphabetisme arecule, particulierement chez les filles et les femmes, suivi en cela par le tauxde mortalite infantile. Les efforts de recouvrement des coats dans les secteurssociaux ont ete limites. L'une des raisons pour lesquelles les clauses de con-ditionnalit6 pourraient n'avoir qu'un impact supplementaire limite sur lessecteurs sociaux tient au fait que la Banque a moins mis l'accent sur la finque sur les moyens. En effet, les conditions etaient davantage axees sur unremaniement des depenses au sein de categories fonctionnelles ou de sec-teurs determines que sur la relation existant entre les ressources utilisees(volume des d6penses, par exemple), les produits obtenus (taux de sco-larisation, taux d'obtention d'un dipl6me) et les resultats finaux (tauxd'alphabetisme, taux de mortalite, acces aux services de base, particu-lierement chez les pauvres et les indigents).
Que peut-on faire?
Priorites qui pourraient s'appliquer au travail de la Banque
La coordination entre la Banque et le Fonds. Reconnaissant que la reforme desfinances publiques etait l'une des cles de la stabilite macroeconomique etde la croissance, la Banque et le Fonds se sont reparti les taches dans cedomaine au cours des dernieres annees. Le r6le du Fonds est pr6ponderantpour les questions relatives aux imp6ts et a la depense nationale totale, celuide la Banque l'est pour les aspects lies aux depenses sectorielles. Si cette re-partition des taches fonctionne bien dans la plupart des cas, elle ne peut etreconcue comme une relation figee. Ainsi, tout en respectant le r6le prepon-derant du Fonds en matiere de conseil budgetaire, la Banque doit davantage
21
s'impliquer dans la conception des r6formes des finances publiques lors deses operations de pret A l'ajustement, particulierement lorsque le Fondsn'intervient pas directement. Par exemple, la Banque doit examiner les re-lations existant entre les reformes de la politique fiscale entreprises dansle cadre des programmes d'ajustement et les autres reformes structurelles(comme celles qui touchent au developpement du secteur prive, aux marchesfinanciers et aux marches des capitaux); entre le poids de l'etat et le niveaudes finances publiques; entre le financement du budget et le niveau et lacomposition des depenses publiques; entre les decisions en matiere d'im-p6ts et de depenses et les programmes de lutte contre la pauvrete. La Banquedoit renforcer ses capacit6s d'analyse pour donner des conseils sur les ques-tions liees aux finances publiques et A l'ajustement, pour definir des prati-ques optimales et pour se pencher sur les questions de politique budgetaireappel6es A occuper une place importante A l'avenir (imposition du secteurfinancier, ecotaxes). A cet egard, le Departement de la recherche sur les poli-tiques de d6veloppement, qui s'est desengag6 des etudes fiscales en octo-bre 1994 pour se consacrer aux questions liees aux depenses, doit aujourd'hui retablir l'equilibre. Un tel renforcement des moyens d'analyse permettrade resserrer la coordination entre le Fonds et la Banque, et de renforcer laconcertation sur les questions budg6taires. La Banque et le Fonds examinentles moyens de mieux coordonner la preparation des cadres macro6conomi-ques pour les differents pays (documents-cadres de politique economique,examens des depenses publiques, documents de la Banque sur les strate-gies d'assistance aux pays, memoires du Fonds sur les strategies-pays). LaBanque et le Fonds doivent aussi collaborer pour ameliorer leurs propresbases de donnees budgetaires et les systemes de donnees sur les financespubliques de leurs clients.
Les conditions de pret. Dans les operations d'ajustement, les clauses de condi-tionnalite applicables aux finances publiques doivent etre mieux definies etplus precises, etre relayees par un certain nombre d'indicateurs de perfor-mance contr6lables et etre axees non seulement sur les moyens a utiliserpour executer les reformes, mais aussi sur les fins budgetaires (et les resul-tats macroeconomiques connexes). Il conviendrait que ces conditions mettentautant l'accent sur la promulgation de nouvelles lois que sur leur applicationet qu'elles insistent davantage sur la mise en oeuvre des recommandationsdes 6tudes que sur la preparation de celles-ci.
Les deficits budgetaires. La Banque doit veiller A ce que les aspects suivantssoient traites avec plus de pr6cision:
* Les comptes publics doivent faire l'objet d'une couverture plus large etla comptabilite doit etre plus transparente. Cela veut dire qu'il faut faireentrer les comptes des etats, des administrations locales et des municipa-lites dans les comptes publics, deceler les deficits parafiscaux, mettre enevidence les incidences des impots implicites, des subventions et desgaranties de l'etat.
* Il faut definir la cat6gorie de deficit qui permettra de remedier aux pro-blemes qui se posent. Dans la plupart des cas, on retiendra le deficit glo-bal; dans certains cas, ce sera le deficit d'exploitation ou le deficit struc-turel; dans d'autres, il faudra s'interesser a l'pargne publique; dansd'autres encore, on surveillera le deficit primaire.
* Les comptes publics doivent etre mieux int6gr6s au cadre macroeco-nomique d'analyse pour permettre un examen plus dynamique desajustements macroeconomiques et, plus particulierement, budgetaires.
22
Cela est indispensable pour evaluer le d6ficit soutenable, pour definirl'equilibre a respecter entre les niveaux des variables macroecono-miques, telles que la dette, l'inflation et les taux d'interet, et pour fixerdes objectifs quantitatifs qui permettront d'aboutir A un deficit soute-nable et de suivre les resultats macro6conomiques.
La reformefiscale. La Banque devrait particulierement s'interesser aux as-pects suivants:
* Simplification et elargissement de l'assiette de l'impot. I1 faut que la Banquecontinue A mettre l'accent sur l'elargissement et la simplification dela base d'imposition pour faciliter l'administration et la disciplinefiscales.
* Bon ordonnancement de la reformefiscale. I1 faut que la Banque mettel'accent sur le bon ordonnancement des mesures de reforme fiscale.Si les impots sur le commerce exterieur contribuent beaucoup aux re-cettes, il faudra peut-etre que les mesures de reforme dans ce domaine- qui conduisent normalement a une baisse des rentrees fiscales -soient prec6dees d'une reforme sur la fiscalite hors commerce exterieurpour degager des revenus supplementaires. La reforme de l'adminis-tration fiscale devra preceder ou accompagner la reforme du baremede l'imp6t.
* Environnement, equite sociale et developpement du secteur prive. Le travailde la Banque sur la reforme fiscale devra comporter une dimensionenvironnementale. Le regime fiscal ne devra pas non plus compro-mettre l1'quit6 sociale, la lutte contre la pauvrete ou la competitiviteinternationale de l'economie.
* Administration fiscale. Les mesures de reforme dans ce domaine devrontessentiellement porter sur la mise en place d'un cadre juridique por-teur, sur l'education du contribuable, les systemes informatiques (uti-lises par les services du fisc), les audits, les prelevements a la source etl'imposition forfaitaire, et l'am6lioration de l'administration de la taxesur la valeur ajoutee (TVA).
* Suivi des progres. L'adoption de meilleurs indicateurs de performancelors de la mise en oeuvre des programmes de reforme de l'imp6t et del'administration fiscale aura des effets positifs sur la conception, l'exe-cution et l'evaluation des operations, et centrera l'attention sur les ob-jectifs de la r6forme. Les indicateurs devront porter sur les taux effec-tifs d'imposition et, dans le cas de l'administration fiscale, sur lesmesures touchant aux cofits et aux resultats obtenus.
La r6forme des depenses publiques. La Banque devra mettre l'accent sur les as-pects suivants:
* Etayer les recommandations qui sontformulees. Les recommandationsayant trait A la reforme des d6penses publiques doivent proceder d'uneanalyse du r6le qui revient A l'6tat. II faut convaincre les pouvoirs pub-lics de la necessite de passer d'une conception dirigiste a une optiquede prestation de services. I1 faut egalement les encourager A inviter lescollectivites locales, les beneficiaires potentiels des services et lesautres acteurs A participer a la reflexion sur le developpement et lesdepenses prioritaires, particulierement dans les secteurs sociaux. Celaimpliquera une reforme des procedures budgetaires et des institutions.
23
* Determiner precisement les objectifs de la reforme. Pour bien choisir les in-struments qui permettront d'agir sur les depenses (ou sur d'autres as-pects) et pour mieux executer les operations, il est important de se con-centrer sur les objectifs ultimes de la reforme des le depart. La Banquedoit favoriser la mise au point d'indicateurs de suivi qui permettront demesurer les resultats intermediaires (court terme) et la performance fi-nale (long terme), ainsi que le niveau et la composition des depenses.
* Attirer I'attention sur la composition des depenses. Lorsque la reduction dudeficit est un objectif majeur, il faut examiner les d6penses de fonction-nement comme les depenses d'equipement, en pretant une attention par-ticuliere a celles qui sont << fixes >> et improductives (comme dans le casde la defense et des subventions non destinees aux pauvres). Bien quel'accent mis par la Banque sur la reduction des depenses en capital fixeait et justifie dans les pays oii les grands projets d'equipement etaientcoupes des besoins el6mentaires de la population, la part de l'equipe-ment (dans les depenses totales ou dans le PIB) est parfois tombee a unniveau qui risque de ralentir la croissance. Dans les pays oil cela s'estproduit, et dans d'autres, la oui une grande partie de la population n'apas acces aux services essentiels, il pourrait etre necessaire de stimulerles investissements de base.
* Mettre l'accent sur la lutte contre la pauvret6. Les programmes de depensespermettent en principe de lutter plus efficacement contre la pauvret6que les reformes dans le secteur des recettes. Aussi la Banque doit-ellerechercher des solutions au niveau des depenses pour mieux cibler lesprogrammes de subvention et donner aux pauvres un meilleur accesaux services de base. La Banque pourrait egalement rechercher des so-lutions novatrices pour faire reculer la pauvrete, notamment par le re-cours a des programmes educatifs pour enseigner aux menages pauvresles regles permettant d'avoir une eau salubre et une bonne hygiene. LaBanque doit aussi encourager ses clients a affecter des ressources dansles zones rurales, la oii vivent la plupart des pauvres.
* Promouvoir l'equite sociale. I1 faut assurer la quasi-totalite des services desant6 et d'6ducation de base pour que tout le monde y ait acces. I1 faut enrevanche trouver des solutions inedites de recouvrement des cofits, quifavorisent egalement la justice sociale, pour 1'6ducation superieure et lessoins tertiaires.

FISCAL MANAGEMENT INADJUSTMENT LENDING
1. Setting the stage
Developing countries as a group experienced a series of external shocks inthe late 1970s and early 1980s in the form of rising international interest rates,falling terms of trade, and loss of access to commercial bank credit. Initiallythe crises were perceived as external account problems, but it soon becameclear that there were internal imbalances to contend with as well. For coun-tries that had had access to borrowing in private capital markets, the recy-cling of petrodollars had encouraged ambitious, but poorly conceived andlow-return, public and private investment programs. When international in-terest rates rose, debtor countries found themselves unable to borrow theirway out of their debt service obligations; for low-income countries the exac-erbation of crises was attributed to deteriorating terms of trade. To help de-veloping countries deal with these problems, the World Bank embarked onadjustment lending in 1978-79.
The typical crisis profile
Several macroeconomic developments presaged the crisis in developingcountries.' They are summarized here and in Figures 1.1 and 1.2 for each offive Bank regions2 (data limitations precluded the inclusion of Europe andCentral Asia). Countries in
* Fiscal deficits were large and persistent in all regions except EAP and crisis hadtended to rise over time. At their peak, deficits ranged from 5 percent inLAC to 9 and 10 percent in MNA and SAS to 13 percent in AFR. several common
* Gross domestic product (GDP) growth rates plummeted. Growth rates macroeconomicfell from more than 9 percent to 3 percent in EAP, from 6 percent to 3 per- features-suchcent in SAS, from more than 3 percent to less than 1 percent in AFR, and as large andturned negative in LAC and MNA. persistentfiscal
* Inflation surged to double-digit levels in all regions except MNA, where deficitsit reached 9 percent.
* Current account deficits were high and volatile. Peak levels of 4.5 percentwere registered in SAS, 6 to 7 percent in LAC and EAP, 11 percent inMNA, and 15 percent in AFR.
* Private investment was low. In AFR, LAC, MNA, and SAS private invest-ment was 10 to 12 percent of GDP and stagnant or declining; in EAP itwas higher, at 19 percent of GDP, but stagnant.
* Contrary to common belief, on average neither the terms of trade3 norinterest payments on external debt were a predominant source of fiscal
25
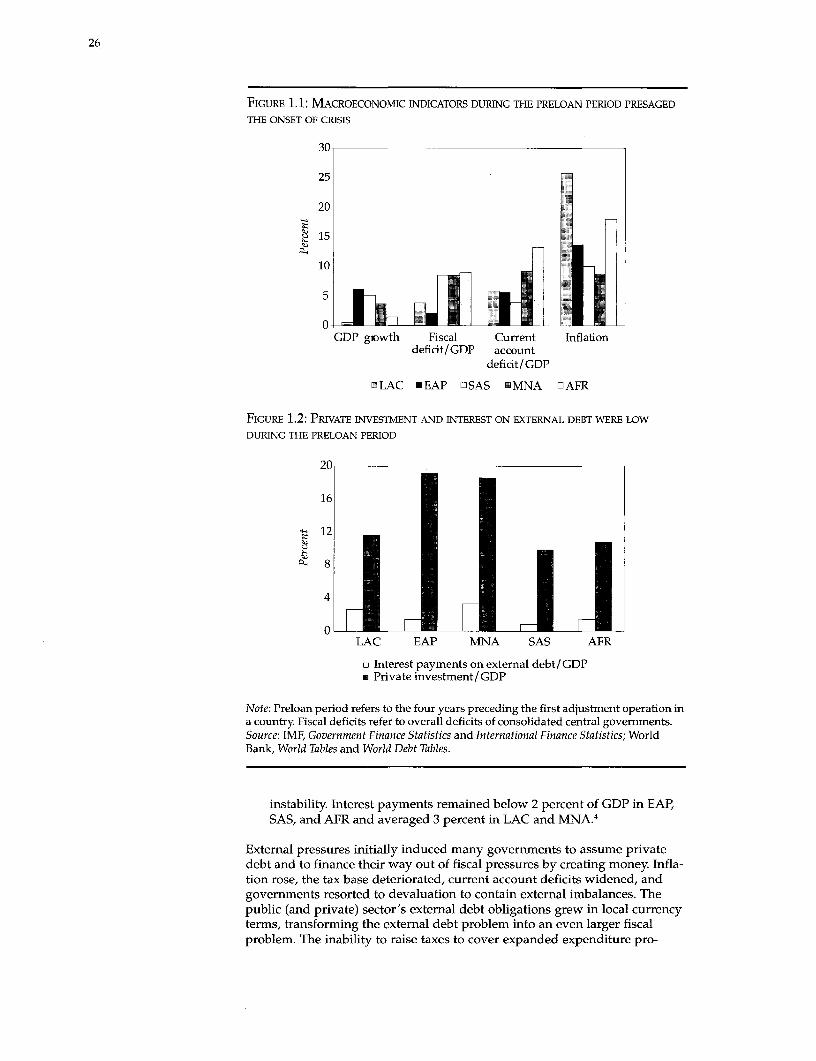
26
FIGURE 1.1: MACROECONOMIC INDICATORS DURING THE PRELOAN PERIOD PRESAGED
THE ONSET OF CRISIS
30
25
20
U 15 0
15
10
GDP glowth Fiscal Current Inflationdeficit/GDP account
defidt/ GDP
E LAC * EAP E1 SAS E MNA E] AFR
FIGURE 1.2: PRIVATE INVESTMENT AND INTEREST ON EXTERNAL DEBT WERE LOW
DURING THE PRELOAN PERIOD
20
16
12
~-8
4
0, LAC EAP MNA SAS AFR
* Interest payments on external debt/GDP* Private investment/ GDP
Note: Preloan period refers to the four years preceding the first adjustment operation ina country. Fiscal deficits refer to overall deficits of consolidated central governments.Source: IMF, Government Finance Statistics and International Finance Statistics; WorldBank, World Tables and World Debt Tables.
instability. Interest payments remained below 2 percent of GDP in EAP,SAS, and AFR and averaged 3 percent in LAC and MNA.4
External pressures initially induced many governments to assume privatedebt and to finance their way out of fiscal pressures by creating money Infla-tion rose, the tax base deteriorated, current account deficits widened, andgovernments resorted to devaluation to contain external imbalances. Thepublic (and private) sector's external debt obligations grew in local currencyterms, transforming the external debt problem into an even larger fiscalproblem. The inability to raise taxes to cover expanded expenditure pro-

27
grams led to indiscriminate expenditure cutting and to the realization thattax systems were inherently flawed.
Policymakers in developing countries eventually came to recognize theneed to distinguish between the short-run problems of stabilization andlonger-run problems impeding the resumption of growth and to devise re-form programs that addressed both types of problems. Stabilization mea-sures addressed problems that needed urgent attention: inflation, loss offoreign exchange reserves, capital flight, and burgeoning current accountdeficits. Structural impediments to long-term growth could usually betraced to inadequate or malfunctioning institutions or to distortions in thepolicy framework: public enterprises that were mismanaged or required topursue conflicting objectives, public sector banks that were induced to fi-nance the losses of public enterprises, distorted production incentives, inef-ficient public expenditure programs, excessive taxes and subsidies, andcontrols on prices, interest rates, and imports, which sent the wrong signalsto economic agents. When the International Monetary Fund (IMF or Fund)and the Bank stepped in to support developing countries with policy-basedfinancial assistance and advice, the IMF generally took the lead in stabiliza-tion and the Bank in structural adjustment. As the reader shall see through-out this report, the Fund's lead role in fiscal reform has affected the Bank'sapproach to the design and scope of fiscal programs in structural adjust-ment loans (SALs) and sectoral adjustment loans (SECALs).
The centrality of fiscal reform
As awareness of the need for structural change grew, policymakers also re-alized that "prudent fiscal policy is the foundation of a stable macroeco-nomic environment" (World Bank 1991b)5 because fiscal policy affects pri-vate sector savings and investment and therefore the private sector'scontribution to growth. Fiscal variables affect private economic decisionsboth directly by affecting taxation and public sector pricing policies and in-directly by affecting other macroeconomic variables. Depending on howdeficits are financed, they can lead to inflation, the crowding out of private Prudentinvestment, current account deficits, or problems of external creditworthi-dness. Recent research in the Bank by Easterly, Rodriguez, and Schmidt- fiscal policyHebbel (1994) demonstrated that public sector balances are correlated with is central toa range of macroeconomic variables, including GDP growth, per capitagrowth, the real interest rate, money creation, investment and consumption macroeconomicrates, the real exchange rate, and the current account. Achieving fiscal bal- stabilityance is therefore central to the success of the adjustment process. While thelevel of the fiscal deficit is a good indicator of the need for fiscal restraint asa central part of the reform process, the size of the required fiscal adjust-ment is usually a matter of debate. The balanced budget rule has given wayto a more flexible approach based on a sustainable budget deficit-one thatcan be financed without causing major macroeconomic imbalances.6 Look-ing at fiscal deficits in this context also places fiscal reform in perspective-as only one aspect of a larger adjustment program of interrelated policies.
Coverage of the report
This study analyzes the Bank's experience with fiscal management in about250 completed and ongoing SALs and SECALs approved by the board dur-ing fiscal years 1979-94. The operations involved 86 countries in all six ofthe Bank's regions. Bank financial support amounted to $34.3 billion, with
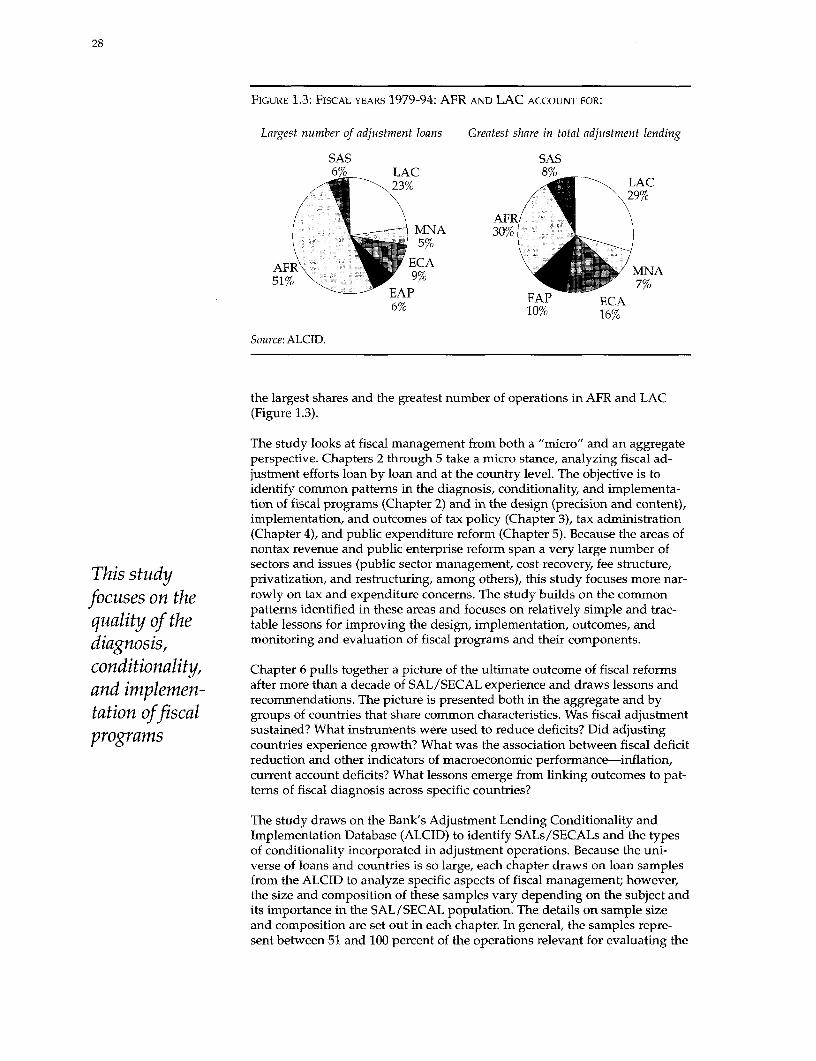
28
FiGURE 1.3: FISCAL YEARS 1979-94: AFR AND LAC ACCOUNT FOR:
Largest number of adjustment loans Greatest share in total adjustment lending
SAS SAS6% LAC 8%
23% LAC29%
AFRMNA 30%5 %
AFR ECA MNA51% 9% 7%
EAP EAP ECA6% ~~~~10% 16%
Source: ALCID.
the largest shares and the greatest number of operations in AFR and LAC(Figure 1.3).
The study looks at fiscal management from both a "micro" and an aggregateperspective. Chapters 2 through 5 take a micro stance, analyzing fiscal ad-justment efforts loan by loan and at the country level. The objective is toidentify common patterns in the diagnosis, conditionality, and implementa-tion of fiscal programs (Chapter 2) and in the design (precision and content),implementation, and outcomes of tax policy (Chapter 3), tax administration(Chapter 4), and public expenditure reform (Chapter 5). Because the areas ofnontax revenue and public enterprise reform span a very large number ofsectors and issues (public sector management, cost recovery, fee structure,
This study privatization, and restructuring, among others), this study focuses more nar-
focuses on the rowly on tax and expenditure concerns. The study builds on the commonpatterns identified in these areas and focuses on relatively simple and trac-
quality of the table lessons for improving the design, implementation, outcomes, and
diagnosis, monitoring and evaluation of fiscal programs and their components.
conditionality, Chapter 6 pulls together a picture of the ultimate outcome of fiscal reforms
and implemen- after more than a decade of SAL/SECAL experience and draws lessons andrecommendations. The picture is presented both in the aggregate and by
tation offiscal groups of countries that share common characteristics. Was fiscal adjustmentprograms sustained? What instruments were used to reduce deficits? Did adjusting
countries experience growth? What was the association between fiscal deficitreduction and other indicators of macroeconomic performance-inflation,current account deficits? What lessons emerge from linking outcomes to pat-terns of fiscal diagnosis across specific countries?
The study draws on the Bank's Adjustment Lending Conditionality andImplementation Database (ALCID) to identify SALs/SECALs and the typesof conditionality incorporated in adjustment operations. Because the uni-verse of loans and countries is so large, each chapter draws on loan samplesfrom the ALCID to analyze specific aspects of fiscal management; however,the size and composition of these samples vary depending on the subject andits importance in the SAL/SECAL population. The details on sample sizeand composition are set out in each chapter. In general, the samples repre-sent between 51 and 100 percent of the operations relevant for evaluating the
29
specific areas under consideration, and between 31 and 100 percent of therelevant countries (see Annex Table 1.1).
The study also taps into Bank and Fund databases, president's reports (PRs),project and implementation completion reports (PCRs/ICRs), project auditreports (PARs), and other Bank documents and staff estimates. However, the The qualitydata series used, particularly those relating to the fiscal accounts, are basedon different definitions and conventions and draw on different institutional offiscal datasources within the Bank's client countries. In view of this, the study has at- is poortempted to ensure consistency in data use within each chapter. However,there are instances, as in Chapter 5, when more than one data source hasbeen enlisted for the same variable; such instances are pointed out in the textand tables.
Notes
1. These developments pertain to the four-year period prior to the Bank's first adjust-ment loans to individual countries in each region.2. Referred to here by their Bank abbreviations: AFR for the Africa Regional Office,EAP for East Asia and Pacific Regional Office, ECA for Europe and Central Asia Re-gional Office, LAC for Latin America and the Caribbean Regional Office, and SAS forthe South Asia Regional Office.3. The regional terms of trade did not worsen sharply enough relative to their levels in1980 to explain the onset of fiscal imbalances.4. The impact of rising international interest rates played itself out more forcefully inthe 1980s.5. The macroeconomic implications of fiscal deficits are well documented in severalBank studies including Jayarajah and Branson 1995; Thomas, Chhibber, Dailami, andde Melo 1991; and World Bank 1988c. See also Faini and de Melo 1990.6. See Anand and Wijnbergen 1989, Dinh 1995, and Chapters 2 and 6 of this study.

FISCAL MANAGEMENT INADJUSTMENT LENDING
2. Fiscal management in SALs/SECALs:a close-up view
This chapter takes a close look at fiscal management by examining 129completed and ongoing adjustment loans in 27 countries drawn fromacross the Bank's regions.' The analysis tracks patterns underlying the di-agnosis of fiscal ills, establishes whether diagnosis and conditionalitywere internally consistent, determines whether implementation was ad-equate, and identifies common problems. The emphasis is on identify-ing elements of commonality rather than on specific details (chapters 3to 5 analyze the details of tax and expenditure reform). Even so, not ev-ery issue raised is common across the board. This chapter advocatesfuller treatment (diagnosis and conditionality) of specific issues with-out implying that such treatment is called for in every report; that is amatter of judgment specific to each case.
The 129 operations in the sample were chosen with a view to capturingthe range of attributes of the countries and operations covered by theBank's adjustment loans (see Annex 2). Random sampling could not beused because of the diversity of the criteria involved. The sample was se-lected to include loans that reflect:
* Specific types of conditionality (including specific budget deficit tar-gets, tax policy and administration reforms, expenditure reforms, andimprovements in budget processes).
* Regional shares in SALs/SECALs.
* Regional country compositions.
* A large number of the Bank's top 15 borrowers.
* Low- and middle-income countries.
* Operations covered by project completion and performance auditreports. 2
* Successful and unsuccessful operations, as assessed by the OperationsEvaluation Department in PCRs and PARs.
Although the number of sample countries represents only 31 percent of to-tal SAL/SECAL borrowers facing fiscal conditions during FY79-84, thenumber of operations represents over half of all SALs/SECALs and about64 percent of the value of loans and credits approved during the periodc
30
31
What was the quality of fiscal diagnosis?
While this study recognizes that fiscal policy is only one aspect of a largeradjustment program of interrelated policy reforms (see subsection on cen-trality of fiscal reform), it limits its purview to fiscal policy per se. The diag-nosis of fiscal issues typically sets the stage for identifying fiscal condition-alities in the Bank's president's reports for SALs/SECALs. To diagnose thefactors behind fiscal imbalance, basic questions need to be asked about thenature and source of the deficit, the role of government, budgetary pro-cesses, and the level and composition of public expenditures and revenues(Box 2.1). The study concludes that the quality of fiscal diagnosis in BankSALs/SECALs was weak-president's reports indicate that Bank programsdid not systematically work through the issues that need to be addressed toensure adequate diagnosis. On the average, diagnosis was somewhat betterin SALs than in SECALs, but this pattern does not necessarily hold in indi-vidual countries.
Measuring thefiscal deficit
Good fiscal diagnosis depends on accurate measurement of the public defi- Goodfiscalcit. Good measurement has two aspects: ensuring appropriate coverage ofthe various levels of government and selecting the measure of the fiscal Agnosisdeficit that best captures a country's specific fiscal ills. depends on
Coverage of the deficit. SALs/SECALs need to work through the fiscal ac- adequatecounts at the broadest possible level before zeroing in on the specific ac- coverage andcounts that are largely responsible for the overall fiscal imbalance. The ad- gequacy of coverage was difficult to determine because coverage was not measurementspecified in almost half (61 of 129) the operations. The source of the deficit of the publicwas identified in only 68 loans or 53 percent of the sample reviewed (Figure deficit
Box 2.1: BASIC ELEM OF DIAGNOSS
1. What was the major source of the deficit?, Did the measure of the deficitreflect the intrinsic fiscal problem? Was the fiscal deficit sustainable?
2. Was the role of government at issue? In light of a more appropriate rolefor govement, what was the source of the fiscal problem (budget sys-tems, expenditures, revenues)?
3. Where budgetary processes were weak, how were they to be reformed?
4. Were total expenditures to be cut? Were pubi investments to be re-duced or restructured? Or were current expenditures to be restrained or al-located differently across sectors? Which components? Were public enter-prises to be reformed?
5. Would increasing public revenue raise pubhc savigs without substitut-ing for private savings? How was revenue to be increased? By increasingtax rates or broadenfing tax bases or improvng tax administrations? Or byincreasing nontax revenues?
6. Were the fiscal accounts effectively integrated with other macroeco-nomic accounts? Were projections spelled out for total expenditures, rev-enues, and their components to faciitate ex post evaluation?

32
FIGURE 2.1: COVERAGE OF FISCAL ACCOUNTS WAS SPECIFIED IN ONLY HALF OF THE
129 SALs/SECALs
Nonfinancialpublic sector
13% %
Didn no
specify Cent47%
Other12%
Source: President's reports for structural and sectoral adjustment loans.
2.1). In these 68 operations, coverage was limited to the central governmentaccounts in 30 operations, to general government (central government andstate and local entities) in 6 operations, and to the nonfinancial public sector(the general government and state-owned enterprises) in 17 operations; in15 operations coverage did not fit any of the above categories but variedfrom loan to loan (Figure 2.1). Even when the coverage was broad enoughto represent the nonfinancial public sector, some levels of government wereexcluded, as in Argentina, which explicitly mentioned local governmentdeficits as contributors to the overall deficit, but excluded the provincialaccounts. 3 In general, president's reports did not separately quantify orpresent the various components of the fiscal accounts.
Though attention has recently focused on quasi-fiscal deficits, central banklosses were identified in only nine countries (Argentina, Chile, Costa Rica,Ghana, Honduras, Mozambique, the Philippines, Tanzania, and Uruguay),and even in those cases the losses were not uniformly reflected in fiscal defi-cit estimates. 4 Evidence in PRs suggests that large quasi-fiscal deficits alsoexisted in other countries (Box 2.2). Social security systems in Argentina,Bulgaria, Chile, Costa Rica, Hungary, Poland, Tunisia, and Uruguay werealso found to have extended overly generous benefits covered by transfersfrom central governments. 5
Selecting the appropriate deficit concept. The appropriate measure of the publicdeficit (whether overall or primary, public savings, structural or opera-tional) depends on the purpose for which it is being used (Blejer and Cheasty1993; World Bank 1988b). If the objective is to measure net claims on re-sources by the public sector (which affects inflation, domestic interest rates,and, to some degree, external balances), the appropriate concept is the pub-lic sector borrowing requirement, or the overall deficit of the nonfinancialpublic sector. The Fund, which puts considerable emphasis on measuringthe fiscal stance, routinely relies on this concept as a first step. Other mea-sures are seen as useful supplements to the overall balance in specific cir-cumstances. Despite the diversity of country experience, 23 of the 33 opera-fions that specified a deficit measure relied on the overall deficit. Perhapsfor consistency with IMF practice, eight SALs/SECALs (all in LAC) usedpublic sector savings (the difference between total current revenue, usually
33
excluding grants, and current expenditures) as a measure of the govern-ment's contribution to total savings.6 When the focus is on how to affect thepublic sector's net indebtedness, the primary (or noninterest) deficit istaken to be the appropriate measure: primary deficits were discussed in sixoperations but included in policy matrices in only two.7 In high-inflationeconomies, the operational deficit-which incorporates an inflation correc-tion to eliminate that part of interest payments that compensates creditorsfor the loss in the real value of the debt principal-may give a truer picturethan a nominal measure. The operational deficit was mentioned in the textdiscussion in only one operation.' And in economies subject to temporarydisturbances from such exogenous factors as terms of trade shifts and inter-est rate shocks or from one-time sales of government assets, the structuraldeficit may be the appropriate one to use. Only 1 of the 129 loans made areference in the text to the structural deficit (see subsection on specifying bud-get deficits and Figure 2.2).9
Identifying sustainable deficits
In addition to the appropriate coverage of the deficit, there is a need todetermine what level of the deficit a country can live with: a sustainable What leveldeficit does not necessarily imply fiscal balance (see Chapter 6). Deficitsare sustainable if they are consistent with feasible levels of other macroeco- of the fiscalnomic indicators: the balance of payments and foreign reserves, public debt delficit is(external and domestic), interest rates, and money creation and inflation J(Anand and Van Wijnbergen 1989). Primary deficits are sustainable, accord- sustainable?ing to Easterly, Rodriguez, and Schmidt-Hebbel (1994), if they do not pushup the shares of debt and money to income. Dinh (1995) proposes a frame-work for calculating fiscal adjustments needed to achieve solvency and sus-tainability over time based on the path of the real interest rate, real GDPgrowth, and the interaction of fiscal, monetary, and exchange rate policies.
Estimates of sustainable deficits help determine what level of deficit isappropriate, what patterns of financing are feasible, and what path adjust-ment should take. Such estimates require the analysis of alternative sce-narios that spell out the tradeoffs between fiscal and other macroeconomicvariables. An important requirement is that the deficit be as broad as pos-sible in its coverage; otherwise, the consistency of the macroeconomicframework is jeopardized. This study suggests that sustainable fiscal defi-cits be estimated for most countries, particularly for those that have tendedto overborrow or to rely excessively on printing money to finance theirdeficits.
This has not been the common practice. Bank SALs/SECALs generally em-bedded reforms in an "acceptable" macroeconomic framework that wasusually estimated with the help of the Revised Minimum Standard Model(RMSM) or RMSM-X accounting framework. Although most SALs/SECALsarrived at some notion of acceptable fiscal deficit levels based on assump-tions regarding target levels of growth, the current account balance, infla-tion, and creditworthiness, several SALs did not integrate public financesor money into the RMSM consistency framework. Even now, the RMSM-Xdoes not generally link external debt and financing to the public finance ac-counts to examine the sustainability or solvency of public debt. Most SALsignored internal debt. The distinction between domestic debt and externaldebt is becoming increasingly blurred, however. The linkages (through do-mestic debt) between fiscal policy and interest rates, exchange rates, and mon-etary policy are becoming stronger in the 1990s as world financial markets be-come more integrated.
34
LACAh Aigentina The h6e roge of accotsi ne Xnc c
Onlyefo uni 1988 conreve (thoe thastine cntraliban ofi houlgaia,Hngand, athe
Delfining the of theupivdiesect aorinted ectorn.exn o9fAgetnsfa deficit reucin. arke falrelatiel
government's sessingbu the govrnmnt'slb onke"aandoing dbot2 erminngthoe aporatyear.x Nonfirole is citical pu lctrentions (troghproeducwith tor publiio nterrif goods Loaner
vcsfiandingblir thectrRefuatorm oca fY u h primaryetraciite) Surplu wasfor determining havemovedicint toi diorection largesnoingia iterat bilovenmdntestcandcextrteronathe level of cor~ebat..invicties fiscaply ofapublicogoodswaspublices savnd andviie the t nonnn-
fer lage (xtheraieso benefhad assme the poor. Only rate and prtoleof gossempublicfinances menti pefinted anksdI Ti~a tecnrlbn generatl cetd a h evlad cmpositionh defci
whenlit esxpendi foure bandsethate faietemiedinl8. nCotRcaheetrlbk
a~cum1aI$d hevy o Budgeom taryin procest ftes drc neesotn
exheangy procsses werecidetifed wit the majoreduinstagueeoneltcwithrforeign
maintralnn bisal lossespline in p6countrLoses fenlludin2 pArcent ina B99/and-
El SadehCos~the Rcera,lSalvakr Kxeny any Mrcredi aind~ Uanda its lossemwer
eimtd atZpecn in 10/1
Aprobl evhdsence of cntalbank ossrehns v es fo xdginfi cou trs yet hexecu
tof, Banue oeatiounts. (pnrticlrelynbi the centra batenk theacentral lagoernmarent
andameipuovandcteS) Minisqutry ontrFinancedh bankio ixpncururedusi-frscal
etraities an h edtleiatepvry areisseocnie in as-0
government's~~~~~~~Th rl o tegoenmn
gove nmen S ~sessing the government's role" and in determining the appropriate mix ofrole is critical public interventions (through production or provision of goods and ser-
1 . . ~~~vices, financing, or the regulation of private sector activities). Some PRsfor determining have moved in this direction, suggesting that governments concentrate on
the level of core activities (supply of public goods and services) and activities that con-fer large externalities or benefits to the poor. Only when the role of govern-
publlcfinances ment is defined and generally accepted, can the level and composition ofpublic expenditures and revenues be determined.
Budgetary processes
Budgetary processes were identified as the major institutional constraint tomaintaining fiscal discipline in 16 countries (including Argentina, Bang-ladesh, Costa Rica, El Salvador, Kenya, Morocco, and Uganda) *12 Commonproblems were the absence of comprehensive budgeting, poor budget execu-tion, vague accounts (particularly the links between the central governmentand the provinces),1 3 inadequate control and audit of expenditures (Argen-
35
(Box 2.2 continued)assumed foreign exchange losses. In Tanzania the central bank gave auto-matic access to credit to the agricultural marketing system. Quasi-fiscal ac-tivities are estimated to have added about 8 percent of GDP a year duringFY84-88 to the more narrowly defined fiscal deficit. The Bank of Uganda tookover the provision of crop finance from the commercial banks from 1989 to1991 and provided credit to the Coffee Marketing Board, which the boardwas not able to repay. The unprogrammed expansion in credit caused infla-tionary pressures.
EAR hi Indonesia the central bank extended subsidized credit to rice farmersand agricultural cooperatives. In the Philippines the central bank incurredheavy losses from assuning foreign currency habilities of public and privateenterprises and from advancing payment of foreign interest on publiclyguaranteed debt. These losses accounted for 55 percent of the consolidatedbudget deficit in 1986-90. The deficits affected the capacity to carry out inde-pendent monetary policy and ihibited liberalization of the exchange rate.
MN/A In Tunisia, credit was extended to priority sectors at concessionalrates. The resources came partly from banks, which became eligible for re-discounting at concessional rates, and partly from the treasury. hi Moroccothe treasury provided interest rebates on certain private investments andgave preferential credit to special institutions, in addition to covering theirexchange risk on foreign borrowing.
ECA. In Poland quasi-fiscal subsidies through the banking system amountedto 9.2 percent of GDP in 1989.
SAS. The State Bank of Pakistan provided low-cost credit lines to enable fi-nancial institutiorts to eam an adequate spread. Concessional credit was alsoprovided to locally manufactured machinery and to an export finance scheme.
tina), earmarking and compulsory spending (Bangladesh, Costa Rica), andbudget fragmentation (El Salvador).
In general, the PR discussions suggested that budgetary process reform wasan area in which the Bank needed to build up expertise. In LAC, proposedstrategies included modernization of auditing and control functions and re-form of provincial processes in Argentina, amendment of laws to control ear-marking in Costa Rica, and implementation of an integrated financial man-agement system in El Salvador. In AFR, the focus was on strengtheningministries and developing capacity for economic management, particularlypublic investment programming. Only a few PRs discussed the need to ex-tend the coverage of fiscal accounts and improve their transparency: Tanza-nia (1991) sought to make the quasi-fiscal activities of the central bank moretransparent, Mozambique (1994) aimed to integrate foreign aid into the gen-eral budget, and Uganda (1991/92) planned to integrate its rehabilitation anddevelopment plan with the development budget. Although the depth ofanalysis improved in later adjustment loans in AFR (for example, in C6ted'Ivoire [1991], Ghana [1987], Kenya [1986], Malawi [1992], Mozambique[19941, Senegal [1987], and Tanzania [1993]), not enough attention appears tohave been paid to expenditure monitoring and control procedures, the data-bases required for such systems, forward budgeting, or management of ex-trabudgetary spending. Only a few PRs (Argentina [1991], Hungary [19911,Pakistan [1994], and Uganda [1994]) discussed decentralization and intergov-

36
ernmental fiscal relations, which may have implications for overall expendi-ture efficiency and control.
Total expenditures
All sample All sample countries focused on the need to adjust total expenditures.
countries President's reports identified a need to decrease total spending to curb thebudget deficit in 22 countries."4 Where total expenditure levels were low (El
focused on Salvador, Ghana, Peru, Philippines, and Uganda), PRs considered increases
the need to appropriate (Chapters 5 and 6). None of the PRs analyzed the consequencesadjust total for the deficit of alternative levels of total spending."5
expenditures Public investment
Operations in 24 countries focused on adjusting capital expenditures; in10 the emphasis was on capital spending restraint or declines (chapters 5and 6). In Costa Rica (1985), Cote d'Ivoire (before 1991), the Gambia (bothloans), Honduras (1988), Kenya (1980), Malawi (1981-83), Morocco (1984),and Tunisia (1986-88) high capital expenditures reflected too many low-priority public investments. However, PRs considered that an increase incapital expenditures was warranted in as many as 14 countries where publicinvestments had either been cut to undesirably low levels (below 10 percentin all countries, save Indonesia, and below 5 percent in as many as 7) or in-vestments were needed to improve the core level of physical or social infra-structure to improve growth (see Table 5.8 in Chapter 5). Several countries(Bangladesh, Morocco, Pakistan, Philippines, Turkey, and several countriesin AFR) sought to enhance efficiency by integrating the investment budgetmore fully into budgetary and expenditure control systems and therebyhighlighting the current expenditures needed to increase the productivityof investments.
Social expenditures
Reflecting the notion that the composition of investment is as important forgrowth as its level, the emphasis in almost all cases was on improving thestructure of public investment. However, social expenditures figured rela-tively little in strategy analysis in SALs/SECALs, particularly in the 1980s.The diagnosis of adjustment issues in El Salvador, Peru, Uruguay, and Ven-ezuela focused on low social indicators, but there was no strategy follow-through in the SALs/SECALs; these issues were set aside for follow-onsocial sector projects or technical assistance projects. Discussion of socialsafety nets was also limited, perhaps because there was little analysis of thelosers and gainers from expenditure reforms. In AFR only 15 of 54 loans (4of them in Mozambique) mention social safety nets. In EAP, MNA, and SASthe issue did not figure at all in strategy discussions, except in Pakistan(1989) and Morocco (1992). In the transition economies, which already hadsafety nets in place to compensate losers, the focus was on controlling ex-penditures and increasing efficiency.
Current expenditures
PRs discussed cutting or holding the line on current expenditures in 25 ofthe 27 sample countries; only in Ghana and the Philippines were increasesconsidered. Reducing subsidies and transfers was discussed in 24 of the 27sample countries (chapters 5 and 6), though the impact of subsidies on thebudget was not well analyzed, perhaps because financing was not alwaystransparent. Explicit subsidies, or payments made by the government to

37
consumers or producers, are reflected in the budget; implicit subsidies arenot. But even explicit subsidies may be hard to detect in public finance databecause they are buried in other public expenditure categories. The PRs indi-cate that implicit subsidies were sometimes financed by taxing producers(through controlled producer prices) or the banking system (through con-trolled interest rates to producers) or by amassing arrears on loans and taxes.Subsidy reform was particularly urgent in the three transition economies inthe sample-Bulgaria, Hungary, and Poland-because it was linked to awide range of structural reforms (the financial system through interest ratereform, the environment through reductions in energy subsidies, improvedproject selection through the phasing out of enterprise subsidies). Subsidies(consumer, production, enterprise investment, housing) accounted for 13percent of GDP in Hungary in 1989 and 16 percent of GDP in Bulgaria in1990. In other regions reform generally involved reductions in consumersubsidies and in transfers to loss-making enterprises. Transfers from thecentral government to state and local governments were not addressed.
Wage and salary reforms figured next in importance. Reductions in the wagebill were planned in 16 countries, mainly through job reductions. A fewcountries-Bangladesh (1986), Ghana (1987), Indonesia (1990), Tanzania(1986), and Uganda (1994)-had let wages and salaries fall so low, sometimesas a result of adjustment, that the strategy was to raise them. Most
The need to restructure current expenditures by squeezing subsidies and trans- countriesfers so that operations and maintenance (O&M) were adequately funded recognizedwas recognized in AFR, EAP, MNA, and SAS, but not in LAC or ECA. In the need togeneral, later adjustment loans recognized the importance of adequate fund-ing of O&M, perhaps in response to the recommendations of the third report restrain, cut,on adjustment lending (World Bank 1992b) .16 However, explicit strategies,particularly for distinguishing between the wage and nonwage components or restructureof O&M, were not always spelled out. In the Gambia (1989), Ghana (1989), currentand Senegal (1990) public expenditure reform called only for monitoring expendituresO&M requirements.
Public enterprise reform
The need for public enterprise reform was identified in almost all countries.The weak financial position of public enterprises was usually at the heart offiscal and banking sector problems in AFR, the transition economies in ECA,and in Argentina and Venezuela. State enterprise losses were often financedthrough the banking system, resulting in nonperforming loans and deterio-rating bank portfolios in almost all AFR countries and transition economies.Losses by marketing boards were particularly large in C6te d'Ivoire, Ghana,Kenya, Senegal, Tanzania, and Uganda. In Cote d'Ivoire price stabilizationfunds for basic consumption goods mushroomed into large, inefficient bu-reaucracies and became a constant drain on the budget. However, severalPRs failed to take the next step and identify the fiscal or macroeconomic im-pacts of explicit and implicit support. In Senegal, where public enterprisesaccounted for 75 percent of the overall deficit in 1988-89, SALs in 1986, 1987,and 1990 continued to grapple with subsidies and cross debts between gov-ernment and public enterprises."7
The strategies proposed varied. For transition economies, defining and legis-lating the distribution of responsibilities between the private and public sec-tors were considered essential. Elsewhere, proposed reforms included reduc-ing public employment, subsidies, and transfers; encouraging private sectoractivity; and increasing tax revenues and economic efficiency through liqui-
38
dation, privatization, or rehabilitation to address production efficiencyproblems for enterprises that were to remain in public hands. Specifyingclear objectives and providing incentives through performance contractswere discussed in the Gambia and Senegal. A variety of reforms were sug-gested for marketing boards: abolishing them (Senegal and Uganda); mak-ing them buyers and sellers of last resort (Kenya); and turning over process-ing and exporting activities to the private sector, adjusting producer pricesin line with international prices, raising consumer prices, and reducing em-ployment in state enterprises (Ghana and Tanzania).
Revenue
Inadequate revenue was identified as a source of budgetary difficulties in allcountries but Chile, yet only the president's report for Chile addressed theimpact of revenue increases on public savings (and whether public savingsadd to or substitute for private savings). Nontax revenue was recognized asbelow potential wherever public enterprise charges did not cover marginalcosts. In most countries tax revenue was diagnosed as insufficient becausetax bases were too narrow and tax administration lax, not because rateswere low (Chapter 3).
Discussion of revenue strategies was extensive in LAC and ECA, includingthe transition economies. In retrospect, however, it appears that the loss ofrevenue from the demise of public enterprises in the transition economieswas underestimated, since more aggressive tax strategies were not pro-posed. Despite an emphasis on tax instruments in LAC, the quality of thestrategy discussions was thin in Costa Rica, Honduras, and Venezuela andimproved in Argentina only in 1988. The limited focus on tax strategies inAFR and the Philippines may have been due to the fact that the IMF hadtaken the lead in this area of adjustment. Revenue strategies were not evenmentioned until the 1990s in Bangladesh and Pakistan.
Broadening the tax base was the primary strategy identified in the tax area.Methods commonly included such tax-related changes as tightening exemp-tions, rationalizing incentives, expanding VAT coverage or the income taxbase, and converting specific taxes to ad valorem taxes. Sometimes the strat-egy was to manipulate macro-policy instruments-indexing for inflation,freeing administered prices, and correcting for the overvaluation of the ex-change rate (when exchange rate appreciation reduced the value of taxabletraded goods in local currencies). Increases in tax revenues were also soughtthrough changes in tax structure. Rarely were increases sought through taxrate increases alone. More commonly, rate increases for some taxes were off-set by rate cuts for others. A reduction in the income tax rate was combined
In discussing with an increase in the asset tax in Argentina, the VAT rate in Peru, and thesales tax and luxury goods tax in Ghana. (These strategies are spelled out in
tax strategies, greater detail in Chapter 3.)
president's In line with the recommendations in the Bank's Lessons of Tax Reform, effi-
reports focused ciency rather than equity was the focus of tax strategy discussions in PRs.
on efficiency, Efficiency issues were discussed in 24 of the sample countries. Equity wasJJ Y' mentioned in PRs in 16 countries, but the quality of the discussions wasnot equity poor compared with the efficiency discussions. Attention to equity issues
appears much later in the adjustment process: C6te d'Ivoire, Malawi, Sene-gal, Pakistan, and the Philippines received adjustment loans with fiscal con-ditions in 1980/81, but equity was not discussed until 1991 in C6te d'Ivoire,1988 in Malawi, 1987 in Senegal, 1994 in Pakistan, and 1987 in the Philip-pines. (For a discussion of equity and tax reform, see Chapter 3.)
39
Tax administration strategies were identified in 21 countries, but in 6 (CostaRica, Honduras, Hungary, Pakistan, the Philippines, and Tunisia) the justifi-cation for the strategy was limited. In general, tax administration reformswere more often prompted by the failure of pure tax policy reforms to de-liver increases in tax revenues, than justified as being integral to a revenueenhancement strategy. In LAC the rationale was reduction of collection lags;in AFR the reforms were wide-ranging and induced as much by revenue asby structural and institutional considerations. The quality of the strategy dis-cussions tended to be more substantial in later loans (for example, the needfor a number system to identify taxpayers was identified in Malawi as earlyas 1981, but discussion of the measure was found in the 1988 and subsequentoperations). (See Chapter 4.)
Nontax revenues were identified in all countries as a potential source of pub-lic funds. Such revenues were expected from adjustments in the prices ofpublicly produced goods, cost recovery in health and education services, andtariff increases for public utilities. Cost recovery for health and educationservices was stressed more in LAC than in AFR. (See Chapter 5.)
Fiscal analysis and projections
Fiscal reform has to be evaluated as part of a larger adjustment program ofinterrelated policies. PRs contained very limited discussion of the fiscal im-plications of reforms involving the exchange rate, the interest rate, and tradepolicy. Exceptions were some qualitative discussions of the fiscal effects ofexchange rate changes in Ghana, Mozambique, Tanzania, and Uganda;"8 ofinterest rate reform in El Salvador, Pakistan, and Tunisia; and of trade liber-alization in Bangladesh, Morocco, and the Philippines.
Projections describe a medium-term perspective, alternative scenarios, andbenchmarks for monitoring performance. Yet only 22 percent of the loansample included projections of revenue and expenditure components, andonly 59 percent provided projections of total revenues and expenditures; therest had no revenue or expenditure projections. The extent of coverage ofcomponent categories of revenue and expenditure varied widely: none of theBangladesh loans included projections, while about 53 percent of loans inLAC did. Though subsidies and transfers were an important preoccupation(see subsection on current expenditures), none of the PRs tackled the issue ofsubsidies as a whole. Whether because of the lack of political will or becausethe effects of implicit subsidies are not always explicitly apparent as revenueor budget consequences, there was little attempt to work through the macro-economic implications of making implicit subsidies (and taxes) transparent.
Was the quality of conditionality adequate?
While it is important to evaluate the success of fiscal management in the con-text of the broader adjustment program, not merely with respect to the per-formance of fiscal instruments but also with respect to its results (in reducinginflation, encouraging private sector activities, ensuring fiscal sustainability,and so on), this chapter limits its focus to fiscal conditionality per se. Chap-ters 3, 4, and 5 discuss whether the specific types of tax and expenditure con-ditions incorporated into SALs/ SECALs were consistent with Bank guide-lines or best practice. Here, sample SALs/SECALs are examined todetermine whether conditionality was consistent with diagnosis and to as-sess the patterns that emerge on the quality of the conditionality, targets, andprojections (the issues investigated are set out in Box 2.3). 19 The study con-
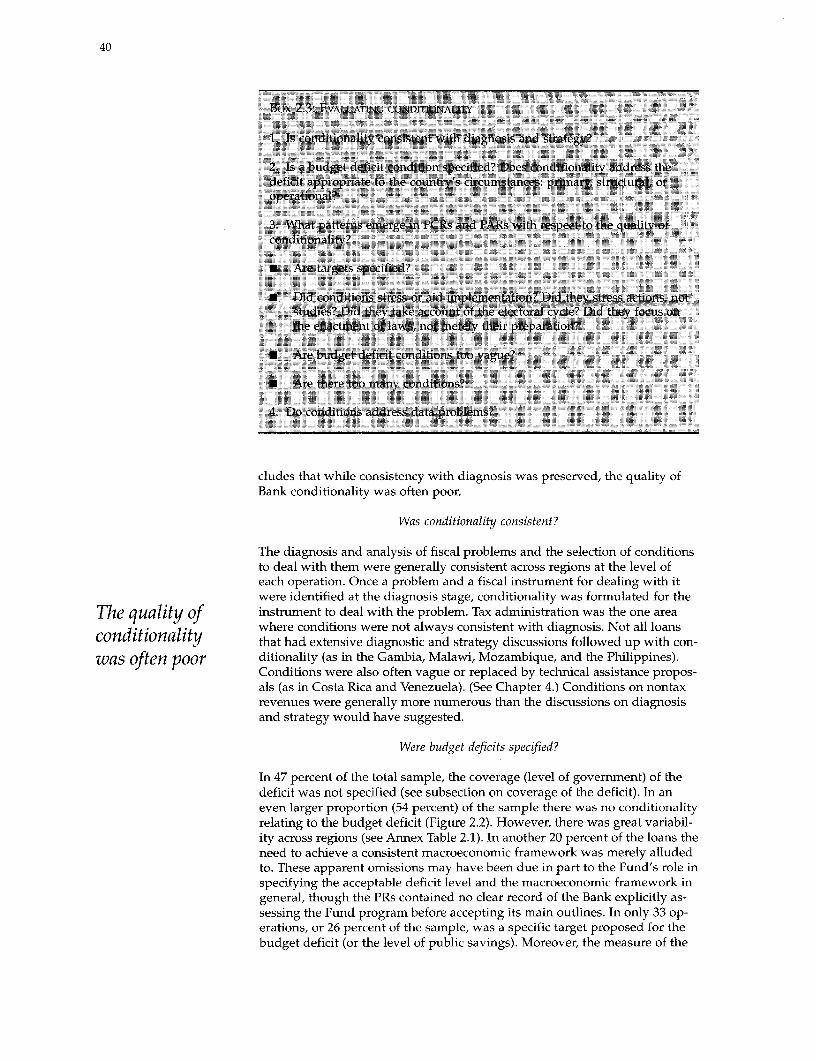
40
L~~ m; lodoar = sinwhi a Sgn\os; and strte lgy
-e idt Xapp nate tos,;'s the ZkK.E nst ~ .ctu o-
* Aretargetsspedfiee- ^- --- -- - - -- ---- -
-- _ , --< --x- -
ft 1)14 co~D='P~ns 't ess=or~id implementation? Did they 'tre-- a--o--s noX
x4~~~~~~~~~~~~~. . .. -- -- -- L - - - - - - . .. . .. . .. ... .. . .
.fh enacimeAt ~il~4at~s;iiotMgy. T ... ... ... ...
''rDDDO,DS~~~~~~~~~~~~i i J e s , D D ,, -, - Di---g, ,, -,' D1- - ---- --- DD 0-- -- D- --- --- ----- D - - - --------...... . .
cludes that while consistency with diagnosis was preserved, the quality ofBank conditionality was often poor.
Was conditionality consistent?
The diagnosis and analysis of fiscal problems and the selection of conditionsto deal with them were generally consistent across regions at the level ofeach operation. Once a problem and a fiscal instrument for dealing with itwere identified at the diagnosis stage, conditionality was formulated for the
The quality of instrument to deal with the problem. Tax administration was the one areaconditionality where conditions were not always consistent with diagnosis. Not all loans
that had extensive diagnostic and strategy discussions followed up with con-was often poor ditionality (as in the Gambia, Malawi, Mozambique, and the Philippines).
Conditions were also often vague or replaced by technical assistance propos-als (as in Costa Rica and Venezuela). (See Chapter 4.) Conditions on nontaxrevenues were generally more numerous than the discussions on diagnosisand strategy would have suggested.
Were budget deficits specified?
In 47 percent of the total sample, the coverage (level of government) of thedeficit was not specified (see subsection on coverage of the deficit). In aneven larger proportion (54 percent) of the sample there was no conditionalityrelating to the budget deficit (Figure 2.2). However, there was great variabil-ity across regions (see Annex Table 2.1). In another 20 percent of the loans theneed to achieve a consistent macroeconomic framework was merely alludedto. These apparent omissions may have been due in part to the Fund's role inspecifying the acceptable deficit level and the macroeconomic framework ingeneral, though the PRs contained no clear record of the Bank explicitly as-sessing the Fund program before accepting its main outlines. In only 33 op-erations, or 26 percent of the sample, was a specific target proposed for thebudget deficit (or the level of public savings). Moreover, the measure of the
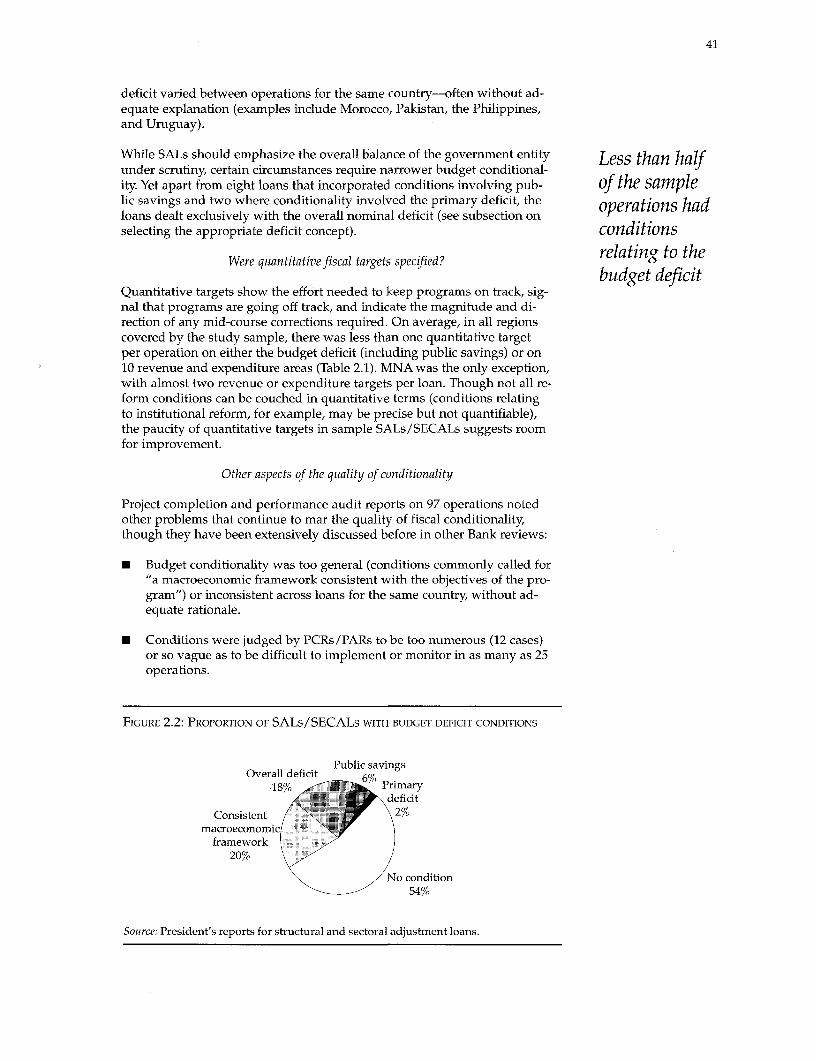
41
deficit varied between operations for the same country-often without ad-equate explanation (examples include Morocco, Pakistan, the Philippines,and Uruguay).
While SALs should emphasize the overall balance of the government entity Less than halfunder scrutiny, certain circumstances require narrower budget conditional-ity. Yet apart from eight loans that incorporated conditions involving pub- of the samplelic savings and two where conditionality involved the primary deficit, the operations hadloans dealt exclusively with the overall nominal deficit (see subsection onselecting the appropriate deficit concept). conditions
Were quantitative fiscal targets specified? relating to thebudget deficit
Quantitative targets show the effort needed to keep programs on track, sig-nal that programs are going off track, and indicate the magnitude and di-rection of any mid-course corrections required. On average, in all regionscovered by the study sample, there was less than one quantitative targetper operation on either the budget deficit (including public savings) or on10 revenue and expenditure areas (Table 2.1). MNA was the only exception,with almost two revenue or expenditure targets per loan. Though not all re-form conditions can be couched in quantitative terms (conditions relatingto institutional reform, for example, may be precise but not quantifiable),the paucity of quantitative targets in sample SALs/SECALs suggests roomfor improvement.
Other aspects of the quality of conditionality
Project completion and performance audit reports on 97 operations notedother problems that continue to mar the quality of fiscal conditionality,though they have been extensively discussed before in other Bank reviews:
* Budget conditionality was too general (conditions commonly called for"a macroeconomic framework consistent with the objectives of the pro-gram") or inconsistent across loans for the same country, without ad-equate rationale.
* Conditions were judged by PCRs/PARs to be too numerous (12 cases)or so vague as to be difficult to implement or monitor in as many as 25operations.
FIGURE 2.2: PROPORTION OF SALs/SECALs WITH BUDGET DEFICIT CONDITIONS
Public savingsOverall deficit 6 Pm
-18% 1 Primarydeficit
Consistent . 2%macroeconomic
framework20%
No condition54%
Source: President's reports for structural and sectoral adjustment loans.
42
* Conditions were "soft" in many cases, calling for the drafting of legisla-tion rather than implementation (in 14 cases) and stressing studiesrather than actions (13 cases).
* Conditions paid too little attention to timing (7 cases where, for ex-ample, the implications of the electoral cycle for the adoption of reform
Conditions were often ignored).
overall were PCRs and PARs indicate that attention to design and timing issues would
too general, have helped implementation in about 56 loans (58 percent of the operations
numerous, and with completed evaluations). (See Annex Table 2.2 on these aspects of con-ditionality) These flaws are not confined to the early adjustment loans. Of
soft, and paid the 19 loans processed after 1990, PCRs/PARs pointed out that 16 percenttoo little focused on studies rather than actions; 47 percent called for the presentation
of laws to lawmaking bodies rather than their implementation; 37 percentattention to had too many conditions; 32 percent had conditionality that was mistimed;timing and 68 percent had conditionality that was characterized as "vague" and
difficult to monitor.
Data quality
Projections, scenarios, and targets provide transparency to the reform pro-cess and bolster borrower ownership. Yet conditionality did not address im-provements in data needed for such analyses. The sample provided severalexamples of data gaps. Lack of data hampered budget formulation andmidyear budget reviews in Bangladesh and calculation of the consolidatedbudget deficit and the public sector borrowing requirement in Turkey. Onthe expenditure front, subsidies that are to be reduced often reappear in theguise of net lending, a category for which data are not often available. Ex-penditure data in education and health are unavailable by functional classi-fication, and the data that are available are not disaggregated by primary,secondary, or tertiary services. Morocco (1992) aimed at redirecting spend-
TABLE 2.1: QUANTITATIVE FISCAL TARGETS IN SALs/SECALs
Number of targets relating to10 revenuel Budget deficit or Total operations
Region/country expenditure areas' public savings per region
Latin Americaand Caribbean 27 12 28
Africa 29 8 54Europe and Central Asia
(Bulgaria, Hungary,Poland, Turkey) 6 8 16
East Asia and Pacific(Indonesia, the Philippines) 4 0 10
Middle East and North Africa(Morocco, Tunisia) 16 2 9
South Asia(Bangladesh, Pakistan) 11 3 12
Total sample 93 33 129
a. Total expenditure, total revenue, tax revenue, nontax revenue, tax administration,current expenditures, employment/wages and salaries, subsidies/transfers, O&M ex-penditures, and capital expenditures.Source: President's reports for structural and sectoral adjustment loans.
43
ing to primary education, but these expenditures were not differentiated inthe budget from expenditures on the first stage of secondary education. InAFR and SAS a key recommendation to increase expenditures for O&Mcould not be monitored because such data were generally not available as aline item classification in budgets.
Was implementation adequate?
The implementation record of detailed tax and expenditure conditions is ex-amined in chapters 3, 4, and 5. Here, patterns of implementation experienceare examined across regions in the broad areas of fiscal reform touched on inprevious sections. The implementation record was tracked by examiningproject completion, implementation completion, and performance audit re-ports for 97 operations; 31 operations had not been evaluated at the time ofthis study; 1 operation (in Costa Rica) was canceled. These documents revealthat borrower performance in implementing adjustment conditionality hasbeen mixed: implementation has been weak in budgetary process and publicenterprise reform and in the reduction or restructuring of current expendi-tures. Tardiness in implementation was also reflected in tranche delays.
Tranche delays
Tranche delays were reported in 45 loans. In 38 of them (about 85 percent),the delay was attributed wholly or in part to the nonfulfillment of fiscalconditionality.
Budget deficit/public savings
The budget deficit/public savings conditions were considered fulfilled in 23of the 33 loans with such conditionality. Central bank losses had been explic-itly identified as a factor in fiscal deficits in the diagnosis of fiscal imbalance Borrowersin nine countries.20 While they are no longer a problem in Argentina andChile, they continue to be a concern in Costa Rica, Mozambique, the Philip- had difficultypines, and Tanzania.21 Social security reform was implemented in Chile, but implementingnot in Bulgaria, Hungary, and Poland in ECA or in Costa Rica and Uruguayin LAC. conditions
related toBudgetary process reform budgetary
The record on budgetary process reform is poor. Implementation of loan con- processes, publicditions was still in progress in a number of countries that emphasized suchreform, such as Argentina, Bangladesh, El Salvador, and Morocco. In Kenya enterpriseseveral loans addressed budget rationalization, but implementation has been reform andweak. In Costa Rica reforms have yet to be implemented. In Ghana, Tanzania, r aand Uganda, budget transparency has been achieved in some areas (for ex- currentample, by reducing or eliminating the subsidies inherent in overvalued ex- Spendinchange rates), but weak budgetary processes remain one of the more impor-tant challenges facing these countries.
Public enterprise reform
Implementation has fallen short on public enterprise reform as well. PCRs re-ported satisfactory implementation in only 5 countries (Argentina, Chile, theGambia, Peru, and the Philippines) and weak implementation in 20 coun-tries. In Mozambique, Senegal, and Tanzania, indirect or implicit subsidieshave continued. In Morocco transfers to enterprises were lower than in 1980

44
but remained significant. In Mozambique the government agreed to stop us-ing bank loan guarantees to cover the operating losses of state enterprises,but the accounts of the Bank of Mozambique and Banco Commercial deMozambique revealed substantial additional credit to state enterprises dur-ing 1987-92.
Public investment programs
Though diagnosis and strategy discussions in president's reports emphasizedchanges in the composition of public investments, most PCRs and PARs havenot assessed progress in this area. (Chapter 5 attempts an assessment ofchanges in investment composition.) The Bank has been successful, however,in assisting countries to evaluate projects and formulate rolling investmentplans. Few countries that had planned to refine estimates of O&M require-ments by evaluating capital budgets have yet done so.
Current expenditure
Conditions calling for reductions of subsidies or transfers have been at leastpartially implemented in a range of countries: C6te d'Ivoire, Kenya, Malawi,and Mozambique in AFR; Bulgaria, Hungary, Poland, and Turkey in ECA;Costa Rica in LAC; and Bangladesh and Pakistan in SAS. Overall results,however, fell short of expectations (see Chapter 5), and success in implement-ing wage and salary conditionality has been mixed. The Gambia and Ghanareduced their wage bills as a ratio of GDP and improved the wage and salarystructure. Some countries that had achieved significant employment reduc-tions were rehiring (Kenya, Senegal, Uruguay). Where initial wage compres-sion had been excessive, wage increases or decompression of salary scaleswas implemented (Argentina before 1991, Chile, El Salvador, Indonesia,Mozambique, Tanzania, and Uganda). Further curtailment of wages and sala-ries is needed in Bangladesh, Morocco, and Pakistan.
Tax revenues
Implementation has generally been slower for direct tax reform than for indi-rect taxes and is continuing in a large number of countries (see Chapter 3,subsection on assessing the efficacy of tax reform). Implementation of tax ad-ministration reforms was not addressed in adequate detail in project andimplementation completion reports (see Chapter 4).
Other issues
Gainers and losers. Identifying likely gainers and losers and strategies to dealwith the losers might have speeded implementation. Such analysis couldhave highlighted problems with the Argentine land tax (1986) and the Uru-guayan social security reform (1992). In Malawi analysis of the impact of re-ductions in the fertilizer subsidy on smallholder productivity might haveprevented delays in implementation. In Hungary the reluctance to acceleratebankruptcy proceedings for state enterprises stemmed from the failure toanalyze the impact on losers or to build in measures to mitigate adverse im-pacts (see Chapter 3).
Bank-Fund collaboration. Bank-Fund collaboration has been recognized in bothinstitutions as essential for ensuring consistency in economic advice: guide-lines for collaboration were formally endorsed by the heads of the two insti-tutions in March 1989. However, the evaluation of Bank adjustment programshas been hampered by the lack of systematic reporting in Bank president's re-
45
ports on the principal Fund actions required. While coordination on stabili-zation has generally been good, the Bank has had some problems in syn-chronizing stabilization and structural adjustment. In Ghana, for example,the Bank failed to consider that the fiscal contraction effected under the IMFprogram would slow the investment program to be financed from the localcurrency proceeds of the Bank's Rehabilitation Import Credit (1983). InMalawi the Bank failed to realize that the country's agreements with theFund to keep public sector wages frozen during 1982-86 would prevent thegovernment from retaining key personnel by granting them compensatorywage increases when prices were deregulated under SAL III (1985).
Coordination with other donors. Donor coordination has been particularlyfruitful in some fiscal areas, notably in devising social safety nets. TheGambian civil service retrenchment program was particularly successfulbecause donors helped set up counseling and retraining programs. Donorsalso financed the cost of staff retrenchment for the Ghanaian cocoa market-ing agency. In Costa Rica, United States Agency for International Develop-ment (USAID) assistance was key to the successful privatization of publicenterprises owned by the government agency CODESA. The unity of pur-pose among donors helped tighten reform objectives and promote the rapidadoption of financial sector reforms under Senegal's Financial Sector Adjust-ment Loan (1989).
Lack of coordination among donors can delay structural reform. Examplesabound. In LAC, AFR, and Bangladesh the lack of coordination with donor In some cases,groups worked against public expenditure control. A study on project aidutilization in Bangladesh found that donor collaboration problems contrib- the lack ofuted to cost overruns of 35-40 percent and prolonged implementation by 60percent relative to estimates in project appraisals. Though the Ugandan gov- coordinationernment had agreed under SAC II (1994) to adopt the basic principles for among donorsdistinguishing between core and noncore projects, problems with getting delayedother donors on board stood in the way of putting the agreement into prac- elytice. The PAR for the Kenya industrial SECAL (1988) stressed that donors structuralworking in isolation tended to send the wrong signals and to thwart govern-ment efforts at expenditure control. The PR for a subsequent agricultural reformSECAL recognized that the availability of numerous sources of external fi-nancing tended to soften the application of rigorous project selection crite-ria, while the excessive number of projects taxed the government's imple-mentation capacity. In Bangladesh the large and unconditional budgetarycontributions of donors may have hampered efforts to mobilize and ratio-nally allocate public resources in the 1980s.
As donors became more aware of the need to support social expendituresand shifted from providing general balance of payments support to ear-marking funding for social programs, budgetary control and expendituremanagement became more complicated. The use of special accounts bydonors in El Salvador contributed to expenditure control problems. InMozambique, aid earmarked for poverty reduction could not be incorpo-rated into the general budget, which jeopardized the efforts of the coordina-tion groups set up to align government expenditure priorities and those ofthe donor community.
Conclusions
Analysis of the 129 loan sample suggests that diagnosis, analysis and strat-egy, and conditionality were generally consistent across all regions: areas di-
46
agnosed in PRs as responsible for fiscal problems were generally also iden-tified in the strategy discussions as eligible for follow-through withreform conditions. However, the quality of diagnosis and conditionalitywarrants improvement. Implementation was also weak in key areas.More specifically,
U The coverage and specific measure of the fiscal deficit were not speci-fied in about half the operations. Not surprisingly, therefore, condition-ality on budget deficits was meager. Despite the diversity in fiscal expe-
Thefiscal rience across countries, almost 70 percent of operations that did specifyproblems a budget deficit condition confined their attention to the overall deficit.
Moreover, the measure of the deficit varied between operations for thediagnosed and same country (often without adequate explanation), the same deficitthe reform terminology was applied to different measures of the deficit across
countries, and none of the loans addressed the level of the sustainable
strategies and deficit.
conditions U Not all loans worked systematically through the various elements of di-
identified in agnosis that needed to be addressed. For example, loans that focusedon revenues/tax reform did not always appraise the role of the publicpresident's sector or explore possibilities for expenditure reduction before diagnos-
reports were ing the need for revenue reform. When strategies called for increasingrevenues, president's reports did not establish whether past perfor-
generally mance provided assurance that public savings would rise when public
consistent revenue did. Nor did the reports discuss whether public savings add toor substitute for private savings. Even if such issues are hard to estab-lish empirically for specific countries, discussions of this nature focusborrower attention on the need for public savings. Further, because di-agnosis and strategy typically failed to identify those who stand to losefrom adjustment operations, the loans included no mitigating measuresthat might have improved the chance of success.
* None of the PRs analyzed the relationships between fiscal and othermacroeconomic variables with respect to a sustainable deficit or dis-cussed the macroeconomic implications of making implicit taxes orsubsidies transparent. Few considered the fiscal impacts of other mac-roeconomic policy reforms, and not all operations that needed to do soworked out the revenue effects of alternative fiscal reforms. One reasonfor these analytical gaps is the poor quality or outright lack of countryfiscal data. Lack of data also hampered monitoring and evaluation. Yetconditionality did not stress the need to address data gaps.
* Though budgetary processes were diagnosed, none of the PRs took anintegrated view of the framework of governance in which the public ex-penditure system is embedded (Campos and Pradhan 1996). For ex-ample, none dealt with the incentives or organizational arrangementsneeded to ensure overall budgetary discipline, the involvement of localinstitutions and beneficiaries in formulating public programs, technicalefficiency in drawing up alternative expenditure proposals and deter-mining the choice of programs, incentive systems for fostering an effi-cient bureaucracy, or information systems for building in transparencyand accountability. The failure to deal with budget transparency, moni-toring and control, database systems, and the management of extrabud-getary spending was particularly evident in AFR, where the discussionwas confined mainly to strengthening public ministries and investmentprogramming. In general, the sample PRs suggest that the Bank needsto build up more expertise in budgetary systems.
47
* Public enterprise reform was a focus of diagnosis, analysis, and condi-tionality in almost all countries, but implementation was incomplete orweak in about 20 (of 25) countries.
* The level and allocation of expenditures within and between capital andcurrent expenditures were identified as factors behind fiscal imbalancesin almost all loans. While PRs focused on project evaluation and rollinginvestment plans, the restructuring of public investments received lessattention. Particularly lacking were discussions of social sector invest-ments. This gap carried over into analyses of current expenditure. Theimportance of holding down or reducing subsidies and the wage bill ifexpenditures on nonwage O&M were to be increased was discussed butnot achieved.
* PCRs/PARs on 97 of the 129 operations sampled noted a set of problemsrelated to conditionality that had already been flagged in other Bank re-views. Conditionality on the deficit or public savings was often too gen-eral or inconsistent between loans for the same country. Other fiscal con-ditionality was judged to be so vague as to be difficult to implement.Conditions were also soft, calling for preparation of legislation rather Both thethan implementation or for studies rather than actions. Conditionalitywas occasionally poorly timed, calling for the most important actions to quality of thebe taken at a time when election pressures were likely to affect the ac- conditionalitiesceptability of reform.
identified* While coordination with other donors was sought, the analysis suggests and their
that the Bank needs to collaborate more effectively with the Fund in syn-chronizing stabilization and structural adjustment in the fiscal area. implementation
* Hitches in implementation have been overwhelmingly responsible for warranttranche delays. PCRs/PARs have drawn attention to implementation improvementproblems in budgetary processes, public enterprise reform, the level andcomposition of public investments, employment and the public sectorwage bill, and social security reform. Improvements in the design andtiming of conditionality would have helped implementation in morethan half the operations with completed evaluations. These shortfallsalso characterize operations approved as recently as 1990-94.
Lessons
In addition to the specific sectoral and functional areas identified above, forwhich attention to design, conditionality, and implementation and the linksamong them could improve the quality of loans, there are some relativelysimple lessons that may apply more generally across all fiscal programs inadjustment loans, as well as some broader issues that the institution needs todebate.
Specific issues include:
* SALs and SECALs need to work through the fiscal accounts at the broad-est institutional level before zeroing in on the specific account that is pri-marily responsible for the fiscal deficit. This implies more detailed atten-tion to aspects of the deficit that are not immediately apparent: losses ofthe central bank and other state banks, arrears of public sector entities,implicit subsidies, and the fiscal implications of other macroeconomicpolicy changes. While the overall deficit should be the starting point, the
48
underlying nature of the deficit-whether primary, structural, or opera-tional-merits attention. Moreover, all adjustment loans need to identifythe level of the sustainable deficit that is consistent with the overall mac-roeconomic framework and to specify quantitative targets over time toachieve it.
* The design and timing of conditionality and the success of implementa-tion might be enhanced by making conditions more specific (using tar-geting where possible), limiting the number of fiscal conditions to helpfocus govermnent attention and scarce technical skills, emphasizing ac-tions rather than studies, identifying gainers and losers and compensat-ing losers, and taking better account of the country's electoral timetable.
* The need to work on improving donor coordination is suggested by con-cerns about synchronization of stabilization and structural adjustmentreforms, the pace of adjustment, overall fiscal and expenditure disci-pline, a focus on strategic issues, performance monitoring indicators,and stricter implementation.
Four general issues need attention:
X While the lead role of the Fund in offering fiscal policy advice to mem-bers should be respected and its long record of expertise and involve-ment in fiscal matters recognized, the Bank needs to take a more hands-on approach to the design of fiscal reforms in adjustment programs. TheBank needs to do more and better analysis to supplement the Fund's per-spectives with its own views on the fiscal measures necessary for long-term efficiency, growth, and poverty reduction. This does not mean thatthe Bank should offer different policy advice to members. Rather, what itsuggests is the benefits of effective coordination on fiscal issues betweenthe two institutions. As the 1989 Concordat puts it, both "the institutionsand borrowing members [would] normally stand to benefit from analy-ses from different perspectives." The Bank could thus assist the Fund inpresenting clients with a broader range of policy options by expandingthe fiscal debate. The modalities for greater coordination between thetwo institutions on macroeconomic and fiscal matters (whether throughthe policy framework paper, public expenditure reviews, the Bank'scountry strategy paper, the Fund's country strategy brief, or some othermeans) would need to be worked out.
* The Bank needs to assist borrowers in determining the appropriate roleof govemment relative to the private sector (a critical determinant of thelevel of the public finances), and the specific mix of public sector rolesthat suits a country's situation: Should the government continue to pro-duce the same goods and services it currently does? Should it assist theprivate sector with financing? In which areas should it withdraw to aregulatory role?
* The overall framework for public expenditures needs to be the focus ofreform, not ad hoc measures. The Bank needs to look systematically athow to maintain overall budget envelopes, encourage local beneficiariesand governments to participate in formulating expenditure proposals,ensure technical efficiency in the choice of expenditure programs, buildin incentives to ensure an efficient civil service, and ensure transparencyand accountability to keep governance open and honest. The Bank's De-velopment Economics Vice Presidency has recently started looking atthese issues. More needs to be done.
49
U Given the central importance of fiscal reforms in the adjustment process,assisting governments to improve their data systems (for identifying thecomponents of the fiscal accounts and the fiscal implications of policychanges in other areas) may be the simplest and yet the single most help-ful fiscal reform that the Bank could support. Focusing on the quality offiscal data would enable countries and the Bank to detect crises earlyand to present alternative projections for guiding strategy, contingencyplanning, implementation, and monitoring. Better data and informationdissemination are also critical for government transparency and ac-countability. This may be an area for stronger Bank-Fund collaboration.The Fund has recognized that despite its greater strength in this area, itspublished fiscal data have shortcomings; it has taken several initiativesover the past year to encourage its members to provide it with compre-hensive, timely, and high-quality information (see IMF 1995a).
Notes
1. This chapter is based on an internal background paper written by Poonam Gupta in1996.2. A few operations were covered by implementation completion reports, which re-placed project completion reports in July 1994.3. In Argentina (1988), the nonfinancial public sector deficit excluded the provincialaccounts, butArgentina (1991) acknowledged that more than half of the nonfinancialpublic sector deficit was accounted for by the provinces and municipalities. In Venezu-ela, where the central government assumed the external debt of public enterprises andfinancial support was provided by the state-owned industrial bank, such support didnot figure in the fiscal accounts (Venezuela 1989). President's reports for Turkey (1982-84) presented the consolidated budget, but in some years the public sector borrowingrequirement (including the consolidated budget, state enterprises, local governmentsand extrabudgetary funds) was twice the size of the borrowing requirement implied bythe consolidated budget. In the Philippines (1983,1987) the accounts referred only tothe national government, but the national government deficit averaged only about 2percent of GDP in 1983-85 when the total public sector deficit including central banklosses was about 8 percent. In Bangladesh (1992), where public enterprises accountedfor 6 percent of GDP and required budgetary support, their losses were not reflectedexplicitly in the budget.4. Quasi-fiscal deficits reflect the activities of the central bank or other financial insti-tutions that exert pressures on financial markets similar to those exerted by the financ-ing of recognized government activities. Fiscal deficit estimates need to identify and in-corporate arrears (of inter alia, public enterprises and banks). Arrears of insolvententerprises and banks amounted to more than 4 percent of GDP in 1989 in Hungary.They were also sizable in Morocco, Poland, and Tunisia.5. The Uruguayan social security system required transfers amounting to 3.8 percentof GDP and 25 percent of current revenues in 1985. ln Poland, budget subsidies to thesocial funds rose from 2 to 8 percent of GDP between 1990 and 1992.6. However, its usefulness is marred by problems of classification (current or capitalexpenditures) and by the implicit assumption that all current expenditures representconsumption whereas all capital expenditures contribute to growth. Vito Tanzi (1993)points out that the concept has drawbacks in that it tells nothing about the impact offiscal policy on the balance of payments, and perhaps not much about the impact offiscal policy on growth.7. The primary deficit concept is central to the measurement of the sustainable deficit(see subsection on identifying sustainable deficits). It was discussed in Argentina (1991,two loans in 1992), C6te d'Jvoire (1991), Peru (1992), and Turkey (1988).8. In Turkey (1988) the PR stated that the nominal public sector borrowing requirementoverstated the government's claims on real resources compared with the operationaldeficit. The same loan also briefly discussed the primary balance.9. The discussions of the operational and structural deficits in Turkey (1988) and Ar-gentina (1991) respectively were not followed up with conditionalities incorporated intheir policy matrix.

50
10. Lessons of Tax Reform notes that "it is important that tax measures not be chosenwithout having made a broader assessment of the role of government in the countryconcerned" (World Bank 1991a, 18).11. A general appraisal of the role of the government is of course implicit in condition-alities calling for private enterprise reform, divestiture, elimination of marketingboards, and the like.12. Budgetary process reform strategy was not discussed at all in the three transitioneconomies in ECA, Indonesia and the Philippines in EAP, Tunisia in MNA, and Paki-stan in SAS.13. The links between central government and provincial fiscal accounts were curso-rily discussed in the PRs for Pakistan and Tunisia.14. The transition economies identified expenditure cuts as necessary for a continuedreduction in the role of the state.15. This study did not draw on public expenditure reviews (PERs) for its evaluation ofpublic spending strategies. The assessment of PERs is the focus of a subsequent OEDstudy, currently in progress, of public expenditure.16. World Bank (1992a) stressed the need to restructure current expenditures and tocorrect the balance between wage and nonwage O&M.17. Explicit subsidies consisted of Treasury loans; implicit subsidies/taxes stemmedfrom tax exemptions, loan guarantees, preferential interest rates, and price controls.18. In the CFA franc countries, Cote d'Ivoire and Senegal, PRs discussed the use of ex-port subsidies to compensate for an overvalued exchange rate.19. Judgments on discernible patterns in the quality of conditionality are drawn fromPCRs and PARs. Conditionality refers to the policy actions set out in matrix form in ev-ery president's report on adjustment operations.20. In some countries, central bank losses were identified in later loans but ignored inearlier loans. Presumptive evidence was available on the existence of central banklosses in the PRs for another eight countries.21. Project completion reports were silent about central bank losses in Honduras andUruguay The Ghana loan (1991) is still unrated.
FISCAL MANAGEMENT INADJUSTMENT LENDING
3. Tax reform
This chapter examines tax policy reforms supported by Bank adjustmentoperations.1 It briefly describes the problems that beset tax systems in de-veloping countries in the early 1980s; summarizes the principles of tax re-form promoted by the Bank and describes how the Bank sought to translatethese principles into specific tax instruments; categorizes the conditionali-ties adopted in adjustment operations by content and regional distribution;and assesses the design, implementation, and efficacy of tax reform.
What the study found
Nontrade tax conditionality
The Bank's policy advice on nontrade tax reform has generally been in linewith the recommendations in Lessons of Tax Reform (World Bank, 1991a)(referred to as Lessons). Over half of the Bank's tax conditionalities aim toachieve broader direct and indirect tax bases and lower marginal incometax rates to make tax systems simpler, more efficient, and easier to adminis- Tter. In general, however, tax conditionalities have represented a small com- The Bank'sponent of SALs and have been selective rather than comprehensive in conditionalitiesscope. Typically, the Bank's conditionality has supported the govern-ment's own reform initiatives or has piggybacked onto other institu- often supportedtional initiatives. the government's
The Bank's design of tax conditionality has often been loosely structured: or other reformnearly half of all conditions specify only the direction of modifications to initiativesbe made to tax statutes, not their extent. Only 40 percent of conditions hadsome quantitative element; 12 percent of all conditions had neither qualita-tive nor quantitative criteria attached.
More than half of a sample of SALs covering 31 countries had been success-ful in implementing all of the Bank's tax conditionality and about a thirdhad been partially successful. Slightly less than 15 percent of the countriessurveyed had failed to implement any of the conditionalities. However,given the imprecision of conditionality, this relatively high level of compli-ance is difficult to assess. Furthermore, PCRs/PARs evaluated tax reformsonly in terms of statutory compliance. None attempted to evaluate tax re-forms in terms of marginal effective tax rates; very few checked on the com-pliance record. However, shifts in tax structure did take place in the direc-tion of less reliance on trade taxes and greater reliance on indirect taxes.Although the Bank's conditions did not generally stipulate rate increases,shifts in tax structures were accompanied by increases in tax to GDP ratiosin a large number of sample countries.
51
52
Trade tax conditionality
Perhaps because the Bank's trade tax conditionality has been extremely spe-cific and nonambiguous, compliance has been exceptionally good; for thesample of countries examined, the Bank has made substantial headway inreducing export barriers and in inducing countries to replace nontariff tradebarriers with tariffs and to reduce both the level and the variability of effec-tive protection. The pace of reform, which has varied from country to coun-try, has been determined by the extent to which trade tax reforms have beensynchronized with nontrade tax reforms.
Successful trade tax adjusters have for the most part also been successfulfiscal adjusters; countries that had reformed their tax systems either beforeor during their period of trade reforms and had instituted a broadly basedsales tax were able to implement large tariff reductions and compensate forany tariff revenue loss. Unsuccessful trade tax adjusters, by contrast, wereunable to cope with the revenue losses accompanying lower trade taxes andso continued to rely on tariffs as a major source of revenue; they either didnot undergo significant tax reform or introduced reforms too late to assisttrade liberalization. Insufficient progress in stabilization also constrainedtrade tax reforms.
Very little effort was made to quantify the revenue implications of tradereforms, partly because the Bank deferred to the Fund on issues of reve-nue adequacy and tax reform. The response to revenue shortfalls has beenhigher trade taxes, something the Bank's conditionalities have soughtto avoid.
The removal of quantitative restrictions (QRs) and their replacement by tar-iffs assumes that tariffs will be applied properly Implementation of tradetax reforms therefore requires effective customs operations, something theBank's trade tax conditionality may have neglected.
Principles of tax reform
In the early 1980s when the Bank embarked on adjustment lending, taxsystems in developing countries shared certain common characteristics(World Bank 1991a):
* Tax revenue to gross national product (GNP) ratios were low (17 percent,compared with 30 percent in industrial countries) (see Annex Table 3.1).
* Reliance on commodity taxes, particularly trade taxes, was high: low-income countries collected almost three-fourths of their tax revenuefrom commodity taxes, more than half from trade taxes alone (see An-nex Table 3.2).
* Income tax systems were highly progressive and functioned poorly,with effective tax rates that might be characterized as proportional atbest (Thirsk 1991).
* Personal income taxes represented a small share of total income tax rev-enue, most of which came from business taxes.
* Both direct and indirect tax systems had highly differentiated rate struc-tures, narrow tax bases, and extensive exemptions and incentives. A
53
narrow tax base with highly differentiated tax rates tended to result inhigh and variable effective tax rates and low collection rates.
* Compliance problems were serious.
It is not surprising that by 1980 many of the developing countries that facedfiscal crises were relying heavily on unsustainable levels of debt or inflationto finance their deficits, experiencing significant losses from tax-induced re-source misallocation, and suffering an erosion of taxpayer confidence. It isagainst this backdrop that the Bank began to promote structural adjustmentprograms that incorporated tax conditionality.
The principles guiding the Bank's tax reform efforts are clearly set out inLessons, and details on the characteristics of specific tax systems are de-scribed in World Development Report 1988. These two volumes provide thebenchmarks against which the tax reforms of the Bank's SALs/SECALsare judged.2
Lessons sets out the following tax principles:
* The primary function of the tax system is to generate revenue. Wheretax increases are not an explicit objective, reform efforts usually seekrevenue neutrality, that is, to improve the structure of taxes (by shiftingthe tax system away from relatively inefficient revenue sources, such astrade taxes) without changing revenues.
* A major goal of tax reform is to reduce the efficiency costs of the tax sys-tem. Compliance costs to the taxpayer and administrative costs to thepublic sector of enforcing tax laws are two of the most transparent ofthese costs. The cost associated with resource misallocation-excessburden-is the least transparent. 3To lessen excess burden, taxation ofproduction should be avoided in favor of consumption-based taxation;if production is taxed, all activities of a similar nature should face thesame effective tax rate. This principle reflects the neutrality objectiveof tax reform in the efficiency context.
* Lessons and many recent tax reforms espouse more broadly based taxa-tion at lower and more uniform rates with fewer incentives on thegrounds that such rules simplify the determination of the tax base andtax liability, increase efficiency, offer fewer incentives to evasion, makeevasion more difficult, strengthen the ability of the tax administration tocollect taxes, and make the tax system politically more acceptable.4
* A fourth goal of tax reform is to lift the tax burden off the poorest house-holds and to ensure that tax structures promote both vertical equity(distributing the tax burden according to ability to pay) and horizontalequity (treating taxpayers with the same amount of income equally, irre-spective of the source of income). Broadly based tax systems promotevertical equity by carefully targeting exemptions to the poor, by relyingon tax bases that apply largely to the rich (higher excise taxes on luxuryitems), and by generating enough revenue to prevent expenditure cutsor increases in inflation, which harm the poor. They promote horizontalequity by extending the tax net to cover the informal sector and hard-to-tax formal activities. Lessons and recent tax reforms recognize, how-ever, that tax systems can avoid taxing the poor but cannot increasetheir incomes. Public expenditure policies are a better instrument forincome redistribution.
54
Precision and content of tax conditionality
What was the quality of conditionality in the Bank's SALs/SECALs? Forthe sake of analytical convenience, conditionalities involving nontradetaxes are discussed separately from trade taxes. Nontrade tax conditionali-ties are analyzed by looking at 92 SALs/SECALs approved by the Bank'sBoard for 53 countries between 1980 and 1993; for trade tax conditionalities,the study looks at a sample of 87 SALs/SECALs involving 23 countries.'
Nontrade tax conditionality
Although the geographical spread of nontrade tax conditionality was wide,the range of such conditionality in most countries was limited. Of the 53countries involved, 49 percent had a single loan involving tax conditional-
The range of ity and 36 percent had two loans. For most of these countries conditionalitywas limited in both the number and the scope of reforms. Typically, coun-
nontrade tax tries faced two or three conditions on changing a few tax code parameters
conditionality to improve compliance. In about 30 percent of countries, more significantreform of a particular part of the tax system was stipulated (usually the
was limited in creation of a value added tax-VAT); in only a few countries, includingmost countries Burundi, Costa Rica, Hungary, Morocco, and Thailand, did conditionality
involve major changes in different parts of the tax system. Eight countrieshad three or more SALs/SECALs incorporating tax conditionality (Bang-ladesh, Ghana, the Philippines, Tunisia, and Turkey had three loans each;Jamaica and Malawi four loans each; and Cote d'Ivoire five loans). For C6ted'Ivoire, Ghana, and Malawi the scope of tax conditionality was broad,requiring reforms across several parts of the tax system as well as the reha-bilitation of investment codes. Elsewhere, as in the Philippines and Jamaica,tax conditionality was more limited.
Specificity. How explicit were the Bank's conditionalities on nontrade taxes?About 40 percent of conditionality included quantitative criteria or stipu-lated adoption of particular tax code provisions. This type of conditionalitytypically involves alterations in tax base or rate structures, which are easilymonitored. For instance, a country may be required to switch from specificto ad valorem excise taxes, to lower its sales tax rate to a certain level, or toremove certain exemptions from an income tax base.
The most common form of conditionality, accounting for about 48 percentof conditions, stipulated specific statutory changes but did not provide anyquantitative measure of performance. These conditions usually specifiedthe direction of change in the tax code-reducing exemptions and marginalincome tax rates and expanding indirect tax bases-without mentioning themagnitude of change. Because these conditions were not quantified, statu-tory compliance could be met through minor alterations in the tax code.
Some 12 percent of conditions examined lacked any explicit performancecriteria, qualitative or quantitative, making it difficult to evaluate tax re-form efforts. An example of this form of conditionality is "adoption by gov-ernment of final draft of the new...investment code" (Gabon).
Content. Policy advice on nontrade taxation has been consistent over timeand across countries and has reflected "best practice" (Table 3. 1).6 (See An-nex Table 3.3 for background data and definitions of conditionality cover-ing all regions.) About 40 percent of conditionality dealt with rationalizingtax bases (base broadening) or rates, indicating the importance the Bank
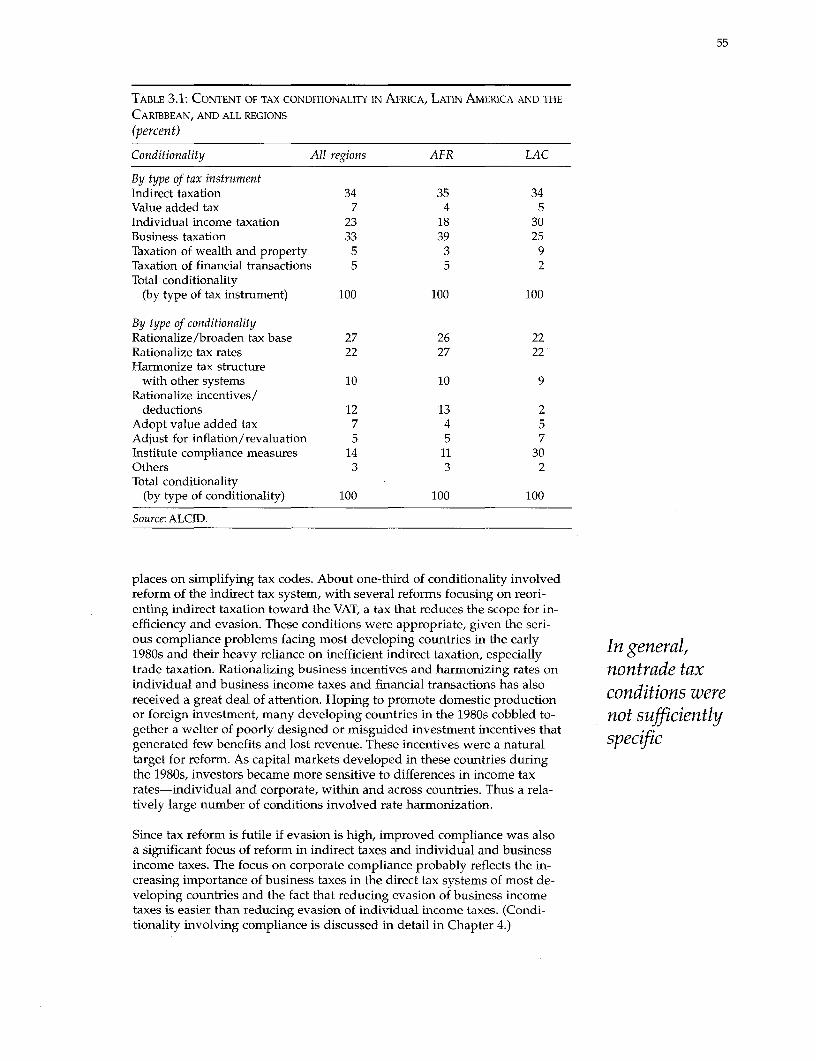
55
TABLE 3.1: CONTENT OF TAX CONDITIONALITY IN AFRICA, LATIN AMERICA AND THE
CARIBBEAN, AND ALL REGIONS
(percent)
Conditionality All regions AFR LAC
By type of tax instrumentIndirect taxation 34 35 34Value added tax 7 4 5Individual income taxation 23 18 30Business taxation 33 39 25Taxation of wealth and property 5 3 9Taxation of financial transactions 5 5 2Total conditionality
(by type of tax instrument) 100 100 100
By type of conditionalityRationalize/broaden tax base 27 26 22Rationalize tax rates 22 27 22Harmonize tax structure
with other systems 10 10 9Rationalize incentives/
deductions 12 13 2Adopt value added tax 7 4 5Adjust for inflation/revaluation 5 5 7Institute compliance measures 14 11 30Others 3 3 2Total conditionality
(by type of conditionality) 100 100 100
Source: ALCID.
places on simplifying tax codes. About one-third of conditionality involvedreform of the indirect tax system, with several reforms focusing on reori-enting indirect taxation toward the VAT, a tax that reduces the scope for in-efficiency and evasion. These conditions were appropriate, given the seri-ous compliance problems facing most developing countries in the early In I1980s and their heavy reliance on inefficient indirect taxation, especially enera,trade taxation. Rationalizing business incentives and harmonizing rates on nontrade taxindividual and business income taxes and financial transactions has also d treceived a great deal of attention. Hoping to promote domestic production conditions wereor foreign investment, many developing countries in the 1980s cobbled to- not sufficientlygether a welter of poorly designed or misguided investment incentives that .p .generated few benefits and lost revenue. These incentives were a natural s fictarget for reform. As capital markets developed in these countries duringthe 1980s, investors became more sensitive to differences in income taxrates-individual and corporate, within and across countries. Thus a rela-tively large number of conditions involved rate harmonization.
Since tax reform is futile if evasion is high, improved compliance was alsoa significant focus of reform in indirect taxes and individual and businessincome taxes. The focus on corporate compliance probably reflects the in-creasing importance of business taxes in the direct tax systems of most de-veloping countries and the fact that reducing evasion of business incometaxes is easier than reducing evasion of individual income taxes. (Condi-tionality involving compliance is discussed in detail in Chapter 4.)
56
About 5 percent of conditionality was aimed at eliminating nuisance taxes(stamp taxes, taxes on financial intermediaries) that fall outside the in-come tax system. These taxes are easy to enforce, but they distort capitalmarket activities.
Another 5 percent of conditionality was devoted to reforming property andwealth taxes, which take a lot of preparatory work to develop. In develop-ing countries, property and wealth are often undertaxed or not taxed at all,and neglect of this area has caused tax bases to evaporate in some countries.This area deserves more attention because some property taxes (such astaxes on land) can be very efficient and permit significant redistributionof income.
Examination of a sample of detailed conditions relating to specific nontradetax instruments confirms that these conditions were consistent with the re-form guidelines set forth in Lessons.
Because of the desirability of shifting taxation away from production towardconsumption and of limiting tax evasion, VAT conditions have been rela-tively popular. These conditions cover broadening the tax base, loweringrates, or moving toward full crediting of inputs. Most countries adopt valueadded taxes to replace sales or excise taxes, but administrative difficultiesusually require the introduction of a modified VAT that does not cover allstages of production. Conditionality ranges from specific, easily monitor-able conditions, such as the elimination of exemptions, to broader require-ments, such as the adoption of a VAT at the manufacturing level.
Most individual income tax conditions aim to reduce the efficiency lossesfrom high rates of taxation and the unequal tax treatment of similar formsof income. In most cases the magnitude of statutory reform is left up to thecountry, presumably in consultation with the Bank (or the IMF).
Business tax conditionality emphasizes reductions in tax rates, clarificationof deductions, and broadening of tax bases. In some inflationary economiesconditionality includes revaluation of balance sheet items. In many casesconditionality aims at harmonizing rates with those of capital-exportingcountries or harmonizing business and individual income taxes to eliminatetax arbitrage opportunities or double taxation of dividends. Conditions oninvestment incentives usually involve adopting a new investment code orrevising an old one that distorts investment incentives. In most cases, how-ever, the conditionality is vague. In no case does a president's report orletter of development policy refer to an underlying analysis of the costsand benefits of the incentives, or the cost-effectiveness of different formsof incentives.
Conditionality involving taxes on financial transactions aims to reduce taxa-tion of capital market activities, especially of financial intermediaries. Suchconditionality is usually reasonably well defined, in part because the taxesinvolved are simple.
Gaps in nontrade tax conditionality. Some areas of nontrade tax conditionalitythat have received inadequate attention in SALs/SECALs need to be revis-ited because they are likely to become important in the future (see Shome1992). These include:
* Investment incentives. The Bank has focused on the most egregiousinvestment incentives, while neglecting investment tax holidays and
57
tax credits (sometimes combined with accelerated depreciation allow-ances), which offer little marginal incentive to invest but manyopportunities for abuse and reduce tax revenues while increasingtheir variability.
* Taxation of global income. The prescription in Lessons advocating a movetoward a global income tax (one that taxes all forms and sources of Ad ustmentincome at the same rate) needs to be modified to take account of a )country's administrative capacity and the fact that some sources of in- loans did notcome (for example, farm incomes) may be hard to identify. A modified pay enoughschedular approach, such as that adopted in the Philippines, may per-mit the evolution of the system toward a global income tax as adminis- attention totration improves.7 some areas of
* Taxation of capital income. The taxation of interest is an unresolved issue. nontrade taxSome countries that fear capital flight do not tax interest income and conditionalityalso exempt dividends and capital gains at the personal income levelout of concern for equity and efficiency in the treatment of debt- andequity-based income. A related issue concerns the deductibility of inter-est expense in a system that does not tax interest income. Disallowanceputs purely domestic companies at a disadvantage relative to compa-nies that are able to deduct interest costs abroad on funds obtainedfrom foreign capital markets. Other unresolved issues concern the ap-propriate tax treatment of all forms of capital income. To promote effi-ciency and avoid capital flight requires low tax rates on capital income,but this limits the tax system's ability to redistribute income (since inmost countries capital income usually accrues to the highest-incomegroups). Further, fear of capital flight and the absence of any interna-tional mechanism for coordinating capital income taxation constraincountries from unilaterally moving toward more uniform tax treatmentof different forms of capital income and saving, resulting in efficiencyand revenue costs. Moreover, the lack of an international mechanismfor exchanging information about incomes of residents and foreign in-vestors makes evasion relatively easy.
* Taxation of thefinancial sector. SALs/SECALs have aimed to reduce oreliminate taxes on financial intermediaries because such taxes distortcapital market activities. In many countries, however, the financial sec-tor represents a growing and easily accessible tax base that cries out tobe tapped. Income taxes and the VAT are hard to apply because it is dif-ficult to measure net annual taxable income or sectoral value added;moreover, a tax on gross interest income receipts risks encouraging in-efficient intermediation. The challenge is to find a tax that neither sub-sidizes nor penalizes financial sector growth.
* Taxation of property (especially land). Although some SALs/SECALsdo incorporate conditions on property taxation, this remains a ne-glected area that is likely to become increasingly important if countriesmove toward greater fiscal decentralization and grapple with tax as-signment issues.
* Environmental taxes. The challenge for developing countries, particu-larly middle-income countries that are likely to consider such taxes inthe 1990s, is to identify environmental tax bases, devise proxy measuresfor environmental damage, and design taxes that are politically accept-able and induce changes in behavior.
58
Trade tax conditionality
Specificity. In contrast with the often imprecise nontrade tax conditionality,trade tax reform objectives have almost invariably been spelled out inclear-cut, quantified policy targets to be reached within a precise timeframe. For example, a country might be required to reduce its maximumtariff from 100 percent to 50 percent within the following year or to reducethe proportion of its imports subject to quantitative restrictions from 40percent to 10 percent within the next six months. When conditionality islaid out in such concrete policy steps, compliance is easy to monitor.
The goals of Content. Import conditions (57 percent of sample conditionality) clearlydominated trade conditionality (see Table 3.2 and Annex Table 3.4). They
trade tax reform involved:
were almostU Simplifying import licensing and removing QRs on imports and re-
always spelled placing them with tariffs ("stage 1" of the Bank's model reform pro-
out in clear-cut, cess).
quantified policy * Reducing the level and average dispersion of tariff rates ("stage 2" of
targets to be trade reform).
reached within * Reducing the number of tariff bands, applying the same rates to similar
a precise time commodities, and eliminating official reference prices.
frame One-fourth of trade conditionality covered exports. The Bank stipulated theremoval of quantitative restrictions on exports (bans and quotas) and theelimination of explicit and implicit export taxes (such as multiple exchangerates, export retention schemes, marketing board price controls). The re-moval of quantitative restrictions and export taxes reduces the anti-exportbias of trade regimes and may have revenue effects. Bank trade conditionsalso stipulated the introduction of drawback schemes to remove customsduties on intermediate and capital goods used in export production by allexporters (including indirect and partial).
Some 19 percent of trade conditionality related to revenue raising reforms,equalization of the domestic treatment of imports and import-competingproduction, customs reform to ensure equal treatment of sales and excisetaxes at the border, and improvements in customs procedures. Compensa-tory revenue measures were explicitly considered in the design of trade taxreform in only 33 percent of sample countries.
The Bank has generally promoted a consistent sequence of trade reform,with the removal of QRs (stage 1) usually preceding trade tax reform (stage2). Making the level of import protection and export taxation visible andmeasurable by replacing QRs with tariffs is a logical first step toward re-ducing the level and variability of taxation of both exports and imports.This sequenced approach to trade tax reform implies that the revenue ef-fects may be quite different depending on the stage of reform. On the ex-port side, removing QRs in countries that levy export taxes may have theeffect of raising revenues. On the import side, trade reform and revenue en-hancement go hand in hand in stage 1, as newly imposed tariffs absorbquota rents and transfer funds from quota recipients to the governmenttreasury. During this first stage of reform the absence of conflict betweentrade tax reform and revenue requirements implies that there is no compel-ling need to combine trade tax reform with nontrade tax reform.
59
TABLE 3.2: TRADE TAX CONDITIONALITY BY TYPE AND REGION
(percent of total conditionality)
Type of conditionality AFR LAC SAS EAP MNA All regions
Export' 24 29 9 38 0 24Import 61 58 64 46 57 57Revenue, harmonization,
and customs reform 15 13 27 15 43 19
a. Includes export subsidy conditions for Cote d'Ivoire, which attempted to implementa uniform export subsidy and a uniform tariff to simulate a devaluation in the absenceof the exchange rate instrument, and Costa Rica, which eliminated export subsidies asdevaluation occurred.Source: Sample of 87 loans from ALCID.
Matters become more complicated during stage 2. Lower export taxes andtariff levels will usually result in lower revenues. Governments need to an-ticipate these effects by adopting compensatory revenue measures (see thesection on effectiveness of trade reform).
How well designed were the Bank's trade tax conditionalities? On the basisof a study by Rajaram (1992) of the Bank's performance in trade reform in 12countries before 1987, this study concludes that the Bank's record in design-ing trade reform has improved, though problems remain. The Rajaram studyconcluded that the Bank's performance in ensuring that the revenue effects oftrade tax measures were reflected in the design of trade taxes was extremelyuneven (see also Mitra 1992). Only in a few cases did the Bank make specificrecommendations on adjusting the country's indirect tax system to compen-sate for the revenue loss expected to accompany trade reform. Rajaram alsofound that the Bank's trade reform proposals paid insufficient attention tothe coordination of trade reform and complementary tax reforms. As a result,several Bank borrowers failed to reduce their reliance on trade taxes for rev-enue purposes.8
This study finds tlhat in 8 of 18 countries (in the study's trade reform sampleof 23 countries) in which conditionalities affected revenues, trade reforms The Bankwere accompanied by (sometimes partially) compensatory tax reform mea-sures. In as many as 10 countries, however, revenue issues were completely generallyneglected.9 This neglect was evident in the case of both import duties and ex-port taxes. Moreover, the removal of unequal tax burdens imposed by salesand excise taxes on imports and domestic production was addressed in only consistent12 of 23 countries (see Table 3.3). sequence of
Revenue factors and harmonization of the impact of indirect and trade taxes trade reformon domestic production and imports may not be the only impediments totrade tax reform. Few PRs examine ways of dealing with the losers in tradereform. Resistance to tariff cuts can be softened by providing adjustment as-sistance for injured parties and allowing producers adequate time to adjustto the new policy environment."0 The need for adjustment assistance was ig-nored in all Bank SALs/SECALs except those in Ghana, Mauritius, Mexico,and Nigeria. Moreover, the one- to two-year period of adjustment appearsto have been insufficient. The Philippines' experience suggests that in somecountries a longer period may have been necessary. An early trade reformeffort in the Philippines failed because of political opposition; a subsequentand so far more successful trade reform program envisages less rapid adjust-ment stretching over five years.
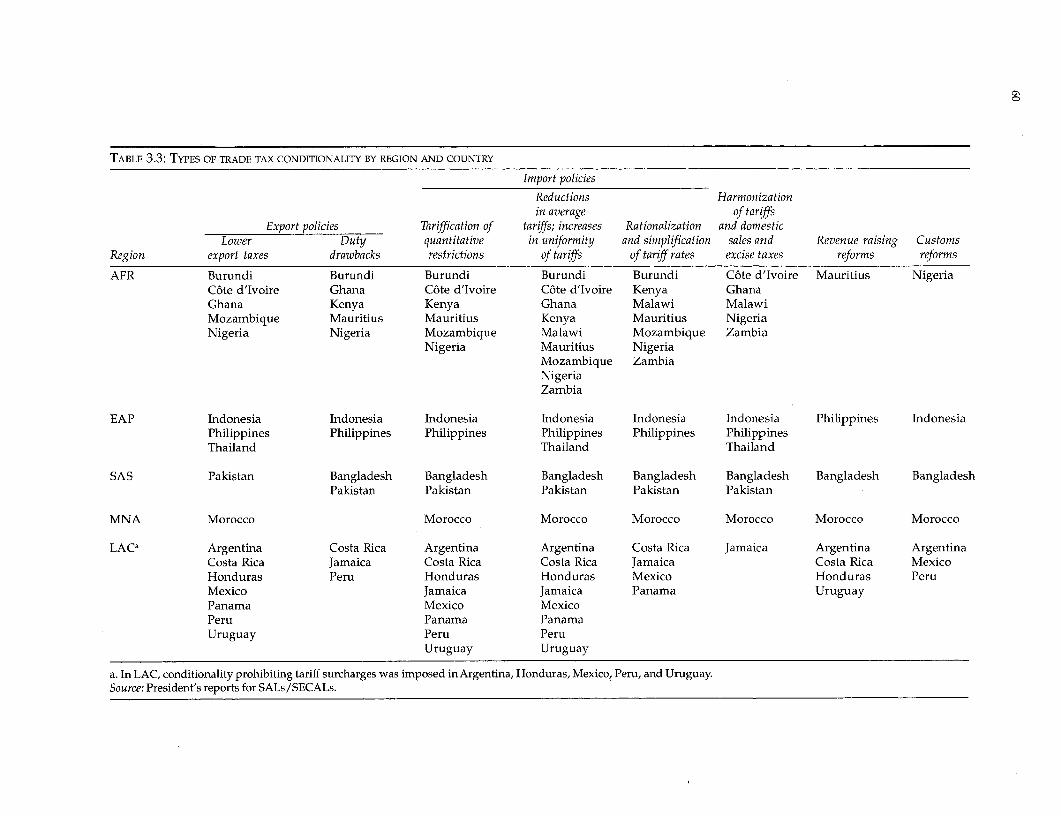
0
TABLE 3.3: TYPES OP TRADE TAX CONDITIONALITY BY REGION AND COUNTRY
Import policies
Reductions Harmonizationin average of tariffs
Export policies Tariffication of tariffs; increases Rationalization and domesticLower Duty quantitative in uniformity and simplification sales and Revenue raising Customs
Region export taxes drawbacks restrictions of tariffs of tariff rates excise taxes reforms reforms
AFR Burundi Burundi Burundi Burundi Burundi C6te d'Ivoire Mauritius NigeriaC6te d'Ivoire Ghana C6te d'Ivoire C6te d'Ivoire Kenya GhanaGhana Kenya Kenya Ghana Malawi MalawiMozambique Mauritius Mauritius Kenya Mauritius NigeriaNigeria Nigeria Mozambique Malawi Mozambique Zambia
Nigeria Mauritius NigeriaMozambique ZambiaNigeriaZambia
EAP Indonesia Indonesia Indonesia Indonesia Indonesia Indonesia Philippines IndonesiaPhilippines Philippines Philippines Philippines Philippines PhilippinesThailand Thailand Thailand
SAS Pakistan Bangladesh Bangladesh Bangladesh Bangladesh Bangladesh Bangladesh BangladeshPakistan Pakistan Pakistan Pakistan Pakistan
MNA Morocco Morocco Morocco Morocco Morocco Morocco Morocco
LACa Argentina Costa Rica Argentina Argentina Costa Rica Jamaica Argentina ArgentinaCosta Rica Jamaica Costa Rica Costa Rica Jamaica Costa Rica MexicoHonduras Peru Honduras Honduras Mexico Honduras PeruMexico Jamaica Jamaica Panama UruguayPanama Mexico MexicoPeru Panama PanamaUruguay Peru Peru
Uruguay Uruguay
a. In LAC, conditionality prohibiting tariff surcharges was imposed in Argentina, Honduras, Mexico, Peru, and Uruguay.Source: President's reports for SALs/SECALs.

61
How successfully were tax conditionalities implemented?
The Bank assesses the implementation of tax conditionality in its PCRs/PARs by examining statutory compliance with conditionality. Compliancewith trade tax conditionalities appears to have been better than compliance Nontrade taxwith nontrade tax conditionalities.
conditionsReview of a sample of PCRs/PARs on 35 of the 92 SALs/SECALs that incor- ot lakedporated nontrade tax conditions reveals that over half (52 percent) of condi- Often acketions were fully implemented, about a third (34 percent) were partially quantitativeimplemented, and 14 percent were not implemented (see Annex Table 2.5). and qualitativeHowever, even though 85 percent of conditions were either fully or partiallyimplemented, it is difficult to assess what was actually achieved because 60 criteria, makingpercent lacked both quantitative and qualitative criteria (see section on preci- it difficult tosion of nontrade tax conditionality).
assess what wasLack of success was not confined to any particular region or income group.In most countries in which conditionalities were not fully implemented, tax achievedreform was an insignificant element in the loans. While usually a small ele-ment in SALs and SECALs, tax policy appears to be better integrated in thosewith a greater macroeconomic focus (for example, financial sector and publicsector management) than in SECALs dealing with narrower sectoral issuessuch as agriculture or industry Such narrow SECALs were overrepresentedin the partial success/failure group.
Analysis of president's reports and project completion and performance au-dit reports for a sample of SALs/SECALs for 23 countries with trade reformconditionalities suggests that the Bank's record in obtaining compliance withcommitments to dismantle trade barriers has been impressive. All 16 coun-tries in which the Bank sought either to reduce or to eliminate export taxesdid so. With the possible exception of Bangladesh, every country that com-mitted itself to replacing QRs with tariffs did so. In 22 out of 23 countries,progress was made toward reducing both the average tariff level and the dis-persion in tariff rates. Conditionalities to rationalize tariff structures, reduceimport exemptions, introduce new or improved duty drawback proceduresfor exports, apply export subsidies, or reform customs procedures have beenconsistently met, although the quality of these adjustments varied. Finally,customs reform complemented trade reform in all seven countries in whichcustoms reform conditionality was stipulated. Such reform has included im-proving valuation procedures, cutting red tape and speeding up clearingprocedures, and enhancing revenue collection.
How effective was tax reform?
The Bank's PCRs/PARs have tended to assess efficacy in terms of statu-tory compliance. Assessing statutory compliance is at best a first cut, how-ever. Translating a country's tax statutes into economically effective provi-sions may founder at various stages: most tax code changes need to beadopted as administrative laws or regulations, tax legislation has to survivethe test of the law courts, administrative structures need to be created toimplement the laws, and the tax administration has to enforce the laws andregulations. Moreover, when conditionality is vague, compliance may havelittle real effect.
Shifts in tax structure are another broad indicator of tax reform. Table 3.4 in-dicates the shifts in tax structure that took place by the postadjustment pe-
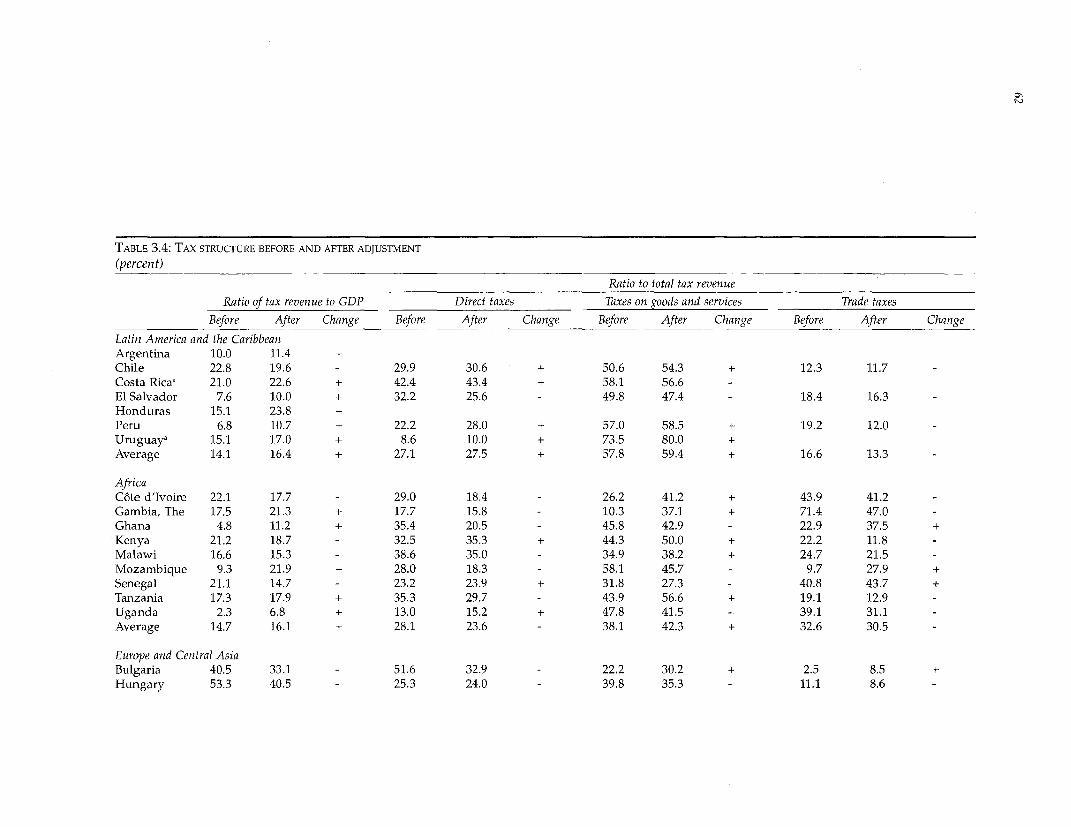
TABLE 3.4: TAX STRUCTURE BEFORE AND AFTER ADJUSTMENT
(percent)
Ratio to total tax revenue
Ratio of tax revenue to GDP Direct taxes Taxes on goods and services Trade taxes
Before After Change Before After Change Before After Change Before After Change
Latin America and the CaribbeanArgentina 10.0 11.4 +Chile 22.8 19.6 - 29.9 30.6 + 50.6 54.3 + 12.3 11.7 -
Costa Ricaa 21.0 22.6 + 42.4 43.4 + 58.1 56.6El Salvador 7.6 10.0 + 32.2 25.6 - 49.8 47.4 - 18.4 16.3 -
Honduras 15.1 23.8 +Peru 6.8 10.7 + 22.2 28.0 + 57.0 58.5 + 19.2 12.0 -
Uruguaya 15.1 17.0 + 8.6 10.0 + 73.5 80.0 +Average 14.1 16.4 + 27.1 27.5 + 57.8 59.4 + 16.6 13.3 -
AfricaC6te d'Ivoire 22.1 17.7 - 29.0 18.4 - 26.2 41.2 + 43.9 41.2 -
Gambia, The 17.5 21.3 + 17.7 15.8 - 10.3 37.1 + 71.4 47.0 -
Ghana 4.8 11.2 + 35.4 20.5 - 45.8 42.9 - 22.9 37.5 +
Kenya 21.2 18.7 - 32.5 35.3 + 44.3 50.0 + 22.2 11.8Malawi 16.6 15.3 - 38.6 35.0 - 34.9 38.2 + 24.7 21.5Mozambique 9.3 21.9 + 28.0 18.3 - 58.1 45.7 - 9.7 27.9 +
Senegal 21.1 14.7 - 23.2 23.9 + 31.8 27.3 - 40.8 43.7 +
Tanzania 17.3 17.9 + 35.3 29.7 - 43.9 56.6 + 19.1 12.9Uganda 2.3 6.8 + 13.0 15.2 + 47.8 41.5 - 39.1 31.1Average 14.7 16.1 + 28.1 23.6 - 38.1 42.3 + 32.6 30.5
Europe and Central AsiaBulgaria 40.5 33.1 - 51.6 32.9 - 22.2 30.2 + 2.5 8.5 +
Hungary 53.3 40.5 - 25.3 24.0 - 39.8 35.3 - 11.1 8.6
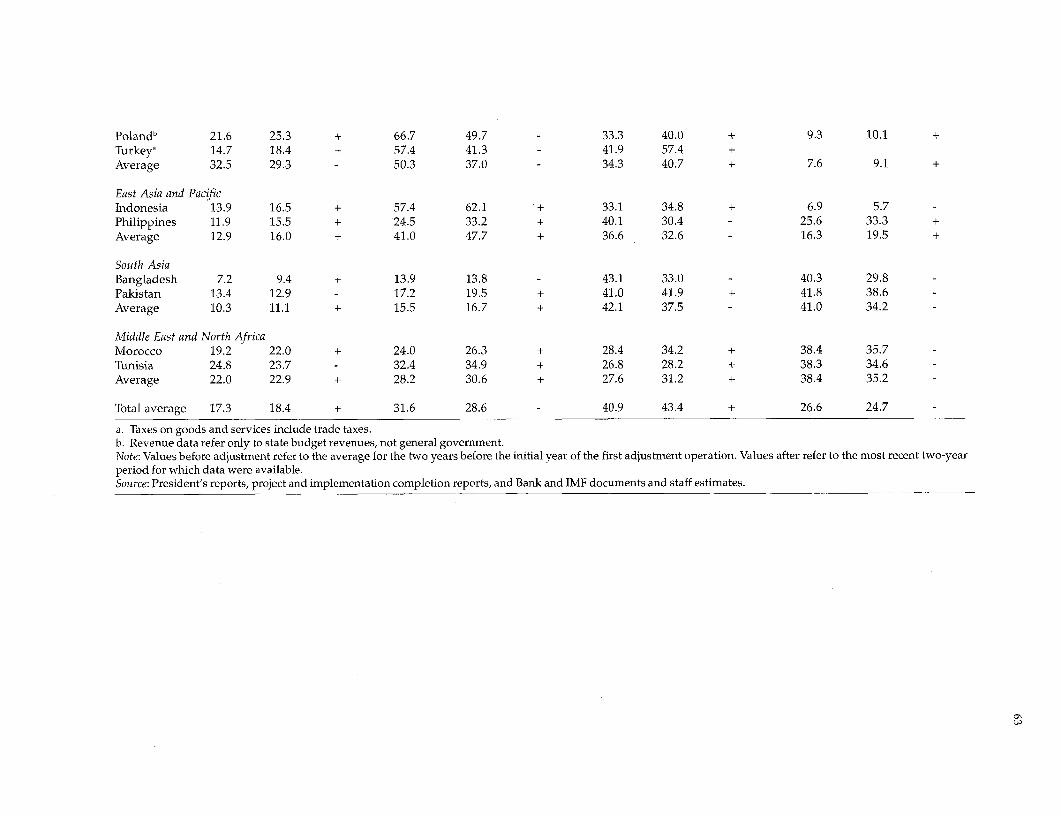
Polandb 21.6 25.3 + 66.7 49.7 - 33.3 40.0 + 9.3 10.1 +Turkey, 14.7 18.4 + 57.4 41.3 41.9 57.4 +Average 32.5 29.3 - 50.3 37.0 - 34.3 40.7 + 7.6 9.1 +
East Asia and PacificIndonesia 13.9 16.5 + 57.4 62.1 + 33.1 34.8 + 6.9 5.7Philippines 11.9 15.5 + 24.5 33.2 + 40.1 30.4 - 25.6 33.3 +Average 12.9 16.0 + 41.0 47.7 + 36.6 32.6 - 16.3 19.5 +
South AsiaBangladesh 7.2 9.4 + 13.9 13.8 - 43.1 33.0 - 40.3 29.8Pakistan 13.4 12.9 - 17.2 19.5 + 41.0 41.9 + 41.8 38.6Average 10.3 11.1 + 15.5 16.7 + 42.1 37.5 - 41.0 34.2
Middle East and North AfricaMorocco 19.2 22.0 + 24.0 26.3 + 28.4 34.2 + 38.4 35.7Tunisia 24.8 23.7 - 32.4 34.9 + 26.8 28.2 + 38.3 34.6Average 22.0 22.9 + 28.2 30.6 + 27.6 31.2 + 38.4 35.2
Total average 17.3 18.4 + 31.6 28.6 - 40.9 43.4 + 26.6 24.7
a. Taxes on goods and services include trade taxes.b. Revenue data refer only to state budget revenues, not general government.Note: Values before adjustment refer to the average for the two years before the initial year of the first adjustment operation. Values after refer to the most recent two-yearperiod for which data were available.Source: President's reports, project and implementation completion reports, and Bank and IMF documents and staff estimates.
wN
64
riod in 26 countries for which detailed revenue data were available. Overallreliance on trade taxes diminished (from 27 to 25 percent) while reliance onindirect taxes increased (from 41 to 43 percent) in all regions except EAP. Thenumber of countries that experienced shifts is significant: 15 out of 21 coun-tries lowered their reliance on trade taxes, and 15 out of 24 countries in-creased their reliance on indirect taxes. The share of direct taxes dropped inAFR and ECA, perhaps because direct taxes are easier to evade. These shiftsin broad tax categories are confirmed by the shifts in tax structure that oc-curred between 1980 and 1993 across regions and income groups in a largersample of countries drawn from the World Development Report 1995 database(see Annex Table 3.2). Although these shifts are consistent with reform, theeffects of reform cannot be isolated: other factors, including recession and in-flation, may have played a role.
Although few SALs/SECALs called for tax rate increases, changes in taxstructure have led to increases in tax revenues as a share of GDP across re-gions: conditionality on revenue increases was incorporated in the adjust-ment programs of 26 countries. Differences in ratios of average revenue toGDP before and after adjustment (typically the year prior to approval of thefirst SAL/SECAL and the two most recent years for which data are available)were used to assess whether these countries took action to increase revenueperformance. Revenues rose in 17 (65 percent) of the countries and declinedin 9 (Table 3.5).11 Success may have come easily in 5 of the 17 countries be-cause of very low pre-adjustment ratios. Moreover, in Bangladesh, Hungary,Pakistan, the Philippines, and Uganda the revenue increase was below ex-pectations. In some countries, tax efficiency problems are still acute (CostaRica, Honduras, the Philippines). In the nine countries where revenues de-clined, weaknesses in tax administration and failure to foresee the full extentof the revenue losses from trade and to devise compensatory nontax revenuemeasures during adjustment were largely responsible for the declines. An-other factor was the Bank's decision to leave tax policy and tax administra-tion reform issues to the Fund, particularly in the early years, in Bulgaria,C6te d'Ivoire, and Uganda.
Did tax reform improve efficiency by reducing excess burden and adminis-Ratios of tax trative and compliance costs (see subsection on principles of tax reform)?
There is no quick or easy way to quantify the reduction in excess burdenrevenues to or to compare differences across countries. But it is possible to determine
GDP have whether reform has moved the tax system in the right direction by estimat-n r 11 ing marginal effective tax rates (as a proxy for the change in excess burden)
generally and by assessing their variance across different types of investments, savings
increased, and instruments, and intermediaries. Although there are differences of opinionon the appropriate methodology for these measures, using the same method-
tax structures ology over time should provide a rough measure of the tax system's impact
have shifted in on resource allocation. 2 Administrative and compliance costs can also betracked using the types of indicators in the checklist in Chapter 4 (see Annex
the right 4). While many of these more informative measures are used in the Bank's re-
direction ports on economic and sector work (ESW) and in conducting its dialoguewith governments, they have not been used in evaluating conditionality.
Assessing the efficacy of tax reform in countries that have received multipleSALs raises other issues. Tax reform is usually an ongoing process, with re-forms in one period leading to reforms in subsequent periods. In the absenceof in-depth studies of these multiple SALs, this study judges efficacy by therecord on statutory compliance and revenue performance. Two broad gener-alizations may be made. First, success has been most evident where the Bankhas played a continuing role in reform, where better tax administration has

65
TABLE 3.5: DIAGNOSIS OF NEED FOR REVENUE REFORM AND PERFORMANCE
Revenue performance
Diagnosis Revenue increased Revenue decreased
17 countries 9 countriesIncrease AFR LAC AFR LACrevenue The Gambia, Argentina,a C6te d'Ivoire, Venezuela(26 countries) Ghana, Mozam- Costa Rica, Kenya,
bique, Tanzania, El Salvador, Malawi,bUganda Honduras, Senegal
Peru, Uruguay
EAP MNA EAP MNAPhilippines Morocco Indonesia Tunisia
ECA SAS ECAPoland, Turkey Bangladesh, Bulgaria,
Pakistan Hungary
Decreaserevenue
a. Adjustment period performance was compared with the postadjustment perfor-mance because consistent data were unavailable for the preadjustment period.b. In Malawi, revenues in the post-adjustment period were affected by the 1992drought.Source: President's reports, project and implementation completion reports, and Bankand IMF documents and staff estimates.
been part of the reform package, and where governments have been commit-ted to the goals of reform (as in Malawi).
Where the Bank has been only peripherally involved and where tax adminis-tration reforms have not been central to reform, performance has been muchworse (as in the Philippines). Second, success has been more easily attainedin reform of indirect taxation, where the Bank's efforts have been concen-trated, than in reform of individual income taxation. This result is due to theimportance of indirect taxes and to the fact that direct tax reforms encountergreater political resistance and require greater tax administration effort. Sev-eral countries in LAC (Bolivia, Mexico, Peru) abandoned traditional corpo-rate and personal income tax systems in favor of presumptive methods oftaxation and withholding.
Two measures have been used to measure the efficacy of trade tax reform: acountry's ability to wean itself away from tariffs as a source of revenue, anda country's ability to implement both stage 1 and stage 2 reforms (see sectionon content of trade tax conditionality). With these criteria in mind, the coun-tries in the sample can be divided into four groups (see Table 3.6):
* Successful adjusters, which do not now use tariffs for revenue reasons andwhich have navigated their way through both stages of trade tax reform.
* Erratic trade adjusters, which have completed the first stage of reformand have gone part way through the second stage but have had signifi-cant policy reversals as a result of revenue declines.
* Limited trade tax adjusters, which are stuck at the first stage of reform.
* Nonadjusters.
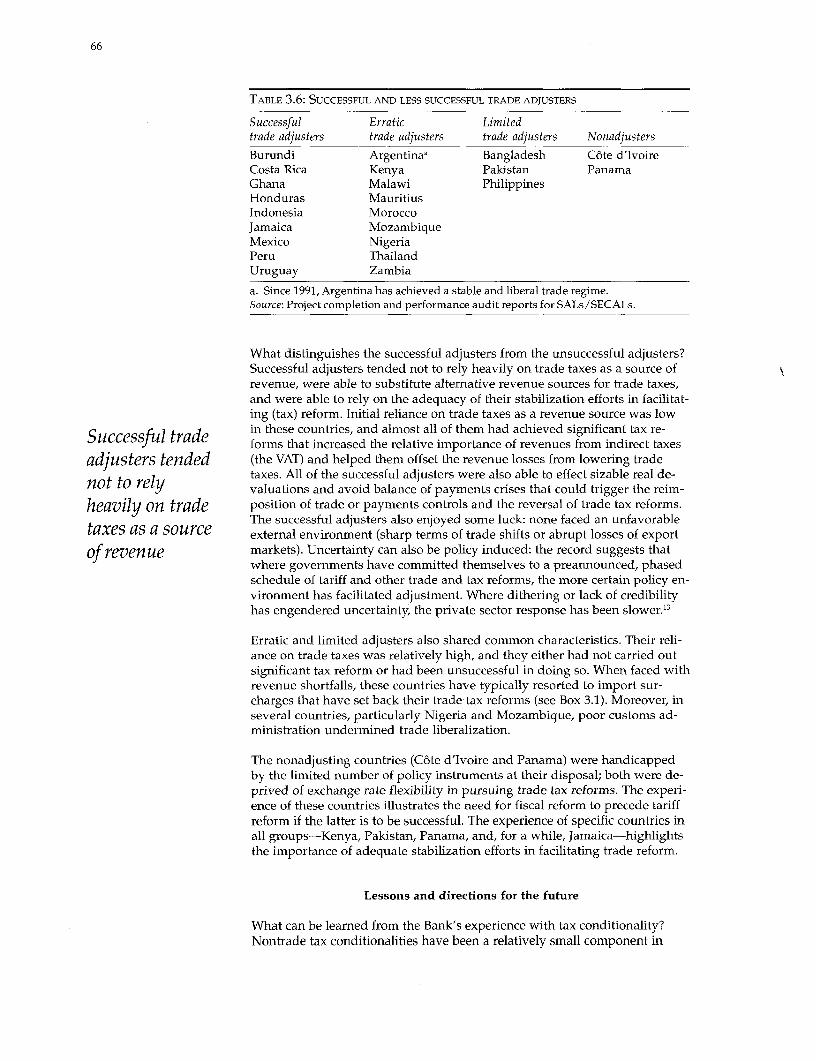
66
TABLE 3.6: SUCCESSFUL AND LESS SUCCESSFUL TRADE ADJUSTERS
Successful Erratic Limitedtrade adjusters trade adjusters trade adjusters Nonadjusters
Burundi Argentinaa Bangladesh Cote d'IvoireCosta Rica Kenya Pakistan PanamaGhana Malawi PhilippinesHonduras MauritiusIndonesia MoroccoJamaica MozambiqueMexico NigeriaPeru ThailandUruguay Zambia
a. Since 1991, Argentina has achieved a stable and liberal trade regime.Source: Project completion and performance audit reports for SALs/SECALs.
What distinguishes the successful adjusters from the unsuccessful adjusters?Successful adjusters tended not to rely heavily on trade taxes as a source ofrevenue, were able to substitute alternative revenue sources for trade taxes,and were able to rely on the adequacy of their stabilization efforts in facilitat-ing (tax) reform. Initial reliance on trade taxes as a revenue source was low
Successful trade in these countries, and almost all of them had achieved significant tax re-forms that increased the relative importance of revenues from indirect taxes
adjusters tended (the VAT) and helped them offset the revenue losses from lowering tradetaxes. All of the successful adjusters were also able to effect sizable real de-
not to rely valuations and avoid balance of payments crises that could trigger the reim-
heavily on trade position of trade or payments controls and the reversal of trade tax reforms.The successful adjusters also enjoyed some luck: none faced an unfavorable
taxes as a source external environment (sharp terms of trade shifts or abrupt losses of export
of revenue markets). Uncertainty can also be policy induced: the record suggests thatwhere governments have committed themselves to a preannounced, phasedschedule of tariff and other trade and tax reforms, the more certain policy en-vironment has facilitated adjustment. Where dithering or lack of credibilityhas engendered uncertainty, the private sector response has been slower.1 3
Erratic and limited adjusters also shared common characteristics. Their reli-ance on trade taxes was relatively high, and they either had not carried outsignificant tax reform or had been unsuccessful in doing so. When faced withrevenue shortfalls, these countries have typically resorted to import sur-charges that have set back their trade tax reforms (see Box 3.1). Moreover, inseveral countries, particularly Nigeria and Mozambique, poor customs ad-ministration undermined trade liberalization.
The nonadjusting countries (Cote d'Ivoire and Panama) were handicappedby the limited number of policy instruments at their disposal; both were de-prived of exchange rate flexibility in pursuing trade tax reforms. The experi-ence of these countries illustrates the need for fiscal reform to precede tariffreform if the latter is to be successful. The experience of specific countries inall groups-Kenya, Pakistan, Panama, and, for a while, Jamaica-highlightsthe importance of adequate stabilization efforts in facilitating trade reform.
Lessons and directions for the future
What can be learned from the Bank's experience with tax conditionality?Nontrade tax conditionalities have been a relatively small component in
67
Box 3.1: FISCAL REFORM NEEDS TO PRECEDE TARIFF REFORM
The experience of Kenya and Jamaica illustrates the need for fiscal reformsto precede tariff reforms. In Kenya most of the trade liberalization achievedunder ffie SALs of the 1980s was reversed by the end of the decade, largelybecause of failure to achieve macro stabilization- Kenya removed quantita-five restrictions before it devalued the shilling, but balance of paymentsproblems forced it to reimpose trade controls. Between 1979 and 1989Kenya's export to GDP ratio declined from 20 percent to 12 percent. How-ever, under the 1991 Export Development Loan. Kenya successfully deval-ued in 1993 and began to beralize its trade regime. It replaced ahnost all itsQRs with equivalent or lower tariffs, lowering the average tariff level from50 percent to 33 percent and reducing tariff dispersion. Revenue losses wereso large, however, that the government felt compelled to raise all rates by 25percent, and the average tariff rate now stands at 40 percent. The govern-ment plans to compensate for the revenue loss by eventually increasing VATrates and coverage.
For revenue reasons Jamaica failed to meet most of the trade tax conditional-ity in its SALs between 1981 and 1984. Only under the 1987 Trade and Fi-nancial Sector Adjustment Loan (TMAL) did Jamaica begin to relax some ofits QRs and to lower tariff levels. A major tax reform also began to bear fruitat that trme~ The pace of trade reform began to pick up in 1991 under a sec-ond TFSAL. Jamaica took the lead in negotiating a new CARICOM agree-ment, which calls for three-stage reductions in-tariffs to a 5 to 20 percentrange by 1997. Jamaica has also opted for the fast track in reaching this tarifftarget before 1997. There is no doubt that the success of Jamaica's new VAThas given it the revenue space it needed to reduce its reliance on trade taxes.Between 1986 and 1992, when the contribution of import duties to total rev-enue fell from 36 percent to 10 percent, taxes as a share of GD1P rose from 21percent to 29 percent, largely as a result of the new VAT.
SALs, and their incidence in SALs/SECALs appears to have been on thewane since 1992. Reform also has tended to be piecemeal. The literature ontax reform in developing countries confirms that "comprehensive tax re-forms, in which all or many components of a country's tax system are ad-justed simultaneously, are a relatively rare occurrence" (Thirsk forthcom-ing). Comprehensive reform is rare because the political process in mostcountries is better able to deal with marginal reform than with wholesale re-form. The lack of emphasis on comprehensive reform in the Bank's SALs/SECALs reflects both recognition of the difficulty of comprehensive tax re-form and deference to the IMF in the area of tax reform. The division of rolesbetween the IMF and the Bank has gradually crystallized since a formal un-derstanding (the Concordat) was reached in March 1989 on Bank-IMF col-laboration. The Bank's Policy Research Department has withdrawn from taxwork since October 1994 and now focuses almost entirely on public expen-diture issues (see subsection on general issues that need attention under"Lessons" in Chapter 2).
As a result, the Bank devotes limited attention to research on evolving taxissues for developing countries, although cross-country studies by the Bankin the past generated much of the available documentation on "best prac-tice." Such research, enormously useful for practitioners in developingcountries, does not normally attract academic scholars, and the Bank mayhave a role to play here in the future. The Bank should complement theFund's shorter-term research efforts with longer-term evaluation of cross-
68
country experiences and with empirical research on special topics that arelikely to be important in the future (environmental taxes, decentralization ofrevenue authority, taxation of the financial sector, consumption-based busi-ness taxes, presumptive taxation methods, rate of return taxes for naturalresources). A cooperative approach to such research by the two institutionswould help avoid overlapping work (see subsection on larger issues inChapter 6).
PCRs/PARs have not proved to be appropriate for evaluating tax reforms.Assessing the efficacy of Bank tax conditionality, particularly in countrieswith multiple SALs, with a view to drawing lessons for the future requiresin-depth studies of specific country tax experiences, rather than general mac-roeconomic evaluations of individual SALs/SECALs.
The different components of tax reform need to be properly sequenced. If ex-port taxes or import tariffs contribute significantly to total revenues, tax re-form should precede tariff reform. Reforms in tax administration need to beclosely sequenced with tax policy reform. In general, tax administration re-form should either precede or accompany the structural reform of tax policy:there is no point in reforming tax structure if tax administration is poor.
In the area of nontrade taxes, some reforms (involving investment incentives,for example) need to be buttressed by better analysis and pushed further.Other reforms-including taxation of the financial sector, particularly inhigh-inflation economies; environmental taxes; and property taxes, particu-larly as fiscal decentralization advances-need to be emphasized becausethey are likely to assume greater importance in the future. Possible reformsneed to be examined in other areas-such as the use of schedular taxes withan emphasis on withholding because of the difficulties of implementing theglobal income tax, and the treatment of capital income in countries that arebeing increasingly drawn into global capital markets.
Conditionality on nontrade tax reform needs to be more precisely structured.Both the design and the evaluation of nontrade tax reform would benefit ifbetter analysis and performance indicators were built into reform programsfrom the beginning. Such indicators include marginal effective tax rates andsuch compliance indicators as arrears collected, penalties, and revenues col-lected relative to forecasts (see also Chapter 4 and Annex 4).
In trade tax reform, the design of Bank loans needs to take better account ofrevenue effects. It also needs to ensure that sales and excise taxes apply withequal force to imports and to domestic sales.
Two neglected aspects of trade tax conditionality are the need to compensatelosers and the appropriate adjustment period. The experience of the erraticand limited adjusters suggests that policy reversals may be avoided if adjust-ment assistance in the form of retraining or retooling is provided and the ad-justment period is extended to five years (rather than the traditional one totwo years).14
Notes
1. This chapter is based on an internal background paper written by Wayne Thirsk andHarry Watson in 1995. Both the paper and this chapter take as their starting point thediscussion of the mnicroeconomic aspects of fiscal reforms in Structural and SectoralAdjustment:World Bank Experience, 1980-92 (Jayarajah and Branson 1995). The ideas
69
contained in this volume are amplified in this chapter and validated against a largersample of Bank SALs/SECALs.2. See Annex 3 on choosing instruments in line with these principles.3. Such misallocation occurs when taxation induces taxpayers to make substitutionsalong a number of margins, including consumption, savings, and investment decisions:savings-consumption tradeoffs, labor-leisure tradeoffs, and portfolio decisions.4. The simplicity principle seems to fly in the face of the optimal tax literature, whichsuggests that the tax structure that minimizes the excess burden of taxation (and alsorespects society's vertical equity norms) is likely to be based on a nonuniform patternof tax rates. However, establishing such an optimal tax framework is difficult becauseof daunting informational requirements, the difficulties of identifying society's socialwelfare function, the likelihood that differentiated tax rates will encourage inefficientrent seeking activities and will be less politically acceptable than uniform rates, and thefact that tax administrations may not be perfect.5. Of the total of about 250 adjustment operations (in 86 countries) that incorporatedfiscal reforms during FY79-94, trade tax conditionality was included in 171 operationsin 75 countries. The sample therefore represents 50 percent of all operations and 31percent of all countries involved in trade tax reform between 1980 and 1993.6. "Collectibility," or the ease of revenue collection, has also been a factor in the choiceof tax instruments. Here such cultural factors as literacy rates and public attitudes to-ward taxes also play a role. See Annex 4.7. Several developing countries, such as the Philippines, have settled on a compromisethat partitions the income tax system into four components, or schedules: a progressivetax on labor incomes withheld at source, a final flat withholding tax on interest anddividend payments, a flat corporate income tax, and a progressive tax on net businessincomes of unincorporated enterprises. Withholding labor and capital income gener-ates timely tax payments, eliminates the need for taxpayers to file tax returns, and al-lows the tax administration to focus on the business sector. This four-pronged ap-proach works better when tax rates are aligned for similar levels of income earned aseither labor or business income because it removes the incentive to represent income inits most tax-favored form. As administrative capacity improves, the approach permitsthe evolution of the system toward a global tax: the final tax on dividends and interestcan eventually be transformed into a creditable tax that effectively integrates the treat-ment of capital incomes at the business and personal levels. However, this four-pronged approach has pitfalls-inefficiencies may result if similar activities do not facethe same tax rate. Countries that have implemented the system with significantly mis-aligned tax rates, such as the Philippines, may have created efficiency losses.8. Predicting the revenue effects of trade tax measures is not easy. Much depends oninitial conditions (whether tariffs were actually paid or avoided) and the impacts ofchanges in exchange rates and tariff rates on imports of different goods.9. In a few of these cases, neglect reflected the inconsequential revenue effects of tradereforms or the presence of well-functioning VATs capable of replenishing revenuelosses from trade reform.10. A counterargument is that if the adjustment period is too long, it gives producerssufficient time to mobilize effective political opposition. For this reason policymakersin Mexico argued for a shock approach to tariff reform.11. This definition of the pre-adjustment period differs from the definition adopted inchapters 1 and 6, which look at the four-year period prior to the initial year of the firstloan. The difference in approach is due to differences in data availability and to differ-ences in data sources: the data in this chapter are drawn largely from Bank and Funddocuments and staff estimates; the data in chapters 1 and 6 are drawn from IMF andBank databases.12. Measuring marginal effective tax rates is a natural extension of the Bank's effortsto measure changes in the level and dispersion of effective rates of import tariff protec-tion. Although both approaches have their limitations-marginal effective tax ratestypically assume perfect tax administration, perfect competition, and perfect certainty,while effective protection rates are grounded in market prices rather than shadowprices-both offer reasonable first approximations as to whether policy reforms aremoving in the right direction.13. In Cote d'Ivoire, for example, the export subsidy policy failed to induce investmentin export activities because the private sector correctly perceived that the subsidywould not materialize. In Pakistan, where tariff reform conflicted with the goal of fiscal
70
deficit cuts, the business community, aware that tariff and tax reforms go hand in hand,fell prey to investment uncertainty.14. More recent SALs appear to have recognized the need for longer adjustment peri-ods: the last round of trade reform in Jamaica, Pakistan, and the Philippines providedfor adjustment periods of four years or more.

FISCAL MANAGEMENT INADJUSTMENT LENDING
4. Tax administration reform
What the study found
The Bank has recognized the need to buttress tax reforms with reforms intax administration since the early 1980s. However, the overall record stillsuggests piecemeal reform-isolated measures that do not add up to acomprehensive effort grounded in a definite reform strategy. Some SALs/SECALs recognized the need for improvements in tax administration. Buteven among these, analysis and strategy were either perfunctory or totallylacking in the early loans, and conditionality was therefore weak or nonex-istent. Only in the later loans were tax administration issues addressed, usu-ally in response to revenue pressures. About a fifth of conditionality wasgeneral or nonspecific about the measures to be applied, and only about 40percent was couched in precise terms. Areas that warrant attention includethe creation of a conducive environment (particularly a legal environment);education of taxpayers; estimation methods; audits; VAT administration;withholding and presumptive taxation; the planning, organization, andstaffing of information systems; and pay structures.
PCRs/PARs that tracked the implementation of conditionality pronouncedcompliance to be high, but given the paucity of monitorable indicators, suchfindings are difficult to assess. Moreover, most evaluations did not track theoutcomes of tax administration reforms. The most common yardstick usedto evaluate tax administration reform was the tax-to-GDP ratio, even thoughmany factors other than tax administration affect tax collection. A few evalu-ations focused on increases in tariff collection, attributing them to improve-ments in customs procedures and administration; others focused on a fewintermediate output indicators (for example, increases in the number of tax-payers); and a handful referred to actions involving inputs (for example,drafting of tax legislation). As with nontrade tax reform, imprecision anda paucity of monitorable indicators impaired the quality of tax administra-tion conditionality.
The ends and means of tax administration reform
The Bank's involvement in tax administration has increased significantlysince 1987. But unlike in the area of tax policy, where the Bank has spelledout generally accepted principles in an accessible handbook-Lessons-reviewed by the Bank's Board, in tax administration reform no guidelineshave been formally articulated. This chapter briefly summarizes the reformmeasures that have been endorsed in the literature and that should serve asbenchmarks for the evaluation of the tax administration reform (TAR) incor-porated in SALs/SECALs.' (See Annex 4 for a checklist for formulatingstrategies for tax administration reform.)
71
72
The literature on tax administration sets forth several goals for reform:
* Reduce the costs of taxpayer compliance.
* Raise the costs of taxpayer noncompliance.
* Increase the efficiency with which tax laws are enforced.
To achieve these goals, TAR must articulate a strategy that includes a "com-prehensive plan that assigns clear prior-ities to the tasks that must be per-formed, tailored to the available resources" (Bird and Casanegra de Jantscher1992). The reform must also focus on some key functional areas and support-ing measures. The six key areas are taxpayer compliance, enumeration of tax-payers, estimation of taxable income, collection of taxes, enforcement of taxregulations, and the organization of the tax authority.
Improving taxpayer compliance
TAR usually aims to simplify the tax system so that it can be applied effec-tively. Moderating tax rates reduces compliance costs, while reducing thenumber of exemptions and discretionary elements in the tax code eliminatesopportunities for tax evasion and thus increases compliance. Eliminating op-
Measures such as portunities for collusion between taxpayers and tax collectors by switching
simplifying tax from an official assessment system to a self-assessment one may also increaseyy ~~~compliance.
laws,forms, andprocedures can Compliance is less burdensome when tax laws are simple and taxpayers do
not need the help of tax specialists to file returns. Simplifying tax laws,streamline tax forms, and procedures makes tax administration simpler and more efficient.a d m i n i s t r a tion udiCompliance may also be improved by the availability of administrative andandiminsratone judicial grievance procedures.and improvetaxpayer Compliance can also be increased by improving the taxpayer environment:
treating the taxpayer as a client, becoming more service-oriented, providingcompliance amenities in tax offices, accelerating refunds, and providing easy access to the
tax authorities for clarification of the tax laws and advance rulings on am-biguous regulations. A related area is taxpayer education: taxpayers need tobe convinced that "taxes are the price paid for civilized society" (Bird 1989)and that their taxes are being used effectively.
Improving taxpayer enumeration and registration
Entities and individuals about whom the tax authorities have no informationare unlikely to pay taxes. The first requirement of good tax administration isthus to identify all those required to pay taxes and issue unique tax identifi-cation numbers (TINs). TINs serve as the building blocks for the taxpayermaster file that is updated every year. The master file also stores other infor-mation that constitutes the taxpayer's current account records. These recordshelp identify evaders or potential taxpayers who have not been brought intothe tax fold, aid cross-checks of information, and reduce the likelihood of error.
Data storage, updating, and retrieval are best done with computers run bytrained staff who ensure that agency employees have timely access to tax-payer current account records.2 The taxpayer current account system may becomplemented by a third-party information system consisting of other gov-ernment agencies, employers, banks, and other corporate entities legally re-quired to provide information.
73
Estimating taxable income and tax liability
Because of the high cost of administrative assessments, most industrial coun-tries have switched to a system of "self-assessment" under which taxpayersassess their own liability, file a return reporting that assessment, and pay thetaxes due. Self-assessment is likely to result in an increase in the number oftaxpayers, but an underassessment of taxes due. It therefore needs to be bol-stered by selective checks, audits, and penalties and by simplified procedures(assessment committees and court appeals) for conflict resolution.
To ensure compliance, many countries have also resorted to withholding andpresumptive taxation. Withholding works best when the number of income Many countriespayers is relatively small (and smaller than the number of income receivers). have resorted toPresumptive taxation helps tax authorities to collect taxes (personal, corpo-rate, property, and land taxes) from groups of taxpayers that find it difficult withholding andto maintain accounts. Presumptive tax assessments are usually based on sur- ps tveys (cadastral surveys, sector studies, surveys of specific types of establish-ments) that identify a few visible indicators of standard of living or scale of taxationbusiness. To work well, presumptive taxation requires monitoring, vigilance,and regular updating of the assessment base.
Improving tax collection
Improving tax collection requires providing numerous and easily accessiblefacilities at which taxes can be voluntarily paid as well as mechanisms for co-ercing payment by noncomplying taxpayers. It also requires adequate with-holding systems, an appropriate penalty structure that is rigorously enforced,and the use of audits and the removal of administrative bottlenecks (such asdelays in government verification of taxes paid or refunds). Critical, too, arethe recordkeeping capabilities of the tax authority. When the number of tax-payers is large, computerization is cost-effective.
To improve collection, some countries have turned over parts of the collec-tion process to private agents, with mixed results (see subsection on improv-ing the organization of the tax authority). Others have offered officials incen-tives linked to tax recovery, and taxpayers incentives for prompt payment.
Improving enforcement of tax regulations
The first step in enforcement is identifying gaps between potential and de-clared taxes, declared and paid taxes, and taxes paid and payments receivedby the treasury. These gaps result from lapses in identification, filing, report-ing of current income, payment, and the transfer of tax payments to the treasury.
To distinguish between genuine errors in tax returns and deliberate mis-reporting, tax departments rely on audits. The authorities need to check allreturns for genuine arithmetic errors, and audit a sample of returns thor-oughly to uncover deliberate evasion and to impress upon all taxpayers thatdetection and punishment are possible. For the threat to be credible, sampleselection needs to be based on appropriate statistical models (such as the dis-criminant index function model used in the United States). However, suchmodels can only be used when auditors have access to sufficient informationon taxpayers and the tax authorities have adequate capacity for processinginformation. Where these conditions are not met, a better use of scarce audit-ing resources may be to identify norms for tax returns for specific activitiesor lines of business and to systematically audit the tax returns that deviatefrom these norms. To do this, the tax administration needs to develop an

74
audit plan and audit techniques and provide audit training. Some countrieshave addressed evasion by setting up special tax units that concentrate onauditing large taxpayers.
Adequate and frequently updated information systems on registered tax-payers are key to the success of enforcement audits. Computerization oftaxpayer records has proved to be critically important in many countries.In some countries tax agencies have access to third-party sources of infor-mation, such as withholdings, bank transactions, foreign exchange transac-tions, transactions in publicly traded instruments above a specific threshold,and large transactions (involving real estate, cars, tax-deductible transac-tions, social security payments, customs payments).
Audits can identify nonfilers, allow better assessment of declared incomes,and reveal discrepancies between potential and declared taxes. For audits tohave real clout, however, the public must be convinced that tax evasion willbe punished and that punishment (fines, penalties, publicizing of evasion,seizures of property) will be significant. An important issue in dealing withdelinquent taxpayers is whether to confiscate assets to recover the tax liabil-ity. Where such practices are permitted, clearly established procedures needto govern tax recovery (such as requiring judicial permission for extremesteps) to prevent abuse of authority.
Tax amnesties have been used effectively in some industrial countries, buthave not proved effective in developing countries, where measures totighten administration have seldom followed the amnesties.
Improving the organization of the tax authority
Tax In most developing countries, tax agencies are characterized by poor train-ing, poor equipment, low salaries, and low status (Acharya 1986). Because
authorities tax authorities usually are poorly funded, a continuing challenge is to iden-tify and abandon unproductive tasks (such as extensive rather than selec-
need to Introduce tive audits).? The development of better management information systems
organizational through computerization has helped tax authorities identify the best uses ofadministrative resources, the output generated by various resource uses
r^eforms (collections, number of cases audited), and potential and actual tax bases.
One of the more important tasks of the tax administration authorities isto set up internal control and accountability systems to detect errors intax assessments. To ensure that taxpayers are not taxed incorrectly, the taxauthorities must also remedy deficiencies in laws, procedures, or practicesthat lead to errors. To deter corruption by tax officials, many developingcountries establish revenue targets for each tax collector, district tax office,and auditor; maintain detailed records of the eventual outcomes of assess-ments by tax officers; entrust sensitive negotiations to special teams; mini-mize contacts between taxpayers and tax collectors and reduce the discre-tionary powers of tax officials; set up supervisory systems with at leastthree hierarchical levels to reduce opportunities for collusion; and deviseincentive systems that better match public and private interests. Some coun-tries have sought to rely on private agents for tax collection. In Bolivia,Chile, Colombia, and Uruguay, banks have assumed an important role incollecting taxes; in Indonesia foreign contractors have been entrusted withcustoms collection (see subsection on improving tax collection). The experi-ence has been mixed. TAR programs should therefore evaluate such propos-als with caution and in the context of an overall reform strategy, not as anisolated option.
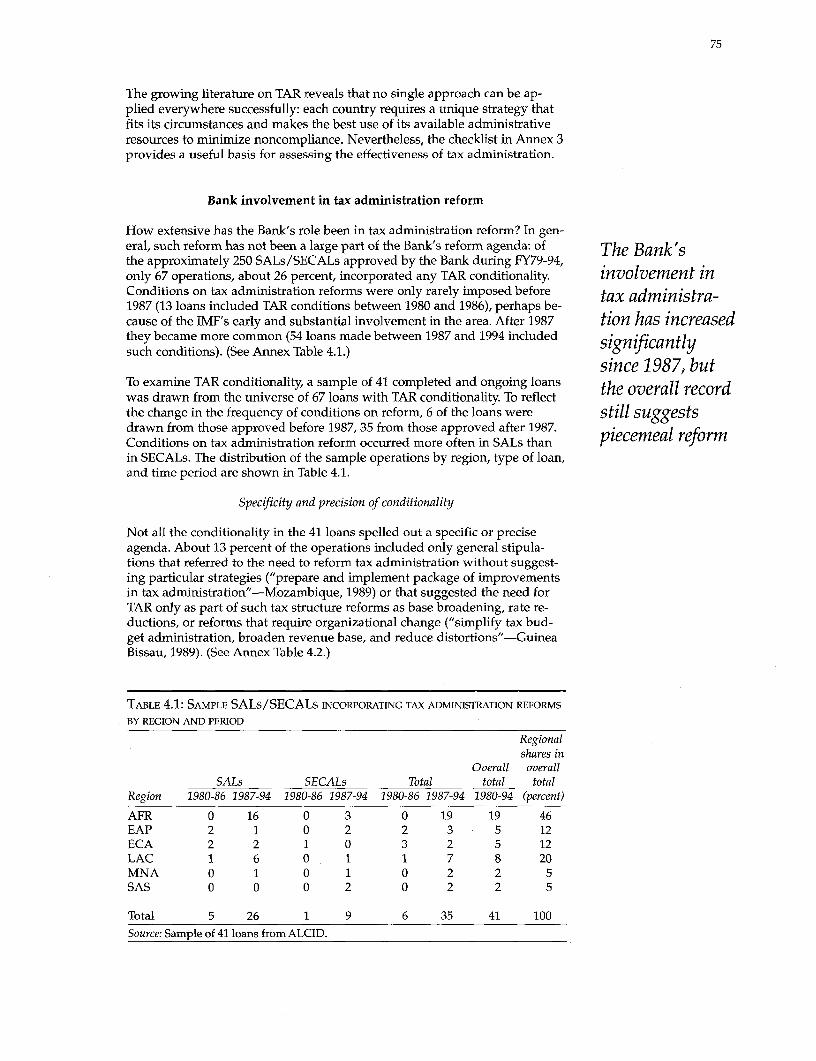
75
The growing literature on TAR reveals that no single approach can be ap-plied everywhere successfully: each country requires a unique strategy thatfits its circumstances and makes the best use of its available administrativeresources to minimize noncompliance. Nevertheless, the checklist in Annex 3provides a useful basis for assessing the effectiveness of tax administration.
Bank involvement in tax administration reform
How extensive has the Bank's role been in tax administration reform? In gen-eral, such reform has not been a large part of the Bank's reform agenda: of The Bank'sthe approximately 250 SALs/SECALs approved by the Bank during FY79-94,only 67 operations, about 26 percent, incorporated any TAR conditionality. involvement inConditions on tax administration reforms were only rarely imposed before tax administra-1987 (13 loans included TAR conditions between 1980 and 1986), perhaps be-cause of the IMF's early and substantial involvement in the area. After 1987 tion has increasedthey became more common (54 loans made between 1987 and 1994 included significantlysuch conditions). (See Annex Table 4.1.)
since 1987, butTo examine TAR conditionality, a sample of 41 completed and ongoing loans the overall recordwas drawn from the universe of 67 loans with TAR conditionality. To reflectthe change in the frequency of conditions on reform, 6 of the loans were still suggestsdrawn from those approved before 1987, 35 from those approved after 1987.Conditions on tax administration reform occurred more often in SALs thanin SECALs. The distribution of the sample operations by region, type of loan,and time period are shown in Table 4.1.
Specificity and precision of conditionality
Not all the conditionality in the 41 loans spelled out a specific or preciseagenda. About 13 percent of the operations included only general stipula-tions that referred to the need to reform tax administration without suggest-ing particular strategies ("prepare and implement package of improvementsin tax administration"-Mozambique, 1989) or that suggested the need forTAR only as part of such tax structure reforms as base broadening, rate re-ductions, or reforms that require organizational change ("simplify tax bud-get administration, broaden revenue base, and reduce distortions"-GuineaB3issau, 1989). (See Annex Table 4.2.)
TABLE 4.1: SAMPLE SALs/SECALs INCORPORATING TAX ADMINISTRATION REFORMS
BY REGION AND PERIOD
Regionalshares in
Overall overallSALs SECALs Total total total
Region 1980-86 1987-94 1980-86 1987-94 1980-86 1987-94 1980-94 (percent)
AFR 0 16 0 3 0 19 19 46EAP 2 1 0 2 2 3 5 12ECA 2 2 1 0 3 2 5 12LAC 1 6 0 1 1 7 8 20MNA 0 1 0 1 0 2 2 5SAS 0 0 0 2 0 2 2 5
Total 5 26 1 9 6 35 41 100
Source: Sample of 41 loans from ALCID.
76
The remaining loans (87 percent) identified one or more of the six key areasof reform cited earlier in the section on ends and means of tax administra-tion. Even here, however, some of the conditionality was nonspecific. InGhana (1991), for example, the Bank stipulated that the borrower continuereforms to encourage voluntary compliance; in its 1990 loan to Senegal, theBank mandated implementation of tax administration measures aimed atimproving tax collection. Only 80 percent of all conditionalities across thesix regions referred to specific reform measures in the six TAR categories(Table 4.2). General or nonspecific stipulations were most prevalent inMNA and ECA, specific conditions in LAC and SAS.
How a specific conditionality is couched can affect the success with whichit is implemented, tracked, and monitored. Because many of the condition-alities deal with institutional reform, which cannot be captured by a fewtechnical parameters, assessing their precision is somewhat subjective.Nevertheless, the general picture that emerges is that many of the condi-tions were stated imprecisely (Table 4.3). Only 40 percent of all condition-alities were couched in reasonably precise tenns; 36 percent were couchedin imprecise language, and another 24 percent in qualitative language.Taken together, the high proportion of imprecise and qualitative conditions(60 percent) suggests considerable room for devising conditionality interms of more precise, monitorable criteria. Such criteria might include tax
Conditions gaps to be narrowed, cost-effectiveness criteria, arrears ratios, proportionswere not of cases subject to appeals, or measures that focus on the outputs rather
than the inputs of tax administration (see Annex 4).uniformly Content
specific or of conditionality
precise, but did TAR conditionalities generally conformed to the best practice guidelinessuggested by the literature and summarized earlier in this chapter. They
conform to best also covered all six TAR areas. The distribution of specific conditionalities
practice is set out in Table 4.4. About 35 percent stipulated organizational reform; ofthese, more than two-thirds focused on the internal reorganization of tax
guidelines departments, and the rest involved improvements in training, supervision,and inspection. Measures to induce taxpayer compliance were stipulated in21 percent of conditionalities, with almost as much emphasis on simplify-ing forms and procedures as on simplifying laws. Improving enumerationwas cited in 18 percent of conditionalities, with most focusing on computer-ization and adoption of taxpayer identification numbers and master rolls.Collection measures were stipulated in 10 percent of conditionalities, andenforcement measures in 13 percent. Collection reform measures focusedon both tax arrears and collection processes, with relatively little emphasison withholding or incentives for quick payment. The wider coverage of en-forcement included audit reform; reform of judicial procedures; establish-ment of special measures for large taxpayers; reliance on third-party infor-mants, searches, and seizures; and introduction of penalties. Measures toimprove estimation were rarely stipulated, appearing in fewer than 4 per-cent of all conditionalities. The coverage of issues in specific conditionali-ties mirrored the coverage of total conditionalities (see Annex Table 4.2).
Regional differences are also apparent when loans are grouped by the num-ber of TAR areas they cover (see Annex Table 4.3). More than half of allloans in AFR, LAC, and EAP covered three or more TAR areas. In contrast,only one loan in ECA and in SAS had relatively comprehensive coverage,and in MNA only general conditionalities were stipulated.
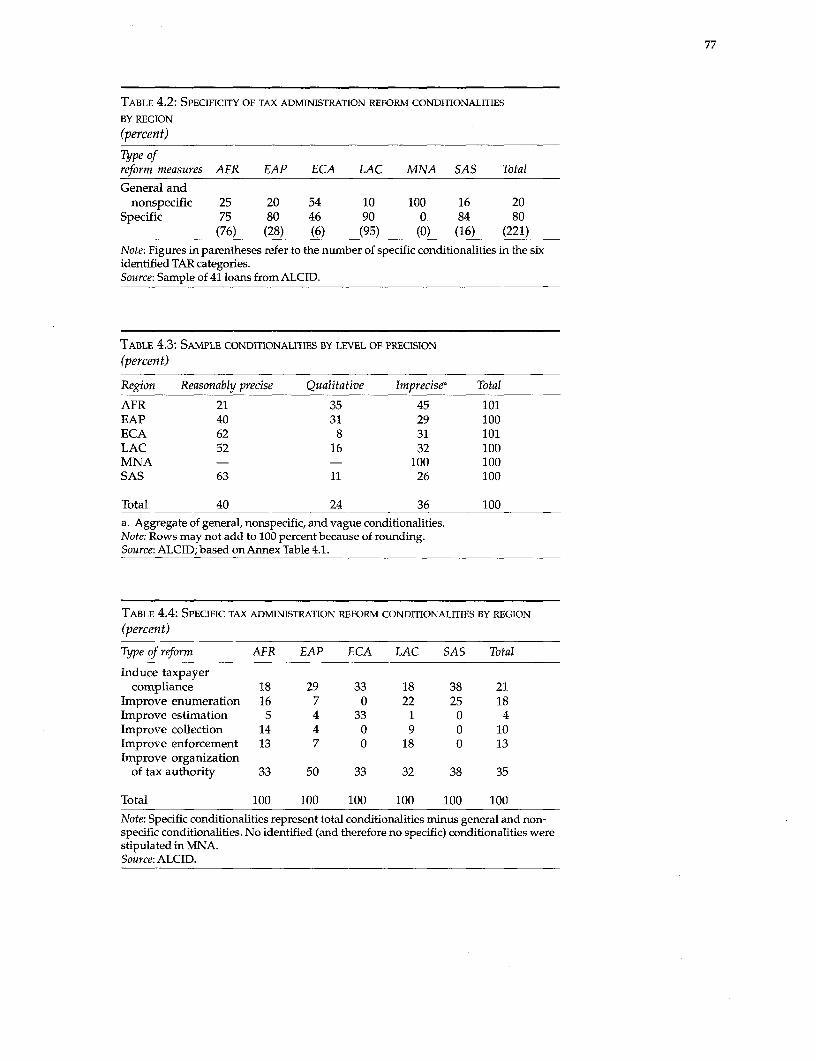
77
TABLE 4.2: SPECIFICITY OF TAX ADMINISTRATION REFORM CONDITIONALITIES
BY REGION
(percent)
Type ofreform measures AFR EAP ECA LAC MNA SAS Total
General andnonspecific 25 20 54 10 100 16 20
Specific 75 80 46 90 0 84 80(76) (28) (6) (95) (0) (16) (221)
Note: Figures in parentheses refer to the number of specific conditionalities in the sixidentified TAR categories.Source: Sample of 41 loans from ALCID.
TABLE 4.3: SAMPLE CONDYTIONALITIES BY LEVEL OF PRECISION(percent)
Region Reasonably precise Qualitative Imprecisea Total
AFR 21 35 45 101EAP 40 31 29 100ECA 62 8 31 101LAC 52 16 32 100MNA - - 100 100SAS 63 11 26 100
Total 40 24 36 100
a. Aggregate of general, nonspecific, and vague conditionalities.Note: Rows may not add to 100 percent because of rounding.Source: ALCID; based on Annex Table 4.1.
TABLE 4.4: SPECIFIC TAX ADMINISTRATION REFORM CONDITIONALITIES BY REGION(percent)
Type of reform AFR EAP ECA LAC SAS Total
Induce taxpayercompliance 18 29 33 18 38 21
Improve enumeration 16 7 0 22 25 18Improve estimation 5 4 33 1 0 4Improve collection 14 4 0 9 0 10Improve enforcement 13 7 0 18 0 13Improve organization
of tax authority 33 50 33 32 38 35
Total 100 100 100 100 100 100
Note: Specific conditionalities represent total conditionalities minus general and non-specific conditionalities. No identified (and therefore no specific) conditionalities werestipulated in MNA.Source: ALCID.
78
Gaps in tax administration reform conditionality
Although some operations have included comprehensive recommendationsfor tax administration reform4 and multiple rounds of tax administration re-form conditionalities have been imposed in several countries, outside ofLAC the Bank has not yet established a solid record in TAR. The picture thatthe record suggests-one of piecemeal reform-is confirmed by the generallack of discussion of the overall TAR strategy in president's reports and therarity of certain types of TAR conditionalities.
Among the early SALs, some recognized the need for improvements in taxadministration (Bangladesh, Bulgaria, C6te d'Ivoire, Ghana, Honduras,Hungary, Malawi, Kenya, Pakistan, Senegal, Uganda, and Venezuela). Butanalysis and strategy were perfunctory or totally lacking, and as a resultconditionality was either nonexistent or weak. For example, conditionalityin Honduras and Hungary only called for tax laws to be presented to thelegislature, and in Kenya it left it to each forward budget proposal to meetthe mandated 15 percent increase in revenues. The quality of conditionalityimproved only in later loans in some countries (as in Bangladesh, C6ted'Ivoire, Ghana, Malawi, Pakistan, and Uganda), usually in response torevenue pressures (see Chapter 2).
Few adjustment Bird and Casanegra (1992) emphasize that TARs need to be impelled by aloans cite the "definite strategy." The strategy needs to specify with precision the pro-
gram's goals, include a comprehensive plan that assigns clear priorities tounderlying specific tasks, and be tailored to a country's circumstances. Few Bank SALs
strategy of tax cite the underlying strategy of reform; most appear to consist of ad hoc steps.
administration Bank conditionalities have tended to ignore estimation and the use of suchmethods as censuses of tax groups or systematic surveys. Although SALs/
reform SECALs have stipulated actions on enforcement, conditionality appears tohave been adopted piecemeal. Moreover, the Bank has ignored such impor-tant issues as enforcement codes and incentives for informants. In organi-zational reform it has generally not raised issues of better pay for tax ad-ministrators-a surprising gap given the corruption, poor morale, andlow productivity that are alleged to prevail in many tax departments. Ithas also largely ignored taxpayer education and assistance. Several areaswarrant attention:
* Creating a conducive (legal) environment. Where judicial processes arelengthy or make excessive demands (maintaining excessively highstandards of evidence or placing the burden of proof on the administra-tion), noncompliance cannot be prosecuted; when tax systems try toshort-circuit the judicial process, the potential gains may be wiped outthrough a loss of public confidence in the fairness of the system. BankSALs need to reflect awareness of these realities, and the Bank needsto examine specific environmental factors, particularly the legal taxsystem-something it did for the first time in the ESW for Argentinain 1990.
* Taxpayer education. Taxpayer education campaigns have been undertakenin some developing countries, with positive results. Public campaignsare sometimes credited with Mexico's success in implementing reforms.In Indonesia and Argentina publicized actions against tax evaders anddefaulters improved tax collection. Korea introduced the VAT with amassive public education effort. Bank SALs need to reflect the value ofinvolving the public in major tax reform.
79
* The information system. The Bank has promoted computerized informa-tion systems in several countries. But computerization has not alwaysbeen preceded by adequate planning, organizational restructuring, andstaff training. Bank SALs need to emphasize that tax information sys-tems must have access to data from other government agencies andsuch third-party sources as banks. Moreover, with increasing globali-zation, tax departments need to pay greater attention to the opportuni-ties for tax evasion or avoidance through treaty shopping: double taxtreaties should help promote the international flow of information.Member countries are already seeking Bank advice on the implicationsof globalization.
* Audits. Bank SALs have focused on the need to devise sound auditstrategies. Greater attention needs to be devoted to audit selection crite-ria, however, and to the scope and efficiency of audits. Economic andsector work reports on Argentina and Indonesia mark a beginning inthis direction.
* Withholding and presumptive taxation. Bank experience in these areaspoints to the following problems:
(a) Withholding, if too stringent, can lead to "overpayment" (as in Indo-nesia). Also, if not final, withholding can generate excessive paperworkand add to the compliance burden of taxpayers.
(b) While presumptive taxation is a convenient device for taxing "hard-to-tax" sectors, the approach requires background work on setting stan-dards and norms for each sector that are neither so lenient as to be un-fair, nor so onerous as to cause business to undertake inefficientmarginal adjustments in activity.
1 VAT administration. The Bank has not pursued ways in which the VAT canextend its reach to small traders and farmers, or sought to implement apractical way of cross-checking credits claimed by taxpayers for taxespaid on purchases. Tracing and checking all VAT invoices is too cumber-some and costly (as experience in Korea and Indonesia demonstrates).Instead, taxpayers should be required to prepare annual lists of salesdata by customer for use in developing lists of purchases that can becross-checked at random against taxpayers' books at audit.
Tracking implementation of reforms
Of the 41 sample loans, only 26 operations involving 25 countries have beenevaluated through project completion and/or performance audit reports, all Almost allbut one of which examined TAR performance. The reports follow up on the reforms wereimplementation of 64 percent of the conditionalities; no data are available onthe other 36 percent, suggesting that some PCRs/PARs accord little impor- implemented;tance to tax administration reforms. This study reviewed the TAR condition- but this may notalities examined in the 25 PCRs/PARs to assess how successfully they wereimplemented. mean much,
Of these conditionalities, 97 percent were reported as implemented, though 7 given the vaguepercent as only partially implemented. Because few PCRs/PARs describe the nature of theextent or quality of implementation, however, it is not possible to distinguish conditionsbetween fully and partially implemented tax administration reforms. Giventhat only a very small share of conditionalities (40 percent) are couched in
80
precise terms, the information on implementation (whether full or partial)may not add up to much.
Because tax administration reform must be tailored to the specific needs ofeach country in order to be successful, proper assessment of the reform mea-sures needed requires a detailed country study, not a quick evaluation. Theweakness of TAR assessments partly reflects the Bank's deference to theFund's superiority in resources, experience, and expertise in the area. It mayalso reflect the fact that tax administration is a relatively esoteric field for de-velopment economists. Finally, tax administration is an area in which bestpractice has not been codified and the Bank is still learning. If the Bank is tocontinue to design, monitor, and assess TAR, it must develop relevant per-formance indicators.
Measuring outcomes
The efficacy of TAR can be determined by measuring final outputs (revenuesas well as fairness and equity in taxation), intermediate outputs (such as thenumber of audits), and the completion of actions involving inputs (such assetting up a tax analysis unit). TAR generally aims to achieve two distinct fi-nal outputs: tax revenues and equity. Because the revenue effects of taxpolicy reforms and TAR are difficult to disentangle and equity outcomes aredifficult to measure, assessments of TAR often focus on intermediate out-puts. Two approaches that measure changes through "marginal" conditions(essentially marginal productivity indicators of resource use) and averagecost-effectiveness are discussed in the literature. Where lack of data pre-cludes assessment of either final or intermediate outputs, results have beentracked in terms of inputs.
Most of the 26 PCRs/PARs reviewed did not explicitly track the outcomes oftax administration reform. Where outcomes were examined, the most com-
Most of the mon yardstick used was the tax-to-GDP ratio (project completion reports forPeru, 1994, and Nicaragua, 1995). Other measures used included the increase
reports reviewed in the rate of tariff collections attributed to improvements in customs proce-
did not track dures and administration (Mozambique PCR, 1995); other reports (CongoPAR, 1991; Mexico PCR, 1993) focused on such intermediate output indica-
explicitly the tors as improvements in the ratio of collections to assessments and increases
outcomes of tax in the number of taxpayers. The 1993 performance audit report for Zaire fo-cused on actions involving inputs for improving the efficiency of tax admin-
administration istration: the preparation of draft legislation to harmonize the tax and tariffreforms codes, the setting up of a fiscal analysis unit, and the setting aside of 5 per-
cent of tax receipts to improve the organization and salary premia of the di-rect and indirect tax units.
In most situations the tax-to-GDP ratio cannot serve as the only measure ofTAR. Since tax policy reforms generally accompany tax administration re-form in SALs/SECALs, it is difficult to disentangle their effects. Moreover,tax revenue is affected by several factors beyond the control of the tax au-thorities, and administrative measures often take a long time to implement.Finally, because the Bank is not always the only player involved in TAR, it isdifficult to isolate its influence. Two of the more informative of the comple-tion documents-the PCR and PAR on the Mexico Financial Sector Adjust-ment Loan of 1989-therefore adopted the twofold approach of describingthe measures actually implemented and supplementing the description witha quantified assessment of final and intermediate outputs (increase in num-ber of taxpayers, improvements in cost-effectiveness of audits, the increased
81
yield of direct taxes attributed qualitatively to improvements in the efficiencyof the tax system, the increase in the overall tax-to-GDP ratio).
The Mexico PAR points to the need for more in-depth country studies if TARis to be better assessed. Some of the in-depth assessment is available in Bankeconomic and sector work, and studies of tax reform in Mexico, Morocco,and Turkey (see Thirsk forthcoming). In the former category are the reportson Indonesia, Argentina (Morisset and Izquierdo 1993), and Guinea-Bissau.These are isolated examples that focus on issues other than tax administra-tion. More such in-depth cross-country studies could flush out commonproblems, point to issues for the future, and provide the basis for best prac-tice guidelines.
Lessons
Tax administration reform in SALs/SECALs needs to be part of a clear re- Taxform strategy that spells out the problems of the tax department, theadministration's priorities, and the plans for achieving those priorities with administrationthe resources at hand. Experience differs. In some countries (Bolivia) shock reform needs totreatment paid dividends; in others (Colombia, Uruguay) a more gradual ap- Jproach was warranted (Bird and Casanegra de Jantscher 1992). Introducing be part of anew taxes such as the VAT may call for meticulous planning, preparation, clear reformand implementation (Trinidad and Tobago).
Several areas of Bank conditionality need strengthening: strategy
* Estimation techniques have generally been neglected everywhere. Thereis considerable room for using more surveys, honing methods of pre-sumptive assessment, shoring up the capabilities of central valuationauthorities, and relying more on their findings.
* Judicial procedures are sometimes so onerous that they encourage taxauthorities to bypass the system. That undermines the credibility of thetax authorities and reduces their effectiveness.
* Information and management systems need to be strengthened. Severaltax departments have computerized their activities, but many systemsare not yet performing at their peak. Reasons range from inadequateplanning and training (data storage may be stressed but not fast re-trieval), to inattention to client needs (such as the extent of decentraliza-tion required), to neglect of means for coordinating conditionalities withother government agencies and third parties.
The Bank has much to learn. Tax administration reform is a relatively newfield for the Bank, and given the Fund's greater expertise in TAR, the Bankstands to gain from closer coordination with the Fund in devising reformprograms. The practice in the Bank has been to concentrate on in-depth stud-ies of the functions, methods, and organization of tax administration depart-ments and to compare country practices with the best cross-country ex-amples. Such an approach depends greatly on the quality and experience ofthe expert employed to assess a country tax department. It also focuses moreon tax administration activities than on final indicators of outputs and effi-ciency. More work therefore needs to be devoted to measuring outputs andcosts and developing monitorable indicators for cost-effectiveness, resourceallocation, and productivity of tax administration agencies. Assessments oftax administration reforms may have to rely on a mixed approach, one that
82
combines the use of such indicators with cross-country comparisons. If re-sources for such tax administration research pose a constraint, this may beanother area for joint Bank-Fund work.
Notes
1. This chapter draws on an internal background paper written by Amaresh Bagchi,and on background work byAmaresh Bagchi, Richard Bird, and Arindam Das-Gupta.2. Computerization has proved to be a powerful tool in supporting tax administrationobjectives in several key functional areas. It is invaluable for setting up and maintain-ing taxpayer master files, for estimation exercises, and for strengthening enforcementand audits. Computerization also helps ensure timeliness, accountability, and manage-rial efficiency (see subsections on improving enforcement of tax regulations and im-proving the organization of the tax authority). For these reasons, TAR programs musthave well-designed plans for setting up computer hardware and software and for hir-ing trained personnel.3. There is a growing body of literature on the economics of resource allocation by taxadministration authorities (see bibliography).4. Six operations-Argentina (1991), Bangladesh (1992), El Salvador (1993), Ghana(1991), Guinea (1988), Peru (1992)-are examples of fairly substantial TAR efforts.5. About seven countries have also gone in for multiple rounds of TAR conditionalitiesin consecutive SALs/SECALs.
FISCAL MANAGEMENT INADJUSTMENT LENDING
5. Public expenditure reform
Chapter 2 described the broad patterns of expenditure reform design andconditionality in the Bank's adjustment loans. The final chapter of thisreport (Chapter 6) will discuss the importance of expenditure cuts relativeto revenue increases in reducing fiscal deficits across regions and countrygroups. This chapter focuses on the problems with the level and composi-tion of expenditures before Bank adjustment lending gained momentum,assesses Bank conditions for changing the structure of expenditures, andevaluates the effect of Bank-supported reforms not only in terms of actualshifts in expenditure composition but also in terms of final outcomes.' Thechapter looks at 219 operations in 83 countries that adopted expenditurereform under the Bank's adjustment lending during FY79-94.'
What the study found
Initial conditions
Before the initiation of adjustment lending, public spending patterns indeveloping countries favored capital spending over operation and mainte-nance of existing facilities, public sector wages over nonwage expenditures,university education over primary education, and tertiary health servicesover basic health services. This spending pattern led to an expanded publicsector but limited access to basic services.
Quality of conditionality and compliance
The Bank sought to introduce public expenditure reform primarily throughconditions on the size and composition of expenditures. The general goal(developed in World Bank 1988a, 1990a, and 1992a) was an initial moveaway from low-return projects followed by a restructuring of priorities anda shift of resources to high-payoff projects; curbs on subsidies, public sectoremployment, and the wage bill; shifts in favor of nonwage operations andmaintenance (O&M) and social expenditures; and within the social sectorsa move away from tertiary services toward primary education and healt'-services. The Bank's conditionality was generally in line with these broadexpenditure guidelines; equity considerations assumed importance only inthe late 1980s.
The adjustment of capital expenditures received the most attention; in recentyears a number of countries that had either overly reduced capital spendingor were unable to provide basic services were called upon to increase capitalexpenditures. Next in importance were reform of public sector employmentand reduction of subsidies. In more recent years Bank lending has increas-ingly emphasized the importance of spending on social sectors. It sought to
83

84
address equity concerns primarily through shifts in spending toward healthand education and, within these sectors, toward basic services.
The degree of specificity in Bank conditions varied widely, with a recenttrend toward detailed conditions. Reflecting tighter resource situations, low-income countries tended to face more binding conditions than higher-incomecountries, and conditions tended to be stronger in AFR and ECA than inLAC. Compliance with Bank conditions has been good. However, a thirdof the conditionalities studied have yet to be evaluated, with half the condi-tions on O&M and social sector expenditures imposed in recent operations.
Changes in expenditure patterns
In general, the study found that countries with conditions did marginallybetter than countries without in improving expenditure patterns betweenthe early 1980s and the early 1990s (though problems of data quality andcomparability need to be kept in mind in interpreting the results). Countrieswith conditions had greater success in increasing social spending and cut-ting defense expenditures. They also had more success in cutting subsidies,and they ended the period with lower wage expenditures than countrieswithout conditions.
Even though both groups started out with roughly equal ratios of totalexpenditure to GDP, adjusters with conditions had less success in cuttingexpenditures. In allocating expenditures between current and capital spend-ing, countries with conditions devoted higher shares to current spendingthan did countries without, in both the initial and the final years of the study.Despite smaller cuts in capital spending, countries with conditions endedthe period with alarmingly low levels of capital expenditure, which wasalready low in the early 1980s. These low spending levels may have partlyreflected relatively large cuts in infrastructure spending during the periodunder review.
Data from Bank reports and staff estimates for the 27 countries studied inChapter 2 indicate that SAL/SECAL recipients have not had much successin restructuring expenditures away from wages and subsidies toward non-wage O&M after a period of adjustment. Attempts to cut public employ-ment have generally been short-lived or modest. Cost recovery efforts inthe social sectors also have been limited. One reason for the relatively mod-est performance on the expenditure front may be the inflexibility that afflictsbudgets in many countries; Bank adjustment lending made little headway inthis area.
Final outcomes
As with expenditure trends, final outcomes do not differ substantially be-tween countries with conditions on health and education and those with-out such conditions. In primary enrollment, adjusters with conditionsappear to have done marginally better than those without. In both groupsilliteracy rates declined, particularly for girls and women, as did infantmortality rates.
Equity considerations
The decline in illiteracy rates and the increase in primary enrollment ratesin countries facing conditions on education suggest that the access of the
85
poor to educational services increased. Similarly, the evidence that infantmortality rates declined in almost all countries indicates that the poor's ac-cess to health services also probably increased as a result of adjustment.However, conditions on nutrition, measures to increase the earning poten-tial of the poor, and income support programs were few. Receiving the leastattention was the provision of safe water and sanitation, particularly in ru-ral areas. Both nutrition and safe water and sanitation services have re-ceived much attention in the Bank's investment lending, however.
Conditions emphasized means rather than ends
One reason that Bank conditions appear to have had little additional impactin these areas is that the Bank emphasized the means of expenditure reformrather than its ends. Expenditure conditions focused on changing expendi-tures in specific economic categories or sectors rather than on the relationbetween inputs (such as the level of expenditures), outputs (such as gradua-tion rates), and final outcomes (such as literacy, mortality rates, or access tobasic services, particularly by the poor and needy).
The role of government
Moreover, loan conditions appear to have been formulated without any in-tegrated overview of expenditure issues and objectives. Conditions were notalways grounded in an appraisal of the role of government in the Bank's cli-ent countries; possibilities for expanding the role of the private sector, par-ticularly in the provision of infrastructure and social services; and the scopefor shifting the government's role away from public provision toward moreextensive regulatory activities. There appear to have been no systemic ef-forts to ensure overall budgetary discipline, to identify what expenditureprograms were needed through discussions with program beneficiaries, toencourage technical soundness at the sectoral or project level, or to improveand maintain the efficiency of the civil service. These issues were not whollyneglected, but they were not placed in the context of a public expenditureframework viewed as an integrated system.3
A framework for evaluating public sector reforms
Assessing the effects of structural adjustment programs on public sectorspending requires some notion of the proper role of government and gov-ernment spending in a market economy. Efficiency and equity argumentsare usually marshaled to explain government interventions. Public sectorprotagonists argue that extensive intervention is needed to protect infant in-dustries and vulnerable groups, jump-start underdeveloped credit markets,relieve critical shortages of basic necessities, and capture the positive exter-nalities associated with education, health care, and infrastructure develop-ment-in short, to remedy market failures and redress inequity Yet marketfailures may be compounded and equity worsened if government deliversservices inefficiently. State firms often require subsidies or protected mar-kets to survive, while inefficiency in the public provision of social servicescan restrict, rather than improve, access for whole segments of the popula-tion, particularly the poor. In addition, there is often disagreement on whichredistributive goals are important and on how much the government shoulddo to achieve them.
86
Emphasizing primary health and education
To establish the need for government spending and to assess the adequacy ofreforms, both output mix and input use need to be considered. From the out-put perspective, economic considerations suggest that governments shouldinvest in public goods with the highest social returns. Studies have generallyfound the highest returns to public investment in education and health(Baffes and Shah 1993). They have also found strong growth effects from cut-backs in military spending (Arora and Rayoumi 1994). In education returnsare highest in primary education (Psacharopolous 1994), while improvinggirls' access to schooling also has well-documented benefits (Appleton andCollier 1995). In health a dollar spent on basic health care or on preventivecare brings higher returns than the same amount spent on hospital or cura-tive care. Equity considerations reinforce these priorities, since these pro-grams tend to reach the poor more than others do (Jimenez 1986; Selden andWasylenko 1995; van de Walle and Nead 1995).
Decentralizing decisionmaking
Changing the government decisionmaking process for determining the mixof spending programs may also be important. Countries with participatorydemocracy at the local level can often ensure more responsive and cost-effective service delivery by devolving responsibility for basic educationand health services to the local level. A system of national norms and stan-dards, accompanied by conditional grants from national to local levels, canhelp ensure quality (Shah 1994).
Getting the right balance between current and capital spending
Efficiency is also important on the input side, particularly in balancing cur-rent and capital spending. Countries with seriously deficient infrastruc-ture will need to spend more on the capital side to increase the number ofschools, health facilities, roads, water and sewerage systems, and so on (Al-derman and others 1995; Lockheed, Verspoor, and others 1991). Countriesthat already have a good infrastructure base will need to spend more onoperation and maintenance to keep it functioning properly (Lockheed,Verspoor, and others 1991).
Getting control of the wage bill
The public sector wage bill is often one of the largest single items in currentbudgets. Here, there are two key issues. One is the size of the overall wagebill. A large wage bill may reflect overstaffing (too many administratorsand managers, for example, at the expense of too few teachers and mainte-nance personnel). The other problem is too much compression in the wagestructure, so that the salaries of higher-level staff do not adequately reflecttheir greater contributions (Nunberg and Nellis 1995). This can make thepublic sector unattractive to people whose skills are better rewarded in theprivate sector.
Improving conditions for private sector involvement
Making sure that government provision is efficient and that spending isproperly distributed between capital and current budgets is one side of thepublic expenditure reform equation. The other side is the promotion of theprivate sector. In some areas the private sector already competes with thegovernment (education, health). In others the government monopoly may be
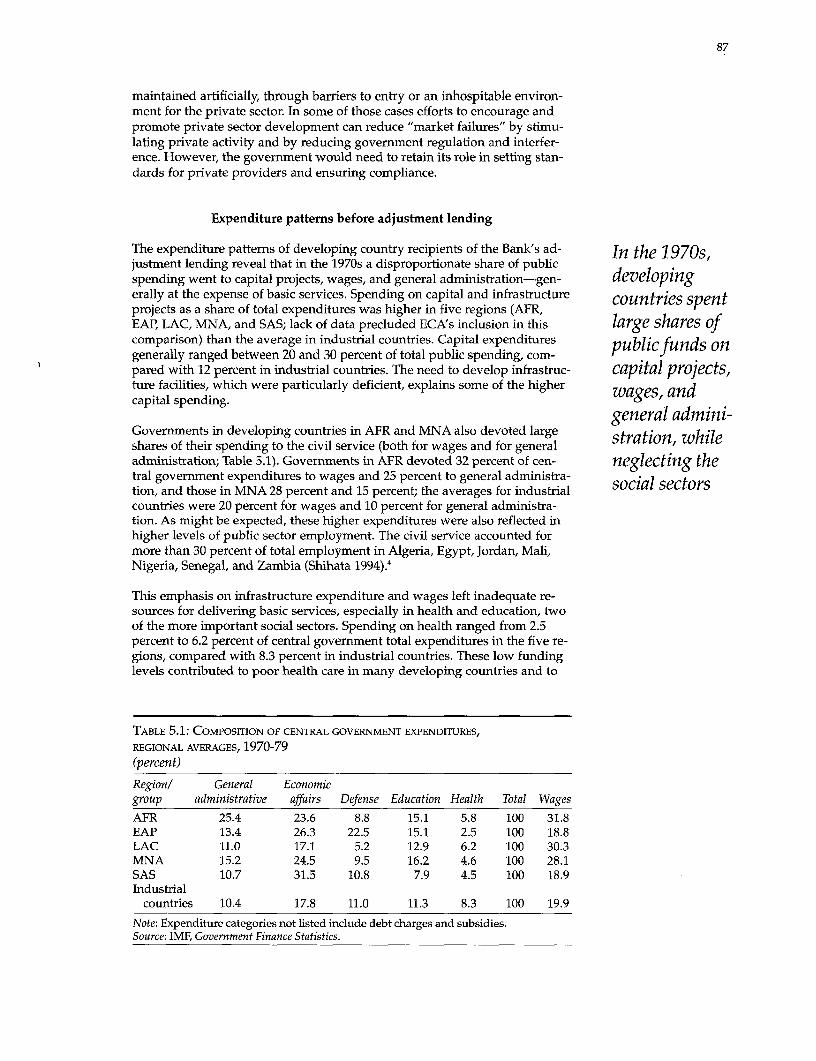
87
maintained artificially, through barriers to entry or an inhospitable environ-ment for the private sector. In some of those cases efforts to encourage andpromote private sector development can reduce "market failures" by stimu-lating private activity and by reducing government regulation and interfer-ence. However, the government would need to retain its role in setting stan-dards for private providers and ensuring compliance.
Expenditure patterns before adjustment lending
The expenditure patterns of developing country recipients of the Bank's ad- In the 1970s,justment lending reveal that in the 1970s a disproportionate share of publicspending went to capital projects, wages, and general administration-gen- developingerally at the expense of basic services. Spending on capital and infrastructure countries spentprojects as a share of total expenditures was higher in five regions (AFR,EAP, LAC, MNA, and SAS; lack of data precluded ECA's inclusion in this large shares ofcomparison) than the average in industrial countries. Capital expenditures publicfunds ongenerally ranged between 20 and 30 percent of total public spending, com-pared with 12 percent in industrial countries. The need to develop infrastruc- capital projects,ture facilities, which were particularly deficient, explains some of the higher wages, andcapital spending. general admini-
Governments in developing countries in AFR and MNA also devoted large stration, whileshares of their spending to the civil service (both for wages and for generaladministration; Table 5.1). Governments in AFR devoted 32 percent of cen- neglecting thetral government expenditures to wages and 25 percent to general administra- social sectorstion, and those in MNA 28 percent and 15 percent; the averages for industrialcountries were 20 percent for wages and 10 percent for general administra-tion. As might be expected, these higher expenditures were also reflected inhigher levels of public sector employment. The civil service accounted formore than 30 percent of total employment in Algeria, Egypt, Jordan, Mali,Nigeria, Senegal, and Zambia (Shihata 1994).4
This emphasis on infrastructure expenditure and wages left inadequate re-sources for delivering basic services, especially in health and education, twoof the more important social sectors. Spending on health ranged from 2.5percent to 6.2 percent of central government total expenditures in the five re-gions, compared with 8.3 percent in industrial countries. These low fundinglevels contributed to poor health care in many developing countries and to
TABLE 5.1: COMPOSITION OF CENTRAL GOVERNMENT EXPENDITURES,
REGIONAL AVERAGES, 1970-79(percent)
Region! General Economicgroup administrative affairs Defense Education Health Total Wages
AFR 25.4 23.6 8.8 15.1 5.8 100 31.8EAP 13.4 26.3 22.5 15.1 2.5 100 18.8LAC 11.0 17.1 5.2 12.9 6.2 100 30.3MNA 15.2 24.5 9.5 16.2 4.6 100 28.1SAS 10.7 31.5 10.8 7.9 4.5 100 18.9Industrial
countries 10.4 17.8 11.0 11.3 8.3 100 19.9
Note: Expenditure categories not listed include debt charges and subsidies.Source: IMF, Government Finance Statistics.

88
serious deficiencies in access. Pre-1985 data for 14 recipients of Bank adjust-ment lending indicate high infant mortality rates (in 9 out of the 14 coun-tries, more than 125 deaths per thousand live births) and wide disparities inaccess to health care services (in 6 countries, more than half the populationlacked access) (see Annex Table 5.1).
Spending on education fluctuated during the 1980s in some regions; in AFRand SAS education spending fell between 1980 and 1985 (from 5.2 percent ofGNP to 4.5 percent for AFR, and from 4.1 percent to 3.3 percent for SAS).Spending began to recover for both regions in the late 1980s.
A breakdown of spending on education during the 1980s shows that pub-lic spending on primary education declined as a share of total educationspending, while spending on secondary education increased in all regionsexcept SAS. Spending on higher education also increased in EAP, LAC, andMNA (see World Bank 1995b).
On a per-pupil basis, education expenditures reveal a more pronouncedbias toward tertiary education in developing countries than in industrialcountries (see Table 5.2). Ratios of per-pupil expenditures on university edu-cation to per-pupil expenditures on primary and secondary education werehigher in all developing regions than in industrial countries, with spendingin AFR particularly skewed toward higher education.
The Bank sought Bank conditionalities
to reform publicspending by Through its adjustment lending program, the Bank has sought to introduce
reform by imposing expenditure-related conditions on 83 countries sinceimposing 1980. Lending was directed mainly to lower-income countries in AFR and
conditions on SAS, upper-middle-income countries in LAC, and lower-middle-incomecountries in ECA. The goal of expenditure conditions is "a desirable pattern
the size and of expenditure shifts [that] includes, in general, an initial move away from
composition of capital expenditure, followed by strong efforts to contain the government
spending... wage bill, mainly by reducing the numbers employed, and to restructure
TABLE 5.2: PUBLIC CURRENT EXPENDITURES PER PUPIL BY LEVEL OF EDUCATION
(US dollars)University!
Region! University! primary +group Year Primary Intermediate University primary intermediate
AFR 1980 47 163 2,808 59.7 13.41990 42 150 1,405 33.5 7.3
EAP 1980 22 57 752 34.2 9.51990 56 128 668 11.9 3.6
LAC 1980 147 252 992 6.7 2.51990 256 319 1,911 7.5 3.3
MNA 1980 - 179a 980 - 5.51990 - 263a 1,394 - 5.3
SAS 1980 50 91 284 5.7 2.01990 78 156 593 7.6 2.5
Industrialcountries 1980 - 1,327a 2,580 - 1.9
a. Figure is for preprimary, primary, and intermediate education.Source: UNESCO 1993a, 1993b.

TABLE 5.3: LOAN CONDITIONS BY EXPENDITURE REFORM OBJECTIVE, 1980-94
No. of countries onObjective Condition which condition imposed
Create governments that serve Rationalize central and local planning processes 8Reform civil service (primarily public employment and wages) 42Streamline budgetary processes and improve financial accounts 42Limit public sector interventions in marketplace (public enterprises) 21Enhance relevance and accountability through participation 1
Set public spending priorities across sectors General 16Reduce military spending 2
Set public spending priorities within sectors General 16Adjust capital expenditures 52Adjust operating expenditures 14Adjust current expenditures-wages 14Adjust current expenditures-nonwages 12Introduce cost recovery 4
Improve educational access Adjust allocations to primary education 17Adjust allocations to secondary and tertiary education 16
Improve access to health Adjust allocations to basic health 15Adjust allocations to other health 12
Improve infrastructure Adjust allocations to water and sanitation 4Adjust allocations to roads 8Adjust allocations to irrigation 3Adjust allocations to other infrastructure 8Adjust operations and maintenance expenditures(see intrasectoral allocations above)
Improve agriculture's contributionsto development Adjust allocations to agriculture 18
Limit market interventions by reducing or eliminating subsidies 33Reach out to the poor and the disadvantaged Alleviate poverty 5
Promote regional development 3Promote rural development 2
Enhance service delivery through increasedprivate sector participation Privatization 6
Source: ALCID.
00
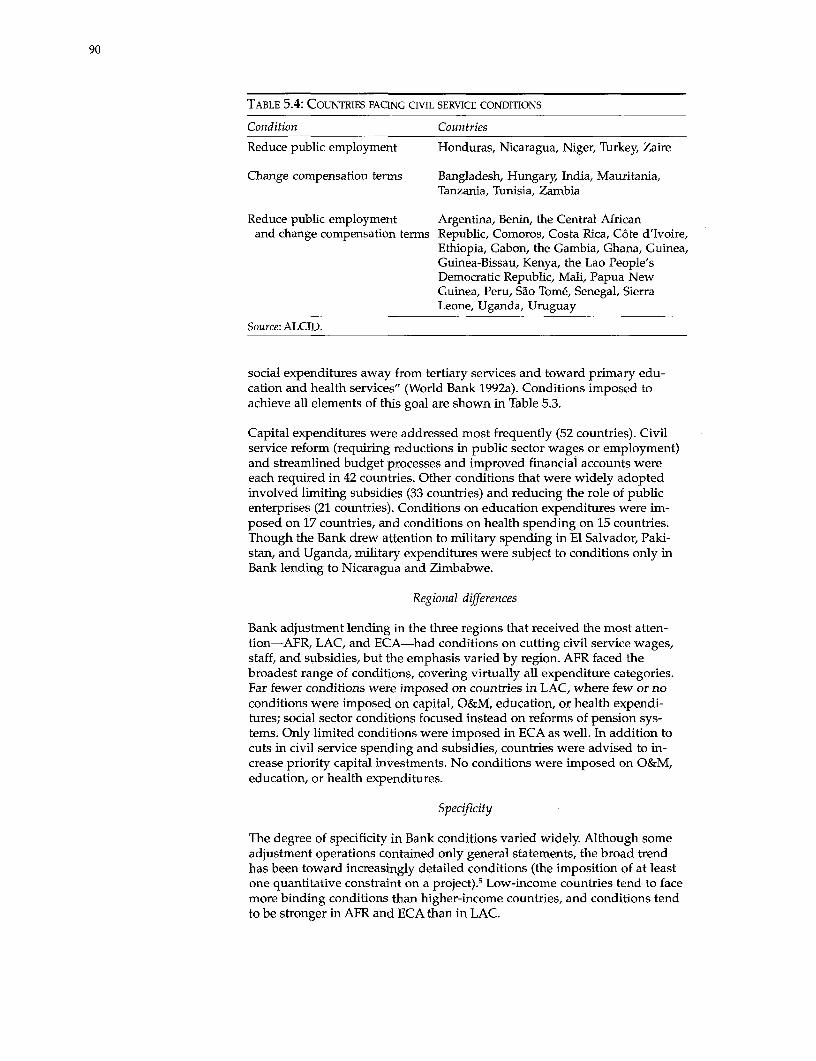
90
TABLE 5.4 COUNTRIES FACING CIVIL SERVICE CONDITIONS
Condition Countries
Reduce public employment Honduras, Nicaragua, Niger, Turkey, Zaire
Change compensation terms Bangladesh, Hungary, India, Mauritania,Tanzania, Tunisia, Zambia
Reduce public employment Argentina, Benin, the Central Africanand change compensation terms Republic, Comoros, Costa Rica, C6te d'Ivoire,
Ethiopia, Gabon, the Gambia, Ghana, Guinea,Guinea-Bissau, Kenya, the Lao People'sDemocratic Republic, Mali, Papua NewGuinea, Peru, Sao Tome, Senegal, SierraLeone, Uganda, Uruguay
Source: ALCID.
social expenditures away from tertiary services and toward primary edu-cation and health services" (World Bank 1992a). Conditions imposed toachieve all elements of this goal are shown in Table 5.3.
Capital expenditures were addressed most frequently (52 countries). Civilservice reform (requiring reductions in public sector wages or employment)and streamlined budget processes and improved financial accounts wereeach required in 42 countries. Other conditions that were widely adoptedinvolved limiting subsidies (33 countries) and reducing the role of publicenterprises (21 countries). Conditions on education expenditures were im-posed on 17 countries, and conditions on health spending on 15 countries.Though the Bank drew attention to military spending in El Salvador, Paki-stan, and Uganda, military expenditures were subject to conditions only inBank lending to Nicaragua and Zimbabwe.
Regional differences
Bank adjustment lending in the three regions that received the most atten-tion-AFR, LAC, and ECA-had conditions on cutting civil service wages,staff, and subsidies, but the emphasis varied by region. AFR faced thebroadest range of conditions, covering virtually all expenditure categories.Far fewer conditions were imposed on countries in LAC, where few or noconditions were imposed on capital, O&M, education, or health expendi-tures; social sector conditions focused instead on reforms of pension sys-tems. Only limited conditions were imposed in ECA as well. In addition tocuts in civil service spending and subsidies, countries were advised to in-crease priority capital investments. No conditions were imposed on O&M,education, or health expenditures.
Specificity
The degree of specificity in Bank conditions varied widely. Although someadjustment operations contained only general statements, the broad trendhas been toward increasingly detailed conditions (the imposition of at leastone quantitative constraint on a project).5 Low-income countries tend to facemore binding conditions than higher-income countries, and conditions tendto be stronger in AFR and ECA than in LAC.

91
Content
Capital and current expenditures. The Bank tailored its advice on capital andcurrent expenditures to the infrastructure and capital investment needs ofthe borrowing country. In countries where large sections of the populationlacked access to basic services (Gabon, Niger, Papua New Guinea, Senegal),the Bank recognized and supported an increase in capital investments in ba-sic facilities as perhaps the most efficient use of public resources. In countrieswith many large capital projects that might not meet the basic needs of thepopulation, however, the Bank generally called for a reduction in capital ex-penditures or for joint review of large new capital projects with the Bank be-fore undertaking them. More emphasis was placed on maintenance expendi-tures, to prolong the useful life of past capital investments. Increased O&Mexpenditures were required in many countries (Chad, the Central African Re-public, the Lao People's Democratic Republic, Papua New Guinea, the Phil-ippines, Somalia, Tanzania, Togo, Uganda, and Zambia). In some cases, Bankconditions called for appropriate funding of O&M before a country fundedadditional capital projects; in many others, countries undertook to establishspending priorities or to streamline the decisionmaking process.
Civil service reform. Civil service reform was addressed through a variety of conditionsconditions (Table 5.4). Most common were mandated staffing reductions andfreezes or limits on increases in wages or staff. Conditions requiring reduc- that required,fortions in the public sector wage bill to deal with the excessive allocation of example staggovernment funds to payrolls have featured in SALs/SECALs since 1980. In IVseveral countries Bank conditions supported the retraining or redeployment reductions andof displaced public sector workers (Costa Rica, Hungary) or the provision of constraints onseverance pay or other assistance to redundant employees (Mauritania, Zam-bia). In Benin and the Central African Republic voluntary departures were civil servants'encouraged by abolishing family, housing, and travel benefits. Since 1985Bank conditionalities have supported government-funded retraining when wagespublic sector employment has been cut.
The Bank has also addressed simplification of the salary structure, wage de-compression, equalization of pay discrepancies, and the monetization of ben-efits. Incentives for public servants were addressed through conditionsaimed at improving salaries in the public sector. In several countries-in-cluding Bangladesh (1984), Ghana (1987), India (1990), Tanzania (1986), andUganda (1994), where wages had fallen to very low levels-the Bank encour-aged increases in public sector wages. Some countries were to increase sala-ries by lowering employment (Argentina, Mali, Uganda); others agreed toadjust public sector salaries to compensate for real wage declines (Ethiopia,Uruguay). In Ghana, where civil service reforms were addressed in a seriesof adjustment operations, some of the reforms were designed to increasesalaries for senior staff.
Subsidies. Bank conditions have consistently required reductions in subsidies(both explicit and implicit). Reductions in fertilizer subsidies were promotedin Bangladesh, Indonesia, Mexico, and Senegal. Conditions focused on re-ductions in subsidies to public enterprises in Burkina Faso, Burundi, theCentral African Republic, the Gambia, Guyana, Jamaica, the Lao People'sDemocratic Republic, Mexico, Mozambique, Nicaragua, Senegal, SierraLeone, Turkey, and Venezuela. Other Bank conditions called for the elimina-tion of guaranteed prices for commodities or agricultural products in Hon-duras and Mexico and for the elimination of implicit subsidies on interest
92
rates (through preferential credit) in Poland, Tunisia, Turkey, and Zaire. En-ergy subsidies received scant attention in Bank conditions on adjustmentlending, even though subsidies on transport fuels are generally regressive aswell as environmentally damaging (see Larsen and Shah 1995). Energy sub-sidies receive considerable attention in investment loans, however.
Equity considerations
In more recent The Bank has focused greater attention on equity concerns since the late1980s, using its adjustment lending to encourage shifts in expenditures to-
years, Bank ward human resource development, particularly basic activities that yieldlending ha Sthe highest returns in both equity and efficiency. Better access to health and
education was addressed most often, with conditions focusing on three is-increasingly sues: the overall budget share for health and education, the share of sectoral
emphasizd *budgets allocated to personnel, and the allocation of resources between ter-tiary and primary activities. Other equity concerns were reflected in condi-
spending on tions for ensuring adequate nutrition or increasing the income and earningpotential of the poor, which were each addressed in adjustment lending to 11
social sectors countries. Income support programs were subject to conditions in nine coun-tries. The distribution of conditions by equity objective is summarized inTable 5.5.
Better access to education and health. Bank conditionalities emphasized a re-allocation of funds toward the social sectors, particularly education andhealth. Some conditions allowed borrowers considerable discretion in howto achieve such shifts: in these countries Bank conditionality called only forpublic expenditure reviews. In two countries the Bank encouraged attentionto the budget process itself through development of "core" budgets to pro-tect essential social services. More common were Bank conditions on theshare of the social sectors in the budget. In 24 operations in 17 countries theBank stipulated that the budget share be agreed on, maintained, or in-creased. Half the PRs included only general statements of intent (the Gam-bia, for example, was encouraged to increase the share of health and educa-tion in the recurrent budget). The remaining Bank operations includeddetailed conditions that left little discretion to the recipient government(Mali was to allocate at least 25 percent of the recurrent budget to educationin FY89; Malawi was to maintain specific expenditure floors).
The size of the wage bill in health and education was the second most frequentlyaddressed issue in the social sectors, with reducing the share of personnelexpenditures a typical general condition. More specific conditions in 14 op-erations in 12 countries required higher expenditures on such nonwage in-puts as teaching materials and health supplies, which have been shown to beimportant for effective service delivery (see Lockheed, Verspoor, and others1991). There was a clear trend toward increasing specificity: 70 percent of op-erations approved in the 1990s included specific conditions, some quite de-tailed. An FY90 credit to Guinea, for example, specified minimum expendi-ture levels on materials per pupil; a 1992 credit to Kenya included ceilingson the number of primary and secondary teachers.
Conditions requiring a shift in health or education resources from tertiary toprimary activities were included in 12 operations in 9 countries, consistentwith empirical evidence that expenditures at the primary level are pro-poor, while tertiary benefits flow to the more affluent (Jimenez 1986; Seldenand Wasylenko 1995). In this area the Bank relies heavily on detailed condi-tions: all but one of the nine projects funded in the 1990s included specificconditions.
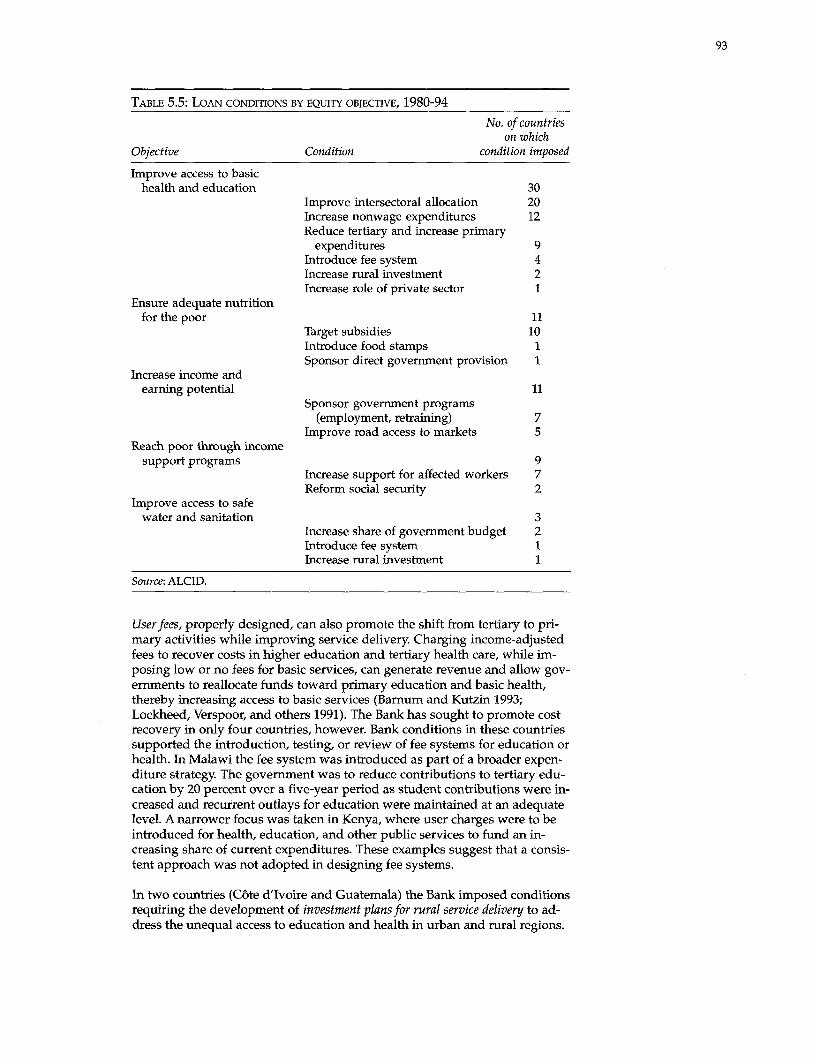
93
TABLE 5.5: LOAN CONDITIONS BY EQUITY OBJECTIVE, 1980-94
No. of countrieson which
Objective Condition condition imposed
Improve access to basichealth and education 30
Improve intersectoral allocation 20Increase nonwage expenditures 12Reduce tertiary and increase primary
expenditures 9Introduce fee system 4Increase rural investment 2Increase role of private sector 1
Ensure adequate nutritionfor the poor 11
Target subsidies 10Introduce food stamps 1Sponsor direct government provision 1
Increase income andearning potential 11
Sponsor government programs(employment, retraining) 7
Improve road access to markets 5Reach poor through income
support programs 9Increase support for affected workers 7Reform social security 2
Improve access to safewater and sanitation 3
Increase share of government budget 2Introduce fee system 1Increase rural investment 1
Source: ALCID.
Userfees, properly designed, can also promote the shift from tertiary to pri-mary activities while improving service delivery. Charging income-adjustedfees to recover costs in higher education and tertiary health care, while im-posing low or no fees for basic services, can generate revenue and allow gov-ernments to reallocate funds toward primary education and basic health,thereby increasing access to basic services (Barnum and Kutzin 1993;Lockheed, Verspoor, and others 1991). The Bank has sought to promote costrecovery in only four countries, however. Bank conditions in these countriessupported the introduction, testing, or review of fee systems for education orhealth. In Malawi the fee system was introduced as part of a broader expen-diture strategy. The government was to reduce contributions to tertiary edu-cation by 20 percent over a five-year period as student contributions were in-creased and recurrent outlays for education were maintained at an adequatelevel. A narrower focus was taken in Kenya, where user charges were to beintroduced for health, education, and other public services to fund an in-creasing share of current expenditures. These examples suggest that a consis-tent approach was not adopted in designing fee systems.
In two countries (C6te d'Ivoire and Guatemala) the Bank imposed conditionsrequiring the development of investment plans for rural service delivery to ad-dress the unequal access to education and health in urban and rural regions.
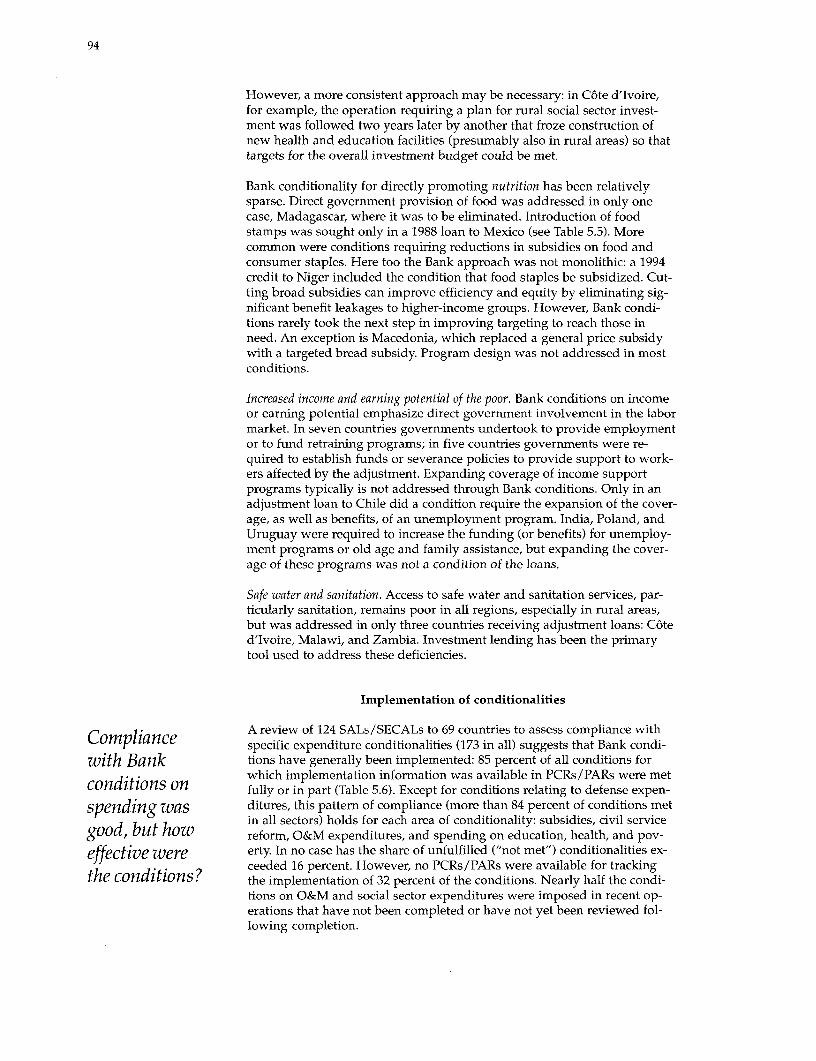
94
However, a more consistent approach may be necessary: in Cote d'Ivoire,for example, the operation requiring a plan for rural social sector invest-ment was followed two years later by another that froze construction ofnew health and education facilities (presumably also in rural areas) so thattargets for the overall investment budget could be met.
Bank conditionality for directly promoting nutrition has been relativelysparse. Direct government provision of food was addressed in only onecase, Madagascar, where it was to be eliminated. Introduction of foodstamps was sought only in a 1988 loan to Mexico (see Table 5.5). Morecommon were conditions requiring reductions in subsidies on food andconsumer staples. Here too the Bank approach was not monolithic: a 1994credit to Niger included the condition that food staples be subsidized. Cut-ting broad subsidies can improve efficiency and equity by eliminating sig-nificant benefit leakages to higher-income groups. However, Bank condi-tions rarely took the next step in improving targeting to reach those inneed. An exception is Macedonia, which replaced a general price subsidywith a targeted bread subsidy. Program design was not addressed in mostconditions.
Increased income and earning potential of the poor. Bank conditions on incomeor earning potential emphasize direct government involvement in the labormarket. In seven countries governments undertook to provide employmentor to fund retraining programs; in five countries governments were re-quired to establish funds or severance policies to provide support to work-ers affected by the adjustment. Expanding coverage of income supportprograms typically is not addressed through Bank conditions. Only in anadjustment loan to Chile did a condition require the expansion of the cover-age, as well as benefits, of an unemployment program. India, Poland, andUruguay were required to increase the funding (or benefits) for unemploy-ment programs or old age and family assistance, but expanding the cover-age of these programs was not a condition of the loans.
Safe water and sanitation. Access to safe water and sanitation services, par-ticularly sanitation, remains poor in all regions, especially in rural areas,but was addressed in only three countries receiving adjustment loans: C6ted'Ivoire, Malawi, and Zambia. Investment lending has been the primarytool used to address these deficiencies.
Implementation of conditionalities
Compliance A review of 124 SALs/SECALs to 69 countries to assess compliance withspecific expenditure conditionalities (173 in all) suggests that Bank condi-with Bank tions have generally been implemented: 85 percent of all conditions for
which implementation information was available in PCRs/PARs were metconditions on fully or in part (Table 5.6). Except for conditions relating to defense expen-
spending was ditures, this pattern of compliance (more than 84 percent of conditions metgood, but how in all sectors) holds for each area of conditionality: subsidies, civil service
good, but how reform, O&M expenditures, and spending on education, health, and pov-
effective were erty. In no case has the share of unfulfilled ("not met") conditionalities ex-ceeded 16 percent. However, no PCRs/PARs were available for tracking
the conditions? the implementation of 32 percent of the conditions. Nearly half the condi-tions on O&M and social sector expenditures were imposed in recent op-erations that have not been completed or have not yet been reviewed fol-lowing completion.
95
TABLE 5.6: IMPLEMENTATION OF BANK CONDITIONS ON PUBLIC EXPENDITURES
EducationTotal Civil health, and
conditions Subsidy service O&M poverty Defense
No. % No. % No. % No. % No. % No. %
Totalconditions 173 100 60 100 66 100 15 100 29 100 3 100No data 55 32 9 15 23 35 7 47 14 48 2 67Data 118 68 51 85 43 65 8 53 15 52 1 33
Conditions on loanswith data 118 100 51 100 43 100 8 100 15 100 1 100Met 75 64 31 61 27 63 6 76 11 74 0 0Partially met 25 21 13 25 9 21 1 12 2 13 0 0Not met 18 15 7 14 7 16 1 12 2 13 1 100
Source: Project and implementation completion reports.
TABLE 5.7: DIAGNOSIS OF NEED FOR TOTAL EXPENDITURE REFORM AND PERFORMANCE
Total expenditure performance
Diagnosis Expenditure increased Expenditure decreased
Increase 5 countriesexpenditure AFR LAC(5 countries) Ghana, El Salvador,
Ugandaa Peru
EAPPhilippinesa
Decrease/ 8 countries 14 countriesrestrain AFR LAC AFR LACexpenditure Mozambiqueb Argentina, Cote d'Ivoire, Chile,(22 countries) Costa Rica, The Gambia, Venezuela
ECA Honduras, Kenya,,Poland, Uruguay Malawi, MNATurkey Senegal, Morocco,
SAS Tanzania TunisiaPakistan
EAP SASIndonesia Bangladesh
ECABulgaria,Hungary
a. Actual increases in expenditure were higher than diagnosed.b. Part of the increase in expenditure identified in Mozambique was due to betteraccounting, for example, expanded coverage of expenditures included in the budget.c. Despite earlier adjustment efforts, the decline in expenditures in Kenya was small.Source: President's reports, project and implementation completion reports, and Bankand IMF documents and staff estimates.

96
How effective were expenditure reform conditions?
This section assesses the efficacy of public expenditure reforms by examiningthe impact of Bank conditionalities on overall and sectoral and functional ex-penditure categories and by identifying final outcomes in each expenditurearea and sector. Two caveats need to be borne in mind. First, data problemspreclude more formal analysis; moreover, even regional comparisons of ex-penditure performance in particular sectors for adjusters with conditionsand those without are not possible because country composition varies foreach type of expenditure. Second, many of the SALs/SECALs, particularlythose with social sector expenditure conditions, have been approved too re-cently for their full effects to be felt. As Summers and Pritchett (1993) pointout, before-and-after comparisons for short periods are likely to underesti-mate the effects of Bank conditions.
Impact on expenditure levels
The impact of Bank diagnoses and conditionalities on expenditures is as-sessed by looking at changes in expenditure performance in 27 countrieswhere a need for reform of total, capital, and current expenditures was diag-nosed in PRs,f and by comparing the performance during the 1980s of adjust-ers that faced conditions in specific sectoral or functional categories of ex-penditure with the performance of countries that faced no conditions.7
Total expenditures. A need for actions affecting total expenditure was diag-nosed in the PRs of all 27 sample countries (Table 5.7 and Annex Table 5.2).Performance matched the diagnosis in 70 percent of the sample. Total expen-ditures increased in all 5 of the countries where initial levels of expenditurewere low and increases were diagnosed as necessary for fiscal health; in 2countries (the Philippines, Uganda), however, the increases were larger thanrequired. Among the 22 countries whose PRs diagnosed a need for a spend-ing cut or restraint, total spending declined in only 14, and in 3 of these thecuts were smaller than diagnosed. Moreover, in several countries-C6ted'Ivoire, Kenya, and Tunisia-the decreases were achieved largely throughreductions in capital spending, not through the current expenditure cutscalled for in their SALs/SECALs.
Capital expenditures. Capital spending performance was even more consistentwith the Bank's diagnosis of the need for reform, with success in 79 percentof the sample (Table 5.8 and Annex Table 5.3). Of the 15 country cases inwhich an increase in capital spending was called for, 11 actually stepped up
Current expenditures. However, even among the countries encouraged to increase
spending capital expenditures were some whose subsequent capital spending levelsremained modest (Bangladesh, El Salvador, Ghana, Pakistan, Peru, the Phil-
behavior proved ippines, Uruguay). This may partially explain the failure of growth rates to
the most recover in Pakistan, Peru, the Philippines, and Uruguay. In other countries,increases exceeded targets, as in Uganda. Of the 10 that undertook to de-
recalcitrant, with crease or restrain capital expenditures, only one failed to comply with the
less than half of Bank's diagnosis. The performance of a few (C6te d'Ivoire, the Gambia,the countries Kenya, Malawi) may have overshot expectations.
modijying Current expenditures. All 27 countries undertook to modify current spending(Table 5.9 and Annex Table 5.3). However, current spending behavior proved
spending levels to be the most recalcitrant; the performance of only 44 percent of the samplematched the diagnosis in Bank PRs of the need for current expenditure re-form. Of the 25 countries where the Bank called for expenditure decreases orrestraint, 10 were successful in curbing current spending, though in Hondu-
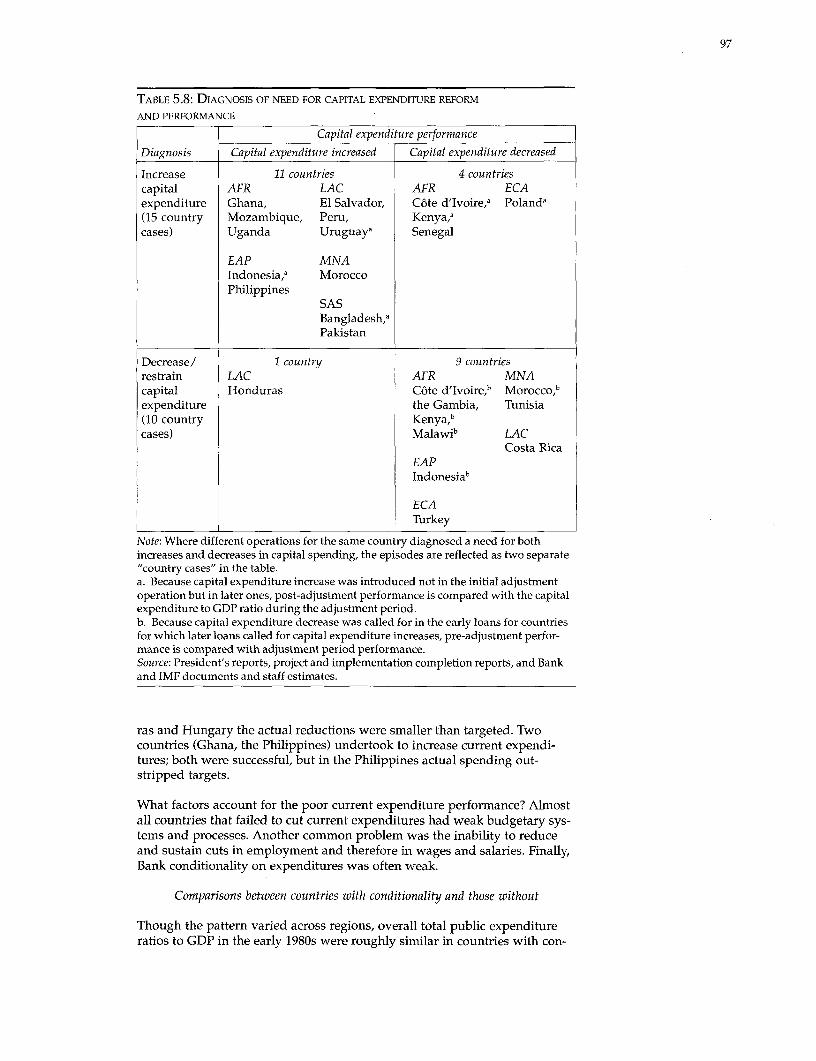
97
TABLE 5.8: DIAGNOSIS OF NEED FOR CAPITAL EXPENDITURE REFORM
AND PERFORMANCE
Capital expenditure performance
Diagnosis Capital expenditure increased Capital expenditure decreased
Increase 11 countries 4 countriescapital AFR LAC AFR ECAexpenditure Ghana, El Salvador, C6te d'Ivoire,a Polanda(15 country Mozambique, Peru, Kenya,acases) Uganda Uruguaya Senegal
EAP MNAIndonesia,, MoroccoPhilippines
SASBangladesh,,Pakistan
Decrease/ 1 country 9 countriesrestrain LAC AFR MNAcapital Honduras Cote d'Ivoire,b Morocco,'expenditure the Gambia, Tunisia(10 country Kenya,"cases) Malawib LAC
Costa RicaEAPIndonesia'
ECATurkey
Note: Where different operations for the same country diagnosed a need for bothincreases and decreases in capital spending, the episodes are reflected as two separate"country cases" in the table.a. Because capital expenditure increase was introduced not in the initial adjustmentoperation but in later ones, post-adjustment performance is compared with the capitalexpenditure to GDP ratio during the adjustment period.b. Because capital expenditure decrease was called for in the early loans for countriesfor which later loans called for capital expenditure increases, pre-adjustment perfor-mance is compared with adjustment period performance.Source: President's reports, project and implementation completion reports, and Bankand IMF documents and staff estimates.
ras and Hungary the actual reductions were smaller than targeted. Twocountries (Ghana, the Philippines) undertook to increase current expendi-tures; both were successful, but in the Philippines actual spending out-stripped targets.
What factors account for the poor current expenditure performance? Almostall countries that failed to cut current expenditures had weak budgetary sys-tems and processes. Another common problem was the inability to reduceand sustain cuts in employment and therefore in wages and salaries. Finally,Bank conditionality on expenditures was often weak.
Comparisonis between countries with conditionality and those without
Though the pattern varied across regions, overall total public expenditureratios to GDP in the early 1980s were roughly similar in countries with con-
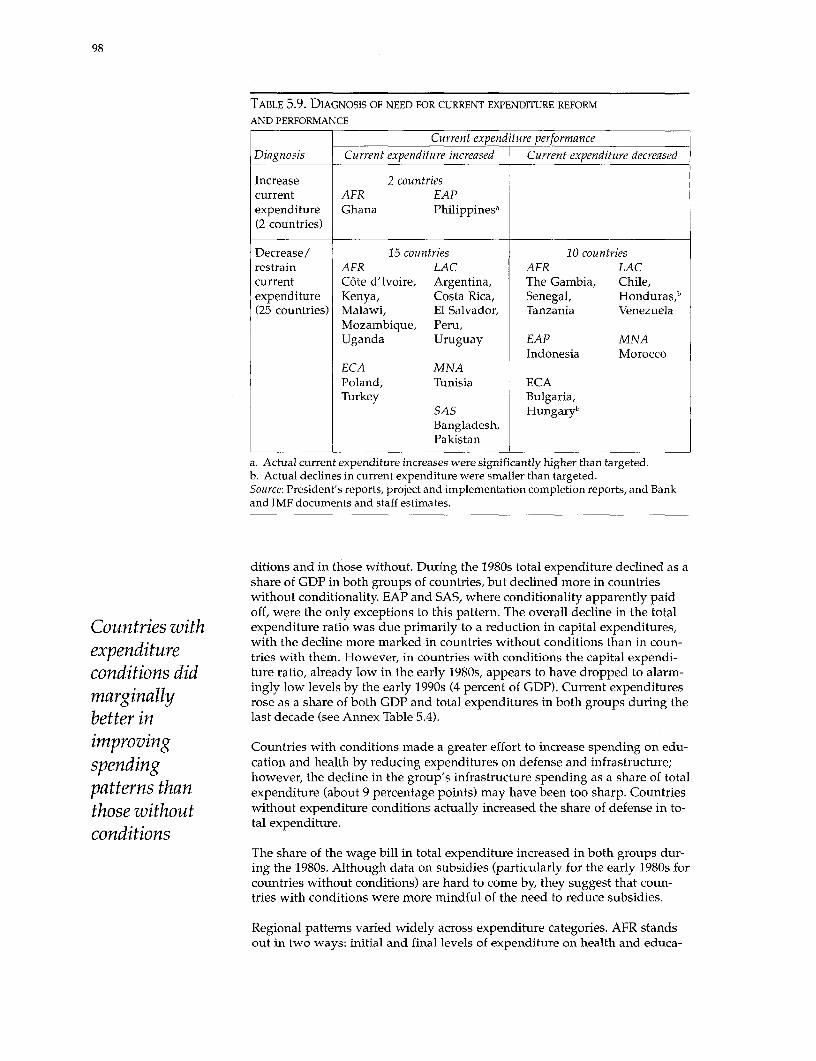
98
TABLE 5.9. DIAGNOSIS OF NEED FOR CURRENT EXPENDITURE REFORM
AND PERFORMANCE
Current expenditure performance
Diagnosis Current expenditure increased Current expenditure decreased
Increase 2 countriescurrent AFR EAPexpenditure Ghana Philippines,(2 countries)
Decrease/ 15 countries 10 countriesrestrain AFR LAC AFR LACcurrent C6te d'Ivoire, Argentina, The Gambia, Chile,expenditure Kenya, Costa Rica, Senegal, Honduras,b(25 countries) Malawi, El Salvador, Tanzania Venezuela
Mozambique, Peru,Uganda Uruguay EAP MNA
Indonesia MoroccoECA MNAPoland, Tunisia ECATurkey Bulgaria,
SAS HungarybBangladesh,Pakistan
a. Actual current expenditure increases were significantly higher than targeted.b. Actual declines in current expenditure were smaller than targeted.Source: President's reports, project and implementation completion reports, and Bankand IMF documents and staff estimates.
ditions and in those without. During the 1980s total expenditure declined as ashare of GDP in both groups of countries, but declined more in countrieswithout conditionality. EAP and SAS, where conditionality apparently paidoff, were the only exceptions to this pattern. The overall decline in the total
Countries with expenditure ratio was due primarily to a reduction in capital expenditures,with the decline more marked in countries without conditions than in coun-expenditure tries with them. However, in countries with conditions the capital expendi-
conditions did ture ratio, already low in the early 1980s, appears to have dropped to alarm-ingly low levels by the early 1990s (4 percent of GDP). Current expenditures
marginally rose as a share of both GDP and total expenditures in both groups during the
better in last decade (see Annex Table 5.4).
improving Countries with conditions made a greater effort to increase spending on edu-
spending cation and health by reducing expenditures on defense and infrastructure;however, the decline in the group's infrastructure spending as a share of total
patterns than expenditure (about 9 percentage points) may have been too sharp. Countries
those without without expenditure conditions actually increased the share of defense in to-
conditions tal expenditure.
The share of the wage bill in total expenditure increased in both groups dur-ing the 1980s. Although data on subsidies (particularly for the early 1980s forcountries without conditions) are hard to come by, they suggest that coun-tries with conditions were more mindful of the need to reduce subsidies.
Regional patterns varied widely across expenditure categories. AFR standsout in two ways: initial and final levels of expenditure on health and educa-

99
tion by countries with conditions were higher than for countries without, anddefense expenditures by countries with conditions were lower at both timesthan for countries without. Shifts in expenditure patterns were in the wrongdirection in education and defense for both groups of countries in AFR. AFRcountries with conditions increased the share of wages in total expenditures,but their wage expenditure remained lower than that in countries withoutconditionality. In SAS, despite expenditure shifts in favor of the social sectors,countries with conditions continued to devote smaller shares of total expen-diture to these sectors.
Reductions inImpact on major expenditure components subsidies were
Subsidies. The limited data on subsidy reductions indicate that although ex- often notpenditures on subsidies were often reduced in response to Bank conditional-ity, the reductions were not often sustained (see Annex Table 5.5). sustained
Civil service reform: wages. Data are even more limited on public sector wageand salary expenditures, covering only 6 of the 14 countries with explicitconditions on wages. Comparing these countries with 9 others that had nowage conditions suggests that, overall, wage conditionality did get results(Table 5.10). Wages fell as a share of total expenditure in 4 of the 6 countrieswith conditions, though the decline was minimal in Hungary. The wageshare increased in 2 of the 6 countries (Costa Rica, Guinea). Wage shares fellin only 4 of the 11 comparator countries with no wage conditions. The data-incomplete as they are-suggest the stability of wages as an expenditure cat-egory, though Bank conditionality appears to have been a relatively success-ful tool.
TABLE 5.10: CHANGES IN WAGE EXPENDITURE SHARES, BEFORE AND
AFTER ADJUSTMENT
(percentage of total expenditure)
AdjustmentCountry period Share before Share after Change
Wage conditionsCosta Rica 1985-89 37.9 41.0 +Guinea 1990 16.9 22.1 +Hungary 1986-88 7.0 6.9 -Togo 1983-85 29.5 24.3 -Uruguay 1984 28.8 23.5 -
1989 21.7 18.0 -Zimbabwe 1983 28.8 24.6 -
No wage conditionsBolivia 1987 35.7 40.9 +
1992 39.2 29.4 -
Brazil 1984 7.5 5.5 -
Chad 1989 23.4 25.7 +Chile 1986-88 20.2 18.2 -
Colombia 1985 18.7 18.8 +Mauritius 1981-87 30.3 35.3 +Mexico 1983 23.1 17.5 -
1989 13.5 26.9 +Morocco 1984-89 32.7 36.5 +Panama 1984-87 28.2 47.2 +
Source: IMF, Government Finance Statistics.

100
Operations and maintenance. Data on current expenditures generally are notbroken out by detailed expenditure categories; data on subsidies in develop-ing countries are very limited or incomplete, and data on nonwage O&Mare particularly difficult to come by. However, data on the ratios to GDPof current expenditures, wages and salaries, and subsidies for 17 of the 27sample countries studied in Chapter 2 (not all of which had wage and sub-sidy conditions) suggest that even in countries where current expendituresincreased as a share of GDP, these increases were often swamped by in-creases in wages, subsidies, and transfers. This suggests that shifts in cur-rent expenditures toward nonwage O&M in this sample of adjusting coun-tries were correspondingly very limited (Annex Table 5.6).
Education expenditures. Data are especially weak on education expenditures.Almost 60 percent of SALs/SECALs with conditions on education expendi-tures were approved after 1990, so it is too early for the expenditure effectsto show up fully. And data availability at the country level is also a prob-lem. Although during the early 1990s SAL/SECAL countries with condi-tions devoted a higher share of public expenditures to education than didcountries without conditions, the regional and country experience underly-ing the overall average is varied (Annex Table 5.4 and Table 5.11). The shareof central government expenditures allocated to education increased in Bul-garia, Indonesia, and Zambia, and decreased in Burkina Faso, Cameroon,and India (in India, where states are responsible for funding education, thedecline in central government expenditures probably reflects cutbacks intertiary funding only).
Eight of the nine adjustment loans that called for shifts of funding from ter-tiary to primary education were approved after 1990, so detailed analysisof the outcomes of these conditionalities is not possible. The only availableevidence on expenditures is for Ghana. Between 1984 and 1990 the share ofcurrent expenditures at the tertiary level declined by slightly less than 2percentage points and the share of primary expenditures increased byslightly less than 5 percentage points.
The pattern of education spending in adjusting countries during the 1980sshows that social sector spending does not necessarily suffer when an ad-
The mixed justment program is adopted (see Annex Table 5.7, which separates coun-performance of tries with education conditions from those without). Of the 55 countries in
Annex Table 5.7, 65 percent showed increases in education spending as acountries share of both total public spending and GDP; the same percentage (but
not the same group) of countries also showed a positive average annualundergoing growth rate in education spending between 1980 and 1990. Some countries
adjustment can with Bank conditions on education (Cameroon, Ghana, Kenya, Malawi,be traced in part Uganda) experienced positive growth rates in education spending. In oth-
be traednpr ers (the Gambia, Mali, Mozambique, Sierra Leone, Trinidad and Tobago,to inflexible Zambia) the Bank called for increases in the allocation of funds to educa-
tion to halt a falling trend in education expenditures. In LAC, a regionbudgets where SALs/SECALs did not include conditions on education spending,
10 of 16 countries listed in Annex Table 5.7 had negative growth rates ineducation spending during the 1980s.
Health expenditures. Annex Table 5.4 suggests that Bank conditionality en-couraged higher levels of health spending, as well as increases in healthspending as a share of total spending, in countries with conditionality rela-tive to countries without. The limited country-specific empirical evidencealso suggests that Bank conditionalities exerted a positive influence oncentral government health expenditures. The share of health expenditures

101
TABLE 5.11: CHANGES IN CENTRAL GOVERNMENT EXPENDITURES ON EDUCATION,
BEFORE AND AFTER ADJUSTMENT
(percentage of total expenditure)
Country Fiscal year of condition Share before Share afterBulgaria 1992 3.1 3.4Burkina Faso 1991 17.9 17.3Cameroona 1989 2.9 2.7India 1993 2.2 1.9Indonesia 1989, 1991 9.0 9.8Zambia 1991 10.2 13.4Note: The adjustment period is the fiscal year listed; for Indonesia the adjustment loanapproval period is 1989-91. Preadjustment periods are three years prior to loan ap-proval. The most recent periods are as follows: Bulgaria, 1993-94; Burkina Faso, 1992;Cameroon, 1993; India, 1994; Indonesia, 1992-93; Zambia, 1992-94.a. For Cameroon, education expenditures are shown as a ratio to GDP.Source: IMF, Government Finance Statistics.
TABLE 5.12: CHANGES IN CENTRAL GOVERNMENT EXPENDITURES ON HEALTH(percentage of total expenditure)
Country Year of loan approval Share before Share after
Bulgaria 1992 2.1 3.1Burkina Faso 1991 6.4 6.9Cameroona 1989 0.8 0.7Indonesia 1989, 1991 1.7 2.6Uruguay 1989 4.5 5.0Zambia 1991 7.3 9.8
Note: The adjustment period is the year of loan approval; for Indonesia this period is1989-91. Preadjustment periods are three years prior to loan approval. The most recentperiods are as follows: Bulgaria, 1993-94; Burkina Faso, 1992; Cameroon, 1993; Indone-sia 1992-93; Uruguay 1990-92; and Zambia 1992-94.a. For Cameroon, health expenditures are shown as ratios to GDP.Source: IMF, Government Finance Statistics.
in total spending increased after adjustment in 5 of the 6 countries inTable 5.12.
Budgetary inflexibility. The mixed performance of adjustment lending recipi-ents can be traced in part to budgetary inflexibility. Several large expenditurecategories, including statutory transfers to lower levels of government, de-fense funding, and debt payments, cannot be adjusted quickly. In Brazil, In-dia, and Zaire, for example, over 90 percent of total revenues were not easilyadjustable during the past decade (Table 5.13). Adjustment lending programsappear to have had little effect on such budgetary inflexibility, and so to havehad limited opportunities to reshape spending priorities. Among regions, Countries withSAS had the least budgetary flexibility (69 percent of expenditures were expenditurefixed on average during 1986-94), followed by AFR (41 percent fixed). conditions and
Outcomes: the ultimate objective of expenditure reform those without
Education. The ultimate goal of Bank conditions on education expenditures is had similarimproving educational outcomes. The overall effectiveness of Bank condi- social sectortions must be evaluated by looking at the basic indicators of education: illit-eracy rates and primary enrollment ratios. Though illiteracy rates adjust very outcomes
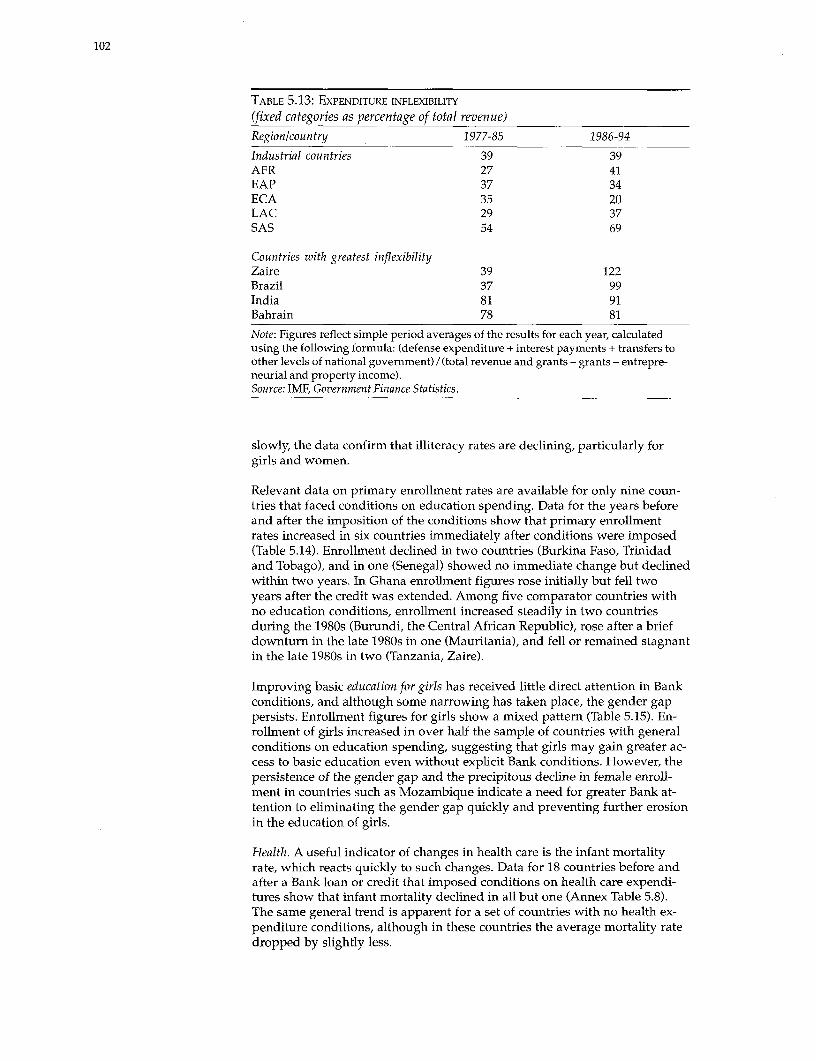
102
TABLE 5.13: EXPENDITURE INFLEXIBILITY
(fixed categories as percentage of total revenue)
Region/country 1977-85 1986-94
Industrial countries 39 39AFR 27 41EAP 37 34ECA 35 20LAC 29 37SAS 54 69
Countries with greatest inflexibilityZaire 39 122Brazil 37 99India 81 91Bahrain 78 81
Note: Figures reflect simple period averages of the results for each year, calculatedusing the following formula: (defense expenditure + interest payments + transfers toother levels of national government)/(total revenue and grants - grants - entrepre-neurial and property income).Source: IMF, Government Finance Statistics.
slowly, the data confirm that illiteracy rates are declining, particularly forgirls and women.
Relevant data on primary enrollment rates are available for only nine coun-tries that faced conditions on education spending. Data for the years beforeand after the imposition of the conditions show that primary enrollmentrates increased in six countries immediately after conditions were imposed(Table 5.14). Enrollment declined in two countries (Burkina Faso, Trinidadand Tobago), and in one (Senegal) showed no immediate change but declinedwithin two years. In Ghana enrollment figures rose initially but fell twoyears after the credit was extended. Among five comparator countries withno education conditions, enrollment increased steadily in two countriesduring the 1980s (Burundi, the Central African Republic), rose after a briefdownturn in the late 1980s in one (Mauritania), and fell or remained stagnantin the late 1980s in two (Tanzania, Zaire).
Improving basic education for girls has received little direct attention in Bankconditions, and although some narrowing has taken place, the gender gappersists. Enrollment figures for girls show a mixed pattern (Table 5.15). En-rollment of girls increased in over half the sample of countries with generalconditions on education spending, suggesting that girls may gain greater ac-cess to basic education even without explicit Bank conditions. However, thepersistence of the gender gap and the precipitous decline in female enroll-ment in countries such as Mozambique indicate a need for greater Bank at-tention to eliminating the gender gap quickly and preventing further erosionin the education of girls.
Health. A useful indicator of changes in health care is the infant mortalityrate, which reacts quickly to such changes. Data for 18 countries before andafter a Bank loan or credit that imposed conditions on health care expendi-tures show that infant mortality declined in all but one (Annex Table 5.8).The same general trend is apparent for a set of countries with no health ex-penditure conditions, although in these countries the average mortality ratedropped by slightly less.
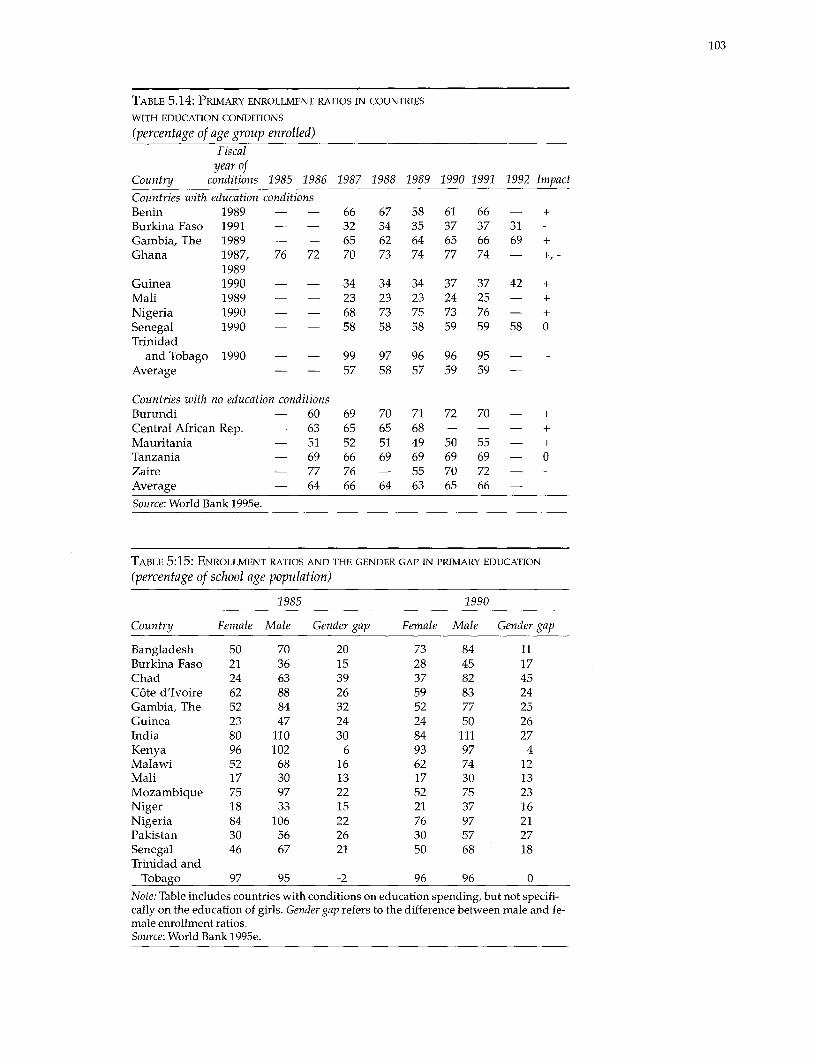
103
TABLE 5.14: PRIMARY ENROLLMENT RATIOS IN COUNTRIES
WITH EDUCATION CONDITIONS
(percentage of age group enrolled)Fiscalyear of
Country conditions 1985 1986 1987 1988 1989 1990 1991 1992 ImpactCountries with education conditionsBenin 1989 - - 66 67 58 61 66 - +Burkina Faso 1991 - - 32 34 35 37 37 31 -Gambia, The 1989 - - 65 62 64 65 66 69 +Ghana 1987, 76 72 70 73 74 77 74 - +, -
1989Guinea 1990 - - 34 34 34 37 37 42 +Mali 1989 - - 23 23 23 24 25 - +Nigeria 1990 - - 68 73 75 73 76 - +Senegal 1990 - - 58 58 58 59 59 58 0Trinidad
and Tobago 1990 - - 99 97 96 96 95 - -Average - - 57 58 57 59 59 -
Countries with no education conditionsBurundi - 60 69 70 71 72 70 - +Central African Rep. - 63 65 65 68 - - - +Mauritania - 51 52 51 49 50 55 - +Tanzania - 69 66 69 69 69 69 - 0Zaire - 77 76 - 55 70 72 - -
Average - 64 66 64 63 65 66 -
Source: World Bank 1995e.
TABLE 5:15: ENROLLMENT RATIOS AND THE GENDER GAP IN PRIMARY EDUCATION
(percentage of school age population)
1985 1990
Country Female Male Gender gap Female Male Gender gap
Bangladesh 50 70 20 73 84 11Burkina Faso 21 36 15 28 45 17Chad 24 63 39 37 82 45C6te d'Ivoire 62 88 26 59 83 24Gambia, The 52 84 32 52 77 25Guinea 23 47 24 24 50 26India 80 110 30 84 111 27Kenya 96 102 6 93 97 4Malawi 52 68 16 62 74 12Mali 17 30 13 17 30 13Mozambique 75 97 22 52 75 23Niger 18 33 15 21 37 16Nigeria 84 106 22 76 97 21Pakistan 30 56 26 30 57 27Senegal 46 67 21 50 68 18Trinidad and
Tobago 97 95 -2 96 96 0
Note: Table includes countries with conditions on education spending, but not specifi-cally on the education of girls. Gender gap refers to the difference between male and fe-male enrollment ratios.Source: World Bank 1995e.
104
Civil service reform: employment. Recent data on public employment in devel-oping countries are available for only a handful of countries (Annex Table5.9). The data reveal an almost flat trend in public employment as a percent-age of the population or the labor force during the 1980s. Most countriesparticipating in Bank-assisted structural adjustment programs met Bankconditions on retrenchment of public service and containment of publicwages, but in some cases the retrenchment was short-lived. In Guinea andSenegal, for example, reductions carried out during the first two years ofthe program were later reversed.
Lessons
The following lessons emerge from this review of public expenditure reform:
* All public expenditure reform programs need to start with an appraisalof the role of government and of the possibilities for shifts away fromthe public provisioning of goods and services toward more extensiveregulatory activities or toward financing that encourages the expansionof private sector activities in infrastructure and social services. The speci-fic mix of government roles will of course differ according to countrycircumstances.
* Public expenditure reforms also need to take account of the sources offinancing, whether tax revenues or other forms of domestic or foreign fi-
Public nancing. An evaluation of the costs of and constraints on financing andthe efficiency costs of different types of revenue is likely to cultivate a
expenditure culture of accountability-by ensuring that spending programs will be
reform programs examined in terms of both their social benefits and their social costs.The Bank needs to engage the Fund in discussions on issues concerning
need to start the financing of public expenditures. The formal arrangements insti-
with an tuted in June 1995 for collaboration between the two institutions onappraisal of the public expenditure issues should provide a means for such discussions.
government S * Governments need to be persuaded to move away from the culture of"command and control" and to orient themselves to a "service delivery"
role... outlook. They also need to be encouraged to invite local governments,potential beneficiaries, and other stakeholders to participate in discus-sions on development and spending priorities, particularly in the socialsectors. The institutional aspects of the budgetary process therefore re-quire attention (see Chapter 2).
* While the Bank's emphasis on capital spending reductions was war-ranted in countries where large capital projects did not meet the basicneeds of the population, capital spending shares (in total spending orGDP) have fallen to low levels in some countries and may be retardinggrowth. In these countries and in others where large sections of thepopulation lack access to basic services, an increase in investments inbasic services may be warranted.
* Where budget deficit reductions continue to be a goal, the Bank mayneed to emphasize cuts in current spending, particularly given its largeshare in total expenditure. Expenditure efficiency can also be improvedthrough reorientation of current expenditure toward O&M or the socialsectors. Where caps on current expenditure need to be maintained, re-structuring in favor of nonwage O&M can only be brought aboutthrough sharper reductions in subsidies and the wage bill.
105
* The dialogue on public expenditure reform will need to focus on inflexibleand unproductive expenditures (such as defense and general subsidies nottargeted to the poor).
* Because expenditure programs have greater potential than revenue re-forms as instruments for reducing poverty, the Bank needs to pursueexpenditure solutions for providing the poor with better access to basicservices and for improving targeting of subsidies (by restricting them tothe type and quality of goods consumed by the poor). (See Chapter 3.)The Bank also needs to seek more innovative solutions to the problemsof poverty, such as using education programs to teach poor households ... and need toabout safe water and sanitation practices. And it needs to encourage cli-ents to direct resources to rural areas, where most of the poor live. persuade the
government to* To promote equity, basic education and health services should be almost g
free. For tertiary education and health services, more innovative cost- move toward arecovery solutions that also promote equity need to be explored. "service delivery'
A The implied inconsistency between the relatively adequate compliance outlookwith Bank conditionality and the relatively modest impact of the condi-tionality on expenditure levels and outcomes can probably be attributedto the Bank's focus on means rather than ends. This focus may invitepurely "accounting" responses (budgetary accounting changes andshifts in resources between departments) rather than improvements inefficiency or in service delivery. The Bank therefore needs to establish amore detailed and intensive dialogue on public sector organization anddelivery systems and capabilities if shifts in public spending are to betranslated into improvements in intermediate and final outcomes.
* Focusing on the goals of public expenditure right from the start is likelynot only to lead to a better choice of expenditure (or other) instruments,but also to aid implementation. The Bank therefore needs to focus on for-mulating better performance indicators that are tied to sectoral objectivesand to the removal of institutional impediments to public sector perfor-mance. Thus in education, in addition to monitoring expenditures at dif-ferent education levels, the Bank needs to monitor enrollments, student-teacher ratios, graduation rates, and drop-out rates in the short run, andachievement scores, literacy rates, and supplies of skilled professionalsin the long run.
Notes
1. The work on this chapter was envisaged as an intermediate step to a broader OEDstudy of the substance and process of Bank public expenditure reviews and their effi-cacy and equity impacts on public spending.2. This chapter is based on an internal background paper written by Jeff Huther, SandraRoberts, and Anwar Shah in 1996.3. The role of government is perhaps discussed more fully in country ESW reports.However, president's reports do not spell out how such analysis has shaped expenditureconditionality.4. For the AFR countries the civil service data relate to 1981; for the MNA countries 1984-90.5. For example, Malawi in 1984 undertook to "ensure adequate budget allocations tokey development departments," but Gabon in 1988 undertook to "reduce public expen-diture on salaries by 10.4 percent."6. This sample of 27 countries is the same as that studied in Chapter 2.7. For consistency reasons this comparison is based on a different data source, the IMF'sGovernment Finance Statistics. The countries in the sample also differ from those ana-lyzed in Chapter 2.
FISCAL MANAGEMENT INADJUSTMENT LENDING
6. Fiscal adjustment under SALs andSECALs: an aggregate view and conclusions
Before drawing lessons about fiscal management in SALs/SECALs, it isimportant first to examine the record on fiscal adjustment-was it achieved,how, and did it last?-and the relationship of fiscal adjustment to other mac-roeconomic variables.' The uniformly high levels of initial deficits motivatedthis focus on deficit reduction. The study did not anchor its assessments offiscal adjustment in independent evaluations of macroeconomic programs(other OED and Bank research reports have carried out such exercises to es-tablish the centrality of fiscal reform). Whether the magnitude of deficit re-ductions is appropriate is discussed in the context of a solvency and sustain-ability exercise carried out by Dinh (1995).
To examine the fiscal record, the study looked at a sample of 26 countries(134 operations in 5 regions) with a long-term history of fiscal adjustment.The sample included 35 percent of countries with adjustment lending and 59percent of all adjustment loans in the 5 regions.2 (Annex Table 6.1 reflects theweight of the sample in the universe of SALs/SECALs approved betweenFY79 and FY94; Annex Table 6.2a lists the sample countries and Annex Table6.2b the sample operations.) Each country's fiscal record is divided into fourphases: the preloan period (the four years preceding the first loan); the me-dium term (years 1-4 beginning with the initial year of the first loan); thelong term (years 5-8 following the first loan); and the two most recent years.In addition to being grouped by region, countries are grouped by two portfo-lio characteristics--OED ratings of macroeconomic performance (successfulor unsuccessful)3 and frequency of adjustment operations (more than threeSALs/SECALs qualify a country as loan-intensive)-and three economiccharacteristics-indebtedness, income level (low or middle), and type of
Fiscal deficits exporter (primary or diversified).4 (Annex Table 6.3 lists the countries in
were not each group.)
reduced in themedium term: Were fiscal deficits reduced?
deficit reduction Not in the medium term
is a long-term In the medium term the average fiscal deficit for the sample increased fromprocess 6.7 percent of GDP to 6.8 percent (Table 6.1).5 This overall pattern dominated
the fiscal performance of countries in a number of the country groups: un-successful, loan-intensive, and low-income adjusters and primary and diver-sified exporters. The pattern of rising deficits also characterized two of theregions, AFR and EAP. In the medium term, deficits worsened for almost allthe AFR subgroups: successful and unsuccessful adjusters, loan-intensiveadjusters, low-income adjusters, and primary and diversified exporters; theonly exceptions were the AFR middle-income adjusters and, surprisingly, theseverely indebted adjusters (see Figure 6.1 and Annex Table 6.4). Deficits
106
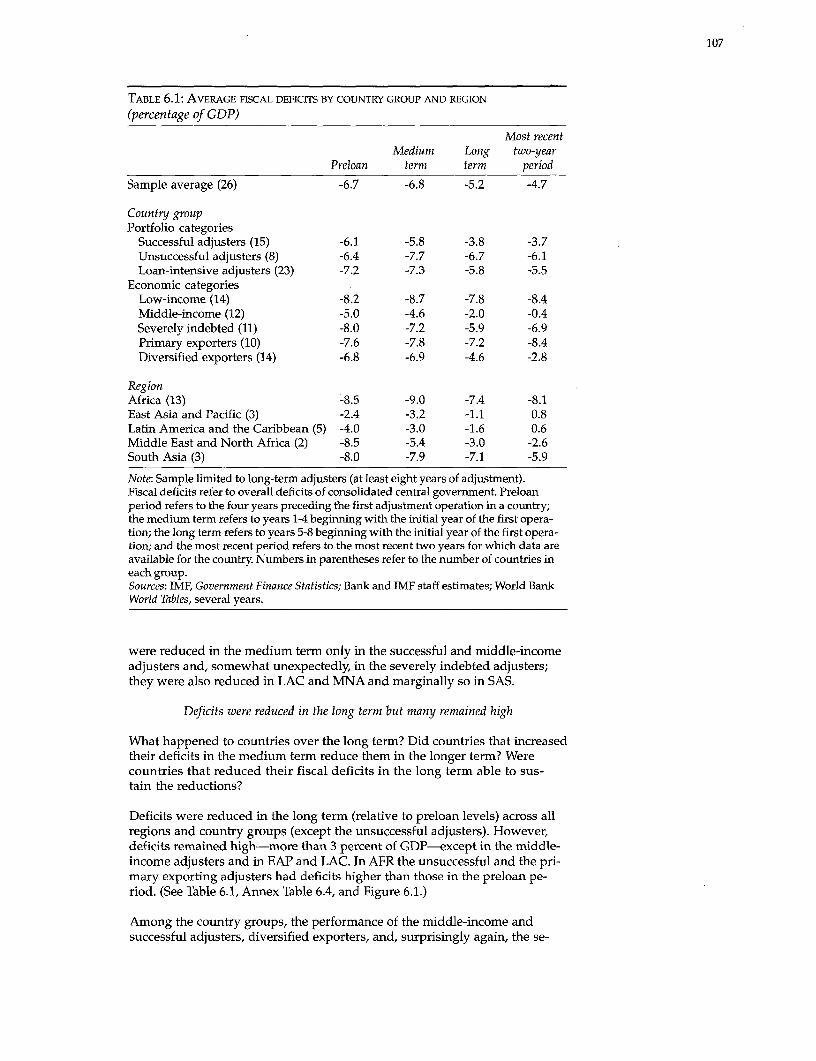
107
TABLE 6.1: AVERAGE FISCAL DEFICrFS BY COUNTRY GROUP AND REGION
(percentage of GDP)
Most recentMedium Long two-year
Preloan term term period
Sample average (26) -6.7 -6.8 -5.2 -4.7
Country groupPortfolio categories
Successful adjusters (15) -6.1 -5.8 -3.8 -3.7Unsuccessful adjusters (8) -6.4 -7.7 -6.7 -6.1Loan-intensive adjusters (23) -7.2 -7.3 -5.8 -5.5
Economic categoriesLow-income (14) -8.2 -8.7 -7.8 -8.4Middle-income (12) -5.0 -4.6 -2.0 -0.4Severely indebted (11) -8.0 -7.2 -5.9 -6.9Primary exporters (10) -7.6 -7.8 -7.2 -8.4Diversified exporters (14) -6.8 -6.9 -4.6 -2.8
RegionAfrica (13) -8.5 -9.0 -7.4 -8.1East Asia and Pacific (3) -2.4 -3.2 -1.1 0.8Latin America and the Caribbean (5) -4.0 -3.0 -1.6 0.6Middle East and North Africa (2) -8.5 -5.4 -3.0 -2.6South Asia (3) -8.0 -7.9 -7.1 -5.9
Note: Sample limited to long-term adjusters (at least eight years of adjustment).Fiscal deficits refer to overall deficits of consolidated central government. Preloanperiod refers to the four years preceding the first adjustment operation in a country;the medium term refers to years 1-4 beginning with the initial year of the first opera-tion; the long term refers to years 5-8 beginning with the initial year of the first opera-tion; and the most recent period refers to the most recent two years for which data areavailable for the country. Numbers in parentheses refer to the number of countries ineach group.Sources: IMF, Government Finance Statistics; Bank and IMF staff estimates; World BankWorld Tables, several years.
were reduced in the medium term only in the successful and middle-incomeadjusters and, somewhat unexpectedly, in the severely indebted adjusters;they were also reduced in LAC and MNA and marginally so in SAS.
Deficits were reduced in the long term but many remained high
What happened to countries over the long term? Did countries that increasedtheir deficits in the medium term reduce them in the longer term? Werecountries that reduced their fiscal deficits in the long term able to sus-tain the reductions?
Deficits were reduced in the long term (relative to preloan levels) across allregions and country groups (except the unsuccessful adjusters). However,deficits remained high-more than 3 percent of GDP-except in the middle-income adjusters and in EAP and LAC. In AFR the unsuccessful and the pri-mary exporting adjusters had deficits higher than those in the preloan pe-riod. (See Table 6.1, Annex Table 6.4, and Figure 6.1.)
Among the country groups, the performance of the middle-income andsuccessful adjusters, diversified exporters, and, surprisingly again, the se-
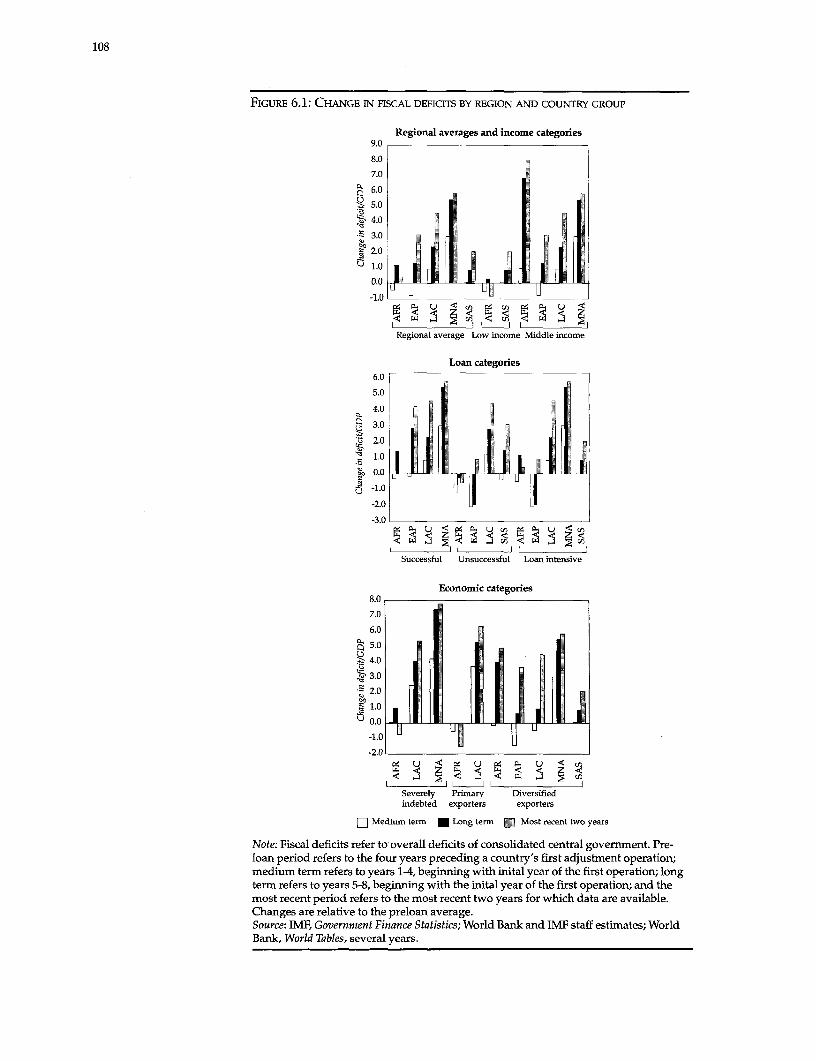
108
FIGuRE 6.1: CHANGE IN FISCAL DEFICITS BY REGION AND COUNTRY GROUP
Regional averages and income categories9.0
8.0
7.0
6.0
5.0
5 3.0
2.0
o1.0
-1.0
1< z < - ¢ I ~~~~m<~~ L
Regional average Low income Middle income
Loan categories6.0
5.0
3.0
c2.0
1.0
0.0
-1.0
-2.0
-3.0
Successful Unsuccessful Loan intensive
Economic categories8.0
7.0
6.0,
5.04.0
~3.02.0
1.0
0.0
-2.0
Severely Primary Diversifiedindebted exporters exporters
D Medium term * Long term R Most recent two years
Note: Fiscal deficits refer to overall deficits of consolidated central government. Pre-loan period refers to the four years preceding a country's first adjustment operation;medium term refers to years 1-4, beginning with inital year of the first operation; longterm refers to years 5-8, beginning with the inital year of the first operation; and themost recent period refers to the most recent two years for which data are available.Changes are relative to the preloan average.Source: IMF, Government Finance Statistics; World Bank and IMF staff estimates; WorldBank, World Tables, several years.
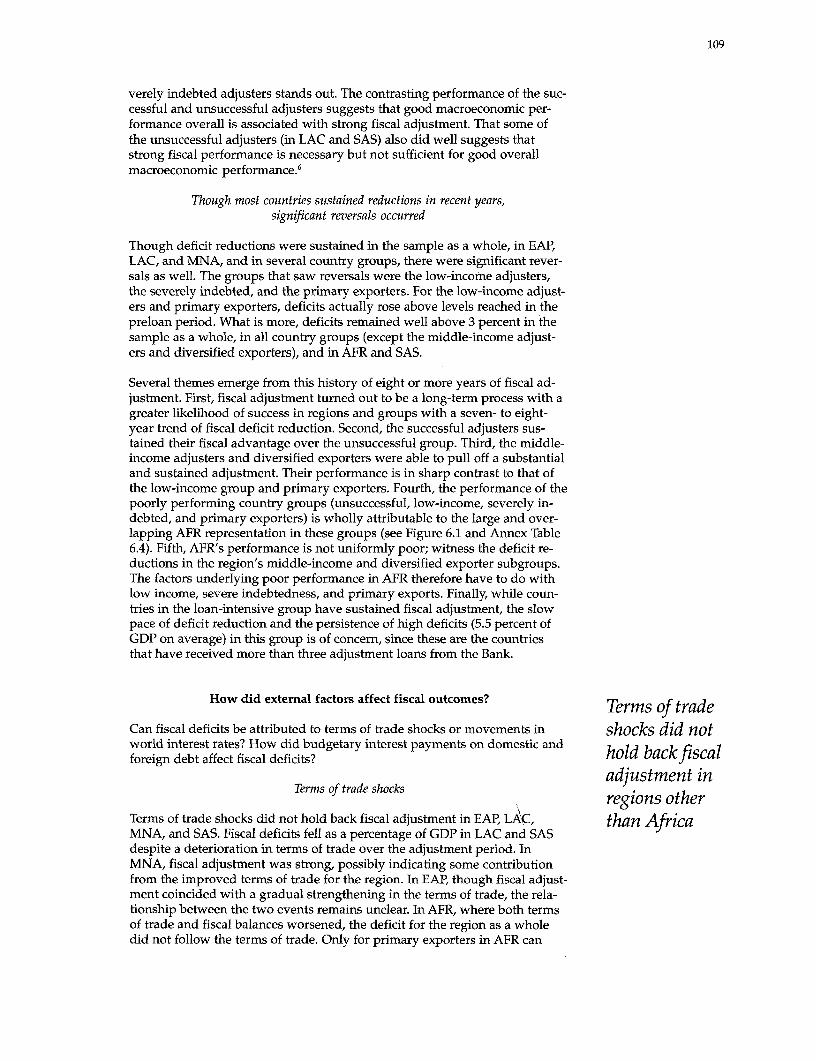
109
verely indebted adjusters stands out. The contrasting performance of the suc-cessful and unsuccessful adjusters suggests that good macroeconomic per-formance overall is associated with strong fiscal adjustment. That some ofthe unsuccessful adjusters (in LAC and SAS) also did well suggests thatstrong fiscal performance is necessary but not sufficient for good overallmacroeconomic performance.6
Though most countries sustained reductions in recent years,significant reversals occurred
Though deficit reductions were sustained in the sample as a whole, in EAP,LAC, and MNA, and in several country groups, there were significant rever-sals as well. The groups that saw reversals were the low-income adjusters,the severely indebted, and the primary exporters. For the low-income adjust-ers and primary exporters, deficits actually rose above levels reached in thepreloan period. What is more, deficits remained well above 3 percent in thesample as a whole, in all country groups (except the middle-income adjust-ers and diversified exporters), and in AFR and SAS.
Several themes emerge from this history of eight or more years of fiscal ad-justment. First, fiscal adjustment turned out to be a long-term process with agreater likelihood of success in regions and groups with a seven- to eight-year trend of fiscal deficit reduction. Second, the successful adjusters sus-tained their fiscal advantage over the unsuccessful group. Third, the middle-income adjusters and diversified exporters were able to pull off a substantialand sustained adjustment. Their performance is in sharp contrast to that ofthe low-income group and primary exporters. Fourth, the performance of thepoorly performing country groups (unsuccessful, low-income, severely in-debted, and primary exporters) is wholly attributable to the large and over-lapping AFR representation in these groups (see Figure 6.1 and Annex Table6.4). Fifth, AFR's performance is not uniformly poor; witness the deficit re-ductions in the region's middle-income and diversified exporter subgroups.The factors underlying poor performance in AFR therefore have to do withlow income, severe indebtedness, and primary exports. Finally, while coun-tries in the loan-intensive group have sustained fiscal adjustment, the slowpace of deficit reduction and the persistence of high deficits (5.5 percent ofGDP on average) in this group is of concern, since these are the countriesthat have received more than three adjustment loans from the Bank.
How did external factors affect fiscal outcomes? Terms of trade
Can fiscal deficits be attributed to terms of trade shocks or movements in shocks did notworld interest rates? How did budgetary interest payments on domestic andforeign debt affect fiscal deficits? hold backfiscal
adjustment inTerms of trade shocks a m
regions otherTerms of trade shocks did not hold back fiscal adjustment in EAP, LAC, than AfricaMNA, and SAS. Fiscal deficits fell as a percentage of GDP in LAC and SASdespite a deterioration in terms of trade over the adjustment period. InMNA, fiscal adjustment was strong, possibly indicating some contributionfrom the improved terms of trade for the region. In EAP, though fiscal adjust-ment coincided with a gradual strengthening in the terms of trade, the rela-tionship between the two events remains unclear. In AFR, where both termsof trade and fiscal balances worsened, the deficit for the region as a wholedid not follow the terms of trade. Only for primary exporters in AFR can
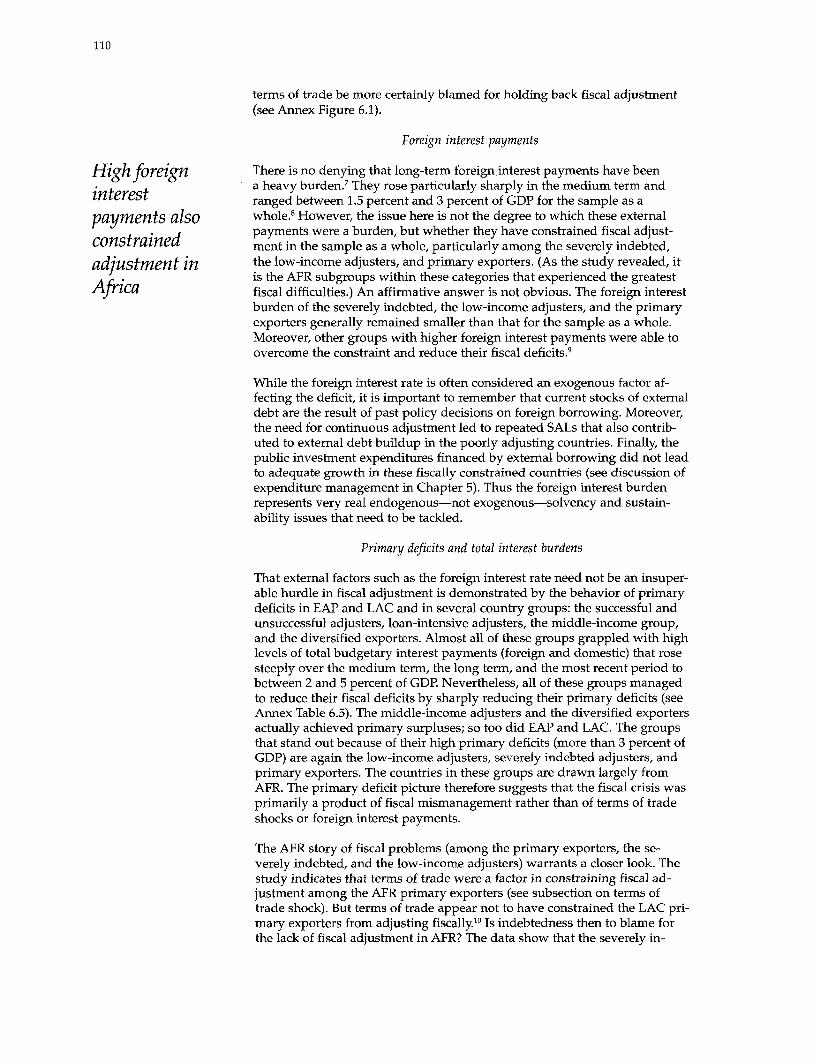
110
terms of trade be more certainly blamed for holding back fiscal adjustment(see Annex Figure 6.1).
Foreign interest payments
Highforeign There is no denying that long-term foreign interest payments have beena heavy burden.7 They rose particularly sharply in the medium term and
interest cranged between 1.5 percent and 3 percent of GDP for the sample as a
payments also whole.8 However, the issue here is not the degree to which these externalpayments were a burden, but whether they have constrained fiscal adjust-
constrained ment in the sample as a whole, particularly among the severely indebted,
adjustment in the low-income adjusters, and primary exporters. (As the study revealed, itA Y ' is the AFR subgroups within these categories that experienced the greatest
Africa fiscal difficulties.) An affirmative answer is not obvious. The foreign interestburden of the severely indebted, the low-income adjusters, and the primaryexporters generally remained smaller than that for the sample as a whole.Moreover, other groups with higher foreign interest payments were able toovercome the constraint and reduce their fiscal deficits.9
While the foreign interest rate is often considered an exogenous factor af-fecting the deficit, it is important to remember that current stocks of externaldebt are the result of past policy decisions on foreign borrowing. Moreover,the need for continuous adjustment led to repeated SALs that also contrib-uted to external debt buildup in the poorly adjusting countries. Finally, thepublic investment expenditures financed by external borrowing did not leadto adequate growth in these fiscally constrained countries (see discussion ofexpenditure management in Chapter 5). Thus the foreign interest burdenrepresents very real endogenous-not exogenous-solvency and sustain-ability issues that need to be tackled.
Primary deficits and total interest burdens
That external factors such as the foreign interest rate need not be an insuper-able hurdle in fiscal adjustment is demonstrated by the behavior of primarydeficits in EAP and LAC and in several country groups: the successful andunsuccessful adjusters, loan-intensive adjusters, the middle-income group,and the diversified exporters. Almost all of these groups grappled with highlevels of total budgetary interest payments (foreign and domestic) that rosesteeply over the medium term, the long term, and the most recent period tobetween 2 and 5 percent of GDP. Nevertheless, all of these groups managedto reduce their fiscal deficits by sharply reducing their primary deficits (seeAnnex Table 6.5). The middle-income adjusters and the diversified exportersactually achieved primary surpluses; so too did EAP and LAC. The groupsthat stand out because of their high primary deficits (more than 3 percent ofGDP) are again the low-income adjusters, severely indebted adjusters, andprimary exporters. The countries in these groups are drawn largely fromAFR. The primary deficit picture therefore suggests that the fiscal crisis wasprimarily a product of fiscal mismanagement rather than of terms of tradeshocks or foreign interest payments.
The AFR story of fiscal problems (among the primary exporters, the se-verely indebted, and the low-income adjusters) warrants a closer look. Thestudy indicates that terms of trade were a factor in constraining fiscal ad-justment among the AFR primary exporters (see subsection on terms oftrade shock). But terms of trade appear not to have constrained the LAC pri-mary exporters from adjusting fiscally.'" Is indebtedness then to blame forthe lack of fiscal adjustment in AFR? The data show that the severely in-
111
debted subgroups in both LAC and MNA carried out significant fiscal ad-justment through-out the period. Is the AFR story of fiscal difficulties attrib-utable then to low income? Perhaps, because there is a great deal of overlapbetween the low-income countries and the primary exporters and severelyindebted adjusters in AFR. Low income has been a severe handicap becauseit constrains revenue, but in addition economic management has not suc-ceeded in adequately increasing growth in low-income AFR. Here the com-parison with South Asia (the other region dominated by low-income coun-tries) is instructive: the SAS low-income countries were able to diversifytheir export base, keep debt levels down, and also grow during the periodunder study. Thus, while low income was a constraint in AFR, so too wasthe quality of economic management.
How was fiscal adjustment achieved?
How countries addressed their fiscal deficit problems-with tax increases,expenditure cuts, or a combination-matters because the choice affects in-centives to save, invest, and produce. Over the long term and during the mostrecent periodfiscal improvements were associated with revenue increases (see An-nex Table 6.6). More than half the instances of fiscal improvement for thecountry groups were related to increases in revenue. Both instruments-revenue increases and expenditure cuts-were used by the middle-incomeand diversified exporter groups in the long term and most recent periodand by the severely indebted countries in the long term. Expenditure in-creases were responsible for the worsening of the fiscal deficit in the me-dium term for the sample as a whole. Worsened fiscal deficits were gener-ally associated with expenditure increases alone (with the only exceptionthe unsuccessful adjusters in the long term, where revenues collapsed rela- In general,tive to preloan levels as expenditures increased). Only in two cases (in the revenuemedium term for the middle-income countries and during the most recenttwo years for the unsuccessful adjusters) was expenditure reduction associ- increases,ated with fiscal improvement. Among the regions, MNA was successful in resulting fromcutting expenditure, making cuts as large as 4 percent of GDP and main-taining them throughout the adjustment period. broadened tax
The data indicate much uniformity across country groups and regions and bases andover time in current and capital expenditure strategies. All country groups simplified taxsave one increased current expenditures, and all groups save one pruned Systems ledcapital expenditures, relative to the preloan period. For the sample as awhole and for all country groups" current expenditures were higher to fiscalthroughout the period relative to preloan levels (Annex Table 6.7). And forall groups (except the unsuccessful adjusters in the medium term and EAP improvementsin the medium term and most recent period) capital expenditures werelower relative to preloan levels throughout the period (see Chapter 5).
Fiscal deficits and other macroeconomic variables
Fiscal deficits, if they can be financed, do not represent an immediate prob-lem. Problems arise because of the economic disequilibria that fiscal defi-cits cause: inflation, credit shortages, distorted interest and exchange rates,current account imbalances, and a large public debt. All are common out-comes of fiscal deficits, and all can crowd out private investment andhurt economic growth. But because many other factors can also causethese macroeconomic problems, only associations between fiscal defi-cits and growth and macroeconomic indicators are explored here, notcausal relationships.' 2
112
For the sample as a whole the correlation between central government fiscalbalances and the GDP growth rate is fairly strong (Annex Table 6.8). The as-sociation was also strong for AFR, EAP, and LAC, for the better fiscal per-
Fiscal deficits formers (the middle-income adjusters and diversified exporters), and forcan be a the weak fiscal performers (the low-income group and the primary export-
ers). Although growth performance was uneven across regions, in general,problem when growth accelerated as fiscal deficits improved in the long run. Thus the datathey raise support the view that while other conditions are also necessary for growth,they raise good fiscal management helps. For inflation the association with deficit re-
doubts about duction was ambiguous. It was fairly pronounced in EAP, MNA, and SASbut was either weak or ran counter to the expected result (that large fiscal
a country s deficits are associated with high inflation) in the sample as a whole, in AFR
creditworthiness and LAC, and in the four country groups. For external balances the sampleas a whole indicates a strong association with fiscal deficits. So do the datafor all regions (except LAC) and for the four country groups. In the mediumand long term, improvements in fiscal deficits were associated with im-provements in current account deficits in all five regions.
Creditworthiness, fiscal solvency, and sustainability
Fiscal deficits were reduced to some degree across all country groups(except the adjusters rated unsuccessful by OED) and all regions in thelong term, but were they reduced enough? Fiscal deficits can be a problemif they raise doubts about creditworthiness. In the 1980s the assessment ofa country's creditworthiness rested mainly on its debt and debt servicingcapacity at the time of the assessment. Today lenders weigh fiscal solvencyand sustainability more heavily because they are good predictors of futureindebtedness and growth (see Box 6.1).13 Since the private sector's decisionto invest is based on the marginal return on alternative financial assets, thesustainability of fiscal deficits plays an important role in investment deci-sions. Unsustainable deficits are perceived as signaling future tax increasesand consequently capital flight, or deficit financing through money cre-ation and consequently higher inflation and devaluations. In either case,unsustainable deficits may lead to a financial or balance of payments cri-sis. These arguments point to the importance of achieving sustainablefiscal deficits.
Dinh (1995) has estimated the fiscal adjustments needed during 1989-93 torestore fiscal solvency and sustainability in specific countries. His estimates,set out in Annex Table 6.9, suggest that fiscal adjustments, some larger than3 percent of GDP, continue to be needed in all regions save EAP (the Philip-pines is the only country in EAP requiring solvency adjustments).
Traditional creditworthiness analysis looks at the external debt to GDPratio. For the sample in this study the ratio rose from 37 percent in the pre-loan period to more than 50 percent in the medium and long terms, to about64 percent in the most recent period. Among country groups, external debtratios have risen to between 48 percent and 102 percent of GDP in recentyears. The primary exporters, the severely indebted, and the low-incomeadjusters had the highest debt ratios in the most recent period, rangingfrom 93 percent to 101 percent. Among regions, recent debt ratios haveranged between 23 percent (EAP) and 96 percent (AFR). The largest growthof debt since the preloan period took place in AFR.
The rapid buildup in debt in most regions and Dinh's 1995 estimates ofthe fiscal adjustments required to restore fiscal solvency and sustainabilityin a range of Bank client countries suggest that the fiscal deficit reductions
113
Box 6.1: D THE SOLVFiCY OF THE FUBUC SECTOR
Three approaches are used to evaluate the slvency of the pubhic sector- Theaccot inig approwh (Butr 1983-i -1990;vXan W*-nbergezt 1989 Dinh_1995) defines a sustainable deficit level as one that can be financed by keep-ing the debt to, GDFratio- constant under reasonable assumpfions aboutgrowt real iterest rates, and iflatio. The difference between actual andsustanable deficit to GDP ratios -is then cakulate&L Dinh calcuates ihe fiscaladjustments required over time to achieve solvency an&dsustamability; Heargues that with the introduction of dynamic components, such as expectedreal interest rates and real GDP growth rate the cnventional debt to GDP-ratios, which are sta components, are ntot sufficit to assess fiscal susVtaablity Dinh argues that it is important to make a distinction betweensolveny and sustanahilt and to calculate the degree of fisc adustmentrneded to achieve bothThe solvency adjus,ment is used to assess the po-tential of thepublic sector to repay debt in the future, while sustainabilityadjustment looks at the current debt payment capacity taking into accoutmcurrent and potential meases in the areas of the exhange-rate and the financial secto
The neoasskal approach (Hamilo and Favi 19, Grilli 1989; Wilcox1989; Buiter and Patel 1990) compares the growth rate of the publi debt toGDP ratio with that of the real interest rate. A country is deemed solvent ifthe public debt to GDP ratio grws no faster an the real interest rate.
The r oriened approach focuseson pres rather than quantities ofdebt, Under this approach the discunts on public debt paper are taken asindictors of the i sector's solvency.
of the 1980s and early 1990s have not been sufficient for the majority of coun-tries studied.
Recommendations
The study suggests that greater fiscal discipline remains a major objectivefor adjusting countries. The first step is to redefine the role of the public sec- The first steptor-an important determinant of the level of the public finances. How muchfiscal discipline is required needs to be systematically identified for each toward greatercountry on the basis of estimates of the sustainable deficit. Looking at fiscal fiscal disciplinedeficits in this context also places fiscal reform in perspective-as only oneaspect of a larger adjustment program of interrelated policies. Estimates of is to redefinesustainable deficits ought to be routinely incorporated into Bank economic the role of theand sector work and should underlie adjustment lending proposals formost countries. public sector
Following are the study's more specific recommendations.
Regional and country performance
Though fiscal deficits have declined on average, the Bank needs to worktoward greater fiscal discipline in AFR and SAS and among low-income, pri-mary exporting, and severely indebted adjusters (particularly in AFR). Con-trary to popular belief, fiscal mismanagement, not external shocks, has beenlargely responsible for the poor fiscal performance in these groups; the onlyexception is the primary exporter group in AFR.
114
Fiscal deficits
The study recommends that:
* Fiscal accounts be expanded to include the broadest possible coverageof the deficit, and that their transparency be improved. This implies aneed to incorporate state, local, and municipal accounts into the fiscal
Fiscal reform accounts and to track quasi-fiscal deficits and work out the implications
needs to be a of implicit taxes and subsidies.
part of a larger a The appropriate measure of the deficit for tackling the problem at handadjustment be identified. In some countries, this measure may be the operational or
the structural deficit; in others, public savings may need to be the focus;program of in yet others, primary deficits may need monitoring.
interrelated a Fiscal accounts be better integrated into the macroeconomic framework
policies... of analysis. This will make it easier to estimate the sustainable deficit,identify tradeoffs among acceptable levels of borrowing, inflation, inter-est rates, and other macroeconomic variables, and set quantitative tar-gets for achieving a sustainable deficit and related macroeconomicoutcomes.
Analysis
The study calls for increasing transparency in the analysis and design of fis-cal programs, through:
* More explicit analysis (in alternative scenarios) of relationships betweenfiscal and other macroeconomic variables and of alternative revenue andexpenditure packages.
L Identification of the revenue effects of alternative fiscal policies.
* Analysis of implicit taxes and subsidies.
* The generation of better, more timely, and more complete fiscal data andthe development of more widely accessible data systems in the Bank'sclient countries.
President's reports need not document the detailed results of all such exer-cises, but they do need to indicate that fiscal programs have taken such alter-natives into consideration.
Conditionality
Renewed attention to some well-known conclusions about what is requiredfor the design of effective conditionality is likely to improve implementationand outcomes:
* Couching conditionality in more precise terms.
* Following through on the reforms in one SAL with related reformsin another.
* Making implementation of new laws-rather than their presentation tothe legislature-a condition of effectiveness or tranche release.
115
* Moving beyond studies (which should certainly precede reform) intoactions as the object of conditionality.
* Improving the timing of conditionality.
Instrument choice: revenue increases versus expenditure cuts
The study suggests that, in addressing the choice of revenue and expendi-ture instruments for reducing fiscal deficits, the Bank needs to focus on thecurrent components of the budget. It needs to emphasize:
* Revenue expansion through broadening tax bases and simplifying andimproving taxpayer compliance and tax administration.
a Cuts or restraint in current expenditure combined with restructuring.
A fresh assessment of the role of government is likely to suggest areas forreducing or redeploying expenditures. Most countries have already madelarge cuts in capital expenditure, however, so the Bank needs to ensure thatgovernments keep their sights focused on maintaining or enhancing infra-structure for the delivery of basic services.
Tax reform
* The Bank needs to emphasize the proper sequencing of tax reform. Iftrade taxes contribute significantly to revenue, nontrade tax reformneeds to precede trade tax reform. Reforms in tax administrationshould be closely sequenced with tax policy reforms, generally preced-ing or accompanying such policy reforms.
* Conditionality needs to be more precisely structured, especially fornontrade tax and tax administration reform.
* Building better performance indicators into reform programs from thebeginning would benefit design, implementation, and evaluation andfocus attention on the goals of reform. For nontrade tax and tax admin- .. inistration reform, SALs/SECALs need to build in performance indica- ...focusrg ontors on marginal effective tax rates and compliance indicators based on better analysiscosts and outputs of resource use. and design,
* Nontrade tax reforms need to be anchored in better analysis (for ex- more effectiveample, estimates of marginal effective tax rates). Some reforms, such as WIthe reduction of investment incentives, need to be pushed further. Other conditionalities,areas of reform likely to assume greater importance in the future need choosing the rightto be emphasized, such as property, environmental, and financial sectortaxes. In yet other areas-the use of schedular taxes and withholdings mstrumentforand the treatment of capital income-possible reforms need to be exam- reducing deficits,ined. Bank-Fund collaboration is important in evaluating cross-countryexperience, "best practice" in reform, and special topics of future im- and properportance in tax policy. sequencing of
* Certain issues need to be emphasized in tax administration reform: a tax reform...conducive legal environment, taxpayer education, information systems(used by tax departments), audits, withholding and presumptive taxa-tion, and improvements in VAT administration.

116
* In trade tax reform the design of Bank loans needs to take better accountof revenue effects. Bank loans also need to ensure that sales and excisetaxes apply with equal force to imports and competing domestic produc-tion. Attention to allowing appropriate adjustment periods and compen-sating losers is also important.
... as well as Public expenditure reform
keeping in * SALs need to keep the ultimate goals of expenditure reform in mind.mindfrom the Focusing on the goals right from the start is likely not only to lead to a
start the goals better choice of expenditure (or other) instruments but also to aid imple-mentation. The Bank needs to promote the development of appropriate
of expenditure performance monitoring indicators that focus not only on the level and
reform. composition of expenditure but also on intermediate (short-run) outputsand final (long-run) outcomes.
* Where cutting budget deficits continues to be a goal, the Bank may needto emphasize reducing current expenditures, particularly given theirlarge share in total expenditures. Restructuring current expendituresin favor of nonwage O&M and social sectors is only possible throughsharper reductions in subsidies, public employment, and the wage bill.
a While the Bank's emphasis on capital spending cuts was warranted incountries where large capital projects did not meet the basic needs ofthe population, capital spending shares (in total spending or GDP) havefallen to low levels in some countries and may be retarding growth. Inthese countries and in others where much of the population lacks accessto basic services, an increase in basic investments may be warranted.
* The dialogue on public expenditure reform will need to focus on inflex-ible and unproductive expenditures (such as defense and subsidies) andreform of budgetary processes. Governments need to be persuaded tomove away from a "command and control" culture and toward a "ser-vice delivery" outlook. They also need to be encouraged to involvelocal governments, potential beneficiaries, and other stakeholders indiscussions on development and spending priorities, particularly inthe social sectors.
* Expenditure programs have greater potential than revenue reforms asinstruments for reducing poverty. Thus the Bank needs to pursue expen-diture solutions for providing the poor with better access to basic ser-vices and for improving the targeting of subsidies (by restricting subsi-dies to the type and quality of goods consumed by the poor). The Bankmight also seek more innovative solutions to the problems of poverty,such as using education programs to teach poor households about safewater and sanitation practices. The Bank also needs to encourage clientsto direct resources to rural areas, where most of the poor live.
* To promote equity, basic education and health services should be almostfree. For tertiary education and health services, more innovative cost-recovery solutions that also promote equity need to be explored.
* The neglect of the ends of reform can be traced in part to the lack of fis-cal data in most of the Bank's client countries. But at the same time, thatneglect bears some responsibility for the absence of data.' 4 If there weremore concern about access to services by specific population groups,there would be more focus on generating and disseminating the public
117
expenditure data needed to make the proper assessments. Very fewSALs/SECALs have tried to promote the collection and disseminationof information that is indispensable for improving the design, imple-mentation, and evaluation of adjustment policies and for enhancingtransparency and accountability in government.
Some larger issues
The study also points to some larger issues that the Bank needs to considerand address:
* The Bank has made a beginning in formulating sectoral performancemonitoring indicators. This study has drawn attention to the need to ex-tend that exercise to all aspects of fiscal reform. Performance indicatorsare best framed if they start from the perspective of the specific goal thatindividual reforms address. Keeping the program's sights on the finaloutcome is likely not only to suggest better performance indicators forthe fiscal instrument identified for reform, but also to prevent the finaloutcome from being forgotten during implementation.
* A difficult issue is the role of government relative to the private sector.Should the government continue to provide basic services? Should itprovide financial assistance for private provision? In which areas shouldit withdraw to a regulatory role? The answers to these questions will dif-fer from country to country.
* The overall framework for public expenditures needs to be clearlydrawn in every case. Years of effort by the Bank in Bank-borrower expen-diture dialogues, public sector expenditure reviews, and the design ofexpenditure conditions have failed to yield commensurate results. Itmay be time for the Bank to look at expenditure issues from a differentperspective. It needs to look systematically at how to maintain overallbudget discipline across core and line ministries and at different levels ofgovernment, encourage local beneficiaries and governments to partici-pate in formulating expenditure proposals, ensure technical efficiency inthe choice of expenditure programs, build in incentives to ensure an effi-cient civil service, and ensure transparency and accountability to keep ... andgovernance open and honest. The literature on such institutional issues addressingoffers no immediate solutions, but the Bank has made a beginning in dis-cussing these questions. The Bank's research efforts on policy analysis in some of thethese areas need to be supported and expanded. larger issues,
* The Bank needs to evaluate its role in the design of fiscal programs. such asThe Fund's lead role in advising clients on fiscal matters needs to be re- formulatingspected; in addition, the Fund has superior resources and expertise anda long tradition of involvement in the area. However, recognizing the and usingstrong convergence of client, Fund, and Bank interests in the fiscal area, erformancethe Bank needs to do more searching analyses of fiscal issues, particu- PJlarly in adjustment areas where the Fund may not be directly involved. indicators in allFor example, the Bank needs to consider the relationships between tax stages thepolicy reforms undertaken in adjustment programs and other structural ofreforms (as in private sector development, financial and capital market reformreforms); between the size and role of the government and the level ofthe public finances; between the financing of the budget and the leveland composition of public expenditures; and between tax and expendi-ture decisions and poverty programs. The Bank needs to retain the ana-lytical capacity to advise staff on fiscal and adjustment issues, to identify
118
best practice, and to analyze new fiscal policy issues that are likely to as-sume importance in the future (financial sector taxation, environmentaltaxes). In this respect, the Bank's Policy Research Department, whichwithdrew from tax analysis in October 1994 to concentrate on expendi-ture issues, needs to correct the balance. Such a capability will enhanceBank-Fund coordination and strengthen dialogue on fiscal issues. As afirst step, the president's reports need to report on the Fund's principalactions so that the Bank's contribution to adjustment is more transpar-ent. The Bank and Fund are exploring new and existing channels for im-proving coordination in the preparation of country macroeconomicframeworks (policy framework papers, public expenditure reviews,Bank country assistance strategy papers, Fund country assistance briefs).The Bank and Fund also need to collaborate in improving their own fis-cal databases and client fiscal data systems.
Notes
1. The aggregative findings reported here draw on an internal background paper writ-ten by Vandana Chandra and Salman Anees in 1996.2. Though doubts have been expressed about the usefulness of regional groupings(because country composition is not homogeneous), they do serve a purpose. Thetables indicate that the fiscal problems of specific groups defined by "portfolio" or"economic" characteristics, were in reality confined to a few regions. This is why theregional groupings have been retained.3. Successful adjusters (as assessed by the Bank and OED) were considered so on thebasis of their overall success in macroeconomic reform. Since fiscal stability and sus-tainability are integral to macroeconomic stability, the successful group would be ex-pected to score higher on fiscal adjustment as well. A finding that that was the casewould reinforce the belief that good macroeconomic management overall is necessaryfor fiscal stability, while the opposite finding would indicate that govemrnents needto do more than achieve external equilibrium to attain fiscal equilibrium and thatthe Bank needs to take a strong position on the centrality of fiscal stabilization inSALs/SECALs.4. The choice of these country groups may appear arbitrary. However, background pa-pers by Vandana Chandra found that in analyzing a handful of successful and unsuc-cessful adjusters, the economic characteristics-indebtedness, income level, and typeof exporters-were important in explaining fiscal performance.5. All changes in deficits are in reference to the four-year preloan average unless other-wise indicated.6. These long-term patterns are corroborated by the larger sample of 198 operations in47 countries discussed in Chandra and Anees' background paper of 1996. Though thenumber of countries varies between the preloan period and the long term, changes indeficit levels are all in the same direction for all country groups and regions. However,in AFR significant deficit reductions were achieved not merely by the middle-incomeadjusters and diversified exporters, but also by the successful adjusters.7. This study focused on long-term foreign interest payments because the data aremore consistent and more readily available than short-term debt data.8. The data here refer to interest actually paid. The interest burden may actually havebeen higher in countries that ran up arrears on interest payments.9. These conclusions should not be taken as running counter to the concerns underly-ing the program of action envisaged by the Bank and the Fund for the heavily indebtedcountries. That program is concemed with external debt stocks and not foreign interestpayments. Moreover, this study focuses only on actual interest payments on long-termexternal debt whereas the multilateral debt initiative paper is concerned with projec-tions of total debt service due in the next 5 to 10 years. The background papers pre-sented to the Board do not deal in detail with the fiscal performance issues raised inthis study.10. The broader sample of 47 countries studied by Chandra and Anees also con-firms that LAC primary exporters were able to adjust fiscally despite terms of tradedeterioration.
119
11. The sole exception was the middle-income adjusters in the most recent period.12. The causal relationships have been explored in depth in other OED publications(Jayarajah and Branson 1995), in World Bank 1988c, and in Easterly, Rodriguez, andSchmidt-Hebbel (1994).13. Solvency is defined as the point at which the intertemporal budget constraint is sat-isfied (that is, the present discounted value of the primary balance is equal to the initiallevel of public debt). It is measured at a point in time. Sustainability refers to the dis-counted value of a country's public sector debt approaching zero as time progresses.It is measured over a period of time.14. The data issue was also flagged in World Bank 1992a.

Annexes
1. Representativeness of samples used in the study 1232. The SAL/SECAL sample 1253. The instruments of tax reform 1294. Checklist for Bank staff in formulating strategies for tax
administration reform 1355. Government expenditures and social indicators 1426. Fiscal solvency and deficits 154
121

Annex 1: Representativeness of samplesused in the study
123
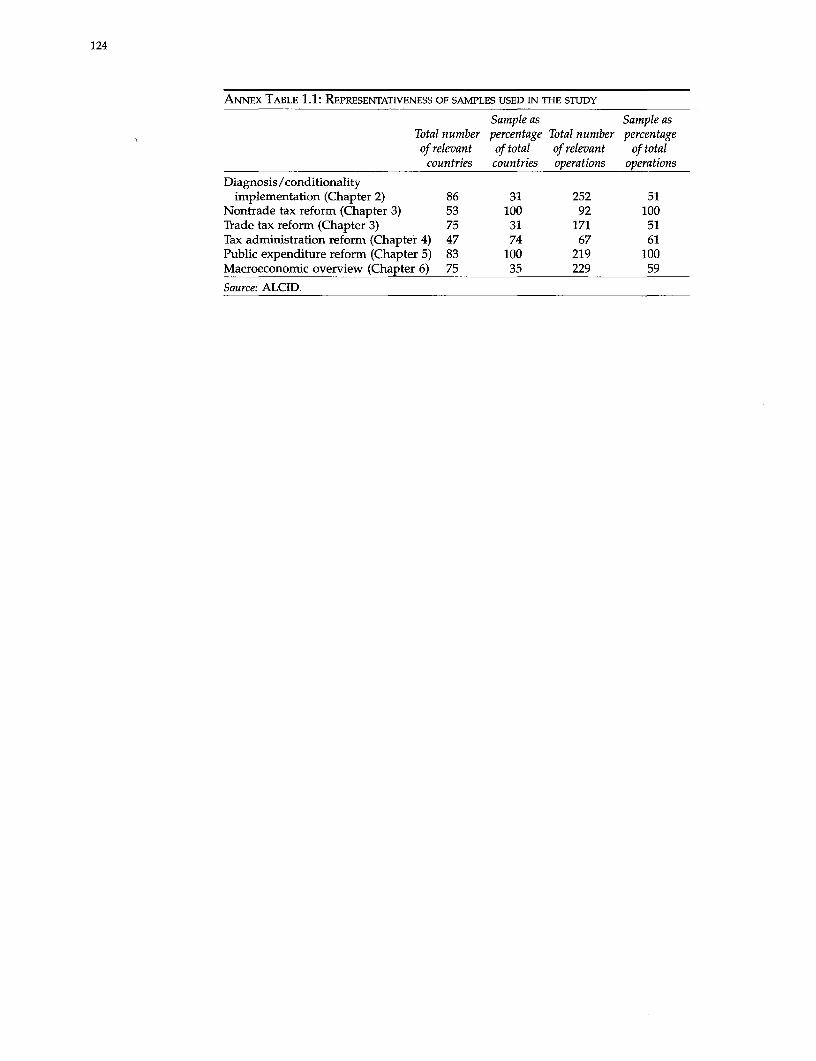
124
ANNEX TABLE 1.1: REPRESENTATIVENESS OF SAMPLES USED IN THE STUDY
Sample as Sample asTotal number percentage Total number percentageof relevant of total of relevant of totalcountries countries operations operations
Diagnosis/conditionalityimplementation (Chapter 2) 86 31 252 51
Nontrade tax reform (Chapter 3) 53 100 92 100Trade tax reform (Chapter 3) 75 31 171 51Tax administration reform (Chapter 4) 47 74 67 61Public expenditure reform (Chapter 5) 83 100 219 100Macroeconomic overview (Chapter 6) 75 35 229 59
Source: ALCID.

Annex 2: The SAL/SECAL sample
1. Country composition by type of conditionalities (ALCID database)
23 out of 40 countries with specific budget deficit conditions11 out of 25 countries with budgetary process reform conditions10 out of 23 countries with tax conditions only11 out of 48 countries with expenditure conditions only6 out of 22 countries with tax and expenditure conditions11 out of 13 countries with conditions related to IMF20 out of 48 countries with other conditions
2. Regional composition (includes only countries with adjustment lending)
Number of Number of Percentage ofRegion countries in region sample countries countries in region
Latin America andthe Caribbean 20 8 40
Africa 37 9 24Europe and Central Asia 12 4 33East Asia and Pacific 7 2 29South Asia 5 2 40Middle East and
North Africa 5 2 40
Total 86 27 31
3. Share of total SAL/SECAL lending by region, FY79-94
Lending to Share in BankTotal lending countries lending to
Region (US$m) selected (US$m) region (%)
Latin America andthe Caribbean 10,126 5,816 57
Africa 10,214 5,673 56Europe and Central Asia 5,501 4,331 79East Asia and Pacific 3,308 2,652 80South Asia 2,600 1,650 63Middle East and
North Africa 2,565 1,849 72
Total 34,314 21,971 64
125
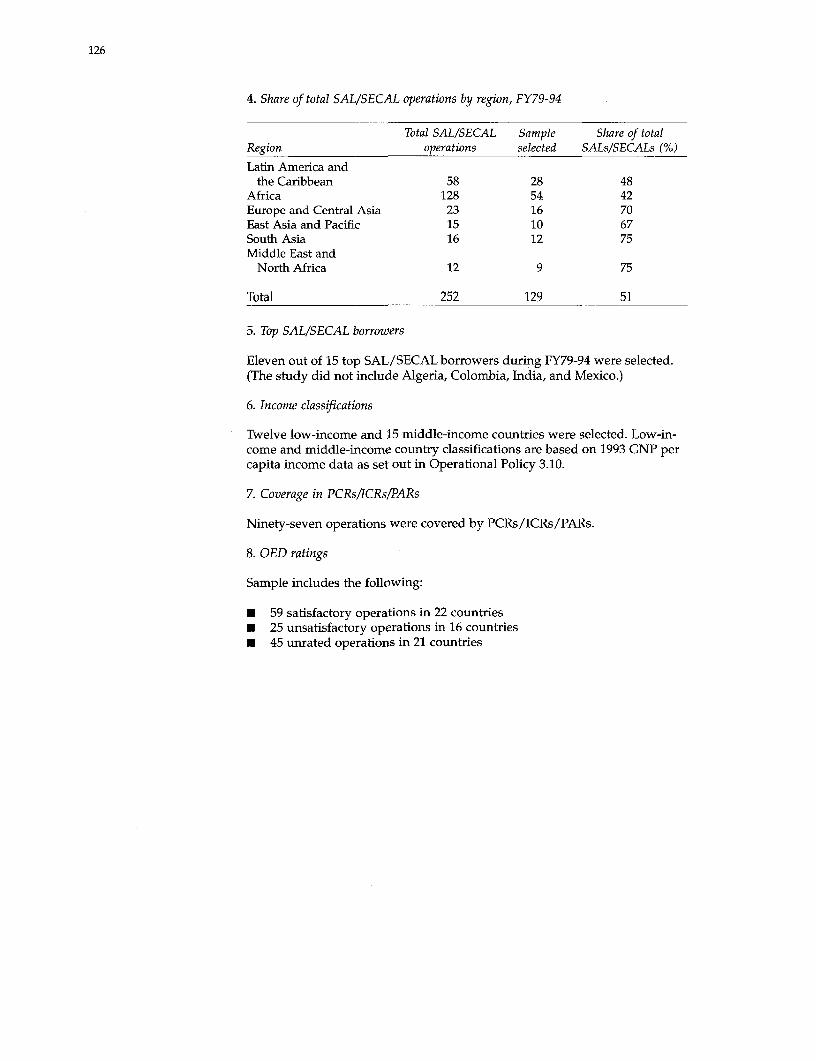
126
4. Share of total SAL/SECAL operations by region, FY79-94
Total SAL/SECAL Sample Share of totalRegion operations selected SALs/SECALs (%)Latin America and
the Caribbean 58 28 48Africa 128 54 42Europe and Central Asia 23 16 70East Asia and Pacific 15 10 67South Asia 16 12 75Middle East and
North Africa 12 9 75
Total 252 129 51
5. Top SAL/SECAL borrowers
Eleven out of 15 top SAL/SECAL borrowers during FY79-94 were selected.(The study did not include Algeria, Colombia, India, and Mexico.)
6. Income classifications
Twelve low-income and 15 middle-income countries were selected. Low-in-come and middle-income country classifications are based on 1993 GNP percapita income data as set out in Operational Policy 3.10.
7. Coverage in PCRs/lICRs/PARs
Ninety-seven operations were covered by PCRs/lCRs/PARs.
8. OED ratings
Sample includes the following:
* 59 satisfactory operations in 22 countries* 25 unsatisfactory operations in 16 countries* 45 unrated operations in 21 countries
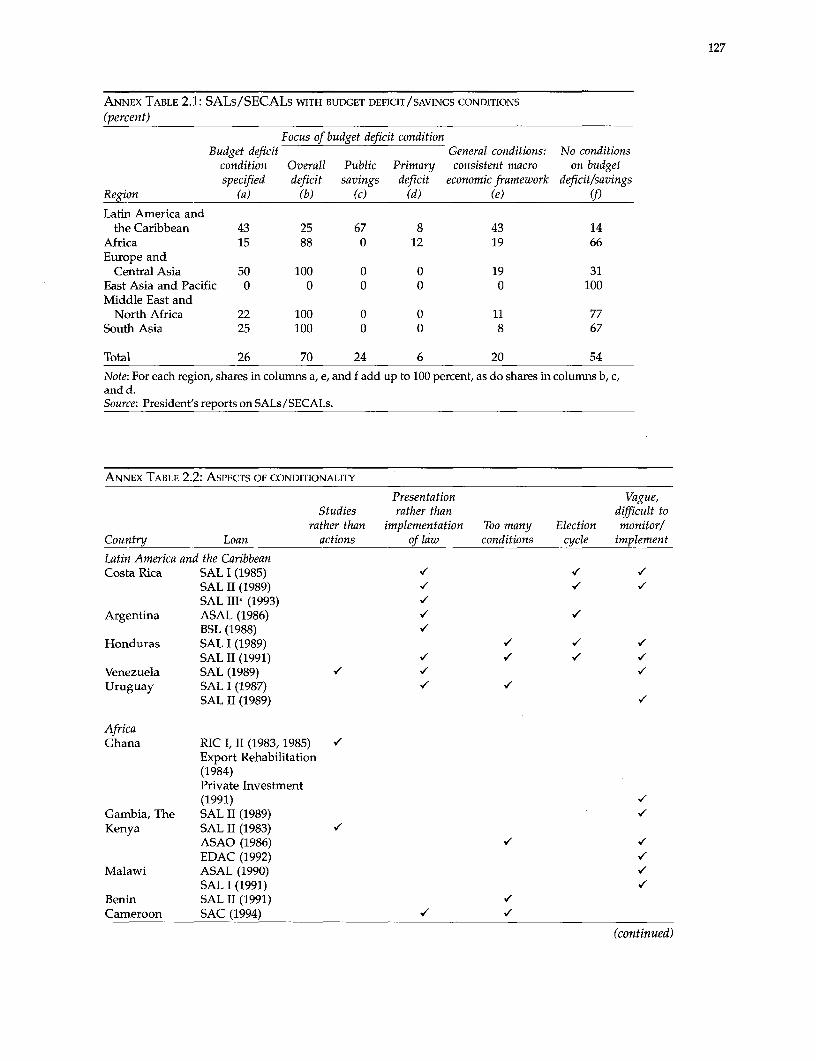
127
ANNEX TABLE 2.1: SALS/SECALs WITH BUDGET DEFICIT/SAVINGS CONDMTIONS
(percent)
Focus of budget deficit conditionBudget deficit General conditions: No conditions
condition Overall Public Primary consistent macro- on budgetspecified deficit savings deficit economic framework deficit/savings
Region (a) (b) (c) (d) (e) ()Latin America and
the Caribbean 43 25 67 8 43 14Africa 15 88 0 12 19 66Europe and
Central Asia 50 100 0 0 19 31East Asia and Pacific 0 0 0 0 0 100Middle East and
North Africa 22 100 0 0 11 77South Asia 25 100 0 0 8 67
Total 26 70 24 6 20 54
Note: For each region, shares in columns a, e, and f add up to 100 percent, as do shares in columns b, c,and d.Source: President's reports on SALs/SECALs.
ANNEX TABLE 2.2: ASPECTS OF CONDITIONALITY
Presentation Vague,Studies rather than difficult to
rather than implementation Too many Election monitorlCountry Loan actions of law conditions cycle implement
Latin America and the CaribbeanCosta Rica SAL 1(1985) % V /
SAL II (1989) "'
SAL 1I1a (1993) VArgentina ASAL (1986) V V
BSL (1988) VHonduras SAL I (1989) V V V
SAL II (1991) VI V V Venezuela SAL (1989) V V VUruguay SAL 1 (1987) v V
SAL II (1989) '
AfricaGhana RIC I, II (1983, 1985) V
Export Rehabilitation(1984)Private Investment(1991)
Gambia, The SAL 11 (1989) VKenya SAL II (1983) V
ASAO (1986) V IEDAC (1992) V
Malawi ASAL (1990) VSAL I (1991) V
Benin SAL H (1991) VCameroon SAC (1994) v /
(continued)
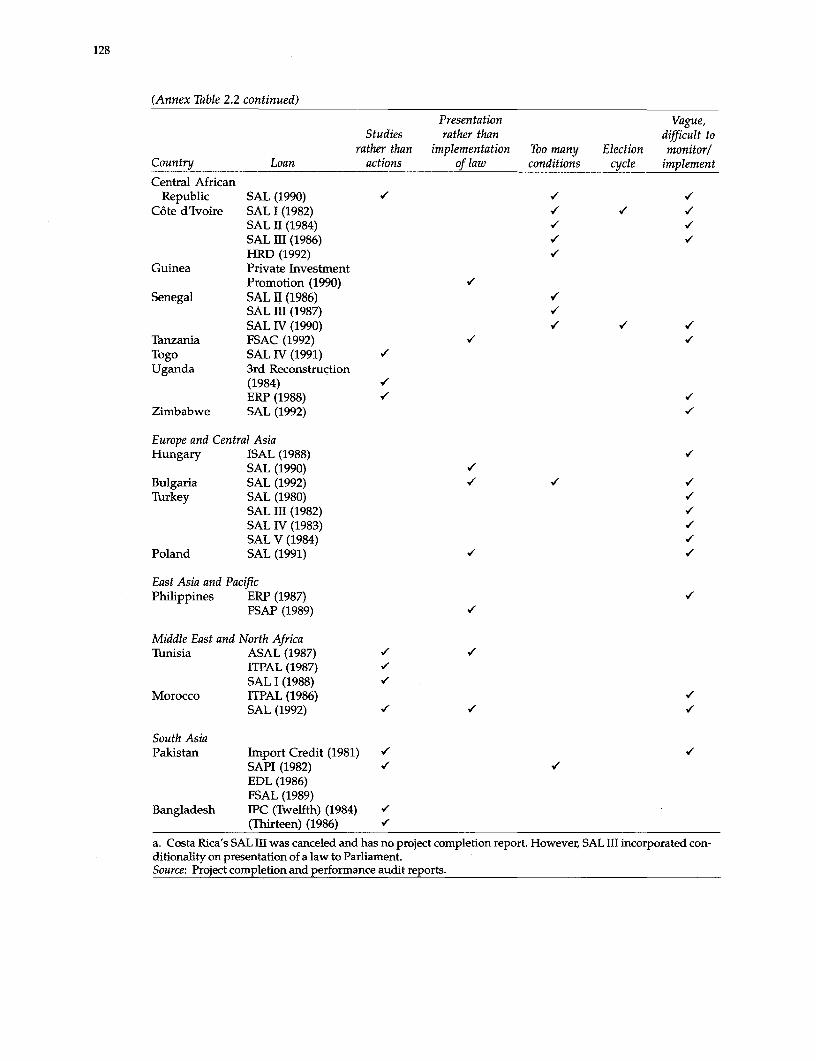
128
(Annex Table 2.2 continued)
Presentation Vague,Studies rather than difficult to
rather than implementation Too many Election monitor!Country Loan actions of law conditions cycle implement
Central AfricanRepublic SAL (1990) V V V
C6te d'Ivoire SAL 1 (1982) VSAL II (1984) V VSAL III (1986) V VHRD (1992) V
Guinea Private InvestmentPromotion (1990) V
Senegal SAL 11 (1986)SAL III (1987) VSAL IV (1990) V V V
Tanzania FSAC (1992) V VTogo SAL IV (1991) VUganda 3rd Reconstruction
(1984) VERP (1988) 1 V
Zimbabwe SAL (1992) V
Europe and Central AsiaHungary ISAL (1988) V
SAL (1990) VBulgaria SAL (1992) V V VTurkey SAL (1980) V
SAL III (1982) VSAL IV (1983) VSAL V (1984) V
Poland SAL (1991) v V
East Asia and PacificPhilippines ERP (1987) /
FSAP (1989) V
Middle East and North AfricaTunisia ASAL (1987) V V
ITPAL (1987) VSAL I (1988) V
Morocco ITPAL (1986) VSAL (1992) V V V
South AsiaPakistan Import Credit (1981) V V
SAPI (1982) V VEDL (1986)FSAL (1989)
Bangladesh IPC (Twelfth) (1984) V(Thirteen) (1986) V
a. Costa Rica's SAL III was canceled and has no project completion report. However, SAL HI incorporated con-ditionality on presentation of a law to Parliament.Source: Project completion and performance audit reports.
Annex 3: The instruments of tax reform
Few tax reforms begin with a tabula rasa-most are anchored in existing taxstructures that are riddled with distortions and opportunities for evasion.The diversity of baseline conditions makes it difficult to devise a set of gen-erally acceptable rules for ensuring that the Bank's tax reform principles aretranslated into practice. The need to grapple with existing tax structuresmeans that reform is generally implemented incrementally rather than com-prehensively. Notwithstanding these difficulties, it is possible to provide ageneral set of guidelines that, modified to take account of country circum-stances, could help implement the Bank's principles of tax reform. (Theseguidelines draw heavily on Lessons and on the tax reform experience of 10developing countries described in Thirsk 1991.)
Indirect taxes
Incremental reform of indirect taxation usually requires that countriesbroaden their indirect tax bases, eliminate cascading by providing creditsfor taxes paid on inputs, and reduce the range of tax rates. To ensure an ad-equate tax base, especially in an inflationary environment, countries needto move from specific to ad valorem taxation. When possible, indirect tax
reform should aim at shifting taxation away from production and towardconsumption. If a more substantial overhaul of the indirect tax system is pos-sible, countries might move to a consumption-based VAT that includes fewzero-rated commodities apart from exports. Designed correctly, a VAT avoidstaxation of production, limits the potential for evasion, and provides a rela-tively large and predictable source of revenue.
Policy reform of trade taxation requires actions in four areas. First, all ex-plicit export taxes and such implicit taxes as export bans, multiple exchangerates, and export retention schemes need to be eliminated, and duty draw-backs on imported inputs used in export production need to be introduced.Second, quantitative restrictions need to be converted into transparent tar-iffs, and the level and dispersion of tariffs must be reduced. Third, trade anddomestic taxes need to be harmonized to ensure that domestic taxes do notundo (or do not exaggerate) the degree of protection intended by the tradetax system. To do so, domestic excise and sales taxes must be designed to ap-ply to both imports and competing domestic production. Fourth, domesticindirect taxes may need to be adjusted to compensate for any revenue lossesassociated with trade tax reforms. To achieve these harmonization and rev-enue goals, tariffs should be designed with only protective purposes inmind, and the sales tax/VAT should be used only for revenue purposes. Be-cause a tariff raises the producer price over the world price, it serves as asubsidy to domestic producers, and since the sales tax/VAT, levied on thetariff-inclusive value of imports, raises the import price to users above the
129
130
world price, it constitutes a tax on domestic users. As long as the sales tax/VAT applies at the same rate to domestic production and imports, it will notdiscriminate among altemative sources of supply and therefore will not en-courage an inefficient production structure.
Income taxes
Guidelines for income taxes are problematic because the economic effects ofstatutory changes are difficult to predict. On efficiency grounds, Lessonspresses for base broadening and uniform treatment along the following lines:
* Ensure that all forms of business proprietorships, partnerships, and cor-porations (including state enterprises) face the same business tax stat-utes and that all individuals face the same income tax statutes.
* Ensure uniformity in the statutory tax treatment of financial instrumentswhenever possible.
* Broaden the income tax base, eliminate schedular taxation (but for an-other point of view see the subsection in the text on gaps in nontrade taxconditionality), and eliminate deductions for individuals unless the de-ductions represent a cost in earning income.
* Eliminate most investment and savings incentives.
* Index nominal magnitudes in the tax code to neutralize the impactof inflation.
3 Equalize marginal effective tax rates across all forms of real investment,savings, and intermediation.
3 Harmonize tax codes across countries by ensuring that the tax ratesfaced by residents are close to those faced by foreign investors. To pre-clude fiscal competition among home and host countries, avoid subsi-dizing the output of foreign-owned subsidiaries and investments, bothdirectly and indirectly (through tariff protection or lower sales taxes).
Wealth and property taxes
Wealth and property tax bases should be defined broadly and adjusted forinflation. Complicated tax structures should be avoided to lessen the likeli-hood that effective tax burdens will vary across types of property or wealth.
Equity improvements
Increased taxation of luxuries, increased reliance on property (especiallyland) taxation, and a rise in income tax thresholds provide some scope forredistribution of income.
Revenue constraints
The effects of changes in specific tax instruments on revenue levels and vari-ability need to be taken into account in designing reforms. Some of the trade-
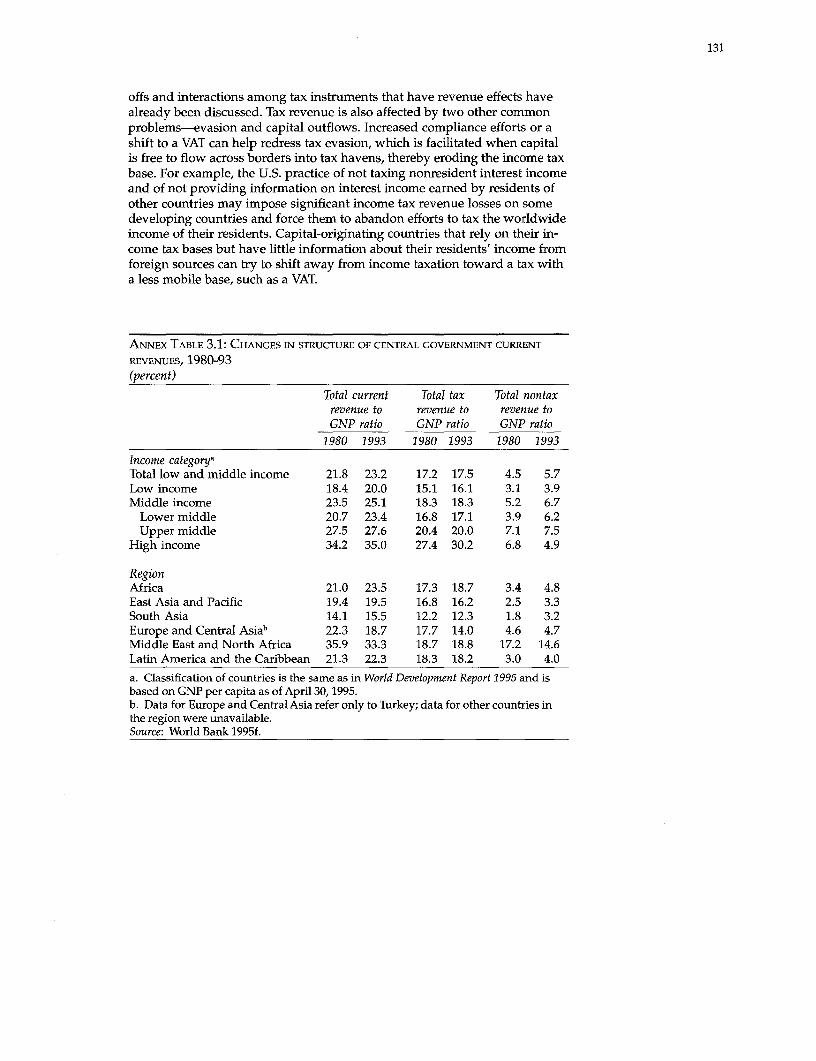
131
offs and interactions among tax instruments that have revenue effects havealready been discussed. Tax revenue is also affected by two other commonproblems-evasion and capital outflows. Increased compliance efforts or ashift to a VAT can help redress tax evasion, which is facilitated when capitalis free to flow across borders into tax havens, thereby eroding the income taxbase. For example, the U.S. practice of not taxing nonresident interest incomeand of not providing information on interest income earned by residents ofother countries may impose significant income tax revenue losses on somedeveloping countries and force them to abandon efforts to tax the worldwideincome of their residents. Capital-originating countries that rely on their in-come tax bases but have little information about their residents' income fromforeign sources can try to shift away from income taxation toward a tax witha less mobile base, such as a VAT.
ANNEX TABLE 3.1: CHANGES IN STRUCTURE OF CENTRAL GOVERNMENT CURRENT
REVENUES, 1980-93
(percent)
Total current Total tax Total nontaxrevenue to revenue to revenue toGNP ratio GNP ratio GNP ratio
1980 1993 1980 1993 1980 1993
Income categoryaTotal low and middle income 21.8 23.2 17.2 17.5 4.5 5.7Low income 18.4 20.0 15.1 16.1 3.1 3.9Middle income 23.5 25.1 18.3 18.3 5.2 6.7
Lower middle 20.7 23.4 16.8 17.1 3.9 6.2Upper middle 27.5 27.6 20.4 20.0 7.1 7.5
High income 34.2 35.0 27.4 30.2 6.8 4.9
RegionAfrica 21.0 23.5 17.3 18.7 3.4 4.8East Asia and Pacific 19.4 19.5 16.8 16.2 2.5 3.3South Asia 14.1 15.5 12.2 12.3 1.8 3.2Europe and Central Asiab 22.3 18.7 17.7 14.0 4.6 4.7Middle East and North Africa 35.9 33.3 18.7 18.8 17.2 14.6Latin America and the Caribbean 21.3 22.3 18.3 18.2 3.0 4.0
a. Classification of countries is the same as in World Development Report 1995 and isbased on GNP per capita as of April 30, 1995.b. Data for Europe and Central Asia refer only to Turkey; data for other countries inthe region were unavailable.Source: World Bank 1995f.
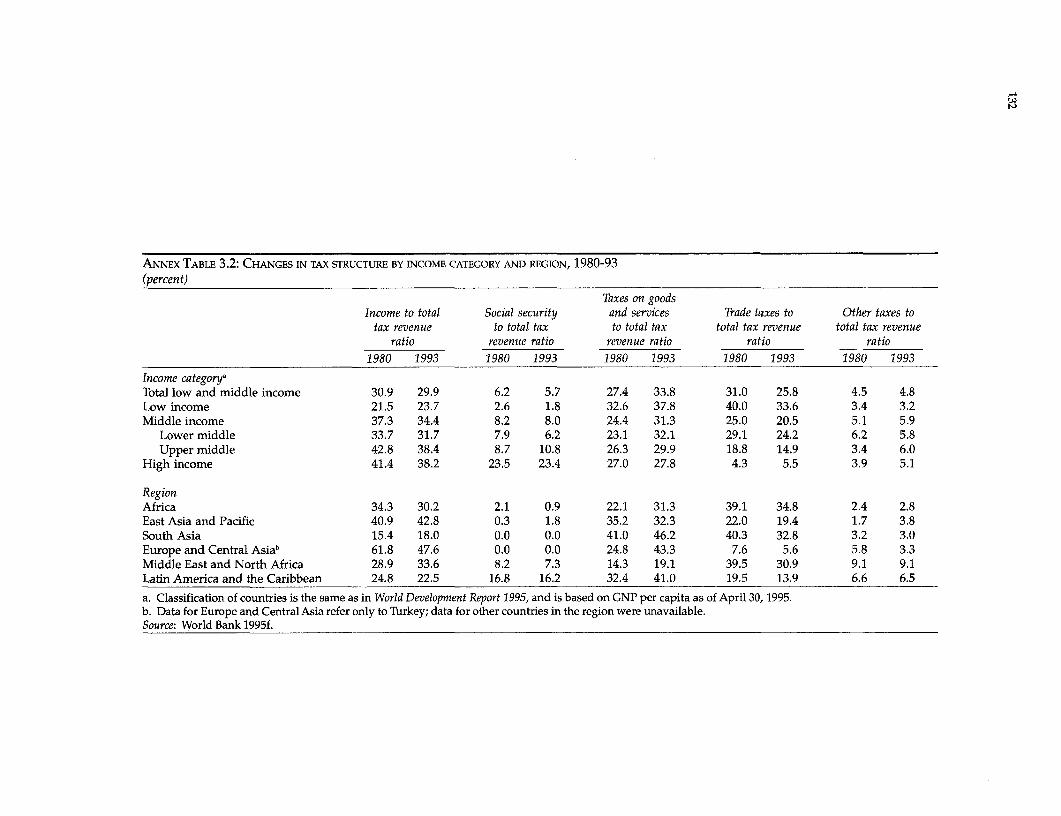
ANNEX TABLE 3.2: CHANGES IN TAX STRUCTURE BY INCOME CATEGORY AND REGION, 1980-93(percent)
Taxes on goodsIncome to total Social security and services Trade taxes to Other taxes to
tax revenue to total tax to total tax total tax revenue total tax revenueratio revenue ratio revenue ratio ratio ratio
1980 1993 1980 1993 1980 1993 1980 1993 1980 1993
Income category'Total low and middle income 30.9 29.9 6.2 5.7 27.4 33.8 31.0 25.8 4.5 4.8Low income 21.5 23.7 2.6 1.8 32.6 37.8 40.0 33.6 3.4 3.2Middle income 37.3 34.4 8.2 8.0 24.4 31.3 25.0 20.5 5.1 5.9
Lower middle 33.7 31.7 7.9 6.2 23.1 32.1 29.1 24.2 6.2 5.8Upper middle 42.8 38.4 8.7 10.8 26.3 29.9 18.8 14.9 3.4 6.0
High income 41.4 38.2 23.5 23.4 27.0 27.8 4.3 5.5 3.9 5.1
RegionAfrica 34.3 30.2 2.1 0.9 22.1 31.3 39.1 34.8 2.4 2.8East Asia and Pacific 40.9 42.8 0.3 1.8 35.2 32.3 22.0 19.4 1.7 3.8South Asia 15.4 18.0 0.0 0.0 41.0 46.2 40.3 32.8 3.2 3.0Europe and Central Asiab 61.8 47.6 0.0 0.0 24.8 43.3 7.6 5.6 5.8 3.3Middle East and North Africa 28.9 33.6 8.2 7.3 14.3 19.1 39.5 30.9 9.1 9.1Latin America and the Caribbean 24.8 22.5 16.8 16.2 32.4 41.0 19.5 13.9 6.6 6.5
a. Classification of countries is the same as in World Development Report 1995, and is based on GNP per capita as of April 30, 1995.b. Data for Europe and Central Asia refer only to Turkey; data for other countries in the region were unavailable.Source: World Bank 1995f.
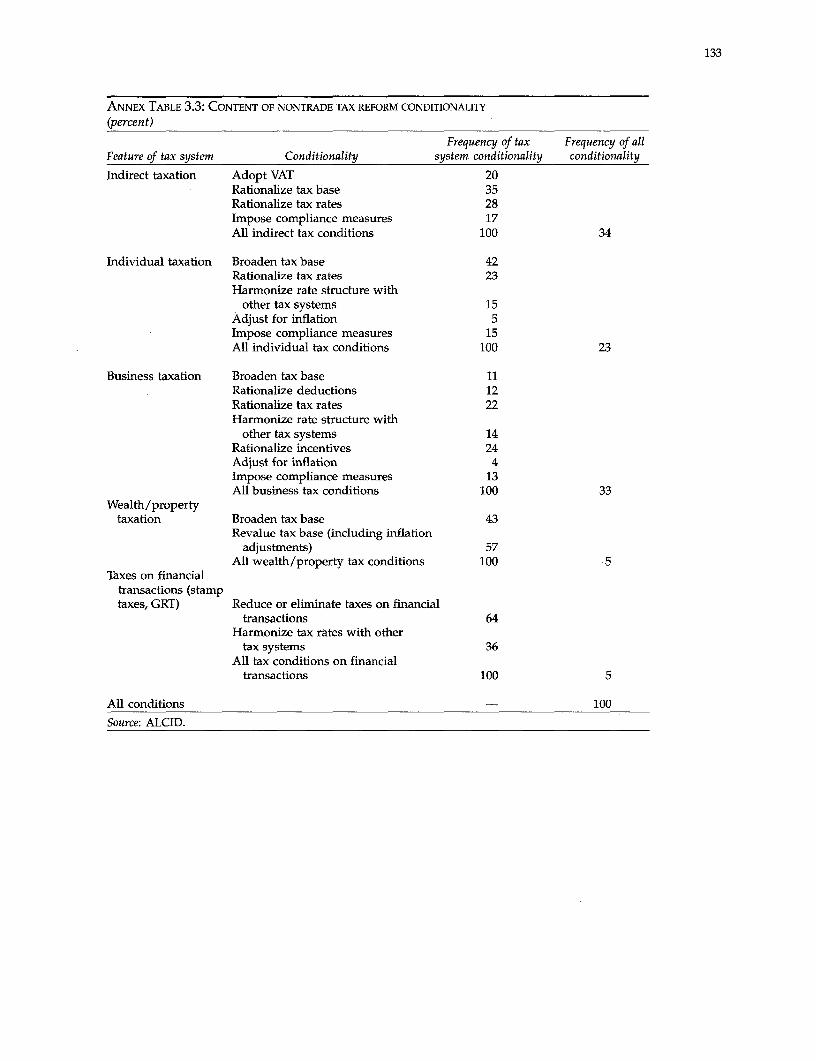
133
ANNEX TABLE 3.3: CONTENT OF NONTRADE TAX REFORM CONDITIONALriY
(percent)
Frequency of tax Frequency of allFeature of tax system Conditionality system conditionality conditionality
Indirect taxation Adopt VAT 20Rationalize tax base 35Rationalize tax rates 28Impose compliance measures 17All indirect tax conditions 100 34
Individual taxation Broaden tax base 42Rationalize tax rates 23Harmonize rate structure with
other tax systems 15Adjust for inflation 5Impose compliance measures 15All individual tax conditions 100 23
Business taxation Broaden tax base 11Rationalize deductions 12Rationalize tax rates 22Harmonize rate structure with
other tax systems 14Rationalize incentives 24Adjust for inflation 4impose compliance measures 13All business tax conditions 100 33
Wealth/propertytaxation Broaden tax base 43
Revalue tax base (including inflationadjustments) 57
All wealth/property tax conditions 100 5Taxes on financial
transactions (stamptaxes, GRT) Reduce or eliminate taxes on financial
transactions 64Harmonize tax rates with other
tax systems 36All tax conditions on financial
transactions 100 5
All conditions - 100
Source: ALCID.
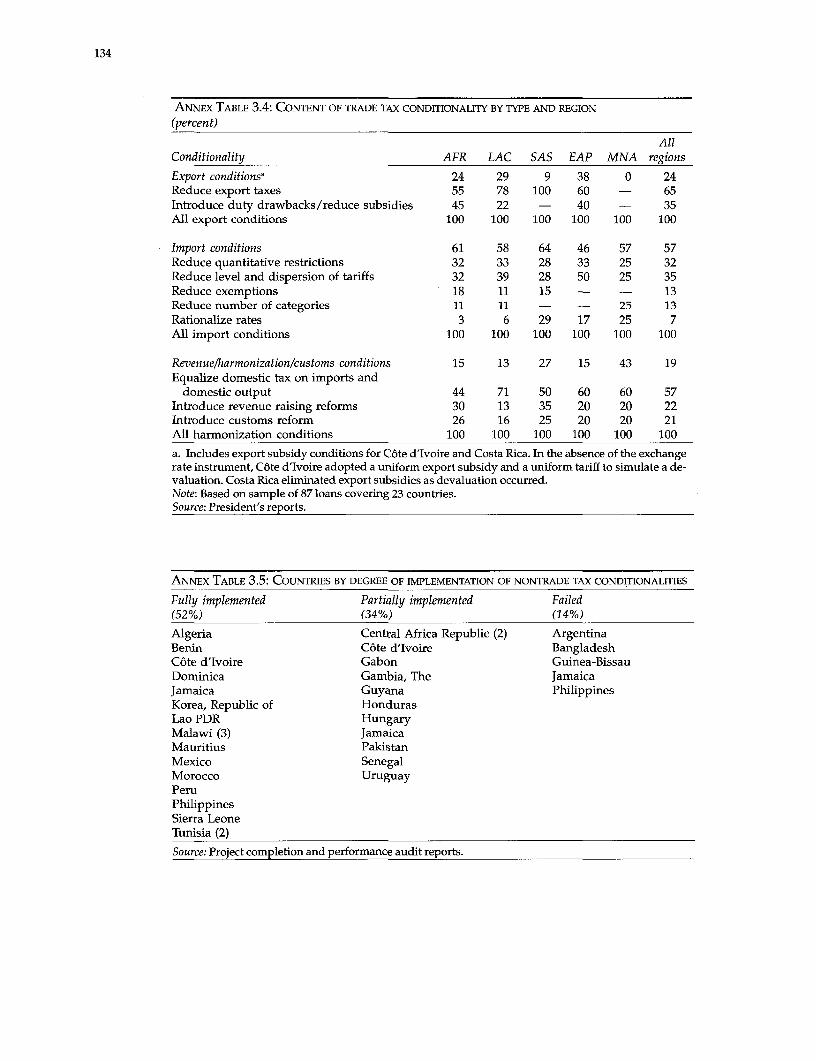
134
ANNEX TABLE 3.4: CONTENT OF TRADE TAX CONDITIONALITY BY TYPE AND REGION
(percent)
AllConditionality AFR LAC SAS EAP MNA regions
Export conditionsa 24 29 9 38 0 24Reduce export taxes 55 78 100 60 - 65Introduce duty drawbacks/reduce subsidies 45 22 - 40 - 35All export conditions 100 100 100 100 100 100
Import conditions 61 58 64 46 57 57Reduce quantitative restrictions 32 33 28 33 25 32Reduce level and dispersion of tariffs 32 39 28 50 25 35Reduce exemptions 18 11 15 - - 13Reduce number of categories 11 11 - - 25 13Rationalize rates 3 6 29 17 25 7All import conditions 100 100 100 100 100 100
Revenue/harmonization/customs conditions 15 13 27 15 43 19Equalize domestic tax on imports and
domestic output 44 71 50 60 60 57Introduce revenue raising reforms 30 13 35 20 20 22Introduce customs reform 26 16 25 20 20 21All harmonization conditions 100 100 100 100 100 100
a. Includes export subsidy conditions for Cote d'Ivoire and Costa Rica. In the absence of the exchangerate instrument, Cote d'Ivoire adopted a uniform export subsidy and a uniform tariff to simulate a de-valuation. Costa Rica eliminated export subsidies as devaluation occurred.Note: Based on sample of 87 loans covering 23 countries.Source: President's reports.
ANNEX TABLE 3.5: COUNTRIES BY DEGREE OF IMPLEMENTATION OF NONTRADE TAX CONDITIONALITIES
Fully implemented Partially implemented Failed(52%) (34%) (14%)
Algeria Central Africa Republic (2) ArgentinaBenin C6te d'Ivoire BangladeshC6te d'Ivoire Gabon Guinea-BissauDominica Gambia, The JamaicaJamaica Guyana PhilippinesKorea, Republic of HondurasLao PDR HungaryMalawi (3) JamaicaMauritius PakistanMexico SenegalMorocco UruguayPeruPhilippinesSierra LeoneTunisia (2)
Source: Project completion and performance audit reports.
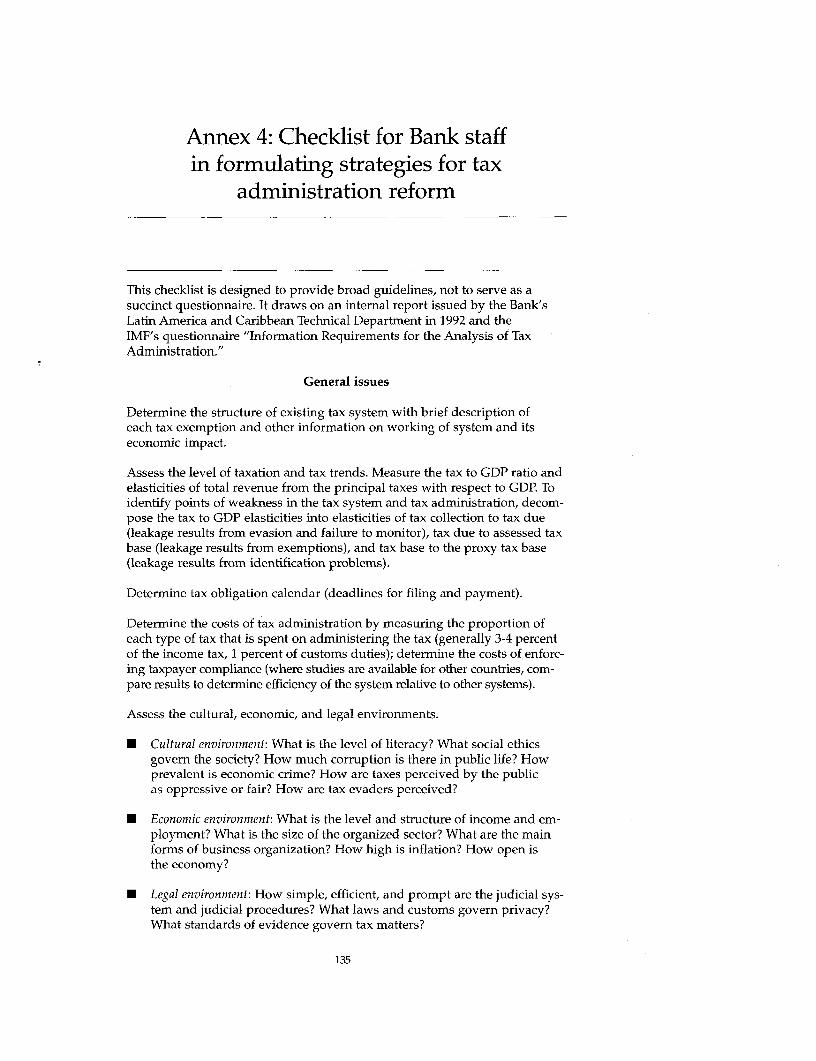
Annex 4: Checklist for Bank staffin formulating strategies for tax
administration reform
This checklist is designed to provide broad guidelines, not to serve as asuccinct questionnaire. It draws on an internal report issued by the Bank'sLatin America and Caribbean Technical Department in 1992 and theIMF's questionnaire "Information Requirements for the Analysis of TaxAdministration."
General issues
Determine the structure of existing tax system with brief description ofeach tax exemption and other information on working of system and itseconomic impact.
Assess the level of taxation and tax trends. Measure the tax to GDP ratio andelasticities of total revenue from the principal taxes with respect to GDP. Toidentify points of weakness in the tax system and tax administration, decom-pose the tax to GDP elasticities into elasticities of tax collection to tax due(leakage results from evasion and failure to monitor), tax due to assessed taxbase (leakage results from exemptions), and tax base to the proxy tax base(leakage results from identification problems).
Determine tax obligation calendar (deadlines for filing and payment).
Determine the costs of tax administration by measuring the proportion ofeach type of tax that is spent on administering the tax (generally 3-4 percentof the income tax, 1 percent of customs duties); determine the costs of enforc-ing taxpayer compliance (where studies are available for other countries, com-pare results to determine efficiency of the system relative to other systems).
Assess the cultural, economic, and legal environments.
* Cultural environment: What is the level of literacy? What social ethicsgovern the society? How much corruption is there in public life? Howprevalent is economic crime? How are taxes perceived by the public-as oppressive or fair? How are tax evaders perceived?
* Economic environment: What is the level and structure of income and em-ployment? What is the size of the organized sector? What are the mainforms of business organization? How high is inflation? How open isthe economy?
* Legal environment: How simple, efficient, and prompt are the judicial sys-tem and judicial procedures? What laws and customs govern privacy?What standards of evidence govern tax matters?
135

136
Identify statistical data.
Identify regularly produced statistical data and dates of availability.
Construct table of economic activities used and the methods for classi-fying them.
Specific issues
Compliance
Are tax laws, forms, and procedures for registration, filing, and tax paymentclear and simple? Are indicators of compliance costs for taxpayers coveringthe quantity and quality of services in use? (Some quantity indicators: thenumber of forms, the number of items per form, the length of time requiredto fill a form. Possible quality indicators: the number of tax forms automati-cally distributed to taxpayers, the number of taxpayer inquiries received bythe agency, the average time that elapses before inquiries are answered.)
* Are tax office facilities user-friendly (telephones, seating)?
* Is there adequate taxpayer education?
* Do taxpayers have easy access to the tax department for answers to que-ries and for advance rulings?
* Are rates moderate and generally well accepted (number of complaintsreceived from chambers of commerce about rates, exemptions, disallow-ances of exemptions)?
* Do trends in number of complaints received suggest a good or bad rela-tionship between taxpayers and tax administration?
* Are assessments generally accepted or contested (ratio of appeals to as-sessments, proportion of assessments contested)?
Enumeration
* How are potential taxpayers identified (censuses of specific taxpayergroups, systematic surveys)?
* What are the sources of information (internal documents of tax agencies,other government agencies, third parties such as banks, municipal au-thorities)? Does the system track payment flows between taxpayers?
* Are master rolls of taxpayer identification numbers broken down by sec-tor, source of tax, and so on?
* How is taxpayer information stored and retrieved (by taxpayer identifi-cation number, payments and receipts, other activities of taxpayer, pasthistory)?
Estimation
* What is the usual method of determining tax liability? If administrativeassessments, are they rational and fair and based on evidence (are as-
137
sessed rates of profit comparable across similar businesses and similarlocalities)? Do taxpayers get a hearing?
* Are accounting standards and practices prevalent in the country?
* Is reliance on self-assessment high?
* Are presumptive norms based on consultation with taxpayer constituen-cies? Are cadastral surveys used? Are the same valuations used for otherrelated taxes to ensure consistency?
Collection
* Is there a single current account for each taxpayer that tracks payments,refunds, and tax liabilities over time and that integrates information forsingle taxpayers across all taxes paid by the taxpayer? Does the systemcalculate totals and averages for tax payments, liabilities, and balancesacross taxpayers and by tax categories (type of tax, specific periods)?Does it calculate the number of taxpayers covered and the average lagbetween tax payment and records updating?
* Does the tax system rely on withholding by third parties or advancepayment by taxpayers?
* How are tax payments monitored? Are large taxpayers monitoredmonthly? How are withholding and advance payment arrangementsmonitored?
* Is the collection process public or private? Are there collection lags? Arearrears records checked?
* Are there discounts for timely payment? Do they induce prompt pay-ment? Do penalties escalate with delay?
I What are the ratios of arrears to taxes due?
* Are penalty rates of interest close to market rates? Are there arrange-ments for property seizure and garnishing (withholding of worker sala-ries by the state to pay off taxes due)?
* Are payment arrears within norms allowed by the tax collection agencyor the appeals authority?
Collection data
* Last five years revenue: nominal and real amounts by tax; refunds andnet collections by tax.
* Collection patterns (as percentage of total collections for each tax) bymajor, medium-size, and small taxpayers; by economic sector.
* Number of returns received per tax. Number of registered taxpayers byeconomic activity. Number and percentage of nonfilers (as share of totalregistered taxpayers) by tax period and by tax.
* Number of delinquent accounts. Amount collected and amount pendingcollection by tax, maturity, and amount due and ratio to total collection.
138
Enforcement
* Are tax gaps measured? Ratio of identified taxpayers to relevant popula-tion? Ratio of taxpayers who file to identified taxpayers? Ratio of incomereturned to assessed income? Ratio of taxes paid to taxes due?
* Are there any estimates of tax evasion? Are quick estimates possible?
* How are audit samples chosen? Are systematic sample selection criteriaused? Are rational and systematically chosen indicators used? How isthe effectiveness of audits assessed (share of audit-assessed tax liabilitiesuncontested by taxpayers, share of appealed audits that are upheld,share of audit-assessed tax liabilities collected, share of detected arith-metical errors or cross-checked discrepancies collected, share of auditsyielding assessed tax liabilities above some threshold, average audit-as-sessed tax liability per audited return)?
* Is there a special cell for large taxpayers?
* Is the information system centralized or decentralized? (Large countriesneed a more decentralized system but a single master roll.) Computer-ized? How are records maintained and updated?
* Is there a system for collecting and matching information across taxagencies? Does it have access to bank accounts? What are the rules ofprivacy? How often is the third-party database used by agency staff toidentify unregistered taxpayers or audit taxpayer returns? What are thecosts of maintaining the third-party system?
* What are the problems with search and seizure procedures? Are therechecks against harassment and invasion of privacy?
* How many penalty cases? Total penalty levied? What proportion of pen-alty cases are sustained by courts? Number of cases prosecuted forfraud? Number of convictions?
* What are the annual number and value of appeals (by type of appeal,type of tax or taxpayer, value of appeal, or basis of appeal)? What arethe number and value of appeals resolved, rejected, or partially rejected?What is the average length of the appeal process? What portion of theappeal board's decisions are appealed or overturned? What is the costper appeal resolved?
* How many amnesties are offered or given within an amnesty period? Dothey increase tax collections? Does compliance improve perceptibly dur-ing the amnesty period?
Organization
* How is tax administration organized? Organizational chart and descrip-tion of organizational structure. Are taxes administered by central or lo-cal government? Are separate functions entrusted to different branches?Description of operational units (regions, districts). Description of unitsresponsible for conceptualizing procedures.
* Are the functions of different sections clearly demarcated? What is thedegree of decentralization?
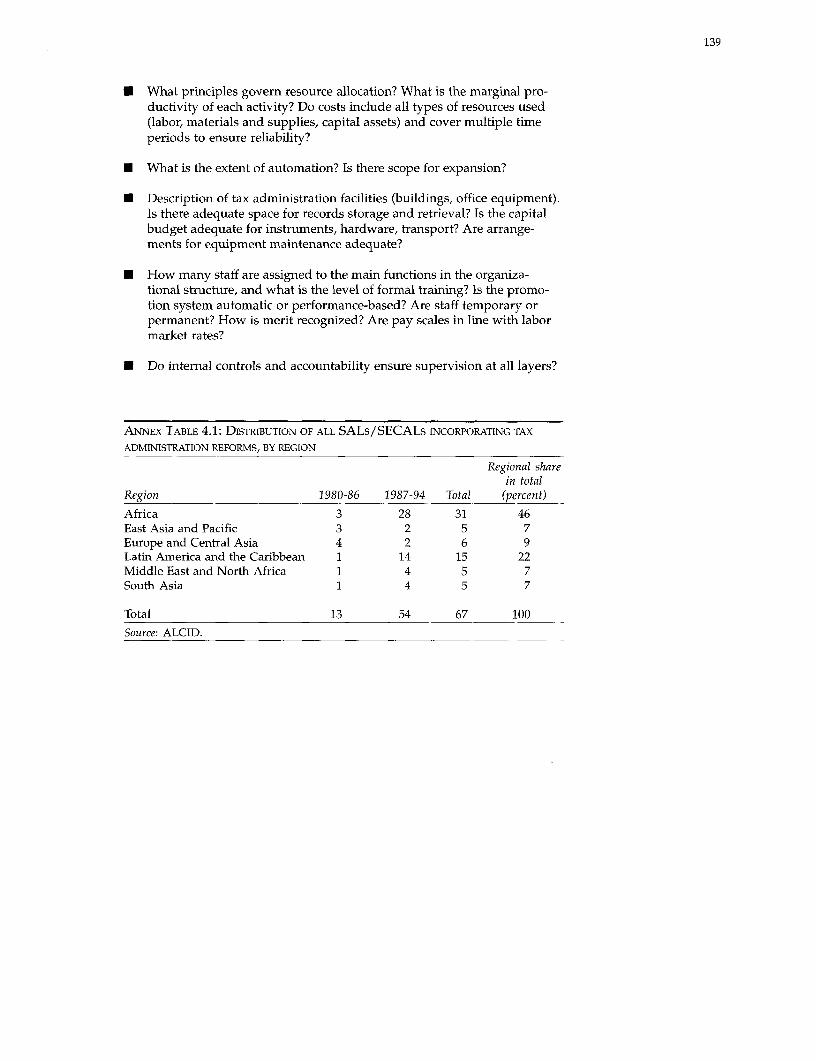
139
U What principles govern resource allocation? What is the marginal pro-ductivity of each activity? Do costs include all types of resources used(labor, materials and supplies, capital assets) and cover multiple timeperiods to ensure reliability?
* What is the extent of automation? Is there scope for expansion?
* Description of tax administration facilities (buildings, office equipment).Is there adequate space for records storage and retrieval? Is the capitalbudget adequate for instruments, hardware, transport? Are arrange-ments for equipment maintenance adequate?
* How many staff are assigned to the main functions in the organiza-tional structure, and what is the level of formal training? Is the promo-tion system automatic or performance-based? Are staff temporary orpermanent? How is merit recognized? Are pay scales in line with labormarket rates?
* Do internal controls and accountability ensure supervision at all layers?
ANNEX TABLE 4.1: DISTRIBUTION OF ALL SALs/SECALs INCORPORATING TAXADMINISTRATION REFORMS, BY REGION
Regional sharein total
Region 1980-86 1987-94 Total (percent)
Africa 3 28 31 46East Asia and Pacific 3 2 5 7Europe and Central Asia 4 2 6 9Latin America and the Caribbean 1 14 15 22Middle East and North Africa 1 4 5 7South Asia 1 4 5 7
Total 13 54 67 100Source: ALCID.

140
ANNEX TABLE 4.2: TYPE OF TAX ADMINISTRATION CONDITIONALITIES IN SAMPLE SALs/ SECALs:GENERAL AND IDENTIFIED
PercentType of conditionality AFR EAP ECA LAC MNA SAS Total of total
Total conditionalities 101 35 13 106 3 19 277 100Regional shares in total
conditionalities 36 13 5 38 1 7 100
General conditionalities 15 4 4 8 3 2 36 13
Identified conditionalities 86 31 9 98 0 17 241 87Induce taxpayer compliance 17 8 2 17 0 6 50 18
Nonspecific measures 3 0 0 0 0 0 3 1Improve enumeration 12 2 1 22 0 4 41 15
Nonspecific measures 0 0 1 1 0 0 2 1Improve estimation 4 1 2 1 0 1 9 3
Nonspecific measures 0 0 0 0 0 1 1 0Improve collection 14 2 2 9 0 0 27 10
Nonspecific measures 3 1 2 0 0 0 6 2Improve enforcement 14 2 0 19 0 0 35 13
Nonspecific measures 3 0 0 2 0 0 6 2Improve organization 25 16 2 30 0 6 79 29
Nonspecific measures 0 2 0 0 0 0 2 1
Identified conditionalityNonspecific 9 3 3 3 0 1 20 7Specific 77 28 6 95 0 16 221 80
Note: Table refers to sample of 41 loans. Identified conditionalities pertain to the six key areas of taxadministration reform.Source: ALCID.
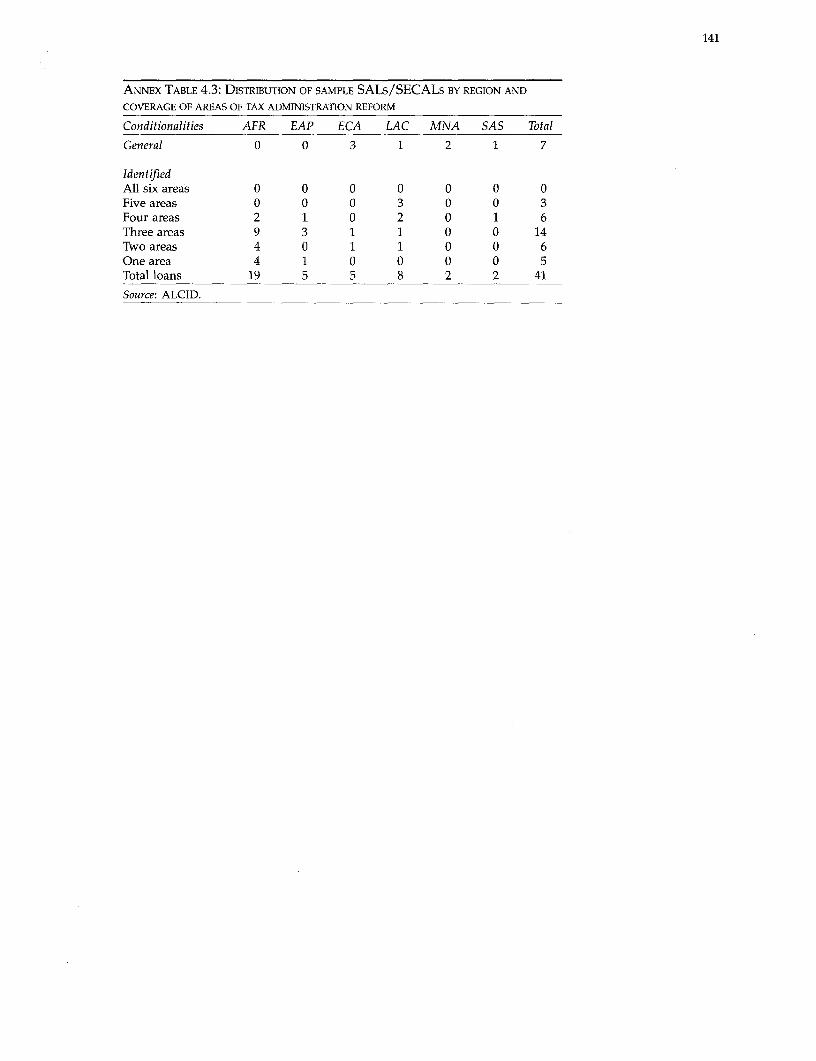
141
ANNEX TABLE 4.3: DISTRIBUTION OF SAMPLE SALs/SECALS BY REGION AND
COVERAGE OF AREAS OF TAX ADMINISTRATION REFORM
Conditionalities AFR EAP ECA LAC MNA SAS Total
General 0 0 3 1 2 1 7
IdentifiedAll six areas 0 0 0 0 0 0 0Five areas 0 0 0 3 0 0 3Four areas 2 1 0 2 0 1 6Three areas 9 3 1 1 0 0 14Two areas 4 0 1 1 0 0 6One area 4 1 0 0 0 0 5Total loans 19 5 5 8 2 2 41
Source: ALCID.
Annex 5: Government expendituresand social indicators
142
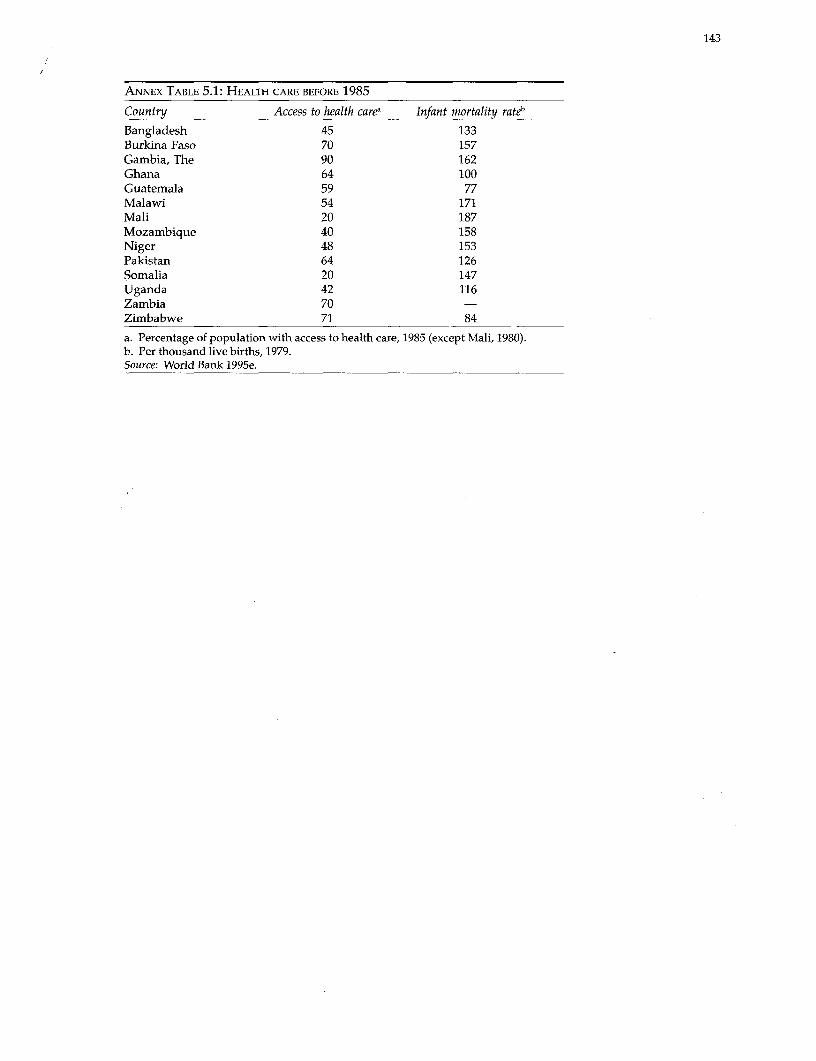
143
ANNEX TABLE 5.1: HEALTH CARE BEFORE 1985
Country Access to health carea Infant mortality rateb
Bangladesh 45 133Burkina Faso 70 157Gambia, The 90 162Ghana 64 100Guatemala 59 77Malawi 54 171Mali 20 187Mozambique 40 158Niger 48 153Pakistan 64 126Somalia 20 147Uganda 42 116Zambia 70Zimbabwe 71 84
a. Percentage of population with access to health care, 1985 (except Mali, 1980).b. Per thousand live births, 1979.Source: World Bank 1995e.

144
ANNEX TABLE 5.2: CHANGES IN TOTAL EXPENDITURE SHARES, BEFORE AND
AFTER ADJUSTMENT
(percentage of GDP)
Adjustment ChangeCountry period Share before Share after in share
AfricaCote d'Ivoire 1981-91 40.1 35.8Gambia, The 1986-91 33.8 26.8Ghana 1983-90 11.1 16.0 +Kenya 1981-91 31.9 30.5Malawi 1981-91 35.0 27.9Mozambique 1987-91 31.1 53.4 +Senegal 1981-91 28.2 18.8Tanzania 1981-91 36.7 28.6Uganda 1982-91 11.4 20.5 +
East Asia and PacificIndonesia 1987-90 23.0 18.3Philippines 1980-91 13.6 19.1 +
Europe and Central AsiaBulgaria 1991-92 57.8 44.9Hungary 1989-92 62.2 60.5Poland 1990-91 39.9 49.0 +Turkey 1980-92 16.4 17.1 +
Latin America and the CaribbeanArgentina, 1990-92 16.9 17.0 +Chile 1985-91 32.6 21.4Costa Rica 1985-91 27.0 28.1 +El Salvador 1990-92 15.8 16.4 +Honduras 1988-91 26.7 32.8 +Peru 1990-92 14.2 15.3 +Uruguay 1987-91 33.8 37.0 +Venezuela 1989-91 33.2 29.8 -
Middle East and North AfricaMorocco 1984-92 33.4 28.6 -
Tunisia 1986-90 38.9 32.7 -
South AsiaBangladesh 1985-92 18.4 17.8 -
Pakistan 1981-92 17.5 23.4 +
a. Argentina's "share before" data correspond to the adjustment period, not the pre-adjustment period.Note: + denotes increase in share, - denotes decrease in share.Source: Bank and IMF documents and staff estimates.

ANNEX TABLE 5.3: CHANGES IN CAPITAL AND CURRENT EXPENDITURE SHARES, BEFORE AND AFTER ADJUSTMENT
(percentage of GDP)
Share before Share after Change in Change inAdjustment Current Capital Current Capital current expenditure capital expenditure
Country period expenditure expenditure expenditure expenditure share shareAfricaCote d'Ivoire, 1981-91 22.0 18.1 32.7 3.1 +Gambia, The 1986-91 19.8 14.0 17.3 9.5 - -
Ghana 1983-90 10.0 1.1 11.4 4.6 + +Kenya, 1981-91 23.3 8.6 24.9 5.6 +Malawib 1981-91 17.5 17.5 21.5 6.4 +Mozambique 1987-91 25.3 5.8 27.1 26.3 + +Senegal 1981-91 23.7 4.5 14.6 4.2Tanzania 1981-91 24.8 11.9 23.3 5.3Uganda 1982-91 6.7 4.7 10.3 10.2 + +
East Asia and PacificIndonesiaa 1987-90 12.5 10.4 9.1 9.1Philippines 1980-91 9.6 2.1 15.7 3.4 + +
Europe and Central AsiaBulgaria 1991-92 54.7 3.1 43.3 1.7Hungary 1989-92 54.6 7.6 53.8 6.8Poland, 1990-91 36.4 3.4 45.9 3.1 +Turkey 1980-92 10.0 6.4 11.6 5.5 +
Latin America and the CaribbeanArgentinab 1990-92 15.8 1.1 15.8 1.2 + +Chile 1985-91 29.7 2.9 18.3 3.1 - +Costa Rica 1985-91 21.0 6.0 22.6 5.5 +El Salvador 1990-92 11.8 4.0 12.2 4.2 + +Honduras 1988-91 21.6 5.1 20.4 12.4 - +Peru 1990-92 10.3 3.9 10.6 4.7 + +Uruguay, 1987-91 29.6 4.0 32.5 4.5 + +Venezuela 1989-91 20.2 13.0 18.7 11.1
(continued)
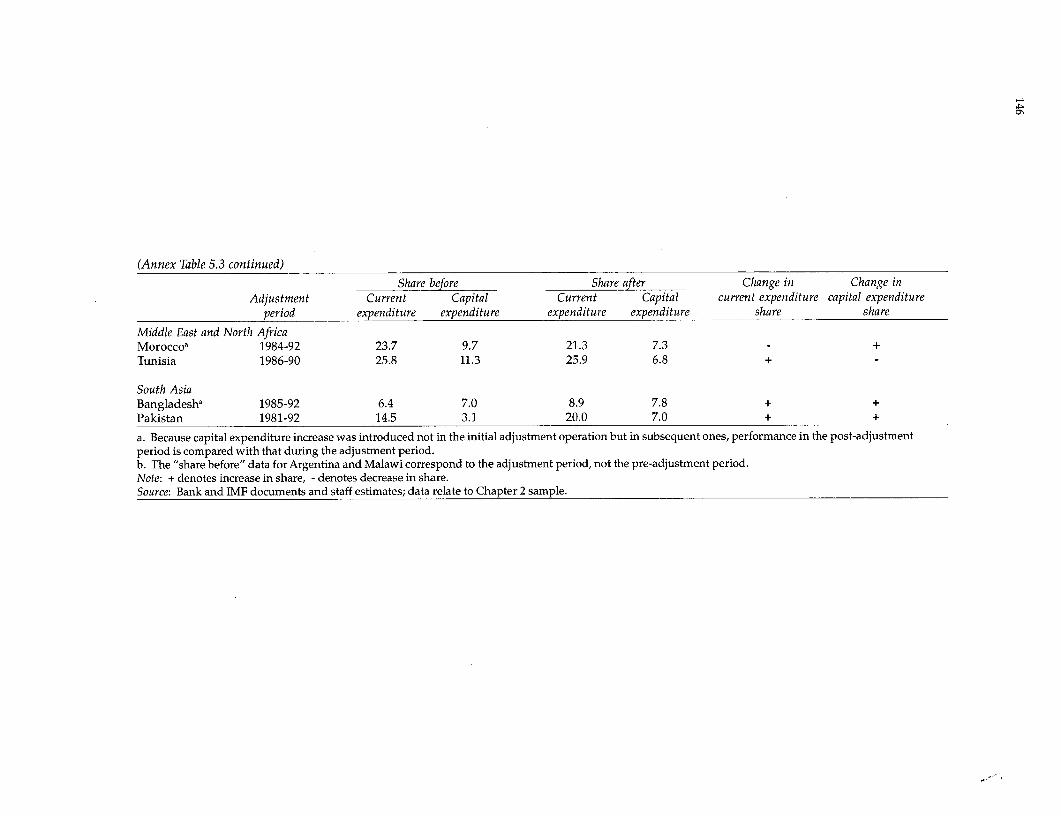
(Annex Table 5.3 continued)
Share before Share after Change in Change inAdjustment Current Capital Current Capital current expenditure capital expenditure
period expenditure expenditure expenditure expenditure share share
Middle East and North AfricaMoroccoa 1984-92 23.7 9.7 21.3 7.3 - +
Tunisia 1986-90 25.8 11.3 25.9 6.8 +
South AsiaBangladesh, 1985-92 6.4 7.0 8.9 7.8 + +Pakistan 1981-92 14.5 3.1 20.0 7.0 + +
a. Because capital expenditure increase was introduced not in the initial adjustment operation but in subsequent ones, performance in the post-adjustmentperiod is compared with that during the adjustment period.b. The "share before" data for Argentina and Malawi correspond to the adjustment period, not the pre-adjustment period.Note: + denotes increase in share, - denotes decrease in share.Source: Bank and IMF documents and staff estimates; data relate to Chapter 2 sample.

ANNEX TABLE 5.4: AVERAGE CENTRAL GOVERNMENT EXPENDITURE SHARES
(percent)
Country group EAP ECA LAC MNA SAS AFR OverallTotal expenditure/GDP With conditions I 20.0 54.9 25.9 34.1 20.5 27.5 30.5
II 16.7 52.4 25.5 30.8 21.3 26.7 28.9Without conditions I 27.5 42.4 23.6 38.3 34.0 18.5 30.7
II 30.5 34.6 17.4 26.7 34.9 22.1 27.7Current expenditure/GDP With conditions I 13.9 47.9 21.9 23.3 16.0 18.8 23.6
II 11.6 50.4 24.7 24.1 18.7 20.9 25.1Without conditions I 17.2 27.3 17.2 27.4 12.7 16.0 19.6
II 18.8 29.7 13.1 20.5 18.7 19.6 20.1Capital expenditure/GDP With conditions I 6.1 7.0 4.2 10.8 6.5 6.6 6.9
II 5.0 2.0 1.9 6.7 4.2 5.7 4.2Without conditions I 10.6 15.1 6.3 10.9 21.3 3.5 11.3
II 11.8 4.9 4.2 6.2 16.1 3.4 7.8Current expenditure/expenditure With conditions I 71.3 78.7 84.7 68.3 76.6 72.3 75.3
II 70.5 90.7 95.2 78.3 83.6 75.8 82.4Without conditions I 65.1 82.1 72.7 70.9 37.8 84.4 68.8
II 65.6 92.7 75.9 76.8 49.6 88.4 74.8Capital expenditure/expenditure With conditions I 28.7 21.3 16.1 31.7 23.4 27.7 24.8
II 29.2 9.3 8.1 21.7 16.4 23.4 18.0Without conditions I 35.6 17.9 26.8 29.1 62.2 20.0 31.9
II 34.6 7.3 23.9 23.1 50.4 15.4 25.8Education/expenditure With conditions I 15.0 9.3 13.4 16.6 6.4 15.1 12.6
II 15.4 10.8 12.8 17.7 7.6 13.3 12.9Without conditions I 12.5 1.5 10.0 10.9 13.6 15.1 10.6
II 16.0 3.2 11.8 14.4 10.3 7.6 10.6Health/expenditure With conditions I 2.6 2.4 10.7 5.3 3.4 7.3 5.3
II 4.0 5.6 12.8 4.7 3.8 7.8 6.5Without conditions I 7.4 0.3 6.1 4.2 5.3 3.2 4.4
II 6.3 4.5 8.0 5.6 6.6 1.9 5.5Defense/expenditure With conditions I 22.9 9.8 6.7 13.7 9.5 4.3 11.2
II 15.2 7.3 7.0 9.9 10.1 5.4 9.2Without conditions I 12.3 27.0 7.1 21.0 0.0 20,7 14.7
II - 29.9 5.4 16.9 0.0 25.5 15.5
(continued)

(Annex Table 5.4 continued)
Country group EAP ECA LAC MNA SAS AFR Overall
Infrastructure/expenditure With conditions I 25.8 34.4 19.7 29.4 36.1 28.1 28.9II 23.9 21.8 9.7 17.8 27.6 20.0 20.1
Without conditions I 39.5 35.6 24.4 23.5 57.6 19.0 33.3II 29.8 30.8 20.8 22.0 49.6 19.9 28.8
Wages/expenditure With conditions 1 18.1 17.1 22.5 29.8 13.4 29.3 21.7II 20.8 22.1 26.5 33.2 14.5 32.7 25.0
Without conditions I 25.2 2.6 36.3 32.2 14.1 36.7 24.5II 31.3 16.2 30.3 33.7 19.0 36.3 27.8
Subsidies/expenditure With conditions I 11.4 - - - 2.9 - 7.1II 1.9 - - - 2.7 - 2.3
Without conditions I - - 0.0 - 0.0 - 0.0II - - 0.2 - 2.5 - 1.3
Note: Country composition in each region varies by type of expenditure. Period I refers to the early 1980s and period II to the early 1990s. For each coun-try included in the table, the early 1980s refers to any two contiguous years during 1980-84 and the early 1990s refers to any two contiguous years during1990-94 for which expenditure data are available.Source: IMF, Government Finance Statistics.

149
ANNEX TABLE 5.5: GOVERNMENT SUBSIDIES BEFORE AND AFTER IMPOSITION OF CONDITION ON SUBSIDY REDUCTION
(1990 prices)
Year ofCountry condition Units 1986 1987 1988 1989 1990 1991 1992 1993
Brazil 1984 Reais (thousands) 208 122 120 212 76 229 151 -
Bulgariaa 1991 Leva (billions) - 6.3 6.4 6.1 6.8 3.4 8.8 -
Hungary 1988, 90, 91 Forints (billions) - 347 - 322 149 - - -Romania 1992 Lei (billions) - - - - 56 41 72 -
Sierra Leone 1992 Leones (billions) - - - - - - 2.4 2.8Sri Lankab 1990 Rupees (billions) 3.91 2.66 3.18 4.84 3.68 3.67 2.46 2.43Tunisia 1988, 90 Dinars (millions) 54 53 152 111 79 66 71 -
a. Figures are nominal.b. Figures are deflated by consumer price index.Note: Figures are deflated by GDP deflator.Source: IMF, Government Finance Statistics.
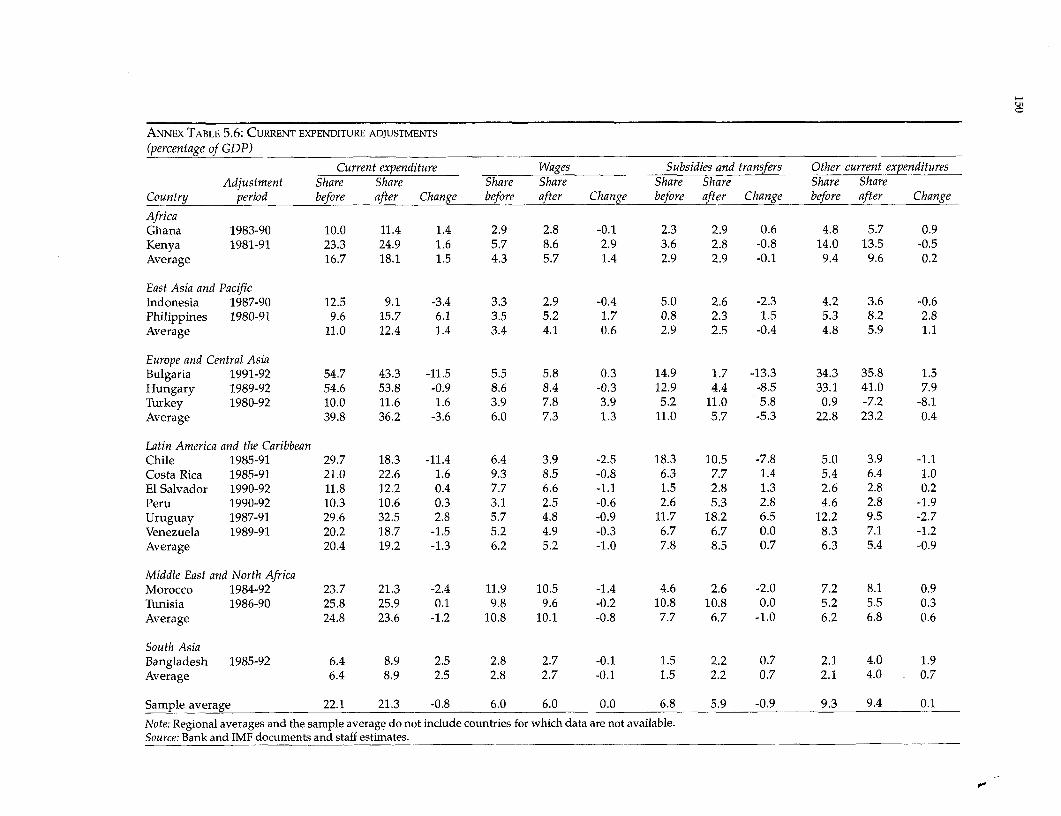
ANNEX TABLE 5.6: CURRENT EXPENDITURE ADJUSTMENTS
(percentage of GDP)
Current expenditure Wages Subsidies and transfers Other current expendituresAdjustment Share Share Share Share Share Share Share Share
Country period before after Change before after Change before after Change before after Change
AfricaGhana 1983-90 10.0 11.4 1.4 2.9 2.8 -0.1 2.3 2.9 0.6 4.8 5.7 0.9Kenya 1981-91 23.3 24.9 1.6 5.7 8.6 2.9 3.6 2.8 -0.8 14.0 13.5 -0.5Average 16.7 18.1 1.5 4.3 5.7 1.4 2.9 2.9 -0.1 9.4 9.6 0.2
East Asia and PacificIndonesia 1987-90 12.5 9.1 -3.4 3.3 2.9 -0.4 5.0 2.6 -2.3 4.2 3.6 -0.6Philippines 1980-91 9.6 15.7 6.1 3.5 5.2 1.7 0.8 2.3 1.5 5.3 8.2 2.8Average 11.0 12.4 1.4 3.4 4.1 0.6 2.9 2.5 -0.4 4.8 5.9 1.1
Europe and Central AsiaBulgaria 1991-92 54.7 43.3 -11.5 5.5 5.8 0.3 14.9 1.7 -13.3 34.3 35.8 1.5Hungary 1989-92 54.6 53.8 -0.9 8.6 8.4 -0.3 12.9 4.4 -8.5 33.1 41.0 7.9Turkey 1980-92 10.0 11.6 1.6 3.9 7.8 3.9 5.2 11.0 5.8 0.9 -7.2 -8.1Average 39.8 36.2 -3.6 6.0 7.3 1.3 11.0 5.7 -5.3 22.8 23.2 0.4
Latin America and the CaribbeanChile 1985-91 29.7 18.3 -11.4 6.4 3.9 -2.5 18.3 10.5 -7.8 5.0 3.9 -1.1Costa Rica 1985-91 21.0 22.6 1.6 9.3 8.5 -0.8 6.3 7.7 1.4 5.4 6.4 1.0El Salvador 1990-92 11.8 12.2 0.4 7.7 6.6 -1.1 1.5 2.8 1.3 2.6 2.8 0.2Peru 1990-92 10.3 10.6 0.3 3.1 2.5 -0.6 2.6 5.3 2.8 4.6 2.8 -1.9Uruguay 1987-91 29.6 32.5 2.8 5.7 4.8 -0.9 11.7 18.2 6.5 12.2 9.5 -2.7Venezuela 1989-91 20.2 18.7 -1.5 5.2 4.9 -0.3 6.7 6.7 0.0 8.3 7.1 -1.2Average 20.4 19.2 -1.3 6.2 5.2 -1.0 7.8 8.5 0.7 6.3 5.4 -0.9
Middle East and North AfricaMorocco 1984-92 23.7 21.3 -2.4 11.9 10.5 -1.4 4.6 2.6 -2.0 7.2 8.1 0.9Tunisia 1986-90 25.8 25.9 0.1 9.8 9.6 -0.2 10.8 10.8 0.0 5.2 5.5 0.3Average 24.8 23.6 -1.2 10.8 10.1 -0.8 7.7 6.7 -1.0 6.2 6.8 0.6
South AsiaBangladesh 1985-92 6.4 8.9 2.5 2.8 2.7 -0.1 1.5 2.2 0.7 2.1 4.0 1.9Average 6.4 8.9 2.5 2.8 2.7 -0.1 1.5 2.2 0.7 2.1 4.0 0.7
Sample average 22.1 21.3 -0.8 6.0 6.0 0.0 6.8 5.9 -0.9 9.3 9.4 0.1
Note: Regional averages and the sample average do not include countries for which data are not available.Source: Bank and IMF documents and staff estimates.
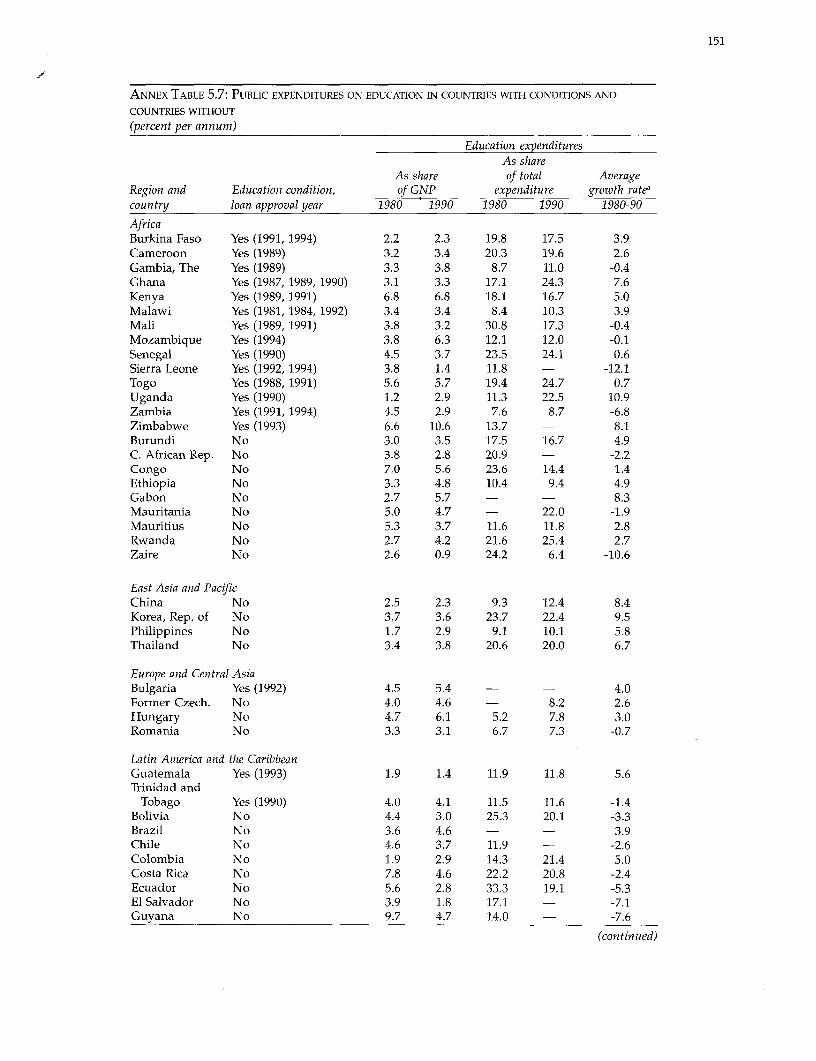
151
ANNEX TABLE 5.7: PUBLIC EXPENDITURES ON EDUCATION IN COUNTRIES WITH CONDITIONS AND
COUNTRIES WITHOUT
(percent per annum)
Education expendituresAs share
As share of total AverageRegion and Education condition, of GNP expenditure growth rateacountry loan approval year 1980 1990 1980 1990 1980-90
AfricaBurkina Faso Yes (1991, 1994) 2.2 2.3 19.8 17.5 3.9Cameroon Yes (1989) 3.2 3.4 20.3 19.6 2.6Gambia, The Yes (1989) 3.3 3.8 8.7 11.0 -0.4Ghana Yes (1987, 1989, 1990) 3.1 3.3 17.1 24.3 7.6Kenya Yes (1989, 1991) 6.8 6.8 18.1 16.7 5.0Malawi Yes (1981, 1984, 1992) 3.4 3.4 8.4 10.3 3.9Mali Yes (1989, 1991) 3.8 3.2 30.8 17.3 -0.4Mozambique Yes (1994) 3.8 6.3 12.1 12.0 -0.1Senegal Yes (1990) 4.5 3.7 23.5 24.1 0.6Sierra Leone Yes (1992, 1994) 3.8 1.4 11.8 - -12.1Togo Yes (1988, 1991) 5.6 5.7 19.4 24.7 0.7Uganda Yes (1990) 1.2 2.9 11.3 22.5 10.9Zambia Yes (1991, 1994) 4.5 2.9 7.6 8.7 -6.8Zimbabwe Yes (1993) 6.6 10.6 13.7 - 8.1Burundi No 3.0 3.5 17.5 16.7 4.9C. African Rep. No 3.8 2.8 20.9 - -2.2Congo No 7.0 5.6 23.6 14.4 1.4Ethiopia No 3.3 4.8 10.4 9.4 4.9Gabon No 2.7 5.7 - - 8.3Mauritania No 5.0 4.7 - 22.0 -1.9Mauritius No 5.3 3.7 11.6 11.8 2.8Rwanda No 2.7 4.2 21.6 25.4 2.7Zaire No 2.6 0.9 24.2 6.4 -10.6
East Asia and PacificChina No 2.5 2.3 9.3 12.4 8.4Korea, Rep. of No 3.7 3.6 23.7 22.4 9.5Philippines No 1.7 2.9 9.1 10.1 5.8Thailand No 3.4 3.8 20.6 20.0 6.7
Europe and Central AsiaBulgaria Yes (1992) 4.5 5.4 - - 4.0Former Czech. No 4.0 4.6 - 8.2 2.6Hungary No 4.7 6.1 5.2 7.8 3.0Romania No 3.3 3.1 6.7 7.3 -0.7
Latin America and the CaribbeanGuatemala Yes (1993) 1.9 1.4 11.9 11.8 5.6Trinidad and
Tobago Yes (1990) 4.0 4.1 11.5 11.6 -1.4Bolivia No 4.4 3.0 25.3 20.1 -3.3Brazil No 3.6 4.6 - - 3.9Chile No 4.6 3.7 11.9 - -2.6Colombia No 1.9 2.9 14.3 21.4 5.0Costa Rica No 7.8 4.6 22.2 20.8 -2.4Ecuador No 5.6 2.8 33.3 19.1 -5.3El Salvador No 3.9 1.8 17.1 - -7.1Guyana No 9.7 4.7 14.0 - -7.6
(continued)
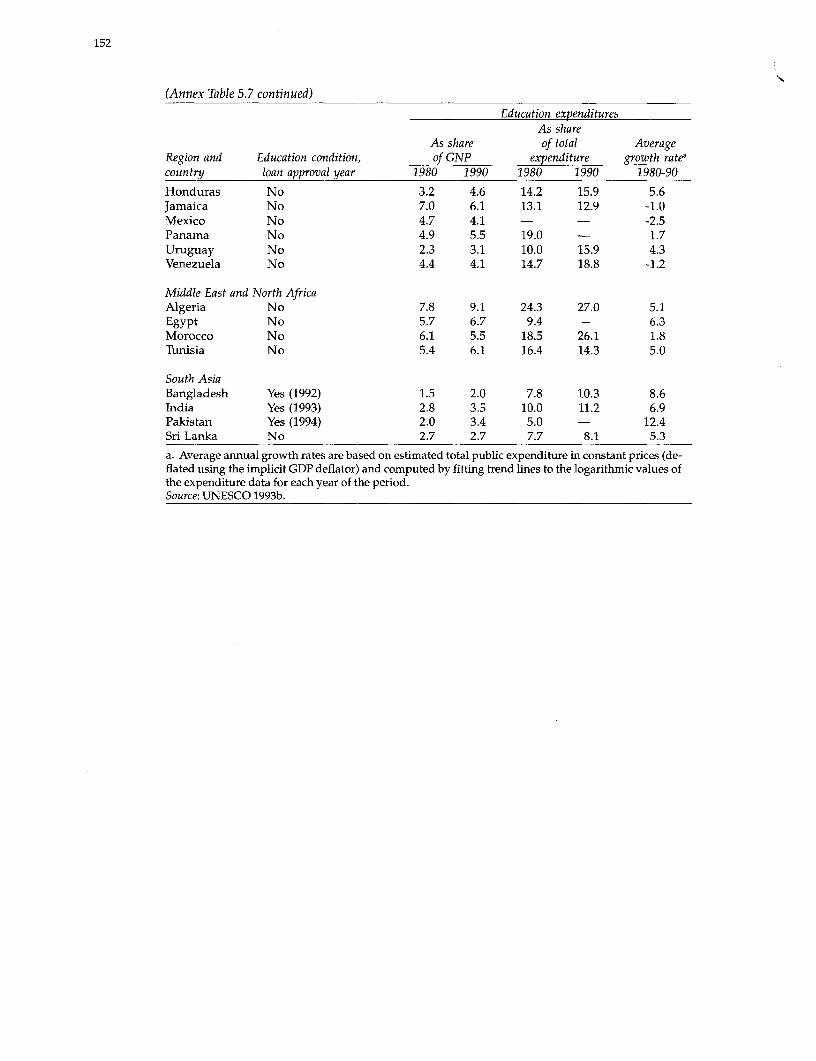
152
(Annex Table 5.7 continued)
Education expendituresAs share
As share of total AverageRegion and Education condition, of GNP expenditure growth rateacountry loan approval year 1980 1990 1980 1990 1980-90
Honduras No 3.2 4.6 14.2 15.9 5.6Jamaica No 7.0 6.1 13.1 12.9 -1.0Mexico No 4.7 4.1 - - -2.5Panama No 4.9 5.5 19.0 - 1.7Uruguay No 2.3 3.1 10.0 15.9 4.3Venezuela No 4.4 4.1 14.7 18.8 -1.2
Middle East and North AfricaAlgeria No 7.8 9.1 24.3 27.0 5.1Egypt No 5.7 6.7 9.4 - 6.3Morocco No 6.1 5.5 18.5 26.1 1.8Tunisia No 5.4 6.1 16.4 14.3 5.0
South AsiaBangladesh Yes (1992) 1.5 2.0 7.8 10.3 8.6India Yes (1993) 2.8 3.5 10.0 11.2 6.9Pakistan Yes (1994) 2.0 3.4 5.0 - 12.4Sri Lanka No 2.7 2.7 7.7 8.1 5.3
a. Average annual growth rates are based on estimated total public expenditure in constant prices (de-flated using the implicit GDP deflator) and computed by fitting trend lines to the logarithmic values ofthe expenditure data for each year of the period.Source: UNESCO 1993b.
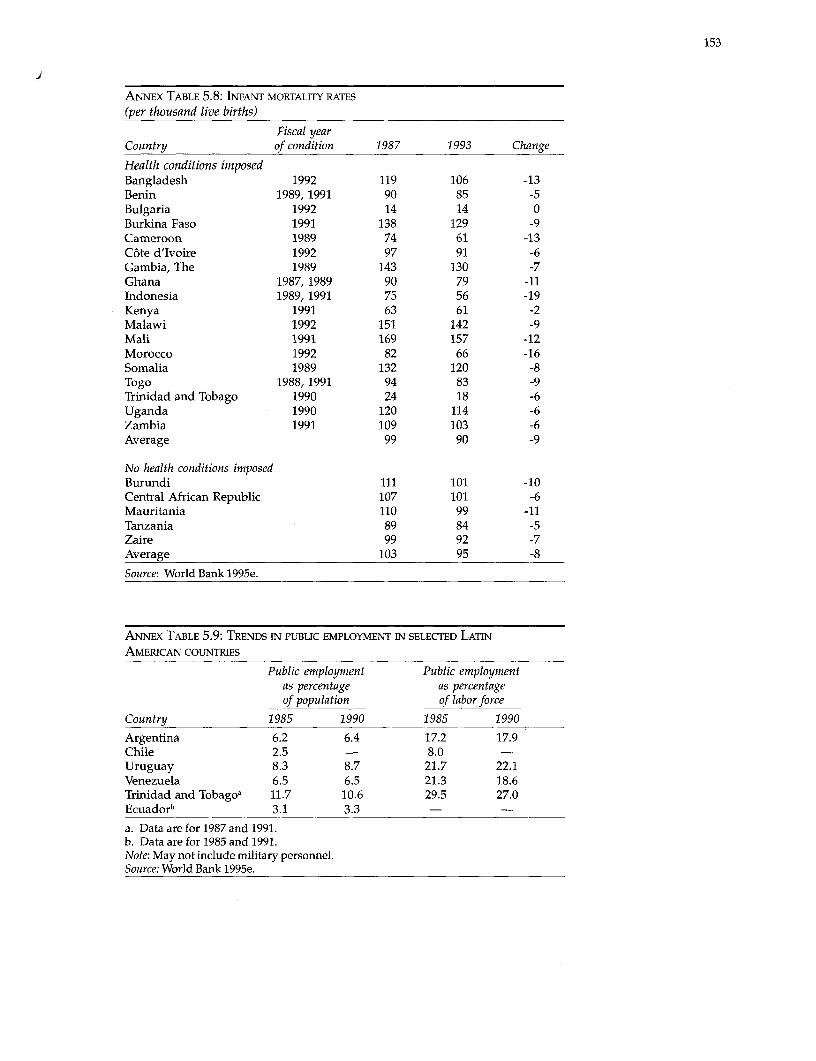
153
i
ANNEX TABLE 5.8: INFANT MORTALITY RATES
(per thousand live births)
Fiscal yearCountry of condition 1987 1993 Change
Health conditions imposedBangladesh 1992 119 106 -13Benin 1989, 1991 90 85 -5Bulgaria 1992 14 14 0Burkina Faso 1991 138 129 -9Cameroon 1989 74 61 -13C6te d'Ivoire 1992 97 91 -6Gambia, The 1989 143 130 -7Ghana 1987, 1989 90 79 -11Indonesia 1989, 1991 75 56 -19Kenya 1991 63 61 -2Malawi 1992 151 142 -9Mali 1991 169 157 -12Morocco 1992 82 66 -16Somalia 1989 132 120 -8Togo 1988, 1991 94 83 -9Trinidad and Tobago 1990 24 18 -6Uganda 1990 120 114 -6Zambia 1991 109 103 -6Average 99 90 -9
No health conditions imposedBurundi 111 101 -10Central African Republic 107 101 -6Mauritania 110 99 -11Tanzania 89 84 -5Zaire 99 92 -7Average 103 95 -8
Source: World Bank 1995e.
ANNEX TABLE 5.9: TRENDS IN PUBLIC EMPLOYMENT IN SELECTED LATIN
AMERICAN COUNTRIES
Public employment Public employmentas percentage as percentageof population of labor force
Country 1985 1990 1985 1990
Argentina 6.2 6.4 17.2 17.9Chile 2.5 - 8.0 -
Uruguay 8.3 8.7 21.7 22.1Venezuela 6.5 6.5 21.3 18.6Trinidad and Tobago, 11.7 10.6 29.5 27.0Ecuadorb 3.1 3.3 - -
a. Data are for 1987 and 1991.b. Data are for 1985 and 1991.Note: May not include military personnel.Source: World Bank 1995e.
Annex 6: Fiscal solvency and deficits
154
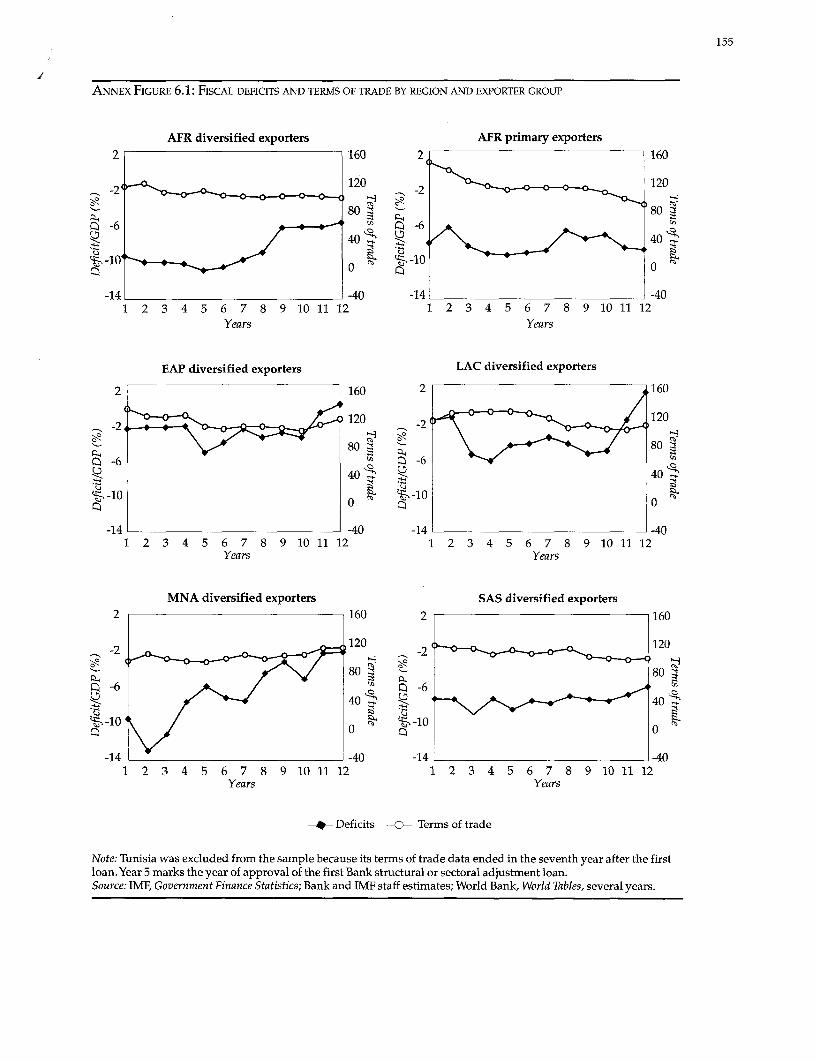
155
ANNEX FIGURE 6.1: FISCAL DEFICITS AND TERMS OF TRADE BY REGION AND EXPORTER GROUP
AFR diversified exporters AFR primary exporters2 160 2< 160
-2( 120 -2 120
80 ~~~~~~~~~~~~80
40~~~~~~~~0t-10<~~~~~~~~ 40 Q gg
0
-14 -40 -14 -401 2 3 4 5 6 7 8 9 10 11 12 1 2 3 4 5 6 7 8 9 10 11 12
Years Years
EAP diversified exporters LAC diversified exporters
2 160 2 160
-20 OF120 -21 120
0 9 8_
-14 -40 -14 -4012 3 4 5 6 7 8 9 10 11 12 1 2 3 4 5 6 7 8 9 10 11 12
Years Years
MNA diversified exporters SAS diversified exporters2 160 2 160
-2 2120 2 120
80~~~~~~~~~ ~~~ ~ 8C -6 -6
40' 40
t-10' V- ok -10
-14 1-40 -14 -401 2 3 4 5 6 7 8 9 10 11 12 1 2 3 4 5 6 7 8 9 10 11 12
Years Years
Deficits -0- Terms of trade
Note: Tunisia was excluded from the sample because its terms of trade data ended in the seventh year after the firstloan. Year 5 marks the year of approval of the first Bank structural or sectoral adjustment loan.Source: IMF, Government Finance Statistics; Bank and ITMF staff estimates; World Bank, World Tables, several years.

156
ANNEX TABLE 6.1: ADJUSTMENT LOANS AND COUNTRIES IN SAMPLE, BY REGION
Countries withAdjustment loans adjustment lending
Percentage PercentageRegion Total Sample of total Total Sample of total
Africa 128 73 57 37 13 33East Asia and Pacific 15 10 67 7 3 43Latin America
and the Caribbean 58 25 43 20 5 28Middle East and
North Africa 12 10 83 5 2 50South Asia 16 20 75 6 3 50
Regional total in study 229 134 59 75 26 35Note: Due to data limitations, Europe and Central Asia was excluded from the sample.
Source: ALCID.
ANNEX TABLE 6.2A: COUNTRIES WITH EIGHT OR MORE YEARS OF FISCAL DEFICIT DATA
AFR EAP LAC MNA SASCote d'Ivoire Korea, Rep. of Argentina Morocco BangladeshGhana Philippines Chile Tunisia IndiaKenya Thailand Costa Rica PakistanMadagascar MexicoMalawi Uruguay
Mauritius
Senegal
Sierra Leone
Tanzania
TogoUganda
Zambia
Zimbabwe
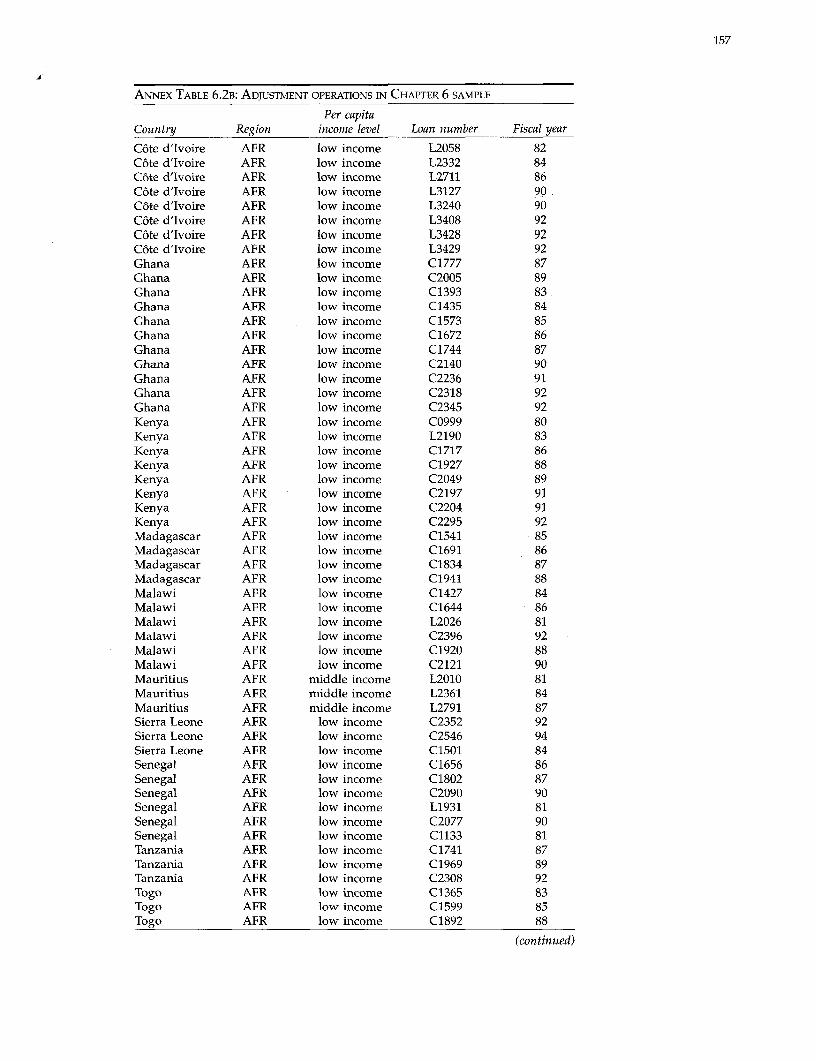
157
ANNEX TABLE 6.2B: ADJUSTMENT OPERATIONS IN CHAPTER 6 SAMPLE
Per capitaCountry Region income level Loan number Fiscal year
Cote d'lvoire AFR low income L2058 82C6te d'Ivoire AFR low income L2332 84Cote d'lvoire AFR low income L2711 86Cote d'lvoire AFR low income L3127 90Cote d'Ivoire AFR low income L3240 90C6te d'Ivoire AFR low income L3408 92Cote d'Ivoire AFR low income L3428 92C6te d'Ivoire AFR low income L3429 92Ghana AFR low income C1777 87Ghana AFR low income C2005 89Ghana AFR low income C1393 83Ghana AFR low income C1435 84Ghana AFR low income C1573 85Ghana AFR low income C1672 86Ghana AFR low income C1744 87Ghana AFR low income C2140 90Ghana AFR low income C2236 91Ghana AFR low income C2318 92Ghana AFR low income C2345 92Kenya AFR low income C0999 80Kenya AFR low income L2190 83Kenya AFR low income C1717 86Kenya AFR low income C1927 88Kenya AFR low income C2049 89Kenya AFR low income C2197 91Kenya AFR low income C2204 91Kenya AFR low income C2295 92Madagascar AFR low income C1541 85Madagascar AFR low income C1691 86Madagascar AFR low income C1834 87Madagascar AFR low income C1941 88Malawi AFR low income C1427 84Malawi AFR low income C1644 86Malawi AFR low income L2026 81Malawi AFR low income C2396 92Malawi AFR low income C1920 88Malawi AFR low income C2121 90Mauritius AFR middle income L2010 81Mauritius AFR middle income L2361 84Mauritius AFR middle income L2791 87Sierra Leone AFR low income C2352 92Sierra Leone AFR low income C2546 94Sierra Leone AFR low income C1501 84Senegal AFR low income C1656 86Senegal AFR low income C1802 87Senegal AFR low income C2090 90Senegal AFR low income L1931 81Senegal AFR low income C2077 90Senegal AFR low income C1133 81Tanzania AFR low income C1741 87Tanzania AFR low income C1969 89Tanzania AFR low income C2308 92Togo AFR low income C1365 83Togo AFR low income C1599 85Togo AFR low income C1892 88
(continued)
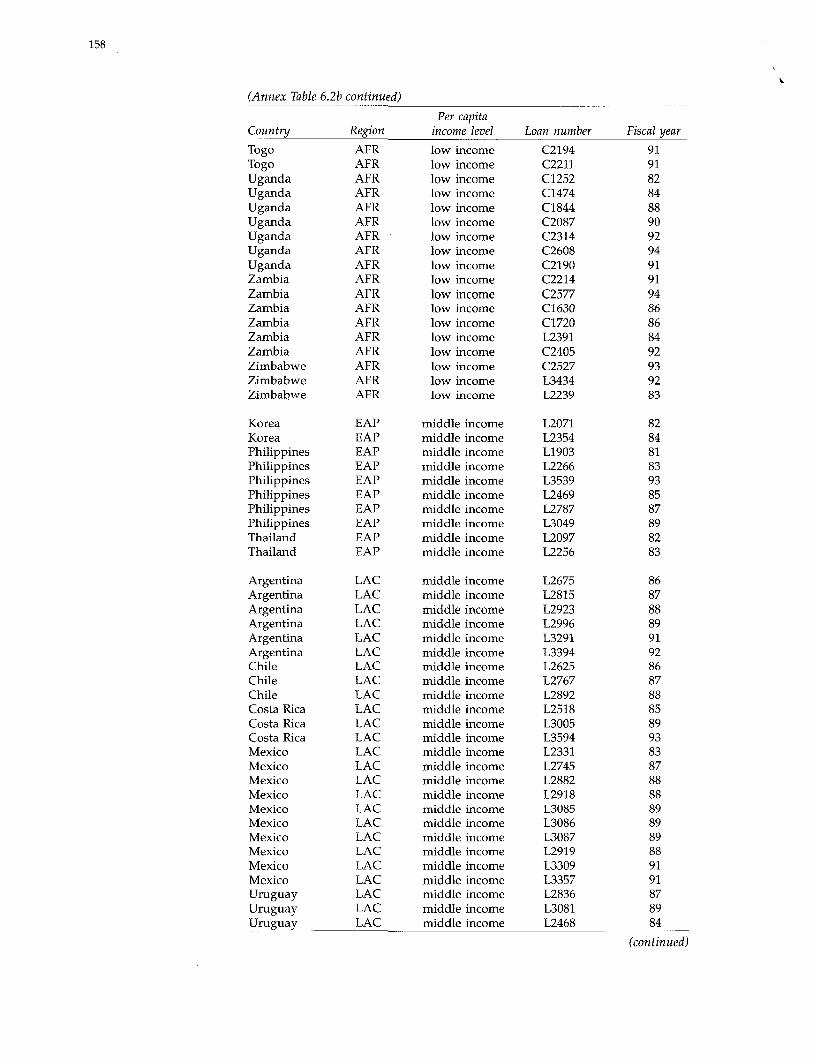
158
(Annex Table 6.2b continued)
Per capitaCountry Region income level Loan number Fiscal year
Togo AFR low income C2194 91Togo AFR low income C2211 91Uganda AFR low income C1252 82Uganda AFR low income C1474 84Uganda AFR low income C1844 88Uganda AFR low income C2087 90Uganda AFR low income C2314 92Uganda AFR low income C2608 94Uganda AFR low income C2190 91Zambia AFR low income C2214 91Zambia AFR low income C2577 94Zambia AFR low income C1630 86Zambia AFR low income C1720 86Zambia AFR low income L2391 84Zambia AFR low income C2405 92Zimbabwe AFR low income C2527 93Zimbabwe AFR low income L3434 92Zimbabwe AFR low income L2239 83
Korea EAP middle income L2071 82Korea EAP middle income L2354 84Philippines EAP middle income L1903 81Philippines EAP middle income L2266 83Philippines EAP middle income L3539 93Philippines EAP middle income L2469 85Philippines EAP middle income L2787 87Philippines EAP middle income L3049 89Thailand EAP middle income L2097 82Thailand EAP middle income L2256 83
Argentina LAC middle income L2675 86Argentina LAC middle income L2815 87Argentina LAC middle income L2923 88Argentina LAC middle income L2996 89Argentina LAC middle income L3291 91Argentina LAC middle income L3394 92Chile LAC middle income L2625 86Chile LAC middle income L2767 87Chile LAC middle income L2892 88Costa Rica LAC middle income L2518 85Costa Rica LAC middle income L3005 89Costa Rica LAC middle income L3594 93Mexico LAC middle income L2331 83Mexico LAC middle income L2745 87Mexico LAC middle income L2882 88Mexico LAC middle income L2918 88Mexico LAC middle income L3085 89Mexico LAC middle income L3086 89Mexico LAC middle income L3087 89Mexico LAC middle income L2919 88Mexico LAC middle income L3309 91Mexico LAC middle income L3357 91Uruguay LAC middle income L2836 87Uruguay LAC middle income L3081 89Uruguay LAC middle income L2468 84
(continued)
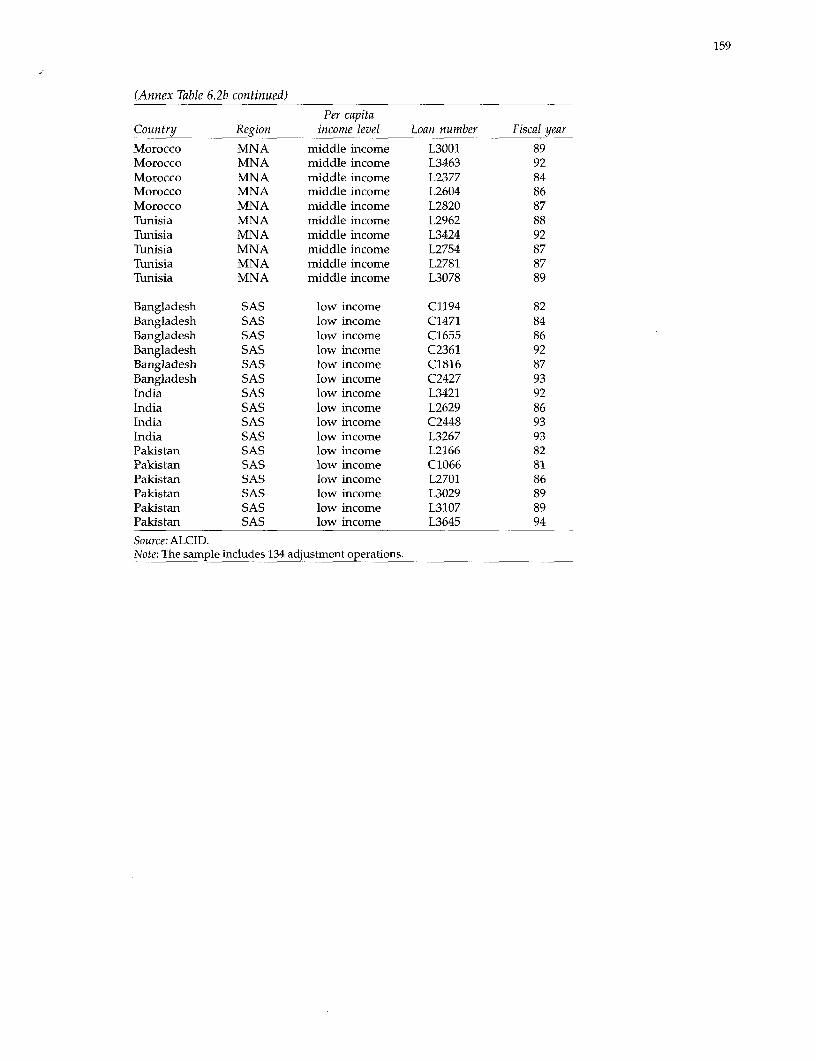
159
(Annex Table 6.2b continued)
Per capitaCountry Region income level Loan number Fiscal year
Morocco MNA middle income L3001 89Morocco MNA middle income L3463 92Morocco MNA middle income L2377 84Morocco MNA middle income L2604 86Morocco MNA middle income L2820 87Tunisia MNA middle income L2962 88Tunisia MNA middle income L3424 92Tunisia MNA middle income L2754 87Tunisia MNA middle income L2781 87Tunisia MNA middle income L3078 89
Bangladesh SAS low income C1194 82Bangladesh SAS low income C1471 84Bangladesh SAS low income C1655 86Bangladesh SAS low income C2361 92Bangladesh SAS low income C1816 87Bangladesh SAS low income C2427 93India SAS low income L3421 92India SAS low income L2629 86India SAS low income C2448 93India SAS low income L3267 93Pakistan SAS low income L2166 82Pakistan SAS low income C1066 81Pakistan SAS low income L2701 86Pakistan SAS low income L3029 89Pakistan SAS low income L3107 89Pakistan SAS low income L3645 94
Source: ALCID.Note: The sample includes 134 adjustment operations.
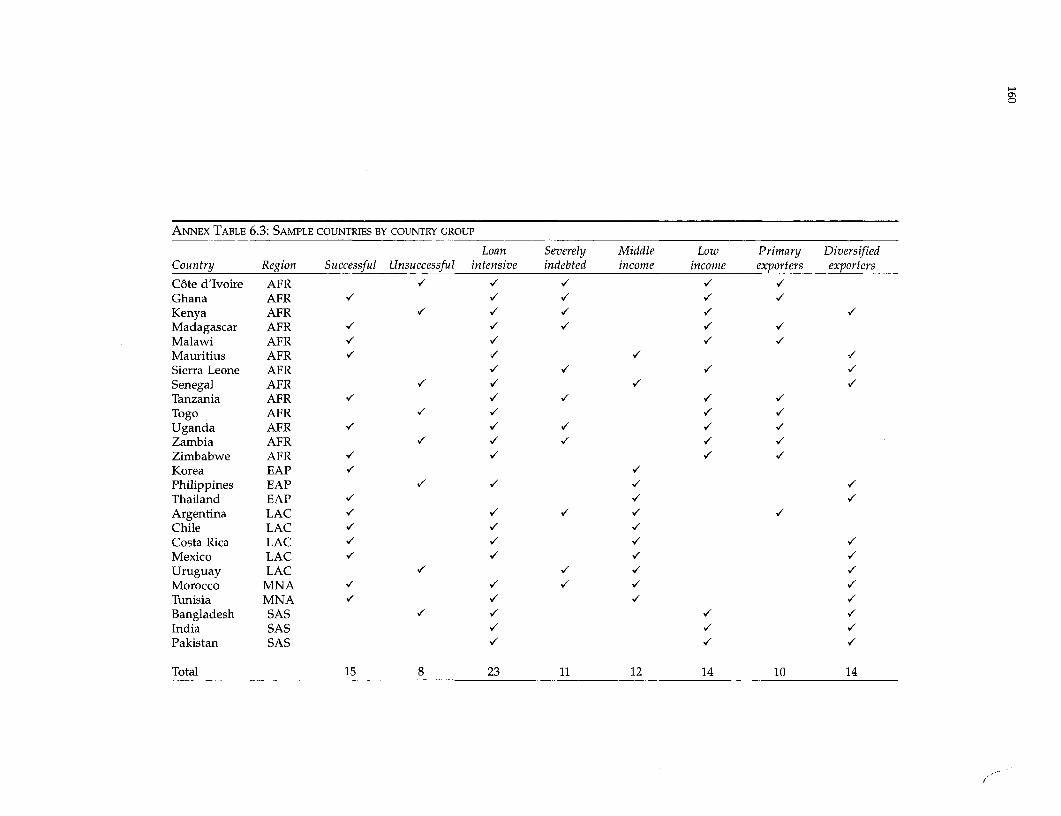
ANNEX TABLE 6.3: SAMPLE COUNTRIES BY COUNTRY GROUP
Loan Severely Middle Low Primary DiversifiedCountry Region Successful Unsuccessful intensive indebted income income exporters exporters
C6te d'Ivoire AFR VV I/Ghana AFR V V V / VKenya AFR / I/ / V Madagascar AFR / V/ / /Malawi AFR V I / VMauritius AFR - / /Sierra Leone AFR / VSenegal AFR / VTanzania AFR V V / VTogo AFRUganda AFR V V V VZambia AFR VI V V vVZimbabwe AFR V V VKorea EAP V VPhilippines EAP V V V VThailand EAP V I VArgentina LAC VV VVChile LAC V V VCosta Rica LAC V/ V VMexico LAC V V VUruguay LAC V V i VMorocco MNA / V V V VTunisia MNA V/ V V Bangladesh SAS VI VI VIndia SAS V V VPakistan SAS V V V
Total 15 8 23 11 12 14 10 14
(.
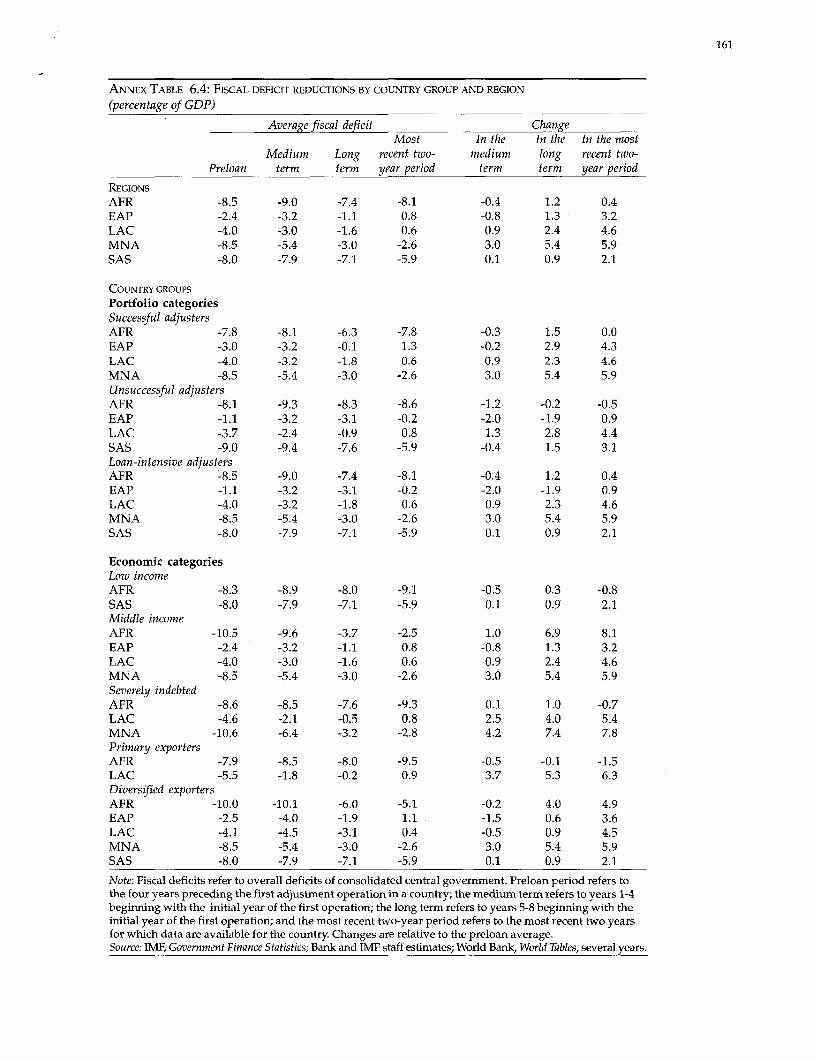
161
ANNEX TABLE 6.4: FISCAL DEFICIT REDUCTIONS BY COUNTRY GROUP AND REGION
(percentage of GDP)
Average fiscal deficit ChangeMost In the In the In the most
Medium Long recent two- medium long recent two-Preloan term term year period term term year period
REGIONS
AFR -8.5 -9.0 -7.4 -8.1 -0.4 1.2 0.4EAP -2.4 -3.2 -1.1 0.8 -0.8 1.3 3.2LAC -4.0 -3.0 -1.6 0.6 0.9 2.4 4.6MNA -8.5 -5.4 -3.0 -2.6 3.0 5.4 5.9SAS -8.0 -7.9 -7.1 -5.9 0.1 0.9 2.1
COUNTRY GROUPS
Portfolio categoriesSuccessful adjustersAFR -7.8 -8.1 -6.3 -7.8 -0.3 1.5 0.0EAP -3.0 -3.2 -0.1 1.3 -0.2 2.9 4.3LAC -4.0 -3.2 -1.8 0.6 0.9 2.3 4.6MNA -8.5 -5.4 -3.0 -2.6 3.0 5.4 5.9Unsuccessful adjustersAFR -8.1 -9.3 -8.3 -8.6 -1.2 -0.2 -0.5EAP -1.1 -3.2 -3.1 -0.2 -2.0 -1.9 0.9LAC -3.7 -2.4 -0.9 0.8 1.3 2.8 4.4SAS -9.0 -9.4 -7.6 -5.9 -0.4 1.5 3.1Loan-intensive adjustersAFR -8.5 -9.0 -7.4 -8.1 -0.4 1.2 0.4EAP -1.1 -3.2 -3.1 -0.2 -2.0 -1.9 0.9LAC -4.0 -3.2 -1.8 0.6 0.9 2.3 4.6MNA -8.5 -5.4 -3.0 -2.6 3.0 5.4 5.9SAS -8.0 -7.9 -7.1 -5.9 0.1 0.9 2.1
Economic categoriesLow incomeAFR -8.3 -8.9 -8.0 -9.1 -0.5 0.3 -0.8SAS -8.0 -7.9 -7.1 -5.9 0.1 0.9 2.1Middle incomeAFR -10.5 -9.6 -3.7 -2.5 1.0 6.9 8.1EAP -2.4 -3.2 -1.1 0.8 -0.8 1.3 3.2LAC -4.0 -3.0 -1.6 0.6 0.9 2.4 4.6MNA -8.5 -5.4 -3.0 -2.6 3.0 5.4 5.9Severely indebtedAFR -8.6 -8.5 -7.6 -9.3 0.1 1.0 -0.7LAC -4.6 -2.1 -0.5 0.8 2.5 4.0 5.4MNA -10.6 -6.4 -3.2 -2.8 4.2 7.4 7.8Primary exportersAFR -7.9 -8.5 -8.0 -9.5 -0.5 -0.1 -1.5LAC -5.5 -1.8 -0.2 0.9 3.7 5.3 6.3Diversified exportersAFR -10.0 -10.1 -6.0 -5.1 -0.2 4.0 4.9EAP -2.5 -4.0 -1.9 1.1 -1.5 0.6 3.6LAC -4.1 -4.5 -3.1 0.4 -0.5 0.9 4.5MNA -8.5 -5.4 -3.0 -2.6 3.0 5.4 5.9SAS -8.0 -7.9 -7.1 -5.9 0.1 0.9 2.1
Note: Fiscal deficits refer to overall deficits of consolidated central government. Preloan period refers tothe four years preceding the first adjustment operation in a country; the medium term refers to years 1-4beginning with the initial year of the first operation; the long term refers to years 5-8 beginning with theinitial year of the first operation; and the most recent two-year period refers to the most recent two yearsfor which data are available for the country. Changes are relative to the preloan average.Source: IMF, Government Finance Statistics; Bank and IMF staff estimates; World Bank, World Tables, several years.
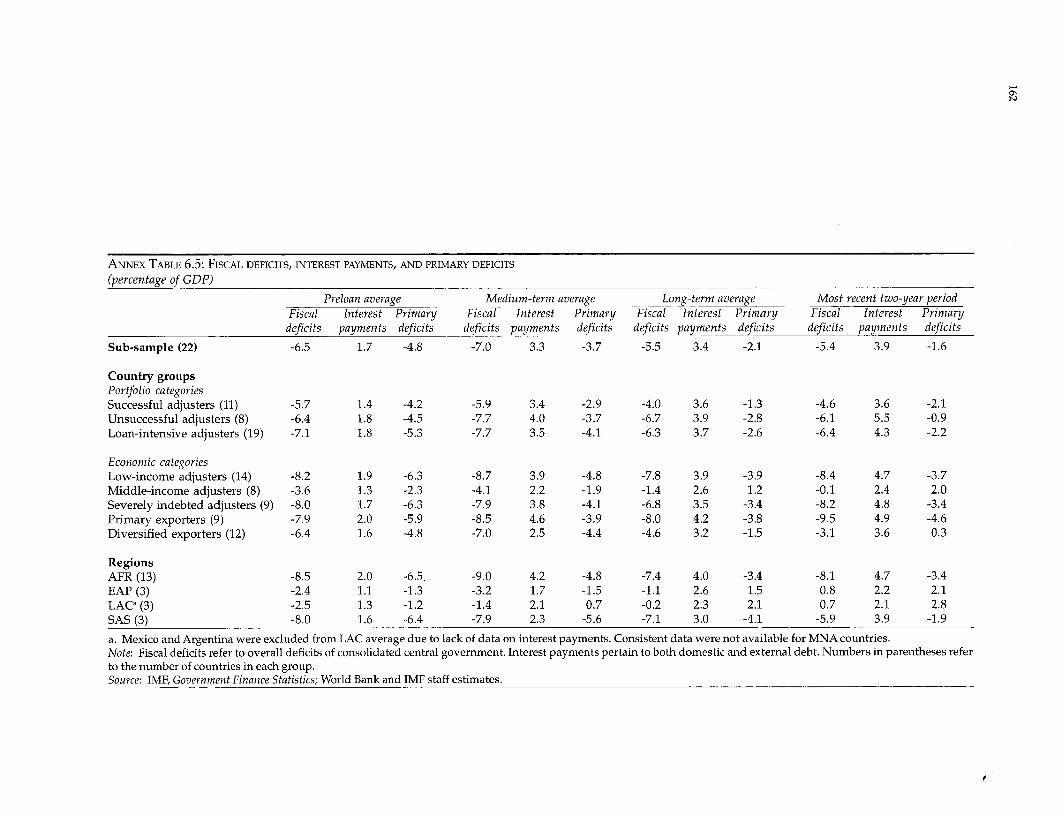
ANNEX TABLE 6.5: FISCAL DEFICITS, INTEREST PAYMENTS, AND PRIMARY DEFICITS
(percentage of GDP)
Preloan average Medium-term average Long-term average Most recent two-year periodFiscal Interest Primary Fiscal Interest Primary Fiscal Interest Primary Fiscal Interest Primarydeficits payments deficits deficits payments deficits deficits payments deficits deficits payments deficits
Sub-sample (22) -6.5 1.7 -4.8 -7.0 3.3 -3.7 -5.5 3.4 -2.1 -5.4 3.9 -1.6
Country groupsPortfolio categoriesSuccessful adjusters (11) -5.7 1.4 -4.2 -5.9 3.4 -2.9 -4.0 3.6 -1.3 -4.6 3.6 -2.1Unsuccessful adjusters (8) -6.4 1.8 -4.5 -7.7 4.0 -3.7 -6.7 3.9 -2.8 -6.1 5.5 -0.9Loan-intensive adjusters (19) -7.1 1.8 -5.3 -7.7 3.5 -4.1 -6.3 3.7 -2.6 -6.4 4.3 -2.2
Economic categoriesLow-income adjusters (14) -8.2 1.9 -6.3 -8.7 3.9 -4.8 -7.8 3.9 -3.9 -8.4 4.7 -3.7Middle-income adjusters (8) -3.6 1.3 -2.3 -4.1 2.2 -1.9 -1.4 2.6 1.2 -0.1 2.4 2.0Severely indebted adjusters (9) -8.0 1.7 -6.3 -7.9 3.8 -4.1 -6.8 3.5 -3.4 -8.2 4.8 -3.4Primary exporters (9) -7.9 2.0 -5.9 -8.5 4.6 -3.9 -8.0 4.2 -3.8 -9.5 4.9 -4.6Diversified exporters (12) -6.4 1.6 -4.8 -7.0 2.5 -4.4 -4.6 3.2 -1.5 -3.1 3.6 0.3
RegionsAFR (13) -8.5 2.0 -6.5. -9.0 4.2 -4.8 -7.4 4.0 -3.4 -8.1 4.7 -3.4EAP (3) -2.4 1.1 -1.3 -3.2 1.7 -1.5 -1.1 2.6 1.5 0.8 2.2 2.1LACa (3) -2.5 1.3 -1.2 -1.4 2.1 0.7 -0.2 2.3 2.1 0.7 2.1 2.8SAS (3) -8.0 1.6 -6.4 -7.9 2.3 -5.6 -7.1 3.0 -4.1 -5.9 3.9 -1.9
a. Mexico and Argentina were excluded from LAC average due to lack of data on interest payments. Consistent data were not available for MNA countries.Note: Fiscal deficits refer to overall deficits of consolidated central government. Interest payments pertain to both domestic and external debt. Numbers in parentheses referto the number of countries in each group.Source: IMF, Government Finance Statistics; World Bank and IMF staff estimates.

163
ANNEX TABLE 6.6: CHANGES IN FISCAL DEFICITS AND PRIMARY TOOL USED, BY COUNTRY GROUP
AND REGION
Medium term Long term Most recent periodChange Change Change
Country group in fiscal Primary in fiscal Primary in fiscal Primaryand region deficit tool used deficit tool used deficit tool used
Sample average X Expenditure V Revenue / Revenue
Country groups
Portfolio categoriesSuccessful / Revenue I/ Revenue V/ Revenue
Unsuccessful X Expenditure X Both V/ Expenditure
Loan-intensive X Expenditure V Revenue V/ Revenue
Economic categoriesLow-income X Expenditure / Revenue X Expenditure
Middle-income V Expenditure V Both V Both
Severely indebted V Revenue V Both Vt RevenuePrimary exporters X Expenditure V Revenue X Expenditure
Diversified exporters X Expenditure V Both V Both
Regions
AFR X Expenditure V Revenue V Revenue
EAP X Both V Both V Revenue
LAC V Revenue V Revenue V Both
MNA V Expenditure V Expenditure V Expenditure
SAS V Revenue V Revenue V Revenue
Note: Fiscal deficit and time period definitions are the same as in Annex Table 6.4. In the case of worsened
fiscal deficits, the "primary tool used" refers to the instrument that worsened the deficit. X denotes wors-
ening of fiscal deficit. / denotes improvement in fiscal deficit.
Source: Table 3.5 and Annex Table 5.7.
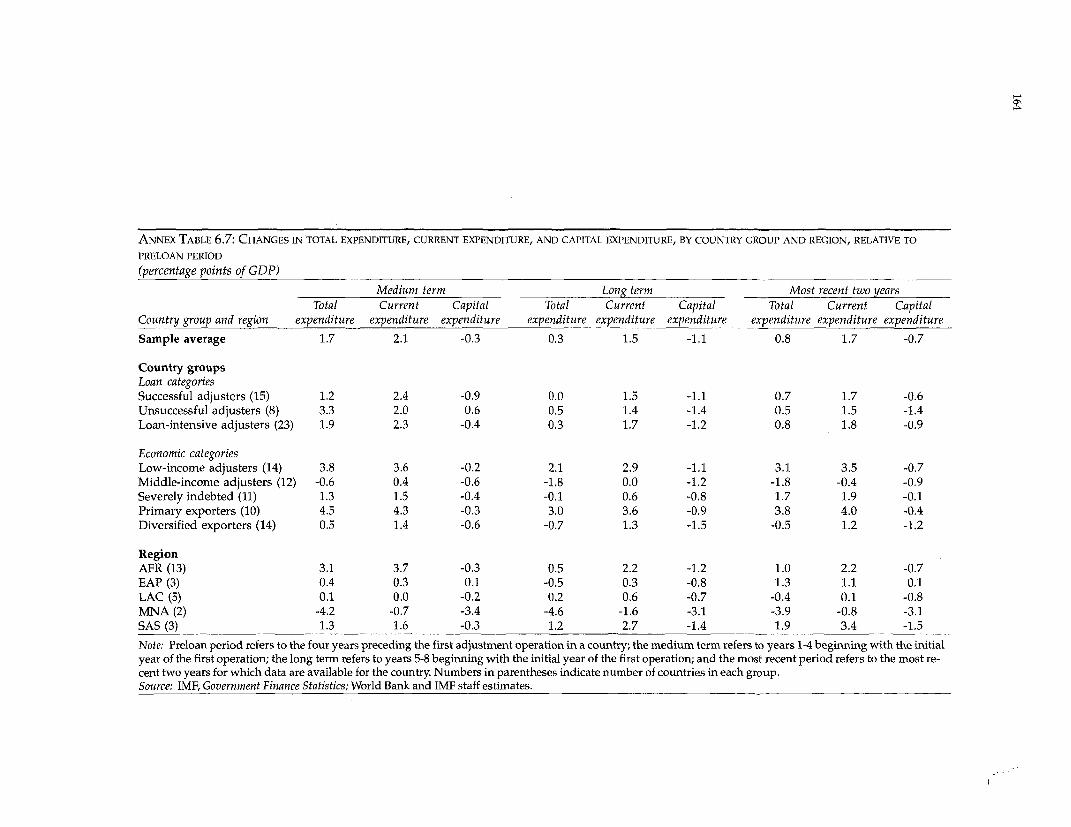
ON
ANNEX TABLE 6.7: CHANGES IN TOTAL EXPENDITURE, CURRENT EXPENDITURE, AND CAPITAL EXPENDITURE, BY COUNTRY GROUP AND REGION, RELATIVE TO
PRELOAN PERIOD
(percentage points of GDP)
Medium term Long term Most recent two yearsTotal Current Capital Total Current Capital Total Current Capital
Country group and region expenditure expenditure expenditure expenditure expenditure expenditure expenditure expenditure expenditure
Sample average 1.7 2.1 -0.3 0.3 1.5 -1.1 0.8 1.7 -0.7
Country groupsLoan categoriesSuccessful adjusters (15) 1.2 2.4 -0.9 0.0 1.5 -1.1 0.7 1.7 -0.6
Unsuccessful adjusters (8) 3.3 2.0 0.6 0.5 1.4 -1.4 0.5 1.5 -1.4
Loan-intensive adjusters (23) 1.9 2.3 -0.4 0.3 1.7 -1.2 0.8 1.8 -0.9
Economic categoriesLow-income adjusters (14) 3.8 3.6 -0.2 2.1 2.9 -1.1 3.1 3.5 -0.7
Middle-income adjusters (12) -0.6 0.4 -0.6 -1.8 0.0 -1.2 -1.8 -0.4 -0.9
Severely indebted (11) 1.3 1.5 -0.4 -0.1 0.6 -0.8 1.7 1.9 -0.1
Primary exporters (10) 4.5 4.3 -0.3 3.0 3.6 -0.9 3.8 4.0 -0.4
Diversified exporters (14) 0.5 1.4 -0.6 -0.7 1.3 -1.5 -0.5 1.2 -1.2
RegionAFR (13) 3.1 3.7 -0.3 0.5 2.2 -1.2 1.0 2.2 -0.7
EAP (3) 0.4 0.3 0.1 -0.5 0.3 -0.8 1.3 1.1 0.1
LAC (5) 0.1 0.0 -0.2 0.2 0.6 -0.7 -0.4 0.1 -0.8
MNA (2) -4.2 -0.7 -3.4 -4.6 -1.6 -3.1 -3.9 -0.8 -3.1
SAS (3) 1.3 1.6 -0.3 1.2 2.7 -1.4 1.9 3.4 -1.5
Note: Preloan period refers to the four years preceding the first adjustment operation in a country; the medium term refers to years 1-4 beginning with the initial
year of the first operation; the long term refers to years 5-8 beginning with the initial year of the first operation; and the most recent period refers to the most re-
cent two years for which data are available for the country. Numbers in parentheses indicate number of countries in each group.Source: IMF, Government Finance Statistics; World Bank and IMF staff estimates.
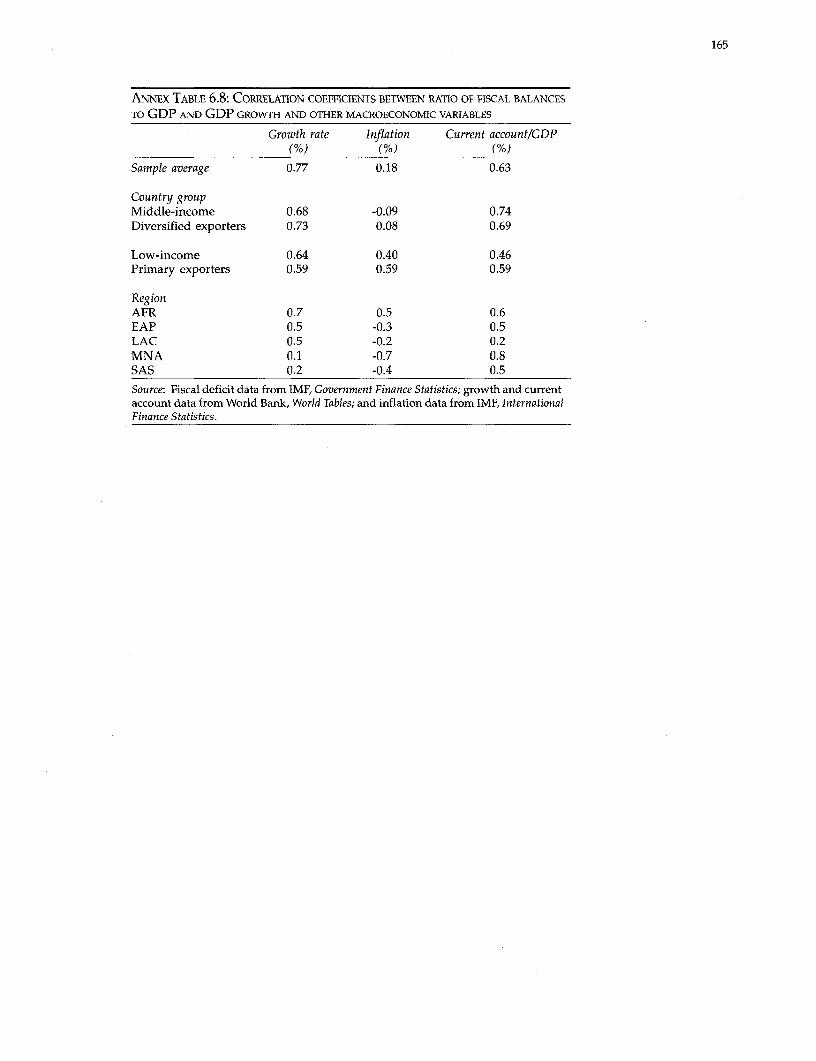
165
ANNEX TABLE 6.8: CORRELATION COEFFICIENTS BETWEEN RATIO OF FISCAL BALANCESTO GDP AND GDP GROWTH AND OTHER MACROECONOMIC VARIABLES
Growth rate inflation Current account/GDP(%) (%) (%)
Sample average 0.77 0.18 0.63
Country groupMiddle-income 0.68 -0.09 0.74Diversified exporters 0.73 0.08 0.69
Low-income 0.64 0.40 0.46Primary exporters 0.59 0.59 0.59
RegionAFR 0.7 0.5 0.6EAP 0.5 -0.3 0.5LAC 0.5 -0.2 0.2MNA 0.1 -0.7 0.8SAS 0.2 -0.4 0.5
Source: Fiscal deficit data from IMF, Government Finance Statistics; growth and currentaccount data from World Bank, World Tables; and inflation data from IMF, InternationalFinance Statistics.
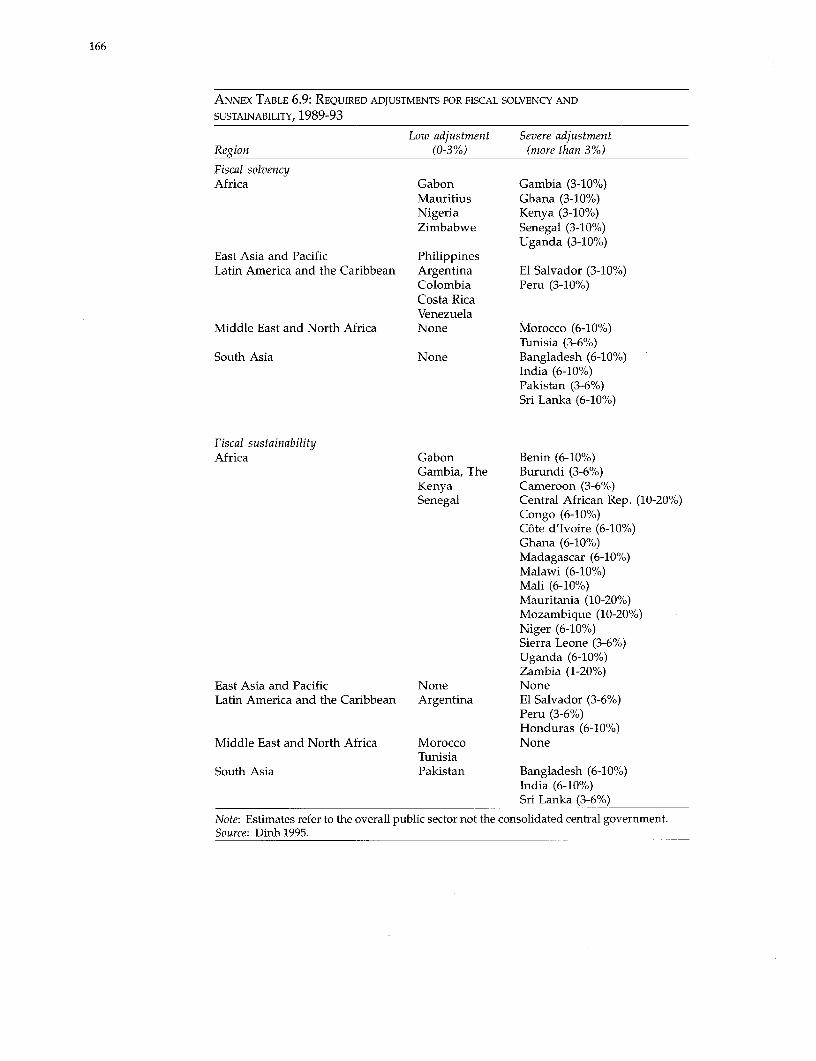
166
ANNEX TABLE 6.9: REQUIRED ADJUSTMENTS FOR FISCAL SOLVENCY AND
SUSTAINABILITY, 1989-93
Low adjustment Severe adjustmentRegion (0-3%) (more than 3%)
Fiscal solvencyAfrica Gabon Gambia (3-10%)
Mauritius Ghana (3-10%)Nigeria Kenya (3-10%)Zimbabwe Senegal (3-10%)
Uganda (3-10%)East Asia and Pacific PhilippinesLatin America and the Caribbean Argentina El Salvador (3-10%)
Colombia Peru (3-10%)Costa RicaVenezuela
Middle East and North Africa None Morocco (6-10%)Tunisia (3-6%)
South Asia None Bangladesh (6-10%)India (6-10%)Pakistan (3-6%)Sri Lanka (6-10%)
Fiscal sustainabilityAfrica Gabon Benin (6-10%)
Gambia, The Burundi (3-6%)Kenya Cameroon (3-6%)Senegal Central African Rep. (10-20%)
Congo (6-10%)C6te d'Ivoire (6-10%)Ghana (6-10%)Madagascar (6-10%)Malawi (6-10%)Mali (6-10%)Mauritania (10-20%)Mozambique (10-20%)Niger (6-10%)Sierra Leone (3-6%)Uganda (6-10%)Zambia (1-20%)
East Asia and Pacific None NoneLatin America and the Caribbean Argentina El Salvador (3-6%)
Peru (3-6%)Honduras (6-10%)
Middle East and North Africa Morocco NoneTunisia
South Asia Pakistan Bangladesh (6-10%)India (6-10%)Sri Lanka (3-6%)
Note: Estimates refer to the overall public sector not the consolidated central government.Source: Dinh 1995.
References
Acharya, Shankar N., et al. (1986). Aspects of the Black Economy in India: ReportSubmitted to the Ministry of Finance, Government of India. New Delhi: NationalInstitute of Public Finance and Policy.
Akin, J., et al. (1987). Financing Health Services in Developing Countries:An Agenda for Reform. A World Bank Policy Study. Washington, D.C.:World Bank.
Alderman, Harold, et al. (1995). "Public Schooling Expenditures in Rural Pa-kistan: Efficiently Targeting Girls and a Lagging Region." In Dominique vande Walle and Kimberly Nead (eds.), Public Spending and the Poor: Theory andEvidence. Baltimore: The Johns Hopkins University Press.
Alesina, Alberto (1995). "The Political Economy of Macroeconomic Stabili-zations and Income Inequality: Myths and Reality" Paper prepared for Inter-national Monetary Fund (IMF) Conference on Income Distribution and Sus-tainable Growth, June 1995. IMF, Washington, D.C.
Anand, Ritu, and Sweder van Wijnbergen (1989). "Inflation and the Financ-ing of Government Expenditure: An Introductory Analysis with an Applica-tion to Turkey" World Bank Economic Review 3(1).
Appleton, Simon, and Paul Collier (1995). "On Gender Targeting of PublicTransfers." In Dominique van de Walle and Kimberly Nead (eds.), PublicSpending and the Poor: Theory and Evidence. Baltimore: The Johns HopkinsUniversity Press.
Arora, Vivek, and Tamim Rayoumi (1994). "Reductions in the World Mili-tary Expenditure: Who Stands to Gain?" Finance and Development 31 (March):24-27.
Baffes, John, and Anwar Shah (1993). "Productivity of Public Spending, Sec-toral Allocation Choices, and Economic Growth." Policy Research WorkingPaper 1178. World Bank, Washington, D.C.
Barnum, Howard, and Joseph Kutzin (1993). Public Hospitals in DevelopingCountries: Resource Use, Cost, Financing. Baltimore: The Johns Hopkins Uni-versity Press.
Bagchi, Amaresh (1991). "Tax Reform in Developing Countries: Agenda forthe 1990s." Asian Development Review 9(2).
Bird, Richard M. (1983). "Income Tax Reform in Developing Countries: TheAdministrative Dimension." International Bureau of Fiscal Documentation,Washington, D.C.
167
168
(1989). "The Administrative Dimension of Tax Reform in Devel-oping Countries." In M. Gillis (ed.), Tax Reform in Developing Countries.Durham: Duke University Press.
, and Milka Casanegra de Jantscher (eds.) (1992). Improving TaxAdministration in Developing Countries. Washington, D.C.: International Mon-etary Fund.
Blejer, Mario I., and Adrienne Cheasty (1993). The Measurement of Fiscal Defi-cits. Washington, D.C.: International Monetary Fund.
Boadway, Robin, Sandra Roberts, and Anwar Shah (1994). "The Reform ofFiscal Systems in Developing and Emerging Market Economies: A Federal-ism Perspective." Policy Research Working Paper 1259. World Bank, Wash-ington, D.C.
Boadway, Robin, and Anwar Shah (1994). "Fiscal Federalism in Developing/Transition Economies: Some Lessons From Industrialized Countries." Na-tional Tax Journal, Proceedings Issue (April):64-71.
Buiter, Willem H. (1983). The Proper Measurement of the Public Sector Deficitand its Implicationsfor Policy Evaluation and Design. DM/82/84. Washington,D.C.: International Monetary Fund.
________ (1985). "Guide to Public Sector Debt and Deficits." A EuropeanForum (UK) 1 (Nov.):13-79.
________ (1990). "The Arithmetic of Solvency." In Principles of Budgetary andFinancial Policy. Cambridge, Massachusetts: Massachusetts Institute of Tech-nology Press.
_______, and Uijit R. Patel (1990). Debt, Deficits and inflation: An Applicationto the Public Finances of India. Washington, D.C.: International MonetaryFund.
Campos, Ed, and Sanjay Pradhan (1996). "Budgetary Institutions and Expen-diture Outcomes: Binding Governments to Fiscal Performance." Policy Re-search Working Paper 1646. World Bank, Washington, D.C.
de Melo, Martha (1988). "Public Investment/Expenditure Reviews: TheBank's Experience." Public Economics Division, Country Economics Depart-ment. World Bank, Washington, D.C.
Dinh, Hinh T. (1995). "Fiscal Solvency and Sustainability in CreditworthinessAnalysis." World Bank, Washington, D.C.
Easterly, William, C.A. Rodriguez, and K. Schmidt-Hebbel (eds.)(1994).Public Sector Deficits and Macroeconomic Performance. New York: Oxford Uni-versity Press.
Faini, Riccardo, and Jaime de Melo (1990). "Fiscal Issues in Adjustment: AnIntroduction." Ricerche Economiche 2-3 (April-September), Department of Po-litical Science, Universita degli Studi Ca' Foscari, Venice.
Grilli, Vittorio. (1989). "Seignorage in Europe." In Marcello De Cecco andAlberto Giovannini (eds.), A European Central Bank? Perspectives on MonetaryUnification after Ten Years of the EMS. Cambridge: Cambridge University Press.
169
Hamilton, J., and Marjorie Flavin (1988). "On the Limitations of GovernmentBorrowing: A Framework for Empirical Testing." American Economic Review76:808-19.
Home, Jocelyn (1991). Indicators of Fiscal Sustainability. WP/91/5. Washing-ton, D.C.: International Monetary Fund.
International Monetary Fund (1995a). IMF Survey, November 6, 1995.Washington, D.C.
(1995b). "Unproductive Public Expenditures: A Pragmatic Ap-proach to Policy Analysis." Pamphlet Series No. 48, Fiscal Affairs Depart-ment. Washington, D.C.
(1994). Overview of Developments in Countries with Stand-By andExtended Arrangements Approved During 1988-91. Washington, D.C.
(several years). Government Finance Statistics. Washington, D.C.
(several years). International Finance Statistics. Washington, D.C.
(1989). Tax Administration in Developing Countries: Strategies andTools of Implementation. Washington, D.C.
Jayarajah, Carl, and William Branson (1995). Structural and Sectoral Adjust-ment: World Bank Experience, 1980-92. A World Bank Operations EvaluationStudy Washington, D.C.: World Bank.
(1996). Social Dimensions of Adjustment: World Bank Experience,1980-93. A World Bank Operations Evaluation Study. Washington, D.C.:World Bank.
Jimenez, E. (1986). "Public Subsidization of Education and Health in Devel-oping Countries: A Review of Equity and Efficiency" The World Bank ResearchObserver 1 (Jan.):111-129.
Khalilzadeh-Shirazi, Javad, and Anwar Shah (eds.) (1991). Tax Policy in Devel-oping Countries. A World Bank Symposium. Washington, D.C.: World Bank.
Larsen, Bjorn, and Anwar Shah (1995). "Global Climate Change, Energy Sub-sidies and National Carbon Taxes." In Lans Bovenberg and Sijbren Cnossen(eds.), Public Economics and the Environment in an Imperfect World. Boston:Kluwer Academic Publishers:113-32.
Lockheed, Marlaine E., Adriaan M. Verspoor, et al. (1991). Improving Pri-mary Education in Developing Countries. London and New York: OxfordUniversity Press.
Mitra, Pradeep (1992). "The Coordinated Reform of Tariffs and IndirectTaxes." The World Bank Research Observer 7(2).
Morisset, Jacques, and Alejandro Izquierdo (1993). "Effects of Tax Reform onArgentina's Revenues." Policy Research Working Paper 1192. World Bank,Washington, D.C.
170
Nashashibi, Karim, Sanjeev Gupta, Claire Liuksila, Henri Lorie, and WalterMahler (1992). The Fiscal Dimensions of Adjustment in Low-Income Countries.Occasional Paper No. 95. Washington, D.C.: International Monetary Fund.
Nunberg, Barbara, and John Nellis (1995). Civil Service Reform and the WorldBank. World Bank Discussion Paper 161. Washington, D.C.: World Bank.
Pradhan, Sanjay (1996). Evaluating Public Spending: A Frameworkfor PublicExpenditure Reviews. World Bank Discussion Paper 323. Washington, D.C.:World Bank.
Psacharopoulos, George (1994). "Returns to Investment in Education: A Glo-bal Update." World Development 22(9):1325-43.
Rajaram, Anand (1992). "Tariff and Tax Reform: Do World Bank Recommen-dations Integrate Revenue and Protection Objectives?" Policy ResearchWorking Paper 1018. World Bank, Washington, D.C.
Ridker, Ronald G. (1994). The World Bank's Role in Human Resource Develop-ment in Sub-Saharan Africa: Education, Training, and Technical Assistance. AWorld Bank Operations Evaluation Study. Washington, D.C.: World Bank.
Ron, A., et al. (1990). Health Insurance in Developing Countries: The Social Secu-rity Approach. Geneva: International Labour Office.
Schmidt-Hebbel, Klaus (1995). "Fiscal Adjustment and Growth: In and Out ofAfrica." Washington, D.C.: World Bank.
Selden, Thomas M., and Michael J. Wasylenko (1995). "Measuring the Distri-butional Effects of Public Education in Peru." In Dominique van de Walleand Kimberly Nead (eds.), Public Spending and the Poor: Theory and Evidence.Baltimore: The Johns Hopkins University Press.
Sen, Amartya (1995). "The Political Economy of Targeting." In Dominiquevan de Walle and Kimberly Nead (eds), Public Spending and the Poor: Theoryand Evidence. Baltimore: The Johns Hopkins University Press.
Shah, Anwar (1992). "Dynamics of Public Infrastructure, Industrial Produc-tivity and Profitability." The Review of Economics and Statistics 74(1): 28-36.
________ (1995). Fiscal Incentivesfor Investment and Innovation. New York andLondon: Oxford University Press.
________ (1994). The Reform of Intergovermental Fiscal Relations in Developingand Emerging Market Economies. Policy and Research Series 23. Washington, D.C.
________ (1991). The New Fiscal Federalism in Brazil. World Bank DiscussionPaper 124. Washington, D.C.: World Bank.
________ (1988). "Public Infrastructure and Private Sector Profitability andProductivity in Mexico." Policy Research Working Paper 100. World Bank,Washington, D.C.
Shihata, Ibrahim (1994). "Civil Service Reform in Developing Countries." InShahid Amjad Chaudhry, Gary Reid, and Waleed Malik (eds.), Civil ServiceReform in Latin America and the Caribbean. World Bank Technical Paper 259.Washington, D.C.: World Bank:11-13.
171
Shome, Parthasarathi (1992). "Trends and Future Directions in Tax Policy Re-form: A Latin America Perspective." WP/92/43. World Bank, Washington, D.C.
Skinner, Jonathan (1989). "Do Taxes Matter? A Review of the Effect of Taxa-tion on Economic Behavior and Output." Policy Research Working Paper 48.World Bank, Washington, D.C.
Stiglitz, Joseph E. (1996). "The Role of Government in Economic Develop-ment." Paper presented at Annual World Bank Conference on DevelopmentEconomics. World Bank, Washington, D.C.
Subbarao, Kalanidhi, Jeanine Braithwaite, and Jyotsna Jalan (1995). "Protect-ing the Poor During Adjustment and Transitions." HCO Working Paper 58.World Bank, Washington, D.C.
Summers, Lawrence, and Lant Pritchett (1993). "The Structural-AdjustmentDebate." American Economic Review, May:383-389.
Talvi, Ernesto (1994). "Fiscal Policy and the Public Sector in Exchange RateBased Stabilizations: Evidence from Uruguay's 1978 and 1991 Programs."Chicago: The University of Chicago and Central Bank of Uruguay.
Tan, Jee-Peng, Vito Tanzi, Jr., and Abdo Yazabeck (1995). Public Spending onHealth in the 1980s: The Impact of Adjustment Lending Programs. BackgroundPaper 16. Baltimore: The Johns Hopkins University.
Tanzi, Vito (1995). "Corruption, Government Activities and Markets." Fi-nance and Development 32(4):24-27.
(1994). "Corruption, Government Activities, and Markets" IMFWorking Paper. Fiscal Affairs Department, International Monetary Fund,Washington, D.C.
(1993). "Fiscal Issues in Adjustment Programs." International Mon-etary Fund, Washington, D.C.
Thirsk, Wayne (forthcoming). The Substance and Process of Tax Reform in TenDeveloping Countries. Washington, D.C.: World Bank.
(1991). "Lessons from Tax Reform: An Overview." Policy ResearchWorking Paper 576. World Bank, Washington, D.C.
Thomas, Vinod, A. Chhibber, M. Dailami, and J. de Melo (eds.) (1991). Re-structuring Economies in Distress: Policy Reform and the World Bank. New York:Oxford University Press.
United Nations Development Programme (1995). The 1995 Human Develop-metnt Report. New York: Oxford University Press.
United Nations Educational, Scientific and Cultural Organization (UNESCO)(1993a). Statistical Yearbook 1993. Paris: UNESCO.
(1993b). World Education Report 1993. France: Oxford University Press.
Van de Walle, Dominique (1995). "Public Spending and the Poor: What WeKnow, What We Need to Know." Policy Research Working Paper 1476. WorldBank, Washington, D.C.
172
, and Kimberly Nead (eds.) (1995). Public Spending and the Poor:Theory and Evidence. Baltimore: The Johns Hopkins University Press.
Van der Gaag, Jacques (1995). Private and Public Initiatives: Working Togetherfor Health and Education. Directions in Development Series. Washington, D.C.:World Bank.
van Wijnbergen, Sweder (1989). "External Debt, Inflation, and the PublicSector: Toward Fiscal Policy for Sustainable Growth." Economic Review3(3):297-320.
World Bank (1995a). Adjustment Lending Conditionality and Implementa-tion Database. World Bank, Washington, D.C.
________ (1995b). Bureaucrats in Business: The Economics and Politics of PublicOwnership. A World Bank Policy Research Report. New York: Oxford Univer-sity Press.
________ (1995c). Evaluation Results 1993. Operations Evaluation Depart-ment. Washington, D.C.
________ (1995d). "Review of Public Expenditure Work." Office of the VicePresident, Development Economics. Washington, D.C.
(1995e). Social Indicators of Development. Washington, D.C.
(1995f). World Development Report 1995. New York: Oxford Univer-sity Press.
________ (1992a). Adjustment Lending and Mobilization of Private and Public Re-sources for Growth. Policy and Research Series Paper 22. Washington, D.C.
________ (1992b). Trade Policy Reforms under Adjustment Programs. OperationsEvaluation Department. Washington, D.C.
(1991a). Lessons of Tax Reform. Washington, D.C.
(1991b). World Development Report 1991. New York: Oxford Univer-sity Press.
(1990a). Adjustment Lending Policies for Sustainable Growth. Policyand Research Series Paper 14. Washington, D.C.
________ (1990b). World Development Report 1990. New York: Oxford Univer-sity Press.
________ (1988a). Adjustment Lending: An Evaluation of Ten Years of Experience.Policy and Research Series Paper 1. Washington, D.C.
(1988b). World Development Report 1988. New York: Oxford Univer-sity Press.
(several years). World Debt Tables. Washington, D.C.
(several years). World Tables. Washington, D.C.
Supplement
Introductory note 174Management response 175Summary of Committee on Development Effectiveness findings 179
173
Introductory note
Feedback of evaluation results within the World Bank
Each study by the Bank's independent Operations Evaluation Department isreviewed by the Bank's management before being discussed by a committeeof the board of executive directors. Management provides a detailed re-sponse to the recommendations outlined in the study. This response isdiscussed by the committee and, together with a record of actions promisedand taken, is recorded in a "policy ledger" accessible to all Bank staff. TheBank's executive directors have requested that all published studies by theOperations Evaluation Department include a synopsis of the managementresponse and the committee's findings.
174

Management response
We welcome this report, which looks at adjustment lending through the lensof fiscal management. Although fiscal management has been an integral partof adjustment-both as a source of the problem and part of the solution-previous studies of adjustment lending have examined it alongside other fac-tors. Given that the "fiscal rationale" is now an accepted part of our ap-proach to adjustment lending, a report that focuses exclusively on fiscalmanagement in adjustment lending is both valuable and timely.
The report provides a compilation of data on fiscal aspects of adjustment,consistent with the Bank's three reports on adjustment lending (1988, 1990,1992). The data reveal some important new facts, such as that fiscal adjust-ment was more likely to be attained by raising revenue than cutting expendi-ture (confirming the findings of the 1992 report on adjustment lending); thatfiscal problems were due to economic mismanagement, and not necessarilyto terms of trade shocks or extemal indebtedness; and that deficit reductionis associated with improved external balances and faster growth.
As for the recommendations of the report, we are in broad agreement withmost of them. The recommendations fall into four categories. One set of rec-ommendations includes those additional general principles and policy goalsthat we, and most reasonable people for that matter, would agree with. Forinstance, we agree that fiscal conditionality should be well defined, that em-phasis should be placed on the proper sequencing of reforms, that fiscal ac-counts should be transparent and cover as much of the public sector as pos-sible, and so on.
A second set of recommendations includes those that reflect good intentionsand that we would broadly agree with, but it is not clear how these recom-mendations follow from the analysis in the report and how they would beimplemented. For instance, under the section on public expenditure reform,the report recommends that the Bank persuade governments to involvestakeholders in developing spending priorities. Yet, the report is silent onhow this might be done, or what evidence there is that such an approachleads to better public expenditure allocations.
A third set of recommendations points the Bank in directions toward whichit is already headed, signaling that there is broad agreement, but that per-haps our efforts should be strengthened. Included in this category are therecommendations to (a) base public expenditure reform on an explicit con-sideration of the government's role in the economy (15 of the 18 public ex-penditure reviews undertaken this year do this); and (b) emphasize basebroadening and tax simplification in tax reform (this was the central messageof the Bank's 1991 Lessons of Tax Reform).
Finally, the report contains some recommendations with which we mayagree in general terms, but would give different emphasis on the specifics.
175
176
For example, the report recommends that fiscal accounts should be better in-tegrated into the macroeconomic framework of analysis since "this willmake it easier to estimate the sustainable deficit...and set quantitative targetsfor achieving a sustainable deficit." Without diminishing the importance ofintegrating fiscal accounts with the medium-term macroeconomic frame-work, we would point out that the determination of the sustainable deficitremains an unresolved issue in theory, let alone in practice. We would re-spond to the OED recommendation, therefore, by initiating a study, possiblyin collaboration with the IMF, on the sustainable fiscal deficit, including ap-plication to two or three countries.
Another issue in this category is the report's recommendations on Bank-Fund relations. The report suggests that the Bank "needs to do more search-ing analysis of fiscal issues and be prepared to discuss with the Fund not justexpenditure policy analysis, but also budget and tax reform proposals..."Elsewhere, too, the report recommends that the Bank should strengthen itsability to analyze tax policy. While we would agree that there is room for im-proved Bank-Fund collaboration on a variety of issues-indeed, steps arecurrently underway to address this-we would have to weigh the benefits ofinvesting resources in tax policy analysis against alternative uses of those re-sources, including investing in areas (such as sector-level public expendi-tures) where the Fund is not doing any work. The overarching principles ofselectivity and partnership among the IFIs argue for the Bank to assess care-fully what it takes on and what its comparative advantages are.
The final issue in this category has to do with conditionality. Observingthat fiscal conditionality in the past has been vaguely defined and weaklyenforced, the report recommends making it more precise, concrete, and sub-ject to monitoring. While we agree with this, we also would point out thatthe need for clarity of and follow-up to conditionality is a generic issue fac-ing all operations.
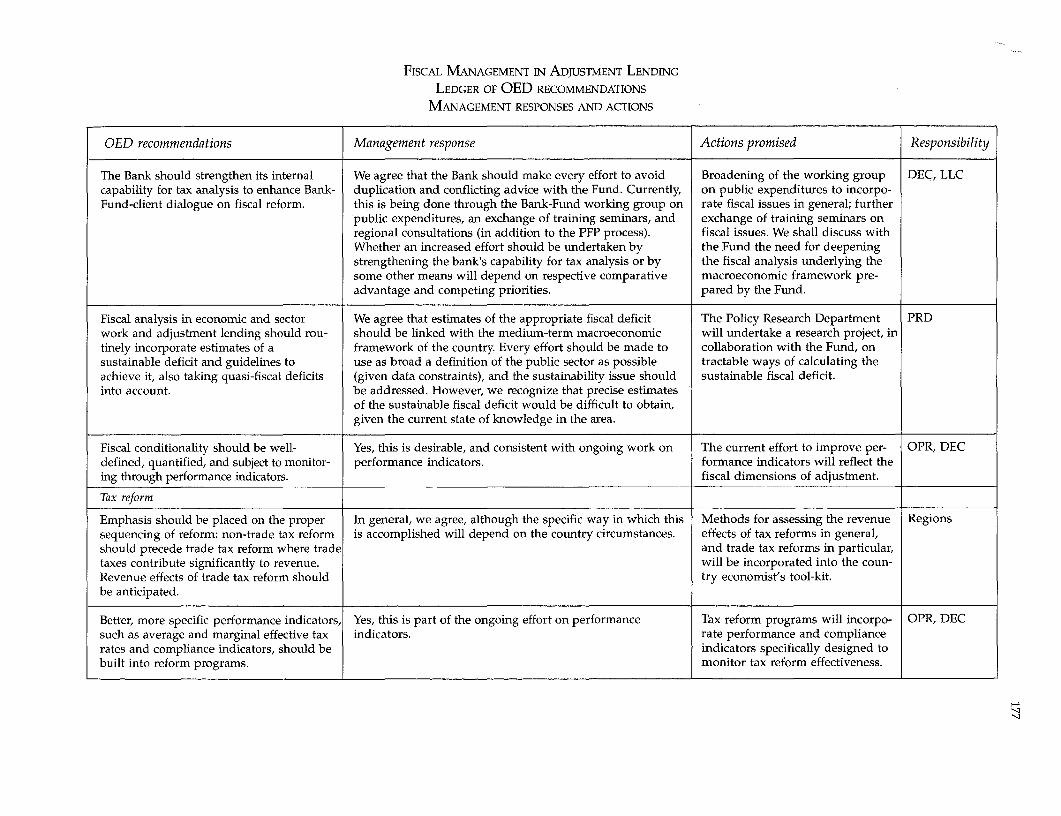
FISCAL MANAGEMENT IN ADJUSTMENT LENDING
LEDGER OF OED RECOMMENDATIONS
MANAGEMENT RESPONSES AND ACTIONS
OED recommendations Management response Actions promised Responsibility
The Bank should strengthen its internal We agree that the Bank should make every effort to avoid Broadening of the working group DEC, LLCcapability for tax analysis to enhance Bank- duplication and conflicting advice with the Fund. Currently, on public expenditures to incorpo-Fund-client dialogue on fiscal reform. this is being done through the Bank-Fund working group on rate fiscal issues in general; further
public expenditures, an exchange of training seminars, and exchange of training seminars onregional consultations (in addition to the PFP process). fiscal issues. We shall discuss withWhether an increased effort should be undertaken by the Fund the need for deepeningstrengthening the bank's capability for tax analysis or by the fiscal analysis underlying thesome other means will depend on respective comparative macroeconomic framework pre-advantage and competing priorities. pared by the Fund.
Fiscal analysis in economic and sector We agree that estimates of the appropriate fiscal deficit The Policy Research Department PRDwork and adjustment lending should rou- should be linked with the medium-term macroeconomic will undertake a research project, intinely incorporate estimates of a framework of the country. Every effort should be made to collaboration with the Fund, onsustainable deficit and guidelines to use as broad a definition of the public sector as possible tractable ways of calculating theachieve it, also taking quasi-fiscal deficits (given data constraints), and the sustainability issue should sustainable fiscal deficit.into account. be addressed. However, we recognize that precise estimates
of the sustainable fiscal deficit would be difficult to obtain,given the current state of knowledge in the area.
Fiscal conditionality should be well- Yes, this is desirable, and consistent with ongoing work on The current effort to improve per- OPR, DECdefined, quantified, and subject to monitor- performance indicators. formance indicators will reflect theing through performance indicators. fiscal dimensions of adjustment.
Tax reform
Emphasis should be placed on the proper In general, we agree, although the specific way in which this Methods for assessing the revenue Regionssequencing of reform: non-trade tax reform is accomplished will depend on the country circumstances. effects of tax reforms in general,should precede trade tax reform where trade and trade tax reforms in particular,taxes contribute significantly to revenue. will be incorporated into the coun-Revenue effects of trade tax reform should try economist's tool-kit.be anticipated.
Better, more specific performance indicators, Yes, this is part of the ongoing effort on performance Tax reform programs will incorpo- OPR, DECsuch as average and marginal effective tax indicators. rate performance and compliancerates and compliance indicators, should be indicators specifically designed tobuilt into reform programs. monitor tax reform effectiveness.
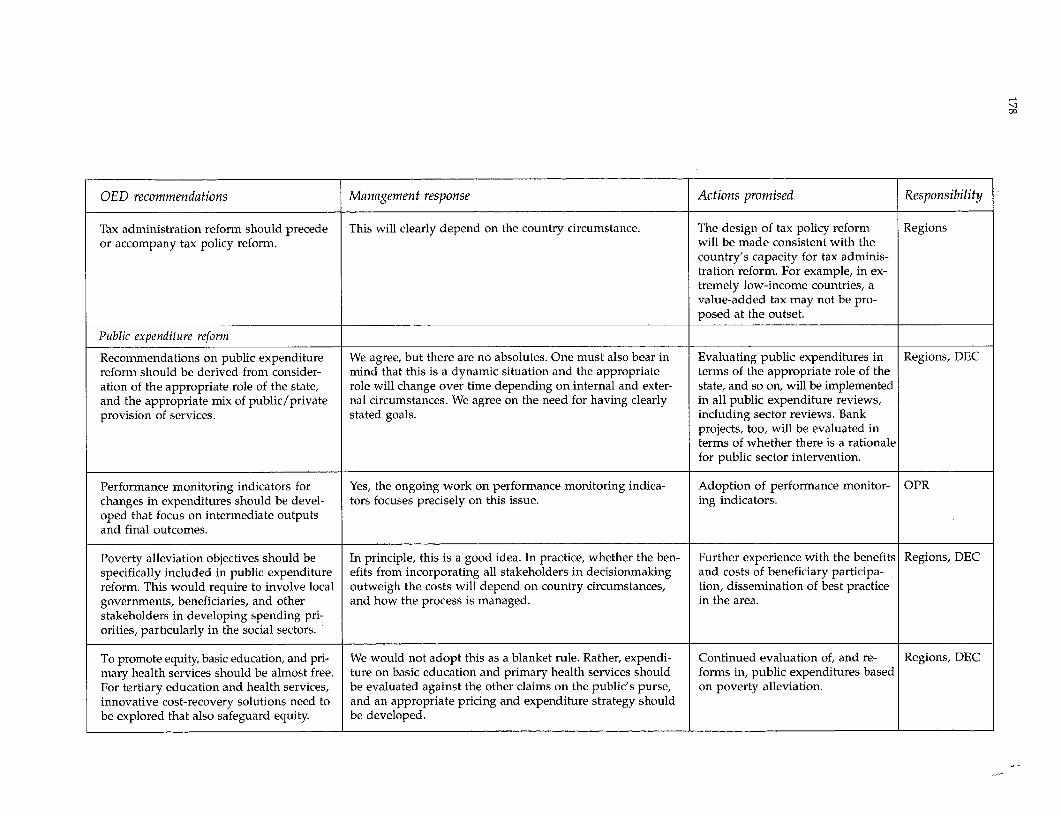
OED recommendations Management response Actions promised Responsibility
Tax administration reform should precede This will clearly depend on the country circumstance. The design of tax policy reform Regionsor accompany tax policy reform. will be made consistent with the
country's capacity for tax adminis-tration reform. For example, in ex-tremely low-income countries, avalue-added tax may not be pro-posed at the outset.
Public expenditure reform
Recommendations on public expenditure We agree, but there are no absolutes. One must also bear in Evaluating public expenditures in Regions, DECreform should be derived from consider- mind that this is a dynamic situation and the appropriate terms of the appropriate role of theation of the appropriate role of the state, role will change over time depending on internal and exter- state, and so on, will be implementedand the appropriate mix of public/private nal circumstances. We agree on the need for having clearly in all public expenditure reviews,provision of services. stated goals. including sector reviews. Bank
projects, too, will be evaluated interms of whether there is a rationalefor public sector intervention.
Performance monitoring indicators for Yes, the ongoing work on performance monitoring indica- Adoption of performance monitor- OPRchanges in expenditures should be devel- tors focuses precisely on this issue. ing indicators.oped that focus on intermediate outputsand final outcomes.
Poverty alleviation objectives should be In principle, this is a good idea. In practice, whether the ben- Further experience with the benefits Regions, DECspecifically included in public expenditure efits from incorporating all stakeholders in decisionmaking and costs of beneficiary participa-reform. This would require to involve local outweigh the costs will depend on country circumstances, tion, dissemination of best practicegovernments, beneficiaries, and other and how the process is managed. in the area.stakeholders in developing spending pri-orities, particularly in the social sectors.
To promote equity, basic education, and pri- We would not adopt this as a blanket rule. Rather, expendi- Continued evaluation of, and re- Regions, DECmary health services should be almost free. ture on basic education and primary health services should forms in, public expenditures basedFor tertiary education and health services, be evaluated against the other claims on the public's purse, on poverty alleviation.innovative cost-recovery solutions need to and an appropriate pricing and expenditure strategy shouldbe explored that also safeguard equity. be developed.
Summary of Committee on DevelopmentEffectiveness findings
The Committee on Development Effectiveness, in its discussion of the OEDstudy, emphasized the need for fiscal conditionality in adjustment operationsto be more precise, supported by specific and monitorable performance indi-cators; the need to define what is a sustainable deficit; the nature and causesof reversals in fiscal reforms; and the appropriate role of the public sector. Thecommittee believes that Bank-Fund collaboration on expenditure policyand budget and tax reform proposals should be strengthened. But it sharesmanagement's view that the principle of selectivity and partnership amonginternational finance institutions argue for the Bank to assess carefully thework it assumes and what its comparative advantages are. As for the appro-priate role of the public sector, the committee said that it is the prerogativeof individual borrowers to decide what is appropriate in the context of theirlocal conditions.
179

The World Bank
1818 H Street, N.WWashington, D.C. 20433, U.S.A.
Telephone: (202) 477-1234Facsimile: (202) 477-6391
Telex: MCI 64145 WORLDBANKMCI 248423 WORLDBANK
Cable Address: INTBAFRAD
WASHINGTONDCWorld Wide Web: http://wwwworldbank.org/
E-rnail: [email protected]
13 9_6
ISBN 0-8213-3965-6
9 780821 339657
Cover design by Joyce C Petruzzelli