firefighter math - usda forest service
TRANSCRIPT
United StatesDepartment ofAgriculture
Forest Service
Technology &DevelopmentProgram
5100—Fire MgmtMay 20000051 1802—SDTDCRevised July 2002
Firefighter MathSelf-Paced Math Course
FOREST SERVICE
DEP A R T MENT OF AGRICUL T U R
E

ACKNOWLEDGMENTS
This self-paced math course is the result of the efforts ofmany Forest Service employees, contractors, and
retired personnel, with special thanks to:
Carol HensonFire Behavior Specialist
Los Padres National Forest
Eric McCormickActing Battalion Chief
San Gabriel River Ranger DistrictAngeles National Forest
Judy L. MollCertified High School Math Instructor
Chemical Engineer
Judy GruenwaldMechanical Engineering Technician
Mark ZavalaEngineering Aide
Karen Joan CordovaPh.D. Candidate Mathematics
University of California at Los Angeles (UCLA)
Firefighter MathSelf-Paced Math Course
Lois P. SickingMechanical Engineer
San Dimas Technology & Development CenterSan Dimas, CA
May 2000Revised July 2002
Information contained in this document has been developed for theguidance of employees of the Forest Service, USDA, its contractors, andcooperating Federal and State agencies. The Department of Agricultureassumes no responsibility for the interpretation or use of this informationby other than its own employees. The use of trade, firm, or corporationnames is for the information and convenience of the reader. Such usedoes not constitute an official evaluation, conclusion, recommendation,endorsement, or approval of any product or service to the exclusion ofothers that may be suitable.
The United States Department of Agriculture (USDA) prohibits discriminationin all its programs and activities on the basis of race, color, national origin,sex, religion, age, disability, political beliefs, sexual orientation, or maritalor family status. (Not all prohibited bases apply to all programs.) Personswith disabilities who require alternative means for communication ofprogram information (Braille, large print, audiotape, etc.) should contactUSDA’s TARGET Center at 202-720-2600 (voice and TDD).
To file a complaint of discrimination, write USDA, Director, Office of CivilRights, Room 326-W, Whitten Building, 1400 Independence Avenue, SW,Washington, D.C. 20250-9410 or call 202-720-5964 (voice and TDD).USDA is an equal opportunity provider and employer.

Preface ............................................................................................................................ 1
Chapter 1—Back to the Basics
1.1 Perimeter of Burn .......................................................................................................................................... 3
1.2 Fractions—Bits and Pieces ............................................................................................................................ 3
1.3 Simplifying Fractions...................................................................................................................................... 4
1.4 Multiplying Fractions ...................................................................................................................................... 5
1.5 Dividing Fractions .......................................................................................................................................... 6
1.6 Adding Fractions ............................................................................................................................................ 6
1.7 Subtracting Fractions ..................................................................................................................................... 7
1.8 Ratios ............................................................................................................................................................ 8
1.9 Area of Burn ................................................................................................................................................ 10
Exercises ........................................................................................................................................................... 13
Chapter 2—Conversions
2.1 Unit Conversion and Conversion Factors ..................................................................................................... 19
Table 2.1—Summarized Conversion Table ............................................................................................... 23
Table 2.2—Approximate Metric System Conversion Factors ..................................................................... 24
Table 2.3—Metric System and Equivalents ............................................................................................... 25
Exercises ........................................................................................................................................................... 26
Chapter 3—Squirt Water
3.1 Volume or Capacity ..................................................................................................................................... 27
3.2 Volume of Water in Hose ............................................................................................................................. 29
3.3 Friction Loss in Fire Hose ............................................................................................................................ 30
3.4 Calculating Engine Pump Pressures ............................................................................................................ 31
3.5 Drafting Guidelines ...................................................................................................................................... 35
3.6 Flow Rates .................................................................................................................................................. 36
Table 3.1—Water Handling Unit Estimations ............................................................................................. 37
Table 3.2—Comparative Diameters and Weights of Coupled Fire Hose .................................................... 38
Table 3.3—Friction Loss of Forestry Hose ................................................................................................. 39
Exercises ........................................................................................................................................................... 40
Chapter 4—Vertical, Horizontal, and Slope
4.1 Flame Length .............................................................................................................................................. 43
4.2 Flame Height ............................................................................................................................................... 43
4.3 Angles ......................................................................................................................................................... 43
4.4 Degrees and Protractor ............................................................................................................................... 43
4.5 Slope ........................................................................................................................................................... 44
4.6 Chain, Pace, Walking a Chain ..................................................................................................................... 47
4.7 Graphs ........................................................................................................................................................ 48
Exercises ........................................................................................................................................................... 50
Table of Contents
Chapter 5—Mapping
5.1 Burn Area and Perimeter ............................................................................................................................. 53
5.2 Map Scale ................................................................................................................................................... 54
5.3 Spread Distance .......................................................................................................................................... 56
5.4 Perimeter and Area Estimation Charts ......................................................................................................... 59
5.5 Contour Lines and Intervals ......................................................................................................................... 63
Exercises ........................................................................................................................................................... 67
Chapter 6—Location
6.1 Bearing ...................................................................................................................................................... 69
6.2 Azimuths ................................................................................................................................................... 69
6.3 Back Azimuth and Backsighting ................................................................................................................. 70
6.4 Compass ................................................................................................................................................... 70
6.5 Declination................................................................................................................................................. 71
6.6 Vector ........................................................................................................................................................ 72
6.7 Closed Traverse ........................................................................................................................................ 74
6.8 Intersection ................................................................................................................................................ 76
6.9 Resection .................................................................................................................................................. 77
6.10 Latitude and Longitude .............................................................................................................................. 77
6.11 Global Positioning System with the Universal Transverse Mercator ............................................................ 78
6.12 Base, Township, Range, Sections, and Corners ......................................................................................... 79
Exercises ........................................................................................................................................................... 81
Chapter 7—Weather Factors
7.1 Dry Bulb Temperature .................................................................................................................................. 85
7.2 Wet Bulb Temperature ................................................................................................................................. 85
7.3 Dew Point .................................................................................................................................................... 85
7.4 Relative Humidity ......................................................................................................................................... 85
Exercises ........................................................................................................................................................... 88
Chapter 8—Fuels For Fire Behavior
8.1 Fuel Models ................................................................................................................................................. 89
8.2 Fuel Moisture Content ................................................................................................................................. 91
Table 8.1—Reference Fuel Moisture, Day ................................................................................................. 92
Table 8.2—Dead Fuel Moisture Content Corrections Day, May, June, July ................................................ 92
Table 8.3—Dead Fuel Moisture Content Corrections Day, February, March, April, August,
September, October ............................................................................................................... 93
Table 8.4—Dead Fuel Moisture Content Corrections Day, November, December, January ........................ 93
Table 8.5—Reference Fuel Moisture Night ................................................................................................ 94
Table 8.6—Dead Fuel Moisture Content Corrections ................................................................................. 94
Table of Contents
8.3 Live Fuel Moisture ....................................................................................................................................... 96
8.4 Determining Fuel Size ................................................................................................................................. 96
Exercises ........................................................................................................................................................... 97
Chapter 9—Fire Behavior
9.1 Surface Fire Behavior Nomograms ............................................................................................................ 99
9.2 Midflame Windspeed ............................................................................................................................... 100
9.3 Fire Behavior Calculations for Fuel Models Using Live and
Fine Dead Fuel Moisture Values ......................................................................................................... 107
9.4 Using the Fire Behavior Nomogram Backwards for Prescribed Burns ...................................................... 115
9.5 Flame Length .......................................................................................................................................... 117
9.6 Map Spread ............................................................................................................................................. 117
9.7 Head, Flank, and Rear Fire Terms ........................................................................................................... 117
9.8 Flame Height ........................................................................................................................................... 117
9.9 Maximum Spotting Distance .................................................................................................................... 117
9.10 Rate of Spread ........................................................................................................................................ 123
9.11 Fire Characteristic and Interpretation Charts ............................................................................................ 123
9.12 Slope Effect on ROS................................................................................................................................ 126
9.13 Probability and Number of Ignitions .......................................................................................................... 126
9.14 Probability of Ignition ................................................................................................................................ 127
Exercises ......................................................................................................................................................... 129
Chapter 10—Precisely, What Do You Mean?
10.1 Accuracy................................................................................................................................................ 131
10.2 Precision ................................................................................................................................................ 131
10.3 Average ................................................................................................................................................. 131
10.4 Range/Variance ..................................................................................................................................... 131
10.5 Deviation/Variability ................................................................................................................................ 131
10.6 Standard Deviation ................................................................................................................................ 132
10.7 Planning ................................................................................................................................................ 133
10.8 Production Rates ................................................................................................................................... 133
10.9 Drought Index ........................................................................................................................................ 134
10.10 Haines Index.......................................................................................................................................... 134
Exercises ......................................................................................................................................................... 135
Table of Contents
Appendixes
A—Mentor’s Guide .......................................................................................................................................... 137
George Polya’s Four Phases in Problem Solving .................................................................................... 138
Problem-Solving Worksheet ................................................................................................................... 139
B—Developmental Units
B.1 Using Numbers ............................................................................................................................... 141
B.2 How to Read Large Numbers .......................................................................................................... 141
B.3 Addition ........................................................................................................................................... 141
B.4 Subtraction ...................................................................................................................................... 143
B.5 Multiplication ................................................................................................................................... 144
B.6 Division ........................................................................................................................................... 145
B.7 Using Decimals ............................................................................................................................... 146
B.8 Powers and Roots ........................................................................................................................... 149
B.9 Order of Operation .......................................................................................................................... 149
Exercises ................................................................................................................................................ 150
C—Solutions to Exercises
Chapter 1 ............................................................................................................................................... 155
Chapter 2 ............................................................................................................................................... 164
Chapter 3 ............................................................................................................................................... 166
Chapter 4 ............................................................................................................................................... 170
Chapter 5 ............................................................................................................................................... 174
Chapter 6 ............................................................................................................................................... 178
Chapter 7 ............................................................................................................................................... 182
Chapter 8 ............................................................................................................................................... 183
Chapter 9 ............................................................................................................................................... 185
Chapter 10 ............................................................................................................................................. 211
Developmental Units .............................................................................................................................. 213
D—Final Exam and Answers ............................................................................................................................ 219
E—Nomograms and Worksheets ..................................................................................................................... 235
Table of Contents
Firefighter Math Preface
1
Introduction and ScopeThis self-paced math course is designed to prepare professional wildland firefighters formath-based training courses required for advancement to positions of greaterresponsibility. Consequently, the Forest Service will be able to more fully utilize the skills ofmore employees. Course content was developed from S244, S290, S390, and othertraining courses that require math.
A Mentor’s Guide (see appendix A) outlines how a mentor can address students’ questionsand provide motivation for working to effectively complete the course. The guide alsoprovides a problem-solving strategy for the student.
Chapters 1, 2, and 3 are a review for some students. Other students will begin this self-paced math course in chapter 4. Each math concept is developed by a text description witha graphic illustration and a sample problem with a detailed solution. In addition, exerciseproblems support each math concept. Appendix B, Developmental Units is a review ofbasic math skills. Appendix C supplies answers to these excercises. Appendix D is a finalexam.
Steps to SuccessBefore starting this self-paced math course, select a mentor to serve as a resource andmotivator. Provide your mentor with the information in appendix A. As a student, you alsohave a responsibility to ensure your success. Read the description for each math concept,follow the sample problems, study the illustrations, and work the exercise problems. If youhave difficulty grasping a math concept, reread the description and review the sampleproblem thoroughly. If it still isn’t clear, talk with your mentor. Typically, mentors can cite reallife examples and descriptions. Follow these steps to success, to be well prepared for thefinal exam and for subsequent math-based training courses.
Some basic equipment is required to complete this math course. You will need a protractor,ruler, pencils, an engineer’s ruler divided into tenths of an inch, a basic scientific calculatorequipped with buttons labeled Tangent or Tan, x , x2 , and a transparency of a ModifiedAcreage Grid (see chapter 5).
123456789012345671234567890123456712345678901234567123456789012345671234567890123456712345678901234567123456789012345671234567890123456712345678901234567123456789012345671234567890123456712345678901234567123456789012345671234567890123456712345678901234567123456789012345671234567890123456712345678901234567123456789012345671234567890123456712345678901234567123456789012345671234567890123456712345678901234567123456789012345671234567890123456712345678901234567123456789012345671234567890123456712345678901234567123456789012345671234567890123456712345678901234567123456789012345671234567890123456712345678901234567123456789012345671234567890123456712345678901234567123456789012345671234567890123456712345678901234567123456789012345671234567890123456712345678901234567123456789012345671234567890123456712345678901234567123456789012345671234567890123456712345678901234567123456789012345671234567890123456712345678901234567123456789012345671234567890123456712345678901234567123456789012345671234567890123456712345678901234567123456789012345671234567890123456712345678901234567123456789012345671234567890123456712345678901234567123456789012345671234567890123456712345678901234567123456789012345671234567890123456712345678901234567123456789012345671234567890123456712345678901234567123456789012345671234567890123456712345678901234567123456789012345671234567890123456712345678901234567
√

3
Back To The Basics Chapter 1
64 ft
84 ft
97 ft
86 ft54 ft
92 ft
L2
L4
L5
L3
L1
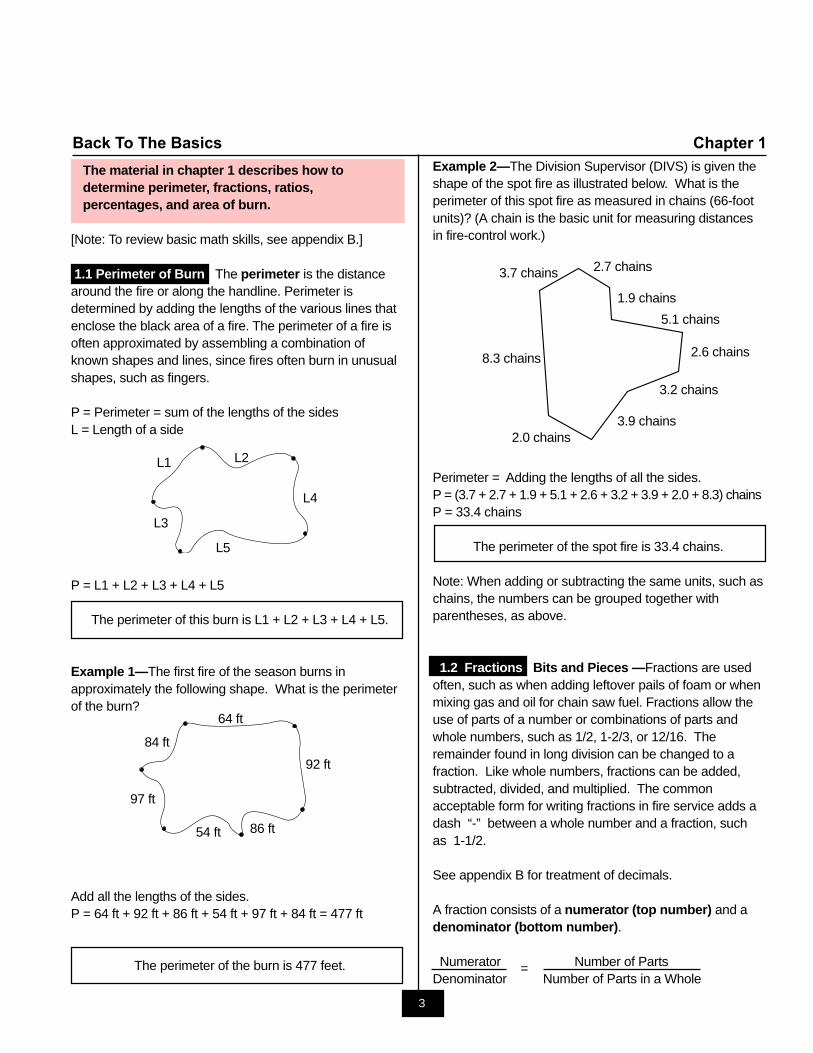
Example 2—The Division Supervisor (DIVS) is given theshape of the spot fire as illustrated below. What is theperimeter of this spot fire as measured in chains (66-footunits)? (A chain is the basic unit for measuring distancesin fire-control work.)
Perimeter = Adding the lengths of all the sides.P = (3.7 + 2.7 + 1.9 + 5.1 + 2.6 + 3.2 + 3.9 + 2.0 + 8.3) chainsP = 33.4 chains
The perimeter of the spot fire is 33.4 chains.
Note: When adding or subtracting the same units, such aschains, the numbers can be grouped together withparentheses, as above.
1.2 Fractions Bits and Pieces —Fractions are usedoften, such as when adding leftover pails of foam or whenmixing gas and oil for chain saw fuel. Fractions allow theuse of parts of a number or combinations of parts andwhole numbers, such as 1/2, 1-2/3, or 12/16. Theremainder found in long division can be changed to afraction. Like whole numbers, fractions can be added,subtracted, divided, and multiplied. The commonacceptable form for writing fractions in fire service adds adash “-” between a whole number and a fraction, suchas 1-1/2.
See appendix B for treatment of decimals.
A fraction consists of a numerator (top number) and adenominator (bottom number).
Numerator = Number of PartsDenominator Number of Parts in a Whole
3.7 chains
5.1 chains
2.6 chains
3.2 chains
8.3 chains
2.7 chains
1.9 chains
3.9 chains2.0 chains
The material in chapter 1 describes how todetermine perimeter, fractions, ratios,percentages, and area of burn.
[Note: To review basic math skills, see appendix B.]
1.1 Perimeter of Burn The perimeter is the distancearound the fire or along the handline. Perimeter isdetermined by adding the lengths of the various lines thatenclose the black area of a fire. The perimeter of a fire isoften approximated by assembling a combination ofknown shapes and lines, since fires often burn in unusualshapes, such as fingers.
P = Perimeter = sum of the lengths of the sidesL = Length of a side
P = L1 + L2 + L3 + L4 + L5
The perimeter of this burn is L1 + L2 + L3 + L4 + L5.
Example 1—The first fire of the season burns inapproximately the following shape. What is the perimeterof the burn?
Add all the lengths of the sides.P = 64 ft + 92 ft + 86 ft + 54 ft + 97 ft + 84 ft = 477 ft
The perimeter of the burn is 477 feet.
4
Chapter 1 Back To The Basics
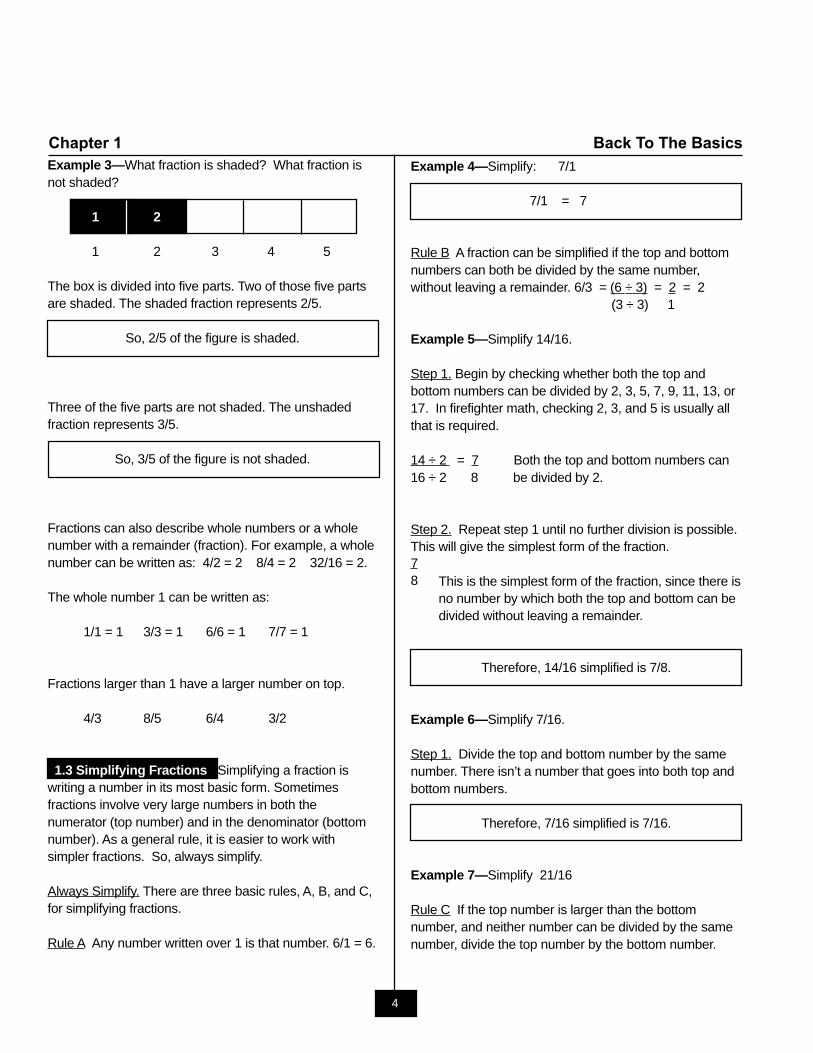
Example 3—What fraction is shaded? What fraction isnot shaded?
1 2
1 2 3 4 5
The box is divided into five parts. Two of those five partsare shaded. The shaded fraction represents 2/5.
So, 2/5 of the figure is shaded.
Three of the five parts are not shaded. The unshadedfraction represents 3/5.
So, 3/5 of the figure is not shaded.
Fractions can also describe whole numbers or a wholenumber with a remainder (fraction). For example, a wholenumber can be written as: 4/2 = 2 8/4 = 2 32/16 = 2.
The whole number 1 can be written as:
1/1 = 1 3/3 = 1 6/6 = 1 7/7 = 1
Fractions larger than 1 have a larger number on top.
4/3 8/5 6/4 3/2
1.3 Simplifying Fractions Simplifying a fraction iswriting a number in its most basic form. Sometimesfractions involve very large numbers in both thenumerator (top number) and in the denominator (bottomnumber). As a general rule, it is easier to work withsimpler fractions. So, always simplify.
Always Simplify. There are three basic rules, A, B, and C,for simplifying fractions.
Rule A Any number written over 1 is that number. 6/1 = 6.
Example 4—Simplify: 7/1
7/1 = 7
Rule B A fraction can be simplified if the top and bottomnumbers can both be divided by the same number,without leaving a remainder. 6/3 = (6 ÷ 3) = 2 = 2
(3 ÷ 3) 1
Example 5—Simplify 14/16.
Step 1. Begin by checking whether both the top andbottom numbers can be divided by 2, 3, 5, 7, 9, 11, 13, or17. In firefighter math, checking 2, 3, and 5 is usually allthat is required.
14 ÷ 2 = 7 Both the top and bottom numbers can16 ÷ 2 8 be divided by 2.
Step 2. Repeat step 1 until no further division is possible.This will give the simplest form of the fraction.
This is the simplest form of the fraction, since there isno number by which both the top and bottom can bedivided without leaving a remainder.
Therefore, 14/16 simplified is 7/8.
Example 6—Simplify 7/16.
Step 1. Divide the top and bottom number by the samenumber. There isn’t a number that goes into both top andbottom numbers.
Therefore, 7/16 simplified is 7/16.
Example 7—Simplify 21/16
Rule C If the top number is larger than the bottomnumber, and neither number can be divided by the samenumber, divide the top number by the bottom number.
78
5
Back To The Basics Chapter 1
Divide the top number by the bottom number.21 ÷ 16
1 Long division provides the whole number—1.16 ) 21 -16 5 The remainder makes up part of the fraction.
To make the fraction, put the remainder overthe denominator—5/16.
Therefore, 21/16 simplified is the whole number plusthe remainder—1-5/16.
Example 8—Simplify 8/1.
Remember that “any number over 1 equals that number,”so 8/1 = 8.
Therefore, 8/1 = 8.
Example 9—Simplify 18/24.
Step 1. Check to see whether the top and bottomnumbers can be divided by 2.
18 ÷ 2 = 9 Yes, both 18 and 24 can be divided by 2.24 ÷ 2 12
Step 2. Repeat Step 1. The top can’t be divided by 2.Check to see whether both numbers can be divided by 3.
9 ÷ 3 = 3 Yes, both the top and bottom numbers12 ÷ 3 4 can be divided by 3. No further division
is possible.
18/24 simplified is 3/4
Example 10—Simplify 5/2.
Step 1. Check to see whether division of both the top andbottom by 2, 3, or 5 is possible. The answer is No.
The top number is larger than the bottom number.
Step 2. Divide the top number by the bottom number.
22 ) 5 The answer to this division problem is 2 remainder
- 4 (R) 1. The whole number is 2, and the remainder is 1.1
Step 3. The remainder 1 goes over the originaldenominator 2, turning the remainder into a fraction.R = 1 remainder 2 original denominator
Add the whole number 2, with remainder 1/2 to get 2-1/2.
5/2 = 2-1/2 = 2.5
See appendix B for treatment of decimals.
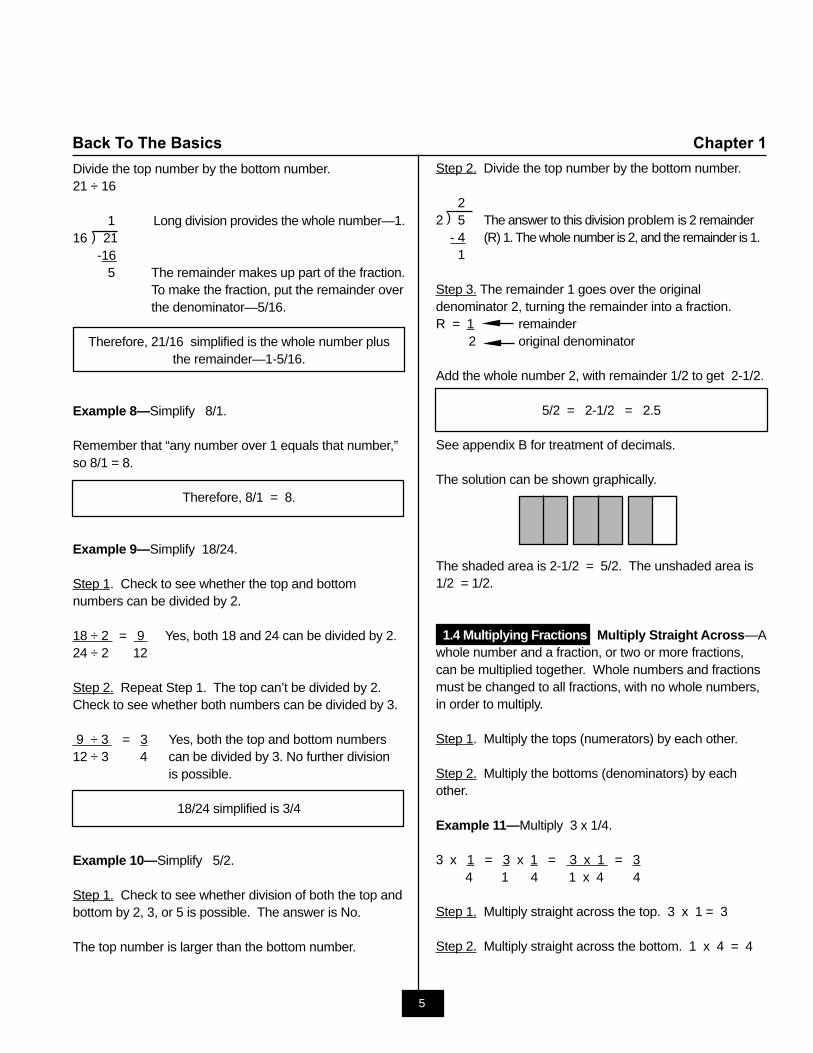
The solution can be shown graphically.
The shaded area is 2-1/2 = 5/2. The unshaded area is1/2 = 1/2.
1.4 Multiplying Fractions Multiply Straight Across—Awhole number and a fraction, or two or more fractions,can be multiplied together. Whole numbers and fractionsmust be changed to all fractions, with no whole numbers,in order to multiply.
Step 1. Multiply the tops (numerators) by each other.
Step 2. Multiply the bottoms (denominators) by eachother.
Example 11—Multiply 3 x 1/4.
3 x 1 = 3 x 1 = 3 x 1 = 34 1 4 1 x 4 4
Step 1. Multiply straight across the top. 3 x 1 = 3
Step 2. Multiply straight across the bottom. 1 x 4 = 4
6
Chapter 1 Back To The Basics
Step 3. Can 3/4 be simplified? No.
3 x 1/4 = 3/4
Example 12—Multiply. 5 x 8 7 4
Step 1. Multiply straight across the top. 5 x 8 = 40
Step 2. Multiply straight across the bottom. 7 x 4 = 28
5 x 8 = 5 x 8 = 407 4 7 x 4 28
Step 3. Simplify the fraction. 40/28
40 ÷ 2 = 20 = 20 ÷ 2 = 10 The top number is larger28 ÷ 2 14 14 ÷ 2 7 than the bottom number, so
divide.
10 ÷ 7 = 1 R 3 = 1-3/7
5/7 x 8/4 = 1-3/7
1.5 Dividing Fractions Flip the second fraction andthen multiply across. Division of fractions involvesusing the reciprocal (flipped form) of the second fraction.The reciprocal of a number is such that the product of anumber and its reciprocal is 1. To get the reciprocal,simply interchange (flip) the numerator and thedenominator. 1/3 becomes 3/1, 4/5 becomes 5/4, and soon. After the second fraction has been flipped, thedivision problem turns into a multiplication problem, andthe numerators and denominators are multiplied straightacross.Example 13—Divide. 1 ÷ 2
2 3
Step 1. Flip the second fraction. 2/3 becomes 3/2.1 ÷ 2 = 1 x 32 3 2 2
Step 2. Multiply. 1 x 3 = 1 x 3 = 32 2 2 x 2 4
Step 3. Can 3/4 be simplified? No.
1/2 ÷ 2/3 = 3/4
Example 14—Divide. 2 ÷ 35 4
Step 1. Flip the second fraction. Then 3/4 becomes 4/3.2 ÷ 3 = 2 x 45 4 5 3
Step 2. Multiply across both top and bottom.2 x 4 = 2 x 4 = 85 3 5 x 3 15
Step 3. Can 8/15 be simplified? No.
2/5 ÷ 3/4 = 8/15
1.6 Adding Fractions Fractions must have a commondenominator (the bottom numbers must be the same)before being added and simplified.
Example 15—Add and simplify. 1/4 + 1/4
Step 1. Are the denominators the same? Yes.
Step 2. Add the numerators (top numbers), and put themover the common denominator.1 + 1 = 1 + 1 = 24 4 4 4
Step 3. Can 2/4 be simplified? Yes, both numbers aredivisible by 2.2 ÷ 2 = 14 ÷ 2 2
1/4 + 1/4 = 1/2
Example 16—Add and simplify. 1/2 + 1/4
Step 1. Are the denominators the same? No.
7
Back To The Basics Chapter 1
Step 2. Is one of the denominators a multiple of theother? Yes.
Step 3. Find a common denominator.1 + 1 2 is a multiple of 4, so change 1 to ?2 4 2 4
2 x 2 = 4 so multiply both the top and bottom by 2.1 x 2 = 2 So, 1 = 22 x 2 4 2 4
Step 4. Substitute 2/4 for 1/2 and add, 1 + 2 = 34 4 4
Step 5. Can 3/4 be simplified? No.
1/4 + 1/2 = 3/4
Example 17—Add and simplify. 1 + 14 3
Step 1. Are the denominators the same? No.
Step 2. Is one of the denominators a multiple of the other?No. Multiply the denominators to find a commondenominator.4 x 3 = 12 The new denominator is 12.
Step 3. Expand (opposite of simplify) both fractions tohave a denominator of 12.
1 x 3 = 3 1 x 4 = 44 x 3 12 3 x 4 12
Step 4. Add and simplify. 3 + 4 = 7 Can 7/12 be simplified? No.12 12 12
1 + 1 = 74 3 12
Adding Multiple FractionsThe same process applies when adding multiple fractions.Add all fractions with like denominators. Then addfractions with denominators that are multiples of the otherdenominators. Then find common denominators for theremaining fractions. Add and simplify.
Example 18—Add and simplify.2 + 3 + 5 + 1 + 1 + 2 + 13 4 8 5 8 4 3
Add all fractions with like denominators and simplify.2 + 1 = 3 = 1 3 + 2 = 5 5 + 1 = 6 = 33 3 3 4 4 4 8 8 8 4
1 + 1 + 5 + 3 = 1 + 1 + 5 + 3 = 1 + 1 + 8 =5 4 4 5 4 5 4
1 + 1 + 2 = 1 + 3 = 3-1/55 5
Can 3-1/5 be simplified further? No.
2 + 3 + 5 + 1 + 1 + 2 + 1 = 3-1/53 4 8 5 8 4 3
1.7 Subtracting Fractions Fractions must have acommon denominator (the bottom numbers must be thesame) before being subtracted.
Example 19—Subtract and simplify. 2-1/2 – 2/3
First, both the numbers must be put in fraction form.Earlier in this chapter, it was shown that 2-1/2 = 5/2. Seeexample 10. 5/2 – 2/3
Step 1. Subtract fractions with like denominators. Thereare none.
Step 2. Subtract fractions with denominators that aremultiples of the other denominators. There are none.
Step 3. Find a common denominator by multiplying thedenominators by each other. 3 x 2 = 6 The commondenominator is 6.
8
Chapter 1 Back To The Basics
Step 4. Expand (opposite of simplify) both fractions tohave a denominator of 6.5 x 3 = 15 2 x 2 = 42 x 3 6 3 x 2 6
Step 5. Subtract.15 – 4 = 11 6 6 6
Step 6. Simplify. Can 11/6 be simplified? Yes.
Since the top number is larger than the bottom number,the fraction can be simplified to a whole number with afraction remainder.
11 – 6 = 5 It is simplified to 1-5/6. 6 6 6 Can this be simplified further? No.
5 – 2 = 1-5/62 3
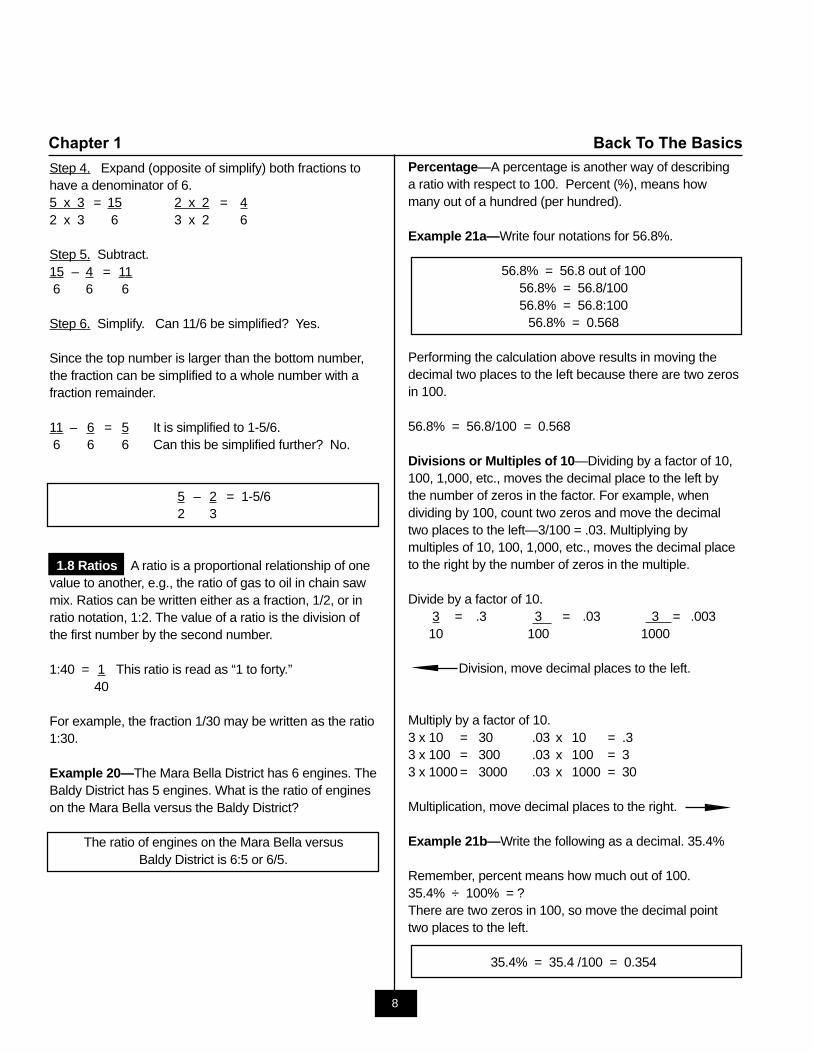
1.8 Ratios A ratio is a proportional relationship of onevalue to another, e.g., the ratio of gas to oil in chain sawmix. Ratios can be written either as a fraction, 1/2, or inratio notation, 1:2. The value of a ratio is the division ofthe first number by the second number.
1:40 = 1 This ratio is read as “1 to forty.”40
For example, the fraction 1/30 may be written as the ratio1:30.
Example 20—The Mara Bella District has 6 engines. TheBaldy District has 5 engines. What is the ratio of engineson the Mara Bella versus the Baldy District?
The ratio of engines on the Mara Bella versusBaldy District is 6:5 or 6/5.
Percentage—A percentage is another way of describinga ratio with respect to 100. Percent (%), means howmany out of a hundred (per hundred).
Example 21a—Write four notations for 56.8%.
56.8% = 56.8 out of 10056.8% = 56.8/10056.8% = 56.8:100
56.8% = 0.568
Performing the calculation above results in moving thedecimal two places to the left because there are two zerosin 100.
56.8% = 56.8/100 = 0.568
Divisions or Multiples of 10—Dividing by a factor of 10,100, 1,000, etc., moves the decimal place to the left bythe number of zeros in the factor. For example, whendividing by 100, count two zeros and move the decimaltwo places to the left—3/100 = .03. Multiplying bymultiples of 10, 100, 1,000, etc., moves the decimal placeto the right by the number of zeros in the multiple.
Divide by a factor of 10.3 = .3 3 = .03 3 = .00310 100 1000
Division, move decimal places to the left.
Multiply by a factor of 10.3 x 10 = 30 .03 x 10 = .33 x 100 = 300 .03 x 100 = 33 x 1000 = 3000 .03 x 1000 = 30
Multiplication, move decimal places to the right.
Example 21b—Write the following as a decimal. 35.4%
Remember, percent means how much out of 100.35.4% ÷ 100% = ?There are two zeros in 100, so move the decimal pointtwo places to the left.
35.4% = 35.4 /100 = 0.354
9
Back To The Basics Chapter 1
Just the opposite happens when multiplying by 100percent.
Example 21c—Change 0.75 to a percentage andmultiply by 100 percent.
There are two zeros in 100. Move the decimal point twoplaces to the right.
0.75 x 100% = 75%
Example 22—Write as a percentage. 0.5090.509 x 100% = ?
There are two zeros in 100, so move the decimal pointtwo places to the right.0.509 x 100% = 50.9%
0.509 = 50.9%
When solving a more complex percentage problem, writethe problem down in words and numbers.
Example 23—The chain saw gas/oil mix is 30 parts gasto 1 part oil. Chain saw oil comes in 2-pint cans. Howmuch gas is added to 2 pints of oil for a 1:30 oil:gasmixture?
The ratio of 1:30 means that for every 1 part of oil, theremust be 30 parts of gas. There are 2 pints of oil.
The amount of gas needed will be 30 times 2.30 x 2 = 60 pints
Sixty pints of gas are needed for a 1:30 oil:gas mixturethat contains 2 pints of oil.
Example 24—Sabrina has a 2-1/2-gallon container. Sheis going to fill it with a 40:1 gas to oil mixture. How muchof each does she need to put into the container?
Step 1. The total of the gas and the oil mixture is 40 + 1 =41 parts.
Step 2. Divide the 2-1/2-gallon container into 41 parts,using a calculator.2-1/2 gallons = 2.5 = 0.06 gallons 41 41
Step 3. The gas has 40 of these parts.0.06 gallons x 40 = 2.44 gallons
Step 4. The oil has 1 part.0.06 gallons x 1 = 0.06 gallons
She needs 2.44 gallons of gas and 0.06 gallons of oil.
Notice that the total amount of gas and oil adds up to 2.5gallons. 2.44 + 0.06 = 2.5 = 2-1/2
See chapter 2, for converting 0.06 gallons of oil to a moreuseful term, such as cups or pints.
Example 25—When the crew leaves for a fire, they havea full tank of foam agent. This tank holds a total of 5gallons. When they return to the station, they find only 1gallon. What percentage of the foam was used? Whatpercentage is left?
(Hint: the percentage used + the percentage left shouldequal 100 percent)
Step 1. Find how much foam was used.5 gallons total – 1 gallon of foam left = 4 gallons of foamused
Step 2. Find the percentage of foam used. Since 4 of thetotal 5 gallons were used, the fraction becomes 4/5.
Step 3. Perform the division to obtain a decimal.0.8
5.0 � 4.0 0- 4.0 0
0
To convert the decimal to a percentage, multiply by 100percent.0.8 x 100% = 80.0%
The crew used 80.0% of the foam.
10
Chapter 1 Back To The Basics
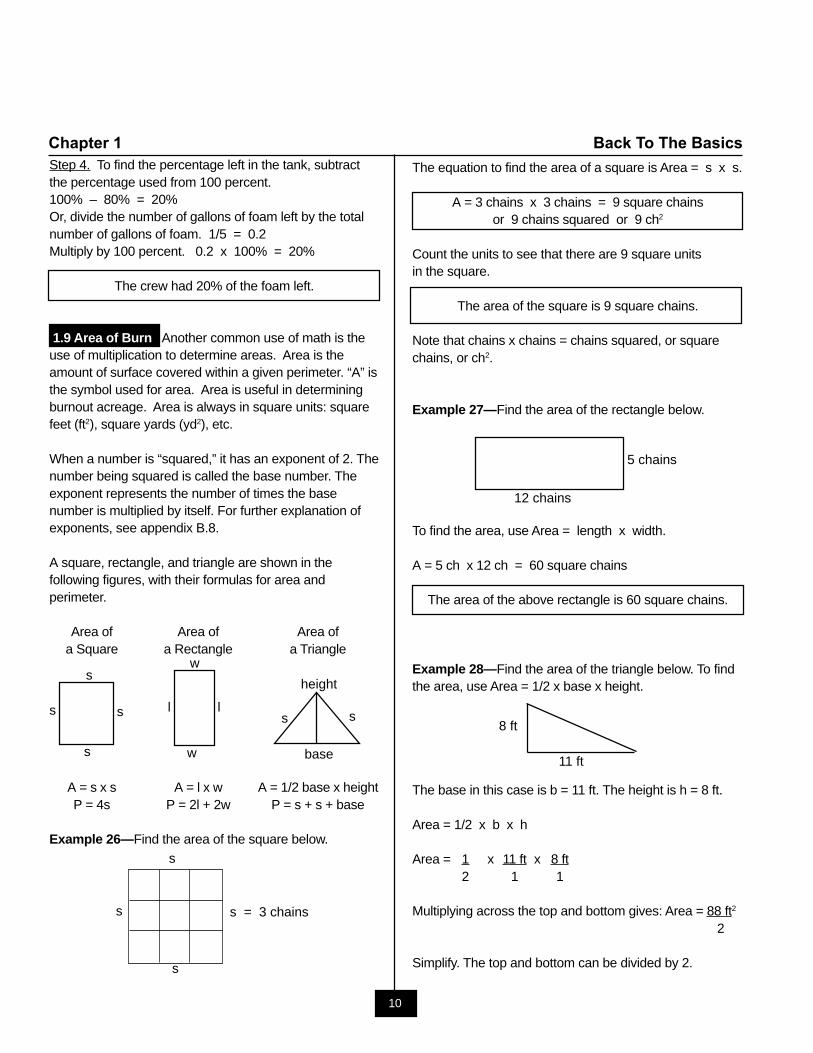
The equation to find the area of a square is Area = s x s.
A = 3 chains x 3 chains = 9 square chainsor 9 chains squared or 9 ch2
Count the units to see that there are 9 square unitsin the square.
The area of the square is 9 square chains.
Note that chains x chains = chains squared, or squarechains, or ch2.
Example 27—Find the area of the rectangle below.
To find the area, use Area = length x width.
A = 5 ch x 12 ch = 60 square chains
The area of the above rectangle is 60 square chains.
Example 28—Find the area of the triangle below. To findthe area, use Area = 1/2 x base x height.
The base in this case is b = 11 ft. The height is h = 8 ft.
Area = 1/2 x b x h
Area = 1 x 11 ft x 8 ft2 1 1
Multiplying across the top and bottom gives: Area = 88 ft2
2
Simplify. The top and bottom can be divided by 2.
w
w
ll
s
ss
s
base
ss
height
s
s
s
s = 3 chains
5 chains
12 chains
8 ft
11 ft
Step 4. To find the percentage left in the tank, subtractthe percentage used from 100 percent.100% – 80% = 20%Or, divide the number of gallons of foam left by the totalnumber of gallons of foam. 1/5 = 0.2Multiply by 100 percent. 0.2 x 100% = 20%
The crew had 20% of the foam left.
1.9 Area of Burn Another common use of math is theuse of multiplication to determine areas. Area is theamount of surface covered within a given perimeter. “A” isthe symbol used for area. Area is useful in determiningburnout acreage. Area is always in square units: squarefeet (ft2), square yards (yd2), etc.
When a number is “squared,” it has an exponent of 2. Thenumber being squared is called the base number. Theexponent represents the number of times the basenumber is multiplied by itself. For further explanation ofexponents, see appendix B.8.
A square, rectangle, and triangle are shown in thefollowing figures, with their formulas for area andperimeter.
Area of Area of Area ofa Square a Rectangle a Triangle
A = s x s A = l x w A = 1/2 base x heightP = 4s P = 2l + 2w P = s + s + base
Example 26—Find the area of the square below.
11
Back To The Basics Chapter 1
Area = 88 ft2/2 = 44 ft2 = 44 ft2
2/2 1
The area of the triangle is 44 ft2.
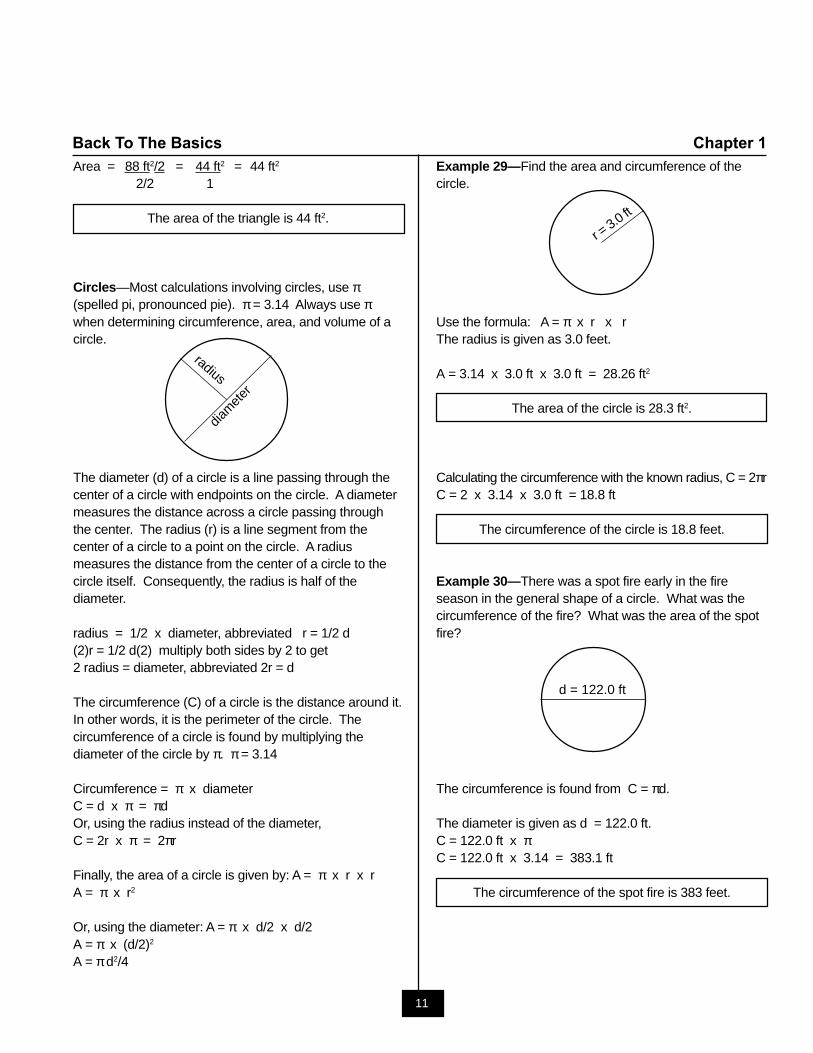
Circles—Most calculations involving circles, use π(spelled pi, pronounced pie). π = 3.14 Always use πwhen determining circumference, area, and volume of acircle.
The diameter (d) of a circle is a line passing through thecenter of a circle with endpoints on the circle. A diametermeasures the distance across a circle passing throughthe center. The radius (r) is a line segment from thecenter of a circle to a point on the circle. A radiusmeasures the distance from the center of a circle to thecircle itself. Consequently, the radius is half of thediameter.
radius = 1/2 x diameter, abbreviated r = 1/2 d(2)r = 1/2 d(2) multiply both sides by 2 to get2 radius = diameter, abbreviated 2r = d
The circumference (C) of a circle is the distance around it.In other words, it is the perimeter of the circle. Thecircumference of a circle is found by multiplying thediameter of the circle by π. π = 3.14
Circumference = π x diameterC = d x π = πdOr, using the radius instead of the diameter,C = 2r x π = 2πr
Finally, the area of a circle is given by: A = π x r x rA = π x r2
Or, using the diameter: A = π x d/2 x d/2A = π x (d/2)2
A = π d2/4
diam
eter
radius
Example 29—Find the area and circumference of thecircle.
Use the formula: A = π x r x rThe radius is given as 3.0 feet.
A = 3.14 x 3.0 ft x 3.0 ft = 28.26 ft2
The area of the circle is 28.3 ft2.
Calculating the circumference with the known radius, C = 2πrC = 2 x 3.14 x 3.0 ft = 18.8 ft
The circumference of the circle is 18.8 feet.
Example 30—There was a spot fire early in the fireseason in the general shape of a circle. What was thecircumference of the fire? What was the area of the spotfire?
The circumference is found from C = πd.
The diameter is given as d = 122.0 ft.C = 122.0 ft x πC = 122.0 ft x 3.14 = 383.1 ft
The circumference of the spot fire is 383 feet.
r = 3.0 ft
d = 122.0 ft
12
Chapter 1 Back To The Basics
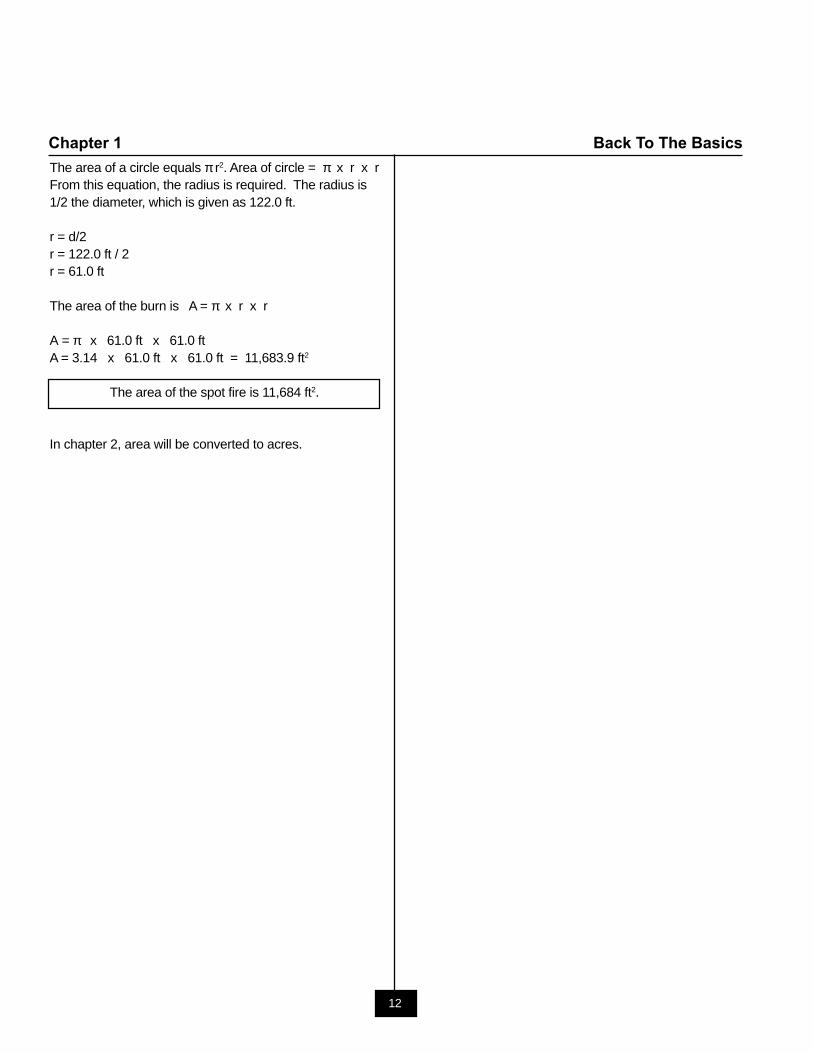
The area of a circle equals π r2. Area of circle = π x r x rFrom this equation, the radius is required. The radius is1/2 the diameter, which is given as 122.0 ft.
r = d/2r = 122.0 ft / 2r = 61.0 ft
The area of the burn is A = π x r x r
A = π x 61.0 ft x 61.0 ftA = 3.14 x 61.0 ft x 61.0 ft = 11,683.9 ft2
The area of the spot fire is 11,684 ft2.
In chapter 2, area will be converted to acres.
13
Back To The Basics Chapter 1
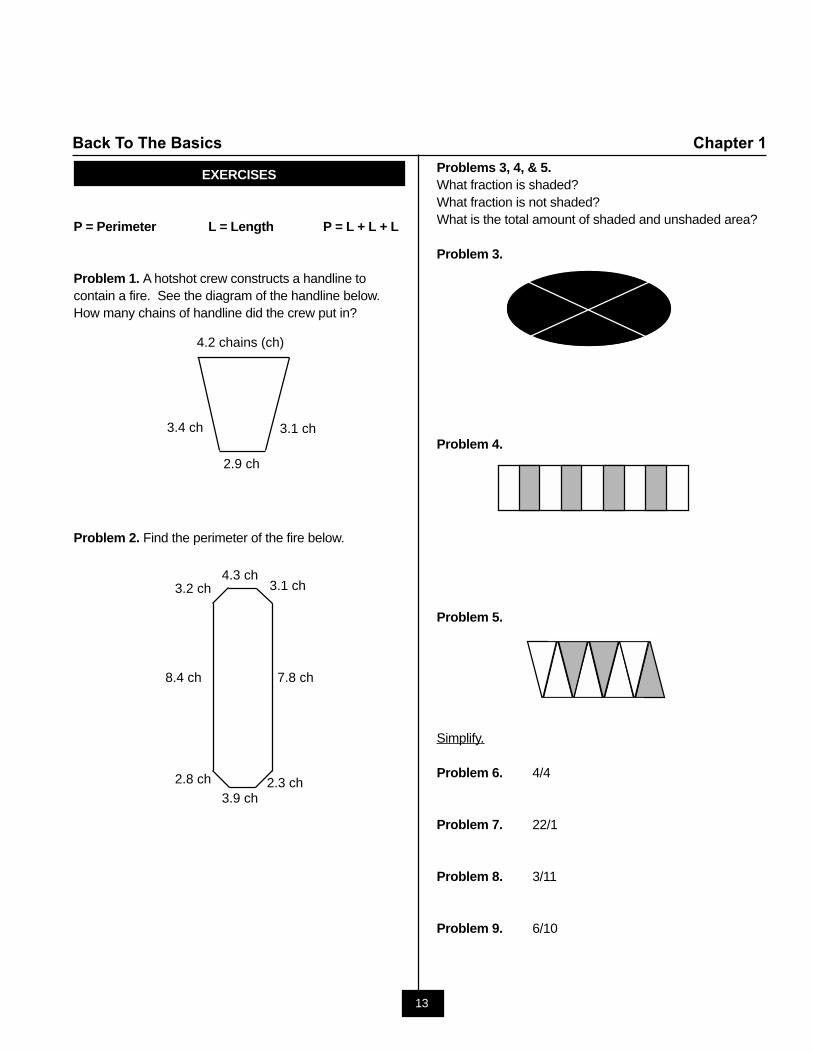
Problems 3, 4, & 5.What fraction is shaded?What fraction is not shaded?What is the total amount of shaded and unshaded area?
Problem 3.
Problem 4.
Problem 5.
Simplify.
Problem 6. 4/4
Problem 7. 22/1
Problem 8. 3/11
Problem 9. 6/10
EXERCISES
P = Perimeter L = Length P = L + L + L
Problem 1. A hotshot crew constructs a handline tocontain a fire. See the diagram of the handline below.How many chains of handline did the crew put in?
Problem 2. Find the perimeter of the fire below.
4.3 ch 3.1 ch
7.8 ch
2.3 ch3.9 ch
2.8 ch
8.4 ch
3.2 ch
4.2 chains (ch)
3.4 ch 3.1 ch
2.9 ch 123456789012345678901234567890121234561234567890123456789012345678901212345612345678901234567890123456789012123456123456789012345678901234567890121234561234567890123456789012345678901212345612345678901234567890123456789012123456123456789012345678901234567890121234561234567890123456789012345678901212345612345678901234567890123456789012123456
14
Chapter 1 Back To The Basics
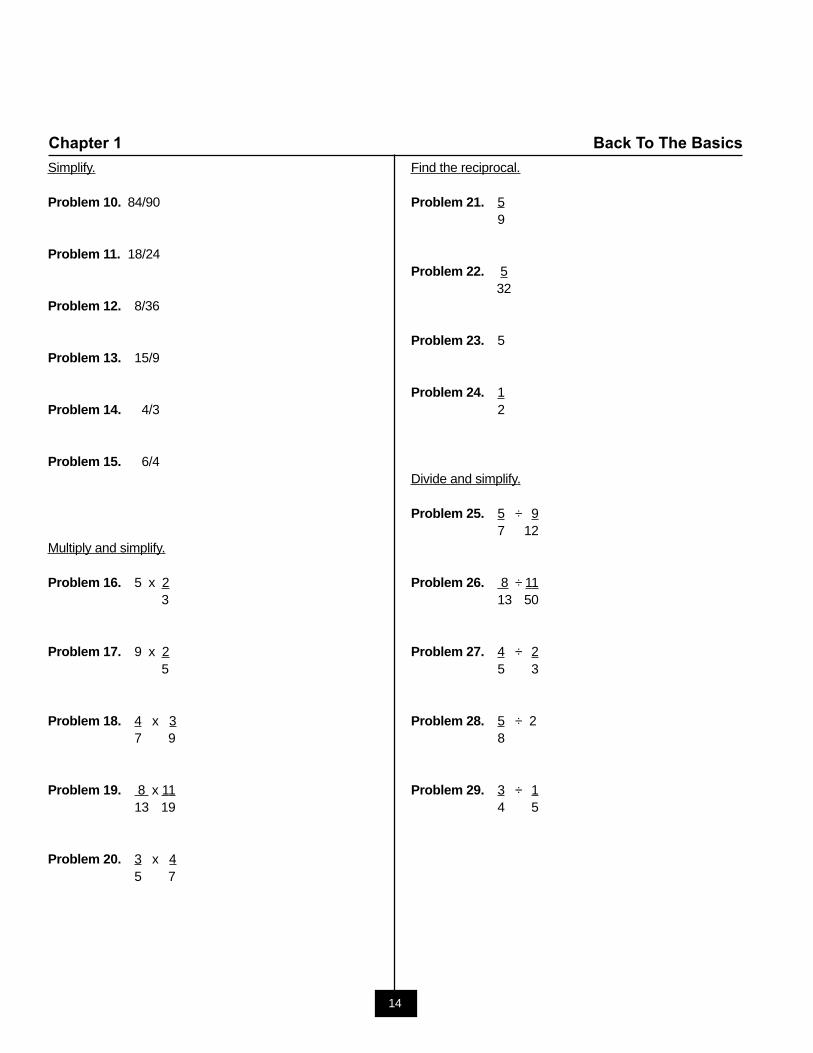
Simplify.
Problem 10. 84/90
Problem 11. 18/24
Problem 12. 8/36
Problem 13. 15/9
Problem 14. 4/3
Problem 15. 6/4
Multiply and simplify.
Problem 16. 5 x 23
Problem 17. 9 x 25
Problem 18. 4 x 37 9
Problem 19. 8 x 1113 19
Problem 20. 3 x 45 7
Find the reciprocal.
Problem 21. 59
Problem 22. 532
Problem 23. 5
Problem 24. 12
Divide and simplify.
Problem 25. 5 ÷ 97 12
Problem 26. 8 ÷ 1113 50
Problem 27. 4 ÷ 25 3
Problem 28. 5 ÷ 28
Problem 29. 3 ÷ 14 5
15
Back To The Basics Chapter 1
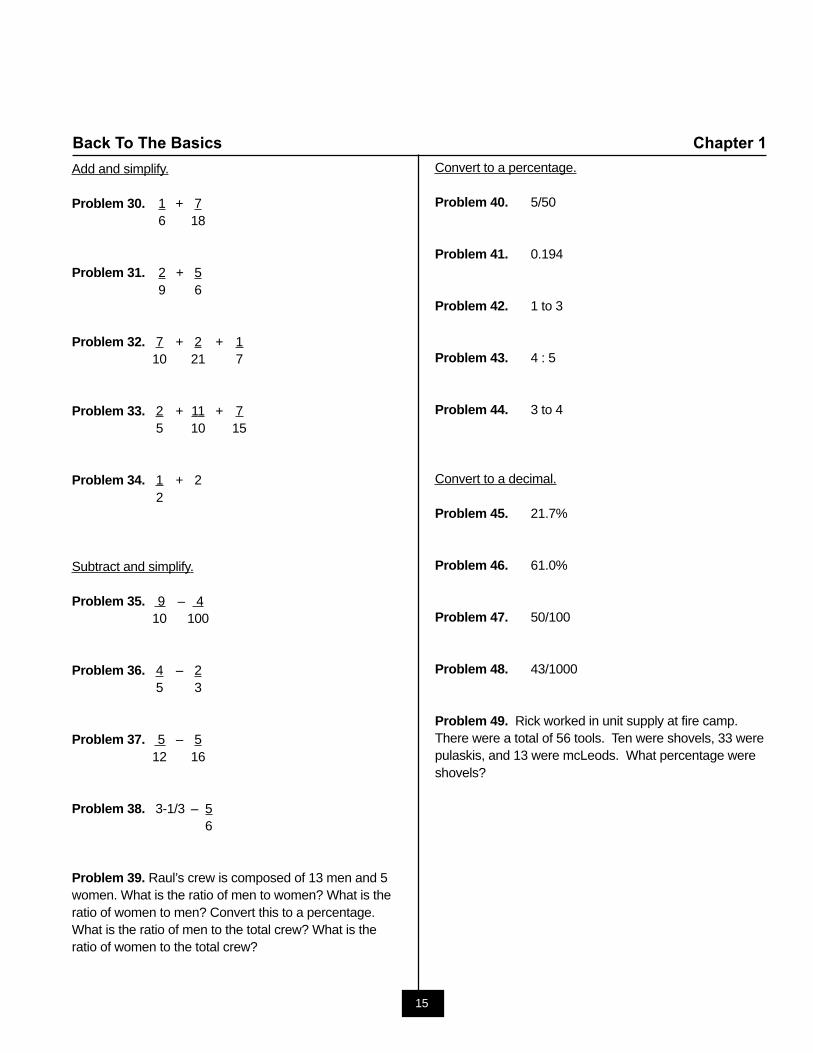
Add and simplify.
Problem 30. 1 + 76 18
Problem 31. 2 + 59 6
Problem 32. 7 + 2 + 110 21 7
Problem 33. 2 + 11 + 75 10 15
Problem 34. 1 + 22
Subtract and simplify.
Problem 35. 9 – 410 100
Problem 36. 4 – 25 3
Problem 37. 5 – 512 16
Problem 38. 3-1/3 – 56
Problem 39. Raul’s crew is composed of 13 men and 5women. What is the ratio of men to women? What is theratio of women to men? Convert this to a percentage.What is the ratio of men to the total crew? What is theratio of women to the total crew?
Convert to a percentage.
Problem 40. 5/50
Problem 41. 0.194
Problem 42. 1 to 3
Problem 43. 4 : 5
Problem 44. 3 to 4
Convert to a decimal.
Problem 45. 21.7%
Problem 46. 61.0%
Problem 47. 50/100
Problem 48. 43/1000
Problem 49. Rick worked in unit supply at fire camp.There were a total of 56 tools. Ten were shovels, 33 werepulaskis, and 13 were mcLeods. What percentage wereshovels?
16
Chapter 1 Back To The Basics
A = areas = sidel = lengthw = widthb = baseh = heightP = perimeter
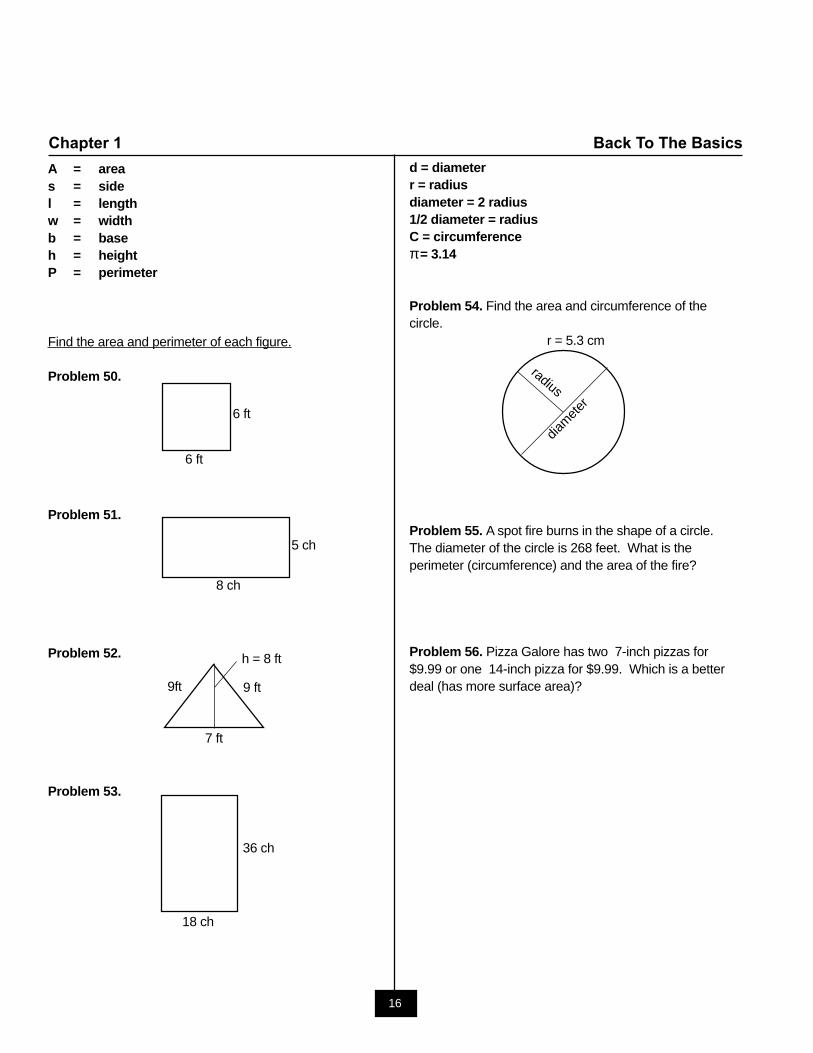
Find the area and perimeter of each figure.
Problem 50.
Problem 51.
Problem 52.
Problem 53.
d = diameterr = radiusdiameter = 2 radius1/2 diameter = radiusC = circumferenceπ = 3.14
Problem 54. Find the area and circumference of thecircle.
r = 5.3 cm
Problem 55. A spot fire burns in the shape of a circle.The diameter of the circle is 268 feet. What is theperimeter (circumference) and the area of the fire?
Problem 56. Pizza Galore has two 7-inch pizzas for$9.99 or one 14-inch pizza for $9.99. Which is a betterdeal (has more surface area)?
6 ft
6 ft
h = 8 ft
9 ft9ft
7 ft
18 ch
36 ch
5 ch
8 ch
diam
eter
radius
17
Back To The Basics Chapter 1
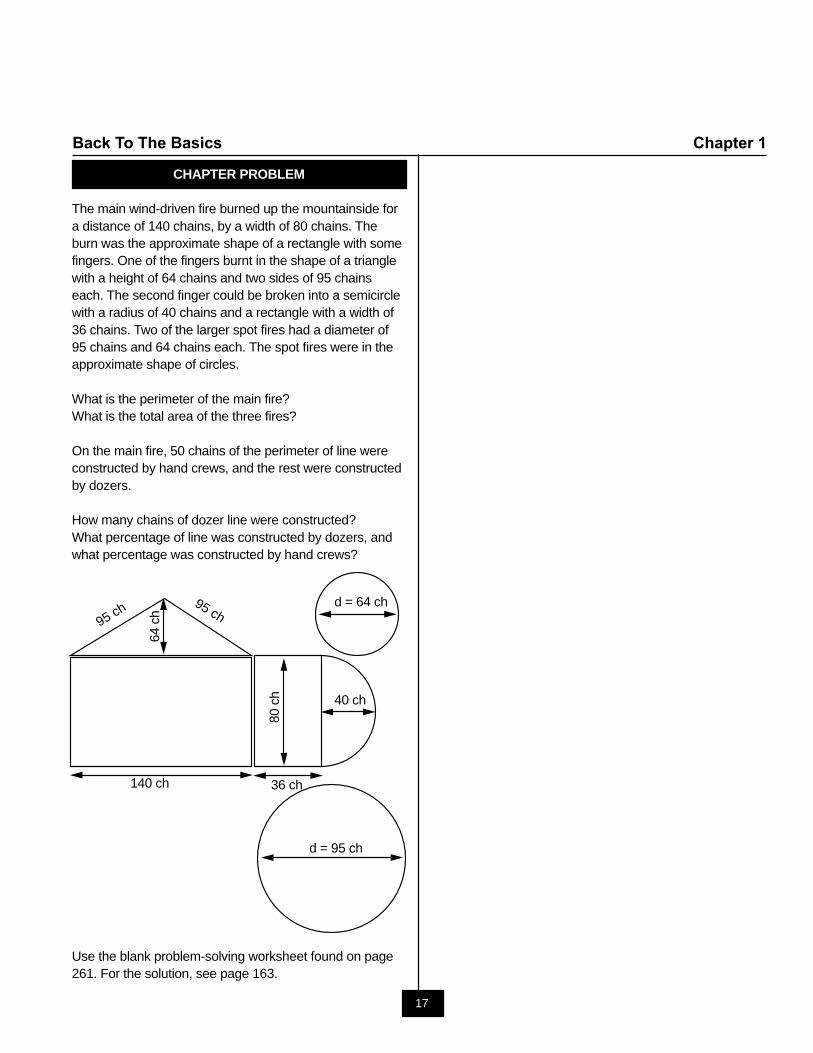
CHAPTER PROBLEM
The main wind-driven fire burned up the mountainside fora distance of 140 chains, by a width of 80 chains. Theburn was the approximate shape of a rectangle with somefingers. One of the fingers burnt in the shape of a trianglewith a height of 64 chains and two sides of 95 chainseach. The second finger could be broken into a semicirclewith a radius of 40 chains and a rectangle with a width of36 chains. Two of the larger spot fires had a diameter of95 chains and 64 chains each. The spot fires were in theapproximate shape of circles.
What is the perimeter of the main fire?What is the total area of the three fires?
On the main fire, 50 chains of the perimeter of line wereconstructed by hand crews, and the rest were constructedby dozers.
How many chains of dozer line were constructed?What percentage of line was constructed by dozers, andwhat percentage was constructed by hand crews?
Use the blank problem-solving worksheet found on page261. For the solution, see page 163.
64
ch
d = 64 ch
80 c
h 40 ch
140 ch 36 ch
d = 95 ch
95 ch 95 ch

19
Conversions Chapter 2
Chapter 2 describes converting units of measure,using conversion factors, and a unit cancellationtable. Conversion tables of typical units in fireservice are included as reference material.
2.1 Unit Conversion and Conversion Factors A unitconversion is an equal exchange of value involvingdifferent units. Often measurements are given in one setof units, such as feet; but are needed in different units,such as chains. A conversion factor enables feet to bechanged to chains as an equal exchange. Problem solvingin units that are familiar to fire staff is crucial to soundplanning. Making a mistake with units can be very costly.
A Conversion Factor is a number used to change oneset of units to another, by multiplying or dividing. When aconversion is necessary, the appropriate conversionfactor/equal value must be used. For example, to convertinches to feet, the appropriate conversion value is 12inches equal 1 foot. To convert minutes to hours, theappropriate conversion value is 60 minutes equal 1 hour.
Setting up a Unit Cancellation Table helps keep unitsstraight, even for the most seasoned professionalfirefighter. This is particularly important when more thanone unit conversion is necessary to obtain the desiredunit. A cancellation table is developed by using knownunits, conversion factors, and the fact that anything ÷anything = 1. Line up the units so all the units cancel,except for the unit desired. To cancel a unit, the same unitmust be in the numerator and in the denominator. This willbecome 1. Multiply straight across. Divide the top numberby the bottom number. This will give the answer desired inthe desired units.
Answers should be presented with the appropriatenumber of significant digits. For significant digits androunding up, see appendix B.7, Using Decimals.
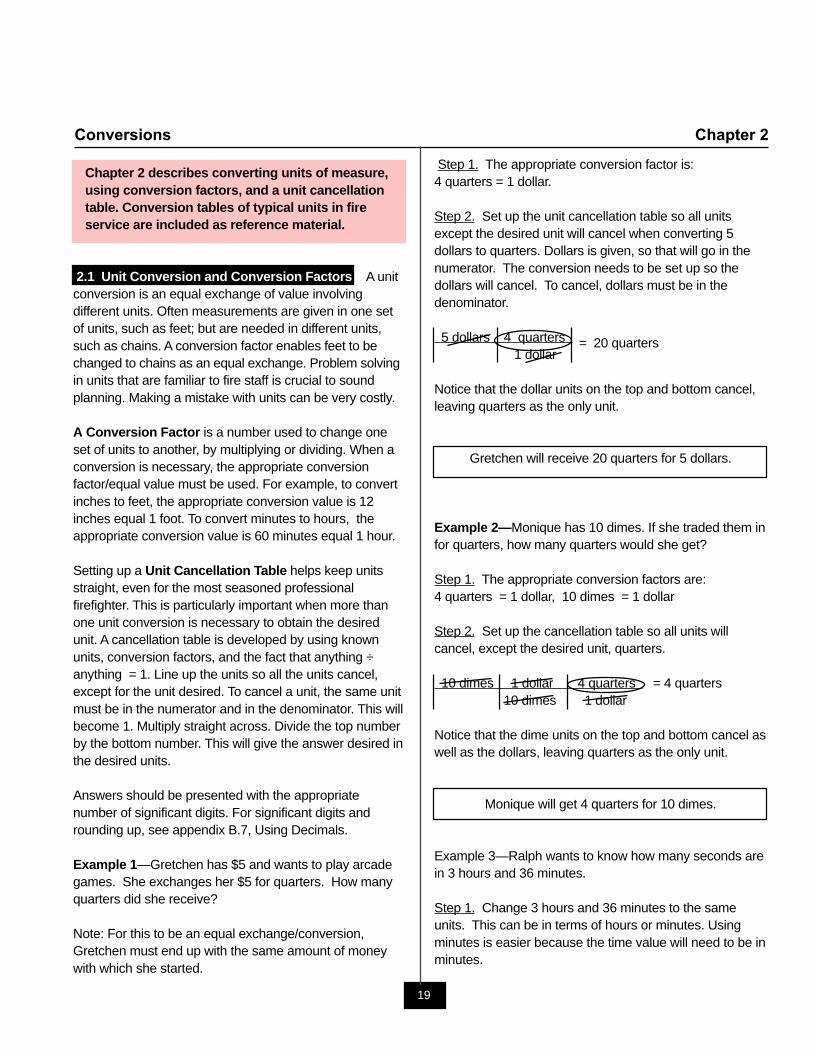
Example 1—Gretchen has $5 and wants to play arcadegames. She exchanges her $5 for quarters. How manyquarters did she receive?
Note: For this to be an equal exchange/conversion,Gretchen must end up with the same amount of moneywith which she started.
Step 1. The appropriate conversion factor is:4 quarters = 1 dollar.
Step 2. Set up the unit cancellation table so all unitsexcept the desired unit will cancel when converting 5dollars to quarters. Dollars is given, so that will go in thenumerator. The conversion needs to be set up so thedollars will cancel. To cancel, dollars must be in thedenominator.
5 dollars 4 quarters = 20 quarters1 dollar
Notice that the dollar units on the top and bottom cancel,leaving quarters as the only unit.
Gretchen will receive 20 quarters for 5 dollars.
Example 2—Monique has 10 dimes. If she traded them infor quarters, how many quarters would she get?
Step 1. The appropriate conversion factors are:4 quarters = 1 dollar, 10 dimes = 1 dollar
Step 2. Set up the cancellation table so all units willcancel, except the desired unit, quarters.
10 dimes 1 dollar 4 quarters = 4 quarters10 dimes 1 dollar
Notice that the dime units on the top and bottom cancel aswell as the dollars, leaving quarters as the only unit.
Monique will get 4 quarters for 10 dimes.
Example 3—Ralph wants to know how many seconds arein 3 hours and 36 minutes.
Step 1. Change 3 hours and 36 minutes to the sameunits. This can be in terms of hours or minutes. Usingminutes is easier because the time value will need to be inminutes.
20
Chapter 2 Conversions
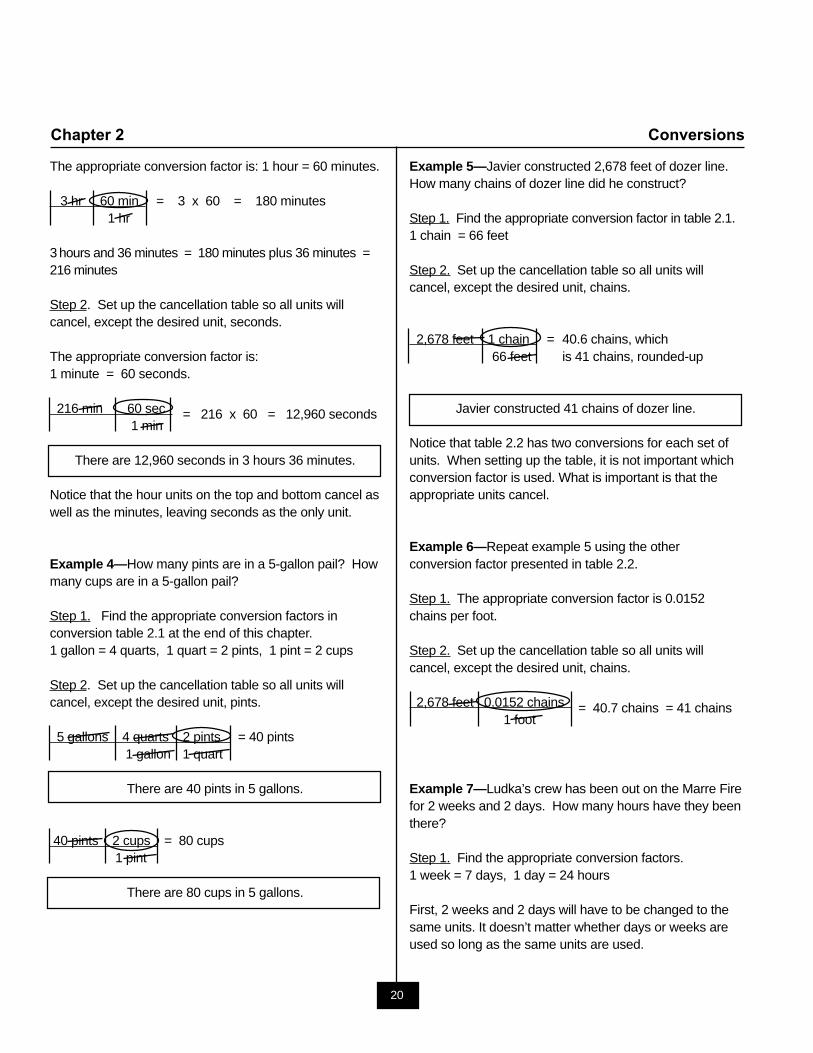
The appropriate conversion factor is: 1 hour = 60 minutes.
3 hr 60 min = 3 x 60 = 180 minutes1 hr
3 hours and 36 minutes = 180 minutes plus 36 minutes =216 minutes
Step 2. Set up the cancellation table so all units willcancel, except the desired unit, seconds.
The appropriate conversion factor is:1 minute = 60 seconds.
216 min 60 sec = 216 x 60 = 12,960 seconds1 min
There are 12,960 seconds in 3 hours 36 minutes.
Notice that the hour units on the top and bottom cancel aswell as the minutes, leaving seconds as the only unit.
Example 4—How many pints are in a 5-gallon pail? Howmany cups are in a 5-gallon pail?
Step 1. Find the appropriate conversion factors inconversion table 2.1 at the end of this chapter.1 gallon = 4 quarts, 1 quart = 2 pints, 1 pint = 2 cups
Step 2. Set up the cancellation table so all units willcancel, except the desired unit, pints.
5 gallons 4 quarts 2 pints = 40 pints1 gallon 1 quart
There are 40 pints in 5 gallons.
40 pints 2 cups = 80 cups1 pint
There are 80 cups in 5 gallons.
Example 5—Javier constructed 2,678 feet of dozer line.How many chains of dozer line did he construct?
Step 1. Find the appropriate conversion factor in table 2.1.1 chain = 66 feet
Step 2. Set up the cancellation table so all units willcancel, except the desired unit, chains.
2,678 feet 1 chain = 40.6 chains, which66 feet is 41 chains, rounded-up
Javier constructed 41 chains of dozer line.
Notice that table 2.2 has two conversions for each set ofunits. When setting up the table, it is not important whichconversion factor is used. What is important is that theappropriate units cancel.
Example 6—Repeat example 5 using the otherconversion factor presented in table 2.2.
Step 1. The appropriate conversion factor is 0.0152chains per foot.
Step 2. Set up the cancellation table so all units willcancel, except the desired unit, chains.
2,678 feet 0.0152 chains = 40.7 chains = 41 chains1 foot
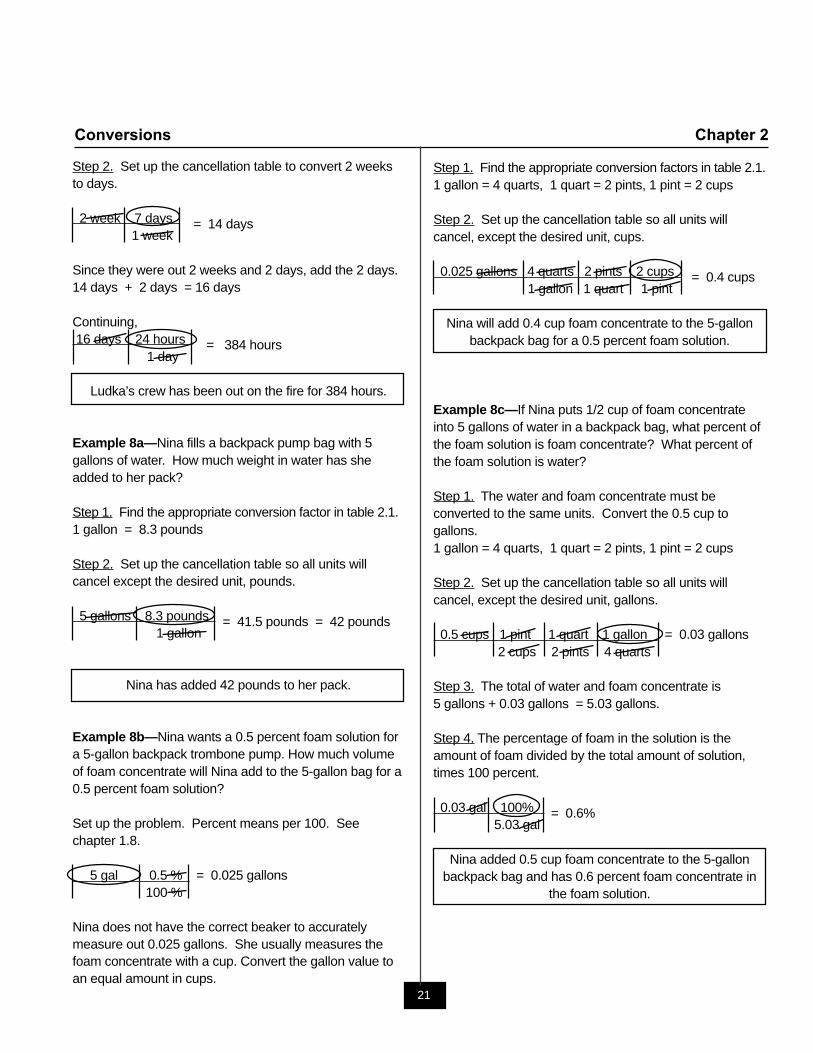
Example 7—Ludka’s crew has been out on the Marre Firefor 2 weeks and 2 days. How many hours have they beenthere?
Step 1. Find the appropriate conversion factors.1 week = 7 days, 1 day = 24 hours
First, 2 weeks and 2 days will have to be changed to thesame units. It doesn’t matter whether days or weeks areused so long as the same units are used.
21
Conversions Chapter 2
Step 2. Set up the cancellation table to convert 2 weeksto days.
2 week 7 days = 14 days1 week
Since they were out 2 weeks and 2 days, add the 2 days.14 days + 2 days = 16 days
Continuing, 16 days 24 hours = 384 hours
1 day
Ludka’s crew has been out on the fire for 384 hours.
Example 8a—Nina fills a backpack pump bag with 5gallons of water. How much weight in water has sheadded to her pack?
Step 1. Find the appropriate conversion factor in table 2.1.1 gallon = 8.3 pounds
Step 2. Set up the cancellation table so all units willcancel except the desired unit, pounds.
5 gallons 8.3 pounds = 41.5 pounds = 42 pounds1 gallon
Nina has added 42 pounds to her pack.
Example 8b—Nina wants a 0.5 percent foam solution fora 5-gallon backpack trombone pump. How much volumeof foam concentrate will Nina add to the 5-gallon bag for a0.5 percent foam solution?
Set up the problem. Percent means per 100. Seechapter 1.8.
5 gal 0.5 % = 0.025 gallons100 %
Nina does not have the correct beaker to accuratelymeasure out 0.025 gallons. She usually measures thefoam concentrate with a cup. Convert the gallon value toan equal amount in cups.
Step 1. Find the appropriate conversion factors in table 2.1.1 gallon = 4 quarts, 1 quart = 2 pints, 1 pint = 2 cups
Step 2. Set up the cancellation table so all units willcancel, except the desired unit, cups.
0.025 gallons 4 quarts 2 pints 2 cups = 0.4 cups1 gallon 1 quart 1 pint
Nina will add 0.4 cup foam concentrate to the 5-gallonbackpack bag for a 0.5 percent foam solution.
Example 8c—If Nina puts 1/2 cup of foam concentrateinto 5 gallons of water in a backpack bag, what percent ofthe foam solution is foam concentrate? What percent ofthe foam solution is water?
Step 1. The water and foam concentrate must beconverted to the same units. Convert the 0.5 cup togallons.1 gallon = 4 quarts, 1 quart = 2 pints, 1 pint = 2 cups
Step 2. Set up the cancellation table so all units willcancel, except the desired unit, gallons.
0.5 cups 1 pint 1 quart 1 gallon = 0.03 gallons2 cups 2 pints 4 quarts
Step 3. The total of water and foam concentrate is5 gallons + 0.03 gallons = 5.03 gallons.
Step 4. The percentage of foam in the solution is theamount of foam divided by the total amount of solution,times 100 percent.
0.03 gal 100% = 0.6%5.03 gal
Nina added 0.5 cup foam concentrate to the 5-gallonbackpack bag and has 0.6 percent foam concentrate in
the foam solution.
22
Chapter 2 Conversions
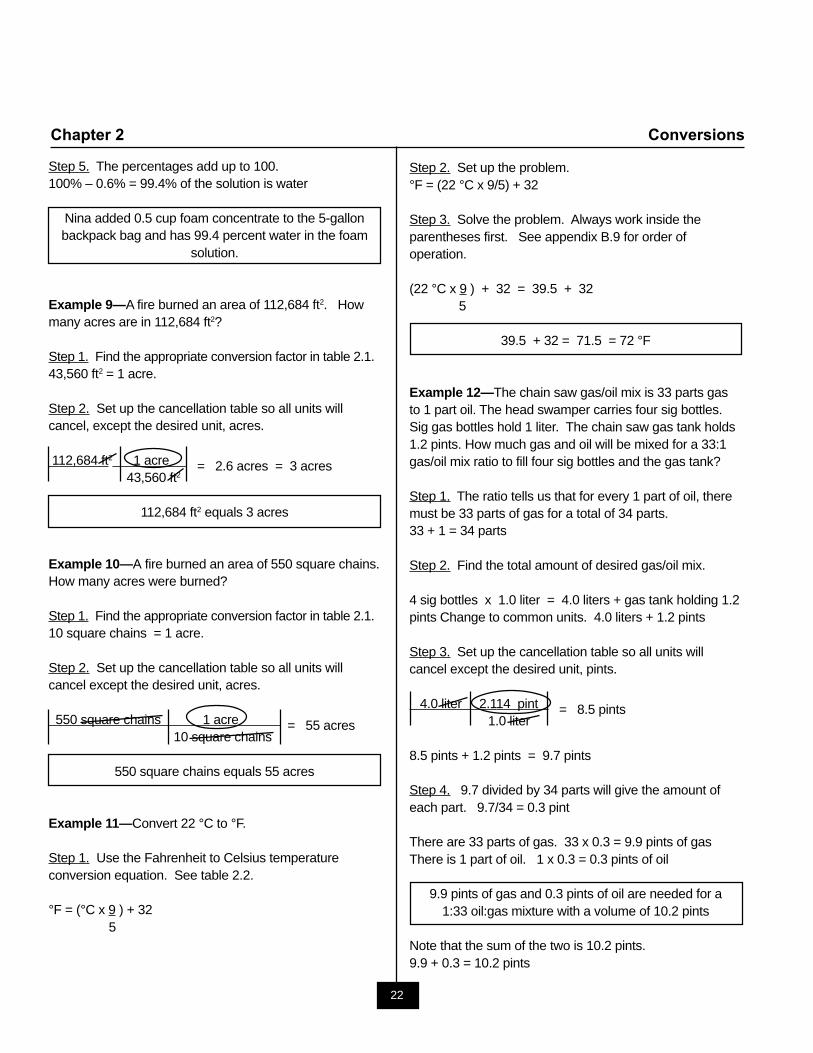
Step 5. The percentages add up to 100.100% – 0.6% = 99.4% of the solution is water
Nina added 0.5 cup foam concentrate to the 5-gallonbackpack bag and has 99.4 percent water in the foam
solution.
Example 9—A fire burned an area of 112,684 ft2. Howmany acres are in 112,684 ft2?
Step 1. Find the appropriate conversion factor in table 2.1.43,560 ft2 = 1 acre.
Step 2. Set up the cancellation table so all units willcancel, except the desired unit, acres.
112,684 ft2 1 acre = 2.6 acres = 3 acres43,560 ft2
112,684 ft2 equals 3 acres
Example 10—A fire burned an area of 550 square chains.How many acres were burned?
Step 1. Find the appropriate conversion factor in table 2.1.10 square chains = 1 acre.
Step 2. Set up the cancellation table so all units willcancel except the desired unit, acres.
550 square chains 1 acre = 55 acres10 square chains
550 square chains equals 55 acres
Example 11—Convert 22 °C to °F.
Step 1. Use the Fahrenheit to Celsius temperatureconversion equation. See table 2.2.
°F = (°C x 9 ) + 325
Step 2. Set up the problem.°F = (22 °C x 9/5) + 32
Step 3. Solve the problem. Always work inside theparentheses first. See appendix B.9 for order ofoperation.
(22 °C x 9 ) + 32 = 39.5 + 325
39.5 + 32 = 71.5 = 72 °F
Example 12—The chain saw gas/oil mix is 33 parts gasto 1 part oil. The head swamper carries four sig bottles.Sig gas bottles hold 1 liter. The chain saw gas tank holds1.2 pints. How much gas and oil will be mixed for a 33:1gas/oil mix ratio to fill four sig bottles and the gas tank?
Step 1. The ratio tells us that for every 1 part of oil, theremust be 33 parts of gas for a total of 34 parts.33 + 1 = 34 parts
Step 2. Find the total amount of desired gas/oil mix.
4 sig bottles x 1.0 liter = 4.0 liters + gas tank holding 1.2pints Change to common units. 4.0 liters + 1.2 pints
Step 3. Set up the cancellation table so all units willcancel except the desired unit, pints.
4.0 liter 2.114 pint = 8.5 pints1.0 liter
8.5 pints + 1.2 pints = 9.7 pints
Step 4. 9.7 divided by 34 parts will give the amount ofeach part. 9.7/34 = 0.3 pint
There are 33 parts of gas. 33 x 0.3 = 9.9 pints of gasThere is 1 part of oil. 1 x 0.3 = 0.3 pints of oil
9.9 pints of gas and 0.3 pints of oil are needed for a1:33 oil:gas mixture with a volume of 10.2 pints
Note that the sum of the two is 10.2 pints.9.9 + 0.3 = 10.2 pints
23
Conversions Chapter 2
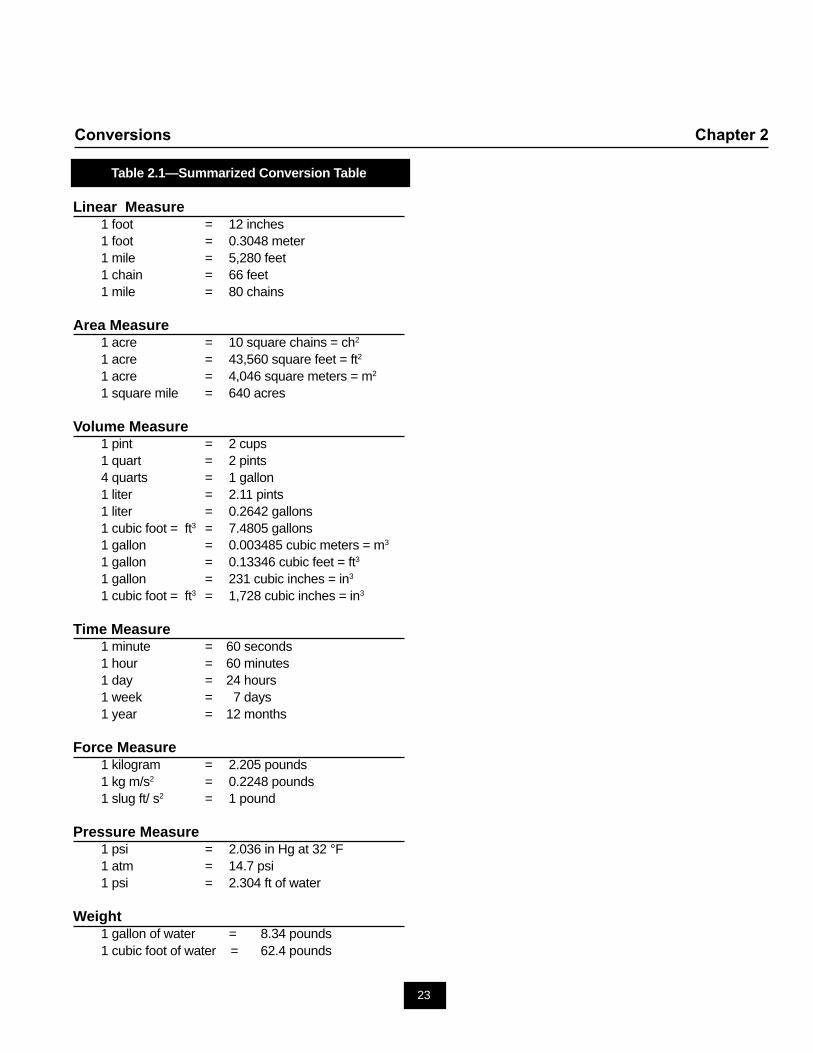
Table 2.1—Summarized Conversion Table
Linear Measure1 foot = 12 inches1 foot = 0.3048 meter1 mile = 5,280 feet1 chain = 66 feet1 mile = 80 chains
Area Measure1 acre = 10 square chains = ch2
1 acre = 43,560 square feet = ft2
1 acre = 4,046 square meters = m2
1 square mile = 640 acres
Volume Measure1 pint = 2 cups1 quart = 2 pints4 quarts = 1 gallon1 liter = 2.11 pints1 liter = 0.2642 gallons1 cubic foot = ft3 = 7.4805 gallons1 gallon = 0.003485 cubic meters = m3
1 gallon = 0.13346 cubic feet = ft3
1 gallon = 231 cubic inches = in3
1 cubic foot = ft3 = 1,728 cubic inches = in3
Time Measure1 minute = 60 seconds1 hour = 60 minutes1 day = 24 hours1 week = 7 days1 year = 12 months
Force Measure1 kilogram = 2.205 pounds1 kg m/s2 = 0.2248 pounds1 slug ft/ s2 = 1 pound
Pressure Measure1 psi = 2.036 in Hg at 32 °F1 atm = 14.7 psi1 psi = 2.304 ft of water
Weight1 gallon of water = 8.34 pounds1 cubic foot of water = 62.4 pounds
24
Chapter 2 Conversions
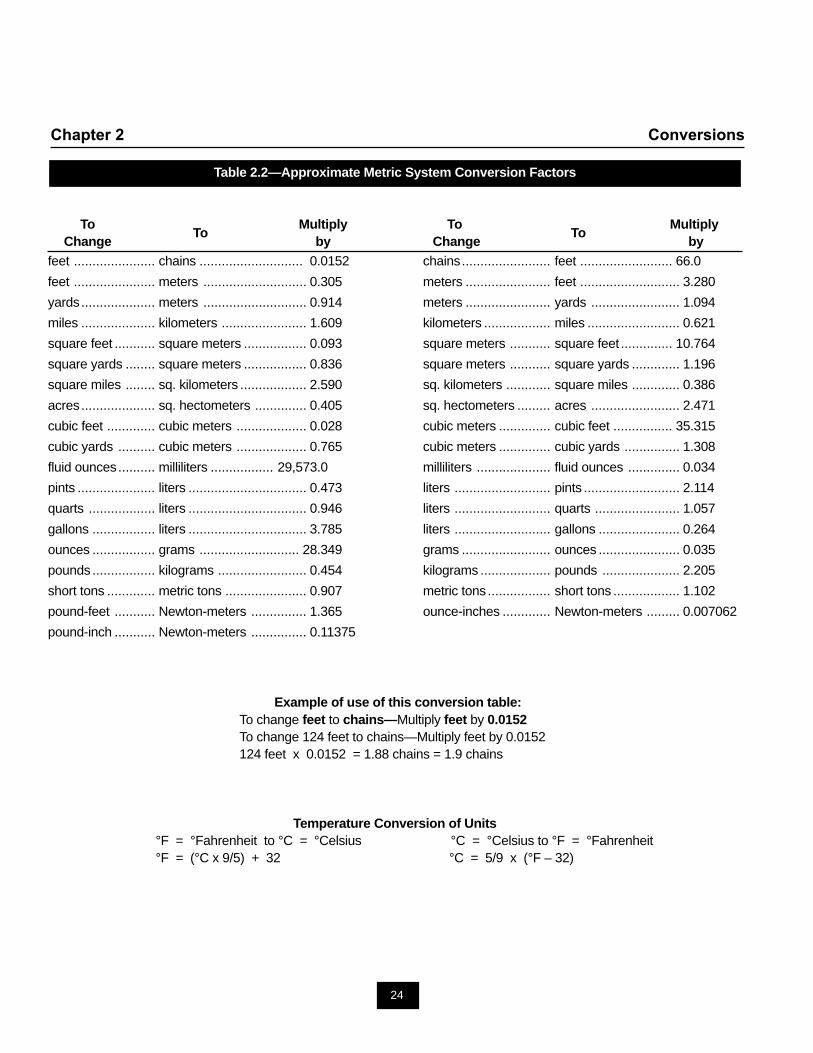
Table 2.2—Approximate Metric System Conversion Factors
To Multiply To MultiplyChange
Toby Change
To by
feet ...................... chains ............................ 0.0152 chains........................ feet ......................... 66.0
feet ...................... meters ............................ 0.305 meters ....................... feet ........................... 3.280
yards.................... meters ............................ 0.914 meters ....................... yards ........................ 1.094
miles .................... kilometers ....................... 1.609 kilometers .................. miles ......................... 0.621
square feet ........... square meters ................. 0.093 square meters ........... square feet .............. 10.764
square yards ........ square meters ................. 0.836 square meters ........... square yards ............. 1.196
square miles ........ sq. kilometers .................. 2.590 sq. kilometers ............ square miles ............. 0.386
acres.................... sq. hectometers .............. 0.405 sq. hectometers ......... acres ........................ 2.471
cubic feet ............. cubic meters ................... 0.028 cubic meters .............. cubic feet ................ 35.315
cubic yards .......... cubic meters ................... 0.765 cubic meters .............. cubic yards ............... 1.308
fluid ounces.......... milliliters ................. 29,573.0 milliliters .................... fluid ounces .............. 0.034
pints ..................... liters ................................ 0.473 liters .......................... pints .......................... 2.114
quarts .................. liters ................................ 0.946 liters .......................... quarts ....................... 1.057
gallons ................. liters ................................ 3.785 liters .......................... gallons ...................... 0.264
ounces ................. grams ........................... 28.349 grams ........................ ounces ...................... 0.035
pounds ................. kilograms ........................ 0.454 kilograms ................... pounds ..................... 2.205
short tons ............. metric tons ...................... 0.907 metric tons ................. short tons .................. 1.102
pound-feet ........... Newton-meters ............... 1.365 ounce-inches ............. Newton-meters ......... 0.007062
pound-inch ........... Newton-meters ............... 0.11375
Example of use of this conversion table:To change feet to chains—Multiply feet by 0.0152To change 124 feet to chains—Multiply feet by 0.0152124 feet x 0.0152 = 1.88 chains = 1.9 chains
Temperature Conversion of Units°F = °Fahrenheit to °C = °Celsius °C = °Celsius to °F = °Fahrenheit°F = (°C x 9/5) + 32 °C = 5/9 x (°F – 32)
25
Conversions Chapter 2
Table 2.3—Metric System and Equivalents
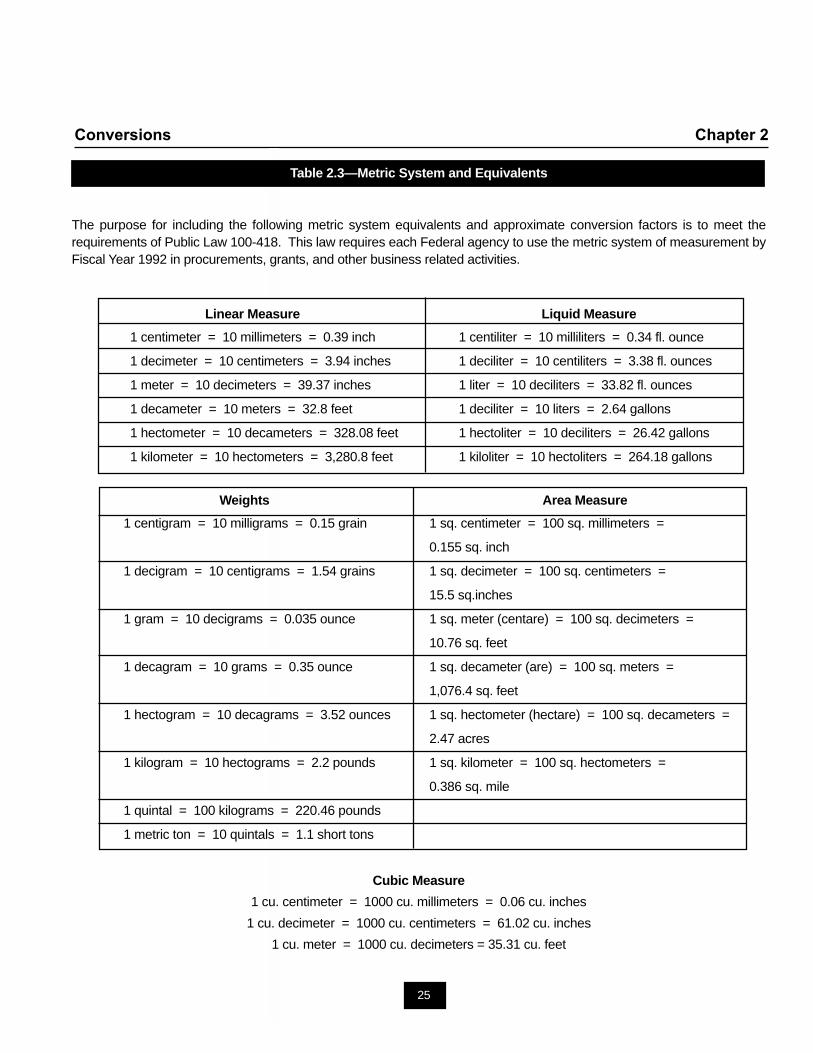
The purpose for including the following metric system equivalents and approximate conversion factors is to meet therequirements of Public Law 100-418. This law requires each Federal agency to use the metric system of measurement byFiscal Year 1992 in procurements, grants, and other business related activities.
Linear Measure Liquid Measure
1 centimeter = 10 millimeters = 0.39 inch 1 centiliter = 10 milliliters = 0.34 fl. ounce
1 decimeter = 10 centimeters = 3.94 inches 1 deciliter = 10 centiliters = 3.38 fl. ounces
1 meter = 10 decimeters = 39.37 inches 1 liter = 10 deciliters = 33.82 fl. ounces
1 decameter = 10 meters = 32.8 feet 1 deciliter = 10 liters = 2.64 gallons
1 hectometer = 10 decameters = 328.08 feet 1 hectoliter = 10 deciliters = 26.42 gallons
1 kilometer = 10 hectometers = 3,280.8 feet 1 kiloliter = 10 hectoliters = 264.18 gallons
Weights Area Measure
1 centigram = 10 milligrams = 0.15 grain 1 sq. centimeter = 100 sq. millimeters =
0.155 sq. inch
1 decigram = 10 centigrams = 1.54 grains 1 sq. decimeter = 100 sq. centimeters =
15.5 sq.inches
1 gram = 10 decigrams = 0.035 ounce 1 sq. meter (centare) = 100 sq. decimeters =
10.76 sq. feet
1 decagram = 10 grams = 0.35 ounce 1 sq. decameter (are) = 100 sq. meters =
1,076.4 sq. feet
1 hectogram = 10 decagrams = 3.52 ounces 1 sq. hectometer (hectare) = 100 sq. decameters =
2.47 acres
1 kilogram = 10 hectograms = 2.2 pounds 1 sq. kilometer = 100 sq. hectometers =
0.386 sq. mile
1 quintal = 100 kilograms = 220.46 pounds
1 metric ton = 10 quintals = 1.1 short tons
Cubic Measure
1 cu. centimeter = 1000 cu. millimeters = 0.06 cu. inches
1 cu. decimeter = 1000 cu. centimeters = 61.02 cu. inches
1 cu. meter = 1000 cu. decimeters = 35.31 cu. feet
26
Chapter 2 Conversions
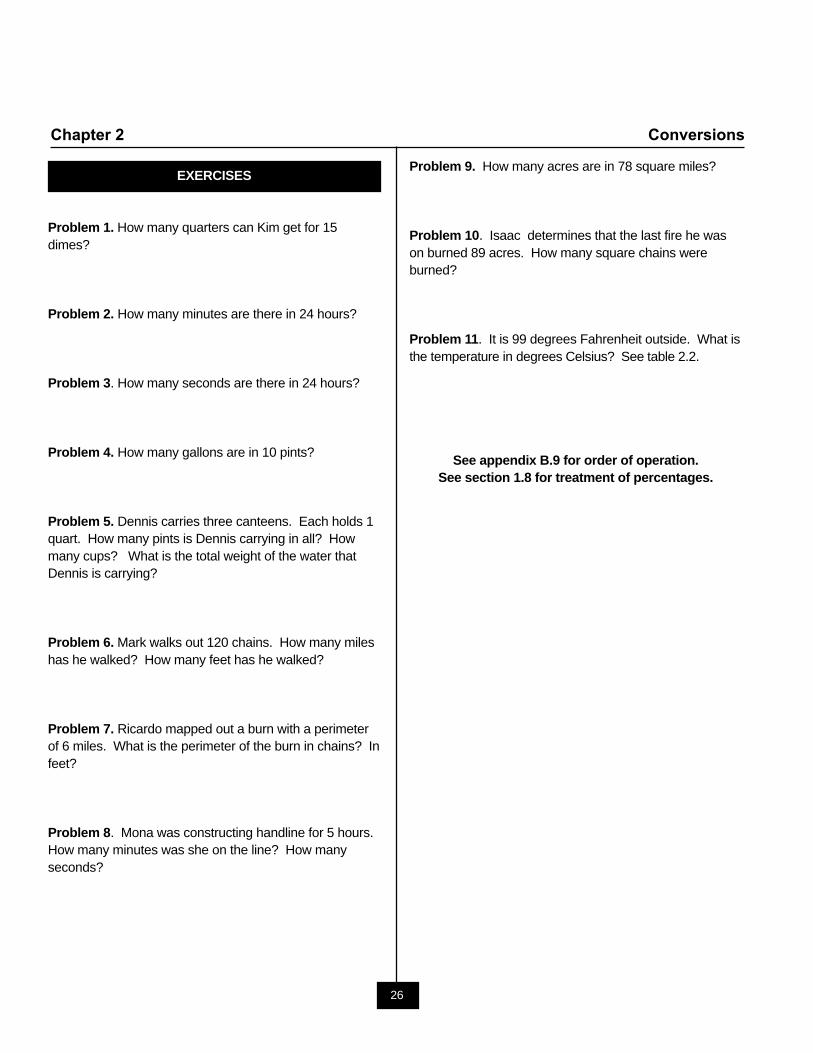
EXERCISES
Problem 1. How many quarters can Kim get for 15dimes?
Problem 2. How many minutes are there in 24 hours?
Problem 3. How many seconds are there in 24 hours?
Problem 4. How many gallons are in 10 pints?
Problem 5. Dennis carries three canteens. Each holds 1quart. How many pints is Dennis carrying in all? Howmany cups? What is the total weight of the water thatDennis is carrying?
Problem 6. Mark walks out 120 chains. How many mileshas he walked? How many feet has he walked?
Problem 7. Ricardo mapped out a burn with a perimeterof 6 miles. What is the perimeter of the burn in chains? Infeet?
Problem 8. Mona was constructing handline for 5 hours.How many minutes was she on the line? How manyseconds?
Problem 9. How many acres are in 78 square miles?
Problem 10. Isaac determines that the last fire he wason burned 89 acres. How many square chains wereburned?
Problem 11. It is 99 degrees Fahrenheit outside. What isthe temperature in degrees Celsius? See table 2.2.
See appendix B.9 for order of operation.See section 1.8 for treatment of percentages.
27
Squirt Water Chapter 3
The material in chapter 3 describes hydraulicconcepts regarding the use of water in wildlandfirefighting. These include determining weight ofwater, a description of factors related to frictionloss, and a review of basic drafting guidelines,volume, pump pressure calculations, and flowrate. Instructions for estimating in the field and around-off table are also provided.
The correct terminology is important in hydraulics. Theunit for pressure that is used in hydraulics is pounds persquare inch, “psi.” This is often confused or replaced with“pounds,” which is a unit for weight. Making this exchangeis incorrect and causes much confusion; therefore, it iscrucial that the correct terminology be used for bothpressure (pounds per square inch) and weight (pounds).
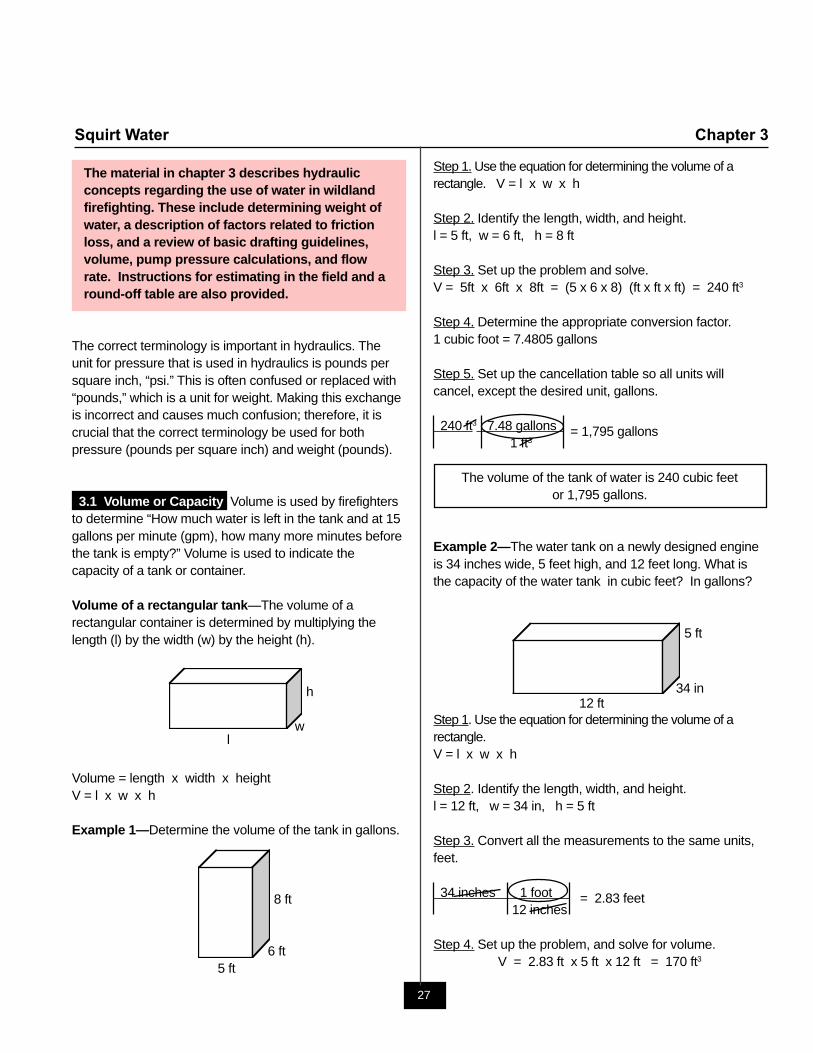
3.1 Volume or Capacity Volume is used by firefightersto determine “How much water is left in the tank and at 15gallons per minute (gpm), how many more minutes beforethe tank is empty?” Volume is used to indicate thecapacity of a tank or container.
Volume of a rectangular tank—The volume of arectangular container is determined by multiplying thelength (l) by the width (w) by the height (h).
h
w l
Volume = length x width x heightV = l x w x h
Example 1—Determine the volume of the tank in gallons.
8 ft
6 ft 5 ft
Step 1. Use the equation for determining the volume of arectangle. V = l x w x h
Step 2. Identify the length, width, and height.l = 5 ft, w = 6 ft, h = 8 ft
Step 3. Set up the problem and solve.V = 5ft x 6ft x 8ft = (5 x 6 x 8) (ft x ft x ft) = 240 ft3
Step 4. Determine the appropriate conversion factor.1 cubic foot = 7.4805 gallons
Step 5. Set up the cancellation table so all units willcancel, except the desired unit, gallons.
240 ft3 7.48 gallons = 1,795 gallons1 ft3
The volume of the tank of water is 240 cubic feetor 1,795 gallons.
Example 2—The water tank on a newly designed engineis 34 inches wide, 5 feet high, and 12 feet long. What isthe capacity of the water tank in cubic feet? In gallons?
5 ft
Step 1. Use the equation for determining the volume of arectangle.V = l x w x h
Step 2. Identify the length, width, and height.l = 12 ft, w = 34 in, h = 5 ft
Step 3. Convert all the measurements to the same units,feet.
34 inches 1 foot = 2.83 feet12 inches
Step 4. Set up the problem, and solve for volume.V = 2.83 ft x 5 ft x 12 ft = 170 ft3
12 ft34 in
28
Chapter 3 Squirt Water
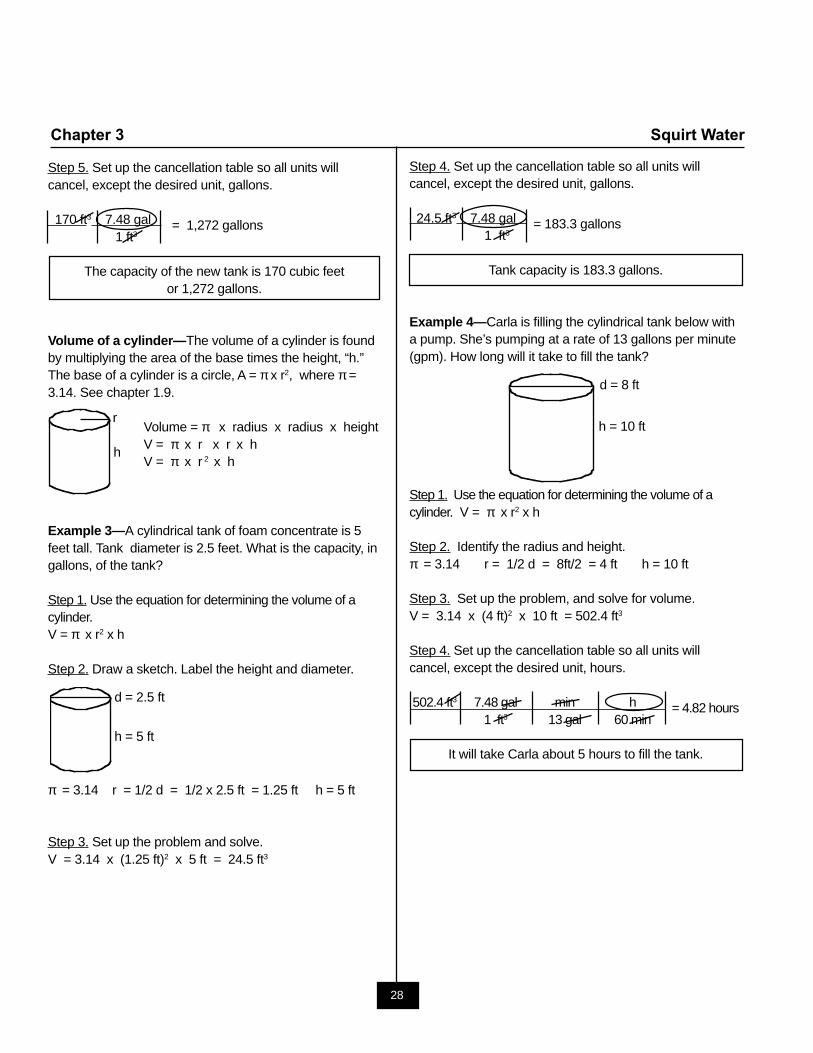
Step 5. Set up the cancellation table so all units willcancel, except the desired unit, gallons.
170 ft3 7.48 gal = 1,272 gallons1 ft3
The capacity of the new tank is 170 cubic feetor 1,272 gallons.
Volume of a cylinder—The volume of a cylinder is foundby multiplying the area of the base times the height, “h.”The base of a cylinder is a circle, A = π x r2, where π =3.14. See chapter 1.9.
Volume = π x radius x radius x heightV = π x r x r x hV = π x r 2 x h
Example 3—A cylindrical tank of foam concentrate is 5feet tall. Tank diameter is 2.5 feet. What is the capacity, ingallons, of the tank?
Step 1. Use the equation for determining the volume of acylinder.V = π x r2 x h
Step 2. Draw a sketch. Label the height and diameter.
π = 3.14 r = 1/2 d = 1/2 x 2.5 ft = 1.25 ft h = 5 ft
Step 3. Set up the problem and solve.V = 3.14 x (1.25 ft)2 x 5 ft = 24.5 ft3
Step 4. Set up the cancellation table so all units willcancel, except the desired unit, gallons.
24.5 ft3 7.48 gal = 183.3 gallons1 ft3
Tank capacity is 183.3 gallons.
Example 4—Carla is filling the cylindrical tank below witha pump. She’s pumping at a rate of 13 gallons per minute(gpm). How long will it take to fill the tank?
Step 1. Use the equation for determining the volume of acylinder. V = π x r2 x h
Step 2. Identify the radius and height.π = 3.14 r = 1/2 d = 8ft/2 = 4 ft h = 10 ft
Step 3. Set up the problem, and solve for volume.V = 3.14 x (4 ft)2 x 10 ft = 502.4 ft3
Step 4. Set up the cancellation table so all units willcancel, except the desired unit, hours.
502.4 ft3 7.48 gal min h = 4.82 hours1 ft3 13 gal 60 min
It will take Carla about 5 hours to fill the tank.
r
h
h = 5 ft
d = 2.5 ft
d = 8 ft
h = 10 ft
29
Squirt Water Chapter 3
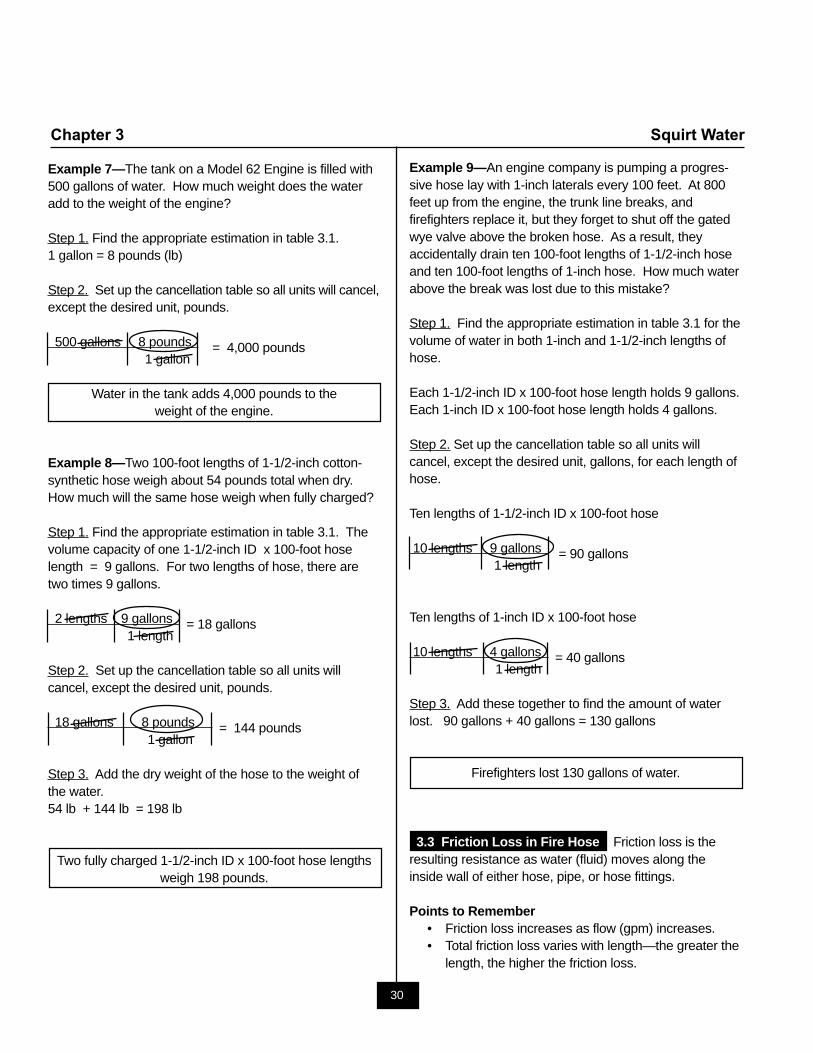
Example 6—Sherman is out on a fire. His crew has atrunk line of 6 lengths of 100-foot, 1-1/2 inch hose. Heneeds to estimate the volume of water in this trunk line.What is a good estimate?
Step 1. Find the appropriate conversion/estimation in table3.1. Commit these rounded values to memory.
The exact tables indicate that a single 100-foot length of1-1/2-inch hose holds 9.2 gallons of water from table 3.1.Use the rounded value of 9 gallons per 100-foot length of1-1/2-inch hose.
Step 2. Set up the table. This may or may not need to bedone on paper. Typical rough estimations involve only onemultiplication or division step, and usually this math can bedone in your head.
6 lengths 9.0 gallons = 54 gallons1 length
Sherman has used 54 gallons of water to chargethe hose lay.
Sherman now knows that he has about 54 gallons ofwater in his hose lay. The exact value would have been6 x 9.2 = 55.2 gallons. This shows that the roundednumber is easier to use, since multiplying whole numbersis simpler than multiplying decimals.
In example 6, the number was rounded down from 9.2 to9.0. If it would have been rounded up from 9.2 to 10.0, thesolution would have been 6 x 10 = 60 gallons. By perform-ing the calculations using whole numbers, both higher andlower than the actual value, a margin is created. Thismargin allows for an upper and lower limit. It is thereforesafe to say that the actual value is between 54 gallons(6 x 9) and 60 gallons (6 x 10).
Determining Weights and Volumes of Water—Table 3.1shows the volumes of water in specific hose lengths,along with the weight of 1 gallon of water. The weight of 1gallon of water is 8.3 pounds (1 gallon = 8.3 pounds).With this, the weight of water can be calculated in acertain length of hose or volume of water by multiplying by8 pounds per gallon (rounded value).
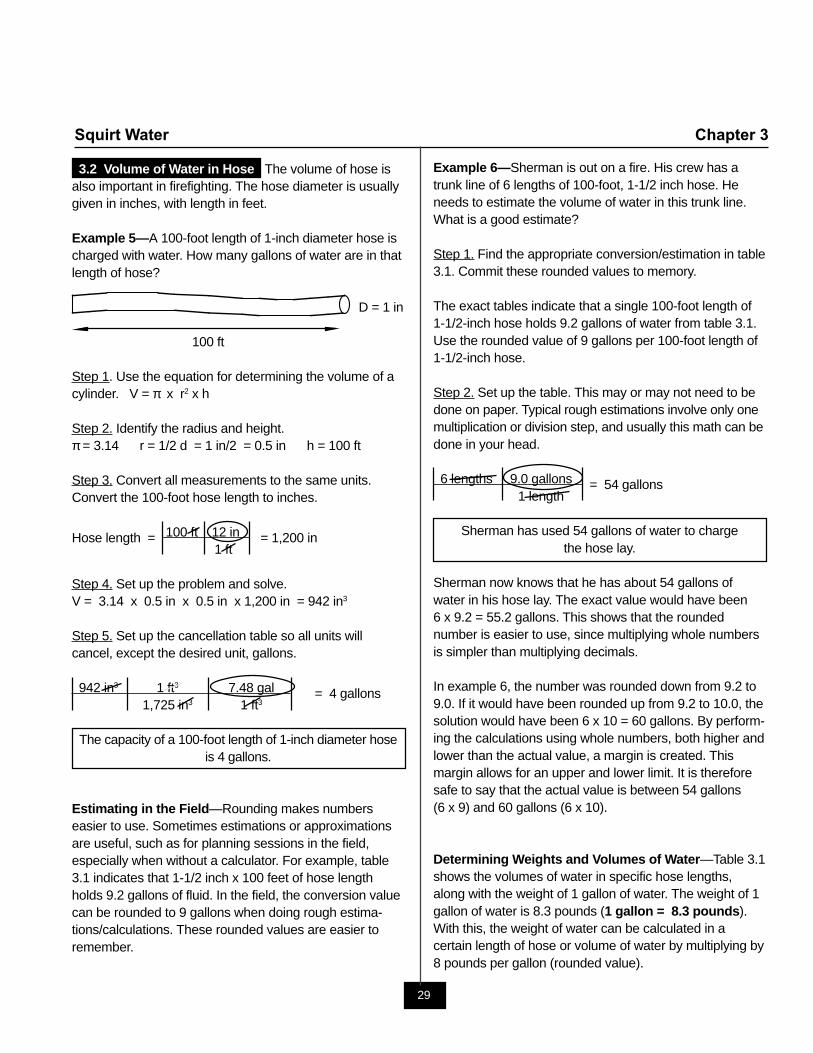
3.2 Volume of Water in Hose The volume of hose isalso important in firefighting. The hose diameter is usuallygiven in inches, with length in feet.
Example 5—A 100-foot length of 1-inch diameter hose ischarged with water. How many gallons of water are in thatlength of hose?
D = 1 in
100 ft
Step 1. Use the equation for determining the volume of acylinder. V = π x r2 x h
Step 2. Identify the radius and height.π = 3.14 r = 1/2 d = 1 in/2 = 0.5 in h = 100 ft
Step 3. Convert all measurements to the same units.Convert the 100-foot hose length to inches.
Hose length = 100 ft 12 in = 1,200 in 1 ft
Step 4. Set up the problem and solve.V = 3.14 x 0.5 in x 0.5 in x 1,200 in = 942 in3
Step 5. Set up the cancellation table so all units willcancel, except the desired unit, gallons.
942 in3 1 ft3 7.48 gal = 4 gallons1,725 in3 1 ft3
The capacity of a 100-foot length of 1-inch diameter hoseis 4 gallons.
Estimating in the Field—Rounding makes numberseasier to use. Sometimes estimations or approximationsare useful, such as for planning sessions in the field,especially when without a calculator. For example, table3.1 indicates that 1-1/2 inch x 100 feet of hose lengthholds 9.2 gallons of fluid. In the field, the conversion valuecan be rounded to 9 gallons when doing rough estima-tions/calculations. These rounded values are easier toremember.
30
Chapter 3 Squirt Water
Example 7—The tank on a Model 62 Engine is filled with500 gallons of water. How much weight does the wateradd to the weight of the engine?
Step 1. Find the appropriate estimation in table 3.1.1 gallon = 8 pounds (lb)
Step 2. Set up the cancellation table so all units will cancel,except the desired unit, pounds.
500 gallons 8 pounds = 4,000 pounds1 gallon
Water in the tank adds 4,000 pounds to theweight of the engine.
Example 8—Two 100-foot lengths of 1-1/2-inch cotton-synthetic hose weigh about 54 pounds total when dry.How much will the same hose weigh when fully charged?
Step 1. Find the appropriate estimation in table 3.1. Thevolume capacity of one 1-1/2-inch ID x 100-foot hoselength = 9 gallons. For two lengths of hose, there aretwo times 9 gallons.
2 lengths 9 gallons = 18 gallons1 length
Step 2. Set up the cancellation table so all units willcancel, except the desired unit, pounds.
18 gallons 8 pounds = 144 pounds1 gallon
Step 3. Add the dry weight of the hose to the weight ofthe water.54 lb + 144 lb = 198 lb
Two fully charged 1-1/2-inch ID x 100-foot hose lengthsweigh 198 pounds.
Example 9—An engine company is pumping a progres-sive hose lay with 1-inch laterals every 100 feet. At 800feet up from the engine, the trunk line breaks, andfirefighters replace it, but they forget to shut off the gatedwye valve above the broken hose. As a result, theyaccidentally drain ten 100-foot lengths of 1-1/2-inch hoseand ten 100-foot lengths of 1-inch hose. How much waterabove the break was lost due to this mistake?
Step 1. Find the appropriate estimation in table 3.1 for thevolume of water in both 1-inch and 1-1/2-inch lengths ofhose.
Each 1-1/2-inch ID x 100-foot hose length holds 9 gallons.Each 1-inch ID x 100-foot hose length holds 4 gallons.
Step 2. Set up the cancellation table so all units willcancel, except the desired unit, gallons, for each length ofhose.
Ten lengths of 1-1/2-inch ID x 100-foot hose
10 lengths 9 gallons = 90 gallons1 length
Ten lengths of 1-inch ID x 100-foot hose
10 lengths 4 gallons = 40 gallons1 length
Step 3. Add these together to find the amount of waterlost. 90 gallons + 40 gallons = 130 gallons
Firefighters lost 130 gallons of water.
3.3 Friction Loss in Fire Hose Friction loss is theresulting resistance as water (fluid) moves along theinside wall of either hose, pipe, or hose fittings.
Points to Remember• Friction loss increases as flow (gpm) increases.• Total friction loss varies with length—the greater the
length, the higher the friction loss.
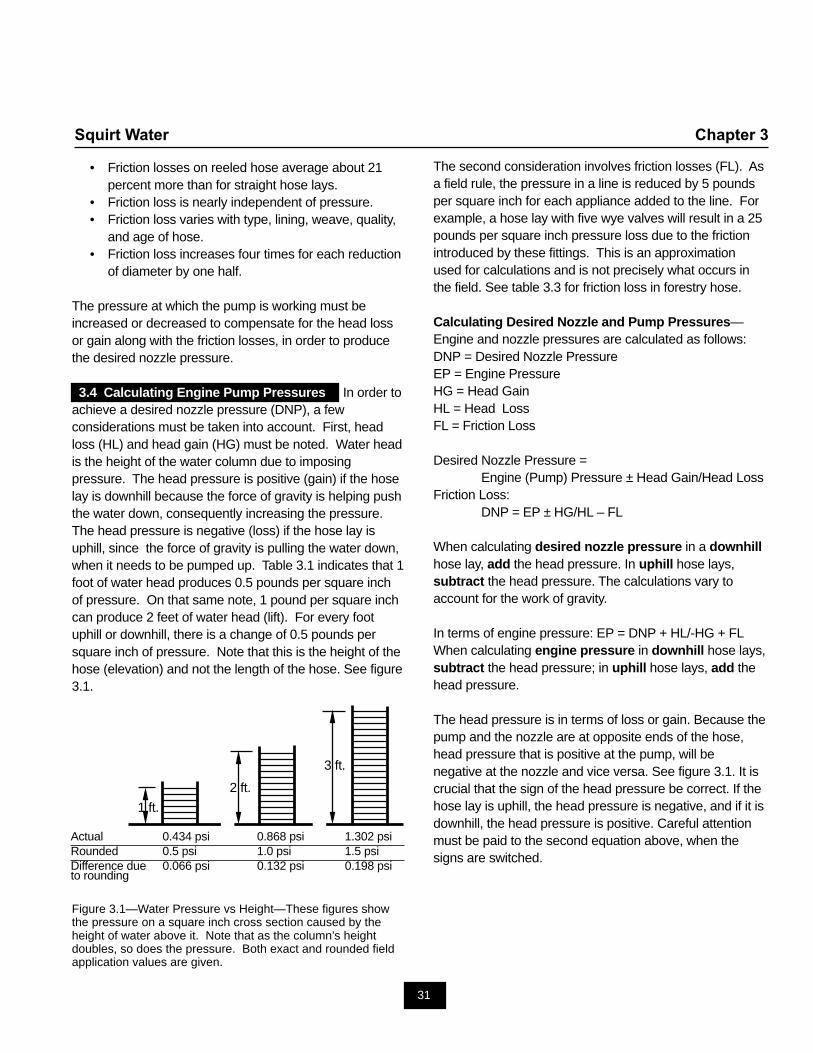
31
Squirt Water Chapter 3
• Friction losses on reeled hose average about 21percent more than for straight hose lays.
• Friction loss is nearly independent of pressure.• Friction loss varies with type, lining, weave, quality,
and age of hose.• Friction loss increases four times for each reduction
of diameter by one half.
The pressure at which the pump is working must beincreased or decreased to compensate for the head lossor gain along with the friction losses, in order to producethe desired nozzle pressure.
3.4 Calculating Engine Pump Pressures In order toachieve a desired nozzle pressure (DNP), a fewconsiderations must be taken into account. First, headloss (HL) and head gain (HG) must be noted. Water headis the height of the water column due to imposingpressure. The head pressure is positive (gain) if the hoselay is downhill because the force of gravity is helping pushthe water down, consequently increasing the pressure.The head pressure is negative (loss) if the hose lay isuphill, since the force of gravity is pulling the water down,when it needs to be pumped up. Table 3.1 indicates that 1foot of water head produces 0.5 pounds per square inchof pressure. On that same note, 1 pound per square inchcan produce 2 feet of water head (lift). For every footuphill or downhill, there is a change of 0.5 pounds persquare inch of pressure. Note that this is the height of thehose (elevation) and not the length of the hose. See figure3.1.
Figure 3.1—Water Pressure vs Height—These figures showthe pressure on a square inch cross section caused by theheight of water above it. Note that as the column’s heightdoubles, so does the pressure. Both exact and rounded fieldapplication values are given.
The second consideration involves friction losses (FL). Asa field rule, the pressure in a line is reduced by 5 poundsper square inch for each appliance added to the line. Forexample, a hose lay with five wye valves will result in a 25pounds per square inch pressure loss due to the frictionintroduced by these fittings. This is an approximationused for calculations and is not precisely what occurs inthe field. See table 3.3 for friction loss in forestry hose.
Calculating Desired Nozzle and Pump Pressures—Engine and nozzle pressures are calculated as follows:DNP = Desired Nozzle PressureEP = Engine PressureHG = Head GainHL = Head LossFL = Friction Loss
Desired Nozzle Pressure =Engine (Pump) Pressure ± Head Gain/Head Loss
Friction Loss:DNP = EP ± HG/HL – FL
When calculating desired nozzle pressure in a downhillhose lay, add the head pressure. In uphill hose lays,subtract the head pressure. The calculations vary toaccount for the work of gravity.
In terms of engine pressure: EP = DNP + HL/-HG + FLWhen calculating engine pressure in downhill hose lays,subtract the head pressure; in uphill hose lays, add thehead pressure.
The head pressure is in terms of loss or gain. Because thepump and the nozzle are at opposite ends of the hose,head pressure that is positive at the pump, will benegative at the nozzle and vice versa. See figure 3.1. It iscrucial that the sign of the head pressure be correct. If thehose lay is uphill, the head pressure is negative, and if it isdownhill, the head pressure is positive. Careful attentionmust be paid to the second equation above, when thesigns are switched.
1 ft.
2 ft.
3 ft.
Actual 0.434 psi 0.868 psi 1.302 psiRounded 0.5 psi 1.0 psi 1.5 psiDifference due 0.066 psi 0.132 psi 0.198 psito rounding
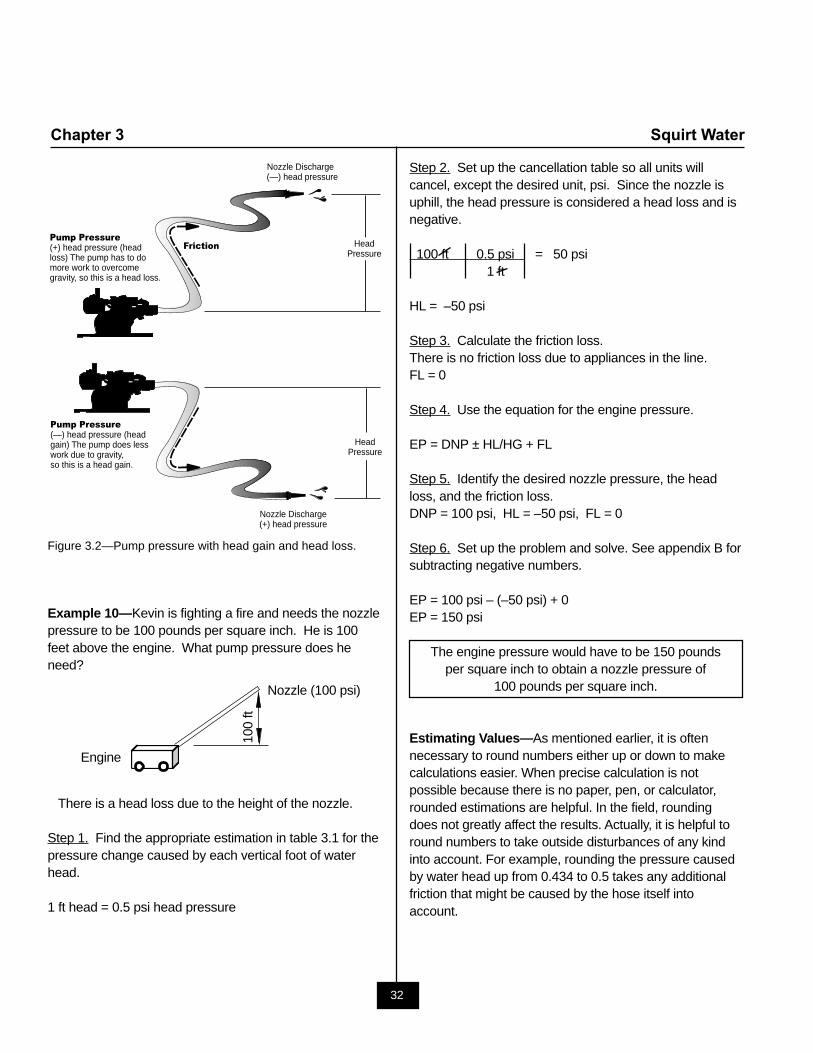
32
Chapter 3 Squirt Water
Figure 3.2—Pump pressure with head gain and head loss.
Example 10—Kevin is fighting a fire and needs the nozzlepressure to be 100 pounds per square inch. He is 100feet above the engine. What pump pressure does heneed?
There is a head loss due to the height of the nozzle.
Step 1. Find the appropriate estimation in table 3.1 for thepressure change caused by each vertical foot of waterhead.
1 ft head = 0.5 psi head pressure
Friction HeadPressure
HeadPressure
Nozzle Discharge(—) head pressure
Nozzle Discharge(+) head pressure
Pump Pressure(+) head pressure (headloss) The pump has to domore work to overcomegravity, so this is a head loss.
Pump Pressure(—) head pressure (headgain) The pump does lesswork due to gravity, so this is a head gain.
Nozzle (100 psi)
100
ft
Engine
Step 2. Set up the cancellation table so all units willcancel, except the desired unit, psi. Since the nozzle isuphill, the head pressure is considered a head loss and isnegative.
100 ft 0.5 psi = 50 psi1 ft
HL = –50 psi
Step 3. Calculate the friction loss.There is no friction loss due to appliances in the line.FL = 0
Step 4. Use the equation for the engine pressure.
EP = DNP ± HL/HG + FL
Step 5. Identify the desired nozzle pressure, the headloss, and the friction loss.DNP = 100 psi, HL = –50 psi, FL = 0
Step 6. Set up the problem and solve. See appendix B forsubtracting negative numbers.
EP = 100 psi – (–50 psi) + 0EP = 150 psi
The engine pressure would have to be 150 poundsper square inch to obtain a nozzle pressure of
100 pounds per square inch.
Estimating Values—As mentioned earlier, it is oftennecessary to round numbers either up or down to makecalculations easier. When precise calculation is notpossible because there is no paper, pen, or calculator,rounded estimations are helpful. In the field, roundingdoes not greatly affect the results. Actually, it is helpful toround numbers to take outside disturbances of any kindinto account. For example, rounding the pressure causedby water head up from 0.434 to 0.5 takes any additionalfriction that might be caused by the hose itself intoaccount.
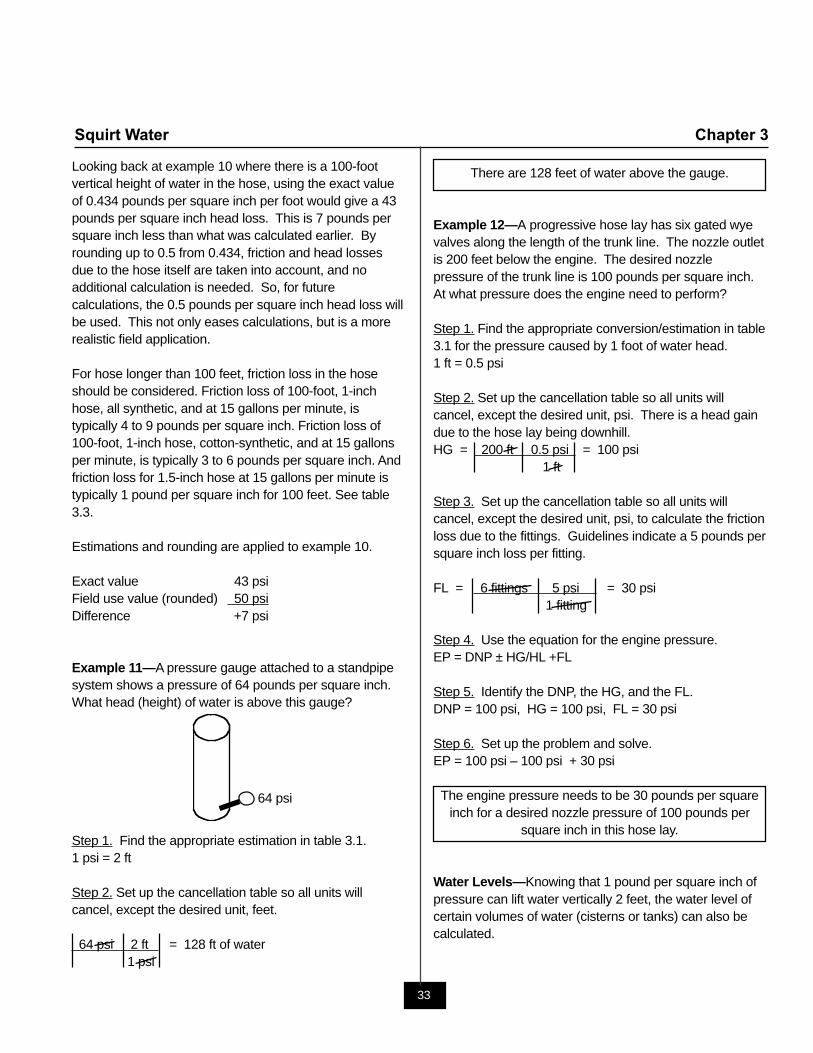
33
Squirt Water Chapter 3
Looking back at example 10 where there is a 100-footvertical height of water in the hose, using the exact valueof 0.434 pounds per square inch per foot would give a 43pounds per square inch head loss. This is 7 pounds persquare inch less than what was calculated earlier. Byrounding up to 0.5 from 0.434, friction and head lossesdue to the hose itself are taken into account, and noadditional calculation is needed. So, for futurecalculations, the 0.5 pounds per square inch head loss willbe used. This not only eases calculations, but is a morerealistic field application.
For hose longer than 100 feet, friction loss in the hoseshould be considered. Friction loss of 100-foot, 1-inchhose, all synthetic, and at 15 gallons per minute, istypically 4 to 9 pounds per square inch. Friction loss of100-foot, 1-inch hose, cotton-synthetic, and at 15 gallonsper minute, is typically 3 to 6 pounds per square inch. Andfriction loss for 1.5-inch hose at 15 gallons per minute istypically 1 pound per square inch for 100 feet. See table3.3.
Estimations and rounding are applied to example 10.
Exact value 43 psiField use value (rounded) 50 psiDifference +7 psi
Example 11—A pressure gauge attached to a standpipesystem shows a pressure of 64 pounds per square inch.What head (height) of water is above this gauge?
Step 1. Find the appropriate estimation in table 3.1.1 psi = 2 ft
Step 2. Set up the cancellation table so all units willcancel, except the desired unit, feet.
64 psi 2 ft = 128 ft of water1 psi
64 psi
There are 128 feet of water above the gauge.
Example 12—A progressive hose lay has six gated wyevalves along the length of the trunk line. The nozzle outletis 200 feet below the engine. The desired nozzlepressure of the trunk line is 100 pounds per square inch.At what pressure does the engine need to perform?
Step 1. Find the appropriate conversion/estimation in table3.1 for the pressure caused by 1 foot of water head.1 ft = 0.5 psi
Step 2. Set up the cancellation table so all units willcancel, except the desired unit, psi. There is a head gaindue to the hose lay being downhill.HG = 200 ft 0.5 psi = 100 psi
1 ft
Step 3. Set up the cancellation table so all units willcancel, except the desired unit, psi, to calculate the frictionloss due to the fittings. Guidelines indicate a 5 pounds persquare inch loss per fitting.
FL = 6 fittings 5 psi = 30 psi1 fitting
Step 4. Use the equation for the engine pressure.EP = DNP ± HG/HL +FL
Step 5. Identify the DNP, the HG, and the FL.DNP = 100 psi, HG = 100 psi, FL = 30 psi
Step 6. Set up the problem and solve.EP = 100 psi – 100 psi + 30 psi
The engine pressure needs to be 30 pounds per squareinch for a desired nozzle pressure of 100 pounds per
square inch in this hose lay.
Water Levels—Knowing that 1 pound per square inch ofpressure can lift water vertically 2 feet, the water level ofcertain volumes of water (cisterns or tanks) can also becalculated.
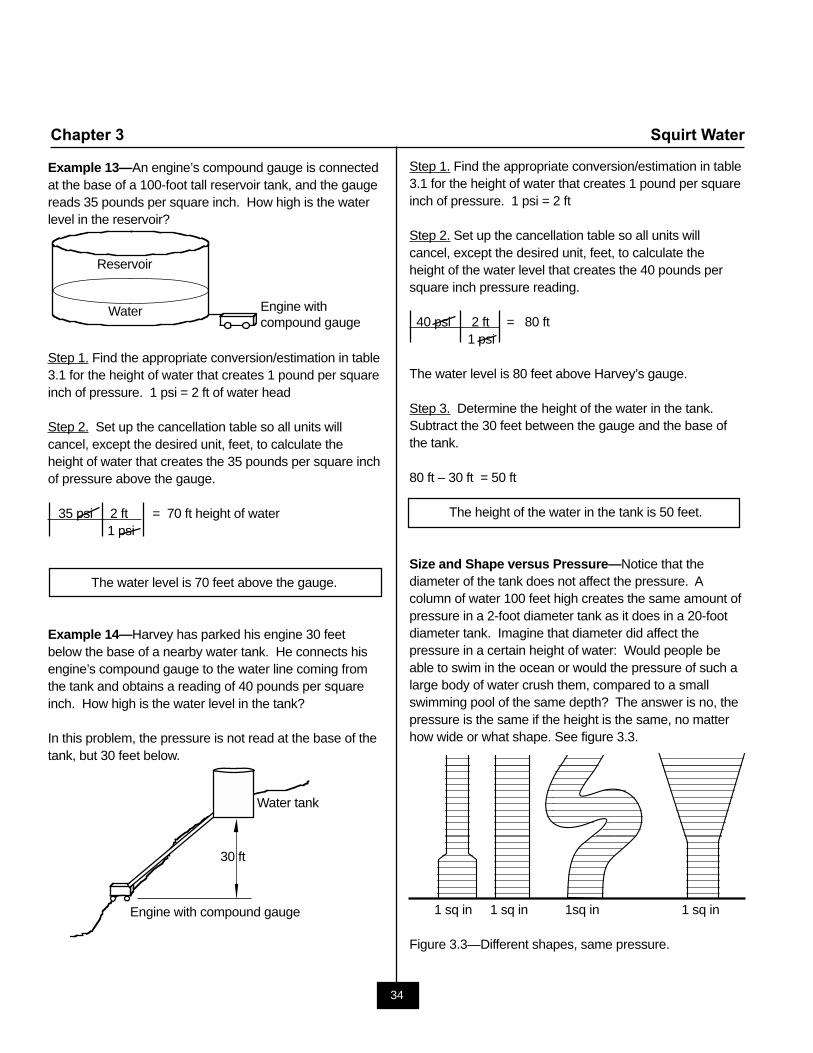
34
Chapter 3 Squirt Water
Example 13—An engine’s compound gauge is connectedat the base of a 100-foot tall reservoir tank, and the gaugereads 35 pounds per square inch. How high is the waterlevel in the reservoir?
Step 1. Find the appropriate conversion/estimation in table3.1 for the height of water that creates 1 pound per squareinch of pressure. 1 psi = 2 ft of water head
Step 2. Set up the cancellation table so all units willcancel, except the desired unit, feet, to calculate theheight of water that creates the 35 pounds per square inchof pressure above the gauge.
35 psi 2 ft = 70 ft height of water1 psi
The water level is 70 feet above the gauge.
Example 14—Harvey has parked his engine 30 feetbelow the base of a nearby water tank. He connects hisengine’s compound gauge to the water line coming fromthe tank and obtains a reading of 40 pounds per squareinch. How high is the water level in the tank?
In this problem, the pressure is not read at the base of thetank, but 30 feet below.
Water tank
Engine with compound gauge
30 ft
Step 1. Find the appropriate conversion/estimation in table3.1 for the height of water that creates 1 pound per squareinch of pressure. 1 psi = 2 ft
Step 2. Set up the cancellation table so all units willcancel, except the desired unit, feet, to calculate theheight of the water level that creates the 40 pounds persquare inch pressure reading.
40 psi 2 ft = 80 ft1 psi
The water level is 80 feet above Harvey’s gauge.
Step 3. Determine the height of the water in the tank.Subtract the 30 feet between the gauge and the base ofthe tank.
80 ft – 30 ft = 50 ft
The height of the water in the tank is 50 feet.
Size and Shape versus Pressure—Notice that thediameter of the tank does not affect the pressure. Acolumn of water 100 feet high creates the same amount ofpressure in a 2-foot diameter tank as it does in a 20-footdiameter tank. Imagine that diameter did affect thepressure in a certain height of water: Would people beable to swim in the ocean or would the pressure of such alarge body of water crush them, compared to a smallswimming pool of the same depth? The answer is no, thepressure is the same if the height is the same, no matterhow wide or what shape. See figure 3.3.
1 sq in 1 sq in 1sq in 1 sq in
Figure 3.3—Different shapes, same pressure.
Engine withcompound gauge
Water
Reservoir
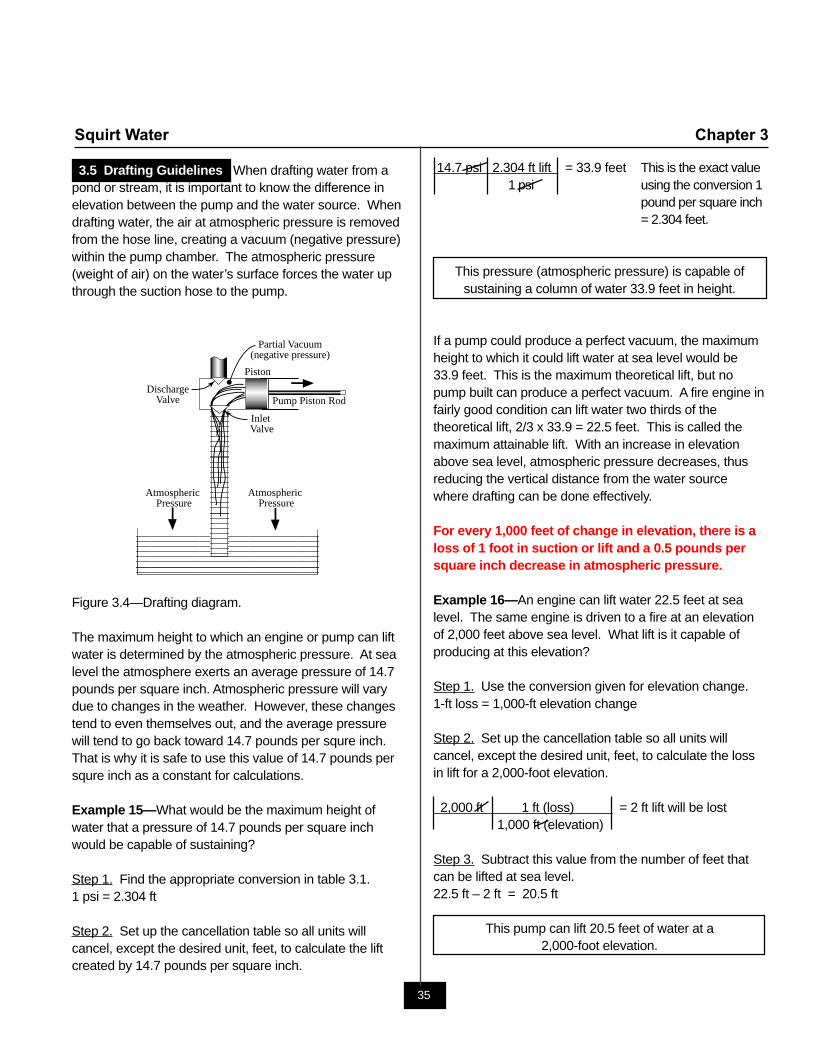
35
Squirt Water Chapter 3
Pump Piston Rod
Piston
DischargeValve
Inlet Valve
Partial Vacuum(negative pressure)
Atmospheric Pressure
Atmospheric Pressure
3.5 Drafting Guidelines When drafting water from apond or stream, it is important to know the difference inelevation between the pump and the water source. Whendrafting water, the air at atmospheric pressure is removedfrom the hose line, creating a vacuum (negative pressure)within the pump chamber. The atmospheric pressure(weight of air) on the water’s surface forces the water upthrough the suction hose to the pump.
Figure 3.4—Drafting diagram.
The maximum height to which an engine or pump can liftwater is determined by the atmospheric pressure. At sealevel the atmosphere exerts an average pressure of 14.7pounds per square inch. Atmospheric pressure will varydue to changes in the weather. However, these changestend to even themselves out, and the average pressurewill tend to go back toward 14.7 pounds per squre inch.That is why it is safe to use this value of 14.7 pounds persqure inch as a constant for calculations.
Example 15—What would be the maximum height ofwater that a pressure of 14.7 pounds per square inchwould be capable of sustaining?
Step 1. Find the appropriate conversion in table 3.1.1 psi = 2.304 ft
Step 2. Set up the cancellation table so all units willcancel, except the desired unit, feet, to calculate the liftcreated by 14.7 pounds per square inch.
14.7 psi 2.304 ft lift = 33.9 feet This is the exact value1 psi using the conversion 1
pound per square inch= 2.304 feet.
This pressure (atmospheric pressure) is capable ofsustaining a column of water 33.9 feet in height.
If a pump could produce a perfect vacuum, the maximumheight to which it could lift water at sea level would be33.9 feet. This is the maximum theoretical lift, but nopump built can produce a perfect vacuum. A fire engine infairly good condition can lift water two thirds of thetheoretical lift, 2/3 x 33.9 = 22.5 feet. This is called themaximum attainable lift. With an increase in elevationabove sea level, atmospheric pressure decreases, thusreducing the vertical distance from the water sourcewhere drafting can be done effectively.
For every 1,000 feet of change in elevation, there is aloss of 1 foot in suction or lift and a 0.5 pounds persquare inch decrease in atmospheric pressure.
Example 16—An engine can lift water 22.5 feet at sealevel. The same engine is driven to a fire at an elevationof 2,000 feet above sea level. What lift is it capable ofproducing at this elevation?
Step 1. Use the conversion given for elevation change.1-ft loss = 1,000-ft elevation change
Step 2. Set up the cancellation table so all units willcancel, except the desired unit, feet, to calculate the lossin lift for a 2,000-foot elevation.
2,000 ft 1 ft (loss) = 2 ft lift will be lost1,000 ft (elevation)
Step 3. Subtract this value from the number of feet thatcan be lifted at sea level.22.5 ft – 2 ft = 20.5 ft
This pump can lift 20.5 feet of water at a2,000-foot elevation.
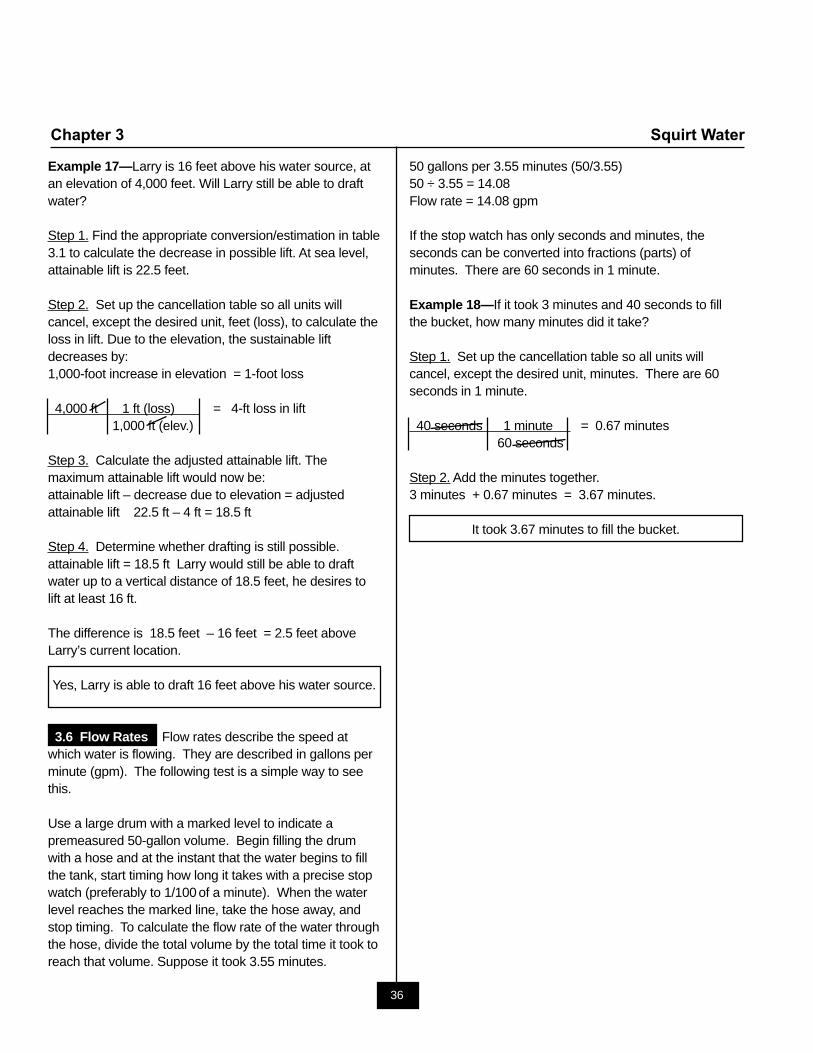
36
Chapter 3 Squirt Water
Example 17—Larry is 16 feet above his water source, atan elevation of 4,000 feet. Will Larry still be able to draftwater?
Step 1. Find the appropriate conversion/estimation in table3.1 to calculate the decrease in possible lift. At sea level,attainable lift is 22.5 feet.
Step 2. Set up the cancellation table so all units willcancel, except the desired unit, feet (loss), to calculate theloss in lift. Due to the elevation, the sustainable liftdecreases by:1,000-foot increase in elevation = 1-foot loss
4,000 ft 1 ft (loss) = 4-ft loss in lift1,000 ft (elev.)
Step 3. Calculate the adjusted attainable lift. Themaximum attainable lift would now be:attainable lift – decrease due to elevation = adjustedattainable lift 22.5 ft – 4 ft = 18.5 ft
Step 4. Determine whether drafting is still possible.attainable lift = 18.5 ft Larry would still be able to draftwater up to a vertical distance of 18.5 feet, he desires tolift at least 16 ft.
The difference is 18.5 feet – 16 feet = 2.5 feet aboveLarry’s current location.
Yes, Larry is able to draft 16 feet above his water source.
3.6 Flow Rates Flow rates describe the speed atwhich water is flowing. They are described in gallons perminute (gpm). The following test is a simple way to seethis.
Use a large drum with a marked level to indicate apremeasured 50-gallon volume. Begin filling the drumwith a hose and at the instant that the water begins to fillthe tank, start timing how long it takes with a precise stopwatch (preferably to 1/100 of a minute). When the waterlevel reaches the marked line, take the hose away, andstop timing. To calculate the flow rate of the water throughthe hose, divide the total volume by the total time it took toreach that volume. Suppose it took 3.55 minutes.
50 gallons per 3.55 minutes (50/3.55)50 ÷ 3.55 = 14.08Flow rate = 14.08 gpm
If the stop watch has only seconds and minutes, theseconds can be converted into fractions (parts) ofminutes. There are 60 seconds in 1 minute.
Example 18—If it took 3 minutes and 40 seconds to fillthe bucket, how many minutes did it take?
Step 1. Set up the cancellation table so all units willcancel, except the desired unit, minutes. There are 60seconds in 1 minute.
40 seconds 1 minute = 0.67 minutes60 seconds
Step 2. Add the minutes together.3 minutes + 0.67 minutes = 3.67 minutes.
It took 3.67 minutes to fill the bucket.
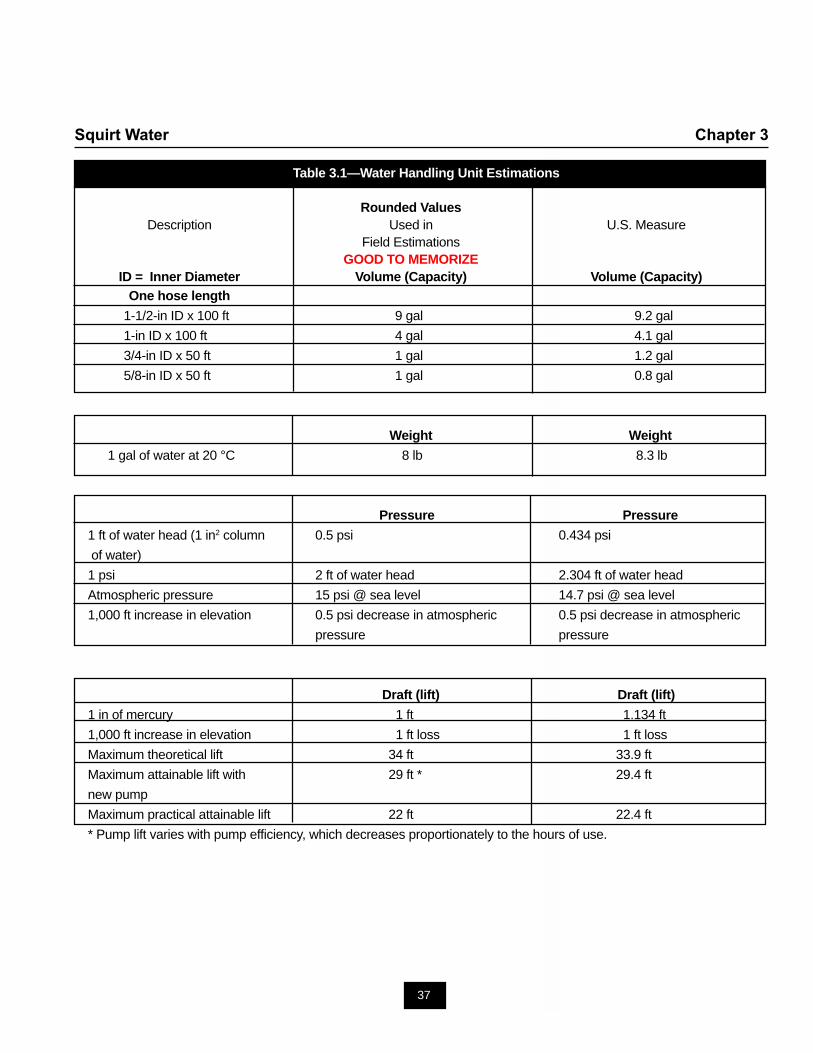
37
Squirt Water Chapter 3
Table 3.1—Water Handling Unit Estimations
Rounded ValuesDescription Used in U.S. Measure
Field EstimationsGOOD TO MEMORIZE
ID = Inner Diameter Volume (Capacity) Volume (Capacity)One hose length
1-1/2-in ID x 100 ft 9 gal 9.2 gal
1-in ID x 100 ft 4 gal 4.1 gal
3/4-in ID x 50 ft 1 gal 1.2 gal
5/8-in ID x 50 ft 1 gal 0.8 gal
Weight Weight
1 gal of water at 20 °C 8 lb 8.3 lb
Pressure Pressure
1 ft of water head (1 in2 column 0.5 psi 0.434 psi
of water)
1 psi 2 ft of water head 2.304 ft of water head
Atmospheric pressure 15 psi @ sea level 14.7 psi @ sea level
1,000 ft increase in elevation 0.5 psi decrease in atmospheric 0.5 psi decrease in atmospheric
pressure pressure
Draft (lift) Draft (lift)
1 in of mercury 1 ft 1.134 ft
1,000 ft increase in elevation 1 ft loss 1 ft loss
Maximum theoretical lift 34 ft 33.9 ft
Maximum attainable lift with 29 ft * 29.4 ft
new pump
Maximum practical attainable lift 22 ft 22.4 ft
* Pump lift varies with pump efficiency, which decreases proportionately to the hours of use.
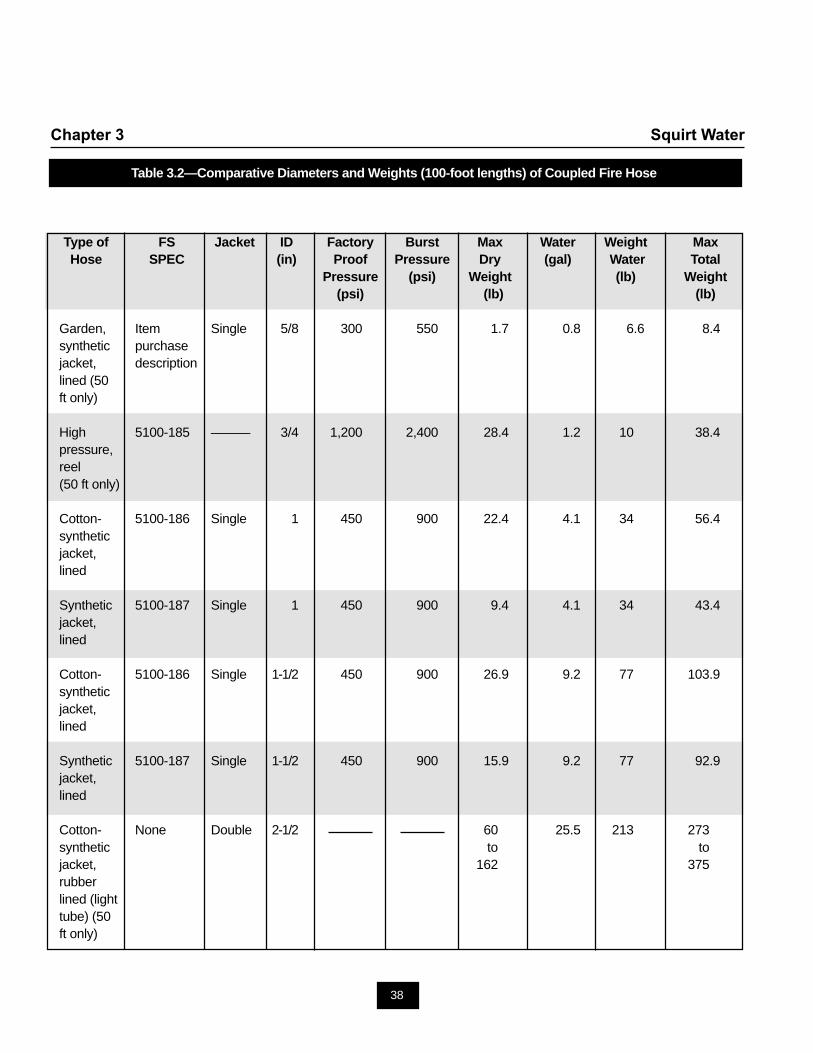
38
Chapter 3 Squirt Water
Table 3.2—Comparative Diameters and Weights (100-foot lengths) of Coupled Fire Hose
Type of FS Jacket ID Factory Burst Max Water Weight MaxHose SPEC (in) Proof Pressure Dry (gal) Water Total
Pressure (psi) Weight (lb) Weight(psi) (lb) (lb)
Garden, Item Single 5/8 300 550 1.7 0.8 6.6 8.4synthetic purchasejacket, descriptionlined (50ft only)
High 5100-185 ——— 3/4 1,200 2,400 28.4 1.2 10 38.4pressure,reel(50 ft only)
Cotton- 5100-186 Single 1 450 900 22.4 4.1 34 56.4syntheticjacket,lined
Synthetic 5100-187 Single 1 450 900 9.4 4.1 34 43.4jacket,lined
Cotton- 5100-186 Single 1-1/2 450 900 26.9 9.2 77 103.9syntheticjacket,lined
Synthetic 5100-187 Single 1-1/2 450 900 15.9 9.2 77 92.9jacket,lined
Cotton- None Double 2-1/2 60 25.5 213 273synthetic to tojacket, 162 375rubberlined (lighttube) (50ft only)
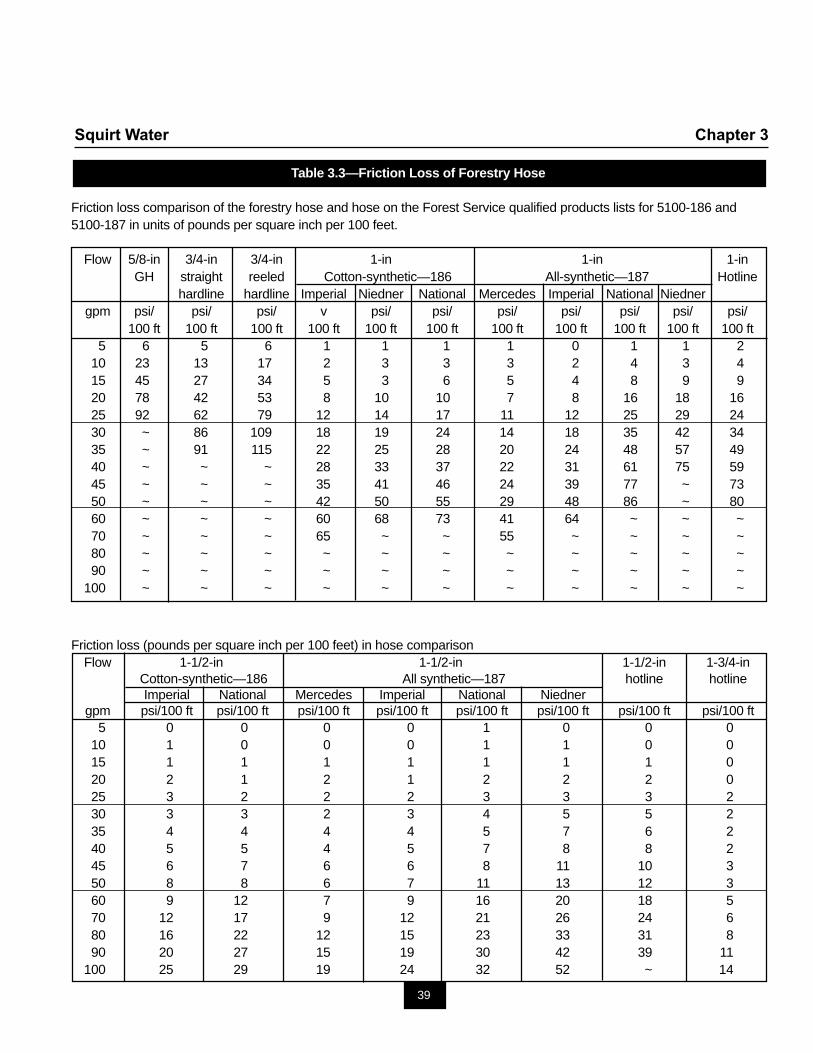
39
Squirt Water Chapter 3
Table 3.3—Friction Loss of Forestry Hose
Friction loss comparison of the forestry hose and hose on the Forest Service qualified products lists for 5100-186 and5100-187 in units of pounds per square inch per 100 feet.
Flow 5/8-in 3/4-in 3/4-in 1-in 1-in 1-inGH straight reeled Cotton-synthetic—186 All-synthetic—187 Hotline
hardline hardline Imperial Niedner National Mercedes Imperial National Niednergpm psi/ psi/ psi/ v psi/ psi/ psi/ psi/ psi/ psi/ psi/
100 ft 100 ft 100 ft 100 ft 100 ft 100 ft 100 ft 100 ft 100 ft 100 ft 100 ft5 6 5 6 1 1 1 1 0 1 1 2
10 23 13 17 2 3 3 3 2 4 3 415 45 27 34 5 3 6 5 4 8 9 920 78 42 53 8 10 10 7 8 16 18 1625 92 62 79 12 14 17 11 12 25 29 2430 ~ 86 109 18 19 24 14 18 35 42 3435 ~ 91 115 22 25 28 20 24 48 57 4940 ~ ~ ~ 28 33 37 22 31 61 75 5945 ~ ~ ~ 35 41 46 24 39 77 ~ 7350 ~ ~ ~ 42 50 55 29 48 86 ~ 8060 ~ ~ ~ 60 68 73 41 64 ~ ~ ~70 ~ ~ ~ 65 ~ ~ 55 ~ ~ ~ ~80 ~ ~ ~ ~ ~ ~ ~ ~ ~ ~ ~90 ~ ~ ~ ~ ~ ~ ~ ~ ~ ~ ~
100 ~ ~ ~ ~ ~ ~ ~ ~ ~ ~ ~
Friction loss (pounds per square inch per 100 feet) in hose comparisonFlow 1-1/2-in 1-1/2-in 1-1/2-in 1-3/4-in
Cotton-synthetic—186 All synthetic—187 hotline hotlineImperial National Mercedes Imperial National Niedner
gpm psi/100 ft psi/100 ft psi/100 ft psi/100 ft psi/100 ft psi/100 ft psi/100 ft psi/100 ft5 0 0 0 0 1 0 0 0
10 1 0 0 0 1 1 0 015 1 1 1 1 1 1 1 020 2 1 2 1 2 2 2 025 3 2 2 2 3 3 3 230 3 3 2 3 4 5 5 235 4 4 4 4 5 7 6 240 5 5 4 5 7 8 8 245 6 7 6 6 8 11 10 350 8 8 6 7 11 13 12 360 9 12 7 9 16 20 18 570 12 17 9 12 21 26 24 680 16 22 12 15 23 33 31 890 20 27 15 19 30 42 39 11
100 25 29 19 24 32 52 ~ 14
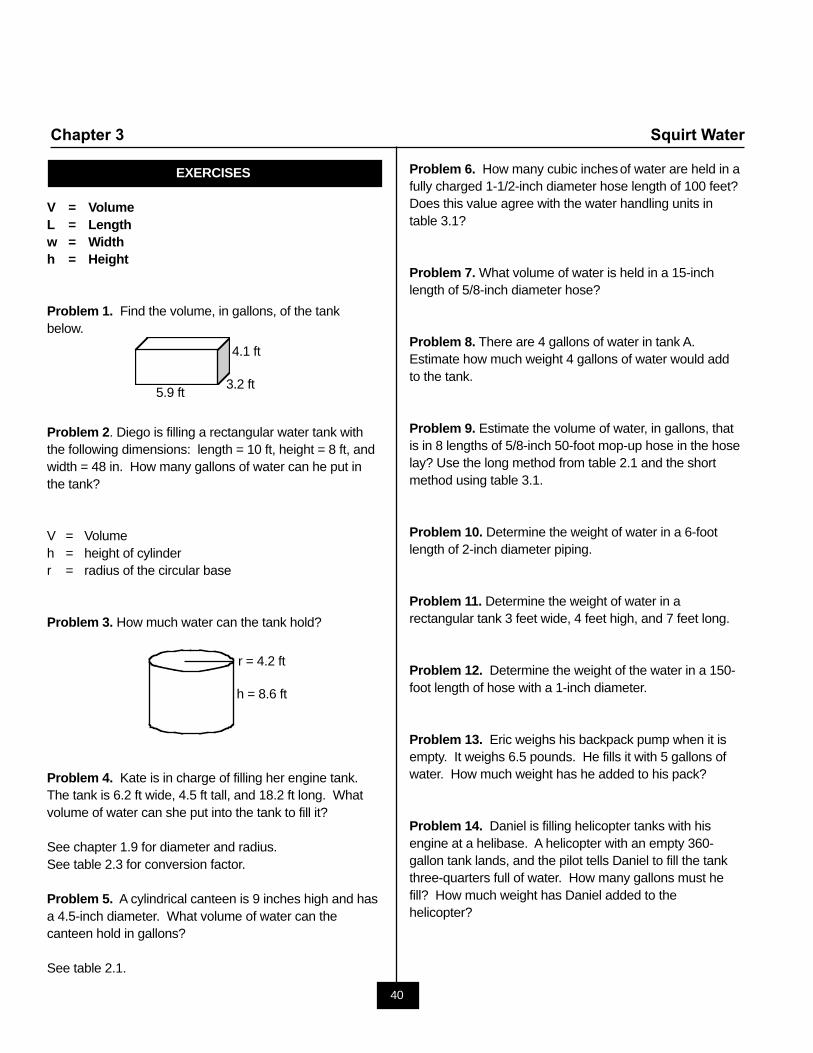
40
Chapter 3 Squirt Water
EXERCISES
V = VolumeL = Lengthw = Widthh = Height
Problem 1. Find the volume, in gallons, of the tankbelow.
Problem 2. Diego is filling a rectangular water tank withthe following dimensions: length = 10 ft, height = 8 ft, andwidth = 48 in. How many gallons of water can he put inthe tank?
V = Volumeh = height of cylinderr = radius of the circular base
Problem 3. How much water can the tank hold?
Problem 4. Kate is in charge of filling her engine tank.The tank is 6.2 ft wide, 4.5 ft tall, and 18.2 ft long. Whatvolume of water can she put into the tank to fill it?
See chapter 1.9 for diameter and radius.See table 2.3 for conversion factor.
Problem 5. A cylindrical canteen is 9 inches high and hasa 4.5-inch diameter. What volume of water can thecanteen hold in gallons?
See table 2.1.
Problem 6. How many cubic inches of water are held in afully charged 1-1/2-inch diameter hose length of 100 feet?Does this value agree with the water handling units intable 3.1?
Problem 7. What volume of water is held in a 15-inchlength of 5/8-inch diameter hose?
Problem 8. There are 4 gallons of water in tank A.Estimate how much weight 4 gallons of water would addto the tank.
Problem 9. Estimate the volume of water, in gallons, thatis in 8 lengths of 5/8-inch 50-foot mop-up hose in the hoselay? Use the long method from table 2.1 and the shortmethod using table 3.1.
Problem 10. Determine the weight of water in a 6-footlength of 2-inch diameter piping.
Problem 11. Determine the weight of water in arectangular tank 3 feet wide, 4 feet high, and 7 feet long.
Problem 12. Determine the weight of the water in a 150-foot length of hose with a 1-inch diameter.
Problem 13. Eric weighs his backpack pump when it isempty. It weighs 6.5 pounds. He fills it with 5 gallons ofwater. How much weight has he added to his pack?
Problem 14. Daniel is filling helicopter tanks with hisengine at a helibase. A helicopter with an empty 360-gallon tank lands, and the pilot tells Daniel to fill the tankthree-quarters full of water. How many gallons must hefill? How much weight has Daniel added to thehelicopter?
4.1 ft
3.2 ft 5.9 ft
r = 4.2 ft
h = 8.6 ft
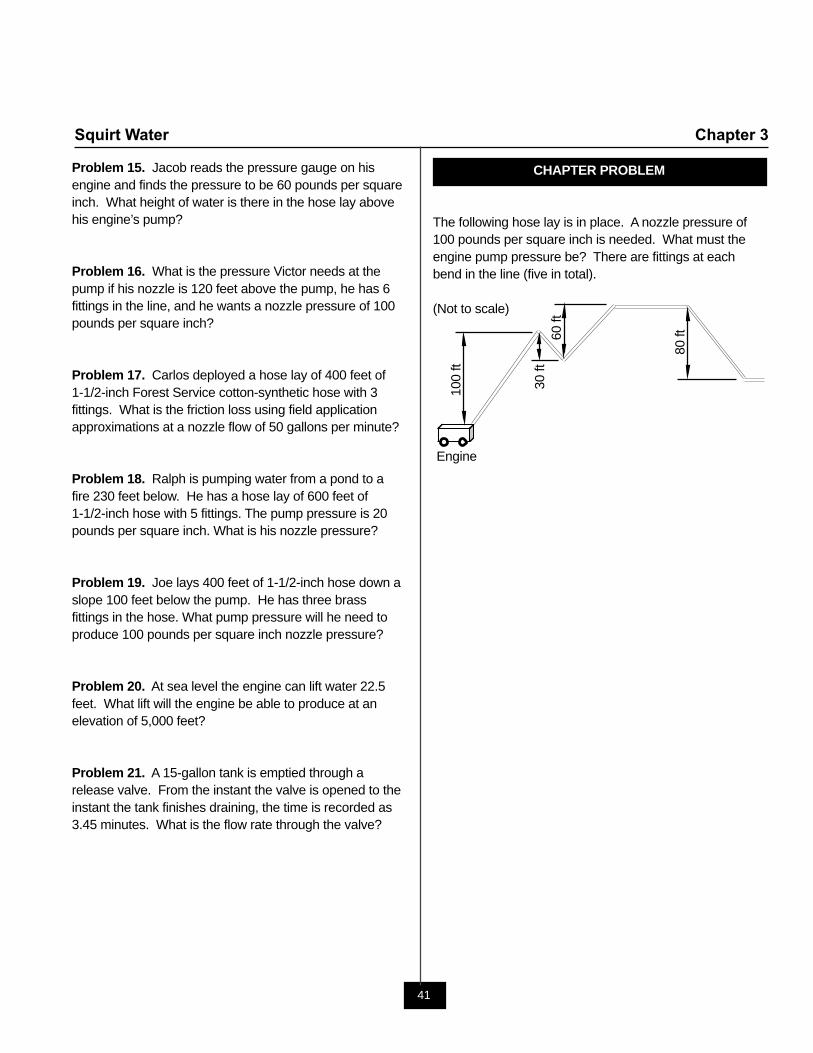
41
Squirt Water Chapter 3
Problem 15. Jacob reads the pressure gauge on hisengine and finds the pressure to be 60 pounds per squareinch. What height of water is there in the hose lay abovehis engine’s pump?
Problem 16. What is the pressure Victor needs at thepump if his nozzle is 120 feet above the pump, he has 6fittings in the line, and he wants a nozzle pressure of 100pounds per square inch?
Problem 17. Carlos deployed a hose lay of 400 feet of1-1/2-inch Forest Service cotton-synthetic hose with 3fittings. What is the friction loss using field applicationapproximations at a nozzle flow of 50 gallons per minute?
Problem 18. Ralph is pumping water from a pond to afire 230 feet below. He has a hose lay of 600 feet of1-1/2-inch hose with 5 fittings. The pump pressure is 20pounds per square inch. What is his nozzle pressure?
Problem 19. Joe lays 400 feet of 1-1/2-inch hose down aslope 100 feet below the pump. He has three brassfittings in the hose. What pump pressure will he need toproduce 100 pounds per square inch nozzle pressure?
Problem 20. At sea level the engine can lift water 22.5feet. What lift will the engine be able to produce at anelevation of 5,000 feet?
Problem 21. A 15-gallon tank is emptied through arelease valve. From the instant the valve is opened to theinstant the tank finishes draining, the time is recorded as3.45 minutes. What is the flow rate through the valve?
CHAPTER PROBLEM
The following hose lay is in place. A nozzle pressure of100 pounds per square inch is needed. What must theengine pump pressure be? There are fittings at eachbend in the line (five in total).
(Not to scale)
60 ft
80 ft
100
ft
30 ft
Engine
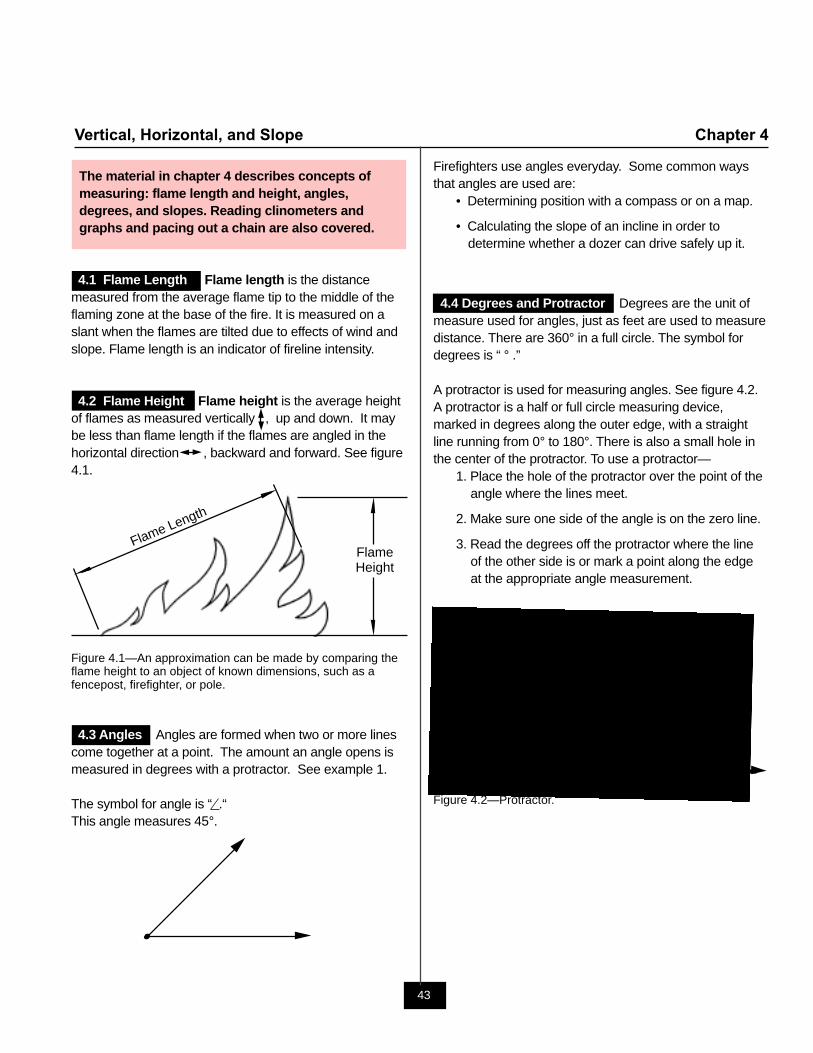
43
Vertical, Horizontal, and Slope Chapter 4
The material in chapter 4 describes concepts ofmeasuring: flame length and height, angles,degrees, and slopes. Reading clinometers andgraphs and pacing out a chain are also covered.
4.1 Flame Length Flame length is the distancemeasured from the average flame tip to the middle of theflaming zone at the base of the fire. It is measured on aslant when the flames are tilted due to effects of wind andslope. Flame length is an indicator of fireline intensity.
4.2 Flame Height Flame height is the average heightof flames as measured vertically , up and down. It maybe less than flame length if the flames are angled in thehorizontal direction , backward and forward. See figure4.1.
Figure 4.1—An approximation can be made by comparing theflame height to an object of known dimensions, such as afencepost, firefighter, or pole.
4.3 Angles Angles are formed when two or more linescome together at a point. The amount an angle opens ismeasured in degrees with a protractor. See example 1.
The symbol for angle is “ .“This angle measures 45°.
FlameHeight
Flame Length
Firefighters use angles everyday. Some common waysthat angles are used are:
• Determining position with a compass or on a map.
• Calculating the slope of an incline in order todetermine whether a dozer can drive safely up it.
4.4 Degrees and Protractor Degrees are the unit ofmeasure used for angles, just as feet are used to measuredistance. There are 360° in a full circle. The symbol fordegrees is “ ° .”
A protractor is used for measuring angles. See figure 4.2.A protractor is a half or full circle measuring device,marked in degrees along the outer edge, with a straightline running from 0° to 180°. There is also a small hole inthe center of the protractor. To use a protractor—
1. Place the hole of the protractor over the point of theangle where the lines meet.
2. Make sure one side of the angle is on the zero line.
3. Read the degrees off the protractor where the lineof the other side is or mark a point along the edgeat the appropriate angle measurement.
Figure 4.2—Protractor.
Baseline Index
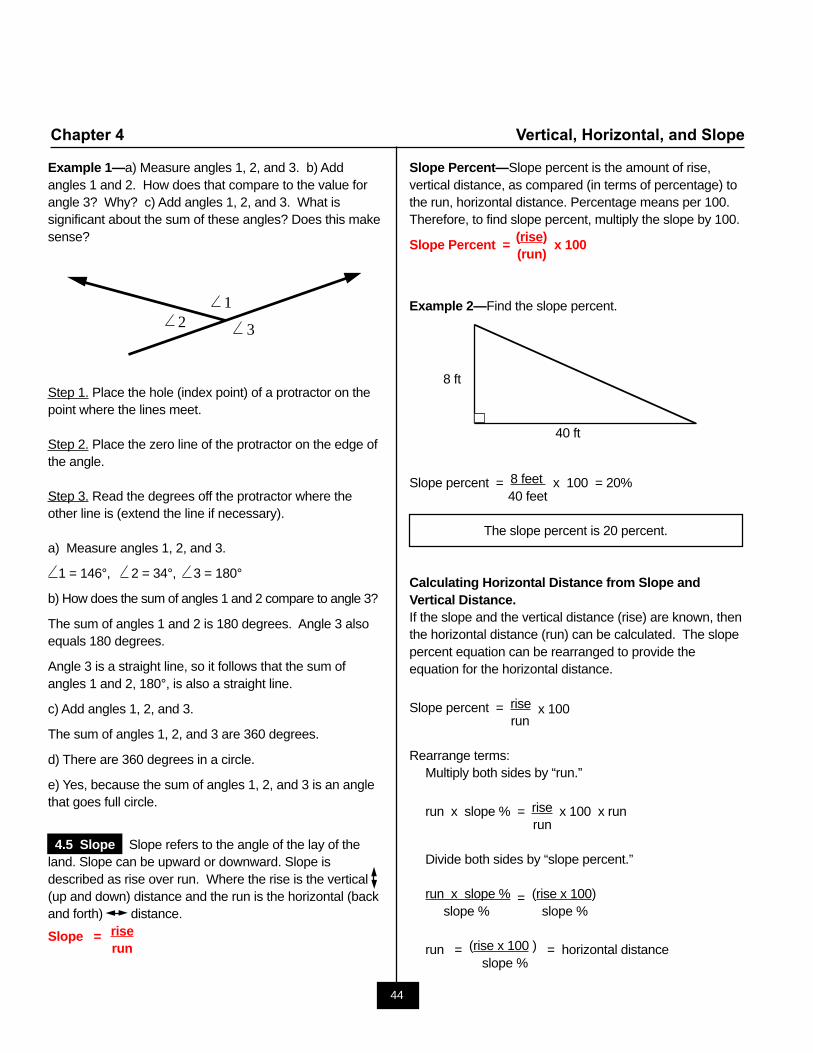
44
Chapter 4 Vertical, Horizontal, and Slope
Example 1—a) Measure angles 1, 2, and 3. b) Addangles 1 and 2. How does that compare to the value forangle 3? Why? c) Add angles 1, 2, and 3. What issignificant about the sum of these angles? Does this makesense?
Step 1. Place the hole (index point) of a protractor on thepoint where the lines meet.
Step 2. Place the zero line of the protractor on the edge ofthe angle.
Step 3. Read the degrees off the protractor where theother line is (extend the line if necessary).
a) Measure angles 1, 2, and 3.
1 = 146°, 2 = 34°, 3 = 180°
b) How does the sum of angles 1 and 2 compare to angle 3?
The sum of angles 1 and 2 is 180 degrees. Angle 3 alsoequals 180 degrees.
Angle 3 is a straight line, so it follows that the sum ofangles 1 and 2, 180°, is also a straight line.
c) Add angles 1, 2, and 3.
The sum of angles 1, 2, and 3 are 360 degrees.
d) There are 360 degrees in a circle.
e) Yes, because the sum of angles 1, 2, and 3 is an anglethat goes full circle.
4.5 Slope Slope refers to the angle of the lay of theland. Slope can be upward or downward. Slope isdescribed as rise over run. Where the rise is the vertical(up and down) distance and the run is the horizontal (backand forth) distance.
riseSlope = run
3
12
Slope Percent—Slope percent is the amount of rise,vertical distance, as compared (in terms of percentage) tothe run, horizontal distance. Percentage means per 100.Therefore, to find slope percent, multiply the slope by 100.
(rise) x 100Slope Percent =
(run)
Example 2—Find the slope percent.
Slope percent = 8 feet x 100 = 20%40 feet
The slope percent is 20 percent.
Calculating Horizontal Distance from Slope andVertical Distance.If the slope and the vertical distance (rise) are known, thenthe horizontal distance (run) can be calculated. The slopepercent equation can be rearranged to provide theequation for the horizontal distance.
Slope percent = rise x 100 run
Rearrange terms:Multiply both sides by “run.”
run x slope % = rise x 100 x runrun
Divide both sides by “slope percent.”
run x slope % = (rise x 100)slope % slope %
run = (rise x 100 ) = horizontal distanceslope %
8 ft
40 ft
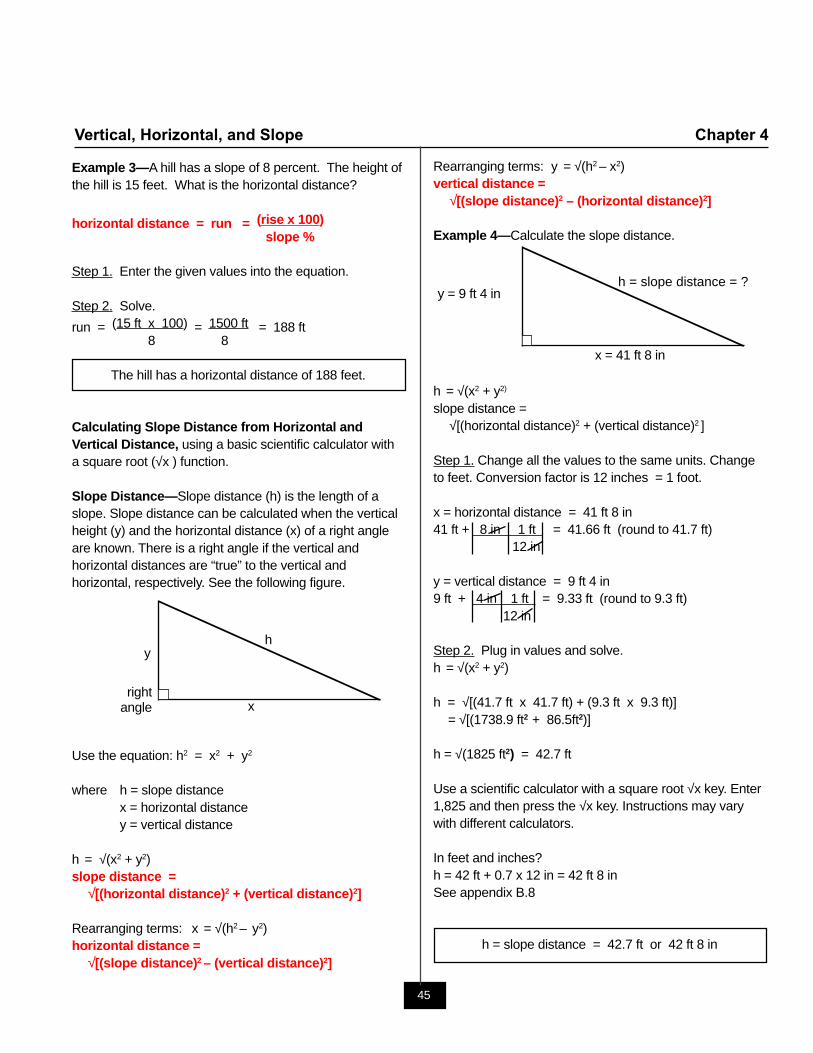
45
Vertical, Horizontal, and Slope Chapter 4
Example 3—A hill has a slope of 8 percent. The height ofthe hill is 15 feet. What is the horizontal distance?
horizontal distance = run = (rise x 100) slope %
Step 1. Enter the given values into the equation.
Step 2. Solve.
run = (15 ft x 100) = 1500 ft = 188 ft8 8
The hill has a horizontal distance of 188 feet.
Calculating Slope Distance from Horizontal andVertical Distance, using a basic scientific calculator witha square root (√x ) function.
Slope Distance—Slope distance (h) is the length of aslope. Slope distance can be calculated when the verticalheight (y) and the horizontal distance (x) of a right angleare known. There is a right angle if the vertical andhorizontal distances are “true” to the vertical andhorizontal, respectively. See the following figure.
Use the equation: h2 = x2 + y2
where h = slope distancex = horizontal distancey = vertical distance
h = √(x2 + y2)slope distance =
√[(horizontal distance)2 + (vertical distance)2]
Rearranging terms: x = √(h2 – y2)horizontal distance =
√[(slope distance)2 – (vertical distance)2]
rightangle
y h
x
Rearranging terms: y = √(h2 – x2)vertical distance =
√[(slope distance)2 – (horizontal distance)2]
Example 4—Calculate the slope distance.
h = √(x2 + y2)
slope distance =√[(horizontal distance)2 + (vertical distance)2 ]
Step 1. Change all the values to the same units. Changeto feet. Conversion factor is 12 inches = 1 foot.
x = horizontal distance = 41 ft 8 in41 ft + 8 in 1 ft = 41.66 ft (round to 41.7 ft)
12 in
y = vertical distance = 9 ft 4 in9 ft + 4 in 1 ft = 9.33 ft (round to 9.3 ft)
12 in
Step 2. Plug in values and solve.h = √(x2 + y2)
h = √[(41.7 ft x 41.7 ft) + (9.3 ft x 9.3 ft)]= √[(1738.9 ft2 + 86.5ft2)]
h = √(1825 ft2) = 42.7 ft
Use a scientific calculator with a square root √x key. Enter1,825 and then press the √x key. Instructions may varywith different calculators.
In feet and inches?h = 42 ft + 0.7 x 12 in = 42 ft 8 inSee appendix B.8
h = slope distance = 42.7 ft or 42 ft 8 in
h = slope distance = ?
x = 41 ft 8 in
y = 9 ft 4 in
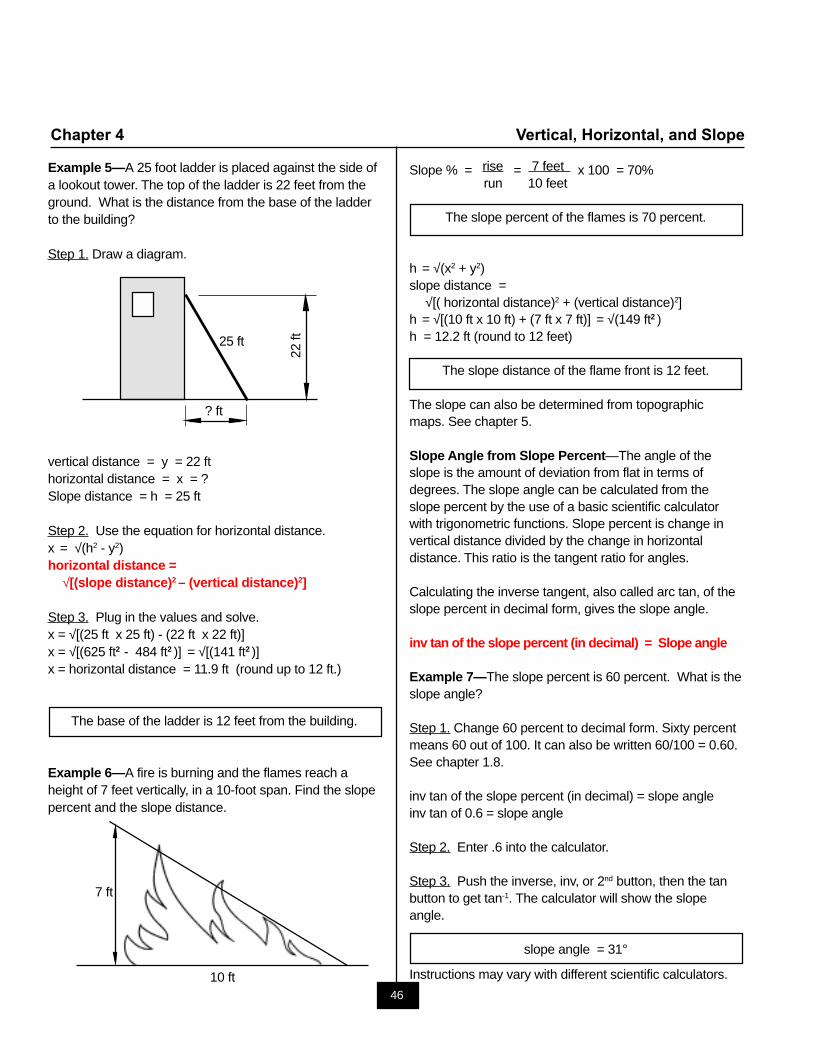
46
Chapter 4 Vertical, Horizontal, and Slope
Example 5—A 25 foot ladder is placed against the side ofa lookout tower. The top of the ladder is 22 feet from theground. What is the distance from the base of the ladderto the building?
Step 1. Draw a diagram.
vertical distance = y = 22 fthorizontal distance = x = ?Slope distance = h = 25 ft
Step 2. Use the equation for horizontal distance.x = √(h2 - y2)horizontal distance =
√[(slope distance)2 – (vertical distance)2]
Step 3. Plug in the values and solve.x = √[(25 ft x 25 ft) - (22 ft x 22 ft)]x = √[(625 ft2 - 484 ft2 )] = √[(141 ft2 )]x = horizontal distance = 11.9 ft (round up to 12 ft.)
The base of the ladder is 12 feet from the building.
Example 6—A fire is burning and the flames reach aheight of 7 feet vertically, in a 10-foot span. Find the slopepercent and the slope distance.
22 ft25 ft
? ft
7 ft
10 ft
Slope % = rise = 7 feet x 100 = 70%run 10 feet
The slope percent of the flames is 70 percent.
h = √(x2 + y2)slope distance =
√[( horizontal distance)2 + (vertical distance)2]h = √[(10 ft x 10 ft) + (7 ft x 7 ft)] = √(149 ft2 )h = 12.2 ft (round to 12 feet)
The slope distance of the flame front is 12 feet.
The slope can also be determined from topographicmaps. See chapter 5.
Slope Angle from Slope Percent—The angle of theslope is the amount of deviation from flat in terms ofdegrees. The slope angle can be calculated from theslope percent by the use of a basic scientific calculatorwith trigonometric functions. Slope percent is change invertical distance divided by the change in horizontaldistance. This ratio is the tangent ratio for angles.
Calculating the inverse tangent, also called arc tan, of theslope percent in decimal form, gives the slope angle.
inv tan of the slope percent (in decimal) = Slope angle
Example 7—The slope percent is 60 percent. What is theslope angle?
Step 1. Change 60 percent to decimal form. Sixty percentmeans 60 out of 100. It can also be written 60/100 = 0.60.See chapter 1.8.
inv tan of the slope percent (in decimal) = slope angleinv tan of 0.6 = slope angle
Step 2. Enter .6 into the calculator.
Step 3. Push the inverse, inv, or 2nd button, then the tanbutton to get tan-1. The calculator will show the slopeangle.
slope angle = 31°
Instructions may vary with different scientific calculators.
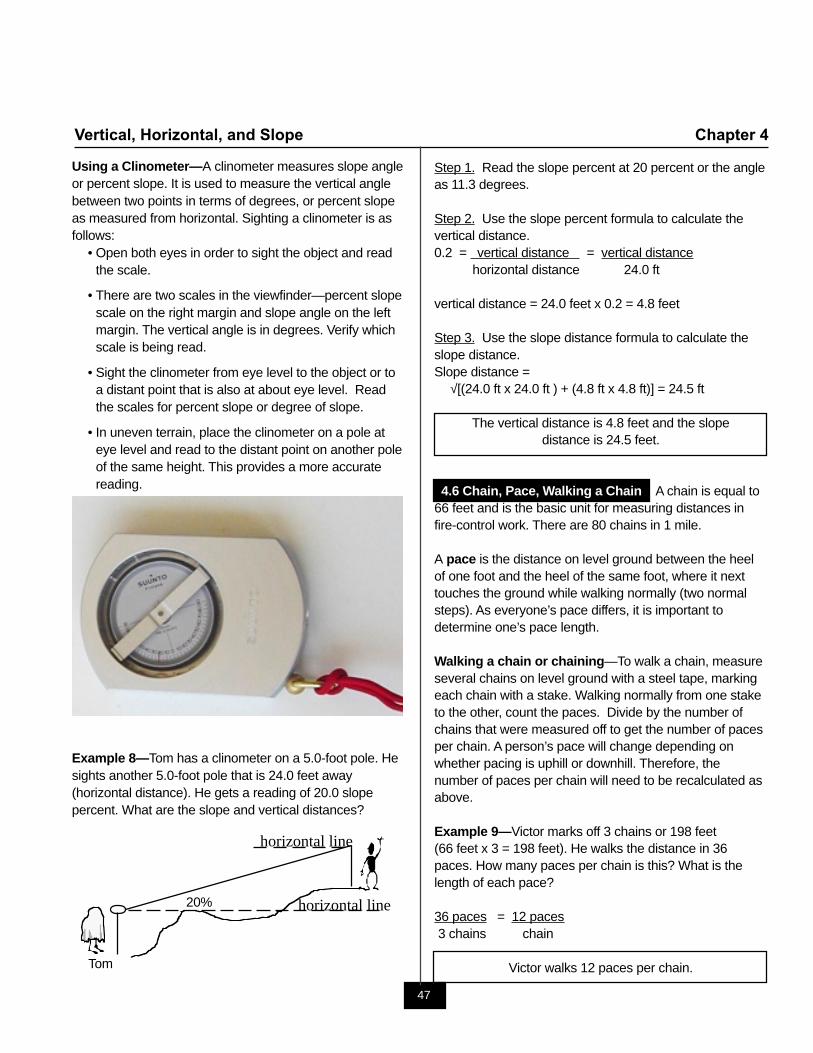
47
Vertical, Horizontal, and Slope Chapter 4
Using a Clinometer—A clinometer measures slope angleor percent slope. It is used to measure the vertical anglebetween two points in terms of degrees, or percent slopeas measured from horizontal. Sighting a clinometer is asfollows:
• Open both eyes in order to sight the object and readthe scale.
• There are two scales in the viewfinder—percent slopescale on the right margin and slope angle on the leftmargin. The vertical angle is in degrees. Verify whichscale is being read.
• Sight the clinometer from eye level to the object or toa distant point that is also at about eye level. Readthe scales for percent slope or degree of slope.
• In uneven terrain, place the clinometer on a pole ateye level and read to the distant point on another poleof the same height. This provides a more accuratereading.
Example 8—Tom has a clinometer on a 5.0-foot pole. Hesights another 5.0-foot pole that is 24.0 feet away(horizontal distance). He gets a reading of 20.0 slopepercent. What are the slope and vertical distances?
20%
Tom
horizontal line
horizontal line
Step 1. Read the slope percent at 20 percent or the angleas 11.3 degrees.
Step 2. Use the slope percent formula to calculate thevertical distance.0.2 = vertical distance = vertical distance
horizontal distance 24.0 ft
vertical distance = 24.0 feet x 0.2 = 4.8 feet
Step 3. Use the slope distance formula to calculate theslope distance.Slope distance =
√[(24.0 ft x 24.0 ft ) + (4.8 ft x 4.8 ft)] = 24.5 ft
The vertical distance is 4.8 feet and the slopedistance is 24.5 feet.
4.6 Chain, Pace, Walking a Chain A chain is equal to66 feet and is the basic unit for measuring distances infire-control work. There are 80 chains in 1 mile.
A pace is the distance on level ground between the heelof one foot and the heel of the same foot, where it nexttouches the ground while walking normally (two normalsteps). As everyone’s pace differs, it is important todetermine one’s pace length.
Walking a chain or chaining—To walk a chain, measureseveral chains on level ground with a steel tape, markingeach chain with a stake. Walking normally from one staketo the other, count the paces. Divide by the number ofchains that were measured off to get the number of pacesper chain. A person’s pace will change depending onwhether pacing is uphill or downhill. Therefore, thenumber of paces per chain will need to be recalculated asabove.
Example 9—Victor marks off 3 chains or 198 feet(66 feet x 3 = 198 feet). He walks the distance in 36paces. How many paces per chain is this? What is thelength of each pace?
36 paces = 12 paces3 chains chain
Victor walks 12 paces per chain.
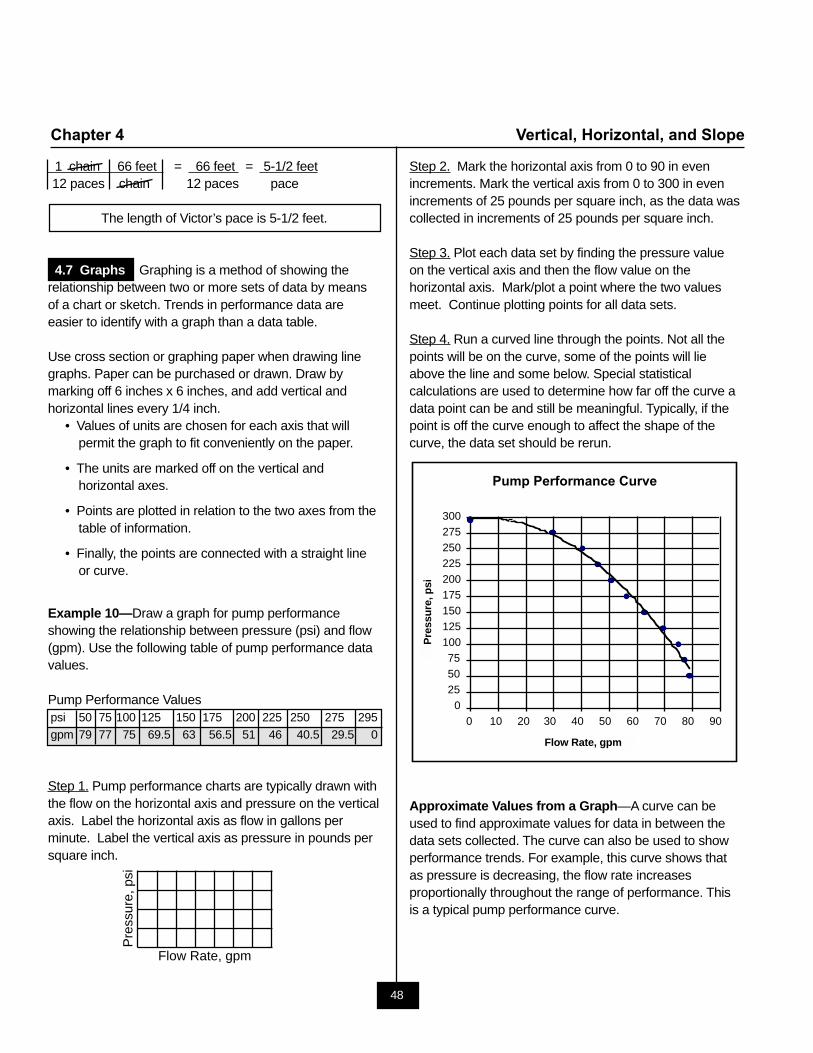
48
Chapter 4 Vertical, Horizontal, and Slope
Step 2. Mark the horizontal axis from 0 to 90 in evenincrements. Mark the vertical axis from 0 to 300 in evenincrements of 25 pounds per square inch, as the data wascollected in increments of 25 pounds per square inch.
Step 3. Plot each data set by finding the pressure valueon the vertical axis and then the flow value on thehorizontal axis. Mark/plot a point where the two valuesmeet. Continue plotting points for all data sets.
Step 4. Run a curved line through the points. Not all thepoints will be on the curve, some of the points will lieabove the line and some below. Special statisticalcalculations are used to determine how far off the curve adata point can be and still be meaningful. Typically, if thepoint is off the curve enough to affect the shape of thecurve, the data set should be rerun.
Approximate Values from a Graph—A curve can beused to find approximate values for data in between thedata sets collected. The curve can also be used to showperformance trends. For example, this curve shows thatas pressure is decreasing, the flow rate increasesproportionally throughout the range of performance. Thisis a typical pump performance curve.
1 chain 66 feet = 66 feet = 5-1/2 feet12 paces chain 12 paces pace
The length of Victor’s pace is 5-1/2 feet.
4.7 Graphs Graphing is a method of showing therelationship between two or more sets of data by meansof a chart or sketch. Trends in performance data areeasier to identify with a graph than a data table.
Use cross section or graphing paper when drawing linegraphs. Paper can be purchased or drawn. Draw bymarking off 6 inches x 6 inches, and add vertical andhorizontal lines every 1/4 inch.
• Values of units are chosen for each axis that willpermit the graph to fit conveniently on the paper.
• The units are marked off on the vertical andhorizontal axes.
• Points are plotted in relation to the two axes from thetable of information.
• Finally, the points are connected with a straight lineor curve.
Example 10—Draw a graph for pump performanceshowing the relationship between pressure (psi) and flow(gpm). Use the following table of pump performance datavalues.
Pump Performance Valuespsi 50 75 100 125 150 175 200 225 250 275 295gpm 79 77 75 69.5 63 56.5 51 46 40.5 29.5 0
Step 1. Pump performance charts are typically drawn withthe flow on the horizontal axis and pressure on the verticalaxis. Label the horizontal axis as flow in gallons perminute. Label the vertical axis as pressure in pounds persquare inch.
Flow Rate, gpm
Pre
ssur
e, p
si
Pump Performance Curve
0255075
100125150175200225250275300
0 10 20 30 40 50 60 70 80 90
Flow Rate gpm
PrePre
ssu
re, p
si
Flow Rate, gpm
Pre
ssu
re, p
si
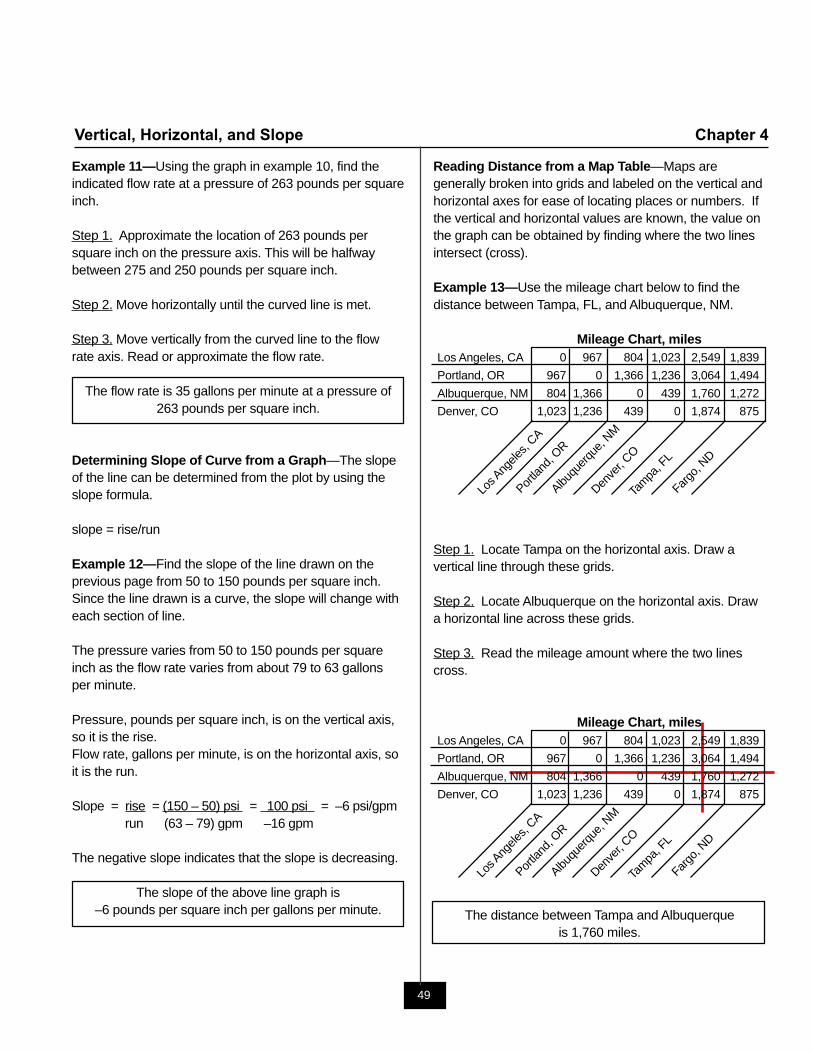
49
Vertical, Horizontal, and Slope Chapter 4
Los A
ngele
s, CA
Portla
nd, O
R
Denve
r, CO
Tam
pa, F
L
Albuqu
erqu
e, NM
Fargo
, ND
Example 11—Using the graph in example 10, find theindicated flow rate at a pressure of 263 pounds per squareinch.
Step 1. Approximate the location of 263 pounds persquare inch on the pressure axis. This will be halfwaybetween 275 and 250 pounds per square inch.
Step 2. Move horizontally until the curved line is met.
Step 3. Move vertically from the curved line to the flowrate axis. Read or approximate the flow rate.
The flow rate is 35 gallons per minute at a pressure of263 pounds per square inch.
Determining Slope of Curve from a Graph—The slopeof the line can be determined from the plot by using theslope formula.
slope = rise/run
Example 12—Find the slope of the line drawn on theprevious page from 50 to 150 pounds per square inch.Since the line drawn is a curve, the slope will change witheach section of line.
The pressure varies from 50 to 150 pounds per squareinch as the flow rate varies from about 79 to 63 gallonsper minute.
Pressure, pounds per square inch, is on the vertical axis,so it is the rise.Flow rate, gallons per minute, is on the horizontal axis, soit is the run.
Slope = rise = (150 – 50) psi = 100 psi = –6 psi/gpmrun (63 – 79) gpm –16 gpm
The negative slope indicates that the slope is decreasing.
The slope of the above line graph is–6 pounds per square inch per gallons per minute.
Reading Distance from a Map Table—Maps aregenerally broken into grids and labeled on the vertical andhorizontal axes for ease of locating places or numbers. Ifthe vertical and horizontal values are known, the value onthe graph can be obtained by finding where the two linesintersect (cross).
Example 13—Use the mileage chart below to find thedistance between Tampa, FL, and Albuquerque, NM.
Mileage Chart, milesLos Angeles, CA 0 967 804 1,023 2,549 1,839
Portland, OR 967 0 1,366 1,236 3,064 1,494
Albuquerque, NM 804 1,366 0 439 1,760 1,272
Denver, CO 1,023 1,236 439 0 1,874 875
Step 1. Locate Tampa on the horizontal axis. Draw avertical line through these grids.
Step 2. Locate Albuquerque on the horizontal axis. Drawa horizontal line across these grids.
Step 3. Read the mileage amount where the two linescross.
Mileage Chart, milesLos Angeles, CA 0 967 804 1,023 2,549 1,839
Portland, OR 967 0 1,366 1,236 3,064 1,494
Albuquerque, NM 804 1,366 0 439 1,760 1,272
Denver, CO 1,023 1,236 439 0 1,874 875
The distance between Tampa and Albuquerqueis 1,760 miles.
Los A
ngele
s, CA
Portla
nd, O
R
Denve
r, CO
Tam
pa, F
L
Albuqu
erqu
e, NM
Fargo
, ND
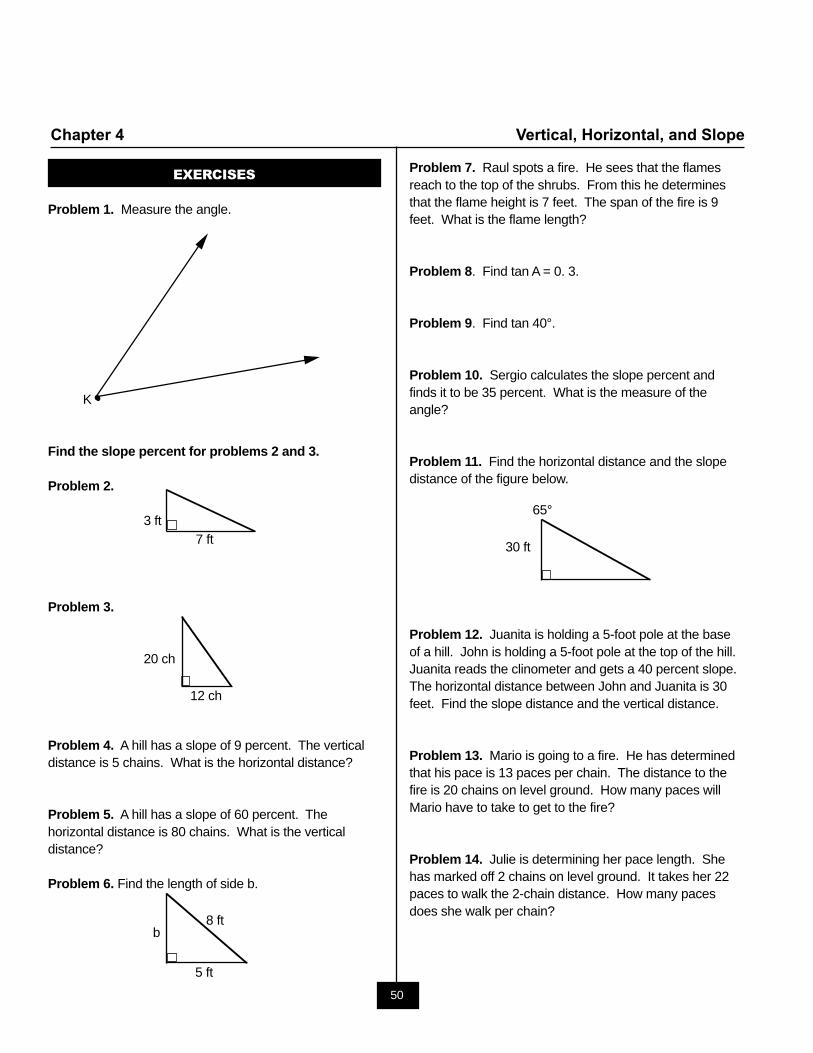
50
Chapter 4 Vertical, Horizontal, and Slope
EXERCISES
Problem 1. Measure the angle.
K
Find the slope percent for problems 2 and 3.
Problem 2.
3 ft
Problem 3.
20 ch
Problem 4. A hill has a slope of 9 percent. The verticaldistance is 5 chains. What is the horizontal distance?
Problem 5. A hill has a slope of 60 percent. Thehorizontal distance is 80 chains. What is the verticaldistance?
Problem 6. Find the length of side b.
7 ft
12 ch
Problem 7. Raul spots a fire. He sees that the flamesreach to the top of the shrubs. From this he determinesthat the flame height is 7 feet. The span of the fire is 9feet. What is the flame length?
Problem 8. Find tan A = 0. 3.
Problem 9. Find tan 40°.
Problem 10. Sergio calculates the slope percent andfinds it to be 35 percent. What is the measure of theangle?
Problem 11. Find the horizontal distance and the slopedistance of the figure below.
Problem 12. Juanita is holding a 5-foot pole at the baseof a hill. John is holding a 5-foot pole at the top of the hill.Juanita reads the clinometer and gets a 40 percent slope.The horizontal distance between John and Juanita is 30feet. Find the slope distance and the vertical distance.
Problem 13. Mario is going to a fire. He has determinedthat his pace is 13 paces per chain. The distance to thefire is 20 chains on level ground. How many paces willMario have to take to get to the fire?
Problem 14. Julie is determining her pace length. Shehas marked off 2 chains on level ground. It takes her 22paces to walk the 2-chain distance. How many pacesdoes she walk per chain?
b8 ft
5 ft
65°
30 ft
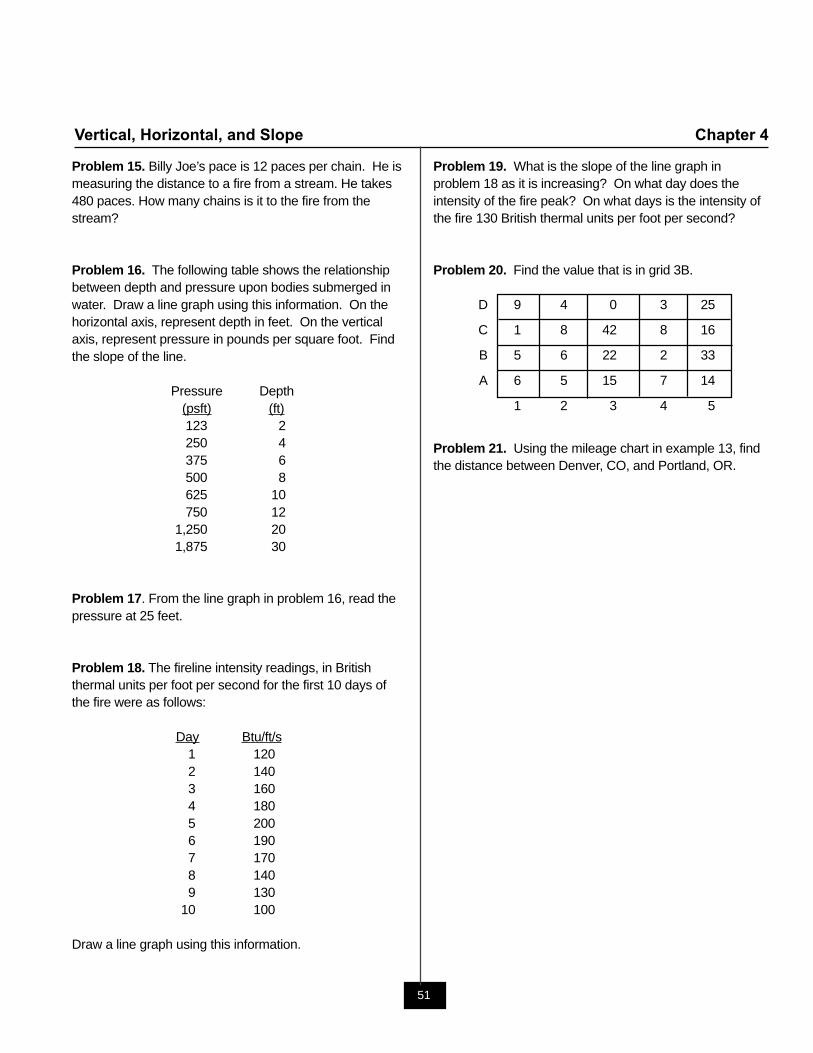
51
Vertical, Horizontal, and Slope Chapter 4
Problem 15. Billy Joe’s pace is 12 paces per chain. He ismeasuring the distance to a fire from a stream. He takes480 paces. How many chains is it to the fire from thestream?
Problem 16. The following table shows the relationshipbetween depth and pressure upon bodies submerged inwater. Draw a line graph using this information. On thehorizontal axis, represent depth in feet. On the verticalaxis, represent pressure in pounds per square foot. Findthe slope of the line.
Pressure Depth(psft) (ft)123 2250 4375 6500 8625 10750 12
1,250 201,875 30
Problem 17. From the line graph in problem 16, read thepressure at 25 feet.
Problem 18. The fireline intensity readings, in Britishthermal units per foot per second for the first 10 days ofthe fire were as follows:
Day Btu/ft/s1 1202 1403 1604 1805 2006 1907 1708 1409 130
10 100
Draw a line graph using this information.
Problem 19. What is the slope of the line graph inproblem 18 as it is increasing? On what day does theintensity of the fire peak? On what days is the intensity ofthe fire 130 British thermal units per foot per second?
Problem 20. Find the value that is in grid 3B.
D 9 4 0 3 25
C 1 8 42 8 16
B 5 6 22 2 33
A 6 5 15 7 14
1 2 3 4 5
Problem 21. Using the mileage chart in example 13, findthe distance between Denver, CO, and Portland, OR.
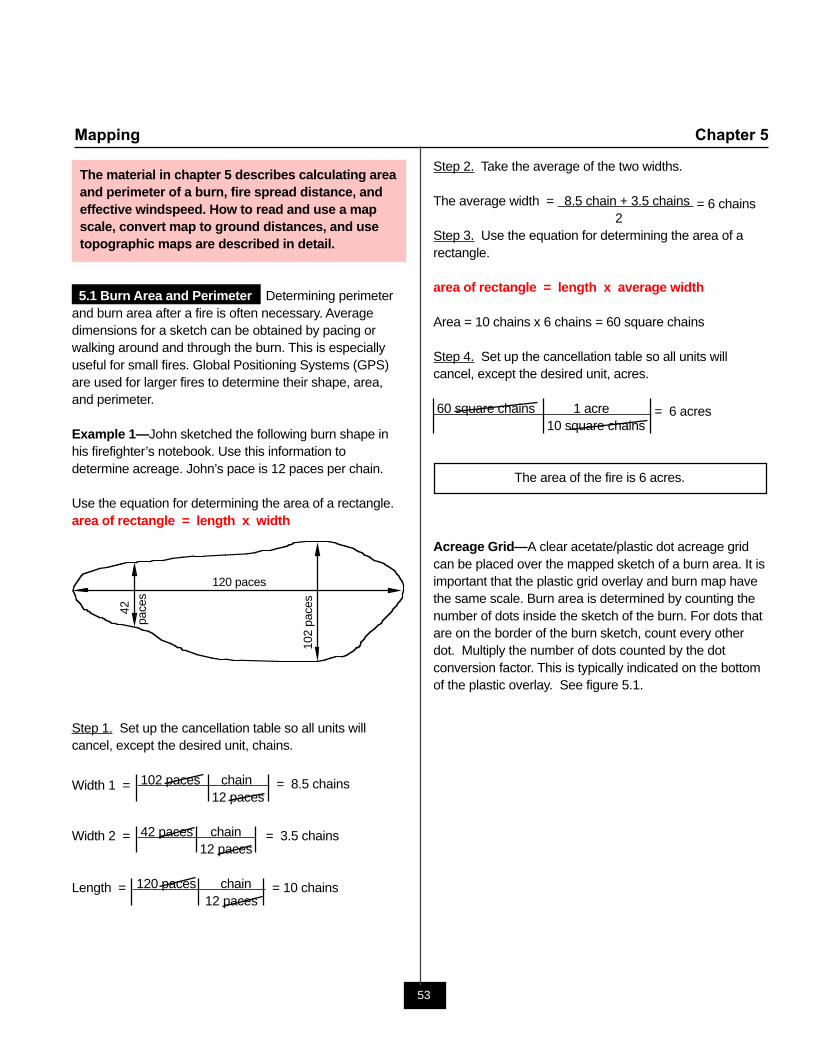
53
Mapping Chapter 5
The material in chapter 5 describes calculating areaand perimeter of a burn, fire spread distance, andeffective windspeed. How to read and use a mapscale, convert map to ground distances, and usetopographic maps are described in detail.
5.1 Burn Area and Perimeter Determining perimeterand burn area after a fire is often necessary. Averagedimensions for a sketch can be obtained by pacing orwalking around and through the burn. This is especiallyuseful for small fires. Global Positioning Systems (GPS)are used for larger fires to determine their shape, area,and perimeter.
Example 1—John sketched the following burn shape inhis firefighter’s notebook. Use this information todetermine acreage. John’s pace is 12 paces per chain.
Use the equation for determining the area of a rectangle.area of rectangle = length x width
Step 1. Set up the cancellation table so all units willcancel, except the desired unit, chains.
Width 1 = 102 paces chain = 8.5 chains12 paces
Width 2 = 42 paces chain = 3.5 chains12 paces
Length = 120 paces chain = 10 chains12 paces
120 paces
42
pace
s
102
pac
es
Step 2. Take the average of the two widths.
The average width = 8.5 chain + 3.5 chains = 6 chains 2Step 3. Use the equation for determining the area of arectangle.
area of rectangle = length x average width
Area = 10 chains x 6 chains = 60 square chains
Step 4. Set up the cancellation table so all units willcancel, except the desired unit, acres.
60 square chains 1 acre = 6 acres10 square chains
The area of the fire is 6 acres.
Acreage Grid—A clear acetate/plastic dot acreage gridcan be placed over the mapped sketch of a burn area. It isimportant that the plastic grid overlay and burn map havethe same scale. Burn area is determined by counting thenumber of dots inside the sketch of the burn. For dots thatare on the border of the burn sketch, count every otherdot. Multiply the number of dots counted by the dotconversion factor. This is typically indicated on the bottomof the plastic overlay. See figure 5.1.
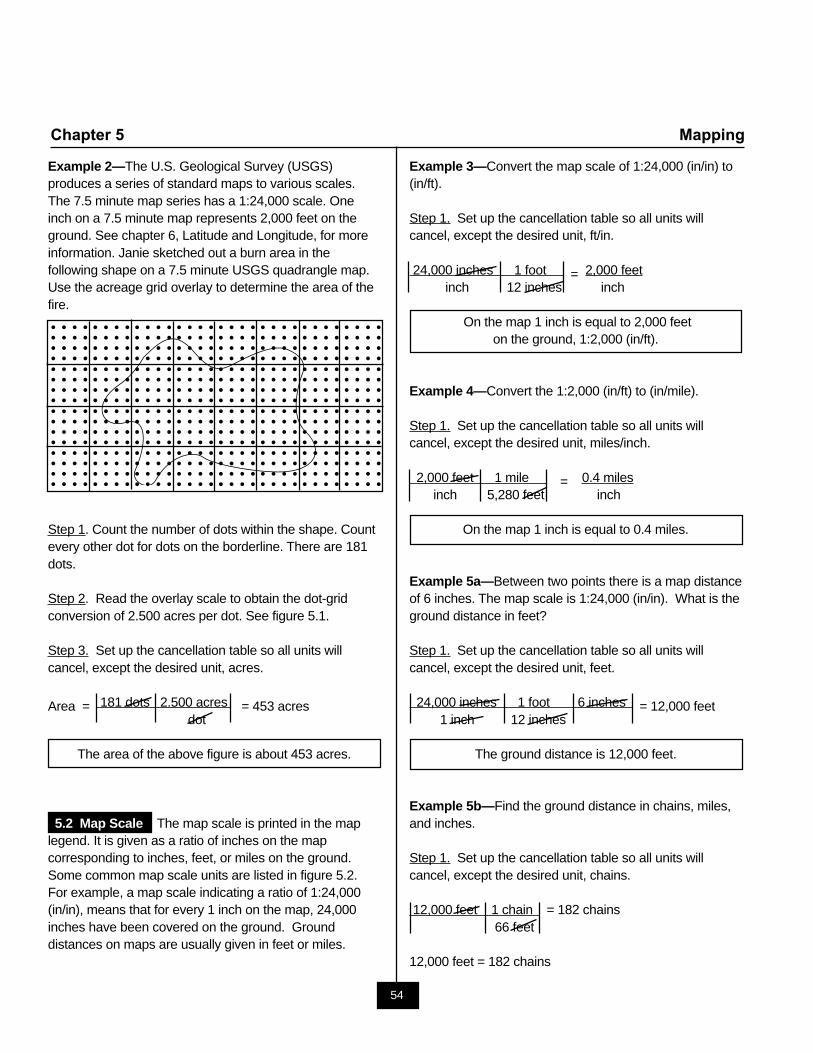
54
Chapter 5 Mapping
. . . .. . . .. . . .. . . .. . . .. . . .. . . .. . . .. . . .. . . .. . . .. . . .. . . .. . . .. . . .. . . .. . . .. . . .. . . .. . . .. . . .. . . .. . . .. . . .. . . .. . . .. . . .. . . .. . . .. . . .. . . .. . . .. . . .. . . .. . . .. . . .. . . .. . . .. . . .. . . .. . . .. . . .. . . .. . . .. . . .. . . .. . . .. . . .. . . .. . . .. . . .. . . .. . . .. . . .. . . .. . . .. . . .. . . .. . . .. . . .. . . .. . . .. . . .. . . .. . . .. . . .. . . .. . . .. . . .. . . .. . . .. . . .. . . .. . . .. . . .. . . .. . . .. . . .. . . .. . . .. . . .. . . .. . . .. . . .. . . .. . . .. . . .. . . .. . . .. . . .. . . .. . . .. . . .. . . .. . . .. . . .. . . .. . . .. . . .. . . .. . . .. . . .. . . .. . . .. . . .. . . .. . . .. . . .. . . .. . . .. . . .. . . .. . . .. . . .. . . .. . . .. . . .. . . .. . . .. . . .. . . .. . . .. . . .. . . .. . . .. . . .. . . .. . . .
Example 2—The U.S. Geological Survey (USGS)produces a series of standard maps to various scales.The 7.5 minute map series has a 1:24,000 scale. Oneinch on a 7.5 minute map represents 2,000 feet on theground. See chapter 6, Latitude and Longitude, for moreinformation. Janie sketched out a burn area in thefollowing shape on a 7.5 minute USGS quadrangle map.Use the acreage grid overlay to determine the area of thefire.
Step 1. Count the number of dots within the shape. Countevery other dot for dots on the borderline. There are 181dots.
Step 2. Read the overlay scale to obtain the dot-gridconversion of 2.500 acres per dot. See figure 5.1.
Step 3. Set up the cancellation table so all units willcancel, except the desired unit, acres.
Area = 181 dots 2.500 acres = 453 acresdot
The area of the above figure is about 453 acres.
5.2 Map Scale The map scale is printed in the maplegend. It is given as a ratio of inches on the mapcorresponding to inches, feet, or miles on the ground.Some common map scale units are listed in figure 5.2.For example, a map scale indicating a ratio of 1:24,000(in/in), means that for every 1 inch on the map, 24,000inches have been covered on the ground. Grounddistances on maps are usually given in feet or miles.
Example 3—Convert the map scale of 1:24,000 (in/in) to(in/ft).
Step 1. Set up the cancellation table so all units willcancel, except the desired unit, ft/in.
24,000 inches 1 foot = 2,000 feetinch 12 inches inch
On the map 1 inch is equal to 2,000 feeton the ground, 1:2,000 (in/ft).
Example 4—Convert the 1:2,000 (in/ft) to (in/mile).
Step 1. Set up the cancellation table so all units willcancel, except the desired unit, miles/inch.
2,000 feet 1 mile = 0.4 milesinch 5,280 feet inch
On the map 1 inch is equal to 0.4 miles.
Example 5a—Between two points there is a map distanceof 6 inches. The map scale is 1:24,000 (in/in). What is theground distance in feet?
Step 1. Set up the cancellation table so all units willcancel, except the desired unit, feet.
24,000 inches 1 foot 6 inches = 12,000 feet1 inch 12 inches
The ground distance is 12,000 feet.
Example 5b—Find the ground distance in chains, miles,and inches.
Step 1. Set up the cancellation table so all units willcancel, except the desired unit, chains.
12,000 feet 1 chain = 182 chains66 feet
12,000 feet = 182 chains
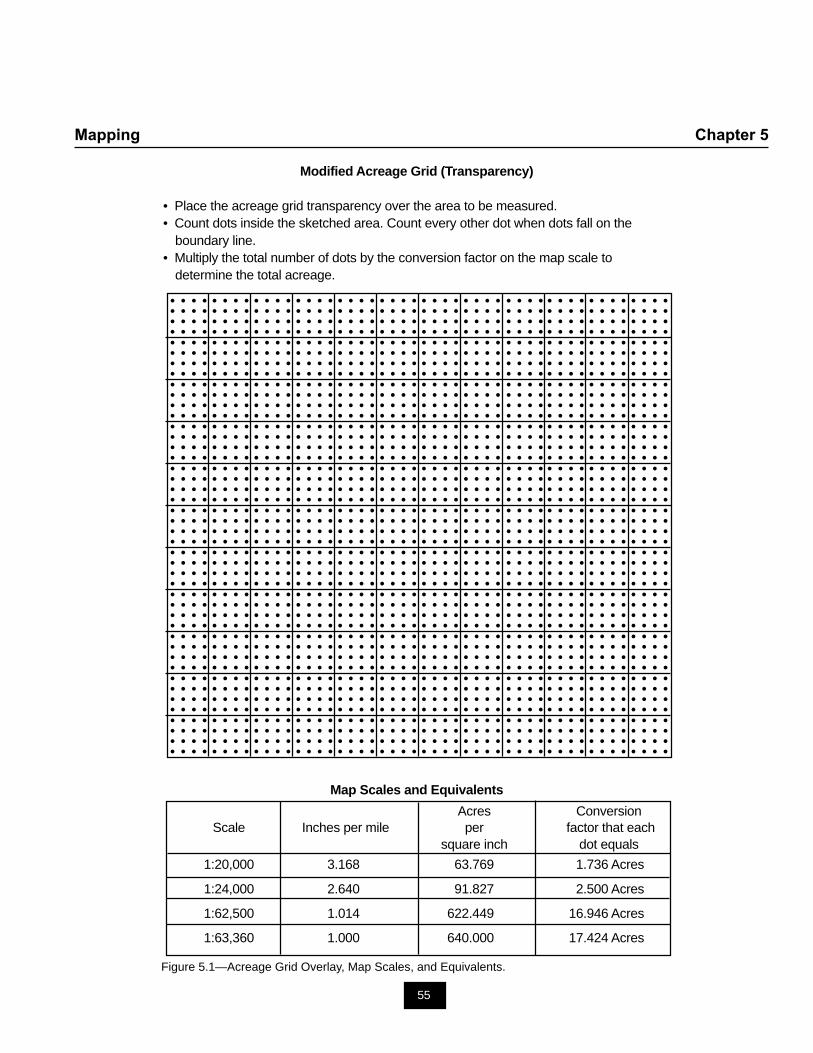
55
Mapping Chapter 5
. . . .. . . .. . . .. . . .. . . .. . . .. . . .. . . . . . . .. . . .. . . .. . . .. . . .. . . .. . . .. . . .. . . .. . . .. . . .. . . . . . . .. . . .. . . .. . . .. . . .. . . .. . . .. . . .. . . .. . . .. . . .. . . . . . . .. . . .. . . .. . . .. . . .. . . .. . . .. . . .. . . .. . . .. . . .. . . . . . . .. . . .. . . .. . . .. . . .. . . .. . . .. . . .. . . .. . . .. . . .. . . . . . . .. . . .. . . .. . . .. . . .. . . .. . . .. . . .. . . .. . . .. . . .. . . . . . . .. . . .. . . .. . . .. . . .. . . .. . . .. . . .. . . .. . . .. . . .. . . . . . . .. . . .. . . .. . . .. . . .. . . .. . . .. . . .. . . .. . . .. . . .. . . . . . . .. . . .. . . .. . . .. . . .. . . .. . . .. . . .. . . .. . . .. . . .. . . . . . . .. . . .. . . .. . . .. . . .. . . .. . . .. . . .. . . .. . . .. . . .. . . . . . . .. . . .. . . .. . . .. . . .. . . .. . . .. . . .. . . .. . . .. . . .. . . . . . . .. . . .. . . .. . . .. . . .. . . .. . . .. . . .. . . .. . . .. . . .. . . . . . . .. . . .. . . .. . . .. . . .. . . .. . . .. . . .. . . .. . . .. . . .. . . . . . . .. . . .. . . .. . . .. . . .. . . .. . . .. . . .. . . .. . . .. . . .. . . . . . . .. . . .. . . .. . . .. . . .. . . .. . . .. . . .. . . .. . . .. . . .. . . . . . . .. . . .. . . .. . . .. . . .. . . .. . . .. . . .. . . .. . . .. . . .. . . . . . . .. . . .. . . .. . . .. . . .. . . .. . . .. . . .. . . .. . . .. . . .. . . . . . . .. . . .. . . .. . . .. . . .. . . .. . . .. . . .. . . .. . . .. . . .. . . . . . . .. . . .. . . .. . . .. . . .. . . .. . . .. . . .. . . .. . . .. . . .. . . . . . . .. . . .. . . .. . . .. . . .. . . .. . . .. . . .. . . .. . . .. . . .. . . . . . . .. . . .. . . .. . . .. . . .. . . .. . . .. . . .. . . .. . . .. . . .. . . . . . . .. . . .. . . .. . . .. . . .. . . .. . . .. . . .. . . .. . . .. . . .. . . . . . . .. . . .. . . .. . . .. . . .. . . .. . . .. . . .. . . .. . . .. . . .. . . . . . . .. . . .. . . .. . . .. . . .. . . .. . . .. . . .. . . .. . . .. . . .. . . . . . . .. . . .. . . .. . . .. . . .. . . .. . . .. . . .. . . .. . . .. . . .. . . . . . . .. . . .. . . .. . . .. . . .. . . .. . . .. . . .. . . .. . . .. . . .. . . . . . . .. . . .. . . .. . . .. . . .. . . .. . . .. . . .. . . .. . . .. . . .. . . . . . . .. . . .. . . .. . . .. . . .. . . .. . . .. . . .. . . .. . . .. . . .. . . . . . . .. . . .. . . .. . . .. . . .. . . .. . . .. . . .. . . .. . . .. . . .. . . . . . . .. . . .. . . .. . . .. . . .. . . .. . . .. . . .. . . .. . . .. . . .. . . . . . . .. . . .. . . .. . . .. . . .. . . .. . . .. . . .. . . .. . . .. . . .. . . . . . . .. . . .. . . .. . . .. . . .. . . .. . . .. . . .. . . .. . . .. . . .. . . . . . . .. . . .. . . .. . . .. . . .. . . .. . . .. . . .. . . .. . . .. . . .. . . . . . . .. . . .. . . .. . . .. . . .. . . .. . . .. . . .. . . .. . . .. . . .. . . . . . . .. . . .. . . .. . . .. . . .. . . .. . . .. . . .. . . .. . . .. . . .. . . . . . . .. . . .. . . .. . . .. . . .. . . .. . . .. . . .. . . .. . . .. . . .. . . . . . . .. . . .. . . .. . . .. . . .. . . .. . . .. . . .. . . .. . . .. . . .. . . . . . . .. . . .. . . .. . . .. . . .. . . .. . . .. . . .. . . .. . . .. . . .. . . . . . . .. . . .. . . .. . . .. . . .. . . .. . . .. . . .. . . .. . . .. . . .. . . . . . . .. . . .. . . .. . . .. . . .. . . .. . . .. . . .. . . .. . . .. . . .. . . . . . . .. . . .. . . .. . . .. . . .. . . .. . . .. . . .. . . .. . . .. . . .. . . . . . . .. . . .. . . .. . . .. . . .. . . .. . . .. . . .. . . .. . . .. . . .. . . . . . . .. . . .. . . .. . . .. . . .. . . .. . . .. . . .. . . .. . . .. . . .. . . . . . . .. . . .. . . .. . . .. . . .. . . .. . . .. . . .. . . .. . . .. . . .. . . . . . . .. . . .. . . .. . . .
Modified Acreage Grid (Transparency)
• Place the acreage grid transparency over the area to be measured.• Count dots inside the sketched area. Count every other dot when dots fall on the
boundary line.• Multiply the total number of dots by the conversion factor on the map scale to
determine the total acreage.
Map Scales and Equivalents
Acres ConversionScale Inches per mile per factor that each
square inch dot equals
1:20,000 3.168 63.769 1.736 Acres
1:24,000 2.640 91.827 2.500 Acres
1:62,500 1.014 622.449 16.946 Acres
1:63,360 1.000 640.000 17.424 Acres
Figure 5.1—Acreage Grid Overlay, Map Scales, and Equivalents.
56
Chapter 5 Mapping
Step 2. Set up the cancellation table so all units willcancel, except the desired unit, miles.
12,000 feet 1 mile = 2.3 miles
5,280 feet
Step 3. Set up the cancellation table so all units willcancel, except the desired unit, inches.
12,000 feet 12 inches = 144,000 inches1 foot
12,000 feet = 182 chains = 2.3 miles = 144,000 inches
Occasionally, a map may not provide a scale. The scalecan be calculated by knowing the distance between twopoints on the map, and measuring the distance on themap. Also, if a map has section lines, the distancebetween section lines is typically 1 mile.
Example 6—The distance between point A and B is 6inches on the map. The known ground distance is 3,600feet. What is the scale in units of inches/foot?
map scale = known distance = 3,600 feet = 600 feetmeasured distance 6 inches inch
The map scale is 1:600 inches/foot.
Example 7—Use the map scale in example 6. The knownground distance between points B and C is 1/2 mile. Howmany inches is this on the map?
map scale = known distancemeasured distance
Rearrange terms by multiplying each side by themeasured distance and dividing each side by the mapscale.
measured distance = known distancemap scale
Step 1. Set up the cancellation table so all units willcancel, except the desired unit, feet.
1/2 mile 5,280 feet = 2,640 feet1 mile
Step 2. Use the map scale from example 6 to find themap distance.
measured distance = known distancemap scale
measured distance = 2,640 feet 1 inch = 4.4 inches 600 feet
On the ground one-half mile is the same as4.4 inches on the map.
Map Scale Conversion FactorsMap Scales
Representative Map Map MapScale Fraction in/mi in/ch ft/in
1:253,440 253.44 0.25 0.0031 21,120
1:126,720 126.72 0.50 0.0063 10,560
1:63,360 63.36 1.00 0.0125 5,280
1:62,500 62.50 1.01 0.0127 5,208
1:31,680 31.68 2 0.025 2,640
1:24,000 24.00 2.64 0.033 2,000
1:21,120 21.12 3 0.038 1,760
1:15,840 15.84 4 0.05 1,320
1:7,920 7.92 8 0.1 660
Figure 5.2—Map Scale Conversion Factors.
5.3 Spread Distance Spread distance (SD) is theforward distance a fire spreads in a given amount of time.SD can be calculated from rate of spread (ROS) andprojected time (PT).
Spread Distance = Rate of Spread x Projected TimeSD = ROS x PT
Example 8—What is the spread distance, in feet, for a firethat has a rate of spread of 6 chains per hour for a 3-hourtime span?
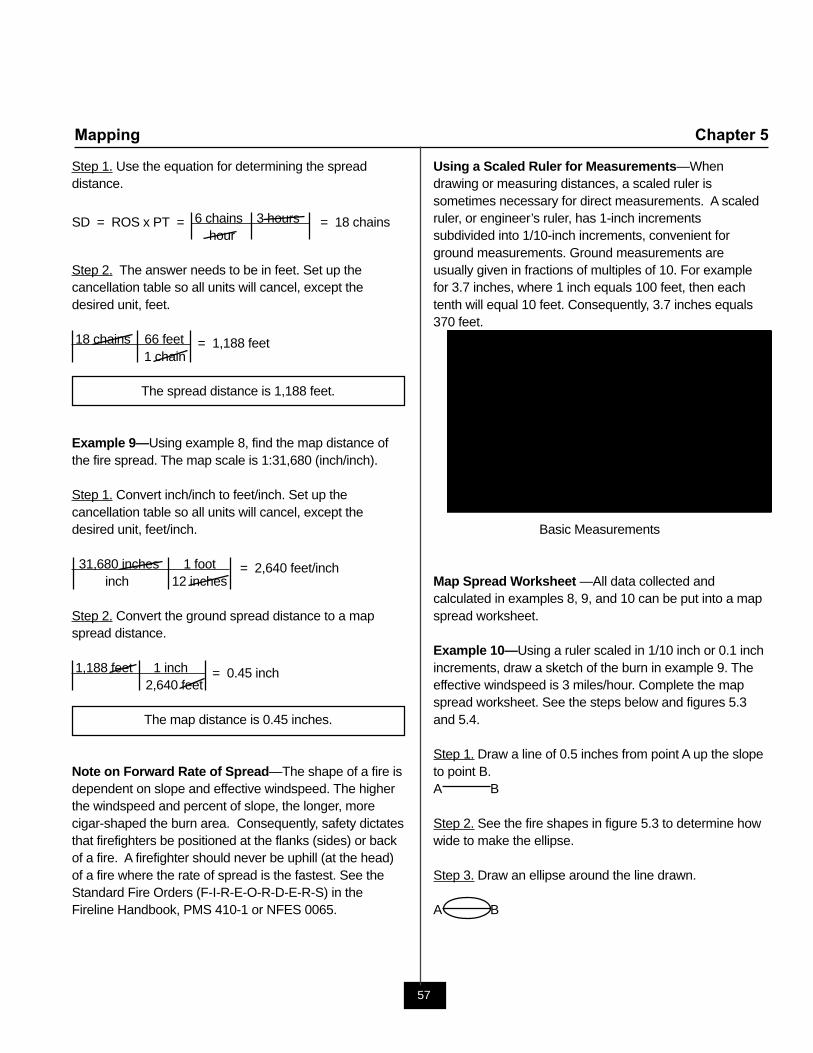
57
Mapping Chapter 5
Step 1. Use the equation for determining the spreaddistance.
SD = ROS x PT = 6 chains 3 hours = 18 chainshour
Step 2. The answer needs to be in feet. Set up thecancellation table so all units will cancel, except thedesired unit, feet.
18 chains 66 feet = 1,188 feet1 chain
The spread distance is 1,188 feet.
Example 9—Using example 8, find the map distance ofthe fire spread. The map scale is 1:31,680 (inch/inch).
Step 1. Convert inch/inch to feet/inch. Set up thecancellation table so all units will cancel, except thedesired unit, feet/inch.
31,680 inches 1 foot = 2,640 feet/inchinch 12 inches
Step 2. Convert the ground spread distance to a mapspread distance.
1,188 feet 1 inch = 0.45 inch2,640 feet
The map distance is 0.45 inches.
Note on Forward Rate of Spread—The shape of a fire isdependent on slope and effective windspeed. The higherthe windspeed and percent of slope, the longer, morecigar-shaped the burn area. Consequently, safety dictatesthat firefighters be positioned at the flanks (sides) or backof a fire. A firefighter should never be uphill (at the head)of a fire where the rate of spread is the fastest. See theStandard Fire Orders (F-I-R-E-O-R-D-E-R-S) in theFireline Handbook, PMS 410-1 or NFES 0065.
Using a Scaled Ruler for Measurements—Whendrawing or measuring distances, a scaled ruler issometimes necessary for direct measurements. A scaledruler, or engineer’s ruler, has 1-inch incrementssubdivided into 1/10-inch increments, convenient forground measurements. Ground measurements areusually given in fractions of multiples of 10. For examplefor 3.7 inches, where 1 inch equals 100 feet, then eachtenth will equal 10 feet. Consequently, 3.7 inches equals370 feet.
Basic Measurements
Map Spread Worksheet —All data collected andcalculated in examples 8, 9, and 10 can be put into a mapspread worksheet.
Example 10—Using a ruler scaled in 1/10 inch or 0.1 inchincrements, draw a sketch of the burn in example 9. Theeffective windspeed is 3 miles/hour. Complete the mapspread worksheet. See the steps below and figures 5.3and 5.4.
Step 1. Draw a line of 0.5 inches from point A up the slopeto point B.A B
Step 2. See the fire shapes in figure 5.3 to determine howwide to make the ellipse.
Step 3. Draw an ellipse around the line drawn.
A B
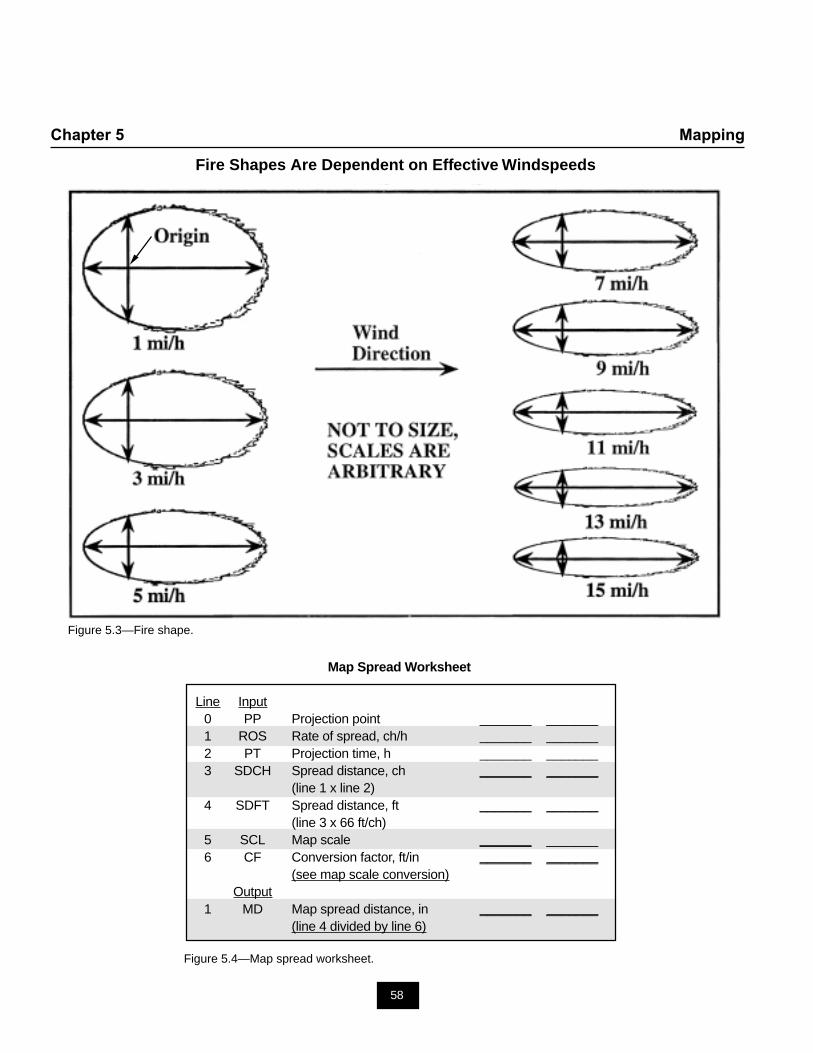
58
Chapter 5 Mapping
Map Spread Worksheet
Line Input0 PP Projection point _______ _______1 ROS Rate of spread, ch/h _______ _______2 PT Projection time, h _______ _______3 SDCH Spread distance, ch _______ _______
(line 1 x line 2)4 SDFT Spread distance, ft _______ _______
(line 3 x 66 ft/ch)5 SCL Map scale _______ _______6 CF Conversion factor, ft/in _______ _______
(see map scale conversion)Output
1 MD Map spread distance, in _______ _______(line 4 divided by line 6)
Figure 5.4—Map spread worksheet.
Figure 5.3—Fire shape.
Fire Shapes Are Dependent on Effective Windspeeds
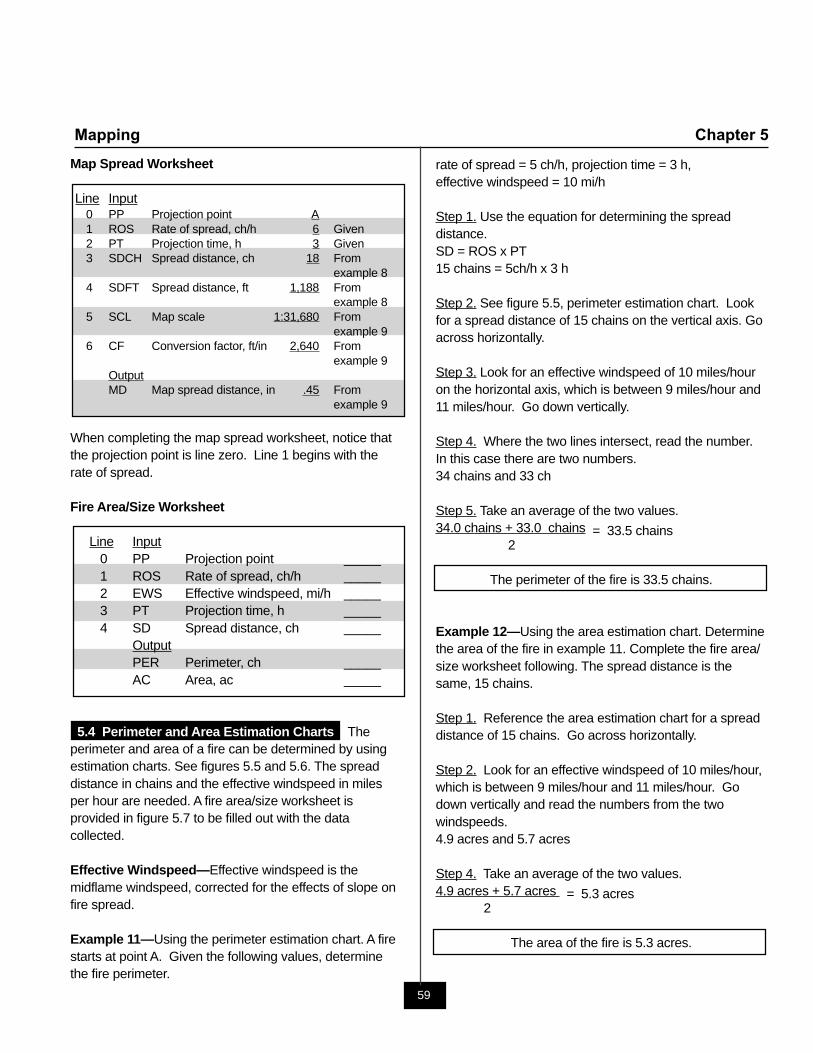
59
Mapping Chapter 5
Map Spread Worksheet
Line Input0 PP Projection point A1 ROS Rate of spread, ch/h 6 Given2 PT Projection time, h 3 Given3 SDCH Spread distance, ch 18 From
example 84 SDFT Spread distance, ft 1,188 From
example 85 SCL Map scale 1:31,680 From
example 96 CF Conversion factor, ft/in 2,640 From
example 9OutputMD Map spread distance, in .45 From
example 9
When completing the map spread worksheet, notice thatthe projection point is line zero. Line 1 begins with therate of spread.
Fire Area/Size Worksheet
Line Input0 PP Projection point _____1 ROS Rate of spread, ch/h _____2 EWS Effective windspeed, mi/h _____3 PT Projection time, h _____4 SD Spread distance, ch _____
OutputPER Perimeter, ch _____AC Area, ac _____
5.4 Perimeter and Area Estimation Charts Theperimeter and area of a fire can be determined by usingestimation charts. See figures 5.5 and 5.6. The spreaddistance in chains and the effective windspeed in milesper hour are needed. A fire area/size worksheet isprovided in figure 5.7 to be filled out with the datacollected.
Effective Windspeed—Effective windspeed is themidflame windspeed, corrected for the effects of slope onfire spread.
Example 11—Using the perimeter estimation chart. A firestarts at point A. Given the following values, determinethe fire perimeter.
rate of spread = 5 ch/h, projection time = 3 h,effective windspeed = 10 mi/h
Step 1. Use the equation for determining the spreaddistance.SD = ROS x PT15 chains = 5ch/h x 3 h
Step 2. See figure 5.5, perimeter estimation chart. Lookfor a spread distance of 15 chains on the vertical axis. Goacross horizontally.
Step 3. Look for an effective windspeed of 10 miles/houron the horizontal axis, which is between 9 miles/hour and11 miles/hour. Go down vertically.
Step 4. Where the two lines intersect, read the number.In this case there are two numbers.34 chains and 33 ch
Step 5. Take an average of the two values.34.0 chains + 33.0 chains = 33.5 chains
2
The perimeter of the fire is 33.5 chains.
Example 12—Using the area estimation chart. Determinethe area of the fire in example 11. Complete the fire area/size worksheet following. The spread distance is thesame, 15 chains.
Step 1. Reference the area estimation chart for a spreaddistance of 15 chains. Go across horizontally.
Step 2. Look for an effective windspeed of 10 miles/hour,which is between 9 miles/hour and 11 miles/hour. Godown vertically and read the numbers from the twowindspeeds.4.9 acres and 5.7 acres
Step 4. Take an average of the two values.4.9 acres + 5.7 acres = 5.3 acres
2
The area of the fire is 5.3 acres.
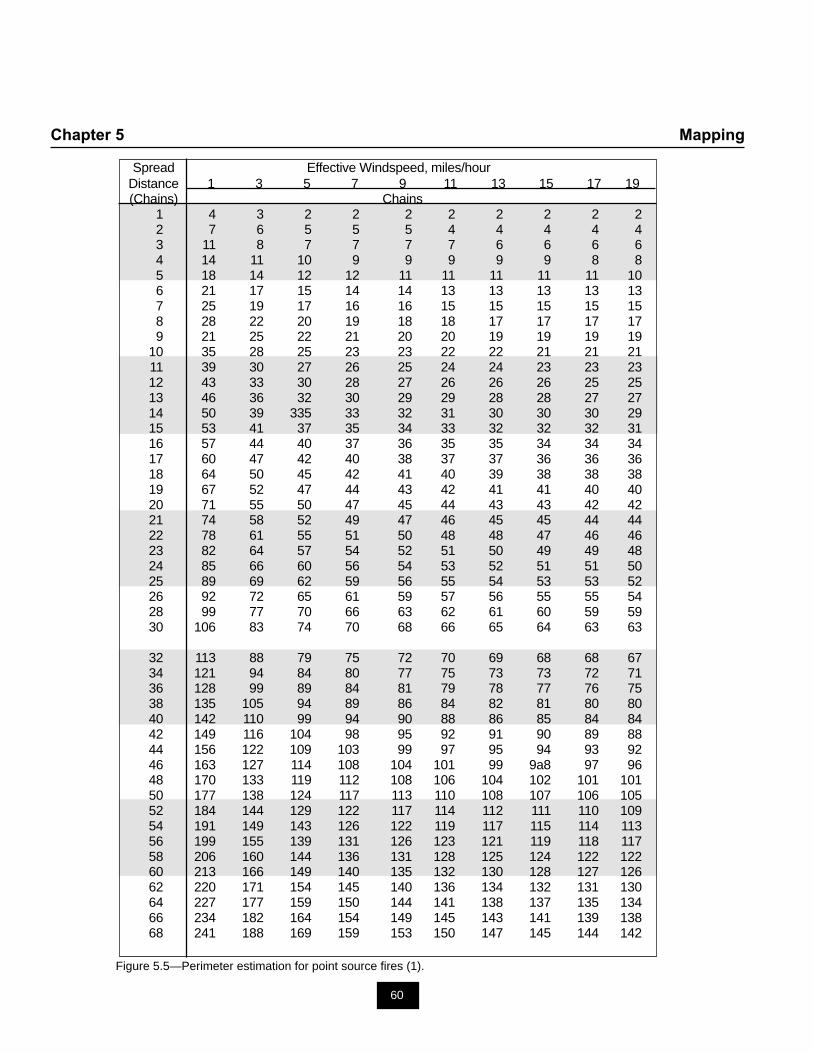
60
Chapter 5 Mapping
Figure 5.5—Perimeter estimation for point source fires (1).
Spread Effective Windspeed, miles/hourDistance 1 3 5 7 9 11 13 15 17 19(Chains) Chains
1 4 3 2 2 2 2 2 2 2 22 7 6 5 5 5 4 4 4 4 43 11 8 7 7 7 7 6 6 6 64 14 11 10 9 9 9 9 9 8 85 18 14 12 12 11 11 11 11 11 106 21 17 15 14 14 13 13 13 13 137 25 19 17 16 16 15 15 15 15 158 28 22 20 19 18 18 17 17 17 179 21 25 22 21 20 20 19 19 19 19
10 35 28 25 23 23 22 22 21 21 2111 39 30 27 26 25 24 24 23 23 2312 43 33 30 28 27 26 26 26 25 2513 46 36 32 30 29 29 28 28 27 2714 50 39 335 33 32 31 30 30 30 2915 53 41 37 35 34 33 32 32 32 3116 57 44 40 37 36 35 35 34 34 3417 60 47 42 40 38 37 37 36 36 3618 64 50 45 42 41 40 39 38 38 3819 67 52 47 44 43 42 41 41 40 4020 71 55 50 47 45 44 43 43 42 4221 74 58 52 49 47 46 45 45 44 4422 78 61 55 51 50 48 48 47 46 4623 82 64 57 54 52 51 50 49 49 4824 85 66 60 56 54 53 52 51 51 5025 89 69 62 59 56 55 54 53 53 5226 92 72 65 61 59 57 56 55 55 5428 99 77 70 66 63 62 61 60 59 5930 106 83 74 70 68 66 65 64 63 63
32 113 88 79 75 72 70 69 68 68 6734 121 94 84 80 77 75 73 73 72 7136 128 99 89 84 81 79 78 77 76 7538 135 105 94 89 86 84 82 81 80 8040 142 110 99 94 90 88 86 85 84 8442 149 116 104 98 95 92 91 90 89 8844 156 122 109 103 99 97 95 94 93 9246 163 127 114 108 104 101 99 9a8 97 9648 170 133 119 112 108 106 104 102 101 10150 177 138 124 117 113 110 108 107 106 10552 184 144 129 122 117 114 112 111 110 10954 191 149 143 126 122 119 117 115 114 11356 199 155 139 131 126 123 121 119 118 11758 206 160 144 136 131 128 125 124 122 12260 213 166 149 140 135 132 130 128 127 12662 220 171 154 145 140 136 134 132 131 13064 227 177 159 150 144 141 138 137 135 13466 234 182 164 154 149 145 143 141 139 13868 241 188 169 159 153 150 147 145 144 142
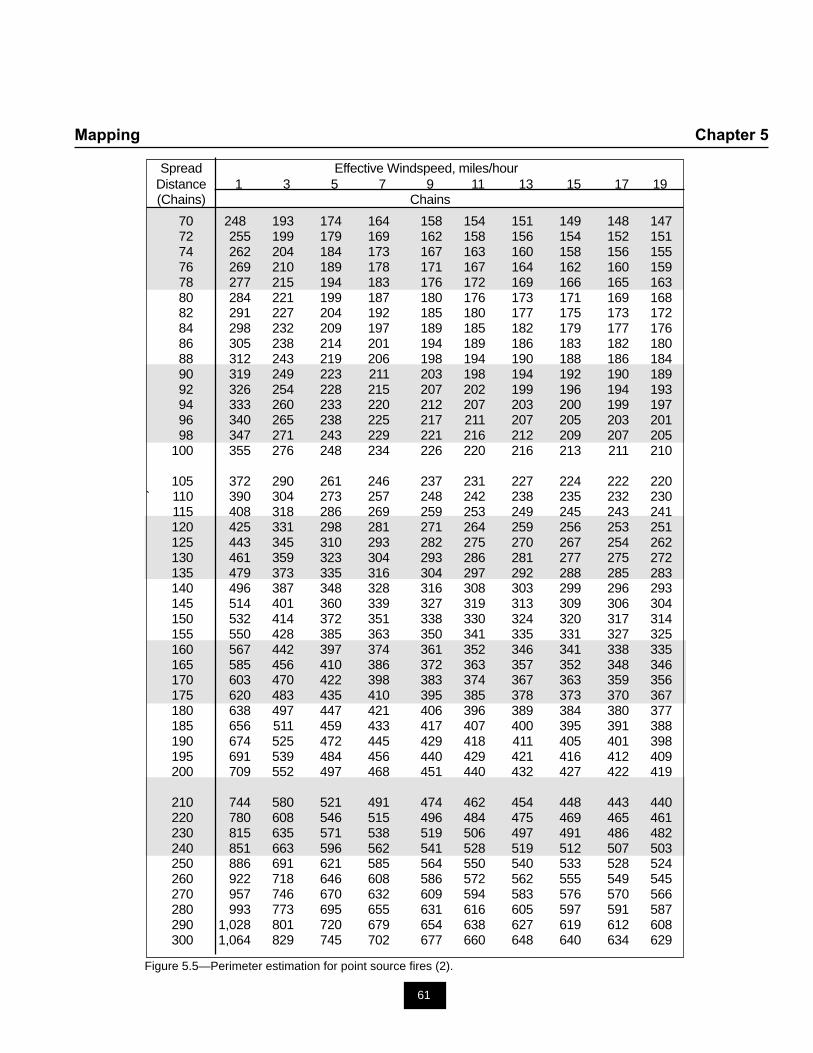
61
Mapping Chapter 5
70 248 193 174 164 158 154 151 149 148 14772 255 199 179 169 162 158 156 154 152 15174 262 204 184 173 167 163 160 158 156 15576 269 210 189 178 171 167 164 162 160 15978 277 215 194 183 176 172 169 166 165 16380 284 221 199 187 180 176 173 171 169 16882 291 227 204 192 185 180 177 175 173 17284 298 232 209 197 189 185 182 179 177 17686 305 238 214 201 194 189 186 183 182 18088 312 243 219 206 198 194 190 188 186 18490 319 249 223 211 203 198 194 192 190 18992 326 254 228 215 207 202 199 196 194 19394 333 260 233 220 212 207 203 200 199 19796 340 265 238 225 217 211 207 205 203 20198 347 271 243 229 221 216 212 209 207 205
100 355 276 248 234 226 220 216 213 211 210
105 372 290 261 246 237 231 227 224 222 220` 110 390 304 273 257 248 242 238 235 232 230
115 408 318 286 269 259 253 249 245 243 241120 425 331 298 281 271 264 259 256 253 251125 443 345 310 293 282 275 270 267 254 262130 461 359 323 304 293 286 281 277 275 272135 479 373 335 316 304 297 292 288 285 283140 496 387 348 328 316 308 303 299 296 293145 514 401 360 339 327 319 313 309 306 304150 532 414 372 351 338 330 324 320 317 314155 550 428 385 363 350 341 335 331 327 325160 567 442 397 374 361 352 346 341 338 335165 585 456 410 386 372 363 357 352 348 346170 603 470 422 398 383 374 367 363 359 356175 620 483 435 410 395 385 378 373 370 367180 638 497 447 421 406 396 389 384 380 377185 656 511 459 433 417 407 400 395 391 388190 674 525 472 445 429 418 411 405 401 398195 691 539 484 456 440 429 421 416 412 409200 709 552 497 468 451 440 432 427 422 419
210 744 580 521 491 474 462 454 448 443 440220 780 608 546 515 496 484 475 469 465 461230 815 635 571 538 519 506 497 491 486 482240 851 663 596 562 541 528 519 512 507 503250 886 691 621 585 564 550 540 533 528 524260 922 718 646 608 586 572 562 555 549 545270 957 746 670 632 609 594 583 576 570 566280 993 773 695 655 631 616 605 597 591 587290 1,028 801 720 679 654 638 627 619 612 608300 1,064 829 745 702 677 660 648 640 634 629
Figure 5.5—Perimeter estimation for point source fires (2).
Spread Effective Windspeed, miles/hourDistance 1 3 5 7 9 11 13 15 17 19(Chains) Chains
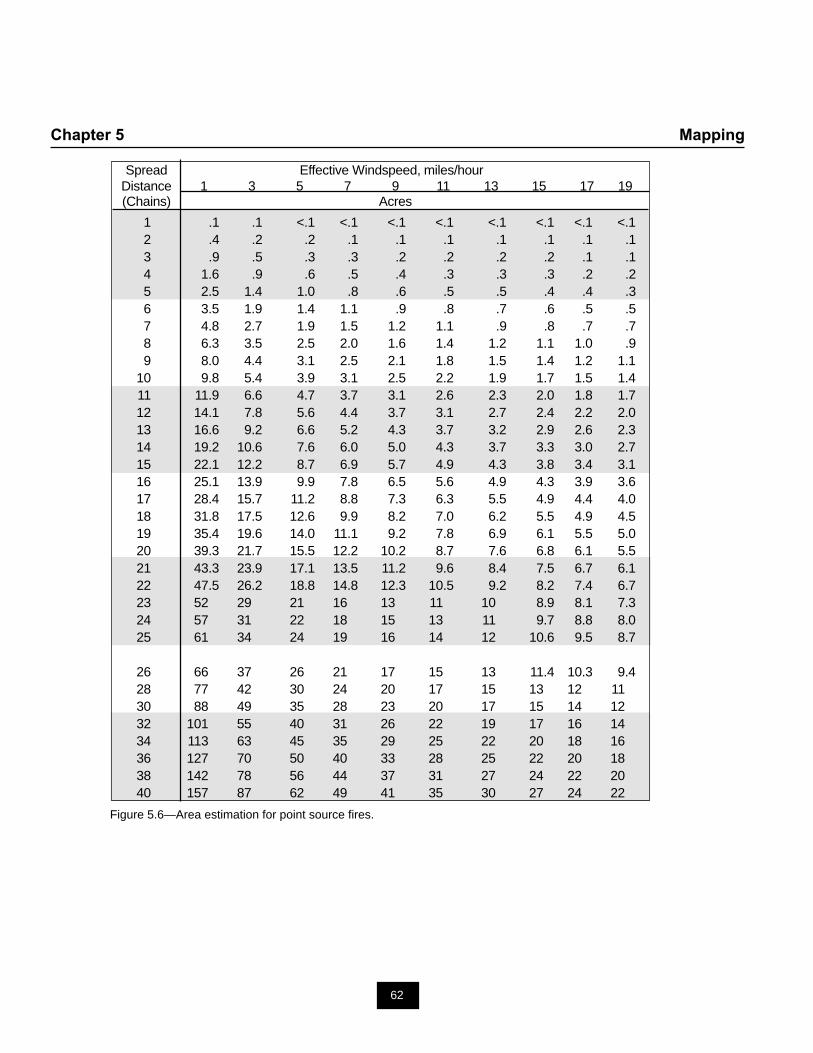
62
Chapter 5 Mapping
Spread Effective Windspeed, miles/hourDistance 1 3 5 7 9 11 13 15 17 19(Chains) Acres
1 .1 .1 <.1 <.1 <.1 <.1 <.1 <.1 <.1 <.12 .4 .2 .2 .1 .1 .1 .1 .1 .1 .13 .9 .5 .3 .3 .2 .2 .2 .2 .1 .14 1.6 .9 .6 .5 .4 .3 .3 .3 .2 .25 2.5 1.4 1.0 .8 .6 .5 .5 .4 .4 .36 3.5 1.9 1.4 1.1 .9 .8 .7 .6 .5 .57 4.8 2.7 1.9 1.5 1.2 1.1 .9 .8 .7 .78 6.3 3.5 2.5 2.0 1.6 1.4 1.2 1.1 1.0 .99 8.0 4.4 3.1 2.5 2.1 1.8 1.5 1.4 1.2 1.1
10 9.8 5.4 3.9 3.1 2.5 2.2 1.9 1.7 1.5 1.411 11.9 6.6 4.7 3.7 3.1 2.6 2.3 2.0 1.8 1.712 14.1 7.8 5.6 4.4 3.7 3.1 2.7 2.4 2.2 2.013 16.6 9.2 6.6 5.2 4.3 3.7 3.2 2.9 2.6 2.314 19.2 10.6 7.6 6.0 5.0 4.3 3.7 3.3 3.0 2.715 22.1 12.2 8.7 6.9 5.7 4.9 4.3 3.8 3.4 3.116 25.1 13.9 9.9 7.8 6.5 5.6 4.9 4.3 3.9 3.617 28.4 15.7 11.2 8.8 7.3 6.3 5.5 4.9 4.4 4.018 31.8 17.5 12.6 9.9 8.2 7.0 6.2 5.5 4.9 4.519 35.4 19.6 14.0 11.1 9.2 7.8 6.9 6.1 5.5 5.020 39.3 21.7 15.5 12.2 10.2 8.7 7.6 6.8 6.1 5.521 43.3 23.9 17.1 13.5 11.2 9.6 8.4 7.5 6.7 6.122 47.5 26.2 18.8 14.8 12.3 10.5 9.2 8.2 7.4 6.723 52 29 21 16 13 11 10 8.9 8.1 7.324 57 31 22 18 15 13 11 9.7 8.8 8.025 61 34 24 19 16 14 12 10.6 9.5 8.7
26 66 37 26 21 17 15 13 11.4 10.3 9.428 77 42 30 24 20 17 15 13 12 1130 88 49 35 28 23 20 17 15 14 1232 101 55 40 31 26 22 19 17 16 1434 113 63 45 35 29 25 22 20 18 1636 127 70 50 40 33 28 25 22 20 1838 142 78 56 44 37 31 27 24 22 2040 157 87 62 49 41 35 30 27 24 22
Figure 5.6—Area estimation for point source fires.
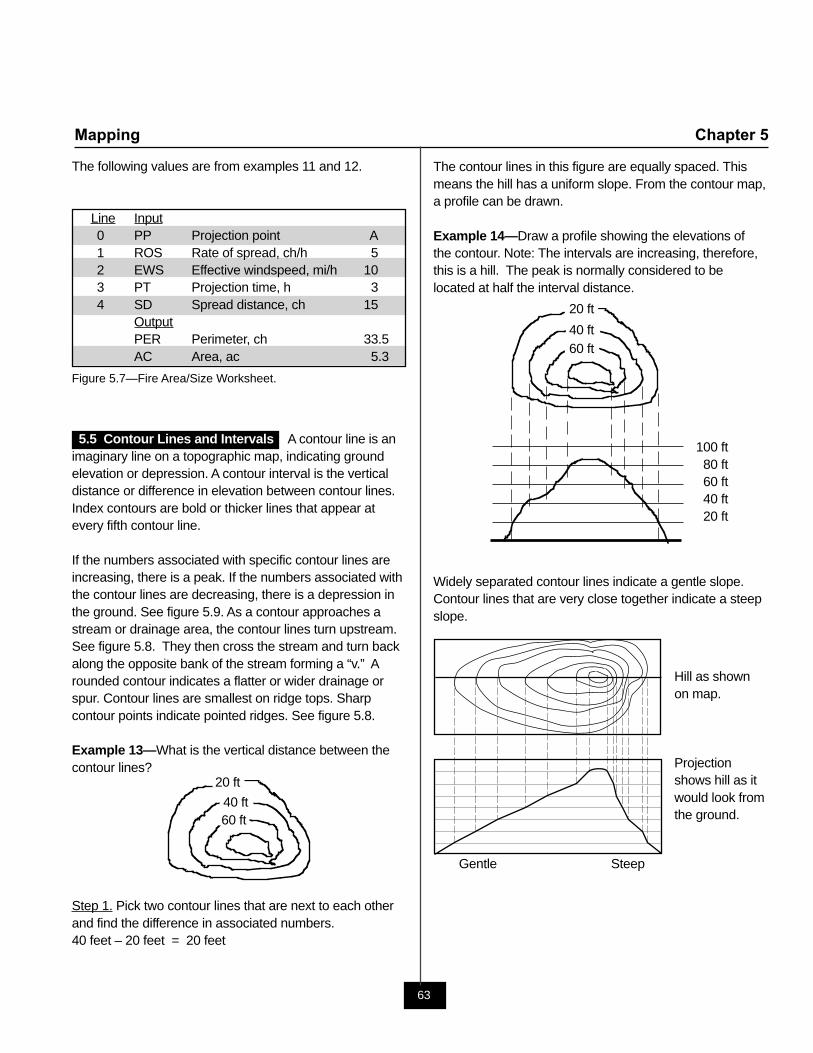
63
Mapping Chapter 5
The following values are from examples 11 and 12.
Line Input0 PP Projection point A1 ROS Rate of spread, ch/h 52 EWS Effective windspeed, mi/h 103 PT Projection time, h 34 SD Spread distance, ch 15
OutputPER Perimeter, ch 33.5AC Area, ac 5.3
Figure 5.7—Fire Area/Size Worksheet.
5.5 Contour Lines and Intervals A contour line is animaginary line on a topographic map, indicating groundelevation or depression. A contour interval is the verticaldistance or difference in elevation between contour lines.Index contours are bold or thicker lines that appear atevery fifth contour line.
If the numbers associated with specific contour lines areincreasing, there is a peak. If the numbers associated withthe contour lines are decreasing, there is a depression inthe ground. See figure 5.9. As a contour approaches astream or drainage area, the contour lines turn upstream.See figure 5.8. They then cross the stream and turn backalong the opposite bank of the stream forming a “v.” Arounded contour indicates a flatter or wider drainage orspur. Contour lines are smallest on ridge tops. Sharpcontour points indicate pointed ridges. See figure 5.8.
Example 13—What is the vertical distance between thecontour lines?
Step 1. Pick two contour lines that are next to each otherand find the difference in associated numbers.40 feet – 20 feet = 20 feet
The contour lines in this figure are equally spaced. Thismeans the hill has a uniform slope. From the contour map,a profile can be drawn.
Example 14—Draw a profile showing the elevations ofthe contour. Note: The intervals are increasing, therefore,this is a hill. The peak is normally considered to belocated at half the interval distance.
Widely separated contour lines indicate a gentle slope.Contour lines that are very close together indicate a steepslope.
20 ft
40 ft60 ft
100 ft80 ft60 ft40 ft20 ft
20 ft
40 ft60 ft
Hill as shownon map.
Projectionshows hill as itwould look fromthe ground.
Gentle Steep
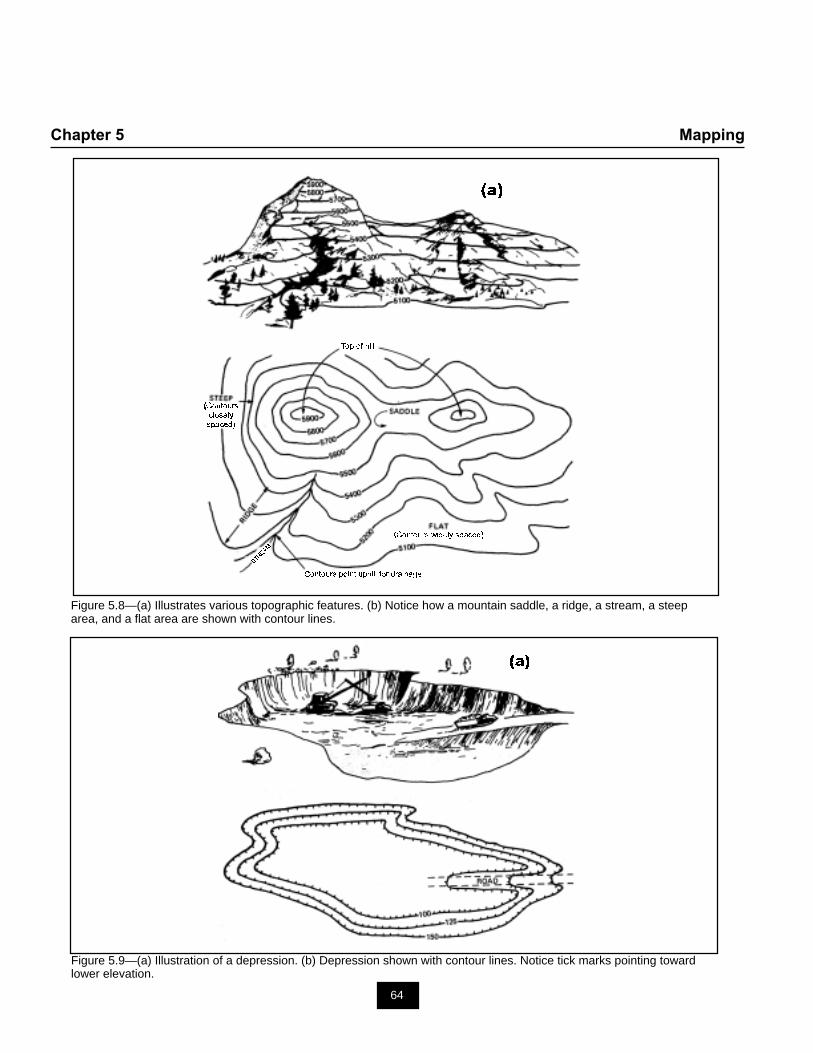
64
Chapter 5 Mapping
Figure 5.9—(a) Illustration of a depression. (b) Depression shown with contour lines. Notice tick marks pointing towardlower elevation.
Figure 5.8—(a) Illustrates various topographic features. (b) Notice how a mountain saddle, a ridge, a stream, a steeparea, and a flat area are shown with contour lines.
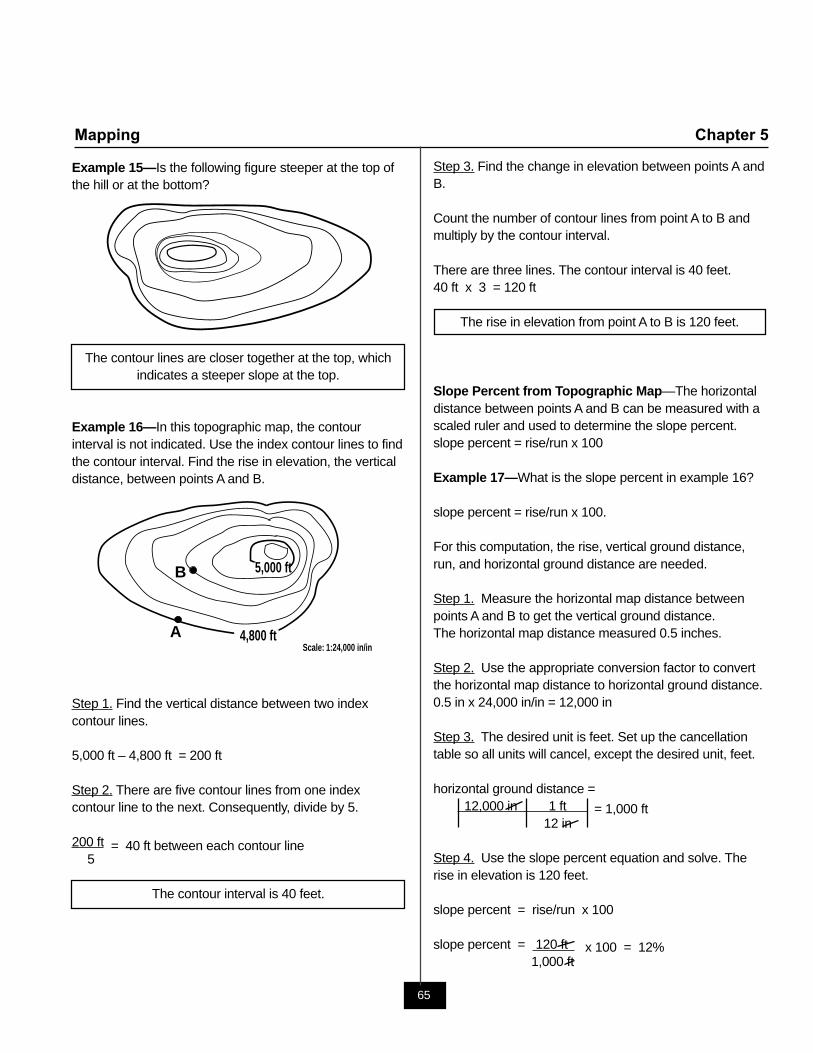
65
Mapping Chapter 5
Example 15—Is the following figure steeper at the top ofthe hill or at the bottom?
The contour lines are closer together at the top, whichindicates a steeper slope at the top.
Example 16—In this topographic map, the contourinterval is not indicated. Use the index contour lines to findthe contour interval. Find the rise in elevation, the verticaldistance, between points A and B.
Step 1. Find the vertical distance between two indexcontour lines.
5,000 ft – 4,800 ft = 200 ft
Step 2. There are five contour lines from one indexcontour line to the next. Consequently, divide by 5.
200 ft = 40 ft between each contour line5
The contour interval is 40 feet.
Step 3. Find the change in elevation between points A andB.
Count the number of contour lines from point A to B andmultiply by the contour interval.
There are three lines. The contour interval is 40 feet.40 ft x 3 = 120 ft
The rise in elevation from point A to B is 120 feet.
Slope Percent from Topographic Map—The horizontaldistance between points A and B can be measured with ascaled ruler and used to determine the slope percent.slope percent = rise/run x 100
Example 17—What is the slope percent in example 16?
slope percent = rise/run x 100.
For this computation, the rise, vertical ground distance,run, and horizontal ground distance are needed.
Step 1. Measure the horizontal map distance betweenpoints A and B to get the vertical ground distance.The horizontal map distance measured 0.5 inches.
Step 2. Use the appropriate conversion factor to convertthe horizontal map distance to horizontal ground distance.0.5 in x 24,000 in/in = 12,000 in
Step 3. The desired unit is feet. Set up the cancellationtable so all units will cancel, except the desired unit, feet.
horizontal ground distance = 12,000 in 1 ft = 1,000 ft
12 in
Step 4. Use the slope percent equation and solve. Therise in elevation is 120 feet.
slope percent = rise/run x 100
slope percent = 120 ft x 100 = 12% 1,000 ft
5,000 ft
4,800 ftScale: 1:24,000 in/in
A
B
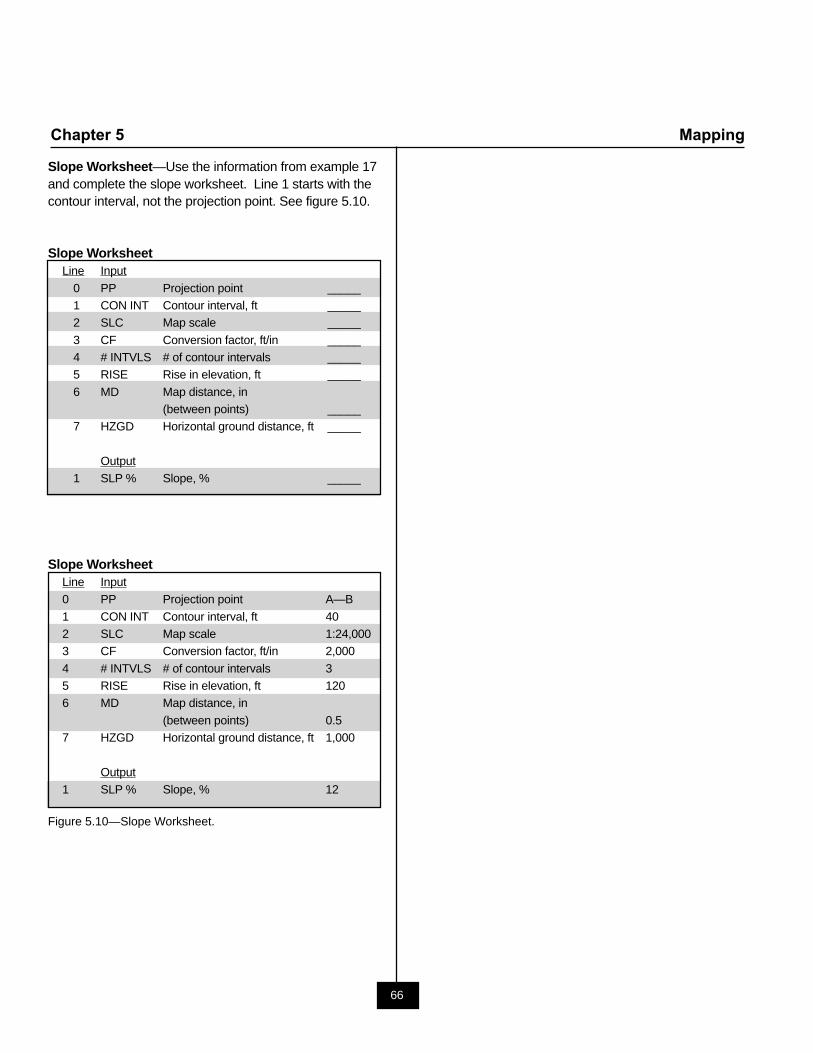
66
Chapter 5 Mapping
Slope Worksheet—Use the information from example 17and complete the slope worksheet. Line 1 starts with thecontour interval, not the projection point. See figure 5.10.
Slope WorksheetLine Input
0 PP Projection point _____1 CON INT Contour interval, ft _____2 SLC Map scale _____
3 CF Conversion factor, ft/in _____4 # INTVLS # of contour intervals _____5 RISE Rise in elevation, ft _____
6 MD Map distance, in(between points) _____
7 HZGD Horizontal ground distance, ft _____
Output1 SLP % Slope, % _____
Slope WorksheetLine Input0 PP Projection point A—B
1 CON INT Contour interval, ft 402 SLC Map scale 1:24,0003 CF Conversion factor, ft/in 2,000
4 # INTVLS # of contour intervals 35 RISE Rise in elevation, ft 1206 MD Map distance, in
(between points) 0.57 HZGD Horizontal ground distance, ft 1,000
Output1 SLP % Slope, % 12
Figure 5.10—Slope Worksheet.
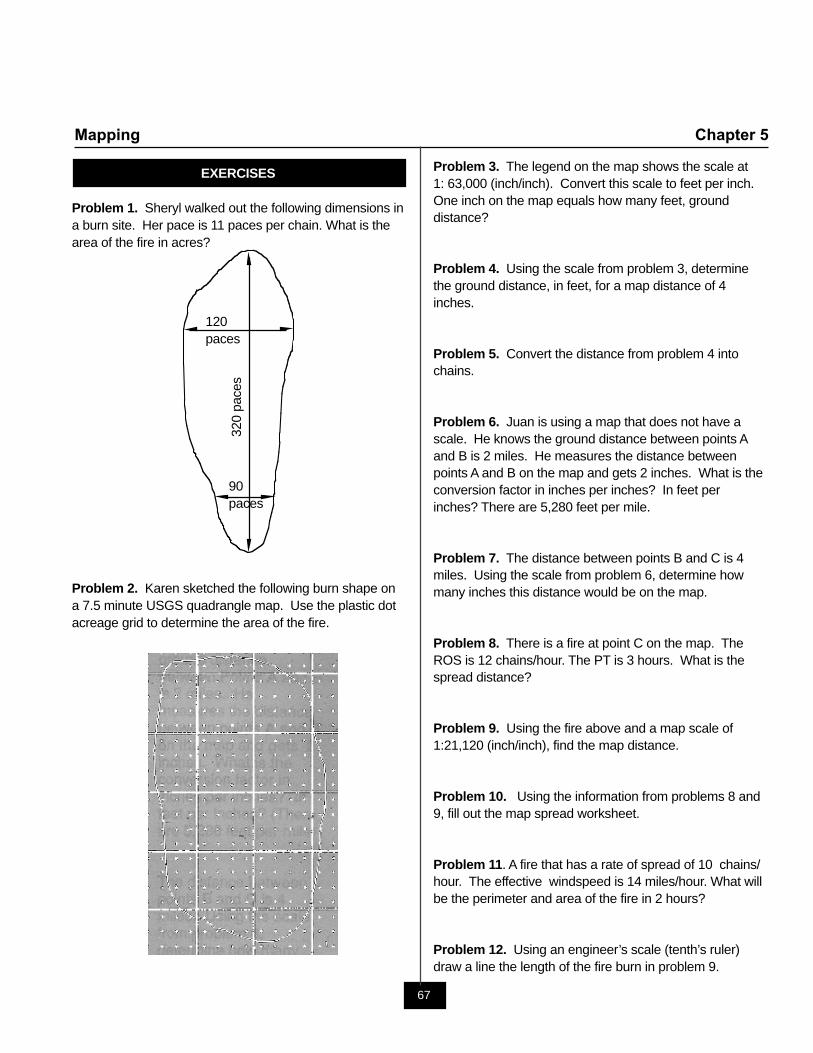
67
Mapping Chapter 5
EXERCISES
Problem 1. Sheryl walked out the following dimensions ina burn site. Her pace is 11 paces per chain. What is thearea of the fire in acres?
Problem 2. Karen sketched the following burn shape ona 7.5 minute USGS quadrangle map. Use the plastic dotacreage grid to determine the area of the fire.
120paces
320
pace
s
90paces
Problem 3. The legend on the map shows the scale at1: 63,000 (inch/inch). Convert this scale to feet per inch.One inch on the map equals how many feet, grounddistance?
Problem 4. Using the scale from problem 3, determinethe ground distance, in feet, for a map distance of 4inches.
Problem 5. Convert the distance from problem 4 intochains.
Problem 6. Juan is using a map that does not have ascale. He knows the ground distance between points Aand B is 2 miles. He measures the distance betweenpoints A and B on the map and gets 2 inches. What is theconversion factor in inches per inches? In feet perinches? There are 5,280 feet per mile.
Problem 7. The distance between points B and C is 4miles. Using the scale from problem 6, determine howmany inches this distance would be on the map.
Problem 8. There is a fire at point C on the map. TheROS is 12 chains/hour. The PT is 3 hours. What is thespread distance?
Problem 9. Using the fire above and a map scale of1:21,120 (inch/inch), find the map distance.
Problem 10. Using the information from problems 8 and9, fill out the map spread worksheet.
Problem 11. A fire that has a rate of spread of 10 chains/hour. The effective windspeed is 14 miles/hour. What willbe the perimeter and area of the fire in 2 hours?
Problem 12. Using an engineer’s scale (tenth’s ruler)draw a line the length of the fire burn in problem 9.
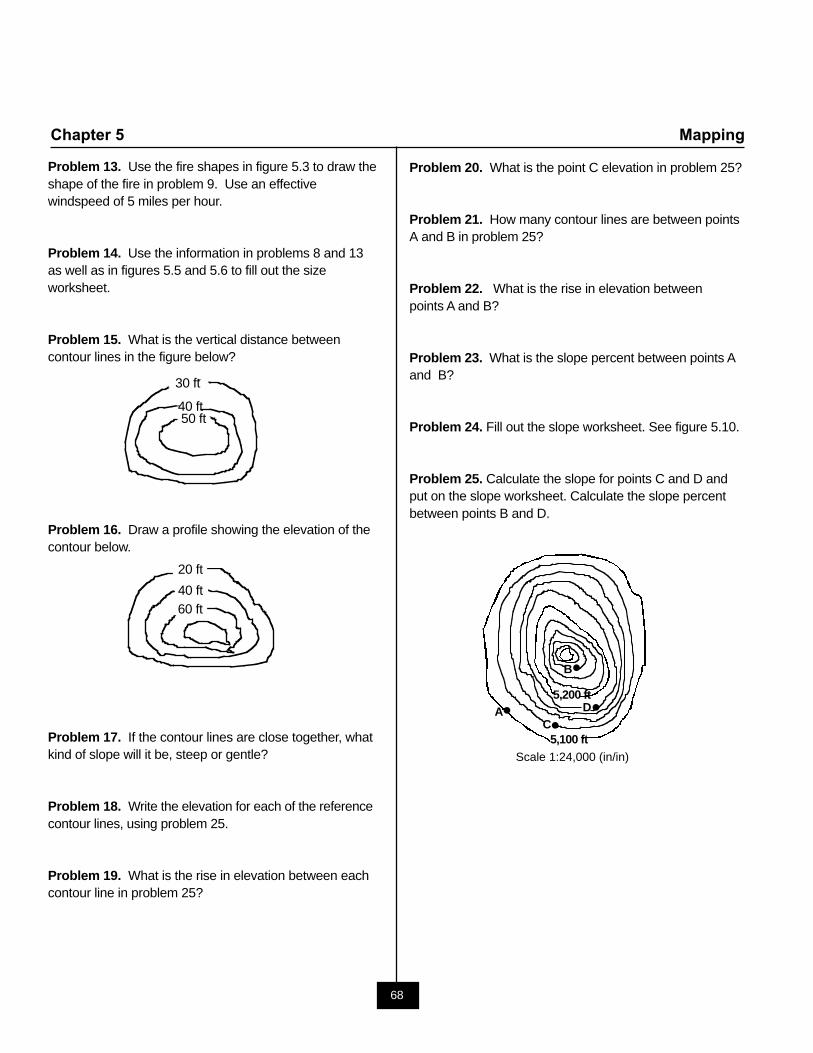
68
Chapter 5 Mapping
Problem 20. What is the point C elevation in problem 25?
Problem 21. How many contour lines are between pointsA and B in problem 25?
Problem 22. What is the rise in elevation betweenpoints A and B?
Problem 23. What is the slope percent between points Aand B?
Problem 24. Fill out the slope worksheet. See figure 5.10.
Problem 25. Calculate the slope for points C and D andput on the slope worksheet. Calculate the slope percentbetween points B and D.
Problem 13. Use the fire shapes in figure 5.3 to draw theshape of the fire in problem 9. Use an effectivewindspeed of 5 miles per hour.
Problem 14. Use the information in problems 8 and 13as well as in figures 5.5 and 5.6 to fill out the sizeworksheet.
Problem 15. What is the vertical distance betweencontour lines in the figure below?
Problem 16. Draw a profile showing the elevation of thecontour below.
Problem 17. If the contour lines are close together, whatkind of slope will it be, steep or gentle?
Problem 18. Write the elevation for each of the referencecontour lines, using problem 25.
Problem 19. What is the rise in elevation between eachcontour line in problem 25?
30 ft
40 ft50 ft
B
A5,200 ft
5,100 ftC
D
Scale 1:24,000 (in/in)
20 ft
40 ft60 ft
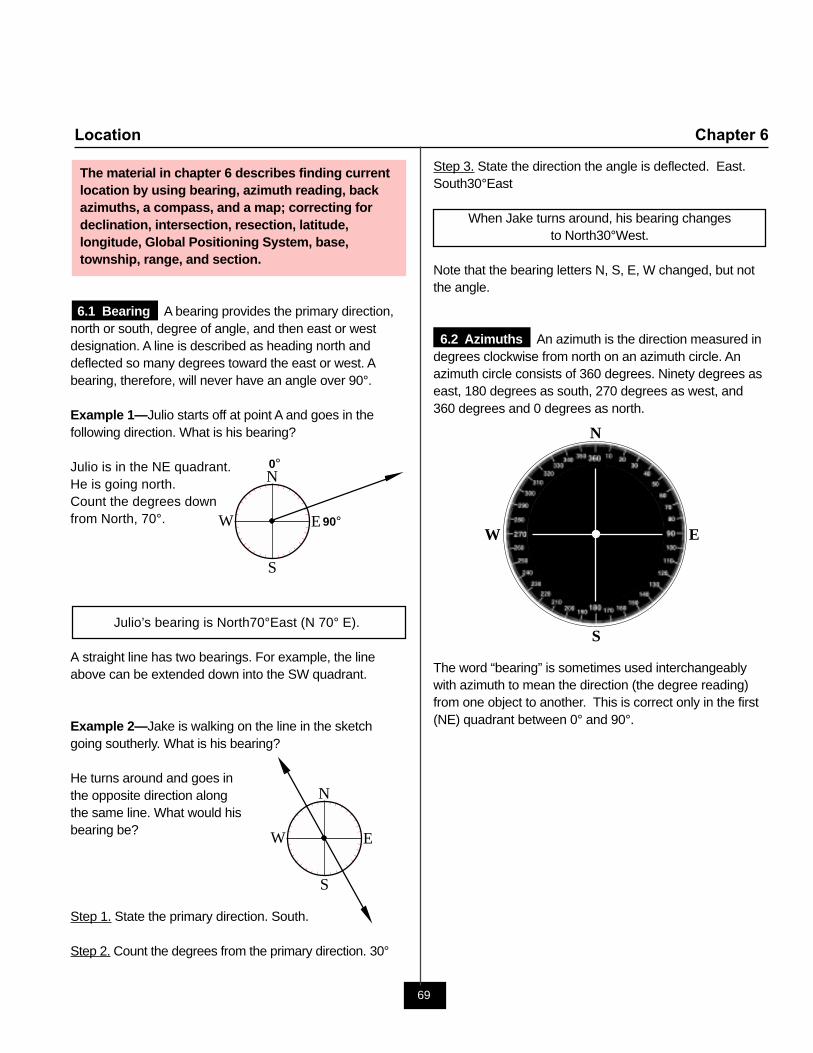
69
Location Chapter 6
The material in chapter 6 describes finding currentlocation by using bearing, azimuth reading, backazimuths, a compass, and a map; correcting fordeclination, intersection, resection, latitude,longitude, Global Positioning System, base,township, range, and section.
6.1 Bearing A bearing provides the primary direction,north or south, degree of angle, and then east or westdesignation. A line is described as heading north anddeflected so many degrees toward the east or west. Abearing, therefore, will never have an angle over 90°.
Example 1—Julio starts off at point A and goes in thefollowing direction. What is his bearing?
Julio is in the NE quadrant.He is going north.Count the degrees downfrom North, 70°.
Julio’s bearing is North70°East (N 70° E).
A straight line has two bearings. For example, the lineabove can be extended down into the SW quadrant.
Example 2—Jake is walking on the line in the sketchgoing southerly. What is his bearing?
He turns around and goes inthe opposite direction alongthe same line. What would hisbearing be?
Step 1. State the primary direction. South.
Step 2. Count the degrees from the primary direction. 30°
Step 3. State the direction the angle is deflected. East.South30°East
When Jake turns around, his bearing changesto North30°West.
Note that the bearing letters N, S, E, W changed, but notthe angle.
6.2 Azimuths An azimuth is the direction measured indegrees clockwise from north on an azimuth circle. Anazimuth circle consists of 360 degrees. Ninety degrees aseast, 180 degrees as south, 270 degrees as west, and360 degrees and 0 degrees as north.
The word “bearing” is sometimes used interchangeablywith azimuth to mean the direction (the degree reading)from one object to another. This is correct only in the first(NE) quadrant between 0° and 90°.
90°
0°
A
N
S
EW
N
S
EW
N
S
EW
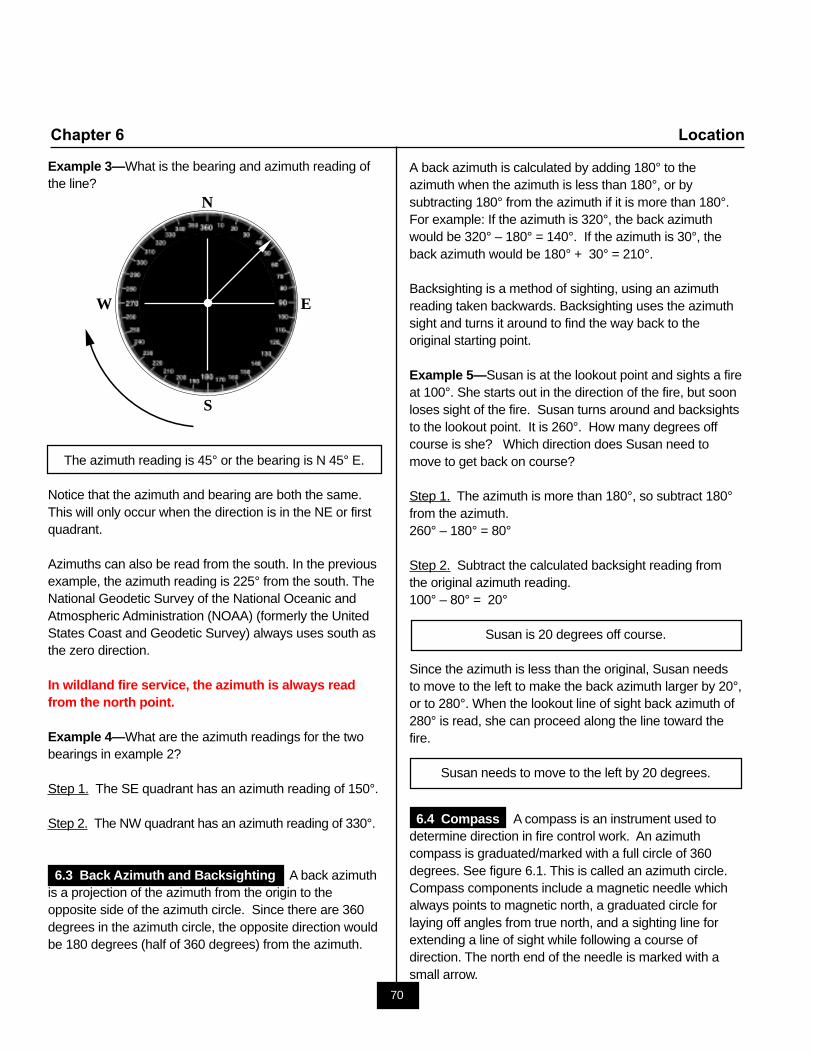
70
Chapter 6 Location
Example 3—What is the bearing and azimuth reading ofthe line?
The azimuth reading is 45° or the bearing is N 45° E.
Notice that the azimuth and bearing are both the same.This will only occur when the direction is in the NE or firstquadrant.
Azimuths can also be read from the south. In the previousexample, the azimuth reading is 225° from the south. TheNational Geodetic Survey of the National Oceanic andAtmospheric Administration (NOAA) (formerly the UnitedStates Coast and Geodetic Survey) always uses south asthe zero direction.
In wildland fire service, the azimuth is always readfrom the north point.
Example 4—What are the azimuth readings for the twobearings in example 2?
Step 1. The SE quadrant has an azimuth reading of 150°.
Step 2. The NW quadrant has an azimuth reading of 330°.
6.3 Back Azimuth and Backsighting A back azimuthis a projection of the azimuth from the origin to theopposite side of the azimuth circle. Since there are 360degrees in the azimuth circle, the opposite direction wouldbe 180 degrees (half of 360 degrees) from the azimuth.
A back azimuth is calculated by adding 180° to theazimuth when the azimuth is less than 180°, or bysubtracting 180° from the azimuth if it is more than 180°.For example: If the azimuth is 320°, the back azimuthwould be 320° – 180° = 140°. If the azimuth is 30°, theback azimuth would be 180° + 30° = 210°.
Backsighting is a method of sighting, using an azimuthreading taken backwards. Backsighting uses the azimuthsight and turns it around to find the way back to theoriginal starting point.
Example 5—Susan is at the lookout point and sights a fireat 100°. She starts out in the direction of the fire, but soonloses sight of the fire. Susan turns around and backsightsto the lookout point. It is 260°. How many degrees offcourse is she? Which direction does Susan need tomove to get back on course?
Step 1. The azimuth is more than 180°, so subtract 180°from the azimuth.260° – 180° = 80°
Step 2. Subtract the calculated backsight reading fromthe original azimuth reading.100° – 80° = 20°
Susan is 20 degrees off course.
Since the azimuth is less than the original, Susan needsto move to the left to make the back azimuth larger by 20°,or to 280°. When the lookout line of sight back azimuth of280° is read, she can proceed along the line toward thefire.
Susan needs to move to the left by 20 degrees.
6.4 Compass A compass is an instrument used todetermine direction in fire control work. An azimuthcompass is graduated/marked with a full circle of 360degrees. See figure 6.1. This is called an azimuth circle.Compass components include a magnetic needle whichalways points to magnetic north, a graduated circle forlaying off angles from true north, and a sighting line forextending a line of sight while following a course ofdirection. The north end of the needle is marked with asmall arrow.
N
S
EW
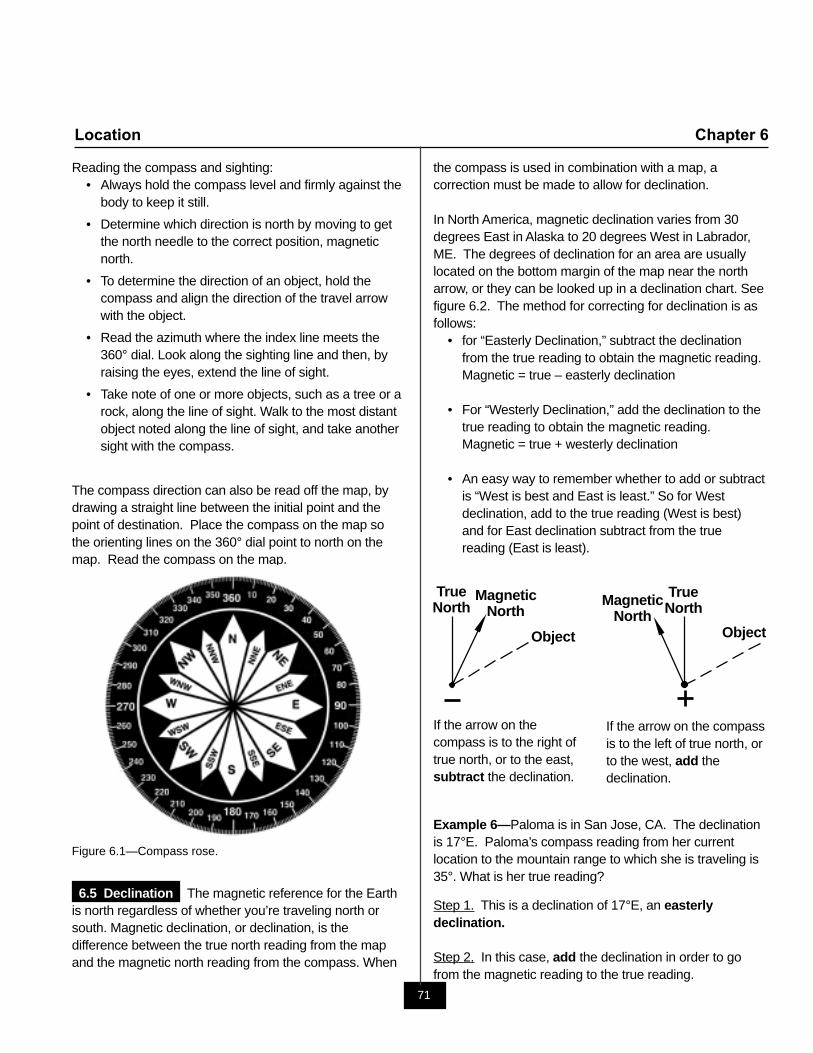
71
Location Chapter 6
Reading the compass and sighting:• Always hold the compass level and firmly against the
body to keep it still.
• Determine which direction is north by moving to getthe north needle to the correct position, magneticnorth.
• To determine the direction of an object, hold thecompass and align the direction of the travel arrowwith the object.
• Read the azimuth where the index line meets the360° dial. Look along the sighting line and then, byraising the eyes, extend the line of sight.
• Take note of one or more objects, such as a tree or arock, along the line of sight. Walk to the most distantobject noted along the line of sight, and take anothersight with the compass.
The compass direction can also be read off the map, bydrawing a straight line between the initial point and thepoint of destination. Place the compass on the map sothe orienting lines on the 360° dial point to north on themap. Read the compass on the map.
Figure 6.1—Compass rose.
6.5 Declination The magnetic reference for the Earthis north regardless of whether you’re traveling north orsouth. Magnetic declination, or declination, is thedifference between the true north reading from the mapand the magnetic north reading from the compass. When
the compass is used in combination with a map, acorrection must be made to allow for declination.
In North America, magnetic declination varies from 30degrees East in Alaska to 20 degrees West in Labrador,ME. The degrees of declination for an area are usuallylocated on the bottom margin of the map near the northarrow, or they can be looked up in a declination chart. Seefigure 6.2. The method for correcting for declination is asfollows:
• for “Easterly Declination,” subtract the declinationfrom the true reading to obtain the magnetic reading.Magnetic = true – easterly declination
• For “Westerly Declination,” add the declination to thetrue reading to obtain the magnetic reading.Magnetic = true + westerly declination
• An easy way to remember whether to add or subtractis “West is best and East is least.” So for Westdeclination, add to the true reading (West is best)and for East declination subtract from the truereading (East is least).
Example 6—Paloma is in San Jose, CA. The declinationis 17°E. Paloma’s compass reading from her currentlocation to the mountain range to which she is traveling is35°. What is her true reading?
Step 1. This is a declination of 17°E, an easterlydeclination.
Step 2. In this case, add the declination in order to gofrom the magnetic reading to the true reading.
TrueNorthMagnetic
NorthObjectObject
TrueNorth
MagneticNorth
If the arrow on thecompass is to the right oftrue north, or to the east,subtract the declination.
If the arrow on the compassis to the left of true north, orto the west, add thedeclination.
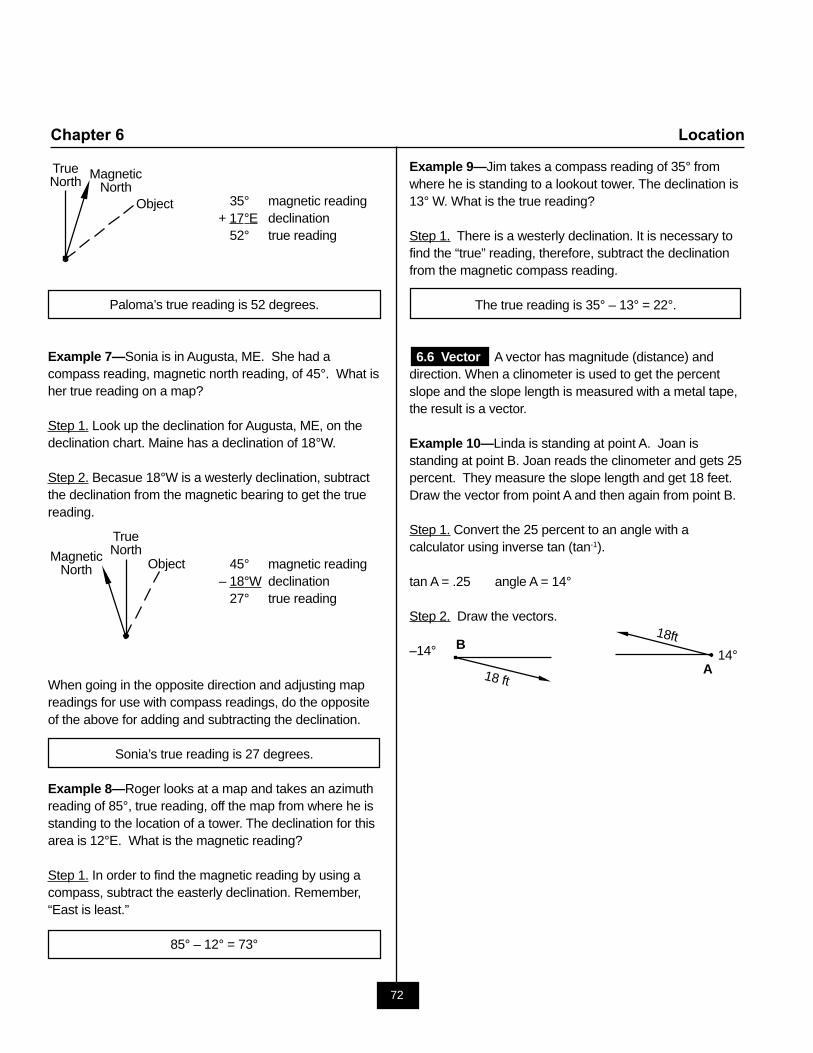
72
Chapter 6 Location
35° magnetic reading+ 17°E declination
52° true reading
Paloma’s true reading is 52 degrees.
Example 7—Sonia is in Augusta, ME. She had acompass reading, magnetic north reading, of 45°. What isher true reading on a map?
Step 1. Look up the declination for Augusta, ME, on thedeclination chart. Maine has a declination of 18°W.
Step 2. Becasue 18°W is a westerly declination, subtractthe declination from the magnetic bearing to get the truereading.
45° magnetic reading– 18°W declination
27° true reading
When going in the opposite direction and adjusting mapreadings for use with compass readings, do the oppositeof the above for adding and subtracting the declination.
Sonia’s true reading is 27 degrees.
Example 8—Roger looks at a map and takes an azimuthreading of 85°, true reading, off the map from where he isstanding to the location of a tower. The declination for thisarea is 12°E. What is the magnetic reading?
Step 1. In order to find the magnetic reading by using acompass, subtract the easterly declination. Remember,“East is least.”
85° – 12° = 73°
Example 9—Jim takes a compass reading of 35° fromwhere he is standing to a lookout tower. The declination is13° W. What is the true reading?
Step 1. There is a westerly declination. It is necessary tofind the “true” reading, therefore, subtract the declinationfrom the magnetic compass reading.
The true reading is 35° – 13° = 22°.
6.6 Vector A vector has magnitude (distance) anddirection. When a clinometer is used to get the percentslope and the slope length is measured with a metal tape,the result is a vector.
Example 10—Linda is standing at point A. Joan isstanding at point B. Joan reads the clinometer and gets 25percent. They measure the slope length and get 18 feet.Draw the vector from point A and then again from point B.
Step 1. Convert the 25 percent to an angle with acalculator using inverse tan (tan-1).
tan A = .25 angle A = 14°
Step 2. Draw the vectors.
–14°
TrueNorth Magnetic
NorthObject
TrueNorthMagnetic
North Object
14°
18ft
A 18 ft
B
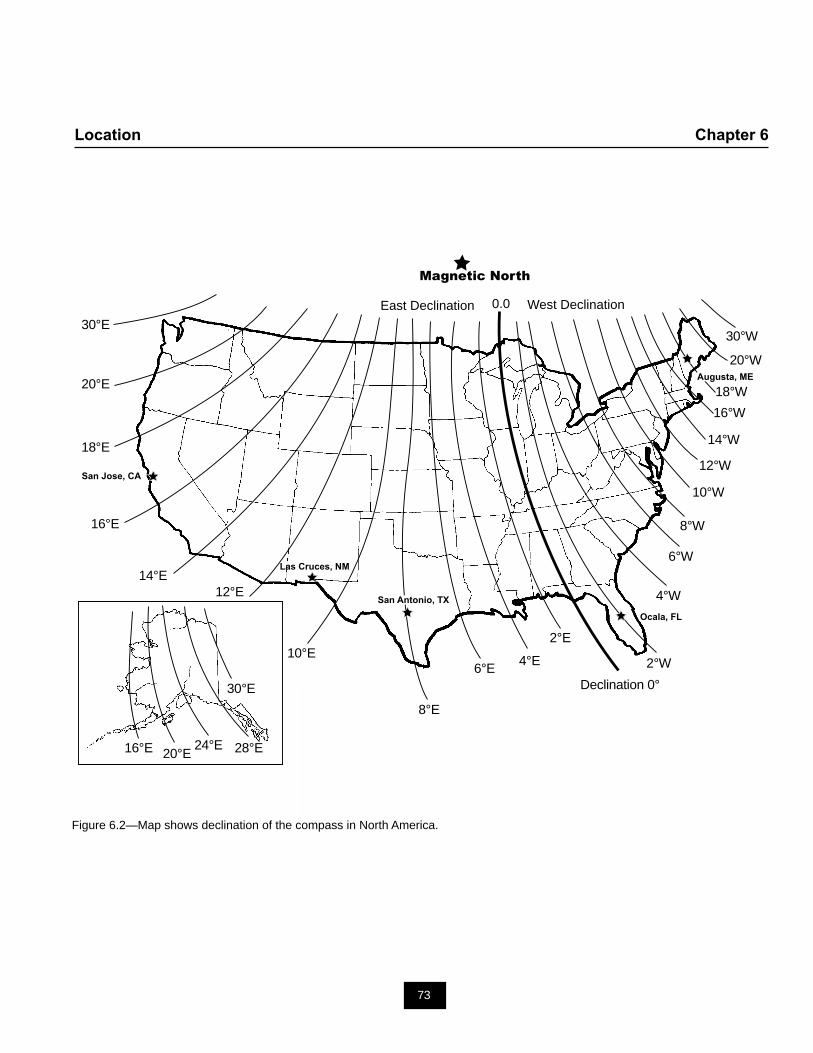
73
Location Chapter 6
Figure 6.2—Map shows declination of the compass in North America.
East Declination West Declination0.0
Magnetic North
San Jose, CA
Las Cruces, NM
Ocala, FL
Augusta, ME
San Antonio, TX
30°E
20°E
18°E
16°E
14°E12°E
10°E
8°E
6°E 4°E
2°E
16°E 20°E 24°E 28°E
30°E Declination 0°2°W
4°W
6°W
8°W
10°W
12°W
16°W18°W
20°W
14°W
30°W
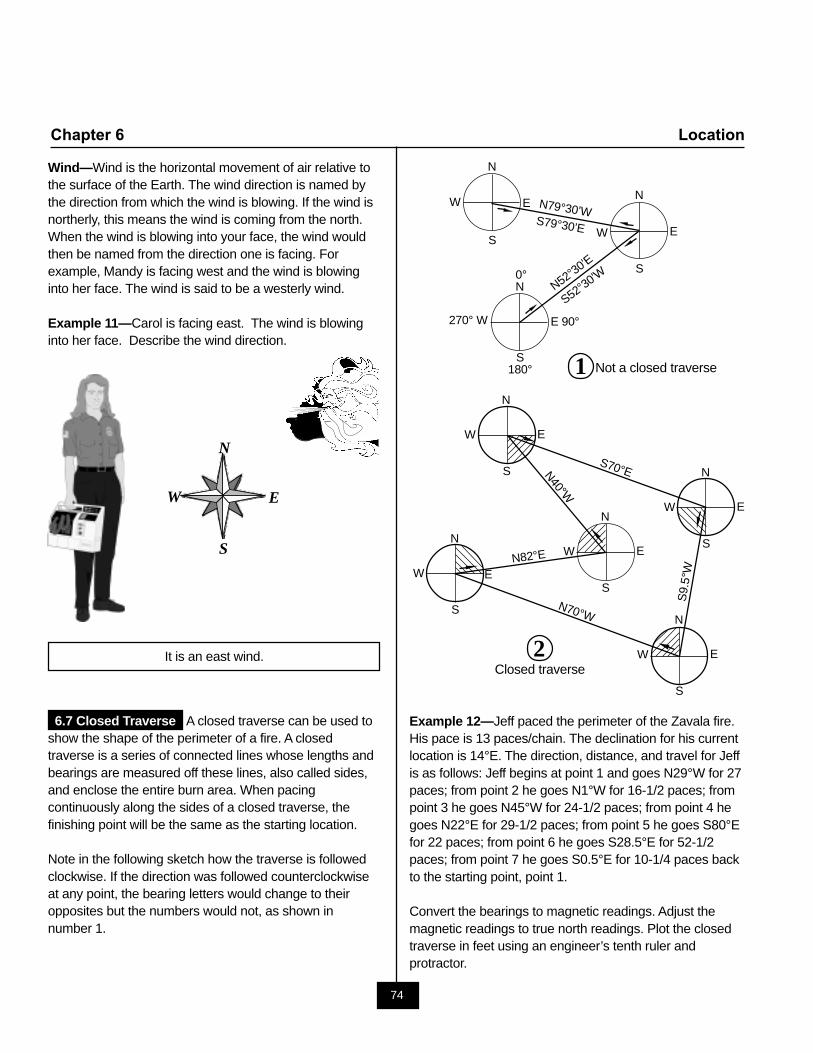
74
Chapter 6 Location
Wind—Wind is the horizontal movement of air relative tothe surface of the Earth. The wind direction is named bythe direction from which the wind is blowing. If the wind isnortherly, this means the wind is coming from the north.When the wind is blowing into your face, the wind wouldthen be named from the direction one is facing. Forexample, Mandy is facing west and the wind is blowinginto her face. The wind is said to be a westerly wind.
Example 11—Carol is facing east. The wind is blowinginto her face. Describe the wind direction.
It is an east wind.
6.7 Closed Traverse A closed traverse can be used toshow the shape of the perimeter of a fire. A closedtraverse is a series of connected lines whose lengths andbearings are measured off these lines, also called sides,and enclose the entire burn area. When pacingcontinuously along the sides of a closed traverse, thefinishing point will be the same as the starting location.
Note in the following sketch how the traverse is followedclockwise. If the direction was followed counterclockwiseat any point, the bearing letters would change to theiropposites but the numbers would not, as shown innumber 1.
N
E
S
W
S
EW N79°30’WS79°30’E
N52°30’E
S52°30’W
1
N
S
EW
N
0°N
S180°
270° W E 90°
Example 12—Jeff paced the perimeter of the Zavala fire.His pace is 13 paces/chain. The declination for his currentlocation is 14°E. The direction, distance, and travel for Jeffis as follows: Jeff begins at point 1 and goes N29°W for 27paces; from point 2 he goes N1°W for 16-1/2 paces; frompoint 3 he goes N45°W for 24-1/2 paces; from point 4 hegoes N22°E for 29-1/2 paces; from point 5 he goes S80°Efor 22 paces; from point 6 he goes S28.5°E for 52-1/2paces; from point 7 he goes S0.5°E for 10-1/4 paces backto the starting point, point 1.
Convert the bearings to magnetic readings. Adjust themagnetic readings to true north readings. Plot the closedtraverse in feet using an engineer’s tenth ruler andprotractor.
S70°E
S9.
5°W
N70°W
N82°E
N40°W
2
N
S
EW
N
S
EW
N
S
EW
N
S
EW
N
S
EW
Not a closed traverse
Closed traverse
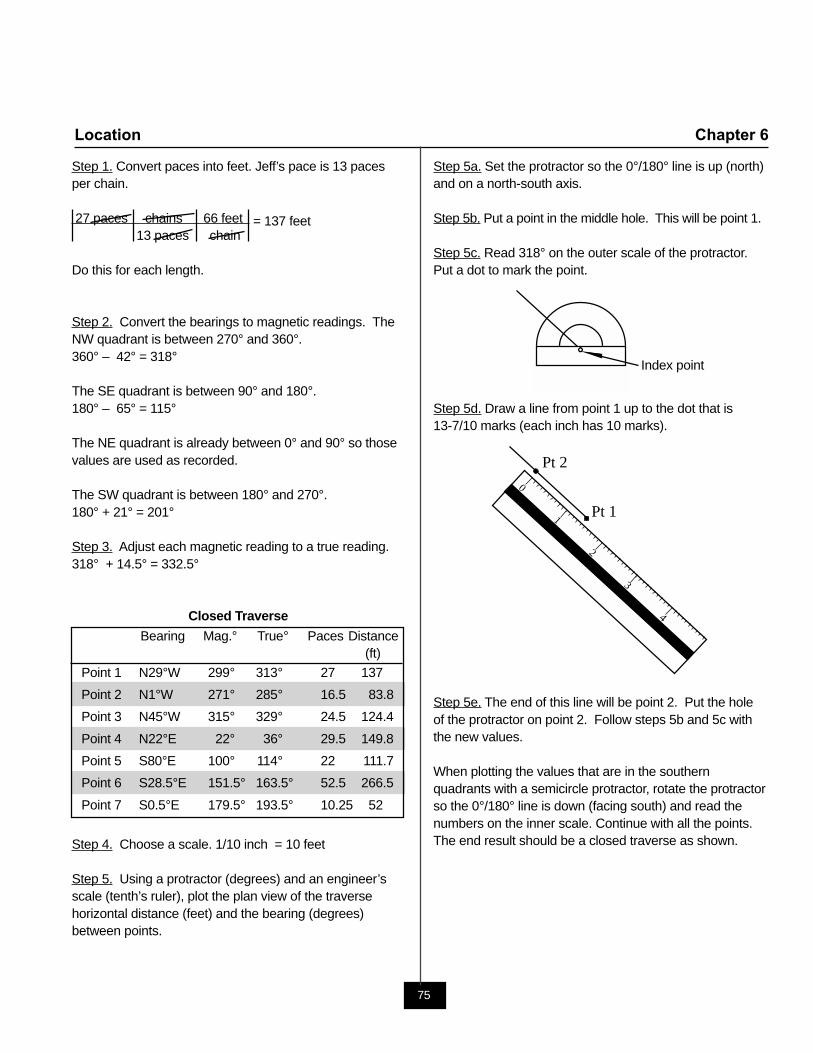
75
Location Chapter 6
Step 5a. Set the protractor so the 0°/180° line is up (north)and on a north-south axis.
Step 5b. Put a point in the middle hole. This will be point 1.
Step 5c. Read 318° on the outer scale of the protractor.Put a dot to mark the point.
Step 5d. Draw a line from point 1 up to the dot that is13-7/10 marks (each inch has 10 marks).
Step 5e. The end of this line will be point 2. Put the holeof the protractor on point 2. Follow steps 5b and 5c withthe new values.
When plotting the values that are in the southernquadrants with a semicircle protractor, rotate the protractorso the 0°/180° line is down (facing south) and read thenumbers on the inner scale. Continue with all the points.The end result should be a closed traverse as shown.
Step 1. Convert paces into feet. Jeff’s pace is 13 pacesper chain.
27 paces chains 66 feet = 137 feet13 paces chain
Do this for each length.
Step 2. Convert the bearings to magnetic readings. TheNW quadrant is between 270° and 360°.360° – 42° = 318°
The SE quadrant is between 90° and 180°.180° – 65° = 115°
The NE quadrant is already between 0° and 90° so thosevalues are used as recorded.
The SW quadrant is between 180° and 270°.180° + 21° = 201°
Step 3. Adjust each magnetic reading to a true reading.318° + 14.5° = 332.5°
Closed Traverse
Bearing Mag.° True° Paces Distance (ft)
Point 1 N29°W 299° 313° 27 137
Point 2 N1°W 271° 285° 16.5 83.8
Point 3 N45°W 315° 329° 24.5 124.4
Point 4 N22°E 22° 36° 29.5 149.8
Point 5 S80°E 100° 114° 22 111.7
Point 6 S28.5°E 151.5° 163.5° 52.5 266.5
Point 7 S0.5°E 179.5° 193.5° 10.25 52
Step 4. Choose a scale. 1/10 inch = 10 feet
Step 5. Using a protractor (degrees) and an engineer’sscale (tenth’s ruler), plot the plan view of the traversehorizontal distance (feet) and the bearing (degrees)between points.
Index point
Pt 1
Pt 20
1
2
3
4
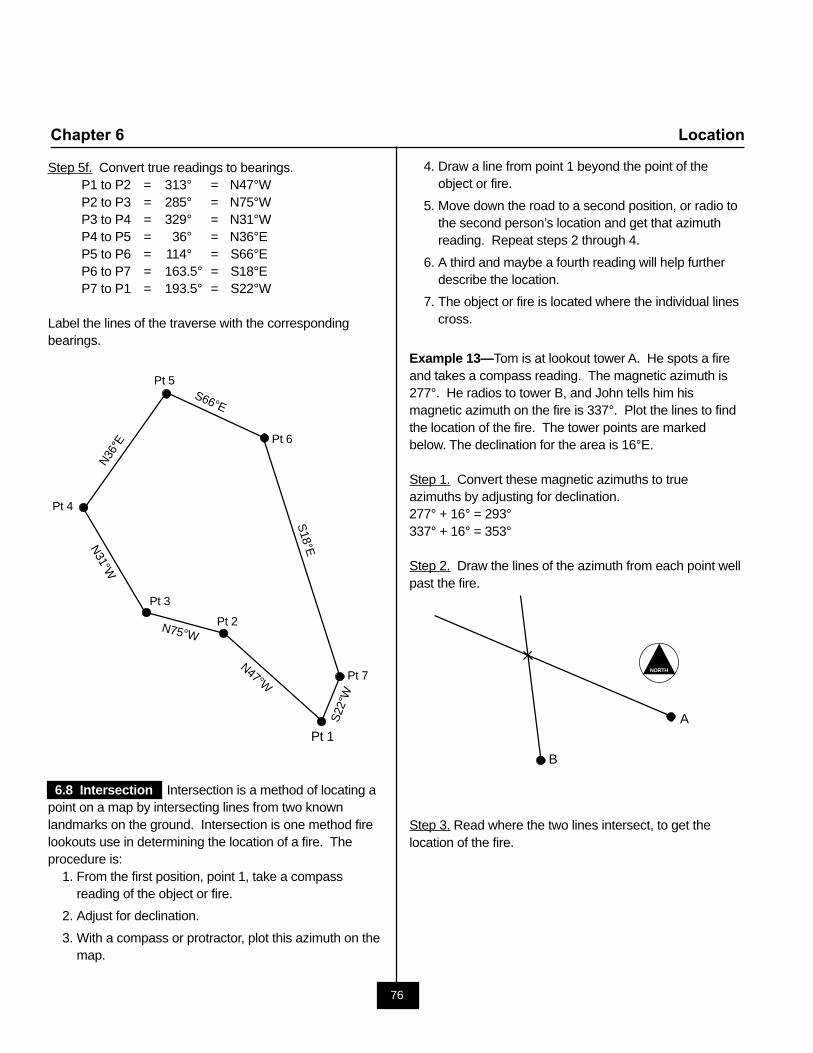
76
Chapter 6 Location
Step 5f. Convert true readings to bearings.P1 to P2 = 313° = N47°WP2 to P3 = 285° = N75°WP3 to P4 = 329° = N31°WP4 to P5 = 36° = N36°EP5 to P6 = 114° = S66°EP6 to P7 = 163.5° = S18°EP7 to P1 = 193.5° = S22°W
Label the lines of the traverse with the correspondingbearings.
6.8 Intersection Intersection is a method of locating apoint on a map by intersecting lines from two knownlandmarks on the ground. Intersection is one method firelookouts use in determining the location of a fire. Theprocedure is:
1. From the first position, point 1, take a compassreading of the object or fire.
2. Adjust for declination.
3. With a compass or protractor, plot this azimuth on themap.
Pt 1
Pt 2
Pt 3
Pt 5
Pt 4
Pt 6
Pt 7N47°W
N75°W
N31°W
N36°
E
S66°E
S18°E
S22
°W
4. Draw a line from point 1 beyond the point of theobject or fire.
5. Move down the road to a second position, or radio tothe second person’s location and get that azimuthreading. Repeat steps 2 through 4.
6. A third and maybe a fourth reading will help furtherdescribe the location.
7. The object or fire is located where the individual linescross.
Example 13—Tom is at lookout tower A. He spots a fireand takes a compass reading. The magnetic azimuth is277°. He radios to tower B, and John tells him hismagnetic azimuth on the fire is 337°. Plot the lines to findthe location of the fire. The tower points are markedbelow. The declination for the area is 16°E.
Step 1. Convert these magnetic azimuths to trueazimuths by adjusting for declination.277° + 16° = 293°337° + 16° = 353°
Step 2. Draw the lines of the azimuth from each point wellpast the fire.
Step 3. Read where the two lines intersect, to get thelocation of the fire.
A
B
NORTH
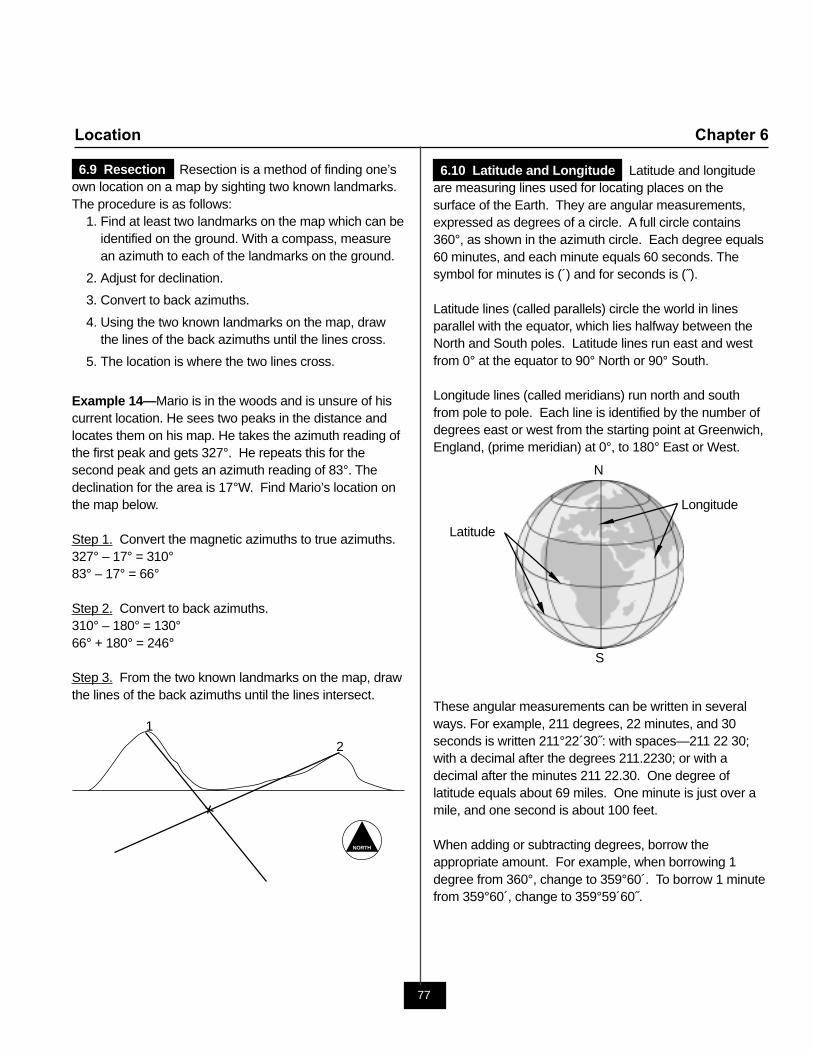
77
Location Chapter 6
1
2
N
S
Longitude
Latitude
NORTH
6.10 Latitude and Longitude Latitude and longitudeare measuring lines used for locating places on thesurface of the Earth. They are angular measurements,expressed as degrees of a circle. A full circle contains360°, as shown in the azimuth circle. Each degree equals60 minutes, and each minute equals 60 seconds. Thesymbol for minutes is (´) and for seconds is (˝).
Latitude lines (called parallels) circle the world in linesparallel with the equator, which lies halfway between theNorth and South poles. Latitude lines run east and westfrom 0° at the equator to 90° North or 90° South.
Longitude lines (called meridians) run north and southfrom pole to pole. Each line is identified by the number ofdegrees east or west from the starting point at Greenwich,England, (prime meridian) at 0°, to 180° East or West.
These angular measurements can be written in severalways. For example, 211 degrees, 22 minutes, and 30seconds is written 211°22´30˝: with spaces—211 22 30;with a decimal after the degrees 211.2230; or with adecimal after the minutes 211 22.30. One degree oflatitude equals about 69 miles. One minute is just over amile, and one second is about 100 feet.
When adding or subtracting degrees, borrow theappropriate amount. For example, when borrowing 1degree from 360°, change to 359°60´. To borrow 1 minutefrom 359°60´, change to 359°59´60˝.
6.9 Resection Resection is a method of finding one’sown location on a map by sighting two known landmarks.The procedure is as follows:
1. Find at least two landmarks on the map which can beidentified on the ground. With a compass, measurean azimuth to each of the landmarks on the ground.
2. Adjust for declination.
3. Convert to back azimuths.
4. Using the two known landmarks on the map, drawthe lines of the back azimuths until the lines cross.
5. The location is where the two lines cross.
Example 14—Mario is in the woods and is unsure of hiscurrent location. He sees two peaks in the distance andlocates them on his map. He takes the azimuth reading ofthe first peak and gets 327°. He repeats this for thesecond peak and gets an azimuth reading of 83°. Thedeclination for the area is 17°W. Find Mario’s location onthe map below.
Step 1. Convert the magnetic azimuths to true azimuths.327° – 17° = 310°83° – 17° = 66°
Step 2. Convert to back azimuths.310° – 180° = 130°66° + 180° = 246°
Step 3. From the two known landmarks on the map, drawthe lines of the back azimuths until the lines intersect.
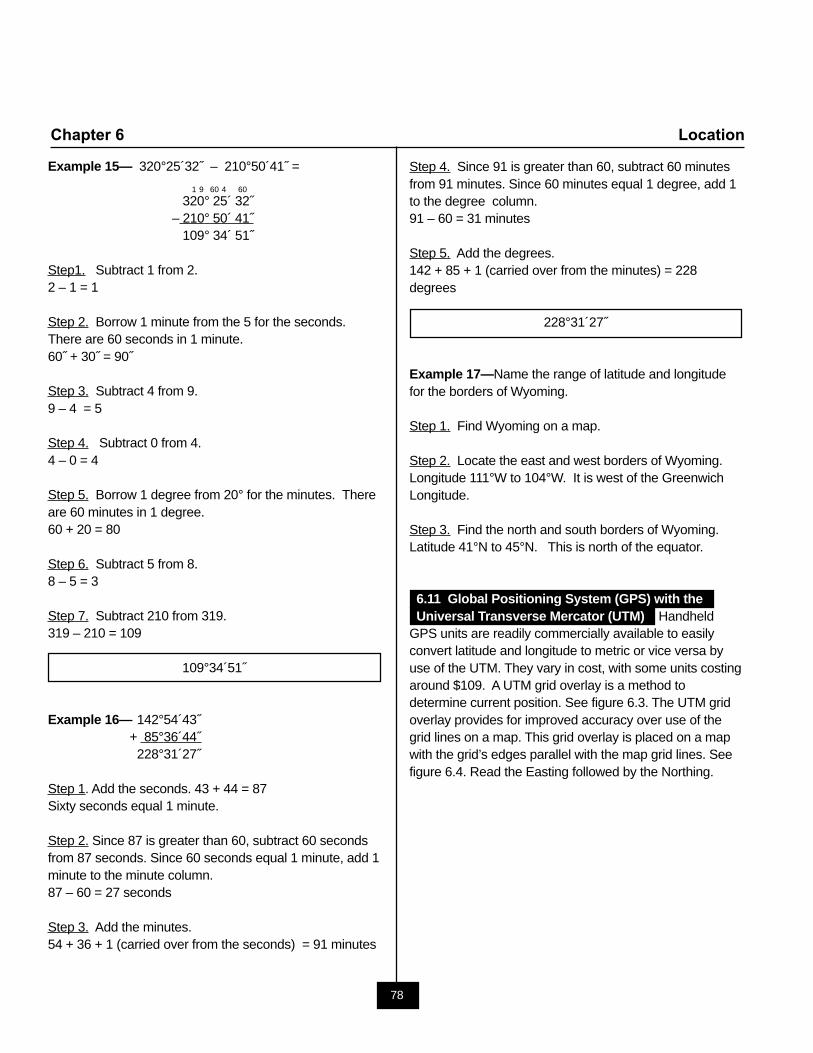
78
Chapter 6 Location
Example 15— 320°25´32˝ – 210°50´41˝ =
320° 25´ 32˝– 210° 50´ 41˝
109° 34´ 51˝
Step1. Subtract 1 from 2.2 – 1 = 1
Step 2. Borrow 1 minute from the 5 for the seconds.There are 60 seconds in 1 minute.60˝ + 30˝ = 90˝
Step 3. Subtract 4 from 9.9 – 4 = 5
Step 4. Subtract 0 from 4.4 – 0 = 4
Step 5. Borrow 1 degree from 20° for the minutes. Thereare 60 minutes in 1 degree.60 + 20 = 80
Step 6. Subtract 5 from 8.8 – 5 = 3
Step 7. Subtract 210 from 319.319 – 210 = 109
109°34´51˝
Example 16— 142°54´43˝+ 85°36´44˝228°31´27˝
Step 1. Add the seconds. 43 + 44 = 87Sixty seconds equal 1 minute.
Step 2. Since 87 is greater than 60, subtract 60 secondsfrom 87 seconds. Since 60 seconds equal 1 minute, add 1minute to the minute column.87 – 60 = 27 seconds
Step 3. Add the minutes.54 + 36 + 1 (carried over from the seconds) = 91 minutes
1 9 60 4 60
Step 4. Since 91 is greater than 60, subtract 60 minutesfrom 91 minutes. Since 60 minutes equal 1 degree, add 1to the degree column.91 – 60 = 31 minutes
Step 5. Add the degrees.142 + 85 + 1 (carried over from the minutes) = 228degrees
228°31´27˝
Example 17—Name the range of latitude and longitudefor the borders of Wyoming.
Step 1. Find Wyoming on a map.
Step 2. Locate the east and west borders of Wyoming.Longitude 111°W to 104°W. It is west of the GreenwichLongitude.
Step 3. Find the north and south borders of Wyoming.Latitude 41°N to 45°N. This is north of the equator.
6.11 Global Positioning System (GPS) with the Universal Transverse Mercator (UTM) HandheldGPS units are readily commercially available to easilyconvert latitude and longitude to metric or vice versa byuse of the UTM. They vary in cost, with some units costingaround $109. A UTM grid overlay is a method todetermine current position. See figure 6.3. The UTM gridoverlay provides for improved accuracy over use of thegrid lines on a map. This grid overlay is placed on a mapwith the grid’s edges parallel with the map grid lines. Seefigure 6.4. Read the Easting followed by the Northing.
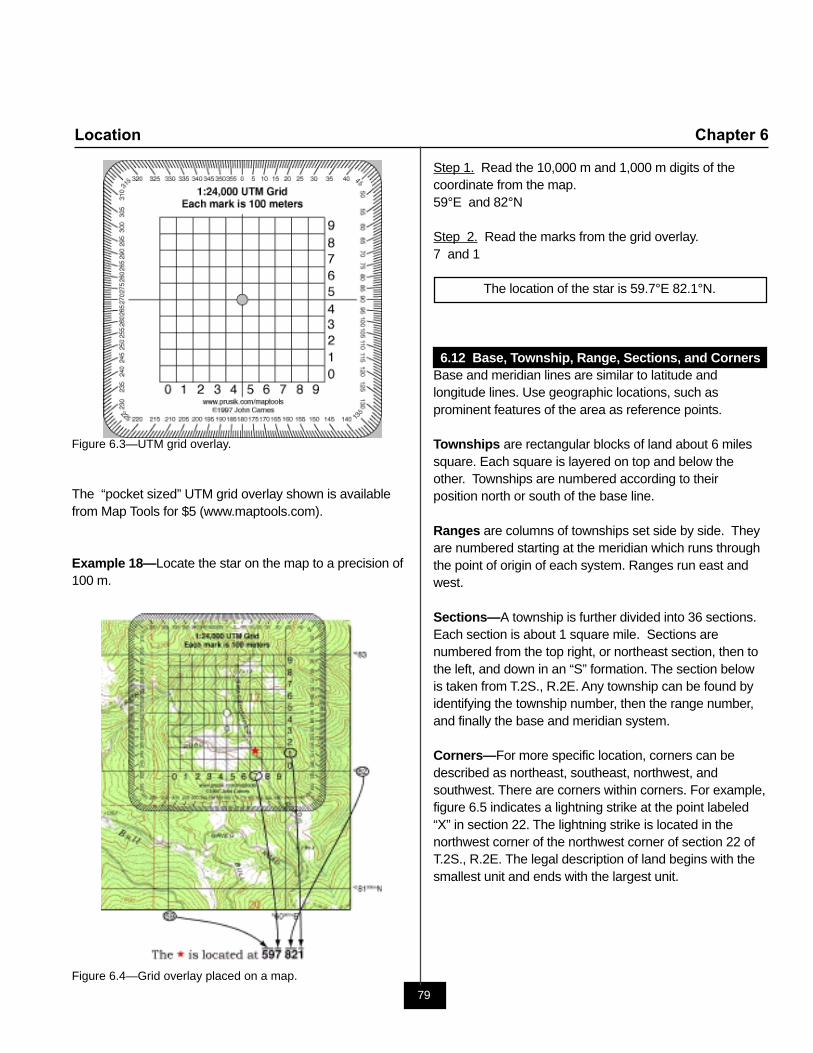
79
Location Chapter 6
Figure 6.3—UTM grid overlay.
The “pocket sized” UTM grid overlay shown is availablefrom Map Tools for $5 (www.maptools.com).
Example 18—Locate the star on the map to a precision of100 m.
Figure 6.4—Grid overlay placed on a map.
Step 1. Read the 10,000 m and 1,000 m digits of thecoordinate from the map.59°E and 82°N
Step 2. Read the marks from the grid overlay.7 and 1
The location of the star is 59.7°E 82.1°N.
6.12 Base, Township, Range, Sections, and CornersBase and meridian lines are similar to latitude andlongitude lines. Use geographic locations, such asprominent features of the area as reference points.
Townships are rectangular blocks of land about 6 milessquare. Each square is layered on top and below theother. Townships are numbered according to theirposition north or south of the base line.
Ranges are columns of townships set side by side. Theyare numbered starting at the meridian which runs throughthe point of origin of each system. Ranges run east andwest.
Sections—A township is further divided into 36 sections.Each section is about 1 square mile. Sections arenumbered from the top right, or northeast section, then tothe left, and down in an “S” formation. The section belowis taken from T.2S., R.2E. Any township can be found byidentifying the township number, then the range number,and finally the base and meridian system.
Corners—For more specific location, corners can bedescribed as northeast, southeast, northwest, andsouthwest. There are corners within corners. For example,figure 6.5 indicates a lightning strike at the point labeled“X” in section 22. The lightning strike is located in thenorthwest corner of the northwest corner of section 22 ofT.2S., R.2E. The legal description of land begins with thesmallest unit and ends with the largest unit.
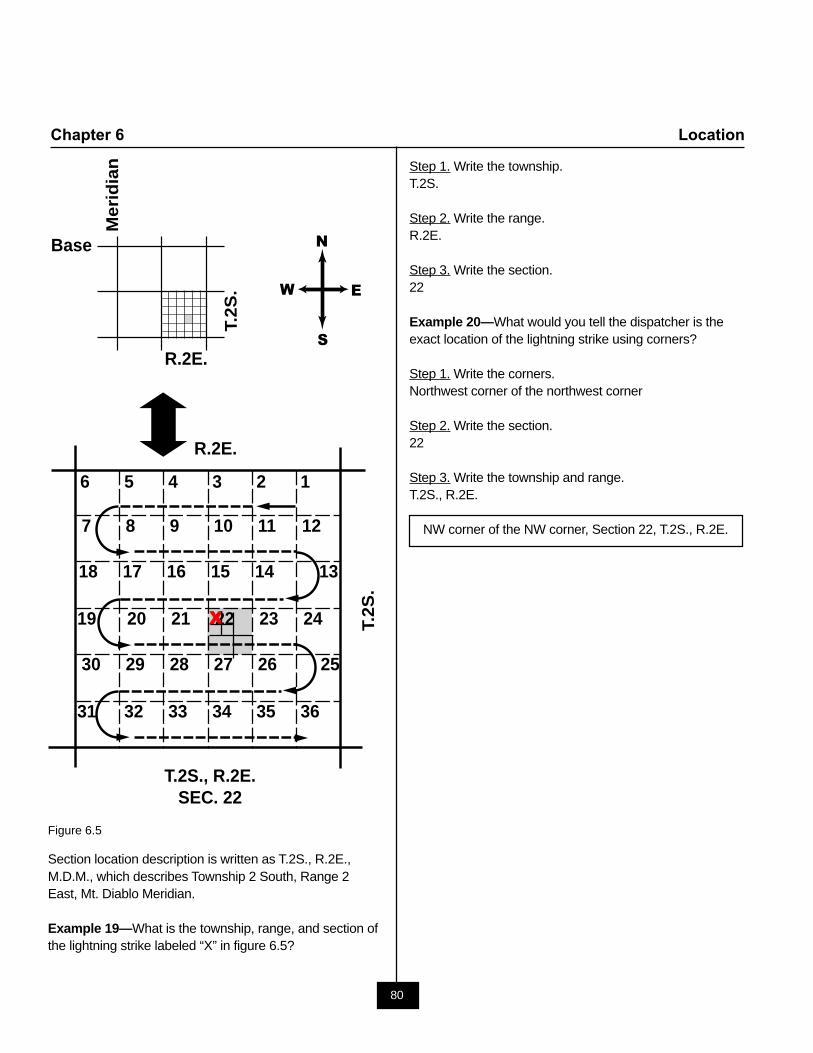
80
Chapter 6 Location
Step 1. Write the township.T.2S.
Step 2. Write the range.R.2E.
Step 3. Write the section.22
Example 20—What would you tell the dispatcher is theexact location of the lightning strike using corners?
Step 1. Write the corners.Northwest corner of the northwest corner
Step 2. Write the section.22
Step 3. Write the township and range.T.2S., R.2E.
NW corner of the NW corner, Section 22, T.2S., R.2E.
Figure 6.5
Section location description is written as T.2S., R.2E.,M.D.M., which describes Township 2 South, Range 2East, Mt. Diablo Meridian.
Example 19—What is the township, range, and section ofthe lightning strike labeled “X” in figure 6.5?
R.2E.
Base
Mer
idia
n
T.2S., R.2E.SEC. 22
6 5 4 3 2 1
7 8 9 10 11 12
18 17 16 15 14
20 21 22 23 24
30 29 28 27 26
32 33 34 35 36
13
19
25
31
N
S
EW
T.2S
.
R.2E.
T.2S
.
X
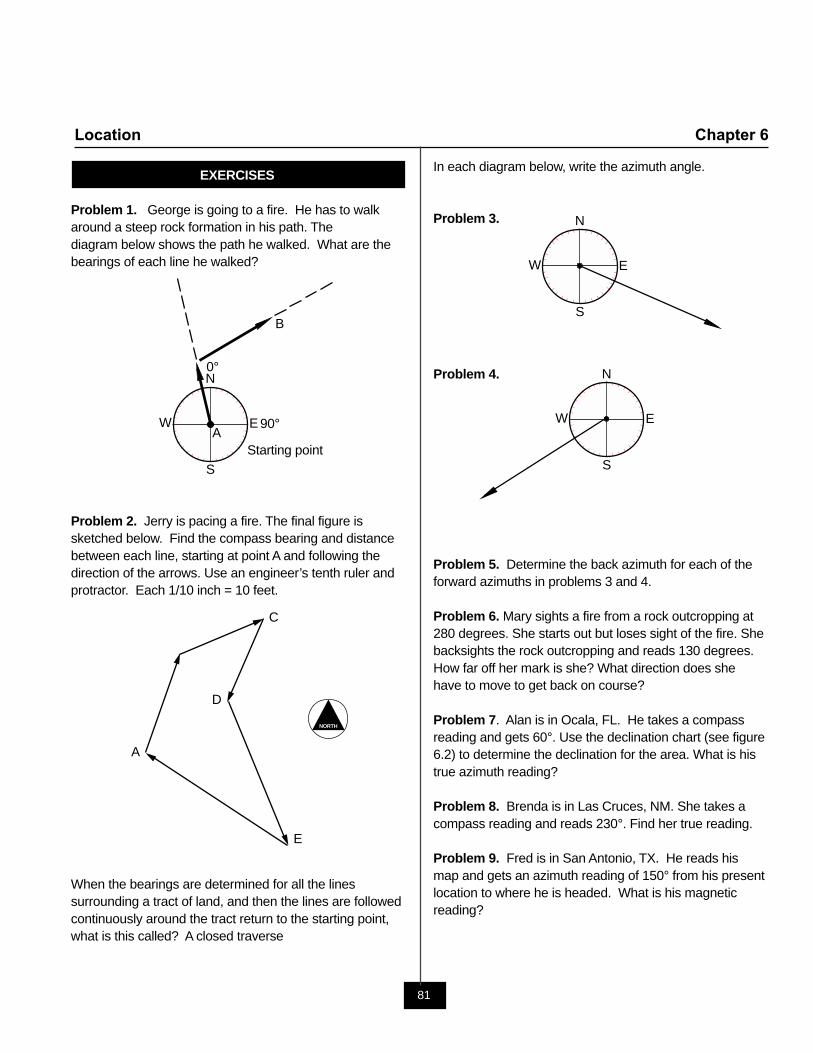
81
Location Chapter 6
EXERCISES
Problem 1. George is going to a fire. He has to walkaround a steep rock formation in his path. Thediagram below shows the path he walked. What are thebearings of each line he walked?
Problem 2. Jerry is pacing a fire. The final figure issketched below. Find the compass bearing and distancebetween each line, starting at point A and following thedirection of the arrows. Use an engineer’s tenth ruler andprotractor. Each 1/10 inch = 10 feet.
When the bearings are determined for all the linessurrounding a tract of land, and then the lines are followedcontinuously around the tract return to the starting point,what is this called? A closed traverse
A
C
D
E
B
N
S
EWA Starting point
0°
90°
In each diagram below, write the azimuth angle.
Problem 3.
Problem 4.
Problem 5. Determine the back azimuth for each of theforward azimuths in problems 3 and 4.
Problem 6. Mary sights a fire from a rock outcropping at280 degrees. She starts out but loses sight of the fire. Shebacksights the rock outcropping and reads 130 degrees.How far off her mark is she? What direction does shehave to move to get back on course?
Problem 7. Alan is in Ocala, FL. He takes a compassreading and gets 60°. Use the declination chart (see figure6.2) to determine the declination for the area. What is histrue azimuth reading?
Problem 8. Brenda is in Las Cruces, NM. She takes acompass reading and reads 230°. Find her true reading.
Problem 9. Fred is in San Antonio, TX. He reads hismap and gets an azimuth reading of 150° from his presentlocation to where he is headed. What is his magneticreading?
N
S
EW
N
S
EW
NORTH
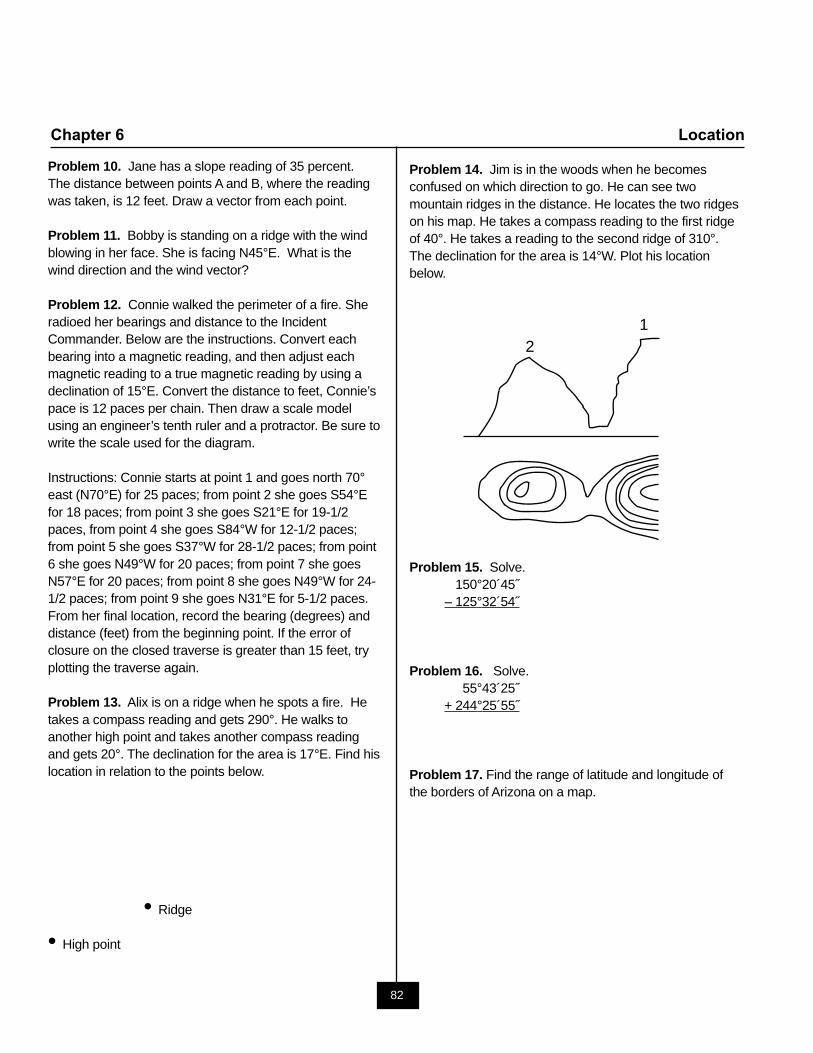
82
Chapter 6 Location
Problem 10. Jane has a slope reading of 35 percent.The distance between points A and B, where the readingwas taken, is 12 feet. Draw a vector from each point.
Problem 11. Bobby is standing on a ridge with the windblowing in her face. She is facing N45°E. What is thewind direction and the wind vector?
Problem 12. Connie walked the perimeter of a fire. Sheradioed her bearings and distance to the IncidentCommander. Below are the instructions. Convert eachbearing into a magnetic reading, and then adjust eachmagnetic reading to a true magnetic reading by using adeclination of 15°E. Convert the distance to feet, Connie’space is 12 paces per chain. Then draw a scale modelusing an engineer’s tenth ruler and a protractor. Be sure towrite the scale used for the diagram.
Instructions: Connie starts at point 1 and goes north 70°east (N70°E) for 25 paces; from point 2 she goes S54°Efor 18 paces; from point 3 she goes S21°E for 19-1/2paces, from point 4 she goes S84°W for 12-1/2 paces;from point 5 she goes S37°W for 28-1/2 paces; from point6 she goes N49°W for 20 paces; from point 7 she goesN57°E for 20 paces; from point 8 she goes N49°W for 24-1/2 paces; from point 9 she goes N31°E for 5-1/2 paces.From her final location, record the bearing (degrees) anddistance (feet) from the beginning point. If the error ofclosure on the closed traverse is greater than 15 feet, tryplotting the traverse again.
Problem 13. Alix is on a ridge when he spots a fire. Hetakes a compass reading and gets 290°. He walks toanother high point and takes another compass readingand gets 20°. The declination for the area is 17°E. Find hislocation in relation to the points below.
• Ridge
• High point
Problem 14. Jim is in the woods when he becomesconfused on which direction to go. He can see twomountain ridges in the distance. He locates the two ridgeson his map. He takes a compass reading to the first ridgeof 40°. He takes a reading to the second ridge of 310°.The declination for the area is 14°W. Plot his locationbelow.
Problem 15. Solve.150°20´45˝
– 125°32´54˝
Problem 16. Solve.55°43´25˝
+ 244°25´55˝
Problem 17. Find the range of latitude and longitude ofthe borders of Arizona on a map.
12
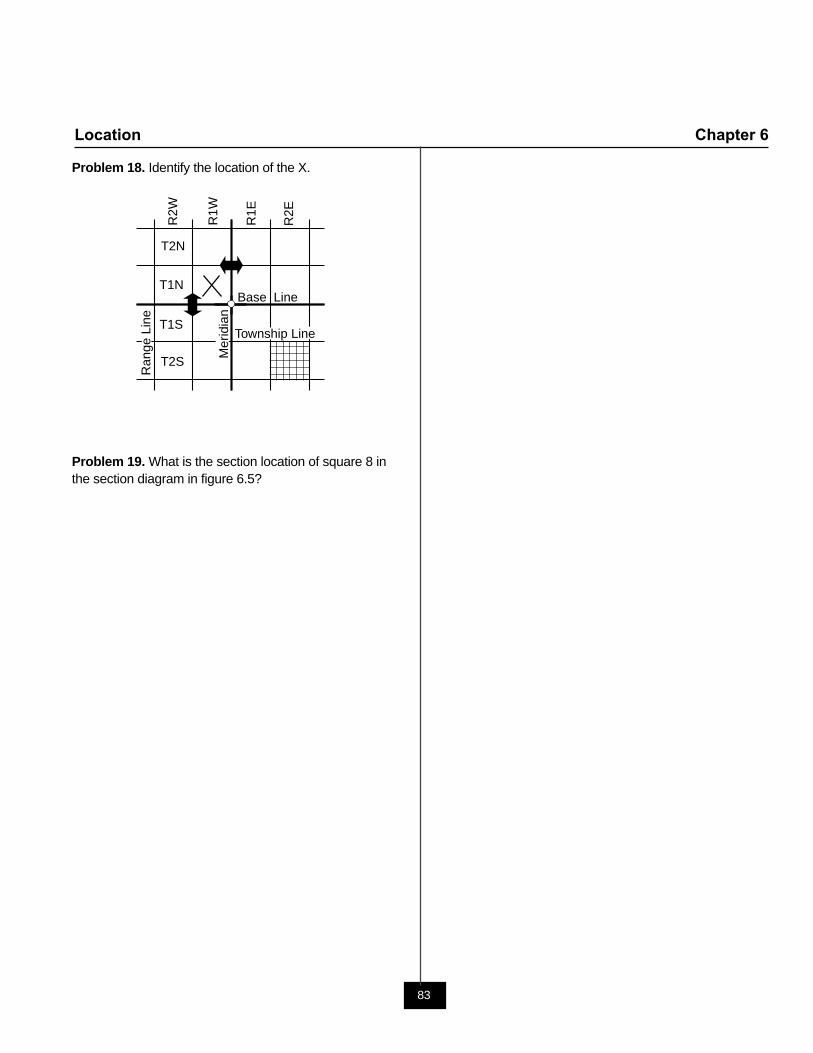
83
Location Chapter 6
T2N
T1N
T1S
T2S
R2W
R1W
R1E
R2E
Base Line
Mer
idia
n
Township Line
Ran
ge L
ine
Problem 18. Identify the location of the X.
Problem 19. What is the section location of square 8 inthe section diagram in figure 6.5?
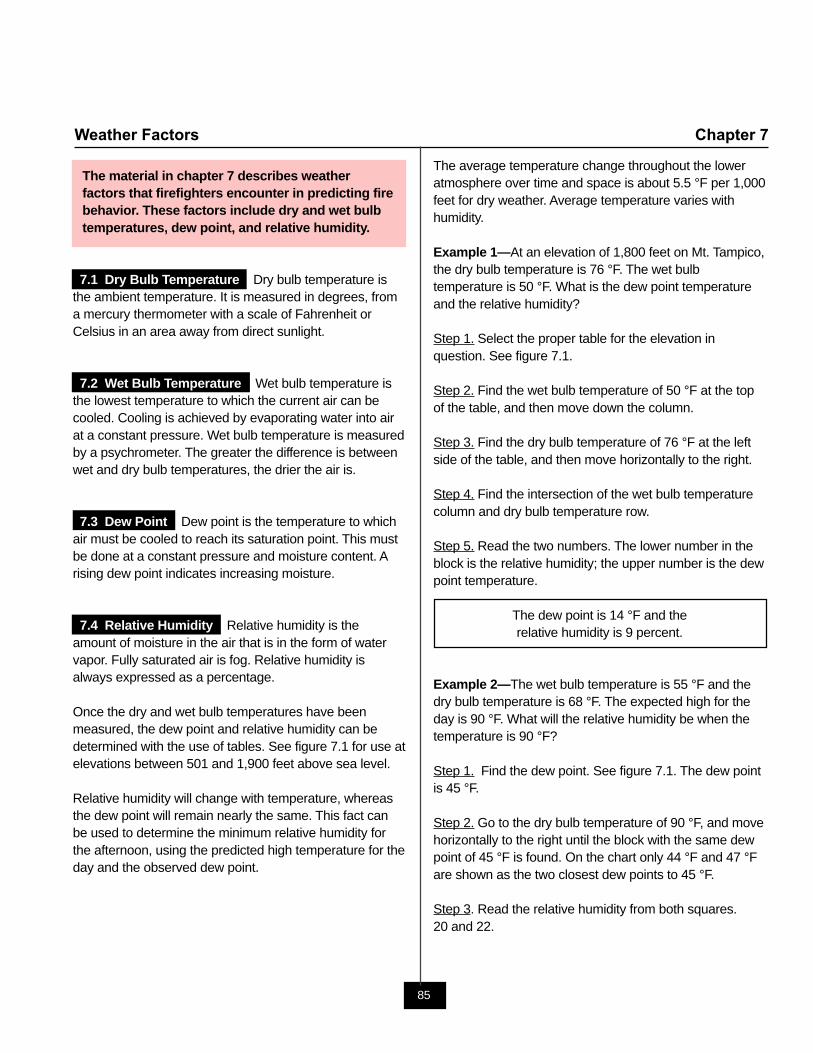
85
Weather Factors Chapter 7
The material in chapter 7 describes weatherfactors that firefighters encounter in predicting firebehavior. These factors include dry and wet bulbtemperatures, dew point, and relative humidity.
7.1 Dry Bulb Temperature Dry bulb temperature isthe ambient temperature. It is measured in degrees, froma mercury thermometer with a scale of Fahrenheit orCelsius in an area away from direct sunlight.
7.2 Wet Bulb Temperature Wet bulb temperature isthe lowest temperature to which the current air can becooled. Cooling is achieved by evaporating water into airat a constant pressure. Wet bulb temperature is measuredby a psychrometer. The greater the difference is betweenwet and dry bulb temperatures, the drier the air is.
7.3 Dew Point Dew point is the temperature to whichair must be cooled to reach its saturation point. This mustbe done at a constant pressure and moisture content. Arising dew point indicates increasing moisture.
7.4 Relative Humidity Relative humidity is theamount of moisture in the air that is in the form of watervapor. Fully saturated air is fog. Relative humidity isalways expressed as a percentage.
Once the dry and wet bulb temperatures have beenmeasured, the dew point and relative humidity can bedetermined with the use of tables. See figure 7.1 for use atelevations between 501 and 1,900 feet above sea level.
Relative humidity will change with temperature, whereasthe dew point will remain nearly the same. This fact canbe used to determine the minimum relative humidity forthe afternoon, using the predicted high temperature for theday and the observed dew point.
The average temperature change throughout the loweratmosphere over time and space is about 5.5 °F per 1,000feet for dry weather. Average temperature varies withhumidity.
Example 1—At an elevation of 1,800 feet on Mt. Tampico,the dry bulb temperature is 76 °F. The wet bulbtemperature is 50 °F. What is the dew point temperatureand the relative humidity?
Step 1. Select the proper table for the elevation inquestion. See figure 7.1.
Step 2. Find the wet bulb temperature of 50 °F at the topof the table, and then move down the column.
Step 3. Find the dry bulb temperature of 76 °F at the leftside of the table, and then move horizontally to the right.
Step 4. Find the intersection of the wet bulb temperaturecolumn and dry bulb temperature row.
Step 5. Read the two numbers. The lower number in theblock is the relative humidity; the upper number is the dewpoint temperature.
The dew point is 14 °F and therelative humidity is 9 percent.
Example 2—The wet bulb temperature is 55 °F and thedry bulb temperature is 68 °F. The expected high for theday is 90 °F. What will the relative humidity be when thetemperature is 90 °F?
Step 1. Find the dew point. See figure 7.1. The dew pointis 45 °F.
Step 2. Go to the dry bulb temperature of 90 °F, and movehorizontally to the right until the block with the same dewpoint of 45 °F is found. On the chart only 44 °F and 47 °Fare shown as the two closest dew points to 45 °F.
Step 3. Read the relative humidity from both squares.20 and 22.
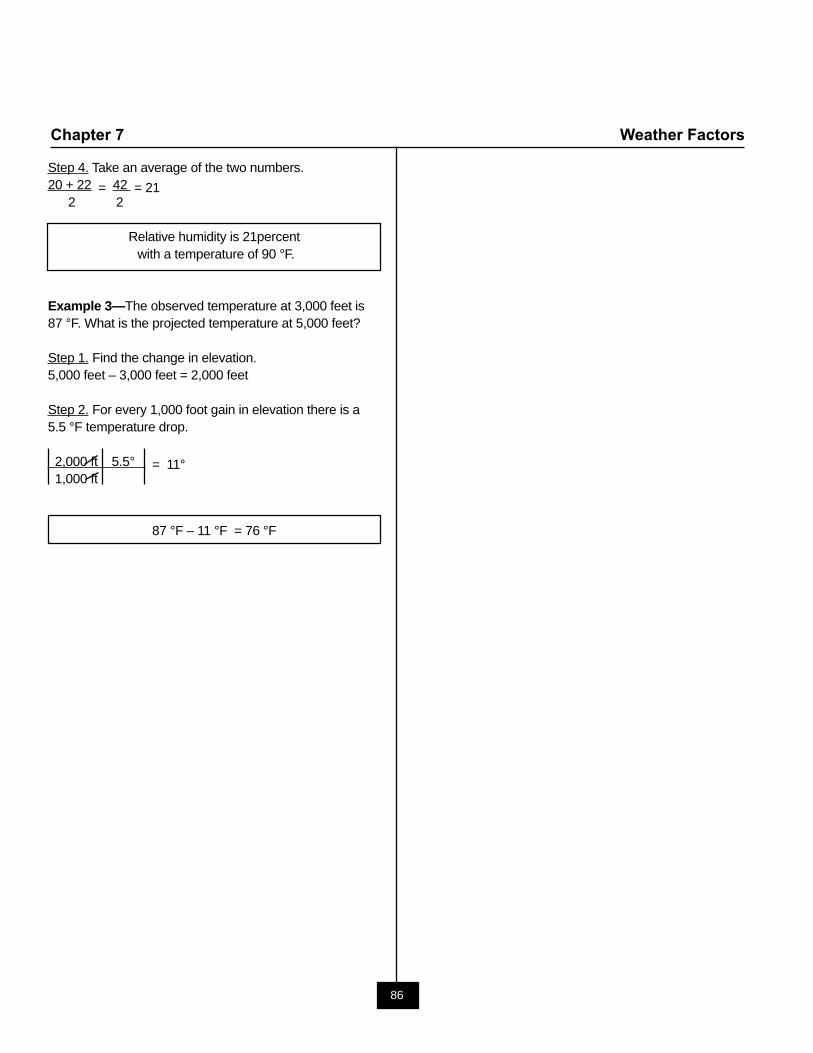
86
Chapter 7 Weather Factors
Step 4. Take an average of the two numbers.20 + 22 = 42 = 21
2 2
Relative humidity is 21percent with a temperature of 90 °F.
Example 3—The observed temperature at 3,000 feet is87 °F. What is the projected temperature at 5,000 feet?
Step 1. Find the change in elevation.5,000 feet – 3,000 feet = 2,000 feet
Step 2. For every 1,000 foot gain in elevation there is a5.5 °F temperature drop.
2,000 ft 5.5° = 11° 1,000 ft
87 °F – 11 °F = 76 °F
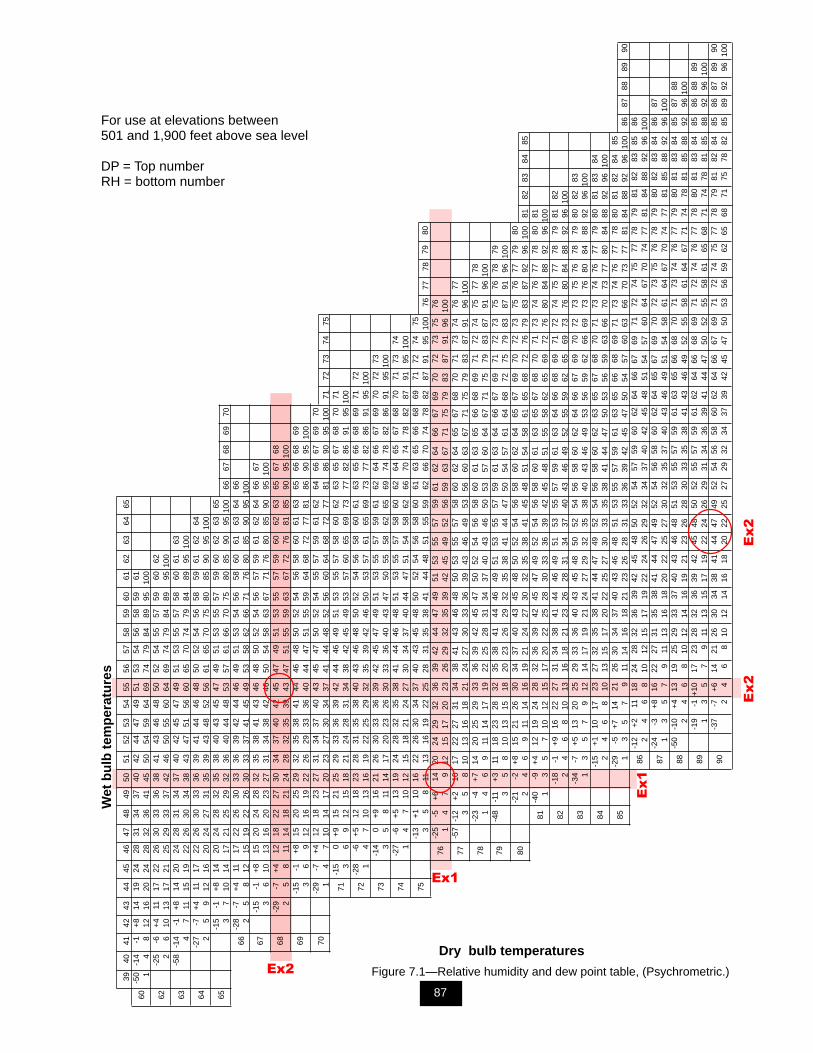
3940
4142
4344
4546
4748
4950
5152
5354
5556
5758
5960
6162
6364
65-5
0-1
4-1
+8
1419
2428
3134
3740
4244
4749
5153
5456
5859
6160
14
812
1620
2428
3236
4145
5054
5964
6974
7984
8995
100
-25
-6+
411
1722
2630
3336
3841
4346
4850
5254
5557
5960
6262
26
1013
1721
2529
3337
4246
5055
6064
6974
7984
8995
100
-58
-14
-1+
814
2024
2831
3437
4042
4547
4951
5355
5758
6061
6363
47
1115
1922
2630
3438
4347
5156
6065
7074
7984
8995
100
-27
-7+
411
1722
2630
3336
3941
4446
4850
5254
5658
5961
6264
642
59
1216
2024
2731
3539
4348
5256
6165
7075
8085
9095
100
-15
-1+
814
2024
2832
3538
4043
4547
4951
5355
5759
6062
6365
653
710
1417
2125
2932
3640
4448
5357
6166
7075
8085
9095
100
6667
6869
70-2
8-7
+4
1117
2226
3033
3639
4244
4649
5153
5456
5860
6163
6466
662
58
1215
1922
2630
3337
4145
4953
5862
6671
7680
8590
9510
0-1
5-1
+8
1520
2428
3235
3841
4346
4850
5254
5657
5961
6264
6667
673
610
1316
2023
2731
3438
4246
5054
5863
6771
7680
8590
9510
0-2
9-7
+4
1218
2227
3034
3740
4245
4749
5153
5557
5960
6263
6567
6868
25
811
1418
2124
2832
3539
4347
5155
5963
6772
7681
8590
9510
0-1
5-1
+8
1520
2529
3235
3841
4446
4850
5254
5658
6061
6365
6668
6969
36
912
1619
2226
2933
3640
4447
5155
5964
6872
7781
8690
9510
0-2
9-7
+4
1218
2327
3134
3740
4345
4750
5254
5557
5961
6264
6667
6970
701
47
1014
1720
2327
3034
3741
4448
5256
6064
6872
7781
8690
9510
071
7273
7475
-15
0+9
1521
2529
3336
3942
4446
4951
5355
5758
6062
6365
6768
7071
713
69
1215
1821
2428
3134
3842
4549
5357
6065
6973
7782
8691
9510
0-2
8-6
+5
1218
2328
3135
3840
4346
4850
5254
5658
6061
6365
6668
6971
7272
14
710
1316
1922
2529
3235
3942
4650
5357
6165
6973
7782
8691
9510
0-1
40
+916
2126
3033
3639
4245
4749
5153
5557
5961
6264
6667
6970
7273
733
58
1114
1720
2326
3033
3640
4347
5055
5862
6569
7478
8286
9195
100
-27
-6+
513
1924
2832
3538
4144
4648
5153
5557
5860
6264
6567
6870
7173
7474
14
710
1215
1821
2427
3034
3740
4447
5154
5862
6670
7478
8287
9195
100
-13
+1
1016
2226
3034
3740
4345
4850
5254
5658
6061
6365
6668
6971
7274
7575
35
811
1316
1922
2528
3135
3841
4448
5155
5962
6670
7478
8287
9195
100
7677
7879
80-2
5-5
+6
1420
2429
3236
3942
4447
4951
5355
5759
6162
6466
6769
7072
7375
7676
14
79
1215
1720
2326
2932
3539
4245
4952
5659
6367
7175
7983
8791
9610
0-5
7-1
2+
210
1722
2731
3438
4143
4648
5053
5557
5860
6264
6567
6870
7173
7476
7777
35
810
1316
1821
2427
3033
3639
4346
4953
5660
6367
7175
7983
8791
9610
0-2
3-4
+7
1420
2529
3336
3942
4547
5052
5456
5860
6163
6566
6869
7172
7475
7778
781
46
911
1417
1922
2528
3134
3740
4346
5053
5760
6467
7175
7983
8791
9610
0-4
8-1
1+3
1118
2328
3235
3841
4446
4951
5355
5759
6163
6466
6769
7172
7375
7678
7979
35
810
1315
1820
2326
2932
3538
4144
4750
5457
6164
6872
7579
8387
9196
100
-21
-2+
815
2126
3034
3740
4345
4850
5254
5658
6062
6465
6769
7072
7375
7677
7980
802
46
911
1416
1921
2427
3032
3538
4145
4851
5458
6165
6872
7679
8387
9296
100
8182
8384
85-4
0-9
+4
1219
2428
3236
3942
4547
4952
5456
5860
6163
6567
6870
7173
7476
7778
8081
811
35
710
1215
1720
2225
2830
3336
3942
4548
5155
5862
6569
7276
8084
8892
9610
0-1
8-1
+9
1622
2731
3438
4144
4649
5153
5557
5961
6364
6668
6971
7274
7577
7879
8182
822
46
810
1316
1821
2326
2831
3437
4043
4649
5255
5962
6569
7376
8084
8892
9610
0-3
4-7
+5
1320
2529
3336
4043
4548
5052
5456
5860
6264
6667
6970
7273
7576
7879
8082
8383
13
57
912
1417
1921
2427
2932
3538
4043
4649
5356
5962
6669
7376
8084
8892
9610
0-1
5+
110
1723
2732
3538
4144
4749
5254
5658
6062
6365
6768
7071
7374
7677
7980
8183
8484
24
68
1013
1517
2022
2527
3033
3538
4144
4750
5356
5963
6670
7377
8084
8892
9610
0-2
9-5
+7
1421
2630
3437
4043
4648
5153
5557
5961
6365
6668
6971
7374
7677
7880
8182
8485
851
35
79
1114
1618
2123
2628
3133
3639
4245
4750
5457
6063
6670
7377
8184
8892
9610
086
8788
8990
-12
+2
1118
2428
3236
3942
4548
5052
5457
5960
6264
6667
6971
7274
7577
7879
8182
8385
8686
24
68
1012
1517
1922
2426
2932
3437
4042
4548
5154
5760
6467
7074
7781
8488
9296
100
-24
-3+
816
2227
3135
3841
4447
4952
5456
5860
6264
6567
6970
7273
7576
7879
8082
8384
8687
871
35
79
1113
1618
2022
2527
3032
3537
4043
4649
5154
5861
6467
7074
7781
8588
9296
100
-50
-10
+4
1319
2529
3337
4043
4648
5153
5557
5961
6365
6668
7071
7374
7677
7980
8183
8485
8788
882
46
810
1214
1619
2123
2628
3033
3538
4143
4649
5255
5861
6467
7174
7881
8588
9296
100
-19
-1+
1017
2328
3236
3942
4548
5052
5557
5961
6264
6668
6971
7274
7677
7880
8183
8485
8688
8989
13
57
911
1315
1719
2224
2629
3134
3639
4144
4750
5255
5861
6568
7174
7881
8588
9296
100
-37
-7+
614
2126
3034
3841
4447
4952
5456
5860
6264
6667
6971
7274
7577
7879
8182
8485
8687
8990
902
46
810
1214
1618
2022
2527
2932
3437
3942
4547
5053
5659
6265
6871
7578
8285
8992
9610
0
Wet
bu
lb t
emp
erat
ure
s
Dry bulb temperatures
For use at elevations between501 and 1,900 feet above sea level
DP = Top numberRH = bottom number
Ex2
Ex2
Ex1
Ex1
Ex2 Figure 7.1—Relative humidity and dew point table, (Psychrometric.)
87
88
Chapter 7 Weather Factors
EXERCISES
Problem 1. Lupe is at an elevation of 1,000 feet. The drybulb temperature is 80 °F. The wet bulb temperature is52 °F. What is the relative humidity and the dew point?
Problem 2. What is the relative humidity if the wet bulbtemperature is 47 °F and the dry bulb temperature is64 °F?
Problem 3. Vivian is trying to determine what theminimum relative humidity will be at 1600 hours. She is atan elevation of 1,200 feet. The current dry bulbtemperature is 67 °F. The wet bulb temperature is 56 °F.The predicted temperature for the afternoon is 80 °F.
89
Fuels for Fire Behavior Chapter 8
may produce firebrands. Some pinyon-juniper may be inthis model.
Fuel Model 3 (2.5-feet deep) Fires in this fuel are themost intense of the grass group and display high rates ofspread under the influence of wind. Fire may be driveninto the upper heights of a grass stand by wind and maycross over standing water. Stands are tall, averagingabout 3 feet, but considerable variation may occur.Approximately one-third or more of the stand isconsidered dead or cured, maintaining the fire.
The Shrub Group—Fuel Models 4, 5, 6, and 7
Fuel Model 4 (6-feet deep) Fire intensity and fastspreading fires involving foliage and live and dead finewoody materials in the crowns of a nearly continuoussecondary overstory characterize Fuel Model 4.Examples are stands of mature shrub 6-or-more-feet tall,such as California mixed chaparral, high pocosins alongthe east coast, pine barrens of New Jersey, or the closedjack pine stands of the north central States. Besidesflammable foliage, there is dead woody material in thestand that significantly contributes to fire intensity. Heightsof stands qualifying for this model vary with localconditions. There may also be a deep litter layer thatcompounds suppression efforts.
Fuel Model 5 (2-feet deep) Fire generally is carried insurface fuels composed of litter cast by shrubs andgrasses, or forbs, in the understory. Fires generally lackintensity as surface fuel loads are light, shrubs are youngwith little dead material, and foliage contains little volatilematerial. Shrubs generally are not tall, but nearly coverthe entire area. Examples are young green stands withlittle or no deadwood, such as laurel, vine maple, alder, oreven chaparral, manzanita, or chamise. As shrub fuelmoisture drops, consider using Fuel Model 6.
Fuel Model 6 (2.5-feet deep) Fires carry through theshrub layer where foliage is more flammable than FuelModel 5, but require moderate winds, greater than 8 milesper hour, at midflame height. Fire will drop to the groundat low windspeeds or openings in the stand. Shrubs areolder, but not as tall as shrub types of Model 4, nor do
The material in chapter 8 describes fuel models forfire behavior variables, including fine dead fuelmoisture and live fuel moisture.
8.1 Fuel Models A fuel model is a preliminaryrepresentation of vegetation characteristics used inanalyzing fire behavior and planning. The models providewildland firefighters with a common way of describingfuels in the area.
There are two sets of fuel models, a set designated withnumbers for the Fire Behavior Prediction System (FBPS)and a set designated with letters for the National FireDanger Rating System (NFDRS). Thirteen fuel modelsassociated with fire behavior are described in this chapter.They are subdivided into the Grass, Shrub, Timber Litter,and Logging Slash Groups. These descriptions provideinsight into various components of the fuel model thathave the potential to carry the fire spread. Choosingappropriate fuel models requires experience and soundpersonal judgment. See figure 8.4.
The Grass Group—Fuel Models 1, 2, and 3
Fuel Model 1 (1-foot deep) Fire spread in Fuel Model 1 isgoverned by fine herbaceous fuels that are cured ornearly cured. Surface fires move rapidly through curedgrass and associated material. Very little shrub or timber ispresent, generally in less than one-third of the area.Grasslands and savanna are represented, along withstubble, grass tundra, and grass shrub combinations thatmeet the above area constraint. Annual and perennialgrasses are included in this fuel model.
Fuel Model 2 (1-foot deep) Fire spread in Fuel Model 2 isprimarily through fine herbaceous fuels, either curing ordead. These are surface fires where the herbaceousmaterial, besides litter and dead-down stemwood from theopen shrub or timber overstory, contribute to the fireintensity. Open shrub lands, pine stands, or scrub oakstands that cover one-third to two-thirds of the area,generally fit this model. However, they may includeclumps of fuels that generate higher fire intensities and
90
Chapter 8 Fuels for Fire Behavior
they contain as much fuel as Model 4. A broad range ofshrub conditions are covered by this model. Typicalexamples include intermediate stands of chamise,chaparral, oak brush, low pocosin, Alaskan spruce taiga,and shrub tundra. Cured hardwood slash can beconsidered. Pinyon-juniper shrub-lands may fit, but mayoverpredict the rate of spread, except at high winds, forexample 20 miles per hour at the 20-foot level.
Fuel Model 7 (2.5-feet deep) Fire burns through thesurface and shrub strata equally. Fire can occur at higherdead fuel moisture contents due to the flammable natureof live foliage. Shrubs are generally 2 to 6 feet high.Examples are Palmetto-gallberry understory-pineoverstory sites, low pocosins, and Alaska black spruceshrub combinations.
The Timber Litter Group—Fuel Models 8, 9, and 10
Fuel Model 8 (0.2-foot deep) Slow burning ground fireswith low flame heights are common to this fuel model,although an occasional “jackpot,” or heavy fuelconcentration, may cause a flareup. Only under severeweather conditions do these fuels pose fire problems.Closed-canopy stands of short-needle conifers orhardwoods that have leafed out support fire in thecompact litter layer. This layer is mainly needles, leaves,and some twigs, since little undergrowth is present in thestand. Representative conifer types are white pine, lodge-pole pine, spruce, true firs, and larches.
Fuel Model 9 (0.2-foot deep) Fires run through surfacelitter faster than in Model 8 and have a higher flameheight. Both long-needle conifer and hardwood stands,especially the oak hickory types, are typical. Fall fires inhardwoods are representative, but high winds will actuallycause higher rates of spread than predicted because ofspotting caused by rolling and blowing leaves. Closedstands of long-needled pine, such as ponderosa, Jeffrey,red pines, or southern pine plantations, are grouped in thismodel. Concentrations of dead-down woody materials willcontribute to possible torching out of trees, spotting, andcrowning activity.
Fuel Model 10 (1-foot deep) The fires in this model burnin surface and ground fuels with greater fire intensity thanin other timber litter models. Dead-down fuels includegreater quantities of 3-inch or larger limb wood, resultingfrom over-maturity or natural events that create a largeload of dead material on the forest floor. Crowning out,spotting, and torching of individual trees are more frequentin this fuel situation, leading to potential fire controldifficulties. Any forest type may be considered whenheavy-down materials are present. Examples are insect-infested or diseased stands, wind-thrown stands, or over-mature situations with deadfall, cured light thinning, orpartial-cut slash.
The Logging Slash Group—Fuel Models 11, 12, and 13
Fuel Model 11 (1-foot deep) Fires are fairly active in slashand herbaceous material intermixed with slash. Spacing ofa rather light fuel load, shading from overstory, or aging offine fuels can contribute to limiting fire potential. Lightpartial cuts or thinning operations in mixed conifer stands,hardwood stands, and southern pine harvests areconsidered representative. Clear cut operations generallyproduce more slash than represented here. The less than3-inch material load is smaller than 12 tons per acre. Theless than 3-inch material is represented by not more than10 pieces, 4 inches in diameter, along a 50-foot transect.
Fuel Model 12 (2.3-feet deep) Rapidly spreading fireswith high intensities capable of generating firebrands canoccur. When fire starts, it is generally sustained until a fuelbreak or change in fuels is encountered. The visualimpression of these stands is one dominated by slash,much of it less than 3 inches in diameter. These fuels totalless than 35 tons per acre and seem well distributed.Heavily thinned conifer stands, clear cuts, and medium orheavy partial cuts are represented. The less than 3-inchmaterial is represented by encountering 11 pieces, 6inches in diameter, along a 50-foot transect.
Fuel Model 13 (3-feet deep) Fire is generally carried by acontinuous layer of slash. Large quantities of greater than3-inch material are present. Fires spread quickly throughfine fuels, and the intensity builds up as large fuels start
91
Fuels for Fire Behavior Chapter 8
burning. Active flaming is sustained for long periods, and awide variety of firebrands can be generated. Firebrandscontribute to spotting problems as weather conditionsbecome more severe. Clear cut and heavy partial cuts inmature and over-mature stands occur where the slashload is dominated by less-than-3-inch material. The totalload may exceed 300 tons per acre, but the less-than-3-inch fuel is generally only 10 percent of the total load.Situations where slash still has “red” needles attached, butthe total load is lighter, such as a Model 12, can berepresented because of an earlier higher fire intensity andfaster rate of spread.
8.2 Fuel Moisture Content Fuel moisture content isthe amount of water in fuel, expressed as a percent of theoven-dry weight of that fuel. If no moisture was in a fuel,as if it was dried in an oven, the fuel moisture contentwould be zero. Fuel moisture content can be estimated inthe field by using fuel moisture tables. Fuel moisture playsa significant role in determining how quickly a fire willspread.
Fine Dead Fuel Moisture—Dead fuel moisture in fuelsranges from about 2 to 30 percent. Fine dead fuelmoisture fluctuates considerably over time due toenvironmental factors. Tables can provide acceptableestimates of 1-hour time-lag fine dead fuel moisturesunder a variety of conditions. To determine the adjustedfine dead fuel moisture (FDFM), add the reference fuelmoisture (RFM) and the fuel moisture correction value(FMC). RFM and FMC values are obtained from tablesreferenced by analysis of specific conditions.
Reference Fuel Moisture, Table 8.1To read a value for reference fuel moisture, the dry bulbtemperature and relative humidity of the site must beknown. Temperature range is on the left and humidity ison the top of the table. Once the appropriate range forboth items is chosen, find where the temperature row andhumidity column intersect. At the intersection, there is aRFM content percent. Note this number.
Dead Fuel Moisture Content Correction,Tables 8.2, 8.3, and 8.4
Three tables are used for correcting dead fuel moisturecontent, based on shaded or unshaded surface fuels,hour during the day, relative location, aspect, and percent
slope. In addition, each table references different monthsof the year.
Table 8.2 provides the correction for the months of May,June, and July between the hours of 0800 and 1959.Table 8.3 is for the months of February, March, April,August, September, and October between the hours of0800 and 1959. Table 8.4 is for the months of November,December, and January between the hours of 0800 and1959. Notice that the time is given in military time. Militarytime is based on 24 hours, i.e., 2400 is midnight, 0100 is1:00 a.m., 1200 is noon, and 1400 is 2:00 p.m.
Each table has a top section indexed for unshadedsurface fuels by daytime hour and a bottom section forshaded surface fuels. Each section is further indexed byrelative location, A for 1,000 to 2,000 feet above the sitelocation, B for 1,000 to 2,000 feet below, and L for 0 to1,000 feet above or below the site location.
Corrections for aspect and percent slope are presented onthe left side of the table. Referencing the appropriatevalues, the intersection of the row and column will indicatethe appropriate fuel moisture correction value.
Fine Dead Fuel Moisture Worksheet, Figure 8.1All of the necessary data for the fine dead fuel moisturecalculation is recorded in the Fine Dead Fuel MoistureWorksheet. The input values are all of the data that isused to compute the final answer or output value. Thisguides the process, and the addition is performed at theconclusion of the data collection.
Example 1—It is October 1, at 1300. Fuels are exposedto the sun on a west aspect. Readings from a belt weatherkit taken 1,500 feet above the fire give a dry bulbtemperature of 93 °F and a relative humidity of 17 percent.The slope is 45 percent. What is the fine dead fuelmoisture content?
Step 1. Enter all the data values given into the worksheet.See figure 8.1.
Step 2. According to table 8.1 the reference fuel moisture(RFM) has an index of 2. Put the result on line 6 of theworksheet.
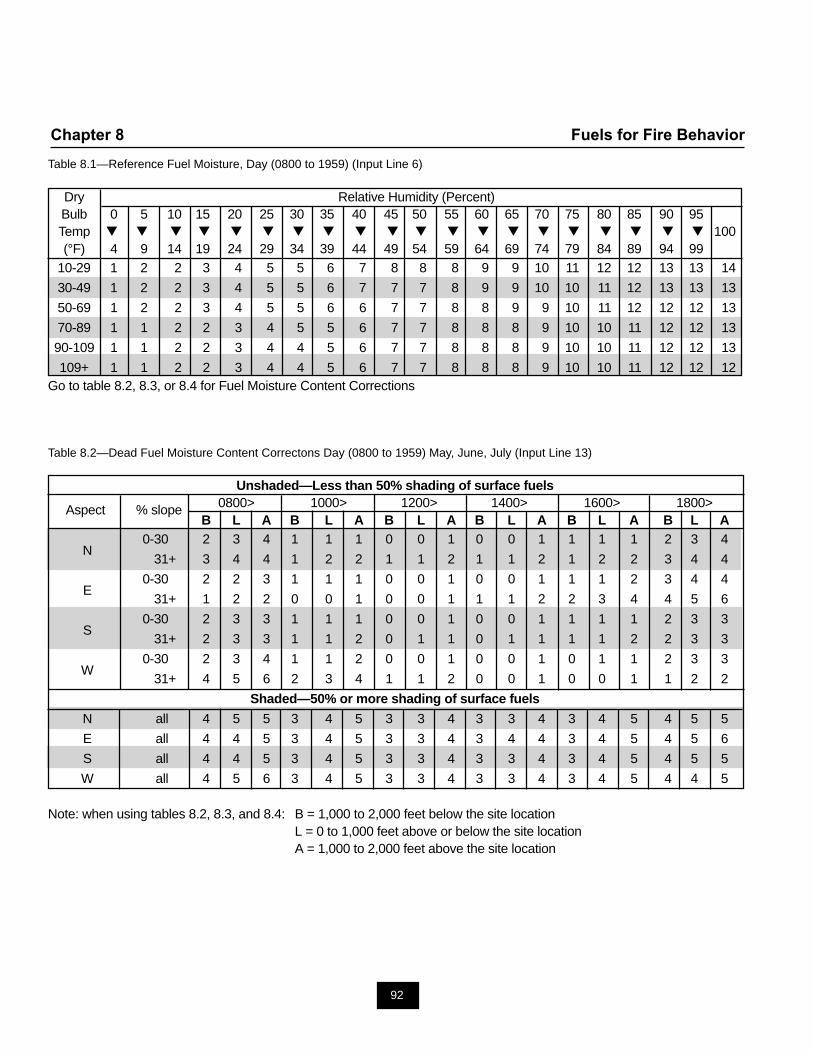
92
Chapter 8 Fuels for Fire Behavior
Table 8.1—Reference Fuel Moisture, Day (0800 to 1959) (Input Line 6)
Dry Relative Humidity (Percent)Bulb 0 5 10 15 20 25 30 35 40 45 50 55 60 65 70 75 80 85 90 95Temp ▼ ▼ ▼ ▼ ▼ ▼ ▼ ▼ ▼ ▼ ▼ ▼ ▼ ▼ ▼ ▼ ▼ ▼ ▼ ▼100(°F) 4 9 14 19 24 29 34 39 44 49 54 59 64 69 74 79 84 89 94 99
10-29 1 2 2 3 4 5 5 6 7 8 8 8 9 9 10 11 12 12 13 13 14
30-49 1 2 2 3 4 5 5 6 7 7 7 8 9 9 10 10 11 12 13 13 13
50-69 1 2 2 3 4 5 5 6 6 7 7 8 8 9 9 10 11 12 12 12 13
70-89 1 1 2 2 3 4 5 5 6 7 7 8 8 8 9 10 10 11 12 12 13
90-109 1 1 2 2 3 4 4 5 6 7 7 8 8 8 9 10 10 11 12 12 13
109+ 1 1 2 2 3 4 4 5 6 7 7 8 8 8 9 10 10 11 12 12 12Go to table 8.2, 8.3, or 8.4 for Fuel Moisture Content Corrections
Table 8.2—Dead Fuel Moisture Content Correctons Day (0800 to 1959) May, June, July (Input Line 13)
Unshaded—Less than 50% shading of surface fuels
Aspect % slope 0800> 1000> 1200> 1400> 1600> 1800>B L A B L A B L A B L A B L A B L A
N0-30 2 3 4 1 1 1 0 0 1 0 0 1 1 1 1 2 3 4
31+ 3 4 4 1 2 2 1 1 2 1 1 2 1 2 2 3 4 4
E0-30 2 2 3 1 1 1 0 0 1 0 0 1 1 1 2 3 4 4
31+ 1 2 2 0 0 1 0 0 1 1 1 2 2 3 4 4 5 6
S0-30 2 3 3 1 1 1 0 0 1 0 0 1 1 1 1 2 3 3
31+ 2 3 3 1 1 2 0 1 1 0 1 1 1 1 2 2 3 3
W0-30 2 3 4 1 1 2 0 0 1 0 0 1 0 1 1 2 3 3
31+ 4 5 6 2 3 4 1 1 2 0 0 1 0 0 1 1 2 2
Shaded—50% or more shading of surface fuels
N all 4 5 5 3 4 5 3 3 4 3 3 4 3 4 5 4 5 5
E all 4 4 5 3 4 5 3 3 4 3 4 4 3 4 5 4 5 6
S all 4 4 5 3 4 5 3 3 4 3 3 4 3 4 5 4 5 5
W all 4 5 6 3 4 5 3 3 4 3 3 4 3 4 5 4 4 5
Note: when using tables 8.2, 8.3, and 8.4: B = 1,000 to 2,000 feet below the site locationL = 0 to 1,000 feet above or below the site locationA = 1,000 to 2,000 feet above the site location
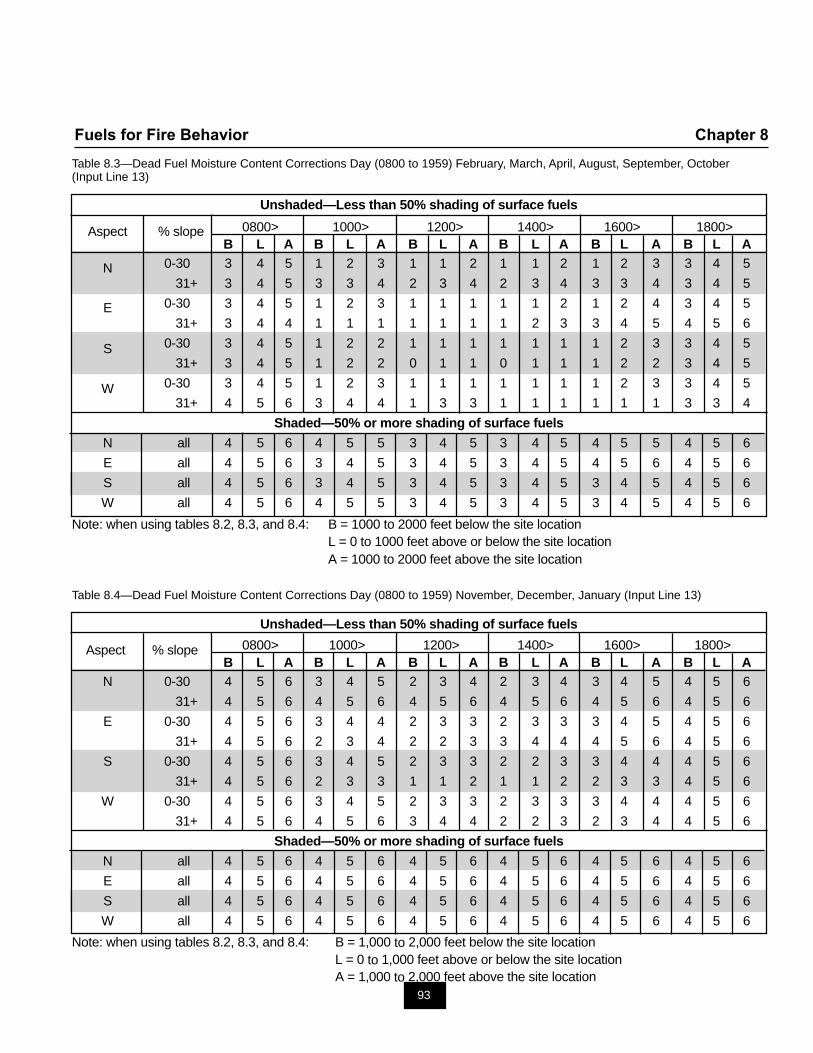
93
Fuels for Fire Behavior Chapter 8
Table 8.3—Dead Fuel Moisture Content Corrections Day (0800 to 1959) February, March, April, August, September, October(Input Line 13)
Unshaded—Less than 50% shading of surface fuels
Aspect % slope 0800> 1000> 1200> 1400> 1600> 1800>B L A B L A B L A B L A B L A B L A
N 0-30 3 4 5 1 2 3 1 1 2 1 1 2 1 2 3 3 4 5
31+ 3 4 5 3 3 4 2 3 4 2 3 4 3 3 4 3 4 5
E 0-30 3 4 5 1 2 3 1 1 1 1 1 2 1 2 4 3 4 5
31+ 3 4 4 1 1 1 1 1 1 1 2 3 3 4 5 4 5 6
S 0-30 3 4 5 1 2 2 1 1 1 1 1 1 1 2 3 3 4 5
31+ 3 4 5 1 2 2 0 1 1 0 1 1 1 2 2 3 4 5
W 0-30 3 4 5 1 2 3 1 1 1 1 1 1 1 2 3 3 4 5
31+ 4 5 6 3 4 4 1 3 3 1 1 1 1 1 1 3 3 4
Shaded—50% or more shading of surface fuels
N all 4 5 6 4 5 5 3 4 5 3 4 5 4 5 5 4 5 6
E all 4 5 6 3 4 5 3 4 5 3 4 5 4 5 6 4 5 6
S all 4 5 6 3 4 5 3 4 5 3 4 5 3 4 5 4 5 6
W all 4 5 6 4 5 5 3 4 5 3 4 5 3 4 5 4 5 6
Note: when using tables 8.2, 8.3, and 8.4: B = 1000 to 2000 feet below the site locationL = 0 to 1000 feet above or below the site locationA = 1000 to 2000 feet above the site location
Table 8.4—Dead Fuel Moisture Content Corrections Day (0800 to 1959) November, December, January (Input Line 13)
Unshaded—Less than 50% shading of surface fuels
Aspect % slope 0800> 1000> 1200> 1400> 1600> 1800>B L A B L A B L A B L A B L A B L A
N 0-30 4 5 6 3 4 5 2 3 4 2 3 4 3 4 5 4 5 6
31+ 4 5 6 4 5 6 4 5 6 4 5 6 4 5 6 4 5 6
E 0-30 4 5 6 3 4 4 2 3 3 2 3 3 3 4 5 4 5 6
31+ 4 5 6 2 3 4 2 2 3 3 4 4 4 5 6 4 5 6
S 0-30 4 5 6 3 4 5 2 3 3 2 2 3 3 4 4 4 5 6
31+ 4 5 6 2 3 3 1 1 2 1 1 2 2 3 3 4 5 6
W 0-30 4 5 6 3 4 5 2 3 3 2 3 3 3 4 4 4 5 6
31+ 4 5 6 4 5 6 3 4 4 2 2 3 2 3 4 4 5 6
Shaded—50% or more shading of surface fuels
N all 4 5 6 4 5 6 4 5 6 4 5 6 4 5 6 4 5 6
E all 4 5 6 4 5 6 4 5 6 4 5 6 4 5 6 4 5 6
S all 4 5 6 4 5 6 4 5 6 4 5 6 4 5 6 4 5 6
W all 4 5 6 4 5 6 4 5 6 4 5 6 4 5 6 4 5 6
Note: when using tables 8.2, 8.3, and 8.4: B = 1,000 to 2,000 feet below the site locationL = 0 to 1,000 feet above or below the site locationA = 1,000 to 2,000 feet above the site location
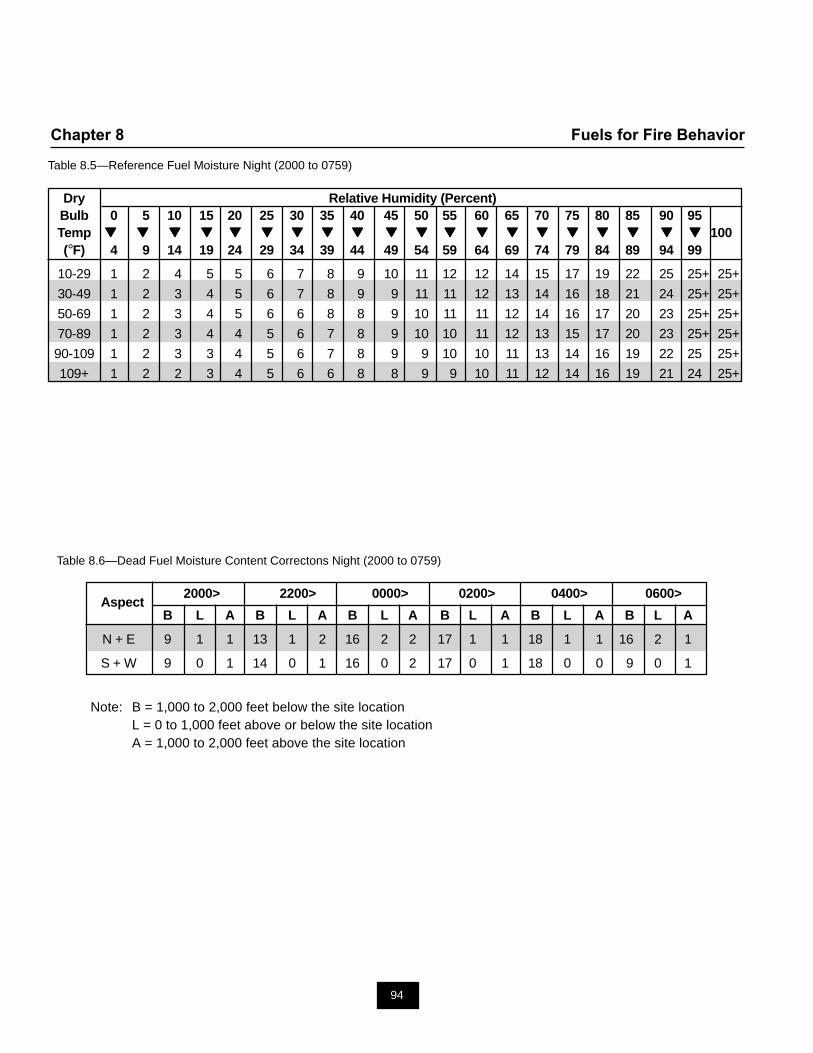
94
Chapter 8 Fuels for Fire Behavior
Table 8.5—Reference Fuel Moisture Night (2000 to 0759)
Dry Relative Humidity (Percent)Bulb 0 5 10 15 20 25 30 35 40 45 50 55 60 65 70 75 80 85 90 95Temp ▼▼▼▼▼ ▼▼▼▼▼ ▼▼▼▼▼ ▼▼▼▼▼ ▼▼▼▼▼ ▼▼▼▼▼ ▼▼▼▼▼ ▼▼▼▼▼ ▼▼▼▼▼ ▼▼▼▼▼ ▼▼▼▼▼ ▼▼▼▼▼ ▼▼▼▼▼ ▼▼▼▼▼ ▼▼▼▼▼ ▼▼▼▼▼ ▼▼▼▼▼ ▼▼▼▼▼ ▼▼▼▼▼ ▼▼▼▼▼ 100(°F) 4 9 14 19 24 29 34 39 44 49 54 59 64 69 74 79 84 89 94 99
10-29 1 2 4 5 5 6 7 8 9 10 11 12 12 14 15 17 19 22 25 25+ 25+
30-49 1 2 3 4 5 6 7 8 9 9 11 11 12 13 14 16 18 21 24 25+ 25+
50-69 1 2 3 4 5 6 6 8 8 9 10 11 11 12 14 16 17 20 23 25+ 25+
70-89 1 2 3 4 4 5 6 7 8 9 10 10 11 12 13 15 17 20 23 25+ 25+
90-109 1 2 3 3 4 5 6 7 8 9 9 10 10 11 13 14 16 19 22 25 25+
109+ 1 2 2 3 4 5 6 6 8 8 9 9 10 11 12 14 16 19 21 24 25+
Table 8.6—Dead Fuel Moisture Content Correctons Night (2000 to 0759)
Aspect2000> 2200> 0000> 0200> 0400> 0600>
B L A B L A B L A B L A B L A B L A
N + E 9 1 1 13 1 2 16 2 2 17 1 1 18 1 1 16 2 1
S + W 9 0 1 14 0 1 16 0 2 17 0 1 18 0 0 9 0 1
Note: B = 1,000 to 2,000 feet below the site locationL = 0 to 1,000 feet above or below the site locationA = 1,000 to 2,000 feet above the site location
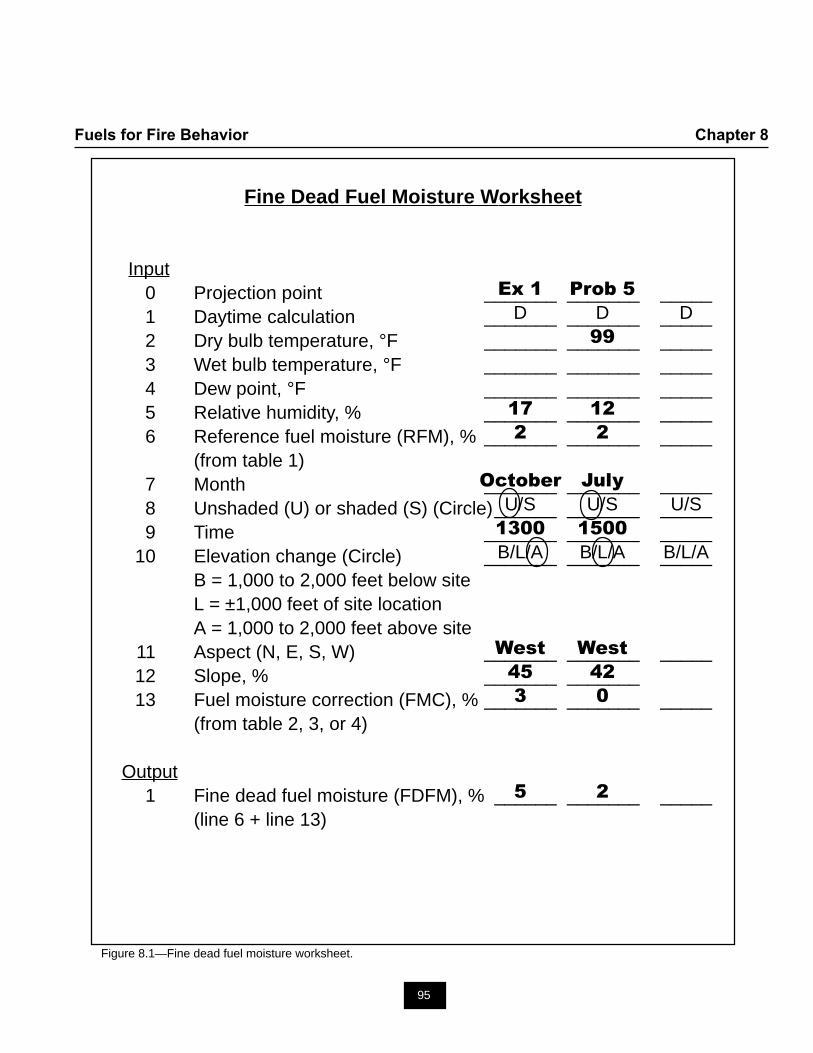
95
Fuels for Fire Behavior Chapter 8
Fine Dead Fuel Moisture Worksheet
Input0 Projection point _______ _______ _____1 Daytime calculation _______ _______ _____2 Dry bulb temperature, °F _______ _______ _____3 Wet bulb temperature, °F _______ _______ _____4 Dew point, °F _______ _______ _____5 Relative humidity, % _______ _______ _____6 Reference fuel moisture (RFM), % _______ _______ _____
(from table 1)7 Month _______ _______ _____8 Unshaded (U) or shaded (S) (Circle)______ _______ _____9 Time _______ _______ _____
10 Elevation change (Circle) _______ _______ _____B = 1,000 to 2,000 feet below siteL = ±1,000 feet of site locationA = 1,000 to 2,000 feet above site
11 Aspect (N, E, S, W) _______ _______ _____12 Slope, % _______ _______13 Fuel moisture correction (FMC), % _______ _______ _____
(from table 2, 3, or 4)
Output1 Fine dead fuel moisture (FDFM), % ______ _______ _____
(line 6 + line 13)
Figure 8.1—Fine dead fuel moisture worksheet.
Ex 1 Prob 5
D D D99
17 12
2 2
October July
U/S U/S U/S1300 1500
B/L/A B/L/A B/L/A
West West
45 42
3 0
5 2
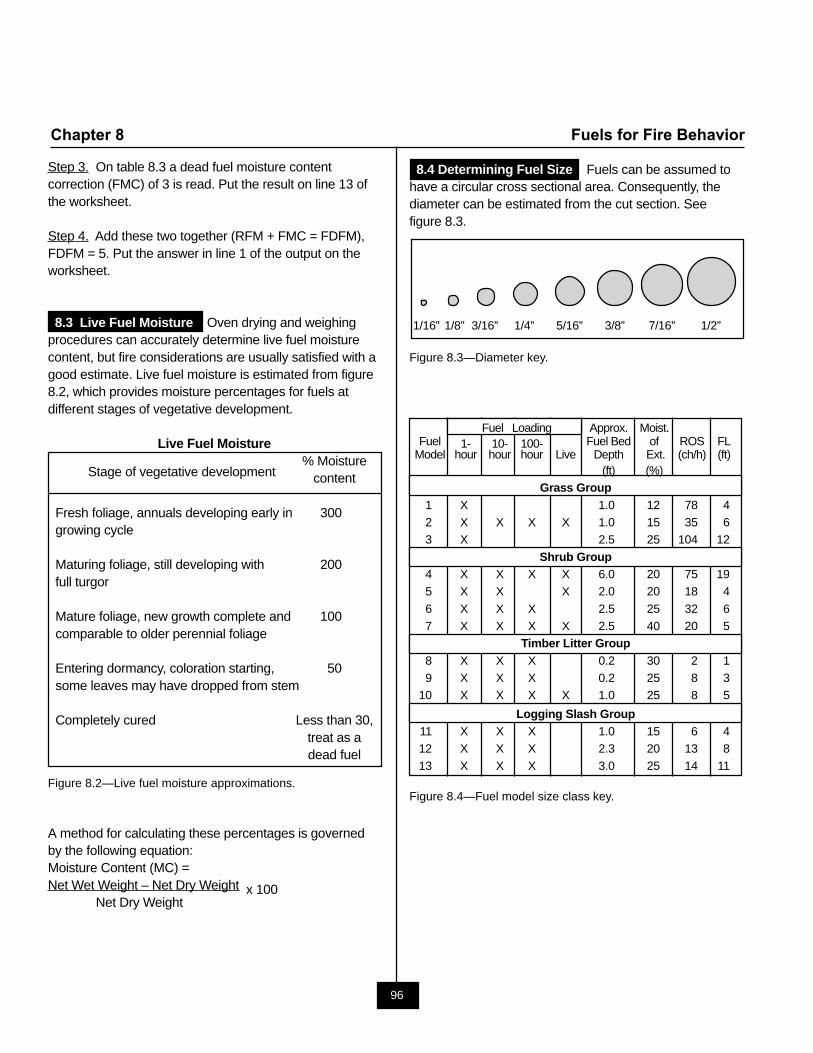
96
Chapter 8 Fuels for Fire Behavior
Step 3. On table 8.3 a dead fuel moisture contentcorrection (FMC) of 3 is read. Put the result on line 13 ofthe worksheet.
Step 4. Add these two together (RFM + FMC = FDFM),FDFM = 5. Put the answer in line 1 of the output on theworksheet.
8.3 Live Fuel Moisture Oven drying and weighingprocedures can accurately determine live fuel moisturecontent, but fire considerations are usually satisfied with agood estimate. Live fuel moisture is estimated from figure8.2, which provides moisture percentages for fuels atdifferent stages of vegetative development.
Live Fuel Moisture
Stage of vegetative development% Moisture
content
Fresh foliage, annuals developing early in 300growing cycle
Maturing foliage, still developing with 200full turgor
Mature foliage, new growth complete and 100comparable to older perennial foliage
Entering dormancy, coloration starting, 50some leaves may have dropped from stem
Completely cured Less than 30,treat as adead fuel
Figure 8.2—Live fuel moisture approximations.
A method for calculating these percentages is governedby the following equation:Moisture Content (MC) =Net Wet Weight – Net Dry Weight x 100
Net Dry Weight
8.4 Determining Fuel Size Fuels can be assumed tohave a circular cross sectional area. Consequently, thediameter can be estimated from the cut section. Seefigure 8.3.
1/16” 1/8” 3/16” 1/4” 5/16” 3/8” 7/16” 1/2”
Figure 8.3—Diameter key.
Fuel Loading Approx. Moist.Fuel 1- 10- 100- Fuel Bed of ROS FL
Model hour hour hour Live Depth Ext. (ch/h) (ft)(ft) (%)
Grass Group1 X 1.0 12 78 42 X X X X 1.0 15 35 63 X 2.5 25 104 12
Shrub Group4 X X X X 6.0 20 75 195 X X X 2.0 20 18 4
6 X X X 2.5 25 32 67 X X X X 2.5 40 20 5
Timber Litter Group8 X X X 0.2 30 2 19 X X X 0.2 25 8 3
10 X X X X 1.0 25 8 5
Logging Slash Group11 X X X 1.0 15 6 412 X X X 2.3 20 13 813 X X X 3.0 25 14 11
Figure 8.4—Fuel model size class key.
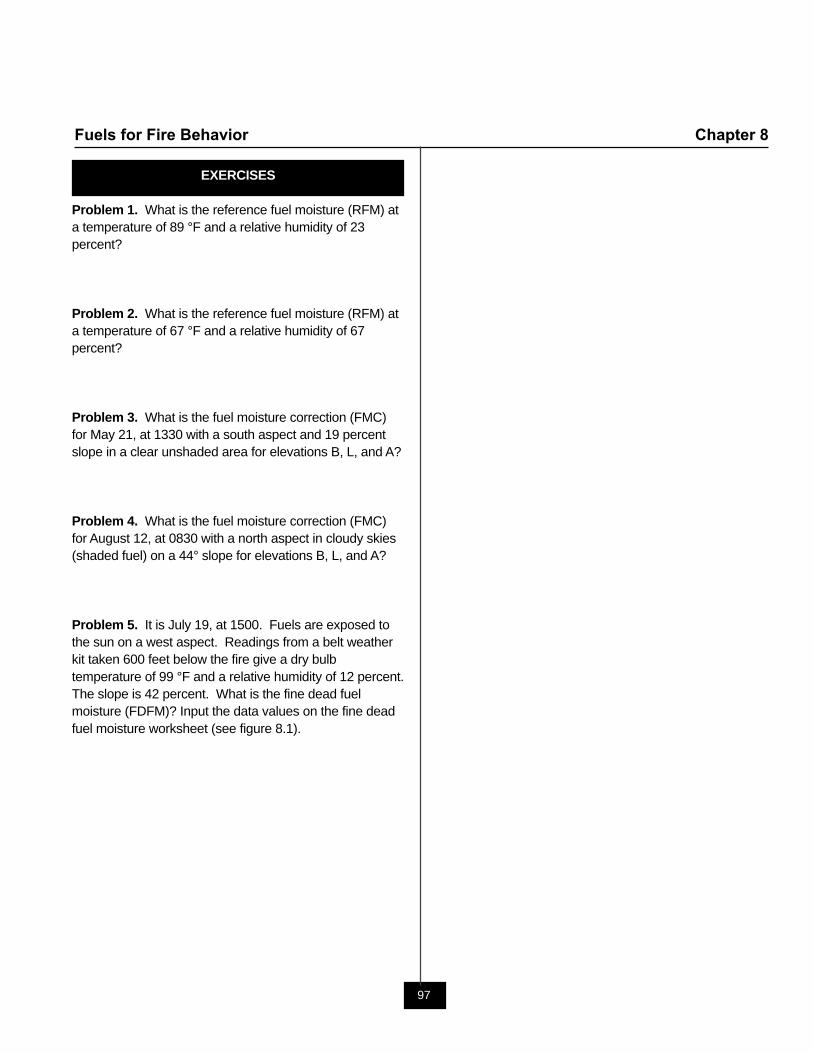
97
Fuels for Fire Behavior Chapter 8
EXERCISES
Problem 1. What is the reference fuel moisture (RFM) ata temperature of 89 °F and a relative humidity of 23percent?
Problem 2. What is the reference fuel moisture (RFM) ata temperature of 67 °F and a relative humidity of 67percent?
Problem 3. What is the fuel moisture correction (FMC)for May 21, at 1330 with a south aspect and 19 percentslope in a clear unshaded area for elevations B, L, and A?
Problem 4. What is the fuel moisture correction (FMC)for August 12, at 0830 with a north aspect in cloudy skies(shaded fuel) on a 44° slope for elevations B, L, and A?
Problem 5. It is July 19, at 1500. Fuels are exposed tothe sun on a west aspect. Readings from a belt weatherkit taken 600 feet below the fire give a dry bulbtemperature of 99 °F and a relative humidity of 12 percent.The slope is 42 percent. What is the fine dead fuelmoisture (FDFM)? Input the data values on the fine deadfuel moisture worksheet (see figure 8.1).

99
Fire Behavior Chapter 9
The material in chapter 9 describes how to usesurface fire behavior and spotting nomograms, firecharacteristic and interpretation charts, probabilityof ignition charts, and associated worksheets.These charts, graphs, and worksheets easilycapture known or calculated information to obtainsurface fire behavior characteristics, such aseffective windspeed, heat per unit area, rate ofspread, and fireline intensity. Fire characteristicsdefined are flame length, spread distance, which isconverted to a map spread distance, flame height,maximum spotting distance, rate of spread, andprobability of ignition.
9.1 Surface Fire Behavior Nomograms Surface firebehavior can be determined by using a series of chartsand graphs called nomograms. Variables of surface firebehavior include the effective windspeed, heat per unitarea, rate of spread, and fireline intensity. A surface firebehavior nomogram is a set of four interconnected graphsthat, when given a set of inputs, provides fire behaviorcharacteristics as output values.
There are 26 surface fire behavior nomograms, consistingof nomograms for each of the 13 fuel models, at both lowand high windspeeds. The range of values for low andhigh windspeed nomograms varies depending on the fueltype. Consequently, windspeed and fuel type willdetermine the correct nomogram to be used.
Nomograms consist of four graphs, positioned in fourquadrants. The upper left quadrant contains dead fuelmoisture in percentages and the live fuel (foliage)moisture in percentages. The upper right quadrantcontains the flame length, rate of spread, fireline intensity,heat per unit area, live fuel moisture in percentages, andthe dead fuel moisture in percentages. The lower leftquadrant contains the midflame windspeed, percentslope, and the effective value of windspeed. The lowerright quadrant contains the effective value of windspeed inmiles per hour.
OverviewNomograms provide essential fire behavior information. Toorganize this information, input and output values arerecorded on a fire behavior worksheet. Before beginningwork on the nomogram, the windspeed (usually obtainedfrom a local weather report) must be used to compute themidflame windspeed. See chapter 9, section 2.
Midflame windspeed and slope are needed to determinethe effective windspeed in the lower left quadrant of thenomogram. Effective windspeed determines the turningpoint in the lower right quadrant of the nomogram. Deadfuel moisture, if not given, must be determined. Seechapter 8, section 2. Dead fuel moisture determines theturning point in the upper left quadrant and is thebeginning of the final information line in the upper rightquadrant. For live fuel moistures, a horizontal line is drawnacross both upper quadrants connecting these two points.Rate of spread, flame length, fireline intensity, and heatper unit area are read from the intersection of the finalinformation line and appropriate quadrant borders.
Begin the nomogram by establishing all the inputs aroundthe nomogram, then draw the information line around thenomogram, using the inputs as turning points, andconclude by reading the outputs. The following steps are aguide on how to read a nomogram. It is important that thecorrect nomogram is chosen for the fuel model beingstudied. The input and output data can be recorded in afire behavior worksheet.
Surface Fire Behavior Nomogram Input Values
1. Fuel model—Select one of the 13 fire behavior fuelmodels discussed in chapter 8.
2. Live and dead fuel moistures—Fuel moisture content isthe water content of a fuel expressed as a percentage ofthe oven dry weight of the fuel. Both dead and live fuelmoisture contents are used as inputs to the nomogram.
3. Midflame windspeed—Midflame windspeed is thewindspeed within a wildland environment at about eyelevel, measured in miles per hour. See chapter 9, section 2.
100
Fire Behavior Chapter 9
4. Slope percent—Slope percent describes the steepnessof the site. For wildland fire behavior calculations, slope isalways expressed as a percentage rather than by degree.It is found on the lower left quadrant of the nomogram.
5. Effective windspeed—Effective windspeed combinesthe midflame windspeed and slope values into one input.It is found by using the nomogram, but is listed as an inputbecause once it is determined, it is used as a turning pointin the lower right quadrant.
Surface Fire Behavior Nomogram Output Values
1. Rate of spread—Rate of spread is the relative activity ofa fire, expressed as a rate of advance of the head of thefire in chains per hour (ch/h).
2. Heat per unit area—Heat per unit area is the totalamount of heat released per square foot during thepassage of the fire front. It is expressed in British thermalunits per square foot (Btu/ft2).
3. Fireline intensity—Fireline intensity is the amount ofheat released per linear foot of fire front per second. It isbased on both rate of spread and heat per unit area of afire and is expressed in British thermal units per foot persecond (Btu/ft/s).
4. Flame length—Flame length is the distance betweenthe flame tip and the midpoint of the flame depth at thebase of the flame (in feet). Flame length is directly relatedto fireline intensity.
9.2 Midflame Windspeed (MFWS) Midflamewindspeed is defined as the velocity of the winds, in milesper hour, taken at the mid-height of the flames. MFWS willdirectly affect the direction of movement of the flamingfront. This is important in fire spread calculations.
The midflame windspeed is determined by use of the windadjustment table, which is in terms of fuel overstoryexposure and fuel model. See figures 9.2 and 9.4.Windspeed that is measured 20 feet above any fuel orobstruction is referred to as a 20-foot windspeed. It isusually measured by a weather station. The midflamewindspeed is obtained by multiplying the 20-foot
windspeed by the appropriate wind adjustment factor fromfigure 9.2. It is very important to know which fuel modeland sheltering configuration is being studied, and whethera given windspeed is a 20-ft windspeed or an alreadyadjusted midflame windspeed. All of this information canbe entered in a wind adjustment worksheet. See figure 9.1.
Example 1—A fire is burning in a fully sheltered area ofdense, or closed, stands described as Fuel Model 4. Thelocal weather station reports the 20-ft windspeed is 15miles per hour. What is the midflame windspeed? Show allwork on the wind adjustment worksheet, figure 9.1.
Solution—Figure 9.2 describes wind reduction factors andis used to determine the appropriate correction factor.
Step 1. See figure 9.2. The correction factor is 0.1 for anyfuel model under fully sheltered conditions with densestands.
Step 2. To find the midflame windspeed, multiply the20-foot windspeed by the adjustment factor.
midflame windspeed =20-foot windspeed x adjustment factor
MFWS = 15 mi/h x 0.1 = 1.5 mi/h
Example 2—A 20-foot windspeed at the top of the ridge isreported to be 35 miles per hour, with fuel model 11vegetation. What is the midflame windspeed? Show allwork on the wind adjustment worksheet, figure 9.1.
Step 1. See figure 9.4. The top of a ridge is indicated to beunsheltered.
Step 2. From figure 9.2, the adjustment factor is 0.4.
Step 3. MFWS = 35 x 0.4 = 14 mi/h
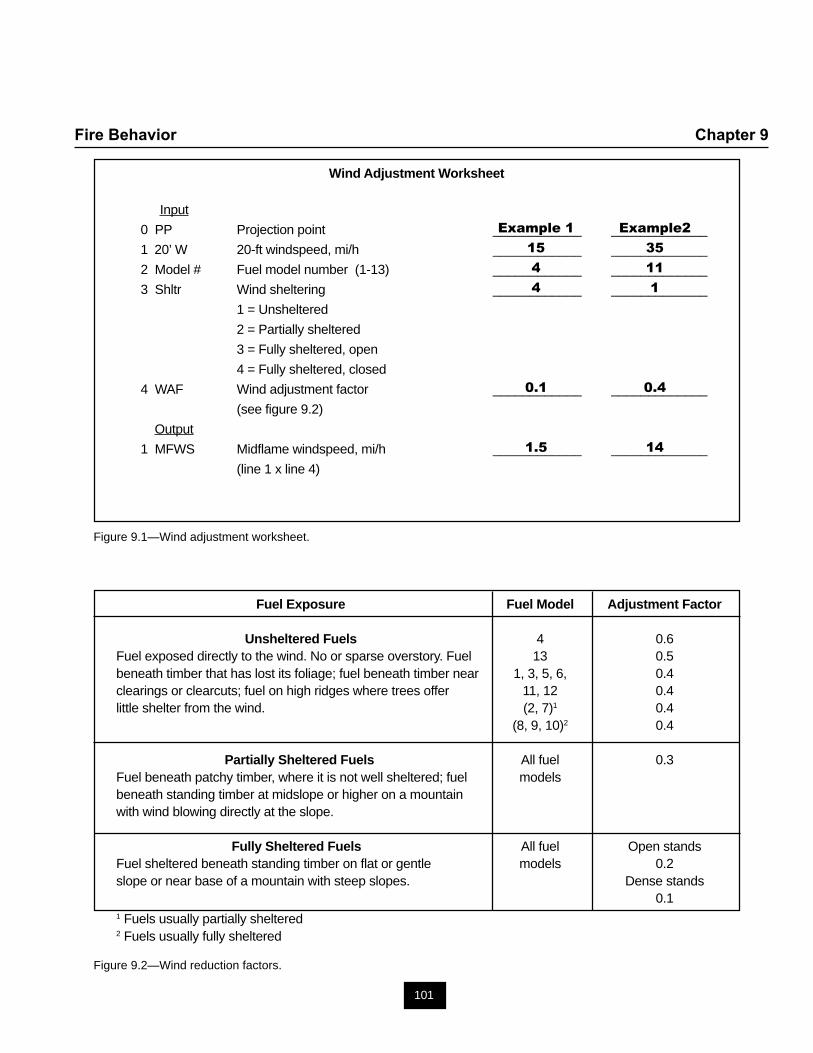
101
Fire Behavior Chapter 9
Wind Adjustment Worksheet
Input
0 PP Projection point ____________ _____________
1 20’ W 20-ft windspeed, mi/h ____________ _____________
2 Model # Fuel model number (1-13) ____________ _____________
3 Shltr Wind sheltering ____________ _____________
1 = Unsheltered
2 = Partially sheltered
3 = Fully sheltered, open
4 = Fully sheltered, closed
4 WAF Wind adjustment factor ____________ _____________
(see figure 9.2)
Output
1 MFWS Midflame windspeed, mi/h ____________ _____________
(line 1 x line 4)
Figure 9.1—Wind adjustment worksheet.
Fuel Exposure Fuel Model Adjustment Factor
Unsheltered Fuels 4 0.6Fuel exposed directly to the wind. No or sparse overstory. Fuel 13 0.5beneath timber that has lost its foliage; fuel beneath timber near 1, 3, 5, 6, 0.4clearings or clearcuts; fuel on high ridges where trees offer 11, 12 0.4little shelter from the wind. (2, 7)1 0.4
(8, 9, 10)2 0.4
Partially Sheltered Fuels All fuel 0.3Fuel beneath patchy timber, where it is not well sheltered; fuel modelsbeneath standing timber at midslope or higher on a mountainwith wind blowing directly at the slope.
Fully Sheltered Fuels All fuel Open standsFuel sheltered beneath standing timber on flat or gentle models 0.2slope or near base of a mountain with steep slopes. Dense stands
0.11 Fuels usually partially sheltered2 Fuels usually fully sheltered
Figure 9.2—Wind reduction factors.
Example 1 Example2
15 35
4 11
4 1
0.1 0.4
1.5 14
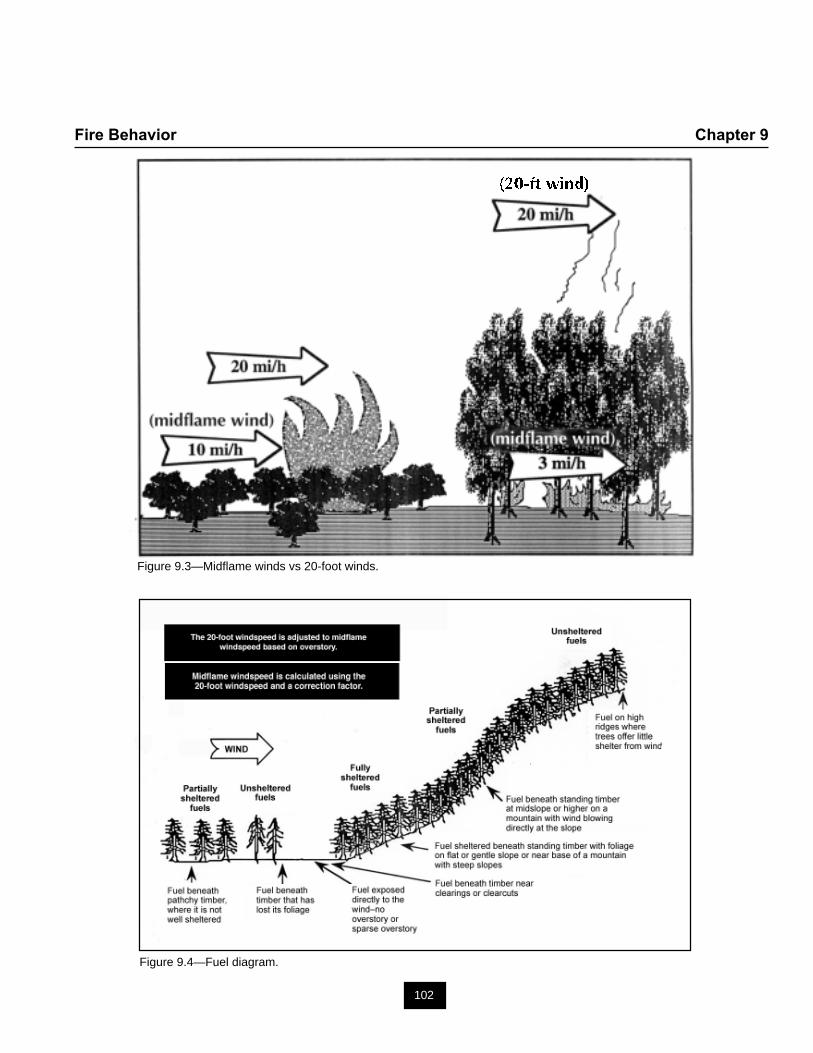
102
Fire Behavior Chapter 9
Figure 9.4—Fuel diagram.
Figure 9.3—Midflame winds vs 20-foot winds.
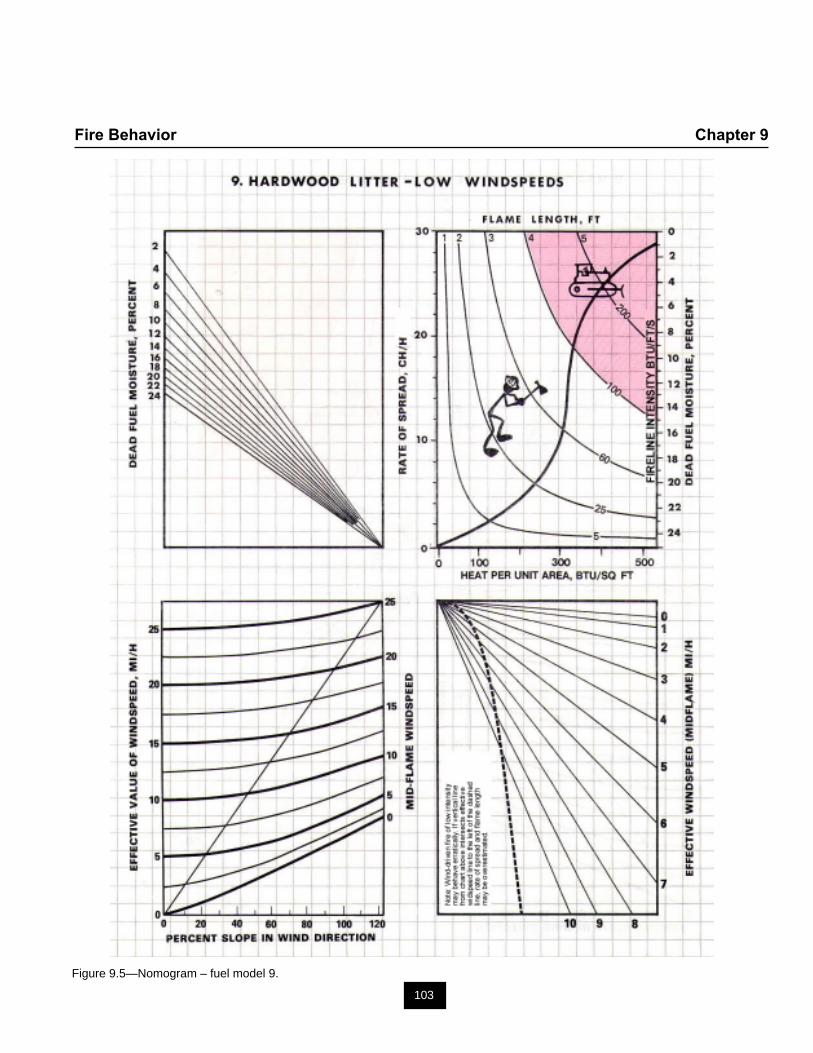
103
Fire Behavior Chapter 9
Figure 9.5—Nomogram – fuel model 9.
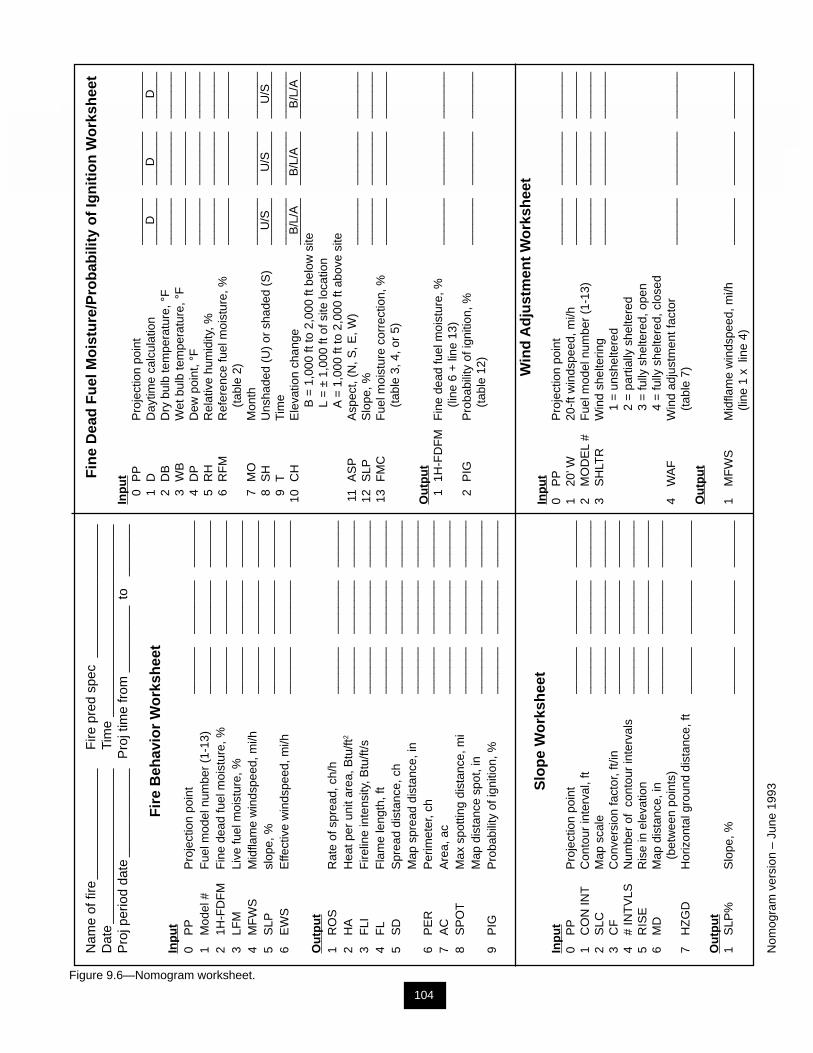
104
Fire Behavior Chapter 9
Nam
e of
fire
____
____
____
___
Fire
pre
d sp
ec__
____
____
____
____
Dat
e__
____
____
____
____
___
Tim
e__
____
____
____
____
____
____
Pro
j per
iod
date
____
____
____
Pro
j tim
e fr
om__
____
___
to__
____
_
Fir
e B
ehav
ior
Wo
rksh
eet
Inp
ut
0P
PP
roje
ctio
n po
int
____
___
____
____
____
___
1M
odel
#F
uel m
odel
num
ber
(1-1
3)__
____
___
____
____
____
_2
1H-F
DF
MF
ine
dead
fuel
moi
stur
e, %
____
___
____
____
____
___
3LF
MLi
ve fu
el m
oist
ure,
%__
____
___
____
____
____
_4
MF
WS
Mid
flam
e w
inds
peed
, mi/h
____
___
____
____
____
___
5S
LPsl
ope,
%__
____
___
____
____
____
_6
EW
SE
ffect
ive
win
dspe
ed, m
i/h__
____
___
____
____
____
_
Ou
tpu
t1
RO
SR
ate
of s
prea
d, c
h/h
____
___
____
____
____
___
2H
AH
eat p
er u
nit a
rea,
Btu
/ft2
____
___
____
____
____
___
3F
LIF
irelin
e in
tens
ity, B
tu/ft
/s__
____
___
____
____
____
_4
FL
Fla
me
leng
th, f
t__
____
___
____
____
____
_5
SD
Spr
ead
dist
ance
, ch
____
___
____
____
____
___
Map
spr
ead
dist
ance
, in
____
___
____
____
____
___
6P
ER
Per
imet
er, c
h__
____
___
____
____
____
_7
AC
Are
a, a
c__
____
___
____
____
____
_8
SP
OT
Max
spo
tting
dis
tanc
e, m
i__
____
___
____
____
____
_M
ap d
ista
nce
spot
, in
____
___
____
____
____
___
9P
IGP
roba
bilit
y of
igni
tion,
%__
____
___
____
____
____
_
Slo
pe
Wo
rksh
eet
Inp
ut
0P
PP
roje
ctio
n po
int
____
___
____
____
____
___
1C
ON
INT
Con
tour
inte
rval
, ft
____
___
____
____
____
___
2S
LCM
ap s
cale
____
___
____
____
____
___
3C
FC
onve
rsio
n fa
ctor
, ft/i
n__
____
___
____
____
____
_4
# IN
TV
LSN
umbe
r of
con
tour
inte
rval
s__
____
___
____
____
____
_5
RIS
ER
ise
in e
leva
tion
____
___
____
____
____
___
6M
DM
ap d
ista
nce,
in__
____
___
____
____
____
_
(bet
wee
n po
ints
)7
HZ
GD
Hor
izon
tal g
roun
d di
stan
ce, f
t__
____
___
____
____
____
_
Ou
tpu
t1
SLP
%S
lope
, %__
____
___
____
____
____
_
Nom
ogra
m v
ersi
on –
Jun
e 19
93
Fin
e D
ead
Fu
el M
ois
ture
/Pro
bab
ility
of
Ign
itio
n W
ork
shee
t
Inp
ut
0P
PP
roje
ctio
n po
int
____
___
____
____
____
___
1D
Day
time
calc
ulat
ion
____
___
____
____
____
___
2D
BD
ry b
ulb
tem
pera
ture
, °F
____
___
____
____
____
___
3W
BW
et b
ulb
tem
pera
ture
, °F
____
___
____
____
____
___
4D
PD
ew p
oint
, °F
____
___
____
____
____
___
5R
HR
elat
ive
hum
idity
, %__
____
___
____
____
____
_6
RF
MR
efer
ence
fuel
moi
stur
e, %
____
___
____
____
____
___
(
tabl
e 2)
7M
OM
onth
____
___
____
____
____
___
8S
HU
nsha
ded
(U)
or s
hade
d (S
)__
____
___
____
____
____
_9
TTi
me
____
___
____
____
____
___
10C
HE
leva
tion
chan
ge__
____
___
____
____
____
_
B =
1,0
00 ft
to 2
,000
ft b
elow
site
L
= ±
1,0
00 ft
of s
ite lo
catio
n
A =
1,0
00 ft
to 2
,000
ft a
bove
site
11A
SP
Asp
ect,
(N, S
, E, W
)__
____
___
____
____
____
_12
SLP
Slo
pe, %
____
___
____
____
____
___
13F
MC
Fue
l moi
stur
e co
rrec
tion,
%__
____
___
____
____
____
_
(ta
ble
3, 4
, or
5)
Ou
tpu
t1
1H-F
DF
MF
ine
dead
fuel
moi
stur
e, %
____
___
____
____
____
___
(
line
6 +
line
13)
2P
IGP
roba
bilit
y of
igni
tion,
%__
____
___
____
____
____
_
(ta
ble
12)
Win
d A
dju
stm
ent
Wo
rksh
eet
Inp
ut
0P
PP
roje
ctio
n po
int
____
___
____
____
____
___
120
’ W20
-ft w
inds
peed
, mi/h
____
___
____
____
____
___
2M
OD
EL
#F
uel m
odel
num
ber
(1-1
3)__
____
___
____
____
____
_3
SH
LTR
Win
d sh
elte
ring
____
___
____
____
____
___
1
= u
nshe
ltere
d
2 =
par
tially
she
ltere
d
3 =
fully
she
ltere
d, o
pen
4
= fu
lly s
helte
red,
clo
sed
4W
AF
Win
d ad
just
men
t fac
tor
____
___
____
____
____
___
(t
able
7)
Ou
tpu
t
1M
FW
SM
idfla
me
win
dspe
ed, m
i/h__
____
___
____
____
____
_
(line
1 x
lin
e 4)
Figure 9.6—Nomogram worksheet.
DD
D
U/S
U/S
U/S
B/L
/AB
/L/A
B/L
/A
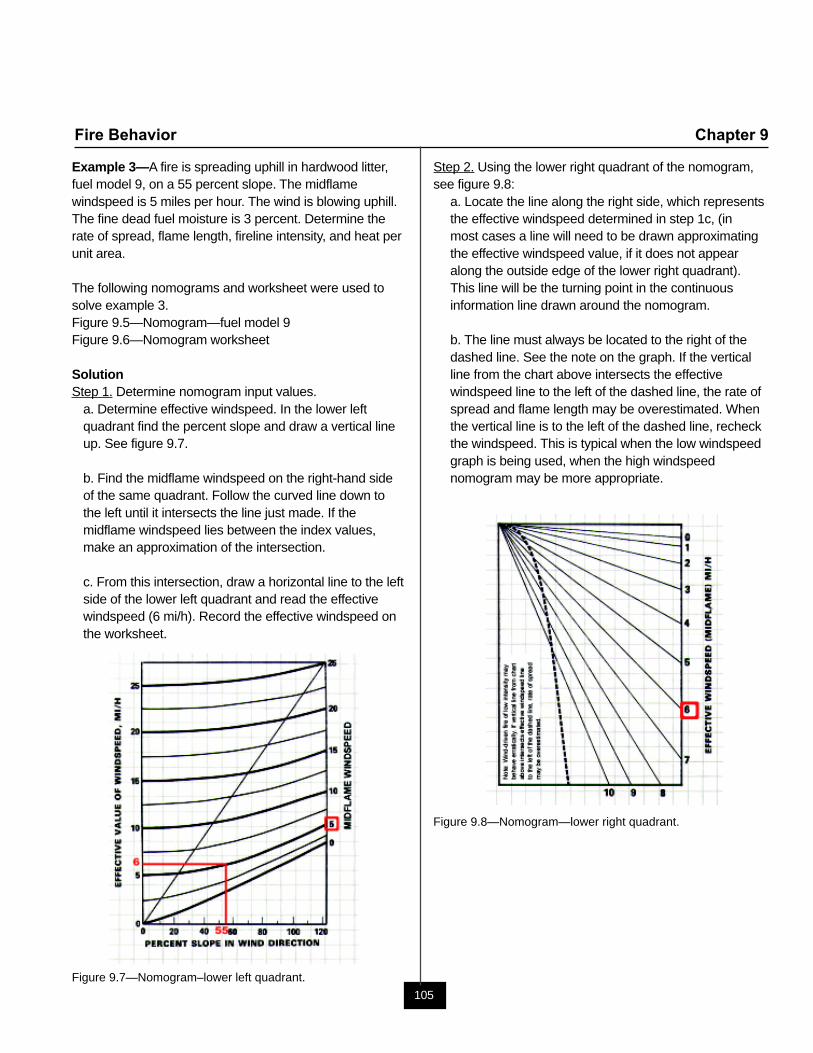
105
Fire Behavior Chapter 9
Step 2. Using the lower right quadrant of the nomogram,see figure 9.8:
a. Locate the line along the right side, which representsthe effective windspeed determined in step 1c, (inmost cases a line will need to be drawn approximatingthe effective windspeed value, if it does not appearalong the outside edge of the lower right quadrant).This line will be the turning point in the continuousinformation line drawn around the nomogram.
b. The line must always be located to the right of thedashed line. See the note on the graph. If the verticalline from the chart above intersects the effectivewindspeed line to the left of the dashed line, the rate ofspread and flame length may be overestimated. Whenthe vertical line is to the left of the dashed line, recheckthe windspeed. This is typical when the low windspeedgraph is being used, when the high windspeednomogram may be more appropriate.
Figure 9.8—Nomogram—lower right quadrant.
Example 3—A fire is spreading uphill in hardwood litter,fuel model 9, on a 55 percent slope. The midflamewindspeed is 5 miles per hour. The wind is blowing uphill.The fine dead fuel moisture is 3 percent. Determine therate of spread, flame length, fireline intensity, and heat perunit area.
The following nomograms and worksheet were used tosolve example 3.Figure 9.5—Nomogram—fuel model 9Figure 9.6—Nomogram worksheet
SolutionStep 1. Determine nomogram input values.
a. Determine effective windspeed. In the lower leftquadrant find the percent slope and draw a vertical lineup. See figure 9.7.
b. Find the midflame windspeed on the right-hand sideof the same quadrant. Follow the curved line down tothe left until it intersects the line just made. If themidflame windspeed lies between the index values,make an approximation of the intersection.
c. From this intersection, draw a horizontal line to the leftside of the lower left quadrant and read the effectivewindspeed (6 mi/h). Record the effective windspeed onthe worksheet.
Figure 9.7—Nomogram–lower left quadrant.
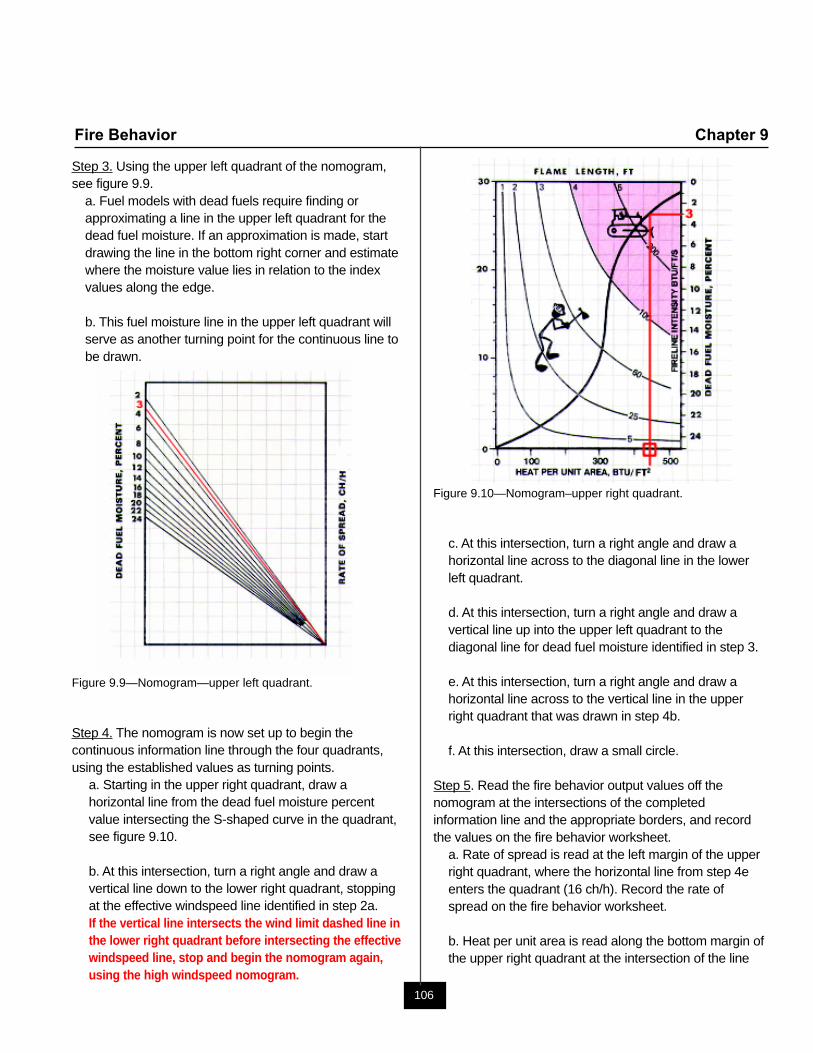
106
Fire Behavior Chapter 9
Step 3. Using the upper left quadrant of the nomogram,see figure 9.9.
a. Fuel models with dead fuels require finding orapproximating a line in the upper left quadrant for thedead fuel moisture. If an approximation is made, startdrawing the line in the bottom right corner and estimatewhere the moisture value lies in relation to the indexvalues along the edge.
b. This fuel moisture line in the upper left quadrant willserve as another turning point for the continuous line tobe drawn.
Figure 9.9—Nomogram—upper left quadrant.
Step 4. The nomogram is now set up to begin thecontinuous information line through the four quadrants,using the established values as turning points.
a. Starting in the upper right quadrant, draw ahorizontal line from the dead fuel moisture percentvalue intersecting the S-shaped curve in the quadrant,see figure 9.10.
b. At this intersection, turn a right angle and draw avertical line down to the lower right quadrant, stoppingat the effective windspeed line identified in step 2a.If the vertical line intersects the wind limit dashed line inthe lower right quadrant before intersecting the effectivewindspeed line, stop and begin the nomogram again,using the high windspeed nomogram.
Figure 9.10—Nomogram–upper right quadrant.
c. At this intersection, turn a right angle and draw ahorizontal line across to the diagonal line in the lowerleft quadrant.
d. At this intersection, turn a right angle and draw avertical line up into the upper left quadrant to thediagonal line for dead fuel moisture identified in step 3.
e. At this intersection, turn a right angle and draw ahorizontal line across to the vertical line in the upperright quadrant that was drawn in step 4b.
f. At this intersection, draw a small circle.
Step 5. Read the fire behavior output values off thenomogram at the intersections of the completedinformation line and the appropriate borders, and recordthe values on the fire behavior worksheet.
a. Rate of spread is read at the left margin of the upperright quadrant, where the horizontal line from step 4eenters the quadrant (16 ch/h). Record the rate ofspread on the fire behavior worksheet.
b. Heat per unit area is read along the bottom margin ofthe upper right quadrant at the intersection of the line
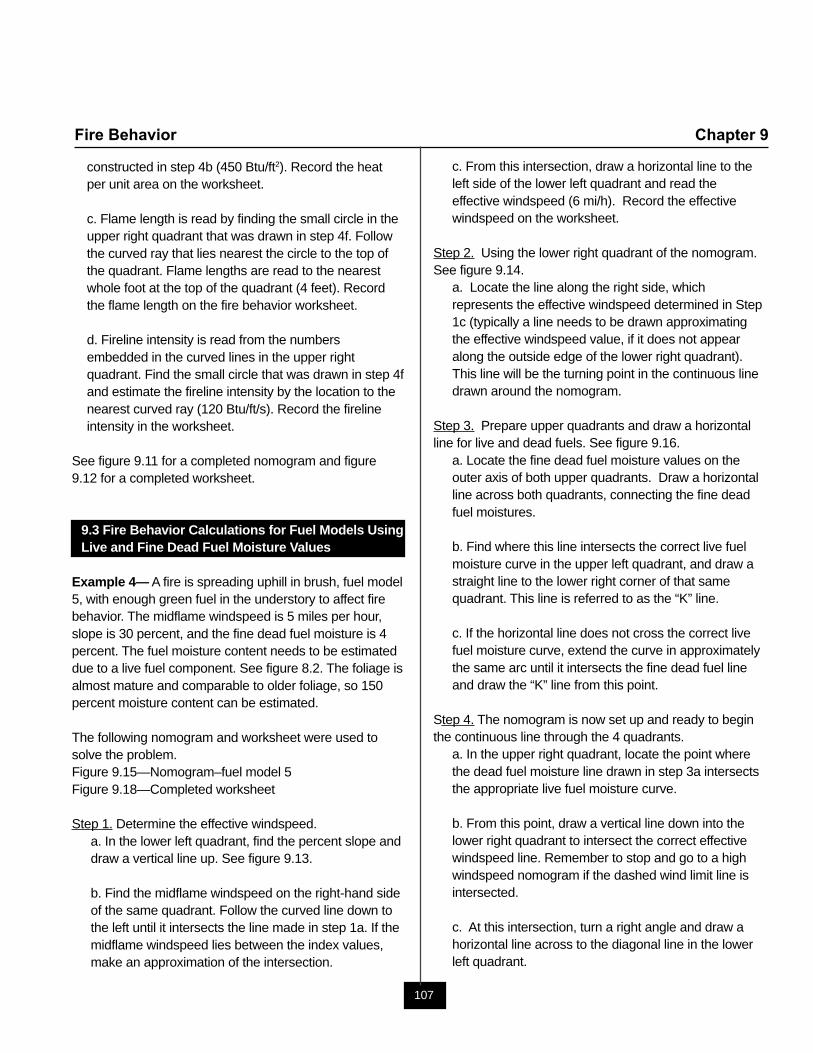
107
Fire Behavior Chapter 9
constructed in step 4b (450 Btu/ft2). Record the heatper unit area on the worksheet.
c. Flame length is read by finding the small circle in theupper right quadrant that was drawn in step 4f. Followthe curved ray that lies nearest the circle to the top ofthe quadrant. Flame lengths are read to the nearestwhole foot at the top of the quadrant (4 feet). Recordthe flame length on the fire behavior worksheet.
d. Fireline intensity is read from the numbersembedded in the curved lines in the upper rightquadrant. Find the small circle that was drawn in step 4fand estimate the fireline intensity by the location to thenearest curved ray (120 Btu/ft/s). Record the firelineintensity in the worksheet.
See figure 9.11 for a completed nomogram and figure9.12 for a completed worksheet.
9.3 Fire Behavior Calculations for Fuel Models UsingLive and Fine Dead Fuel Moisture Values
Example 4— A fire is spreading uphill in brush, fuel model5, with enough green fuel in the understory to affect firebehavior. The midflame windspeed is 5 miles per hour,slope is 30 percent, and the fine dead fuel moisture is 4percent. The fuel moisture content needs to be estimateddue to a live fuel component. See figure 8.2. The foliage isalmost mature and comparable to older foliage, so 150percent moisture content can be estimated.
The following nomogram and worksheet were used tosolve the problem.Figure 9.15—Nomogram–fuel model 5Figure 9.18—Completed worksheet
Step 1. Determine the effective windspeed.a. In the lower left quadrant, find the percent slope anddraw a vertical line up. See figure 9.13.
b. Find the midflame windspeed on the right-hand sideof the same quadrant. Follow the curved line down tothe left until it intersects the line made in step 1a. If themidflame windspeed lies between the index values,make an approximation of the intersection.
c. From this intersection, draw a horizontal line to theleft side of the lower left quadrant and read theeffective windspeed (6 mi/h). Record the effectivewindspeed on the worksheet.
Step 2. Using the lower right quadrant of the nomogram.See figure 9.14.
a. Locate the line along the right side, whichrepresents the effective windspeed determined in Step1c (typically a line needs to be drawn approximatingthe effective windspeed value, if it does not appearalong the outside edge of the lower right quadrant).This line will be the turning point in the continuous linedrawn around the nomogram.
Step 3. Prepare upper quadrants and draw a horizontalline for live and dead fuels. See figure 9.16.
a. Locate the fine dead fuel moisture values on theouter axis of both upper quadrants. Draw a horizontalline across both quadrants, connecting the fine deadfuel moistures.
b. Find where this line intersects the correct live fuelmoisture curve in the upper left quadrant, and draw astraight line to the lower right corner of that samequadrant. This line is referred to as the “K” line.
c. If the horizontal line does not cross the correct livefuel moisture curve, extend the curve in approximatelythe same arc until it intersects the fine dead fuel lineand draw the “K” line from this point.
Step 4. The nomogram is now set up and ready to beginthe continuous line through the 4 quadrants.
a. In the upper right quadrant, locate the point wherethe dead fuel moisture line drawn in step 3a intersectsthe appropriate live fuel moisture curve.
b. From this point, draw a vertical line down into thelower right quadrant to intersect the correct effectivewindspeed line. Remember to stop and go to a highwindspeed nomogram if the dashed wind limit line isintersected.
c. At this intersection, turn a right angle and draw ahorizontal line across to the diagonal line in the lowerleft quadrant.
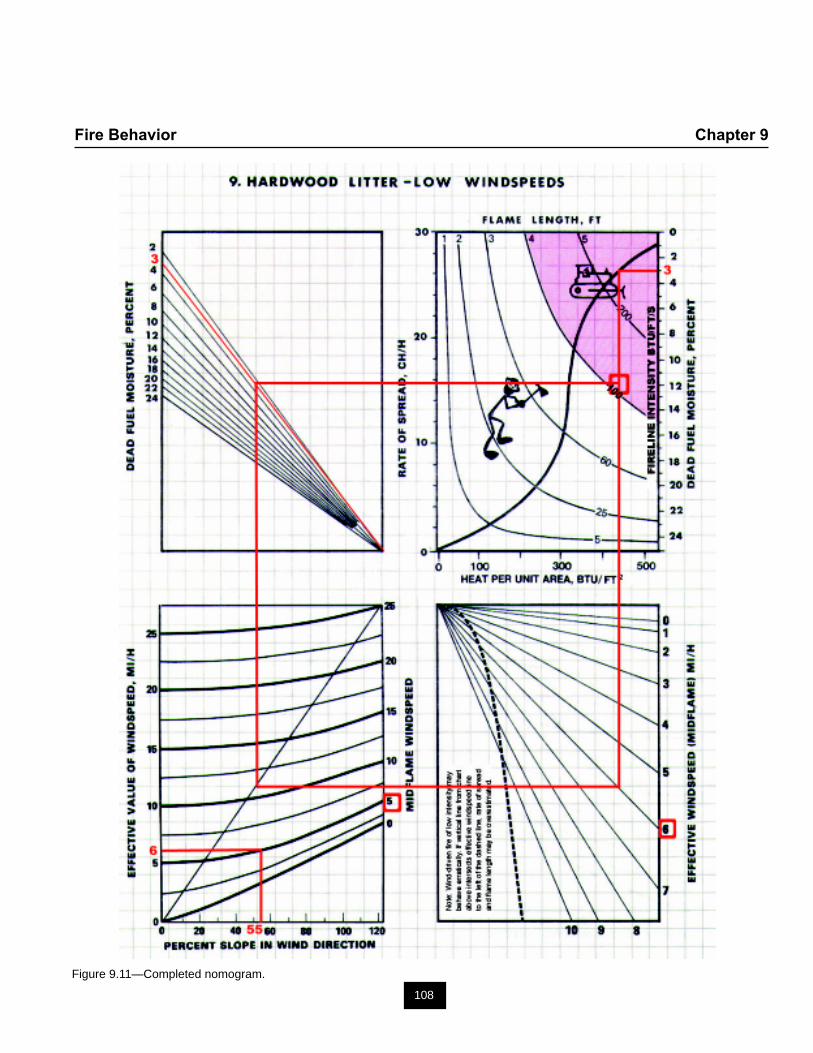
108
Fire Behavior Chapter 9
Figure 9.11—Completed nomogram.
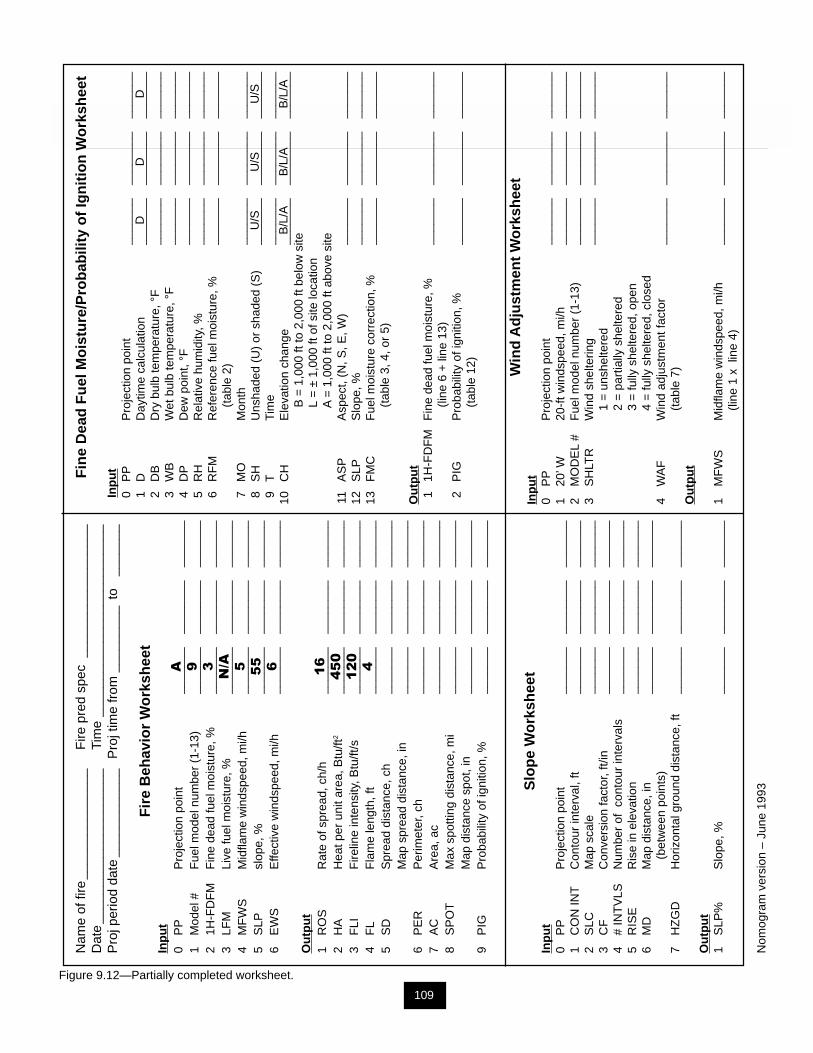
109
Fire Behavior Chapter 9
Nam
e of
fire
____
____
____
___
Fire
pre
d sp
ec__
____
____
____
____
Dat
e__
____
____
____
____
___
Tim
e__
____
____
____
____
____
____
Pro
j per
iod
date
____
____
____
Pro
j tim
e fr
om__
____
___
to__
____
_
Fir
e B
ehav
ior
Wo
rksh
eet
Inp
ut
0P
PP
roje
ctio
n po
int
____
___
____
____
____
___
1M
odel
#F
uel m
odel
num
ber
(1-1
3)__
____
___
____
____
____
_2
1H-F
DF
MF
ine
dead
fuel
moi
stur
e, %
____
___
____
____
____
___
3LF
MLi
ve fu
el m
oist
ure,
%__
____
___
____
____
____
_4
MF
WS
Mid
flam
e w
inds
peed
, mi/h
____
___
____
____
____
___
5S
LPsl
ope,
%__
____
___
____
____
____
_6
EW
SE
ffect
ive
win
dspe
ed, m
i/h__
____
___
____
____
____
_
Ou
tpu
t1
RO
SR
ate
of s
prea
d, c
h/h
____
___
____
____
____
___
2H
AH
eat p
er u
nit a
rea,
Btu
/ft2
____
___
____
____
____
___
3F
LIF
irelin
e in
tens
ity, B
tu/ft
/s__
____
___
____
____
____
_4
FL
Fla
me
leng
th, f
t__
____
___
____
____
____
_5
SD
Spr
ead
dist
ance
, ch
____
___
____
____
____
___
Map
spr
ead
dist
ance
, in
____
___
____
____
____
___
6P
ER
Per
imet
er, c
h__
____
___
____
____
____
_7
AC
Are
a, a
c__
____
___
____
____
____
_8
SP
OT
Max
spo
tting
dis
tanc
e, m
i__
____
___
____
____
____
_M
ap d
ista
nce
spot
, in
____
___
____
____
____
___
9P
IGP
roba
bilit
y of
igni
tion,
%__
____
___
____
____
____
_
Slo
pe
Wo
rksh
eet
Inp
ut
0P
PP
roje
ctio
n po
int
____
___
____
____
____
___
1C
ON
INT
Con
tour
inte
rval
, ft
____
___
____
____
____
___
2S
LCM
ap s
cale
____
___
____
____
____
___
3C
FC
onve
rsio
n fa
ctor
, ft/i
n__
____
___
____
____
____
_4
# IN
TV
LSN
umbe
r of
con
tour
inte
rval
s__
____
___
____
____
____
_5
RIS
ER
ise
in e
leva
tion
____
___
____
____
____
___
6M
DM
ap d
ista
nce,
in__
____
___
____
____
____
_
(bet
wee
n po
ints
)7
HZ
GD
Hor
izon
tal g
roun
d di
stan
ce, f
t__
____
___
____
____
____
_
Ou
tpu
t1
SLP
%S
lope
, %__
____
___
____
____
____
_
Nom
ogra
m v
ersi
on –
Jun
e 19
93
Fin
e D
ead
Fu
el M
ois
ture
/Pro
bab
ility
of
Ign
itio
n W
ork
shee
t
In
pu
t0
PP
Pro
ject
ion
poin
t__
____
___
____
____
____
_1
DD
aytim
e ca
lcul
atio
n__
____
___
____
____
____
_2
DB
Dry
bul
b te
mpe
ratu
re, °
F__
____
___
____
____
____
_3
WB
Wet
bul
b te
mpe
ratu
re, °
F__
____
___
____
____
____
_4
DP
Dew
poi
nt, °
F__
____
___
____
____
____
_5
RH
Rel
ativ
e hu
mid
ity, %
____
___
____
____
____
___
6R
FM
Ref
eren
ce fu
el m
oist
ure,
%__
____
___
____
____
____
_
(ta
ble
2)7
MO
Mon
th__
____
___
____
____
____
_8
SH
Uns
hade
d (U
) or
sha
ded
(S)
____
___
____
____
____
___
9T
Tim
e__
____
___
____
____
____
_10
CH
Ele
vatio
n ch
ange
____
___
____
____
____
___
B
= 1
,000
ft to
2,0
00 ft
bel
ow s
ite
L =
± 1
,000
ft o
f site
loca
tion
A
= 1
,000
ft to
2,0
00 ft
abo
ve s
ite11
AS
PA
spec
t, (N
, S, E
, W)
____
___
____
____
____
___
12S
LPS
lope
, %__
____
___
____
____
____
_13
FM
CF
uel m
oist
ure
corr
ectio
n, %
____
___
____
____
____
___
(
tabl
e 3,
4, o
r 5)
Ou
tpu
t1
1H-F
DF
MF
ine
dead
fuel
moi
stur
e, %
____
___
____
____
____
___
(
line
6 +
line
13)
2P
IGP
roba
bilit
y of
igni
tion,
%__
____
___
____
____
____
_
(ta
ble
12)
Win
d A
dju
stm
ent
Wo
rksh
eet
Inp
ut
0P
PP
roje
ctio
n po
int
____
___
____
____
____
___
120
’ W20
-ft w
inds
peed
, mi/h
____
___
____
____
____
___
2M
OD
EL
#F
uel m
odel
num
ber
(1-1
3)__
____
___
____
____
____
_3
SH
LTR
Win
d sh
elte
ring
____
___
____
____
____
___
1
= u
nshe
ltere
d
2 =
par
tially
she
ltere
d
3 =
fully
she
ltere
d, o
pen
4
= fu
lly s
helte
red,
clo
sed
4W
AF
Win
d ad
just
men
t fac
tor
____
___
____
____
____
___
(t
able
7)
Ou
tpu
t
1M
FW
SM
idfla
me
win
dspe
ed, m
i/h__
____
___
____
____
____
_
(line
1 x
lin
e 4)
Figure 9.12—Partially completed worksheet.
DD
D
U/S
U/S
U/S
B/L
/AB
/L/A
B/L
/A
A 9 3
N/A 5 55 6 16
45
0
12
0
4
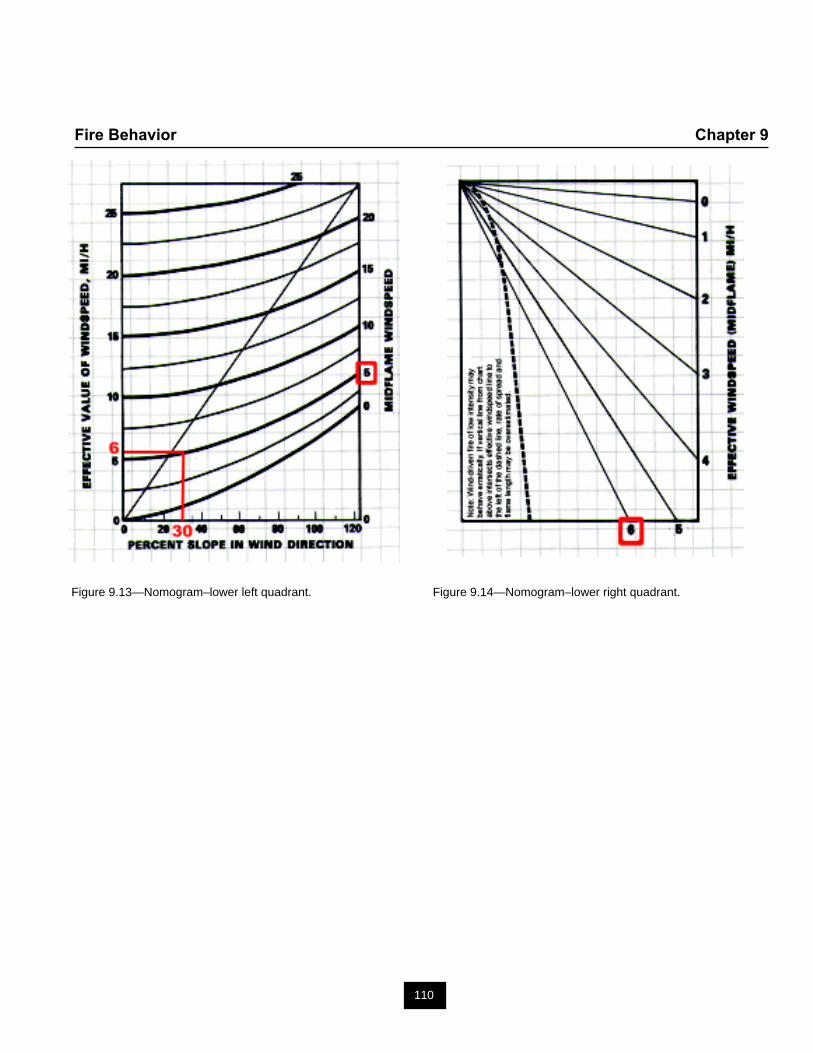
110
Fire Behavior Chapter 9
Figure 9.13—Nomogram–lower left quadrant. Figure 9.14—Nomogram–lower right quadrant.
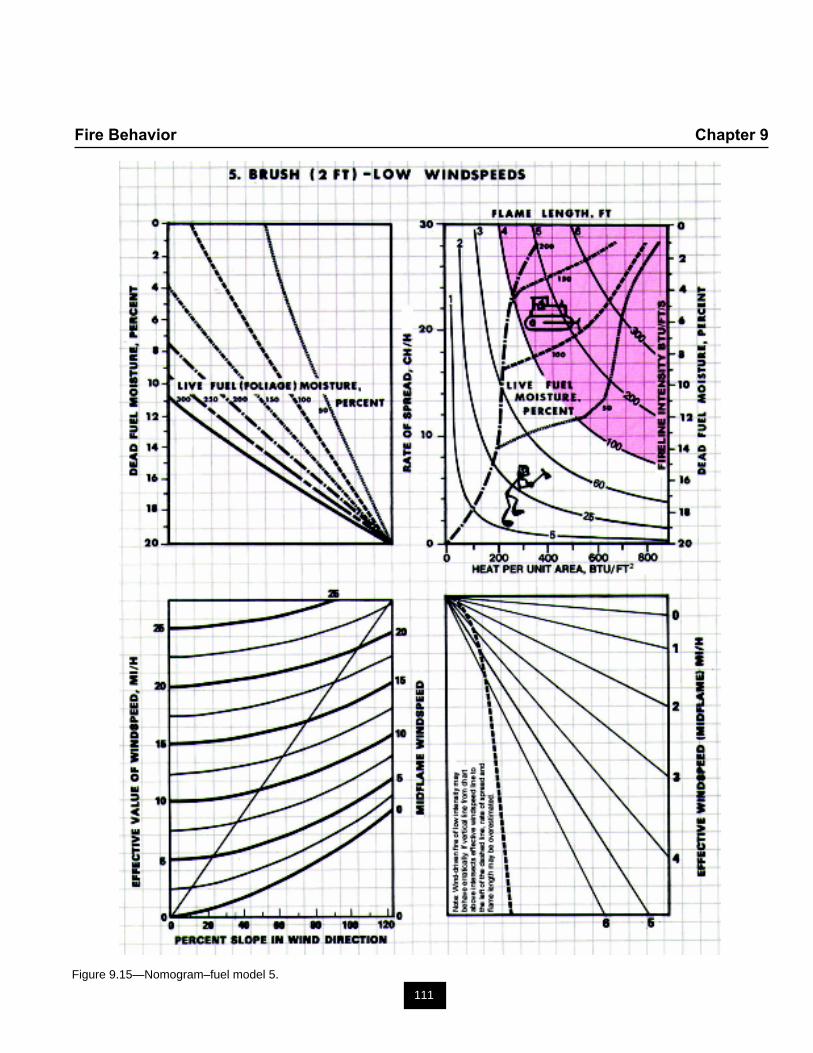
111
Fire Behavior Chapter 9
Figure 9.15—Nomogram–fuel model 5.
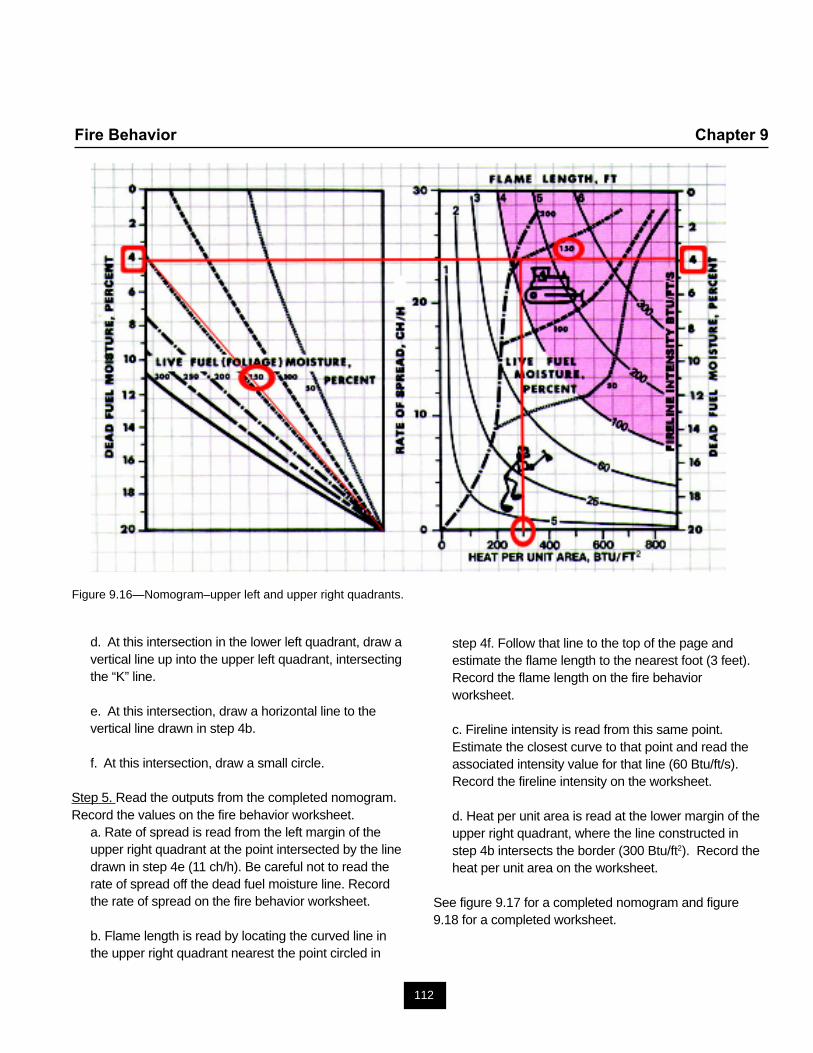
112
Fire Behavior Chapter 9
Figure 9.16—Nomogram–upper left and upper right quadrants.
d. At this intersection in the lower left quadrant, draw avertical line up into the upper left quadrant, intersectingthe “K” line.
e. At this intersection, draw a horizontal line to thevertical line drawn in step 4b.
f. At this intersection, draw a small circle.
Step 5. Read the outputs from the completed nomogram.Record the values on the fire behavior worksheet.
a. Rate of spread is read from the left margin of theupper right quadrant at the point intersected by the linedrawn in step 4e (11 ch/h). Be careful not to read therate of spread off the dead fuel moisture line. Recordthe rate of spread on the fire behavior worksheet.
b. Flame length is read by locating the curved line inthe upper right quadrant nearest the point circled in
step 4f. Follow that line to the top of the page andestimate the flame length to the nearest foot (3 feet).Record the flame length on the fire behaviorworksheet.
c. Fireline intensity is read from this same point.Estimate the closest curve to that point and read theassociated intensity value for that line (60 Btu/ft/s).Record the fireline intensity on the worksheet.
d. Heat per unit area is read at the lower margin of theupper right quadrant, where the line constructed instep 4b intersects the border (300 Btu/ft2). Record theheat per unit area on the worksheet.
See figure 9.17 for a completed nomogram and figure9.18 for a completed worksheet.
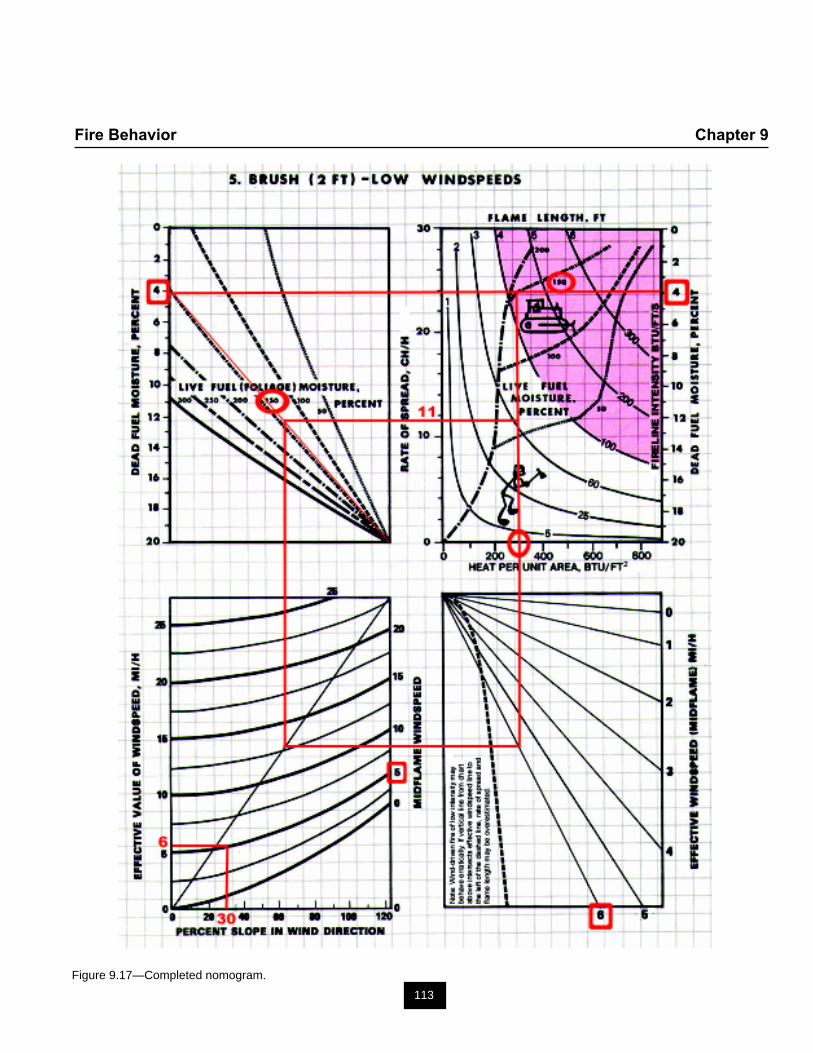
113
Fire Behavior Chapter 9
Figure 9.17—Completed nomogram.
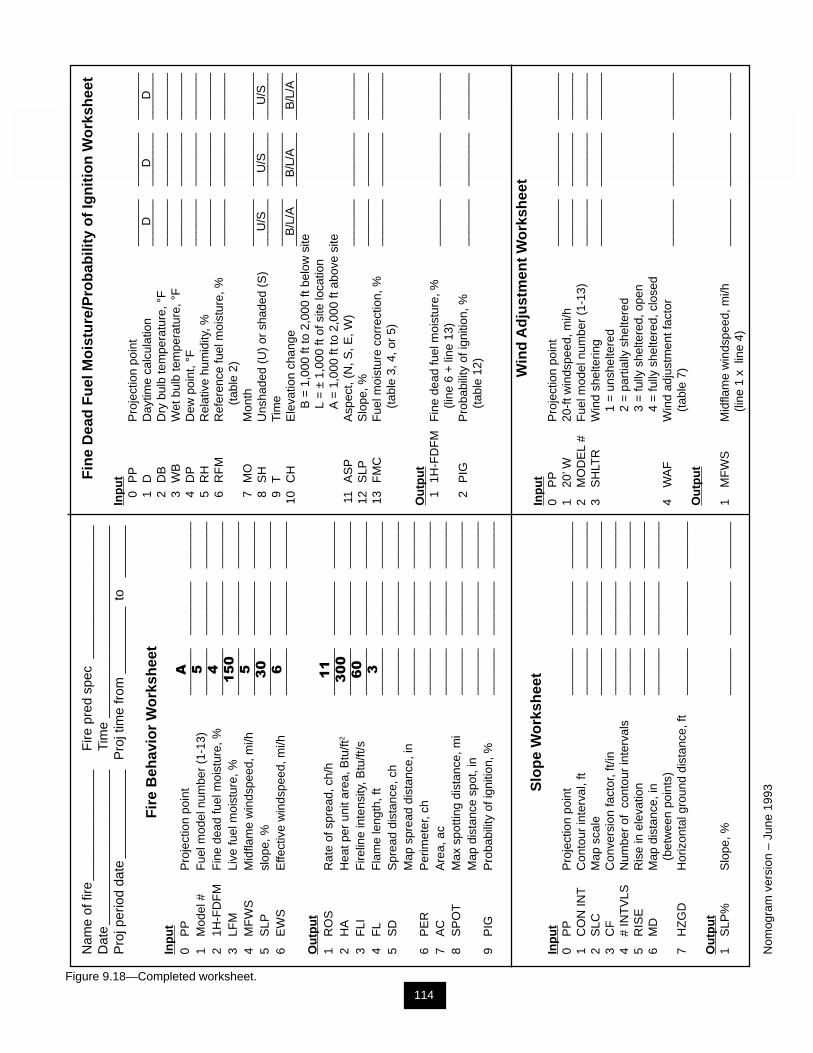
114
Fire Behavior Chapter 9
Nam
e of
fire
____
____
____
___
Fire
pre
d sp
ec__
____
____
____
____
Dat
e__
____
____
____
____
___
Tim
e__
____
____
____
____
____
____
Pro
j per
iod
date
____
____
____
Pro
j tim
e fr
om__
____
___
to__
____
_
Fir
e B
ehav
ior
Wo
rksh
eet
Inp
ut
0P
PP
roje
ctio
n po
int
____
___
____
____
____
___
1M
odel
#F
uel m
odel
num
ber
(1-1
3)__
____
___
____
____
____
_2
1H-F
DF
MF
ine
dead
fuel
moi
stur
e, %
____
___
____
____
____
___
3LF
MLi
ve fu
el m
oist
ure,
%__
____
___
____
____
____
_4
MF
WS
Mid
flam
e w
inds
peed
, mi/h
____
___
____
____
____
___
5S
LPsl
ope,
%__
____
___
____
____
____
_6
EW
SE
ffect
ive
win
dspe
ed, m
i/h__
____
___
____
____
____
_
Ou
tpu
t1
RO
SR
ate
of s
prea
d, c
h/h
____
___
____
____
____
___
2H
AH
eat p
er u
nit a
rea,
Btu
/ft2
____
___
____
____
____
___
3F
LIF
irelin
e in
tens
ity, B
tu/ft
/s__
____
___
____
____
____
_4
FL
Fla
me
leng
th, f
t__
____
___
____
____
____
_5
SD
Spr
ead
dist
ance
, ch
____
___
____
____
____
___
Map
spr
ead
dist
ance
, in
____
___
____
____
____
___
6P
ER
Per
imet
er, c
h__
____
___
____
____
____
_7
AC
Are
a, a
c__
____
___
____
____
____
_8
SP
OT
Max
spo
tting
dis
tanc
e, m
i__
____
___
____
____
____
_M
ap d
ista
nce
spot
, in
____
___
____
____
____
___
9P
IGP
roba
bilit
y of
igni
tion,
%__
____
___
____
____
____
_
Slo
pe
Wo
rksh
eet
Inp
ut
0P
PP
roje
ctio
n po
int
____
___
____
____
____
___
1C
ON
INT
Con
tour
inte
rval
, ft
____
___
____
____
____
___
2S
LCM
ap s
cale
____
___
____
____
____
___
3C
FC
onve
rsio
n fa
ctor
, ft/i
n__
____
___
____
____
____
_4
# IN
TV
LSN
umbe
r of
con
tour
inte
rval
s__
____
___
____
____
____
_5
RIS
ER
ise
in e
leva
tion
____
___
____
____
____
___
6M
DM
ap d
ista
nce,
in__
____
___
____
____
____
_
(bet
wee
n po
ints
)7
HZ
GD
Hor
izon
tal g
roun
d di
stan
ce, f
t__
____
___
____
____
____
_
Ou
tpu
t1
SLP
%S
lope
, %__
____
___
____
____
____
_
Nom
ogra
m v
ersi
on –
Jun
e 19
93
Fin
e D
ead
Fu
el M
ois
ture
/Pro
bab
ility
of
Ign
itio
n W
ork
shee
t
Inp
ut
0P
PP
roje
ctio
n po
int
____
___
____
____
____
___
1D
Day
time
calc
ulat
ion
____
___
____
____
____
___
2D
BD
ry b
ulb
tem
pera
ture
, °F
____
___
____
____
____
___
3W
BW
et b
ulb
tem
pera
ture
, °F
____
___
____
____
____
___
4D
PD
ew p
oint
, °F
____
___
____
____
____
___
5R
HR
elat
ive
hum
idity
, %__
____
___
____
____
____
_6
RF
MR
efer
ence
fuel
moi
stur
e, %
____
___
____
____
____
___
(
tabl
e 2)
7M
OM
onth
____
___
____
____
____
___
8S
HU
nsha
ded
(U)
or s
hade
d (S
)__
____
___
____
____
____
_9
TTi
me
____
___
____
____
____
___
10C
HE
leva
tion
chan
ge__
____
___
____
____
____
_
B =
1,0
00 ft
to 2
,000
ft b
elow
site
L
= ±
1,0
00 ft
of s
ite lo
catio
n
A =
1,0
00 ft
to 2
,000
ft a
bove
site
11A
SP
Asp
ect,
(N, S
, E, W
)__
____
___
____
____
____
_12
SLP
Slo
pe, %
____
___
____
____
____
___
13F
MC
Fue
l moi
stur
e co
rrec
tion,
%__
____
___
____
____
____
_
(ta
ble
3, 4
, or
5)
Ou
tpu
t1
1H-F
DF
MF
ine
dead
fuel
moi
stur
e, %
____
___
____
____
____
___
(
line
6 +
line
13)
2P
IGP
roba
bilit
y of
igni
tion,
%__
____
___
____
____
____
_
(ta
ble
12)
Win
d A
dju
stm
ent
Wo
rksh
eet
Inp
ut
0P
PP
roje
ctio
n po
int
____
___
____
____
____
___
120
’ W20
-ft w
inds
peed
, mi/h
____
___
____
____
____
___
2M
OD
EL
#F
uel m
odel
num
ber
(1-1
3)__
____
___
____
____
____
_3
SH
LTR
Win
d sh
elte
ring
____
___
____
____
____
___
1
= u
nshe
ltere
d
2 =
par
tially
she
ltere
d
3 =
fully
she
ltere
d, o
pen
4
= fu
lly s
helte
red,
clo
sed
4W
AF
Win
d ad
just
men
t fac
tor
____
___
____
____
____
___
(t
able
7)
Ou
tpu
t
1M
FW
SM
idfla
me
win
dspe
ed, m
i/h__
____
___
____
____
____
_
(line
1 x
lin
e 4)
Figure 9.18—Completed worksheet.
DD
D
U/S
U/S
U/S
B/L
/AB
/L/A
B/L
/A
A 5 4
15
0
5 30 6 11
30
0
60 3
115
Fire Behavior Chapter 9
9.4 Using the Fire Behavior Nomogram Backwardsfor Prescribed Burns
Prescribed fire is the controlled application of fire towildland fuels, in either their natural or modified state,under specified environmental conditions. Theseconditions allow the fire to be confined to a predeterminedarea. At the same time, these fires produce the intensity ofheat, flame length, and rate of spread required to attainplanned resource management objectives. Usingnomograms backwards develops a range of effectivewindspeeds and fine fuel moistures, which will yield thedesired resource management objectives.
Step 1. Using nomograms in reverse.a. Locate the desired point on the flame length curve.Draw a line from this point, intersecting the S-curveand continuing down through all windspeed lines in thelower right quadrant.
b. Draw a horizontal line from the S-curve intersectionin the upper right quadrant to determine the fine fuelmoisture. Circle this fuel moisture value in the upperright and upper left quadrants.
c. In the upper right quadrant, draw a horizontal lineinto the left quadrant from the point intersecting the finefuel moisture line.
d. Draw a vertical line down into the lower leftquadrant, turning at the diagonal, and continuing with ahorizontal line into the lower right quadrant.
e. Locate the intersecting point of the line in part d withthe vertical line drawn in part a, and determine theeffective windspeed.
Example 5—Prepare a prescription for a firing operationfor tomorrow’s shift. Handcrews are constructing indirecthandline in advance of the fire. The concern is that the firewill burn through the area before the crews can completethis line. Determine a range of dead fuel moistures andeffective windspeeds that will keep the fire’s forwardspread within a rate of 16 chains per hour, using fuel model6.
What is the range of dead fuel moistures and effectivewindspeeds needed to safely complete the handline?
What are the flame lengths?
Note that the rate of spread is given, rather than a flamelength.
a. The 16 chain per hour rate of spread is located.
b. A horizontal line is drawn across the upper rightquadrant. The intersection at the right axis indicatesthe fine dead fuel moisture. See figure 9.19.
c. The fine dead fuel moisture is circled in both theupper right and upper left quadrants. For this example,18 percent is circled.
e. A horizontal line is drawn from the intersection of theS-curve in the upper right quadrant to the line of 18percent fine dead fuel moisture in the upper leftquadrant.
f. A vertical line is drawn from the intersection with theS-curve in the upper right quadrant, down through allthe effective windspeeds in the lower right quadrant.
g. A vertical line is drawn into the lower left quadrantfrom the fuel moisture intersection in the upper leftquadrant, until the diagonal is reached. At this point, ahorizontal line is drawn into the lower right quadrant.
h. The intersection point with the vertical line is locatedin the lower right quadrant. The effective windspeed isdetermined as 5 miles per hour (approximation).
i. The flame length can be approximated from theupper right quadrant as 4 feet.
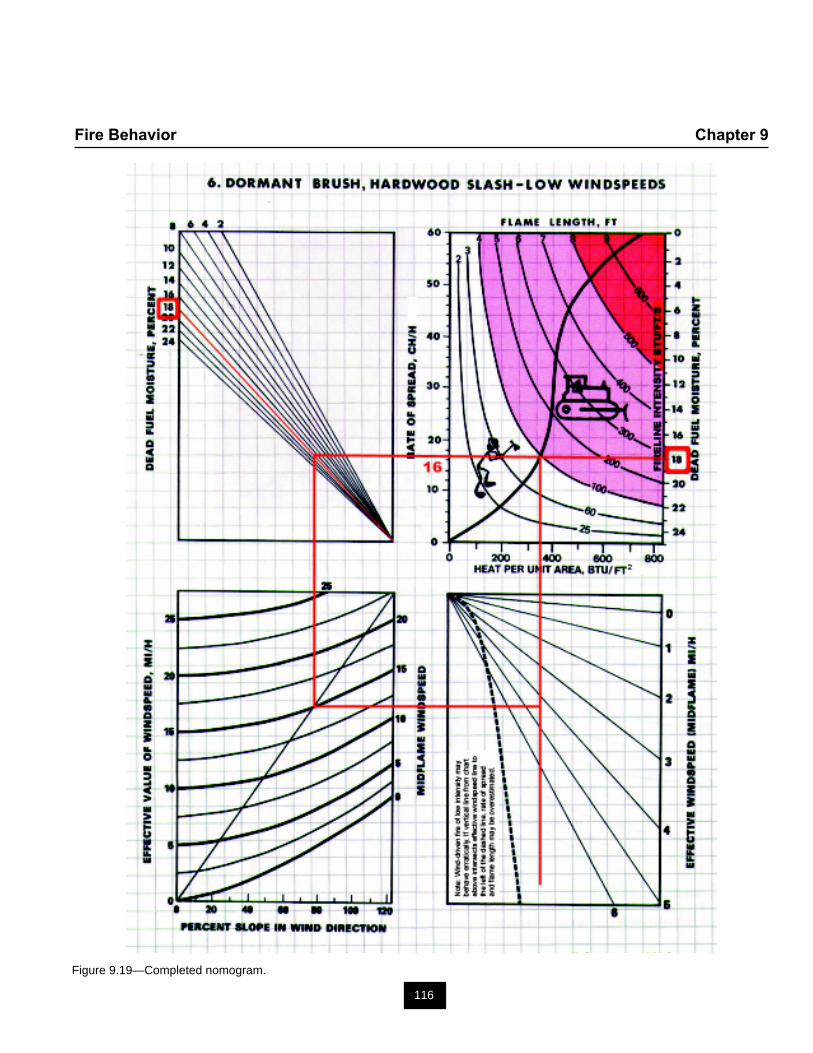
116
Fire Behavior Chapter 9
Figure 9.19—Completed nomogram.
117
Fire Behavior Chapter 9
9.5 Flame Length The flame length is the distancebetween the flame tip and the midpoint of the flame depthat the base of the flame. Flame length is an observable,measurable indicator of fireline intensity. Spread distance,in chains, is the distance of forward fire spread for aspecified amount of time.
spread distance (SD) =rate of spread (ROS) x projection time (PT)SD = ROS x PT
Example 6—The rate of a fire spread is 4 chains per hour.What will the spread distance be in 3 hours?
SD = ROS x PT = 4 ch/h x 3h = 12 ch
9.6 Map Spread Map spread, in inches, is the size ofa fire as scaled to a map.
Example 7—Using example 6, find the map distance forthe fire spread. Plot the distance using a tenths ruler foraccuracy. The map scale is 1:24,000.
Step 1. Convert the map scale to feet per inch. 24,000 inches 1 foot = 2,000 feet
12 inches
Step 2. Convert the spread distance to feet. 12 chains 66 feet = 792 feet
1 chain
Step 3. Convert the ground spread distance to a mapspread distance. 792 feet 1 inch = 0.396 inch = 0.4 inch
2,000 feet
Step 4. Using a ruler, measure the distance from the pointof origin to the distance of the fire spread.
Map spread distance is 0.4 inch.
9.7 Head, Flank, and Rear Fire Terms Each side ofthe fire is described in terms of head, flank, and rear. Thehead is the fastest spreading part of a fire’s perimeter.This is usually the side toward which the wind is blowing(leeward) or the upslope side. The head of the fire is ofprimary interest. The right and left flanks describe thesides of the fire. Flanks are perpendicular to the head ofthe fire. The rear of the fire is the side of the fire oppositethe head.
Example 8—Plot the perimeter and label the head, rear,and flanks of the fire in example 7. Assume the wind isblowing from left to right across the page. ➤➤➤➤➤➤
Left flank
Rear Head
Right flank
9.8 Flame Height Flame height is the average heightof flames, as measured on a vertical axis.
Example 9—The torching tree diameter at breast height(dbh) is 25 inches in a forest of ponderosa pine. What isthe flame height?
Step 1. Use spotting nomogram 1, figure 9.21. Find 25inches diameter at breast height on the horizontal axis.
Step 2. Go up to the ponderosa pine line.
Step 3. Move to the left to find the flame height on thevertical axis.
The flame height is 57 feet.
9.9 Maximum Spotting Distance Maximum spottingdistance, in miles, is the maximum transported distance ofa firebrand. It can be predicted for various firebrandsources using such factors as the probability of productionof firebrands, windspeed, fire intensity, and the number offirebrands. The maximum spotting distance will bedetermined by using spotting nomograms. The maximumspotting distance can also be determined by using acomputer program called Behave or by the HP-71B.
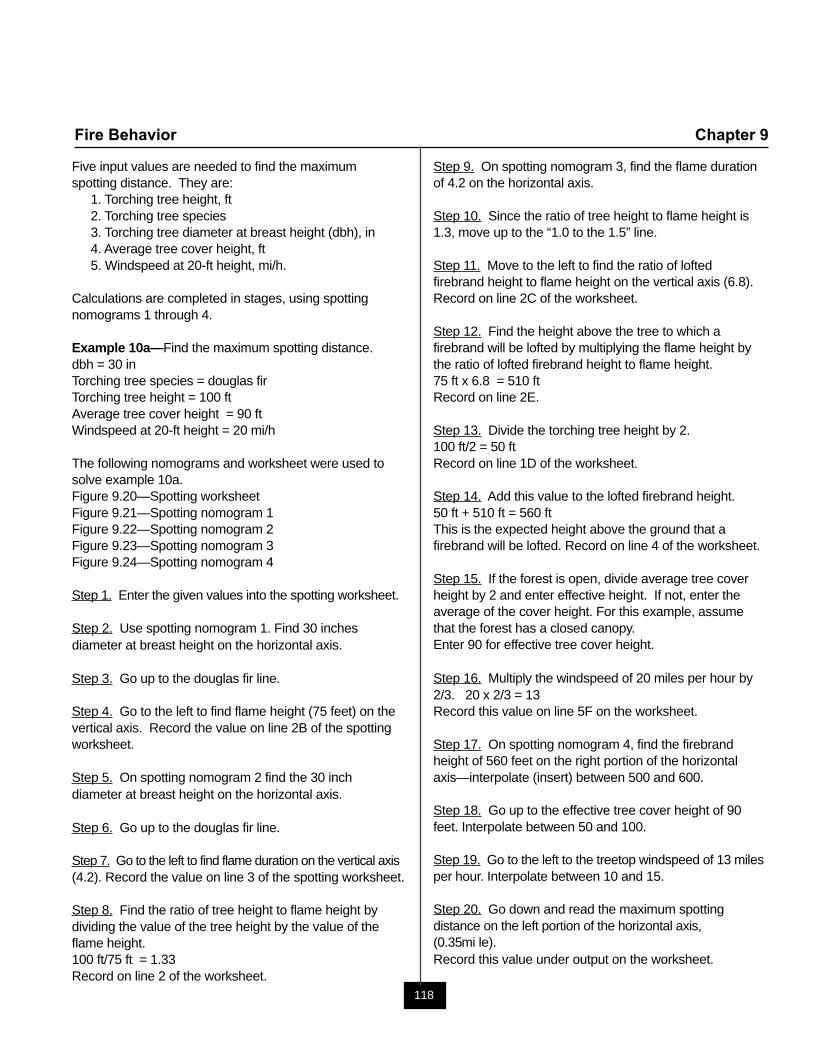
118
Fire Behavior Chapter 9
Five input values are needed to find the maximumspotting distance. They are:
1. Torching tree height, ft2. Torching tree species3. Torching tree diameter at breast height (dbh), in4. Average tree cover height, ft5. Windspeed at 20-ft height, mi/h.
Calculations are completed in stages, using spottingnomograms 1 through 4.
Example 10a—Find the maximum spotting distance.dbh = 30 inTorching tree species = douglas firTorching tree height = 100 ftAverage tree cover height = 90 ftWindspeed at 20-ft height = 20 mi/h
The following nomograms and worksheet were used tosolve example 10a.Figure 9.20—Spotting worksheetFigure 9.21—Spotting nomogram 1Figure 9.22—Spotting nomogram 2Figure 9.23—Spotting nomogram 3Figure 9.24—Spotting nomogram 4
Step 1. Enter the given values into the spotting worksheet.
Step 2. Use spotting nomogram 1. Find 30 inchesdiameter at breast height on the horizontal axis.
Step 3. Go up to the douglas fir line.
Step 4. Go to the left to find flame height (75 feet) on thevertical axis. Record the value on line 2B of the spottingworksheet.
Step 5. On spotting nomogram 2 find the 30 inchdiameter at breast height on the horizontal axis.
Step 6. Go up to the douglas fir line.
Step 7. Go to the left to find flame duration on the vertical axis(4.2). Record the value on line 3 of the spotting worksheet.
Step 8. Find the ratio of tree height to flame height bydividing the value of the tree height by the value of theflame height.100 ft/75 ft = 1.33Record on line 2 of the worksheet.
Step 9. On spotting nomogram 3, find the flame durationof 4.2 on the horizontal axis.
Step 10. Since the ratio of tree height to flame height is1.3, move up to the “1.0 to the 1.5” line.
Step 11. Move to the left to find the ratio of loftedfirebrand height to flame height on the vertical axis (6.8).Record on line 2C of the worksheet.
Step 12. Find the height above the tree to which afirebrand will be lofted by multiplying the flame height bythe ratio of lofted firebrand height to flame height.75 ft x 6.8 = 510 ftRecord on line 2E.
Step 13. Divide the torching tree height by 2.100 ft/2 = 50 ftRecord on line 1D of the worksheet.
Step 14. Add this value to the lofted firebrand height.50 ft + 510 ft = 560 ftThis is the expected height above the ground that afirebrand will be lofted. Record on line 4 of the worksheet.
Step 15. If the forest is open, divide average tree coverheight by 2 and enter effective height. If not, enter theaverage of the cover height. For this example, assumethat the forest has a closed canopy.Enter 90 for effective tree cover height.
Step 16. Multiply the windspeed of 20 miles per hour by2/3. 20 x 2/3 = 13Record this value on line 5F on the worksheet.
Step 17. On spotting nomogram 4, find the firebrandheight of 560 feet on the right portion of the horizontalaxis—interpolate (insert) between 500 and 600.
Step 18. Go up to the effective tree cover height of 90feet. Interpolate between 50 and 100.
Step 19. Go to the left to the treetop windspeed of 13 milesper hour. Interpolate between 10 and 15.
Step 20. Go down and read the maximum spottingdistance on the left portion of the horizontal axis,(0.35mi le).Record this value under output on the worksheet.
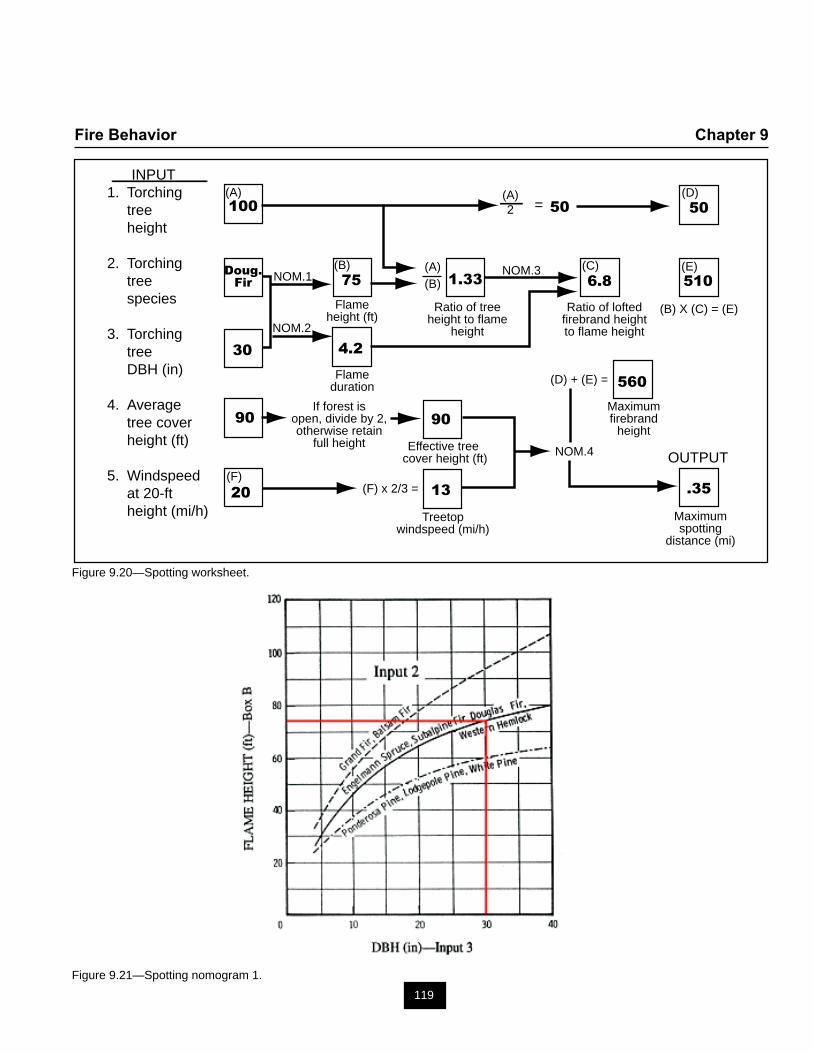
119
Fire Behavior Chapter 9
Figure 9.20—Spotting worksheet.
Figure 9.21—Spotting nomogram 1.
INPUT1. Torching tree height
2. Torching tree species
3. Torching tree DBH (in)
4. Average tree cover height (ft)
5. Windspeed at 20-ft height (mi/h)
(A) (D)(A)2 =
NOM.1
NOM.2
(B) (A)(B)
(C)
(B) X (C) = (E)
(E)
Flameheight (ft)
Ratio of treeheight to flame
height
Ratio of loftedfirebrand heightto flame height
NOM.3
Flameduration
If forest isopen, divide by 2,otherwise retain
full height
(D) + (E) =
Maximumfirebrand
heightEffective tree
cover height (ft) NOM.4
(F)(F) x 2/3 =
Treetopwindspeed (mi/h)
OUTPUT
Maximumspotting
distance (mi)
100
Doug.Fir
30
90
20
75
4.2
90
13
1.33
50 50
6.8 510
560
.35
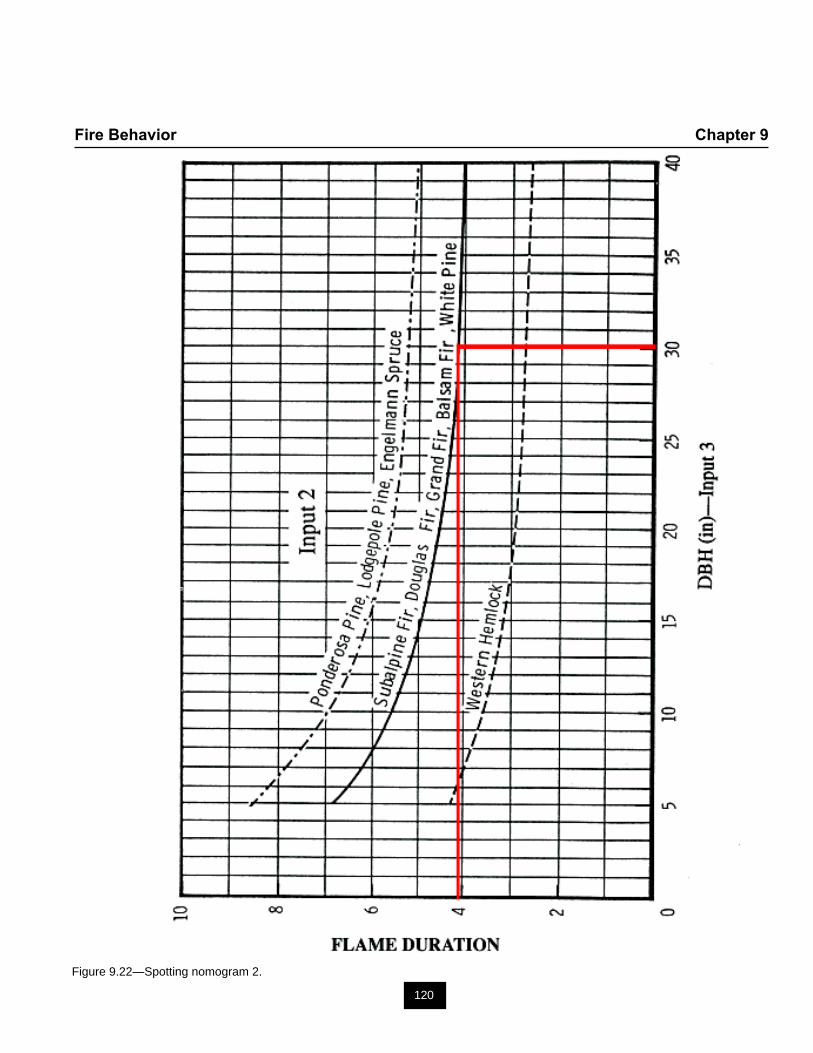
120
Fire Behavior Chapter 9
Figure 9.22—Spotting nomogram 2.
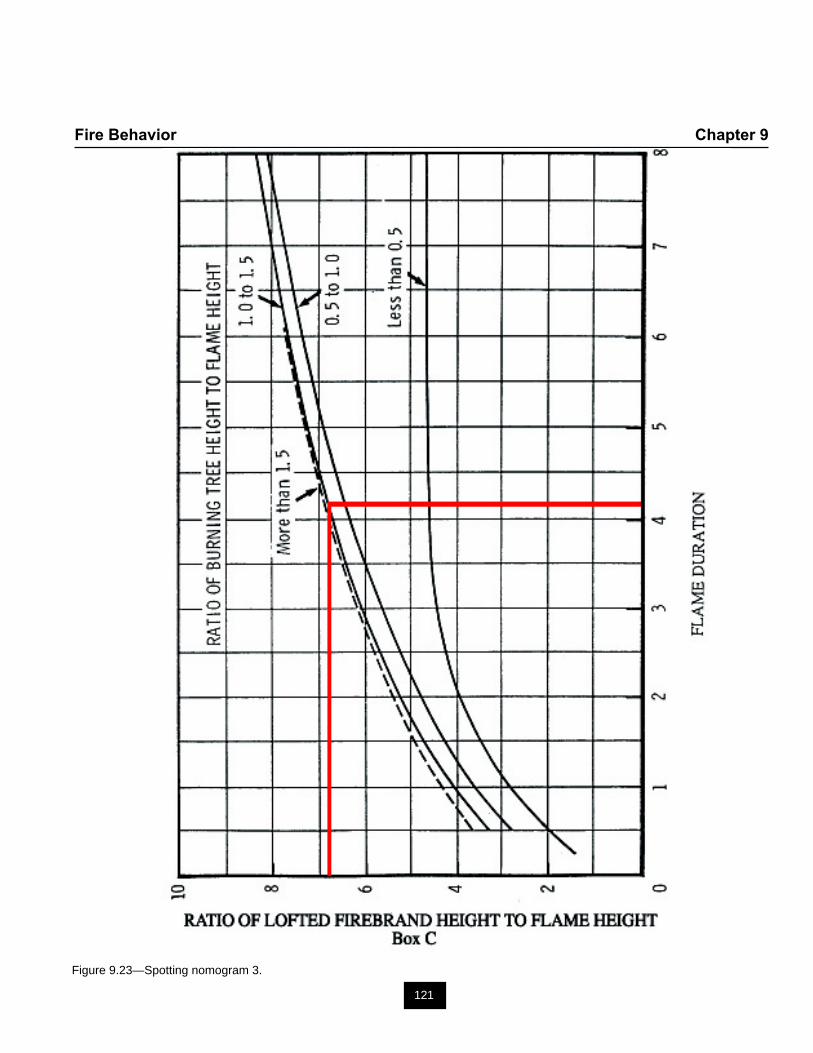
121
Fire Behavior Chapter 9
Figure 9.23—Spotting nomogram 3.
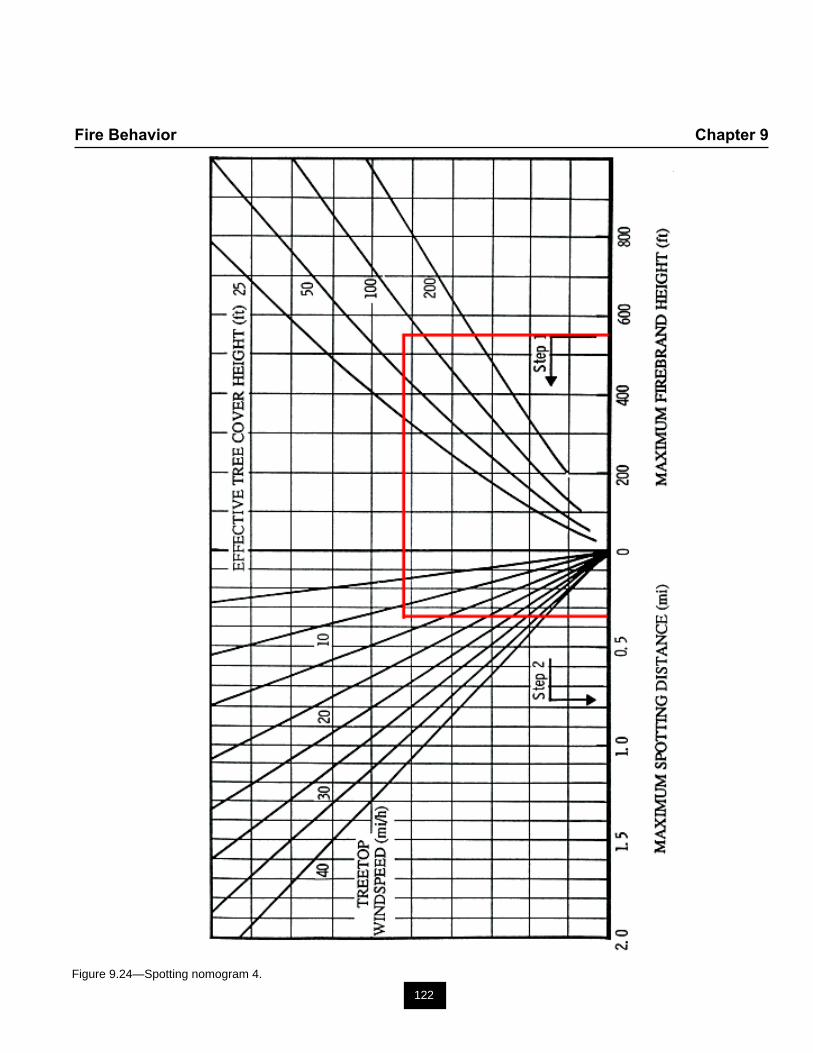
122
Fire Behavior Chapter 9
Figure 9.24—Spotting nomogram 4.
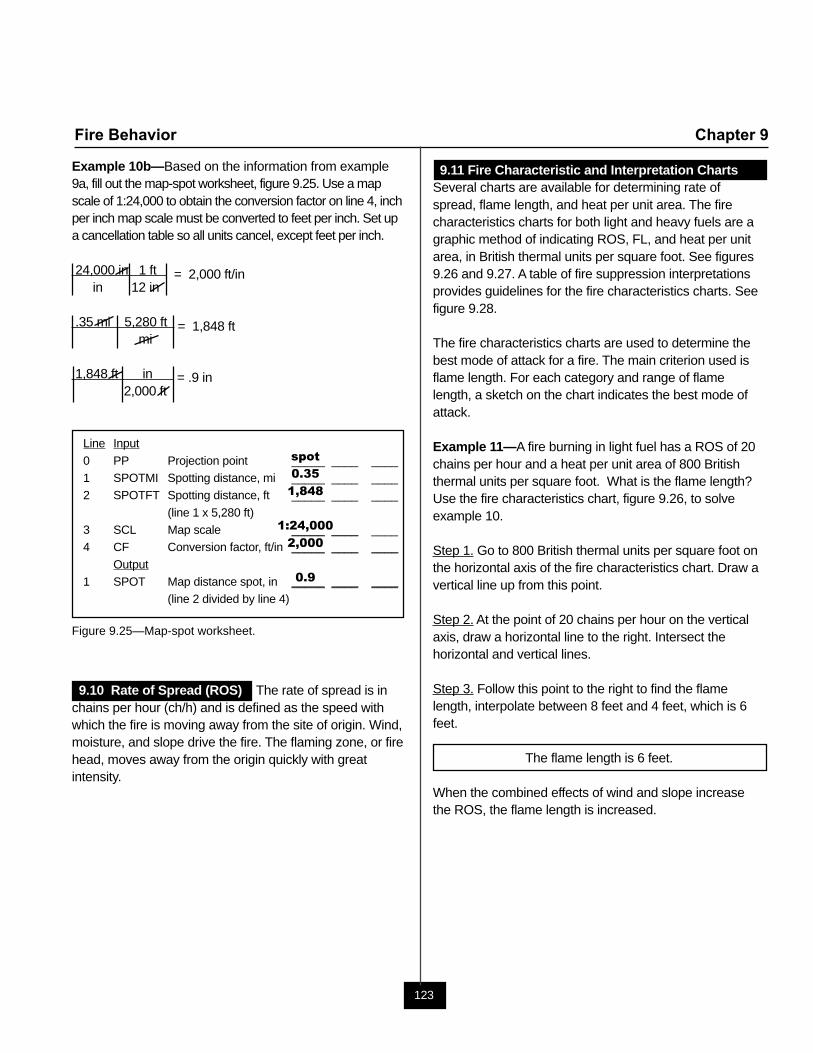
123
Fire Behavior Chapter 9
Example 10b—Based on the information from example9a, fill out the map-spot worksheet, figure 9.25. Use a mapscale of 1:24,000 to obtain the conversion factor on line 4, inchper inch map scale must be converted to feet per inch. Set upa cancellation table so all units cancel, except feet per inch.
24,000 in 1 ft = 2,000 ft/inin 12 in
.35 mi 5,280 ft = 1,848 ftmi
1,848 ft in = .9 in2,000 ft
Line Input
0 PP Projection point _____ ____ ____1 SPOTMI Spotting distance, mi _____ ____ ____2 SPOTFT Spotting distance, ft _____ ____ ____
(line 1 x 5,280 ft)3 SCL Map scale _____ ____ ____4 CF Conversion factor, ft/in _____ ____ ____
Output1 SPOT Map distance spot, in _____ ____ ____
(line 2 divided by line 4)
Figure 9.25—Map-spot worksheet.
9.10 Rate of Spread (ROS) The rate of spread is inchains per hour (ch/h) and is defined as the speed withwhich the fire is moving away from the site of origin. Wind,moisture, and slope drive the fire. The flaming zone, or firehead, moves away from the origin quickly with greatintensity.
spot
0.35
1,848
1:24,000
2,000
0.9
9.11 Fire Characteristic and Interpretation ChartsSeveral charts are available for determining rate ofspread, flame length, and heat per unit area. The firecharacteristics charts for both light and heavy fuels are agraphic method of indicating ROS, FL, and heat per unitarea, in British thermal units per square foot. See figures9.26 and 9.27. A table of fire suppression interpretationsprovides guidelines for the fire characteristics charts. Seefigure 9.28.
The fire characteristics charts are used to determine thebest mode of attack for a fire. The main criterion used isflame length. For each category and range of flamelength, a sketch on the chart indicates the best mode ofattack.
Example 11—A fire burning in light fuel has a ROS of 20chains per hour and a heat per unit area of 800 Britishthermal units per square foot. What is the flame length?Use the fire characteristics chart, figure 9.26, to solveexample 10.
Step 1. Go to 800 British thermal units per square foot onthe horizontal axis of the fire characteristics chart. Draw avertical line up from this point.
Step 2. At the point of 20 chains per hour on the verticalaxis, draw a horizontal line to the right. Intersect thehorizontal and vertical lines.
Step 3. Follow this point to the right to find the flamelength, interpolate between 8 feet and 4 feet, which is 6feet.
The flame length is 6 feet.
When the combined effects of wind and slope increasethe ROS, the flame length is increased.
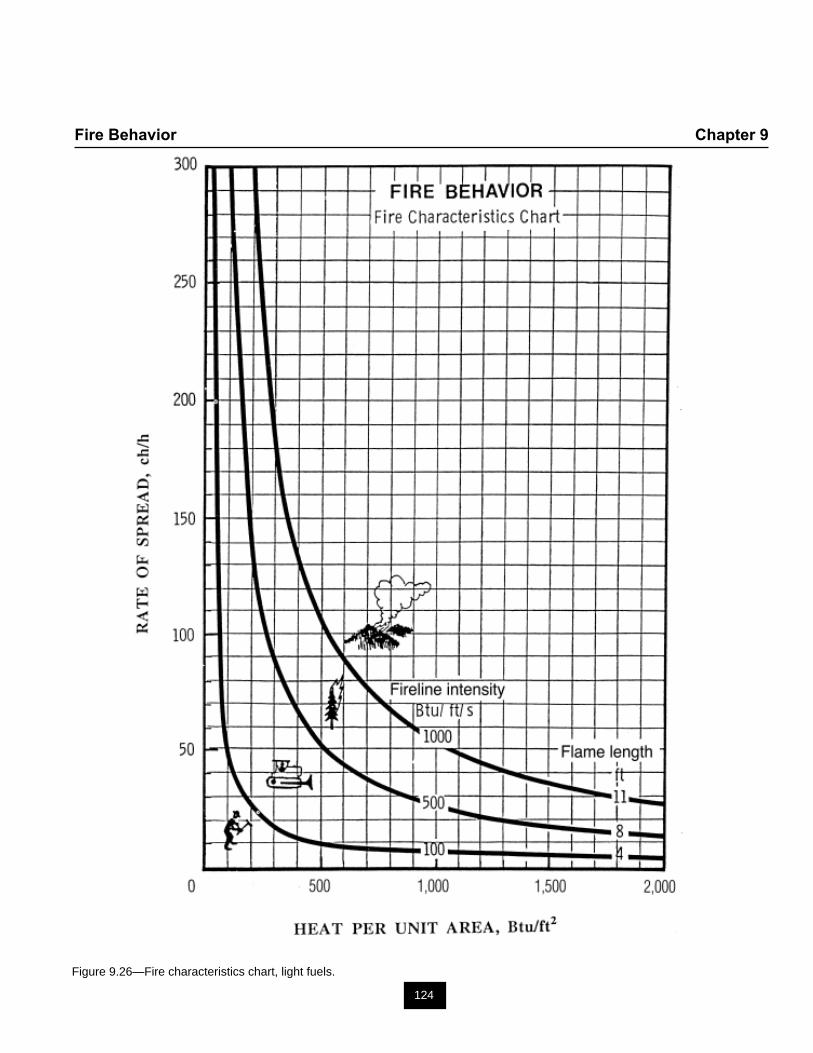
124
Fire Behavior Chapter 9
Figure 9.26—Fire characteristics chart, light fuels.
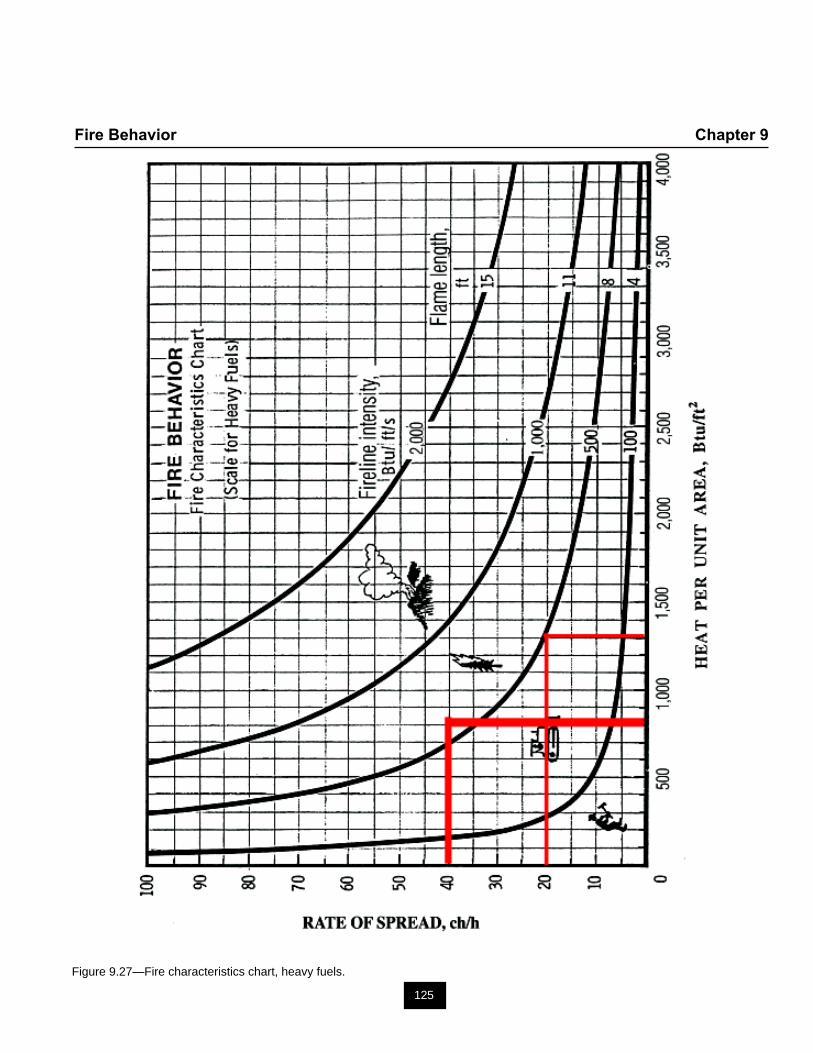
125
Fire Behavior Chapter 9
Figure 9.27—Fire characteristics chart, heavy fuels.
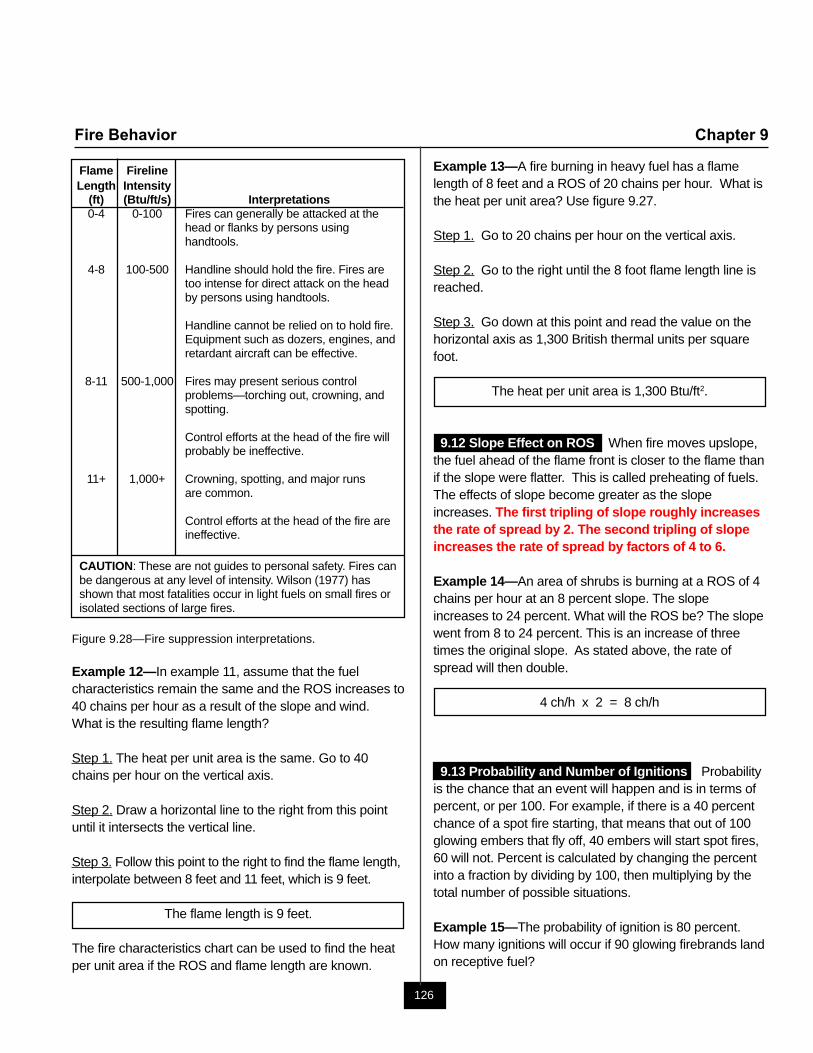
126
Fire Behavior Chapter 9
Flame FirelineLength Intensity
(ft) (Btu/ft/s) Interpretations0-4 0-100 Fires can generally be attacked at the
head or flanks by persons usinghandtools.
4-8 100-500 Handline should hold the fire. Fires aretoo intense for direct attack on the headby persons using handtools.
Handline cannot be relied on to hold fire.Equipment such as dozers, engines, andretardant aircraft can be effective.
8-11 500-1,000 Fires may present serious controlproblems—torching out, crowning, andspotting.
Control efforts at the head of the fire willprobably be ineffective.
11+ 1,000+ Crowning, spotting, and major runsare common.
Control efforts at the head of the fire areineffective.
CAUTION: These are not guides to personal safety. Fires canbe dangerous at any level of intensity. Wilson (1977) hasshown that most fatalities occur in light fuels on small fires orisolated sections of large fires.
Figure 9.28—Fire suppression interpretations.
Example 12—In example 11, assume that the fuelcharacteristics remain the same and the ROS increases to40 chains per hour as a result of the slope and wind.What is the resulting flame length?
Step 1. The heat per unit area is the same. Go to 40chains per hour on the vertical axis.
Step 2. Draw a horizontal line to the right from this pointuntil it intersects the vertical line.
Step 3. Follow this point to the right to find the flame length,interpolate between 8 feet and 11 feet, which is 9 feet.
The flame length is 9 feet.
The fire characteristics chart can be used to find the heatper unit area if the ROS and flame length are known.
Example 13—A fire burning in heavy fuel has a flamelength of 8 feet and a ROS of 20 chains per hour. What isthe heat per unit area? Use figure 9.27.
Step 1. Go to 20 chains per hour on the vertical axis.
Step 2. Go to the right until the 8 foot flame length line isreached.
Step 3. Go down at this point and read the value on thehorizontal axis as 1,300 British thermal units per squarefoot.
The heat per unit area is 1,300 Btu/ft2.
9.12 Slope Effect on ROS When fire moves upslope,the fuel ahead of the flame front is closer to the flame thanif the slope were flatter. This is called preheating of fuels.The effects of slope become greater as the slopeincreases. The first tripling of slope roughly increasesthe rate of spread by 2. The second tripling of slopeincreases the rate of spread by factors of 4 to 6.
Example 14—An area of shrubs is burning at a ROS of 4chains per hour at an 8 percent slope. The slopeincreases to 24 percent. What will the ROS be? The slopewent from 8 to 24 percent. This is an increase of threetimes the original slope. As stated above, the rate ofspread will then double.
4 ch/h x 2 = 8 ch/h
9.13 Probability and Number of Ignitions Probabilityis the chance that an event will happen and is in terms ofpercent, or per 100. For example, if there is a 40 percentchance of a spot fire starting, that means that out of 100glowing embers that fly off, 40 embers will start spot fires,60 will not. Percent is calculated by changing the percentinto a fraction by dividing by 100, then multiplying by thetotal number of possible situations.
Example 15—The probability of ignition is 80 percent.How many ignitions will occur if 90 glowing firebrands landon receptive fuel?
127
Fire Behavior Chapter 9
Step 1. Change 80 percent to a fraction, 80 = 0.8then into a decimal. 100
Step 2. Multiply by the total number of situations, in thiscase glowing firebrands. 0.8 x 90 = 72
Expect 72 ignitions outof 90 glowing firebrands.
9.14 Probability of Ignition Probability of ignition is arating of the probability that a glowing firebrand will causea fire, providing it lands on receptive fuels and the fuelsare dry enough to support ignition. Probability of ignition isdetermined by fuel shading, fine dead fuel moisture, andthe dry bulb temperature. These inputs are determinedwhen the fine dead fuel moistures are calculated.Probability of ignition can be determined by using theProbability of Ignition Table, figure 9.29. Fuel shading canbe caused by clouds, canopy cover, or both. This table isdivided into two portions, fuels that have either less thanor more than 50 percent cloud or canopy cover.
Example 16—A fire is burning under a dense canopy ofpole-sized trees. The dry bulb temperature is 84 °F. Thefine dead fuel moisture is 5 percent. What is theprobability of ignition?
Step 1. In the lower portion of the probability of ignitiontable, >50 percent, find the dry bulb temperature rangethat would include 84 °F. 80-89; draw a line across.
Step 2. Find the fine dead fuel moisture of 5 on the tophorizontal row. Go down until the 80-89 line is intersected.Read 60 percent off the chart.
The probability of ignition is 60 percent.
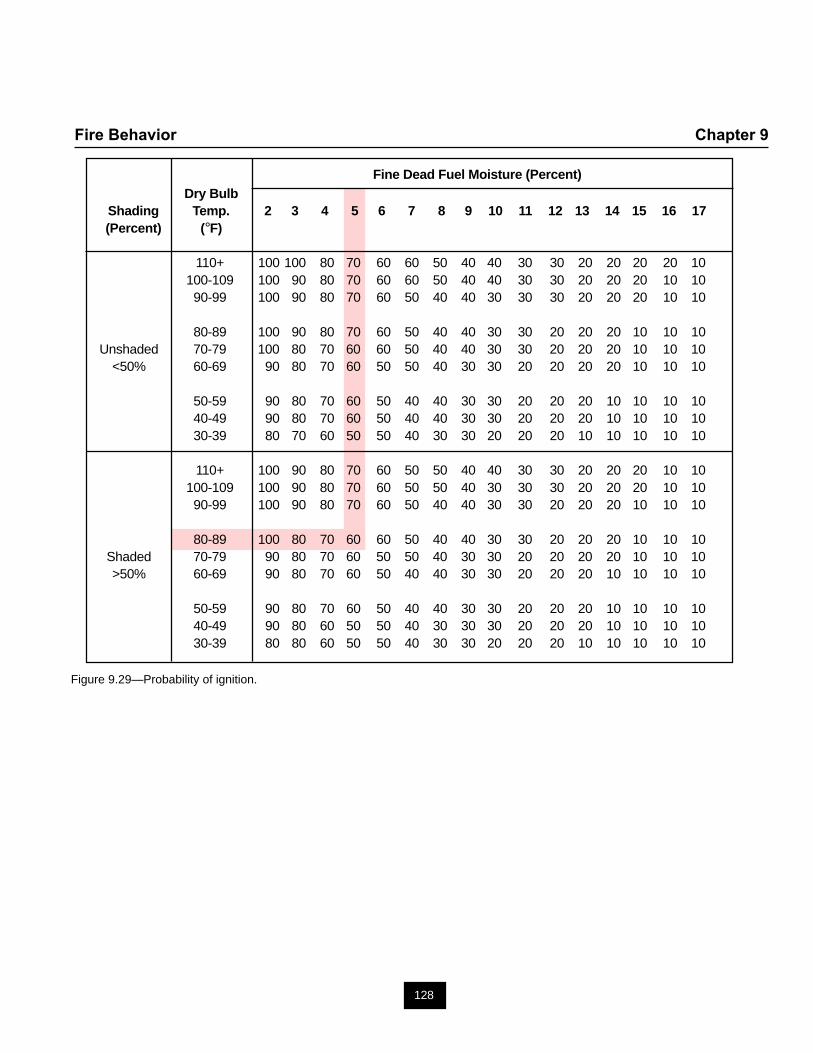
128
Fire Behavior Chapter 9
Fine Dead Fuel Moisture (Percent)Dry Bulb
Shading Temp. 2 3 4 5 6 7 8 9 10 11 12 13 14 15 16 17(Percent) (°F)
110+ 100 100 80 70 60 60 50 40 40 30 30 20 20 20 20 10100-109 100 90 80 70 60 60 50 40 40 30 30 20 20 20 10 1090-99 100 90 80 70 60 50 40 40 30 30 30 20 20 20 10 10
80-89 100 90 80 70 60 50 40 40 30 30 20 20 20 10 10 10Unshaded 70-79 100 80 70 60 60 50 40 40 30 30 20 20 20 10 10 10
<50% 60-69 90 80 70 60 50 50 40 30 30 20 20 20 20 10 10 10
50-59 90 80 70 60 50 40 40 30 30 20 20 20 10 10 10 1040-49 90 80 70 60 50 40 40 30 30 20 20 20 10 10 10 1030-39 80 70 60 50 50 40 30 30 20 20 20 10 10 10 10 10
110+ 100 90 80 70 60 50 50 40 40 30 30 20 20 20 10 10100-109 100 90 80 70 60 50 50 40 30 30 30 20 20 20 10 1090-99 100 90 80 70 60 50 40 40 30 30 20 20 20 10 10 10
80-89 100 80 70 60 60 50 40 40 30 30 20 20 20 10 10 10Shaded 70-79 90 80 70 60 50 50 40 30 30 20 20 20 20 10 10 10>50% 60-69 90 80 70 60 50 40 40 30 30 20 20 20 10 10 10 10
50-59 90 80 70 60 50 40 40 30 30 20 20 20 10 10 10 1040-49 90 80 60 50 50 40 30 30 30 20 20 20 10 10 10 1030-39 80 80 60 50 50 40 30 30 20 20 20 10 10 10 10 10
Figure 9.29—Probability of ignition.
129
Fire Behavior Chapter 9
EXERCISES
Problem 1. What is the midflame windspeed in a partiallysheltered area of fuel model 13 if the 20-foot windspeed isgiven as 16 miles per hour?
Problem 2. A fire is burning in unsheltered fuel. Joydetermines that the fuel is a model 4 fuel and is told thatthe 20-foot winds are blowing at 11 miles per hour. Whatis the midflame windspeed?
Problem 3. A fire is spreading up a 35 percent slope intall grass of fuel model 3. The midflame windspeed is 4miles per hour and is blowing uphill. The fine dead fuelmoisture in the grass is 4 percent. Determine the rate ofspread, flame length, fireline intensity, and heat per unitarea. Use the following nomograms and worksheet inappendix E to solve the problem.
Nomogram—3. Tall grass (2.5 ft)—Low windspeedNomogram worksheet
Problem 4. A fire is spreading uphill in timber litter withenough green fuel in the understory to affect fire behavior.The timber is considered a fuel model 10. The midflamewindspeed is 5 miles per hour, the fine dead fuel moistureis 3 percent, and the slope is 20 percent. The live fuelmoisture can be approximated at 100 percent.
Determine the rate of spread, heat per unit area, flamelength, and fireline intensity for this fire. Use the followingnomograms and worksheet found in appendix E to solvethe problem.
Nomogram –10. Timber (Litter & Understory)—Lowwindspeed Nomogram worksheet
Problem 5. The operations unit has asked Peg toprepare a “prescription” for an operational plan fortomorrow’s day shift. Handcrews are constructing indirecthandline in advance of the fire. The concern is that thefire will burn through the area before the crews cancomplete the line.
The operations unit needs a range of dead fuel moisturesand effective windspeeds that will keep the fire’s forwardspread within 18 chains per hour. This will allow thehandcrews to safely complete the indirect line. Shedetermines that the fire is burning in a fuel model 9.
What is the range of dead fuel moistures and effectivewindspeeds needed to safely complete the handline?
What is the flame length?
Use Nomogram – 9. Hardwood litter. See appendix E.
Problem 6. The rate of spread of the fire is 6 chains perhour. What will the spread distance be in 4 hours?
Problem 7. What is the map distance of the groundspread distance from problem 6 on a map with a scale of1:62,500?
Problem 8. There is a fire in a Grand Fir forest. Thediameter at breast height is 33 inches. What is the flameheight?
Problem 9. Input the following values into the spottingworksheet.Torching tree DBH = 15 inTorching tree height = 120 ftAverage tree cover height = 100 ftWindspeed at 20-ft height = 30mi/hTorching tree species—lodgepole pine
Problem 10. Using the data above, find the flame heightand flame duration.
Problem 11. Using the data above, find the ratio of loftedfirebrand height to flame height.
Problem 12. For a closed canopy forest with the abovedata, find the maximum spotting distance.
130
Fire Behavior Chapter 9
Problem 13. A fire has a ROS of 30 chains per hour anda heat per unit area of 900 British thermal units per squarefoot. What is the flame length?
Problem 14. If the wind and slope increase the ROS to60 chains per hour, but the fuel characteristics remain thesame, what will the resulting flame length be?
Problem 15. A fire is spreading at a rate of 40 chains perhour. The flame length is 8 feet. What is the heat per unitarea?
Problem 16. In the fire in problem 15, the ROS increasedto 70 chains per hour. The fuel characteristics are thesame. What is the flame length?
Problem 17. There is a fire in a field of tall grass. Theslope is 8 percent and the ROS is 5 chains per hour. If theslope increases to 24 percent, what will the ROS be? If itincreases to 72 percent, what will the ROS be?
Problem 18. The probability of ignition is 60 percent.How many ignitions will there be if 75 glowing firebrandsland on receptive fuel?
Problem 19. A fire is burning in brush under 30 percentsky cover. The dry bulb temperature is 94 °F. The finedead fuel moisture is 4 percent. What is the probability ofignition?
CHAPTER PROBLEM
A fire is burning in the Los Padres National Forest in themiddle of July. Readings are taken at a site 500 feetabove the fire. The weather conditions are as follows:
20-foot windspeed of 15 mi/hFuel model 4 dbh = 15 inDry bulb temperature of 85 °F % slope is 40 percentWet bulb temperature of 52 °F West aspectLive fuel moisture of 150 percent
Find the fine dead fuel moisture, effective windspeed(EWS), flame length (FL), rate of spread (ROS), firelineintensity, and midflame windspeed (MFWS).
Can crew B take direct attack of the fire at the head?
The fire is under 60 percent canopy and sky cover. Whatis the probability of ignition?
The time is 1400 hours. What will the forward spreaddistance be at 2100 hours?
Plot the forward spread distance on a map with a scale of1:7,920. What is the probability of ignition?
131
Precisely, What Do You Mean? Chapter 10
The material in chapter 10 describes accuracy,precision, average, mean, range, and standarddeviation of measured values. This chapter alsoincludes planning, production rate, drought index,and the Haines index.
10.1 Accuracy Accuracy is how close the measuredvalue is to the true value. The accuracy of ameasurement refers to the number of significant digits.See appendix B.7.
Example 1—Gabe is measuring a piece of trim for thewall. He measures it three times. The values he gets are2.1 feet, 2.2 feet, and 2.2 feet. The actual value is 2.15feet. How accurate are Gabe’s three measured values?
Step 1. The accuracy of the measurements is thedifference between the true value and the measuredvalue.2.15 – 2.1 = 0.05
Step 2. Repeat the same process for the othermeasurements.2.15 – 2.2 = – 0.05
The accuracy of the measurement is ±0.05 feet.
10.2 Precision Precision is how close the repeatedmeasurements are to each other. Precision of ameasurement refers to the smallest unit with which ameasurement is made.
Example 2—Find the precision of the measurementsGabe took in example 1.
Step 1. Subtract the measurements from each other.2.1 – 2.2 = –0.1
The precision of the measurement is ±0.1 feet.
10.3 Average The average, or the mean, is the sum ofall the numbers divided by the number of terms.
Example 3—The line production rates for the members ofa hand crew were as follows: 8.0 chains per hour, 7.0chains per hour, 6.0 chains per hour, 7.5 chains per hour,and 7.0 chains per hour. What is the average number offireline chains constructed per hour?
Step 1. Add all the numbers.8.0 + 7.0 + 6.0 + 7.5 + 7.0 = 35.5 chains
Step 2. Count the number of terms.5 terms
Step 3. Divide the numbers added in step 1 by thenumber of terms.35.5 / 5 = 7.1 chains
The average is 7.1 chains of fireline constructed per hour.
10.4 Range/Variance Range is the differencebetween the smallest number and the largest number.
Example 4—Find the range in example 3.
Step 1. Arrange the numbers in ascending order (from thesmallest to the largest).6.0, 7.0, 7.0, 7.5, 8.0 (chains)
Step 2. Subtract the largest number from the smallestnumber.8.0 – 6.0 = 2.0 chains
The range is from 6.0 chains to 8.0 chains or 2.0 chains.
10.5 Deviation/Variability Deviation is the differencebetween the average and any of the terms.
Example 5—Find the deviation of each term in example 3.
Step 1. Find the average (see example 3).7.1 chains
132
Chapter 10 Precisely, What Do You Mean?
Step 2. Subtract each term from the average.7.1 – 6.0 = 1.1 chains7.1 – 7.0 = 0.1 chains7.1 – 7.0 = 0.1 chains7.1 – 7.5 = – 0.4 chains7.1 – 8.0 = – 0.9 chains
10.6 Standard Deviation Standard deviation, orvariance, is a measure of the closeness of each term tothe average (mean). If the terms are bunched closelyaround the mean, then the mean is an accuratedescription of distribution. To calculate: each deviation issquared, added together, divided by the number of termsminus one, and the square root taken.
Example 6—Find the standard deviation in example 3.
Step 1. Find the average (see example 3).7.1 chains
Step 2. Find the deviation of each term (see example 5).7.1 – 6.0 = 1.1 chains7.1 – 7.0 = 0.1 chains7.1 – 7.0 = 0.1 chains7.1 – 7.5 = – 0.4 chains7.1 – 8.0 = – 0.9 chains
Step 3. Square each deviation above.1.1 x 1.1 = 1.210.1 x 0.1 = 0.010.1 x 0.1 = 0.010.4 x 0.4 = 0.160.9 x 0.9 = 0.81
Step 4. Add the squared deviations together.1.21 + 0.01 + 0.01 + 0.16 + 0.81 = 2.20
Step 5. Divide the sum of the squared deviations by thenumber of terms minus 1.2.2/4 = 0.55
Step 6. Find the square root 0.55 = 0.74
The standard deviation is 0.7 chains.
Example 7—Joe was determining the slope with aclinometer. The following numbers were recorded: 30, 27,29, 30, 31, 30, 32 degrees. What are the average, range,and standard deviations of these values?
The AverageStep 1. Add all the numbers.30 + 27 + 29 + 30 + 31 + 30 + 32 = 209 (degrees)
Step 2. Count the number of entrants. 7
Step 3. Divide the sum of all the numbers by the numberof entrants.
average = 30 + 27 + 29 + 30 + 31 + 30 + 32 = 209 =7 7
29.8 or 30 degrees
The average is 30 degrees.
The RangeStep 1. Find the smallest number, 27.
Step 2. Find the largest number, 32.
Step 3. Subtract the smallest number from the largestnumber.range = 32 – 27 = 5
The range is from 27 degrees to 32 degreesor 5 degrees.
The Standard DeviationStep 1. Find the difference between the average and eachterm.30 – 30 = 0; 27 – 30 = –3; 29 – 30 = –1; 30 – 30 = 0;31 – 30 = 1; 30 – 30 = 0; 32 – 30 = 2
Step 2. Square each of the deviations: 0 x 0 = 0;(–3)(–3) = 9; (–1)(–1) = 1; 0 x 0 = 0; 1 x 1 = 1;0 x 0 = 0; 2 x 2 = 4
Step 3. Add all the squares.0 + 9 + 1 + 0 + 1 + 4 + 0 = 15
√
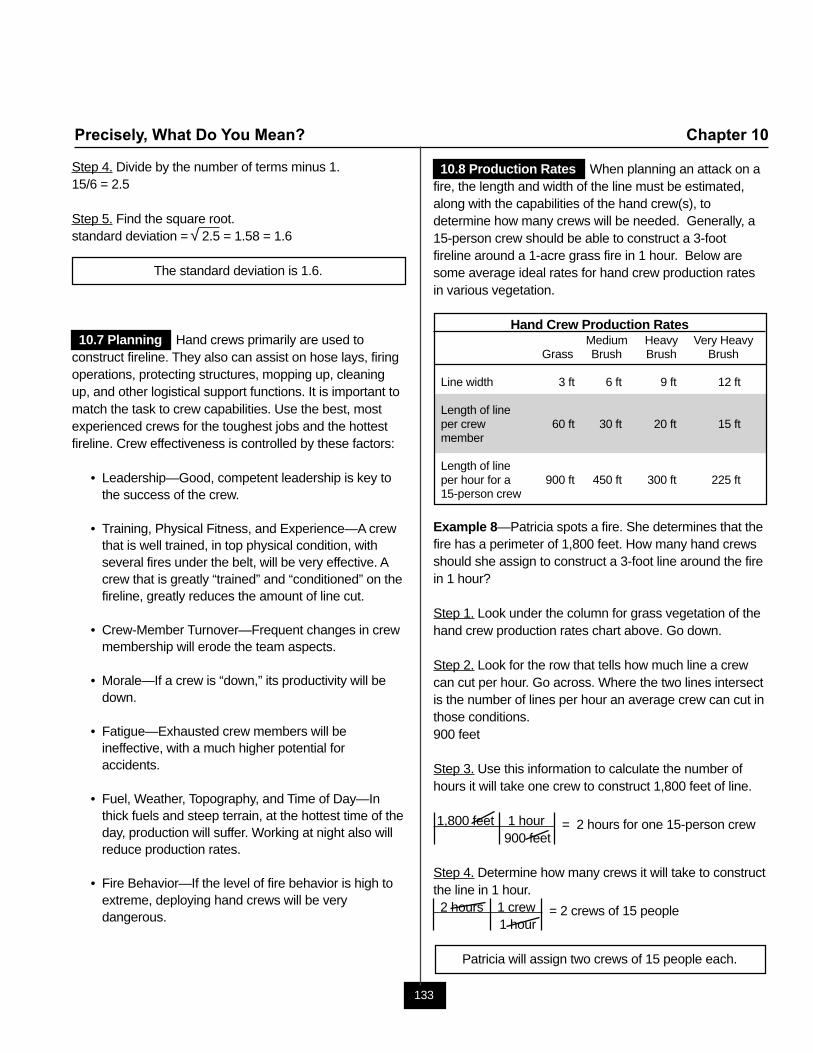
133
Precisely, What Do You Mean? Chapter 10
Step 4. Divide by the number of terms minus 1.15/6 = 2.5
Step 5. Find the square root.standard deviation = 2.5 = 1.58 = 1.6
The standard deviation is 1.6.
10.7 Planning Hand crews primarily are used toconstruct fireline. They also can assist on hose lays, firingoperations, protecting structures, mopping up, cleaningup, and other logistical support functions. It is important tomatch the task to crew capabilities. Use the best, mostexperienced crews for the toughest jobs and the hottestfireline. Crew effectiveness is controlled by these factors:
• Leadership—Good, competent leadership is key tothe success of the crew.
• Training, Physical Fitness, and Experience—A crewthat is well trained, in top physical condition, withseveral fires under the belt, will be very effective. Acrew that is greatly “trained” and “conditioned” on thefireline, greatly reduces the amount of line cut.
• Crew-Member Turnover—Frequent changes in crewmembership will erode the team aspects.
• Morale—If a crew is “down,” its productivity will bedown.
• Fatigue—Exhausted crew members will beineffective, with a much higher potential foraccidents.
• Fuel, Weather, Topography, and Time of Day—Inthick fuels and steep terrain, at the hottest time of theday, production will suffer. Working at night also willreduce production rates.
• Fire Behavior—If the level of fire behavior is high toextreme, deploying hand crews will be verydangerous.
√
10.8 Production Rates When planning an attack on afire, the length and width of the line must be estimated,along with the capabilities of the hand crew(s), todetermine how many crews will be needed. Generally, a15-person crew should be able to construct a 3-footfireline around a 1-acre grass fire in 1 hour. Below aresome average ideal rates for hand crew production ratesin various vegetation.
Hand Crew Production RatesMedium Heavy Very Heavy
Grass Brush Brush Brush
Line width 3 ft 6 ft 9 ft 12 ft
Length of lineper crew 60 ft 30 ft 20 ft 15 ftmember
Length of lineper hour for a 900 ft 450 ft 300 ft 225 ft15-person crew
Example 8—Patricia spots a fire. She determines that thefire has a perimeter of 1,800 feet. How many hand crewsshould she assign to construct a 3-foot line around the firein 1 hour?
Step 1. Look under the column for grass vegetation of thehand crew production rates chart above. Go down.
Step 2. Look for the row that tells how much line a crewcan cut per hour. Go across. Where the two lines intersectis the number of lines per hour an average crew can cut inthose conditions.900 feet
Step 3. Use this information to calculate the number ofhours it will take one crew to construct 1,800 feet of line.
1,800 feet 1 hour = 2 hours for one 15-person crew900 feet
Step 4. Determine how many crews it will take to constructthe line in 1 hour. 2 hours 1 crew = 2 crews of 15 people
1 hour
Patricia will assign two crews of 15 people each.
134
Chapter 10 Precisely, What Do You Mean?
When arriving at a fire scene, assess the entiresituation, to determine the best way to suppress thefire.
Example 9—Gabe has three crews with him. He standson a high point to survey the fire and form a completepicture. The fire is in medium brush. He estimates thelength of line needed to flank the fire as 1,350 feet. Howlong will it take his three crews to construct this line?
Step 1. Look in the hand crew production rates chart onthe previous page, under the column for medium brush.Go down.
Step 2. Find the row that tells how much line a crew cancut per hour. Go across. Where the two lines intersect isthe number of lines per hour an average crew can cut inthose conditions.450 feet
Step 3. Use this information to calculate the number ofhours it will take one crew to construct 1,350 feet of line.
1,350 feet 1 hour = 3 hours for 1 crew450 feet
There are three crews working on the line. 3 hours 1 crew = 3 crews
1 hour
It would take 1 hour for three crews to construct1,350 feet of line.
10.9 Drought Index The drought index is the numberrepresenting net effect of moisture in the deep duff orupper soil layers. The drought index is tracked to give ameasure of fire potential. There are several indexes. Twoof them are the Keetch-Byram, which is updated daily, andthe Palmer, which is updated weekly. These two indexvalues can be obtained through the Internet. Factors inthe index are maximum daily temperature, dailyprecipitation, antecedent (previous) precipitation, andannual precipitation.
The Keetch-Byram index ranges from 0 (no drought) to800 (extreme drought). The Palmer index ranges from –4(extreme drought) to +4 (extremely moist). A normal rangewould be from –1.9 to +1.9.
10.10 Haines Index The Haines index is a stabilityindex specially designed for fire weather. It is determinedby combining the stability and moisture content of thelower atmosphere into a single number that correlatesvery well with large fire growth.
Dry air affects fire behavior by lowering fuel moisture,which results in more fuel available for fire, and byincreasing the probability of spotting. Instability of theatmosphere affects fire behavior by enhancing the verticalsize of the smoke column, resulting in strong surfacewinds as air rushes into the fire to replace air evacuatedby the smoke column. This is the mechanism by whichfires create their own wind.
Haines Index Potential for large fire growth2 or 3 very low
4 low5 moderate6 high
135
Precisely, What Do You Mean? Chapter 10
EXERCISES
Problem 1. The mean monthly rainfalls in the coastalplains of Georgia are listed below. Determine the averageannual rainfall. What is the range of these values?
Jan—4.6 in Jul—5.5 inFeb—4.4 in Aug—4.3 inMar—5.2 in Sep—3.5 inApr—3.6 in Oct—2.4 in
May—3.6 in Nov—2.8 inJun—4.5 in Dec—3.8 in
Problem 2. Vince has determined the windspeed with ahandheld rangefinder. He took six readings: 18 chains perhour, 20 chains per hour,18 chains per hour, 21chains perhour, 21chains per hour, 22 chains per hour.
What is the average, range, and standard deviation of thisgroup of readings? The true reading is 19 chains per hour.How accurate is each reading and what is the precision?
Problem 3. Marty has to construct 600 feet of fireline inheavy brush in half an hour. How many crews does sheneed to assign to the task?
Problem 4. Crystal has four crews. She needs 1,500 feetof fireline constructed in very heavy brush. How long will ittake the crews to build this amount of line?

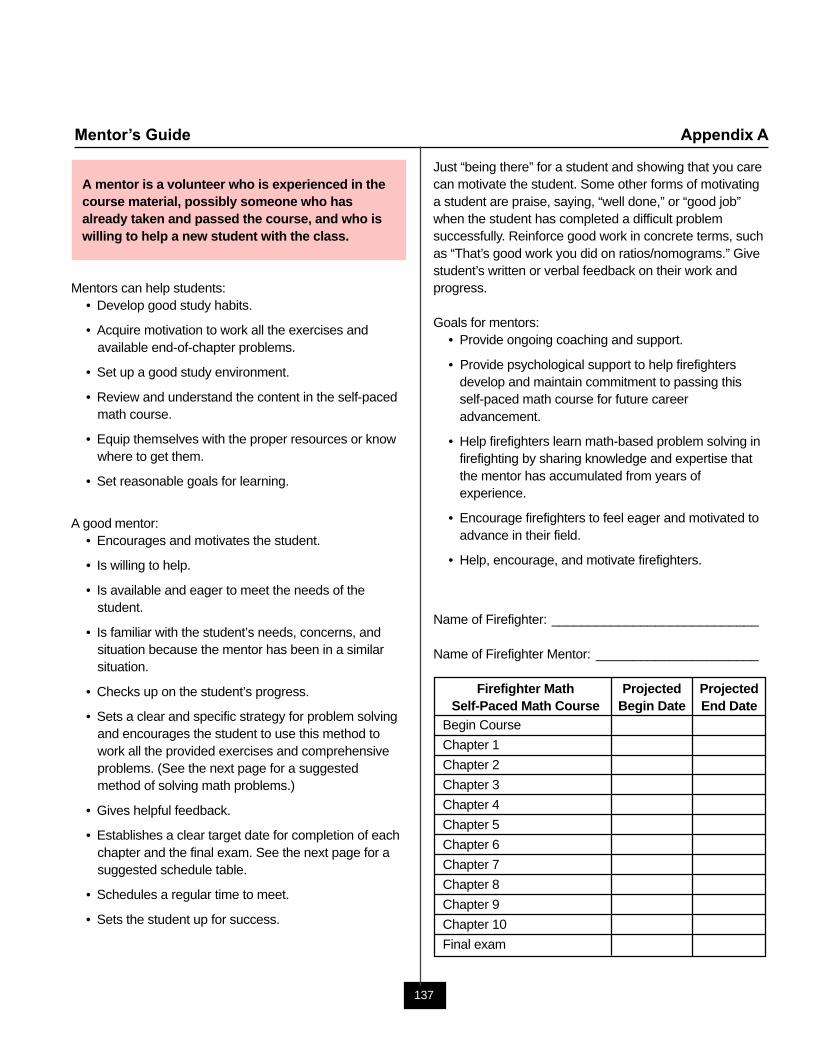
137
Mentor’s Guide Appendix A
A mentor is a volunteer who is experienced in thecourse material, possibly someone who hasalready taken and passed the course, and who iswilling to help a new student with the class.
Mentors can help students:• Develop good study habits.
• Acquire motivation to work all the exercises andavailable end-of-chapter problems.
• Set up a good study environment.
• Review and understand the content in the self-pacedmath course.
• Equip themselves with the proper resources or knowwhere to get them.
• Set reasonable goals for learning.
A good mentor:• Encourages and motivates the student.
• Is willing to help.
• Is available and eager to meet the needs of thestudent.
• Is familiar with the student’s needs, concerns, andsituation because the mentor has been in a similarsituation.
• Checks up on the student’s progress.
• Sets a clear and specific strategy for problem solvingand encourages the student to use this method towork all the provided exercises and comprehensiveproblems. (See the next page for a suggestedmethod of solving math problems.)
• Gives helpful feedback.
• Establishes a clear target date for completion of eachchapter and the final exam. See the next page for asuggested schedule table.
• Schedules a regular time to meet.
• Sets the student up for success.
Just “being there” for a student and showing that you carecan motivate the student. Some other forms of motivatinga student are praise, saying, “well done,” or “good job”when the student has completed a difficult problemsuccessfully. Reinforce good work in concrete terms, suchas “That’s good work you did on ratios/nomograms.” Givestudent’s written or verbal feedback on their work andprogress.
Goals for mentors:• Provide ongoing coaching and support.
• Provide psychological support to help firefightersdevelop and maintain commitment to passing thisself-paced math course for future careeradvancement.
• Help firefighters learn math-based problem solving infirefighting by sharing knowledge and expertise thatthe mentor has accumulated from years ofexperience.
• Encourage firefighters to feel eager and motivated toadvance in their field.
• Help, encourage, and motivate firefighters.
Name of Firefighter: ____________________________
Name of Firefighter Mentor: ______________________
Firefighter Math Projected ProjectedSelf-Paced Math Course Begin Date End Date
Begin Course
Chapter 1
Chapter 2
Chapter 3
Chapter 4
Chapter 5
Chapter 6
Chapter 7
Chapter 8
Chapter 9
Chapter 10
Final exam
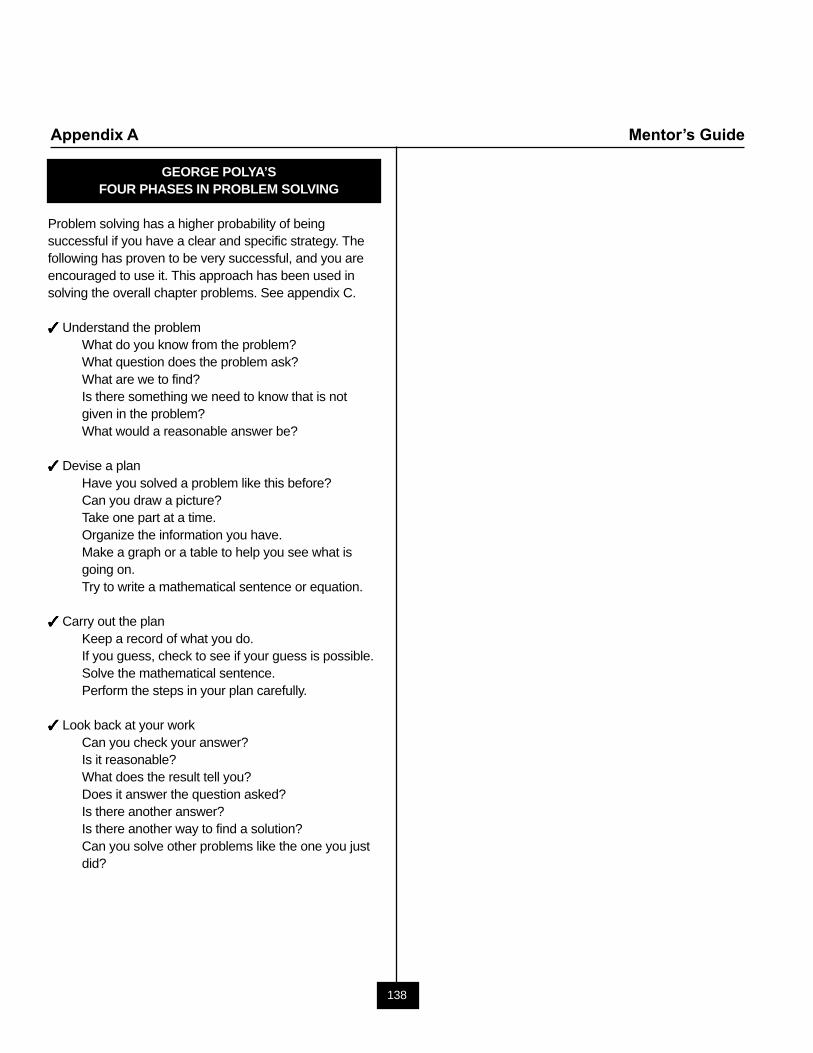
138
Appendix A Mentor’s Guide
GEORGE POLYA’SFOUR PHASES IN PROBLEM SOLVING
Problem solving has a higher probability of beingsuccessful if you have a clear and specific strategy. Thefollowing has proven to be very successful, and you areencouraged to use it. This approach has been used insolving the overall chapter problems. See appendix C.
✓✓✓✓✓ Understand the problemWhat do you know from the problem?What question does the problem ask?What are we to find?Is there something we need to know that is notgiven in the problem?What would a reasonable answer be?
✓✓✓✓✓ Devise a planHave you solved a problem like this before?Can you draw a picture?Take one part at a time.Organize the information you have.Make a graph or a table to help you see what isgoing on.Try to write a mathematical sentence or equation.
✓✓✓✓✓ Carry out the planKeep a record of what you do.If you guess, check to see if your guess is possible.Solve the mathematical sentence.Perform the steps in your plan carefully.
✓✓✓✓✓ Look back at your workCan you check your answer?Is it reasonable?What does the result tell you?Does it answer the question asked?Is there another answer?Is there another way to find a solution?Can you solve other problems like the one you justdid?
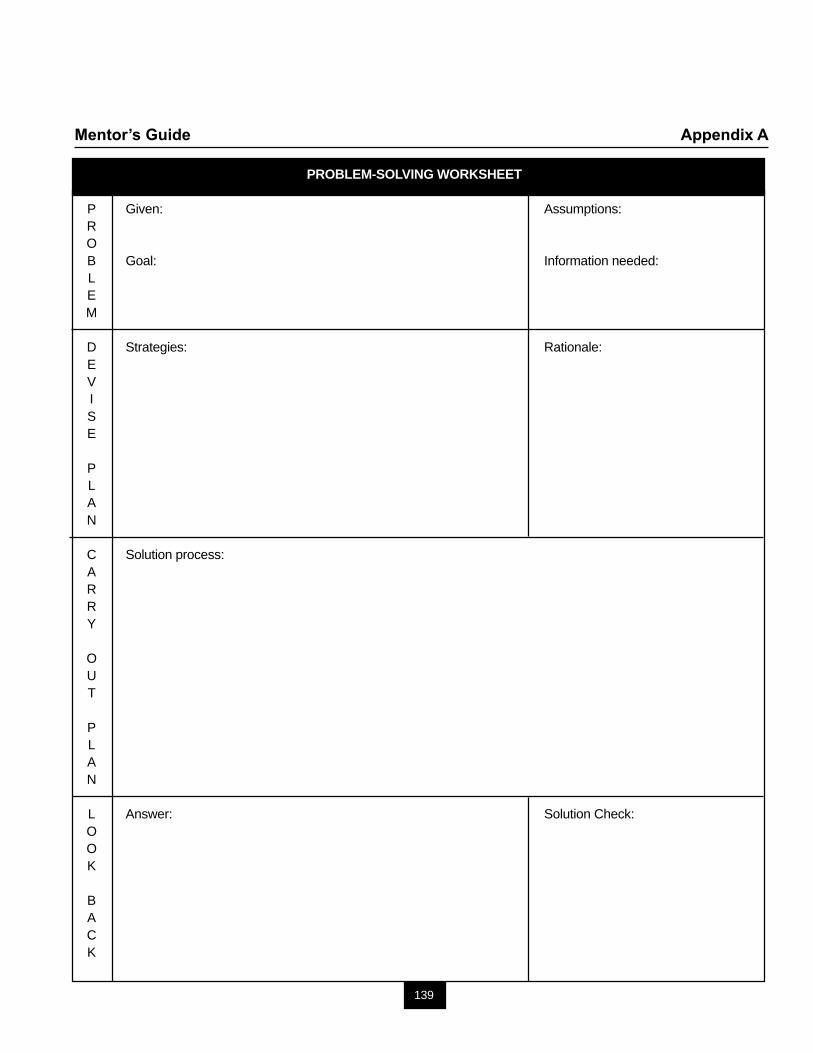
139
Mentor’s Guide Appendix A
PROBLEM-SOLVING WORKSHEET
P Given: Assumptions:ROB Goal: Information needed:LEM
D Strategies: Rationale:EVISE
PLAN
C Solution process:ARRY
OUT
PLAN
L Answer: Solution Check:OOK
BACK

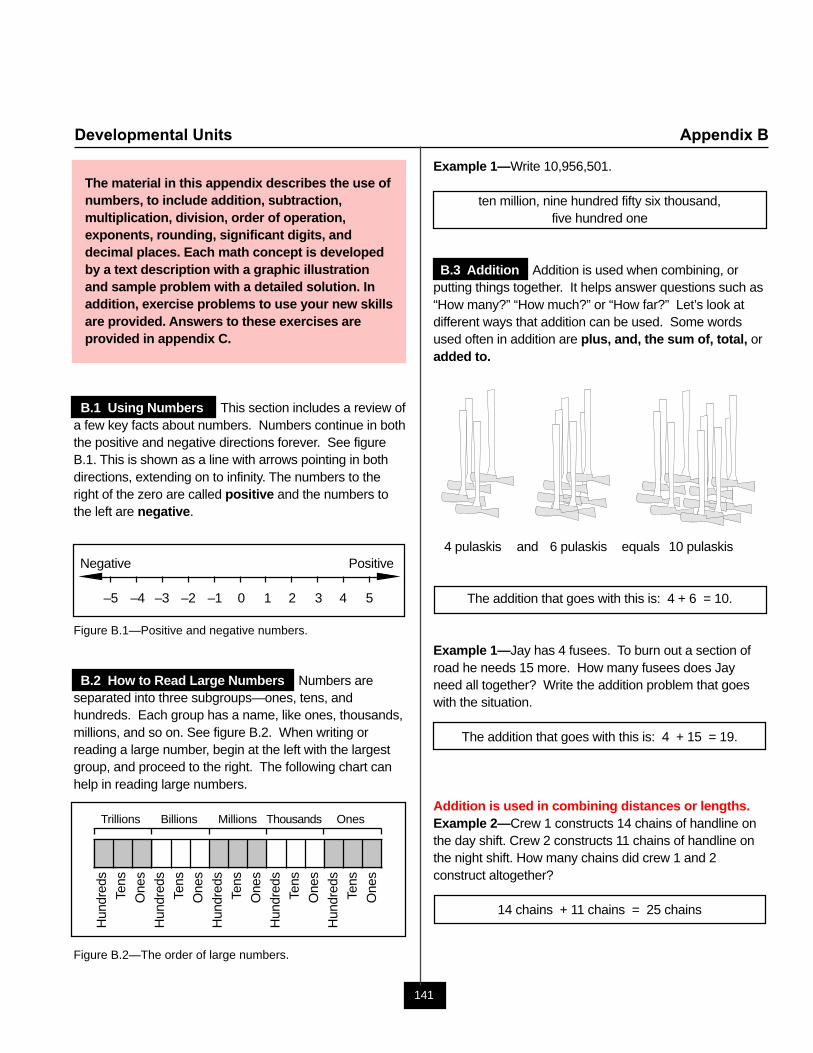
141
Developmental Units Appendix B
The material in this appendix describes the use ofnumbers, to include addition, subtraction,multiplication, division, order of operation,exponents, rounding, significant digits, anddecimal places. Each math concept is developedby a text description with a graphic illustrationand sample problem with a detailed solution. Inaddition, exercise problems to use your new skillsare provided. Answers to these exercises areprovided in appendix C.
B.1 Using Numbers This section includes a review ofa few key facts about numbers. Numbers continue in boththe positive and negative directions forever. See figureB.1. This is shown as a line with arrows pointing in bothdirections, extending on to infinity. The numbers to theright of the zero are called positive and the numbers tothe left are negative.
Negative Positive
–5 –4 –3 –2 –1 0 1 2 3 4 5
Figure B.1—Positive and negative numbers.
B.2 How to Read Large Numbers Numbers areseparated into three subgroups—ones, tens, andhundreds. Each group has a name, like ones, thousands,millions, and so on. See figure B.2. When writing orreading a large number, begin at the left with the largestgroup, and proceed to the right. The following chart canhelp in reading large numbers.
Trillions Billions Millions Thousands Ones
Figure B.2—The order of large numbers.
Hun
dred
s
Tens
One
s
Hun
dred
s
Tens
One
s
Hun
dred
s
Tens
One
s
Hun
dred
sTe
ns
One
s
Hun
dred
s
Tens
One
s
Example 1—Write 10,956,501.
ten million, nine hundred fifty six thousand,five hundred one
B.3 Addition Addition is used when combining, orputting things together. It helps answer questions such as“How many?” “How much?” or “How far?” Let’s look atdifferent ways that addition can be used. Some wordsused often in addition are plus, and, the sum of, total, oradded to.
4 pulaskis and 6 pulaskis equals 10 pulaskis
The addition that goes with this is: 4 + 6 = 10.
Example 1—Jay has 4 fusees. To burn out a section ofroad he needs 15 more. How many fusees does Jayneed all together? Write the addition problem that goeswith the situation.
The addition that goes with this is: 4 + 15 = 19.
Addition is used in combining distances or lengths.Example 2—Crew 1 constructs 14 chains of handline onthe day shift. Crew 2 constructs 11 chains of handline onthe night shift. How many chains did crew 1 and 2construct altogether?
14 chains + 11 chains = 25 chains
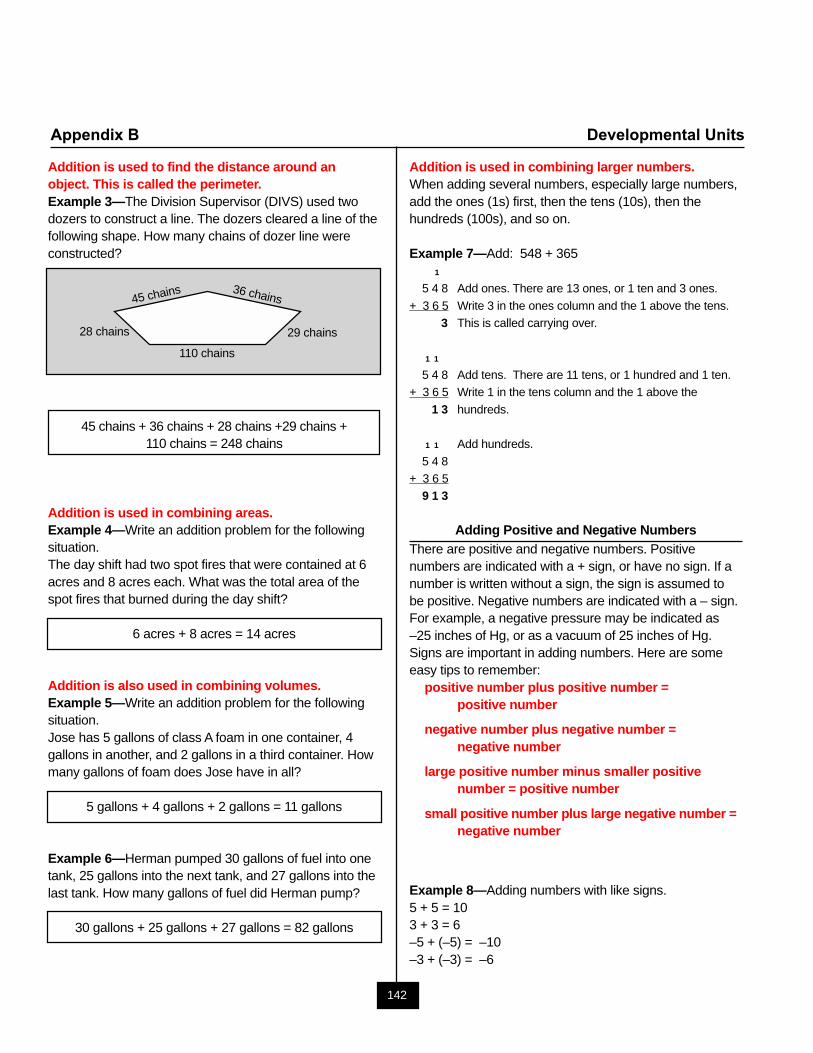
142
Appendix B Developmental Units
Addition is used to find the distance around anobject. This is called the perimeter.Example 3—The Division Supervisor (DIVS) used twodozers to construct a line. The dozers cleared a line of thefollowing shape. How many chains of dozer line wereconstructed?
45 chains + 36 chains + 28 chains +29 chains +110 chains = 248 chains
Addition is used in combining areas.Example 4—Write an addition problem for the followingsituation.The day shift had two spot fires that were contained at 6acres and 8 acres each. What was the total area of thespot fires that burned during the day shift?
6 acres + 8 acres = 14 acres
Addition is also used in combining volumes.Example 5—Write an addition problem for the followingsituation.Jose has 5 gallons of class A foam in one container, 4gallons in another, and 2 gallons in a third container. Howmany gallons of foam does Jose have in all?
5 gallons + 4 gallons + 2 gallons = 11 gallons
Example 6—Herman pumped 30 gallons of fuel into onetank, 25 gallons into the next tank, and 27 gallons into thelast tank. How many gallons of fuel did Herman pump?
30 gallons + 25 gallons + 27 gallons = 82 gallons
Addition is used in combining larger numbers.When adding several numbers, especially large numbers,add the ones (1s) first, then the tens (10s), then thehundreds (100s), and so on.
Example 7—Add: 548 + 365 1 5 4 8 Add ones. There are 13 ones, or 1 ten and 3 ones.
+ 3 6 5 Write 3 in the ones column and the 1 above the tens. 3 This is called carrying over.
1 1
5 4 8 Add tens. There are 11 tens, or 1 hundred and 1 ten.+ 3 6 5 Write 1 in the tens column and the 1 above the
1 3 hundreds.
1 1 Add hundreds.
5 4 8+ 3 6 5 9 1 3
Adding Positive and Negative NumbersThere are positive and negative numbers. Positivenumbers are indicated with a + sign, or have no sign. If anumber is written without a sign, the sign is assumed tobe positive. Negative numbers are indicated with a – sign.For example, a negative pressure may be indicated as–25 inches of Hg, or as a vacuum of 25 inches of Hg.Signs are important in adding numbers. Here are someeasy tips to remember:
positive number plus positive number =positive number
negative number plus negative number =negative number
large positive number minus smaller positivenumber = positive number
small positive number plus large negative number =negative number
Example 8—Adding numbers with like signs.5 + 5 = 103 + 3 = 6–5 + (–5) = –10–3 + (–3) = –6
45 chains 36 chains
29 chains
110 chains
28 chains
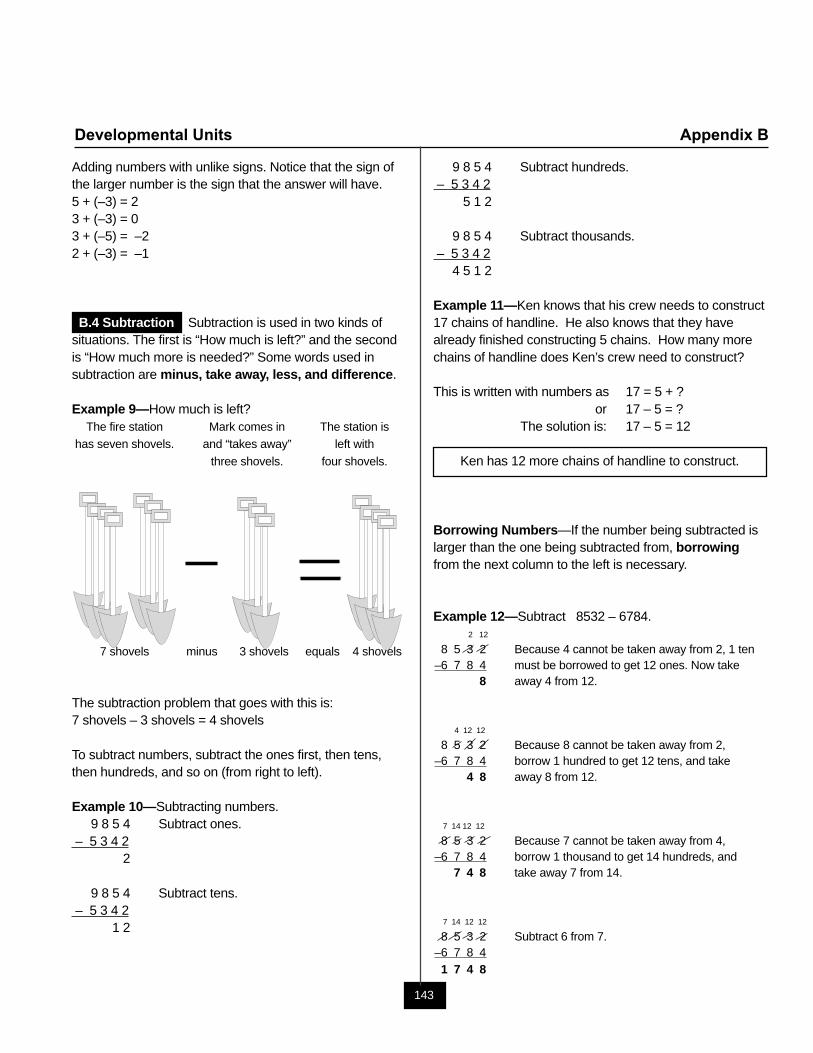
143
Developmental Units Appendix B
9 8 5 4 Subtract hundreds. – 5 3 4 2
5 1 2
9 8 5 4 Subtract thousands. – 5 3 4 2
4 5 1 2
Example 11—Ken knows that his crew needs to construct17 chains of handline. He also knows that they havealready finished constructing 5 chains. How many morechains of handline does Ken’s crew need to construct?
This is written with numbers as 17 = 5 + ?or 17 – 5 = ?
The solution is: 17 – 5 = 12
Ken has 12 more chains of handline to construct.
Borrowing Numbers—If the number being subtracted islarger than the one being subtracted from, borrowingfrom the next column to the left is necessary.
Example 12—Subtract 8532 – 6784. 2 12
8 5 3 2 Because 4 cannot be taken away from 2, 1 ten–6 7 8 4 must be borrowed to get 12 ones. Now take
8 away 4 from 12.
4 12 12
8 5 3 2 Because 8 cannot be taken away from 2,–6 7 8 4 borrow 1 hundred to get 12 tens, and take
4 8 away 8 from 12.
7 14 12 12
8 5 3 2 Because 7 cannot be taken away from 4,–6 7 8 4 borrow 1 thousand to get 14 hundreds, and
7 4 8 take away 7 from 14.
7 14 12 12
8 5 3 2 Subtract 6 from 7.–6 7 8 41 7 4 8
Adding numbers with unlike signs. Notice that the sign ofthe larger number is the sign that the answer will have.5 + (–3) = 23 + (–3) = 03 + (–5) = –22 + (–3) = –1
B.4 Subtraction Subtraction is used in two kinds ofsituations. The first is “How much is left?” and the secondis “How much more is needed?” Some words used insubtraction are minus, take away, less, and difference.
Example 9—How much is left?The fire station Mark comes in The station is
has seven shovels. and “takes away” left with
three shovels. four shovels.
7 shovels minus 3 shovels equals 4 shovels
The subtraction problem that goes with this is:7 shovels – 3 shovels = 4 shovels
To subtract numbers, subtract the ones first, then tens,then hundreds, and so on (from right to left).
Example 10—Subtracting numbers.9 8 5 4 Subtract ones.
– 5 3 4 2 2
9 8 5 4 Subtract tens. – 5 3 4 2
1 2
144
Appendix B Developmental Units
Subtracting Signed Numbers—Signs are important insubtracting numbers. Subtracting a number changes thesign of the number subtracted. Subtracting a “–” numbermakes that number a “+” number. Writing the numbersdirectly over each other makes it easier to subtract.
7 7For example – (– 3) becomes + 3
? 10
Example 13—Subtract –20 from –50.–50 –50
– (–20) +20? –30
Example 14—Subtract 20 from –50.–50 –50
– (+20) –20? –70
See adding positive and negative numbers in appendixB.3.
B.5 Multiplication Multiplication is easier to use thanrepeated addition. Some words and symbols used inmultiplication are times, the product of, “x,” or a dotlike “•.” Sometimes numbers that are being multiplied willbe put in parentheses ( ). A table-like format is used forconversions, so that the units will be sure to cancel.
Multiplication is a repeated set of additions.
For example: The multiplication of 2 x 3 is the same as theaddition of three 2’s, 2 + 2 + 2, or two 3’s, 3 + 3.
Example 15—Sarah can do 30 pushups in one minute. Ifshe kept at that pace, how many pushups could she do in15 minutes?
The multiplication problem would be 30 x 15 = 450.This is the same as adding 30 fifteen times.
When larger numbers are involved, multiplication is mucheasier than the repeated addition.
Example 16—Multiply 45 by 37.Step 1. Multiply by the number in the ones spot, which is 7.
45x 7315
Step 2. Multiply by the number in the tens spot, or 30.45
x 301,350
Step 3. Add these together.45
x 37315
+1,3501,665
Example 17—Multiply 374 x 261.
Step 1. Multiply 374 by 1.374
x 261374
Step 2. Multiply by 60. Put in 0 and then multiply 374 by 6. 4 2
374x 261
37422,440
145
Developmental Units Appendix B
Step 3. Multiply by 200. Put in 00 and then multiply 374 by 2.1
374x 261
37422,440
+74,800Step 4. Add the numbers. 97,614
Multiplying Signed Numbers—When multiplying twonumbers with the same sign, the answer will be a positivenumber. A positive number times a positive number givesa positive answer.5 x 5 = 254 x 8 = 322 x 6 = 12
A negative number times a negative number gives apositive answer.– 5 x (–5) = 25– 4 x (–8) = 32– 2 x (–6) = 12
A positive number times a negative number gives anegative answer.
5 x (–5) = – 25– 4 x 8= –322 x (–6) = –12
B.6 Division Division is used to split groups up intosmaller sections. Some words and symbols often seen indivision are divided by, into, “÷,” and “/.” Just asmultiplication is thought of as repeated additions, divisioncan be thought of as repeated subtractions.
Divisior—the number by which a dividend is divided (a).Dividend—a sum or amount to be divided and distributed (b).Quotient—the number resulting from the division of one
number by another (c).Remainder—the number left after subtraction that is
smaller than the divisior.b = ca
Example 18—There are 20 nozzles for 5 engines. If thenozzles were to be divided evenly for the engines, howmany nozzles would go on each engine?
20– 515
– 510
– 55
– 5 Subtraction was performed four times.0 So, 20 ÷ 5 = 4
Example 19—Divide 15 by 4.15
– 411
– 47 Because 4 cannot be subtracted from 3, the 3 is
– 4 called the remainder and is noted by the3 symbol “R”.
The remainder is never larger than the divisor. The divisorin example 19 is 4. So, 15 / 4 = 3 R 3
If these were fifteen nozzles for four engines on yourdistrict, four nozzles would go on three engines
and only three nozzles would go on the last engine.
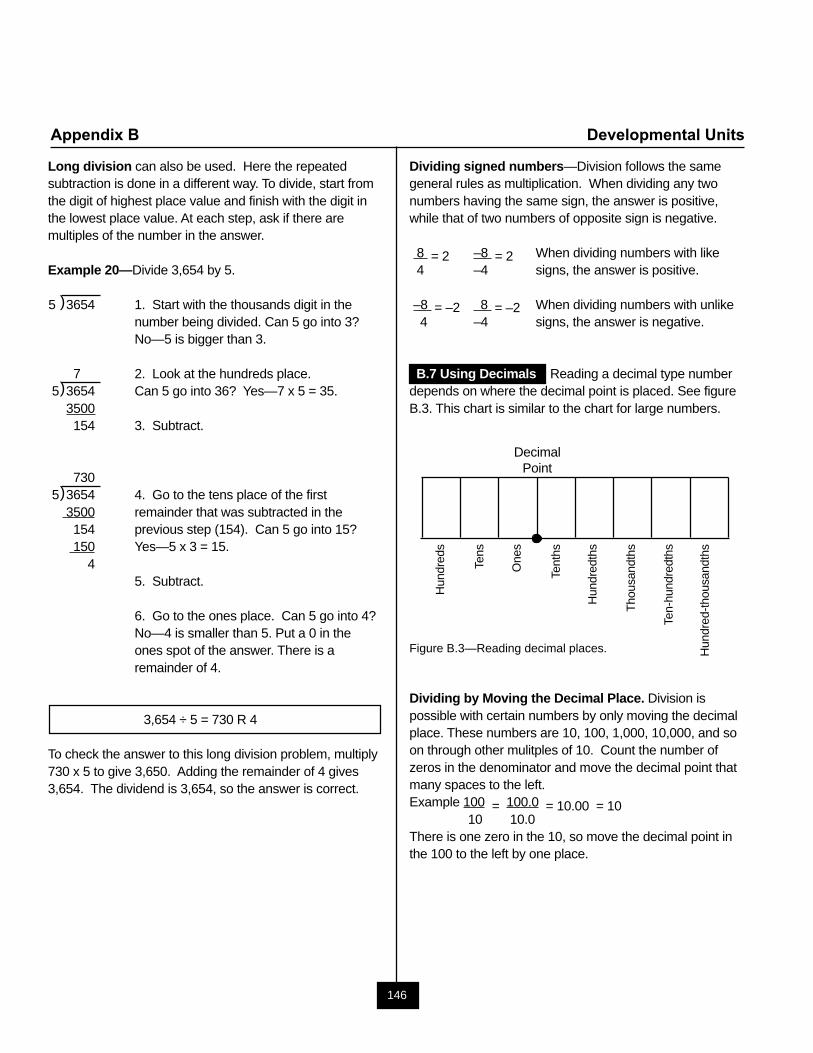
146
Appendix B Developmental Units
Long division can also be used. Here the repeatedsubtraction is done in a different way. To divide, start fromthe digit of highest place value and finish with the digit inthe lowest place value. At each step, ask if there aremultiples of the number in the answer.
Example 20—Divide 3,654 by 5.
5 3654 1. Start with the thousands digit in thenumber being divided. Can 5 go into 3?No—5 is bigger than 3.
700 2. Look at the hundreds place.5 3654 Can 5 go into 36? Yes—7 x 5 = 35.
3500154 3. Subtract.
7305 3654 4. Go to the tens place of the first
3500 remainder that was subtracted in the 154 previous step (154). Can 5 go into 15?
150 Yes—5 x 3 = 15.4
5. Subtract.
6. Go to the ones place. Can 5 go into 4?No—4 is smaller than 5. Put a 0 in theones spot of the answer. There is aremainder of 4.
3,654 ÷ 5 = 730 R 4
To check the answer to this long division problem, multiply730 x 5 to give 3,650. Adding the remainder of 4 gives3,654. The dividend is 3,654, so the answer is correct.
Dividing signed numbers—Division follows the samegeneral rules as multiplication. When dividing any twonumbers having the same sign, the answer is positive,while that of two numbers of opposite sign is negative.
8 = 2 –8 = 2 When dividing numbers with like 4 –4 signs, the answer is positive.
–8 = –2 8 = –2 When dividing numbers with unlike 4 –4 signs, the answer is negative.
B.7 Using Decimals Reading a decimal type numberdepends on where the decimal point is placed. See figureB.3. This chart is similar to the chart for large numbers.
Figure B.3—Reading decimal places.
Dividing by Moving the Decimal Place. Division ispossible with certain numbers by only moving the decimalplace. These numbers are 10, 100, 1,000, 10,000, and soon through other mulitples of 10. Count the number ofzeros in the denominator and move the decimal point thatmany spaces to the left.Example 100 = 100.0 = 10.00 = 10
10 10.0There is one zero in the 10, so move the decimal point inthe 100 to the left by one place.
)
)
)
DecimalPoint
Hun
dred
s
Tens
One
s
Tent
hs
Hun
dred
ths
Tho
usan
dths
Ten-
hund
redt
hs
Hun
dred
-tho
usan
dths
147
Developmental Units Appendix B
Example 21—8679 There are three zeros.1000
8.679 Move the decimal point three places tothe left. Remember that whole numbershave a decimal point at the end that’s
8679 = 8.679 been dropped off.1000
Example 24 = 24. 16 = 16., etc
Significant Figures and Rounding for Accuracy—Thedecimal place indicates the accuracy of the given number.The accuracy of an answer is determined by the lowestlevel of accuracy of the original numbers being added,subtracted, multiplied, or divided. Accuracy does notimprove with addition, subtraction, multiplication, ordivision. This is especially important with multiplicationand division with decimal places.
8.2 + 0.25 = ? The lowest level of accuracy is to the 1/10thdecimal place, so the correct answer is to the 1/10thdecimal place. Rounding up or down is a method ofbringing the answer to the correct level of accuracy.8.2+0.25 = 8.45? The answer is only accurate to the1/10th. Round up if the numbers are 5 to 9, and rounddown if the numbers are 4 to 1. What is 8.45 to thenearest 1/10th? Round up .45 to .5 to give an answer of8.5 with the correct accuracy.
Example: 10 x 20 = 10. x 20. = 200. = 20010 x 20 ≠ 200.0
986.1 – 459.8
526.3
Example 22—Round 984.23644 to the nearesthundredth.
Since the number to the right of the 3 is greater than 5—round up.
984.24
Example 23—Round 543.64 to the nearest tenth.
Since the number to the right of 6 is less than 5,keep the number as it is.
543.6
All digits of a number are significant. For example, thereare 4 significant digits/places in 37.40 grams. The zero in37.40 grams is significant because it implies a precision of± 0.01 gram. This means that the answer before roundingup or down was between 37.395 grams and 37.414grams. When adding, subtracting, multiplying, or dividingdigits, all numbers must have the same number ofsignificant digits as the least accurate original number.
Example 24—Add the following weights:20.11 lb, 1,035.000 lb, and 5.1794 lb.
20.111035.000
+ 5.17941060.2894 lb
Round the answer to the correct number of significantplaces. The least accurate is 20.11, so round the answerto the nearest 1/100th.
1,060.2894 rounded to the correct accuracy =1,060.29 lb
Example 25—43,357.9 + 8,764.003
43,357.9+ 8,764.003
52,121.903 = 52,121.9
Example 26—878.6003 – 32.15
878.6003– 32.15
846.4503 = 846.45
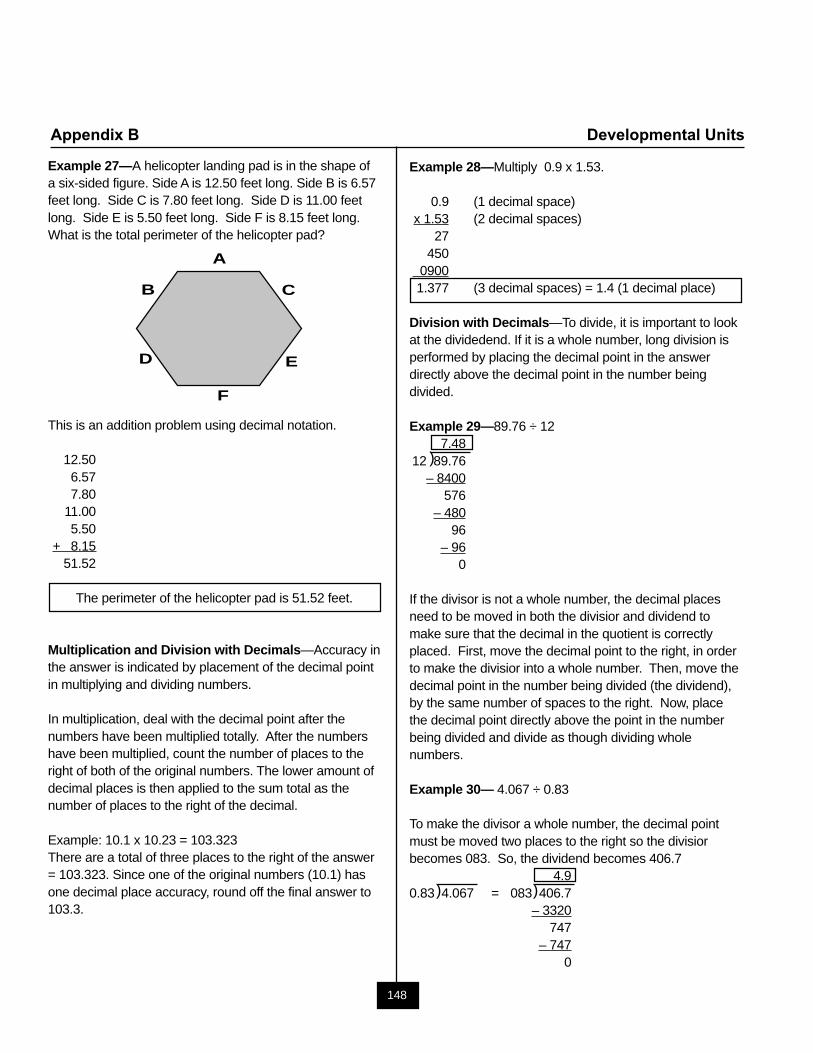
148
Appendix B Developmental Units
)
Example 27—A helicopter landing pad is in the shape ofa six-sided figure. Side A is 12.50 feet long. Side B is 6.57feet long. Side C is 7.80 feet long. Side D is 11.00 feetlong. Side E is 5.50 feet long. Side F is 8.15 feet long.What is the total perimeter of the helicopter pad?
This is an addition problem using decimal notation.
12.506.577.80
11.005.50
+ 8.1551.52
The perimeter of the helicopter pad is 51.52 feet.
Multiplication and Division with Decimals—Accuracy inthe answer is indicated by placement of the decimal pointin multiplying and dividing numbers.
In multiplication, deal with the decimal point after thenumbers have been multiplied totally. After the numbershave been multiplied, count the number of places to theright of both of the original numbers. The lower amount ofdecimal places is then applied to the sum total as thenumber of places to the right of the decimal.
Example: 10.1 x 10.23 = 103.323There are a total of three places to the right of the answer= 103.323. Since one of the original numbers (10.1) hasone decimal place accuracy, round off the final answer to103.3.
Example 28—Multiply 0.9 x 1.53.
0.9 (1 decimal space)x 1.53 (2 decimal spaces)
27450
09001.377 (3 decimal spaces) = 1.4 (1 decimal place)
Division with Decimals—To divide, it is important to lookat the dividedend. If it is a whole number, long division isperformed by placing the decimal point in the answerdirectly above the decimal point in the number beingdivided.
Example 29—89.76 ÷ 127.48
12 89.76 – 8400
576 – 480
96– 96
0
If the divisor is not a whole number, the decimal placesneed to be moved in both the divisior and dividend tomake sure that the decimal in the quotient is correctlyplaced. First, move the decimal point to the right, in orderto make the divisior into a whole number. Then, move thedecimal point in the number being divided (the dividend),by the same number of spaces to the right. Now, placethe decimal point directly above the point in the numberbeing divided and divide as though dividing wholenumbers.
Example 30— 4.067 ÷ 0.83
To make the divisor a whole number, the decimal pointmust be moved two places to the right so the divisiorbecomes 083. So, the dividend becomes 406.7
4.90.83 4.067 = 083 406.7
– 3320747
– 7470
A
B C
D E
F
)
)
149
Developmental Units Appendix B
√ √√ √
√ √
√√
B.9 Order of Operation Some math problems are amixture of addition, subtraction, division, andmultiplication. Furthermore, the information can be true forone item but not another, so parentheses are used ().There is a specific order to follow when makingcalculations. This order is:
a. Parentheses: ( )b. Exponents: 23
c. Multiplication and divisiond. Addition and subtractione. Left to right
Note—The student may also add parentheses to clarifythe order.
Example 34—Solve 10 + 10 ÷ 10
Step 1. Division is done before addition.10 ÷ 10 = 1
Step 2. Add.10 + 1 = 11
10 + 10 ÷ 10 = 11
The same example rewritten:10 + 10 ÷ 1010 + (10 ÷ 10)10 + 1 = 11
Example 35—Solve 63 ÷ (10 – 8)2 ÷ 2 + 2
Step 1. Parentheses.63 ÷ (10 – 8)2 ÷ 2 + 2 = 63 ÷ 22 ÷ 2 + 2
Step 2. Exponents.216 ÷ 4 ÷ 2 + 2
Step 3. Division in order from left to right.216 ÷ 4 = 5454 ÷ 2 = 27
Step 4. Addition.27 + 2 = 29
63 ÷ (10 – 8)2 ÷ 2 + 2 = 29
B.8 Powers and Roots When a number is multipliedby itself several times, instead of writing each repetition ofthe multiplication, it is easier to use exponential notation.For example, 3 x 3 x 3 x 3 x 3 would be 35. The numberbeing multiplied is called the base and the number oftimes it is multiplied by itself is called the exponent. In theabove case, the base is 3 and the exponent is 5. When anumber has an exponent of 2, it is “squared.” When theexponent is 3, it is “cubed.” When the exponent is 4, it is“to the fourth power.”
Example 31—Write 6 x 6 x 6 in exponential notation andin words.
6 x 6 x 6 = 63 or “six cubed”It can also be solved as 63 = 216.
This can also be worked backwards by finding the squareroot of the number and will appear under a square rootsign: “√ .” The square root of a number is the originalnumber that would have to be squared in order to get thatnumber.
For example, the square root of 4 would be 2, since 22 = 4.
Example 32—Find √49
√49 = 7 because 7 x 7 = 49
Some numbers are not “perfect squares.” In this situation,divide once again to see whether the number can beseparated into a number that is a perfect square and therest stays as a square root.
Example 33—Find √18
9 x 2 = 3 2
The 2 remains under the square root symbol, since it isnot a perfect square, but the square root of 9 is a perfectsquare, so it can be simplified to a 3 and taken outside ofthe square root symbol.
18 = 3 2
150
Appendix B Developmental Units
EXERCISES
Write an addition problem for each situation. Solve.
Problem 1. Manuel earns $121 worth of overtime onMonday and $142 on Wednesday. How much overtimemoney does he earn in all?
Problem 2. Mike has seven hose lengths. He goes tosupply and picks up six more. How many hose lengthsdoes he have in all?
Problem 3. Carol has 200 feet of hose in her pack.Bernie has 100 feet of hose and Tyrone has 200 feet inhis pack. How many feet of hose do they have in all?
Problem 4. There were two fires on the Tonto Forestyesterday. One fire burned 235 acres of national forestland and the other burned 68 acres outside of the nationalforest boundary. How many acres were burned in all?
Problem 5. Loren is filling containers with fire foam. Inone container she put 28 gallons and in the secondcontainer she put 53 gallons. How many gallons did shefill in all?
Problem 6. Lois pumps 267 gallons of water into anengine. For the next engine she pumps 350 gallons. Shepumps 288 gallons into the third engine. How manygallons did Lois pump in all?
Add.
Problem 7. 5 3 0 4+ 3 5 4 2
Problem 8. 7 9 6 8+ 5 4 9 7
Problem 9. 9 8 0 4+ 7 5 8 9
Problem 10. – 6 + – 6
Problem 11. 7 + – 4
Write a subtraction problem for each situation. Solve.
Problem 12. Anthony is working in the supply room. Hehas 36 hard hats. A crew of 24 comes in and takes 1 foreach person. How many hard hats does Anthony haveleft?
Problem 13. The foam tank on an engine is filled with 45gallons before leaving for a fire. The crew uses up 27gallons on that fire. How many gallons are left?
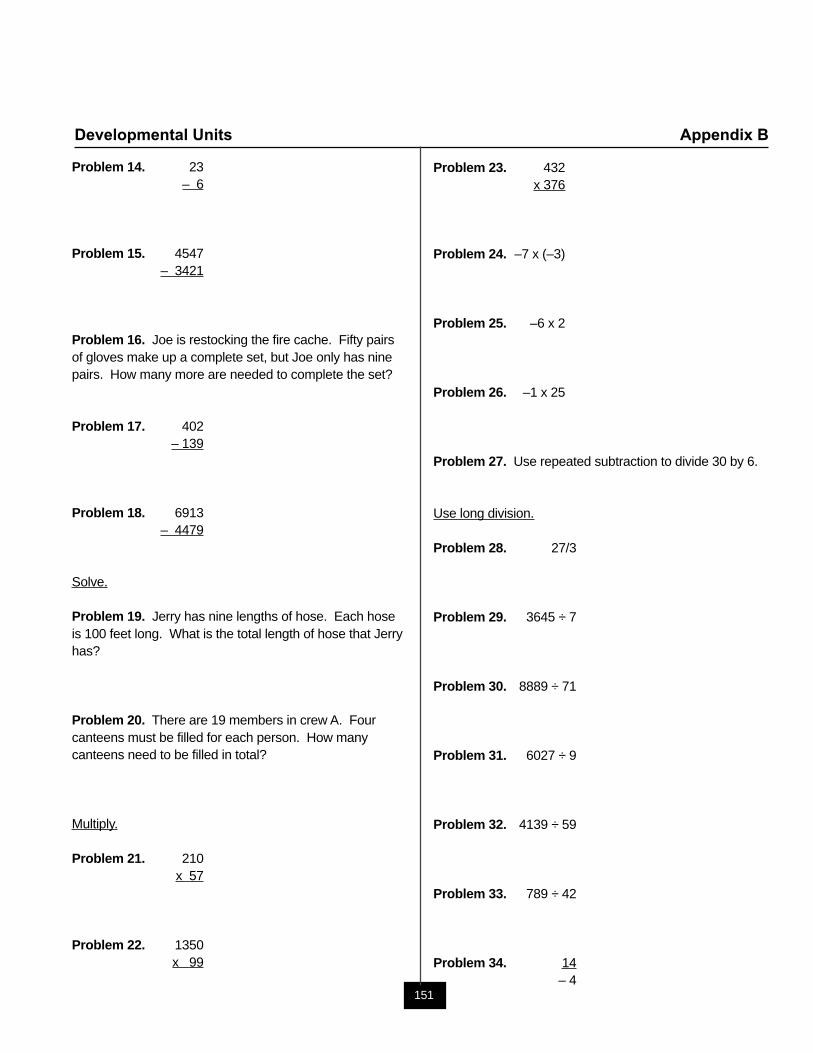
151
Developmental Units Appendix B
Problem 14. 23– 6
Problem 15. 4547 – 3421
Problem 16. Joe is restocking the fire cache. Fifty pairsof gloves make up a complete set, but Joe only has ninepairs. How many more are needed to complete the set?
Problem 17. 402– 139
Problem 18. 6913– 4479
Solve.
Problem 19. Jerry has nine lengths of hose. Each hoseis 100 feet long. What is the total length of hose that Jerryhas?
Problem 20. There are 19 members in crew A. Fourcanteens must be filled for each person. How manycanteens need to be filled in total?
Multiply.
Problem 21. 210x 57
Problem 22. 1350x 99
Problem 23. 432x 376
Problem 24. –7 x (–3)
Problem 25. –6 x 2
Problem 26. –1 x 25
Problem 27. Use repeated subtraction to divide 30 by 6.
Use long division.
Problem 28. 27/3
Problem 29. 3645 ÷ 7
Problem 30. 8889 ÷ 71
Problem 31. 6027 ÷ 9
Problem 32. 4139 ÷ 59
Problem 33. 789 ÷ 42
Problem 34. 14– 4
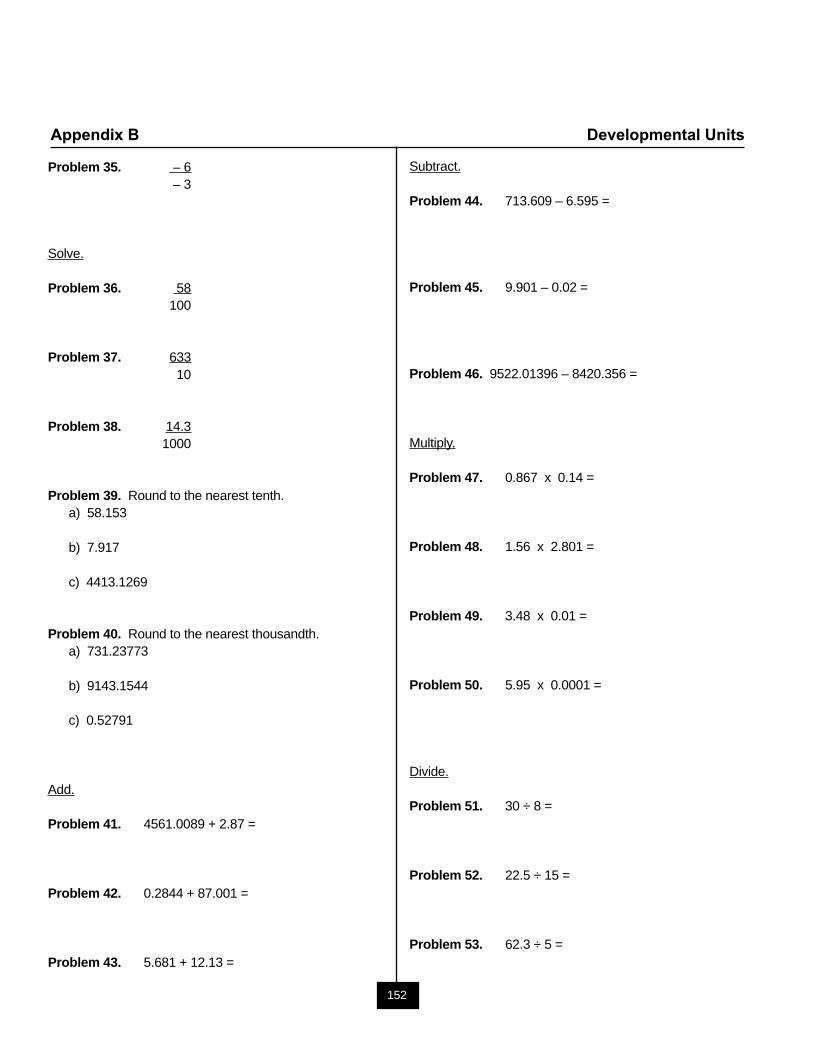
152
Appendix B Developmental Units
Problem 35. – 6 – 3
Solve.
Problem 36. 58100
Problem 37. 63310
Problem 38. 14.31000
Problem 39. Round to the nearest tenth.a) 58.153
b) 7.917
c) 4413.1269
Problem 40. Round to the nearest thousandth.a) 731.23773
b) 9143.1544
c) 0.52791
Add.
Problem 41. 4561.0089 + 2.87 =
Problem 42. 0.2844 + 87.001 =
Problem 43. 5.681 + 12.13 =
Subtract.
Problem 44. 713.609 – 6.595 =
Problem 45. 9.901 – 0.02 =
Problem 46. 9522.01396 – 8420.356 =
Multiply.
Problem 47. 0.867 x 0.14 =
Problem 48. 1.56 x 2.801 =
Problem 49. 3.48 x 0.01 =
Problem 50. 5.95 x 0.0001 =
Divide.
Problem 51. 30 ÷ 8 =
Problem 52. 22.5 ÷ 15 =
Problem 53. 62.3 ÷ 5 =
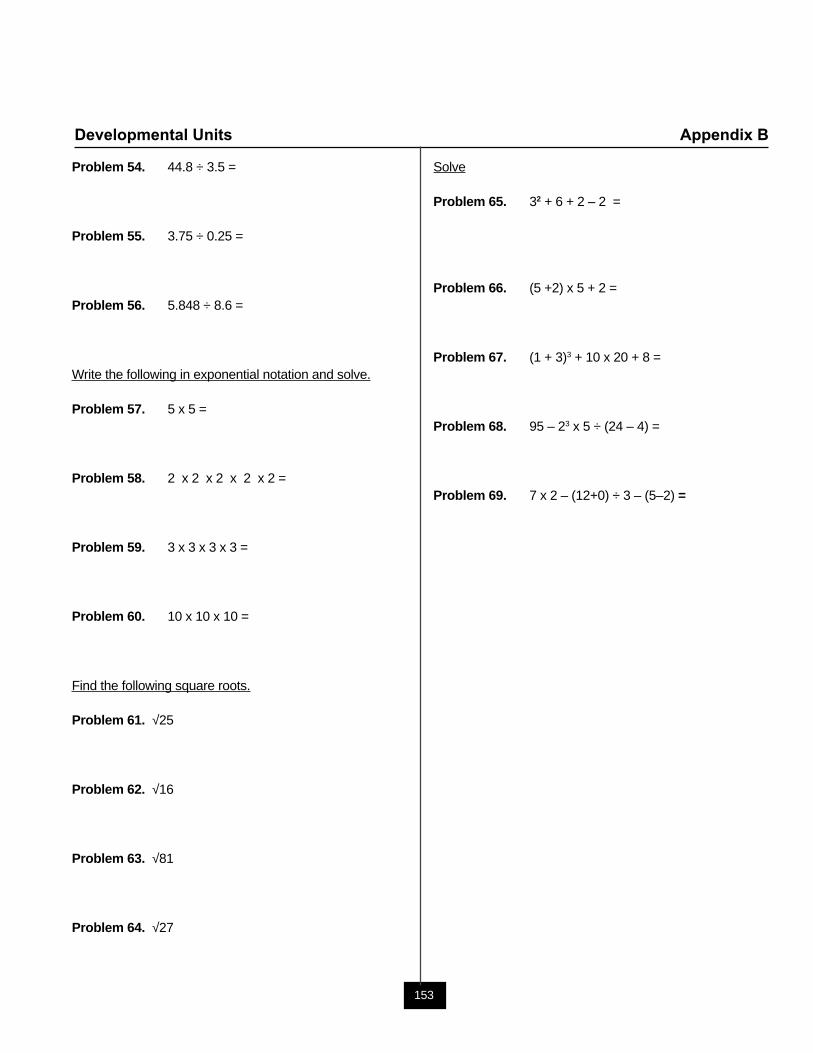
153
Developmental Units Appendix B
Problem 54. 44.8 ÷ 3.5 =
Problem 55. 3.75 ÷ 0.25 =
Problem 56. 5.848 ÷ 8.6 =
Write the following in exponential notation and solve.
Problem 57. 5 x 5 =
Problem 58. 2 x 2 x 2 x 2 x 2 =
Problem 59. 3 x 3 x 3 x 3 =
Problem 60. 10 x 10 x 10 =
Find the following square roots.
Problem 61. √25
Problem 62. √16
Problem 63. √81
Problem 64. √27
Solve
Problem 65. 32 + 6 + 2 – 2 =
Problem 66. (5 +2) x 5 + 2 =
Problem 67. (1 + 3)3 + 10 x 20 + 8 =
Problem 68. 95 – 23 x 5 ÷ (24 – 4) =
Problem 69. 7 x 2 – (12+0) ÷ 3 – (5–2) =

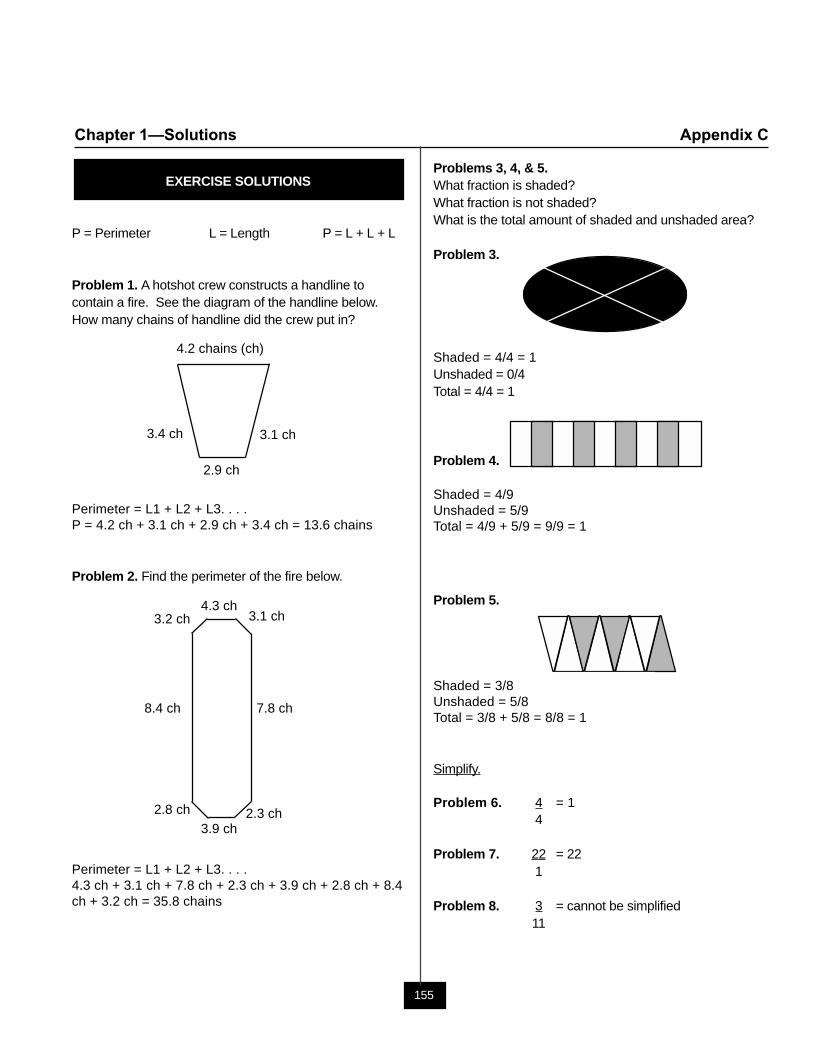
155
Chapter 1—Solutions Appendix C
EXERCISE SOLUTIONS
P = Perimeter L = Length P = L + L + L
Problem 1. A hotshot crew constructs a handline tocontain a fire. See the diagram of the handline below.How many chains of handline did the crew put in?
Perimeter = L1 + L2 + L3. . . .P = 4.2 ch + 3.1 ch + 2.9 ch + 3.4 ch = 13.6 chains
Problem 2. Find the perimeter of the fire below.
Perimeter = L1 + L2 + L3. . . .4.3 ch + 3.1 ch + 7.8 ch + 2.3 ch + 3.9 ch + 2.8 ch + 8.4ch + 3.2 ch = 35.8 chains
4.3 ch 3.1 ch
7.8 ch
2.3 ch3.9 ch
2.8 ch
8.4 ch
3.2 ch
4.2 chains (ch)
3.4 ch 3.1 ch
2.9 ch
Problems 3, 4, & 5.What fraction is shaded?What fraction is not shaded?What is the total amount of shaded and unshaded area?
Problem 3.
Shaded = 4/4 = 1Unshaded = 0/4Total = 4/4 = 1
Problem 4.
Shaded = 4/9Unshaded = 5/9Total = 4/9 + 5/9 = 9/9 = 1
Problem 5.
Shaded = 3/8Unshaded = 5/8Total = 3/8 + 5/8 = 8/8 = 1
Simplify.
Problem 6. 4 = 14
Problem 7. 22 = 221
Problem 8. 3 = cannot be simplified11
12345678901234567890123456789012123456123456789012345678901234567890121234561234567890123456789012345678901212345612345678901234567890123456789012123456123456789012345678901234567890121234561234567890123456789012345678901212345612345678901234567890123456789012123456123456789012345678901234567890121234561234567890123456789012345678901212345612345678901234567890123456789012123456
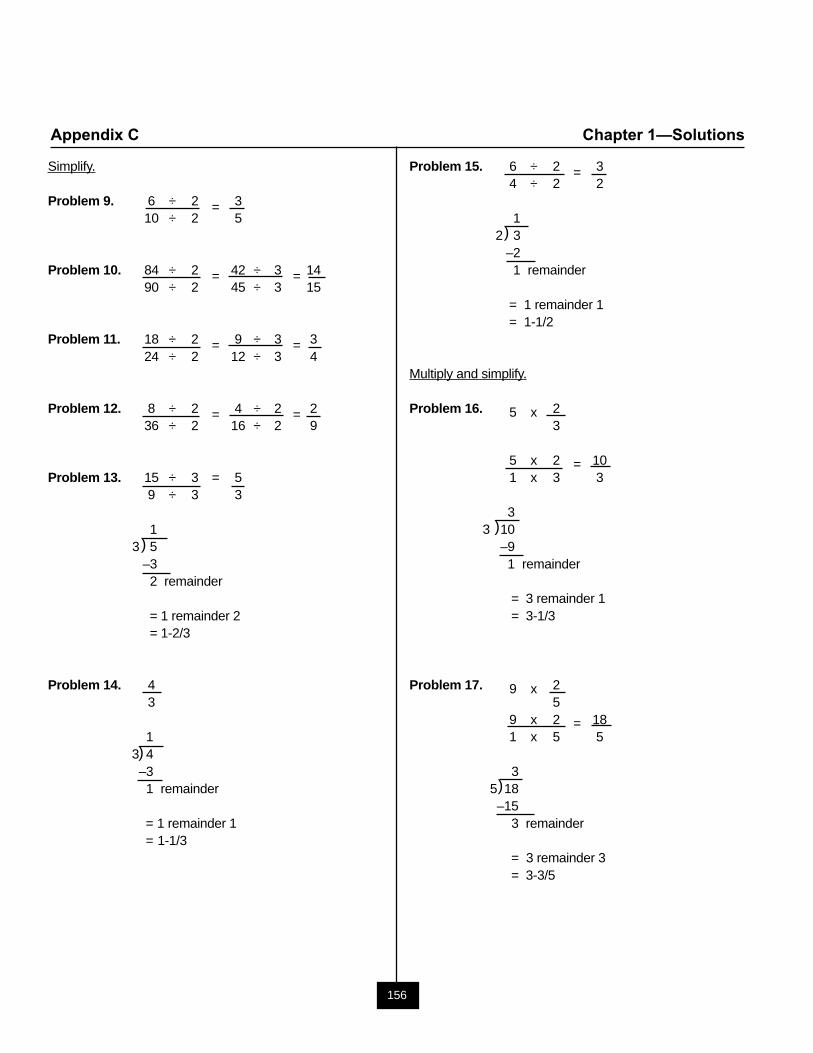
156
Appendix C Chapter 1—Solutions
Simplify.
Problem 9. 6 ÷ 2 = 310 ÷ 2 5
Problem 10. 84 ÷ 2 = 42 ÷ 3 = 1490 ÷ 2 45 ÷ 3 15
Problem 11. 18 ÷ 2 = 9 ÷ 3 = 324 ÷ 2 12 ÷ 3 4
Problem 12. 8 ÷ 2 = 4 ÷ 2 = 236 ÷ 2 16 ÷ 2 9
Problem 13. 15 ÷ 3 = 59 ÷ 3 3
13 5
–32 remainder
= 1 remainder 2= 1-2/3
Problem 14. 43
13 4–31 remainder
= 1 remainder 1= 1-1/3
)
)
Problem 15. 6 ÷ 2 = 34 ÷ 2 2
12 3
–21 remainder
= 1 remainder 1= 1-1/2
Multiply and simplify.
Problem 16. 5 x 23
5 x 2 = 101 x 3 3
33 10
–91 remainder
= 3 remainder 1= 3-1/3
Problem 17. 9 x 25
9 x 2 = 181 x 5 5
35 18–15
3 remainder
= 3 remainder 3= 3-3/5
)
)
)
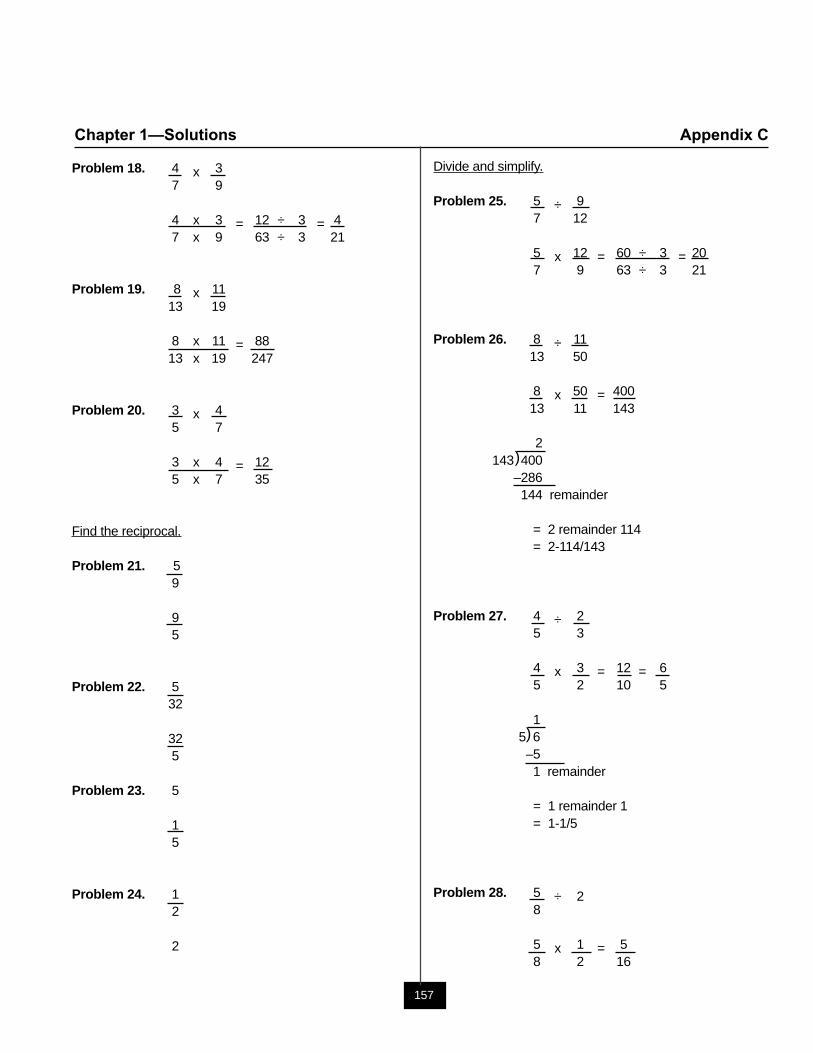
157
Chapter 1—Solutions Appendix C
Problem 18. 4 x 37 9
4 x 3 = 12 ÷ 3 = 47 x 9 63 ÷ 3 21
Problem 19. 8 x 1113 19
8 x 11 = 8813 x 19 247
Problem 20. 3 x 45 7
3 x 4 = 125 x 7 35
Find the reciprocal.
Problem 21. 59
95
Problem 22. 532
325
Problem 23. 5
15
Problem 24. 12
2
Divide and simplify.
Problem 25. 5 ÷ 97 12
5 x 12 = 60 ÷ 3 = 207 9 63 ÷ 3 21
Problem 26. 8 ÷ 1113 50
8 x 50 = 40013 11 143
2143 400
–286144 remainder
= 2 remainder 114= 2-114/143
Problem 27. 4 ÷ 25 3
4 x 3 = 12 = 65 2 10 5
15 6–51 remainder
= 1 remainder 1= 1-1/5
Problem 28. 5 ÷ 28
5 x 1 = 58 2 16
)
)
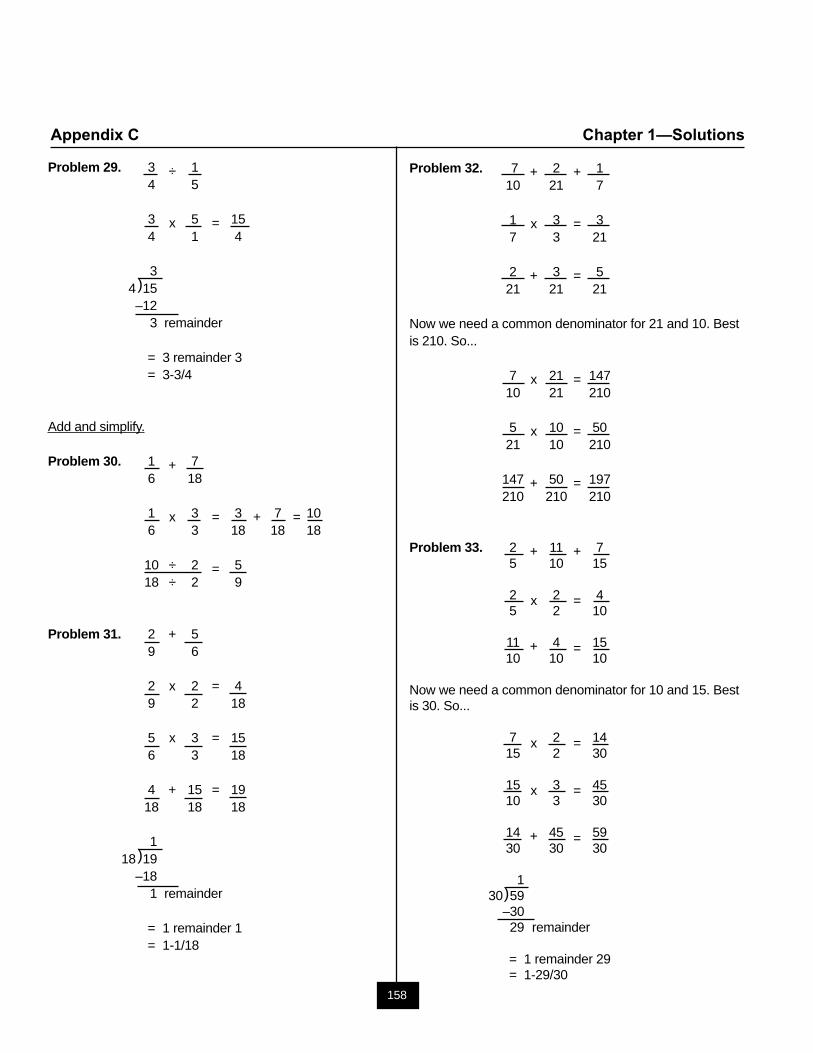
158
Appendix C Chapter 1—Solutions
Problem 29. 3 ÷ 14 5
3 x 5 = 154 1 4
34 15–12
3 remainder
= 3 remainder 3= 3-3/4
Add and simplify.
Problem 30. 1 + 76 18
1 x 3 = 3 + 7 = 106 3 18 18 18
10 ÷ 2 = 518 ÷ 2 9
Problem 31. 2 + 59 6
2 x 2 = 49 2 18
5 x 3 = 156 3 18
4 + 15 = 1918 18 18
118 19
–181 remainder
= 1 remainder 1= 1-1/18
)
)
Problem 32. 7 + 2 + 110 21 7
1 x 3 = 37 3 21
2 + 3 = 521 21 21
Now we need a common denominator for 21 and 10. Bestis 210. So...
7 x 21 = 14710 21 210
5 x 10 = 5021 10 210
147 + 50 = 197210 210 210
Problem 33. 2 + 11 + 75 10 15
2 x 2 = 45 2 10
11 + 4 = 1510 10 10
Now we need a common denominator for 10 and 15. Bestis 30. So...
7 x 2 = 1415 2 30
15 x 3 = 4510 3 30
14 + 45 = 5930 30 30
130 59
–3029 remainder
= 1 remainder 29= 1-29/30
)
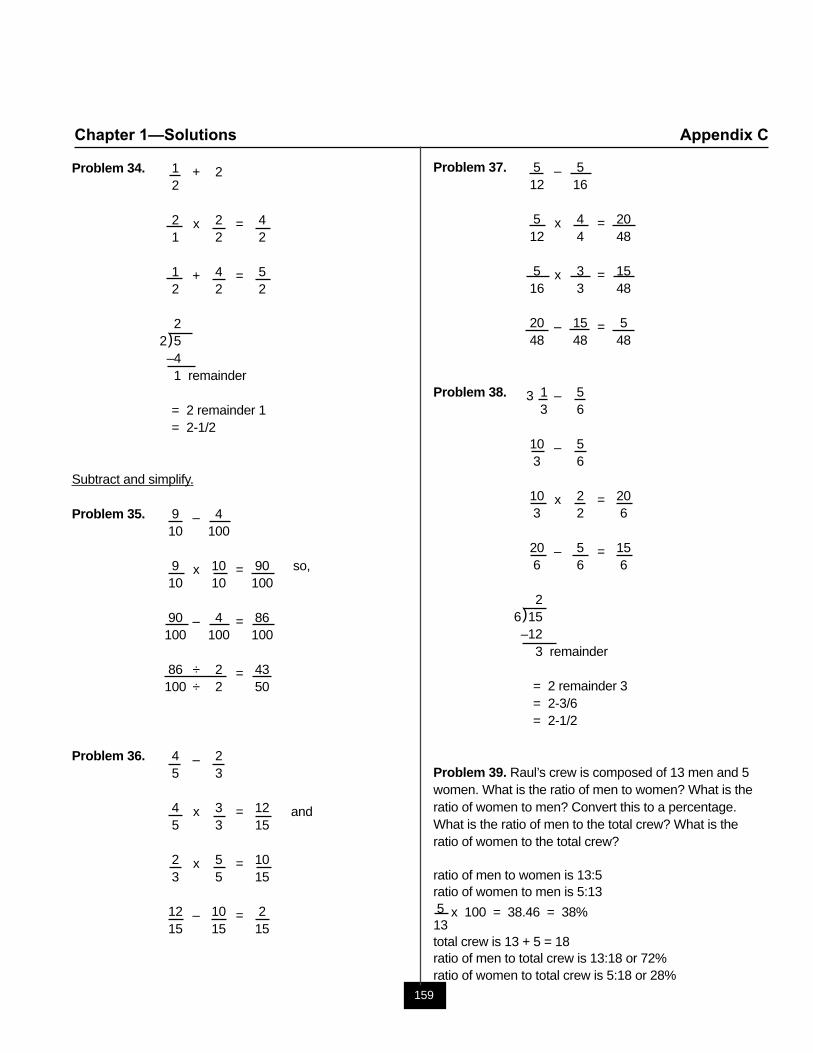
159
Chapter 1—Solutions Appendix C
Problem 34. 1 + 22
2 x 2 = 41 2 2
1 + 4 = 52 2 2
22 5–41 remainder
= 2 remainder 1= 2-1/2
Subtract and simplify.
Problem 35. 9 – 410 100
9 x 10 = 90 so,10 10 100
90 – 4 = 86100 100 100
86 ÷ 2 = 43100 ÷ 2 50
Problem 36. 4 – 25 3
4 x 3 = 12 and5 3 15
2 x 5 = 103 5 15
12 – 10 = 215 15 15
)
Problem 37. 5 – 512 16
5 x 4 = 2012 4 48
5 x 3 = 1516 3 48
20 – 15 = 548 48 48
Problem 38. 3 1 – 5 3 6
10 – 53 6
10 x 2 = 203 2 6
20 – 5 = 156 6 6
26 15–12
3 remainder
= 2 remainder 3= 2-3/6= 2-1/2
Problem 39. Raul’s crew is composed of 13 men and 5women. What is the ratio of men to women? What is theratio of women to men? Convert this to a percentage.What is the ratio of men to the total crew? What is theratio of women to the total crew?
ratio of men to women is 13:5ratio of women to men is 5:13 5 x 100 = 38.46 = 38%13total crew is 13 + 5 = 18ratio of men to total crew is 13:18 or 72%ratio of women to total crew is 5:18 or 28%
)
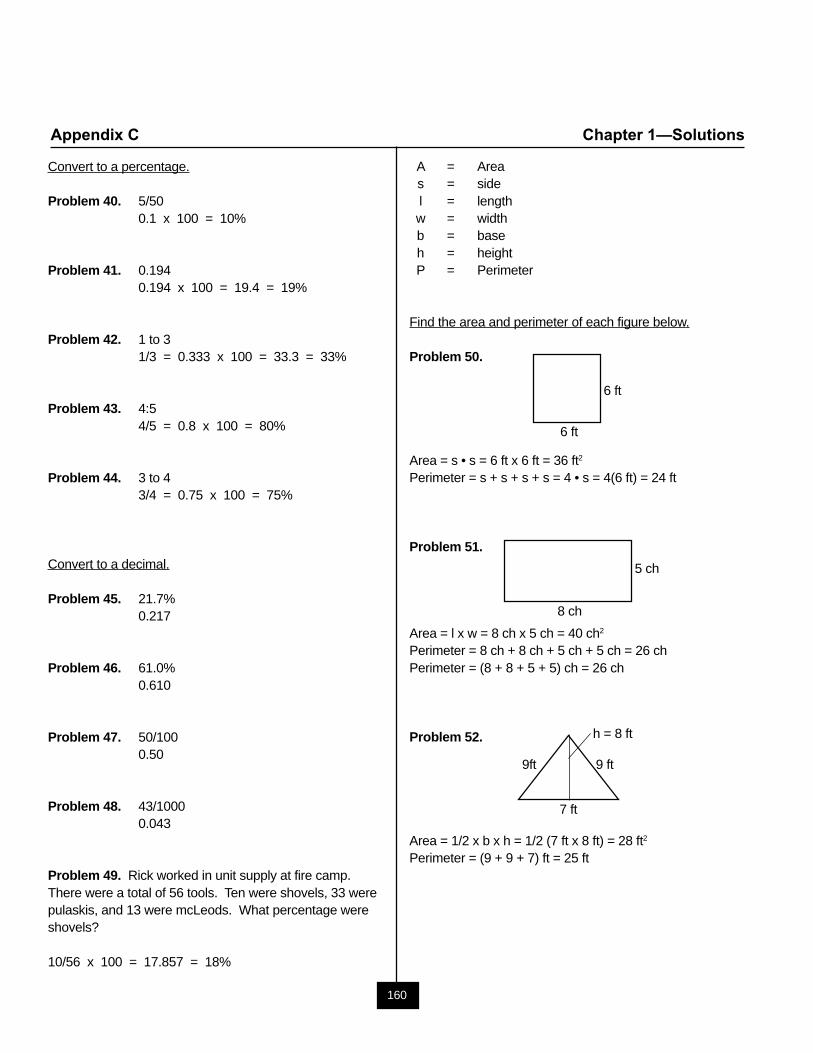
160
Appendix C Chapter 1—Solutions
Convert to a percentage.
Problem 40. 5/500.1 x 100 = 10%
Problem 41. 0.1940.194 x 100 = 19.4 = 19%
Problem 42. 1 to 31/3 = 0.333 x 100 = 33.3 = 33%
Problem 43. 4:54/5 = 0.8 x 100 = 80%
Problem 44. 3 to 43/4 = 0.75 x 100 = 75%
Convert to a decimal.
Problem 45. 21.7%0.217
Problem 46. 61.0%0.610
Problem 47. 50/1000.50
Problem 48. 43/10000.043
Problem 49. Rick worked in unit supply at fire camp.There were a total of 56 tools. Ten were shovels, 33 werepulaskis, and 13 were mcLeods. What percentage wereshovels?
10/56 x 100 = 17.857 = 18%
A = Areas = sidel = lengthw = widthb = baseh = heightP = Perimeter
Find the area and perimeter of each figure below.
Problem 50.
Area = s • s = 6 ft x 6 ft = 36 ft2
Perimeter = s + s + s + s = 4 • s = 4(6 ft) = 24 ft
Problem 51.
Area = l x w = 8 ch x 5 ch = 40 ch2
Perimeter = 8 ch + 8 ch + 5 ch + 5 ch = 26 chPerimeter = (8 + 8 + 5 + 5) ch = 26 ch
Problem 52.
Area = 1/2 x b x h = 1/2 (7 ft x 8 ft) = 28 ft2
Perimeter = (9 + 9 + 7) ft = 25 ft
6 ft
6 ft
8 ch
5 ch
9ft
h = 8 ft
9 ft
7 ft
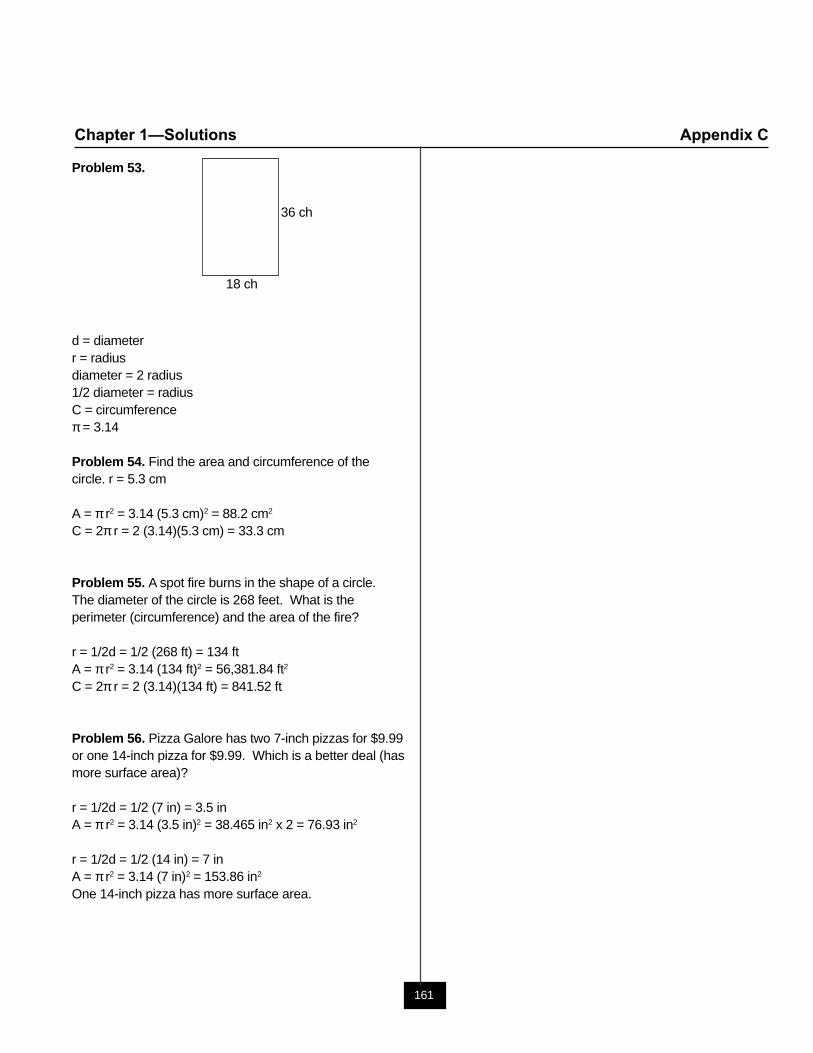
161
Chapter 1—Solutions Appendix C
Problem 53.
d = diameterr = radiusdiameter = 2 radius1/2 diameter = radiusC = circumferenceπ = 3.14
Problem 54. Find the area and circumference of thecircle. r = 5.3 cm
A = π r2 = 3.14 (5.3 cm)2 = 88.2 cm2
C = 2π r = 2 (3.14)(5.3 cm) = 33.3 cm
Problem 55. A spot fire burns in the shape of a circle.The diameter of the circle is 268 feet. What is theperimeter (circumference) and the area of the fire?
r = 1/2d = 1/2 (268 ft) = 134 ftA = π r2 = 3.14 (134 ft)2 = 56,381.84 ft2
C = 2π r = 2 (3.14)(134 ft) = 841.52 ft
Problem 56. Pizza Galore has two 7-inch pizzas for $9.99or one 14-inch pizza for $9.99. Which is a better deal (hasmore surface area)?
r = 1/2d = 1/2 (7 in) = 3.5 inA = π r2 = 3.14 (3.5 in)2 = 38.465 in2 x 2 = 76.93 in2
r = 1/2d = 1/2 (14 in) = 7 inA = π r2 = 3.14 (7 in)2 = 153.86 in2
One 14-inch pizza has more surface area.
18 ch
36 ch
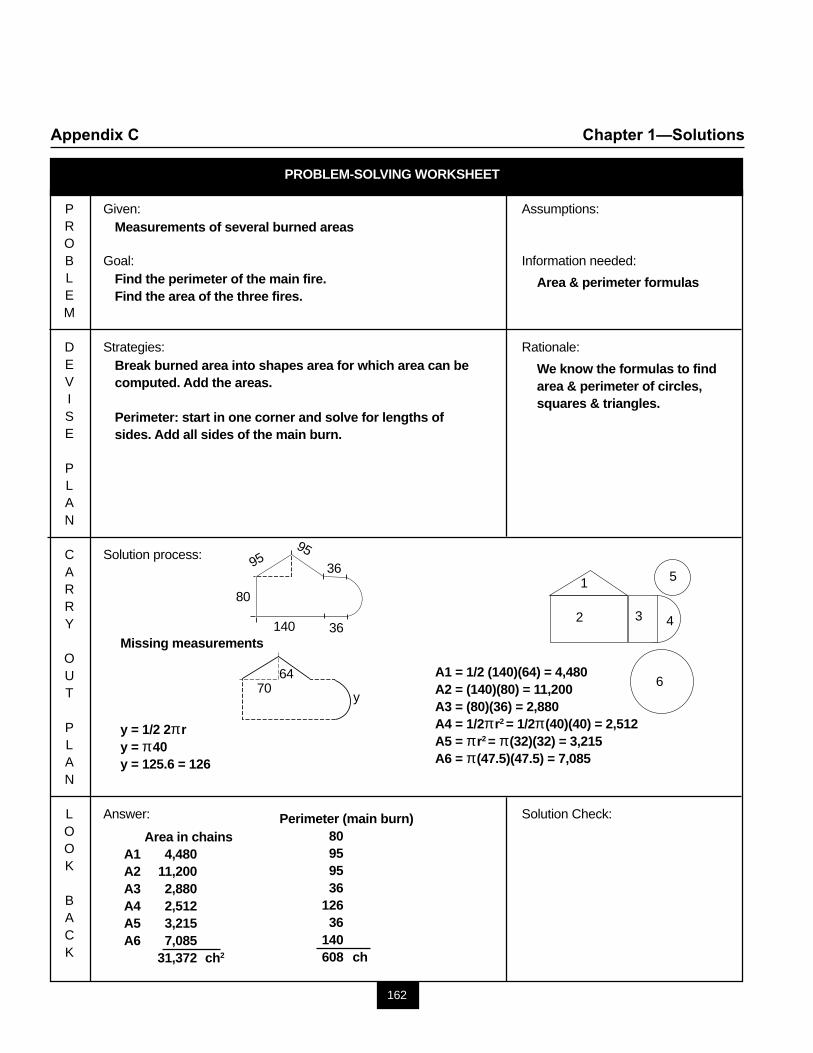
162
Appendix C Chapter 1—Solutions
PROBLEM-SOLVING WORKSHEET
P Given: Assumptions:ROB Goal: Information needed:LEM
D Strategies: Rationale:EVISE
PLAN
C Solution process:ARRY
OUT
PLAN
L Answer: Solution Check:OOK
BACK
Measurements of several burned areas
Find the perimeter of the main fire.Find the area of the three fires.
Break burned area into shapes area for which area can becomputed. Add the areas.
Perimeter: start in one corner and solve for lengths ofsides. Add all sides of the main burn.
Area & perimeter formulas
We know the formulas to findarea & perimeter of circles,squares & triangles.
Perimeter (main burn)80959536
12636
140 608 ch
Area in chainsA1 4,480A2 11,200A3 2,880A4 2,512A5 3,215A6 7,085
31,372 ch2
Missing measurements
y = 1/2 2π ry = π 40y = 125.6 = 126
A1 = 1/2 (140)(64) = 4,480A2 = (140)(80) = 11,200A3 = (80)(36) = 2,880A4 = 1/2π r2 = 1/2π (40)(40) = 2,512A5 = π r2 = π (32)(32) = 3,215A6 = π (47.5)(47.5) = 7,085
1
2 3 4
5
6
80
36
36140
9595
6470
y
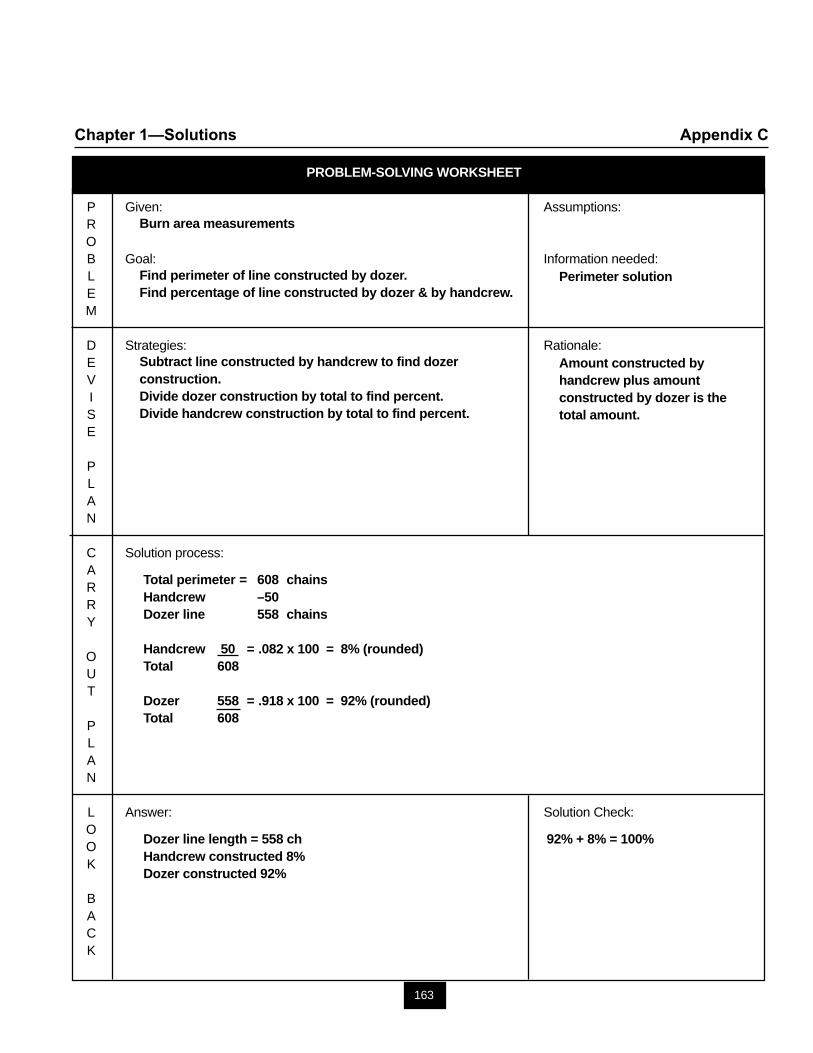
163
Chapter 1—Solutions Appendix C
PROBLEM-SOLVING WORKSHEET
P Given: Assumptions:ROB Goal: Information needed:LEM
D Strategies: Rationale:EVISE
PLAN
C Solution process:ARRY
OUT
PLAN
L Answer: Solution Check:OOK
BACK
Burn area measurements
Find perimeter of line constructed by dozer.Find percentage of line constructed by dozer & by handcrew.
Subtract line constructed by handcrew to find dozerconstruction.Divide dozer construction by total to find percent.Divide handcrew construction by total to find percent.
Perimeter solution
Amount constructed byhandcrew plus amountconstructed by dozer is thetotal amount.
Total perimeter = 608 chainsHandcrew –50Dozer line 558 chains
Handcrew 50 = .082 x 100 = 8% (rounded)Total 608
Dozer 558 = .918 x 100 = 92% (rounded)Total 608
Dozer line length = 558 ch 92% + 8% = 100%Handcrew constructed 8%Dozer constructed 92%
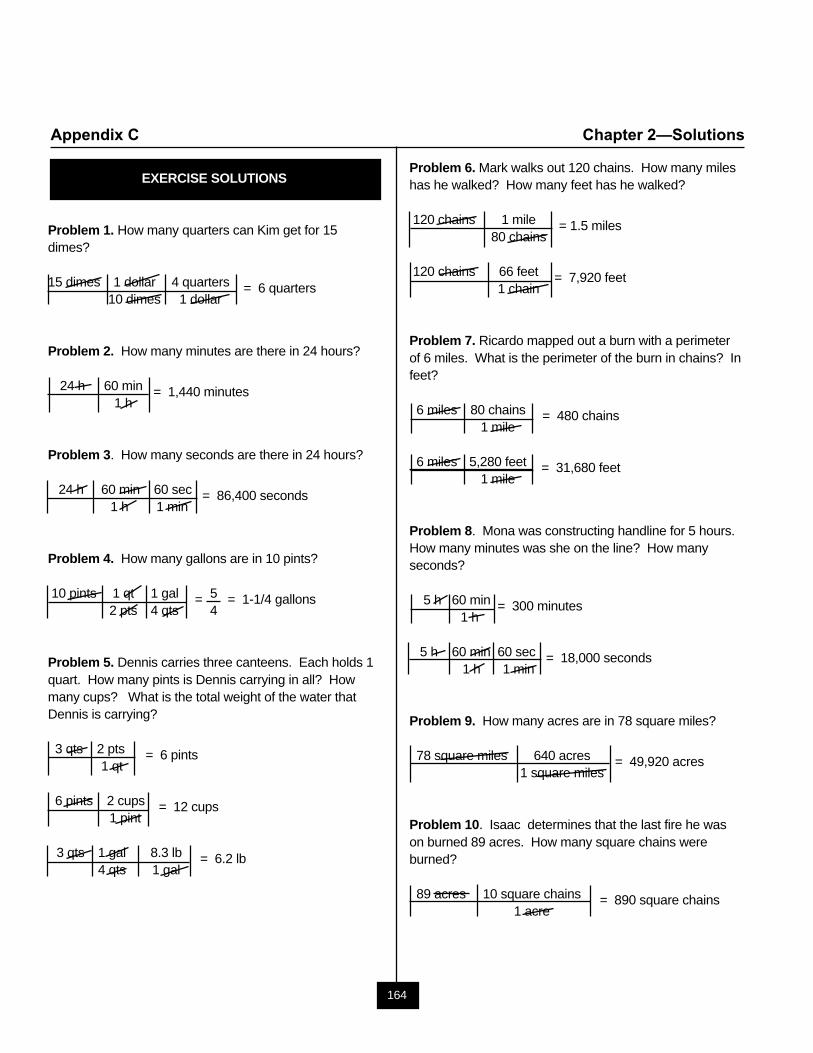
164
Appendix C Chapter 2—Solutions
EXERCISE SOLUTIONS
Problem 1. How many quarters can Kim get for 15dimes?
15 dimes 1 dollar 4 quarters = 6 quarters10 dimes 1 dollar
Problem 2. How many minutes are there in 24 hours?
24 h 60 min = 1,440 minutes1 h
Problem 3. How many seconds are there in 24 hours?
24 h 60 min 60 sec = 86,400 seconds1 h 1 min
Problem 4. How many gallons are in 10 pints?
10 pints 1 qt 1 gal = 5 = 1-1/4 gallons2 pts 4 qts 4
Problem 5. Dennis carries three canteens. Each holds 1quart. How many pints is Dennis carrying in all? Howmany cups? What is the total weight of the water thatDennis is carrying?
3 qts 2 pts = 6 pints1 qt
6 pints 2 cups = 12 cups1 pint
3 qts 1 gal 8.3 lb = 6.2 lb4 qts 1 gal
Problem 6. Mark walks out 120 chains. How many mileshas he walked? How many feet has he walked?
120 chains 1 mile = 1.5 miles80 chains
120 chains 66 feet = 7,920 feet1 chain
Problem 7. Ricardo mapped out a burn with a perimeterof 6 miles. What is the perimeter of the burn in chains? Infeet?
6 miles 80 chains = 480 chains1 mile
6 miles 5,280 feet = 31,680 feet1 mile
Problem 8. Mona was constructing handline for 5 hours.How many minutes was she on the line? How manyseconds?
5 h 60 min = 300 minutes1 h
5 h 60 min 60 sec = 18,000 seconds1 h 1 min
Problem 9. How many acres are in 78 square miles?
78 square miles 640 acres = 49,920 acres1 square miles
Problem 10. Isaac determines that the last fire he wason burned 89 acres. How many square chains wereburned?
89 acres 10 square chains = 890 square chains1 acre

165
Chapter 2—Solutions Appendix C
Problem 11. It is 99 degrees Fahrenheit outside. What isthe temperature in degrees Celsius? See table 2.2.
C = 5/9 x (99-32)= 5/9 x (67)= 335/9= 37 degrees Celsius
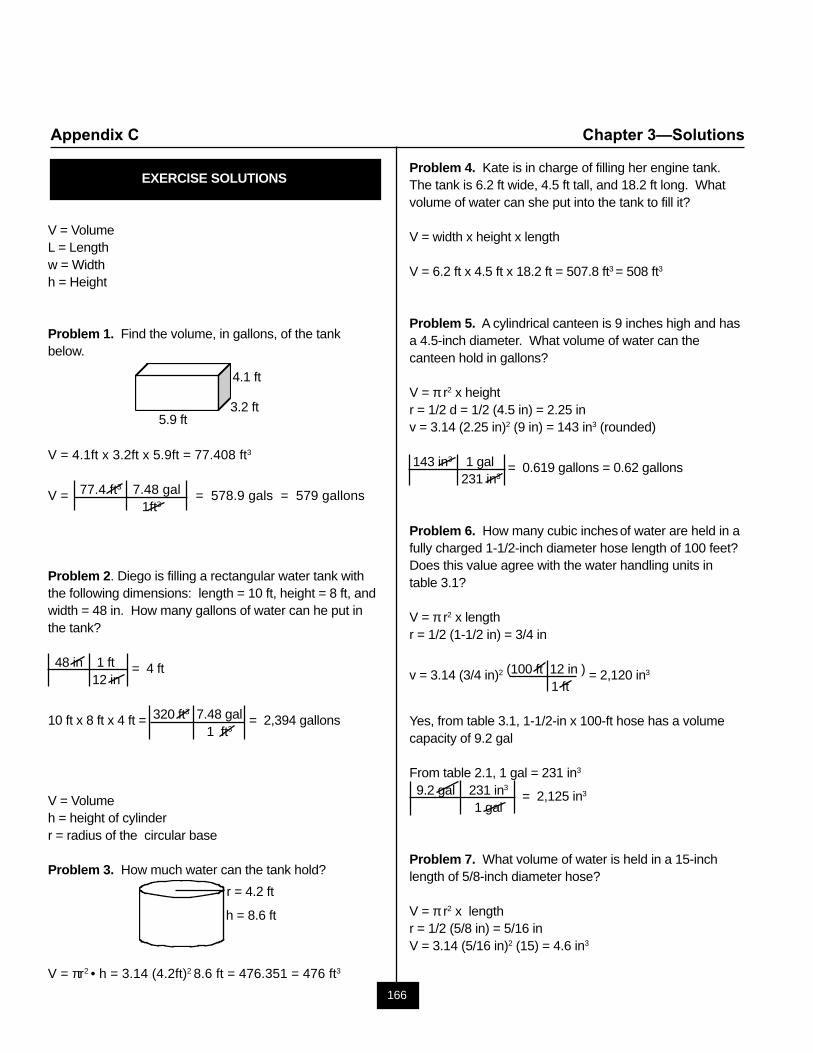
166
Appendix C Chapter 3—Solutions
EXERCISE SOLUTIONS
V = VolumeL = Lengthw = Widthh = Height
Problem 1. Find the volume, in gallons, of the tankbelow.
V = 4.1ft x 3.2ft x 5.9ft = 77.408 ft3
V = 77.4 ft3 7.48 gal = 578.9 gals = 579 gallons 1ft3
Problem 2. Diego is filling a rectangular water tank withthe following dimensions: length = 10 ft, height = 8 ft, andwidth = 48 in. How many gallons of water can he put inthe tank?
48 in 1 ft = 4 ft12 in
10 ft x 8 ft x 4 ft = 320 ft3 7.48 gal = 2,394 gallons1 ft3
V = Volumeh = height of cylinderr = radius of the circular base
Problem 3. How much water can the tank hold?
V = πr2 • h = 3.14 (4.2ft)2 8.6 ft = 476.351 = 476 ft3
Problem 4. Kate is in charge of filling her engine tank.The tank is 6.2 ft wide, 4.5 ft tall, and 18.2 ft long. Whatvolume of water can she put into the tank to fill it?
V = width x height x length
V = 6.2 ft x 4.5 ft x 18.2 ft = 507.8 ft3 = 508 ft3
Problem 5. A cylindrical canteen is 9 inches high and hasa 4.5-inch diameter. What volume of water can thecanteen hold in gallons?
V = π r2 x heightr = 1/2 d = 1/2 (4.5 in) = 2.25 inv = 3.14 (2.25 in)2 (9 in) = 143 in3 (rounded)
143 in3 1 gal = 0.619 gallons = 0.62 gallons231 in3
Problem 6. How many cubic inches of water are held in afully charged 1-1/2-inch diameter hose length of 100 feet?Does this value agree with the water handling units intable 3.1?
V = π r2 x lengthr = 1/2 (1-1/2 in) = 3/4 in
v = 3.14 (3/4 in)2 (100 ft 12 in ) = 2,120 in3
1 ft
Yes, from table 3.1, 1-1/2-in x 100-ft hose has a volumecapacity of 9.2 gal
From table 2.1, 1 gal = 231 in3
9.2 gal 231 in3 = 2,125 in3
1 gal
Problem 7. What volume of water is held in a 15-inchlength of 5/8-inch diameter hose?
V = π r2 x lengthr = 1/2 (5/8 in) = 5/16 inV = 3.14 (5/16 in)2 (15) = 4.6 in3
4.1 ft
3.2 ft 5.9 ft
h = 8.6 ft
r = 4.2 ft
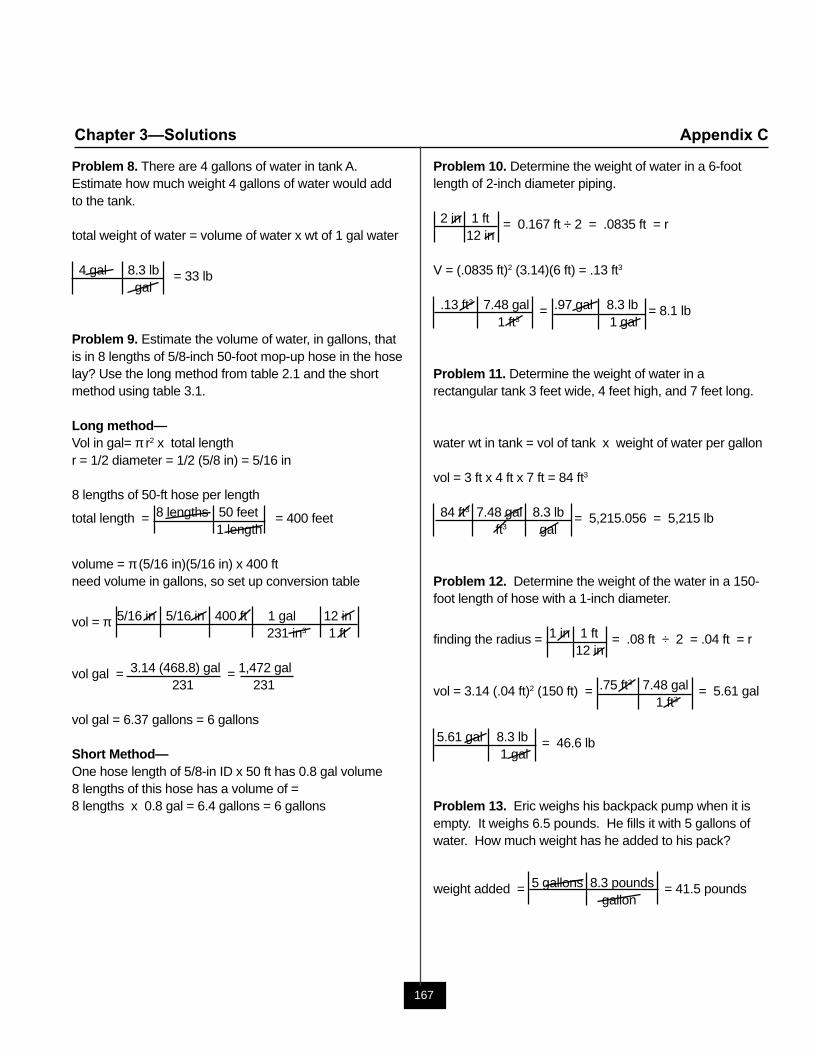
167
Chapter 3—Solutions Appendix C
Problem 8. There are 4 gallons of water in tank A.Estimate how much weight 4 gallons of water would addto the tank.
total weight of water = volume of water x wt of 1 gal water
4 gal 8.3 lb = 33 lbgal
Problem 9. Estimate the volume of water, in gallons, thatis in 8 lengths of 5/8-inch 50-foot mop-up hose in the hoselay? Use the long method from table 2.1 and the shortmethod using table 3.1.
Long method—Vol in gal= π r2 x total lengthr = 1/2 diameter = 1/2 (5/8 in) = 5/16 in
8 lengths of 50-ft hose per length
total length = 8 lengths 50 feet = 400 feet 1 length
volume = π (5/16 in)(5/16 in) x 400 ftneed volume in gallons, so set up conversion table
vol = π 5/16 in 5/16 in 400 ft 1 gal 12 in231 in3 1 ft
vol gal = 3.14 (468.8) gal = 1,472 gal231 231
vol gal = 6.37 gallons = 6 gallons
Short Method—One hose length of 5/8-in ID x 50 ft has 0.8 gal volume8 lengths of this hose has a volume of =8 lengths x 0.8 gal = 6.4 gallons = 6 gallons
Problem 10. Determine the weight of water in a 6-footlength of 2-inch diameter piping.
2 in 1 ft = 0.167 ft ÷ 2 = .0835 ft = r12 in
V = (.0835 ft)2 (3.14)(6 ft) = .13 ft3
.13 ft3 7.48 gal = .97 gal 8.3 lb = 8.1 lb1 ft3 1 gal
Problem 11. Determine the weight of water in arectangular tank 3 feet wide, 4 feet high, and 7 feet long.
water wt in tank = vol of tank x weight of water per gallon
vol = 3 ft x 4 ft x 7 ft = 84 ft3
84 ft3 7.48 gal 8.3 lb = 5,215.056 = 5,215 lbft3 gal
Problem 12. Determine the weight of the water in a 150-foot length of hose with a 1-inch diameter.
finding the radius = 1 in 1 ft = .08 ft ÷ 2 = .04 ft = r12 in
vol = 3.14 (.04 ft)2 (150 ft) = .75 ft3 7.48 gal = 5.61 gal1 ft3
5.61 gal 8.3 lb = 46.6 lb1 gal
Problem 13. Eric weighs his backpack pump when it isempty. It weighs 6.5 pounds. He fills it with 5 gallons ofwater. How much weight has he added to his pack?
weight added = 5 gallons 8.3 pounds = 41.5 pounds gallon
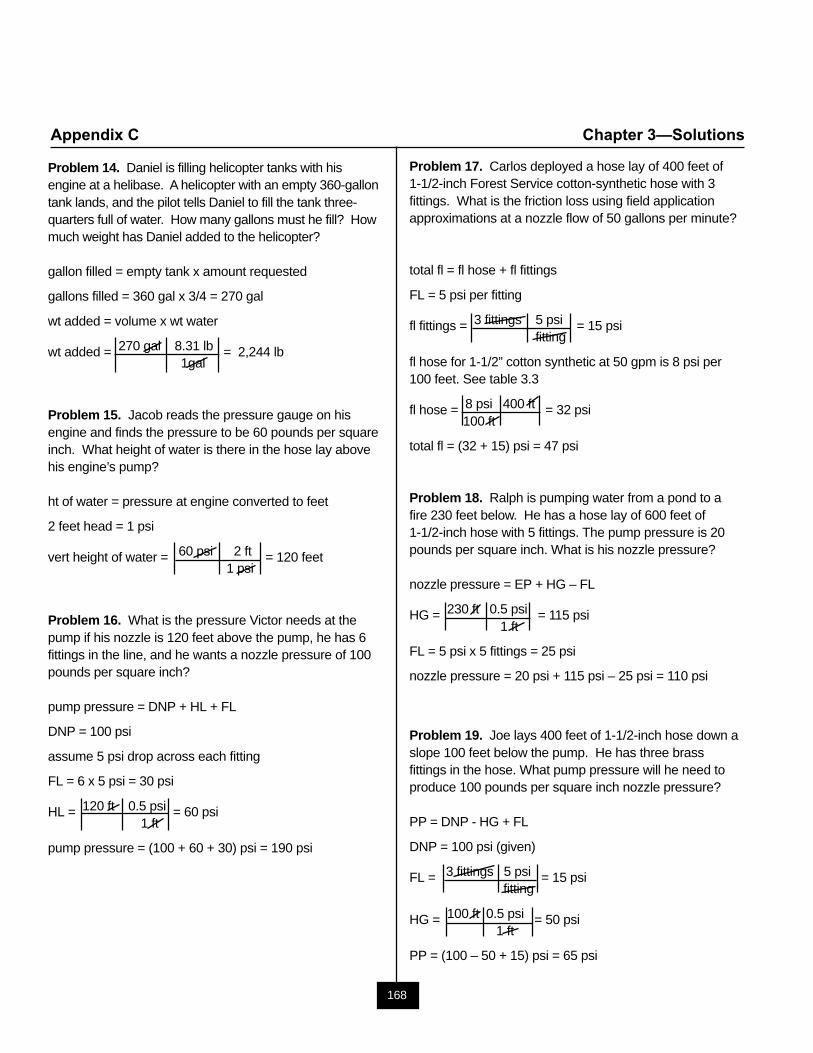
168
Appendix C Chapter 3—Solutions
Problem 14. Daniel is filling helicopter tanks with hisengine at a helibase. A helicopter with an empty 360-gallontank lands, and the pilot tells Daniel to fill the tank three-quarters full of water. How many gallons must he fill? Howmuch weight has Daniel added to the helicopter?
gallon filled = empty tank x amount requested
gallons filled = 360 gal x 3/4 = 270 gal
wt added = volume x wt water
wt added = 270 gal 8.31 lb = 2,244 lb1gal
Problem 15. Jacob reads the pressure gauge on hisengine and finds the pressure to be 60 pounds per squareinch. What height of water is there in the hose lay abovehis engine’s pump?
ht of water = pressure at engine converted to feet
2 feet head = 1 psi
vert height of water = 60 psi 2 ft = 120 feet1 psi
Problem 16. What is the pressure Victor needs at thepump if his nozzle is 120 feet above the pump, he has 6fittings in the line, and he wants a nozzle pressure of 100pounds per square inch?
pump pressure = DNP + HL + FL
DNP = 100 psi
assume 5 psi drop across each fitting
FL = 6 x 5 psi = 30 psi
HL = 120 ft 0.5 psi = 60 psi1 ft
pump pressure = (100 + 60 + 30) psi = 190 psi
Problem 17. Carlos deployed a hose lay of 400 feet of1-1/2-inch Forest Service cotton-synthetic hose with 3fittings. What is the friction loss using field applicationapproximations at a nozzle flow of 50 gallons per minute?
total fl = fl hose + fl fittings
FL = 5 psi per fitting
fl fittings = 3 fittings 5 psi = 15 psifitting
fl hose for 1-1/2” cotton synthetic at 50 gpm is 8 psi per100 feet. See table 3.3
fl hose = 8 psi 400 ft = 32 psi100 ft
total fl = (32 + 15) psi = 47 psi
Problem 18. Ralph is pumping water from a pond to afire 230 feet below. He has a hose lay of 600 feet of1-1/2-inch hose with 5 fittings. The pump pressure is 20pounds per square inch. What is his nozzle pressure?
nozzle pressure = EP + HG – FL
HG = 230 ft 0.5 psi = 115 psi1 ft
FL = 5 psi x 5 fittings = 25 psi
nozzle pressure = 20 psi + 115 psi – 25 psi = 110 psi
Problem 19. Joe lays 400 feet of 1-1/2-inch hose down aslope 100 feet below the pump. He has three brassfittings in the hose. What pump pressure will he need toproduce 100 pounds per square inch nozzle pressure?
PP = DNP - HG + FL
DNP = 100 psi (given)
FL = 3 fittings 5 psi = 15 psifitting
HG = 100 ft 0.5 psi = 50 psi1 ft
PP = (100 – 50 + 15) psi = 65 psi
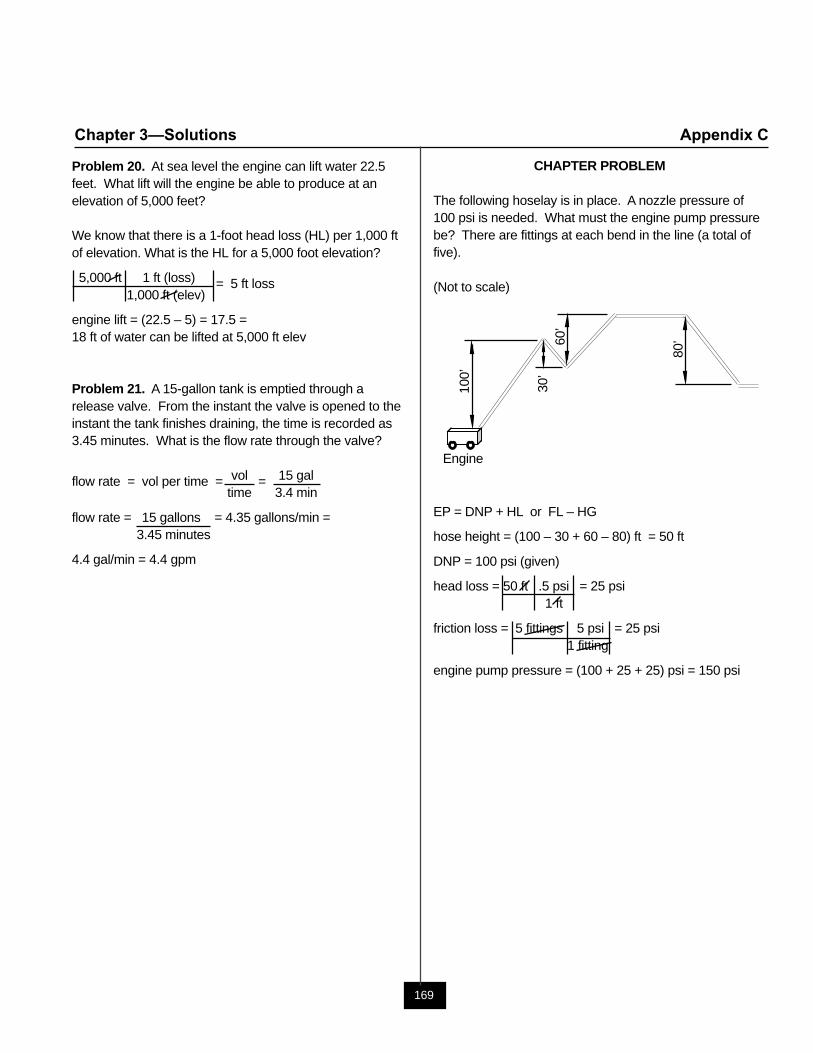
169
Chapter 3—Solutions Appendix C
Problem 20. At sea level the engine can lift water 22.5feet. What lift will the engine be able to produce at anelevation of 5,000 feet?
We know that there is a 1-foot head loss (HL) per 1,000 ftof elevation. What is the HL for a 5,000 foot elevation?
5,000 ft 1 ft (loss) = 5 ft loss 1,000 ft (elev)
engine lift = (22.5 – 5) = 17.5 =18 ft of water can be lifted at 5,000 ft elev
Problem 21. A 15-gallon tank is emptied through arelease valve. From the instant the valve is opened to theinstant the tank finishes draining, the time is recorded as3.45 minutes. What is the flow rate through the valve?
flow rate = vol per time = vol = 15 galtime 3.4 min
flow rate = 15 gallons = 4.35 gallons/min =3.45 minutes
4.4 gal/min = 4.4 gpm
CHAPTER PROBLEM
The following hoselay is in place. A nozzle pressure of100 psi is needed. What must the engine pump pressurebe? There are fittings at each bend in the line (a total offive).
(Not to scale)
EP = DNP + HL or FL – HG
hose height = (100 – 30 + 60 – 80) ft = 50 ft
DNP = 100 psi (given)
head loss = 50 ft .5 psi = 25 psi1 ft
friction loss = 5 fittings 5 psi = 25 psi1 fitting
engine pump pressure = (100 + 25 + 25) psi = 150 psi
60’
80’
100’
30’
Engine
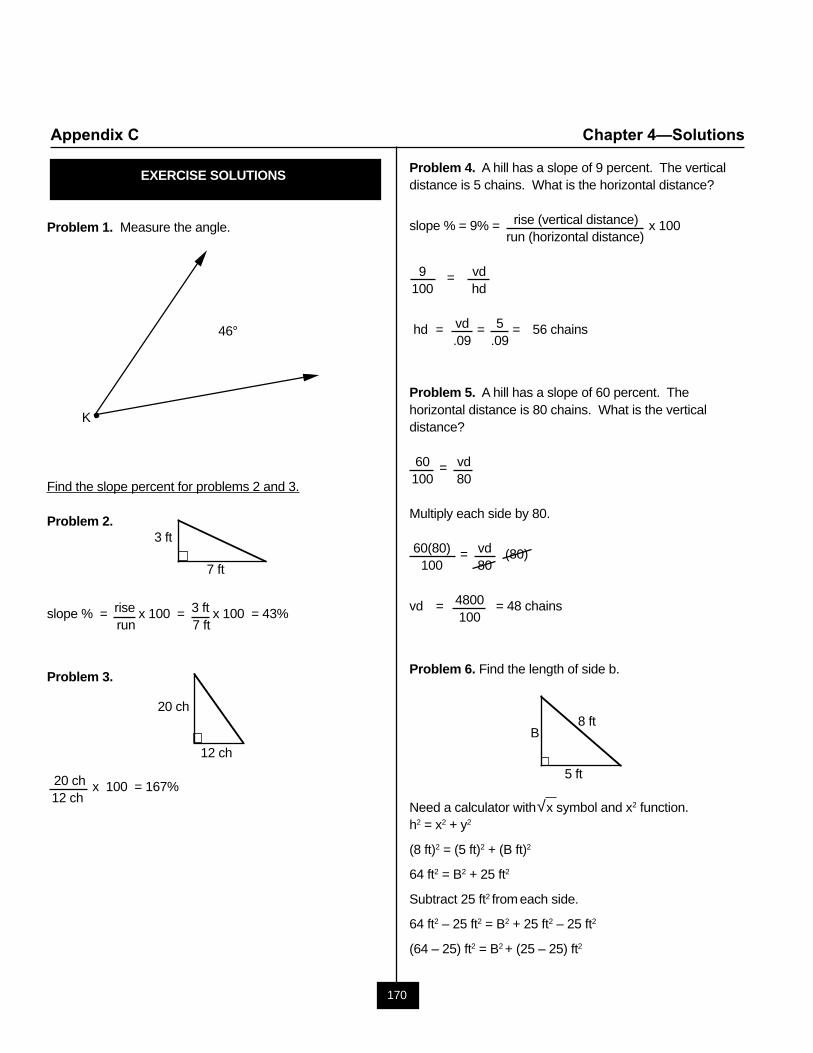
170
Appendix C Chapter 4—Solutions
EXERCISE SOLUTIONS
Problem 1. Measure the angle.
46°
K
Find the slope percent for problems 2 and 3.
Problem 2.
slope % = rise x 100 = 3 ft x 100 = 43%run 7 ft
Problem 3.
20 ch x 100 = 167%12 ch
Problem 4. A hill has a slope of 9 percent. The verticaldistance is 5 chains. What is the horizontal distance?
slope % = 9% = rise (vertical distance) x 100run (horizontal distance)
9 = vd100 hd
hd = vd = 5 = 56 chains.09 .09
Problem 5. A hill has a slope of 60 percent. Thehorizontal distance is 80 chains. What is the verticaldistance?
60 = vd100 80
Multiply each side by 80.
60(80) = vd (80)100 80
vd = 4800 = 48 chains100
Problem 6. Find the length of side b.
Need a calculator with x symbol and x2 function.h2 = x2 + y2
(8 ft)2 = (5 ft)2 + (B ft)2
64 ft2 = B2 + 25 ft2
Subtract 25 ft2 from each side.
64 ft2 – 25 ft2 = B2 + 25 ft2 – 25 ft2
(64 – 25) ft2 = B2 + (25 – 25) ft2
7 ft
3 ft
12 ch
20 ch
B8 ft
5 ft
√
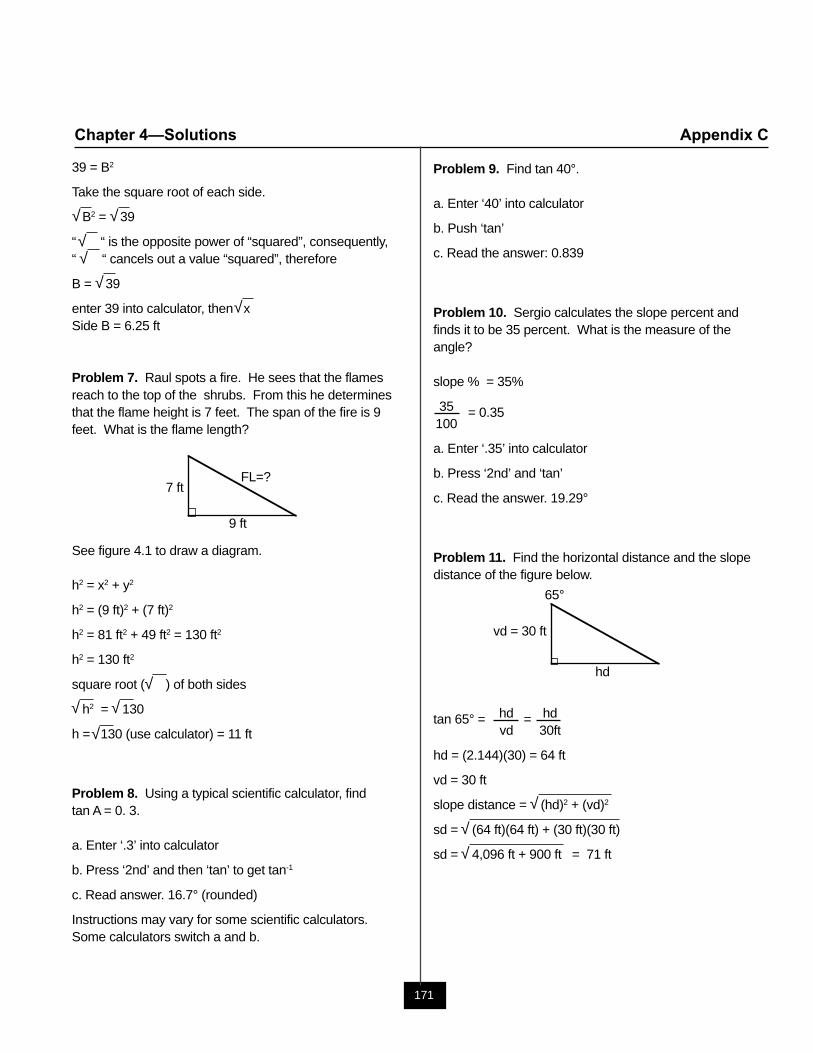
171
Chapter 4—Solutions Appendix C
Problem 9. Find tan 40°.
a. Enter ‘40’ into calculator
b. Push ‘tan’
c. Read the answer: 0.839
Problem 10. Sergio calculates the slope percent andfinds it to be 35 percent. What is the measure of theangle?
slope % = 35%
35 = 0.35100
a. Enter ‘.35’ into calculator
b. Press ‘2nd’ and ‘tan’
c. Read the answer. 19.29°
Problem 11. Find the horizontal distance and the slopedistance of the figure below.
tan 65° = hd = hdvd 30ft
hd = (2.144)(30) = 64 ft
vd = 30 ft
slope distance = (hd)2 + (vd)2
sd = (64 ft)(64 ft) + (30 ft)(30 ft)
sd = 4,096 ft + 900 ft = 71 ft
39 = B2
Take the square root of each side.
B2 = 39
“ “ is the opposite power of “squared”, consequently,“ “ cancels out a value “squared”, therefore
B = 39
enter 39 into calculator, then xSide B = 6.25 ft
Problem 7. Raul spots a fire. He sees that the flamesreach to the top of the shrubs. From this he determinesthat the flame height is 7 feet. The span of the fire is 9feet. What is the flame length?
See figure 4.1 to draw a diagram.
h2 = x2 + y2
h2 = (9 ft)2 + (7 ft)2
h2 = 81 ft2 + 49 ft2 = 130 ft2
h2 = 130 ft2
square root ( ) of both sides
h2 = 130
h = 130 (use calculator) = 11 ft
Problem 8. Using a typical scientific calculator, findtan A = 0. 3.
a. Enter ‘.3’ into calculator
b. Press ‘2nd’ and then ‘tan’ to get tan-1
c. Read answer. 16.7° (rounded)
Instructions may vary for some scientific calculators.Some calculators switch a and b.
√ √√√
√√
FL=?7 ft
9 ft
√√ √
√
65°
vd = 30 ft
hd
√√√
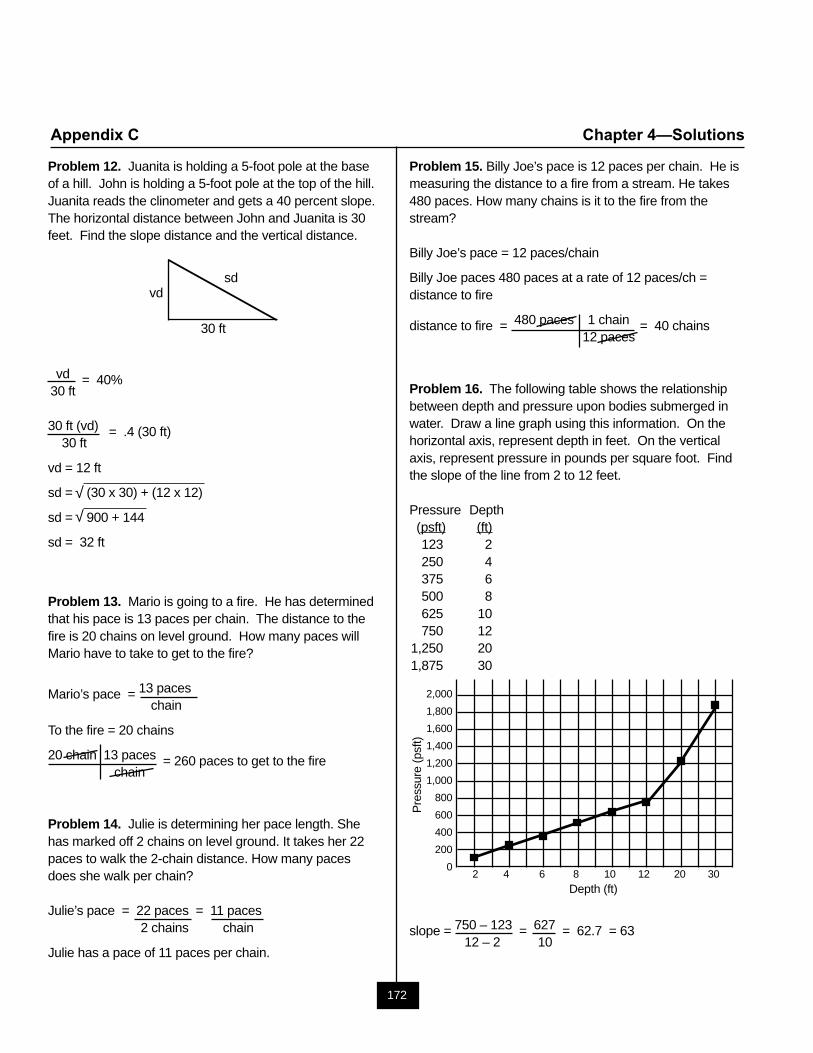
172
Appendix C Chapter 4—Solutions
Problem 12. Juanita is holding a 5-foot pole at the baseof a hill. John is holding a 5-foot pole at the top of the hill.Juanita reads the clinometer and gets a 40 percent slope.The horizontal distance between John and Juanita is 30feet. Find the slope distance and the vertical distance.
vd = 40%30 ft
30 ft (vd) = .4 (30 ft)30 ft
vd = 12 ft
sd = (30 x 30) + (12 x 12)
sd = 900 + 144
sd = 32 ft
Problem 13. Mario is going to a fire. He has determinedthat his pace is 13 paces per chain. The distance to thefire is 20 chains on level ground. How many paces willMario have to take to get to the fire?
Mario’s pace = 13 paceschain
To the fire = 20 chains
20 chain 13 paces = 260 paces to get to the fire chain
Problem 14. Julie is determining her pace length. Shehas marked off 2 chains on level ground. It takes her 22paces to walk the 2-chain distance. How many pacesdoes she walk per chain?
Julie’s pace = 22 paces = 11 paces2 chains chain
Julie has a pace of 11 paces per chain.
Problem 15. Billy Joe’s pace is 12 paces per chain. He ismeasuring the distance to a fire from a stream. He takes480 paces. How many chains is it to the fire from thestream?
Billy Joe’s pace = 12 paces/chain
Billy Joe paces 480 paces at a rate of 12 paces/ch =distance to fire
distance to fire = 480 paces 1 chain = 40 chains12 paces
Problem 16. The following table shows the relationshipbetween depth and pressure upon bodies submerged inwater. Draw a line graph using this information. On thehorizontal axis, represent depth in feet. On the verticalaxis, represent pressure in pounds per square foot. Findthe slope of the line from 2 to 12 feet.
Pressure Depth (psft) (ft)
123 2250 4375 6500 8625 10750 12
1,250 201,875 30
slope = 750 – 123 = 627 = 62.7 = 6312 – 2 10
sdvd
30 ft
√√
2,000
1,800
1,600
1,400
1,200
1,000
800
600
400
200
02 4 6 8 10 12 20 30
Depth (ft)
Pre
ssur
e (p
sft)
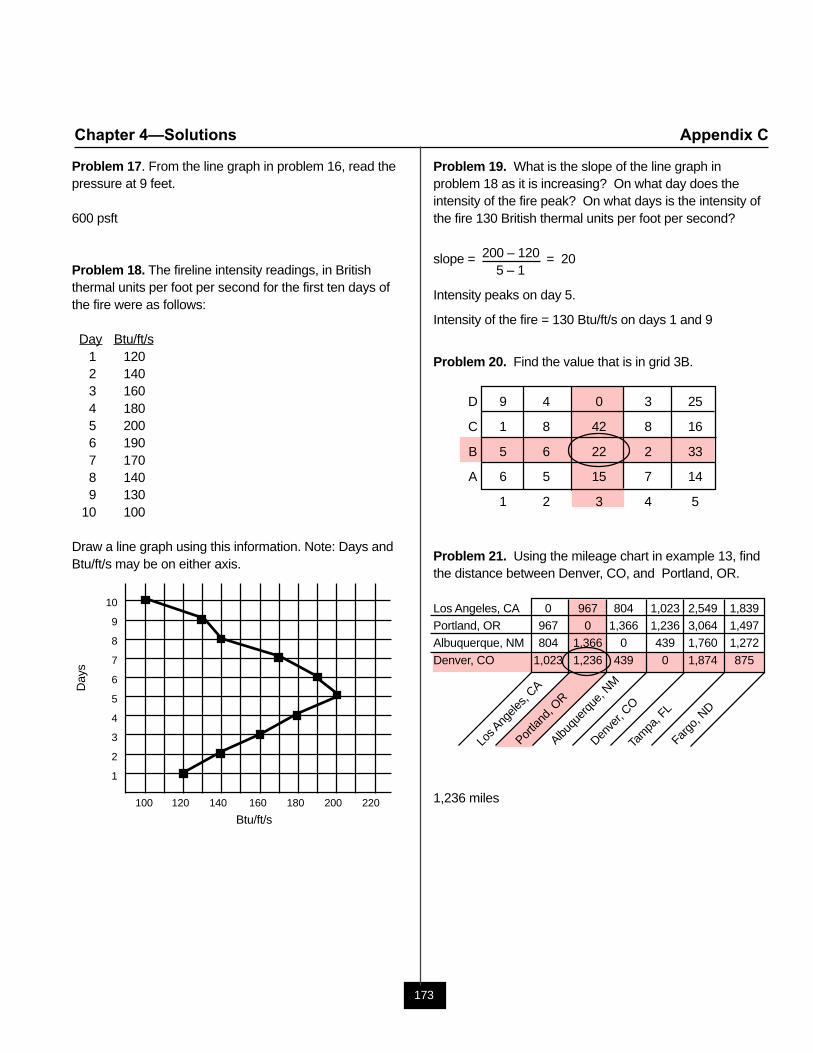
173
Chapter 4—Solutions Appendix C
Problem 17. From the line graph in problem 16, read thepressure at 9 feet.
600 psft
Problem 18. The fireline intensity readings, in Britishthermal units per foot per second for the first ten days ofthe fire were as follows:
Day Btu/ft/s1 1202 1403 1604 1805 2006 1907 1708 1409 130
10 100
Draw a line graph using this information. Note: Days andBtu/ft/s may be on either axis.
100 120 140 160 180 200 220
10
9
8
7
6
5
4
3
2
1
Btu/ft/s
Day
s
Problem 19. What is the slope of the line graph inproblem 18 as it is increasing? On what day does theintensity of the fire peak? On what days is the intensity ofthe fire 130 British thermal units per foot per second?
slope = 200 – 120 = 205 – 1
Intensity peaks on day 5.
Intensity of the fire = 130 Btu/ft/s on days 1 and 9
Problem 20. Find the value that is in grid 3B.
D 9 4 0 3 25
C 1 8 42 8 16
B 5 6 22 2 33
A 6 5 15 7 14
1 2 3 4 5
Problem 21. Using the mileage chart in example 13, findthe distance between Denver, CO, and Portland, OR.
Los Angeles, CA 0 967 804 1,023 2,549 1,839Portland, OR 967 0 1,366 1,236 3,064 1,497Albuquerque, NM 804 1,366 0 439 1,760 1,272
Denver, CO 1,023 1,236 439 0 1,874 875
1,236 miles
Los A
ngele
s, CA
Portla
nd, O
R
Denve
r, CO
Tam
pa, F
L
Albuqu
erqu
e, NM
Fargo
, ND
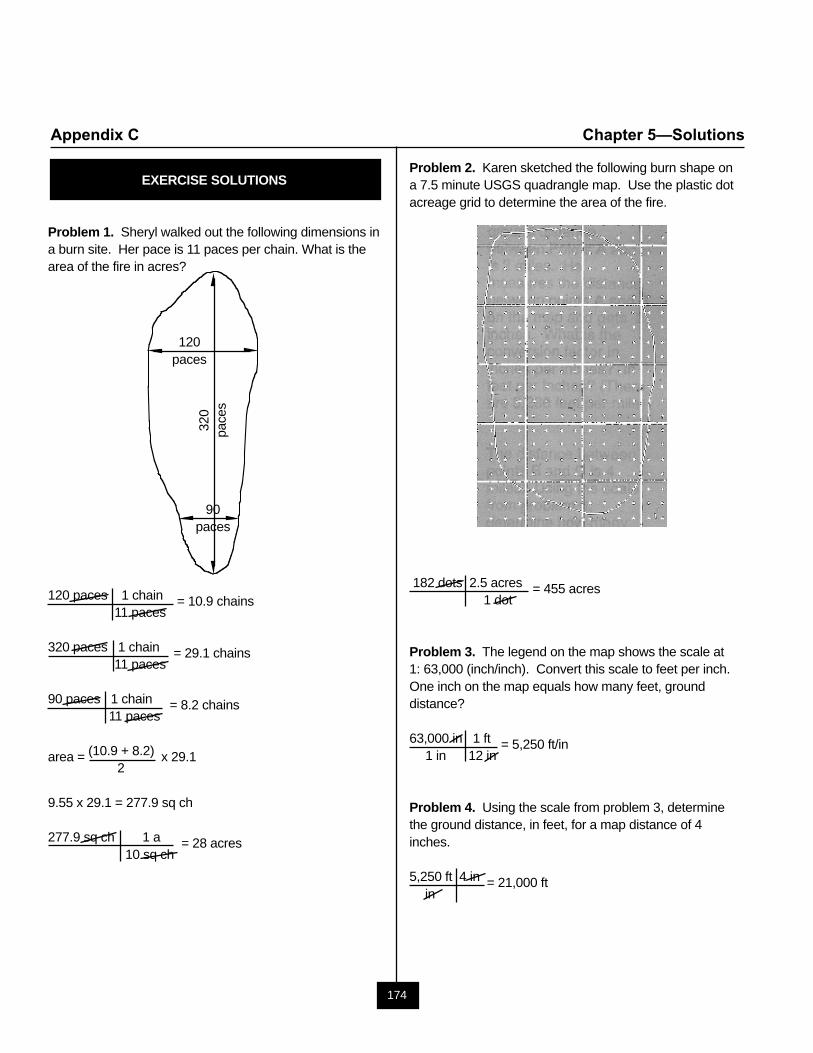
174
Appendix C Chapter 5—Solutions
EXERCISE SOLUTIONS
Problem 1. Sheryl walked out the following dimensions ina burn site. Her pace is 11 paces per chain. What is thearea of the fire in acres?
120 paces 1 chain = 10.9 chains11 paces
320 paces 1 chain = 29.1 chains11 paces
90 paces 1 chain = 8.2 chains11 paces
area = (10.9 + 8.2) x 29.12
9.55 x 29.1 = 277.9 sq ch
277.9 sq ch 1 a = 28 acres10 sq ch
120paces
320
pace
s
90paces
Problem 2. Karen sketched the following burn shape ona 7.5 minute USGS quadrangle map. Use the plastic dotacreage grid to determine the area of the fire.
182 dots 2.5 acres = 455 acres1 dot
Problem 3. The legend on the map shows the scale at1: 63,000 (inch/inch). Convert this scale to feet per inch.One inch on the map equals how many feet, grounddistance?
63,000 in 1 ft = 5,250 ft/in1 in 12 in
Problem 4. Using the scale from problem 3, determinethe ground distance, in feet, for a map distance of 4inches.
5,250 ft 4 in = 21,000 ftin
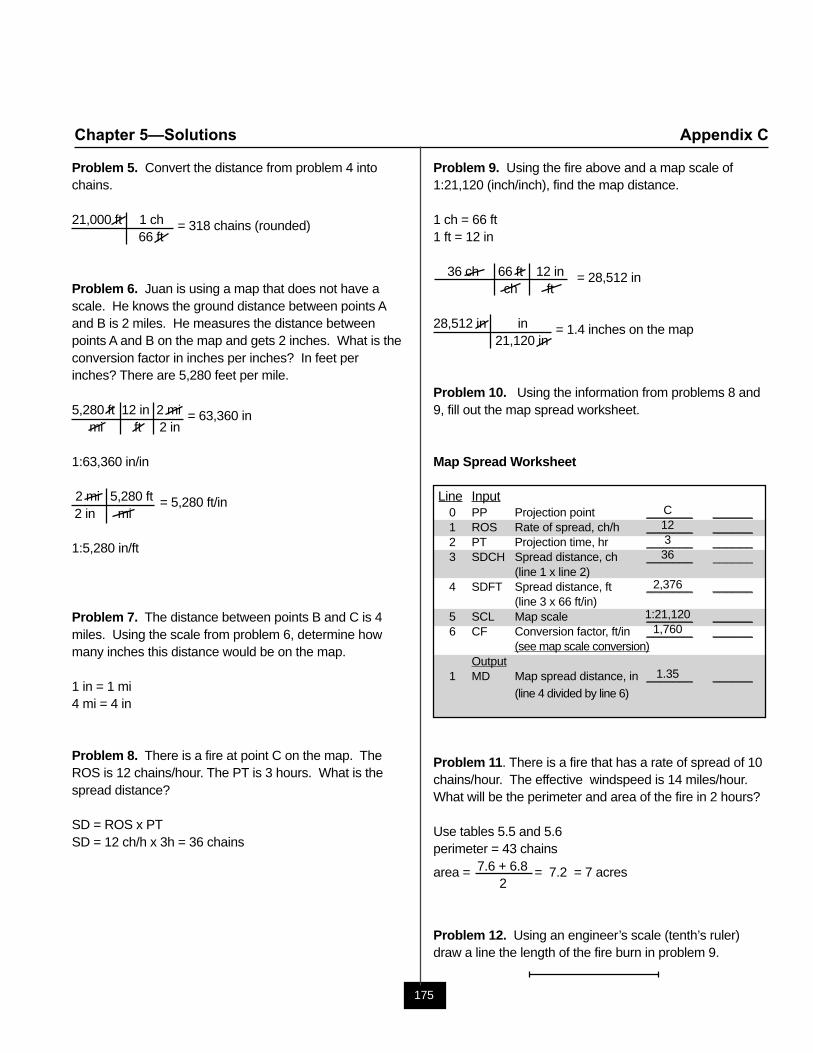
175
Chapter 5—Solutions Appendix C
C123
36
2,376
1:21,1201,760
1.35
Problem 5. Convert the distance from problem 4 intochains.
21,000 ft 1 ch = 318 chains (rounded)66 ft
Problem 6. Juan is using a map that does not have ascale. He knows the ground distance between points Aand B is 2 miles. He measures the distance betweenpoints A and B on the map and gets 2 inches. What is theconversion factor in inches per inches? In feet perinches? There are 5,280 feet per mile.
5,280 ft 12 in 2 mi = 63,360 inmi ft 2 in
1:63,360 in/in
2 mi 5,280 ft = 5,280 ft/in2 in mi
1:5,280 in/ft
Problem 7. The distance between points B and C is 4miles. Using the scale from problem 6, determine howmany inches this distance would be on the map.
1 in = 1 mi4 mi = 4 in
Problem 8. There is a fire at point C on the map. TheROS is 12 chains/hour. The PT is 3 hours. What is thespread distance?
SD = ROS x PTSD = 12 ch/h x 3h = 36 chains
Problem 9. Using the fire above and a map scale of1:21,120 (inch/inch), find the map distance.
1 ch = 66 ft1 ft = 12 in
36 ch 66 ft 12 in = 28,512 inch ft
28,512 in in = 1.4 inches on the map21,120 in
Problem 10. Using the information from problems 8 and9, fill out the map spread worksheet.
Map Spread Worksheet
Line Input0 PP Projection point _______ ______1 ROS Rate of spread, ch/h _______ ______2 PT Projection time, hr _______ ______3 SDCH Spread distance, ch _______ ______
(line 1 x line 2)4 SDFT Spread distance, ft _______ ______
(line 3 x 66 ft/in)5 SCL Map scale _______ ______6 CF Conversion factor, ft/in _______ ______
(see map scale conversion)Output
1 MD Map spread distance, in _______ ______(line 4 divided by line 6)
Problem 11. There is a fire that has a rate of spread of 10chains/hour. The effective windspeed is 14 miles/hour.What will be the perimeter and area of the fire in 2 hours?
Use tables 5.5 and 5.6perimeter = 43 chains
area = 7.6 + 6.8 = 7.2 = 7 acres2
Problem 12. Using an engineer’s scale (tenth’s ruler)draw a line the length of the fire burn in problem 9.
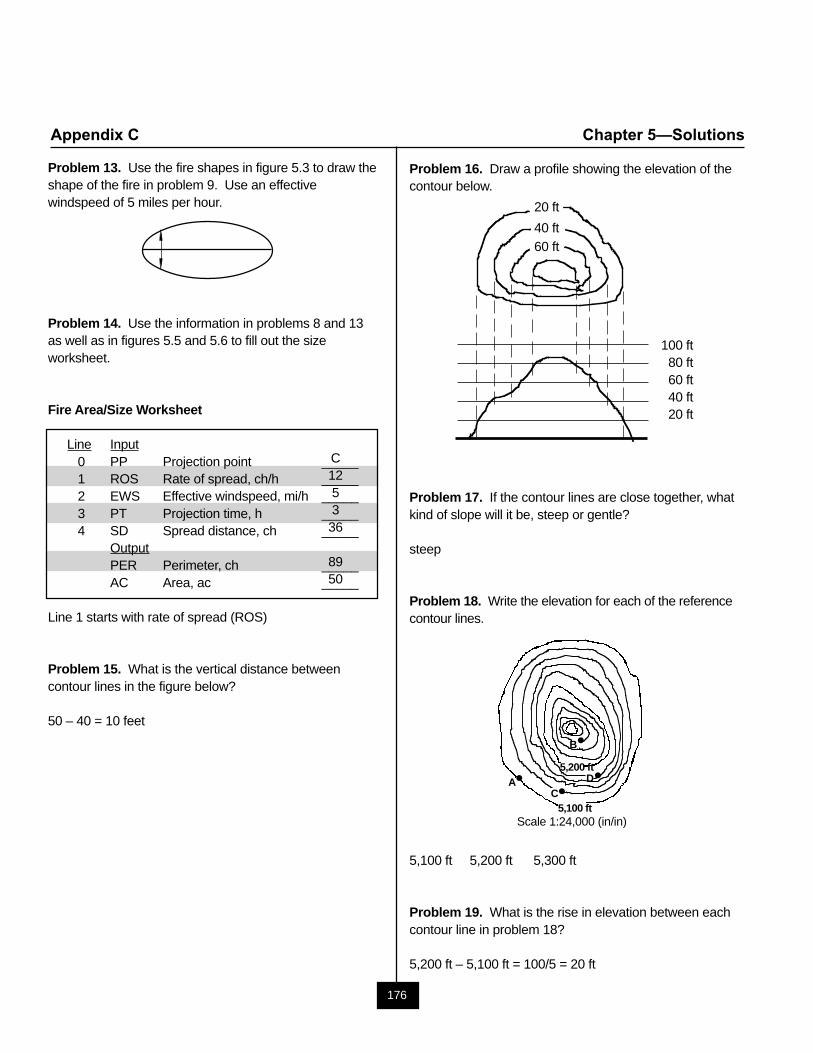
176
Appendix C Chapter 5—Solutions
C125336
8950
Problem 13. Use the fire shapes in figure 5.3 to draw theshape of the fire in problem 9. Use an effectivewindspeed of 5 miles per hour.
Problem 14. Use the information in problems 8 and 13as well as in figures 5.5 and 5.6 to fill out the sizeworksheet.
Fire Area/Size Worksheet
Line Input0 PP Projection point _____1 ROS Rate of spread, ch/h _____2 EWS Effective windspeed, mi/h _____3 PT Projection time, h _____4 SD Spread distance, ch _____
OutputPER Perimeter, ch _____AC Area, ac _____
Line 1 starts with rate of spread (ROS)
Problem 15. What is the vertical distance betweencontour lines in the figure below?
50 – 40 = 10 feet
Problem 16. Draw a profile showing the elevation of thecontour below.
Problem 17. If the contour lines are close together, whatkind of slope will it be, steep or gentle?
steep
Problem 18. Write the elevation for each of the referencecontour lines.
5,100 ft 5,200 ft 5,300 ft
Problem 19. What is the rise in elevation between eachcontour line in problem 18?
5,200 ft – 5,100 ft = 100/5 = 20 ft
100 ft80 ft60 ft40 ft20 ft
20 ft
40 ft60 ft
B
A5,200 ft
5,100 ftC
D
Scale 1:24,000 (in/in)
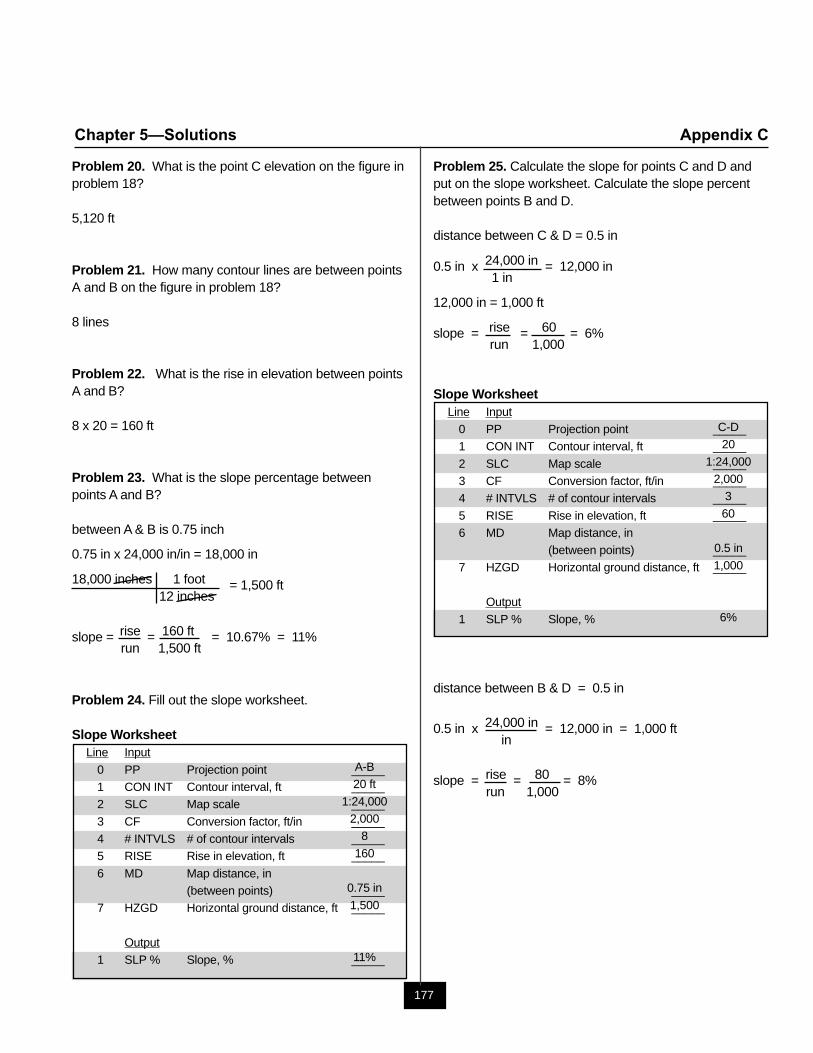
177
Chapter 5—Solutions Appendix C
C-D20
1:24,0002,000
3
60
0.5 in
1,000
6%
A-B20 ft
1:24,0002,000
8
160
0.75 in
1,500
11%
Problem 20. What is the point C elevation on the figure inproblem 18?
5,120 ft
Problem 21. How many contour lines are between pointsA and B on the figure in problem 18?
8 lines
Problem 22. What is the rise in elevation between pointsA and B?
8 x 20 = 160 ft
Problem 23. What is the slope percentage betweenpoints A and B?
between A & B is 0.75 inch
0.75 in x 24,000 in/in = 18,000 in
18,000 inches 1 foot = 1,500 ft12 inches
slope = rise = 160 ft = 10.67% = 11%run 1,500 ft
Problem 24. Fill out the slope worksheet.
Slope WorksheetLine Input
0 PP Projection point _____1 CON INT Contour interval, ft _____2 SLC Map scale _____
3 CF Conversion factor, ft/in _____4 # INTVLS # of contour intervals _____5 RISE Rise in elevation, ft _____
6 MD Map distance, in(between points) _____
7 HZGD Horizontal ground distance, ft _____
Output1 SLP % Slope, % _____
Problem 25. Calculate the slope for points C and D andput on the slope worksheet. Calculate the slope percentbetween points B and D.
distance between C & D = 0.5 in
0.5 in x 24,000 in = 12,000 in 1 in
12,000 in = 1,000 ft
slope = rise = 60 = 6%run 1,000
Slope WorksheetLine Input
0 PP Projection point _____1 CON INT Contour interval, ft _____
2 SLC Map scale _____3 CF Conversion factor, ft/in _____4 # INTVLS # of contour intervals _____
5 RISE Rise in elevation, ft _____6 MD Map distance, in
(between points) _____7 HZGD Horizontal ground distance, ft _____
Output1 SLP % Slope, %
distance between B & D = 0.5 in
0.5 in x 24,000 in = 12,000 in = 1,000 ftin
slope = rise = 80 = 8%run 1,000
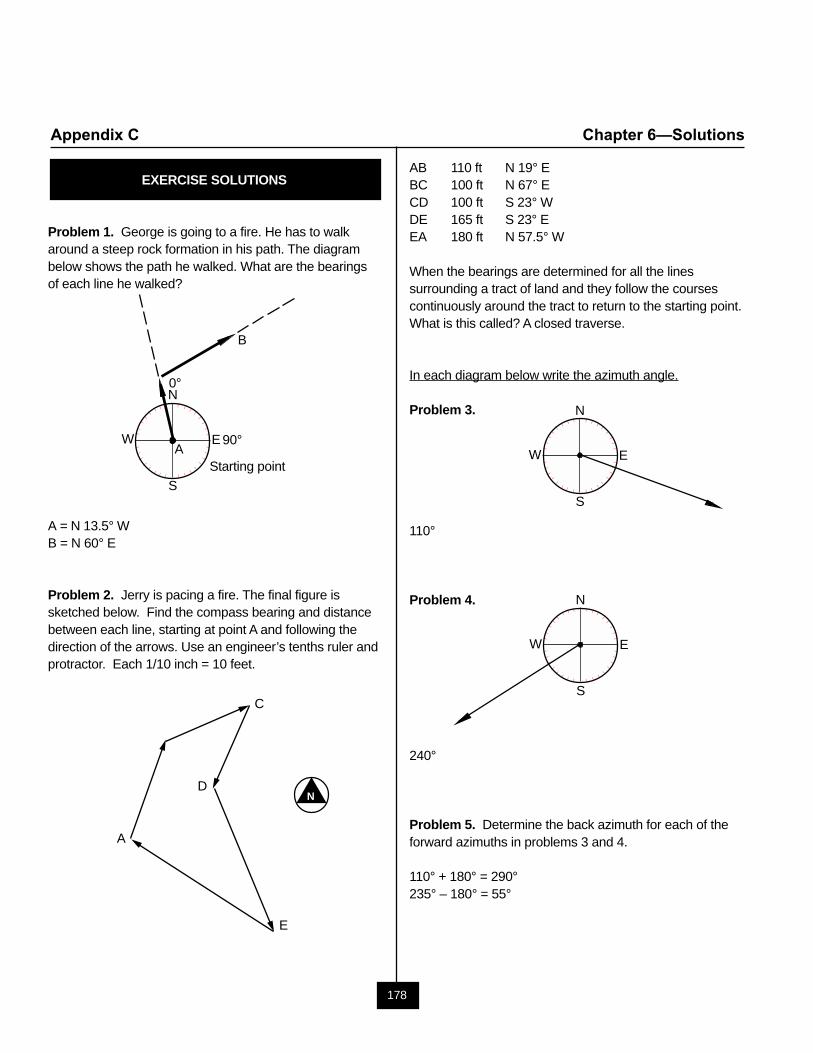
178
Appendix C Chapter 6—Solutions
EXERCISE SOLUTIONS
Problem 1. George is going to a fire. He has to walkaround a steep rock formation in his path. The diagrambelow shows the path he walked. What are the bearingsof each line he walked?
A = N 13.5° WB = N 60° E
Problem 2. Jerry is pacing a fire. The final figure issketched below. Find the compass bearing and distancebetween each line, starting at point A and following thedirection of the arrows. Use an engineer’s tenths ruler andprotractor. Each 1/10 inch = 10 feet.
B
N
S
EWA Starting point
0°
90°
A
C
D
E
AB 110 ft N 19° EBC 100 ft N 67° ECD 100 ft S 23° WDE 165 ft S 23° EEA 180 ft N 57.5° W
When the bearings are determined for all the linessurrounding a tract of land and they follow the coursescontinuously around the tract to return to the starting point.What is this called? A closed traverse.
In each diagram below write the azimuth angle.
Problem 3.
110°
Problem 4.
240°
Problem 5. Determine the back azimuth for each of theforward azimuths in problems 3 and 4.
110° + 180° = 290°235° – 180° = 55°
N
S
EW
N
S
EW
N
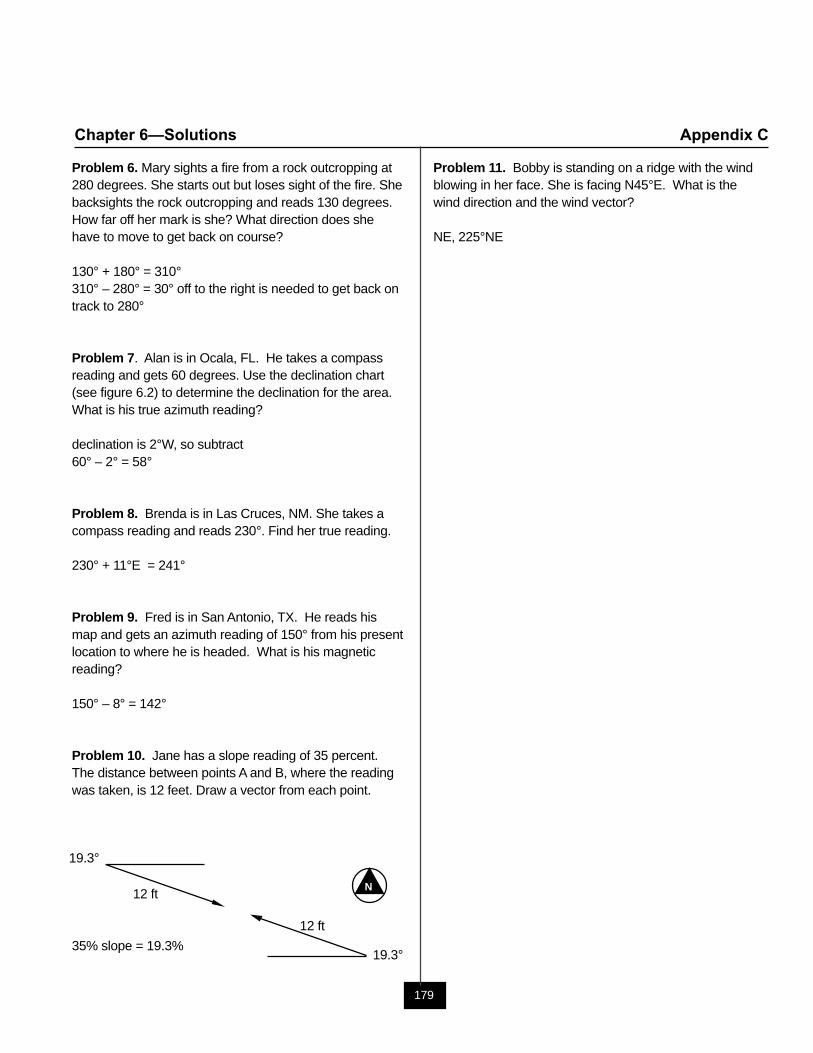
179
Chapter 6—Solutions Appendix C
Problem 6. Mary sights a fire from a rock outcropping at280 degrees. She starts out but loses sight of the fire. Shebacksights the rock outcropping and reads 130 degrees.How far off her mark is she? What direction does shehave to move to get back on course?
130° + 180° = 310°310° – 280° = 30° off to the right is needed to get back ontrack to 280°
Problem 7. Alan is in Ocala, FL. He takes a compassreading and gets 60 degrees. Use the declination chart(see figure 6.2) to determine the declination for the area.What is his true azimuth reading?
declination is 2°W, so subtract60° – 2° = 58°
Problem 8. Brenda is in Las Cruces, NM. She takes acompass reading and reads 230°. Find her true reading.
230° + 11°E = 241°
Problem 9. Fred is in San Antonio, TX. He reads hismap and gets an azimuth reading of 150° from his presentlocation to where he is headed. What is his magneticreading?
150° – 8° = 142°
Problem 10. Jane has a slope reading of 35 percent.The distance between points A and B, where the readingwas taken, is 12 feet. Draw a vector from each point.
35% slope = 19.3%
Problem 11. Bobby is standing on a ridge with the windblowing in her face. She is facing N45°E. What is thewind direction and the wind vector?
NE, 225°NE
N
12 ft
12 ft
19.3°
19.3°
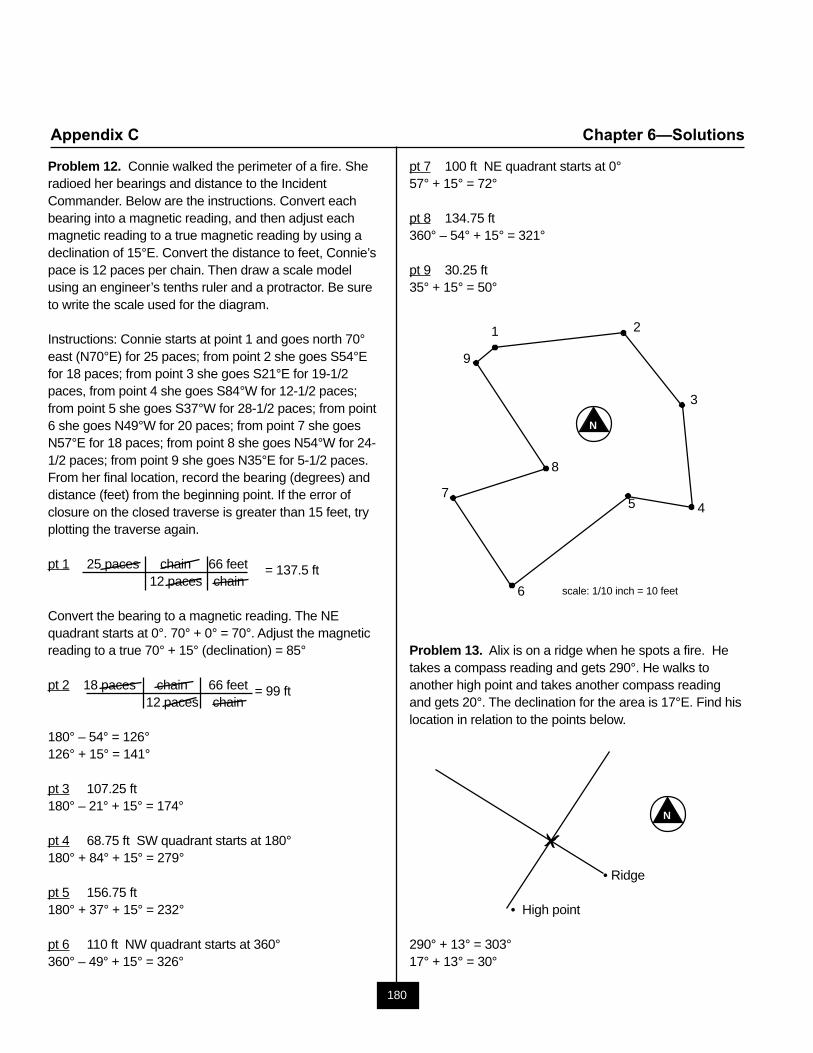
180
Appendix C Chapter 6—Solutions
Problem 12. Connie walked the perimeter of a fire. Sheradioed her bearings and distance to the IncidentCommander. Below are the instructions. Convert eachbearing into a magnetic reading, and then adjust eachmagnetic reading to a true magnetic reading by using adeclination of 15°E. Convert the distance to feet, Connie’space is 12 paces per chain. Then draw a scale modelusing an engineer’s tenths ruler and a protractor. Be sureto write the scale used for the diagram.
Instructions: Connie starts at point 1 and goes north 70°east (N70°E) for 25 paces; from point 2 she goes S54°Efor 18 paces; from point 3 she goes S21°E for 19-1/2paces, from point 4 she goes S84°W for 12-1/2 paces;from point 5 she goes S37°W for 28-1/2 paces; from point6 she goes N49°W for 20 paces; from point 7 she goesN57°E for 18 paces; from point 8 she goes N54°W for 24-1/2 paces; from point 9 she goes N35°E for 5-1/2 paces.From her final location, record the bearing (degrees) anddistance (feet) from the beginning point. If the error ofclosure on the closed traverse is greater than 15 feet, tryplotting the traverse again.
pt 1 25 paces chain 66 feet = 137.5 ft12 paces chain
Convert the bearing to a magnetic reading. The NEquadrant starts at 0°. 70° + 0° = 70°. Adjust the magneticreading to a true 70° + 15° (declination) = 85°
pt 2 18 paces chain 66 feet = 99 ft12 paces chain
180° – 54° = 126°126° + 15° = 141°
pt 3 107.25 ft180° – 21° + 15° = 174°
pt 4 68.75 ft SW quadrant starts at 180°180° + 84° + 15° = 279°
pt 5 156.75 ft180° + 37° + 15° = 232°
pt 6 110 ft NW quadrant starts at 360°360° – 49° + 15° = 326°
pt 7 100 ft NE quadrant starts at 0°57° + 15° = 72°
pt 8 134.75 ft360° – 54° + 15° = 321°
pt 9 30.25 ft35° + 15° = 50°
Problem 13. Alix is on a ridge when he spots a fire. Hetakes a compass reading and gets 290°. He walks toanother high point and takes another compass readingand gets 20°. The declination for the area is 17°E. Find hislocation in relation to the points below.
• Ridge
• High point
290° + 13° = 303°17° + 13° = 30°
1 2
3
45
6
7
8
9
N
scale: 1/10 inch = 10 feet
X
N
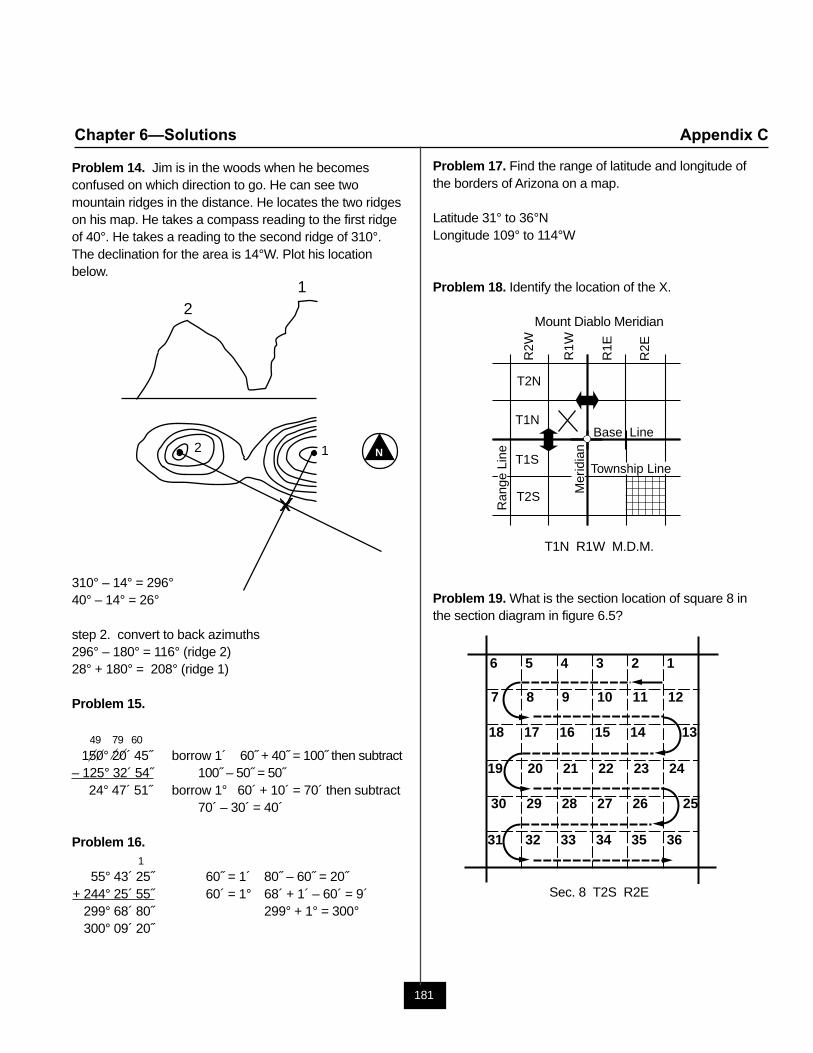
181
Chapter 6—Solutions Appendix C
Problem 14. Jim is in the woods when he becomesconfused on which direction to go. He can see twomountain ridges in the distance. He locates the two ridgeson his map. He takes a compass reading to the first ridgeof 40°. He takes a reading to the second ridge of 310°.The declination for the area is 14°W. Plot his locationbelow.
310° – 14° = 296°40° – 14° = 26°
step 2. convert to back azimuths296° – 180° = 116° (ridge 2)28° + 180° = 208° (ridge 1)
Problem 15.
150° 20´ 45˝ borrow 1´ 60˝ + 40˝ = 100˝ then subtract– 125° 32´ 54˝ 100˝ – 50˝ = 50˝
24° 47´ 51˝ borrow 1° 60´ + 10´ = 70´ then subtract70´ – 30´ = 40´
Problem 16.
55° 43´ 25˝ 60˝ = 1´ 80˝ – 60˝ = 20˝+ 244° 25´ 55˝ 60´ = 1° 68´ + 1´ – 60´ = 9´
299° 68´ 80˝ 299° + 1° = 300°300° 09´ 20˝
12
X
Problem 17. Find the range of latitude and longitude ofthe borders of Arizona on a map.
Latitude 31° to 36°NLongitude 109° to 114°W
Problem 18. Identify the location of the X.
Mount Diablo Meridian
T1N R1W M.D.M.
Problem 19. What is the section location of square 8 inthe section diagram in figure 6.5?
Sec. 8 T2S R2E
12
N
49 79 60
1
T2N
T1N
T1S
T2S
R2W
R1W
R1E
R2E
Base Line
Mer
idia
n
Township Line
Ran
ge L
ine
6 5 4 3 2 1
7 8 9 10 11 12
18 17 16 15 14
20 21 22 23 24
30 29 28 27 26
32 33 34 35 36
13
19
25
31
182
Appendix C Chapter 7—Solutions
EXERCISE SOLUTIONS
Problem 1. Lupe is at an elevation of 1,000 feet. The drybulb temperature is 80 °F. The wet bulb temperature is52 °F. What is the relative humidity and the dew point?
Use figure 7.1RH = 9DP = 15
Problem 2. What is the relative humidity if the wet bulbtemperature is 47 °F and the dry bulb temperature is64 °F?
Use figure 7.1RH = 24
Problem 3. Vivian is trying to determine what theminimum relative humidity will be at 1600 hours. She is atan elevation of 1,200 feet. The current dry bulbtemperature is 67 °F. The wet bulb temperature is 56 °F.The predicted temperature for the afternoon is 80 °F.
Use figure 7.1DP = 48RH = 32
183
Chapter 8—Solutions Appendix C
EXERCISE SOLUTIONS
Problem 1. What is the reference fuel moisture (RFM) ata temperature of 89 °F and a relative humidity of 23percent?
between 800-1959, uncorrected RFM = 3% RFM
Problem 2. What is the reference fuel moisture (RFM) ata temperature of 67 °F and a relative humidity of 67percent?
between 800-1959, uncorrected RFM = 9% RFM
Problem 3. What is the fuel moisture correction (FMC)for May 21, at 1330 with a south aspect and 19 percentslope in a clear unshaded area for elevations B, L, and A?
use table 8.2FMC 1,000-2,000 feet below the site 0% FMC
± 1,000 feet of site location 0% FMC1,000-2,000 feet above site 1% FMC
Problem 4. What is the fuel moisture correction (FMC)for August 12, at 0830 with a north aspect in cloudy skies(shaded fuel) on a 44 percent slope for elevations B, L,and A?
use table 8.31,000-2,000 ft below site location = 4% FMC±1,000 ft from site location = 5% FMC1,000-2,000 ft above site location = 6% FMC
Problem 5. It is July 19, at 1500. Fuels are exposed tothe sun on a west aspect. Readings from a belt weatherkit taken 600 feet below the fire give a dry bulbtemperature of 99 °F and a relative humidity of 12 percent.The slope is 42 percent. What is the fine dead fuelmoisture (FDFM)? Input the data values on the fine deadfuel moisture worksheet (see figure 8.1).
from table 8.1 reference fuel moisture is 2%
from table 8.2 dead fuel moisture content correction is0%FMC
Add the values together (RFM + FMC = FDFM) = 2%
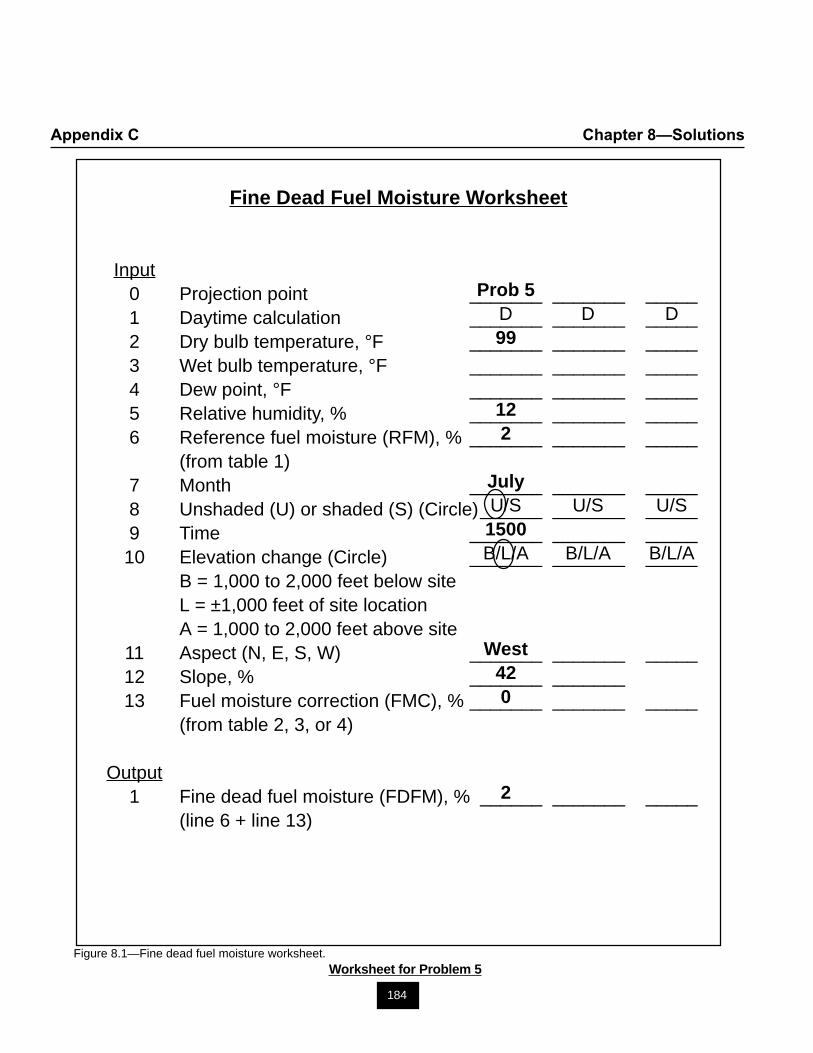
184
Appendix C Chapter 8—Solutions
Fine Dead Fuel Moisture Worksheet
Input0 Projection point _______ _______ _____1 Daytime calculation _______ _______ _____2 Dry bulb temperature, °F _______ _______ _____3 Wet bulb temperature, °F _______ _______ _____4 Dew point, °F _______ _______ _____5 Relative humidity, % _______ _______ _____6 Reference fuel moisture (RFM), % _______ _______ _____
(from table 1)7 Month _______ _______ _____8 Unshaded (U) or shaded (S) (Circle)______ _______ _____9 Time _______ _______ _____10 Elevation change (Circle) _______ _______ _____
B = 1,000 to 2,000 feet below siteL = ±1,000 feet of site locationA = 1,000 to 2,000 feet above site
11 Aspect (N, E, S, W) _______ _______ _____12 Slope, % _______ _______13 Fuel moisture correction (FMC), % _______ _______ _____
(from table 2, 3, or 4)
Output1 Fine dead fuel moisture (FDFM), % ______ _______ _____
(line 6 + line 13)
Prob 5D D D99
122
JulyU/S U/S U/S1500B/L/A B/L/A B/L/A
West420
2
Worksheet for Problem 5Figure 8.1—Fine dead fuel moisture worksheet.
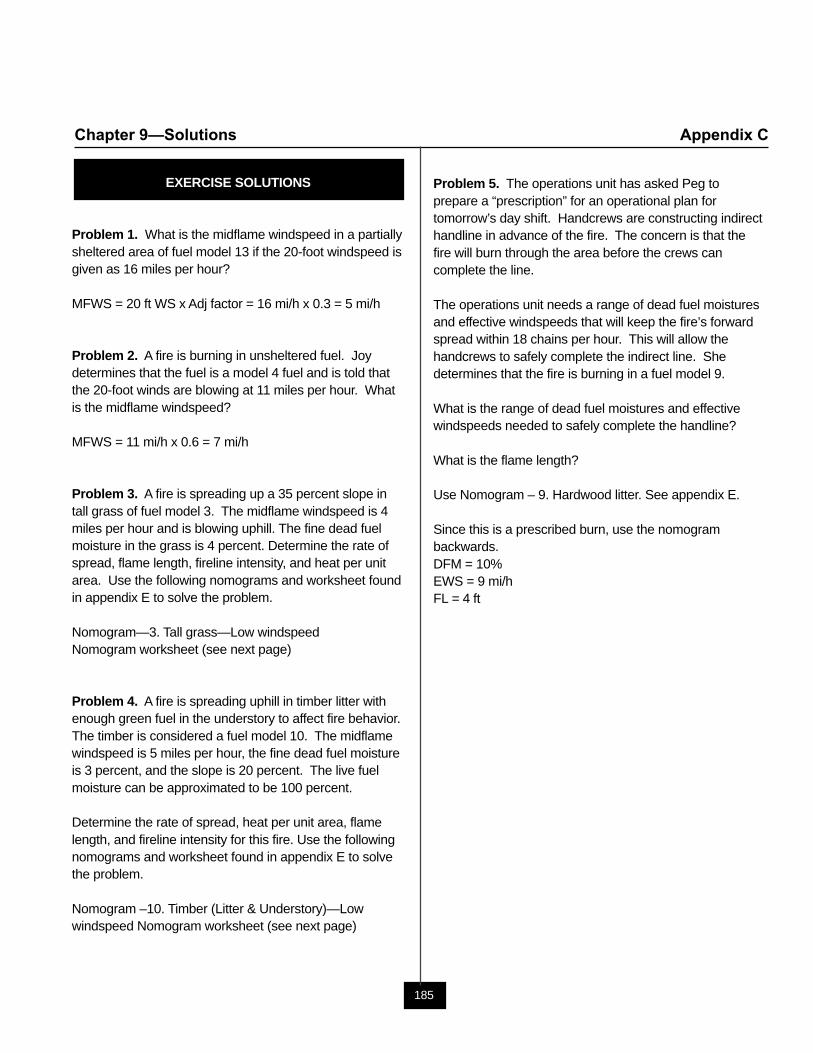
185
Chapter 9—Solutions Appendix C
EXERCISE SOLUTIONS
Problem 1. What is the midflame windspeed in a partiallysheltered area of fuel model 13 if the 20-foot windspeed isgiven as 16 miles per hour?
MFWS = 20 ft WS x Adj factor = 16 mi/h x 0.3 = 5 mi/h
Problem 2. A fire is burning in unsheltered fuel. Joydetermines that the fuel is a model 4 fuel and is told thatthe 20-foot winds are blowing at 11 miles per hour. Whatis the midflame windspeed?
MFWS = 11 mi/h x 0.6 = 7 mi/h
Problem 3. A fire is spreading up a 35 percent slope intall grass of fuel model 3. The midflame windspeed is 4miles per hour and is blowing uphill. The fine dead fuelmoisture in the grass is 4 percent. Determine the rate ofspread, flame length, fireline intensity, and heat per unitarea. Use the following nomograms and worksheet foundin appendix E to solve the problem.
Nomogram—3. Tall grass—Low windspeedNomogram worksheet (see next page)
Problem 4. A fire is spreading uphill in timber litter withenough green fuel in the understory to affect fire behavior.The timber is considered a fuel model 10. The midflamewindspeed is 5 miles per hour, the fine dead fuel moistureis 3 percent, and the slope is 20 percent. The live fuelmoisture can be approximated to be 100 percent.
Determine the rate of spread, heat per unit area, flamelength, and fireline intensity for this fire. Use the followingnomograms and worksheet found in appendix E to solvethe problem.
Nomogram –10. Timber (Litter & Understory)—Lowwindspeed Nomogram worksheet (see next page)
Problem 5. The operations unit has asked Peg toprepare a “prescription” for an operational plan fortomorrow’s day shift. Handcrews are constructing indirecthandline in advance of the fire. The concern is that thefire will burn through the area before the crews cancomplete the line.
The operations unit needs a range of dead fuel moisturesand effective windspeeds that will keep the fire’s forwardspread within 18 chains per hour. This will allow thehandcrews to safely complete the indirect line. Shedetermines that the fire is burning in a fuel model 9.
What is the range of dead fuel moistures and effectivewindspeeds needed to safely complete the handline?
What is the flame length?
Use Nomogram – 9. Hardwood litter. See appendix E.
Since this is a prescribed burn, use the nomogrambackwards.DFM = 10%EWS = 9 mi/hFL = 4 ft
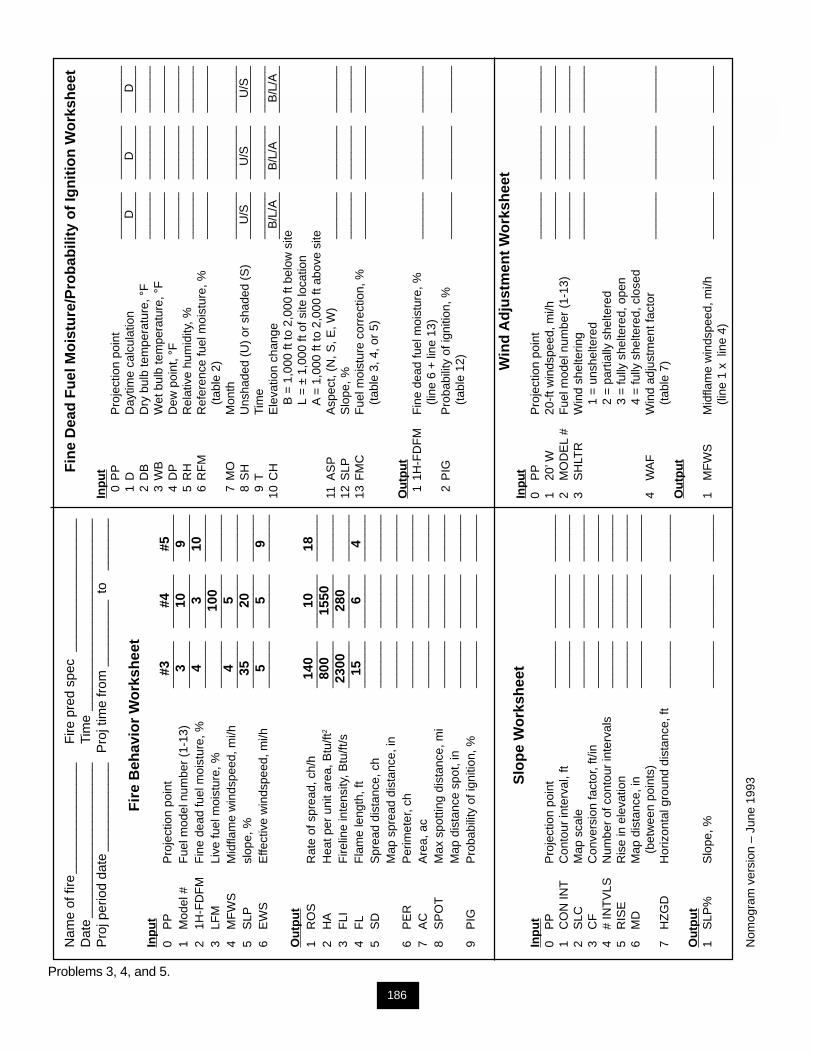
186
Appendix C Chapter 9—Solutions
Nam
e of
fire
____
____
____
___
Fire
pre
d sp
ec__
____
____
____
____
Dat
e__
____
____
____
____
___
Tim
e__
____
____
____
____
____
____
Pro
j per
iod
date
____
____
____
Pro
j tim
e fr
om__
____
___
to__
____
_
Fir
e B
ehav
ior
Wo
rksh
eet
Inp
ut
0P
PP
roje
ctio
n po
int
____
___
____
____
____
___
1M
odel
#F
uel m
odel
num
ber
(1-1
3)__
____
___
____
____
____
_2
1H-F
DF
MF
ine
dead
fuel
moi
stur
e, %
____
___
____
____
____
___
3LF
MLi
ve fu
el m
oist
ure,
%__
____
___
____
____
____
_4
MF
WS
Mid
flam
e w
inds
peed
, mi/h
____
___
____
____
____
___
5S
LPsl
ope,
%__
____
___
____
____
____
_6
EW
SE
ffect
ive
win
dspe
ed, m
i/h__
____
___
____
____
____
_
Ou
tpu
t1
RO
SR
ate
of s
prea
d, c
h/h
____
___
____
____
____
___
2H
AH
eat p
er u
nit a
rea,
Btu
/ft2
____
___
____
____
____
___
3F
LIF
irelin
e in
tens
ity, B
tu/ft
/s__
____
___
____
____
____
_4
FL
Fla
me
leng
th, f
t__
____
___
____
____
____
_5
SD
Spr
ead
dist
ance
, ch
____
___
____
____
____
___
Map
spr
ead
dist
ance
, in
____
___
____
____
____
___
6P
ER
Per
imet
er, c
h__
____
___
____
____
____
_7
AC
Are
a, a
c__
____
___
____
____
____
_8
SP
OT
Max
spo
tting
dis
tanc
e, m
i__
____
___
____
____
____
_M
ap d
ista
nce
spot
, in
____
___
____
____
____
___
9P
IGP
roba
bilit
y of
igni
tion,
%__
____
___
____
____
____
_
Slo
pe
Wo
rksh
eet
Inp
ut
0P
PP
roje
ctio
n po
int
____
___
____
____
____
___
1C
ON
INT
Con
tour
inte
rval
, ft
____
___
____
____
____
___
2S
LCM
ap s
cale
____
___
____
____
____
___
3C
FC
onve
rsio
n fa
ctor
, ft/i
n__
____
___
____
____
____
_4
# IN
TV
LSN
umbe
r of
con
tour
inte
rval
s__
____
___
____
____
____
_5
RIS
ER
ise
in e
leva
tion
____
___
____
____
____
___
6M
DM
ap d
ista
nce,
in__
____
___
____
____
____
_
(bet
wee
n po
ints
)7
HZ
GD
Hor
izon
tal g
roun
d di
stan
ce, f
t__
____
___
____
____
____
_
Ou
tpu
t1
SLP
%S
lope
, %__
____
___
____
____
____
_
Nom
ogra
m v
ersi
on –
Jun
e 19
93
Fin
e D
ead
Fu
el M
ois
ture
/Pro
bab
ility
of
Ign
itio
n W
ork
shee
t
Inp
ut
0P
PP
roje
ctio
n po
int
____
___
____
____
____
___
1D
Day
time
calc
ulat
ion
____
___
____
____
____
___
2D
BD
ry b
ulb
tem
pera
ture
, °F
____
___
____
____
____
___
3W
BW
et b
ulb
tem
pera
ture
, °F
____
___
____
____
____
___
4D
PD
ew p
oint
, °F
____
___
____
____
____
___
5R
HR
elat
ive
hum
idity
, %__
____
___
____
____
____
_ 6
RF
MR
efer
ence
fuel
moi
stur
e, %
____
___
____
____
____
___
(t
able
2)
7M
OM
onth
____
___
____
____
____
___
8S
HU
nsha
ded
(U)
or s
hade
d (S
)__
____
___
____
____
____
_ 9
TTi
me
____
___
____
____
____
___
10C
HE
leva
tion
chan
ge__
____
___
____
____
____
_
B =
1,0
00 ft
to 2
,000
ft b
elow
site
L
= ±
1,0
00 ft
of s
ite lo
catio
n
A =
1,0
00 ft
to 2
,000
ft a
bove
site
11A
SP
Asp
ect,
(N, S
, E, W
)__
____
___
____
____
____
_12
SLP
Slo
pe, %
____
___
____
____
____
___
13F
MC
Fue
l moi
stur
e co
rrec
tion,
%__
____
___
____
____
____
_
(tab
le 3
, 4, o
r 5)
Ou
tpu
t 1
1H-F
DF
MF
ine
dead
fuel
moi
stur
e, %
____
___
____
____
____
___
(li
ne 6
+ li
ne 1
3) 2
PIG
Pro
babi
lity
of ig
nitio
n, %
____
___
____
____
____
___
(t
able
12) W
ind
Ad
just
men
t W
ork
shee
tIn
pu
t0
PP
Pro
ject
ion
poin
t__
____
___
____
____
____
_1
20’ W
20-f
t win
dspe
ed, m
i/h__
____
___
____
____
____
_2
MO
DE
L #
Fue
l mod
el n
umbe
r (1
-13)
____
___
____
____
____
___
3S
HLT
RW
ind
shel
terin
g__
____
___
____
____
____
_
1 =
uns
helte
red
2
= p
artia
lly s
helte
red
3
= fu
lly s
helte
red,
ope
n
4 =
fully
she
ltere
d, c
lose
d4
WA
FW
ind
adju
stm
ent f
acto
r__
____
___
____
____
____
_
(tab
le 7
)O
utp
ut
1M
FW
SM
idfla
me
win
dspe
ed, m
i/h__
____
___
____
____
____
_
(line
1 x
lin
e 4)
Problems 3, 4, and 5.
DD
D
U/S
U/S
U/S
B/L
/AB
/L/A
B/L
/A
#3#4
#53
109
43
1010
04
535
205
59
140
1018
800
1550
2300
280
156
4
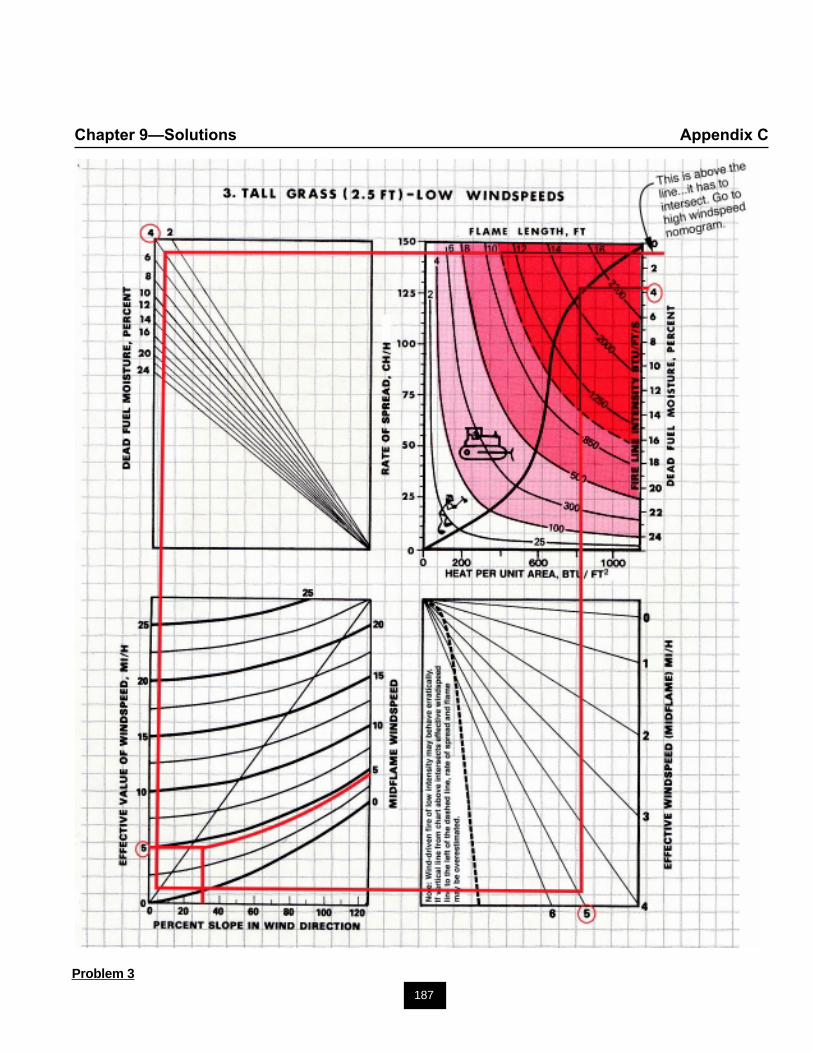
187
Chapter 9—Solutions Appendix C
Problem 3
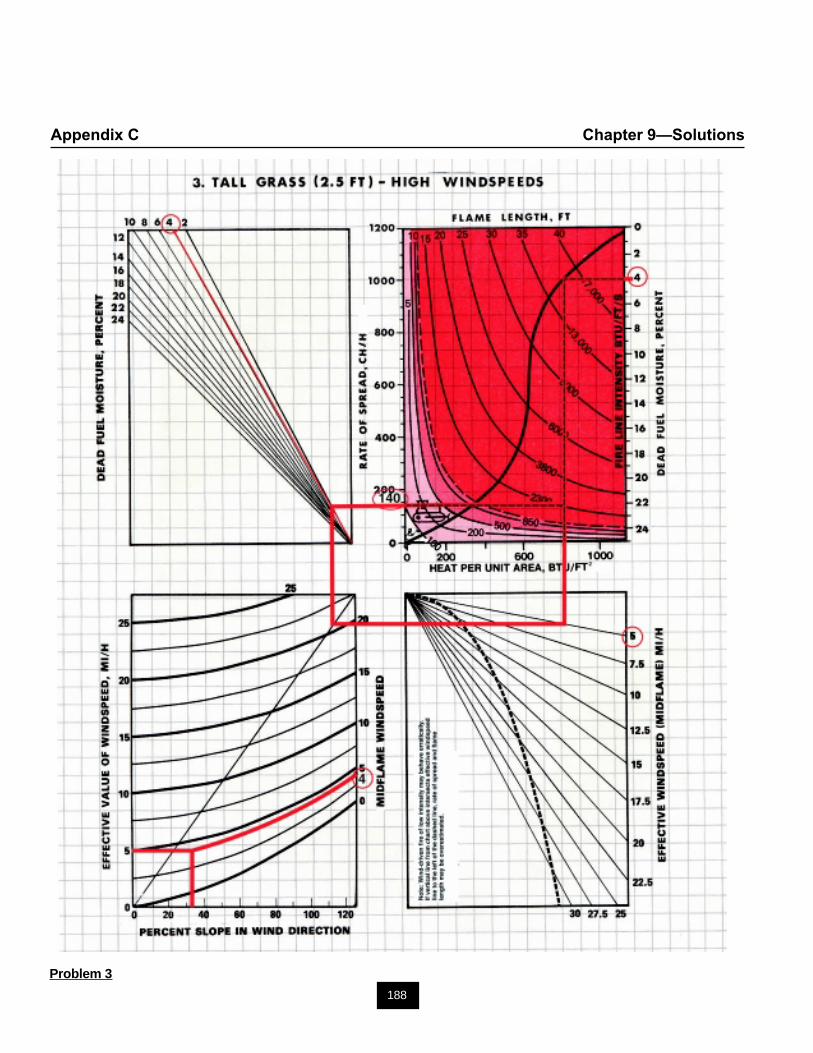
188
Appendix C Chapter 9—Solutions
Problem 3
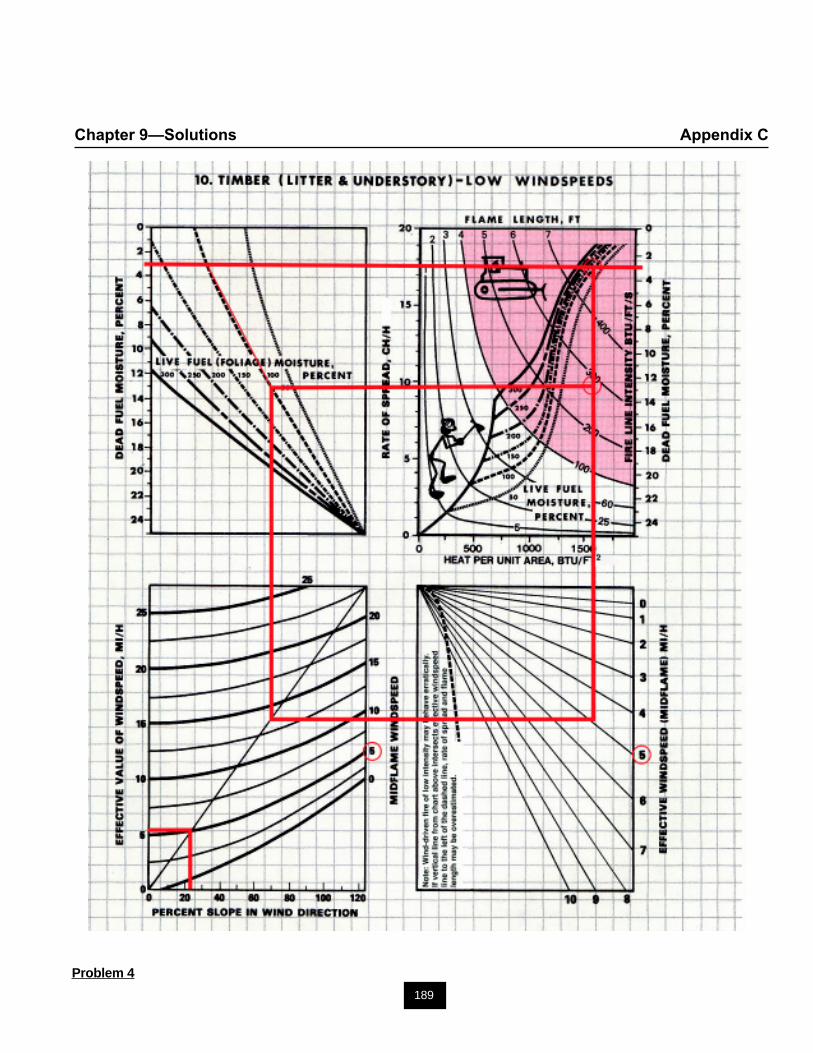
189
Chapter 9—Solutions Appendix C
Problem 4
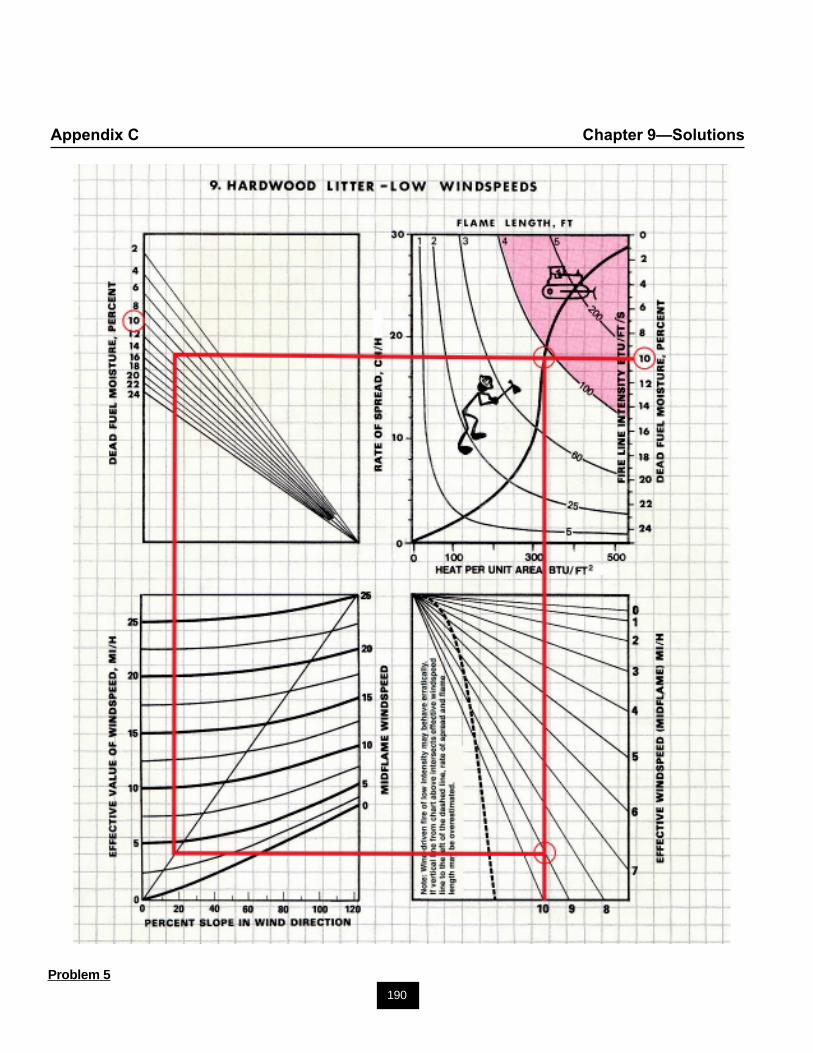
190
Appendix C Chapter 9—Solutions
Problem 5
191
Chapter 9—Solutions Appendix C
Problem 5
A. Locate 18 ch/h rate of spread.
B. Draw a horizontal line from this point to right edge of upper right quadrant.
C. Circle dead fuel moisture value in both upper left and upper right quadrants.
D. Draw horizontal line from where the line in step B intersects the s-curve to the line pertaining to the dead fuel moisturevalue in the upper left quadrant.
E. Draw a vertical line from the s-curve intersection down through all the effective windspeeds in the lower rightquadrant.
F. Draw a vertical line from the dead fuel moisture intersection in upper left down into the lower left quadrant, until thediagonal is reached. Draw a horizontal line from this point directly into lower right quadrant until the vertical line isreached.
G. Effective windspeed is determined from this intersection point as 9mi/h.
H. Flame length can be approximated as 4 ft based on the s-curve intersection point in upper right quadrant.
192
Appendix C Chapter 9—Solutions
Problem 6. The rate of spread of the fire is 6 chains perhour. What will the spread distance be in 4 hours?
SD = ROS x PTSD = 6 ch/h x 4h = 24 ch
Problem 7. What is the map distance of the groundspread distance from problem 6 on a map with a scale of1:62,500?
24 ch 66 ft 12 in = 19,008 inch ft
19,008 in 1 in = 0.3 inches62,500 in
Problem 8. There is a fire in a Grand Fir forest. Thediameter at breast height is 33 inches. What is the flameheight?
97 ftUse spotting nomogram 1
Problem 9. Input the following values into the spottingworksheet.Torching tree DBH = 15 inTorching tree height = 120 ftAverage tree cover height = 100 ftWindspeed at 20-ft height = 30mi/hTorching tree species—lodgepole pine
See next page
Problem 10. Using the data above, find the flame heightand flame duration.
Use nomogram 1 for flame height of 47 ftUse nomogram 2 for flame duration of 6.1Input the values in the spotting worksheet
Problem 11. Using the data above, find the ratio of loftedfirebrand height to flame height.
Use spotting nomogram 3 and the spotting worksheet7:8
Problem 12. For a closed canopy forest with the abovedata, find the maximum spotting distance.
Use nomogram 4 and the spotting worksheet0.4 mi
Problem 13. A fire has a ROS of 30 chains per hour anda heat per unit area of 900 British thermal units per squarefoot. What is the flame length?
Use the fire characteristics chart8 ft
Problem 14. If the wind and slope increase the ROS to60 chains per hour, but the fuel characteristics remain thesame, what will the resulting flame length be?
11 ft
Problem 15. A fire is spreading at a rate of 40 chains perhour. The flame length is 8 feet. What is the heat per unitarea?
650 Btu/ft2
Problem 16. In the fire in problem 15, the ROS increasedto 70 chains per hour. The fuel characteristics are thesame. What is the flame length?
10 ft
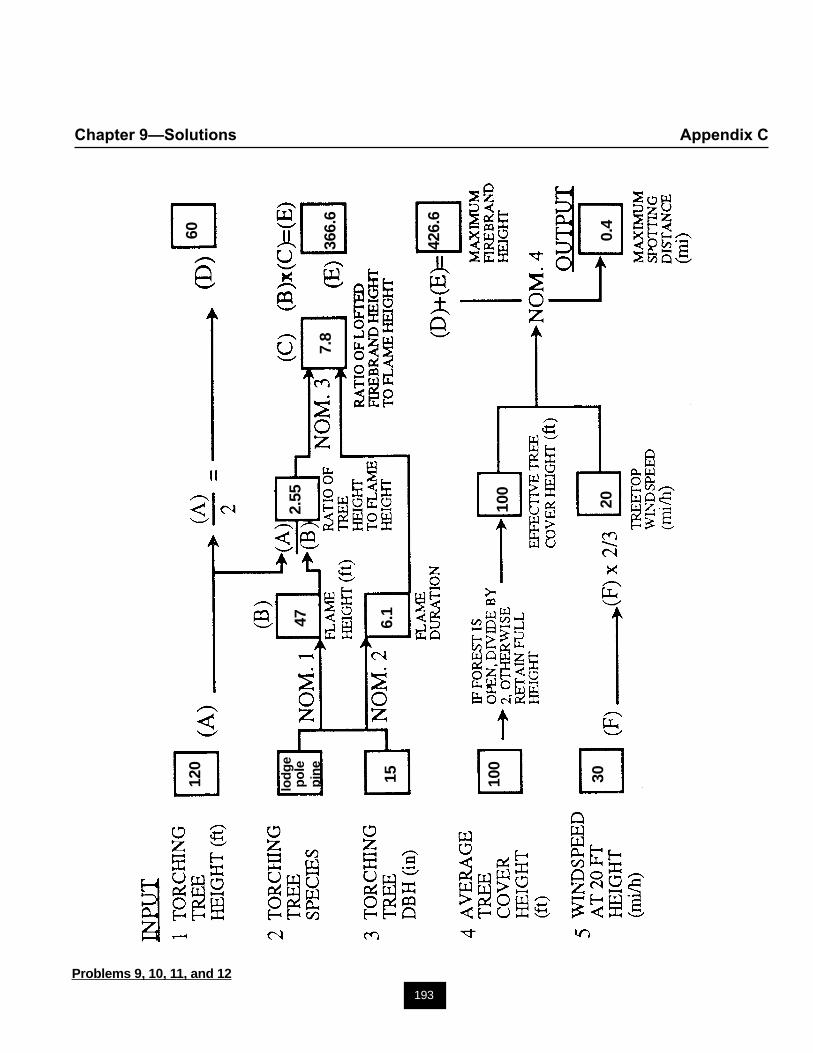
193
Chapter 9—Solutions Appendix C
120
lod
ge
po
lep
ine
15 100
30
47 6.1
2.55
100
20
7.8
60
366.
6
426.
6
0.4
Problems 9, 10, 11, and 12
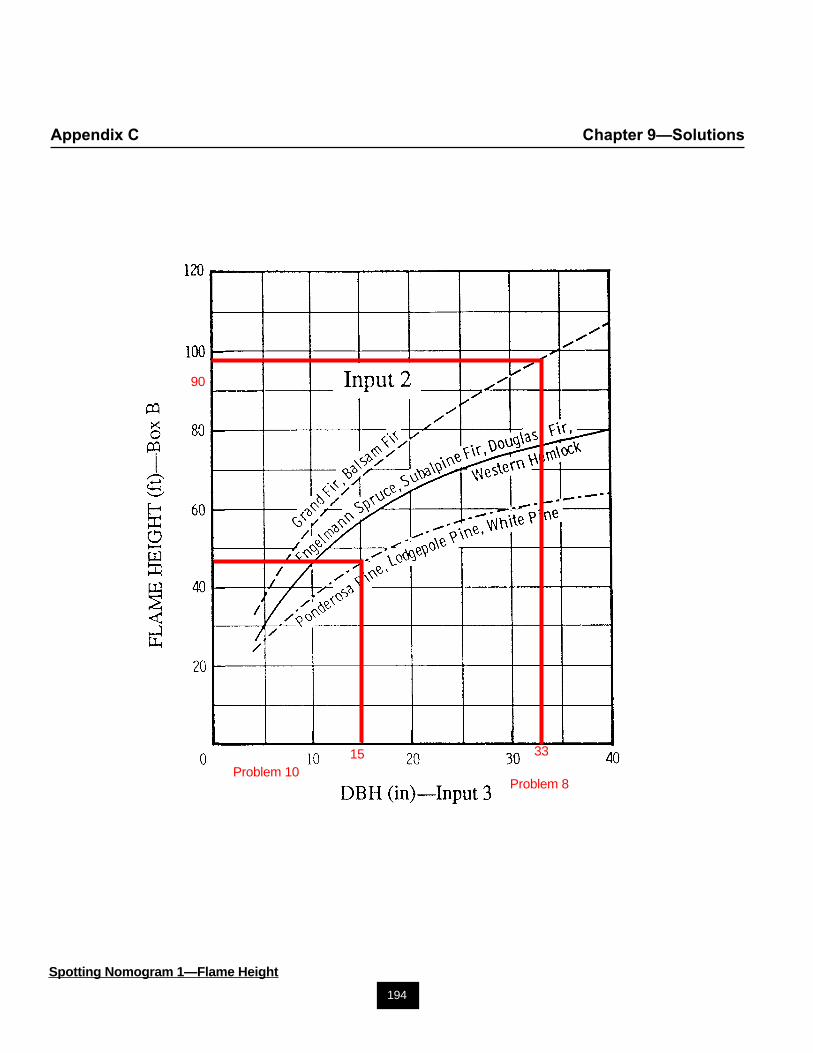
194
Appendix C Chapter 9—Solutions
90
15 33
Problem 10Problem 8
Spotting Nomogram 1—Flame Height
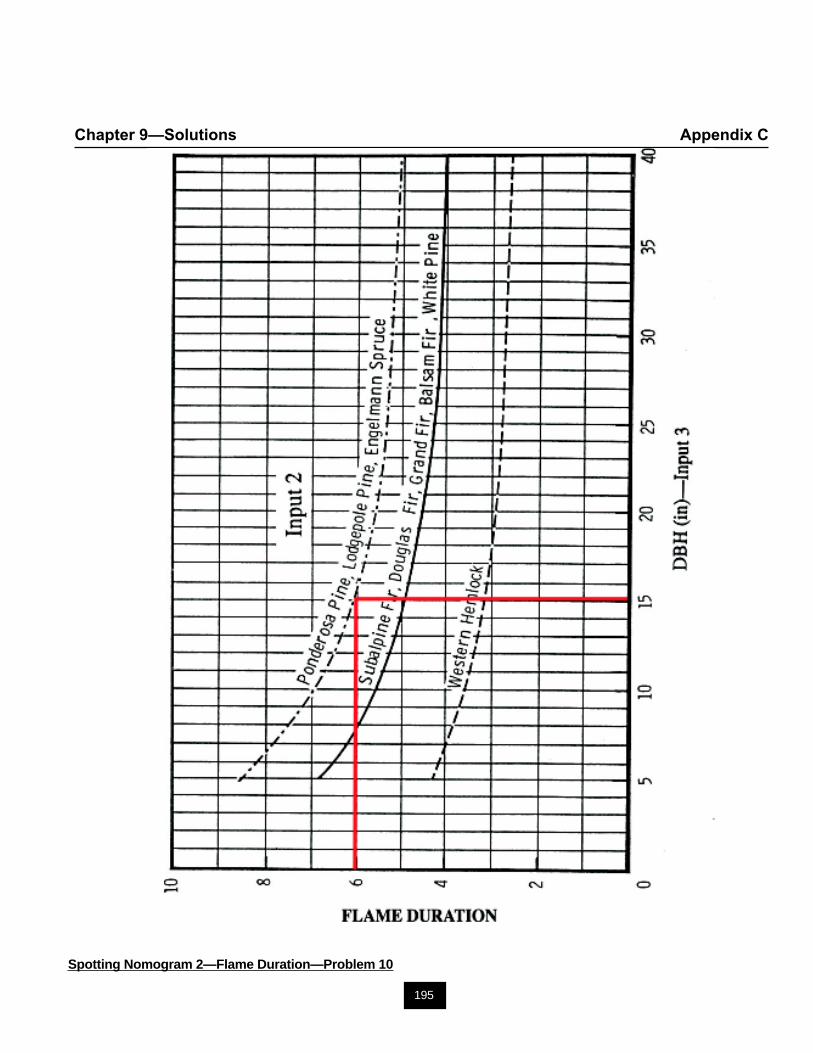
195
Chapter 9—Solutions Appendix C
Spotting Nomogram 2—Flame Duration—Problem 10
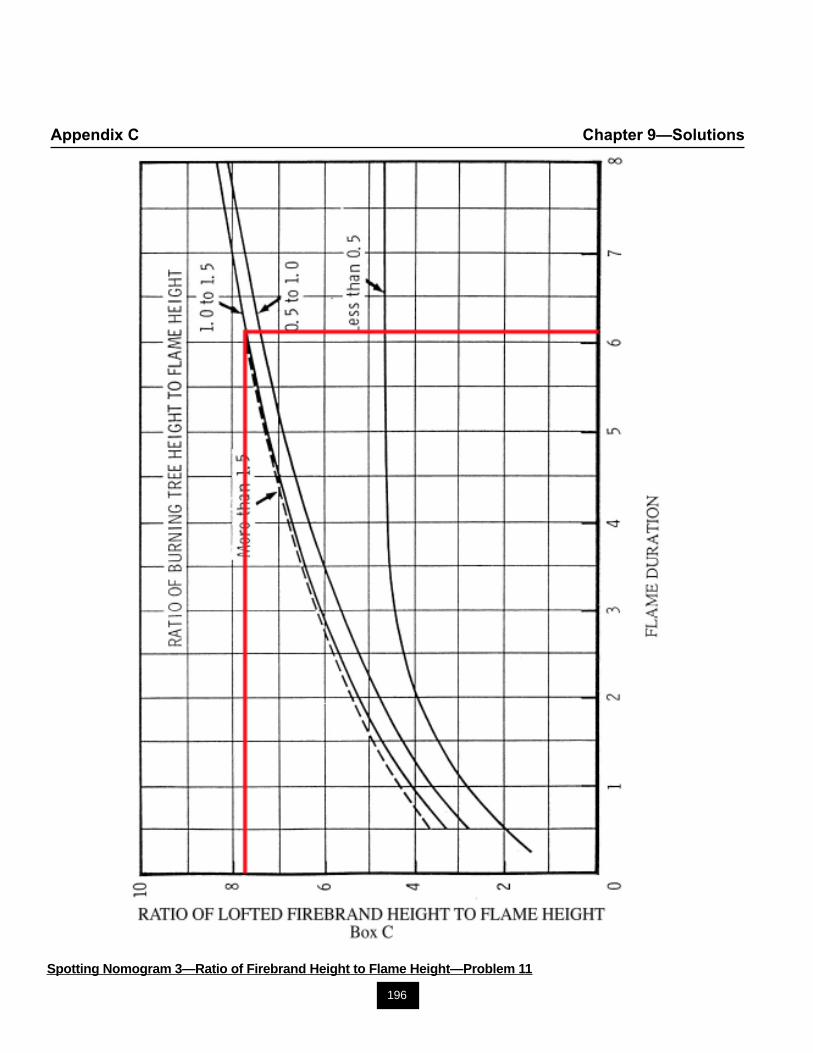
196
Appendix C Chapter 9—Solutions
Spotting Nomogram 3—Ratio of Firebrand Height to Flame Height—Problem 11
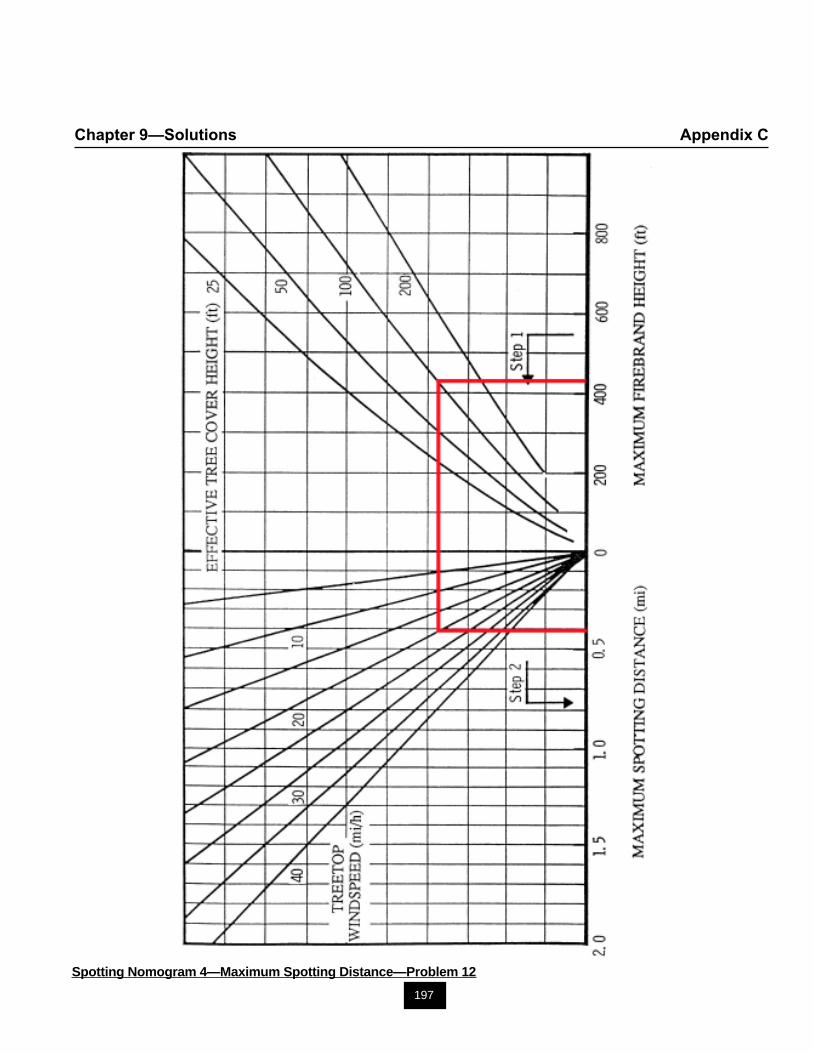
197
Chapter 9—Solutions Appendix C
Spotting Nomogram 4—Maximum Spotting Distance—Problem 12
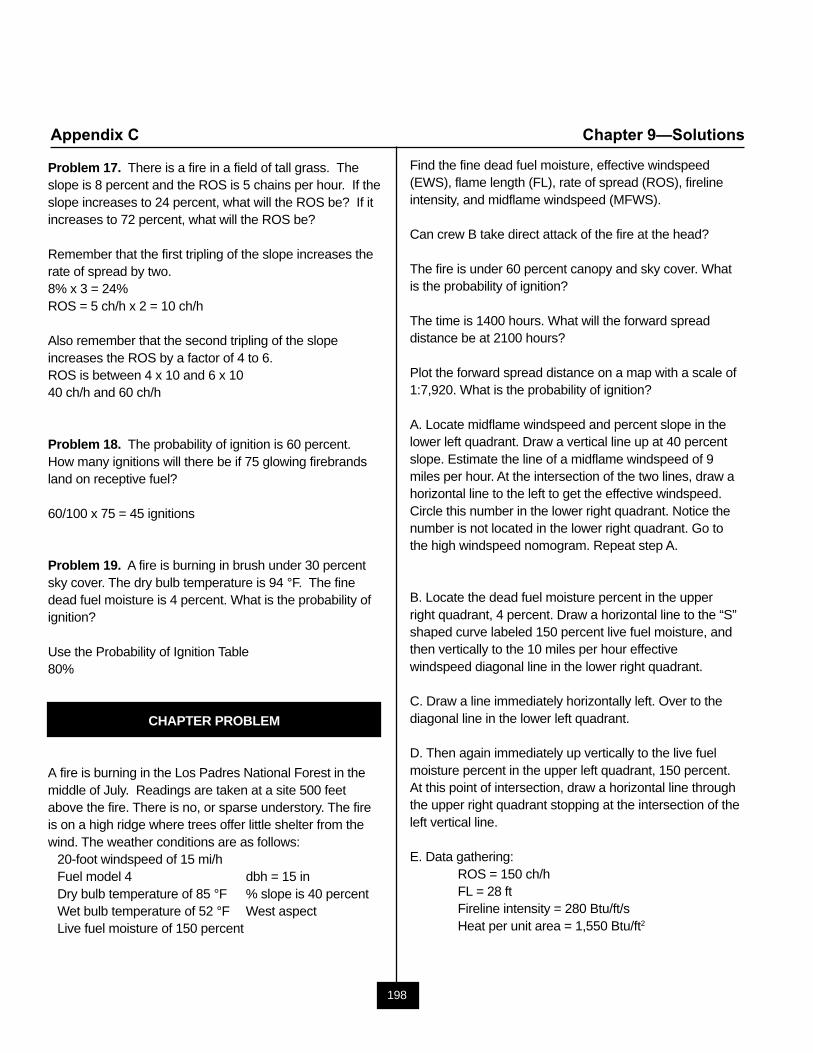
198
Appendix C Chapter 9—Solutions
Problem 17. There is a fire in a field of tall grass. Theslope is 8 percent and the ROS is 5 chains per hour. If theslope increases to 24 percent, what will the ROS be? If itincreases to 72 percent, what will the ROS be?
Remember that the first tripling of the slope increases therate of spread by two.8% x 3 = 24%ROS = 5 ch/h x 2 = 10 ch/h
Also remember that the second tripling of the slopeincreases the ROS by a factor of 4 to 6.ROS is between 4 x 10 and 6 x 1040 ch/h and 60 ch/h
Problem 18. The probability of ignition is 60 percent.How many ignitions will there be if 75 glowing firebrandsland on receptive fuel?
60/100 x 75 = 45 ignitions
Problem 19. A fire is burning in brush under 30 percentsky cover. The dry bulb temperature is 94 °F. The finedead fuel moisture is 4 percent. What is the probability ofignition?
Use the Probability of Ignition Table80%
CHAPTER PROBLEM
A fire is burning in the Los Padres National Forest in themiddle of July. Readings are taken at a site 500 feetabove the fire. There is no, or sparse understory. The fireis on a high ridge where trees offer little shelter from thewind. The weather conditions are as follows:
20-foot windspeed of 15 mi/hFuel model 4 dbh = 15 inDry bulb temperature of 85 °F % slope is 40 percentWet bulb temperature of 52 °F West aspectLive fuel moisture of 150 percent
Find the fine dead fuel moisture, effective windspeed(EWS), flame length (FL), rate of spread (ROS), firelineintensity, and midflame windspeed (MFWS).
Can crew B take direct attack of the fire at the head?
The fire is under 60 percent canopy and sky cover. Whatis the probability of ignition?
The time is 1400 hours. What will the forward spreaddistance be at 2100 hours?
Plot the forward spread distance on a map with a scale of1:7,920. What is the probability of ignition?
A. Locate midflame windspeed and percent slope in thelower left quadrant. Draw a vertical line up at 40 percentslope. Estimate the line of a midflame windspeed of 9miles per hour. At the intersection of the two lines, draw ahorizontal line to the left to get the effective windspeed.Circle this number in the lower right quadrant. Notice thenumber is not located in the lower right quadrant. Go tothe high windspeed nomogram. Repeat step A.
B. Locate the dead fuel moisture percent in the upperright quadrant, 4 percent. Draw a horizontal line to the “S”shaped curve labeled 150 percent live fuel moisture, andthen vertically to the 10 miles per hour effectivewindspeed diagonal line in the lower right quadrant.
C. Draw a line immediately horizontally left. Over to thediagonal line in the lower left quadrant.
D. Then again immediately up vertically to the live fuelmoisture percent in the upper left quadrant, 150 percent.At this point of intersection, draw a horizontal line throughthe upper right quadrant stopping at the intersection of theleft vertical line.
E. Data gathering:ROS = 150 ch/hFL = 28 ftFireline intensity = 280 Btu/ft/sHeat per unit area = 1,550 Btu/ft2
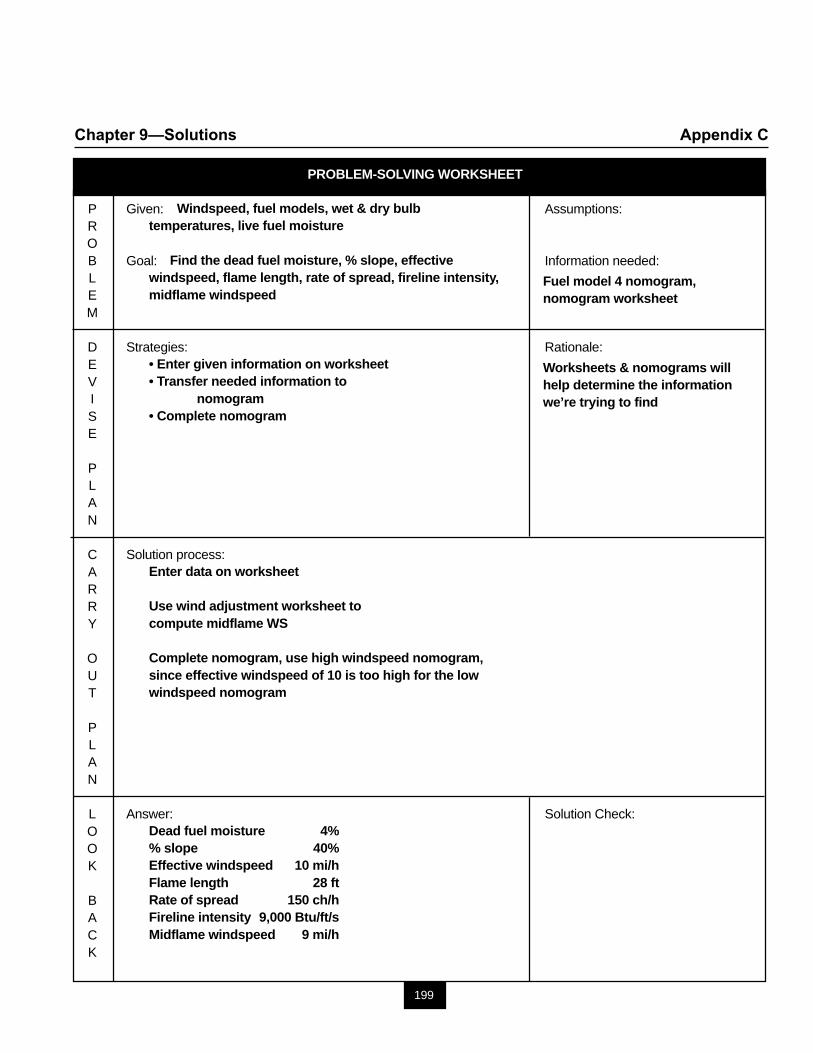
199
Chapter 9—Solutions Appendix C
PROBLEM-SOLVING WORKSHEET
P Given: Assumptions:ROB Goal: Information needed:LEM
D Strategies: Rationale:EVISE
PLAN
C Solution process:ARRY
OUT
PLAN
L Answer: Solution Check:OOK
BACK
Windspeed, fuel models, wet & dry bulbtemperatures, live fuel moisture
Find the dead fuel moisture, % slope, effectivewindspeed, flame length, rate of spread, fireline intensity,midflame windspeed
• Enter given information on worksheet• Transfer needed information to
nomogram• Complete nomogram
Enter data on worksheet
Use wind adjustment worksheet tocompute midflame WS
Complete nomogram, use high windspeed nomogram,since effective windspeed of 10 is too high for the lowwindspeed nomogram
Dead fuel moisture 4%% slope 40%Effective windspeed 10 mi/hFlame length 28 ftRate of spread 150 ch/hFireline intensity 9,000 Btu/ft/sMidflame windspeed 9 mi/h
Fuel model 4 nomogram,nomogram worksheet
Worksheets & nomograms willhelp determine the informationwe’re trying to find
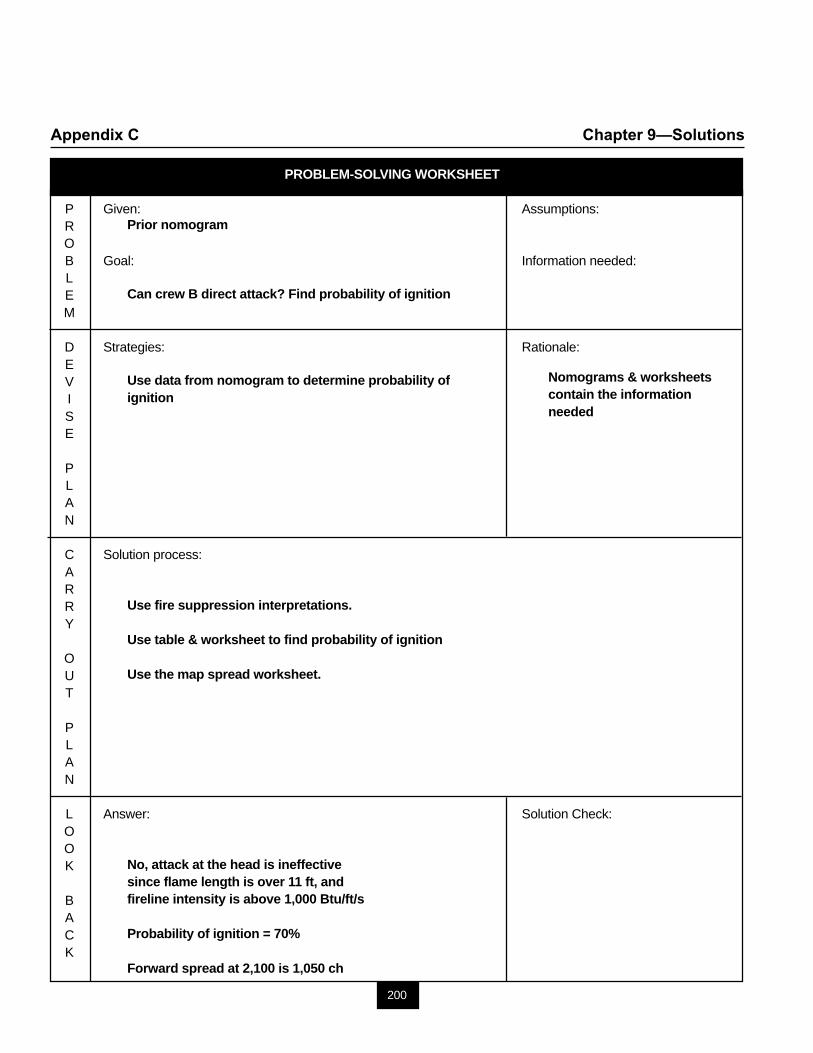
200
Appendix C Chapter 9—Solutions
PROBLEM-SOLVING WORKSHEET
P Given: Assumptions:ROB Goal: Information needed:LEM
D Strategies: Rationale:EVISE
PLAN
C Solution process:ARRY
OUT
PLAN
L Answer: Solution Check:OOK
BACK
Prior nomogram
Can crew B direct attack? Find probability of ignition
Use data from nomogram to determine probability ofignition
Use fire suppression interpretations.
Use table & worksheet to find probability of ignition
Use the map spread worksheet.
No, attack at the head is ineffectivesince flame length is over 11 ft, andfireline intensity is above 1,000 Btu/ft/s
Probability of ignition = 70%
Forward spread at 2,100 is 1,050 ch
Nomograms & worksheetscontain the informationneeded
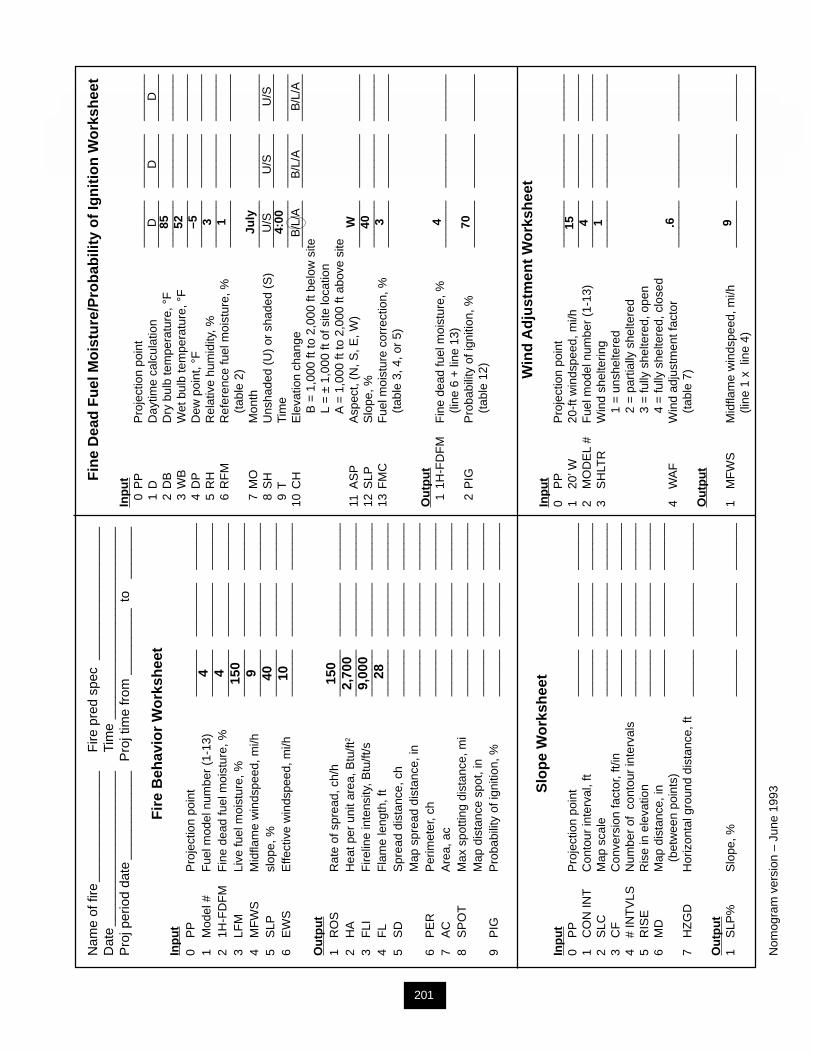
201
Chapter 9—Solutions Appendix C
Nam
e of
fire
____
____
____
___
Fire
pre
d sp
ec__
____
____
____
____
Dat
e__
____
____
____
____
___
Tim
e__
____
____
____
____
____
____
Pro
j per
iod
date
____
____
____
Pro
j tim
e fr
om__
____
___
to__
____
_
Fir
e B
ehav
ior
Wo
rksh
eet
Inp
ut
0P
PP
roje
ctio
n po
int
____
___
____
____
____
___
1M
odel
#F
uel m
odel
num
ber
(1-1
3)__
____
___
____
____
____
_2
1H-F
DF
MF
ine
dead
fuel
moi
stur
e, %
____
___
____
____
____
___
3LF
MLi
ve fu
el m
oist
ure,
%__
____
___
____
____
____
_4
MF
WS
Mid
flam
e w
inds
peed
, mi/h
____
___
____
____
____
___
5S
LPsl
ope,
%__
____
___
____
____
____
_6
EW
SE
ffect
ive
win
dspe
ed, m
i/h__
____
___
____
____
____
_
Ou
tpu
t1
RO
SR
ate
of s
prea
d, c
h/h
____
___
____
____
____
___
2H
AH
eat p
er u
nit a
rea,
Btu
/ft2
____
___
____
____
____
___
3F
LIF
irelin
e in
tens
ity, B
tu/ft
/s__
____
___
____
____
____
_4
FL
Fla
me
leng
th, f
t__
____
___
____
____
____
_5
SD
Spr
ead
dist
ance
, ch
____
___
____
____
____
___
Map
spr
ead
dist
ance
, in
____
___
____
____
____
___
6P
ER
Per
imet
er, c
h__
____
___
____
____
____
_7
AC
Are
a, a
c__
____
___
____
____
____
_8
SP
OT
Max
spo
tting
dis
tanc
e, m
i__
____
___
____
____
____
_M
ap d
ista
nce
spot
, in
____
___
____
____
____
___
9P
IGP
roba
bilit
y of
igni
tion,
%__
____
___
____
____
____
_
Slo
pe
Wo
rksh
eet
Inp
ut
0P
PP
roje
ctio
n po
int
____
___
____
____
____
___
1C
ON
INT
Con
tour
inte
rval
, ft
____
___
____
____
____
___
2S
LCM
ap s
cale
____
___
____
____
____
___
3C
FC
onve
rsio
n fa
ctor
, ft/i
n__
____
___
____
____
____
_4
# IN
TV
LSN
umbe
r of
con
tour
inte
rval
s__
____
___
____
____
____
_5
RIS
ER
ise
in e
leva
tion
____
___
____
____
____
___
6M
DM
ap d
ista
nce,
in__
____
___
____
____
____
_
(bet
wee
n po
ints
)7
HZ
GD
Hor
izon
tal g
roun
d di
stan
ce, f
t__
____
___
____
____
____
_
Ou
tpu
t1
SLP
%S
lope
, %__
____
___
____
____
____
_
Nom
ogra
m v
ersi
on –
Jun
e 19
93
Fin
e D
ead
Fu
el M
ois
ture
/Pro
bab
ility
of
Ign
itio
n W
ork
shee
t
Inp
ut
0P
PP
roje
ctio
n po
int
____
___
____
____
____
___
1D
Day
time
calc
ulat
ion
____
___
____
____
____
___
2D
BD
ry b
ulb
tem
pera
ture
, °F
____
___
____
____
____
___
3W
BW
et b
ulb
tem
pera
ture
, °F
____
___
____
____
____
___
4D
PD
ew p
oint
, °F
____
___
____
____
____
___
5R
HR
elat
ive
hum
idity
, %__
____
___
____
____
____
_ 6
RF
MR
efer
ence
fuel
moi
stur
e, %
____
___
____
____
____
___
(t
able
2)
7M
OM
onth
____
___
____
____
____
___
8S
HU
nsha
ded
(U)
or s
hade
d (S
)__
____
___
____
____
____
_ 9
TTi
me
____
___
____
____
____
___
10C
HE
leva
tion
chan
ge__
____
___
____
____
____
_
B =
1,0
00 ft
to 2
,000
ft b
elow
site
L
= ±
1,0
00 ft
of s
ite lo
catio
n
A =
1,0
00 ft
to 2
,000
ft a
bove
site
11A
SP
Asp
ect,
(N, S
, E, W
)__
____
___
____
____
____
_12
SLP
Slo
pe, %
____
___
____
____
____
___
13F
MC
Fue
l moi
stur
e co
rrec
tion,
%__
____
___
____
____
____
_
(tab
le 3
, 4, o
r 5)
Ou
tpu
t 1
1H-F
DF
MF
ine
dead
fuel
moi
stur
e, %
____
___
____
____
____
___
(li
ne 6
+ li
ne 1
3) 2
PIG
Pro
babi
lity
of ig
nitio
n, %
____
___
____
____
____
___
(t
able
12) W
ind
Ad
just
men
t W
ork
shee
tIn
pu
t0
PP
Pro
ject
ion
poin
t__
____
___
____
____
____
_1
20’ W
20-f
t win
dspe
ed, m
i/h__
____
___
____
____
____
_2
MO
DE
L #
Fue
l mod
el n
umbe
r (1
-13)
____
___
____
____
____
___
3S
HLT
RW
ind
shel
terin
g__
____
___
____
____
____
_
1 =
uns
helte
red
2
= p
artia
lly s
helte
red
3
= fu
lly s
helte
red,
ope
n
4 =
fully
she
ltere
d, c
lose
d4
WA
FW
ind
adju
stm
ent f
acto
r__
____
___
____
____
____
_
(tab
le 7
)O
utp
ut
1M
FW
SM
idfla
me
win
dspe
ed, m
i/h__
____
___
____
____
____
_
(line
1 x
lin
e 4)
DD
D
U/S
U/S
U/S
B/L
/AB
/L/A
B/L
/A
4 4 150 9 40 10 150
2,70
09,
000
28
85 52 –5 3 1
July
4:00 W 40 3 4 70 15 4 1 .6 9
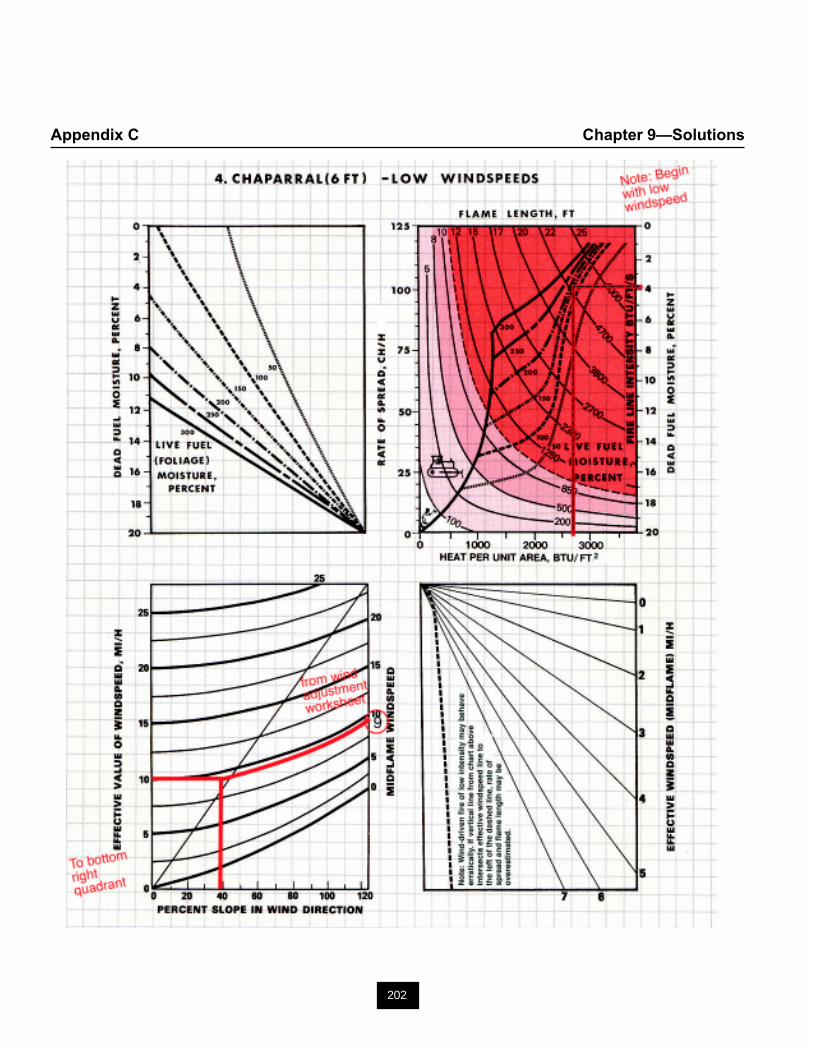
202
Appendix C Chapter 9—Solutions
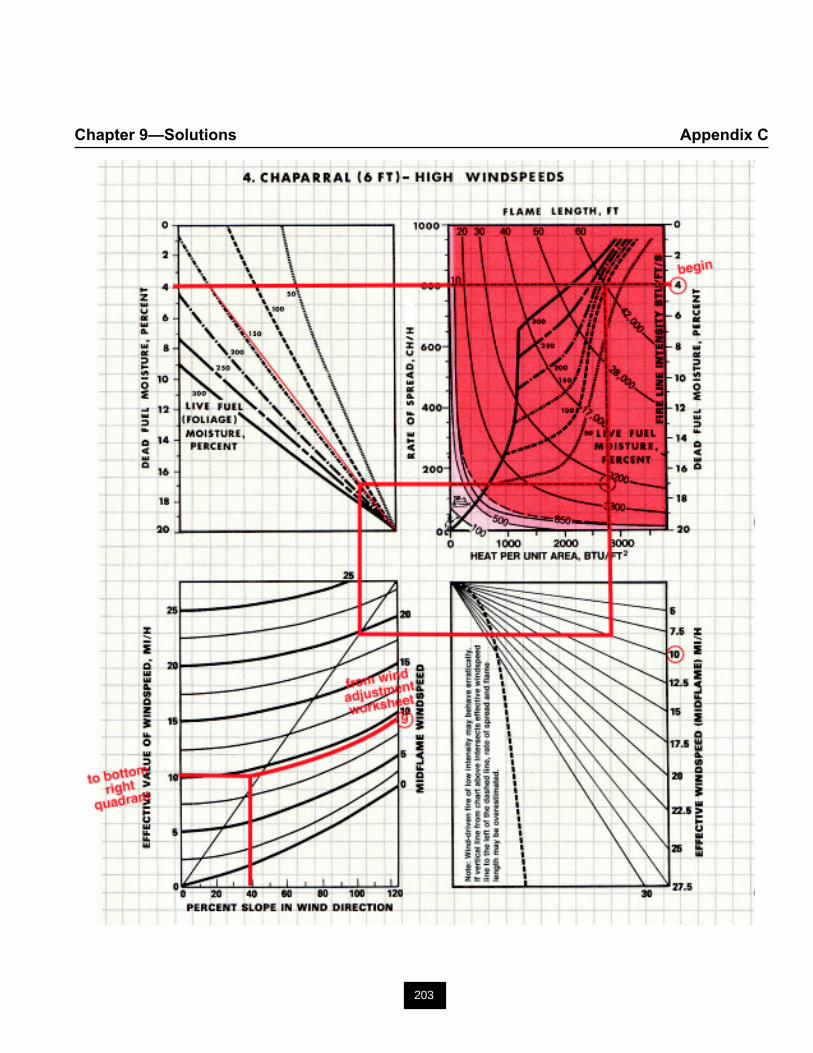
203
Chapter 9—Solutions Appendix C
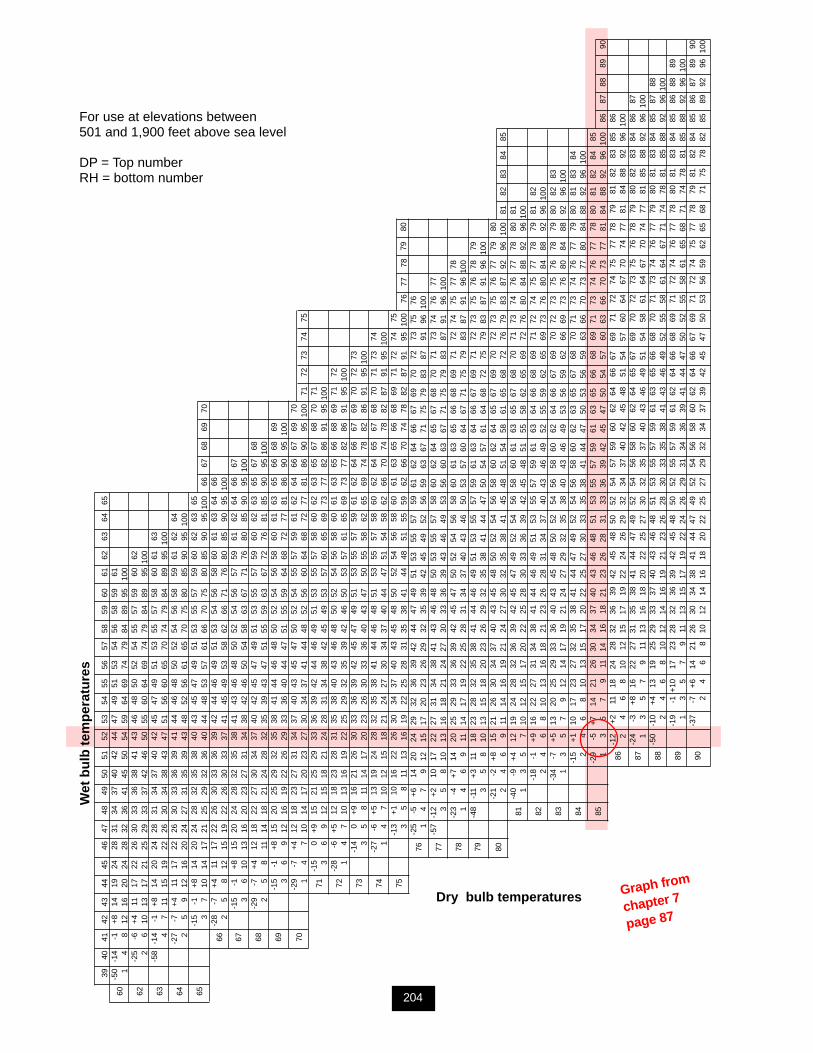
3940
4142
4344
4546
4748
4950
5152
5354
5556
5758
5960
6162
6364
65-5
0-1
4-1
+8
1419
2428
3134
3740
4244
4749
5153
5456
5859
6160
14
812
1620
2428
3236
4145
5054
5964
6974
7984
8995
100
-25
-6+
411
1722
2630
3336
3841
4346
4850
5254
5557
5960
6262
26
1013
1721
2529
3337
4246
5055
6064
6974
7984
8995
100
-58
-14
-1+
814
2024
2831
3437
4042
4547
4951
5355
5758
6061
6363
47
1115
1922
2630
3438
4347
5156
6065
7074
7984
8995
100
-27
-7+
411
1722
2630
3336
3941
4446
4850
5254
5658
5961
6264
642
59
1216
2024
2731
3539
4348
5256
6165
7075
8085
9095
100
-15
-1+
814
2024
2832
3538
4043
4547
4951
5355
5759
6062
6365
653
710
1417
2125
2932
3640
4448
5357
6166
7075
8085
9095
100
6667
6869
70-2
8-7
+4
1117
2226
3033
3639
4244
4649
5153
5456
5860
6163
6466
662
58
1215
1922
2630
3337
4145
4953
5862
6671
7680
8590
9510
0-1
5-1
+8
1520
2428
3235
3841
4346
4850
5254
5657
5961
6264
6667
673
610
1316
2023
2731
3438
4246
5054
5863
6771
7680
8590
9510
0-2
9-7
+4
1218
2227
3034
3740
4245
4749
5153
5557
5960
6263
6567
6868
25
811
1418
2124
2832
3539
4347
5155
5963
6772
7681
8590
9510
0-1
5-1
+8
1520
2529
3235
3841
4446
4850
5254
5658
6061
6365
6668
6969
36
912
1619
2226
2933
3640
4447
5155
5964
6872
7781
8690
9510
0-2
9-7
+4
1218
2327
3134
3740
4345
4750
5254
5557
5961
6264
6667
6970
701
47
1014
1720
2327
3034
3741
4448
5256
6064
6872
7781
8690
9510
071
7273
7475
-15
0+9
1521
2529
3336
3942
4446
4951
5355
5758
6062
6365
6768
7071
713
69
1215
1821
2428
3134
3842
4549
5357
6065
6973
7782
8691
9510
0-2
8-6
+5
1218
2328
3135
3840
4346
4850
5254
5658
6061
6365
6668
6971
7272
14
710
1316
1922
2529
3235
3942
4650
5357
6165
6973
7782
8691
9510
0-1
40
+916
2126
3033
3639
4245
4749
5153
5557
5961
6264
6667
6970
7273
733
58
1114
1720
2326
3033
3640
4347
5055
5862
6569
7478
8286
9195
100
-27
-6+
513
1924
2832
3538
4144
4648
5153
5557
5860
6264
6567
6870
7173
7474
14
710
1215
1821
2427
3034
3740
4447
5154
5862
6670
7478
8287
9195
100
-13
+1
1016
2226
3034
3740
4345
4850
5254
5658
6061
6365
6668
6971
7274
7575
35
811
1316
1922
2528
3135
3841
4448
5155
5962
6670
7478
8287
9195
100
7677
7879
80-2
5-5
+6
1420
2429
3236
3942
4447
4951
5355
5759
6162
6466
6769
7072
7375
7676
14
79
1215
1720
2326
2932
3539
4245
4952
5659
6367
7175
7983
8791
9610
0-5
7-1
2+
210
1722
2731
3438
4143
4648
5053
5557
5860
6264
6567
6870
7173
7476
7777
35
810
1316
1821
2427
3033
3639
4346
4953
5660
6367
7175
7983
8791
9610
0-2
3-4
+7
1420
2529
3336
3942
4547
5052
5456
5860
6163
6566
6869
7172
7475
7778
781
46
911
1417
1922
2528
3134
3740
4346
5053
5760
6467
7175
7983
8791
9610
0-4
8-1
1+3
1118
2328
3235
3841
4446
4951
5355
5759
6163
6466
6769
7172
7375
7678
7979
35
810
1315
1820
2326
2932
3538
4144
4750
5457
6164
6872
7579
8387
9196
100
-21
-2+
815
2126
3034
3740
4345
4850
5254
5658
6062
6465
6769
7072
7375
7677
7980
802
46
911
1416
1921
2427
3032
3538
4145
4851
5458
6165
6872
7679
8387
9296
100
8182
8384
85-4
0-9
+4
1219
2428
3236
3942
4547
4952
5456
5860
6163
6567
6870
7173
7476
7778
8081
811
35
710
1215
1720
2225
2830
3336
3942
4548
5155
5862
6569
7276
8084
8892
9610
0-1
8-1
+9
1622
2731
3438
4144
4649
5153
5557
5961
6364
6668
6971
7274
7577
7879
8182
822
46
810
1316
1821
2326
2831
3437
4043
4649
5255
5962
6569
7376
8084
8892
9610
0-3
4-7
+5
1320
2529
3336
4043
4548
5052
5456
5860
6264
6667
6970
7273
7576
7879
8082
8383
13
57
912
1417
1921
2427
2932
3538
4043
4649
5356
5962
6669
7376
8084
8892
9610
0-1
5+
110
1723
2732
3538
4144
4749
5254
5658
6062
6365
6768
7071
7374
7677
7980
8183
8484
24
68
1013
1517
2022
2527
3033
3538
4144
4750
5356
5963
6670
7377
8084
8892
9610
0-2
9-5
+7
1421
2630
3437
4043
4648
5153
5557
5961
6365
6668
6971
7374
7677
7880
8182
8485
851
35
79
1114
1618
2123
2628
3133
3639
4245
4750
5457
6063
6670
7377
8184
8892
9610
086
8788
8990
-12
+2
1118
2428
3236
3942
4548
5052
5457
5960
6264
6667
6971
7274
7577
7879
8182
8385
8686
24
68
1012
1517
1922
2426
2932
3437
4042
4548
5154
5760
6467
7074
7781
8488
9296
100
-24
-3+
816
2227
3135
3841
4447
4952
5456
5860
6264
6567
6970
7273
7576
7879
8082
8384
8687
871
35
79
1113
1618
2022
2527
3032
3537
4043
4649
5154
5861
6467
7074
7781
8588
9296
100
-50
-10
+4
1319
2529
3337
4043
4648
5153
5557
5961
6365
6668
7071
7374
7677
7980
8183
8485
8788
882
46
810
1214
1619
2123
2628
3033
3538
4143
4649
5255
5861
6467
7174
7881
8588
9296
100
-19
-1+
1017
2328
3236
3942
4548
5052
5557
5961
6264
6668
6971
7274
7677
7880
8183
8485
8688
8989
13
57
911
1315
1719
2224
2629
3134
3639
4144
4750
5255
5861
6568
7174
7881
8588
9296
100
-37
-7+
614
2126
3034
3841
4447
4952
5456
5860
6264
6667
6971
7274
7577
7879
8182
8485
8687
8990
902
46
810
1214
1618
2022
2527
2932
3437
3942
4547
5053
5659
6265
6871
7578
8285
8992
9610
0
Wet
bu
lb t
emp
erat
ure
s
Dry bulb temperatures
For use at elevations between501 and 1,900 feet above sea level
DP = Top numberRH = bottom number
204
Graph from
chapter 7
page 87
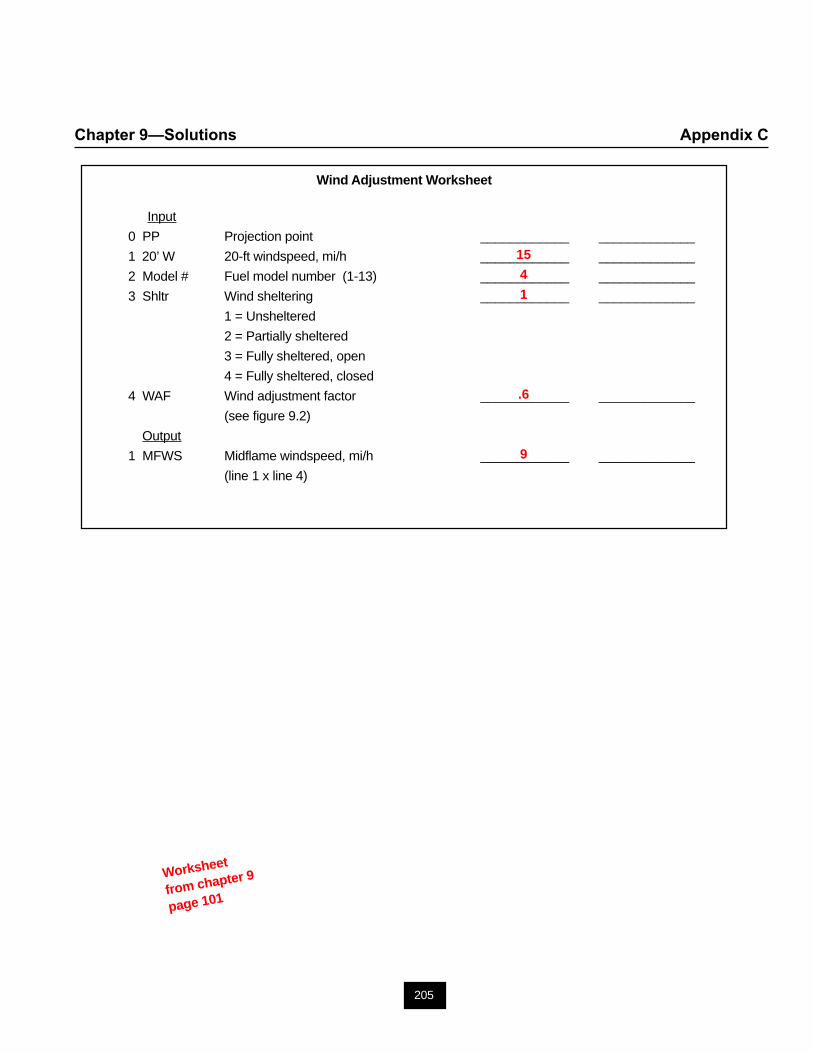
205
Chapter 9—Solutions Appendix C
Wind Adjustment Worksheet
Input
0 PP Projection point ____________ _____________
1 20’ W 20-ft windspeed, mi/h ____________ _____________
2 Model # Fuel model number (1-13) ____________ _____________
3 Shltr Wind sheltering ____________ _____________
1 = Unsheltered
2 = Partially sheltered
3 = Fully sheltered, open
4 = Fully sheltered, closed
4 WAF Wind adjustment factor ____________ _____________
(see figure 9.2)
Output
1 MFWS Midflame windspeed, mi/h ____________ _____________
(line 1 x line 4)
15
4
1
.6
9
Worksheet
from chapter 9
page 101
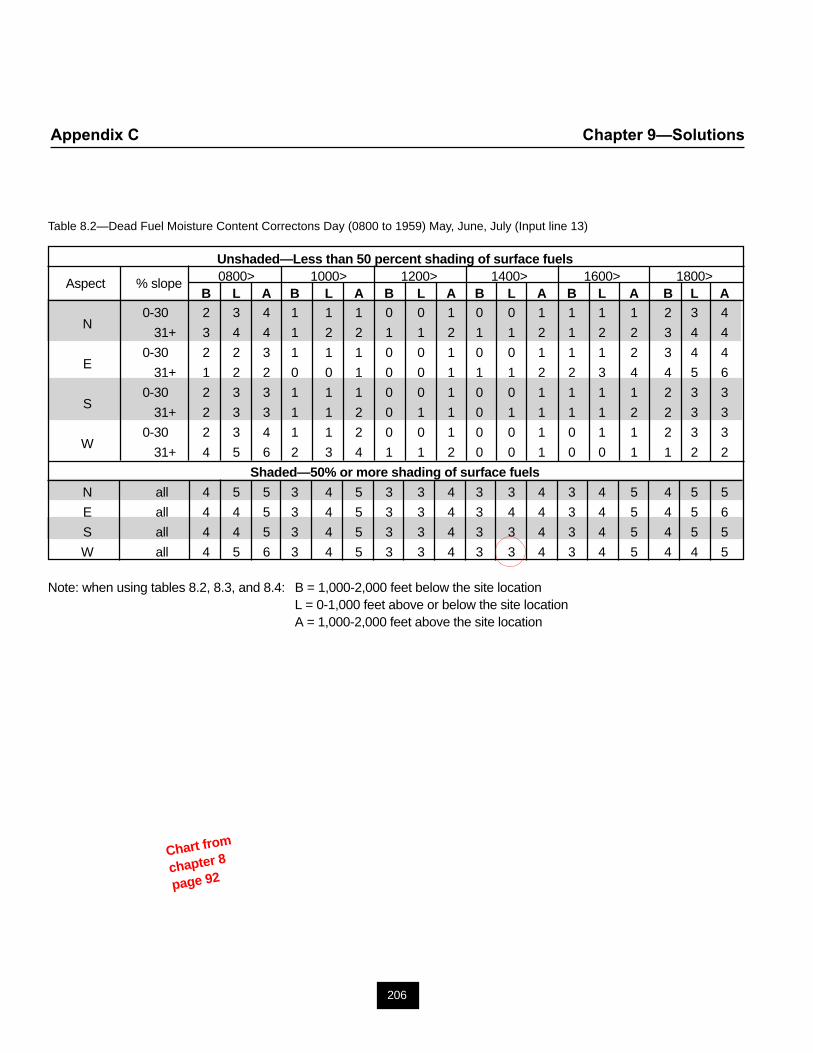
206
Appendix C Chapter 9—Solutions
Table 8.2—Dead Fuel Moisture Content Correctons Day (0800 to 1959) May, June, July (Input line 13)
Unshaded—Less than 50 percent shading of surface fuels
Aspect % slope 0800> 1000> 1200> 1400> 1600> 1800>B L A B L A B L A B L A B L A B L A
N0-30 2 3 4 1 1 1 0 0 1 0 0 1 1 1 1 2 3 4
31+ 3 4 4 1 2 2 1 1 2 1 1 2 1 2 2 3 4 4
E0-30 2 2 3 1 1 1 0 0 1 0 0 1 1 1 2 3 4 4
31+ 1 2 2 0 0 1 0 0 1 1 1 2 2 3 4 4 5 6
S0-30 2 3 3 1 1 1 0 0 1 0 0 1 1 1 1 2 3 3
31+ 2 3 3 1 1 2 0 1 1 0 1 1 1 1 2 2 3 3
W0-30 2 3 4 1 1 2 0 0 1 0 0 1 0 1 1 2 3 3
31+ 4 5 6 2 3 4 1 1 2 0 0 1 0 0 1 1 2 2
Shaded—50% or more shading of surface fuels
N all 4 5 5 3 4 5 3 3 4 3 3 4 3 4 5 4 5 5
E all 4 4 5 3 4 5 3 3 4 3 4 4 3 4 5 4 5 6
S all 4 4 5 3 4 5 3 3 4 3 3 4 3 4 5 4 5 5
W all 4 5 6 3 4 5 3 3 4 3 3 4 3 4 5 4 4 5
Note: when using tables 8.2, 8.3, and 8.4: B = 1,000-2,000 feet below the site locationL = 0-1,000 feet above or below the site locationA = 1,000-2,000 feet above the site location
Chart from
chapter 8
page 92
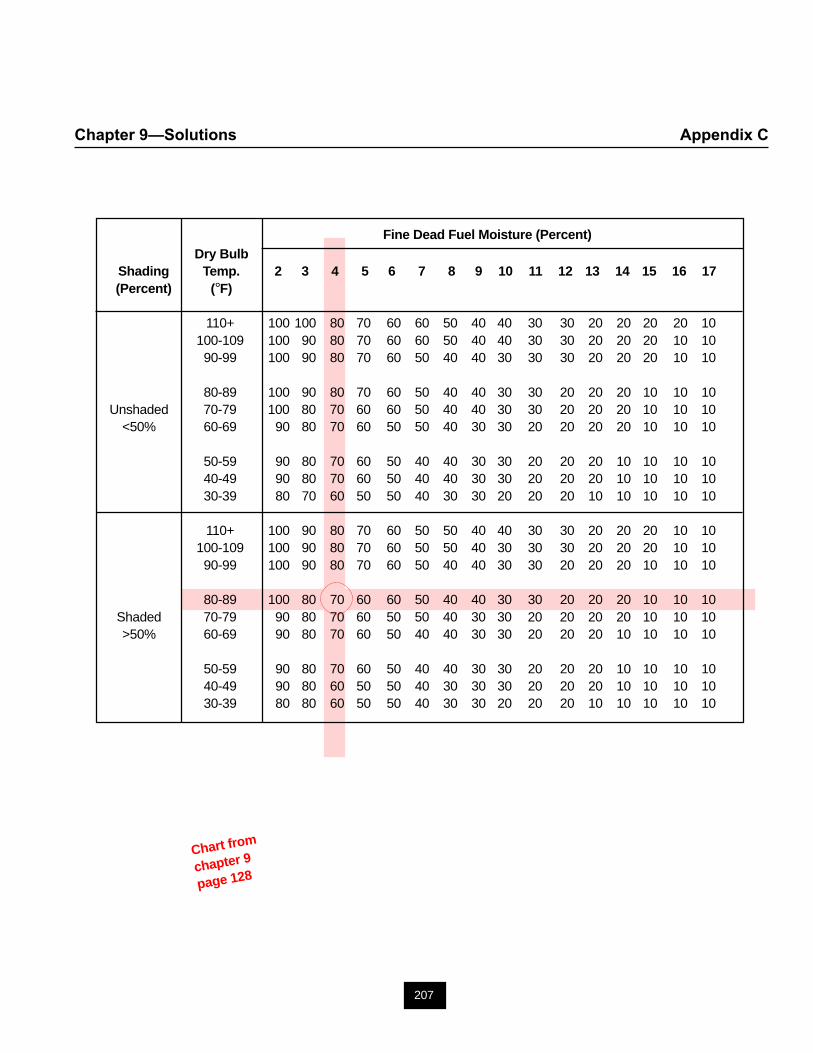
207
Chapter 9—Solutions Appendix C
Fine Dead Fuel Moisture (Percent)Dry Bulb
Shading Temp. 2 3 4 5 6 7 8 9 10 11 12 13 14 15 16 17(Percent) (°F)
110+ 100 100 80 70 60 60 50 40 40 30 30 20 20 20 20 10100-109 100 90 80 70 60 60 50 40 40 30 30 20 20 20 10 1090-99 100 90 80 70 60 50 40 40 30 30 30 20 20 20 10 10
80-89 100 90 80 70 60 50 40 40 30 30 20 20 20 10 10 10Unshaded 70-79 100 80 70 60 60 50 40 40 30 30 20 20 20 10 10 10
<50% 60-69 90 80 70 60 50 50 40 30 30 20 20 20 20 10 10 10
50-59 90 80 70 60 50 40 40 30 30 20 20 20 10 10 10 1040-49 90 80 70 60 50 40 40 30 30 20 20 20 10 10 10 1030-39 80 70 60 50 50 40 30 30 20 20 20 10 10 10 10 10
110+ 100 90 80 70 60 50 50 40 40 30 30 20 20 20 10 10100-109 100 90 80 70 60 50 50 40 30 30 30 20 20 20 10 1090-99 100 90 80 70 60 50 40 40 30 30 20 20 20 10 10 10
80-89 100 80 70 60 60 50 40 40 30 30 20 20 20 10 10 10Shaded 70-79 90 80 70 60 50 50 40 30 30 20 20 20 20 10 10 10>50% 60-69 90 80 70 60 50 40 40 30 30 20 20 20 10 10 10 10
50-59 90 80 70 60 50 40 40 30 30 20 20 20 10 10 10 1040-49 90 80 60 50 50 40 30 30 30 20 20 20 10 10 10 1030-39 80 80 60 50 50 40 30 30 20 20 20 10 10 10 10 10
Chart from
chapter 9
page 128
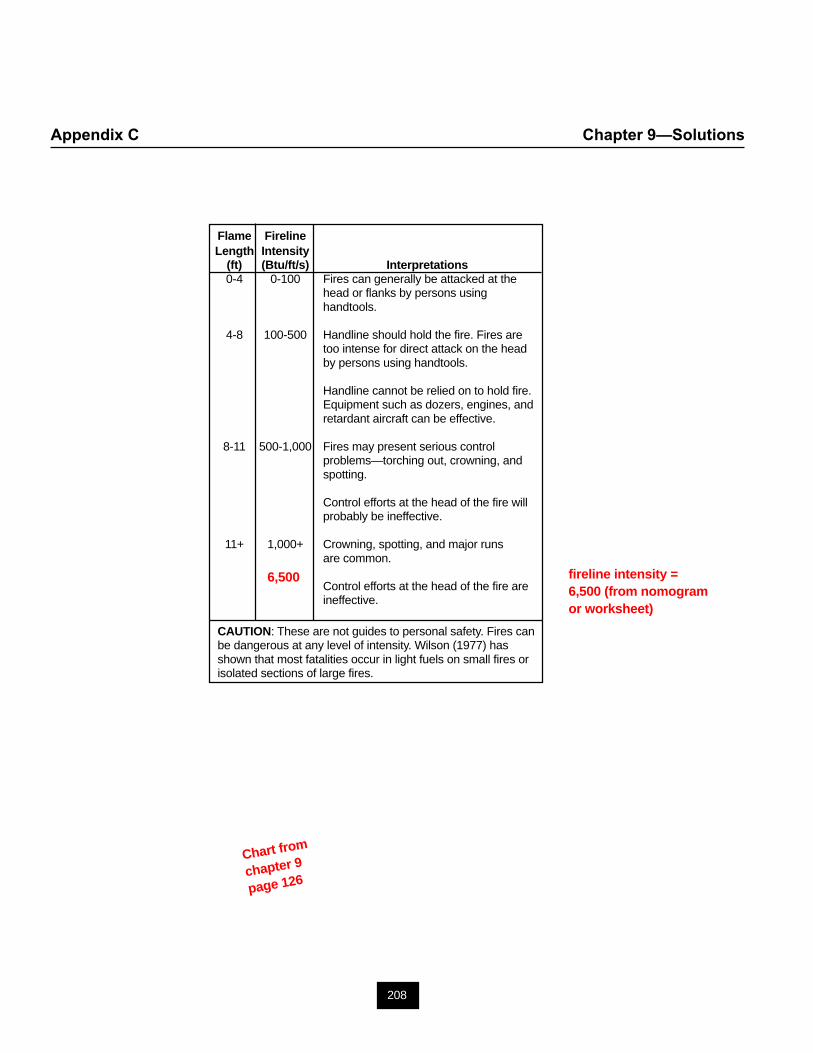
208
Appendix C Chapter 9—Solutions
Flame FirelineLength Intensity
(ft) (Btu/ft/s) Interpretations0-4 0-100 Fires can generally be attacked at the
head or flanks by persons usinghandtools.
4-8 100-500 Handline should hold the fire. Fires aretoo intense for direct attack on the headby persons using handtools.
Handline cannot be relied on to hold fire.Equipment such as dozers, engines, andretardant aircraft can be effective.
8-11 500-1,000 Fires may present serious controlproblems—torching out, crowning, andspotting.
Control efforts at the head of the fire willprobably be ineffective.
11+ 1,000+ Crowning, spotting, and major runsare common.
Control efforts at the head of the fire areineffective.
CAUTION: These are not guides to personal safety. Fires canbe dangerous at any level of intensity. Wilson (1977) hasshown that most fatalities occur in light fuels on small fires orisolated sections of large fires.
Chart from
chapter 9
page 126
6,500 fireline intensity =6,500 (from nomogramor worksheet)
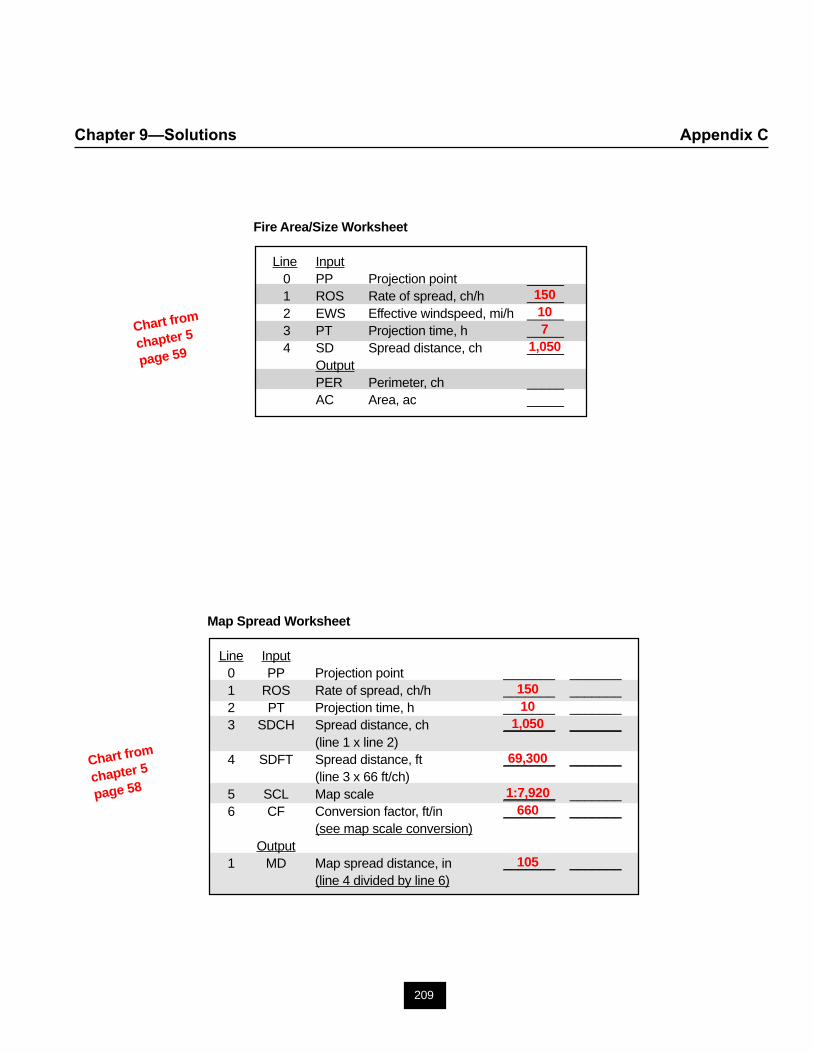
209
Chapter 9—Solutions Appendix C
Chart from
chapter 5
page 59
Chart from
chapter 5
page 58
Fire Area/Size Worksheet
Line Input0 PP Projection point _____1 ROS Rate of spread, ch/h _____2 EWS Effective windspeed, mi/h _____3 PT Projection time, h _____4 SD Spread distance, ch _____
OutputPER Perimeter, ch _____AC Area, ac _____
150107
1,050
Map Spread Worksheet
Line Input0 PP Projection point _______ _______1 ROS Rate of spread, ch/h _______ _______2 PT Projection time, h _______ _______3 SDCH Spread distance, ch _______ _______
(line 1 x line 2)4 SDFT Spread distance, ft _______ _______
(line 3 x 66 ft/ch)5 SCL Map scale _______ _______6 CF Conversion factor, ft/in _______ _______
(see map scale conversion)Output
1 MD Map spread distance, in _______ _______(line 4 divided by line 6)
15010
1,050
69,300
1:7,920660
105

210
Appendix C Chapter 9—Solutions
Plotted forward spread distance.See chapter 5, page 58 (Fire Shape)
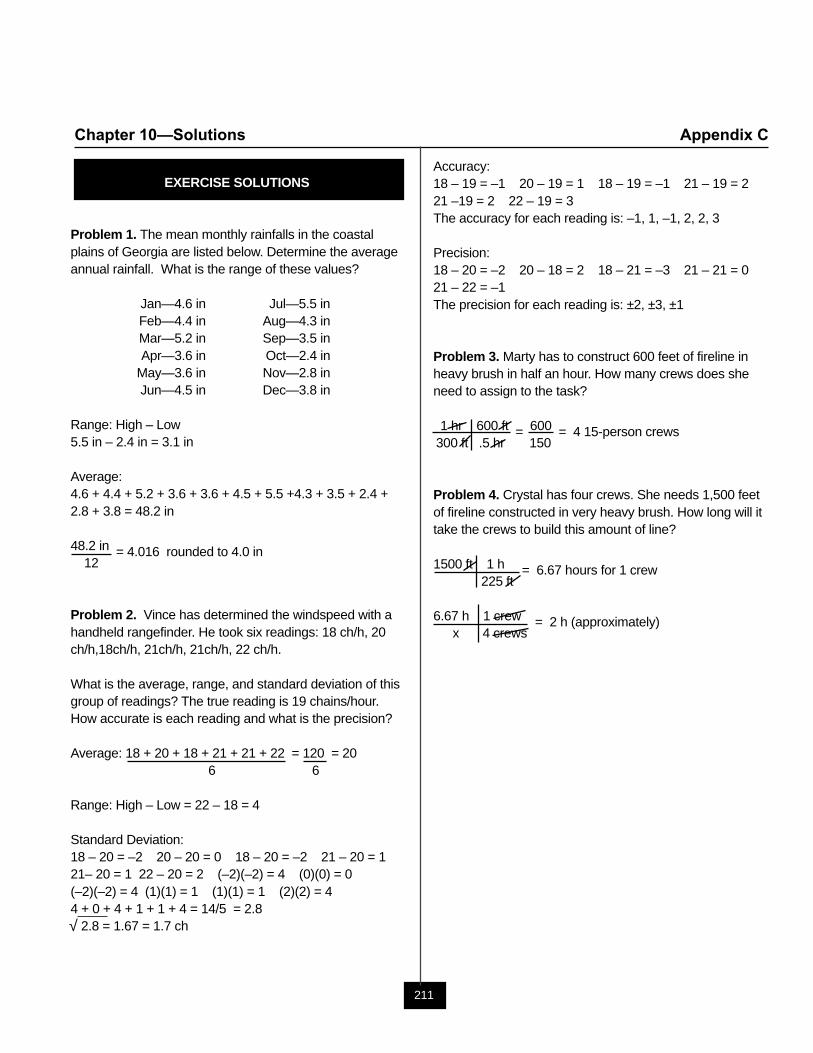
211
Chapter 10—Solutions Appendix C
EXERCISE SOLUTIONS
Problem 1. The mean monthly rainfalls in the coastalplains of Georgia are listed below. Determine the averageannual rainfall. What is the range of these values?
Jan—4.6 in Jul—5.5 inFeb—4.4 in Aug—4.3 inMar—5.2 in Sep—3.5 inApr—3.6 in Oct—2.4 in
May—3.6 in Nov—2.8 inJun—4.5 in Dec—3.8 in
Range: High – Low5.5 in – 2.4 in = 3.1 in
Average:4.6 + 4.4 + 5.2 + 3.6 + 3.6 + 4.5 + 5.5 +4.3 + 3.5 + 2.4 +2.8 + 3.8 = 48.2 in
48.2 in = 4.016 rounded to 4.0 in12
Problem 2. Vince has determined the windspeed with ahandheld rangefinder. He took six readings: 18 ch/h, 20ch/h,18ch/h, 21ch/h, 21ch/h, 22 ch/h.
What is the average, range, and standard deviation of thisgroup of readings? The true reading is 19 chains/hour.How accurate is each reading and what is the precision?
Average: 18 + 20 + 18 + 21 + 21 + 22 = 120 = 206 6
Range: High – Low = 22 – 18 = 4
Standard Deviation:18 – 20 = –2 20 – 20 = 0 18 – 20 = –2 21 – 20 = 121– 20 = 1 22 – 20 = 2 (–2)(–2) = 4 (0)(0) = 0(–2)(–2) = 4 (1)(1) = 1 (1)(1) = 1 (2)(2) = 44 + 0 + 4 + 1 + 1 + 4 = 14/5 = 2.8 2.8 = 1.67 = 1.7 ch
Accuracy:18 – 19 = –1 20 – 19 = 1 18 – 19 = –1 21 – 19 = 221 –19 = 2 22 – 19 = 3The accuracy for each reading is: –1, 1, –1, 2, 2, 3
Precision:18 – 20 = –2 20 – 18 = 2 18 – 21 = –3 21 – 21 = 021 – 22 = –1The precision for each reading is: ±2, ±3, ±1
Problem 3. Marty has to construct 600 feet of fireline inheavy brush in half an hour. How many crews does sheneed to assign to the task?
1 hr 600 ft = 600 = 4 15-person crews300 ft .5 hr 150
Problem 4. Crystal has four crews. She needs 1,500 feetof fireline constructed in very heavy brush. How long will ittake the crews to build this amount of line?
1500 ft 1 h = 6.67 hours for 1 crew225 ft
6.67 h 1 crew = 2 h (approximately)x 4 crews
√

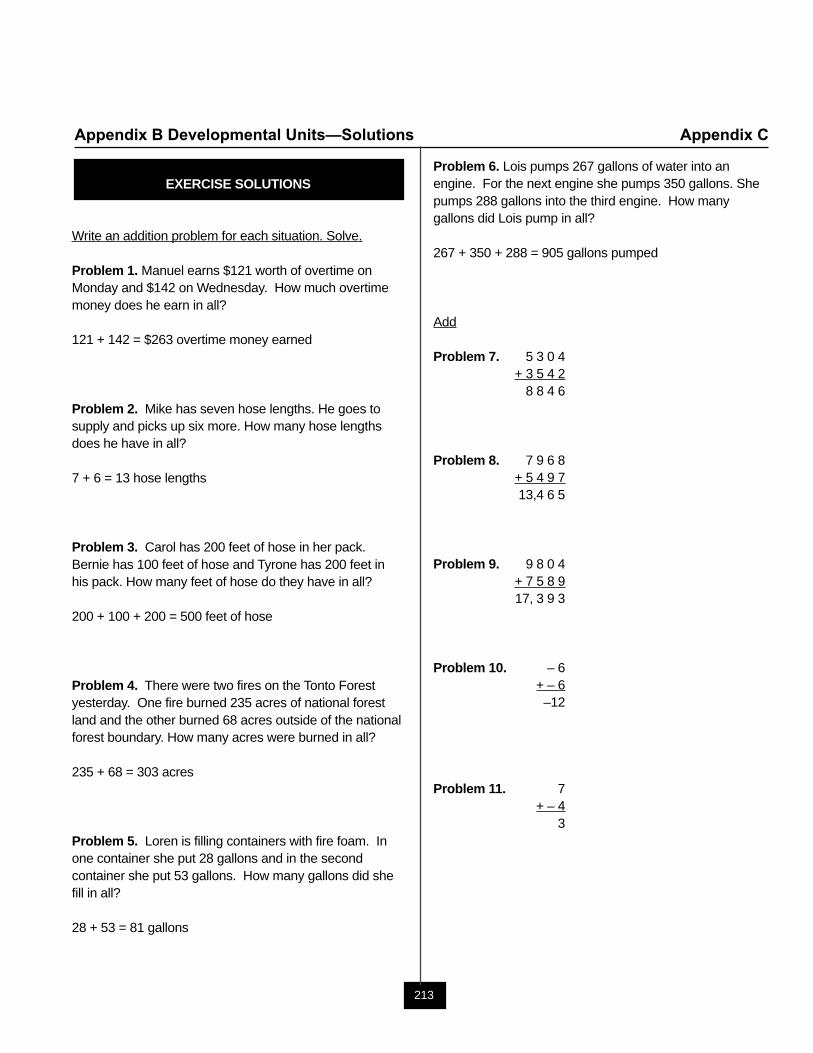
213
Appendix B Developmental Units—Solutions Appendix C
EXERCISE SOLUTIONS
Write an addition problem for each situation. Solve.
Problem 1. Manuel earns $121 worth of overtime onMonday and $142 on Wednesday. How much overtimemoney does he earn in all?
121 + 142 = $263 overtime money earned
Problem 2. Mike has seven hose lengths. He goes tosupply and picks up six more. How many hose lengthsdoes he have in all?
7 + 6 = 13 hose lengths
Problem 3. Carol has 200 feet of hose in her pack.Bernie has 100 feet of hose and Tyrone has 200 feet inhis pack. How many feet of hose do they have in all?
200 + 100 + 200 = 500 feet of hose
Problem 4. There were two fires on the Tonto Forestyesterday. One fire burned 235 acres of national forestland and the other burned 68 acres outside of the nationalforest boundary. How many acres were burned in all?
235 + 68 = 303 acres
Problem 5. Loren is filling containers with fire foam. Inone container she put 28 gallons and in the secondcontainer she put 53 gallons. How many gallons did shefill in all?
28 + 53 = 81 gallons
Problem 6. Lois pumps 267 gallons of water into anengine. For the next engine she pumps 350 gallons. Shepumps 288 gallons into the third engine. How manygallons did Lois pump in all?
267 + 350 + 288 = 905 gallons pumped
Add
Problem 7. 5 3 0 4+ 3 5 4 2
8 8 4 6
Problem 8. 7 9 6 8+ 5 4 9 7 13,4 6 5
Problem 9. 9 8 0 4+ 7 5 8 917, 3 9 3
Problem 10. – 6 + – 6
–12
Problem 11. 7 + – 4
3
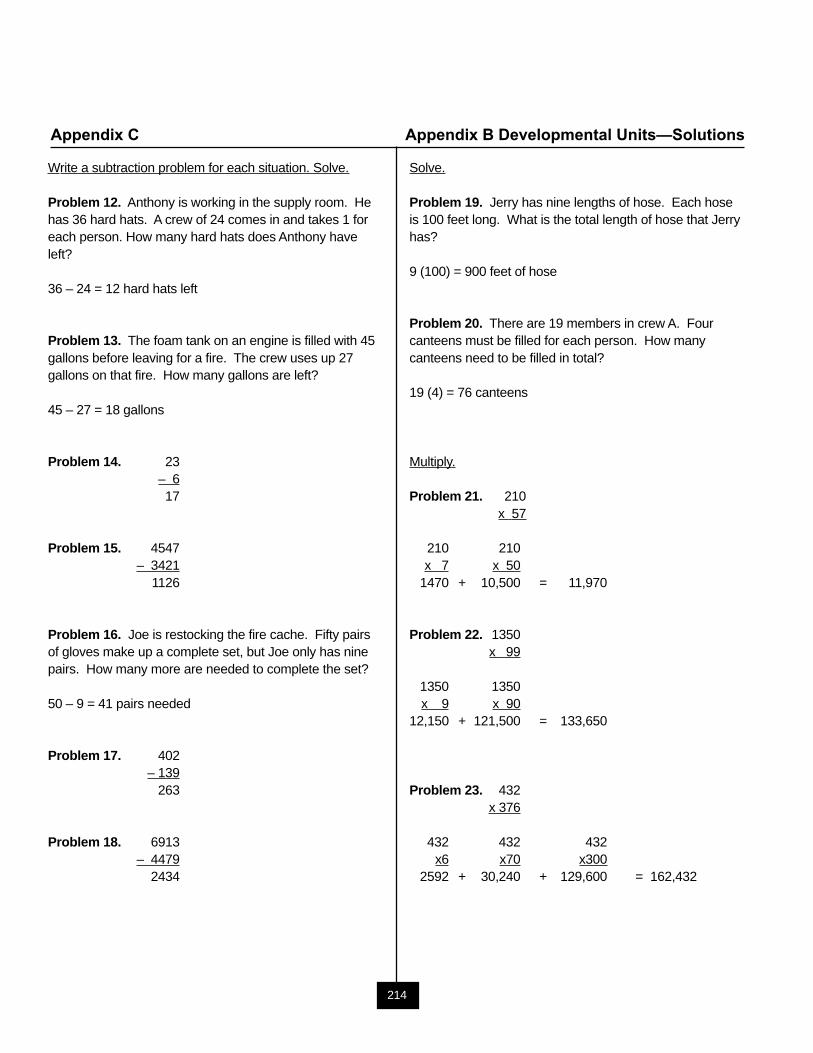
214
Appendix C Appendix B Developmental Units—Solutions
Write a subtraction problem for each situation. Solve.
Problem 12. Anthony is working in the supply room. Hehas 36 hard hats. A crew of 24 comes in and takes 1 foreach person. How many hard hats does Anthony haveleft?
36 – 24 = 12 hard hats left
Problem 13. The foam tank on an engine is filled with 45gallons before leaving for a fire. The crew uses up 27gallons on that fire. How many gallons are left?
45 – 27 = 18 gallons
Problem 14. 23– 617
Problem 15. 4547 – 3421
1126
Problem 16. Joe is restocking the fire cache. Fifty pairsof gloves make up a complete set, but Joe only has ninepairs. How many more are needed to complete the set?
50 – 9 = 41 pairs needed
Problem 17. 402– 139
263
Problem 18. 6913– 4479
2434
Solve.
Problem 19. Jerry has nine lengths of hose. Each hoseis 100 feet long. What is the total length of hose that Jerryhas?
9 (100) = 900 feet of hose
Problem 20. There are 19 members in crew A. Fourcanteens must be filled for each person. How manycanteens need to be filled in total?
19 (4) = 76 canteens
Multiply.
Problem 21. 210x 57
210 210x 7 x 50
1470 + 10,500 = 11,970
Problem 22. 1350x 99
1350 1350x 9 x 90
12,150 + 121,500 = 133,650
Problem 23. 432x 376
432 432 432x6 x70 x300
2592 + 30,240 + 129,600 = 162,432
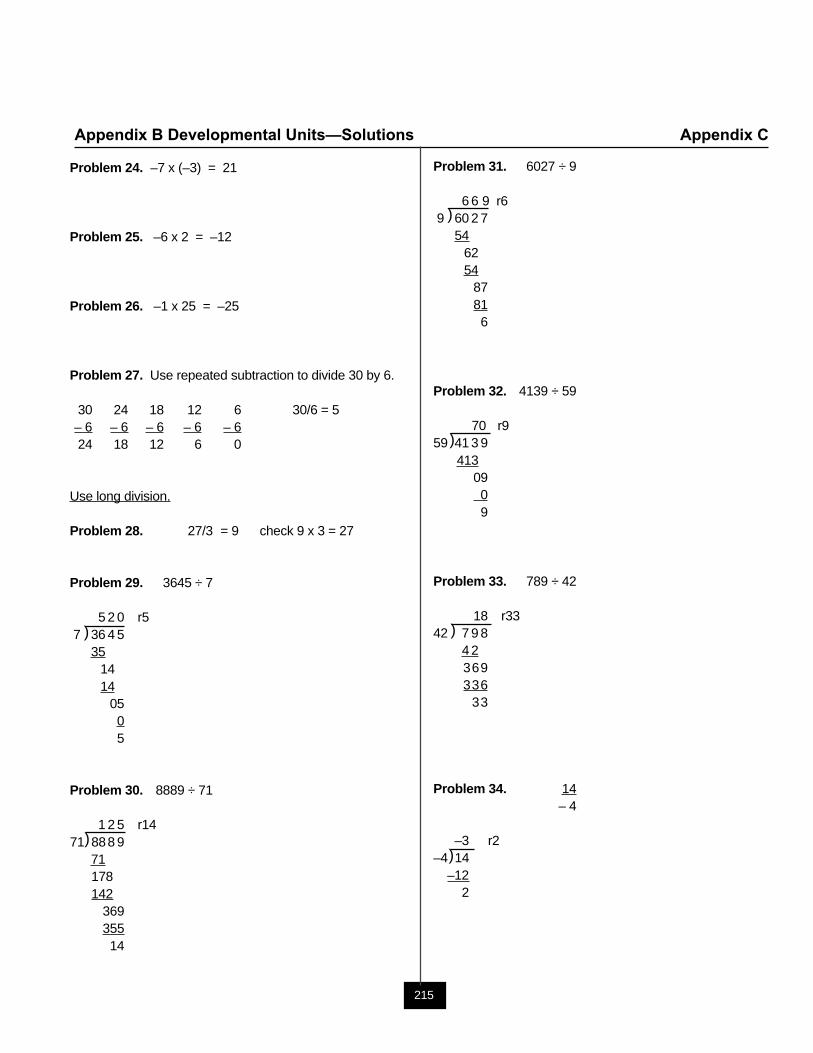
215
Appendix B Developmental Units—Solutions Appendix C
Problem 24. –7 x (–3) = 21
Problem 25. –6 x 2 = –12
Problem 26. –1 x 25 = –25
Problem 27. Use repeated subtraction to divide 30 by 6.
30 24 18 12 6 30/6 = 5– 6 – 6 – 6 – 6 – 624 18 12 6 0
Use long division.
Problem 28. 27/3 = 9 check 9 x 3 = 27
Problem 29. 3645 ÷ 7
5 2 0 r5 7 36 4 5
351414
0505
Problem 30. 8889 ÷ 71
1 2 5 r1471 888 9
71178142
36935514
Problem 31. 6027 ÷ 9
6 6 9 r69 60 2 7
546254
87816
Problem 32. 4139 ÷ 59
70 r959 41 3 9
41309 09
Problem 33. 789 ÷ 42
18 r3342 7 9 8
4 2369336
33
Problem 34. 14– 4
–3 r2–4 14 –12
2
)
)
)
)
)
)
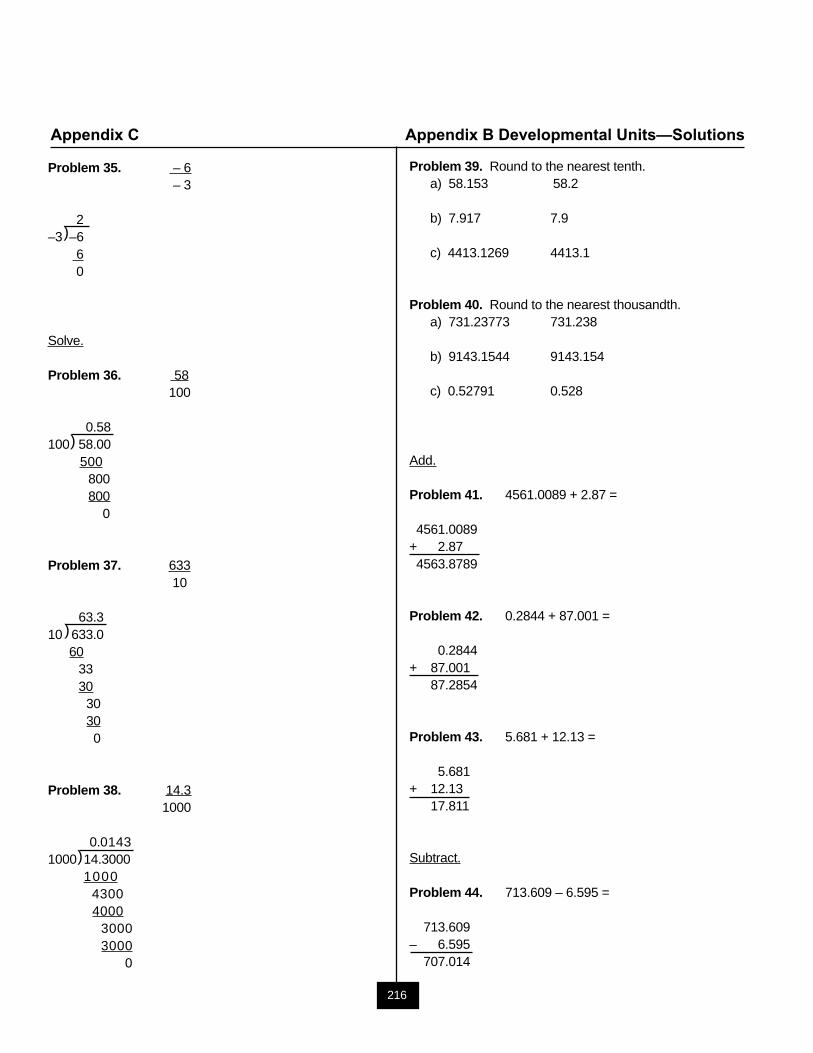
216
Appendix C Appendix B Developmental Units—Solutions
Problem 35. – 6 – 3
2–3 –6
60
Solve.
Problem 36. 58100
0.58100 58.00
500800800
0
Problem 37. 63310
63.310 633.0
603330
30300
Problem 38. 14.31000
0.01431000 14.3000
100043004000
30003000
0
Problem 39. Round to the nearest tenth.a) 58.153 58.2
b) 7.917 7.9
c) 4413.1269 4413.1
Problem 40. Round to the nearest thousandth.a) 731.23773 731.238
b) 9143.1544 9143.154
c) 0.52791 0.528
Add.
Problem 41. 4561.0089 + 2.87 =
4561.0089+ 2.874563.8789
Problem 42. 0.2844 + 87.001 =
0.2844+ 87.001
87.2854
Problem 43. 5.681 + 12.13 =
5.681+ 12.13
17.811
Subtract.
Problem 44. 713.609 – 6.595 =
713.609– 6.595
707.014
)
)
)
)
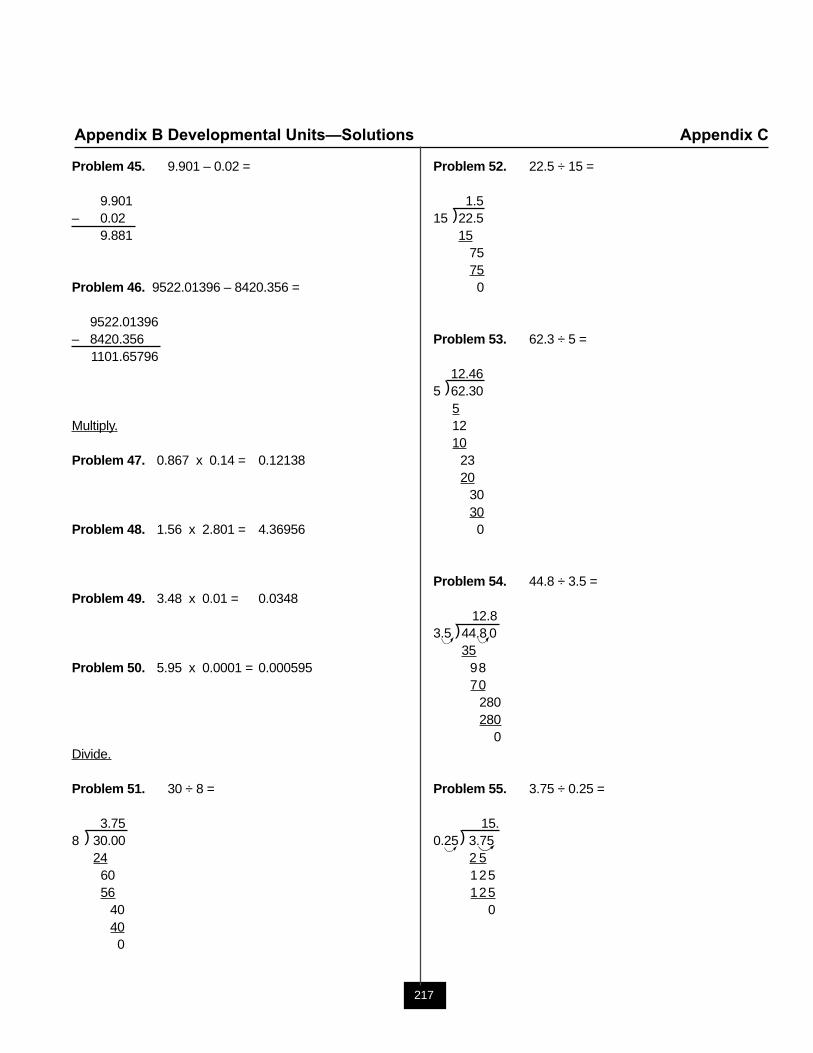
217
Appendix B Developmental Units—Solutions Appendix C
Problem 45. 9.901 – 0.02 =
9.901– 0.02
9.881
Problem 46. 9522.01396 – 8420.356 =
9522.01396– 8420.356
1101.65796
Multiply.
Problem 47. 0.867 x 0.14 = 0.12138
Problem 48. 1.56 x 2.801 = 4.36956
Problem 49. 3.48 x 0.01 = 0.0348
Problem 50. 5.95 x 0.0001 = 0.000595
Divide.
Problem 51. 30 ÷ 8 =
3.758 30.00
246056
40400
Problem 52. 22.5 ÷ 15 =
1.515 22.5
1575750
Problem 53. 62.3 ÷ 5 =
12.465 62.30
51210
2320
30300
Problem 54. 44.8 ÷ 3.5 =
12.83.5 44.8 0
359870
280280
0
Problem 55. 3.75 ÷ 0.25 =
15.0.25 3.75
2 5125125
0
)
)
)
)
)
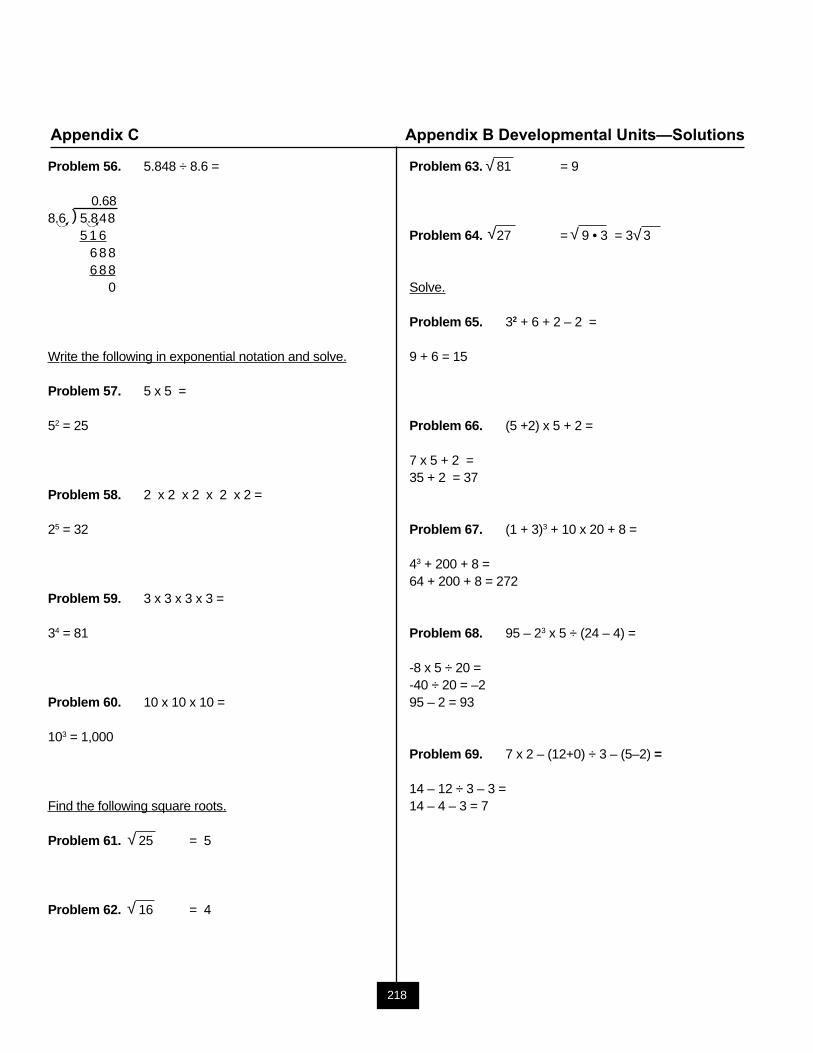
218
Appendix C Appendix B Developmental Units—Solutions
Problem 56. 5.848 ÷ 8.6 =
0.688.6 5.848
5 1 6688688
0
Write the following in exponential notation and solve.
Problem 57. 5 x 5 =
52 = 25
Problem 58. 2 x 2 x 2 x 2 x 2 =
25 = 32
Problem 59. 3 x 3 x 3 x 3 =
34 = 81
Problem 60. 10 x 10 x 10 =
103 = 1,000
Find the following square roots.
Problem 61. 25 = 5
Problem 62. 16 = 4
Problem 63. 81 = 9
Problem 64. 27 = 9 • 3 = 3 3
Solve.
Problem 65. 32 + 6 + 2 – 2 =
9 + 6 = 15
Problem 66. (5 +2) x 5 + 2 =
7 x 5 + 2 =35 + 2 = 37
Problem 67. (1 + 3)3 + 10 x 20 + 8 =
43 + 200 + 8 =64 + 200 + 8 = 272
Problem 68. 95 – 23 x 5 ÷ (24 – 4) =
-8 x 5 ÷ 20 =-40 ÷ 20 = –295 – 2 = 93
Problem 69. 7 x 2 – (12+0) ÷ 3 – (5–2) =
14 – 12 ÷ 3 – 3 =14 – 4 – 3 = 7
)
√
√
√
√ √ √
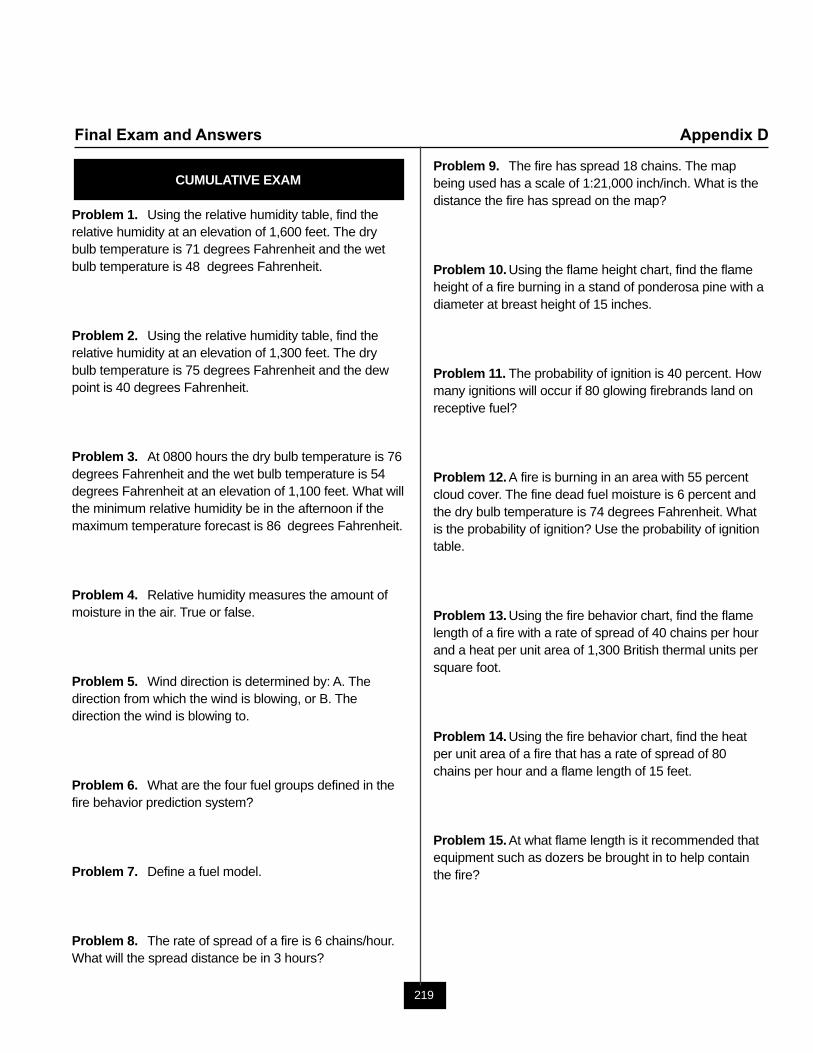
219
Final Exam and Answers Appendix D
CUMULATIVE EXAM
Problem 1. Using the relative humidity table, find therelative humidity at an elevation of 1,600 feet. The drybulb temperature is 71 degrees Fahrenheit and the wetbulb temperature is 48 degrees Fahrenheit.
Problem 2. Using the relative humidity table, find therelative humidity at an elevation of 1,300 feet. The drybulb temperature is 75 degrees Fahrenheit and the dewpoint is 40 degrees Fahrenheit.
Problem 3. At 0800 hours the dry bulb temperature is 76degrees Fahrenheit and the wet bulb temperature is 54degrees Fahrenheit at an elevation of 1,100 feet. What willthe minimum relative humidity be in the afternoon if themaximum temperature forecast is 86 degrees Fahrenheit.
Problem 4. Relative humidity measures the amount ofmoisture in the air. True or false.
Problem 5. Wind direction is determined by: A. Thedirection from which the wind is blowing, or B. Thedirection the wind is blowing to.
Problem 6. What are the four fuel groups defined in thefire behavior prediction system?
Problem 7. Define a fuel model.
Problem 8. The rate of spread of a fire is 6 chains/hour.What will the spread distance be in 3 hours?
Problem 9. The fire has spread 18 chains. The mapbeing used has a scale of 1:21,000 inch/inch. What is thedistance the fire has spread on the map?
Problem 10. Using the flame height chart, find the flameheight of a fire burning in a stand of ponderosa pine with adiameter at breast height of 15 inches.
Problem 11. The probability of ignition is 40 percent. Howmany ignitions will occur if 80 glowing firebrands land onreceptive fuel?
Problem 12. A fire is burning in an area with 55 percentcloud cover. The fine dead fuel moisture is 6 percent andthe dry bulb temperature is 74 degrees Fahrenheit. Whatis the probability of ignition? Use the probability of ignitiontable.
Problem 13. Using the fire behavior chart, find the flamelength of a fire with a rate of spread of 40 chains per hourand a heat per unit area of 1,300 British thermal units persquare foot.
Problem 14. Using the fire behavior chart, find the heatper unit area of a fire that has a rate of spread of 80chains per hour and a flame length of 15 feet.
Problem 15. At what flame length is it recommended thatequipment such as dozers be brought in to help containthe fire?
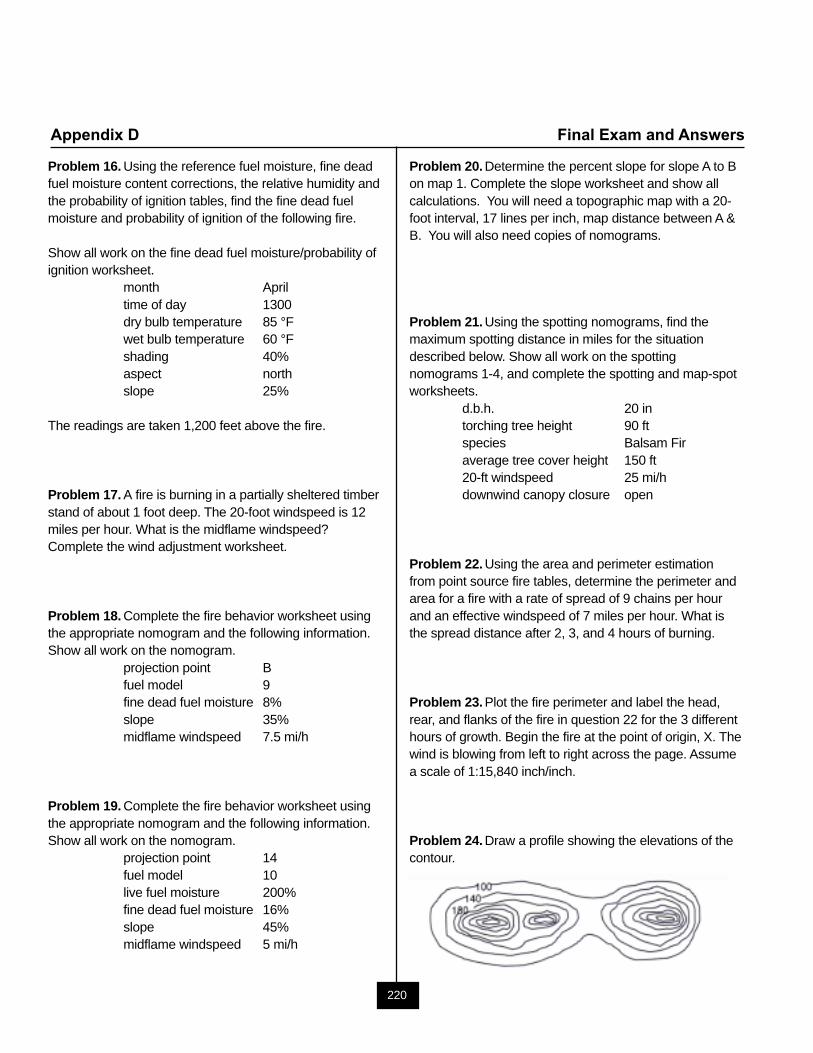
220
Appendix D Final Exam and Answers
Problem 16. Using the reference fuel moisture, fine deadfuel moisture content corrections, the relative humidity andthe probability of ignition tables, find the fine dead fuelmoisture and probability of ignition of the following fire.
Show all work on the fine dead fuel moisture/probability ofignition worksheet.
month Apriltime of day 1300dry bulb temperature 85 °Fwet bulb temperature 60 °Fshading 40%aspect northslope 25%
The readings are taken 1,200 feet above the fire.
Problem 17. A fire is burning in a partially sheltered timberstand of about 1 foot deep. The 20-foot windspeed is 12miles per hour. What is the midflame windspeed?Complete the wind adjustment worksheet.
Problem 18. Complete the fire behavior worksheet usingthe appropriate nomogram and the following information.Show all work on the nomogram.
projection point Bfuel model 9fine dead fuel moisture 8%slope 35%midflame windspeed 7.5 mi/h
Problem 19. Complete the fire behavior worksheet usingthe appropriate nomogram and the following information.Show all work on the nomogram.
projection point 14fuel model 10live fuel moisture 200%fine dead fuel moisture 16%slope 45%midflame windspeed 5 mi/h
Problem 20. Determine the percent slope for slope A to Bon map 1. Complete the slope worksheet and show allcalculations. You will need a topographic map with a 20-foot interval, 17 lines per inch, map distance between A &B. You will also need copies of nomograms.
Problem 21. Using the spotting nomograms, find themaximum spotting distance in miles for the situationdescribed below. Show all work on the spottingnomograms 1-4, and complete the spotting and map-spotworksheets.
d.b.h. 20 intorching tree height 90 ftspecies Balsam Firaverage tree cover height 150 ft20-ft windspeed 25 mi/hdownwind canopy closure open
Problem 22. Using the area and perimeter estimationfrom point source fire tables, determine the perimeter andarea for a fire with a rate of spread of 9 chains per hourand an effective windspeed of 7 miles per hour. What isthe spread distance after 2, 3, and 4 hours of burning.
Problem 23. Plot the fire perimeter and label the head,rear, and flanks of the fire in question 22 for the 3 differenthours of growth. Begin the fire at the point of origin, X. Thewind is blowing from left to right across the page. Assumea scale of 1:15,840 inch/inch.
Problem 24. Draw a profile showing the elevations of thecontour.
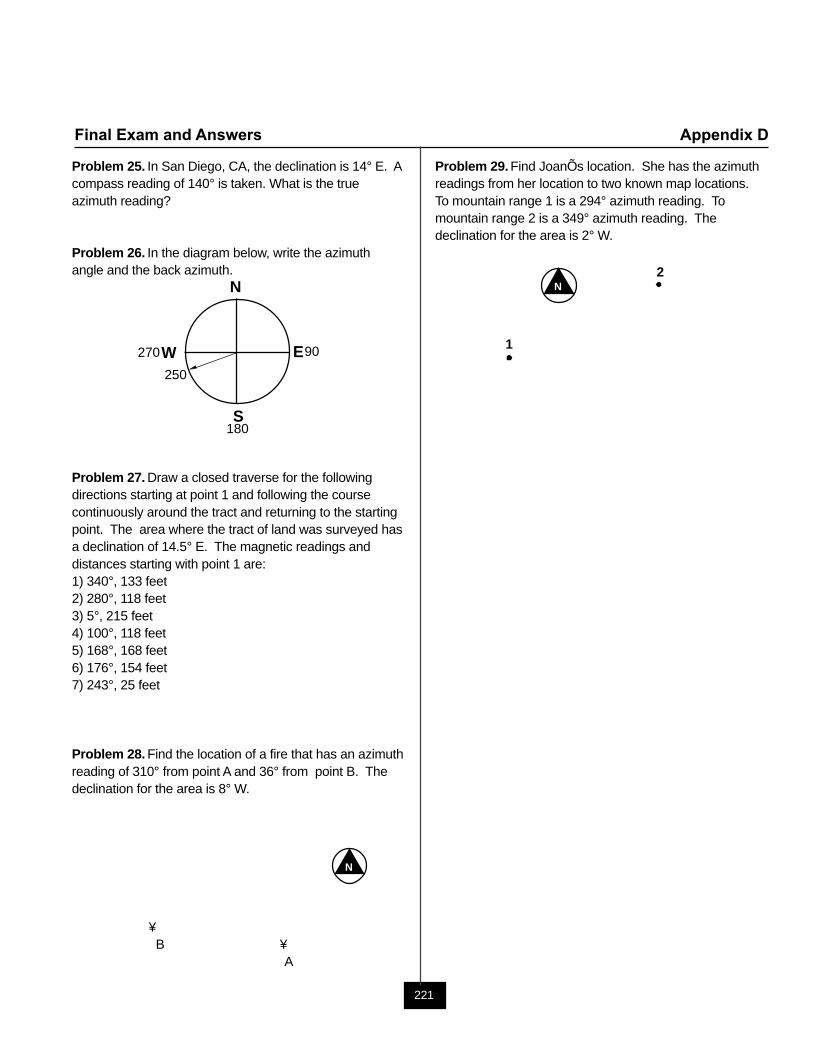
221
Final Exam and Answers Appendix D
Problem 25. In San Diego, CA, the declination is 14° E. Acompass reading of 140° is taken. What is the trueazimuth reading?
Problem 26. In the diagram below, write the azimuthangle and the back azimuth.
Problem 27. Draw a closed traverse for the followingdirections starting at point 1 and following the coursecontinuously around the tract and returning to the startingpoint. The area where the tract of land was surveyed hasa declination of 14.5° E. The magnetic readings anddistances starting with point 1 are:1) 340°, 133 feet2) 280°, 118 feet3) 5°, 215 feet4) 100°, 118 feet5) 168°, 168 feet6) 176°, 154 feet7) 243°, 25 feet
Problem 28. Find the location of a fire that has an azimuthreading of 310° from point A and 36° from point B. Thedeclination for the area is 8° W.
¥ B ¥ A
N
S
EW 90
180
270
250
Problem 29. Find JoanÕs location. She has the azimuthreadings from her location to two known map locations.To mountain range 1 is a 294° azimuth reading. Tomountain range 2 is a 349° azimuth reading. Thedeclination for the area is 2° W.
2
1
N
N
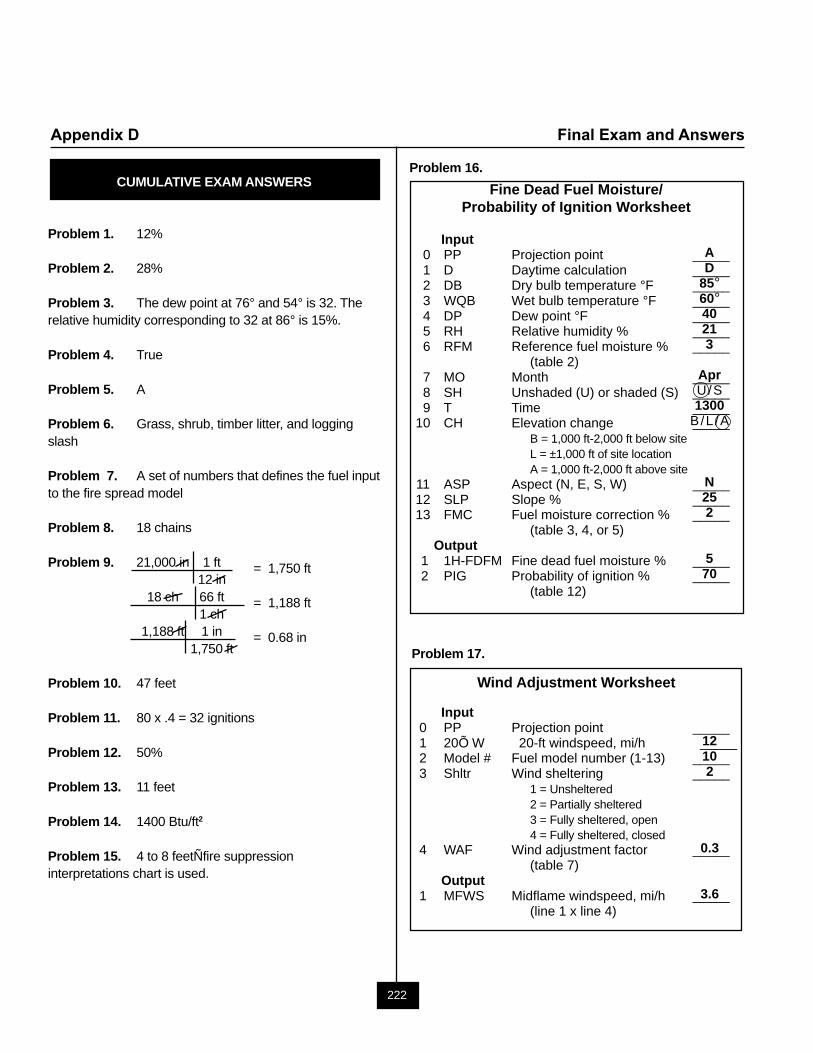
222
Appendix D Final Exam and Answers
CUMULATIVE EXAM ANSWERS
Problem 1. 12%
Problem 2. 28%
Problem 3. The dew point at 76° and 54° is 32. Therelative humidity corresponding to 32 at 86° is 15%.
Problem 4. True
Problem 5. A
Problem 6. Grass, shrub, timber litter, and loggingslash
Problem 7. A set of numbers that defines the fuel inputto the fire spread model
Problem 8. 18 chains
Problem 9. 21,000 in 1 ft = 1,750 ft12 in
18 ch 66 ft = 1,188 ft1 ch
1,188 ft 1 in = 0.68 in1,750 ft
Problem 10. 47 feet
Problem 11. 80 x .4 = 32 ignitions
Problem 12. 50%
Problem 13. 11 feet
Problem 14. 1400 Btu/ft2
Problem 15. 4 to 8 feetÑfire suppressioninterpretations chart is used.
Problem 16.
Fine Dead Fuel Moisture/Probability of Ignition Worksheet
Input 0 PP Projection point _____ 1 D Daytime calculation _____ 2 DB Dry bulb temperature °F _____ 3 WQB Wet bulb temperature °F _____ 4 DP Dew point °F _____ 5 RH Relative humidity % _____ 6 RFM Reference fuel moisture % _____
(table 2) 7 MO Month _____ 8 SH Unshaded (U) or shaded (S) _____ 9 T Time _____10 CH Elevation change _____
B = 1,000 ft-2,000 ft below siteL = ±1,000 ft of site locationA = 1,000 ft-2,000 ft above site
11 ASP Aspect (N, E, S, W) _____12 SLP Slope % _____13 FMC Fuel moisture correction % _____
(table 3, 4, or 5) Output 1 1H-FDFM Fine dead fuel moisture % _____ 2 PIG Probability of ignition % _____
(table 12)
Problem 17.
Wind Adjustment Worksheet
Input0 PP Projection point _____1 20Õ W 20-ft windspeed, mi/h _____2 Model # Fuel model number (1-13) _____3 Shltr Wind sheltering _____
1 = Unsheltered2 = Partially sheltered3 = Fully sheltered, open4 = Fully sheltered, closed
4 WAF Wind adjustment factor _____(table 7)
Output1 MFWS Midflame windspeed, mi/h _____
(line 1 x line 4)
AD
85°60°40213
AprU/S1300
B/L /A
N252
570
12102
0.3
3.6
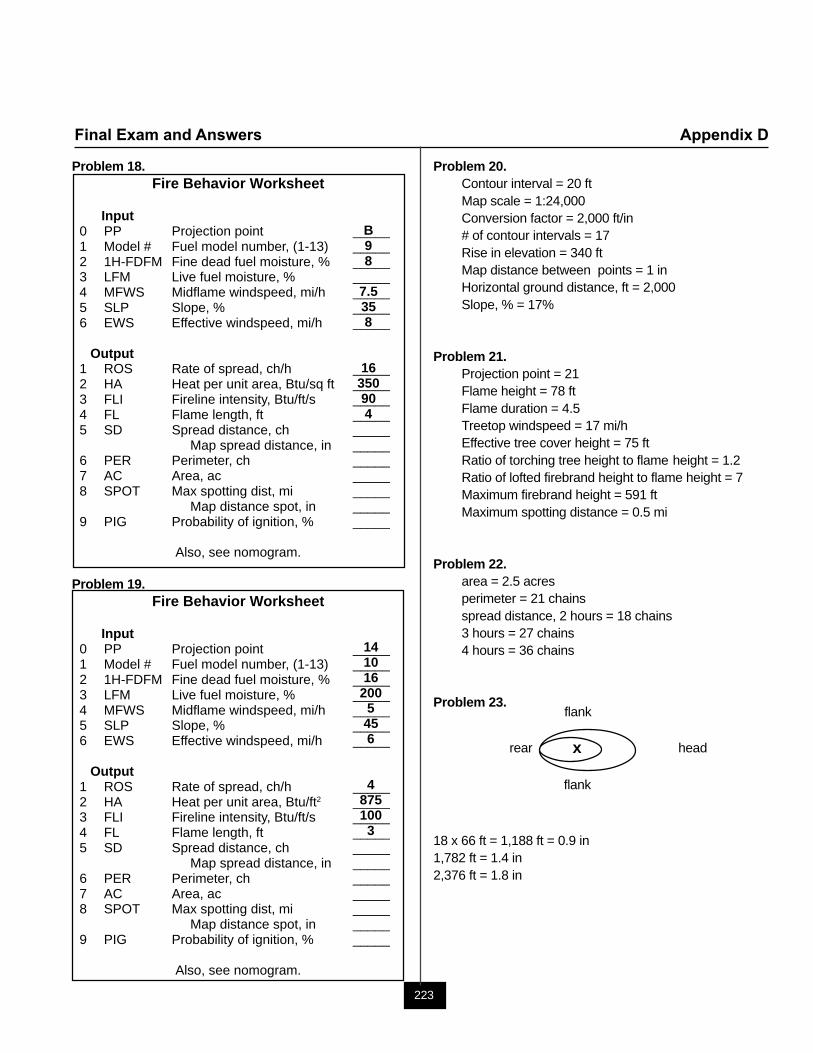
223
Final Exam and Answers Appendix D
Problem 20.Contour interval = 20 ftMap scale = 1:24,000Conversion factor = 2,000 ft/in# of contour intervals = 17Rise in elevation = 340 ftMap distance between points = 1 inHorizontal ground distance, ft = 2,000Slope, % = 17%
Problem 21.Projection point = 21Flame height = 78 ftFlame duration = 4.5Treetop windspeed = 17 mi/hEffective tree cover height = 75 ftRatio of torching tree height to flame height = 1.2Ratio of lofted firebrand height to flame height = 7Maximum firebrand height = 591 ftMaximum spotting distance = 0.5 mi
Problem 22.area = 2.5 acresperimeter = 21 chainsspread distance, 2 hours = 18 chains3 hours = 27 chains4 hours = 36 chains
Problem 23.
18 x 66 ft = 1,188 ft = 0.9 in1,782 ft = 1.4 in2,376 ft = 1.8 in
Problem 18.Fire Behavior Worksheet
Input0 PP Projection point _____1 Model # Fuel model number, (1-13) _____2 1H-FDFM Fine dead fuel moisture, % _____3 LFM Live fuel moisture, % _____4 MFWS Midflame windspeed, mi/h _____5 SLP Slope, % _____6 EWS Effective windspeed, mi/h _____
Output1 ROS Rate of spread, ch/h _____2 HA Heat per unit area, Btu/sq ft _____3 FLI Fireline intensity, Btu/ft/s _____4 FL Flame length, ft _____5 SD Spread distance, ch _____
Map spread distance, in _____6 PER Perimeter, ch _____7 AC Area, ac _____8 SPOT Max spotting dist, mi _____
Map distance spot, in _____9 PIG Probability of ignition, % _____
Also, see nomogram.
Problem 19.Fire Behavior Worksheet
Input0 PP Projection point _____1 Model # Fuel model number, (1-13) _____2 1H-FDFM Fine dead fuel moisture, % _____3 LFM Live fuel moisture, % _____4 MFWS Midflame windspeed, mi/h _____5 SLP Slope, % _____6 EWS Effective windspeed, mi/h _____
Output1 ROS Rate of spread, ch/h _____2 HA Heat per unit area, Btu/ft2 _____3 FLI Fireline intensity, Btu/ft/s _____4 FL Flame length, ft _____5 SD Spread distance, ch _____
Map spread distance, in _____6 PER Perimeter, ch _____7 AC Area, ac _____8 SPOT Max spotting dist, mi _____
Map distance spot, in _____9 PIG Probability of ignition, % _____
Also, see nomogram.
B98
7.5358
16350904
141016
2005456
48751003
flank
flank
rear headx
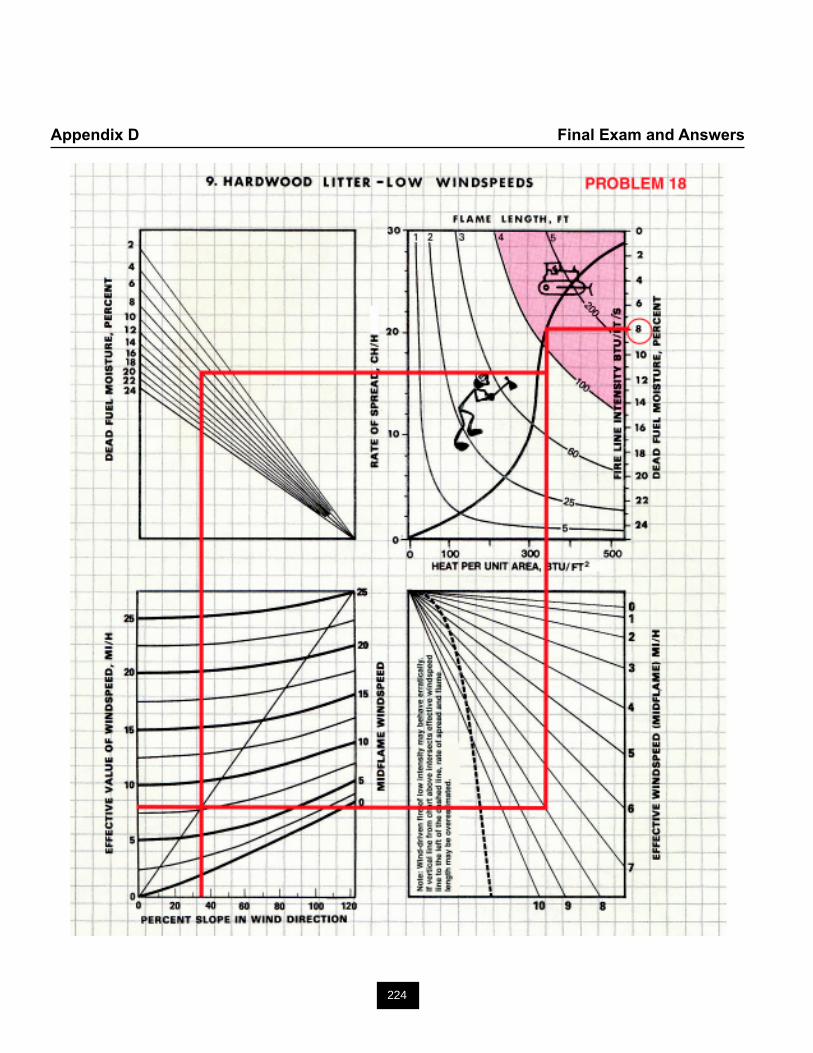
224
Appendix D Final Exam and Answers
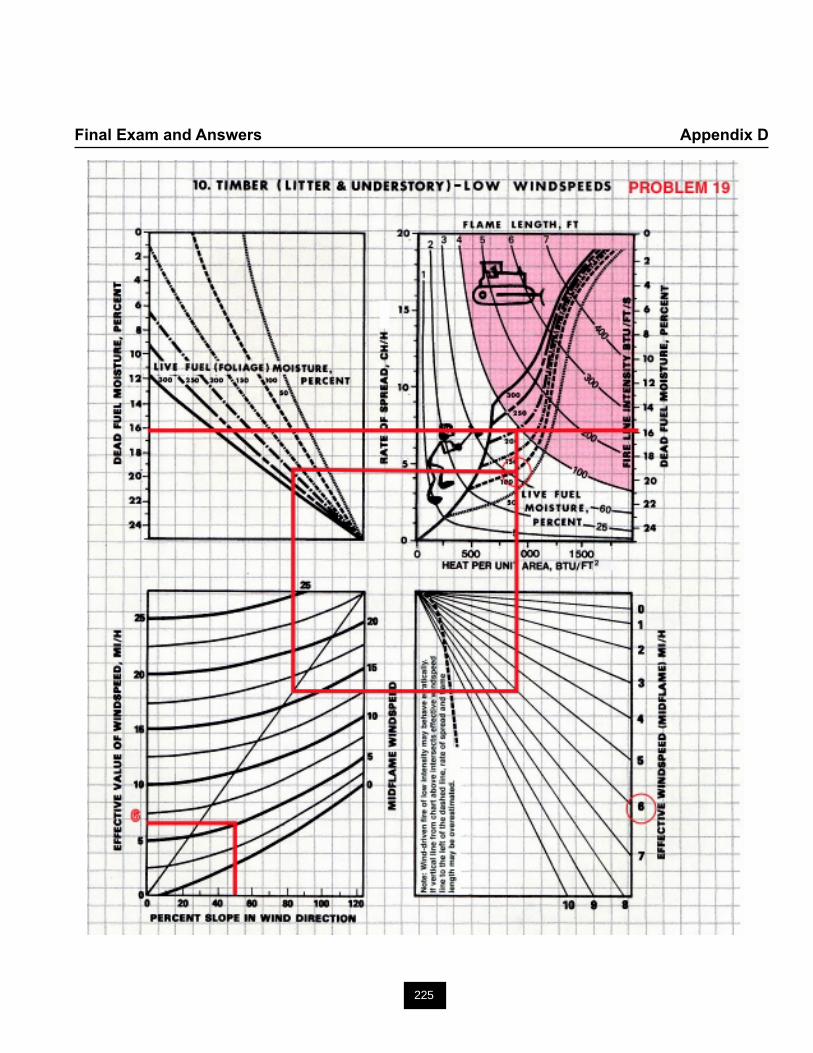
225
Final Exam and Answers Appendix D
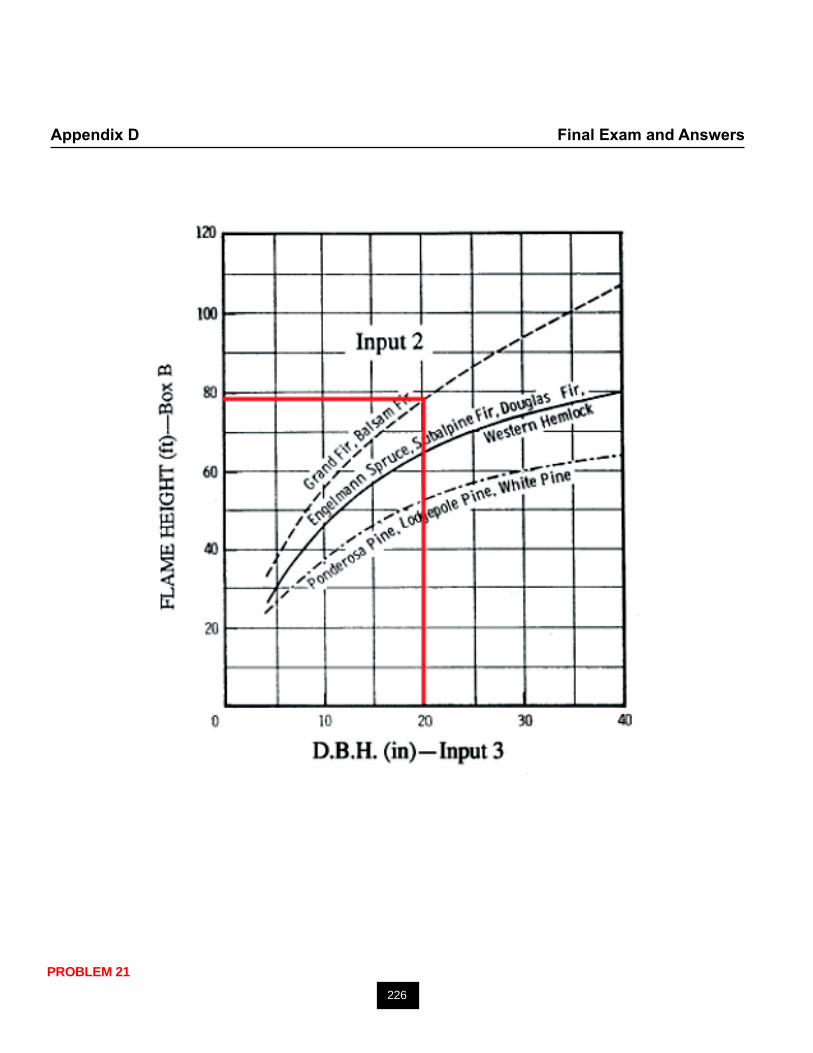
226
Appendix D Final Exam and Answers
PROBLEM 21
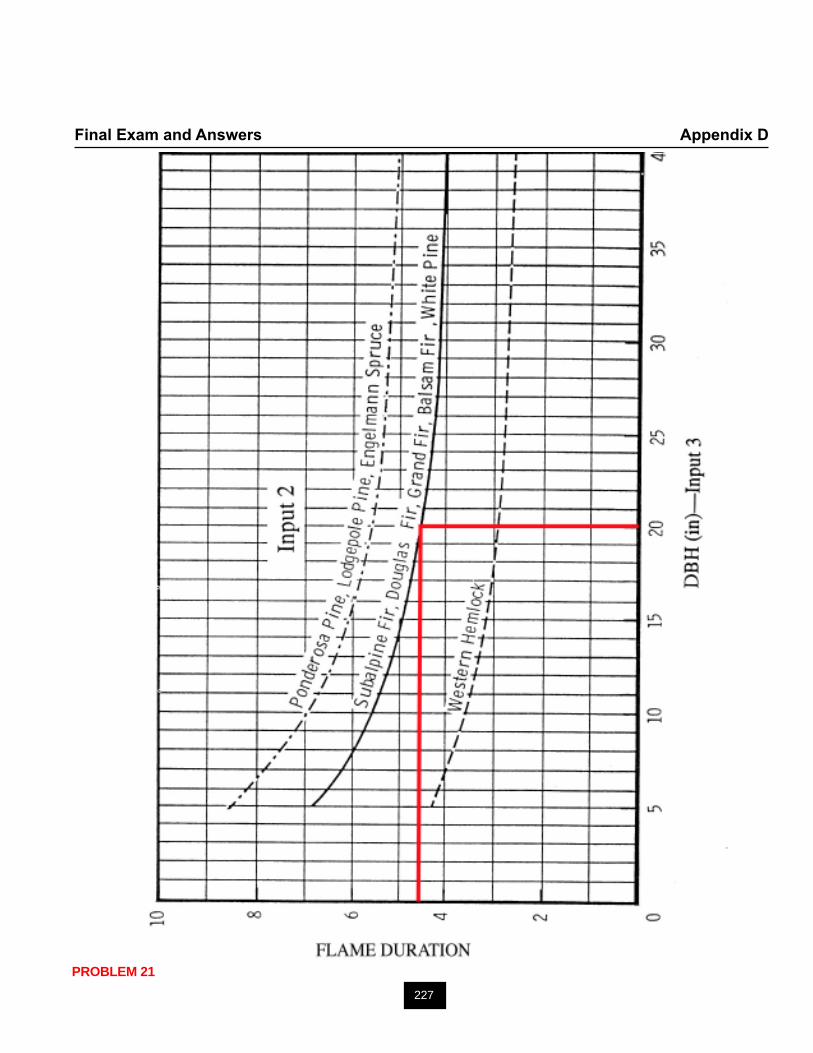
227
Final Exam and Answers Appendix D
PROBLEM 21
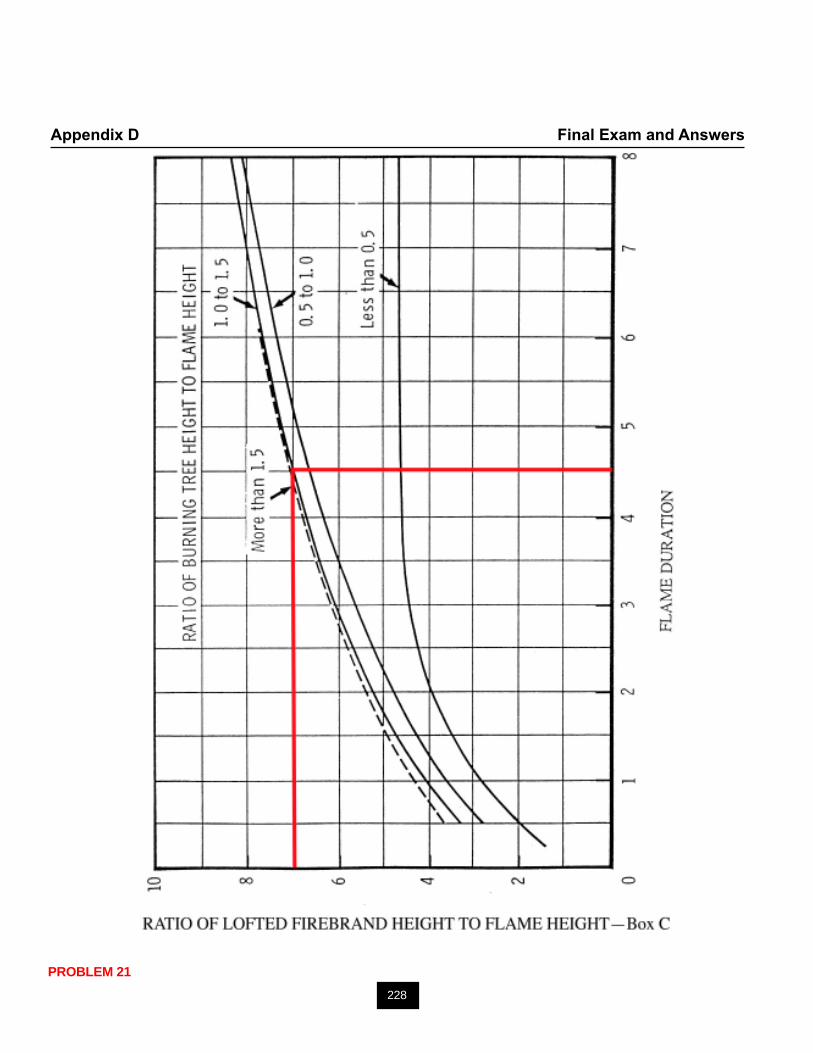
228
Appendix D Final Exam and Answers
PROBLEM 21
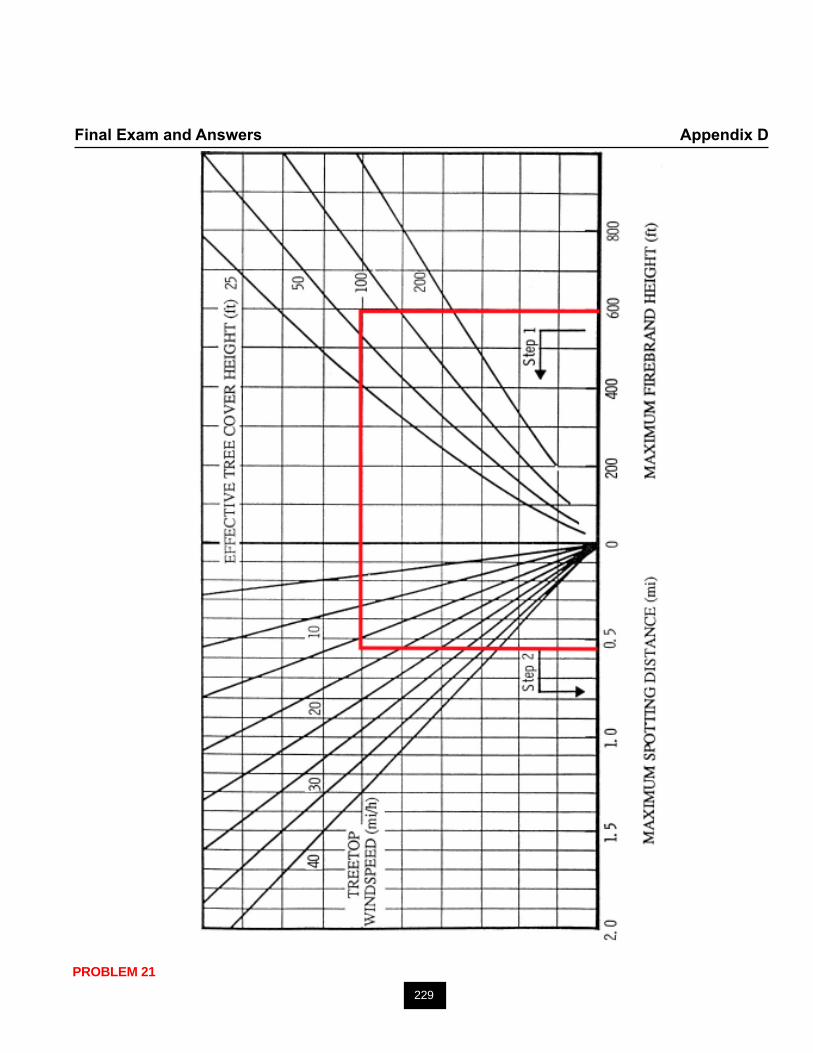
229
Final Exam and Answers Appendix D
PROBLEM 21
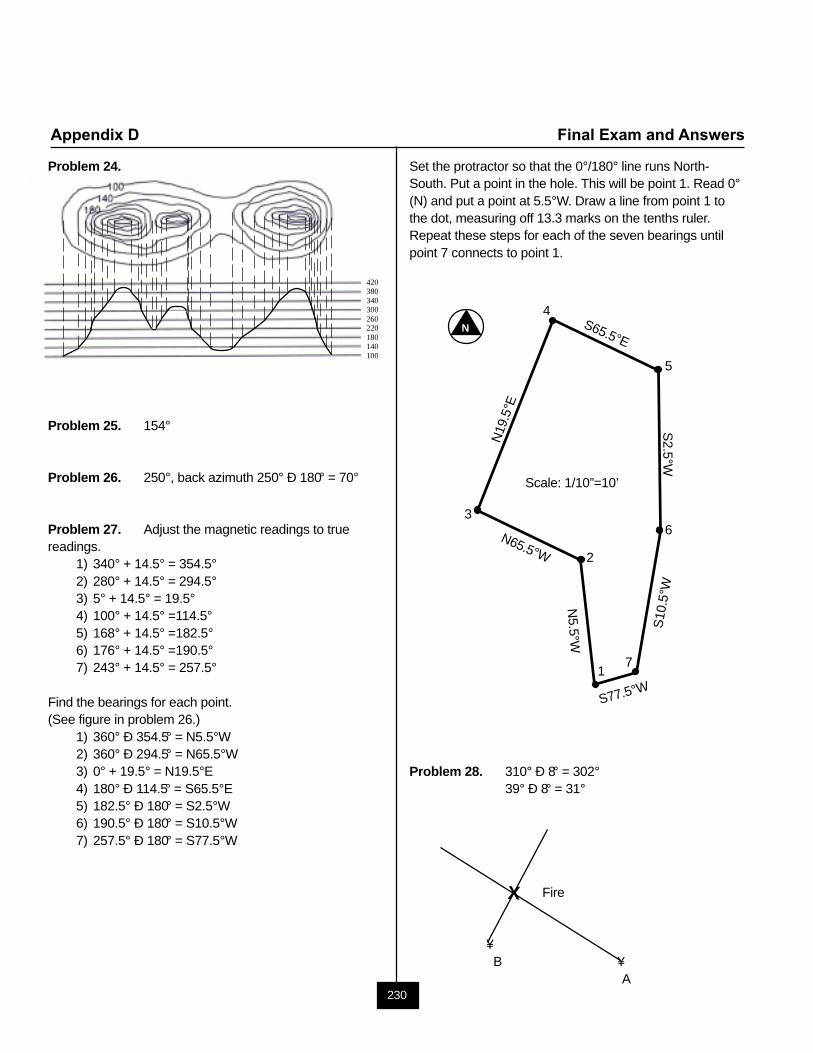
230
Appendix D Final Exam and Answers
Problem 24.
Problem 25. 154°
Problem 26. 250°, back azimuth 250° Ð 180° = 70°
Problem 27. Adjust the magnetic readings to truereadings.
1) 340° + 14.5° = 354.5°2) 280° + 14.5° = 294.5°3) 5° + 14.5° = 19.5°4) 100° + 14.5° =114.5°5) 168° + 14.5° =182.5°6) 176° + 14.5° =190.5°7) 243° + 14.5° = 257.5°
Find the bearings for each point.(See figure in problem 26.)
1) 360° Ð 354.5° = N5.5°W2) 360° Ð 294.5° = N65.5°W3) 0° + 19.5° = N19.5°E4) 180° Ð 114.5° = S65.5°E5) 182.5° Ð 180° = S2.5°W6) 190.5° Ð 180° = S10.5°W7) 257.5° Ð 180° = S77.5°W
Set the protractor so that the 0°/180° line runs North-South. Put a point in the hole. This will be point 1. Read 0°(N) and put a point at 5.5°W. Draw a line from point 1 tothe dot, measuring off 13.3 marks on the tenths ruler.Repeat these steps for each of the seven bearings untilpoint 7 connects to point 1.
Problem 28. 310° Ð 8° = 302°39° Ð 8° = 31°
Fire
¥ B ¥ A
420380340300260220180140100
1
2
3
4
5
6
7
S65.5°E
S2.5°W
S10
.5°W
N5.5°W
N65.5°W
N19
.5°E
S77.5°W
Scale: 1/10”=10’
N
X
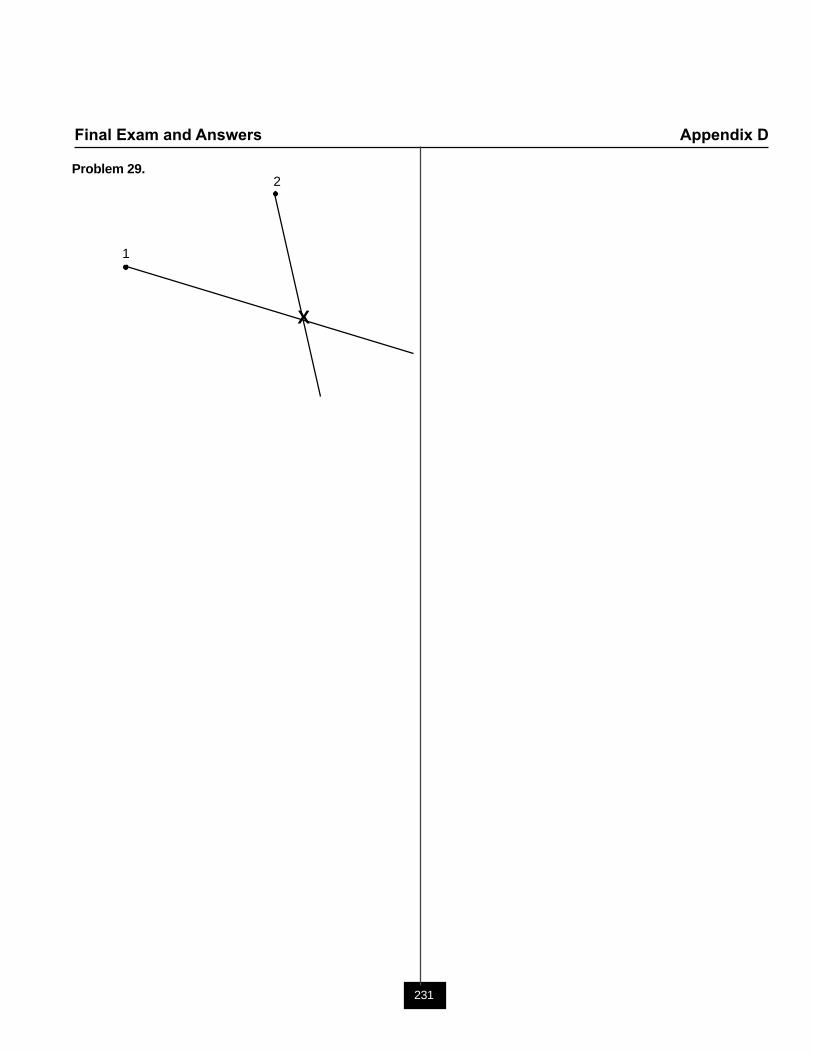
231
Final Exam and Answers Appendix D
Problem 29.2
1
X


Appendix E
NomogramsandWorksheets

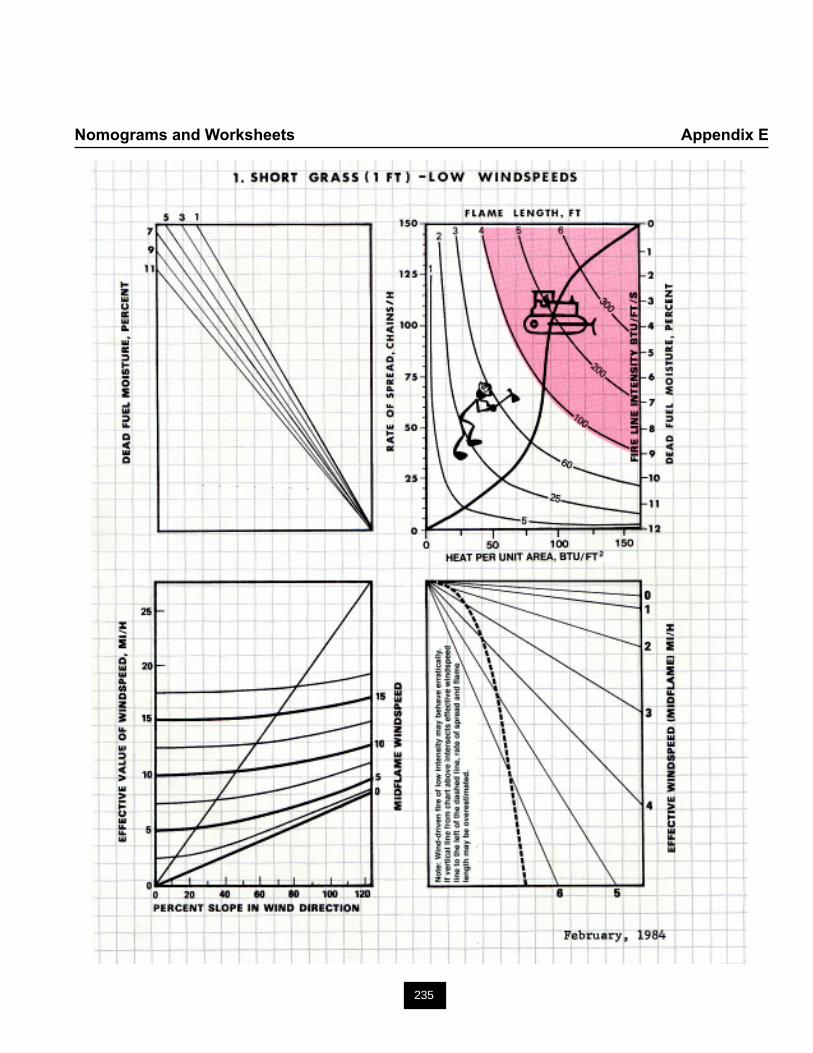
235
Nomograms and Worksheets Appendix E
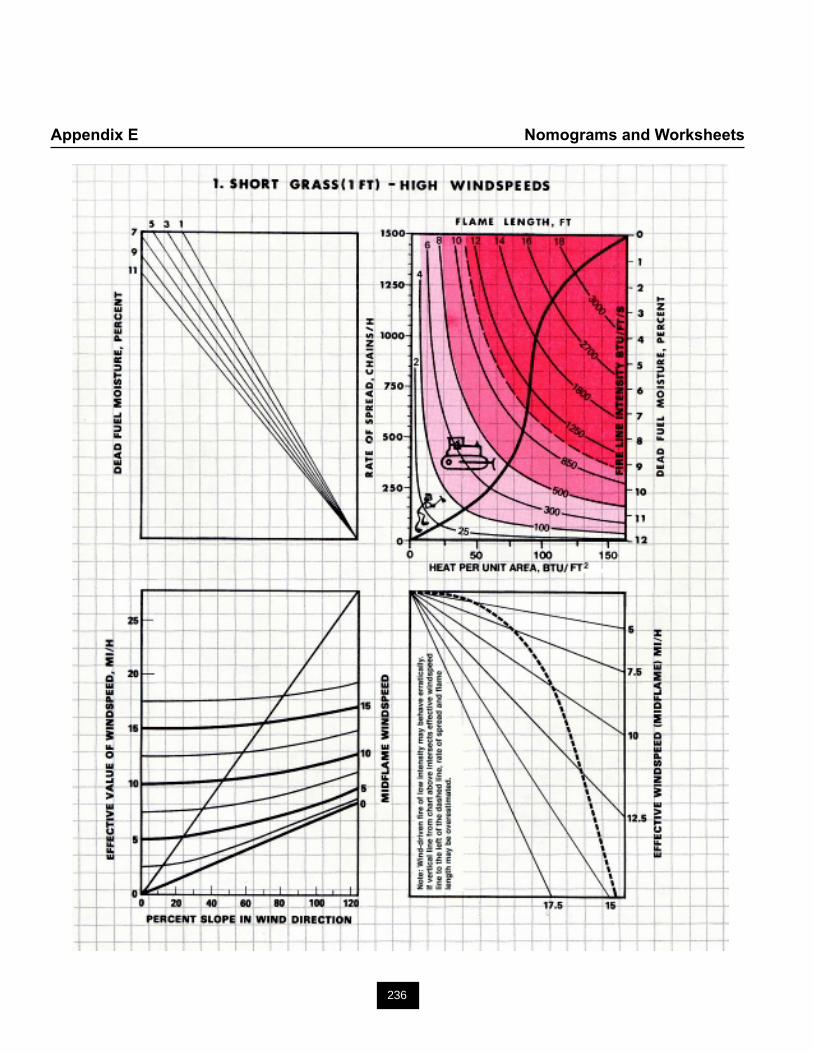
236
Appendix E Nomograms and Worksheets
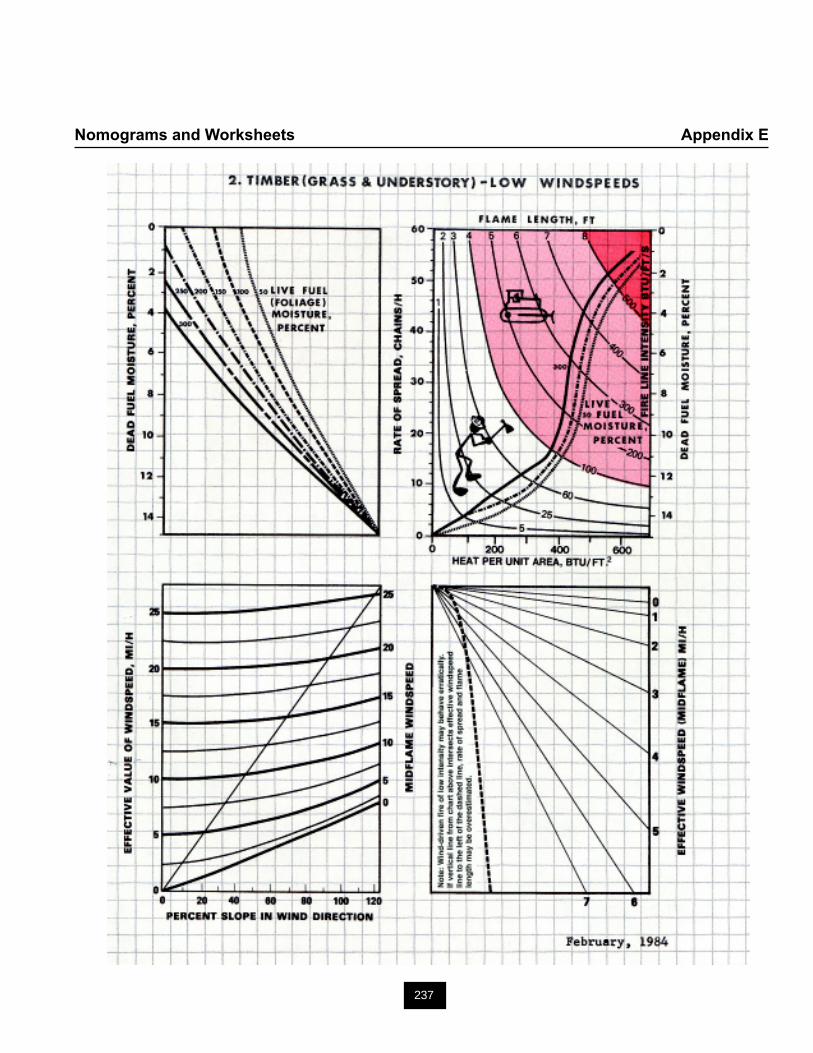
237
Nomograms and Worksheets Appendix E
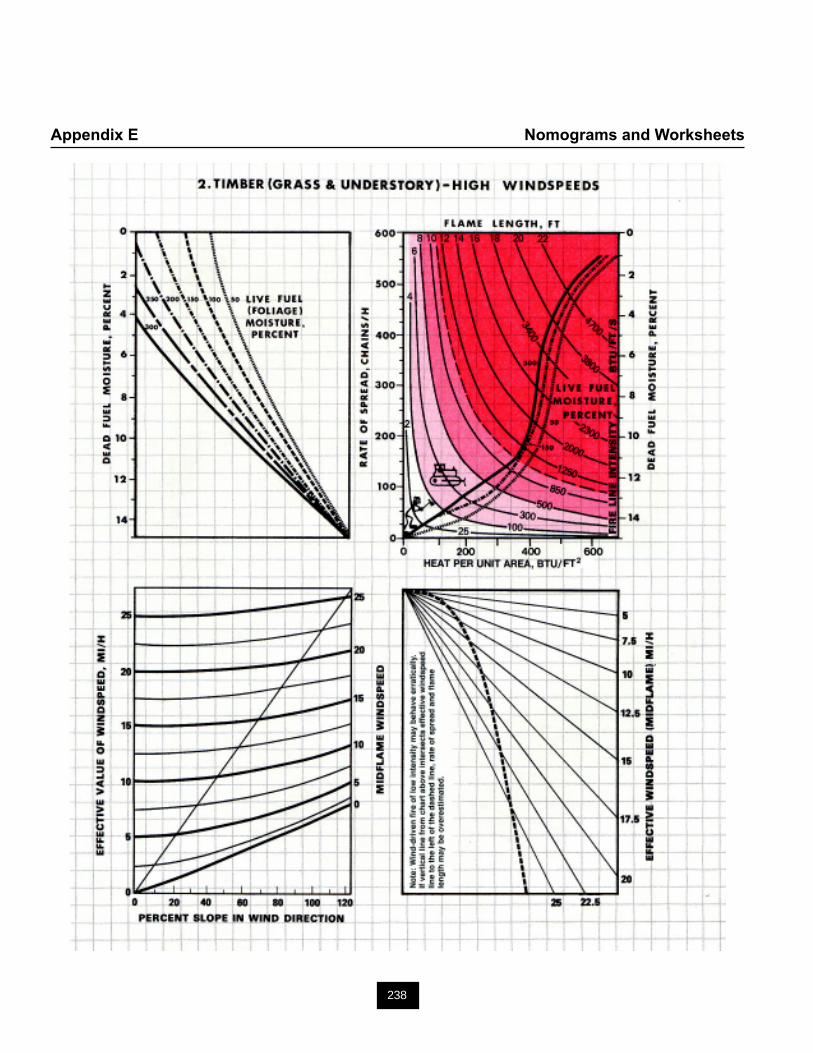
238
Appendix E Nomograms and Worksheets
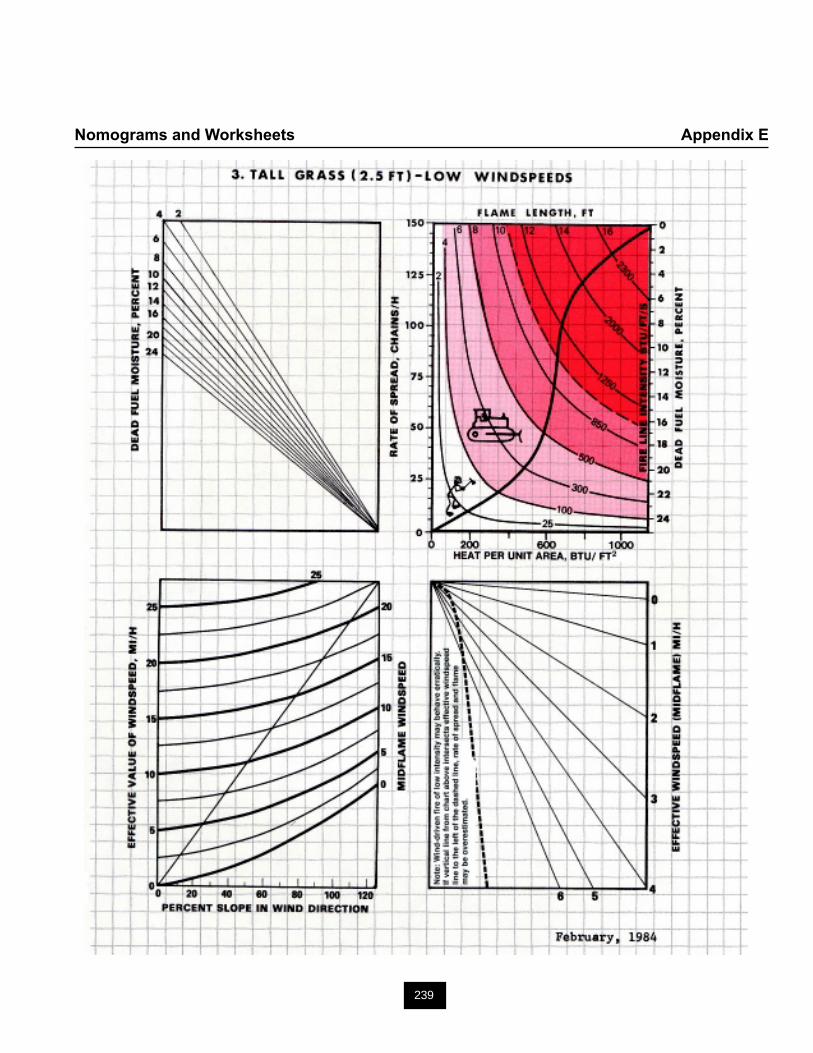
239
Nomograms and Worksheets Appendix E

240
Appendix E Nomograms and Worksheets
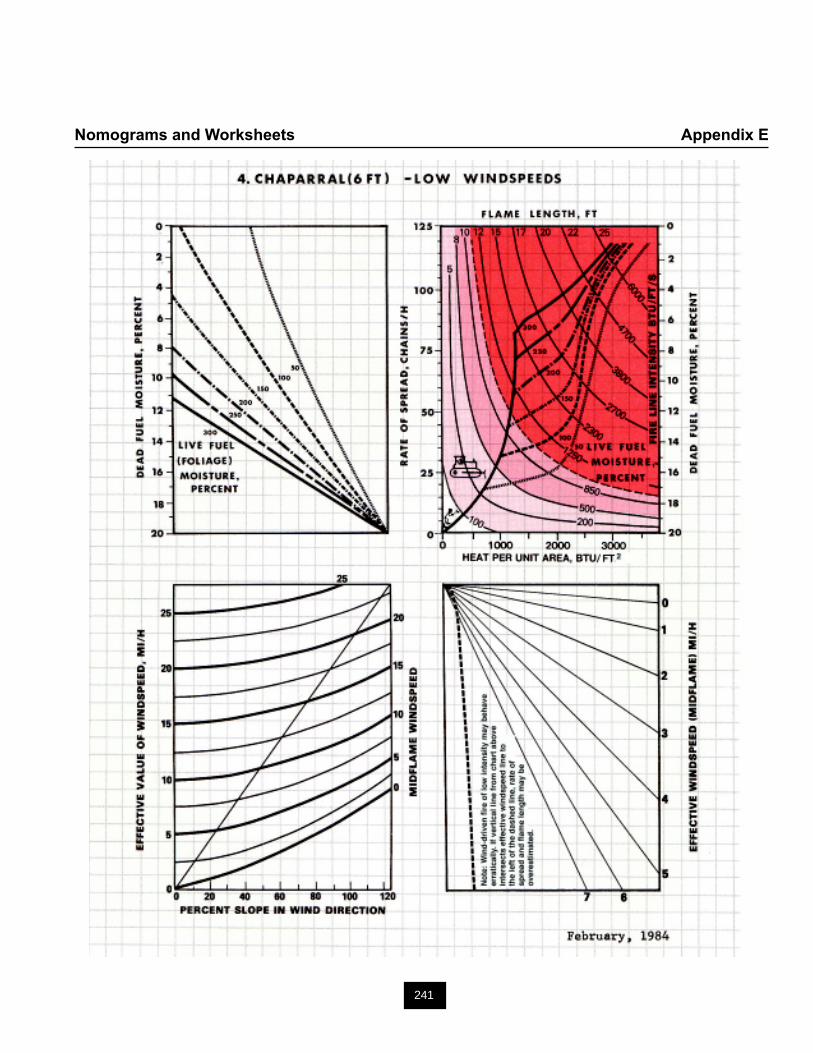
241
Nomograms and Worksheets Appendix E
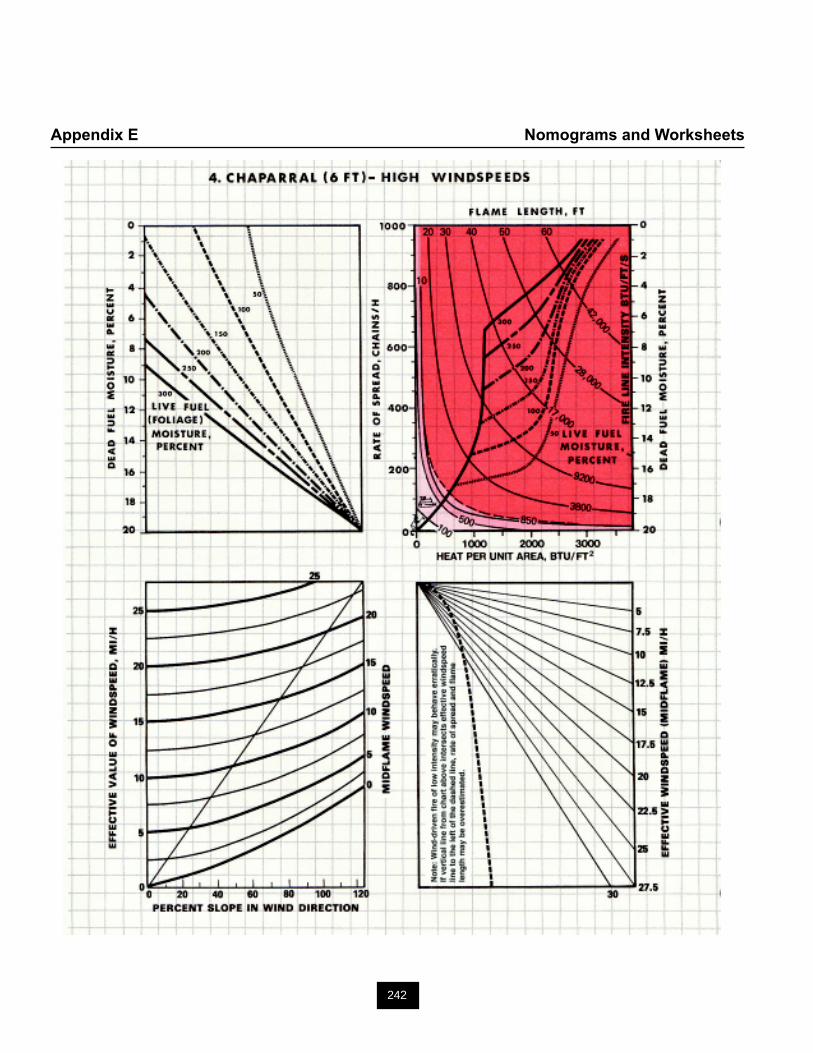
242
Appendix E Nomograms and Worksheets
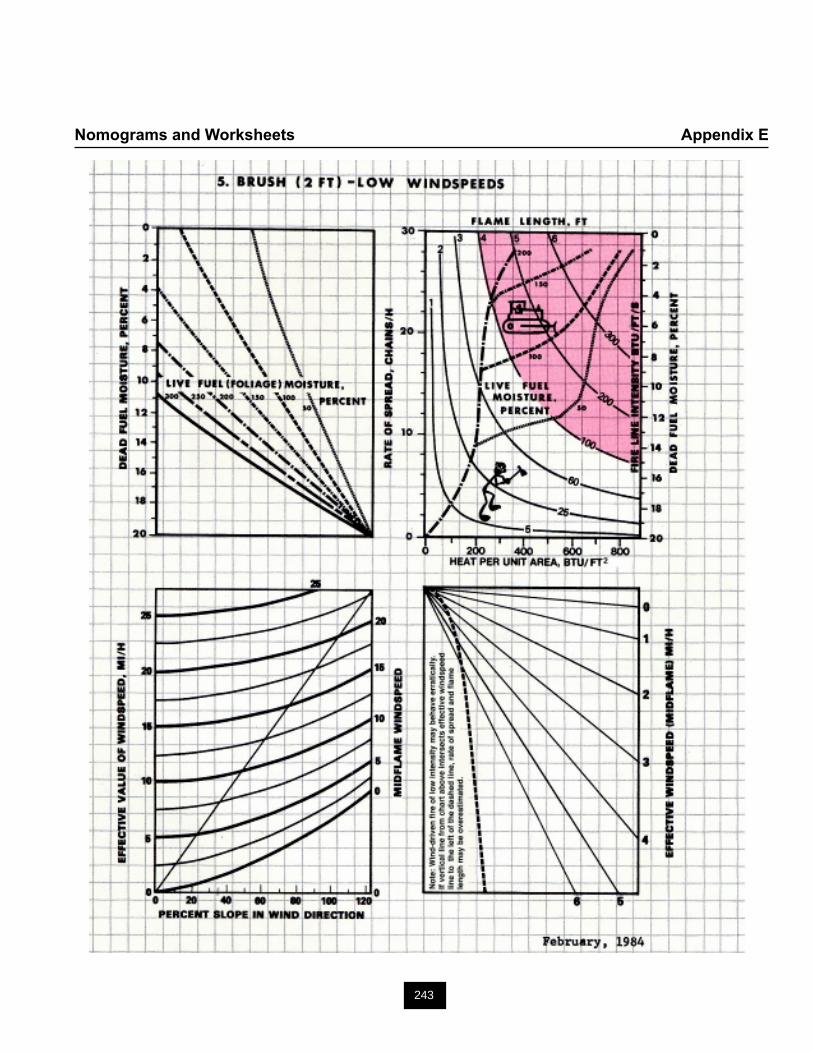
243
Nomograms and Worksheets Appendix E
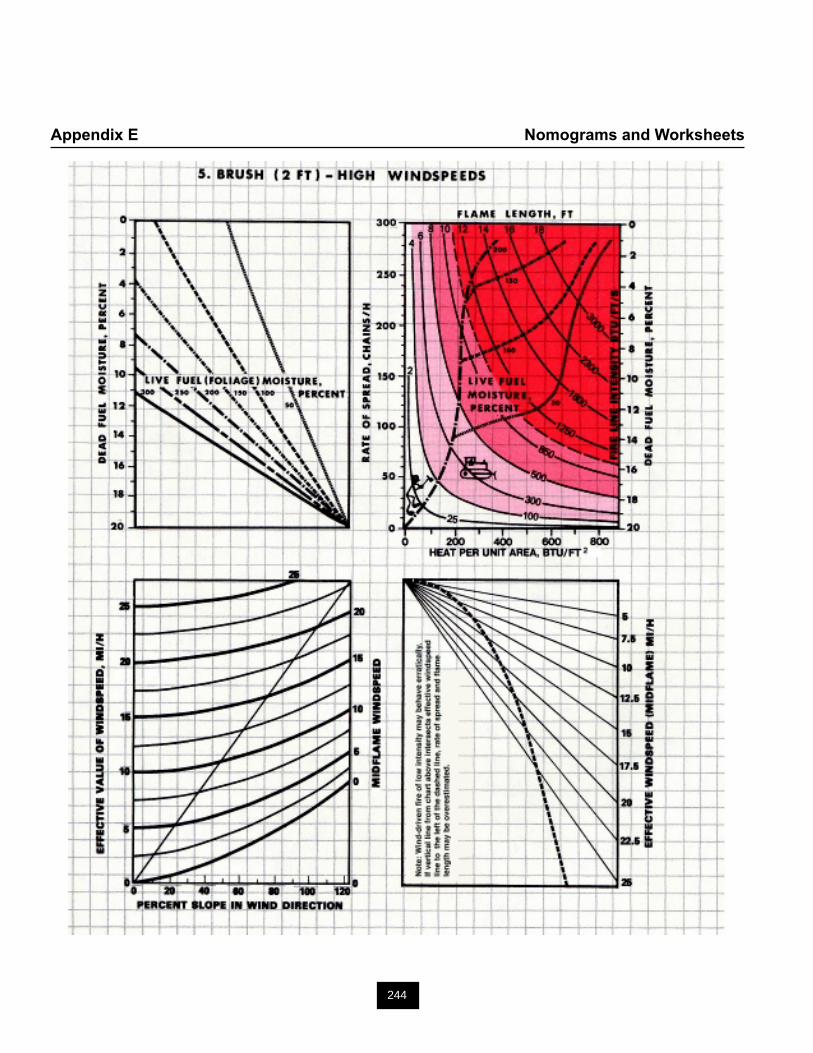
244
Appendix E Nomograms and Worksheets
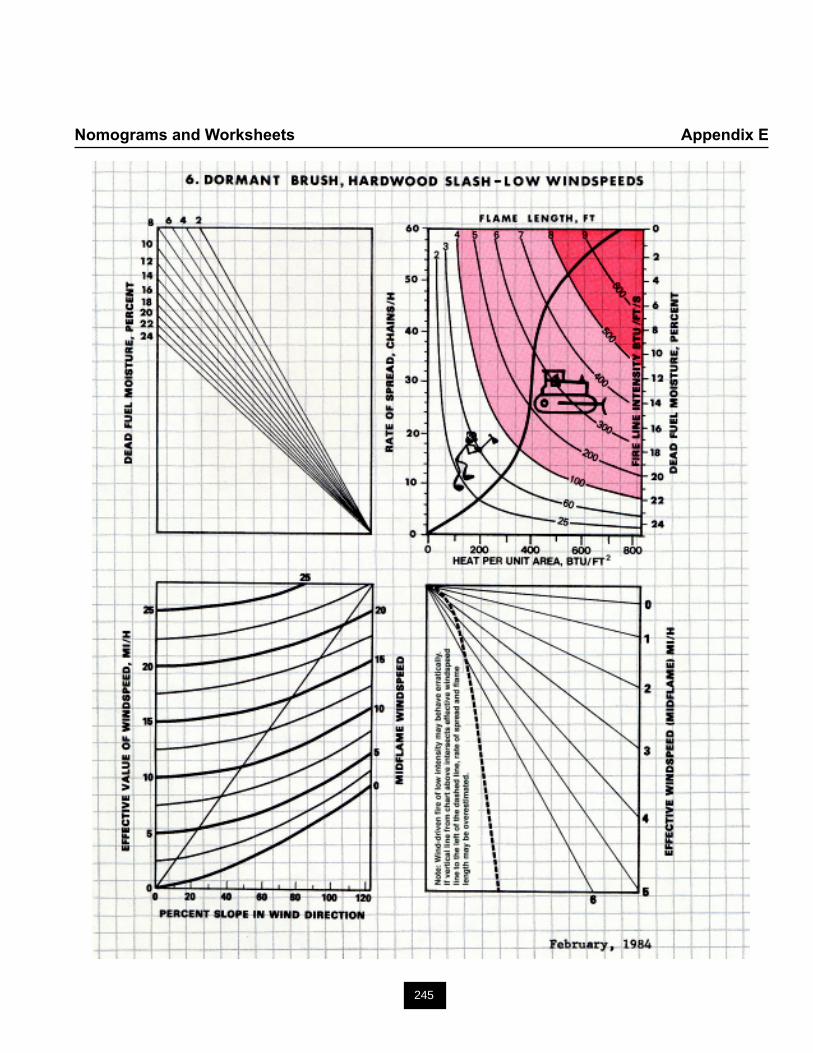
245
Nomograms and Worksheets Appendix E
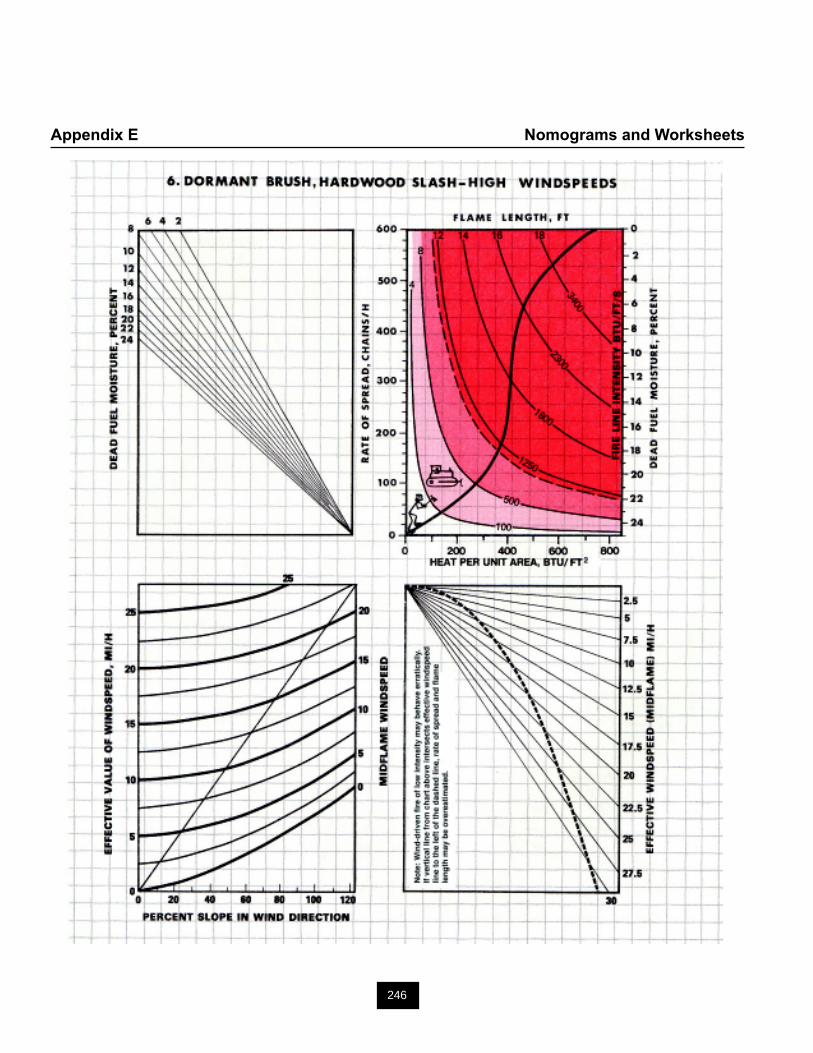
246
Appendix E Nomograms and Worksheets
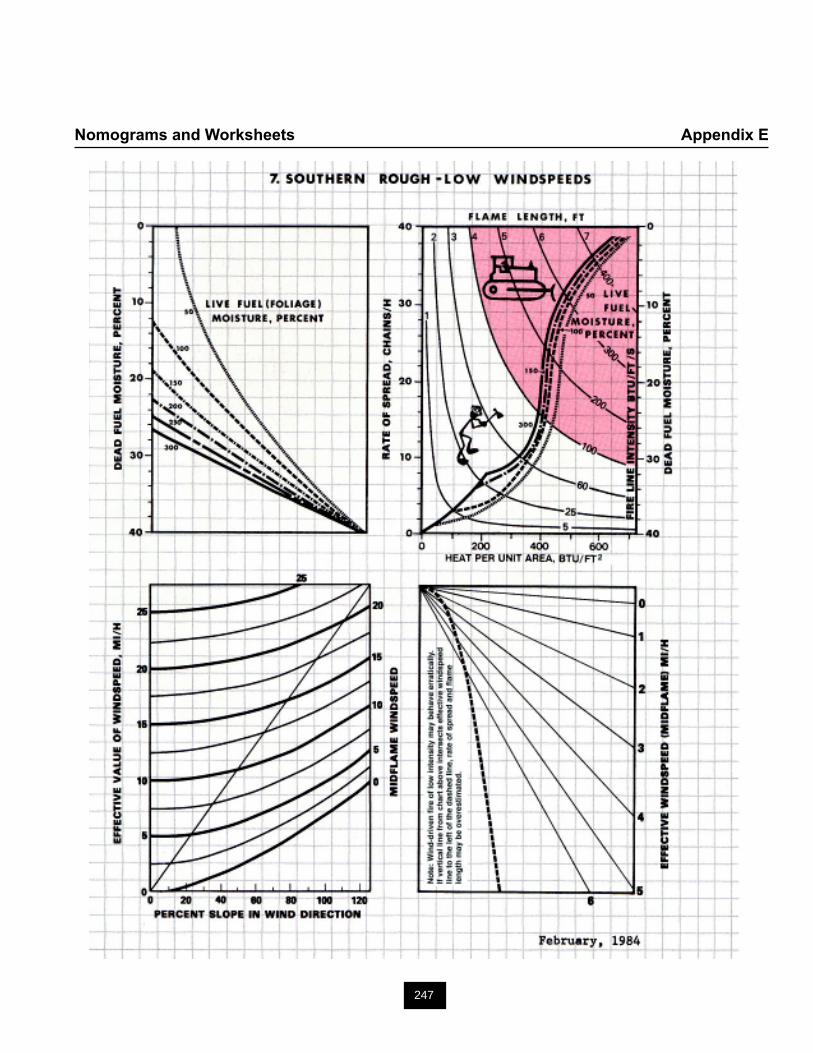
247
Nomograms and Worksheets Appendix E
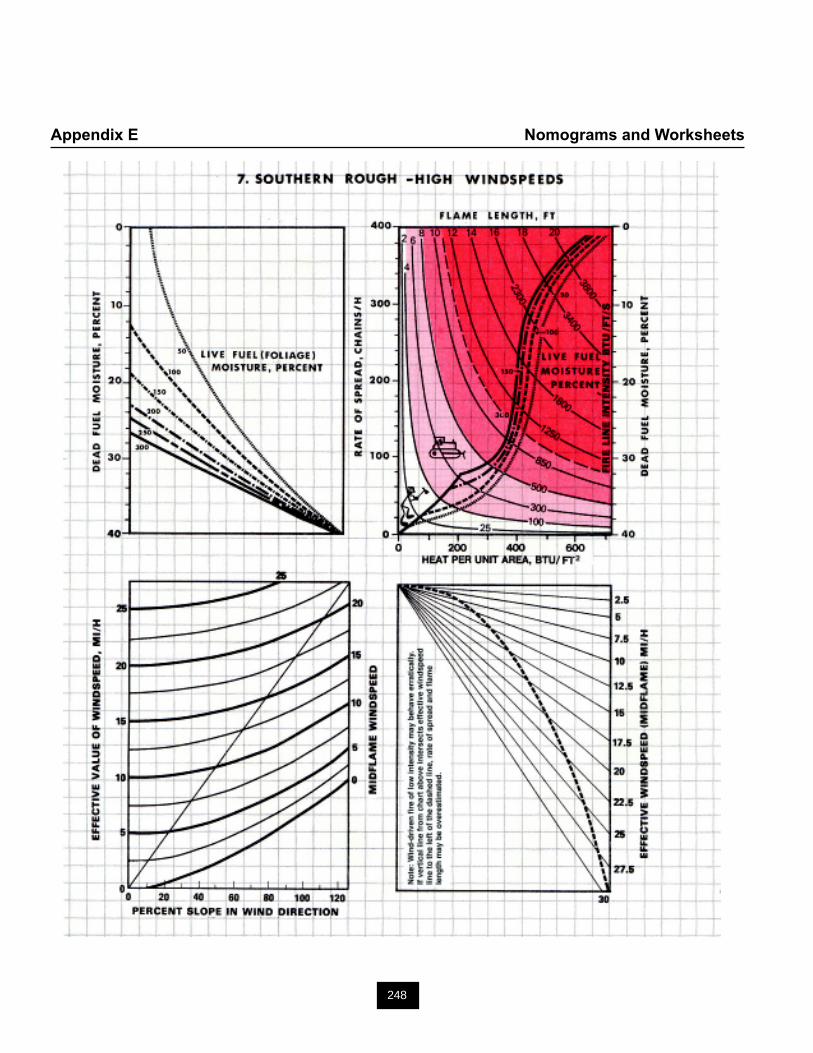
248
Appendix E Nomograms and Worksheets
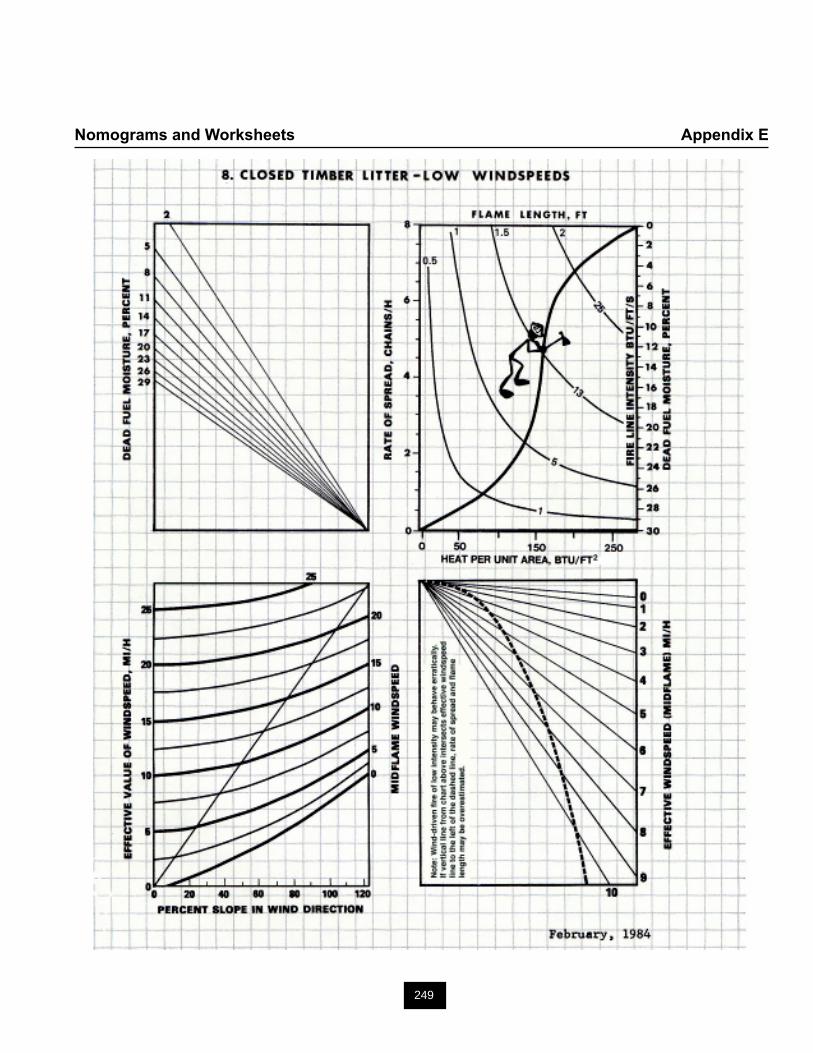
249
Nomograms and Worksheets Appendix E
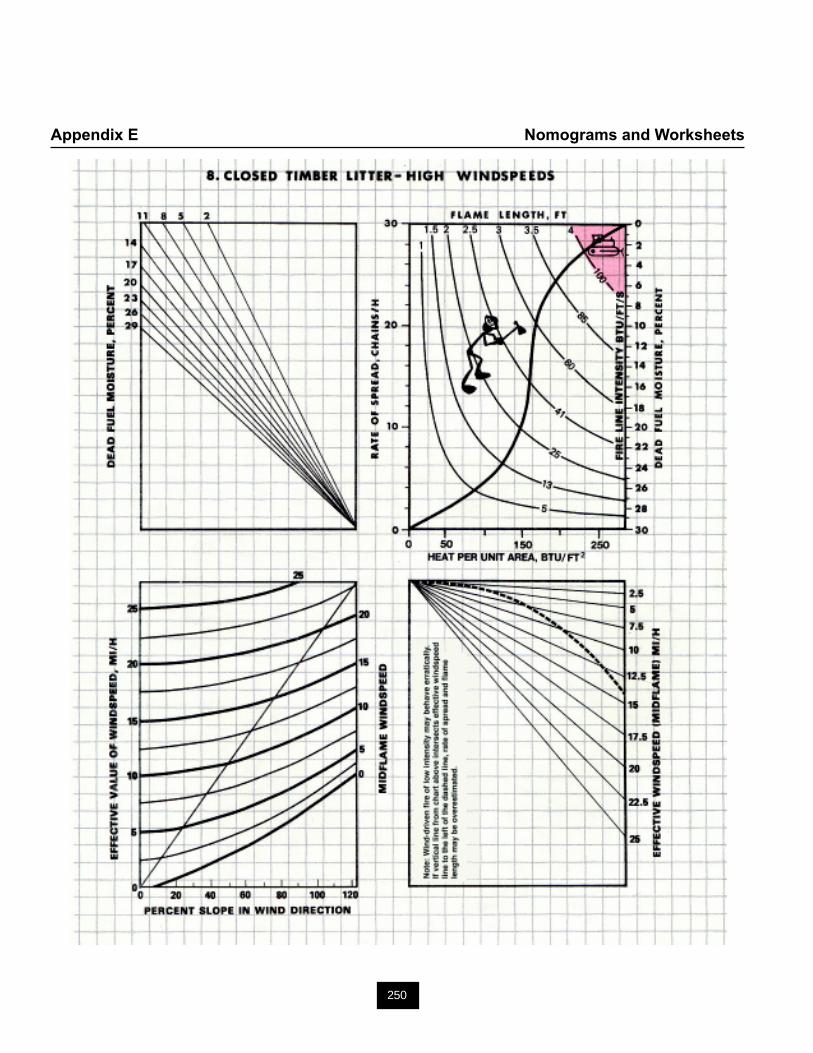
250
Appendix E Nomograms and Worksheets
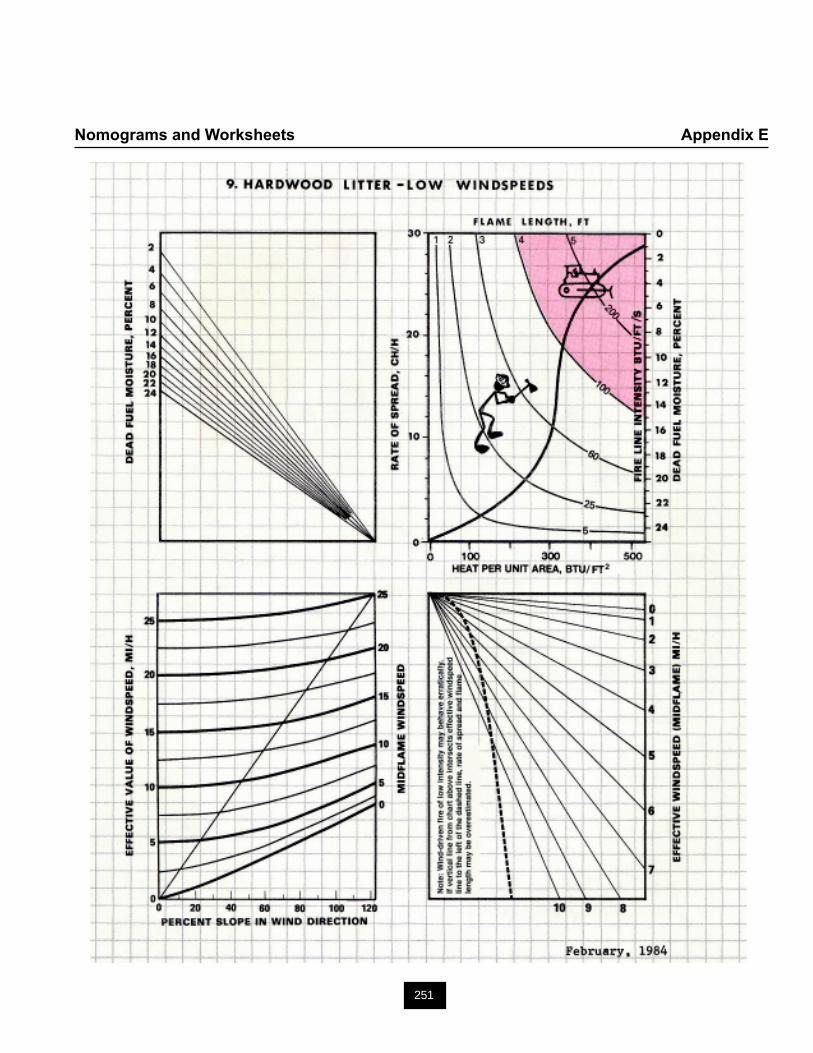
251
Nomograms and Worksheets Appendix E
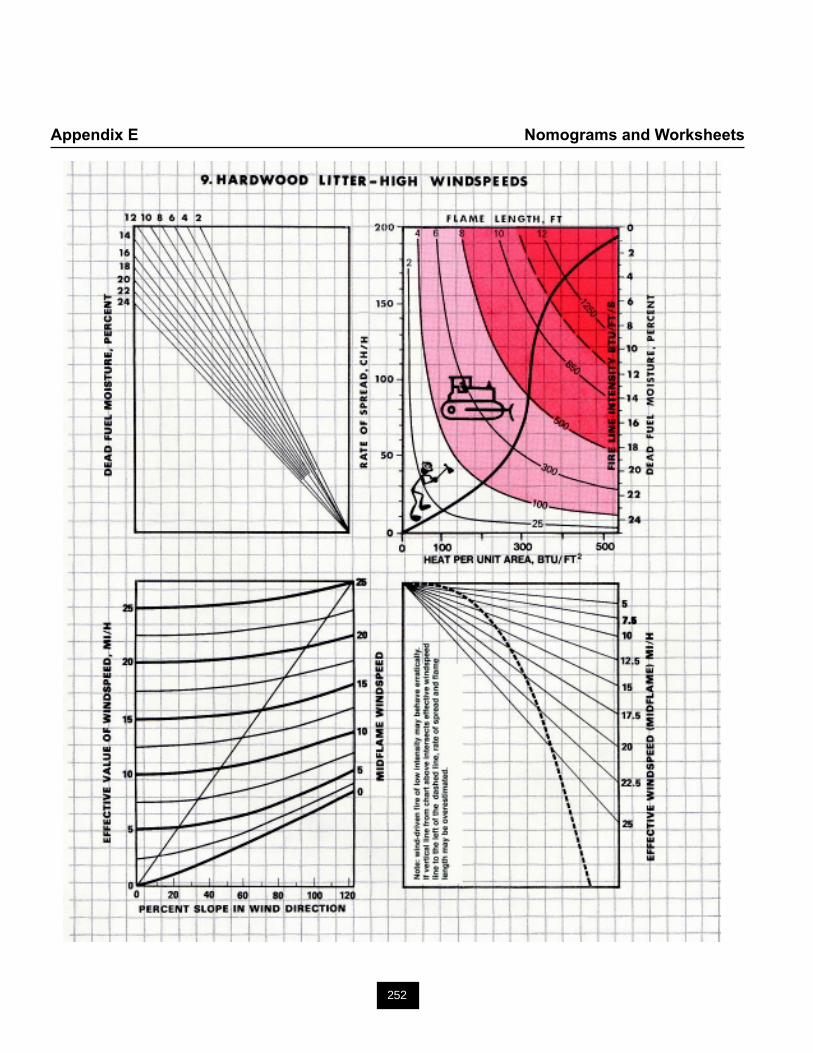
252
Appendix E Nomograms and Worksheets
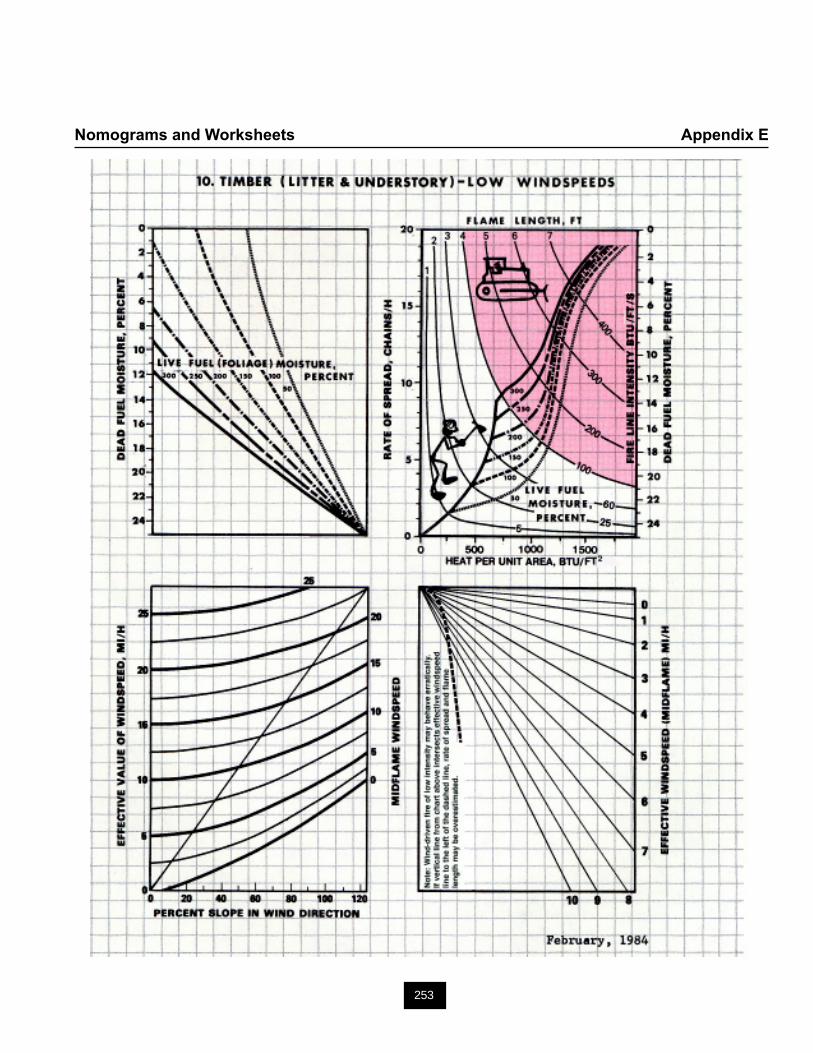
253
Nomograms and Worksheets Appendix E
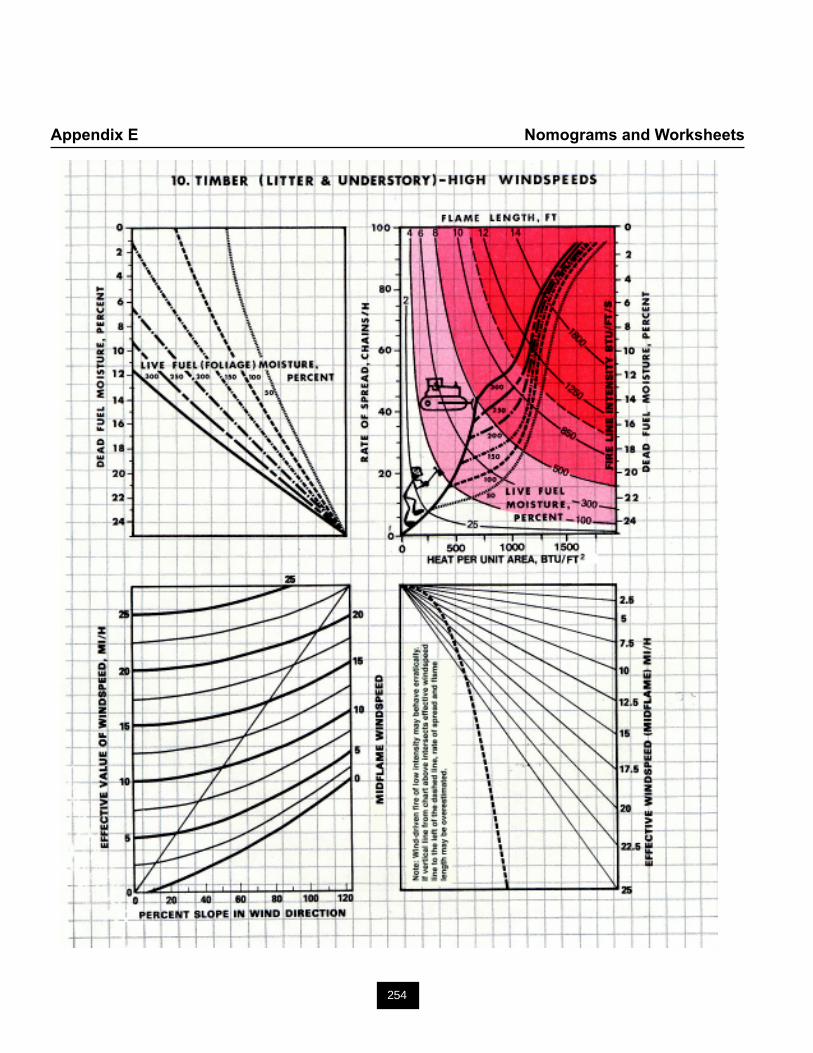
254
Appendix E Nomograms and Worksheets
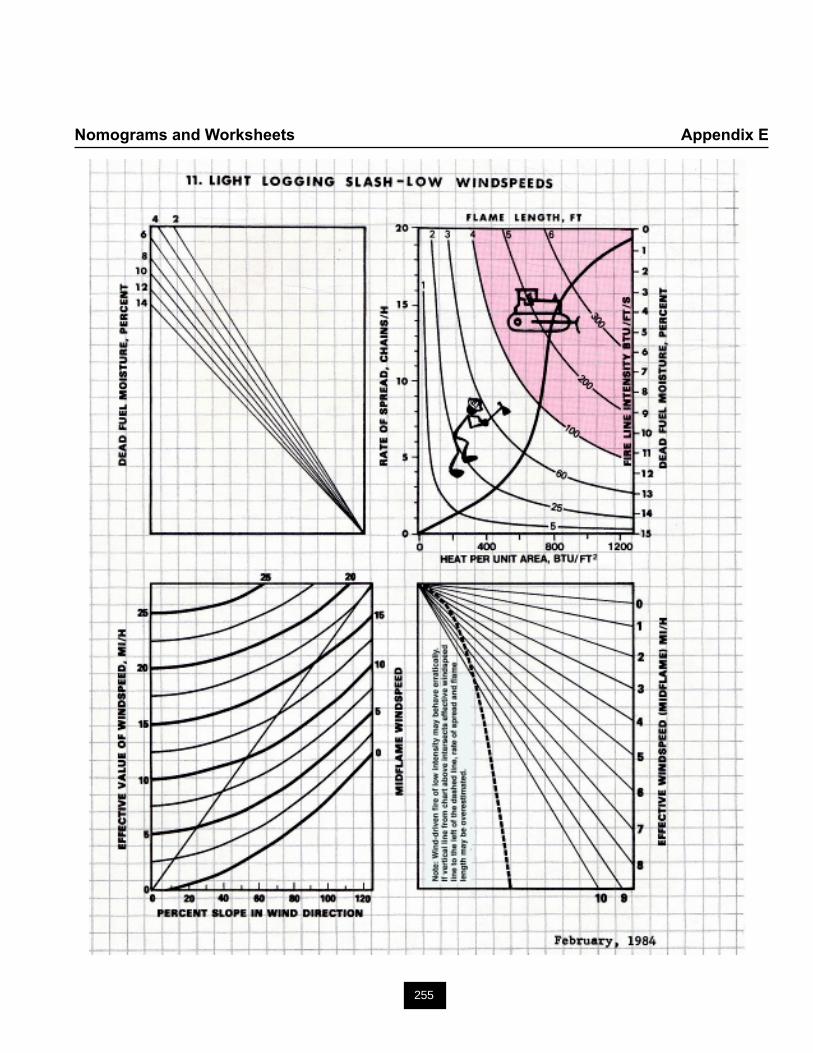
255
Nomograms and Worksheets Appendix E
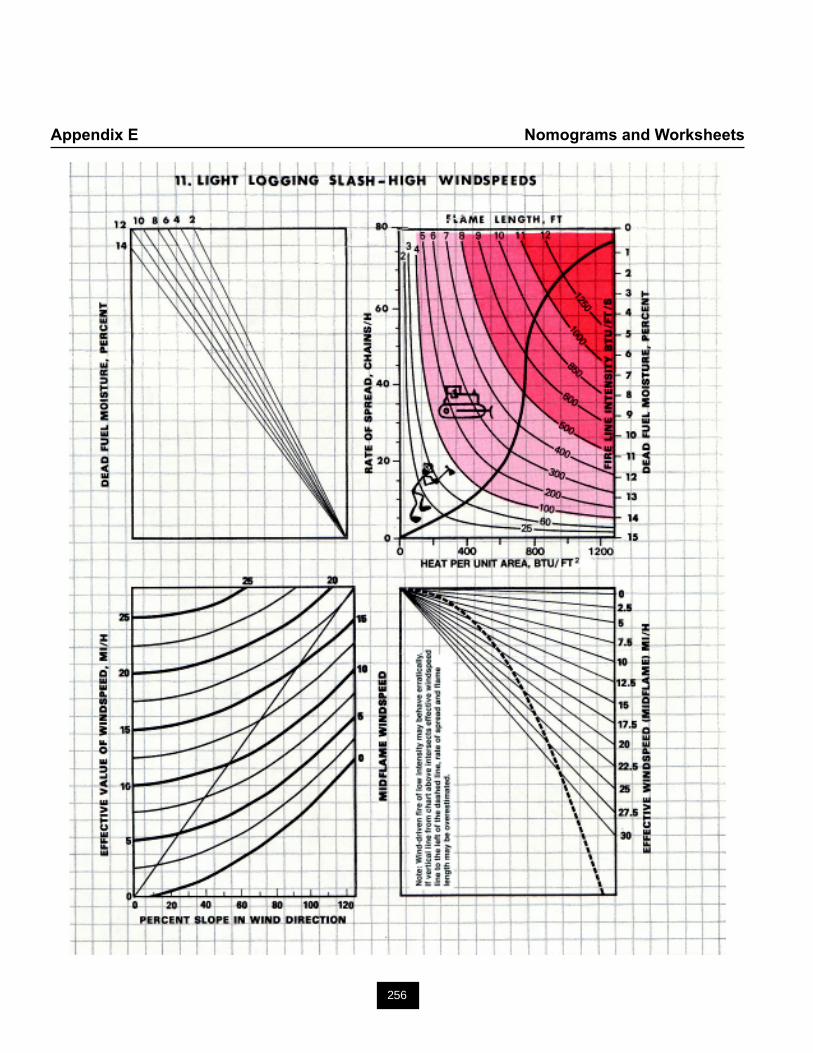
256
Appendix E Nomograms and Worksheets
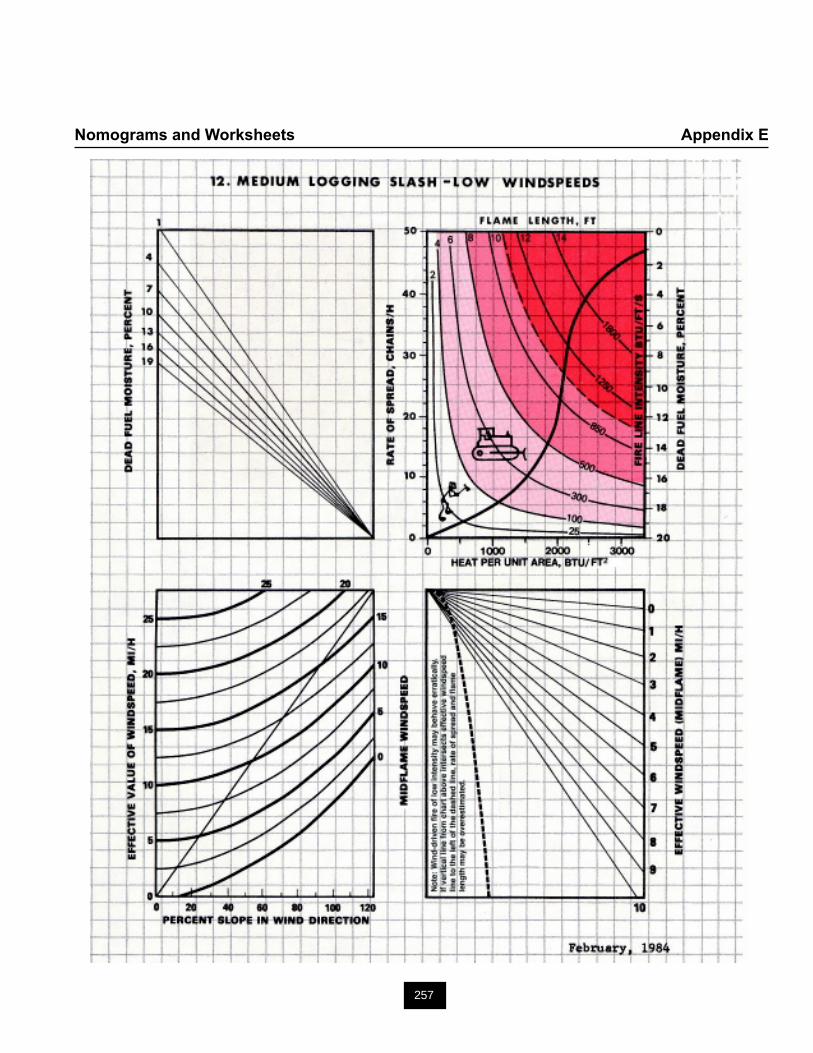
257
Nomograms and Worksheets Appendix E
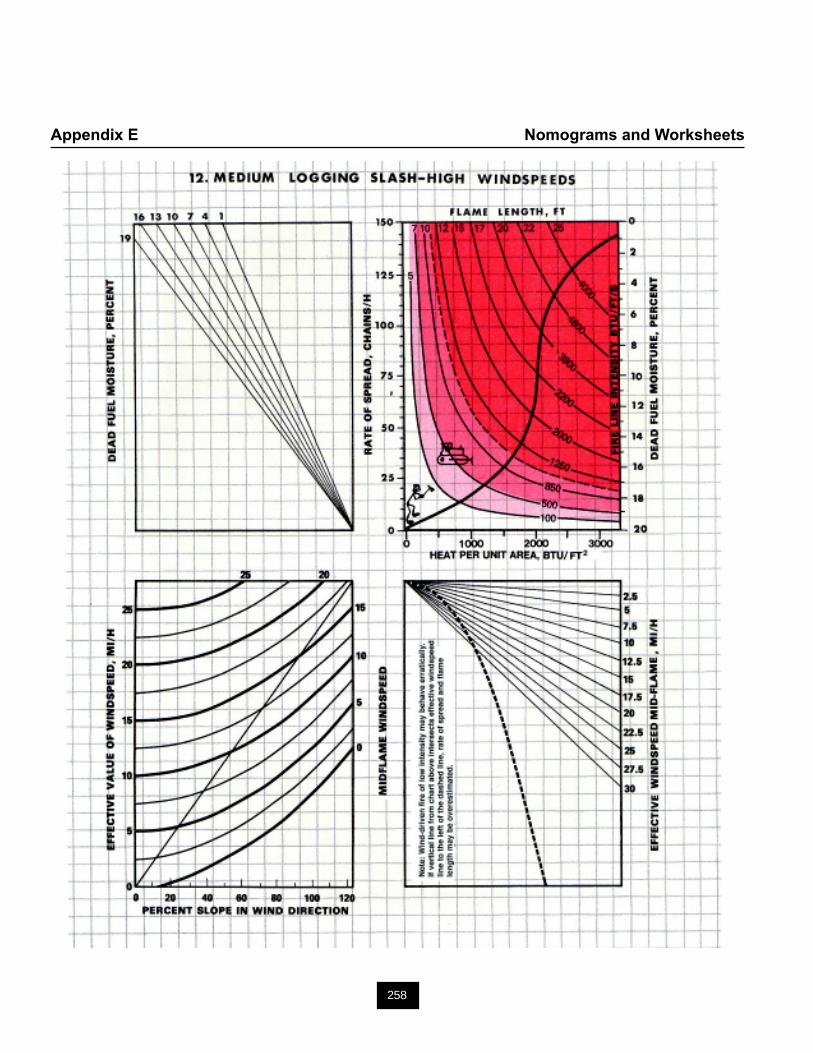
258
Appendix E Nomograms and Worksheets
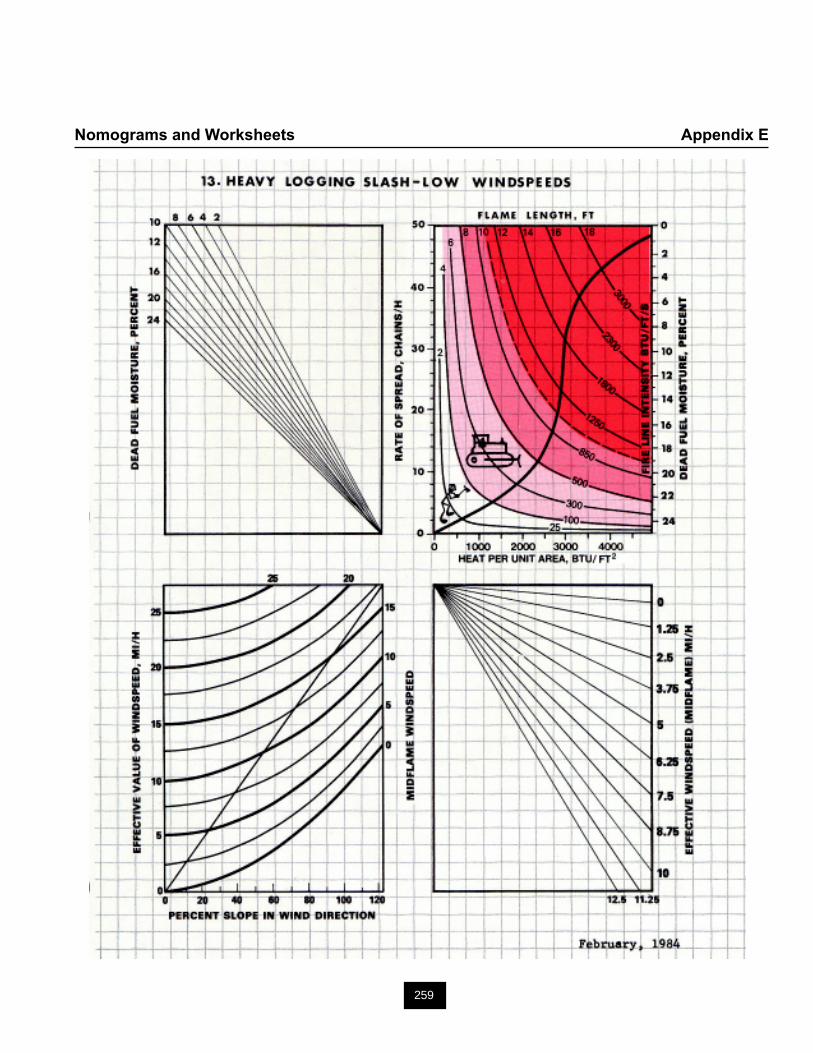
259
Nomograms and Worksheets Appendix E
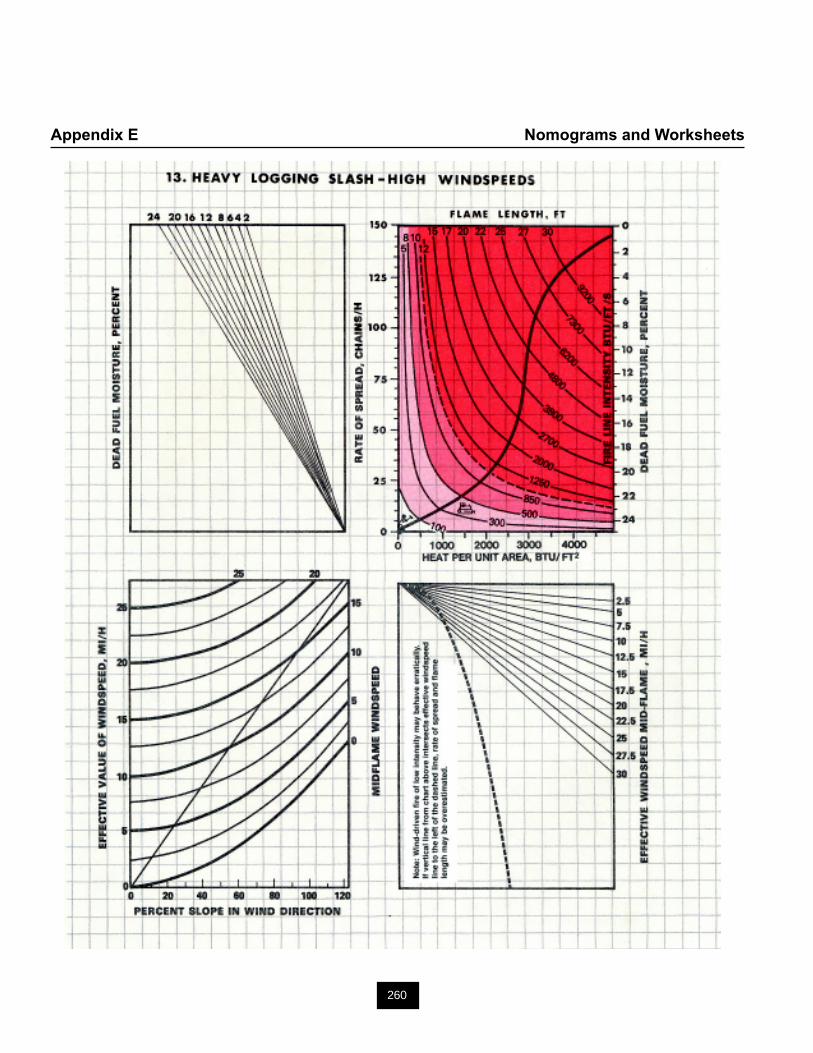
260
Appendix E Nomograms and Worksheets

261
Nomograms and Worksheets Appendix E
PROBLEM SOLVING WORKSHEET
P Given: Assumptions:ROB Goal: Information needed:LEM
D Strategies: Rationale:EVISE
PLAN
C Solution process:ARRY
OUT
PLAN
L Answer: Solution Check:OOK
BACK
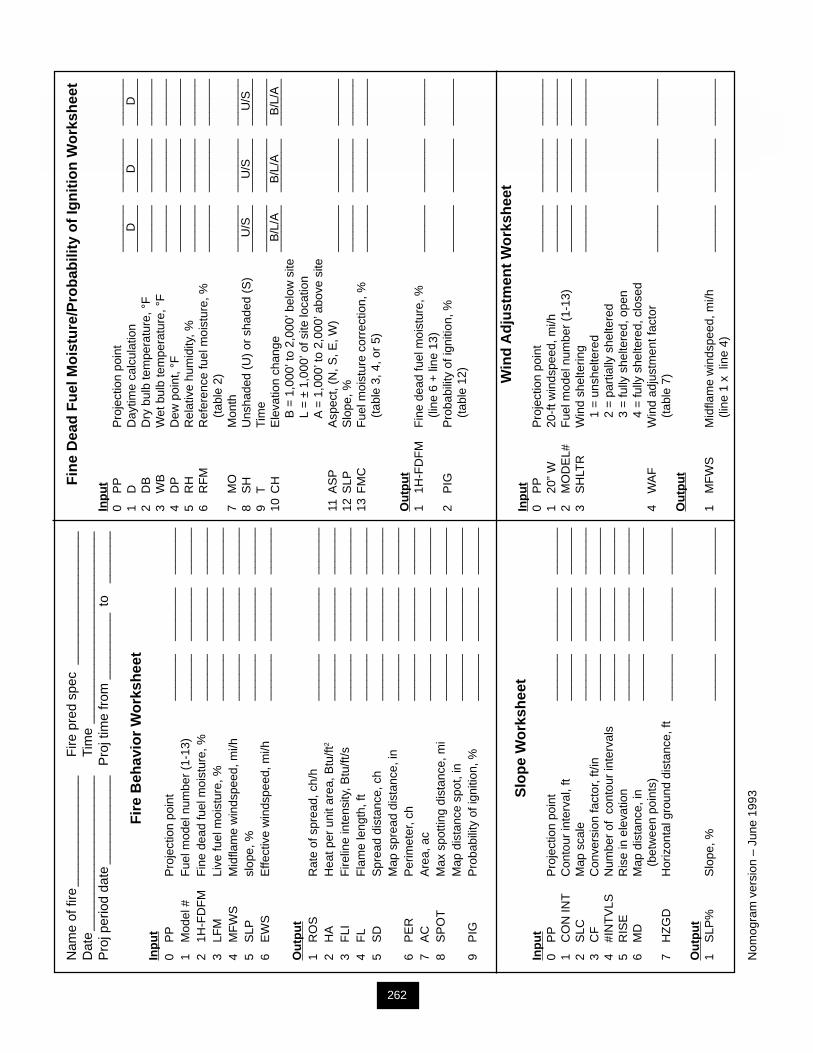
262
Appendix E Nomograms and Worksheets
Nam
e of
fire
____
____
____
___
Fire
pre
d sp
ec__
____
____
____
____
Dat
e__
____
____
____
____
___
Tim
e__
____
____
____
____
____
____
Pro
j per
iod
date
____
____
____
Pro
j tim
e fr
om__
____
___
to__
____
_
Fir
e B
ehav
ior
Wo
rksh
eet
Inp
ut
0P
PP
roje
ctio
n po
int
____
___
____
____
____
___
1M
odel
#F
uel m
odel
num
ber
(1-1
3)__
____
___
____
____
____
_2
1H-F
DF
MF
ine
dead
fuel
moi
stur
e, %
____
___
____
____
____
___
3LF
MLi
ve fu
el m
oist
ure,
%__
____
___
____
____
____
_4
MF
WS
Mid
flam
e w
inds
peed
, mi/h
____
___
____
____
____
___
5S
LPsl
ope,
%__
____
___
____
____
____
_6
EW
SE
ffect
ive
win
dspe
ed, m
i/h__
____
___
____
____
____
_
Ou
tpu
t1
RO
SR
ate
of s
prea
d, c
h/h
____
___
____
____
____
___
2H
AH
eat p
er u
nit a
rea,
Btu
/ft2
____
___
____
____
____
___
3F
LIF
irelin
e in
tens
ity, B
tu/ft
/s__
____
___
____
____
____
_4
FL
Fla
me
leng
th, f
t__
____
___
____
____
____
_5
SD
Spr
ead
dist
ance
, ch
____
___
____
____
____
___
Map
spr
ead
dist
ance
, in
____
___
____
____
____
___
6P
ER
Per
imet
er, c
h__
____
___
____
____
____
_7
AC
Are
a, a
c__
____
___
____
____
____
_8
SP
OT
Max
spo
tting
dis
tanc
e, m
i__
____
___
____
____
____
_M
ap d
ista
nce
spot
, in
____
___
____
____
____
___
9P
IGP
roba
bilit
y of
igni
tion,
%__
____
___
____
____
____
_
Slo
pe
Wo
rksh
eet
Inp
ut
0P
PP
roje
ctio
n po
int
____
___
____
____
____
___
1C
ON
INT
Con
tour
inte
rval
, ft
____
___
____
____
____
___
2S
LCM
ap s
cale
____
___
____
____
____
___
3C
FC
onve
rsio
n fa
ctor
, ft/i
n__
____
___
____
____
____
_4
#IN
TV
LSN
umbe
r of
con
tour
inte
rval
s__
____
___
____
____
____
_5
RIS
ER
ise
in e
leva
tion
____
___
____
____
____
___
6M
DM
ap d
ista
nce,
in__
____
___
____
____
____
_
(bet
wee
n po
ints
)7
HZ
GD
Hor
izon
tal g
roun
d di
stan
ce, f
t__
____
___
____
____
____
_
Ou
tpu
t1
SLP
%S
lope
, %__
____
___
____
____
____
_
Nom
ogra
m v
ersi
on –
Jun
e 19
93
Fin
e D
ead
Fu
el M
ois
ture
/Pro
bab
ility
of
Ign
itio
n W
ork
shee
t
Inp
ut
0P
PP
roje
ctio
n po
int
____
___
____
____
____
___
1D
Day
time
calc
ulat
ion
____
___
____
____
____
___
2D
BD
ry b
ulb
tem
pera
ture
, °F
____
___
____
____
____
___
3W
BW
et b
ulb
tem
pera
ture
, °F
____
___
____
____
____
___
4D
PD
ew p
oint
, °F
____
___
____
____
____
___
5R
HR
elat
ive
hum
idity
, %__
____
___
____
____
____
_6
RF
MR
efer
ence
fuel
moi
stur
e, %
____
___
____
____
____
___
(t
able
2)
7M
OM
onth
____
___
____
____
____
___
8S
HU
nsha
ded
(U)
or s
hade
d (S
)__
____
___
____
____
____
_9
TTi
me
____
___
____
____
____
___
10C
HE
leva
tion
chan
ge__
____
___
____
____
____
_
B =
1,0
00’ t
o 2,
000’
bel
ow s
ite
L =
± 1
,000
’ of s
ite lo
catio
n
A =
1,0
00’ t
o 2,
000’
abo
ve s
ite11
AS
PA
spec
t, (N
, S, E
, W)
____
___
____
____
____
___
12S
LPS
lope
, %__
____
___
____
____
____
_13
FM
CF
uel m
oist
ure
corr
ectio
n, %
____
___
____
____
____
___
(t
able
3, 4
, or
5)
Ou
tpu
t1
1H-F
DF
MF
ine
dead
fuel
moi
stur
e, %
____
___
____
____
____
___
(li
ne 6
+ li
ne 1
3)2
PIG
Pro
babi
lity
of ig
nitio
n, %
____
___
____
____
____
___
(t
able
12) W
ind
Ad
just
men
t W
ork
shee
tIn
pu
t0
PP
Pro
ject
ion
poin
t__
____
___
____
____
____
_1
20”
W20
-ft w
inds
peed
, mi/h
____
___
____
____
____
___
2M
OD
EL#
Fue
l mod
el n
umbe
r (1
-13)
____
___
____
____
____
___
3S
HLT
RW
ind
shel
terin
g__
____
___
____
____
____
_
1 =
uns
helte
red
2
= p
artia
lly s
helte
red
3
= fu
lly s
helte
red,
ope
n
4 =
fully
she
ltere
d, c
lose
d4
WA
FW
ind
adju
stm
ent f
acto
r__
____
___
____
____
____
_
(tab
le 7
)O
utp
ut
1M
FW
SM
idfla
me
win
dspe
ed, m
i/h__
____
___
____
____
____
_
(line
1 x
lin
e 4)
DD
D
U/S
U/S
U/S
B/L
/AB
/L/A
B/L
/A
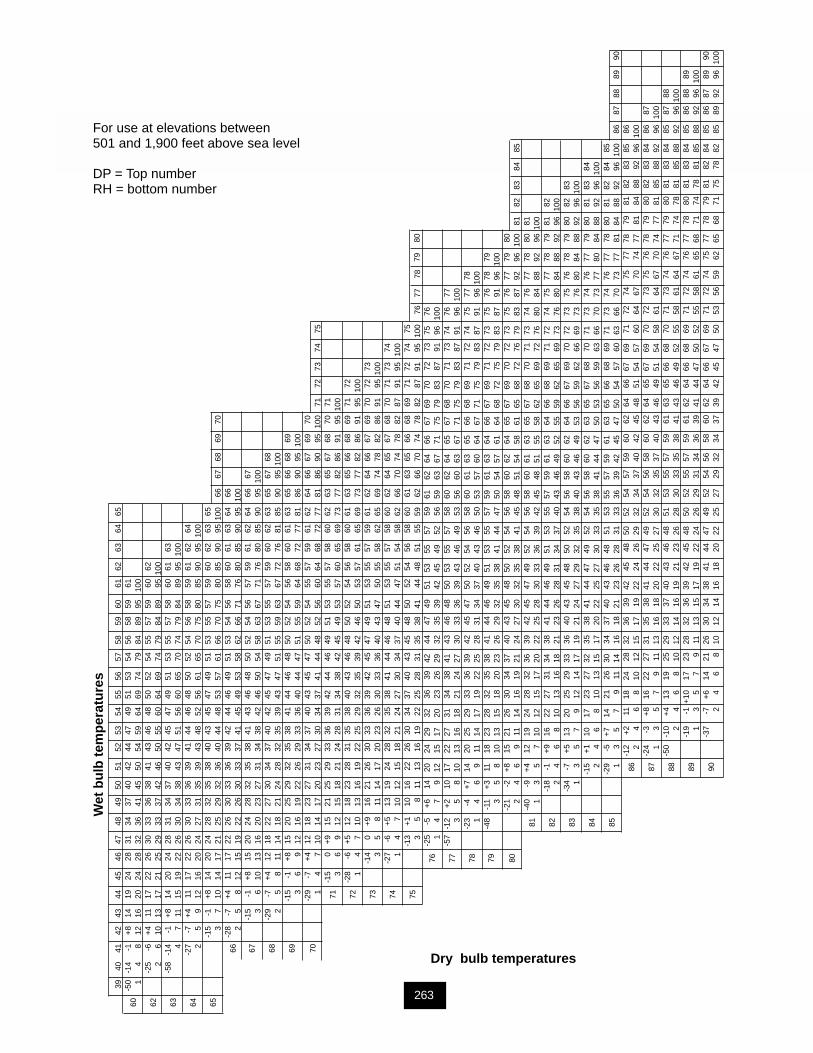
263
Nomograms and Worksheets Appendix E
3940
4142
4344
4546
4748
4950
5152
5354
5556
5758
5960
6162
6364
65-5
0-1
4-1
+8
1419
2428
3134
3740
4244
4749
5153
5456
5859
6160
14
812
1620
2428
3236
4145
5054
5964
6974
7984
8995
100
-25
-6+
411
1722
2630
3336
3841
4346
4850
5254
5557
5960
6262
26
1013
1721
2529
3337
4246
5055
6064
6974
7984
8995
100
-58
-14
-1+
814
2024
2831
3437
4042
4547
4951
5355
5758
6061
6363
47
1115
1922
2630
3438
4347
5156
6065
7074
7984
8995
100
-27
-7+
411
1722
2630
3336
3941
4446
4850
5254
5658
5961
6264
642
59
1216
2024
2731
3539
4348
5256
6165
7075
8085
9095
100
-15
-1+
814
2024
2832
3538
4043
4547
4951
5355
5759
6062
6365
653
710
1417
2125
2932
3640
4448
5357
6166
7075
8085
9095
100
6667
6869
70-2
8-7
+4
1117
2226
3033
3639
4244
4649
5153
5456
5860
6163
6466
662
58
1215
1922
2630
3337
4145
4953
5862
6671
7680
8590
9510
0-1
5-1
+8
1520
2428
3235
3841
4346
4850
5254
5657
5961
6264
6667
673
610
1316
2023
2731
3438
4246
5054
5863
6771
7680
8590
9510
0-2
9-7
+4
1218
2227
3034
3740
4245
4749
5153
5557
5960
6263
6567
6868
25
811
1418
2124
2832
3539
4347
5155
5963
6772
7681
8590
9510
0-1
5-1
+8
1520
2529
3235
3841
4446
4850
5254
5658
6061
6365
6668
6969
36
912
1619
2226
2933
3640
4447
5155
5964
6872
7781
8690
9510
0-2
9-7
+4
1218
2327
3134
3740
4345
4750
5254
5557
5961
6264
6667
6970
701
47
1014
1720
2327
3034
3741
4448
5256
6064
6872
7781
8690
9510
071
7273
7475
-15
0+9
1521
2529
3336
3942
4446
4951
5355
5758
6062
6365
6768
7071
713
69
1215
1821
2428
3134
3842
4549
5357
6065
6973
7782
8691
9510
0-2
8-6
+5
1218
2328
3135
3840
4346
4850
5254
5658
6061
6365
6668
6971
7272
14
710
1316
1922
2529
3235
3942
4650
5357
6165
6973
7782
8691
9510
0-1
40
+916
2126
3033
3639
4245
4749
5153
5557
5961
6264
6667
6970
7273
733
58
1114
1720
2326
3033
3640
4347
5055
5862
6569
7478
8286
9195
100
-27
-6+
513
1924
2832
3538
4144
4648
5153
5557
5860
6264
6567
6870
7173
7474
14
710
1215
1821
2427
3034
3740
4447
5154
5862
6670
7478
8287
9195
100
-13
+1
1016
2226
3034
3740
4345
4850
5254
5658
6061
6365
6668
6971
7274
7575
35
811
1316
1922
2528
3135
3841
4448
5155
5962
6670
7478
8287
9195
100
7677
7879
80-2
5-5
+6
1420
2429
3236
3942
4447
4951
5355
5759
6162
6466
6769
7072
7375
7676
14
79
1215
1720
2326
2932
3539
4245
4952
5659
6367
7175
7983
8791
9610
0-5
7-1
2+
210
1722
2731
3438
4143
4648
5053
5557
5860
6264
6567
6870
7173
7476
7777
35
810
1316
1821
2427
3033
3639
4346
4953
5660
6367
7175
7983
8791
9610
0-2
3-4
+7
1420
2529
3336
3942
4547
5052
5456
5860
6163
6566
6869
7172
7475
7778
781
46
911
1417
1922
2528
3134
3740
4346
5053
5760
6467
7175
7983
8791
9610
0-4
8-1
1+3
1118
2328
3235
3841
4446
4951
5355
5759
6163
6466
6769
7172
7375
7678
7979
35
810
1315
1820
2326
2932
3538
4144
4750
5457
6164
6872
7579
8387
9196
100
-21
-2+
815
2126
3034
3740
4345
4850
5254
5658
6062
6465
6769
7072
7375
7677
7980
802
46
911
1416
1921
2427
3032
3538
4145
4851
5458
6165
6872
7679
8387
9296
100
8182
8384
85-4
0-9
+4
1219
2428
3236
3942
4547
4952
5456
5860
6163
6567
6870
7173
7476
7778
8081
811
35
710
1215
1720
2225
2830
3336
3942
4548
5155
5862
6569
7276
8084
8892
9610
0-1
8-1
+9
1622
2731
3438
4144
4649
5153
5557
5961
6364
6668
6971
7274
7577
7879
8182
822
46
810
1316
1821
2326
2831
3437
4043
4649
5255
5962
6569
7376
8084
8892
9610
0-3
4-7
+5
1320
2529
3336
4043
4548
5052
5456
5860
6264
6667
6970
7273
7576
7879
8082
8383
13
57
912
1417
1921
2427
2932
3538
4043
4649
5356
5962
6669
7376
8084
8892
9610
0-1
5+
110
1723
2732
3538
4144
4749
5254
5658
6062
6365
6768
7071
7374
7677
7980
8183
8484
24
68
1013
1517
2022
2527
3033
3538
4144
4750
5356
5963
6670
7377
8084
8892
9610
0-2
9-5
+7
1421
2630
3437
4043
4648
5153
5557
5961
6365
6668
6971
7374
7677
7880
8182
8485
851
35
79
1114
1618
2123
2628
3133
3639
4245
4750
5457
6063
6670
7377
8184
8892
9610
086
8788
8990
-12
+2
1118
2428
3236
3942
4548
5052
5457
5960
6264
6667
6971
7274
7577
7879
8182
8385
8686
24
68
1012
1517
1922
2426
2932
3437
4042
4548
5154
5760
6467
7074
7781
8488
9296
100
-24
-3+
816
2227
3135
3841
4447
4952
5456
5860
6264
6567
6970
7273
7576
7879
8082
8384
8687
871
35
79
1113
1618
2022
2527
3032
3537
4043
4649
5154
5861
6467
7074
7781
8588
9296
100
-50
-10
+4
1319
2529
3337
4043
4648
5153
5557
5961
6365
6668
7071
7374
7677
7980
8183
8485
8788
882
46
810
1214
1619
2123
2628
3033
3538
4143
4649
5255
5861
6467
7174
7881
8588
9296
100
-19
-1+
1017
2328
3236
3942
4548
5052
5557
5961
6264
6668
6971
7274
7677
7880
8183
8485
8688
8989
13
57
911
1315
1719
2224
2629
3134
3639
4144
4750
5255
5861
6568
7174
7881
8588
9296
100
-37
-7+
614
2126
3034
3841
4447
4952
5456
5860
6264
6667
6971
7274
7577
7879
8182
8485
8687
8990
902
46
810
1214
1618
2022
2527
2932
3437
3942
4547
5053
5659
6265
6871
7578
8285
8992
9610
0
Wet
bu
lb t
emp
erat
ure
s
Dry bulb temperatures
For use at elevations between501 and 1,900 feet above sea level
DP = Top numberRH = bottom number
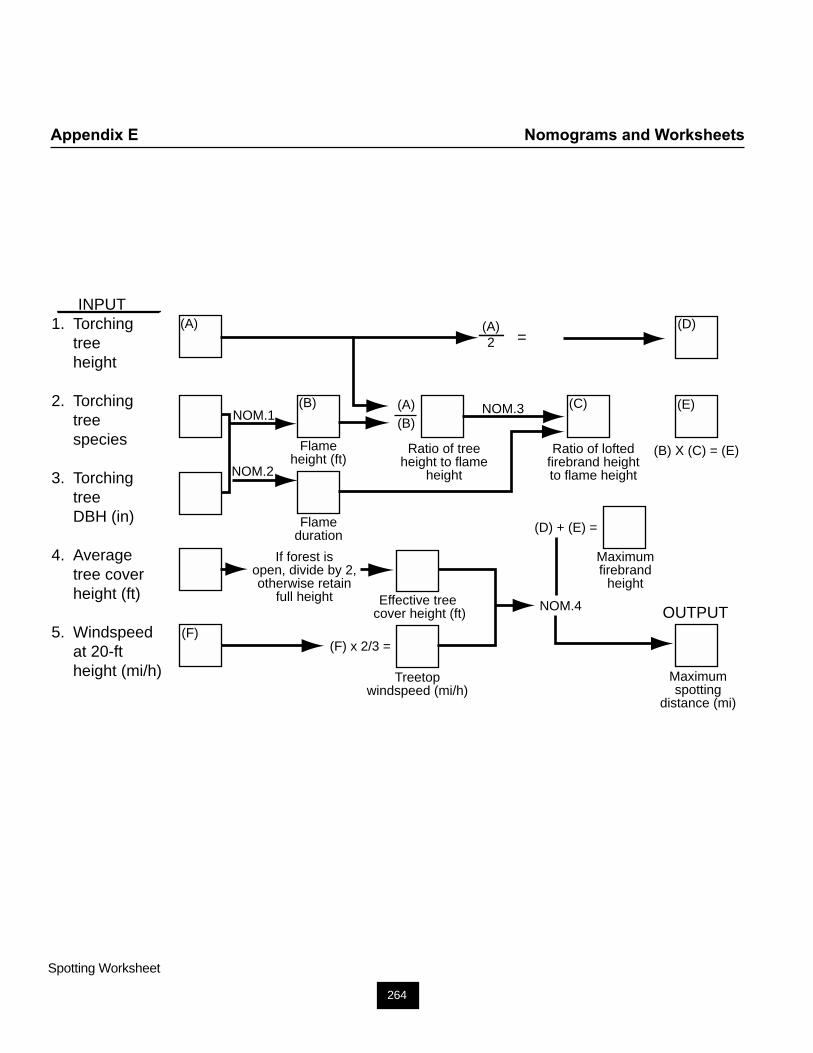
264
Appendix E Nomograms and Worksheets
INPUT1. Torching
tree height
2. Torchingtreespecies
3. TorchingtreeDBH (in)
4. Averagetree coverheight (ft)
5. Windspeedat 20-ftheight (mi/h)
(A) (D)(A)2 =
NOM.1
NOM.2
(B) (A)(B)
(C)
(B) X (C) = (E)
(E)
Flameheight (ft)
Ratio of treeheight to flame
height
Ratio of loftedfirebrand heightto flame height
NOM.3
Flameduration
If forest isopen, divide by 2,otherwise retain
full height
(D) + (E) =
Maximumfirebrand
heightEffective tree
cover height (ft) NOM.4
(F)(F) x 2/3 =
Treetopwindspeed (mi/h)
OUTPUT
Maximumspotting
distance (mi)
Spotting Worksheet
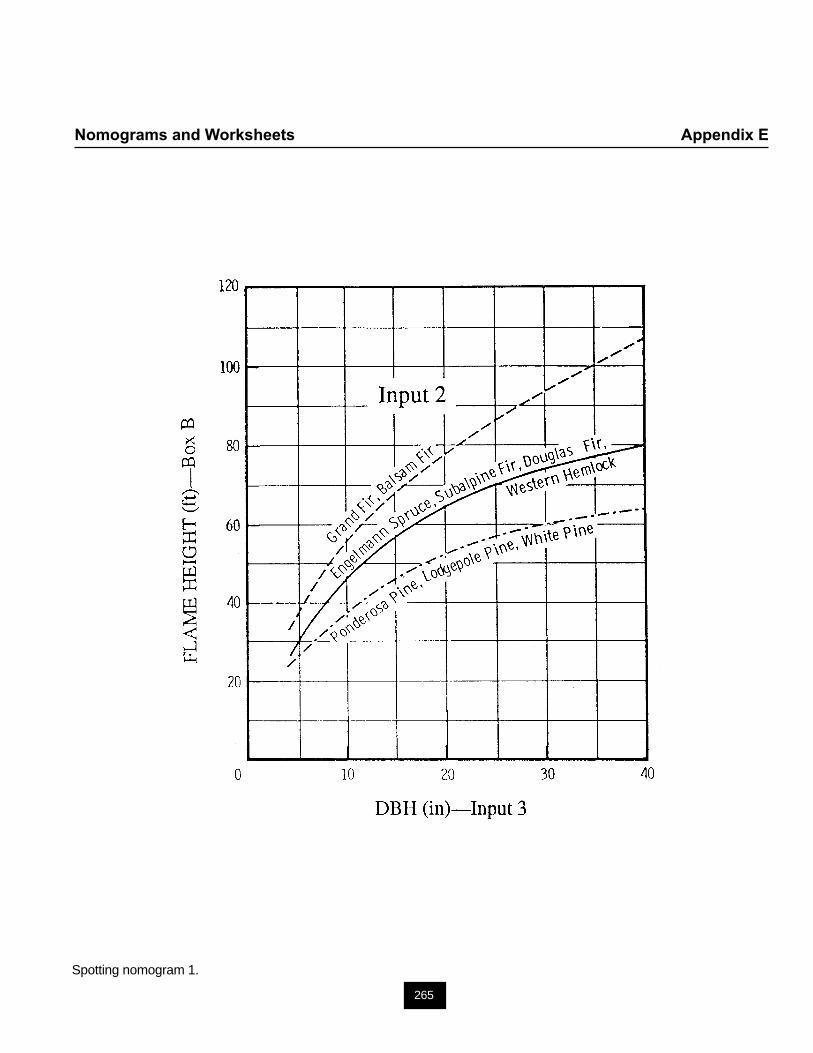
265
Nomograms and Worksheets Appendix E
Spotting nomogram 1.
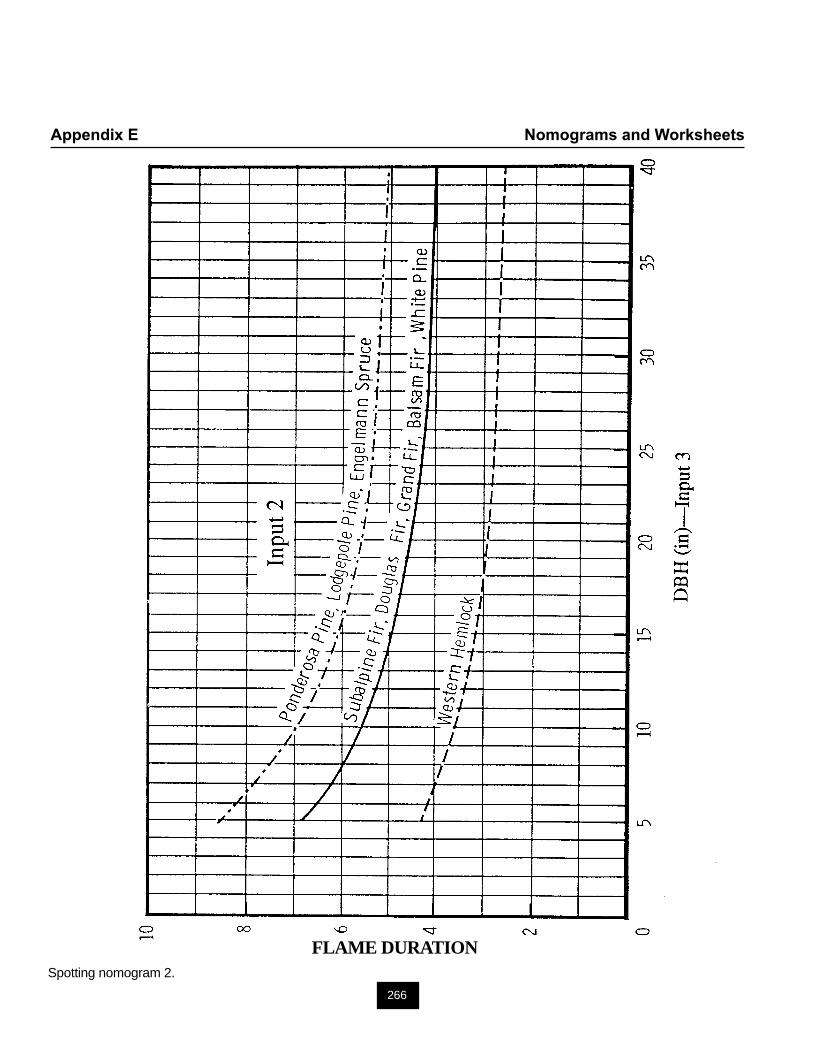
266
Appendix E Nomograms and Worksheets
FLAME DURATIONSpotting nomogram 2.
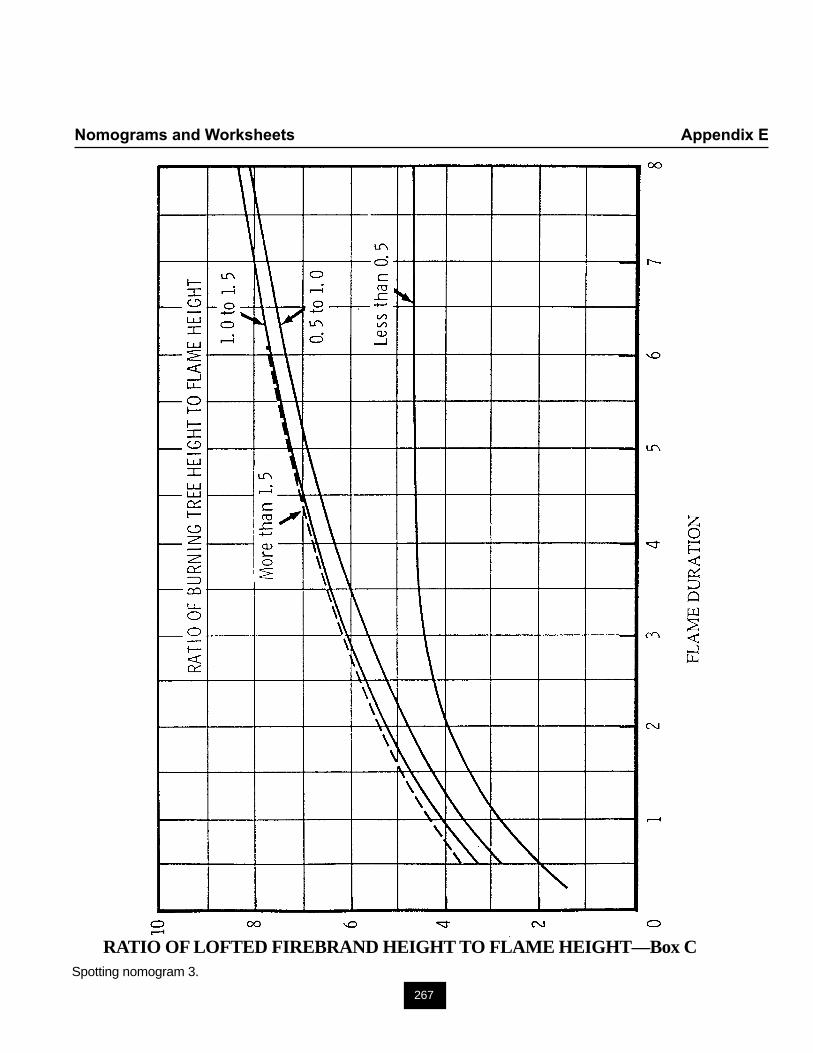
267
Nomograms and Worksheets Appendix E
RATIO OF LOFTED FIREBRAND HEIGHT TO FLAME HEIGHT—Box CSpotting nomogram 3.
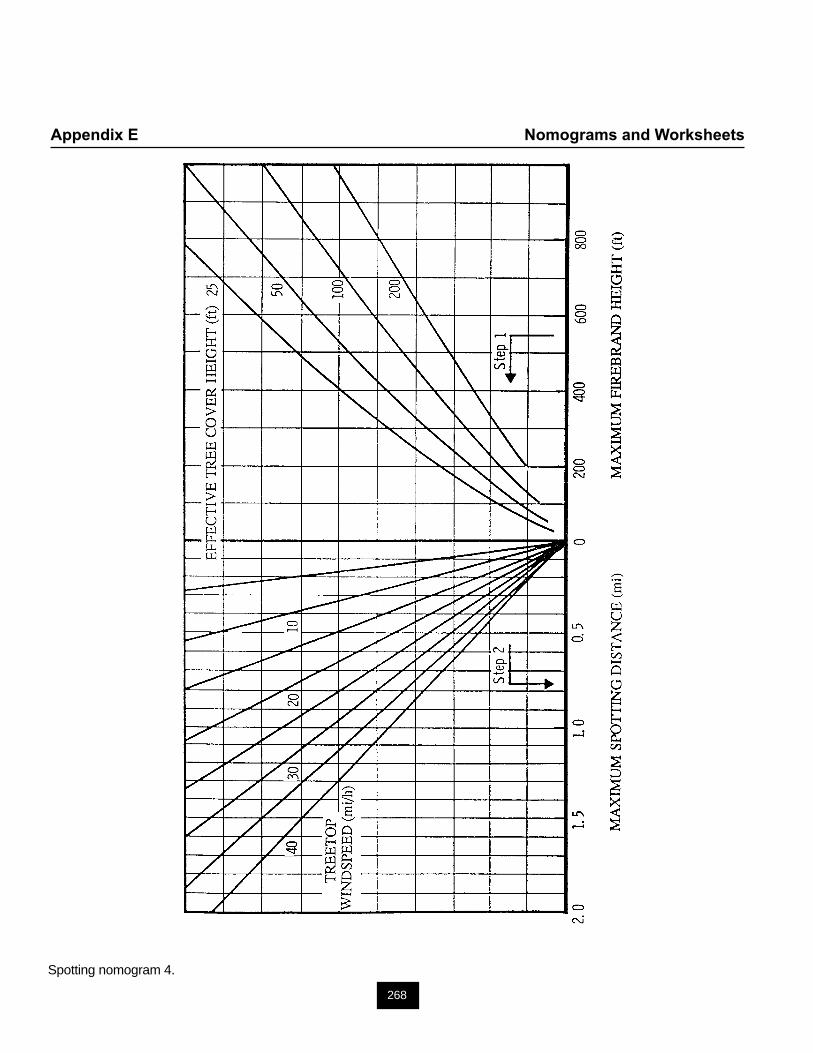
268
Appendix E Nomograms and Worksheets
Spotting nomogram 4.
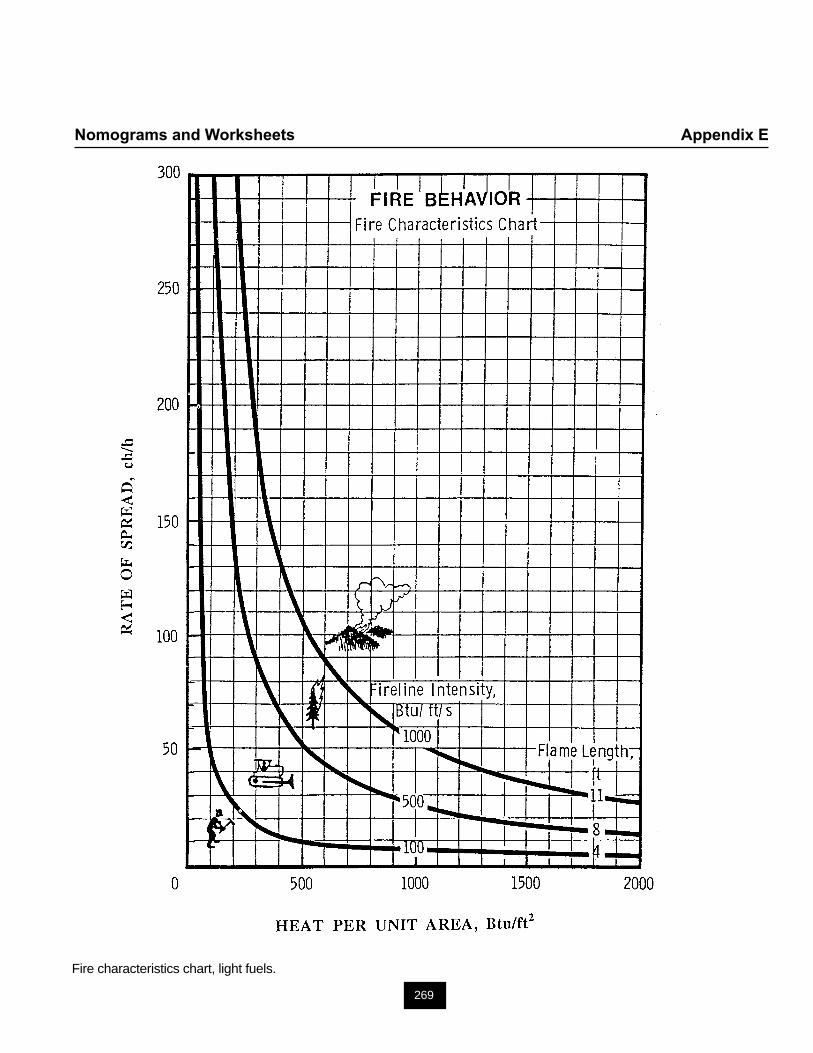
269
Nomograms and Worksheets Appendix E
Fire characteristics chart, light fuels.
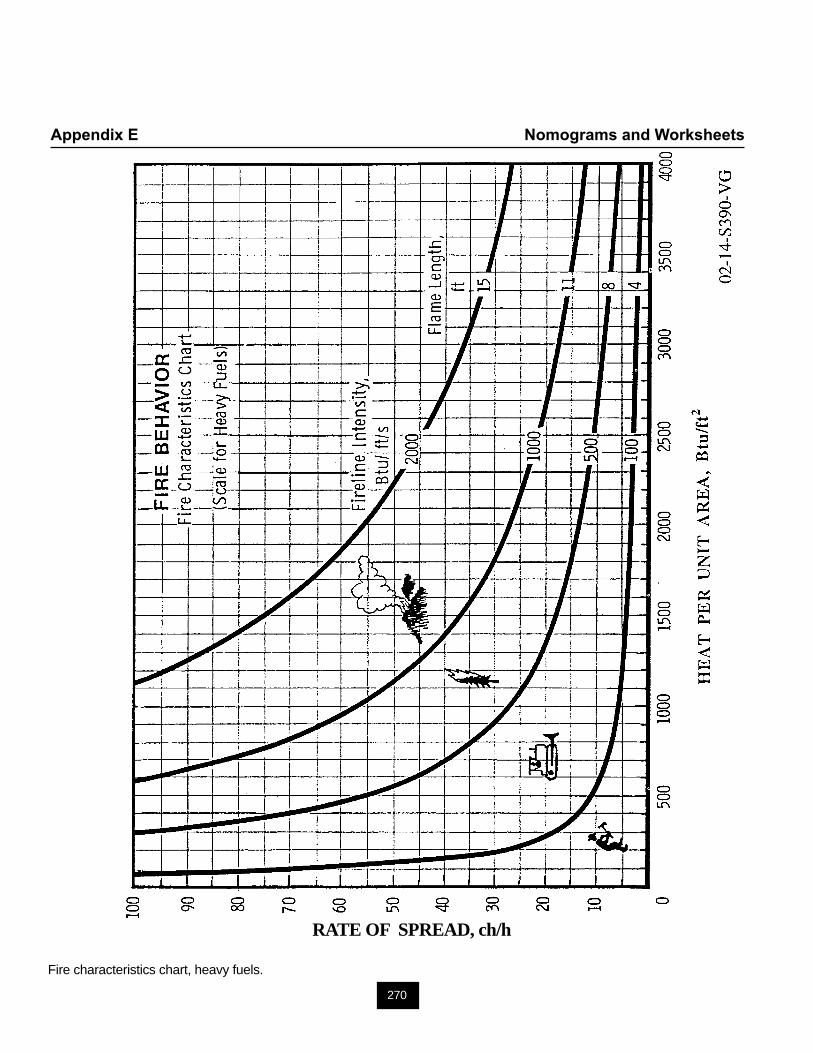
270
Appendix E Nomograms and Worksheets
RATE OF SPREAD, ch/h
Fire characteristics chart, heavy fuels.