finite element modelling and design of a concentration gradient generating bioreactor: application...
TRANSCRIPT
Toxicology in Vitro 24 (2010) 1828–1837
Contents lists available at ScienceDirect
Toxicology in Vitro
journal homepage: www.elsevier .com/locate / toxinvi t
Finite element modelling and design of a concentration gradient generatingbioreactor: Application to biological pattern formation and toxicology
Giovanni Vozzi a,b,*, Daniele Mazzei a, Annalisa Tirella a,c, Federico Vozzi d, Arti Ahluwalia a,b
a Interdepartmental Research Center ‘‘E. Piaggio”, University of Pisa, via Diotisalvi 2, 56126 Pisa, Italyb Department of Chemical Engineering Industrial Chemistry and Materials Science, via Diotisalvi 2, 56126 Pisa, Italyc Department of Chemical Science and Technology, University of Rome ‘‘Tor Vergata”, Roma, Italyd CNR Institute of Clinical Physiology, via G. Moruzzi 1, Pisa, Italy
a r t i c l e i n f o
Article history:Received 26 November 2009Accepted 17 May 2010Available online 24 May 2010
Keywords:MicrofluidicsGerier–Meinhardt modelConcentration gradient makerAnaestheticsCell testing
0887-2333/$ - see front matter � 2010 Elsevier Ltd. Adoi:10.1016/j.tiv.2010.05.010
* Corresponding author at: Interdepartmental ReUniversity of Pisa, via Diotisalvi 2, 56126 Pisa, Italy.
E-mail address: [email protected] (G. Vozzi).
a b s t r a c t
This paper describes the use of a microfluidic gradient maker for the toxicological analysis of some con-ventional biomolecules such as hydrogen peroxide and a local anaesthetic, lidocaine on different cell cul-tures, human endothelial cells and myoblasts, respectively. The microfluidic device was designed andsimulated using COMSOL Multiphysics� and the concentration gradient in the microfluidic networkwas analysed through a fluid-dynamic and mass-transport study. Subsequently the device was fabricatedwith soft lithography, casting PDMS in a master to obtain channels about 250 lm deep. Hydrogen perox-ide was tested on human endothelial cells, while lidocaine was tested on C2C12 myoblasts and an anal-ysis was performed using propidium iodide staining followed by an imaging processing routine to obtainquantitative dose–response profiles in the gradient maker. The results show that the Gradient Maker(GM) bioreactor is a more sensitive method for detection of cell toxicity, and compared with testing ofdrug toxicity using microwells with individual cell cultures, allows one shot testing with a single cell cul-ture exposed to a large number of concentrations. Moreover, the Gradient Maker was also modelled inorder to realise biological pattern formation using two morphogenes acting as activator and inhibitorwith varying diffusion rates.
� 2010 Elsevier Ltd. All rights reserved.
1. Introduction
The microfluidic device proposed by Whitesides for generatingconcentration gradients through laminar flow (McDonald et al.,2000) has been extensively used by several researchers for gener-ating large concentration gradients over small length scales. Basi-cally, the Gradient Maker (GM) is a microfluidic device consistingof a series of channels connected to a chamber where the gradientis formed. An essential requisite of the GM system is the presenceof a laminar flow with a very small Reynolds number in order toprevent convective mixing. A wide range of biological studiesand applications have been performed with this type of gradientgenerating systems (Glawdel et al., 2009; Atencia et al., 2009;Toh et al., 2009).
One of the main topics in which these systems are usuallyused are studies of chemiotactic gradients that can be used toguide cell migration. These devices are highly effective for analy-sis of cell behaviour in a simple two dimensional environment.This type of study can help to understand how specific gradients,
ll rights reserved.
search Center ‘‘E. Piaggio”,
controlled in space and time, are able to steer cell fate and func-tion. Moreover it is possible to distinguish studies in whichimmobilised gradients are created on an adhesive surface (Adamset al., 2005), or steady state gradients of soluble molecules, suchas a morphogenes (Lander et al., 2007) or chemokines (Saadiet al., 2007), are established with a continuous perfusion of a spe-cific solution.
Since these systems have the ability to generate large concen-tration gradients in just few millimetres, dose–response curvescan be easily constructed with a single experiment and using justa single cell culture (Tirella et al., 2008). Toxicity tests are easilyimplemented with this novel system, giving the possibility to runa single ‘‘one-shot” test instead of the classical protocols, that areusually based on a multi concentration set of experiments.
Alan Turing in his seminal paper ‘‘The chemical basis of mor-phogenesis” (Turing, 1952), showed that steady state chemical pat-terns can be generated in two component system due to differentdiffusion rates of the reacting chemical substances. Since then, sev-eral specific models for pattern formation using reaction–diffusionsystems have been developed. For examples, Gierer and Meinhardtproposed a model for biological pattern formation in which twomorphogenes acted as activator and inhibitor (Meinhardt, 2008;Gierer and Meinhardt, 1972).
G. Vozzi et al. / Toxicology in Vitro 24 (2010) 1828–1837 1829
Here we describe the design and realisation of a gradient gener-ating microfluidic bioreactor using multiphysics finite elementmodelling in particular to test the toxicity effect of molecules ondifferent cell lines. Moreover using the FEM analysis we modelledthe GM bioreactor in order to realise biological patterns using theGierer and Meinhardt (G&M) theory (Meinhardt, 2008).
The GM bioreactor was used to analyse the toxicological effectof hydrogen peroxide on human endothelial cells, and the toxicityof a local anaesthetic namely bupivacaine and lidocaine, which isknown to induce apoptosis in striated muscle fibres in vitro andin vivo (Zink and Graf, 2004; Irwin et al., 2002) on myoblasts cells.
Our aim was to demonstrate the feasibility of using the GM sys-tem as an alternative to early stage screening of drugs, and to crit-ically assess its efficiency in single shot testing compared withclassic microwell analyses. In the GM a single cell culture is ex-posed to a range of drug concentrations, so that it may also be pos-sible to discern the protective effects of less damaged or healthycells on damaged ones, or even sympathetic toxification. Cell tox-icity was analysed following the application of a steady statewell-defined concentration gradient for 6 h.
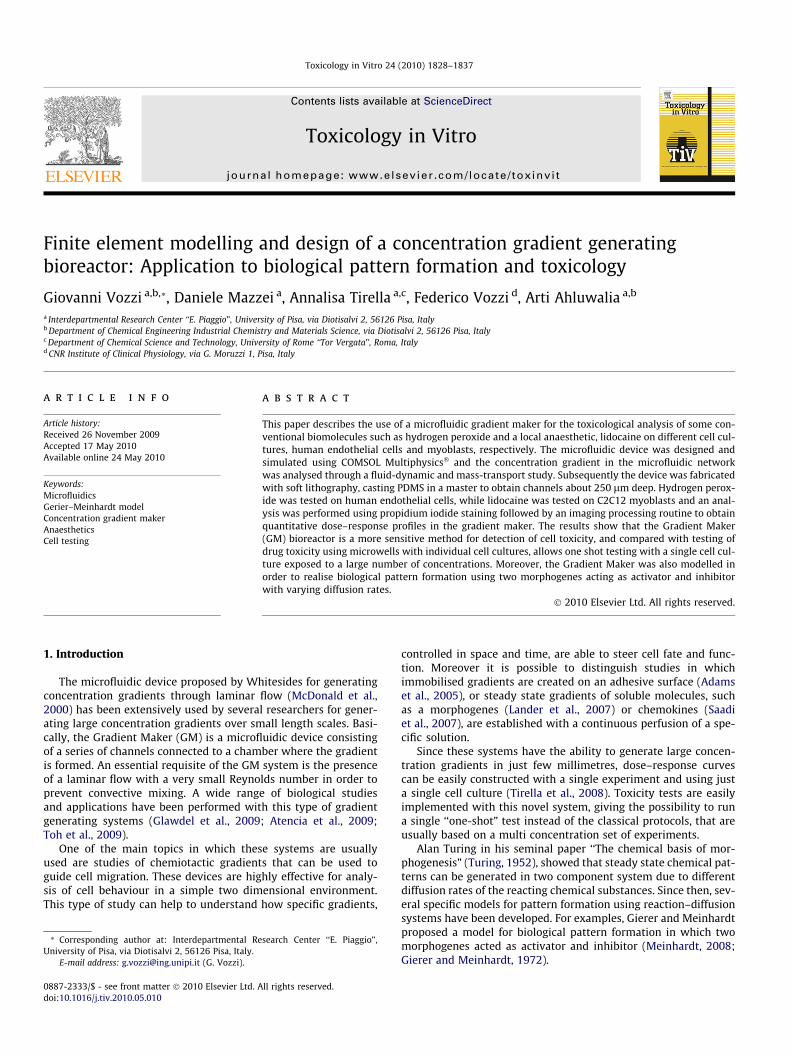
Fig. 1. (a) Scheme of gradient maker bior
Furthermore, we show how the GM can be used, at least in theory,to produce patterns based on reaction–diffusion of morphogenes.
2. Materials and methods
2.1. Design and realization of the gradient maker chamber
The microfluidic GM circuit is based on the geometry originallyproposed by Whitesides (Li Jeon et al., 2002; Jiang et al., 2005) withtwo inputs and with 6 final channels coming out as affluents afterflowing through a ‘‘serpentine” shaped mixer (Fig. 1a). The pres-ence of 6 channels allows a smother resolution of concentrationgradient to be obtained. The topology of the GM is composed oftwo parts: a serpentine shaped circuit and a cell treatment cham-ber. The development of the concentration gradient is possible ifthere is a completely developed laminar flow inside the treatmentchamber and the fluids at the exit of the microchannels are per-fectly mixed. For this last reason, the treatment chamber and theacute angles were minimized. The GM Bioreactor is made of
eactor (b) the system all assembled.
1830 G. Vozzi et al. / Toxicology in Vitro 24 (2010) 1828–1837
Poly(dimethylsiloxane) (PDMS) (Sylgard 184, Dow Corning, USA)and is obtained by Soft-molding of a silicon master. The masterwas realized by lithographic process as reported in (Vozzi et al.,2003) using EPON-SU8-100 (Microchem, Netwton, MA, USA) asphotoresist. PDMS is prepared by mixing the monomer and cataly-ser in a 10:1 w/w ratio. The mixture is degassed and casted on thesilicon master and, then, degassed again to improve filling of themicrochannels. The mould is finally baked in an oven for four hoursat 65 �C and detached from the wafer after cooling. The GM biore-actor also has 3 silicone tubes of 1 mm inner diameter glued di-rectly in the mold. To ensure complete sealing between thePDMS circuit and the plexiglass, the device was clamped with aTeflon frame (Fig. 1b). A mini peristaltic pump (P720, Instech,Plymouth, PA, USA) was connected to the two inlet tubes whichin turn were connected to two reservoirs. The output silicone tubeinstead was connected to a beaker.
2.2. FEM modelling
Prior to the modeling in COMSOL (COMSOL AB, Stockholm, Swe-den), basic geometric features of the GM system were establishedsuch that the complete microfluidic circuit fitted inside a standardsilicon wafer, and the cell culture chamber had same area as3.14 cm2 microwell plate.
The microfluidic circuit was designed using COMSOL, and fol-lowing dimensions were chosen:
� microchannel width: 1.6 mm;� width of the cell culture chamber: 14.6 mm;� length of the cell culture chamber: 20 mm.
The microfluidic GM network system was analyzed using finiteelement modeling in order to determine the efficiency of the 6microchannels and estimate the concentration gradients in the cellchamber. Two application modes of COMSOL Software were used:fluid dynamics and convection and diffusion, the ruling mode wasthe fluid dynamic regime.
The first mode determined the motion and the velocity profilepresent inside the system using the Navier–Stokes equations foran isothermal incompressible fluid; the second mode allowed cal-culation of the concentration gradient using the convection–diffu-sion equation using the velocity calculated from the Navier–Stokes equations as an input. Since the microchannels were250 lm deep (this is the range obtained with the soft lithographytechnique) the device was approximated to a 2D system. In factthe microchannels had an infinitesimal height along the z axisin comparison with the characteristic dimensions along the otheraxes.
To carry out the simulation the following constants and bound-ary conditions were imposed:
� the temperature was set to 37 �C and the fluid was assumed tobe water because the viscosity and density of the culture med-ium are almost identical to that of water;� the two input concentrations C1 and C2 were initially set at
C1 = 0 and C2 = 1 mM to enable the effects of the drug diffusioncoefficient on the concentration profile to be evaluated;� since the exact value will depend on the experimental parame-
ters, various simulations were carried out using different valuesof D (diffusion coefficient) ranging from 10�5 to 10�10 m2/s;� the flow rate was fixed at 170 ll/min to reduce the number of
experimental variables. It was shown to be adequate to ensurethe formation of a smooth gradient at all the values of D tested.Lower flow rates give rise to flat concentration profiles (or nearzero concentration gradients) while higher rates could lead tocell damage from shear stress;
� the fluid dynamic boundary conditions imposed within COM-SOL were no-slip at all walls and zero pressure or resistanceto flow at the outlet of the device.
The equations used for fluid dynamic analysis of the systemwere the following:
q@u@tþ q u � rð Þuþ �rp� gr2u ¼ 0 ð1Þ
r � u ¼ 0 ð2Þ
where u is the velocity vector, q the fluid density, g the dynamicviscosity and p the pressure. The first equation is the momentumbalance, and the second is the equation of continuity for incom-pressible fluids.
The equation used for concentration analysis was:@C@tþr � �DrCð Þ ¼ �u � rC ð3Þ
where C is the concentration, and u is the velocity vector calculatedin the fluid dynamic mode.
The number of elements of mesh was around 200.000, obvi-ously increasing them the results become more precise.
2.3. Gierer and Meinhardt reaction–diffusion model
The possibility to generate new patterns with previously de-scribed and tested microfluidic devices was also evaluated, usinga reaction–diffusion model proposed by Gierer and Meinhardt(1972). Gierer and Meinhardt (G&M) modeled the reaction be-tween an activator and an inhibitor, and show how short rangeactivation and long range inhibition are able to explain the effectof morphogenes and also the formation of morphogenetic patterns.The pattern topology is essentially determined by ranges of activa-tion and inhibition, where the range is the mean distance betweenproduction and decay (or removal) of respective species. In thisanalysis the lateral-inhibition model considered and expressedwith two equations:
@a@t¼ q
a2
b� laþ Da
@2a@x2 ð4Þ
@b@t¼ q0a2 � mbþ Db
@2b@x2 ð5Þ
where a is the activator and b is inhibitor respectively, q and q0 areproduction rates of a and b, respectively, while l and m are con-sumption rates of a and b, respectively.
In order to realise patterns with a specific topology it is neces-sary to respect some condition expressed by the G&M model,moreover initial conditions represent a significant role for the sta-bility of the pattern generated.
To model the activator-inhibitor model proposed by G&M, twoconvection–diffusion analyses were performed and combined withthe Mass balance module using COMSOL Multiphysics.
Initially we modeled a spatial 2D environment having the samedimensions as the treatment area of the GM bioreactor.
To carry out the simulation the following constants and bound-ary conditions were imposed:
� the temperature was set to 37 �C and the fluid was assumed tobe water because the viscosity and density of the culture med-ium are almost identical to that of water;� the two input concentrations C1 and C2 were initially set at
C1 = 10�6 M and C2 = 0 M;� the initial condition of variable a is set as a controlled uniform
constant a0 that are equal to the input concentrations previ-ously reported (C1 and C2). The reaction rate Ra is defined asdescribed by G&M:
G. Vozzi et al. / Toxicology in Vitro 24 (2010) 1828–1837 1831
Ra ¼ q � a2
b� l � a ð6Þ
� the initial condition of variable b is set as a constant b0 equal to10�5 mM, while the reaction Rb is written in the subdomainexpression as:
Rb ¼ q0 � a2 � m � b ð7Þ
� An isotropic diffusion was assumed and selected values were10�9 for the activator (Da), and 10�7 for the inhibitor (Db);� the flow rate was fixed at 170 ll/min with boundary conditions
as in the previous model;� the value of q, q0, l, and m were fixed to have a single or periodic
pattern in the treatment area. For the single patternq = 6 � 10�5, q0 = 2 � 10�4, l = 10�5, and m = 10�4 (moles/s);
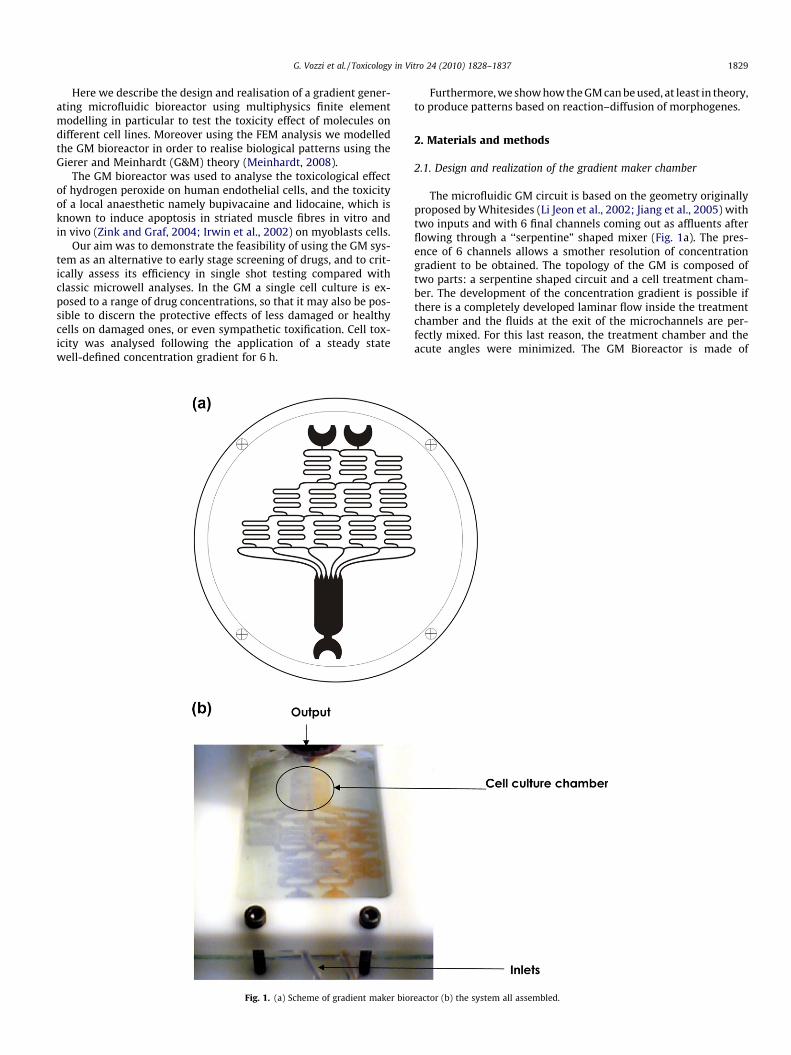
Fig. 2. (a) 2D profile of velocity (b) 3D-gradient co
for the periodic pattern q = 6 � 10�3, q0 = 2 � 10�2, l = 10�3,and m = 10�2 (moles/s).
When the activator has reached the treatment area reactionwith the inhibitor (supposed uniformly distributed in the treat-ment zone at a concentration b0) starts. Initial concentration, a0of the activator determined the pattern generation for the lat-eral-inhibition model proposed by G&M. We also modeled this sys-tem using Microfluidics Analysis of MEMS Module, combining twoconvection–diffusion modules (one for activator, one for inhibitor),as it enables a pseudo 2D analysis to be performed on microfluidicdevice. The subdomain settings were the same as the previousmodel, with reaction rated Ra and Rb described by G&M. Usingthe stationary solver a pseudo-stationary state in which a single
ncentration in the gradient maker bioreactor.
1832 G. Vozzi et al. / Toxicology in Vitro 24 (2010) 1828–1837
pattern is generated was obtained. The number of elements ofmesh was equal to the previous simulations.
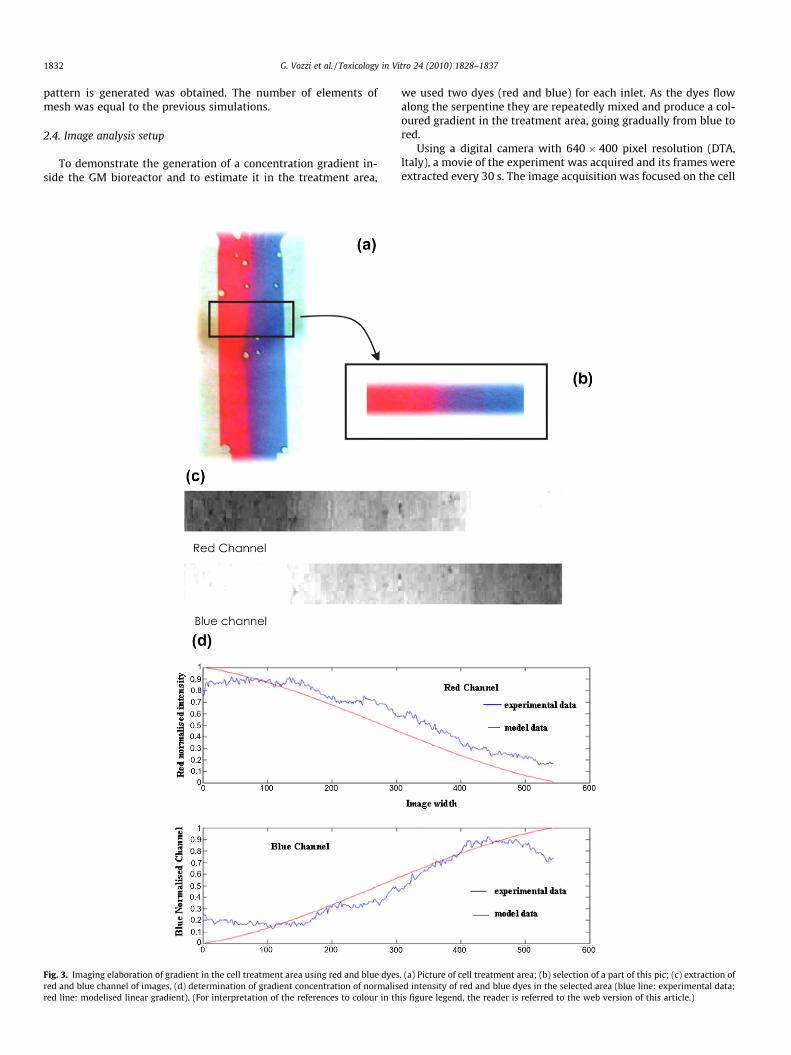
2.4. Image analysis setup
To demonstrate the generation of a concentration gradient in-side the GM bioreactor and to estimate it in the treatment area,
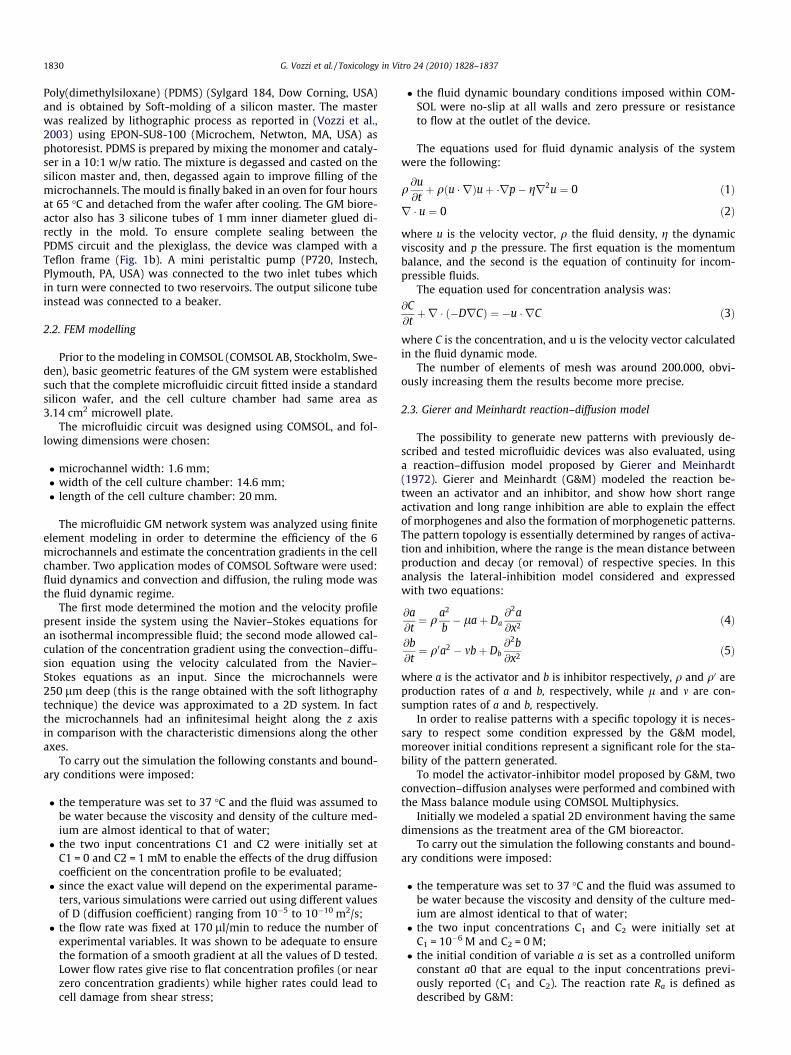
Fig. 3. Imaging elaboration of gradient in the cell treatment area using red and blue dyesred and blue channel of images, (d) determination of gradient concentration of normalisred line: modelised linear gradient). (For interpretation of the references to colour in th
we used two dyes (red and blue) for each inlet. As the dyes flowalong the serpentine they are repeatedly mixed and produce a col-oured gradient in the treatment area, going gradually from blue tored.
Using a digital camera with 640 � 400 pixel resolution (DTA,Italy), a movie of the experiment was acquired and its frames wereextracted every 30 s. The image acquisition was focused on the cell
. (a) Picture of cell treatment area; (b) selection of a part of this pic; (c) extraction ofed intensity of red and blue dyes in the selected area (blue line: experimental data;is figure legend, the reader is referred to the web version of this article.)
G. Vozzi et al. / Toxicology in Vitro 24 (2010) 1828–1837 1833
treatment area. The frames were filtered to remove the noise andto improve the contrast of the picture without changing the colourgradient properties.
Filtering was necessary to reduce the noise due to discontinuityof the light source and to shadows caused by the bioreactor frame.
RGB Images were decomposed in 3 matrices each one corre-sponding to Red, Blue and Green channels, using Matlab ImageProcessing Toolbox (The Math–Works Inc., USA). To obtain the con-centration profile in the treatment area, the image matrix was re-duced to a vector, where each point was the mean of each matrixcolumn.
The values obtained were plotted in a semilog space for Red andBlue matrices. The experiment was performed at different peristal-tic pump velocities.
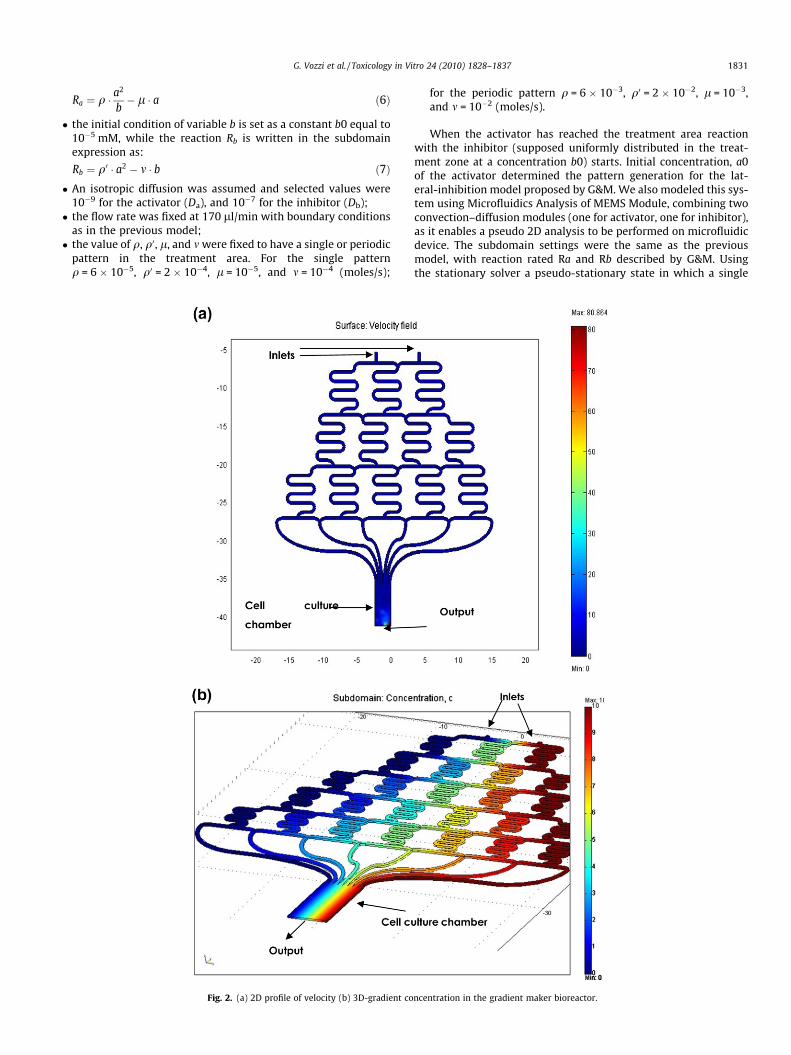
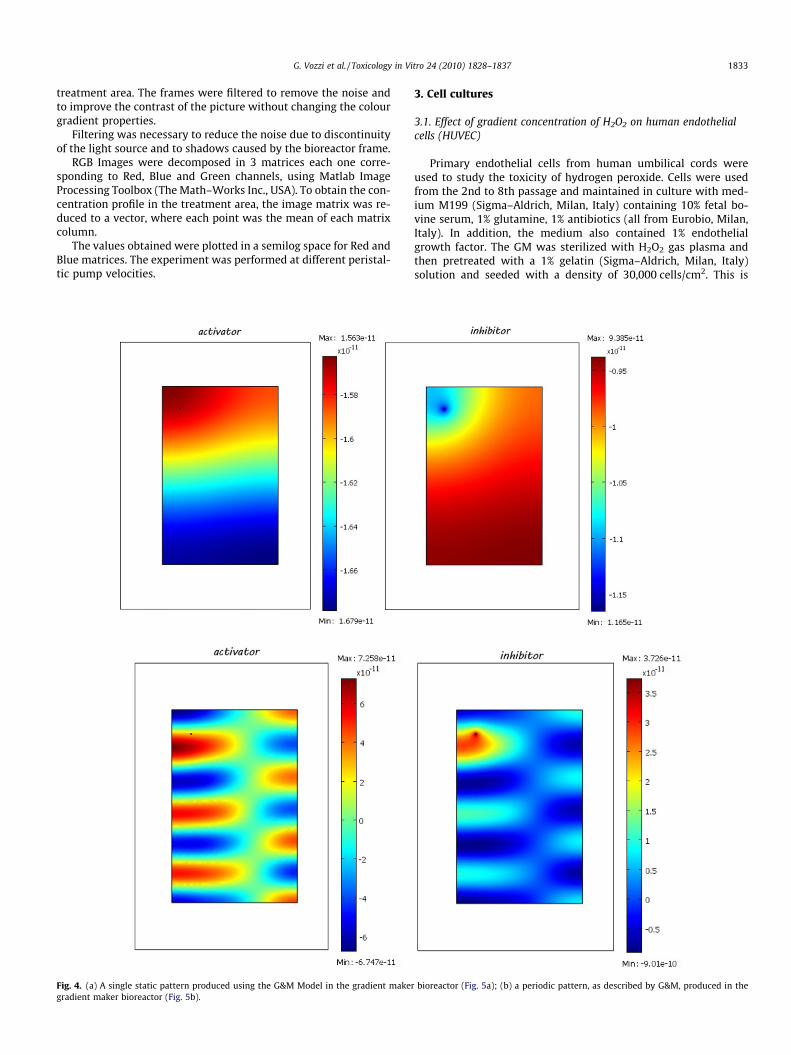
Fig. 4. (a) A single static pattern produced using the G&M Model in the gradient makergradient maker bioreactor (Fig. 5b).
3. Cell cultures
3.1. Effect of gradient concentration of H2O2 on human endothelialcells (HUVEC)
Primary endothelial cells from human umbilical cords wereused to study the toxicity of hydrogen peroxide. Cells were usedfrom the 2nd to 8th passage and maintained in culture with med-ium M199 (Sigma–Aldrich, Milan, Italy) containing 10% fetal bo-vine serum, 1% glutamine, 1% antibiotics (all from Eurobio, Milan,Italy). In addition, the medium also contained 1% endothelialgrowth factor. The GM was sterilized with H2O2 gas plasma andthen pretreated with a 1% gelatin (Sigma–Aldrich, Milan, Italy)solution and seeded with a density of 30,000 cells/cm2. This is
bioreactor (Fig. 5a); (b) a periodic pattern, as described by G&M, produced in the
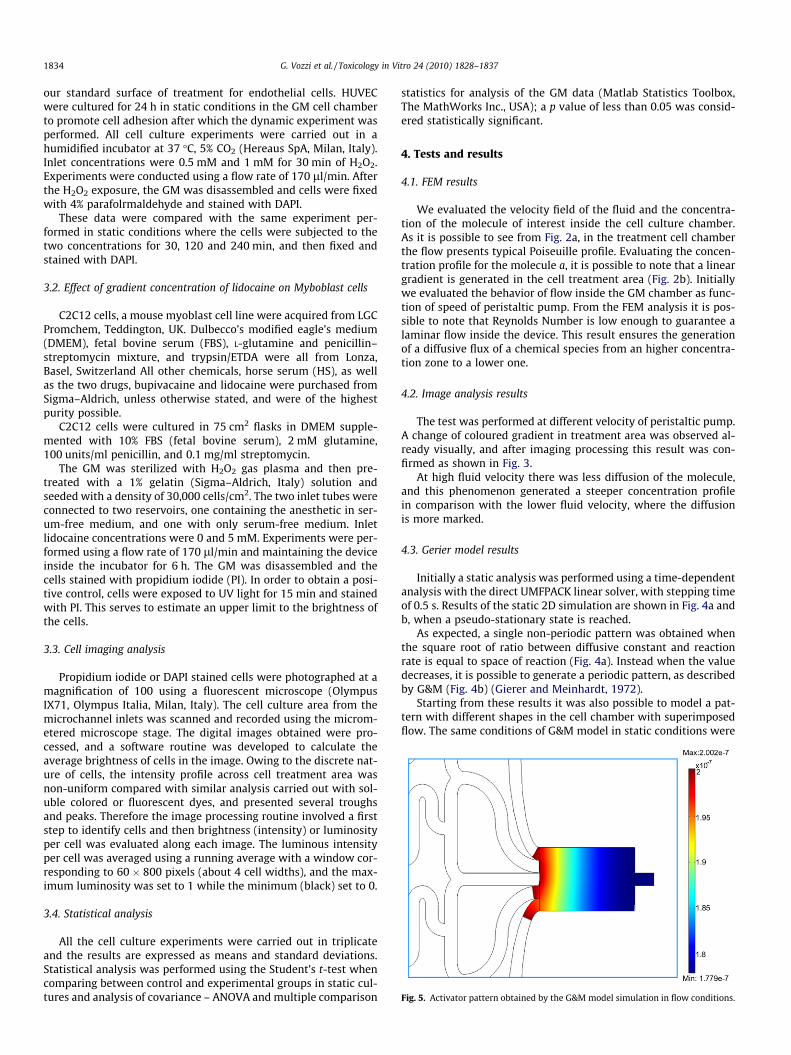
Fig. 5. Activator pattern obtained by the G&M model simulation in flow conditions.
1834 G. Vozzi et al. / Toxicology in Vitro 24 (2010) 1828–1837
our standard surface of treatment for endothelial cells. HUVECwere cultured for 24 h in static conditions in the GM cell chamberto promote cell adhesion after which the dynamic experiment wasperformed. All cell culture experiments were carried out in ahumidified incubator at 37 �C, 5% CO2 (Hereaus SpA, Milan, Italy).Inlet concentrations were 0.5 mM and 1 mM for 30 min of H2O2.Experiments were conducted using a flow rate of 170 ll/min. Afterthe H2O2 exposure, the GM was disassembled and cells were fixedwith 4% parafolrmaldehyde and stained with DAPI.
These data were compared with the same experiment per-formed in static conditions where the cells were subjected to thetwo concentrations for 30, 120 and 240 min, and then fixed andstained with DAPI.
3.2. Effect of gradient concentration of lidocaine on Myboblast cells
C2C12 cells, a mouse myoblast cell line were acquired from LGCPromchem, Teddington, UK. Dulbecco’s modified eagle’s medium(DMEM), fetal bovine serum (FBS), L-glutamine and penicillin–streptomycin mixture, and trypsin/ETDA were all from Lonza,Basel, Switzerland All other chemicals, horse serum (HS), as wellas the two drugs, bupivacaine and lidocaine were purchased fromSigma–Aldrich, unless otherwise stated, and were of the highestpurity possible.
C2C12 cells were cultured in 75 cm2 flasks in DMEM supple-mented with 10% FBS (fetal bovine serum), 2 mM glutamine,100 units/ml penicillin, and 0.1 mg/ml streptomycin.
The GM was sterilized with H2O2 gas plasma and then pre-treated with a 1% gelatin (Sigma–Aldrich, Italy) solution andseeded with a density of 30,000 cells/cm2. The two inlet tubes wereconnected to two reservoirs, one containing the anesthetic in ser-um-free medium, and one with only serum-free medium. Inletlidocaine concentrations were 0 and 5 mM. Experiments were per-formed using a flow rate of 170 ll/min and maintaining the deviceinside the incubator for 6 h. The GM was disassembled and thecells stained with propidium iodide (PI). In order to obtain a posi-tive control, cells were exposed to UV light for 15 min and stainedwith PI. This serves to estimate an upper limit to the brightness ofthe cells.
3.3. Cell imaging analysis
Propidium iodide or DAPI stained cells were photographed at amagnification of 100 using a fluorescent microscope (OlympusIX71, Olympus Italia, Milan, Italy). The cell culture area from themicrochannel inlets was scanned and recorded using the microm-etered microscope stage. The digital images obtained were pro-cessed, and a software routine was developed to calculate theaverage brightness of cells in the image. Owing to the discrete nat-ure of cells, the intensity profile across cell treatment area wasnon-uniform compared with similar analysis carried out with sol-uble colored or fluorescent dyes, and presented several troughsand peaks. Therefore the image processing routine involved a firststep to identify cells and then brightness (intensity) or luminosityper cell was evaluated along each image. The luminous intensityper cell was averaged using a running average with a window cor-responding to 60 � 800 pixels (about 4 cell widths), and the max-imum luminosity was set to 1 while the minimum (black) set to 0.
3.4. Statistical analysis
All the cell culture experiments were carried out in triplicateand the results are expressed as means and standard deviations.Statistical analysis was performed using the Student’s t-test whencomparing between control and experimental groups in static cul-tures and analysis of covariance – ANOVA and multiple comparison
statistics for analysis of the GM data (Matlab Statistics Toolbox,The MathWorks Inc., USA); a p value of less than 0.05 was consid-ered statistically significant.
4. Tests and results
4.1. FEM results
We evaluated the velocity field of the fluid and the concentra-tion of the molecule of interest inside the cell culture chamber.As it is possible to see from Fig. 2a, in the treatment cell chamberthe flow presents typical Poiseuille profile. Evaluating the concen-tration profile for the molecule a, it is possible to note that a lineargradient is generated in the cell treatment area (Fig. 2b). Initiallywe evaluated the behavior of flow inside the GM chamber as func-tion of speed of peristaltic pump. From the FEM analysis it is pos-sible to note that Reynolds Number is low enough to guarantee alaminar flow inside the device. This result ensures the generationof a diffusive flux of a chemical species from an higher concentra-tion zone to a lower one.
4.2. Image analysis results
The test was performed at different velocity of peristaltic pump.A change of coloured gradient in treatment area was observed al-ready visually, and after imaging processing this result was con-firmed as shown in Fig. 3.
At high fluid velocity there was less diffusion of the molecule,and this phenomenon generated a steeper concentration profilein comparison with the lower fluid velocity, where the diffusionis more marked.
4.3. Gerier model results
Initially a static analysis was performed using a time-dependentanalysis with the direct UMFPACK linear solver, with stepping timeof 0.5 s. Results of the static 2D simulation are shown in Fig. 4a andb, when a pseudo-stationary state is reached.
As expected, a single non-periodic pattern was obtained whenthe square root of ratio between diffusive constant and reactionrate is equal to space of reaction (Fig. 4a). Instead when the valuedecreases, it is possible to generate a periodic pattern, as describedby G&M (Fig. 4b) (Gierer and Meinhardt, 1972).
Starting from these results it was also possible to model a pat-tern with different shapes in the cell chamber with superimposedflow. The same conditions of G&M model in static conditions were
0
10
20
30
40
50
60
70
80
90
100
30 120 240
Cel
l Lu
min
osi
ty
Time (min)
0.5 mM
1 mM
control
(a)
(b)
(c)
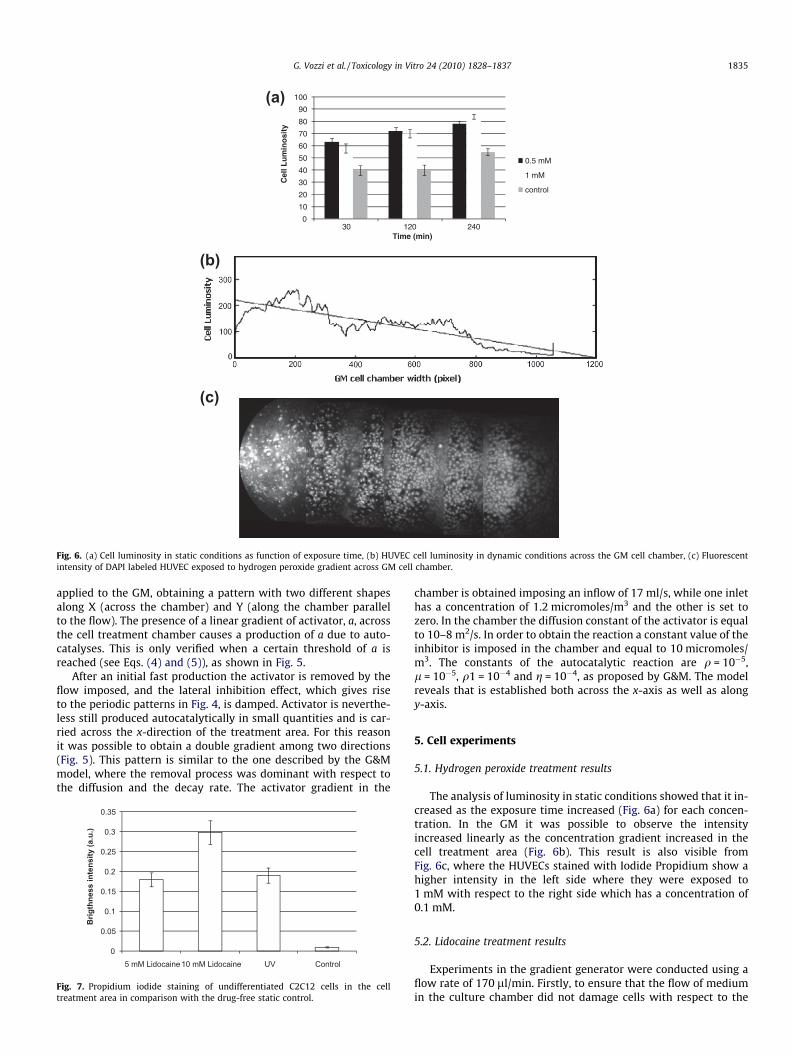
Fig. 6. (a) Cell luminosity in static conditions as function of exposure time, (b) HUVEC cell luminosity in dynamic conditions across the GM cell chamber, (c) Fluorescentintensity of DAPI labeled HUVEC exposed to hydrogen peroxide gradient across GM cell chamber.
G. Vozzi et al. / Toxicology in Vitro 24 (2010) 1828–1837 1835
applied to the GM, obtaining a pattern with two different shapesalong X (across the chamber) and Y (along the chamber parallelto the flow). The presence of a linear gradient of activator, a, acrossthe cell treatment chamber causes a production of a due to auto-catalyses. This is only verified when a certain threshold of a isreached (see Eqs. (4) and (5)), as shown in Fig. 5.
After an initial fast production the activator is removed by theflow imposed, and the lateral inhibition effect, which gives riseto the periodic patterns in Fig. 4, is damped. Activator is neverthe-less still produced autocatalytically in small quantities and is car-ried across the x-direction of the treatment area. For this reasonit was possible to obtain a double gradient among two directions(Fig. 5). This pattern is similar to the one described by the G&Mmodel, where the removal process was dominant with respect tothe diffusion and the decay rate. The activator gradient in the
0
0.05
0.1
0.15
0.2
0.25
0.3
0.35
5 mM Lidocaine 10 mM Lidocaine UV Control
Brig
thne
ss in
tens
ity (a
.u.)
Fig. 7. Propidium iodide staining of undifferentiated C2C12 cells in the celltreatment area in comparison with the drug-free static control.
chamber is obtained imposing an inflow of 17 ml/s, while one inlethas a concentration of 1.2 micromoles/m3 and the other is set tozero. In the chamber the diffusion constant of the activator is equalto 10–8 m2/s. In order to obtain the reaction a constant value of theinhibitor is imposed in the chamber and equal to 10 micromoles/m3. The constants of the autocatalytic reaction are q = 10�5,l = 10�5, q1 = 10�4 and g = 10�4, as proposed by G&M. The modelreveals that is established both across the x-axis as well as alongy-axis.
5. Cell experiments
5.1. Hydrogen peroxide treatment results
The analysis of luminosity in static conditions showed that it in-creased as the exposure time increased (Fig. 6a) for each concen-tration. In the GM it was possible to observe the intensityincreased linearly as the concentration gradient increased in thecell treatment area (Fig. 6b). This result is also visible fromFig. 6c, where the HUVECs stained with Iodide Propidium show ahigher intensity in the left side where they were exposed to1 mM with respect to the right side which has a concentration of0.1 mM.
5.2. Lidocaine treatment results
Experiments in the gradient generator were conducted using aflow rate of 170 ll/min. Firstly, to ensure that the flow of mediumin the culture chamber did not damage cells with respect to the
1836 G. Vozzi et al. / Toxicology in Vitro 24 (2010) 1828–1837
static controls, experiments were run without drugs, so that bothmicrofluidic inlets contained only serum-free culture medium.After 6 h the cells were stained with propidium iodide and the re-gion of interest was photographed with a fluorescence microscopeusing a 10X objective. In control conditions, PI staining of the cellsshowed that the luminosity of the cells was constant across thechamber in the region of interest, with low intensity values similarto those shown in Fig. 7 for the drug-free static controls.
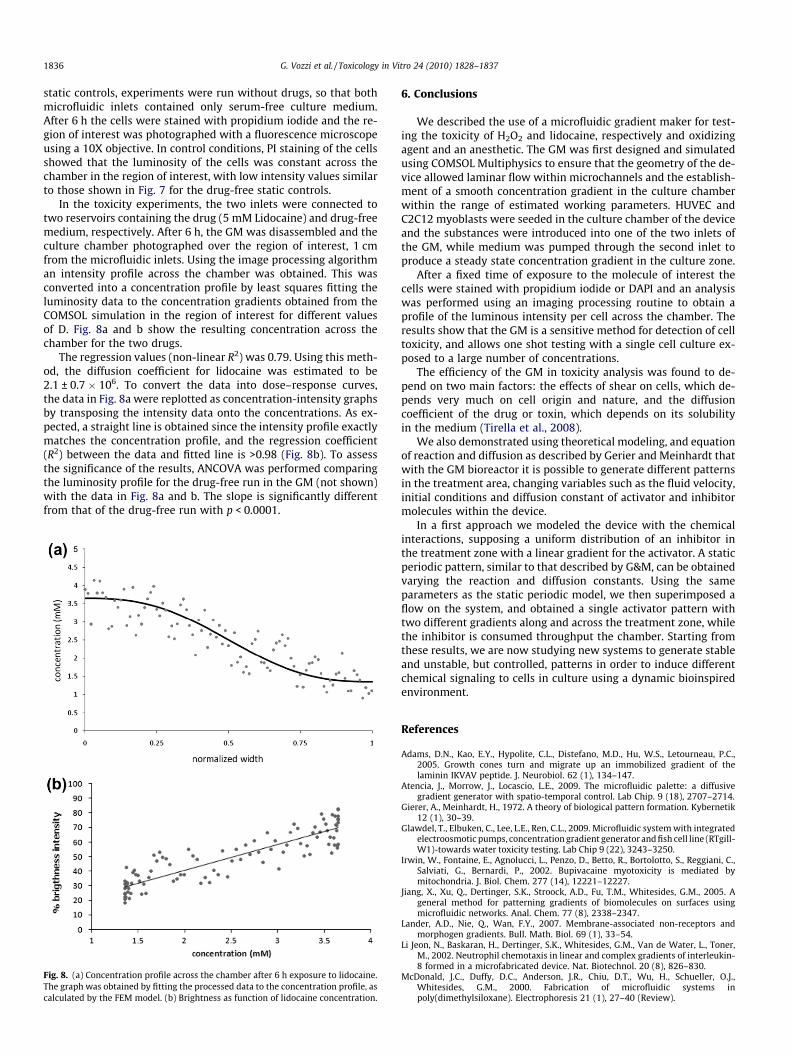
In the toxicity experiments, the two inlets were connected totwo reservoirs containing the drug (5 mM Lidocaine) and drug-freemedium, respectively. After 6 h, the GM was disassembled and theculture chamber photographed over the region of interest, 1 cmfrom the microfluidic inlets. Using the image processing algorithman intensity profile across the chamber was obtained. This wasconverted into a concentration profile by least squares fitting theluminosity data to the concentration gradients obtained from theCOMSOL simulation in the region of interest for different valuesof D. Fig. 8a and b show the resulting concentration across thechamber for the two drugs.
The regression values (non-linear R2) was 0.79. Using this meth-od, the diffusion coefficient for lidocaine was estimated to be2.1 ± 0.7 � 106. To convert the data into dose–response curves,the data in Fig. 8a were replotted as concentration-intensity graphsby transposing the intensity data onto the concentrations. As ex-pected, a straight line is obtained since the intensity profile exactlymatches the concentration profile, and the regression coefficient(R2) between the data and fitted line is >0.98 (Fig. 8b). To assessthe significance of the results, ANCOVA was performed comparingthe luminosity profile for the drug-free run in the GM (not shown)with the data in Fig. 8a and b. The slope is significantly differentfrom that of the drug-free run with p < 0.0001.
Fig. 8. (a) Concentration profile across the chamber after 6 h exposure to lidocaine.The graph was obtained by fitting the processed data to the concentration profile, ascalculated by the FEM model. (b) Brightness as function of lidocaine concentration.
6. Conclusions
We described the use of a microfluidic gradient maker for test-ing the toxicity of H2O2 and lidocaine, respectively and oxidizingagent and an anesthetic. The GM was first designed and simulatedusing COMSOL Multiphysics to ensure that the geometry of the de-vice allowed laminar flow within microchannels and the establish-ment of a smooth concentration gradient in the culture chamberwithin the range of estimated working parameters. HUVEC andC2C12 myoblasts were seeded in the culture chamber of the deviceand the substances were introduced into one of the two inlets ofthe GM, while medium was pumped through the second inlet toproduce a steady state concentration gradient in the culture zone.
After a fixed time of exposure to the molecule of interest thecells were stained with propidium iodide or DAPI and an analysiswas performed using an imaging processing routine to obtain aprofile of the luminous intensity per cell across the chamber. Theresults show that the GM is a sensitive method for detection of celltoxicity, and allows one shot testing with a single cell culture ex-posed to a large number of concentrations.
The efficiency of the GM in toxicity analysis was found to de-pend on two main factors: the effects of shear on cells, which de-pends very much on cell origin and nature, and the diffusioncoefficient of the drug or toxin, which depends on its solubilityin the medium (Tirella et al., 2008).
We also demonstrated using theoretical modeling, and equationof reaction and diffusion as described by Gerier and Meinhardt thatwith the GM bioreactor it is possible to generate different patternsin the treatment area, changing variables such as the fluid velocity,initial conditions and diffusion constant of activator and inhibitormolecules within the device.
In a first approach we modeled the device with the chemicalinteractions, supposing a uniform distribution of an inhibitor inthe treatment zone with a linear gradient for the activator. A staticperiodic pattern, similar to that described by G&M, can be obtainedvarying the reaction and diffusion constants. Using the sameparameters as the static periodic model, we then superimposed aflow on the system, and obtained a single activator pattern withtwo different gradients along and across the treatment zone, whilethe inhibitor is consumed throughput the chamber. Starting fromthese results, we are now studying new systems to generate stableand unstable, but controlled, patterns in order to induce differentchemical signaling to cells in culture using a dynamic bioinspiredenvironment.
References
Adams, D.N., Kao, E.Y., Hypolite, C.L., Distefano, M.D., Hu, W.S., Letourneau, P.C.,2005. Growth cones turn and migrate up an immobilized gradient of thelaminin IKVAV peptide. J. Neurobiol. 62 (1), 134–147.
Atencia, J., Morrow, J., Locascio, L.E., 2009. The microfluidic palette: a diffusivegradient generator with spatio-temporal control. Lab Chip. 9 (18), 2707–2714.
Gierer, A., Meinhardt, H., 1972. A theory of biological pattern formation. Kybernetik12 (1), 30–39.
Glawdel, T., Elbuken, C., Lee, L.E., Ren, C.L., 2009. Microfluidic system with integratedelectroosmotic pumps, concentration gradient generator and fish cell line (RTgill-W1)-towards water toxicity testing. Lab Chip 9 (22), 3243–3250.
Irwin, W., Fontaine, E., Agnolucci, L., Penzo, D., Betto, R., Bortolotto, S., Reggiani, C.,Salviati, G., Bernardi, P., 2002. Bupivacaine myotoxicity is mediated bymitochondria. J. Biol. Chem. 277 (14), 12221–12227.
Jiang, X., Xu, Q., Dertinger, S.K., Stroock, A.D., Fu, T.M., Whitesides, G.M., 2005. Ageneral method for patterning gradients of biomolecules on surfaces usingmicrofluidic networks. Anal. Chem. 77 (8), 2338–2347.
Lander, A.D., Nie, Q., Wan, F.Y., 2007. Membrane-associated non-receptors andmorphogen gradients. Bull. Math. Biol. 69 (1), 33–54.
Li Jeon, N., Baskaran, H., Dertinger, S.K., Whitesides, G.M., Van de Water, L., Toner,M., 2002. Neutrophil chemotaxis in linear and complex gradients of interleukin-8 formed in a microfabricated device. Nat. Biotechnol. 20 (8), 826–830.
McDonald, J.C., Duffy, D.C., Anderson, J.R., Chiu, D.T., Wu, H., Schueller, O.J.,Whitesides, G.M., 2000. Fabrication of microfluidic systems inpoly(dimethylsiloxane). Electrophoresis 21 (1), 27–40 (Review).

G. Vozzi et al. / Toxicology in Vitro 24 (2010) 1828–1837 1837
Meinhardt, H., 2008. Models of biological pattern formation: from elementarysteps to the organization of embryonic axes. Curr. Top Dev. Biol. 81, 1–63(Review).
Saadi, W., Rhee, S.W., Lin, F., Vahidi, B., Chung, B.G., Jeon, N.L., 2007. Generation ofstable concentration gradients in 2D and 3D environments using a microfluidicladder chamber. Biomed. Microdevices 9 (5), 627–635.
Tirella, A., Marano, M., Vozzi, F., Ahluwalia, A., 2008. A microfluidic gradientmaker for toxicity testing of bupivacaine and lidocaine. Toxicol. In Vitro 22 (8),1957–1964.
Toh, Y.C., Lim, T.C., Tai, D., Xiao, G., van Noort, D., Yu, H., 2009. A microfluidic 3Dhepatocyte chip for drug toxicity testing. Lab Chip. 9 (14), 2026–2035.
Turing, A., 1952. The Chemical Basis of Morphogenesis. Phil. Trans. R. Soc. London B237, 37–72.
Vozzi, G., Flaim, C., Ahluwalia, A., Bhatia, S., 2003. Fabrication of PLGA scaffoldsusing soft lithography and microsyringe deposition. Biomaterials 24 (14), 2533–2540.
Zink, W., Graf, B.M., 2004. Local anesthetic myotoxicity. Reg. Anesth Pain Med.,29(4), 333–340 (Review).