financial statement analysis as a tool for investment decisions
TRANSCRIPT
International Journal of Financial, Accounting, and Management (IJFAM) ISSN: 2656-3355, Vol 4, No 1, 2022, 49-66 https://doi.org/10.35912/ijfam.v4i1.852
Financial statement analysis as a tool for
investment decisions and assessment of
companies’ performance Aminu Abdulrahim Olayinka
Accountancy Department, Mai Idris Alooma Polytechnic, Geidam, Yobe State, Nigeria
Article History
Received on 31 July 2021
1st Revision on 13 September 2021
2nd Revision on 21 September
2021
3rd Revision on 21 October 2021
4th Revision on 2 November 2021
5th Revision 15 November 2021
Accepted on 18 November 2021
Abstract
Purpose: Financial Statement Analysis (FSA) and Interpretation is
a vital instruments for good management decision-making in
business. The main objective of this study is therefore to determine
how firms could use FSA and its interpretation to aid funding and
investment decisions and to avert low profitability or low
investment returns.
Research methodology: Data from the annual report of Nestlé
Nigeria Plc are utilized for the Analysis and Interpretation of the
financial ratio using descriptive statistical analytical tools for
presentations.
Result: The study concludes that analysis of FSs is adequate for
effective decision making and that firms should pay great attention
to the use of FSA to properly equip themselves with this tool and
also a combination of different ratios should be used in analyzing a
firm's financial performance. Proper use of FSA should be made
not only in investment but also in other areas of decision-making.
Limitations: The study is limited to FSs published by Nestlé
Nigeria plc between the years 2014 to 2019.
Contribution: The paper serves as an aid to different categories of
investors when making critical investment decisions.
Keywords: Decision, Financial statement, Financial reporting,
Investment, Regulatory bodies
How to Cite: Olayinka, A. A. (2022). Financial statement analysis
as a tool for investment decisions and assessment of companies’
performance. International Journal of Financial, Accounting, and
Management, 4(1), 49-66.
1. Introduction Financial statement analysis (FSA) is a process that examines past and current financial data to
evaluate performance and estimate future risks and potential. According to Auwalu and Ibrahim
(2017), financial statements (FSs) present information about the financial position, performance, and
changes of an entity in a standardized and accurate form to investors, regulators, financial analysts,
and other users in making economic decisions. FSA is used by potential investors, proprietors,
creditors, security analysts, leading houses, managers, Government regulatory agencies and tax
authorities, trade unions, customers, and many other stakeholders who rely on financial data for
making both financial and economic decisions about a firm.
Analysis of FSs focuses primarily on data provided in the firm’s annual reports which contained the
FS and other supplementary information. Significant changes or turning points in patterns, amounts,
SWOT, and other relationships were identified during the analysis. Therefore FSs are merely
summaries of detailed financial information that can only be a piece of meaningful information when
analyzed and interpret. Different categories of financial information users are concerned in getting
access to the Firm’s FS, chiefly among them are the investors and creditors than other internal and
external users, though they might have distinct objectives sometimes but more often related
objectives. Nevertheless, the basic models, techniques, and tools of FSs can be effectively put into
2022 | International Journal of Financial, Accounting, and Management/ Vol 4 No 1, 49-66
50
practice by all the categories of users. To this end, FSA can assist investors, creditors, and other users
in the discovery of the sort of data they needed settling on an ideal choice relating to funding, credit
facilities, or other interests in a particular firm.
Accountants, auditors, financial analysts, and other financial advisors have utmost interest in the tools
and techniques of FSA since they have the same basic information from FSs like their principal,
employer, investors, leasers, or creditors as it relates to their customers and expected customers. For
that reason, they use FSA tools and techniques on current financial data to evaluate performance and
estimate future risks and potential of the firm and thereafter interpret the outcome to their clients.
Financial analysts frequently do adjust the FSs drawn up by the client firm’s accountants for things
they don’t consider noteworthy or for things they consider critical however which don’t show up on
the FS.
Securities and Exchange Commission (SEC) (2000), stated categorically that, when investors decided
on the merits and comparability of an investment opportunity through FSA, allocation of financial
resources is made easier and investor reliance is nurtured. The usefulness of comparable FSs is under
cored in the financial accounting standard board (FASB). FASB (2000) affirmed that funding,
investing and lending decision prerequisites, involve analysis and evaluations of alternative
opportunities and they cannot be carryout rationally if comparative information is not obtainable.
Textbooks on FSA as well, emphasize the importance of comparability across FSs in judging a firm's
performance using ratios analysis.
The firm’s accounting year-end annual reports and FSs are the main documents that are expected to
be produced by registered business entities at the end of every twelve calendar months. The financial
ratio analysis (FRA) is considered an important tool for the organization to evaluate its financial
situation, competitiveness, liquidity, solvency, risk, Operational effectiveness, productivity, and
appropriate use of funds (Asrizal, Linzzy & Shinta, 2018).
Suryanto and Thalassions (2017) expressed that the FSs are an open wellspring of data, and their
content, structure presentation, and approval are bound together by fundamental guidelines so as
provide details, timely, accurate, and reliable information content that is of great value to the users.
Among those values is the ability to use the firms’ FSs to predict the performance of firms. For
effective decision-making, to this end information contained in the FSs cannot be overemphasized.
The information depicted in the FS for the firm past and current financial transactions enhances
decision-making. Hence, it can safely be concluded that FSA is not the conclusion in itself but a
means to a conclusion i.e. decision-making to improve firm performance (Susan, Innocent & Philip
2018).
Decision-making is not the fundamental goal of each financial or venture activity, the decision is a
choice from a set of identifies alternatives. However, the achievement of financial or investment
goals and objectives depends on the proper implementation of meaningful decisions, on the contrary
execution of wrong decisions emphatically leads to financial or investment disappointment. The
definitive target of each operation in every investment are cost minimization, profit augmentation, and
wealth growth, subsequently, to achieve the aforementioned objectives it becomes necessary that
capital structure and other financial decisions about the firm or investment opportunities have to be
made and implemented. All the significant information required with regard to investment opportunity
is mainly concerned with the financial aspect and the record that contains those financial aspects is the
FS while FSA is a process that analyzes the financial statement (FS).
The focus of this research work examines the FSs of a firm as a tool for evaluating a firm’s value,
funding, or investment decisions, the researcher will base her analysis on FSs published by Nestlé
Nigeria plc. Nestlé Nigeria plc is a top-ranking consumer goods firm in Nigeria and one of the biggest
food companies in Africa. Nestlé Nigeria plc began trading operations in Nigeria in 1961 and got
listed on the floor of the Nigerian Stock Exchange on April 20, 1979. Nestlé Nigeria plc establish its

2022 | International Journal of Financial, Accounting, and Management/ Vol 4 No 1, 49-66
51
first factory at Agbara, Ogun State Nigeria in 1982. Securities and Exchange Commission (SEC)
(2000) proclaims that, when investors judge the benefits of investments and equivalency of
investment, proficient distribution of capital is facilitated and investor certainty sustained. The
functionality of equivalent FSs is under cored in the financial accounting standard board (FASB).
FASB (2000) proclaims that "contributing, funding and lending choice basically include assessments
of alternative opportunities and they can’t be made rationally if comparative information is not
available". FSA textbooks also stress the importance of comparability across FSs in judging a firm's
performance using financial ratios.
Corporate yearly reports and FSs is a specific report that is expected to be delivered by all business
entities at regular interval. The financial ratio analysis is considered an important tool for the
organization to evaluate its financial situation, competitiveness, liquidity, solvency, risk, operational
effectiveness, productivity, and appropriate use of funds (Asrizal, Linzzy & Shinta, 2018). Suryanto
and Thalassions (2017) expressed that the FSs are an open wellspring of financial data, which their
structure, content, and presentation forms are bound together by fundamental rules and parameters to
generate financial information content that has prominent value to the users. Part of this prominent
value is the ability of the user to use the FS to predict the performance of a firm or an investment. For
effective decision making, FS information depicted cannot be overemphasized, as that information
enhances decision making. Hence, it can safely be concluded that FSA is not the conclusion in itself
but a means to an optimal conclusion i.e. decision-making to improve firm performance (Susan,
Innocent & Philip 2018).
A decision is a choice between at least two other alternatives, though it isn’t the center of each
investment activity, yet the execution of meaningful choices gives way to the accomplishment of
investment aims and purposes while the execution of erroneous decisions positively gives a lead to
investment disappointment or non-performance. The paramount aims and objectives for investments
are profit maximization and wealth growth, consequently, it becomes fundamental that capital
structure and investment funding decisions must be made and carried out to accomplish the previously
mentioned targets objectives. Among the prime information required with regards to an investment
opportunity is concerned with the aspect of financial data and the book of records that contains the
financial aspect of an investment for analysis is what is referred to as the financial statement (FS).
This research work is based on the FSA as a tool for investment or funding decisions through
evaluating a firm’s performance and the analysis will be based on FSs published by Nestlé Nigeria
plc. Nestlé Nigeria plc is in the consumer goods industry in Nigeria and is one of the biggest food
manufacturing firms in Africa. Nestlé Nigeria plc began trading merchandise activities in Nigeria in
early 1961 and was listed on the floor of the Nigerian Stock Exchange for the stock market on April
20, 1979. Nestlé Nigeria plc commissioned its first factory at Agbara, Ogun State Nigeria In 1982.
Problem statements The achievement of financial or investment goals and objectives depends on a proper understanding
of such investment opportunities (Aniefor & Oboro 2015). However, many potential investors are
known to have adventured into an investment opportunity without appropriate apprehension of such
investment opportunity, thus settling on and executing erroneous decisions effectually the investment
will collapse when the going demonstrated unfeasibly. In some instances, the investment ventures
may become to pass, but the aim for such investment may not be realized. Kapellas and Siougle
(2018) debated that the principal driver of the stock exchange market is information depicted in the
FSs and with proper analysis of investment opportunities derived from FSs, adverse selection or moral
hazard will be reduced drastically.
Fortunately, numerous investments are done without emphasis laid on those indexes that show such
investments would be solvency and effective to generate great returns, in the long run, so likewise the
danger implied and the advantages to be derived whenever set out on such investment with the limited
financial resources and the resultant effect of non-performance. According to Conteh and Akuntansi
(2021), for an effective and efficient investment decision, FSA is an important process needed to be

2022 | International Journal of Financial, Accounting, and Management/ Vol 4 No 1, 49-66
52
carryout by potential investors, if the investors fail to carryout FSA on the financial data of investment
opportunity, such an investment is at higher risk of surviving and meet its targeted objectives. All the
aforementioned problems emerge due to erroneous financial decisions making hence, this review will,
therefore, point out the means through which meaningful financial and investment decisions can be
inferred with the aid of FSA to enhance the changes available for investment opportunities or firms’
financial activities through analyzing financial information concerning such investment opportunities.
This study will be centered on the FS presented to the stakeholders by Nestlé Nigeria plc and also
available to potential investors and stockholders as a means of getting information for efficient and
effective decision-making using financial ratio analysis (FRA) tools and techniques.
The objectives of the study
The general objective of this study is to ascertain the role of FSs in investment decision-making in
Nestlé Nigeria plc in particular while the definite objectives go as follows:
i. To undersee how FSs as prescribed analytics tools succor anticipated proprietors when
evaluating the financial status of the firm.
ii. To commend the fundamental use of FS information, in supplying relevant financial
information for investment decision-making.
iii. To examine the task accomplishment of a firm for making choices from a set of identified
alternatives investment from FS outlook.
Research questions
The research questions are:
i. How can analysis of FSs be used as tools to succor investment decisions?
ii. To what stretch does the FS information empower the users in acquiring the required
knowledge for investment decision-making?
iii. Are FSs useful for projecting a firm's achievement?
Significance of the study
The paper will make the case study (Nestlé Nigeria plc) to value the prominence of sound FSs in the
provision of knowledge needed for decision making. The paper will augment greater benefit, by
serving as an aid to different categories of stakeholders or potential investors when making a critical
decision on an investment opportunity that will improve their firms’ performance, firms value, and
also additional knowledge will be acquired on the use of the FS when making choices among
investment opportunities. Stakeholders like financial analysts, investors, creditors, and other financial
organizations. Furthermore, the paper will similarly serve as a reference to students in the various
institution and other researchers who may be interested to embark on further research.
2. Literature review
Proprietary and residual (prospective) equity theory
The basic conceptual structure provides the concept of FSA concerning the models and theories on a
financial statement (FS), most commonly used theories are proprietary & residual equity theory and
DuPont mean-variance of portfolio investment theory. Proprietary & residual equity theory debated
that the accounting procedures of an enterprise imperatively be managed from the shareholders'
outlook. The Residual equity theory which was developed by Staubus (1959), deliberated that the
accounting procedure of a business needed to be fashionable from the vista of the prospective equity
shareholders, simultaneously for the accounting concept of a going concern concurs with that of the
capital stockholders. Though the theory of residual equity on the other hand is a more hypothetical
form of proprietary theory, however, in the proprietary theory, transactions and events are accounted
for, recorded, and analyzed as to their immediate effect on the proprietors’ outlook. Financial
statements (FSs) are prepared from the outlook of the proprietors and are meant to value and analyses
their net worth expressed by the accounting expressions:
1) Total equity, proprietorship or net worth = Total assets - Total liabilities
In the proprietary theory assumption, the total assets are regarded as the proprietors' total
assets, and the total liabilities are the proprietors' total liabilities. Newslove and Garner (1951)
debated beneath the proprietary theory, "liabilities described as assets minus proprietorship,
2022 | International Journal of Financial, Accounting, and Management/ Vol 4 No 1, 49-66
53
and they ought to be delineated and differentiated in the accounting records procedures." The
higher the revenues the higher the proprietorship equity while expenses shrink proprietorship
equity. Gross profit is the excess of sales over the cost of sales while net profits on the other
hand are the excess of Gross profit overall expenditure, which accrues directly or indirectly to
the income of equity stockholders, therefore it is an increase in the wealth of the equity
shareholders. Staubus (1959) contracted the concept of owners/proprietors to ordinary equity
shareholders, while preferred ordinary or preference shareholders are considered as liability
shareholders and that distinguishes the two is very important in the estimation of the firm
future solvency. To this end, the accounting expressions is modified as:
2) Residual Equity = Total Assets – Total liabilities & Specific Equities (Liabilities + Preferred
Stock)
The proprietary and prospective equity model assumption is a principal and agent relationship
theory assumption that the main responsibility of the enterprise agent/management is to
organize the firm accounting process and procedure in the best interests of the
proprietors/owners (Nkuhi, 2015). Furthermore, beneath both the proprietary and prospective
theories and approaches to income valuation, equity shareholders' interests must be carefully
distinguished from the interests of the debts’ providers. The approach will enable the
measurement of the increase in net assets.
DuPont mean-variance of portfolio investment theory
Adebimpe (2009) espoused the DuPont equation in his research work and concluded that the DuPont
equation is an equality expression that splits return on equity (ROE) into three categories. DuPont
mean-variance originated from the DuPont Corporation, DuPont Corporation designed and practiced
this mean-variance formula into its enterprise's transformation in the years 1920s. However, the
DuPont mean-variance theory of DuPont Corporation was adapted from Markowitz's Mean-Variance
Portfolio, the theory postulated that the profit or loss of a firm is a mapping of turnover, fixed &
current assets, shareholder funds (equity), and total liabilities (debts). This model is also referring to
has Strategic profit model; DuPont identity model; the DuPont method/model or the DuPont analysis.
Under DuPont analysis, ROE is equal to the profit margin multiplied by asset turnover multiplied by
financial leverage. Nonetheless splitting ROE (return on equity) into three parts, enable firms to easily
understand changes in their ROE over time. The components of the DuPont Equation are Profit
Margin, Asset Turnover, and Financial Leverage.
The profitability and efficiency of firms are measured by profit margin. A firm’s profit margin depicts
the efficiency of a firm's pricing policy and how well the firm commands its operating costs and
expenses. To derive the firm’s profit margin the proportion of net profit is taken as a percentage of the
total revenue. The attribute of the DuPont equation is that the higher the profit margin the higher the
profit generated from every sale making the firm more solvency and resulting in a higher overall
ROE.
To determine how the firm proficiently make uses its assets to generate turnover or sales income for
the firm, the asset turnover ratio is applied. This financial ratio is another constituent of the DuPont
equation but slightly differs from the profit margin assumption because, firms that recorded low-profit
margins tend to experience high asset turnover, while those with high profit margins tend to record
low asset turnover. However, similar to profit margin, if asset turnover rises, a firm will generate
more turnover per asset owned making the firm more solvency and once again resulting in a higher
overall ROE.
Financial leverage is another component of the DuPont equation that is used in calculating the
proportion of the total (liabilities) debt that a firm utilizes in financing its business operations, as
compared with the amount of owner’s equity that the firm utilizes. Similar to the case of asset
turnover and profit margin rise in leverage (debt) will also lead to a higher overall ROE. Simply
because, an increase in the use of debt as a means of financing though will make the firm have a
higher interest obligation to meet, however, those interests are tax-deductible, while dividend
2022 | International Journal of Financial, Accounting, and Management/ Vol 4 No 1, 49-66
54
payments are not tax-deductible. Therefore maintaining a high percentage of debt in a firm's capital
structure leads to a higher ROE.
Decision making
This is a complex, cognitive intellectual way of making choices out of identifying alternatives, which
outcome might produce an action, an opinion, or a recommendation. The act of remaining neutral or
doing nothing is normally amidst the set of alternatives that one selected from a set of identifies
alternatives and selecting that choice is the outcome of a decision. Omodero (2019) debated that, the
most important financial information needed in the process of investment decision comes from FSs.
Financial information analysts desire to analyze and evaluate firms earning capability make future
projections and make comparisons. Furthermore, the financial information derived from FS will as
well aid in the firm’s economic activities, investment, and financing decision-making process.
Analyzing an investment and making a decision thereafter has to do with an efficient allocation of
financial resources and the structure of firm capital (Pandeg, 2005). It also involves the choice of
allocating the firm's financial resources to the procurement of long-term fixed assets and servicing
long-term leverages. Making such decisions are valuable choices and are important to the value of the
firm since a firm tends to determine its value size by influencing its growth, profitability index and
stability. The financial information of an enterprise required for making the decision is contained in
the FS.
Financial Statements (FSs)
Records of financial transactions, events, and performances of an enterprise serve as a yardstick for
making choices from a set of identified alternatives if the decisions are to be realistic. The FSs
disclosed vital information concerning past and recent financial activities, outcomes of management
activities on the profitability of the firm, and the firm’s financial status. Diverse users of FSs such as
proprietors/owners, local and foreign investors, trade creditors, lending house management, etc., need
to analyze FSs to make appropriate choices. According to Ige and Adewumi (2020), the micro
determinants of firms’ profitability are entrenched in the FS, therefore, FSs is the wherewithal of
conveying to interested users both insiders and outsiders of the firm, a succinct reality of the
profitability index and financial status of the firm. FSs is the summary report of the firm's financial
transactions, status, and accounting procedures for twelve months accounting period which provides
succinct financial transactions of the period after the financial year is concluded. FSs provide the
statement disclosing profit or loss for the period covered and the statement of the financial position of
a firm at the same period. FSs are the financial year-end accounts records prepared to convey the
profit or loss, the financial status, and cash flow position of the firm on a particular date. Data
provided by FSs convey the past and current financial activities of the firm.
A financial statement (FS) according to Mercy (2014) can be described as a computation statement
that reviews periodically the financial health of a firm for a disclosed period. Included in FS is a
statement of income portraying the profit or loss and its appropriation including retained profit
transfer to revenue reserve, a cash flow statement showing the flow of liquidity, and a balance sheet
that discloses the financial status of the firm. Academic of organization Dictionary also described FS
as a document that disclosed the equity, assets, liability, income, and expenses of a firm to allow the
interested party to evaluate the firm's financial health.
Features of Financial Statements (FSs) a) FSs of an enterprise should be prepared in such a way that comparison could be made with
the other firms’ FSs in the same industry or with past FSs of the same firm.
b) FSs are those statements that disclose historic data, meaning that FSs disclose transaction that
has already happened, however, they do not reveal anything about the future.
c) FSs do not reveal qualitative factors such as the satisfactory level of the firm’s workers or no
financial contributions of the proprietor of the enterprise etcetera. Such factors are not
included in the FSs.

2022 | International Journal of Financial, Accounting, and Management/ Vol 4 No 1, 49-66
55
d) FSs are explicitly in monetary value, incomes and appropriation statement show the
profitability of the enterprises, the statement of an affair or the statement of financial
condition reveal the financial health of the enterprise and the statement of fund flow or cash
flow display the cash position or solvency of the enterprises.
e) FSs should reveal all financial transactions within the stated period and is not expected to
conceal any information which materially capable to alters the decision of the users who are
reading that FS for deciding on the firm. For example, prospective shareholders looked at FSs
before deciding on an investment opportunity.
Objectives of Financial Statements (FSs)
The FSs of a firm or an enterprise are the outcomes of management activities. Information reveals in
the FSs is the result of the accounting process and procedures. FSs depict the solvency and how
profit-wise a firm is to the public. The primary goals of the FSs are as follows:
a) To furnish the general public with the required financial information about the firm.
b) To generate useful information for the process of making financial choices.
c) To disclose the profitability, stability, solvency etcetera of the firm.
d) To aid in evaluating management efficiency and firm financial health
Distinctive of Financial Statements (FSs)
a) Pertinence: The information generated from FSs must be pertinent to the desire of the users.
This may entail reporting particularly pertinent information or information whose omission or
misstatement could influence the economic decisions of users.
b) Dependability: The information reveals in the FS needs to be substantive error and prejudice-
free, and must not be a piece of misleading information. Thus, it has to reliably portray
financial transactions and other financial engagement, and prudently present investment
projections, estimates, and uncertainties through proper revelation.
c) Equivalence: The information must be comparable to the financial information disclosed for
similar accounting periods, this will enable the users to identify trends in the performance and
financial position of the reporting firm.
d) Comprehend potentiality: The information disclosed needs to be easily comprehendible to
users of the FSs. An indication that information needs to be presented together with further
information to be provided in the supporting footnotes that will aid in unbundling some facts
and figures.
Financial Statement Analysis (FSA)
Both external and internal users of FSs will get further insight into the financial SWOT (strengths,
weaknesses, opportunities, and threats) of the firm if the information disclosed in the FSs is properly
analyzed. To this end, financial statement analysis (FSA) is the task or set of the program of
identifying the financial SWOT of a firm through establishing relationships between the items
depicted in the FSs, Francis and Schipper (1999) argued that to enhance the acceptance and promote
the usage of financial data extracted from FSs in the purpose of decision-making procedure, FSA of
those data in the FSs presented should be done. From that point of view, the FSA can be depicted as
the procedure/process where financial facts and figures transform from FSs into usable information
for a firm’s quality measurement and evaluation by using a series of analytical tools and techniques.
The task of FSA to a great extent vital in the process of rational administration and business
management. To this end, knowing the prevailing level of business entity status, value and financial
health is an important instrument in the context of future firm management and stakeholders, because
the management of every enterprise tries to ensure the relevance and existence of the firm in the
market environment. Furthermore, FSA comes before the management planning process which is the
component of the management process.
Financial planning is very vital for good investment management. A good financial plan has to reflect
on all the firm's SWOT. The task of FSA is to recognize the strength and opportunities of a firm, so
that management could use most of those strengths and opportunities for the firm’s financial planning,
similarly the firm's weaknesses and threats were also recognized to take corrective measures. To that

2022 | International Journal of Financial, Accounting, and Management/ Vol 4 No 1, 49-66
56
end, we can say that firm’s management is the most significant user of FSA. In carrying out FSA on
FS presented, it is feasible to use a series of methods, instruments & procedures. For instance, the
horizontal analysis model is used when considering comparative FSs, and then use the vertical
analysis model for structural FSs. The horizontal analysis that forms based form comparative FSs,
tries to observe the trend and dynamics of changes in specific basic FSs positions. The firm
effectiveness, efficiency, and security are appraised based on observed changes. The foundation for
vertical analysis on the other hand is the structural FSs which allows insight into FSs structure. FSs
structure is very noteworthy in the context of firm financial stability and firm value, however, FSs
which does not depict the accurate financial condition of a firm is capable of misleading investors in
making funding decision (Sanyaolu, Odunayo, Akintan & Ogunmefun 2020).
Internal users
Individuals who have a direct bearing on the business of the firm are referred to as internal users.
Categories of internal users are as follows:
a) Agent and proprietors: The managers who manage the affairs of the firm and the proprietors
who are the owners and equity contributors of the needed financial reports essential to make
financial and economic decisions. In the process of formulating contractual terms and
agreements between the firm and other organizations FS is used by managers and owners.
The outcome from FSA like the current or working capital ratio which is the proportion of
current assets to current liabilities is very significant in deciding the ability of the firm to meet
its short-term obligations, as they fall due out of its short-term assets. The FSs of other firms
in the same business environment and industry can also project investment solutions to
different firms in the industry. In some instances, deciding on the right investment to which
scarce resources may be a channel can be difficult. In a situation like this, the FSs of other
firms provide felicitous guidelines.
b) Employees: The outcome from FSA that was derived from FSs is of immense importance to
the workers of the firm for making a contractual agreement. Matters relating to workers'
salary increases and other remuneration packages, welfare, promotion, and ranking are
discussed with the aid of information derived from the FSA.
External users
These categories of users comprise:
a) Potential Investors: This categories of external users make use of FSA outcomes to appraise
the financial SWOT of a firm. FSA aid these categories to make reasonable funding or
investment decisions.
b) Government/Regulatory Agency: The FSs of different firms are also used by the government
agency like the Board of Inland Revenue to scrutinize whether the breakdown of company tax
paid by those firms is precise and is in line with the financial status of the firms.
c) Lend house/Financial Institutions: Other categories of users of FSs for FSA are different
financial institutions like banks insurance and other lending institutions who decide whether
to provide the firm with working capital, debenture, or to issue other bonds security to it.
d) Creditors: The creditors who intend to provide credit facilities to the firm require FSs to
assess the creditworthiness of the firm (Jennins, 2004).
Financial Statement Components
Cash Flow Statement (CFS): In making investment decisions, the statement of cash flows also refers
to as the statement of fund flows also figure out useful information. It shows the solvency and the net
change in the firm's liquidity status during a particular period. Stable or growing cash flow portrays
that the firm is solvency and can cover its short-term debt payments and expenses on demand and also
keep up with any long-term debt obligations. The structure of the cash flow also discloses how much
cash is generated from operating activities when compared with the financing and investments
resource. A situation where cash from the operating profit routine outweighs net income is a good
solvency situation for the firm. Normally, an effective liquidity status of a firm is pleasing in
investment because it shows the relative amount of assets in cash or which can be quickly converted
into cash, available to meet short-term liabilities. Effective liquidity is an indication that the firm is
2022 | International Journal of Financial, Accounting, and Management/ Vol 4 No 1, 49-66
57
less at risk of loan defaults or bankruptcy. Liquid assets consist of cash and bank balance, debtors, and
marketable securities.
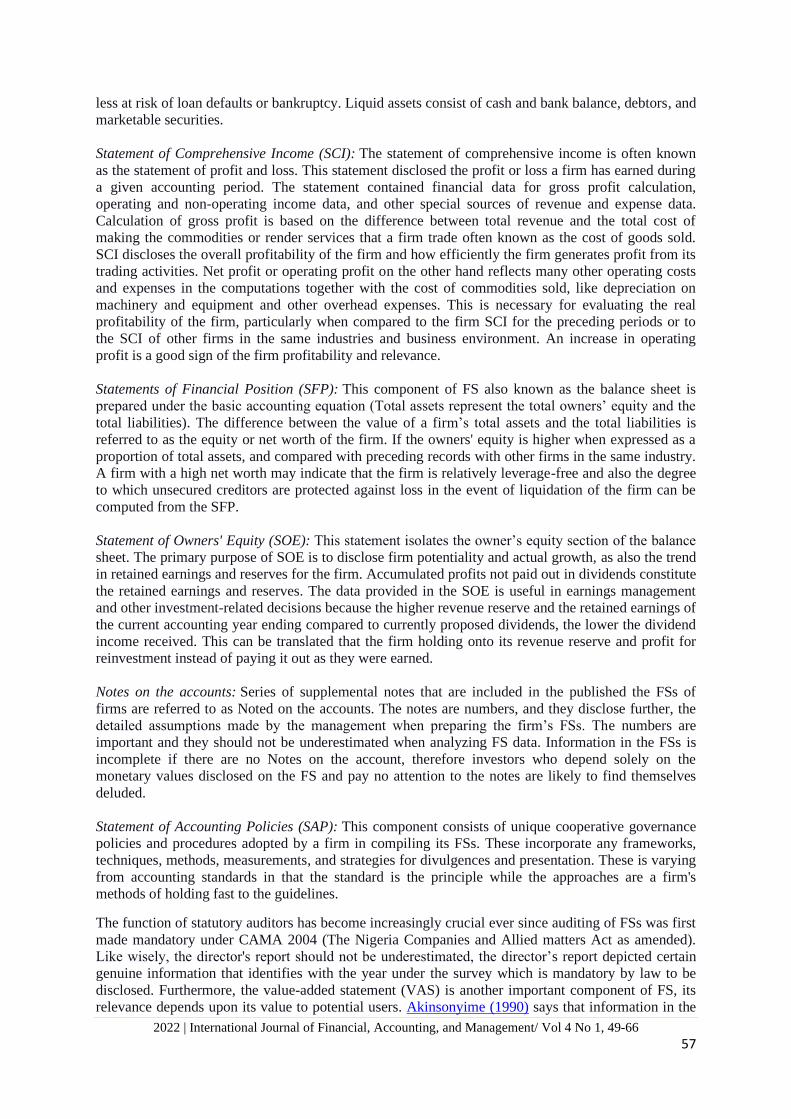
Statement of Comprehensive Income (SCI): The statement of comprehensive income is often known
as the statement of profit and loss. This statement disclosed the profit or loss a firm has earned during
a given accounting period. The statement contained financial data for gross profit calculation,
operating and non-operating income data, and other special sources of revenue and expense data.
Calculation of gross profit is based on the difference between total revenue and the total cost of
making the commodities or render services that a firm trade often known as the cost of goods sold.
SCI discloses the overall profitability of the firm and how efficiently the firm generates profit from its
trading activities. Net profit or operating profit on the other hand reflects many other operating costs
and expenses in the computations together with the cost of commodities sold, like depreciation on
machinery and equipment and other overhead expenses. This is necessary for evaluating the real
profitability of the firm, particularly when compared to the firm SCI for the preceding periods or to
the SCI of other firms in the same industries and business environment. An increase in operating
profit is a good sign of the firm profitability and relevance.
Statements of Financial Position (SFP): This component of FS also known as the balance sheet is
prepared under the basic accounting equation (Total assets represent the total owners’ equity and the
total liabilities). The difference between the value of a firm’s total assets and the total liabilities is
referred to as the equity or net worth of the firm. If the owners' equity is higher when expressed as a
proportion of total assets, and compared with preceding records with other firms in the same industry.
A firm with a high net worth may indicate that the firm is relatively leverage-free and also the degree
to which unsecured creditors are protected against loss in the event of liquidation of the firm can be
computed from the SFP.
Statement of Owners' Equity (SOE): This statement isolates the owner’s equity section of the balance
sheet. The primary purpose of SOE is to disclose firm potentiality and actual growth, as also the trend
in retained earnings and reserves for the firm. Accumulated profits not paid out in dividends constitute
the retained earnings and reserves. The data provided in the SOE is useful in earnings management
and other investment-related decisions because the higher revenue reserve and the retained earnings of
the current accounting year ending compared to currently proposed dividends, the lower the dividend
income received. This can be translated that the firm holding onto its revenue reserve and profit for
reinvestment instead of paying it out as they were earned.
Notes on the accounts: Series of supplemental notes that are included in the published the FSs of
firms are referred to as Noted on the accounts. The notes are numbers, and they disclose further, the
detailed assumptions made by the management when preparing the firm’s FSs. The numbers are
important and they should not be underestimated when analyzing FS data. Information in the FSs is
incomplete if there are no Notes on the account, therefore investors who depend solely on the
monetary values disclosed on the FS and pay no attention to the notes are likely to find themselves
deluded.
Statement of Accounting Policies (SAP): This component consists of unique cooperative governance
policies and procedures adopted by a firm in compiling its FSs. These incorporate any frameworks,
techniques, methods, measurements, and strategies for divulgences and presentation. These is varying
from accounting standards in that the standard is the principle while the approaches are a firm's
methods of holding fast to the guidelines.
The function of statutory auditors has become increasingly crucial ever since auditing of FSs was first
made mandatory under CAMA 2004 (The Nigeria Companies and Allied matters Act as amended).
Like wisely, the director's report should not be underestimated, the director’s report depicted certain
genuine information that identifies with the year under the survey which is mandatory by law to be
disclosed. Furthermore, the value-added statement (VAS) is another important component of FS, its
relevance depends upon its value to potential users. Akinsonyime (1990) says that information in the

2022 | International Journal of Financial, Accounting, and Management/ Vol 4 No 1, 49-66
58
value-added statements (VASs) is vital information that provides a sound base to a viable and more
practical and realistic decision-making process.
Financial Statement Analysis (FSA) in Investment Decision
Investment analysis and decisions focus on the structure and an efficient allocation of financial
resources (Pandeg, 2005). An FS aims to provide financial information about a firm to interested
stakeholders for efficient allocation of the firm’s financial and economic resources. The investigation,
analysis, and understanding of FS and decision-making thereafter unveil the significant features of
FSs as the significant possessor of financial information essential for any venture or funding choices.
Therefore, the information provided by the FS can only become valuable with the aid of financial
interpretations obtained from the analysis of the FS.
The major tool for analyzing FSs to make investment or funding decisions is ratio analysis (RA).
Ratio analysis in this context refers to as Financial Ratio Analysis (FRA), is the judgmental procedure
that was intended to assess the current and past financial condition and the status of a firm with the
primary aim of discovering the best feasible prediction. Elliot and Elliot (2004) stated that FRA
established a quick diagnostic expression of a firm's financial condition and triggers off subsequent
investment, financial, and performance analysis. However, data and figures that are utilized in the
FRA are being generated from the financial statements (FS) which thusly inspire our funding,
financial performance, and investment decisions.
Financial Ratio Analysis (FRA) according to Gavtan (2005) is a procedure for determining and
interpreting the relationship between the data generated in the FS to build up a valuable
comprehension of the productivity, liquidity, dissolvability, and profitability of a firm. Moreover, for
the ratio to be relevant and a guide for investment decisions, it has to be compared with preceding
accounting periods of the firm to show the patterns or contrasted and comparable firms in the industry
to ascertain its SWOT. Ideally, a comparison has to be made within the industrial average. With the
aid of FSA, the management of the firm gets familiarized with the firm’s operational standards.
According to Bragg (2012), in the context of computing and evaluating business operational standards
based on FSs, the most noteworthy FRA derived from basic FSs should be used, they are divided into
five fundamental categories, and these are as follows:
a) Short-term Solvency and Liquidity Ratio: The solvency ratio measures the ability of the firm
to provide for its ripping short-term (current) obligations or liabilities as at when due.
b) Long-term Solvency and Stability Ratio: This ratio measures the capital structure of the firm,
which is the extent of the obligation to value in the financing of the firm's assets.
c) Efficiency Ratio (ER): The efficiency Ratio indicates the overall profitability of the
investment, it measures how productively and viably the firm’s management is using its scant
financial and economic resources. The overall effectiveness is depicted by the profit/benefit
created by turnovers and investment.
d) Potential and Actual Growth Ratio: This ratio indicates potential returns of investment, it
estimates the firm's potential to keep up with its financial and economic status in the
development of the economy and business climate (Ratu & Yoga 2021).
e) Performance Ratio (PR): The performance ratio is the most complete evaluation of a firm’s
performance, this ratio mirrors the danger and returns ratio. PRs are vital in FRA since they
are connected straightforwardly to the objective of a firm’s value expansion and shareholders’
wealth. The list of ratios is not exhaustive here, however, the types of FRA to be used need to
be tailored to the ideal nature of the problem, which it is expected to help in answering.
Empirical literature review
Otley (2012) proclaims that FS is an important part of the firms’ framework and needed to be judged,
analysis and interpreted in their wider managerial, entity and environmental context. Otley (2012)
2022 | International Journal of Financial, Accounting, and Management/ Vol 4 No 1, 49-66
59
argues further that the effectiveness of an FS doesn’t just rely upon the objectives of such a firm, it
additionally relies upon the possible elements of each firm. When the information generated and
depicted by FS widely meets the requirements of users, such FS is said to be effective. Effective FS
should consistently depict information that has a prospective effect on investment, financial, and
management decision-making by the management and potential & prospective investors. The above
finding from previous pieces of literature has demonstrated clearly that FSs play a prime role in
funding or investment decision-making. However, they abstain from demonstrating how prospective
investors will concentrate, analyze, and comprehend the information contained in FS for an
appropriate funding choice.
Mercy (2014) argues that FSs are practically important for forecasting a firm’s performance. They
made the conclusion based on findings that FSs play a vital role in funding decision-making and
recommend that the firm's FS should be strongly considered before any funding or financial decision
would be taken.
Adebayo, Idowo, Yusuf, and Bolarinwa (2013) look into the significance of accounting information
provided in FS in aiding the firms in making sound and productive financial, economic, or funding
decisions. The paramount wellspring of data for their study was primary data through the
administration of questionnaires. Regression was analyzed and Karl pear son's correlation was utilized
for data analysis. Their discoveries show that accounting information in the firms’ FS is an
exceptional tool in business management choice-making in today's unrest business environment.
However, they advised firms’ stakeholders to put resources in information technology (IT) tools to
improve their productivity, viability, and their general business execution.
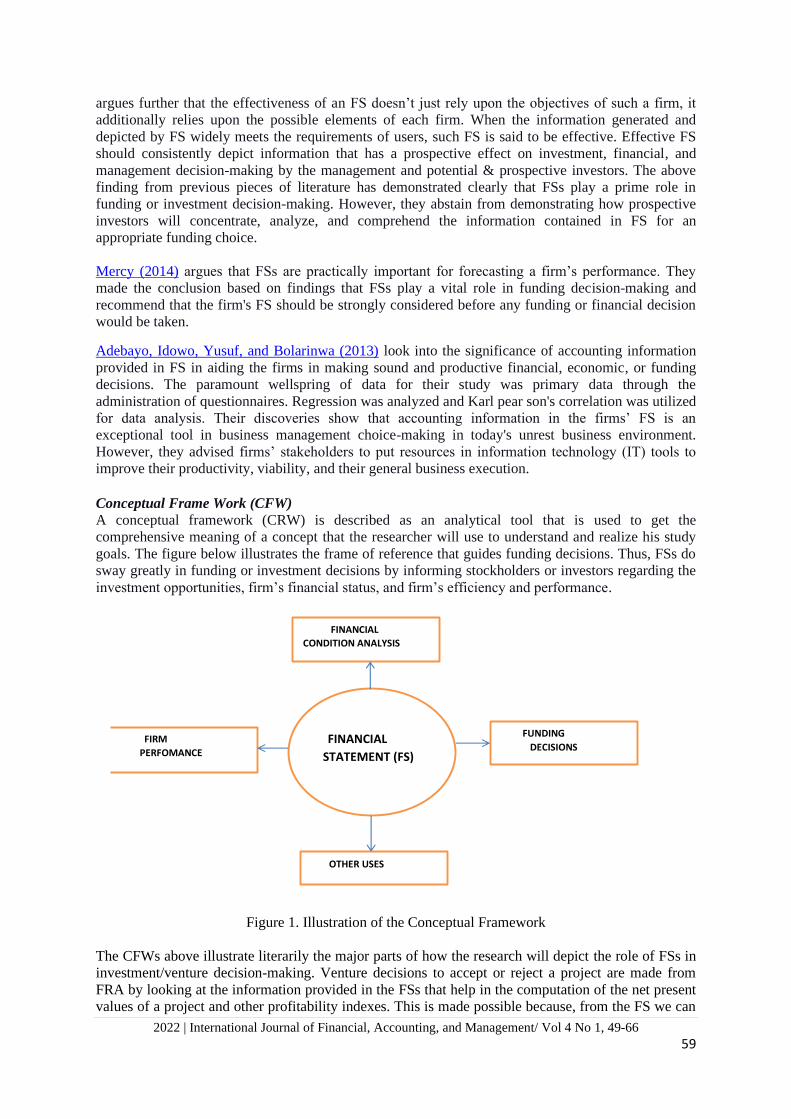
Conceptual Frame Work (CFW) A conceptual framework (CRW) is described as an analytical tool that is used to get the
comprehensive meaning of a concept that the researcher will use to understand and realize his study
goals. The figure below illustrates the frame of reference that guides funding decisions. Thus, FSs do
sway greatly in funding or investment decisions by informing stockholders or investors regarding the
investment opportunities, firm’s financial status, and firm’s efficiency and performance.
Figure 1. Illustration of the Conceptual Framework
The CFWs above illustrate literarily the major parts of how the research will depict the role of FSs in
investment/venture decision-making. Venture decisions to accept or reject a project are made from
FRA by looking at the information provided in the FSs that help in the computation of the net present
values of a project and other profitability indexes. This is made possible because, from the FS we can
FIRM PERFOMANCE
FINANCIAL CONDITION ANALYSIS
OTHER USES
FUNDING DECISIONS
FINANCIAL STATEMENT (FS)
2022 | International Journal of Financial, Accounting, and Management/ Vol 4 No 1, 49-66
60
be able to calculate the firm’s financial status, investment profitability prediction, firm’s performance
and also understand the firm’s financial condition as far as asset and liability differentiation from the
preceding FS of a similar accounting period.
Another important aspects of the conceptual framework are Investment profitability projects. From
the analysis of the FSs, the firm’s stakeholders or potential investors can choose which investment
opportunities to target since FSs depict distinctly the drift of performance of investment projects.
Furthermore, FSs dictate the capital structure and mode of funding that should be adopted by a firm to
arrive at an optimal capital structure. When FSs are analyzed, the firm’s capital structure can be
determined and thereafter ascertain the funding options in the pursuit of identifying financing
alternatives. This is the basis of obtaining the firm's financial position which is depicted by the firm’s
FSs.
Finally, FSs information has various figures and facts that if properly analyzed can influence a firm’s
financial performance through timely and objective investment decisions. Capital and financial
market information depicted in the FS can lead to trends in the value of stock market variables and
economic growth index and also greatly influence funding or investment decisions. This is because
such information established through FSs depicts the performance of the firm and its value in the
stock market.
3. Research methodology The research method adopted for this project is quantitative, as quantitative research methodology
seeks to quantify the data, and typically, applies a form of statistical analysis (Malhotra, 2007). Thus,
the Financial Statement Analysis was applied since the study is to examine the role of financial
statement analysis as a tool for evaluating the performance of companies and investment decisions.
The information regarding the individual firm's income statement, cash-flow statement, and balance
sheet was obtained through the firms' annual report, the Nigeria Stock Exchange factbook, and the
handbook of the Nigeria Stock Exchange.
Research design
A research design/method is simply the structure, framework, or plan for the study, which is used as
the modus operandi for collecting appropriate records and data. In this study, the financial ratio
analysis method is espoused with particular concentration on the financial statement data. This is
preferred to others given the identity of the study, concerning the effect of FSA and its interpretation
as a tool for funding, investment, and management decisions and also firm’s performance evaluation.
Sources and method of data collection
The leading sources and methods of data collection used in the study are secondary sources. This
includes Nestlé Nigeria plc Annual Reports, textbooks, journals, and experts' schools of thought on
the subject. The secondary source provides the theoretical structure and analysis data for the study.
Research instrument
A research instrument is a measuring device constructed for the recording of measuring data. It is the
means for generating appropriate information to be used for solving the research questions and issues
(Olakunori, 1997) to this end, in other to obtain valuable records and data for analysis, interpretation,
and answering research questions raised at the introduction of this study, data related to the
information needed for series of financial ratio analyzes were extracted from Nestlé Nigeria plc
annual report from 2014 to 2019.
4. Results and discussion Method of data analysis
Descriptive statistical analytical tools (Tables and figures) were used in preparing and analyzing the
data generated for this study.

2022 | International Journal of Financial, Accounting, and Management/ Vol 4 No 1, 49-66
61
Financial ratio (business ratios) analysis method
To assist these various groups, creditors, bankers, investors and management, and to facilitate
financial control, a Financial Ratio Analysis of the organization's financial records is required.
Usually, this consist of determining groups of specific ratios from selected items of the balance sheet
and profit and loss account for several consecutive years. In this manner, trends are ascertained and it
may even be possible through the introduction of additional data to make comparisons with external
industry standards and with the internal goals and budgets of the organization.
In most circumstances, if the analyst is to gain a complete picture of the financial condition of the
firm, he must know the characteristics of the business, its seasonality and trade customs and in
addition, he must utilize several different ratios. Moreover, if the data are to be fully comparable the
term must be adequately defined.
Classification of financial ratios used in this study:
1) Potential, Actual Growth and Profitability Ratios.
2) Efficiency and Activity Ratios.
3) Long term Solvency, Stability Leverage Ratios.
4) Short-term Solvency and Liquidity Ratios.
Potential, Actual Growth and Profitability Ratios:
a) Gross Profit Margin = Gross Profit / Sales
b) Net profit margin = Profit After Tax / Sales
c) Return on Capital Employed (ROCE) = Profit Before Tax / Capital employed
d) Return on Equity (ROE) = Profit After Tax / Equity
e) Earnings Per Share
Efficiency and Activity Ratios:
a) Debtors Turnover = Sales / Debtors
b) Current Assets turnover = Sales / Current Assets
c) Total Assets Turnover: = Sales / Total Assets
Long term Solvency, Stability Leverage Ratios
a) Debt Ratio = Total Debt (TD) / Total Assets (TA)
b) Debt –Equity Ratio = Total debt / Equity
Short-term Solvency and Liquidity Ratios
a) Current ratio = Current Assets / Current liabilities
b) Quick Ratio = Current Assets – (Inventories + Prepaid) / Current liabilities
For quantitative data analysis in social science, the appropriate analytical tools rely upon the kind of
estimation scales utilized and the variables being scrutinized (Kothari, 2004). The study stockpiled
data that can be used for Financial Ratio Analysis (FRA) from the firm's FS.
Data generated will be analyzed and interpreted using FRA which involves a comparison of one
figure against another to show the relationship between the firm’s operation results. FRA is useful in
the determination of the following:
1) The efficiency with which the company is utilizing its various assets in generating sales
revenue.
2) The overall operating efficiency and performance of the company.
3) Company's ability to meet its current obligations.
4) The extent to which the company has used its long-term solvency by borrowing funds.
To enhance good understanding, easy appreciation, and interpretation of accounts, the ratios analysis
will be grouped into four categories namely:

2022 | International Journal of Financial, Accounting, and Management/ Vol 4 No 1, 49-66
62
1) Efficiency and profitability
2) Potential and growth
3) Short-term solvency and liquidity
4) Long-term solvency and liquidity
Table 1. Data Extracted
S/N Particulars 2019 2018 2017 2016 2015 2014
1 Sales 284,035,255 226,274,621 244,151,411 181,910,977 151,271,526 143,328,987
2 Gross Profit 128146782 113,920,176 100,871,151 75,327,592 67,345,569 61,229,931
3 Profit/Loss
Before Tax
71123824 59,750,846 46,828,682 21,548,408 29,322,477 24,445,978
4 Profit/Loss After
Tax
45683113 43,008,026 33,723,730 7,924,968 23,736,777 22,235,640
5 EPS 57.63 54.26 42.55 10.00 29.95 28.05
6 Trade and other
receivable
65820188 42,175,062 31,430,450 24,035,411 24,445,995 22,330,813
7 Current Assets 107037314 82,734,317 72,270,783 97,736,155 48,714,656 37,389,330
8 Total Asset 193374314 162,334,422 146,804,128 169,585,932 119,215,053 106,062,067
9 Share Capital
Employed
396,328 396,328 396,328 396,328 396,328 396,328
9 Equity 45557630 50,220,486 44,878,177 30,878,075 38,007,074 35,939,643
10 Current Liability 125535430 92,117,501 79,680,495 121,033,434 59,731,857 44,638,052
11 Total Liability 147816685 112,113,936 101,925,951 138,707,857 81,207,979 70,122,424
Source: Nestlé Nigeria plc annual report from 2014 to 2019
Table 2. Descriptive Analysis
Range Minimum Maximum Mean Std. Deviation
Sales 140706268.00 143328987.00 284035255.00 205162129.5000 55596802.14717
Gross profit 66916851.00 61229931.00 128146782.00 91140200.1667 27180702.90882
PBT 49575416.00 21548408.00 71123824.00 42170035.8333 20364494.82788
PAT 37758145.00 7924968.00 45683113.00 29385375.6667 14237897.64559
EPS 47.63 10.00 57.63 37.0733 17.96151
Debtors 43489375.00 22330813.00 65820188.00 35039653.1667 16770302.85201
Inventories 22464984.00 10813960.00 33278944.00 20453497.8333 8564229.95514
Current Assets 69647984.00 37389330.00 107037314.00 74313759.1667 27251593.58851
Total Assets 87312247.00 106062067.00 193374314.00 149562652.6667 32571148.86877
Capital Employed .00 396328.00 396328.00 396328.0000 .00000
Equity 19342411.00 30878075.00 50220486.00 40913514.1667 7180569.83887
Current Liability 80597378.00 44638052.00 125235430.00 87072797.8333 32366773.67076
Total Liability 77694261.00 70122424.00 147816685.00 108649138.6667 30764116.41324
Source: SPSS data computation from data extracted
Potential, Actual Growth, and Profitability Ratios
To measure the potential, actual growth, and profitability of the company:
1. Gross Profit Margin: It indicates the average spread between the cost of goods sold and the
sales revenue.
2. Net Profit Margin: This ratio indicates management's efficiency in manufacturing,
administering, and selling of products.
3. Return on Capital Employed (ROCE): ROCE designates the firm’s earning power.
4. Return on Equity: ROE on the other hand indicates how well the firm has used the resources of
its owners.
5. Earnings Per Share

2022 | International Journal of Financial, Accounting, and Management/ Vol 4 No 1, 49-66
63
Table 3. Potential, Actual Growth and Profitability Ratios
Gross
Profit
Margin
Net
Profit
Margin ROCE ROE EPS
2014 0.43 0.16 61.68 0.62 28.05
2015 0.45 0.16 73.99 0.62 29.95
2016 0.41 0.04 54.37 0.26 10
2017 0.41 0.14 118.16 0.75 42.55
2018 0.50 0.19 150.76 0.86 54.26
2019 0.45 0.16 179.46 1.00 57.63
Min 0.41 0.04 54.37 0.26 10.00
Max 0.50 0.19 179.46 1.00 57.63
Average 0.44 0.14 106.40 0.69 37.07
Source: Processed data
These ratios convey how well Nestlé Nigeria plc generate profit from its operations between 2014 to
2019
Efficiency and Activity Ratios:
To measure the Efficiency and Activity Ratios of the company:
1. Debtor (Account Receivable) Turnover: It specifies the number of times debtors turnover
within an accounting period.
2. Total and Current Assets Turnover: It measures the preparedness of the firm to efficiently make
use of its total and current assets discretely.
Table 4. Efficiency and Activity Ratios
Debtor
Turnover
Current
Asset
Turnover
Total
Asset
Turnover
2014 6.42 3.83 1.35
2015 6.19 3.11 1.27
2016 7.57 1.86 1.07
2017 7.77 3.38 1.66
2018 5.37 2.73 1.39
2019 4.32 2.65 1.47
Min 4.32 1.86 1.07
Max 7.77 3.83 1.66
Average 6.27 2.93 1.37
Source: Processed data
How Efficiently Nestlé Nigeria plc used its assets and liabilities to generate sales and maximize profit
during the accounting periods 2014 to 2019 is shown in Table 4
Long-term Solvency, Stability Leverage Ratios
To measure Long term Solvency and Stability Leverage of the company:
1. Debt Ratio: This ratio is used to compute the proportion of the firm's total assets which are
financed by both long and short-term debt. It is calculated as Total Debt (TD) / Total Assets
(TA).
2. Debt – Equity Ratio: DER on the other hand is used to compute the direct proportion of debt to
owners’ equity. It is indirectly computed by dividing total debt by net worth. That is total
debt/equity. Debt –Equity Ratio = Total debt / Equity.
2022 | International Journal of Financial, Accounting, and Management/ Vol 4 No 1, 49-66
64
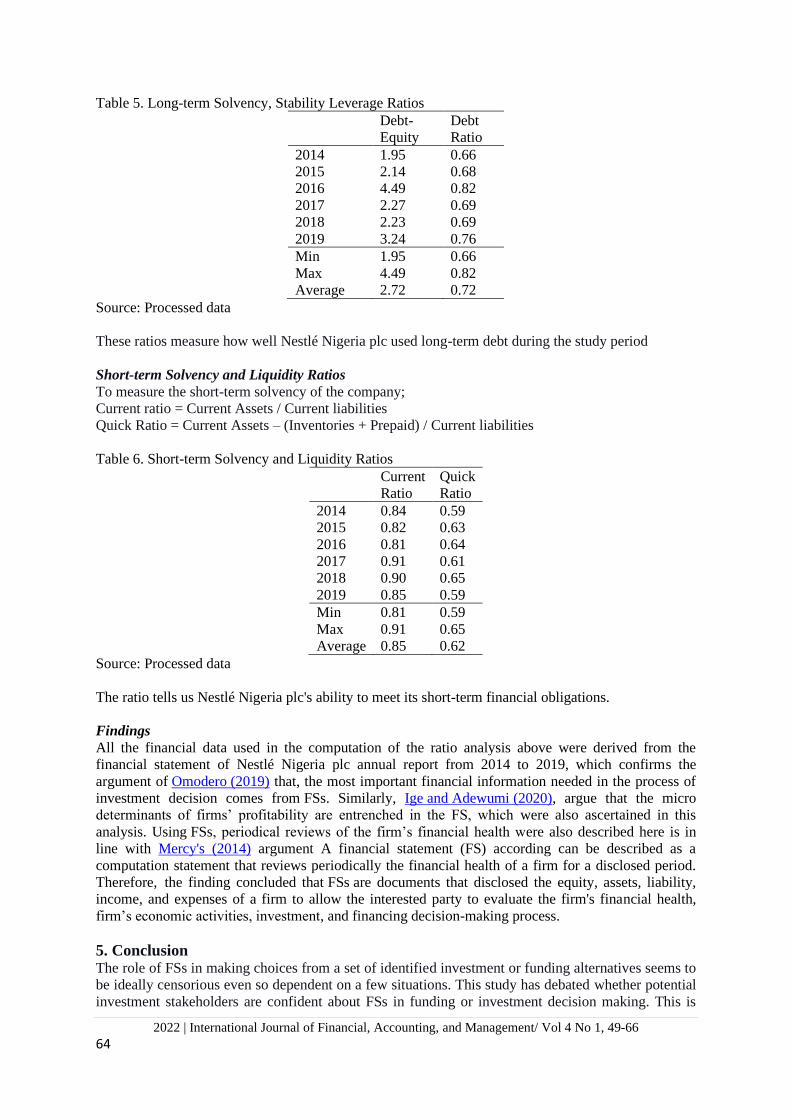
Table 5. Long-term Solvency, Stability Leverage Ratios
Debt-
Equity
Debt
Ratio
2014 1.95 0.66
2015 2.14 0.68
2016 4.49 0.82
2017 2.27 0.69
2018 2.23 0.69
2019 3.24 0.76
Min 1.95 0.66
Max 4.49 0.82
Average 2.72 0.72
Source: Processed data
These ratios measure how well Nestlé Nigeria plc used long-term debt during the study period
Short-term Solvency and Liquidity Ratios
To measure the short-term solvency of the company;
Current ratio = Current Assets / Current liabilities
Quick Ratio = Current Assets – (Inventories + Prepaid) / Current liabilities
Table 6. Short-term Solvency and Liquidity Ratios
Current
Ratio
Quick
Ratio
2014 0.84 0.59
2015 0.82 0.63
2016 0.81 0.64
2017 0.91 0.61
2018 0.90 0.65
2019 0.85 0.59
Min 0.81 0.59
Max 0.91 0.65
Average 0.85 0.62
Source: Processed data
The ratio tells us Nestlé Nigeria plc's ability to meet its short-term financial obligations.
Findings
All the financial data used in the computation of the ratio analysis above were derived from the
financial statement of Nestlé Nigeria plc annual report from 2014 to 2019, which confirms the
argument of Omodero (2019) that, the most important financial information needed in the process of
investment decision comes from FSs. Similarly, Ige and Adewumi (2020), argue that the micro
determinants of firms’ profitability are entrenched in the FS, which were also ascertained in this
analysis. Using FSs, periodical reviews of the firm’s financial health were also described here is in
line with Mercy's (2014) argument A financial statement (FS) according can be described as a
computation statement that reviews periodically the financial health of a firm for a disclosed period.
Therefore, the finding concluded that FSs are documents that disclosed the equity, assets, liability,
income, and expenses of a firm to allow the interested party to evaluate the firm's financial health,
firm’s economic activities, investment, and financing decision-making process.
5. Conclusion The role of FSs in making choices from a set of identified investment or funding alternatives seems to
be ideally censorious even so dependent on a few situations. This study has debated whether potential
investment stakeholders are confident about FSs in funding or investment decision making. This is

2022 | International Journal of Financial, Accounting, and Management/ Vol 4 No 1, 49-66
65
largely for the fact that it was established that in general, the FSs are adequate for effective funding or
investment decision-making. Expressly, the key variables referenced to aid investment decision-
making included; Efficiency and profitability ratio, Potential and growth ratio, Short-term solvency
and liquidity ratio, and Long-term solvency and liquidity ratio.
Recommendations From the findings of this research work as presented, analyzed, and interpreted, the following
recommendations were considered imperative by the researcher:
1) There should be a sufficient period for the collection of FSs data and preparation for their
analysis.
2) FSs should be accurately and adequately explicated and should be made to reflect
contemporary accounting and transaction costs to reduce the adverse consequences of the
historical cost principle on FS's decisions.
3) The consequence of inflation on FSs results ought to be observed to reduce the inflation risk.
4) The adequacy of financial information should be accentuated, as it will give enough
fundamental subtleties for investment speculation and management choice.
5) A mixture of non-identical ratios ought to be used to analyze a firm's financial and/or
operating performance.
6) Lastly, the stakeholders of the selected firm should make proper use of FSA in other decision
areas of the firm’s administration and management not only in the funding or investment
decision.
References Adebayo, M, Idowo, K.A, Yusuf, B & Bolarinwa, S.A (2013). Accounting Information System as an
aid to decision-making in food and beverage companies in Nigeria. Australian Journal of
Business and Management Research, 3 (9) 26-33.
Adebimpe, O. U. (2009). Accounting Disclosures and Corporate Attributes in Nigeria Listed
Companies. Unpublished PhD Thesis submitted to the Department of Accounting, College of
Business and Social Sciences, Covenant University, Ota, Ogun State, Nigeria.
Akinsonyime, A. B. (1990). The Objective of Accounting in a Dynamic Society. Seminar NCAI Jos
Nigeria.
Aniefor, S. O., & Oboro, O. G. (2015). Accounting ratio as a veritable tool for corporate Investment
Decision: A study of selected organization in Delta State. Journal of Policy and Development
Studies, 9(5), 38-49.
Asrizal, E. N., Linzzy, P. P. & Shinta, D. (2018). The effect of debt to equity ratio and total asset
turnover on return on equity in automotive companies and components in Indonesia,
International Conference on Accounting, Management and Economics, 12 (9), 33 – 44.
Auwalu, M & Ibrahim, M. T (2017). International Financial Reporting Standards and Value
Relevance of Financial Information: An Empirical Evaluation of Selected Nigerian Listed
Companies. International Journal of Accounting & Finance Review 1(1) 1-11.
Bragg, S. (2012). Financial Analysis: A Controller's Guide, 2nd edition, Wiley, Canada.
Conteh. S, & Akuntansi M (2021) Financial Statement Analysisa tool for Investment Decision
Making in the Gambia: Case of Trust Bank Gambia Limited. International Journal of
Accounting Review 9(5) 2-9.
Elliot, B & Elliot, J., (2004). Financial Accounting and reporting Prentice-Hall International, UK.
FASB. (2000). SFAC No.7: Using Cash Flow Information and Present Value in Accounting
Measurement. FASB, Connecticut.
Francis, J. & Schipper, K. (1999). Have financial statements lost their relevance. Journal of
Accounting Research,
Gavtan, U. S. (2005). Accountancy. New Delhi; Vrinda Publications.
Ige O. T. & Adewumi O., (2020). A comparative analysis of the determinants of profitability of
commercial and microfinance banks in Nigeria. International Journal of Financial, Accounting,
and Management 1(3) 1- 23 https://doi.org/10.35912/ijfam.v1i3.135
Jennins, A.R (2004). Financial Accounting 2 Edition. New York; Thomson learning.
2022 | International Journal of Financial, Accounting, and Management/ Vol 4 No 1, 49-66
66
Kapellas, K., & Siougle, G. (2018). The effect of IFRS adoption on investment management: A
review of the literature. Technology and investment, 9, 1-23.
Kothari, C. R, (2004). Research Methodology: Methods and Techniques, 2nd Edition, New Age
International Publishers, New Delhi India.
Malhotra, N.K. (2007), "Review of Marketing Research", Malhotra, N.K. (Ed.) Review of Marketing
Research (Review of Marketing Research, Vol. 3), Emerald Group Publishing Limited, Bingley,
pp. v-v. https://doi.org/10.1108/S1548-6435(2007)0000003004.
Mercy A.A, (2014). The role of financial statement in investment decision making; A case
study of First Bank of Nigerian Plc. International journal of accounting information
system (2), 91-105.
Newslove & Gardner 1951 New Age International Publishers, 2nd Revised Editions, 5-236.
Nkuhi, A. H (2015). The role of financial statements in investment decision making a case of Tanga
port authority. Published Master of Business Administration Dissertation submitted to Mzumbe
University.
Olakunori, O.K. (1997). Successful research theory and practice. Enugu: Computer Edge Publishers.
Omodero, C. O. (2019). Genesis of accountability and its impact on accounting. International Journal
of Financial, Accounting, and Management, 1(1), 47-55. https://doi.org/10.35912/ijfam.v1i1.78
Otley, D. (2012). The contingency Theory of Management and Prognosis Accounting organisation
and society 194-208.
Pandeg, I. M. (2005). Financial Management, 9th Edition. Vikas Publishing House PVT Ltd New
Delhi. India.
Ratu L. & Yoga T. R., (2021). The influence of leverage, sales growth, and
dividend policy on company value International Journal of Financial, Accounting, and
Management 3(2) 165-178 https://doi.org/10.35912/ijfam.v3i2.189.
Sanyaolu, W.A., Odunayo, J., Akintan, I.O., & Ogunmefun, G.T. (2020)). Financial statement
analysis and investment decision of Nigeria banks. Accounting and Taxation Revieww, 4(4): 32-
43.
Security and Exchange Commission. (2000). Rules and Regulations Act, Nigeria Security and
Exchange Commission, 1-360.
Staubus, G. J. (1959). The Residual Equity Point of View in Accounting.’ The Accounting Review,
34(1), pp. 3-13.
Suryanto, T. & Thalassinos, I.E. (2017). Cultural ethics and consequences in whistle-blowing among
professional accountants: An empirical analysis. Journal of Applied Economic Sciences, 12(6),
1725-1731.
Susan, P. T, Innocent F. I, & Philip A. (2018) Accounting Information System: A Prevailing Tool for
Appraising Firm Performance. International Journal of Accounting & Finance Review; 2(2) 15-
20.