financial results for fy2020
TRANSCRIPT
Financial Results for FY2020
May 19, 2021
1
Table of Contents
Management policy for FY2021
‐ Management policy for FY2021 P. 38
‐ Economic outlook P. 39
‐ Consolidated Net Business Profits P. 40
‐ Expenses P. 41
‐ Credit-related costs P. 42
‐ Shareholdings P. 43
‐ Earnings Plan P. 44
‐ Current CET1 capital ratio and future outlook P. 46
‐ Revision of the basic policy on capital strategy P. 47
‐ Revision of the shareholder return policy P. 48
‐ Sustainability-centered business promotion P. 49
‐ Creating business and strengthening risk management
through engagement P. 50
‐ In-house company strategies: Retrospect P. 51
‐ FY2021 in-house company strategies P. 52
‐ Corporate foundations supporting the promotion of
sustainability P. 58
‐ Employee engagement leading to Mizuho’s sustainable
growth P. 59
‐ Operations framework enhancements in line with in-house
company strategies P. 60
‐ Merging strengths in non-financial business areas P. 61
Appendix
Financial Results for FY2020: Executive Summary
‐ Executive summary of financial results P. 3
‐ Financial highlights P. 4
‐ Reference: Progress against the 5-Year Business Plan P. 7
‐ Financial results by In-house Company P. 8
‐ Overview of Income Statement P. 15
‐ Overview of Balance Sheet P. 16
‐ Consolidated Gross Profits P. 17
‐ Loans P. 20
‐ Reference: Outlook of Loans P. 23
‐ Non-interest Income P. 24
‐ General and Administrative Expenses P. 25
‐ Securities portfolio P. 26
‐ Asset quality P. 29
‐ Loan portfolio outside Japan P. 30
‐ Exposure in specific sectors and products P. 31
‐ Credit portfolio soundness P. 32
‐ Basel Regulatory Disclosures P. 33
‐ Progress against Fundamental Structural Reform Plan P. 35
‐ Progress on sustainability KPIs/targets P. 36
Financial Results for FY2020: Executive Summary
3
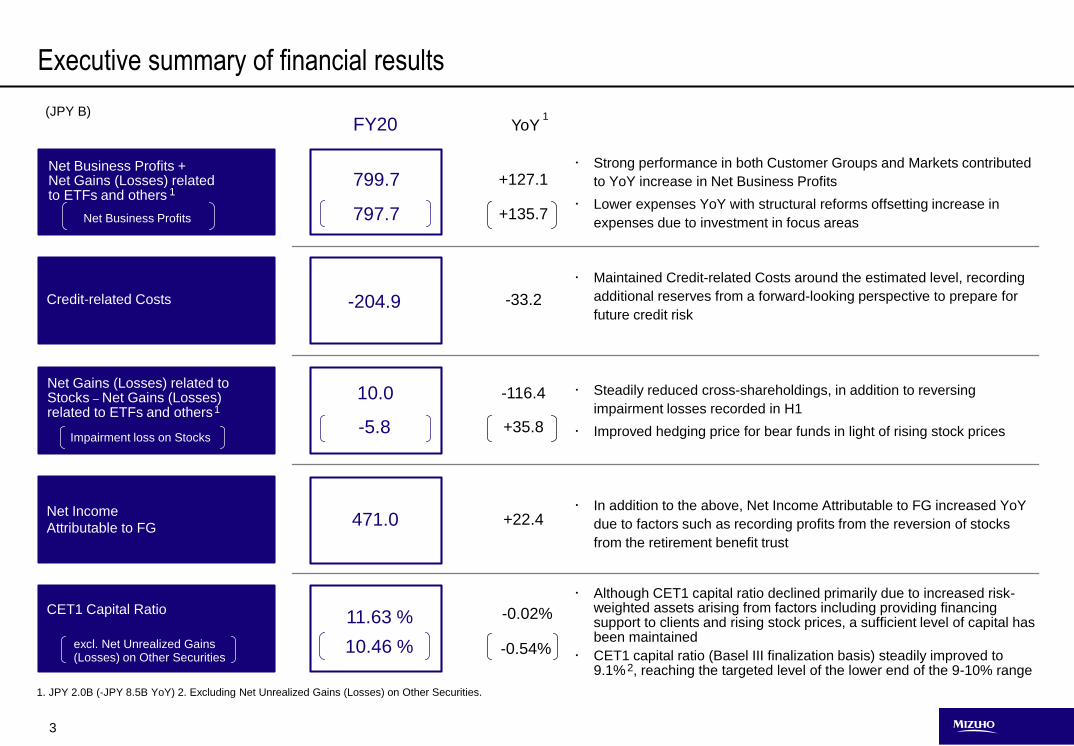
CET1 Capital Ratio
excl. Net Unrealized Gains(Losses) on Other Securities
Impairment loss on Stocks
Net Gains (Losses) related to Stocks – Net Gains (Losses) related to ETFs and others1
Net Business Profits + Net Gains (Losses) related to ETFs and others
YoY(JPY B)
FY20
799.7
Net Business Profits 797.7
1
1. JPY 2.0B (-JPY 8.5B YoY) 2. Excluding Net Unrealized Gains (Losses) on Other Securities.
10.0
-5.8
Executive summary of financial results
11.63 %
10.46 %
1
-204.9
471.0
+135.7
-33.2
+22.4
-0.02%
-0.54%
+127.1
-116.4
+35.8
Credit-related Costs
Net Income
Attributable to FG
Strong performance in both Customer Groups and Markets contributed
to YoY increase in Net Business Profits
Lower expenses YoY with structural reforms offsetting increase in
expenses due to investment in focus areas
Maintained Credit-related Costs around the estimated level, recording
additional reserves from a forward-looking perspective to prepare for
future credit risk
Steadily reduced cross-shareholdings, in addition to reversing
impairment losses recorded in H1
Improved hedging price for bear funds in light of rising stock prices
In addition to the above, Net Income Attributable to FG increased YoY
due to factors such as recording profits from the reversion of stocks
from the retirement benefit trust
Although CET1 capital ratio declined primarily due to increased risk-weighted assets arising from factors including providing financing support to clients and rising stock prices, a sufficient level of capital has been maintained
CET1 capital ratio (Basel III finalization basis) steadily improved to 9.1% , reaching the targeted level of the lower end of the 9-10% range2
4
446.8
207.8
549.6
268.2672.5
799.7
FY19 FY20
0.55% 0.54%0.52%
0.54%
0.49% 0.49%0.48% 0.49%
FY19 H1 H2 FY20 H1 H2
Loans to Middle MarketFirms & SMEs
Loans to Large CorporateBanking Clients
13.3 10.9
175.6 210.0
245.7
286.1
12.2
42.5446.8
549.6
FY19 FY20
175.1 172.2
46.994.6
207.8
268.2
FY19 FY20
S&T
Banking
0.81% 0.82%
0.89%
0.99%
FY19 H1 H2 FY20 H1 H2
116.1 118.9 123.2 116.6
77.5 82.1 98.5 88.2
54.9 59.065.1
59.3
248.5 260.0286.8
264.0
FY19 H1 H2 FY20 H1 H2
54.5 55.0 59.1 59.3
FY19 H1 H2 FY20 H1 H2
EMEA
Americas
Asia
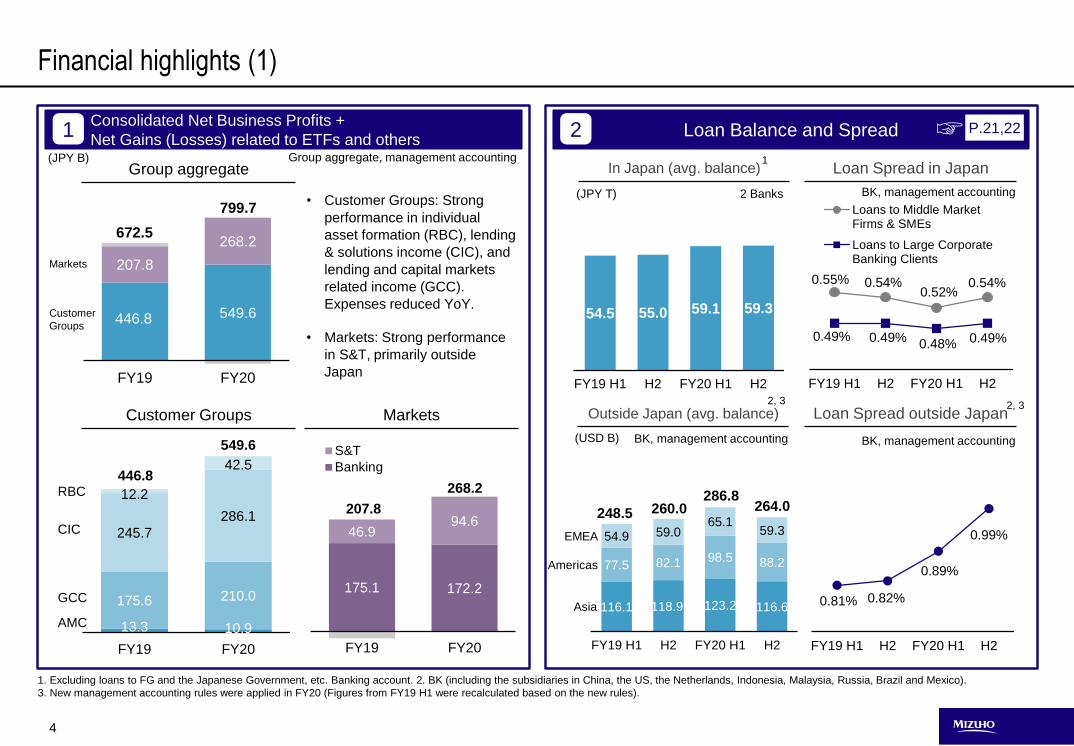
1. Excluding loans to FG and the Japanese Government, etc. Banking account. 2. BK (including the subsidiaries in China, the US, the Netherlands, Indonesia, Malaysia, Russia, Brazil and Mexico).
3. New management accounting rules were applied in FY20 (Figures from FY19 H1 were recalculated based on the new rules).
BK, management accounting
BK, management accounting
Loan Spread outside Japan
(USD B) BK, management accounting
2 Banks(JPY T)
(JPY B) Group aggregate, management accounting
Consolidated Net Business Profits +
Net Gains (Losses) related to ETFs and others1 Loan Balance and Spread2 P.21,22☞
Financial highlights (1)
Outside Japan (avg. balance)
In Japan (avg. balance) Loan Spread in Japan1
MarketsCustomer Groups
RBC
CIC
GCC
AMC
Group aggregate
Customer
Groups
Markets
2, 3 2, 3
• Customer Groups: Strong
performance in individual
asset formation (RBC), lending
& solutions income (CIC), and
lending and capital markets
related income (GCC).
Expenses reduced YoY.
• Markets: Strong performance
in S&T, primarily outside
Japan
5
31.2
97.8 27.3
60.0
58.5
157.9
FY19 FY20
Americas
SC Consolidated
101 96
225 247
275 293
381 408
9821,044
FY19 FY20
33.1 32.9202.6 218.2
245.3 251.1
215.7 209.6
673.1 640.6
1,411.4 1,408.6
FY19 FY20
307.5272.7
230.5201.4
75%74%
Mar-20 Mar-21
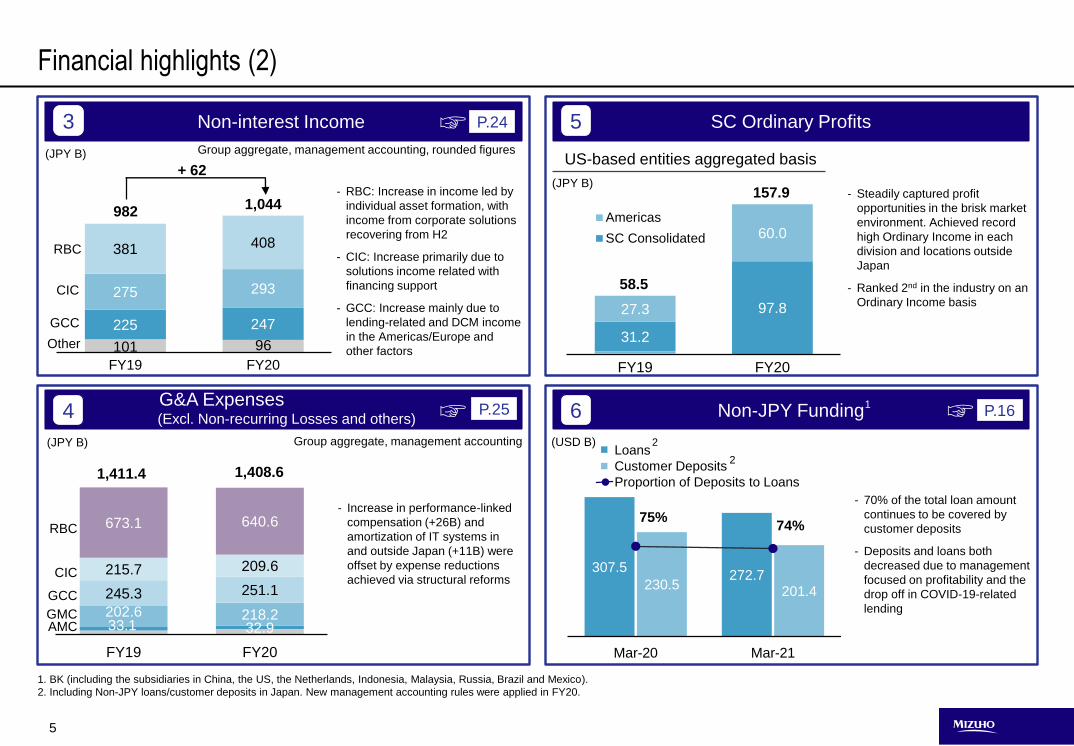
Non-JPY Funding6 ☞1P.16
Loans
Customer Deposits
Proportion of Deposits to Loans
(JPY B)
Other
(JPY B) Group aggregate, management accounting, rounded figuresUS-based entities aggregated basis
Financial highlights (2)
Non-interest Income 3 P.24
1. BK (including the subsidiaries in China, the US, the Netherlands, Indonesia, Malaysia, Russia, Brazil and Mexico).
2. Including Non-JPY loans/customer deposits in Japan. New management accounting rules were applied in FY20.
RBC
CIC
GCC
2
2
(USD B)
G&A Expenses (Excl. Non-recurring Losses and others)4 ☞ P.25
Group aggregate, management accounting
(JPY B)
SC Ordinary Profits5☞
+ 62
RBC
CIC
GCC
GMCAMC
- Increase in performance-linked
compensation (+26B) and
amortization of IT systems in
and outside Japan (+11B) were
offset by expense reductions
achieved via structural reforms
- RBC: Increase in income led by
individual asset formation, with
income from corporate solutions
recovering from H2
- CIC: Increase primarily due to
solutions income related with
financing support
- GCC: Increase mainly due to
lending-related and DCM income
in the Americas/Europe and
other factors
- 70% of the total loan amount
continues to be covered by
customer deposits
- Deposits and loans both
decreased due to management
focused on profitability and the
drop off in COVID-19-related
lending
- Steadily captured profit
opportunities in the brisk market
environment. Achieved record
high Ordinary Income in each
division and locations outside
Japan
- Ranked 2nd in the industry on an
Ordinary Income basis
6
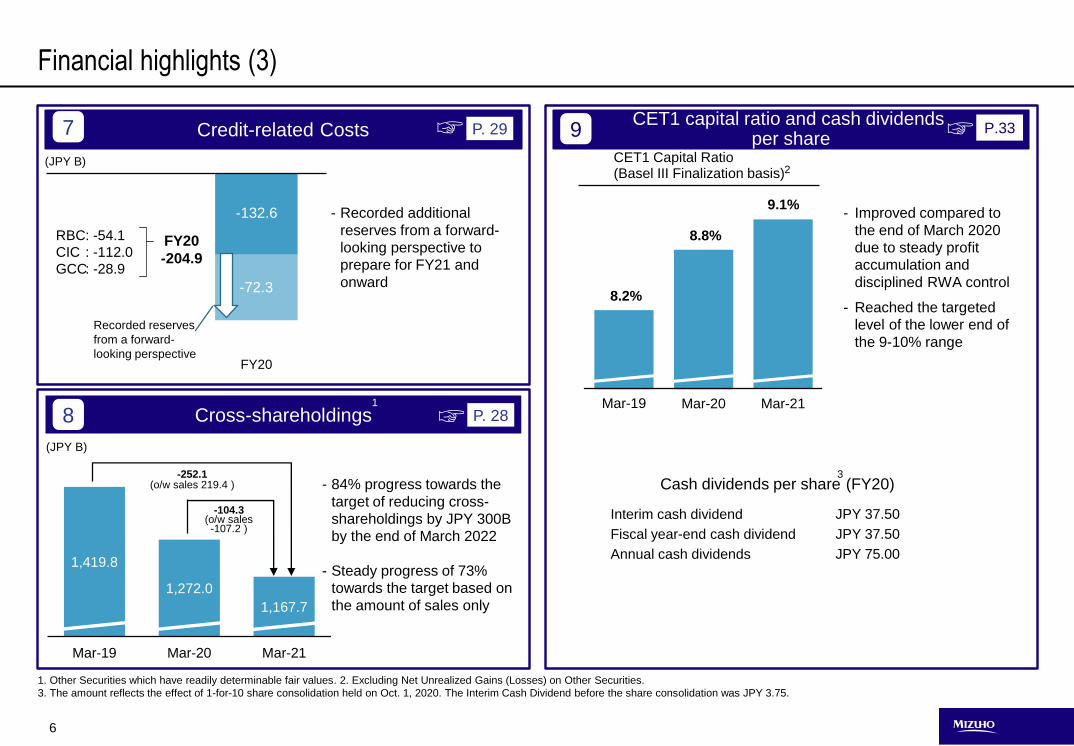
Credit-related Costs
1,419.8
1,272.0
1,167.7
Mar-19 Mar-20 Mar-21
FY20
Financial highlights (3)
-374
7 ☞ P. 29
1. Other Securities which have readily determinable fair values. 2. Excluding Net Unrealized Gains (Losses) on Other Securities.
3. The amount reflects the effect of 1-for-10 share consolidation held on Oct. 1, 2020. The Interim Cash Dividend before the share consolidation was JPY 3.75.
(JPY B)
Cross-shareholdings8 ☞1
P. 28
-252.1(o/w sales 219.4 )
-104.3(o/w sales -107.2 )
Recorded reserves
from a forward-
looking perspective
-438
(JPY B)
-72.3
-132.6
FY20
-204.9
RBC
CIC
GCC
: -54.1
: -112.0
: -28.9
Interim cash dividend
Fiscal year-end cash dividend
Annual cash dividends
Cash dividends per share (FY20)
JPY 37.50
JPY 37.50
JPY 75.00
3
- Improved compared to
the end of March 2020
due to steady profit
accumulation and
disciplined RWA control
- Reached the targeted
level of the lower end of
the 9-10% range
CET1 capital ratio and cash dividends per share9 P.33☞
Mar-19
8.2%
Mar-20
8.8%
Mar-21
9.1%
CET1 Capital Ratio (Basel III Finalization basis)
- Recorded additional
reserves from a forward-
looking perspective to
prepare for FY21 and
onward
- 84% progress towards the
target of reducing cross-
shareholdings by JPY 300B
by the end of March 2022
- Steady progress of 73%
towards the target based on
the amount of sales only
2
7
Mar-19 Mar-21 Mar-22
FY18 FY20 FY23
Mar-19 Mar-21
FY18 FY20 FY23
-JPY 300B
(JPY B)
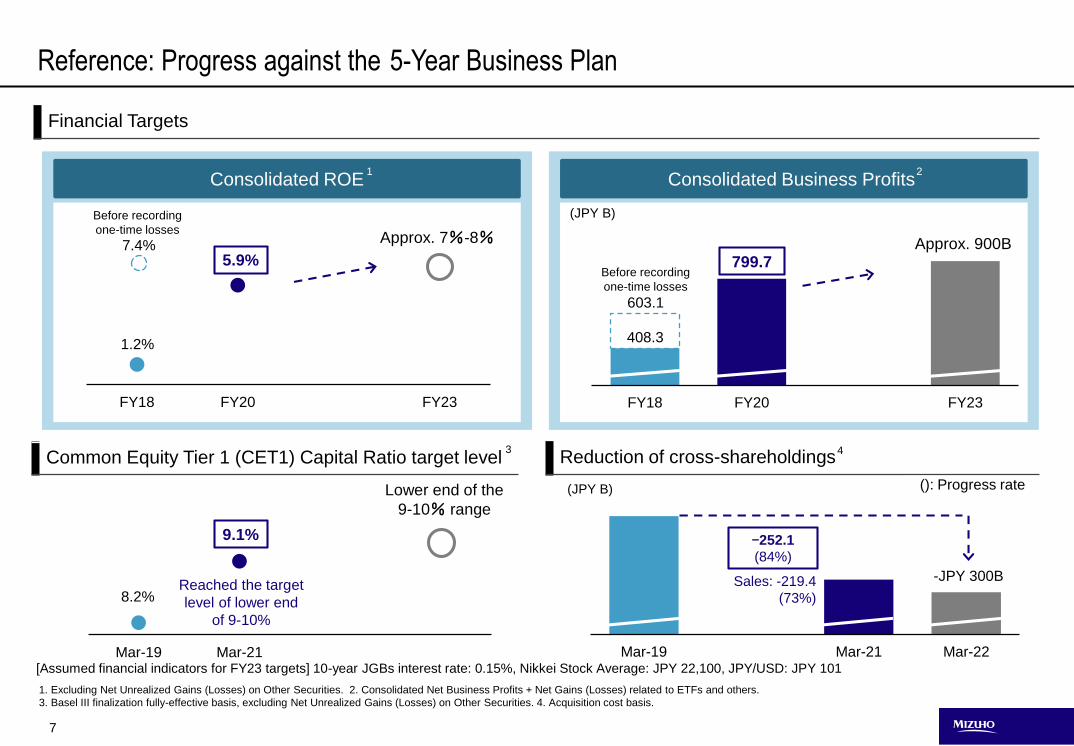
Common Equity Tier 1 (CET1) Capital Ratio target level
[Assumed financial indicators for FY23 targets] 10-year JGBs interest rate: 0.15%, Nikkei Stock Average: JPY 22,100, JPY/USD: JPY 101
Reference: Progress against the 5-Year Business Plan
Financial Targets
Consolidated Business Profits Consolidated ROE
Reduction of cross-shareholdings
8.2%
9.1%
1 2
3 4
1.2%
5.9%
408.3
Before recording
one-time lossesApprox. 7%-8%
(JPY B)
Before recording
one-time losses
603.1
Approx. 900B
Lower end of the
9-10% range
1. Excluding Net Unrealized Gains (Losses) on Other Securities. 2. Consolidated Net Business Profits + Net Gains (Losses) related to ETFs and others.
3. Basel III finalization fully-effective basis, excluding Net Unrealized Gains (Losses) on Other Securities. 4. Acquisition cost basis.
7.4%799.7
-252.1
(84%)
Sales: -219.4
(73%)
(): Progress rate
Reached the target
level of lower end
of 9-10%
8
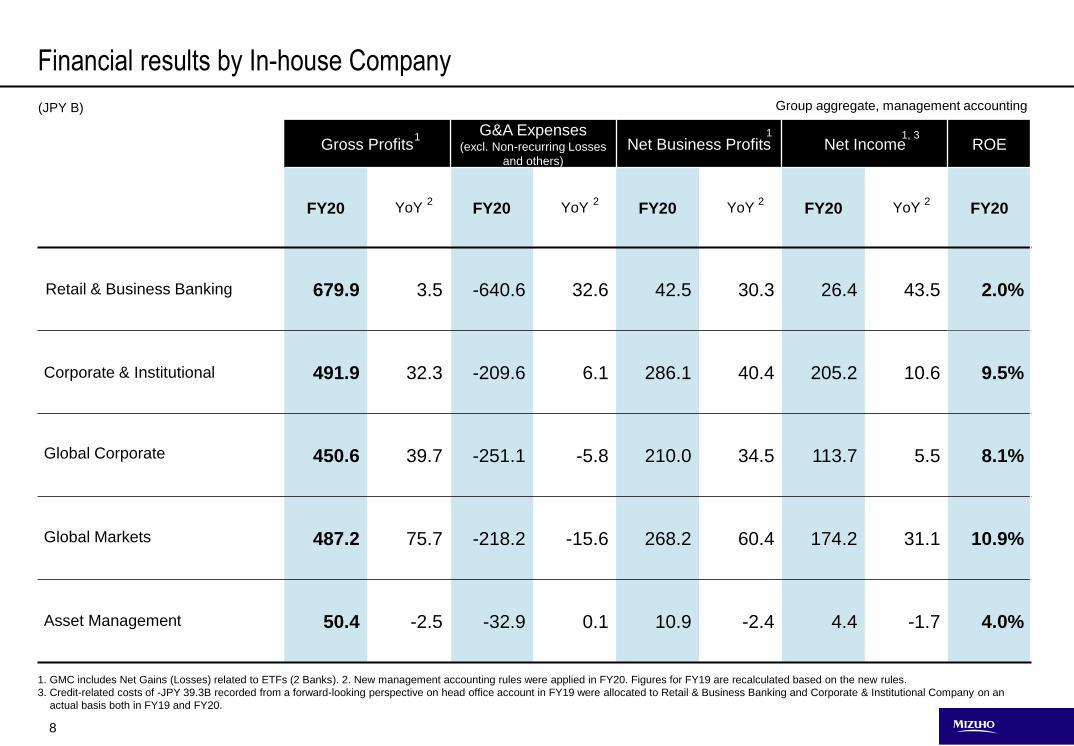
1. GMC includes Net Gains (Losses) related to ETFs (2 Banks). 2. New management accounting rules were applied in FY20. Figures for FY19 are recalculated based on the new rules.
3. Credit-related costs of -JPY 39.3B recorded from a forward-looking perspective on head office account in FY19 were allocated to Retail & Business Banking and Corporate & Institutional Company on an
actual basis both in FY19 and FY20.
Gross ProfitsG&A Expenses
(excl. Non-recurring Losses
and others)
Net Business Profits Net Income ROE
FY20 YoY FY20 YoY FY20 YoY FY20 YoY FY20
679.9 3.5 -640.6 32.6 42.5 30.3 26.4 43.5 2.0%
491.9 32.3 -209.6 6.1 286.1 40.4 205.2 10.6 9.5%
450.6 39.7 -251.1 -5.8 210.0 34.5 113.7 5.5 8.1%
487.2 75.7 -218.2 -15.6 268.2 60.4 174.2 31.1 10.9%
50.4 -2.5 -32.9 0.1 10.9 -2.4 4.4 -1.7 4.0%
Financial results by In-house Company
Retail & Business Banking
Corporate & Institutional
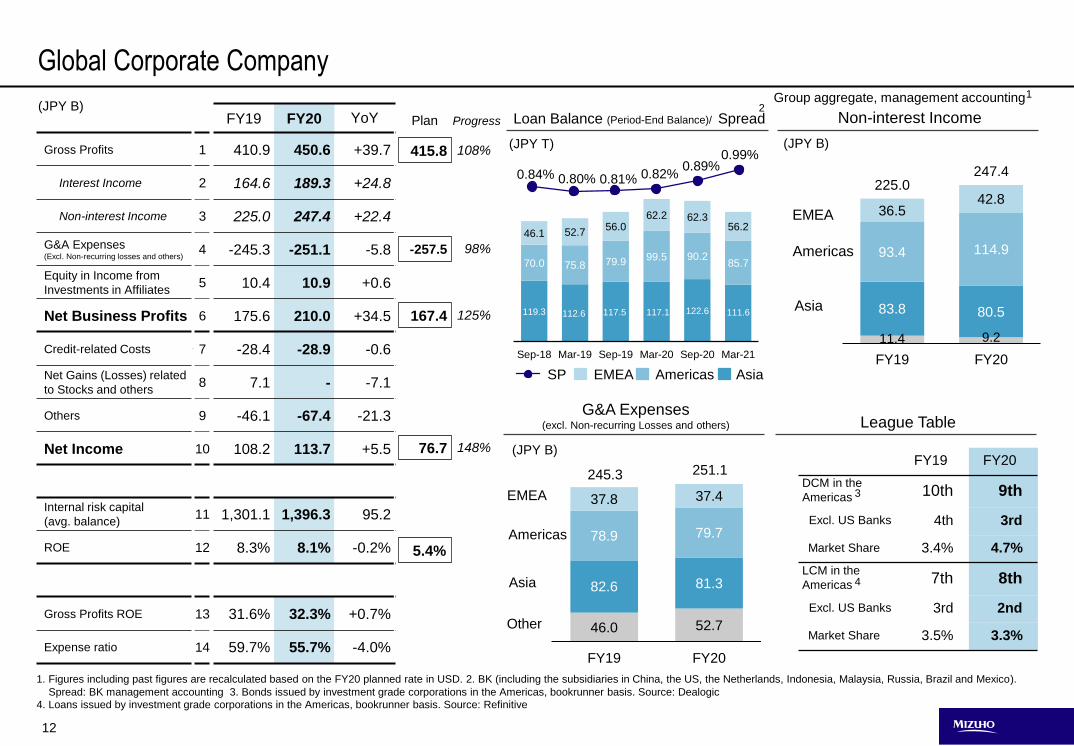
Global Corporate
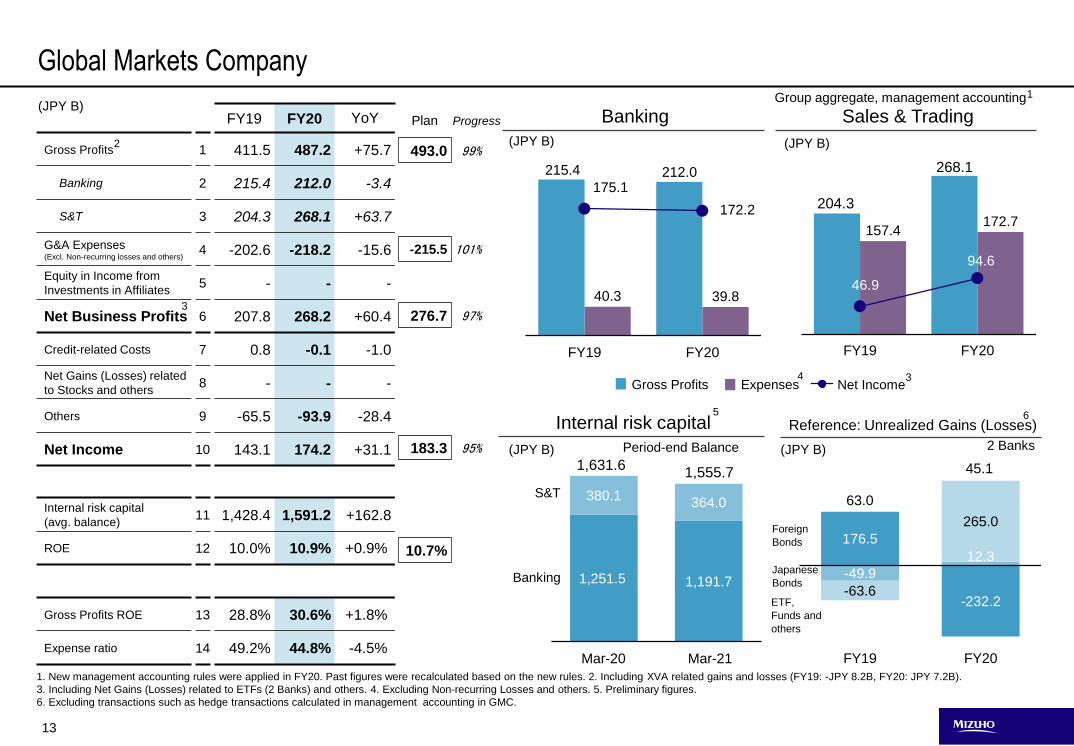
Global Markets
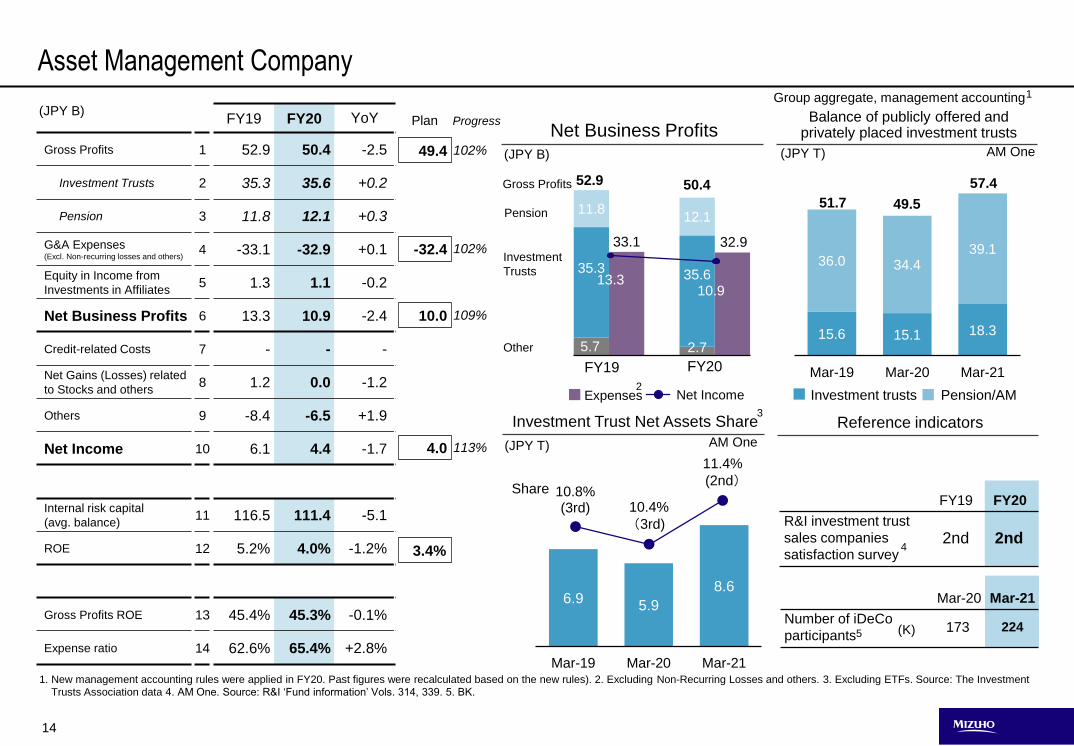
Asset Management
1
2 2 2
1, 31
2
Group aggregate, management accounting(JPY B)
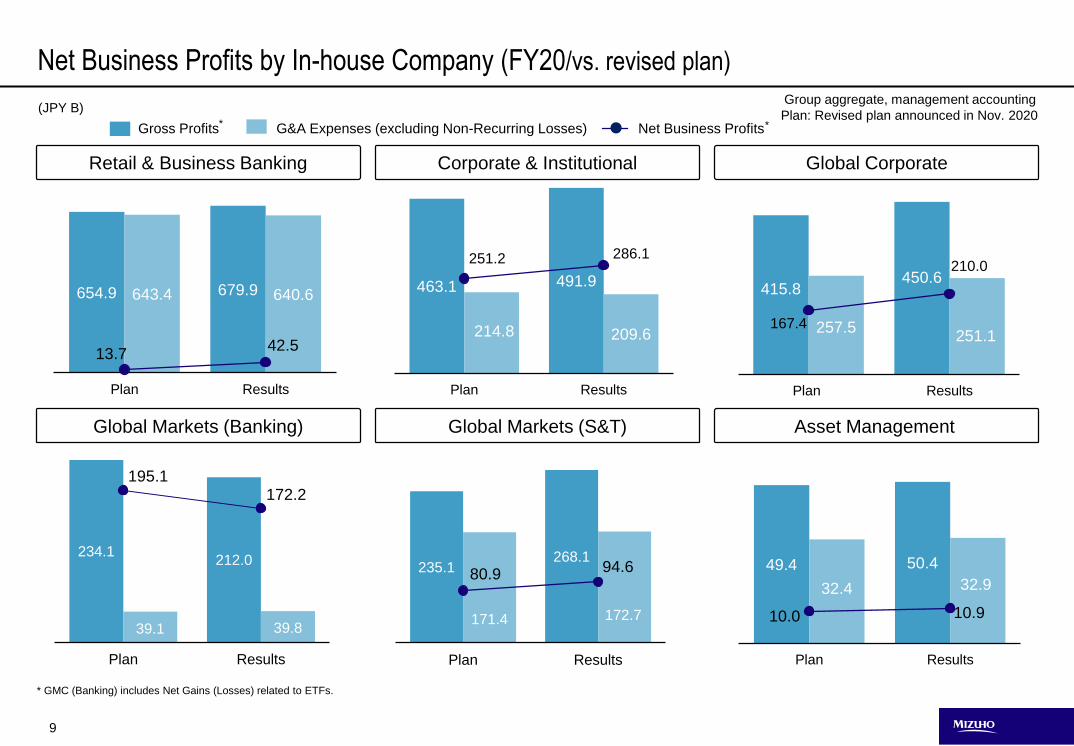
9
235.1268.1
171.4 172.7
Plan Results
234.1212.0
39.1 39.8
Plan Results
49.4 50.4
32.4 32.9
Plan Results
415.8450.6
257.5251.1
Plan Results
463.1 491.9
214.8 209.6
Plan Results
654.9 679.9643.4 640.6
Plan Results
G&A Expenses (excluding Non-Recurring Losses) Net Business Profits
Net Business Profits by In-house Company (FY20/vs. revised plan)
Retail & Business Banking Corporate & Institutional Global Corporate
Global Markets (Banking) Global Markets (S&T) Asset Management
Gross Profits
* GMC (Banking) includes Net Gains (Losses) related to ETFs.
**
Group aggregate, management accounting(JPY B)
13.742.5
251.2 286.1
167.4
210.0
10.0 10.9
172.2195.1
80.9 94.6
Plan: Revised plan announced in Nov. 2020
10
Group aggregate, management accounting1
198.2 179.1
94.9 91.0
123.4114.0
256.7256.6
673.1 640.6
FY19 FY20
66.7 66.6 9.2 4.8
92.8 86.1
98.4 98.0
114.0 152.0
381.1 407.5
FY19 FY20
9.8 9.6 9.4 9.2 8.9 8.7
22.6 23.5 23.9 24.6 25.8 26.8
32.4 33.1 33.3 33.8 34.7 35.5
Sep-18 Mar-19 Sep-19 Mar-20 Sep-20 Mar-21
0.60% 0.58% 0.55% 0.54% 0.52% 0.54%
Individual
(JPY T)(JPY B)
FM costs
System Expenses
Personnel Expenses
Settlement &
Foreign Exchange
Individual
Asset Formation
Solutions
Business
Other
Derivatives
(JPY T) (JPY B)
SP for SME
FY19 FY20
IPO 2nd 2nd
Mar-20 Mar-21
Balance of Assets
in Custody 43.1 53.8
SC 37.6 48.3
2 Banks 5.5 5.5
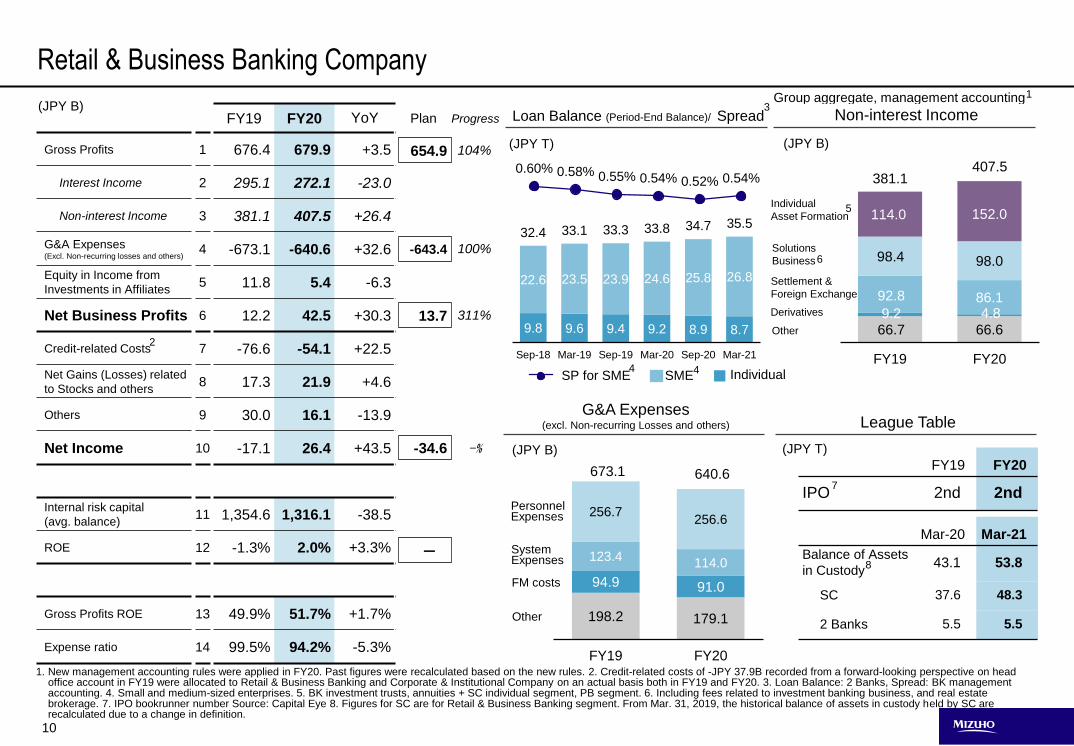
FY19 FY20 YoY
Gross Profits 1 676.4 679.9 +3.5
Interest Income 2 295.1 272.1 -23.0
Non-interest Income 3 381.1 407.5 +26.4
G&A Expenses (Excl. Non-recurring losses and others)
4 -673.1 -640.6 +32.6
Equity in Income from
Investments in Affiliates5 11.8 5.4 -6.3
Net Business Profits 6 12.2 42.5 +30.3
Credit-related Costs 7 -76.6 -54.1 +22.5
Net Gains (Losses) related
to Stocks and others8 17.3 21.9 +4.6
Others 9 30.0 16.1 -13.9
Net Income 10 -17.1 26.4 +43.5
Internal risk capital
(avg. balance)11 1,354.6 1,316.1 -38.5
ROE 12 -1.3% 2.0% +3.3%
Gross Profits ROE 13 49.9% 51.7% +1.7%
Expense ratio 14 99.5% 94.2% -5.3%
Retail & Business Banking Company
Non-interest Income
G&A Expenses (excl. Non-recurring Losses and others) League Table
22.522.6
7
8
13.7
-34.6
Plan
311%
-%
Progress
-
654.9 104%
-643.4 100%
Loan Balance (Period-End Balance)/ Spread
SME
3
44
2
(JPY B)
5
6
Other
1. New management accounting rules were applied in FY20. Past figures were recalculated based on the new rules. 2. Credit-related costs of -JPY 37.9B recorded from a forward-looking perspective on headoffice account in FY19 were allocated to Retail & Business Banking and Corporate & Institutional Company on an actual basis both in FY19 and FY20. 3. Loan Balance: 2 Banks, Spread: BK managementaccounting. 4. Small and medium-sized enterprises. 5. BK investment trusts, annuities + SC individual segment, PB segment. 6. Including fees related to investment banking business, and real estatebrokerage. 7. IPO bookrunner number Source: Capital Eye 8. Figures for SC are for Retail & Business Banking segment. From Mar. 31, 2019, the historical balance of assets in custody held by SC arerecalculated due to a change in definition.
11
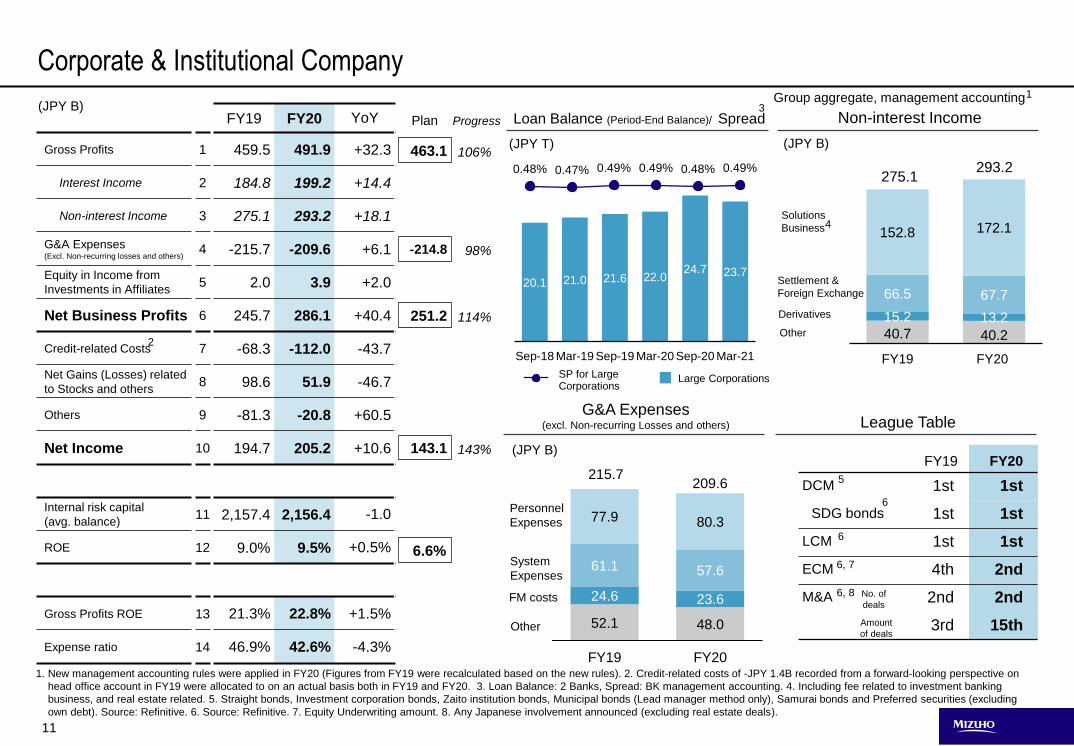
1. New management accounting rules were applied in FY20 (Figures from FY19 were recalculated based on the new rules). 2. Credit-related costs of -JPY 1.4B recorded from a forward-looking perspective on
head office account in FY19 were allocated to on an actual basis both in FY19 and FY20. 3. Loan Balance: 2 Banks, Spread: BK management accounting. 4. Including fee related to investment banking
business, and real estate related. 5. Straight bonds, Investment corporation bonds, Zaito institution bonds, Municipal bonds (Lead manager method only), Samurai bonds and Preferred securities (excluding
own debt). Source: Refinitive. 6. Source: Refinitive. 7. Equity Underwriting amount. 8. Any Japanese involvement announced (excluding real estate deals).
Solutions
Business
Non-interest Income
52.1 48.0
24.6 23.6
61.1 57.6
77.9 80.3
215.7209.6
FY19 FY20
40.7 40.2
15.2 13.2
66.5 67.7
152.8 172.1
FY19 FY20
Settlement &
Foreign Exchange
Other
Derivatives
20.1 21.0 21.6 22.024.7 23.7
Sep-18 Mar-19 Sep-19 Mar-20 Sep-20 Mar-21
0.48% 0.47% 0.49% 0.49% 0.48% 0.49%
FM costs
System
Expenses
Personnel
Expenses
Other
SP for Large Corporations
Large Corporations
(JPY B)
Group aggregate, management accounting
Plan ProgressFY19 FY20 YoY
Gross Profits 1 459.5 491.9 +32.3
Interest Income 2 184.8 199.2 +14.4
Non-interest Income 3 275.1 293.2 +18.1
G&A Expenses (Excl. Non-recurring losses and others)
4 -215.7 -209.6 +6.1
Equity in Income from
Investments in Affiliates5 2.0 3.9 +2.0
Net Business Profits 6 245.7 286.1 +40.4
Credit-related Costs 7 -68.3 -112.0 -43.7
Net Gains (Losses) related
to Stocks and others8 98.6 51.9 -46.7
Others 9 -81.3 -20.8 +60.5
Net Income 10 194.7 205.2 +10.6
Internal risk capital
(avg. balance)11 2,157.4 2,156.4 -1.0
ROE 12 9.0% 9.5% +0.5%
Gross Profits ROE 13 21.3% 22.8% +1.5%
Expense ratio 14 46.9% 42.6% -4.3%
FY19 FY20
DCM 1st 1st
SDG bonds 1st 1st
LCM 1st 1st
ECM 4th 2nd
M&A 2nd 2nd
3rd 15th
Corporate & Institutional Company
5
6, 8 No. of
deals
Amount
of deals
6
6, 7
4
6
22.522.6
251.2
143.1
114%
143%
6.6%
463.1 106%
-214.8 98%
(JPY B)Loan Balance (Period-End Balance)/ Spread
3
(JPY T) (JPY B)
G&A Expenses (excl. Non-recurring Losses and others) League Table
1
2
275.1293.2
12
11.4 9.2
83.8 80.5
93.4 114.9
36.542.8
225.0247.4
FY19 FY20
46.0 52.7
82.6 81.3
78.9 79.7
37.8 37.4
245.3 251.1
FY19 FY20
119.3 112.6 117.5 117.1 122.6 111.6
70.0 75.8 79.9 99.5 90.285.7
46.1 52.756.0
62.2 62.356.2
Sep-18 Mar-19 Sep-19 Mar-20 Sep-20 Mar-21
0.84% 0.80% 0.81% 0.82%0.89%
0.99%
Non-interest Income
(JPY B)
EMEA
Americas
Asia
(JPY B)
1. Figures including past figures are recalculated based on the FY20 planned rate in USD. 2. BK (including the subsidiaries in China, the US, the Netherlands, Indonesia, Malaysia, Russia, Brazil and Mexico).
Spread: BK management accounting 3. Bonds issued by investment grade corporations in the Americas, bookrunner basis. Source: Dealogic
4. Loans issued by investment grade corporations in the Americas, bookrunner basis. Source: Refinitive
League TableG&A Expenses
(excl. Non-recurring Losses and others)
EMEA
Americas
Other
Asia
(JPY T)
Loan Balance (Period-End Balance)/ Spread2
Plan ProgressFY19 FY20 YoY
Gross Profits
△
1 410.9 450.6 +39.7
Interest Income 2 164.6 189.3 +24.8
Non-interest Income 3 225.0 247.4 +22.4
G&A Expenses (Excl. Non-recurring losses and others)
4 -245.3 -251.1 -5.8
Equity in Income from
Investments in Affiliates5 10.4 10.9 +0.6
Net Business Profits 6 175.6 210.0 +34.5
Credit-related Costs 7 -28.4 -28.9 -0.6
Net Gains (Losses) related
to Stocks and others8 7.1 - -7.1
Others 9 -46.1 -67.4 -21.3
Net Income 10 108.2 113.7 +5.5
Internal risk capital
(avg. balance)11 1,301.1 1,396.3 95.2
ROE 12 8.3% 8.1% -0.2%
Gross Profits ROE 13 31.6% 32.3% +0.7%
Expense ratio 14 59.7% 55.7% -4.0%
(JPY B)
FY19 FY20
DCM in the
Americas 10th 9th
Excl. US Banks 4th 3rd
Market Share 3.4% 4.7%
LCM in the
Americas 7th 8th
Excl. US Banks 3rd 2nd
Market Share 3.5% 3.3%
Global Corporate Company
3
4
167.4
76.7
125%
148%
5.4%
415.8 108%
-257.5 98%
Group aggregate, management accounting1
SP AsiaEMEA Americas
13
Sales & Trading
(JPY B)
-49.9
12.3
176.5
-232.2-63.6
265.0
63.0
45.1
FY19 FY20
1,251.5 1,191.7
380.1364.0
215.4 212.0
40.3 39.8
175.1
172.2
FY19 FY20
204.3
268.1
157.4172.7
46.9
94.6
FY19 FY20
1. New management accounting rules were applied in FY20. Past figures were recalculated based on the new rules. 2. Including XVA related gains and losses (FY19: -JPY 8.2B, FY20: JPY 7.2B).
3. Including Net Gains (Losses) related to ETFs (2 Banks) and others. 4. Excluding Non-recurring Losses and others. 5. Preliminary figures.
6. Excluding transactions such as hedge transactions calculated in management accounting in GMC.
ETF,
Funds and
others
Foreign
Bonds
Period-end Balance(JPY B)
Plan Progress
(JPY B)(JPY B)
Group aggregate, management accounting1
(JPY B)
3Net IncomeGross Profits Expenses
4
Reference: Unrealized Gains (Losses)
Global Markets Company
FY19 FY20 YoY
Gross Profits 1 411.5 487.2 +75.7
Banking 2 215.4 212.0 -3.4
S&T 3 204.3 268.1 +63.7
G&A Expenses (Excl. Non-recurring losses and others)
4 -202.6 -218.2 -15.6
Equity in Income from
Investments in Affiliates5 - - -
Net Business Profits 6 207.8 268.2 +60.4
Credit-related Costs 7 0.8 -0.1 -1.0
Net Gains (Losses) related
to Stocks and others8 - - -
Others 9 -65.5 -93.9 -28.4
Net Income 10 143.1 174.2 +31.1
Internal risk capital
(avg. balance)11 1,428.4 1,591.2 +162.8
ROE 12 10.0% 10.9% +0.9%
Gross Profits ROE 13 28.8% 30.6% +1.8%
Expense ratio 14 49.2% 44.8% -4.5%
3
2
2 Banks
6
Japanese
Bonds
276.7
183.3
97%
95%
10.7%
493.0 99%
-215.5 101%
Banking
Internal risk capital
Banking
S&T
Mar-20 Mar-21
5
1,631.61,555.7
14
2.75.7
35.335.6
11.8
33.1
12.1
32.9
15.6 15.1 18.3
36.0 34.439.1
Mar-19 Mar-20 Mar-21
6.95.9
8.6
Mar-19 Mar-20 Mar-21
Expenses
(JPY T)
Gross Profits
Investment
Trusts
Pension
Other
(JPY B)
Plan Progress(JPY B)
Mar-20 Mar-21
Number of iDeCo
participants173 224
Balance of publicly offered and privately placed investment trusts
Investment Trust Net Assets Share Reference indicators
Asset Management Company
FY19 FY20 YoY
Gross Profits 1 52.9 50.4 -2.5
Investment Trusts 2 35.3 35.6 +0.2
Pension 3 11.8 12.1 +0.3
G&A Expenses (Excl. Non-recurring losses and others)
4 -33.1 -32.9 +0.1
Equity in Income from
Investments in Affiliates5 1.3 1.1 -0.2
Net Business Profits 6 13.3 10.9 -2.4
Credit-related Costs 7 - - -
Net Gains (Losses) related
to Stocks and others8 1.2 0.0 -1.2
Others 9 -8.4 -6.5 +1.9
Net Income 10 6.1 4.4 -1.7
Internal risk capital
(avg. balance)11 116.5 111.4 -5.1
ROE 12 5.2% 4.0% -1.2%
Gross Profits ROE 13 45.4% 45.3% -0.1%
Expense ratio 14 62.6% 65.4% +2.8%
2
FY19 FY20
Investment trusts
49.551.7
AM One
50.452.9 57.4
3
10.0
4.0
109%
113%
3.4%
49.4 102%
-32.4 102%
Net Business Profits(JPY T)
(K)
FY19 FY20
R&I investment trust
sales companies
satisfaction survey2nd 2nd
5
4
Share
AM One
10.913.3
10.8%(3rd) 10.4%
(3rd)
11.4%
(2nd)
1. New management accounting rules were applied in FY20. Past figures were recalculated based on the new rules). 2. Excluding Non-Recurring Losses and others. 3. Excluding ETFs. Source: The Investment
Trusts Association data 4. AM One. Source: R&I ‘Fund information’ Vols. 314, 339. 5. BK.
Net Income Pension/AM
Group aggregate, management accounting1
15
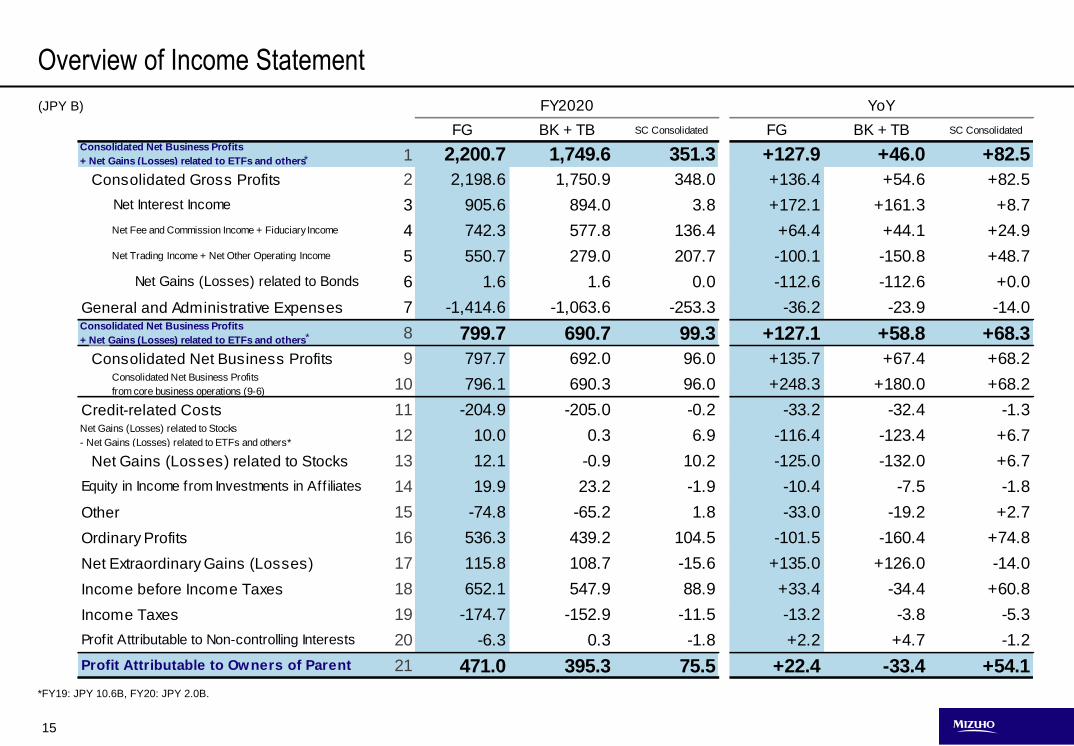
FG BK + TB SC Consolidated FG BK + TB SC Consolidated
1 2,200.7 1,749.6 351.3 +127.9 +46.0 +82.5
Consolidated Gross Profits 2 2,198.6 1,750.9 348.0 +136.4 +54.6 +82.5
Net Interest Income 3 905.6 894.0 3.8 +172.1 +161.3 +8.7
4 742.3 577.8 136.4 +64.4 +44.1 +24.9
5 550.7 279.0 207.7 -100.1 -150.8 +48.7
Net Gains (Losses) related to Bonds 6 1.6 1.6 0.0 -112.6 -112.6 +0.0
General and Administrative Expenses 7 -1,414.6 -1,063.6 -253.3 -36.2 -23.9 -14.0
8 799.7 690.7 99.3 +127.1 +58.8 +68.3
Consolidated Net Business Profits 9 797.7 692.0 96.0 +135.7 +67.4 +68.2
10 796.1 690.3 96.0 +248.3 +180.0 +68.2
Credit-related Costs 11 -204.9 -205.0 -0.2 -33.2 -32.4 -1.3
12 10.0 0.3 6.9 -116.4 -123.4 +6.7
Net Gains (Losses) related to Stocks 13 12.1 -0.9 10.2 -125.0 -132.0 +6.7
Equity in Income from Investments in Aff iliates 14 19.9 23.2 -1.9 -10.4 -7.5 -1.8
Other 15 -74.8 -65.2 1.8 -33.0 -19.2 +2.7
Ordinary Profits 16 536.3 439.2 104.5 -101.5 -160.4 +74.8
Net Extraordinary Gains (Losses) 17 115.8 108.7 -15.6 +135.0 +126.0 -14.0
Income before Income Taxes 18 652.1 547.9 88.9 +33.4 -34.4 +60.8
Income Taxes 19 -174.7 -152.9 -11.5 -13.2 -3.8 -5.3
Profit Attributable to Non-controlling Interests 20 -6.3 0.3 -1.8 +2.2 +4.7 -1.2
Profit Attributable to Owners of Parent 21 471.0 395.3 75.5 +22.4 -33.4 +54.1
FY2020 YoY
Net Gains (Losses) related to Stocks
- Net Gains (Losses) related to ETFs and others
Consolidated Net Business Profits
from core business operations (9-6)
Consolidated Net Business Profits
+ Net Gains (Losses) related to ETFs and others
Net Fee and Commission Income + Fiduciary Income
Net Trading Income + Net Other Operating Income
Consolidated Net Business Profits
+ Net Gains (Losses) related to ETFs and others
*FY19: JPY 10.6B, FY20: JPY 2.0B.
Overview of Income Statement
*
*
*
(JPY B)
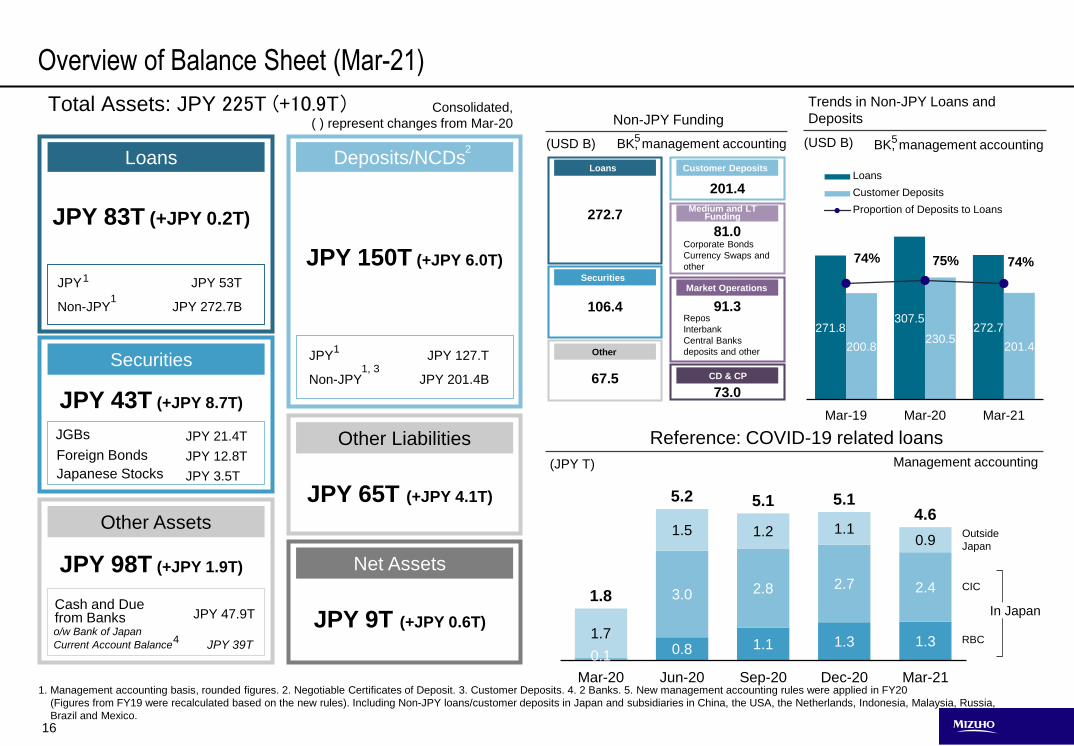
16
0.8 1.1 1.3 1.30.1
3.0 2.8 2.7 2.4
1.7
1.5 1.2 1.10.9
1.8
5.2 5.1 5.14.6
Mar-20 Jun-20 Sep-20 Dec-20 Mar-21
271.8 307.5
272.7
200.8230.5
201.4
74% 75% 74%
Mar-19 Mar-20 Mar-21
Loans
Customer Deposits
Proportion of Deposits to Loans
1. Management accounting basis, rounded figures. 2. Negotiable Certificates of Deposit. 3. Customer Deposits. 4. 2 Banks. 5. New management accounting rules were applied in FY20
(Figures from FY19 were recalculated based on the new rules). Including Non-JPY loans/customer deposits in Japan and subsidiaries in China, the USA, the Netherlands, Indonesia, Malaysia, Russia,
Brazil and Mexico.
(USD B) (USD B) BK, management accounting5
o/w Bank of Japan
Current Account Balance
Cash and Due from Banks
JGBs
Japanese Stocks
Foreign Bonds
JPY
Non-JPY
Consolidated,
( ) represent changes from Mar-20
Trends in Non-JPY Loans and
DepositsNon-JPY Funding
Reference: COVID-19 related loans
Total Assets: JPY 225T (+10.9T)
Overview of Balance Sheet (Mar-21)
Loans
Securities
Deposits/NCDs
Other Liabilities
Net Assets
Other Assets
JPY 83T (+JPY 0.2T)
JPY 43T (+JPY 8.7T)
JPY 98T (+JPY 1.9T)
JPY 53T
JPY 272.7B
1
1
4
JPY 21.4T
JPY 12.8T
JPY 3.5T
JPY 47.9T
JPY 39T
JPY 150T (+JPY 6.0T)
JPY 9T (+JPY 0.6T)
JPY 65T (+JPY 4.1T)
JPY 127.T
JPY 201.4B
JPY
Non-JPY
1
1, 3
BK, management accounting
Outside
Japan
In Japan
(JPY T) Management accounting
5
Loans
272.7
Securities
106.4
Other
67.5
Customer Deposits
201.4
Medium and LT Funding
81.0
Market Operations
91.3
CD & CP
73.0
Corporate Bonds
Currency Swaps and
other
Repos
Interbank
Central Banks
deposits and other
CIC
RBC
2
17
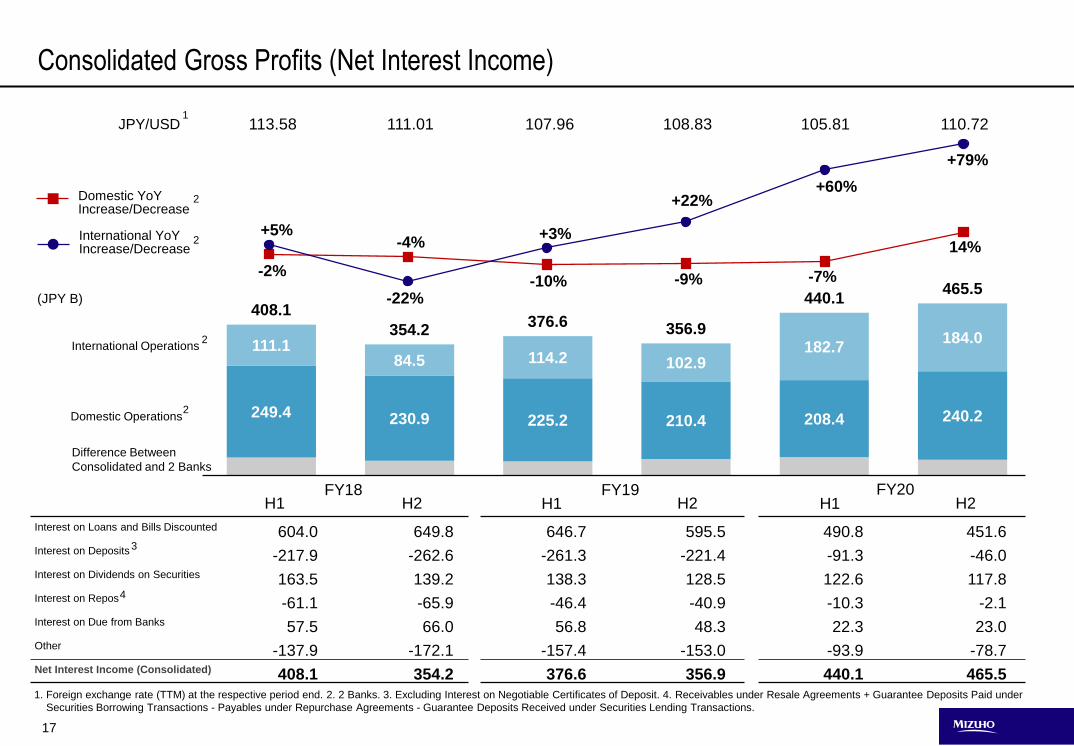
249.4 230.9 225.2 210.4 208.4 240.2
111.184.5 114.2 102.9
182.7184.0
408.1
354.2376.6 356.9
440.1465.5
-2%
-4%
-10% -9% -7%
14%+5%
-22%
+3%
+22%+60%
+79%
1. Foreign exchange rate (TTM) at the respective period end. 2. 2 Banks. 3. Excluding Interest on Negotiable Certificates of Deposit. 4. Receivables under Resale Agreements + Guarantee Deposits Paid under
Securities Borrowing Transactions - Payables under Repurchase Agreements - Guarantee Deposits Received under Securities Lending Transactions.
Difference Between
Consolidated and 2 Banks
International Operations
Domestic Operations
(JPY B)
International YoY Increase/Decrease
Domestic YoY Increase/Decrease
Interest on Loans and Bills Discounted 604.0 649.8 Interest on Deposits -217.9 -262.6 Interest on Dividends on Securities 163.5 139.2 Interest on Repos -61.1 -65.9 Interest on Due from Banks 57.5 66.0 Other -137.9 -172.1 Net Interest Income (Consolidated) 408.1 354.2
4
JPY/USD1
2
2
2
3
2
Consolidated Gross Profits (Net Interest Income)
113.58 111.01 107.96 108.83 105.81 110.72
FY18 FY19 FY20H1 H2
646.7 595.5
-261.3 -221.4
138.3 128.5
-46.4 -40.9
56.8 48.3
-157.4 -153.0
376.6 356.9
490.8 451.6
-91.3 -46.0
122.6 117.8
-10.3 -2.1
22.3 23.0
-93.9 -78.7
440.1 465.5
H1 H2 H1 H2
18
H1 H2 H1 H2 H1 H2
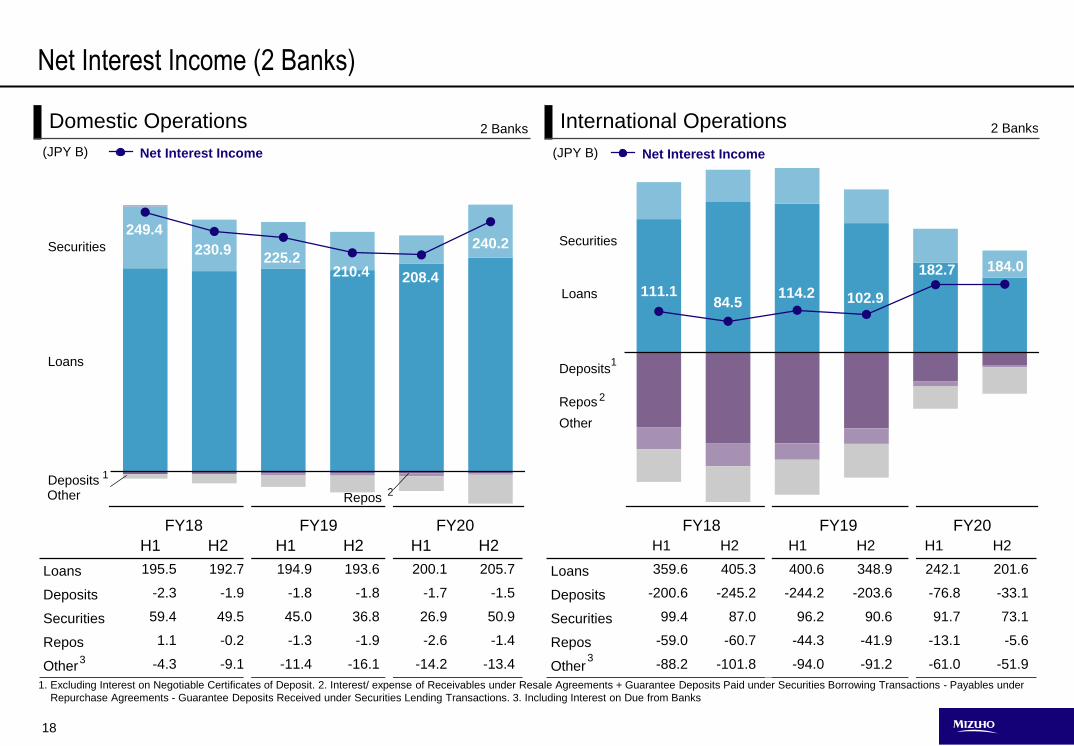
Loans 359.6 405.3 400.6 348.9 242.1 201.6
Deposits -200.6 -245.2 -244.2 -203.6 -76.8 -33.1
Securities 99.4 87.0 96.2 90.6 91.7 73.1
Repos -59.0 -60.7 -44.3 -41.9 -13.1 -5.6
Other -88.2 -101.8 -94.0 -91.2 -61.0 -51.9
H1 H2 H1 H2 H1 H2
Loans 195.5 192.7 194.9 193.6 200.1 205.7
Deposits -2.3 -1.9 -1.8 -1.8 -1.7 -1.5
Securities 59.4 49.5 45.0 36.8 26.9 50.9
Repos 1.1 -0.2 -1.3 -1.9 -2.6 -1.4
Other -4.3 -9.1 -11.4 -16.1 -14.2 -13.4
Domestic Operations
Deposits
Repos
Other
Securities
Loans
(JPY B)(JPY B)
Loans
Deposits
Securities
2 Banks2 Banks International Operations
Net Interest Income (2 Banks)
Repos
1
2
Net Interest Income Net Interest Income
3 3
1
208.4
249.4
230.9225.2
210.4 184.0
111.184.5
114.2 102.9
182.7
FY18 FY19 FY20 FY18 FY19 FY20
Other
1. Excluding Interest on Negotiable Certificates of Deposit. 2. Interest/ expense of Receivables under Resale Agreements + Guarantee Deposits Paid under Securities Borrowing Transactions - Payables under
Repurchase Agreements - Guarantee Deposits Received under Securities Lending Transactions. 3. Including Interest on Due from Banks
240.2
2
19
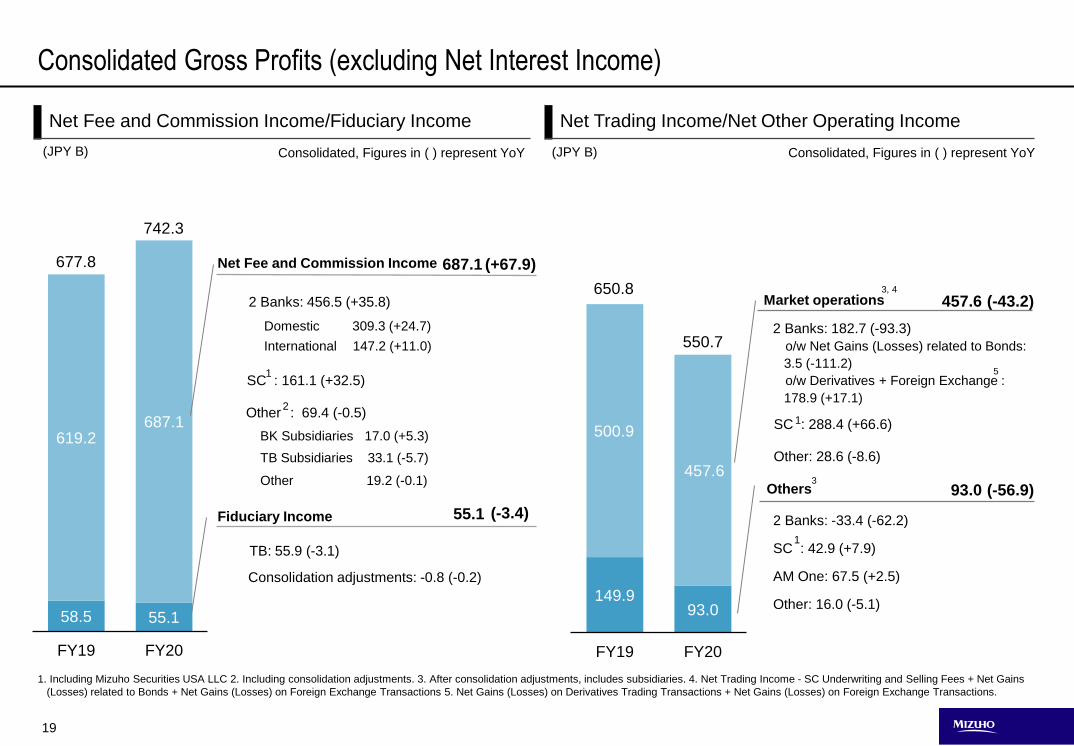
58.5 55.1
619.2687.1
677.8
742.3
FY19 FY20
149.993.0
500.9
457.6
650.8
550.7
FY19 FY20
SC : 161.1 (+32.5)
Domestic 309.3 (+24.7)
SC : 288.4 (+66.6)
Market operations
2 Banks: 182.7 (-93.3)
o/w Net Gains (Losses) related to Bonds:
3.5 (-111.2)
o/w Derivatives + Foreign Exchange :
178.9 (+17.1)
3, 4
Others
2 Banks: -33.4 (-62.2)
SC : 42.9 (+7.9)
AM One: 67.5 (+2.5)
Other: 16.0 (-5.1)
Fiduciary Income
TB: 55.9 (-3.1)
Consolidation adjustments: -0.8 (-0.2)
1. Including Mizuho Securities USA LLC 2. Including consolidation adjustments. 3. After consolidation adjustments, includes subsidiaries. 4. Net Trading Income - SC Underwriting and Selling Fees + Net Gains
(Losses) related to Bonds + Net Gains (Losses) on Foreign Exchange Transactions 5. Net Gains (Losses) on Derivatives Trading Transactions + Net Gains (Losses) on Foreign Exchange Transactions.
TB Subsidiaries 33.1 (-5.7)
2 Banks: 456.5 (+35.8)
Net Fee and Commission Income
International 147.2 (+11.0)
Other : 69.4 (-0.5)
BK Subsidiaries 17.0 (+5.3)
Other 19.2 (-0.1)
Consolidated, Figures in ( ) represent YoY(JPY B)Consolidated, Figures in ( ) represent YoY
Net Fee and Commission Income/Fiduciary Income Net Trading Income/Net Other Operating Income
Consolidated Gross Profits (excluding Net Interest Income)
(JPY B)
(+67.9)
(-3.4)
687.1
55.1
(-43.2)
(-56.9)
457.6
93.03
1
2
5
1
1
Other: 28.6 (-8.6)
20
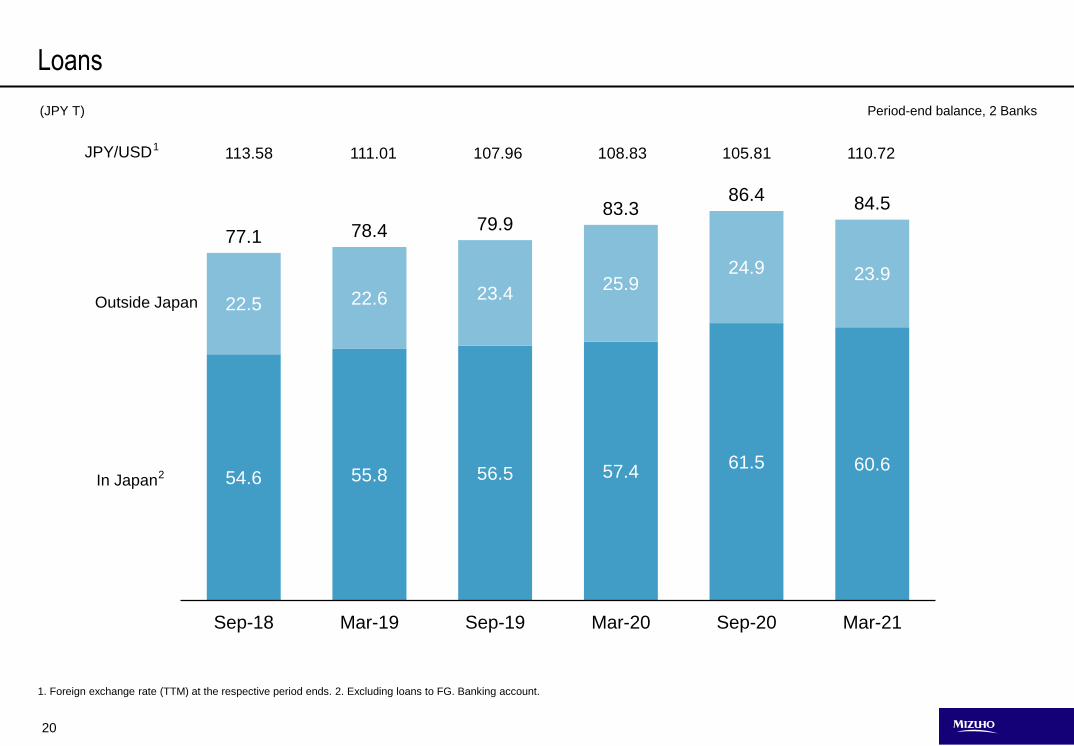
54.6 55.8 56.5 57.4 61.5 60.6
22.5 22.6 23.4 25.9
24.9 23.9
77.1 78.4 79.9 83.3
86.4 84.5
Sep-18 Mar-19 Sep-19 Mar-20 Sep-20 Mar-21
In Japan
113.58 111.01 107.96 108.83 105.81 110.72JPY/USD
1. Foreign exchange rate (TTM) at the respective period ends. 2. Excluding loans to FG. Banking account.
1
2
Loans
Outside Japan
(JPY T) Period-end balance, 2 Banks
21
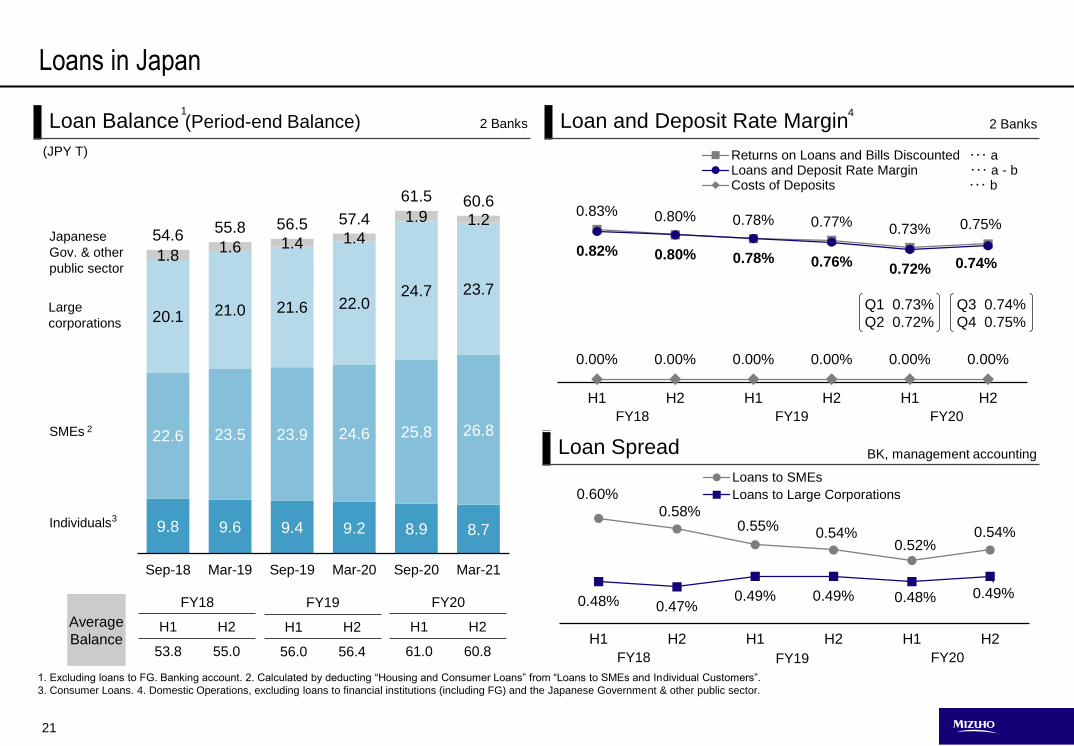
0.60%
0.58%0.55%
0.54%0.52%
0.54%
0.48% 0.47%0.49% 0.49% 0.48% 0.49%
H1 H2 H1 H2 H1 H2
Loans to SMEs
Loans to Large Corporations
0.83% 0.80% 0.78% 0.77%0.73% 0.75%
0.82% 0.80% 0.78% 0.76%0.72% 0.74%
0.00% 0.00% 0.00% 0.00% 0.00% 0.00%
H1 H2 H1 H2 H1 H2
Returns on Loans and Bills Discounted ・・・ aLoans and Deposit Rate Margin ・・・ a - bCosts of Deposits ・・・ b
Loan Balance (Period-end Balance)
(JPY T)
BK, management accounting
1. Excluding loans to FG. Banking account. 2. Calculated by deducting “Housing and Consumer Loans” from “Loans to SMEs and Individual Customers”.
3. Consumer Loans. 4. Domestic Operations, excluding loans to financial institutions (including FG) and the Japanese Government & other public sector.
Japanese
Gov. & other
public sector
Large
corporations
Individuals
SMEs 2
3
2 Banks Loan and Deposit Rate Margin 2 Banks
Loan Spread
Q3 0.74%
Q4 0.75%
Q1 0.73%
Q2 0.72%
Loans in Japan
41
FY18 FY19 FY20
Average
Balance
FY18
H1 H2
53.8 55.0
FY19
H1 H2
56.0 56.4
FY20
H1 H2
61.0 60.8
9.8 9.6 9.4 9.2 8.9 8.7
22.6 23.5 23.9 24.6 25.8 26.8
20.1 21.0 21.6 22.0 24.7 23.7
1.8 1.6 1.4 1.4
1.9 1.2 54.6
55.8 56.5 57.4
61.5 60.6
Sep-18 Mar-19 Sep-19 Mar-20 Sep-20 Mar-21
FY18 FY19 FY20
22
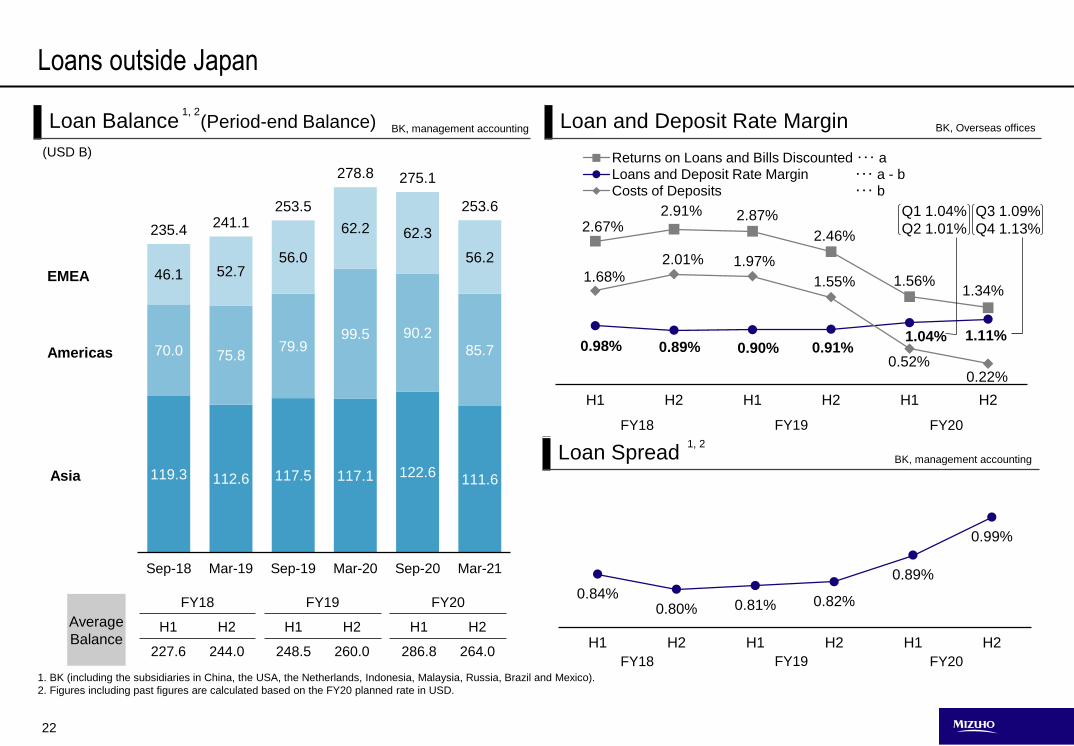
2.67%2.91% 2.87%
2.46%
1.56%1.34%
0.98% 0.89% 0.90% 0.91%1.04% 1.11%
1.68%
2.01% 1.97%
1.55%
0.52%0.22%
H1 H2 H1 H2 H1 H2
Returns on Loans and Bills Discounted ・・・ a
Loans and Deposit Rate Margin ・・・ a - b
Costs of Deposits ・・・ b
0.84%0.80% 0.81% 0.82%
0.89%
0.99%
H1 H2 H1 H2 H1 H2
119.3 112.6 117.5 117.1 122.6 111.6
70.0 75.879.9
99.5 90.2
85.7
46.1 52.756.0
62.2 62.3
56.2
235.4 241.1
253.5
278.8 275.1
253.6
Sep-18 Mar-19 Sep-19 Mar-20 Sep-20 Mar-21
Loan Spread
Loan and Deposit Rate Margin
BK, management accounting
BK, Overseas offices
1. BK (including the subsidiaries in China, the USA, the Netherlands, Indonesia, Malaysia, Russia, Brazil and Mexico).
2. Figures including past figures are calculated based on the FY20 planned rate in USD.
(USD B)
Loan Balance (Period-end Balance)
EMEA
Americas
Asia
Loans outside Japan
1, 2
BK, management accounting
1, 2
FY18 FY19 FY20
FY18
H1 H2
227.6 244.0
FY19
H1 H2
248.5 260.0
FY20
H1 H2
286.8 264.0
Average
Balance
Q1 1.04%
Q2 1.01%
Q3 1.09%
Q4 1.13%
FY18 FY19 FY20
23
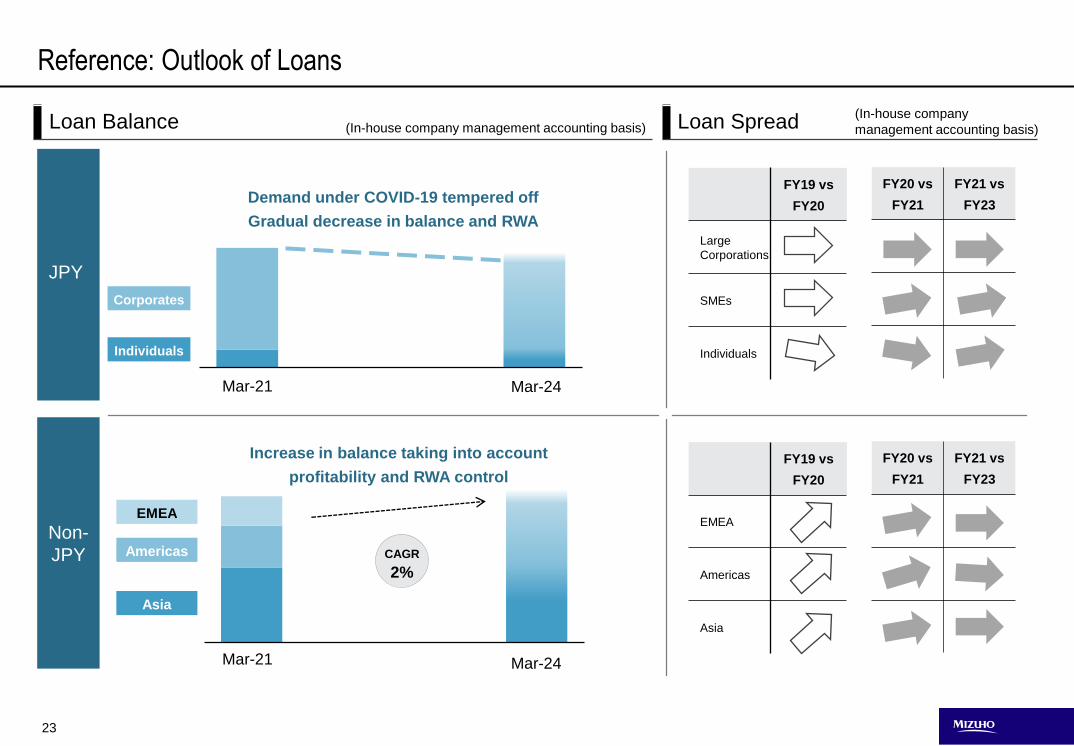
Loan Spread(In-house company
management accounting basis)Loan Balance (In-house company management accounting basis)
21/3末 24/3末
21/3末 24/3末
Reference: Outlook of Loans
JPY
Non-
JPY
Demand under COVID-19 tempered off
Gradual decrease in balance and RWA
Increase in balance taking into account
profitability and RWA control
CAGR
2%
FY19 vs
FY20
Large
Corporations
SMEs
Individuals
FY20 vs
FY21
FY21 vs
FY23
FY19 vs
FY20
EMEA
Americas
Asia
FY20 vs
FY21
FY21 vs
FY23
Corporates
Individuals
Asia
Americas
EMEA
Mar-21 Mar-24
Mar-21 Mar-24
24
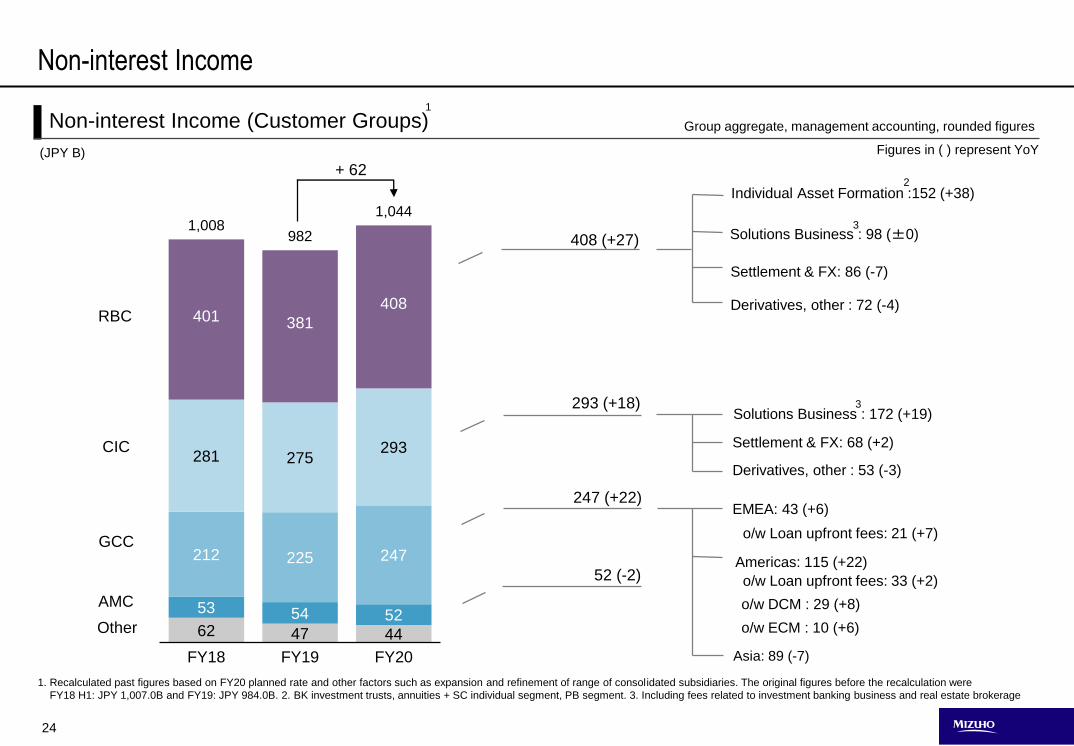
62 47 44
53 54 52
212 225 247
281 275293
401 381
408
1,008982
1,044
FY18 FY19 FY20 Asia: 89 (-7)
o/w Loan upfront fees: 33 (+2)
o/w DCM : 29 (+8)
o/w ECM : 10 (+6)
Solutions Business : 172 (+19)
1. Recalculated past figures based on FY20 planned rate and other factors such as expansion and refinement of range of consolidated subsidiaries. The original figures before the recalculation were
FY18 H1: JPY 1,007.0B and FY19: JPY 984.0B. 2. BK investment trusts, annuities + SC individual segment, PB segment. 3. Including fees related to investment banking business and real estate brokerage
Figures in ( ) represent YoY
Group aggregate, management accounting, rounded figuresNon-interest Income (Customer Groups)
+ 62
Settlement & FX: 86 (-7)
EMEA: 43 (+6)
Derivatives, other : 72 (-4)
Non-interest Income
408 (+27)
293 (+18)
Individual Asset Formation :152 (+38)
Settlement & FX: 68 (+2)
Derivatives, other : 53 (-3)
1
2
3
3
(JPY B)
RBC
CIC
GCC
AMC
Other
247 (+22)
52 (-2)
o/w Loan upfront fees: 21 (+7)
Solutions Business : 98 (±0)
Americas: 115 (+22)
25
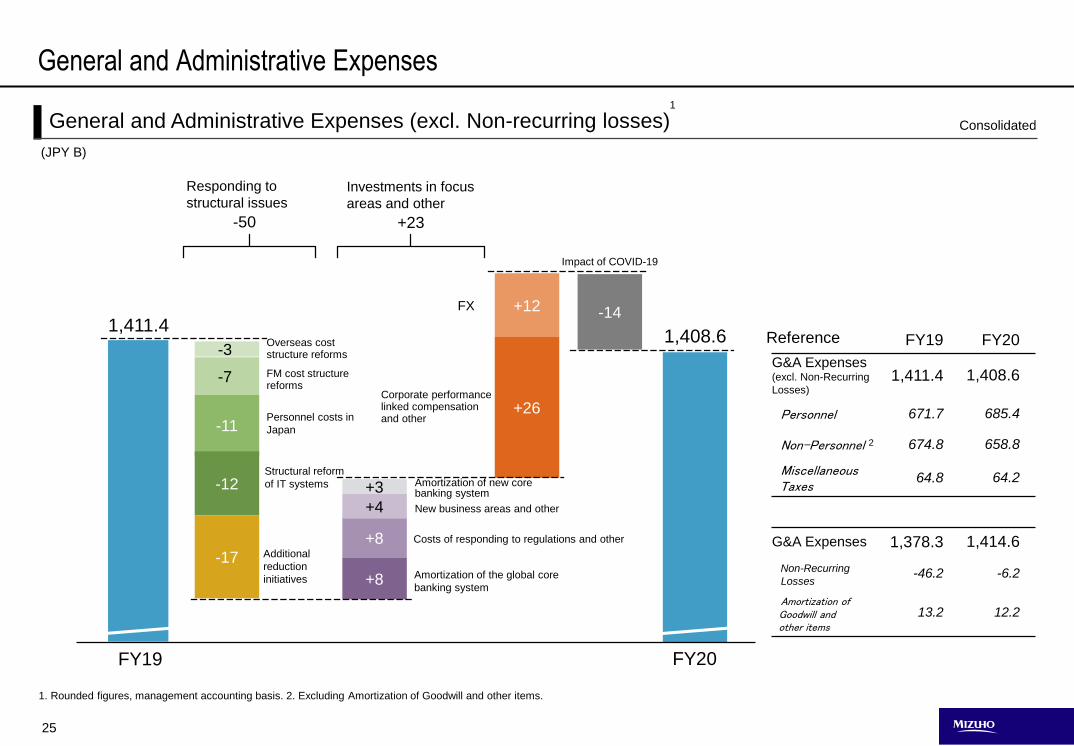
Amortization of new core banking system
Amortization of the global core
banking system
Costs of responding to regulations and other
New business areas and other
FM cost structure reforms
Structural reform
of IT systems
Overseas cost structure reforms
Personnel costs in
Japan
Additional
reduction
initiatives
Corporate performance linked compensation and other
Impact of COVID-19
Investments in focus
areas and other
Responding to
structural issues
(JPY B)
ConsolidatedGeneral and Administrative Expenses (excl. Non-recurring losses)
General and Administrative Expenses
1. Rounded figures, management accounting basis. 2. Excluding Amortization of Goodwill and other items.
1,408.61,411.4
FY19 FY20
-50 +23
FY19 FY20
G&A Expenses (excl. Non-Recurring
Losses)
1,411.4 1,408.6
Personnel 671.7 685.4
Non-Personnel 674.8 658.8
MiscellaneousTaxes
64.8 64.2
G&A Expenses 1,378.3 1,414.6
Non-Recurring
Losses-46.2 -6.2
Amortization ofGoodwill andother items
13.2 12.2
Reference
+8
+8
+3
+4
+12
-11
-12
-3
-17
-7
+26
-14FX
2
1
26
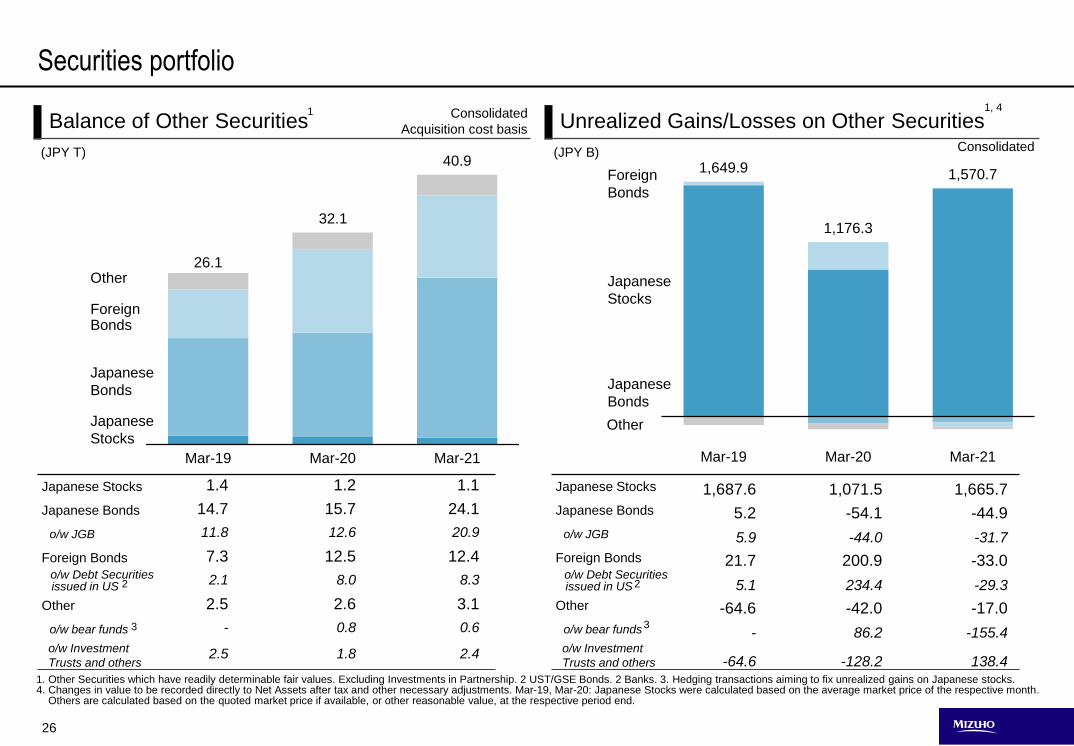
1. Other Securities which have readily determinable fair values. Excluding Investments in Partnership. 2 UST/GSE Bonds. 2 Banks. 3. Hedging transactions aiming to fix unrealized gains on Japanese stocks. 4. Changes in value to be recorded directly to Net Assets after tax and other necessary adjustments. Mar-19, Mar-20: Japanese Stocks were calculated based on the average market price of the respective month.
Others are calculated based on the quoted market price if available, or other reasonable value, at the respective period end.
26.1
32.1
40.9
Mar-19 Mar-20 Mar-21
1,649.9
1,176.3
1,570.7
Mar-19 Mar-20 Mar-21
Foreign
Bonds
Japanese
Stocks
Japanese
Bonds
Other
Japanese
Bonds
Foreign Bonds
Other
Japanese
Stocks
(JPY B)(JPY T)
Consolidated
Acquisition cost basis Unrealized Gains/Losses on Other Securities
Securities portfolio
Balance of Other Securities
Japanese Stocks 1.4 1.2 1.1
Japanese Bonds 14.7 15.7 24.1
o/w JGB 11.8 12.6 20.9
Foreign Bonds 7.3 12.5 12.4o/w Debt Securitiesissued in US
2.1 8.0 8.3
Other 2.5 2.6 3.1
o/w bear funds - 0.8 0.6
o/w Investment
Trusts and others2.5 1.8 2.4
Japanese Stocks 1,687.6 1,071.5 1,665.7
Japanese Bonds 5.2 -54.1 -44.9
o/w JGB 5.9 -44.0 -31.7
Foreign Bonds 21.7 200.9 -33.0o/w Debt Securitiesissued in US 5.1 234.4 -29.3
Other -64.6 -42.0 -17.0
o/w bear funds - 86.2 -155.4o/w Investment
Trusts and others -64.6 -128.2 138.4
2
3
Consolidated
1, 41
2
3
27
-0.5
0.0
0.5
1.0
1.5
2.0
2.5
19/3 19/9 20/3 20/9 21/3
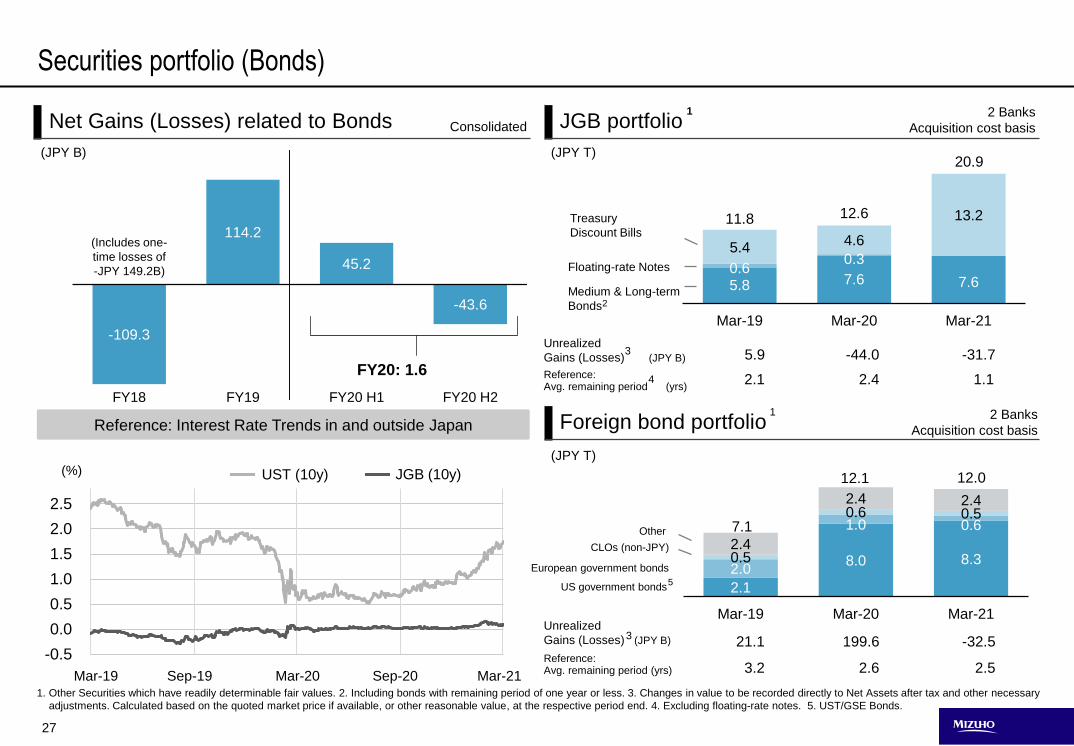
2.1
8.0 8.3 2.0
1.0 0.6
0.5
0.6 0.5
2.4
2.4 2.4
7.1
12.1 12.0
Mar-19 Mar-20 Mar-21
5.8 7.6 7.60.6
0.35.4
4.6
13.211.8 12.6
20.9
Mar-19 Mar-20 Mar-21-109.3
114.2
45.2
-43.6
FY18 FY19 FY20 H1 FY20 H2
Net Gains (Losses) related to Bonds
1. Other Securities which have readily determinable fair values. 2. Including bonds with remaining period of one year or less. 3. Changes in value to be recorded directly to Net Assets after tax and other necessary
adjustments. Calculated based on the quoted market price if available, or other reasonable value, at the respective period end. 4. Excluding floating-rate notes. 5. UST/GSE Bonds.
Reference: Interest Rate Trends in and outside Japan2 Banks
Acquisition cost basis
JGB portfolio
Reference: Avg. remaining period (yrs)
(JPY T)
Unrealized
Gains (Losses) (JPY B)
(Includes one-
time losses of
-JPY 149.2B)
Medium & Long-term
Bonds
Floating-rate Notes
Treasury
Discount Bills
(JPY B) (JPY T)
Consolidated 2 Banks
Acquisition cost basis
Reference: Avg. remaining period (yrs)
Foreign bond portfolio
Securities portfolio (Bonds)
(%)
1
1
3
US government bonds
European government bonds
CLOs (non-JPY)
Other
5
JGB (10y)
2
UST (10y)
Unrealized
Gains (Losses) (JPY B)3
4FY20: 1.6
5.9 -44.0 -31.7
2.1 2.4 1.1
199.621.1 -32.5
3.2 2.6 2.5Mar-19 Sep-19 Mar-20 Sep-20 Mar-21
28
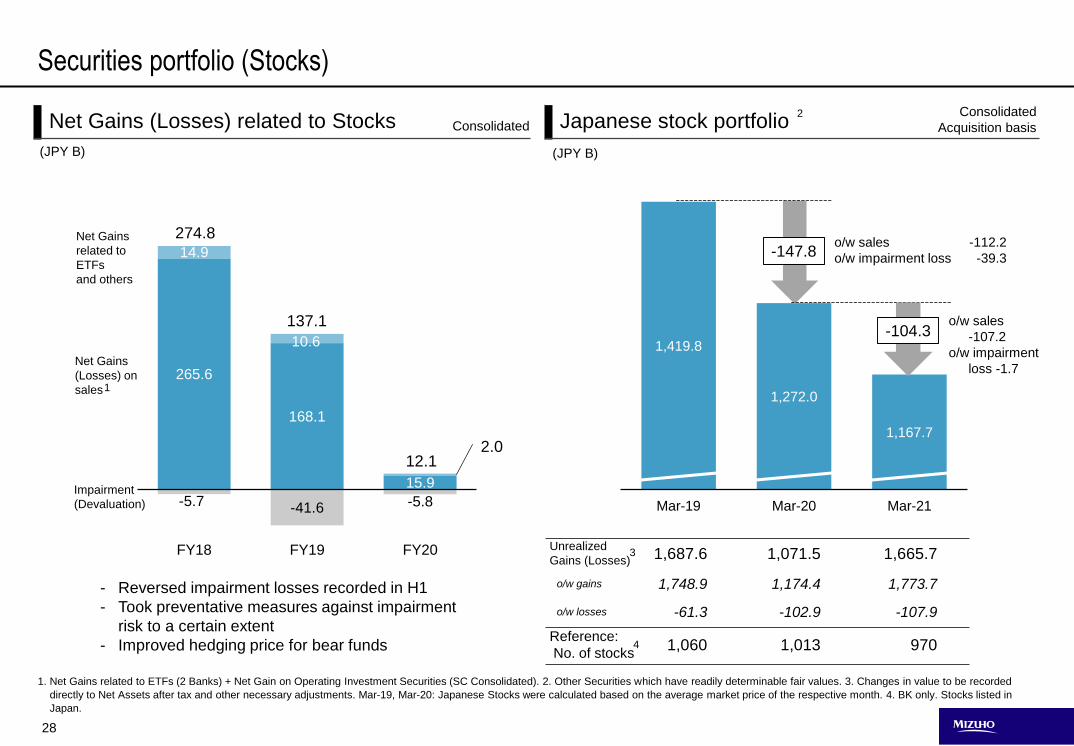
1,419.8
1,272.0
1,167.7
Mar-19 Mar-20 Mar-21
Consolidated
Acquisition basis
265.6
168.1
15.9
14.9
10.6
-5.7 -41.6 -5.8
FY18 FY19 FY20
1. Net Gains related to ETFs (2 Banks) + Net Gain on Operating Investment Securities (SC Consolidated). 2. Other Securities which have readily determinable fair values. 3. Changes in value to be recorded
directly to Net Assets after tax and other necessary adjustments. Mar-19, Mar-20: Japanese Stocks were calculated based on the average market price of the respective month. 4. BK only. Stocks listed in
Japan.
o/w sales
-107.2
o/w impairment
loss -1.7
(JPY B)(JPY B)
Net Gains
(Losses) on
sales
Impairment
(Devaluation)
Net Gains
related to
ETFs
and others
Net Gains (Losses) related to Stocks Consolidated
Unrealized
Gains (Losses) 1,687.6 1,071.5 1,665.7
o/w gains 1,748.9 1,174.4 1,773.7
o/w losses -61.3 -102.9 -107.9
Reference:
No. of stocks1,060 1,013 970
Securities portfolio (Stocks)
Japanese stock portfolio
274.8
137.1
12.1
3
2
1
- Reversed impairment losses recorded in H1
- Took preventative measures against impairment
risk to a certain extent
- Improved hedging price for bear funds 4
-147.8
-104.3
2.0
o/w sales
o/w impairment loss
-112.2
-39.3
29
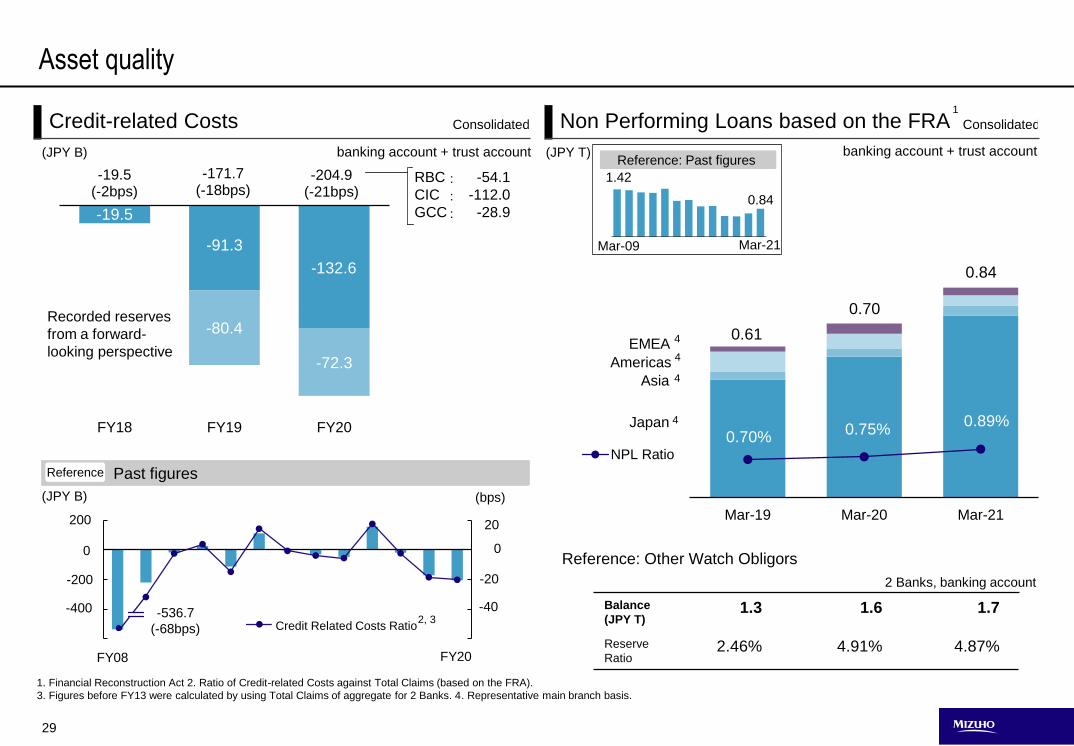
-19.5(-2bps)
-171.7(-18bps)
-204.9(-21bps)
-80.4
-72.3
FY18 FY19 FY20
与信関係費用比率
0
0.5
1
1.5
0.61
0.70
0.84
0.70%0.75%
0.89%
Mar-19 Mar-20 Mar-21
NPL Ratio
Reference: Past figures
1. Financial Reconstruction Act 2. Ratio of Credit-related Costs against Total Claims (based on the FRA).
3. Figures before FY13 were calculated by using Total Claims of aggregate for 2 Banks. 4. Representative main branch basis.
2 Banks, banking account
Japan
Americas
(JPY T)
20
-20
Past figuresReference
Recorded reserves
from a forward-
looking perspective
(JPY B) banking account + trust account
Consolidated
banking account + trust account
Consolidated
Reference: Other Watch Obligors
Non Performing Loans based on the FRACredit-related Costs
Asset quality
4
(JPY B)
0
-40
(bps)
FY08
-536.7
(-68bps)
0.84
1.42
Mar-21Mar-09
Balance
(JPY T)1.3 1.6 1.7
Reserve
Ratio2.46% 4.91% 4.87%
FY20
-132.6
-91.3
-19.5
RBC
CIC
GCC
-54.1
-112.0
-28.9
:::
Credit Related Costs Ratio
4
EMEA
Asia
4
4
200
0
-200
-4002, 3
1
30
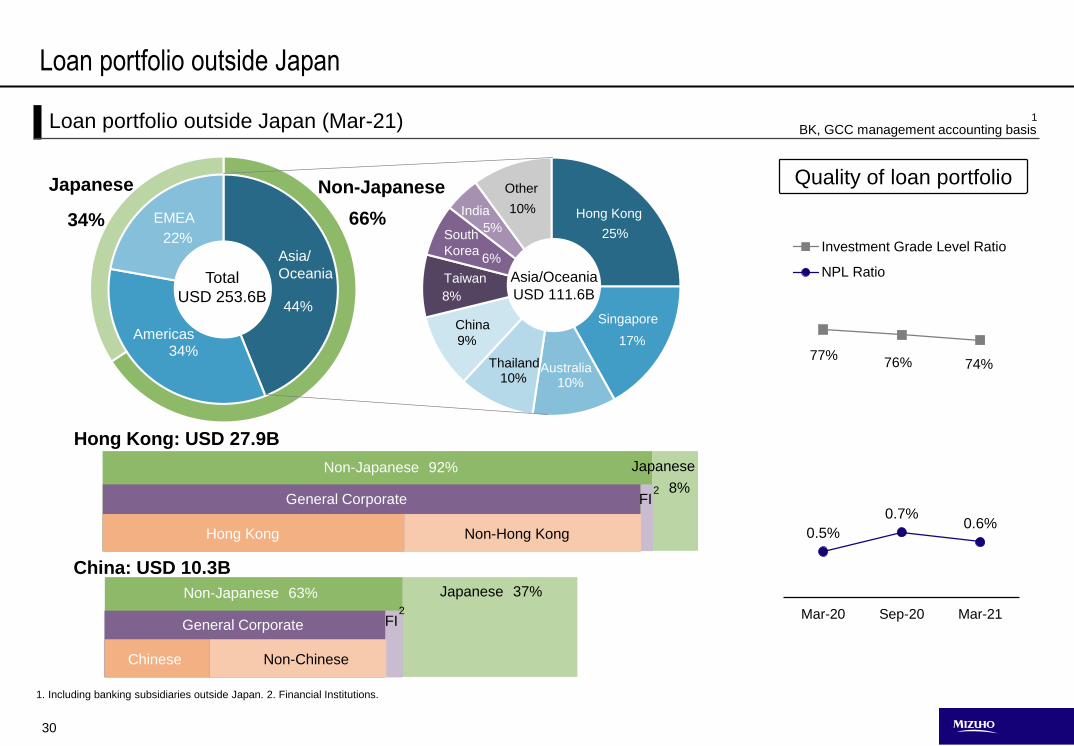
77%76% 74%
0.5%
0.7%0.6%
Mar-20 Sep-20 Mar-21
Investment Grade Level Ratio
NPL Ratio
BK, GCC management accounting basis
Loan portfolio outside Japan
Quality of loan portfolioJapanese Non-Japanese
Total
USD 253.6B
Asia/
Oceania
44%
Americas34%
EMEA
22%
Hong Kong
25%
Singapore
17%
Australia10%
Thailand10%
9%
China
Hong Kong: USD 27.9B
China: USD 10.3B
Hong Kong
General Corporate FI
Non-Japanese 92% Japanese
8%
Asia/Oceania
USD 111.6B8%
Taiwan
6%
South
Korea
5%
India 10%
Other
Non-Hong Kong
Chinese Non-Chinese
FI
Non-Japanese 63% Japanese 37%
34% 66%
General Corporate
1. Including banking subsidiaries outside Japan. 2. Financial Institutions.
2
2
1Loan portfolio outside Japan (Mar-21)
31
Exposure in specific sectors and products
Resource sector Real estate sector
Aircraft / LBO Loans outside Japan
17%
28%
13%NRLs
18%
1 1
Total
JPY
14.7T
24%
NRLs
JPY
2.7T
18%
BK + TB
Management accounting basis
BK
management accounting basis
BK
management accounting basis
1. The sum of loans, foreign exchange, and unused committed lines of credit and other. 2. Credit where the lender is exposed to residual value risk of the asset. Exclusively warehouse facilities premised on
takeouts by ABS and other securities. 3. Including those in which we have won mandates.
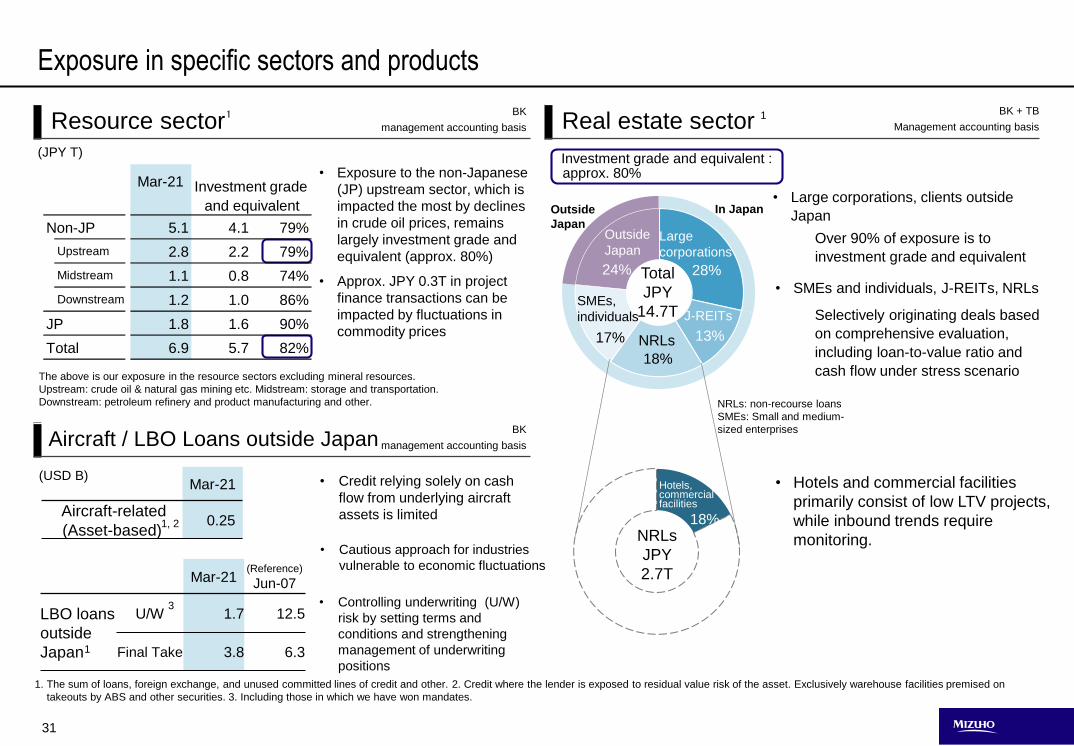
The above is our exposure in the resource sectors excluding mineral resources.
Upstream: crude oil & natural gas mining etc. Midstream: storage and transportation.
Downstream: petroleum refinery and product manufacturing and other.
Mar-21
Non-JP 5.1 4.1 79%
Upstream 2.8 2.2 79%
Midstream 1.1 0.8 74%
Downstream 1.2 1.0 86%
JP 1.8 1.6 90%
Total 6.9 5.7 82%
Investment grade
and equivalent
(JPY T)
• Exposure to the non-Japanese
(JP) upstream sector, which is
impacted the most by declines
in crude oil prices, remains
largely investment grade and
equivalent (approx. 80%)
• Approx. JPY 0.3T in project
finance transactions can be
impacted by fluctuations in
commodity prices
Mar-21(Reference)
Jun-07
LBO loans
outside
Japan
U/W 1.7 12.5
Final Take 3.8 6.3
Mar-21
Aircraft-related
(Asset-based)0.25
3
(USD B)
1
1, 2
• Credit relying solely on cash
flow from underlying aircraft
assets is limited
• Cautious approach for industries
vulnerable to economic fluctuations
• Controlling underwriting (U/W)
risk by setting terms and
conditions and strengthening
management of underwriting
positions
Investment grade and equivalent : approx. 80%
SMEs,
individuals
Large
corporations
J-REITs
Outside
Japan
In JapanOutside
Japan
• Large corporations, clients outside
Japan
• SMEs and individuals, J-REITs, NRLs
Over 90% of exposure is to
investment grade and equivalent
Selectively originating deals based
on comprehensive evaluation,
including loan-to-value ratio and
cash flow under stress scenario
NRLs: non-recourse loans
SMEs: Small and medium-
sized enterprises
Hotels, commercial facilities
• Hotels and commercial facilities
primarily consist of low LTV projects,
while inbound trends require
monitoring.
32
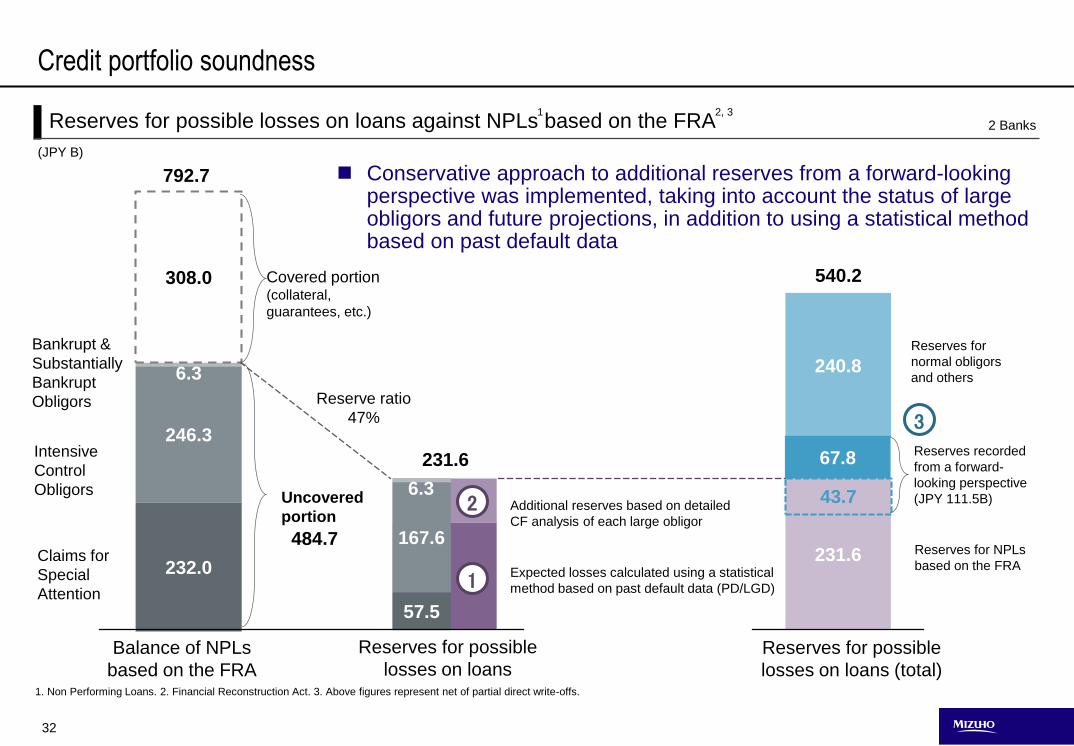
57.5
167.6
6.3
232.0
246.3
6.3
308.0
1. Non Performing Loans. 2. Financial Reconstruction Act. 3. Above figures represent net of partial direct write-offs.
Reserves for NPLs
based on the FRA
Reserves for
normal obligors
and others
Additional reserves based on detailed
CF analysis of each large obligor
Expected losses calculated using a statistical
method based on past default data (PD/LGD)
Reserves for possible
losses on loansBalance of NPLs
based on the FRA
Reserves for possible
losses on loans (total)
Covered portion(collateral,
guarantees, etc.)
Conservative approach to additional reserves from a forward-looking perspective was implemented, taking into account the status of large obligors and future projections, in addition to using a statistical method based on past default data
2 BanksReserves for possible losses on loans against NPLs based on the FRA2, 3
Intensive
Control
Obligors
Claims for
Special
Attention
Bankrupt &
Substantially
Bankrupt
Obligors
Credit portfolio soundness
792.7
231.6
231.6
1
2
540.2
(JPY B)
3
43.7
240.8
67.8
Reserve ratio
47%
Uncovered
portion
484.7
Reserves recorded
from a forward-
looking perspective
(JPY 111.5B)
1
33
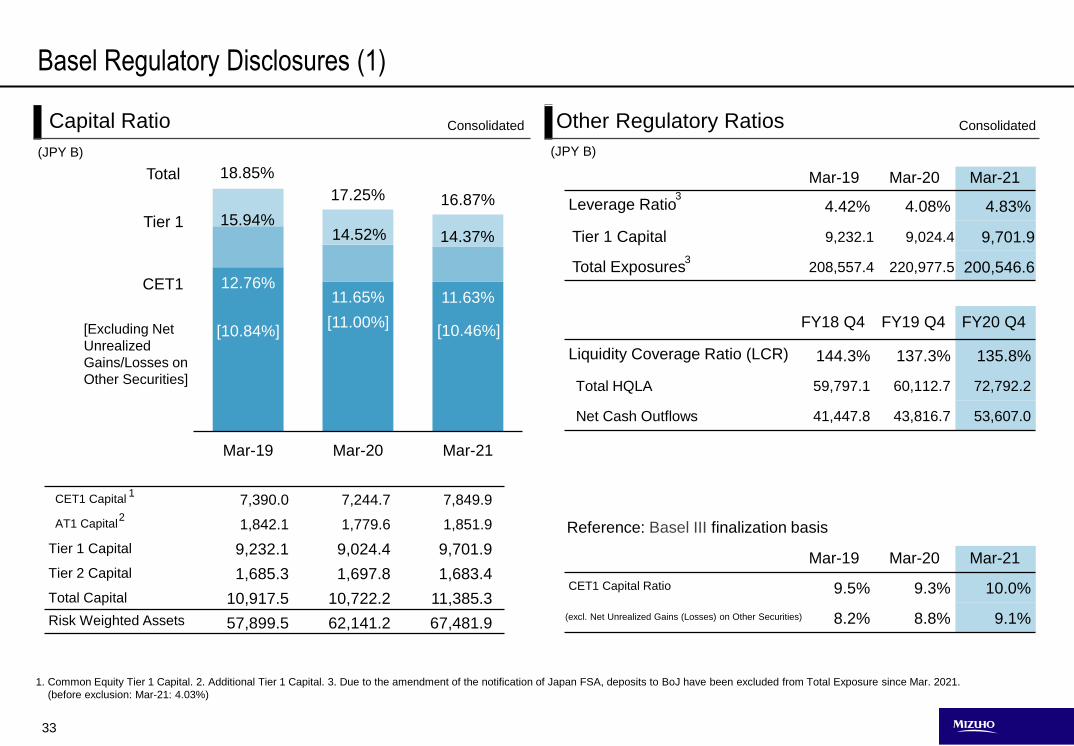
Capital Ratio
Mar-19 Mar-20 Mar-21
CET1 Capital Ratio 9.5% 9.3% 10.0%
8.2% 8.8% 9.1%
Consolidated
[Excluding Net
Unrealized
Gains/Losses on
Other Securities]
CET1
Tier 1
Total
(JPY B)(JPY B)
12.76%11.65% 11.63%
18.85%
17.25% 16.87%
Mar-19 Mar-20 Mar-21
Reference: Basel III finalization basis
Mar-19 Mar-20 Mar-21
Leverage Ratio 4.42% 4.08% 4.83%
Tier 1 Capital 9,232.1 9,024.4 9,701.9
Total Exposures 208,557.4 220,977.5 200,546.6
CET1 Capital 7,390.0 7,244.7 7,849.9
AT1 Capital 1,842.1 1,779.6 1,851.9
Tier 1 Capital 9,232.1 9,024.4 9,701.9
Tier 2 Capital 1,685.3 1,697.8 1,683.4
Total Capital 10,917.5 10,722.2 11,385.3
Risk Weighted Assets 57,899.5 62,141.2 67,481.9
[10.84%] [10.46%][11.00%]
15.94%14.52% 14.37%
Basel Regulatory Disclosures (1)
FY18 Q4 FY19 Q4 FY20 Q4
Liquidity Coverage Ratio (LCR) 144.3% 137.3% 135.8%
Total HQLA 59,797.1 60,112.7 72,792.2
Net Cash Outflows 41,447.8 43,816.7 53,607.0
3
(excl. Net Unrealized Gains (Losses) on Other Securities)
Other Regulatory Ratios
1
2
1. Common Equity Tier 1 Capital. 2. Additional Tier 1 Capital. 3. Due to the amendment of the notification of Japan FSA, deposits to BoJ have been excluded from Total Exposure since Mar. 2021.
(before exclusion: Mar-21: 4.03%)
Consolidated
3
34
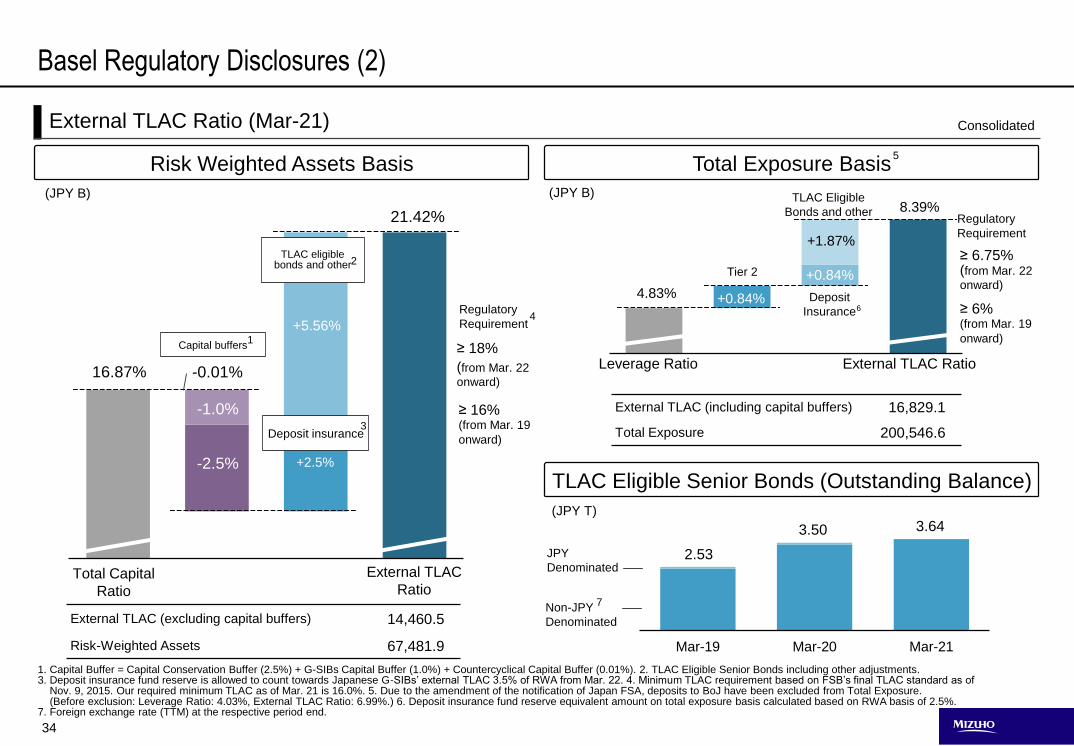
Mar-19 Mar-20 Mar-21
16.87%
21.42%
1. Capital Buffer = Capital Conservation Buffer (2.5%) + G-SIBs Capital Buffer (1.0%) + Countercyclical Capital Buffer (0.01%). 2. TLAC Eligible Senior Bonds including other adjustments.3. Deposit insurance fund reserve is allowed to count towards Japanese G-SIBs’ external TLAC 3.5% of RWA from Mar. 22. 4. Minimum TLAC requirement based on FSB’s final TLAC standard as of
Nov. 9, 2015. Our required minimum TLAC as of Mar. 21 is 16.0%. 5. Due to the amendment of the notification of Japan FSA, deposits to BoJ have been excluded from Total Exposure. (Before exclusion: Leverage Ratio: 4.03%, External TLAC Ratio: 6.99%.) 6. Deposit insurance fund reserve equivalent amount on total exposure basis calculated based on RWA basis of 2.5%.
7. Foreign exchange rate (TTM) at the respective period end.
Non-JPY
Denominated
7
JPY
Denominated
(JPY T)
(JPY B) TLAC Eligible
Bonds and other
Deposit
Insurance6 ≥ 6%(from Mar. 19
onward)
≥ 6.75%(from Mar. 22
onward)
Regulatory
Requirement
Leverage Ratio External TLAC Ratio
≥ 16%(from Mar. 19
onward)
≥ 18%
(from Mar. 22
onward)
Regulatory
Requirement
Deposit insurance3
Total Capital
Ratio
External TLAC
Ratio
Capital buffers
TLAC eligiblebonds and other
(JPY B)
Risk Weighted Assets Basis Total Exposure Basis
TLAC Eligible Senior Bonds (Outstanding Balance)
External TLAC Ratio (Mar-21)
Basel Regulatory Disclosures (2)
External TLAC (excluding capital buffers) 14,460.5
Risk-Weighted Assets 67,481.9
-2.5%
-1.0%
+2.5%
+5.56%
2
External TLAC (including capital buffers) 16,829.1
Total Exposure 200,546.6
Tier 2
8.39%
4.83% +0.84%
+0.84%
+1.87%
2.53
3.50 3.64
5
Consolidated
1
4
-0.01%
35
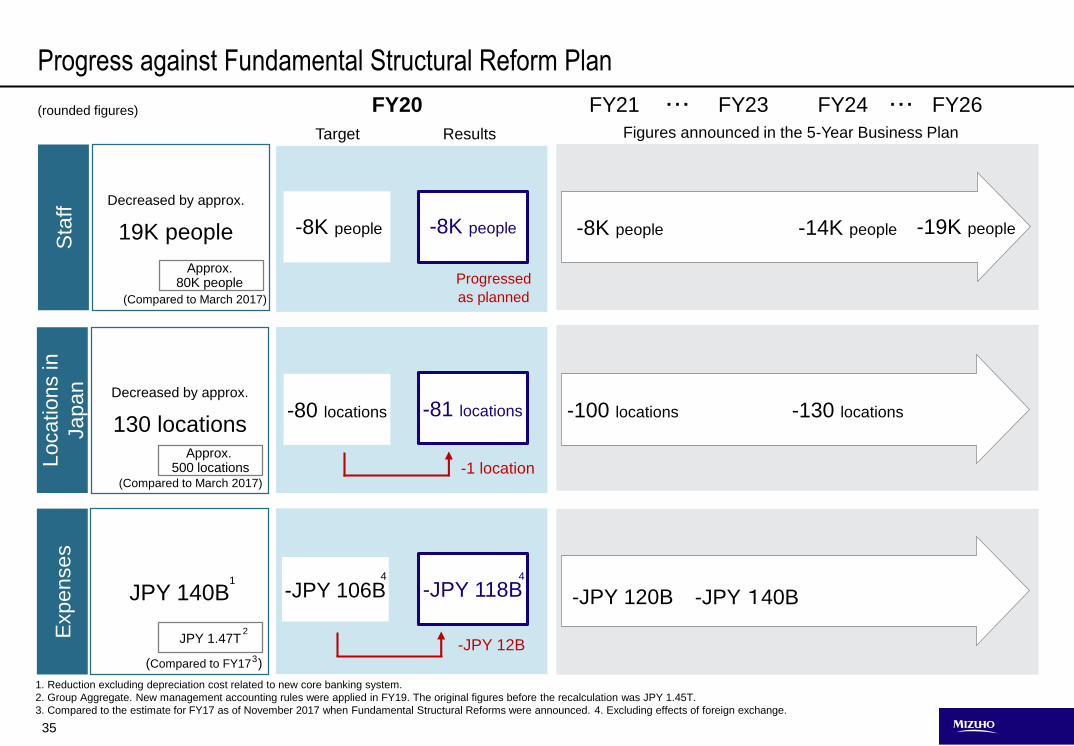
(Compared to March 2017)
Decreased by approx.
19K people
(Compared to March 2017)
Decreased by approx.
130 locations
JPY 140B
Approx. 80K people
Approx. 500 locations
JPY 1.47T
(Compared to FY17 )
1
1. Reduction excluding depreciation cost related to new core banking system.
2. Group Aggregate. New management accounting rules were applied in FY19. The original figures before the recalculation was JPY 1.45T.
3. Compared to the estimate for FY17 as of November 2017 when Fundamental Structural Reforms were announced. 4. Excluding effects of foreign exchange.
Sta
ffLocations in
Ja
pa
nE
xpenses
(rounded figures)
Progress against Fundamental Structural Reform Plan
FY24 FY26・・・・・・ FY23
-80 locations
-JPY 106B4
-81 locations
-JPY 118B4
FY21
-1 location
-JPY 12B
-14K people-8K people
-100 locations -130 locations
-JPY 140B-JPY 120B
-19K people
2
-8K people -8K people
Progressed
as planned
Results
FY20
Target Figures announced in the 5-Year Business Plan
3
36
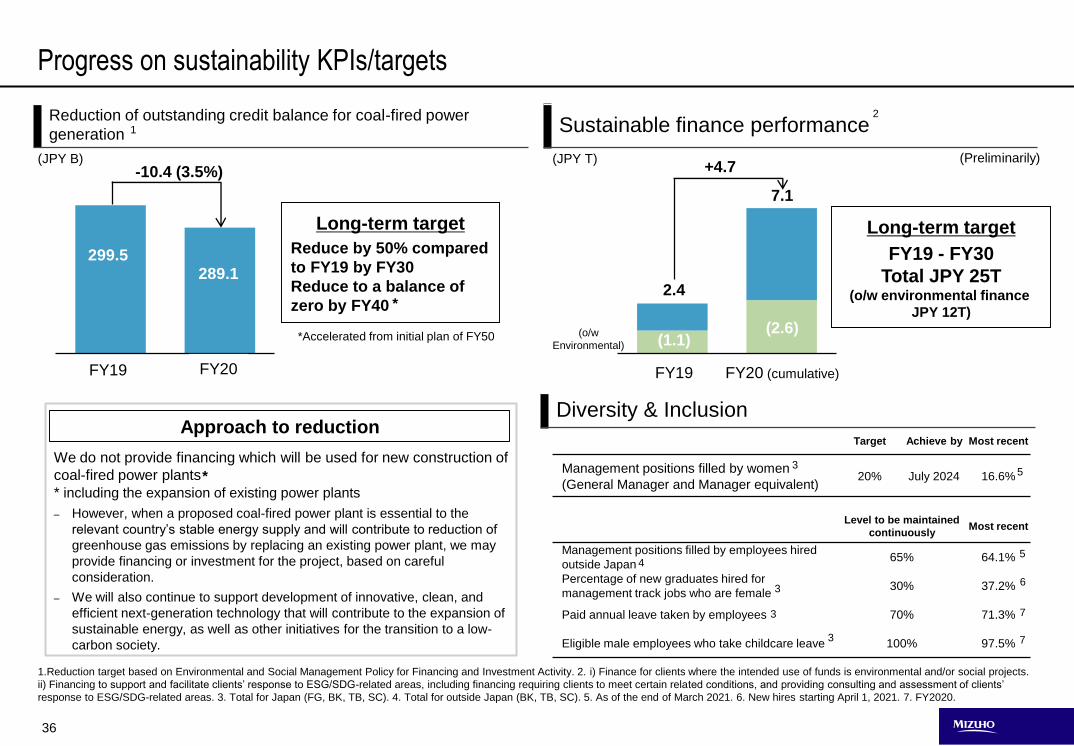
Target Achieve by Most recent
Management positions filled by women
(General Manager and Manager equivalent)20% July 2024 16.6%
Level to be maintained
continuouslyMost recent
Management positions filled by employees hired
outside Japan65% 64.1%
Percentage of new graduates hired for
management track jobs who are female30% 37.2%
Paid annual leave taken by employees 70% 71.3%
Eligible male employees who take childcare leave 100% 97.5%
1.Reduction target based on Environmental and Social Management Policy for Financing and Investment Activity. 2. i) Finance for clients where the intended use of funds is environmental and/or social projects.
ii) Financing to support and facilitate clients’ response to ESG/SDG-related areas, including financing requiring clients to meet certain related conditions, and providing consulting and assessment of clients’
response to ESG/SDG-related areas. 3. Total for Japan (FG, BK, TB, SC). 4. Total for outside Japan (BK, TB, SC). 5. As of the end of March 2021. 6. New hires starting April 1, 2021. 7. FY2020.
20/3 21/3
Progress on sustainability KPIs/targets
Diversity & Inclusion
Sustainable finance performanceReduction of outstanding credit balance for coal-fired power
generation
2
FY20FY19
299.5
-10.4 (3.5%)
289.1
1
20/3 21/3
+4.7
7.1
2.4
(2.6)(1.1)
FY20 (cumulative)FY19
3
4
3
3
3
5
7
5
6
We do not provide financing which will be used for new construction of
coal-fired power plants
* including the expansion of existing power plants
– However, when a proposed coal-fired power plant is essential to the
relevant country’s stable energy supply and will contribute to reduction of
greenhouse gas emissions by replacing an existing power plant, we may
provide financing or investment for the project, based on careful
consideration.
– We will also continue to support development of innovative, clean, and
efficient next-generation technology that will contribute to the expansion of
sustainable energy, as well as other initiatives for the transition to a low-
carbon society.
Approach to reduction
Long-term target
Reduce by 50% compared
to FY19 by FY30
Reduce to a balance of
zero by FY40
(Preliminarily)
7
*Accelerated from initial plan of FY50
(JPY B) (JPY T)
(o/w
Environmental)
Long-term target
FY19 - FY30
Total JPY 25T(o/w environmental finance
JPY 12T)*
*
Management policy for FY2021
38
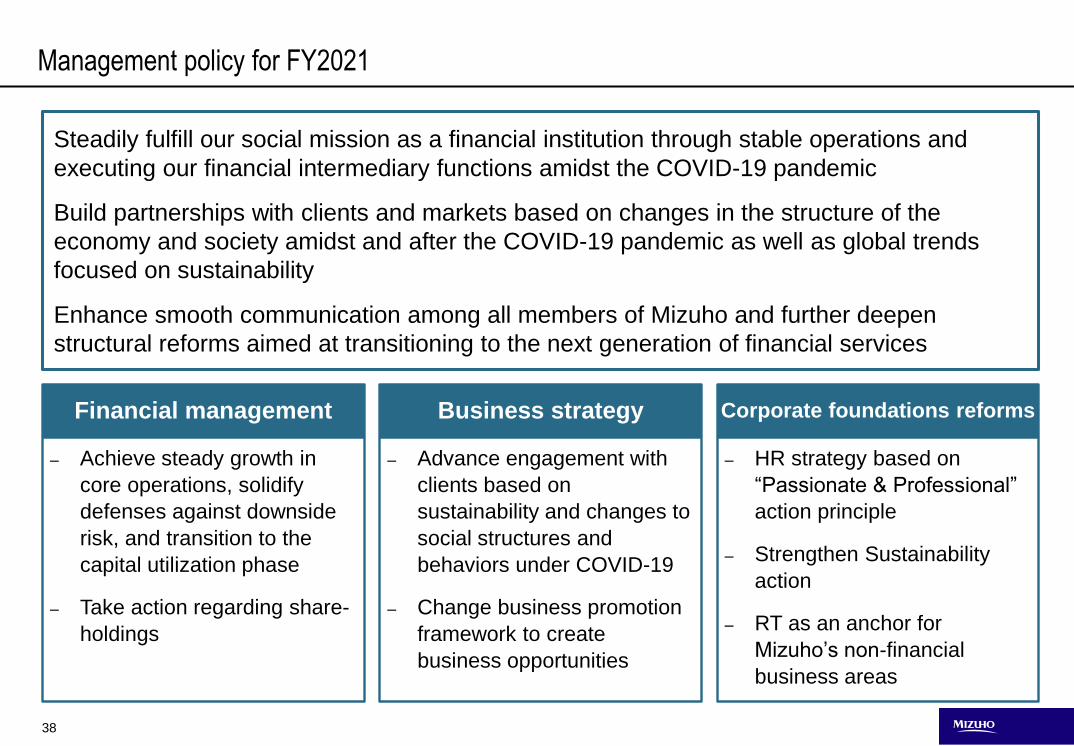
Management policy for FY2021
Steadily fulfill our social mission as a financial institution through stable operations and
executing our financial intermediary functions amidst the COVID-19 pandemic
Build partnerships with clients and markets based on changes in the structure of the
economy and society amidst and after the COVID-19 pandemic as well as global trends
focused on sustainability
Enhance smooth communication among all members of Mizuho and further deepen
structural reforms aimed at transitioning to the next generation of financial services
Financial management Business strategy Corporate foundations reforms
‒ Achieve steady growth in
core operations, solidify
defenses against downside
risk, and transition to the
capital utilization phase
‒ Take action regarding share-
holdings
‒ Advance engagement with
clients based on
sustainability and changes to
social structures and
behaviors under COVID-19
‒ Change business promotion
framework to create
business opportunities
‒ HR strategy based on
“Passionate & Professional”
action principle
‒ Strengthen Sustainability
action
‒ RT as an anchor for
Mizuho’s non-financial
business areas
39
0.5
1.0
1.5
2.0
2.5
20年 21年 22年 23年1,400
1,600
1,800
2,000
2,200
20年 21年 22年 23年24年85
90
95
100
105
110
20年 21年 22年 23年 24年85
90
95
100
105
110
20年 21年 22年 23年 24年
USA 10Y treasury interest rateTOPIX
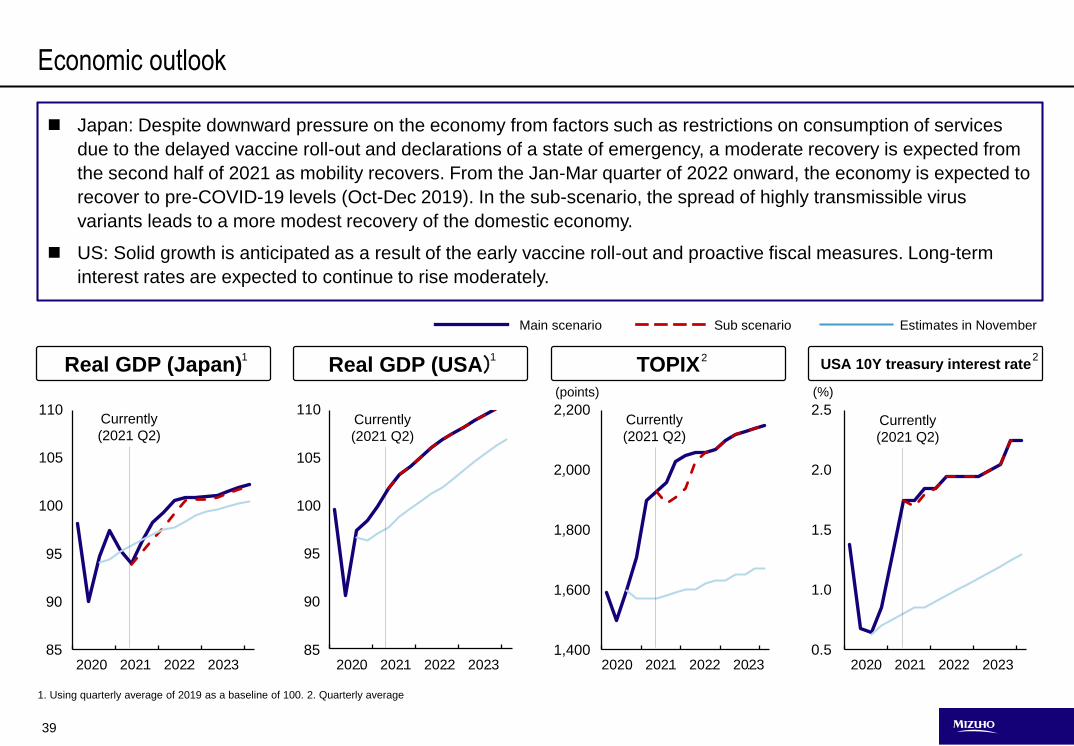
Japan: Despite downward pressure on the economy from factors such as restrictions on consumption of services
due to the delayed vaccine roll-out and declarations of a state of emergency, a moderate recovery is expected from
the second half of 2021 as mobility recovers. From the Jan-Mar quarter of 2022 onward, the economy is expected to
recover to pre-COVID-19 levels (Oct-Dec 2019). In the sub-scenario, the spread of highly transmissible virus
variants leads to a more modest recovery of the domestic economy.
US: Solid growth is anticipated as a result of the early vaccine roll-out and proactive fiscal measures. Long-term
interest rates are expected to continue to rise moderately.
(points)
Economic outlook
Main scenario Sub scenario Estimates in November
Real GDP (Japan)1
Real GDP (USA)1
1. Using quarterly average of 2019 as a baseline of 100. 2. Quarterly average
20年 21年 22年 23年 20年 21年 22年 23年 20年 21年 22年 23年 20年 21年 22年 23年
2 2
Currently
(2021 Q2)現在
(21年2Q)現在
(21年2Q)
2020 2021 2022 2023 20年 21年 22年 23年2020 2021 2022 2023 20年 21年 22年 23年2020 2021 2022 2023 20年 21年 22年 23年2020 2021 2022 2023
Currently
(2021 Q2)
Currently
(2021 Q2)Currently
(2021 Q2)
85
90
95
100
105
110
85
90
95
100
105
110
1,400
1,600
1,800
2,000
2,200
0.5
1.0
1.5
2.0
2.5
(%)
40
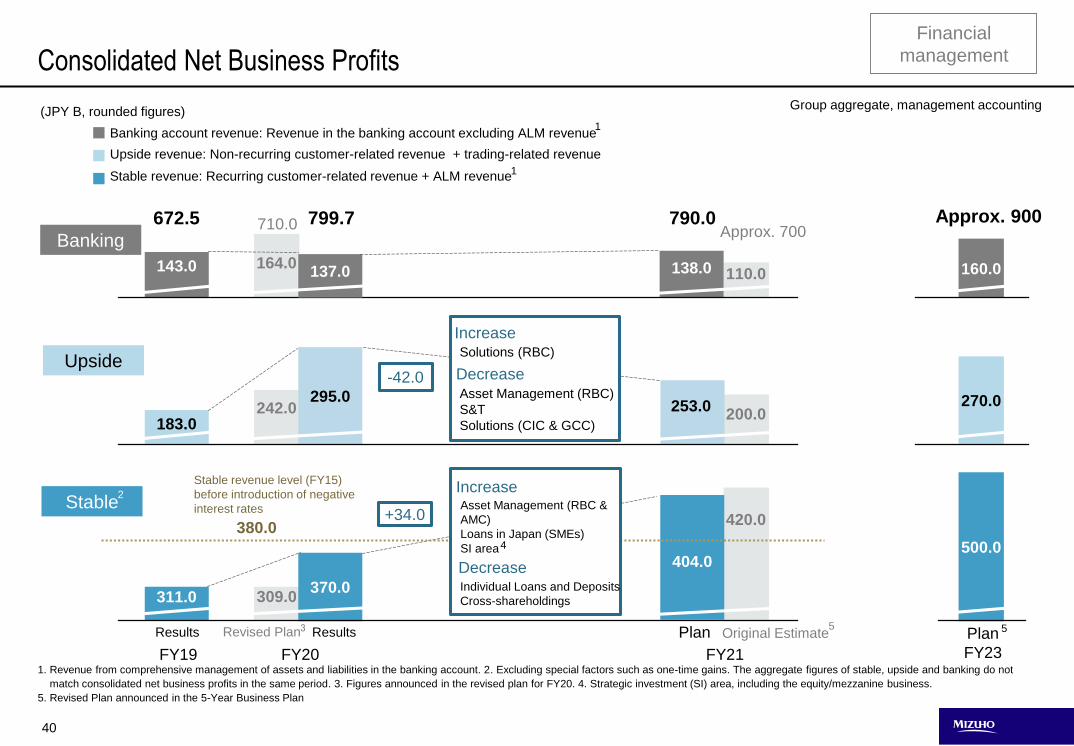
1. Revenue from comprehensive management of assets and liabilities in the banking account. 2. Excluding special factors such as one-time gains. The aggregate figures of stable, upside and banking do not
match consolidated net business profits in the same period. 3. Figures announced in the revised plan for FY20. 4. Strategic investment (SI) area, including the equity/mezzanine business.
5. Revised Plan announced in the 5-Year Business Plan
Increase
Upside
Banking
(JPY B, rounded figures)
Upside revenue: Non-recurring customer-related revenue + trading-related revenue
Stable revenue: Recurring customer-related revenue + ALM revenue
Banking account revenue: Revenue in the banking account excluding ALM revenue
Group aggregate, management accounting
Financial
managementConsolidated Net Business Profits
1
270.0
160.0
500.0
Approx. 900
Stable
Approx. 700
Plan
FY23
Original Estimate 5
420.0
110.0
200.0
5
380.0
2
FY20
311.0
FY19 FY21
+34.0
Stable revenue level (FY15)
before introduction of negative
interest rates
183.0
-42.0
404.0
Solutions (RBC)
Asset Management (RBC)
S&T
Solutions (CIC & GCC)
Increase
Decrease
253.0
143.0 138.0
799.7672.5 790.0
Revised Plan
710.0
3
309.0
164.0
242.0
370.0
295.0
137.0
Asset Management (RBC &
AMC)
Loans in Japan (SMEs)
SI area
Decrease
Increase
PlanResultsResults
4
Individual Loans and Deposits
Cross-shareholdings
1
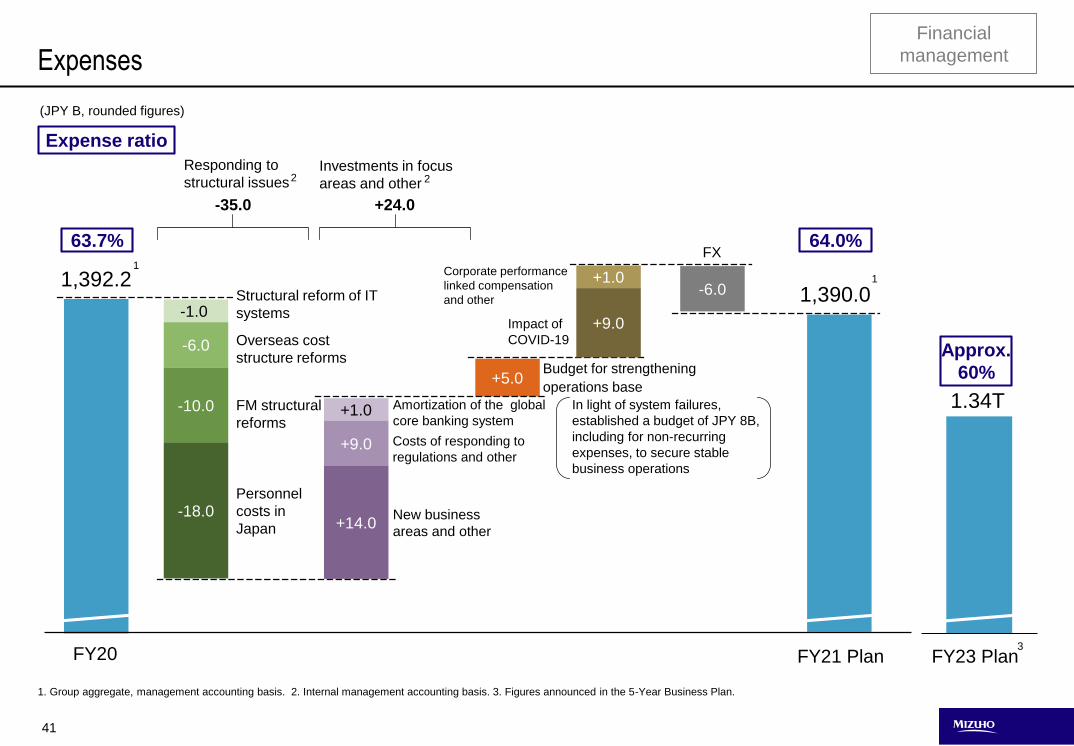
41
+5.0
FY23 Plan
Responding to
structural issuesInvestments in focus
areas and other 2
(JPY B, rounded figures)
FY21 Plan
1,390.0
1.34T
1,392.2
1. Group aggregate, management accounting basis. 2. Internal management accounting basis. 3. Figures announced in the 5-Year Business Plan.
2
1
FY20
Expense ratio
63.7% 64.0%
Approx.
60%
Expenses
Amortization of the global
core banking system
+14.0New business
areas and other
+1.0
-6.0
Personnel
costs in
Japan
Structural reform of IT
systems
-6.0
-10.0
-1.0
FM structural
reforms
Impact of
COVID-19
1
-35.0
Corporate performance
linked compensation
and other
FX
+1.0
+9.0
+24.0
Costs of responding to
regulations and other+9.0
-18.0
Overseas cost
structure reformsBudget for strengthening
operations base
In light of system failures,
established a budget of JPY 8B,
including for non-recurring
expenses, to secure stable
business operations
3
Financial
management
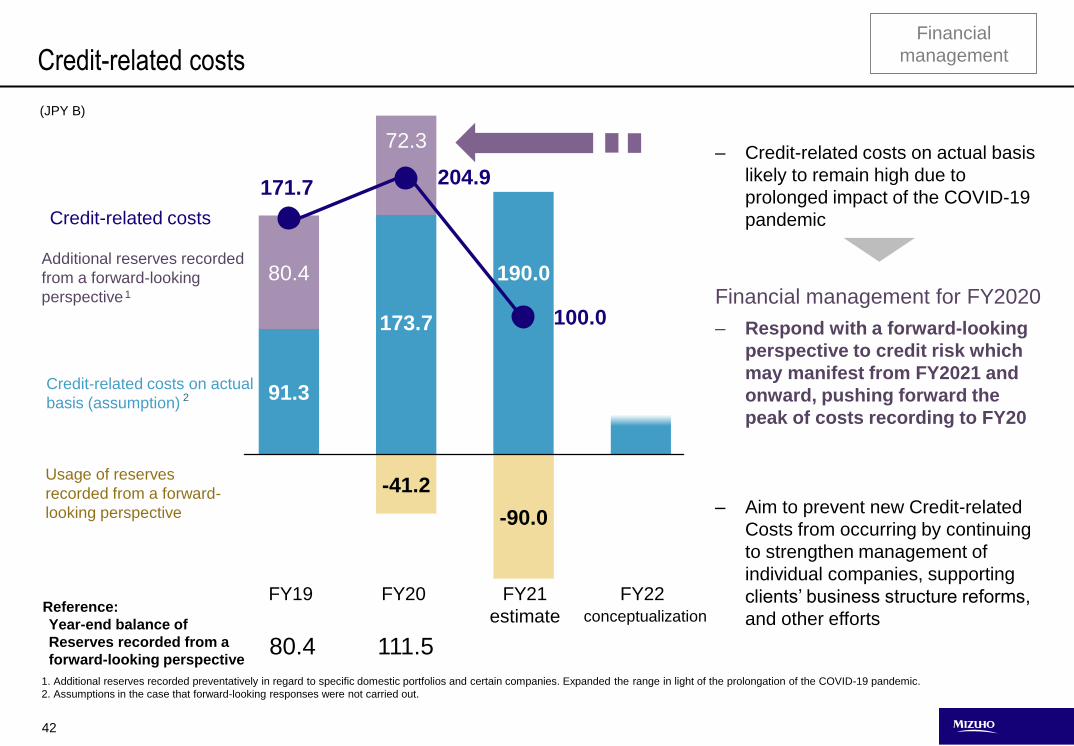
42
(JPY B)
FY22
111.5Year-end balance of
Reserves recorded from a
forward-looking perspective
Reference: FY19
80.4
Credit-related costs on actual
basis (assumption)
Additional reserves recorded
from a forward-looking
perspective
Credit-related costs
FY20 FY21
estimate
Usage of reserves
recorded from a forward-
looking perspective
‒ Credit-related costs on actual basis
likely to remain high due to
prolonged impact of the COVID-19
pandemic
Financial management for FY2020
‒ Respond with a forward-looking
perspective to credit risk which
may manifest from FY2021 and
onward, pushing forward the
peak of costs recording to FY20
‒ Aim to prevent new Credit-related
Costs from occurring by continuing
to strengthen management of
individual companies, supporting
clients’ business structure reforms,
and other efforts
1
2
72.3
190.0
173.7
91.3
80.4
-41.2
-90.0
204.9171.7
100.0
Credit-related costs
1. Additional reserves recorded preventatively in regard to specific domestic portfolios and certain companies. Expanded the range in light of the prolongation of the COVID-19 pandemic.
2. Assumptions in the case that forward-looking responses were not carried out.
conceptualization
Financial
management
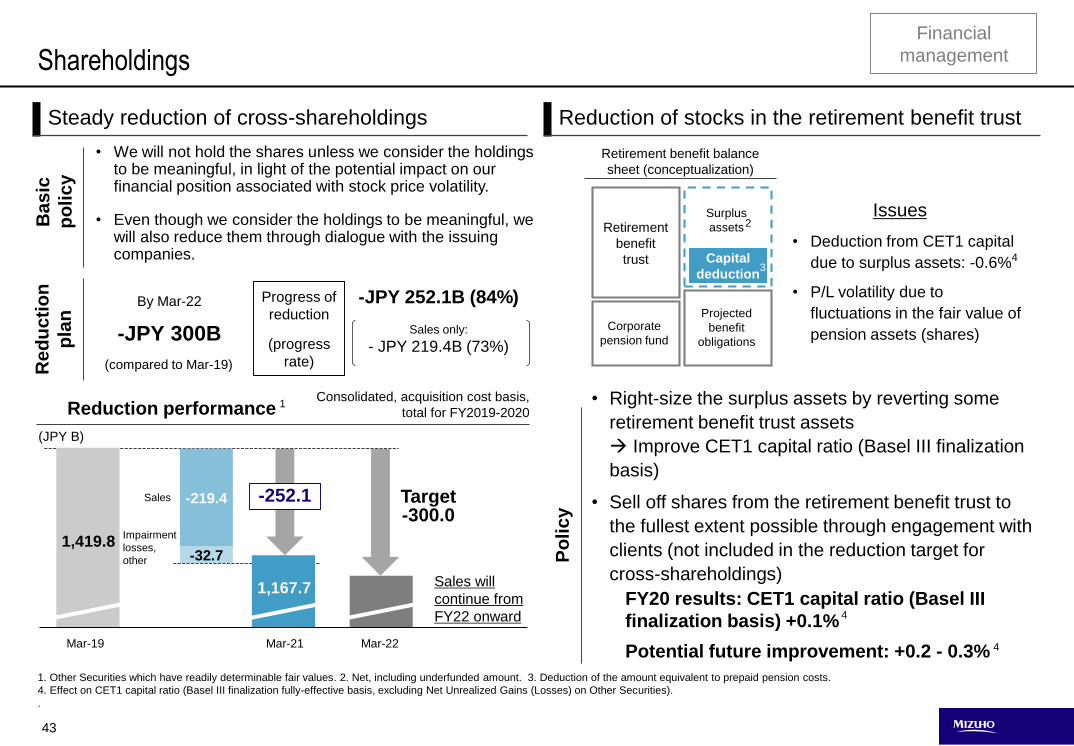
43
Shareholdings
Target -300.0
-219.4
-32.7
-252.1Sales
1
Reduction of stocks in the retirement benefit trust
Retirement
benefit
trust Capital
deduction3
2
• Right-size the surplus assets by reverting some
retirement benefit trust assets
Improve CET1 capital ratio (Basel III finalization
basis)
• Sell off shares from the retirement benefit trust to
the fullest extent possible through engagement with
clients (not included in the reduction target for
cross-shareholdings)
Issues
• Deduction from CET1 capital
due to surplus assets: -0.6%
• P/L volatility due to
fluctuations in the fair value of
pension assets (shares)
Po
lic
y
Projected
benefit
obligations
Surplus
assets
Corporate
pension fund
Retirement benefit balance
sheet (conceptualization)
4
FY20 results: CET1 capital ratio (Basel III
finalization basis) +0.1%
Potential future improvement: +0.2 - 0.3%
4
4
Ba
sic
po
lic
y
• We will not hold the shares unless we consider the holdings to be meaningful, in light of the potential impact on our financial position associated with stock price volatility.
• Even though we consider the holdings to be meaningful, we will also reduce them through dialogue with the issuing companies.
Re
du
cti
on
pla
n
-JPY 300B
(compared to Mar-19)
By Mar-22 Progress of
reduction
(progress
rate)
-JPY 252.1B (84%)
Sales only:
- JPY 219.4B (73%)
Steady reduction of cross-shareholdings
Reduction performanceConsolidated, acquisition cost basis,
total for FY2019-2020
(JPY B)
1. Other Securities which have readily determinable fair values. 2. Net, including underfunded amount. 3. Deduction of the amount equivalent to prepaid pension costs.
4. Effect on CET1 capital ratio (Basel III finalization fully-effective basis, excluding Net Unrealized Gains (Losses) on Other Securities).
.
Sales will
continue from
FY22 onward
Impairment
losses,
other
1,419.8
1,167.7
Mar-22Mar-21Mar-19
Financial
management
44
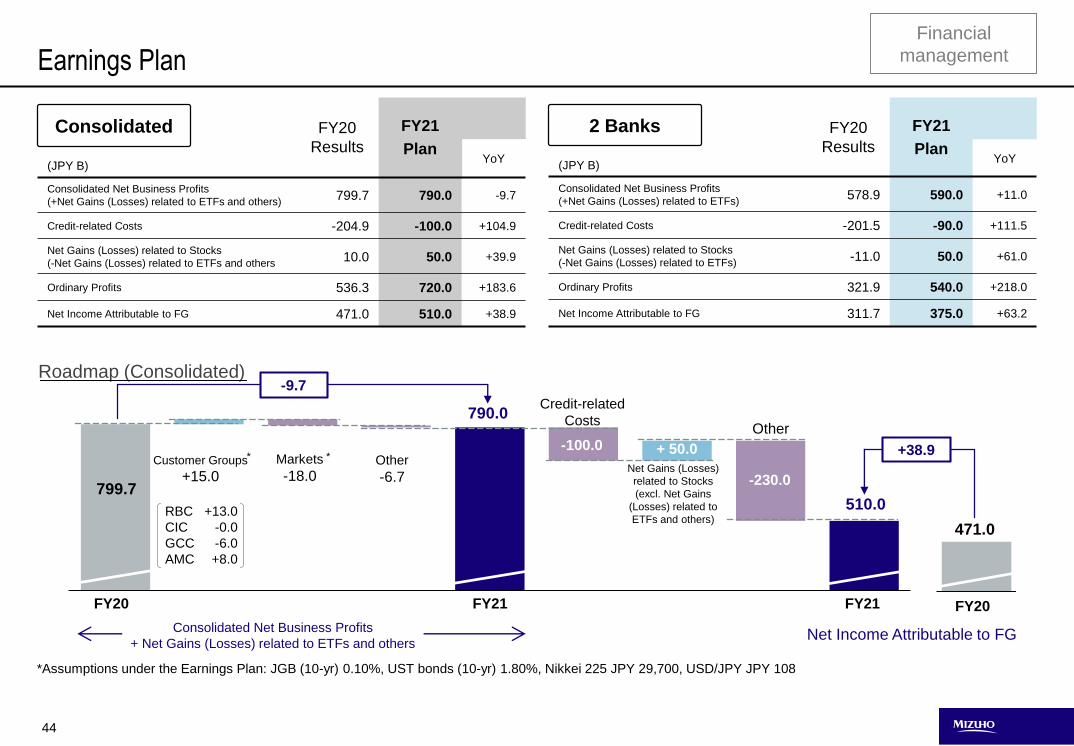
Earnings Plan
FY20
Results
FY21
Plan(JPY B)
YoY
Consolidated Net Business Profits
(+Net Gains (Losses) related to ETFs and others) 799.7 790.0 -9.7
Credit-related Costs -204.9 -100.0 +104.9
Net Gains (Losses) related to Stocks
(-Net Gains (Losses) related to ETFs and others10.0 50.0 +39.9
Ordinary Profits 536.3 720.0 +183.6
Net Income Attributable to FG 471.0 510.0 +38.9
Consolidated
*Assumptions under the Earnings Plan: JGB (10-yr) 0.10%, UST bonds (10-yr) 1.80%, Nikkei 225 JPY 29,700, USD/JPY JPY 108
+38.9
FY20 FY21
Credit-related
CostsOther
Net Gains (Losses)
related to Stocks
(excl. Net Gains
(Losses) related to
ETFs and others)
799.7
Customer Groups
+15.0
Markets
-18.0
790.0
FY21
Net Income Attributable to FG
FY20
471.0
Roadmap (Consolidated)
Other
-6.7
-9.7
+13.0
-0.0
-6.0
+8.0
RBC
CIC
GCC
AMC
-100.0
-230.0
+ 50.0
510.0
Consolidated Net Business Profits
+ Net Gains (Losses) related to ETFs and others
FY20
Results
FY21
Plan(JPY B)
YoY
Consolidated Net Business Profits
(+Net Gains (Losses) related to ETFs) 578.9 590.0 +11.0
Credit-related Costs -201.5 -90.0 +111.5
Net Gains (Losses) related to Stocks
(-Net Gains (Losses) related to ETFs)-11.0 50.0 +61.0
Ordinary Profits 321.9 540.0 +218.0
Net Income Attributable to FG 311.7 375.0 +63.2
2 Banks
Financial
management
* *
45
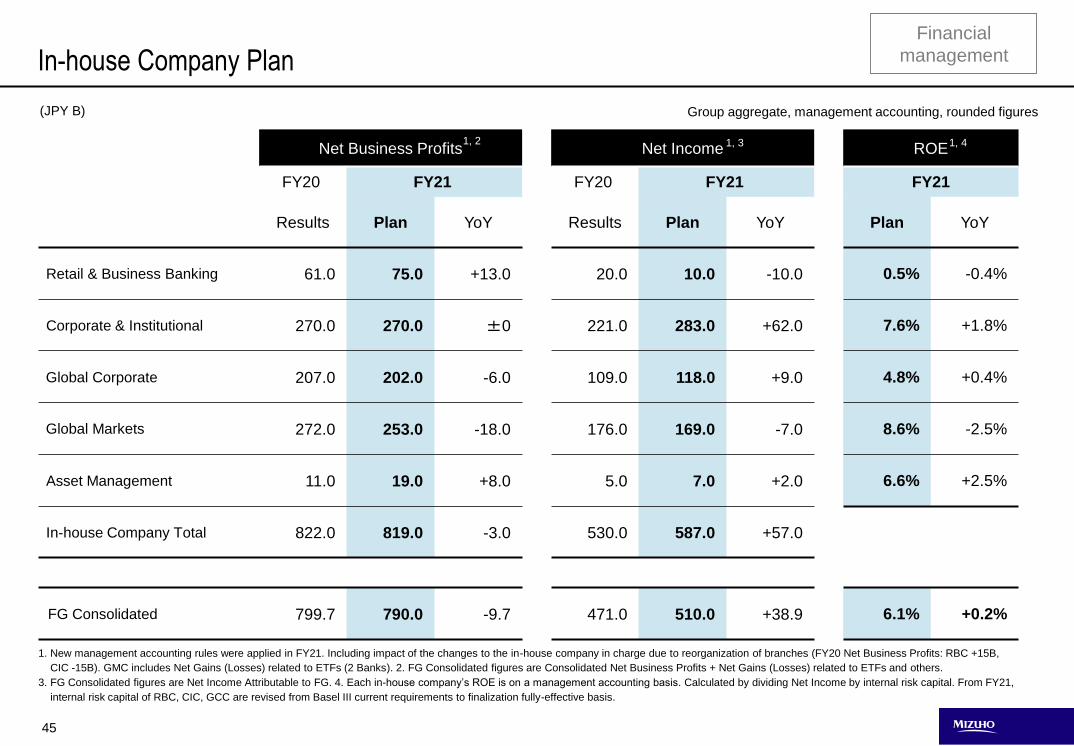
1. New management accounting rules were applied in FY21. Including impact of the changes to the in-house company in charge due to reorganization of branches (FY20 Net Business Profits: RBC +15B,
CIC -15B). GMC includes Net Gains (Losses) related to ETFs (2 Banks). 2. FG Consolidated figures are Consolidated Net Business Profits + Net Gains (Losses) related to ETFs and others.
3. FG Consolidated figures are Net Income Attributable to FG. 4. Each in-house company’s ROE is on a management accounting basis. Calculated by dividing Net Income by internal risk capital. From FY21,
internal risk capital of RBC, CIC, GCC are revised from Basel III current requirements to finalization fully-effective basis.
Group aggregate, management accounting, rounded figures(JPY B)
In-house Company Plan
Net Business Profits Net Income ROE
FY20 FY21 FY20 FY21 FY21
Results Plan YoY Results Plan YoY Plan YoY
Retail & Business Banking 61.0 75.0 +13.0 20.0 10.0 -10.0 0.5% -0.4%
Corporate & Institutional 270.0 270.0 ±0 221.0 283.0 +62.0 7.6% +1.8%
Global Corporate 207.0 202.0 -6.0 109.0 118.0 +9.0 4.8% +0.4%
Global Markets 272.0 253.0 -18.0 176.0 169.0 -7.0 8.6% -2.5%
Asset Management 11.0 19.0 +8.0 5.0 7.0 +2.0 6.6% +2.5%
In-house Company Total 822.0 819.0 -3.0 530.0 587.0 +57.0
FG Consolidated 799.7 790.0 -9.7 471.0 510.0 +38.9 6.1% +0.2%
1, 2 1, 3 1, 4
Financial
management
46
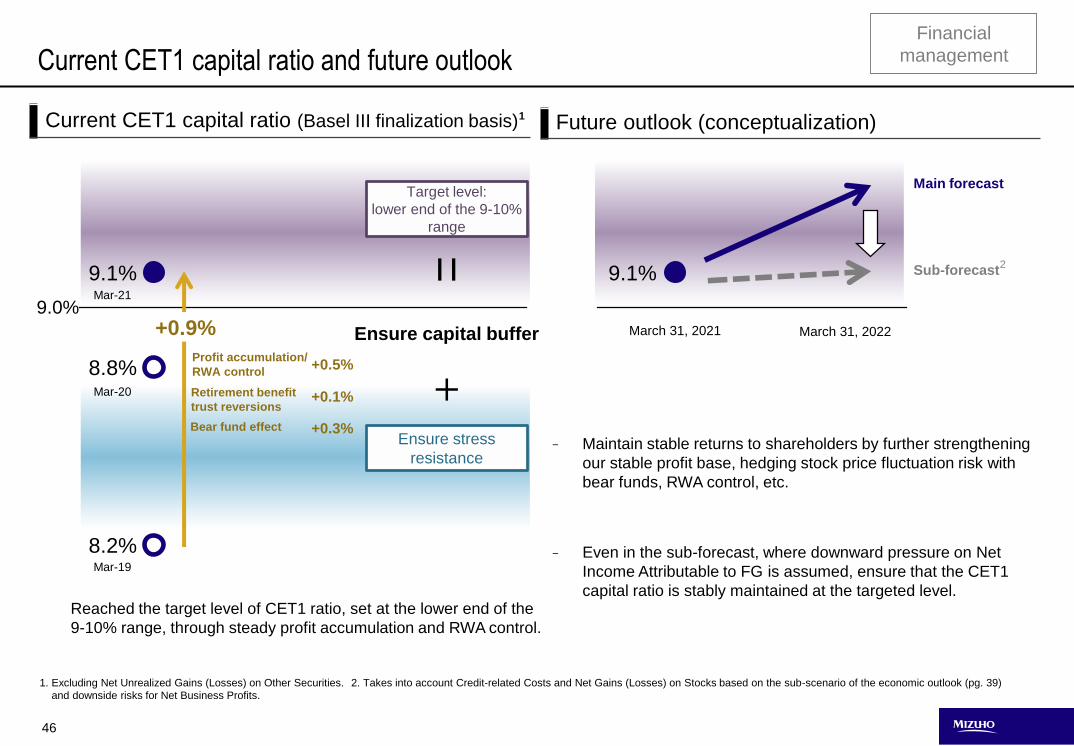
9.0%
Current CET1 capital ratio and future outlook
Current CET1 capital ratio (Basel III finalization basis) Future outlook (conceptualization)
Reached the target level of CET1 ratio, set at the lower end of the
9-10% range, through steady profit accumulation and RWA control.
- Maintain stable returns to shareholders by further strengthening
our stable profit base, hedging stock price fluctuation risk with
bear funds, RWA control, etc.
- Even in the sub-forecast, where downward pressure on Net
Income Attributable to FG is assumed, ensure that the CET1
capital ratio is stably maintained at the targeted level.
Main forecast
9.1%
March 31, 2021
Sub-forecast9.1%
Target level:
lower end of the 9-10%
range
8.8%
8.2%
Ensure capital buffer
Retirement benefit
trust reversions
Ensure stress
resistance
Bear fund effect +0.3%
+0.1%
Profit accumulation/
RWA control+0.5%
1. Excluding Net Unrealized Gains (Losses) on Other Securities. 2. Takes into account Credit-related Costs and Net Gains (Losses) on Stocks based on the sub-scenario of the economic outlook (pg. 39)
and downside risks for Net Business Profits.
2
1
Mar-21
Mar-20
Mar-19
March 31, 2022+0.9%
Financial
management
47
Financial
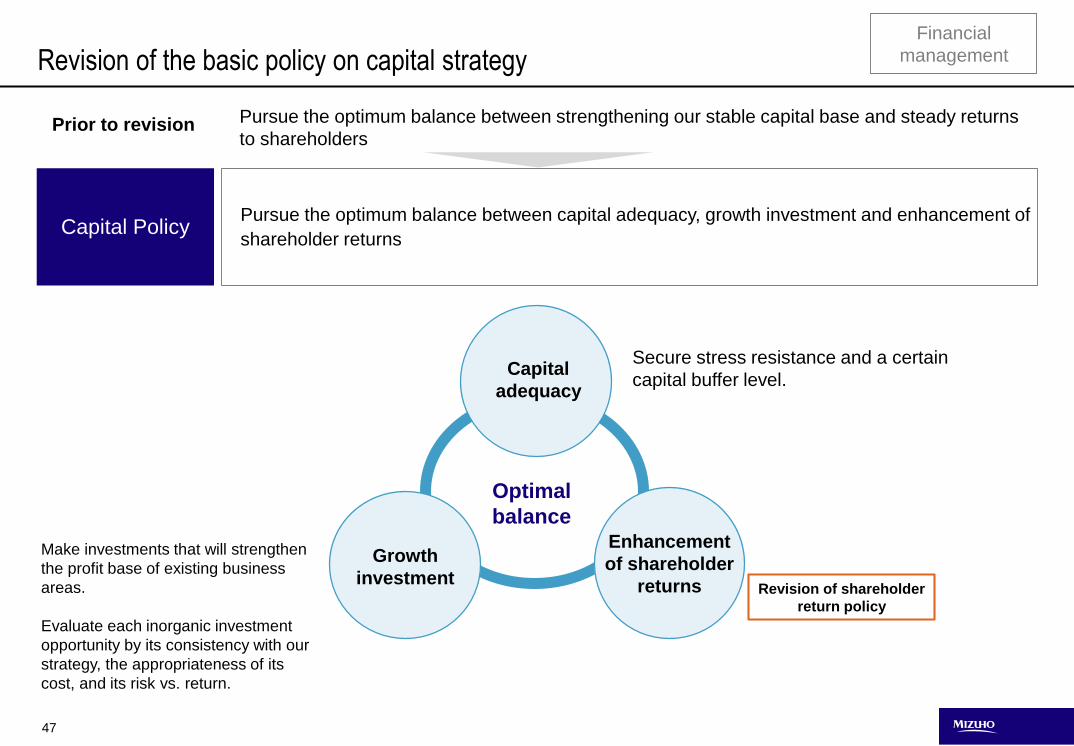
managementRevision of the basic policy on capital strategy
Secure stress resistance and a certain
capital buffer level.Capital
adequacy
Enhancement
of shareholder
returns
Growth
investment
Make investments that will strengthen
the profit base of existing business
areas.
Evaluate each inorganic investment
opportunity by its consistency with our
strategy, the appropriateness of its
cost, and its risk vs. return.
Optimal
balance
Capital PolicyPursue the optimum balance between capital adequacy, growth investment and enhancement of
shareholder returns
Pursue the optimum balance between strengthening our stable capital base and steady returns
to shareholdersPrior to revision
Revision of shareholder
return policy
48
Revision of the shareholder return policy
Cash
dividend
per share
JPY 75.00
JPY 37.50
JPY 37.50
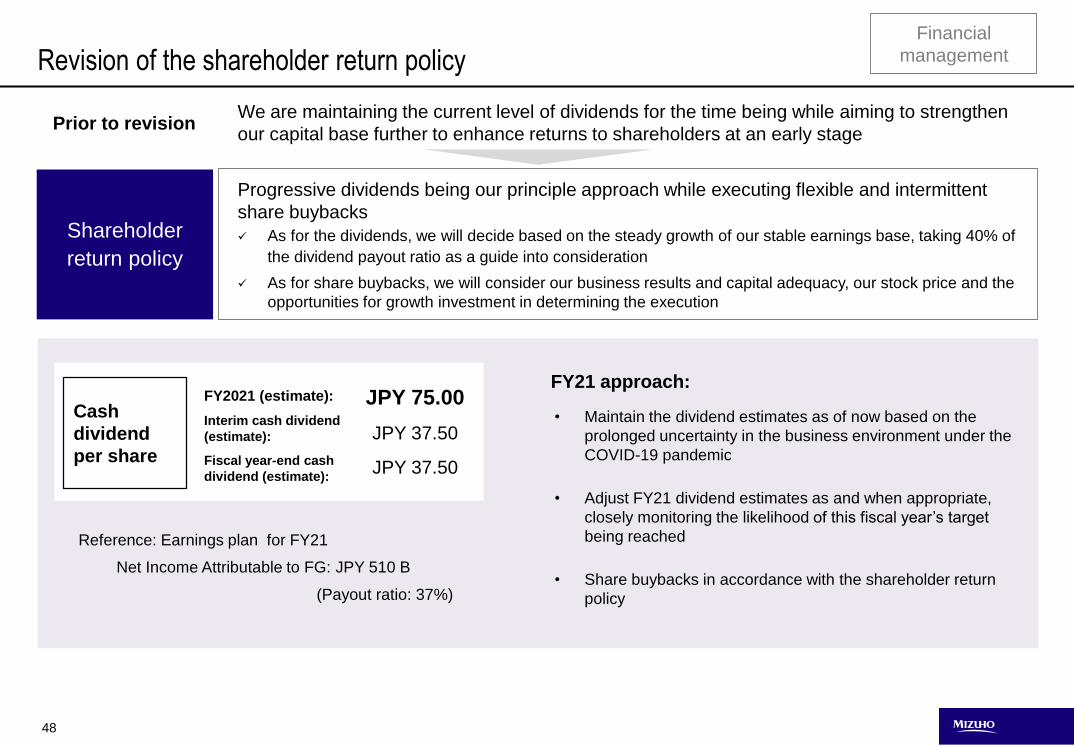
• Maintain the dividend estimates as of now based on the
prolonged uncertainty in the business environment under the
COVID-19 pandemic
• Adjust FY21 dividend estimates as and when appropriate,
closely monitoring the likelihood of this fiscal year’s target
being reached
• Share buybacks in accordance with the shareholder return
policy
FY21 approach:
Progressive dividends being our principle approach while executing flexible and intermittent
share buybacks
As for the dividends, we will decide based on the steady growth of our stable earnings base, taking 40% of
the dividend payout ratio as a guide into consideration
As for share buybacks, we will consider our business results and capital adequacy, our stock price and the
opportunities for growth investment in determining the execution
We are maintaining the current level of dividends for the time being while aiming to strengthen
our capital base further to enhance returns to shareholders at an early stage
FY2021 (estimate):
Interim cash dividend
(estimate):
Fiscal year-end cash
dividend (estimate):
Reference: Earnings plan for FY21
Net Income Attributable to FG: JPY 510 B
(Payout ratio: 37%)
Shareholder
return policy
Prior to revision
Financial
management
49
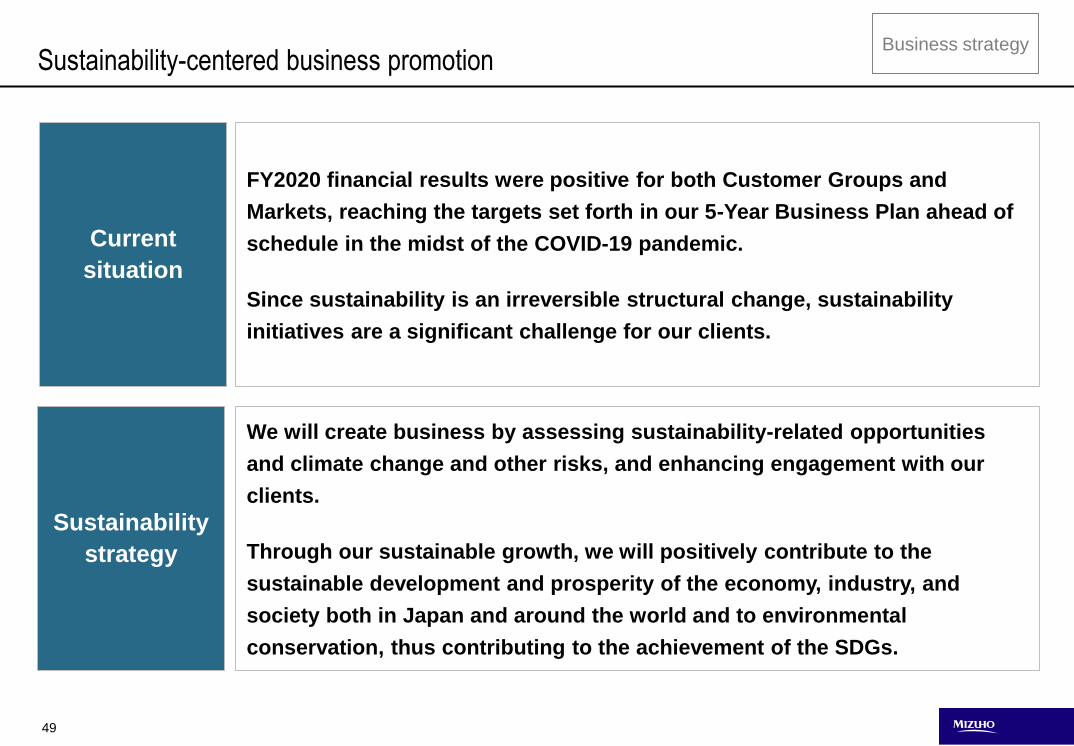
Sustainability-centered business promotion
Current
situation
FY2020 financial results were positive for both Customer Groups and
Markets, reaching the targets set forth in our 5-Year Business Plan ahead of
schedule in the midst of the COVID-19 pandemic.
Since sustainability is an irreversible structural change, sustainability
initiatives are a significant challenge for our clients.
Sustainability
strategy
We will create business by assessing sustainability-related opportunities
and climate change and other risks, and enhancing engagement with our
clients.
Through our sustainable growth, we will positively contribute to the
sustainable development and prosperity of the economy, industry, and
society both in Japan and around the world and to environmental
conservation, thus contributing to the achievement of the SDGs.
Business strategy
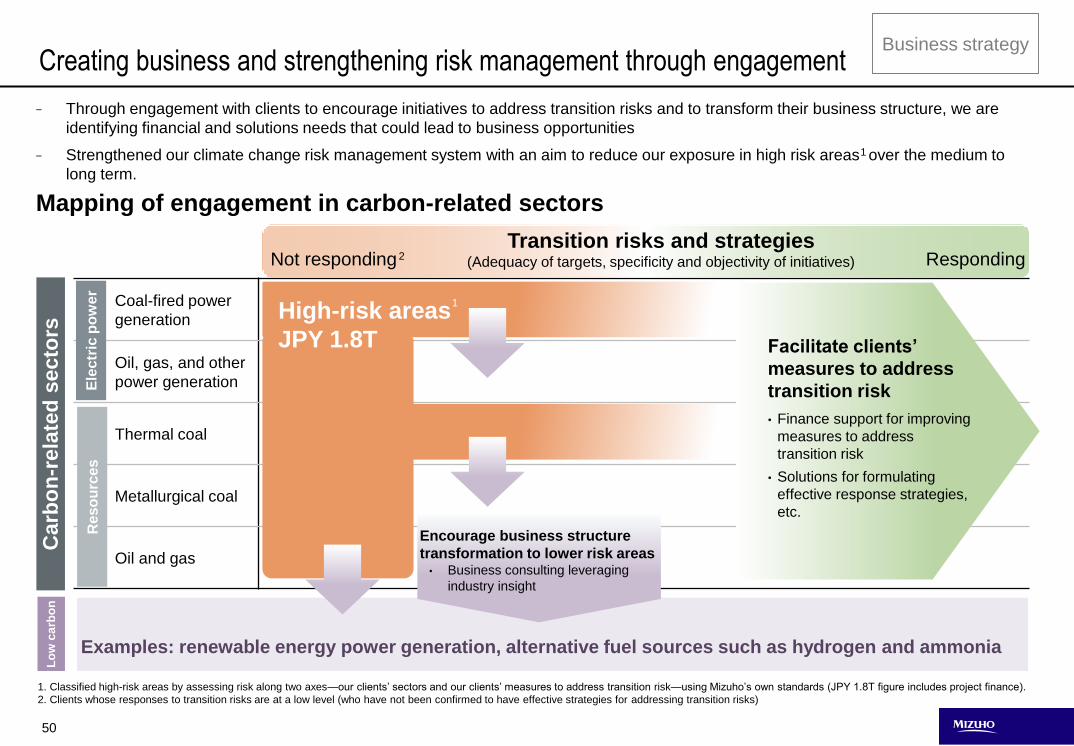
50
Coal-fired power
generation
Oil, gas, and other
power generation
Thermal coal
Metallurgical coal
Oil and gas
Creating business and strengthening risk management through engagement
- Through engagement with clients to encourage initiatives to address transition risks and to transform their business structure, we are
identifying financial and solutions needs that could lead to business opportunities
- Strengthened our climate change risk management system with an aim to reduce our exposure in high risk areas over the medium to
long term.
Carb
on
-rela
ted
secto
rs
Mapping of engagement in carbon-related sectors
Business strategy
High-risk areas
JPY 1.8T
Examples: renewable energy power generation, alternative fuel sources such as hydrogen and ammonia
Lo
w c
arb
on
Ele
ctr
ic p
ow
er
Re
so
urc
es
Facilitate clients’
measures to address
transition risk
• Finance support for improving
measures to address
transition risk
• Solutions for formulating
effective response strategies,
etc.
Not responding RespondingTransition risks and strategies
(Adequacy of targets, specificity and objectivity of initiatives)2
1. Classified high-risk areas by assessing risk along two axes—our clients’ sectors and our clients’ measures to address transition risk—using Mizuho’s own standards (JPY 1.8T figure includes project finance).
2. Clients whose responses to transition risks are at a low level (who have not been confirmed to have effective strategies for addressing transition risks)
Encourage business structure
transformation to lower risk areas• Business consulting leveraging
industry insight
1
1
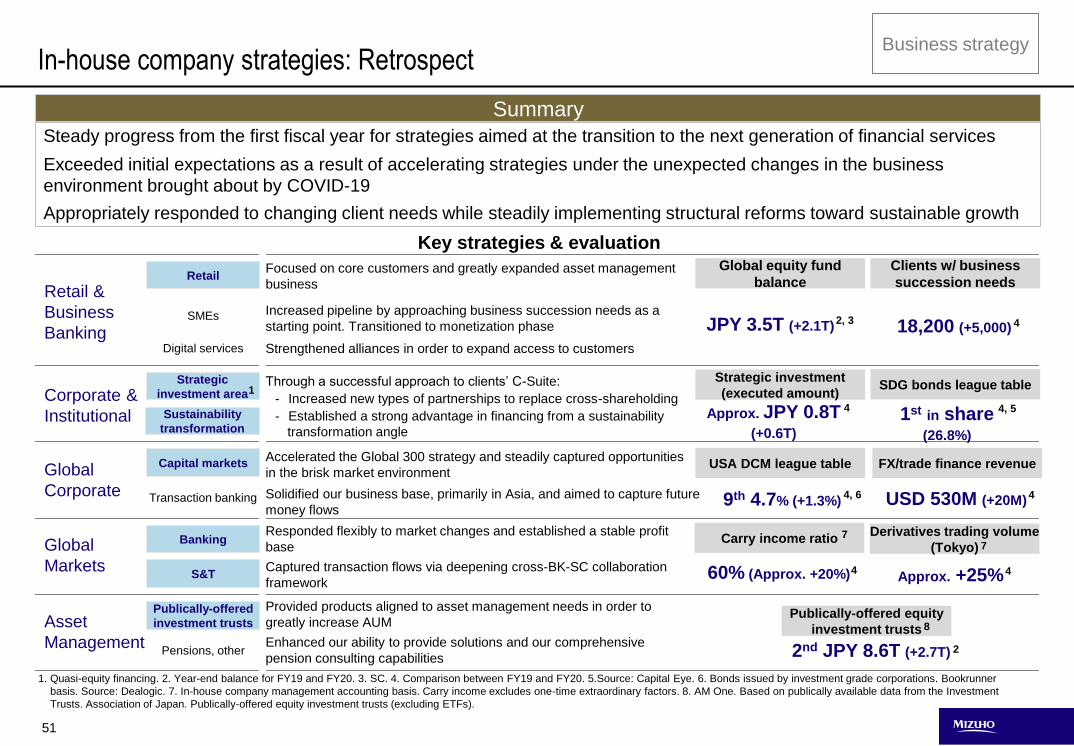
51
In-house company strategies: Retrospect
Steady progress from the first fiscal year for strategies aimed at the transition to the next generation of financial services
Exceeded initial expectations as a result of accelerating strategies under the unexpected changes in the business
environment brought about by COVID-19
Appropriately responded to changing client needs while steadily implementing structural reforms toward sustainable growth
Key strategies & evaluation
Retail
SMEs
Digital services
Capital markets
Transaction banking
Banking
S&T
Publically-offered
investment trusts
Pensions, other
Global equity fund
balance
Clients w/ business
succession needs
Sustainability
transformation
Strategic
investment area
Strategic investment
(executed amount)SDG bonds league table
USA DCM league table FX/trade finance revenue
Carry income ratioDerivatives trading volume
(Tokyo)
Publically-offered equity
investment trusts
Summary
Retail &
Business
Banking
Global
Markets
Corporate &
Institutional
Global
Corporate
Asset
Management
Focused on core customers and greatly expanded asset management
business
Increased pipeline by approaching business succession needs as a
starting point. Transitioned to monetization phase
Strengthened alliances in order to expand access to customers
Through a successful approach to clients’ C-Suite:
- Increased new types of partnerships to replace cross-shareholding
- Established a strong advantage in financing from a sustainability
transformation angle
Accelerated the Global 300 strategy and steadily captured opportunities
in the brisk market environment
Solidified our business base, primarily in Asia, and aimed to capture future
money flows
Responded flexibly to market changes and established a stable profit
base
Captured transaction flows via deepening cross-BK-SC collaboration
framework
Provided products aligned to asset management needs in order to
greatly increase AUM
Enhanced our ability to provide solutions and our comprehensive
pension consulting capabilities
1. Quasi-equity financing. 2. Year-end balance for FY19 and FY20. 3. SC. 4. Comparison between FY19 and FY20. 5.Source: Capital Eye. 6. Bonds issued by investment grade corporations. Bookrunner
basis. Source: Dealogic. 7. In-house company management accounting basis. Carry income excludes one-time extraordinary factors. 8. AM One. Based on publically available data from the Investment
Trusts. Association of Japan. Publically-offered equity investment trusts (excluding ETFs).
JPY 3.5T (+2.1T) 2, 3 18,200 (+5,000) 4
Approx. JPY 0.8T (+0.6T)
1st in share(26.8%)
4 4, 5
9th 4.7% (+1.3%) USD 530M (+20M)
60% (Approx. +20%)
2nd JPY 8.6T (+2.7T)
4, 6 4
4 4
2
Approx. +25%
Business strategy
77
8
1
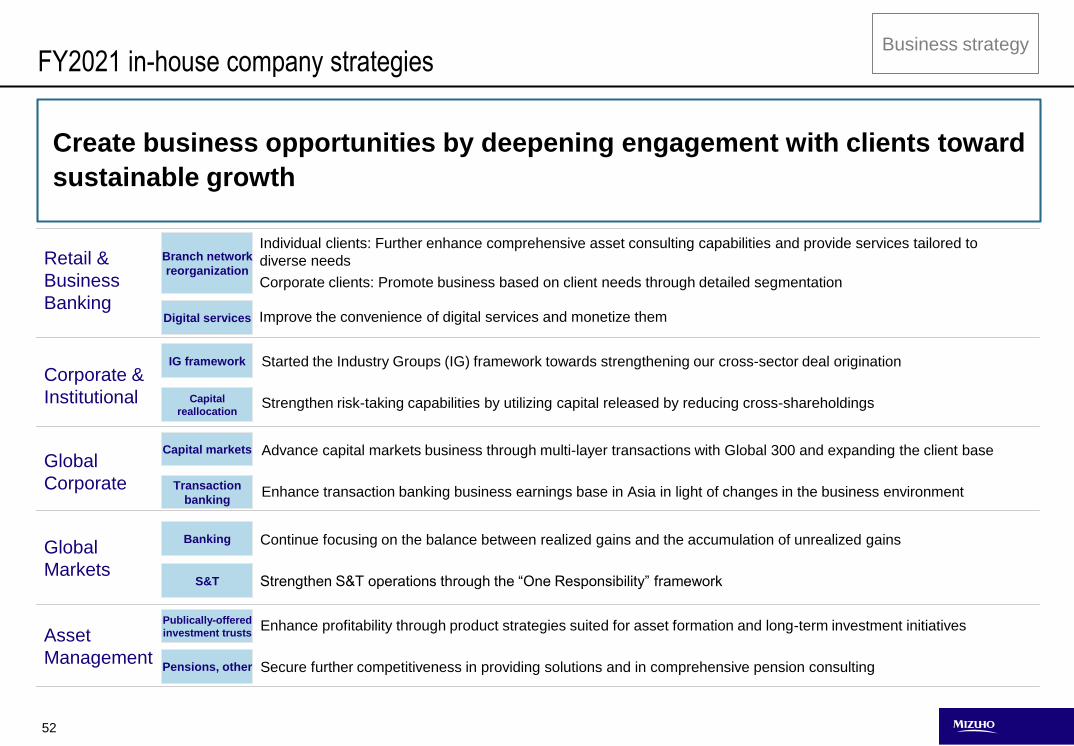
52
FY2021 in-house company strategies
Create business opportunities by deepening engagement with clients toward
sustainable growth
Individual clients: Further enhance comprehensive asset consulting capabilities and provide services tailored to
diverse needs
Corporate clients: Promote business based on client needs through detailed segmentation
Branch network
reorganization
Digital services
IG framework
Capital
reallocation
Capital markets
Transaction
banking
Banking
S&T
Publically-offered
investment trusts
Pensions, other
Retail &
Business
Banking
Global
Markets
Corporate &
Institutional
Global
Corporate
Asset
Management
Started the Industry Groups (IG) framework towards strengthening our cross-sector deal origination
Strengthen risk-taking capabilities by utilizing capital released by reducing cross-shareholdings
Advance capital markets business through multi-layer transactions with Global 300 and expanding the client base
Enhance transaction banking business earnings base in Asia in light of changes in the business environment
Continue focusing on the balance between realized gains and the accumulation of unrealized gains
Strengthen S&T operations through the “One Responsibility” framework
Enhance profitability through product strategies suited for asset formation and long-term investment initiatives
Secure further competitiveness in providing solutions and in comprehensive pension consulting
Improve the convenience of digital services and monetize them
Business strategy
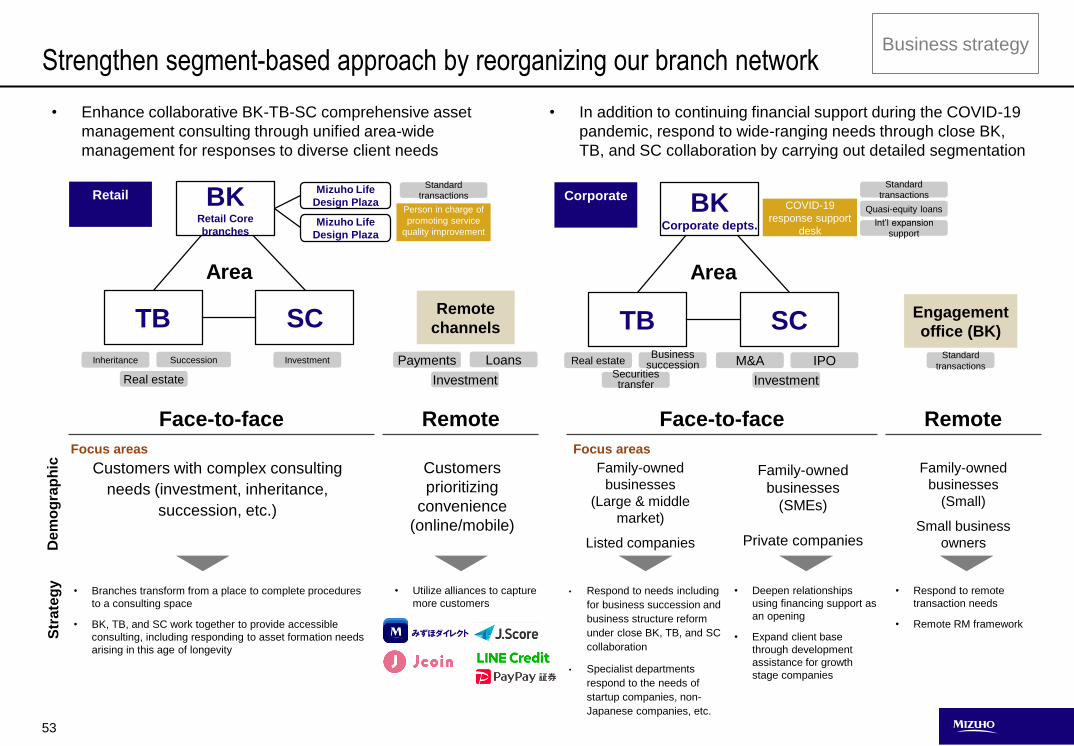
53
• Respond to needs including
for business succession and
business structure reform
under close BK, TB, and SC
collaboration
• Specialist departments
respond to the needs of
startup companies, non-
Japanese companies, etc.
Customers with complex consulting
needs (investment, inheritance,
succession, etc.)
• Respond to remote
transaction needs
• Remote RM framework
Family-owned
businesses
(Large & middle
market)
Listed companies
Strengthen segment-based approach by reorganizing our branch network
Face-to-face Remote Face-to-face Remote
De
mo
gra
ph
icS
tra
teg
y
Family-owned
businesses
(SMEs)
Private companies
• Deepen relationships
using financing support as
an opening
• Expand client base
through development
assistance for growth
stage companies
Family-owned
businesses
(Small)
Small business
owners
Focus areas
Customers
prioritizing
convenience
(online/mobile)
• Branches transform from a place to complete procedures
to a consulting space
• BK, TB, and SC work together to provide accessible
consulting, including responding to asset formation needs
arising in this age of longevity
Engagement
office (BK)
Businesssuccession M&AReal estate
Investment
TB SC
Securities transfer
IPO
BKCorporate depts.
Area
Corporate
Int’l expansion support
Quasi-equity loans
Standard transactions
Standard
transactions
• Utilize alliances to capture
more customers
Focus areas
Business strategy
• Enhance collaborative BK-TB-SC comprehensive asset
management consulting through unified area-wide
management for responses to diverse client needs
みずほダイレクト
Mizuho Life
Design Plaza
InvestmentInheritance Succession
Retail
TB SC
BKRetail Core
branches
Area
Standard transactions
Mizuho Life
Design Plaza
Remote
channels
Payments
Real estate
Loans
Investment
Person in charge of
promoting service
quality improvement
COVID-19
response support
desk
• In addition to continuing financial support during the COVID-19
pandemic, respond to wide-ranging needs through close BK,
TB, and SC collaboration by carrying out detailed segmentation
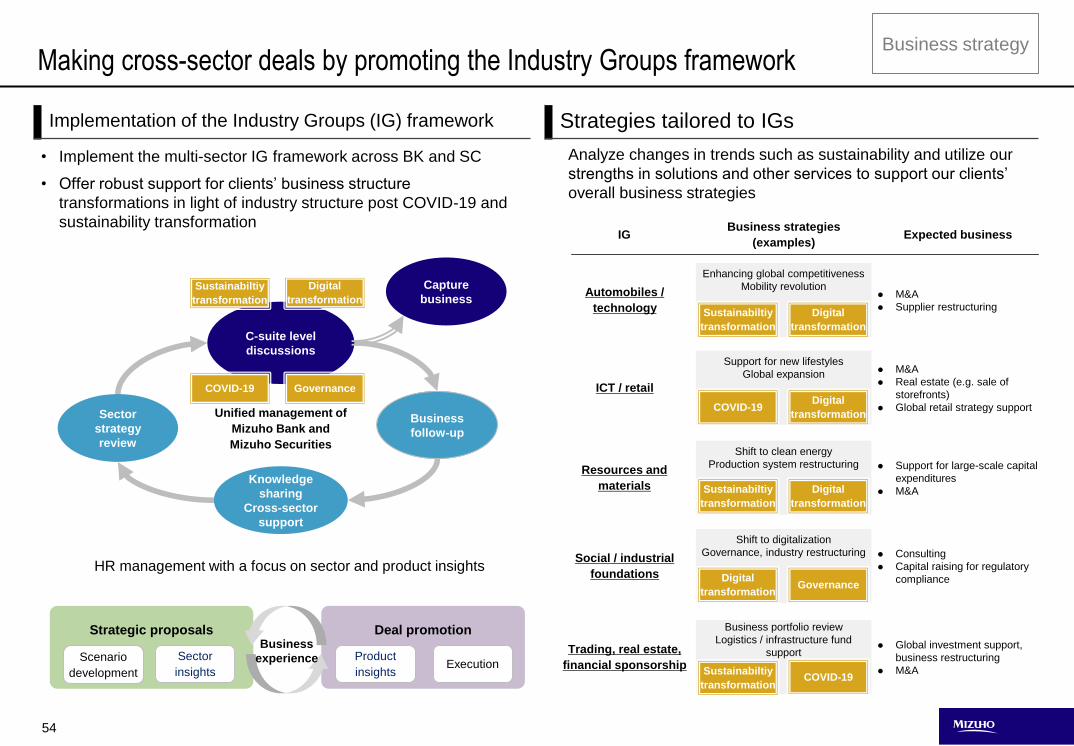
54
HR management with a focus on sector and product insights
Making cross-sector deals by promoting the Industry Groups framework
Implementation of the Industry Groups (IG) framework Strategies tailored to IGs
Analyze changes in trends such as sustainability and utilize our
strengths in solutions and other services to support our clients’
overall business strategies
Automobiles /
technology
ICT / retail
Resources and
materials
Trading, real estate,
financial sponsorship
Social / industrial
foundations
Enhancing global competitiveness
Mobility revolution
Support for new lifestyles
Global expansion
Shift to clean energy
Production system restructuring
Business portfolio review
Logistics / infrastructure fund
support
Shift to digitalization
Governance, industry restructuring
M&A
Supplier restructuring
M&A
Real estate (e.g. sale of
storefronts)
Global retail strategy support
Support for large-scale capital
expenditures
M&A
Global investment support,
business restructuring
M&A
Consulting
Capital raising for regulatory
compliance
IGBusiness strategies
(examples)Expected business
Sustainabiltiy
transformation
Digital
transformation
COVID-19Digital
transformation
Sustainabiltiy
transformation
Digital
transformation
Digital
transformationGovernance
Sustainabiltiy
transformationCOVID-19
Strategic proposals Deal promotion
Sector
insights
Product
insights
Scenario
developmentExecution
Business
experience
Unified management of
Mizuho Bank and
Mizuho Securities
C-suite level
discussions
Business
follow-up
Knowledge
sharing
Cross-sector
support
Sector
strategy
review
Capture
businessSustainabiltiy
transformation
Digital
transformation
COVID-19 Governance
• Implement the multi-sector IG framework across BK and SC
• Offer robust support for clients’ business structure
transformations in light of industry structure post COVID-19 and
sustainability transformation
Business strategy
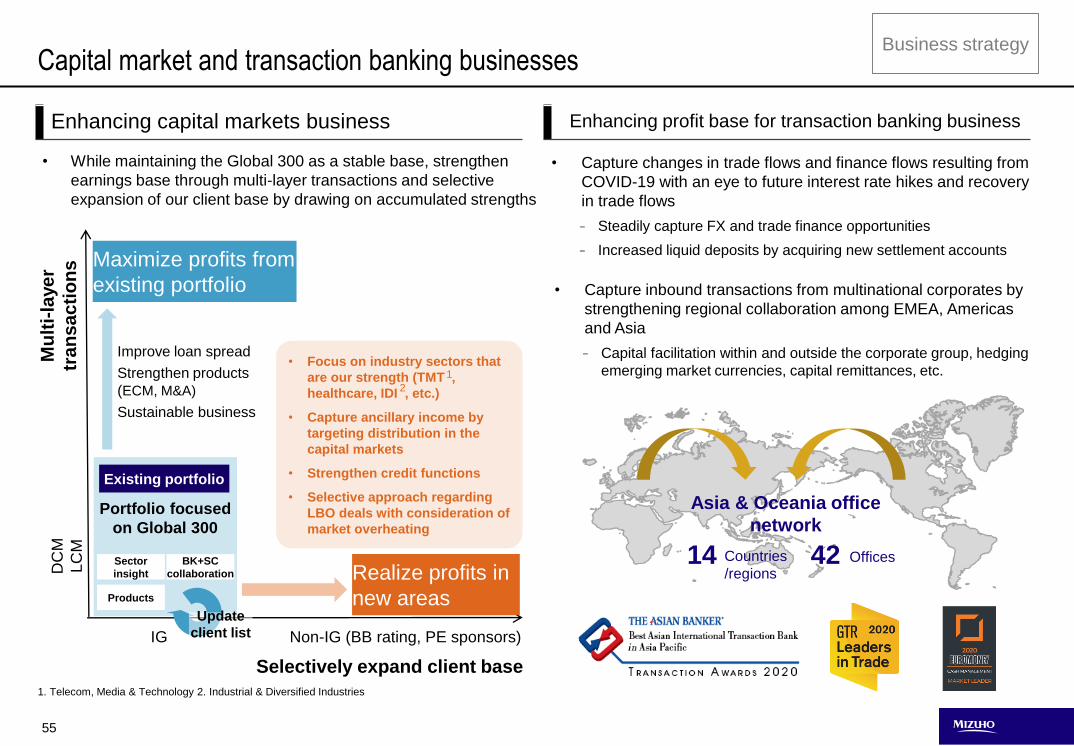
55
Capital market and transaction banking businesses
Enhancing capital markets business Enhancing profit base for transaction banking business
• Capture changes in trade flows and finance flows resulting from
COVID-19 with an eye to future interest rate hikes and recovery
in trade flows
‒ Steadily capture FX and trade finance opportunities
‒ Increased liquid deposits by acquiring new settlement accounts
Selectively expand client base
• While maintaining the Global 300 as a stable base, strengthen
earnings base through multi-layer transactions and selective
expansion of our client base by drawing on accumulated strengths
Business strategyM
ult
i-la
ye
r
tra
ns
ac
tio
ns Maximize profits from
existing portfolio
Portfolio focused
on Global 300
Existing portfolio
Sector
insight
Products
BK+SC
collaboration
Improve loan spread
Strengthen products
(ECM, M&A)
Sustainable business
Realize profits in
new areas
DC
M
LC
M
IG
Update
client list Non-IG (BB rating, PE sponsors)
• Focus on industry sectors that
are our strength (TMT ,
healthcare, IDI , etc.)
• Capture ancillary income by
targeting distribution in the
capital markets
• Strengthen credit functions
• Selective approach regarding
LBO deals with consideration of
market overheating
Asia & Oceania office
network
14 Countries
/regionsOffices42
1. Telecom, Media & Technology 2. Industrial & Diversified Industries
1
2
• Capture inbound transactions from multinational corporates by
strengthening regional collaboration among EMEA, Americas
and Asia
‒ Capital facilitation within and outside the corporate group, hedging
emerging market currencies, capital remittances, etc.
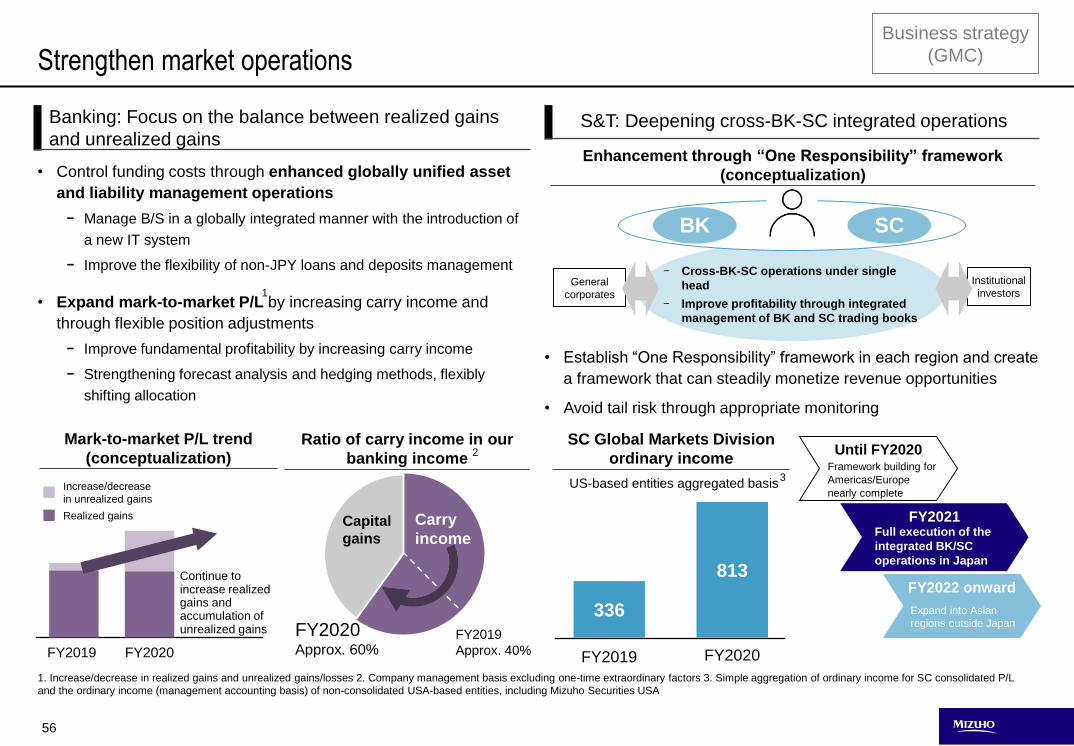
56
• Control funding costs through enhanced globally unified asset
and liability management operations
- Manage B/S in a globally integrated manner with the introduction of
a new IT system
- Improve the flexibility of non-JPY loans and deposits management
• Expand mark-to-market P/L by increasing carry income and
through flexible position adjustments
- Improve fundamental profitability by increasing carry income
- Strengthening forecast analysis and hedging methods, flexibly
shifting allocation
Ratio of carry income in our
banking income
S&T: Deepening cross-BK-SC integrated operationsBanking: Focus on the balance between realized gains
and unrealized gains
Business strategy
(GMC)
FY2019
Approx. 40%
FY2020Approx. 60%
1
FY2019 FY2020
Realized gains
Increase/decrease
in unrealized gains
Strengthen market operations
Capital
gains
Carry
income
2Mark-to-market P/L trend
(conceptualization)
- Cross-BK-SC operations under single
head
- Improve profitability through integrated
management of BK and SC trading books
Enhancement through “One Responsibility” framework
(conceptualization)
• Establish “One Responsibility” framework in each region and create
a framework that can steadily monetize revenue opportunities
• Avoid tail risk through appropriate monitoring
BK SC
Institutional
investorsGeneral
corporates
Until FY2020Framework building for
Americas/Europe
nearly complete
FY2021Full execution of the
integrated BK/SC
operations in Japan
FY2022 onward
Expand into Asian
regions outside Japan
SC Global Markets Division
ordinary income
336
FY2019
813
FY2020
3US-based entities aggregated basis
1. Increase/decrease in realized gains and unrealized gains/losses 2. Company management basis excluding one-time extraordinary factors 3. Simple aggregation of ordinary income for SC consolidated P/L
and the ordinary income (management accounting basis) of non-consolidated USA-based entities, including Mizuho Securities USA
Continue to increase realized gains and accumulation of unrealized gains
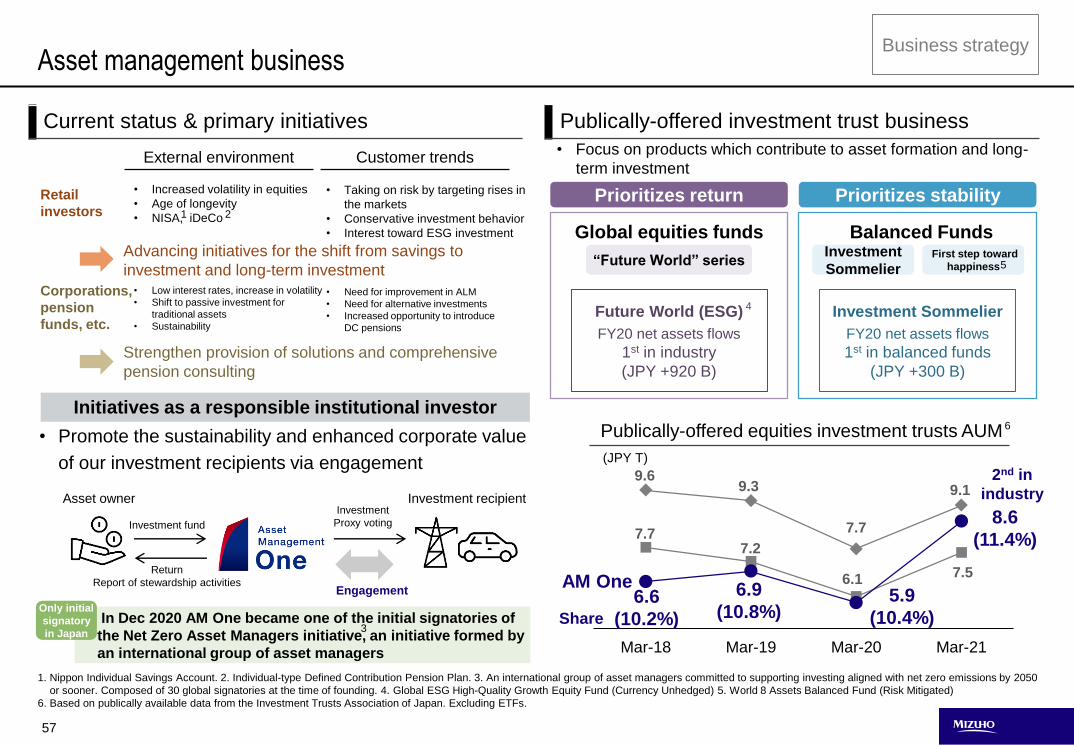
57
• Promote the sustainability and enhanced corporate value
of our investment recipients via engagement
• Focus on products which contribute to asset formation and long-
term investment
1. Nippon Individual Savings Account. 2. Individual-type Defined Contribution Pension Plan. 3. An international group of asset managers committed to supporting investing aligned with net zero emissions by 2050
or sooner. Composed of 30 global signatories at the time of founding. 4. Global ESG High-Quality Growth Equity Fund (Currency Unhedged) 5. World 8 Assets Balanced Fund (Risk Mitigated)
6. Based on publically available data from the Investment Trusts Association of Japan. Excluding ETFs.
1
Asset management business
Current status & primary initiatives
External environment Customer trends
• Increased volatility in equities
• Age of longevity
• NISA, iDeCo
Strengthen provision of solutions and comprehensive
pension consulting
Advancing initiatives for the shift from savings to
investment and long-term investment
Publically-offered investment trust business
• Taking on risk by targeting rises in
the markets
• Conservative investment behavior
• Interest toward ESG investment
• Low interest rates, increase in volatility
• Shift to passive investment for
traditional assets
• Sustainability
• Need for improvement in ALM
• Need for alternative investments
• Increased opportunity to introduce
DC pensions
Business strategy
Initiatives as a responsible institutional investor
In Dec 2020 AM One became one of the initial signatories of
the Net Zero Asset Managers initiative, an initiative formed by
an international group of asset managers
Only initial
signatory
in Japan
Retail
investors
Corporations,
pension
funds, etc.
Investment recipientAsset owner
Investment fund
Return
Report of stewardship activities
Investment
Proxy voting
Engagement
Mar-18 Mar-19 Mar-20 Mar-21
(JPY T)
Publically-offered equities investment trusts AUM
AM One6.6
(10.2%)
7.7
9.6
6.9
(10.8%)5.9
(10.4%)
8.6
(11.4%)
9.3
7.7
9.1
7.2
6.1 7.5
Global equities funds
Prioritizes return
“Future World” series
Future World (ESG)
FY20 net assets flows
1st in industry
(JPY +920 B)
Prioritizes stability
Balanced FundsInvestment
SommelierFirst step toward
happiness
Investment Sommelier
FY20 net assets flows
1st in balanced funds
(JPY +300 B)
2nd in
industry
6
3Share
5
4
1 2
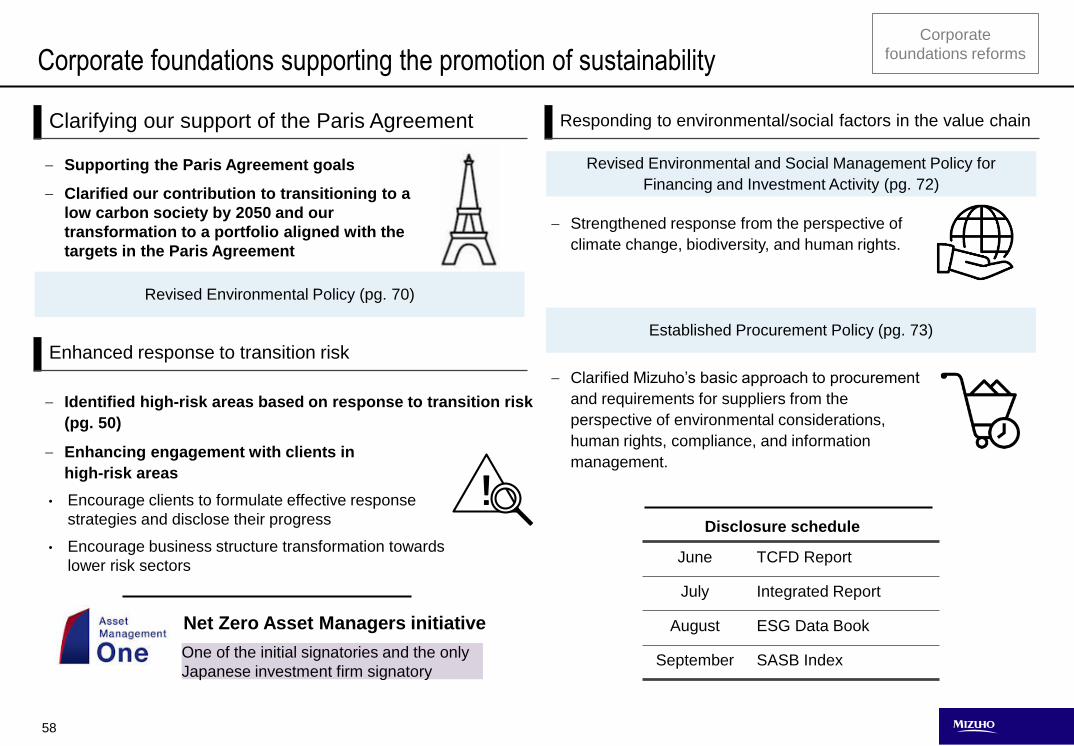
58
Corporate
foundations reformsCorporate foundations supporting the promotion of sustainability
Revised Environmental and Social Management Policy for
Financing and Investment Activity (pg. 72)
Established Procurement Policy (pg. 73)
Clarifying our support of the Paris Agreement
— Supporting the Paris Agreement goals
— Clarified our contribution to transitioning to a
low carbon society by 2050 and our
transformation to a portfolio aligned with the
targets in the Paris Agreement
Revised Environmental Policy (pg. 70)
— Strengthened response from the perspective of
climate change, biodiversity, and human rights.
— Clarified Mizuho’s basic approach to procurement
and requirements for suppliers from the
perspective of environmental considerations,
human rights, compliance, and information
management.
— Identified high-risk areas based on response to transition risk
(pg. 50)
— Enhancing engagement with clients in
high-risk areas
Responding to environmental/social factors in the value chain
Enhanced response to transition risk
!• Encourage clients to formulate effective response
strategies and disclose their progress
• Encourage business structure transformation towards
lower risk sectors
Net Zero Asset Managers initiative
One of the initial signatories and the only
Japanese investment firm signatory
Disclosure schedule
June TCFD Report
July Integrated Report
August ESG Data Book
September SASB Index
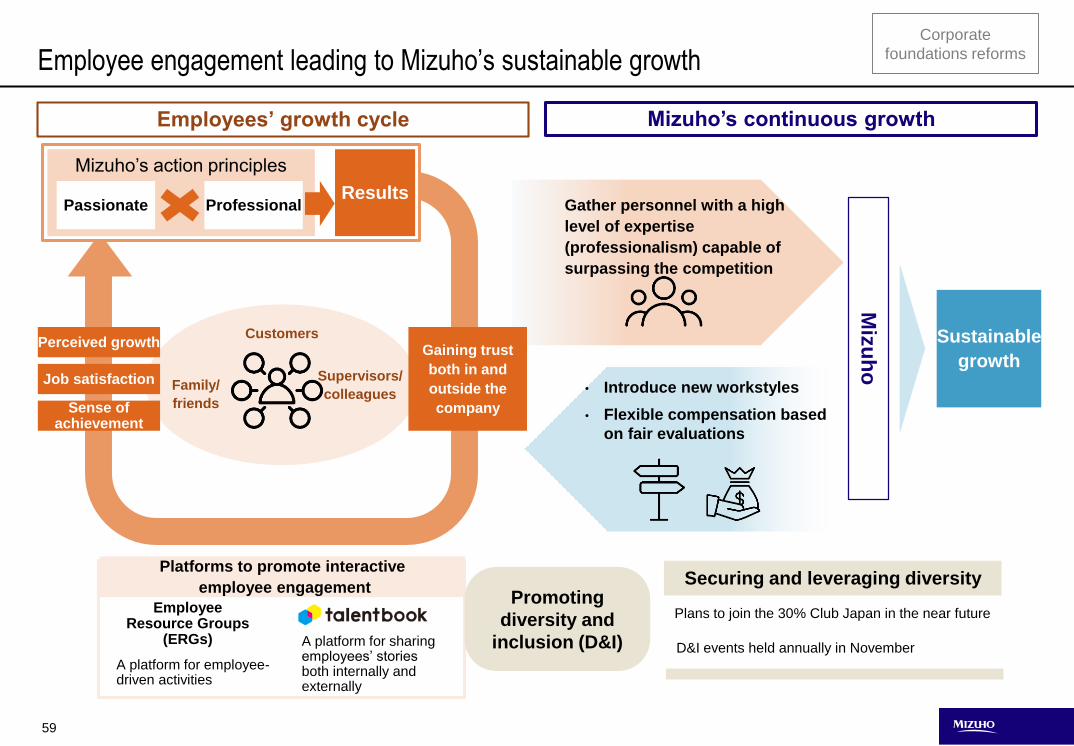
59
Customers
Supervisors/
colleaguesFamily/
friends
Employee engagement leading to Mizuho’s sustainable growth
• Introduce new workstyles
• Flexible compensation based
on fair evaluations
Employees’ growth cycle
Miz
uh
oGather personnel with a high
level of expertise
(professionalism) capable of
surpassing the competition
Sustainable
growth
Mizuho’s action principles
Passionate ProfessionalResults
Perceived growth
Job satisfaction
Gaining trust
both in and
outside the
companySense of achievement
Employee Resource Groups
(ERGs)
A platform for employee-driven activities
Platforms to promote interactive
employee engagement
Corporate
foundations reforms
Mizuho’s continuous growth
A platform for sharing employees’ stories both internally and externally
Promoting
diversity and
inclusion (D&I)
Securing and leveraging diversity
Plans to join the 30% Club Japan in the near future
D&I events held annually in November
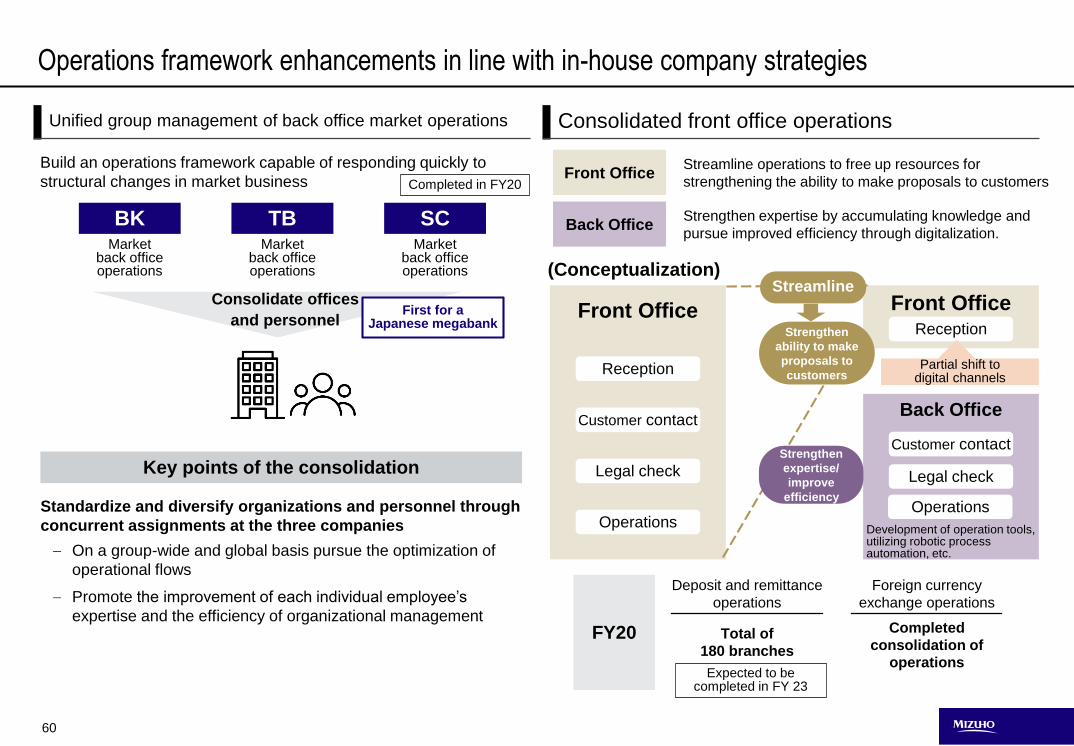
60
Back Office
Legal check
Operations
Customer contact
Front OfficeReception
Operations framework enhancements in line with in-house company strategies
Unified group management of back office market operations
Standardize and diversify organizations and personnel through
concurrent assignments at the three companies
— On a group-wide and global basis pursue the optimization of
operational flows
— Promote the improvement of each individual employee’s
expertise and the efficiency of organizational management
Key points of the consolidation
Consolidate offices
and personnel
Build an operations framework capable of responding quickly to
structural changes in market business
Front Office
Reception
Legal check
Operations
Customer contact
(Conceptualization)
Partial shift to digital channels
Streamline
Strengthen
expertise/
improve
efficiency
First for a Japanese megabank
BKMarket
back office operations
TBMarket
back office operations
SCMarket
back office operations
Development of operation tools, utilizing robotic process automation, etc.
Deposit and remittance
operations
Foreign currency
exchange operations
Completed
consolidation of
operations
Total of
180 branches FY20
Strengthen
ability to make
proposals to
customers
Consolidated front office operations
Streamline operations to free up resources for
strengthening the ability to make proposals to customersFront Office
Back OfficeStrengthen expertise by accumulating knowledge and
pursue improved efficiency through digitalization.
Completed in FY20
Expected to be completed in FY 23
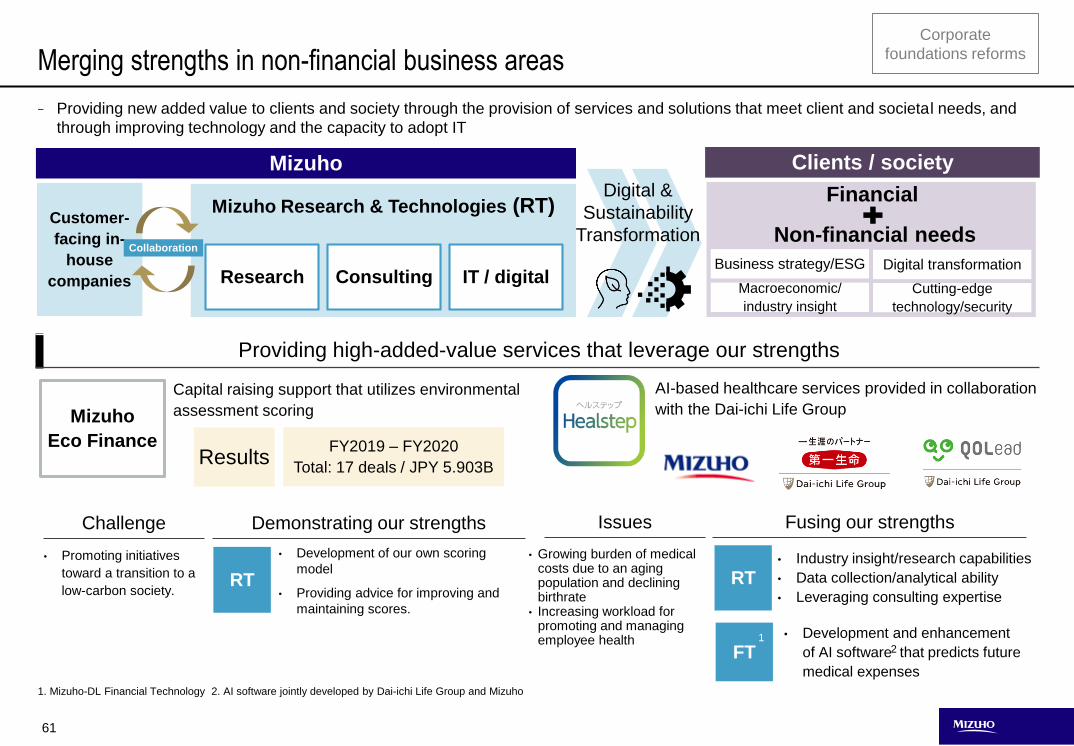
61
Clients / society
Mizuho Research & Technologies (RT)
Business strategy/ESG
Macroeconomic/
industry insight
Digital transformation
Cutting-edge
technology/security
Customer-
facing in-
house
companies
Mizuho
Collaboration
Research IT / digitalConsulting
Merging strengths in non-financial business areas
- Providing new added value to clients and society through the provision of services and solutions that meet client and societal needs, and
through improving technology and the capacity to adopt IT
Providing high-added-value services that leverage our strengths
Mizuho
Eco Finance
Challenge Demonstrating our strengths
• Development of our own scoring
model
• Providing advice for improving and
maintaining scores.
• Promoting initiatives
toward a transition to a
low-carbon society.
Capital raising support that utilizes environmental
assessment scoring
RT
AI-based healthcare services provided in collaboration
with the Dai-ichi Life Group
ResultsFY2019 – FY2020
Total: 17 deals / JPY 5.903B
FT
RT
Issues Fusing our strengths
• Growing burden of medical costs due to an aging population and declining birthrate
• Increasing workload for promoting and managing employee health
• Development and enhancement
of AI software that predicts future
medical expenses
12
• Industry insight/research capabilities
• Data collection/analytical ability
• Leveraging consulting expertise
1. Mizuho-DL Financial Technology 2. AI software jointly developed by Dai-ichi Life Group and Mizuho
Digital &
Sustainability
Transformation
Financial
Non-financial needs
Corporate
foundations reforms

Appendix
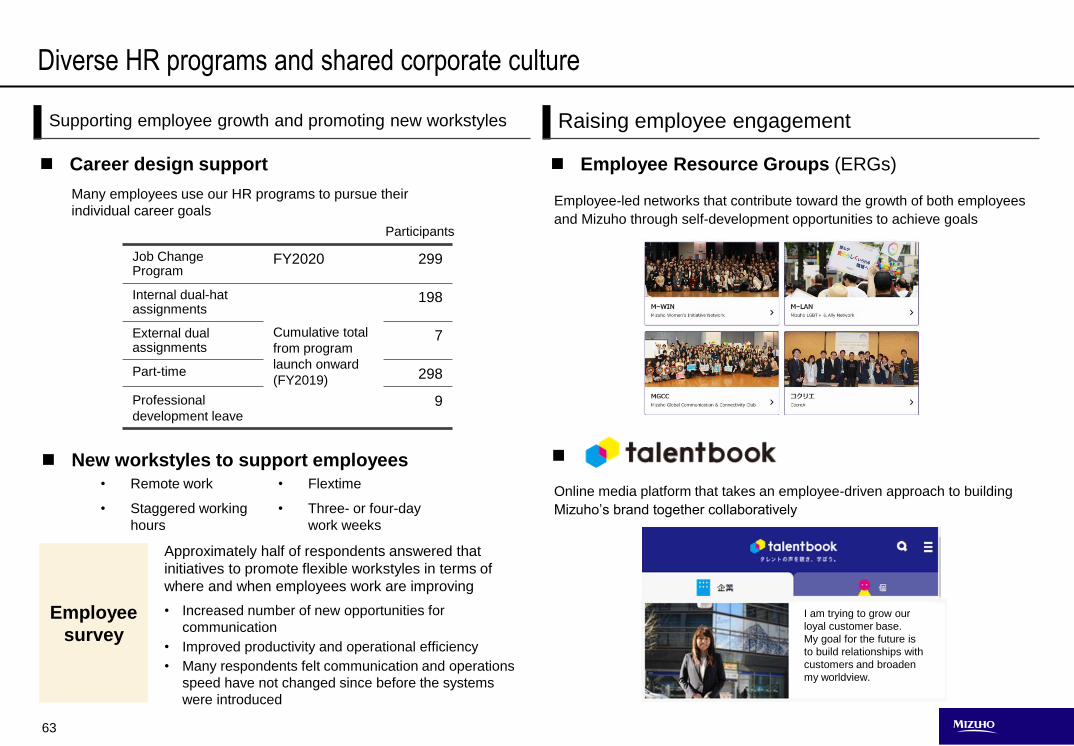
63
Diverse HR programs and shared corporate culture
• Remote work
• Staggered working
hours
Supporting employee growth and promoting new workstyles
Many employees use our HR programs to pursue their
individual career goals
Online media platform that takes an employee-driven approach to building
Mizuho’s brand together collaboratively
Raising employee engagement
Employee-led networks that contribute toward the growth of both employees
and Mizuho through self-development opportunities to achieve goals
Job Change Program
FY2020 299
Internal dual-hat assignments
Cumulative total
from program
launch onward
(FY2019)
198
External dual assignments
7
Part-time 298
Professional
development leave9
Approximately half of respondents answered that
initiatives to promote flexible workstyles in terms of
where and when employees work are improving
• Flextime
• Three- or four-day
work weeks
• Increased number of new opportunities for
communication
• Improved productivity and operational efficiency
• Many respondents felt communication and operations
speed have not changed since before the systems
were introduced
Employee
survey
Career design support
New workstyles to support employees
Employee Resource Groups (ERGs)
Participants
I am trying to grow our
loyal customer base.
My goal for the future is
to build relationships with
customers and broaden
my worldview.
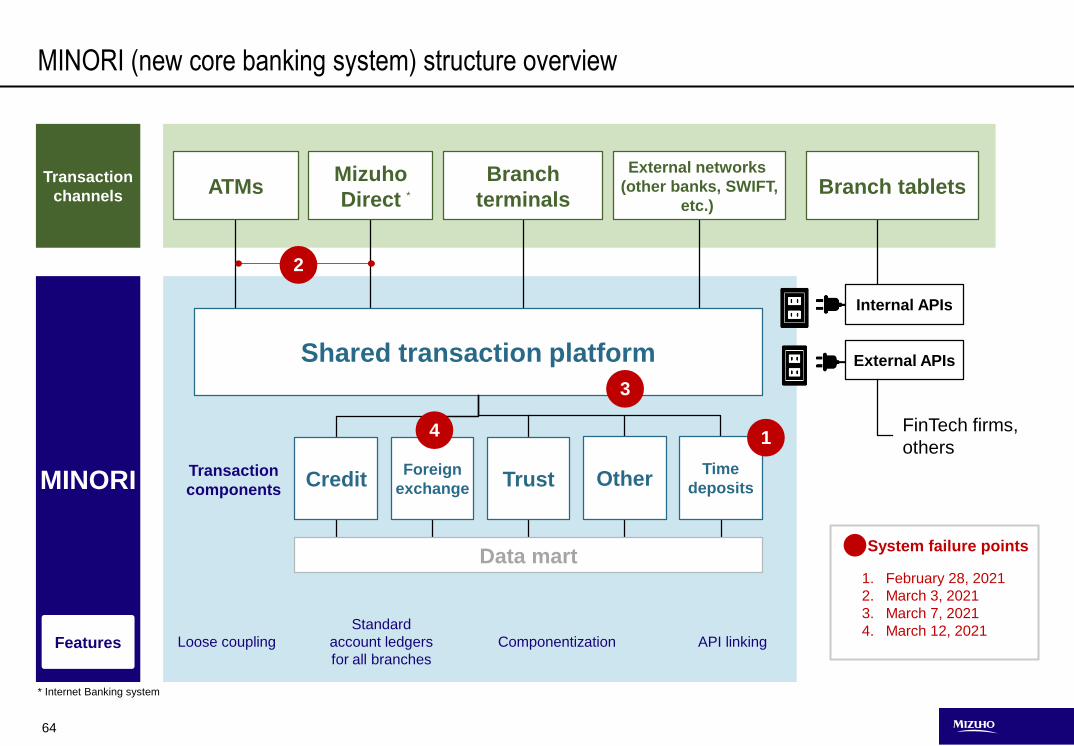
64
MINORI (new core banking system) structure overview
Loose coupling
Standard
account ledgers
for all branches
Componentization API linking
Transaction
channels
Shared transaction platform
ATMsMizuho
Direct
Branch
terminals
External networks
(other banks, SWIFT,
etc.)
CreditForeign
exchange
Time
depositsTrust Other
1
Data mart
3
4
System failure points
External APIs
FinTech firms,
others
2
MINORITransaction
components
Features
1. February 28, 2021
2. March 3, 2021
3. March 7, 2021
4. March 12, 2021
Branch tablets
Internal APIs
*
* Internet Banking system
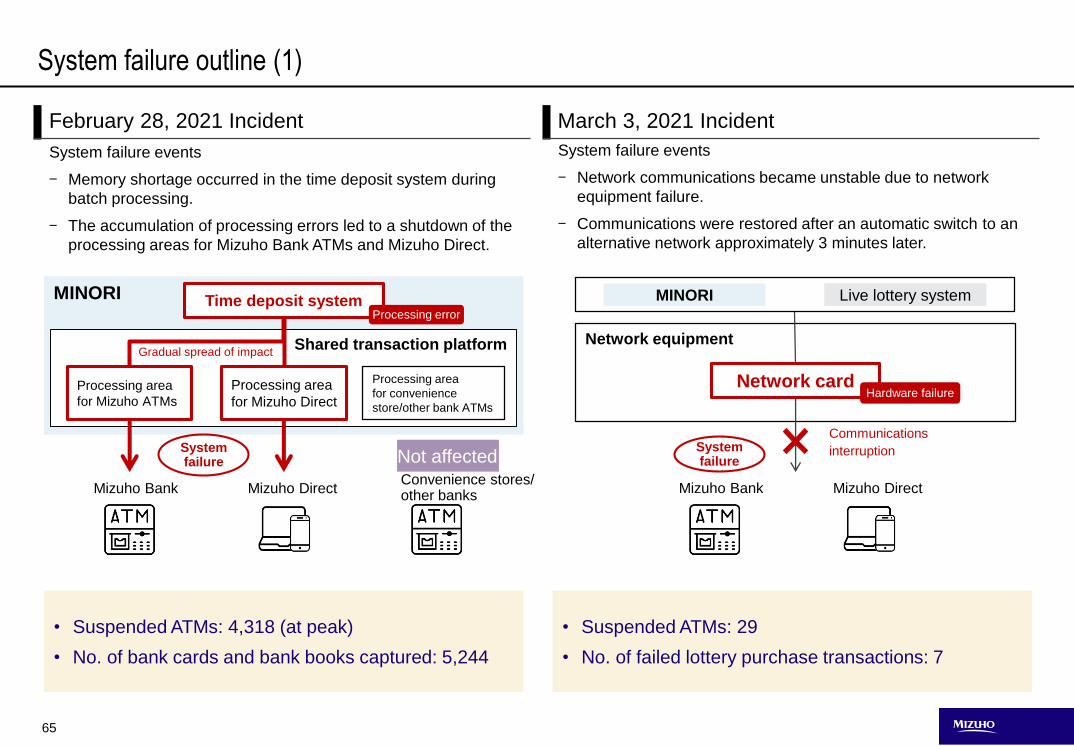
65
MINORI
System failure outline (1)
System failure events
- Memory shortage occurred in the time deposit system during
batch processing.
- The accumulation of processing errors led to a shutdown of the
processing areas for Mizuho Bank ATMs and Mizuho Direct.
Network equipment
February 28, 2021 Incident March 3, 2021 Incident
Shared transaction platform
Mizuho Bank Mizuho DirectConvenience stores/other banks
Processing area
for convenience
store/other bank ATMs
Not affected
Time deposit system
Processing area
for Mizuho ATMs
Processing area
for Mizuho Direct
Processing error
System failure
• Suspended ATMs: 4,318 (at peak)
• No. of bank cards and bank books captured: 5,244
System failure events
- Network communications became unstable due to network
equipment failure.
- Communications were restored after an automatic switch to an
alternative network approximately 3 minutes later.
Mizuho Bank Mizuho Direct
System failure
Network cardHardware failure
MINORI Live lottery system
• Suspended ATMs: 29
• No. of failed lottery purchase transactions: 7
Gradual spread of impact
Communications
interruption
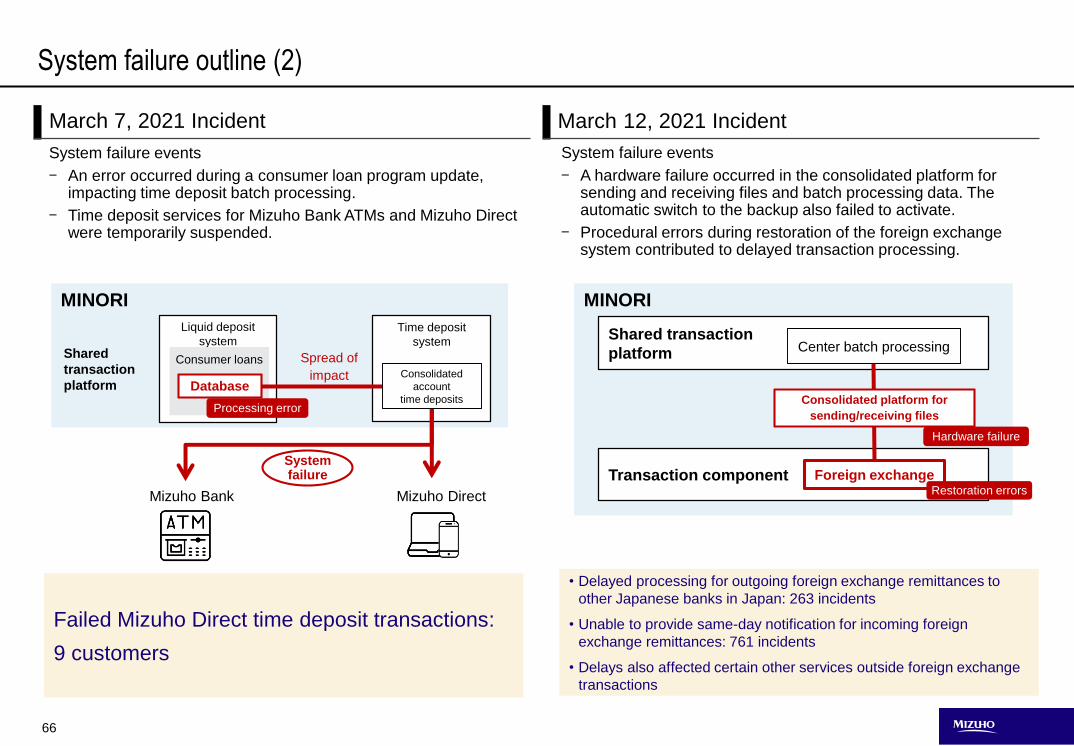
66
System failure outline (2)
System failure events
- An error occurred during a consumer loan program update, impacting time deposit batch processing.
- Time deposit services for Mizuho Bank ATMs and Mizuho Direct were temporarily suspended.
March 7, 2021 Incident March 12, 2021 Incident
Failed Mizuho Direct time deposit transactions:
9 customers
• Delayed processing for outgoing foreign exchange remittances to
other Japanese banks in Japan: 263 incidents
• Unable to provide same-day notification for incoming foreign
exchange remittances: 761 incidents
• Delays also affected certain other services outside foreign exchange
transactions
System failure events
- A hardware failure occurred in the consolidated platform for sending and receiving files and batch processing data. The automatic switch to the backup also failed to activate.
- Procedural errors during restoration of the foreign exchange system contributed to delayed transaction processing.
MINORI
Mizuho Bank Mizuho Direct
Liquid deposit
systemTime deposit
system
Consumer loansShared
transaction
platform
Spread of
impactDatabase
Processing error
Consolidated
account
time deposits
System failure
MINORI
Shared transaction
platform
Transaction component
Center batch processing
Consolidated platform for
sending/receiving files
Hardware failure
Foreign exchangeRestoration errors
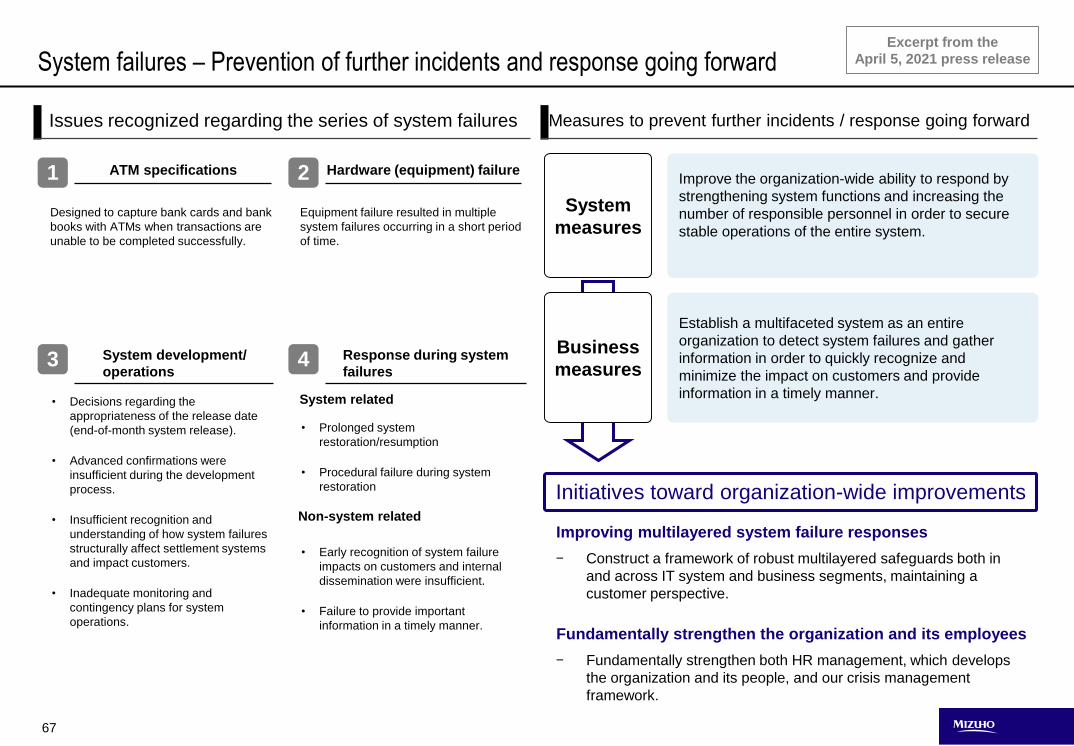
67
System failures – Prevention of further incidents and response going forwardExcerpt from the
April 5, 2021 press release
Establish a multifaceted system as an entire
organization to detect system failures and gather
information in order to quickly recognize and
minimize the impact on customers and provide
information in a timely manner.
Improve the organization-wide ability to respond by
strengthening system functions and increasing the
number of responsible personnel in order to secure
stable operations of the entire system.
Issues recognized regarding the series of system failures
Fundamentally strengthen the organization and its employees
- Fundamentally strengthen both HR management, which develops
the organization and its people, and our crisis management
framework.
Improving multilayered system failure responses
- Construct a framework of robust multilayered safeguards both in
and across IT system and business segments, maintaining a
customer perspective.
Measures to prevent further incidents / response going forward
ATM specifications Hardware (equipment) failure
System development/
operations
Response during system
failures
Designed to capture bank cards and bank
books with ATMs when transactions are
unable to be completed successfully.
Equipment failure resulted in multiple
system failures occurring in a short period
of time.
• Decisions regarding the
appropriateness of the release date
(end-of-month system release).
• Advanced confirmations were
insufficient during the development
process.
• Insufficient recognition and
understanding of how system failures
structurally affect settlement systems
and impact customers.
• Inadequate monitoring and
contingency plans for system
operations.
• Prolonged system
restoration/resumption
• Procedural failure during system
restoration
• Early recognition of system failure
impacts on customers and internal
dissemination were insufficient.
• Failure to provide important
information in a timely manner.
System related
1 2
3 4
Non-system related
System
measures
Business
measures
Initiatives toward organization-wide improvements
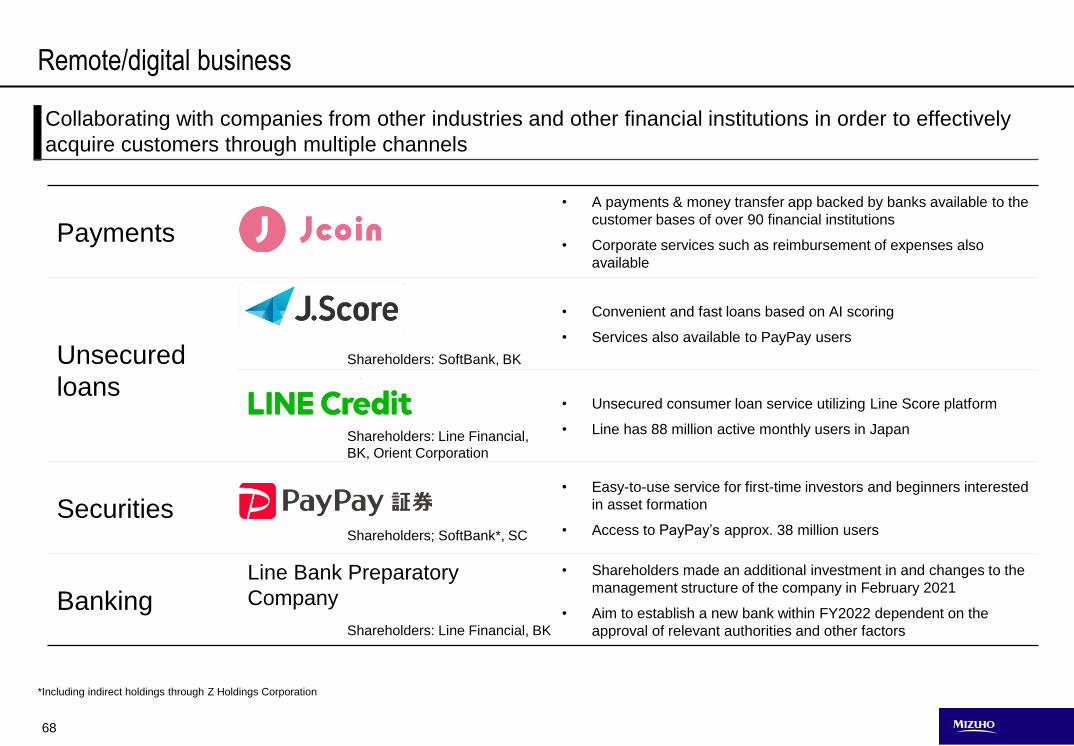
68
Payments
• A payments & money transfer app backed by banks available to the
customer bases of over 90 financial institutions
• Corporate services such as reimbursement of expenses also
available
Unsecured
loans
• Convenient and fast loans based on AI scoring
• Services also available to PayPay users
• Unsecured consumer loan service utilizing Line Score platform
• Line has 88 million active monthly users in Japan
Securities• Easy-to-use service for first-time investors and beginners interested
in asset formation
• Access to PayPay’s approx. 38 million users
BankingLine Bank Preparatory
Company
• Shareholders made an additional investment in and changes to the
management structure of the company in February 2021
• Aim to establish a new bank within FY2022 dependent on the
approval of relevant authorities and other factors
Remote/digital business
Collaborating with companies from other industries and other financial institutions in order to effectively
acquire customers through multiple channels
Shareholders: SoftBank, BK
Shareholders: Line Financial,
BK, Orient Corporation
Shareholders; SoftBank*, SC
Shareholders: Line Financial, BK
*Including indirect holdings through Z Holdings Corporation
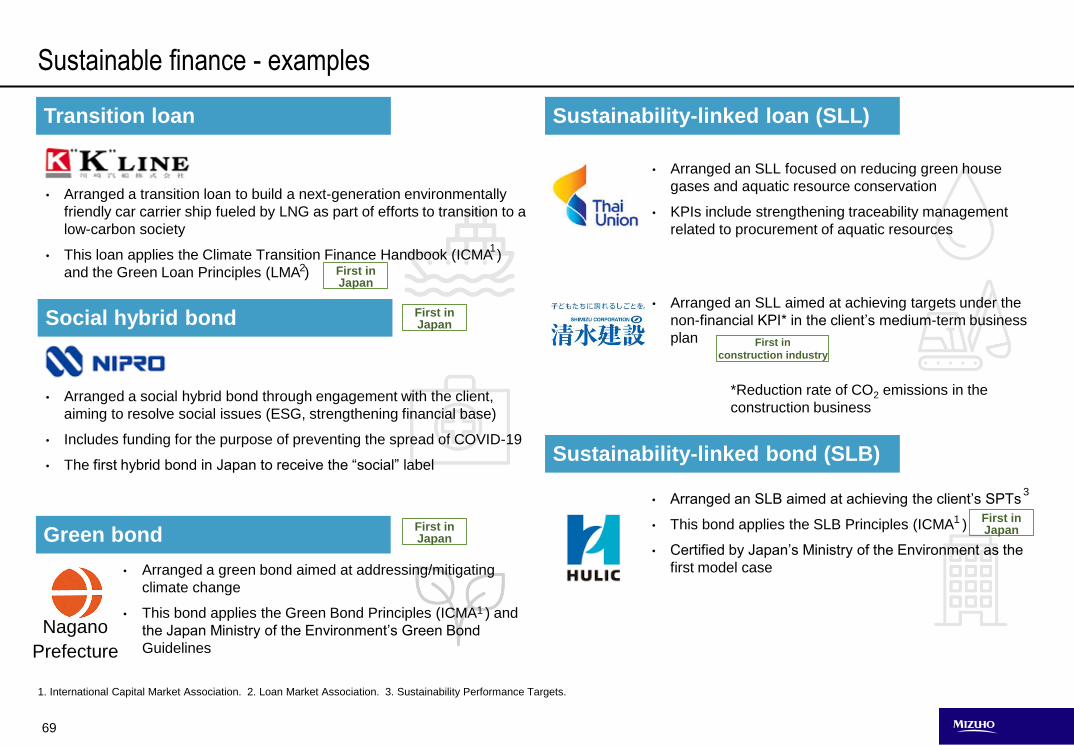
69
Sustainable finance - examples
1. International Capital Market Association. 2. Loan Market Association. 3. Sustainability Performance Targets.
Nagano
Prefecture
• Arranged an SLL focused on reducing green house
gases and aquatic resource conservation
• KPIs include strengthening traceability management
related to procurement of aquatic resources
• Arranged an SLL aimed at achieving targets under the
non-financial KPI* in the client’s medium-term business
plan
• Arranged a transition loan to build a next-generation environmentally
friendly car carrier ship fueled by LNG as part of efforts to transition to a
low-carbon society
• This loan applies the Climate Transition Finance Handbook (ICMA )
and the Green Loan Principles (LMA )
• Arranged a green bond aimed at addressing/mitigating
climate change
• This bond applies the Green Bond Principles (ICMA ) and
the Japan Ministry of the Environment’s Green Bond
Guidelines
1
• Arranged a social hybrid bond through engagement with the client,
aiming to resolve social issues (ESG, strengthening financial base)
• Includes funding for the purpose of preventing the spread of COVID-19
• The first hybrid bond in Japan to receive the “social” label
• Arranged an SLB aimed at achieving the client’s SPTs
• This bond applies the SLB Principles (ICMA )
• Certified by Japan’s Ministry of the Environment as the
first model case
First in Japan
First in Japan
First in Japan
First in
construction industry
Sustainability-linked loan (SLL)
Sustainability-linked bond (SLB)
Transition loan
Social hybrid bond
Green bond
*Reduction rate of CO2 emissions in the
construction business
2
1
3
1
First in Japan
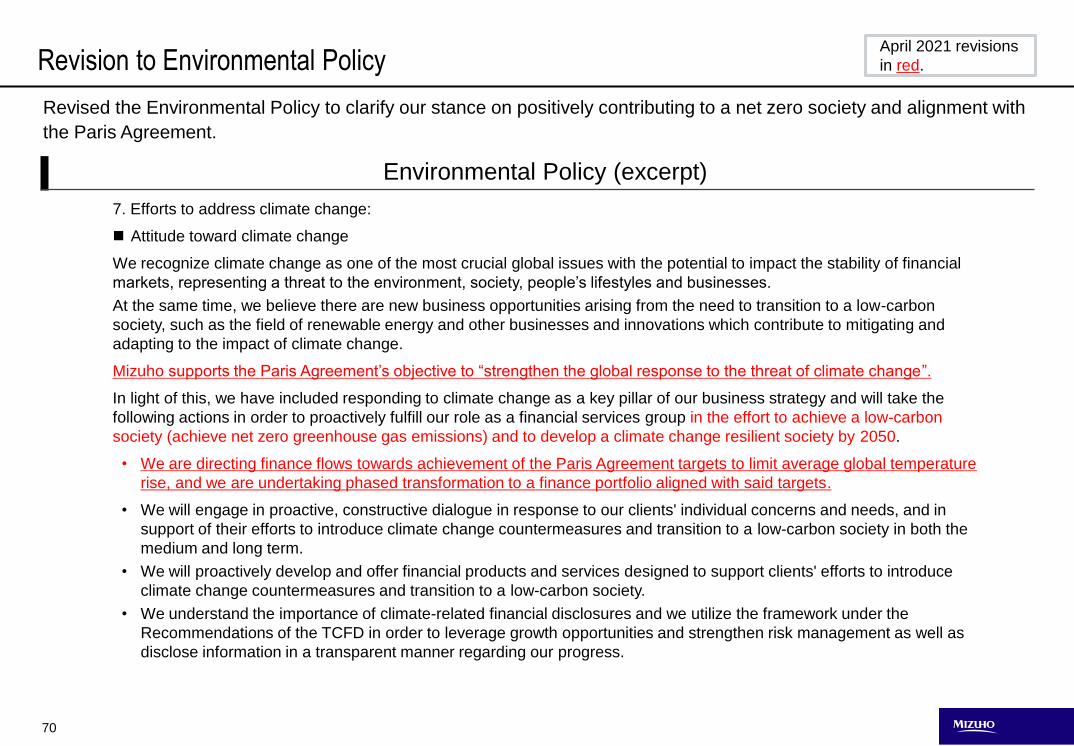
70
Revision to Environmental Policy
7. Efforts to address climate change:
Attitude toward climate change
We recognize climate change as one of the most crucial global issues with the potential to impact the stability of financial
markets, representing a threat to the environment, society, people’s lifestyles and businesses.
At the same time, we believe there are new business opportunities arising from the need to transition to a low-carbon
society, such as the field of renewable energy and other businesses and innovations which contribute to mitigating and
adapting to the impact of climate change.
Mizuho supports the Paris Agreement’s objective to “strengthen the global response to the threat of climate change”.
In light of this, we have included responding to climate change as a key pillar of our business strategy and will take the
following actions in order to proactively fulfill our role as a financial services group in the effort to achieve a low-carbon
society (achieve net zero greenhouse gas emissions) and to develop a climate change resilient society by 2050.
• We are directing finance flows towards achievement of the Paris Agreement targets to limit average global temperature
rise, and we are undertaking phased transformation to a finance portfolio aligned with said targets.
• We will engage in proactive, constructive dialogue in response to our clients' individual concerns and needs, and in
support of their efforts to introduce climate change countermeasures and transition to a low-carbon society in both the
medium and long term.
• We will proactively develop and offer financial products and services designed to support clients' efforts to introduce
climate change countermeasures and transition to a low-carbon society.
• We understand the importance of climate-related financial disclosures and we utilize the framework under the
Recommendations of the TCFD in order to leverage growth opportunities and strengthen risk management as well as
disclose information in a transparent manner regarding our progress.
Revised the Environmental Policy to clarify our stance on positively contributing to a net zero society and alignment with
the Paris Agreement.
Environmental Policy (excerpt)
April 2021 revisions
in red.
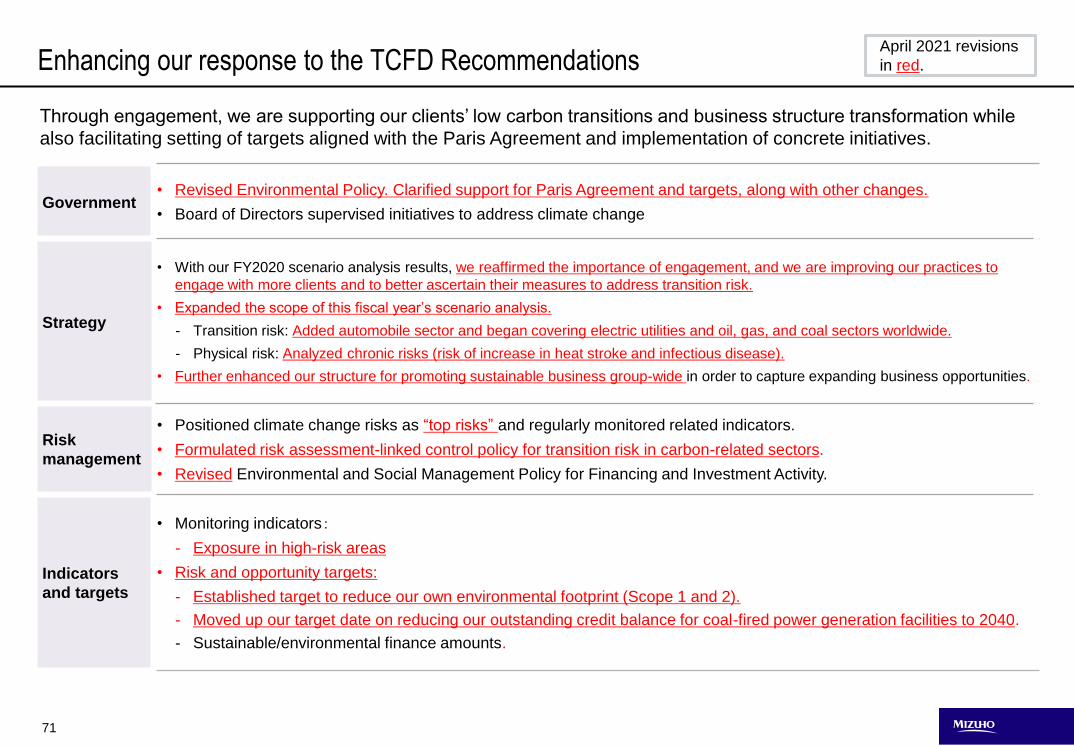
71
Government• Revised Environmental Policy. Clarified support for Paris Agreement and targets, along with other changes.
• Board of Directors supervised initiatives to address climate change
Strategy
• With our FY2020 scenario analysis results, we reaffirmed the importance of engagement, and we are improving our practices to
engage with more clients and to better ascertain their measures to address transition risk.
• Expanded the scope of this fiscal year’s scenario analysis.
- Transition risk: Added automobile sector and began covering electric utilities and oil, gas, and coal sectors worldwide.
- Physical risk: Analyzed chronic risks (risk of increase in heat stroke and infectious disease).
• Further enhanced our structure for promoting sustainable business group-wide in order to capture expanding business opportunities.
Risk
management
• Positioned climate change risks as “top risks” and regularly monitored related indicators.
• Formulated risk assessment-linked control policy for transition risk in carbon-related sectors.
• Revised Environmental and Social Management Policy for Financing and Investment Activity.
Indicators
and targets
• Monitoring indicators:
- Exposure in high-risk areas
• Risk and opportunity targets:
- Established target to reduce our own environmental footprint (Scope 1 and 2).
- Moved up our target date on reducing our outstanding credit balance for coal-fired power generation facilities to 2040.
- Sustainable/environmental finance amounts.
Through engagement, we are supporting our clients’ low carbon transitions and business structure transformation while
also facilitating setting of targets aligned with the Paris Agreement and implementation of concrete initiatives.
Enhancing our response to the TCFD RecommendationsApril 2021 revisions
in red.
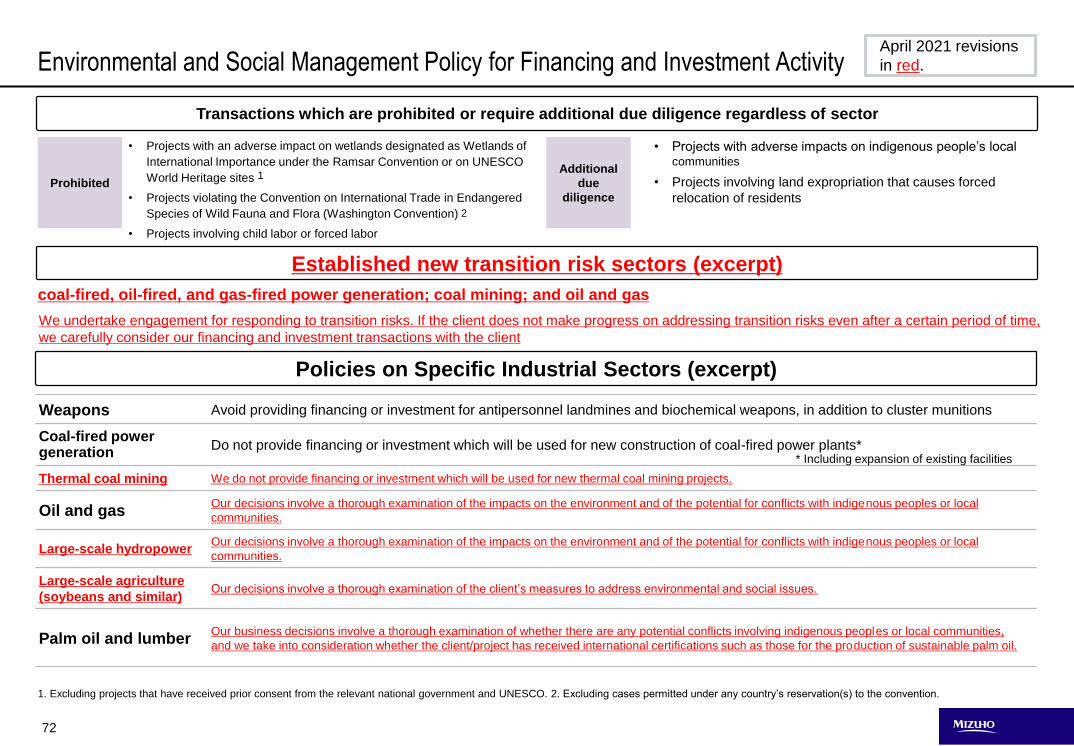
72
Prohibited
Additional
due
diligence
Environmental and Social Management Policy for Financing and Investment Activity
1. Excluding projects that have received prior consent from the relevant national government and UNESCO. 2. Excluding cases permitted under any country’s reservation(s) to the convention.
Weapons Avoid providing financing or investment for antipersonnel landmines and biochemical weapons, in addition to cluster munitions
Coal-fired power generation
Do not provide financing or investment which will be used for new construction of coal-fired power plants*
Thermal coal mining We do not provide financing or investment which will be used for new thermal coal mining projects.
Oil and gasOur decisions involve a thorough examination of the impacts on the environment and of the potential for conflicts with indigenous peoples or local
communities.
Large-scale hydropowerOur decisions involve a thorough examination of the impacts on the environment and of the potential for conflicts with indigenous peoples or local
communities.
Large-scale agriculture
(soybeans and similar)Our decisions involve a thorough examination of the client’s measures to address environmental and social issues.
Palm oil and lumberOur business decisions involve a thorough examination of whether there are any potential conflicts involving indigenous peoples or local communities,
and we take into consideration whether the client/project has received international certifications such as those for the production of sustainable palm oil.
• Projects with an adverse impact on wetlands designated as Wetlands of
International Importance under the Ramsar Convention or on UNESCO
World Heritage sites
• Projects violating the Convention on International Trade in Endangered
Species of Wild Fauna and Flora (Washington Convention)
• Projects involving child labor or forced labor
• Projects with adverse impacts on indigenous people’s local communities
• Projects involving land expropriation that causes forced
relocation of residents
coal-fired, oil-fired, and gas-fired power generation; coal mining; and oil and gas
We undertake engagement for responding to transition risks. If the client does not make progress on addressing transition risks even after a certain period of time,
we carefully consider our financing and investment transactions with the client
Policies on Specific Industrial Sectors (excerpt)
Transactions which are prohibited or require additional due diligence regardless of sector
Established new transition risk sectors (excerpt)
* Including expansion of existing facilities
1
2
April 2021 revisions
in red.
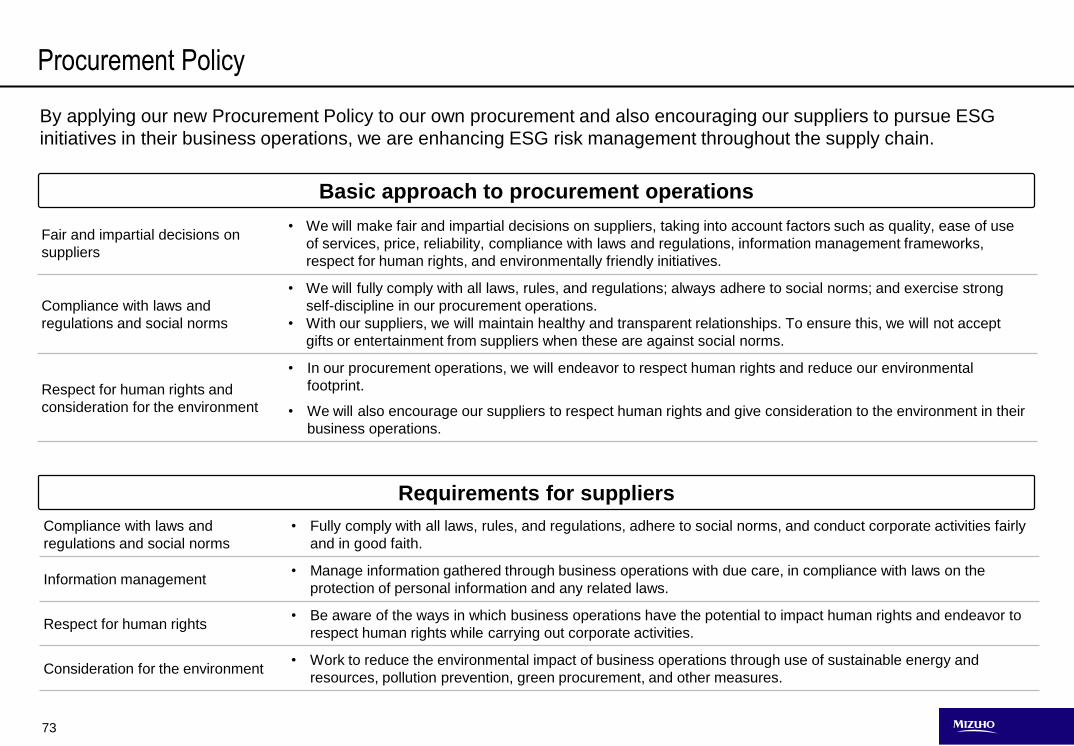
73
Procurement Policy
Fair and impartial decisions on
suppliers
• We will make fair and impartial decisions on suppliers, taking into account factors such as quality, ease of use
of services, price, reliability, compliance with laws and regulations, information management frameworks,
respect for human rights, and environmentally friendly initiatives.
Compliance with laws and
regulations and social norms
• We will fully comply with all laws, rules, and regulations; always adhere to social norms; and exercise strong
self-discipline in our procurement operations.
• With our suppliers, we will maintain healthy and transparent relationships. To ensure this, we will not accept
gifts or entertainment from suppliers when these are against social norms.
Respect for human rights and
consideration for the environment
• In our procurement operations, we will endeavor to respect human rights and reduce our environmental
footprint.
• We will also encourage our suppliers to respect human rights and give consideration to the environment in their
business operations.
Compliance with laws and
regulations and social norms
• Fully comply with all laws, rules, and regulations, adhere to social norms, and conduct corporate activities fairly
and in good faith.
Information management• Manage information gathered through business operations with due care, in compliance with laws on the
protection of personal information and any related laws.
Respect for human rights• Be aware of the ways in which business operations have the potential to impact human rights and endeavor to
respect human rights while carrying out corporate activities.
Consideration for the environment• Work to reduce the environmental impact of business operations through use of sustainable energy and
resources, pollution prevention, green procurement, and other measures.
By applying our new Procurement Policy to our own procurement and also encouraging our suppliers to pursue ESG
initiatives in their business operations, we are enhancing ESG risk management throughout the supply chain.
Basic approach to procurement operations
Requirements for suppliers
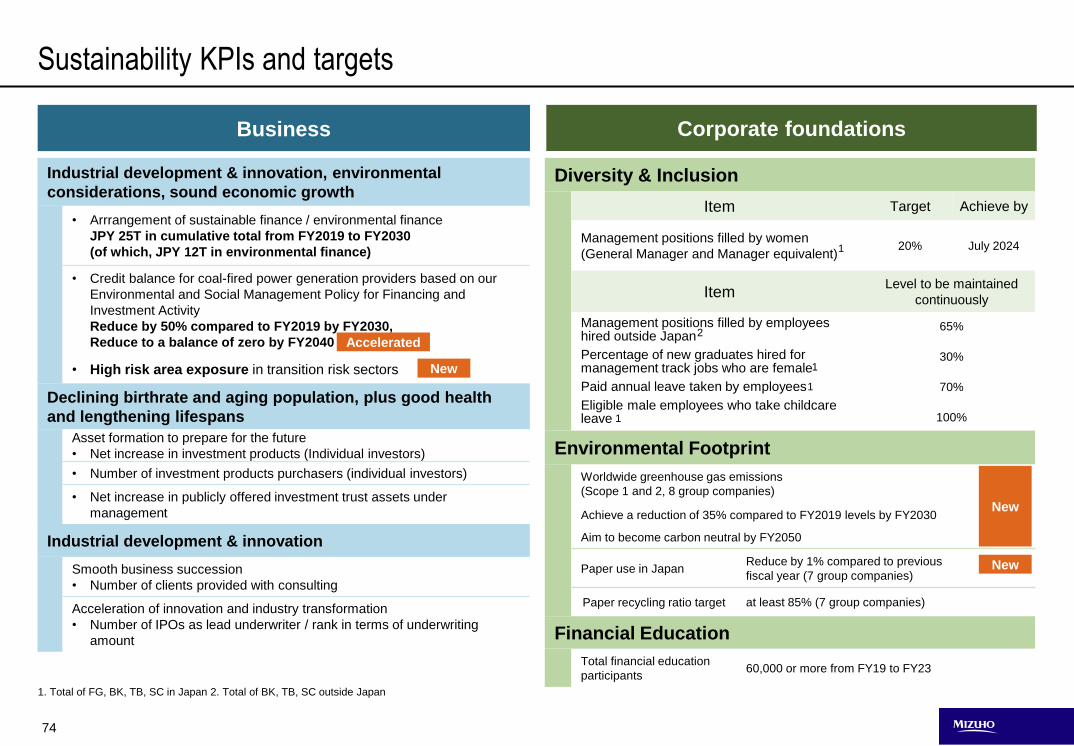
74
Sustainability KPIs and targets
Industrial development & innovation, environmental
considerations, sound economic growth
• Arrrangement of sustainable finance / environmental finance
JPY 25T in cumulative total from FY2019 to FY2030
(of which, JPY 12T in environmental finance)
• Credit balance for coal-fired power generation providers based on our
Environmental and Social Management Policy for Financing and
Investment Activity
Reduce by 50% compared to FY2019 by FY2030,
Reduce to a balance of zero by FY2040
• High risk area exposure in transition risk sectors
Declining birthrate and aging population, plus good health
and lengthening lifespans
Asset formation to prepare for the future
• Net increase in investment products (Individual investors)
• Number of investment products purchasers (individual investors)
• Net increase in publicly offered investment trust assets under
management
Industrial development & innovation
Smooth business succession
• Number of clients provided with consulting
Acceleration of innovation and industry transformation
• Number of IPOs as lead underwriter / rank in terms of underwriting
amount
Diversity & Inclusion
Item Target Achieve by
Management positions filled by women
(General Manager and Manager equivalent)20% July 2024
ItemLevel to be maintained
continuously
Management positions filled by employees hired outside Japan
Percentage of new graduates hired for management track jobs who are female
Paid annual leave taken by employees
Eligible male employees who take childcare leave
65%
30%
70%
100%
Environmental Footprint
Worldwide greenhouse gas emissions
(Scope 1 and 2, 8 group companies)
Achieve a reduction of 35% compared to FY2019 levels by FY2030
Aim to become carbon neutral by FY2050
Paper use in JapanReduce by 1% compared to previous
fiscal year (7 group companies)
Paper recycling ratio target at least 85% (7 group companies)
Financial Education
Total financial education
participants60,000 or more from FY19 to FY23
Business Corporate foundations
1. Total of FG, BK, TB, SC in Japan 2. Total of BK, TB, SC outside Japan
Accelerated
New
New
New
1
2
1
1
1
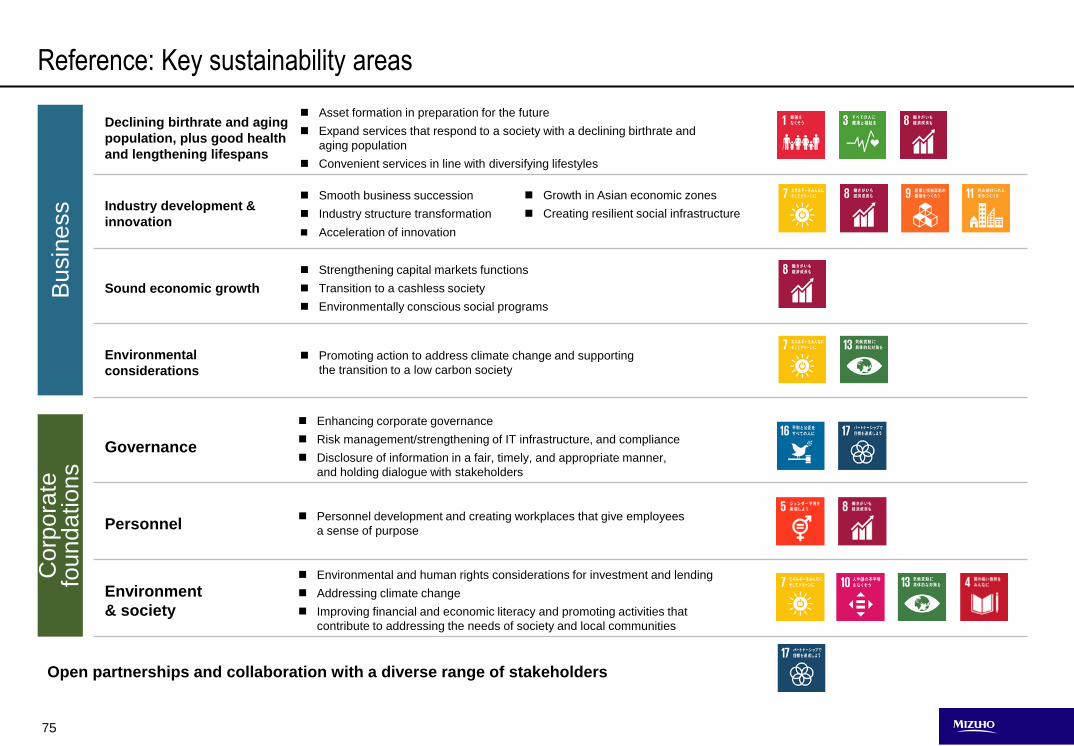
75
Declining birthrate and aging
population, plus good health
and lengthening lifespans
Asset formation in preparation for the future
Expand services that respond to a society with a declining birthrate and
aging population
Convenient services in line with diversifying lifestyles
Industry development &
innovation
Smooth business succession
Industry structure transformation
Acceleration of innovation
Sound economic growth
Strengthening capital markets functions
Transition to a cashless society
Environmentally conscious social programs
Environmental
considerations
Promoting action to address climate change and supporting
the transition to a low carbon society
Governance
Enhancing corporate governance
Risk management/strengthening of IT infrastructure, and compliance
Disclosure of information in a fair, timely, and appropriate manner,
and holding dialogue with stakeholders
Personnel Personnel development and creating workplaces that give employees
a sense of purpose
Environment
& society
Environmental and human rights considerations for investment and lending
Addressing climate change
Improving financial and economic literacy and promoting activities that
contribute to addressing the needs of society and local communities
Reference: Key sustainability areasB
usin
ess
Corp
ora
te
foundations
Open partnerships and collaboration with a diverse range of stakeholders
Growth in Asian economic zones
Creating resilient social infrastructure
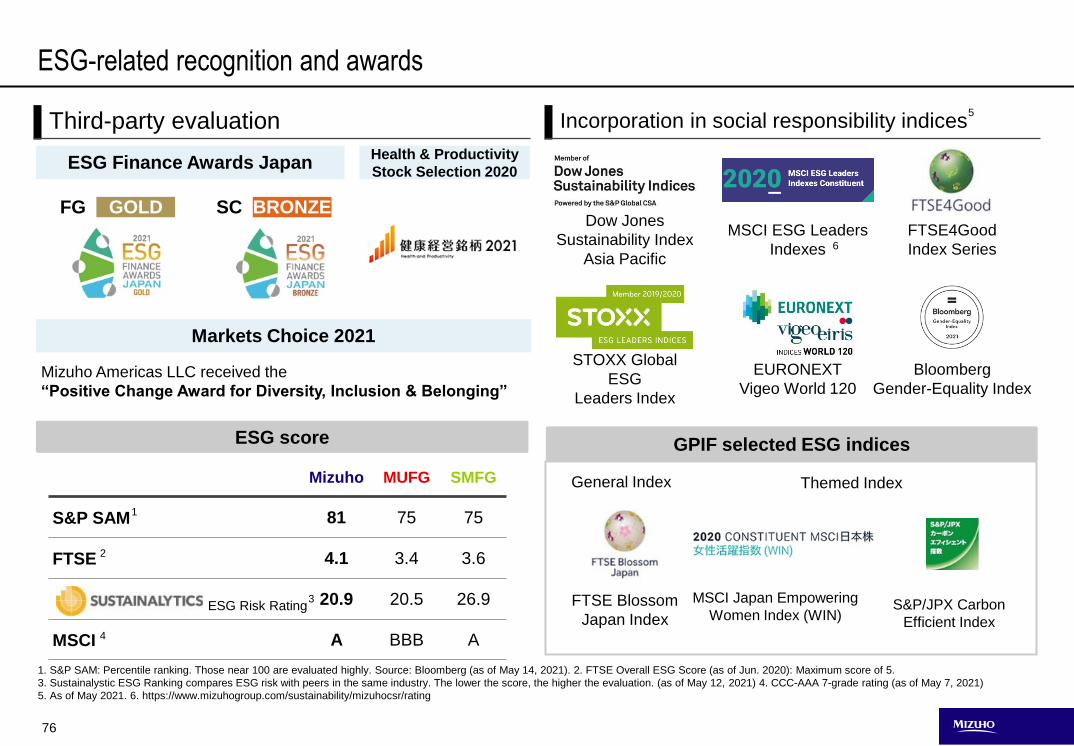
76
1. S&P SAM: Percentile ranking. Those near 100 are evaluated highly. Source: Bloomberg (as of May 14, 2021). 2. FTSE Overall ESG Score (as of Jun. 2020): Maximum score of 5.
3. Sustainalystic ESG Ranking compares ESG risk with peers in the same industry. The lower the score, the higher the evaluation. (as of May 12, 2021) 4. CCC-AAA 7-grade rating (as of May 7, 2021)
5. As of May 2021. 6. https://www.mizuhogroup.com/sustainability/mizuhocsr/rating
MSCI Japan Empowering
Women Index (WIN)
Incorporation in social responsibility indicesThird-party evaluation
ESG-related recognition and awards
Dow Jones
Sustainability Index
Asia Pacific
MSCI ESG Leaders
Indexes
FTSE4Good
Index Series
Bloomberg
Gender-Equality Index
EURONEXT
Vigeo World 120
FTSE Blossom
Japan Index
GPIF selected ESG indicesESG score
STOXX Global
ESG
Leaders Index
6
Mizuho MUFG SMFG
S&P SAM 81 75 75
FTSE 4.1 3.4 3.6
20.9 20.5 26.9
MSCI A BBB A
1
3
2
ESG Risk Rating
Mizuho Americas LLC received the
“Positive Change Award for Diversity, Inclusion & Belonging”
ESG Finance Awards Japan
Markets Choice 2021
Health & Productivity
Stock Selection 2020
FG SCGOLD BRONZE
5
Themed IndexGeneral Index
S&P/JPX Carbon
Efficient Index4
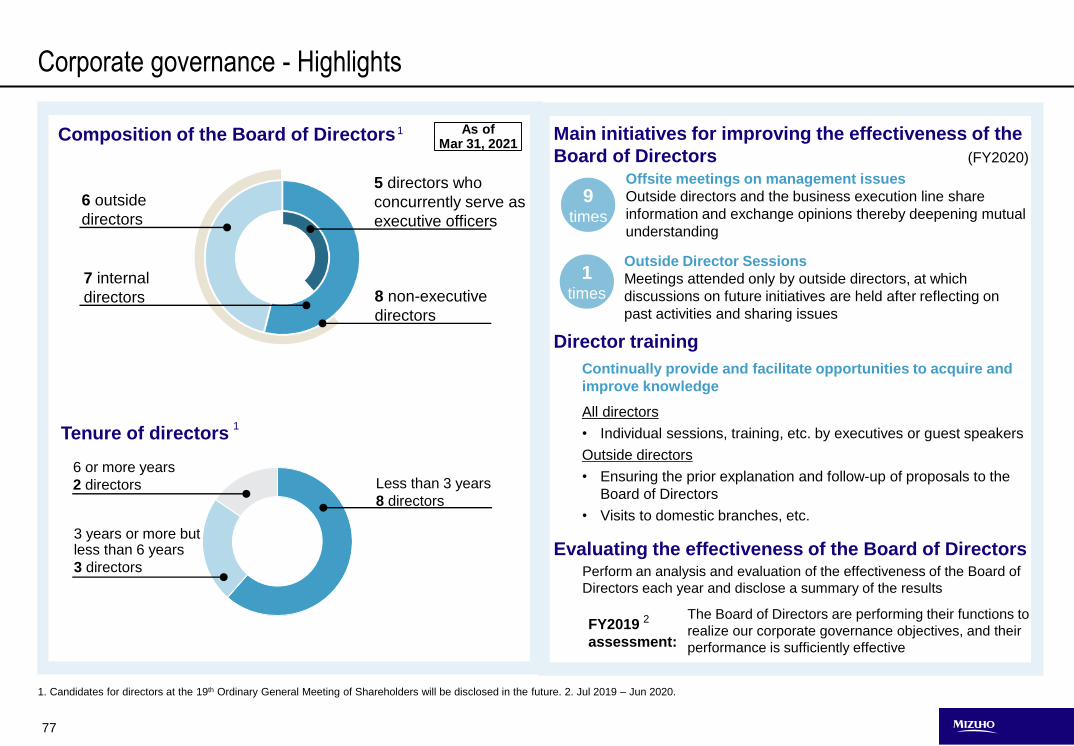
77
9times
Offsite meetings on management issues
Outside directors and the business execution line share
information and exchange opinions thereby deepening mutual
understanding
Corporate governance - Highlights
Main initiatives for improving the effectiveness of the
Board of Directors
1times
Outside Director Sessions
Meetings attended only by outside directors, at which
discussions on future initiatives are held after reflecting on
past activities and sharing issues
Director training
Perform an analysis and evaluation of the effectiveness of the Board of
Directors each year and disclose a summary of the results
Evaluating the effectiveness of the Board of Directors
Continually provide and facilitate opportunities to acquire and
improve knowledge
All directors
• Individual sessions, training, etc. by executives or guest speakers
Outside directors
• Ensuring the prior explanation and follow-up of proposals to the
Board of Directors
• Visits to domestic branches, etc.
The Board of Directors are performing their functions to
realize our corporate governance objectives, and their
performance is sufficiently effective
Composition of the Board of Directors
Tenure of directors
1. Candidates for directors at the 19th Ordinary General Meeting of Shareholders will be disclosed in the future. 2. Jul 2019 – Jun 2020.
1
(FY2020)
FY2019
assessment:
6 outside
directors
7 internal
directors 8 non-executive
directors
5 directors who
concurrently serve as
executive officers
6 or more years
2 directors
3 years or more but less than 6 years
3 directors
Less than 3 years
8 directors
1
2
As of Mar 31, 2021
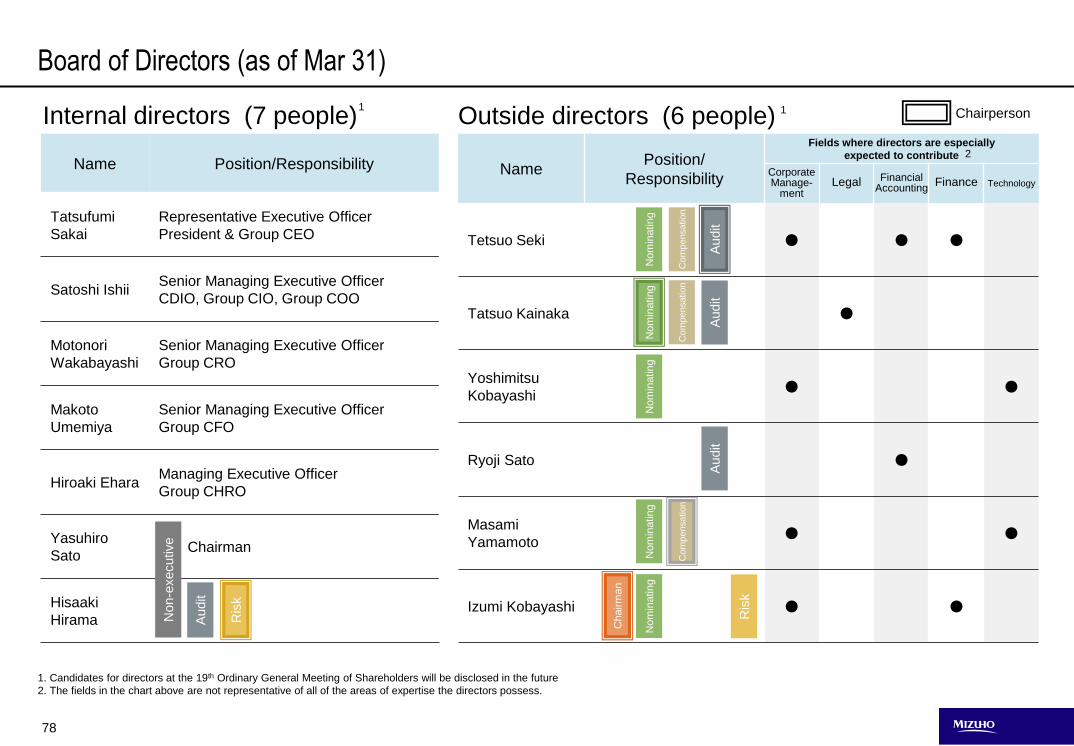
78
Name Position/Responsibility
Tatsufumi
Sakai
Representative Executive Officer
President & Group CEO
Satoshi IshiiSenior Managing Executive Officer
CDIO, Group CIO, Group COO
Motonori
Wakabayashi
Senior Managing Executive Officer
Group CRO
Makoto
Umemiya
Senior Managing Executive Officer
Group CFO
Hiroaki EharaManaging Executive Officer
Group CHRO
Yasuhiro
SatoChairman
Hisaaki
Hirama
Board of Directors (as of Mar 31)
1. Candidates for directors at the 19th Ordinary General Meeting of Shareholders will be disclosed in the future
2. The fields in the chart above are not representative of all of the areas of expertise the directors possess.
NamePosition/
Responsibility
Fields where directors are especially
expected to contribute
CorporateManage-
mentLegal Financial
AccountingFinance Technology
Tetsuo Seki ● ● ●
Tatsuo Kainaka ●
Yoshimitsu
Kobayashi● ●
Ryoji Sato ●
Masami
Yamamoto● ●
Izumi Kobayashi ● ●
Nom
inatin
g
Com
pensation
Audit
Outside directors (6 people)Internal directors (7 people)
2
Nom
inatin
g
Com
pensation
Audit
Audit
Nom
inatin
g
Com
pensation
Nom
inatin
g
Chairm
an
Nom
inatin
g
Audit
Ris
k
Non-e
xecutive
Chairperson
Ris
k
1 1
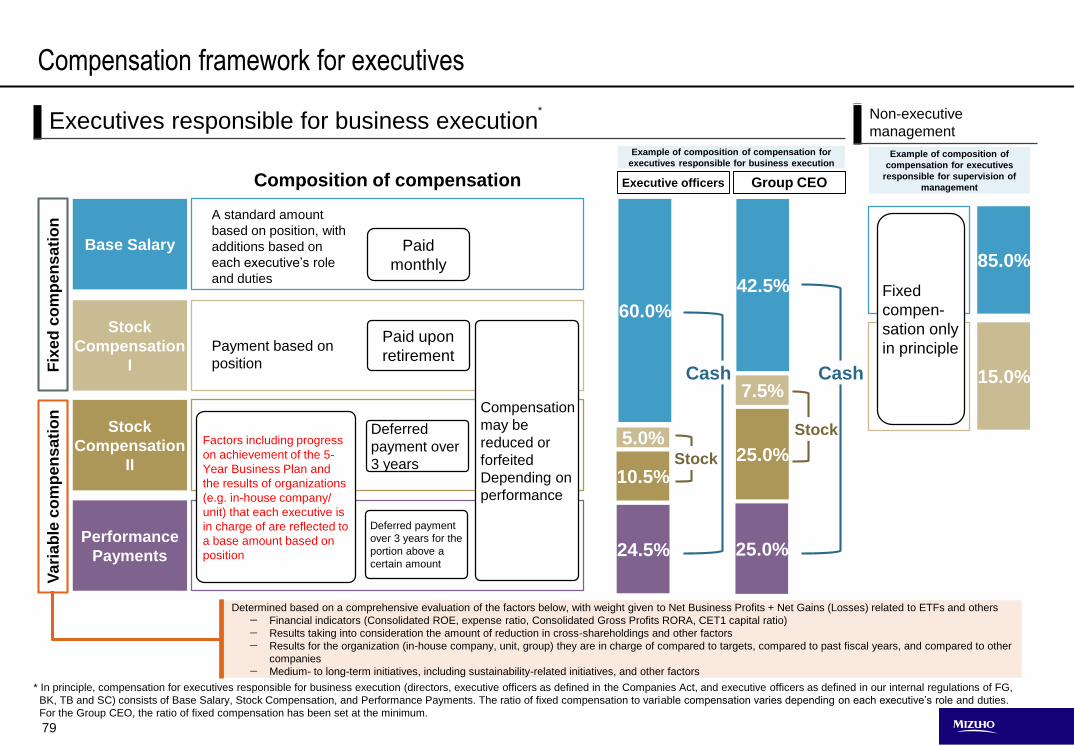
79
Executives responsible for business execution
Compensation framework for executives
* Non-executive
management
Performance
Payments
Base Salary
Stock
Compensation
II
Stock
Compensation
I
Paid
monthly
Paid upon
retirement
Deferred
payment over
3 years
Compensation
may be
reduced or
forfeited
Depending on
performance
Fix
ed
co
mp
en
sa
tio
nV
ari
ab
le c
om
pe
ns
ati
on
Factors including progress
on achievement of the 5-
Year Business Plan and
the results of organizations
(e.g. in-house company/
unit) that each executive is
in charge of are reflected to
a base amount based on
position
85.0%
15.0%
Fixed
compen-
sation only
in principle
Group CEOComposition of compensation
A standard amount
based on position, with
additions based on
each executive’s role
and duties
Payment based on
position
Deferred payment
over 3 years for the
portion above a
certain amount
Executive officers
60.0%
5.0%
10.5%
24.5%
42.5%
7.5%
25.0%
25.0%
Stock
* In principle, compensation for executives responsible for business execution (directors, executive officers as defined in the Companies Act, and executive officers as defined in our internal regulations of FG,
BK, TB and SC) consists of Base Salary, Stock Compensation, and Performance Payments. The ratio of fixed compensation to variable compensation varies depending on each executive’s role and duties.
For the Group CEO, the ratio of fixed compensation has been set at the minimum.
Determined based on a comprehensive evaluation of the factors below, with weight given to Net Business Profits + Net Gains (Losses) related to ETFs and others
— Financial indicators (Consolidated ROE, expense ratio, Consolidated Gross Profits RORA, CET1 capital ratio)
— Results taking into consideration the amount of reduction in cross-shareholdings and other factors
— Results for the organization (in-house company, unit, group) they are in charge of compared to targets, compared to past fiscal years, and compared to other
companies
— Medium- to long-term initiatives, including sustainability-related initiatives, and other factors
Stock
Cash Cash
Example of composition of compensation for
executives responsible for business executionExample of composition of
compensation for executives
responsible for supervision of
management
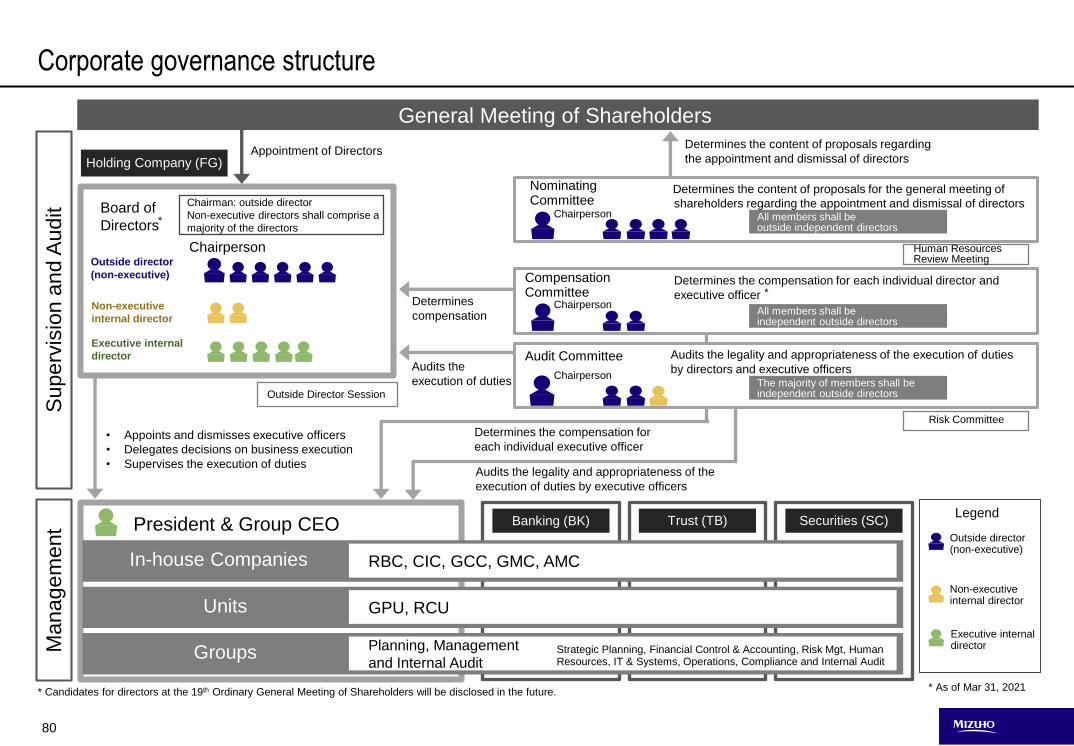
80
Audits the
execution of duties
Manag
em
ent
Outside director (non-executive)
Executive internal director
Non-executive internal director
LegendPresident & Group CEO Banking (BK) Trust (TB) Securities (SC)
In-house Companies
Units
Groups
Audits the legality and appropriateness of the
execution of duties by executive officers
Determines the content of proposals for the general meeting of
shareholders regarding the appointment and dismissal of directors
Nominating Committee
Determines
compensation
Determines the compensation for each individual director and
executive officer
Board of
Directors
Determines the compensation for
each individual executive officer
Compensation Committee
All members shall be outside independent directors
Chairman: outside director
Non-executive directors shall comprise a
majority of the directors
Executive internal
director
Outside director
(non-executive)
Non-executive
internal director
Chairperson
Outside Director Session
Risk Committee
Human ResourcesReview Meeting
General Meeting of Shareholders
Determines the content of proposals regarding
the appointment and dismissal of directors
• Appoints and dismisses executive officers
• Delegates decisions on business execution
• Supervises the execution of duties
Supe
rvis
ion a
nd A
udit
Holding Company (FG)
Audits the legality and appropriateness of the execution of duties
by directors and executive officersAudit Committee
The majority of members shall be independent outside directors
RBC, CIC, GCC, GMC, AMC
GPU, RCU
Planning, Management
and Internal Audit Strategic Planning, Financial Control & Accounting, Risk Mgt, Human Resources, IT & Systems, Operations, Compliance and Internal Audit
Chairperson
Chairperson
Corporate governance structure
Appointment of Directors
All members shall be independent outside directors
* As of Mar 31, 2021
Chairperson
*
* Candidates for directors at the 19th Ordinary General Meeting of Shareholders will be disclosed in the future.
*
FG : Mizuho Financial Group, Inc.
BK : Mizuho Bank, Ltd.
TB : Mizuho Trust & Banking Co., Ltd.
SC : Mizuho Securities Co., Ltd.
AM One : Asset Management One Co., Ltd
RT : Mizuho Research & Technologies, Ltd.
RBC : Retail & Business Banking Company
CIC : Corporate & Institutional Company
GCC : Global Corporate Company
GMC : Global Markets Company
AMC : Asset Management Company
GPU : Global Products Unit
RCU : Research & Consulting Unit
Abbreviations
Definitions
Foreign exchange rate
TTM at the
respective period endMar-20 Mar-21
USD/JPY 108.83 110.72
EUR/JPY 119.65 129.76
Management
accountingFY20 Planned rate
USD/JPY 108.00
EUR/JPY 118.80
- Customer Groups
- Markets
- Group aggregate
- In-house company management basis
- Net Business Profits by In-house Company
- Internal risk capital
- ROE by In-house Company
- 2 Banks
- Consolidated Net Business Profits
- Net Gains (Losses) related to ETFs and others
- G&A Expenses (excl. Non-recurring Losses and others)
- Net Income Attributable to FG
- Consolidated ROE
- CET1 Capital Ratio (excl. Net Unrealized Gains (Losses)
on Other Securities)
: RBC + CIC + GCC + AMC
: GMC
: BK + TB + SC + AM One + other major subsidiaries on a non-consolidated basis
: Figure of the respective in-house company
: Gross Profits - G&A Expenses (excluding Non-Recurring Losses) + Equity in Income from Investments in Affiliates –
Amortization of Goodwill and other items
: Risk capital calculated taking account of factors such as regulatory risk-weighted assets (RWA) and interest rate risk in
the banking account
: Calculated dividing Net Income by each company’s internal risk capital
Financial accounting
Management accounting
: BK + TB on a non-consolidated basis (financial accounting)
: Consolidated Gross Profits – G&A Expenses (excl. Non-Recurring Losses). + Equity in Income from Investments in
Affiliates and certain other consolidation adjustments
: Net Gains (Losses) related to ETFs (2 Banks) + Net Gains on Operating Investment Securities (SC Consolidated)
: G&A Expenses (excl. Non-recurring Losses) – Amortization of Goodwill and other items
: Profit Attributable to Owners of Parent
: Calculated dividing Net Income by (Total Shareholders’ Equity + Total Accumulated Other Comprehensive Income
(excluding Net Unrealized Gains (Losses) on Other Securities))
: Includes the effect of partially fixing unrealized gains on Japanese stocks through hedging transactions
[Numerator]
[Denominator]
: Estimated figures reflecting the effect of Basel III finalization. The capital floor is calculated after deducting the
associated reserves from RWA using the standardized approach
- CET1 Capital Ratio (Basel III finalization basis)
Calculated by excluding Net Unrealized Gains (Losses) on Other Securities and its associated
Deferred Gains or Losses on Hedges
Calculated by excluding RWA associated with Net Unrealized Gains (Losses) on Other Securities (stocks)
Forward-looking Statements
Financial information in this presentation uses figures under Japanese GAAP unless otherwise stated (including management accounting
basis).
This presentation contains statements that constitute forward-looking statements including estimates, forecasts, targets and plans. These
statements reflect our current views with respect to future events and are subject to risks, uncertainties and assumptions. Such forward-
looking statements do not represent any guarantee of future performance by management.
Further information regarding factors that could affect our financial condition and results of operations is included in our most recent Form 20-
F and our report on Form 6-K.
We do not intend to update our forward-looking statements. We are under no obligation, and disclaim any obligation, to update or alter our
forward-looking statements, whether as a result of new information, future events or otherwise, except as may be required by the rules of the
Tokyo Stock Exchange.
Information on companies and entities outside Mizuho group that is recorded in this presentation has been obtained from publicly available
information and other sources. The accuracy and appropriateness of that information has not been verified by Mizuho group and cannot be
guaranteed.
This presentation does not constitute a solicitation of an offer for acquisition or an offer for sale of any securities.