final thesis _kasia_weina (2).pdf
TRANSCRIPT

Dissertation
submitted to the
Combined Faculties for the Natural Sciences and for Mathematics
of the Ruperto-Carola University of Heidelberg, Germany
for the degree of
Doctor of Natural Sciences
presented by
Kasia Weina, Master of Science in Drug Discovery
born in: Two Rivers, Wisconsin USA
Oral-examination: 21.04.2015

Functional analysis of SOX2 in
melanocyte development
and melanoma pathogenesis
Referees:
Prof. Dr. Viktor Umanksy
Prof. Dr. Jochen Utikal

Declarations according to § 8 (3) b) and c) of the doctoral degree regulations: b) I hereby declare that I have written the submitted dissertation myself and in this process have used no other sources or materials than those expressly indicated, c) I hereby declare that I have not applied to be examined at any other institution, nor have I used the dissertation in this or any other form at any other institution as an examination paper, nor submitted it to any other faculty as a dissertation. Heidelberg, 10.02.2015
Kasia Weina

This PhD thesis is dedicated to my
Grandma Kutsunai
who always believed in me and
gave me the courage to reach higher
than I ever dreamed possible.
Parts of this thesis have been published in:
Conferences and workshop presentations:
Weina, K and Utikal, J
Poster presentation: “Role of SOX2 in melanocyte development and melanoma”
DKFZ PhD Retreat, July 2014, Weil der Stadt, Germany
Weina, K and Utikal, J
Poster presentation: “Role of SOX2 in melanocyte development and melanoma”
DKFZ PhD poster session, November 2013, Heidelberg, Germany
Weina, K and Utikal, J
Poster presentation: “Influence of Melanoma-Associated Genes on iPS Cell Generation”
The 6th International PhD Student Cancer Conference, June 2012, Amsterdam, Netherlands
Weina, K and Utikal, J
Poster presentation: “Influence of Melanoma-Associated Genes on iPS Cell Generation”
2nd SFB 873 junior retreat, April 2012, Grasellenbach, Germany
Within the thesis, work from the following publications was included:
1. Stadler, S, Weina, K, Gebhardt, C and Utikal, J. (2015), New therapeutic options for advanced non-resectable malignant melanoma. Advances in Medical Sciences, 60:1 (In publishing: due March 2015).
2. Weina, K. and Utikal, J. (2014), SOX2 and cancer: current research and its implication in the clinic. Clinical and Translational Medicine, 3: 19.
3. Novak, D., Weina, K. and Utikal, J. (2014), From skin to other cell types of the body. Journal of the German Society of Dermatology, 12: 789-792.
Table of Contents
I
Table of Contents
Table of Contents ___________________________________________________________ I
Summary __________________________________________________________________ V
Zusammenfassung _________________________________________________________ VI
List of abbreviations _______________________________________________________ VIII
List of Figures ____________________________________________________________ XIII
List of Tables _____________________________________________________________ XIV
List of Supplemental Figures _________________________________________________XV
1 Introduction ____________________________________________________________ 1
1.1 The neural crest ______________________________________________________________ 1
1.1.1 Induction, delamination and migration of the neural crest ___________________________________ 1
1.1.2 Melanoblasts and terminal differentiation of melanocytes___________________________________ 5
1.1.3 Neural crest as a model system__________________________________________________________10
1.2 Melanocytes and their function in the skin ______________________________________ 11
1.2.1 MITF: master regulator of the melanocytic lineage_________________________________________12
1.2.2 SOX10: crucial regulator of melanocyte survival and specification ___________________________13
1.2.3 Other important genes in melanocyte biology: PAX3, KIT and EDNs __________________________13
1.2.4 Functions of melanocytes: pigmentation and ultraviolet radiation response __________________14
1.3 Melanoma _________________________________________________________________ 16
1.3.1 Origins of melanoma ___________________________________________________________________17
1.3.2 Familial mutations in melanoma _________________________________________________________17
1.3.3 Somatic mutations in melanoma: BRAF, RAS, MITF, KIT and PTEN ___________________________18
1.3.4 Pathways affected by somatic mutations in melanoma: MAPK, PI3K-AKT and TGF-β signaling ___21
1.3.5 Current targeted melanoma therapies ___________________________________________________24
1.3.6 Therapy resistance in melanoma ________________________________________________________26
1.3.7 Melanoma invasion, metastasis and plasticity _____________________________________________28
1.4 SOX proteins: Discovery, structure and function _________________________________ 31
1.4.1 SOX family ____________________________________________________________________________31
1.4.2 SOX HMG domain structure and local architecture remodeling ______________________________32
1.4.3 SOX protein partners and function _______________________________________________________33
1.4.4 Post-translational modifications of SOX proteins __________________________________________35
1.4.5 SOX2 and its role in embryonic development, disease and cancer ___________________________36
Table of Contents
II
2 Aim of study ___________________________________________________________ 41
3 Materials _____________________________________________________________ 42
3.1 Reagents ___________________________________________________________________ 42
3.2 Materials __________________________________________________________________ 42
3.3 Antibodies _________________________________________________________________ 42
3.4 Small molecule inhibitors _____________________________________________________ 43
3.5 Human cell lines ____________________________________________________________ 43
3.6 Cell culture _________________________________________________________________ 44
3.7 Buffers and gels _____________________________________________________________ 45
3.8 Kits _______________________________________________________________________ 45
3.9 Devices ____________________________________________________________________ 46
3.10 Software ___________________________________________________________________ 46
3.11 Online databases ____________________________________________________________ 46
4 Methods ______________________________________________________________ 47
4.1 Cell culture _________________________________________________________________ 47
4.2 Human induced pluripotent stem cell culture ____________________________________ 47
4.2.1 Matrigel® preparation __________________________________________________________________47
4.3 Melanocyte differentiation protocol ___________________________________________ 47
4.3.1 NIH 3T3 feeder cell preparation _________________________________________________________48
4.4 Lentiviral particle production and transduction __________________________________ 48
4.5 Overexpression of SOX2 in human melanoma cell lines ___________________________ 49
4.6 Knockdown of SOX2 and SOX10 in human melanoma cell lines _____________________ 49
4.7 Antibiotic selection __________________________________________________________ 50
4.8 Quantitative polymerase chain reaction ________________________________________ 51
4.9 Immunoblotting_____________________________________________________________ 51
4.10 Immunocytochemistry _______________________________________________________ 52
4.11 Immunohistochemistry ______________________________________________________ 53
4.12 Tissue microarray analysis ____________________________________________________ 53
Table of Contents
III
4.13 Migration (scratch) assay _____________________________________________________ 53
4.14 Invasion assays _____________________________________________________________ 54
4.15 alamarBlue® assay___________________________________________________________ 54
4.16 TGF-β stimulation experiments ________________________________________________ 55
4.17 Gene expressing profiling_____________________________________________________ 55
4.18 Statistical analysis ___________________________________________________________ 55
5 Results _______________________________________________________________ 56
5.1 Establishment and validation of a protocol for the differentiation of melanocytes derived
from human induced pluripotent stem cells ___________________________________________ 56
5.2 Role of SOX2 and SOX10 during melanocyte differentiation from human induced
pluripotent stem cells ______________________________________________________________ 62
5.3 Mutation-independent SOX2 function in melanoma ______________________________ 63
5.4 Influence of SOX10 on SOX2 expression in human melanoma cells __________________ 72
5.5 TGF-β induces SOX2 expression in melanoma in vitro _____________________________ 74
5.6 SOX2 and novel protein-protein interactions ____________________________________ 78
5.6.1 SOX2 forms protein-protein interactions with novel candidates related to SUMOylation _______81
5.7 SOX2 in the clinic ____________________________________________________________ 83
6 Discussion _____________________________________________________________ 85
6.1 Embryonic stem cell marker expression during melanocytic differentiation from human
induced pluripotent stem cells_______________________________________________________ 85
6.2 Functional analysis of SOX2 in melanoma _______________________________________ 88
6.2.1 Genomic SOX2 amplification in melanoma ________________________________________________89
6.2.2 SOX2 expression induces dedifferentiation of melanoma cells in vitro ________________________90
6.2.3 SOX2 is required for melanoma cell invasion and induces EMT-marker expression _____________92
6.3 SOX2 expression is induced by TGF-β signaling ___________________________________ 95
6.4 SOX2 may form potential interactions with several melanocyte- and SUMO-related
proteins __________________________________________________________________________ 96
6.5 SOX2 in the clinic ___________________________________________________________ 100
7 Conclusions___________________________________________________________ 103

Table of Contents
IV
8 Supplemental material _________________________________________________ 105
8.1 Extended experimental procedures ___________________________________________ 105
8.1.1 Experimental procedures performed by others in the Utikal laboratory ____________________ 105
8.1.2 Extended experimental procedures performed in collaborations __________________________ 106
8.2 Supplemental figures _______________________________________________________ 107
9 References ___________________________________________________________ 110
10 Acknowledgements ____________________________________________________ 131
Summary
V
Summary
Malignant melanoma remains the most deadly form of skin cancer due to its quick metastatic
spread and the development of resistance to available treatment. The cause of melanoma is
still under investigation but environmental factors, such as ultraviolet radiation, have been
associated with the initiation of melanoma. Moreover, studies have revealed that the
melanocytic lineage is predisposed to malignant transformation due to its developmental
program. Melanocytes are derived from the embryonic neural crest, which utilizes processes
such as the epithelial-to-mesenchymal transition (EMT) during their normal development to
spatially migrate and complete terminal differentiation. Therefore, recent work in the field of
melanoma has focused on investigating embryonic and neural crest-related genes since they
may be reactivated during melanomagenesis and metastatic spread.
To date, limited studies have suggested an important role of the embryonic stem cell marker,
sex determining region Y-box 2 (SOX2), in melanoma; however a lack of detailed analyses
and understanding of its function remains. In this study, SOX2 was found to be highly
expressed in primary melanomas compared to melanocytic nevi. Additionally, using
fluorescence in situ hybridization analysis, genomic SOX2 was found to be significantly
amplified in both primary melanomas and metastatic melanomas compared to melanocytic
nevi. Gain-of-function studies revealed that melanoma cells lost differentiation marker
expression upon SOX2 overexpression in vitro. The dedifferentiated phenotype displayed
can be in part explained by SOX2 binding to the promoter region of the microphthalmia-
associated transcription factor-M (MITF-M), thereby repressing its transcription. Additionally,
SOX2 was shown to be required for melanoma cell migration and invasion in vitro. Invasion-
related EMT markers were upmodulated upon SOX2 overexpression and
immunohistochemical analysis revealed high SOX2 expression in deep regions of primary
melanomas and in stroma-infiltrating melanoma cells. In vitro enhanced SOX2 expression
could be induced by TGF-β, indicating TGF-β signaling as an upstream regulator of SOX2
expression in melanoma.
This study proposes that TGF-β1 induces SOX2 expression, which may lead to melanoma
progression by: i) SOX2 binding and repressing the MITF-M promoter, which may influence
the dedifferentiation of human melanoma cells, and ii) SOX2 inducing high expression of
ZEB1 and TWIST1, which promotes a mesenchymal phenotype. In line with the described
phenotypic alterations, this work revealed that SOX2 enhances melanoma cell migration and
invasion and depletion of this transcription factor results in loss of cellular motility. Therefore,
I identified SOX2 as a key player in the complex molecular network that governs invasion-
related processes and I revealed a role for SOX2 as an invasion-related marker with
potential clinical application.
Zusammenfassung
VI
Zusammenfassung
Aufgrund der starken Metastasierung und der Entwicklung von Resistenzen gegen gängige
Therapien ist das maligne Melanom eine der tödlichsten Hautkrebsarten. Obwohl
Umwelteinflüsse wie Exposition durch ultraviolettes Licht mit der Entstehung des malignen
Melanoms in Zusammenhang gebracht worden sind, ist die Ursache bisher nicht vollständig
geklärt. Studien haben jedoch gezeigt, dass die Zellen der melanozytären Linie aufgrund
ihres molekularen Entwicklungsprogramms besonders anfällig für eine maligne
Transformation sind. Melanozyten entstehen aus den embryonalen Neuralleisten-Zellen, die
während ihrer normalen Entwicklung einen sogenannten epithelial-mesenchymalen Wechsel
durchlaufen. Basierend auf dieser Entdeckung haben sich mehrere Studien der letzten Jahre
auf die Untersuchung verschiedener embryonaler und neuralleisten-assoziierter Gene
spezialisiert, da diese womöglich während der malignen Transformation reaktiviert werden
und dadurch zur Entstehung und zur Metastasierung des Melanoms beitragen können.
Einige Studien haben in diesem Kontext dem Gen SOX2 (sex determining region Y-box 2)
eine wichtige Rolle zugewiesen, es fehlen jedoch detaillierte Analysen, um dessen genaue
Funktion bestimmen zu können. Die vorliegende Studie zeigt, dass SOX2 in primären
Melanomen stärker exprimiert wird als in melanozytären Nävi. Zusätzlich wurde eine
genomische Amplifikation von SOX2 sowohl in primären Melanomen als auch in Melanom-
Metastasen im Vergleich zu melanozytären Nävi festgestellt. Anhand humaner
Melanomzelllinien wurde gezeigt, dass die Expression mehrerer Differenzierungsmarker
verloren geht, wenn SOX2 überexprimiert wird. Dieser Phänotyp war zum Teil durch die
Bindung von SOX2 an die Promoterregion des Mikrophthalmia-assoziierten
Transkriptionsfaktors M (MITF-M) und der Repression dessen Transkription zu erklären. Des
Weiteren wurde gezeigt, dass die Expression von SOX2 für die Invasionsfähigkeit der
Melanomzellen in vitro erforderlich ist. Einige Marker für den epithelial-mesenchymalen
Wechsel waren hochreguliert, wenn SOX2 überexprimiert wurde und eine
immunhistochemische Analyse hat ergeben, dass SOX2 in tiefen Regionen primärer
Melanome und in Stroma-infiltrierenden Zellen stärker exprimiert ist als in oberflächlichen
Regionen primärer Melanome. Erhöhte SOX2 Expression konnte in vitro durch die
Stimulierung humaner Melanomzelllinien mit TGF-β1 induziert werden, was darauf hinweist,
dass sich TGF-β1-aktivierte Signalwege regulatorisch auf die SOX2 Expression im malignen
Melanom auswirken.
Zusammengefasst deuten die Ergebnisse der vorliegenden Studie darauf hin, dass TGF-β
die Expression von SOX2 induziert und dass dies durch folgende Mechanismen zur
Melanomentwicklung beitragen kann: erstens, indem SOX2 an den MITF-M Promoter bindet
und dessen Transkription inhibiert, sodass es zu einer generellen De-Differenzierung der
Zusammenfassung
VII
Melanomzellen kommt, und zweitens, indem die Überexpression von SOX2 zu einer
Hochregulierung der Expression von ZEB1 und TWIST1 führt, was zu einem
mesenchymalen Phänotyp führt. In Einklang mit den phänotypischen Veränderungen bei
starker SOX2 Expression, ist dieser Transkriptionsfaktor auch funktionell für erhöhte
Invasionskapazität notwendig und seine Repression führt zu Motilitätsverlust in humanen
Melanomzellen.
Ich konnte daher in dieser Studie SOX2 als einen Schlüsselfaktor identifizieren, welcher in
einem hoch komplexen Netzwerk für die aggressive Entwicklung des malignen Melanoms
verantwortlich ist. Außerdem weist SOX2 Potential auf, um als invasionsassoziierter Marker
in der klinischen Anwendung genutzt zu werden.
List of abbreviations
VIII
List of abbreviations
°C Degree Celsius
18S 18S ribosomal RNA
µ Micro
A
ATP Adenosine triphosphate
B
BiFC Bimolecular fluorescence complementation assay
BMP4 Bone morphogenetic protein 4
bp Base pairs
BRAF v-Raf murine sarcoma viral oncogene homolog B
BRN2 POU domain, class 3, transcription factor 2 (POU3F2)
BSA Bovine serum albumin
C
CCLE Cancer cell line encyclopedia
CCND1 Cyclin D1
CD117 Tyrosine-protein kinase kit (cKIT)
CDH1 E-cadherin
CDH2 N-cadherin
cDNA Complementary deoxyribonucleic acid
CSCs Cancer stem cells
CTLA-4 Cytotoxic T lymphocyte antigen 4
ctrl Control
D
DAPI 4',6-diamidino-2-phenylindole
DCT Dopachrome tautomerase (TRP2)
DKFZ Deutsches Krebsforschungzentrum (German Cancer Research Center)
List of abbreviations
IX
DMEM Dulbecco’s modified eagle’s medium
DNA Deoxyribonucleic acid
dox Doxycycline
dH2O Distilled water
DMSO Dimethylsulfoxide
E
e.g. exempli gratia (for example)
ECM Extracellular matrix
EDN endothelin
EGF Epidermal growth factor
EGFR Epidermal growth factor receptor
EM Electron microscopy
EMA European medicines regulatory agency
EMT Epithelial-to-mesenchymal transition
ESCs Embryonic stem cells
ERK Extracellular-signal regulated kinase
et al. et alteri
EtOH Ethanol
F
FACS Fluorescence activated cell sorting
FCS Fetal calf serum
FDA Food and drug administration
FISH Fluorescence in situ hybridization
G
GDP Guanosine diphosphate
GFP Green fluorescent protein
GTP Guanosine-5'-triphosphate
List of abbreviations
X
H
h Hour
HH Hedgehog
hESCs Human embryonic stem cells
hiPSCs Human induced pluripotent stem cells
HMG High-mobility box
HPRT Hypoxanthine phosphoribosyltransferase
HRP Horseradish peroxidase
HTS High throughput screen
I
i.e. id est (that is)
ICM Inner cell mass
IF Immunofluorescence
IHC Immunohistochemistry
iPSCs Induced pluripotent stem cells
K
KD Knockdown
kDA Kilo dalton
M
MAPK Mitogen activated protein kinase
MEK Mitogen activated protein kinase kinase
min Minute
MITF Microphthalmia-associated transcription factor
mRNA Messenger ribonucleic acid
MSA Migration staging area
MT Mutant
mTOR Mammilian target of rapamycin
List of abbreviations
XI
N
NC Neural crest
NCCs Neural crest cells
neo Neomycin
NHMs Normal human melanocytes
NRAS Neuroblastoma RAS viral oncogene homolog
NSCLC Non-small cell lung cancer
O
OE Overexpression
P
PBS Phosphate buffered saline
PCR Polymerase chain reaction
PD-1 Programmed death 1
PD-L1 Programmed death 1 ligand 1
pH potentia hydrogenii
PI Propidium Iodide
PTEN Phosphatase and tensin homolog
Q
qRT-PCR Quantitative real time polymerase chain reaction (qPCR)
R
RFUs Relative fluorescence units
RNA Ribonucleic acid
RPM Rotations per minute
RT Room temperature
S
SCF Stem cell factor
SCLC Small cell lung cancer
List of abbreviations
XII
SD Standard deviation
SDS-PAGE Sodium dodecyl sulfate polyacrylamide gel electrophoresis
SEM Standard error of the mean
shRNA Short hairpin RNA
SOX2 SRY (sex determining region Y)-box 2
SOX10 SRY (sex determining region Y)-box 10
SCC Squamous cell carcinoma
STAT3 Signal transducer and activator of transcription 3
T
TAD Transactivation domain
TGF-β Transforming growth factor beta
TMA Tissue microarray
TP53 Tumor protein 53 (p53)
TRP1 Tyrosinase-related protein 1
TRP2 Tyrosinase-related protein 2 (DCT)
TYR Tyrosinase
U
UMM Universitätsklinikum Mannheim (University Medical Center Mannheim)
UV Ultraviolet
V
V Volt
W
WT Wildtype
Y
y2h Yeast-2-Hybrid
List of Figures
XIII
List of Figures
Figure 1 Overview of neural crest development: stages, signals and regulation ______ 5
Figure 2 SOX2 homology, structure and protein function _______________________ 34
Figure 3 Melanocyte differentiation from human induced pluripotent stem cells _____ 56
Figure 4 Characterization of hiPSC-derived melanocytes_______________________ 58
Figure 5 Melanosome development in Mel D1 cells ___________________________ 59
Figure 6 Whole genome expression analyses of hiPSC-derived melanocytes ______ 61
Figure 7 SOX2 and SOX10 in melanocyte differentiation and the neural crest ______ 63
Figure 8 SOX2 is highly expressed in primary melanomas and human melanoma
cell lines ______________________________________________________ 65
Figure 9 SOX2 overexpression in human melanoma cell lines induces a
dedifferentiated phenotype via the repression of the MITF promoter_______ 68
Figure 10 SOX2 overexpression in human melanoma cell lines increases migratory
and invasive capacity and induces EMT-related marker expression _______ 71
Figure 11 SOX2 knockdown in melanoma cell line SK Mel 103 induces a more
differentiated and less invasive phenotype ___________________________ 73
Figure 12 SOX10 knockdown in melanoma cell line C32 does not induce SOX2
expression in vitro ______________________________________________ 75
Figure 13 TGF-β1 induces SOX2 expression in melanoma cells in vitro ____________ 77
Figure 14 SOX2 protein-protein interaction studies_____________________________ 79
Figure 15 SOX2 is upregulated in primary melanoma samples compared to
melanocytic nevi________________________________________________ 83

List of Tables
XIV
List of Tables
Table 1 Genes involved in neural crest development, melanocyte development and
melanoma pathogenesis _________________________________________ 30
Table 2 Melanocyte differentiation medium components _______________________ 48
Table 3 Human melanoma cell line antibiotic selection ________________________ 50
Table 4 QPCR primer sequences _________________________________________ 52
List of Supplemental Figures
XV
List of Supplemental Figures
Figure S1 Vector maps of FU-Tet-O human SOX2 and M2-rtTA _________________ 107
Figure S2 Tissue microarray analysis and scoring ____________________________ 108
Figure S3 Immunofluorescence analysis of SMAD3 in A375 and SK Mel 30 human
melanoma cell lines ____________________________________________ 108
Figure S4 Immunohistochemistry analysis of SOX2 in invasive primary
melanoma tissue ______________________________________________ 109
Figure S5 Yeast-2-Hybrid high throughput screen bait validation _________________ 109
Introduction
1
1 Introduction Development is a complex process orchestrated by the temporal and spatial control of
specific genes. Unique to vertebrates, the development of the neural crest (NC) gives rise to
various lineages including melanocytes. First discovered in 1868 by Wilhelm His, the neural
crest was described as a band of cells in between the neural tube and ectoderm in chick
embryos [1, 2]. Nearly two centuries later, the neural crest is a well-described cell population
which undergoes a complex developmental process comprised of several key steps:
induction, delamination and migration. Recently, some of these processes have been
implicated in the pathogenesis of the deadly skin cancer: melanoma. Since melanocytes are
derived from the neural crest, one hypothesis for malignant transformation suggests the
reactivation of this developmental process. Therefore, understanding the neural crest and
other embryonic-related systems and molecules coordinating them may help elucidate novel
mechanisms controlling the transformation of malignant melanoma.
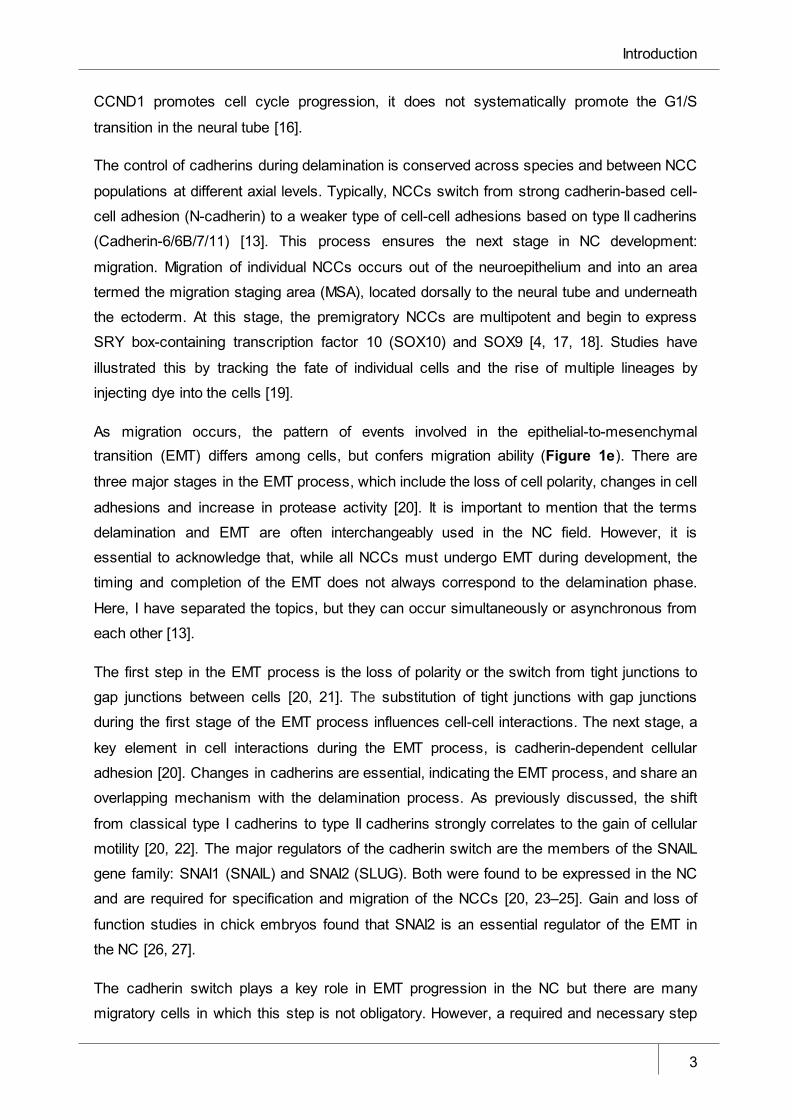
1.1 The neural crest In a normal developing embryo, characteristic patterning of the nervous system and exterior
structures requires the motility of the pluripotent population of cells known as the NC. Neural
crest cells (NCCs) are formed along the vertebrate axis in the dorsal neural tube. These
pluripotent cells give rise to various lineages, including bone, neurons and melanocytes.
Here, I will only discuss the development of the trunk NC, where melanocytes are derived.
1.1.1 Induction, delamination and migration of the neural crest The cells that form the NC are induced between the neural plate, which later develops into
the central nervous system (CNS) and the non-neural ectoderm that builds the epidermis.
The formation of the NC begins post-gastrulation, when the neural plate folds on itself to form
the neural tube, the process where the neural folds from opposite ends of the ectoderm converge and eventually fuse (Figure 1a-c). Following fusion, NCCs leave the neural tube
during or after neural tube closure, depending on the species, and migrate throughout the
body [3]. The NCCs develop as the neural tube closes on day eight of gestation in mice and
day 22 in humans [4]. From the dorsal neural tube, NCCs migrate into the surrounding
tissue. This process gives rise to various tissue types, including bone and cartilage,
pigmented cells, neurons and glial cells of the peripheral nervous system. NCC derivatives
are specified via spatial and temporal patterning, migration patterns, lineage-specific markers
and inherent cell characteristics [4, 5]; for an overview of NC developmental stages refer to
Figure 1.
Introduction
2
There are several models for the induction of the neural crest, namely neural default model,
variation of the neural default model and the two signal model of neural crest induction. The
models differ in the potential fates of the neural plate, as well as in the nature of inductive
signals and neural crest specifiers leading to the induction of neural crest effector genes. The
two signal model is the most accepted model and elucidates combinations of signaling that
are capable of inducing the NC. Several second signals have been identified (wingless type
(WNT), fibroblast growth factor (FGF) and/or retinoic acid) and, in combination with bone
morphogenetic protein (BMP) inhibitors, are able to induce snail family zinc finger 2 (SNAI2
or SLUG) expression and, in turn, NC induction [3, 6–8]. The induction of the NC potential is
assayed by SNAI2 expression, a factor responsible for final emigration of NCCs. Many of the
factors that are able to induce NC formation are found to be endogenously expressed in
neighboring tissues at the appropriate stages during NC development. For example, the
paraxial mesoderm, located adjacent to the neural tube, expresses the candidate induction
signals eFGF, WNT8 and BMP4. Studies in vivo demonstrated, upon excision of the paraxial
mesoderm from Xenopus embryos, SNAI2 expression was greatly reduced. The study
proposed that the paraxial mesoderm and its corresponding signals are a possible
requirement for NC induction [9, 10]. Additional NC-inducing signals may come from
interactions between the epithelium and the neural plate [3]. Moreover, there are other
potential signals that are able to induce the NC besides BMP and WNT, such as Notch/Delta
signaling [11].
After the induction of the NC and formation of the neural tube, NC potential is maintained via
BMP signaling [3, 12]. The next process to occur during NC development is delamination.
Delamination is defined as the splitting of a tissue into separate populations, regardless of
cellular mechanisms [13] (Figure 1d). Regarding the NC delamination, this process is
triggered by BMP and canonical WNT signaling, accompanied by the expression of WNT1
and WNT3 and paired box transcription factor (PAX3), BMP4 and Msh homeobox 1 (MSX-1)
[13–15]. The BMP and WNT signaling cascades are crucial for the G1/S cell cycle transition
in NC precursor cells, since NCCs are only capable of delamination in the S-phase.
However, this prerequisite is not sufficient to initiate delamination or trigger onset of migration
[13].
Additionally, the activation of the BMP/WNT1 signaling cascade activates downstream
mediators like a disintegrin and metalloproteinase (ADAM)-10. ADAM10 is able to cleave the
extracellular domain of N-cadherin (CDH2). Therefore, the expression of ADAM10 helps to
reduce cell-cell adhesion not only between NCCs but also between NCCs and
neuroepithelial cells [13]. N-cadherin is then degraded or the remaining domain is further
cleaved into a cytoplasmic fragment (CTF2) and activates CCND1 (Cyclin-D1). While
Introduction
3
CCND1 promotes cell cycle progression, it does not systematically promote the G1/S
transition in the neural tube [16].
The control of cadherins during delamination is conserved across species and between NCC
populations at different axial levels. Typically, NCCs switch from strong cadherin-based cell-
cell adhesion (N-cadherin) to a weaker type of cell-cell adhesions based on type II cadherins
(Cadherin-6/6B/7/11) [13]. This process ensures the next stage in NC development:
migration. Migration of individual NCCs occurs out of the neuroepithelium and into an area
termed the migration staging area (MSA), located dorsally to the neural tube and underneath
the ectoderm. At this stage, the premigratory NCCs are multipotent and begin to express
SRY box-containing transcription factor 10 (SOX10) and SOX9 [4, 17, 18]. Studies have
illustrated this by tracking the fate of individual cells and the rise of multiple lineages by
injecting dye into the cells [19].
As migration occurs, the pattern of events involved in the epithelial-to-mesenchymal transition (EMT) differs among cells, but confers migration ability (Figure 1e). There are
three major stages in the EMT process, which include the loss of cell polarity, changes in cell
adhesions and increase in protease activity [20]. It is important to mention that the terms
delamination and EMT are often interchangeably used in the NC field. However, it is
essential to acknowledge that, while all NCCs must undergo EMT during development, the
timing and completion of the EMT does not always correspond to the delamination phase.
Here, I have separated the topics, but they can occur simultaneously or asynchronous from
each other [13].
The first step in the EMT process is the loss of polarity or the switch from tight junctions to
gap junctions between cells [20, 21]. The substitution of tight junctions with gap junctions
during the first stage of the EMT process influences cell-cell interactions. The next stage, a
key element in cell interactions during the EMT process, is cadherin-dependent cellular
adhesion [20]. Changes in cadherins are essential, indicating the EMT process, and share an
overlapping mechanism with the delamination process. As previously discussed, the shift
from classical type I cadherins to type II cadherins strongly correlates to the gain of cellular
motility [20, 22]. The major regulators of the cadherin switch are the members of the SNAIL
gene family: SNAI1 (SNAIL) and SNAI2 (SLUG). Both were found to be expressed in the NC
and are required for specification and migration of the NCCs [20, 23–25]. Gain and loss of
function studies in chick embryos found that SNAI2 is an essential regulator of the EMT in
the NC [26, 27].
The cadherin switch plays a key role in EMT progression in the NC but there are many
migratory cells in which this step is not obligatory. However, a required and necessary step
Introduction
4
for all cells to complete the EMT process is the ability to digest extracellular matrix (ECM).
This enzymatic activity is carried out by proteins called matrix metalloproteases (MMPs). In
the NC, MMPs play an important role in the last stage of development, migration.
Interestingly, SNAI1 has been suggested to induce MMP expression [7]. In summary, the
final step in NC development involves the initiation and completion of the EMT. The cells of
the NC must lose polarity, switch from tight junctions to gap junctions, lose cell-cell adhesion
and gain protease activity. The combination of these functions completes the EMT process
and allows the migration of the NC cell population (Figure 1).
The migratory route of these NCCs form segregated streams that emerge adjacent to
specific locations along the vertebrate axis [28–31]. NCCs arise along the dorsal neural tube
and avoid migrating in certain areas adjacent to the neural tube [32–35]. These cells travel
either ventrally, following a path between somites and the neural tube and becoming the
peripheral nervous system and endocrine cells, or dorsal-laterally away from the neural tube,
following a path between dermamyotome and the ectoderm and ultimately forming
melanocytes [4].
There are several theories regarding melanocyte precursor migration. The traditional view is
that lineage specification occurs during the early stage of development. Progenitors of neural
derivatives migrate ventrally and melanocyte precursor cells enter the MSA, located close to
the neural tube, before migrating on a dorsolateral pathway underneath the ectoderm [36].
However, evidence has suggested an alternative migratory pathway for melanocyte
precursor cells. Studies have revealed that a small portion of melanocytes arises ventrally
along the pathway containing neural precursors [37]. Studies performed in zebrafish, mouse
and chick embryos found that melanocyte precursors are capable of migrating both
dorsolaterally and ventrally [38, 39]. In chick embryo studies, if the dorsal neural tube and the
dorsal root ganglion (DRG) were ablated after the emergence of the initial melanocytes, the
number of melanocytes in the skin was significantly reduced. However, if the dorsolateral
skin surface containing the first melanocytes was removed, the complete melanocyte
production was hardly affected. This suggests that a large majority of melanocytes in the skin
are actually derived from nerve-associated precursors instead of dorsolaterally migrating
NCCs [36, 38, 39]. Studies performed in mouse embryos using the Cre/loxP system revealed
that nerve cells are able to produce cells with melanocytic features in vivo. This in vivo
mapping analysis showed that a large majority of dermal melanocytes found in the trunk and
limbs appear to be derived from cells previously associated with nerves [36, 38]. Moreover,
recent work has elucidated that there is a prenatal capacity to form pigmented cells through
the generation of a glial/melanocyte progenitor cells [40, 41].
Introduction
5
It is important to note that NC development is highly regulated by the presence of
environmental cues at all stages. Several thorough studies have investigated the importance
of intrinsic and local extrinsic signals from the microenvironment in the NC. These studies
used tissue transplantation, cellular labeling and molecular analysis to show that the
migratory streams of NCC are defined by a combination of intrinsic and extrinsic cues [42–
45]. In other words, there are several intrinsic and extrinsic modulators of NC development
and early melanocyte fate determination.
1.1.2 Melanoblasts and terminal differentiation of melanocytes Upon migrating away from the neural tube, some NCCs become specified into melanoblasts
and continue migrating through the dermis and into the epidermis of the skin [4].
Introduction
6
Melanoblasts are the precursors of melanocytes and are highly migratory, proliferative and
terminally differentiate en route to their final destination in the basal epidermis and hair
follicles [46]. Melanoblasts are the descendants of the multipotent NCC population and there
are two theories regarding when NCCs are specified into the melanocytic lineage [4].
The first theory states that melanocyte markers, such as microphthalmia-associated
transcription factor (MITF) and the proto-oncogene KIT (also known as mast/stem cell growth
factor receptor (SCFR) or CD117), are expressed during NC migration. The expression of
dopachrome tautomerase (DCT), also known as tyrosinase-related protein 2 (TRP2), follows
soon after [4]. This theory suggests that NCCs are predetermined to become melanocytes
before they migrate along the dorsal-lateral pathway and the migratory path is therefore a
consequence of these pre-specifications.
The second theory acknowledges extrinsic factors in the environment which may influence
the determination of the NCC population toward the melanocytic lineage. Therefore,
migrating NCCs encounter factors which may have an overall impact on the terminal
differentiation of the cells. To support this theory several studies found that expression of
adhesion-related proteins, including extracellular matrix (ECM) proteins and cadherins, was
reduced in melanoblasts upon migration initiation [8, 47–51]. The true mechanism may be a
combination of both theories, where initiation of some melanocyte markers promotes initial
migration and the additional expression of other genes, possibly externally induced, and
further drives migration.
There are several key players involved in melanoblast specification and securing the
melanocytic lineage fate. MITF is regarded as key factor involved in melanocyte specification
from NCCs [36]. The expression of MITF occurs shortly after NCCs emigrate from the neural
tube and in the MSA. Fate mapping studies found melanoblast survival to depend on MITF
expression [52]. Moreover, MITF is responsible for initiating transcription of important
downstream targets, such as TRP2. However, MITF is not required for the migratory
behavior of melanoblasts [53]. Therefore, MITF plays an important role in promoting cellular
survival and development of melanoblasts. However, other factors are required in
combination for complete specification [36].
SOX10 and PAX3 are two important genes in melanoblast specification and activators of
MITF transcription. Studies reported that SOX10 and PAX3 synergistically activate the MITF
promoter in vitro [54, 55]. Additional work investigated the specific role of both PAX3 and
SOX10 independently from each other during early stages of melanocyte development.
Mouse embryos homozygous for mutated PAX3 were found to still possess TRP2-
expressing migrating melanoblasts along the dorsolateral pathway [52]. In mouse embryos
Introduction
7
negative for SOX10, the melanocytic markers TRP2 and MITF were virtually absent [54].
This analysis of both genes independent of one another suggests that PAX3 activity is not
required for melanocyte specification, but is required for expansion of the melanocyte
progenitor pool in early melanoblast stages. Studies have revealed that the WNT1 promoter
possesses a PAX3 binding motif, allowing PAX3 to use these enhancer elements to activate
WNT1. This suggests that PAX3 may be a direct regulator of WNT1 in the development of
NC populations [56, 57]. Furthermore, TRP2 and MITF are direct transcriptional targets of
SOX10 and are required for melanoblast specification [36, 54, 55].
Since SOX10 is crucial for melanocyte development, it is important to understand other
factors that may be responsible for modulating its expression. Another member of the SOX
family of transcription factors was found to be an antagonistic rather than synergistic
interactor with SOX10. SOX5, a member of the SOXD subfamily, has little impact on
melanocyte development alone [58]. Studies found that loss of SOX5 alone had little effect
on melanocyte specification. However, when combined with SOX10 heterozygosity, the loss
of SOX5 partially rescued impaired melanocyte development. This indicated that SOX10
activity is being modulated, in part, by SOX5 [36, 58].
While SOX10 is an activator of MITF expression and acts as a specifier of the melanocytic
lineage, the forkhead transcription factor (FOX) D3 plays an opposing role. FOXD3
functionally represses MITF expression and melanogenesis [36]. In quail NCCs, FOXD3
expression was found in all NCCs with the exception of late-emigrating cells pre-specified for
the melanocytic lineage [59]. Additional studies in quail, where FOXD3 was overexpressed,
demonstrated that FOXD3 repressed MITF expression, resulted in glial marker expression
instead of melanocyte markers [60]. In summary, FOXD3 is involved in controlling
melanocyte fate determination and migration, but represents only one factor in a complex
network orchestrating melanocyte fate in NCCs.
As described during NC induction, environmental cues are also responsible for regulating
fate decision in the NC. These extrinsic signals are capable of directing NCCs towards a
particular cell fate, which has been proven using clonal expansion studies. Many of these
responsible factors have been identified for other lineages, including neurogenesis and
gliogenesis, but inducers of the melanocytic fate remain to be discovered [36]. Nevertheless,
there are several known growth factors that play a role during the melanocytic fate
determination process. Among those growth factors are the members of the endothelin
(EDN) family. Several studies have proven the EDN family to be important in determining the
melanocytic fate. Upon exposure to EDN3 in quail NCCs, promotion and expansion of
unipotent glial and melanocytic clones was observed. In addition, bipotent glial/melanocytic
Introduction
8
clones were found [61]. Moreover, EDN3 was found to induce the generation of bipotent
glial/melanocytic precursor cells from Schwann cells [40, 62]. In mouse NCCs cell cultures
incubated in complex medium containing EDN, melanoblasts proliferated and successfully
differentiated. However, upon the removal of EDN, melanoblast cells still emerged,
suggesting that EDN signaling is not involved in melanocytic specification from NCCs [63].
Furthermore, continued migration of melanoblasts along the dorsolateral pathway requires
EDN signaling. The absence of EDN signaling causes stalling of specified melanoblasts in
the MSA [36, 64]. Lastly, mutations in the receptor or ligand of EDN signaling cause
pigmentation defects. These defects were found to not be caused by a failure in melanocyte
specification but, rather, in the later role of EDN signaling in melanocyte development [65].
Since the EDN pathway does not play a role in melanoblast survival and differentiation, this
pathway is thought to be partially redundant with other pathways involved in melanocyte
development.
Another pathway required for melanocyte development is tyrosine kinase receptor KIT. KIT
signaling has been well-studied and found to regulate melanoblast survival, proliferation but
not late melanoblast migration. Upon injection of KIT antibodies into pregnant mice at varying
developmental stages, three different patterns of melanocyte pigmentation and densities
were observed in embryos and adult mice [66, 67]. Mutations found in the KIT also led to
hypopigmentation defects. KIT signaling is involved in melanoblast proliferation, survival and
dispersal along dorsolateral pathway. It also partly mediates the melanocytic differentiation
program. However, melanocyte specification in the early stages of NCC fate determination
occurs independently of KIT signaling [36].
Canonical WNT/β-catenin signaling has been implicated in the early stages of melanocyte
development [68]. The WNT ligand binds to its receptor, Frizzled, and β-catenin accumulates
in the cytoplasm. β-catenin is translocated into the nucleus and subsequently interacts with
the lymphoid enhancer-binding factor (LEF)-1/T-cell factor (TCF). This interaction modulates
the transcription of several target genes, including MITF and CCND1 (Cyclin D1) [4]. In
mouse studies, the directed gene transfer of WNT1 to NCCs resulted in the expansion and
accelerated differentiation into pigmented cells [69]. Similarly, studies in quail NCCs
demonstrated that signaling by WNT3A increased the number of melanocytes while
simultaneously reducing the number of neural cells [70]. Finally, in zebrafish studies, in vivo
overexpression of activated β-catenin promoted the formation of pigmented cells and
repressed the generation of sensory neuronal and glial lineages [71]. When WNT signaling
was inhibited via the injection of dominant negative WNT1, NCCs adopted a neural fate
rather than a pigmented cell phenotype. β-catenin-deficient NCCs fail to express melanocytic
markers such as MITF and TRP2. Therefore, canonical WNT/β-catenin signaling controls
Introduction
9
expression of key melanocytic genes, MITF, and is important for melanocytic specification
[36, 71, 72].
However, other studies suggest a more complex mechanism of Wnt/β-catenin signaling and
melanocyte specification and development. For example, further studies in zebrafish
observed that the inactivation of β-catenin inhibited the formation of both pigmented and
neuronal cells [73]. Recent work tried to explain the inconsistent findings in Wnt/β-catenin
signaling and melanocyte development. Using Cre cell lines, β-catenin was conditionally
activated in NCCs at different developmental stages [74]. The activation of β-catenin in
premigratory NCCs led to the formation of ectopic melanoblasts, while suppression of all
other lineages was observed. Additionally, the activation of β-catenin in glial precursors or
melanoblasts did not promote enhanced production of melanoblasts. This study
demonstrated that NCC fate decisions in vivo are subject to strict temporal control by WNT/β-
catenin, where WNT/β-catenin responsiveness is highest during NCC migration [74].
As mentioned above, the migration of melanocyte precursors is possible through two routes:
dorsolaterally (traditional view) and ventrally (new theory). Different extrinsic growth factors
control progenitors traveling ventrally compared to those on the dorsolateral route. However,
since this route was only recently described, many mechanisms remain poorly understood. A
few mechanisms have been studied. The growth factor neuregulin-1 (NRG1) is a well-
established controller of axonal signaling in Schwann cells, regulating proliferation, migration
and myelination. This signaling is mainly mediated by the ERBB2/3 heterodimer receptor. In
mice lacking ERBB3, Schwann cells along nerves are completely abolished while
melanoblast MITF expression significantly increases [38]. Other signaling mechanisms
involved in regulating melanoblasts along nerves include platelet-derived growth factor
(PDGF) and cytokines interleukin (IL) 3 and 5 [36]. Further investigations are required for a
complete understanding of these mechanisms in regards to melanoblast formation and
specification.
Visualization of melanoblast migration has been achieved in mice using a lacZ transgene
with the TRP2 promoter [75]. Melanocytes differentiate from the pluripotent NCC population
at embryonic day (E) 8.5 before migrating along the dorsal-lateral pathway and ventrally
through the dermis. However, it is now accepted that melanocytes precursors migrate both
dorsolaterally and ventrally and can be derived from nerve cells, where a dominant fraction of
skin melanocytes is formed [36]. By E14.5 in mice, differentiated melanocytes populate the
epidermis and developing hair follicles [46, 75].
As melanoblasts migrate, they are constantly proliferating and, as the population expands,
apoptosis is also inhibited. The melanoblast population is able to migrate vast distances
Introduction
10
through the dermis, across the basement membrane, eventually settling in the epidermis [4].
Upon reaching their final destination in the epidermis, melanoblasts become fully
differentiated melanocytes.
1.1.3 Neural crest as a model system The NC is an important and crucial part of embryonic development in vertebrates. The NC is
an excellent system for studying developmental processes [3]. For these reasons, many
studies have tried to recreate NC development in vitro for further analysis.
Earlier studies of the NC in vivo typically used embryos from avian, Xenopus or mouse
species. For example, mouse embryos were used to examine melanocyte development in
vivo and resulted in the discovery of the importance and dependence for the transcription
factor MITF [76]. These studies used mouse embryos expressing wild-type (WT) MITF and
MITF mutant embryos homozygous for the MITFv ga-9 or MITFmi-ew alleles, which encode non-
functional proteins. Moreover, these studies required neural tube explants obtained from
embryos at E9.5 [76]. Though these studies laid the groundwork for NC and melanocyte
development and identified crucial regulators in these processes, further advancement in
biology has allowed for alternative ways of studying NC development.
Recently, studies have successfully modeled the NC in vitro without the use of animal
models. Authors developed a model using human embryonic stem cells (hESCs), where
migratory cells undergo EMT to acquire properties of the NC [77]. The model used various
culture conditions at different stages to promote propagation, segregation, gliogenesis and
finally neurogenesis. With this model, the study identified another member of the SOX family,
SOX2, involved in sensory neurogenesis [77]. This step-wise protocol was reproduced in
another study as well [78]. Together, these studies gave insights into how modeling the NC
will provide new perspectives without using animal models. However, the use of hESCs
raises ethical concerns and is not an ideal model system.
In particular, melanoblast model systems have also been established in vitro for further
analysis into the melanocytic lineage. One study established a cell culture system to
generate melanoblast-related cells (MBrc) [79]. This method was first described by Cook et
al. [80]. The study demonstrated that the MBrc model is a reproducible system and may
provide new insights into the role of melanoblast-related genes in melanoma progression.
The most recent and groundbreaking research came with the discovery of induced
pluripotent stem cells (iPSCs). Seminal research by Yamanaka and colleagues found that a
terminally differentiated cell can be reprogrammed to its pluripotent state via the induction of
four factors: SOX2, KLF4, OCT4 and NANOG [81]. This enabled further intensive research in
Introduction
11
the field of development. The generation of iPSCs avoided ethical issues associated with
hESCs and also provided research with better tools for development and disease modeling.
In 2011, Ohta and colleagues successfully differentiated human iPSCs into melanocytes by
supplementing culture medium with WNT3A, stem cell factor (SCF) and endothelin (ET)-3
[82].
Recently, Studer and colleagues successfully modeled NC induction and the eventual
specification of melanocytes using an in vitro system [83]. This work provided a complete
model system from iPSC to NCCs to melanoblasts and finally ending with terminally
differentiated melanocytes. Upon using timed exposure to WNT, BMP, and EDN3 and under
dual-SMAD inhibition culture conditions, this triggered the sequential induction of NC and
melanocyte precursor fates. Moreover, the global gene expression profile was analyzed
throughout the model, giving new perspectives into NC and melanocyte fate determination
[83]. In summary, the future of NC development and melanocyte progenitor research lies with
in vitro modeling systems. These models allow for efficient analysis and new insights into
development that were otherwise impossible due to constraints of animal models, ethics or
limited resources.
1.2 Melanocytes and their function in the skin The skin is the largest organ of the human body and plays one of the most important roles in
protecting the body and its internal organs from external harm, such as microbes and
environmental stress. Moreover, the skin maintains body temperature, prevents water loss,
allows for the feeling of touch and protects against harmful ultraviolet (UV) radiation from the
sun. The skin is composed of several layers of ectodermal tissue. The two primary layers in
the skin are the epidermis and dermis. The epidermis is the outermost layer and contains
melanocytes and keratinocytes. The epidermis is divided into five sublayers: stratum
corneum, stratum lucidum, stratum granulosum, stratum spinosum and stratum basale. The
dermis is where connective tissue, hair follicles, sweat glands, sebaceous glands and blood
vessels are mainly located. The hypodermis is not a part of the skin but is located below the
dermis and responsible for attaching the skin to muscle and bone [84].
Melanocytes are pigmented cells located in the stratum basale of the skin's epidermis. These
cells populate the integument, inner ear and eyes of vertebrate organisms and arise from
pluripotent NCCs [4]. These cells become fully differentiated upon reaching the basal
membrane of the epidermis and their development and differentiation status are regulated by
a complex network of genes. Additionally, melanocytes at hair follicles are produced by
melanocyte stem cells.
Introduction
12
1.2.1 MITF: master regulator of the melanocytic lineage MITF is the most critical regulator of the melanocytic lineage. This gene is not only
responsible for melanin biosynthesis but also regulates cellular proliferation, survival, lineage
determinacy and the replenishment of follicular melanocytes in adults [85, 86]. In vertebrates,
MITF is expressed in melanoblasts and melanin-containing melanocytes and retinoid
pigmented epithelia (RPE) cells [85]. Moreover, loss of MITF studies performed in mice and
zebrafish showed a complete loss of melanocytes, further illustrating its key function in
melanocyte biology [87]. Several isoforms (assigned A, B, C, D, E, H, M and Mc) of the MITF
protein have been identified and characterized. They differ in their N-terminal region due to
alternative promoters and first exons. It remains unclear whether the various isoforms have
specific functions [86]. However, the MITF-M gene transcript has been found to be heavily
involved in melanocytic lineage and is the only isoform that will be further discussed.
The four main regulators of MITF-M transcription are CREB, SOX10, PAX3 and LEF1/TCF.
Of several loci identified, the melanocortin-1 receptor (MC1R) has been found to be a major
determinant of the pigmentation phenotype [46, 88]. MC1R encodes a seven-transmembrane
domain G protein-coupled receptor. Once it has been bound by its agonist, typically α-
melanocyte stimulating hormone (α-MSH), it activates adenylate cyclase and induces cyclic
AMP (cAMP) production [89]. This production leads to the phosphorylation of cAMP
responsive-element-binding protein (CREB) which further transcriptionally activates
numerous other genes, including MITF.
Another crucial regulator of MITF and the melanocytic lineage is SOX10. SOX10 is also
important and expressed in the NCC population [90]. Though SOX10 is not required for the
development or early migration of NCCs, NCCs in mice lacking SOX10 undergo apoptosis
before completing terminal differentiation [19]. Studies have shown that SOX10 is a direct
regulator of MITF-M and therefore plays a crucial role in melanocyte differentiation [54, 55,
91]. Moreover, the SOX10-mediated activation of MITF can be improved by the presence of
PAX3, which suggests a synergy between SOX10 and PAX3 [54, 92].
Other regulators of MITF-M transcription are the lymphoid enhancer binding factor LEF-
1/TCF HMG-domain transcription factors. These factors mediate their functions in canonical
WNT signaling via interaction with β-catenin [93, 94]. The MITF-M promoter contains LEF-
1/TCF consensus binding sites and is directly regulated by WNT signaling when complexed
with LEF-1 [68, 72]. Upon transcription, MITF is further regulated via post-translational
modification by phosphorylation, which enhances the binding of MITF to the tyrosinase
promoter [95–97].
Introduction
13
Perhaps, the most crucial role of MITF in melanocyte biology is its regulation of
melanogenesis or pigmentation. The pigmentation process only occurs after complete
differentiation from melanoblast precursors. Studies have demonstrated that MITF is capable
of transactivating the promoters of three major pigmentation-related genes: TRP1, TRP2 and
TYR. Downregulation of TYR and TRP1 was observed upon MITF inhibition [98]. Despite the
evidence indicating a direct effect of MITF on pigmentation-related genes, overexpression of
MITF in either mouse B16 melanoma cells or human melanocytes did not result in
upregulation of TYR expression [99]. Lastly, MITF is also responsible for many other target
genes crucial for the melanocytic lineage, including glycoprotein (GP)-100 (PMEL17) and
melanoma antigen recognized by T cells (MART)-1 [100]. Taken together, MITF can drive
the activation of target pigmentation-related genes. However, this might depend on further
cooperation with additional proteins.
1.2.2 SOX10: crucial regulator of melanocyte survival and specification SOX10 has proven its importance in NC specification and terminal differentiation of
melanocytes. SOX10 is capable of controlling melanocyte development on two levels. First,
SOX10 is crucial for the survival, maintenance, and proliferation of NCCs. This controls the
overall size of the NCC population and indirectly influences the number of melanocytes.
Second, SOX10 regulates melanocyte specification by modulating melanocyte differentiation
factor MITF-M via directly binding to the proximal promoter and activating transcription [101].
In addition to these essential roles, SOX10 is also able to influence another important factor
in melanogenesis, TRP2. Studies found that SOX10 is capable of binding to the TRP2
promoter in a similar manner to that of MITF, thereby activating its transcription [102].
Moreover, SOX10-dependent activation of the TRP2 promoter could be synergistically
increased by MITF [103]. The TRP2 promoter also contains CREB and β-catenin/LEF-1
binding sites, though the function of these sites and the role of SOX10 may play in this
pathway remains under investigation.
1.2.3 Other important genes in melanocyte biology: PAX3, KIT and EDNs The expression of genes involved in melanoblast and late stages of melanocyte development
are often found in fully differentiated melanocytes. These include MITF and SOX10 but also
PAX3, KIT and EDNs. These genes remain important regulators of the melanocytic lineage
throughout the lifespan of a melanocyte.
Not only is PAX3 important for the regulation of MITF-M, it also plays a crucial role in
proliferation, migration, resistance to apoptosis, lineage specificity and differentiation of
melanocytes. PAX3 is important in NC and early melanocyte development and its expression
continues to be essential in differentiated melanocytes for promoting and inhibiting
Introduction
14
melanogenesis [56]. PAX3 also is capable of inhibiting TRP2 and blocking binding of MITF to
the promoter of TRP2. PAX3 forms an inhibitor complex with LEF-1 and the groucho-related
gene (GRG)-4. When β-catenin is present, LEF-1 switches partners, forming an activating
complex composed of LEF-1, MITF, and β-catenin. This activating complex is able to
displace PAX3 from the TRP2 enhancer and activate transcription [56]. PAX3 is also capable
of influencing the melanocyte lineage via the binding to the promoter and driving expression
of TRP1. Therefore, PAX3 is a crucial regulator of melanogenesis and is able to influence
cellular proliferation and apoptosis.
Another key NC marker and essential melanocyte development gene is KIT, a type III
receptor tyrosine kinase [104]. The function of KIT remains of importance throughout the
complete differentiation and life of a melanocyte. Detailed analyses of KIT mutants found that
KIT and its corresponding ligand play a complex role in final melanocyte migration from the
dermis to the epidermis as well as regulating cellular survival [47]. In differentiated
melanocytes, KIT signaling remains important for melanocytic survival in the skin. The ligand
of KIT receptor, SCF, is a paracrine factor synthesized by various other skin cells, including
epidermal keratinocytes [105].
In addition to c-KIT/SCF, there are other mechanisms likely to be involved in the late steps of
melanocyte migration from the dermis into the epidermis, including the EDNs [46]. The
endothelin-1 (ET1) peptide is a paracrine factor also synthesized by surrounding
keratinocytes. The function of ET1 is primarily to bind and activate the endothelin-B receptor
(ETBR). Upon ligand binding, a complex signaling network is activated, including the
activation of protein kinase (PK) C [105]. This network, which is also important in
melanoblast migration, is thought to play a role as a paracrine regulator of melanocytes,
since ET1 is expressed by surrounding keratinocytes.
1.2.4 Functions of melanocytes: pigmentation and ultraviolet radiation response
Pigmentation in the skin is an essential defense mechanism against ultraviolet (UV) radiation
of the sun. The pigment produced by melanocytes is termed melanin and is synthesized only
by membrane surrounded organelles called melanosomes [100]. In the typical response to
UV radiation, melanin-containing melanosomes are transferred to the periphery of
melanocytes, where they are ultimately transported to keratinocytes [106]. The most
important proteins involved in melanin catalysis include TRP1, TRP2 and TYR, whose genes
are all activated by MITF-M. Another crucial protein which maintains the structural integrity of
melanosomes is known as GP100, PMEL 17 or premelanosome protein (PMEL) [100].
Introduction
15
The biochemistry of melanin production in melanosomes by the catalytic enzyme tyrosinase
has been well studied. Tyrosinase converts the amino acid tyrosine into melanin via several
straightforward reactions. The initial and critical reaction involves the hydroxylation of
tyrosine into 3, 4-dihydroxyphenylalanine (DOPA). After synthesis of DOPA, this byproduct
can give rise to biopolymer melanin via extensive reactions, termed the Raper-Mason
scheme [107–109]. In brief, these reactions are a series of oxidation reactions which form
indole-quinone ring structures and permit the polymerization and quick configuration of
pigmented biopolymers [110–112]. These biopolymers become different forms of melanin,
depending on several external factors [46, 113].
After the production of melanin in the melanosomes, these organelles are transported for
protective measures against environmental responses. Melanosome transport has been well-
studied in mice in which the pigmentation pathway has been altered or compromised. There
are three major players in the transport of melanosomes through the cytoplasm to the
periphery dendrites. These genes are Ras-related protein RAB27A, melanophilin, and
myosin VA (MYO5A) [114–116]. On a molecular level, melanosomes become tethered to
myosin motors which move the organelles through the cytoplasm. Upon reaching the
periphery dendrites, the melanosomes are captured by actin filaments and remain there until
they are delivered to keratinocytes by a process which remains poorly understood. However,
recent studies have revealed that protease activated receptor 2 (PAR2) is involved in this
process [117, 118]. After melanosomes reach the keratinocytes, they are distributed and, in
response to UV radiation, positioned strategically over the ‘sun-exposed’ side of nuclei to
form cap-like structures resembling umbrellas [46].
Melanocyte dendricity is not only important for the structure of the cell but also for the
transfer of melanosomes to neighboring keratinocytes. Dendricity affects cell-to-cell
communication, especially with keratinocytes, which stimulate melanocytes to proliferate and
become more dendritic by secreting their own factors [119, 120]. Moreover, actin and
RAC1/RHO have been shown to be important in the formation of dendrites. These can be
externally regulated by physiological factors, such as MSH or UV radiation [121, 122].
UV radiation stimulates pigmentation in the skin by a process more commonly known as
tanning. There are two main tanning processes in the skin. The first is called the immediate
pigment darkening, where tanning occurs within minutes of the UV exposure. The second
type of tanning process is known as delayed tanning, where the tanning response is only
seen after several days [100]. The major regulator of the melanocytic lineage MITF tightly
controls melanogenesis and the UV response mechanism. On a molecular level, MSH, which
functions mainly through MC1R, controls the expression of MITF and its downstream targets
Introduction
16
TYR, TRP1, TRP2, GP100 and MART1. Studies found, that regardless of racial background,
similar increases in MITF expression were found within one day of exposure to UV radiation.
Additionally, levels of TYR, TRP1, GP100 and MART1 were also similarly expressed
between one and seven days, regardless of race [100].
Aside from the many protective responses exerted by melanocytes, UV radiation has many
adverse side effects in the skin, including the induction of DNA damage. Upon
characterization of melanocytes and keratinocytes after UV radiation, there is an inverse
relationship between melanin content and DNA damage induced in situ [100]. Moreover,
between individuals, there is great variability in UV-induced DNA damage. UV-induced DNA
damage can also cause mutations to occur in other key regulatory genes.
1.3 Melanoma Melanoma is a dangerous form of skin cancer derived from the malignant transformation of
melanocytes. Though malignant melanoma only accounts for four percent of all
dermatological cancers, it remains the most lethal by far, accounting for 80 % of all skin
cancer-related deaths [106]. Additionally, the incidence of melanoma has nearly doubled in
westernized countries over the past 20 years [123]. According to the Skin Cancer
Foundation, melanoma kills an estimated 9,710 people in the US annually. The American
Cancer Society estimates that, to date, there are more than 120,000 new cases of melanoma
in the US each year. In 2014, an estimated 76,100 of these will be invasive melanomas, with
about 43,890 cases in males and 32,210 cases in women [124].
If melanoma is recognized and treated early, it can be easily cured, typically by surgical
resection. Approximately 80 % of melanomas are treated in this manner [123]. However,
once the cancer has metastasized and spread to other regions of the body, therapy options
become limited and poor prognosis is common, with a median survival rate of 6 months and
5-year survival rate of less than 5 % [123, 125]. The development of immunotherapies and
targeted therapy has improved the treatment and survival of melanoma patients. However,
resistance to these treatments has now become the major obstacle in melanoma therapy.
Once the melanoma has spread from its initiation site to distant organs it becomes difficult to
treat. The major risk factors associated with melanoma include multiple benign or atypical
nevi and a family history of melanoma. Other genetic predispositions or environmental risks
include sun sensitivity, immunosuppression and exposure to UV radiation [106].
The pathogenesis of melanoma was first characterized and classified in the 1970s by Clark
[126]. This model describes different histological stages of melanoma, beginning from a
benign melanocytic nevus to malignant melanoma via dysplastic nevus [127]. Although this
model portrays linear progression, where each lesion is the immediate precursor to the next,
Introduction
17
research has found that the pathways by which melanoma develops may vary [128].
Nevertheless, the model is still used and describes the first lesion type as a benign nevus or
mole (small, well-defined). The next lesion is termed a dysplastic nevus, which is clinically
defined as a nevus containing one or more features of melanoma, such as a larger size or
irregular borders. The next phase is the radial growth-phase (RGP) of melanoma, where the
lesion grows progressively but only ‘radially’. This phase occurs within the epidermis only.
The last phase of the Clark model is the vertical growth-phase (VGP), where the melanoma
forms large, distinct nodules in the dermis, indicating the potential for metastatic spread
[128].
1.3.1 Origins of melanoma The deregulation of several pathways allows melanocytes to escape their tight regulation by
keratinocytes and thereby facilitate malignant transformation. These transforming-promoting
mechanisms include mutations in growth regulatory genes, production of autocrine growth
factors and the loss of adhesion receptors [129]. Much research has been done to
investigate the risk factors associated with melanoma initiation. One well-studied cause of
malignant transformation in melanocytes is exposure to UV radiation.
Exposure to UV light is the most well-known environmental risk factor associated with
melanoma initiation. UV radiation causes mutations in skin cells, increases the production of
growth factors, induces the formation of DNA-damaging reactive oxygen and affects
cutaneous immune function [106]. Tanning of the skin is a natural defensive and protective
measure taken by the skin against UV radiation. In response to UV radiation, keratinocytes
excrete factors which control several functional processes of melanocytes, including the
stimulation of melanin production [123].
As seen with many other cancer types, genetic familial predisposition is also a cause of
malignant melanoma in some cases. A family history of melanoma occurs in approximately
10 % of melanoma patients and increases the risk of acquiring the disease by nearly two-fold
[130]. Melanoma is often considered a genetic disease due to a range of heritable risk
factors such as skin complexion and eye color.
1.3.2 Familial mutations in melanoma Due to the familial link, it has been suggested that, in melanoma, there is an inheritance of
melanoma susceptibility genes. To date there have been four different genes at three
different loci identified to confer susceptibility in melanoma, the genes include: p16INK4a,
p14ARF, CDK4 and TERT.
Introduction
18
The cyclin-dependent kinase inhibitor 2A (CDKN2A) locus, located on chromosome 9p21, is
unique because it encodes two different, unrelated protein products: p16INK4a and p14ARF
[131]. These two transcripts can be altered simultaneously in both familial and sporadic
melanoma cases. Inactivation of the CDKN2A locus is mainly caused by deletion, mutation
or promoter silencing by hypermethylation (review in [132]). Mutations in this locus are
strongly related to familial history, when three or more family members are affected, 35.5 %
of patients developed melanoma, while only 8.2 % of those without any family history
develop melanoma [133]. Both gene products impact cellular proliferation; however via
separate mechanisms. p16INK4a protein blocks cell cycle progression inhibiting the activity of
cyclin D1-dependent kinase 4 (CDK4). This inhibition blocks CDK4 from phosphorylating the
retinoblastoma (RB) protein and induces cell cycle arrest at G1 phase. While p14ARF plays an
important role in stabilizing p53 by inhibiting the ubiquitin ligase murine double minute 2
(MDM2) protein responsible for degrading p53 [134]. Disrupting the degradation of p53
promotes cellular growth, since p53 normally arrests cell division at G1 to either allow DNA
repair or induce apoptosis in possibly transformed cells [132].
Another melanoma susceptibility gene is CDK4, located at 12q13.6 and which encodes
proteins that interact with p16INK4a. Mutation in CDK4 is extremely rare but has been reported
in the germline of melanoma-prone families. Typically, these mutations are observed at an
arginine residue (Arg 24) and eliminate regulatory interactions with p16INK4a, leading to
enhanced cell cycle progression (reviewed in [130]). It is important to note that the result of
mutations in either p16INK4a or CDK4 seem to be functionally equivalent and both block the
association between each other and hence impair the ability of p16INK4a to activate the RB
family [135].
Recent studies identified a new melanoma susceptibility gene, the telomerase reverse
transcriptase (TERT). Researchers investigated melanoma-prone families using linkage
analysis and identified a germline mutation in the promoter of the gene that encodes the
catalytic subunit of telomerase. This mutation is capable of creating a new binding motif
which enhances its transcription two-fold [136]. Additionally, work identified that mutations in
TERT can occur somatically in melanoma. The functions of TERT mutations in melanoma
progression are currently being investigated [136, 137].
1.3.3 Somatic mutations in melanoma: BRAF, RAS, MITF, KIT and PTEN Somatic mutations, like in other cancer types, are a main driving force in melanoma initiation
and progression. UV-induced DNA damage can cause the formation of somatic mutations
and, when these mutations are induced in key regulatory genes or oncogenes, the result is
carcinogenesis. Mutations which upregulate murine sarcoma viral oncogene homolog B
Introduction
19
(BRAF) are most common mutations in melanoma, occurring in nearly 65 % of all melanoma
cases. The most common somatic mutation in the BRAF gene is a missense mutation from
valine to glutamic acid at amino acid 600 (BRAFV600E) in the ATP-binding region of the
protein. This specific mutation comprises of nearly 90 % of all BRAF-mutated melanomas,
while other variations, including BRAFV600K, are rare [138]. These mutations occur
somatically, since wild-type forms of both genes are also found in normal tissue of melanoma
patients [139]. In fact, there is a very low incidence of BRAF mutations found in melanomas
arising from non-sun exposed skin, suggesting that UV exposure plays a crucial role in
inducing BRAF mutations in cutaneous melanoma [135].
Functionally, the BRAFV600E mutation causes a 10-12-fold increase in its activity, triggering
the hyperactivation of the mitogen-activated protein kinase (MAPK) signaling cascade
leading to cellular survival and proliferation [135]. Studies in immortalized mouse
melanocytes showed this connection by expressing mutant BRAF and observing the
induction of extracellular signal-regulated kinase (ERK) and the initiation of malignant
transformation [140]. Moreover, upon treating human melanoma cell lines with BRAF
mutations with mitogen-activated protein kinase kinase (MEK)-1/2 inhibitor U0126 the
blockade of MAPK signaling and cell cycle progression was observed, but had no effect on
melanoma cells harboring oncogenic neuroblastoma viral oncogene homolog (NRAS).
Therefore, mutated BRAF can act as a potent oncogene in early stages of melanoma
progression through activated MAPK signaling. However, mutated BRAF is not required for
RAS-transformed melanocytes due to the innate redundancy within the pathway [140].
The BRAFV600E mutation is found in approximately 80 % of benign nevi. In zebrafish,
expression of melanocyte-specific BRAF proteins induces ectopic proliferation of
melanocytes, analogous to human nevi [141]. However, it is unknown why mutated BRAF
leads to benign nevi formation and malignant formation. Multiple requirements are needed
for transformation. A BRAF mutation alone is not sufficient to progress towards malignancy.
In the zebrafish study described above, a combination of a BRAF mutation and inactivation
of the tumor-suppressor gene p53 led to the malignant transformation of melanocytes [141].
Additionally, studies identified the association between mutant BRAFV600E and p16INK4a/p19ARF
loss or mutations in p53 and PTEN leading to malignant transformation [142–144]. These
studies provide an explanation for how BRAF mutations exist in nevi without directly inducing
malignant transformation.
The RAS family is also affected by somatic mutations in melanoma and functions as a
transducer of extracellular growth factor signals in the cell. Among the RAS gene family,
NRAS is the most commonly mutated and represents the second most common mutation
Introduction
20
found in melanoma, comprising of nearly 20 % of mutations in the disease. This mutation is a
point mutation of amino acid 61 from a glutamine to a lysine (NRASQ61K) or arginine
(NRASQ61R), but there are many variations. Mutations also occur in other RAS family
members but mutations in NRAS seem to be the most detrimental and oncogenic. Studies in
mice investigated the different consequences of HRAS and NRAS in melanocytes. The
hyperactivation of HRAS in combination with loss-of-function mutations in CDKN2A and/or
p53 led to non-metastatic melanomas in mice. Activation of NRAS together with CDKN2A
loss led to the production of melanomas with severe metastatic spread to both lymph nodes
and distant organs in mice [135, 145, 146].
As described above, MITF plays a crucial role in melanocyte development and differentiation.
The function of this gene in malignant transformation and melanoma progression has
become important and remains not well understood. The role of MITF in differentiation and
cell cycle arrest in normal melanocytes is known, but conversely MITF in melanoma cells
does not possess the same function. A large study investigated genomic changes in
melanocytes using analysis of high-density single-nucleotide polymorphisms (SNPs) and
discovered an increased copy number of a region on chromosome 3 that included the MITF
locus [147]. Moreover, this increase was accompanied by increased expression of the MITF
protein. Upon the overexpression of both MITF and BRAF, primary human melanocyte
cultures were malignantly transformed. The amplification of MITF correlates to poor
prognosis and is associated with melanoma therapy resistance [147]. Taken together, these
results suggest that MITF is an oncogene and a lineage-survival gene in melanoma [147–
149].
There are many other somatic mutations found in melanoma [136, 137, 150–153]. For
example, another gene susceptible to somatic mutations is the KIT oncogene. Approximately
1-2 % of all melanomas contain point mutations in the KIT receptor tyrosine kinase gene.
Most of these mutations are found in mucosal and acral melanomas and also in constantly
sun-damaged melanomas [138, 154]. An influential study observed that the MAPK signaling
pathway was activated upon stimulating melanoma cells with the KIT ligand, SCF. This
resulted in the phosphorylation of MITF and in the transactivation of the promoter of the
pigmentation-related gene TYR [95]. This link between external signals transduced by KIT
into gene regulation became an early indication for the importance of KIT in
melanomagenesis.
Another gene susceptible to somatic mutations in melanoma is the phosphatase and tensin
homolog (PTEN) gene. Somatic mutations in PTEN are found in 40-60 % of melanoma cell
lines and in approximately 10-20 % of primary melanomas, where the majority of the
Introduction
21
mutations occur in the phosphatase domain (reviewed in [132], [155]). However, the contrast
between low mutation frequency detection and a high level of gene silencing can be
explained by other mechanisms important for the inactivation of PTEN, including epigenetic
silencing and altered subcellular location of this protein [135]. Several methylation sites have
been found within the PTEN promoter. Hypermethylation of these sites reduce PTEN
expression in melanoma [132]. Moreover, genetic studies have found that deletions in
chromosome 10q, including the PTEN locus, occur at high frequencies in BRAF-mutated
melanoma, while deletions in this chromosome were less common in NRAS-mutated
melanomas [156, 157]. This work suggests that BRAF and PTEN may cooperate in
melanoma progression. PTEN is commonly regarded as a tumor suppressor because it acts
as an antagonist of the phosphatidylionositol-3 kinase (PI3K) pathway and MAPK signaling,
which will be discussed further in the following sections.
1.3.4 Pathways affected by somatic mutations in melanoma: MAPK, PI3K-AKT and TGF-β signaling
The complex signaling network which initiates, maintains and drives melanoma progression
is well-studied. However, the depth of complexity leaves much left to uncover. In the next
section, I will only highlight the key signaling pathways involved in melanomagenesis,
including MAPK, PI3K-AKT and TGF-β signaling.
The RAS/RAF/MEK/ERK signaling cascade, also known as MAPK pathway, is a serine-
threonine cascade involved in the regulation of cell growth, survival and differentiation. In
melanocytes, this pathway drives melanogenesis by regulating cell proliferation and survival.
In addition, the MAPK pathway has been meticulously studied in melanoma, since somatic
mutations in BRAF and NRAS cause an overactivation of this pathway. First, the signaling
cascade starts by the binding of a growth factor (e.g. SCF, EGF or PDGF) to its
corresponding receptor (e.g. KIT, EGFR or PDGFR). This binding allows for RAS (a GTPase)
to exchange its bound guanosine diphosphate (GDP) for guanosine-5'-triphosphate (GTP).
This exchange initiates the recruitment and phosphorylation of membrane-bound RAF
proteins. Lastly, activated RAF induces downstream signaling via phosphorylation of MEK
and, subsequently, ERK. ERK phosphorylation results in its translocation to the nucleus
where it controls expression of key survival, cell-cycle progression and differentiation-
associated genes [142, 158, 159].
The hyperactivation of the MAPK signaling is well-understood and strongly linked to the
somatic mutation of BRAF. However, mutation of BRAF alone is not sufficient to induce
malignant transformation. The MAPK signaling pathway is heavily involved in
melanomagenesis by promoting cellular proliferation, inhibiting apoptosis and inducing tumor
Introduction
22
invasion and metastasis. The overactivation of ERK controls cell proliferation by playing a
role in the G1-phase to S-phase transition. The activation of ERK negatively regulates the
p27/Kip1 inhibitor and upregulates c-MYC, leading to melanoma cell growth. Likewise, the
inhibition of ERK leads to G1-phase cell cycle arrest mediated by the upregulation of cyclin-
dependent kinase (CDK) inhibitor p27/Kip1 and hypophosphorylation of the RB protein [160].
Additionally, ERK activation targets downstream transcription of POU domain, class 3,
transcription factor 2 (POU3F2 or BRN2), which then leads to an increase in cell proliferation
[135].
Inhibition of apoptosis is another important effect of the hyperactivation of the MAPK
signaling pathway. The overactivation of ERK mediates melanoma-specific survival signaling
by regulating ribosome S6 kinase (RSK)-mediated phosphorylation leading to inactivation of
proapoptotic Bcl-2-associated death promoter (BAD) protein. Aside from controlling
apoptosis, the MAPK pathway is also important for the acquisition of the invasive phenotype.
ERK activation regulates MMP production, especially the production of MMP-1. Studies
found that, upon blocking ERK activity, melanoma cell proliferation and collagen degradation
was inhibited [161]. Additional functions of the MAPK signaling cascade lie in its induction by
α-MSH and, therefore, cAMP levels. This cAMP-induced activation of ERK induces
differentiation via inducing MITF expression, leading to the upregulation of the differentiation-
associated genes TRP1 and TRP2, though this activation is weak and transient [162].
In summary, the MAPK signaling cascade is an important pathway for maintaining
melanocytic proliferation. However, the introduction of somatic mutations in RAS or RAF can
cause the hyperactivation of this pathway and induce malignant transformation of
melanocytes into melanoma. Although the hyperactivation of this pathway alone is not
sufficient to induce transformation, the sustained activation of this pathway leads to cell
proliferation, survival, inhibition of apoptosis and induction of cellular invasion. The weak and
transient activation of this pathway via α-MSH and cAMP can also lead to cellular
differentiation, further underscoring the complexity of melanomagenesis.
The phosphatidylinositide 3-kinases (PI3K) is commonly dysregulated in melanoma, typically
by mutation and silencing of the tumor suppressor gene phosphatase and tensin homolog
(PTEN). PTEN encodes a phosphatase that inactivates the products of PI3K. The PI3K-AKT
pathway functions by first activating PI3K, which then increases phosphatidylinositol 3, 4, 5-
triphosphate (PIP3) production. Conformational changes activate protein kinase B (also
known as AKT), leading to cell cycle progression, survival and migration. However, PTEN
antagonizes this pathway with two main biochemical functions: protein phosphatase and lipid
phosphatase. The lipid phosphatase activity plays an anti-tumorigenic role by decreasing the
Introduction
23
function of downstream AKT. PTEN dephosphorylates the cytosolic second messengers of
the PI3K-AKT pathways, PIP3 and phosphatidylionositol 3, 4-bisphosphate (PIP2) [163, 164].
The loss of function of PTEN in tumor cells leads to the accumulation of these second
messenger lipids and activates AKT and decreases apoptosis, while the reintroduction of
PTEN into PTEN-null cells reverts this effect [130, 132, 135].
AKT activation induces many functional changes in the cell, including cell cycle progression,
survival and migration. A main activating mechanism for AKT is DNA copy gain, which is
found in 40-60 % of melanomas. Mutations in the catalytic subunit of PI3K also occur in
melanoma but at a low frequency (5 %). Studies have found that activated AKT promotes
cellular proliferation by downregulating cyclin-dependent inhibitor p27 and upregulating
CDNN1 (Cyclin D1). Additionally, the activation of AKT suppresses apoptosis via several
mechanisms, including inactivation of pro-apoptotic proteins such as BAD [132]. Lastly, AKT
activation can promote tumor migration and invasion through the induction of MMP proteins,
including MMP-2 and MMP-9. Studies proposed that AKT activation leads to NF-κB binding
to the promoter of MMP promoting its transcription [165].
Taken together, the PI3K-AKT pathway is extremely important in melanoma progression and
survival. Mutation in the tumor suppressor PTEN enables the overactivation of AKT which
further promotes cell cycle progression, inhibition of apoptosis and promotion of cellular
migration and invasion. Moreover, there are activating mutations in AKT, which also lead to
its overactivation in melanoma.
There are several other important signaling pathways that are crucial for melanoma
progression and metastatic spread. One of those pathways is the transformation growth
factor (TGF)-β signaling pathway. The TGF-β signaling is involved in regulating development
and cellular growth. The TGF-β ligand, TGF-β1, binds to membrane receptors, such as
transforming growth factor beta receptor (TGFBR)-2, that contain a cytoplasmic
serine/threonine kinase domain. Ligand binding induces assembly of a receptor complex
which phosphorylates proteins of the mothers against decapentaplegic (SMAD) family [135,
166]. Upon phosphorylation, SMAD proteins form heterodimers and they translocate into the
nucleus, where they assemble complexes, bind DNA and regulate target gene transcription.
Of note, there is substantial versatility in TGF-β responses. For example, there are countless
combinations of interactions between the receptor and SMAD-interacting proteins, within the
SMAD protein complexes and other sequence-specific transcription factors [167].
To date, studies have revealed the importance of TGF-β signaling in melanoma
pathogenesis. One of the first observations was that there is increased expression and
secretion of the different TGF-β isoforms in melanoma cell lines when compared with normal
Introduction
24
melanocytes (reviewed in [168]). TGF-β was found to suppress the growth of normal human
melanocytes, while melanoma cell proliferation was only slightly inhibited by TGF-β.
Therefore, melanoma, cells have developed a resistance mechanism to inhibit anti-
proliferative signals through TGF-β. A study found that melanoma cells express higher levels
of SKI and SnoN in comparison to normal human melanocytes and that these molecules are
capable of interfering with SMAD-dependent transcription of cell cycle regulator p21,
therefore elucidating one possible mechanism used by melanoma cells to resist the anti-
proliferative signals from TGF-β signaling [169, 170].
Additionally, TGF-β signaling is involved in melanoma metastasis. One study found the
blockade of SMAD7 inhibited 1205Lu melanoma cells from forming bone metastasis [168,
171]. Moreover, tumor-stroma interactions where found to be important in melanoma, since
the expression of TGF-β1 stimulated neighboring stoma cells via increased deposition and
production of ECM proteins. This led to increased tumor cell survival and metastasis [172].
Taken together, TGF-β signaling plays an important yet complicated role in
melanomagenesis and further work is required to fully understand the depth of its function in
the context of this disease.
1.3.5 Current targeted melanoma therapies The preferred treatment for melanoma is surgical resection. If detected early, melanomas
can be removed surgically, with high progression-free survival. Therefore, early diagnosis
remains crucial for improving clinical outcome of melanoma patients. However, once
melanomas spread into the lymphatic or the circulatory system and home to distant organs,
such as the liver, they become non-resectable and difficult to treat. The development of
targeted therapies allows for the specific inhibition of factors responsible for the activation of
mealnoma-driving pathways. To date, there are targeted therapies in melanoma inhibiting c-
KIT, BRAF, CRAF, MEK1/2, mTOR, AKT and CDK4 (reviewed in [138]).
The BRAF kinase inhibitor vemurafenib was the first targeted therapy developed and shown
to improve the clinical outcome of melanoma patients. Vemurafenib competes with
adenosine-triphosphate (ATP) to bind the kinase domain of BRAF, leading to inhibition of
BRAF-induced MEK activation [173]. Clinical trials found that, upon vemurafenib
administration, patients displayed a response rate of 48 % and improved survival compared
to dacarbazine, another chemotherapeutic agent [174]. This compound was approved by the
Food and Drug Administration (FDA) and the European Medicines Regulatory Agency (EMA)
in 2011. Soon after, a second BRAF inhibitor, dabrafenib, was developed and showed similar
response rates but with different side effects [175]. The use of both of these compounds was
not restricted to melanoma patients only possessing the V600E mutation. They were also
Introduction
25
found to be effective in patients with other BRAF mutations, including V600K, V600R,
p.T599del mutations and D594G [176]. Although the aforementioned compounds are
generally tolerated well and considered safe, side effects associated with their use include,
but are not limited to, fatigue, diarrhea and nausea [177, 178].
Another strategy for targeting the MAPK signaling pathway is the inhibition of the
downstream proteins MEK1 and MEK2. The first developed MEK1/2 inhibitor, trametinib, was
shown to improve the progression-free survival of stage IV melanoma patients harboring a
BRAFV600E or V600K mutation [179]. In 2013, this compound was approved by the FDA for the
treatment of patients with BRAFV600E-mutated metastatic melanoma. Phase I trials showed
that trametinib may also be used in combination with paclitaxel, a mitotic inhibitor used in
cancer chemotherapy [180]. Another MEK1/2 inhibitor, selumetinib, was developed and
displays similar clinical activity in BRAF-mutant melanoma. Moreover, in a phase II double-
blinded randomized clinical trial, this compound was tested in combination with dacarbazine
in both BRAF-mutated and unknown primary melanoma, patients showed significantly
improved progression-free survival compared with the control group receiving the placebo
plus dacarbazine [181].
In addition to BRAF inhibition, another common mutation, observed in approximately 20-
30 % of melanoma patients, is found in the NRAS gene. There are no current therapies
which target NRAS directly; however, other treatments showing off-target effects on
oncogenic NRAS are being used. For example, in patients harboring the NRAS mutation,
treatment with MEK 1/2 inhibitors can lead to tumor regression. In a recent clinical trial, it was
observed that 20 % of patients with NRAS-mutated melanoma had a partial response upon
treatment with MEK inhibitor binimetinib (MEK162) [182]. Another strategy for targeting
NRAS-mutated melanoma is via the simultaneous inhibition of MEK and CDK4/6. This is
beneficial in NRAS-mutated melanoma patients because studies have revealed enhanced
MAPK signaling and dysregulation of cell cycle checkpoints in NRAS-mutated melanoma
[183]. Recent encouraging phase 1b/2 clinical trials showed that the combination of
binimetinib (MEK162) and CDK4/6 inhibitor LEE011 resulted in partial responses in 43 % of
patients [184].
Mutations in the oncogene KIT can lead to the overactivation of MAPK signaling and
advance melanoma progression. Therefore, melanomas containing such regions were
evaluated, leading to the development of the first targeted therapies against tyrosine kinase.
One inhibitor, imatinib, showed an overall response rate of 16 %, with a response rate of
23.3 % in patients harboring a KIT mutation [185]. Other KIT inhibitors currently being
Introduction
26
investigated in clinical trials including dasatinib, which targets the L576P mutation in KIT, and
nilotinib [138].
In addition to targeted therapy, another novel approach to treating melanoma is stimulation of
the immune system, known as immunotherapy. One therapy, ipilimumab, is a human IgG1
monoclonal antibody which blocks the cytotoxic T lymophocyte-associated antigen (CTLA-4).
By inhibiting CTLA-4 activity, which normally is responsible for negatively regulating active T
cells, results in an increase in proliferation of T cells. In clinical trials, patients with cutaneous
melanoma showed an overall survival benefit when given ipilimumab [138, 154, 186].
Additionally, ipilimumab was used as adjuvant therapy in a placebo-controlled trial and
showed significant improvement in recurrence-free survival in patients with stage III
melanoma with a high risk of recurrence [187].
Another immunotherapy option in melanoma treatment is a monoclonal antibody which
targets the programmed death receptor (PD)-1. PD-1 is responsible for downregulating the
initial T cell activation by binding the immunosuppressive ligand PD-L1. By blocking this
interaction, T cell activation is halted, therefore PD-1 signaling stimulates an immune
response. The anti-PD-1 antibody MK3475, pembrolizumab, was first examined in patients in
advanced stages of melanoma and was found to extend progression-free survival for more
than seven months and sustained tumor regression was observed [188]. In September 2014,
pembrolizumab (MK3475) received accelerated approval by the FDA for the treatment of
patients with either advanced or non-resectable melanoma. Similarly, another PD-1 inhibitor
was developed, nivolumab, and demonstrated beneficial two- and three-year progression-
free survival rates [189]. In summary, the use of immunotherapy in treating melanoma has
beneficial impact on overall survival and on tumor regression.
1.3.6 Therapy resistance in melanoma The most prevalent issue with current melanoma therapy is the prompt acquisition of therapy
resistance hypothesized in one theory to be acquired by selective pressure within the tumor.
Typically, it is observed that the response to therapy, such as BRAF inhibitors, is transient.
Therefore, mechanisms of resistance have been studied in detail.
The effectiveness of targeted therapy is limited to cancer cells which lack the ability to confer
resistance. There are several general and extremely complicated resistance mechanisms
that cancer cells employ in order to evade treatment, including membrane transport systems
that control drug entry/export/distribution, enzymatic mechanisms that metabolize the drugs,
anti-apoptotic pathways that alter cell death programs and tumor physiology associated with
its microenvironment [190]. The variety of mechanisms highlight the complexity associated
Introduction
27
with acquired resistance. Next, I will briefly provide some examples of known mechanisms
associated with melanoma therapy resistance, especially with BRAF and MEK inhibitors.
The use of BRAF inhibitors showed much success in initial treatment, but the development of
resistance is inevitable. Typically, resistance is acquired against targeted therapy by the
development of secondary mutations. For example, resistance to KIT inhibitors, such as
imatinib, may be caused by mechanisms induced by NRAS mutation and KIT copy number
gain [154]. Conversely, instead of developing secondary gatekeeper mutations to reactivate
BRAF, melanoma cells typically reactivate other members in the MAPK signaling cascade
[191] upon BRAF inhibitor treatment. For example, patients that are resistant to BRAF
inhibition have additional mutations in NRAS that reactivate the MAPK pathway (reviewed in
[192, 193]). Moreover, BRAF activity is capable of being substituted by other paralogs of
BRAF, such as CRAF and ARAF. Lastly, kinases that activate MAPK signaling are also
involved in melanoma therapy resistance. One study identified the cobalt uptake protein
(COT1) as an adaptive response mechanism to BRAF inhibition in melanoma cell lines. In
the absence of activated BRAF, COT1 is able to stimulate the MAPK signaling pathway,
leading to resistance [194]. Recently, work was done to better understand resistance
mechanisms involved in BRAF and MEK inhibition in more detail. Studies found that
suppression of SOX10 in melanoma induced the activation of TGF-β signaling, leading to the
upregulation of epidermal growth factor receptor (EGFR) and platelet-derived growth factor
receptor-β (PDGFRβ) responsible for resistance to BRAF and MEK inhibitors [195].
Moreover, this work suggests that EGFR-positive melanoma may benefit from re-treatment
of BRAF inhibitors after structured treatment suspension.
Due to the high occurrence of melanoma therapy resistance, many clinical trials have
focused on combining already approved targeted therapy for synergistic and more potent
effects in the clinic. Clinical studies have investigated selective BRAF inhibitors
(vemurafenib, darafenib, encorafenib) in combination with selective MEK 1/2 inhibitors
(trametinib, cobimetinib, binimetinib) [138]. One clinical trial investigated the effects of
combining darafenib and trametinib as a first-line therapy option for patients with non-
resectable or metastatic BRAFV600E/K-mutated melanoma stage IIIC or stage IV. The trial
observed an overall response rate of 67 % for the combination therapy compared to 51 % for
darafenib only. Moreover, the progression-free survival rate was 93 % for the combination
therapy compared to 85 % with darafenib only [196]. Correspondingly, another combinatorial
phase III clinical trial found similar results when the combination of the BRAF inhibitor
vemurafenib and the MEK inhibitor cobimetinib were used [197]. Lastly a recent clinical trial
in metastatic melanoma patients, tested darafenib in combination with trametinib in
comparison to vermurafenib monotherapy. Significantly improved overall survival was
Introduction
28
observed in patients receiving combinatorial therapy compared to monotherapy after 12
months, with progression-free survival rates of 72 % and 65 %, respectively [198].
Another combinatorial tactic for avoiding the development of therapy resistance is the
combination of immunotherapy and targeted therapy to treat melanoma. A phase I study
investigated the use of ipilimumab, an anti-CTLA-4 antibody, in combination with different
doses of BRAF inhibitor vemurafenib. However, there were several adverse side effects
observed, including hepatotoxicity [199]. Another phase IB study investigated the
combination of ipilimumab with peginterferon alfa-2b in patients with unresectable melanoma
stages IIIB/C/IV. Peginterferon alfa-2b was initially approved for the treatment of hepatitis C
and, in 2011, was approved for the treatment of melanoma. Peginterferon alfa-2b modulates
the JAK-STAT pathway and controls the immune response by transcribing genes, including
interleukin 4 (IL4), and subsequently inducing type 2 helper T cells, stimulating B cells
amplifying the immune response [200]. Combinational therapy of peginterferon alfa-2b and
ipilimumab led to a clinical benefit rate of 53.8 % and response rate of 42.3 % in
unresectable stage IIIB/C/IV melanoma patient population [201]. Melanoma therapy
resistance remains a major roadblock for the successful treatment of melanoma patients.
However, there has been some progress in understanding the mechanisms by which
melanoma cells become resistant and tackling resistance using combinatorial treatment
strategies.
1.3.7 Melanoma invasion, metastasis and plasticity Activating invasion and enabling metastasis is not only a hallmark of cancer in general but
also causes most cancer-related deaths, especially in malignant melanoma [202]. Invasion
and metastatic spreading are processes that alter tumor cell shape and their attachment to
other cells and the ECM. Alterations in cadherin expression represent a well characterized
feature of invasive cells [202] and the activation of the EMT process [202].
The EMT is driven by a network of embryonic EMT-inducing transcription factors from the
following gene families: SNAIL, twist family bHLH transcription factors (TWIST) and zinc
finger E-box binding homeobox (ZEB). In various cancer types, aberrant expression of these
genes is a common occurrence and is correlated to poor prognosis and risk of metastatic
spread. The EMT leads to the in the acquisition of stem cell-like qualities such as self-
renewal and reduced proliferation [203, 204]. Importantly, the EMT is flexible and transient
which allows high tumor cell plasticity, driven primarily by microenvironment cues [205, 206].
In melanoma, tumor cell plasticity is mainly controlled by MITF. Unlike other epithelial
tissues, melanocytes express EMT markers SNAI2 and ZEB2 and therefore one hypothesis
claim this expression predisposes the lineage towards malignant transformation [207]. It is
Introduction
29
important to note that since melanocytes do not belong to the epithelial lineage and the EMT
cannot be fully attributed to malignant transformation, however melanocytes do express E-
cadherin to form close contacts to neighboring keratinocytes. Recently, the EMT
transcriptional network in melanoma was revealed to undergo remodeling to favor expression
of TWIST1 and ZEB1 upon NRAS/BRAF activation promoting an invasive phenotype [203].
The development of the NC during normal embryogenesis requires induction of the EMT and
initiation of a migratory phenotype. Many of these phenotypes exhibited by NCCs,
specifically during their migration phase, have also been implicated in cancer cell invasion
and metastasis. For example, some of the overlapping mechanisms include the cadherin
switch from E-cadherin to N-cadherin expression, expression of members of the SNAIL
superfamily and the induction of MMP expression. For these reasons, studying the NC during
normal development has been of significant interest to the field of cancer research, including
melanoma. The current knowledge of processes underlying melanocyte specification and
lineage determination are now becoming relevant in understanding melanoma initiation,
progression and invasion. Overlapping pathways between the neural crest, melanocyte development and melanoma are summarized in Table 1.
The melanocytic lineage has been heavily implicated in malignant transformation. Multiple
behavioral and functional aspects important in NC development, including the cadherin
switch and MMP expression and secretion, are also detected in melanoma (reviewed in
[208]). Taken together, this indicates that the NC differentiation program can cooperate with
oncogenic mutations and lead to malignant transformation. Further evidence linking the NC
developmental program to malignant transformation in melanoma is provided in
transplantation experiments, where melanoma cells and melanocytes were exposed to an
embryonic environment. Upon transplantation into avian embryos, highly aggressive
malignant melanoma cell lines were able to migrate along normal NCC routes, suggesting
that melanoma cells are able to respond to environmental cues [209]. These migrating
malignant melanoma cells downregulated pluripotency-associated genes while re-expressing
early melanocytic and neuronal markers [210]. Interestingly, when these cells were implanted
into non-NC regions, such as the embryonic optic cup, the cells gave rise to invasive
malignant melanomas [211]. This data suggests that NC environmental cues are able to
direct only NC-derived lineages [212]. However, these results only suggest that malignant
melanoma can respond to NC-related extrinsic cues but does not implicate these cues in
transformation itself.
The aberrant regulation of NC developmental genes promotes plasticity and invasiveness in
malignant melanoma [213]. This ability of melanoma cells to regain NCC migrative properties
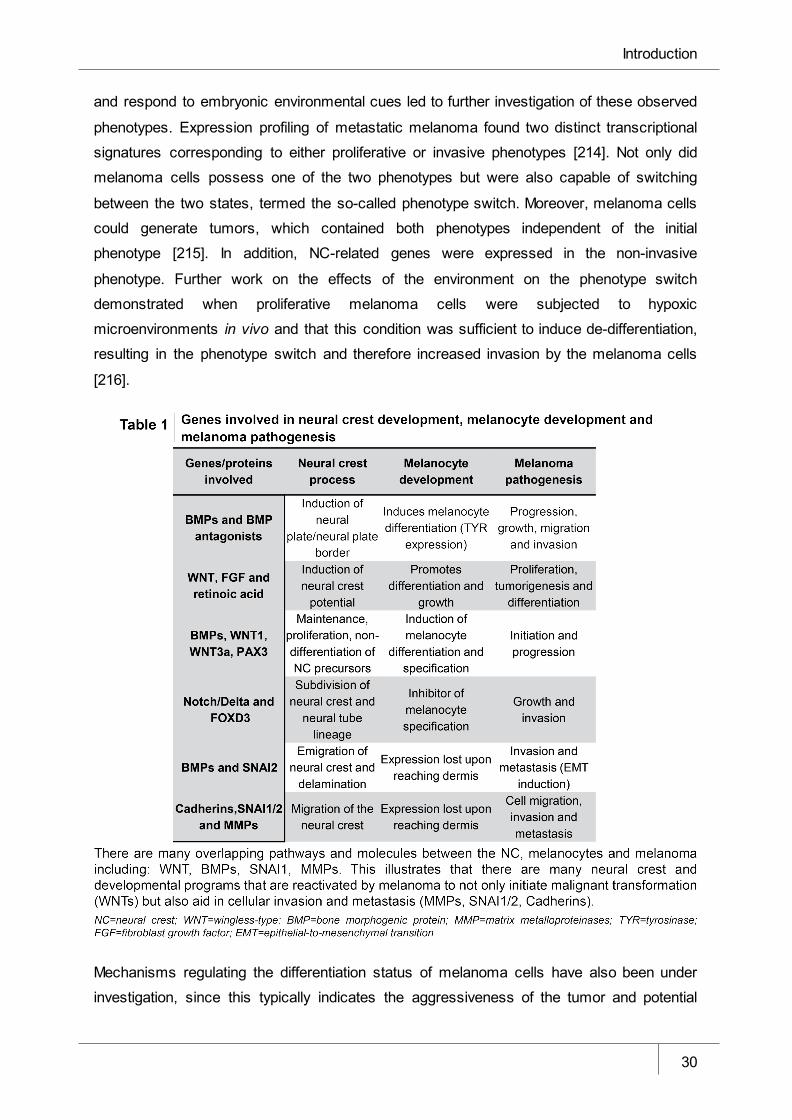
Introduction
30
and respond to embryonic environmental cues led to further investigation of these observed
phenotypes. Expression profiling of metastatic melanoma found two distinct transcriptional
signatures corresponding to either proliferative or invasive phenotypes [214]. Not only did
melanoma cells possess one of the two phenotypes but were also capable of switching
between the two states, termed the so-called phenotype switch. Moreover, melanoma cells
could generate tumors, which contained both phenotypes independent of the initial
phenotype [215]. In addition, NC-related genes were expressed in the non-invasive
phenotype. Further work on the effects of the environment on the phenotype switch
demonstrated when proliferative melanoma cells were subjected to hypoxic
microenvironments in vivo and that this condition was sufficient to induce de-differentiation,
resulting in the phenotype switch and therefore increased invasion by the melanoma cells
[216].
Mechanisms regulating the differentiation status of melanoma cells have also been under
investigation, since this typically indicates the aggressiveness of the tumor and potential
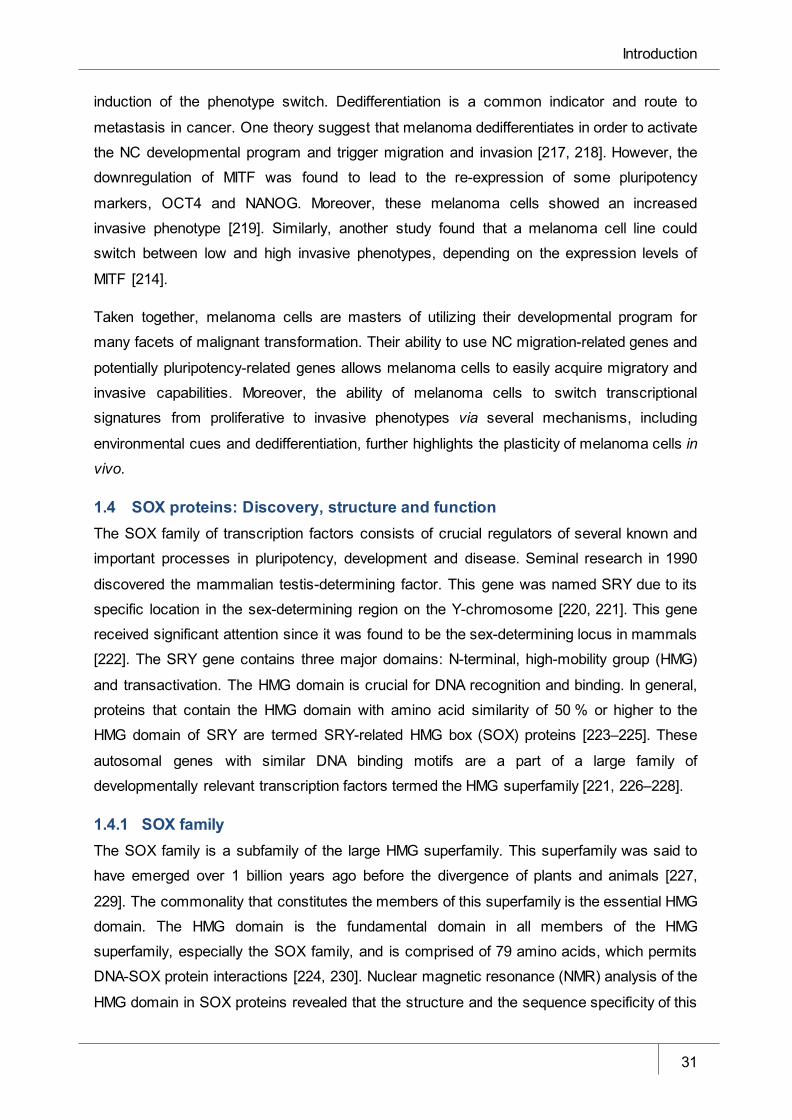
Introduction
31
induction of the phenotype switch. Dedifferentiation is a common indicator and route to
metastasis in cancer. One theory suggest that melanoma dedifferentiates in order to activate
the NC developmental program and trigger migration and invasion [217, 218]. However, the
downregulation of MITF was found to lead to the re-expression of some pluripotency
markers, OCT4 and NANOG. Moreover, these melanoma cells showed an increased
invasive phenotype [219]. Similarly, another study found that a melanoma cell line could
switch between low and high invasive phenotypes, depending on the expression levels of
MITF [214].
Taken together, melanoma cells are masters of utilizing their developmental program for
many facets of malignant transformation. Their ability to use NC migration-related genes and
potentially pluripotency-related genes allows melanoma cells to easily acquire migratory and
invasive capabilities. Moreover, the ability of melanoma cells to switch transcriptional
signatures from proliferative to invasive phenotypes via several mechanisms, including
environmental cues and dedifferentiation, further highlights the plasticity of melanoma cells in
vivo.
1.4 SOX proteins: Discovery, structure and function The SOX family of transcription factors consists of crucial regulators of several known and
important processes in pluripotency, development and disease. Seminal research in 1990
discovered the mammalian testis-determining factor. This gene was named SRY due to its
specific location in the sex-determining region on the Y-chromosome [220, 221]. This gene
received significant attention since it was found to be the sex-determining locus in mammals
[222]. The SRY gene contains three major domains: N-terminal, high-mobility group (HMG)
and transactivation. The HMG domain is crucial for DNA recognition and binding. In general,
proteins that contain the HMG domain with amino acid similarity of 50 % or higher to the
HMG domain of SRY are termed SRY-related HMG box (SOX) proteins [223–225]. These
autosomal genes with similar DNA binding motifs are a part of a large family of
developmentally relevant transcription factors termed the HMG superfamily [221, 226–228].
1.4.1 SOX family The SOX family is a subfamily of the large HMG superfamily. This superfamily was said to
have emerged over 1 billion years ago before the divergence of plants and animals [227,
229]. The commonality that constitutes the members of this superfamily is the essential HMG
domain. The HMG domain is the fundamental domain in all members of the HMG
superfamily, especially the SOX family, and is comprised of 79 amino acids, which permits
DNA-SOX protein interactions [224, 230]. Nuclear magnetic resonance (NMR) analysis of the
HMG domain in SOX proteins revealed that the structure and the sequence specificity of this
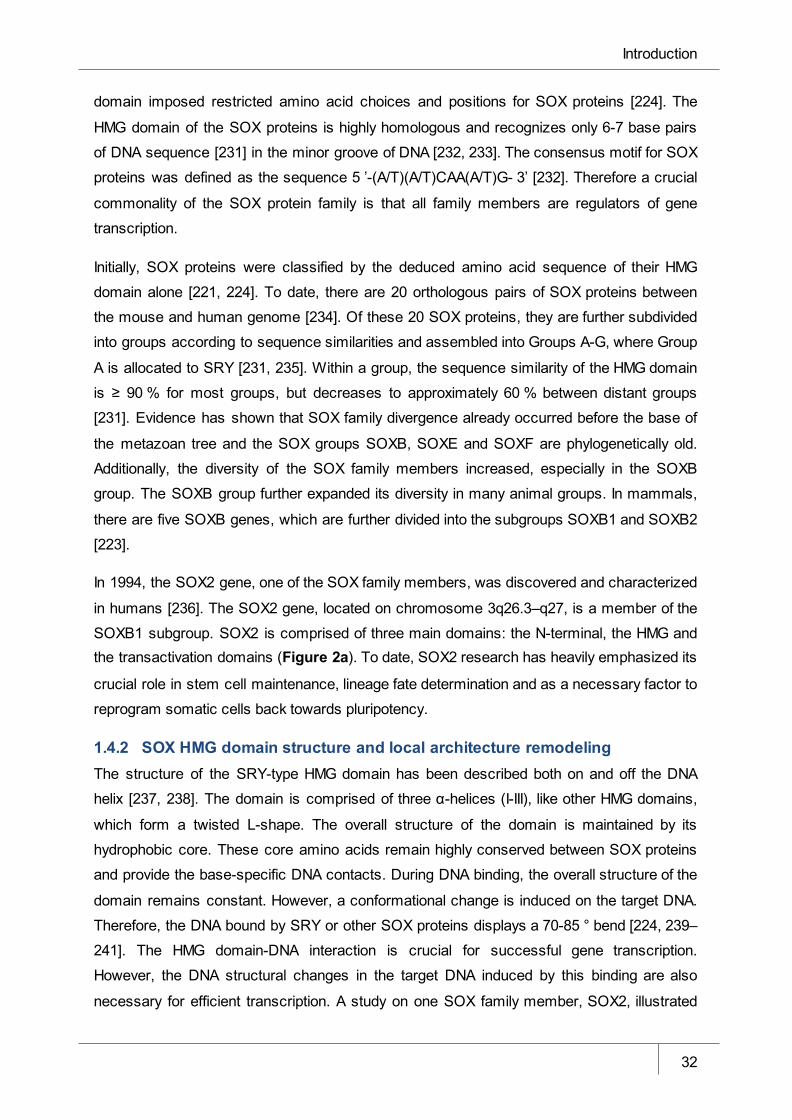
Introduction
32
domain imposed restricted amino acid choices and positions for SOX proteins [224]. The
HMG domain of the SOX proteins is highly homologous and recognizes only 6-7 base pairs
of DNA sequence [231] in the minor groove of DNA [232, 233]. The consensus motif for SOX
proteins was defined as the sequence 5 ’-(A/T)(A/T)CAA(A/T)G- 3’ [232]. Therefore a crucial
commonality of the SOX protein family is that all family members are regulators of gene
transcription.
Initially, SOX proteins were classified by the deduced amino acid sequence of their HMG
domain alone [221, 224]. To date, there are 20 orthologous pairs of SOX proteins between
the mouse and human genome [234]. Of these 20 SOX proteins, they are further subdivided
into groups according to sequence similarities and assembled into Groups A-G, where Group
A is allocated to SRY [231, 235]. Within a group, the sequence similarity of the HMG domain
is ≥ 90 % for most groups, but decreases to approximately 60 % between distant groups
[231]. Evidence has shown that SOX family divergence already occurred before the base of
the metazoan tree and the SOX groups SOXB, SOXE and SOXF are phylogenetically old.
Additionally, the diversity of the SOX family members increased, especially in the SOXB
group. The SOXB group further expanded its diversity in many animal groups. In mammals,
there are five SOXB genes, which are further divided into the subgroups SOXB1 and SOXB2
[223].
In 1994, the SOX2 gene, one of the SOX family members, was discovered and characterized
in humans [236]. The SOX2 gene, located on chromosome 3q26.3–q27, is a member of the
SOXB1 subgroup. SOX2 is comprised of three main domains: the N-terminal, the HMG and the transactivation domains (Figure 2a). To date, SOX2 research has heavily emphasized its
crucial role in stem cell maintenance, lineage fate determination and as a necessary factor to
reprogram somatic cells back towards pluripotency.
1.4.2 SOX HMG domain structure and local architecture remodeling The structure of the SRY-type HMG domain has been described both on and off the DNA
helix [237, 238]. The domain is comprised of three α-helices (I-III), like other HMG domains,
which form a twisted L-shape. The overall structure of the domain is maintained by its
hydrophobic core. These core amino acids remain highly conserved between SOX proteins
and provide the base-specific DNA contacts. During DNA binding, the overall structure of the
domain remains constant. However, a conformational change is induced on the target DNA.
Therefore, the DNA bound by SRY or other SOX proteins displays a 70-85 ° bend [224, 239–
241]. The HMG domain-DNA interaction is crucial for successful gene transcription.
However, the DNA structural changes in the target DNA induced by this binding are also
necessary for efficient transcription. A study on one SOX family member, SOX2, illustrated
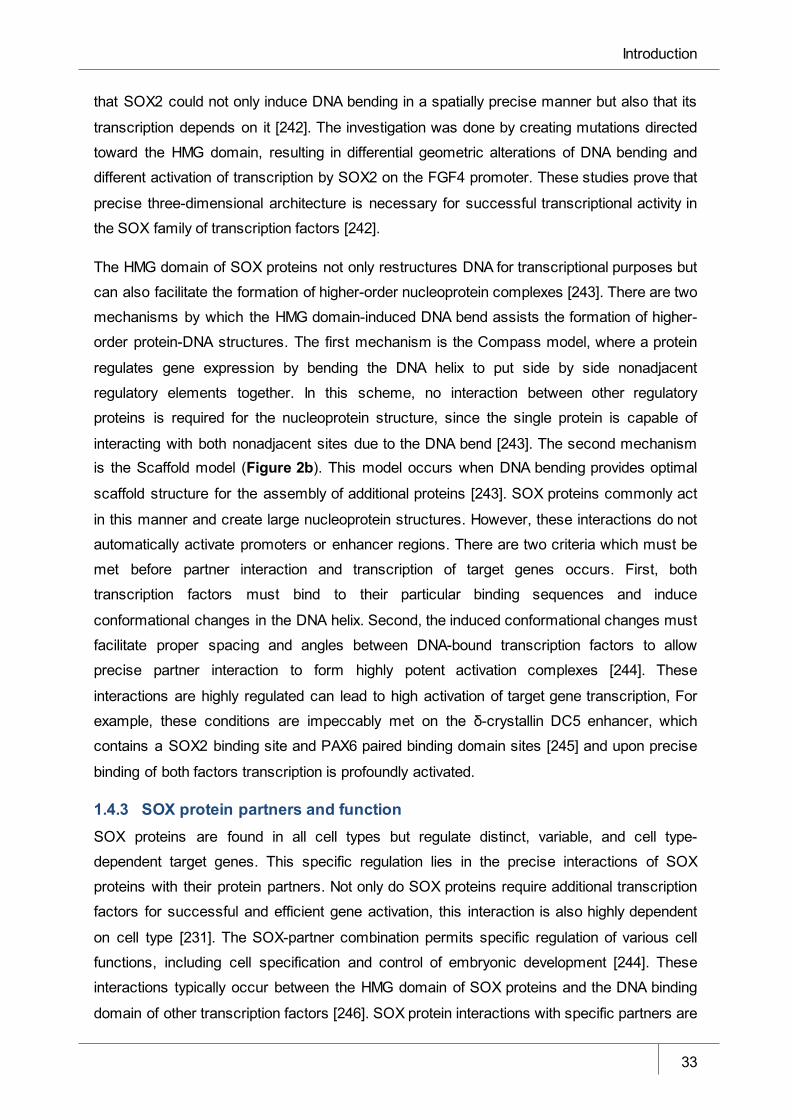
Introduction
33
that SOX2 could not only induce DNA bending in a spatially precise manner but also that its
transcription depends on it [242]. The investigation was done by creating mutations directed
toward the HMG domain, resulting in differential geometric alterations of DNA bending and
different activation of transcription by SOX2 on the FGF4 promoter. These studies prove that
precise three-dimensional architecture is necessary for successful transcriptional activity in
the SOX family of transcription factors [242].
The HMG domain of SOX proteins not only restructures DNA for transcriptional purposes but
can also facilitate the formation of higher-order nucleoprotein complexes [243]. There are two
mechanisms by which the HMG domain-induced DNA bend assists the formation of higher-
order protein-DNA structures. The first mechanism is the Compass model, where a protein
regulates gene expression by bending the DNA helix to put side by side nonadjacent
regulatory elements together. In this scheme, no interaction between other regulatory
proteins is required for the nucleoprotein structure, since the single protein is capable of
interacting with both nonadjacent sites due to the DNA bend [243]. The second mechanism is the Scaffold model (Figure 2b). This model occurs when DNA bending provides optimal
scaffold structure for the assembly of additional proteins [243]. SOX proteins commonly act
in this manner and create large nucleoprotein structures. However, these interactions do not
automatically activate promoters or enhancer regions. There are two criteria which must be
met before partner interaction and transcription of target genes occurs. First, both
transcription factors must bind to their particular binding sequences and induce
conformational changes in the DNA helix. Second, the induced conformational changes must
facilitate proper spacing and angles between DNA-bound transcription factors to allow
precise partner interaction to form highly potent activation complexes [244]. These
interactions are highly regulated can lead to high activation of target gene transcription, For
example, these conditions are impeccably met on the δ-crystallin DC5 enhancer, which
contains a SOX2 binding site and PAX6 paired binding domain sites [245] and upon precise
binding of both factors transcription is profoundly activated.
1.4.3 SOX protein partners and function SOX proteins are found in all cell types but regulate distinct, variable, and cell type-
dependent target genes. This specific regulation lies in the precise interactions of SOX
proteins with their protein partners. Not only do SOX proteins require additional transcription
factors for successful and efficient gene activation, this interaction is also highly dependent
on cell type [231]. The SOX-partner combination permits specific regulation of various cell
functions, including cell specification and control of embryonic development [244]. These
interactions typically occur between the HMG domain of SOX proteins and the DNA binding
domain of other transcription factors [246]. SOX protein interactions with specific partners are
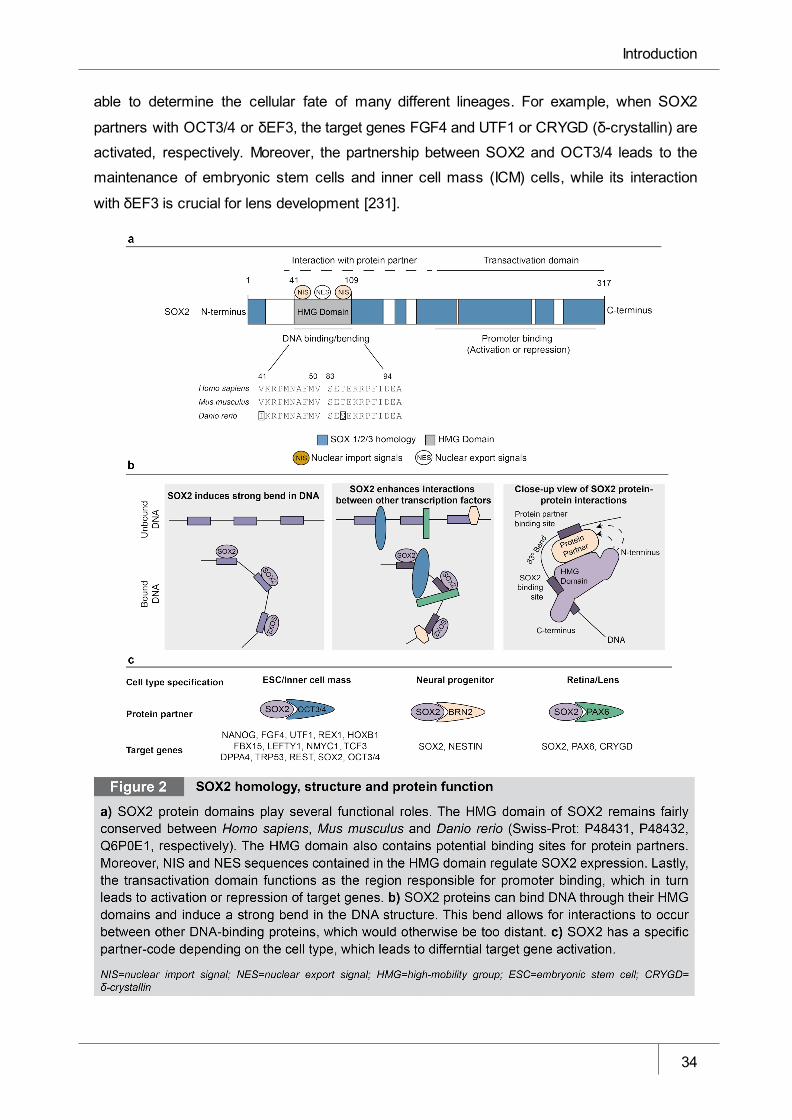
Introduction
34
able to determine the cellular fate of many different lineages. For example, when SOX2
partners with OCT3/4 or δEF3, the target genes FGF4 and UTF1 or CRYGD (δ-crystallin) are
activated, respectively. Moreover, the partnership between SOX2 and OCT3/4 leads to the
maintenance of embryonic stem cells and inner cell mass (ICM) cells, while its interaction
with δEF3 is crucial for lens development [231].
Introduction
35
1.4.4 Post-translational modifications of SOX proteins Post-translational modifications of proteins represent an additional level of regulation in the
cell. These processes include altering or additional protein folding before the mature protein
product is produced. Additionally, these modifications can be introduced chemically, with the
addition of cofactors or in the presence of additional proteins and complexes. Some of these
post-translational modifications that involve additional proteins include ubiquitination and
SUMOylation. SUMOylation is the reversible covalent linkage to a small ubiquitin-related
modifier (SUMO) protein (reviewed in [247]).
The mechanism of SUMOylation is similar to that of ubiquitination, where the outcome is the
formation of an isopeptide bond located between the C-terminal Gly residue of the modified
protein and the ε-amino group of a Lys residue of the acceptor protein [247]. Though both
pathways require the activation of enzymatic cascades, there is no overlap in enzymes
utilized by each pathway. Before conjugation can occur in the SUMOylation process, the
immature SUMO protein must be proteolytically processed by SUMO-specific isopeptidases
sentrin-specific proteases (SENPs) to reveal its C-terminal Gly-Gly motif. Once processed,
the SUMO protein is mature and ready for the attachment to substrates. The first step in the
attachment of mature SUMO proteins to substrates is the activation of the C-terminus via the
SUMO-specific E1-activating enzyme heterodimer A0S1-UBA2. Next, SUMO-AOS1-UBA2 is
transferred to the E2-conjugating enzyme UBC9, where a thioester linkage is formed
between the Cys residue of UBC9 and the C-terminal region of SUMO. Lastly, the UBC9
transfers SUMO to its final substrate, facilitated by E3 ligases (including members of the
protein inhibitor of activated STAT (PIAS) family), which catalyze the transfer of SUMO from
UBC9 to the substrate [247]. This process is reversible and the substrate can be removed by
SENPs.
The molecular consequence of SUMOylation on its target protein is difficult to predict.
SUMOylation can influence several aspects of its target proteins function in vivo, such as
localization, stability, activity and interaction with protein partners [247]. Since SUMOylation
alters the surface of its target protein, interactions with other protein partners can either be
promoted, through the addition of interfaces, or destroyed, by masking of pre-existing binding
sites. Moreover, protein-protein interactions can be altered upon SUMOylation due to
conformational changes in the target protein which lead to the destruction or exposure of
binding sites [247].
In the SOX family, SUMOylation has been shown to be important for functional diversity in
the SOXE subgroup. Studies found that in Xenopus, both SOX9 and SOX10 can be SUMO-
modified in vivo [248]. In this study, two phenotypes were compared. Xenopus embryos
Introduction
36
either overexpressed WT SOXE (non-SUMOylatable SOXE mutant) or a SOXE-SUMO1-
fusion. The non-SUMOylatable SOXE promoted the expression of NC-related markers, while
the SOXE-SUMO-1 fusion inhibited the expression of NC-related markers. Moreover, neither
phenotype was able to completely reproduce the WT phenotype, which suggests that both
unmodified and SUMOylated forms of SOXE proteins contribute to the WT SOXE activities in
vivo [248, 249]. Additionally, another study observed that SUMOylation of SOX10 represses
the transcriptional activity of its target genes, including MITF [250]. Recent work further
investigated this topic and showed that the SUMOylation of SOXE proteins alters the
recruitment of transcriptional cofactors. Specifically, SUMOylation caused the displacement
of CREB-binding protein/p300 while promoting the recruitment of corepressor GRG4 [251]. In
addition to the SOXE group, a study found that SOX2, when conjugated to SUMO-1, reduced
its binding to the FGF4 enhancer [252].
Taken together, SOXE proteins can function as transcriptional repressors in a SUMO-
dependent manner in the NC. Moreover, SOX2 conjugated to SUMO-1 also functions as a
transcriptional repressor. Therefore, the role of SUMOylation in the context of SOX proteins
may be crucial in further understanding their regulation in development and disease.
1.4.5 SOX2 and its role in embryonic development, disease and cancer SOX2 has been heavily studied in many aspects of normal human development but also in
areas of disease and cancer. The first function of SOX2 was identified in embryonic
development and now it’s well understood that SOX2 is a critical factor throughout
embryogenesis.
SOX2 was first discovered in embryogenesis and development and this remains a major field
of study of this protein. It plays an important role in lineage specification, proliferation,
morphogenesis and differentiation of various developing tissues in a fetus (reviewed in
[225]). Here, I will briefly discuss the function of SOX2 in a developing embryo.
SOX2 is initially present in both ICM and the trophectoderm (TE) but is later restricted to the
ICM. Studies have shown that the zygotic deletion of SOX2 results in early embryonic
lethality caused by the failure to form the pluripotent epiblast [253]. When both the maternal
and zygotic SOX2 transcripts were depleted using RNAi, embryos underwent early arrest at
the morula stage, leading to a complete failure of TE formation. These experiments suggest
that SOX2 is required for the segregation of the TE and ICM [225, 253]. Therefore, SOX2 is
critical for the maintenance of pluripotency in embryonic stem cells (ESCs). Expression
levels of SOX2 heavily influence ESC self-renewal and differentiation in a dose-dependent
manner. Moreover, SOX2 cooperates with other dosage-sensitive transcription factors, such
as OCT4 and NANOG, to sustain the vital network responsible for self-renewal and
Introduction
37
repression of differentiation programs in ESCs [254]. On a molecular level, SOX2 and OCT4
interact and collaborate to efficiently bind DNA and recruit other factors to initiate or repress
gene transcription. Additionally, many target genes contain OCT4/SOX2 consensus binding
sequences, further indicating the importance of the interaction in regulating gene
transcription.
After gastrulation occurs in the embryo, SOX2 expression becomes largely restricted to the
neuroectoderm, sensory placodes, branchial arches, primordial germ cells and gut endoderm
[225]. In the ectoderm, SOX2 is expressed during the early stages of ESC differentiation
towards the neural lineage, where SOX2 directly suppresses key regulators of the
mesendodermal lineage, such as Brachyury [255]. Furthermore, SOX2 is important in the
fate decision of bipotent axial stem cells into either paraxial mesoderm (dermis, skeletal
muscle, and vertebral column) or the neural plate (central nervous system). SOX2 continues
to be involved in the developing central and peripheral nervous system. Lastly, in the
endoderm, SOX2 is responsible for organ specification, including the foregut [225]. In
summary, SOX2 is heavily involved in key steps during embryonic development, from
maintaining ESCs to fate decisions in the mesoderm and nervous system.
Many of the key regulatory features of SOX2 mentioned above are not performed by SOX2
alone. In fact, SOX2 regulates many aspects of embryogenesis in collaboration with a protein
partner. The interaction of SOX2 and OCT4 is crucial for the activation of key embryonic
genes responsible for ICM and ESC maintenance. Additionally, SOX2 is known to form
heterodimers with transcription factor BRN2, which creates a positive feedback loop and
transcribes SOX2 as well as the target gene NESTIN to maintain neural progenitor identity
[244]. Another well-described interaction partner of SOX2 during lens development is PAX6.
This interaction creates a positive feedback loop of both SOX2 and PAX6 transcription while also targeting the transcription of CRYGD (δ-crystallin) (Figure 2c). Recent work has tried to
identify new interacting partners of SOX2 using proteomic analysis. However, the candidates
need to be validated and investigated in a developmental context [256, 257].
Since SOX proteins play a crucial role in development and cell regulation, the mutation or
deletion of SOX proteins often leads to congenital disease or developmental defects in
humans [224]. For example, a heterozygous mutation of SOX2 results in an abnormal
development of ectodermal and endodermal tissues, known as anophthalmia-esophageal-
genital (AEG) syndrome. Individuals with anophthalmia are typically born with small eyes
(microphthalmia) or even completely without eyes [258]. These patients also suffer from
symptoms such as brain anomalies, hearing loss, esophageal atresia, genital abnormalities,
pituitary defects and delayed motor skill development [258–260]. An interesting study in 2011
Introduction
38
set out to further investigated SOX2 regulation in neural stem cells. Instead, they identified
CHD7 as a SOX2 transcriptional co-factor [261], and revealed that SOX2 and CHD7 have
overlapping genome-wide binding sites. Therefore, they are capable of regulating a common
set of target genes: JAG1, GLI3 and MYCN. These genes are typically mutated in the
genetic diseases Alagille, Pallister-Hall and Feingold syndromes [261]. This research further
implicated SOX2 in human disease.
Current research on SOX2 has expanded focus from embryonic development to its
implications in disease and cancer. SOX2 has been shown to play various roles in several
cancer types and have important associations to the clinic [262, 263]. The function of SOX2
in cancer has illuminated its multifaceted capabilities in the cell. It has been shown to
influence many pathways, from cellular proliferation to cancer cell invasion and metastasis
(reviewed in [262]).
SOX2 amplification is induced by the multiplication of the 3q26.3 gene locus [264, 265].
Which occurs in esophageal squamous cell carcinoma (SCC), glioblastoma, oral SCC,
sinonasal cancer, small cell lung cancer (SCLC), non-small cell lung cancer (NSCLC) and
lung SCC [264, 266–271]. A large study determined the copy number from 40 esophageal
SCC DNA samples and 47 primary lung SCC DNA samples and found that the most
significant amplification peak was located on chromosome 3q26.33 [266]. Moreover,
researchers found that SOX2 was not only amplified, but that its expression was required for
proliferation and anchorage-independent growth of both lung and esophageal cancer cell
lines. This study identified SOX2 as a lineage-dependent oncogene in lung and esophageal
SCC [266].
SOX2 has not only been shown to be amplified in some cancer types. Much work has been
put into understanding how it functions in multiple cancer types. Generally, SOX2 has been
shown to influence cellular migration, invasion, proliferation and self-renewal of cancer stem
cells, tumorigenicity, autophagy and metastasis. This illustrates the molecular complexity of
SOX2’s role in cancer and further proves that SOX2 is of great importance in oncology.
SOX2 typically plays differential roles, depending on the cancer type, further highlighting its
intricacy in oncology. Though a few examples of SOX2’s involvement in cancer are
described here, the field is immense and was recently reviewed in [262].
The regulation of cellular proliferation by SOX2 was observed in various types of cancer,
including breast, colorectal and pancreatic cancer. For instance, functionally inhibited SOX2
via cellular transfection with a tetracycline-inducible C-terminally-truncated version of SOX2,
dnSOX2. Although lacking the transactivation domain, dnSOX2 could bind SOX2 recognition
sites on DNA and compete with WT SOX2. This inhibition led to a decrease in cellular
Introduction
39
proliferation in AZ-521 gastric cancer cells [272]. Numerous gain and loss of function studies
in several cancer types (gastric cancer, ovarian cancer and hepatocellular carcinoma)
enforced the link between SOX2 and cellular invasion and migration (reviewed in [262]). For
example, the overexpression of SOX2 in the SOX2-negative glioma cell line U-87 resulted in
a significant increase in the number of migratory and invasive cells [273]. Recently, SOX2’s
involvement in promoting invasion and migration was demonstrated in laryngeal cancer cells
through the induction of MMP-2 and the PI3K/AKT/mTOR pathway [274].
SOX2 induces these functional changes in cancer by being heavily involved in various
oncogenic signaling pathways. In breast and prostate cancer cells, SOX2 has shown to
promote metastasis via the EMT through WNT/β-catenin signaling. In chromatin
immunoprecipitation (ChIP) studies, SOX2 was found to bind to the promoter region of β-
catenin, which further implicates a role for SOX2 in this signaling pathway [275]. Another
study revealed that SOX2 was induced upon TGF-β stimulation in glioma-initiating cells.
Furthermore, ChIP studies elucidated SOX4 as a direct regulator of SOX2 upon TGF-β
stimulation by binding to the promoter region of SOX2 [276].
The ability to improve reliability of diagnosis and prognosis for a cancer patient can have
immense impact on patient survival and contribute to overall improved responses to
therapies. Since SOX2 has great influence on cancer pathogenesis, research has aimed to
understand the impact of SOX2 in clinical settings. In one study, 162 esophageal squamous
cancer patients were analyzed for SOX2 and OCT3/4 expression. High expression of both
markers was associated with a higher histological grade or stage (p < 0.001 for both factors).
Furthermore, a significant correlation between high SOX2 expression and decreasing patient
survival was observed (p < 0.001) [277]. However, it is important to note that SOX2 does not
correlate with poor prognosis or decreased progression free survival in all cancer types. In
fact, it has been shown to correlate with a favorable prognosis in lung cancer [262, 278].
To date, little is known about SOX2 and its function in melanoma. As mentioned above, SOX
proteins play a critical role during early development and the NC and only recently has been
associated with melanoma progression [195, 279, 280]. Since studies have shown that the
melanocytic developmental program may predispose the lineage to malignant
transformation, SOX2 has raise great interest in the field of melanoma [207] Initial studies
found that SOX2 was highly expressed in primary melanoma (67 %) and metastatic
melanomas (80 %) compared to nevi (14 %) [281, 282]. Moreover, SOX2 expression was
associated to dermal invasion, which was determined by increased tumor thickness [281]. A
bioinformatic study that used the database Oncomine to investigate stem cell markers in 40
different cancer types found that SOX2 was significantly overexpressed in melanoma
Introduction
40
metastasis patients who died after three years compared to those patients who remained
alive after three years [283]. This study hinted towards SOX2 playing a role in melanoma
pathogenesis.
A study in 2011 began to further investigate SOX2 in melanoma and how this protein may be
functionally affecting melanoma cells [284]. Upon examining patient melanoma samples and
melanoma xenografts, SOX2 was found to be highly expressed in cells which bordered and
infiltrated dermal stroma. Subsequently, gain and loss of function studies were performed in
melanoma cell lines and changes in invasion capacity were observed. An RT-PCR screen
revealed MMP-3 to be a potential mediator of the SOX2-induced invasive phenotype of
human melanoma cells [284]. In addition, one study suggested that SOX2 is able to
modulate MITF in normal human melanocytes and melanoma cell lines in vitro, but the exact
mechanism remains to be elucidated [285].
Recently, work has implicated SOX2 in the regulation of self-renewal and tumorigenicity of
melanoma-initiating cells [286]. This study investigated SOX2 in melanoma-initiating cells
and Hedgehog-GLI (HH-GLI) signaling and functionally revealed that the ectopic expression
of SOX2 in vitro caused enhanced self-renewal capacity in melanoma cells. Moreover, GLI1
and GLI2, downstream transcription factors of HH-GLI signaling, were able to bind to the
proximal promoter of SOX2 in primary melanoma cells in ChIP studies. These data indicate
that SOX2 is regulated by HH signaling [286]. In summary, SOX2 is a critical regulator of
embryonic development and is also responsible for oncogenic functionalities in various
cancer types. The further understanding of SOX2 in the context of cancer will provide more
insights into cancer pathogenesis and potentially be beneficial in the clinic.
Taken together, melanocytes are derived from the pluripotent stem cell population of cells
known as the neural crest. The neural crest consists of several well-described stages
including: induction, delamination and migration. Understanding the neural crest using in vitro
models will aid in understanding development in depth but also becomes relevant in disease.
Malignant melanoma originates from the neural crest-derived melanocytes. To date,
overlapping mechanisms between the developmental neural crest and malignant melanoma,
such as the role of BMP [287] and WNT signaling [288, 289] and initiation of the EMT [203],
have given rise to the hypothesis that melanoma reactivates its developmental program to assist in malignant transformation (Table 1). For these reasons, studying neural crest and
embryonic-related markers may reveal novel mechanisms that are also being reactivated in
malignant melanoma.
Aim of study
41
2 Aim of study The plasticity of melanoma cells makes them capable of switching between highly
proliferative and highly invasive phenotypes depending on environmental cues, stage of
disease or evasion of therapy [215]. To date, neural crest-related genes have been heavily
implicated in melanoma suggesting that the melanocytic developmental program may
predispose the lineage to malignant transformation [207, 283, 290]. Therefore, there is an
urgency to analyze genes, which are involved in stem cell and/or neural crest processes in
order to elucidate those that may be reactivated during melanoma pathogenesis. Taken
together, this study aims to address the following questions:
1. Do any of the stem cell-associated genes, OCT4, SOX2 and NANOG, play a distinct
role during directed melanocyte differentiation from hiPSCs?
2. Are any of the stem cell-associated genes, which are involved in directed melanocyte
differentiation from hiPSCs, also linked to melanoma pathogenesis? If so, what
functional roles do these genes play?
By first investigating stem cell-markers during directed melanocyte differentiation from
hiPSCs, the study may identify critical genes that are reactivated during melanoma
pathogenesis and melanoma plasticity. This method is a general ectodermal lineage
differentiation method and therefore provides a favorable tool for identifying genes
universally involved in ectodermal differentiation. Therefore, we are likely to elucidate novel
genes associated with the ectodermal lineage that may be switched back on during
malignant melanoma transformation. The identification of genes linked to melanoma
plasticity would provide novel markers with possible clinical relevance for anti-melanoma
therapy.
Materials
42
3 Materials All reagents not listed below are commercially available analytical reagents or laboratory-
grade materials.
3.1 Reagents Product Description Company Branch Agarose NEEO Ultra Qualität Carl Roth Karlsruhe, Germany alamarBlue® Invitrogen Darmstadt, Germany APS Carl Roth Karlsruhe, Germany Dimethylsulfoxide (DMSO) Carl Roth Karlsruhe, Germany PhosSTOP Phosphatase Inhibitor Cocktail Tablets Roche Mannheim, Germany Rotiphorese® gel 30 Carl Roth Karlsruhe, Germany Skim milk powder Fluka Analytical Steinheim, Germany TMED(C6H16N2) Carl Roth Karlsruhe, Germany Tween® 20 Applichem Darmstadt, Germany X-treme GENE® Roche Mannheim, Germany
3.2 Materials Product Description Company Branch DAPI Roche Mannheim, Germany High performance chemiluminescence film
GE Healthcare Buckinghamshire, UK
ibidi® 30 µ-Dish Culture Insert (35mm high)
ibidi Munich, Germany
Immobilon-P Transfer Membrane Pore size: 0.45uM
Millipore Schwalbach, Germany
Mini Trans-Blot® Cell Bio-Rad Munich, Germany Parafilm Sigma-Aldrich Steinheim, Germany Whatman chromatography paper
GE Healthcare Buckinghamshire, UK
3.3 Antibodies Product Description Company Branch Rabbit anti-c-Jun (N) Santa Cruz Biotechnology Heidelberg, Germany Mouse anti-MITF (C5) Abcam Cambridge, UK Rabbit anti-SMAD2 Cell Signaling Technology Cell Signaling Technology
Europe, B.V. Rabbit anti-SMAD3 Cell Signaling Technology Cell Signaling Technology
Europe, B.V. Rabbit anti-SOX10 Abcam Cambridge, UK Goat anti-SOX2 R & D Systems Wiesbaden, Germany Rabbit anti-SOX2 Abcam Cambridge, UK Rabbit anti-TGFβ RII (C16) Santa Cruz Biotechnology Heidelberg, Germany Mouse anti-TRP1 Abcam Cambridge, UK
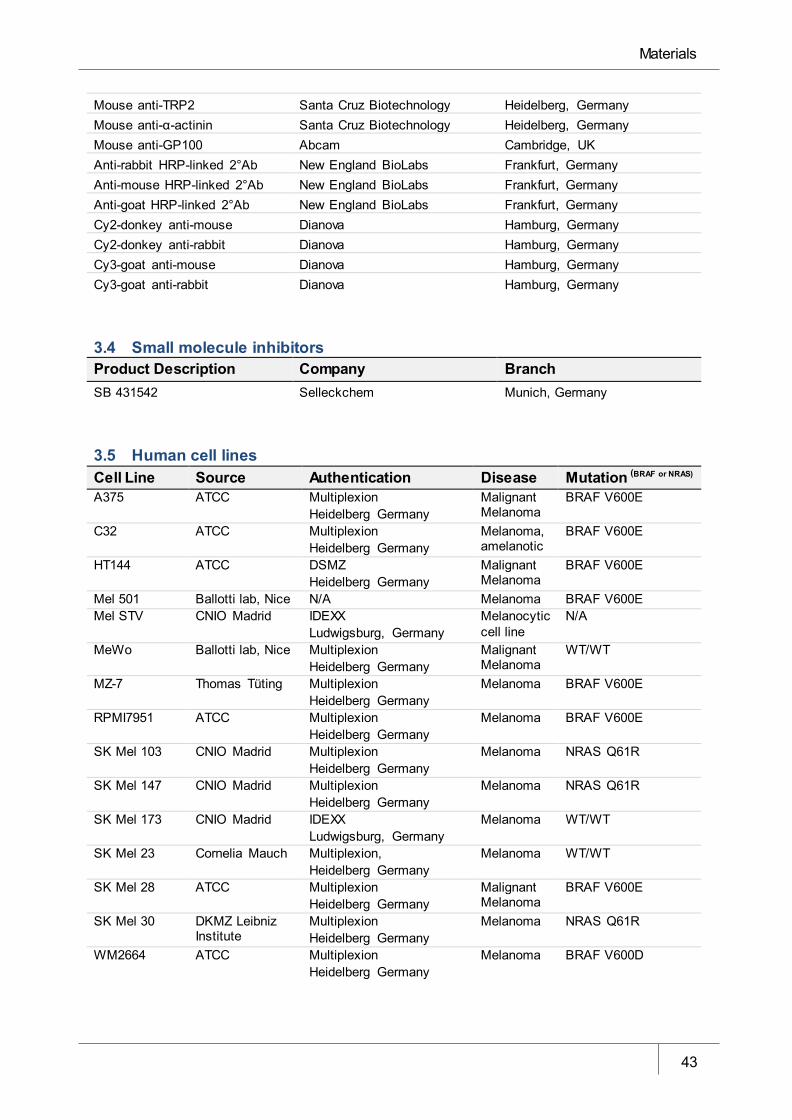
Materials
43
Mouse anti-TRP2 Santa Cruz Biotechnology Heidelberg, Germany Mouse anti-α-actinin Santa Cruz Biotechnology Heidelberg, Germany Mouse anti-GP100 Abcam Cambridge, UK Anti-rabbit HRP-linked 2°Ab New England BioLabs Frankfurt, Germany Anti-mouse HRP-linked 2°Ab New England BioLabs Frankfurt, Germany Anti-goat HRP-linked 2°Ab New England BioLabs Frankfurt, Germany Cy2-donkey anti-mouse Dianova Hamburg, Germany Cy2-donkey anti-rabbit Dianova Hamburg, Germany Cy3-goat anti-mouse Dianova Hamburg, Germany Cy3-goat anti-rabbit Dianova Hamburg, Germany
3.4 Small molecule inhibitors Product Description Company Branch SB 431542 Selleckchem Munich, Germany
3.5 Human cell lines Cell Line Source Authentication Disease Mutation (BRAF or NRAS) A375 ATCC Multiplexion
Heidelberg Germany Malignant Melanoma
BRAF V600E
C32 ATCC Multiplexion Heidelberg Germany
Melanoma, amelanotic
BRAF V600E
HT144 ATCC DSMZ Heidelberg Germany
Malignant Melanoma
BRAF V600E
Mel 501 Ballotti lab, Nice N/A Melanoma BRAF V600E Mel STV CNIO Madrid IDEXX
Ludwigsburg, Germany Melanocytic cell line
N/A
MeWo Ballotti lab, Nice Multiplexion Heidelberg Germany
Malignant Melanoma
WT/WT
MZ-7 Thomas Tüting Multiplexion Heidelberg Germany
Melanoma BRAF V600E
RPMI7951 ATCC Multiplexion Heidelberg Germany
Melanoma BRAF V600E
SK Mel 103 CNIO Madrid Multiplexion Heidelberg Germany
Melanoma NRAS Q61R
SK Mel 147 CNIO Madrid Multiplexion Heidelberg Germany
Melanoma NRAS Q61R
SK Mel 173 CNIO Madrid IDEXX Ludwigsburg, Germany
Melanoma WT/WT
SK Mel 23 Cornelia Mauch Multiplexion, Heidelberg Germany
Melanoma WT/WT
SK Mel 28 ATCC Multiplexion Heidelberg Germany
Malignant Melanoma
BRAF V600E
SK Mel 30 DKMZ Leibniz Institute
Multiplexion Heidelberg Germany
Melanoma NRAS Q61R
WM2664 ATCC Multiplexion Heidelberg Germany
Melanoma BRAF V600D
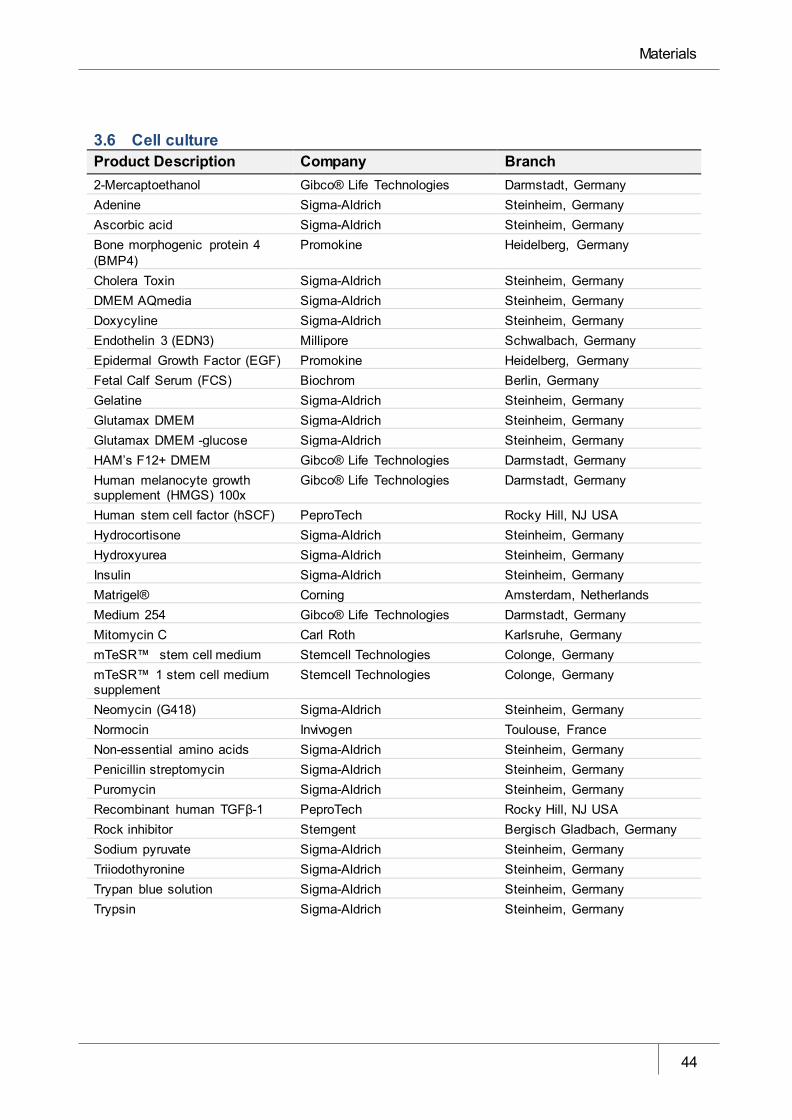
Materials
44
3.6 Cell culture Product Description Company Branch 2-Mercaptoethanol Gibco® Life Technologies Darmstadt, Germany Adenine Sigma-Aldrich Steinheim, Germany Ascorbic acid Sigma-Aldrich Steinheim, Germany Bone morphogenic protein 4 (BMP4)
Promokine Heidelberg, Germany
Cholera Toxin Sigma-Aldrich Steinheim, Germany DMEM AQmedia Sigma-Aldrich Steinheim, Germany Doxycyline Sigma-Aldrich Steinheim, Germany Endothelin 3 (EDN3) Millipore Schwalbach, Germany Epidermal Growth Factor (EGF) Promokine Heidelberg, Germany Fetal Calf Serum (FCS) Biochrom Berlin, Germany Gelatine Sigma-Aldrich Steinheim, Germany Glutamax DMEM Sigma-Aldrich Steinheim, Germany Glutamax DMEM -glucose Sigma-Aldrich Steinheim, Germany HAM’s F12+ DMEM Gibco® Life Technologies Darmstadt, Germany Human melanocyte growth supplement (HMGS) 100x
Gibco® Life Technologies Darmstadt, Germany
Human stem cell factor (hSCF) PeproTech Rocky Hill, NJ USA Hydrocortisone Sigma-Aldrich Steinheim, Germany Hydroxyurea Sigma-Aldrich Steinheim, Germany Insulin Sigma-Aldrich Steinheim, Germany Matrigel® Corning Amsterdam, Netherlands Medium 254 Gibco® Life Technologies Darmstadt, Germany Mitomycin C Carl Roth Karlsruhe, Germany mTeSR™ stem cell medium Stemcell Technologies Colonge, Germany mTeSR™ 1 stem cell medium supplement
Stemcell Technologies Colonge, Germany
Neomycin (G418) Sigma-Aldrich Steinheim, Germany Normocin Invivogen Toulouse, France Non-essential amino acids Sigma-Aldrich Steinheim, Germany Penicillin streptomycin Sigma-Aldrich Steinheim, Germany Puromycin Sigma-Aldrich Steinheim, Germany Recombinant human TGFβ-1 PeproTech Rocky Hill, NJ USA Rock inhibitor Stemgent Bergisch Gladbach, Germany Sodium pyruvate Sigma-Aldrich Steinheim, Germany Triiodothyronine Sigma-Aldrich Steinheim, Germany Trypan blue solution Sigma-Aldrich Steinheim, Germany Trypsin Sigma-Aldrich Steinheim, Germany
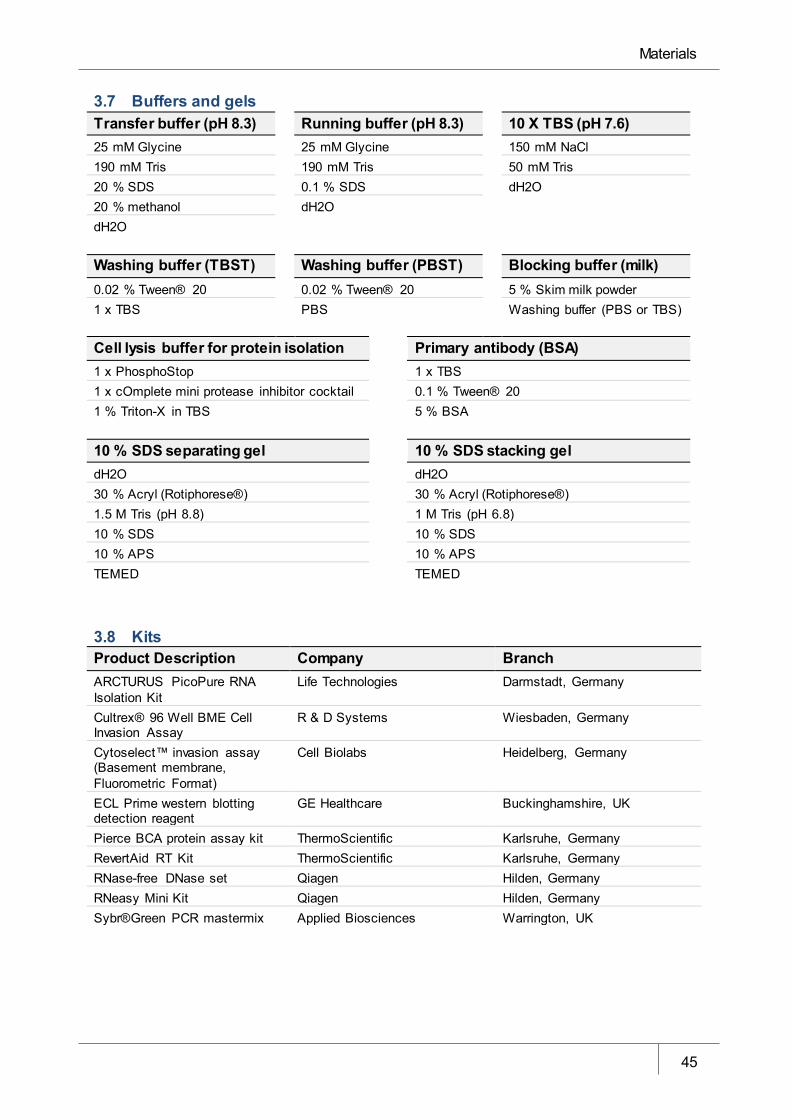
Materials
45
3.7 Buffers and gels Transfer buffer (pH 8.3) Running buffer (pH 8.3) 10 X TBS (pH 7.6) 25 mM Glycine 25 mM Glycine 150 mM NaCl 190 mM Tris 190 mM Tris 50 mM Tris 20 % SDS 0.1 % SDS dH2O 20 % methanol dH2O dH2O Washing buffer (TBST) Washing buffer (PBST) Blocking buffer (milk) 0.02 % Tween® 20 0.02 % Tween® 20 5 % Skim milk powder 1 x TBS PBS Washing buffer (PBS or TBS) Cell lysis buffer for protein isolation Primary antibody (BSA) 1 x PhosphoStop 1 x TBS 1 x cOmplete mini protease inhibitor cocktail 0.1 % Tween® 20 1 % Triton-X in TBS 5 % BSA 10 % SDS separating gel 10 % SDS stacking gel dH2O dH2O 30 % Acryl (Rotiphorese®) 30 % Acryl (Rotiphorese®) 1.5 M Tris (pH 8.8) 1 M Tris (pH 6.8) 10 % SDS 10 % SDS 10 % APS 10 % APS TEMED TEMED
3.8 Kits Product Description Company Branch ARCTURUS PicoPure RNA Isolation Kit
Life Technologies Darmstadt, Germany
Cultrex® 96 Well BME Cell Invasion Assay
R & D Systems Wiesbaden, Germany
Cytoselect™ invasion assay (Basement membrane, Fluorometric Format)
Cell Biolabs Heidelberg, Germany
ECL Prime western blotting detection reagent
GE Healthcare Buckinghamshire, UK
Pierce BCA protein assay kit ThermoScientific Karlsruhe, Germany RevertAid RT Kit ThermoScientific Karlsruhe, Germany RNase-free DNase set Qiagen Hilden, Germany RNeasy Mini Kit Qiagen Hilden, Germany Sybr®Green PCR mastermix Applied Biosciences Warrington, UK
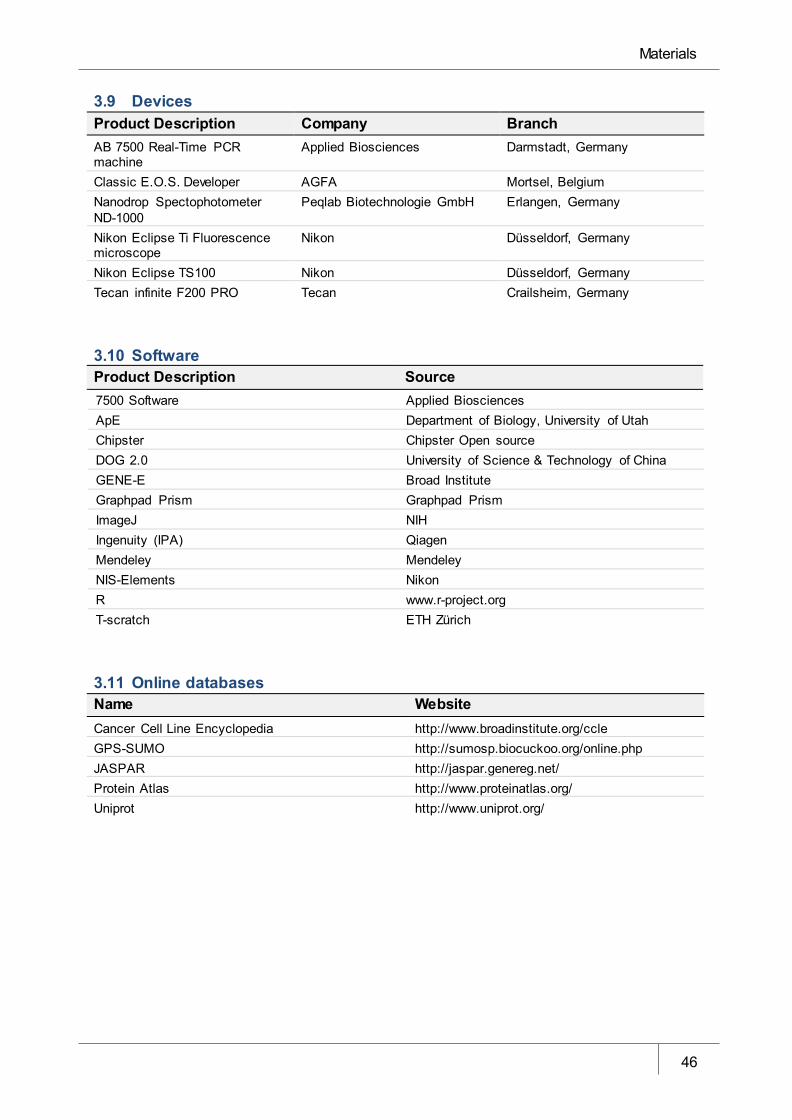
Materials
46
3.9 Devices Product Description Company Branch AB 7500 Real-Time PCR machine
Applied Biosciences Darmstadt, Germany
Classic E.O.S. Developer AGFA Mortsel, Belgium Nanodrop Spectophotometer ND-1000
Peqlab Biotechnologie GmbH Erlangen, Germany
Nikon Eclipse Ti Fluorescence microscope
Nikon Düsseldorf, Germany
Nikon Eclipse TS100 Nikon Düsseldorf, Germany Tecan infinite F200 PRO Tecan Crailsheim, Germany
3.10 Software Product Description Source 7500 Software Applied Biosciences ApE Department of Biology, University of Utah Chipster Chipster Open source DOG 2.0 University of Science & Technology of China GENE-E Broad Institute Graphpad Prism Graphpad Prism ImageJ NIH Ingenuity (IPA) Qiagen Mendeley Mendeley NIS-Elements Nikon R www.r-project.org T-scratch ETH Zürich
3.11 Online databases Name Website Cancer Cell Line Encyclopedia http://www.broadinstitute.org/ccle GPS-SUMO http://sumosp.biocuckoo.org/online.php JASPAR http://jaspar.genereg.net/ Protein Atlas http://www.proteinatlas.org/ Uniprot http://www.uniprot.org/
Methods
47
4 Methods 4.1 Cell culture All human melanoma cell lines and NIH 3T3 feeder cells were cultured in DMEM
supplemented with 10 % FCS, 1 % penicillin (100 units/ mL) and streptomycin (100 µg/ mL),
1 % mL non-essential amino acids solution (10 mM) and 0.75 % ß-mercaptoethanol,
hereafter referred to as MEF medium.
Normal human melanocyte cell lines and melanocytes differentiated from hiPSCs were
cultured in Medium 254 (Gibco® Life Technologies) and supplemented with human
melanocyte growth supplement (HMGS), 100 x (Gibco® Life Technologies).
All cell lines were cultured in a humidified incubator with 5 % CO2 and 95 % air.
4.2 Human induced pluripotent stem cell culture Stables clones of human induced pluripotent stem cells (hiPSCs) were generated from
primary human fibroblasts in the Utikal lab following the protocol from Sommer et al. [291]
using a lentiviral vector system. The hiPSCs were cultivated under xeno-free cell culture on a synthetic surface matrix. Matrigel plates were prepared one day prior to use (Section 4.2.1).
Human iPSCs were washed in PBS and undifferentiated parts were manually dissociated
into small cell clusters of 50-100 cells. These aggregates were transferred to Matrigel-coated
plates and cultured in mTeSR1 medium containing 20 % (v/v) mTeSR1 supplements
(Stemcell Technologies) and 50 µg/mL normocin. Human iPSCs were maintained by
manually removing differentiated areas using a pipette tip to ensure clean colonies.
4.2.1 Matrigel® preparation Matrigel® plates were prepared before seeding hiPSCs. Matrigel® was thawed on ice for 1-
2 h. Next, 25 mL of DMEM+F12 medium were transferred to a 50 mL falcon. Matrigel® was
added to medium and 1 mL of the mixture was transferred to each well of a 6-well plate or
6 cm dish. Plates incubated for 1 h at RT and were then ready for use. For storage up to two
weeks, plates were not aspirated and wrapped with parafilm and placed at 4 °C.
4.3 Melanocyte differentiation protocol Melanocytes were differentiated from hiPSCs by following the protocol described in Nissan et
al. [292]. In preparation for the differentiation experiment, 6 cm cell culture dishes were pre-
coated with 0.2 % gelatin and left to set for 15 min at RT. 3T3 NIH feeder cells (Section 4.3.1) were thawed and counted. Cells were seeded at a density of 660,000
cells/6 cm dish. Feeder cells were cultured overnight in normal MEF medium. The next day,
hiPSCs were manually picked (about 3 colonies per 6 cm dish) using a pipette. Cells were
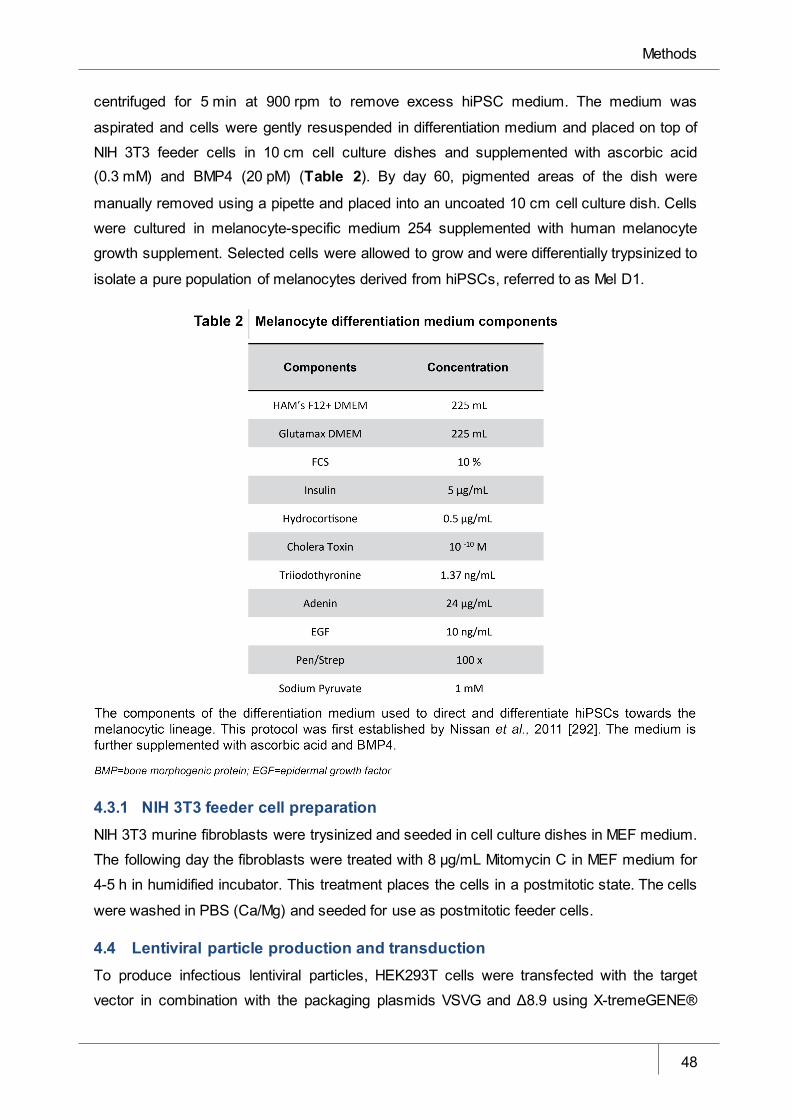
Methods
48
centrifuged for 5 min at 900 rpm to remove excess hiPSC medium. The medium was
aspirated and cells were gently resuspended in differentiation medium and placed on top of
NIH 3T3 feeder cells in 10 cm cell culture dishes and supplemented with ascorbic acid (0.3 mM) and BMP4 (20 pM) (Table 2). By day 60, pigmented areas of the dish were
manually removed using a pipette and placed into an uncoated 10 cm cell culture dish. Cells
were cultured in melanocyte-specific medium 254 supplemented with human melanocyte
growth supplement. Selected cells were allowed to grow and were differentially trypsinized to
isolate a pure population of melanocytes derived from hiPSCs, referred to as Mel D1.
4.3.1 NIH 3T3 feeder cell preparation NIH 3T3 murine fibroblasts were trysinized and seeded in cell culture dishes in MEF medium.
The following day the fibroblasts were treated with 8 µg/mL Mitomycin C in MEF medium for
4-5 h in humidified incubator. This treatment places the cells in a postmitotic state. The cells
were washed in PBS (Ca/Mg) and seeded for use as postmitotic feeder cells.
4.4 Lentiviral particle production and transduction To produce infectious lentiviral particles, HEK293T cells were transfected with the target
vector in combination with the packaging plasmids VSVG and Δ8.9 using X-tremeGENE®
Methods
49
Transfection Reagent (Roche) according to the manufacturer’s protocol. Supernatant was
discarded 12 h after transduction. Viral supernatant was harvested 24, 36 and 48 h after
transfection and directly used for transductions of target cells or centrifuged at 13500 rpm for
5 h at 4 °C and stored as concentrated virus, stocks.
4.5 Overexpression of SOX2 in human melanoma cell lines Gain-of-function experiments were performed using both an inducible FU-Tet-O human
SOX2 construct selectable with G418, together with a lentiviral vector encoding the M2
reverse tetracycline transactivator (kindly provided by K. Hochedlinger) (M2-rtTA, for
construct design of FU-Tet-O human SOX2 and M2-rtTA see vector maps provided in
Figure S1). As a negative control cells were transduced both constructs without doxycycline
administration in order to exclude that observed effects were due to the expression of the
constructs or the presence of doxycycline.
The cloning of FU-TetO-hSOX2 neomycin was performed as follows. A resistance cassette
comprising the neomycin-kanamycin phosphotransferase type II under the control of the
murine PGK promoter was cut with EcoRI from the MIR Neomycin vector (provided by Dr.
Daniel Novak) and blunted with the Phusion proofreading polymerase. In parallel, the FU-
Tet-O-hSox2 vector (kindly provided by K. Hochedlinger) was linearized with XhoI and
blunted with the Phusion proofreading polymerase. Subsequently, the resistance cassette
was inserted via blunt-end ligation into the linearized vector. The selection of the FU-TetO-
hSOX2 construct was performed using geneticin, G418, since resistance to G418 is
conferred by the neomycin resistance gene.
Lentiviral particles were produced following the protocol above (Section 4.4) and cells were
transduced with supernatant containing lentiviral particles of SOX2 and M2 under S2
conditions. Cells were seeded in 6-well plates and transferred to the S2 laboratory. Cells
were infected with 500 µL of each virus for each corresponding condition. Cells were
incubated overnight. The next day cells were superinfected with both constructs with the
same amount of virus supernatant. The following day, cells were washed three times with
PBS and transferred to the S1 laboratory. Cells were then induced with 1 µg/mL doxycycline for three days before selected with G418 for one week. Table 3 indicates the antibacterial
selection concentration used for various melanoma cell lines.
4.6 Knockdown of SOX2 and SOX10 in human melanoma cell lines shRNA constructs targeted against SOX2 were purchased from Genecopoeia
(cat. #HSH017628-LvH1). Four different shRNA clones and a scrambled control
(cat. #CSHCTR001-LvH1) were provided and clone 1 was used in experiments. shRNA
constructs were selectable with puromycin and contained an eGFP reporter gene. Lentiviral
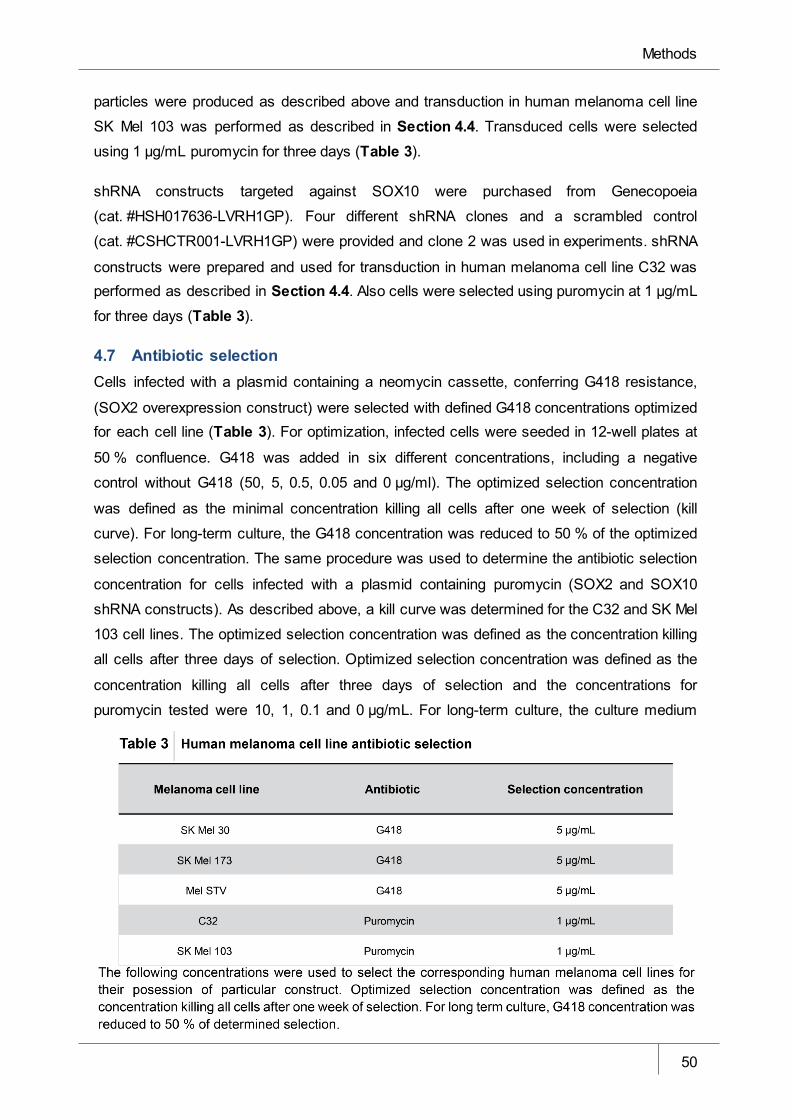
Methods
50
particles were produced as described above and transduction in human melanoma cell line
SK Mel 103 was performed as described in Section 4.4. Transduced cells were selected
using 1 µg/mL puromycin for three days (Table 3).
shRNA constructs targeted against SOX10 were purchased from Genecopoeia
(cat. #HSH017636-LVRH1GP). Four different shRNA clones and a scrambled control
(cat. #CSHCTR001-LVRH1GP) were provided and clone 2 was used in experiments. shRNA
constructs were prepared and used for transduction in human melanoma cell line C32 was performed as described in Section 4.4. Also cells were selected using puromycin at 1 µg/mL
for three days (Table 3).
4.7 Antibiotic selection Cells infected with a plasmid containing a neomycin cassette, conferring G418 resistance,
(SOX2 overexpression construct) were selected with defined G418 concentrations optimized for each cell line (Table 3). For optimization, infected cells were seeded in 12-well plates at
50 % confluence. G418 was added in six different concentrations, including a negative
control without G418 (50, 5, 0.5, 0.05 and 0 µg/ml). The optimized selection concentration
was defined as the minimal concentration killing all cells after one week of selection (kill
curve). For long-term culture, the G418 concentration was reduced to 50 % of the optimized
selection concentration. The same procedure was used to determine the antibiotic selection
concentration for cells infected with a plasmid containing puromycin (SOX2 and SOX10
shRNA constructs). As described above, a kill curve was determined for the C32 and SK Mel
103 cell lines. The optimized selection concentration was defined as the concentration killing
all cells after three days of selection. Optimized selection concentration was defined as the
concentration killing all cells after three days of selection and the concentrations for
puromycin tested were 10, 1, 0.1 and 0 µg/mL. For long-term culture, the culture medium
Methods
51
was supplemented with puromycin every 10 days at 50 % of the optimal selection
concentration.
4.8 Quantitative polymerase chain reaction Total RNA was extracted using the RNeasy Mini Kit (Qiagen) or the ARCTURUS PicoPure
RNA Isolation Kit (Life Technology) according to the manufacturer’s protocol. Briefly, cells
were lysed and RNA was purified using a column-based system. After washing and on-
column DNAse treatment, RNA was eluted from the column using nuclease-free water.
Concentration and integrity were measured using a Nanodrop Spectophotometer ND-1000.
Complementary DNA (cDNA) was generated from 500 ng RNA using the First Strand cDNA
Synthesis Kit according to the manufacturer’s protocol. For all experiments, oligo-dT primers
were used for cDNA synthesis, including the optional incubation step at 65 °C. cDNA was
diluted 1:10 in nuclease-free water use in quantitative PCR (qPCR).
qPCR was performed using SYBR Green in combination with the Applied Biosystems® 7500
Real-Time PCR System (Life Technologies) according to manufacturer’s protocols. Primer
sequences used are listed in Table 4. Expression of target genes was normalized to the
housekeeping gene HPRT, 18S or both after testing all cells for low inter-sample variance of
housekeeping gene expression (<3 cycles). All primers were validated; primers with
amplification efficiencies between 80 – 120 % were defined as functional. All samples were
analyzed in triplicate and data was processed using the 7500 Software and the delta (delta
(Ct)) method, including the efficiency of each primer pair. Graphs were generated using
GraphPad Prism software. Error bars show variance as 95 % confidence intervals calculated
by the 7500 software.
4.9 Immunoblotting Proteins were extracted using radioimmunoprecipitation assay (RIPA) buffer (Invitrogen)
containing complete protease inhibitor cocktail (Roche). Protein yield was measured using
the bicinchoninic acid (BCA) method (ThermoScientific) prior to protein separation on self-
made 10 % Tris/glycine SDS-polyacrylamide gels (Section 3.7) at 70 V for 30 min through
stacking gel and then at 100 V for one h or until desired separation was obtained. Proteins
were transferred onto methanol-activated polyvinylidene fluoride membranes for 70 min at
100 V. Unspecific binding was blocked for 1 h using 5 % BSA in PBS or milk depending on
antibody used, according to manufactures protocol. After overnight incubation with primary
antibodies at 4 °C and washing three times with TBST or PBST washing buffer (at least for
10 min each), depending on antibody used, the membrane was incubated with secondary
antibodies against either mouse or rabbit IgG labeled with horseradish peroxidase for 1-2 h
at RT. After washing three times with TBST or PBST, signals were visualized using ECL™
Methods
52
Western Blotting Detection Reagents (GE Healthcare) according to the manufacturer’s
protocol and imaging was performed using Classic E.O.S. Developer. Protein quantification
was performed using ImageJ.
4.10 Immunocytochemistry Seeded cells were washed with PBS and fixed for 30 min using 4 % PFA. After several
washing steps with PBS, unspecific binding sites were blocked with 2.5 % bovine serum
Methods
53
albumin (BSA) in PBS before the cells were incubated with primary antibody. For primary
antibodies that were not directly labelled, additional washing with PBS and incubation with a
fluorescence-labeled secondary antibody was performed. Cells were washed with PBS and
nuclei were stained with PBS containing 1 µg/mL of DAPI for 3 min. After mounting samples
with DAKO mounting medium, cells were analyzed using a fluorescence microscope (Nikon).
4.11 Immunohistochemistry Tumor tissues provided by UMM and prepared with support from our technician, Sayran Arif-
Said. The tissues were embedded in paraffin. Paraffin-embedded tissues were stained with
hematoxylin and eosin (H&E) and additional indirect staining against SOX2 (1:100, ab97959
Abcam) was performed as indicated in figure legends. Using biotinylated secondary
antibody, expression could be analyzed by light microscopy.
4.12 Tissue microarray analysis All analyses involving human melanoma tissue were carried out in accordance with the
ethical committee II of the University of Heidelberg. 37 nevi and 26 primary melanomas were
included in the tissue microarray (TMA) used in this study. TMA was generated at the core
facility of the National Center for Tumor Diseases (NCT), Department of Pathology,
University of Heidelberg. TMA-slides were prepared with support from our technician, Sayran
Arif-Said. TMA-slides were stained for SOX2 with anti-SOX2 (1:100, ab97959 Abcam)
overnight and after washing with TBST, slides were incubated with secondary, anti-rabbit
antibody (Dako EnVisionTM + System-HRP; AEC K4009) for 60 min. After 15 min incubation
with AEC according to the manufacturer’s protocol and additional washing steps, samples
were counterstained with H&E and stabilized with mounting medium (Dako S3025) for
storage and analysis. Each sample was included in duplicates to the TMA and control
staining against S100B was performed to visualized tumor cells. Two blinded individuals applying a quantity/intensity- based IHC scoring system, which is displayed in Figure S2,
performed scoring of tissue microarrays.
4.13 Migration (scratch) assay Migration assay was performed in a manner similar to a scratch assay. However, cells were
seeded using ibidi® chambers to achieve a precise 500 µm gap. The ibidi® chambers were
removed from the slides, placed into a 6-well cell culture plate and allowed to adhere for at
least 30 min. Next, cells were seeded at an optimized density of 70,000 cells per ibidi® side
for each condition. Cells were allowed to attach for 4-5 h. The medium was then aspirated
and replaced with MEF medium supplemented with 5 µM hydroxyurea (proliferation inhibitor)
into the chambers. Cells were incubated overnight. The next day, the ibidi® chambers were
removed very carefully. Cells were washed twice in pre-warmed medium and 2 mL of MEF
Methods
54
medium supplemented with 5 µM hydroxyurea were added to each well. Cells and scratch
were imaged using a fluorescence microscope at the following time points: 0, 6, 12, 24, and
48 h. T-scratch software (ETH Zürich) was used to analyze images and quantify migration-
covered area.
4.14 Invasion assays The Cytoselect™ invasion assay (basement membrane, Cell Biolabs) was used according to
the manufacturer’s protocol to measure the invasive potential of cells. In brief, the basement
membrane was rehydrated and 200,000 cells were seeded per well in serum-free medium.
Next, 150 µL of media containing 10 % fetal bovine serum were added to corresponding
wells of the feeder tray (bottom). The plate was covered and transferred to an incubator for
24 h. After 24 h, medium was removed and replaced with cell dissociation solution. Cells
were incubated for 30 min. Next, 4 x Lysis Buffer/CyQuant® GR dye solution was added to
each well and allowed to incubate for 20 min at RT. Lastly, the mixture was transferred to a
96-well plate suitable for fluorescence measurement. Fluorescence was measured at
480 nm/520 nm. Relative invasion potential was determined by comparing relative
fluorescent units (RFUs).
A second assay used to determine the migration and invasion potential was the Cultrex® 96
Well BME Cell Invasion Assay (©2008, Trevigen Inc.), applied according to the
manufacturer’s protocol. Briefly, cells were starved in serum-free MEF-medium and transwell
chambers were coated with 0.1 x basal membrane equivalent (BME) coating solution. After
24 h, cells were seeded at a density of 50,000 cells/well in coated (invasion) and non-coated
(migration) wells. Cells that migrated into the bottom chamber within a 24 h-period were
lysed and stained with a fluorescent dye. Fluorescence was measured at 485 nm (excitation)
and 520 nm (emission). Relative migratory and invasive potential was determined by
comparing RFUs.
4.15 alamarBlue® assay Cells were seeded in triplicate into black 96-well plates and growth capacity was analyzed
after 72 h. Medium was carefully removed, 10 % alamarBlue® REDOX indicator dye
(Invitrogen) in medium was applied and fluorescence was measured after indicated time with
an excitation wavelength of 530-560 nm and emission wavelength of 590 nm using the
Tecan Infinite® 200 PRO plate reader. Fluorescence intensity was normalized to wells
containing 10 % alamarBlue® REDOX indicator dye in medium only. Percentage of celluar
metabolism was determined by normalizing fluorescence emission to non-treated control
cells.
Methods
55
4.16 TGF-β stimulation experiments Cells were seeded at 30 % confluence and allowed to attach overnight. The next day, cells
were stimulated for up to one week with either TGF-β1, 10 pM, 100 pM, or 1 nM
(PeproTech), or SB431542, 100 nM, 1 µM, or 10 µM of SB431542 (Selleckchem) cultured in
MEF medium. SB431542 was dissolved in DMSO to a stock concentration of 10 mM,
according to manufacturer’s protocol. Aliquots of the inhibitors solutions were stored at -20°C
and applied at the indicated concentrations. Cells were also seeded as control cells and
incubated in MEF medium with 0.1 % DMSO.
4.17 Gene expressing profiling Total RNA extracted using the RNeasy Kit (Qiagen) was submitted to the microarray unit of
the DKFZ Genomics and Proteomics Core Facility. Illumina expression profiling was
performed using whole genome Illumina® arrays (Human-HT12V4).
4.18 Statistical analysis Tests for all data except microarray data were performed using GraphPad Prism version 5.00
(2007) with the appropriate tests. Significance in two-tailed t-tests was assumed for p-values
< 0.05 (*), < 0.01 (**) or < 0.001 (***).
For all expression array data, significantly deregulated gene expression was determined
using Chipster v2.12.0. After quantile normalization of raw data using Illumina normalization
in Chipster, genes which were differentially regulated in two selected groups were extracted
using the empirical bayes two-group test with Benjamini and Hochberg (BH) as the chosen p-
value adjustment method [293]. A p-value cutoff of 0.05 was chosen, if not otherwise
indicated.
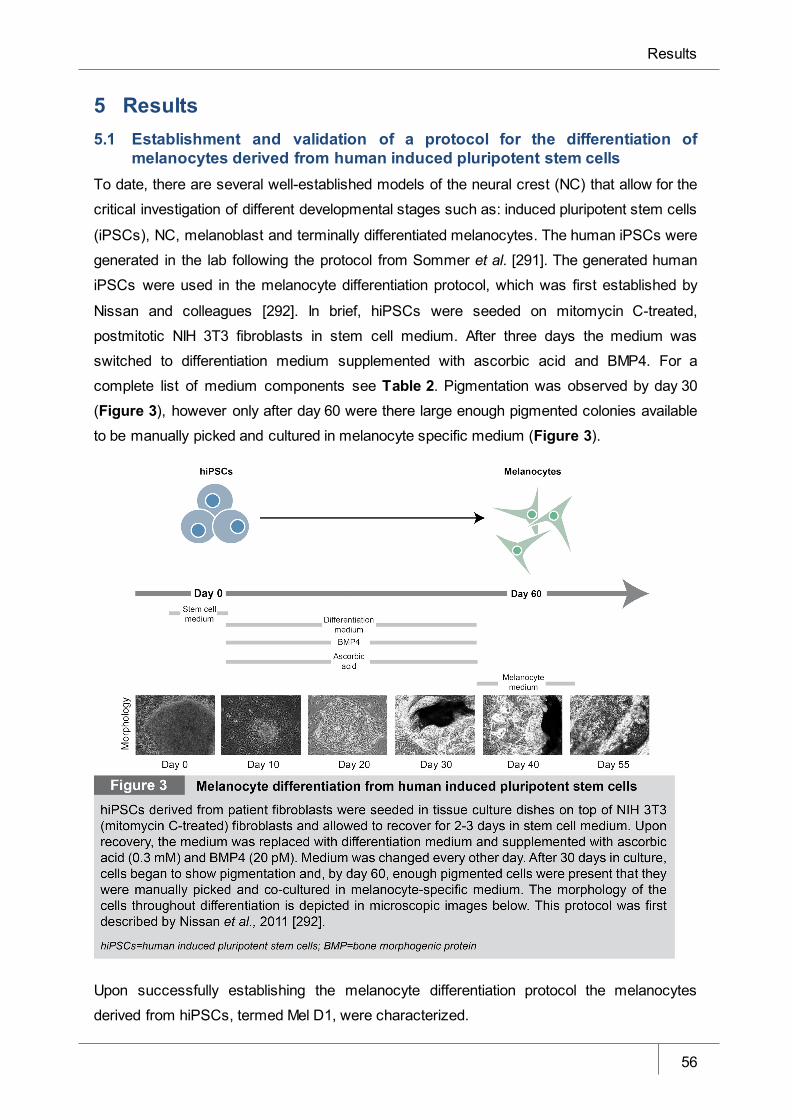
Results
56
5 Results 5.1 Establishment and validation of a protocol for the differentiation of
melanocytes derived from human induced pluripotent stem cells To date, there are several well-established models of the neural crest (NC) that allow for the
critical investigation of different developmental stages such as: induced pluripotent stem cells
(iPSCs), NC, melanoblast and terminally differentiated melanocytes. The human iPSCs were
generated in the lab following the protocol from Sommer et al. [291]. The generated human
iPSCs were used in the melanocyte differentiation protocol, which was first established by
Nissan and colleagues [292]. In brief, hiPSCs were seeded on mitomycin C-treated,
postmitotic NIH 3T3 fibroblasts in stem cell medium. After three days the medium was
switched to differentiation medium supplemented with ascorbic acid and BMP4. For a
complete list of medium components see Table 2. Pigmentation was observed by day 30
(Figure 3), however only after day 60 were there large enough pigmented colonies available
to be manually picked and cultured in melanocyte specific medium (Figure 3).
Upon successfully establishing the melanocyte differentiation protocol the melanocytes
derived from hiPSCs, termed Mel D1, were characterized.
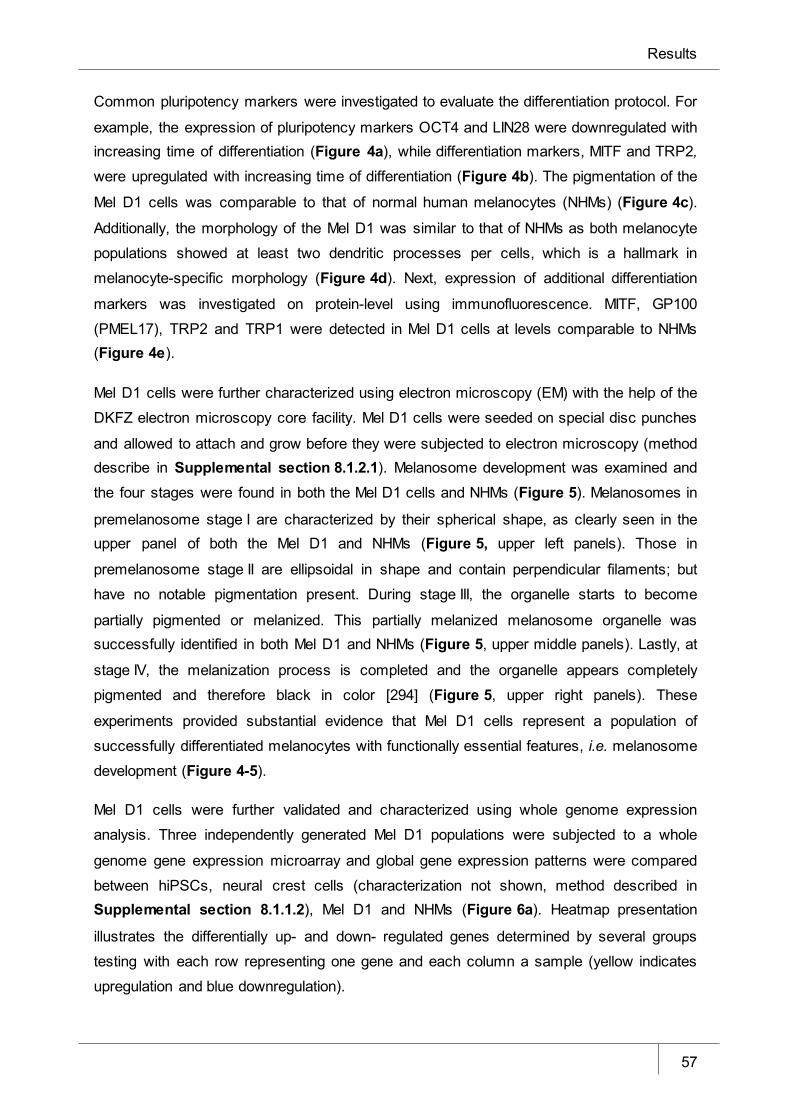
Results
57
Common pluripotency markers were investigated to evaluate the differentiation protocol. For
example, the expression of pluripotency markers OCT4 and LIN28 were downregulated with increasing time of differentiation (Figure 4a), while differentiation markers, MITF and TRP2,
were upregulated with increasing time of differentiation (Figure 4b). The pigmentation of the
Mel D1 cells was comparable to that of normal human melanocytes (NHMs) (Figure 4c).
Additionally, the morphology of the Mel D1 was similar to that of NHMs as both melanocyte
populations showed at least two dendritic processes per cells, which is a hallmark in
melanocyte-specific morphology (Figure 4d). Next, expression of additional differentiation
markers was investigated on protein-level using immunofluorescence. MITF, GP100
(PMEL17), TRP2 and TRP1 were detected in Mel D1 cells at levels comparable to NHMs (Figure 4e).
Mel D1 cells were further characterized using electron microscopy (EM) with the help of the
DKFZ electron microscopy core facility. Mel D1 cells were seeded on special disc punches
and allowed to attach and grow before they were subjected to electron microscopy (method describe in Supplemental section 8.1.2.1). Melanosome development was examined and
the four stages were found in both the Mel D1 cells and NHMs (Figure 5). Melanosomes in
premelanosome stage I are characterized by their spherical shape, as clearly seen in the upper panel of both the Mel D1 and NHMs (Figure 5, upper left panels). Those in
premelanosome stage II are ellipsoidal in shape and contain perpendicular filaments; but
have no notable pigmentation present. During stage III, the organelle starts to become
partially pigmented or melanized. This partially melanized melanosome organelle was successfully identified in both Mel D1 and NHMs (Figure 5, upper middle panels). Lastly, at
stage IV, the melanization process is completed and the organelle appears completely
pigmented and therefore black in color [294] (Figure 5, upper right panels). These
experiments provided substantial evidence that Mel D1 cells represent a population of
successfully differentiated melanocytes with functionally essential features, i.e. melanosome
development (Figure 4-5).
Mel D1 cells were further validated and characterized using whole genome expression
analysis. Three independently generated Mel D1 populations were subjected to a whole
genome gene expression microarray and global gene expression patterns were compared
between hiPSCs, neural crest cells (characterization not shown, method described in Supplemental section 8.1.1.2), Mel D1 and NHMs (Figure 6a). Heatmap presentation
illustrates the differentially up- and down- regulated genes determined by several groups
testing with each row representing one gene and each column a sample (yellow indicates
upregulation and blue downregulation).
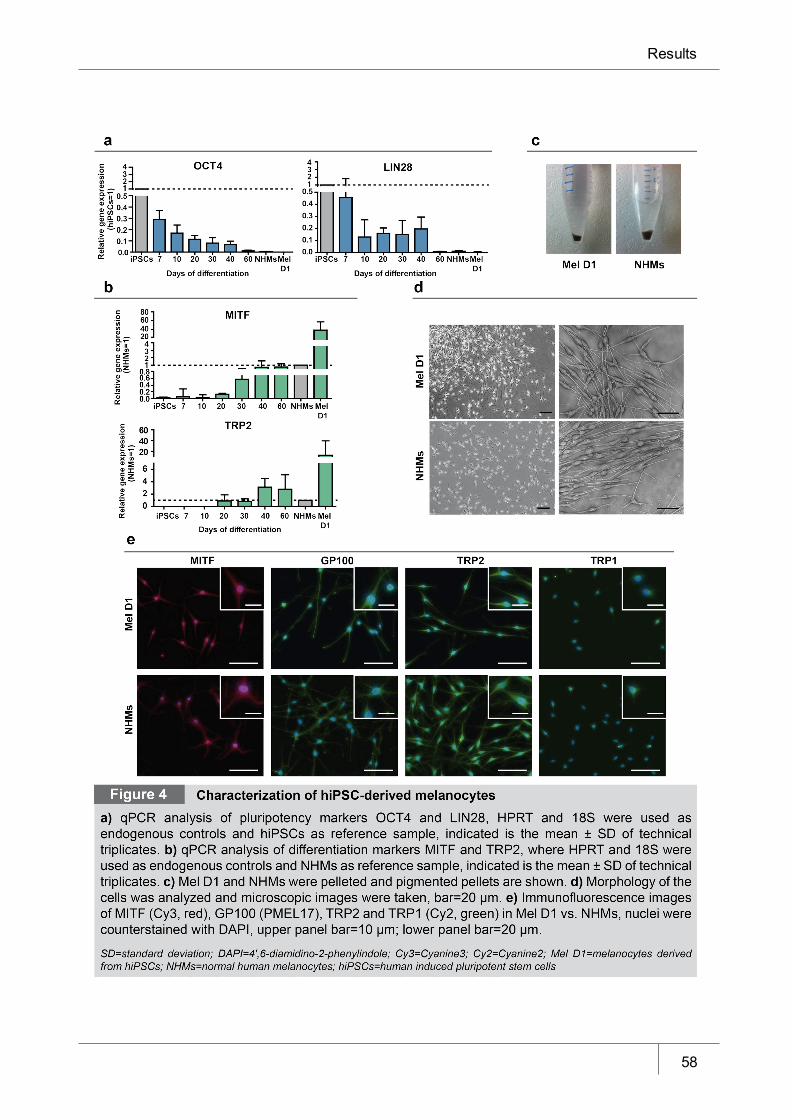
Results
58
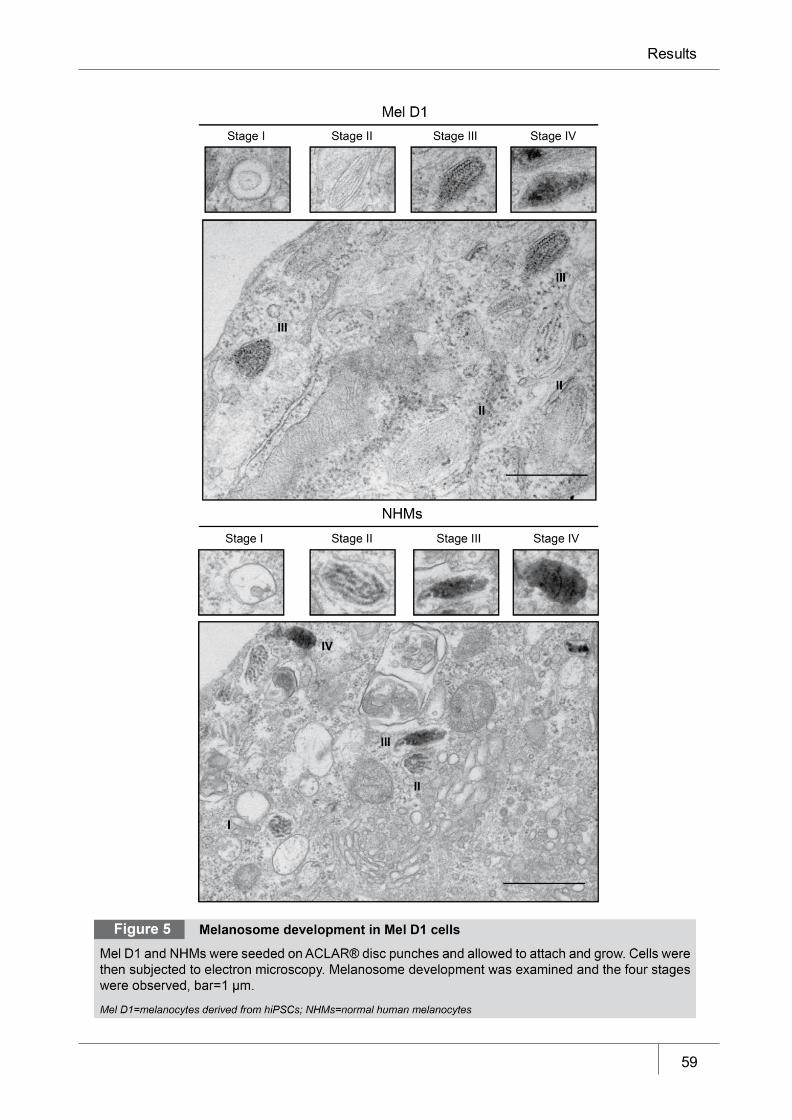
Results
59
Results
60
Pearson distance shows that Mel D1 cells have strong similarities to NHMs in contrast to
their derivative hiPSCs. Upon hierarchical clustering, Mel D1 and NHMs cluster closely together and exhibit similar genome-wide expression patterns (Figure 6a).
Moreover, comparable analyses were performed for Mel D1 vs. hiPSCs (group A) and NHMs
vs. hiPSCs (group B). First, gene expression values for pluripotency-related markers and differentiation-related markers were extracted using Chipster software (Figure 6b). All
pluripotency markers were similarly downregulated in both comparison groups, whereas
differentiation markers were upregulated in both groups, shown as log2 [fold change].
Notably, expression of TRP2 detected by microarray analysis was higher in NHMs compared to expression in Mel D1, which is in contrast to expression analysis using qPCR (Figure 4b),
where higher TRP2 levels were observed in Mel D1 cells. This pattern was also observed for MITF expression with higher expression levels in Mel D1 cells detected by qPCR (Figure 4b)
but higher expression levels in NHMs using the gene expression microarray (Figure 6b).
Ingenuity analysis (IPA) revealed that most pathways enriched in differentially expressed genes (Figure 6c, +2≤ fold change ≤-2) were similarly deregulated between Mel D1 vs.
hiPSCs and NHMs vs. hiPSCs. However, a difference was observed in the pathway
‘transcriptional regulatory network in embryonic stem cells’ between the two groups with a
stronger enrichment in differentially expressed genes in NHMs compared to Mel D1 cells. If
this has any significant meaning remains under investigation, but it is not surprising that
differentiating hiPSCs towards the melanocytic lineage would utilize slightly different
canonical pathways.
More detailed analysis of the canonical pathway ‘melanocyte development and pigmentation
signaling’ using IPA revealed that genes involved in the melanocyte pigmentation pathway
were specifically differentially regulated when comparing Mel D1 vs. hiPSCs and NHMs vs. hiSPCs (Figure 6d). Nearly all genes that were upregulated in Mel D1 vs. hiPSCs were also
upregulated when NHMs were compared to hiPSCs. In general, NHMs vs. hiPSCs
pigmentation pathway was more highly upregulated compared to Mel D1 vs. hiPSCs. For
example, TRP2 was slightly upregulated 2.35 and highly upregulated 6.6 fold in Mel D1 vs.
hiPSCs and NHMs vs. hiPSCs respectively. Strikingly, genes essential for the melanin
production in melanocytes, TRP1, TRP2 and TYR, were strongly upregulated in both NHMs
and Mel D1 cells compared to hiPSCs confirming data from electron microscopy that the pigmented organelles were present in both melanocytic populations (Figure 6d).
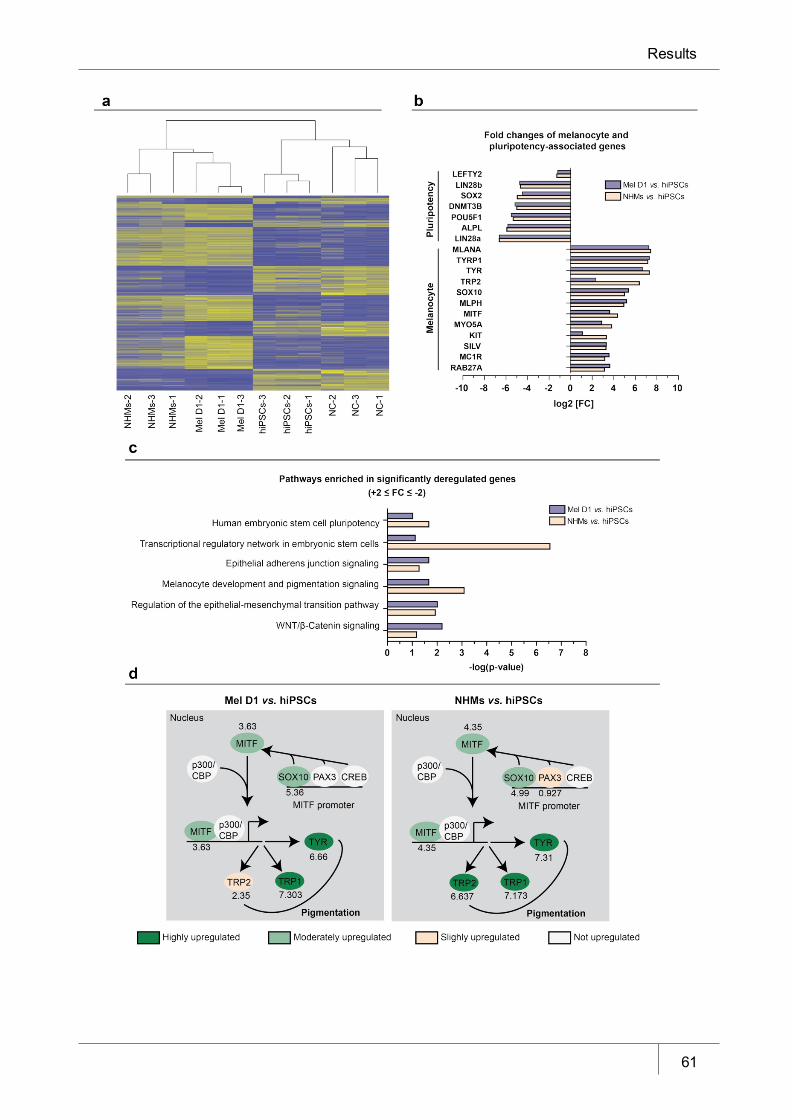
Results
61
Results
62
Based on these results, I conclude that I was able to successfully differentiate hiPSCs into
melanocytes. For this work, the functionality of these melanocytes was not tested, for
example, in an in vitro model of reconstituted melanized epidermis or organotypic skin
reconstruction. However, this should be investigated in the future.
5.2 Role of SOX2 and SOX10 during melanocyte differentiation from human induced pluripotent stem cells
Detailed investigation of specific pluripotency genes during the established melanocyte
differentiation protocol revealed a complete loss of OCT4 during the melanocyte differentiation protocol (Figure 4a). In addition, NANOG expression was diminished
throughout the early days of differentiation (day 11-15) by day 15 (Figure 7a). However,
SOX2 remained moderately expressed compared to hiPSCs (Figure 7a). This hinted that
SOX2 may play a role not only in regulating pluripotency but also in further stages of
ectodermal lineage development. Therefore SOX2 expression was analyzed in comparison
to the neural crest marker SOX10 throughout all days of differentiation (Figure 7b). SOX10
expression was highest at day 20 followed by a steady decrease at the later days of differentiation (Figure 7b). Similarly, SOX2 expression followed the same pattern with
highest expression at day 20; however relative expression was lower than SOX10
expression.
Investigating the expression of SOX2 in a NC cell population generated from Dr. Lionel
Larribere from our laboratory, which was specifically enriched for neural crest cells via cell sorting for HNK1 and p75 (NGFR/CD271) (method described in Supplemental section 8.1.1.2) , revealed that SOX2 was highly expressed in the NC cell population
compared to hiPSCs (Figure 7c). Taken together, SOX2 seems to play an important role
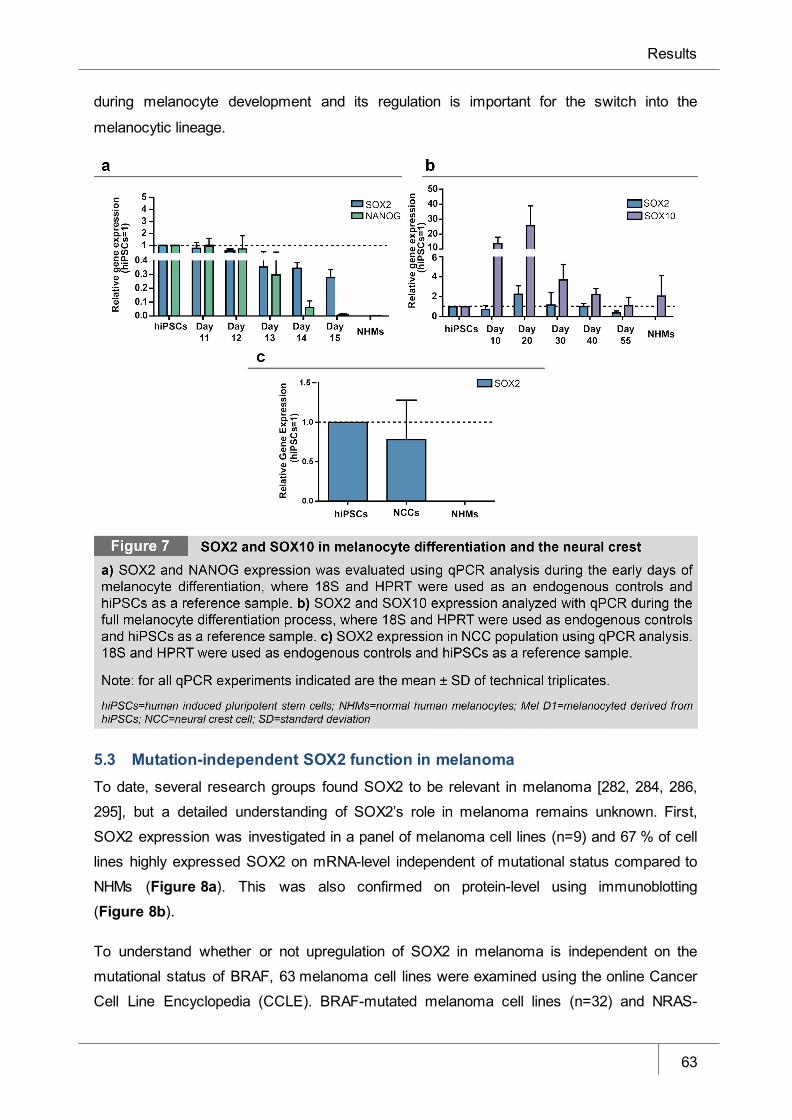
Results
63
during melanocyte development and its regulation is important for the switch into the
melanocytic lineage.
5.3 Mutation-independent SOX2 function in melanoma To date, several research groups found SOX2 to be relevant in melanoma [282, 284, 286,
295], but a detailed understanding of SOX2’s role in melanoma remains unknown. First,
SOX2 expression was investigated in a panel of melanoma cell lines (n=9) and 67 % of cell
lines highly expressed SOX2 on mRNA-level independent of mutational status compared to
NHMs (Figure 8a). This was also confirmed on protein-level using immunoblotting
(Figure 8b).
To understand whether or not upregulation of SOX2 in melanoma is independent on the
mutational status of BRAF, 63 melanoma cell lines were examined using the online Cancer
Cell Line Encyclopedia (CCLE). BRAF-mutated melanoma cell lines (n=32) and NRAS-
Results
64
mutated melanoma cell lines (n=7) were separated and relative mRNA expression of SOX2
compared to all BRAF/NRAS WT melanoma cell lines available regardless of any other
mutational status (n=24). No significant difference in SOX2 expression between BRAF- or
NRAS-mutated cell lines were found compared to the remaining melanoma cell lines
(Figure 8c). This suggests that the upregulation of SOX2 in melanoma is independent of the
mutational status.
Next, SOX2 expression was investigated on protein-level in melanocytic nevi, primary and metastatic melanoma samples using immunohistochemistry (IHC) (Figure 8d). A skin section
containing a melanocytic nevus revealed that SOX2 was not expressed in nevus cells but in a sebaceous gland (Figure 8d, upper panel,* indicates location of dermal nevus cells). In a
superficial primary melanoma, SOX2 was slightly expressed, whereas in metastatic melanoma tissue stronger staining was observed (Figure 8d, middle and lower panel). This
indicated that SOX2 is highly expressed in both primary melanoma and melanoma
metastases.
Lastly, fluorescence in situ hybridization (FISH) was performed with the help of Elias Orouji
from our laboratory (method described in Supplemental section 8.1.1.1) to investigate if the
SOX2 gene locus is amplified in human melanoma patient tissue (Figure 8e). Similar to the
results observed in IHC, SOX2 was amplified in primary and metastatic tissue samples
compared to melanocytic nevi, with only intact FISH signals in non-overlapping nuclei were
counted (n=100). Control hybridizations were performed on metaphase spreads of euploid
cells. The total number of SOX2 gene copies in relation to the reference probe copy number
is indicated as SOX2 FISH ratio. Amplification of SOX2 was defined as a calculated FISH
ratio > 1.3. A ratio less than 1 was considered no amplification. These values were
empirically determined using Hothorn and Lausen method and could vary under different conditions [296]. Representative images of FISH analysis are shown in Figure 8f.
To further confirm the mutation-independent effect of SOX2 in melanoma and to understand
the functional effects of SOX2 in melanoma, gain-of-function studies in the BRAF-and NRAS-
WT melanoma cell line SK Mel 173 and the NRASQ61R-mutated cell line SK Mel 30 were
performed. In addition, the melanocytic cell line Mel STV was transduced with the same
overexpression construct. All cells were transduced using a lentiviral vector encoding for
human SOX2 under the control of a tetracycline-inducible promoter in combination with a
constitutively expressed neomycin selection cassette. In addition, cells were transduced with
a lentiviral vector encoding for the constitutively active M2-rt-TA under the control of the human ubiquitin C promoter (Figure 9a, vector maps refer to Figure S1). Expression of
SOX2 was induced by administration of doxycycline for three days before cells were selected
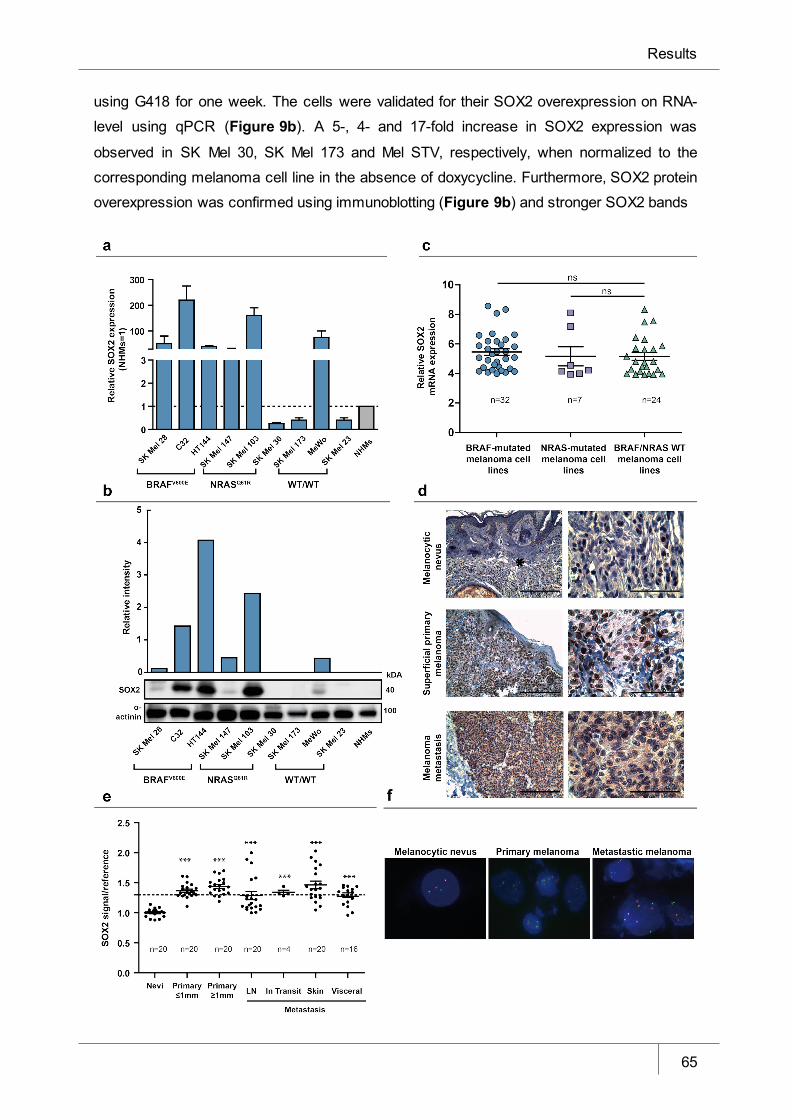
Results
65
using G418 for one week. The cells were validated for their SOX2 overexpression on RNA-
level using qPCR (Figure 9b). A 5-, 4- and 17-fold increase in SOX2 expression was
observed in SK Mel 30, SK Mel 173 and Mel STV, respectively, when normalized to the
corresponding melanoma cell line in the absence of doxycycline. Furthermore, SOX2 protein
overexpression was confirmed using immunoblotting (Figure 9b) and stronger SOX2 bands
Results
66
were detected in doxycycline-treated cells. The morphology of the SOX2-overexpressing cells was assessed and few differences were noted (Figure 9c). In general, doxycycline-
induced SOX2-overexpressing cells showed more dendritic-like protrusions and had a tendency to grow in smaller colonies rather than in larger clusters, (Figure 9c, black
arrowheads).
Dedifferentiation in melanoma has been well studied in recent years and since SOX2 is a
known pluripotency marker the differentiation status of the SOX2-overexpressing cells was
assessed. First, qPCR analysis was performed and expression of the differentiation markers MITF and TRP2 was determined (Figure 9d). A reduction in expression of both
differentiation markers was observed in all three SOX2-overexpressing cell lines. This loss of
MITF was further verified on protein-level using immunoblotting in the SOX2-overexpressing
cell line SK Mel 30 (Figure 9f). No difference in MITF reduction was observed upon G418
administration in the absence of doxycycline, indicating that the observed downregulation of
MITF on protein-level was caused by the overexpression of SOX2 and not a side effect of
selection (not shown). Band intensities revealed a 50 % loss of MITF protein (Figure 9f).
The strong repression of MITF on protein-level upon SOX2 overexpression led to further
investigation of these two molecules. The relationship between MITF and SOX2 has been
investigated by researchers in a short letter, which indicated that SOX2 may be possibly
modulating MITF expression in NHMs and melanoma cells [285]. In 2012, interactions
between SOX2 and MITF were investigated heavily in mouse, specifically in the cranial
neural crest [297]. Authors found that not only can SOX2 bind to the proximal promoter of
MITF in mouse, but was able to repress MITF-transcription in B16-F10 murine melanoma
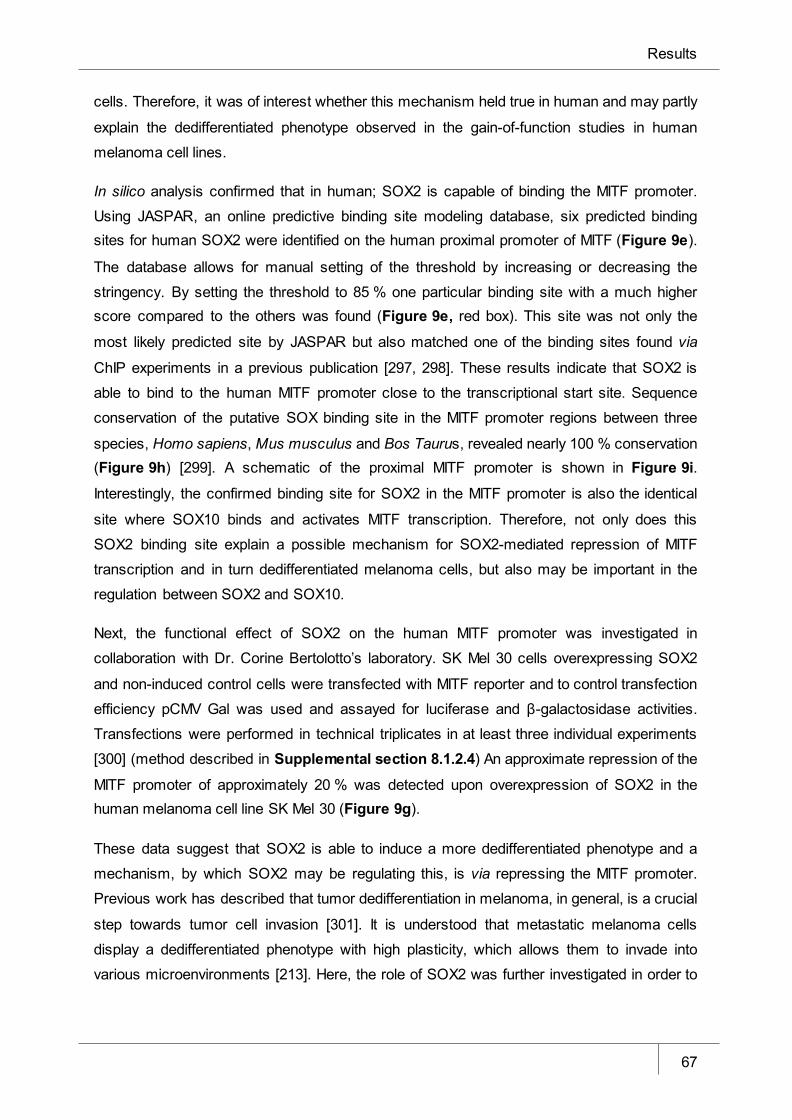
Results
67
cells. Therefore, it was of interest whether this mechanism held true in human and may partly
explain the dedifferentiated phenotype observed in the gain-of-function studies in human
melanoma cell lines.
In silico analysis confirmed that in human; SOX2 is capable of binding the MITF promoter.
Using JASPAR, an online predictive binding site modeling database, six predicted binding sites for human SOX2 were identified on the human proximal promoter of MITF (Figure 9e).
The database allows for manual setting of the threshold by increasing or decreasing the
stringency. By setting the threshold to 85 % one particular binding site with a much higher score compared to the others was found (Figure 9e, red box). This site was not only the
most likely predicted site by JASPAR but also matched one of the binding sites found via
ChIP experiments in a previous publication [297, 298]. These results indicate that SOX2 is
able to bind to the human MITF promoter close to the transcriptional start site. Sequence
conservation of the putative SOX binding site in the MITF promoter regions between three
species, Homo sapiens, Mus musculus and Bos Taurus, revealed nearly 100 % conservation (Figure 9h) [299]. A schematic of the proximal MITF promoter is shown in Figure 9i. Interestingly, the confirmed binding site for SOX2 in the MITF promoter is also the identical
site where SOX10 binds and activates MITF transcription. Therefore, not only does this
SOX2 binding site explain a possible mechanism for SOX2-mediated repression of MITF
transcription and in turn dedifferentiated melanoma cells, but also may be important in the
regulation between SOX2 and SOX10.
Next, the functional effect of SOX2 on the human MITF promoter was investigated in
collaboration with Dr. Corine Bertolotto’s laboratory. SK Mel 30 cells overexpressing SOX2
and non-induced control cells were transfected with MITF reporter and to control transfection
efficiency pCMV Gal was used and assayed for luciferase and β-galactosidase activities.
Transfections were performed in technical triplicates in at least three individual experiments
[300] (method described in Supplemental section 8.1.2.4) An approximate repression of the
MITF promoter of approximately 20 % was detected upon overexpression of SOX2 in the human melanoma cell line SK Mel 30 (Figure 9g).
These data suggest that SOX2 is able to induce a more dedifferentiated phenotype and a
mechanism, by which SOX2 may be regulating this, is via repressing the MITF promoter.
Previous work has described that tumor dedifferentiation in melanoma, in general, is a crucial
step towards tumor cell invasion [301]. It is understood that metastatic melanoma cells
display a dedifferentiated phenotype with high plasticity, which allows them to invade into
various microenvironments [213]. Here, the role of SOX2 was further investigated in order to
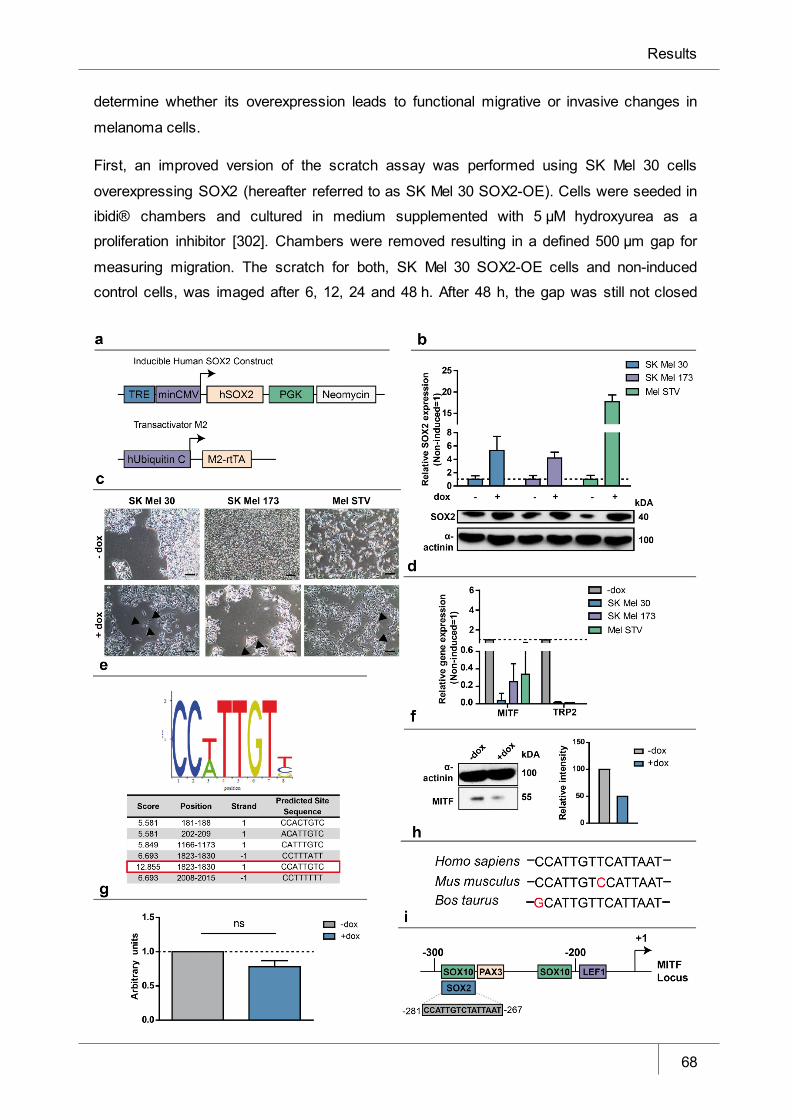
Results
68
determine whether its overexpression leads to functional migrative or invasive changes in
melanoma cells.
First, an improved version of the scratch assay was performed using SK Mel 30 cells
overexpressing SOX2 (hereafter referred to as SK Mel 30 SOX2-OE). Cells were seeded in
ibidi® chambers and cultured in medium supplemented with 5 µM hydroxyurea as a
proliferation inhibitor [302]. Chambers were removed resulting in a defined 500 µm gap for
measuring migration. The scratch for both, SK Mel 30 SOX2-OE cells and non-induced
control cells, was imaged after 6, 12, 24 and 48 h. After 48 h, the gap was still not closed
Results
69
completely. For quantification, images were analyzed using the open software T-scratch and
a significant increase in the migration capacity in the SK Mel 30 SOX2 OE cells compared to non-induced control cells was observed (Figure 10a).
After detection of enhanced migratory capacity when overexpressing SOX2 in melanoma
cells, the invasive potential of these cells was assessed. A transwell chamber system was
used to determine the invasive capacity of both SK Mel 30 and SK Mel 173 SOX2-OE cells
through an artificial basal membrane equivalent. SK Mel 30 SOX2-OE cells demonstrated a
significant increase in invasive capacity and same tendency was observed for SK Mel 173 SOX2-OE cells; however this was not significant (Figure 10c). This further confirmed that
SOX2 is plays a role in migratory and invasive capacity of melanoma cells in vitro.
The epithelial-to-mesenchymal transition (EMT) is a process strongly related to migration and
invasion in both NC development and cancer. Melanoma studies found that upregulation of
TWIST1 and ZEB1 indicated EMT restructuring towards a more dedifferentiated, invasive
phenotype [203]. For these reasons, these EMT-related markers were investigated in SK Mel
30 SOX2-OE cells and an upmodulation of ZEB1 and TWIST1 was observed, while ZEB2
Results
70
and SNAI2 expression was decreased (Figure 10b). Next, this SOX2-related invasive
phenotype observed in vitro was further evaluated in primary melanoma patient samples.
Moderate expression of SOX2 was observed at superficial regions of primary melanomas (Figure 10e, upper panel); however extremely high levels of SOX2 expression were detected
in deeper regions of the same tumor (Figure 10e, lower panel). Next, SOX2 positive cells
were observed, which invaded through the dermis and extracellular matrix supporting functional in vitro data (Figure 10f). Moreover, strong positivity was detected near an
invasive border of a primary melanoma close to a nerve cell (Figure 10g). The nerve cell
served as a positive control for SOX2 staining in IHC since SOX2 is highly expressed in this
cell type (reviewed in [303]).
Melanoma research has highlighted the unique, so-called phenotype switch phenomenon,
where melanoma cells oscillate between highly proliferative and non-invasive or highly
invasive and low proliferative states [304]. Since a highly invasive phenotype was observed
upon SOX2 overexpression, the metabolic activity of these cells was investigated to further
confirm that SOX2 plays a role in the induction of the phenotype switch. The alamarBlue®
assay was used to determine metabolic activity of the cells, which correlates with cellular
viability and proliferation. Both SOX2-overexpressing cell lines, SK Mel 30 and SK Mel 173,
were seeded into black 96-well plates. alamarBlue® was applied, three days after seeding
and its conversion was measured using a fluorescence plate reader after three hours. A
significant decrease in cellular metabolism in SK Mel 30 SOX2-OE cells was observed
compared to the corresponding non-induced control cells (Figure 10d). However, only a
slight decrease in cellular metabolism was detected in the SK Mel 173 SOX2-OE cells.
Next, SOX2-knockdown studies were performed in the human melanoma cell line NRASQ61R-
mutated SK Mel 103. SK Mel 103 was chosen due to its high expression of SOX2 on RNA and protein-level (Figure 8a-b). The cells were transduced with shRNA targeting human
SOX2 gene or with vectors encoding for a scrambled control that were selectable using puromycin (Table 3). Upon selection for three days, knockdown of SOX2 was validated for
RNA expression by qPCR analysis and on protein-level by immunoblotting (Figure 11a).
60 % reduction of SOX2 was observed in SK Mel 103 knockdown cells and no morphological
changed were evident when compared to control cells (Figure 11a, g). Subsequently, SOX2
knockdown (KD) cells were evaluated regarding the expression of NC markers. An increase
in expression of SOX10 and a decrease in p75 expression were observed, suggesting a
more differentiated state of the cells (Figure 11b). Moreover, an increase in differentiation-
markers MITF and TRP2 was observed in the SK Mel 103 KD cells compared to the scrambled control (Figure 11f).
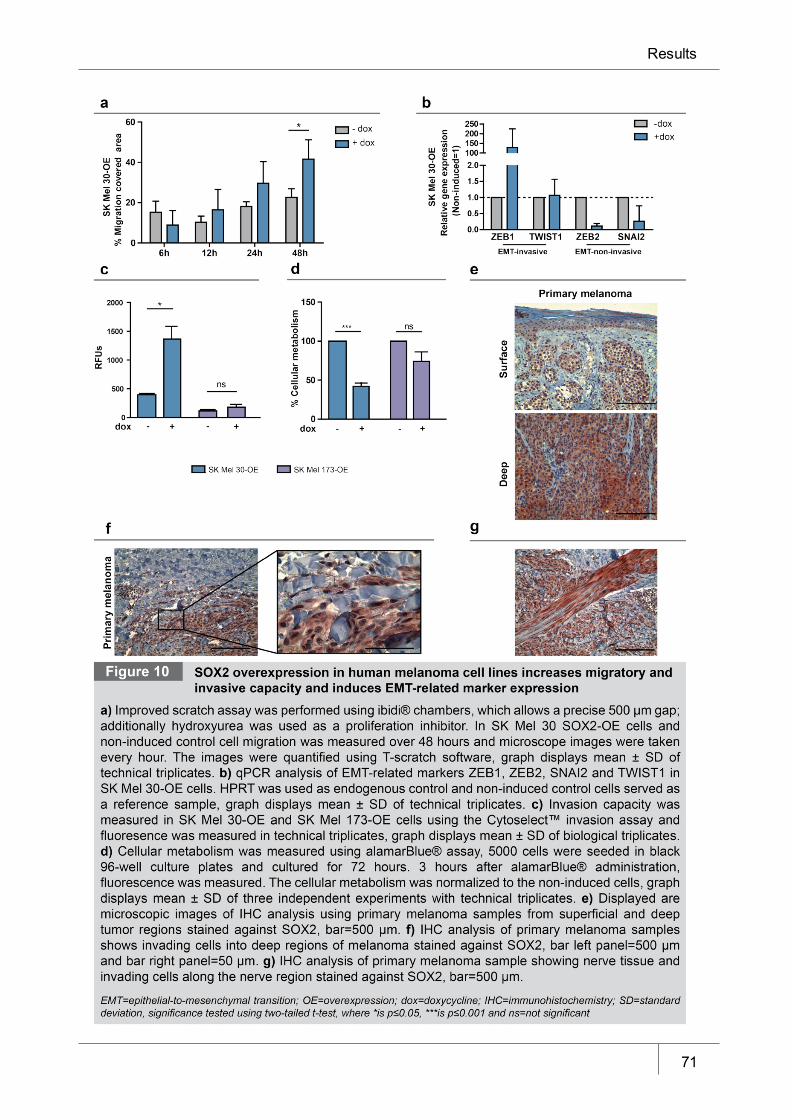
Results
71
Results
72
Furthermore to investigate EMT-related marker expression, cadherins were investigated and
upon SOX2 KD in SK Mel 103 melanoma cell line an upmodulation of E-cadherin (CDH1) was observed together with a slight downmodulation of N-cadherin (CDH2) (Figure 11c).
Additionally, an upregulation of ZEB2 and SNAI2 was observed in the SK Mel 103 KD cells
compared to the scrambled control, which suggests the cells were in a less invasive state (Figure 11f). Taken together, these data suggest the cells were more epithelial-like and the
loss of SOX2 in the melanoma cell line SK Mel 103 leads to a more differentiated phenotype.
Following, the alamarBlue® assay was performed to assess cellular metabolic activity of the
SK Mel 103 SOX2 KD cells indicating effects of SOX2 depletion on proliferation. 4000 cells
were seeded per well, and three days later alamarBlue® was applied. Three hours after
alamarBlue® administration, measurements were taken (Figure 11d). No difference was
observed in cellular metabolism when the scrambled control was compared to the SOX2 KD
cells.
Lastly, the invasive capacity of SOX2 KD cells was assessed using the Cultrex® 96 Well
BME Cell Invasion Assay and wells were coated with 0.1 x basement membrane extract
(BME). A significant decrease in invasive capacity was observed upon knocking down SOX2 in the SK Mel 103 melanoma cell line (Figure 11e).
5.4 Influence of SOX10 on SOX2 expression in human melanoma cells Independently, SOX2 and SOX10 have been closely studied in melanoma. SOX10 studies
have shown that its expression is required for melanoma initiation and maintenance [280].
Meanwhile SOX2, previously described in studies and the data shown, has been associated
to melanoma cell invasion and regulation of melanoma-initiating cell self-renewal and
tumorigenicity [284, 286, 295].
This reciprocal function of SOX2 and SOX10 was further investigated by analyzing the
expression of SOX10 in SOX2-OE cell lines. When SOX2 was overexpressed in several human melanoma cell lines, SOX10 was drastically downregulated (Figure 12a). Moreover,
when relative gene expression of SOX2 and SOX10 was analyzed in a panel of 12
melanoma cell lines an inverse correlation between the two genes was discovered (r=-0.2120) (Figure 12b). This data illustrated that there is inverse expression between
SOX2 and SOX10 in melanoma.
To further understand the reciprocal function of SOX10 in melanoma compared to SOX2
loss-of-function studies were performed using shRNA targeting SOX10. The BRAF-mutated
C32 cell line was transduced with four different shRNA clones and the scrambled control. After transduction, these cells were selected with puromycin for three days (Table 3). Next,
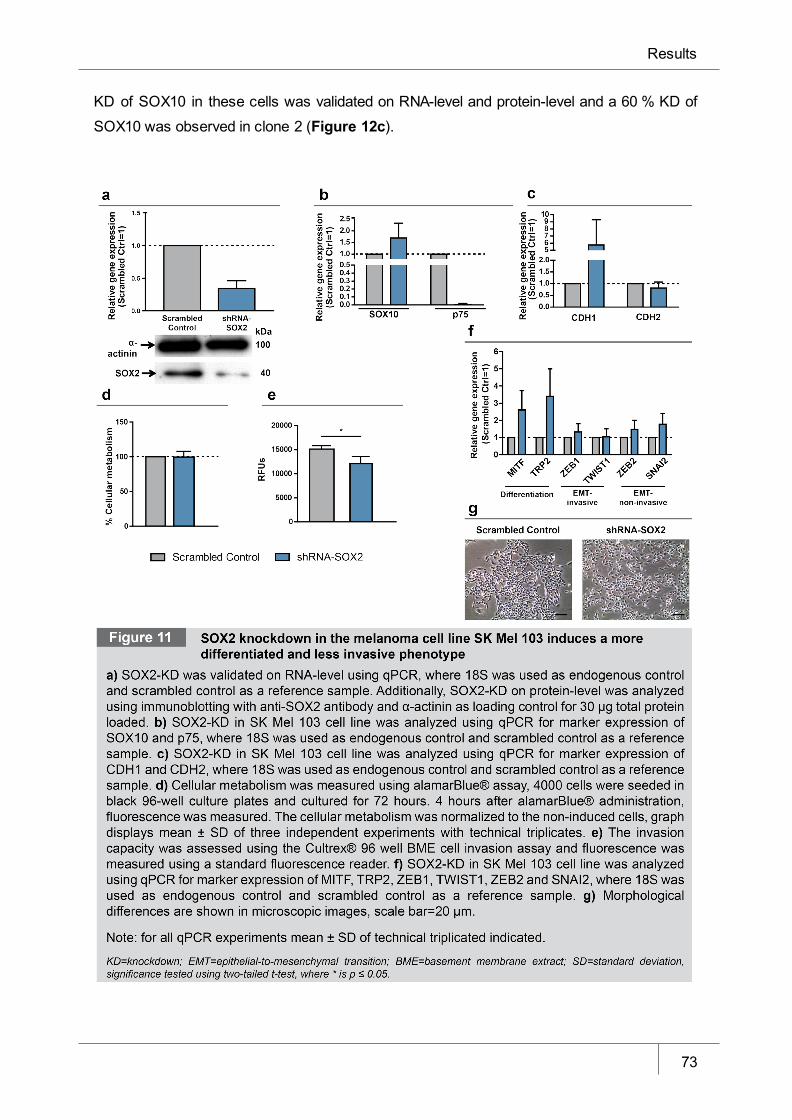
Results
73
KD of SOX10 in these cells was validated on RNA-level and protein-level and a 60 % KD of
SOX10 was observed in clone 2 (Figure 12c).
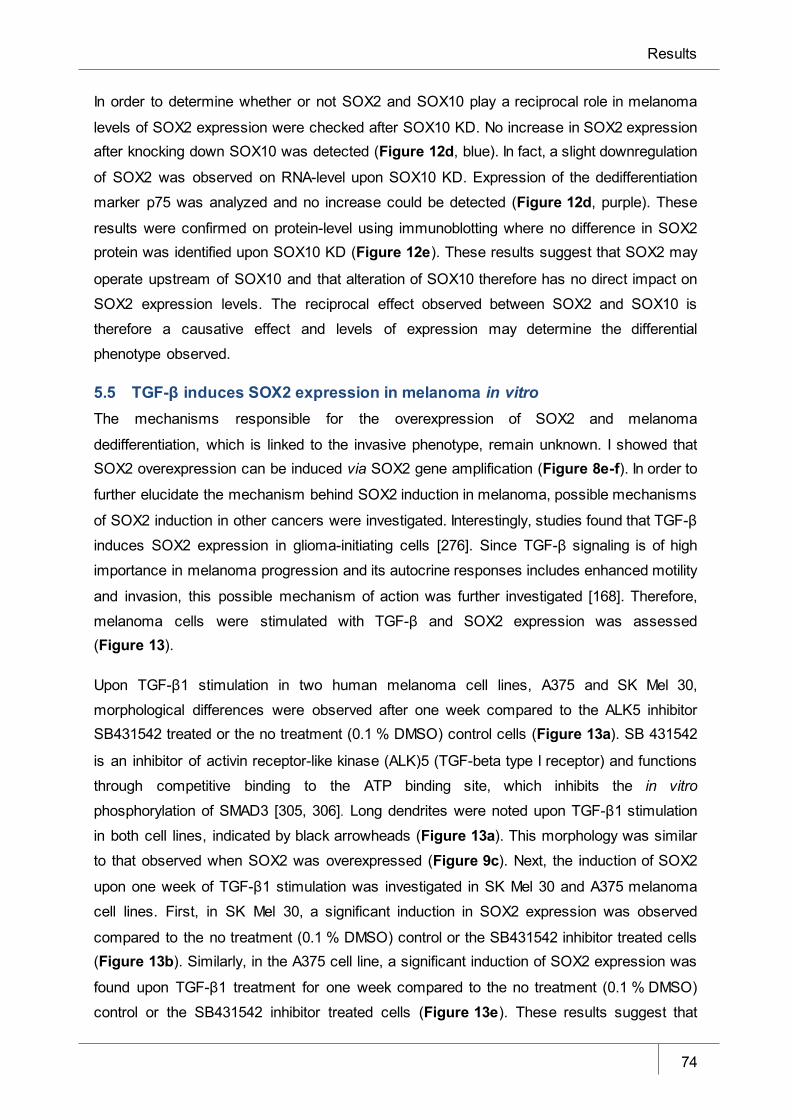
Results
74
In order to determine whether or not SOX2 and SOX10 play a reciprocal role in melanoma
levels of SOX2 expression were checked after SOX10 KD. No increase in SOX2 expression after knocking down SOX10 was detected (Figure 12d, blue). In fact, a slight downregulation
of SOX2 was observed on RNA-level upon SOX10 KD. Expression of the dedifferentiation
marker p75 was analyzed and no increase could be detected (Figure 12d, purple). These
results were confirmed on protein-level using immunoblotting where no difference in SOX2 protein was identified upon SOX10 KD (Figure 12e). These results suggest that SOX2 may
operate upstream of SOX10 and that alteration of SOX10 therefore has no direct impact on
SOX2 expression levels. The reciprocal effect observed between SOX2 and SOX10 is
therefore a causative effect and levels of expression may determine the differential
phenotype observed.
5.5 TGF-β induces SOX2 expression in melanoma in vitro The mechanisms responsible for the overexpression of SOX2 and melanoma
dedifferentiation, which is linked to the invasive phenotype, remain unknown. I showed that SOX2 overexpression can be induced via SOX2 gene amplification (Figure 8e-f). In order to
further elucidate the mechanism behind SOX2 induction in melanoma, possible mechanisms
of SOX2 induction in other cancers were investigated. Interestingly, studies found that TGF-β
induces SOX2 expression in glioma-initiating cells [276]. Since TGF-β signaling is of high
importance in melanoma progression and its autocrine responses includes enhanced motility
and invasion, this possible mechanism of action was further investigated [168]. Therefore,
melanoma cells were stimulated with TGF-β and SOX2 expression was assessed (Figure 13).
Upon TGF-β1 stimulation in two human melanoma cell lines, A375 and SK Mel 30,
morphological differences were observed after one week compared to the ALK5 inhibitor SB431542 treated or the no treatment (0.1 % DMSO) control cells (Figure 13a). SB 431542
is an inhibitor of activin receptor-like kinase (ALK)5 (TGF-beta type I receptor) and functions
through competitive binding to the ATP binding site, which inhibits the in vitro
phosphorylation of SMAD3 [305, 306]. Long dendrites were noted upon TGF-β1 stimulation
in both cell lines, indicated by black arrowheads (Figure 13a). This morphology was similar
to that observed when SOX2 was overexpressed (Figure 9c). Next, the induction of SOX2
upon one week of TGF-β1 stimulation was investigated in SK Mel 30 and A375 melanoma
cell lines. First, in SK Mel 30, a significant induction in SOX2 expression was observed
compared to the no treatment (0.1 % DMSO) control or the SB431542 inhibitor treated cells (Figure 13b). Similarly, in the A375 cell line, a significant induction of SOX2 expression was
found upon TGF-β1 treatment for one week compared to the no treatment (0.1 % DMSO)
control or the SB431542 inhibitor treated cells (Figure 13e). These results suggest that
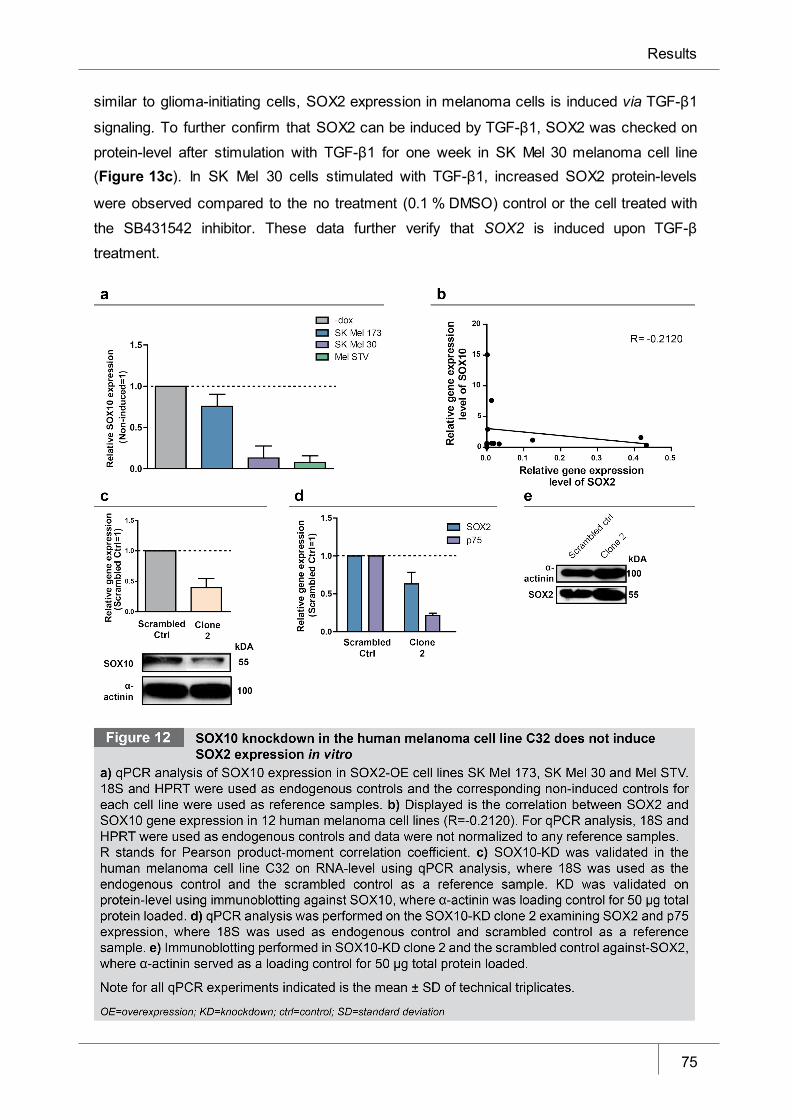
Results
75
similar to glioma-initiating cells, SOX2 expression in melanoma cells is induced via TGF-β1
signaling. To further confirm that SOX2 can be induced by TGF-β1, SOX2 was checked on
protein-level after stimulation with TGF-β1 for one week in SK Mel 30 melanoma cell line (Figure 13c). In SK Mel 30 cells stimulated with TGF-β1, increased SOX2 protein-levels
were observed compared to the no treatment (0.1 % DMSO) control or the cell treated with
the SB431542 inhibitor. These data further verify that SOX2 is induced upon TGF-β
treatment.
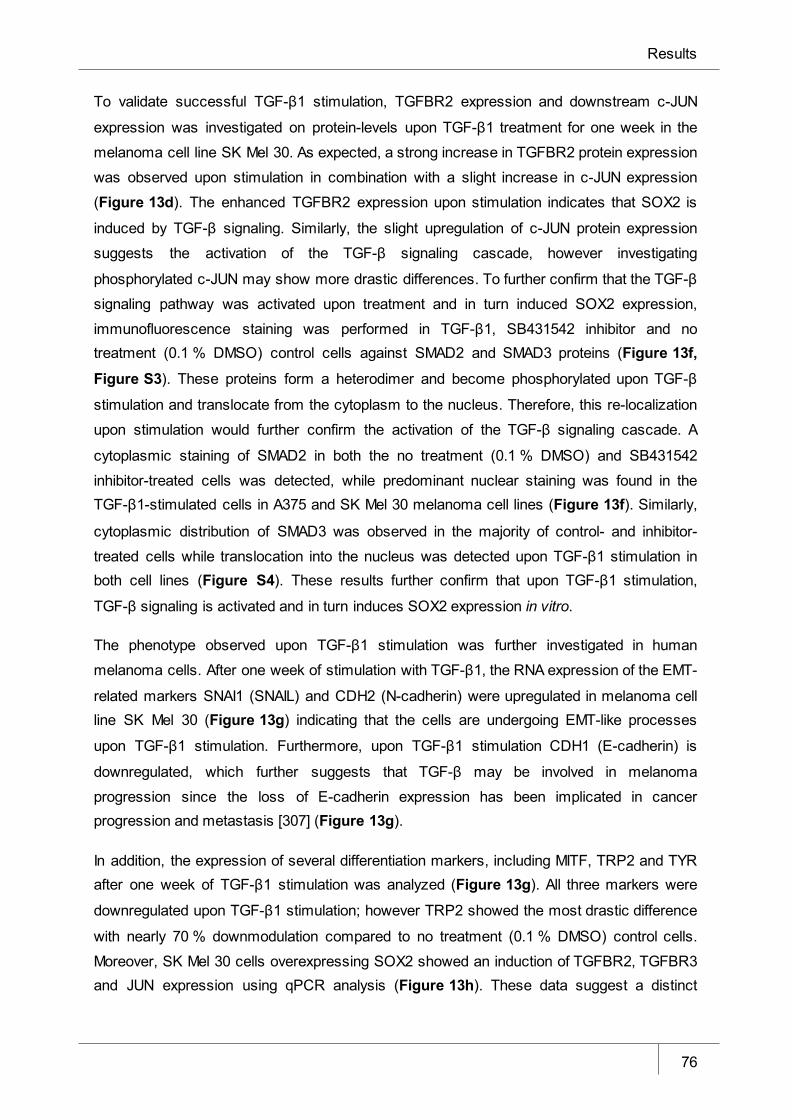
Results
76
To validate successful TGF-β1 stimulation, TGFBR2 expression and downstream c-JUN
expression was investigated on protein-levels upon TGF-β1 treatment for one week in the
melanoma cell line SK Mel 30. As expected, a strong increase in TGFBR2 protein expression
was observed upon stimulation in combination with a slight increase in c-JUN expression
(Figure 13d). The enhanced TGFBR2 expression upon stimulation indicates that SOX2 is
induced by TGF-β signaling. Similarly, the slight upregulation of c-JUN protein expression
suggests the activation of the TGF-β signaling cascade, however investigating
phosphorylated c-JUN may show more drastic differences. To further confirm that the TGF-β
signaling pathway was activated upon treatment and in turn induced SOX2 expression,
immunofluorescence staining was performed in TGF-β1, SB431542 inhibitor and no treatment (0.1 % DMSO) control cells against SMAD2 and SMAD3 proteins (Figure 13f, Figure S3). These proteins form a heterodimer and become phosphorylated upon TGF-β
stimulation and translocate from the cytoplasm to the nucleus. Therefore, this re-localization
upon stimulation would further confirm the activation of the TGF-β signaling cascade. A
cytoplasmic staining of SMAD2 in both the no treatment (0.1 % DMSO) and SB431542
inhibitor-treated cells was detected, while predominant nuclear staining was found in the TGF-β1-stimulated cells in A375 and SK Mel 30 melanoma cell lines (Figure 13f). Similarly,
cytoplasmic distribution of SMAD3 was observed in the majority of control- and inhibitor-
treated cells while translocation into the nucleus was detected upon TGF-β1 stimulation in both cell lines (Figure S4). These results further confirm that upon TGF-β1 stimulation,
TGF-β signaling is activated and in turn induces SOX2 expression in vitro.
The phenotype observed upon TGF-β1 stimulation was further investigated in human
melanoma cells. After one week of stimulation with TGF-β1, the RNA expression of the EMT-
related markers SNAI1 (SNAIL) and CDH2 (N-cadherin) were upregulated in melanoma cell line SK Mel 30 (Figure 13g) indicating that the cells are undergoing EMT-like processes
upon TGF-β1 stimulation. Furthermore, upon TGF-β1 stimulation CDH1 (E-cadherin) is
downregulated, which further suggests that TGF-β may be involved in melanoma
progression since the loss of E-cadherin expression has been implicated in cancer progression and metastasis [307] (Figure 13g).
In addition, the expression of several differentiation markers, including MITF, TRP2 and TYR after one week of TGF-β1 stimulation was analyzed (Figure 13g). All three markers were
downregulated upon TGF-β1 stimulation; however TRP2 showed the most drastic difference
with nearly 70 % downmodulation compared to no treatment (0.1 % DMSO) control cells.
Moreover, SK Mel 30 cells overexpressing SOX2 showed an induction of TGFBR2, TGFBR3 and JUN expression using qPCR analysis (Figure 13h). These data suggest a distinct
Results
77
mechanism, by which SOX2 regulates its own expression and TGF-β signaling in a positive
feedforward loop.
Results
78
5.6 SOX2 and novel protein-protein interactions Protein-protein interactions play crucial roles in regulating important cellular pathways.
Therefore, novel potential interacting partners of SOX2 were investigated using yeast-2-
hybrid (y2h) pairwise experiments and bimolecular fluorescence complementation (BiFC)
experiments in collaboration with the DKFZ proteomics core facility (methods described in Supplemental section 8.1.2.2 and 8.1.2.3)
Using BiFC, the potential interaction between SOX2 and PAX3, SOX10, and PAX6,
respectively, was investigated. PAX6 is a known interacting partner of SOX2, particularly in
the retina and was used as a positive control [245]. HEK 293T cells were transfected with
bait and prey vectors containing fragments of complementary fluorescent reporter proteins.
Upon interaction in vitro, the fusion reporter protein reforms and fluoresces. A positive
interaction between PAX3 and SOX2 was observed in three independent BiFC experiments, similar to that of the positive control (Figure 14a, left panel). The differential role of SOX2
and SOX10 was investigated in melanoma progression and therapy and it was found that
SOX2 and SOX10 share a binding site on the proximal MITF promoter. Therefore, the
mechanism, by which SOX2 and SOX10 may be regulated on protein-level, was of interest.
Strong fluorescence was observed when SOX2-bait and SOX10-prey were transfected into HEK 293T cells, where the fluorescence was equal to positive control (Figure 14a, middle
panel). The same fluorescence was observed when SOX10 was used as bait and SOX2 as prey (Figure 14a, middle panel).
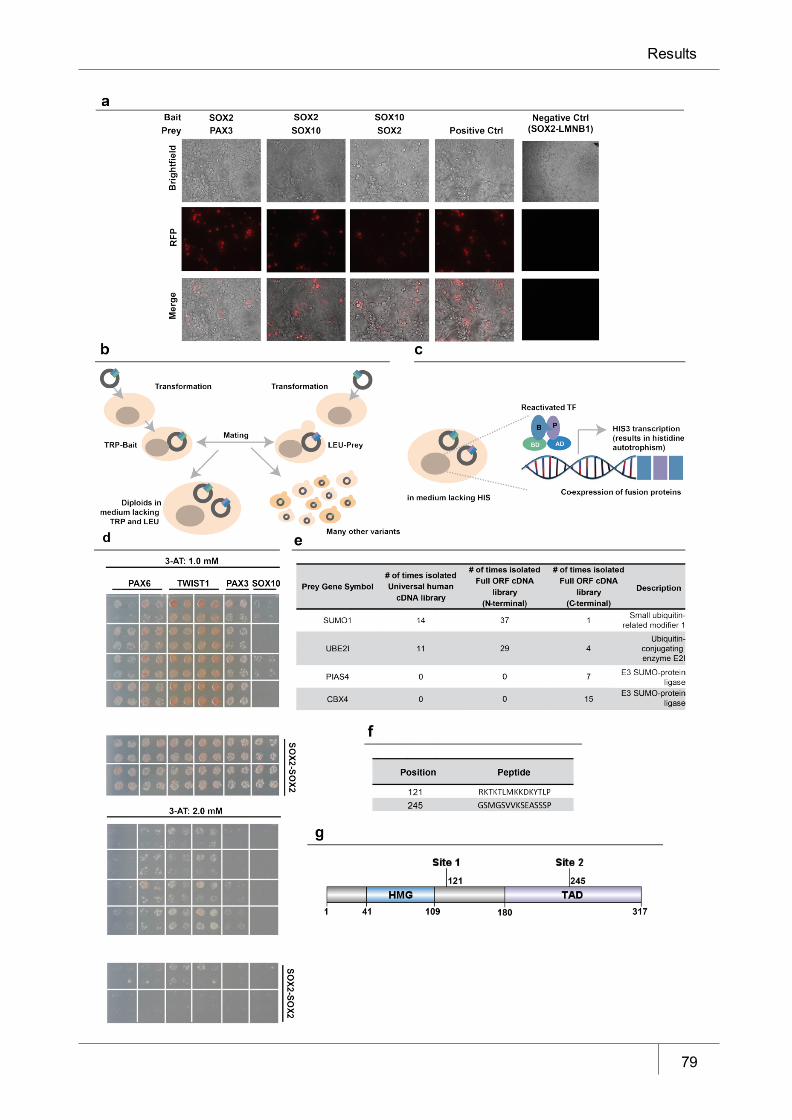
Results
79
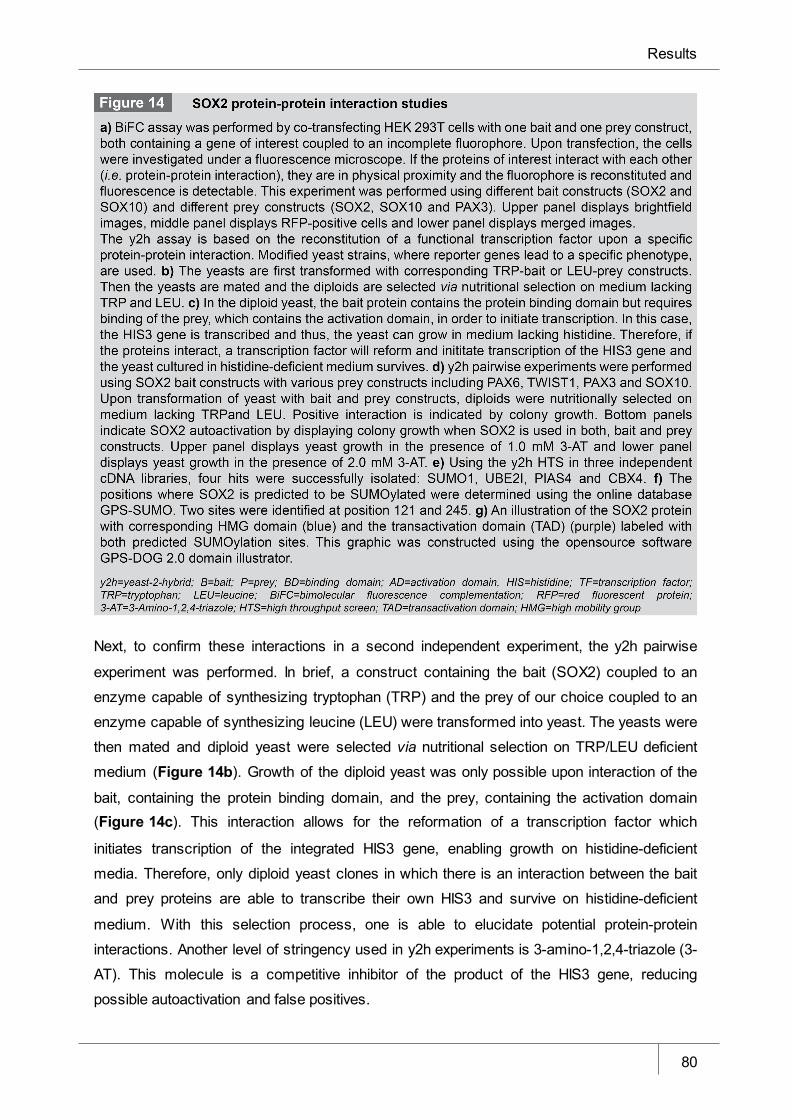
Results
80
Next, to confirm these interactions in a second independent experiment, the y2h pairwise
experiment was performed. In brief, a construct containing the bait (SOX2) coupled to an
enzyme capable of synthesizing tryptophan (TRP) and the prey of our choice coupled to an
enzyme capable of synthesizing leucine (LEU) were transformed into yeast. The yeasts were
then mated and diploid yeast were selected via nutritional selection on TRP/LEU deficient
medium (Figure 14b). Growth of the diploid yeast was only possible upon interaction of the
bait, containing the protein binding domain, and the prey, containing the activation domain (Figure 14c). This interaction allows for the reformation of a transcription factor which
initiates transcription of the integrated HIS3 gene, enabling growth on histidine-deficient
media. Therefore, only diploid yeast clones in which there is an interaction between the bait
and prey proteins are able to transcribe their own HIS3 and survive on histidine-deficient
medium. With this selection process, one is able to elucidate potential protein-protein
interactions. Another level of stringency used in y2h experiments is 3-amino-1,2,4-triazole (3-
AT). This molecule is a competitive inhibitor of the product of the HIS3 gene, reducing
possible autoactivation and false positives.
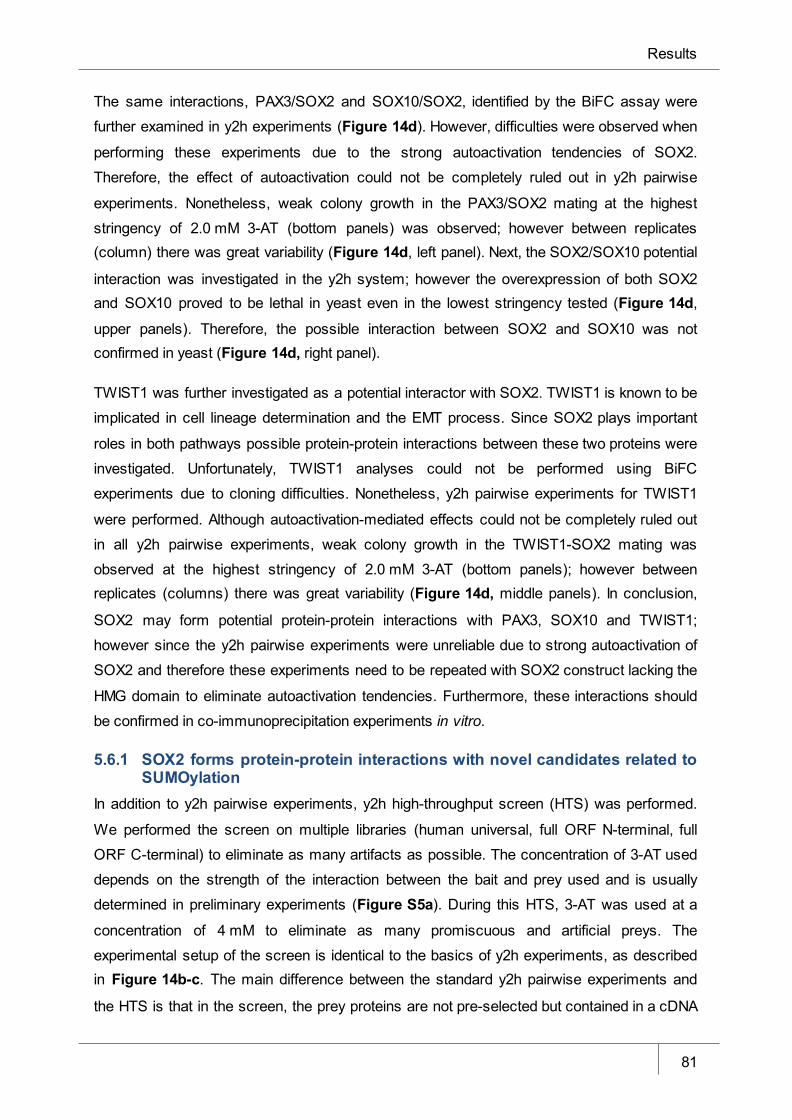
Results
81
The same interactions, PAX3/SOX2 and SOX10/SOX2, identified by the BiFC assay were
further examined in y2h experiments (Figure 14d). However, difficulties were observed when
performing these experiments due to the strong autoactivation tendencies of SOX2.
Therefore, the effect of autoactivation could not be completely ruled out in y2h pairwise
experiments. Nonetheless, weak colony growth in the PAX3/SOX2 mating at the highest
stringency of 2.0 mM 3-AT (bottom panels) was observed; however between replicates (column) there was great variability (Figure 14d, left panel). Next, the SOX2/SOX10 potential
interaction was investigated in the y2h system; however the overexpression of both SOX2 and SOX10 proved to be lethal in yeast even in the lowest stringency tested (Figure 14d,
upper panels). Therefore, the possible interaction between SOX2 and SOX10 was not confirmed in yeast (Figure 14d, right panel).
TWIST1 was further investigated as a potential interactor with SOX2. TWIST1 is known to be
implicated in cell lineage determination and the EMT process. Since SOX2 plays important
roles in both pathways possible protein-protein interactions between these two proteins were
investigated. Unfortunately, TWIST1 analyses could not be performed using BiFC
experiments due to cloning difficulties. Nonetheless, y2h pairwise experiments for TWIST1
were performed. Although autoactivation-mediated effects could not be completely ruled out
in all y2h pairwise experiments, weak colony growth in the TWIST1-SOX2 mating was
observed at the highest stringency of 2.0 mM 3-AT (bottom panels); however between replicates (columns) there was great variability (Figure 14d, middle panels). In conclusion,
SOX2 may form potential protein-protein interactions with PAX3, SOX10 and TWIST1;
however since the y2h pairwise experiments were unreliable due to strong autoactivation of
SOX2 and therefore these experiments need to be repeated with SOX2 construct lacking the
HMG domain to eliminate autoactivation tendencies. Furthermore, these interactions should
be confirmed in co-immunoprecipitation experiments in vitro.
5.6.1 SOX2 forms protein-protein interactions with novel candidates related to SUMOylation
In addition to y2h pairwise experiments, y2h high-throughput screen (HTS) was performed.
We performed the screen on multiple libraries (human universal, full ORF N-terminal, full
ORF C-terminal) to eliminate as many artifacts as possible. The concentration of 3-AT used
depends on the strength of the interaction between the bait and prey used and is usually
determined in preliminary experiments (Figure S5a). During this HTS, 3-AT was used at a
concentration of 4 mM to eliminate as many promiscuous and artificial preys. The
experimental setup of the screen is identical to the basics of y2h experiments, as described in Figure 14b-c. The main difference between the standard y2h pairwise experiments and
the HTS is that in the screen, the prey proteins are not pre-selected but contained in a cDNA
Results
82
library. Therefore, the mating occurred between a particular bait of interest (SOX2) and the
prey offered by the cDNA library. Upon the reformation of the transcription factor, reporter
genes were transcribed allowing fluorescence readout. After mating, the yeast were dispensed onto ten microtiter plates and allowed to grow (Figure S5b). Fluorescence was
measured and the positive wells collected. Next, PCR was performed and the bands were
sequenced and analyzed.
Three independent HTSs were performed using three different cDNA libraries: universal
human, full ORF library (N-terminal) and full ORF library (C-terminal). Several hits were
isolated in at least two of the three screens. These hits included SUMO1, UBE2I, PIAS4, PCFG2, and CBX4 (Figure 14e). For example, small ubiquitin-related modifier 1 (SUMO1)
was isolated 14 times from the universal human library and 37 times from the full ORF
library. Ubiquitin-conjugating enzyme E2I (UBE2I) was isolated 11 times from the universal human library and 29 times from the full ORF library (C-terminal) (Figure 14e).
The first hit, SUMO1, was particularly interesting since this protein is heavily involved in
protein SUMOylation or post-translational modifications [252]. Literature research revealed
that the conjugation of SOX2 to SUMO1 has already been investigated [252]. Moreover, it
was discovered that upon conjugation of SUMO1 to SOX2, inhibition of the DNA binding
activity by SOX2 was observed. This work not only suggests that SUMOylation has a
functional effect on SOX2 but also validates that the y2h HTS likely identified true protein-
protein interactions. Likewise, the next hit, ubiquitin-conjugating enzyme (UBE) - 2I, is an
enzyme responsible for performing SUMO conjugation is related to the SUMOylation
process. Further hits, E3 SUMO-protein ligase (PIAS4) and Chromobox protein homolog 4
(CBX4), function in the SUMOylation process by stabilizing the interaction between UBE2I
and the substrate [247]. The identification of potential interactions occurring between SOX2
and proteins related to the SUMOylation process suggest SOX2 can be SUMOylated.
To determine whether SOX2 can be SUMOylated, the GPS-SUMO online database was used to predict SUMOlyation sites within the SOX2 protein (Figure 14f). The database
identified two predicted SUMOylation sites for SOX2; one located at amino acid position 121
and the other at 245. Interestingly, the publication which reported conjugation of SOX2 to
SUMO1 describes a conjugation at lysine 247 [252]; but the exact positions where SOX2 is
SUMOylated in vitro needs to be confirmed. Lastly, the SOX2 protein domains and its
predicted SUMOylation sites were constructed using the open source software DOG 2.0 (Figure 14g).
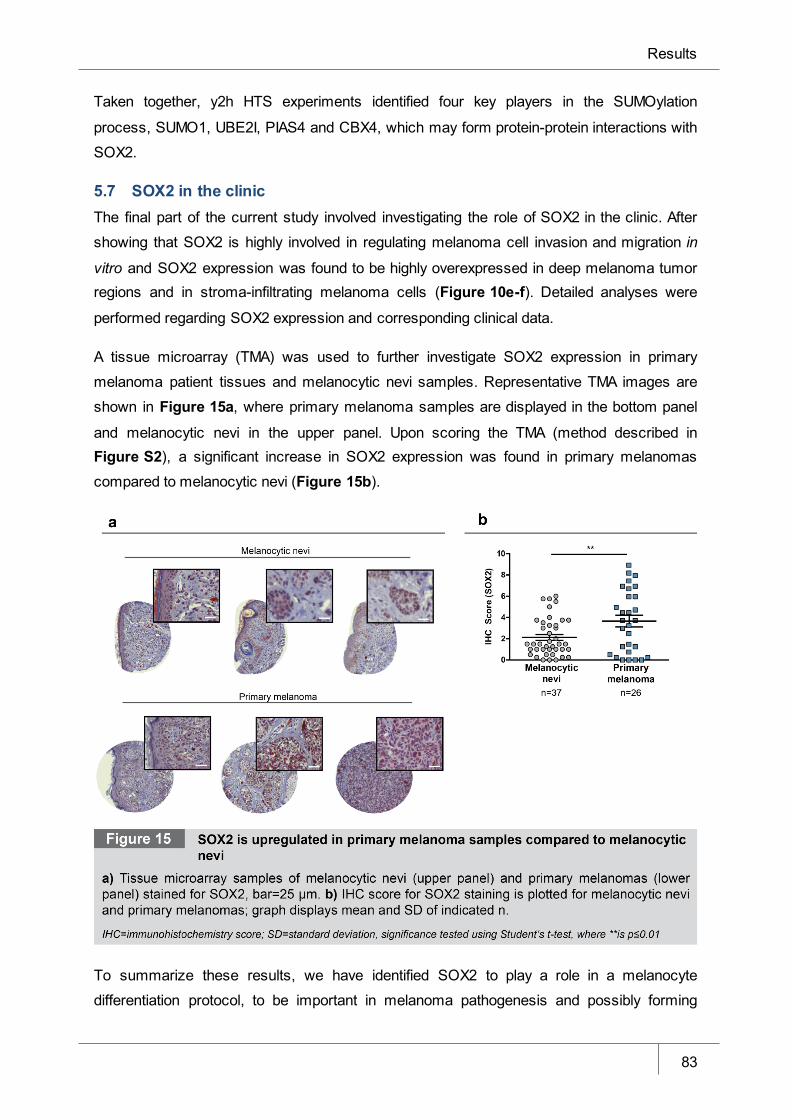
Results
83
Taken together, y2h HTS experiments identified four key players in the SUMOylation
process, SUMO1, UBE2I, PIAS4 and CBX4, which may form protein-protein interactions with
SOX2.
5.7 SOX2 in the clinic The final part of the current study involved investigating the role of SOX2 in the clinic. After
showing that SOX2 is highly involved in regulating melanoma cell invasion and migration in
vitro and SOX2 expression was found to be highly overexpressed in deep melanoma tumor regions and in stroma-infiltrating melanoma cells (Figure 10e-f). Detailed analyses were
performed regarding SOX2 expression and corresponding clinical data.
A tissue microarray (TMA) was used to further investigate SOX2 expression in primary
melanoma patient tissues and melanocytic nevi samples. Representative TMA images are
shown in Figure 15a, where primary melanoma samples are displayed in the bottom panel
and melanocytic nevi in the upper panel. Upon scoring the TMA (method described in Figure S2), a significant increase in SOX2 expression was found in primary melanomas
compared to melanocytic nevi (Figure 15b).
To summarize these results, we have identified SOX2 to play a role in a melanocyte
differentiation protocol, to be important in melanoma pathogenesis and possibly forming

Results
84
novel protein-protein interactions with SUMO-related proteins. SOX2 was identified to be
expressed at low levels during the established melanocyte differentiation protocol from
human iPSCs. Using FISH analysis, we demonstrated SOX2 amplification in primary
melanoma tissue compared to melanocytic nevi. The functional analysis of SOX2 in
melanoma revealed the requirement for SOX2 in melanoma cell invasion in vitro and was
linked to EMT-marker induction. Furthermore, dedifferentiation in melanoma cell may be
influenced by SOX2 binding and repression of the MITF-M promoter. Additionally, we found
that SOX2 was induced by TGF-β1 in vitro. Finally, in protein studies using y2h HTS, we
identified potential new interacting partners of SOX2 related to the SUMOylation process.
Discussion
85
6 Discussion The resistance of advanced melanoma to current targeted therapies, unavailable prognostic
tools and lack of knowledge about the molecular mechanisms underlying the pathogenesis of
this cancer together highlight the deficiencies in the melanoma field. To date, research has
identified alterations in key regulators in both, tumor suppressor and oncogenic pathways,
which are responsible for disturbed signaling in mitogen-activated protein kinase (MAPK)
pathway [308], inhibition of the RB tumor suppressor pathway [309] and further activation of
downstream tyrosine kinases [310]. In melanoma, these modifications cause cellular
proliferation and uncontrolled growth which can progress quickly into metastatic cancer.
Accordingly, widespread dissemination of melanoma cells to distant organs is a common
occurrence in melanoma progression.
There are several proposed mechanisms for malignant transformation in melanoma. One
mechanism is through the acquisition of genetic aberrations that lead to malignant
transformation, such as the acquisition of mutant BRAFV600E and p16INK4a/p19ARF loss or
mutations in p53 and PTEN [142–144]. The acquisition of these aberrations can occur
through various means including exposure to environmental risk factors, such as UV
radiation. Aside from somatic mutations, it has been suggested that, in melanoma, there is
an inheritance of melanoma susceptibility genes. To date there have been four different
genes at three different loci identified to confer susceptibility in melanoma, the genes include:
p16INK4a, p14ARF, CDK4 and TERT. Lastly, melanocytes are derived from embryonic,
migratory neural crest cells (NCCs). Throughout development, the NCC population gives rise
to various lineages including bone and cartilage, pigmented cells, neurons and glial cells of
the peripheral nervous system. Upon the induction of the neural crest (NC) and formation of
the neural tube, NCCs migrate dorsolaterally by acquiring migratory features through the
epithelial-to-mesenchymal transition (EMT), before becoming fully differentiated melanocytes
when reaching the epidermis [4]. Due to their developmental program, which gives the
lineage invasive, metastatic qualities [207], melanocytes may be intrinsically predisposed to
transformation and metastasis. Taken together, melanoma has several routes towards
malignant transformation and it’s likely a combination of routes that ultimately confers
malignancy.
6.1 Embryonic stem cell marker expression during melanocytic differentiation from human induced pluripotent stem cells
In this study, a protocol was established to terminally differentiate melanocytes from human induced pluripotent stem cells. For this approach differentiation medium (Table 4)
supplemented with BMP4 and ascorbic acid was used; which directed differentiation into all ectodermal lineages (Figures 3). Further cultivation in melanocyte medium successfully
Discussion
86
selected a pure population of melanocytes, which were characterized in depth for their
differentiation- and pluripotency-marker expression (Figure 4a-b,e), melanosome
development (Figure 5), and whole genome expression array analyses (Figure 6) compared
to normal human melanocytes (NHMs). Minor differences were noted when comparing the
hiPSC-derived melanocytes (Mel D1) compared to NHMs, such as the observed difference in
the Ingenuity-derived pathway ‘transcriptional regulatory network in embryonic stem cells’
where there was stronger enrichment in differentially expressed genes in NHMs compared to
Mel D1 cells. If this has any significant meaning remains under investigation, but it is not
surprising that differentiating hiPSCs towards the melanocytic lineage would utilize slightly different pathways (Figure 6c).
To date, there are several well-established models of the NC that allow for the critical
investigation of different developmental stages such as: iPSCs, NC, melanoblast and
terminally differentiated melanocytes. Of note, Studer and colleagues recently modeled the
NC using a complete and comprehensive in vitro system [83]. Upon using timed exposure to
WNT, BMP, and EDN3 and under dual-SMAD inhibiting culture conditions, the sequential
induction of the NC and melanocyte precursor fates was triggered. Moreover, the global
gene expression profile was analyzed throughout the differentiation process, giving new
perspectives into the NC and melanocyte fate determination [83]. In comparison, our
established melanocyte differentiation protocol did not include the usage of the particular
factors driving a specific route of melanocyte differentiation. It cannot be excluded that also
other factor combinations may induce the development of neural crest cells or melanocyte
differentiation. The Studer protocol permits for the investigation of defined stages throughout
melanocyte development which makes it an ideal model for studying processes such as the
NC; while the protocol used in this study is a more general approach that directs cells into
the ectodermal lineage. Although the Studer protocol allows in-depth analyses of each
processes throughout melanocyte development, both protocols end with terminally
differentiated melanocytes which indicates that either can be used for this purpose.
The lack of characterization throughout the differentiation process allows limited
interpretation of the particular differentiation stages; however, the protocol used in the current
study generated terminally differentiated melanocytes at a reasonable efficiency. The
protocol used was not necessarily established for neural crest modeling purposes by Nissan
and colleagues [292] but rather to obtain fully functional melanocytes. The protocol used in
this study was based on a study that differentiated human embryonic stem cells (hESCs) into
another ectodermal derivative: keratinocytes [311]. Researchers found that high
concentrations of BMP4 and ascorbic acid controlled and mediated pluripotent stem cell
differentiation along the ectodermal lineage resulting in keratinocyte lineage differentiation in
Discussion
87
approximately 50-60 % of cells, while the remaining cells formed clusters of pigmented cells.
Consequently, Nissan and colleagues hypothesized that these pigmented cells may contain
melanocytes or neuroectodermally-derived RPE cells [312] and adapted the protocol for the
derivation of terminally differentiated melanocytes [292].
In the current study, this protocol was utilized due to its high efficiency in generating
terminally differentiated melanocytes. After the completion of the differentiation protocol, a
pure population of hiPSC-derived Mel D1 cells was achieved without any keratinocyte or
RPE cell contamination. A pure population was generated by culturing the pigmented
colonies from the differentiation protocol in separate culture dishes with a melanocytes
specific medium, which only permits growth of melanocytes.
One would assume that after placing human iPSCs in differentiation medium containing high
levels of BMP4 and ascorbic acid, expression of all pluripotency markers would diminish at a
rapid pace. This holds true for both OCT4 (Figure 4a) and NANOG (Figure 7a) expression.
Interestingly, SOX2 remained expressed after an initial decrease upon the initiation of differentiation (Figure 7a-b). Moreover, SOX2 was found to be highly expressed in NC-
derived cells (Figure 7c). The expression of SOX2 in cells that were enriched for NCCs by
sorting for HNK-1 and p75 expression (method described in Supplemental section 8.1.1.2),
suggested that SOX2 may play a role in the developing NC (Figure 7c). To date, there have
been several important studies, which have investigated the role and function of SOX2 in NC
development; one of which used an in vitro model for NC characterization to demonstrate a
key role for SOX2 is neurogenesis [77]. Moreover, an in vivo system for modeling NC
development examined tumor cell invasion by transplanting human metastatic melanoma
cells into chick embryonic NC environment [210]. These transplantation experiments
revealed that the invasion and migratory pathways employed by melanoma cells were
heavily influenced by NC microenvironmental signals. In addition to in vivo modeling, laser
capture microdissection (LCM)-assisted gene profiling was utilized to identify novel
interactions and signaling networks. Cells were collected from distinct locations, including
migrating NCCs, from the in vivo model and analyzed using qPCR [210]. Pluripotency
markers were analyzed and SOX2 showed the highest expression in the migratory cells,
supporting the model used in the current study that also suggests a role for SOX2 in the NC.
Although the spatiotemporal expression of SOX genes in the NC has not been fully
investigated, some of these genes have been analyzed in detail, e.g. SOX10 [313]. SOX10 is
expressed in early migrating NCCs [314, 315]. In detailed investigations of NC-derived cells
in vitro, SOX10 was required for survival and glial differentiation [316]. High expression of
SOX10 was observed throughout the days of differentiation towards the ectodermal lineage
Discussion
88
in our melanocyte differentiation protocol (Figure 7b), which suggests that this protocol not
only follows a NC-like path but that SOX10 is also important for this lineage determination.
During the differentiation process, SOX2 expression levels remain lower than SOX10
expression levels but remain detectable even at late differentiation stages, suggesting that
complete ablation of SOX2 is not required for successful ectodermal lineage differentiation.
Moreover, these experiments were normalized to hiPSCs, therefore SOX2 expression levels
remain equivalent or slightly to that of hiPSCs (Figure 7b).This is in agreement with the fact
that the majority of terminally differentiated cells derived from the ectoderm requires the expression of SOX2, such as neurons (Figure 7b) (reviewed in [303]).Conversely, SOX2 has
been reported to inhibit NC formation and subsequent EMT in avian studies [313]. Moreover,
SOX2 is actually downregulated in both early premigratory and migratory NCCs [11, 313]. In
neural plate explants and in the embryonic ectoderm, SOX2 expression was aberrant and
mutant forms of SOX2 were used to reveal that SOX2 is an inhibitor of NC formation [313].
This may explain the lower levels of SOX2 expression seen throughout the melanocyte differentiation protocol compared to SOX10 expression (Figure 7b). Moreover, the observed
downregulation of NC-related markers, such as SOX10, upon the overexpression of SOX2 in
the human melanoma cell lines (Figure 12a) might be explained by the inhibitory effect
SOX2 has on the neural crest during development. The patterning of SOX10 vs. SOX2
observed during melanocyte differentiation from hiPSCs is in line with this hypothesis (Figure 7b). Since SOX2 was suggested to be an inhibitor of the induction of NCCs, the
expression of SOX2 found in NC-derived cells remains under investigation (Figure 7c).
However, the expression of SOX2 in this NCC- population may provide evidence that further
characterization of these cells is needed to ensure the population contains cells in the pure
NC-state.
In summary, the temporal expression of SOX2 and SOX10 during the ectodermal-specific
differentiation supports developmental studies showing the importance of SOX10 expression
and lower relative levels of SOX2 for successful ectodermal lineage development and
progression. Several studies, including the current one, reveal that NC development and the
characterization of melanocyte progenitors can be successfully simulated using in vitro
modeling systems. These model systems require full characterization to allow for
comprehensive analyses of melanocyte development that was otherwise impossible to study
due to constraints of animal models, ethics or limited resources.
6.2 Functional analysis of SOX2 in melanoma The function of stem cell-associated markers in cancer has been investigated in several
studies (reviewed in [317]). One study found significant overexpression of at least one out of
Discussion
89
the four pluripotency factors OCT4, SOX2, c-MYC or KLF4 in 45 % of cancer types
investigated using the Oncomine online database [283]. Another study identified three stem
cell markers, CD166, CD133 and NESTIN, and observed increased expression of these
markers in metastatic melanoma samples, where at least one of the markers was expressed
in all metastatic samples [290]. Taken together, these studies illustrate the importance of
stem cell-associated markers in cancer, including melanoma.
To date, limited research has been done on SOX2 in the context of malignant melanoma.
The 3-year median survival for patients with SOX2-positive metastatic melanomas
decreased by 145 days compared to patients with SOX2-negative metastatic melanomas
[283, 284], implicating role for SOX2 in melanoma progression. Further functional studies
have been performed linking SOX2 to melanoma cell invasion, growth and to NESTIN
expression [282, 284, 295, 318]. Recently, it has been demonstrated that SOX2 is crucial for
regulating self-renewal capacity and tumorigenicity in melanoma initiating cells via Hedgehog
(HH) signaling [286]. The complete understanding of SOX2 in melanoma pathogenesis
including its induction, regulatory mechanisms involved in SOX2 expression in melanoma
and potential protein binding partners of SOX2 remains not well understood. The current
study set out to confirm defined key functions of SOX2 in melanoma pathogenesis.
6.2.1 Genomic SOX2 amplification in melanoma Tumor formation and development occurs when a cell accumulates genetic aberrations that
alter normal cell cycle control. There are several means of genetic aberrations including gene
deletions or gene amplifications. Gene amplification is defined as a copy number increase of
a particular chromosomal region and SOX2 amplification is caused by multiplication of the
3q26.3 gene locus [264, 265]. SOX2 amplification has been widely studied in several cancer
types including glioblastoma, SCLC and many forms of SCC [264, 266–269, 271, 273, 319].
(reviewed in [262]). To date SOX2 amplifications have not been investigated in melanoma,
however the amplification of SOX2 in SCC is well established [269]. In order to understand if
amplification is one possible mechanism, by which the SOX2 gene is upregulated in
melanoma, fluorescence in situ hybridization (FISH) analyses were performed in primary
melanoma tissue using previously described protocols (Figure 8e-f, method describe in Supplemental section 8.1.1.1) [320]. Notably, SOX2 was significantly amplified in both low-
risk (≤1mm) and high-risk (≥1mm) primary melanoma compared to nevi samples (Figure 8e).
Additionally, all metastatic samples from lymph-nodes, in-transit (metastasis moving towards
lymph-nodes), skin and visceral organs, were significantly amplified when compared to melanocytic nevi (Figure 8e). A common drawback to this technique is the high false-positive
rate due to the evident co-localization of two signals, which occurs when viewing a three-
dimensional nucleus in two dimensions [321]. However, the location of the investigated locus
Discussion
90
and the clear pairs of reference signals per nuclei confirm the amplification observed
(Figure 8f).
Amplification typically correlates with expression levels and thus these data suggest
accelerated SOX2 expression in both low- and high-risk primary melanoma and metastatic melanoma compared to melanocytic nevi samples (Figure 8e-f). Correspondingly, these
results correlate with the significant increase of SOX2 expression in primary melanoma
compared to melanocytic nevi in the TMA analyses (Figure 15) and, in IHC analyses,
metastatic melanoma, displayed strong immunopositivity of SOX2 compared to slight staining of primary melanoma and no staining in the melanocytic nevi (Figure 8d).
Furthermore, SOX2 was seen to be highly expressed in 67 % of human melanoma cell lines
(n=9) (Figure 8a-b). Taken together, the amplification of SOX2 in melanoma likely enhances
SOX2 expression in primary and metastatic melanoma compared to melanocytic nevi.
6.2.2 SOX2 expression induces dedifferentiation of melanoma cells in vitro The differentiation status of tumor can have drastic impacts on the phenotype and
aggression of the disease. In fact, tumor cell dedifferentiation is a crucial step towards the
acquisition of invasive properties and even subtle changes in the differentiation status allows
tumor progression [301]. In epithelial cancers, i.e. carcinomas, both primary tumors and
corresponding metastasis display similar heterogeneous organization, where dedifferentiated
tumor cells are observed along the invasive front [218]. These regions of dedifferentiated
cells possess hallmarks of EMT and the acquisition of this process is now heavily associated
with tumor cell dissemination. In melanoma, the high heterogeneity allows for subpopulations
to switch into a more dedifferentiated phenotype, known in melanoma as the ‘phenotype-
switch’ (reviewed in [217]). The phenotype-switch is a phenomenon where melanoma cells
switch from a proliferative to an invasive state, which is a process that resembles the EMT
and permits the acquisition of therapy resistance [322]. The dedifferentiated subpopulations
within melanomas retain stem cell-like properties and dedifferentiation is a key step in
switching towards an invasive phenotype that also correlates to therapy resistance. In
regards to therapy resistance, differentiation-related markers were downregulated and the
dedifferentiation-related marker p75 (also known as NGFR and CD271) was upregulated
upon TNF-α treatment, which mimics immunotherapy-induced tumor inflammation [323].
Moreover, in B16 murine melanoma cells, the inhibition of MITF led to the upregulation of
stem cell-associated markers, OCT4 and NANOG, and promoted an invasive phenotype
[219]. This agrees with work revealing that MITF expression regulates the phenotype switch
and controls dedifferentiation in melanoma [214, 215, 304].
Discussion
91
Although SOX2 expression is low in terminally differentiated melanocytes the observed
expression of SOX2 in melanoma may be caused by insufficient silencing of SOX2 in
melanocyte precursors which facilitates tumorigenic potential; this supports the theory that
cancers arise from early progenitor or cancer stem cells. Conversely, SOX2 may be
expressed in melanoma but not in melanocytes due to early molecular events during the
initiation of transformation process which leads to the re-expression of SOX2 in melanoma
cells. However, to date, the reactivation of SOX2 in human melanoma and its influence on
melanoma dedifferentiation remains unknown.
Studies in murine melanoma cells revealed that SOX2 is capable of binding directly to the
promoter of MITF-M [297], suggesting a connection between SOX2, MITF expression and
dedifferentiation of melanoma cells. Here, binding of human SOX2 to the human promoter of
MITF-M promoter was suggested using a computer-based DNA sequence analysis with
JASPAR [298]. One putative binding site that matches results from the murine study was
confirmed (Figure 9e). Furthermore, there is high conservation between mouse and human
for this particular binding site (Figure 9h) [299], which further supports the identification of a
putative binding site for SOX2 on the MITF-M promoter in silico. However, future chromatin
immunoprecipitation experiments are required to confirm this in vitro. Consistent with results
from the mouse study, I observed a functional repression of the MITF promoter upon SOX2 expression using luciferase reporter assays (Figure 9g, method described in Supplemental section 8.1.2.4). However, in the murine work an approximate 80 % repression was
observed [297], in contrast to 20 % repression that was observed using SOX2 overexpression in human melanoma cells (Figure 9g). There are several explanations for
this variance regarding the repressive effect of SOX2 expression on MITF-promoter activity
between the human and murine system. First, the difference in species may represent one
reason for the difference in functionality of SOX2-mediated repression of the MITF-M
promoter activity. However, due to the high conservation of the SOX2 binding site of interest,
it is unlikely that the difference in species influences functional assays to such an extent.
Secondly, another explanation might be the experimental setup used in the current work
compared to the murine studies. In the B16 murine melanoma study, a MITF reporter was
used that contains a fragment of the full-length MITF promoter including the regions between
-515 and +90 [60], which contained the SOX2 binding site. This setup omitted further
upstream activation elements including additional SOX10 binding sites [297]. In contrast, the
reporter system used in the current study includes the full-length MITF-M promoter and
therefore possesses all activation sites for SOX10 upstream from the SOX2 binding site
[300]. In other words, the slight repression of the human MITF-M promoter observed in
Discussion
92
SOX2-overexpressing human melanoma cells is likely weakened due to potential SOX10-
activation sites located upstream, which were eliminated in the murine studies.
The implications of SOX2 binding to the MITF-M promoter in human melanoma cells would
explain the downregulation of MITF upon SOX2 overexpression and upregulation upon SOX2 knockdown (Figure 9d-f, Figure 11f). To confirm the loss of MITF protein expression
was due to SOX2 overexpression and not doxycycline or G418 side effects SK Mel 30-OE
cells were cultured in the absence of doxycycline, treated with G418 or in the presence of
both and immunoblotting of MITF revealed no difference compared to the non-selected cells
(not shown). Therefore, the downregulation of MITF was caused by the upregulation of
SOX2. For further experiments, only non-induced cells were used for control. Furthermore,
the location of the putative binding site for SOX2 in the human MITF-M promoter revealed
that this site is identical to a SOX10 binding site. This suggests that SOX2 and SOX10
compete for binding at this particular binding site to either repress or activate the MITF-M
promoter, respectively. It is of interest whether or not competitive binding assays will confirm
this hypothesis. Nevertheless, the current study suggests one mechanism, by which SOX2
may be contributing to melanoma dedifferentiation through binding and repressing the MITF-
M promoter in vitro.
6.2.3 SOX2 is required for melanoma cell invasion and induces EMT-marker expression
Activating invasion and enabling metastasis is not only a hallmark of cancer in general but
also causes most cancer-related deaths, especially in malignant melanoma [202]. Invasion
and metastatic spreading are processes that alter tumor cell shape and their attachment to
other cells and the extracellular matrix (ECM). Alterations in cadherin expression represent a
well characterized feature of invasive cells [202]. Typically, invasive cells lose their
expression of E-cadherin (CDH1), which is a key cell-to-cell adhesion molecule. In contrast,
N-cadherin (CDH2) is upregulated in invasive tumor cells and gives the cells a more
meschenchymal phenotype [202]. In 2003, a depiction of the connections between invasive
properties of cancer cells and metastatic spreading was described by Fidler [324, 325].
There are different stages in tumor cell invasion and metastatic dissemination. First, local
invasion is detectable, followed by intravasation of tumor cells into neighboring blood and
lymphatic vessels. The tumor cells are transported through these circulation systems, then
escape from lumina into distant tissues by extravasation and finally, they form small nodules
of tumor cells, i.e. micrometastases [202, 324, 325].
The EMT has been implicated in regulating both, tumor cell invasion and metastatic spread.
This developmental regulatory process allows tumor cells to gain abilities to resist apoptosis,
Discussion
93
invade and disseminate from the primary tumor [202, 218]. A set of transcription factors,
mainly SNAI1 (SNAIL), SNAI2 (SLUG), TWIST and ZEB1/2 are responsible for orchestrating
the EMT process and many of these factors have been implicated in melanoma invasion and
metastasis [218]. These transcription factors are responsible for several hallmark features of
invasive cancer cells including: loss of adherent junctions, changes in morphology and
polarity [202].
To date, many associations have been made between SOX2 expression and tumor cell
invasion (reviewed in [262]). For example, SOX2 has been implicated in cellular migration
and invasion in vitro by regulating MMP-2 in colorectal cancer cells [326]. Likewise, the
overexpression of SOX2 in a glioma cell line resulted in significant increase in migratory and
invasive properties of cells [273]. This association has also been demonstrated in melanoma.
A SOX2 knockdown study in the human melanoma cell line A375 showed a 4.5-fold
decrease in invasive capacity [284]. Results from this current study confirm this by
demonstrating that both, migratory and invasive capacities were significantly increased in the human melanoma cell line SK Mel 30 upon SOX2 overexpression (Figure 10a & c) In
agreement, shRNA-mediated knock down of SOX2 expression in the human melanoma cell
line SK Mel 103 confirms a significant decrease in invasion capacity (Figure 11e). Taken
together, the current study confirms that SOX2 is required for melanoma cell invasion, which
is in line with results from previous studies.
SOX2 expression has also been investigated in melanoma patients. In preliminary analyses
SOX2 immunopositivity correlated with dermal invasion and was found in close proximity to
invasive-fronts of a melanoma [282, 284]. Here, using immunohistochemistry analysis, high
expression of SOX2 in primary and metastatic melanoma patient samples compared to melanocytic nevi was confirmed (Figure 8d). Moreover, a drastically increased
immunopositivity of SOX2 was found in deeper regions of primary melanoma samples
(Figure 10e). In line with previous studies and the functional data, high SOX2-positive cells
were observed invading into the extracellular matrix (Figure 10f), between fat cells
(Figure S4b), into the epidermis (Figure S4a) and along nerve cells (Figure 10g). These
results further indicate an important role for SOX2 in melanoma cell invasion, not only in
vitro, but also in melanoma patients in vivo.
Tumor cell invasion is mainly regulated and orchestrated by a set of transcription factors
(TFs) governing the EMT process. SOX2 has been demonstrated in many cancer types to be
associated with these EMT-TFs. For example, in colorectal cancer cells, SOX2 induced
EMT-TFs which led to the downregulation of E-cadherin [327]. Melanoma represents a
unique case in EMT-TF expression because normal melanocytes express SNAIL2 and ZEB2
Discussion
94
and these markers activate the MITF differentiation program resulting in tumor-suppressive
signaling. However, upon melanoma initiation, either by BRAF or NRAS hyperactivation, the
EMT-TF network undergoes dramatic restructuring and the expression of TWIST1 and ZEB1
are favored [203]. Moreover, after this reorganization, melanoma cells are more
dedifferentiated and invasion is enhanced. Results from the current study are in agreement
with this work since SOX2 leads to melanoma cell dedifferentiation and is required for melanoma cell invasion (Figure 9-10). Furthermore, upon the overexpression of SOX2 in the
human melanoma cell line SK Mel 30, an upregulation of both ZEB1 and TWIST1 expression was observed (Figure 10b). Additionally, in the knockdown of SOX2 in SK Mel 103
melanoma cell lines, a slight increase in SNAI2 and ZEB2 expression was demonstrated (Figure 11f). Taken together, this suggests that SOX2 may be involved in regulating several
aspects of the melanoma invasive switch, by controlling dedifferentiation which may in part
be caused via repressing the MITF-M promoter, being required for melanoma invasive
capacity and enhancing EMT-TFs, TWIST1 and ZEB1, identified to be involved in melanoma
progression.
Linking SOX2 to these aspects further implicates SOX2 in the melanoma phenotype switch.
This switch describes highly proliferative cells with low invasion capacity, which is converted
into highly invasive and slow proliferating cells during melanoma progression. This switch
provides melanoma cells with mechanisms in progression, maintenance and evasion of
melanoma therapy [304]. After investigating SOX2 in melanoma cell invasion, the effect of
SOX2 overexpression on melanoma cell metabolism was investigated. Thereby, a significant
decrease in melanoma cell metabolism in the SOX2 overexpressing cells was revealed (Figure 10d) although knockdown experiments had little effect on the metabolism (Figure 11d). It is important to mention that the alamarBlue® assay is a metabolism-based method
and therefore one cannot rule out that metabolic changes may lead to altered reduction of
the dye without true impact on the cell cycle. Further cell cycle analysis using fluorescence-
activated cell sorting (FACS) is needed to reveal whether SOX2 overexpression had a
cytostatic effect or induced apoptosis resulting in cellular cytotoxicity. Furthermore, one
explanation why there was not a significant increase in invasion and in turn significant
decrease in cellular metabolism in the SK Mel 173-OE may be explained by the lower levels
SOX2 overexpression observed in this cell line compared to the high levels of SOX2 in the SK Mel 30-OE (Figure 9b). Therefore, the effect seen is only a slight tendency but not
significant. Nonetheless, these studies suggest that SOX2 overexpression induces a highly
invasive, slowly proliferative phenotype and taken together with the knockdown studies,
SOX2 is required for melanoma cell invasion in vitro, but not cellular metabolism.
Discussion
95
In summary, SOX2 is a key regulator in melanoma cell plasticity. This stem cell-marker
dedifferentiates human melanoma cells by repressing the MITF-M promoter, is required for
melanoma cell invasion and upregulates EMT-TFs related to dedifferentiation and an
invasive phenotype.
6.3 SOX2 expression is induced by TGF-β signaling The mechanisms of melanoma cell invasion and metastatic spreading are governed by
several signaling pathways, mainly TGF-β and WNT/β-catenin signaling. The initiation of
invasive properties is predominantly induced by the EMT process. EMT-like processes are
typically initiated in epithelial precursor cells in response to extrinsic TGF-β stimulation.
TGF-β has been described as a potent inducer of the EMT [328, 329] via SMAD-related or
SMAD-independent pathways [330], and the blockade of transforming growth factor receptor-
I (TGFBRI) led to the induction of a more epithelial phenotype [204]. Furthermore, in human
carcinomas, characteristic features of the EMT were observed at the invasive front of the
tumors, an area containing high levels of stromal TGF-β [166]. In melanoma, the common
routes towards tumor cell invasion heavily involve TGF-β signaling. A reduction in colony
formation, invasion and expression of MMP-2 and MMP-9 was observed after the
overexpression of the inhibitory SMAD protein, SMAD7 [331]. Furthermore, studies in mice
demonstrated that similar to breast cancer bone metastasis [332, 333], SMAD7
overexpression blocked melanoma bone metastasis [171].
For these reasons, an understanding of the mechanisms controlling TGF-β signaling is
needed to prevent invasion and metastatic spreading. In glioma-initiating cells, TGF-β was
found to induce the expression of SOX2 in vitro. This mechanism was confirmed in
melanoma in two independent human melanoma cell lines after one week of TGF-β stimulation (Figure 13b & e). Moreover, a more mesenchymal phenotype was observed
upon stimulation, where cells stimulated with TGF-β had long protrusions and loss of the
polygonal body shape (Figure 13a). In accordance with this, drastic upregulation of
N-cadherin expression and corresponding downregulation of E-cadherin was found (Figure 13g), demonstrating the key characteristics of the activation of tumor cell invasion [202].
As described in Section 6.2.3, melanoma cells undergo dramatic reorganization of EMT-
related TFs upon tumor initiation [203]. Moreover, this reorganization operates upstream of
MITF and controls dedifferentiation and melanomagenesis. The EMT-TFs ZEB1 and TWIST1
were found to induce TGF-β and, in turn, melanoma cell invasion [203]. In line with these
findings, data from the current study suggest that SOX2 is playing a critical role in this
process. This study proposes that TGF-β1 induces SOX2 expression, which may lead to
melanoma progression by: i) SOX2 binding and repressing the MITF-M promoter, which may
Discussion
96
influence the dedifferentiation of human melanoma cells, and ii) SOX2 inducing high
expression of ZEB1 and TWIST1, which promotes a mesenchymal phenotype. In line with
the described phenotypic alterations, this work revealed that SOX2 enhances melanoma cell
migration and invasion and depletion of this transcription factor results in loss of cellular
motility. The overall phenotype observed upon the overexpression of SOX2 matches parts of
EMT-TF restructuring and the dedifferentiation phenotype in melanoma. Therefore, I
identified a key player in this complex network that is responsible for several mechanisms
observed in aggressive melanoma. Future experiments will solidify these finding, such as
chromatin immunoprecipitation (ChIP) experiments to elucidate the possible direct regulation
of EMT-TFs by SOX2 promoter binding. This has been demonstrated in pancreatic cancer,
where SOX2 was demonstrated to bind to the promoter of SNAI1 [327]. Furthermore, in
affinity capture mass spectrometry experiments, SOX2 was found to potentially form a
protein-protein interaction with ZEB2 [334], which may be another mechanism by which
SOX2 controls the restructuring of the EMT-TF network in melanoma to promote the invasive
phenotype switch.
Interestingly, the results from the current study also suggest a unique role for SOX2 in
regulating itself and possibly parts of the TGF-β signaling pathway. The induction of several
TGF-β-related markers: TGFβR2, TGFβR3 and JUN in SK Mel 30 SOX2 overexpressing cells was demonstrated (Figure 13h). This suggests that SOX2 may be involved in a positive
feedforward loop in regulating first, TGF-β signaling-related genes and second, itself since
SOX2 expression is also induced by TGF-β. Furthermore, this has been demonstrated in
pluripotency and SOX2 was found to contain SOX2 binding sites for its own autoactivation
[335]. It is of great interest to understand this mechanism in more detail and further studies
need to be done to confirm this, such as determining if SOX2 can bind the promoters of
genes involved in TGF-β signaling using ChIP analysis.
6.4 SOX2 may form potential interactions with several melanocyte- and SUMO-related proteins
Understanding expression levels of particular gene sets gives an impression of the cellular
state, activated signaling pathways and possible phenotypes. However, there are many
levels of regulation that are involved in controlling cellular functions, such as protein-protein
interactions. SOX2 is essential in embryogenesis and development, and there are many
different partners that can associate with SOX2 (Figure 2c). The recent association between
SOX2 expression and tumorigenesis has led to investigations attempting to identify novel
SOX2-interacting partners in the context of cancer. Mass spectrometry studies identified
several novel heterogeneous nuclear ribonucleoprotein family proteins, including
Discussion
97
HNRNPA2B1, HNRNPA3, as well as other ribonucleoproteins, DNA repair proteins and
helicases as potential interacting partners of SOX2 if glioblastoma [257].
Next to mass spectrometry, the bimolecular fluorescence complementation (BiFC) assay can
be used to determine novel interactions between proteins. [336]. The principle of the BiFC
assay is the reformation and fluorescence of two fragments of a single fluorescent protein
upon interaction. Using BiFC experiments, interactions between three proteins, ERNI, BERT,
and Geminin, were found to modulate the choice of repressors and regulate SOX2
expression in early neuronal development [337]. The experiments performed in the current
study investigated potential interactions between SOX2 and PAX3, and between SOX2 and
SOX10, respectively, using BiFC experiments. PAX3 was chosen since it is known to be
important for the melanocytic lineage and responsible for co-activating the MITF promoter
[56, 92, 338, 339]. Moreover, studies discovered that PAX3 interacts with SOX10 using its
paired domain that binds to the HMG domain of SOX10 [92]. Therefore, it is likely that SOX2
may be using its HMG domain to form an interaction with the paired domain of PAX3.
The interactions between SOX family members remain not well studied. However, the
interaction between SOX2 and SOX10 would have immense impact on further understanding
the regulation between the two. Results from the current study suggest that in melanoma,
SOX2 operates upstream of SOX10, since knockdown of SOX10 had no effect on the expression of SOX2 (Figure 12). Therefore, further investigations are needed to understand
the reciprocal role and possible interactions between these two proteins and what functional
effect this has in vitro.
Upon co-transfection of SOX2-bait and either PAX3- or SOX10-prey constructs into
HEK293T cells, a positive fluorescent signals was observed when using both combinations (Figure 14a), with fluorescence at levels similar to the positive control. This experiment was
performed three times independently with a reproducible outcome indicating true interaction
between SOX2 and PAX3 or SOX10, respectively. However, these results must be
confirmed using parallel BiFC analysis of proteins containing mutated interaction interfaces.
It is important to note that although these studies are performed in vitro, the prospect of false
positives is still possible since the overexpression of proteins may not represent proteins
concentrations reached in vivo.
Yeast-2-hybrid (y2h) pairwise experiments were performed to verify these observed
interactions in a different system. PAX3-SOX2 interactions were analyzed in the y2h pairwise
setup with PAX6 a positive control (known interactor of SOX2) [245]. However, difficulties
were observed because SOX2 showed strong autoactivation tendencies. Therefore, it cannot
completely be ruled out that the effect of autoactivation in the y2h pairwise experiments
Discussion
98
influences the results. Nonetheless, weak colony growth was observed in the PAX3/SOX2
mating at the highest stringency of 2.0 mM 3-AT, though there was great variability between replicates (column) (Figure 14d, bottom panels). Another level of stringency used in y2h
experiments is 3-amino-1, 2, 4-triazole (3-AT). This molecule is a competitive inhibitor of the
product of the HIS3 gene, reducing possible autoactivation and false positives.
Furthermore, we aimed at confirming the interactions between SOX2-SOX10 in pairwise y2h
experiments; however the overexpression of both SOX2 and SOX10 proved to be lethal in yeast even at the lowest 3-AT concentrations tested (Figure 14d, upper panels). Therefore,
possible interactions between SOX2 and SOX10 could not be confirmed in yeast (Figure 14).
Since the yeast-2-hybrid (y2h) pairwise experiments could not independently confirm these
interactions, these experiments should be repeated using SOX2-bait construct lacking the
HMG domain to remove autoactivation tendencies. The autoactivation function of the SOX2
protein has been thoroughly studied, as previously mentioned, and SOX2 itself contains
SOX2 binding sites to regulate its own transcription. In the field of pluripotency this has been
well described and SOX2 has been shown to autoactivate itself in a complex and well-
described pluripotency circuit [335, 340].
TWIST1 is known to be implicated in cell lineage determination and the EMT process.
Therefore, the interaction between SOX2 and TWIST1 would further implicate SOX2 in the
regulation of the EMT process. The interaction between SOX2 and TWIST1 was found in
affinity capture-mass spectrometry [261], but was not the focus of the study. This work
suggests that SOX2 and TWIST1 are likely to interact but further in vitro studies need to
confirm this. Nonetheless, y2h pairwise experiments for TWIST1 were performed but due to
the strong SOX2 autoactivation, false positive results cannot be completely ruled out.
Nevertheless, weak colony growth in the TWIST1/SOX2 mating setup was observed at the
highest stringency of 2.0 mM 3-AT; however between replicates (column) there was great variability, due to technical problems (Figure 14d, bottom panels).
In conclusion, SOX2 may form potential protein-protein interactions with PAX3, SOX10 and
TWIST1; however this needs to be confirmed by further protein studies, such as co-
immunoprecipitation.
In addition to protein-protein interactions, cellular regulation can also occur through post-
translational modifications. These modifications include protein cleavage or additional protein
folding, which can allow additional co-factors to bind or complexes to form. SUMOylation is a
Discussion
99
type of post-translational modification by which a SUMO molecule is attached by reversible
covalent linkage (reviewed in [247]).
In the SOX family, SUMOylation has been shown to be important for functional diversity in
the SOXE subgroup. Studies found that in Xenopus, both SOX9 and SOX10 can be SUMO-
modified in vivo [248]. Non-SUMOylatable SOX9 and SOX10 promoted the expression of NC
markers and the SOX9/10-SUMO-1 fusion inhibited the expression of NC markers.
Moreover, neither phenotype was able to completely reproduce the wildtype (WT)
phenotype, which suggests that both unmodified and SUMOylated forms of SOXE proteins
contribute to the activities of WT SOXE family members in vivo [248, 249]. Additionally,
another study observed that SUMOylation of SOX10 represses the transcriptional activity of
its target genes, including MITF [250]. In addition to the SOXE group, a study found that
SOX2 reduced its binding to the FGF4 enhancer element when conjugated to SUMO-1 [252].
In accordance to these studies, four SUMO-related proteins were identified that may form protein-protein interactions with SOX2 in y2h high throughput screens (HTS) (Figure 14e). In
detail, Small ubiquitin-related modifier 1 (SUMO1), Ubiquitin-conjugating E2I (UBE2I), E3
SUMO-protein ligase (PIAS4), and chromobox homolog 4 (CBX4), which is also an E3 SUMO-protein ligase were found (Figure 14e). Interestingly, SOX2 was shown to bind to
SUMO1 in another study using y2h HTS and bioinformatics analyses [341]. Furthermore,
other hits were previously identified, including SOX2 interaction with CBX4, using affinity
capture mass spectrometry [334]. These studies support results derived from the y2h HTS
used in the current study and suggests that true interaction partners of SOX2 and not false-
positives were identified. Validation of these hits and the function of their interaction with
SOX2 remain under investigation.
In summary, this work suggests that SOX2 may be SUMOylated and this could have further
functional implications. There may be important functional effects of SUMOylation on SOX2
in melanoma that remain unknown, since one study found the conjugation of SOX2 with
SUMO1 decreased the transcriptional activity of the protein [252]. Furthermore, I could
predict two SUMOylation sites within the SOX2 protein using GPS-SUMO online database;
one located close to the HMG domain and the other one located in the transactivation domain (Figure 14f-g). This further supports results from the y2h HTS. Taken together, the
identification of four SUMO-related proteins and identification of putative SUMOylation sites
in the SOX2 protein suggests that SOX2 can be SUMOylated. Therefore, the role of
SUMOylation in the context of SOX2 may be crucial in further understanding its regulation in
melanocyte development and melanoma.
Discussion
100
6.5 SOX2 in the clinic Malignant melanoma remains a challenging disease to treat due to the acquisition of
resistance and fast metastatic spread. Therefore, the identification of new markers for
prognostic and therapeutic intervention would greatly benefit melanoma patients. SOX2 has
proven to be clinically relevant in many different cancer types. Not only is SOX2 highly
expressed in many different cancer types but it has also shown potential as a useful
biomarker in the clinic for some cancer types, for the identification of cancer stem cell
populations and in tumor staging (reviewed in [262]). For example, SOX2 was found to be
overexpressed with SALL4, another stemness regulator, in esophageal cancer samples.
Moreover, the co-expression of these markers correlated with depth of tumor invasion and
occurrence of metastasis [342].
To date, only a few studies have investigated the impact of SOX2 in the clinic. Studies found
that SOX2 and NESTIN expression are able to distinguish between melanocytic nevi and
metastatic melanoma samples [282, 318]. Moreover, SOX2 was discovered to be present in
up to 67 % of primary and 80 % of metastatic melanomas compared to only 14 % in
melanocytic nevi samples [281, 284]. This work is in line with the tissue microarray (TMA)
data form the current study where a significant increase in expression of SOX2 was observed in primary melanoma compared to melanocytic nevi samples (Figure 15b).
Furthermore, bioinformatic studies investigating embryonic stem cell-associated markers in
cancer analyzed mRNA expression using the Oncomine database. They revealed that the 3-
year median survival was decreased by 145 days in SOX2-expressing metastatic melanoma
patients compared to those patients with SOX2-negative metastatic tumors [283]. Taken
together, these data illustrate the potential ability of SOX2 to become a powerful diagnostic
tool in melanoma.
For the most part, therapeutic strategies targeting SOX2 remain unrealistic due to the
functional nature of the protein and its importance in many normal processes. Nonetheless,
recent studies have attempted to investigate SOX2 as a therapeutic target. For example, one
study in oligodendroglioma, examined the use of SOX2 peptides for immunotherapy
treatment in mice [343]. C57BL/6N mice were injected with WT oligodendroglioma cells from
an established mouse model and, upon vaccination with SOX2 peptides, a significant delay
in tumor growth was observed (reviewed in [262]). In another study, an experimental DNA
vaccine against SOX2 was developed and, upon injection, found to significantly induce
SOX2-specific lymphocyte activation. The vaccine was able to significantly reduce tumor
growth but not prevent development in mice [344].
Discussion
101
Though a few studies have provided experimental evidence that direct inhibition of SOX2
may have a therapeutic benefit in mice, targeting SOX2 directly remains impractical in
humans, since the proper function of this protein is also important in many aspects of cellular
function. Furthermore, SOX2 remains highly expressed and important in the brain and
nervous system throughout adulthood and targeted therapy will likely cause many unwanted
complications (reviewed in [262]). Nonetheless, targeting up- or-downstream of SOX2 may
prove beneficial in anticancer therapy. In NSCLC CSCs, SOX2 is highly expressed and relies
heavily on EGFR signaling in order to promote self-renewal [345]. Anticancer therapies
targeting EGFR currently available on the market include gefitinib and erlotinib. These
molecules may prove useful in inhibiting SOX2’s role in self-renewal capacity of NSCLC
CSCs. However, resistance acquisition to anti-EGFR therapies is common in cancer cells
and therefore it may be useful to further target SOX2-signaling in EGFR-mutant cancer cells
with PI3K/AKT inhibitors to yield better results (reviewed in [262], [345]).
My work suggests that SOX2 plays a pivotal role in the melanoma phenotype switch by
dedifferentiating melanoma cells, enhancing invasion and inducing expression of EMT-TFs.
Since highly invasive, slowly proliferating cells are more prone to melanoma therapy
resistance, work has been done to investigate if switching these cells back to a highly
proliferative, poorly invasive phenotype might be a successful anti-melanoma therapy option
[322]. A directed phenotype switching method demonstrated the sensitization of melanoma
cells to lineage-specific therapies [346]. Upon methotrexate (MTX) treatment, cells
expressed MITF, showed differentiation-associated marker expression and inhibited
invasiveness. Furthermore, after treatment with MTX, cells were sensitized to treatment with
the tyrosinase-processed antifolate prodrug 3-O-(3,4,5-trimethoxybenzoyl)-(-)-epicatechin
(TMECG) [346]. This strategy shows the potential of inducing a phenotype switch as an
effective, tissue-specific treatment for aggressive melanoma both in vitro and in vivo.
However, successful pre-clinical and clinical trials need to be performed before this therapy
can be applied to patients in the clinic.
In light of these new results suggesting that SOX2 can be induced by TGF-β (Figure 13),
several new therapeutic options are now being investigated to be utilized for the treatment of
melanoma. The complexity of TGF-β signaling, as discussed above, also presents intricacies
in therapy targeting TGF-β. The inhibition of TGF-β signaling through antagonists is currently
under development in both pre-clinical and clinical studies (reviewed in [347]). To date, there
are several options to target this pathway, including ligand traps [348], antisense
olignonucleotides (ASOs) [349], peptide aptamers [350] and small molecule receptor kinase
inhibitors [351]. Ligand traps, including anti-ligand neutralizing antibodies and soluble decoy
receptor proteins, are able to capture excess TGF-β ligand produced by tumor cells and
Discussion
102
fibroblasts, blocking the progression of tumor development [166, 352–354]. Similarly, ASOs
can reduce the bioavailability of TGF-β ligands in the local microenvironment by directly
blocking TGF-β synthesis and leading to enhanced mRNA degradation [355]. Another
strategy is blocking the activity of TGF-β receptor signaling by using small kinase inhibitors
that competitively block ATP catalytic activity. Moreover, additional targets include the
intracellular SMAD proteins, which can be inhibited by using peptide aptamers that target,
bind and interfere with SMAD downstream function (reviewed in [347]).
All TGF-β therapeutic strategies face complex and problematic overlapping mechanisms that
are essential for normal physiological function (reviewed in [347]). For instance, outgrowths
of drug-resistant carcinomas was observed in a mouse study after long-term suppression of
the TGF-β signaling pathway using the TβRI/II kinase inhibitor, LY2109761, [356]. However,
with correct dose and duration of treatment with TGF-β therapies, beneficial outcomes may
follow especially in malignant melanoma.
Current pre-clinical and clinical trials using the therapeutic strategies targeting TGF-β
signaling mentioned above are ongoing. Of these, the ligand traps are fully developed, with
humanized pan-TGF-β monoclonal neutralizing antibodies, including Lerdelimumab [357,
358], Metelimumab [359] and GC1008 or Fresolimumab [360]. In 2014, Genzyme sponsored
a clinical trial for investigating GC1008 in patients with advanced renal cell carcinoma (RCC)
and malignant melanoma. 25 % of malignant melanoma patients exhibited stable disease or
improvement upon receiving therapy. Of those responders, 21 % had stable disease with a
median progression-free survival of 24 weeks and one patient achieved partial repsonse
[360]. Another pre-clinical study investigated the kinase inhibitor of TGF-β receptor I kinase
(TβRI), SD-208, and revealed a reduction in both, progression and frequency of bone
metastases in mice [361]. Further clinical trials will help to gain final approval of anti-
melanoma treatment using TGFβ-targeted therapy.
The benefit of targeting TGF-β may improve the therapeutic prospects of success of
melanoma patients in the future. Whether or not this tumor suppressive effect, which is seen
when TGF-β signaling is impeded, is partially due to the downregulation of SOX2 remains
unknown and future investigations are required to solidify the role of SOX2 in TGF-β
signaling and anti-melanoma therapy.
Conclusions
103
7 Conclusions In the present study, I investigated the function of SOX2 in both, melanocyte differentiation
from human induced pluripotent stem cells (hiPSCs) and melanoma progression. This work
highlights the importance of this transcription factor during the differentiation from hiPSCs via
the ectodermal lineage into fully differentiated melanocytes. It also outlines that SOX2 may
regulate key processes in melanoma pathogenesis.
The ectodermal germ layer specifies different lineages such as neuronal cells, retinoid
pigmented epithelial cells and melanocytes. Interestingly, upon directed ectodermal lineage
differentiation from hiPSCs, expression of all pluripotency markers decreased while SOX2
remained moderately expressed, which suggests its role in this specific germ layer. Since
SOX2 plays a role in the development of neurons its expression in cells derived via
ectodermal-directed lineage differentiation is expected. However, this work proposes the
investigation of early ectodermal markers in ectodermal-derived tumors, since these genes
may also be reactivated during carcinogenesis. To date, melanoma research has focused on
the predisposition of the lineage to malignant transformation due to its neural crest
developmental program; however this work suggests that it may also be the reactivation of
early ectodermal markers that are responsible for malignant behavior
In-depth functional analyses of SOX2 in melanoma pathogenesis revealed multiple facets of
SOX2 function emphasizing the importance of investigating ectodermal lineage markers in
melanomagenesis. Upon the overexpression of SOX2 in melanoma cells, a change of the
differentiation state in human melanoma cells was observed in vitro, which I demonstrated,
may be achieved through its binding and repressing of the MITF-M promoter.
Dedifferentiation in melanoma correlates to the aggressive behavior of melanoma cells and
in agreement with that, SOX2 also demonstrated to enhance melanoma cell invasion and
migration functionally, in combination with upregulated epithelial-to-mesenchymal transition
(EMT) marker expression. In line, its depletion led to a loss of motility and EMT-marker
expression. The invasive melanoma phenotype seems to rely heavily on the upregulation of
SOX2 in order to orchestrate invasion-related processes including the induction of the EMT
and repression of differentiation-related markers
The regulation of SOX2 in melanoma remains unknown even though it plays a crucial role in
melanoma pathogenesis. This study found additional genomic SOX2 copy numbers in
primary and metastatic melanoma samples compared to melanocytic nevi, which correlated
to SOX2 overexpression in tissue samples. On a molecular level, TGF-β1 was found to
induce SOX2 expression in human melanoma cell lines. This suggests TGF-β to be an
upstream regulator of SOX2 in melanoma, and furthermore SOX2 may play a role in a
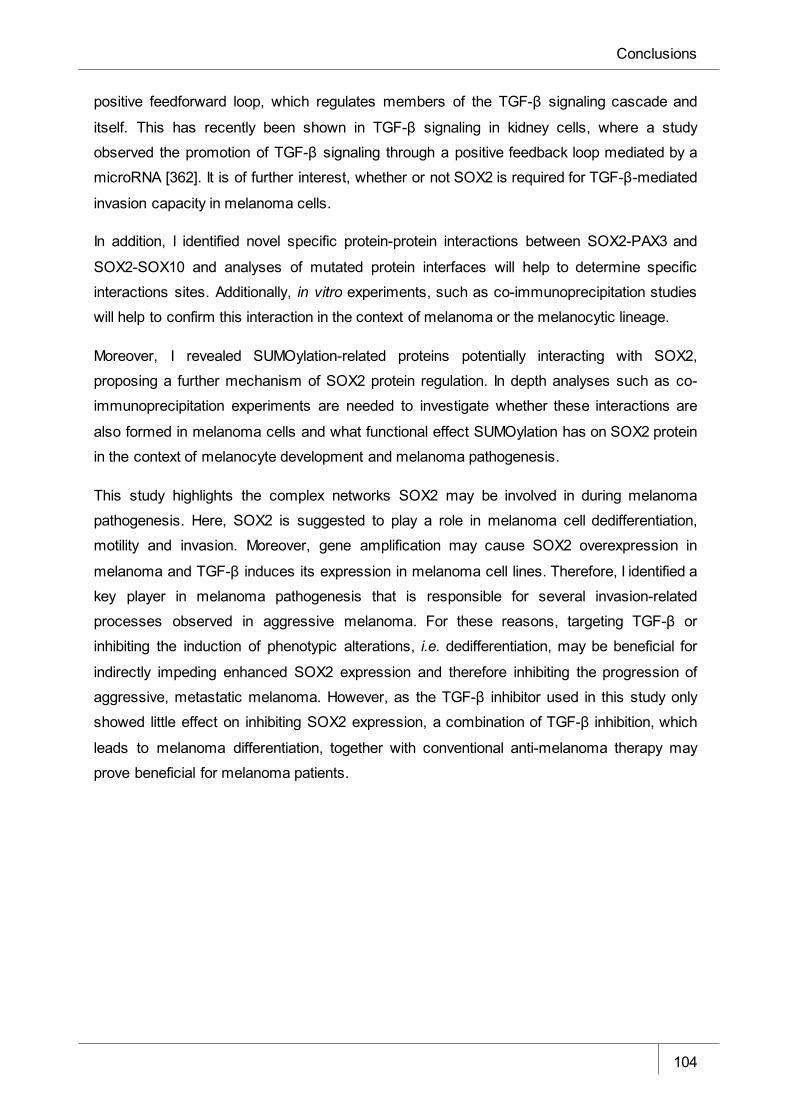
Conclusions
104
positive feedforward loop, which regulates members of the TGF-β signaling cascade and
itself. This has recently been shown in TGF-β signaling in kidney cells, where a study
observed the promotion of TGF-β signaling through a positive feedback loop mediated by a
microRNA [362]. It is of further interest, whether or not SOX2 is required for TGF-β-mediated
invasion capacity in melanoma cells.
In addition, I identified novel specific protein-protein interactions between SOX2-PAX3 and
SOX2-SOX10 and analyses of mutated protein interfaces will help to determine specific
interactions sites. Additionally, in vitro experiments, such as co-immunoprecipitation studies
will help to confirm this interaction in the context of melanoma or the melanocytic lineage.
Moreover, I revealed SUMOylation-related proteins potentially interacting with SOX2,
proposing a further mechanism of SOX2 protein regulation. In depth analyses such as co-
immunoprecipitation experiments are needed to investigate whether these interactions are
also formed in melanoma cells and what functional effect SUMOylation has on SOX2 protein
in the context of melanocyte development and melanoma pathogenesis.
This study highlights the complex networks SOX2 may be involved in during melanoma
pathogenesis. Here, SOX2 is suggested to play a role in melanoma cell dedifferentiation,
motility and invasion. Moreover, gene amplification may cause SOX2 overexpression in
melanoma and TGF-β induces its expression in melanoma cell lines. Therefore, I identified a
key player in melanoma pathogenesis that is responsible for several invasion-related
processes observed in aggressive melanoma. For these reasons, targeting TGF-β or
inhibiting the induction of phenotypic alterations, i.e. dedifferentiation, may be beneficial for
indirectly impeding enhanced SOX2 expression and therefore inhibiting the progression of
aggressive, metastatic melanoma. However, as the TGF-β inhibitor used in this study only
showed little effect on inhibiting SOX2 expression, a combination of TGF-β inhibition, which
leads to melanoma differentiation, together with conventional anti-melanoma therapy may
prove beneficial for melanoma patients.
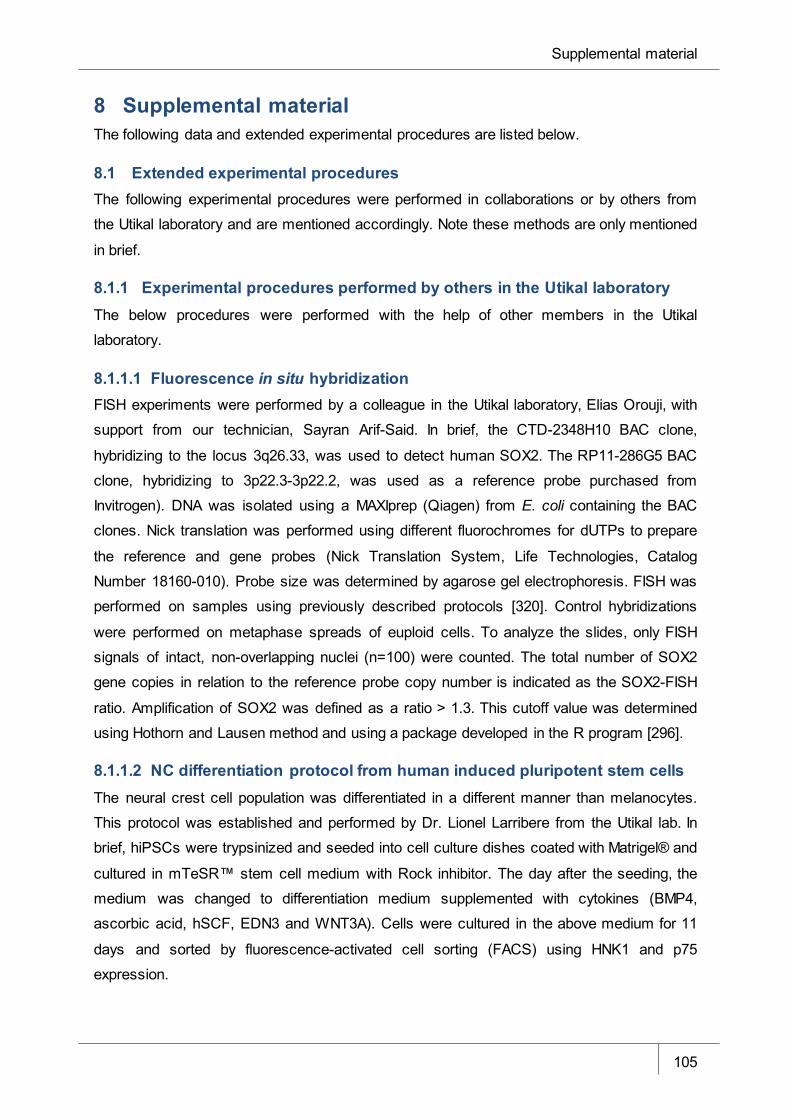
Supplemental material
105
8 Supplemental material The following data and extended experimental procedures are listed below.
8.1 Extended experimental procedures The following experimental procedures were performed in collaborations or by others from
the Utikal laboratory and are mentioned accordingly. Note these methods are only mentioned
in brief.
8.1.1 Experimental procedures performed by others in the Utikal laboratory The below procedures were performed with the help of other members in the Utikal
laboratory.
8.1.1.1 Fluorescence in situ hybridization FISH experiments were performed by a colleague in the Utikal laboratory, Elias Orouji, with
support from our technician, Sayran Arif-Said. In brief, the CTD-2348H10 BAC clone,
hybridizing to the locus 3q26.33, was used to detect human SOX2. The RP11-286G5 BAC
clone, hybridizing to 3p22.3-3p22.2, was used as a reference probe purchased from
Invitrogen). DNA was isolated using a MAXIprep (Qiagen) from E. coli containing the BAC
clones. Nick translation was performed using different fluorochromes for dUTPs to prepare
the reference and gene probes (Nick Translation System, Life Technologies, Catalog
Number 18160-010). Probe size was determined by agarose gel electrophoresis. FISH was
performed on samples using previously described protocols [320]. Control hybridizations
were performed on metaphase spreads of euploid cells. To analyze the slides, only FISH
signals of intact, non-overlapping nuclei (n=100) were counted. The total number of SOX2
gene copies in relation to the reference probe copy number is indicated as the SOX2-FISH
ratio. Amplification of SOX2 was defined as a ratio > 1.3. This cutoff value was determined
using Hothorn and Lausen method and using a package developed in the R program [296].
8.1.1.2 NC differentiation protocol from human induced pluripotent stem cells The neural crest cell population was differentiated in a different manner than melanocytes.
This protocol was established and performed by Dr. Lionel Larribere from the Utikal lab. In
brief, hiPSCs were trypsinized and seeded into cell culture dishes coated with Matrigel® and
cultured in mTeSR™ stem cell medium with Rock inhibitor. The day after the seeding, the
medium was changed to differentiation medium supplemented with cytokines (BMP4,
ascorbic acid, hSCF, EDN3 and WNT3A). Cells were cultured in the above medium for 11
days and sorted by fluorescence-activated cell sorting (FACS) using HNK1 and p75
expression.

Supplemental material
106
8.1.2 Extended experimental procedures performed in collaborations The following procedures were performed in collaboration with other groups or core facilities
at the DKFZ.
8.1.2.1 Electron microscopy Electron microscopy was performed in collaboration with the DKFZ Microscopy Core Facility.
Cells were seeded on ACLAR® cover slips and cultured for one week before submission to
the Microscopy Core Facility, where they were fixed, sliced and imaged.
8.1.2.2 Yeast-2-Hybrid experiments Yeast two-hybrid (y2h) experiments were performed in collaboration with the DKFZ
Proteomics Core Facility. Constructs were provided by the core facility or cloned in our
laboratory with the help of Dr. Daniel Novak. In brief, yeast were transformed with bait and
prey vectors of our choice. Bait- and prey-transformed yeast were mated and successful
diploids were nutritionally selected on medium lacking tryptophan and leucine. The y2h high-
throughput screen was performed similarly to aforementioned experiments, expect that only
the bait construct was needed and the prey constructs were provided in selected cDNA
libraries. Positive matings were detected via fluorescence. These signals were further
analyzed by PCR and sequencing to determine potential new interacting partners.
8.1.2.3 Bimolecular fluorescence complementation assay The bimolecular fluorescence complementation (BiFC) assay was performed in collaboration
with the DKFZ Proteomics Core Facility. In brief, HEK293T cells were seeded in 96-well plate
format and transfected with both bait and prey constructs containing the gene of interest plus
a partially fluorescent fluorophore. Upon transfection, cells were visualized and imaged under
fluorescence microscope.
8.1.2.4 Luciferase reporter assay Luciferase reporter assay was performed in the lab of Dr. Corine Bertolotto at the INSERM
institute in Nice, France. Briefly, The luciferase reporter plasmids pMITF and the expression
vector encoding the wild-type or the dominant negative form of MITF were previously
described [363]. The SK Mel 30 SOX2-overexpressing cells and non-induced control were
seeded in 24-well dishes and transient transfections were performed the following day using
2 µL of lipofectamine and 0.5 g of total DNA plasmid. pCMV Gal was transfected with the test
plasmids to control the variability in transfection efficiency. After 48 h, cells were harvested in
50 µL of lysis buffer and assayed for luciferase and galactosidase activities. All transfections
were repeated at least three times and performed in triplicate [300].
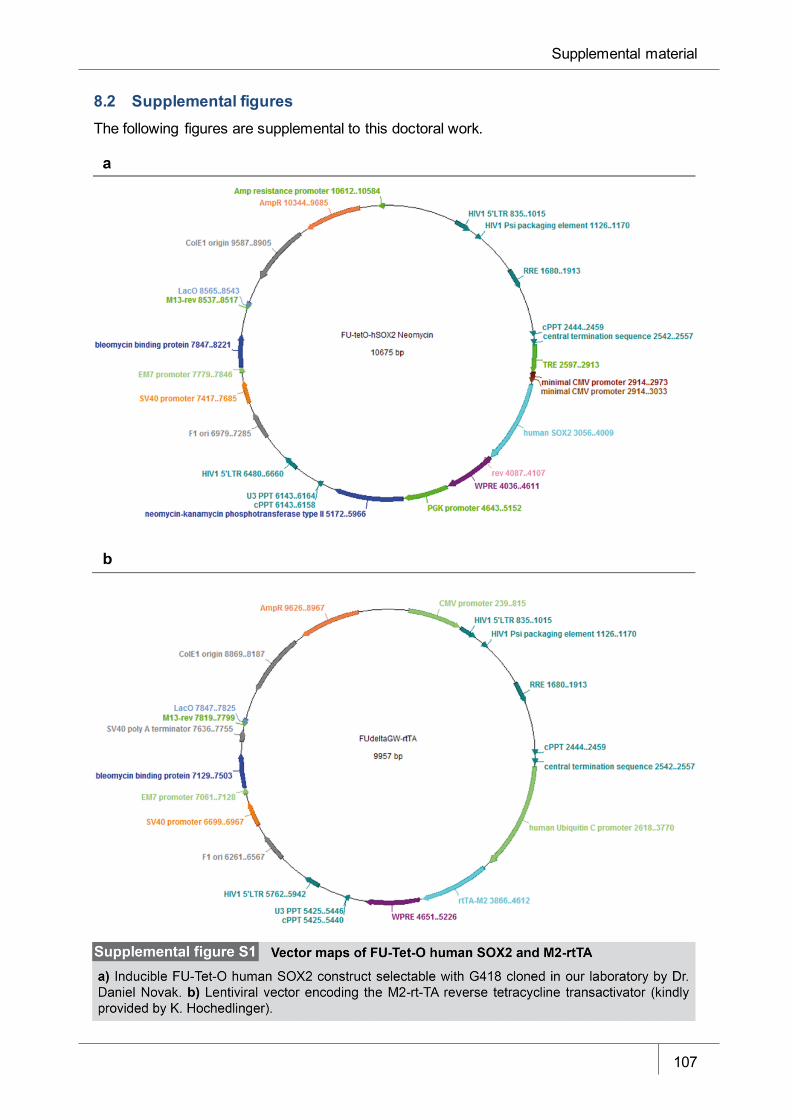
Supplemental material
107
8.2 Supplemental figures The following figures are supplemental to this doctoral work.
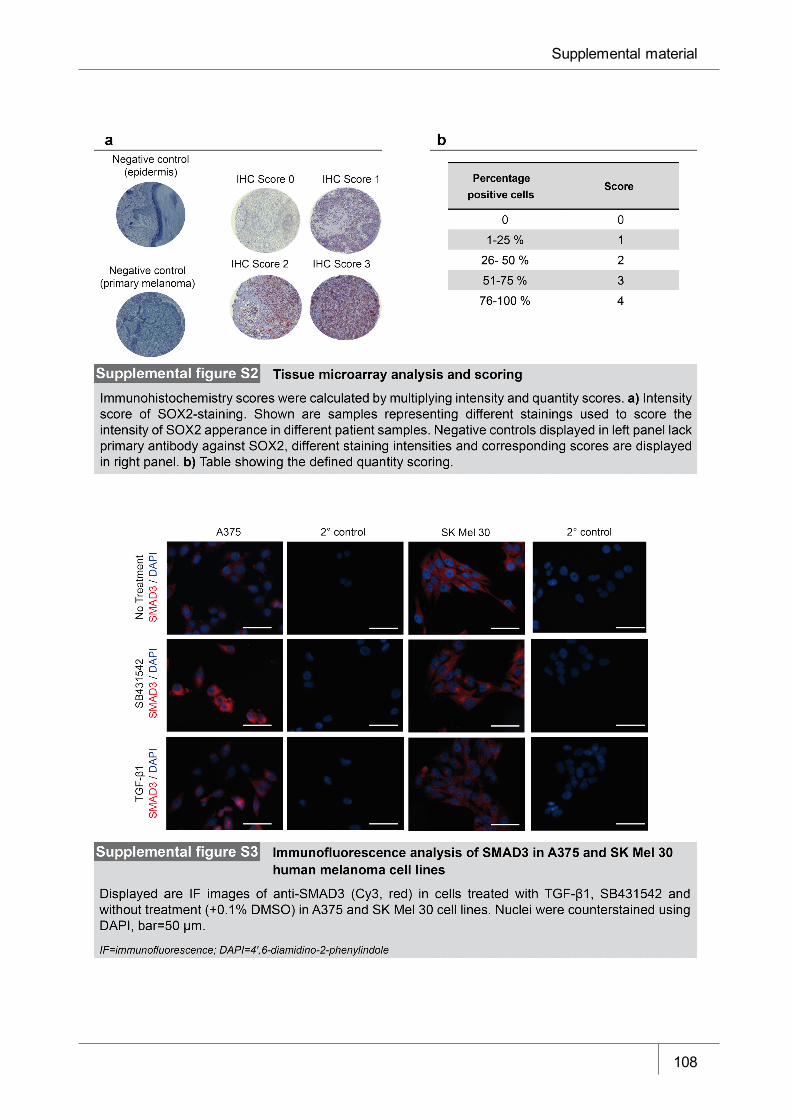
Supplemental material
108
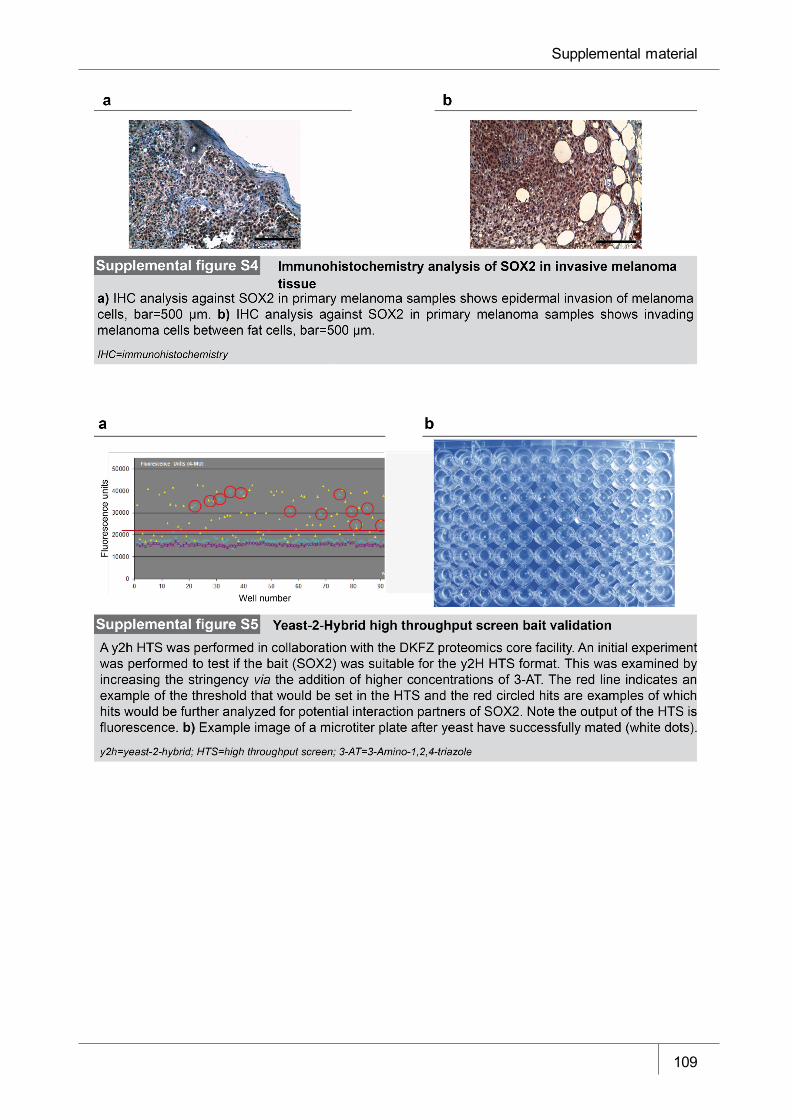
Supplemental material
109
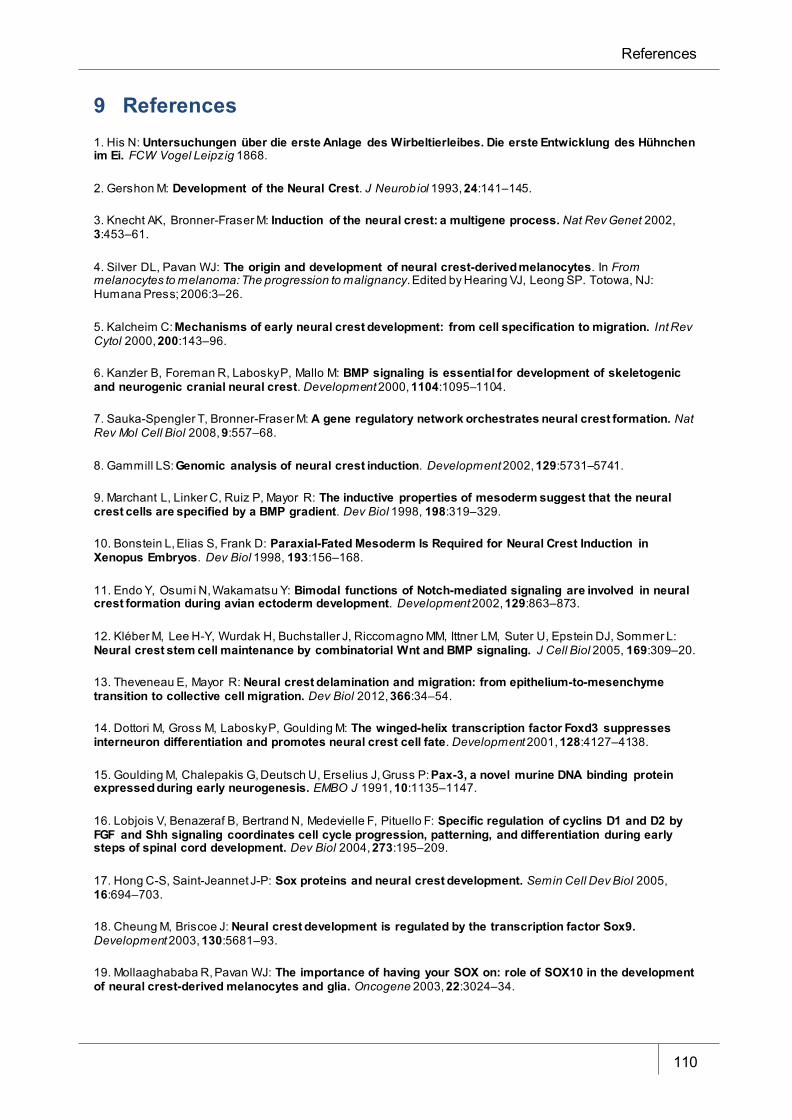
References
110
9 References 1. His N: Untersuchungen über die erste Anlage des Wirbeltierleibes. Die erste Entwicklung des Hühnchen im Ei. FCW Vogel Leipzig 1868.
2. Gershon M: Development of the Neural Crest. J Neurobiol 1993, 24:141–145.
3. Knecht AK, Bronner-Fraser M: Induction of the neural crest: a multigene process. Nat Rev Genet 2002, 3:453–61.
4. Silver DL, Pavan WJ: The origin and development of neural crest-derived melanocytes. In From melanocytes to melanoma: The progression to malignancy. Edited by Hearing VJ, Leong SP. Totowa, NJ: Humana Press; 2006:3–26.
5. Kalcheim C: Mechanisms of early neural crest development: from cell specification to migration. Int Rev Cytol 2000, 200:143–96.
6. Kanzler B, Foreman R, Labosky P, Mallo M: BMP signaling is essential for development of skeletogenic and neurogenic cranial neural crest. Development 2000, 1104:1095–1104.
7. Sauka-Spengler T, Bronner-Fraser M: A gene regulatory network orchestrates neural crest formation. Nat Rev Mol Cell Biol 2008, 9:557–68.
8. Gammill LS: Genomic analysis of neural crest induction. Development 2002, 129:5731–5741.
9. Marchant L, Linker C, Ruiz P, Mayor R: The inductive properties of mesoderm suggest that the neural crest cells are specified by a BMP gradient. Dev Biol 1998, 198:319–329.
10. Bonstein L, Elias S, Frank D: Paraxial-Fated Mesoderm Is Required for Neural Crest Induction in Xenopus Embryos. Dev Biol 1998, 193:156–168.
11. Endo Y, Osumi N, Wakamatsu Y: Bimodal functions of Notch-mediated signaling are involved in neural crest formation during avian ectoderm development. Development 2002, 129:863–873.
12. Kléber M, Lee H-Y, Wurdak H, Buchstaller J, Riccomagno MM, Ittner LM, Suter U, Epstein DJ, Sommer L: Neural crest stem cell maintenance by combinatorial Wnt and BMP signaling. J Cell Biol 2005, 169:309–20.
13. Theveneau E, Mayor R: Neural crest delamination and migration: from epithelium-to-mesenchyme transition to collective cell migration. Dev Biol 2012, 366:34–54.
14. Dottori M, Gross M, Labosky P, Goulding M: The winged-helix transcription factor Foxd3 suppresses interneuron differentiation and promotes neural crest cell fate. Development 2001, 128:4127–4138.
15. Goulding M, Chalepakis G, Deutsch U, Erselius J, Gruss P: Pax-3, a novel murine DNA binding protein expressed during early neurogenesis. EMBO J 1991, 10:1135–1147.
16. Lobjois V, Benazeraf B, Bertrand N, Medevielle F, Pituello F: Specific regulation of cyclins D1 and D2 by FGF and Shh signaling coordinates cell cycle progression, patterning, and differentiation during early steps of spinal cord development. Dev Biol 2004, 273:195–209.
17. Hong C-S, Saint-Jeannet J-P: Sox proteins and neural crest development. Semin Cell Dev Biol 2005, 16:694–703.
18. Cheung M, Briscoe J: Neural crest development is regulated by the transcription factor Sox9. Development 2003, 130:5681–93.
19. Mollaaghababa R, Pavan WJ: The importance of having your SOX on: role of SOX10 in the development of neural crest-derived melanocytes and glia. Oncogene 2003, 22:3024–34.
References
111
20. Kuriyama S, Mayor R: Molecular analysis of neural crest migration. Philos Trans R Soc Lond B Biol Sci 2008, 363:1349–62.
21. Cheung M, Chaboissier M-C, Mynett A, Hirst E, Schedl A, Briscoe J: The transcriptional control of trunk neural crest induction, survival, and delamination. Dev Cell 2005, 8:179–92.
22. DeLuca S, Gerhart J, Cochran E, Simak E, Blitz J, Mattiacci-Paessler M, Knudsen K, George-Weinstein M: Hepatocyte growth factor/scatter factor promotes a switch from E-to N-cadherin in chick embryo epiblast cells. Exp Cell Res 1999, 251:3–15.
23. Cano A, Pérez-Moreno M, Rodrigo I, Locascio A, Blanco M, del Barrio M, Portillo F, Nieto M: The transcription factor snail controls epithelial–mesenchymal transitions by repressing E-cadherin expression. Nat Cell Biol 2000, 2:76–83.
24. Carl T, Dufton C, Hanken J, Klymkowsky M: Inhibition of Neural Crest Migration in Xenopus Using Antisense Slug RNA. Dev Biol 1999, 213:101–115.
25. LaBonne C, Bronner-Fraser M: Snail-related transcriptional repressors are required in Xenopus for both the induction of the neural crest and its subsequent migration. Dev Biol 2000, 221:195–205.
26. Nieto M, Sargent M, Wilkinson D, Cooke J: Control of cell behavior during vertebrate development by Slug, a zinc finger gene. Science (80- ) 1994, 264:835–839.
27. Barrio M del, Nieto M: Overexpression of Snail family members highlights their ability to promote chick neural crest formation. Development 2002, 129:1583–1593.
28. Rickmann M: The migration of neural crest cells and the growth of motor axons through the rostral half of the chick somite. J Embryol Exp Morphol 1985, 455:437–455.
29. Lumsden A, Keynes R: Segmental patterns of neuronal development in the chick hindbrain. Nature 1989.
30. Schilling TF, Kimmel CB: Segment and cell type lineage restrictions during pharyngeal arch development in the zebrafish embryo. Development 1994, 494:483–494.
31. Kulesa PM, Fraser SE: Segmentation of the vertebrate hindbrain : a time-lapse analysis. Int J Dev Biol 1998, 392:385–392.
32. Farlie P, Kerr R, Thomas P: A paraxial exclusion zone creates patterned cranial neural crest cell outgrowth adjacent to rhombomeres 3 and 5. Dev Biol 1999, 84:70–84.
33. Sechrist J, Serbedzija G, Scherson T: Segmental migration of the hindbrain neural crest does not arise from its segmental generation. Development 1993, 703:691–703.
34. Birgbauer E, Sechrist J: Rhombomeric origin and rostrocaudal reassortment of neural crest cells revealed by intravital microscopy. Development 1995, 945:935–945.
35. Krull C, Collazo A, Fraser S, Bronner-Fraser M: Segmental migration of trunk neural crest: time-lapse analysis reveals a role for PNA-binding molecules. Development 1995, 3743:3733–3743.
36. Sommer L: Generation of melanocytes from neural crest cells. Pigment Cell Melanoma Res 2011, 24:411–21.
37. Ernfors P: Cellular origin and developmental mechanisms during the formation of skin melanocytes. Exp Cell Res 2010, 316:1397–407.
38. Adameyko I, Lallemend F, Aquino JB, Pereira J a, Topilko P, Müller T, Fritz N, Beljajeva A, Mochii M, Liste I, Usoskin D, Suter U, Birchmeier C, Ernfors P: Schwann cell precursors from nerve innervation are a cellular origin of melanocytes in skin. Cell 2009, 139:366–79.
References
112
39. Camp E, Lardelli M: Tyrosinase gene expression in zebrafish embryos. Dev Genes Evol 2001, 211:150–153.
40. Dupin E, Real C, Glavieux-Pardanaud C, Vaigot P, Le Douarin N: Reversal of developmental restrictions in neural crest lineages: transition from Schwann cells to glial-melanocytic precursors in vitro. PNAS 2003, 100:5229–5233.
41. Dupin E, Sommer L: Neural crest progenitors and stem cells: from early development to adulthood. Dev Biol 2012, 366:83–95.
42. Trainor P, Krumlauf R: Plasticity in mouse neural crest cells reveals a new patterning role for cranial mesoderm. Nat Cell Biol 2000, 2(February).
43. Kulesa P, Ellies DL, Trainor P a: Comparative analysis of neural crest cell death, migration, and function during vertebrate embryogenesis. Dev Dyn 2004, 229:14–29.
44. Krull CE: Segmental organization of neural crest migration. Mech Dev 2001, 105:37–45.
45. Graham A, Begbie J, McGonnell I: Significance of the cranial neural crest. Dev Dyn 2004, 229:5–13.
46. Lin JY, Fisher DE: Melanocyte biology and skin pigmentation. Nature 2007, 445:843–50.
47. Wehrle-Haller B, Weston J: Soluble and cell-bound forms of steel factor activity play distinct roles in melanocyte precursor dispersal and survival on the lateral neural crest migration pathway. Development 1995, 742:731–742.
48. Nishimura E, Yoshida H: Regulation of E-and P-cadherin expression correlated with melanocyte migration and diversification. Dev Biol 1999, 215:155–166.
49. Jouneau A, Yu Y-Q, Pasdar M, Larue L: Plasticity of cadherin–catenin expression in the melanocyte lineage. Pigment Cell Res 2000:260–272.
50. Nakagawa S, Takeichi M: Neural crest emigration from the neural tube depends on regulated cadherin expression. Development 1998, 2971:2963–2971.
51. Nakagawa S, Takeichi M: Neural crest cell-cell adhesion controlled by sequential and subpopulation-specific expression of novel cadherins. Development 1995, 1332:1321–1332.
52. Hornyak T, Hayes D, Chiu L, Ziff E: Transcription factors in melanocyte development: distinct roles for Pax-3 and Mitf. Mech Dev 2001, 101:47–59.
53. Thomas AJ, Erickson C a: The making of a melanocyte: the specification of melanoblasts from the neural crest. Pigment Cell Melanoma Res 2008, 21:598–610.
54. Bondurand N, Pingault V, Goerich DE, Lemort N, Sock E, Le Caignec C, Wegner M, Goossens M: Interaction among SOX10, PAX3 and MITF, three genes altered in Waardenburg syndrome. Hum Mol Genet 2000, 9:1907–17.
55. Potterf S, Furumura M, Dunn K, Arnheiter H, Pavan WJ: Transcription factor hierarchy in Waardenburg syndrome: regulation of MITF expression by SOX10 and PAX3. Hum Genet 2000, 107:1–6.
56. Kubic JD, Young KP, Plummer RS, Ludvik AE, Lang D: Pigmentation PAX-ways: the role of Pax3 in melanogenesis, melanocyte stem cell maintenance, and disease. Pigment Cell Melanoma Res 2008, 21:627–45.
57. Fenby BT, Fotaki V, Mason JO: Pax3 regulates Wnt1 expression via a conserved binding site in the 5’ proximal promoter. Biochim Biophys Acta 2008, 1779:115–21.
58. Stolt CC, Lommes P, Hillgärtner S, Wegner M: The transcription factor Sox5 modulates Sox10 function during melanocyte development. Nucleic Acids Res 2008, 36:5427–40.
References
113
59. Kos R, Reedy M, Johnson R, Erickson C: The winged-helix transcription factor FoxD3 is important for establishing the neural crest lineage and repressing melanogenesis in avian embryos. Development 2001, 128:1467–1479.
60. Thomas AJ, Erickson C a: FOXD3 regulates the lineage switch between neural crest-derived glial cells and pigment cells by repressing MITF through a non-canonical mechanism. Development 2009, 136:1849–58.
61. Lahav R, Dupin E, Lecoin L, Glavieux C, Champeval D, Ziller C, Le Douarin N: Endothelin 3 selectively promotes survival and proliferation of neural crest-derived glial and melanocytic precursors in vitro. PNAS 1998, 95:14214–14219.
62. Dupin E, Glavieux C, Vaigot P, Le Douarin N: Endothelin 3 induces the reversion of melanocytes to glia through a neural crest-derived glial-melanocytic progenitor. PNAS 2000, 97:7882–7887.
63. Opdecamp K, Kos L, Arnheiter H, Pavan W: Endothelin signaling in the development of neural crest-derived melanocytes. Biochem cell Biol 1998, 76:1093–1099.
64. Pla P, Alberti C, Solov’eva O, Pasdar M, Kunisada T, Larue L: Ednrb2 orients cell migration towards the dorsolateral neural crest pathway and promotes melanocyte differentiation. Pigment Cell Res 2005, 18:181–7.
65. Shin M, Levorse J, Ingram R, Tilghman S: The temporal requirement for endothelin receptor-B signalling during neural crest development. Nature 1999, 402:496–501.
66. Nishikawa S, Kusakabe M, Yoshinaga K, Ogawa M, Hayashi S, Kunisada T, Era T, Sakakura T, Nishikawa S-I: In utero manipulation of coat color formation by a monoclonal anti-c-kit antibody: two distinct waves of c-kit-dependency during melanocyte development. EMBO J 1991, 10:2111–2118.
67. Yoshida H, Kunisada T, Kusakabe M, Nishikawa S, Nishikawa S-I: Distinct stages of melanocyte differentiation revealed by anlaysis of nonuniform pigmentation patterns. Development 1996, 122:1207–1214.
68. Larue L, Kumasaka M, Goding CR: Beta-Catenin in the Melanocyte Lineage. Pigment cell Res 2003, 16:312–317.
69. Dunn K, Williams B, Li Y, Pavan WJ: Neural crest-directed gene transfer demonstrates Wnt1 role in melanocyte expansion and differentiation during mouse development. PNAS 2000, 97:10050–10055.
70. Jin EJ, Erickson C a, Takada S, Burrus LW: Wnt and BMP signaling govern lineage segregation of melanocytes in the avian embryo. Dev Biol 2001, 233:22–37.
71. Dorsky R, Moon R, Raible D: Control of neural crest cell fate by the Wnt signalling pathway. Nature 1998, 396:370–373.
72. Takeda K: Induction of Melanocyte-specific Microphthalmia-associated Transcription Factor by Wnt-3a. J Biol Chem 2000, 275:14013–14016.
73. Hari L, Brault V, Kléber M, Lee H-Y, Ille F, Leimeroth R, Paratore C, Suter U, Kemler R, Sommer L: Lineage-specific requirements of beta-catenin in neural crest development. J Cell Biol 2002, 159:867–80.
74. Hari L, Miescher I, Shakhova O, Suter U, Chin L, Taketo M, Richardson WD, Kessaris N, Sommer L: Temporal control of neural crest lineage generation by Wnt/β-catenin signaling. Development 2012, 139:2107–17.
75. Mackenzie M, Jordan S, Budd P, Jackson I: Activation of the receptor tyrosine kinase Kit is required for the proliferation of melanoblasts in the mouse embryo. Dev Biol 1997, 107:99–107.
76. Opdecamp K, Nakayama a, Nguyen MT, Hodgkinson C a, Pavan WJ, Arnheiter H: Melanocyte development in vivo and in neural crest cell cultures: crucial dependence on the Mitf basic-helix-loop-helix-zipper transcription factor. Development 1997, 124:2377–86.
References
114
77. Cimadamore F, Fishwick K, Giusto E, Gnedeva K, Cattarossi G, Miller A, Pluchino S, Brill LM, Bronner-Fraser M, Terskikh A V: Human ESC-derived neural crest model reveals a key role for SOX2 in sensory neurogenesis. Cell Stem Cell 2011, 8:538–51.
78. Lee G, Chambers SM, Tomishima MJ, Studer L: Derivation of neural crest cells from human pluripotent stem cells. Nat Protoc 2010, 5:688–701.
79. Bosserhoff AK, Ellmann L, Kuphal S: Melanoblasts in culture as an in vitro system to determine molecular changes in melanoma. Exp Dermatol 2011, 20:435–40.
80. Cook AL, Donatien PD, Smith AG, Murphy M, Jones MK, Herlyn M, Bennett DC, Leonard JH, Sturm R a: Human melanoblasts in culture: expression of BRN2 and synergistic regulation by fibroblast growth factor-2, stem cell factor, and endothelin-3. J Invest Dermatol 2003, 121:1150–9.
81. Takahashi K, Yamanaka S: Induction of pluripotent stem cells from mouse embryonic and adult fibroblast cultures by defined factors. Cell 2006, 126:663–76.
82. Ohta S, Imaizumi Y, Okada Y, Akamatsu W, Kuwahara R, Ohyama M, Amagai M, Matsuzaki Y, Yamanaka S, Okano H, Kawakami Y: Generation of human melanocytes from induced pluripotent stem cells. PLoS One 2011, 6:e16182.
83. Mica Y, Lee G, Chambers SM, Tomishima MJ, Studer L: Modeling neural crest induction, melanocyte specification, and disease-related pigmentation defects in hESCs and patient-specific iPSCs. Cell Rep 2013, 3:1140–52.
84. Koster MI, Roop DR: Mechanisms regulating epithelial stratification. Annu Rev Cell Dev Biol 2007, 23:93–113.
85. Arnheiter H, Hou L, Nguyen M-TT, Bismuth K, Csermely T, Murakami H, Skuntz S, Liu W, Bharti K: MITF: A matter of life and death for developing melanocytes. In From melanocytes to melanoma: The progression to malignancy. Edited by Hearing VJ, Leong S. Totowa, NJ: Humana Press; 2006:27–49.
86. Feige E, Poling LL, Fisher DE: MITF: Critical regulator of the melanocyte lineage. In From melanocytes to melanoma: The progression to malignancy. Edited by Hearing VJ, Leong S. Totowa, NJ: Humana Press; 2006:51–79.
87. Lister J, Robertson C, Lepage T, Johnson S, Raible D: Nacre encodes a zebrafish microphthalmia-related protein that regulates neural-crest-derived pigment cell fate. Development 1999, 126:3757–3767.
88. Rees JL: Genetics of hair and skin color. Annu Rev Genet 2003, 37:67–90.
89. Mountjoy K, Robbins L, Mortrud M, Cone R: The cloning of a family of genes that encode the melanocortin receptors. Science (80- ) 1992, 257:16–19.
90. Wahlbuhl M, Reiprich S, Vogl MR, Bösl MR, Wegner M: Transcription factor Sox10 orchestrates activity of a neural crest-specific enhancer in the vicinity of its gene. Nucleic Acids Res 2012, 40:88–101.
91. Lee M, Goodall J, Verastegui C, Ballotti R, Goding CR: Direct regulation of the Microphthalmia promoter by Sox10 links Waardenburg-Shah syndrome (WS4)-associated hypopigmentation and deafness to WS2. J Biol Chem 2000, 275:37978–83.
92. Lang D, Epstein JA: Sox10 and Pax3 physically interact to mediate activation of a conserved c-RET enhancer. Hum Mol Genet 2003, 12:937–945.
93. Kim K, Hay E: Direct evidence for a role of the beta-catcnin/LEF-1 signaling pathway in induction of EMT. Cell Biol Int 2000, 26:463–476.
94. Eastman Q, Grosschedl R: Regulation of LEF-1/TCF transcription factors by Wnt and other signals. Curr Opin Cell Biol 1999:233–240.
References
115
95. Hemesath T, Price E, Takemoto C, Badalian T, Fisher D: MAP kinase links the transcription factor Microphthalmia to c-Kit signalling in melanocytes. Nature 1998, 391:298–301.
96. Wu M, Hemesath T, Takemoto C, Horstmann M, Wells A, Price E, Fisher D, Fisher D: c-Kit triggers dual phosphorylations, which couple activation and degradation of the essential melanocyte factor Mi. Genes Dev 2000, 14:301–312.
97. Takeda K, Takemoto C, Kobayashi I, Watanabe a, Nobukuni Y, Fisher DE, Tachibana M: Ser298 of MITF, a mutation site in Waardenburg syndrome type 2, is a phosphorylation site with functional significance. Hum Mol Genet 2000, 9:125–32.
98. Fang D, Tsuji Y, Setaluri V: Selective down-regulation of tyrosinase family gene TYRP1 by inhibition of the activity of melanocyte transcription factor, MITF. Nucleic Acids Res 2002, 30:3096–3106.
99. Gaggioli C, Busca R, Abbe P, Ortonne J, Ballotti R: Microphthalmia-Associated Transcription Factor (MITF) is Required but is Not Sufficient to Induce the Expression of Melanogenic Genes. Pigment cell Res 2003, 16:374–382.
100. Yamaguchi Y, Hearing VJ: Melanocyte distribution and function in human skin: Effects of ultraviolet radiation. In From melanocytes to melanoma: The progression to malignancy. Edited by Hearing VJ, Leong SP. Totowa, NJ: Humana Press; 2006:101–115.
101. Wegner M: Melanocytes and the Transcription Factor Sox10. In From melanocytes to melanoma: The progression to malignancy. Edited by Hearing VJ, Leong S. Totowa, NJ: Humana Press; 2006:71–80.
102. Jiao Z, Mollaaghababa R, Pavan WJ, Antonellis A, Green ED, Hornyak TJ: Direct interaction of Sox10 with the promoter of murine Dopachrome Tautomerase (Dct) and synergistic activation of Dct expression with Mitf. Pigment Cell Res 2004, 17:352–62.
103. Ludwig A, Rehberg S, Wegner M: Melanocyte-specific expression of dopachrome tautomerase is dependent on synergistic gene activation by the Sox10 and Mitf transcription factors. FEBS Lett 2004, 556:236–244.
104. Uong A, Zon LI: Melanocytes in development and cancer. J Cell Physiol 2010, 222:38–41.
105. Abdel-malek ZA, Kadekaro A: Human Cutaneous Pigmentation. In From melanocytes to melanoma: The progression to malignancy. Edited by Hearing VJ, Leong S. Totowa, NJ: Humana Press; 2006:81–100.
106. Miller AJ, Mihm MC: Melanoma. NEJM 2006, 355:51–65.
107. Mason H: The structure of melanins. In Pigment Cell Biology. Edited by Gordon M. New York,NY: Academic; 1959:563–582.
108. Mason H: The structure of melanin. In Advances in Biology of Skin VIII The Pigmentary System . Edited by Montagna W, Hu F. Oxford UK: Pergamon; 1967:293–312.
109. Raper H, Wormall A: The tyrosinase-tyrosine reaction. Biochem J 1923.
110. Riley P: The evolution of melanogenesis. In Melanin: Its Role in Human Photoprotection. Edited by Zeise L, Chedekel M, TB F. Overland Park, Kansas: Valdenmar; 1995:1–10.
111. Sekulic A: Malignant Melanoma in the 21st century: the emerging molecular landscape. Mayo Clin Proc 2008, 83:825–846.
112. Land E, Riley P: Spontaneous redox reactions of dopaquinone and the balance between the eumelanic and phaeomelanic pathways. Pigment Cell Res 2000(V):273–277.
113. Slominski A, Tobin D, Shibahara S, Wortsman J: Melanin pigmentation in mammalian skin and its hormonal regulation. Physiol Rev 2004:1155–1228.
References
116
114. Wu X, Hammer III JA: Making sense of melanosome dynamics in mouse melanocytes. Pigment Cell Res 2000:241–247.
115. Wu X, Wang F, Rao K, Sellers J, Hammer III JA: Rab27a is an essential component of melanosome receptor for myosin Va. Mol Biol Cell 2002, 13:1735–1749.
116. Rogers S, Gelfand V: Membrane trafficking, organelle transport, and the cytoskeleton. Curr Opin Cell Biol 2000:57–62.
117. Sakuraba K, Hayashi N, Kawashima M, Imokawa G: Down-Regulated PAR-2 is Associated in Part with Interrupted Melanosome Transfer in Pigmented Basal Cell Epithelioma. Pigment Cell Res 2004, 17:371–378.
118. Babiarz-Magee L, Chen N, Seiberg M, Lin C: The Expression and Activation of Protease-Activated Receptor-2 Correlate with Skin Color. Pigment Cell Res 2004:241–251.
119. Kippenberger S, Bernd A, Bereiter-Hahn J, Ramirez-Bosca A, Kaufmann R: The mechanism of melanocyte dendrite formation: the impact of differentiating keratinocytes. Pigment Cell Res 1998:34–37.
120. Lei TC, Virador VM, Vieira WD, Hearing VJ: A melanocyte-keratinocyte coculture model to assess regulators of pigmentation in vitro. Anal Biochem 2002, 305:260–8.
121. Scott G, Cassidy L: Rac1 mediates dendrite formation in response to melanocyte stimulating hormone and ultraviolet light in a murine melanoma model. J Invest Dermatol 1998, 111:243–50.
122. Scott G: Rac and rho: the story behind melanocyte dendrite formation. Pigment cell Res 2002:322–330.
123. Gray-Schopfer V, Wellbrock C, Marais R: Melanoma biology and new targeted therapy. Nature 2007, 445:851–7.
124. Melanoma Skin Cancer [http://www.cancer.org/cancer/skincancer-melanoma/detailedguide/melanoma-skin-cancer-key-statistics]
125. Cummins DL, Cummins JM, Pantle H, Silverman M a, Leonard AL, Chanmugam A: Cutaneous malignant melanoma. Mayo Clin Proc 2006, 81:500–7.
126. Clark Jr W, Goldman L, Mastrangelo M: Human Malignant Melanoma. New York (USA): Grune & Stratton; 1979.
127. Takata M, Murata H, Saida T: Molecular pathogenesis of malignant melanoma: a different perspective from the studies of melanocytic nevus and acral melanoma. Pigment Cell Melanoma Res 2010, 23:64–71.
128. Bennett DC: Familial melanoma genes, melanocyte immortalization, and melanoma initiation. In From melanocytes to melanoma: The progression to malignancy. Edited by Hearing VJ, Leong S. Totowa, NJ: Humana Press; 2006:183–196.
129. Hocker TL, Singh MK, Tsao H: Melanoma genetics and therapeutic approaches in the 21st century: moving from the benchside to the bedside. J Invest Dermatol 2008, 128:2575–95.
130. Tsao H, Chin L, Garraway L a, Fisher DE: Melanoma: from mutations to medicine. Genes Dev 2012, 26:1131–55.
131. Quelle D, Zindy F, Ashmun R, Sherr C: Alternative reading frames of the INK4a tumor suppressor gene encode two unrelated proteins capable of inducing cell cycle arrest. Cell 1995, 83:993–1000.
132. Palmieri G, Capone M, Ascierto ML, Gentilcore G, Stroncek DF, Casula M, Sini MC, Palla M, Mozzillo N, Ascierto P a: Main roads to melanoma. J Transl Med 2009, 7:86.
133. Eliason M, Hansen C, Hart M, Porter-Gill P, Chen W, Sturm R, Bowen G, Florell S, Harris R, Cannon-Albright L, Swinyer L, Leachman S: Multiple primary melanomas in a CDKN2A mutation carrier exposed to ionizing radiation. Arch Dermatol Res 1979, 143:1409–1412.
References
117
134. Fang S, Jensen J, Ludwig R, Vausden K, Weissmann A: Mdm2 Is a RING Finger-dependent Ubiquitin Protein Ligase for Itself and p53. J Biol Chem 2000, 275:8945–8951.
135. Bergami P, Bhoumik A, Ronai Z: Altered signal transduction in melanoma. In From melanocytes to melanoma: The progression to malignancy. Edited by Hearing V, Leong S. Totowa, NJ: Humana Press; 2006:119–147.
136. Horn S, Figl A, Rachakonda PS, Fischer C, Sucker A, Gast A, Kadel S, Moll I, Nagore E, Hemminki K, Schadendorf D, Kumar R: TERT promoter mutations in familial and sporadic melanoma. Science 2013, 339:959–61.
137. Huang FW, Hodis E, Xu MJ, Kryukov G V, Chin L, Garraway L a: Highly recurrent TERT promoter mutations in human melanoma. Science 2013, 339:957–9.
138. Stadler S, Weina K, Gebhardt C, Utikal J: New therapeutic options for advanced non-resectable malignant melanoma. Adv Med Sci 2014.
139. Davies H, Bignell GR, Cox C, Stephens P, Edkins S, Clegg S, Teague J, Woffendin H, Garnett MJ, Bottomley W, Davis N, Dicks E, Ewing R, Floyd Y, Gray K, Hall S, Hawes R, Hughes J, Kosmidou V, Menzies A, Mould C, Parker A, Stevens C, Watt S, Hooper S, Wilson R, Jayatilake H, Gusterson B a, Cooper C, Shipley J, et al.: Mutations of the BRAF gene in human cancer. Nature 2002, 417:949–54.
140. Wellbrock C, Ogilvie L, Hedley D, Karasarides M, Martin J, Niculescu-duvaz D, Springer CJ, Marais R: V599E B-RAF is an Oncogene in Melanocytes. Cancer Res 2004, 64:2338–2342.
141. Patton EE, Widlund HR, Kutok JL, Kopani KR, Amatruda JF, Murphey RD, Berghmans S, Mayhall EA, Traver D, Fletcher CDM, Aster JC, Granter SR, Look AT, Lee C, Fisher DE, Zon LI: BRAF mutations are sufficient to promote nevi formation and cooperate with p53 in the genesis of melanoma. Curr Biol 2005, 15:249–54.
142. Wellbrock C: Melanoma development and pigment cell transformation. In From melanocytes to melanoma: The progression to malignancy. Edited by Hearing VJ, Leong S. Totowa, NJ: Humana Press; 2006:247–263.
143. Daniotti M, Oggionni M, Ranzani T, Vallacchi V, Campi V, Di Stasi D, Torre G Della, Perrone F, Luoni C, Suardi S, Frattini M, Pilotti S, Anichini A, Tragni G, Parmiani G, Pierotti M a, Rodolfo M: BRAF alterations are associated with complex mutational profiles in malignant melanoma. Oncogene 2004, 23:5968–77.
144. Tsao H, Zhang X, Fowlkes K, Haluska F: Relative reciprocity of NRAS and PTEN/MMAC1 alterations in cutaneous melanoma cell lines. Cancer Res 2000, 60:1800–1804.
145. Chin L, Pomerantz J, Polsky D, Jacobson M, Cohen C, Cordon-Cardo C, Horner II JW, DePinho R: Cooperative effects of INK4a and ras in melanoma susceptibility in vivo. Genes Dev 1997, 11:2822–2834.
146. Ackermann J, Frutschi M, Kaloulis K, McKee T, Trumpp A, Beermann F: Metastasizing melanoma formation caused by expression of activated N-RasQ61K on an INK4a-deficient background. Cancer Res 2005, 65:4005–4012.
147. Garraway L a, Widlund HR, Rubin M a, Getz G, Berger AJ, Ramaswamy S, Beroukhim R, Milner D a, Granter SR, Du J, Lee C, Wagner SN, Li C, Golub TR, Rimm DL, Meyerson ML, Fisher DE, Sellers WR: Integrative genomic analyses identify MITF as a lineage survival oncogene amplified in malignant melanoma. Nature 2005, 436:117–22.
148. Wellbrock C, Rana S, Paterson H, Pickersgill H, Brummelkamp T, Marais R: Oncogenic BRAF regulates melanoma proliferation through the lineage specific factor MITF. PLoS One 2008, 3:e2734.
149. Widlund HR, Fisher DE: Microphthalamia-associated transcription factor: a critical regulator of pigment cell development and survival. Oncogene 2003, 22:3035–41.
150. Hodis E, Watson IR, Kryukov G V, Arold ST, Imielinski M, Theurillat J-P, Nickerson E, Auclair D, Li L, Place C, Dicara D, Ramos AH, Lawrence MS, Cibulskis K, Sivachenko A, Voet D, Saksena G, Stransky N, Onofrio RC,
References
118
Winckler W, Ardlie K, Wagle N, Wargo J, Chong K, Morton DL, Stemke-Hale K, Chen G, Noble M, Meyerson M, Ladbury JE, et al.: A landscape of driver mutations in melanoma. Cell 2012, 150:251–63.
151. Parker SCJ, Gartner J, Cardenas-Navia I, Wei X, Ozel Abaan H, Ajay SS, Hansen NF, Song L, Bhanot UK, Killian JK, Gindin Y, Walker RL, Meltzer PS, Mullikin JC, Furey TS, Crawford GE, Rosenberg S a, Samuels Y, Margulies EH: Mutational signatures of de-differentiation in functional non-coding regions of melanoma genomes. PLoS Genet 2012, 8:e1002871.
152. Dahl C, Guldberg P: The genome and epigenome of malignant melanoma. APMIS 2007, 115:1161–76.
153. Russo AE, Torrisi E, Bevelacqua Y, Perrotta R, Libra M, McCubrey JA, Spandidos DA, Stivala F, Malaponte G: Melanoma: molecular pathogenesis and emerging target therapies (Review). Int J Oncol 2009, 34:1481–1489.
154. Hodi FS, Corless CL, Giobbie-Hurder A, Fletcher J a, Zhu M, Marino-Enriquez A, Friedlander P, Gonzalez R, Weber JS, Gajewski TF, O’Day SJ, Kim KB, Lawrence D, Flaherty KT, Luke JJ, Collichio F a, Ernstoff MS, Heinrich MC, Beadling C, Zukotynski K a, Yap JT, Van den Abbeele AD, Demetri GD, Fisher DE: Imatinib for melanomas harboring mutationally activated or amplified KIT arising on mucosal, acral, and chronically sun-damaged skin. J Clin Oncol 2013, 31:3182–90.
155. Tsao H, Zhang X, Benoit E, Haluska F: Identification of PTEN/MMAC1 alterations in uncultured melanomas and melanoma cell lines. Oncogene 1998, 16:3397–3402.
156. Bastian BC: Understanding the progression of melanocytic neoplasia using genomic analysis: from fields to cancer. Oncogene 2003, 22:3081–6.
157. Lin WM, Baker AC, Beroukhim R, Winckler W, Feng W, Marmion JM, Laine E, Greulich H, Tseng H, Gates C, Hodi FS, Dranoff G, Sellers WR, Thomas RK, Meyerson M, Golub TR, Dummer R, Herlyn M, Getz G, Garraway L a: Modeling genomic diversity and tumor dependency in malignant melanoma. Cancer Res 2008, 68:664–73.
158. Dhillon a S, Hagan S, Rath O, Kolch W: MAP kinase signalling pathways in cancer. Oncogene 2007, 26:3279–90.
159. Cargnello M, Roux PP: Activation and function of the MAPKs and their substrates, the MAPK-activated protein kinases. Microbiol Mol Biol Rev 2011, 75:50–83.
160. Kortylewski M, Heinrich P, Kauffmann M, Bohm M, Mackiewicz A, Behrmann I: Mitogen-activated protein kinases control p27/Kip1 expression and growth of human melanoma cells. Biochem J 2001, 357:297–303.
161. Huntington JT, Shields JM, Der CJ, Wyatt C a, Benbow U, Slingluff CL, Brinckerhoff CE: Overexpression of collagenase 1 (MMP-1) is mediated by the ERK pathway in invasive melanoma cells: role of BRAF mutation and fibroblast growth factor signaling. J Biol Chem 2004, 279:33168–76.
162. Wellbrock C, Weisser C, Geissinger E, Troppmair J, Schartl M: Activation of p59(Fyn) leads to melanocyte dedifferentiation by influencing MKP-1-regulated mitogen-activated protein kinase signaling. J Biol Chem 2002, 277:6443–54.
163. Maehama T, Dixon JE: The Tumor Suppressor, PTEN/MMAC1, Dephosphorylates the Lipid Second Messenger, Phosphatidylinositol 3,4,5-Trisphosphate. J Biol Chem 1998, 273:13375–13378.
164. Vazquez F, Sellers WR: The PTEN tumor suppressor protein: an antagonist of phosphoinositide 3-kinase signaling. Biochim Biophys Acta Rev Cancer 2000, 1470:21–35.
165. Kim D, Kim S, Koh H, Yoon S, Chung A, Cho K, Chung J: Akt/PKB promotes cancer cell invasion via increased motility and metalloproteinase production. FASEB J 2001, 15:1953–1962.
166. Massagué J: TGFbeta in Cancer. Cell 2008, 134:215–30.
167. Derynck R, Zhang YE: Smad-dependent and Smad-independent pathways in TGF-β family signalling. Nature 2003, 425:577–584.
References
119
168. Javelaud D, Alexaki V-I, Mauviel A: Transforming growth factor-beta in cutaneous melanoma. Pigment Cell Melanoma Res 2008, 21:123–32.
169. Poser I, Rothhammer T, Dooley S, Wiskirchen R, Bosserhoff AK: Characterization of Sno expression in malignant melanoma. Int J Oncol 2005, 26:1411–1417.
170. Reed J, Bales E, Xu W, Okan N, Bandyopadhyay D, Medrano E: Cytoplasmic Localization of the Oncogenic Protein Ski in Human Cutaneous Melanomas in Vivo Functional Implications for Transforming Growth Factor β Signaling. Cancer Res 2001, 250:8074–8078.
171. Javelaud D, Mohammad KS, McKenna CR, Fournier P, Luciani F, Niewolna M, André J, Delmas V, Larue L, Guise T a, Mauviel A: Stable overexpression of Smad7 in human melanoma cells impairs bone metastasis. Cancer Res 2007, 67:2317–24.
172. Berking C, Takemoto R, Schaider H, Showe L, Satyamoorthy K, Robbins P, Herlyn M: Transforming Growth Factor-B1 Increases Survival of Human Melanoma through Stroma Remodeling. Cancer Res 2001, 61:8306–8316.
173. Bollag G, Hirth P, Tsai J, Zhang J, Ibrahim P, Cho H, Spevak W, Zhang C, Zhang Y, Habets G, Burton E, Wong B, Tsang G, West B, Powell B, Shellooe R, Marimuthu A, Nguyen H, Zhang KY, Artis D, Schlessinger J, Su F, Higgins B, Iyer R, D’Andrea K, Koehler A, Stumm M, Lin P, Lee R, Grippo J, et al.: Clinical efficacy of a RAF inhibitor needs broad target blockade in BRAF-mutant melanoma. Nature 2010, 467:596–599.
174. Chapman P, Hauschild A, Robert C, Haanen J, Ascierto P, Larkin J, Dummer R, Garbe C, Testori A, Maio M, Hogg D, Lorigan P, Lebbe C, Jouary T, Schadendorf D, Ribas A, O’day S, Sosman J, Kirkwood J, Eggermont AMM, Dreno B, Nolop K, Li J, Nelson B, Hou J, Lee R, Flaherty K, McArthur G: Improved survival with vemurafenib in melanoma with BRAF V600E mutation. N Engl J Med 2011, 364:2507–2516.
175. Ascierto P a, Minor D, Ribas A, Lebbe C, O’Hagan A, Arya N, Guckert M, Schadendorf D, Kefford RF, Grob J-J, Hamid O, Amaravadi R, Simeone E, Wilhelm T, Kim KB, Long G V, Martin A-M, Mazumdar J, Goodman VL, Trefzer U: Phase II trial (BREAK-2) of the BRAF inhibitor dabrafenib (GSK2118436) in patients with metastatic melanoma. J Clin Oncol 2013, 31:3205–11.
176. Hallmeyer S, Hamid O, Sorof T, Mun Y, Liu S, Abhyankar S: Phase II study of vemurafenib in patients with locally advanced, unresectable stage IIIc or metastatic melanoma and activating exon 15 BRAF mutations othen than V600E. J Clin Oncol 2014, 32:suppl; abstract 9075.
177. Orouji E, Ziegler B, Umansky V, Gebhardt C, Utikal J: Leukocyte count restoration under dabrafenib treatment in a melanoma patient with vemurafenib-induced leukopenia: case report. Med 2014, 93:e161.
178. Schilling B, Sondermann W, Zhao F, Griewank KG, Livingstone E, Sucker a, Zelba H, Weide B, Trefzer U, Wilhelm T, Loquai C, Berking C, Hassel J, Kähler KC, Utikal J, Al Ghazal P, Gutzmer R, Goldinger SM, Zimmer L, Paschen a, Hillen U, Schadendorf D: Differential influence of vemurafenib and dabrafenib on patients’ lymphocytes despite similar clinical efficacy in melanoma. Ann Oncol 2014, 25:747–53.
179. Flaherty KT, Infante JR, Daud A, Gonzalez R, Kefford RF, Sosman J, Hamid O, Schuchter L, Cebon J, Ibrahim N, Kudchadkar R, Burris H a, Falchook G, Algazi A, Lewis K, Long G V, Puzanov I, Lebowitz P, Singh A, Little S, Sun P, Allred A, Ouellet D, Kim KB, Patel K, Weber J: Combined BRAF and MEK inhibition in melanoma with BRAF V600 mutations. N Engl J Med 2012, 367:1694–703.
180. Coupe N, Corrie P, Hategan M, Larkin J, Gore M, Gupta A, Wise A, Suter S, Ciria C, Love S, Collins L, Middleton MR: PACMEL: A phase 1 dose escalation trial of trametinib (GSK1120212) in combination with paclitaxel. Eur J Cancer 2014.
181. Robert C, Dummer R, Gutzmer R, Lorigan P, Kim KB, Nyakas M, Arance A, Liszkay G, Schadendorf D, Cantarini M, Spencer S, Middleton MR: Selumetinib plus dacarbazine versus placebo plus dacarbazine as first-line treatment for BRAF-mutant metastatic melanoma: a phase 2 double-blind randomised study. Lancet Oncol 2013, 14:733–40.
182. Ascierto PA, Schadendorf D, Berking C, Agarwala SS, van Herpen CM, Queirolo P, Blank CU, Hauschild A, Beck JT, St-Pierre A, Niazi F, Wandel S, Peters M, Zubel A, Dummer R: MEK162 for patients with advanced
References
120
melanoma harbouring NRAS or Val600 BRAF mutations: a non-randomised, open-label phase 2 study. Lancet Oncol 2013, 14:249–56.
183. Kwong L, Costello J, Liu H, Genovese G, Jiang S, Jeong J, Bender R, Collines J, Chin L: Oncogenic NRAS signaling differentially regulates survival and proliferation in melanoma. Nat Med 2012, 18:1503–1510.
184. Sosman J, Kittaneh M, Lolkema M, Postow M, Schwartz G, Franklin C: A phase IB/2 study of LEE011 in combination with binimetinib (MEK162) in patients with NRAS-mutant melanoma: Early encouraging clinical activity. J Clin Oncol 2014, 32:suppl; abstract 9009.
185. Guo J, Si L, Kong Y, Flaherty KT, Xu X, Zhu Y, Corless CL, Li L, Li H, Sheng X, Cui C, Chi Z, Li S, Han M, Mao L, Lin X, Du N, Zhang X, Li J, Wang B, Qin S: Phase II, open-label, single-arm trial of imatinib mesylate in patients with metastatic melanoma harboring c-Kit mutation or amplification. J Clin Oncol 2011, 29:2904–9.
186. Zimmer L, Callahan M, Postow M, Romano E, Ramaiya N, Bluth M: Open-label, multicenter, single-arm phase II study (DeCOG-Trial) to further evaluate the efficacy and safety of ipilimumab in patients with cutaneous melanoma and rare subgroups. J Clin Oncol 2014, 32:suppl; abstract 9031.
187. Eggermont AM, Chiarion-Sileni V, Grobb J, Dummer R, Wolchok J, Schmidt H: Ipilimumab versus placebo after complete resection of stage III melanoma: initial efficacy and safety results from the EORTC 18071 phase III trial. J Clin Oncol 2014, 32:suppl; abstract LBA9008.
188. Hamid O, Robert C, Daud A, Hodi FS, Hwu W-J, Kefford R, Wolchok JD, Hersey P, Joseph RW, Weber JS, Dronca R, Gangadhar TC, Patnaik A, Zarour H, Joshua AM, Gergich K, Elassaiss-Schaap J, Algazi A, Mateus C, Boasberg P, Tumeh PC, Chmielowski B, Ebbinghaus SW, Li XN, Kang SP, Ribas A: Safety and tumor responses with lambrolizumab (anti-PD-1) in melanoma. N Engl J Med 2013, 369:134–44.
189. Hodi F, Sznol M, Kluger HM, McDermott D, Carvajal RD, Lawrence DP: Long-term survival of ipilimumab-naive patients (pts) with advanced melanoma (MEL) treated with nivolumabb (anti-PD-1, BMS-936558, ONO-4538) in a phase I trial. J Clin Oncol 2014, 32:suppl; abstract 9002.
190. Chen K, Gottesman M: How Melanoma Cells Evade Chemotherapy: Role of Transporter-Dependent and -Independent Resistance Mechanisms. In From melanocytes to melanoma: The progression to malignancy. Edited by Hearing VJ, Leong S. Totowa, NJ: Humana Press; 2006.
191. Nazarian R, Shi H, Wang Q, Kong X, Koya R, Lee H, Chen Z, Lee M, Attar N, Sazegar H, Chodon T, Nelson S, McArthur G, Sosman J, Ribas A, Lo R: Melanomas acquire resistance to B-RAF (V600E) inhibition by RTK or N-RAS upregulation. Nature 2010, 468:973–977.
192. Kaplan FM, Mastrangelo MJ, Aplin AE: The wrath of RAFs: rogue behavior of B-RAF kinase inhibitors. J Invest Dermatol 2010, 130:2669–71.
193. Aplin AE, Kaplan FM, Shao Y: Mechanisms of resistance to RAF inhibitors in melanoma. J Invest Dermatol 2011, 131:1817–20.
194. Johannessen CM, Boehm JS, Kim SY, Thomas SR, Cogdill P, Barretina J, Caponigro G, Hieronymus H, Ryan R, Yang X, Alkan O, Kim S, Harris JL, Christopher J, Flaherty KT, Dummer R, Weber B, Sellers WR, Schlegel R, Wargo J, Hahn W, Garraway LA: COT/MAP3K8 drives resistance to RAF inhibition through MAP kinase pathway reactivation. Nature 2011, 468:968–972.
195. Sun C, Wang L, Huang S, Heynen GJJE, Prahallad A, Robert C, Haanen J, Blank C, Wesseling J, Willems SM, Zecchin D, Hobor S, Bajpe PK, Lieftink C, Mateus C, Vagner S, Grernrum W, Hofland I, Schlicker A, Wessels LF a, Beijersbergen RL, Bardelli A, Di Nicolantonio F, Eggermont AMM, Bernards R: Reversible and adaptive resistance to BRAF(V600E) inhibition in melanoma. Nature 2014, 508:118–22.
196. Long G V, Stroyakovskiy D, Gogas H, Levchenko E, de Braud F, Larkin J, Garbe C, Jouary T, Hauschild A, Grob J-J, Sileni V, Lebbe C, Mandala M, Milward M, Arance A, Bondarenko I, Haanen J, Jansson J, Utikal J, Ferraresi V, Kovalenko N, Mohr P, Probachai V, Schadendorf D, Nathan P, Robert C, Ribas A, DeMarini D, Irani J, Casey M, et al.: Combined BRAF and MEK inhibition versus BRAF Inhibition Alone in Melanoma. N Engl J Med 2014, 371:1877–1888.
References
121
197. Larkin J, Ascierto P, Dreno B, Atkinson V, Linszkay G, Maio M, Mandala M, Demidov L, Stroyakovskiy D, Thomas L, de la Cruz-Merino L, Dutriaux C, Garbe C, Sovak M, Chang I, Choong N, Hack S, McArthur G, Ribas A: Combined vemurafenib and cobimetinib in BRAF-mutated melanoma. N Engl J Med 2014, 371:1867–1876.
198. Robert C, Karaszewska B, Schanchter J, Rutkowski P, Mackiewicz A, Strojakovski D, Lichinistser M, Dummer R, Grange F, Mortier L, Chiarion-Sileni V, Drucis K, Krajsova I, Hauschild A, Lorigan P, Wolter P, Long G, Flaherty K, Nathan P, Ribas A, Martin A, Sun P, Crist W, Legos J, Rubin S, Little S, Schadendorf D: Improved overall survival in melanoma with combined dabrafenib and trametinib. N Engl J Med 2015, 372:30–39.
199. Ribas A, Hodi F, Callahan M, Konto C, Wolchok JD: Hepatotoxicity with combination of vemurafenib and ipilimumab. N Engl J Med 2013, 368:1365–1360.
200. Ward A, Touw I, Yoshimura A: The Jak-Stat pathway in normal and perturbed hematopoiesis. Blood 2000, 95:19–30.
201. Kudchadkar RR, Gibney G, Dorman D, Merek S, Ramadan H, Chen A: A phase IB study of ipilimumab with peginterferon alfa-2b for patients with unresectable stages IIIB/C/IV melanoma. J Clin Oncol 2014, 32:suppl; abstract 9098.
202. Hanahan D, Weinberg RA: Hallmarks of cancer: the next generation. Cell 2011, 144:646–74.
203. Caramel J, Papadogeorgakis E, Hill L, Browne GJ, Richard G, Wierinckx A, Saldanha G, Osborne J, Hutchinson P, Tse G, Lachuer J, Puisieux A, Pringle JH, Ansieau S, Tulchinsky E: A Switch in the Expression of Embryonic EMT-Inducers Drives the Development of Malignant Melanoma. Cancer Cell 2013, 24:466–80.
204. Mani S a, Guo W, Liao M, Eaton EN, Zhou AY, Brooks M, Reinhard F, Zhang CC, Campbell LL, Polyak K, Brisken C, Yang J, Weinberg RA: The epithelial-mesenchymal transition generates cells with properties of stem cells. Cell 2009, 133:704–715.
205. Ocaña OH, Córcoles R, Fabra Á, Moreno-Bueno G, Acloque H, Vega S, Barrallo-Gimeno A, Cano A, Nieto MA: Metastatic Colonization Requires the Repression of the Epithelial-Mesenchymal Transition Inducer Prrx1. Cancer Cell 2012, 22:709–724.
206. Tsai J, Donaher J, Murphy D, Chau S, Yang J: Spatiotemporal Regulation of Epithelial-Mesenchymal Transition is Essential for Squamous Cell Carcinoma Metastasis. Cancer Cell 2012, 22:726–736.
207. Gupta PB, Kuperwasser C, Brunet J-P, Ramaswamy S, Kuo W-L, Gray JW, Naber SP, Weinberg R a: The melanocyte differentiation program predisposes to metastasis after neoplastic transformation. Nat Genet 2005, 37:1047–54.
208. Maguire L, Thomas A, Goldstein A: Tumors of the neural crest: Common themes in development and cancer. Dev Dyn 2014:1–12.
209. Kulesa PM, Kasemeier-Kulesa JC, Teddy JM, Margaryan N V, Seftor E a, Seftor REB, Hendrix MJC: Reprogramming metastatic melanoma cells to assume a neural crest cell-like phenotype in an embryonic microenvironment. PNAS 2006, 103:3752–7.
210. Kulesa PM, Morrison J a, Bailey CM: The neural crest and cancer: a developmental spin on melanoma. Cells Tissues Organs 2013, 198:12–21.
211. Oppitz M, Busch C, Schriek G, Metzger M, Just L, Drews U: Non-malignant migration of B16 mouse melanoma cells in the neural crest and invasive growth in the eye cup of the chick embyro. Melanoma Res 2007, 17:17–30.
212. Bailey C, Kulesa P: Dynamic Interactions between Cancer Cells and the Embryonic Microenvironment Regulate Cell Invasion and Reveal EphB6 as a Metastasis Suppressor. Mol Cancer Res 2014, 12:1303–1313.
213. Bailey C: Melanoma revives an embryonic migration program to promote plasticity and invasion. Pigment Cell Melanoma Res 2012, 25:573–583.
References
122
214. Hoek K, Schlegel N, Brafford P, Sucker A, Ugurel S, Kumar R, Weber B, Nathanson K, Phillips D, M H, Schadendorf D, Dummer R: Metastatic potential of melanomas defined by specific gene expression profiles with no BRAF signature. Pigment Cell Res 2006, 19:290–302.
215. Hoek KS, Eichhoff OM, Schlegel NC, Döbbeling U, Kobert N, Schaerer L, Hemmi S, Dummer R: In vivo switching of human melanoma cells between proliferative and invasive states. Cancer Res 2008, 68:650–6.
216. O’Connell MMP, Marchbank K, Webster MMR, Valiga AA, Kaur A, Vultur A, Li L, Herlyn M, Villanueva J, Liu Q, Yin X, Widura S, Nelson J, Ruiz N, Camilli TCT, Indig FEF, Flaherty KKT, Wargo J a J, Frederick DDT, Cooper Z a, Nair S, Amaravadi RRK, Schuchter LML, Karakousis GGC, Xu W, Xu X, Weeraratna ATA, Ling L, Herlyn M, Villanueva J, et al.: Hypoxia induces phenotypic plasticity and therapy resistance in melanoma via the tyrosine kinase receptors ROR1 and ROR2. Cancer Discov 2013, 3:1378–1393.
217. Larribere L, Utikal J: De- and re-differentiation of the melanocytic lineage. Eur J Cell Biol 2014, 93:30–5.
218. Brabletz T: To differentiate or not--routes towards metastasis. Nat Rev Cancer 2012, 12:425–36.
219. Cheli Y, Giuliano S, Botton T, Rocchi S, Hofman V, Hofman P, Bahadoran P, Bertolotto C, Ballotti R: Mitf is the key molecular switch between mouse or human melanoma initiating cells and their differentiated progeny. Oncogene 2011, 30:2307–2318.
220. Sinclair AH, Berta P, Palmer MS, Hawkins JR, Griffiths BL, Smith MJ, Foster JW, Frischauf AM, Lovell-Badge R, Goodfellow PN: A gene from the human sex-determining region encodes a protein with homology to a conserved DNA-binding motif. Nature 1990, 346:240–244.
221. Gubbay J, Collignon J, Koopman P, Capel B, Economou A, Muensterberg A, Vivian N, Goodfellow P, Lovell-Badge R: A gene mapping to the sex-determining region of the mouse Y chromosome is a member of a novel family of embryonically expressed genes. Nature 1990, 346:245–250.
222. Waugh RJ, T PP: Evolution of the Sry Genes. Mol Biol Evol 1997, 14:49–55.
223. Guth SIE, Wegner M: Having it both ways: Sox protein function between conservation and innovation. Cell Mol Life Sci 2008, 65:3000–18.
224. Wegner M: From head to toes: the multiple facets of Sox proteins. Nucleic Acids Res 1999, 27:1409–20.
225. Sarkar A, Hochedlinger K: The sox family of transcription factors: versatile regulators of stem and progenitor cell fate. Cell Stem Cell 2013, 12:15–30.
226. Coriat a M, Muller U, Harry JL, Uwanogho D, Sharpe PT: PCR amplification of SRY-related gene sequences reveals evolutionary conservation of the SRY-box motif. Genome Res 1993, 2:218–222.
227. Laudet V, Stehelin D, Clevers H: Ancestry and diversity of the HMG box superfamily. Nucleic Acids Res 1993, 21:2493–501.
228. Uwanogho D, Rex M, Cartwright EJ, Pearl G, Healy C, Scotting PJ, Sharpe PT: Embryonic expression of the chicken Sox2, Sox3 and Sox11 genes suggests an interactive role in neuronal development. Mech Dev 1995, 49:23–36.
229. Nagai K: Molecular evolution of Sry and Sox gene. Gene 2001, 270:161–9.
230. Pevny LH, Lovell-Badge R: Sox genes find their feet. Curr Opin Genet Dev 1997, 7:338–44.
231. Kamachi Y, Uchikawa M, Kondoh H: Pairing SOX off: with partners in the regulation of embryonic development. Trends Genet 2000, 9525:2–7.
232. Harley VR, Lovell-Badge R, Goodfellow PN: Definition of a consensus DNA binding site for SRY. Nucleic Acids Res 1994, 22:1500–1.
References
123
233. Wetering M Van De, Clevers H: Sequence-specific interaction of the HMG box proteins Watson -Crick double helix. EMBO J 1992, 1:3039–3044.
234. Schepers GE, Teasdale RD, Koopman P: Twenty Pairs of Sox : Extent, Homology, and Nomenclature of Mouse and Human Sox Transcription Factor Gene Families. Dev Cell 2002, 3:167–170.
235. Bowles J, Schepers G, Koopman P: Phylogeny of the SOX family of developmental transcription factors based on sequence and structural indicators. Dev Biol 2000, 227:239–55.
236. Stevanovic M, Zuffardi O, Collignon J, Lovell-Badge R, Goodfellow P: The cDNA sequence and chromosomal location of the human SOX2 gene. Mamm Genome 1994, 5:640–2.
237. Van Houte LP a., Chuprina VP, van der Wetering M, Boelens R, Kaptein R, Clevers H: Solution Structure of the Sequence-specific HMG Box of the Lymphocyte Transcriptional Activator Sox-4. J Biol Chem 1995, 270:30516–30524.
238. Werner MH, Huth JR, Gronenborn a M, Clore GM: Molecular basis of human 46X,Y sex reversal revealed from the three-dimensional solution structure of the human SRY-DNA complex. Cell 1995, 81:705–14.
239. Ferrari S, Harley V: SRY, like HMG1, recognizes sharp angles in DNA. EMBO J 1992, 1:4497–4506.
240. Connor F, Cary PD, Read CM, Preston NS, Driscoll PC, Denny P, Crane-Robinson C, Ashworth a: DNA binding and bending properties of the post-meiotically expressed Sry-related protein Sox-5. Nucleic Acids Res 1994, 22:3339–46.
241. Pontiggia a, Rimini R, Harley VR, Goodfellow PN, Lovell-Badge R, Bianchi ME: Sex-reversing mutations affect the architecture of SRY-DNA complexes. EMBO J 1994, 13:6115–24.
242. Scaffidi P, Bianchi ME: Spatially precise DNA bending is an essential activity of the Sox2 transcription factor. J Biol Chem 2001, 276:47296–302.
243. Grosschedl R, Giese K, Pagel J: HMG domain proteins: architectural elements in the assembly of nucleoprotein structures. Trends Genet 1994, 10:94–100.
244. Kondoh H, Kamachi Y: SOX-partner code for cell specification: Regulatory target selection and underlying molecular mechanisms. Int J Biochem Cell Biol 2010, 42:391–9.
245. Kamachi Y, Uchikawa M: Pax6 and SOX2 form a co-DNA-binding partner complex that regulates initiation of lens development. Genes Dev 2001:1272–1286.
246. Wissmüller S, Kosian T, Wolf M, Finzsch M, Wegner M, Wißmüller S, Kosian T, Wolf M, Finzsch M, Wegner M: The high-mobility-group domain of Sox proteins interacts with DNA-binding domains of many transcription factors. Nucleic Acids Res 2006, 34:1735–44.
247. Geiss-Friedlander R, Melchior F: Concepts in sumoylation: a decade on. Nat Rev Mol Cell Biol 2007, 8:947–56.
248. Taylor KM, Labonne C: SoxE factors function equivalently during neural crest and inner ear development and their activity is regulated by SUMOylation. Dev Cell 2005, 9:593–603.
249. Gill G: SUMO changes Sox for developmental diversity. Mol Cell 2005, 20:495–6.
250. Girard M, Goossens M: Sumoylation of the SOX10 transcription factor regulates its transcriptional activity. FEBS Lett 2006, 580:1635–41.
251. Lee P-C, Taylor-Jaffe KM, Nordin KM, Prasad MS, Lander RM, LaBonne C: SUMOylated SoxE factors recruit Grg4 and function as transcriptional repressors in the neural crest. J Cell Biol 2012, 198:799–813.
References
124
252. Tsuruzoe S, Ishihara K, Uchimura Y, Watanabe S, Sekita Y, Aoto T, Saitoh H, Yuasa Y, Niwa H, Kawasuji M, Baba H, Nakao M: Inhibition of DNA binding of Sox2 by the SUMO conjugation. Biochem Biophys Res Commun 2006, 351:920–6.
253. Avilion A a, Nicolis SK, Pevny LH, Perez L, Vivian N, Lovell-Badge R: Multipotent cell lineages in early mouse development depend on SOX2 function. Genes Dev 2003, 17:126–40.
254. Orkin SH, Hochedlinger K: Chromatin connections to pluripotency and cellular reprogramming. Cell 2011, 145:835–50.
255. Thomson M, Liu SJ, Zou L-N, Smith Z, Meissner A, Ramanathan S: Pluripotency factors in embryonic stem cells regulate differentiation into germ layers. Cell 2011, 145:875–89.
256. Cox JL, Mallanna SK, Luo X, Rizzino A: Sox2 uses multiple domains to associate with proteins present in Sox2-protein complexes. PLoS One 2010, 5:e15486.
257. Fang X, Yoon J-G, Li L, Tsai YS, Zheng S, Hood L, Goodlett DR, Foltz G, Lin B: Landscape of the SOX2 protein-protein interactome. Proteomics 2011, 11:921–34.
258. Williamson K a, Hever AM, Rainger J, Rogers RC, Magee A, Fiedler Z, Keng WT, Sharkey FH, McGill N, Hill CJ, Schneider A, Messina M, Turnpenny PD, Fantes J a, van Heyningen V, FitzPatrick DR: Mutations in SOX2 cause anophthalmia-esophageal-genital (AEG) syndrome. Hum Mol Genet 2006, 15:1413–22.
259. Kelberman D, Rizzoti K, Avilion A, Bitner-glindzicz M, Cianfarani S, Collins J, Chong WK, Kirk JMW, Achermann JC, Ross R, Carmignac D, Lovell-badge R, Robinson ICAF, Dattani MT: Mutations within SOX2/SOX2 are associated with abnormalities in the hypothalamo- pituitary-gonadal axis in mice and humans. J Clin Invest 2006, 116:2442–2455.
260. Hagstrom S a, Pauer GJT, Reid J, Simpson E, Crowe S, Maumenee IH, Traboulsi EI: SOX2 mutation causes anophthalmia, hearing loss, and brain anomalies. Am J Med Genet A 2005, 138A:95–8.
261. Engelen E, Akinci U, Bryne JC, Hou J, Gontan C, Moen M, Szumska D, Kockx C, van Ijcken W, Dekkers DHW, Demmers J, Rijkers E-J, Bhattacharya S, Philipsen S, Pevny LH, Grosveld FG, Rottier RJ, Lenhard B, Poot R a: Sox2 cooperates with Chd7 to regulate genes that are mutated in human syndromes. Nat Genet 2011, 43:607–11.
262. Weina K, Utikal J: SOX2 and cancer: current research and its implications in the clinic. Clin Transl Med 2014, 3:19.
263. Liu K, Lin B, Zhao M, Yang X, Chen M, Gao A, Liu F, Que J, Lan X: The multiple roles for Sox2 in stem cell maintenance and tumorigenesis. Cell Signal 2013, 25:1264–71.
264. Hussenet T, Dali S, Exinger J, Monga B, Jost B, Dembelé D, Martinet N, Thibault C, Huelsken J, Brambilla E, du Manoir S: SOX2 is an oncogene activated by recurrent 3q26.3 amplifications in human lung squamous cell carcinomas. PLoS One 2010, 5:e8960.
265. Albertson DG: Gene amplification in cancer. Trends Genet 2006, 22:447–455.
266. Bass AJ, Watanabe H, Mermel CH, Yu S, Perner S, Verhaak RG, Kim SY, Wardwell L, Tamayo P, Gat-Viks I, Ramos AH, Woo MS, Weir B a, Getz G, Beroukhim R, O’Kelly M, Dutt A, Rozenblatt-Rosen O, Dziunycz P, Komisarof J, Chirieac LR, Lafargue CJ, Scheble V, Wilbertz T, Ma C, Rao S, Nakagawa H, Stairs DB, Lin L, Giordano TJ, et al.: SOX2 is an amplified lineage-survival oncogene in lung and esophageal squamous cell carcinomas. Nat Genet 2009, 41:1238–42.
267. Annovazzi L, Mellai M, Caldera V, Valente G, Schiffer D: SOX2 expression and amplification in gliomas and glioma cell lines. Cancer Genomics Proteomics 2011, 8:139–47.
268. Freier K, Knoepfle K, Flechtenmacher C, Pungs S, Devens F, Toedt G, Hofele C, Joos S, Lichter P, Radlwimmer B: Recurrent copy number gain of transcription factor SOX2 and corresponding high protein expression in oral squamous cell carcinoma. Genes Chromosomes Cancer 2010, 49:9–16.
References
125
269. Hussenet T, Manoir S du: SOX2 in squamous cell carcinoma: amplifying a pleiotropic oncogene along carcinogenesis. Cell Cycle 2010, 9:1480–1486.
270. Schröck A, Göke F, Wagner P, Bode M, Franzen A, Braun M, Huss S, Agaimy A, Ihrler S, Menon R, Kirsten R, Kristiansen G, Bootz F, Lengerke C, Perner S: Sex determining region Y-box 2 (SOX2) amplification is an independent indicator of disease recurrence in sinonasal cancer. PLoS One 2013, 8:e59201.
271. Rudin CM, Durinck S, Stawiski EW, Poirier JT, Modrusan Z, Shames DS, Bergbower E a, Guan Y, Shin J, Guillory J, Rivers CS, Foo CK, Bhatt D, Stinson J, Gnad F, Haverty PM, Gentleman R, Chaudhuri S, Janakiraman V, Jaiswal BS, Parikh C, Yuan W, Zhang Z, Koeppen H, Wu TD, Stern HM, Yauch RL, Huffman KE, Paskulin DD, Illei PB, et al.: Comprehensive genomic analysis identifies SOX2 as a frequently amplified gene in small-cell lung cancer. Nat Genet 2012, 44:1111–6.
272. Hütz K, Mejías-Luque R, Farkasova K, Ogris M, Krebs S, Anton M, Vieth M, Schüller U, Schneider MR, Blum H, Wagner E, Jung A, Gerhard M, Farsakova K: The stem cell factor SOX2 regulates the tumorigenic potential in human gastric cancer cells. Carcinogenesis 2014, 35:942–50.
273. Alonso MM, Diez-Valle R, Manterola L, Rubio A, Liu D, Cortes-Santiago N, Urquiza L, Jauregi P, Lopez de Munain A, Sampron N, Aramburu A, Tejada-Solís S, Vicente C, Odero MD, Bandrés E, García-Foncillas J, Idoate M a, Lang FF, Fueyo J, Gomez-Manzano C: Genetic and epigenetic modifications of Sox2 contribute to the invasive phenotype of malignant gliomas. PLoS One 2011, 6:e26740.
274. Yang N, Hui L, Wang Y, Yang H, Jiang X: SOX2 promotes the migration and invasion of laryngeal cancer cells by induction of MMP-2 via the PI3K/Akt/mTOR pathway. Oncol Rep 2014, 31:2651–9.
275. Li X, Xu Y, Chen Y, Chen S, Jia X, Sun T, Liu Y, Li X, Xiang R, Li N: SOX2 promotes tumor metastasis by stimulating epithelial-to-mesenchymal transition via regulation of WNT/β-catenin signal network. Cancer Lett 2013, 336:379–89.
276. Ikushima H, Todo T, Ino Y, Takahashi M, Miyazawa K, Miyazono K: Autocrine TGF-beta signaling maintains tumorigenicity of glioma-initiating cells through Sry-related HMG-box factors. Cell Stem Cell 2009, 5:504–14.
277. Wang Q, He W, Lu C, Wang Z, Wang J, Giercksky KE, Nesland JM, Suo Z: Oct3/4 and Sox2 are significantly associated with an unfavorable clinical outcome in human esophageal squamous cell carcinoma. Anticancer Res 2009, 29:1233–41.
278. Toschi L, Finocchiaro G, Nguyen TT, Skokan MC, Giordano L, Gianoncelli L, Perrino M, Siracusano L, Di Tommaso L, Infante M, Alloisio M, Roncalli M, Scorsetti M, Jänne P a, Santoro A, Varella-Garcia M: Increased SOX2 Gene Copy Number Is Associated with FGFR1 and PIK3CA Gene Gain in Non-Small Cell Lung Cancer and Predicts Improved Survival in Early Stage Disease. PLoS One 2014, 9:e95303.
279. Harris ML, Baxter LL, Loftus SK, Pavan WJ: Sox proteins in melanocyte development and melanoma. Pigment Cell Melanoma Res 2010, 23:496–513.
280. Shakhova O, Zingg D, Schaefer SM, Hari L, Civenni G, Blunschi J, Claudinot S, Okoniewski M, Beermann F, Mihic-Probst D, Moch H, Wegner M, Dummer R, Barrandon Y, Cinelli P, Sommer L: Sox10 promotes the formation and maintenance of giant congenital naevi and melanoma. Nat Cell Biol 2012, 14:882–90.
281. Laga AC, Lai C-Y, Zhan Q, Huang SJ, Velazquez EF, Yang Q, Hsu M-Y, Murphy GF: Expression of the embryonic stem cell transcription factor SOX2 in human skin: relevance to melanocyte and merkel cell biology. Am J Pathol 2010, 176:903–13.
282. Laga A, Zhan Q, Weishaupt C: SOX2 and nestin expression in human melanoma: an immunohistochemical and experimental study. Exp Dermatol 2011, 20:339–345.
283. Schoenhals M, Kassambara A, De Vos J, Hose D, Moreaux J, Klein B: Embryonic stem cell markers expression in cancers. Biochem Biophys Res Commun 2009, 383:157–62.
284. Girouard SD, Laga AC, Mihm MC, Scolyer R a, Thompson JF, Zhan Q, Widlund HR, Lee C-W, Murphy GF: SOX2 contributes to melanoma cell invasion. Lab Invest 2012, 92:362–70.
References
126
285. Cimadamore F, Shah M, Amador-Arjona A, Navarro-Peran E, Chen C, Huang C-T, Terskikh A V: SOX2 modulates levels of MITF in normal human melanocytes, and melanoma lines in vitro. Pigment Cell Melanoma Res 2012, 25:533–6.
286. Santini R, Pietrobono S, Pandolfi S, Montagnani V, D’Amico M, Penachioni JY, Vinci MC, Borgognoni L, Stecca B: SOX2 regulates self-renewal and tumorigenicity of human melanoma-initiating cells. Oncogene 2014(August 2013):1–12.
287. Hsu M, Rovinsky S, Penmatcha S, Herlyn M, Murihead D: Bone morphogenetic proteins in melanoma: angel or devil?. Cancer Metastasis Rev 2005, 24:251–263.
288. Webster MR, Weeraratna AT: A Wnt-er migration: the confusing role of β-catenin in melanoma metastasis. Sci Signal 2013, 6:pe11.
289. Weeraratna A: A Wnt-er wonderland—the complexity of Wnt signaling in melanoma. Cancer Metastasis Rev 2005, 24:237–250.
290. Klein WM, Wu BP, Zhao S, Wu H, Klein-Szanto AJP, Tahan SR: Increased expression of stem cell markers in malignant melanoma. Mod Pathol 2007, 20:102–7.
291. Sommer C a, Stadtfeld M, Murphy GJ, Hochedlinger K, Kotton DN, Mostoslavsky G: Induced pluripotent stem cell generation using a single lentiviral stem cell cassette. Stem Cells 2008, 27:543–9.
292. Nissan X, Larribere L, Saidani M, Hurbain I, Delevoye C, Feteira J, Lemaitre G, Peschanski M, Baldeschi C: Functional melanocytes derived from human pluripotent stem cells engraft into pluristratified epidermis. PNAS 2011, 108:14861–14866.
293. Benjamini Y, Hochberg Y: Controlling the false discovery rate: a practical and powerful approach to multiple testing. J R Stat Soc 1995, 57:289–300.
294. Raposo G, Marks MS: Melanosomes--dark organelles enlighten endosomal membrane transport. Nat Rev Mol Cell Biol 2007, 8:786–97.
295. Ortenberg R, Galore-Haskel G, Greenberg I, Zamlin B, Sapoznik S, Greenberg E, Barshack I, Avivi C, Feiler Y, Zan-Bar I, Besser MJ, Azizi E, Eitan F, Schachter J, Markel G: CEACAM1 promotes melanoma cell growth through Sox-2. Neoplasia 2014, 16:451–60.
296. Hothorn T, Lausen B: On the exact distribution of maximally selected rank statistics. Comput Stat Data Anal 2003, 43:121–137.
297. Adameyko I, Lallemend F, Furlan A, Zinin N, Aranda S, Kitambi SS, Blanchart A, Favaro R, Nicolis S, Lübke M, Müller T, Birchmeier C, Suter U, Zaitoun I, Takahashi Y, Ernfors P: Sox2 and Mitf cross-regulatory interactions consolidate progenitor and melanocyte lineages in the cranial neural crest. Development 2012, 139:397–410.
298. Sandelin A, Alkema W, Engström P, Wasserman WW, Lenhard B: JASPAR: an open-access database for eukaryotic transcription factor binding profiles. Nucleic Acids Res 2004, 32(Database issue):D91–4.
299. Hallsson JH, Haflidadóttir BS, Schepsky A, Arnheiter H, Steingrímsson E: Evolutionary sequence comparison of the Mitf gene reveals novel conserved domains. Pigment Cell Res 2007, 20:185–200.
300. Khaled M, Larribere L, Bille K, Ortonne J-P, Ballotti R, Bertolotto C: Microphthalmia associated transcription factor is a target of the phosphatidylinositol-3-kinase pathway. J Invest Dermatol 2003, 121:831–836.
301. Gabbert H, Wagner R, Moll R, Gerharz CD: Tumor dedifferentiation: an important step in tumor invasion. Clin Exp Metastasis 1985, 3:257–79.
302. Benito JM, López M, Lozano S, Ballesteros C, González-Lahoz J, Soriano V: Hydroxyurea exerts an anti-proliferative effect on T cells but has no direct impact on cellular activation. Clin Exp Immunol 2007, 149:171–177.
References
127
303. De la Rocha AMA, Sampron N, Alonso MM, Matheu A: Role of SOX family of transcription factors in central nervous system tumors. Am J Cancer Res 2014, 4:312–24.
304. Hoek KS, Goding CR: Cancer stem cells versus phenotype-switching in melanoma. Pigment Cell Melanoma Res 2010, 23:746–59.
305. Inman GJ, Nicolás FJ, Callahan JF, Harling JD, Gaster LM, Reith AD, Laping NJ, Hill CS: SB-431542 is a potent and specific inhibitor of transforming growth factor-beta superfamily type I activin receptor-like kinase (ALK) receptors ALK4, ALK5, and ALK7. Mol Pharmacol 2002, 62:65–74.
306. Callahan J, Burgress J, Fornwald J, Gaster L, Harling J, Harrington F, Heer J, Kwon C, Lehr R, Mathur A, Olson B, Weinstock J, Laping N: Indentification of novel inhibitors of the transforming growth factor B1 (TGFB1) type 1 receptor (ALK5). J Med Chem 2002, 45:999–1001.
307. Weinberg RA: The Biology of Cancer. 2006:864.
308. Omholt K, Platz A, Kanter L, Ringborg U, Hansson J: NRAS and BRAF mutations arise early during melanoma pathogenesis and are preserved throughout tumor progression. Clin Cancer Res 2003, 9:6483–6488.
309. Bartkova J, Lukas J, Guldberg P, Alsner J, Kirkin A, Zeuthen J, Bartek J: The p16-cyclin D/Cdk4-pRb pathway as a functional unit frequently altered in melanoma pathogenesis. Cancer Res 1996, 56:5475–5483.
310. Chin L: The genetics of malignant melanoma: lessons from mouse and man. Nat Rev Cancer 2003, 3:559–570.
311. Guenou H, Nissan X, Larcher F, Feteira J, Lemaitre G, Saidani M, Del Rio M, Barrault CC, Bernard F-X, Peschanski M, Baldeschi C, Waksman G: Human embryonic stem-cell derivatives for full reconstruction of the pluristratified epidermis: a preclinical study. Lancet 2009, 374:1745–53.
312. Idelson M, Alper R, Obolensky A, Ben-Shushan E, Hemo I, Yachimovich-Cohen N, Khaner H, Smith Y, Wiser O, Gropp M, Cohen M a, Even-Ram S, Berman-Zaken Y, Matzrafi L, Rechavi G, Banin E, Reubinoff B: Directed differentiation of human embryonic stem cells into functional retinal pigment epithelium cells. Cell Stem Cell 2009, 5:396–408.
313. Wakamatsu Y, Endo Y, Osumi N, Weston J a: Multiple roles of Sox2, an HMG-box transcription factor in avian neural crest development. Dev Dyn 2004, 229:74–86.
314. Bondurand N, Kobetz A, Pingault V, Lemort N, Encha-Razavi F, Couly G, Goerich DE, Wegner M, Abitbol M, Goossens M: Expression of the SOX10 gene during human development. FEBS Lett 1998, 432:168–172.
315. Cheng Y-C, Cheung M, Abu-Elmagd MM, Orme A, Scotting PJ: Chick Sox10, a transcription factor expressed in both early neural crest cells and central nervous system. Dev Brain Res 2000, 121:233–241.
316. Paratore C, Goerich DE, Suter U, Wegner M, Sommer L: Survival and glial fate acquisition of neural crest cells are regulated by an interplay between the transcription factor Sox10 and extrinsic combinatorial signaling. Development 2001, 128:3949–61.
317. Bernhardt M, Galach M, Novak D, Utikal J: Mediators of induced pluripotency and their role in cancer cells – current scientific knowledge and future perspectives. Biotechnol J 2012, 7:810–821.
318. Chen P-L, Chen W-S, Li J, Lind AC, Lu D: Diagnostic utility of neural stem and progenitor cell markers nestin and SOX2 in distinguishing nodal melanocytic nevi from metastatic melanomas. Mod Pathol 2013, 26:44–53.
319. Maier S, Wilbertz T, Braun M, Scheble V, Reischl M, Mikut R, Menon R, Nikolov P, Petersen K, Beschorner C, Moch H, Kakies C, Protzel C, Bauer J, Soltermann A, Fend F, Staebler A, Lengerke C, Perner S: SOX2 amplification is a common event in squamous cell carcinomas of different organ sites. Hum Pathol 2011, 42:1078–88.
References
128
320. Kraehn G, Utikal J, Udart M: Extra c-myc oncogene copies in high risk cutaneous malignant melanoma and melanoma metastases. Br J Cancer 2001, 84:72–79.
321. Bishop R: Applications of fluorescence in situ hybridization (FISH) in detecting genetic aberrations of medical significance. Biosci Horizons 2010, 3:85–95.
322. Kemper K, de Goeje PL, Peeper DS, van Amerongen R: Phenotype Switching: Tumor Cell Plasticity as a Resistance Mechanism and Target for Therapy. Cancer Res 2014:5937–5941.
323. Landsberg J, Kohlmeyer J, Renn M, Bald T, Rogava M, Cron M, Fatho M, Lennerz V, Wölfel T, Hölzel M, Tüting T: Melanomas resist T-cell therapy through inflammation-induced reversible dedifferentiation. Nature 2012, 490:412–6.
324. Talmadge JE, Fidler IJ: AACR centennial series: The biology of cancer metastasis: Historical perspective. Cancer Res 2010, 70:5649–5669.
325. Fidler I: The pathogenesis of cancer metastasis: the “seed and soil” hypothesis revisited. Nat Rev Cancer 2003, 3:453–458.
326. Han X, Fang X, Lou X, Hua D, Ding W, Foltz G, Hood L, Yuan Y, Lin B: Silencing SOX2 induced mesenchymal-epithelial transition and its expression predicts liver and lymph node metastasis of CRC patients. PLoS One 2012, 7:e41335.
327. Herreros-Villanueva M, Zhang J-S, Koenig a, Abel E V, Smyrk TC, Bamlet WR, de Narvajas a a-M, Gomez TS, Simeone DM, Bujanda L, Billadeau DD: SOX2 promotes dedifferentiation and imparts stem cell-like features to pancreatic cancer cells. Oncogenesis 2013, 2:e61.
328. Derynck R, Akhurst R: Differentiation plasticity regulated by TGF-beta family proteins in development and disease. Nat Cell Biol 2007, 9:1000–1004.
329. Thiery JP: Epithelial–mesenchymal transitions in development and pathologies. Curr Opin Cell Biol 2003, 15:740–746.
330. Aomatsu K, Arao T, Sugioka K, Matsumoto K, Tamura D, Kudo K, Kaneda H, Tanaka K, Fujita Y, Shimomura Y, Nishio K: TGF-β induces sustained upregulation of SNAI1 and SNAI2 through Smad and non-Smad pathways in a human corneal epithelial cell line. Invest Ophthalmol Vis Sci 2011, 52:2437–43.
331. Javelaud D, Delmas V, Möller M, Sextius P, André J, Menashi S, Larue L, Mauviel A: Stable overexpression of Smad7 in human melanoma cells inhibits their tumorigenicity in vitro and in vivo. Oncogene 2005, 24:7624–7629.
332. Kang Y, He W, Tulley S, Gupta GP, Serganova I, Chen C-R, Manova-Todorova K, Blasberg R, Gerald WL, Massagué J: Breast cancer bone metastasis mediated by the Smad tumor suppressor pathway. Proc Natl Acad Sci U S A 2005, 102:13909–13914.
333. Yin JJ, Selander K, Chirgwin JM, Dallas M, Grubbs BG, Wieser R, Massagué J, Mundy GR, Guise T a.: TGF-β signaling blockade inhibits PTHrP secretion by breast cancer cells and bone metastases development. J Clin Invest 1999, 103:197–206.
334. Cox JL, Wilder PJ, Gilmore JM, Wuebben EL, Washburn MP, Rizzino A: The SOX2-interactome in brain cancer cells identifies the requirement of MSI2 and USP9X for the growth of brain tumor cells. PLoS One 2013, 8:e62857.
335. Boyer LA, Lee TI, Cole MF, Johnstone SE, Stuart S., Zucker JP, Guenther MG, Kumar RM, Murray HL, Jenner RG, Gifford DK, Melton D a, Jaenisch R, Young RA: Core Transcriptional Regulatory Circuitry in Human Embryonic Stem Cells. Cell 2005, 122:947–956.
336. Kerppola T: Design and implementation of bimolecular fluorescence complementation (BiFC) assays for the visualization of protein interactions in living cells. Nat Protoc 2006, 1:1278–1286.
References
129
337. Papanayotou C, Mey A, Birot A-M, Saka Y, Boast S, Smith JC, Samarut J, Stern CD: A mechanism regulating the onset of Sox2 expression in the embryonic neural plate. PLoS Biol 2008, 6:e2.
338. Lang D, Lu MM, Huang L, Engleka K a, Zhang M, Chu EY, Lipner S, Skoultchi A, Millar SE, Epstein J a: Pax3 functions at a nodal point in melanocyte stem cell differentiation. Nature 2005, 433:884–7.
339. Medic S, Ziman M: PAX3 expression in normal skin melanocytes and melanocytic lesions (naevi and melanomas). PLoS One 2010, 5:e9977.
340. Jaenisch R, Young R: Stem cells, the molecular circuitry of pluripotency and nuclear reprogramming. Cell 2008, 132:567–582.
341. Rolland T, Taşan M, Charloteaux B, Pevzner SJ, Zhong Q, Sahni N, Yi S, Lemmens I, Fontanillo C, Mosca R, Kamburov A, Ghiassian SD, Yang X, Ghamsari L, Balcha D, Begg BE, Braun P, Brehme M, Broly MP, Carvunis A-R, Convery-Zupan D, Corominas R, Coulombe-Huntington J, Dann E, Dreze M, Dricot A, Fan C, Franzosa E, Gebreab F, Gutierrez BJ, et al.: A Proteome-Scale Map of the Human Interactome Network. Cell 2014, 159:1212–1226.
342. Forghanifard MM, Ardalan Khales S, Javdani-Mallak A, Rad A, Farshchian M, Abbaszadegan MR: Stemness state regulators SALL4 and SOX2 are involved in progression and invasiveness of esophageal squamous cell carcinoma. Med Oncol 2014, 31:922.
343. Favaro R, Appolloni I, Pellegatta S, Sanga AB, Pagella P, Gambini E, Pisati F, Ottolenghi S, Foti M, Finocchiaro G, Malatesta P, Nicolis SK: Sox2 is required to maintain cancer stem cells in a mouse model of high-grade oligodendroglioma. Cancer Res 2014, 74:1833–44.
344. Polakova I, Duskova M, Smahel M: Antitumor DNA vaccination against the Sox2 transcription factor. Int J Oncol 2014, 45:139–46.
345. Dogan I, Kawabata S, Bergbower E, Gills JJ, Ekmekci A, Wilson W, Rudin CM, Dennis P a: SOX2 expression is an early event in a murine model of EGFR mutant lung cancer and promotes proliferation of a subset of EGFR mutant lung adenocarcinoma cell lines. Lung Cancer 2014.
346. Sáez-Ayala M, Montenegro MF, Sánchez-Del-Campo L, Fernández-Pérez MP, Chazarra S, Freter R, Middleton M, Piñero-Madrona A, Cabezas-Herrera J, Goding CR, Rodríguez-López JN: Directed phenotype switching as an effective antimelanoma strategy. Cancer Cell 2013, 24:105–19.
347. Connolly EC, Freimuth J, Akhurst RJ: Complexities of TGF-β targeted cancer therapy. Int J Biol Sci 2012, 8:964–78.
348. De Larco JE, Todaro GJ: Growth factors from murine sarcoma virus-transformed cells. PNAS 1978, 75:4001–4005.
349. Roberts AB, Anzano MA, Lamb LC, Smith JM, Sporn MB: New class of transforming growth factors potentiated by epidermal growth factor: isolation from non-neoplastic tissues. PNAS 1981, 78:5339–5343.
350. Seydin S, Thompson A, Bentz H: Cartilage-inducing factor-A: Apparent identity to transforming growth factor-beta. J Biol Chem 1986, 261:5693–5695.
351. Moses H, Branum E, Proper J, Robinson R: Transforming growth factor production by chemically transformed cells. Cancer Res 1981, 41:2842–2848.
352. Siegel P, Massagué J: Cytostatic and apoptotic actions of TGF-beta in homeostasis and cancer. Nat Rev Cancer 2003, 3:807–820.
353. Muraoka-Cook R, Kurokawa H, Koh Y, Forbes J, Roebuck L, Barcellos-Hoff M, Moody S, Chodosh L, Arteaga C: Conditional overexpression of active transforming growth factor β1 in vivo accelerates metastases of transgenic mammary tumors. Cancer Res 2004, 64:9002–9011.
References
130
354. Muraoka R, Dumont N, Ritter C, Dugger T, Brantley D, Chen J, Easterly E, Roebuck L, Ryan S, Gotwals P, Koteliansky V, Arteaga C: Blockade of TGF-β inhibits mammary tumor cell viability, migration, and metastases. J clini 2002, 109:1533–1536.
355. Bennett C, Swayze E: RNA Targeting Therapeutics: Molecular Mechanisms of Antisense Oligonucleotides as a Therapeutic Platform. Annu Rev Pharmacol Toxicol 2010, 50:259–293.
356. Connolly EC, Saunier EF, Quigley D, Luu MT, De Sapio A, Hann B, Yingling JM, Akhurst RJ: Outgrowth of drug-resistant carcinomas expressing markers of tumor aggression after long-term TβRI/II kinase inhibition with LY2109761. Cancer Res 2011, 71:2339–49.
357. Mead A, Wong T, Cordeiro M, Anderson I, Khaw P: Evaluation of Anti-TGF- 2 Antibody as a New Postoperative Anti-scarring Agent in Glaucoma Surgery. Invest Ophthalmol Vis Sci 2003, 44:3394–3401.
358. Thompson JE, Vaughan TJ, Williams AJ, Wilton J, Johnson KS, Bacon L, Green JA, Field R, Ruddock S, Martins M, Pope AR, Tempest PR, Jackson RH: A fully human antibody neutralising biologically active human TGFβ2 for use in therapy. J Immunol Methods 1999, 227:17–29.
359. Cordeiro M, Gay J, Khaw P: Human anti-transforming growth factor-β2 antibody: a new glaucoma anti-scarring agent. Invest Ophthalmol Vis Sci 1999, 40:2225–2234.
360. Morris JC, Tan AR, Olencki TE, Shapiro GI, Dezube BJ, Reiss M, Hsu FJ, Berzofsky J a, Lawrence DP: Phase I study of GC1008 (fresolimumab): a human anti-transforming growth factor-beta (TGFβ) monoclonal antibody in patients with advanced malignant melanoma or renal cell carcinoma. PLoS One 2014, 9:e90353.
361. Mohammad KS, Javelaud D, Fournier PGJ, Niewolna M, McKenna CR, Peng XH, Duong V, Dunn LK, Mauviel A, Guise T a: TGF-beta-RI kinase inhibitor SD-208 reduces the development and progression of melanoma bone metastases. Cancer Res 2011, 71:175–84.
362. Li R, Chung a C, Dong Y, Yang W, Zhong X, Lan HY: The microRNA miR-433 promotes renal fibrosis by amplifying the TGF-beta/Smad3-Azin1 pathway. Kidney Int 2013, 84:1129–1144.
363. Bertolotto C, Abbe P, Bille K: Different cis-acting elements are involved in the regulation of TRP1 and TRP2 promoter activities by cyclic AMP: pivotal role of M boxes (GTCATGTGCT) and of. Mol Cell Biol 1998, 18:694–702.

Acknowledgements
131
10 Acknowledgements I would first like to thank Prof. Dr. Jochen Utikal for giving me this opportunity to perform my
doctoral thesis work in his laboratory. Also, I would like to thank Prof. Dr. Viktor Umansky
for being my first supervisor and giving me guidance throughout this doctoral work. Moreover, I want to thank my TAC members, Dr. Martin Sprick and Prof. Dr. Stefan
Schneider, for their critical input throughout the duration of my work. Additionally, I want to
thank Dr. Christoffer Gebhardt for his input into my project and assistance with the tissue
microarray.
This work would have not been possible without the constant help, laughs and dedication
from the Utikal lab. I would especially like to thank Daniel Roth for his great technician work
and undeniable joy he brought to the lab every day. The scientific help from Maike Reith,
Mathias Bernhardt and Kathrin Taranidis allowed me to push my project further than I ever
imagined. Also, I want to thank Dr. Lionel Larribere for his supervision in the beginning of
my PhD that laid the groundwork for my doctoral work. I would like to give a special thank you to Dr. Daniel Novak for providing me with tons of cloning assistance and daily doses of
happiness.
This work would not have been possible without the constant support from my dear friend, Dr. Janet Lei. She taught me how to survive the entire PhD process and was with me every
step of the way. The endless lessons we both learned and taught each other in parallel
guided us to thesis completion.
I want to give a special thanks to Nathalie Knappe for everything she has done for me over
the past three years. She has put continual effort in my doctoral work from the beginning and
has helped me through the good and the bad days. Thank you for giving me strength when I
needed it, input when it was lacking and most of all laughs and joy every single day.
This doctoral work was supported constantly by my loving friends and family here and back home: I want to thank my parents for their support and love sent across the ocean and also
Uli and Ilona Zellmann for their overwhelming amounts of reassurance and love. Also, I
want thank my best friend Emily Sanfilippo for her continual jokes, encouragement and
optimism. Lastly, I want to thank Asma Fikri for her endless motivation and kindness no
matter where we meet in the world.
Finally, I would like to thank Jan who has been my biggest supporter from the beginning.
Thank you for believing in me when I didn’t, listening to me when no one else would and
always making me smile when I thought I couldn’t. I would not have been able to do this
without you and for that I am forever grateful.