final report quantitative research report: ‘attitudes towards online shopping and knowledge about...
TRANSCRIPT
FINAL REPORT
QUANTITATIVE RESEARCH REPORT: ‘Attitudes towards online shopping and knowledge about shopping
online securely’
PREPARED FOR: NSW Fair Trading
30 October 2012
PREPARED BY: Stancombe Research + Planning P/L
18 Glenmore Road Paddington, NSW 2021
ABN: 70 056 731 670
ACN: 056 731 670
QUANTITATIVE RESEARCH REPORT: ‘Attitudes towards online shopping and knowledge about shopping online securely’. Prepared by Stancombe Research & Planning for NSW Fair Trading, 2012.
2
Table of contents 1 Executive summary ....................................................................................3
1.1 Background ..........................................................................................3 1.2 Research objectives .............................................................................3
1.2.1 Consumer specific objectives.........................................................3 1.2.2 Business specific objectives...........................................................4
1.3 Methodology.........................................................................................4 1.3.1 Research design ............................................................................4 1.3.2 Sample structure............................................................................5 1.3.3 Analysis and reporting of results ....................................................5
1.4 Key findings and implications ...............................................................6 2 Background ................................................................................................8
2.1 Research background ..........................................................................8 2.2 Research objectives .............................................................................9
2.2.1 Consumer specific objectives.........................................................9 2.2.2 Business specific objectives.........................................................10
3 Methodology.............................................................................................12 3.1.1 Research design ..........................................................................12 3.1.2 Sample structure..........................................................................14 3.1.3 About this report...........................................................................15
4 Key Themes .............................................................................................17 4.1 The PayPal disparity ..........................................................................17 4.2 The disconnect over drivers of online shopping .................................17 4.3 Australian consumer law ....................................................................18 4.4 Online security concerns ....................................................................18
5 Online Shopping and Selling Behaviours .................................................19 5.1 Frequency of shopping, goods and services purchased ....................19 5.2 Seller origin, payment and delivery methods......................................20
6 Drivers and Barriers to Shopping and Selling Online................................22 6.1 Consumer and business drivers.........................................................22 6.2 Consumer and Business Barriers.......................................................23 6.3 Negative experiences.........................................................................24
7 Awareness and Behaviours to Online Security.........................................26 7.1 Awareness of security indicators ........................................................26 7.2 Australian consumer law ....................................................................27
8 Summary and Conclusions.......................................................................28 9 Appendices...............................................................................................31
9.1 Appendix 1: Consumer Questionnaire................................................31 9.2 Appendix 2: Business Questionnaire..................................................46
Index of tables Table 1 Survey structure 14 Table 2 Consumer sample 15 Table 3 SMS sample 15 © State of New South Wales through NSW Fair Trading, 2012
QUANTITATIVE RESEARCH REPORT: ‘Attitudes towards online shopping and knowledge about shopping online securely’. Prepared by Stancombe Research & Planning for NSW Fair Trading, 2012.
3
1 Executive summary
1.1 Background
NSW Fair Trading has identified the fact that, while much research has been
conducted about Australians’ online shopping behaviours, there has been little
research into attitudes towards it or into safety and security measures taken.
With the growth in Australian consumers shopping online and Australian
businesses selling online, and in the context of a growing number of
complaints about online shopping received by NSW Fair Trading, this topic is
worthy of deeper understanding and exploration.
1.2 Research objectives This research aims to provide understanding and quantification of consumer
and business attitudes towards online shopping and knowledge about
shopping online securely and provides recommendations to improving the
experience for both consumers and small-medium businesses.
Two consumer groups and two business groups were surveyed.
Consumers:
• NSW People who have shopped online in the last year
• NSW People who have not-shopped online in the last year
Businesses:
• Small to Medium Businesses (SMBs) with an existing online business
payment option
• SMBs who do not sell online, but have an online presence
1.2.1 Consumer specific objectives
The objectives specific to NSW consumers were as follows:
• Measure how often Australians are shopping online
• Determine which types of goods are bought online
• Determine which payment methods are used when shopping online
• Confirm the drivers and barriers to shopping online, in particular,
the security concerns about online shopping
QUANTITATIVE RESEARCH REPORT: ‘Attitudes towards online shopping and knowledge about shopping online securely’. Prepared by Stancombe Research & Planning for NSW Fair Trading, 2012.
4
• Ascertain the source of concerns related to shopping online (e.g.
personal experience, friends’ experiences, media reports etc.)
• Measure awareness of indicators or signs that an online shopping
site is safe and secure
• Measure the incidence of negative experiences with online
shopping, with detail around the types of problems
• Establish whether there are any differences in attitudes towards
domestic online retail and international
1.2.2 Business specific objectives
The objectives specific to NSW Small to Medium Businesses were as
follows:
• Ascertain the proportion of sales made online
• Determine which types of goods are sold online
• Determine which payment methods are offered for online shopping
• Confirm the drivers and barriers to selling online
• Determine the measures taken by online retailers to indicate their
site is safe and secure
• Measure SMB perceptions of the impact of consumer concerns
about online shopping on their business
• Measure the incidence of negative customer feedback or issues
with online sales
1.3 Methodology
1.3.1 Research design
Two bespoke and complementary 15-minute online surveys were used
to target consumer and business audiences respectively. The
complementary nature of the surveys allowed for comparison between
consumer and business points of view in developing the online shopping
insights. The 15-minute duration of the surveys permitted the gathering
of detailed information to develop comprehensive insights, and the
online survey instrument was highly suited to the context of the study.
QUANTITATIVE RESEARCH REPORT: ‘Attitudes towards online shopping and knowledge about shopping online securely’. Prepared by Stancombe Research & Planning for NSW Fair Trading, 2012.
5
The sample was drawn from an online panel and appropriate
respondents identified using existing profile information, before being
invited to complete the survey via email. In determining appropriate
respondents, consumers were screened based on gender, age, and
location; businesses were screened based on business
owner/manager/decision maker, number of employees, and location.
1.3.2 Sample structure
Two separate samples were used, one consumer (n=1000) and one
business (n=201). The consumer and business surveys aimed to
represent the New South Wales (NSW) consumer population who use
the Internet, and NSW Small to Medium Business population with an
online presence respectively. Demographic breakdowns of the
consumer and SMB samples are detailed in tables 2 and 3.
1.3.3 Analysis and reporting of results
This study produced results from both the consumer and business
viewpoints. Results from the consumer viewpoint are considered in total,
and compared between different subgroups (e.g. Website or online,
Online auction, Group buying voucher). One-tailed statistical significance
tests were conducted to test for differences between the responses of
subgroups, as well as against the total. Where significant differences are
reported, a confidence interval of 95% has been used. Similarly, results
from the business viewpoint are considered in total, and by Business
website as a subgroup. One-tailed statistical significant tests were also
applied to test for differences, and a 95% confidence interval was also
used. Where possible, consumer and business viewpoints are compared
to provide a contrast and build a more meaningful representation of the
online shopping picture. Consequently, results from both the consumer
and business viewpoints are reported, and the validity of results is
determined through statistical significance.
QUANTITATIVE RESEARCH REPORT: ‘Attitudes towards online shopping and knowledge about shopping online securely’. Prepared by Stancombe Research & Planning for NSW Fair Trading, 2012.
6
1.4 Key findings and implications
Combining the consumer and SMB perspectives revealed a number of key
themes from the research. Firstly, there is a disparity in the importance of
using PayPal as a payment method. From the consumer perspective, PayPal
is the first choice payment method. 59% of consumers use PayPal when
shopping from websites. Additionally, 13% of consumers can cite, without
prompting, that PayPal is a security feature when shopping online.
Conversely, less than half of SMBs offer a PayPal payment option. Even
though 11% of SMBs recognise PayPal as a security feature, the primary
payment methods from the business perspective are credit card and bank
transfer. PayPal could be promoted among SMBs as a way of offering
customers what they want and subsequently alleviating some potential
security concerns.
Second, there is a fundamental disconnect between consumers and
businesses over the drivers of online shopping. Overall, 58% of consumers
spontaneously mentioned access to lower prices as a reason for shopping
online. Similarly, 61% mentioned lower prices when prompted. Conversely,
when prompted, only 35% of SMBs cited the ability to offer discounts to
customers as a reason for selling online. Further, the main motive (71%)
reported by SMBs for selling online was to reach a broader customer base.
Interestingly, approximately 60% of both consumers and businesses cited
convenience as a reason for shopping online; this represents a mutual middle
ground. Nevertheless, consumers are driven to shop online primarily by the
access to lower prices, whereas businesses are far less concerned with
providing this value proposition to consumers. SMBs need to be aware that
consumers expect lower prices when shopping online.
Third, consumers and businesses are confused as to whether or how
Australian Consumer Law applies to online shopping. Around half (51%) of
consumers make online purchases from auction websites, however both
consumers (54%) and SMBs (54%) are largely unsure how Australian
Consumer Law may or may not apply to private sellers. Similarly, 6% of
QUANTITATIVE RESEARCH REPORT: ‘Attitudes towards online shopping and knowledge about shopping online securely’. Prepared by Stancombe Research & Planning for NSW Fair Trading, 2012.
7
consumers have reported receiving damaged goods, and another 6% have
reported ordering goods they never received. Also, 13% of SMBs claim to
have received reports of missing goods, and 9% damaged goods. Despite
these rates of incidence, large proportions of both consumers (46%) and
SMBs (42%) are unsure who is responsible for replacing damaged or missing
goods. These examples suggest consumers are making purchasing decisions
irrespective of the added risks of not understanding the legal context.
Consequently, there is scope to educate consumers and SMBs about the
application of Australian Consumer Law.
Fourth, security is a concern when shopping online. The majority (88%) of
those who do not shop online cite security concerns as a barrier. Of those
who do shop online, 2% claim to have been victim of fraud when shopping
online. When thinking of features that may identify a secure website, just
under half (47%) of consumers are aware of ‘Https’ indicating a secure site,
and 11% are aware of ‘the padlock symbol’. Importantly, while 68% of SMBs
are aware of ‘https’ as a security feature, only around half (52%) offer this
security when selling online. Consumers are largely unsure of what indicates
a secure site for online shopping, and the majority of businesses are aware
but far fewer provide the security as part of their value proposition to
customers. As a result, there is a need to raise awareness among consumers
of ‘https’ sites and perhaps some room to promote their use among SMBs. It
may be beneficial to raise ‘padlock symbol’ awareness alongside an ‘https’
promotion.
QUANTITATIVE RESEARCH REPORT: ‘Attitudes towards online shopping and knowledge about shopping online securely’. Prepared by Stancombe Research & Planning for NSW Fair Trading, 2012.
8
2 Background
2.1 Research background
Online shopping is a rapidly growing phenomenon. The topic attracts regular
mainstream media attention and is common conversation across social media
and face-to-face. The latest NAB Online Retail Sales Index 1 found that
Australians spent more than $11 billion in online retail sales in the 12 months
to April 2012. This represents around five percent (5%) of all retail spending in
Australia. The Australian Productivity Commission2 estimates that online retail
shopping will increase by between ten precent (10%) and fifteen percent
(15%) per annum over the next three years, while some commentators predict
even stronger growth.
Three main factors have been previously found to drive retail online shopping
frequency among Australian consumers. These include: 1) lower prices, 2)
convenience, and 3) a wider range of goods to choose from. Additionally,
online access is becoming easier and more frequent. New mobile electronic
devices such as smart phones and tablets are stimulating further growth in
online sales together with online price comparison sites and apps.
Some research into only shopping behaviours has previously been
conducted. Contrary to popular belief, the majority of online sales are made
with domestic retailers. According to the 2012 NAB Online Retail Sales Index3
almost three quarters of online sales were made with domestic retailers. Fair
Trading received more than 7,000 complaints about online shopping issues in
the last financial year. 1 NAB (2012) “NAB Online Retail Sales Index Monthly update – August 2012”. Retrieved from: http://business.nab.com.au/nab-online-retail-sales-index-monthly-update-august-2012-1433/. 26 Oct 2012 2 APC (2011) “Trends and issues related to online retailing – December 2011”. Retrieved from: http://www.pc.gov.au/projects/inquiry/retail-industry/report. 26 Oct 2012 3 NAB (2012) “NAB Online Retail Sales Index Monthly update – August 2012”. Retrieved from: http://business.nab.com.au/nab-online-retail-sales-index-monthly-update-august-2012-1433/. 26 Oct 2012
QUANTITATIVE RESEARCH REPORT: ‘Attitudes towards online shopping and knowledge about shopping online securely’. Prepared by Stancombe Research & Planning for NSW Fair Trading, 2012.
9
Australians spent more than $11bn on online retail sales in the 12 months to
April 2012, and 5% of all retail spending in Australia is online. In the U.K,
approximately three-quarters of Internet users are worried about identity theft,
viruses, or ‘being conned’. 14 per cent of online shoppers said they had ‘lost
out’ or ‘been scammed’ while shopping online. Generally, a lack of trust was a
key feature of the British public’s attitude towards shopping over the Internet.
While much is known about online shopping behaviours, little (if any) research
had been done into Australians’ attitudes towards online shopping, nor into
their knowledge about shopping securely online or which warning signs to
look for. This research aimed to fill these information gaps.
2.2 Research objectives This research aims to provide understanding and quantification of consumer
and business attitudes towards online shopping and knowledge about
shopping online securely and provides recommendations to improving the
experience for both consumers and small-medium businesses.
Two consumer groups and two business groups were surveyed.
Consumers:
• NSW People who have shopped online in the last year
• NSW People who have not-shopped online in the last year
Businesses:
• Small to Medium Businesses (SMBs) with an existing online business
payment option
• SMBs who do not sell online, but have an online presence
2.2.1 Consumer specific objectives
The objectives specific to NSW consumers were as follows:
• Measure how often Australians are shopping online
• Determine which types of goods are bought online
• Determine which payment methods are used when shopping online
QUANTITATIVE RESEARCH REPORT: ‘Attitudes towards online shopping and knowledge about shopping online securely’. Prepared by Stancombe Research & Planning for NSW Fair Trading, 2012.
10
• Confirm the drivers and barriers to shopping online, in particular,
the security concerns about online shopping
• Ascertain the source of concerns related to shopping online (e.g.
personal experience, friends’ experiences, media reports etc.)
• Measure awareness of indicators or signs that an online shopping
site is safe and secure
• Measure the incidence of negative experiences with online
shopping, with detail around the types of problems
• Measure awareness of rights and responsibilities when shopping
online
• Establish whether there are any differences in attitudes towards
domestic online retail and international.
2.2.2 Business specific objectives
The objectives specific to NSW Small to Medium Businesses were as
follows:
• Ascertain the proportion of sales made online
• Determine which types of goods are sold online
• Determine which payment methods are offered for online shopping
• Confirm the drivers and barriers to selling online
• Determine the measures taken by online retailers to indicate their
site is safe and secure
• Measure SMB perceptions of the impact of consumer concerns
about online shopping on their business
• Measure the incidence of negative customer feedback or issues
with online sales
• Measure awareness of rights and responsibilities when shopping
online.

QUANTITATIVE RESEARCH REPORT: ‘Attitudes towards online shopping and knowledge about shopping online securely’. Prepared by Stancombe Research & Planning for NSW Fair Trading, 2012.
11
QUANTITATIVE RESEARCH REPORT: ‘Attitudes towards online shopping and knowledge about shopping online securely’. Prepared by Stancombe Research & Planning for NSW Fair Trading, 2012.
12
3 Methodology
3.1.1 Research design
Two bespoke and complementary 15-minute online surveys were used
to target consumer and Small to Medium Businesses (SMB) audiences
respectively. The complementary nature of the surveys allowed for
comparison between consumer and SMB points of view in developing
the online shopping insights. The 15-minute duration of the surveys
permitted the gathering of detailed information to develop
comprehensive insights, and the online survey instrument was highly
suited to the context of the study. Specifically, the questionnaire targeted
online behaviours and online retail offerings, drivers and barriers to
shopping and selling online, online shopping and selling experiences,
and online shopping and selling security issues. Both surveys are
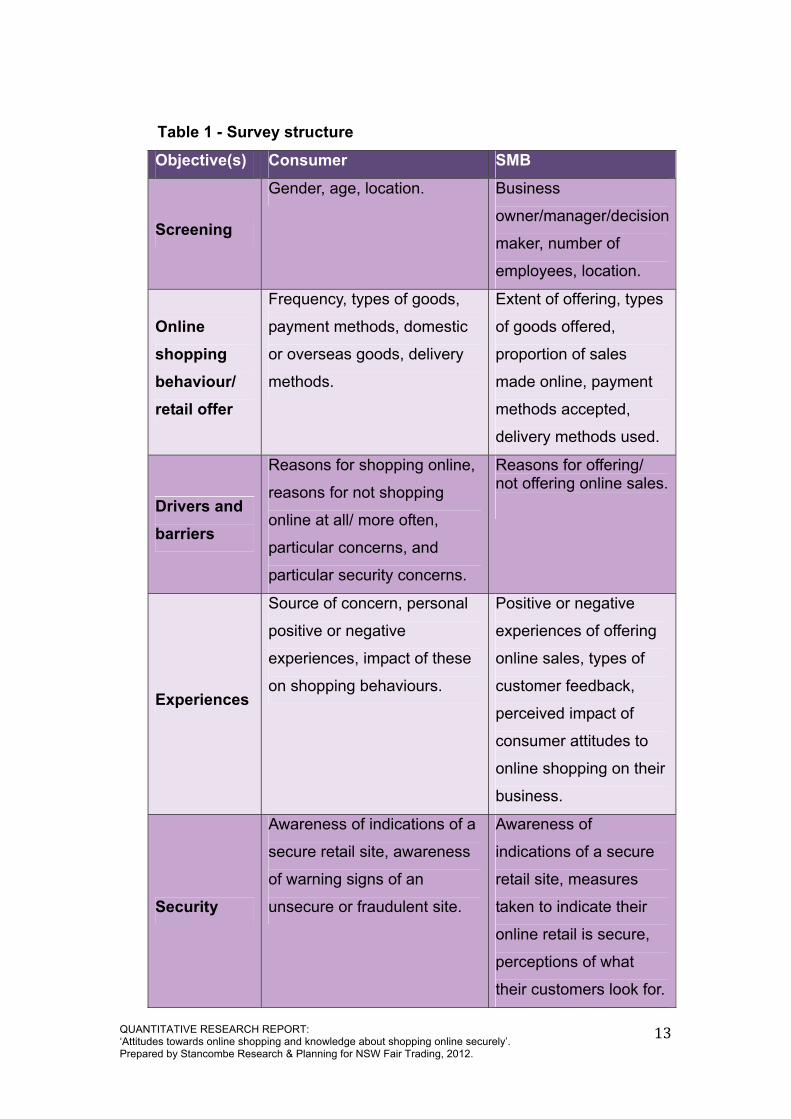
appended as Appendix 1 and Appendix 2. Table 1 provides details of the
survey structure.
The sample was drawn from an online panel and appropriate
respondents were identified using existing profile information before
being invited to complete the survey via email. In determining
appropriate respondents, existing panel information was used to screen
respondents based on gender, age, and location; businesses were
screened based on business owner/manager/decision maker, number of
employees, and location. Table 2 details the consumer sample, and
Table 3 the SMB sample.
QUANTITATIVE RESEARCH REPORT: ‘Attitudes towards online shopping and knowledge about shopping online securely’. Prepared by Stancombe Research & Planning for NSW Fair Trading, 2012.
13
Table 1 - Survey structure
Objective(s) Consumer SMB
Screening
Gender, age, location. Business
owner/manager/decision
maker, number of
employees, location.
Online shopping behaviour/ retail offer
Frequency, types of goods,
payment methods, domestic
or overseas goods, delivery
methods.
Extent of offering, types
of goods offered,
proportion of sales
made online, payment
methods accepted,
delivery methods used.
Drivers and barriers
Reasons for shopping online,
reasons for not shopping
online at all/ more often,
particular concerns, and
particular security concerns.
Reasons for offering/ not offering online sales.
Experiences
Source of concern, personal
positive or negative
experiences, impact of these
on shopping behaviours.
Positive or negative
experiences of offering
online sales, types of
customer feedback,
perceived impact of
consumer attitudes to
online shopping on their
business.
Security
Awareness of indications of a
secure retail site, awareness
of warning signs of an
unsecure or fraudulent site.
Awareness of
indications of a secure
retail site, measures
taken to indicate their
online retail is secure,
perceptions of what
their customers look for.
QUANTITATIVE RESEARCH REPORT: ‘Attitudes towards online shopping and knowledge about shopping online securely’. Prepared by Stancombe Research & Planning for NSW Fair Trading, 2012.
14
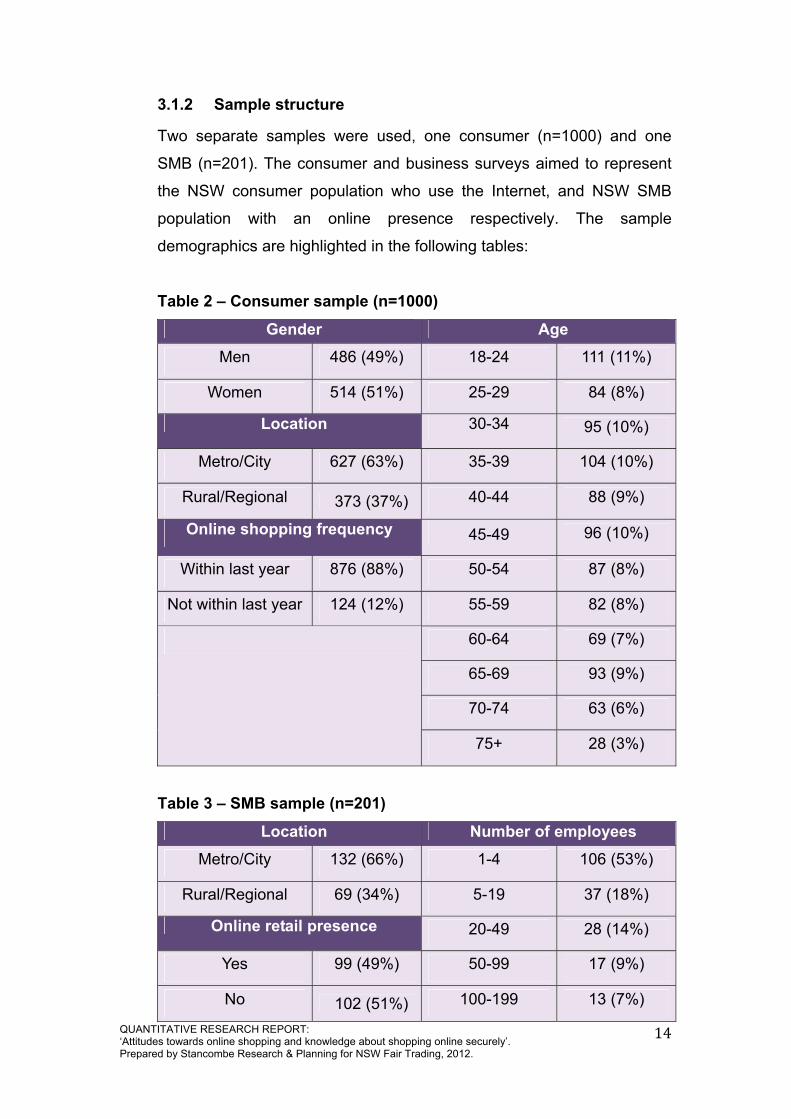
3.1.2 Sample structure
Two separate samples were used, one consumer (n=1000) and one
SMB (n=201). The consumer and business surveys aimed to represent
the NSW consumer population who use the Internet, and NSW SMB
population with an online presence respectively. The sample
demographics are highlighted in the following tables:
Table 2 – Consumer sample (n=1000)
Gender Age Men 486 (49%) 18-24 111 (11%)
Women 514 (51%) 25-29 84 (8%)
Location 30-34 95 (10%)
Metro/City 627 (63%) 35-39 104 (10%)
Rural/Regional 373 (37%) 40-44 88 (9%)
Online shopping frequency 45-49 96 (10%)
Within last year 876 (88%) 50-54 87 (8%)
Not within last year 124 (12%) 55-59 82 (8%)
60-64 69 (7%)
65-69 93 (9%)
70-74 63 (6%)
75+ 28 (3%)
Table 3 – SMB sample (n=201)
Location Number of employees Metro/City 132 (66%) 1-4 106 (53%)
Rural/Regional 69 (34%) 5-19 37 (18%)
Online retail presence 20-49 28 (14%)
Yes 99 (49%) 50-99 17 (9%)
No 102 (51%) 100-199 13 (7%)
QUANTITATIVE RESEARCH REPORT: ‘Attitudes towards online shopping and knowledge about shopping online securely’. Prepared by Stancombe Research & Planning for NSW Fair Trading, 2012.
15
3.1.3 About this report
This report represents key findings from the NSW Fair Trading
commissioned research into online retail shopping in NSW.
Samples in this study are drawn from NSW consumers and businesses
(SMBs). Responses from consumers and businesses are examined from
both total and subgroup perspectives. Specifically, subgroups were
based on the channels by which consumers made online purchases and
business made sales. More specifically, consumer purchasing
subgroups included website or online, online auction, and group buying
voucher. Comparatively, business website was the single subgroup for
SMBs. However, responses were not always mutually exclusive. In other
words, respondents may belong to multiple purchasing subgroups. For
example, fifteen hundred and forty six (1546) responses were derived
from one thousand (1000) consumer respondents. Specifically, of the
consumer respondents, seven hundred and forty one (741) used website
or online, fife hundred and fourteen (514) used online auction, and two
hundred and nineteen (219) used group buying vouchers.
Statistical tests (one-tailed) were undertaken to establish whether
differences between the responses of subgroups within each sample, as
well as between subgroups and total, were statistically significant at the
95% confidence level. This infers that the differences are not due to the
random statistical variation inherent in all data, as they do not overlap
within the ‘margins of error’ associated with the results. To understand
this, margins of error depend on the base size of the sub-group in
question but also the extremeness of response. For example, the margin
of error for a sample size of 1000, such as the NSW consumer sample,
is approximately 3% for a response of 50% and this gets smaller with
responses closer to the extremes e.g. 1.9% error for a response of 90%.
In other words, assuming a 95% confidence level, if a result based on
the consumer sample is reported as 50%, we can be 95% certain that
the true result is between 47% and 53%.
QUANTITATIVE RESEARCH REPORT: ‘Attitudes towards online shopping and knowledge about shopping online securely’. Prepared by Stancombe Research & Planning for NSW Fair Trading, 2012.
16
The margins of error will be larger for any analysis using sub-samples of
the total population e.g. those who purchase via a website or online
store, etc. Consequently, it may not be viable to compare results
between sub groups with small base sizes, e.g. why SMBs are not split
into three subgroups. This also explains why differences between sub
groups may be large but may not be statistically significant.
QUANTITATIVE RESEARCH REPORT: ‘Attitudes towards online shopping and knowledge about shopping online securely’. Prepared by Stancombe Research & Planning for NSW Fair Trading, 2012.
17
4 Key Themes
4.1 The PayPal disparity
The importance of PayPal differs from consumer and business
viewpoints. From the consumer perspective, PayPal is the first choice
payment method. Specifically, 59% of consumers use PayPal when
shopping from websites. Additionally, 13% of consumers can cite,
without prompting, that PayPal is a security feature when shopping
online. Despite the strong consumer preference for using PayPal when
shopping online, less than half of SMBs offer a PayPal payment option;
the primary payment methods from the business perspective are credit
card and bank transfer. Considering online security, 11% of SMBs
recognise PayPal as a security feature. Despite common ground
between consumers and SMBs regarding PayPal security benefits, a
key disparity in the use of PayPal is evident between consumers and
SMBs.
4.2 The disconnect over drivers of online shopping There is a large disconnect between why consumers shop online and
why SMBs sell online. 58% of consumers spontaneously mentioned
access to lower prices as a reason for shopping online. Similarly, 61%
mentioned lower prices when prompted. Conversely, zero percent (0%)
of SMBs spontaneously suggested offering lower prices. However, when
prompted, 35% of SMBs cited the ability to offer discounts to customers
as a reason for selling online. Further, the main motive (71%) reported
by SMBs for selling online was to reach a broader customer base.
Interestingly, approximately 60% of both consumers and businesses
cited convenience as a reason for shopping online; this represents a
shared middle ground. Nevertheless, consumers are driven to shop
online primarily by the access to lower prices, whereas businesses are
far less concerned with providing this value proposition to consumers.
QUANTITATIVE RESEARCH REPORT: ‘Attitudes towards online shopping and knowledge about shopping online securely’. Prepared by Stancombe Research & Planning for NSW Fair Trading, 2012.
18
4.3 Australian consumer law Consumers and SMBs were asked to state whether example
applications of Australia Consumer Law in the online shopping context
were true or false. Generally, consumers and SMBs are confused as to
whether or how Australian Consumer Law applied. About half (51%) of
consumers make online purchases from auction websites, however both
consumers (54%) and SMBs (54%) are largely unsure how Australian
Consumer Law may or may not apply to private sellers. Similarly, 6% of
consumers reported receiving damaged goods, and another 6% have
reported they ordered goods they never received. Also, 13% of SMBs
claim to have received reports of missing goods, and 9% damaged
goods. Despite these rates of incidence, large proportions of both
consumers (46%) and SMBs (42%) are unsure who is responsible for
replacing damaged or missing goods. These examples suggest
consumers are making purchasing decisions irrespective of the added
risks of not understanding the legal context.
4.4 Online security concerns Security is a concern when considering shopping online. The vast
majority (88%) of those who do not shop online cite security concerns as
a barrier. Of those who do shop online, 2% claim to have been victim of
fraud when shopping online. When thinking of features that may identify
a secure website, just under half (47%) of consumers are aware of
‘https’ indicating a secure site, and 11% are aware of ‘the padlock
symbol’. Importantly, while 68% of SMBs are aware of ‘https’ as a
security feature, only 52% offer this security when selling online. 41% of
consumers are largely unsure of what indicates a secure site for online
shopping. The same percentage (41%) of businesses are also unaware,
yet 76% take some steps to indicate to customers that the site is safe
and secure to buy from.
QUANTITATIVE RESEARCH REPORT: ‘Attitudes towards online shopping and knowledge about shopping online securely’. Prepared by Stancombe Research & Planning for NSW Fair Trading, 2012.
19
5 Online Shopping and Selling Behaviours
5.1 Frequency of shopping, goods and services purchased
The majority (88%) of the NSW population who use the internet shop
online, although only half of SMBs in the state sell online. 88% of the
NSW online population has shopped online via some method in the last
year, whereas 49% of SMBs with an online presence had sold goods or
services online during the same period. More specifically, of those
consumers who did shop online in the last year (n=741), 45% shop online
once a month, and 70% at least every few months. Conversely, of the
cumulative SMBs online business channels (n=126), 55% sell less than
30% of their products or services online. When consumers shop online,
90% have done so from home, and around 20% from work. A computer or
laptop has been used by around 90% of consumers, 15% have purchase
via a smartphone, and 10% via tablet. Most online shopping is done via a
computer or laptop from home, and there is a disparity between the
percentage and frequency of consumers shopping online and SMBs
selling online.
To purchase products or services online, consumers most frequently use
common websites or online stores. In fact, approximately 75% of
consumers buy from these channels. Online auctions also play a
substantial role with 50% of consumers reporting the use of this channel.
Additionally, group-buying vouchers are used by approximately 30% of
consumers. Generally, discretionary spending dominates the online
consumer market. For example, roughly 35% of people bought
books/CD’s/DVDs, whereas around 10% bought groceries online.
However, certain products and services are more commonly purchased
through specific channels. Online auctions play a significant role for
physical goods, and group-buying vouchers occupy a niche space for
leisure and services. For example, 49% of those consumers who have
used a group-buying voucher did so to purchase meals at restaurants.
QUANTITATIVE RESEARCH REPORT: ‘Attitudes towards online shopping and knowledge about shopping online securely’. Prepared by Stancombe Research & Planning for NSW Fair Trading, 2012.
20
Comparatively, 7% of those who used a website or online store, and only
2% of those who used an online auction, did so to buy meals at
restaurants. While online purchasing may be common, the channel used
to buy a particular product or service may differ greatly.
5.2 Seller origin, payment and delivery methods
The majority of goods and services consumers purchase online come
from within Australia. Just under half of all online purchases are from
sellers based only in Australia, a further one-third (30%) are mostly from
Australian sellers, and around 15% are half from Australian businesses
and half from overseas businesses. The remainder of online purchases,
roughly 10%, are mostly or all from sellers based overseas. Similarly,
from the SMB perspective, just over half of sales are to NSW customers
and a further one-third is mostly to Australians. However, this could be
partly a function of a high Australia dollar impacting exports. Importantly,
there is some variance in consumer purchases by channel used.
Consumers using websites or online stores, and online auctions, are more
likely to purchase from overseas sellers compared to using group buying
vouchers. Moreover, due to the nature of the channel, group-buying
vouchers are almost exclusively purchased from domestic sellers.
Nevertheless, the majority of online purchases being from local sellers is
true across all online purchasing channels.
PayPal is the most common online payment method used by consumers.
Considering all types of online purchases, approximately three in every
five consumers have used PayPal in the last year. This compares to
roughly two in every five using credit card, and one in five for debit card,
while bank transfers are around one in ten. Conversely, just less than one
half (47%) of SMBs have accepted payment via PayPal in the last year,
yet approximately two-thirds (64%) have accepted credit card payments.
Amazingly, 65% of SMBs reported accepting payment via bank transfer,
compared to 10% of consumers making payment. Similarly, one-third of
SMBs have accepted cash on delivery although only one in ten
consumers have reported using this method. These staggering
QUANTITATIVE RESEARCH REPORT: ‘Attitudes towards online shopping and knowledge about shopping online securely’. Prepared by Stancombe Research & Planning for NSW Fair Trading, 2012.
21
differences highlight the disparity between payment methods of NSW
consumers and NSW SMBs, and suggest local SMBs could be missing
out on sales.
Standard mail is used to deliver the majority of goods purchased online.
Almost three-fifths (57%) of consumers received goods purchased online
by standard mail, and just more than one-third (35%) via courier. This
trend increases with purchases via website or online store, compared to
other methods. SMBs align with consumers in reporting that standard mail
and courier are the most common delivery methods used. Additionally,
the majority of online sales are received within 2-3 business days, and
over four in five purchases are received within 4-5 working days. The
standard mail and courier delivery methods represent a safe and secure
way to deliver and receive goods.
QUANTITATIVE RESEARCH REPORT: ‘Attitudes towards online shopping and knowledge about shopping online securely’. Prepared by Stancombe Research & Planning for NSW Fair Trading, 2012.
22
6 Drivers and Barriers to Shopping and Selling Online
6.1 Consumer and business drivers
The drivers for consumer online shopping and SMB online selling differ
greatly. From the consumer perspective, the top-of-mind reasons for
shopping online are access to cheaper products and discounts.
Approximately three in five (58%) online consumers reported this
spontaneously. Roughly one-third (30%) of online shoppers suggested
convenience was a benefit to shopping online, whereas less than one-fifth
(16%) shopped online because they could not find the product locally.
This suggests just more than four in five (84%) online purchases are
substitutes for locally available physical store based products or services.
However, when prompted, convenience becomes an equally important
driver of online consumer purchasing as price, around three in five (60%)
consumers report this. While price (61%) and convenience (60%)
standout as the two key drivers, choice (38%) and availability (37%) are
acknowledged as important secondary considerations. Convenience
seems most applicable to shopping via websites, while group-buying
vouchers are attractive for online-only discounts, and are the most likely
to be purchase spontaneously. Ultimately, the role of online shopping
form the consumer perspective is not to offer enjoyment or relief from
physical shopping, rather its role is largely functional.
The picture is vastly different from the SMB perspective. The standout
top-of-mind reason for selling online for SMBs is to reach a wider
customer base. Approximately two in five (39%) businesses
spontaneously reported this as a benefit to selling online; efficiency (18%)
and cost-effectiveness (16%) also feature. However, when prompted,
most SMBs identified reaching more or niche customers, and
convenience for both themselves and customers, as reasons for online
selling. While consumers (60%) and SMBs (61%) are in consensus over
the convenience of online shopping, the low prices that are a priority for
QUANTITATIVE RESEARCH REPORT: ‘Attitudes towards online shopping and knowledge about shopping online securely’. Prepared by Stancombe Research & Planning for NSW Fair Trading, 2012.
23
consumers (61%) are very low (35%) from the SMB perspective. Due to
the disparity between consumer and business drivers for participating in
the online marketplace, the clear takeout message is that SMBs are not
taking a customer-centric approach to online sales.
6.2 Consumer and Business Barriers
Safety concerns and a need to seeing a product before buying are the two
barriers to online shopping prevalent from the consumer viewpoint. Of the
responses (372) by those consumers who had not shopped online in the
last year, just over one-third (36%) spontaneously cited safety concerns
as a reasons preventing them from shopping online. This was closely
followed by the need to see a product before purchasing it, at around one-
quarter (27%) of offline customers. Specifically, when prompted, payment
security (38%) and not knowing exactly what you are getting (31%) were
the two key barriers. However, tied in with this are concerns about quality
(27%), delivery (26%), and returns (27%). When exploring these concerns
by online purchasing channel, strong lack of understanding for the way
online auctions (17%) and group buying vouchers (22%) operate was
discovered. This compares to a 9% lack of understanding for website and
online stores. Consequently, the key barriers for consumers to shopping
online are themes of security, knowing what is being purchased, and
understanding.
The barriers to selling online from the SMBs perspective are much
clearer. The top-of-mind barrier for SMBs was that the product or service
offering is not conducive to online sales (25%). This suggests that most
SMBs offering products or services suitable for online sale will attempt to
sell online. Beyond the perceived plausibility issues of online sale as a
barrier for business to sell online, some SMBs reported control over
pre/post sale service (9%) and safety concerns (4%). Specifically, around
10% of SMBs not currently online value their service to customers to the
point that it becomes a barrier to transacting online. In other words, some
SMBs (10%) believe their service based value proposition would be at risk
QUANTITATIVE RESEARCH REPORT: ‘Attitudes towards online shopping and knowledge about shopping online securely’. Prepared by Stancombe Research & Planning for NSW Fair Trading, 2012.
24
by moving online. Nevertheless, suitability of the online marketplace for
the products or services is the key barrier to online sales for SMBs.
6.3 Negative experiences
Online consumers are impacted by negative experiences in multiple ways.
one in five (21%) shoppers have had some kind of negative experience
with goods taking longer than expected to arrive. This represents the most
common negative experience online. Generally though, the problems
experienced vary little (<3%) between the online purchasing channels.
Otherwise, the most prevalent problems are with goods not meeting
expectations (10%) or problems with delivery (10%), perhaps justifying
consumer concerns over these issues. Incidences of fraud or incorrect
charges when shopping online are very low (2%) – it seems consumer
concern outweighs the actual risk. However, one-quarter (26%) of online
shoppers who have had a negative experience say it made them more
reluctant to shop online. Nevertheless, negative experiences with online
shopping do not tend to deter customers generally. Rather, they may be
cautious of a particular seller in the future (26%), and/or read the fine print
more thoroughly (21%). Further, about one-fifth (18%) of consumers who
have had a negative online experience (435) claim the problem was
resolved easily which led to them being more confident to shop online.
Overall, the impact of negative experiences on online customers is varied.
Comparatively, awareness of other people’s negative online experiences
is more detrimental to those offline shoppers. Of those who have not
shopped online in the last year, the quality of goods or services not
meeting the expected standards was the most commonly known negative
experience of online shopping (13%). This suggests bad experiences
relating to quality are a more ‘voiced’ complaint than duration of delivery
(10%). Beyond this, minimal differentiation was made between other
types of negative online experience. Most of these experiences are
associated with websites and online stores, since, as aforementioned,
online auctions and group buying vouchers are poorly understood offline
consumers. Ultimately, awareness of other people’s negative online
QUANTITATIVE RESEARCH REPORT: ‘Attitudes towards online shopping and knowledge about shopping online securely’. Prepared by Stancombe Research & Planning for NSW Fair Trading, 2012.
25
experiences magnifies the general reluctance of offline consumers to
shop online (32%).
Reports received by businesses relating to online sales supports the
consumer findings. With the exception of goods not arriving within
expected timeframes, businesses are generally aware of negative online
experiences just as much as consumers. Although fewer SMBs than
consumers reported ‘goods taking longer than expected to arrive’, it is
likely that businesses would not get to hear about this if the goods
eventually arrived. It may be that not meeting timeframe expectations
could be silently turning customers away. Nevertheless, customer
feedback has had positive impacts on businesses. Approximately three-
quarters (72%) of SMBs have made changes to their sales operations as
a result. More specifically, around one-third (33%) of SMBs responded by
making terms and conditions clearer, and one-quarter (26%) included
more detailed product descriptions. Similarly, two-thirds (66%) of those
businesses not online and who have witnessed negative online
experiences also improved their business operations.
QUANTITATIVE RESEARCH REPORT: ‘Attitudes towards online shopping and knowledge about shopping online securely’. Prepared by Stancombe Research & Planning for NSW Fair Trading, 2012.
26
7 Awareness and Behaviours to Online Security
7.1 Awareness of security indicators
Most consumers can identify indicators of online shopping security. To
identify safety when shopping online, consumers chiefly look for familiar
brands (16%), secure payment certifications (15%), and PayPal (13%).
The key warning signs for consumers are bad feedback or ratings (16%),
or unfamiliarity with a website (12%). Interestingly, most of those who
have not shopped online in the last year find it difficult to recognise any
sort of online safety indicators (64%). Also, almost two-thirds (65%)
concede they cannot recognise any safety indicators of online shopping,
or simply do not know. However, about one in ten (9%) could mention a
padlock security symbol, and about one in twenty (6%) ‘https’.
Nevertheless, there is a very apparent lack of understanding of online
shopping from the offline cohort.
Strangely, offline SMBs are better at recognising security indicators of
online shopping than those online SMBs. Among those online, PayPal
(11%) and secure sites (18%) are the most commonly identified security
indications. Disturbingly, 41% of online SMBs are not aware of anything
that might make customers suspect a site may not be safe and secure to
buy from. Consequently, these SMBs are less able to ensure safe selling
practices for their customers. This figure reduces to around 25% when
among offline SMBs. Many more offline SMBs can name PayPal (6%
more), https (11% more), or general website quality (7% more), as
indicators of security or warning signs for consumers shopping online.
When prompted, both consumers and SMBs are far more aware of online
shopping security measures. Generally, consumers have quite high
awareness (>65%) of most online security measures, though there is
room for education around https (47%), and verifying addresses (39%).
Interestingly, ‘check a seller’s reputation’ was markedly lower for those
QUANTITATIVE RESEARCH REPORT: ‘Attitudes towards online shopping and knowledge about shopping online securely’. Prepared by Stancombe Research & Planning for NSW Fair Trading, 2012.
27
using group buying vouchers (18% lower). Consumers could be so
tempted by the price discounts of group buying vouchers that they forego
this security step. Comparatively, among both online and offline
businesses, SMBs have better knowledge than consumers about https
(18% more), and businesses providing a physical address (25% more).
7.2 Australian consumer law
Both consumers and businesses are largely confused as to the
application of Australian Consumer Law to online shopping scenarios.
More than half of consumers (54%) and the same amount of SMBs (54%)
are unsure how Australian Consumer Law may or may not apply to
private sellers versus businesses. Very similar findings point to both
consumers (46%) and SMBs (42%) misunderstandings of whether or not
Australian Consumer Law applies to who is responsible for goods
damaged in transit. Despite the confusion surrounding the application of
Australian Consumer Law, SMBs go some way towards ensuring
customers are aware of their rights and responsibilities. In particular,
publishing terms and conditions on their websites (59%), returns policy
(52%), and expected delivery timings (45%). Clearly though, much could
be done to improve both consumer and SMB understandings of the
application of Australia Consumer Law.
QUANTITATIVE RESEARCH REPORT: ‘Attitudes towards online shopping and knowledge about shopping online securely’. Prepared by Stancombe Research & Planning for NSW Fair Trading, 2012.
28
8 Summary and Conclusions
8.1 Key themes Five key themes were discovered from this research. These include: the
PayPal disparity, the disconnect over drivers of online shopping, Australian
consumer law, and Online security concerns.
Since PayPal is the first choice payment method from the consumer
perspective (59%), yet less than half of SMBs offer this payment method
(47%), can the use of PayPal be promoted among SMBs as a way of offering
customers what they want and alleviating potential security concerns?
Consumers (61%) cite lower prices as a reason for shopping online, whereas
only 35% SMBs mentioned this value proposition. Moreover, the main reason
(71%) SMBs are driven to sell online is to reach a broader customer base.
Therefore, there is a disconnect between consumers and SMBs as to the
primary reasons they shop/sell online. SMBs need to be aware that
consumers expect lower prices when shopping online.
Consumers (54%) and SMBs (54%) are largely unsure how Australian
Consumer Law may or may not apply to private sellers. Similarly, large
proportions of both consumers (46%) and SMBs (42%) are unsure who is
responsible for replacing damaged or missing goods. There is scope to
educate consumers and SMBs about the application of Australian Consumer
Law and, in particular, who is responsible for goods lost or damaged in transit.
47% of consumers are aware of ‘https’ indicating a secure site, and 11% are
aware of ‘the padlock symbol’. While 68% of SMBs are aware of ‘https’ as a
security feature, only 52% offer this security when selling online. There is a
need to raise awareness among consumers of https sites and perhaps some
room to promote their use among SMBs. With the padlock symbol having
higher awareness than ‘https’ it may be beneficial to promote the two
alongside each other.
QUANTITATIVE RESEARCH REPORT: ‘Attitudes towards online shopping and knowledge about shopping online securely’. Prepared by Stancombe Research & Planning for NSW Fair Trading, 2012.
29
8.2 Online shopping and selling behaviours The majority (88%) of NSW’s online population shop online, particularly for
discretionary spending, though only half (49%) of SMBs in the state sell
online. When online, websites are the most commonly used (74%) but online
auctions also play a significant role (51%), particularly for physical goods.
Group buying vouchers occupy a niche space for leisure and services (26%).
Consumers use PayPal most of all to shop online (63%) but SMBs may be
missing out here by not offering this method – just under half of them do
(47%). After PayPal, credit cards are the most commonly used (42%), and
debit cards (23%) when shopping through websites or online stores. The
majority (74%) of online shopping is for goods from within Australia, though a
quarter (26%) of consumers make half or more of their purchases overseas.
Most goods arrive to consumers by standard mail (57%) although SMBs are
just as likely to use couriers as standard mail (48%), a sensible way to ensure
goods arrive safely. Further, SMBs report that most goods (72%) arrive within
2-3 business days and it’s likely that this has set consumer expectations for
delivery times – leaving potential for delays.
8.3 Drivers and barriers to shopping and selling online The key reason for consumers to shop online is to access lower prices (61%),
though this is at odds with SMBs’ reasons for selling online: to reach a wider
range of customers (71%). Consumers and SMBs do align on the
convenience online shopping offers (both 60%) and this is a key benefit to
both parties. However, that convenience may be marred slightly when goods
take longer to arrive – the most common complaint by consumers that may
not be getting fed back to SMBs. The key barrier for consumers to shopping
online is concerns over the security of their financial details (38%), though not
knowing exactly what’s being purchased is a close second (31%). The latter is
borne out of goods being unsuitable (10%), of lower quality than expected
(10%), or not matching the description online (7%) are the next most common
problems consumers experience. Negative experiences have made some
consumers check policies more carefully and avoid problem sellers (28%),
while SMBs have taken positive steps to displaying policies more clearly and
QUANTITATIVE RESEARCH REPORT: ‘Attitudes towards online shopping and knowledge about shopping online securely’. Prepared by Stancombe Research & Planning for NSW Fair Trading, 2012.
30
ensuring descriptions of goods are detailed and accurate (33%). For SMBs,
the key barrier to selling online is that it is not a suitable channel for their
offering (25%).
8.4 Awareness and behaviours relating to online security Consumers are most comfortable shopping via familiar sites (16%
spontaneous) and are well versed in the basic security measures: keeping
records (68%), not giving out details and passwords (71), checking bank
statements (72%). They claim to look for ‘secure payment’ options (15%
spontaneous) but awareness of https sites as a security feature is relatively
low (47%). PayPal is known to be a secure method of payment and is sought
out by consumers (13% spontaneous). Among SMBs, there is room for
improvement – while most have some security measures in place for online
customers (68%), they are certainly not covering them all. There is some
room for education among both consumers (43%) and SMBs (40%) as to
when Australian consumer law applies given that there is confusion over its
application to private sellers. There is also some room for education among
consumers (37%) and SMBs (38%) as to who is responsible for goods that
are lost in transit or arrive damaged.
QUANTITATIVE RESEARCH REPORT: ‘Attitudes towards online shopping and knowledge about shopping online securely’. Prepared by Stancombe Research & Planning for NSW Fair Trading, 2012.
31
9 Appendices
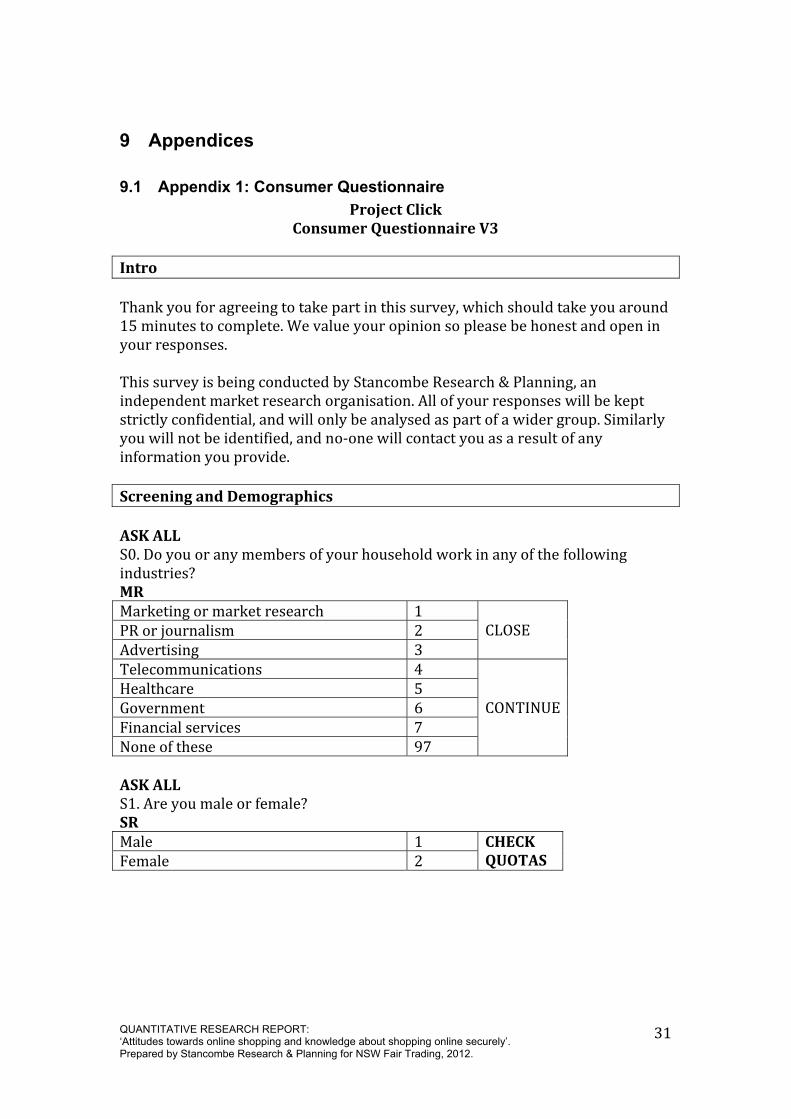
9.1 Appendix 1: Consumer Questionnaire Project Click
Consumer Questionnaire V3 Intro Thank you for agreeing to take part in this survey, which should take you around 15 minutes to complete. We value your opinion so please be honest and open in your responses. This survey is being conducted by Stancombe Research & Planning, an independent market research organisation. All of your responses will be kept strictly confidential, and will only be analysed as part of a wider group. Similarly you will not be identified, and no-one will contact you as a result of any information you provide. Screening and Demographics ASK ALL S0. Do you or any members of your household work in any of the following industries? MR Marketing or market research 1 PR or journalism 2 Advertising 3 CLOSE Telecommunications 4 Healthcare 5 Government 6 Financial services 7 None of these 97 CONTINUE ASK ALL S1. Are you male or female? SR Male 1 Female 2 CHECK
QUOTAS
QUANTITATIVE RESEARCH REPORT: ‘Attitudes towards online shopping and knowledge about shopping online securely’. Prepared by Stancombe Research & Planning for NSW Fair Trading, 2012.
32
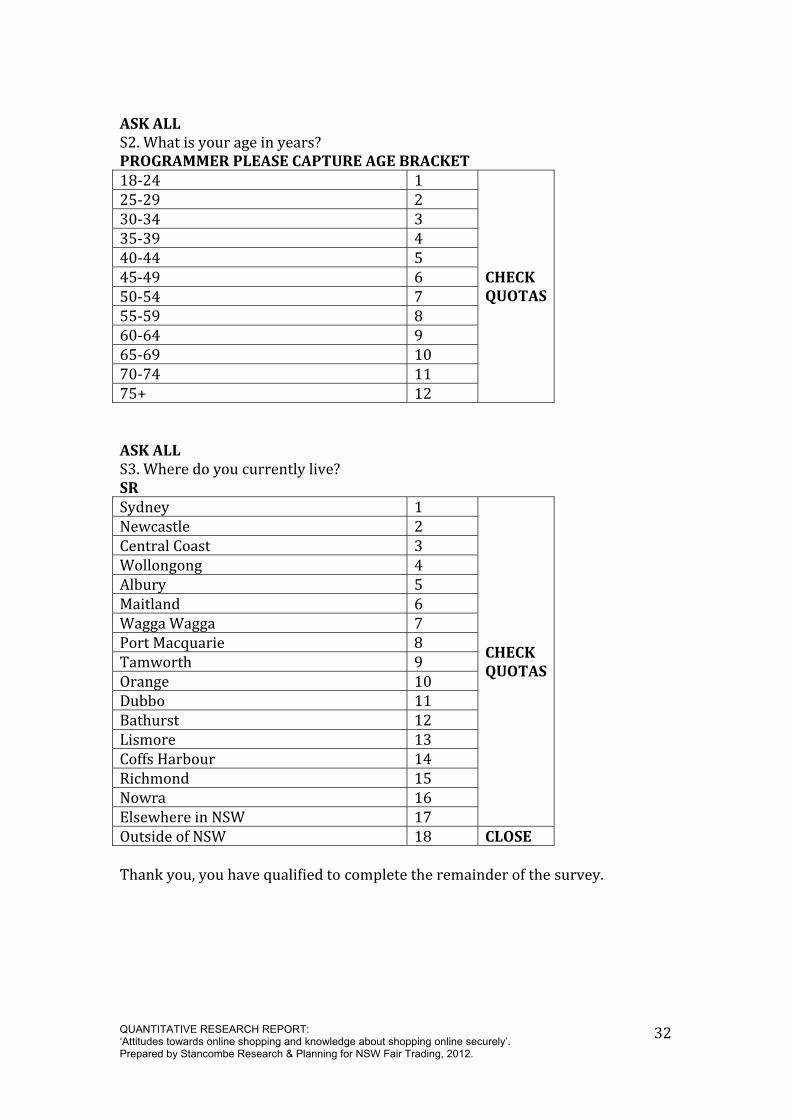
ASK ALL S2. What is your age in years? PROGRAMMER PLEASE CAPTURE AGE BRACKET 18-24 1 25-29 2 30-34 3 35-39 4 40-44 5 45-49 6 50-54 7 55-59 8 60-64 9 65-69 10 70-74 11 75+ 12
CHECK QUOTAS
ASK ALL S3. Where do you currently live? SR Sydney 1 Newcastle 2 Central Coast 3 Wollongong 4 Albury 5 Maitland 6 Wagga Wagga 7 Port Macquarie 8 Tamworth 9 Orange 10 Dubbo 11 Bathurst 12 Lismore 13 Coffs Harbour 14 Richmond 15 Nowra 16 Elsewhere in NSW 17
CHECK QUOTAS
Outside of NSW 18 CLOSE Thank you, you have qualified to complete the remainder of the survey.
QUANTITATIVE RESEARCH REPORT: ‘Attitudes towards online shopping and knowledge about shopping online securely’. Prepared by Stancombe Research & Planning for NSW Fair Trading, 2012.
33
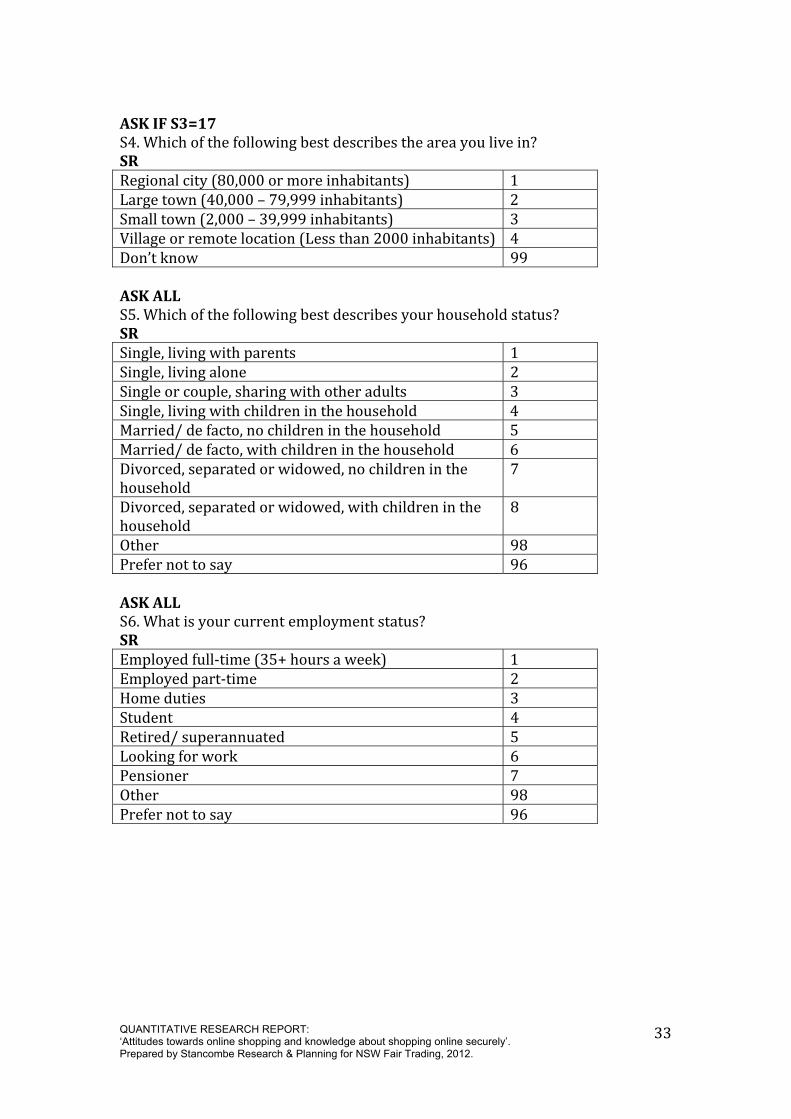
ASK IF S3=17 S4. Which of the following best describes the area you live in? SR Regional city (80,000 or more inhabitants) 1 Large town (40,000 – 79,999 inhabitants) 2 Small town (2,000 – 39,999 inhabitants) 3 Village or remote location (Less than 2000 inhabitants) 4 Don’t know 99 ASK ALL S5. Which of the following best describes your household status? SR Single, living with parents 1 Single, living alone 2 Single or couple, sharing with other adults 3 Single, living with children in the household 4 Married/ de facto, no children in the household 5 Married/ de facto, with children in the household 6 Divorced, separated or widowed, no children in the household 7 Divorced, separated or widowed, with children in the household 8 Other 98 Prefer not to say 96 ASK ALL S6. What is your current employment status? SR Employed full-time (35+ hours a week) 1 Employed part-time 2 Home duties 3 Student 4 Retired/ superannuated 5 Looking for work 6 Pensioner 7 Other 98 Prefer not to say 96
QUANTITATIVE RESEARCH REPORT: ‘Attitudes towards online shopping and knowledge about shopping online securely’. Prepared by Stancombe Research & Planning for NSW Fair Trading, 2012.
34
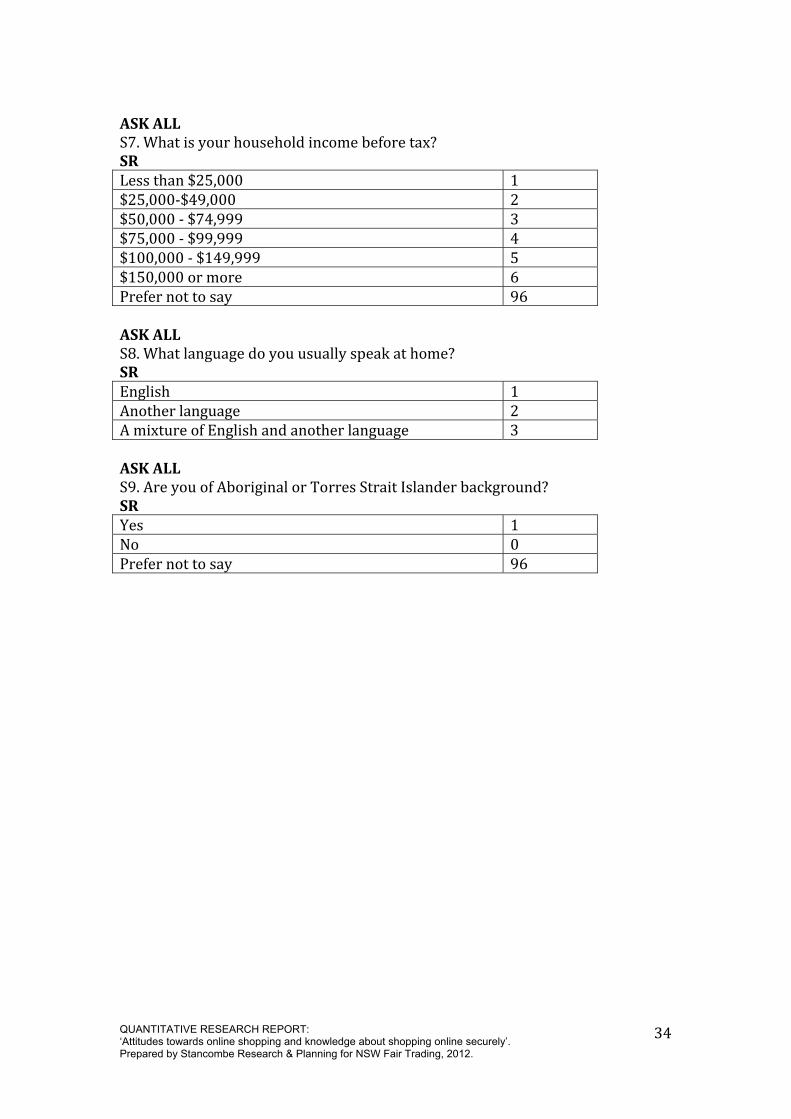
ASK ALL S7. What is your household income before tax? SR Less than $25,000 1 $25,000-$49,000 2 $50,000 - $74,999 3 $75,000 - $99,999 4 $100,000 - $149,999 5 $150,000 or more 6 Prefer not to say 96 ASK ALL S8. What language do you usually speak at home? SR English 1 Another language 2 A mixture of English and another language 3 ASK ALL S9. Are you of Aboriginal or Torres Strait Islander background? SR Yes 1 No 0 Prefer not to say 96
QUANTITATIVE RESEARCH REPORT: ‘Attitudes towards online shopping and knowledge about shopping online securely’. Prepared by Stancombe Research & Planning for NSW Fair Trading, 2012.
35
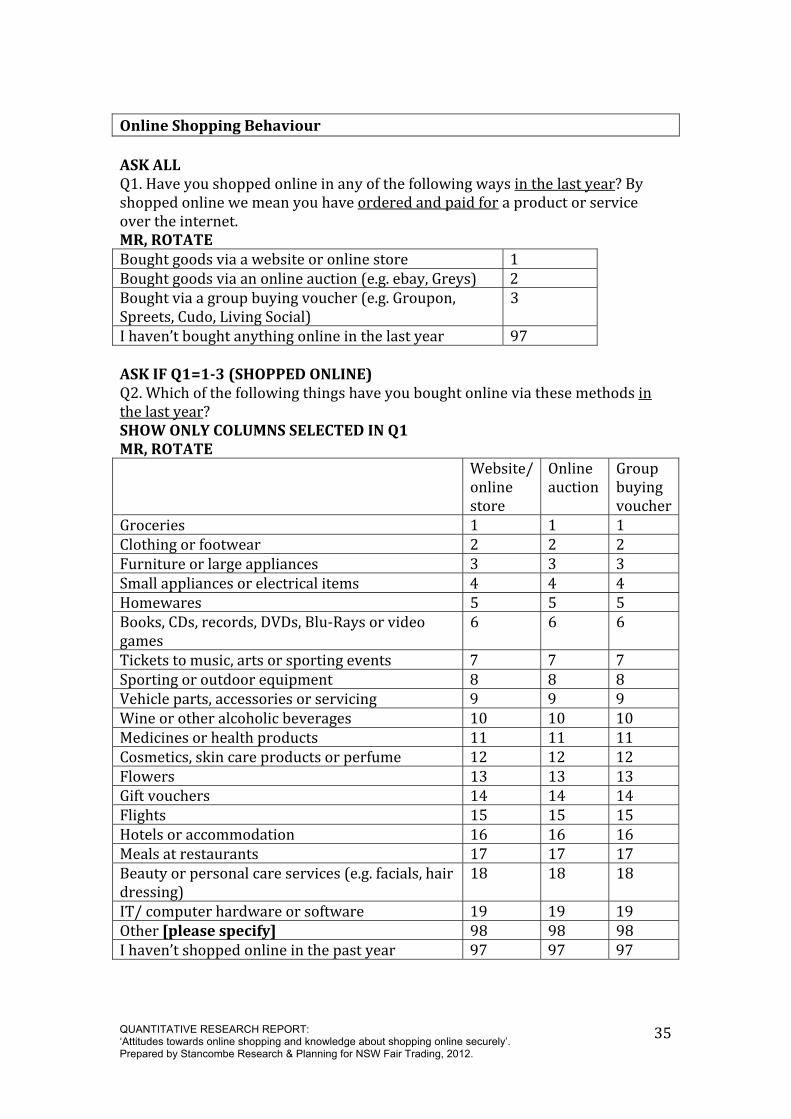
Online Shopping Behaviour ASK ALL Q1. Have you shopped online in any of the following ways in the last year? By shopped online we mean you have ordered and paid for a product or service over the internet. MR, ROTATE Bought goods via a website or online store 1 Bought goods via an online auction (e.g. ebay, Greys) 2 Bought via a group buying voucher (e.g. Groupon, Spreets, Cudo, Living Social) 3 I haven’t bought anything online in the last year 97 ASK IF Q1=1-3 (SHOPPED ONLINE) Q2. Which of the following things have you bought online via these methods in the last year? SHOW ONLY COLUMNS SELECTED IN Q1 MR, ROTATE Website/ online store Online auction Group buying voucherGroceries 1 1 1 Clothing or footwear 2 2 2 Furniture or large appliances 3 3 3 Small appliances or electrical items 4 4 4 Homewares 5 5 5 Books, CDs, records, DVDs, Blu-Rays or video games 6 6 6 Tickets to music, arts or sporting events 7 7 7 Sporting or outdoor equipment 8 8 8 Vehicle parts, accessories or servicing 9 9 9 Wine or other alcoholic beverages 10 10 10 Medicines or health products 11 11 11 Cosmetics, skin care products or perfume 12 12 12 Flowers 13 13 13 Gift vouchers 14 14 14 Flights 15 15 15 Hotels or accommodation 16 16 16 Meals at restaurants 17 17 17 Beauty or personal care services (e.g. facials, hair dressing) 18 18 18 IT/ computer hardware or software 19 19 19 Other [please specify] 98 98 98 I haven’t shopped online in the past year 97 97 97
QUANTITATIVE RESEARCH REPORT: ‘Attitudes towards online shopping and knowledge about shopping online securely’. Prepared by Stancombe Research & Planning for NSW Fair Trading, 2012.
36
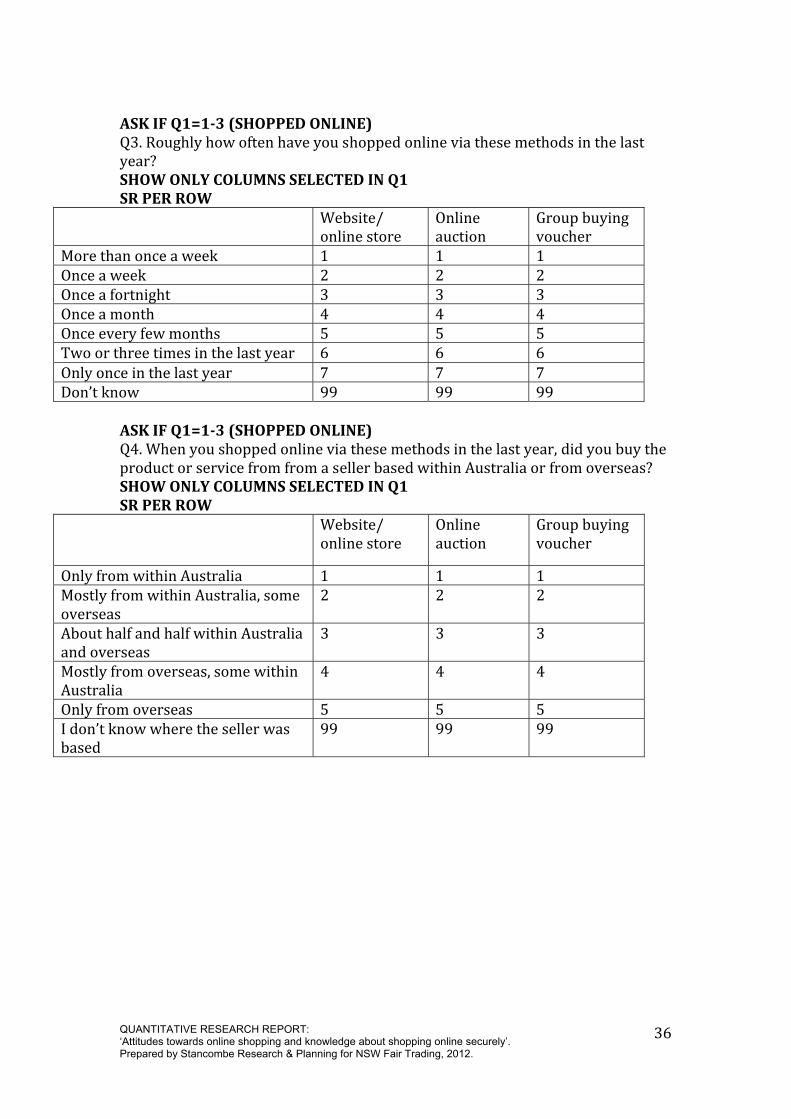
ASK IF Q1=1-3 (SHOPPED ONLINE) Q3. Roughly how often have you shopped online via these methods in the last year? SHOW ONLY COLUMNS SELECTED IN Q1 SR PER ROW Website/ online store Online auction Group buying voucher More than once a week 1 1 1 Once a week 2 2 2 Once a fortnight 3 3 3 Once a month 4 4 4 Once every few months 5 5 5 Two or three times in the last year 6 6 6 Only once in the last year 7 7 7 Don’t know 99 99 99 ASK IF Q1=1-3 (SHOPPED ONLINE) Q4. When you shopped online via these methods in the last year, did you buy the product or service from from a seller based within Australia or from overseas? SHOW ONLY COLUMNS SELECTED IN Q1 SR PER ROW Website/ online store Online auction Group buying voucher Only from within Australia 1 1 1 Mostly from within Australia, some overseas 2 2 2 About half and half within Australia and overseas 3 3 3 Mostly from overseas, some within Australia 4 4 4 Only from overseas 5 5 5 I don’t know where the seller was based 99 99 99
QUANTITATIVE RESEARCH REPORT: ‘Attitudes towards online shopping and knowledge about shopping online securely’. Prepared by Stancombe Research & Planning for NSW Fair Trading, 2012.
37
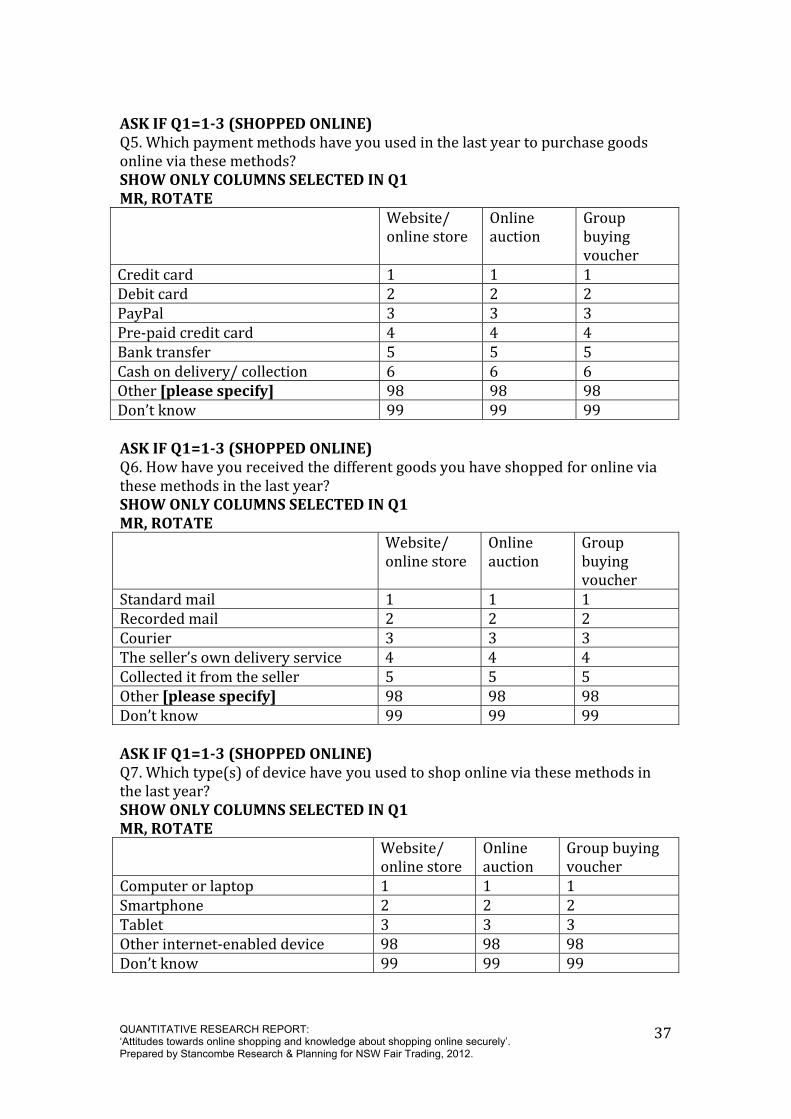
ASK IF Q1=1-3 (SHOPPED ONLINE) Q5. Which payment methods have you used in the last year to purchase goods online via these methods? SHOW ONLY COLUMNS SELECTED IN Q1 MR, ROTATE Website/ online store Online auction Group buying voucher Credit card 1 1 1 Debit card 2 2 2 PayPal 3 3 3 Pre-paid credit card 4 4 4 Bank transfer 5 5 5 Cash on delivery/ collection 6 6 6 Other [please specify] 98 98 98 Don’t know 99 99 99 ASK IF Q1=1-3 (SHOPPED ONLINE) Q6. How have you received the different goods you have shopped for online via these methods in the last year? SHOW ONLY COLUMNS SELECTED IN Q1 MR, ROTATE Website/ online store Online auction Group buying voucher Standard mail 1 1 1 Recorded mail 2 2 2 Courier 3 3 3 The seller’s own delivery service 4 4 4 Collected it from the seller 5 5 5 Other [please specify] 98 98 98 Don’t know 99 99 99 ASK IF Q1=1-3 (SHOPPED ONLINE) Q7. Which type(s) of device have you used to shop online via these methods in the last year? SHOW ONLY COLUMNS SELECTED IN Q1 MR, ROTATE Website/ online store Online auction Group buying voucher Computer or laptop 1 1 1 Smartphone 2 2 2 Tablet 3 3 3 Other internet-enabled device 98 98 98 Don’t know 99 99 99
QUANTITATIVE RESEARCH REPORT: ‘Attitudes towards online shopping and knowledge about shopping online securely’. Prepared by Stancombe Research & Planning for NSW Fair Trading, 2012.
38
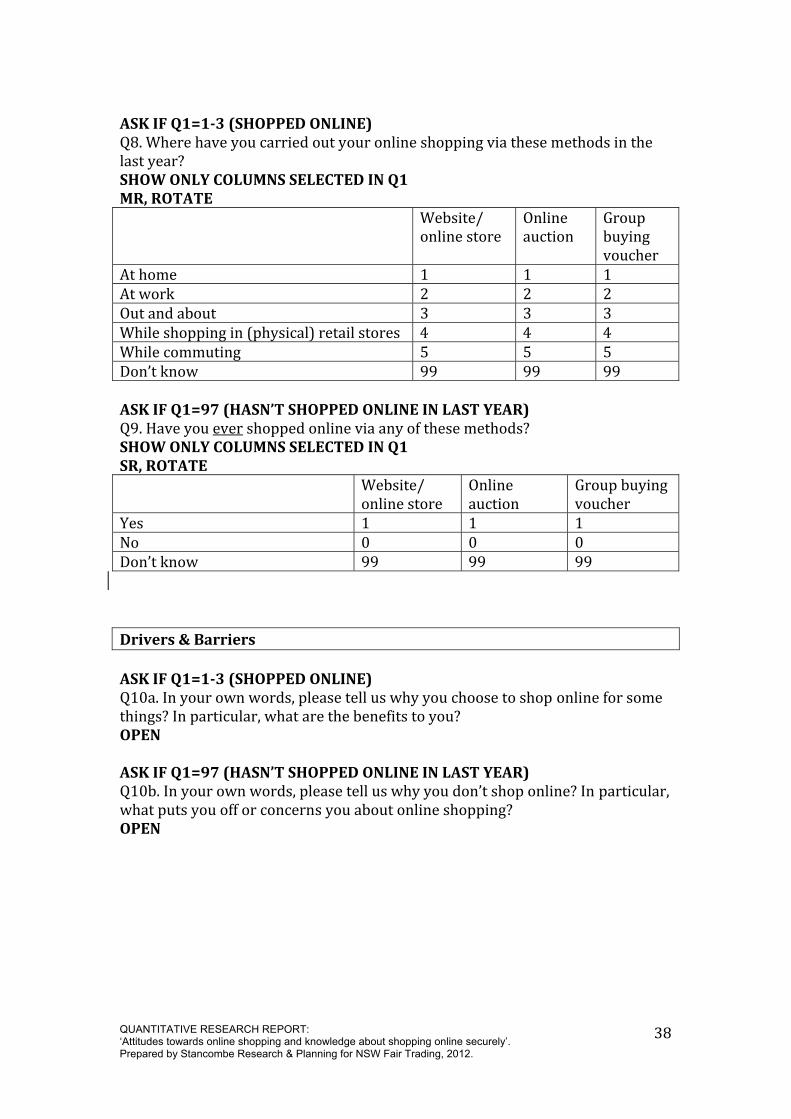
ASK IF Q1=1-3 (SHOPPED ONLINE) Q8. Where have you carried out your online shopping via these methods in the last year? SHOW ONLY COLUMNS SELECTED IN Q1 MR, ROTATE Website/ online store Online auction Group buying voucher At home 1 1 1 At work 2 2 2 Out and about 3 3 3 While shopping in (physical) retail stores 4 4 4 While commuting 5 5 5 Don’t know 99 99 99 ASK IF Q1=97 (HASN’T SHOPPED ONLINE IN LAST YEAR) Q9. Have you ever shopped online via any of these methods? SHOW ONLY COLUMNS SELECTED IN Q1 SR, ROTATE Website/ online store Online auction Group buying voucher Yes 1 1 1 No 0 0 0 Don’t know 99 99 99 Drivers & Barriers ASK IF Q1=1-3 (SHOPPED ONLINE) Q10a. In your own words, please tell us why you choose to shop online for some things? In particular, what are the benefits to you? OPEN ASK IF Q1=97 (HASN’T SHOPPED ONLINE IN LAST YEAR) Q10b. In your own words, please tell us why you don’t shop online? In particular, what puts you off or concerns you about online shopping? OPEN
QUANTITATIVE RESEARCH REPORT: ‘Attitudes towards online shopping and knowledge about shopping online securely’. Prepared by Stancombe Research & Planning for NSW Fair Trading, 2012.
39
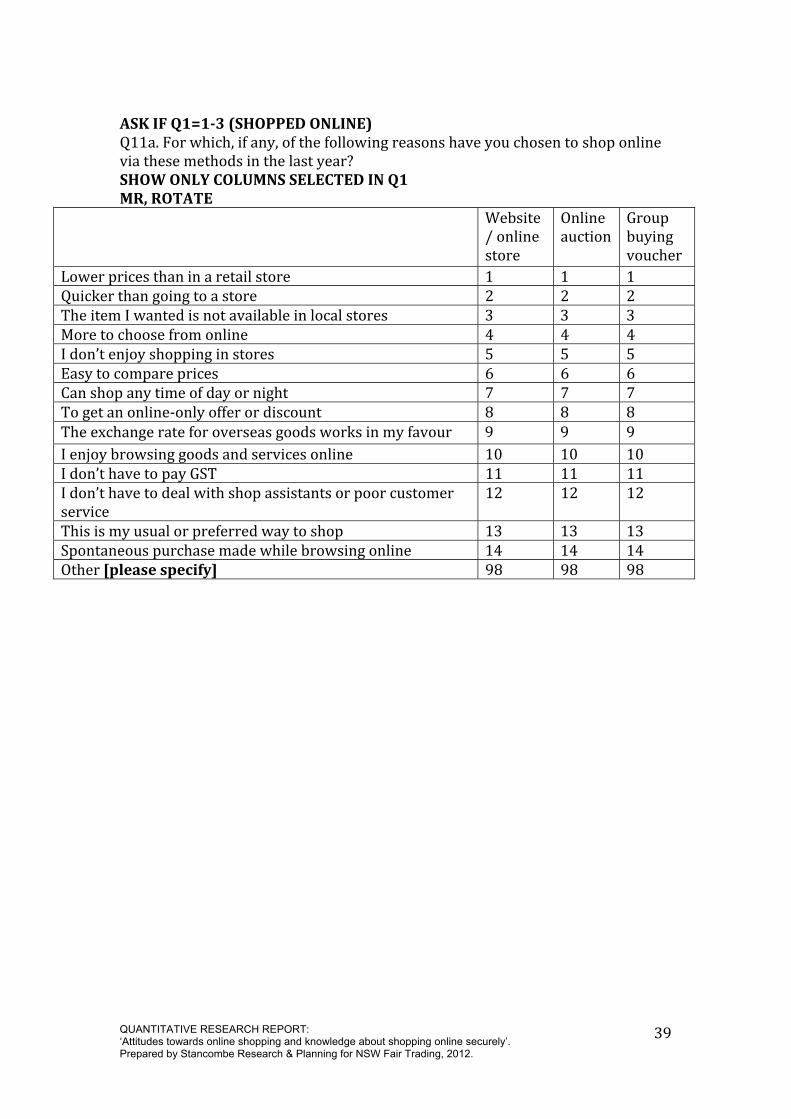
ASK IF Q1=1-3 (SHOPPED ONLINE) Q11a. For which, if any, of the following reasons have you chosen to shop online via these methods in the last year? SHOW ONLY COLUMNS SELECTED IN Q1 MR, ROTATE Website/ online store Online auction Group buying voucher Lower prices than in a retail store 1 1 1 Quicker than going to a store 2 2 2 The item I wanted is not available in local stores 3 3 3 More to choose from online 4 4 4 I don’t enjoy shopping in stores 5 5 5 Easy to compare prices 6 6 6 Can shop any time of day or night 7 7 7 To get an online-only offer or discount 8 8 8 The exchange rate for overseas goods works in my favour 9 9 9 I enjoy browsing goods and services online 10 10 10 I don’t have to pay GST 11 11 11 I don’t have to deal with shop assistants or poor customer service 12 12 12 This is my usual or preferred way to shop 13 13 13 Spontaneous purchase made while browsing online 14 14 14 Other [please specify] 98 98 98
QUANTITATIVE RESEARCH REPORT: ‘Attitudes towards online shopping and knowledge about shopping online securely’. Prepared by Stancombe Research & Planning for NSW Fair Trading, 2012.
40
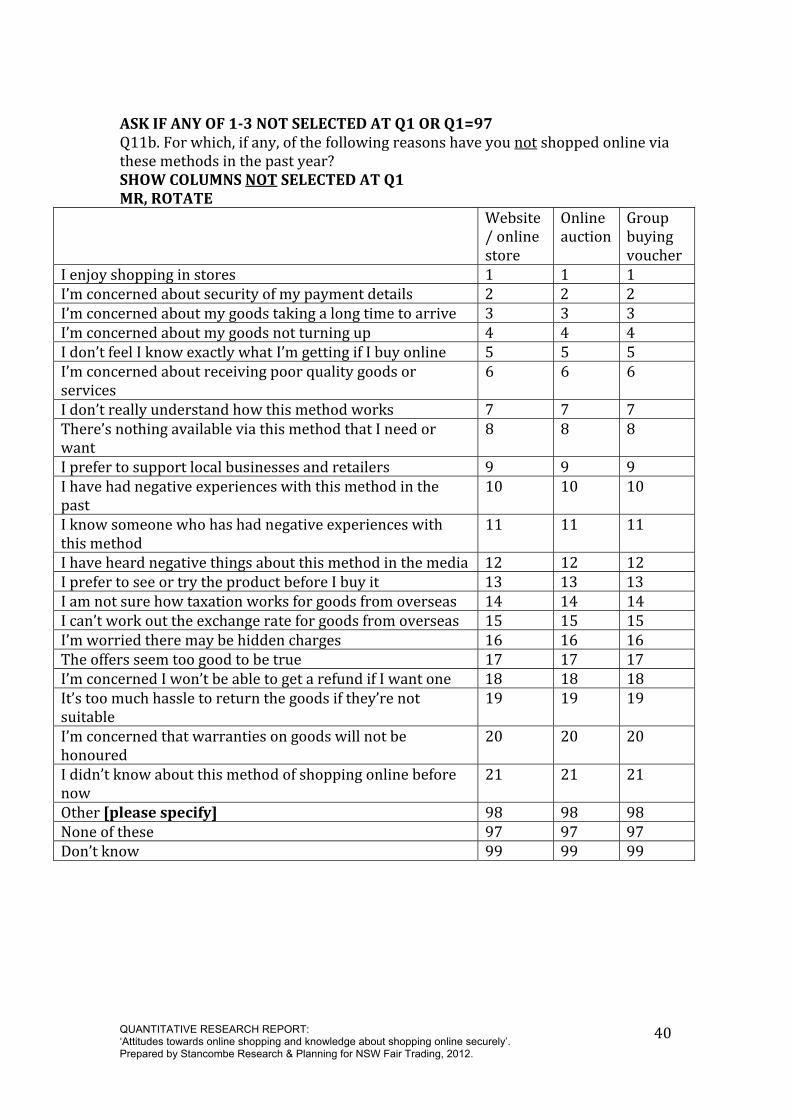
ASK IF ANY OF 1-3 NOT SELECTED AT Q1 OR Q1=97 Q11b. For which, if any, of the following reasons have you not shopped online via these methods in the past year? SHOW COLUMNS NOT SELECTED AT Q1 MR, ROTATE Website/ online store Online auction Group buying voucher I enjoy shopping in stores 1 1 1 I’m concerned about security of my payment details 2 2 2 I’m concerned about my goods taking a long time to arrive 3 3 3 I’m concerned about my goods not turning up 4 4 4 I don’t feel I know exactly what I’m getting if I buy online 5 5 5 I’m concerned about receiving poor quality goods or services 6 6 6 I don’t really understand how this method works 7 7 7 There’s nothing available via this method that I need or want 8 8 8 I prefer to support local businesses and retailers 9 9 9 I have had negative experiences with this method in the past 10 10 10 I know someone who has had negative experiences with this method 11 11 11 I have heard negative things about this method in the media 12 12 12 I prefer to see or try the product before I buy it 13 13 13 I am not sure how taxation works for goods from overseas 14 14 14 I can’t work out the exchange rate for goods from overseas 15 15 15 I’m worried there may be hidden charges 16 16 16 The offers seem too good to be true 17 17 17 I’m concerned I won’t be able to get a refund if I want one 18 18 18 It’s too much hassle to return the goods if they’re not suitable 19 19 19 I’m concerned that warranties on goods will not be honoured 20 20 20 I didn’t know about this method of shopping online before now 21 21 21 Other [please specify] 98 98 98 None of these 97 97 97 Don’t know 99 99 99
QUANTITATIVE RESEARCH REPORT: ‘Attitudes towards online shopping and knowledge about shopping online securely’. Prepared by Stancombe Research & Planning for NSW Fair Trading, 2012.
41
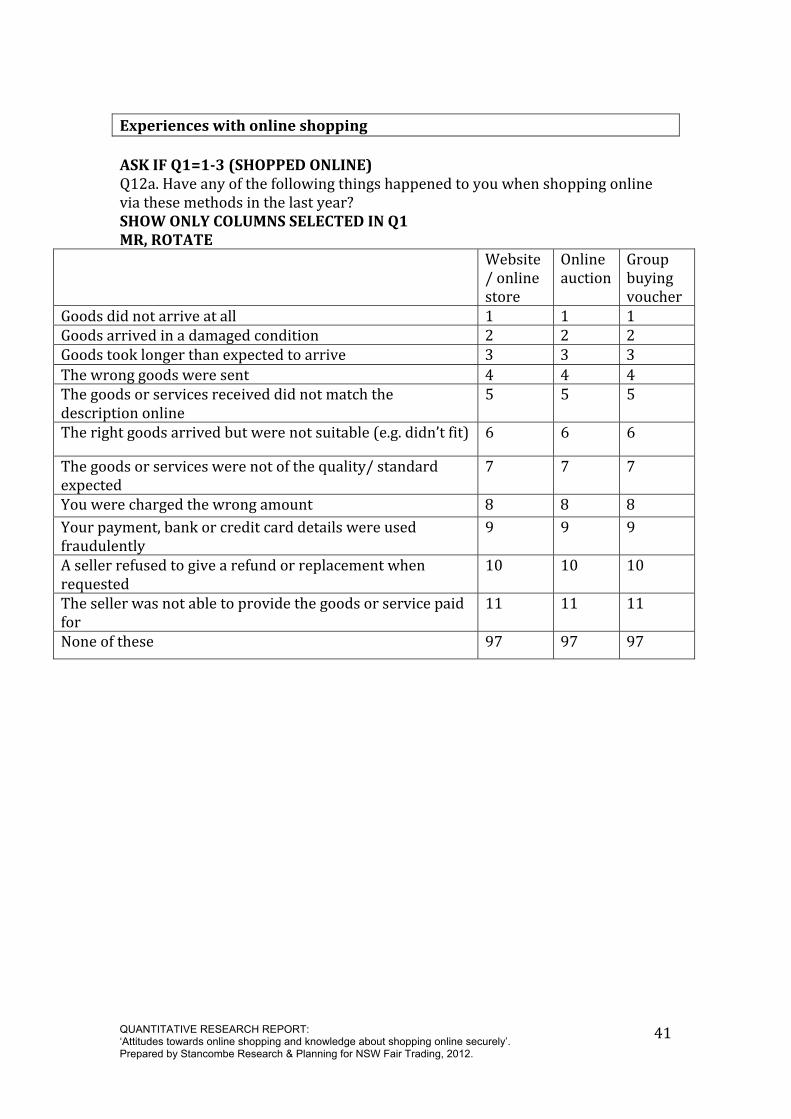
Experiences with online shopping ASK IF Q1=1-3 (SHOPPED ONLINE) Q12a. Have any of the following things happened to you when shopping online via these methods in the last year? SHOW ONLY COLUMNS SELECTED IN Q1 MR, ROTATE Website/ online store Online auction Group buying voucher Goods did not arrive at all 1 1 1 Goods arrived in a damaged condition 2 2 2 Goods took longer than expected to arrive 3 3 3 The wrong goods were sent 4 4 4 The goods or services received did not match the description online 5 5 5 The right goods arrived but were not suitable (e.g. didn’t fit) 6 6 6 The goods or services were not of the quality/ standard expected 7 7 7 You were charged the wrong amount 8 8 8 Your payment, bank or credit card details were used fraudulently 9 9 9 A seller refused to give a refund or replacement when requested 10 10 10 The seller was not able to provide the goods or service paid for 11 11 11 None of these 97 97 97
QUANTITATIVE RESEARCH REPORT: ‘Attitudes towards online shopping and knowledge about shopping online securely’. Prepared by Stancombe Research & Planning for NSW Fair Trading, 2012.
42
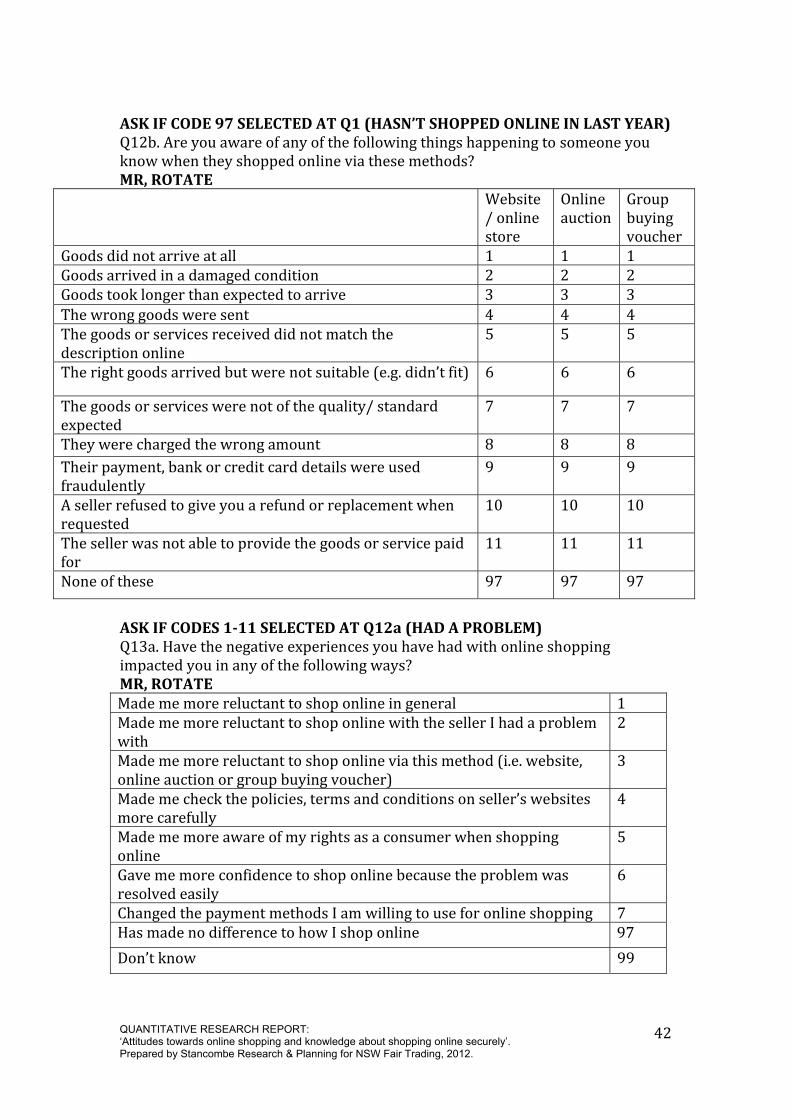
ASK IF CODE 97 SELECTED AT Q1 (HASN’T SHOPPED ONLINE IN LAST YEAR) Q12b. Are you aware of any of the following things happening to someone you know when they shopped online via these methods? MR, ROTATE Website/ online store Online auction Group buying voucher Goods did not arrive at all 1 1 1 Goods arrived in a damaged condition 2 2 2 Goods took longer than expected to arrive 3 3 3 The wrong goods were sent 4 4 4 The goods or services received did not match the description online 5 5 5 The right goods arrived but were not suitable (e.g. didn’t fit) 6 6 6 The goods or services were not of the quality/ standard expected 7 7 7 They were charged the wrong amount 8 8 8 Their payment, bank or credit card details were used fraudulently 9 9 9 A seller refused to give you a refund or replacement when requested 10 10 10 The seller was not able to provide the goods or service paid for 11 11 11 None of these 97 97 97 ASK IF CODES 1-11 SELECTED AT Q12a (HAD A PROBLEM) Q13a. Have the negative experiences you have had with online shopping impacted you in any of the following ways? MR, ROTATE Made me more reluctant to shop online in general 1 Made me more reluctant to shop online with the seller I had a problem with 2 Made me more reluctant to shop online via this method (i.e. website, online auction or group buying voucher) 3 Made me check the policies, terms and conditions on seller’s websites more carefully 4 Made me more aware of my rights as a consumer when shopping online 5 Gave me more confidence to shop online because the problem was resolved easily 6 Changed the payment methods I am willing to use for online shopping 7 Has made no difference to how I shop online 97 Don’t know 99
QUANTITATIVE RESEARCH REPORT: ‘Attitudes towards online shopping and knowledge about shopping online securely’. Prepared by Stancombe Research & Planning for NSW Fair Trading, 2012.
43
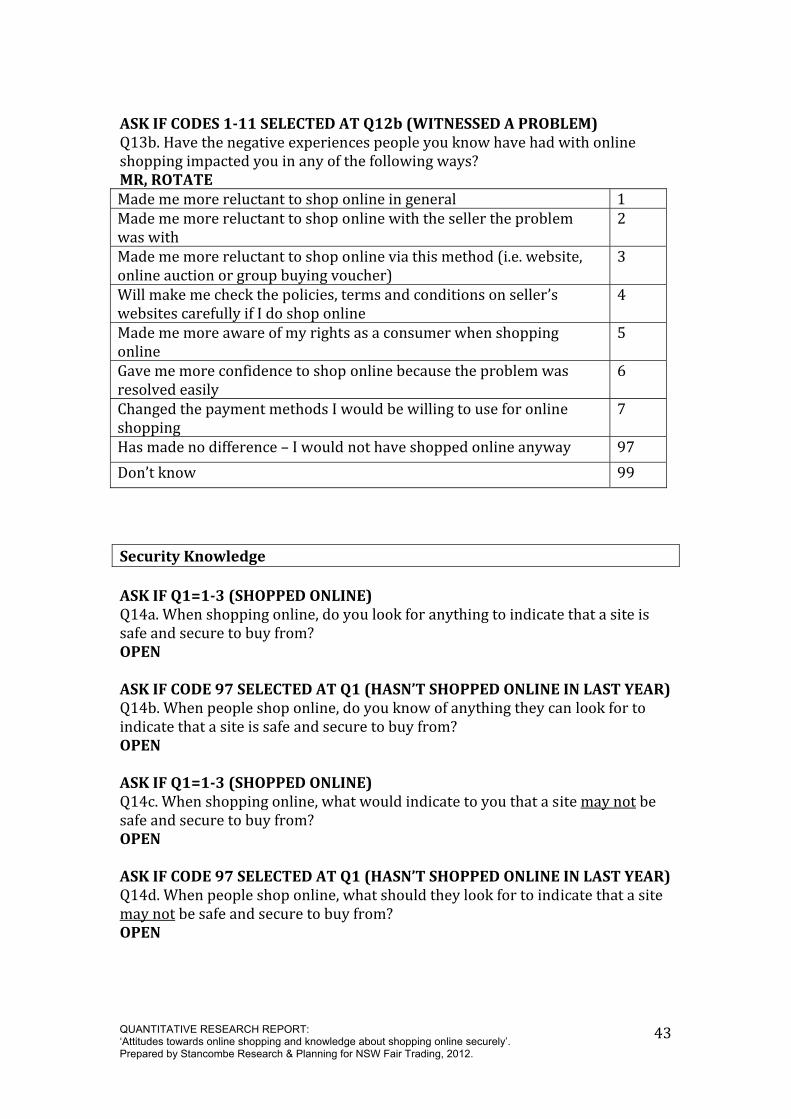
ASK IF CODES 1-11 SELECTED AT Q12b (WITNESSED A PROBLEM) Q13b. Have the negative experiences people you know have had with online shopping impacted you in any of the following ways? MR, ROTATE Made me more reluctant to shop online in general 1 Made me more reluctant to shop online with the seller the problem was with 2 Made me more reluctant to shop online via this method (i.e. website, online auction or group buying voucher) 3 Will make me check the policies, terms and conditions on seller’s websites carefully if I do shop online 4 Made me more aware of my rights as a consumer when shopping online 5 Gave me more confidence to shop online because the problem was resolved easily 6 Changed the payment methods I would be willing to use for online shopping 7 Has made no difference – I would not have shopped online anyway 97 Don’t know 99 Security Knowledge ASK IF Q1=1-3 (SHOPPED ONLINE) Q14a. When shopping online, do you look for anything to indicate that a site is safe and secure to buy from? OPEN ASK IF CODE 97 SELECTED AT Q1 (HASN’T SHOPPED ONLINE IN LAST YEAR) Q14b. When people shop online, do you know of anything they can look for to indicate that a site is safe and secure to buy from? OPEN ASK IF Q1=1-3 (SHOPPED ONLINE) Q14c. When shopping online, what would indicate to you that a site may not be safe and secure to buy from? OPEN ASK IF CODE 97 SELECTED AT Q1 (HASN’T SHOPPED ONLINE IN LAST YEAR) Q14d. When people shop online, what should they look for to indicate that a site may not be safe and secure to buy from? OPEN
QUANTITATIVE RESEARCH REPORT: ‘Attitudes towards online shopping and knowledge about shopping online securely’. Prepared by Stancombe Research & Planning for NSW Fair Trading, 2012.
44
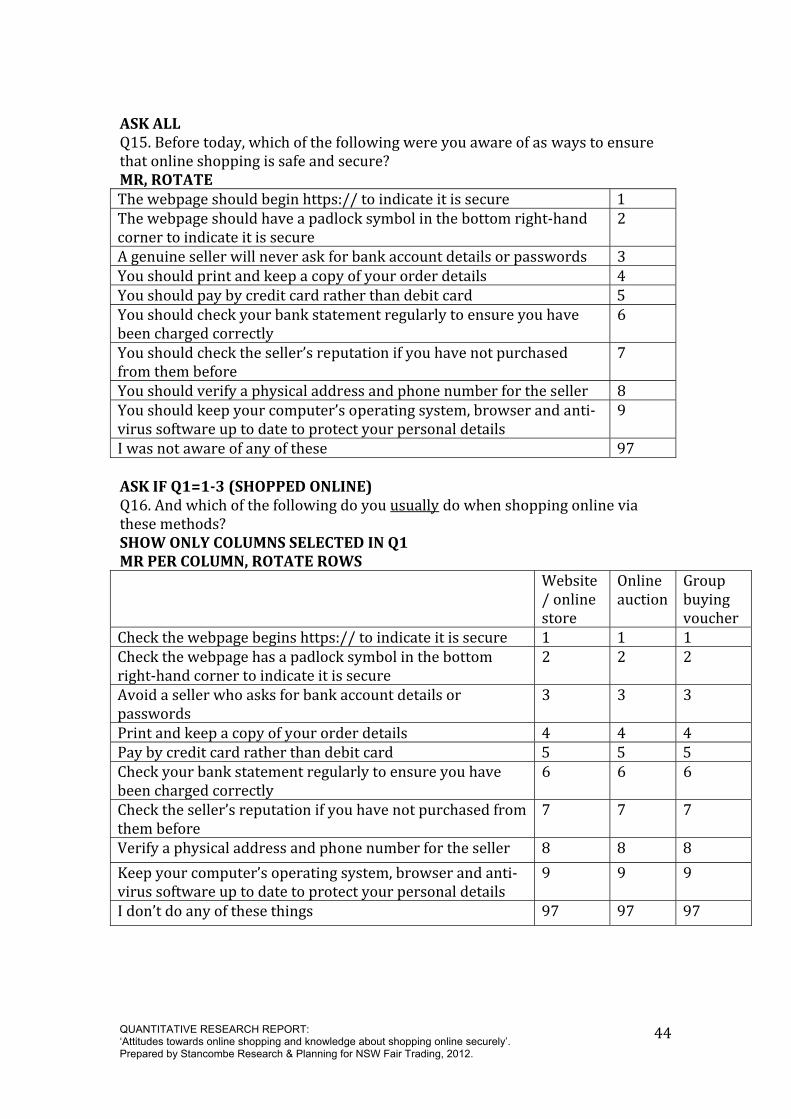
ASK ALL Q15. Before today, which of the following were you aware of as ways to ensure that online shopping is safe and secure? MR, ROTATE The webpage should begin https:// to indicate it is secure 1 The webpage should have a padlock symbol in the bottom right-hand corner to indicate it is secure 2 A genuine seller will never ask for bank account details or passwords 3 You should print and keep a copy of your order details 4 You should pay by credit card rather than debit card 5 You should check your bank statement regularly to ensure you have been charged correctly 6 You should check the seller’s reputation if you have not purchased from them before 7 You should verify a physical address and phone number for the seller 8 You should keep your computer’s operating system, browser and anti-virus software up to date to protect your personal details 9 I was not aware of any of these 97 ASK IF Q1=1-3 (SHOPPED ONLINE) Q16. And which of the following do you usually do when shopping online via these methods? SHOW ONLY COLUMNS SELECTED IN Q1 MR PER COLUMN, ROTATE ROWS Website/ online store Online auction Group buying voucher Check the webpage begins https:// to indicate it is secure 1 1 1 Check the webpage has a padlock symbol in the bottom right-hand corner to indicate it is secure 2 2 2 Avoid a seller who asks for bank account details or passwords 3 3 3 Print and keep a copy of your order details 4 4 4 Pay by credit card rather than debit card 5 5 5 Check your bank statement regularly to ensure you have been charged correctly 6 6 6 Check the seller’s reputation if you have not purchased from them before 7 7 7 Verify a physical address and phone number for the seller 8 8 8 Keep your computer’s operating system, browser and anti-virus software up to date to protect your personal details 9 9 9 I don’t do any of these things 97 97 97
QUANTITATIVE RESEARCH REPORT: ‘Attitudes towards online shopping and knowledge about shopping online securely’. Prepared by Stancombe Research & Planning for NSW Fair Trading, 2012.
45
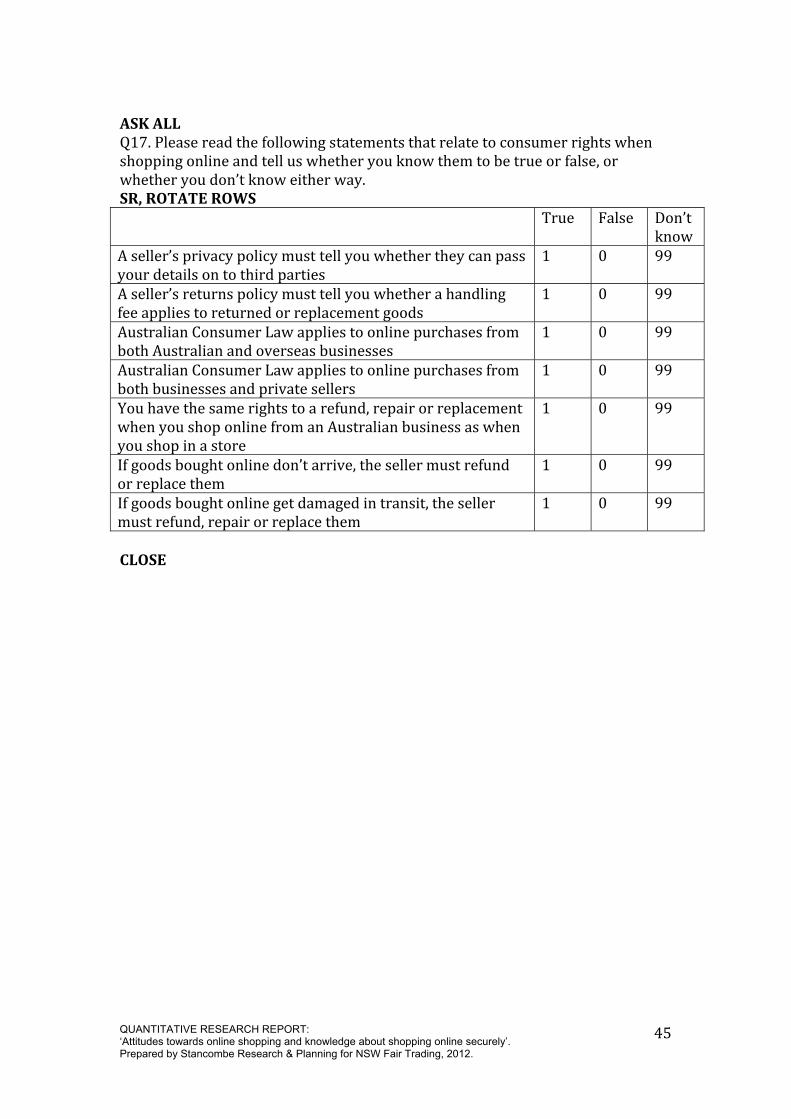
ASK ALL Q17. Please read the following statements that relate to consumer rights when shopping online and tell us whether you know them to be true or false, or whether you don’t know either way. SR, ROTATE ROWS True False Don’t know A seller’s privacy policy must tell you whether they can pass your details on to third parties 1 0 99 A seller’s returns policy must tell you whether a handling fee applies to returned or replacement goods 1 0 99 Australian Consumer Law applies to online purchases from both Australian and overseas businesses 1 0 99 Australian Consumer Law applies to online purchases from both businesses and private sellers 1 0 99 You have the same rights to a refund, repair or replacement when you shop online from an Australian business as when you shop in a store 1 0 99 If goods bought online don’t arrive, the seller must refund or replace them 1 0 99 If goods bought online get damaged in transit, the seller must refund, repair or replace them 1 0 99 CLOSE
QUANTITATIVE RESEARCH REPORT: ‘Attitudes towards online shopping and knowledge about shopping online securely’. Prepared by Stancombe Research & Planning for NSW Fair Trading, 2012.
46
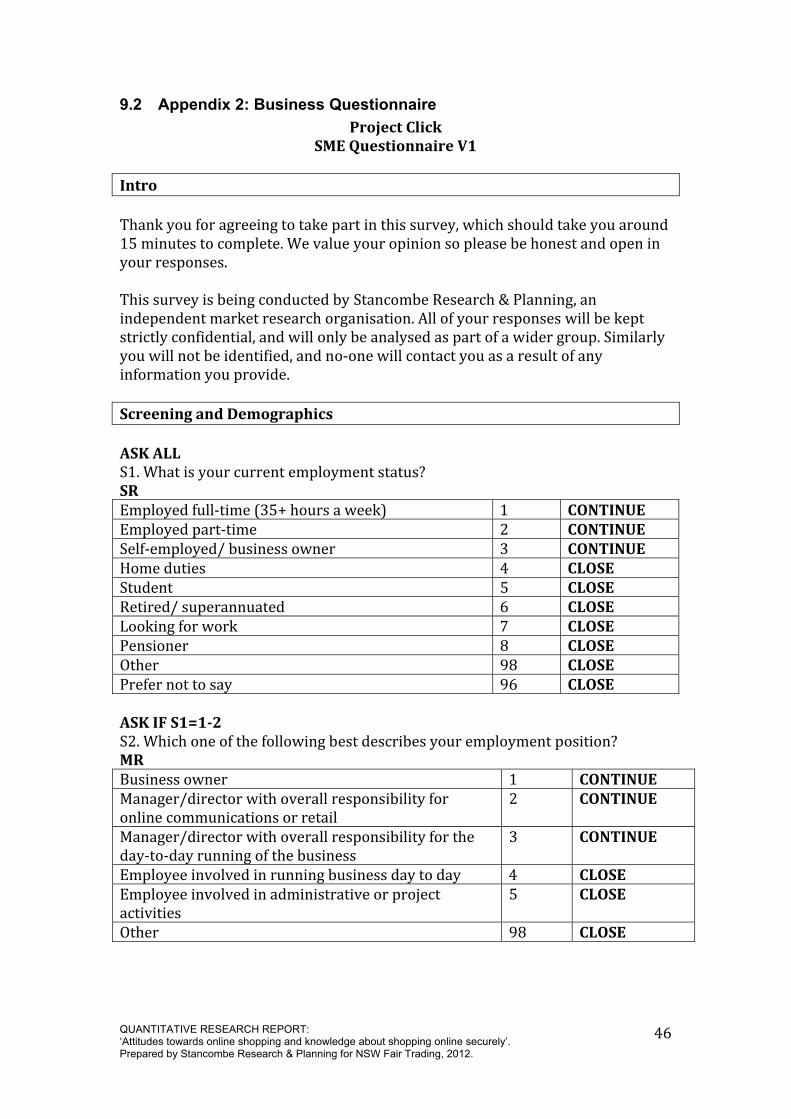
9.2 Appendix 2: Business Questionnaire Project Click
SME Questionnaire V1 Intro Thank you for agreeing to take part in this survey, which should take you around 15 minutes to complete. We value your opinion so please be honest and open in your responses. This survey is being conducted by Stancombe Research & Planning, an independent market research organisation. All of your responses will be kept strictly confidential, and will only be analysed as part of a wider group. Similarly you will not be identified, and no-one will contact you as a result of any information you provide. Screening and Demographics ASK ALL S1. What is your current employment status? SR Employed full-time (35+ hours a week) 1 CONTINUE Employed part-time 2 CONTINUE Self-employed/ business owner 3 CONTINUE Home duties 4 CLOSE Student 5 CLOSE Retired/ superannuated 6 CLOSE Looking for work 7 CLOSE Pensioner 8 CLOSE Other 98 CLOSE Prefer not to say 96 CLOSE ASK IF S1=1-2 S2. Which one of the following best describes your employment position? MR Business owner 1 CONTINUE Manager/director with overall responsibility for online communications or retail 2 CONTINUE Manager/director with overall responsibility for the day-to-day running of the business 3 CONTINUE Employee involved in running business day to day 4 CLOSE Employee involved in administrative or project activities 5 CLOSE Other 98 CLOSE
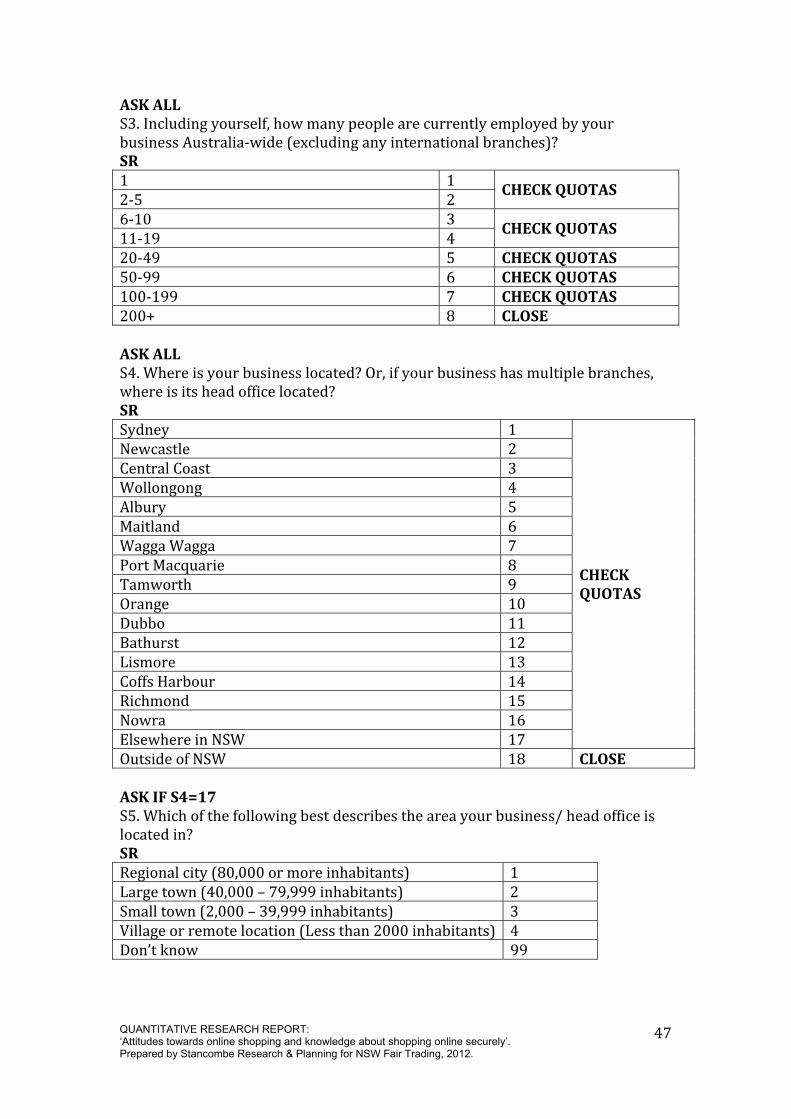
QUANTITATIVE RESEARCH REPORT: ‘Attitudes towards online shopping and knowledge about shopping online securely’. Prepared by Stancombe Research & Planning for NSW Fair Trading, 2012.
47
ASK ALL S3. Including yourself, how many people are currently employed by your business Australia-wide (excluding any international branches)? SR 1 1 2-5 2 CHECK QUOTAS 6-10 3 11-19 4 CHECK QUOTAS 20-49 5 CHECK QUOTAS 50-99 6 CHECK QUOTAS 100-199 7 CHECK QUOTAS 200+ 8 CLOSE ASK ALL S4. Where is your business located? Or, if your business has multiple branches, where is its head office located? SR Sydney 1 Newcastle 2 Central Coast 3 Wollongong 4 Albury 5 Maitland 6 Wagga Wagga 7 Port Macquarie 8 Tamworth 9 Orange 10 Dubbo 11 Bathurst 12 Lismore 13 Coffs Harbour 14 Richmond 15 Nowra 16 Elsewhere in NSW 17
CHECK QUOTAS
Outside of NSW 18 CLOSE ASK IF S4=17 S5. Which of the following best describes the area your business/ head office is located in? SR Regional city (80,000 or more inhabitants) 1 Large town (40,000 – 79,999 inhabitants) 2 Small town (2,000 – 39,999 inhabitants) 3 Village or remote location (Less than 2000 inhabitants) 4 Don’t know 99
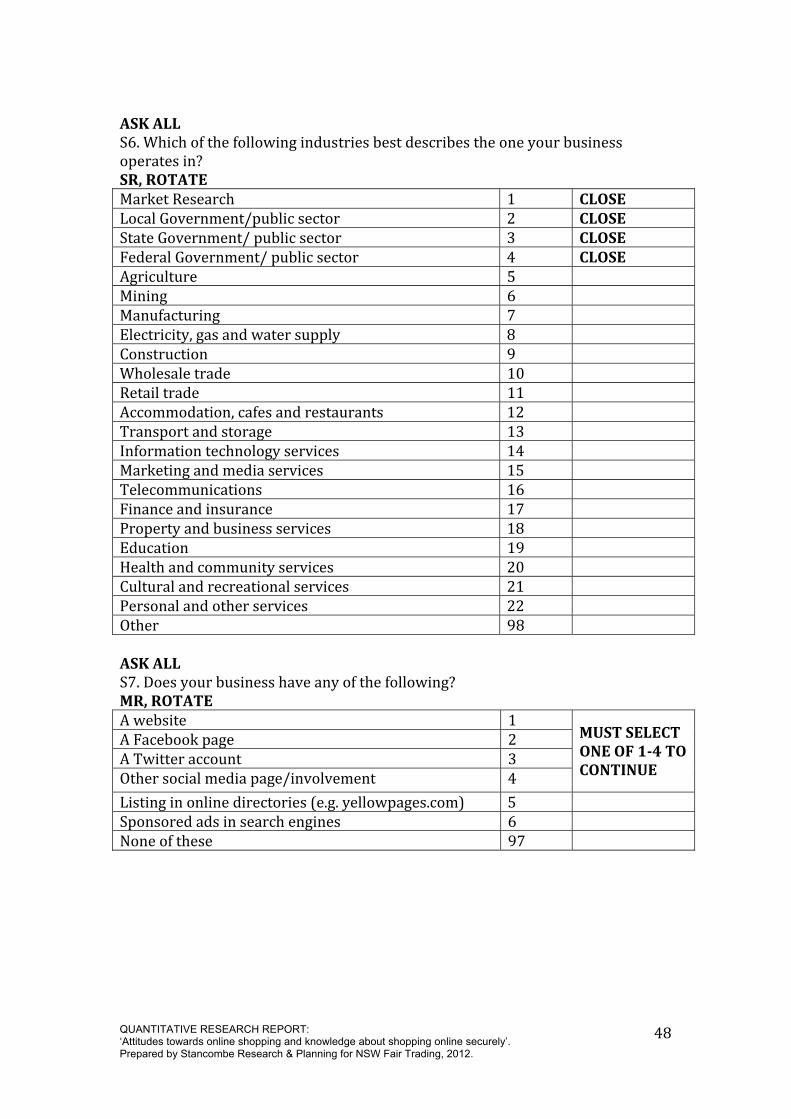
QUANTITATIVE RESEARCH REPORT: ‘Attitudes towards online shopping and knowledge about shopping online securely’. Prepared by Stancombe Research & Planning for NSW Fair Trading, 2012.
48
ASK ALL S6. Which of the following industries best describes the one your business operates in? SR, ROTATE Market Research 1 CLOSE Local Government/public sector 2 CLOSE State Government/ public sector 3 CLOSE Federal Government/ public sector 4 CLOSE Agriculture 5 Mining 6 Manufacturing 7 Electricity, gas and water supply 8 Construction 9 Wholesale trade 10 Retail trade 11 Accommodation, cafes and restaurants 12 Transport and storage 13 Information technology services 14 Marketing and media services 15 Telecommunications 16 Finance and insurance 17 Property and business services 18 Education 19 Health and community services 20 Cultural and recreational services 21 Personal and other services 22 Other 98 ASK ALL S7. Does your business have any of the following? MR, ROTATE A website 1 A Facebook page 2 A Twitter account 3 Other social media page/involvement 4
MUST SELECT ONE OF 1-4 TO CONTINUE Listing in online directories (e.g. yellowpages.com) 5 Sponsored ads in search engines 6 None of these 97
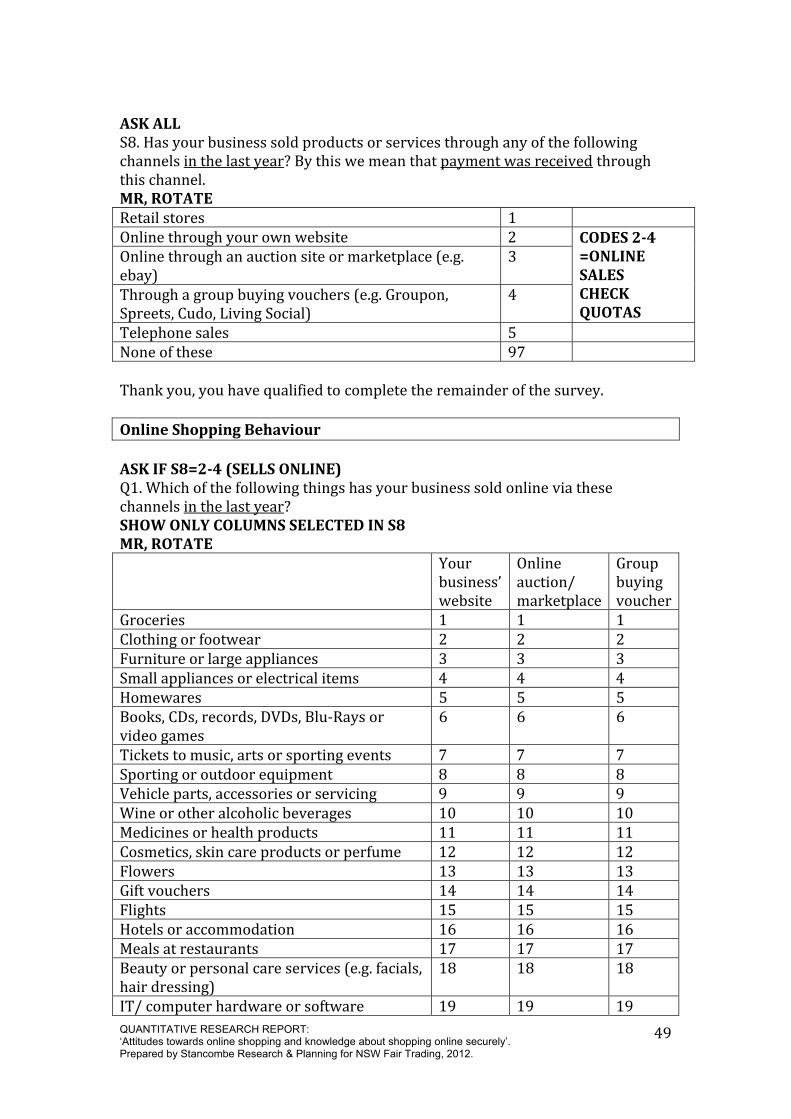
QUANTITATIVE RESEARCH REPORT: ‘Attitudes towards online shopping and knowledge about shopping online securely’. Prepared by Stancombe Research & Planning for NSW Fair Trading, 2012.
49
ASK ALL S8. Has your business sold products or services through any of the following channels in the last year? By this we mean that payment was received through this channel. MR, ROTATE Retail stores 1 Online through your own website 2 Online through an auction site or marketplace (e.g. ebay) 3 Through a group buying vouchers (e.g. Groupon, Spreets, Cudo, Living Social) 4
CODES 2-4 =ONLINE SALES CHECK QUOTAS Telephone sales 5 None of these 97
Thank you, you have qualified to complete the remainder of the survey. Online Shopping Behaviour ASK IF S8=2-4 (SELLS ONLINE) Q1. Which of the following things has your business sold online via these channels in the last year? SHOW ONLY COLUMNS SELECTED IN S8 MR, ROTATE Your business’ website Online auction/ marketplace Group buying voucherGroceries 1 1 1 Clothing or footwear 2 2 2 Furniture or large appliances 3 3 3 Small appliances or electrical items 4 4 4 Homewares 5 5 5 Books, CDs, records, DVDs, Blu-Rays or video games 6 6 6 Tickets to music, arts or sporting events 7 7 7 Sporting or outdoor equipment 8 8 8 Vehicle parts, accessories or servicing 9 9 9 Wine or other alcoholic beverages 10 10 10 Medicines or health products 11 11 11 Cosmetics, skin care products or perfume 12 12 12 Flowers 13 13 13 Gift vouchers 14 14 14 Flights 15 15 15 Hotels or accommodation 16 16 16 Meals at restaurants 17 17 17 Beauty or personal care services (e.g. facials, hair dressing) 18 18 18 IT/ computer hardware or software 19 19 19
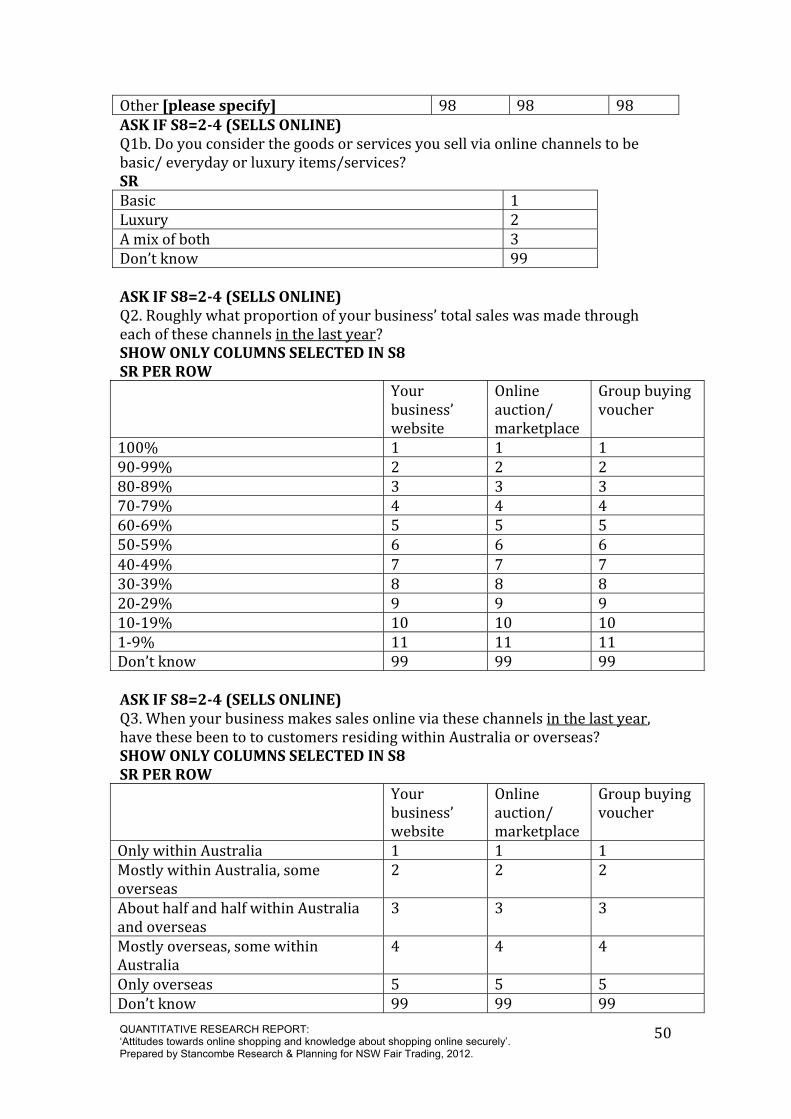
QUANTITATIVE RESEARCH REPORT: ‘Attitudes towards online shopping and knowledge about shopping online securely’. Prepared by Stancombe Research & Planning for NSW Fair Trading, 2012.
50
Other [please specify] 98 98 98 ASK IF S8=2-4 (SELLS ONLINE) Q1b. Do you consider the goods or services you sell via online channels to be basic/ everyday or luxury items/services? SR Basic 1 Luxury 2 A mix of both 3 Don’t know 99 ASK IF S8=2-4 (SELLS ONLINE) Q2. Roughly what proportion of your business’ total sales was made through each of these channels in the last year? SHOW ONLY COLUMNS SELECTED IN S8 SR PER ROW Your business’ website Online auction/ marketplace Group buying voucher 100% 1 1 1 90-99% 2 2 2 80-89% 3 3 3 70-79% 4 4 4 60-69% 5 5 5 50-59% 6 6 6 40-49% 7 7 7 30-39% 8 8 8 20-29% 9 9 9 10-19% 10 10 10 1-9% 11 11 11 Don’t know 99 99 99 ASK IF S8=2-4 (SELLS ONLINE) Q3. When your business makes sales online via these channels in the last year, have these been to to customers residing within Australia or overseas? SHOW ONLY COLUMNS SELECTED IN S8 SR PER ROW Your business’ website Online auction/ marketplace Group buying voucher Only within Australia 1 1 1 Mostly within Australia, some overseas 2 2 2 About half and half within Australia and overseas 3 3 3 Mostly overseas, some within Australia 4 4 4 Only overseas 5 5 5 Don’t know 99 99 99

QUANTITATIVE RESEARCH REPORT: ‘Attitudes towards online shopping and knowledge about shopping online securely’. Prepared by Stancombe Research & Planning for NSW Fair Trading, 2012.
51
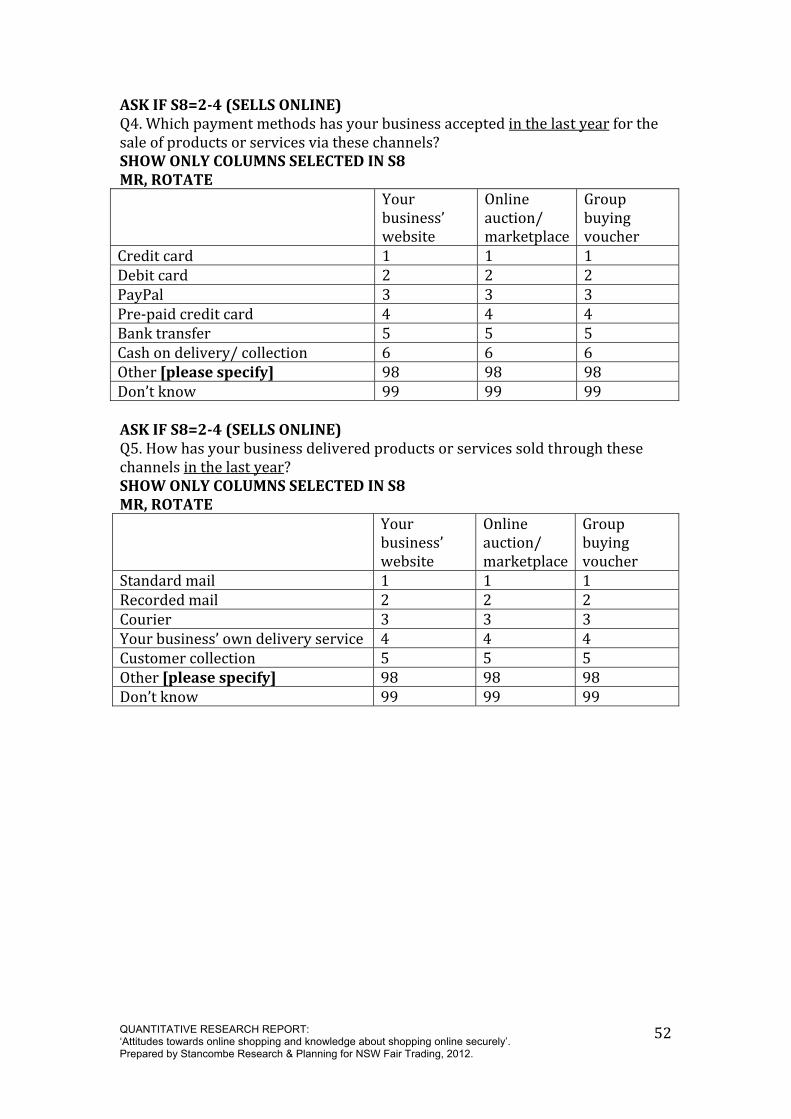
QUANTITATIVE RESEARCH REPORT: ‘Attitudes towards online shopping and knowledge about shopping online securely’. Prepared by Stancombe Research & Planning for NSW Fair Trading, 2012.
52
ASK IF S8=2-4 (SELLS ONLINE) Q4. Which payment methods has your business accepted in the last year for the sale of products or services via these channels? SHOW ONLY COLUMNS SELECTED IN S8 MR, ROTATE Your business’ website Online auction/ marketplace Group buying voucher Credit card 1 1 1 Debit card 2 2 2 PayPal 3 3 3 Pre-paid credit card 4 4 4 Bank transfer 5 5 5 Cash on delivery/ collection 6 6 6 Other [please specify] 98 98 98 Don’t know 99 99 99 ASK IF S8=2-4 (SELLS ONLINE) Q5. How has your business delivered products or services sold through these channels in the last year? SHOW ONLY COLUMNS SELECTED IN S8 MR, ROTATE Your business’ website Online auction/ marketplace Group buying voucher Standard mail 1 1 1 Recorded mail 2 2 2 Courier 3 3 3 Your business’ own delivery service 4 4 4 Customer collection 5 5 5 Other [please specify] 98 98 98 Don’t know 99 99 99
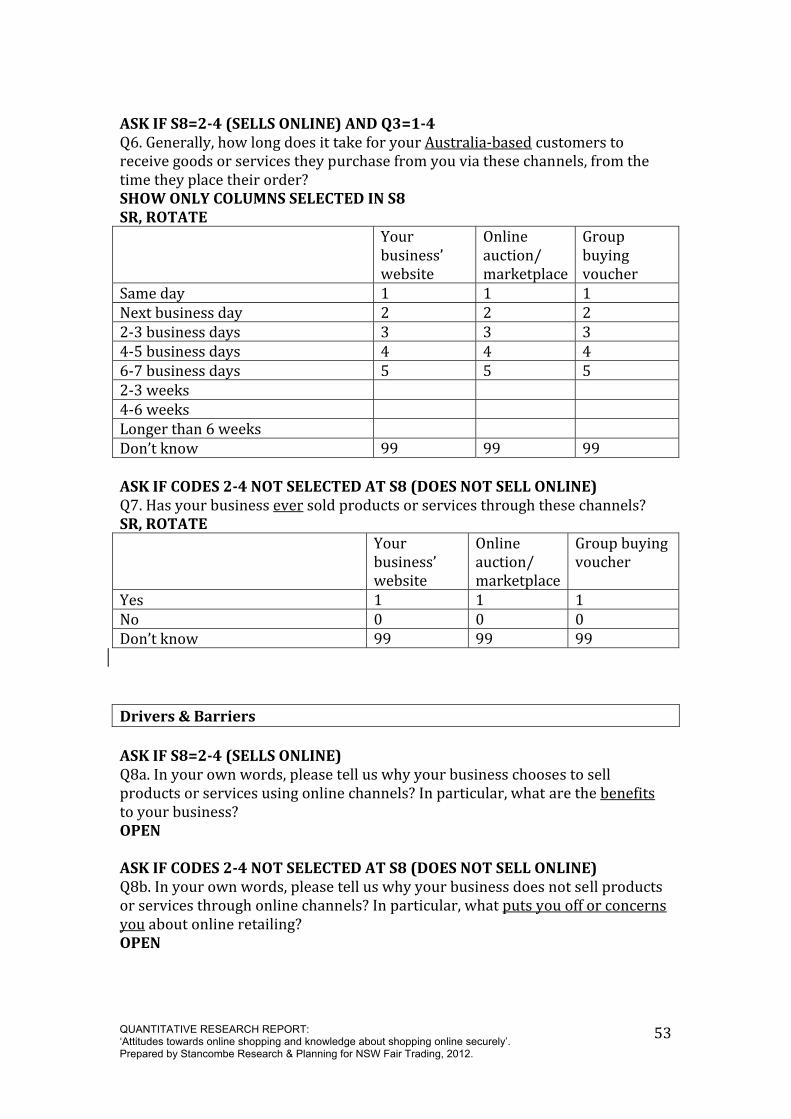
QUANTITATIVE RESEARCH REPORT: ‘Attitudes towards online shopping and knowledge about shopping online securely’. Prepared by Stancombe Research & Planning for NSW Fair Trading, 2012.
53
ASK IF S8=2-4 (SELLS ONLINE) AND Q3=1-4 Q6. Generally, how long does it take for your Australia-based customers to receive goods or services they purchase from you via these channels, from the time they place their order? SHOW ONLY COLUMNS SELECTED IN S8 SR, ROTATE Your business’ website Online auction/ marketplace Group buying voucher Same day 1 1 1 Next business day 2 2 2 2-3 business days 3 3 3 4-5 business days 4 4 4 6-7 business days 5 5 5 2-3 weeks 4-6 weeks Longer than 6 weeks Don’t know 99 99 99 ASK IF CODES 2-4 NOT SELECTED AT S8 (DOES NOT SELL ONLINE) Q7. Has your business ever sold products or services through these channels? SR, ROTATE Your business’ website Online auction/ marketplace Group buying voucher Yes 1 1 1 No 0 0 0 Don’t know 99 99 99 Drivers & Barriers ASK IF S8=2-4 (SELLS ONLINE) Q8a. In your own words, please tell us why your business chooses to sell products or services using online channels? In particular, what are the benefits to your business? OPEN ASK IF CODES 2-4 NOT SELECTED AT S8 (DOES NOT SELL ONLINE) Q8b. In your own words, please tell us why your business does not sell products or services through online channels? In particular, what puts you off or concerns you about online retailing? OPEN
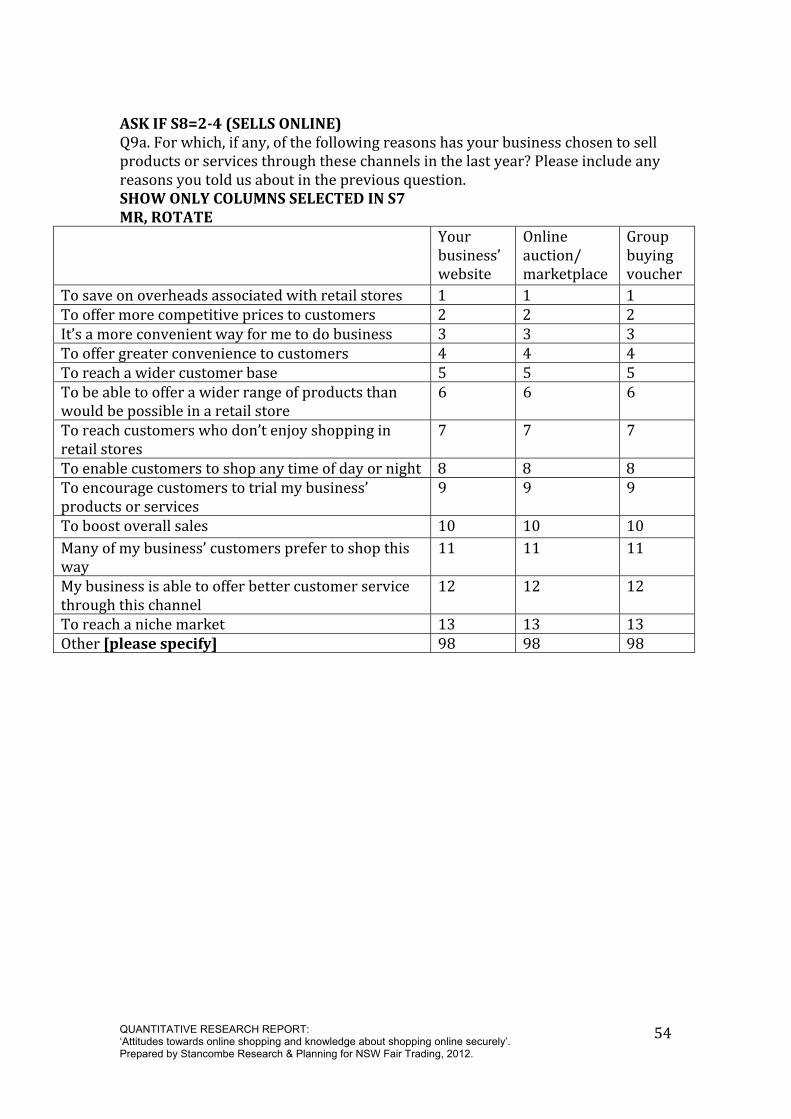
QUANTITATIVE RESEARCH REPORT: ‘Attitudes towards online shopping and knowledge about shopping online securely’. Prepared by Stancombe Research & Planning for NSW Fair Trading, 2012.
54
ASK IF S8=2-4 (SELLS ONLINE) Q9a. For which, if any, of the following reasons has your business chosen to sell products or services through these channels in the last year? Please include any reasons you told us about in the previous question. SHOW ONLY COLUMNS SELECTED IN S7 MR, ROTATE Your business’ website Online auction/ marketplace Group buying voucher To save on overheads associated with retail stores 1 1 1 To offer more competitive prices to customers 2 2 2 It’s a more convenient way for me to do business 3 3 3 To offer greater convenience to customers 4 4 4 To reach a wider customer base 5 5 5 To be able to offer a wider range of products than would be possible in a retail store 6 6 6 To reach customers who don’t enjoy shopping in retail stores 7 7 7 To enable customers to shop any time of day or night 8 8 8 To encourage customers to trial my business’ products or services 9 9 9 To boost overall sales 10 10 10 Many of my business’ customers prefer to shop this way 11 11 11 My business is able to offer better customer service through this channel 12 12 12 To reach a niche market 13 13 13 Other [please specify] 98 98 98
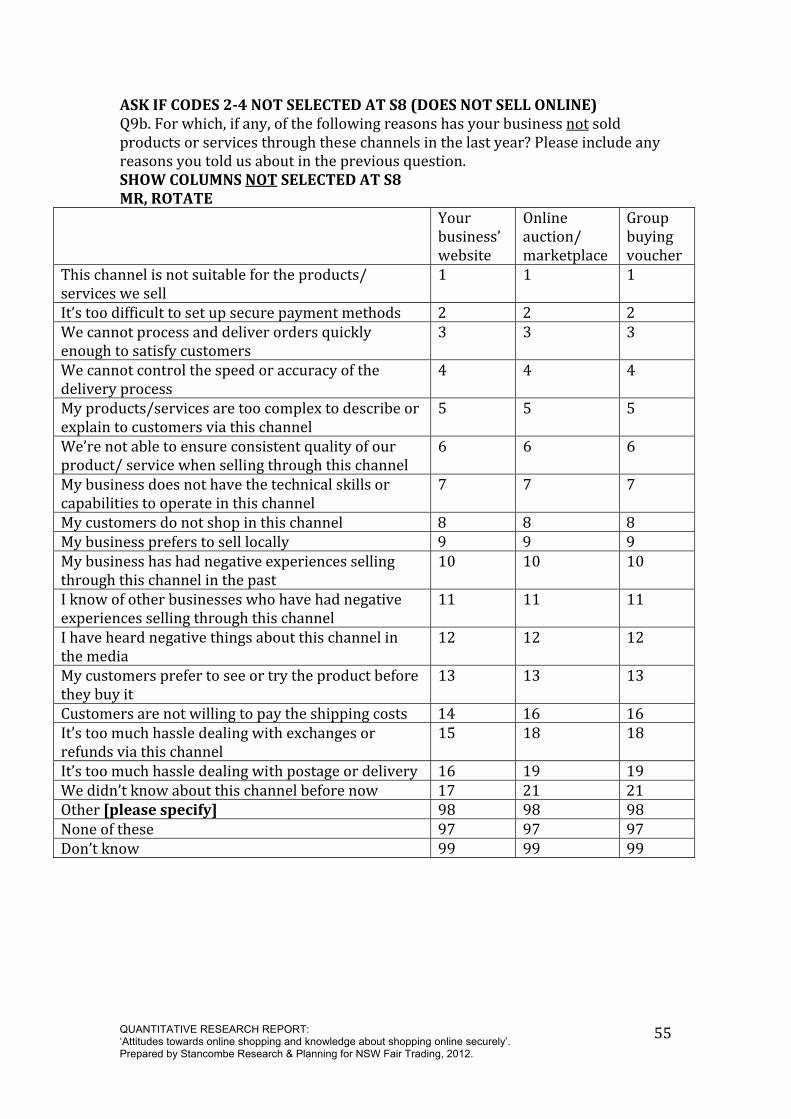
QUANTITATIVE RESEARCH REPORT: ‘Attitudes towards online shopping and knowledge about shopping online securely’. Prepared by Stancombe Research & Planning for NSW Fair Trading, 2012.
55
ASK IF CODES 2-4 NOT SELECTED AT S8 (DOES NOT SELL ONLINE) Q9b. For which, if any, of the following reasons has your business not sold products or services through these channels in the last year? Please include any reasons you told us about in the previous question. SHOW COLUMNS NOT SELECTED AT S8 MR, ROTATE Your business’ website Online auction/ marketplace Group buying voucher This channel is not suitable for the products/ services we sell 1 1 1 It’s too difficult to set up secure payment methods 2 2 2 We cannot process and deliver orders quickly enough to satisfy customers 3 3 3 We cannot control the speed or accuracy of the delivery process 4 4 4 My products/services are too complex to describe or explain to customers via this channel 5 5 5 We’re not able to ensure consistent quality of our product/ service when selling through this channel 6 6 6 My business does not have the technical skills or capabilities to operate in this channel 7 7 7 My customers do not shop in this channel 8 8 8 My business prefers to sell locally 9 9 9 My business has had negative experiences selling through this channel in the past 10 10 10 I know of other businesses who have had negative experiences selling through this channel 11 11 11 I have heard negative things about this channel in the media 12 12 12 My customers prefer to see or try the product before they buy it 13 13 13 Customers are not willing to pay the shipping costs 14 16 16 It’s too much hassle dealing with exchanges or refunds via this channel 15 18 18 It’s too much hassle dealing with postage or delivery 16 19 19 We didn’t know about this channel before now 17 21 21 Other [please specify] 98 98 98 None of these 97 97 97 Don’t know 99 99 99
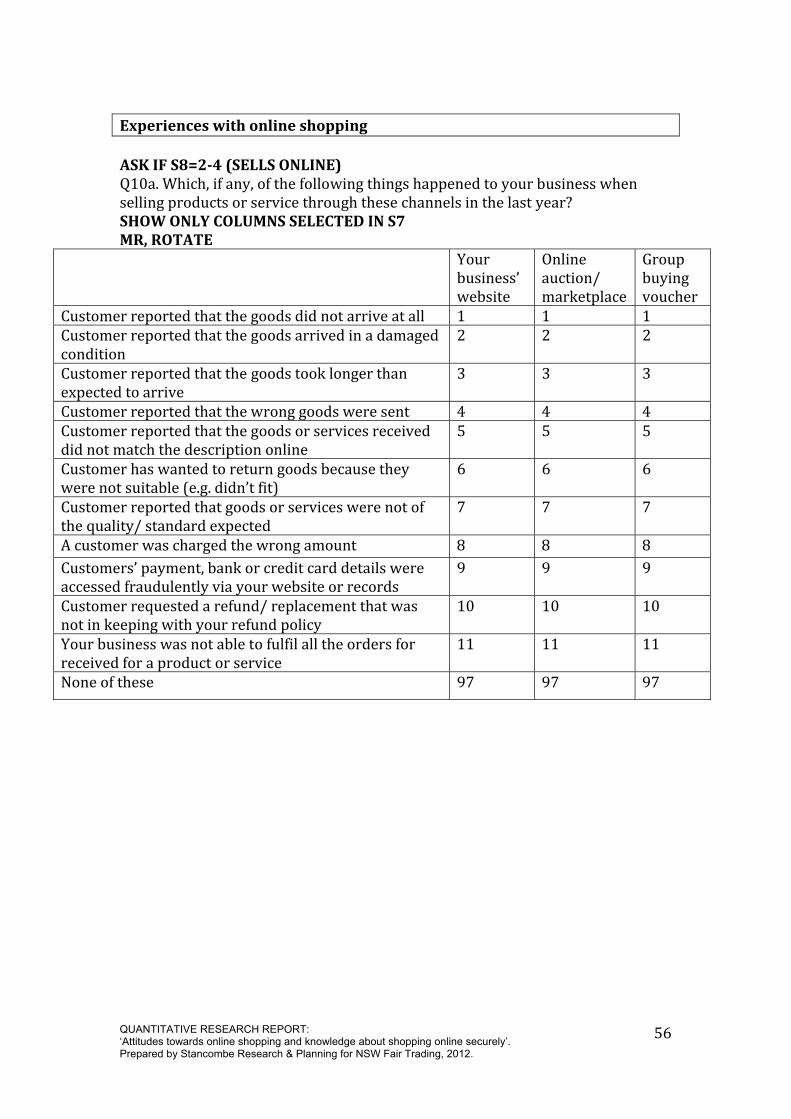
QUANTITATIVE RESEARCH REPORT: ‘Attitudes towards online shopping and knowledge about shopping online securely’. Prepared by Stancombe Research & Planning for NSW Fair Trading, 2012.
56
Experiences with online shopping ASK IF S8=2-4 (SELLS ONLINE) Q10a. Which, if any, of the following things happened to your business when selling products or service through these channels in the last year? SHOW ONLY COLUMNS SELECTED IN S7 MR, ROTATE Your business’ website Online auction/ marketplace Group buying voucher Customer reported that the goods did not arrive at all 1 1 1 Customer reported that the goods arrived in a damaged condition 2 2 2 Customer reported that the goods took longer than expected to arrive 3 3 3 Customer reported that the wrong goods were sent 4 4 4 Customer reported that the goods or services received did not match the description online 5 5 5 Customer has wanted to return goods because they were not suitable (e.g. didn’t fit) 6 6 6 Customer reported that goods or services were not of the quality/ standard expected 7 7 7 A customer was charged the wrong amount 8 8 8 Customers’ payment, bank or credit card details were accessed fraudulently via your website or records 9 9 9 Customer requested a refund/ replacement that was not in keeping with your refund policy 10 10 10 Your business was not able to fulfil all the orders for received for a product or service 11 11 11 None of these 97 97 97
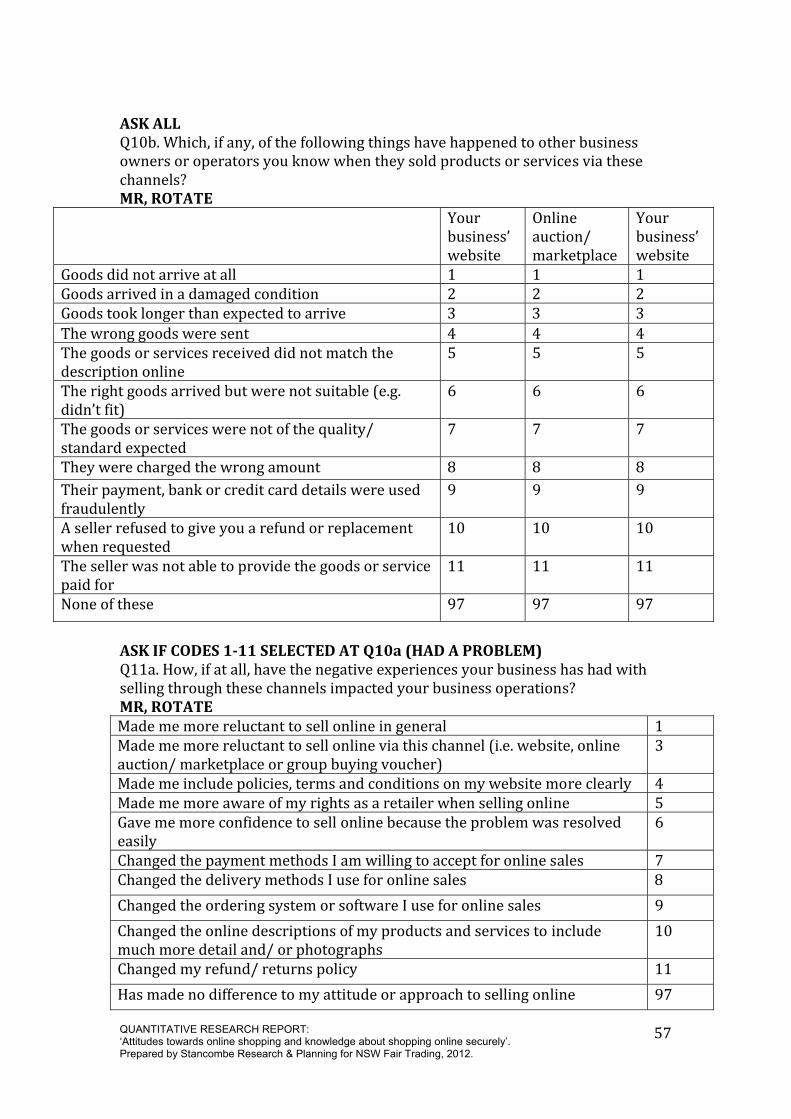
QUANTITATIVE RESEARCH REPORT: ‘Attitudes towards online shopping and knowledge about shopping online securely’. Prepared by Stancombe Research & Planning for NSW Fair Trading, 2012.
57
ASK ALL Q10b. Which, if any, of the following things have happened to other business owners or operators you know when they sold products or services via these channels? MR, ROTATE Your business’ website Online auction/ marketplace Your business’ website Goods did not arrive at all 1 1 1 Goods arrived in a damaged condition 2 2 2 Goods took longer than expected to arrive 3 3 3 The wrong goods were sent 4 4 4 The goods or services received did not match the description online 5 5 5 The right goods arrived but were not suitable (e.g. didn’t fit) 6 6 6 The goods or services were not of the quality/ standard expected 7 7 7 They were charged the wrong amount 8 8 8 Their payment, bank or credit card details were used fraudulently 9 9 9 A seller refused to give you a refund or replacement when requested 10 10 10 The seller was not able to provide the goods or service paid for 11 11 11 None of these 97 97 97 ASK IF CODES 1-11 SELECTED AT Q10a (HAD A PROBLEM) Q11a. How, if at all, have the negative experiences your business has had with selling through these channels impacted your business operations? MR, ROTATE Made me more reluctant to sell online in general 1 Made me more reluctant to sell online via this channel (i.e. website, online auction/ marketplace or group buying voucher) 3 Made me include policies, terms and conditions on my website more clearly 4 Made me more aware of my rights as a retailer when selling online 5 Gave me more confidence to sell online because the problem was resolved easily 6 Changed the payment methods I am willing to accept for online sales 7 Changed the delivery methods I use for online sales 8 Changed the ordering system or software I use for online sales 9 Changed the online descriptions of my products and services to include much more detail and/ or photographs 10 Changed my refund/ returns policy 11 Has made no difference to my attitude or approach to selling online 97
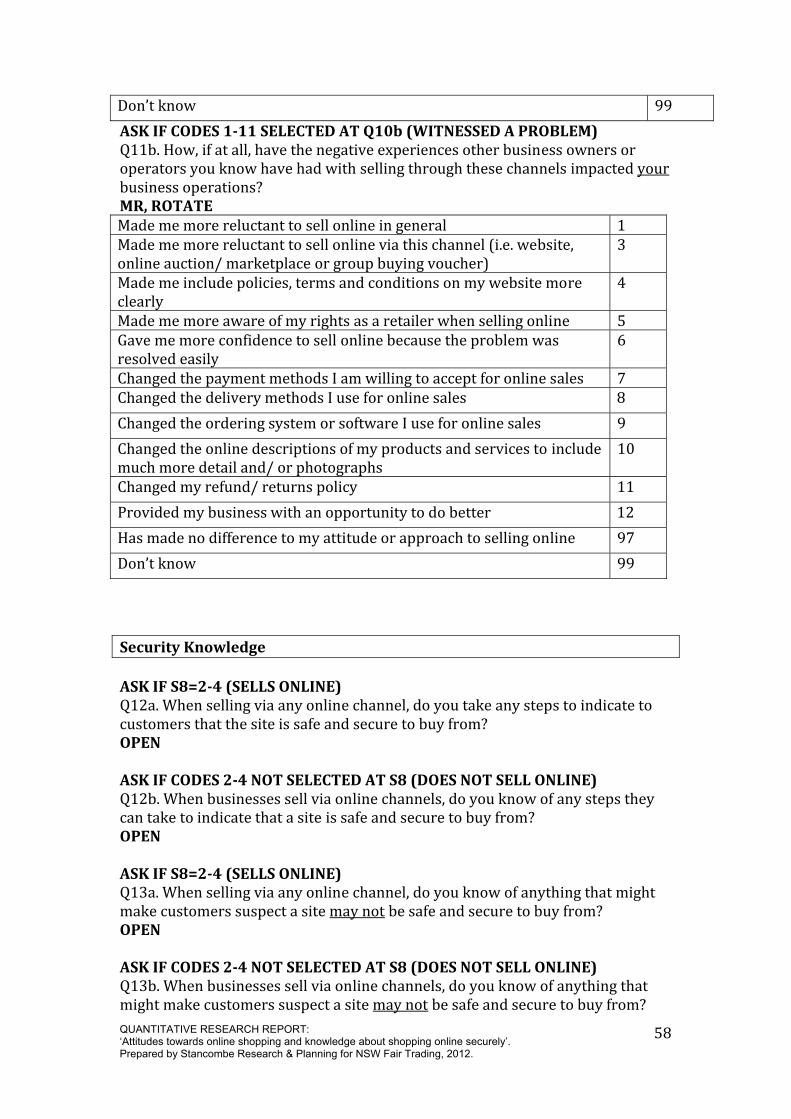
QUANTITATIVE RESEARCH REPORT: ‘Attitudes towards online shopping and knowledge about shopping online securely’. Prepared by Stancombe Research & Planning for NSW Fair Trading, 2012.
58
Don’t know 99 ASK IF CODES 1-11 SELECTED AT Q10b (WITNESSED A PROBLEM) Q11b. How, if at all, have the negative experiences other business owners or operators you know have had with selling through these channels impacted your business operations? MR, ROTATE Made me more reluctant to sell online in general 1 Made me more reluctant to sell online via this channel (i.e. website, online auction/ marketplace or group buying voucher) 3 Made me include policies, terms and conditions on my website more clearly 4 Made me more aware of my rights as a retailer when selling online 5 Gave me more confidence to sell online because the problem was resolved easily 6 Changed the payment methods I am willing to accept for online sales 7 Changed the delivery methods I use for online sales 8 Changed the ordering system or software I use for online sales 9 Changed the online descriptions of my products and services to include much more detail and/ or photographs 10 Changed my refund/ returns policy 11 Provided my business with an opportunity to do better 12 Has made no difference to my attitude or approach to selling online 97 Don’t know 99 Security Knowledge ASK IF S8=2-4 (SELLS ONLINE) Q12a. When selling via any online channel, do you take any steps to indicate to customers that the site is safe and secure to buy from? OPEN ASK IF CODES 2-4 NOT SELECTED AT S8 (DOES NOT SELL ONLINE) Q12b. When businesses sell via online channels, do you know of any steps they can take to indicate that a site is safe and secure to buy from? OPEN ASK IF S8=2-4 (SELLS ONLINE) Q13a. When selling via any online channel, do you know of anything that might make customers suspect a site may not be safe and secure to buy from? OPEN ASK IF CODES 2-4 NOT SELECTED AT S8 (DOES NOT SELL ONLINE) Q13b. When businesses sell via online channels, do you know of anything that might make customers suspect a site may not be safe and secure to buy from?
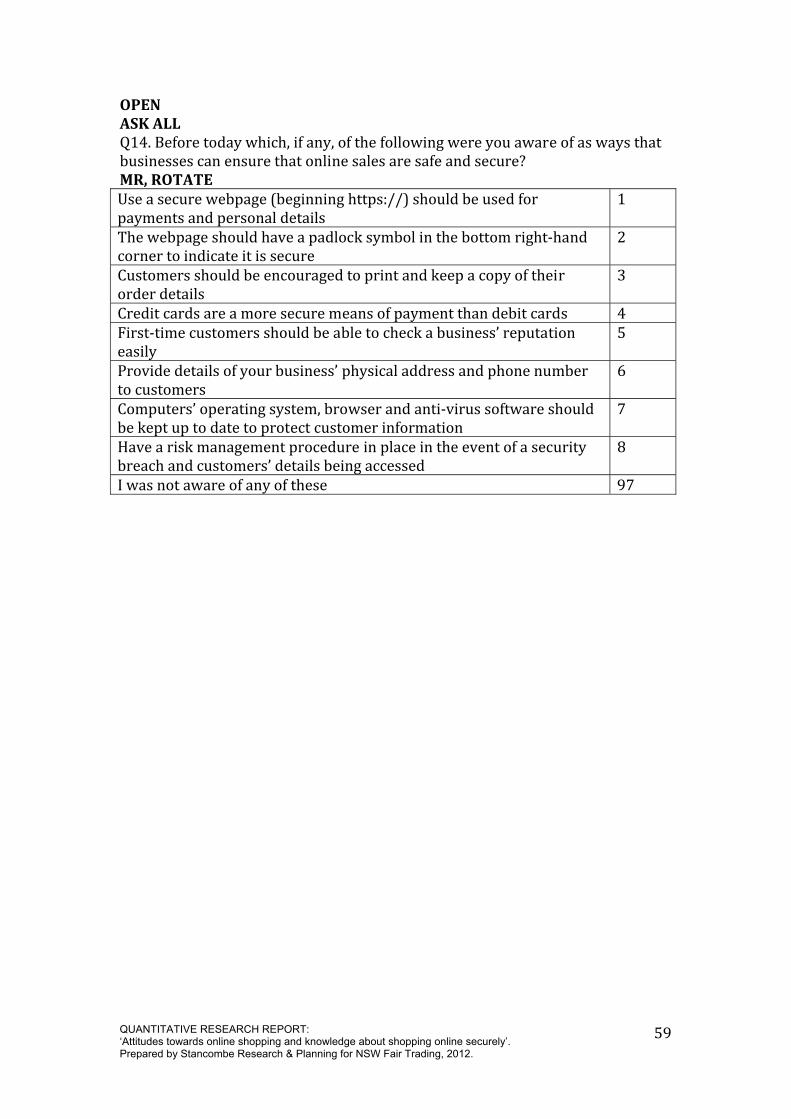
QUANTITATIVE RESEARCH REPORT: ‘Attitudes towards online shopping and knowledge about shopping online securely’. Prepared by Stancombe Research & Planning for NSW Fair Trading, 2012.
59
OPEN ASK ALL Q14. Before today which, if any, of the following were you aware of as ways that businesses can ensure that online sales are safe and secure? MR, ROTATE Use a secure webpage (beginning https://) should be used for payments and personal details 1 The webpage should have a padlock symbol in the bottom right-hand corner to indicate it is secure 2 Customers should be encouraged to print and keep a copy of their order details 3 Credit cards are a more secure means of payment than debit cards 4 First-time customers should be able to check a business’ reputation easily 5 Provide details of your business’ physical address and phone number to customers 6 Computers’ operating system, browser and anti-virus software should be kept up to date to protect customer information 7 Have a risk management procedure in place in the event of a security breach and customers’ details being accessed 8 I was not aware of any of these 97
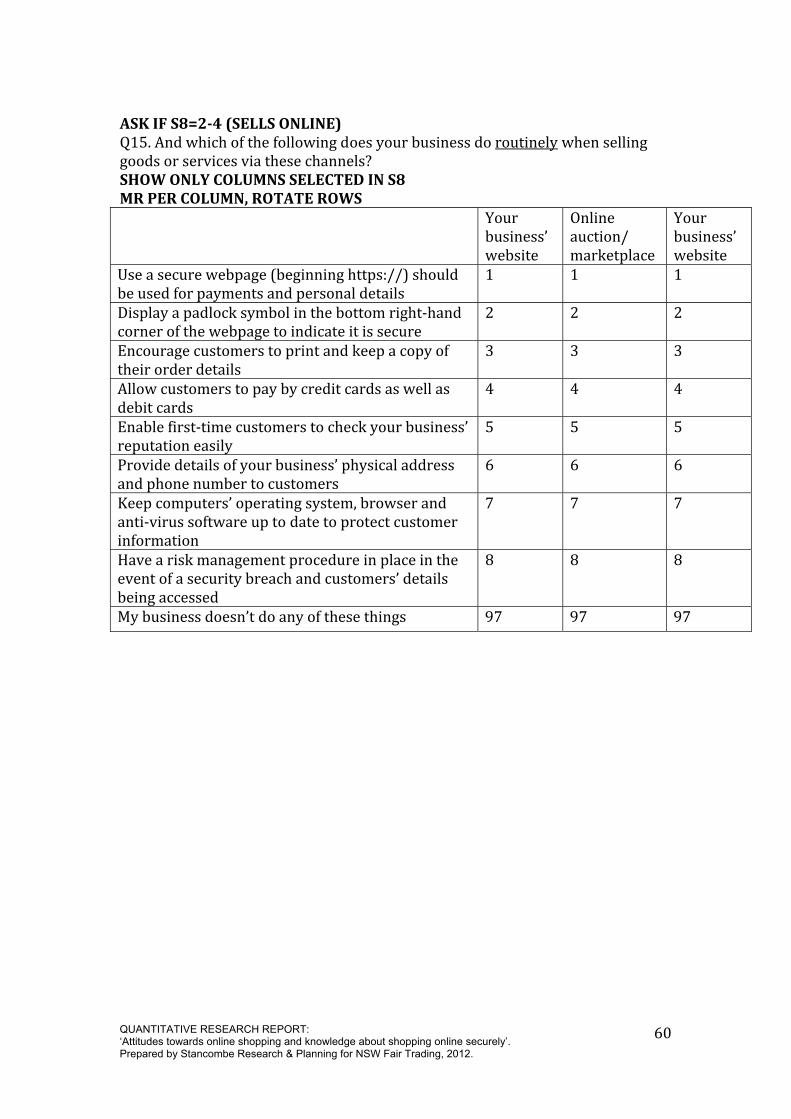
QUANTITATIVE RESEARCH REPORT: ‘Attitudes towards online shopping and knowledge about shopping online securely’. Prepared by Stancombe Research & Planning for NSW Fair Trading, 2012.
60
ASK IF S8=2-4 (SELLS ONLINE) Q15. And which of the following does your business do routinely when selling goods or services via these channels? SHOW ONLY COLUMNS SELECTED IN S8 MR PER COLUMN, ROTATE ROWS Your business’ website Online auction/ marketplace Your business’ website Use a secure webpage (beginning https://) should be used for payments and personal details 1 1 1 Display a padlock symbol in the bottom right-hand corner of the webpage to indicate it is secure 2 2 2 Encourage customers to print and keep a copy of their order details 3 3 3 Allow customers to pay by credit cards as well as debit cards 4 4 4 Enable first-time customers to check your business’ reputation easily 5 5 5 Provide details of your business’ physical address and phone number to customers 6 6 6 Keep computers’ operating system, browser and anti-virus software up to date to protect customer information 7 7 7 Have a risk management procedure in place in the event of a security breach and customers’ details being accessed 8 8 8 My business doesn’t do any of these things 97 97 97
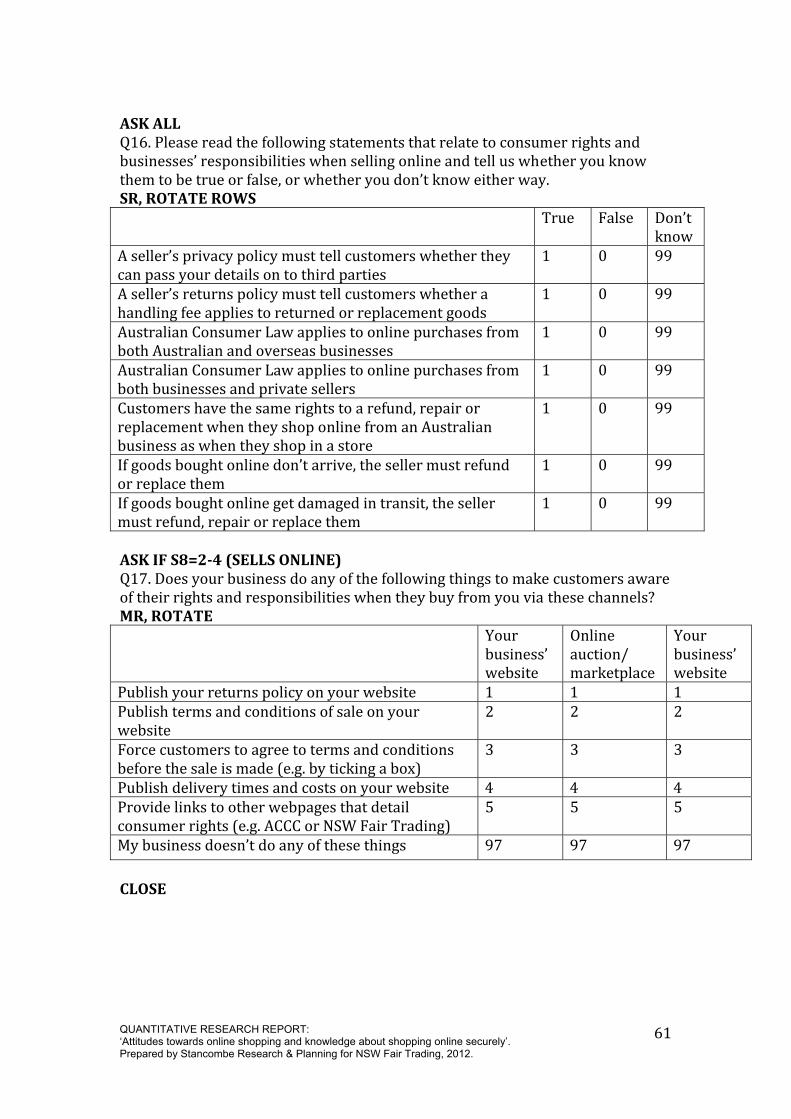
QUANTITATIVE RESEARCH REPORT: ‘Attitudes towards online shopping and knowledge about shopping online securely’. Prepared by Stancombe Research & Planning for NSW Fair Trading, 2012.
61
ASK ALL Q16. Please read the following statements that relate to consumer rights and businesses’ responsibilities when selling online and tell us whether you know them to be true or false, or whether you don’t know either way. SR, ROTATE ROWS True False Don’t know A seller’s privacy policy must tell customers whether they can pass your details on to third parties 1 0 99 A seller’s returns policy must tell customers whether a handling fee applies to returned or replacement goods 1 0 99 Australian Consumer Law applies to online purchases from both Australian and overseas businesses 1 0 99 Australian Consumer Law applies to online purchases from both businesses and private sellers 1 0 99 Customers have the same rights to a refund, repair or replacement when they shop online from an Australian business as when they shop in a store 1 0 99 If goods bought online don’t arrive, the seller must refund or replace them 1 0 99 If goods bought online get damaged in transit, the seller must refund, repair or replace them 1 0 99 ASK IF S8=2-4 (SELLS ONLINE) Q17. Does your business do any of the following things to make customers aware of their rights and responsibilities when they buy from you via these channels? MR, ROTATE Your business’ website Online auction/ marketplace Your business’ website Publish your returns policy on your website 1 1 1 Publish terms and conditions of sale on your website 2 2 2 Force customers to agree to terms and conditions before the sale is made (e.g. by ticking a box) 3 3 3 Publish delivery times and costs on your website 4 4 4 Provide links to other webpages that detail consumer rights (e.g. ACCC or NSW Fair Trading) 5 5 5 My business doesn’t do any of these things 97 97 97 CLOSE