final report - countrystat: uganda
TRANSCRIPT
1
Agro Dealer Network Strengthening for Uganda
FINALFINALFINALFINAL REPORTREPORTREPORTREPORT
NATIONAL AGRO INPUT DEALER CENSUS NATIONAL AGRO INPUT DEALER CENSUS NATIONAL AGRO INPUT DEALER CENSUS NATIONAL AGRO INPUT DEALER CENSUS AND NEEDS ASSESSMENTAND NEEDS ASSESSMENTAND NEEDS ASSESSMENTAND NEEDS ASSESSMENT
AT Uganda Limited Plot 1 Muwafu Road NtindaAT Uganda Limited Plot 1 Muwafu Road NtindaAT Uganda Limited Plot 1 Muwafu Road NtindaAT Uganda Limited Plot 1 Muwafu Road Ntinda P.O. Box 8830, Kampala Tel. P.O. Box 8830, Kampala Tel. P.O. Box 8830, Kampala Tel. P.O. Box 8830, Kampala Tel. +256 414 258803/288470+256 414 258803/288470+256 414 258803/288470+256 414 258803/288470
Email: Email: Email: Email: [email protected]@[email protected]@spacenet.co.ug
March 2009 ByByByBy Shoreline Services LimitedShoreline Services LimitedShoreline Services LimitedShoreline Services Limited McKiN Place Plot 109 Entebbe RoadMcKiN Place Plot 109 Entebbe RoadMcKiN Place Plot 109 Entebbe RoadMcKiN Place Plot 109 Entebbe Road P.O. Box 9075 KampalaP.O. Box 9075 KampalaP.O. Box 9075 KampalaP.O. Box 9075 Kampala Tel. Tel. Tel. Tel. +256 772 426153/312 122928/772 426153+256 772 426153/312 122928/772 426153+256 772 426153/312 122928/772 426153+256 772 426153/312 122928/772 426153
2
Table of Contents
EXECUTIVE SUMMARY .....................................................................................................3
CHAPTER 1 Background ................................................................................................... 19
CHAPTER 2 General Characteristics of Agro-Input Dealers ............................................ 25
CHAPTER 3 Agro- Input Dealers- Supply Linkages ......................................................... 35
CHAPTER 4 Agro-Input Dealer – Market Linkages.......................................................... 44
CHAPTER 5 Access to Financial Services.......................................................................... 48
CHAPTER 6 Agro-Input dealers’ Awareness on Agro Input Support Organizations ....... 52
CHAPTER 7 Regulatory Environment and Policy Awareness .......................................... 62
CHAPTER 8 Agro Input Dealers Training Needs ............................................................. 71
CHAPTER 9 Conclusion ..................................................................................................... 74
APPENDIX 1 Spatial Location Maps ................................................................................ 76
3
Executive Summary
Introduction
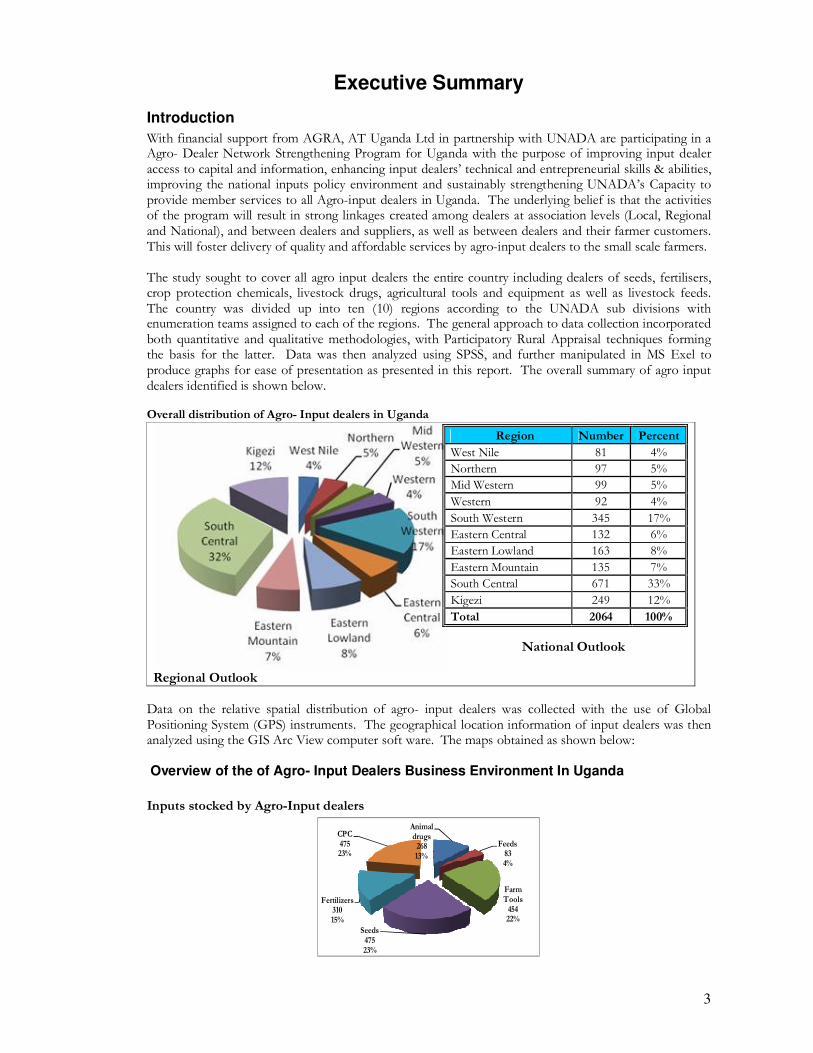
With financial support from AGRA, AT Uganda Ltd in partnership with UNADA are participating in a Agro- Dealer Network Strengthening Program for Uganda with the purpose of improving input dealer access to capital and information, enhancing input dealers’ technical and entrepreneurial skills & abilities, improving the national inputs policy environment and sustainably strengthening UNADA’s Capacity to provide member services to all Agro-input dealers in Uganda. The underlying belief is that the activities of the program will result in strong linkages created among dealers at association levels (Local, Regional and National), and between dealers and suppliers, as well as between dealers and their farmer customers. This will foster delivery of quality and affordable services by agro-input dealers to the small scale farmers. The study sought to cover all agro input dealers the entire country including dealers of seeds, fertilisers, crop protection chemicals, livestock drugs, agricultural tools and equipment as well as livestock feeds. The country was divided up into ten (10) regions according to the UNADA sub divisions with enumeration teams assigned to each of the regions. The general approach to data collection incorporated both quantitative and qualitative methodologies, with Participatory Rural Appraisal techniques forming the basis for the latter. Data was then analyzed using SPSS, and further manipulated in MS Exel to produce graphs for ease of presentation as presented in this report. The overall summary of agro input dealers identified is shown below. Overall distribution of Agro- Input dealers in Uganda
National Outlook
Regional Outlook
Region Number Percent
West Nile 81 4%
Northern 97 5%
Mid Western 99 5%
Western 92 4%
South Western 345 17%
Eastern Central 132 6%
Eastern Lowland 163 8%
Eastern Mountain 135 7%
South Central 671 33%
Kigezi 249 12%
Total 2064 100%
Data on the relative spatial distribution of agro- input dealers was collected with the use of Global Positioning System (GPS) instruments. The geographical location information of input dealers was then analyzed using the GIS Arc View computer soft ware. The maps obtained as shown below:
Overview of the of Agro- Input Dealers Business Environment In Uganda
Inputs stocked by Agro-Input dealers
Animal drugs26813%
Feeds834%
Farm Tools45422%
Seeds47523%
Fertilizers31015%
CPC47523%
4
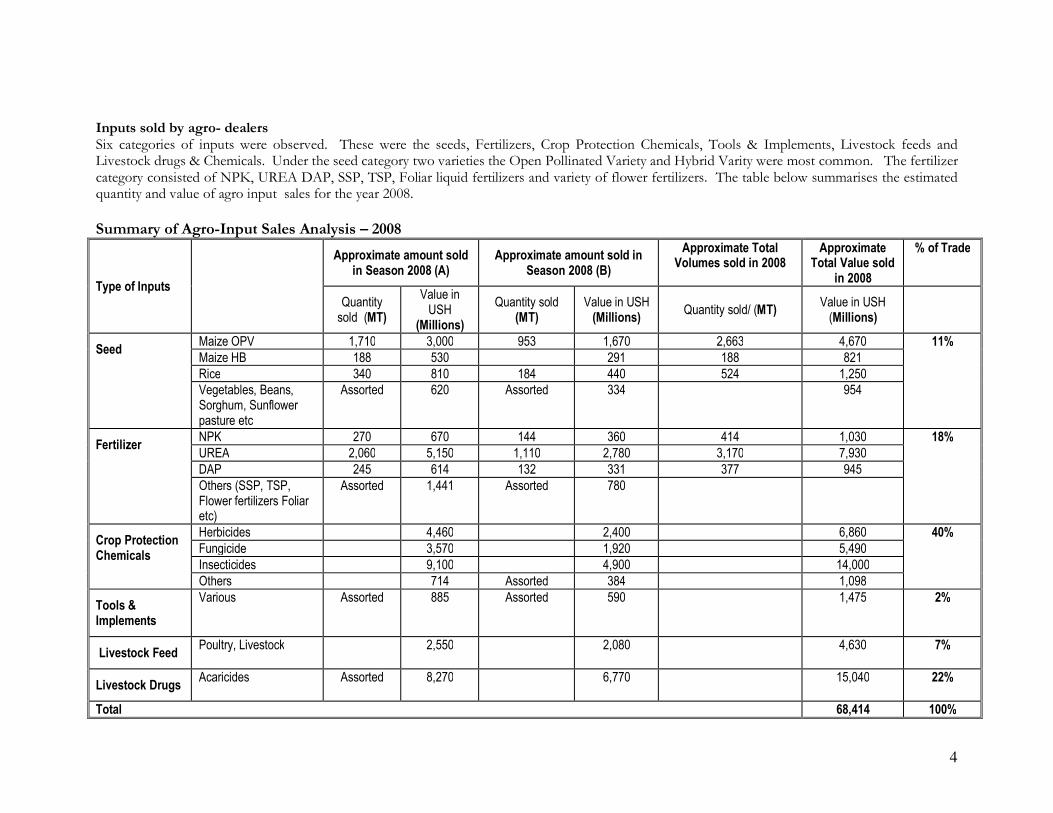
Inputs sold by agro- dealers Six categories of inputs were observed. These were the seeds, Fertilizers, Crop Protection Chemicals, Tools & Implements, Livestock feeds and Livestock drugs & Chemicals. Under the seed category two varieties the Open Pollinated Variety and Hybrid Varity were most common. The fertilizer category consisted of NPK, UREA DAP, SSP, TSP, Foliar liquid fertilizers and variety of flower fertilizers. The table below summarises the estimated quantity and value of agro input sales for the year 2008.
Summary of Agro-Input Sales Analysis – 2008
Type of Inputs
Approximate amount sold in Season 2008 (A)
Approximate amount sold in Season 2008 (B)
Approximate Total Volumes sold in 2008
Approximate Total Value sold
in 2008
% of Trade
Quantity sold (MT)
Value in USH
(Millions)
Quantity sold (MT)
Value in USH (Millions)
Quantity sold/ (MT) Value in USH (Millions)
Seed Maize OPV 1,710 3,000 953 1,670 2,663 4,670 11%
Maize HB 188 530 291 188 821
Rice 340 810 184 440 524 1,250
Vegetables, Beans, Sorghum, Sunflower pasture etc
Assorted 620 Assorted 334 954
Fertilizer NPK 270 670 144 360 414 1,030 18%
UREA 2,060 5,150 1,110 2,780 3,170 7,930
DAP 245 614 132 331 377 945
Others (SSP, TSP, Flower fertilizers Foliar etc)
Assorted 1,441 Assorted 780
Crop Protection Chemicals
Herbicides 4,460 2,400 6,860 40%
Fungicide 3,570 1,920 5,490
Insecticides 9,100 4,900 14,000
Others 714 Assorted 384 1,098
Tools & Implements
Various Assorted 885 Assorted 590 1,475 2%
Livestock Feed Poultry, Livestock 2,550 2,080 4,630 7%
Livestock Drugs Acaricides Assorted 8,270 6,770 15,040 22%
Total 68,414 100%
5
General Characteristics of Agro-Input Dealers
Form of trading conducted By Agro- Input Dealers
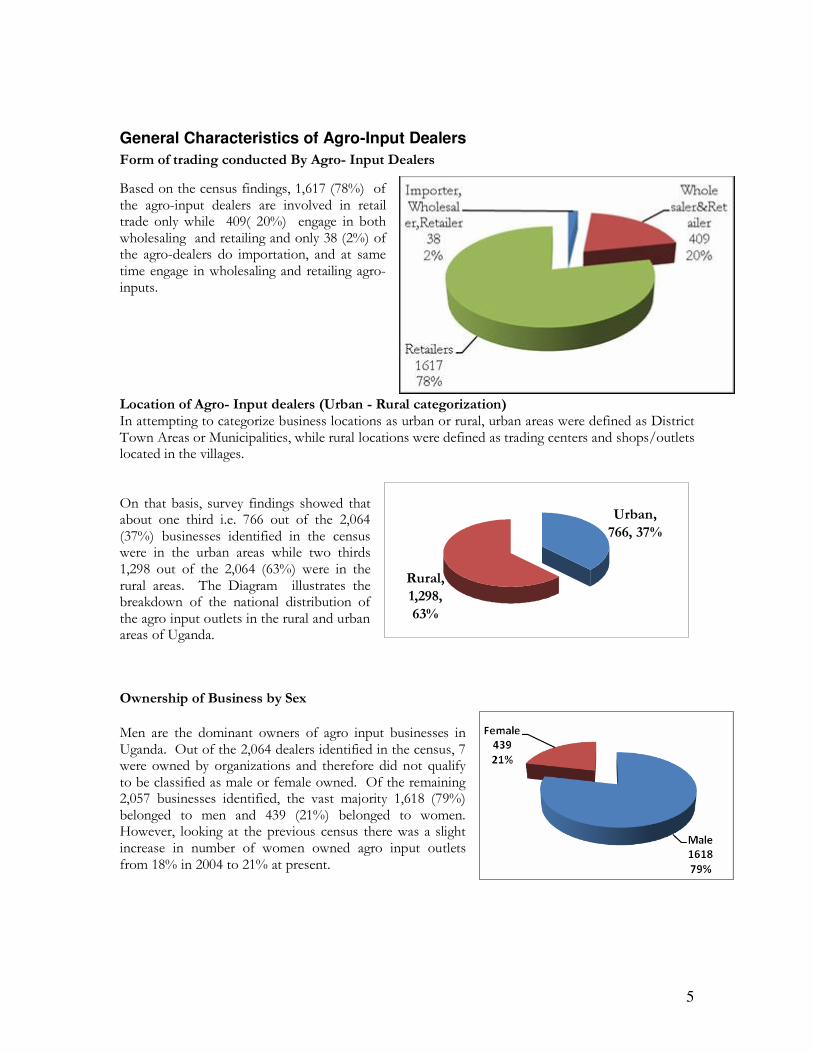
Based on the census findings, 1,617 (78%) of the agro-input dealers are involved in retail trade only while 409( 20%) engage in both wholesaling and retailing and only 38 (2%) of the agro-dealers do importation, and at same time engage in wholesaling and retailing agro- inputs.
Location of Agro- Input dealers (Urban - Rural categorization) In attempting to categorize business locations as urban or rural, urban areas were defined as District Town Areas or Municipalities, while rural locations were defined as trading centers and shops/outlets located in the villages.
On that basis, survey findings showed that about one third i.e. 766 out of the 2,064 (37%) businesses identified in the census were in the urban areas while two thirds 1,298 out of the 2,064 (63%) were in the rural areas. The Diagram illustrates the breakdown of the national distribution of the agro input outlets in the rural and urban areas of Uganda.
Ownership of Business by Sex
Men are the dominant owners of agro input businesses in Uganda. Out of the 2,064 dealers identified in the census, 7 were owned by organizations and therefore did not qualify to be classified as male or female owned. Of the remaining 2,057 businesses identified, the vast majority 1,618 (79%) belonged to men and 439 (21%) belonged to women. However, looking at the previous census there was a slight increase in number of women owned agro input outlets from 18% in 2004 to 21% at present.
Urban,
766, 37%
Rural,
1,298,
63%
6
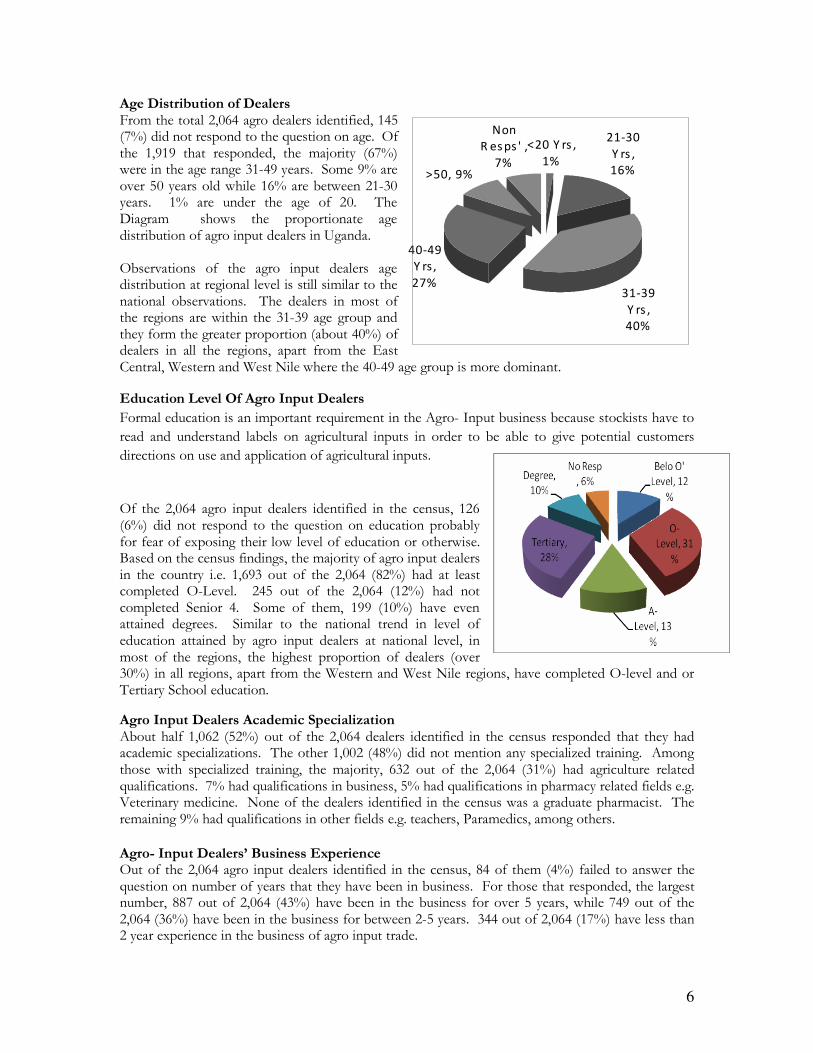
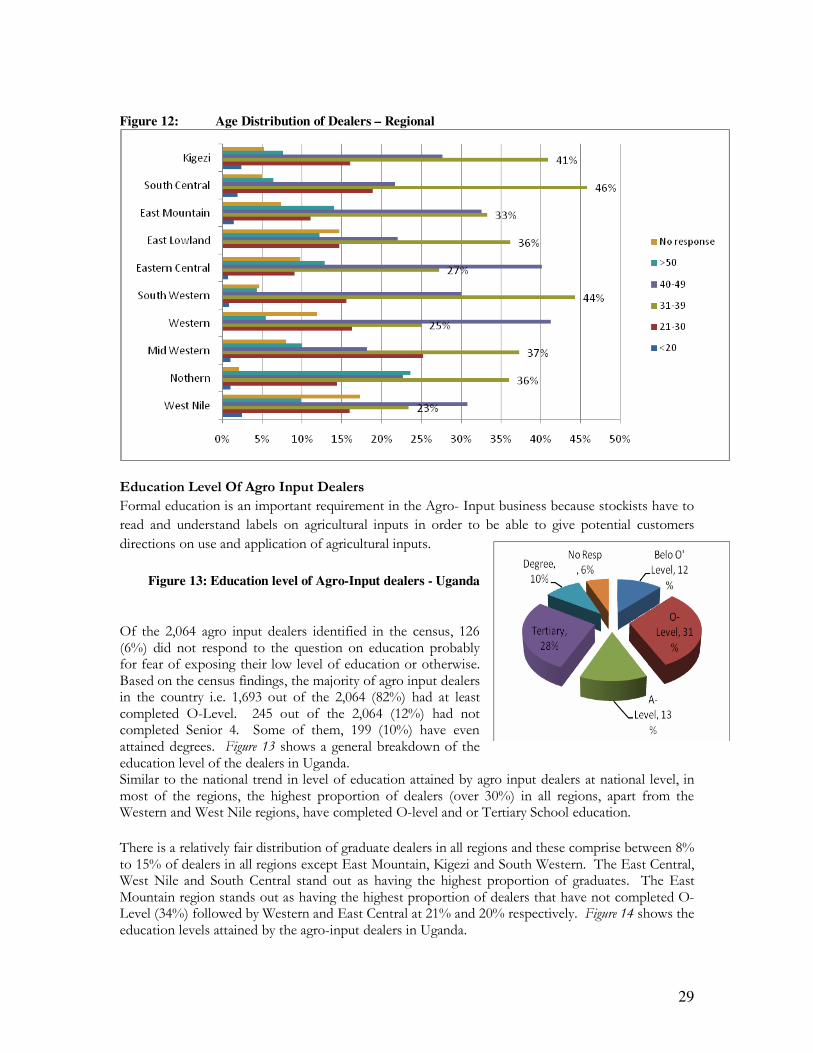
Age Distribution of Dealers From the total 2,064 agro dealers identified, 145 (7%) did not respond to the question on age. Of the 1,919 that responded, the majority (67%) were in the age range 31-49 years. Some 9% are over 50 years old while 16% are between 21-30 years. 1% are under the age of 20. The Diagram shows the proportionate age distribution of agro input dealers in Uganda. Observations of the agro input dealers age distribution at regional level is still similar to the national observations. The dealers in most of the regions are within the 31-39 age group and they form the greater proportion (about 40%) of dealers in all the regions, apart from the East Central, Western and West Nile where the 40-49 age group is more dominant.
Education Level Of Agro Input Dealers
Formal education is an important requirement in the Agro- Input business because stockists have to
read and understand labels on agricultural inputs in order to be able to give potential customers
directions on use and application of agricultural inputs.
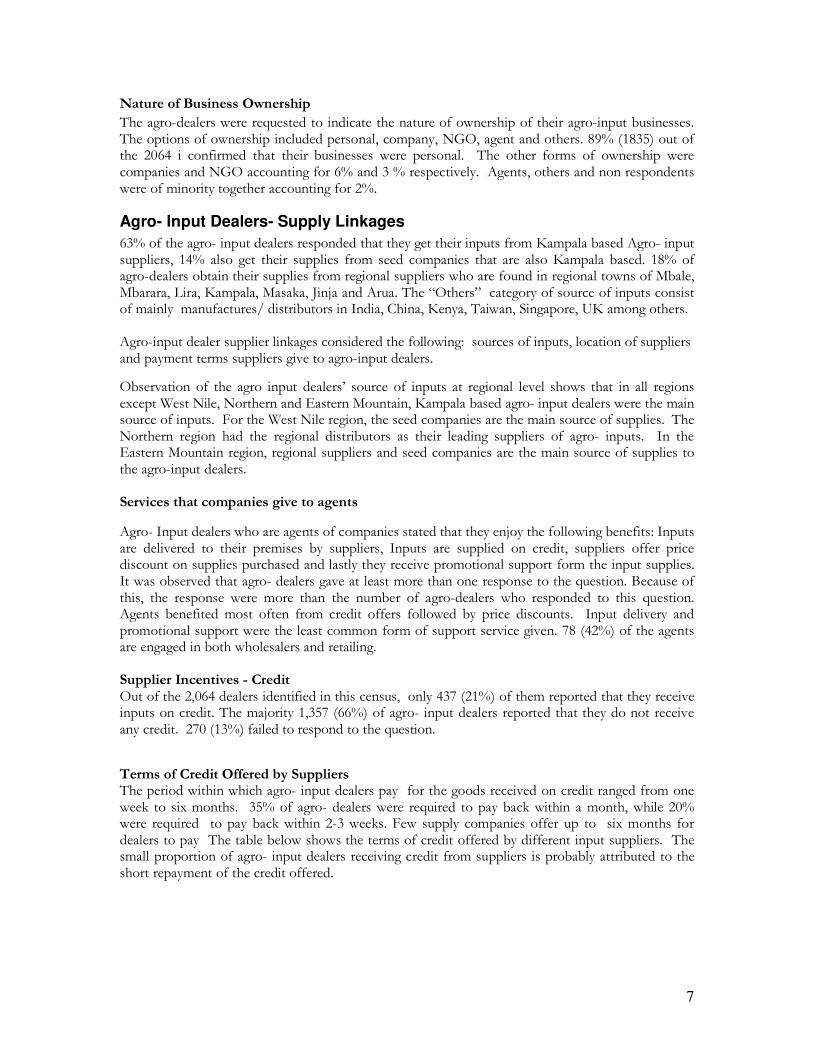
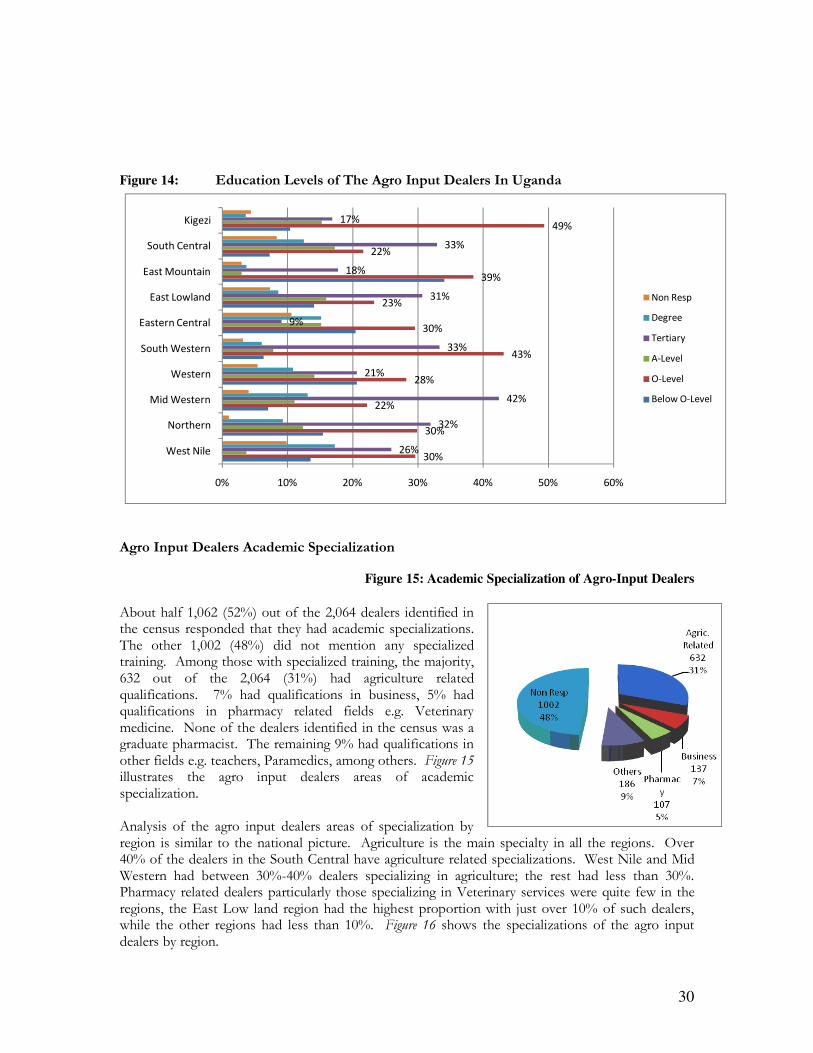
Of the 2,064 agro input dealers identified in the census, 126 (6%) did not respond to the question on education probably for fear of exposing their low level of education or otherwise. Based on the census findings, the majority of agro input dealers in the country i.e. 1,693 out of the 2,064 (82%) had at least completed O-Level. 245 out of the 2,064 (12%) had not completed Senior 4. Some of them, 199 (10%) have even attained degrees. Similar to the national trend in level of education attained by agro input dealers at national level, in most of the regions, the highest proportion of dealers (over 30%) in all regions, apart from the Western and West Nile regions, have completed O-level and or Tertiary School education.
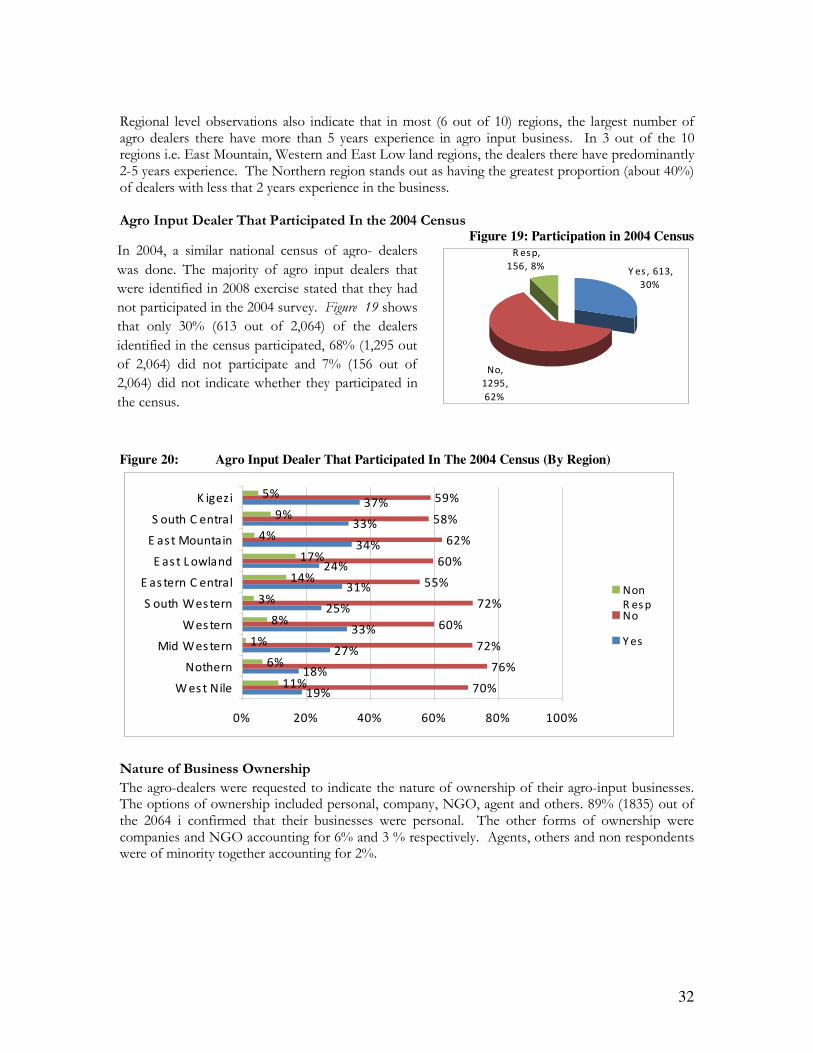
Agro Input Dealers Academic Specialization About half 1,062 (52%) out of the 2,064 dealers identified in the census responded that they had academic specializations. The other 1,002 (48%) did not mention any specialized training. Among those with specialized training, the majority, 632 out of the 2,064 (31%) had agriculture related qualifications. 7% had qualifications in business, 5% had qualifications in pharmacy related fields e.g. Veterinary medicine. None of the dealers identified in the census was a graduate pharmacist. The remaining 9% had qualifications in other fields e.g. teachers, Paramedics, among others. Agro- Input Dealers’ Business Experience Out of the 2,064 agro input dealers identified in the census, 84 of them (4%) failed to answer the question on number of years that they have been in business. For those that responded, the largest number, 887 out of 2,064 (43%) have been in the business for over 5 years, while 749 out of the 2,064 (36%) have been in the business for between 2-5 years. 344 out of 2,064 (17%) have less than 2 year experience in the business of agro input trade.
<20 Y rs ,
1%
21-30
Y rs ,
16%
31-39
Y rs ,
40%
40-49
Y rs,
27%
>50, 9%
Non
R es ps ' ,
7%
7
Nature of Business Ownership
The agro-dealers were requested to indicate the nature of ownership of their agro-input businesses. The options of ownership included personal, company, NGO, agent and others. 89% (1835) out of the 2064 i confirmed that their businesses were personal. The other forms of ownership were companies and NGO accounting for 6% and 3 % respectively. Agents, others and non respondents were of minority together accounting for 2%.
Agro- Input Dealers- Supply Linkages
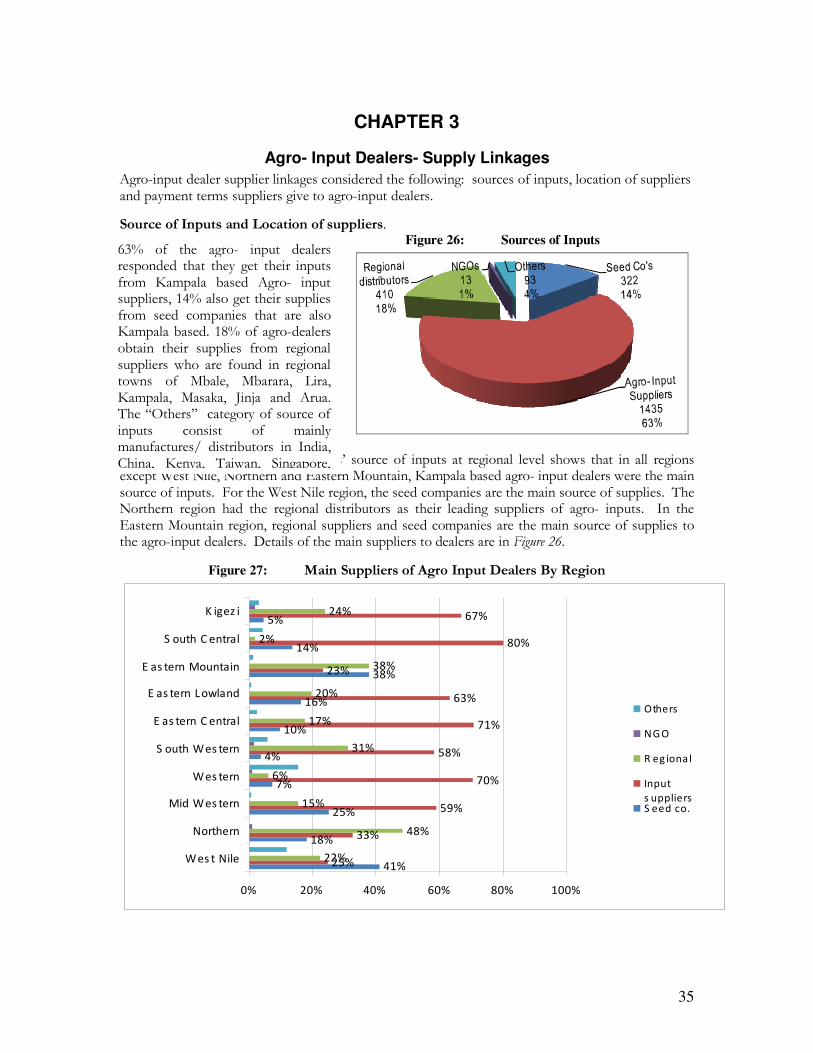
63% of the agro- input dealers responded that they get their inputs from Kampala based Agro- input suppliers, 14% also get their supplies from seed companies that are also Kampala based. 18% of agro-dealers obtain their supplies from regional suppliers who are found in regional towns of Mbale, Mbarara, Lira, Kampala, Masaka, Jinja and Arua. The “Others” category of source of inputs consist of mainly manufactures/ distributors in India, China, Kenya, Taiwan, Singapore, UK among others. Agro-input dealer supplier linkages considered the following: sources of inputs, location of suppliers and payment terms suppliers give to agro-input dealers.
Observation of the agro input dealers’ source of inputs at regional level shows that in all regions except West Nile, Northern and Eastern Mountain, Kampala based agro- input dealers were the main source of inputs. For the West Nile region, the seed companies are the main source of supplies. The Northern region had the regional distributors as their leading suppliers of agro- inputs. In the Eastern Mountain region, regional suppliers and seed companies are the main source of supplies to the agro-input dealers. Services that companies give to agents
Agro- Input dealers who are agents of companies stated that they enjoy the following benefits: Inputs are delivered to their premises by suppliers, Inputs are supplied on credit, suppliers offer price discount on supplies purchased and lastly they receive promotional support form the input supplies. It was observed that agro- dealers gave at least more than one response to the question. Because of this, the response were more than the number of agro-dealers who responded to this question. Agents benefited most often from credit offers followed by price discounts. Input delivery and promotional support were the least common form of support service given. 78 (42%) of the agents are engaged in both wholesalers and retailing. Supplier Incentives - Credit Out of the 2,064 dealers identified in this census, only 437 (21%) of them reported that they receive inputs on credit. The majority 1,357 (66%) of agro- input dealers reported that they do not receive any credit. 270 (13%) failed to respond to the question.
Terms of Credit Offered by Suppliers The period within which agro- input dealers pay for the goods received on credit ranged from one week to six months. 35% of agro- dealers were required to pay back within a month, while 20% were required to pay back within 2-3 weeks. Few supply companies offer up to six months for dealers to pay The table below shows the terms of credit offered by different input suppliers. The small proportion of agro- input dealers receiving credit from suppliers is probably attributed to the short repayment of the credit offered.
8
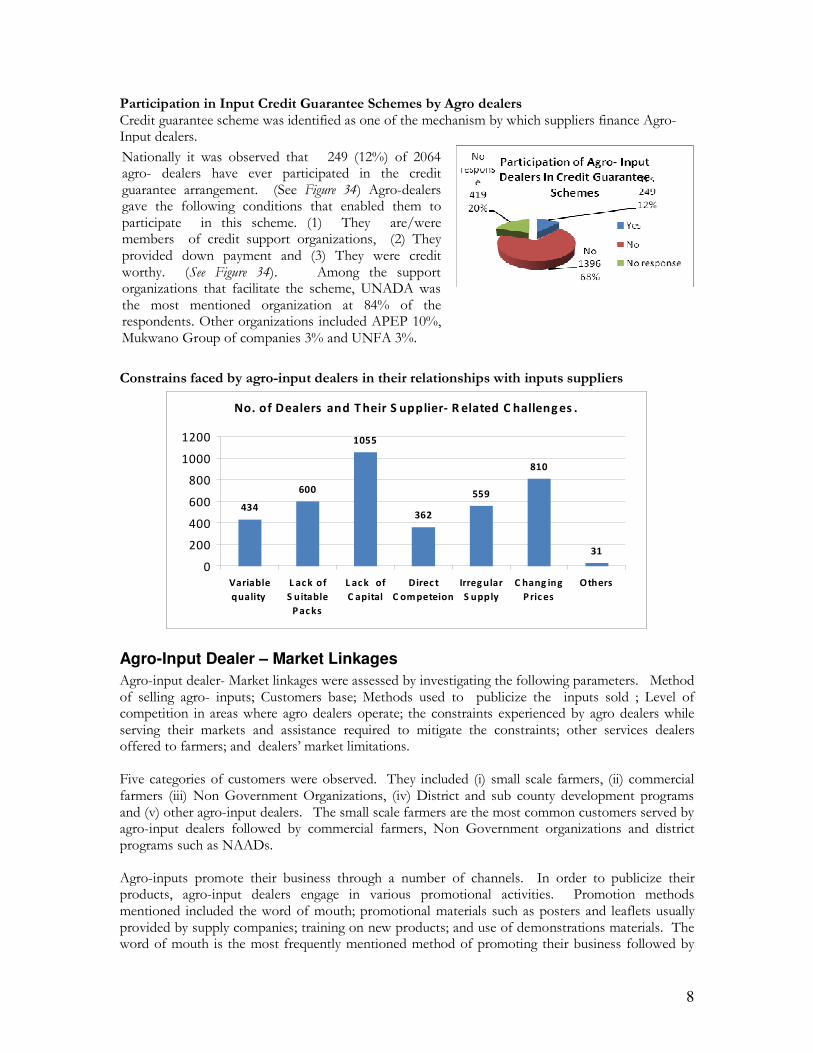
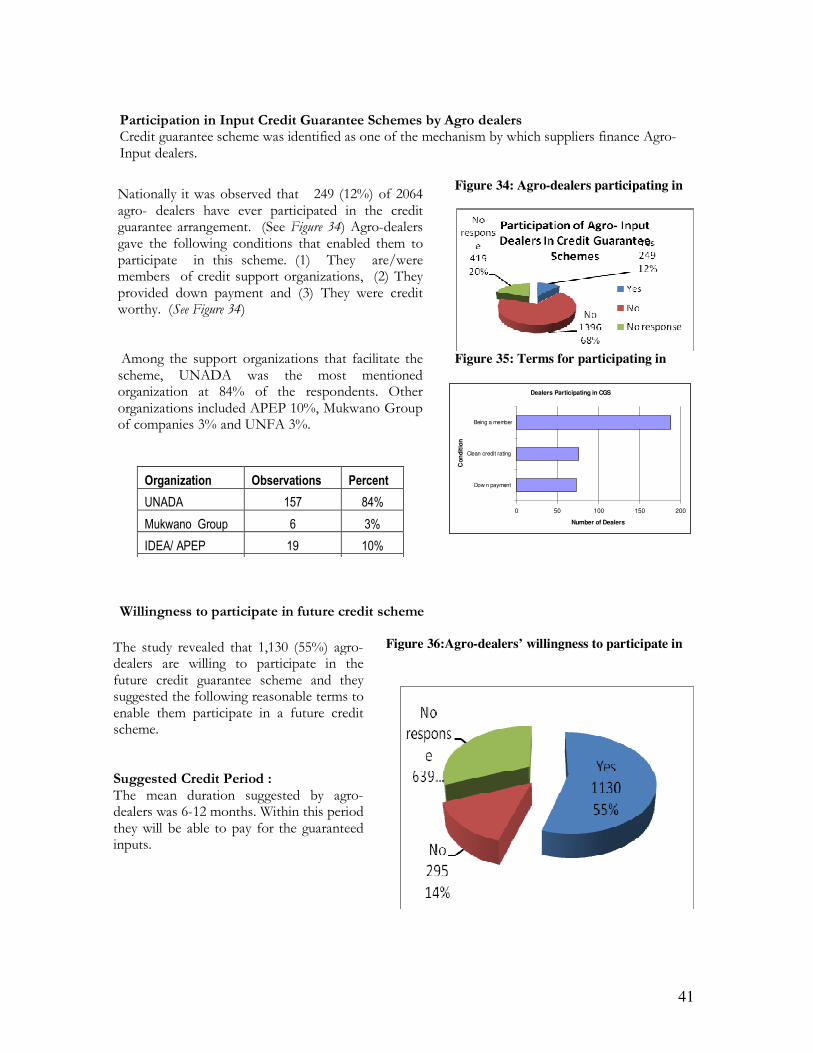
Participation in Input Credit Guarantee Schemes by Agro dealers Credit guarantee scheme was identified as one of the mechanism by which suppliers finance Agro- Input dealers.
Constrains faced by agro-input dealers in their relationships with inputs suppliers
No. of Dealers and T heir S upplier- R elated C halleng es .
434
600
1055
362
559
810
31
0
200
400
600
800
1000
1200
Variable
quality
L ac k of
S uitable
P ac ks
L ac k of
C apital
Direc t
C om peteion
Irreg ular
S upply
C hang ing
P ric es
Others
Agro-Input Dealer – Market Linkages
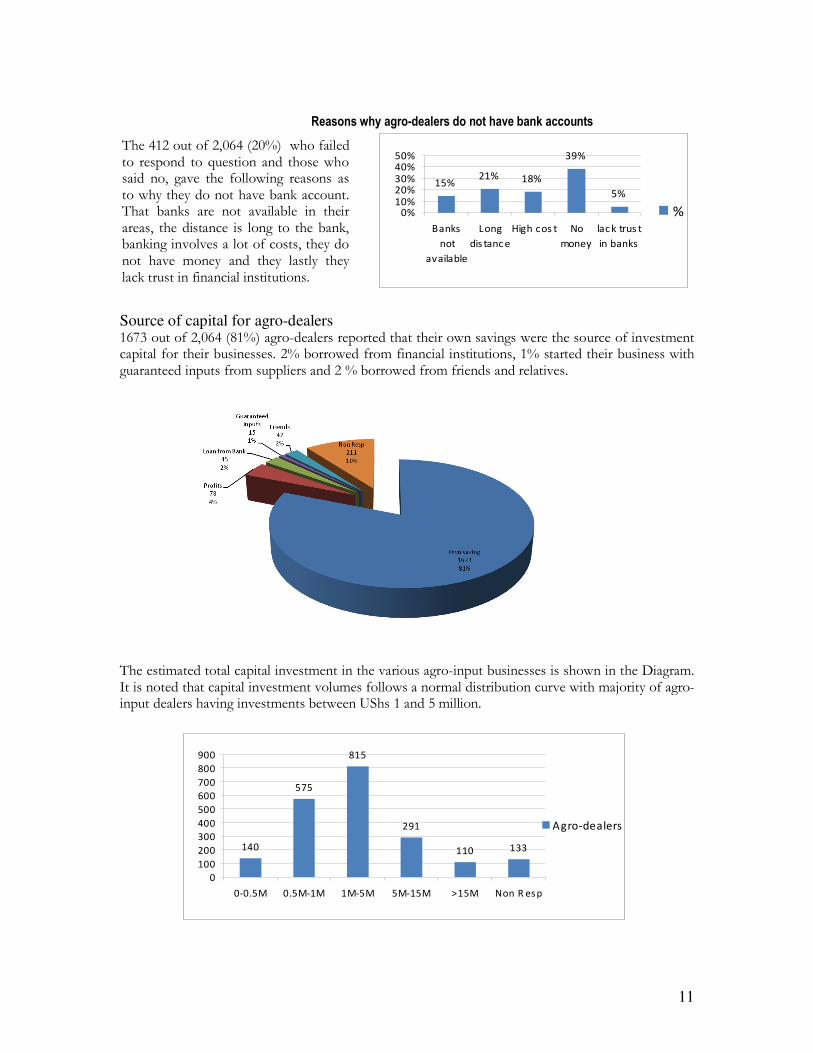
Agro-input dealer- Market linkages were assessed by investigating the following parameters. Method of selling agro- inputs; Customers base; Methods used to publicize the inputs sold ; Level of competition in areas where agro dealers operate; the constraints experienced by agro dealers while serving their markets and assistance required to mitigate the constraints; other services dealers offered to farmers; and dealers’ market limitations. Five categories of customers were observed. They included (i) small scale farmers, (ii) commercial farmers (iii) Non Government Organizations, (iv) District and sub county development programs and (v) other agro-input dealers. The small scale farmers are the most common customers served by agro-input dealers followed by commercial farmers, Non Government organizations and district programs such as NAADs. Agro-inputs promote their business through a number of channels. In order to publicize their products, agro-input dealers engage in various promotional activities. Promotion methods mentioned included the word of mouth; promotional materials such as posters and leaflets usually provided by supply companies; training on new products; and use of demonstrations materials. The word of mouth is the most frequently mentioned method of promoting their business followed by
Nationally it was observed that 249 (12%) of 2064 agro- dealers have ever participated in the credit guarantee arrangement. (See Figure 34) Agro-dealers gave the following conditions that enabled them to participate in this scheme. (1) They are/were members of credit support organizations, (2) They provided down payment and (3) They were credit worthy. (See Figure 34). Among the support organizations that facilitate the scheme, UNADA was the most mentioned organization at 84% of the respondents. Other organizations included APEP 10%, Mukwano Group of companies 3% and UNFA 3%.
9
advertising by use of promotional materials, demonstrations as well as training done by the suppliers, respectively. With regards to the number of customers served by agro-input dealers , majority of agro- input dealers serve between 11-50 households. The census results also show that in most cases there are at least 3 agro-input dealers in any given busy trading centre.
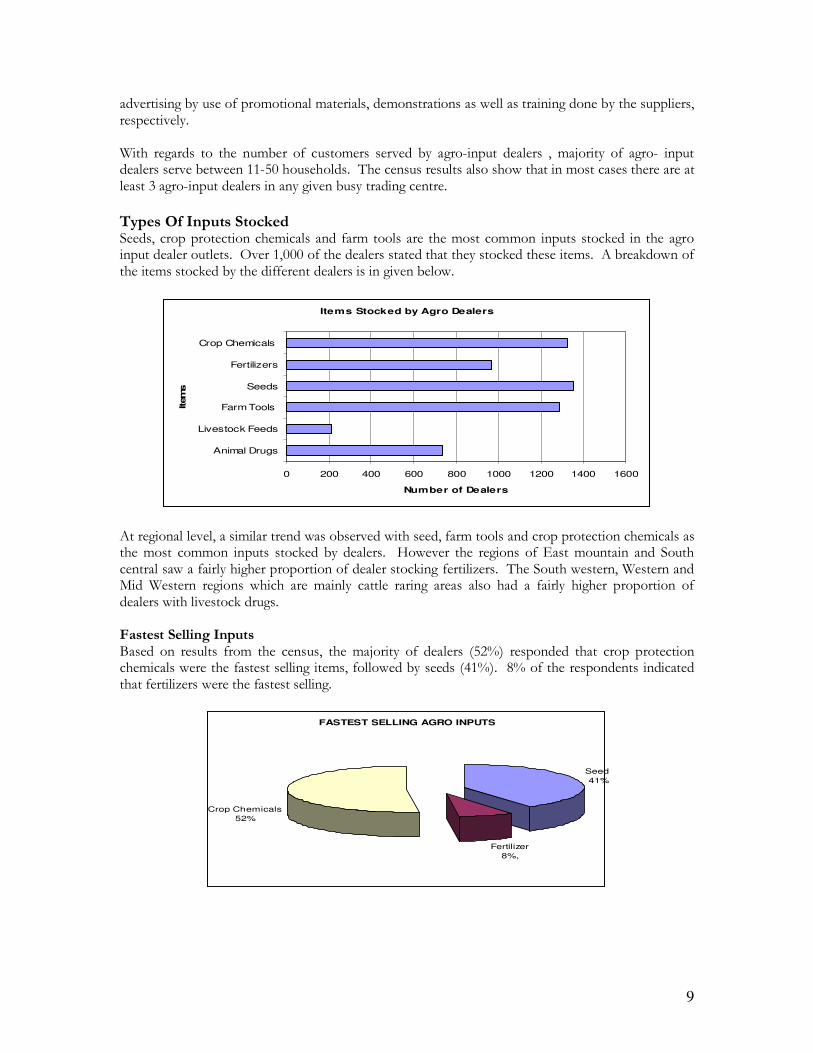
Types Of Inputs Stocked Seeds, crop protection chemicals and farm tools are the most common inputs stocked in the agro input dealer outlets. Over 1,000 of the dealers stated that they stocked these items. A breakdown of the items stocked by the different dealers is in given below.
Items Stocked by Agro Dealers
0 200 400 600 800 1000 1200 1400 1600
Animal Drugs
Livestock Feeds
Farm Tools
Seeds
Fertilizers
Crop Chemicals
Item
s
Number of Dealers
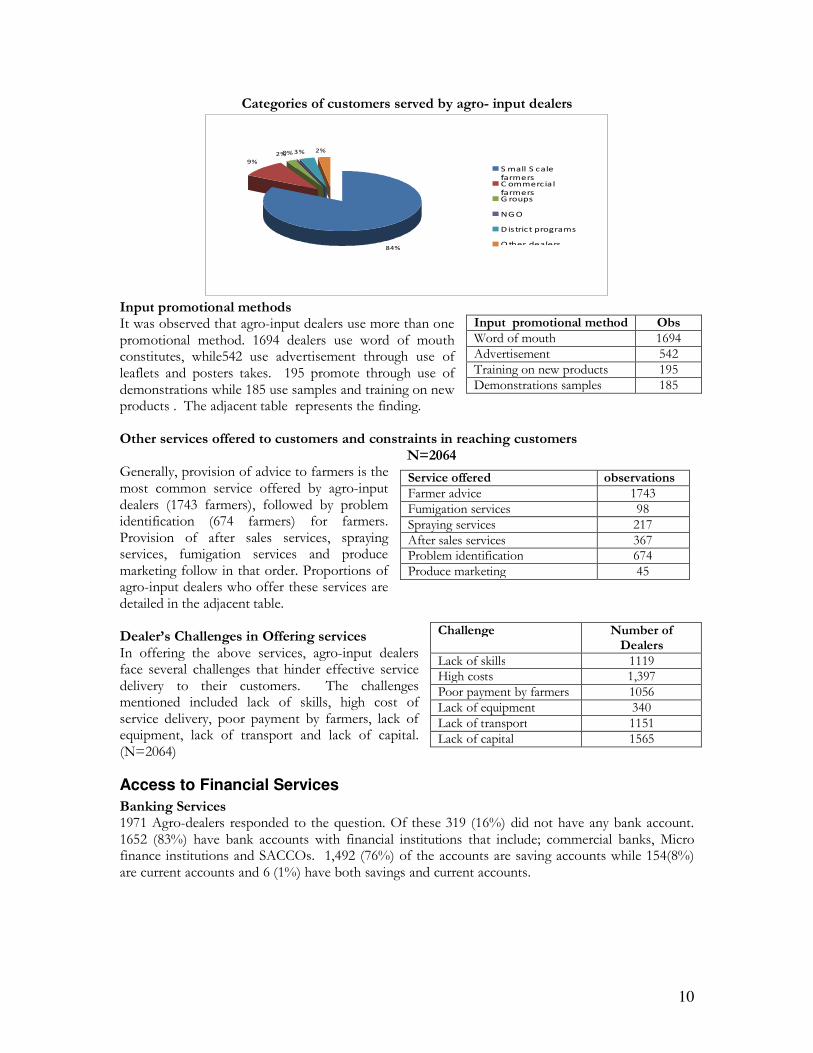
At regional level, a similar trend was observed with seed, farm tools and crop protection chemicals as the most common inputs stocked by dealers. However the regions of East mountain and South central saw a fairly higher proportion of dealer stocking fertilizers. The South western, Western and Mid Western regions which are mainly cattle raring areas also had a fairly higher proportion of dealers with livestock drugs. Fastest Selling Inputs Based on results from the census, the majority of dealers (52%) responded that crop protection chemicals were the fastest selling items, followed by seeds (41%). 8% of the respondents indicated that fertilizers were the fastest selling.
FASTEST SELLING AGRO INPUTS
Seed
41%
Fertilizer
8%,
Crop Chemicals
52%
10
Categories of customers served by agro- input dealers
84%
9%
2%0% 3% 2%
S mall S cale
farmersC ommercial
farmersG roups
NG O
D istrict programs
O ther dealers
Input promotional methods It was observed that agro-input dealers use more than one promotional method. 1694 dealers use word of mouth constitutes, while542 use advertisement through use of leaflets and posters takes. 195 promote through use of demonstrations while 185 use samples and training on new products . The adjacent table represents the finding. Other services offered to customers and constraints in reaching customers N=2064 Generally, provision of advice to farmers is the most common service offered by agro-input dealers (1743 farmers), followed by problem identification (674 farmers) for farmers. Provision of after sales services, spraying services, fumigation services and produce marketing follow in that order. Proportions of agro-input dealers who offer these services are detailed in the adjacent table. Dealer’s Challenges in Offering services In offering the above services, agro-input dealers face several challenges that hinder effective service delivery to their customers. The challenges mentioned included lack of skills, high cost of service delivery, poor payment by farmers, lack of equipment, lack of transport and lack of capital. (N=2064)
Access to Financial Services
Banking Services 1971 Agro-dealers responded to the question. Of these 319 (16%) did not have any bank account. 1652 (83%) have bank accounts with financial institutions that include; commercial banks, Micro finance institutions and SACCOs. 1,492 (76%) of the accounts are saving accounts while 154(8%) are current accounts and 6 (1%) have both savings and current accounts.
Input promotional method Obs Word of mouth 1694 Advertisement 542 Training on new products 195 Demonstrations samples 185
Service offered observations Farmer advice 1743 Fumigation services 98 Spraying services 217 After sales services 367 Problem identification 674 Produce marketing 45
Challenge Number of Dealers
Lack of skills 1119 High costs 1,397 Poor payment by farmers 1056 Lack of equipment 340 Lack of transport 1151 Lack of capital 1565
11
Reasons why agro-dealers do not have bank accounts
15%21% 18%
39%
5%
0%10%20%30%40%50%
Banks
not
available
Long
dis tanc e
High cos t No
money
lac k trus t
in banks
%
Source of capital for agro-dealers 1673 out of 2,064 (81%) agro-dealers reported that their own savings were the source of investment capital for their businesses. 2% borrowed from financial institutions, 1% started their business with guaranteed inputs from suppliers and 2 % borrowed from friends and relatives.
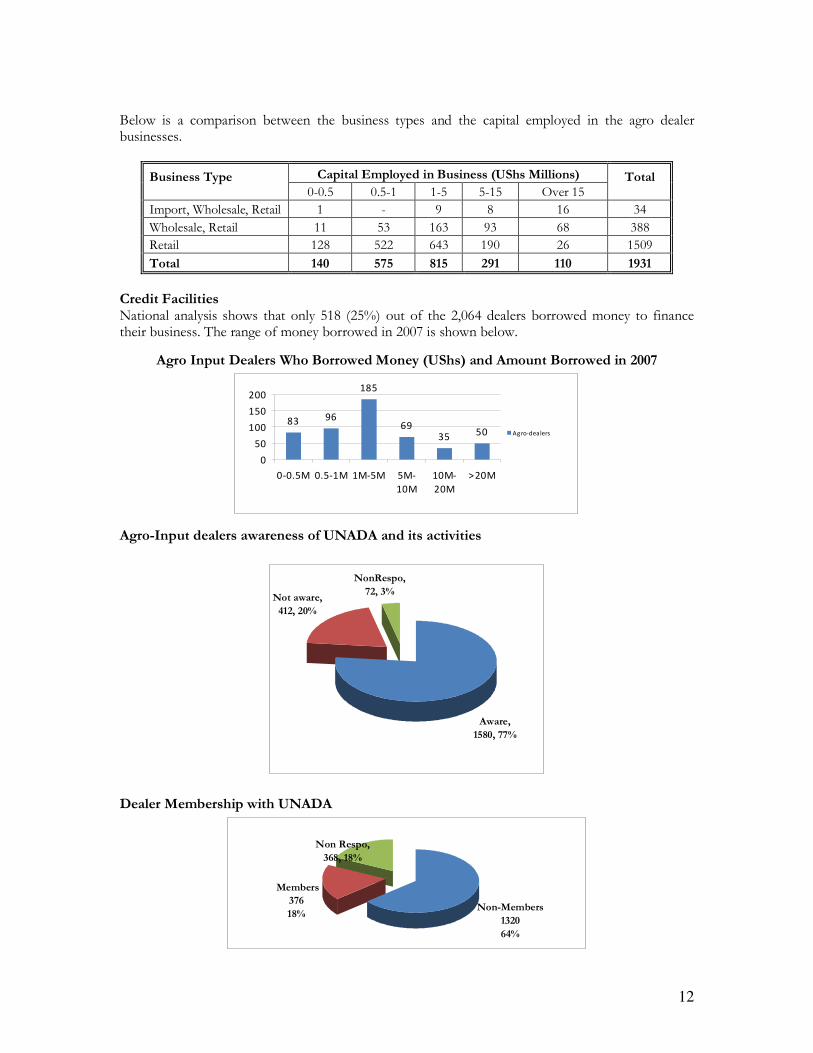
The estimated total capital investment in the various agro-input businesses is shown in the Diagram. It is noted that capital investment volumes follows a normal distribution curve with majority of agro-input dealers having investments between UShs 1 and 5 million.
140
575
815
291
110 133
0
100
200
300
400
500
600
700
800
900
0-0.5M 0.5M-1M 1M-5M 5M-15M >15M Non R es p
Agro-dealers
The 412 out of 2,064 (20%) who failed to respond to question and those who said no, gave the following reasons as to why they do not have bank account. That banks are not available in their areas, the distance is long to the bank, banking involves a lot of costs, they do not have money and they lastly they lack trust in financial institutions.
12
Below is a comparison between the business types and the capital employed in the agro dealer businesses.
Business Type
Capital Employed in Business (UShs Millions) Total 0-0.5 0.5-1 1-5 5-15 Over 15
Import, Wholesale, Retail 1 - 9 8 16 34
Wholesale, Retail 11 53 163 93 68 388
Retail 128 522 643 190 26 1509
Total 140 575 815 291 110 1931
Credit Facilities National analysis shows that only 518 (25%) out of the 2,064 dealers borrowed money to finance their business. The range of money borrowed in 2007 is shown below.
Agro Input Dealers Who Borrowed Money (UShs) and Amount Borrowed in 2007
83 96
185
6935
50
0
50
100
150
200
0-0.5M 0.5-1M 1M-5M 5M-
10M
10M-
20M
>20M
Agro-dealers
Agro-Input dealers awareness of UNADA and its activities
Aware,
1580, 77%
Not aware,
412, 20%
NonRespo,
72, 3%
Dealer Membership with UNADA
Members
376
18%Non-Members
1320
64%
Non Respo,
368, 18%
13
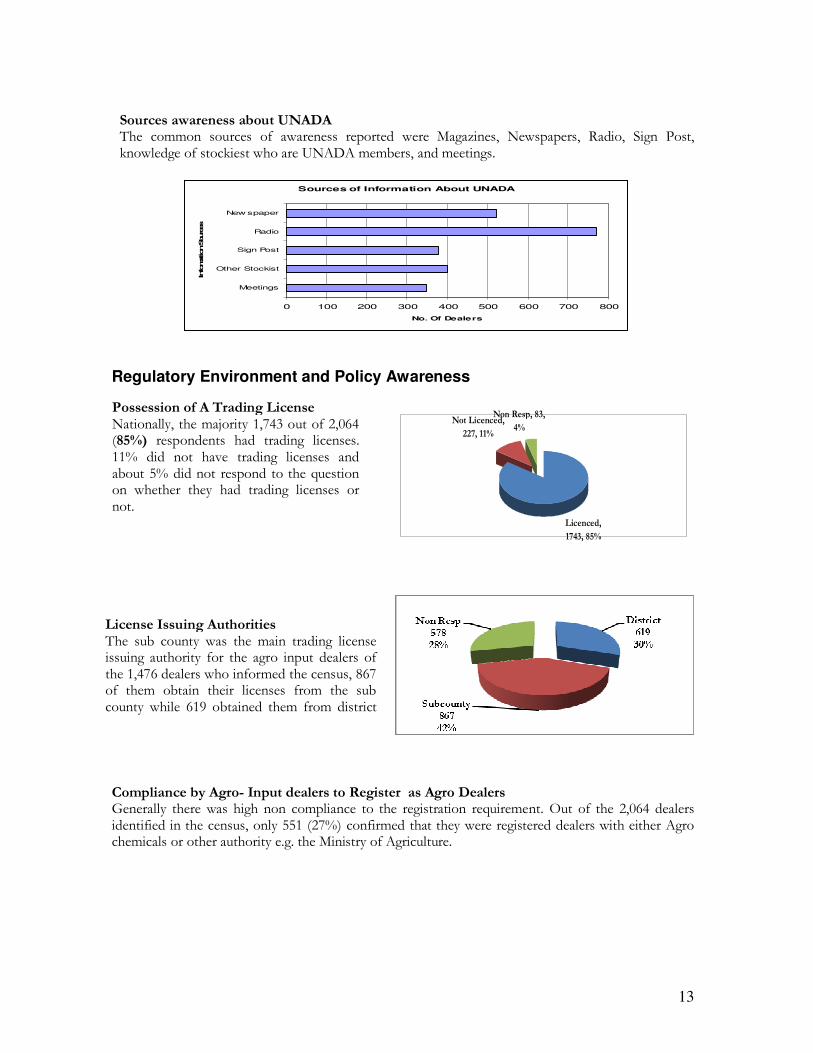
Sources awareness about UNADA The common sources of awareness reported were Magazines, Newspapers, Radio, Sign Post, knowledge of stockiest who are UNADA members, and meetings.
Sources of Information About UNADA
0 100 200 300 400 500 600 700 800
Meetings
Other Stockist
Sign Post
Radio
New spaper
Infomation Sources
No. Of Dealers
Regulatory Environment and Policy Awareness
Licenced,
1743, 85%
Not Licenced,
227, 11%
Non Resp, 83,
4%
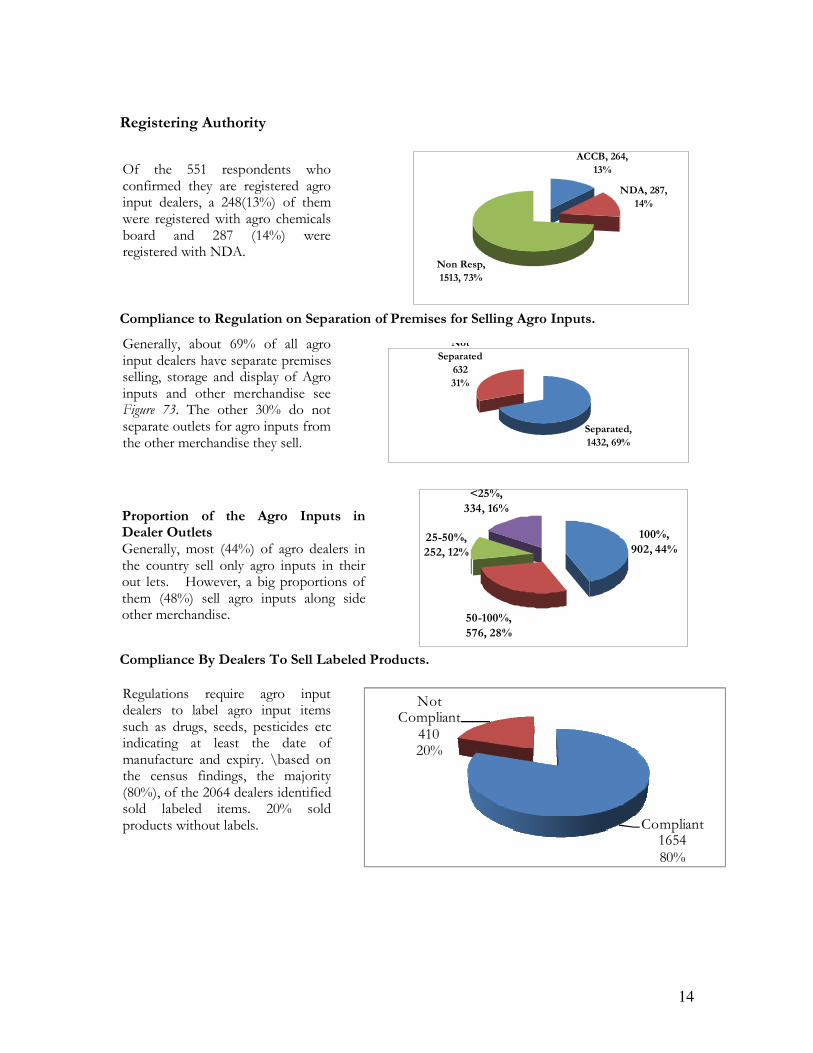
Compliance by Agro- Input dealers to Register as Agro Dealers Generally there was high non compliance to the registration requirement. Out of the 2,064 dealers identified in the census, only 551 (27%) confirmed that they were registered dealers with either Agro chemicals or other authority e.g. the Ministry of Agriculture.
License Issuing Authorities The sub county was the main trading license issuing authority for the agro input dealers of the 1,476 dealers who informed the census, 867 of them obtain their licenses from the sub county while 619 obtained them from district offices.
Possession of A Trading License Nationally, the majority 1,743 out of 2,064 (85%) respondents had trading licenses. 11% did not have trading licenses and about 5% did not respond to the question on whether they had trading licenses or not.
14
Registering Authority
ACCB, 264,
13%
NDA, 287,
14%
Non Resp,
1513, 73%
Compliance to Regulation on Separation of Premises for Selling Agro Inputs.
Separated,
1432, 69%
Not
Separated
632
31%
100%,
902, 44%
50-100%,
576, 28%
25-50%,
252, 12%
<25%,
334, 16%
Compliance By Dealers To Sell Labeled Products.
Compliant165480%
Not Compliant
41020%
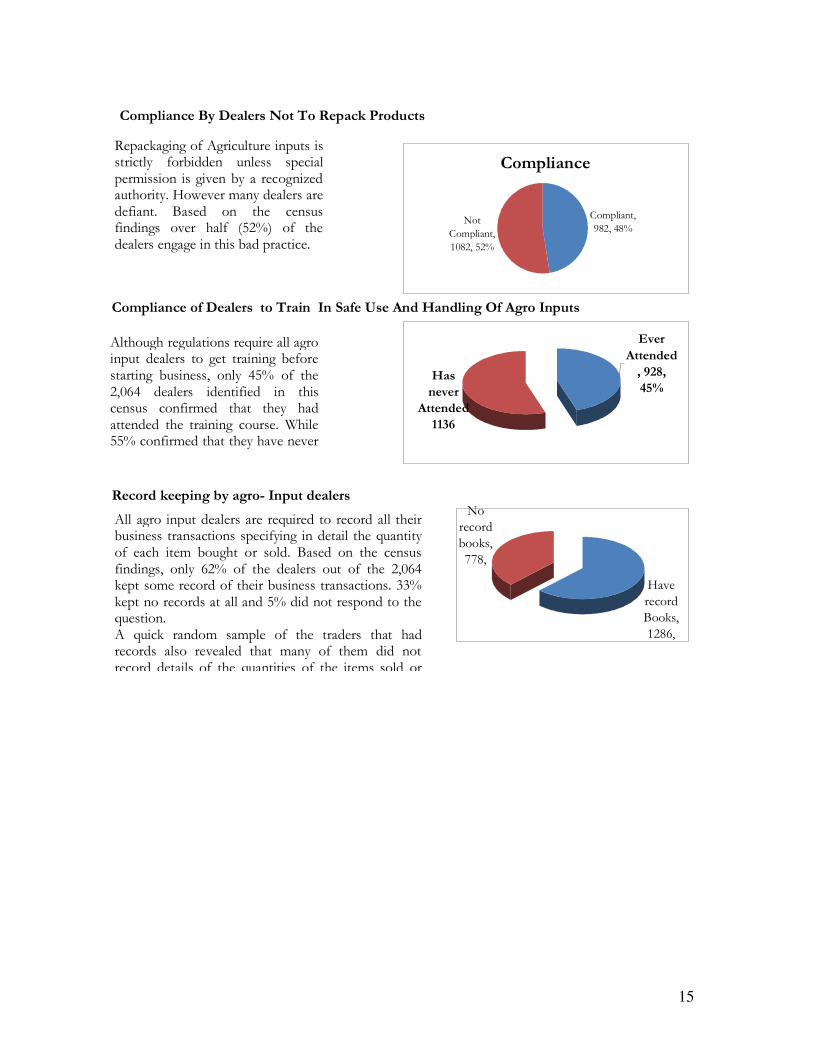
Of the 551 respondents who confirmed they are registered agro input dealers, a 248(13%) of them were registered with agro chemicals board and 287 (14%) were registered with NDA.
Generally, about 69% of all agro input dealers have separate premises selling, storage and display of Agro inputs and other merchandise see Figure 73. The other 30% do not separate outlets for agro inputs from the other merchandise they sell.
Proportion of the Agro Inputs in Dealer Outlets Generally, most (44%) of agro dealers in the country sell only agro inputs in their out lets. However, a big proportions of them (48%) sell agro inputs along side other merchandise.
Regulations require agro input dealers to label agro input items such as drugs, seeds, pesticides etc indicating at least the date of manufacture and expiry. \based on the census findings, the majority (80%), of the 2064 dealers identified sold labeled items. 20% sold products without labels.
15
Compliance By Dealers Not To Repack Products
Compliance
Compliant,
982, 48%Not
Compliant,
1082, 52%
Compliance of Dealers to Train In Safe Use And Handling Of Agro Inputs
Ever
Attended
, 928,
45%Has
never
Attended
1136
Record keeping by agro- Input dealers
Have
record
Books,
1286,
No
record
books,
778,
Repackaging of Agriculture inputs is strictly forbidden unless special permission is given by a recognized authority. However many dealers are defiant. Based on the census findings over half (52%) of the dealers engage in this bad practice.
Although regulations require all agro input dealers to get training before starting business, only 45% of the 2,064 dealers identified in this census confirmed that they had attended the training course. While 55% confirmed that they have never trained at all .
All agro input dealers are required to record all their business transactions specifying in detail the quantity of each item bought or sold. Based on the census findings, only 62% of the dealers out of the 2,064 kept some record of their business transactions. 33% kept no records at all and 5% did not respond to the question. A quick random sample of the traders that had records also revealed that many of them did not record details of the quantities of the items sold or
16
Agro Input Dealers Training Needs
Training Needs
(i) Finance and Business Management Skills and Competence
FINANCIAL MANAGEMENT SKILLS COMPETENCIES
0 500 1000 1500 2000
Business planning
Book Keeping
Financial Analysis
Credit Management
Skills
/Co
mp
ete
nce
No. OF DEALERS
Not Compeptent
Competent
Not Important
Important
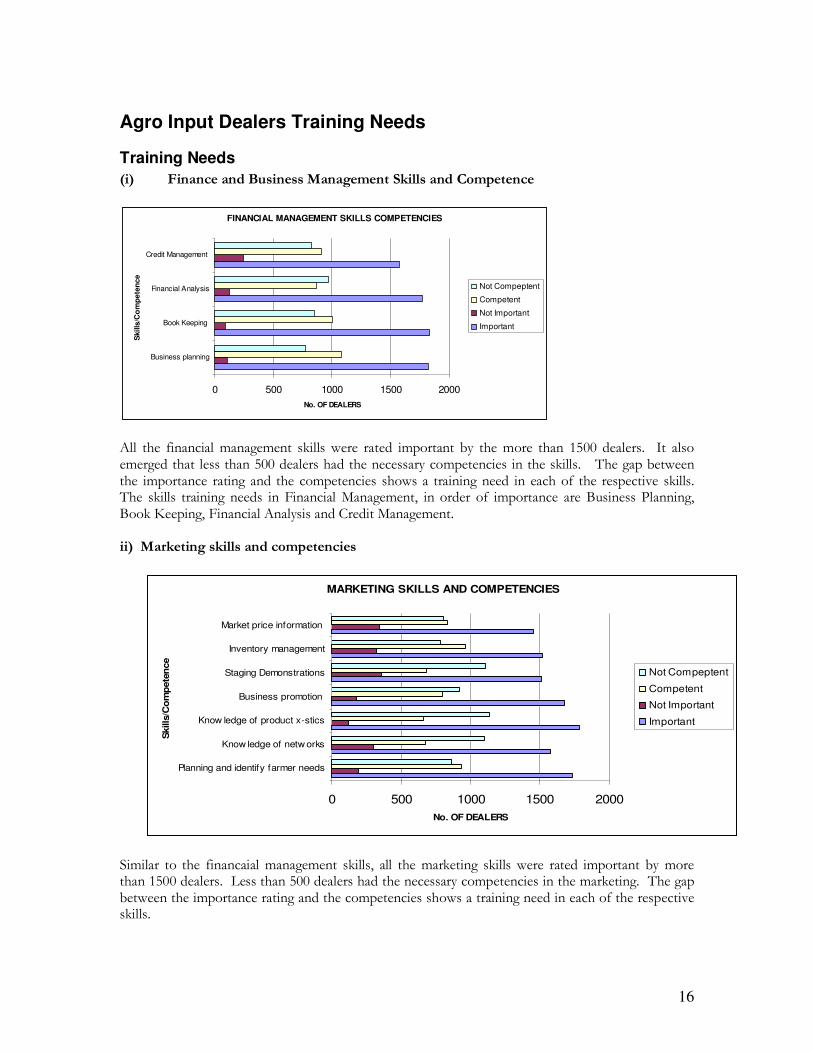
All the financial management skills were rated important by the more than 1500 dealers. It also emerged that less than 500 dealers had the necessary competencies in the skills. The gap between the importance rating and the competencies shows a training need in each of the respective skills. The skills training needs in Financial Management, in order of importance are Business Planning, Book Keeping, Financial Analysis and Credit Management. ii) Marketing skills and competencies
MARKETING SKILLS AND COMPETENCIES
0 500 1000 1500 2000
Planning and identify farmer needs
Know ledge of netw orks
Know ledge of product x-stics
Business promotion
Staging Demonstrations
Inventory management
Market price information
Skills
/Co
mp
ete
nce
No. OF DEALERS
Not Compeptent
Competent
Not Important
Important
Similar to the financaial management skills, all the marketing skills were rated important by more than 1500 dealers. Less than 500 dealers had the necessary competencies in the marketing. The gap between the importance rating and the competencies shows a training need in each of the respective skills.
17
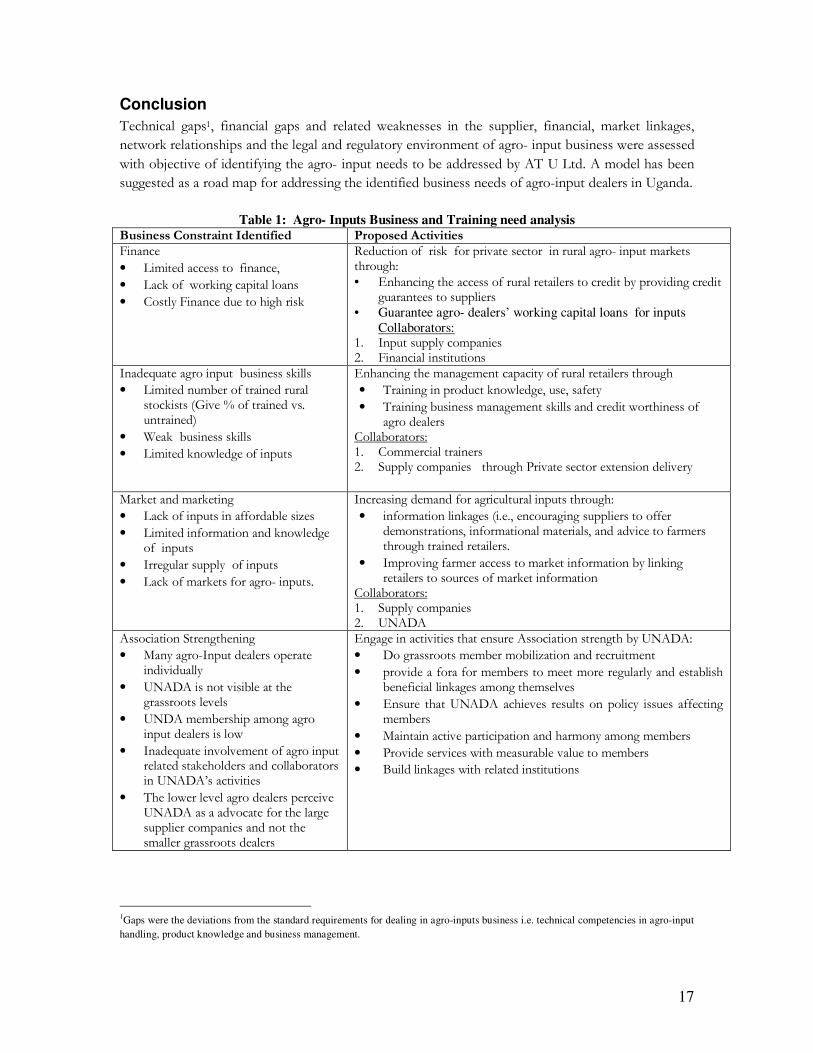
Conclusion
Technical gaps1, financial gaps and related weaknesses in the supplier, financial, market linkages,
network relationships and the legal and regulatory environment of agro- input business were assessed
with objective of identifying the agro- input needs to be addressed by AT U Ltd. A model has been
suggested as a road map for addressing the identified business needs of agro-input dealers in Uganda.
Table 1: Agro- Inputs Business and Training need analysis Business Constraint Identified Proposed Activities Finance
• Limited access to finance,
• Lack of working capital loans
• Costly Finance due to high risk
Reduction of risk for private sector in rural agro- input markets through: • Enhancing the access of rural retailers to credit by providing credit
guarantees to suppliers • Guarantee agro- dealers’ working capital loans for inputs
Collaborators: 1. Input supply companies 2. Financial institutions
Inadequate agro input business skills
• Limited number of trained rural stockists (Give % of trained vs. untrained)
• Weak business skills
• Limited knowledge of inputs
Enhancing the management capacity of rural retailers through
• Training in product knowledge, use, safety
• Training business management skills and credit worthiness of agro dealers
Collaborators: 1. Commercial trainers 2. Supply companies through Private sector extension delivery
Market and marketing
• Lack of inputs in affordable sizes
• Limited information and knowledge of inputs
• Irregular supply of inputs
• Lack of markets for agro- inputs.
Increasing demand for agricultural inputs through:
• information linkages (i.e., encouraging suppliers to offer demonstrations, informational materials, and advice to farmers through trained retailers.
• Improving farmer access to market information by linking retailers to sources of market information
Collaborators: 1. Supply companies 2. UNADA
Association Strengthening
• Many agro-Input dealers operate individually
• UNADA is not visible at the grassroots levels
• UNDA membership among agro input dealers is low
• Inadequate involvement of agro input related stakeholders and collaborators in UNADA’s activities
• The lower level agro dealers perceive UNADA as a advocate for the large supplier companies and not the smaller grassroots dealers
Engage in activities that ensure Association strength by UNADA:
• Do grassroots member mobilization and recruitment
• provide a fora for members to meet more regularly and establish beneficial linkages among themselves
• Ensure that UNADA achieves results on policy issues affecting members
• Maintain active participation and harmony among members
• Provide services with measurable value to members
• Build linkages with related institutions
1Gaps were the deviations from the standard requirements for dealing in agro-inputs business i.e. technical competencies in agro-input
handling, product knowledge and business management.
18
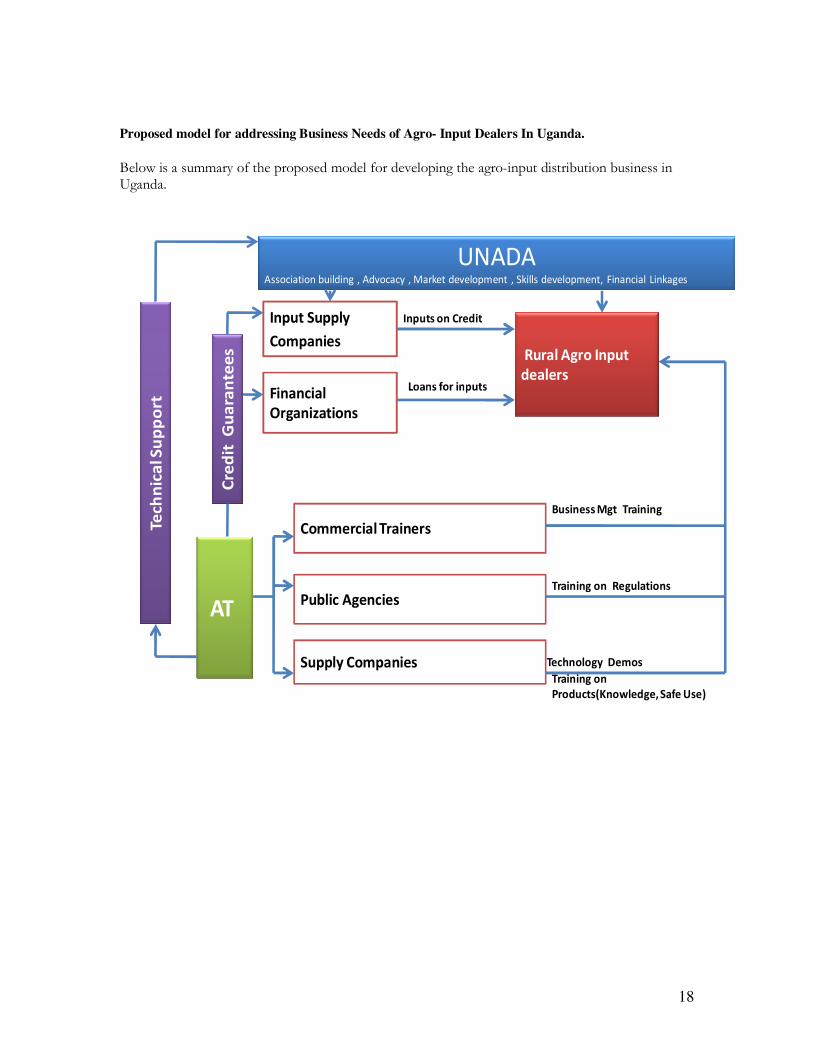
Proposed model for addressing Business Needs of Agro- Input Dealers In Uganda.
Below is a summary of the proposed model for developing the agro-input distribution business in Uganda.
Input Supply
Companies
Financial
Organizations
AT
Cre
dit
Gu
ara
nte
es
UNADAAssociation building , Advocacy , Market development , Skills development, Financial Linkages
Rural Agro Input
dealers
Commercial Trainers
Public Agencies
Supply Companies
Tech
nic
al S
up
po
rt
Training on Regulations
Technology Demos
Training on
Products(Knowledge, Safe Use)
Business Mgt Training
Inputs on Credit
19
CHAPTER 1
Background
Access to affordable and quality agricultural inputs i.e. equipment, seeds, fertilizers, crop protection chemicals and services by the small scale farmers is one of the factors contributing to the gap between potential and actual farm yields. Indeed and is of great concern to community development. Agro-Input dealers are the primary contacts for small-holder farmers for supply of seeds, fertilizers and other farm inputs critical for increasing farm productivity and incomes. Because over 90% of agricultural production in Uganda is by small-holder farmers and agriculture accounts for over 40% of the national GDP, the services of agro-input dealers are not only essential in enhancement of accessibility of inputs to small scale farmers, but also to overall economic development. As agro-Input dealers endeavor to competently deliver quality and affordable services to small- scale farmers, they face many market development constraints such as limited access to capital and credit to expand their business, lack of technical skills and knowledge to deliver agro- input information and technologies associated with their use, lack of business knowledge needed to ensure business survival & profitability, as well as national policy and institutional constraints in the business operating environment.. With financial support from AGRA, AT Uganda Ltd in partnership with UNADA are participating in a Agro- Dealer Network Strengthening Program for Uganda with the purpose of improving input dealer access to capital and information, enhancing input dealers’ technical and entrepreneurial skills & abilities, improving the national inputs policy environment and sustainably strengthening UNADA’s Capacity to provide member services to all Agro-input dealers in Uganda. The underlying belief is that the activities of the program will result in strong linkages created among dealers at association levels (Local, Regional and National), and between dealers and suppliers, as well as between dealers and their farmer customers. This will foster delivery of quality and affordable services by agro-input dealers to the small scale farmers. To successfully design interventions that will address the constraints faced by the agro input dealers, AT Uganda commissioned a census and technical business needs assessment study of agro input dealers in Uganda, between December 2008 and January 2009. The main objectives of the study were to:
i. Develop an updated comprehensive data base of all businesses involved in the sale and distribution of crop and livestock production inputs,
ii. Understand the nature and effectiveness of the existing input distribution network to help in identifying gaps and opportunities for strengthening and enhancing its performance.
iii. Carry out a technical and business needs assessment that will enable UNADA to target its member services to satisfying clearly identified member needs.
iv. Assess public understanding of UNADA’s current public image as a member organization and identifying means to enhance that image, and correct any false impressions that may be held by the public. Assessment would provide the organization with the market position and possible opportunities to strengthen the organization.
The study sought to cover all agro input dealers the entire country including dealers of seeds, fertilisers, crop protection chemicals, livestock drugs, agricultural implements and equipment as well as livestock feeds. The country was divided up into ten (10) regions according to the UNADA sub divisions with enumeration teams assigned to each of the regions. The general approach to data collection incorporated both quantitative and qualitative methodologies, with Participatory Rural Appraisal techniques forming the basis for the latter. Combining these methodologies was found to
20
be the most suitable way to comprehensively achieve the census and needs assessment objectives since the results obtained from the different approaches were triangulated to provide a more rigorous and accurate analysis. Specifically the following methods were used: [1] Desk Review of existing documentation related to the Agro-input business, [2] Key Informant Interviews, of different agricultural undertakings supported by development partners, public and private sector (including GoU, NGOs, CBOs and individual entrepreneurs). [3] Agro-input dealer interviews using structured questionnaires and [4] Feedback workshops as stipulated in the TORS. A summary of the results of the census is contained in this document.
Study Methodology
The census and needs assessment was conducted in all the 10 regions of West Nile, Northern, East Lowland, East Mountain, East Central, South Central, Mid – Western, Western, South Western and Kigezi based on the UNADA geographical categorization.
Prior to the start of the field surveys the consultants held meetings with the client, reviewed relevant literature relating to the programme, designed survey instruments and recruited enumerators. The enumerators were trained and participated in pre-testing the instruments. In order to ensure maximum coverage of all agro input dealers in the census, secondary data on the current UNADA member list given by district and region, list of agro-input dealers from the 2004 census, list of all participants in the trainings carried out by the UNADA, Crop Life and other relevant Organizations were used to obtain the initial list of stockists. From the list, we extracted wherever possible: the name of the business, name of the owner, telephone contact, physical location (sub-county, parish and village). These lists were distributed to and discussed with respective enumerators during the enumerator training meeting. The lists generated were updated further during data collection. Information was sought using key informant interviews e.g. NGOs, CBOs and individual entrepreneurs, discussions with district production department staff (agriculture officers, NAADS) District Farmers’ Organizations Secretariat, UNADA branch leaders as well as UNADA program officers where applicable. Also, referrals were sought from the initially targeted agro-input dealers in order to generate a list of additional stockists engaged in input business in their locality. These agro-input dealers were traced and included in the census.
While the methodology used in this census focused on identifying active dealers of agro inputs, with specific operational premises, methodology used in 2004 census covered other forms of distributors that included:
i) Contact farmers representing cotton ginners and processors. These contact farmers are only active during the cotton planting seasons, and actually they are not dealers.
ii) General merchandise and hardware dealers that sell equipment similar to farm tools e.g. hoes, pangas, rakes, wheel burrows, among others
iii) NGOs/Projects that were active at the time in Northern and West Nile regions. Many of these have since closed. Examples are COPCOT, ACORD, the West Nile Agric Development Programme, among others.
A team was recruited for coding and data entry. During the coding exercise, further manual editing of the questionnaires was done in addition to identifying errors and unclear responses for further clarification from the research assistants. A customized screen was designed in EPINFO software programme to enter the data. Each data entrant was responsible for data cleaning before submission of the database to the consultant. Data was then analyzed using SPSS, and further manipulated in MS Exel to produce graphs for ease of presentation as presented in this report. The data analysis tables are in Appendix 1 The overall summary of agro input dealers identified is in Figure 1.
21
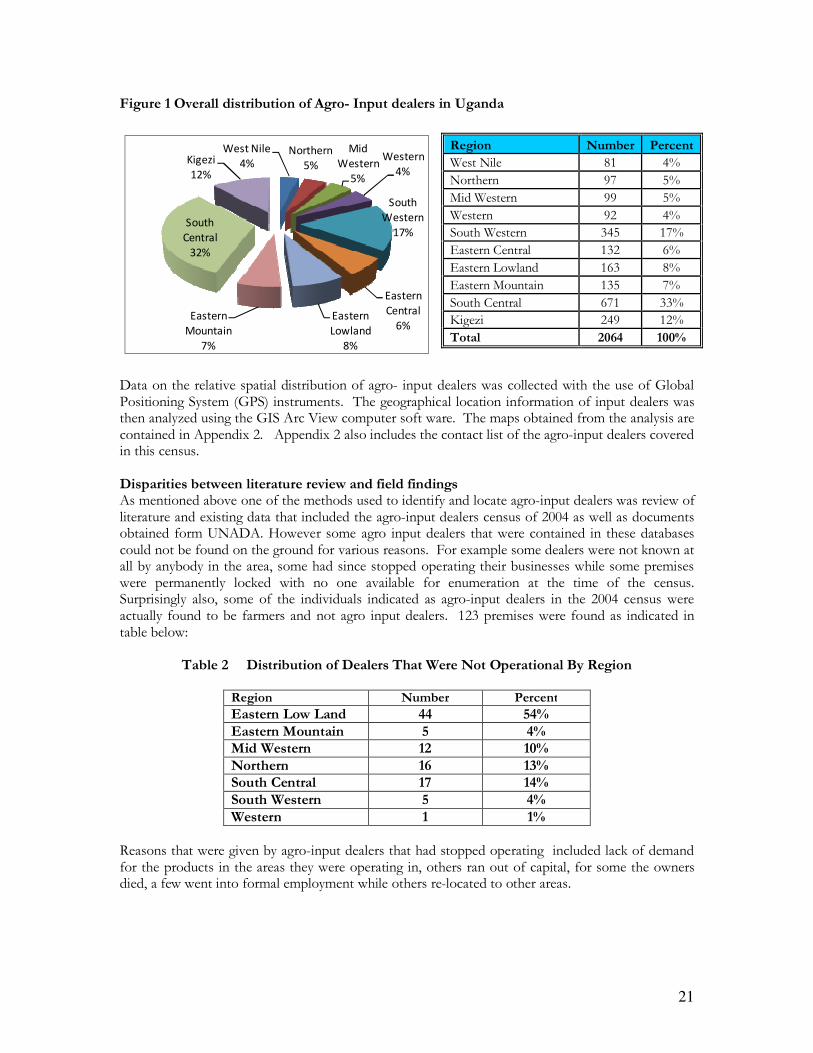
Figure 1 Overall distribution of Agro- Input dealers in Uganda
West Nile
4%Northern
5%
Mid
Western
5%
Western
4%
South
Western
17%
Eastern
Central
6%Eastern
Lowland
8%
Eastern
Mountain
7%
South
Central
32%
Kigezi
12%
Data on the relative spatial distribution of agro- input dealers was collected with the use of Global Positioning System (GPS) instruments. The geographical location information of input dealers was then analyzed using the GIS Arc View computer soft ware. The maps obtained from the analysis are contained in Appendix 2. Appendix 2 also includes the contact list of the agro-input dealers covered in this census. Disparities between literature review and field findings As mentioned above one of the methods used to identify and locate agro-input dealers was review of literature and existing data that included the agro-input dealers census of 2004 as well as documents obtained form UNADA. However some agro input dealers that were contained in these databases could not be found on the ground for various reasons. For example some dealers were not known at all by anybody in the area, some had since stopped operating their businesses while some premises were permanently locked with no one available for enumeration at the time of the census. Surprisingly also, some of the individuals indicated as agro-input dealers in the 2004 census were actually found to be farmers and not agro input dealers. 123 premises were found as indicated in table below:
Table 2 Distribution of Dealers That Were Not Operational By Region
Region Number Percent
Eastern Low Land 44 54% Eastern Mountain 5 4% Mid Western 12 10% Northern 16 13% South Central 17 14% South Western 5 4% Western 1 1%
Reasons that were given by agro-input dealers that had stopped operating included lack of demand for the products in the areas they were operating in, others ran out of capital, for some the owners died, a few went into formal employment while others re-located to other areas.
Region Number Percent
West Nile 81 4%
Northern 97 5%
Mid Western 99 5%
Western 92 4%
South Western 345 17%
Eastern Central 132 6%
Eastern Lowland 163 8%
Eastern Mountain 135 7%
South Central 671 33%
Kigezi 249 12%
Total 2064 100%
22
Overview of the of Agro- Input Dealers Business Environment In Uganda
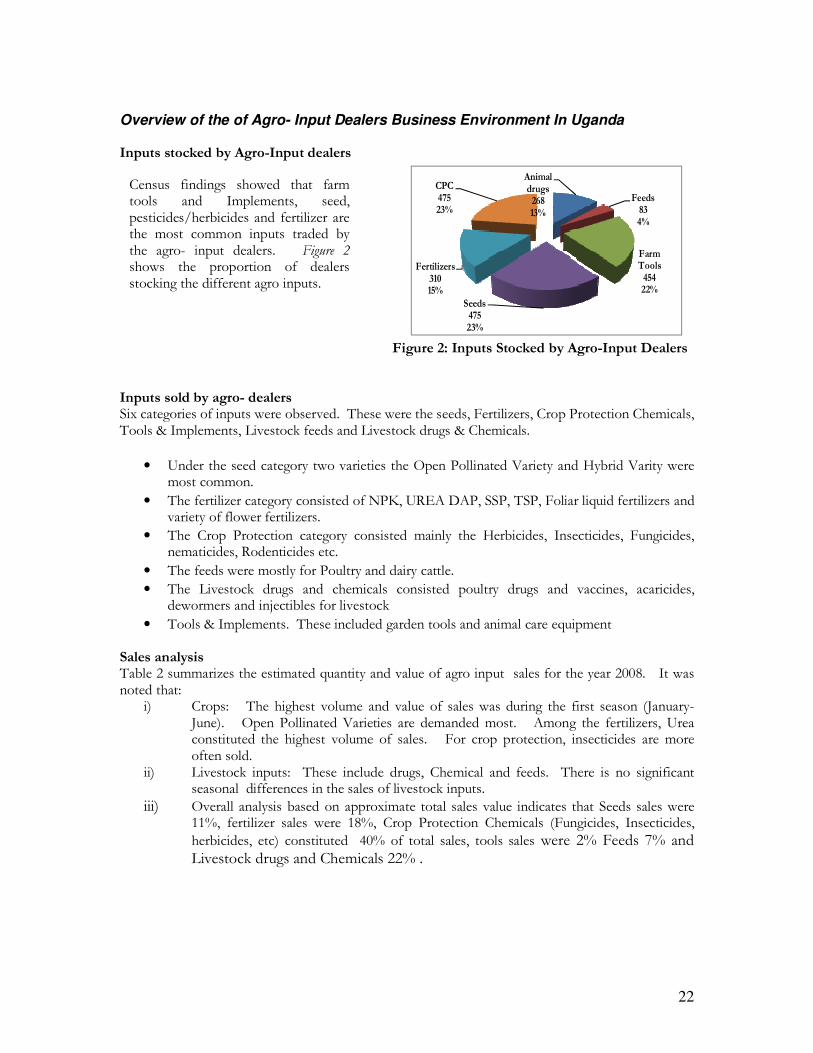
Inputs stocked by Agro-Input dealers
Animal drugs26813%
Feeds834%
Farm Tools45422%
Seeds47523%
Fertilizers31015%
CPC47523%
Figure 2: Inputs Stocked by Agro-Input Dealers
Inputs sold by agro- dealers Six categories of inputs were observed. These were the seeds, Fertilizers, Crop Protection Chemicals, Tools & Implements, Livestock feeds and Livestock drugs & Chemicals.
• Under the seed category two varieties the Open Pollinated Variety and Hybrid Varity were most common.
• The fertilizer category consisted of NPK, UREA DAP, SSP, TSP, Foliar liquid fertilizers and variety of flower fertilizers.
• The Crop Protection category consisted mainly the Herbicides, Insecticides, Fungicides, nematicides, Rodenticides etc.
• The feeds were mostly for Poultry and dairy cattle.
• The Livestock drugs and chemicals consisted poultry drugs and vaccines, acaricides, dewormers and injectibles for livestock
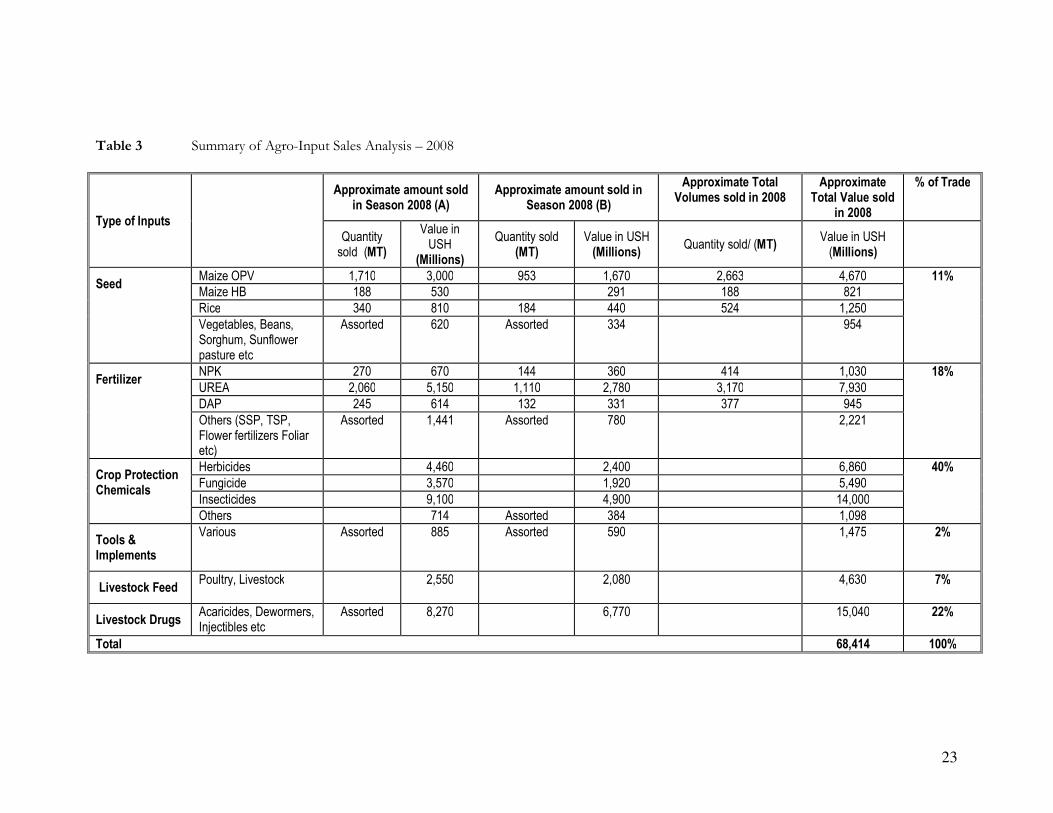
• Tools & Implements. These included garden tools and animal care equipment Sales analysis Table 2 summarizes the estimated quantity and value of agro input sales for the year 2008. It was noted that:
i) Crops: The highest volume and value of sales was during the first season (January-June). Open Pollinated Varieties are demanded most. Among the fertilizers, Urea constituted the highest volume of sales. For crop protection, insecticides are more often sold.
ii) Livestock inputs: These include drugs, Chemical and feeds. There is no significant seasonal differences in the sales of livestock inputs.
iii) Overall analysis based on approximate total sales value indicates that Seeds sales were 11%, fertilizer sales were 18%, Crop Protection Chemicals (Fungicides, Insecticides,
herbicides, etc) constituted 40% of total sales, tools sales were 2% Feeds 7% and Livestock drugs and Chemicals 22% .
Census findings showed that farm tools and Implements, seed, pesticides/herbicides and fertilizer are the most common inputs traded by the agro- input dealers. Figure 2 shows the proportion of dealers stocking the different agro inputs.
23
Table 3 Summary of Agro-Input Sales Analysis – 2008
Type of Inputs
Approximate amount sold in Season 2008 (A)
Approximate amount sold in Season 2008 (B)
Approximate Total Volumes sold in 2008
Approximate Total Value sold
in 2008
% of Trade
Quantity sold (MT)
Value in USH
(Millions)
Quantity sold (MT)
Value in USH (Millions)
Quantity sold/ (MT) Value in USH (Millions)
Seed Maize OPV 1,710 3,000 953 1,670 2,663 4,670 11%
Maize HB 188 530 291 188 821
Rice 340 810 184 440 524 1,250
Vegetables, Beans, Sorghum, Sunflower pasture etc
Assorted 620 Assorted 334 954
Fertilizer NPK 270 670 144 360 414 1,030 18%
UREA 2,060 5,150 1,110 2,780 3,170 7,930
DAP 245 614 132 331 377 945
Others (SSP, TSP, Flower fertilizers Foliar etc)
Assorted 1,441 Assorted 780 2,221
Crop Protection Chemicals
Herbicides 4,460 2,400 6,860 40%
Fungicide 3,570 1,920 5,490
Insecticides 9,100 4,900 14,000
Others 714 Assorted 384 1,098
Tools & Implements
Various Assorted 885 Assorted 590 1,475 2%
Livestock Feed Poultry, Livestock 2,550 2,080 4,630 7%
Livestock Drugs Acaricides, Dewormers, Injectibles etc
Assorted 8,270 6,770 15,040 22%
Total 68,414 100%
24
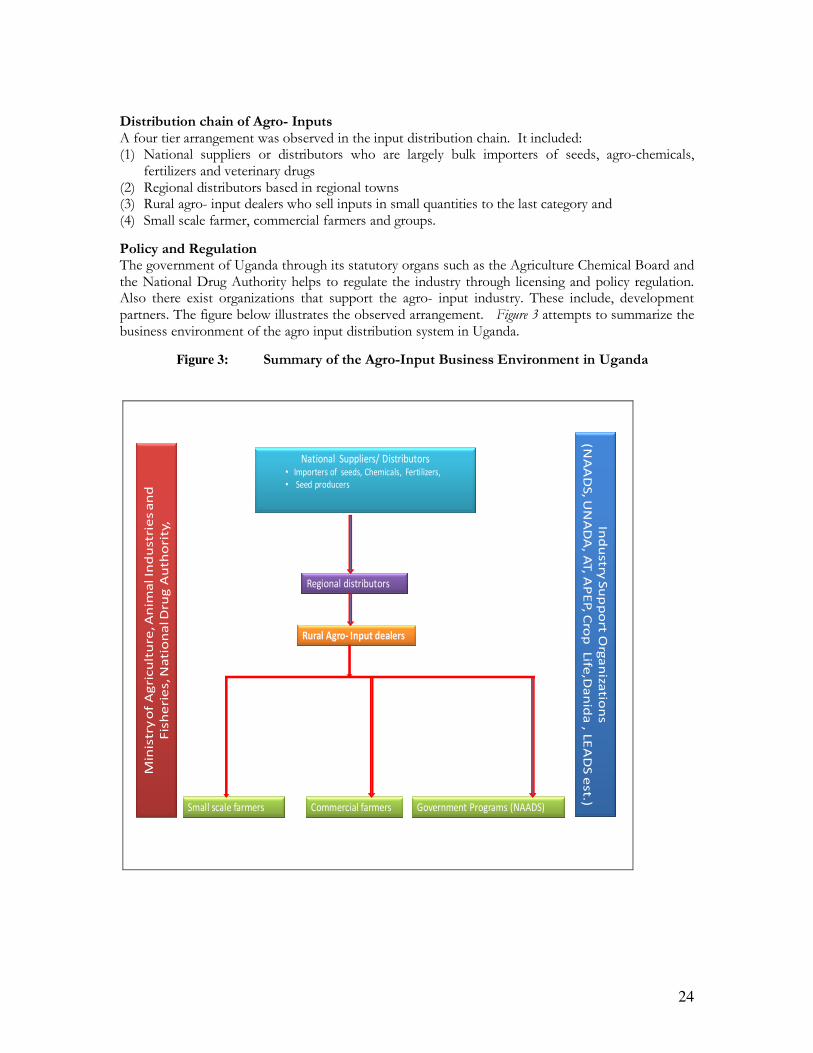
Distribution chain of Agro- Inputs A four tier arrangement was observed in the input distribution chain. It included: (1) National suppliers or distributors who are largely bulk importers of seeds, agro-chemicals,
fertilizers and veterinary drugs (2) Regional distributors based in regional towns (3) Rural agro- input dealers who sell inputs in small quantities to the last category and (4) Small scale farmer, commercial farmers and groups.
Policy and Regulation The government of Uganda through its statutory organs such as the Agriculture Chemical Board and the National Drug Authority helps to regulate the industry through licensing and policy regulation. Also there exist organizations that support the agro- input industry. These include, development partners. The figure below illustrates the observed arrangement. Figure 3 attempts to summarize the business environment of the agro input distribution system in Uganda.
Figure 3: Summary of the Agro-Input Business Environment in Uganda
National Suppliers/ Distributors• Importers of seeds, Chemicals, Fertilizers,
• Seed producers
Regional distributors
Rural Agro- Input dealers
Small scale farmers Commercial farmers Government Programs (NAADS)
Min
istr
y o
f A
gri
cu
ltu
re, A
nim
al In
du
str
ies a
nd
Fis
he
rie
s, N
ati
on
al D
rug
Au
tho
rity
, Ind
ustry
Su
pp
ort O
rga
niza
tion
s
(NA
AD
S, U
NA
DA
, AT, A
PE
P, C
rop
Life
,Da
nid
a , L
EA
DS e
st.)
25
CHAPTER 2
General Characteristics of Agro-Input Dealers
This section details the general characteristics of agro- input dealers. The parameters investigated included the following: � Form of trading conducted by agro- input dealers, i.e. whether involved in importing,
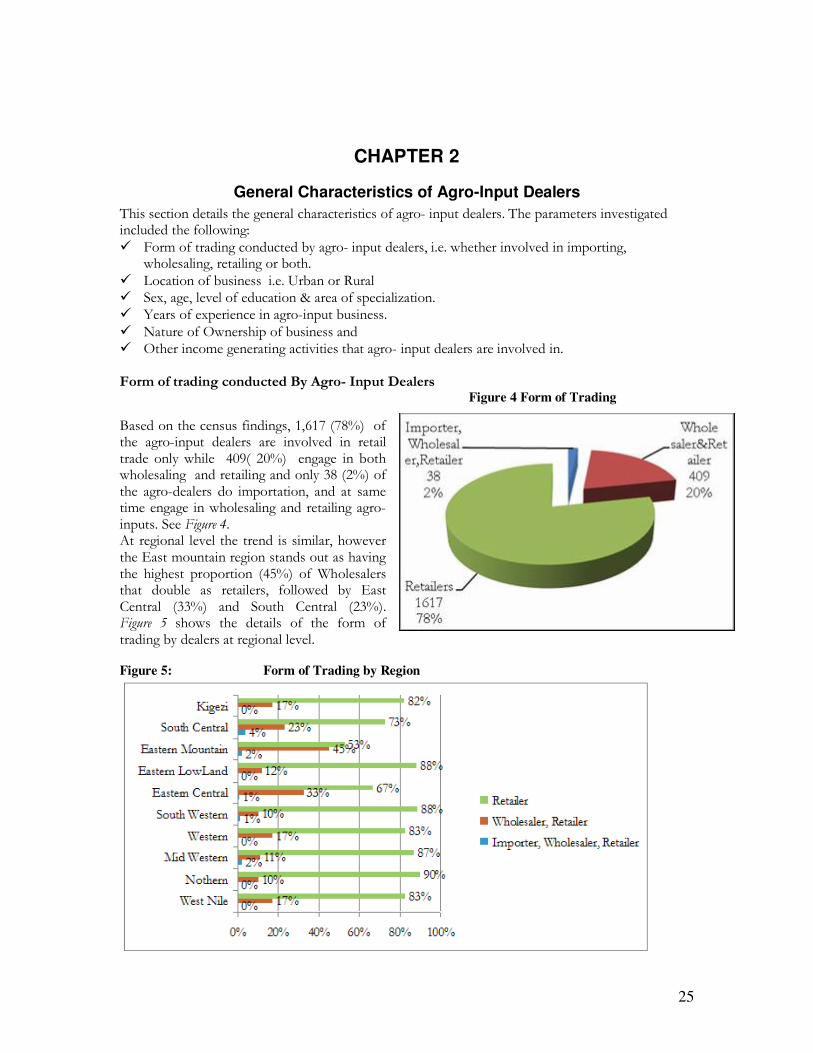
wholesaling, retailing or both. � Location of business i.e. Urban or Rural � Sex, age, level of education & area of specialization. � Years of experience in agro-input business. � Nature of Ownership of business and � Other income generating activities that agro- input dealers are involved in. Form of trading conducted By Agro- Input Dealers
Figure 4 Form of Trading
Based on the census findings, 1,617 (78%) of the agro-input dealers are involved in retail trade only while 409( 20%) engage in both wholesaling and retailing and only 38 (2%) of the agro-dealers do importation, and at same time engage in wholesaling and retailing agro- inputs. See Figure 4. At regional level the trend is similar, however the East mountain region stands out as having the highest proportion (45%) of Wholesalers that double as retailers, followed by East Central (33%) and South Central (23%). Figure 5 shows the details of the form of trading by dealers at regional level.
Figure 5: Form of Trading by Region
26
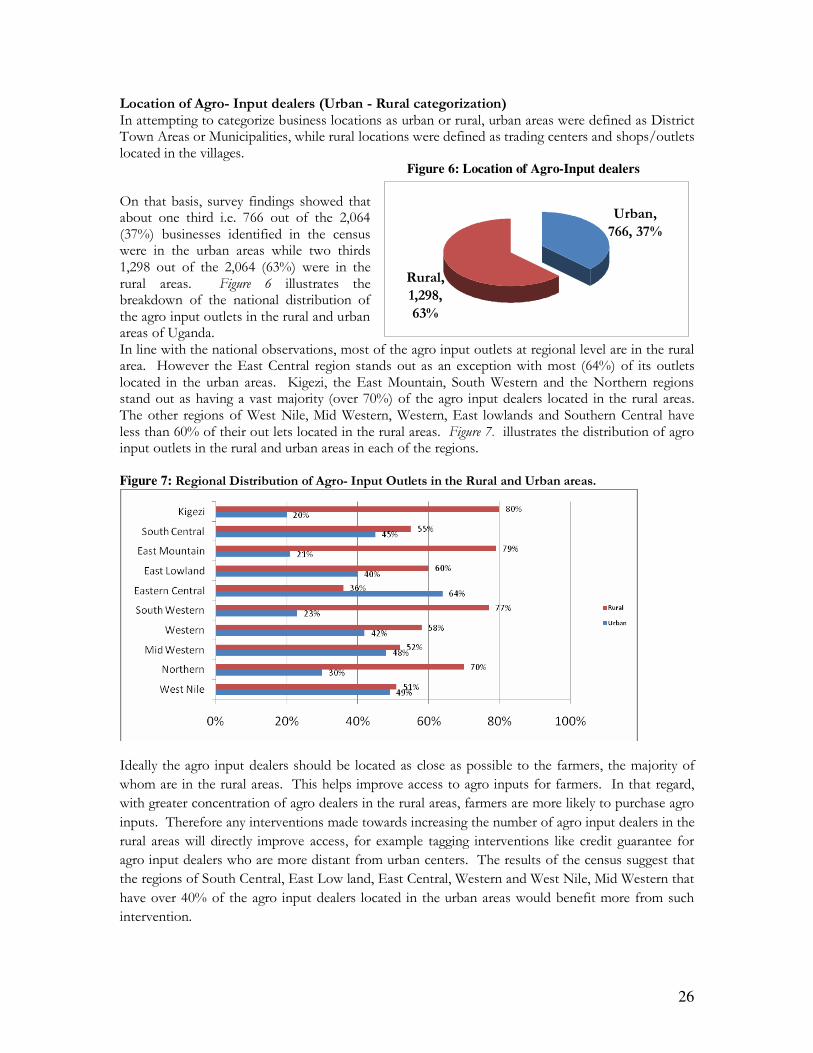
Location of Agro- Input dealers (Urban - Rural categorization) In attempting to categorize business locations as urban or rural, urban areas were defined as District Town Areas or Municipalities, while rural locations were defined as trading centers and shops/outlets located in the villages. Figure 6: Location of Agro-Input dealers
On that basis, survey findings showed that about one third i.e. 766 out of the 2,064 (37%) businesses identified in the census were in the urban areas while two thirds 1,298 out of the 2,064 (63%) were in the rural areas. Figure 6 illustrates the breakdown of the national distribution of the agro input outlets in the rural and urban areas of Uganda. In line with the national observations, most of the agro input outlets at regional level are in the rural area. However the East Central region stands out as an exception with most (64%) of its outlets located in the urban areas. Kigezi, the East Mountain, South Western and the Northern regions stand out as having a vast majority (over 70%) of the agro input dealers located in the rural areas. The other regions of West Nile, Mid Western, Western, East lowlands and Southern Central have less than 60% of their out lets located in the rural areas. Figure 7. illustrates the distribution of agro input outlets in the rural and urban areas in each of the regions. Figure 7: Regional Distribution of Agro- Input Outlets in the Rural and Urban areas.
Ideally the agro input dealers should be located as close as possible to the farmers, the majority of
whom are in the rural areas. This helps improve access to agro inputs for farmers. In that regard,
with greater concentration of agro dealers in the rural areas, farmers are more likely to purchase agro
inputs. Therefore any interventions made towards increasing the number of agro input dealers in the
rural areas will directly improve access, for example tagging interventions like credit guarantee for
agro input dealers who are more distant from urban centers. The results of the census suggest that
the regions of South Central, East Low land, East Central, Western and West Nile, Mid Western that
have over 40% of the agro input dealers located in the urban areas would benefit more from such
intervention.
Urban,
766, 37%
Rural,
1,298,
63%
27
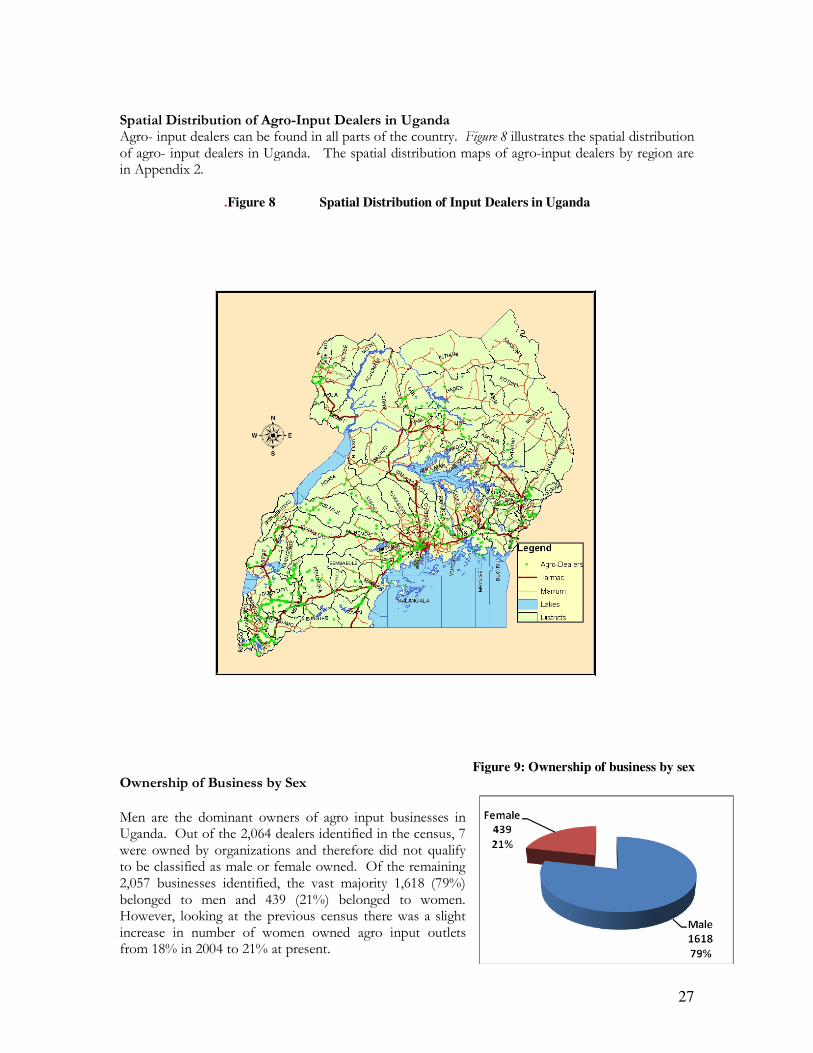
Spatial Distribution of Agro-Input Dealers in Uganda Agro- input dealers can be found in all parts of the country. Figure 8 illustrates the spatial distribution of agro- input dealers in Uganda. The spatial distribution maps of agro-input dealers by region are in Appendix 2.
.Figure 8 Spatial Distribution of Input Dealers in Uganda
Figure 9: Ownership of business by sex Ownership of Business by Sex
Men are the dominant owners of agro input businesses in Uganda. Out of the 2,064 dealers identified in the census, 7 were owned by organizations and therefore did not qualify to be classified as male or female owned. Of the remaining 2,057 businesses identified, the vast majority 1,618 (79%) belonged to men and 439 (21%) belonged to women. However, looking at the previous census there was a slight increase in number of women owned agro input outlets from 18% in 2004 to 21% at present.
28
Further analysis of the agro input dealers at regional level still shows male dominance in agro input trade as illustrated in Figure 10. With the exception of businesses in the South Central region that has 66% male owned businesses; the other regions have over 75% of the businesses owned by men. West Nile, Eastern Central, and East Mountain have up to 90% ownership by men.
Figure 10: Ownership Of Agro Input Businesses Between Men And Women At Regional Level
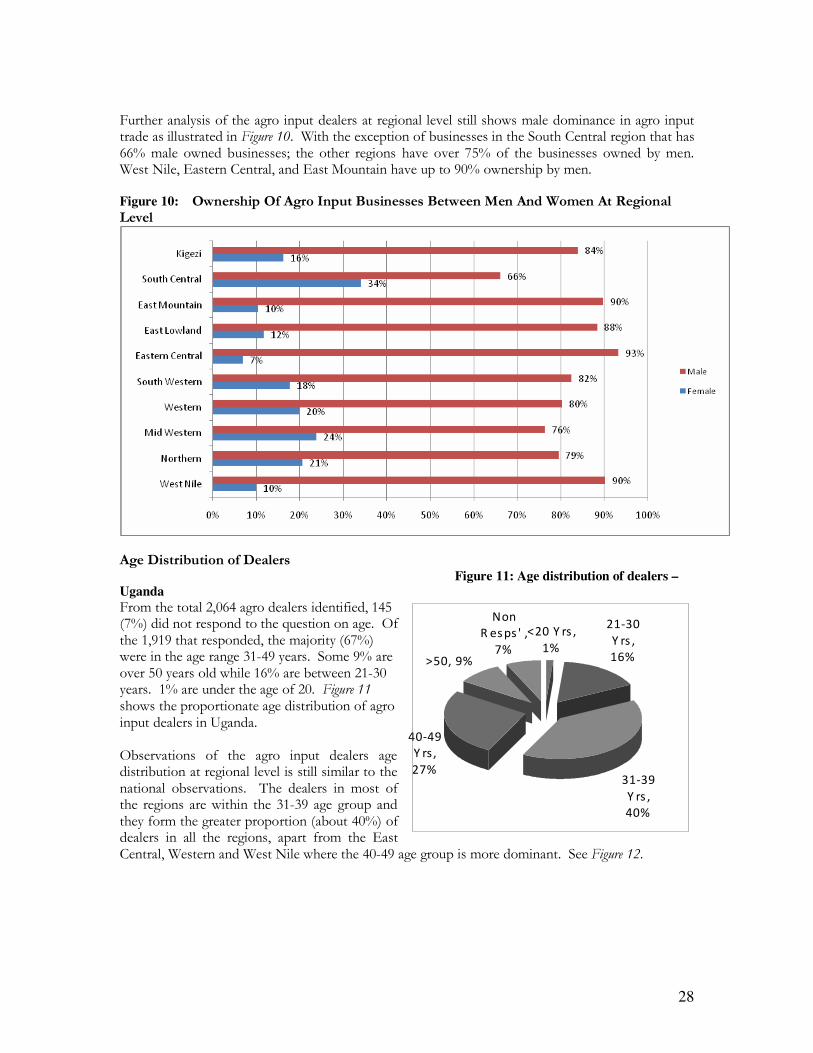
Age Distribution of Dealers
Figure 11: Age distribution of dealers –
Uganda From the total 2,064 agro dealers identified, 145 (7%) did not respond to the question on age. Of the 1,919 that responded, the majority (67%) were in the age range 31-49 years. Some 9% are over 50 years old while 16% are between 21-30 years. 1% are under the age of 20. Figure 11 shows the proportionate age distribution of agro input dealers in Uganda. Observations of the agro input dealers age distribution at regional level is still similar to the national observations. The dealers in most of the regions are within the 31-39 age group and they form the greater proportion (about 40%) of dealers in all the regions, apart from the East Central, Western and West Nile where the 40-49 age group is more dominant. See Figure 12.
<20 Y rs ,
1%
21-30
Y rs ,
16%
31-39
Y rs ,
40%
40-49
Y rs,
27%
>50, 9%
Non
R es ps ' ,
7%
29
Figure 12: Age Distribution of Dealers – Regional
Education Level Of Agro Input Dealers
Formal education is an important requirement in the Agro- Input business because stockists have to
read and understand labels on agricultural inputs in order to be able to give potential customers
directions on use and application of agricultural inputs.
Figure 13: Education level of Agro-Input dealers - Uganda
Of the 2,064 agro input dealers identified in the census, 126 (6%) did not respond to the question on education probably for fear of exposing their low level of education or otherwise. Based on the census findings, the majority of agro input dealers in the country i.e. 1,693 out of the 2,064 (82%) had at least completed O-Level. 245 out of the 2,064 (12%) had not completed Senior 4. Some of them, 199 (10%) have even attained degrees. Figure 13 shows a general breakdown of the education level of the dealers in Uganda. Similar to the national trend in level of education attained by agro input dealers at national level, in most of the regions, the highest proportion of dealers (over 30%) in all regions, apart from the Western and West Nile regions, have completed O-level and or Tertiary School education.
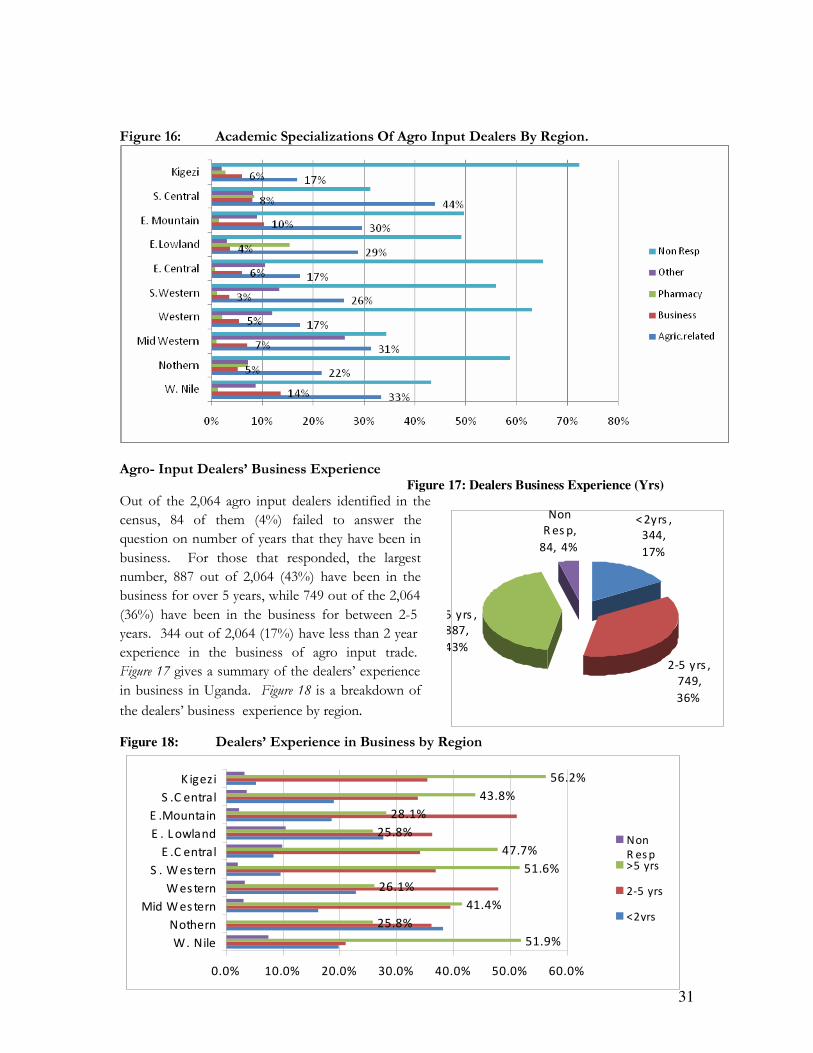
There is a relatively fair distribution of graduate dealers in all regions and these comprise between 8% to 15% of dealers in all regions except East Mountain, Kigezi and South Western. The East Central, West Nile and South Central stand out as having the highest proportion of graduates. The East Mountain region stands out as having the highest proportion of dealers that have not completed O-Level (34%) followed by Western and East Central at 21% and 20% respectively. Figure 14 shows the education levels attained by the agro-input dealers in Uganda.
30
Figure 14: Education Levels of The Agro Input Dealers In Uganda
30%
30%
22%
28%
43%
30%
23%
39%
22%
49%
26%
32%
42%
21%
33%
9%
31%
18%
33%
17%
0% 10% 20% 30% 40% 50% 60%
West Nile
Northern
Mid Western
Western
South Western
Eastern Central
East Lowland
East Mountain
South Central
Kigezi
Non Resp
Degree
Tertiary
A-Level
O-Level
Below O-Level
Agro Input Dealers Academic Specialization
Figure 15: Academic Specialization of Agro-Input Dealers
About half 1,062 (52%) out of the 2,064 dealers identified in the census responded that they had academic specializations. The other 1,002 (48%) did not mention any specialized training. Among those with specialized training, the majority, 632 out of the 2,064 (31%) had agriculture related qualifications. 7% had qualifications in business, 5% had qualifications in pharmacy related fields e.g. Veterinary medicine. None of the dealers identified in the census was a graduate pharmacist. The remaining 9% had qualifications in other fields e.g. teachers, Paramedics, among others. Figure 15 illustrates the agro input dealers areas of academic specialization. Analysis of the agro input dealers areas of specialization by region is similar to the national picture. Agriculture is the main specialty in all the regions. Over 40% of the dealers in the South Central have agriculture related specializations. West Nile and Mid Western had between 30%-40% dealers specializing in agriculture; the rest had less than 30%. Pharmacy related dealers particularly those specializing in Veterinary services were quite few in the regions, the East Low land region had the highest proportion with just over 10% of such dealers, while the other regions had less than 10%. Figure 16 shows the specializations of the agro input dealers by region.
31
Figure 16: Academic Specializations Of Agro Input Dealers By Region.
Agro- Input Dealers’ Business Experience Figure 17: Dealers Business Experience (Yrs)
Out of the 2,064 agro input dealers identified in the
census, 84 of them (4%) failed to answer the
question on number of years that they have been in
business. For those that responded, the largest
number, 887 out of 2,064 (43%) have been in the
business for over 5 years, while 749 out of the 2,064
(36%) have been in the business for between 2-5
years. 344 out of 2,064 (17%) have less than 2 year
experience in the business of agro input trade.
Figure 17 gives a summary of the dealers’ experience
in business in Uganda. Figure 18 is a breakdown of
the dealers’ business experience by region.
Figure 18: Dealers’ Experience in Business by Region
< 2yrs ,
344,
17%
2-5 yrs ,
749,
36%
> 5 yrs ,
887,
43%
Non
R es p,
84, 4%
51.9%
25.8%
41.4%
26.1%
51.6%
47.7%
25.8%
28.1%
43.8%
56.2%
0.0% 10.0% 20.0% 30.0% 40.0% 50.0% 60.0%
W. Nile
Nothern
Mid W es tern
W es tern
S . W es tern
E .C entral
E . L owland
E .Mountain
S .C entral
K igezi
Non
R es p>5 yrs
2-5 yrs
<2yrs
32
Regional level observations also indicate that in most (6 out of 10) regions, the largest number of agro dealers there have more than 5 years experience in agro input business. In 3 out of the 10 regions i.e. East Mountain, Western and East Low land regions, the dealers there have predominantly 2-5 years experience. The Northern region stands out as having the greatest proportion (about 40%) of dealers with less that 2 years experience in the business. Agro Input Dealer That Participated In the 2004 Census
Figure 19: Participation in 2004 Census
Y es , 613,
30%
No,
1295,
62%
Non
R es p,
156, 8%
Figure 20: Agro Input Dealer That Participated In The 2004 Census (By Region)
19%
18%
27%
33%
25%
31%
24%
34%
33%
37%
70%
76%
72%
60%
72%
55%
60%
62%
58%
59%
11%
6%
1%
8%
3%
14%
17%
4%
9%
5%
0% 20% 40% 60% 80% 100%
W es t Nile
Nothern
Mid Wes tern
Wes tern
S outh Wes tern
E as tern C entral
E as t L owland
E as t Mountain
S outh C entral
K igezi
Non
R es pNo
Y es
Nature of Business Ownership
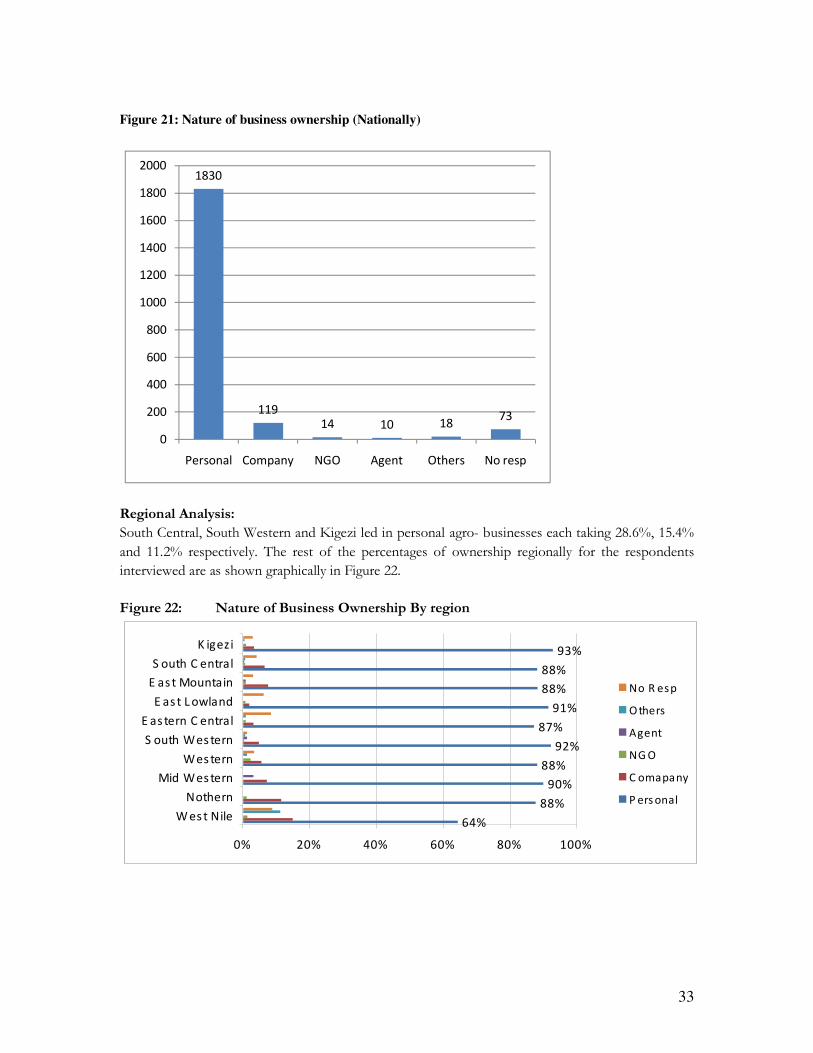
The agro-dealers were requested to indicate the nature of ownership of their agro-input businesses. The options of ownership included personal, company, NGO, agent and others. 89% (1835) out of the 2064 i confirmed that their businesses were personal. The other forms of ownership were companies and NGO accounting for 6% and 3 % respectively. Agents, others and non respondents were of minority together accounting for 2%.
In 2004, a similar national census of agro- dealers
was done. The majority of agro input dealers that
were identified in 2008 exercise stated that they had
not participated in the 2004 survey. Figure 19 shows
that only 30% (613 out of 2,064) of the dealers
identified in the census participated, 68% (1,295 out
of 2,064) did not participate and 7% (156 out of
2,064) did not indicate whether they participated in
the census.
33
Figure 21: Nature of business ownership (Nationally)
1830
11914 10 18
73
0
200
400
600
800
1000
1200
1400
1600
1800
2000
Personal Company NGO Agent Others No resp
Regional Analysis:
South Central, South Western and Kigezi led in personal agro- businesses each taking 28.6%, 15.4%
and 11.2% respectively. The rest of the percentages of ownership regionally for the respondents
interviewed are as shown graphically in Figure 22.
Figure 22: Nature of Business Ownership By region
64%
88%
90%
88%
92%
87%
91%
88%
88%
93%
0% 20% 40% 60% 80% 100%
W es t Nile
Nothern
Mid Wes tern
Wes tern
S outh Wes tern
E as tern C entral
E as t L owland
E as t Mountain
S outh C entral
K igezi
No R esp
O thers
Agent
NG O
C omapany
P ers onal
34
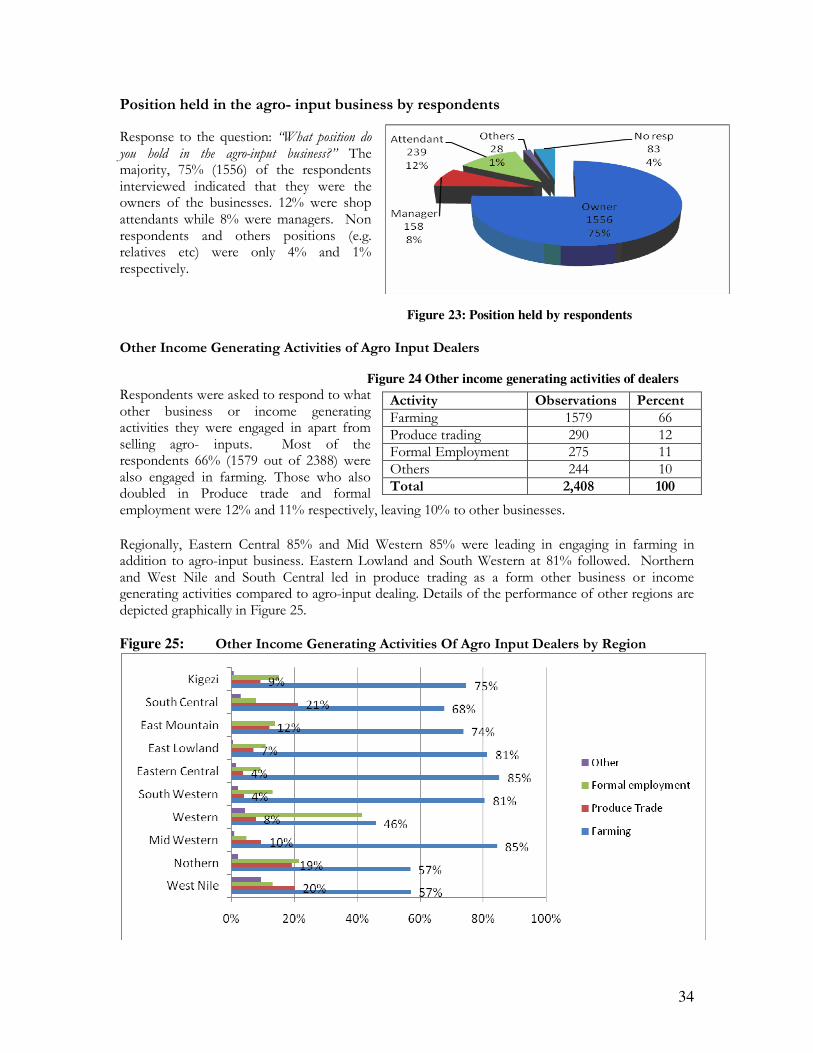
Position held in the agro- input business by respondents
Response to the question: “What position do you hold in the agro-input business?” The majority, 75% (1556) of the respondents interviewed indicated that they were the owners of the businesses. 12% were shop attendants while 8% were managers. Non respondents and others positions (e.g. relatives etc) were only 4% and 1% respectively.
Figure 23: Position held by respondents
Other Income Generating Activities of Agro Input Dealers
Figure 24 Other income generating activities of dealers Respondents were asked to respond to what other business or income generating activities they were engaged in apart from selling agro- inputs. Most of the respondents 66% (1579 out of 2388) were also engaged in farming. Those who also doubled in Produce trade and formal employment were 12% and 11% respectively, leaving 10% to other businesses. Regionally, Eastern Central 85% and Mid Western 85% were leading in engaging in farming in addition to agro-input business. Eastern Lowland and South Western at 81% followed. Northern and West Nile and South Central led in produce trading as a form other business or income generating activities compared to agro-input dealing. Details of the performance of other regions are depicted graphically in Figure 25. Figure 25: Other Income Generating Activities Of Agro Input Dealers by Region
Activity Observations Percent Farming 1579 66 Produce trading 290 12 Formal Employment 275 11 Others 244 10 Total 2,408 100
35
CHAPTER 3
Agro- Input Dealers- Supply Linkages
Agro-input dealer supplier linkages considered the following: sources of inputs, location of suppliers and payment terms suppliers give to agro-input dealers.
Source of Inputs and Location of suppliers. Figure 26: Sources of Inputs
Observation of the agro input dealers’ source of inputs at regional level shows that in all regions except West Nile, Northern and Eastern Mountain, Kampala based agro- input dealers were the main source of inputs. For the West Nile region, the seed companies are the main source of supplies. The Northern region had the regional distributors as their leading suppliers of agro- inputs. In the Eastern Mountain region, regional suppliers and seed companies are the main source of supplies to the agro-input dealers. Details of the main suppliers to dealers are in Figure 26.
Figure 27: Main Suppliers of Agro Input Dealers By Region
41%
18%
25%
7%
4%
10%
16%
38%
14%
5%
25%
33%
59%
70%
58%
71%
63%
23%
80%
67%
22%
48%
15%
6%
31%
17%
20%
38%
2%
24%
0% 20% 40% 60% 80% 100%
Wes t Nile
Northern
Mid Wes tern
Wes tern
S outh Wes tern
E as tern C entral
E as tern L owland
E as tern Mountain
S outh C entral
K igez i
Others
NG O
R eg ional
Input
s uppliersS eed co.
63% of the agro- input dealers responded that they get their inputs from Kampala based Agro- input suppliers, 14% also get their supplies from seed companies that are also Kampala based. 18% of agro-dealers obtain their supplies from regional suppliers who are found in regional towns of Mbale, Mbarara, Lira, Kampala, Masaka, Jinja and Arua. The “Others” category of source of inputs consist of mainly manufactures/ distributors in India, China, Kenya, Taiwan, Singapore,
36
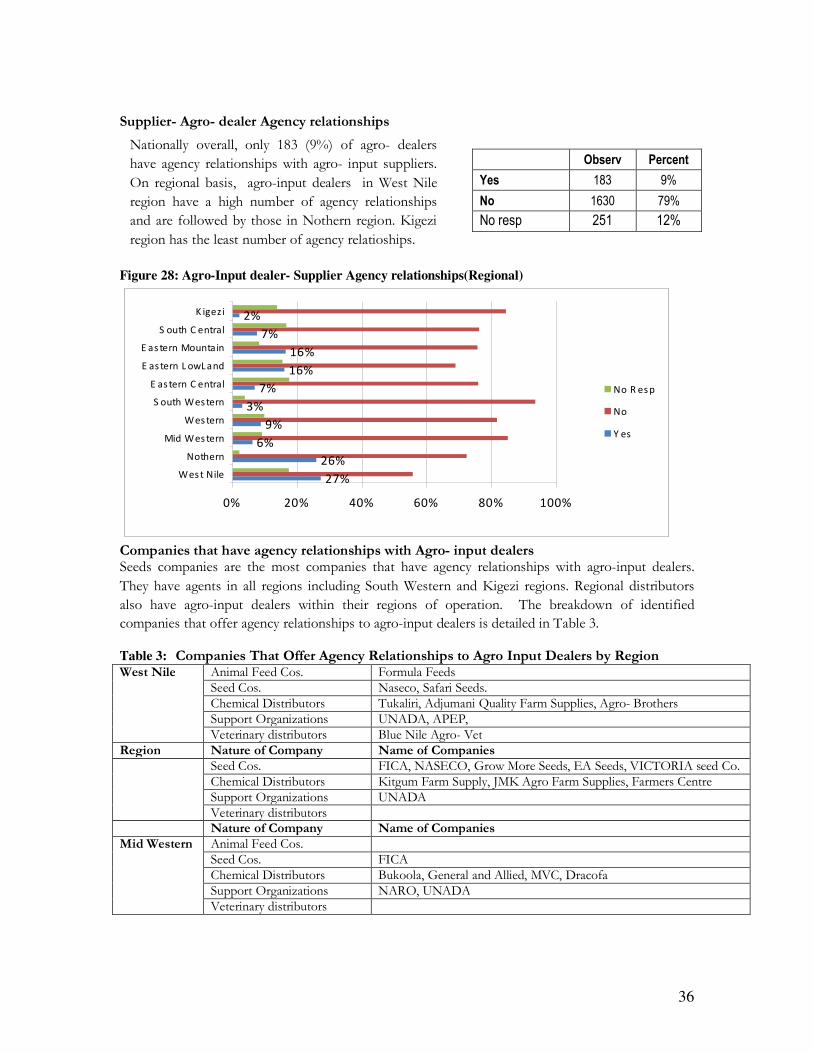
Supplier- Agro- dealer Agency relationships
Observ Percent
Yes 183 9%
No 1630 79%
No resp 251 12%
Figure 28: Agro-Input dealer- Supplier Agency relationships(Regional)
27%
26%
6%
9%
3%
7%
16%
16%
7%
2%
0% 20% 40% 60% 80% 100%
Wes t Nile
Nothern
Mid Wes tern
Wes tern
S outh Wes tern
E as tern C entral
E as tern L owL and
E as tern Mountain
S outh C entral
K igezi
No R es p
No
Y es
Companies that have agency relationships with Agro- input dealers Seeds companies are the most companies that have agency relationships with agro-input dealers.
They have agents in all regions including South Western and Kigezi regions. Regional distributors
also have agro-input dealers within their regions of operation. The breakdown of identified
companies that offer agency relationships to agro-input dealers is detailed in Table 3.
Table 3: Companies That Offer Agency Relationships to Agro Input Dealers by Region West Nile Animal Feed Cos. Formula Feeds
Seed Cos. Naseco, Safari Seeds. Chemical Distributors Tukaliri, Adjumani Quality Farm Supplies, Agro- Brothers Support Organizations UNADA, APEP, Veterinary distributors Blue Nile Agro- Vet
Region Nature of Company Name of Companies Seed Cos. FICA, NASECO, Grow More Seeds, EA Seeds, VICTORIA seed Co.
Chemical Distributors Kitgum Farm Supply, JMK Agro Farm Supplies, Farmers Centre Support Organizations UNADA Veterinary distributors
Nature of Company Name of Companies Mid Western Animal Feed Cos.
Seed Cos. FICA Chemical Distributors Bukoola, General and Allied, MVC, Dracofa Support Organizations NARO, UNADA Veterinary distributors
Nationally overall, only 183 (9%) of agro- dealers
have agency relationships with agro- input suppliers.
On regional basis, agro-input dealers in West Nile
region have a high number of agency relationships
and are followed by those in Nothern region. Kigezi
region has the least number of agency relatioships.
37
Nature of Company Name of Companies Western Animal Feed Cos. Ngondwe, Ugachic
Seed Cos. Naseco, EA Seed Co. Chemical Distributors Support Organizations Farmers Associations Veterinary distributors Eram, Coopers
South Western
Animal Feed Cos. Kagodo Feeds, Maganjo Feeds, NUMA Feeds, Nuvita Feeds Support Organizations UNADA Veterinary distributors NORBROOK
Eastern Central
Animal Feed Cos. Seed Cos. FICA, Naseco Chemical Distributors Support Organizations Veterinary distributors Henri Vet
Eastern LowLand
Animal Feed Cos. Seed Cos. Naseco, Victoria Seed Company, Real Seeds, SACOSE,
Pramukuh Seed Co. Chemical Distributors Ongodia Farm Supply, ElShadai, Support Organizations Nile Breweries, UNADA, CDO, CN company, Veterinary distributors Medron Pharmacy,
Seed Cos. FICA, Naseco, Victoria Seed Co, Mt. Elgon Seed Company, Kenya Seed Co.
Chemical Distributors Trust Chemicals, Balton South Central
Animal Feed Cos. Ugachic, Ngondwe Feeds Seed Cos. FICA, Naseko, Monsanto, EA Seeds, Victoria Seeds, Afri
Seeds, Regina Seeds, Crifaton, Mt. Elgon Seeds Chemical Distributors Nsanja Farm Supplies, Twiga Chemicals, Balton, Bayer
S.A,Bukoola, Veterinary Distributors Sekalala Enterprises, Eram, Coopers, Quality Chemicals, Kigezi Support Organizations NAADS, NARO, UNADA
Services that companies give to agents
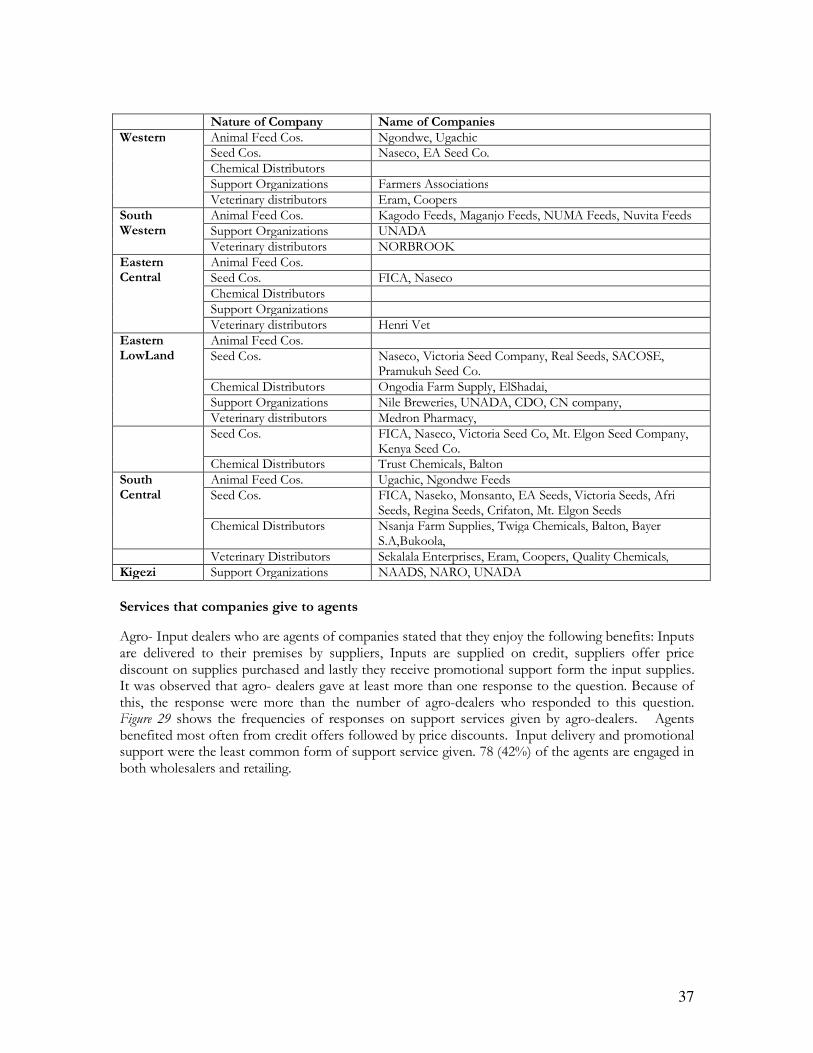
Agro- Input dealers who are agents of companies stated that they enjoy the following benefits: Inputs are delivered to their premises by suppliers, Inputs are supplied on credit, suppliers offer price discount on supplies purchased and lastly they receive promotional support form the input supplies. It was observed that agro- dealers gave at least more than one response to the question. Because of this, the response were more than the number of agro-dealers who responded to this question. Figure 29 shows the frequencies of responses on support services given by agro-dealers. Agents benefited most often from credit offers followed by price discounts. Input delivery and promotional support were the least common form of support service given. 78 (42%) of the agents are engaged in both wholesalers and retailing.
38
Figure 29: Services gained for being agents
Agency Benefits
0 20 40 60 80 100 120
Price Discount
Priomotional
Support
Input Delivery
Credit Facility
Benefits
No. of Beneficiaries
Transportation of Inputs from source of supply to Agro-input dealers ’ premises
Figure 30: How inputs are transported by agro- dealers
P ublic
76%
P rivate
11%
B oth
(P rivate&
P ublic)
11%
C o. delivers
2%
Payment of transport of Inputs by dealers
Figure 31: Payment for Inputs
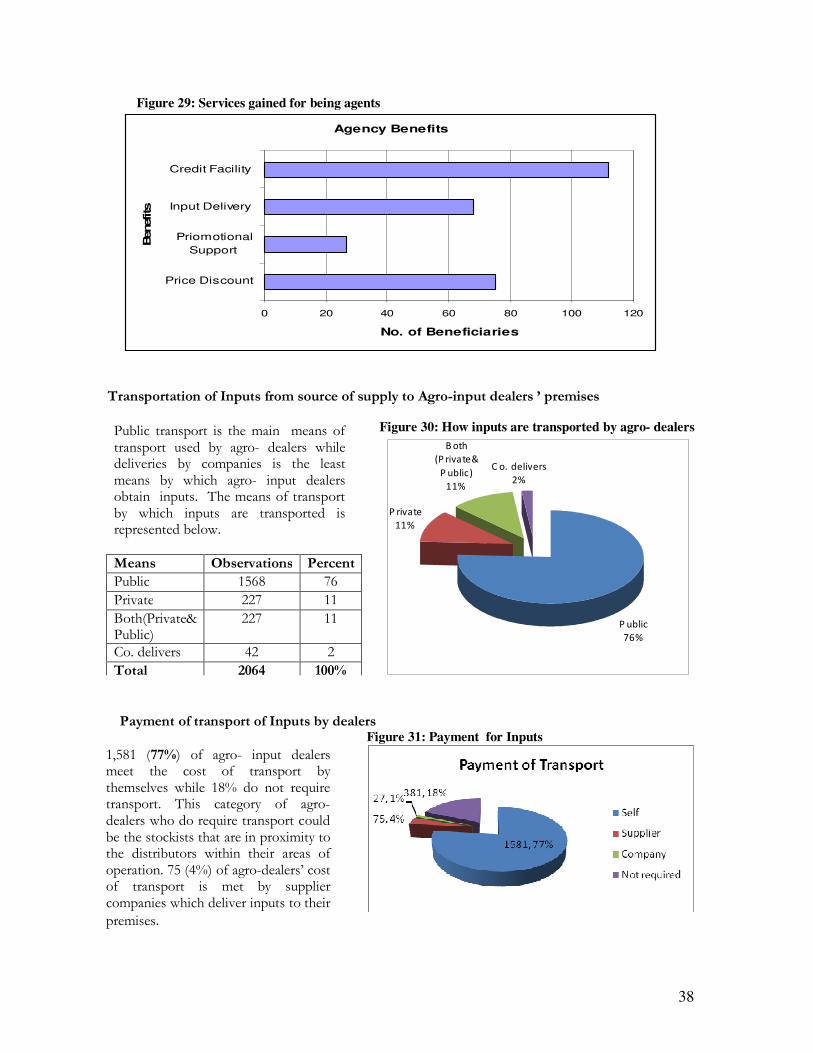
Public transport is the main means of transport used by agro- dealers while deliveries by companies is the least means by which agro- input dealers obtain inputs. The means of transport by which inputs are transported is represented below. Means Observations Percent
Public 1568 76
Private 227 11
Both(Private& Public)
227 11
Co. delivers 42 2
Total 2064 100%
1,581 (77%) of agro- input dealers meet the cost of transport by themselves while 18% do not require transport. This category of agro- dealers who do require transport could be the stockists that are in proximity to the distributors within their areas of operation. 75 (4%) of agro-dealers’ cost of transport is met by supplier companies which deliver inputs to their
premises.
39
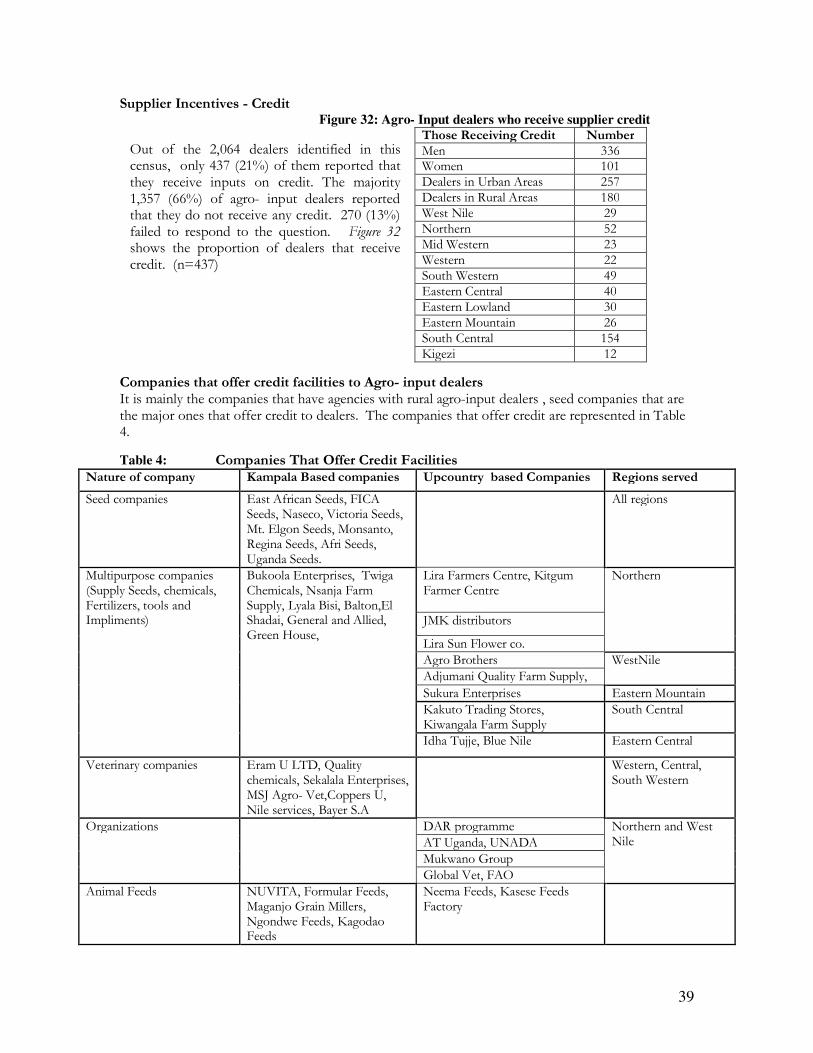
Supplier Incentives - Credit Figure 32: Agro- Input dealers who receive supplier credit
Those Receiving Credit Number Men 336 Women 101 Dealers in Urban Areas 257 Dealers in Rural Areas 180 West Nile 29 Northern 52 Mid Western 23 Western 22 South Western 49 Eastern Central 40 Eastern Lowland 30 Eastern Mountain 26 South Central 154 Kigezi 12
Companies that offer credit facilities to Agro- input dealers It is mainly the companies that have agencies with rural agro-input dealers , seed companies that are the major ones that offer credit to dealers. The companies that offer credit are represented in Table 4.
Table 4: Companies That Offer Credit Facilities Nature of company Kampala Based companies Upcountry based Companies Regions served
Seed companies East African Seeds, FICA Seeds, Naseco, Victoria Seeds, Mt. Elgon Seeds, Monsanto, Regina Seeds, Afri Seeds, Uganda Seeds.
All regions
Multipurpose companies (Supply Seeds, chemicals, Fertilizers, tools and Impliments)
Bukoola Enterprises, Twiga Chemicals, Nsanja Farm Supply, Lyala Bisi, Balton,El Shadai, General and Allied, Green House,
Lira Farmers Centre, Kitgum Farmer Centre
Northern
JMK distributors
Lira Sun Flower co.
Agro Brothers WestNile
Adjumani Quality Farm Supply,
Sukura Enterprises Eastern Mountain
Kakuto Trading Stores, Kiwangala Farm Supply
South Central
Idha Tujje, Blue Nile Eastern Central
Veterinary companies Eram U LTD, Quality chemicals, Sekalala Enterprises, MSJ Agro- Vet,Coppers U, Nile services, Bayer S.A
Western, Central, South Western
Organizations DAR programme Northern and West Nile AT Uganda, UNADA
Mukwano Group
Global Vet, FAO
Animal Feeds NUVITA, Formular Feeds, Maganjo Grain Millers, Ngondwe Feeds, Kagodao Feeds
Neema Feeds, Kasese Feeds Factory
Out of the 2,064 dealers identified in this census, only 437 (21%) of them reported that they receive inputs on credit. The majority 1,357 (66%) of agro- input dealers reported that they do not receive any credit. 270 (13%) failed to respond to the question. Figure 32 shows the proportion of dealers that receive credit. (n=437)
40
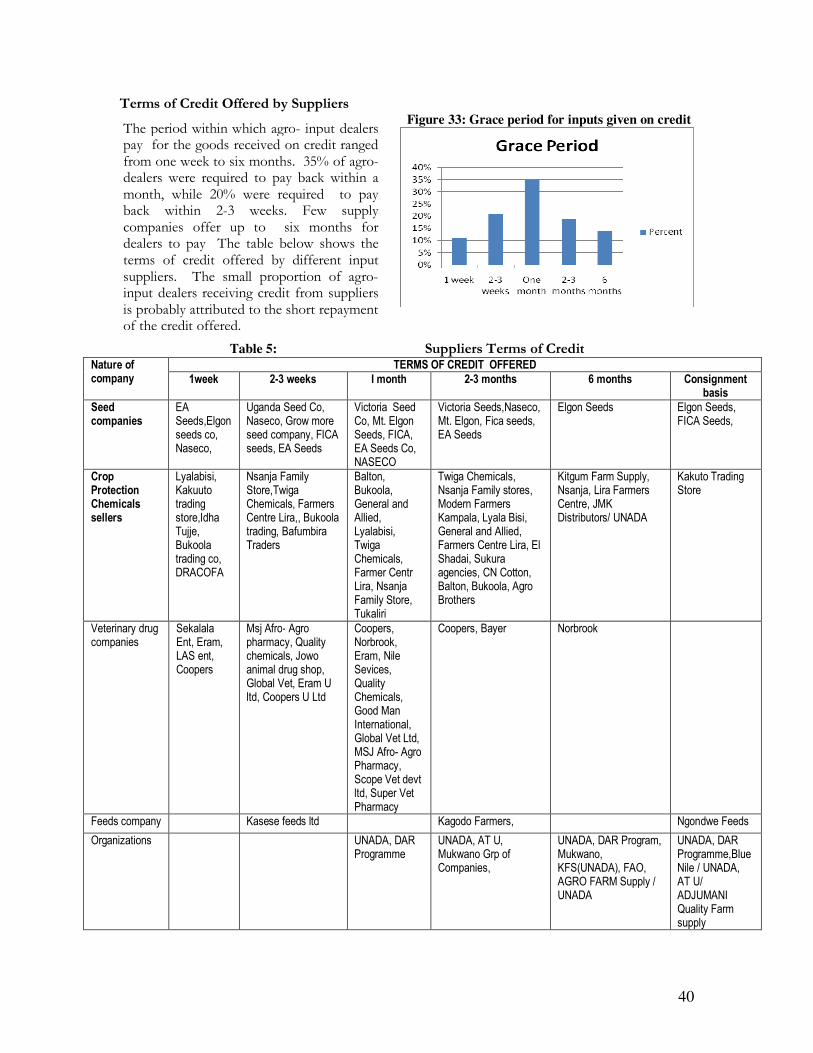
Terms of Credit Offered by Suppliers Figure 33: Grace period for inputs given on credit
Table 5: Suppliers Terms of Credit Nature of company
TERMS OF CREDIT OFFERED
1week 2-3 weeks I month 2-3 months 6 months Consignment basis
Seed companies
EA Seeds,Elgon seeds co, Naseco,
Uganda Seed Co, Naseco, Grow more seed company, FICA seeds, EA Seeds
Victoria Seed Co, Mt. Elgon Seeds, FICA, EA Seeds Co, NASECO
Victoria Seeds,Naseco, Mt. Elgon, Fica seeds, EA Seeds
Elgon Seeds Elgon Seeds, FICA Seeds,
Crop Protection Chemicals sellers
Lyalabisi, Kakuuto trading store,Idha Tujje, Bukoola trading co, DRACOFA
Nsanja Family Store,Twiga Chemicals, Farmers Centre Lira,, Bukoola trading, Bafumbira Traders
Balton, Bukoola, General and Allied, Lyalabisi, Twiga Chemicals, Farmer Centr Lira, Nsanja Family Store, Tukaliri
Twiga Chemicals, Nsanja Family stores, Modern Farmers Kampala, Lyala Bisi, General and Allied, Farmers Centre Lira, El Shadai, Sukura agencies, CN Cotton, Balton, Bukoola, Agro Brothers
Kitgum Farm Supply, Nsanja, Lira Farmers Centre, JMK Distributors/ UNADA
Kakuto Trading Store
Veterinary drug companies
Sekalala Ent, Eram, LAS ent, Coopers
Msj Afro- Agro pharmacy, Quality chemicals, Jowo animal drug shop, Global Vet, Eram U ltd, Coopers U Ltd
Coopers, Norbrook, Eram, Nile Sevices, Quality Chemicals, Good Man International, Global Vet Ltd, MSJ Afro- Agro Pharmacy, Scope Vet devt ltd, Super Vet Pharmacy
Coopers, Bayer Norbrook
Feeds company Kasese feeds ltd Kagodo Farmers, Ngondwe Feeds
Organizations UNADA, DAR Programme
UNADA, AT U, Mukwano Grp of Companies,
UNADA, DAR Program, Mukwano, KFS(UNADA), FAO, AGRO FARM Supply / UNADA
UNADA, DAR Programme,Blue Nile / UNADA, AT U/ ADJUMANI Quality Farm supply
The period within which agro- input dealers pay for the goods received on credit ranged from one week to six months. 35% of agro- dealers were required to pay back within a month, while 20% were required to pay back within 2-3 weeks. Few supply companies offer up to six months for dealers to pay The table below shows the terms of credit offered by different input suppliers. The small proportion of agro- input dealers receiving credit from suppliers is probably attributed to the short repayment of the credit offered.
41
Participation in Input Credit Guarantee Schemes by Agro dealers Credit guarantee scheme was identified as one of the mechanism by which suppliers finance Agro- Input dealers. Figure 34: Agro-dealers participating in
CGS
Figure 35: Terms for participating in
CGS
Dealers Participating in CGS
0 50 100 150 200
Dow n payment
Clean credit rating
Being a member
Co
nd
itio
n
Number of Dealers
Willingness to participate in future credit scheme
Figure 36:Agro-dealers’ willingness to participate in
CGS
Nationally it was observed that 249 (12%) of 2064 agro- dealers have ever participated in the credit guarantee arrangement. (See Figure 34) Agro-dealers gave the following conditions that enabled them to participate in this scheme. (1) They are/were members of credit support organizations, (2) They provided down payment and (3) They were credit worthy. (See Figure 34) Among the support organizations that facilitate the scheme, UNADA was the most mentioned organization at 84% of the respondents. Other organizations included APEP 10%, Mukwano Group of companies 3% and UNFA 3%.
Organization Observations Percent
UNADA 157 84%
Mukwano Group 6 3%
IDEA/ APEP 19 10%
The study revealed that 1,130 (55%) agro- dealers are willing to participate in the future credit guarantee scheme and they suggested the following reasonable terms to enable them participate in a future credit scheme. Suggested Credit Period : The mean duration suggested by agro- dealers was 6-12 months. Within this period they will be able to pay for the guaranteed inputs.
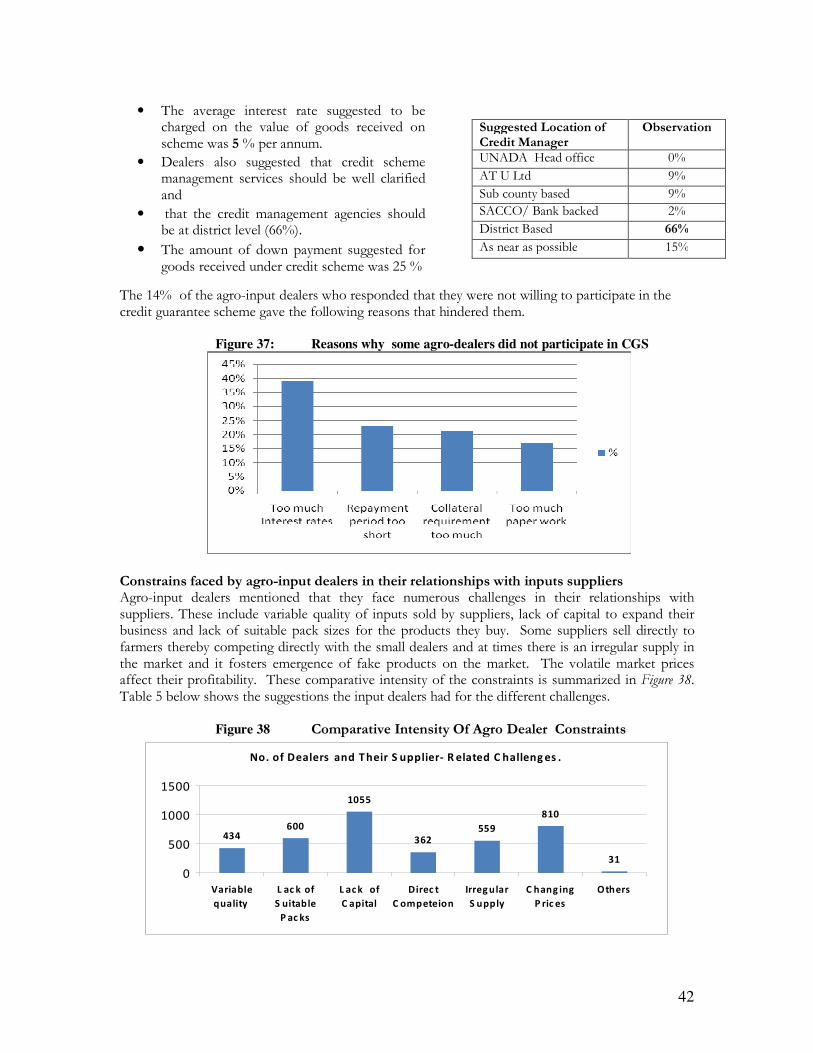
42
The 14% of the agro-input dealers who responded that they were not willing to participate in the credit guarantee scheme gave the following reasons that hindered them. Figure 37: Reasons why some agro-dealers did not participate in CGS
Constrains faced by agro-input dealers in their relationships with inputs suppliers Agro-input dealers mentioned that they face numerous challenges in their relationships with suppliers. These include variable quality of inputs sold by suppliers, lack of capital to expand their business and lack of suitable pack sizes for the products they buy. Some suppliers sell directly to farmers thereby competing directly with the small dealers and at times there is an irregular supply in the market and it fosters emergence of fake products on the market. The volatile market prices affect their profitability. These comparative intensity of the constraints is summarized in Figure 38. Table 5 below shows the suggestions the input dealers had for the different challenges.
Figure 38 Comparative Intensity Of Agro Dealer Constraints
No. of Dealers and T heir S upplier- R elated C halleng es .
434600
1055
362559
810
31
0
500
1000
1500
Variable
quality
L ac k of
S uitable
P ac ks
L ac k of
C apital
Direc t
C ompeteion
Irreg ular
S upply
C hang ing
P ric es
Others
Suggested Location of Credit Manager
Observation
UNADA Head office 0%
AT U Ltd 9%
Sub county based 9%
SACCO/ Bank backed 2%
District Based 66%
As near as possible 15%
• The average interest rate suggested to be charged on the value of goods received on scheme was 5 % per annum.
• Dealers also suggested that credit scheme management services should be well clarified and
• that the credit management agencies should be at district level (66%).
• The amount of down payment suggested for goods received under credit scheme was 25 %
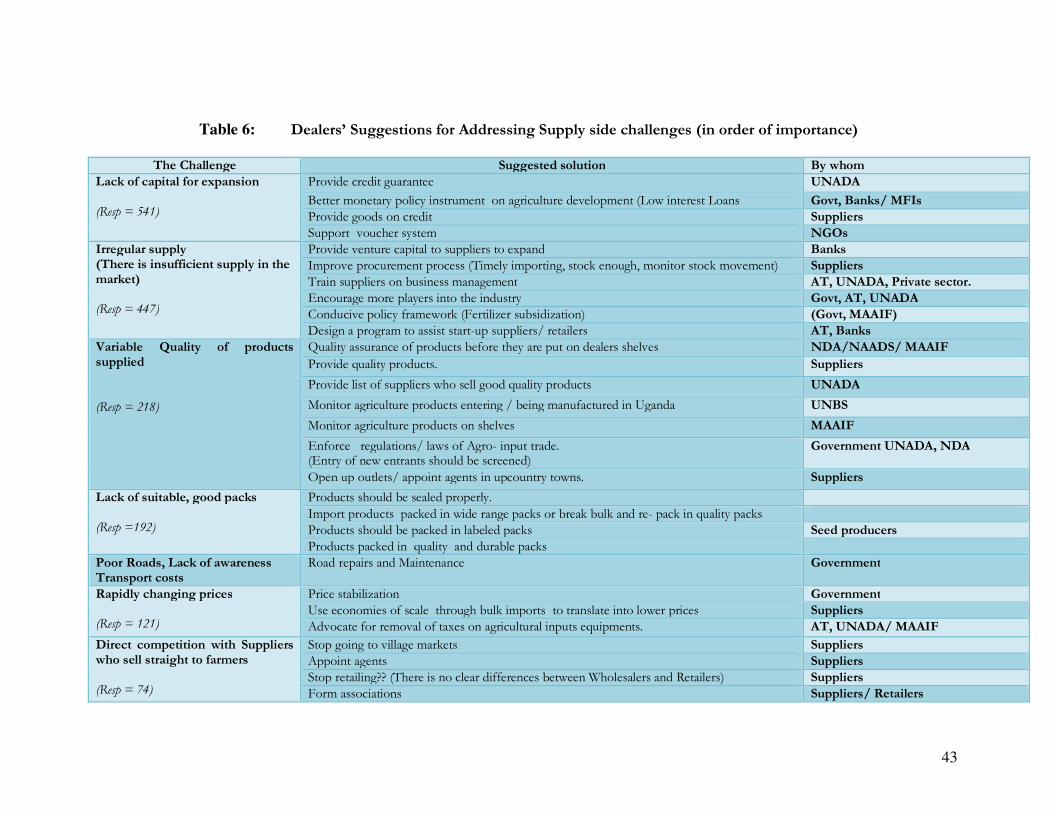
43
Table 6: Dealers’ Suggestions for Addressing Supply side challenges (in order of importance)
The Challenge Suggested solution By whom
Lack of capital for expansion (Resp = 541)
Provide credit guarantee UNADA
Better monetary policy instrument on agriculture development (Low interest Loans Govt, Banks/ MFIs
Provide goods on credit Suppliers
Support voucher system NGOs
Irregular supply (There is insufficient supply in the market) (Resp = 447)
Provide venture capital to suppliers to expand Banks
Improve procurement process (Timely importing, stock enough, monitor stock movement) Suppliers
Train suppliers on business management AT, UNADA, Private sector.
Encourage more players into the industry Govt, AT, UNADA
Conducive policy framework (Fertilizer subsidization) (Govt, MAAIF)
Design a program to assist start-up suppliers/ retailers AT, Banks
Variable Quality of products supplied (Resp = 218)
Quality assurance of products before they are put on dealers shelves NDA/NAADS/ MAAIF
Provide quality products. Suppliers
Provide list of suppliers who sell good quality products UNADA
Monitor agriculture products entering / being manufactured in Uganda UNBS
Monitor agriculture products on shelves MAAIF
Enforce regulations/ laws of Agro- input trade. (Entry of new entrants should be screened)
Government UNADA, NDA
Open up outlets/ appoint agents in upcountry towns. Suppliers
Lack of suitable, good packs (Resp =192)
Products should be sealed properly.
Import products packed in wide range packs or break bulk and re- pack in quality packs
Products should be packed in labeled packs Seed producers
Products packed in quality and durable packs
Poor Roads, Lack of awareness Transport costs
Road repairs and Maintenance Government
Rapidly changing prices (Resp = 121)
Price stabilization Government
Use economies of scale through bulk imports to translate into lower prices Suppliers
Advocate for removal of taxes on agricultural inputs equipments. AT, UNADA/ MAAIF
Direct competition with Suppliers who sell straight to farmers (Resp = 74)
Stop going to village markets Suppliers
Appoint agents Suppliers
Stop retailing?? (There is no clear differences between Wholesalers and Retailers) Suppliers
Form associations Suppliers/ Retailers
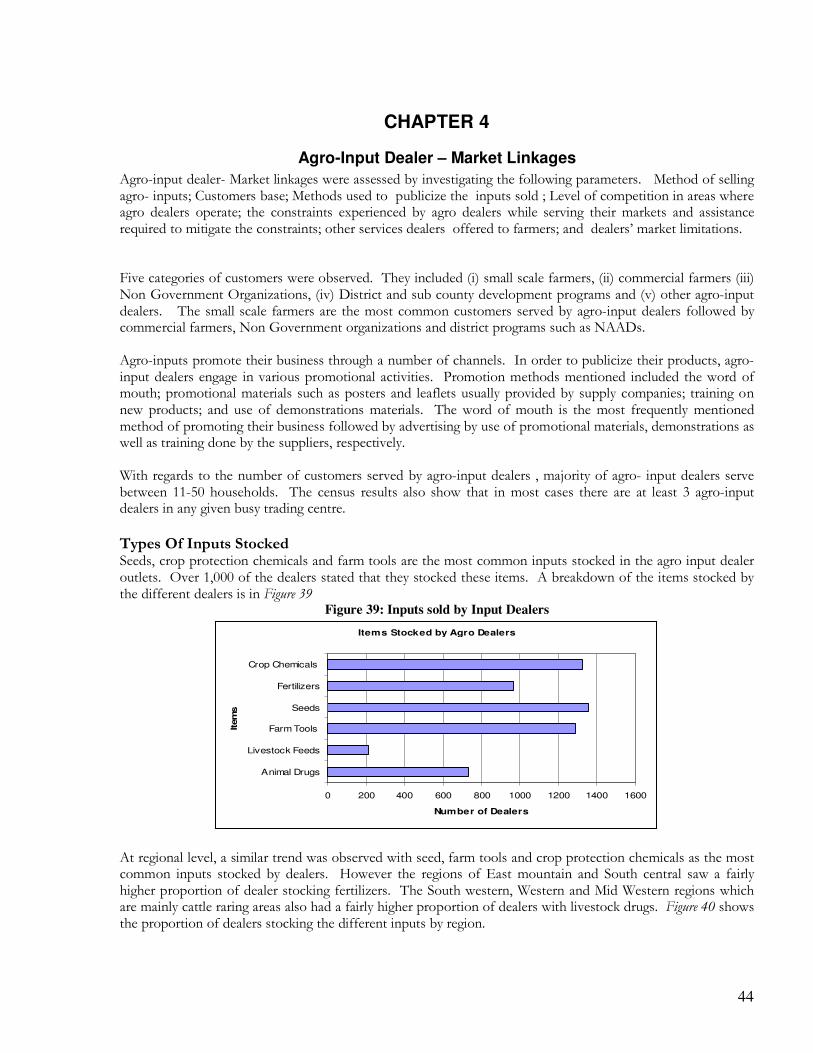
44
CHAPTER 4
Agro-Input Dealer – Market Linkages
Agro-input dealer- Market linkages were assessed by investigating the following parameters. Method of selling agro- inputs; Customers base; Methods used to publicize the inputs sold ; Level of competition in areas where agro dealers operate; the constraints experienced by agro dealers while serving their markets and assistance required to mitigate the constraints; other services dealers offered to farmers; and dealers’ market limitations. Five categories of customers were observed. They included (i) small scale farmers, (ii) commercial farmers (iii) Non Government Organizations, (iv) District and sub county development programs and (v) other agro-input dealers. The small scale farmers are the most common customers served by agro-input dealers followed by commercial farmers, Non Government organizations and district programs such as NAADs. Agro-inputs promote their business through a number of channels. In order to publicize their products, agro-input dealers engage in various promotional activities. Promotion methods mentioned included the word of mouth; promotional materials such as posters and leaflets usually provided by supply companies; training on new products; and use of demonstrations materials. The word of mouth is the most frequently mentioned method of promoting their business followed by advertising by use of promotional materials, demonstrations as well as training done by the suppliers, respectively. With regards to the number of customers served by agro-input dealers , majority of agro- input dealers serve between 11-50 households. The census results also show that in most cases there are at least 3 agro-input dealers in any given busy trading centre.
Types Of Inputs Stocked Seeds, crop protection chemicals and farm tools are the most common inputs stocked in the agro input dealer outlets. Over 1,000 of the dealers stated that they stocked these items. A breakdown of the items stocked by the different dealers is in Figure 39
Figure 39: Inputs sold by Input Dealers
Items Stocked by Agro Dealers
0 200 400 600 800 1000 1200 1400 1600
Animal Drugs
Livestock Feeds
Farm Tools
Seeds
Fertilizers
Crop Chemicals
Item
s
Number of Dealers
At regional level, a similar trend was observed with seed, farm tools and crop protection chemicals as the most common inputs stocked by dealers. However the regions of East mountain and South central saw a fairly higher proportion of dealer stocking fertilizers. The South western, Western and Mid Western regions which are mainly cattle raring areas also had a fairly higher proportion of dealers with livestock drugs. Figure 40 shows the proportion of dealers stocking the different inputs by region.
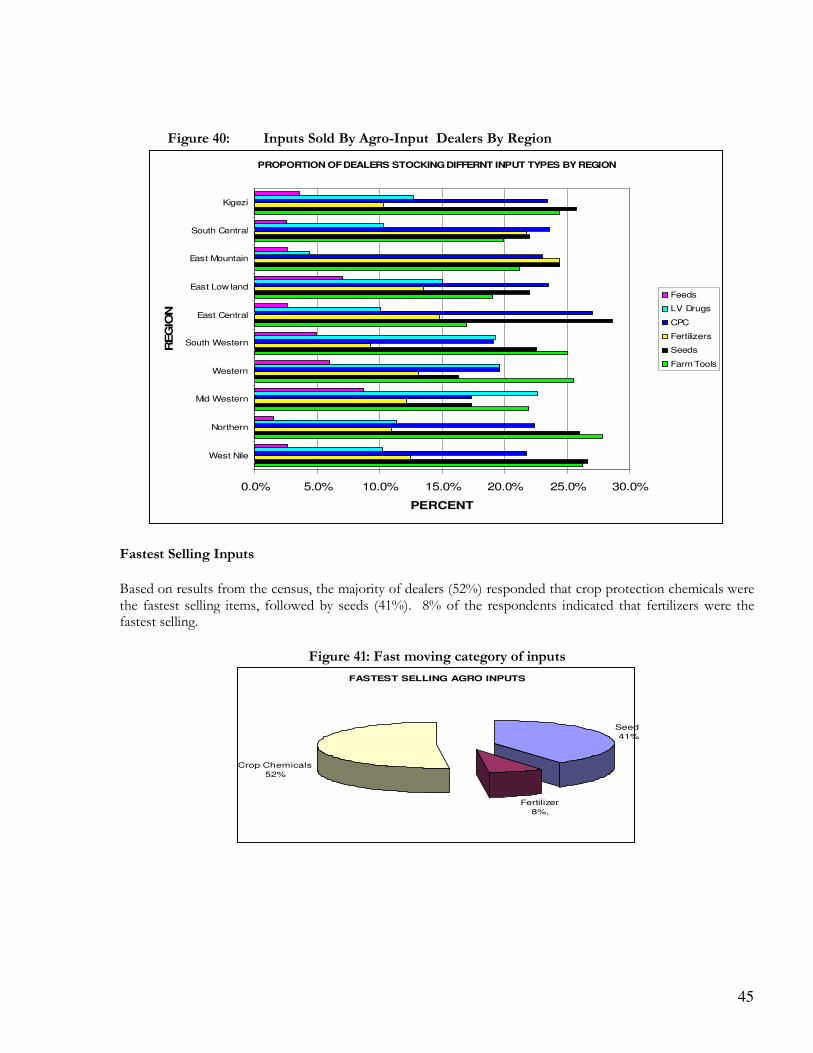
45
Figure 40: Inputs Sold By Agro-Input Dealers By Region
PROPORTION OF DEALERS STOCKING DIFFERNT INPUT TYPES BY REGION
0.0% 5.0% 10.0% 15.0% 20.0% 25.0% 30.0%
West Nile
Northern
Mid Western
Western
South Western
East Central
East Low land
East Mountain
South Central
Kigezi
REG
ION
PERCENT
Feeds
LV Drugs
CPC
Fertilizers
Seeds
Farm Tools
Fastest Selling Inputs
Based on results from the census, the majority of dealers (52%) responded that crop protection chemicals were the fastest selling items, followed by seeds (41%). 8% of the respondents indicated that fertilizers were the fastest selling.
Figure 41: Fast moving category of inputs
FASTEST SELLING AGRO INPUTS
Seed
41%
Fertilizer
8%,
Crop Chemicals
52%
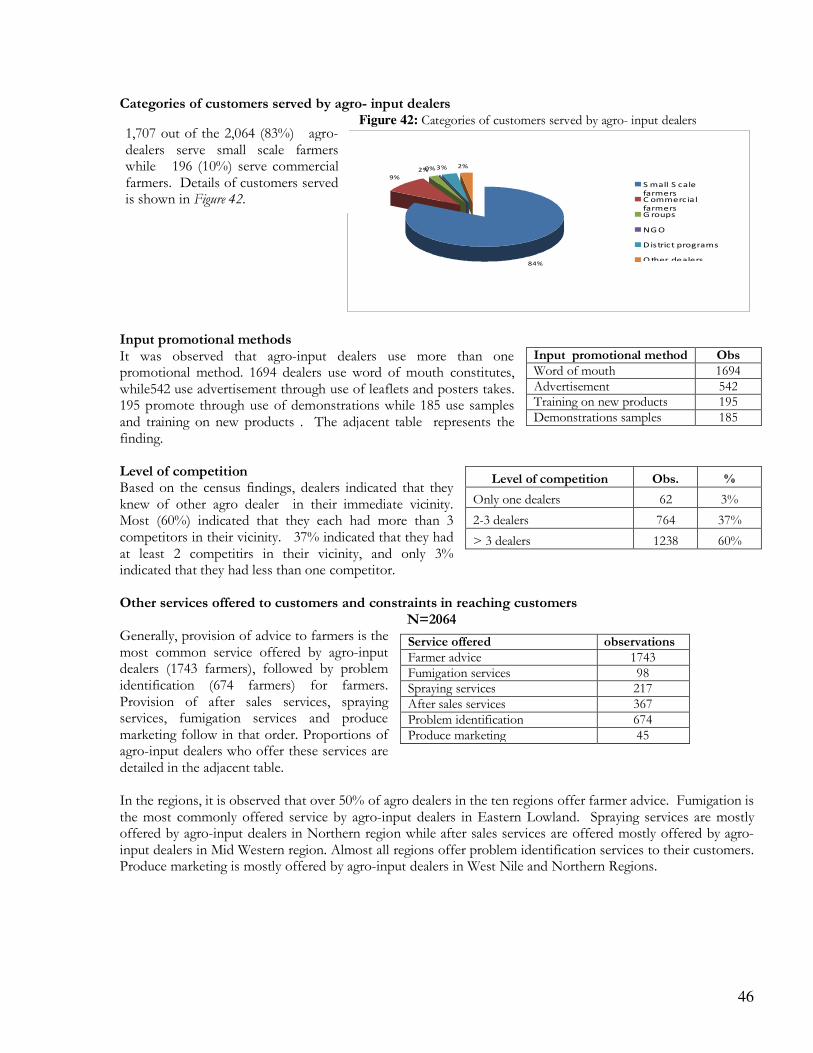
46
Categories of customers served by agro- input dealers Figure 42: Categories of customers served by agro- input dealers
84%
9%
2%0% 3% 2%
S mall S cale
farmersC ommercial
farmersG roups
NG O
D istrict programs
O ther dealers
Input promotional methods It was observed that agro-input dealers use more than one promotional method. 1694 dealers use word of mouth constitutes, while542 use advertisement through use of leaflets and posters takes. 195 promote through use of demonstrations while 185 use samples and training on new products . The adjacent table represents the finding. Level of competition Based on the census findings, dealers indicated that they knew of other agro dealer in their immediate vicinity. Most (60%) indicated that they each had more than 3 competitors in their vicinity. 37% indicated that they had at least 2 competitirs in their vicinity, and only 3% indicated that they had less than one competitor. Other services offered to customers and constraints in reaching customers N=2064 Generally, provision of advice to farmers is the most common service offered by agro-input dealers (1743 farmers), followed by problem identification (674 farmers) for farmers. Provision of after sales services, spraying services, fumigation services and produce marketing follow in that order. Proportions of agro-input dealers who offer these services are detailed in the adjacent table. In the regions, it is observed that over 50% of agro dealers in the ten regions offer farmer advice. Fumigation is the most commonly offered service by agro-input dealers in Eastern Lowland. Spraying services are mostly offered by agro-input dealers in Northern region while after sales services are offered mostly offered by agro-input dealers in Mid Western region. Almost all regions offer problem identification services to their customers. Produce marketing is mostly offered by agro-input dealers in West Nile and Northern Regions.
Input promotional method Obs Word of mouth 1694 Advertisement 542 Training on new products 195 Demonstrations samples 185
Level of competition Obs. %
Only one dealers 62 3%
2-3 dealers 764 37%
> 3 dealers 1238 60%
Service offered observations Farmer advice 1743 Fumigation services 98 Spraying services 217 After sales services 367 Problem identification 674 Produce marketing 45
1,707 out of the 2,064 (83%) agro-dealers serve small scale farmers while 196 (10%) serve commercial farmers. Details of customers served is shown in Figure 42.
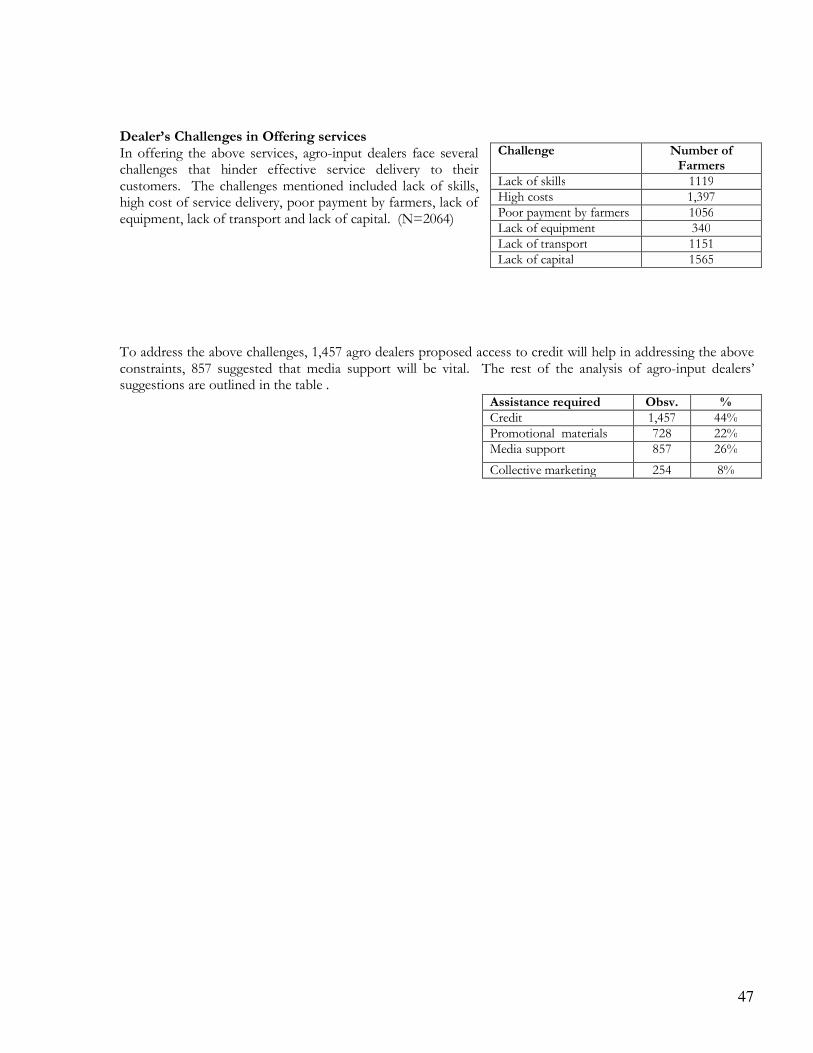
47
Dealer’s Challenges in Offering services In offering the above services, agro-input dealers face several challenges that hinder effective service delivery to their customers. The challenges mentioned included lack of skills, high cost of service delivery, poor payment by farmers, lack of equipment, lack of transport and lack of capital. (N=2064)
To address the above challenges, 1,457 agro dealers proposed access to credit will help in addressing the above constraints, 857 suggested that media support will be vital. The rest of the analysis of agro-input dealers’ suggestions are outlined in the table .
Challenge Number of Farmers
Lack of skills 1119 High costs 1,397 Poor payment by farmers 1056 Lack of equipment 340 Lack of transport 1151 Lack of capital 1565
Assistance required Obsv. % Credit 1,457 44% Promotional materials 728 22% Media support 857 26%
Collective marketing 254 8%
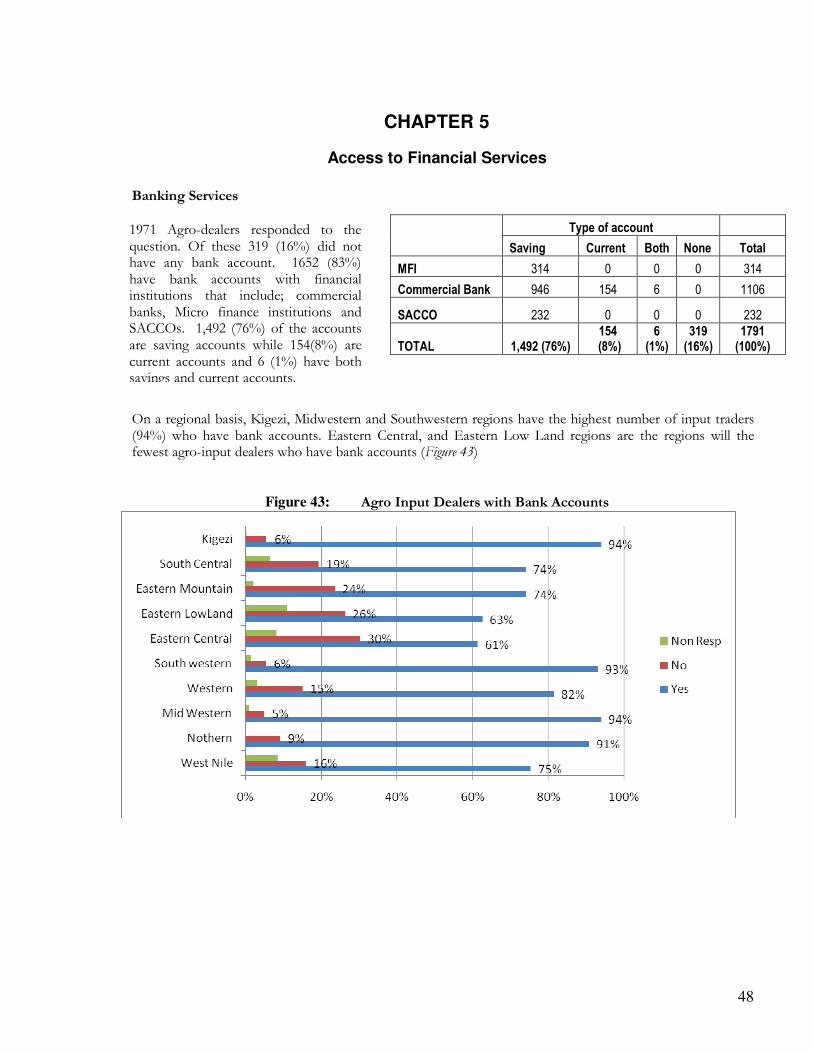
48
CHAPTER 5
Access to Financial Services
Banking Services
On a regional basis, Kigezi, Midwestern and Southwestern regions have the highest number of input traders (94%) who have bank accounts. Eastern Central, and Eastern Low Land regions are the regions will the fewest agro-input dealers who have bank accounts (Figure 43)
Figure 43: Agro Input Dealers with Bank Accounts
Type of account
Saving Current Both None Total
MFI 314 0 0 0 314
Commercial Bank 946 154 6 0 1106
SACCO 232 0 0 0 232
TOTAL 1,492 (76%) 154 (8%)
6 (1%)
319 (16%)
1791 (100%)
1971 Agro-dealers responded to the question. Of these 319 (16%) did not have any bank account. 1652 (83%) have bank accounts with financial institutions that include; commercial banks, Micro finance institutions and SACCOs. 1,492 (76%) of the accounts are saving accounts while 154(8%) are current accounts and 6 (1%) have both savings and current accounts.
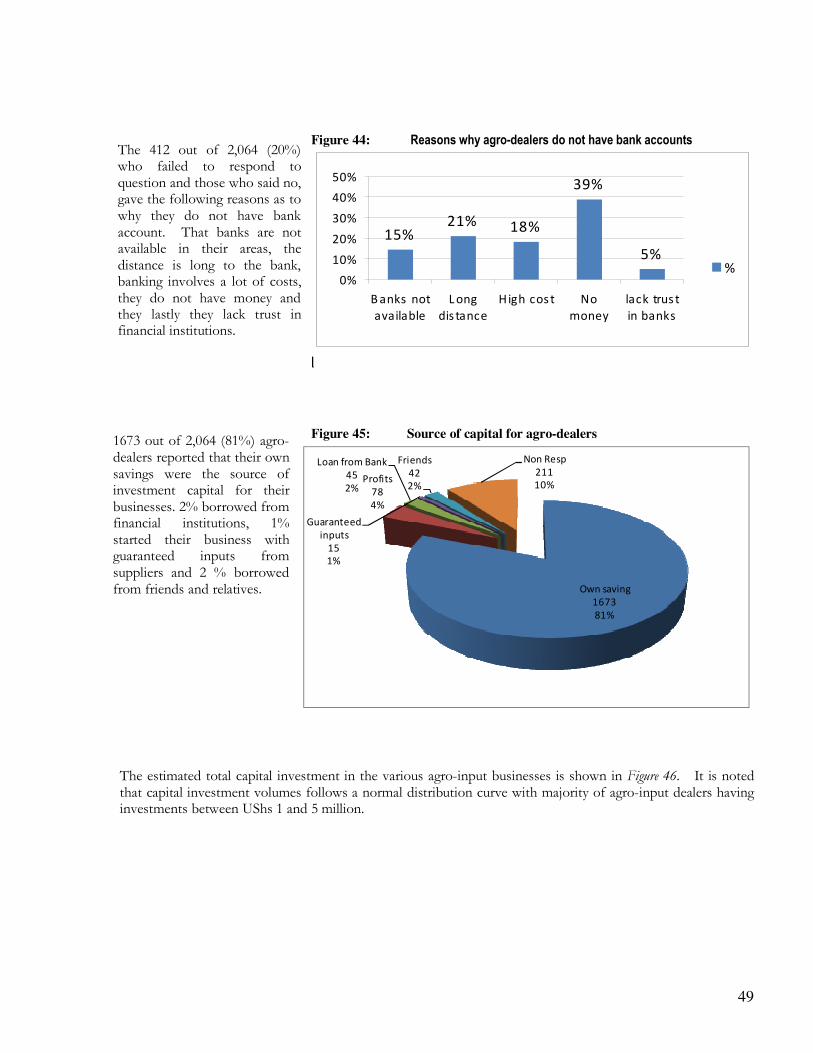
49
Figure 44: Reasons why agro-dealers do not have bank accounts
15%21% 18%
39%
5%
0%
10%
20%
30%
40%
50%
B anks not
available
L ong
dis tance
High cos t No
money
lack trus t
in banks
%
Source of Investment capital
Figure 45: Source of capital for agro-dealers
Own saving
1673
81%
Profits
78
4%
Loan from Bank
45
2%
Guaranteed
inputs
15
1%
Friends
42
2%
Non Resp
211
10%
The estimated total capital investment in the various agro-input businesses is shown in Figure 46. It is noted that capital investment volumes follows a normal distribution curve with majority of agro-input dealers having investments between UShs 1 and 5 million.
The 412 out of 2,064 (20%) who failed to respond to question and those who said no, gave the following reasons as to why they do not have bank account. That banks are not available in their areas, the distance is long to the bank, banking involves a lot of costs, they do not have money and they lastly they lack trust in financial institutions.
1673 out of 2,064 (81%) agro-dealers reported that their own savings were the source of investment capital for their businesses. 2% borrowed from financial institutions, 1% started their business with guaranteed inputs from suppliers and 2 % borrowed from friends and relatives.
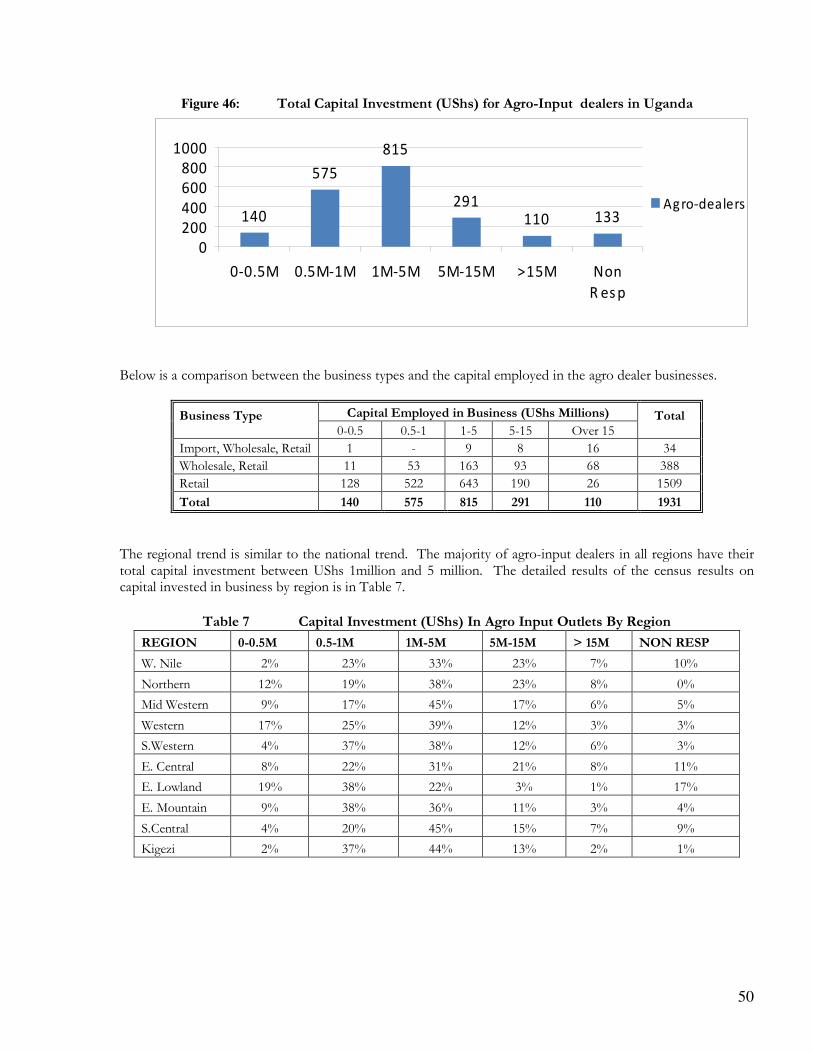
50
Figure 46: Total Capital Investment (UShs) for Agro-Input dealers in Uganda
140
575
815
291110 133
0
200
400
600
800
1000
0-0.5M 0.5M-1M 1M-5M 5M-15M >15M Non
R es p
Agro-dealers
Below is a comparison between the business types and the capital employed in the agro dealer businesses.
Business Type
Capital Employed in Business (UShs Millions) Total 0-0.5 0.5-1 1-5 5-15 Over 15
Import, Wholesale, Retail 1 - 9 8 16 34
Wholesale, Retail 11 53 163 93 68 388
Retail 128 522 643 190 26 1509
Total 140 575 815 291 110 1931
The regional trend is similar to the national trend. The majority of agro-input dealers in all regions have their total capital investment between UShs 1million and 5 million. The detailed results of the census results on capital invested in business by region is in Table 7.
Table 7 Capital Investment (UShs) In Agro Input Outlets By Region
REGION 0-0.5M 0.5-1M 1M-5M 5M-15M > 15M NON RESP
W. Nile 2% 23% 33% 23% 7% 10%
Northern 12% 19% 38% 23% 8% 0%
Mid Western 9% 17% 45% 17% 6% 5%
Western 17% 25% 39% 12% 3% 3%
S.Western 4% 37% 38% 12% 6% 3%
E. Central 8% 22% 31% 21% 8% 11%
E. Lowland 19% 38% 22% 3% 1% 17%
E. Mountain 9% 38% 36% 11% 3% 4%
S.Central 4% 20% 45% 15% 7% 9%
Kigezi 2% 37% 44% 13% 2% 1%
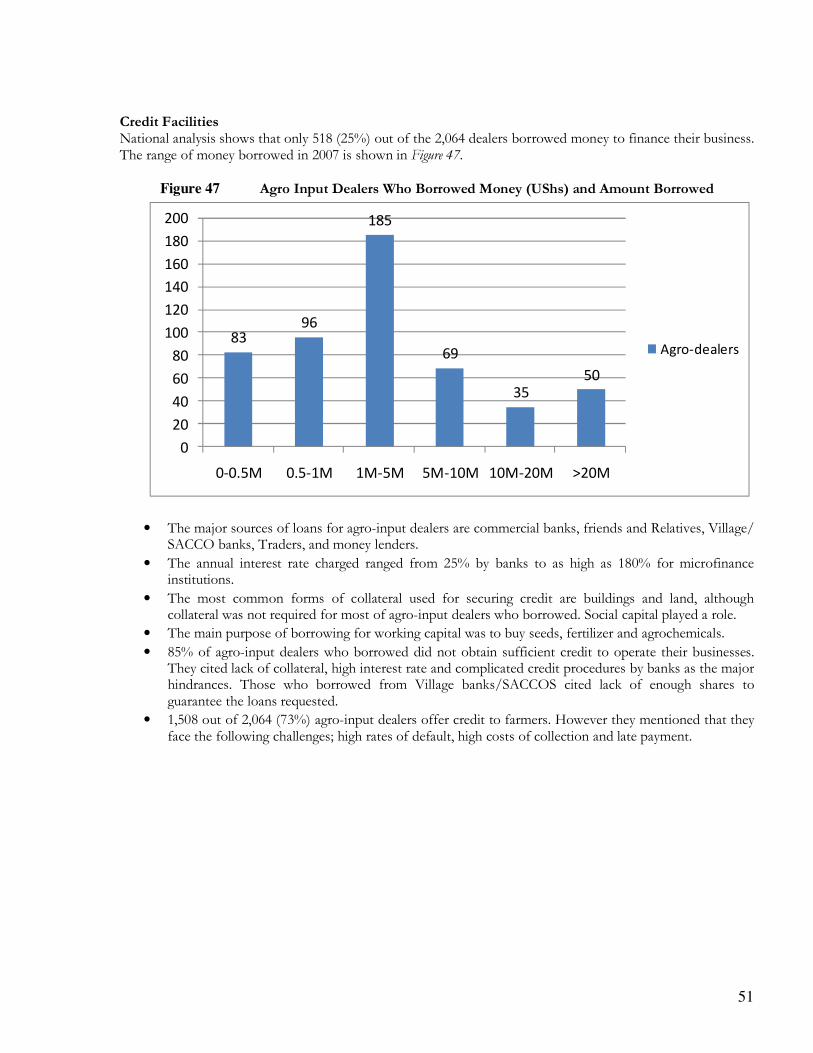
51
Credit Facilities National analysis shows that only 518 (25%) out of the 2,064 dealers borrowed money to finance their business. The range of money borrowed in 2007 is shown in Figure 47.
Figure 47 Agro Input Dealers Who Borrowed Money (UShs) and Amount Borrowed
8396
185
69
3550
0
20
40
60
80
100
120
140
160
180
200
0-0.5M 0.5-1M 1M-5M 5M-10M 10M-20M >20M
Agro-dealers
• The major sources of loans for agro-input dealers are commercial banks, friends and Relatives, Village/ SACCO banks, Traders, and money lenders.
• The annual interest rate charged ranged from 25% by banks to as high as 180% for microfinance institutions.
• The most common forms of collateral used for securing credit are buildings and land, although collateral was not required for most of agro-input dealers who borrowed. Social capital played a role.
• The main purpose of borrowing for working capital was to buy seeds, fertilizer and agrochemicals.
• 85% of agro-input dealers who borrowed did not obtain sufficient credit to operate their businesses. They cited lack of collateral, high interest rate and complicated credit procedures by banks as the major hindrances. Those who borrowed from Village banks/SACCOS cited lack of enough shares to guarantee the loans requested.
• 1,508 out of 2,064 (73%) agro-input dealers offer credit to farmers. However they mentioned that they face the following challenges; high rates of default, high costs of collection and late payment.
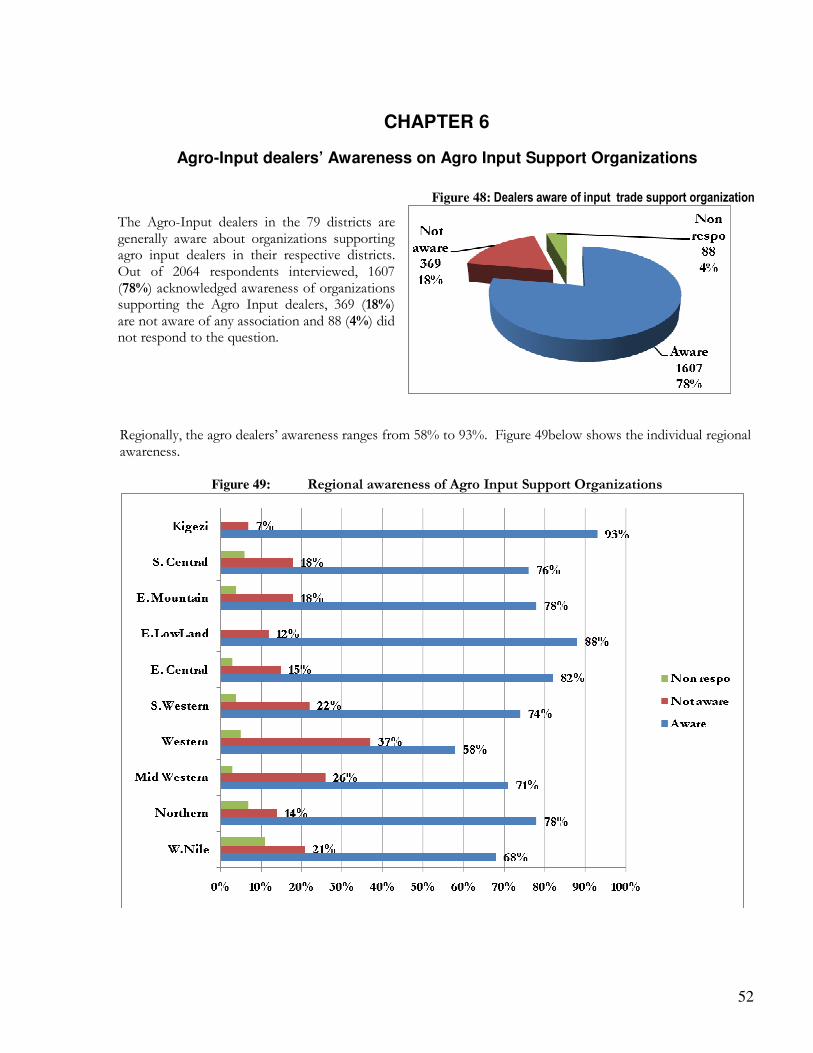
52
CHAPTER 6
Agro-Input dealers’ Awareness on Agro Input Support Organizations
Figure 48: Dealers aware of input trade support organization
Regionally, the agro dealers’ awareness ranges from 58% to 93%. Figure 49below shows the individual regional awareness.
Figure 49: Regional awareness of Agro Input Support Organizations
The Agro-Input dealers in the 79 districts are generally aware about organizations supporting agro input dealers in their respective districts. Out of 2064 respondents interviewed, 1607 (78%) acknowledged awareness of organizations supporting the Agro Input dealers, 369 (18%) are not aware of any association and 88 (4%) did not respond to the question.
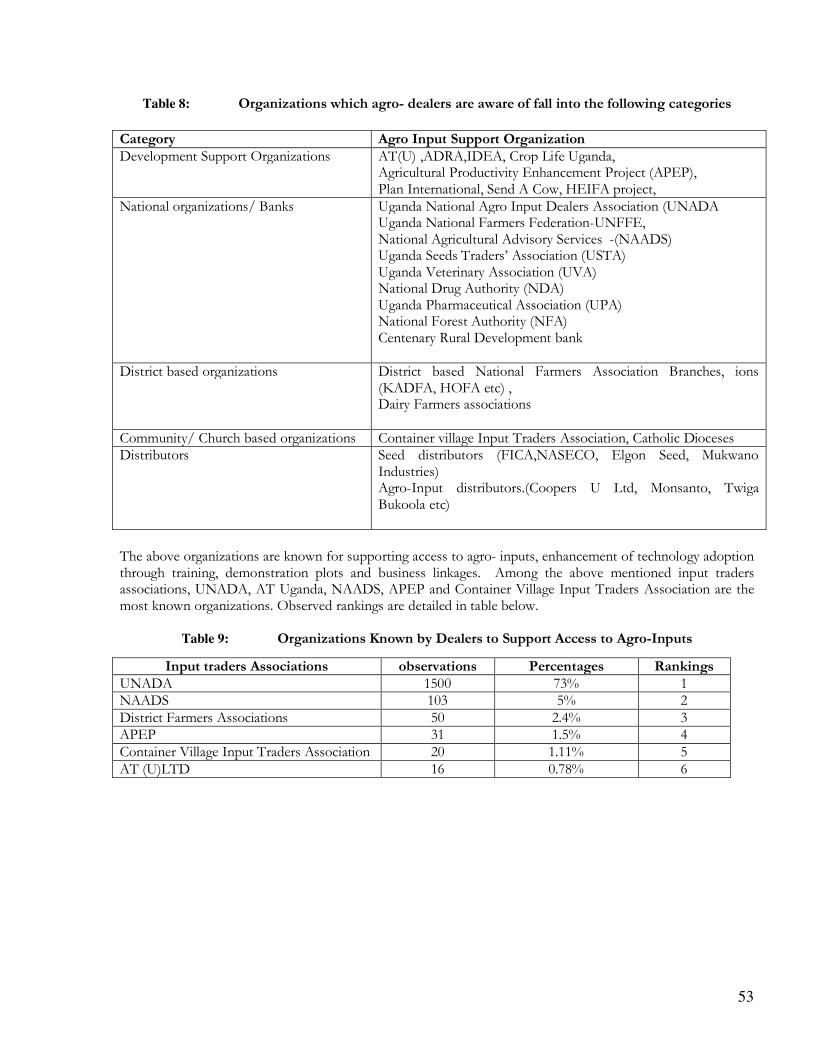
53
Table 8: Organizations which agro- dealers are aware of fall into the following categories
Category Agro Input Support Organization Development Support Organizations AT(U) ,ADRA,IDEA, Crop Life Uganda,
Agricultural Productivity Enhancement Project (APEP), Plan International, Send A Cow, HEIFA project,
National organizations/ Banks Uganda National Agro Input Dealers Association (UNADA Uganda National Farmers Federation-UNFFE, National Agricultural Advisory Services -(NAADS) Uganda Seeds Traders’ Association (USTA) Uganda Veterinary Association (UVA) National Drug Authority (NDA) Uganda Pharmaceutical Association (UPA) National Forest Authority (NFA) Centenary Rural Development bank
District based organizations District based National Farmers Association Branches, ions (KADFA, HOFA etc) , Dairy Farmers associations
Community/ Church based organizations Container village Input Traders Association, Catholic Dioceses Distributors Seed distributors (FICA,NASECO, Elgon Seed, Mukwano
Industries) Agro-Input distributors.(Coopers U Ltd, Monsanto, Twiga Bukoola etc)
The above organizations are known for supporting access to agro- inputs, enhancement of technology adoption through training, demonstration plots and business linkages. Among the above mentioned input traders associations, UNADA, AT Uganda, NAADS, APEP and Container Village Input Traders Association are the most known organizations. Observed rankings are detailed in table below.
Table 9: Organizations Known by Dealers to Support Access to Agro-Inputs
Input traders Associations observations Percentages Rankings UNADA 1500 73% 1 NAADS 103 5% 2 District Farmers Associations 50 2.4% 3 APEP 31 1.5% 4 Container Village Input Traders Association 20 1.11% 5 AT (U)LTD 16 0.78% 6
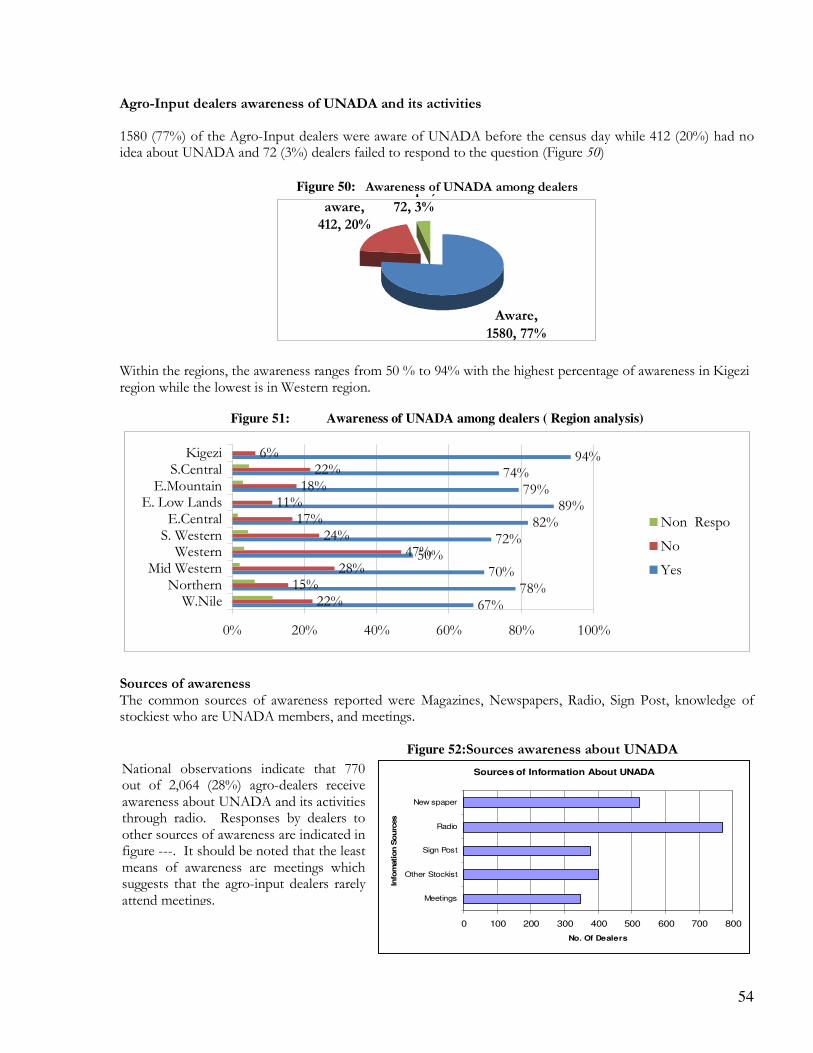
54
Agro-Input dealers awareness of UNADA and its activities
1580 (77%) of the Agro-Input dealers were aware of UNADA before the census day while 412 (20%) had no idea about UNADA and 72 (3%) dealers failed to respond to the question (Figure 50)
Figure 50: Awareness of UNADA among dealers
Aware,
1580, 77%
Not
aware,
412, 20%
Respo,
72, 3%
Within the regions, the awareness ranges from 50 % to 94% with the highest percentage of awareness in Kigezi region while the lowest is in Western region.
Figure 51: Awareness of UNADA among dealers ( Region analysis)
67%78%
70%50%
72%82%
89%79%
74%94%
22%15%
28%47%
24%17%
11%18%22%
6%
0% 20% 40% 60% 80% 100%
W.NileNorthern
Mid WesternWestern
S. WesternE.Central
E. Low LandsE.Mountain
S.CentralKigezi
Non Respo
No
Yes
Sources of awareness The common sources of awareness reported were Magazines, Newspapers, Radio, Sign Post, knowledge of stockiest who are UNADA members, and meetings. Figure 52:Sources awareness about UNADA
Sources of Information About UNADA
0 100 200 300 400 500 600 700 800
Meetings
Other Stockist
Sign Post
Radio
New spaper
Info
mation S
ourc
es
No. Of Dealers
National observations indicate that 770 out of 2,064 (28%) agro-dealers receive awareness about UNADA and its activities through radio. Responses by dealers to other sources of awareness are indicated in figure ---. It should be noted that the least means of awareness are meetings which suggests that the agro-input dealers rarely attend meetings.
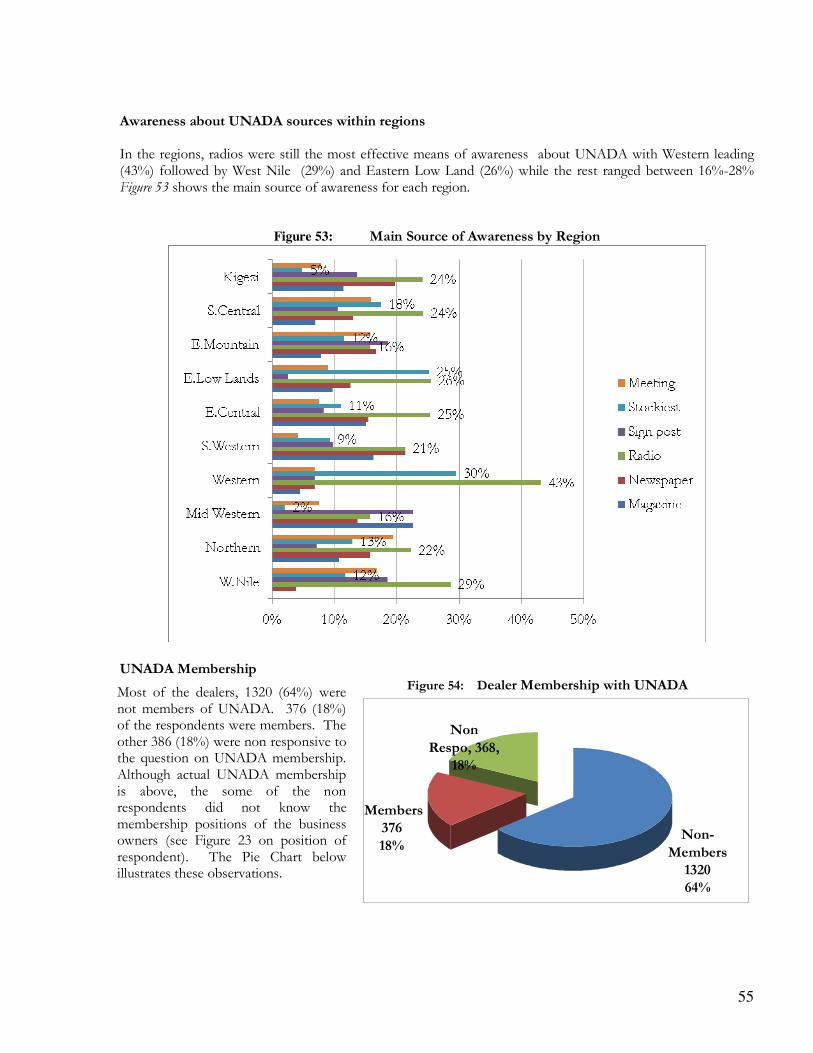
55
Awareness about UNADA sources within regions In the regions, radios were still the most effective means of awareness about UNADA with Western leading (43%) followed by West Nile (29%) and Eastern Low Land (26%) while the rest ranged between 16%-28% Figure 53 shows the main source of awareness for each region.
Figure 53: Main Source of Awareness by Region
UNADA Membership Figure 54: Dealer Membership with UNADA
Members
376
18%Non-
Members
1320
64%
Non
Respo, 368,
18%
Most of the dealers, 1320 (64%) were not members of UNADA. 376 (18%) of the respondents were members. The other 386 (18%) were non responsive to the question on UNADA membership. Although actual UNADA membership is above, the some of the non respondents did not know the membership positions of the business owners (see Figure 23 on position of respondent). The Pie Chart below illustrates these observations.
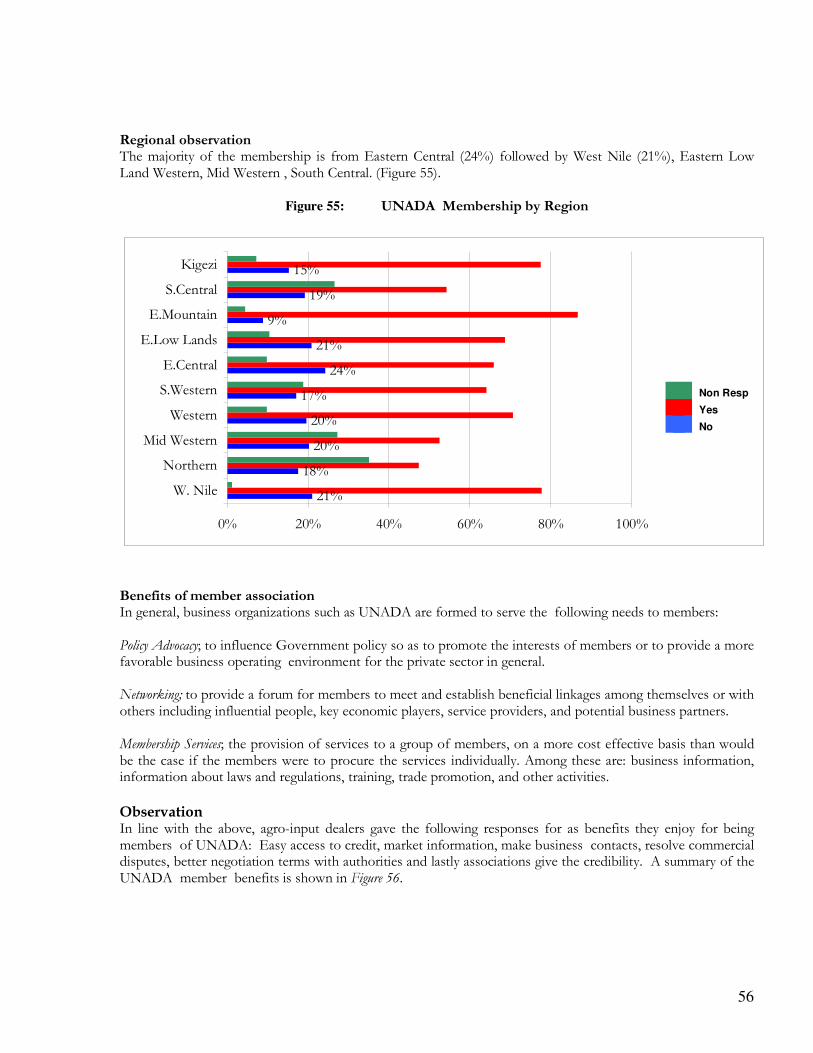
56
Regional observation The majority of the membership is from Eastern Central (24%) followed by West Nile (21%), Eastern Low Land Western, Mid Western , South Central. (Figure 55).
Figure 55: UNADA Membership by Region
21%
18%
20%
20%
17%
24%
21%
9%
19%
15%
0% 20% 40% 60% 80% 100%
W. Nile
Northern
Mid Western
Western
S.Western
E.Central
E.Low Lands
E.Mountain
S.Central
Kigezi
Benefits of member association In general, business organizations such as UNADA are formed to serve the following needs to members: Policy Advocacy; to influence Government policy so as to promote the interests of members or to provide a more favorable business operating environment for the private sector in general.
Networking; to provide a forum for members to meet and establish beneficial linkages among themselves or with others including influential people, key economic players, service providers, and potential business partners. Membership Services; the provision of services to a group of members, on a more cost effective basis than would be the case if the members were to procure the services individually. Among these are: business information, information about laws and regulations, training, trade promotion, and other activities.
Observation
In line with the above, agro-input dealers gave the following responses for as benefits they enjoy for being members of UNADA: Easy access to credit, market information, make business contacts, resolve commercial disputes, better negotiation terms with authorities and lastly associations give the credibility. A summary of the UNADA member benefits is shown in Figure 56.
Non Resp
Yes
No
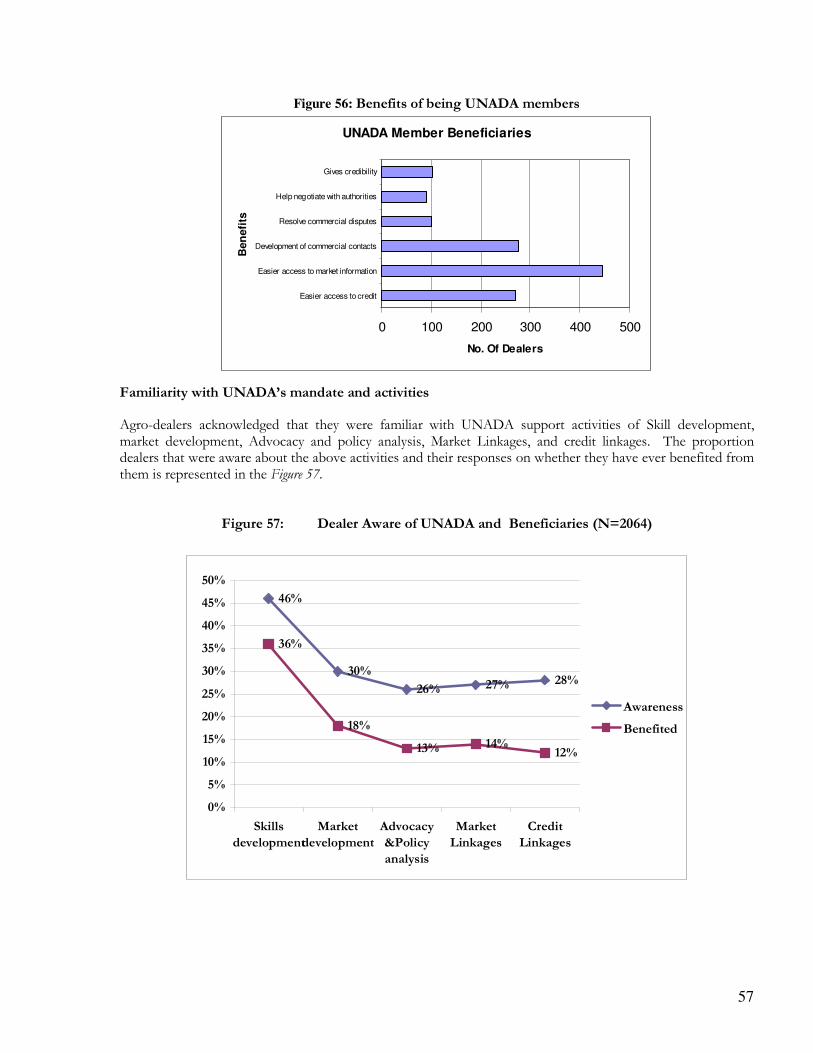
57
Figure 56: Benefits of being UNADA members
UNADA Member Beneficiaries
0 100 200 300 400 500
Easier access to credit
Easier access to market information
Development of commercial contacts
Resolve commercial disputes
Help negotiate with authorities
Gives credibility
Ben
efi
ts
No. Of Dealers
Familiarity with UNADA’s mandate and activities
Agro-dealers acknowledged that they were familiar with UNADA support activities of Skill development, market development, Advocacy and policy analysis, Market Linkages, and credit linkages. The proportion dealers that were aware about the above activities and their responses on whether they have ever benefited from them is represented in the Figure 57.
Figure 57: Dealer Aware of UNADA and Beneficiaries (N=2064)
46%
30%
26% 27% 28%
36%
18%
13% 14%12%
0%
5%
10%
15%
20%
25%
30%
35%
40%
45%
50%
Skills
development
Market
development
Advocacy
&Policy
analysis
Market
Linkages
Credit
Linkages
Awareness
Benefited
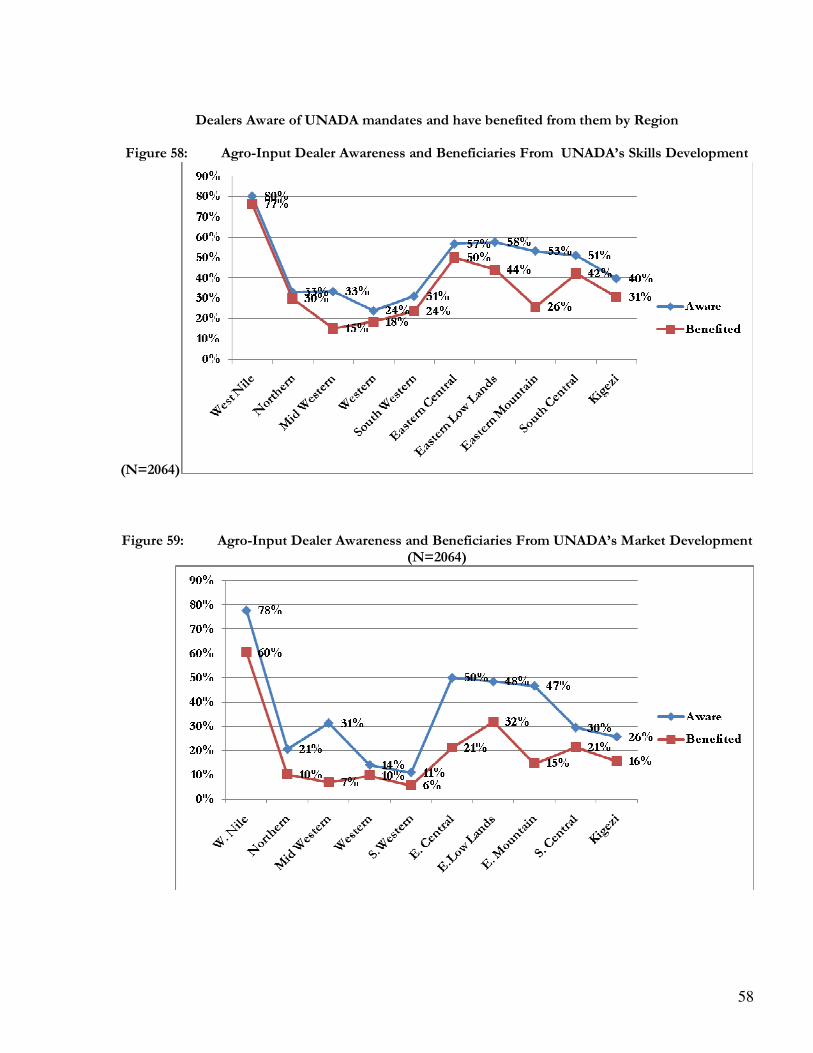
58
Dealers Aware of UNADA mandates and have benefited from them by Region
Figure 58: Agro-Input Dealer Awareness and Beneficiaries From UNADA’s Skills Development
(N=2064)
Figure 59: Agro-Input Dealer Awareness and Beneficiaries From UNADA’s Market Development (N=2064)
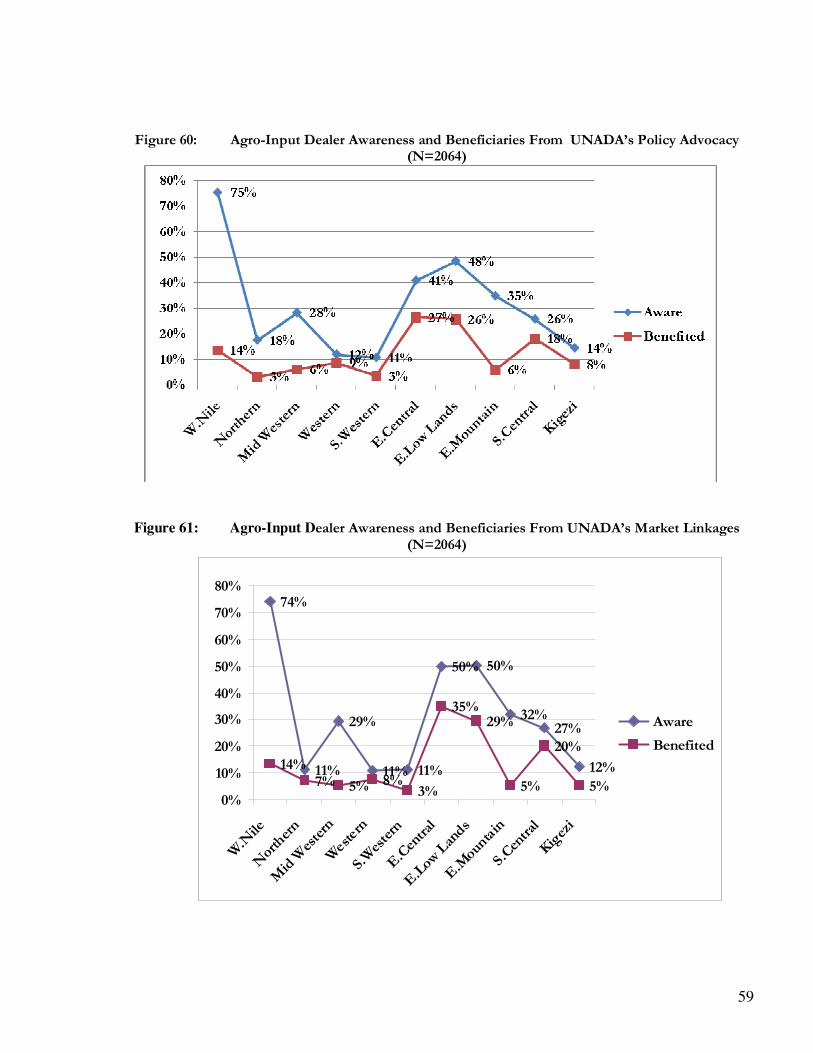
59
Figure 60: Agro-Input Dealer Awareness and Beneficiaries From UNADA’s Policy Advocacy (N=2064)
Figure 61: Agro-Input Dealer Awareness and Beneficiaries From UNADA’s Market Linkages (N=2064)
74%
11%
29%
11% 11%
50% 50%
32%27%
12%14%7% 5% 8%
3%
35%29%
5%
20%
5%0%
10%
20%
30%
40%
50%
60%
70%
80%
W.Nile
Northern
Mid Western
Western
S.Western
E.Central
E.Low Lands
E.Mountain
S.Central
Kigezi
Aware
Benefited
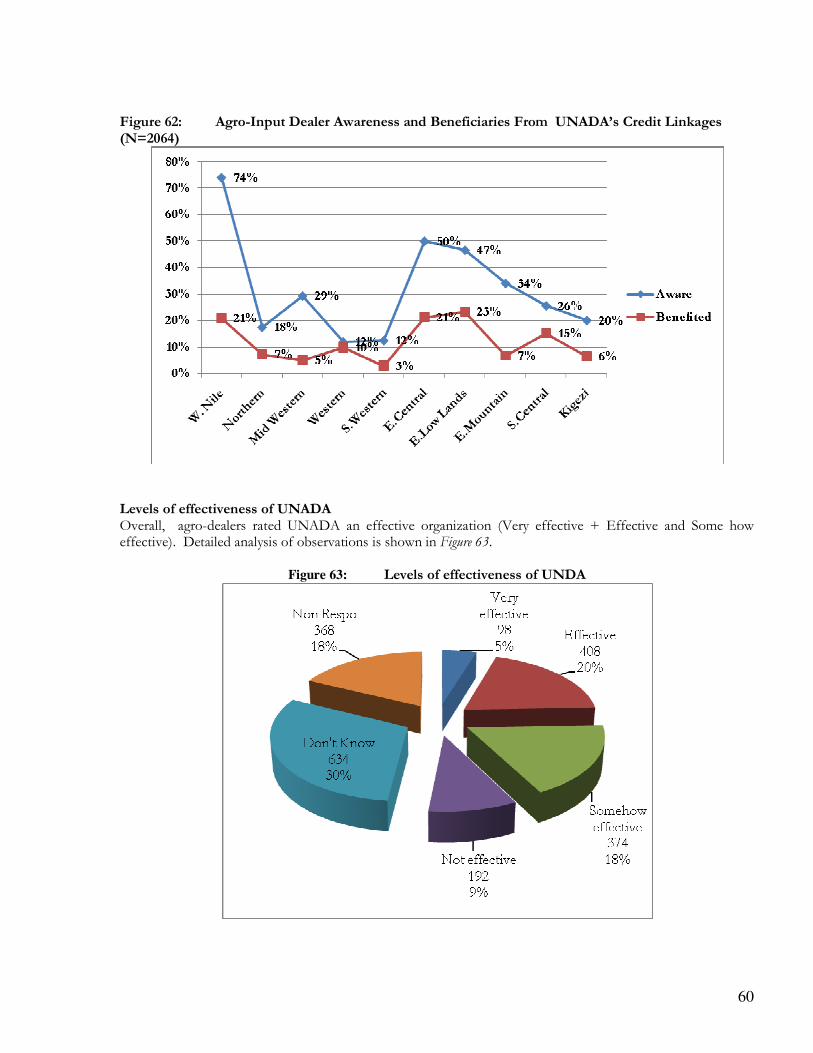
60
Figure 62: Agro-Input Dealer Awareness and Beneficiaries From UNADA’s Credit Linkages (N=2064)
Levels of effectiveness of UNADA Overall, agro-dealers rated UNADA an effective organization (Very effective + Effective and Some how effective). Detailed analysis of observations is shown in Figure 63.
Figure 63: Levels of effectiveness of UNDA
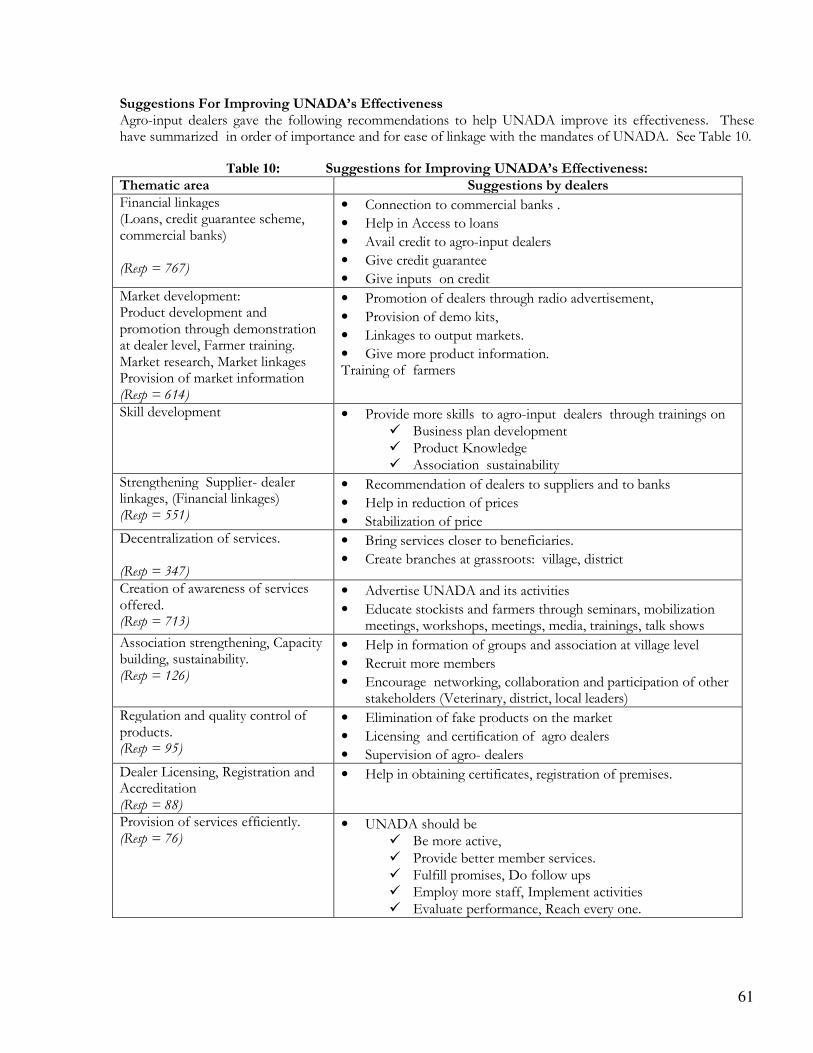
61
Suggestions For Improving UNADA’s Effectiveness Agro-input dealers gave the following recommendations to help UNADA improve its effectiveness. These have summarized in order of importance and for ease of linkage with the mandates of UNADA. See Table 10.
Table 10: Suggestions for Improving UNADA’s Effectiveness: Thematic area Suggestions by dealers Financial linkages (Loans, credit guarantee scheme, commercial banks) (Resp = 767)
• Connection to commercial banks .
• Help in Access to loans
• Avail credit to agro-input dealers
• Give credit guarantee
• Give inputs on credit Market development: Product development and promotion through demonstration at dealer level, Farmer training. Market research, Market linkages Provision of market information (Resp = 614)
• Promotion of dealers through radio advertisement,
• Provision of demo kits,
• Linkages to output markets.
• Give more product information. Training of farmers
Skill development • Provide more skills to agro-input dealers through trainings on � Business plan development � Product Knowledge � Association sustainability
Strengthening Supplier- dealer linkages, (Financial linkages) (Resp = 551)
• Recommendation of dealers to suppliers and to banks
• Help in reduction of prices
• Stabilization of price Decentralization of services. (Resp = 347)
• Bring services closer to beneficiaries.
• Create branches at grassroots: village, district
Creation of awareness of services offered. (Resp = 713)
• Advertise UNADA and its activities
• Educate stockists and farmers through seminars, mobilization meetings, workshops, meetings, media, trainings, talk shows
Association strengthening, Capacity building, sustainability. (Resp = 126)
• Help in formation of groups and association at village level
• Recruit more members
• Encourage networking, collaboration and participation of other stakeholders (Veterinary, district, local leaders)
Regulation and quality control of products. (Resp = 95)
• Elimination of fake products on the market
• Licensing and certification of agro dealers
• Supervision of agro- dealers Dealer Licensing, Registration and Accreditation (Resp = 88)
• Help in obtaining certificates, registration of premises.
Provision of services efficiently. (Resp = 76)
• UNADA should be � Be more active, � Provide better member services. � Fulfill promises, Do follow ups � Employ more staff, Implement activities � Evaluate performance, Reach every one.
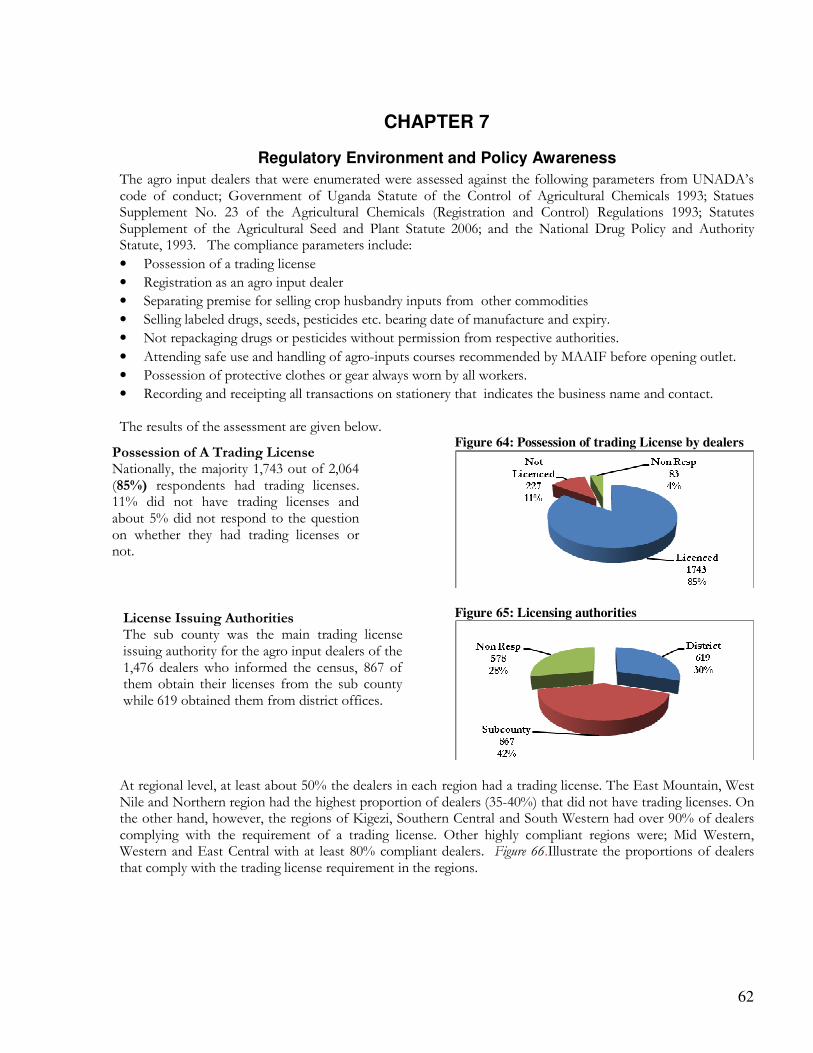
62
CHAPTER 7
Regulatory Environment and Policy Awareness
The agro input dealers that were enumerated were assessed against the following parameters from UNADA’s code of conduct; Government of Uganda Statute of the Control of Agricultural Chemicals 1993; Statues Supplement No. 23 of the Agricultural Chemicals (Registration and Control) Regulations 1993; Statutes Supplement of the Agricultural Seed and Plant Statute 2006; and the National Drug Policy and Authority Statute, 1993. The compliance parameters include:
• Possession of a trading license
• Registration as an agro input dealer
• Separating premise for selling crop husbandry inputs from other commodities
• Selling labeled drugs, seeds, pesticides etc. bearing date of manufacture and expiry.
• Not repackaging drugs or pesticides without permission from respective authorities.
• Attending safe use and handling of agro-inputs courses recommended by MAAIF before opening outlet.
• Possession of protective clothes or gear always worn by all workers.
• Recording and receipting all transactions on stationery that indicates the business name and contact. The results of the assessment are given below. Figure 64: Possession of trading License by dealers
Figure 65: Licensing authorities
At regional level, at least about 50% the dealers in each region had a trading license. The East Mountain, West Nile and Northern region had the highest proportion of dealers (35-40%) that did not have trading licenses. On the other hand, however, the regions of Kigezi, Southern Central and South Western had over 90% of dealers complying with the requirement of a trading license. Other highly compliant regions were; Mid Western, Western and East Central with at least 80% compliant dealers. Figure 66.Illustrate the proportions of dealers that comply with the trading license requirement in the regions.
License Issuing Authorities The sub county was the main trading license issuing authority for the agro input dealers of the 1,476 dealers who informed the census, 867 of them obtain their licenses from the sub county while 619 obtained them from district offices.
Possession of A Trading License Nationally, the majority 1,743 out of 2,064 (85%) respondents had trading licenses. 11% did not have trading licenses and about 5% did not respond to the question on whether they had trading licenses or not.
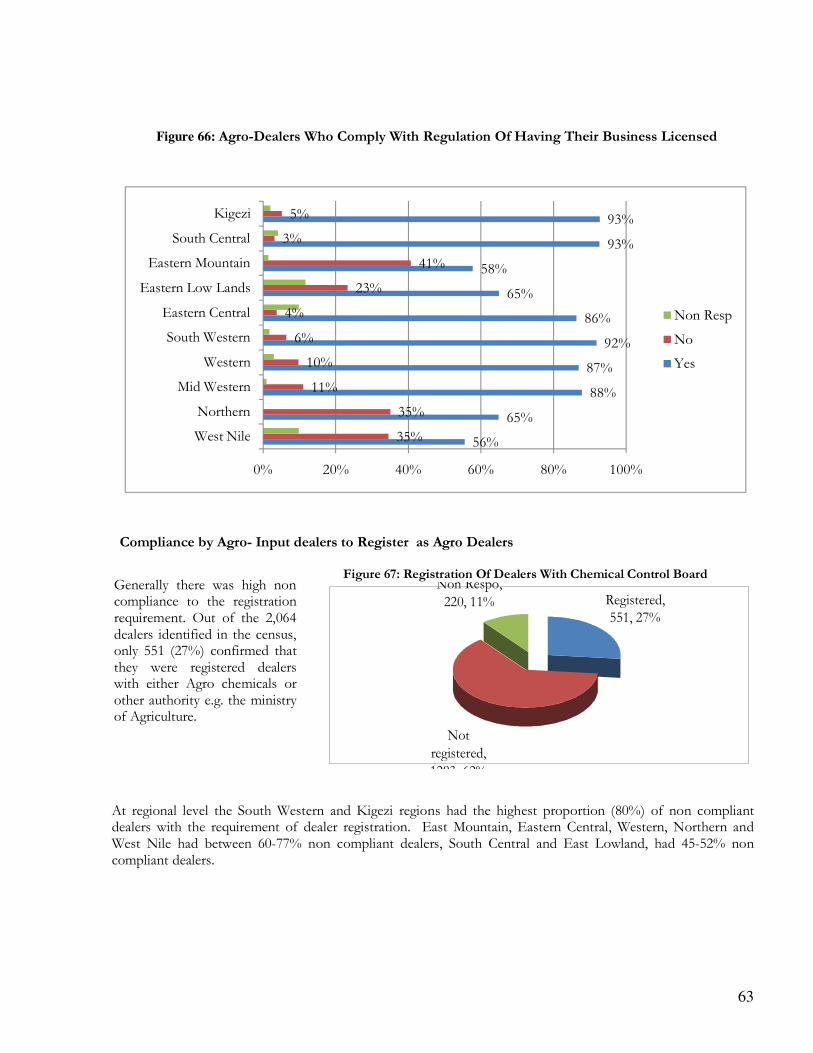
63
Figure 66: Agro-Dealers Who Comply With Regulation Of Having Their Business Licensed
56%
65%
88%
87%
92%
86%
65%
58%
93%
93%
35%
35%
11%
10%
6%
4%
23%
41%
3%
5%
0% 20% 40% 60% 80% 100%
West Nile
Northern
Mid Western
Western
South Western
Eastern Central
Eastern Low Lands
Eastern Mountain
South Central
Kigezi
Non Resp
No
Yes
Compliance by Agro- Input dealers to Register as Agro Dealers
Figure 67: Registration Of Dealers With Chemical Control Board
Registered, 551, 27%
Not
registered,
1293, 62%
Non Respo,
220, 11%
At regional level the South Western and Kigezi regions had the highest proportion (80%) of non compliant dealers with the requirement of dealer registration. East Mountain, Eastern Central, Western, Northern and West Nile had between 60-77% non compliant dealers, South Central and East Lowland, had 45-52% non compliant dealers.
Generally there was high non compliance to the registration requirement. Out of the 2,064 dealers identified in the census, only 551 (27%) confirmed that they were registered dealers with either Agro chemicals or other authority e.g. the ministry of Agriculture.
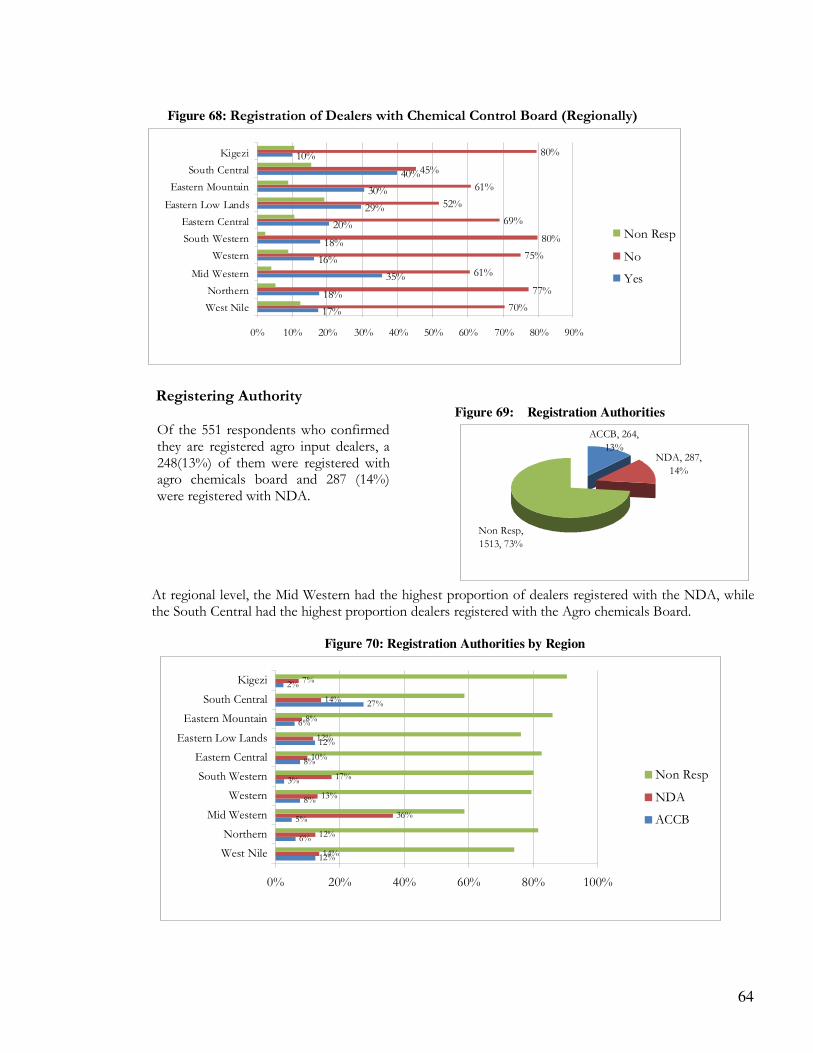
64
Figure 68: Registration of Dealers with Chemical Control Board (Regionally)
17%
18%
35%
16%
18%
20%
29%
30%
40%
10%
70%
77%
61%
75%
80%
69%
52%
61%
45%
80%
0% 10% 20% 30% 40% 50% 60% 70% 80% 90%
West Nile
Northern
Mid Western
Western
South Western
Eastern Central
Eastern Low Lands
Eastern Mountain
South Central
Kigezi
Non Resp
No
Yes
Registering Authority Figure 69: Registration Authorities
NDA, 287,
14%
Non Resp,
1513, 73%
ACCB, 264,
13%
At regional level, the Mid Western had the highest proportion of dealers registered with the NDA, while the South Central had the highest proportion dealers registered with the Agro chemicals Board.
Figure 70: Registration Authorities by Region
12%
6%
5%
8%
3%
8%
12%
6%
27%
2%
14%
12%
36%
13%
17%
10%
12%
8%
14%
7%
0% 20% 40% 60% 80% 100%
West Nile
Northern
Mid Western
Western
South Western
Eastern Central
Eastern Low Lands
Eastern Mountain
South Central
Kigezi
Non Resp
NDA
ACCB
Of the 551 respondents who confirmed they are registered agro input dealers, a 248(13%) of them were registered with agro chemicals board and 287 (14%) were registered with NDA.
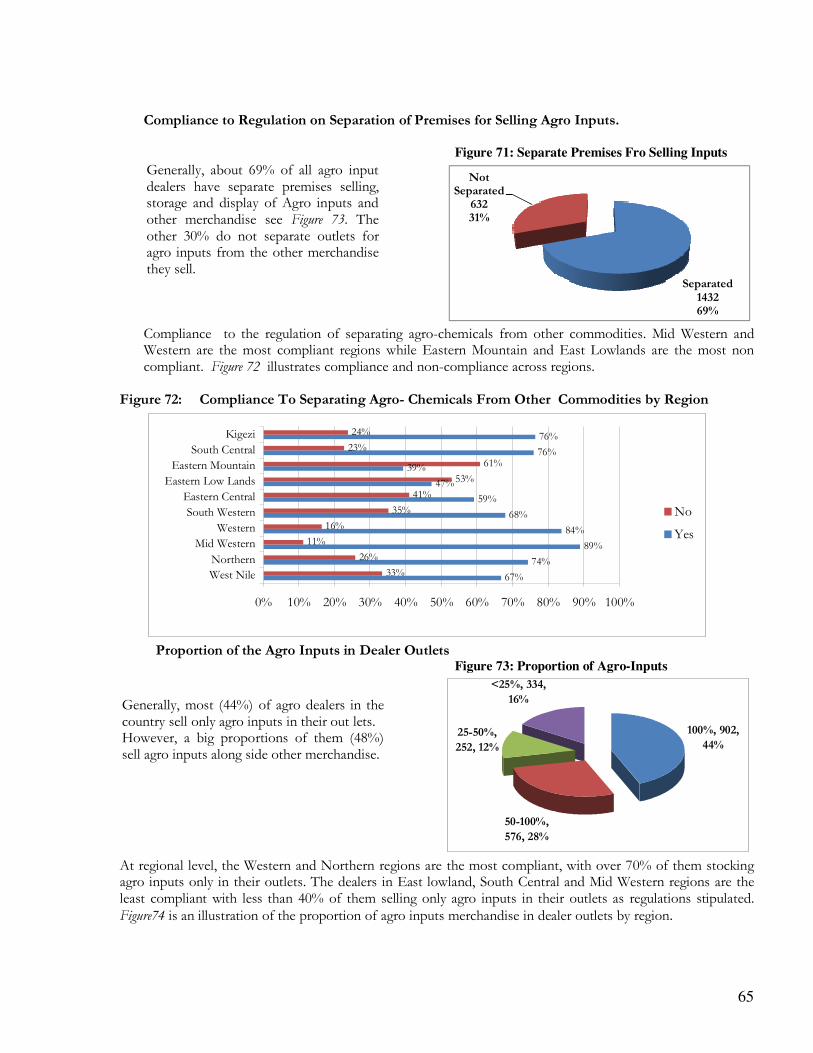
65
Compliance to Regulation on Separation of Premises for Selling Agro Inputs.
Figure 71: Separate Premises Fro Selling Inputs
Separated143269%
Not Separated
63231%
Compliance to the regulation of separating agro-chemicals from other commodities. Mid Western and Western are the most compliant regions while Eastern Mountain and East Lowlands are the most non compliant. Figure 72 illustrates compliance and non-compliance across regions.
Figure 72: Compliance To Separating Agro- Chemicals From Other Commodities by Region
67%
74%
89%
84%
68%
59%
47%
39%
76%
76%
33%
26%
11%
16%
35%
41%
53%
61%
23%
24%
0% 10% 20% 30% 40% 50% 60% 70% 80% 90% 100%
West Nile
Northern
Mid Western
Western
South Western
Eastern Central
Eastern Low Lands
Eastern Mountain
South Central
Kigezi
No
Yes
Proportion of the Agro Inputs in Dealer Outlets
Figure 73: Proportion of Agro-Inputs
100%, 902,
44%
50-100%,
576, 28%
25-50%,
252, 12%
<25%, 334,
16%
At regional level, the Western and Northern regions are the most compliant, with over 70% of them stocking agro inputs only in their outlets. The dealers in East lowland, South Central and Mid Western regions are the least compliant with less than 40% of them selling only agro inputs in their outlets as regulations stipulated. Figure74 is an illustration of the proportion of agro inputs merchandise in dealer outlets by region.
Generally, about 69% of all agro input dealers have separate premises selling, storage and display of Agro inputs and other merchandise see Figure 73. The other 30% do not separate outlets for agro inputs from the other merchandise they sell.
Generally, most (44%) of agro dealers in the country sell only agro inputs in their out lets. However, a big proportions of them (48%) sell agro inputs along side other merchandise.
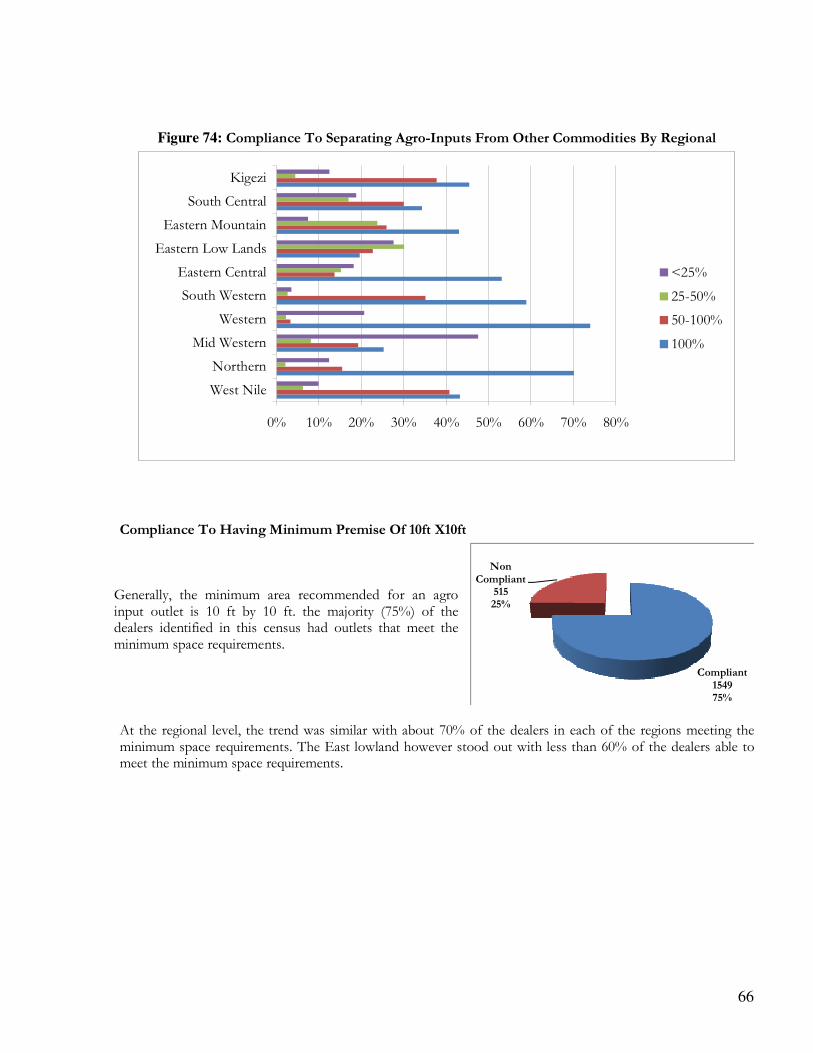
66
Figure 74: Compliance To Separating Agro-Inputs From Other Commodities By Regional
0% 10% 20% 30% 40% 50% 60% 70% 80%
West Nile
Northern
Mid Western
Western
South Western
Eastern Central
Eastern Low Lands
Eastern Mountain
South Central
Kigezi
<25%
25-50%
50-100%
100%
Compliance To Having Minimum Premise Of 10ft X10ft
Compliant154975%
Non Compliant
51525%
At the regional level, the trend was similar with about 70% of the dealers in each of the regions meeting the minimum space requirements. The East lowland however stood out with less than 60% of the dealers able to meet the minimum space requirements.
Generally, the minimum area recommended for an agro input outlet is 10 ft by 10 ft. the majority (75%) of the dealers identified in this census had outlets that meet the minimum space requirements.
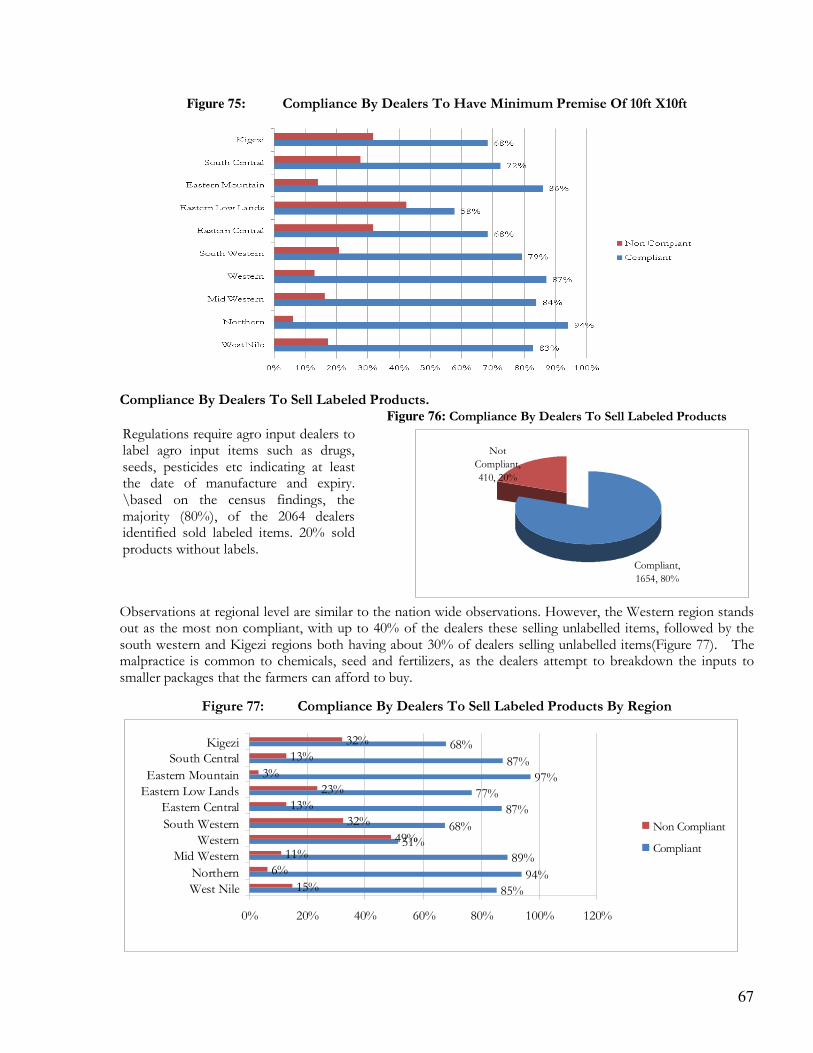
67
Figure 75: Compliance By Dealers To Have Minimum Premise Of 10ft X10ft Compliance By Dealers To Sell Labeled Products.
Figure 76: Compliance By Dealers To Sell Labeled Products
Compliant,
1654, 80%
Not
Compliant,
410, 20%
Observations at regional level are similar to the nation wide observations. However, the Western region stands out as the most non compliant, with up to 40% of the dealers these selling unlabelled items, followed by the south western and Kigezi regions both having about 30% of dealers selling unlabelled items(Figure 77). The malpractice is common to chemicals, seed and fertilizers, as the dealers attempt to breakdown the inputs to smaller packages that the farmers can afford to buy.
Figure 77: Compliance By Dealers To Sell Labeled Products By Region
85%
94%
89%
51%
68%
87%
77%
97%
87%
68%
15%
6%
11%
49%
32%
13%
23%
3%
13%
32%
0% 20% 40% 60% 80% 100% 120%
West Nile
Northern
Mid Western
Western
South Western
Eastern Central
Eastern Low Lands
Eastern Mountain
South Central
Kigezi
Non Compliant
Compliant
Regulations require agro input dealers to label agro input items such as drugs, seeds, pesticides etc indicating at least the date of manufacture and expiry. \based on the census findings, the majority (80%), of the 2064 dealers identified sold labeled items. 20% sold products without labels.
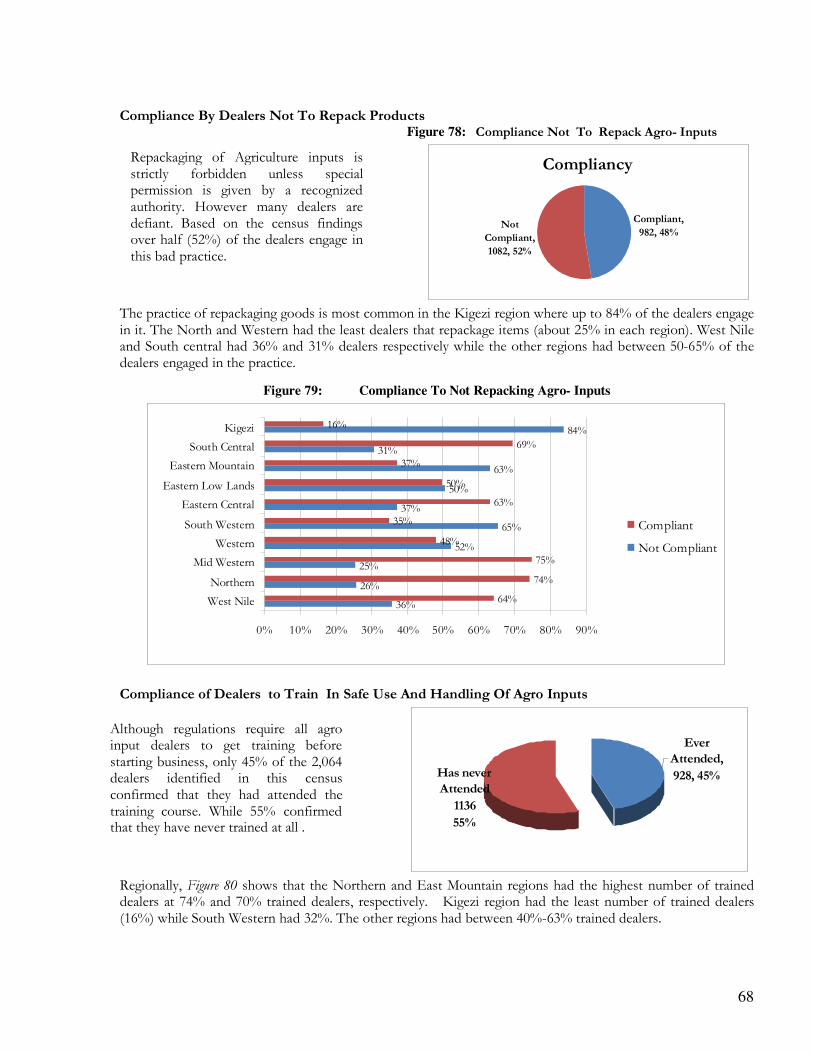
68
Compliance By Dealers Not To Repack Products Figure 78: Compliance Not To Repack Agro- Inputs
Compliancy
Compliant,
982, 48%Not
Compliant,
1082, 52%
The practice of repackaging goods is most common in the Kigezi region where up to 84% of the dealers engage in it. The North and Western had the least dealers that repackage items (about 25% in each region). West Nile and South central had 36% and 31% dealers respectively while the other regions had between 50-65% of the dealers engaged in the practice.
Figure 79: Compliance To Not Repacking Agro- Inputs
36%
26%
25%
52%
65%
37%
50%
63%
31%
84%
64%
74%
75%
48%
35%
63%
50%
37%
69%
16%
0% 10% 20% 30% 40% 50% 60% 70% 80% 90%
West Nile
Northern
Mid Western
Western
South Western
Eastern Central
Eastern Low Lands
Eastern Mountain
South Central
Kigezi
Compliant
Not Compliant
Compliance of Dealers to Train In Safe Use And Handling Of Agro Inputs
Ever
Attended,
928, 45%Has never
Attended
1136
55%
Regionally, Figure 80 shows that the Northern and East Mountain regions had the highest number of trained dealers at 74% and 70% trained dealers, respectively. Kigezi region had the least number of trained dealers (16%) while South Western had 32%. The other regions had between 40%-63% trained dealers.
Repackaging of Agriculture inputs is strictly forbidden unless special permission is given by a recognized authority. However many dealers are defiant. Based on the census findings over half (52%) of the dealers engage in this bad practice.
Although regulations require all agro input dealers to get training before starting business, only 45% of the 2,064 dealers identified in this census confirmed that they had attended the training course. While 55% confirmed that they have never trained at all .
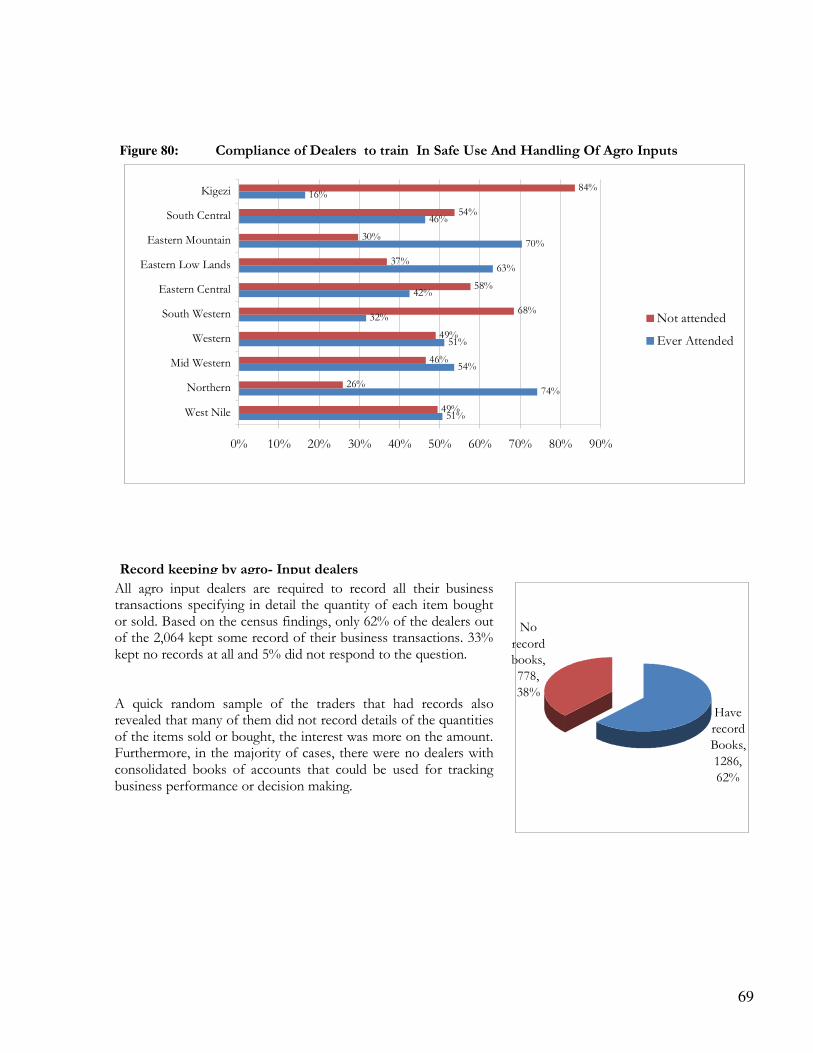
69
Figure 80: Compliance of Dealers to train In Safe Use And Handling Of Agro Inputs
51%
74%
54%
51%
32%
42%
63%
70%
46%
16%
49%
26%
46%
49%
68%
58%
37%
30%
54%
84%
0% 10% 20% 30% 40% 50% 60% 70% 80% 90%
West Nile
Northern
Mid Western
Western
South Western
Eastern Central
Eastern Low Lands
Eastern Mountain
South Central
Kigezi
Not attended
Ever Attended
Record keeping by agro- Input dealers
Have
record
Books,
1286,
62%
No
record
books,
778,
38%
All agro input dealers are required to record all their business transactions specifying in detail the quantity of each item bought or sold. Based on the census findings, only 62% of the dealers out of the 2,064 kept some record of their business transactions. 33% kept no records at all and 5% did not respond to the question. A quick random sample of the traders that had records also revealed that many of them did not record details of the quantities of the items sold or bought, the interest was more on the amount. Furthermore, in the majority of cases, there were no dealers with consolidated books of accounts that could be used for tracking business performance or decision making.
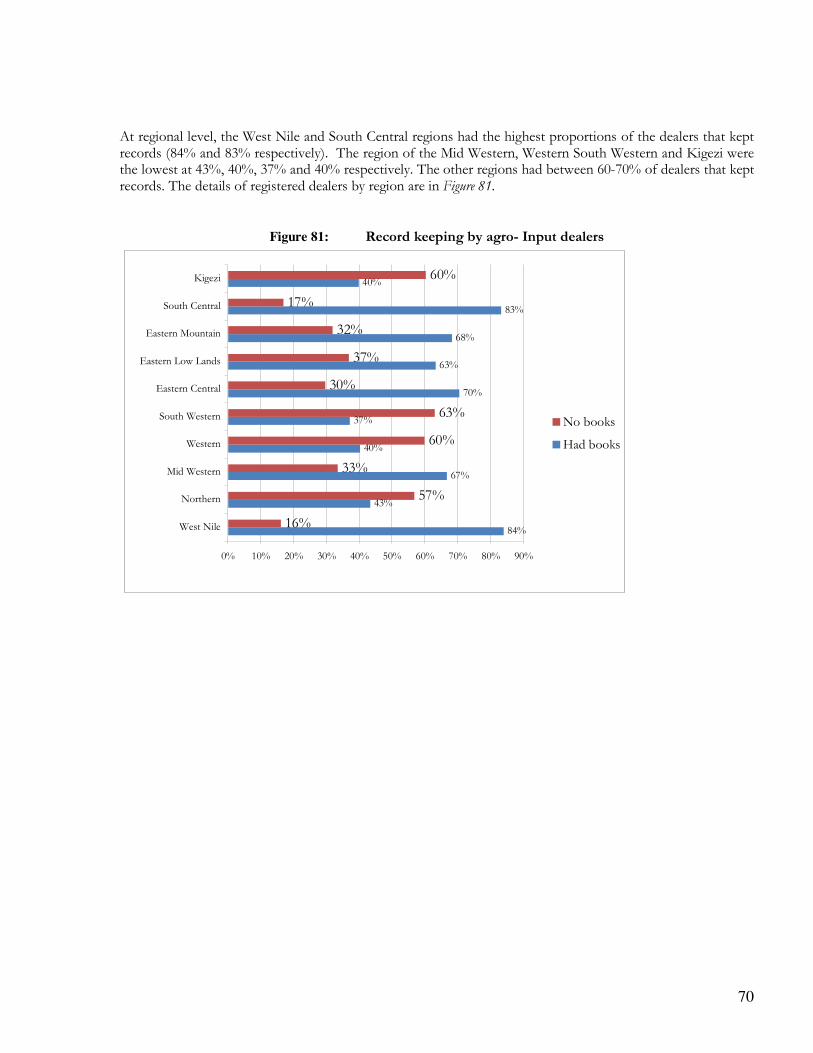
70
At regional level, the West Nile and South Central regions had the highest proportions of the dealers that kept records (84% and 83% respectively). The region of the Mid Western, Western South Western and Kigezi were the lowest at 43%, 40%, 37% and 40% respectively. The other regions had between 60-70% of dealers that kept records. The details of registered dealers by region are in Figure 81.
Figure 81: Record keeping by agro- Input dealers
84%
43%
67%
40%
37%
70%
63%
68%
83%
40%
16%
57%
33%
60%
63%
30%
37%
32%
17%
60%
0% 10% 20% 30% 40% 50% 60% 70% 80% 90%
West Nile
Northern
Mid Western
Western
South Western
Eastern Central
Eastern Low Lands
Eastern Mountain
South Central
Kigezi
No books
Had books
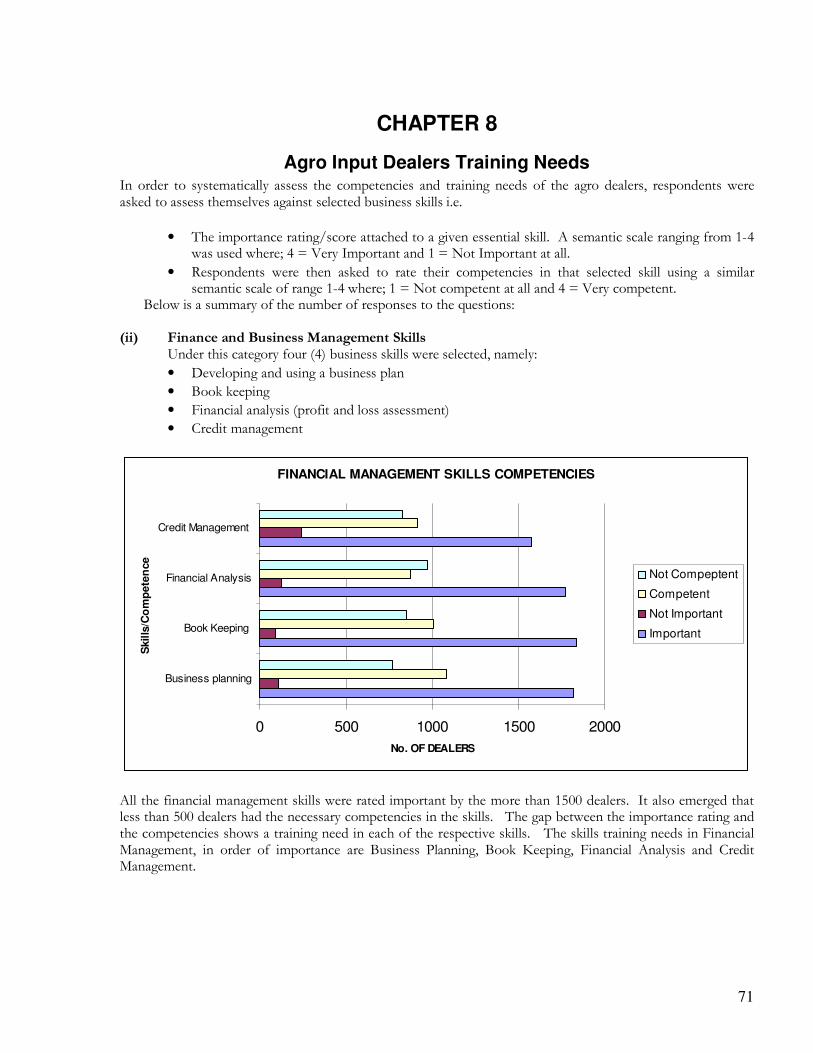
71
CHAPTER 8
Agro Input Dealers Training Needs In order to systematically assess the competencies and training needs of the agro dealers, respondents were asked to assess themselves against selected business skills i.e.
• The importance rating/score attached to a given essential skill. A semantic scale ranging from 1-4 was used where; 4 = Very Important and 1 = Not Important at all.
• Respondents were then asked to rate their competencies in that selected skill using a similar semantic scale of range 1-4 where; 1 = Not competent at all and 4 = Very competent.
Below is a summary of the number of responses to the questions: (ii) Finance and Business Management Skills
Under this category four (4) business skills were selected, namely:
• Developing and using a business plan
• Book keeping
• Financial analysis (profit and loss assessment)
• Credit management
FINANCIAL MANAGEMENT SKILLS COMPETENCIES
0 500 1000 1500 2000
Business planning
Book Keeping
Financial Analysis
Credit Management
Skills
/Co
mp
ete
nce
No. OF DEALERS
Not Compeptent
Competent
Not Important
Important
All the financial management skills were rated important by the more than 1500 dealers. It also emerged that less than 500 dealers had the necessary competencies in the skills. The gap between the importance rating and the competencies shows a training need in each of the respective skills. The skills training needs in Financial Management, in order of importance are Business Planning, Book Keeping, Financial Analysis and Credit Management.
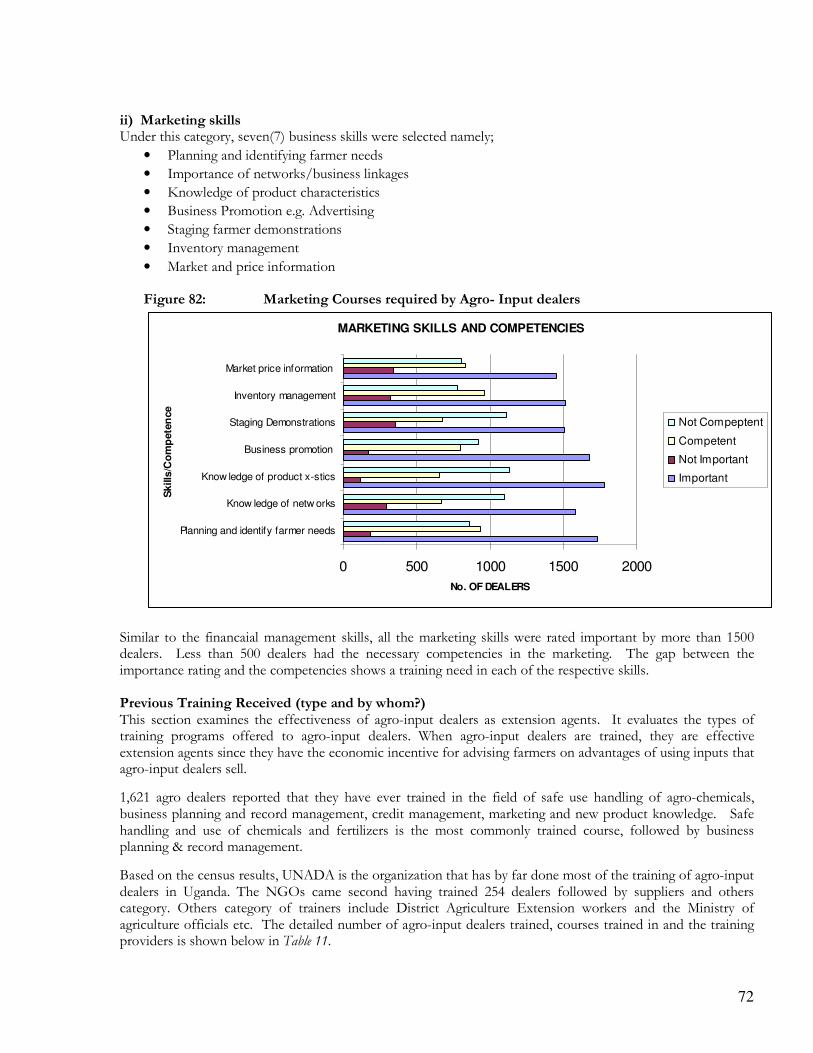
72
ii) Marketing skills Under this category, seven(7) business skills were selected namely;
• Planning and identifying farmer needs
• Importance of networks/business linkages
• Knowledge of product characteristics
• Business Promotion e.g. Advertising
• Staging farmer demonstrations
• Inventory management
• Market and price information
Figure 82: Marketing Courses required by Agro- Input dealers
MARKETING SKILLS AND COMPETENCIES
0 500 1000 1500 2000
Planning and identify farmer needs
Know ledge of netw orks
Know ledge of product x-stics
Business promotion
Staging Demonstrations
Inventory management
Market price information
Skills
/Co
mp
ete
nce
No. OF DEALERS
Not Compeptent
Competent
Not Important
Important
Similar to the financaial management skills, all the marketing skills were rated important by more than 1500 dealers. Less than 500 dealers had the necessary competencies in the marketing. The gap between the importance rating and the competencies shows a training need in each of the respective skills. Previous Training Received (type and by whom?) This section examines the effectiveness of agro-input dealers as extension agents. It evaluates the types of training programs offered to agro-input dealers. When agro-input dealers are trained, they are effective extension agents since they have the economic incentive for advising farmers on advantages of using inputs that agro-input dealers sell.
1,621 agro dealers reported that they have ever trained in the field of safe use handling of agro-chemicals, business planning and record management, credit management, marketing and new product knowledge. Safe handling and use of chemicals and fertilizers is the most commonly trained course, followed by business planning & record management.
Based on the census results, UNADA is the organization that has by far done most of the training of agro-input dealers in Uganda. The NGOs came second having trained 254 dealers followed by suppliers and others category. Others category of trainers include District Agriculture Extension workers and the Ministry of agriculture officials etc. The detailed number of agro-input dealers trained, courses trained in and the training providers is shown below in Table 11.
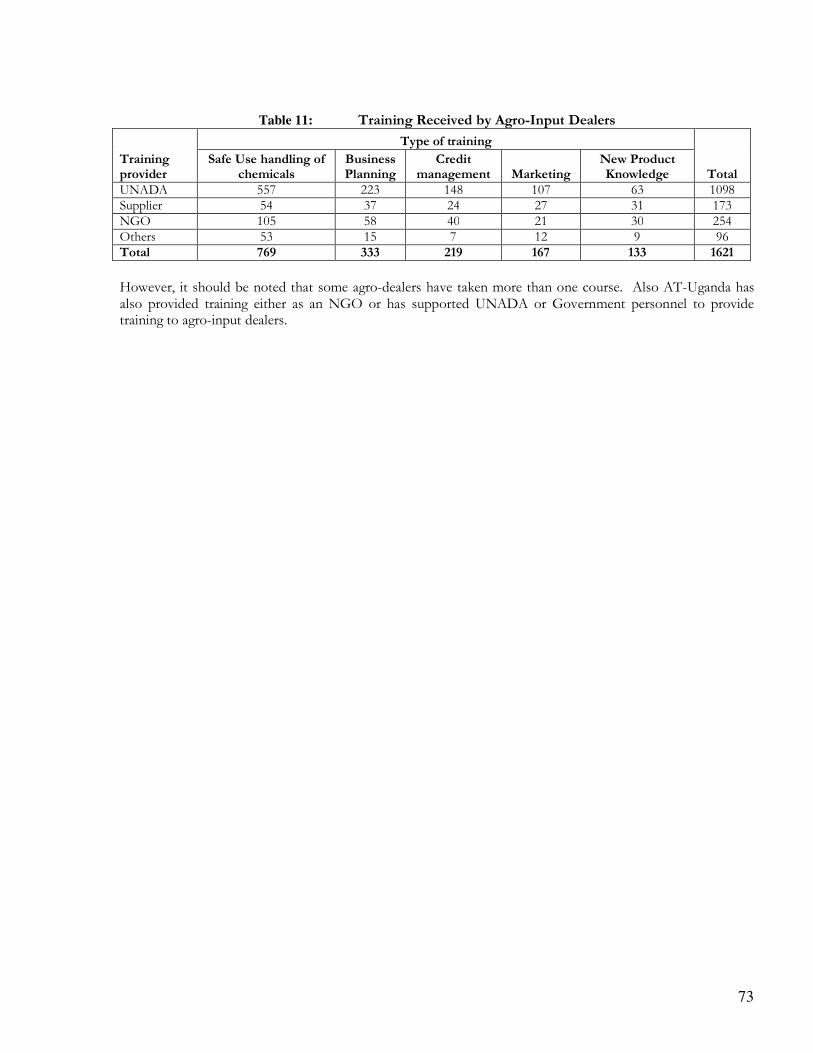
73
Table 11: Training Received by Agro-Input Dealers
Training provider
Type of training
Total Safe Use handling of
chemicals Business Planning
Credit management Marketing
New Product Knowledge
UNADA 557 223 148 107 63 1098 Supplier 54 37 24 27 31 173 NGO 105 58 40 21 30 254 Others 53 15 7 12 9 96 Total 769 333 219 167 133 1621
However, it should be noted that some agro-dealers have taken more than one course. Also AT-Uganda has also provided training either as an NGO or has supported UNADA or Government personnel to provide training to agro-input dealers.
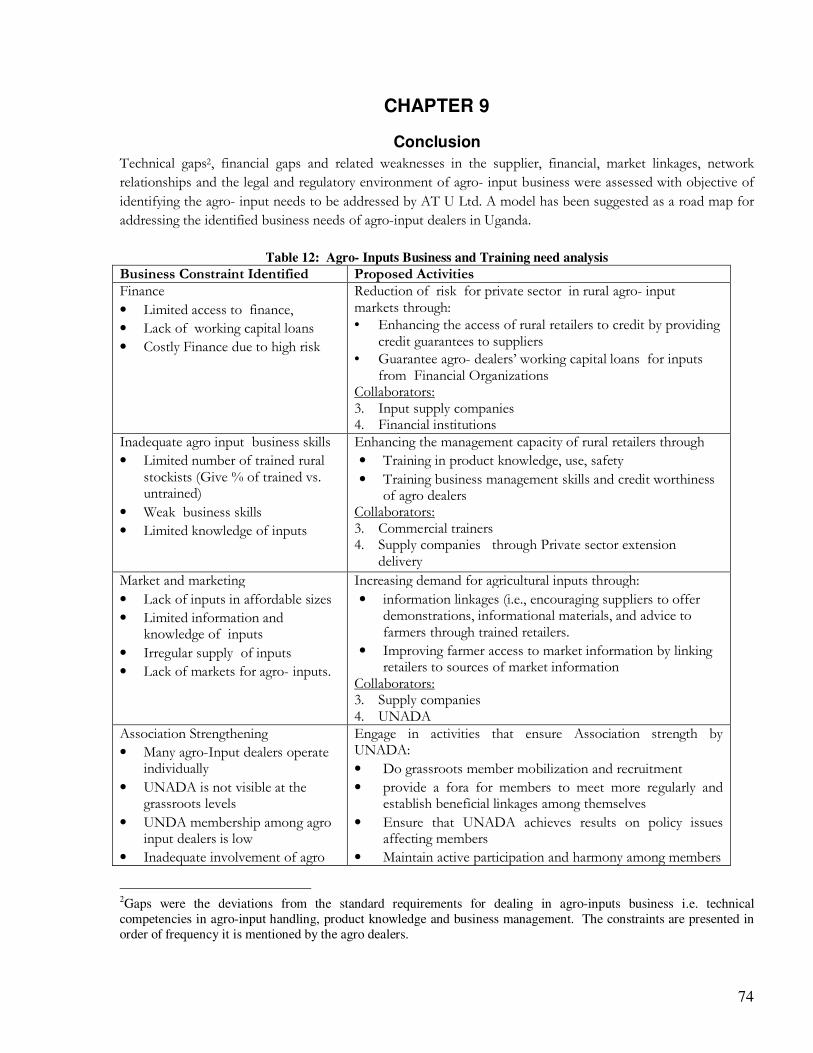
74
CHAPTER 9
Conclusion
Technical gaps2, financial gaps and related weaknesses in the supplier, financial, market linkages, network
relationships and the legal and regulatory environment of agro- input business were assessed with objective of
identifying the agro- input needs to be addressed by AT U Ltd. A model has been suggested as a road map for
addressing the identified business needs of agro-input dealers in Uganda.
Table 12: Agro- Inputs Business and Training need analysis Business Constraint Identified Proposed Activities Finance
• Limited access to finance,
• Lack of working capital loans
• Costly Finance due to high risk
Reduction of risk for private sector in rural agro- input markets through: • Enhancing the access of rural retailers to credit by providing
credit guarantees to suppliers • Guarantee agro- dealers’ working capital loans for inputs
from Financial Organizations Collaborators: 3. Input supply companies 4. Financial institutions
Inadequate agro input business skills
• Limited number of trained rural stockists (Give % of trained vs. untrained)
• Weak business skills
• Limited knowledge of inputs
Enhancing the management capacity of rural retailers through
• Training in product knowledge, use, safety
• Training business management skills and credit worthiness of agro dealers
Collaborators: 3. Commercial trainers 4. Supply companies through Private sector extension
delivery
Market and marketing
• Lack of inputs in affordable sizes
• Limited information and knowledge of inputs
• Irregular supply of inputs
• Lack of markets for agro- inputs.
Increasing demand for agricultural inputs through:
• information linkages (i.e., encouraging suppliers to offer demonstrations, informational materials, and advice to farmers through trained retailers.
• Improving farmer access to market information by linking retailers to sources of market information
Collaborators: 3. Supply companies 4. UNADA
Association Strengthening
• Many agro-Input dealers operate individually
• UNADA is not visible at the grassroots levels
• UNDA membership among agro input dealers is low
• Inadequate involvement of agro
Engage in activities that ensure Association strength by UNADA:
• Do grassroots member mobilization and recruitment
• provide a fora for members to meet more regularly and establish beneficial linkages among themselves
• Ensure that UNADA achieves results on policy issues affecting members
• Maintain active participation and harmony among members
2Gaps were the deviations from the standard requirements for dealing in agro-inputs business i.e. technical
competencies in agro-input handling, product knowledge and business management. The constraints are presented in
order of frequency it is mentioned by the agro dealers.
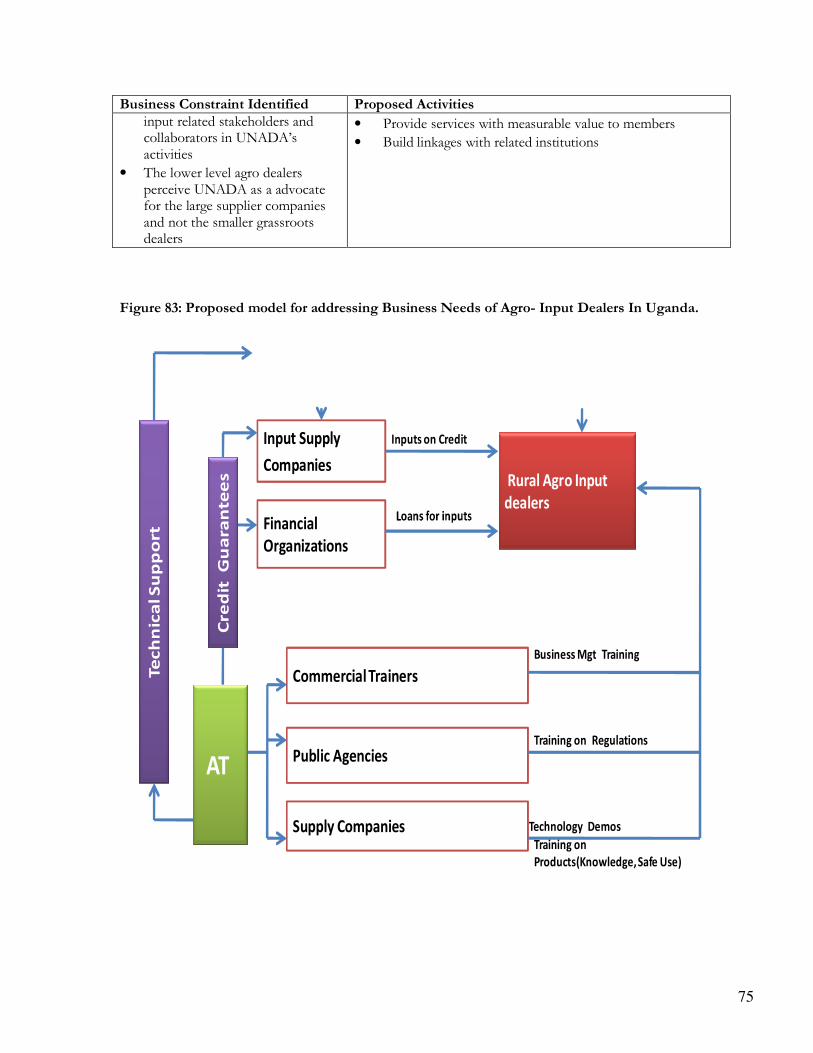
75
Business Constraint Identified Proposed Activities input related stakeholders and collaborators in UNADA’s activities
• The lower level agro dealers perceive UNADA as a advocate for the large supplier companies and not the smaller grassroots dealers
• Provide services with measurable value to members
• Build linkages with related institutions
Figure 83: Proposed model for addressing Business Needs of Agro- Input Dealers In Uganda.
Input Supply
Companies
Financial
Organizations
AT
Cre
dit
G
ua
ran
tee
s
UNADAAssociation building , Advocacy , Market development , Skills development, Financial Linkages
Rural Agro Input
dealers
Commercial Trainers
Public Agencies
Supply Companies
Te
ch
nic
al S
up
po
rt
Training on Regulations
Technology Demos
Training on
Products(Knowledge, Safe Use)
Business Mgt Training
Inputs on Credit
76
APPENDIX 1
Spatial Location Maps