final report lalit
TRANSCRIPT
1
EXECUTIVE SUMMARY
Introduction
Orissa Manganese & Minerals Ltd. Has been undertaking various
peripheral development activities as part of Corporate Social Responsibility to enrich
the quality of rural life in and around the areas of mine site.Orissa Manganese
and Minerals Pvt. Ltd. (OMM) a private Limited company is engaged primarily
in mining and marketing of minerals. Various minerals covered include Iron Ore,
Manganese and Graphite. OMM possess a number of mining leases in Jharkhand and
Odisha.
The Government has been doing a number of development projects for people in
rural areas. OMML on its part has been participating for augmenting the quality of
life of people in mining areas surrounding its projects and establishments and
society in general. The purpose of these contributing efforts would be not only to
help people by providing facilities for health, education, civic amenities etc. but
also to create opportunities for development of skills, employment including self ‐
employment and improves the standard of living.
2
Duration of Study was from 18th April-18 June.
3
CHAPTER 1
INTRODUCTION
1.1Corporate Social Responsibility(CSR):
Corporate Social Responsibility is a management concept whereby companies integrate social
and environmental concerns in their business operations and interactions with their
stakeholders. CSR is generally understood as being the way through which a company achieves
a balance of economic, environmental and social imperatives (“Triple-Bottom-Line-
Approach”), while at the same time addressing the expectations of shareholders and
stakeholders. In this sense it is important to draw a distinction between CSR, which can be a
strategic business management concept, and charity, sponsorships or philanthropy. Even
though the latter can also make a valuable contribution to poverty reduction, will directly
enhance the reputation of a company and strengthen its brand, the concept of CSR clearly goes
beyond that.
1.2 Areas of activities under CSR:
Drinking water facility
Education
Health and family welfare
Electrification of households
Sanitation & Public Health
Promotion of Sports and Games
Promotion of Art and Culture
Skill development and training facilities for youth
Supplementing development programmes off the Govt.
The development trend in the Indian economy witnessed over the past few Years are expected
to continue and the economy yis expected to grow at the rateof 8 to 9% per annum. To maintain
this resilience in the economy, the industries and service sectors are expected to grow at a faster
rate to achieve the projected overall growth rate. Core industries like steel, power and
infrastructure are expected to take a quantum leap. Orissa being a state with multiple natural
resources became the attraction of many such investors. Presence of rich quality ore, adequate
land and water resource and progressive administration convinced many industrialists of
international repute to invest for largescale units. The Government of Orissa is making all
efforts to accelerate the industrialization Process in the state influenced mainly by two
factors;firstly there is a surge in the Demand for steel globally creating favorable market
4
conditions.Secondly, Orissa desire to improve its economy by exploiting the rich mineral
resource base emphasizing on maximum‘value addition’ within the state. The Government of
Orissa formulated a new Industrial Policy in 2006toensure balanced economic development of
the region, and to increase employment opportunities and industrial production by encouraging
private investors to invest in the state. Earlier the state’s mineral resources were exported
outside for value addition Either within country or overseas. The new industrial policy helps
the willingness of investors to carry out value addition by setting new industrial projects in the
state.
1.3 Socioeconomic assessment:
Socioeconomic environment refers to a wide range of interrelated and diverse aspects and
variables relating to or involving a combination of social and economic factors. These aspects
and variables could, in general, be categorized into several categories including, economic,
demographic, public services, fiscal and social. The social aspects may, for instance, involve
community life as well as social and cultural attitude and values. Community services may
meanwhile be concerned with housing and requirements for public services such as water,
sanitation, communications, police and fire protection facilities, solid waste disposal as well as
health and educational services. Demographic aspects may include population growth
structures, distribution and density. Similarly, economic factors may include general
characteristics, structures and changes various economic activities and employment.
A socioeconomic assessment is a wa y to learn about the social, cultural, economic and political
conditions of stakeholders including individuals, groups, communities and organizations.
The socioeconomic study is intended to:
Assess the prevailing socioeconomic conditions in the study site. This includes
provision of a baseline study and characterizing the existing state of the study site. This
will assist in identifying the main areas of concern.
Analyse the impacts of the prevailing environmental conditions on the Socioeconomic
structure of the study sites.
Develop a set of guidelines for establishing viable communities.
3.1 Possible impacts:
Generally, it should be stated that socioeconomic conditions are usually hard to identify and
assess, as they are related to the human beings and their characteristics, which usually differ
widely within the same community and from one community to another. Furthermore, as
socioeconomic assessment deals with dynamic variables, no comprehensive list of areas of
5
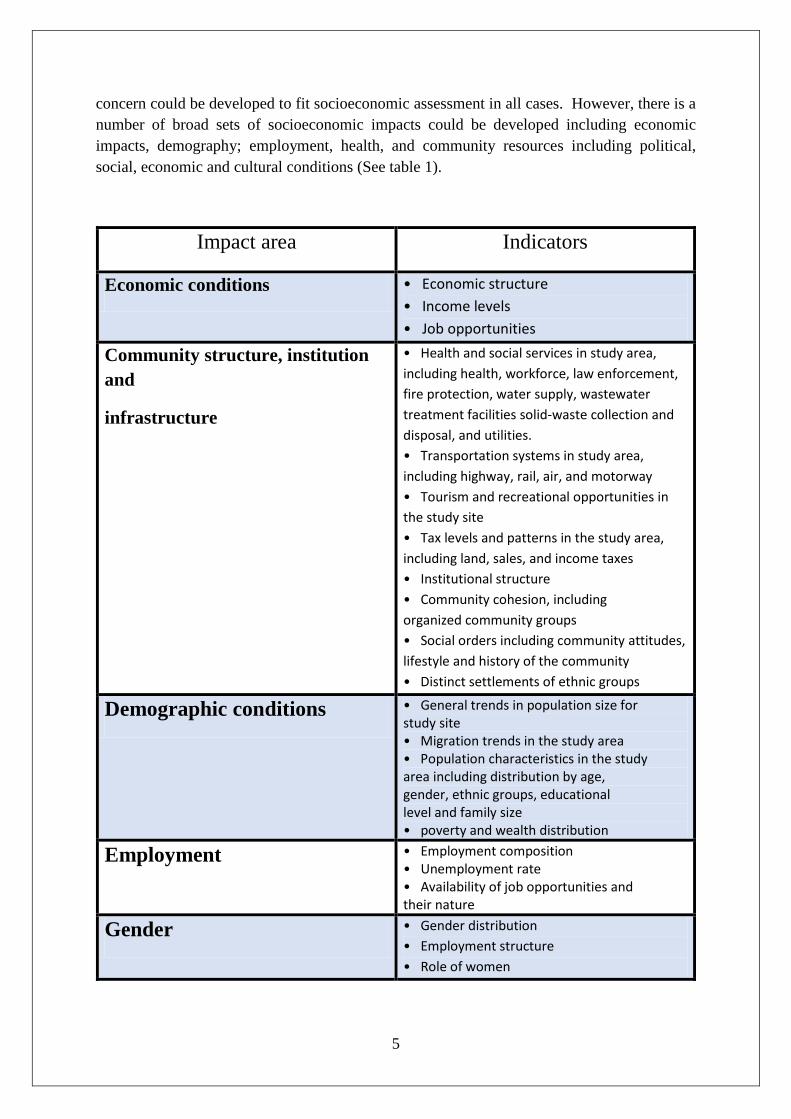
concern could be developed to fit socioeconomic assessment in all cases. However, there is a
number of broad sets of socioeconomic impacts could be developed including economic
impacts, demography; employment, health, and community resources including political,
social, economic and cultural conditions (See table 1).
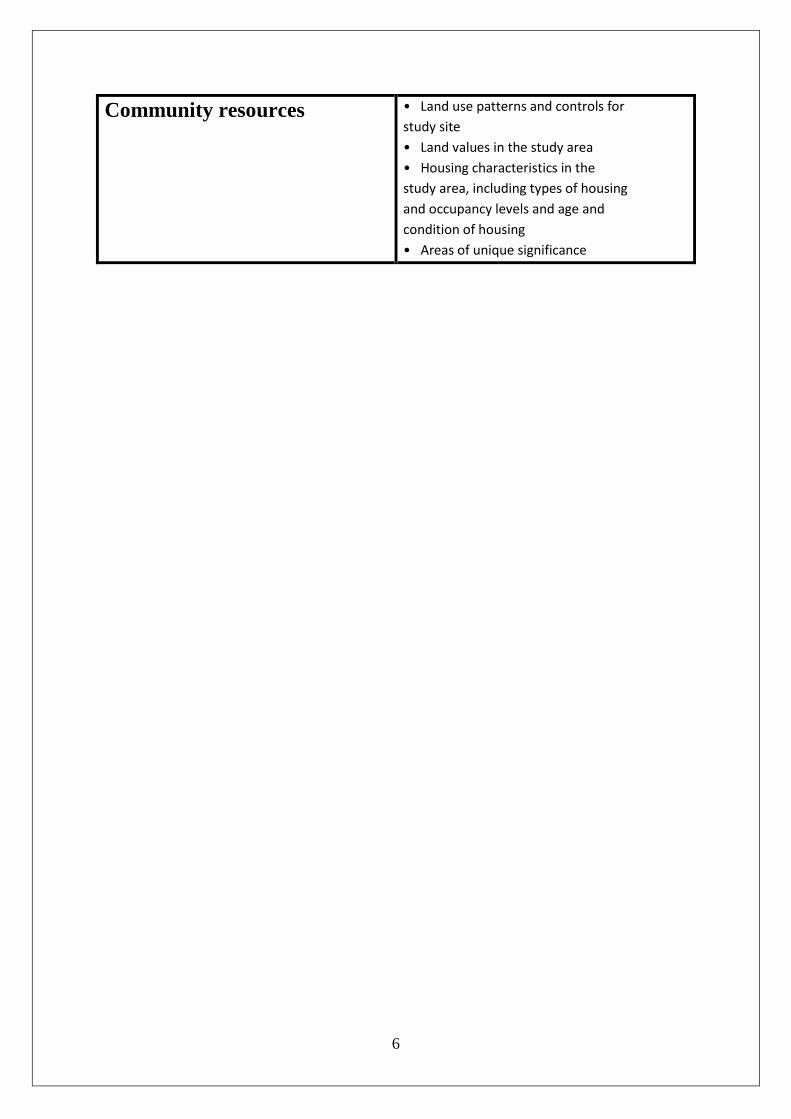
Impact area Indicators
Economic conditions • Economic structure
• Income levels
• Job opportunities
Community structure, institution
and
infrastructure
• Health and social services in study area,
including health, workforce, law enforcement,
fire protection, water supply, wastewater
treatment facilities solid-waste collection and
disposal, and utilities.
• Transportation systems in study area,
including highway, rail, air, and motorway
• Tourism and recreational opportunities in
the study site
• Tax levels and patterns in the study area,
including land, sales, and income taxes
• Institutional structure
• Community cohesion, including
organized community groups
• Social orders including community attitudes,
lifestyle and history of the community
• Distinct settlements of ethnic groups
Demographic conditions • General trends in population size for study site • Migration trends in the study area • Population characteristics in the study area including distribution by age, gender, ethnic groups, educational level and family size • poverty and wealth distribution
Employment • Employment composition • Unemployment rate • Availability of job opportunities and their nature
Gender • Gender distribution
• Employment structure
• Role of women
6
Community resources • Land use patterns and controls for
study site
• Land values in the study area
• Housing characteristics in the
study area, including types of housing
and occupancy levels and age and
condition of housing
• Areas of unique significance
7
CHAPTER 2:
REVIEW OF LITERATURE
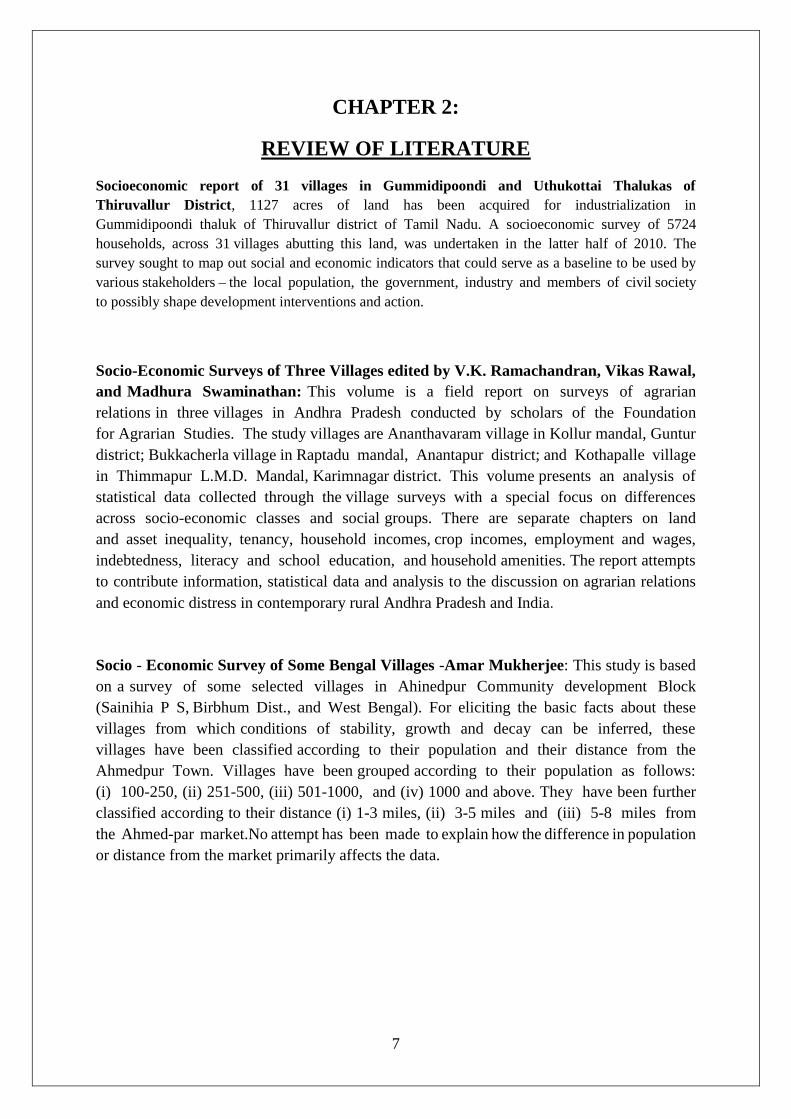
Socioeconomic report of 31 villages in Gummidipoondi and Uthukottai Thalukas of
Thiruvallur District, 1127 acres of land has been acquired for industrialization in
Gummidipoondi thaluk of Thiruvallur district of Tamil Nadu. A socioeconomic survey of 5724
households, across 31 villages abutting this land, was undertaken in the latter half of 2010. The
survey sought to map out social and economic indicators that could serve as a baseline to be used by
various stakeholders – the local population, the government, industry and members of civil society
to possibly shape development interventions and action.
Socio-Economic Surveys of Three Villages edited by V.K. Ramachandran, Vikas Rawal,
and Madhura Swaminathan: This volume is a field report on surveys of agrarian
relations in three villages in Andhra Pradesh conducted by scholars of the Foundation
for Agrarian Studies. The study villages are Ananthavaram village in Kollur mandal, Guntur
district; Bukkacherla village in Raptadu mandal, Anantapur district; and Kothapalle village
in Thimmapur L.M.D. Mandal, Karimnagar district. This volume presents an analysis of
statistical data collected through the village surveys with a special focus on differences
across socio-economic classes and social groups. There are separate chapters on land
and asset inequality, tenancy, household incomes, crop incomes, employment and wages,
indebtedness, literacy and school education, and household amenities. The report attempts
to contribute information, statistical data and analysis to the discussion on agrarian relations
and economic distress in contemporary rural Andhra Pradesh and India.
Socio - Economic Survey of Some Bengal Villages -Amar Mukherjee: This study is based
on a survey of some selected villages in Ahinedpur Community development Block
(Sainihia P S, Birbhum Dist., and West Bengal). For eliciting the basic facts about these
villages from which conditions of stability, growth and decay can be inferred, these
villages have been classified according to their population and their distance from the
Ahmedpur Town. Villages have been grouped according to their population as follows:
(i) 100-250, (ii) 251-500, (iii) 501-1000, and (iv) 1000 and above. They have been further
classified according to their distance (i) 1-3 miles, (ii) 3-5 miles and (iii) 5-8 miles from
the Ahmed-par market.No attempt has been made to explain how the difference in population
or distance from the market primarily affects the data.
8
CHAPTER 3
ORGANIZATIONAL PROFILE
INTRODUCTION:
Orissa Manganese & Minerals Ltd. has been undertaking various peripheral developm
ent activities as part of Corporate Social Responsibility to enrich the quality of
rural life in and around the areas of mine sites.
Orissa Manganese and Minerals Pvt. Ltd. (OMML) a private Limited company is
engaged primarily in mining and marketing of minerals. Various minerals covered
include Iron Ore, Manganese and Graphite. OMM possess a number of mining leas
es in Jharkhand and Odisha. It is a 100% subsidiary of Adhunik Metaliks.
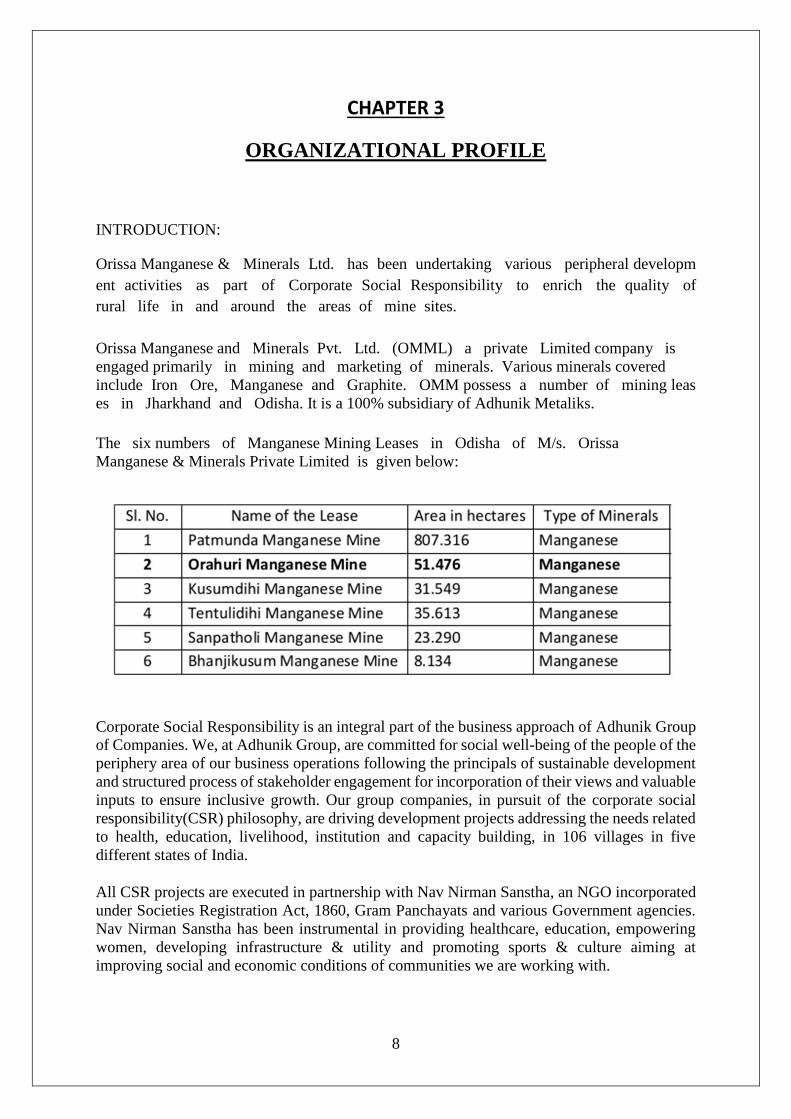
The six numbers of Manganese Mining Leases in Odisha of M/s. Orissa
Manganese & Minerals Private Limited is given below:
Corporate Social Responsibility is an integral part of the business approach of Adhunik Group
of Companies. We, at Adhunik Group, are committed for social well-being of the people of the
periphery area of our business operations following the principals of sustainable development
and structured process of stakeholder engagement for incorporation of their views and valuable
inputs to ensure inclusive growth. Our group companies, in pursuit of the corporate social
responsibility(CSR) philosophy, are driving development projects addressing the needs related
to health, education, livelihood, institution and capacity building, in 106 villages in five
different states of India.
All CSR projects are executed in partnership with Nav Nirman Sanstha, an NGO incorporated
under Societies Registration Act, 1860, Gram Panchayats and various Government agencies.
Nav Nirman Sanstha has been instrumental in providing healthcare, education, empowering
women, developing infrastructure & utility and promoting sports & culture aiming at
improving social and economic conditions of communities we are working with.
9
Owing a great deal to society, Adhunik Group firmly believes that ‘human beings are at centre
of all the developmental activities’ and hence it discharges its social responsibility for welfare
and well-being of the employees and society at large and at the same time encourages
Employee Volunteering leading to employee‘s satisfaction and corporate sustainability.
10
CHAPTER -4
AREA PROFILE
Sundargarh District was constituted on the 1st January, 1948, out of the two ex–States of Gangpur and
Bonai, which merged with Odisha on that day. True to its name, this beautiful District of Sundargarh
with about 43 percent of its total area under forest cover and numerous colourful tribes dotting its
landscape and with abundant mining potential is bounded by Ranchi District of Jharkhand on the North,
Raigarh District of Chhatisgarh on the west and North West, Jharsuguda, Sambalpur and Angul Districts
of Odisha on the South and South East and Singhbhum District of Jharkhand and Keonjhar District of
Odisha on the east.
The Sundargarh town is the district headquarter. Geographically, the district is not a compact unit and
consists of widely dissimilar tracts of expansive and fairly open, dotted with tree, clad isolated peaks,
vast inaccessible forests, extensive river valleys and mountainous terrain. Broadly speaking, it is an
undulating tableland of different elevations broken up by rugged hill ranges and cut up by torrential hill
streams and the rivers IB and Brahmani. The general slope of the District is from north to south. Because
of this undulating, hilly and sloping nature of landscape, the area is subjected to rapid runoff leading
not only to soil erosion but also to scarcity of water for both agriculture and drinking purposes.
Brahmani, Sankh, Koel and IB are the major rivers flowing though this District. Covering a
geographical area of 9712 sq.kms, Sundargarh District is the second largest District of the state,
accounting for 6.23 percent of its total area. Out of this total area, forests cover 4232.57 sq km, this
being the second largest in the state, accounting for 8.53 percent of the state total.
Sundargarh District has 3 sub divisions, 16 Tehsils, 17 Blocks and 262 Gram panchayats.
Topographically, this district is located between latitude 21 degree 36’ N to 22 degree 32’ N
and longitude 83 degree 32’ E to 85 degree 22’ E. The population of this District is 2,080,664,
this being the fifth most populous District of the state. Its rural population exceeds twelve lakhs
and the urban population is more than six lakhs. The male literacy rate is 82.13 and female
literacy rate in the District is 65.93.
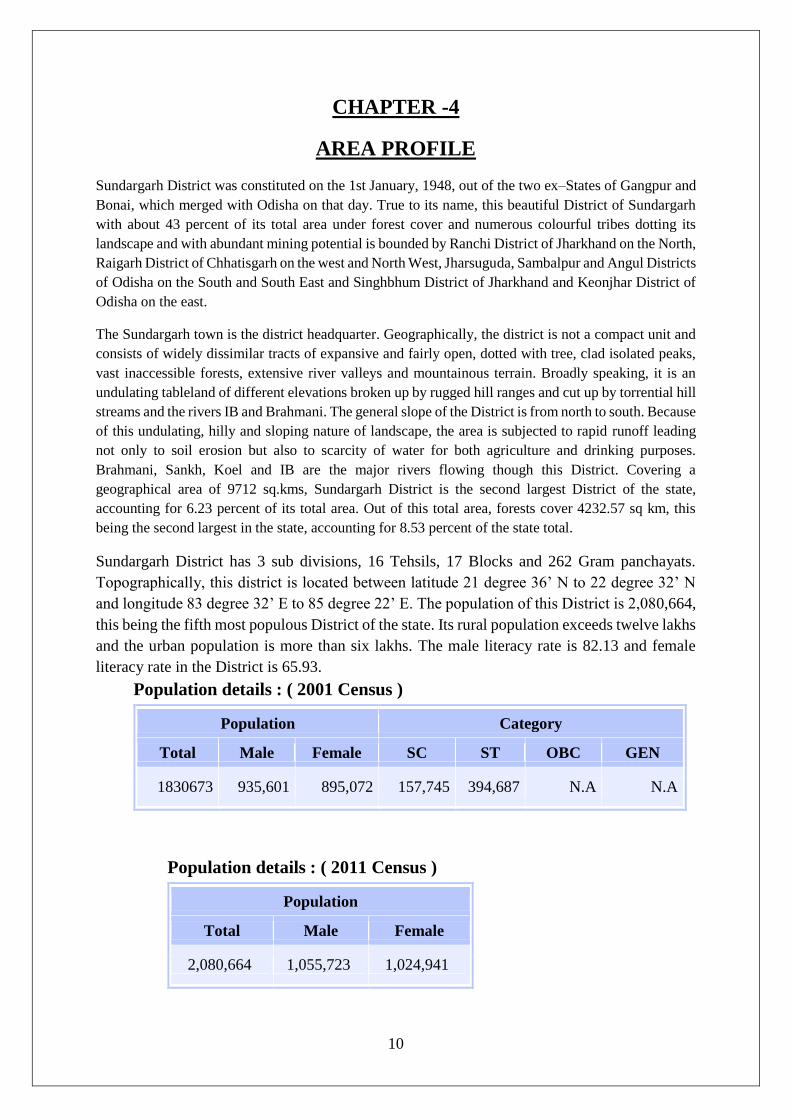
Population details : ( 2001 Census )
Population Category
Total Male Female SC ST OBC GEN
1830673 935,601 895,072 157,745 394,687 N.A N.A
Population details : ( 2011 Census )
Population
Total Male Female
2,080,664 1,055,723 1,024,941

11
12
CHAPTER 5
Aims and objectives
The basic aims and objectives of the survey was–
1. To study socio-economic condition of the periphery villages of OMML,Koira.
2. To understand the standard of living of people of the periphery villages of OMML,Koira.
3. To give suggestion for making this village as Model village
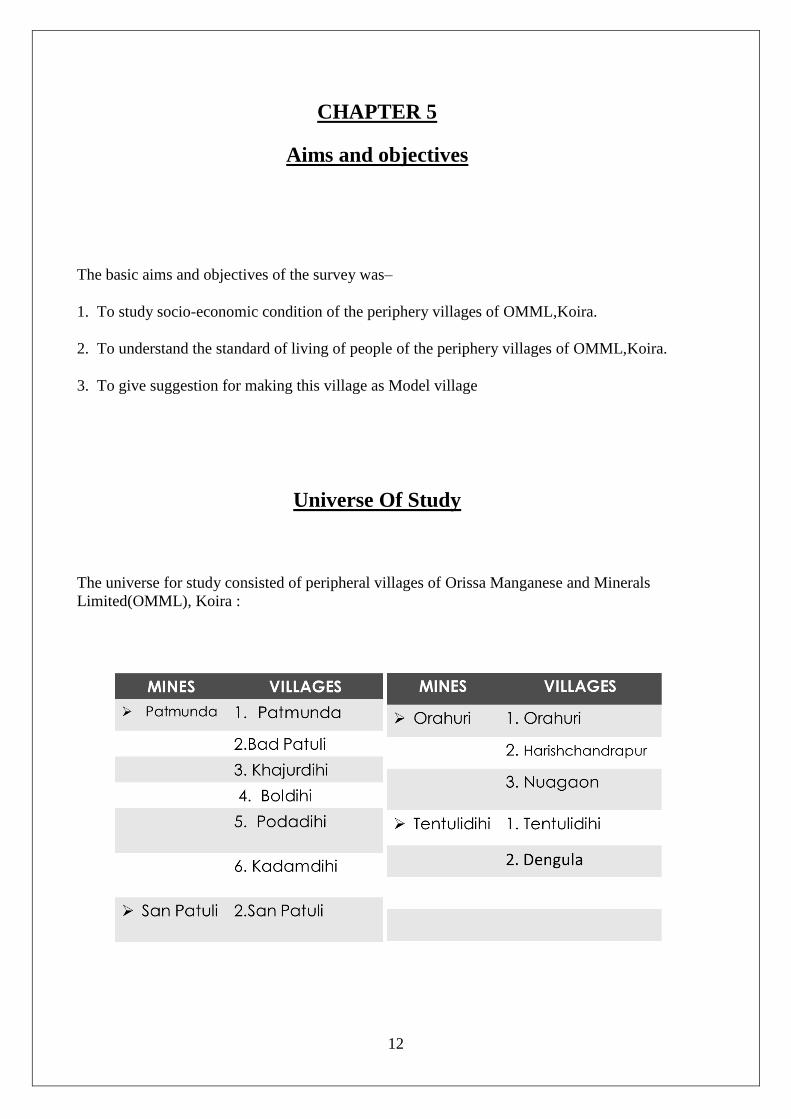
Universe Of Study
The universe for study consisted of peripheral villages of Orissa Manganese and Minerals
Limited(OMML), Koira :
13
CHAPTER 6
METHODOLOGY
Approaches, Methods and Tools used for collection of information:
All researchers are involved in collection of data in order to arrive at valid conclusion of the
study. Therefore for every study collection of data is a must. Data are of two types’ viz. primary
data and secondary data. There are different methods of data collection. Data collection can be
either through primary sources or secondary sources.
1. Primary source of data collection:
2.
The tools for collecting primary data were:-
Interview schedule
Observation
Focused group discussion
Participatory rural appraisal
Interview schedule:
An interview schedule was prepared containing several preceded close and open ended
questions. It was divided in different categories covering all aspects of target group. It was used
to collect a lot of information about an individual like name of the respondent, sex, caste, size
of the family, people perception about AAPL etc.
Observation:
Basically this method was more useful for data collection, by the use of eyes rather than ear
and the voice. The researcher collected the data by being physically present with the
respondent or around them often the whole day.
Focused Group Discussion (FGD):
All the data cannot be collected or gathered through interview because of social barrier and
less free line, so FGD method was used. It consisted of people from all age group and from
14
both male and female. It started with a formal discussion and ended up on core issues. It
helped the researcher to bring forward the detailed aspects of the issues.
Participatory Rural Appraisal (PRA):
The tool was very useful for getting though and authentic information regarding the
topic, by being it fully people participation oriented. It was applied by the researcher to
ensure villagers participation. PRA tools like resource mapping, social mapping etc were
used for collecting the data relevant to study, regarding need for education, and accessibility
of the educational institute.
Secondary Source of Data Collection:
Apart from the primary sources secondary sources was also explored for data collection
Sources were:
1. Books and journals
2. Articles
3. Organization report
4. Data from Block
15
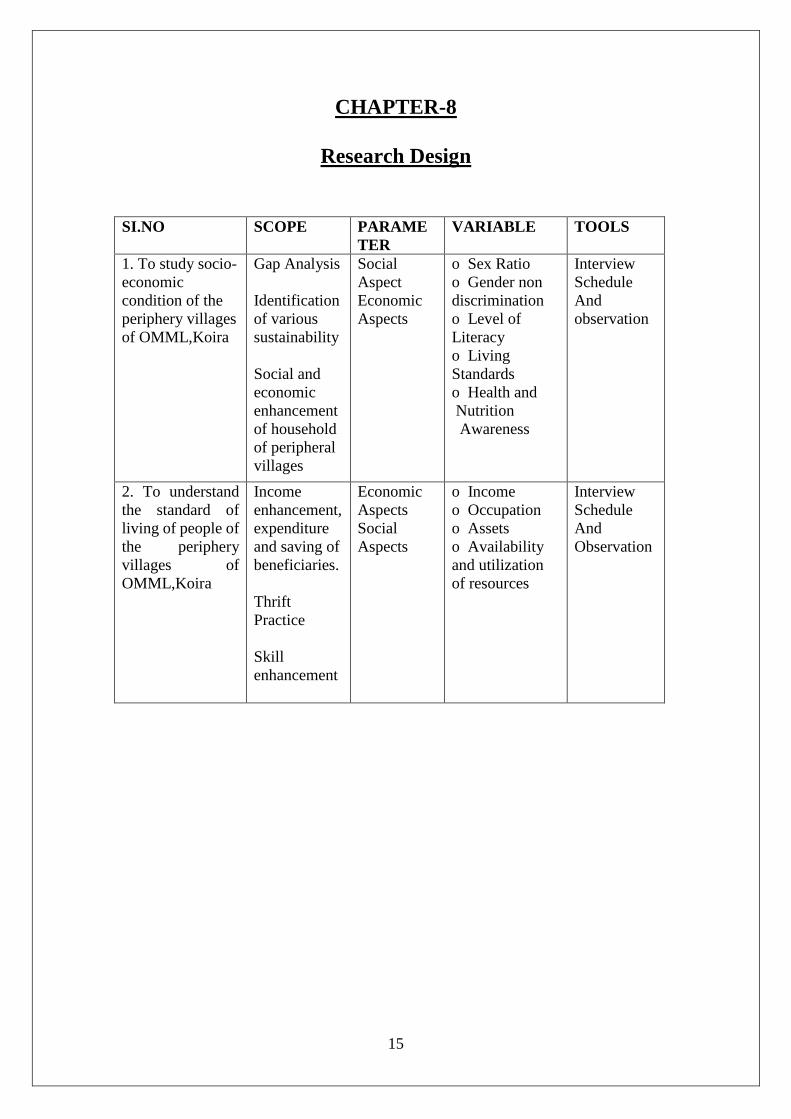
CHAPTER-8
Research Design
SI.NO SCOPE PARAME
TER
VARIABLE TOOLS
1. To study socio-
economic
condition of the
periphery villages
of OMML,Koira
Gap Analysis
Identification
of various
sustainability
Social and
economic
enhancement
of household
of peripheral
villages
Social
Aspect
Economic
Aspects
o Sex Ratio
o Gender non
discrimination
o Level of
Literacy
o Living
Standards
o Health and
Nutrition
Awareness
Interview
Schedule
And
observation
2. To understand
the standard of
living of people of
the periphery
villages of
OMML,Koira
Income
enhancement,
expenditure
and saving of
beneficiaries.
Thrift
Practice
Skill
enhancement
Economic
Aspects
Social
Aspects
o Income
o Occupation
o Assets
o Availability
and utilization
of resources
Interview
Schedule
And
Observation
16
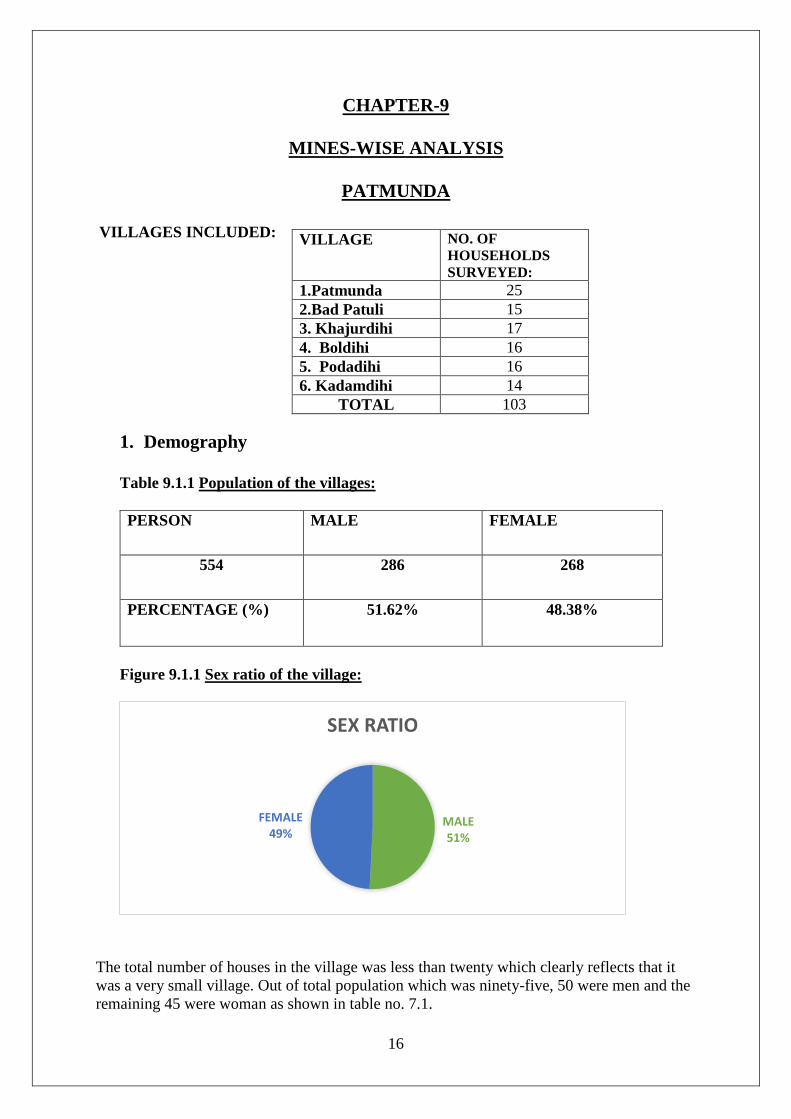
CHAPTER-9
MINES-WISE ANALYSIS
PATMUNDA
VILLAGES INCLUDED:
1. Demography
Table 9.1.1 Population of the villages:
PERSON MALE FEMALE
554 286 268
PERCENTAGE (%) 51.62% 48.38%
Figure 9.1.1 Sex ratio of the village:
The total number of houses in the village was less than twenty which clearly reflects that it
was a very small village. Out of total population which was ninety-five, 50 were men and the
remaining 45 were woman as shown in table no. 7.1.
MALE51%
FEMALE49%
SEX RATIO
VILLAGE NO. OF
HOUSEHOLDS
SURVEYED:
1.Patmunda 25
2.Bad Patuli 15
3. Khajurdihi 17
4. Boldihi 16
5. Podadihi 16
6. Kadamdihi 14
TOTAL 103
17
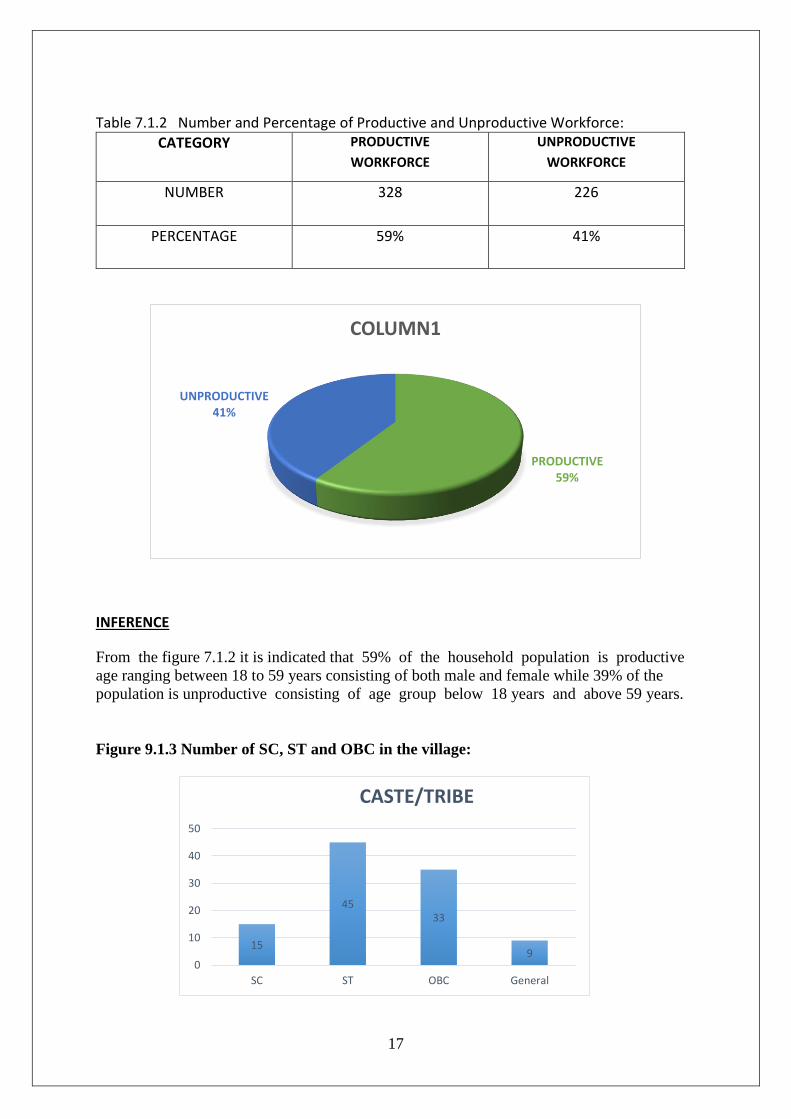
Table 7.1.2 Number and Percentage of Productive and Unproductive Workforce: CATEGORY PRODUCTIVE
WORKFORCE
UNPRODUCTIVE
WORKFORCE
NUMBER 328 226
PERCENTAGE 59% 41%
INFERENCE
From the figure 7.1.2 it is indicated that 59% of the household population is productive
age ranging between 18 to 59 years consisting of both male and female while 39% of the
population is unproductive consisting of age group below 18 years and above 59 years.
Figure 9.1.3 Number of SC, ST and OBC in the village:
PRODUCTIVE59%
UNPRODUCTIVE41%
COLUMN1
15
4533
90
10
20
30
40
50
SC ST OBC General
CASTE/TRIBE
18
INFERENCE:
Out of total people living in the village majority of them was ST. ST accounts for 44%
while OBC accounts for 33% of the total population residing in the village.
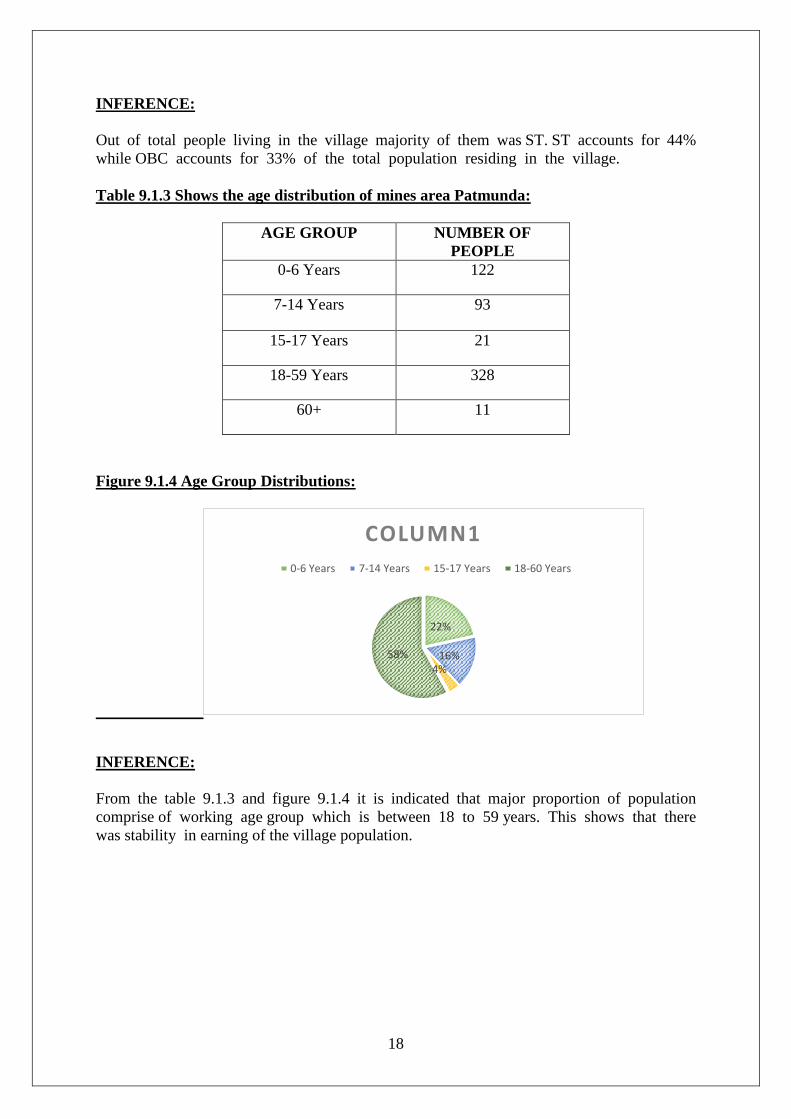
Table 9.1.3 Shows the age distribution of mines area Patmunda:
AGE GROUP NUMBER OF
PEOPLE
0-6 Years 122
7-14 Years 93
15-17 Years 21
18-59 Years 328
60+ 11
Figure 9.1.4 Age Group Distributions:
INFERENCE:
From the table 9.1.3 and figure 9.1.4 it is indicated that major proportion of population
comprise of working age group which is between 18 to 59 years. This shows that there
was stability in earning of the village population.
22%
16%4%
58%
COLUMN1
0-6 Years 7-14 Years 15-17 Years 18-60 Years
19
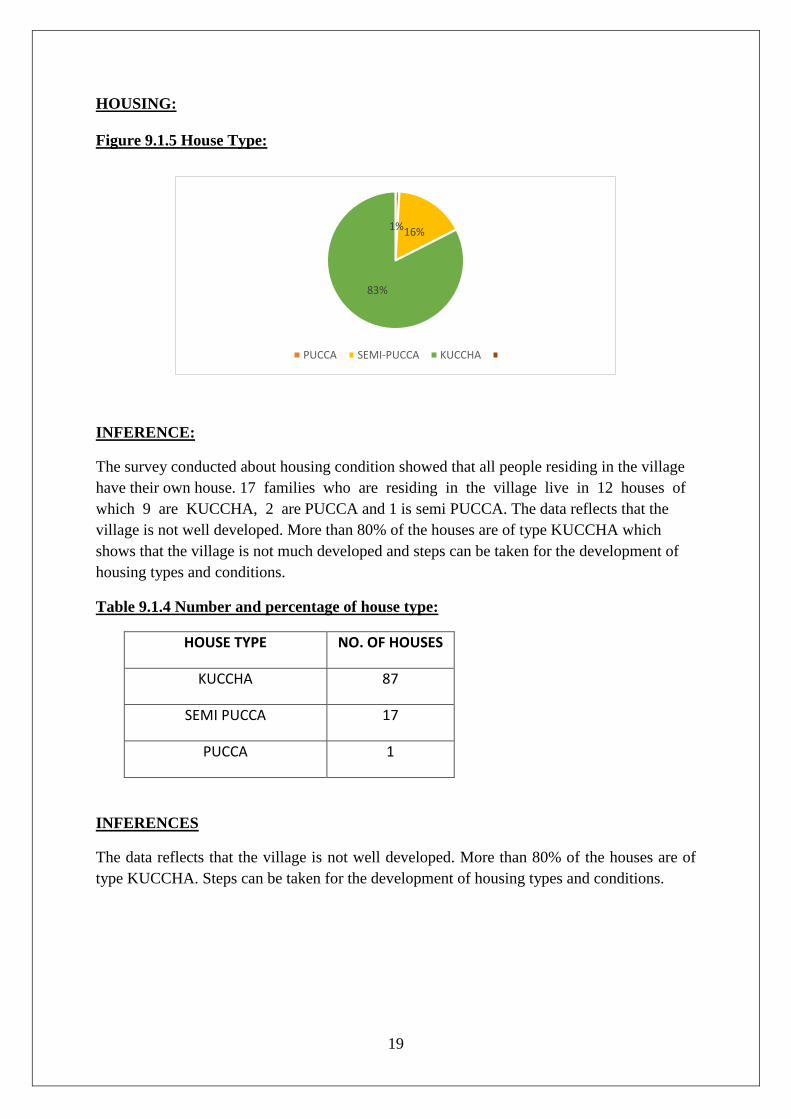
HOUSING:
Figure 9.1.5 House Type:
INFERENCE:
The survey conducted about housing condition showed that all people residing in the village
have their own house. 17 families who are residing in the village live in 12 houses of
which 9 are KUCCHA, 2 are PUCCA and 1 is semi PUCCA. The data reflects that the
village is not well developed. More than 80% of the houses are of type KUCCHA which
shows that the village is not much developed and steps can be taken for the development of
housing types and conditions.
Table 9.1.4 Number and percentage of house type:
HOUSE TYPE NO. OF HOUSES
KUCCHA 87
SEMI PUCCA 17
PUCCA 1
INFERENCES
The data reflects that the village is not well developed. More than 80% of the houses are of
type KUCCHA. Steps can be taken for the development of housing types and conditions.
1%16%
83%
PUCCA SEMI-PUCCA KUCCHA
20
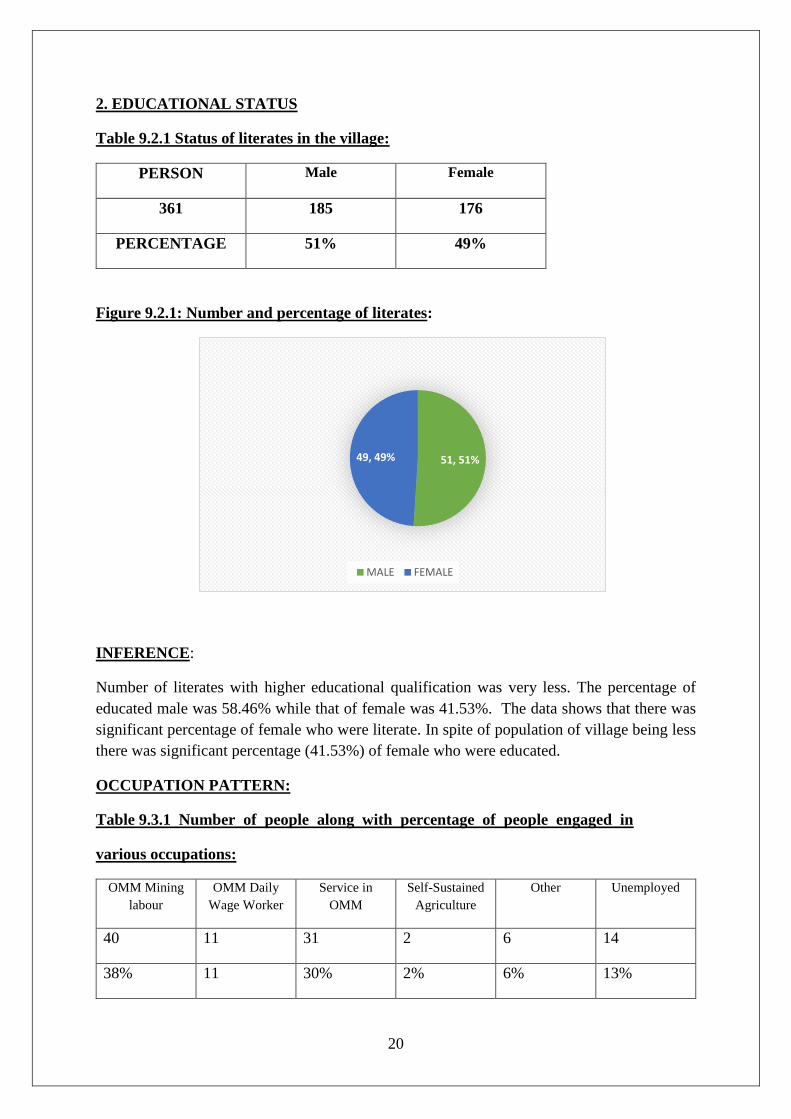
2. EDUCATIONAL STATUS
Table 9.2.1 Status of literates in the village:
PERSON Male Female
361 185 176
PERCENTAGE 51% 49%
Figure 9.2.1: Number and percentage of literates:
INFERENCE:
Number of literates with higher educational qualification was very less. The percentage of
educated male was 58.46% while that of female was 41.53%. The data shows that there was
significant percentage of female who were literate. In spite of population of village being less
there was significant percentage (41.53%) of female who were educated.
OCCUPATION PATTERN:
Table 9.3.1 Number of people along with percentage of people engaged in
various occupations:
OMM Mining
labour
OMM Daily
Wage Worker
Service in
OMM
Self-Sustained
Agriculture
Other Unemployed
40 11 31 2 6 14
38% 11 30% 2% 6% 13%
51, 51%49, 49%
MALE FEMALE
21
INFERENCE:
Of the total number of people residing in Patmunda, most of the people were involved in OMM
Mining jobs which were clearly reflected as 38% and 11% respectively.Out of 103 families,
82 families were OMML for employment. The remaining families depend on agriculture and
other jobs such as teaching.
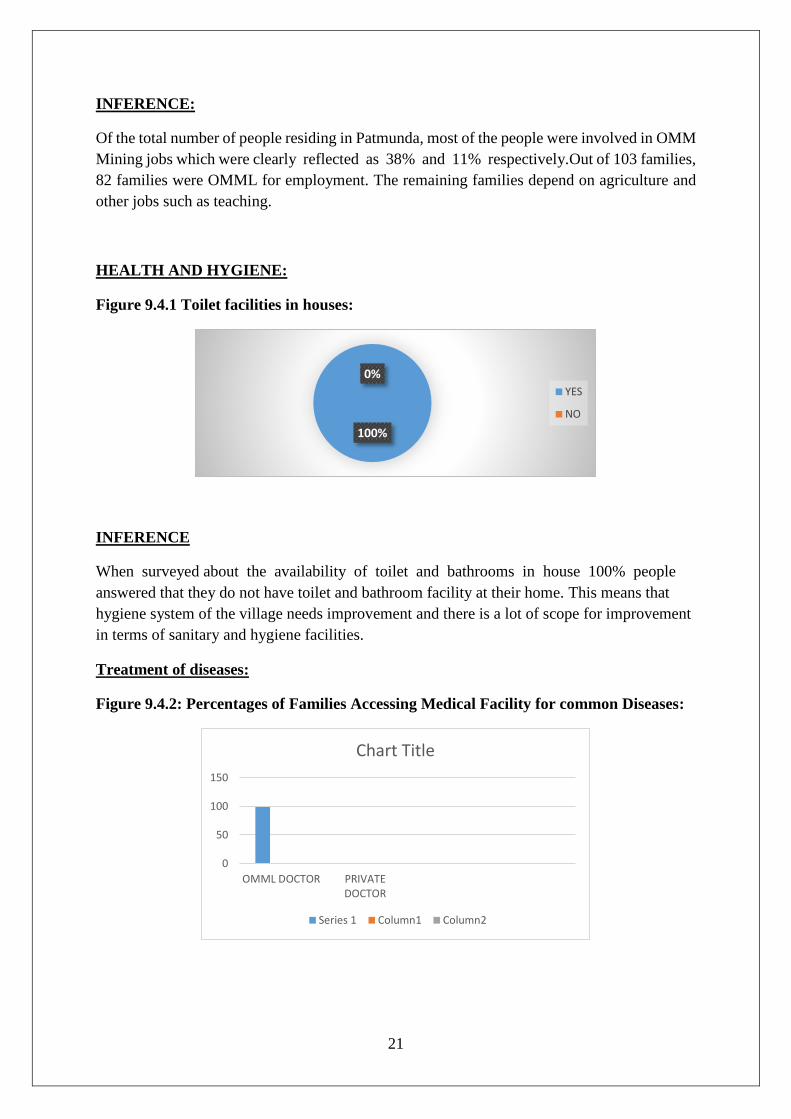
HEALTH AND HYGIENE:
Figure 9.4.1 Toilet facilities in houses:
INFERENCE
When surveyed about the availability of toilet and bathrooms in house 100% people
answered that they do not have toilet and bathroom facility at their home. This means that
hygiene system of the village needs improvement and there is a lot of scope for improvement
in terms of sanitary and hygiene facilities.
Treatment of diseases:
Figure 9.4.2: Percentages of Families Accessing Medical Facility for common Diseases:
100%
0%
YES
NO
0
50
100
150
OMML DOCTOR PRIVATEDOCTOR
Chart Title
Series 1 Column1 Column2
22
ECONOMIC STATUS:
Analysis of average annual Income, Expenditure and saving:
Most of the income of the villages comes from Private sector, Service in OMML, Job
contracts. The average annual income as per the survey was found to be 54,000.
INCOME RANGE No. OF FAMILIES
0-40,000 31
41,000-1,00,000 43
1,00,000+ 11
NO INCOME 18
ELECTRICITY AND WATER FACILITIES
ELECTRICITY
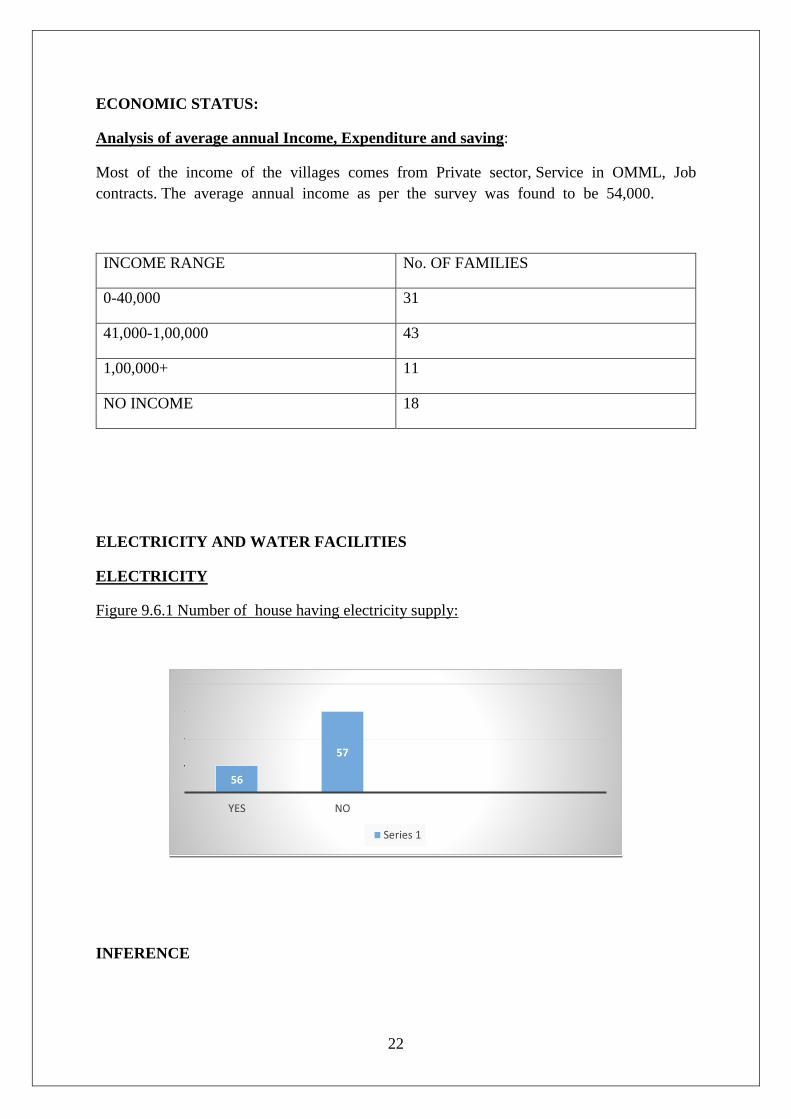
Figure 9.6.1 Number of house having electricity supply:
INFERENCE
56
57
YES NO
Series 1
23
When asked about the ELECTRICITY availability, 56 families responded that there was
electricity supply in their houses while 57 families responded that they do not have
electricity in their houses.
Water Facilities Out of the two well in the village only 1 is functional while the other
is dry. There is also a provision of water tank having a capacity of 2000 L which is used
by the villagers .There were 4 hand pump in the village. 17 families hence depend on the well
and water tank and hand pump.
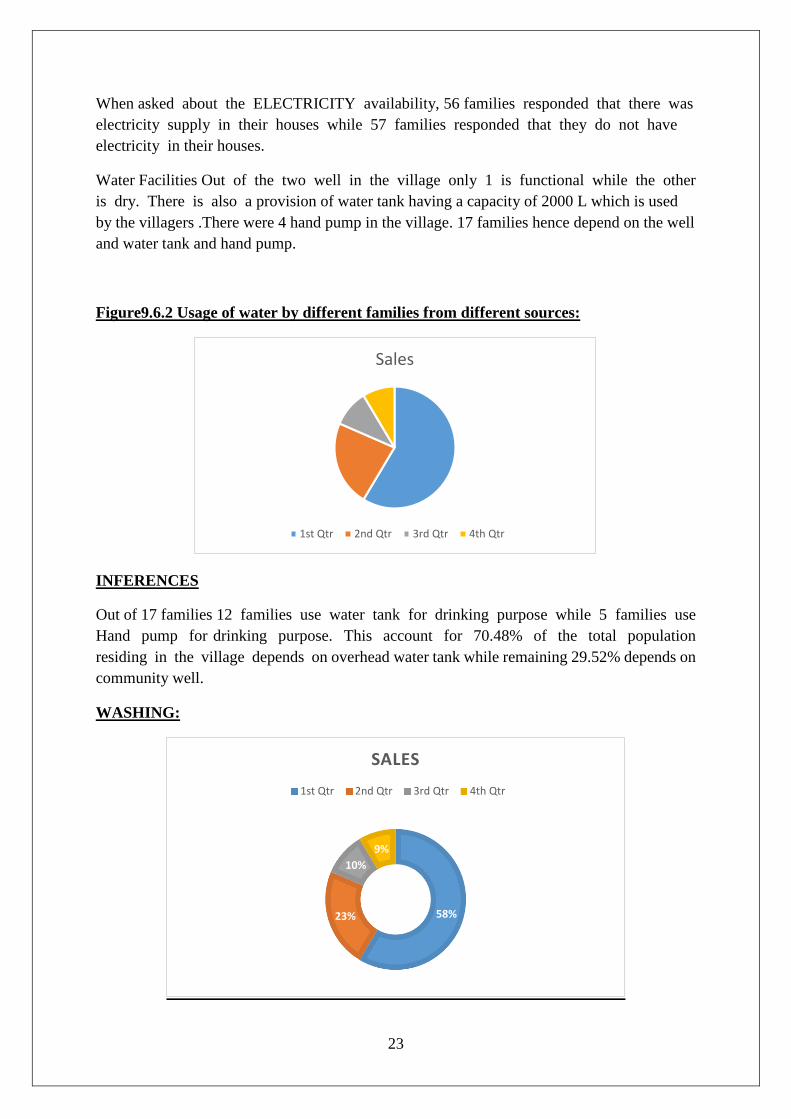
Figure9.6.2 Usage of water by different families from different sources:
INFERENCES
Out of 17 families 12 families use water tank for drinking purpose while 5 families use
Hand pump for drinking purpose. This account for 70.48% of the total population
residing in the village depends on overhead water tank while remaining 29.52% depends on
community well.
WASHING:
Sales
1st Qtr 2nd Qtr 3rd Qtr 4th Qtr
58%23%
10%
9%
SALES
1st Qtr 2nd Qtr 3rd Qtr 4th Qtr
24
INFERENCES:
Out of 17 families 6 families use water tank for washing purpose while 11 families
use community well for washing purpose. This account for 35.29% of the total population
residing in the village depends on water tank while remaining 64.71% depends on community
well.
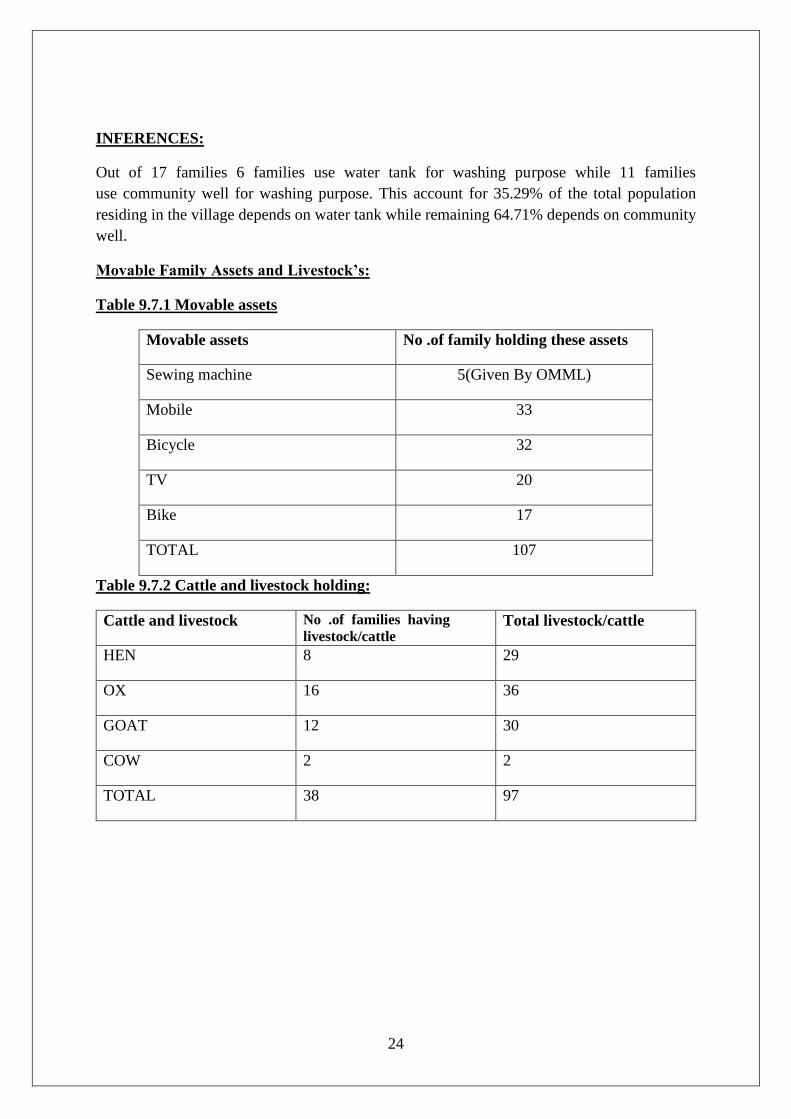
Movable Family Assets and Livestock’s:
Table 9.7.1 Movable assets
Movable assets No .of family holding these assets
Sewing machine 5(Given By OMML)
Mobile 33
Bicycle 32
TV 20
Bike 17
TOTAL 107
Table 9.7.2 Cattle and livestock holding:
Cattle and livestock No .of families having
livestock/cattle Total livestock/cattle
HEN 8 29
OX 16 36
GOAT 12 30
COW 2 2
TOTAL 38 97
25
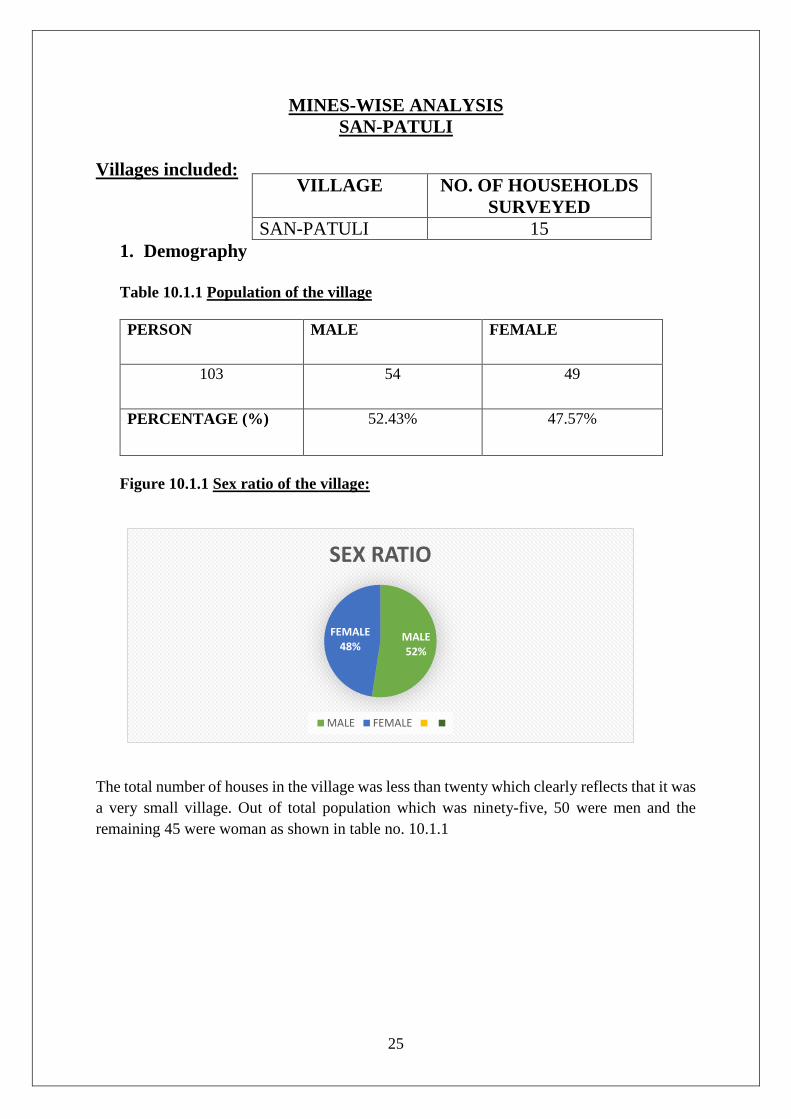
MINES-WISE ANALYSIS
SAN-PATULI
Villages included:
1. Demography
Table 10.1.1 Population of the village
PERSON MALE FEMALE
103 54 49
PERCENTAGE (%) 52.43% 47.57%
Figure 10.1.1 Sex ratio of the village:
The total number of houses in the village was less than twenty which clearly reflects that it was
a very small village. Out of total population which was ninety-five, 50 were men and the
remaining 45 were woman as shown in table no. 10.1.1
VILLAGE NO. OF HOUSEHOLDS
SURVEYED
SAN-PATULI 15
MALE52%
FEMALE48%
SEX RATIO
MALE FEMALE
26
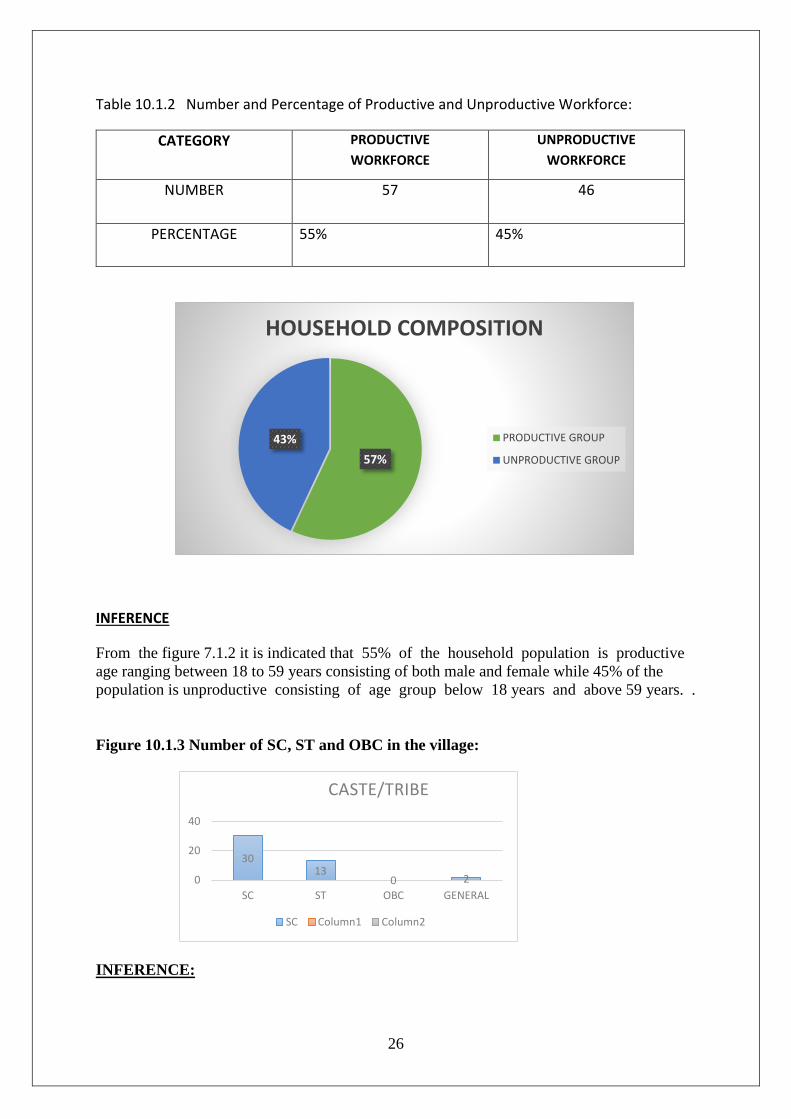
Table 10.1.2 Number and Percentage of Productive and Unproductive Workforce:
CATEGORY PRODUCTIVE
WORKFORCE
UNPRODUCTIVE
WORKFORCE
NUMBER 57 46
PERCENTAGE 55% 45%
INFERENCE
From the figure 7.1.2 it is indicated that 55% of the household population is productive
age ranging between 18 to 59 years consisting of both male and female while 45% of the
population is unproductive consisting of age group below 18 years and above 59 years. .
Figure 10.1.3 Number of SC, ST and OBC in the village:
INFERENCE:
57%
43%
HOUSEHOLD COMPOSITION
PRODUCTIVE GROUP
UNPRODUCTIVE GROUP
3013
0 20
20
40
SC ST OBC GENERAL
CASTE/TRIBE
SC Column1 Column2
27
Out of total people living in the village majority of them was OBC. ST accounts for
4% while OBC accounts for 96% of the total population residing in the village. The
ratio of SC, ST and OBC accounts as 0:1:24 showing that majority of people were OBC.
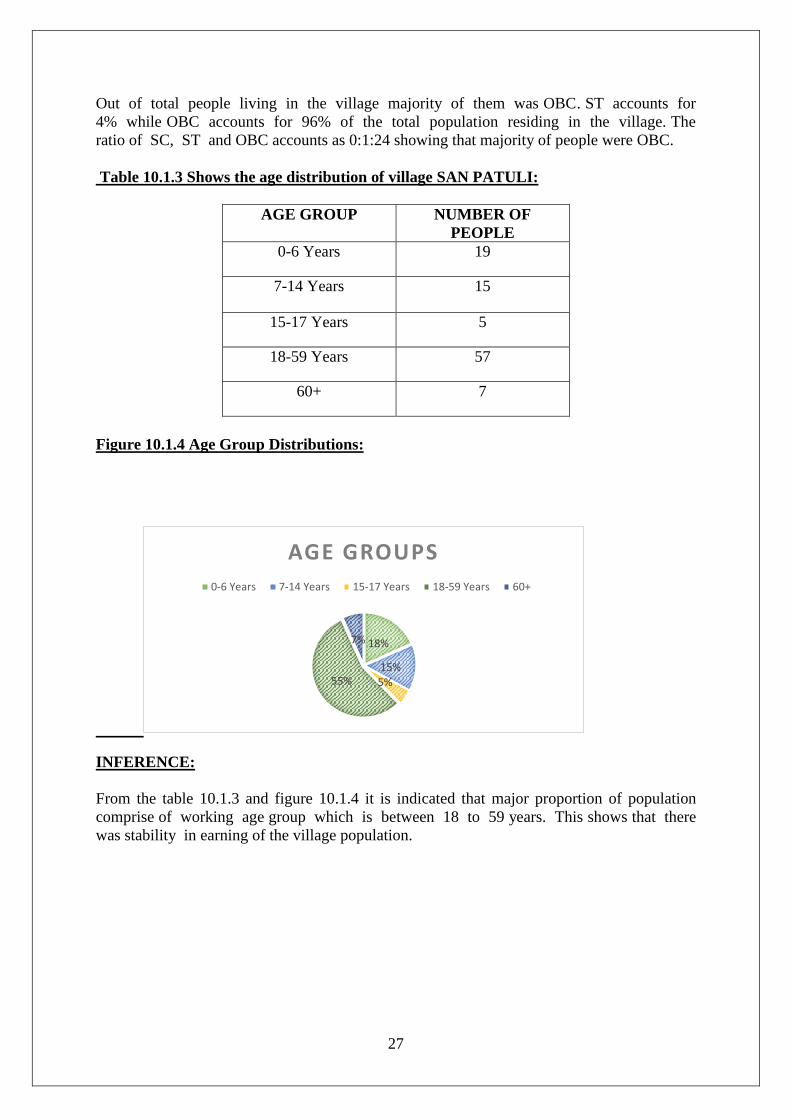
Table 10.1.3 Shows the age distribution of village SAN PATULI:
AGE GROUP NUMBER OF
PEOPLE
0-6 Years 19
7-14 Years 15
15-17 Years 5
18-59 Years 57
60+ 7
Figure 10.1.4 Age Group Distributions:
INFERENCE:
From the table 10.1.3 and figure 10.1.4 it is indicated that major proportion of population
comprise of working age group which is between 18 to 59 years. This shows that there
was stability in earning of the village population.
18%
15%
5%55%
7%
AGE GROUPS
0-6 Years 7-14 Years 15-17 Years 18-59 Years 60+
28
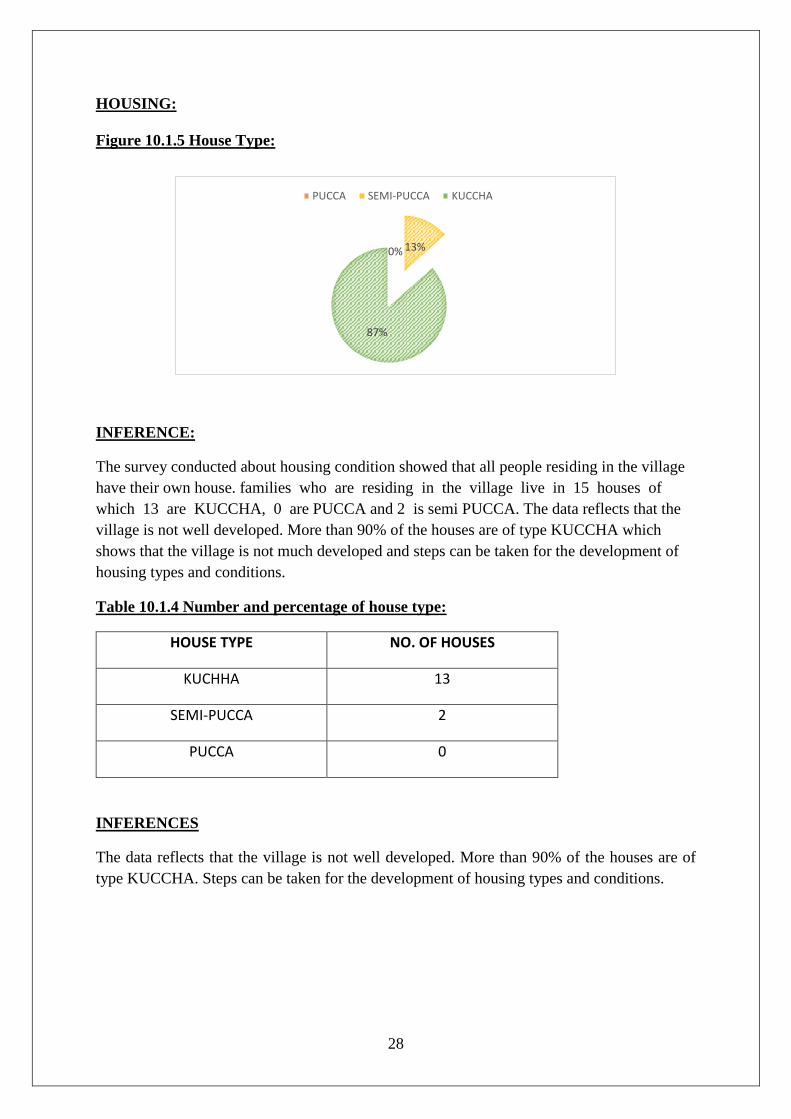
HOUSING:
Figure 10.1.5 House Type:
INFERENCE:
The survey conducted about housing condition showed that all people residing in the village
have their own house. families who are residing in the village live in 15 houses of
which 13 are KUCCHA, 0 are PUCCA and 2 is semi PUCCA. The data reflects that the
village is not well developed. More than 90% of the houses are of type KUCCHA which
shows that the village is not much developed and steps can be taken for the development of
housing types and conditions.
Table 10.1.4 Number and percentage of house type:
HOUSE TYPE NO. OF HOUSES
KUCHHA 13
SEMI-PUCCA 2
PUCCA 0
INFERENCES
The data reflects that the village is not well developed. More than 90% of the houses are of
type KUCCHA. Steps can be taken for the development of housing types and conditions.
0% 13%
87%
PUCCA SEMI-PUCCA KUCCHA
29
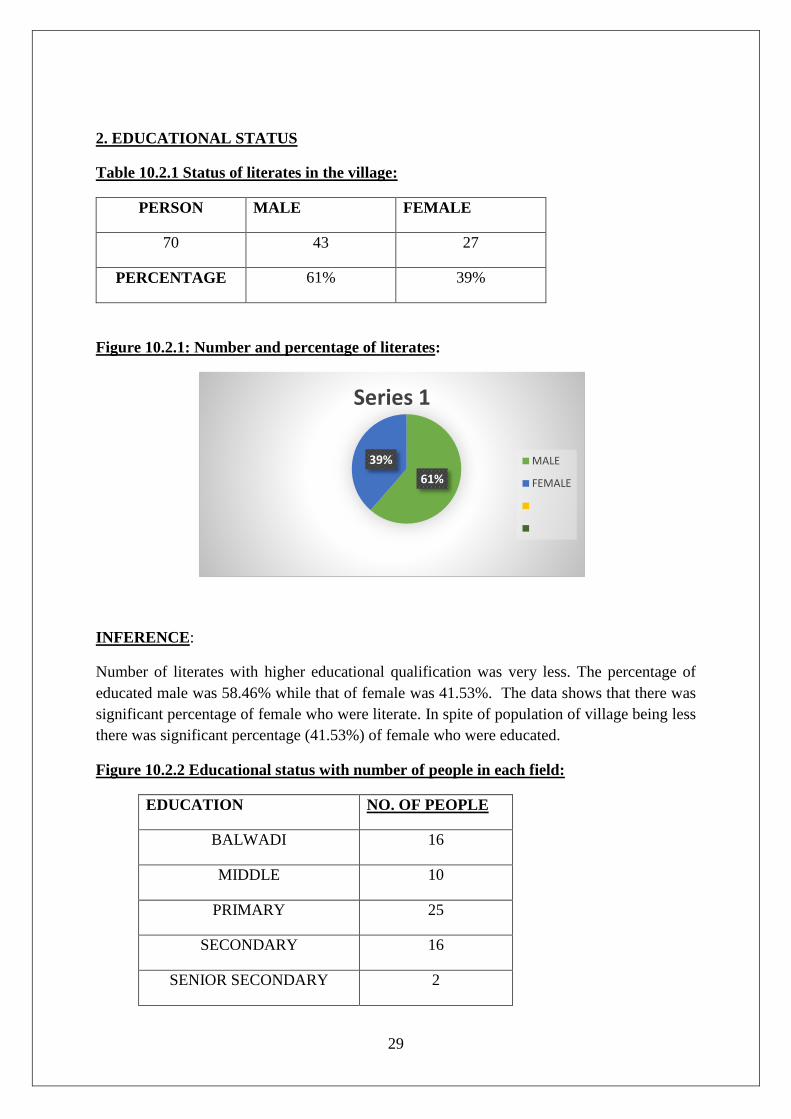
2. EDUCATIONAL STATUS
Table 10.2.1 Status of literates in the village:
PERSON MALE FEMALE
70 43 27
PERCENTAGE 61% 39%
Figure 10.2.1: Number and percentage of literates:
INFERENCE:
Number of literates with higher educational qualification was very less. The percentage of
educated male was 58.46% while that of female was 41.53%. The data shows that there was
significant percentage of female who were literate. In spite of population of village being less
there was significant percentage (41.53%) of female who were educated.
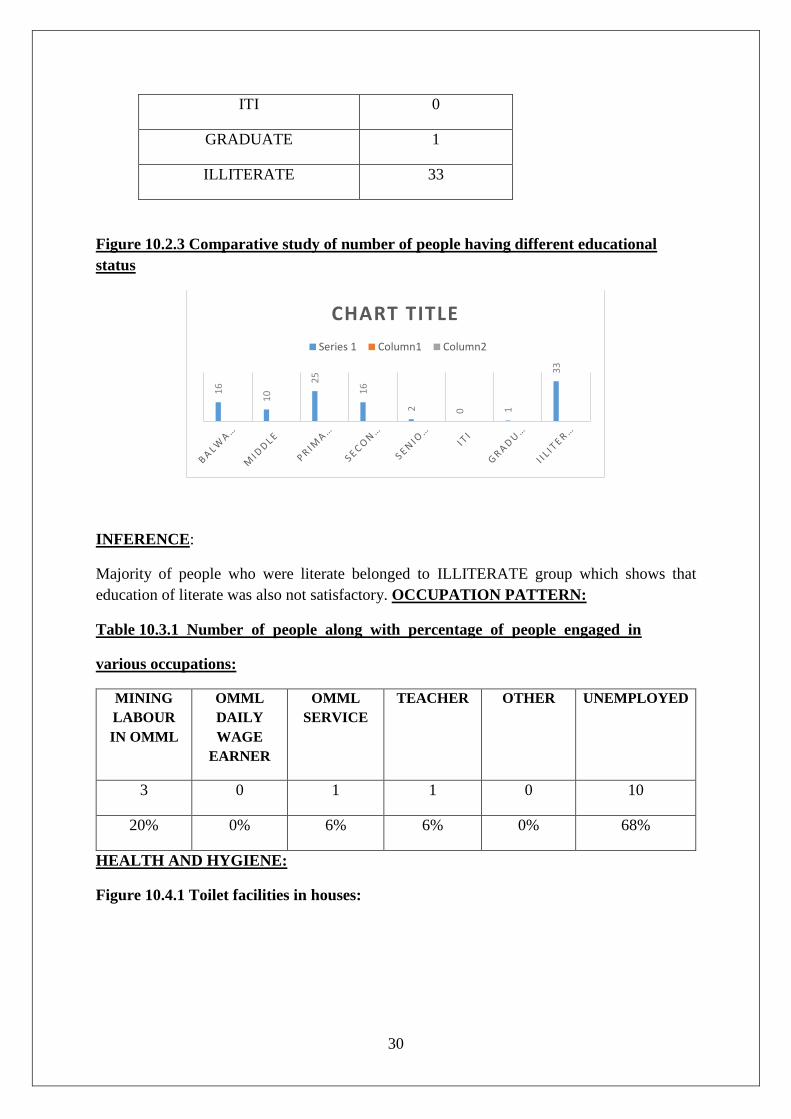
Figure 10.2.2 Educational status with number of people in each field:
EDUCATION NO. OF PEOPLE
BALWADI 16
MIDDLE 10
PRIMARY 25
SECONDARY 16
SENIOR SECONDARY 2
61%
39%
Series 1
MALE
FEMALE
30
ITI 0
GRADUATE 1
ILLITERATE 33
Figure 10.2.3 Comparative study of number of people having different educational
status
INFERENCE:
Majority of people who were literate belonged to ILLITERATE group which shows that
education of literate was also not satisfactory. OCCUPATION PATTERN:
Table 10.3.1 Number of people along with percentage of people engaged in
various occupations:
MINING
LABOUR
IN OMML
OMML
DAILY
WAGE
EARNER
OMML
SERVICE
TEACHER OTHER UNEMPLOYED
3 0 1 1 0 10
20% 0% 6% 6% 0% 68%
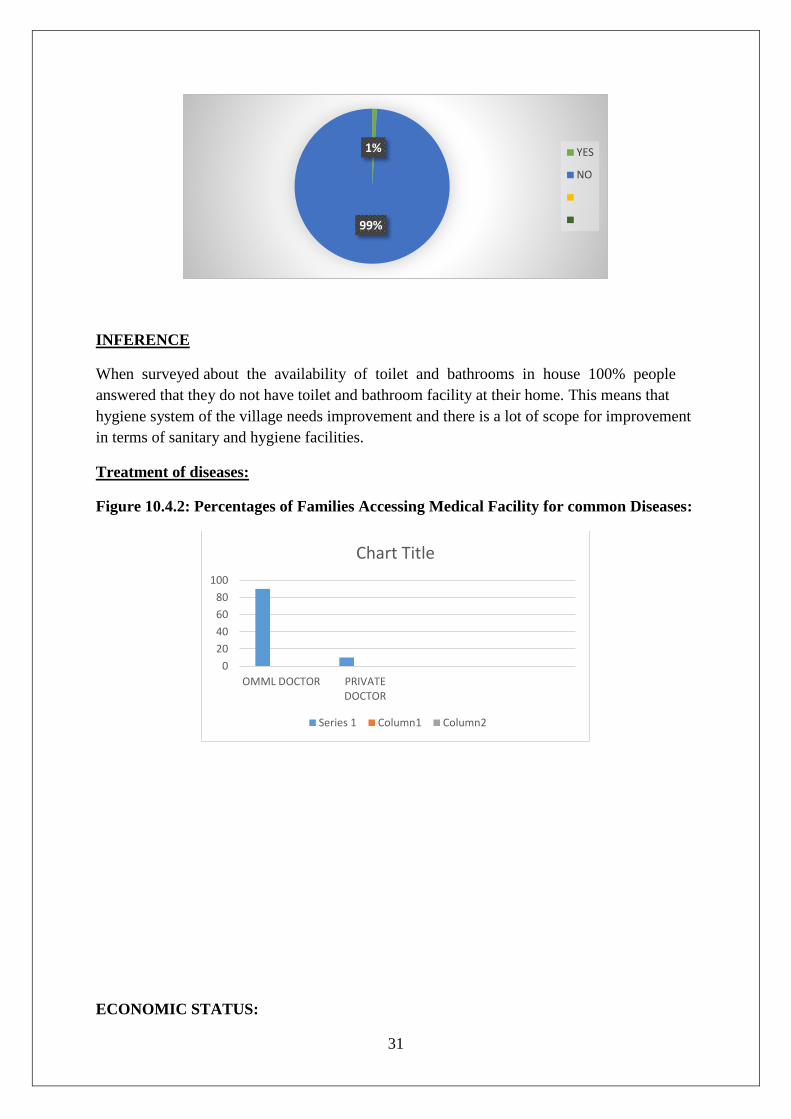
HEALTH AND HYGIENE:
Figure 10.4.1 Toilet facilities in houses:
16
10
25
16
2 0 1
33
CHART TITLE
Series 1 Column1 Column2
31
INFERENCE
When surveyed about the availability of toilet and bathrooms in house 100% people
answered that they do not have toilet and bathroom facility at their home. This means that
hygiene system of the village needs improvement and there is a lot of scope for improvement
in terms of sanitary and hygiene facilities.
Treatment of diseases:
Figure 10.4.2: Percentages of Families Accessing Medical Facility for common Diseases:
ECONOMIC STATUS:
1%
99%
YES
NO
0
20
40
60
80
100
OMML DOCTOR PRIVATEDOCTOR
Chart Title
Series 1 Column1 Column2
32
Analysis of average annual Income, Expenditure and saving:
Most of the villagers are unemployed. Few work as a mining labour in OMML.The average
annual income as per the survey was found to be 36,000.
ELECTRICITY AND WATER FACILITIES
ELECTRICITY
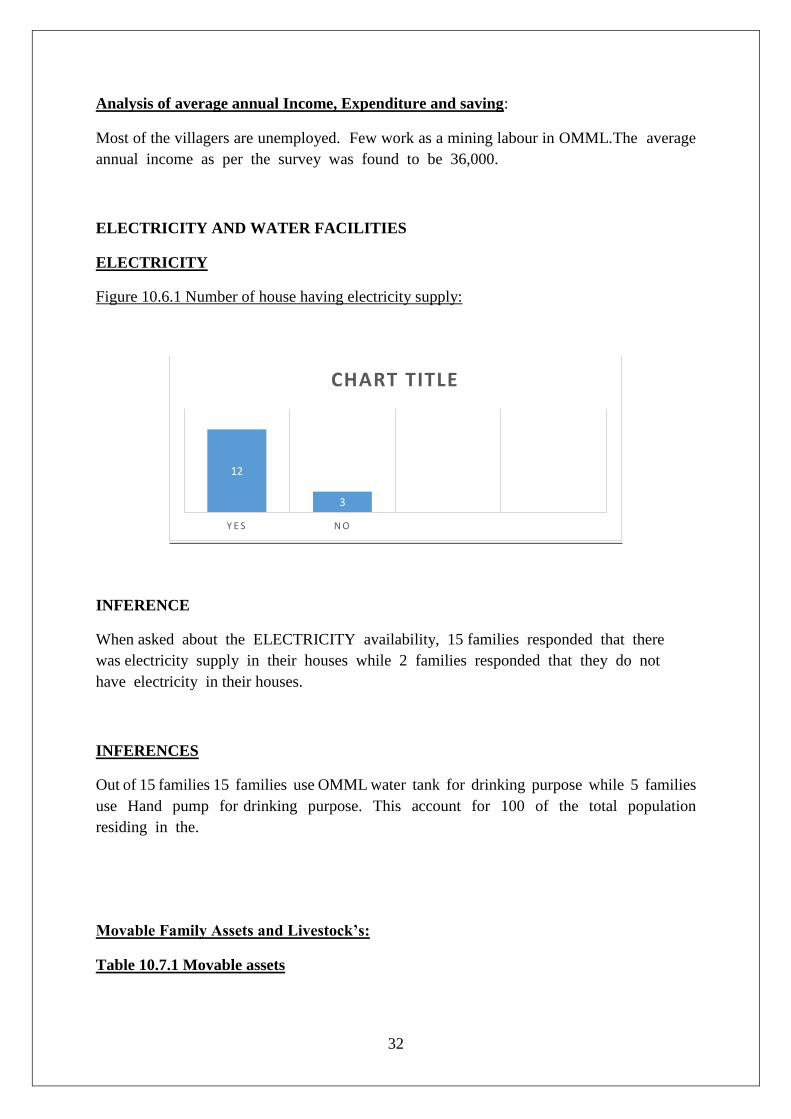
Figure 10.6.1 Number of house having electricity supply:
INFERENCE
When asked about the ELECTRICITY availability, 15 families responded that there
was electricity supply in their houses while 2 families responded that they do not
have electricity in their houses.
INFERENCES
Out of 15 families 15 families use OMML water tank for drinking purpose while 5 families
use Hand pump for drinking purpose. This account for 100 of the total population
residing in the.
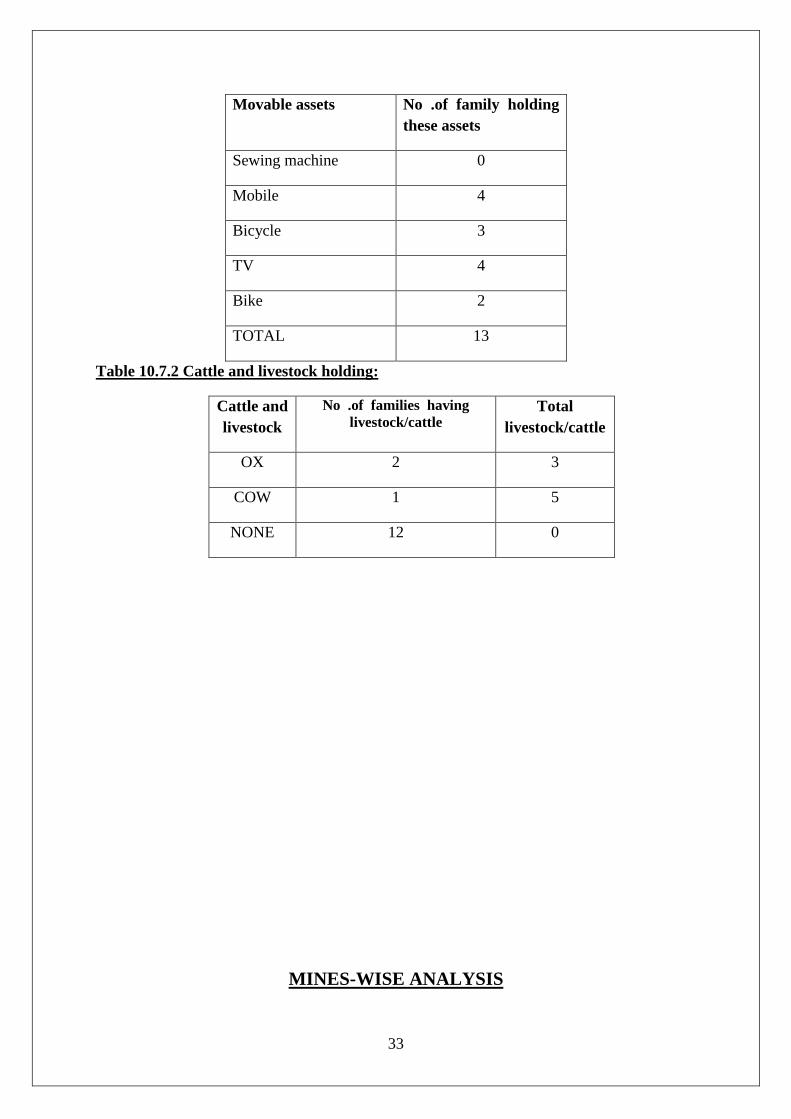
Movable Family Assets and Livestock’s:
Table 10.7.1 Movable assets
12
3
Y E S N O
CHART TITLE
33
Movable assets No .of family holding
these assets
Sewing machine 0
Mobile 4
Bicycle 3
TV 4
Bike 2
TOTAL 13
Table 10.7.2 Cattle and livestock holding:
Cattle and
livestock
No .of families having
livestock/cattle Total
livestock/cattle
OX 2 3
COW 1 5
NONE 12 0
MINES-WISE ANALYSIS
34
Tentulidihi
VILLAGES: Tentulidihi,Dengula
1. Demography
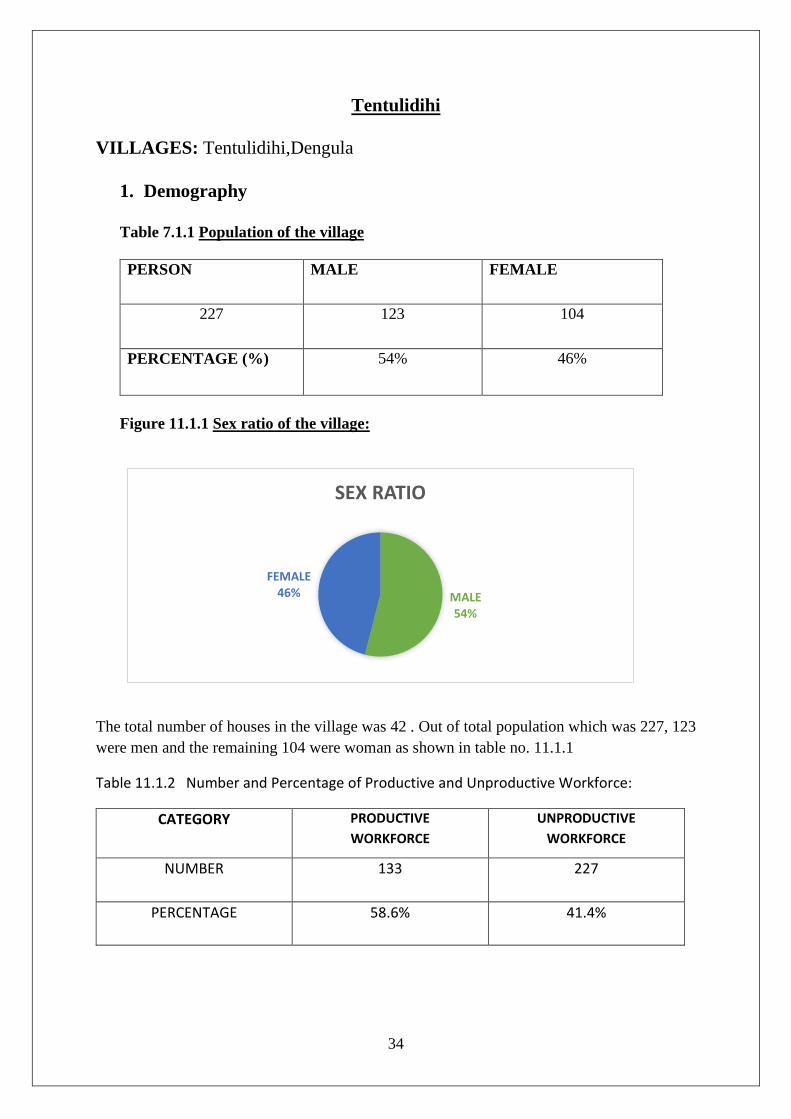
Table 7.1.1 Population of the village
PERSON MALE FEMALE
227 123 104
PERCENTAGE (%) 54% 46%
Figure 11.1.1 Sex ratio of the village:
The total number of houses in the village was 42 . Out of total population which was 227, 123
were men and the remaining 104 were woman as shown in table no. 11.1.1
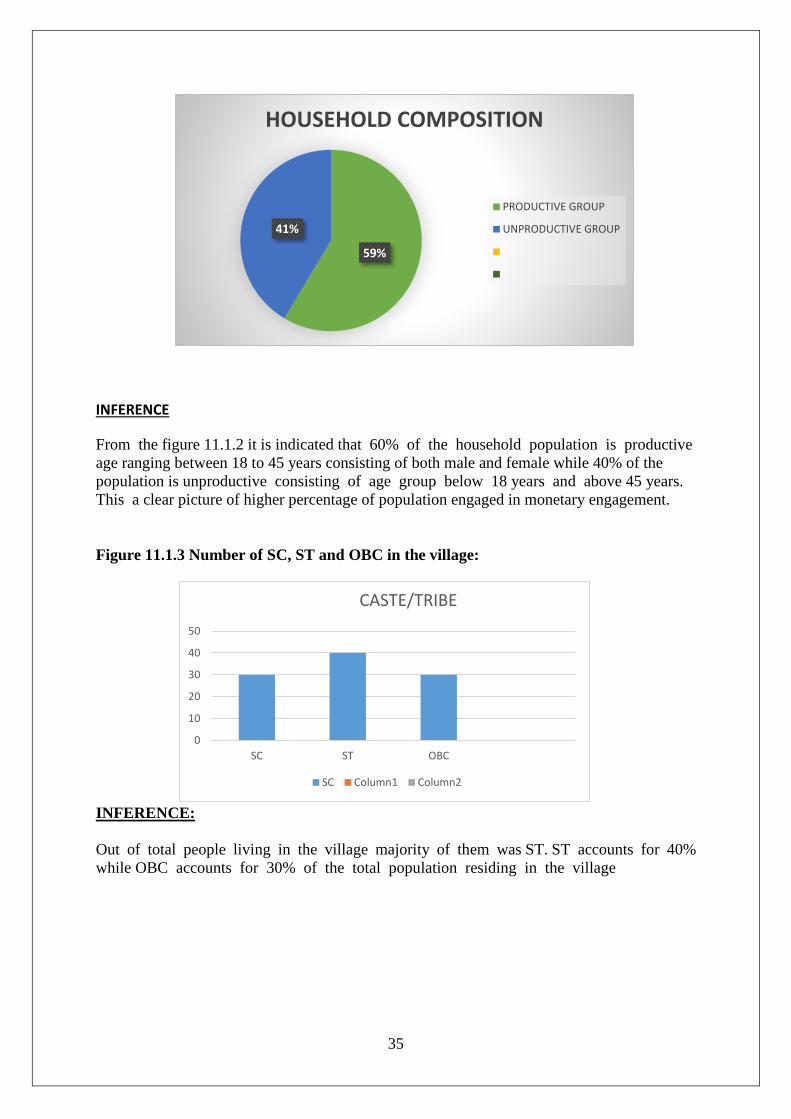
Table 11.1.2 Number and Percentage of Productive and Unproductive Workforce:
CATEGORY PRODUCTIVE
WORKFORCE
UNPRODUCTIVE
WORKFORCE
NUMBER 133 227
PERCENTAGE 58.6% 41.4%
MALE54%
FEMALE46%
SEX RATIO
35
INFERENCE
From the figure 11.1.2 it is indicated that 60% of the household population is productive
age ranging between 18 to 45 years consisting of both male and female while 40% of the
population is unproductive consisting of age group below 18 years and above 45 years.
This a clear picture of higher percentage of population engaged in monetary engagement.
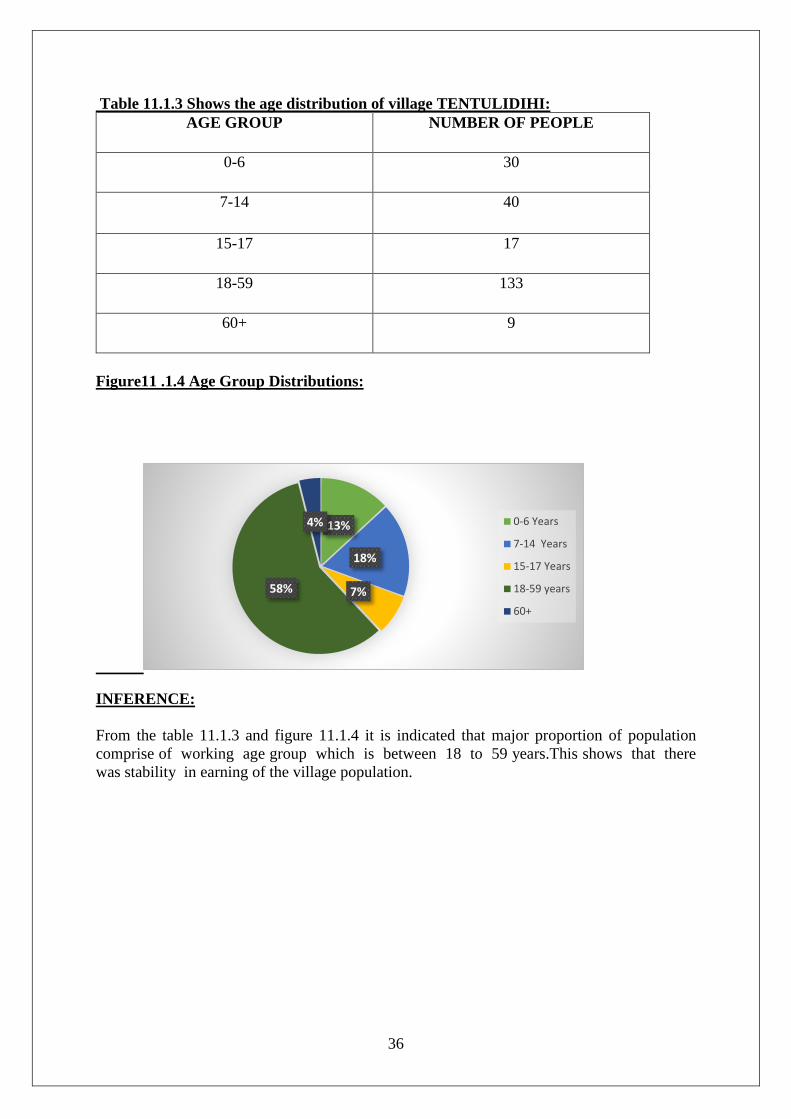
Figure 11.1.3 Number of SC, ST and OBC in the village:
INFERENCE:
Out of total people living in the village majority of them was ST. ST accounts for 40%
while OBC accounts for 30% of the total population residing in the village
59%
41%
HOUSEHOLD COMPOSITION
PRODUCTIVE GROUP
UNPRODUCTIVE GROUP
0
10
20
30
40
50
SC ST OBC
CASTE/TRIBE
SC Column1 Column2
36
Table 11.1.3 Shows the age distribution of village TENTULIDIHI:
AGE GROUP NUMBER OF PEOPLE
0-6 30
7-14 40
15-17 17
18-59 133
60+ 9
Figure11 .1.4 Age Group Distributions:
INFERENCE:
From the table 11.1.3 and figure 11.1.4 it is indicated that major proportion of population
comprise of working age group which is between 18 to 59 years.This shows that there
was stability in earning of the village population.
13%
18%
7%58%
4% 0-6 Years
7-14 Years
15-17 Years
18-59 years
60+
37
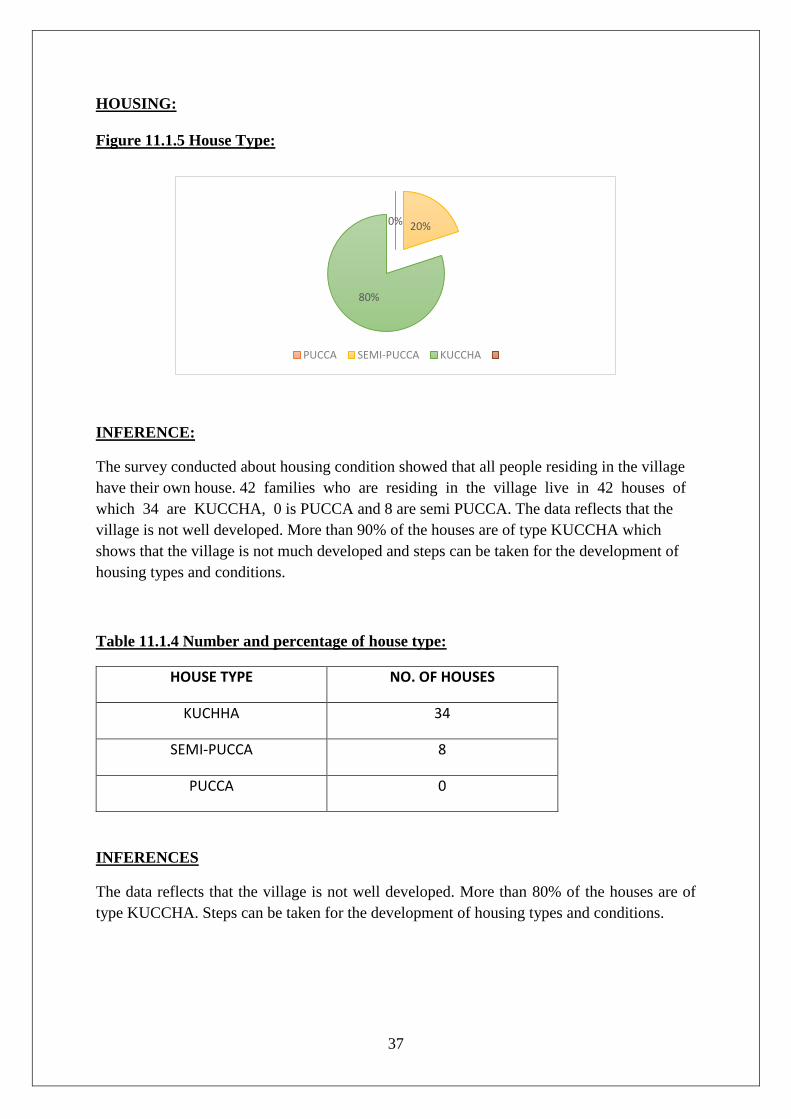
HOUSING:
Figure 11.1.5 House Type:
INFERENCE:
The survey conducted about housing condition showed that all people residing in the village
have their own house. 42 families who are residing in the village live in 42 houses of
which 34 are KUCCHA, 0 is PUCCA and 8 are semi PUCCA. The data reflects that the
village is not well developed. More than 90% of the houses are of type KUCCHA which
shows that the village is not much developed and steps can be taken for the development of
housing types and conditions.
Table 11.1.4 Number and percentage of house type:
HOUSE TYPE NO. OF HOUSES
KUCHHA 34
SEMI-PUCCA 8
PUCCA 0
INFERENCES
The data reflects that the village is not well developed. More than 80% of the houses are of
type KUCCHA. Steps can be taken for the development of housing types and conditions.
0% 20%
80%
PUCCA SEMI-PUCCA KUCCHA
38
2. EDUCATIONAL STATUS
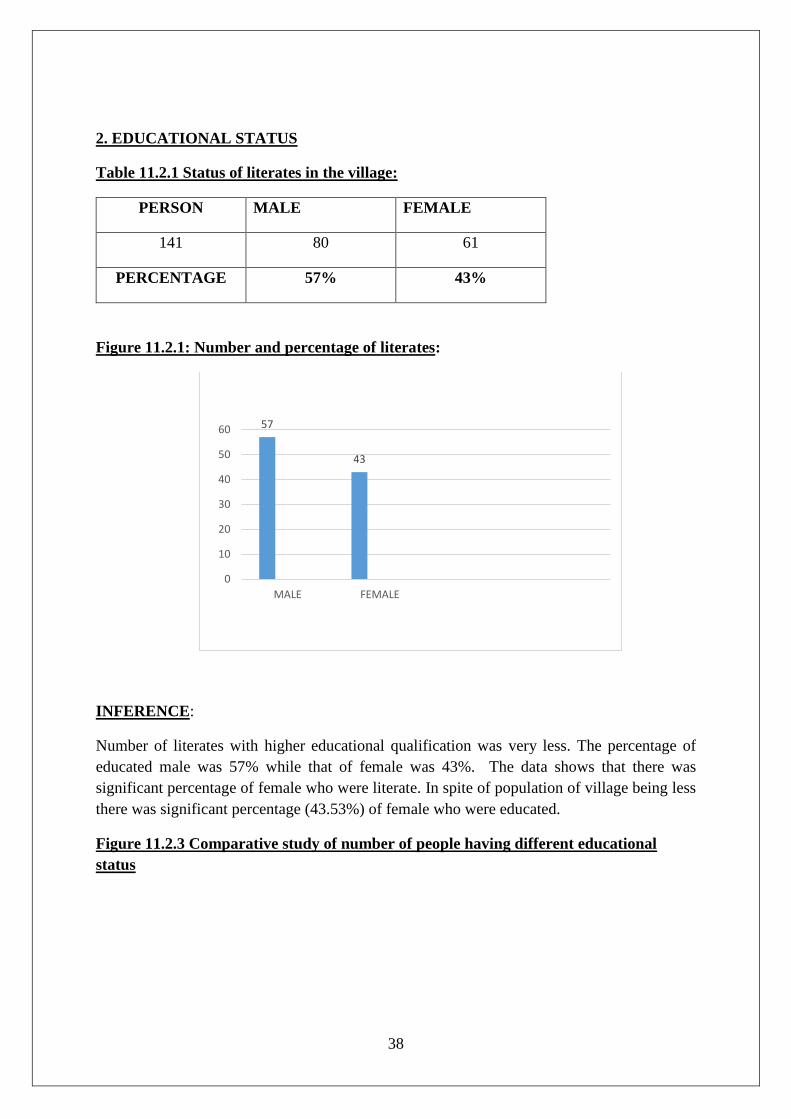
Table 11.2.1 Status of literates in the village:
PERSON MALE FEMALE
141 80 61
PERCENTAGE 57% 43%
Figure 11.2.1: Number and percentage of literates:
INFERENCE:
Number of literates with higher educational qualification was very less. The percentage of
educated male was 57% while that of female was 43%. The data shows that there was
significant percentage of female who were literate. In spite of population of village being less
there was significant percentage (43.53%) of female who were educated.
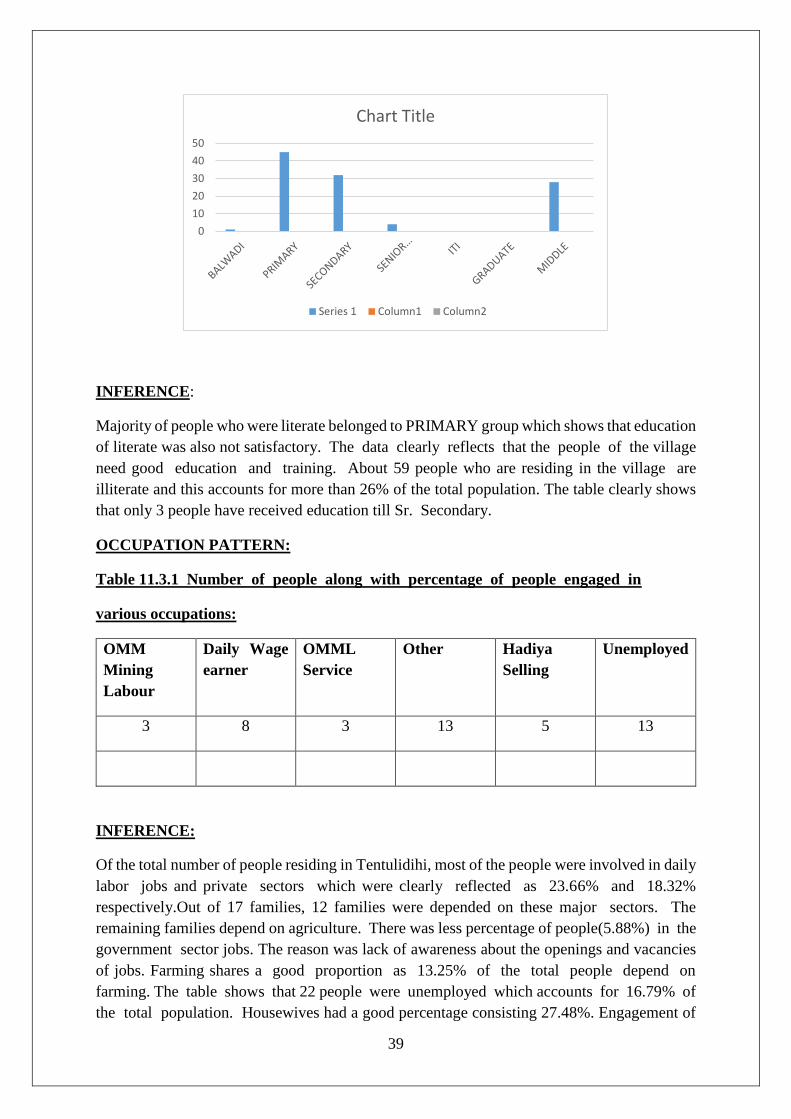
Figure 11.2.3 Comparative study of number of people having different educational
status
57
43
0
10
20
30
40
50
60
MALE FEMALE
39
INFERENCE:
Majority of people who were literate belonged to PRIMARY group which shows that education
of literate was also not satisfactory. The data clearly reflects that the people of the village
need good education and training. About 59 people who are residing in the village are
illiterate and this accounts for more than 26% of the total population. The table clearly shows
that only 3 people have received education till Sr. Secondary.
OCCUPATION PATTERN:
Table 11.3.1 Number of people along with percentage of people engaged in
various occupations:
OMM
Mining
Labour
Daily Wage
earner
OMML
Service
Other Hadiya
Selling
Unemployed
3 8 3 13 5 13
INFERENCE:
Of the total number of people residing in Tentulidihi, most of the people were involved in daily
labor jobs and private sectors which were clearly reflected as 23.66% and 18.32%
respectively.Out of 17 families, 12 families were depended on these major sectors. The
remaining families depend on agriculture. There was less percentage of people(5.88%) in the
government sector jobs. The reason was lack of awareness about the openings and vacancies
of jobs. Farming shares a good proportion as 13.25% of the total people depend on
farming. The table shows that 22 people were unemployed which accounts for 16.79% of
the total population. Housewives had a good percentage consisting 27.48%. Engagement of
0
10
20
30
40
50
Chart Title
Series 1 Column1 Column2
40
people as daily labour (23.6%) was more as compared to agriculture (13.7%) which has
resulted due to industrial growth livelihood.
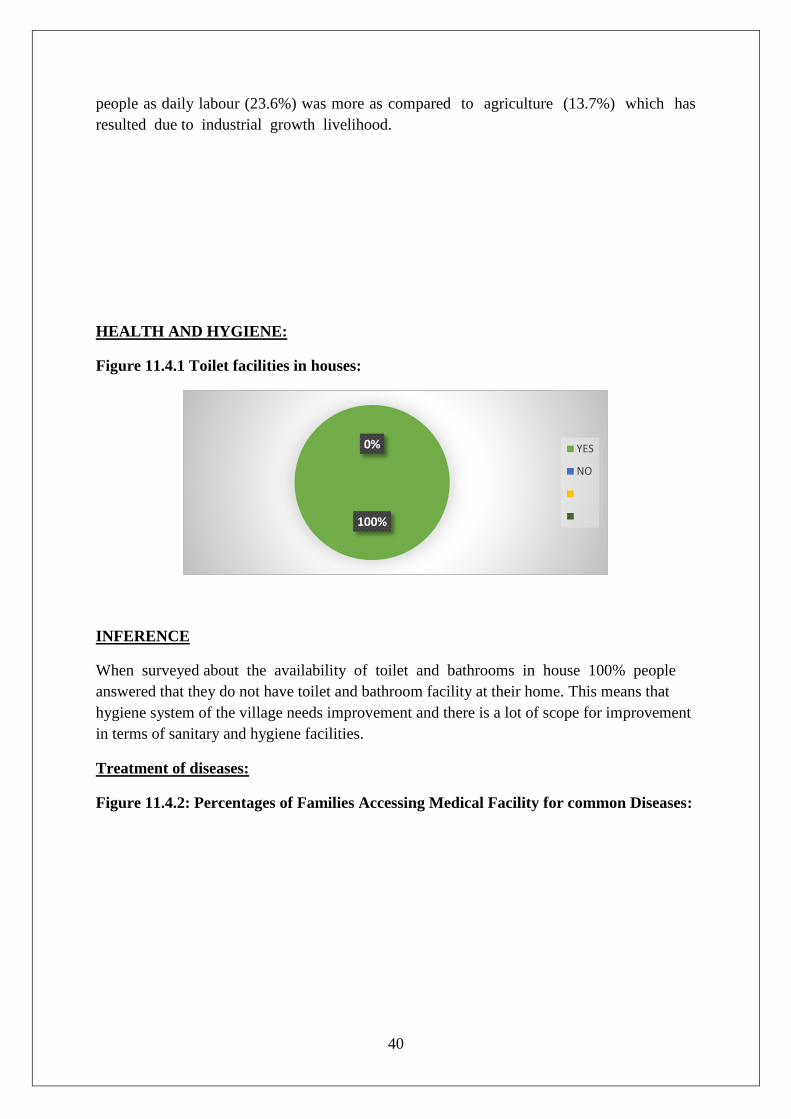
HEALTH AND HYGIENE:
Figure 11.4.1 Toilet facilities in houses:
INFERENCE
When surveyed about the availability of toilet and bathrooms in house 100% people
answered that they do not have toilet and bathroom facility at their home. This means that
hygiene system of the village needs improvement and there is a lot of scope for improvement
in terms of sanitary and hygiene facilities.
Treatment of diseases:
Figure 11.4.2: Percentages of Families Accessing Medical Facility for common Diseases:
100%
0% YES
NO
41
ECONOMIC STATUS:
Analysis of average annual Income, Expenditure and saving:
Most of the income of the village comes from Private sector, Service in OMML AND
HADIYA selling. The average annual income as per the survey was found to be 36,000.
ELECTRICITY AND WATER FACILITIES
ELECTRICITY
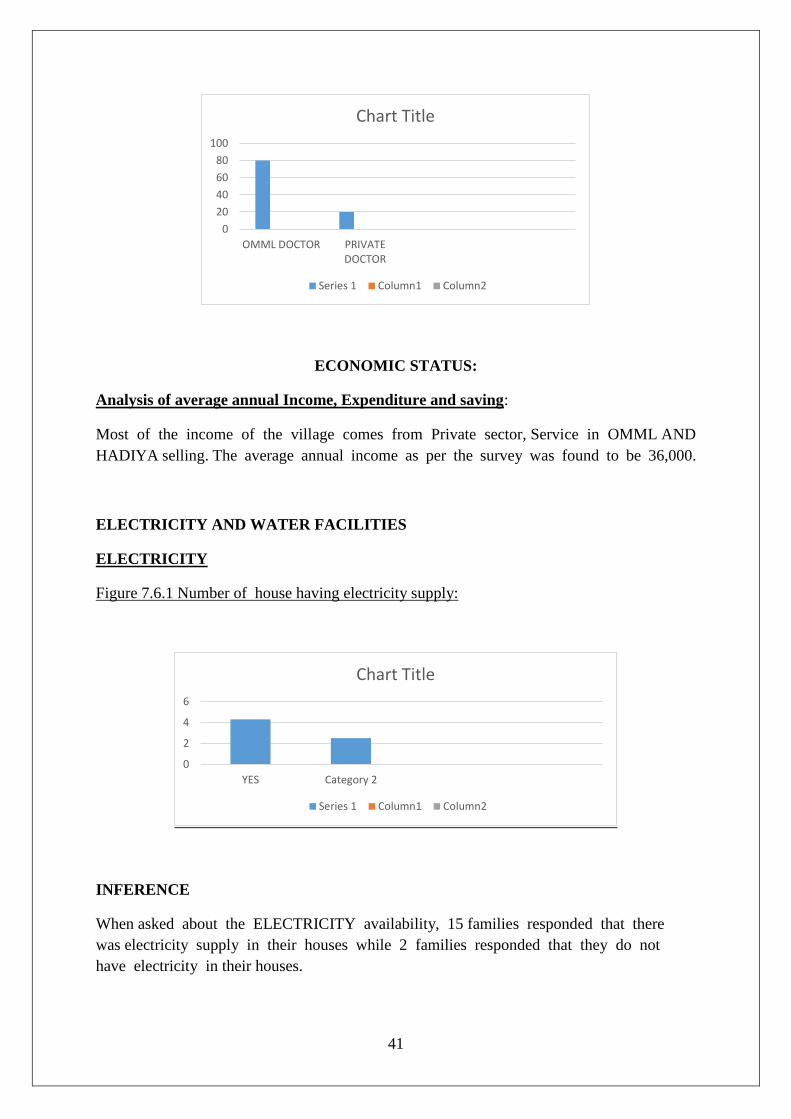
Figure 7.6.1 Number of house having electricity supply:
INFERENCE
When asked about the ELECTRICITY availability, 15 families responded that there
was electricity supply in their houses while 2 families responded that they do not
have electricity in their houses.
0
20
40
60
80
100
OMML DOCTOR PRIVATEDOCTOR
Chart Title
Series 1 Column1 Column2
0
2
4
6
YES Category 2
Chart Title
Series 1 Column1 Column2
42
Water Facilities Out of the two well in the village only 1 is functional while the other
is dry. There is also a provision of water tank having a capacity of 2000 L which is used
by the villagers .There were 4 hand pump in the village. 17 families hence depend on the well
and water tank and hand pump.
INFERENCES
Out of 17 families 12 families use water tank for drinking purpose while 5 families use
Hand pump for drinking purpose. This account for 70.48% of the total population
residing in the village depends on overhead water tank while remaining 29.52% depends on
community well.
Movable Family Assets and Livestock’s:
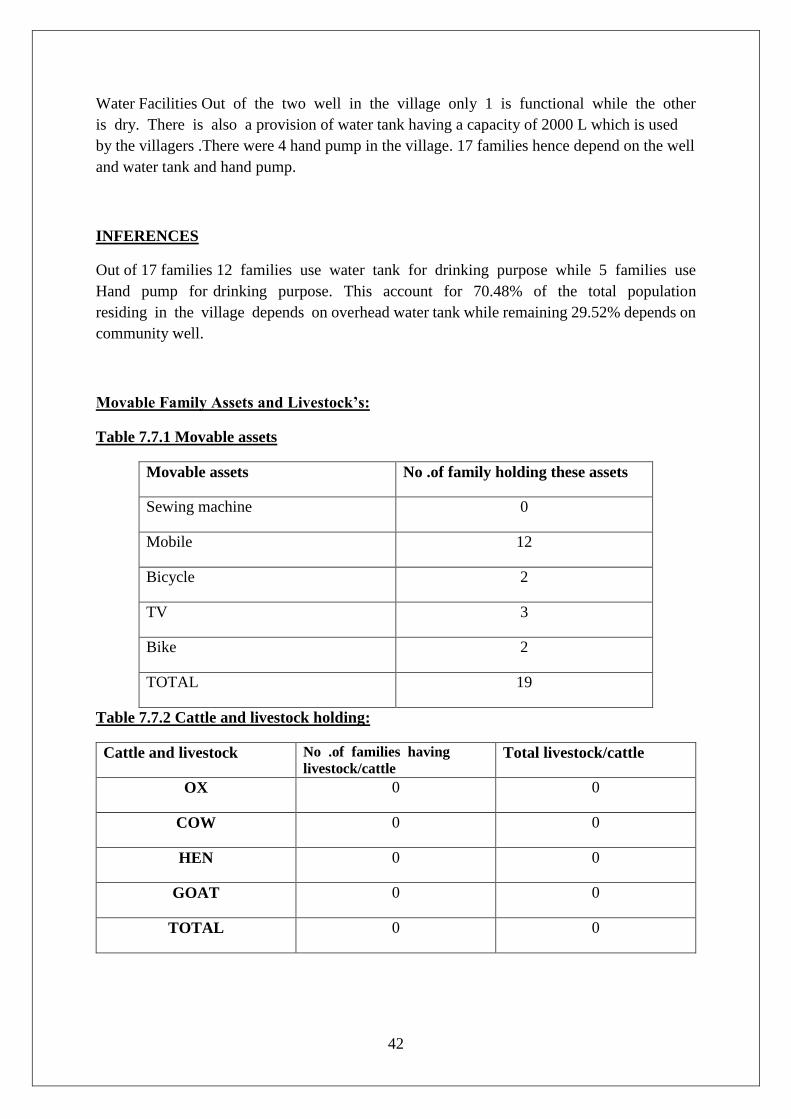
Table 7.7.1 Movable assets
Movable assets No .of family holding these assets
Sewing machine 0
Mobile 12
Bicycle 2
TV 3
Bike 2
TOTAL 19
Table 7.7.2 Cattle and livestock holding:
Cattle and livestock No .of families having
livestock/cattle Total livestock/cattle
OX 0 0
COW 0 0
HEN 0 0
GOAT 0 0
TOTAL 0 0
43
MINES-WISE ANALYSIS
Orahuri
1. Demography
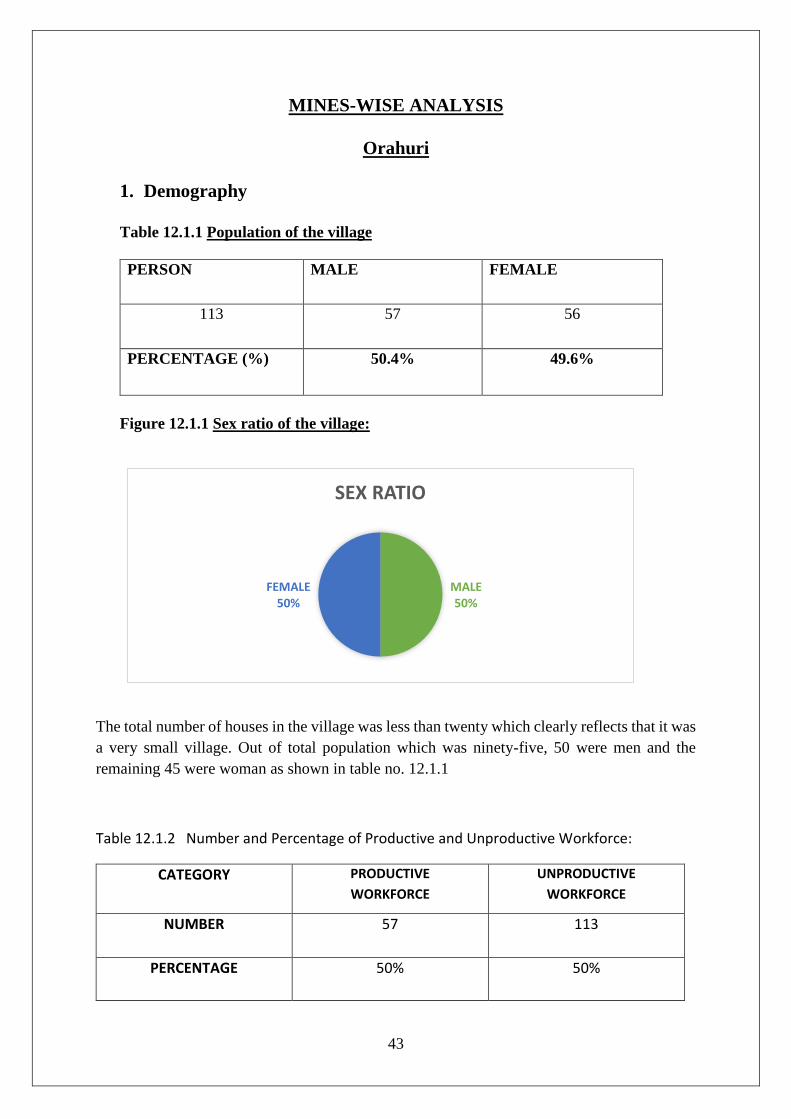
Table 12.1.1 Population of the village
PERSON MALE FEMALE
113 57 56
PERCENTAGE (%) 50.4% 49.6%
Figure 12.1.1 Sex ratio of the village:
The total number of houses in the village was less than twenty which clearly reflects that it was
a very small village. Out of total population which was ninety-five, 50 were men and the
remaining 45 were woman as shown in table no. 12.1.1
Table 12.1.2 Number and Percentage of Productive and Unproductive Workforce:
CATEGORY PRODUCTIVE
WORKFORCE
UNPRODUCTIVE
WORKFORCE
NUMBER 57 113
PERCENTAGE 50% 50%
MALE50%
FEMALE50%
SEX RATIO
44
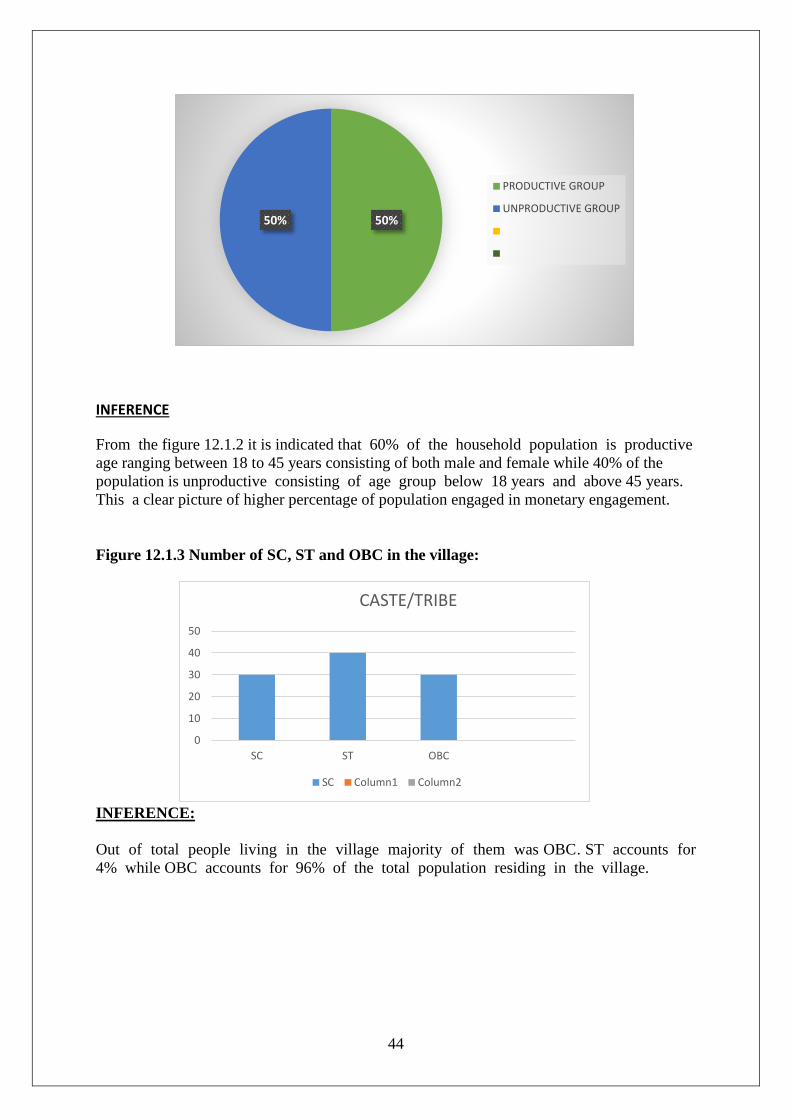
INFERENCE
From the figure 12.1.2 it is indicated that 60% of the household population is productive
age ranging between 18 to 45 years consisting of both male and female while 40% of the
population is unproductive consisting of age group below 18 years and above 45 years.
This a clear picture of higher percentage of population engaged in monetary engagement.
Figure 12.1.3 Number of SC, ST and OBC in the village:
INFERENCE:
Out of total people living in the village majority of them was OBC. ST accounts for
4% while OBC accounts for 96% of the total population residing in the village.
50%50%
PRODUCTIVE GROUP
UNPRODUCTIVE GROUP
0
10
20
30
40
50
SC ST OBC
CASTE/TRIBE
SC Column1 Column2
45
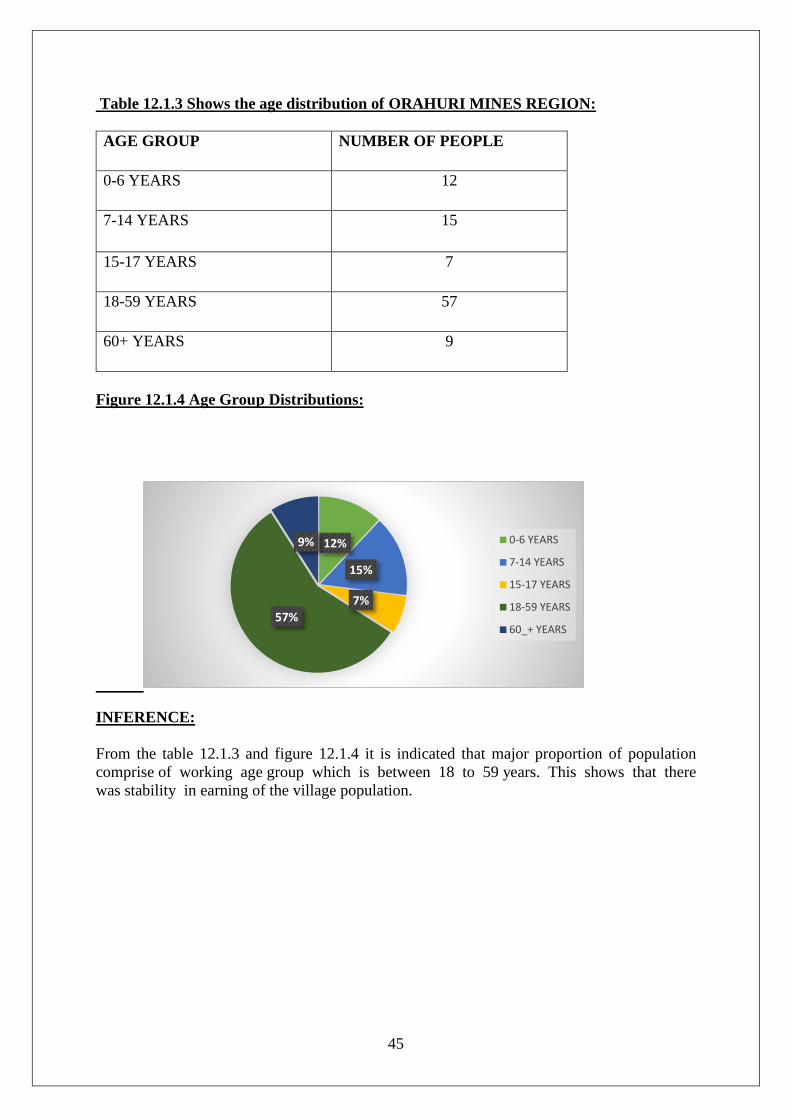
Table 12.1.3 Shows the age distribution of ORAHURI MINES REGION:
AGE GROUP NUMBER OF PEOPLE
0-6 YEARS 12
7-14 YEARS 15
15-17 YEARS 7
18-59 YEARS 57
60+ YEARS 9
Figure 12.1.4 Age Group Distributions:
INFERENCE:
From the table 12.1.3 and figure 12.1.4 it is indicated that major proportion of population
comprise of working age group which is between 18 to 59 years. This shows that there
was stability in earning of the village population.
12%
15%
7%
57%
9% 0-6 YEARS
7-14 YEARS
15-17 YEARS
18-59 YEARS
60_+ YEARS
46
HOUSING:
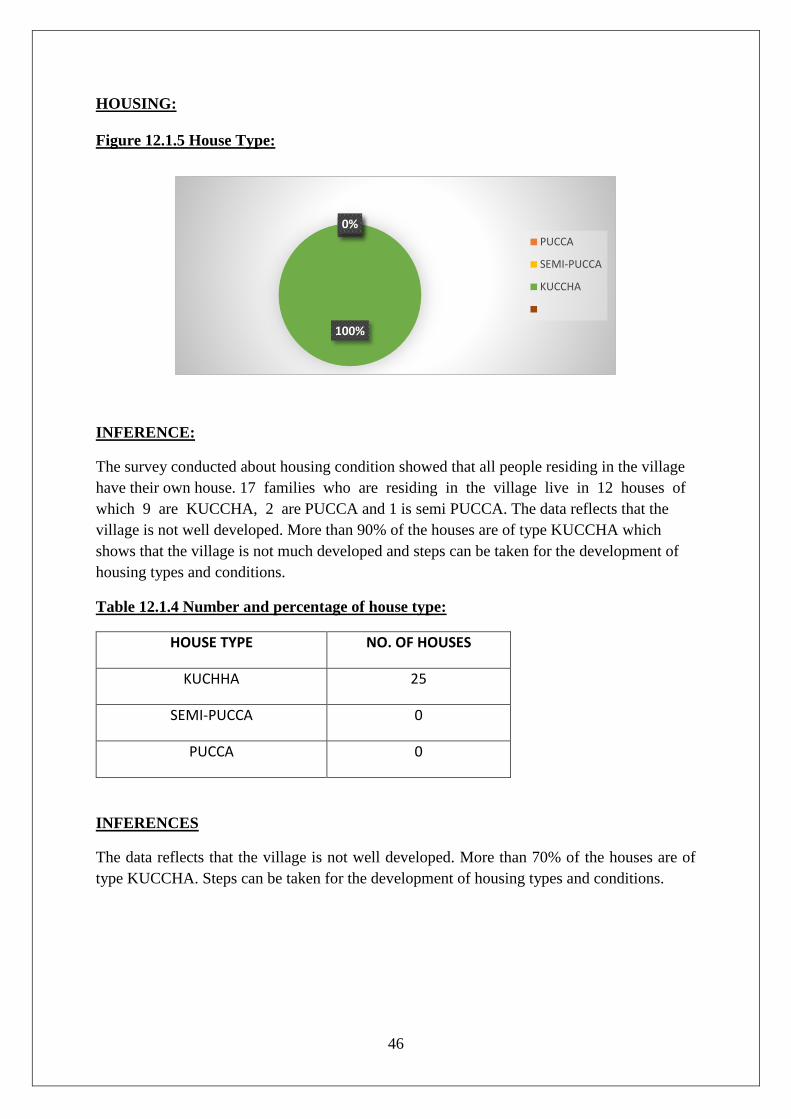
Figure 12.1.5 House Type:
INFERENCE:
The survey conducted about housing condition showed that all people residing in the village
have their own house. 17 families who are residing in the village live in 12 houses of
which 9 are KUCCHA, 2 are PUCCA and 1 is semi PUCCA. The data reflects that the
village is not well developed. More than 90% of the houses are of type KUCCHA which
shows that the village is not much developed and steps can be taken for the development of
housing types and conditions.
Table 12.1.4 Number and percentage of house type:
HOUSE TYPE NO. OF HOUSES
KUCHHA 25
SEMI-PUCCA 0
PUCCA 0
INFERENCES
The data reflects that the village is not well developed. More than 70% of the houses are of
type KUCCHA. Steps can be taken for the development of housing types and conditions.
0%0%
100%
PUCCA
SEMI-PUCCA
KUCCHA
47
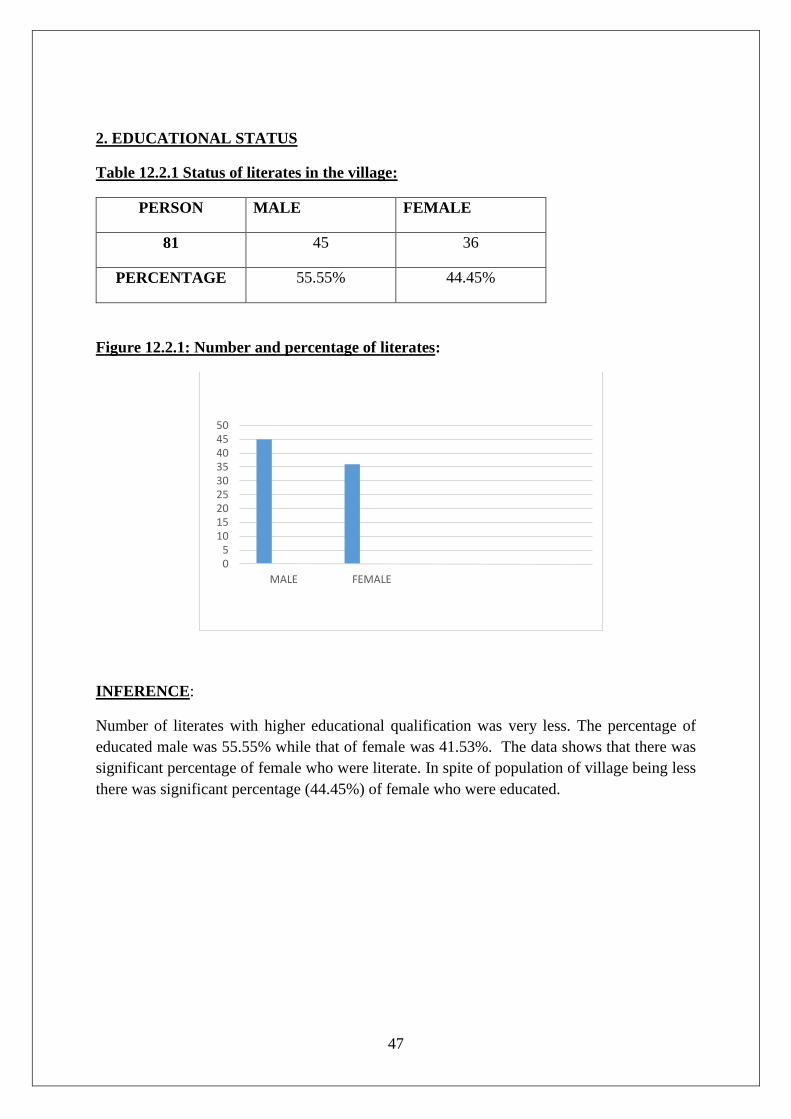
2. EDUCATIONAL STATUS
Table 12.2.1 Status of literates in the village:
PERSON MALE FEMALE
81 45 36
PERCENTAGE 55.55% 44.45%
Figure 12.2.1: Number and percentage of literates:
INFERENCE:
Number of literates with higher educational qualification was very less. The percentage of
educated male was 55.55% while that of female was 41.53%. The data shows that there was
significant percentage of female who were literate. In spite of population of village being less
there was significant percentage (44.45%) of female who were educated.
05
101520253035404550
MALE FEMALE
48
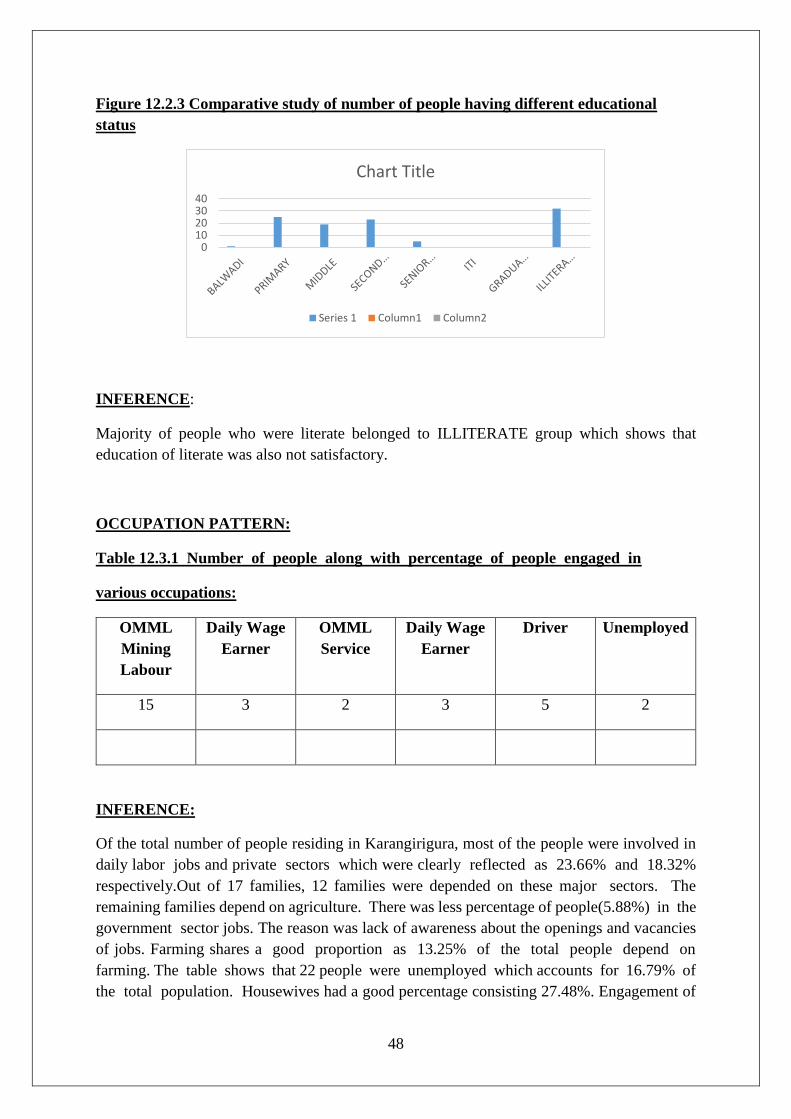
Figure 12.2.3 Comparative study of number of people having different educational
status
INFERENCE:
Majority of people who were literate belonged to ILLITERATE group which shows that
education of literate was also not satisfactory.
OCCUPATION PATTERN:
Table 12.3.1 Number of people along with percentage of people engaged in
various occupations:
OMML
Mining
Labour
Daily Wage
Earner
OMML
Service
Daily Wage
Earner
Driver Unemployed
15 3 2 3 5 2
INFERENCE:
Of the total number of people residing in Karangirigura, most of the people were involved in
daily labor jobs and private sectors which were clearly reflected as 23.66% and 18.32%
respectively.Out of 17 families, 12 families were depended on these major sectors. The
remaining families depend on agriculture. There was less percentage of people(5.88%) in the
government sector jobs. The reason was lack of awareness about the openings and vacancies
of jobs. Farming shares a good proportion as 13.25% of the total people depend on
farming. The table shows that 22 people were unemployed which accounts for 16.79% of
the total population. Housewives had a good percentage consisting 27.48%. Engagement of
010203040
Chart Title
Series 1 Column1 Column2
49
people as daily labour (23.6%) was more as compared to agriculture (13.7%) which has
resulted due to industrial growth livelihood.
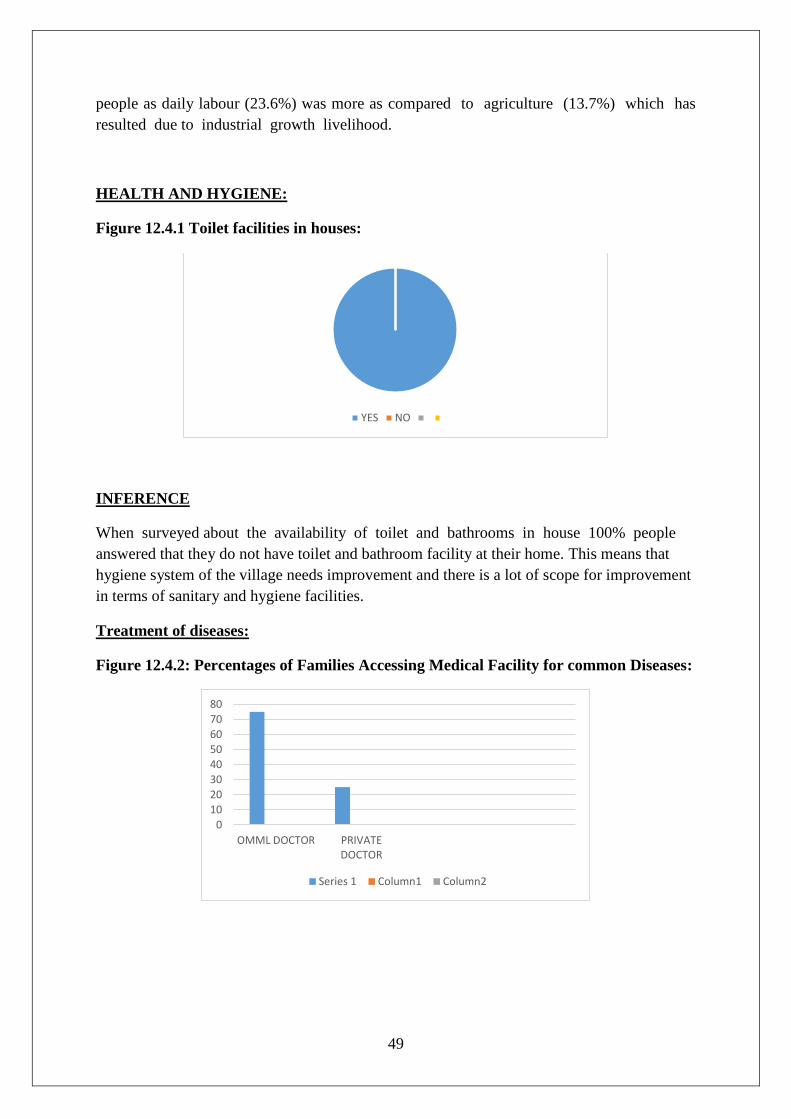
HEALTH AND HYGIENE:
Figure 12.4.1 Toilet facilities in houses:
INFERENCE
When surveyed about the availability of toilet and bathrooms in house 100% people
answered that they do not have toilet and bathroom facility at their home. This means that
hygiene system of the village needs improvement and there is a lot of scope for improvement
in terms of sanitary and hygiene facilities.
Treatment of diseases:
Figure 12.4.2: Percentages of Families Accessing Medical Facility for common Diseases:
YES NO
0
10
20
30
40
50
60
70
80
OMML DOCTOR PRIVATEDOCTOR
Series 1 Column1 Column2
50
ECONOMIC STATUS:
Analysis of average annual Income, Expenditure and saving:
Most of the income of the village comes from Private sector, Service in OMML, Job
contracts. The average annual income as per the survey was found to be 46,500.
ELECTRICITY AND WATER FACILITIES
ELECTRICITY
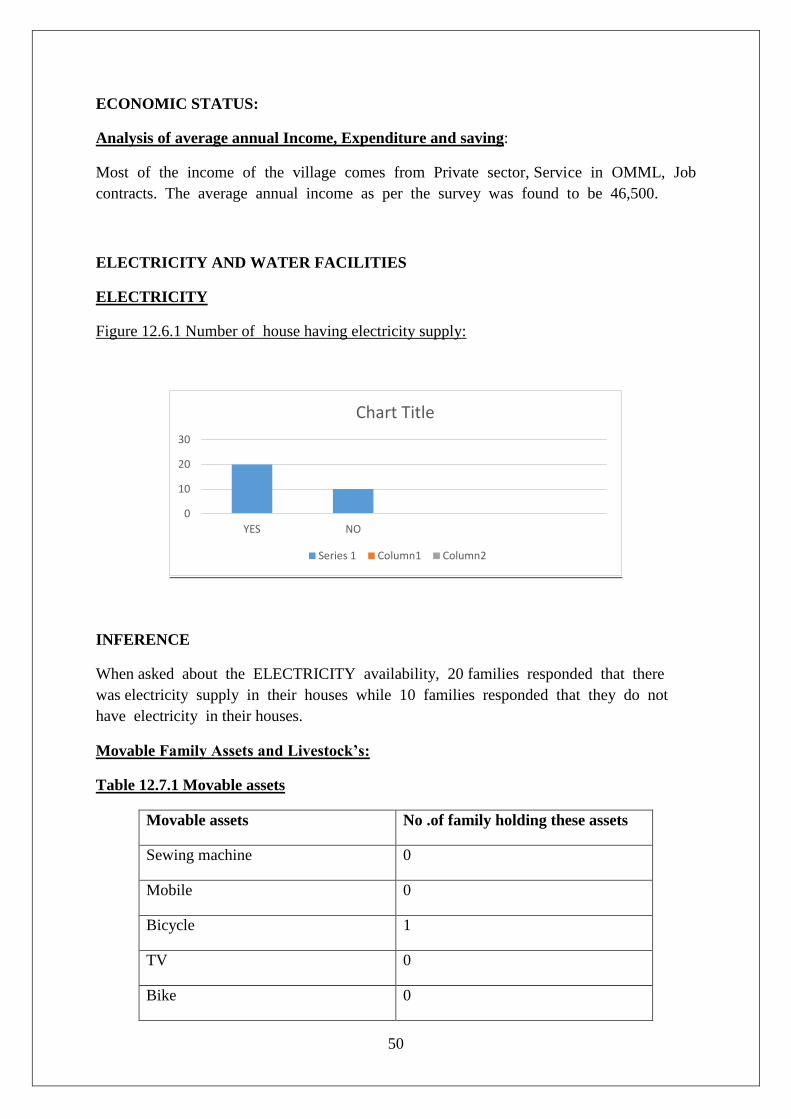
Figure 12.6.1 Number of house having electricity supply:
INFERENCE
When asked about the ELECTRICITY availability, 20 families responded that there
was electricity supply in their houses while 10 families responded that they do not
have electricity in their houses.
Movable Family Assets and Livestock’s:
Table 12.7.1 Movable assets
Movable assets No .of family holding these assets
Sewing machine 0
Mobile 0
Bicycle 1
TV 0
Bike 0
0
10
20
30
YES NO
Chart Title
Series 1 Column1 Column2
51
TOTAL 1
Table 12.7.2 Cattle and livestock holding:
Cattle and livestock No .of families having
livestock/cattle Total livestock/cattle
OX
2 2
COW 0 0
GOAT 2 8
HEN 0 0
TOTAL 4 10
52
CHAPTER-13
Overall finding and analysis of the villages
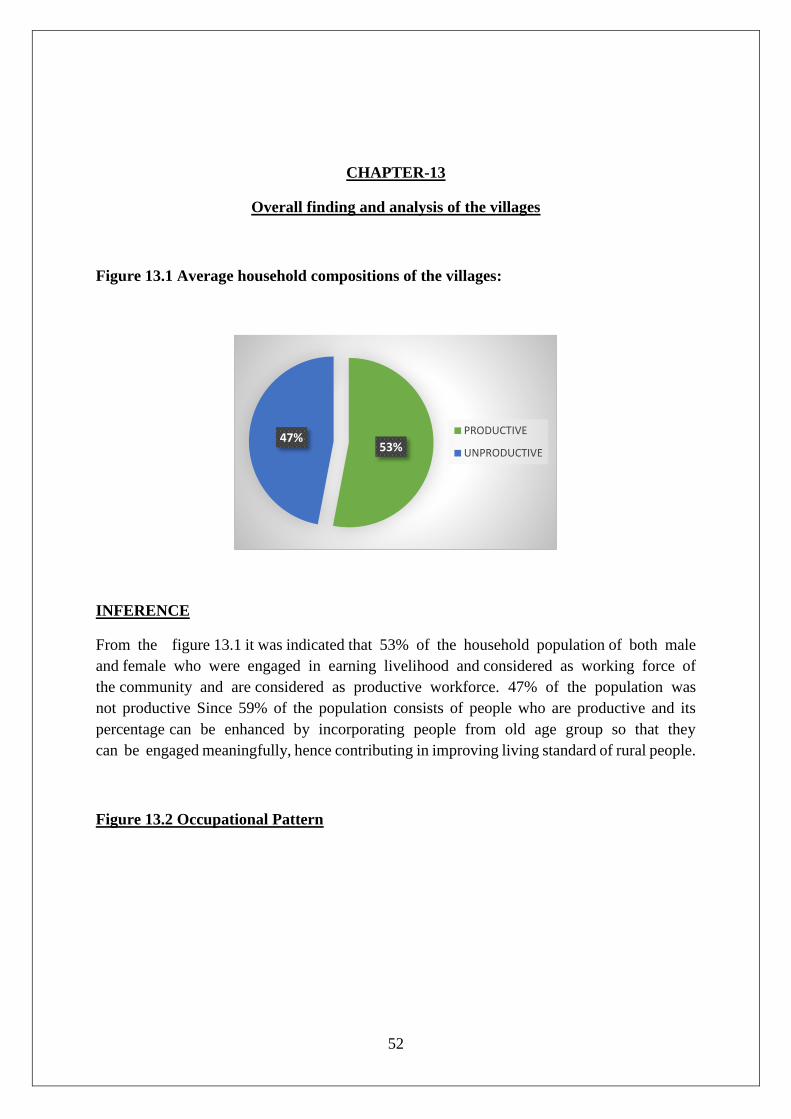
Figure 13.1 Average household compositions of the villages:
INFERENCE
From the figure 13.1 it was indicated that 53% of the household population of both male
and female who were engaged in earning livelihood and considered as working force of
the community and are considered as productive workforce. 47% of the population was
not productive Since 59% of the population consists of people who are productive and its
percentage can be enhanced by incorporating people from old age group so that they
can be engaged meaningfully, hence contributing in improving living standard of rural people.
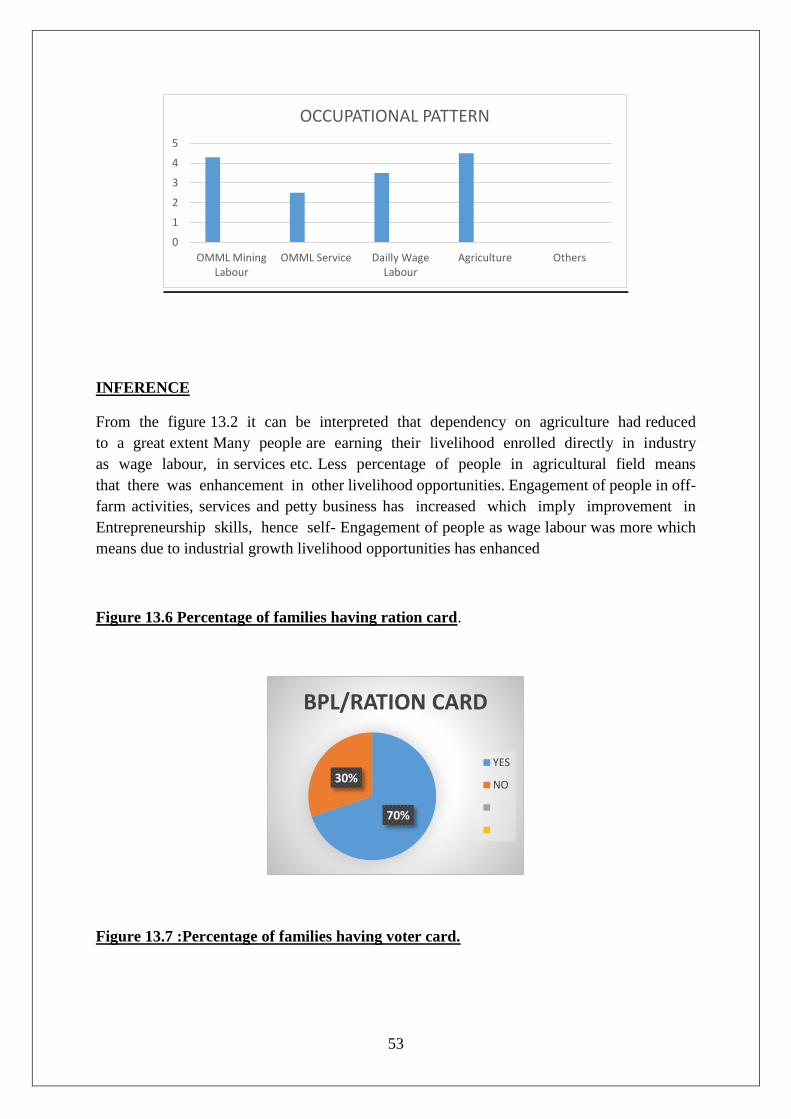
Figure 13.2 Occupational Pattern
53%47%
PRODUCTIVE
UNPRODUCTIVE
53
INFERENCE
From the figure 13.2 it can be interpreted that dependency on agriculture had reduced
to a great extent Many people are earning their livelihood enrolled directly in industry
as wage labour, in services etc. Less percentage of people in agricultural field means
that there was enhancement in other livelihood opportunities. Engagement of people in off-
farm activities, services and petty business has increased which imply improvement in
Entrepreneurship skills, hence self- Engagement of people as wage labour was more which
means due to industrial growth livelihood opportunities has enhanced
Figure 13.6 Percentage of families having ration card.
Figure 13.7 :Percentage of families having voter card.
0
1
2
3
4
5
OMML MiningLabour
OMML Service Dailly WageLabour
Agriculture Others
OCCUPATIONAL PATTERN
70%
30%
BPL/RATION CARD
YES
NO
54
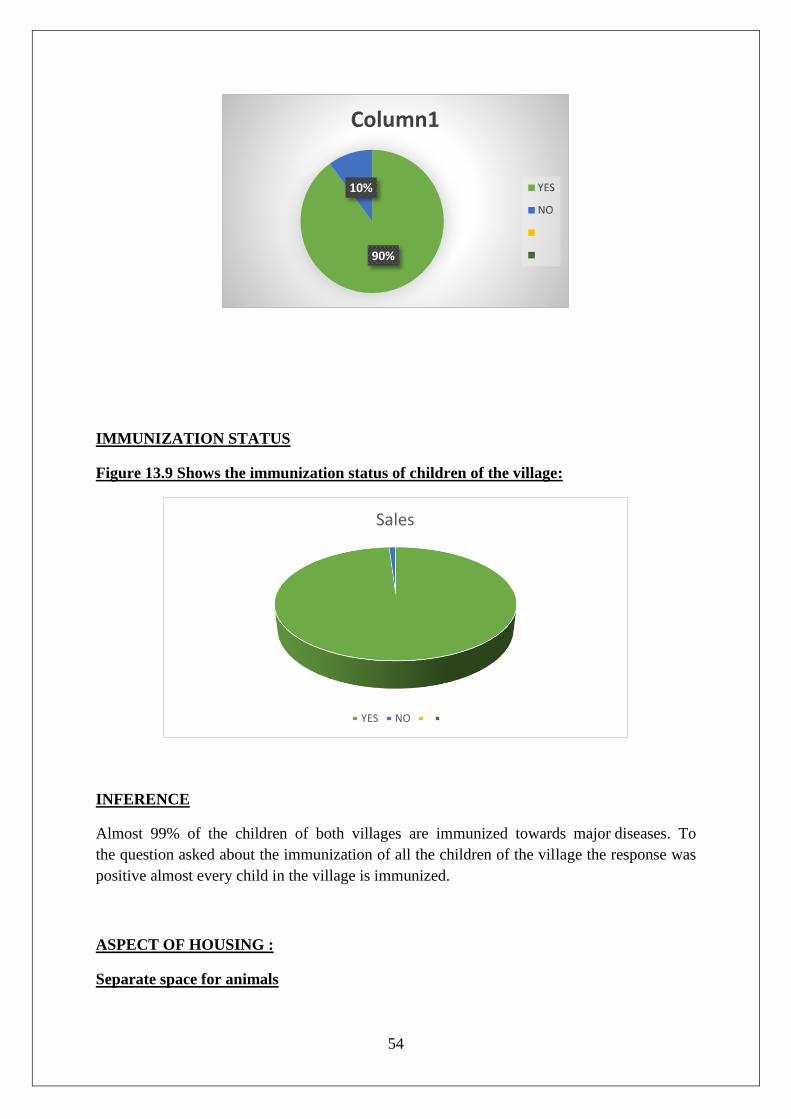
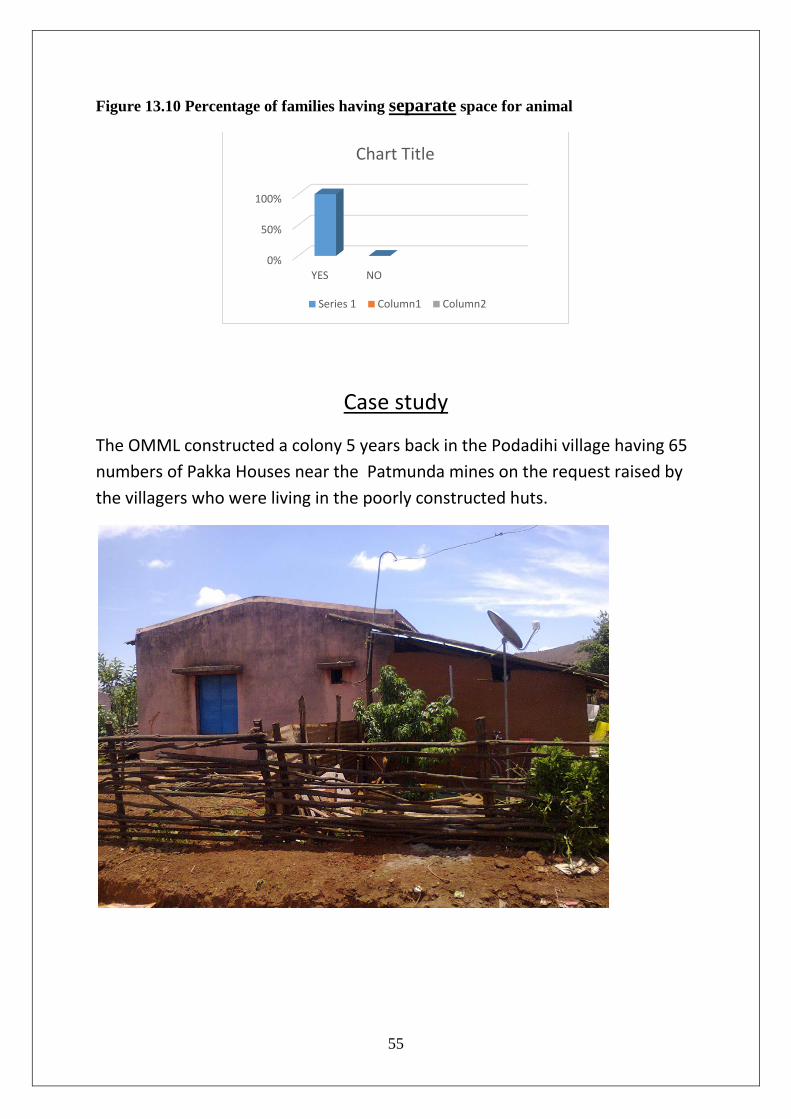
IMMUNIZATION STATUS
Figure 13.9 Shows the immunization status of children of the village:
INFERENCE
Almost 99% of the children of both villages are immunized towards major diseases. To
the question asked about the immunization of all the children of the village the response was
positive almost every child in the village is immunized.
ASPECT OF HOUSING :
Separate space for animals
90%
10%
Column1
YES
NO
Sales
YES NO
55
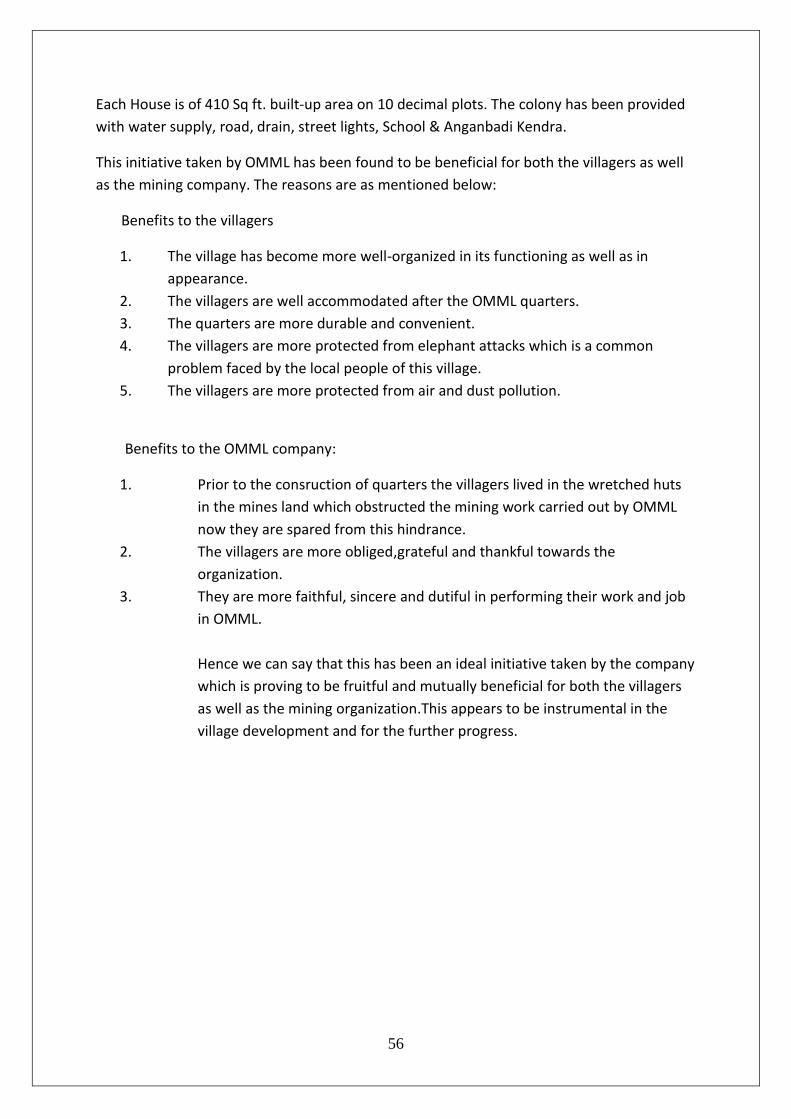
Figure 13.10 Percentage of families having separate space for animal
Case study
The OMML constructed a colony 5 years back in the Podadihi village having 65
numbers of Pakka Houses near the Patmunda mines on the request raised by
the villagers who were living in the poorly constructed huts.
0%
50%
100%
YES NO
Chart Title
Series 1 Column1 Column2
56
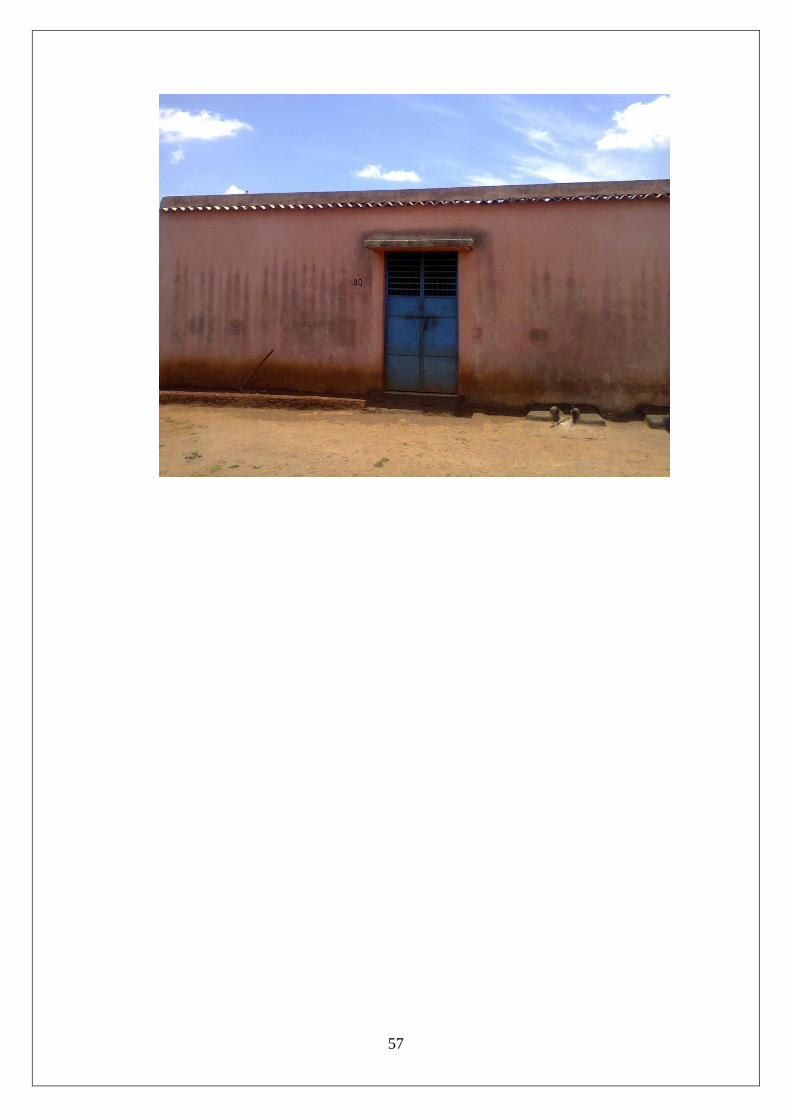
Each House is of 410 Sq ft. built‐up area on 10 decimal plots. The colony has been provided
with water supply, road, drain, street lights, School & Anganbadi Kendra.
This initiative taken by OMML has been found to be beneficial for both the villagers as well
as the mining company. The reasons are as mentioned below:
Benefits to the villagers
1. The village has become more well-organized in its functioning as well as in
appearance.
2. The villagers are well accommodated after the OMML quarters.
3. The quarters are more durable and convenient.
4. The villagers are more protected from elephant attacks which is a common
problem faced by the local people of this village.
5. The villagers are more protected from air and dust pollution.
Benefits to the OMML company:
1. Prior to the consruction of quarters the villagers lived in the wretched huts
in the mines land which obstructed the mining work carried out by OMML
now they are spared from this hindrance.
2. The villagers are more obliged,grateful and thankful towards the
organization.
3. They are more faithful, sincere and dutiful in performing their work and job
in OMML.
Hence we can say that this has been an ideal initiative taken by the company
which is proving to be fruitful and mutually beneficial for both the villagers
as well as the mining organization.This appears to be instrumental in the
village development and for the further progress.
57
58
Conclusion
From the survey conducted in 12 periphery villages the presence of OMML has been felt to
great extent making it prominent that it has both direct as well as indirect impact on upliftment
of social and economic standard of living of the people. In the village Corporate Social
Responsibility department has done a commendable job by providing them with water tank
facilities, providing employment to the villagers and conducting medical camp. This led
to paradigm shift in occupational pattern, engagement pattern as well as in skilled
development for various income generations Programme. Sustainable development is an
integral part of Adhunik Group’s business philosophy. The Group is committed towards the
improvement of the human development index of the population it serves. It has developed
and implemented CSR projects in all its locations to address the needs, concerns and aspirations
of the community and it is evident from Adhunik’s project execution, monitoring and review
in the CSR arena. It has adopted 106 villages around its plants & mines periphery and
is working continuously for their betterment Adhunik Group has been engaged in healthcare,
education, infrastructure, women empowerment and economic development of the people
in and around its areas of operations through its social arm Nav Nirman Sanstha
(registered under the Societies Act).
The area of its interventions are: Health and family welfare, Education, Capacity
building program for women empowerment, Infrastructure development, drinking water
and sanitation, Income generation activities, Sports promotion and cultural, welfare activities.
So from the analysis it can be seen that industrial development has certain impact (may
be positive or negative ) on any economy as it creates opportunities for other sector
growth and enhance the standard of living Hence OMML and ADHUNIK is playing a vital
role in overall development.
59
SUGGESTIONS

60
61
DATE: SL NO.
SOCIO-ECONOMIC SURVEY SCHEDULE
VILLAGE: -
TOLA / HAMLET : -
PANCHAYAT: -
DISTRICT : -
BLOCK: -
NAME OF THE RESPONDENT: -
AGE:-
GENDER:-
RELIGION:-
CASTE:-
62
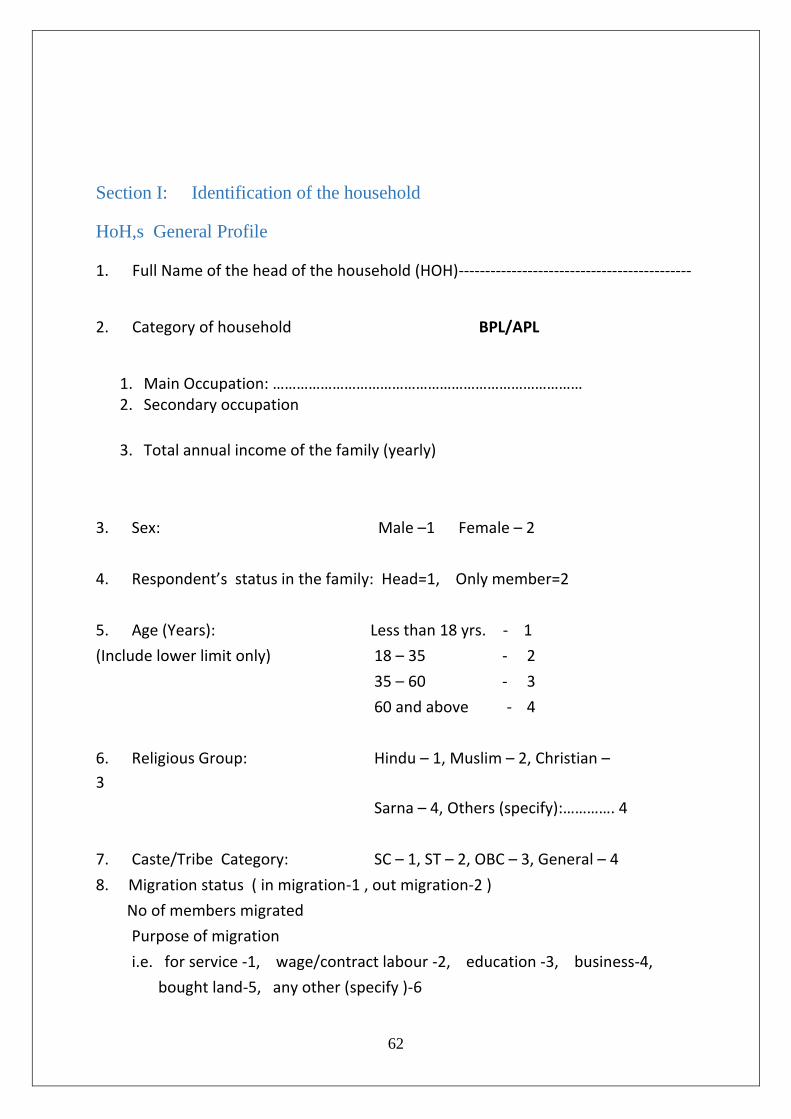
Section I: Identification of the household
HoH,s General Profile
1. Full Name of the head of the household (HOH)--------------------------------------------
2. Category of household BPL/APL
1. Main Occupation: …………………………………………………………………… 2. Secondary occupation
3. Total annual income of the family (yearly)
3. Sex: Male –1 Female – 2
4. Respondent’s status in the family: Head=1, Only member=2
5. Age (Years): Less than 18 yrs. - 1
(Include lower limit only) 18 – 35 - 2
35 – 60 - 3
60 and above - 4
6. Religious Group: Hindu – 1, Muslim – 2, Christian –
3
Sarna – 4, Others (specify):…………. 4
7. Caste/Tribe Category: SC – 1, ST – 2, OBC – 3, General – 4
8. Migration status ( in migration-1 , out migration-2 )
No of members migrated
Purpose of migration
i.e. for service -1, wage/contract labour -2, education -3, business-4,
bought land-5, any other (specify )-6
63
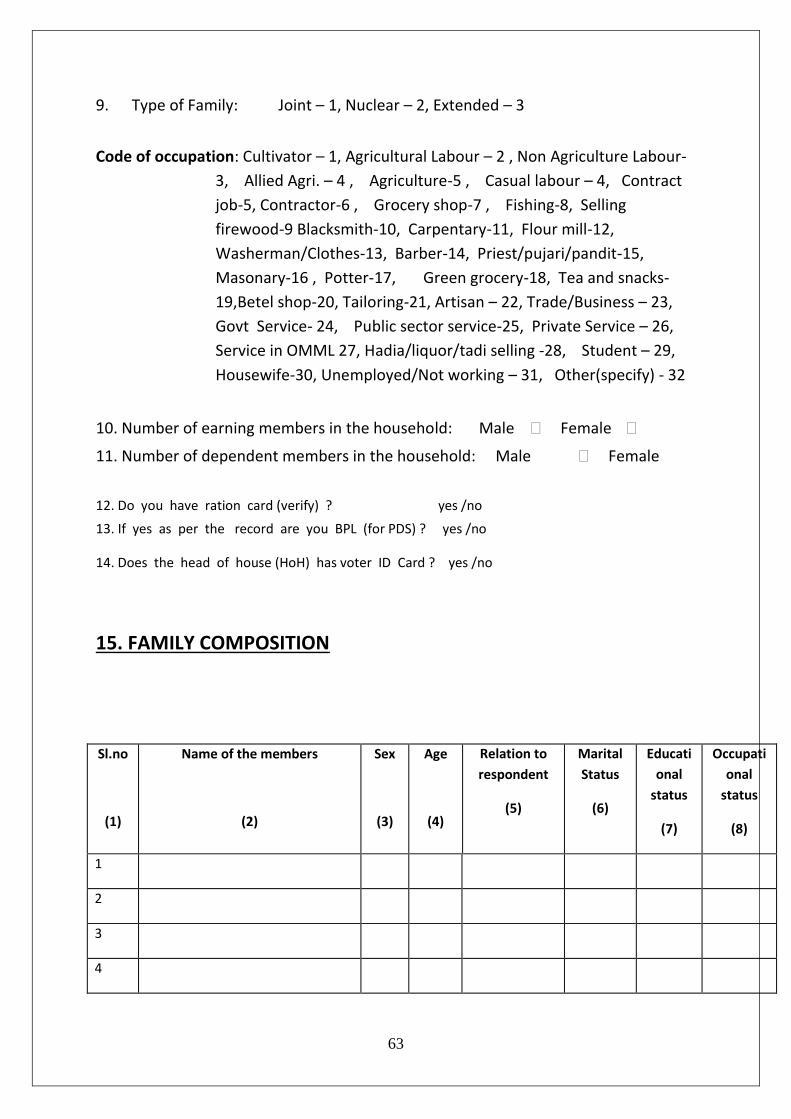
9. Type of Family: Joint – 1, Nuclear – 2, Extended – 3
Code of occupation: Cultivator – 1, Agricultural Labour – 2 , Non Agriculture Labour-
3, Allied Agri. – 4 , Agriculture-5 , Casual labour – 4, Contract
job-5, Contractor-6 , Grocery shop-7 , Fishing-8, Selling
firewood-9 Blacksmith-10, Carpentary-11, Flour mill-12,
Washerman/Clothes-13, Barber-14, Priest/pujari/pandit-15,
Masonary-16 , Potter-17, Green grocery-18, Tea and snacks-
19,Betel shop-20, Tailoring-21, Artisan – 22, Trade/Business – 23,
Govt Service- 24, Public sector service-25, Private Service – 26,
Service in OMML 27, Hadia/liquor/tadi selling -28, Student – 29,
Housewife-30, Unemployed/Not working – 31, Other(specify) - 32
10. Number of earning members in the household: Male Female
11. Number of dependent members in the household: Male Female
12. Do you have ration card (verify) ? yes /no
13. If yes as per the record are you BPL (for PDS) ? yes /no
14. Does the head of house (HoH) has voter ID Card ? yes /no
15. FAMILY COMPOSITION
Sl.no
(1)
Name of the members
(2)
Sex
(3)
Age
(4)
Relation to
respondent
(5)
Marital
Status
(6)
Educati
onal
status
(7)
Occupati
onal
status
(8)
1
2
3
4
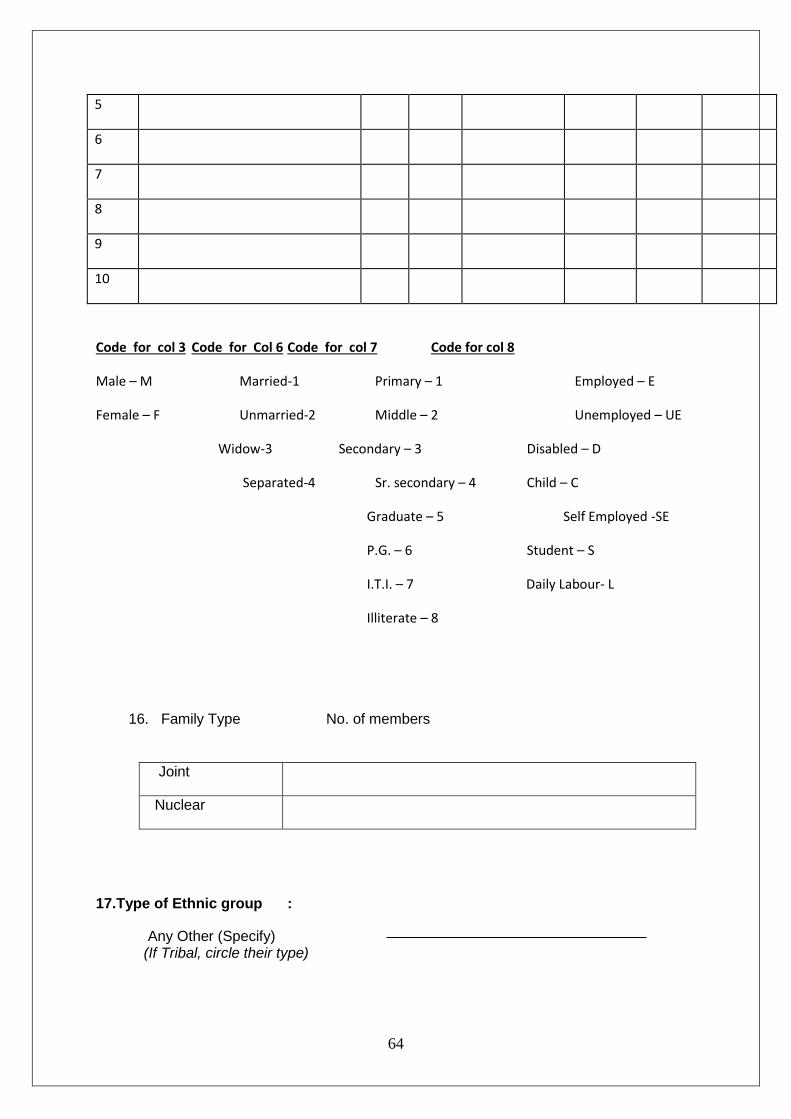
64
5
6
7
8
9
10
Code for col 3 Code for Col 6 Code for col 7 Code for col 8
Male – M Married-1 Primary – 1 Employed – E
Female – F Unmarried-2 Middle – 2 Unemployed – UE
Widow-3 Secondary – 3 Disabled – D
Separated-4 Sr. secondary – 4 Child – C
Graduate – 5 Self Employed -SE
P.G. – 6 Student – S
I.T.I. – 7 Daily Labour- L
Illiterate – 8
16. Family Type No. of members
Joint
Nuclear
17.Type of Ethnic group :
Any Other (Specify) (If Tribal, circle their type)
65
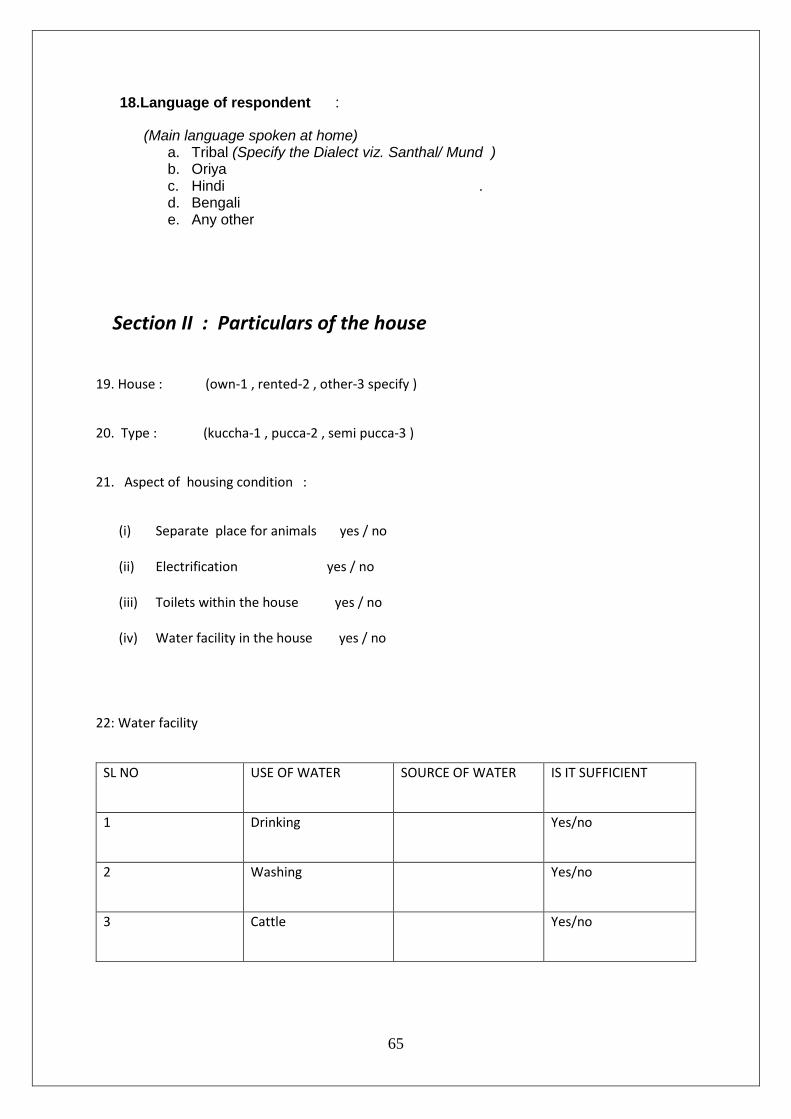
18.Language of respondent :
(Main language spoken at home) a. Tribal (Specify the Dialect viz. Santhal/ Mund ) b. Oriya c. Hindi . d. Bengali e. Any other
Section II : Particulars of the house
19. House : (own-1 , rented-2 , other-3 specify )
20. Type : (kuccha-1 , pucca-2 , semi pucca-3 )
21. Aspect of housing condition :
(i) Separate place for animals yes / no
(ii) Electrification yes / no
(iii) Toilets within the house yes / no
(iv) Water facility in the house yes / no
22: Water facility
SL NO USE OF WATER SOURCE OF WATER IS IT SUFFICIENT
1 Drinking Yes/no
2 Washing Yes/no
3 Cattle Yes/no
66
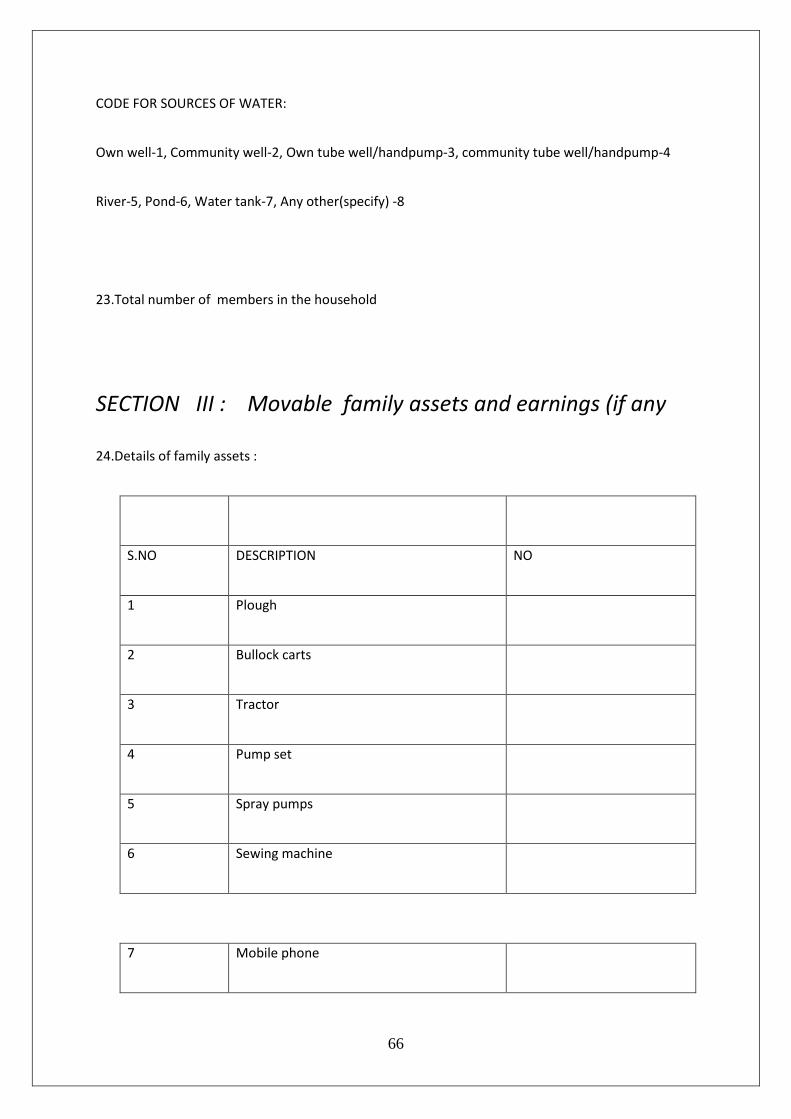
CODE FOR SOURCES OF WATER:
Own well-1, Community well-2, Own tube well/handpump-3, community tube well/handpump-4
River-5, Pond-6, Water tank-7, Any other(specify) -8
23.Total number of members in the household
SECTION III : Movable family assets and earnings (if any
24.Details of family assets :
S.NO DESCRIPTION NO
1 Plough
2 Bullock carts
3 Tractor
4 Pump set
5 Spray pumps
6 Sewing machine
7 Mobile phone
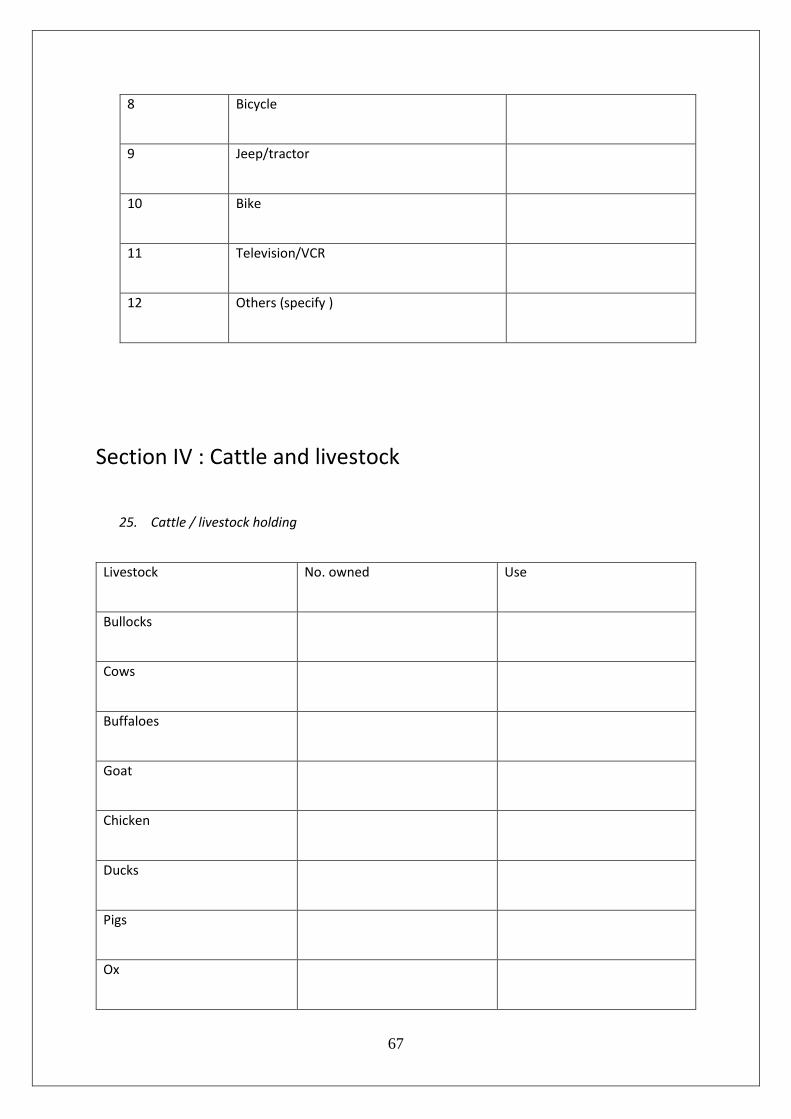
67
8 Bicycle
9 Jeep/tractor
10 Bike
11 Television/VCR
12 Others (specify )
Section IV : Cattle and livestock
25. Cattle / livestock holding
Livestock No. owned Use
Bullocks
Cows
Buffaloes
Goat
Chicken
Ducks
Pigs
Ox

68
Use code: For sale-1, Rent-2, Milk-3, Agriculture-4, Other uses-5
Section v : Health and hygiene
1 Do you have toilets in your house ? Yes/ No
2 If yes, is it sanitary toilet ? Yes/ Semi sanitary/ No
3 Do you have bathroom facility for woman in
your house ?
Yes/ No
4 Where do you go first for treatment of common
diseases ?
1. Private Doctor (put tick )
2. Govt. Doctor
3. Hospital
4. Ojha
5. Baid
6. Homeopathy
5 Where do you go first for treatment of serious
diseases ?
1. Private Doctor 2. Govt Doctor 3. Hospital 4. PHC 5. Ojha 6. Baid 7. Homeopathy
6 Have you immunized your children ? Fully/partly/one/two/nil
69
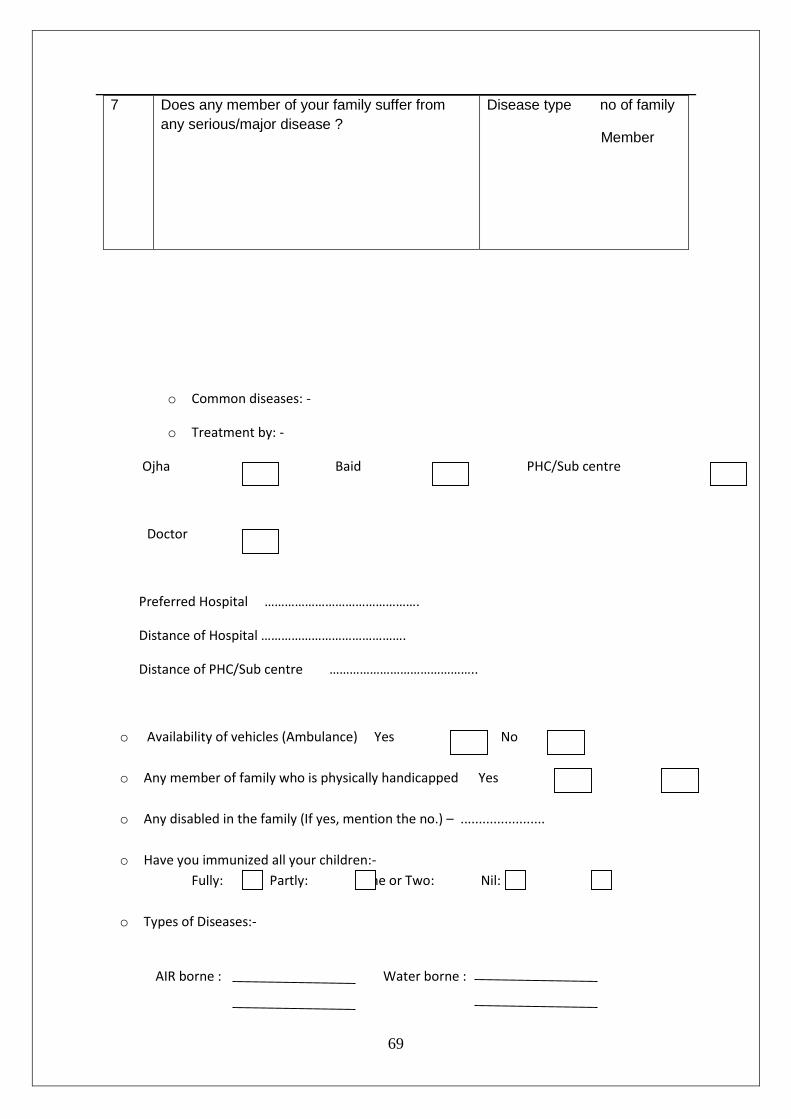
7 Does any member of your family suffer from
any serious/major disease ?
Disease type no of family
Member
o Common diseases: -
o Treatment by: -
Ojha Baid PHC/Sub centre
Doctor
Preferred Hospital ……………………………………….
Distance of Hospital …………………………………….
Distance of PHC/Sub centre ……………………………………..
o Availability of vehicles (Ambulance) Yes No
o Any member of family who is physically handicapped Yes No
o Any disabled in the family (If yes, mention the no.) – .......................
o Have you immunized all your children:-
Fully: Partly: One or Two: Nil:
o Types of Diseases:-
AIR borne : Water borne :
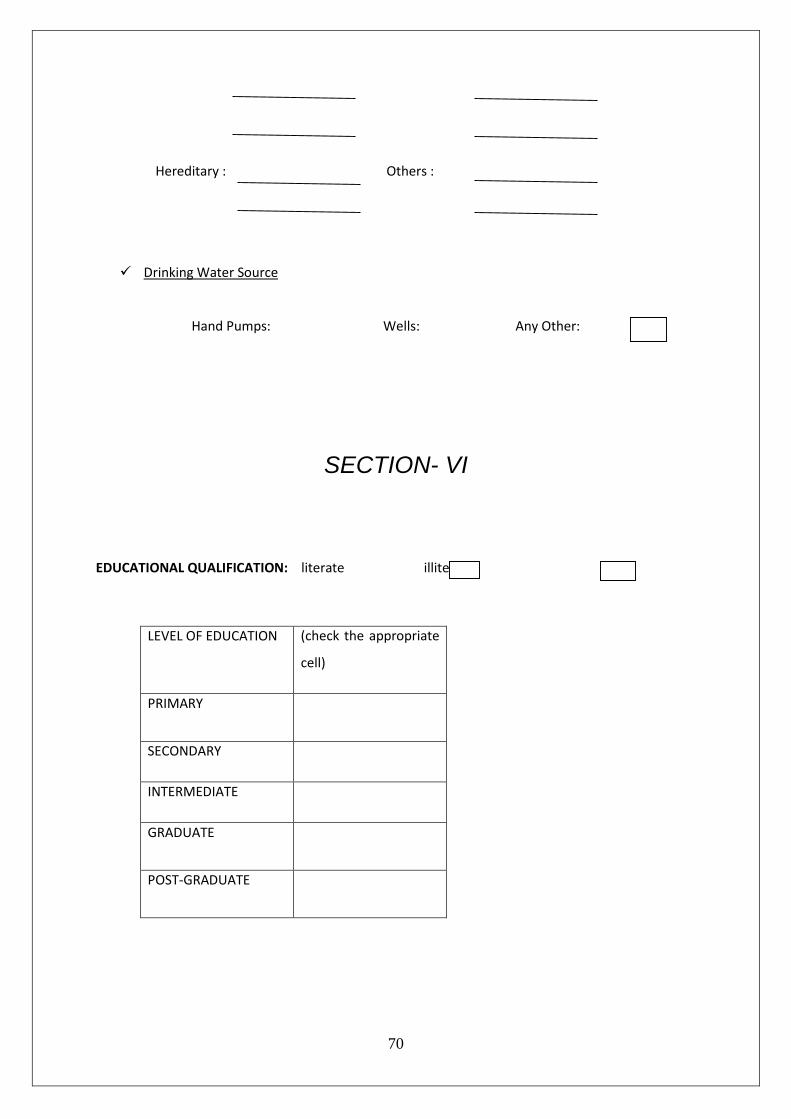
70
Hereditary : Others :
Drinking Water Source
Hand Pumps: Wells: Any Other:
SECTION- VI
EDUCATIONAL QUALIFICATION: literate illiterate
LEVEL OF EDUCATION (check the appropriate
cell)
PRIMARY
SECONDARY
INTERMEDIATE
GRADUATE
POST-GRADUATE
71
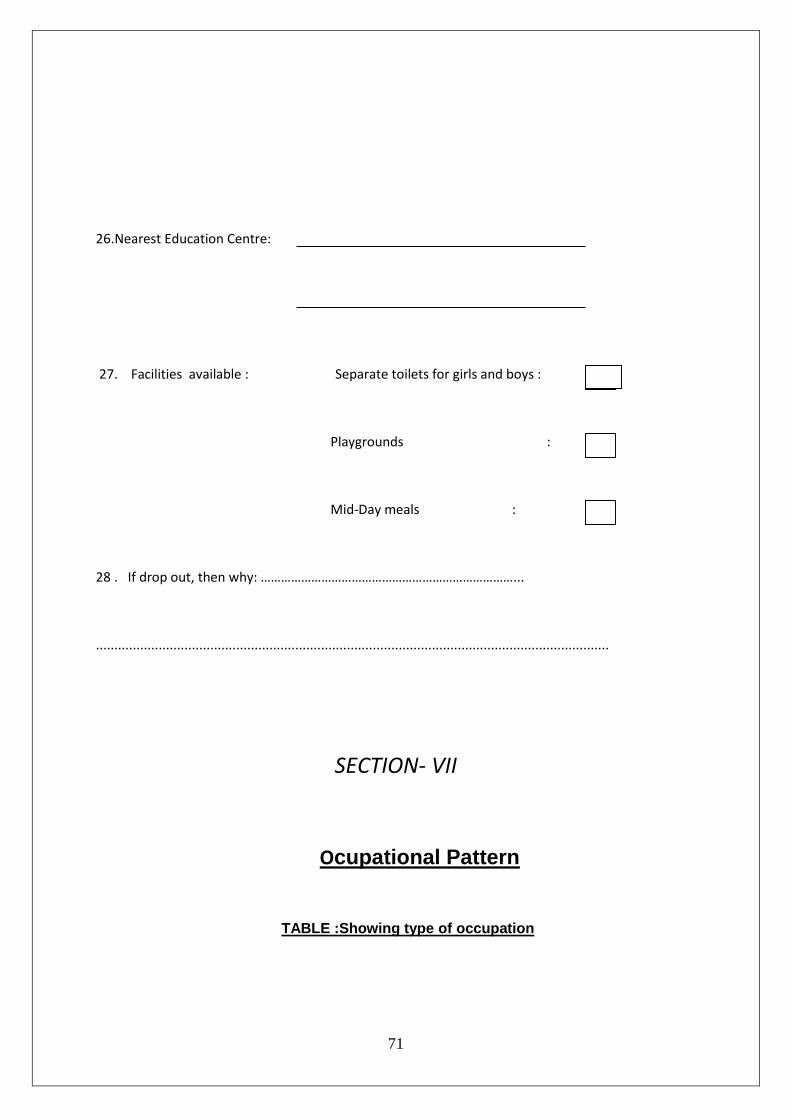
26.Nearest Education Centre:
27. Facilities available : Separate toilets for girls and boys :
Playgrounds :
Mid-Day meals :
28 . If drop out, then why: …………………………………………………………………...
...........................................................................................................................................
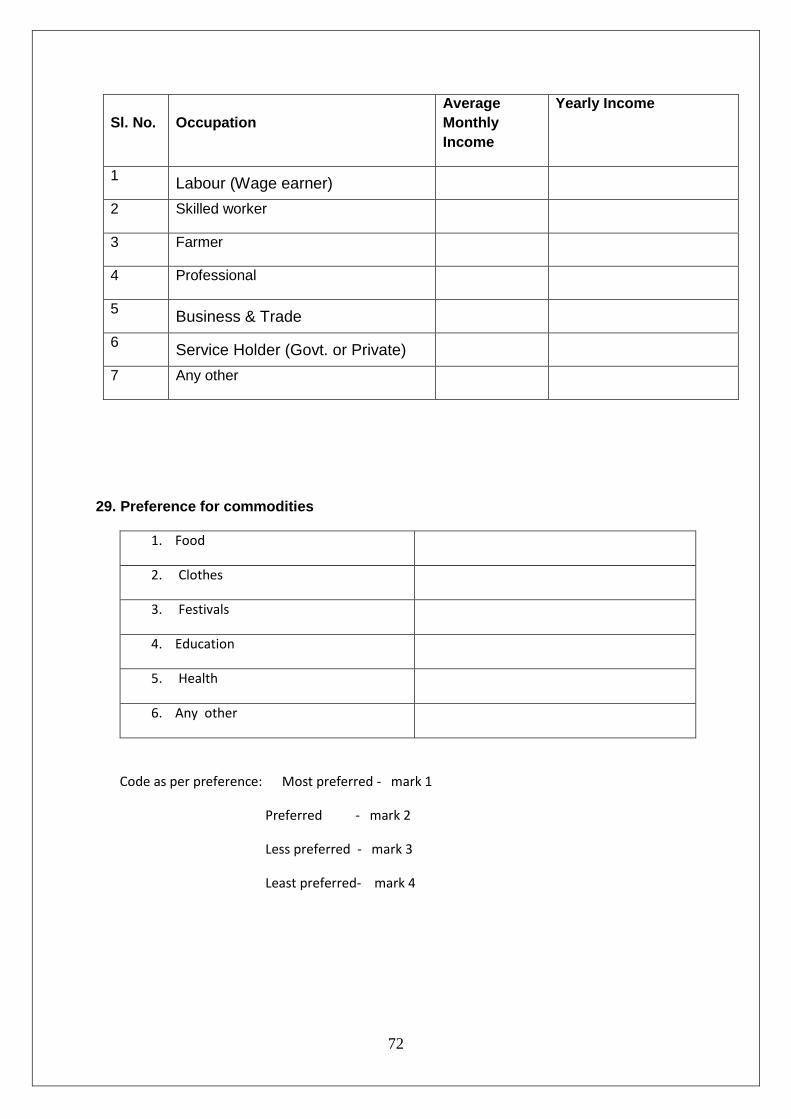
SECTION- VII
Ocupational Pattern
TABLE :Showing type of occupation
72
Sl. No. Occupation
Average
Monthly
Income
Yearly Income
1 Labour (Wage earner)
2 Skilled worker
3 Farmer
4 Professional
5 Business & Trade
6 Service Holder (Govt. or Private)
7 Any other
29. Preference for commodities
1. Food
2. Clothes
3. Festivals
4. Education
5. Health
6. Any other
Code as per preference: Most preferred - mark 1
Preferred - mark 2
Less preferred - mark 3
Least preferred- mark 4
73
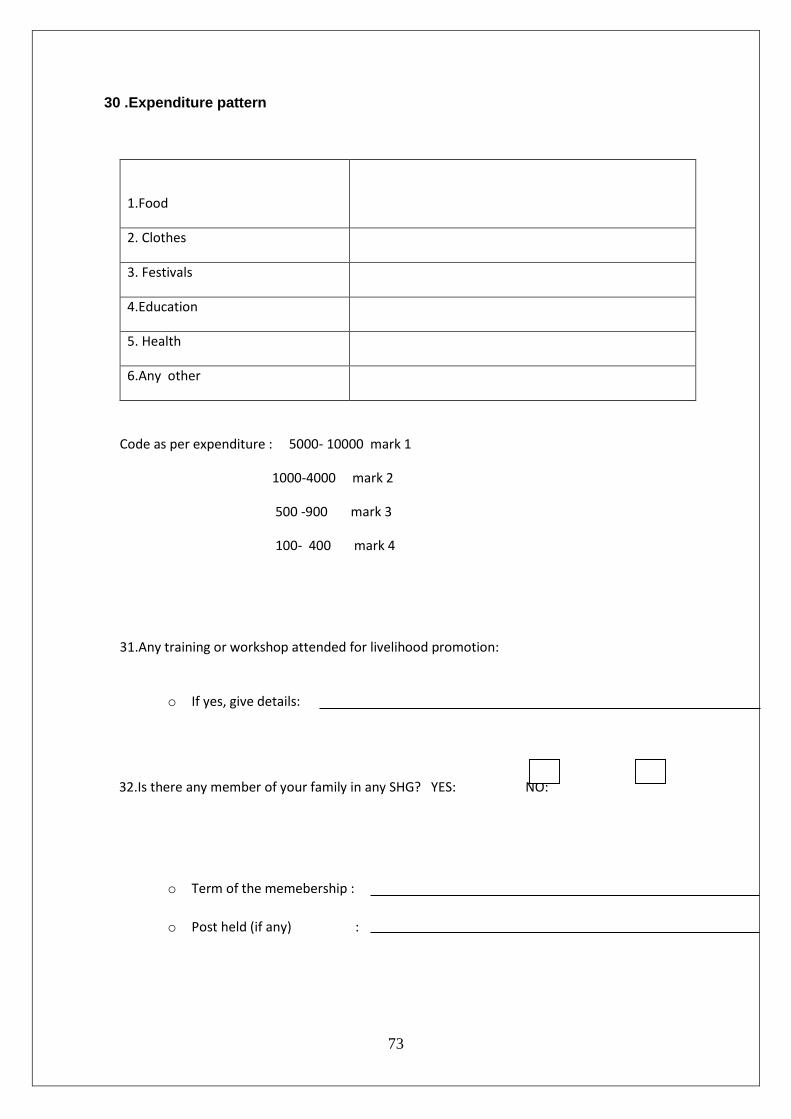
30 .Expenditure pattern
1.Food
2. Clothes
3. Festivals
4.Education
5. Health
6.Any other
Code as per expenditure : 5000- 10000 mark 1
1000-4000 mark 2
500 -900 mark 3
100- 400 mark 4
31.Any training or workshop attended for livelihood promotion:
o If yes, give details:
32.Is there any member of your family in any SHG? YES: NO:
o Term of the memebership :
o Post held (if any) :
74
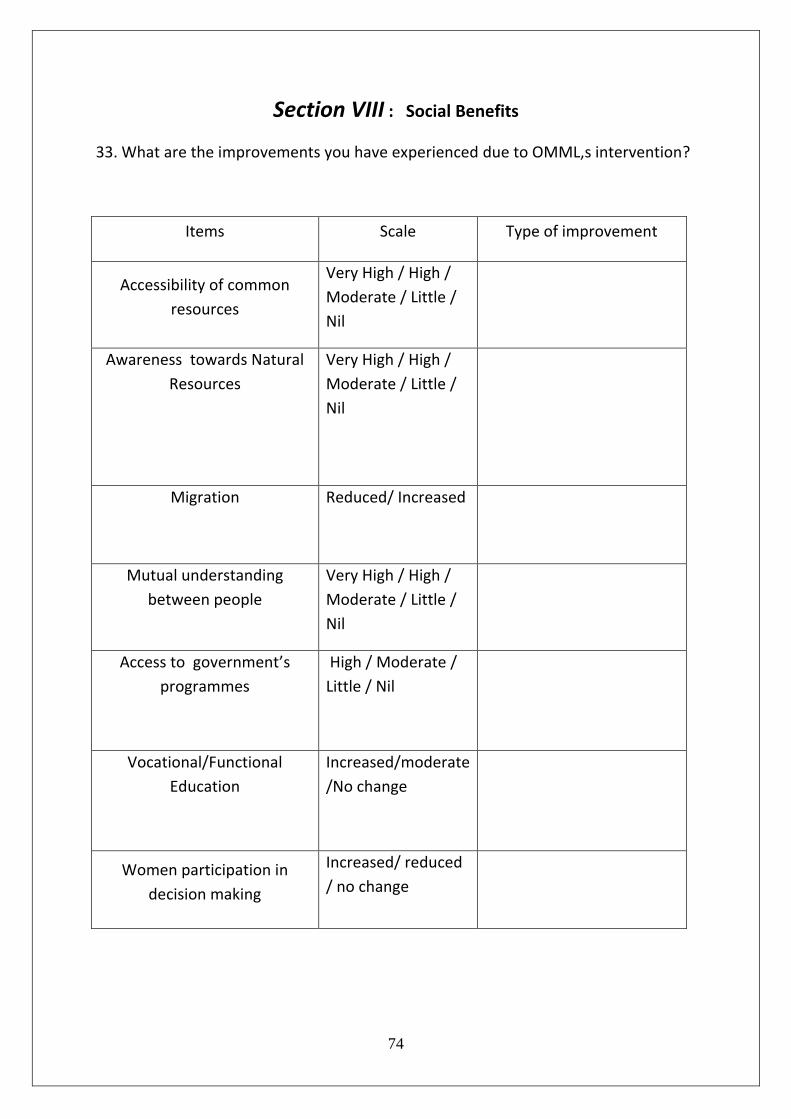
Section VIII : Social Benefits
33. What are the improvements you have experienced due to OMML,s intervention?
Items Scale Type of improvement
Accessibility of common
resources
Very High / High /
Moderate / Little /
Nil
Awareness towards Natural
Resources
Very High / High /
Moderate / Little /
Nil
Migration
Reduced/ Increased
Mutual understanding
between people
Very High / High /
Moderate / Little /
Nil
Access to government’s
programmes
High / Moderate /
Little / Nil
Vocational/Functional
Education
Increased/moderate
/No change
Women participation in
decision making
Increased/ reduced
/ no change
75
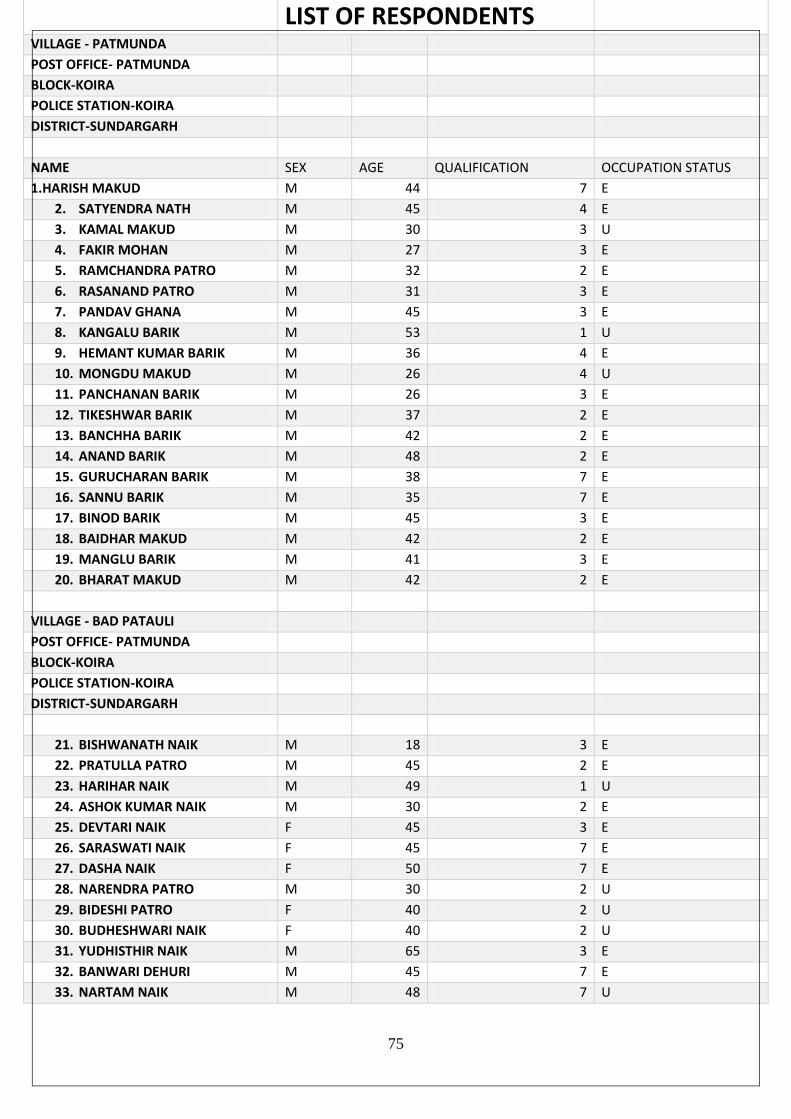
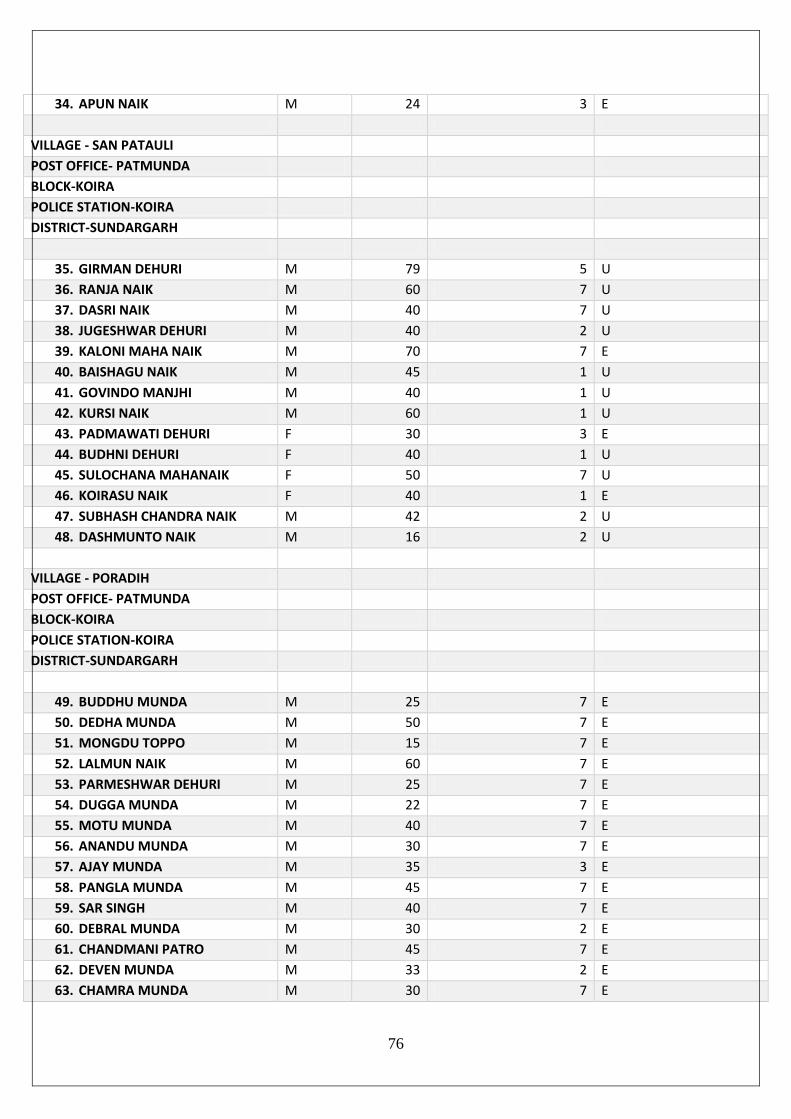
LIST OF RESPONDENTS VILLAGE - PATMUNDA
POST OFFICE- PATMUNDA
BLOCK-KOIRA
POLICE STATION-KOIRA
DISTRICT-SUNDARGARH
NAME SEX AGE QUALIFICATION OCCUPATION STATUS
1.HARISH MAKUD M 44 7 E
2. SATYENDRA NATH M 45 4 E
3. KAMAL MAKUD M 30 3 U
4. FAKIR MOHAN M 27 3 E
5. RAMCHANDRA PATRO M 32 2 E
6. RASANAND PATRO M 31 3 E
7. PANDAV GHANA M 45 3 E
8. KANGALU BARIK M 53 1 U
9. HEMANT KUMAR BARIK M 36 4 E
10. MONGDU MAKUD M 26 4 U
11. PANCHANAN BARIK M 26 3 E
12. TIKESHWAR BARIK M 37 2 E
13. BANCHHA BARIK M 42 2 E
14. ANAND BARIK M 48 2 E
15. GURUCHARAN BARIK M 38 7 E
16. SANNU BARIK M 35 7 E
17. BINOD BARIK M 45 3 E
18. BAIDHAR MAKUD M 42 2 E
19. MANGLU BARIK M 41 3 E
20. BHARAT MAKUD M 42 2 E
VILLAGE - BAD PATAULI
POST OFFICE- PATMUNDA
BLOCK-KOIRA
POLICE STATION-KOIRA
DISTRICT-SUNDARGARH
21. BISHWANATH NAIK M 18 3 E
22. PRATULLA PATRO M 45 2 E
23. HARIHAR NAIK M 49 1 U
24. ASHOK KUMAR NAIK M 30 2 E
25. DEVTARI NAIK F 45 3 E
26. SARASWATI NAIK F 45 7 E
27. DASHA NAIK F 50 7 E
28. NARENDRA PATRO M 30 2 U
29. BIDESHI PATRO F 40 2 U
30. BUDHESHWARI NAIK F 40 2 U
31. YUDHISTHIR NAIK M 65 3 E
32. BANWARI DEHURI M 45 7 E
33. NARTAM NAIK M 48 7 U
76
34. APUN NAIK M 24 3 E
VILLAGE - SAN PATAULI
POST OFFICE- PATMUNDA
BLOCK-KOIRA
POLICE STATION-KOIRA
DISTRICT-SUNDARGARH
35. GIRMAN DEHURI M 79 5 U
36. RANJA NAIK M 60 7 U
37. DASRI NAIK M 40 7 U
38. JUGESHWAR DEHURI M 40 2 U
39. KALONI MAHA NAIK M 70 7 E
40. BAISHAGU NAIK M 45 1 U
41. GOVINDO MANJHI M 40 1 U
42. KURSI NAIK M 60 1 U
43. PADMAWATI DEHURI F 30 3 E
44. BUDHNI DEHURI F 40 1 U
45. SULOCHANA MAHANAIK F 50 7 U
46. KOIRASU NAIK F 40 1 E
47. SUBHASH CHANDRA NAIK M 42 2 U
48. DASHMUNTO NAIK M 16 2 U
VILLAGE - PORADIH
POST OFFICE- PATMUNDA
BLOCK-KOIRA
POLICE STATION-KOIRA
DISTRICT-SUNDARGARH
49. BUDDHU MUNDA M 25 7 E
50. DEDHA MUNDA M 50 7 E
51. MONGDU TOPPO M 15 7 E
52. LALMUN NAIK M 60 7 E
53. PARMESHWAR DEHURI M 25 7 E
54. DUGGA MUNDA M 22 7 E
55. MOTU MUNDA M 40 7 E
56. ANANDU MUNDA M 30 7 E
57. AJAY MUNDA M 35 3 E
58. PANGLA MUNDA M 45 7 E
59. SAR SINGH M 40 7 E
60. DEBRAL MUNDA M 30 2 E
61. CHANDMANI PATRO M 45 7 E
62. DEVEN MUNDA M 33 2 E
63. CHAMRA MUNDA M 30 7 E
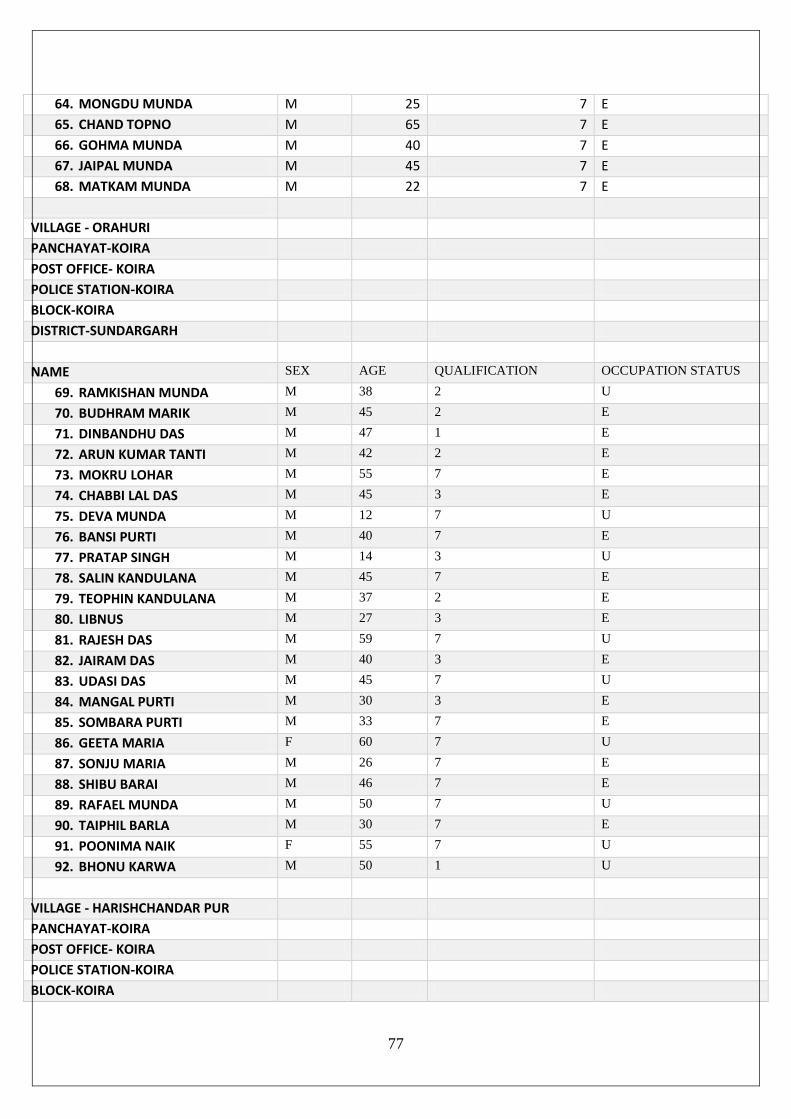
77
64. MONGDU MUNDA M 25 7 E
65. CHAND TOPNO M 65 7 E
66. GOHMA MUNDA M 40 7 E
67. JAIPAL MUNDA M 45 7 E
68. MATKAM MUNDA M 22 7 E
VILLAGE - ORAHURI
PANCHAYAT-KOIRA
POST OFFICE- KOIRA
POLICE STATION-KOIRA
BLOCK-KOIRA
DISTRICT-SUNDARGARH
NAME SEX AGE QUALIFICATION OCCUPATION STATUS
69. RAMKISHAN MUNDA M 38 2 U
70. BUDHRAM MARIK M 45 2 E
71. DINBANDHU DAS M 47 1 E
72. ARUN KUMAR TANTI M 42 2 E
73. MOKRU LOHAR M 55 7 E
74. CHABBI LAL DAS M 45 3 E
75. DEVA MUNDA M 12 7 U
76. BANSI PURTI M 40 7 E
77. PRATAP SINGH M 14 3 U
78. SALIN KANDULANA M 45 7 E
79. TEOPHIN KANDULANA M 37 2 E
80. LIBNUS M 27 3 E
81. RAJESH DAS M 59 7 U
82. JAIRAM DAS M 40 3 E
83. UDASI DAS M 45 7 U
84. MANGAL PURTI M 30 3 E
85. SOMBARA PURTI M 33 7 E
86. GEETA MARIA F 60 7 U
87. SONJU MARIA M 26 7 E
88. SHIBU BARAI M 46 7 E
89. RAFAEL MUNDA M 50 7 U
90. TAIPHIL BARLA M 30 7 E
91. POONIMA NAIK F 55 7 U
92. BHONU KARWA M 50 1 U
VILLAGE - HARISHCHANDAR PUR
PANCHAYAT-KOIRA
POST OFFICE- KOIRA
POLICE STATION-KOIRA
BLOCK-KOIRA
78
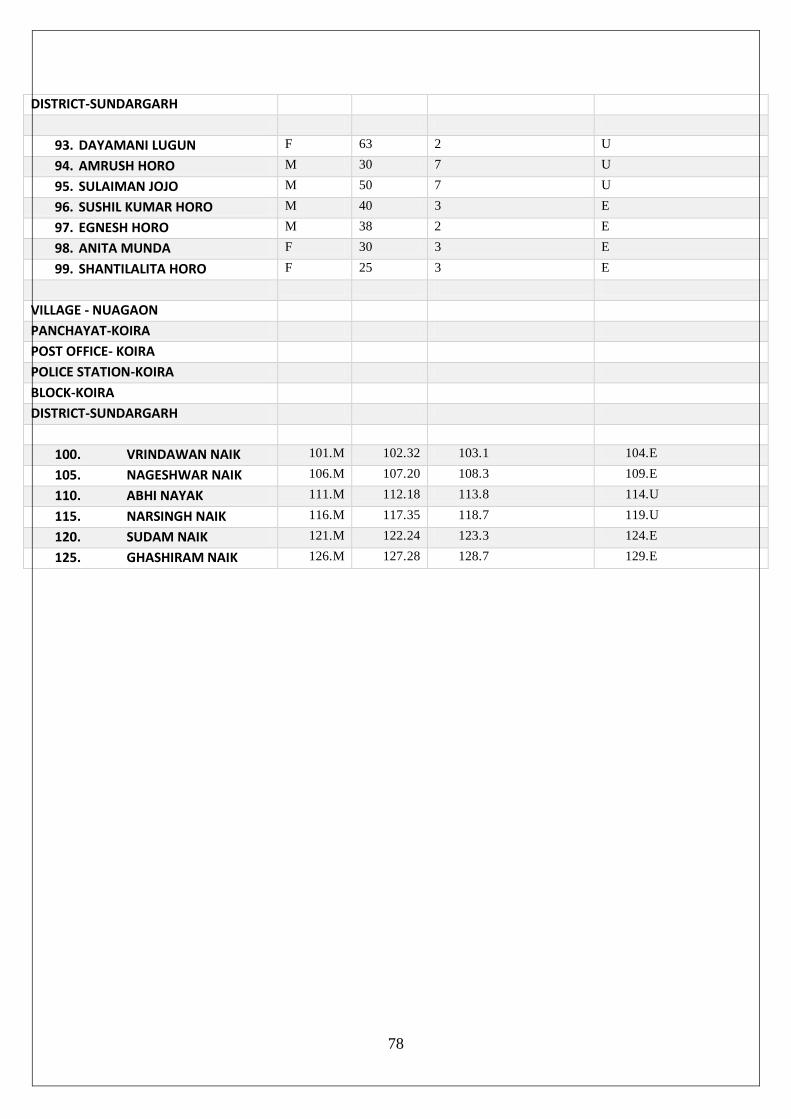
DISTRICT-SUNDARGARH
93. DAYAMANI LUGUN F 63 2 U
94. AMRUSH HORO M 30 7 U
95. SULAIMAN JOJO M 50 7 U
96. SUSHIL KUMAR HORO M 40 3 E
97. EGNESH HORO M 38 2 E
98. ANITA MUNDA F 30 3 E
99. SHANTILALITA HORO F 25 3 E
VILLAGE - NUAGAON
PANCHAYAT-KOIRA
POST OFFICE- KOIRA
POLICE STATION-KOIRA
BLOCK-KOIRA
DISTRICT-SUNDARGARH
100. VRINDAWAN NAIK 101. M 102. 32 103. 1 104. E
105. NAGESHWAR NAIK 106. M 107. 20 108. 3 109. E
110. ABHI NAYAK 111. M 112. 18 113. 8 114. U
115. NARSINGH NAIK 116. M 117. 35 118. 7 119. U
120. SUDAM NAIK 121. M 122. 24 123. 3 124. E
125. GHASHIRAM NAIK 126. M 127. 28 128. 7 129. E

79